UNITED STATES
SECURITIES AND EXCHANGE COMMISSION
Washington, D.C. 20549
FORM N-CSR
CERTIFIED SHAREHOLDER REPORT OF REGISTERED
MANAGEMENT INVESTMENT COMPANIES
Investment Company Act file number 811-22525
Managed Portfolio Series
(Exact name of registrant as specified in charter)
615 East Michigan Street
Milwaukee, WI 53202
(Address of principal executive offices) (Zip code)
Brian R. Wiedmeyer, President
Managed Portfolio Series
c/o U.S. Bancorp Fund Services, LLC
777 East Wisconsin Ave, 5th Fl
Milwaukee, WI 53202
(Name and address of agent for service)
(414) 765-6844
Registrant’s telephone number, including area code
Date of fiscal year end: November 30, 2020
Date of reporting period: November 30, 2020
Updated August 1, 2011
Item 1. Reports to Stockholders.

2020 Annual Report
November 30, 2020

Tortoise North American Pipeline Fund
NYSE Arca:TPYP
Ecofin Global Water ESG Fund
NYSE Arca: EBLU
Ecofin Digital Payments Infrastructure Fund
NYSE Arca:TPAY
www.TortoiseEcofin.com
Tortoise
2020 Annual Report
Table of Contents
TortoiseEcofin
2020 Annual Report | November 30, 2020
Sector allocations
| Name/Ticker | | Primary focus | | Total assets
($ Millions)1 | | By asset type2 | | By ownership structure2 |
Tortoise North American Pipeline Fund NYSE Arca: TPYP Inception: 6/29/2015 | | North American pipeline companies | | | $367.3 | | | 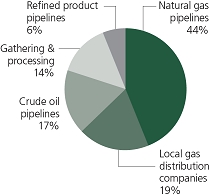 | | 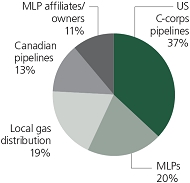 |
| Name/Ticker | | Primary focus | | Total assets
($ Millions)1 | | By sector2 | | By geography2 |
Ecofin Global Water ESG Fund CBOE Bzx: EBLU Inception: 2/14/2017 | | Water companies | | | $23.6 | | | 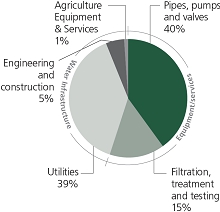 | | 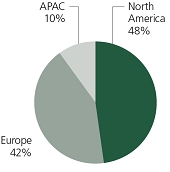 |
| Name/Ticker | | Primary focus | | Total assets
($ Millions)1 | | By sector2 | | By revenue2 |
Ecofin Digital Payments Infrastructure Fund CBOE Bzx: TPAY Inception: 1/31/2019 | | Digital payment companies | | | $9.0 | | | 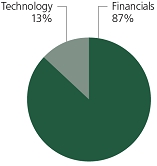 | | 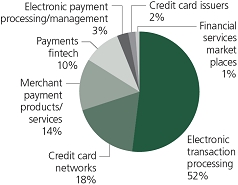 |
1 As of 12/31/2020
2 As of 11/30/2020
| | (unaudited) |
| | |
| TortoiseEcofin | 1 |
Letter to shareholders
Dear shareholder,
Tortoise invests in essential assets and creates product solutions that allow investors to participate in the opportunities, innovations and development of these critical and essential assets including energy infrastructure, sustainable water and digital payments.
The 2020 fiscal year, ending on November 30, 2020 was certainly like no other. The COVID-19 global pandemic affected every part of our lives and the essential asset in which we invest. Energy demand concerns and volatile commodity prices plagued the energy sector. Sustainable water had a strong year propelled even higher by the growth in sustainable investing and desire to make an impact through investments. Digital payments became critical as the pandemic underscored the need for contactless payments. As we move into 2021, with COVID-19 vaccinations being administered throughout the world driving energy demand toward pre-COVID-19 levels and the push toward cleaner energy gaining momentum, we are optimistic that 2021 will be a strong year for investors in these essential assets sectors.
Energy value chain
The broader energy sector, as represented by the S&P Energy Select Sector® Index, finished the fourth fiscal quarter ending November 30, 2020 in positive territory, returning 4.9%, bringing fiscal year 2020 performance to -31.7%. Energy markets and prices experienced significant volatility throughout the fiscal year driven by the uncertainty around energy demand due to COVID-19, concerns over the massively oversupplied global oil market in April, and ultimately a recovery in the latter part of 2020. Looking ahead to 2021, all eyes are focused on energy demand and the subsequent rollout of COVID-19 vaccinations. Pfizer and Moderna’s November announcements of positive data regarding their vaccines for COVID-19 led to a stock market surge, with beaten down energy companies leading the charge, along with commodities such as crude oil. With the growing belief in vaccine success and visibility to significantly improved economic activity, 2021 energy demand growth could exceed anything ever seen on a year-over-year basis.
Following the price war between Saudi Arabia and Russia in early March, the Organization of Petroleum Exporting Countries (OPEC) and their Non-OPEC partners (OPEC+) announced deep production cuts with a clear goal of balancing the global crude oil market. The market dramatically shifted from an approximate 20 million barrels per day (b/d) surplus in April to an approximate 4 million b/d deficit in July, providing the path for market rebalancing. Overall adherence to the production cut agreement remained strong in the second half of 2020 leading to inventory draws. Entering 2021, the global crude oil market remains in deficit, supported by the OPEC+ crude oil production cut agreement, and expected inventory draws are expected to continue throughout 2021.
U.S. crude oil production declined in 2020 in response to the supply-demand imbalance resulting from the economic shutdowns and stay-at-home orders in March and April. This resulted in the first annual decline in U.S. production since 2016. Specifically, U.S. crude oil production fell from a record 12.9 million barrels per day (b/d) in November 2019 to 11.2 million b/d in November 20201. EIA forecasts that U.S. crude oil production will average 11.1 million b/d in 2021.
For U.S. producers, 2020 was a year of change. The COVID-19 pandemic accelerated producers’ capital discipline as investors focused on higher free cash flow generation and return of capital to shareholders. This free-cash-flow emphasis led to a host of merger and acquisition deals as exploration and production companies prioritized the importance of scale, diversity and strengthening balance sheets in a challenging oil price environment.
While oil dominated the headlines, natural gas continued to provide a cleaner burning source. As a result, we continue to see natural gas as a critical source of energy supply going forward. During the 2020 fiscal year, a reduction in natural gas demand caused by COVID-19 initially resulted in the convergence of global natural gas prices. However, in the final months of the year, LNG exports from the U.S. rapidly shot back up driven by increasing demand for natural gas in Asia and resulting in Asian gas prices trading at a premium relative to the U.S. Henry Hub prices. Domestically, the backdrop of slowing production growth and strong domestic and export demand paints a picture of improving natural gas fundamentals in the future. Rising U.S. energy exports of liquids and natural gas are expected to positively affect the U.S. trade deficit and to ultimately help reduce global CO2emissions, along with renewables, as they take market share from coal.
Midstream energy outperformed broader energy in the fourth fiscal quarter and the fiscal year with the Tortoise North American Pipeline IndexSM returning 6.3% and the Tortoise MLP Index® returning 11.2%, bringing fiscal year performance to -15.8% and -23.6%, respectively. There were several contributors to midstream energy’s negative performance for the fiscal year including: negative energy sentiment following energy demand uncertainty, excess pipeline takeaway capacity related to the COVID-19 pandemic resulting in lower production, and political rhetoric focused on an energy transition to cleaner energy sources. Midstream companies structured as C-Corporations continued to benefit from several items versus MLPs, including: stronger corporate governance, broad market index inclusion for some companies, lack of K-1s, and a more certain corporate structure.
There were a couple of positive themes standing out for midstream businesses throughout the fiscal year. First, resiliency. Resilient cash flows confirm the essential nature of the assets that midstream businesses operate. Strong contractual obligations (take or pay contracts) and customer profiles (large, investment grade rated counterparties) helped midstream energy companies generate consistent cash flow from operations even in the low and volatile 2020 price environment. At the onset of the COVID-19 pandemic, we forecasted midstream earnings before interest, taxes, depreciation, and amortization (EBITDA) declining 5%-10% in 2020. However, heading into the final months of 2020, companies revised their forecasts higher and EBITDA is expected to be only be down 4% for the year. Notably, companies with significant natural gas businesses and/or take or pay contracts reaffirmed guidance, whereas others with cash flows tied to wellhead volumes provided a wider range of outcomes.
The other clear trend in earnings was virtually every midstream energy company transitioning to a capital allocation focused on positive free-cash-flow after dividends. This is a stark change made
| (unaudited) | |
| | |
| 2 | TortoiseEcofin |
2020 Annual Report | November 30, 2020
possible by declining capital expenditures for midstream projects and sale of non-core assets. We forecast growth capex to decline by approximately $16 billion YTD as midstream rationalizes project spending. This shift in spending has allowed the midstream sector to not only be free cash flow positive, but materially so, especially compared to other asset classes and the S&P 500. In 2021, midstream companies are expected to have $8 billion of free cash flow after distributions and by 2024 we expect $21 billion of free cash flow after distributions.
We believe midstream companies will more directly return cash flow to shareholders in the form of dividends, debt reduction and share buybacks. While continuing to pay out very high dividend yields, we are advocating for companies to utilize stock buybacks to create their own flows and help turn the tide on stock performance. The numbers show that this can be achieved this while still reducing leverage in a meaningful way.
During the last few months of the fiscal year, the buyback announcements started coming in earnest. In early October, Targa Resources (TRGP) announced a $500 million stock buyback program. MPLX and Plains All American followed suit, announcing significant buyback programs for $1 billion and $500 million, respectively. In total, 10 midstream companies announced share buyback programs in 2020, including six during the fourth quarter. We believe the forthcoming free cash flow and share buyback themes can help can drive sustainable outperformance for the midstream sector.
One of the key regulatory announcements of 2020 was the Army Corps of Engineers announcing it began work on an environmental impact statement for the Dakota Access Pipeline, something the district court requested for the better part of the year. Another requirement of the court was that the Corps determine a remedy for the fact that the pipeline no longer has a permit to cross Federal land. The Corps stated that it would require no immediate action and that it does not think the court has jurisdiction over the matter. We are closely monitoring Dakota Access Pipeline developments as the fate of the pipeline impacts several midstream companies. In other pipeline news, in July, the Supreme Court agreed to reinstate streamlined permitting for pipelines across the country, except for Keystone XL. This is positive for the Mountain Valley Pipeline, Equitrans’ 300+ mile natural gas pipeline which is nearing completion after a series of several delays. Construction of the pipeline continues, and we expect for it to be in service within the next year.
While the 2020 presidential election created headline risks for the energy sector, we believe the consensus path forward for the Biden Administration will focus on getting Americans back to work with supportive policies versus policies aimed at opposing the oil and gas industry or destroying jobs. The predominant theme around Biden’s energy plan is to address climate change and create substantial job opportunities for Americans. The topic of climate change and related opportunities for the overall economy was one of the four pillars of the convention platform, integrated into an overall vision of revitalization of America. We expect market economics to dictate the trajectory of future energy supply and demand. Renewables and natural gas are more economic than coal in generating electricity and will likely continue to take share, while crude oil will likely remain the predominant fuel source in the transportation sector for the near future.
Finally, despite past comments early on during the campaign, we do not expect a ban on fracking. It is worth noting that under the Obama Administration, the ban on crude oil exports was lifted which was supportive of the energy industry. Ironically, regulatory pressures have the potential to tighten new supply, pushing oil and gas prices up, and making existing infrastructure more valuable.
2020 also ushered in continued questions about midstream energy’s role in an energy transition environment. During the fiscal year there were three oil majors, Shell, Total SE and BP, that openly discussed a path forward around renewable energy. The European Union (EU) moved further towards renewables and 7 of the 10 largest economies stated their intention to have net-zero emissions by 2050. While the energy transition will take time to play out, midstream management teams openly discussed the role their companies could play in such a transition. Pipeline infrastructure, for example, could be repurposed to transport hydrogen. As the world continues to demand more energy and less carbon, we are encouraging midstream companies to view energy transition opportunistically.
Within the downstream portion of the energy value chain, the refining sector remained among the most challenged sectors in 2020 due to the COVID-19 pandemic. Refinery utilization has recovered from the depths of the economic contraction in March and April but remains below 2019 levels. Permanent refinery closures have and should continue to help balance the market from a supply and demand perspective. From a U.S. refined product standpoint, we believe gasoline and diesel will continue to inch towards pre-COVID levels during 2021 while a slower recovery should be expected in jet fuel. As U.S. energy demand recovers in 2021, U.S. refinery utilization and throughput should exhibit strong growth and return to more normalized levels.
Natural gas liquids, unlike the refining sector, has proved resilient despite challenges faced during the COVID-19 pandemic. Strength can be seen in LPGs (liquid petroleum gases) where demand is driven by global population growth and improvements in living standards in Asia, notably in China and India.
Water
The water sector, as measured by the Ecofin Global Water ESG Index, returned 11.1% during the fourth fiscal quarter, bringing the fiscal year ending November 30, 2020 return to 17.2%. Water infrastructure was the strongest performing sub-sector during the period. This was driven by continued strong momentum from engineering & construction (E&C) water companies focusing on “green” infrastructure, which are expected to benefit from the potential infrastructure package promoted by President Joe Biden. The Equipment and Services subsector saw a strong rebound at the end of the period driven by broader economic strength and improved visibility to the economic recovery following the announcement of the Pfizer and Moderna’s successful vaccines and additional U.S. stimulus.
Our outlook for the water sector remains favorable heading into 2021. We see tailwinds for the Equipment and Services subsector due the continued economic recovery and robust investment in water infrastructure and technology. Companies within the subsector that offer innovative technologies are expected to produce leading
| (unaudited) | |
| | |
| TortoiseEcofin | 3 |
growth and profitability as COVID-19 has accelerated the adoption of technologies enabling digitalization and automation of operations. Our outlook for regulated water utilities remains constructive as well, with the group producing attractive earnings growth driven by significant capex programs and elevated merger and acquisition activity. As a whole, we believe the sector will continue to benefit from growing ESG fund flows as investor appetite for sustainable investments increases.
Digital payments
The Ecofin Global Digital Payments Infrastructure Index returned 9.3% during the fourth fiscal quarter, bringing the fiscal year return to 31.3%. While COVID-19 has underscored the need for contactless payments and accelerated its adoption, both Visa and Mastercard saw strong trends globally toward contactless payments even pre-COVID. While there are many drivers of contactless adoption such as increased customer experience and safety and cleanliness, the drivers most likely to boost adoption will be acceptance and convenience. For consumers, this can help to avoid waiting in line and the need to carry physical cards or tickets. For businesses this means a more automated and efficient process that requires less maintenance. One important sign of adoption is the growth of contactless payments under $25. Historically, this price range was dominated by cash, so reports of this growth are a major indicator of more broad adoption2. We think that contactless payments is just one segment of digital payment infrastructure that is poised to grow. We believe there are several tailwinds for the sector that may provide investment opportunities now and into the future.
Concluding thoughts
We believe that energy infrastructure is poised for a strong rebound in 2021. Sustainable water is positioned well as investors continue to look for impact investments. And we don’t believe the tailwinds for digital payments will stop with the end of the pandemic. We are positioning the funds to take advantage of these trends and have an optimistic outlook for 2021 and beyond.
The S&P 500® Index is an unmanaged market-value weighted index of stocks, which is widely regarded as the standard for measuring large-cap U.S. stock market performance. The S&P Energy Select Sector® Index is |a capitalization-weighted index of S&P 500® Index companies in the energy sector involved in the development or production of energy products. The Tortoise North American Oil and Gas Producers IndexSM is a float-adjusted, capitalization-weighted index of North American energy companies engaged primarily in the production of crude oil, condensate, natural gas or natural gas liquids (NGLs). The Tortoise North American Pipeline IndexSM is a float adjusted, capitalization-weighted index of energy pipeline companies domiciled in the United States and Canada. The Tortoise MLP Index® is a float-adjusted, capitalization-weighted index of energy master limited partnerships. The Tortoise Global Water ESG IndexSM is a proprietary, rules-based, modified
capitalization-weighted, float-adjusted index comprised of companies that are materially engaged in the water infrastructure or water management industries. The Tortoise Global Digital Payments Infrastructure IndexSM is a proprietary, rules-based, modified market capitalization-weighted, float-adjusted index comprised of companies that are materially engaged in digital payments, including merchant processing and settlement, real time record keeping, settlement networks, and fintech products/services that facilitate the ease, efficiency and speed of electronic transactions. This includes companies whose primary business is comprised of one or a combination of the following categories: credit card networks, electronic transaction processing and associated products/services, credit card issuers, electronic transaction processing software (payments fintech) or online financial services market places.
TIS Advisors has contracted with S&P Opco, LLC (a subsidiary of S&P Dow Jones Indices LLC) to calculate and maintain the Tortoise MLP Index®, Tortoise North American Pipeline IndexSM, Tortoise North American Oil and Gas Producers IndexSM and Tortoise Global Water ESG IndexSM. These Indices are not sponsored by S&P Dow Jones Indices or its affiliates or its third party licensors (collectively, “S&P Dow Jones Indices LLC”). S&P Dow Jones Indices will not be liable for any errors or omission in calculating these Indices. “Calculated by S&P Dow Jones Indices” and its related stylized mark(s) are service marks of S&P Dow Jones Indices and have been licensed for use by TIS Advisors and its affiliates. S&P® is a registered trademark of Standard & Poor’s Financial Services LLC (“SPFS”), and Dow Jones® is a registered trademark of Dow Jones Trademark Holdings LLC (“Dow Jones”).
TIS Advisors has contracted with Solactive AG (“Solactive”) to calculate the Tortoise Global Digital Payments Infrastructure IndexSM. The financial instrument that is based on the index is not sponsored, endorsed, promoted or sold by Solactive in any way, and Solactive makes no express or implied representation, guarantee or assurance with regard to: (a) the advisability in investing in the financial instruments; (b) the quality, accuracy and/or completeness of these indices or the calculations thereof; and/or (c) the results obtained or to be obtained by any person or entity from the use of the index.
Tortoise Indices are the exclusive property of TIS Advisors.
Free cash flow is the cash a company produces through its operations, less the cost of total capital expenditures (growth and maintenance).
It is not possible to invest directly in an index.
Performance data quoted represents past performance; past performance does not guarantee future results. Like any other stock, total return and market value will fluctuate so that an investment, when sold, may be worth more or less than its original cost.
1. Energy Information Administration, December 2020 STEO
2. Barclays Equity Research “The transition to cash-light societies”, June 25, 2020
| (unaudited) | |
| | |
| 4 | TortoiseEcofin |
2020 Annual Report | November 30, 2020
Tortoise North American Pipeline Fund
Top ten holdings (as of November 30, 2020)
| 1. | | Kinder Morgan, Inc. | 7.6% |
| 2. | | Enterprise Products Partners L.P. | 7.1% |
| 3. | | The Williams Companies, Inc. | 7.0% |
| 4. | | Enbridge Inc. | 6.9% |
| 5. | | TC Energy Corporation | 6.6% |
| 6. | | ONEOK, Inc. | 5.1% |
| 7. | | Cheniere Energy, Inc. | 4.3% |
| 8. | | NiSource Inc. | 4.1% |
| 9. | | Pembina Pipeline Corporation | 4.0% |
| 10. | | Energy Transfer LP | 3.8% |
TPYP key benefits
| • | Access to the sizable pipeline network of one of the world’s largest consumers of energy |
| | |
| • | Attractive total return potential in a historically defensive sector |
| | |
| • | Flow-through structure allows for tax-efficient access to the pipeline sector |
| | |
| • | Exposure to Tortoise North American Pipeline IndexSM |
| | |
| | – | Effectively represents the characteristics of the market |
| | | |
| | – | A leading benchmark for analysis of the pipeline sector |
| | | |
| | – | Proprietary, research-driven and rules-based methodology |
| | | |
| | – | Constituent caps to allow for broader representation of the market and investability |
Value of $10,000 vs. Tortoise North American Pipeline IndexSM
Since inception on June 29, 2015 through November 30, 2020
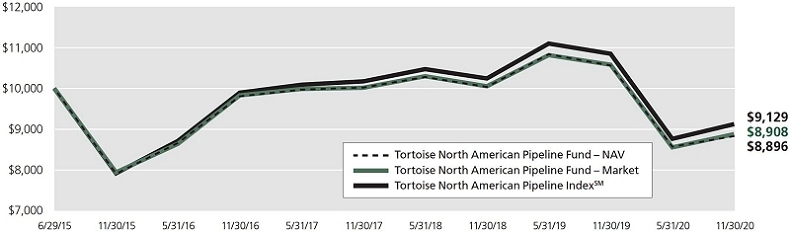
This chart illustrates the performance of a hypothetical $10,000 investment made on June 29, 2015 and is not intended to imply any future performance. The returns shown do not reflect the deduction of taxes that a shareholder would pay on the fund’s distributions or the redemption of fund shares. The chart assumes reinvestment of capital gains and dividends for the fund and dividends for the index.
The performance data quoted above represents past performance since June 29, 2015 through November 30, 2020. Past performance is no guarantee of future results. The investment return and value of an investment will fluctuate so that an investor’s shares, when redeemed, may be worth more or less than their original cost. Current performance of the fund may be obtained through the most recent month-end by calling 844-TR-INDEX (844-874-6339). Future performance may be lower or higher than the performance stated above.
The Tortoise North American Pipeline IndexSM is a float-adjusted, capitalization weighted index of pipeline companies headquartered in the United States and Canada. Returns include reinvested dividends. You cannot invest directly in an index.
| (unaudited) | |
| | |
| TortoiseEcofin | 5 |
Tortoise North American Pipeline Fund (continued)
Total returns (as of November 30, 2020)
| Ticker | 1 year | | 3 year | | 5 year | | Since inception(1) | | Gross expense ratio |
| TPYP @ Market | | -15.76% | | | | -3.82% | | | | 2.30% | | | | -2.10% | | | | 0.40% | |
| TPYP @ NAV | | -15.74% | | | | -3.88% | | | | 2.36% | | | | -2.13% | | | | 0.40% | |
| S&P 500® Index(2) | | 17.46% | | | | 13.17% | | | | 13.99% | | | | 13.25% | | | | — | |
| TNAPT(3) | | -15.83% | | | | -3.54% | | | | 2.86% | | | | -1.67% | | | | — | |
| | |
| (1) | Reflects period from fund inception on June 29, 2015 through November 30, 2020. |
| (2) | The S&P 500® Index is an unmanaged market-value weighted index of stocks, which is widely regarded as the standard for measuring large-cap U.S. stock market performance. Returns include reinvested dividends. You cannot invest directly in an index. |
| (3) | The Tortoise North American Pipeline IndexSM is a float-adjusted, capitalization weighted index of pipeline companies headquartered in the United States and Canada. You cannot invest directly in an index. |
Note: For periods over 1 year, performance reflected is for the average annual returns.
Performance data quoted represents past performance; past performance does not guarantee future results. The investment return and principal value of an investment will fluctuate so that an investor’s shares, when redeemed, may be worth more or less than their original cost. Current performance of the portfolio may be lower or higher than the performance quoted. Performance data current to the most recent month end may be obtained by calling 844-TR-INDEX (844-874-6339).
| (unaudited) | |
| | |
| 6 | TortoiseEcofin |
2020 Annual Report | November 30, 2020
Ecofin Global Water ESG Fund
Top ten holdings (as of November 30, 2020)
| 1. | | Ferguson PLC | 8.0% |
| 2. | | Xylem, Inc. | 7.5% |
| 3. | | American Water Works Co., Inc. | 7.3% |
| 4. | | Geberit AG | 7.1% |
| 5. | | Veolia Environnement SA | 5.6% |
| 6. | | Essential Utilities, Inc. | 4.4% |
| 7. | | A.O. Smith Corporation | 4.2% |
| 8. | | Pentair PLC | 4.2% |
| 9. | | Suez | 3.9% |
| 10. | | United Utilities Group PLC | 3.9% |
EBLU key benefits
| • | Provides access to the water infrastructure, management and treatment companies that we believe appear poised to benefit from the expected and much needed investment in rebuilding existing infrastructure, constructing new infrastructure and better managing this vital, but finite resource |
| | |
| • | Flow-through ETF structure provides tax-efficient access to the water sector |
| | |
| • | Purest exposure to the water industry by incorporating a fundamental weighting aspect |
| | |
| • | Continuous liquidity |
| | |
| • | Exposure to the Ecofin Global Water ESG Index® |
| | |
| | – | Proprietary, rules-based, research-driven methodology |
| | | |
| | – | Fundamental weighting technique provides significant direct exposure to the water industry |
| | | |
| | – | A leading benchmark for analysis of the water sector |
| | | |
| | – | Backed by Tortoise’s proprietary fundamental research and index generation process |
Value of $10,000 vs. Ecofin Global Water ESG Index®
Since inception on February 14, 2017 through November 30, 2020
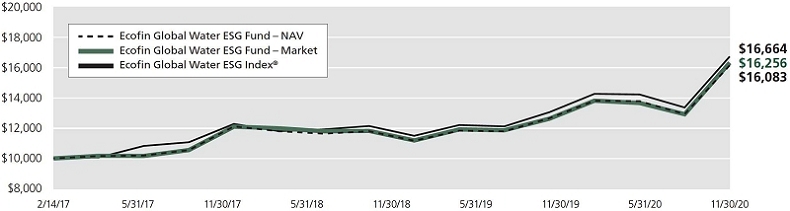
This chart illustrates the performance of a hypothetical $10,000 investment made on February 14, 2017 and is not intended to imply any future performance. The returns shown do not reflect the deduction of taxes that a shareholder would pay on the fund’s distributions or the redemption of fund shares. The chart assumes reinvestment of capital gains and dividends for the fund and dividends for the index.
The performance data quoted above represents past performance since February 14, 2017 through November 30, 2020. Past performance is no guarantee of future results. The investment return and value of an investment will fluctuate so that an investor’s shares, when redeemed, may be worth more or less than their original cost. Current performance of the fund may be obtained through the most recent month-end by calling 844-TR-INDEX (844-874-6339). Future performance may be lower or higher than the performance stated above.
The Ecofin Global Water ESG Index® is a proprietary, rules-based, modified capitalization-weighted, float-adjusted index comprised of companies that are materially engaged in the water infrastructure or water management industries. Water infrastructure companies’ principal business is providing public water distribution or supporting water distribution infrastructure via equipment or engineering and construction. Water management companies’ primary business is providing technologies or products that manage or facilitate water distribution and usage, including the fields of water efficiency, water treatment and irrigation. You cannot invest directly in an index.
| (unaudited) | |
| | |
| TortoiseEcofin | 7 |
Ecofin Global Water ESG Fund (continued)
Total returns (as of November 30, 2020)
| Ticker | 1 year | | 3 year | | Since inception(1) | | Gross expense ratio |
| EBLU @ Market | | 18.02% | | | | 10.41% | | | | 13.67% | | | | 0.40% | |
| EBLU @ NAV | | 16.80% | | | | 9.96% | | | | 13.35% | | | | 0.40% | |
| S&P 500® Index(2) | | 17.46% | | | | 13.17% | | | | 14.45% | | | | — | |
| Ecofin Global Water ESG Index®(3) | | 17.16% | | | | 10.78% | | | | 14.42% | | | | — | |
| | |
| (1) | Reflects period from fund inception on February 14, 2017 through November 30, 2020. |
| (2) | The S&P 500® Index is an unmanaged market-value weighted index of stocks, which is widely regarded as the standard for measuring large-cap U.S. stock market performance. Returns include reinvested dividends. You cannot invest directly in an index. |
| (3) | The Ecofin Global Water ESG Index® is a proprietary, rules-based, modified capitalization-weighted, float-adjusted index comprised of companies that are materially engaged in the water infrastructure or water management industries. Water infrastructure companies’ principal business is providing public water distribution or supporting water distribution infrastructure via equipment or engineering and construction. Water management companies’ primary business is providing technologies or products that manage or facilitate water distribution and usage, including the fields of water efficiency, water treatment and irrigation. You cannot invest directly in an index. |
Note: For periods over 1 year, performance reflected is for the average annual returns.
Performance data quoted represents past performance; past performance does not guarantee future results. The investment return and principal value of an investment will fluctuate so that an investor’s shares, when redeemed, may be worth more or less than their original cost. Current performance of the portfolio may be lower or higher than the performance quoted. Performance data current to the most recent month end may be obtained by calling 844-TR-INDEX (844-874-6339).
| (unaudited) | |
| | |
| 8 | TortoiseEcofin |
2020 Annual Report | November 30, 2020
Ecofin Digital Payments Infrastructure Fund
Top ten holdings (as of November 30, 2020)
| 1. | | Worldline SA | 6.5% |
| 2. | | Square, Inc. | 5.7% |
| 3. | | Discover Financial Services | 5.4% |
| 4. | | Adyen N.V. | 4.7% |
| 5. | | Fiserv, Inc. | 4.7% |
| 6. | | Afterpay Touch Group Limited | 4.7% |
| 7. | | Global Payments Inc. | 4.5% |
| 8. | | American Express Company | 4.5% |
| 9. | | FleetCor Technologies Inc. | 4.4% |
| 10. | | PayPal Holdings, Inc. | 4.3% |
TPAY key benefits
| • | The fund invests in companies that we believe have the potential to benefit as the world continues to evolve from traditional cash payments to the speed, accuracy and efficiency of digital payments |
| | |
| • | Access to all participants in the fee-based credit card value chain, including merchant acquirers, processors, networks and issuers |
| | |
| • | Exposure to new forms of digital payments, such as mobile, point-of-sale devices and P2P matching engines |
| | |
| • | Market cap and liquidity filters that provide a comparatively high level of liquidity |
Value of $10,000 vs. Tortoise Global Digital Payments Infrastructure IndexSM
Since inception on January 31, 2019 through November 30, 2020
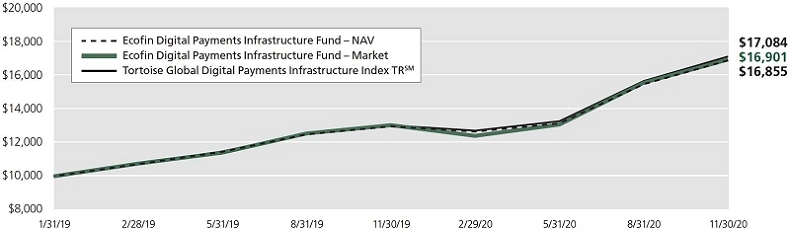
This chart illustrates the performance of a hypothetical $10,000 investment made on January 31, 2019, and is not intended to imply any future performance. The returns shown do not reflect the deduction of taxes that a shareholder would pay on the fund’s distributions or the redemption of fund shares. The chart assumes reinvestment of capital gains and dividends for the fund and dividends for the index.
Performance data quoted above represents past performance since January 31, 2019 through November 30, 2020. Past performance is no guarantee of future results. The investment return and value of an investment will fluctuate so that an investor’s shares, when redeemed, may be worth more or less than their original cost. Current performance of the fund may be obtained through the most recent month-end by calling 844-TR-INDEX (844-874-6339). Future performance may be lower or higher than the performance stated above.
The Tortoise Global Digital Payments Infrastructure IndexSM represents the existing global digital payments landscape. It is a proprietary, rules-based, modified market capitalization-weighted, float-adjusted index comprised of companies that are materially engaged in digital payments, including merchant processing and settlement, real time record keeping, settlement networks, and fintech products/services that facilitate the ease, efficiency and speed of electronic transactions.
| (unaudited) | |
| | |
| TortoiseEcofin | 9 |
Ecofin Digital Payments Infrastructure Fund (continued)
Total returns (as of November 30, 2020)
| Ticker | 1 year | | Since inception(1) | | Gross expense ratio |
| TPAY @ Market | | 29.79% | | | | 33.21% | | | | 0.40% | |
| TPAY @ NAV | | 30.17% | | | | 33.01% | | | | 0.40% | |
| S&P 500® Index(2) | | 17.46% | | | | 19.62% | | | | — | |
| Tortoise Global Digital Payments IndexSM(3) | | 31.25% | | | | 34.00% | | | | — | |
| | |
| (1) | Reflects period from fund inception on January 31, 2019 through November 30, 2020. |
| | |
| (2) | The S&P 500® Index is an unmanaged market-value weighted index of stocks, which is widely regarded as the standard for measuring large-cap U.S. stock market performance. Returns include reinvested dividends. You cannot invest directly in an index. |
| | |
| (3) | The Tortoise Global Digital Payments Infrastructure IndexSM represents the existing global digital payments landscape. It is a proprietary, rules-based, modified market capitlization-weighted, float-adjusted index comprised of companies that are materially engaged in digital payments, including merchant processing and settlement, real time record keeping, settlement networks, and fintech products/services that facilitate the ease, efficiency and speed of electronic transactions. |
Performance data quoted represents past performance; past performance does not guarantee future results. The investment return and principal value of an investment will fluctuate so that an investor’s shares, when redeemed, may be worth more or less than their original cost. Current performance of the portfolio may be lower or higher than the performance quoted. Performance data current to the most recent month end may be obtained by calling 844-TR-INDEX (844-874-6339).
| (unaudited) | |
| | |
| 10 | TortoiseEcofin |
2020 Annual Report | November 30, 2020
Tortoise North American Pipeline Fund
Investing involves risk. Principal loss is possible. The Fund has the same risks as the underlying securities traded on the exchange throughout the day. Redemptions are limited and often commissions are charged on each trade, and ETFs may trade at a premium or discount to their net asset value. The Fund is non-diversified, meaning it may concentrate its assets in fewer individual holdings than a diversified fund. Therefore, the Fund is more exposed to individual stock volatility than a diversified fund. The Fund may experience tracking error to a greater extent than a fund that seeks to replicate an index. The Fund is not actively managed and may be affected by a general decline in market segments related to the index. Unlike mutual funds, ETFs may trade at a premium or discount to their net asset value. Investing in specific sectors such as energy infrastructure may involve greater risk and volatility than less concentrated investments. Risks include, but are not limited to, risks associated with companies owning and/or operating pipelines and complementary assets, as well as Master Limited Partnerships (MLPs), MLP affiliates, capital markets, terrorism, natural disasters, climate change, operating, regulatory, environmental, supply and demand, and price volatility risks. The tax benefits received by an investor investing in the portfolio differs from that of a direct investment in an MLP by an investor. The value of the portfolio’s investment in an MLP will depend largely on the MLP’s treatment as a partnership for U.S. federal income tax purposes. If the MLP is deemed to be a corporation then its income would be subject to federal taxation, reducing the amount of cash available for distribution to the portfolio which could result in a reduction of the portfolio’s value. Investments in foreign issuers involve risk not ordinarily associated with investments in securities and instruments of U.S. issuers, including risks related to political, social and economic developments abroad, differences between U.S. and foreign regulatory and accounting requirements, tax risk and market practices, as well as fluctuations in foreign currencies. The portfolio invests in small and mid-cap companies, which involve additional risks such as limited liquidity and greater volatility than larger companies. Investments in debt securities typically decrease in value when interest rates rise. This risk is usually greater for longer-term debt securities. Investment in lower-rated and non-rated securities presents a greater risk of loss to principal and interest than higher-rated securities. The portfolio may also write call options which may limit the portfolio’s ability to profit from increases in the market value of a security, but cause it to retain the risk of loss should the price of the security decline.
Ecofin Global Water ESG Fund
Investment in the water infrastructure and management industry may significantly affect the value of the shares of the fund. Companies in the water industry are subject to environmental considerations, taxes, government regulation, price and supply fluctuations, competition and water conservation influences. Investments in non-U.S. companies (including Canadian issuers) involve risk not ordinarily associated with investments in securities and instruments of U.S. issuers, including risks related to political, social and economic developments abroad, differences between U.S. and foreign regulatory and accounting requirements, tax risk and market practices, as well as fluctuations in foreign currencies. The fund invests in small and mid-cap companies, which involve additional risks such as limited liquidity and greater volatility than larger companies. The fund is not actively managed, and therefore the fund generally will not sell a security due to current or projected underperformance of a security, industry or sector, unless that security is removed from the index or the selling of the security is otherwise required upon a rebalancing of the index. There is no guarantee that the fund will achieve a high degree of correlation to the index and therefore achieve its investment objective. The fund has elected to be, and intends to qualify each year for treatment as, a regulated investment company (RIC). To maintain the fund’s qualification for federal income tax treatment as a RIC, the fund must meet certain source of income, asset diversification and annual distribution requirements. If for any taxable year the fund fails to qualify for the special federal income tax treatment afforded to RICs, all of the fund’s taxable income will be subject to federal income tax at regular corporate rates (without any deduction for distributions to its shareholders) and its income available for distribution will be reduced. Derivatives involve risks different from, and in certain cases, greater than the risks presented by more traditional investments. The fund is non-diversified, meaning it may concentrate its assets in fewer individual holdings than a diversified fund. Therefore, the fund is more exposed to individual stock volatility than a diversified fund.
| (unaudited) | |
| | |
| TortoiseEcofin | 11 |
Ecofin Digital Payments Infrastructure Fund
Investing involves risk. Principal loss is possible. Investing in specific sectors such as digital payments may involve greater risk and volatility than less concentrated investments. Risks include, but are not limited to, risks associated with investing in digital payments industry including major changes in technology, security considerations, taxes, government regulations, economic conditions, competition, political influences, the cyclical nature of the industry, and consumer preferences. Investments in non-U.S. companies (including Canadian issuers) involve risk not ordinarily associated with investments in securities and instruments of U.S. issuers, including risks related to political, social and economic developments abroad, differences between U.S. and foreign regulatory and accounting requirements, tax risk and market practices, as well as fluctuations in foreign currencies. The fund invests in small and mid-cap companies, which involve additional risks such as limited liquidity and greater volatility than larger companies. The fund is not actively managed and therefore the fund generally will not sell a security due to current or projected underperformance of a security, industry or sector, unless that security is removed from the index or the selling of the security is otherwise required upon a rebalancing of the index. There is no guarantee that the fund will achieve a high degree of correlation to the index and therefore achieve its investment objective. Shares may trade at prices different than net asset value per share.
Cash flow is the total amount of money moving into and out of a business.
Nothing contained on this communication constitutes tax, legal, or investment advice. Investors must consult their tax advisor or legal counsel for advice and information concerning their particular situation.
This report reflects our views and opinions as of the date herein, which are subject to change at any time based on market and other conditions. We disclaim any responsibility to update these views. The views should not be relied on as investment advice or an indication of trading intent on behalf of the fund.
Portfolio holdings and sector allocations are subject to change at any time and should not be considered recommendations to buy or sell any security. For a complete list of fund holdings, please refer to the Schedule of Investments in this report.
| (unaudited) | |
| | |
| 12 | TortoiseEcofin |
2020 Annual Report | November 30, 2020
Expense example
As a shareholder of the Fund, you incur two types of costs: (1) transaction costs, including brokerage commissions on purchases and sales of Fund shares, and (2) ongoing costs, including management fees and other Fund expenses. This example is intended to help you understand your ongoing costs (in dollars) of investing in the Fund and to compare these costs with the ongoing costs of investing in other funds. The example is based on an investment of $1,000 invested at the beginning of the period and held for the entire period (June 1, 2020 – November 30, 2020).
Actual expenses
The first line of the table below provides information about actual account values based on actual returns and actual expenses. You may use the information in this line, together with the amount you invested, to estimate the expenses that you paid over the period. Simply divide your account value by $1,000 (for example, an $8,600 account value divided by $1,000 = 8.6), then multiply the result by the number in the first line under the heading entitled “Expenses Paid During Period” to estimate the expenses you paid on your account during this period.
Hypothetical example for comparison purposes
The second line of the table below provides information about hypothetical account values and hypothetical expenses based on the Fund’s actual expense ratio and an assumed rate of return of 5% per year before expenses, which is not the Fund’s actual return. The hypothetical account values and expenses may not be used to estimate the actual ending account balance or expenses you paid for the period. You may use this information to compare the ongoing costs of investing in the Fund and other funds. To do so, compare this 5% hypothetical example with the 5% hypothetical examples that appear in the shareholder reports of the other funds.
Please note that the expenses shown in the table are meant to highlight your ongoing costs only and do not reflect any transactional costs, such as redemption fees or exchange fees. Therefore, the second line of the table is useful in comparing ongoing costs only and will not help you determine the relative total costs of owning different funds. In addition, if these transactional costs were included, your costs would have been higher.
Tortoise North American Pipeline Fund
| | Beginning
Account Value
(06/01/2020) | Ending
Account Value
(11/30/2020) | Expenses Paid
During Period(1)
(06/01/2020 – 11/30/2020) |
| Actual(2) | $1,000.00 | $1,037.10 | $2.04 |
| Hypothetical (5% annual return before expenses) | $1,000.00 | $1,023.00 | $2.02 |
| | |
| (1) | Expenses are equal to the Fund’s annualized expense ratio for the most recent six-month period of 0.40% multiplied by the average account value over the period, multiplied 183/366 to reflect the one-half year period. |
| (2) | Based on the actual returns for the six month period ended November 30, 2020 of 3.71%. |
Ecofin Global Water ESG Fund
| | Beginning
Account Value
(06/01/2020) | Ending
Account Value
(11/30/2020) | Expenses Paid
During Period(1)
(06/01/2020 – 11/30/2020) |
| Actual(2) | $1,000.00 | $1,247.10 | $2.25 |
| Hypothetical (5% annual return before expenses) | $1,000.00 | $1,023.00 | $2.02 |
| | |
| (1) | Expenses are equal to the Fund’s annualized expense ratio for the most recent six-month period of 0.40% multiplied by the average account value over the period, multiplied 183/366 to reflect the one-half year period. |
| (2) | )Based on the actual returns for the six month period ended November 30, 2020 of 24.71%. |
Ecofin Digital Payments Infrastructure Fund
| | Beginning
Account Value
(06/01/2020) | Ending
Account Value
(11/30/2020) | Expenses Paid
During Period(1)
(06/01/2020 – 11/30/2020) |
| Actual(2) | $1,000.00 | $1,283.80 | $2.28 |
| Hypothetical (5% annual return before expenses) | $1,000.00 | $1,023.00 | $2.02 |
| | |
| (1) | Expenses are equal to the Fund’s annualized expense ratio for the most recent six-month period of 0.40% multiplied by the average account value over the period, multiplied 183/366 to reflect the one-half year period. |
| (2) | Based on the actual returns for the six-month period ended November 30, 2020 of 28.38%. |
| (unaudited) | |
| | |
| TortoiseEcofin | 13 |
Tortoise North American Pipeline Fund
Schedule of Investments
November 30, 2020
| | | Shares | | | Fair Value | |
| | | | | | | | | |
| Common Stock — 79.6%(1) | | | | | | | | |
| | | | | | | | | |
| Canada Crude Oil Pipelines — 14.7%(1) |
| Enbridge Inc. | | | 792,967 | | | $ | 24,748,500 | |
| Gibson Energy Inc. | | | 306,778 | | | | 4,927,535 | |
| Inter Pipeline Ltd. | | | 900,503 | | | | 8,972,441 | |
| Pembina Pipeline Corporation | | | 559,608 | | | | 14,271,361 | |
| | | | | | | | 52,919,837 | |
| | | | | | | | | |
| Canada Natural Gas/Natural Gas Liquids Pipelines — 11.2%(1) |
| AltaGas Ltd. | | | 585,847 | | | | 8,408,553 | |
| Keyera Corp. | | | 458,578 | | | | 7,913,092 | |
| TC Energy Corporation | | | 543,515 | | | | 23,876,614 | |
| | | | | | | | 40,198,259 | |
| | | | | | | | | |
| United States Crude Oil Pipelines — 0.3%(1) |
| Plains GP Holdings, L.P. | | | 157,098 | | | | 1,245,787 | |
| | | | | | | | | |
| United States Local Distribution Companies — 19.3%(1) |
| Atmos Energy Corporation | | | 138,804 | | | | 13,309,916 | |
| Chesapeake Utilities Corporation | | | 34,537 | | | | 3,592,193 | |
| New Jersey Resources Corporation | | | 200,897 | | | | 6,635,628 | |
| NiSource Inc. | | | 606,791 | | | | 14,684,342 | |
| Northwest Natural Holding Co. | | | 62,512 | | | | 2,995,575 | |
| ONE Gas, Inc. | | | 110,931 | | | | 8,783,517 | |
| South Jersey Industries, Inc. | | | 210,963 | | | | 4,856,368 | |
| Southwest Gas Corporation | | | 117,284 | | | | 7,535,497 | |
| Spire Inc. | | | 107,984 | | | | 6,906,657 | |
| | | | | | | | 69,299,693 | |
| | | | | | | | | |
| United States Natural Gas Gathering/Processing — 7.5%(1) |
| Antero Midstream Corp. | | | 598,883 | | | | 4,036,471 | |
| Archrock, Inc. | | | 260,232 | | | | 2,022,003 | |
| EnLink Midstream, LLC | | | 537,003 | | | | 1,986,911 | |
| Equitrans Midstream Corp. | | | 852,736 | | | | 6,958,325 | |
| Hess Midstream LP | | | 14,128 | | | | 254,728 | |
| Rattler Midstream LP | | | 37,502 | | | | 310,892 | |
| Targa Resources Corp. | | | 489,241 | | | | 11,497,163 | |
| | | | | | | | 27,066,493 | |
| | | Shares | | | Fair Value | |
| | | | | | | | | |
| United States Natural Gas/Natural Gas Liquids Pipelines — 26.6%(1) |
| Altus Midstream Co.(2) | | | 5,338 | | | $ | 208,823 | |
| Cheniere Energy, Inc.(2) | | | 271,944 | | | | 15,416,505 | |
| Kinder Morgan, Inc. | | | 1,903,359 | | | | 27,370,302 | |
| National Fuel Gas Company | | | 190,695 | | | | 7,850,913 | |
| New Fortress Energy LLC | | | 34,921 | | | | 1,505,444 | |
| ONEOK, Inc. | | | 506,638 | | | | 18,173,105 | |
| The Williams Companies, Inc. | | | 1,197,045 | | | | 25,114,004 | |
| | | | | | | | 95,639,096 | |
Total Common Stock
(Cost $322,386,568) | | | | | | | 286,369,165 | |
| | | | | | | | | |
| Master Limited Partnerships — 20.1%(1) |
| |
| United States Crude Oil Pipelines — 1.9%(1) |
| BP Midstream Partners LP | | | 36,634 | | | | 415,430 | |
| Delek Logistics Partners LP | | | 7,029 | | | | 212,838 | |
| Genesis Energy, L.P. | | | 96,132 | | | | 618,129 | |
| NuStar Energy L.P. | | | 83,796 | | | | 1,113,649 | |
| PBF Logistics LP | | | 21,274 | | | | 198,486 | |
| Plains All American Pipeline, L.P. | | | 391,177 | | | | 3,105,945 | |
| Shell Midstream Partners, L.P. | | | 103,959 | | | | 1,066,619 | |
| | | | | | | | 6,731,096 | |
| | | | | | | | | |
| United States Natural Gas Gathering/Processing — 1.1%(1) |
| Crestwood Equity Partners LP | | | 43,058 | | | | 702,276 | |
| Enable Midstream Partners, LP | | | 74,272 | | | | 378,044 | |
| Noble Midstream Partners LP | | | 28,496 | | | | 271,567 | |
| Oasis Midstream Partners LP | | | 9,221 | | | | 97,374 | |
| USA Compression Partners LP | | | 42,097 | | | | 495,061 | |
| Western Midstream Partners LP | | | 168,230 | | | | 2,170,167 | |
| | | | | | | | 4,114,489 | |
| See accompanying Notes to Financial Statements. | |
| | |
| 14 | TortoiseEcofin |
2020 Annual Report | November 30, 2020
Tortoise North American Pipeline Fund
Schedule of Investments (continued)
November 30, 2020
| | | Shares | | | Fair Value | |
| | | | | | | | | |
| United States Natural Gas/Natural Gas Liquids Pipelines — 12.0%(1) |
| Cheniere Energy Partners, L.P. | | | 35,675 | | | $ | 1,359,218 | |
| DCP Midstream Partners, LP | | | 78,155 | | | | 1,262,203 | |
| Energy Transfer LP | | | 2,218,013 | | | | 13,707,320 | |
| Enterprise Products Partners L.P. | | | 1,320,720 | | | | 25,621,968 | |
| TC PipeLines, LP | | | 45,047 | | | | 1,391,952 | |
| | | | | | | | 43,342,661 | |
| | | | | | | | | |
| United States Refined Product Pipelines — 5.1%(1) |
| CrossAmerica Partners LP | | | 15,510 | | | | 265,841 | |
| Global Partners LP | | | 23,173 | | | | 386,989 | |
| Holly Energy Partners, L.P. | | | 38,658 | | | | 523,429 | |
| Magellan Midstream Partners, L.P. | | | 191,751 | | | | 7,890,554 | |
| MPLX LP | | | 307,241 | | | | 6,464,351 | |
| Phillips 66 Partners LP | | | 50,011 | | | | 1,344,296 | |
| Sprague Resources LP | | | 8,602 | | | | 148,385 | |
| Sunoco LP | | | 46,031 | | | | 1,279,201 | |
| | | | | | | | 18,303,046 | |
Total Master Limited Partnerships
(Cost $86,255,150) | | | | | | | 72,491,292 | |
| | | Shares | | | Fair Value | |
| | | | | | | | | |
| Short-Term Investment — 0.1%(1) | | | | | | | | |
| United States Investment Company — 0.1%(1) |
Invesco Government & Agency Portfolio — Institutional Class, 0.01%(3)
(Cost $193,599) | | | 193,599 | | | $ | 193,599 | |
Total Investments — 99.8%(1)
(Cost $408,835,317) | | | | | | | 359,054,056 | |
| Other Assets in Excess of Liabilities, Net — 0.2%(1) | | | | 659,004 | |
| Total Net Assets — 100.0%(1) | | | | | | $ | 359,713,060 | |
| (1) | Calculated as a percentage of net assets. |
| (2) | Non-income producing security. |
| (3) | Rate indicated is the current yield as of November 30, 2020. |
| See accompanying Notes to Financial Statements. |
| | |
| TortoiseEcofin | 15 |
Ecofin Global Water ESG Fund
Schedule of Investments
November 30, 2020
| | | Shares | | | Fair Value | |
| | | | | | | |
| Common Stock — 99.7%(1) | | | | | | |
| | | | | | | |
| Australia Flow Control Equipment — 1.3%(1) |
| Reliance Worldwide Corporation Limited | | | 91,845 | | | $ | 279,787 | |
| | | | | | | | | |
| Brazil Water Utilities — 1.6%(1) | | | | | | | | |
| Cia de Saneamento Basico do Estado de Sao Paulo — ADR | | | 39,885 | | | | 331,045 | |
| | | | | | | | | |
| Finland Water Equipment/Services — 0.6%(1) |
| Uponor OYJ | | | 6,305 | | | | 128,307 | |
| | | | | | | | | |
| France Water Infrastructure — 9.5%(1) |
| Suez | | | 42,385 | | | | 815,767 | |
| Veolia Environnement SA | | | 51,196 | | | | 1,176,190 | |
| | | | | | | | 1,991,957 | |
| | | | | | | | | |
| Hong Kong Water Equipment/Services — 1.0%(1) |
| China Lesso Group Holdings Ltd. | | | 117,222 | | | | 209,307 | |
| | | | | | | | | |
| Hong Kong Water Infrastructure — 1.7%(1) |
| Beijing Enterprises Water Group Ltd. | | | 702,218 | | | | 284,473 | |
| China Water Affairs Group Limited | | | 101,888 | | | | 80,053 | |
| CT Environmental Group Limited(2)(3) | | | 113,060 | | | | — | |
| | | | | | | | 364,526 | |
| | | | | | | | | |
| Japan Water Equipment/Services — 5.5%(1) |
| Kurita Water Industries Ltd. | | | 12,423 | | | | 458,128 | |
| MIURA CO., LTD. | | | 13,200 | | | | 694,138 | |
| | | | | | | | 1,152,266 | |
| | | | | | | | | |
| Japan Water Infrastructure — 0.5%(1) |
| METAWATER Co. Ltd. | | | 2,620 | | | | 59,301 | |
| Organo Corp. | | | 800 | | | | 45,441 | |
| | | | | | | | 104,742 | |
| | | | | | | | | |
| Netherlands Water Equipment/Services — 2.3%(1) |
| Aalberts Industries N.V. | | | 11,196 | | | | 484,791 | |
| | | | | | | | | |
| Switzerland Water Equipment/Services — 11.6%(1) |
| Ferguson PLC | | | 14,761 | | | | 1,657,735 | |
| Georg Fischer AG | | | 479 | | | | 557,669 | |
| Sulzer AG | | | 2,035 | | | | 202,212 | |
| | | | | | | | 2,417,616 | |
| | | | | | | | | |
| Switzerland Water Management — 7.1%(1) |
| Geberit AG | | | 2,462 | | | | 1,481,941 | |
| | | | | | | | | |
| United Kingdom Water Infrastructure — 14.7%(1) |
| Pennon Group Plc | | | 49,368 | | | | 622,480 | |
| Pentair PLC | | | 16,857 | | | | 873,530 | |
| Severn Trent Plc | | | 24,069 | | | | 766,576 | |
| United Utilities Group PLC | | | 67,561 | | | | 810,984 | |
| | | | | | | | 3,073,570 | |
| | | Shares | | | Fair Value | |
| | | | | | | | | |
| United States Water Infrastructure — 18.5%(1) |
| Aegion Corp.(3) | | | 3,579 | | | $ | 61,380 | |
| Franklin Electric Co., Inc. | | | 4,469 | | | | 302,060 | |
| Middlesex Water Company | | | 2,035 | | | | 139,377 | |
| Montrose Environmental Group, Inc.(3) | | | 1,162 | | | | 31,827 | |
| Mueller Water Products, Inc. | | | 18,402 | | | | 218,432 | |
| Rexnord Corporation | | | 13,966 | | | | 523,865 | |
| SJW Group | | | 3,026 | | | | 198,506 | |
| Tetra Tech, Inc. | | | 6,301 | | | | 751,394 | |
| The York Water Company | | | 1,520 | | | | 68,461 | |
| Xylem, Inc. | | | 16,381 | | | | 1,572,084 | |
| | | | | | | | 3,867,386 | |
| | | | | | | | | |
| United States Water Management — 8.1%(1) |
| A.O. Smith Corporation | | | 15,668 | | | | 882,265 | |
| Badger Meter, Inc. | | | 3,397 | | | | 280,049 | |
| Lindsay Corporation | | | 1,263 | | | | 146,280 | |
| Watts Water Technologies, Inc. | | | 3,207 | | | | 375,700 | |
| | | | | | | | 1,684,294 | |
| | | | | | | | | |
| United States Water Treatment — 1.2%(1) |
| Evoqua Water Technologies Corp.(3) | | | 9,550 | | | | 249,160 | |
| | | | | | | | | |
| United States Water Utilities — 14.5%(1) |
| American States Water Company | | | 4,303 | | | | 317,648 | |
| American Water Works Co., Inc. | | | 9,874 | | | | 1,514,474 | |
| California Water Service Group | | | 5,683 | | | | 281,195 | |
| Essential Utilities, Inc. | | | 20,351 | | | | 921,493 | |
| | | | | | | | 3,034,810 | |
Total Common Stock
(Cost $19,584,845) | | | | | | | 20,855,505 | |
| | | | | | | | | |
| Short-Term Investment — 0.0%(1) | | | | | | | | |
| United States Investment Company — 0.0%(1) | | | | | | | | |
First American Government Obligations Fund, Class X, 0.05%(4)
(Cost $6,356) | | | 6,356 | | | | 6,356 | |
Total Investments — 99.7%(1)
(Cost $19,591,201) | | | | | | | 20,861,861 | |
| Other Assets in Excess of Liabilities, Net — 0.3%(1) | | | | 65,540 | |
| Total Net Assets — 100.0%(1) | | | | | | $ | 20,927,401 | |
| (1) | Calculated as a percentage of net assets. |
| (2) | Security considered illiquid and is categorized in Level 3 of the fair value hierarchy. See Note 3 in Notes to Financial Statements. |
| (3) | Non-income producing security. |
| (4) | Rate indicated is the current yield as of November 30, 2020. |
ADR – American Depository Receopt
| See accompanying Notes to Financial Statements. | |
| | |
| 16 | TortoiseEcofin |
2020 Annual Report | November 30, 2020
Ecofin Digital Payments Infrastructure Fund
Schedule of Investments
November 30, 2020
| | | Shares | | | Fair Value | |
| | | | | | | |
| Common Stock — 99.9%(1) | | | | | | |
| | | | | | | |
| Australia Electronic Transaction Processing — 4.7%(1) |
| Afterpay Touch Group Limited(2) | | | 5,535 | | | $ | 386,021 | |
| | | | | | | | | |
| Australia Payments Fintech — 0.4%(1) | | | | | | | | |
| Iress Limited | | | 4,156 | | | | 31,758 | |
| | | | | | | | | |
| Brazil Electronic Transaction Processing — 6.7%(1) |
| Pagseguro Digital Ltd.(2) | | | 4,546 | | | | 215,299 | |
| StoneCo Ltd.(2) | | | 4,647 | | | | 340,253 | |
| | | | | | | | 555,552 | |
| | | | | | | | | |
| France Software and Services — 6.5%(1) |
| Worldline SA(2) | | | 5,847 | | | | 540,530 | |
| | | | | | | | | |
| Hong Kong Credit Card Issuer — 1.1%(1) |
| China Youzan Limited(2) | | | 353,999 | | | | 93,626 | |
| | | | | | | | | |
| Hong Kong Merchant Payment Products/Services — 0.2%(1) |
| Huifu Payment Limited(2) | | | 20,400 | | | | 6,317 | |
| PAX Global Technology Ltd. | | | 18,125 | | | | 11,271 | |
| | | | | | | | 17,588 | |
| | | | | | | | | |
| Italy Electronic Transaction Processing — 2.4%(1) |
| Nexi SpA(2) | | | 10,577 | | | | 199,345 | |
| | | | | | | | | |
| Japan Credit Card Issuer — 1.1%(1) | | | | | | | | |
| AEON Financial Service Co. Ltd. | | | 2,700 | | | | 29,431 | |
| Credit Saison Co., Ltd. | | | 3,799 | | | | 43,485 | |
| Orient Corporation | | | 13,500 | | | | 14,870 | |
| | | | | | | | 87,786 | |
| | | | | | | | | |
| Japan Electronic Transaction Processing — 1.9%(1) |
| GMO Payment Gateway, Inc. | | | 1,100 | | | | 154,253 | |
| | | | | | | | | |
| Netherlands Electronic Transaction Processing — 4.7%(1) |
| Adyen N.V.(2) | | | 204 | | | | 389,832 | |
| | | Shares | | | Fair Value | |
| | | | | | | |
| New Zealand Other — 0.3%(1) | | | | | | |
| Pushpay Holdings Limited(2) | | | 19,868 | | | $ | 24,659 | |
| | | | | | | | | |
| United Kingdom Credit Card Issuer — 0.3%(1) |
| Provident Financial plc(2) | | | 6,377 | | | | 23,566 | |
| | | | | | | | | |
| United Kingdom Software and Services — 0.6%(1) |
| Network International Holdings PLC(2) | | | 12,651 | | | | 45,234 | |
| | | | | | | | | |
| United States Credit Card Networks — 17.8%(1) |
| American Express Company | | | 3,122 | | | | 370,238 | |
| Discover Financial Services | | | 5,886 | | | | 448,337 | |
| Mastercard, Inc. | | | 954 | | | | 321,030 | |
| Visa Inc. | | | 1,591 | | | | 334,667 | |
| | | | | | | | 1,474,272 | |
| | | | | | | | | |
| United States Electronic Payment Processing/Management — 2.1%(1) |
| ACI Worldwide, Inc.(2) | | | 2,876 | | | | 93,700 | |
| Bottomline Technologies (de), Inc.(2) | | | 1,105 | | | | 50,432 | |
| Zuora, Inc.(2) | | | 2,592 | | | | 29,523 | |
| | | | | | | | 173,655 | |
| | | | | | | | | |
| United States Electronic Transaction Processing — 25.2%(1) |
| Cass Information Systems, Inc. | | | 332 | | | | 14,087 | |
| CSG Systems International, Inc. | | | 819 | | | | 35,528 | |
| EVERTEC, Inc. | | | 1,779 | | | | 66,125 | |
| Evo Payments, Inc.(2) | | | 1,026 | | | | 25,794 | |
| Fidelity National Information Services, Inc. | | | 2,186 | | | | 324,424 | |
| Fiserv, Inc.(2) | | | 3,360 | | | | 387,005 | |
| FleetCor Technologies Inc.(2) | | | 1,379 | | | | 365,725 | |
| Green Dot Corporation(2) | | | 1,170 | | | | 62,665 | |
| PayPal Holdings, Inc.(2) | | | 1,668 | | | | 357,152 | |
| QIWI plc — ADR | | | 1,307 | | | | 19,030 | |
| Western Union Company | | | 10,349 | | | | 233,473 | |
| WEX Inc.(2) | | | 1,111 | | | | 192,470 | |
| | | | | | | | 2,083,478 | |
| See accompanying Notes to Financial Statements. |
| | |
| TortoiseEcofin | 17 |
Ecofin Digital Payments Infrastructure Fund
Schedule of Investments (continued)
November 30, 2020
| | | Shares | | | Fair Value | |
| | | | | | | | | |
| United States Financial Services Market Place — 0.4%(1) |
| GreenSky, Inc.(2) | | | 1,735 | | | $ | 7,391 | |
| LendingClub Corporation(2) | | | 1,820 | | | | 14,524 | |
| Yirendai Ltd. — ADR(2) | | | 2,356 | | | | 9,023 | |
| | | | | | | | 30,938 | |
| | | | | | | | | |
| United States Merchant Payment Products/Services — 13.4%(1) |
| Euronet Worldwide, Inc.(2) | | | 1,272 | | | | 171,008 | |
| Global Payments Inc. | | | 1,918 | | | | 374,374 | |
| NCR Corporation(2) | | | 3,206 | | | | 88,710 | |
| Square, Inc.(2) | | | 2,251 | | | | 474,871 | |
| USA Technologies, Inc.(2) | | | 1,288 | | | | 10,948 | |
| | | | | | | | 1,119,911 | |
| | | | | | | | | |
| United States Payments Fintech — 9.9%(1) |
| DocuSign, Inc.(2) | | | 1,531 | | | | 348,884 | |
| Jack Henry & Associates, Inc. | | | 1,933 | | | | 310,942 | |
| OneSpan Inc.(2) | | | 860 | | | | 17,011 | |
| Q2 Holdings, Inc.(2) | | | 1,258 | | | | 142,620 | |
| | | | | | | | 819,457 | |
| | | | | | | | | |
| United States Software and Services — 0.2%(1) |
| BigCommerce Holdings, Inc.(2) | | | 259 | | | | 20,891 | |
Total Common Stock
(Cost $7,276,301) | | | | | | | 8,272,352 | |
| | | Shares | | | Fair Value | |
| | | | | | | |
| Short-Term Investment — 0.1%(1) | | | | | | |
| United States Investment Company — 0.1%(1) |
First American Government Obligations Fund, Class X, 0.05%(3)
(Cost $5,021) | | | 5,021 | | | $ | 5,021 | |
Total Investments — 100.0%(1)
(Cost $7,281,322) | | | | | | | 8,277,373 | |
| Other Assets in Excess of Liabilities, Net — 0.0%(1) | | | | 2,519 | |
| Total Net Assets — 100.0%(1) | | | | | | $ | 8,279,892 | |
| (1) | Calculated as a percentage of net assets. |
| (2) | Non-income producing security. |
| (3) | Rate indicated is the current yield as of November 30, 2020. |
ADR – American Depositary Receipt
| See accompanying Notes to Financial Statements. | |
| | |
| 18 | TortoiseEcofin |
2020 Annual Report | November 30, 2020
Statements of Assets & Liabilities
November 30, 2020
| | | Tortoise
North American
Pipeline Fund | | | Ecofin
Global Water
ESG Fund | | | Ecofin
Digital Payments
Infrastructure
Fund | |
| Assets: | | | | | | | | | | | | |
| Investments, at fair value (cost $408,835,317, $19,591,201, and $7,281,322, respectively) | | $ | 359,054,056 | | | $ | 20,861,861 | | | $ | 8,277,373 | |
| Cash | | | 413 | | | | — | | | | — | |
| Dividends and interest receivable | | | 777,570 | | | | 71,226 | | | | 4,389 | |
| Receivable for capital shares sold | | | 2,625,645 | | | | — | | | | — | |
| Total assets | | | 362,457,684 | | | | 20,933,087 | | | | 8,281,762 | |
| Liabilities: | | | | | | | | | | | | |
| Payable for investment securities purchased | | | 2,638,822 | | | | — | | | | — | |
| Payable to Adviser | | | 105,802 | | | | 5,686 | | | | 1,870 | |
| Total liabilities | | | 2,744,624 | | | | 5,686 | | | | 1,870 | |
| Net Assets | | $ | 359,713,060 | | | $ | 20,927,401 | | | $ | 8,279,892 | |
| Net Assets Consist of: | | | | | | | | | | | | |
| Capital Stock | | $ | 440,939,119 | | | $ | 20,050,672 | | | $ | 7,894,495 | |
| Total distributable earnings (loss) | | | (81,226,059 | ) | | | 876,729 | | | | 385,397 | |
| Net Assets | | $ | 359,713,060 | | | $ | 20,927,401 | | | $ | 8,279,892 | |
| | | | | | | | | | | | | |
| Net Assets | | $ | 359,713,060 | | | $ | 20,927,401 | | | $ | 8,279,892 | |
| Shares issued and outstanding(1) | | | 20,550,000 | | | | 550,000 | | | | 200,000 | |
| Net asset value, redemption price and offering price per share | | $ | 17.50 | | | $ | 38.05 | | | $ | 41.40 | |
| (1) | Unlimited shares authorized. |
See accompanying Notes to Financial Statements.
Statements of Operations
For the Year Ended November 30, 2020
| | | Tortoise
North American
Pipeline Fund | | | Ecofin
Global Water
ESG Fund | | | Ecofin
Digital Payments
Infrastructure
Fund | |
| Investment Income: | | | | | | | | | | | | |
| Dividends and distributions from common stock | | $ | 16,174,667 | | | $ | 384,338 | | | $ | 50,434 | |
| Distributions from master limited partnerships | | | 6,733,469 | | | | — | | | | — | |
| Less: return of capital on distributions | | | (12,769,223 | ) | | | — | | | | — | |
| Less: foreign taxes withheld | | | (875,038 | ) | | | (20,184 | ) | | | (607 | ) |
| Net dividends and distributions from investments | | | 9,263,875 | | | | 364,154 | | | | 49,827 | |
| Dividends from money market mutual funds | | | 18,371 | | | | 216 | | | | 190 | |
| Total investment income | | | 9,282,246 | | | | 364,370 | | | | 50,017 | |
| Expenses: | | | | | | | | | | | | |
| Advisory fees (See Note 5) | | | 1,353,099 | | | | 67,984 | | | | 32,254 | |
| Total expenses | | | 1,353,099 | | | | 67,984 | | | | 32,254 | |
| Net Investment Income | | | 7,929,147 | | | | 296,386 | | | | 17,763 | |
| Realized and Unrealized Gain (Loss) on Investments and Translations of Foreign Currency: | | | | | | | | | | | | |
| Net realized gain (loss) on investments, including foreign currency gain (loss) | | | (17,824,421 | ) | | | 1,137,150 | | | | 226,346 | |
| Net change in unrealized appreciation (depreciation) of investments and translations of foreign currency | | | (59,600,047 | ) | | | 190,630 | | | | 115,807 | |
| Net Realized and Unrealized Gain (Loss) on Investments and Translations of Foreign Currency: | | | (77,424,468 | ) | | | 1,327,780 | | | | 342,153 | |
| Net Increase (Decrease) in Net Assets Resulting from Operations | | $ | (69,495,321 | ) | | $ | 1,624,166 | | | $ | 359,916 | |
See accompanying Notes to Financial Statements.
2020 Annual Report | November 30, 2020
Statements of Changes in Net Assets
| | | Tortoise North American Pipeline Fund | | | Ecofin Global Water ESG Fund | |
| | | Year Ended
November 30,
2020 | | | Year Ended
November 30,
2019 | | | Year Ended
November 30,
2020 | | | Year Ended
November 30,
2019 | |
| Operations | | | | | | | | | | | | | | | | |
| Net investment income | | $ | 7,929,147 | | | $ | 6,620,339 | | | $ | 296,386 | | | $ | 116,944 | |
| Net realized gain (loss) on investments, including foreign currency gain (loss) | | | (17,824,421 | ) | | | 998,822 | | | | 1,137,150 | | | | (68,562 | ) |
| Net change in unrealized appreciation (depreciation) of investments and translations of foreign currency | | | (59,600,047 | ) | | | 16,451,396 | | | | 190,630 | | | | 1,170,786 | |
| Net increase (decrease) in net assets resulting from operations | | | (69,495,321 | ) | | | 24,070,557 | | | | 1,624,166 | | | | 1,219,168 | |
| Capital Share Transactions | | | | | | | | | | | | | | | | |
| Proceeds from shares sold | | | 170,830,105 | | | | 230,383,290 | | | | 28,070,610 | | | | 9,644,285 | |
| Payments for shares redeemed | | | (135,526,475 | ) | | | (14,907,125 | ) | | | (23,418,405 | ) | | | — | |
| Net increase in net assets resulting from capital share transactions | | | 35,303,630 | | | | 215,476,165 | | | | 4,652,205 | | | | 9,644,285 | |
| Distributions to Shareholders | | | | | | | | | | | | | | | | |
| From distributable earnings | | | (7,894,972 | ) | | | (6,397,624 | ) | | | (224,038 | ) | | | (79,267 | ) |
| From tax return of capital | | | (11,785,468 | ) | | | (7,556,816 | ) | | | — | | | | — | |
| Total distributions to shareholders | | | (19,680,440 | ) | | | (13,954,440 | ) | | | (224,038 | ) | | | (79,267 | ) |
| Total Increase (Decrease) in Net Assets | | | (53,872,131 | ) | | | 225,592,282 | | | | 6,052,333 | | | | 10,784,186 | |
| Net Assets | | | | | | | | | | | | | | | | |
| Beginning of year | | | 413,585,191 | | | | 187,992,909 | | | | 14,875,068 | | | | 4,090,882 | |
| End of year | | $ | 359,713,060 | | | $ | 413,585,191 | | | $ | 20,927,401 | | | $ | 14,875,068 | |
| Transactions in Shares | | | | | | | | | | | | | | | | |
| Shares sold | | | 9,550,000 | | | | 10,750,000 | | | | 850,000 | | | | 300,000 | |
| Shares redeemed | | | (7,650,000 | ) | | | (650,000 | ) | | | (750,000 | ) | | | — | |
| Net increase | | | 1,900,000 | | | | 10,100,000 | | | | 100,000 | | | | 300,000 | |
See accompanying Notes to Financial Statements.
Statements of Changes in Net Assets (continued)
| | | Ecofin Digital Payments Infrastructure Fund | |
| | | Year Ended
November 30, 2020 | | | Period from
January 31, 2019(1)
to November 30, 2019 | |
| Operations | | | | | | | | |
| Net investment income | | $ | 17,763 | | | $ | 9,662 | |
| Net realized gain on investments, including foreign currency gain (loss) | | | 226,346 | | | | 156,998 | |
| Net change in unrealized appreciation of investments and translations of foreign currency | | | 115,807 | | | | 880,260 | |
| Net increase in net assets resulting from operations | | | 359,916 | | | | 1,046,920 | |
| Capital Share Transactions | | | | | | | | |
| Proceeds from shares sold | | | 8,523,410 | | | | 7,043,985 | |
| Payments for shares redeemed | | | (8,526,915 | ) | | | — | |
| Transaction fees (See Note 1) | | | — | | | | 1,869 | |
| Net increase (decrease) in net assets resulting from capital share transactions | | | (3,505 | ) | | | 7,045,854 | |
| Distributions to Shareholders | | | | | | | | |
| From distributable earnings | | | (169,293 | ) | | | — | |
| Total Increase in Net Assets | | | 187,118 | | | | 8,092,774 | |
| Net Assets | | | | | | | | |
| Beginning of period | | | 8,092,774 | | | | — | |
| End of period | | $ | 8,279,892 | | | $ | 8,092,774 | |
| Transactions in Shares | | | | | | | | |
| Shares sold | | | 250,000 | | | | 250,000 | |
| Shares redeemed | | | (300,000 | ) | | | — | |
| Net increase (decrease) | | | (50,000 | ) | | | 250,000 | |
| (1) | Inception date of the fund. |
See accompanying Notes to Financial Statements.
2020 Annual Report | November 30, 2020
Tortoise North American Pipeline Fund
Financial Highlights
| | | Year Ended
November 30,
2020 | | | Year Ended
November 30,
2019 | | | Year Ended
November 30,
2018 | | | Year Ended
November 30,
2017 | | | Year Ended
November 30,
2016 | |
| Per Common Share Data(1) | | | | | | | | | | | | | | | | | | | | |
| Net asset value, beginning of year | | $ | 22.18 | | | $ | 21.99 | | | $ | 22.87 | | | $ | 23.23 | | | $ | 19.59 | |
| Investment operations: | | | | | | | | | | | | | | | | | | | | |
| Net investment income(2) | | | 0.48 | | | | 0.62 | | | | 0.69 | | | | 0.64 | | | | 0.67 | |
| Net realized and unrealized gain (loss) on investments and translations of foreign currency(2) | | | (4.12 | ) | | | 0.55 | | | | (0.64 | ) | | | (0.13 | ) | | | 3.85 | |
| Total from investment operations | | | (3.64 | ) | | | 1.17 | | | | 0.05 | | | | 0.51 | | | | 4.52 | |
| Less distributions from: | | | | | | | | | | | | | | | | | | | | |
| Net investment income | | | (0.42 | ) | | | (0.45 | ) | | | (0.53 | ) | | | (0.58 | ) | | | (0.65 | ) |
| Net realized gains | | | — | | | | — | | | | — | | | | — | | | | — | |
| Return of capital | | | (0.62 | ) | | | (0.53 | ) | | | (0.40 | ) | | | (0.29 | ) | | | (0.23 | ) |
| Total distributions | | | (1.04 | ) | | | (0.98 | ) | | | (0.93 | ) | | | (0.87 | ) | | | (0.88 | ) |
| Net asset value, end of year | | $ | 17.50 | | | $ | 22.18 | | | $ | 21.99 | | | $ | 22.87 | | | $ | 23.23 | |
| Total Return | | | (15.74 | )% | | | 5.22 | % | | | 0.15 | % | | | 2.19 | % | | | 23.84 | % |
| Supplemental Data and Ratios | | | | | | | | | | | | | | | | | | | | |
| Net assets, end of year (in 000’s) | | $ | 359,713 | | | $ | 413,585 | | | $ | 187,993 | | | $ | 82,334 | | | $ | 44,133 | |
| Ratios to average net assets: | | | | | | | | | | | | | | | | | | | | |
| Expenses | | | 0.40 | % | | | 0.40 | % | | | 0.40 | % | | | 0.40 | % | | | 0.50 | % |
| Net investment income | | | 2.34 | % | | | 2.01 | % | | | 2.11 | % | | | 2.22 | % | | | 2.40 | % |
| Portfolio turnover rate | | | 28 | % | | | 13 | % | | | 16 | % | | | 18 | % | | | 28 | % |
| (1) | For a Fund share outstanding for the entire period. |
| (2) | The per common share data for the years ended November 30, 2019, 2018, 2017 and 2016 does not reflect the change in estimate of investment income and return of capital. See Note 2 to the financial statements for further disclosure. |
See accompanying Notes to Financial Statements.
Ecofin Global Water ESG Fund
Financial Highlights
| | | Year Ended
November 30,
2020 | | | Year Ended
November 30,
2019 | | | Year Ended
November 30,
2018 | | | Period from
February 14,
2017(1) to
November 30,
2017 | |
| Per Common Share Data(2) | | | | | | | | | | | | | | | | |
| Net asset value, beginning of period | | $ | 33.06 | | | $ | 27.27 | | | $ | 30.07 | | | $ | 25.00 | |
| Investment operations: | | | | | | | | | | | | | | | | |
| Net investment income | | | 0.57 | | | | 0.56 | | | | 0.34 | | | | 0.21 | |
| Net realized and unrealized gain (loss) on investments and translations of foreign currency | | | 4.88 | | | | 5.76 | | | | (2.65 | ) | | | 5.01 | |
| Total from investment operations | | | 5.45 | | | | 6.32 | | | | (2.31 | ) | | | 5.22 | |
| Less distributions from: | | | | | | | | | | | | | | | | |
| Net investment income | | | (0.46 | ) | | | (0.53 | ) | | | (0.30 | ) | | | (0.15 | ) |
| Net realized gains | | | — | | | | — | | | | (0.19 | ) | | | — | |
| Total distributions | | | (0.46 | ) | | | (0.53 | ) | | | (0.49 | ) | | | (0.15 | ) |
| Net asset value, end of period | | $ | 38.05 | | | $ | 33.06 | | | $ | 27.27 | | | $ | 30.07 | |
| Total Return(3) | | | 16.80 | % | | | 23.42 | % | | | (7.76 | )% | | | 20.96 | % |
| Supplemental Data and Ratios | | | | | | | | | | | | | | | | |
| Net assets, end of period (in 000’s) | | $ | 20,927 | | | $ | 14,875 | | | $ | 4,091 | | | $ | 3,007 | |
| Ratios to average net assets: | | | | | | | | | | | | | | | | |
| Expenses(4) | | | 0.40 | % | | | 0.40 | % | | | 0.40 | % | | | 0.40 | % |
| Net investment income(4) | | | 1.74 | % | | | 2.01 | % | | | 1.24 | % | | | 0.98 | % |
| Portfolio turnover rate(3) | | | 19 | % | | | 16 | % | | | 36 | % | | | 22 | % |
| (1) | Inception date of the Fund. |
| (2) | For a Fund share outstanding for the entire period. |
| (3) | Not annualized for period less than one year. |
| (4) | Annualized for period less than one year. |
See accompanying Notes to Financial Statements.
2020 Annual Report | November 30, 2020
Ecofin Digital Payments Infrastructure
Fund Financial Highlights
| | | Year Ended
November 30,
2020 | | | Period from
January 31,
2019(1) to
November 30,
2019 | |
| Per Common Share Data(2) | | | | | | | | |
| Net asset value, beginning of period | | $ | 32.37 | | | $ | 25.00 | |
| Investment operations: | | | | | | | | |
| Net investment income | | | 0.08 | | | | 0.04 | |
| Net realized and unrealized gain on investments and translations of foreign currency | | | 9.52 | | | | 7.33 | |
| Total from investment operations | | | 9.60 | | | | 7.37 | |
| Less distributions from: | | | | | | | | |
| Net investment income | | | (0.57 | ) | | | — | |
| Total distributions | | | (0.57 | ) | | | — | |
| Net asset value, end of period | | $ | 41.40 | | | $ | 32.37 | |
| Total Return(3) | | | 30.17 | % | | | 29.48 | % |
| Supplemental Data and Ratios | | | | | | | | |
| Net assets, end of period (in 000’s) | | $ | 8,280 | | | $ | 8,093 | |
| Ratios to average net assets: | | | | | | | | |
| Expenses(4) | | | 0.40 | % | | | 0.40 | % |
| Net investment income(4) | | | 0.22 | % | | | 0.25 | % |
| Portfolio turnover rate(3) | | | 19 | % | | | 34 | % |
| (1) | Inception date of the Fund. |
| (2) | For a Fund share outstanding for the entire period. |
| (3) | Not annualized for period less than one year. |
| (4) | Annualized for period less than one year. |
See accompanying Notes to Financial Statements.
Notes to Financial Statements
November 30, 2020
1. Organization
Managed Portfolio Series (the “Trust”) was organized as a Delaware statutory trust on January 27, 2011. The Trust is registered under the Investment Company Act of 1940, as amended (the “1940 Act”), as an open-end management investment company. The Tortoise North American Pipeline Fund (the “North American Pipeline Fund”), the Ecofin Global Water ESG Fund (the “Global Water ESG Fund”) and the Ecofin Digital Payments Infrastructure Fund (the “Digital Payments Infrastructure Fund”) (or collectively, “the Funds”) are each a non-diversified series with their own investment objectives and policies within the Trust. The Trust has evaluated the structure, objective and activities of the Funds and determined that they meet the characteristics of an investment company. As such, these financial statements have applied the guidance as set forth in the Accounting Standards Codifications (“ASC”) 946, Financial Services Investment Companies.
The investment objective of the North American Pipeline Fund seeks investment results that correspond generally to the price and distribution rate (total return) performance of the Tortoise North American Pipeline IndexSM (the “North American Pipeline Index”). The Fund commenced operations on June 29, 2015.
The investment objective of the Global Water ESG Fund seeks investment results that correspond (before fees and expenses) generally to the price and distribution rate (total return) performance of the Tortoise Global Water ESG IndexSM (the “Water Index”). The Fund commenced operations on February 14, 2017.
The investment objective of the Digital Payments Infrastructure Fund seeks investment results that correspond (before fees and expenses) generally to the price and distribution rate (total return) performance of the Tortoise Global Digital Payments Infrastructure IndexSM (the “Digital Payments Index”). The Fund commenced operations on January 31, 2019.
Shares of the North American Pipeline Fund, Global Water ESG Fund and Digital Payments Infrastructure Fund are listed and traded on the NYSE Arca, Inc. (the “NYSE”). Market prices for the shares may be different from their net asset value (“NAV”). The Funds issue and redeem shares on a continuous basis at NAV only in blocks of 50,000 shares, called “Creation Units.” Creation Units are issued and redeemed principally in-kind for securities included in a specified universe, with cash included to balance to the Creation Unit total. Once created, shares generally trade in the secondary market at market prices that change throughout the day in amounts less than a Creation Unit. Except when aggregated in Creation Units, shares are not redeemable securities of the Funds. Shares of the Funds may only be purchased or redeemed by certain financial institutions (“Authorized Participants”). An Authorized Participant is either (i) a broker-dealer or other participant in the clearing process through the Continuous Net Settlement System of the National Securities Clearing Corporation or (ii) a Depository Trust Company participant and, in each case, must have executed a Participation Agreement with the Distributor. Most retail investors do not qualify as Authorized Participants nor have the resources to buy and sell whole Creation Units. Therefore, they are unable to purchase or redeem the shares directly from the Funds. Rather, most retail investors may purchase shares in the secondary market with the assistance of a broker and are subject to customary brokerage commissions or fees.
The Funds currently offer one class of shares, which have no front-end sales load, no deferred sales charge, and no redemption fee. A purchase (i.e. creation) transaction fee is imposed for the transfer and other transaction costs associated with the purchase of Creation Units. The standard fixed creation transaction fee for each Fund is $500, which is payable by the Advisor. In addition, a variable fee may be charged on all cash transactions or substitutes for Creation Units of up to a maximum of 2% as a percentage of the value of the Creation Units subject to the transaction. Variable fees are imposed to compensate the Funds for the transaction costs associated with the cash transactions. Variable fees received by the Funds are displayed in the capital shares transaction section of the Statement of Changes in Net Assets. The Funds may issue an unlimited number of shares of beneficial interest, with no par value. All shares of the Funds have equal rights and privileges.
2. Significant Accounting Policies
The following is a summary of significant accounting policies followed by the Funds in the preparation of its financial statements. These policies are in conformity with generally accepted accounting principles in the United States of America (“GAAP”).
Securities Valuation — All investments in securities are recorded at their estimated fair value, as described in Note 3.
Foreign Currency Translation — The books and records relating to the Funds’ non-U.S. dollar denominated investments are maintained in U.S. dollars on the following bases: (1) market value of investment securities, assets, and liabilities are translated at the current rate of exchange; and (2) purchases and sales of investment securities, income, and expenses are translated at the relevant rates of exchange prevailing on the respective dates of such transactions. The Funds do not isolate the portion of gains and losses on investments in equity securities that is due to changes in the foreign exchange rates from that which is due to changes in market prices of equity securities. The Funds report certain foreign currency-related transactions as components of realized gains for financial reporting purposes, whereas such components are treated as ordinary income for federal income tax purposes.
Federal Income Taxes — The Funds intend to meet the requirements of subchapter M of the Internal Revenue Code applicable to regulated investment companies and to distribute substantially all net taxable investment income and net realized gains to shareholders in a manner which results in no tax cost to the Funds. Therefore, no federal income or excise tax provision is required. As of November 30, 2020, the Funds did not have any tax positions that did not meet the “more-likely-than-not” threshold of being sustained by the applicable tax authority. The Funds recognize interest and penalties, if any, related to unrecognized tax benefits on uncertain tax positions as income tax expense in the
2020 Annual Report | November 30, 2020
Notes to Financial Statements (continued)
Statement of Operations. During the period ended November 30, 2020, the Funds did not incur any interest or penalties. Each of the tax years in the four-year period ended November 30, 2020 remains subject to examination by taxing authorities for North American Pipeline Fund. The Global Water ESG Fund and Digital Payments Infrastructure Fund are subject to examination by U.S. taxing authorities for the tax periods since the commencement of operations.
Securities Transactions, Income and Distributions — Security transactions are accounted for on the date the securities are purchased or sold (trade date). Realized gains and losses are reported on a specific identified cost basis. Interest income is recognized on an accrual basis, including amortization of premiums and accretion of discounts. Dividend income and distributions are recorded on the ex-dividend date. Withholding taxes on foreign dividends have been provided for in accordance with the Fund’s understanding of the applicable country’s tax rules and regulations. Distributions received from the Funds’ investments generally are comprised of ordinary income and return of capital. The Funds allocate distributions between investment income and return of capital based on estimates made at the time such distributions are received. Such estimates are based on information provided by each portfolio company and other industry sources. These estimates may subsequently be revised based on actual allocations received from the portfolio companies after their tax reporting periods are concluded, as the actual character of these distributions is not known until after the fiscal year end of the Funds.
During the year ended November 30, 2020, the North American Pipeline Fund reallocated the amount of return of capital recognized based on the 2019 tax reporting information received. The impact of this adjustment is a decrease to return of capital of approximately $872,867 or $0.04 per share.
The North American Pipeline Fund will make distributions of net investment income, if any, quarterly. The Global Water ESG Fund will make distributions of net investment income, if any, semiannually. The Digital Payments Infrastructure Fund will make distributions of net investment income, if any, annually. The Funds will also distribute net realized capital gains, if any, annually. Distributions to shareholders are recorded on the ex-dividend date. The treatment for financial reporting purposes of distributions made to shareholders during the year from net investment income or net realized capital gains may differ from their ultimate treatment for federal income tax purposes. These differences are caused primarily by differences in the timing of the recognition of certain components of income, expense or realized capital gain for federal income tax purposes. Where such differences are permanent in nature, GAAP requires that they be reclassified in the components of the net assets based on their ultimate characterization for federal income tax purposes. Any such reclassifications will have no effect on net assets, results of operations or net asset values per share of the Funds.
For the period ended November 30, 2020, the following reclassifications were made:
| Fund | | Distributable
Earnings (Losses) | | Paid-in Capital | |
| North American Pipeline Fund | | | $ (7,023,059 | ) | | | | $ 7,023,059 | |
| Global Water ESG Fund | | | (1,551,815 | ) | | | | 1,551,815 | |
| Digital Payment Global Infrastructure Fund | | | (852,146 | ) | | | | 852,146 | |
Use of Estimates — The preparation of financial statements in conformity with GAAP requires management to make estimates and assumptions that affect the reported amounts of assets and liabilities and disclosure of contingent assets and liabilities at the date of the financial statements and the reported amounts of revenues and expenses during the reporting period. Actual results could differ from those estimates.
Share Valuation — The NAV per share of the Funds are calculated by dividing the sum of the value of the securities held by the Funds, plus cash and other assets, minus all liabilities (including estimated accrued expenses) by the total number of shares outstanding for the Funds, rounded to the nearest cent. The North American Pipeline Fund’s shares will not be priced on the days on which the NYSE is closed for trading and the Global Water ESG Fund’s and the Digital Payments Infrastructure Fund’s shares will not be priced on the days on which CBOE is closed for trading. The offering and redemption price per share for the Funds are equal to the Funds’ net asset value per share.
Indemnifications — Under the Trust’s organizational documents, its officers and trustees are indemnified against certain liabilities arising out of the performance of their duties to the Trust. In addition, in the normal course of business, the Trust may enter into contracts that provide general indemnification to other parties. The Trust’s maximum exposure under these arrangements is unknown, as this would involve future claims that may be made against the Trust that have not yet occurred and may not occur. However, the Trust has not had prior claims or losses pursuant to these contracts and expects the risk of loss to be remote.
Cash and Cash Equivalents — Cash and cash equivalents include short-term, liquid investments with an original maturity of three months or less and include money market fund accounts.
Illiquid Securities — A security may be considered illiquid if it lacks a readily available market. Securities are generally considered liquid if they can be sold or disposed of in the ordinary course of business within seven days at approximately the price at which the security is valued by the Fund. Illiquid securities may be valued under methods approved by the Board of Trustees (the “Board”) as reflecting fair value. The Fund will not hold more than 15% of the value of its net assets in illiquid securities. At November 30, 2020, the Global Water ESG Fund had investments in illiquid securities with a total value of $0 or 0.0% of total net assets. At November 30, 2020, the North American Pipeline Fund and Digital Payments Infrastructure Fund did not hold any illiquid securities.
| Security | | Shares | | Date Acquired | | | Cost Basis | |
| CT Environmental Group Limited | | 113,060 | | 6/2018 | | | $ 15,150 | |
Notes to Financial Statements (continued)
3. Securities Valuation
The Funds have adopted fair value accounting standards, which establish an authoritative definition of fair value and set out a hierarchy for measuring fair value. These standards require additional disclosures about the various inputs and valuation techniques used to develop the measurements of fair value, a discussion in changes in valuation techniques and related inputs during the period and expanded disclosure of valuation levels for major security types. These inputs are summarized in the three broad levels listed below:
| Level 1 | — | Quoted prices in active markets for identical assets or liabilities. |
| | | |
| Level 2 | — | Observable inputs other than quoted prices included in Level 1. These inputs may include quoted prices for similar instruments, interest rates, prepayment speeds, credit risk, yield curves, default rates and similar data. |
| | | |
| Level 3 | — | Significant unobservable inputs for the asset or liability, representing the Fund’s view of assumptions a market participant would use in valuing the asset or liability. |
Following is a description of the valuation techniques applied to each Fund’s major categories of assets and liabilities measured at fair value on a recurring basis. Each Fund’s investments are carried at fair value.
Common stock (including MLPs) — Securities that are primarily traded on a national securities exchange are valued at the last sale price on the exchange on which they are primarily traded on the day of valuation or, if there has been no sale on such day, at the mean between the bid and ask prices. Securities traded primarily on the Nasdaq Global Market System for which market quotations are readily available are valued using the Nasdaq Official Closing Price (“NOCP”). If the NOCP is not available, such securities are valued at the last sale price on the day of valuation, or if there has been no sale on such day, at the mean between the bid and ask prices. To the extent these securities are actively traded and valuation adjustments are not applied, they are categorized in Level 1 of the fair value hierarchy.
Investment Companies — Investments in other mutual funds, including money market funds, are valued at their net asset value per share. To the extent these securities are actively traded and valuation adjustments are not applied, they are categorized in Level 1 of the fair value hierarchy.
Securities for which market quotations are not readily available, or if the closing price does not represent fair value, are valued following procedures approved by the Board of Trustees. These procedures consider many factors, including the type of security, size of holding, trading volume and news events. There can be no assurance that the Fund could obtain the fair value assigned to a security if they were to sell the security at approximately the time at which the Fund determines their net asset values per share. The Board of Trustees has established a Valuation Committee to administer, implement, and oversee the fair valuation process, and to make fair value decisions when necessary. The Board of Trustees regularly reviews reports that describe any fair value determinations and methods.
The inputs or methodology used for valuing securities are not an indication of the risk associated with investing in those securities.
The following table is a summary of the inputs used to value each Fund’s securities by level within the fair value hierarchy as of November 30, 2020:
| North American Pipeline Fund | | Level 1 | | | Level 2 | | | Level 3 | | | Total | |
| Common stock | | $ | 286,369,165 | | | $ | — | | | $ | — | | | $ | 286,369,165 | |
| Master limited partnerships | | | 72,491,292 | | | | — | | | | — | | | | 72,491,292 | |
| Short-term investment | | | 193,599 | | | | — | | | | — | | | | 193,599 | |
| Total investments in securities | | $ | 359,054,056 | | | $ | — | | | $ | — | | | $ | 359,054,056 | |
| | | | | | | | | | | | | | | | | |
| Global Water ESG Fund | | Level 1 | | | Level 2 | | | Level 3 | | | Total | |
| Common stock | | $ | 20,855,505 | | | $ | — | | | $ | — | | | $ | 20,855,505 | |
| Short-term investment | | | 6,356 | | | | — | | | | — | | | | 6,356 | |
| Total investments in securities | | $ | 20,861,861 | | | $ | — | | | $ | — | | | $ | 20,861,861 | |
| | | | | | | | | | | | | | | | | |
| Digital Payments Infrastructure Fund | | Level 1 | | | Level 2 | | | Level 3 | | | Total | |
| Common stock | | $ | 8,272,352 | | | $ | — | | | $ | — | | | $ | 8,272,352 | |
| Short-term investment | | | 5,021 | | | | — | | | | — | | | | 5,021 | |
| Total investments in securities | | $ | 8,277,373 | | | $ | — | | | $ | — | | | $ | 8,277,373 | |
Refer to each Fund’s Schedule of Investments for additional industry information.
2020 Annual Report | November 30, 2020
Notes to Financial Statements (continued)
The following is a reconciliation of Level 3 assets for which significant unobservable inputs were used to determine fair value.
| Global Water ESG Fund | | Investments in
Securities | |
| Balance as of 11/30/2019 | | $ | — | |
| Accrued discounts/premiums | | | — | |
| Realized gain (loss) | | | — | |
| Change in net unrealized appreciation (depreciation) | | | — | |
| Net purchases (sales) | | | — | |
| Transfers into and/or out of Level 3 | | | — | |
| Balance as of 11/30/2020 | | $ | — | |
| Net unrealized depreciation of Level 3 Securities as of November 30, 2020 | | $ | (15,150 | ) |
4. Concentration Risk and General Risk
Because the North American Pipeline Fund’s assets are concentrated in the energy pipeline industry, the Global Water ESG Fund’s assets are concentrated in the water industry and the Digital Payments Infrastructure Fund’s assets are concentrated in the digital payments industry, the Funds are subject to loss due to adverse occurrences that may affect those industries. Funds that primarily invest in a particular industry may experience greater volatility than funds investing in a broad range of industries.
The global outbreak of COVID-19 (commonly referred to as “coronavirus”) has disrupted economic markets and the prolonged economic impact is uncertain. The ultimate economic fallout from the pandemic, and the long-term impact on economies, markets, industries and individual issuers, are not known. The operational and financial performance of the issuers of securities in which the Funds invest depends on future developments, including the duration and spread of the outbreak, and such uncertainty may in turn adversely affect the value and liquidity of the Funds’ investments, impair the Funds’ ability to satisfy redemption requests, and negatively impact the Funds’ performance.
5. Investment Advisory Fee and Other Transactions with Affiliates
The Trust has an agreement with Tortoise Index Solutions, L.L.C. (the “Adviser”) to furnish investment advisory services to the Funds. Pursuant to an Investment Advisory Agreement between the Trust and the Adviser, the Adviser is entitled to receive, on a monthly basis, an annual advisory fee equal to 0.40% of each Fund’s average daily net assets. The Adviser bears the cost of all advisor and non-advisory services required to operate each Fund.
Effective March 30, 2020, the Adviser has engaged Vident Investment Advisory, LLC (the “Sub-Adviser”) as the Sub-Adviser to the Funds. Subject to the supervision of the Adviser, the Sub-Adviser is primarily responsible for the day-to-day management of the Funds’ portfolio, including purchase, retention and sale of securities. Fees associated with these services are paid to the Sub-Adviser by the Adviser.
U.S. Bancorp Fund Services, LLC, doing business as U.S. Global Fund Services (“Fund Services” or the “Administrator”) acts as the Funds’ Administrator, Transfer Agent and Fund Accountant. U.S. Bank, N.A. (the “Custodian”) serves as the custodian to the Funds. The Custodian is an affiliate of the Administrator. The Administrator performs various administrative and accounting services for the Funds. The Administrator prepares various federal and state regulatory filings, reports and returns for the Funds; prepares reports and materials to be supplied to the Trustees and monitors the activities of the Funds’ custodian, transfer agent and accountants. The officers of the Trust including the Chief Compliance Officer are employees of the Administrator. As compensation for its services, the Administrator is entitled to a monthly fee at an annual rate based upon the average daily net assets of the Funds, subject to annual minimums.
Quasar Distributors, LLC (the “Distributor”) acts as the Funds’ principal underwriter in a continuous public offering of the Funds’ shares. Effective March 31, 2020, Foreside Financial Group, LLC (“Foreside”) acquired Quasar from U.S. Bancorp. As a result of the acquisition, Quasar became a wholly-owned broker-dealer subsidiary of Foreside and is no longer affiliated with U.S. Bancorp. The Board of Trustees of the Funds has approved a new Distribution Agreement to enable Quasar to continue serving as the Fund’s distributor.
Notes to Financial Statements (continued)
6. Investment Transactions
The aggregate purchases and sales, excluding U.S. government securities, short-term investments and in-kind transactions, by each Fund for the period ended November 30, 2020, were as follows:
| | | Purchases | | | Sales | |
| North American Pipeline Fund | | $ | 101,000,899 | | | $ | 94,214,852 | |
| Global Water ESG Fund | | | 3,308,231 | | | | 3,172,072 | |
| Digital Payments Infrastructure Fund | | | 1,530,616 | | | | 1,769,101 | |
During the period ended November 30, 2020, in-kind transactions associated with creation and redemptions were as follows:
| | | Purchases | | | Sales | |
| North American Pipeline Fund | | $ | 168,022,854 | | | $ | 134,265,195 | |
| Global Water ESG Fund | | | 27,891,757 | | | | 23,236,863 | |
| Digital Payments Infrastructure Fund | | | 8,429,893 | | | | 8,181,147 | |
During the period ended November 30, 2020, net capital gains resulting from in-kind redemptions were as follows:
| North American Pipeline Fund | | $ | 12,984,308 | |
| Global Water ESG Fund | | | 1,580,163 | |
| Digital Payments Infrastructure Fund | | | 878,954 | |
7. Federal Tax Information
As of November 30, 2020, the cost basis of investments for federal income tax purposes and the components of accumulated losses on a tax basis were as follows:
| | | North American
Pipeline Fund | | | Global Water
ESG Fund | | | Digital Payments
Infrastructure
Fund | |
| Cost of investments | | $ | 423,051,764 | | | $ | 19,958,880 | | | $ | 7,459,873 | |
| Gross unrealized appreciation | | | 15,531,719 | | | | 2,212,555 | | | | 1,349,864 | |
| Gross unrealized depreciation | | | (89,758,431 | ) | | | (1,307,888 | ) | | | (532,348 | ) |
| Net unrealized appreciation (depreciation) | | | (74,226,712 | ) | | | 904,667 | | | | 817,516 | |
| Undistributed ordinary income | | | — | | | | 112,436 | | | | 19,052 | |
| Undistributed long-term capital gain | | | — | | | | — | | | | — | |
| Total distributable earnings | | | — | | | | 112,436 | | | | 19,052 | |
| Other accumulated losses | | | (6,999,347 | ) | | | (140,374 | ) | | | (451,171 | ) |
| Total accumulated gain (loss) | | $ | (81,226,059 | ) | | $ | 876,729 | | | $ | 385,397 | |
The difference between book and tax-basis cost is attributable primarily to wash sales and master limited partnership (“MLP”) adjustments.
As of November 30, 2020, the North American Pipeline Fund had a short-term capital loss carryforward of $4,032,859 and a long-term capital loss carryforward of $2,966,488, the Global Water ESG Fund had a short-term capital loss carryforward of $101,015 and a long-term capital loss carryforward of $39,359, the Ecofin Digital Payments Infrastructure Fund had a short-term capital loss carryforward of $368,253 and a long-term capital loss carryfoward of $82,918, which may be carried forward for an unlimited period under the Regulated Investment Company Modernization Act of 2010. To the extent Funds realize future net capital gains, those gains will be offset by any unused capital loss carryforwards. Capital loss carryforwards will retain their character as either short-term or long-term capital losses. Thus, such losses must be used first to offset gains of the same character; for example, long-term loss carryforwards will first offset long-term gains, before they can be used to offset short-term gains. The capital gains and losses have been estimated based on information currently available and are subject to revision upon receipt of the 2020 tax reporting information from the individual MLPs.
In order to meet certain excise tax distribution requirements, the Funds are required to measure and distribute annually net capital gains realized during a twelve month period ending November 30 and net investment income earned during a twelve month period ending December 31. In connection with this, the Funds are permitted for tax purposes to defer into its next fiscal year qualified late year ordinary losses. Qualified late year ordinary losses are generally losses incurred between January 1 and the end of its fiscal year, November 30, 2020. The Funds do not plan to defer any late year ordinary losses for the taxable year ended November 30, 2020.
2020 Annual Report | November 30, 2020
Notes to Financial Statements (continued)
During the year ended November 30, 2020, the Funds paid the following distributions to shareholders:
| | | North American
Pipeline Fund | | | Global Water
ESG Fund | | | Digital Payments
Infrastructure
Fund | |
| Ordinary income* | | $ | 7,894,972 | | | $ | 224,038 | | | $ | 169,293 | |
| Long-term capital gains** | | | — | | | | — | | | | — | |
| Return of capital | | | 11,785,468 | | | | — | | | | — | |
| Total distributions | | $ | 19,680,440 | | | $ | 224,038 | | | $ | 169,293 | |
During the year ended November 30, 2019, the Funds paid the following distributions to shareholders:
| | | North American
Pipeline Fund | | | Global Water
ESG Fund | | | | | |
| Ordinary income* | | $ | 6,397,624 | | | $ | 79,267 | | | | | |
| Long-term capital gains** | | | — | | | | — | | | | | |
| Return of capital | | | 7,556,816 | | | | — | | | | | |
| Total distributions | | $ | 13,954,440 | | | $ | 79,267 | | | | | |
| * | | For federal income tax purposes, distributions of short-term capital gains are treated as ordinary income distributions. |
| ** | | The Fund designates as long-term capital gain distributions, pursuant to Internal Revenue Code Section 852(b)(3)(C). |
8. Subsequent Events
On December 30, 2020, the North American Pipeline Fund paid an income distribution to shareholders in the amount of $5,141,000, or $0.2425000 per share.
On December 30, 2020, the Global Water ESG Fund paid an income distribution to shareholders in the amount of $134,540, or $0.22423334 per share.
On December 30, 2020, the Digital Payments Infrastructure Fund paid an income distribution to shareholders in the amount of $20,412, or $0.10206000 per share.
Upon recommendation from the Adviser to change the listing exchange for the Global Water ESG Fund and the Digital Payments Infrastructure Fund from the CBOE BZX Exchange, Inc. to the NYSE Arca, Inc., the Board of Trustees approved the change on December 11, 2020. The change in listing became effective on January 4, 2021.
Management has performed an evaluation of subsequent events through the date the financial statements were issued and has determined that no additional items require recognition or disclosure.
Report of Independent Registered Public Accounting Firm
To the Shareholders and the Board of Trustees
Tortoise North American Pipeline Fund
Ecofin Global Water ESG Fund
Ecofin Digital Payments Infrastructure Fund
Opinion on the Financial Statements
We have audited the accompanying statements of assets and liabilities of Tortoise North American Pipeline Fund, Ecofin Global Water ESG Fund, and Ecofin Digital Payments Infrastructure Fund (collectively referred to as the “Funds”), (three of the Funds constituting the Managed Portfolio Series (the “Trust”)), including the schedules of investments, as of November 30, 2020, and the related statements of operations, changes in net assets, and the financial highlights for each of the periods indicated in the table below and the related notes (collectively referred to as the “financial statements”). In our opinion, the financial statements present fairly, in all material respects, the financial position of each of the Funds (three of the funds constituting Managed Portfolio Series) at November 30, 2020, the results of their operations, changes in their net assets and financial highlights for the periods indicated in the table below, in conformity with U.S. generally accepted accounting principles.
Funds constituting
Managed Portfolio Series | | Statement
of operations | | Statement of
changes in net assets | | Financial highlights |
| Tortoise North American Pipeline Fund | | For the year ended November 30, 2020 | | For each of the two years in the period ended November 30, 2020 | | For each of the five years in the period ended November 30, 2020 |
| Ecofin Global Water ESG Fund | | For the year ended November 30, 2020 | | For each of the two years in the period ended November 30, 2020 | | For each of the three years in the period ended November 30, 2020 and the period from February 14, 2017 (inception date of the fund) through November 30, 2017 |
| Ecofin Digital Payments Infrastructure Fund | | For the year ended November 30, 2020 | | For the year ended November 30, 2020 and the period from January 31, 2019 (inception date of the fund) through November 30, 2019 |
Basis for Opinion
These financial statements are the responsibility of the Trust’s management. Our responsibility is to express an opinion on each of the Funds’ financial statements based on our audits. We are a public accounting firm registered with the Public Company Accounting Oversight Board (United States) (“PCAOB”) and are required to be independent with respect to the Trust in accordance with the U.S. federal securities laws and the applicable rules and regulations of the Securities and Exchange Commission and the PCAOB.
We conducted our audits in accordance with the standards of the PCAOB. Those standards require that we plan and perform the audit to obtain reasonable assurance about whether the financial statements are free of material misstatement, whether due to error or fraud. The Trust is not required to have, nor were we engaged to perform, an audit of the Trust’s internal control over financial reporting. As part of our audits we are required to obtain an understanding of internal control over financial reporting but not for the purpose of expressing an opinion on the effectiveness of the Trust’s internal control over financial reporting. Accordingly, we express no such opinion.
Our audits included performing procedures to assess the risks of material misstatement of the financial statements, whether due to error or fraud, and performing procedures that respond to those risks. Such procedures included examining, on a test basis, evidence regarding the amounts and disclosures in the financial statements. Our procedures included confirmation of securities owned as of November 30, 2020, by correspondence with the custodian and brokers. Our audits also included evaluating the accounting principles used and significant estimates made by management, as well as evaluating the overall presentation of the financial statements. We believe that our audits provide a reasonable basis for our opinion.

We have served as the auditor of one or more of the portfolios that comprise the Managed Portfolio Series since 2011.
Minneapolis, Minnesota
January 29, 2021
2020 Annual Report | November 30, 2020
Trustees & Officers (unaudited)
November 30, 2020
Name, Address
and Year of Birth | | Position(s) Held
with the Trust | | Term of Office
and Length of
Time Served | | Number of
Portfolios
in Trust
Overseen
by Trustee | | Principal Occupation(s)
During the Past Five Years | | Other Directorships
Held by Trustee During
the Past Five Years |
| Independent Trustees | | | | | | | | | | |
Leonard M. Rush, CPA
615 E. Michigan St.
Milwaukee, WI 53202
Year of Birth: 1946 | | Lead Independent Trustee and Audit Committee Chairman | | Indefinite Term; Since April 2011 | | 37 | | Retired, Chief Financial Officer, Robert W. Baird & Co. Incorporated (2000-2011). | | Independent Trustee, ETF Series Solutions (49 Portfolios) (2012-Present); Director, Anchor Bancorp Wisconsin, Inc. (2011-2013). |
David A. Massart
615 E. Michigan St.
Milwaukee, WI 53202
Year of Birth: 1967 | | Trustee and Valuation Committee Chairman | | Indefinite Term;
Since April 2011 | | 37 | | Co-Founder and Chief Investment Strategist, Next Generation Wealth Management, Inc. (2005-present). | | Independent Trustee, ETF Series Solutions (49 Portfolios) (2012-Present). |
David M. Swanson
615 E. Michigan St.
Milwaukee, WI 53202
Year of Birth: 1957 | | Trustee and Nominating & Governance Committee Chairman | | Indefinite Term;
Since April 2011 | | 37 | | Founder and Managing Principal, SwanDog Strategic Marketing, LLC (2006-present). | | Independent Trustee, ALPS Variable Investment Trust (7 Portfolios) (2006-Present); Independent Trustee, RiverNorth Funds (3 Portfolios) (2018-Present); RiverNorth Managed Duration Municipal Income Fund Inc. (1 Portfolio) (2019-Present); RiverNorth Marketplace Leading Corporation (1 Portfolio) (2018-Present); RiverNorth/ DoubleLine Strategic Opportunity Fund, Inc. (1 Portfolio) (2018-Present); RiverNorth Opportunities Fund, Inc. (1 Portfolio) (2018-Present); RiverNorth Opportunistic Municipal Income Fund, Inc. (1 Portfolio) (2018-Present). |
Robert J. Kern*
615 E. Michigan St.
Milwaukee, WI 53202
Year of Birth: 1958 | | Chairman, and Trustee | | Indefinite Term;
Since January 2011 | | 37 | | Retired Executive Vice President, U.S. Bancorp Fund Services, LLC (1994-2018). | | None |
* Mr. Kern became an independent Trustee on July 6, 2020. Previously he was an Interested Trustee.
Trustees & Officers (unaudited) (continued)
November 30, 2020
Name, Address
and Year of Birth | | Position(s) Held
with the Trust | | Term of Office
and Length of
Time Served | | Number of
Portfolios
in Trust
Overseen
by Trustee | | Principal Occupation(s)
During the Past Five Years | | Other Directorships
Held by Trustee During
the Past Five Years |
| Officers | | | | | | | | | | |
Brian R. Wiedmeyer
615 E. Michigan St.
Milwaukee, WI 53202
Year of Birth: 1973 | | President and Principal Executive Officer | | Indefinite Term;
Since November 2018 | | N/A | | Vice President,
U.S. Bancorp Fund Services, LLC
(2005-present). | | N/A |
Deborah Ward
615 E. Michigan St.
Milwaukee, WI 53202
Year of Birth: 1966 | | Vice President, Chief Compliance Officer and Anti-Money Laundering Officer | | Indefinite Term;
Since April 2013 | | N/A | | Senior Vice President,
U.S. Bancorp Fund Services, LLC
(2004-present). | | N/A |
Benjamin Eirich
615 E. Michigan St.
Milwaukee, WI 53202
Year of Birth: 1981 | | Vice President, Treasurer and Principal Financial Officer | | Indefinite Term;
Since August 2019 (Treasurer); Since November 2018 (Vice President) | | N/A | | Assistant Vice President,
U.S. Bancorp Fund Services, LLC
(2008-present). | | N/A |
Thomas A. Bausch, Esq.
615 E. Michigan St.
Milwaukee, WI 53202
Year of Birth: 1979 | | Secretary | | Indefinite Term;
Since November 2017 | | N/A | | Assistant Vice President,
U.S. Bancorp Fund Services, LLC
(2016-Present); Associate,
Godfrey & Kahn S.C. (2012-2016). | | N/A |
Douglas Schafer
615 E. Michigan St.
Milwaukee, WI 53202
Year of Birth: 1970 | | Vice President and Assistant Treasurer | | Indefinite Term;
Since May 2016 (Assistant Treasurer); Since November 2018 (Vice President) | | N/A | | Assistant Vice President,
U.S. Bancorp Fund Services, LLC
(2002-present). | | N/A |
Michael Cyr II, CPA
615 E. Michigan St.
Milwaukee, WI 53202
Year of Birth: 1992 | | Vice President and Assistant Treasurer | | Indefinite Term;
Since August 2019 | | N/A | | Assistant Vice President,
U.S. Bancorp Fund Services, LLC
(2013-present). | | N/A |
2020 Annual Report | November 30, 2020
Additional Information (unaudited)
Availability of Fund Portfolio Information
The Fund files complete schedules of portfolio holdings with the SEC for the first and third quarters of each fiscal year on Part F of Form N-PORT. The Funds’ Part F of Form N-PORT are available on the SEC’s website at www.sec.gov and may be reviewed and copied at the SEC’s Public Reference Room in Washington, D.C. Information on the operation of the Public Reference Room may be obtained by calling 1-800-732-0330. The Funds’ Part F of Form N-PORT may also be obtained by calling toll-free 1-844-TR-INDEX or 1-844-874-6339.
Availability of Proxy Voting Information
A description of the Fund’s Proxy Voting Policies and Procedures is available without charge, upon request, by calling 1-844-TR-INDEX or 1-844-874-6339. Information regarding how the Fund voted proxies relating to portfolio securities during the most recent 12 month period ended June 30, is available (1) without charge, upon request, by calling 1-844-TR-INDEX or 1-844-874-6339, or (2) on the SEC’s website at www.sec.gov.
Qualified Dividend Income/Dividends Received Deduction
For the fiscal year ended November 30, 2020, certain dividends paid by the Funds may be reported as qualified dividend income and may be eligible for taxation at capital gain rates. The percentage of dividends declared from ordinary income designated as qualified dividend income was 100.00%, 98.45%, and 1.41% for the North American Pipeline Fund, Global Water ESG Fund, and the Digital Payments Infrastructure Fund, respectively.
For corporate shareholders, the percent of ordinary income distributions qualifying for the corporate dividends received deduction for the fiscal year ended November 30, 2020 was 42.30%, 32.39%, and 12.38% for the North American Pipeline Fund, Global Water ESG Fund, and the Digital Payments Infrastructure Fund, respectively.
The percentage of taxable ordinary income distributions that are designated as short-term capital gain distributions under Internal Revenue Section 871(k)(2)(C) was 0.00%, 0.00% and 93.39% for the North American Pipeline Fund, Global Water ESG Fund and the Digital Payments Infrastructure Fund, respectively.
Frequency Distribution of Premiums and Discounts
Information regarding how often shares of the Fund trades on the Exchange at a price about (i.e., at a premium) or below (i.e., at a discount) the NAV of the Fund is available, free of charge, on the Fund’s website at etp.tortoiseindexsolutions.com.
Additional Information (unaudited) (continued)
Privacy Notice
The Funds collect only relevant information about you that the law allows or requires us to have in order to conduct our business and properly service you. The Funds collect financial and personal information about you (“Personal Information”) directly (e.g., information on account applications and other forms, such as your name, address, and social security number, and information provided to access account information or conduct account transactions online, such as password, account number, e-mail address, and alternate telephone number), and indirectly (e.g., information about your transactions with us, such as transaction amounts, account balance and account holdings).
The Funds do not disclose any non-public personal information about its shareholders or former shareholders other than for everyday business purposes such as to process a transaction, service an account, to respond to court orders and legal investigations or as otherwise permitted by law. Third parties that may receive this information include companies that provide transfer agency, technology and administrative services to the Funds, as well as the Funds’ investment adviser who is an affiliate of the Funds. If you maintain a retirement/educational custodial account directly with the Funds, we may also disclose your Personal Information to the custodian for that account for shareholder servicing purposes. We limit access to your Personal Information provided to unaffiliated third parties to information necessary to carry out their assigned responsibilities to the Funds. All shareholder records will be disposed of in accordance with applicable law.
The Trust maintains physical, electronic and procedural safeguards to protect Personal Information and requires its third parties service provides with access to such information to treat the Personal Information with the same high degree of confidentiality.
In the event that you hold shares of a Fund through a financial intermediary, including, but not limited to, a broker-dealer, bank, credit union or trust company, the privacy policy of the your financial intermediary would govern how their non-public personal information would be shared with unaffiliated third parties.
With respect to the Funds, issues and redemptions of their shares at net asset value (“NAV”) occur only in large aggregations of a specified number of shares (e.g., 50,000) called “Creation Units.” Only Authorized Participants (“APs”) may acquire shares directly from an ETF, and only APs may tender their ETF shares for redemption directly to the ETF, at NAV. APs must be (i) a broker-dealer or other participant in the clearing process through the Continuous Net Settlement System of the NSCC, a clearing agency that is registered with the SEC; or (ii) a DTC participant. In addition, each AP must execute a Participant Agreement that has been agreed to by the Funds’ distributor, and that has been accepted by the Funds’ transfer agent, with respect to purchases and redemptions of Creation Units.
Because of this structure, the Funds do not have any information regarding any “consumers” as defined in Rule 3 of Regulation S-P with respect to any ETFs, and consequently are not required by Regulation S-P to deliver a notice of the Funds’ privacy policy to any ETF shareholders.

Contacts
Board of Trustees
David Massart
Leonard Rush, CPA
David Swanson
Robert Kern
Investment Adviser
Tortoise Index Solutions, L.L.C.
d/b/a TIS Advisors
5100 W. 115th Place
Leawood, KS 66211
Independent Registered Public
Accounting Firm
Ernst & Young, LLP
220 South Sixth Street, Suite 1400
Minneapolis, MN 55402
Transfer Agent, Fund Accountant
and Fund Administrator
U.S. Bancorp Fund Services, LLC
615 E. Michigan Street
Milwaukee, WI 53202
Distributor
Quasar Distributors, LLC
111 E. Kilbourn Avenue, Suite 2200
Milwaukee, WI 53202
Custodian
U.S. Bank, N.A.
1555 North Rivercenter
Drive Milwaukee, WI 53212
Fund Counsel
Stradley Ronon Stevens & Young LLP
2005 Market Street
Suite 2600
Philadelphia, PA 19103
844-TR-INDEX
(844-874-6339)
This report must be accompanied or preceded by a prospectus.
The Fund’s Statement of Additional Information contains additional information about the Fund’s trustees and is available without charge upon request by calling 1-844-TR-INDEX or 1-844-874-6339.

5100 W. 115th Place
Leawood, KS 66211
www.TortoiseEcofin.com
Item 2. Code of Ethics.
The registrant has adopted a code of ethics that applies to the registrant’s principal executive officer and principal financial officer. The registrant has not made any substantive amendments to its code of ethics during the period covered by this period.
The registrant has not granted any waivers from any provisions of the code of ethics during the period covered by this report.
A copy of the registrant’s code of ethics that applies to the registrant’s principal executive officer and principal financial officer is filed herewith.
Item 3. Audit Committee Financial Expert.
The registrant’s Board of Trustees has determined that there is at least one audit committee financial expert serving on its audit committee. Leonard M. Rush is the “audit committee financial expert” and is considered to be “independent” as each term is defined in Item 3 of Form N-CSR.
Item 4. Principal Accountant Fees and Services.
The registrant has engaged its principal accountant to perform audit services, audit-related services, tax services and other services during the past fiscal year. “Audit services” refer to performing an audit of the registrant’s annual financial statements or services that are normally provided by the accountant in connection with statutory and regulatory filings or engagements for the past fiscal year. “Audit-related services” refer to the assurance and related services by the principal accountant that are reasonably related to the performance of the audit. “Tax services” refer to professional services rendered by the principal accountant for tax compliance, tax advice, and tax planning, including reviewing the Fund’s tax returns and distribution calculations. There were no “other services” provided by the principal accountant. For the fiscal years ended November 30, 2020 and November 30, 2019, the Fund’s principal accountant was Ernst & Young. The following table details the aggregate fees billed or expected to be billed for each of the last fiscal year for audit fees, audit-related fees, tax fees and other fees by the principal accountant.
| | FYE 11/30/2020 | FYE 11/30/2019 |
| Audit Fees | $191,000 | $194,000 |
| Audit-Related Fees | $0 | $0 |
| Tax Fees | $111,500 | $91,645 |
| All Other Fees | $0 | $0 |
The audit committee has adopted pre-approval policies and procedures that require the audit committee to pre-approve all audit and non-audit services of the registrant, including services provided to any entity affiliated with the registrant.
1
The percentage of fees billed by Ernst & Young applicable to non-audit services pursuant to waiver of pre-approval requirement was as follows:
| | FYE 11/30/2020 | FYE 11/30/2019 |
| Audit-Related Fees | 0% | 0% |
| Tax Fees | 0% | 0% |
| All Other Fees | 0% | 0% |
All of the principal accountant’s hours spent on auditing the registrant’s financial statements were attributed to work performed by full-time permanent employees of the principal accountant.
The following table indicates the non-audit fees, other than the tax services as noted above, billed or expected to be billed by the registrant’s accountant for services to the registrant and to the registrant’s investment adviser (and any other controlling entity, etc.—not sub-adviser) for the last two years. The audit committee of the board of trustees/directors has considered whether the provision of non-audit services that were rendered to the registrant’s investment adviser is compatible with maintaining the principal accountant’s independence and has concluded that the provision of such non-audit services by the accountant has not compromised the accountant’s independence.
| Non-Audit Related Fees | FYE 11/30/2020 | FYE 11/30/2019 |
| Registrant | $0 | $0 |
| Registrant’s Investment Adviser | $31,850 | $45,100 |
Item 5. Audit Committee of Listed Registrants.
Not applicable to registrants who are not listed issuers (as defined in Rule 10A-3 under the Securities Exchange Act of 1934).
Item 6. Investments.
(a) Schedule of Investments is included as part of the report to shareholders filed under Item 1 of this Form.
(b) Not applicable.
Item 7. Disclosure of Proxy Voting Policies and Procedures for Closed-End Management Investment Companies.
Not applicable to open-end investment companies.
Item 8. Portfolio Managers of Closed-End Management Investment Companies.
Not applicable to open-end investment companies.
Item 9. Purchases of Equity Securities by Closed-End Management Investment Company and Affiliated Purchasers.
Not applicable to open-end investment companies.
2
Item 10. Submission of Matters to a Vote of Security Holders.
There have been no material changes to the procedures by which shareholders may recommend nominees to the registrant’s board of trustees.
Item 11. Controls and Procedures.
| (a) | The Registrant’s President and Treasurer have reviewed the Registrant’s disclosure controls and procedures (as defined in Rule 30a-3(c) under the Investment Company Act of 1940 (the “Act”)) as of a date within 90 days of the filing of this report, as required by Rule 30a-3(b) under the Act and Rules 13a-15(b) or 15d-15(b) under the Securities Exchange Act of 1934. Based on their review, such officers have concluded that the disclosure controls and procedures are effective in ensuring that information required to be disclosed in this report is appropriately recorded, processed, summarized and reported and made known to them by others within the Registrant and by the Registrant’s service provider. |
| (b) | There were no significant changes in the Registrant’s internal control over financial reporting (as defined in Rule 30a-3(d) under the Act) that occurred during the period covered by this report that has materially affected, or is reasonably likely to materially affect, the Registrant’s internal control over financial reporting. |
Item 12. Disclosure of Securities Lending Activities for Closed-End Management Investment Companies
Not applicable to open-end investment companies.
Item 13. Exhibits.
(2) Certifications pursuant to Section 302 of the Sarbanes-Oxley Act of 2002. Filed herewith.
(3) Any written solicitation to purchase securities under Rule 23c-1 under the Act sent or given during the period covered by the report by or on behalf of the registrant to 10 or more persons. Not applicable to open-end investment companies.
(4) Change in the registrant’s independent public accountant. There was no change in the registrant’s independent public accountant for the period covered by this report
3
SIGNATURES
Pursuant to the requirements of the Securities Exchange Act of 1934 and the Investment Company Act of 1940, the registrant has duly caused this report to be signed on its behalf by the undersigned, thereunto duly authorized.
| | (Registrant) | Managed Portfolio Series | |
| | | | |
| | By (Signature and Title)* | /s/ Brian R. Wiedmeyer | |
| | | Brian R. Wiedmeyer, President | |
| | | | |
| | Date February 5, 2021 | |
Pursuant to the requirements of the Securities Exchange Act of 1934 and the Investment Company Act of 1940, this report has been signed below by the following persons on behalf of the registrant and in the capacities and on the dates indicated.
| | By (Signature and Title)* | /s/ Brian R. Wiedmeyer | |
| | | Brian R. Wiedmeyer, President | |
| | | | |
| | Date February 5, 2021 |
| | | | |
| | By (Signature and Title)* | /s/ Benjamin J. Eirich | |
| | | Benjamin J. Eirich, Treasurer | |
| | | | |
| | Date February 5, 2021 |
* Print the name and title of each signing officer under his or her signature.
4