| | | Ticker Symbols | |
| | Investor Class | Institutional Class | IS Class |
| | | | |
| Jackson Square | [Not available | [Not available | |
| All-Cap Growth Fund | for purchase] | for purchase] | JSSSX |
| | | | |
| Jackson Square | [Not available | | |
| Global Growth Fund | for purchase] | JSPTX | JSPUX |
| | | | |
| Jackson Square | | | |
| Large-Cap Growth Fund | JSPJX | JSPIX | DPLGX |
| | | | |
| Jackson Square | [Not available | [Not available | |
| Select 20 Growth Fund | for purchase] | for purchase] | DPCEX |
| | | | |
| Jackson Square | | | |
| SMID-Cap Growth Fund | JSMVX | JSMTX | DCGTX |
Beginning on January 1, 2021, as permitted by regulations adopted by the Securities and Exchange Commission, paper copies of the Funds’ annual and semi-annual shareholder reports will no longer be sent by mail, unless you specifically request paper copies of the reports. Instead, the reports will be made available on the Funds’ website (www.jspfunds.com), and you will be notified by mail each time a report is posted and provided with a website link to access the report.
If you already elected to receive shareholder reports electronically, you will not be affected by this change and you need not take any action. You may elect to receive shareholder reports and other communications from a Fund electronically anytime by contacting your financial intermediary (such as a broker-dealer or bank) or, if you are a direct investor, by calling 1-844-577-3863 or by sending an e-mail request to info@jspfunds.com.
You may elect to receive all future reports in paper free of charge. If you invest through a financial intermediary, you can contact your financial intermediary to request that you continue to receive paper copies of your shareholder reports. If you invest directly with a Fund, you can call 1-844-577-3863 or send an email request to info@jspfunds.com to let the Fund know you wish to continue receiving paper copies of your shareholder reports. Your election to receive reports in paper will apply to all funds held in your account if you invest through your financial intermediary or all Funds held with the fund complex if you invest directly with a Fund.
Annual Report
| www.jspfunds.com | October 31, 2020 |
(This Page Intentionally Left Blank.)
Jackson Square Funds
October 31, 2020
Dear Shareholders:
Jackson Square Partners, LLC (“Jackson Square”), a U.S. registered investment adviser, is the adviser to the Jackson Square All-Cap Growth Fund, Jackson Square Global Growth Fund, Jackson Square Large-Cap Growth Fund, Jackson Square Select 20 Growth Fund, and Jackson Square SMID-Cap Growth Fund.
After significant positive absolute returns in the equity market over the past several years, we saw continued market strength as measured by the entire fiscal period but with extreme volatility during several months in 2020 brought about by the COVID-19 global pandemic. The volatility was primarily a function of fundamental concerns of investors assessing the economic damage brought by the impacts of COVID-19. Such a disruption in economic activity by both the virus itself and by mitigation efforts by authorities worldwide (e.g. economic shutdowns, restrictions on gatherings and travel) caused a significant market sell off in the early spring, only to reverse to a strong recovery throughout the following months as mitigation efforts and the potential for better treatments and vaccine candidates become more promising. Before COVID-19, investors were already struggling with accurately predicting the pace of global economic recovery and assessing external factors that threaten economic fundamentals, such as central bank actions and fiscal policy debates across the globe. However, the decade-long market strength has been fueled at least partly by a supportive condition of low interest rates and a lack of geopolitical shocks. The pandemic is certainly a unique and unprecedented global development in modern times, but the fiscal period ended with investors more focused on the potential economic recovery outlook in 2021 and beyond than in wallowing in the hard and soft costs of the virus to the global economy. Within this backdrop, investors have leaned toward equities as a preferred asset allocation choice resulting in a strong U.S. equity market with only minor pullbacks.
Soon after the fiscal year ended October 31, 2020, the post-election period was not without drama as President Trump is challenging the results of President-Elect Joseph Biden’s victory, and there remains some concern for disruption to what is normally an orderly Presidential transition. However, the financial markets do not appear to be factoring in any particular risk of national crisis. Despite the unusual external factors brought in 2020 in the form of a global pandemic and the President contending election results, and any other macro events or circumstances that may arise, we remain consistent in our long-term investment philosophy:
We want to own what we view as strong secular-growth companies with solid business models and competitive positions that we believe can grow market share and have the potential to deliver shareholder value in a variety of market environments.
Jackson Square All-Cap Growth Fund
All-Cap Growth Fund
Within the Fund
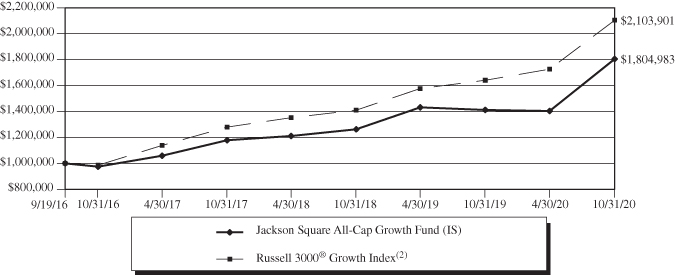
For the fiscal year ended Oct. 31, 2020, All-Cap Growth Fund IS Class shares gained 27.81%. These figures reflect all distributions reinvested. During the same period, the Fund’s benchmark, the Russell 3000® Growth Index, rose 28.20%. For complete, annualized performance of All-Cap Growth Fund, please see the table on page 4.
Strong relative performance in information technology outperformed weak relative performance in consumer discretionary. On a stock-specific level, the following were the most significant contributors and detractors during the period.
Twilio, Inc. Class A, a cloud communications platform, was a contributor to performance during the period. We believe that instant digital communication with customers and employees across any medium in any geography is a hugely complex problem that businesses increasingly need to solve, and we believe Twilio, as the leading communications-as-a-service platform, at multiples the size of its next largest competitor, will be the primary beneficiary of that trend. The addressable market is tens of billions of procurement dollars and essentially untapped with Twilio’s still negligible penetration, which we believe is set to expand meaningfully and drive consistently high revenue growth for many years.
Coupa Software, Inc., a cloud-based enterprise software-as-a-service platform addressing business spend management, was a contributor to performance during the period. The brand is relatively nascent but is rapidly inflecting from “cool but risky startup”, nibbling at the heels of sleepy incumbents SAP and Oracle, to the gold standard for procurement organizations within the enterprise. We believe Coupa is the next horizontal software category killer and is very early on a long journey of disrupting a giant spend management total addressable market with rapid topline growth and healthy unit economics supporting high terminal profitability. Additionally, the company is rapidly approaching $2 trillion of customer spend running through its platform with aspirations to be the mousetrap for businesses to consolidate and optimize payment to suppliers.
SailPoint Technologies, Inc., a software company focusing on identity governance, was a contributor to performance during the period. COVID-19 proved to be a demand tailwind as best-of-breed identity governance became a strategic priority during lockdown, driving a sharp acceleration in billings. We believe recent results reinforce our thesis which continues to focus on SAIL’s dominant competitive lead and long growth runway against a sea of inferior legacy competition in a cybersecurity category that is becoming increasingly vital. The business model also continues to shift from on-premise perpetual licenses to subscription-as-a-service which we believe will improve the visibility of key financial metrics and therefore decrease the stock’s implied cost of capital over time.
Airbus SE, a European civil and defense aircraft manufacturer was a detractor from performance during the period. Although the stock began to recover from its sharp decline in March, it lagged the broader market index as investors continued to be cautious about travel related names. Investors’ debate has shifted to the medium term demand for new aircraft as Airbus has now mapped out a reasonable near term crisis management plan. We believe the company can significantly raise production rates in 2022 and 2023 and is significantly undervalued on that potential.
Jackson Square All-Cap Growth Fund
Amazon.com, Inc., a global e-commerce and technology service provider, was a detractor during the period but for purely technical reasons. The stock significantly outperformed the benchmark during the period, but our average weight in the stock was underweight. While we do not explicitly manage to the benchmark and individual stock weights are merely a residual effect of our bottom up, stock specific fundamental analysis, we would expect our weight in the position to increase as the stock has performed better than most stocks and because of our increased conviction in the fundamentals and valuation of the company.
Liberty TripAdvisor Holdings, Inc., a travel website providing travel advice and planning features, detracted from performance during the period. The company’s hotel segment has struggled amid competitive headwinds, including increased challenges from Google’s search practices. We exited the stock to redeploy capital elsewhere.
Jackson Square All-Cap Growth Fund
Value of $1,000,000 Investment (Unaudited)
The chart assumes an initial investment of $1,000,000. Performance reflects waivers of fee and operating expenses in effect. In the absence of such waivers, total return would be reduced. Past performance is not predictive of future performance. Investment return and principal value will fluctuate, so that your shares, when redeemed may be worth more or less than their original cost. Performance current to the most recent month-end may be lower or higher than the performance quoted and can be obtained by calling 1-844-577-3863. Performance assumes the reinvestment of capital gains and income distributions. The performance does not reflect the deduction of taxes that a shareholder would pay on Fund distributions or the redemption of Fund shares.
Annualized Rates of Return as of October 31, 2020
| | 1 year | 3 year | Since Inception(1) |
| IS Class | 27.81% | 15.26% | 15.43% |
Russell 3000® Growth Index(2) | 28.20% | 18.01% | 19.81% |
| (1) | The IS Class commenced operations on September 19, 2016. |
| (2) | The Russell 3000® Growth Index measures the growth segment of the U.S. equity universe. It includes those Russell 3000® Index. companies with higher price-to-book ratios and higher forecasted growth values. One cannot invest directly in an Index. |
The following is expense information for the All-Cap Growth Fund (the “Fund”) as disclosed in the most recent prospectus dated February 28, 2020: Gross Expenses: 2.47%, Net Expenses: 0.90%. Jackson Square Partners, LLC (the “Adviser”) has contractually agreed to waive its management fees and pay Fund expenses in order to ensure the Total Annual Fund Operating Expenses (excluding Rule 12b-1 fees, shareholder servicing fees, acquired fund fees and expenses, brokerage commissions, leverage, interest, taxes, and extraordinary expenses) do not exceed 0.90% of the average daily net assets of the Fund. Fees waived and expenses paid by the Adviser may be recouped by the Adviser for a period of 36 months following the month during which such fee waiver and expense payment was made if such recoupment can be achieve without exceeding the expense limit in effect at the time the fee waiver and/or expense payment occurred and the expense limit in place at the time of recoupment. The Operating Expenses Limitation Agreement is indefinite, but cannot be terminated through at least February 28, 2021. Thereafter, the agreement may be terminated at any time upon 60 days’ written notice by the Board of Trustees (the “Board”) or the Adviser.
The actual expense ratio applicable to investors, as disclosed in the Financial Highlights for the fiscal year ended October 31, 2020, was 0.90% for the IS Class.
Jackson Square All-Cap Growth Fund
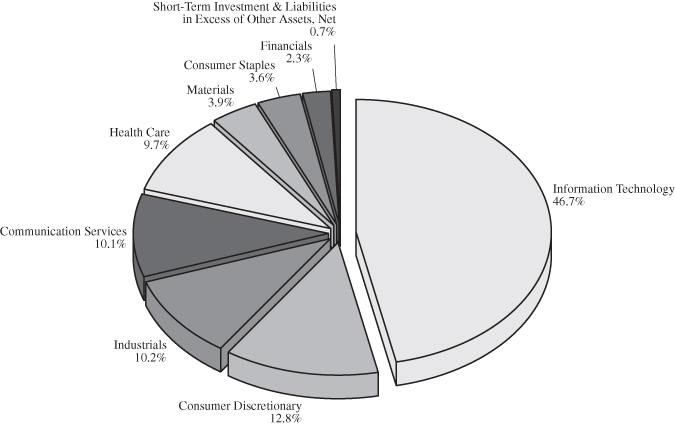
Sector Allocation(1) (Unaudited)
As of October 31, 2020
(% of Net Assets)
Top Ten Equity Holdings(1) (Unaudited)
As of October 31, 2020
(% of Net Assets)
| | Microsoft | | | 8.9 | % |
| | Ball | | | 3.9 | % |
| | Wix.com | | | 3.6 | % |
| | Grocery Outlet Holding | | | 3.6 | % |
| | Visa – Class A | | | 3.4 | % |
| | New York Times – Class A | | | 3.3 | % |
| | Coupa Software | | | 3.1 | % |
| | Amazon.com | | | 3.1 | % |
| | Twilio – Class A | | | 2.9 | % |
| | ServiceNow | | | 2.9 | % |
| (1) | Fund holdings and sector allocations are subject to change at any time and are not recommendations to buy or sell any security. |
Jackson Square Global Growth Fund
Global Growth Fund
Within the Fund
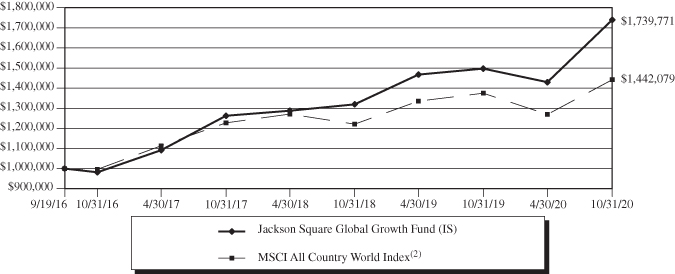
For the fiscal year ended Oct. 31, 2020, Jackson Square Global Growth Fund IS and Institutional Class shares gained 16.20% and 16.17%, respectively. These figures reflect all distributions reinvested. During the same period, the Fund’s benchmark, the MSCI All Country World Index, rose 4.89%. For complete, annualized performance of Jackson Square Global Growth Fund, please see the table on page 8.
Strong relative performance in information technology outperformed weak relative performance in health care. On a stock-specific level, the following were the most significant contributors and detractors during the period.
Wix.com Ltd., a cloud-based web development platform, was contributor to performance during the period. The impact of COVID-19 brought the need for more small and medium businesses to go online and expanded Wix.com’s reach. We believe the growth opportunity remains attractive, due in part to the fact that there are over 400 million small and medium size businesses that are the company’s target market--the majority of which have yet to obtain an online presence. We believe such a presence is becoming more necessary given the COVID-19-driven disruption and challenges to the physical presence of many companies, along with the need to accurately and efficiently market online to customers.
Farfetch Limited Class A, a UK-based online retail business selling multi-brand digital luxury goods in over 100 countries, was a contributor to performance during the period. Following a difficult 2019 for the company, we went through an extensive re-underwriting of the position and determined that Farfetch remains in the best position to capitalize on the luxury industry moving online over the next several years. While we have expected this to play out in a linear fashion over many years as brands reassess their distribution strategies, we believe COVID-19 has accelerated this shift. Given 90% of luxury purchases are in store and the vast majority of demand is derived from cross-border travel, we believe the company is in the enviable position of having the best platform for the brands to utilize as demand migrates online. The stock continues to outperform following a strong earnings report that highlighted growth is accelerating. In addition, the company continues to sign on new brands to the platform. We remain constructive on the risk/reward profile at these price levels and would note the balance sheet is well capitalized to absorb temporary disruptions.
MercadoLibre, Inc., a top online retailer in Latin America, was a contributor to performance during the period. Third-party data sources showed continued acceleration across its ecommerce and payments platforms with strong momentum in monthly users and transaction volumes. We believe the data highlights that the company remains well positioned to benefit from the secular growth of e-commerce within the region and further accelerated by COVID impacts.
Airbus SE, a European civil and defense aircraft manufacturer was a detractor from performance during the period. Although the stock began to recover from its sharp decline in March, it lagged the broader market index as investors continued to be cautious about travel related names. Investors’ debate has shifted to the medium term demand for new aircraft as Airbus has now mapped out a reasonable near term crisis management plan. We believe the company can significantly raise production rates in 2022 and 2023 and is significantly undervalued on that potential.
Haemonetics Corporation, an automated blood collection device company, was a detractor from performance during the period. We believe that several items contributed to its underperformance, including: (i) neutral intra-quarter commentary on COVID-19’s near-term fundamental impact, (ii) significant forced selling during an index rebalance, and (iii) potential threats of competing plasma therapies to the company’s customers given
Jackson Square Global Growth Fund
Argenx’s earlier-than-expected Phase III readout of its FcRn antagonist solution designed to treat myasthenia gravis (MG). After a deeper dive into competitive threats, we believe too much long-term uncertainty existed around several paths for competing therapies to disrupt the company’s customers, and therefore its fundamentals, so we decided to move on for a higher confidence new idea.
InterContinental Hotels Group PLC, an owner and operator of hotels, was a detractor from performance during the period. Intercontinental Hotel Group (IHG), a pure play hotel franchisor, has been adversely impacted by the COVID-19 virus as travel and hotel stays have declined materially. The hotel franchise model is a pro-cyclical structure that requires very little capital for IHG to grow in normal times. However, in a severe adverse economic travel environment, like the current situation, the health of the franchises becomes un-analyzable (balance sheets; loan covenants etc.). Given our lack of conviction in the overall health of the IHG ecosystem, we have decided to sell our position and redeploy the capital into higher conviction travel names.
Jackson Square Global Growth Fund
Value of $1,000,000 Investment (Unaudited)
The chart assumes an initial investment of $1,000,000. Performance reflects waivers of fee and operating expenses in effect. In the absence of such waivers, total return would be reduced. Past performance is not predictive of future performance. Investment return and principal value will fluctuate, so that your shares, when redeemed may be worth more or less than their original cost. Performance current to the most recent month-end may be lower or higher than the performance quoted and can be obtained by calling 1-844-577-3863. Performance assumes the reinvestment of capital gains and income distributions. The performance does not reflect the deduction of taxes that a shareholder would pay on Fund distributions or the redemption of Fund shares.
Annualized Rates of Return as of October 31, 2020
| | 1 year | 3 year | Since Inception(1) |
| IS Class | 16.20% | 11.27% | 14.40% |
| Institutional Class | 16.17% | 11.27% | 14.38% |
MSCI All Country World Index(2) | 4.89% | 5.52% | 9.30% |
| (1) | Inception date of each class was September 19, 2016. |
| (2) | The MSCI All Country World Index is a free float adjusted market capitalization weighted index that is designed to measure the equity market performance of developed emerging markets. One cannot invest directly in an Index. |
The following is expense information for the Jackson Square Global Growth Fund (the “Fund”) as disclosed in the Fund’s most recent prospectus dated February 28, 2020: Institutional Class – Gross Expenses: 2.11%, Net Expenses: 1.15%; IS Class – Gross Expenses: 2.01%, Net Expenses: 1.05%. The Adviser has contractually agreed to waive its management fees and pay Fund expenses in order to ensure the Total Annual Fund Operating Expenses (excluding Rule 12b-1 fees, shareholder servicing fees, acquired fund fees and expenses, brokerage commissions, leverage, interest, taxes, and extraordinary expenses) do not exceed 1.05% of the average daily net assets of the Fund. Fees waived and expenses paid by the Adviser may be recouped by the Adviser for a period of 36 months following the month during which such fee waiver and expense payment was made if such recoupment can be achieve without exceeding the expense limit in effect at the time the fee waiver and/or expense payment occurred and the expense limit in place at the time of recoupment. The Operating Expenses Limitation Agreement is indefinite, but cannot be terminated through at least February 28, 2021. Thereafter, the agreement may be terminated at any time upon 60 days’ written notice by the Board or the Adviser.
The actual expense ratio applicable to investors, as disclosed in the Financial Highlights for the fiscal year ended October 31, 2020, was 1.05% and 1.05% for the IS Class and Institutional Class, respectively.
Jackson Square Global Growth Fund
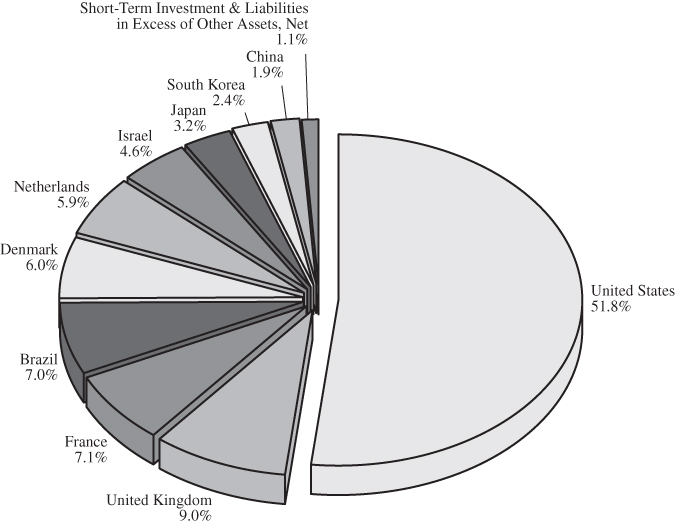
Country Allocation(1) (Unaudited)
As of October 31, 2020
(% of Net Assets)
Top Ten Equity Holdings(1) (Unaudited)
As of October 31, 2020
(% of Net Assets)
| | Microsoft | | | 6.5 | % |
| | Mastercard – Class A | | | 3.8 | % |
| | Wix.com | | | 3.6 | % |
| | New York Times – Class A | | | 3.6 | % |
| | Visa – Class A | | | 3.5 | % |
| | MercadoLibre | | | 3.4 | % |
| | Netflix | | | 3.2 | % |
| | Experian | | | 3.2 | % |
| | MonotaRO | | | 3.2 | % |
| | Farfetch – Class A | | | 3.2 | % |
| (1) | Fund holdings and sector allocations are subject to change at any time and are not recommendations to buy or sell any security. |
Jackson Square Large-Cap Growth Fund
Large-Cap Growth Fund
Within the Fund
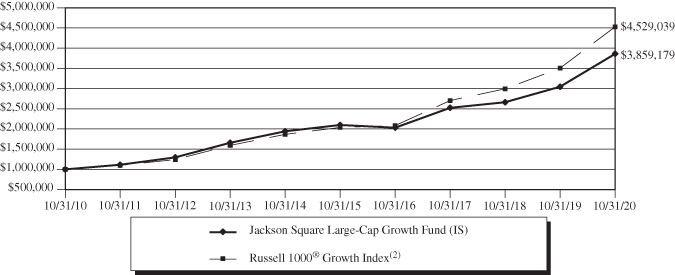
For the fiscal year ended Oct. 31, 2020, Jackson Square Large-Cap Growth Fund IS, Institutional and Investor Classes shares gained 26.73%, 26.78% and 26.49%, respectively. These figures reflect all distributions reinvested. During the same period, the Fund’s benchmark, the Russell 1000® Growth Index, gained 29.22%. For complete, annualized performance of Large-Cap Growth Fund, please see the table on page 12.
Strong relative performance in information technology was unable to overcome weak relative performance in financials. On a stock-specific level, the following were the most significant contributors and detractors during the period.
Twilio, Inc. Class A, a cloud communications platform, was a contributor to performance during the period. We believe that instant digital communication with customers and employees across any medium in any geography is a hugely complex problem that businesses increasingly need to solve, and we believe Twilio, as the leading communications-as-a-service platform, at multiples the size of its next largest competitor, will be the primary beneficiary of that trend. The addressable market is tens of billions of procurement dollars and essentially untapped with Twilio’s still negligible penetration, which we believe is set to expand meaningfully and drive consistently high revenue growth for many years.
ServiceNow, Inc., a cloud-based software company focusing on core systems for IT departments, was a contributor to performance during the period. The company’s new management team led by CEO Bill McDermott delivered strong growth and profitability against fears of slowing performance during the management transition period. During the COVID-19 pandemic, the company also successfully stabilized and reaccelerated growth in a rapid time frame as they focused on rapidly digitizing large companies, a trend which is likely to lead to additional tailwinds in upcoming years. We believe the company’s growth will remain exceptionally strong for a software company of this scale driven by continued modernization of IT departments and continuing success expanding into HR, Finance, and other adjacent workflows.
PayPal Holdings Inc., a technology platform company that enables digital and mobile payments on behalf of consumers and merchants, was a contributor to performance during the period. The company noted marked acceleration for new users, retention, engagement, and volumes across their entire brand portfolio as COVID-19 effects have pulled forward consumer e-commerce demand across the globe. Third party data released in June has shown a significant acceleration in new application installs for both PayPal and Venmo, which have helped sustain the stock’s outperformance. We believe the strength across the portfolio highlights the reach, scale and technology of the company that is uniquely situated to capture market share of digital payments.
Constellation Brands, Inc. Class A, a producer and marketer of beer, wine, and spirits, was a detractor from performance during the period. Investors became concerned about the company’s leverage profile on the balance sheet as well as the Mexican government taking several unexpected anti-business initiatives which hurt Constellation. We sold our position in favor of more attractive opportunities.
CME Group Inc. Class A, a financial market company operating options and futures exchanges, was a detractor from performance during the period. CME’s stock underperformed the market during the period as a result of generally lower volumes on its futures exchange. Since the company’s costs base is relatively fixed, lower volumes directly lead to lower earnings and cash flows. Although we greatly admire the company’s business model and management team, we have decided to exit the position as we believe the probability of sustained lower volumes has increased as a result of global central bank intervention efforts, thereby reducing interest rate volatility and associated futures trading volumes.
Jackson Square Large-Cap Growth Fund
Dollar Tree, Inc., a chain of discount variety stores, was a detractor from performance during the period. We considered re-underwriting the position but ultimately concluded that this company requires a new management team to realize the substantial value creation opportunities related to a Family Dollar turnaround and expanding price tiers at Dollar Tree. Given our increased concerns of challenging fundamentals and management execution, we decided to redeploy assets elsewhere.
Jackson Square Large-Cap Growth Fund
Value of $1,000,000 Investment (Unaudited)
The chart assumes an initial investment of $1,000,000. Performance reflects waivers of fee and operating expenses in effect. In the absence of such waivers, total return would be reduced. Past performance is not predictive of future performance. Investment return and principal value will fluctuate, so that your shares, when redeemed may be worth more or less than their original cost. Performance current to the most recent month-end may be lower or higher than the performance quoted and can be obtained by calling 1-844-577-3863. Performance assumes the reinvestment of capital gains and income distributions. The performance does not reflect the deduction of taxes that a shareholder would pay on Fund distributions or the redemption of Fund shares.
Annualized Rates of Return as of October 31, 2020
| | 1 year | 5 years | 10 years | Since Inception(1) |
| IS Class | 26.73% | 12.96% | 14.46% | 9.89% |
| Institutional Class | 26.78% | 12.94% | 14.39% | 9.81% |
| Investor Class | 26.49% | 12.67% | 14.11% | 9.54% |
Russell 1000® Growth Index(2) | 29.22% | 17.32% | 16.31% | 11.80% |
| (1) | The IS Class commenced operations on November 1, 2005, and the Institutional Class and Investor Class shares commenced operations on September 19, 2016. Performance for the Institutional Class and Investor Class prior to period inception of each class is based on the performance of the IS Class shares, adjusted for higher expenses applicable to each class’ shares. |
| (2) | The Russell 1000® Growth Index measures the performance of the large cap growth segment of the U.S. equity universe. It includes those Russell 1000® Index companies with higher price-to-book ratios and higher forecasted growth values. One cannot invest directly in an Index. |
The following is expense information for the Jackson Square Large-Cap Growth Fund (the “Fund”) as disclosed in the Fund’s most recent prospectus dated February 28, 2020: Investor Class – Gross Expenses: 1.16%, Net Expenses: 0.99%; Institutional Class – Gross Expenses: 0.91%, Net Expenses: 0.74%; IS Class – Gross Expenses: 0.80%, Net Expenses: 0.64%. The Adviser has contractually agreed to waive its management fees and pay Fund expenses in order to ensure the Total Annual Fund Operating Expenses (excluding Rule 12b-1 fees, shareholder servicing fees, acquired fund fees and expenses, brokerage commissions, leverage, interest, taxes, and extraordinary expenses) do not exceed 0.64% of the average daily net assets of the Fund. Fees waived and expenses paid by the Adviser may be recouped by the Adviser for a period of 36 months following the month during which such fee waiver and expense payment was made if such recoupment can be achieve without exceeding the expense limit in effect at the time the fee waiver and/or expense payment occurred and the expense limit in place at the time of recoupment. The Operating Expenses Limitation Agreement is indefinite, but cannot be terminated through at least February 28, 2021. Thereafter, the agreement may be terminated at any time upon 60 days’ written notice by the Board or the Adviser.
The actual expense ratio applicable to investors, as disclosed in the Financial Highlights for the year ending October 31, 2020, was 0.64%, 0.64% and 0.89%, for the IS class, Institutional Class and Investor Class, respectively.
Jackson Square Large-Cap Growth Fund
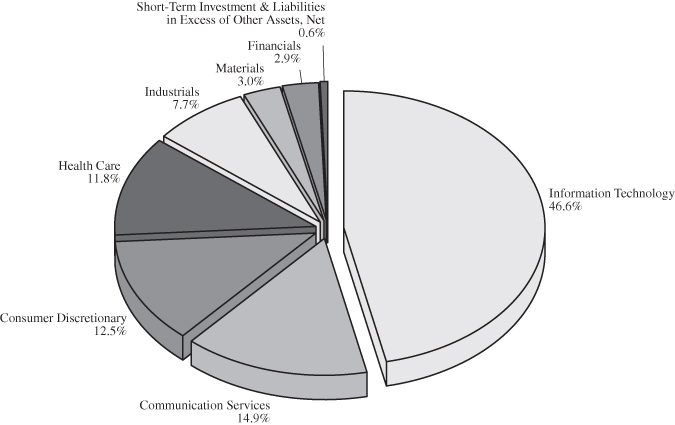
Sector Allocation(1) (Unaudited)
As of October 31, 2020
(% of Net Assets)
Top Ten Equity Holdings(1) (Unaudited)
As of October 31, 2020
(% of Net Assets)
| | Microsoft | | | 8.6 | % |
| | Amazon.com | | | 6.5 | % |
| | Visa – Class A | | | 5.5 | % |
| | Twilio – Class A | | | 5.1 | % |
| | ServiceNow | | | 4.8 | % |
| | Charter Communications – Class A | | | 4.7 | % |
| | Uber Technologies | | | 4.5 | % |
| | PayPal Holdings | | | 4.3 | % |
| | Mastercard – Class A | | | 4.1 | % |
| | Match Group | | | 3.8 | % |
| (1) | Fund holdings and sector allocations are subject to change at any time and are not recommendations to buy or sell any security. |
Jackson Square Select 20 Growth Fund
Select 20 Growth Fund
Within the Fund
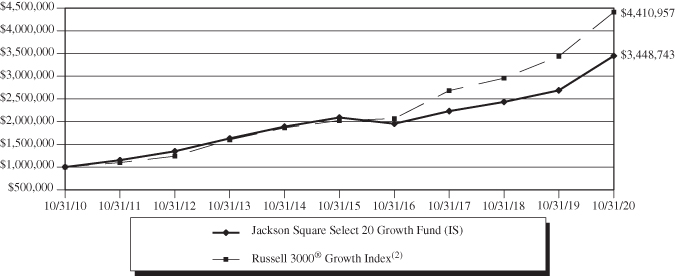
For the fiscal year ended Oct. 31, 2020, Jackson Square Select 20 Fund IS Class shares gained 28.26%. These figures reflect all distributions reinvested. During the same period, the Fund’s benchmark, the Russell 3000® Growth Index, rose 28.20%. For complete, annualized performance of Jackson Square Select 20 Fund, please see the table on page 16.
Strong relative performance in information technology could not overcome the relative weak performance in consumer discretionary. On a stock-specific level, the following were the most significant contributors and detractors during the period.
Twilio, Inc. Class A, a cloud communications platform, was a contributor to performance during the period. We believe that instant digital communication with customers and employees across any medium in any geography is a hugely complex problem that businesses increasingly need to solve, and we believe Twilio, as the leading communications-as-a-service platform, at multiples the size of its next largest competitor, will be the primary beneficiary of that trend. The addressable market is tens of billions of procurement dollars and essentially untapped with Twilio’s still negligible penetration, which we believe is set to expand meaningfully and drive consistently high revenue growth for many years.
Coupa Software, Inc., a cloud-based enterprise software-as-a-service platform addressing business spend management, was a contributor to performance during the period. The brand is relatively nascent but is rapidly inflecting from “cool but risky startup”, nibbling at the heels of sleepy incumbents SAP and Oracle, to the gold standard for procurement organizations within the enterprise. We believe Coupa is the next horizontal software category killer and is very early on a long journey of disrupting a giant spend management total addressable market with rapid topline growth and healthy unit economics supporting high terminal profitability. Additionally, the company is rapidly approaching $2 trillion of customer spend running through its platform with aspirations to be the mousetrap for businesses to consolidate and optimize payment to suppliers.
Autodesk, Inc., a software company for the architecture, engineering, construction, manufacturing, media, and entertainment industries, was a contributor to performance during the period. Autodesk hosted an investor day with a bullish long-term outlook across its businesses and reiterated its medium-term financial outlook despite the challenging macro environment. Construction activity across key markets has also continued to rebound. Although we believe Autodesk’s shift in business model to cloud-based services and green-field growth opportunity in construction and manufacturing will continue to drive value over the long-term, we exited the stock to redeploy assets elsewhere.
Wyndham Hotels & Resorts, Inc., a franchised hotel chain, was a detractor from performance during the period. As an asset-lite hotel franchisor with ~85% of its earnings before interest, taxes, depreciation, and amortization generated in the U.S., the company’s earnings have been hit hard by COVID-19. We exited the stock to redeploy assets elsewhere.
CME Group Inc. Class A, a financial market company operating options and futures exchanges, was a detractor from performance during the period. CME’s stock underperformed the market during the period as a result of generally lower volumes on its futures exchange. Since the company’s costs base is relatively fixed, lower volumes directly lead to lower earnings and cash flows. Although we greatly admire the company’s business model and management team, we have decided to exit the position as we believe the probability of sustained lower volumes has increased as a result of global central bank intervention efforts, thereby reducing interest rate volatility and associated futures trading volumes.
Jackson Square Select 20 Growth Fund
Constellation Brands, Inc. Class A, a producer and marketer of beer, wine, and spirits, was a detractor from performance during the period. Investors became concerned about the company’s leverage profile on the balance sheet as well as the Mexican government taking several unexpected anti-business initiatives which hurt Constellation. We sold our position in favor of more attractive opportunities.
Jackson Square Select 20 Growth Fund
Value of $1,000,000 Investment (Unaudited)
The chart assumes an initial investment of $1,000,000. Performance reflects waivers of fee and operating expenses in effect. In the absence of such waivers, total return would be reduced. Past performance is not predictive of future performance. Investment return and principal value will fluctuate, so that your shares, when redeemed may be worth more or less than their original cost. Performance current to the most recent month-end may be lower or higher than the performance quoted and can be obtained by calling 1-844-577-3863. Performance assumes the reinvestment of capital gains and income distributions. The performance does not reflect the deduction of taxes that a shareholder would pay on Fund distributions or the redemption of Fund shares.
Annualized Rates of Return as of October 31, 2020
| | 1 year | 5 years | 10 years | Since Inception(1) |
| IS Class | 28.26% | 10.52% | 13.18% | 4.46% |
Russell 3000® Growth Index(2) | 28.20% | 16.84% | 16.00% | 5.59% |
| (1) | The IS Class commenced operations on March 31, 2000. |
| (2) | The Russell 3000® Growth Index measures the growth segment of the U.S. equity universe. It includes those Russell 3000® Index composites with higher price-to-book ratios and higher forecasted growth values. One cannot invest directly in an Index. |
The following is expense information for the Select 20 Growth Fund (the “Fund”) as disclosed in the most recent prospectus dated February 28, 2020: Gross Expenses: 2.68%, Net Expenses: 0.87%. The Adviser has contractually agreed to waive its management fees and pay Fund expenses in order to ensure the Total Annual Fund Operating Expenses (excluding Rule 12b-1 fees, shareholder servicing fees, acquired fund fees and expenses, brokerage commissions, leverage, interest, taxes, and extraordinary expenses) do not exceed 0.87% of the average daily net assets of the Fund. Fees waived and expenses paid by the Adviser may be recouped by the Adviser for a period of 36 months following the month during which such fee waiver and expense payment was made if such recoupment can be achieve without exceeding the expense limit in effect at the time the fee waiver and/or expense payment occurred and the expense limit in place at the time of recoupment. The Operating Expenses Limitation Agreement is indefinite, but cannot be terminated through at least February 28, 2021. Thereafter, the agreement may be terminated at any time upon 60 days’ written notice by the Board or the Adviser.
The actual expense ratio applicable to investors, as disclosed in the Financial Highlights for the fiscal year ended October 31, 2020, was 0.87% for the IS Class.
Jackson Square Select 20 Growth Fund
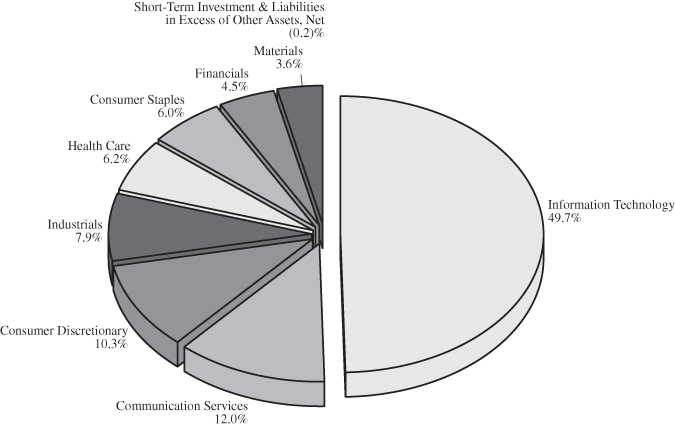
Sector Allocation(1) (Unaudited)
As of October 31, 2020
(% of Net Assets)
Top Ten Equity Holdings(1) (Unaudited)
As of October 31, 2020
(% of Net Assets)
| | Microsoft | | | 10.7 | % |
| | Amazon.com | | | 6.9 | % |
| | LiveRamp Holdings | | | 6.5 | % |
| | Twilio – Class A | | | 6.2 | % |
| | Grocery Outlet Holding | | | 6.0 | % |
| | GCI Liberty – Class A | | | 5.4 | % |
| | Visa – Class A | | | 5.2 | % |
| | ServiceNow | | | 4.7 | % |
| | Elastic | | | 4.7 | % |
| | KKR & Co. – Class A | | | 4.5 | % |
| (1) | Fund holdings and sector allocations are subject to change at any time and are not recommendations to buy or sell any security. |
Jackson Square SMID-Cap Growth Fund
SMID-Cap Growth Fund
Within the Fund
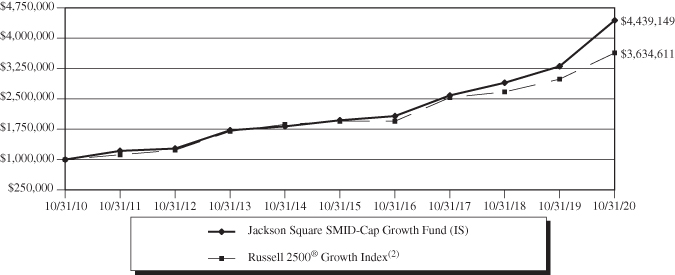
For the fiscal year ended Oct. 31, 2020, SMID-Cap Growth Fund IS, Institutional and Investor Class shares gained 34.36%, 34.20% and 33.88%, respectively. These figures reflect all distributions reinvested. During the same period, the Fund’s benchmark, the Russell 2500® Growth Index, rose 21.71%. For complete, annualized performance of Jackson Square SMID-Cap Growth Fund, please see the table on page 20.
Strong relative performance in information technology was unable to overcome weak relative performance in health care. On a stock-specific level, the following were the most significant contributors and detractors during the period.
Wix.com Ltd., a cloud-based web development platform, was contributor to performance during the period. The impact of COVID-19 brought the need for more small and medium businesses to go online and expanded Wix.com’s reach. We believe the growth opportunity remains attractive, due in part to the fact that there are over 400 million small and medium size businesses that are the company’s target market--the majority of which have yet to obtain an online presence. We believe such a presence is becoming more necessary given the COVID-19-driven disruption and challenges to the physical presence of many companies, along with the need to accurately and efficiently market online to customers.
Farfetch Limited Class A, a UK-based online retail business selling multi-brand digital luxury goods in over 100 countries, was a contributor to performance during the period. Following a difficult 2019 for the company, we went through an extensive re-underwriting of the position and determined that Farfetch remains in the best position to capitalize on the luxury industry moving online over the next several years. While we have expected this to play out in a linear fashion over many years as brands reassess their distribution strategies, we believe COVID-19 has accelerated this shift. Given 90% of luxury purchases are in store and the vast majority of demand is derived from cross-border travel, we believe the company is in the enviable position of having the best platform for the brands to utilize as demand migrates online. The stock continues to outperform following a strong earnings report that highlighted growth is accelerating. In addition, the company continues to sign on new brands to the platform. We remain constructive on the risk/reward profile at these price levels and would note the balance sheet is well capitalized to absorb temporary disruptions.
Redfin Corporation, the web-based real estate database and brokerage service, was a contributor to performance during the period. The company’s digital capabilities, such as virtual tours and digital closing processes, allowed it to continue taking share in the tough COVID-19 environment. Furthermore, the residential real estate market is showing strong signs of recovery. We continue to believe there is ample opportunity in the long run for the company to gain market share as it disrupts the real estate brokerage market by streamlining the home buying and selling process and by emphasizing pricing and inventory transparency.
Liberty TripAdvisor Holdings, Inc., a travel website providing travel advice and planning features, detracted from performance during the period. The company’s hotel segment has struggled amid competitive headwinds, including increased challenges from Google’s search practices. We exited the stock to redeploy capital elsewhere.
Jackson Square SMID-Cap Growth Fund
J2 Global, Inc., a digital media ad platform and provider of cloud services to small and medium businesses, was a detractor from performance during the period. The stock declined on earnings and weaker guidance due to the deleterious impact of COVID-19, primarily on its advertising business. We exited the stock to redeploy capital elsewhere.
Wyndham Hotels & Resorts, Inc., a franchised hotel chain, was a detractor from performance during the period. As an asset-lite hotel franchisor with ~85% of its earnings before interest, taxes, depreciation, and amortization generated in the U.S., the company’s earnings have been hit hard by COVID-19. The stock significantly dislocated from our estimate of intrinsic business value in March and early spring allowing us to add to the position. It has since rebounded and we have trimmed it back as we monitor the risk/reward given the volatility and travel restrictions put in place due to COVID-19. We believe the company’s franchisees – mostly economy and midscale owners – are holding up much better than hotel peers in the upscale and luxury segment. While the situation remains fluid and the stock will remain volatile in the short-term, we remain patient long-term owners as we believe the risk/reward over a 3-5 year time horizon is compelling.
Jackson Square SMID-Cap Growth Fund
Value of $1,000,000 Investment (Unaudited)
The chart assumes an initial investment of $1,000,000. Performance reflects waivers of fee and operating expenses in effect. In the absence of such waivers, total return would be reduced. Past performance is not predictive of future performance. Investment return and principal value will fluctuate, so that your shares, when redeemed may be worth more or less than their original cost. Performance current to the most recent month-end may be lower or higher than the performance quoted and can be obtained by calling 1-844-577-3863. Performance assumes the reinvestment of capital gains and income distributions. The performance does not reflect the deduction of taxes that a shareholder would pay on Fund distributions or the redemption of Fund shares.
Annualized Rates of Returns as of October 31, 2020
| | 1 year | 5 years | 10 years | Since Inception(1) |
| IS Class | 34.36% | 17.64% | 16.07% | 12.50% |
| Institutional Class | 34.20% | 17.58% | 15.99% | 12.41% |
| Investor Class | 33.88% | 17.25% | 15.68% | 12.12% |
Russell 2500® Growth Index(2) | 21.71% | 13.30% | 13.77% | 10.27% |
| (1) | The IS Class commenced operations on December 1, 2003, the Institutional Class commenced operations on September 16, 2016 and the Investor Class commenced operations on September 19, 2016. Performance of the Institutional Class and Investor Class prior to inception of each class is based on the performance of the IS Class, adjusted for the higher expenses applicable to each class’ shares. |
| (2) | The Russell 2500® Growth Index measures the performance of the small to mid-cap growth segment of the U.S. equity universe. It includes those Russell 2500® companies with price-to-book ratios and higher forecasted growth values. One cannot invest directly in an Index. |
The following is expense information for the Jackson Square SMID-Cap Growth Fund (the “Fund”) as disclosed in the Fund’s most recent prospectus dated February 28, 2020: Investor Class – Gross/Net Expenses: 1.22%; Institutional Class – Gross/Net Expenses: 0.97%; IS Class – Gross/Net Expenses: 0.87%. The Adviser has contractually agreed to waive its management fees and pay Fund expenses in order to ensure the Total Annual Fund Operating Expenses (excluding Rule 12b-1 fees, shareholder servicing fees, acquired fund fees and expenses, brokerage commissions, leverage, interest, taxes, and extraordinary expenses) do not exceed 0.87% of the average daily net assets of the Fund. Fees waived and expenses paid by the Adviser may be recouped by the Adviser for a period of 36 months following the month during which such fee waiver and expense payment was made if such recoupment can be achieve without exceeding the expense limit in effect at the time the fee waiver and/or expense payment occurred and the expense limit in place at the time of recoupment. The Operating Expenses Limitation Agreement is indefinite, but cannot be terminated through at least February 28, 2021. Thereafter, the agreement may be terminated at any time upon 60 days’ written notice by the Board or the Adviser.
The actual expense ratio applicable to investors, as disclosed in the Financial Highlights for the year ending October 31, 2020, was 0.87%, 0.95% and 1.22%, for the IS class, Institutional Class and Investor Class, respectively.
Jackson Square SMID-Cap Growth Fund
Sector Allocation(1) (Unaudited)
As of October 31, 2020
(% of Net Assets)
Top Ten Equity Holdings(1)(2) (Unaudited)
As of October 31, 2020
(% of Net Assets)
| | LiveRamp Holdings | | | 6.6 | % |
| | Grocery Outlet Holding | | | 5.8 | % |
| | Bio-Techne | | | 4.5 | % |
| | GCI Liberty – Class A | | | 4.3 | % |
| | Stitch Fix – Class A | | | 4.1 | % |
| | Wix.com | | | 3.9 | % |
| | Varonis Systems | | | 3.9 | % |
| | New York Times – Class A | | | 3.9 | % |
| | Papa John’s International | | | 3.7 | % |
| | Elastic | | | 3.6 | % |
| (1) | Fund holdings and sector allocations are subject to change at any time and are not recommendations to buy or sell any security. |
| (2) | Short-term investments are not included. |
Jackson Square Funds
Expense Examples (Unaudited)
October 31, 2020
As a shareholder of a Fund, you incur two type of costs: (1) transactions costs, including brokerage commissions on purchases and sales of Fund shares, and (2) ongoing costs, including management fees; distribution and/or service (12b-1) fees, shareholder servicing fees, and other Fund expenses. This Example is intended to help you understand your ongoing costs (in dollars) of investing in a Fund and to compare these costs with the ongoing costs of investing in other mutual funds. The Example is based on an investment of $1,000 invested at the beginning of the period and held for the entire period (May 1, 2020 – October 31, 2020).
ACTUAL EXPENSES
For each class, the first line of the table provides information about actual account values and actual expenses. You may use the information in this line, together with the amount you invested, to estimate the expenses that you paid over the period. Simply divide your account value by $1,000 (for example, an $8,600 account value divided by $1,000 = 8.6), then multiply the result by the number in the first line under the heading entitled “Expenses Paid During Period” to estimate the expenses you paid on your account during this period.
HYPOTHETICAL EXAMPLE FOR COMPARISON PURPOSES
For each class, the second line of the table below provides information about hypothetical account values and hypothetical expenses based on the Fund’s actual expense ratio and an assumed rate of return of 5% per year before expenses, which is not the Fund’s actual return. The hypothetical account values and expenses may not be used to estimate the actual ending account balance or expenses you paid for the period.You may use this information to compare the ongoing costs of investing in the Fund and other funds. To do so, compare this 5% hypothetical example with the 5% hypothetical examples that appear in the shareholder reports of the other funds.
Please note that the expenses shown in the tables are meant to highlight your ongoing costs only. Therefore, the second line of the tables are useful in comparing ongoing costs only, and will not help you determine the relative total costs of owning different funds, In addition, if transactional costs were included, your costs may have been higher.
All-Cap Growth Fund
| | Beginning | Ending | Expenses Paid |
| | Account Value | Account Value | During Period(1) |
| | (5/1/2020) | (10/31/2020) | (5/1/2020 to 10/31/2020) |
IS Class Actual(2) | $1,000.00 | $1,285.60 | $5.17 |
| IS Class Hypothetical | | | |
| (5% return before expenses) | $1,000.00 | $1,020.61 | $4.57 |
| (1) | Expenses are equal to the Fund’s annualized expense ratio for the most recent six-month period of 0.90% for the IS Class, multiplied by the average account value over the period, multiplied by 184/366 to reflect the one-half year period. |
| (2) | Based on the actual return for the six-month period ended October 31, 2020 of 28.56% for the IS Class. |
Jackson Square Funds
Expense Examples (Unaudited) – Continued
October 31, 2020
Global Growth Fund
| | Beginning | Ending | Expenses Paid |
| | Account Value | Account Value | During Period(1) |
| | (5/1/2020) | (10/31/2020) | (5/1/2020 to 10/31/2020) |
IS Class Actual(2) | $1,000.00 | $1,216.80 | $5.85 |
| IS Class Hypothetical | | | |
| (5% return before expenses) | $1,000.00 | $1,019.86 | $5.33 |
| | | | |
Institutional Class Actual(2) | $1,000.00 | $1,216.50 | $5.85 |
| Institutional Class Hypothetical | | | |
| (5% return before expenses) | $1,000.00 | $1,019.86 | $5.33 |
| (1) | Expenses are equal to the Fund’s annualized expense ratio for the most recent six-month period of 1.05% and 1.05% for the IS Class and Institutional Class, respectively, multiplied by the average account value over the period, multiplied by 184/366 to reflect the one-half year period. |
| (2) | Based on the actual returns for the six-month period ended October 31, 2020 of 21.68% and 21.65% for the IS Class and Institutional Class, respectively. |
Large-Cap Growth Fund
| | Beginning | Ending | Expenses Paid |
| | Account Value | Account Value | During Period(3) |
| | (5/1/2020) | (10/31/2020) | (5/1/2020 to 10/31/2020) |
IS Class Actual(4) | $1,000.00 | $1,214.80 | $3.56 |
| IS Class Hypothetical | | | |
| (5% return before expenses) | $1,000.00 | $1,021.92 | $3.25 |
| | | | |
Institutional Class Actual(4) | $1,000.00 | $1,214.10 | $3.56 |
| Institutional Class Hypothetical | | | |
| (5% return before expenses) | $1,000.00 | $1,021.92 | $3.25 |
| | | | |
Investor Class Actual(4) | $1,000.00 | $1,213.40 | $4.95 |
| Investor Class Hypothetical | | | |
| (5% return before expenses) | $1,000.00 | $1,020.66 | $4.52 |
| (3) | Expenses are equal to the Fund’s annualized expense ratio for the most recent six-month period of 0.64%, 0.64% and 0.89% for the IS Class, Institutional Class and Investor Class, respectively, multiplied by the average account value over the period, multiplied by 184/366 to reflect the one-half year period. |
| (4) | Based on the actual returns for the six-month period ended October 31, 2020 of 21.48%, 21.41% and 21.34% for the IS Class, Institutional Class and Investor Class, respectively. |
Jackson Square Funds
Expense Examples (Unaudited) – Continued
October 31, 2020
Select 20 Growth Fund
| | Beginning | Ending | Expenses Paid |
| | Account Value | Account Value | During Period(1) |
| | (5/1/2020) | (10/31/2020) | (5/1/2020 to 10/31/2020) |
IS Class Actual(2) | $1,000.00 | $1,293.60 | $5.02 |
| IS Class Hypothetical | | | |
| (5% return before expenses) | $1,000.00 | $1,020.76 | $4.42 |
| (1) | Expenses are equal to the Fund’s annualized expense ratio for the most recent six-month period of 0.87% for the IS Class, multiplied by the average account value over the period, multiplied by 184/366 to reflect the one-half year period. |
| (2) | Based on the actual return for the six-month period ended October 31, 2020 of 29.36% for the IS Class. |
SMID-Cap Growth Fund
| | Beginning | Ending | Expenses Paid |
| | Account Value | Account Value | During Period(3) |
| | (5/1/2020) | (10/31/2020) | (5/1/2020 to 10/31/2020) |
IS Class Actual(4) | $1,000.00 | $1,370.90 | $5.18 |
| IS Class Hypothetical | | | |
| (5% return before expenses) | $1,000.00 | $1,020.76 | $4.42 |
| | | | |
Institutional Class Actual(4) | $1,000.00 | $1,370.00 | $5.66 |
| Institutional Class Hypothetical | | | |
| (5% return before expenses) | $1,000.00 | $1,020.36 | $4.82 |
| | | | |
Investor Class Actual(4) | $1,000.00 | $1,368.30 | $7.26 |
| Investor Class Hypothetical | | | |
| (5% return before expenses) | $1,000.00 | $1,019.00 | $6.19 |
| (3) | Expenses are equal to the Fund’s annualized expense ratio for the most recent six-month period of 0.87%, 0.95% and 1.22% for the IS Class, Institutional Class and Investor Class, respectively, multiplied by the average account value over the period, multiplied by 184/366 to reflect the one-half year period. |
| (4) | Based on the actual returns for the six-month period ended October 31, 2020 of 37.09%, 37.00% and 36.83% for the IS Class, Institutional Class and Investor Class, respectively. |
Jackson Square All-Cap Growth Fund
Schedule of Investments
October 31, 2020
Description | | Shares | | | Value | |
| | | | | | | |
| COMMON STOCKS – 99.3% | | | | | | |
| | | | | | | |
| Communication Services – 10.1% | | | | | | |
Alphabet – Class C* | | | 13 | | | $ | 21,073 | |
Bilibili* | | | 1,477 | | | | 65,978 | |
Charter Communications – Class A* | | | 313 | | | | 188,996 | |
GCI Liberty – Class A* | | | 304 | | | | 24,694 | |
Match Group* | | | 1,116 | | | | 130,326 | |
Netflix* | | | 107 | | | | 50,904 | |
New York Times – Class A | | | 5,952 | | | | 236,056 | |
| | | | | | | | 718,027 | |
| | | | | | | | | |
| Consumer Discretionary – 12.8% | | | | | | | | |
Amazon.com* | | | 72 | | | | 218,603 | |
Dunkin’ Brands Group | | | 974 | | | | 97,118 | |
Farfetch – Class A* | | | 3,939 | | | | 110,804 | |
Fiverr International* | | | 422 | | | | 61,789 | |
MercadoLibre* | | | 59 | | | | 71,629 | |
NIKE – Class B | | | 400 | | | | 48,032 | |
Papa John’s International | | | 484 | | | | 37,074 | |
Shake Shack – Class A* | | | 1,408 | | | | 95,068 | |
Starbucks | | | 349 | | | | 30,349 | |
Stitch Fix – Class A* | | | 3,909 | | | | 134,587 | |
| | | | | | | | 905,053 | |
| | | | | | | | | |
| Consumer Staples – 3.6% | | | | | | | | |
Grocery Outlet Holding* | | | 5,766 | | | | 253,819 | |
| | | | | | | | | |
| Financials – 2.3% | | | | | | | | |
KKR & Co. – Class A | | | 4,800 | | | | 163,920 | |
| | | | | | | | | |
| Health Care – 9.7% | | | | | | | | |
ABIOMED* | | | 162 | | | | 40,805 | |
DexCom* | | | 110 | | | | 35,154 | |
Illumina* | | | 295 | | | | 86,347 | |
Intuitive Surgical* | | | 178 | | | | 118,740 | |
IQVIA Holdings* | | | 821 | | | | 126,426 | |
Nevro* | | | 301 | | | | 44,912 | |
Silk Road Medical* | | | 783 | | | | 47,450 | |
Twist Bioscience* | | | 1,397 | | | | 107,066 | |
UnitedHealth Group | | | 260 | | | | 79,336 | |
| | | | | | | | 686,236 | |
See Notes to the Financial Statements
Jackson Square All-Cap Growth Fund
Schedule of Investments – Continued
October 31, 2020
Description | | Shares | | | Value | |
| | | | | | | |
| COMMON STOCKS – 99.3% (Continued) | | | | | | |
| | | | | | | |
| Industrials – 10.2% | | | | | | |
Airbus* (a)(b) | | | 1,710 | | | $ | 125,114 | |
Experian (a)(b) | | | 3,950 | | | | 144,705 | |
IHS Markit | | | 537 | | | | 43,427 | |
Safran* (a)(b) | | | 820 | | | | 86,493 | |
Uber Technologies* | | | 5,769 | | | | 192,742 | |
Waste Management | | | 1,188 | | | | 128,197 | |
| | | | | | | | 720,678 | |
| | | | | | | | | |
Information Technology – 46.7%# | | | | | | | | |
Adobe* | | | 160 | | | | 71,536 | |
Adyen* (a)(b) | | | 120 | | | | 201,689 | |
ASML Holding (a)(b) | | | 450 | | | | 162,811 | |
Autodesk* | | | 222 | | | | 52,290 | |
Bill.com Holdings* | | | 296 | | | | 29,600 | |
Coupa Software* | | | 825 | | | | 220,852 | |
Guidewire Software* | | | 216 | | | | 20,760 | |
LiveRamp Holdings* | | | 2,918 | | | | 192,851 | |
Logitech International (a)(b) | | | 356 | | | | 29,949 | |
Mastercard – Class A | | | 502 | | | | 144,897 | |
Microsoft | | | 3,098 | | | | 627,252 | |
Paycom Software* | | | 545 | | | | 198,429 | |
PayPal Holdings* | | | 998 | | | | 185,758 | |
SailPoint Technologies Holding* | | | 4,843 | | | | 201,033 | |
ServiceNow* | | | 406 | | | | 202,013 | |
Twilio – Class A* | | | 731 | | | | 203,927 | |
Varonis Systems* | | | 542 | | | | 62,639 | |
Visa – Class A | | | 1,329 | | | | 241,492 | |
Wix.com* | | | 1,034 | | | | 255,729 | |
| | | | | | | | 3,305,507 | |
| | | | | | | | | |
| Materials – 3.9% | | | | | | | | |
Ball | | | 3,115 | | | | 277,235 | |
| TOTAL COMMON STOCKS | | | | | | | | |
| (Cost $4,914,883) | | | | | | | 7,030,475 | |
See Notes to the Financial Statements
Jackson Square All-Cap Growth Fund
Schedule of Investments – Continued
October 31, 2020
Description | | Shares | | | Value | |
| | | | | | | |
| SHORT-TERM INVESTMENT – 1.9% | | | | | | |
| | | | | | | |
| Money Market Deposit Account – 1.9% | | | | | | |
U.S. Bank N.A., 0.02% (c) | | | | | | |
Total Money Market Deposit Account | | | 139,025 | | | $ | 139,025 | |
| TOTAL SHORT-TERM INVESTMENT | | | | | | | | |
| (Cost $139,025) | | | | | | | 139,025 | |
| Total Investments – 101.2% | | | | | | | | |
| (Cost $5,053,908) | | | | | | | 7,169,500 | |
| Liabilities in Excess of Other Assets – (1.2)% | | | | | | | (88,199 | ) |
| Total Net Assets – 100.0% | | | | | | $ | 7,081,301 | |
| * | Non-income producing security. |
| (a) | Foreign Security. |
| (b) | Level 2 Security. |
| (c) | The Money Market Deposit Account (“MMDA”) is a short-term investment vehicle in which the Fund holds cash balances. The MMDA will bear interest at a variable rate that is determined based on conditions and may change daily and by any amount. The rate shown is as of October 31, 2020. |
| # | As of October 31, 2020, the Fund had a significant portion of its assets invested in this sector and therefore is subject to additional risks. See Note 10 in Notes to the Financial Statements. |
The Global Industry Classification Standard (“GICS®”) was developed by and/or is the exclusive property of MSCI, Inc. (“MSCI”) and Standard & Poor’s Financial Services LLC (“S&P”). GICS® is a service mark of MSCI and S&P and has been licensed for use.
See Notes to the Financial Statements
Jackson Square Global Growth Fund
Schedule of Investments
October 31, 2020
Description | | Shares | | | Value | |
| | | | | | | |
| COMMON STOCKS – 98.9% | | | | | | |
| | | | | | | |
| Brazil – 7.0% | | | | | | |
Afya – Class A* | | | 9,457 | | | $ | 226,968 | |
Arco Platform – Class A* | | | 7,222 | | | | 246,126 | |
MercadoLibre* | | | 371 | | | | 450,413 | |
| | | | | | | | 923,507 | |
| | | | | | | | | |
| China – 1.9% | | | | | | | | |
Bilibili* | | | 5,545 | | | | 247,695 | |
| | | | | | | | | |
| Denmark – 6.0% | | | | | | | | |
DSV (a) | | | 2,510 | | | | 407,226 | |
Vestas Wind Systems (a) | | | 2,304 | | | | 395,283 | |
| | | | | | | | 802,509 | |
| | | | | | | | | |
| France – 7.1% | | | | | | | | |
Airbus* (a) | | | 4,363 | | | | 319,223 | |
LVMH Moet Hennessy Louis Vuitton (a) | | | 628 | | | | 294,372 | |
Safran* (a) | | | 3,137 | | | | 330,889 | |
| | | | | | | | 944,484 | |
| | | | | | | | | |
| Israel – 4.6% | | | | | | | | |
Fiverr International* | | | 959 | | | | 140,417 | |
Wix.com* | | | 1,918 | | | | 474,360 | |
| | | | | | | | 614,777 | |
| | | | | | | | | |
| Japan – 3.2% | | | | | | | | |
MonotaRO (a) | | | 7,587 | | | | 419,650 | |
| | | | | | | | | |
| Netherlands – 5.9% | | | | | | | | |
Adyen* (a) | | | 245 | | | | 411,781 | |
ASML Holding (a) | | | 1,012 | | | | 366,143 | |
| | | | | | | | 777,924 | |
| | | | | | | | | |
| South Korea – 2.4% | | | | | | | | |
Samsung Electronics (a) | | | 6,292 | | | | 316,271 | |
| | | | | | | | | |
| United Kingdom – 9.0% | | | | | | | | |
Experian (a) | | | 11,621 | | | | 425,724 | |
Farfetch – Class A* | | | 14,901 | | | | 419,165 | |
Intertek Group (a) | | | 4,848 | | | | 349,207 | |
| | | | | | | | 1,194,096 | |
See Notes to the Financial Statements
Jackson Square Global Growth Fund
Schedule of Investments – Continued
October 31, 2020
Description | | Shares | | | Value | |
| | | | | | | |
| COMMON STOCKS – 98.9% (Continued) | | | | | | |
| | | | | | | |
| United States – 51.8% | | | | | | |
Adobe* | | | 480 | | | $ | 214,608 | |
Aon | | | 1,316 | | | | 242,157 | |
Ball | | | 4,537 | | | | 403,793 | |
DexCom* | | | 781 | | | | 249,592 | |
Edwards Lifesciences* | | | 4,756 | | | | 340,958 | |
Guidewire Software* | | | 2,566 | | | | 246,618 | |
IHS Markit | | | 4,232 | | | | 342,242 | |
Illumina* | | | 953 | | | | 278,943 | |
Mastercard – Class A | | | 1,757 | | | | 507,140 | |
Match Group* | | | 3,224 | | | | 376,499 | |
Microsoft | | | 4,255 | | | | 861,510 | |
Netflix* | | | 902 | | | | 429,117 | |
New York Times – Class A | | | 11,894 | | | | 471,716 | |
ServiceNow* | | | 810 | | | | 403,032 | |
Snowflake – Class A* | | | 179 | | | | 44,754 | |
Twilio – Class A* | | | 1,082 | | | | 301,846 | |
Uber Technologies* | | | 10,480 | | | | 350,137 | |
UnitedHealth Group | | | 1,143 | | | | 348,775 | |
Visa – Class A | | | 2,532 | | | | 460,090 | |
| | | | | | | | 6,873,527 | |
| | | | | | | | | |
| TOTAL COMMON STOCKS | | | | | | | | |
| (Cost $8,851,590) | | | | | | | 13,114,440 | |
| | | | | | | | | |
| SHORT-TERM INVESTMENT – 1.6% | | | | | | | | |
| | | | | | | | | |
| Money Market Deposit Account – 1.6% | | | | | | | | |
U.S. Bank N.A., 0.02% (b) | | | | | | | | |
Total Money Market Deposit Account | | | 216,715 | | | | 216,715 | |
| TOTAL SHORT-TERM INVESTMENT | | | | | | | | |
| (Cost $216,715) | | | | | | | 216,715 | |
| Total Investments – 100.5% | | | | | | | | |
| (Cost $9,068,305) | | | | | | | 13,331,155 | |
| Liabilities in Excess of Other Assets – (0.5)% | | | | | | | (70,911 | ) |
| Total Net Assets – 100.0% | | | | | | $ | 13,260,244 | |
| * | | Non-income producing security. |
| (a) | | Level 2 Security. |
| (b) | | The Money Market Deposit Account (“MMDA”) is a short-term investment vehicle in which the Fund holds cash balances. The MMDA will bear interest at a variable rate that is determined based on conditions and may change daily and by any amount. The rate shown is as of October 31, 2020. |
The Global Industry Classification Standard (“GICS®”) was developed by and/or is the exclusive property of MSCI, Inc. (“MSCI”) and Standard & Poor’s Financial Services LLC (“S&P”). GICS® is a service mark of MSCI and S&P and has been licensed for use.
See Notes to the Financial Statements
Jackson Square Global Growth Fund
Schedule of Investments – Continued
October 31, 2020
At October 31, 2020, the sector diversification for the Fund was as follows:
| | | % of |
| Sector | | Net Assets |
Information Technology# | | | 34.8 | % |
Industrials# | | | 25.2 | % |
Consumer Discretionary | | | 13.4 | % |
| Communication Services | | | 11.5 | % |
Health Care | | | 9.2 | % |
Materials | | | 3.0 | % |
Financials | | | 1.8 | % |
Short-Term Investment | | | 1.6 | % |
Liabilities in Excess of Other Assets | | | (0.5 | )% |
Total | | | 100.0 | % |
| # | As of October 31, 2020, the Fund had a significant portion of its assets invested in these sectors and therefore is subject to additional risks. See Note 10 in Notes to the Financial Statements. |
See Notes to the Financial Statements
Jackson Square Large-Cap Growth Fund
Schedule of Investments
October 31, 2020
Description | | Shares | | | Value | |
| | | | | | | |
| COMMON STOCKS – 99.4% | | | | | | |
| | | | | | | |
| Communication Services – 14.9% | | | | | | |
Alphabet – Class A* | | | 1,669 | | | $ | 2,697,287 | |
Charter Communications – Class A* | | | 6,357 | | | | 3,838,484 | |
Match Group* | | | 26,637 | | | | 3,110,669 | |
Netflix* | | | 5,205 | | | | 2,476,227 | |
| | | | | | | | 12,122,667 | |
| | | | | | | | | |
| Consumer Discretionary – 12.5% | | | | | | | | |
Amazon.com* | | | 1,730 | | | | 5,252,540 | |
NIKE – Class B | | | 24,455 | | | | 2,936,556 | |
Starbucks | | | 22,823 | | | | 1,984,688 | |
| | | | | | | | 10,173,784 | |
| | | | | | | | | |
| Financials – 2.9% | | | | | | | | |
KKR & Co. – Class A | | | 68,944 | | | | 2,354,438 | |
| | | | | | | | | |
| Health Care – 11.8% | | | | | | | | |
Edwards Lifesciences* | | | 38,123 | | | | 2,733,038 | |
Illumina* | | | 6,641 | | | | 1,943,821 | |
Intuitive Surgical* | | | 3,808 | | | | 2,540,240 | |
IQVIA Holdings* | | | 15,382 | | | | 2,368,674 | |
| | | | | | | | 9,585,773 | |
| | | | | | | | | |
| Industrials – 7.7% | | | | | | | | |
Uber Technologies* | | | 108,787 | | | | 3,634,573 | |
Waste Management | | | 23,914 | | | | 2,580,560 | |
| | | | | | | | 6,215,133 | |
| | | | | | | | | |
Information Technology – 46.6%# | | | | | | | | |
Adobe* | | | 4,089 | | | | 1,828,192 | |
Autodesk* | | | 11,313 | | | | 2,664,664 | |
Coupa Software* | | | 8,744 | | | | 2,340,769 | |
Mastercard – Class A | | | 11,645 | | | | 3,361,213 | |
Microsoft | | | 34,653 | | | | 7,016,193 | |
Paycom Software* | | | 8,510 | | | | 3,098,406 | |
PayPal Holdings* | | | 18,779 | | | | 3,495,335 | |
ServiceNow* | | | 7,915 | | | | 3,938,266 | |
Twilio – Class A* | | | 14,742 | | | | 4,112,576 | |
Visa – Class A | | | 24,588 | | | | 4,467,885 | |
Wix.com* | | | 6,296 | | | | 1,557,127 | |
| | | | | | | | 37,880,626 | |
See Notes to the Financial Statements
Jackson Square Large-Cap Growth Fund
Schedule of Investments – Continued
October 31, 2020
Description | | Shares | | | Value | |
| | | | | | | |
| COMMON STOCKS – 99.4% (Continued) | | | | | | |
| | | | | | | |
| Materials – 3.0% | | | | | | |
Ball | | | 27,307 | | | $ | 2,430,323 | |
| TOTAL COMMON STOCKS | | | | | | | | |
| (Cost $56,795,363) | | | | | | | 80,762,744 | |
| | | | | | | | | |
| SHORT-TERM INVESTMENT – 0.7% | | | | | | | | |
| | | | | | | | | |
| Money Market Deposit Account – 0.7% | | | | | | | | |
U.S. Bank N.A., 0.02% (a) | | | | | | | | |
Total Money Market Deposit Account | | | 525,096 | | | | 525,096 | |
| TOTAL SHORT-TERM INVESTMENT | | | | | | | | |
| (Cost $525,096) | | | | | | | 525,096 | |
| Total Investments – 100.1% | | | | | | | | |
| (Cost $57,320,459) | | | | | | | 81,287,840 | |
| Liabilities in Excess of Other Assets – (0.1)% | | | | | | | (49,355 | ) |
| Total Net Assets – 100.0% | | | | | | $ | 81,238,485 | |
| * | | Non-income producing security. |
| # | | As of October 31, 2020, the Fund had a significant portion of its assets invested in this sector and therefore is subject to additional risks. See Note 10 in Notes to the Financial Statements. |
| (a) | | The Money Market Deposit Account (“MMDA”) is a short-term investment vehicle in which the Fund holds cash balances. The MMDA will bear interest at a variable rate that is determined based on conditions and may change daily and by any amount. The rate shown is as of October 31, 2020. |
The Global Industry Classification Standard (“GICS®”) was developed by and/or is the exclusive property of MSCI, Inc. (“MSCI”) and Standard & Poor’s Financial Services LLC (“S&P”). GICS® is a service mark of MSCI and S&P and has been licensed for use.
See Notes to the Financial Statements
Jackson Square Select 20 Growth Fund
Schedule of Investments
October 31, 2020
Description | | Shares | | | Value | |
| | | | | | | |
| COMMON STOCKS – 100.2% | | | | | | |
| | | | | | | |
| Communication Services – 12.0% | | | | | | |
GCI Liberty – Class A* | | | 4,631 | | | $ | 376,176 | |
Match Group* | | | 2,171 | | | | 253,530 | |
New York Times – Class A | | | 5,317 | | | | 210,872 | |
| | | | | | | | 840,578 | |
| | | | | | | | | |
| Consumer Discretionary – 10.3% | | | | | | | | |
Amazon.com* | | | 160 | | | | 485,784 | |
Dollar General | | | 1,146 | | | | 239,181 | |
| | | | | | | | 724,965 | |
| | | | | | | | | |
| Consumer Staples – 6.0% | | | | | | | | |
Grocery Outlet Holding* | | | 9,652 | | | | 424,881 | |
| | | | | | | | | |
| Financials – 4.5% | | | | | | | | |
KKR & Co. – Class A | | | 9,179 | | | | 313,463 | |
| | | | | | | | | |
| Health Care – 6.2% | | | | | | | | |
Edwards Lifesciences* | | | 3,378 | | | | 242,169 | |
Nevro* | | | 1,319 | | | | 196,808 | |
| | | | | | | | 438,977 | |
| | | | | | | | | |
| Industrials – 7.9% | | | | | | | | |
Uber Technologies* | | | 9,234 | | | | 308,508 | |
Waste Management | | | 2,278 | | | | 245,819 | |
| | | | | | | | 554,327 | |
| | | | | | | | | |
Information Technology – 49.7%# | | | | | | | | |
Bill.com Holdings* | | | 3,054 | | | | 305,400 | |
Coupa Software* | | | 1,053 | | | | 281,888 | |
Elastic* | | | 3,249 | | | | 329,481 | |
LiveRamp Holdings* | | | 6,878 | | | | 454,567 | |
Microsoft | | | 3,705 | | | | 750,151 | |
ServiceNow* | | | 666 | | | | 331,382 | |
Twilio – Class A* | | | 1,569 | | | | 437,704 | |
Visa – Class A | | | 2,029 | | | | 368,690 | |
Wix.com* | | | 929 | | | | 229,760 | |
| | | | | | | | 3,489,023 | |
| | | | | | | | | |
| Materials – 3.6% | | | | | | | | |
Ball | | | 2,821 | | | | 251,069 | |
| TOTAL COMMON STOCKS | | | | | | | | |
| (Cost $4,407,316) | | | | | | | 7,037,283 | |
See Notes to the Financial Statements
Jackson Square Select 20 Growth Fund
Schedule of Investments – Continued
October 31, 2020
Description | | Shares | | | Value | |
| | | | | | | |
| SHORT-TERM INVESTMENT – 0.3% | | | | | | |
| | | | | | | |
| Money Market Deposit Account – 0.3% | | | | | | |
U.S. Bank N.A., 0.02% (a) | | | | | | |
Total Money Market Deposit Account | | | 24,906 | | | $ | 24,906 | |
| TOTAL SHORT-TERM INVESTMENT | | | | | | | | |
| (Cost $24,906) | | | | | | | 24,906 | |
| Total Investments – 100.5% | | | | | | | | |
| (Cost $4,432,222) | | | | | | | 7,062,189 | |
| Liabilities in Excess of Other Assets – (0.5)% | | | | | | | (37,418 | ) |
| Total Net Assets – 100.0% | | | | | | $ | 7,024,771 | |
| * | | Non-income producing security. |
| # | | As of October 31, 2020, the Fund had a significant portion of its assets invested in this sector and therefore is subject to additional risks. See Note 10 in Notes to the Financial Statements. |
| (a) | | The Money Market Deposit Account (“MMDA”) is a short-term investment vehicle in which the Fund holds cash balances. The MMDA will bear interest at a variable rate that is determined based on conditions and may change daily and by any amount. The rate shown is as of October 31, 2020. |
The Global Industry Classification Standard (“GICS®”) was developed by and/or is the exclusive property of MSCI, Inc. (“MSCI”) and Standard & Poor’s Financial Services LLC (“S&P”). GICS® is a service mark of MSCI and S&P and has been licensed for use.
See Notes to the Financial Statements
Jackson Square SMID-Cap Growth Fund
Schedule of Investments
October 31, 2020
Description | | Shares | | | Value | |
| | | | | | | |
| COMMON STOCKS – 94.1% | | | | | | |
| | | | | | | |
| Communication Services – 8.1% | | | | | | |
GCI Liberty – Class A* | | | 765,877 | | | $ | 62,212,189 | |
New York Times – Class A | | | 1,413,452 | | | | 56,057,506 | |
| | | | | | | | 118,269,695 | |
| | | | | | | | | |
| Consumer Discretionary – 18.4% | | | | | | | | |
Dunkin’ Brands Group | | | 275,286 | | | | 27,448,767 | |
Farfetch – Class A* | | | 1,718,590 | | | | 48,343,937 | |
Five Below* | | | 197,424 | | | | 26,324,516 | |
Fiverr International* | | | 112,317 | | | | 16,445,455 | |
Papa John’s International | | | 705,683 | | | | 54,055,318 | |
Stitch Fix – Class A* | | | 1,750,849 | | | | 60,281,731 | |
Wyndham Hotels & Resorts | | | 733,973 | | | | 34,137,084 | |
| | | | | | | | 267,036,808 | |
| | | | | | | | | |
| Consumer Staples – 5.8% | | | | | | | | |
Grocery Outlet Holding* | | | 1,910,430 | | | | 84,097,129 | |
| | | | | | | | | |
| Financials – 4.1% | | | | | | | | |
Carlyle Group | | | 894,097 | | | | 22,280,897 | |
LendingTree* | | | 116,169 | | | | 37,591,127 | |
| | | | | | | | 59,872,024 | |
| | | | | | | | | |
| Health Care – 17.5% | | | | | | | | |
ABIOMED* | | | 159,103 | | | | 40,074,863 | |
Bio-Techne | | | 261,973 | | | | 66,124,605 | |
HealthEquity* | | | 1,000,978 | | | | 51,540,357 | |
Nevro* | | | 265,146 | | | | 39,562,435 | |
Pacific Biosciences of California* | | | 1,555,589 | | | | 20,393,772 | |
Tandem Diabetes Care* | | | 335,837 | | | | 36,606,233 | |
| | | | | | | | 254,302,265 | |
| | | | | | | | | |
| Industrials – 5.0% | | | | | | | | |
Graco | | | 627,257 | | | | 38,827,208 | |
Lyft – Class A* | | | 1,507,690 | | | | 34,420,563 | |
| | | | | | | | 73,247,771 | |
| | | | | | | | | |
Information Technology – 30.3%# | | | | | | | | |
Anaplan* | | | 714,187 | | | | 39,530,250 | |
Bill.com Holdings* | | | 401,952 | | | | 40,195,200 | |
Dolby Laboratories – Class A | | | 127,504 | | | | 9,573,000 | |
Elastic* | | | 522,532 | | | | 52,989,970 | |
Guidewire Software* | | | 473,043 | | | | 45,464,163 | |
See Notes to the Financial Statements
Jackson Square SMID-Cap Growth Fund
Schedule of Investments – Continued
October 31, 2020
Description | | Shares | | | Value | |
| | | | | | | |
| COMMON STOCKS – 94.1% (Continued) | | | | | | |
| | | | | | | |
Information Technology – 30.3%# (Continued) | | | | | | |
LiveRamp Holdings* | | | 1,450,689 | | | $ | 95,876,036 | |
SailPoint Technologies Holding* | | | 1,068,140 | | | | 44,338,491 | |
Varonis Systems* | | | 486,156 | | | | 56,185,049 | |
Wix.com* | | | 227,705 | | | | 56,316,001 | |
| | | | | | | | 440,468,160 | |
| | | | | | | | | |
| Real Estate – 4.9% | | | | | | | | |
Equity Commonwealth – REIT | | | 1,462,687 | | | | 38,644,190 | |
Redfin* | | | 801,858 | | | | 33,493,609 | |
| | | | | | | | 72,137,799 | |
| TOTAL COMMON STOCKS | | | | | | | | |
| (Cost $1,041,397,217) | | | | | | | 1,369,431,651 | |
| | | | | | | | | |
| SHORT-TERM INVESTMENT – 6.7% | | | | | | | | |
| | | | | | | | | |
| Money Market Deposit Account – 6.7% | | | | | | | | |
U.S. Bank N.A., 0.02% (a) | | | 97,100,521 | | | | 97,100,521 | |
| TOTAL SHORT-TERM INVESTMENT | | | | | | | | |
| (Cost $97,100,521) | | | | | | | 97,100,521 | |
| Total Investments – 100.8% | | | | | | | | |
| (Cost $1,138,497,738) | | | | | | | 1,466,532,172 | |
| Liabilities in Excess of Other Assets – (0.8)% | | | | | | | (12,158,330 | ) |
| Total Net Assets – 100.0% | | | | | | $ | 1,454,373,842 | |
| * | | Non-income producing security. |
| # | | As of October 31, 2020, the Fund had a significant portion of its assets invested in this sector and therefore is subject to additional risks. See Note 10 in Notes to the Financial Statements. |
| (a) | | The Money Market Deposit Account (“MMDA”) is a short-term investment vehicle in which the Fund holds cash balances. The MMDA will bear interest at a variable rate that is determined based on conditions and may change daily and by any amount. The rate shown is as of October 31, 2020. |
REIT – Real Estate Investment Trust
The Global Industry Classification Standard “GICS®”) was developed by and/or is the exclusive property of MSCI, Inc. (“MSCI”) and Standard & Poor’s Financial Services LLC (“S&P”). GICS® is a service mark of MSCI and S&P and has been licensed for use.
See Notes to the Financial Statements
Jackson Square Funds
Statements of Assets and Liabilities
October 31, 2020
| | | All-Cap | | | Global | | | Large-Cap | |
| | | Growth Fund | | | Growth Fund | | | Growth Fund | |
| ASSETS | | | | | | | | | |
| Investment securities: | | | | | | | | | |
| At cost | | $ | 5,053,908 | | | $ | 9,068,305 | | | $ | 57,320,459 | |
| At value | | $ | 7,169,500 | | | $ | 13,331,155 | | | $ | 81,287,840 | |
| Receivable for investment securities sold | | | — | | | | 44,625 | | | | — | |
| Dividends & interest receivable | | | 732 | | | | 4,235 | | | | 4,845 | |
| Receivable from investment adviser | | | 4,597 | | | | 291 | | | | — | |
| Prepaid expenses | | | 3,008 | | | | 3,513 | | | | 24,632 | |
| Total Assets | | | 7,177,837 | | | | 13,383,819 | | | | 81,317,317 | |
| LIABILITIES | | | | | | | | | | | | |
| Payable for investment securities purchased | | | 63,508 | | | | 86,181 | | | | — | |
| Payable to investment adviser | | | — | | | | — | | | | 28,524 | |
| Payable for fund administration & accounting fees | | | 4,093 | | | | 5,288 | | | | 12,084 | |
| Payable for compliance fees | | | 40 | | | | 74 | | | | 470 | |
| Payable for transfer agent fees & expenses | | | 3,551 | | | | 6,213 | | | | 9,919 | |
| Payable for custody fees | | | 2,805 | | | | 2,705 | | | | 2,300 | |
| Payable for trustee fees | | | 564 | | | | 570 | | | | 612 | |
| Accrued distribution and/or shareholder service fees | | | — | | | | 42 | | | | 242 | |
| Payable for audit fees | | | 16,004 | | | | 16,501 | | | | 17,501 | |
| Accrued expenses | | | 5,971 | | | | 6,001 | | | | 7,180 | |
| Total Liabilities | | | 96,536 | | | | 123,575 | | | | 78,832 | |
| NET ASSETS | | $ | 7,081,301 | | | $ | 13,260,244 | | | $ | 81,238,485 | |
| NET ASSETS CONSIST OF: | | | | | | | | | | | | |
| Paid-in capital | | | 4,612,148 | | | | 8,594,173 | | | | 52,725,078 | |
| Total distributable earnings | | | 2,469,153 | | | | 4,666,071 | | | | 28,513,407 | |
| Total net assets | | $ | 7,081,301 | | | $ | 13,260,244 | | | $ | 81,238,485 | |
| | | | | | | | | | | | | |
IS Class Shares: | | | | | | | | | | | | |
| Net Assets | | $ | 7,081,301 | | | $ | 12,993,071 | | | $ | 77,839,492 | |
Shares issued and outstanding(1) | | | 255,033 | | | | 462,020 | | | | 6,312,143 | |
| Net asset value, offering price, and redemption price per share | | $ | 27.77 | | | $ | 28.12 | | | $ | 12.33 | |
| | | | | | | | | | | | | |
| Institutional Class Shares: | | | | | | | | | | | | |
| Net Assets | | $ | — | | | $ | 267,173 | | | $ | 3,355,521 | |
Shares issued and outstanding(1) | | | — | | | | 9,510 | | | | 271,417 | |
| Net asset value, offering price, and redemption price per share | | $ | — | | | $ | 28.09 | | | $ | 12.36 | |
| | | | | | | | | | | | | |
Investor Class Shares: | | | | | | | | | | | | |
| Net Assets | | $ | — | | | $ | — | | | $ | 43,472 | |
Shares issued and outstanding(1) | | | — | | | | — | | | | 3,541 | |
| Net asset value, offering price, and redemption price per share | | $ | — | | | $ | — | | | $ | 12.28 | |
(1) | Unlimited shares authorized without par value |
See Notes to the Financial Statements
Jackson Square Funds
Statements of Assets and Liabilities – Continued
October 31, 2020
| | | Select 20 | | | SMID-Cap | |
| | | Growth Fund | | | Growth Fund | |
| ASSETS | | | | | | |
| Investment securities: | | | | | | |
| At cost | | $ | 4,432,222 | | | $ | 1,138,497,738 | |
| At value | | $ | 7,062,189 | | | $ | 1,466,532,172 | |
| Receivable for investment securities sold | | | 40,336 | | | | — | |
| Dividends & interest receivable | | | 2,403 | | | | 447,255 | |
| Receivable from investment adviser | | | 4,076 | | | | — | |
| Receivable for capital shares sold | | | — | | | | 3,331,090 | |
| Prepaid expenses | | | 10,410 | | | | 32,210 | |
| Total Assets | | | 7,119,414 | | | | 1,470,342,727 | |
| LIABILITIES | | | | | | | | |
| Payable for investment securities purchased | | | 64,115 | | | | 14,243,917 | |
| Payable for capital shares redeemed | | | — | | | | 342,730 | |
| Payable to investment adviser | | | — | | | | 976,998 | |
| Payable for fund administration & accounting fees | | | 3,332 | | | | 131,485 | |
| Payable for compliance fees | | | 38 | | | | 7,679 | |
| Payable for transfer agent fees & expenses | | | 3,521 | | | | 23,209 | |
| Payable for custody fees | | | 897 | | | | 26,003 | |
| Payable for trustee fees | | | 568 | | | | 661 | |
| Accrued distribution and/or shareholder service fees | | | — | | | | 167,391 | |
| Payable for audit fees | | | 15,999 | | | | 17,501 | |
| Accrued expenses | | | 6,173 | | | | 31,311 | |
| Total Liabilities | | | 94,643 | | | | 15,968,885 | |
| NET ASSETS | | $ | 7,024,771 | | | $ | 1,454,373,842 | |
| NET ASSETS CONSIST OF: | | | | | | | | |
| Paid-in capital | | | 4,313,500 | | | | 1,036,706,389 | |
| Total distributable earnings | | | 2,711,271 | | | | 417,667,453 | |
| Total net assets | | $ | 7,024,771 | | | $ | 1,454,373,842 | |
| | | | | | | | | |
IS Class Shares: | | | | | | | | |
| Net Assets | | $ | 7,024,771 | | | $ | 650,845,310 | |
Shares issued and outstanding(1) | | | 966,039 | | | | 21,167,621 | |
| Net asset value, offering price, and redemption price per share | | $ | 7.27 | | | $ | 30.75 | |
| | | | | | | | | |
Institutional Class Shares: | | | | | | | | |
| Net Assets | | $ | — | | | $ | 725,203,937 | |
Shares issued and outstanding(1) | | | — | | | | 23,596,597 | |
| Net asset value, offering price, and redemption price per share | | $ | — | | | $ | 30.73 | |
| | | | | | | | | |
Investor Class Shares: | | | | | | | | |
| Net Assets | | $ | — | | | $ | 78,324,595 | |
Shares issued and outstanding(1) | | | — | | | | 2,577,124 | |
| Net asset value, offering price, and redemption price per share | | $ | — | | | $ | 30.39 | |
(1) | Unlimited shares authorized without par value |
See Notes to the Financial Statements
Jackson Square Funds
Statements of Operations
For the Year Ended October 31, 2020
| | | All-Cap | | | Global | | | Large-Cap | |
| | | Growth Fund | | | Growth Fund | | | Growth Fund | |
| INVESTMENT INCOME: | | | | | | | | | |
| Dividend income | | $ | 33,074 | | | $ | 78,723 | | | $ | 489,313 | |
| Less: Foreign taxes withheld | | | (136 | ) | | | (5,309 | ) | | | — | |
| Interest income | | | 6 | | | | 10 | | | | 3,555 | |
| Total investment income | | | 32,944 | | | | 73,424 | | | | 492,868 | |
| | | | | | | | | | | | | |
| EXPENSES: | | | | | | | | | | | | |
| Investment advisory fees (See Note 4) | | | 41,507 | | | | 99,220 | | | | 430,499 | |
| Fund administration & accounting fees (See Note 4) | | | 22,511 | | | | 30,000 | | | | 67,895 | |
| Transfer agent fees & expenses (See Note 4) | | | 21,272 | | | | 37,255 | | | | 58,608 | |
| Audit fees | | | 16,003 | | | | 16,503 | | | | 17,499 | |
| Custody fees (See Note 4) | | | 15,966 | | | | 16,716 | | | | 12,457 | |
| Trustee fees | | | 12,989 | | | | 12,978 | | | | 12,967 | |
| Other expenses | | | 10,933 | | | | 10,958 | | | | 7,012 | |
| Legal fees | | | 6,133 | | | | 6,133 | | | | 6,133 | |
| Federal & state registration fees | | | 4,497 | | | | 5,596 | | | | 43,479 | |
| Insurance fees | | | 1,389 | | | | 1,409 | | | | 1,758 | |
| Postage & printing fees | | | 1,076 | | | | 1,225 | | | | 371 | |
| Compliance fees (See Note 4) | | | 251 | | | | 487 | | | | 2,762 | |
| Distribution and/or shareholder service fees (See Note 5) | | | | | | | | | | | | |
| Institutional Class | | | — | | | | — | | | | — | |
| Investor Class | | | — | | | | — | | | | 99 | |
| Total expenses before reimbursement/waiver | | | 154,527 | | | | 238,480 | | | | 661,539 | |
| Less: reimbursement/waiver from adviser (See Note 4) | | | (97,056 | ) | | | (108,254 | ) | | | (160,496 | ) |
| Total net expenses | | | 57,471 | | | | 130,226 | | | | 501,043 | |
| NET INVESTMENT LOSS | | | (24,527 | ) | | | (56,802 | ) | | | (8,175 | ) |
| | | | | | | | | | | | | |
| REALIZED AND UNREALIZED GAIN ON INVESTMENTS | | | | | | | | | | | | |
| AND TRANSLATIONS OF FOREIGN CURRENCY | | | | | | | | | | | | |
| Net realized gain on investments, including foreign currency gain/loss | | | 390,170 | | | | 484,656 | | | | 5,782,617 | |
| Net change in unrealized appreciation/depreciation of | | | | | | | | | | | | |
| investments and translations of foreign currency | | | 1,194,508 | | | | 1,526,770 | | | | 13,344,919 | |
| Net realized and unrealized gain on investments | | | 1,584,678 | | | | 2,011,426 | | | | 19,127,536 | |
| | | | | | | | | | | | | |
| NET INCREASE IN NET ASSETS RESULTING FROM OPERATIONS | | $ | 1,560,151 | | | $ | 1,954,624 | | | $ | 19,119,361 | |
See Notes to the Financial Statements
Jackson Square Funds
Statements of Operations – Continued
For the Year Ended October 31, 2020
| | | Select 20 | | | SMID-Cap | |
| | | Growth Fund | | | Growth Fund | |
| INVESTMENT INCOME: | | | | | | |
| Dividend income | | $ | 60,357 | | | $ | 6,519,967 | |
| Less: Foreign taxes withheld | | | — | | | | (64,809 | ) |
| Interest income | | | 2 | | | | 264,483 | |
| Total investment income | | | 60,359 | | | | 6,719,641 | |
| | | | | | | | | |
| EXPENSES: | | | | | | | | |
| Investment advisory fees (See Note 4) | | | 39,599 | | | | 8,866,216 | |
| Federal & state registration fees | | | 23,323 | | | | 84,575 | |
| Transfer agent fees & expenses (See Note 4) | | | 21,180 | | | | 136,005 | |
| Fund administration & accounting fees (See Note 4) | | | 17,151 | | | | 684,294 | |
| Audit fees | | | 16,002 | | | | 17,499 | |
| Trustee fees | | | 12,978 | | | | 13,266 | |
| Other expenses | | | 6,968 | | | | 9,394 | |
| Legal fees | | | 6,133 | | | | 6,133 | |
| Custody fees (See Note 4) | | | 5,774 | | | | 136,255 | |
| Insurance fees | | | 1,378 | | | | 6,047 | |
| Postage & printing fees | | | 1,148 | | | | 39,875 | |
| Compliance fees (See Note 4) | | | 240 | | | | 46,110 | |
| Distribution and/or shareholder service fees (See Note 5) | | | | | | | | |
| Institutional Class | | | — | | | | 499,744 | |
| Investor Class | | | — | | | | 254,069 | |
| Total expenses before interest expense | | | 151,874 | | | | 10,799,482 | |
| Interest expense (See Note 9) | | | — | | | | 85 | |
| Total expenses before reimbursement/waiver | | | 151,874 | | | | 10,799,567 | |
| Plus: Adviser recoupment (See Note 4) | | | — | | | | 239,141 | |
| Less: reimbursement/waiver from adviser (See Note 4) | | | (98,873 | ) | | | — | |
| Total net expenses | | | 53,001 | | | | 11,038,708 | |
| NET INVESTMENT INCOME (LOSS) | | | 7,358 | | | | (4,319,067 | ) |
| | | | | | | | | |
| REALIZED AND UNREALIZED GAIN ON INVESTMENTS | | | | | | | | |
| AND TRANSLATIONS OF FOREIGN CURRENCY | | | | | | | | |
| Net realized gain on investments, including foreign currency gain/loss | | | 103,853 | | | | 101,950,759 | |
| Net change in unrealized appreciation/depreciation | | | | | | | | |
| of investments and translations of foreign currency | | | 1,447,820 | | | | 258,759,212 | |
Net realized and unrealized gain on investments | | | 1,551,673 | | | | 360,709,971 | |
| | | | | | | | | |
| NET INCREASE IN NET ASSETS RESULTING FROM OPERATIONS | | $ | 1,559,031 | | | $ | 356,390,904 | |
See Notes to the Financial Statements
Jackson Square All-Cap Growth Fund
Statements of Changes in Net Assets
| | | For the | | | For the | |
| | | Year Ended | | | Year Ended | |
| | | October 31, 2020 | | | October 31, 2019 | |
| OPERATIONS: | | | | | | |
| Net investment loss | | $ | (24,527 | ) | | $ | (9,869 | ) |
| Net realized gain on investments, including foreign currency gain/loss | | | 390,170 | | | | 251,265 | |
| Net change in unrealized appreciation/depreciation | | | | | | | | |
| on investments and translations of foreign currency | | | 1,194,508 | | | | 379,637 | |
Net increase in net assets resulting from operations | | | 1,560,151 | | | | 621,033 | |
| | | | | | | | | |
| CAPITAL SHARE TRANSACTIONS: | | | | | | | | |
| IS Class: | | | | | | | | |
| Proceeds from shares sold | | | 88,793 | | | | 53,077 | |
| Proceeds from reinvestment of distributions | | | 189,025 | | | | 416,586 | |
| Payments for shares redeemed | | | (503,565 | ) | | | (20,070 | ) |
| Increase (Decrease) in net assets resulting from IS Class transactions | | | (225,747 | ) | | | 449,593 | |
Net increase (decrease) in net assets resulting from capital share transactions | | | (225,747 | ) | | | 449,593 | |
| | | | | | | | | |
| DISTRIBUTIONS TO SHAREHOLDERS: | | | | | | | | |
| IS Class | | | (243,056 | ) | | | (551,144 | ) |
Total distributions to shareholders | | | (243,056 | ) | | | (551,144 | ) |
| TOTAL INCREASE IN NET ASSETS | | | 1,091,348 | | | | 519,482 | |
| | | | | | | | | |
| NET ASSETS: | | | | | | | | |
| Beginning of year | | | 5,989,953 | | | | 5,470,471 | |
| End of year | | $ | 7,081,301 | | | $ | 5,989,953 | |
See Notes to the Financial Statements
Jackson Square Global Growth Fund
Statements of Changes in Net Assets
| | | For the | | | For the | |
| | | Year Ended | | | Year Ended | |
| | | October 31, 2020 | | | October 31, 2019 | |
| OPERATIONS: | | | | | | |
| Net investment loss | | $ | (56,802 | ) | | $ | (19,187 | ) |
| Net realized gain on investments, including foreign currency gain/loss | | | 484,656 | | | | 247,482 | |
| Net change in unrealized appreciation/depreciation | | | | | | | | |
| on investments and translations of foreign currency | | | 1,526,770 | | | | 1,142,278 | |
Net increase in net assets resulting from operations | | | 1,954,624 | | | | 1,370,573 | |
| | | | | | | | | |
| CAPITAL SHARE TRANSACTIONS: | | | | | | | | |
| IS Class: | | | | | | | | |
| Proceeds from shares sold | | | 600,914 | | | | 392,985 | |
| Proceeds from reinvestment of distributions | | | 217,380 | | | | 534,970 | |
| Payments for shares redeemed | | | (1,132,360 | ) | | | (148,704 | ) |
| Increase (Decrease) in net assets resulting from IS Class transactions | | | (314,066 | ) | | | 779,251 | |
| Institutional Class: | | | | | | | | |
| Proceeds from shares sold | | | 200,000 | | | | — | |
| Proceeds from reinvestment of distributions | | | — | | | | — | |
| Payments for shares redeemed | | | — | | | | — | |
| Increase in net assets resulting from Institutional Class transactions | | | 200,000 | | | | — | |
Net increase (decrease) in net assets resulting from capital share transactions | | | (114,066 | ) | | | 779,251 | |
| | | | | | | | | |
| DISTRIBUTIONS TO SHAREHOLDERS: | | | | | | | | |
| IS Class | | | (247,951 | ) | | | (616,474 | ) |
| Institutional Class | | | (1,488 | ) | | | (3,968 | ) |
Total distributions to shareholders | | | (249,439 | ) | | | (620,442 | ) |
| TOTAL INCREASE IN NET ASSETS | | | 1,591,119 | | | | 1,529,382 | |
| | | | | | | | | |
| NET ASSETS: | | | | | | | | |
| Beginning of year | | | 11,669,125 | | | | 10,139,743 | |
| End of year | | $ | 13,260,244 | | | $ | 11,669,125 | |
See Notes to the Financial Statements
Jackson Square Large-Cap Growth Fund
Statements of Changes in Net Assets
| | | For the | | | For the | |
| | | Year Ended | | | Year Ended | |
| | | October 31, 2020 | | | October 31, 2019 | |
| OPERATIONS: | | | | | | |
| Net investment income (loss) | | $ | (8,175 | ) | | $ | 188,185 | |
| Net realized gain on investments, including foreign currency gain/loss | | | 5,782,617 | | | | 19,553,135 | |
| Net change in unrealized appreciation/depreciation | | | | | | | | |
| on investments and translations of foreign currency | | | 13,344,919 | | | | (4,323,129 | ) |
Net increase in net assets resulting from operations | | | 19,119,361 | | | | 15,418,191 | |
| | | | | | | | | |
| CAPITAL SHARE TRANSACTIONS: | | | | | | | | |
| IS Class: | | | | | | | | |
| Proceeds from shares sold | | | 1,888,587 | | | | 2,154,671 | |
| Proceeds from reinvestment of distributions | | | 13,423,459 | | | | 24,070,256 | |
| Payments for shares redeemed | | | (14,438,700 | ) | | | (59,238,083 | ) |
| Increase (Decrease) in net assets resulting from IS Class transactions | | | 873,346 | | | | (33,013,156 | ) |
| Institutional Class: | | | | | | | | |
| Proceeds from shares sold | | | — | | | | 583,043 | |
| Proceeds from reinvestment of distributions | | | 505,190 | | | | 399,968 | |
| Payments for shares redeemed | | | — | | | | — | |
| Increase in net assets resulting from Institutional Class transactions | | | 505,190 | | | | 983,011 | |
| Investor Class: | | | | | | | | |
| Proceeds from shares sold | | | — | | | | — | |
| Proceeds from reinvestment of distributions | | | — | | | | — | |
| Payments for shares redeemed | | | — | | | | — | |
| Increase in net assets resulting from Investor Class transactions | | | — | | | | — | |
Net increase (decrease) in net assets resulting from capital share transactions | | | 1,378,536 | | | | (32,030,145 | ) |
| | | | | | | | | |
| DISTRIBUTIONS TO SHAREHOLDERS: | | | | | | | | |
| IS Class | | | (13,583,677 | ) | | | (26,818,122 | ) |
| Institutional Class | | | (513,579 | ) | | | (411,593 | ) |
| Investor Class | | | (8,152 | ) | | | (11,363 | ) |
Total distributions to shareholders | | | (14,105,408 | ) | | | (27,241,078 | ) |
| TOTAL INCREASE (DECREASE) IN NET ASSETS | | | 6,392,489 | | | | (43,853,032 | ) |
| | | | | | | | | |
| NET ASSETS: | | | | | | | | |
| Beginning of year | | | 74,845,996 | | | | 118,699,028 | |
| End of year | | $ | 81,238,485 | | | $ | 74,845,996 | |
See Notes to the Financial Statements
Jackson Square Select 20 Growth Fund
Statements of Changes in Net Assets
| | | For the | | | For the | |
| | | Year Ended | | | Year Ended | |
| | | October 31, 2020 | | | October 31, 2019 | |
| OPERATIONS: | | | | | | |
| Net investment income (loss) | | $ | 7,358 | | | $ | (4,630 | ) |
| Net realized gain on investments, including foreign currency gain/loss | | | 103,853 | | | | 422,067 | |
| Net change in unrealized appreciation/depreciation | | | | | | | | |
| on investments and translations of foreign currency | | | 1,447,820 | | | | 111,203 | |
Net increase in net assets resulting from operations | | | 1,559,031 | | | | 528,640 | |
| | | | | | | | | |
| CAPITAL SHARE TRANSACTIONS: | | | | | | | | |
| IS Class: | | | | | | | | |
| Proceeds from shares sold | | | 63,664 | | | | 188,787 | |
| Proceeds from reinvestment of distributions | | | 350,612 | | | | — | |
| Payments for shares redeemed | | | (45,510 | ) | | | (677 | ) |
| Increase in net assets resulting from IS Class transactions | | | 368,766 | | | | 188,110 | |
Net increase in net assets resulting from capital share transactions | | | 368,766 | | | | 188,110 | |
| | | | | | | | | |
| DISTRIBUTIONS TO SHAREHOLDERS: | | | | | | | | |
| IS Class | | | (422,715 | ) | | | — | |
Total distributions to shareholders | | | (422,715 | ) | | | — | |
| TOTAL INCREASE IN NET ASSETS | | | 1,505,082 | | | | 716,750 | |
| | | | | | | | | |
| NET ASSETS: | | | | | | | | |
| Beginning of year | | | 5,519,689 | | | | 4,802,939 | |
| End of year | | $ | 7,024,771 | | | $ | 5,519,689 | |
See Notes to the Financial Statements
Jackson Square SMID-Cap Growth Fund
Statements of Changes in Net Assets
| | | For the | | | For the | |
| | | Year Ended | | | Year Ended | |
| | | October 31, 2020 | | | October 31, 2019 | |
| OPERATIONS: | | | | | | |
| Net investment loss | | $ | (4,319,067 | ) | | $ | (311,441 | ) |
| Net realized gain on investments, including foreign currency gain/loss | | | 101,950,759 | | | | 48,398,577 | |
| Net change in unrealized appreciation/depreciation | | | | | | | | |
| on investments and translations of foreign currency | | | 258,759,212 | | | | 37,241,052 | |
Net increase in net assets resulting from operations | | | 356,390,904 | | | | 85,328,188 | |
| | | | | | | | | |
| CAPITAL SHARE TRANSACTIONS: | | | | | | | | |
| IS Class: | | | | | | | | |
| Proceeds from shares sold | | | 157,740,671 | | | | 275,696,568 | |
| Proceeds from reinvestment of distributions | | | 19,238,798 | | | | 20,860,812 | |
| Payments for shares redeemed | | | (116,046,399 | ) | | | (50,981,990 | ) |
| Increase in net assets resulting from IS Class transactions | | | 60,933,070 | | | | 245,575,390 | |
| Institutional Class: | | | | | | | | |
| Proceeds from shares sold | | | 191,547,831 | | | | 237,880,527 | |
| Proceeds from reinvestment of distributions | | | 20,626,602 | | | | 34,730,983 | |
| Payments for shares redeemed | | | (143,336,709 | ) | | | (78,850,138 | ) |
| Increase in net assets resulting from Institutional Class transactions | | | 68,837,724 | | | | 193,761,372 | |
| Investor Class: | | | | | | | | |
| Proceeds from shares sold | | | 12,375,096 | | | | 36,420,311 | |
| Proceeds from reinvestment of distributions | | | 3,262,845 | | | | 8,137,647 | |
| Payments for shares redeemed | | | (33,095,068 | ) | | | (35,837,698 | ) |
| Increase (Decrease) in net assets resulting from Investor Class transactions | | | (17,457,127 | ) | | | 8,720,260 | |
Net increase in net assets resulting from capital share transactions | | | 112,313,667 | | | | 448,057,022 | |
| | | | | | | | | |
| DISTRIBUTIONS TO SHAREHOLDERS: | | | | | | | | |
| IS Class | | | (19,750,206 | ) | | | (22,085,967 | ) |
| Institutional Class | | | (21,831,079 | ) | | | (35,681,080 | ) |
| Investor Class | | | (3,263,044 | ) | | | (8,138,155 | ) |
Total distributions to shareholders | | | (44,844,329 | ) | | | (65,905,202 | ) |
| TOTAL INCREASE IN NET ASSETS | | | 423,860,242 | | | | 467,480,008 | |
| | | | | | | | | |
| NET ASSETS: | | | | | | | | |
| Beginning of year | | | 1,030,513,600 | | | | 563,033,592 | |
| End of year | | $ | 1,454,373,842 | | | $ | 1,030,513,600 | |
See Notes to the Financial Statements
Jackson Square All-Cap Growth Fund
Financial Highlights
For a Fund share outstanding throughout the periods.
IS Class
| | | Year Ended | | | Year Ended | | | Year Ended | | | Year Ended | | | For the Period | |
| | | October 31, | | | October 31, | | | October 31, | | | October 31, | | | Inception(1) through | |
| | | 2020 | | | 2019 | | | 2018 | | | 2017 | | | October 31, 2016 | |
| Per Share Data | | | | | | | | | | | | | | | |
| | | | | | | | | | | | | | | | |
Net asset value, beginning of period | | $ | 22.60 | | | $ | 22.68 | | | $ | 21.21 | | | $ | 17.55 | | | $ | 18.00 | |
| | | | | | | | | | | | | | | | | | | | | |
| Investment operations: | | | | | | | | | | | | | | | | | | | | |
Net investment loss(2) | | | (0.09 | ) | | | (0.04 | ) | | | (0.03 | ) | | | (0.02 | ) | | | (0.01 | ) |
| Net realized and unrealized | | | | | | | | | | | | | | | | | | | | |
| gain (loss) on investments | | | 6.18 | | | | 2.24 | | | | 1.53 | | | | 3.69 | | | | (0.44 | ) |
| Total from investment operations | | | 6.09 | | | | 2.20 | | | | 1.50 | | | | 3.67 | | | | (0.45 | ) |
| | | | | | | | | | | | | | | | | | | | | |
| Less distributions from: | | | | | | | | | | | | | | | | | | | | |
| Net investment income | | | — | | | | — | (3) | | | — | | | | (0.01 | ) | | | — | |
| Net realized gains | | | (0.92 | ) | | | (2.28 | ) | | | (0.03 | ) | | | — | | | | — | |
| Total distributions | | | (0.92 | ) | | | (2.28 | ) | | | (0.03 | ) | | | (0.01 | ) | | | — | |
Net asset value, end of period | | $ | 27.77 | | | $ | 22.60 | | | $ | 22.68 | | | $ | 21.21 | | | $ | 17.55 | |
| | | | | | | | | | | | | | | | | | | | | |
Total Return(4) | | | 27.81 | % | | | 11.85 | % | | | 7.10 | % | | | 20.90 | % | | | -2.50 | % |
| | | | | | | | | | | | | | | | | | | | | |
| Supplemental Data and Ratios | | | | | | | | | | | | | | | | | | | | |
Net assets, end of period (in 000’s) | | $ | 7,081 | | | $ | 5,990 | | | $ | 5,470 | | | $ | 5,070 | | | $ | 2,681 | |
| | | | | | | | | | | | | | | | | | | | | |
Ratio of expenses to average net assets: | | | | | | | | | | | | | | | | | | | | |
Before expense reimbursement/waiver(5) | | | 2.42 | % | | | 2.47 | % | | | 2.45 | % | | | 2.93 | % | | | 18.59 | % |
After expense reimbursement/waiver(5) | | | 0.90 | % | | | 0.90 | % | | | 0.90 | % | | | 0.90 | % | | | 0.90 | % |
| | | | | | | | | | | | | | | | | | | | | |
Ratio of net investment loss to average net assets: | | | | | | | | | | | | | | | | | | | | |
After expense reimbursement/waiver(5) | | | (0.38 | )% | | | (0.17 | )% | | | (0.12 | )% | | | (0.10 | )% | | | (0.50 | )% |
| | | | | | | | | | | | | | | | | | | | | |
Portfolio Turnover(4) | | | 59 | % | | | 49 | % | | | 61 | % | | | 60 | % | | | 3 | % |
(1) | Inception date of the IS Class was September 19, 2016. |
(2) | Per share amounts calculated using the average shares method. |
(3) | Amount is less than $0.01 per share. |
(4) | Not annualized for periods less than one year. |
(5) | Annualized for periods less than one year. |
See Notes to the Financial Statements
Jackson Square Global Growth Fund
Financial Highlights
For a Fund share outstanding throughout the periods.
IS Class
| | | Year Ended | | | Year Ended | | | Year Ended | | | Year Ended | | | For the Period | |
| | | October 31, | | | October 31, | | | October 31, | | | October 31, | | | Inception(1) through | |
| | | 2020 | | | 2019 | | | 2018 | | | 2017 | | | October 31, 2016 | |
| Per Share Data | | | | | | | | | | | | | | | |
| | | | | | | | | | | | | | | | |
Net asset value, beginning of period | | $ | 24.70 | | | $ | 23.28 | | | $ | 22.73 | | | $ | 17.66 | | | $ | 18.00 | |
| | | | | | | | | | | | | | | | | | | | | |
| Investment operations: | | | | | | | | | | | | | | | | | | | | |
Net investment loss(2) | | | (0.12 | ) | | | (0.04 | ) | | | (0.07 | ) | | | (0.02 | ) | | | (0.01 | ) |
| Net realized and unrealized | | | | | | | | | | | | | | | | | | | | |
| gain (loss) on investments | | | 4.07 | | | | 2.87 | | | | 1.08 | | | | 5.09 | | | | (0.33 | ) |
| Total from investment operations | | | 3.95 | | | | 2.83 | | | | 1.01 | | | | 5.07 | | | | (0.34 | ) |
| | | | | | | | | | | | | | | | | | | | | |
| Less distributions from: | | | | | | | | | | | | | | | | | | | | |
| Net investment income | | | — | | | | — | | | | (0.01 | ) | | | — | | | | — | |
| Net realized gains | | | (0.53 | ) | | | (1.41 | ) | | | (0.45 | ) | | | — | | | | — | |
| Total distributions | | | (0.53 | ) | | | (1.41 | ) | | | (0.46 | ) | | | — | | | | — | |
Net asset value, end of period | | $ | 28.12 | | | $ | 24.70 | | | $ | 23.28 | | | $ | 22.73 | | | $ | 17.66 | |
| | | | | | | | | | | | | | | | | | | | | |
Total Return(3) | | | 16.20 | % | | | 13.47 | % | | | 4.49 | % | | | 28.71 | % | | | -1.89 | % |
| | | | | | | | | | | | | | | | | | | | | |
| Supplemental Data and Ratios | | | | | | | | | | | | | | | | | | | | |
Net assets, end of period (in 000’s) | | $ | 12,993 | | | $ | 11,599 | | | $ | 10,074 | | | $ | 9,121 | | | $ | 3,516 | |
| | | | | | | | | | | | | | | | | | | | | |
Ratio of expenses to average net assets: | | | | | | | | | | | | | | | | | | | | |
Before expense reimbursement/waiver(4) | | | 1.92 | % | | | 2.01 | % | | | 2.00 | % | | | 2.39 | % | | | 14.49 | % |
After expense reimbursement/waiver(4) | | | 1.05 | % | | | 1.05 | % | | | 1.05 | % | | | 1.05 | % | | | 1.05 | % |
| | | | | | | | | | | | | | | | | | | | | |
Ratio of net investment loss to average net assets: | | | | | | | | | | | | | | | | | | | | |
After expense reimbursement/waiver(4) | | | (0.46 | )% | | | (0.17 | )% | | | (0.31 | )% | | | (0.12 | )% | | | (0.62 | )% |
| | | | | | | | | | | | | | | | | | | | | |
Portfolio Turnover(3) | | | 41 | % | | | 28 | % | | | 41 | % | | | 37 | % | | | 3 | % |
(1) | Inception date of the IS Class was September 19, 2016. |
(2) | Per share amounts calculated using the average shares method. |
(3) | Not annualized for periods less than one year. |
(4) | Annualized for periods less than one year. |
See Notes to the Financial Statements
Jackson Square Global Growth Fund
Financial Highlights
For a Fund share outstanding throughout the periods.
Institutional Class
| | | Year Ended | | | Year Ended | | | Year Ended | | | Year Ended | | | For the Period | |
| | | October 31, | | | October 31, | | | October 31, | | | October 31, | | | Inception(1) through | |
| | | 2020 | | | 2019 | | | 2018 | | | 2017 | | | October 31, 2016 | |
| Per Share Data | | | | | | | | | | | | | | | |
| | | | | | | | | | | | | | | | |
Net asset value, beginning of period | | $ | 24.68 | | | $ | 23.25 | | | $ | 22.71 | | | $ | 17.66 | | | $ | 18.00 | |
| | | | | | | | | | | | | | | | | | | | | |
| Investment operations: | | | | | | | | | | | | | | | | | | | | |
Net investment loss(2) | | | (0.12 | ) | | | (0.04 | ) | | | (0.07 | ) | | | (0.04 | ) | | | (0.02 | ) |
| Net realized and unrealized | | | | | | | | | | | | | | | | | | | | |
| gain (loss) on investments | | | 4.06 | | | | 2.88 | | | | 1.07 | | | | 5.09 | | | | (0.32 | ) |
| Total from investment operations | | | 3.94 | | | | 2.84 | | | | 1.00 | | | | 5.05 | | | | (0.34 | ) |
| | | | | | | | | | | | | | | | | | | | | |
| Less distributions from: | | | | | | | | | | | | | | | | | | | | |
| Net investment income | | | — | | | | — | | | | (0.01 | ) | | | — | | | | — | |
| Net realized gains | | | (0.53 | ) | | | (1.41 | ) | | | (0.45 | ) | | | — | | | | — | |
| Total distributions | | | (0.53 | ) | | | (1.41 | ) | | | (0.46 | ) | | | — | | | | — | |
Net asset value, end of period | | $ | 28.09 | | | $ | 24.68 | | | $ | 23.25 | | | $ | 22.71 | | | $ | 17.66 | |
| | | | | | | | | | | | | | | | | | | | | |
Total Return(3) | | | 16.17 | % | | | 13.53 | % | | | 4.45 | % | | | 28.60 | % | | | -1.89 | % |
| | | | | | | | | | | | | | | | | | | | | |
| Supplemental Data and Ratios | | | | | | | | | | | | | | | | | | | | |
Net assets, end of period (in 000’s) | | $ | 267 | | | $ | 70 | | | $ | 66 | | | $ | 64 | | | $ | 49 | |
| | | | | | | | | | | | | | | | | | | | | |
Ratio of expenses to average net assets: | | | | | | | | | | | | | | | | | | | | |
Before expense reimbursement/waiver(4) | | | 1.92 | % | | | 2.01 | % | | | 2.01 | % | | | 2.59 | % | | | 14.61 | % |
After expense reimbursement/waiver(4) | | | 1.05 | % | | | 1.05 | % | | | 1.05 | % | | | 1.12 | % | | | 1.15 | % |
| | | | | | | | | | | | | | | | | | | | | |
Ratio of net investment loss to average net assets: | | | | | | | | | | | | | | | | | | | | |
After expense reimbursement/waiver(4) | | | (0.46 | )% | | | (0.18 | )% | | | (0.31 | )% | | | (0.19 | )% | | | (0.72 | )% |
| | | | | | | | | | | | | | | | | | | | | |
Portfolio Turnover(3) | | | 41 | % | | | 28 | % | | | 41 | % | | | 37 | % | | | 3 | % |
(1) | Inception date of the Institutional Class was September 19, 2016. |
(2) | Per share amounts calculated using the average shares method. |
(3) | Not annualized for periods less than one year. |
(4) | Annualized for periods less than one year. |
See Notes to the Financial Statements
Jackson Square Large-Cap Growth Fund
Financial Highlights
For a Fund share outstanding throughout the years.
IS Class
| | | Year Ended | | | Year Ended | | | Year Ended | | | Year Ended | | | Year Ended | |
| | | October 31, | | | October 31, | | | October 31, | | | October 31, | | | October 31, | |
| | | 2020 | | | 2019 | | | 2018 | | | 2017 | | | 2016 | |
| Per Share Data | | | | | | | | | | | | | | | |
| | | | | | | | | | | | | | | | |
Net asset value, beginning of year | | $ | 11.99 | | | $ | 13.94 | | | $ | 14.79 | | | $ | 13.89 | | | $ | 16.79 | |
| | | | | | | | | | | | | | | | | | | | | |
| Investment operations: | | | | | | | | | | | | | | | | | | | | |
Net investment income (loss)(1) | | | — | (2) | | | 0.02 | | | | 0.02 | | | | 0.04 | | | | 0.05 | |
| Net realized and unrealized | | | | | | | | | | | | | | | | | | | | |
| gain (loss) on investments | | | 2.66 | | | | 1.26 | | | | 0.74 | | | | 2.83 | | | | (0.51 | ) |
| Total from investment operations | | | 2.66 | | | | 1.28 | | | | 0.76 | | | | 2.87 | | | | (0.46 | ) |
| | | | | | | | | | | | | | | | | | | | | |
| Less distributions from: | | | | | | | | | | | | | | | | | | | | |
| Net investment income | | | (0.03 | ) | | | (0.02 | ) | | | (0.04 | ) | | | (0.04 | ) | | | (0.11 | ) |
| Net realized gains | | | (2.29 | ) | | | (3.21 | ) | | | (1.57 | ) | | | (1.93 | ) | | | (2.33 | ) |
| Total distributions | | | (2.32 | ) | | | (3.23 | ) | | | (1.61 | ) | | | (1.97 | ) | | | (2.44 | ) |
Net asset value, end of year | | $ | 12.33 | | | $ | 11.99 | | | $ | 13.94 | | | $ | 14.79 | | | $ | 13.89 | |
| | | | | | | | | | | | | | | | | | | | | |
| Total Return | | | 26.73 | % | | | 14.40 | % | | | 5.49 | % | | | 24.21 | % | | | -3.20 | % |
| | | | | | | | | | | | | | | | | | | | | |
| Supplemental Data and Ratios | | | | | | | | | | | | | | | | | | | | |
Net assets, end of year (in 000’s) | | $ | 77,839 | | | $ | 72,150 | | | $ | 116,867 | | | $ | 155,475 | | | $ | 191,583 | |
| | | | | | | | | | | | | | | | | | | | | |
Ratio of expenses to average net assets: | | | | | | | | | | | | | | | | | | | | |
| Before expense reimbursement/waiver | | | 0.84 | % | | | 0.80 | % | | | 0.76 | % | | | 0.76 | % | | | 0.65 | % |
| After expense reimbursement/waiver | | | 0.64 | % | | | 0.64 | % | | | 0.64 | % | | | 0.64 | % | | | 0.64 | % |
| | | | | | | | | | | | | | | | | | | | | |
Ratio of net investment income (loss) to average net assets: | | | | | | | | | | | | | | | | | |
| After expense reimbursement/waiver | | | (0.01 | )% | | | 0.17 | % | | | 0.12 | % | | | 0.29 | % | | | 0.36 | % |
| | | | | | | | | | | | | | | | | | | | | |
Portfolio Turnover(3) | | | 53 | % | | | 37 | % | | | 53 | % | | | 25 | % | | | 27 | %(4) |
(1) | Per share amounts calculated using the average shares method. |
(2) | Amount is less than $0.01 per share. |
(3) | Portfolio turnover disclosed is for the Fund as a whole. |
(4) | Excludes value of Fund securities received or delivered as a result of in-kind purchases or redemptions of the Fund’s capital shares. |
See Notes to the Financial Statements
Jackson Square Large-Cap Growth Fund
Financial Highlights
For a Fund share outstanding throughout the periods.
Institutional Class
| | | Year Ended | | | Year Ended | | | Year Ended | | | Year Ended | | | For the Period | |
| | | October 31, | | | October 31, | | | October 31, | | | October 31, | | | Inception(1) through | |
| | | 2020 | | | 2019 | | | 2018 | | | 2017 | | | October 31, 2016 | |
| Per Share Data | | | | | | | | | | | | | | | |
| | | | | | | | | | | | | | | | |
Net asset value, beginning of period | | $ | 12.01 | | | $ | 13.95 | | | $ | 14.78 | | | $ | 13.89 | | | $ | 14.12 | |
| | | | | | | | | | | | | | | | | | | | | |
| Investment operations: | | | | | | | | | | | | | | | | | | | | |
Net investment income (loss)(2) | | | — | (3) | | | 0.02 | | | | 0.02 | | | | 0.03 | | | | (0.01 | ) |
| Net realized and unrealized | | | | | | | | | | | | | | | | | | | | |
| gain (loss) on investments | | | 2.67 | | | | 1.26 | | | | 0.75 | | | | 2.83 | | | | (0.22 | ) |
| Total from investment operations | | | 2.67 | | | | 1.28 | | | | 0.77 | | | | 2.86 | | | | (0.23 | ) |
| | | | | | | | | | | | | | | | | | | | | |
| Less distributions from: | | | | | | | | | | | | | | | | | | | | |
| Net investment income | | | (0.03 | ) | | | (0.01 | ) | | �� | (0.03 | ) | | | (0.04 | ) | | | — | |
| Net realized gains | | | (2.29 | ) | | | (3.21 | ) | | | (1.57 | ) | | | (1.93 | ) | | | — | |
| Total distributions | | | (2.32 | ) | | | (3.22 | ) | | | (1.60 | ) | | | (1.97 | ) | | | — | |
Net asset value, end of period | | $ | 12.36 | | | $ | 12.01 | | | $ | 13.95 | | | $ | 14.78 | | | $ | 13.89 | |
| | | | | | | | | | | | | | | | | | | | | |
Total Return(4) | | | 26.78 | % | | | 14.44 | % | | | 5.54 | % | | | 24.08 | % | | | -1.63 | % |
| | | | | | | | | | | | | | | | | | | | | |
| Supplemental Data and Ratios | | | | | | | | | | | | | | | | | | | | |
Net assets, end of period (in 000’s) | | $ | 3,356 | | | $ | 2,654 | | | $ | 1,783 | | | $ | 179 | | | $ | 49 | |
| | | | | | | | | | | | | | | | | | | | | |
Ratio of expenses to average net assets: | | | | | | | | | | | | | | | | | | | | |
Before expense reimbursement/waiver(5) | | | 0.84 | % | | | 0.81 | % | | | 0.75 | % | | | 0.82 | % | | | 0.83 | % |
After expense reimbursement/waiver(5) | | | 0.64 | % | | | 0.64 | % | | | 0.64 | % | | | 0.70 | % | | | 0.74 | % |
| | | | | | | | | | | | | | | | | | | | | |
Ratio of net investment income (loss) | | | | | | | | | | | | | | | | | | | | |
to average net assets: | | | | | | | | | | | | | | | | | | | | |
After expense reimbursement/waiver(5) | | | (0.01 | )% | | | 0.17 | % | | | 0.12 | % | | | 0.23 | % | | | (0.60 | )% |
| | | | | | | | | | | | | | | | | | | | | |
Portfolio Turnover(4)(6) | | | 53 | % | | | 37 | % | | | 53 | % | | | 25 | % | | | 27 | %(7) |
(1) | Inception date of the Institutional Class was September 19, 2016. |
(2) | Per share amounts calculated using the average shares method. |
(3) | Amount is less than $0.01 per share. |
(4) | Not annualized for periods less than one year. |
(5) | Annualized for periods less than one year. |
(6) | Portfolio turnover disclosed is for the Fund as a whole. |
(7) | Excludes value of Fund securities received or delivered as a result of in-kind purchases or redemptions of the Fund’s capital shares. |
See Notes to the Financial Statements
Jackson Square Large-Cap Growth Fund
Financial Highlights
For a Fund share outstanding throughout the periods.
Investor Class
| | | Year Ended | | | Year Ended | | | Year Ended | | | Year Ended | | | For the Period | |
| | | October 31, | | | October 31, | | | October 31, | | | October 31, | | | Inception(1) through | |
| | | 2020 | | | 2019 | | | 2018 | | | 2017 | | | October 31, 2016 | |
| Per Share Data | | | | | | | | | | | | | | | |
| | | | | | | | | | | | | | | | |
Net asset value, beginning of period | | $ | 11.95 | | | $ | 13.91 | | | $ | 14.75 | | | $ | 13.89 | | | $ | 14.12 | |
| | | | | | | | | | | | | | | | | | | | | |
| Investment operations: | | | | | | | | | | | | | | | | | | | | |
Net investment loss(2) | | | (0.03 | ) | | | (0.01 | )(3) | | | (0.02 | ) | | | — | (4) | | | (0.01 | ) |
| Net realized and unrealized | | | | | | | | | | | | | | | | | | | | |
| gain (loss) on investments | | | 2.66 | | | | 1.26 | | | | 0.75 | | | | 2.82 | | | | (0.22 | ) |
| Total from investment operations | | | 2.63 | | | | 1.25 | | | | 0.73 | | | | 2.82 | | | | (0.23 | ) |
| | | | | | | | | | | | | | | | | | | | | |
| Less distributions from: | | | | | | | | | | | | | | | | | | | | |
| Net investment income | | | (0.01 | ) | | | — | | | | — | | | | (0.03 | ) | | | — | |
| Net realized gains | | | (2.29 | ) | | | (3.21 | ) | | | (1.57 | ) | | | (1.93 | ) | | | — | |
| Total distributions | | | (2.30 | ) | | | (3.21 | ) | | | (1.57 | ) | | | (1.96 | ) | | | — | |
Net asset value, end of period | | $ | 12.28 | | | $ | 11.95 | | | $ | 13.91 | | | $ | 14.75 | | | $ | 13.89 | |
| | | | | | | | | | | | | | | | | | | | | |
Total Return(5) | | | 26.49 | % | | | 14.18 | % | | | 5.25 | % | | | 23.74 | % | | | -1.63 | % |
| | | | | | | | | | | | | | | | | | | | | |
| Supplemental Data and Ratios | | | | | | | | | | | | | | | | | | | | |
Net assets, end of period (in 000’s) | | $ | 43 | | | $ | 42 | | | $ | 49 | | | $ | 52 | | | $ | 49 | |
| | | | | | | | | | | | | | | | | | | | | |
Ratio of expenses to average net assets: | | | | | | | | | | | | | | | | | | | | |
Before expense reimbursement/waiver(6) | | | 1.09 | % | | | 1.06 | % | | | 1.01 | % | | | 1.08 | % | | | 1.08 | % |
After expense reimbursement/waiver(6) | | | 0.89 | % | | | 0.89 | % | | | 0.89 | % | | | 0.96 | % | | | 0.99 | % |
| | | | | | | | | | | | | | | | | | | | | |
Ratio of net investment loss | | | | | | | | | | | | | | | | | | | | |
to average net assets: | | | | | | | | | | | | | | | | | | | | |
After expense reimbursement/waiver(6) | | | (0.26 | )% | | | (0.08 | )% | | | (0.13 | )% | | | (0.03 | )% | | | (0.84 | )% |
| | | | | | | | | | | | | | | | | | | | | |
Portfolio Turnover(5)(7) | | | 53 | % | | | 37 | % | | | 53 | % | | | 25 | % | | | 27 | %(8) |
(1) | Inception date of the Investor Class was September 19, 2016. |
(2) | Per share amounts calculated using the average shares method. |
(3) | Net realized and unrealized loss per share in this caption is a balancing amount necessary to reconcile the change in net asset value per share for the year, and may not reconcile with the aggregate gain on the Statement of Operations due to share transactions for the year. |
(4) | Amount is less than $0.01 per share. |
(5) | Not annualized for periods less than one year. |
(6) | Annualized for periods less than one year. |
(7) | Portfolio turnover disclosed is for the Fund as a whole. |
(8) | Excludes value of Fund securities received or delivered as a result of in-kind purchases or redemptions of the Fund’s capital shares. |
See Notes to the Financial Statements
Jackson Square Select 20 Growth Fund
Financial Highlights
For a Fund share outstanding throughout the years.
IS Class
| | | Year Ended | | | Year Ended | | | Year Ended | | | Year Ended | | | Year Ended | |
| | | October 31, | | | October 31, | | | October 31, | | | October 31, | | | October 31, | |
| | | 2020 | | | 2019 | | | 2018 | | | 2017 | | | 2016 | |
| Per Share Data | | | | | | | | | | | | | | | |
| | | | | | | | | | | | | | | | |
Net asset value, beginning of year | | $ | 6.12 | | | $ | 5.54 | | | $ | 7.80 | | | $ | 6.83 | | | $ | 8.95 | |
| | | | | | | | | | | | | | | | | | | | | |
| Investment operations: | | | | | | | | | | | | | | | | | | | | |
Net investment income (loss)(1) | | | 0.01 | | | | (0.01 | ) | | | 0.01 | | | | — | (2) | | | — | (2) |
| Net realized and unrealized | | | | | | | | | | | | | | | | | | | | |
| gain (loss) on investments | | | 1.61 | | | | 0.59 | | | | 0.44 | | | | 0.97 | | | | (0.52 | ) |
| Total from investment operations | | | 1.62 | | | | 0.58 | | | | 0.45 | | | | 0.97 | | | | (0.52 | ) |
| | | | | | | | | | | | | | | | | | | | | |
Less distributions from: | | | | | | | | | | | | | | | | | | | | |
| Net investment income | | | (0.01 | ) | | | — | | | | — | | | | — | | | | (0.01 | ) |
| Net realized gains | | | (0.46 | ) | | | — | | | | (2.71 | ) | | | — | | | | (1.59 | ) |
| Total distributions | | | (0.47 | ) | | | — | | | | (2.71 | ) | | | — | | | | (1.60 | ) |
Net asset value, end of year | | $ | 7.27 | | | $ | 6.12 | | | $ | 5.54 | | | $ | 7.80 | | | $ | 6.83 | |
| | | | | | | | | | | | | | | | | | | | | |
| Total Return | | | 28.26 | % | | | 10.47 | % | | | 9.05 | % | | | 14.20 | % | | | -6.54 | % |
| | | | | | | | | | | | | | | | | | | | | |
| Supplemental Data and Ratios | | | | | | | | | | | | | | | | | | | | |
Net assets, end of year (in 000’s) | | $ | 7,025 | | | $ | 5,520 | | | $ | 4,803 | | | $ | 34,082 | | | $ | 79,941 | |
| | | | | | | | | | | | | | | | | | | | | |
Ratio of expenses to average net assets: | | | | | | | | | | | | | | | | | | | | |
| Before expense reimbursement/waiver | | | 2.49 | % | | | 2.68 | % | | | 2.00 | % | | | 0.89 | % | | | 0.90 | % |
| After expense reimbursement/waiver | | | 0.87 | % | | | 0.87 | % | | | 0.87 | % | | | 0.87 | % | | | 0.89 | % |
| | | | | | | | | | | | | | | | | | | | | |
Ratio of net investment income (loss) | | | | | | | | | | | | | | | | | | | | |
to average net assets: | | | | | | | | | | | | | | | | | | | | |
| After expense reimbursement/waiver | | | 0.12 | % | | | (0.09 | )% | | | 0.10 | % | | | 0.01 | % | | | 0.04 | % |
| | | | | | | | | | | | | | | | | | | | | |
Portfolio Turnover | | | 60 | % | | | 42 | % | | | 41 | %(3) | | | 40 | % | | | 22 | % |
(1) | Per share amounts calculated using the average shares method. |
(2) | Amount is less than $0.01 per share. |
(3) | Excludes value of Fund securities received or delivered as a result of in-kind purchases or redemptions of the Fund’s capital shares. |
See Notes to the Financial Statements
Jackson Square SMID-Cap Growth Fund
Financial Highlights
For a Fund share outstanding throughout the years.
IS Class
| | | Year Ended | | | Year Ended | | | Year Ended | | | Year Ended | | | Year Ended | |
| | | October 31, | | | October 31, | | | October 31, | | | October 31, | | | October 31, | |
| | | 2020 | | | 2019 | | | 2018 | | | 2017 | | | 2016 | |
| Per Share Data | | | | | | | | | | | | | | | |
| | | | | | | | | | | | | | | | |
Net asset value, beginning of year | | $ | 23.88 | | | $ | 23.83 | | | $ | 21.37 | | | $ | 17.24 | | | $ | 18.44 | |
| | | | | | | | | | | | | | | | | | | | | |
| Investment operations: | | | | | | | | | | | | | | | | | | | | |
Net investment income (loss)(1) | | | (0.08 | ) | | | 0.01 | (2) | | | 0.08 | | | | 0.02 | | | | 0.05 | |
| Net realized and unrealized gain on investments | | | 7.99 | | | | 2.70 | | | | 2.50 | | | | 4.20 | | | | 0.91 | |
| Total from investment operations | | | 7.91 | | | | 2.71 | | | | 2.58 | | | | 4.22 | | | | 0.96 | |
| | | | | | | | | | | | | | | | | | | | | |
| Less distributions from: | | | | | | | | | | | | | | | | | | | | |
| Net investment income | | | (0.02 | ) | | | (0.06 | ) | | | — | | | | (0.02 | ) | | | (0.04 | ) |
| Net realized gains | | | (1.02 | ) | | | (2.60 | ) | | | (0.12 | ) | | | (0.07 | ) | | | (2.12 | ) |
| Total distributions | | | (1.04 | ) | | | (2.66 | ) | | | (0.12 | ) | | | (0.09 | ) | | | (2.16 | ) |
Net asset value, end of year | | $ | 30.75 | | | $ | 23.88 | | | $ | 23.83 | | | $ | 21.37 | | | $ | 17.24 | |
| | | | | | | | | | | | | | | | | | | | | |
| Total Return | | | 34.36 | % | | | 14.02 | % | | | 12.13 | % | | | 24.59 | % | | | 5.27 | % |
| | | | | | | | | | | | | | | | | | | | | |
| Supplemental Data and Ratios | | | | | | | | | | | | | | | | | | | | |
Net assets, end of year (in 000’s) | | $ | 650,845 | | | $ | 452,234 | | | $ | 197,5380 | | | $ | 162,033 | | | $ | 72,224 | |
| | | | | | | | | | | | | | | | | | | | | |
Ratio of expenses to average net assets: | | | | | | | | | | | | | | | | | | | | |
| Before expense waiver/recoupment | | | 0.85 | % | | | 0.87 | % | | | 0.89 | % | | | 0.93 | % | | | 0.91 | % |
| After expense waiver/recoupment | | | 0.87 | % | | | 0.87 | % | | | 0.87 | % | | | 0.87 | % | | | 0.90 | % |
| | | | | | | | | | | | | | | | | | | | | |
Ratio of net investment income (loss) | | | | | | | | | | | | | | | | | | | | |
to average net assets: | | | | | | | | | | | | | | | | | | | | |
| After expense waiver/recoupment | | | (0.30 | )% | | | 0.04 | % | | | 0.33 | % | | | 0.10 | % | | | 0.27 | % |
| | | | | | | | | | | | | | | | | | | | | |
Portfolio Turnover(3) | | | 49 | % | | | 35 | % | | | 47 | % | | | 23 | % | | | 20 | % |
| (1) | Per share amounts calculated using the average shares method. |
| (2) | Net realized and unrealized loss per share in this caption is a balancing amount necessary to reconcile the change in net asset value per share for the year, and may not reconcile with the aggregate gain on the Statement of Operations due to share transactions for the year. |
| (3) | Portfolio turnover disclosed is for the Fund as a whole. |
See Notes to the Financial Statements
Jackson Square SMID-Cap Growth Fund
Financial Highlights
For a Fund share outstanding throughout the periods.
Institutional Class
| | | Year Ended | | | Year Ended | | | Year Ended | | | Year Ended | | | For the Period | |
| | | October 31, | | | October 31, | | | October 31, | | | October 31, | | | Inception(1) through | |
| | | 2020 | | | 2019 | | | 2018 | | | 2017 | | | October 31, 2016 | |
| Per Share Data | | | | | | | | | | | | | | | |
| | | | | | | | | | | | | | | | |
Net asset value, beginning of period | | $ | 23.89 | | | $ | 23.81 | | | $ | 21.37 | | | $ | 17.24 | | | $ | 17.82 | |
| | | | | | | | | | | | | | | | | | | | | |
| Investment operations: | | | | | | | | | | | | | | | | | | | | |
Net investment income (loss)(2) | | | (0.10 | ) | | | (0.01 | ) | | | 0.06 | | | | 0.01 | | | | — | (3) |
| Net realized and unrealized | | | | | | | | | | | | | | | | | | | | |
| gain (loss) on investments | | | 7.98 | | | | 2.74 | | | | 2.50 | | | | 4.21 | | | | (0.58 | )(4) |
| Total from investment operations | | | 7.88 | | | | 2.73 | | | | 2.56 | | | | 4.22 | | | | (0.58 | ) |
| | | | | | | | | | | | | | | | | | | | | |
Less distributions from: | | | | | | | | | | | | | | | | | | | | |
| Net investment income | | | (0.02 | ) | | | (0.05 | ) | | | — | | | | (0.02 | ) | | | — | |
| Net realized gains | | | (1.02 | ) | | | (2.60 | ) | | | (0.12 | ) | | | (0.07 | ) | | | — | |
| Total distributions | | | (1.04 | ) | | | (2.65 | ) | | | (0.12 | ) | | | (0.09 | ) | | | — | |
Net asset value, end of period | | $ | 30.73 | | | $ | 23.89 | | | $ | 23.81 | | | $ | 21.37 | | | $ | 17.24 | |
| | | | | | | | | | | | | | | | | | | | | |
Total Return(5) | | | 34.20 | % | | | 14.08 | % | | | 12.04 | % | | | 24.50 | % | | | -3.25 | % |
| | | | | | | | | | | | | | | | | | | | | |
| Supplemental Data and Ratios | | | | | | | | | | | | | | | | | | | | |
Net assets, end of period (in 000’s) | | $ | 725,204 | | | $ | 499,461 | | | $ | 297,023 | | | $ | 211,787 | | | $ | 87,274 | |
| | | | | | | | | | | | | | | | | | | | | |
Ratio of expenses to average net assets: | | | | | | | | | | | | | | | | | | | | |
Before expense waiver/recoupment(6) | | | 0.93 | % | | | 0.95 | % | | | 0.97 | % | | | 0.99 | % | | | 1.00 | % |
After expense waiver/recoupment(6) | | | 0.95 | % | | | 0.95 | % | | | 0.95 | % | | | 0.92 | % | | | 0.97 | % |
| | | | | | | | | | | | | | | | | | | | | |
Ratio of net investment income (loss) | | | | | | | | | | | | | | | | | | | | |
to average net assets: | | | | | | | | | | | | | | | | | | | | |
After expense waiver/recoupment(6) | | | (0.39 | )% | | | (0.04 | )% | | | 0.26 | % | | | 0.04 | % | | | 0.05 | % |
| | | | | | | | | | | | | | | | | | | | | |
Portfolio Turnover(5)(7) | | | 49 | % | | | 35 | % | | | 47 | % | | | 23 | % | | | 20 | % |
(1) | Inception date of the Institutional Class was September 16, 2016. |
(2) | Per share amounts calculated using the average shares method. |
(3) | Amount is less than $0.01 per share. |
(4) | Net realized and unrealized loss per share in this caption is a balancing amount necessary to reconcile the change in net asset value per share for the period, and may not reconcile with the aggregate gain on the Statement of Operations due to share transactions for the period. |
(5) | Not annualized for periods less than one year. |
(6) | Annualized for periods less than one year. |
(7) | Portfolio turnover disclosed is for the Fund as a whole. |
See Notes to the Financial Statements
Jackson Square SMID-Cap Growth Fund
Financial Highlights
For a Fund share outstanding throughout the periods.
Investor Class
| | | Year Ended | | | Year Ended | | | Year Ended | | | Year Ended | | | For the Period | |
| | | October 31, | | | October 31, | | | October 31, | | | October 31, | | | Inception(1) through | |
| | | 2020 | | | 2019 | | | 2018 | | | 2017 | | | October 31, 2016 | |
| Per Share Data | | | | | | | | | | | | | | | |
| | | | | | | | | | | | | | | | |
Net asset value, beginning of period | | $ | 23.68 | | | $ | 23.67 | | | $ | 21.30 | | | $ | 17.23 | | | $ | 17.84 | |
| | | | | | | | | | | | | | | | | | | | | |
| Investment operations: | | | | | | | | | | | | | | | | | | | | |
Net investment loss(2) | | | (0.17 | ) | | | (0.07 | ) | | | — | (3) | | | (0.05 | ) | | | — | (3) |
| Net realized and unrealized | | | | | | | | | | | | | | | | | | | | |
| gain (loss) on investments | | | 7.91 | | | | 2.70 | | | | 2.49 | | | | 4.21 | | | | (0.61 | )(4) |
| Total from investment operations | | | 7.74 | | | | 2.63 | | | | 2.49 | | | | 4.16 | | | | (0.61 | ) |
| | | | | | | | | | | | | | | | | | | | | |
| Less distributions from: | | | | | | | | | | | | | | | | | | | | |
| Net investment income | | | (0.01 | ) | | | (0.02 | ) | | | — | | | | (0.02 | ) | | | — | |
| Net realized gains | | | (1.02 | ) | | | (2.60 | ) | | | (0.12 | ) | | | (0.07 | ) | | | — | |
| Total distributions | | | (1.03 | ) | | | (2.62 | ) | | | (0.12 | ) | | | (0.09 | ) | | | — | |
Net asset value, end of period | | $ | 30.39 | | | $ | 23.68 | | | $ | 23.67 | | | $ | 21.30 | | | $ | 17.23 | |
| | | | | | | | | | | | | | | | | | | | | |
Total Return(5) | | | 33.88 | % | | | 13.69 | % | | | 11.75 | % | | | 24.12 | % | | | -3.42 | % |
| | | | | | | | | | | | | | | | | | | | | |
| Supplemental Data and Ratios | | | | | | | | | | | | | | | | | | | | |
Net assets, end of period (in 000’s) | | $ | 78,325 | | | $ | 78,819 | | | $ | 68,451 | | | $ | 4,935 | | | $ | 48 | |
| | | | | | | | | | | | | | | | | | | | | |
Ratio of expenses to average net assets: | | | | | | | | | | | | | | | | | | | | |
Before expense waiver/recoupment(6) | | | 1.20 | % | | | 1.22 | % | | | 1.24 | % | | | 1.28 | % | | | 1.25 | % |
After expense waiver/recoupment(6) | | | 1.22 | % | | | 1.22 | % | | | 1.22 | % | | | 1.22 | % | | | 1.22 | % |
| | | | | | | | | | | | | | | | | | | | | |
Ratio of net investment loss | | | | | | | | | | | | | | | | | | | | |
to average net assets: | | | | | | | | | | | | | | | | | | | | |
After expense waiver/recoupment(6) | | | (0.65 | )% | | | (0.31 | )% | | | (0.02 | )% | | | (0.25 | )% | | | (0.20 | )% |
| | | | | | | | | | | | | | | | | | | | | |
Portfolio Turnover(5)(7) | | | 49 | % | | | 35 | % | | | 47 | % | | | 23 | % | | | 20 | % |
(1) | Inception date of the Investor Class was September 19, 2016. |
(2) | Per share amounts calculated using the average shares method. |
(3) | Amount is less than $0.01 per share. |
(4) | Net realized and unrealized loss per share in this caption is a balancing amount necessary to reconcile the change in net asset value per share for the period, and may not reconcile with the aggregate gain on the Statement of Operations due to share transactions for the period. |
(5) | Not annualized for periods less than one year. |
(6) | Annualized for periods less than one year. |
(7) | Portfolio turnover disclosed is for the Fund as a whole. |
See Notes to the Financial Statements
Jackson Square Funds
Notes to the Financial Statements
October 31, 2020
1. ORGANIZATION
Managed Portfolio Series (the “Trust”) was organized as a Delaware statutory trust on January 27, 2011. The Trust is registered under the Investment Company Act of 1940, as amended (the “1940 Act”), as an open-end management investment company. The Jackson Square All-Cap Growth Fund (“All-Cap Growth Fund”), Jackson Square Global Growth Fund (“Global Growth Fund”), Jackson Square Large-Cap Growth Fund (“Large-Cap Growth Fund”), Jackson Square Select 20 Growth Fund (“Select 20 Growth Fund”), and Jackson Square SMID-Cap Growth Fund (“SMID-Cap Growth Fund”) (each a “Fund” and collectively, the “Funds”) are investment companies and therefore follow the investment company accounting and reporting guidance of the Financial Accounting Standards Board (“FASB”) Accounting Standards Codification Topic 946 Financial Services – Investment Companies. The All-Cap Growth Fund and Global Growth Fund are each a diversified series with their own investment objectives and policies within the Trust. The Large-Cap Growth Fund, Select 20 Growth Fund, and SMID-Cap Growth Fund are each a non-diversified series with their own investment objectives and policies within the Trust. The investment objective of each Fund is long-term capital appreciation. The Funds offer three different share classes – Investor Class, Institutional Class, and IS class; although not all share classes have commenced operations for certain Funds as of October 31, 2020, and therefore are not currently available for purchase. The All-Cap Growth Fund currently offers the IS Class shares, which commenced operations on September 19, 2016. The Global Growth Fund currently offers the IS Class shares and Institutional Class shares, each of which commenced operations on September 19, 2016. The Large-Cap Growth Fund currently offers the IS Class shares, which commenced operations on November 1, 2005, and the Institutional Class shares and Investor Class shares, each of which commenced operations on September 19, 2016. The Select 20 Growth Fund currently offers the IS Class shares, which commenced operations on March 31, 2000. The SMID-Cap Growth Fund currently offers the IS Class shares, which commenced operations on November 1, 2005, the Institutional Class shares which commenced operations on September 16, 2016, and the Investor Class shares, which commenced operations on September 19, 2016. Each class of shares has identical rights and privileges except with respect to shareholder servicing fees, 12b-1 fees, and voting rights on matters affecting a single share class. Institutional Class shares are subject to a maximum 0.10% shareholder servicing fee. Investor Class shares are subject to a 0.25% Rule 12b-1 distribution and servicing fee and a maximum 0.10% shareholder servicing fee. The Funds may issue an unlimited number of shares of beneficial interest with no par value.
2. SIGNIFICANT ACCOUNTING POLICIES
The following is a summary of significant accounting policies consistently followed by the Funds in preparation of its financial statements. These policies are in conformity with generally accepted accounting principles in the United States of America (“GAAP”).
Security Valuation – All investments in securities are recorded at their estimated fair value, as described in Note 3.
Federal Income Taxes – The Funds comply with the requirements of subchapter M of the Internal Revenue Code of 1986, as amended, necessary to qualify as regulated investment companies and distribute substantially all net taxable investment income and net realized gains to shareholders in a manner which results in no tax cost to the Funds. Therefore, no federal income or excise tax provision is required. As of and during the year ended October 31, 2020, the Funds did not have any tax positions that did not meet the “more-likely-than-not” threshold of being sustained by the applicable tax authority. As of and during the year ended October 31, 2020, the Funds did not have liabilities for any unrecognized tax benefits. The Funds recognize interest and penalties, if any, related to unrecognized tax benefits on uncertain tax positions as income tax expense in the Statement of Operations. As of
Jackson Square Funds
Notes to the Financial Statements – Continued
October 31, 2020
and during the year ended October 31, 2020, the Funds did not incur any interest or penalties. The Funds are not subject to examination by U.S. tax authorities for tax years prior to the fiscal year ended October 31, 2017.
Security Transactions, Investment Income and Distributions – The Funds follow industry practice and record security transactions on the trade date. Realized gains and losses on sales of securities are calculated on the basis of identified cost. Dividend income is recorded on the ex-dividend date and interest income is recorded on an accrual basis. Withholding taxes on foreign dividends have been provided for in accordance with the Funds’ understanding of the applicable country’s tax rules and regulations. Discounts and premiums on securities purchased are amortized over the expected life of the respective securities using the constant yield method.
The Funds distribute substantially all net investment income and net realized capital gains, if any, at least annually. Distributions to shareholders are recorded on the ex-dividend date. The treatment for financial reporting purposes of distributions made to shareholders during the year from net investment income or net realized capital gains may differ from their treatment for federal income tax purposes. These differences are caused primarily by differences in the timing of the recognition of certain components of income, expense, or realized capital gain for federal income tax purposes. Where such differences are permanent in nature, GAAP requires that they be reclassified in the components of the net assets based on their ultimate characterization for federal income tax purposes. Any such reclassifications will have no effect on net assets, results of operations or net asset value (“NAV”) per share of the Funds. For the year ended October 31, 2020, the following reclassifications were made:
| Fund | | Distributable Earnings | | | Paid-in Capital | |
All-Cap Growth Fund | | $ | 1,859 | | | $ | (1,859 | ) |
Large-Cap Growth Fund | | | (544,854 | ) | | | 544,854 | |
SMID-Cap Growth Fund | | | (5,078,968 | ) | | | 5,078,968 | |
Adjustments to the Funds shown in the table above were due to one or more of the following reasons: net operating loss forfeiture or equalization utilized.
Foreign Currency – Investment securities and other assets and liabilities denominated in foreign currencies are translated into U.S. dollar amounts at the date of valuation. Purchases and sales of investment securities and income and expense items denominated in foreign currencies are translated into U.S. dollar amounts on the respective dates of such transactions. The Funds do not isolate that portion of the results of operations resulting from changes in foreign exchange rates on investments from the fluctuations arising from changes in market prices of securities held. Such fluctuations are included with the net realized and unrealized gain or loss from investments and translations of foreign currency. The Funds report net realized foreign exchange gains or losses that arise from sales of foreign currencies, currency gains or losses realized between the trade and settlement dates on securities transactions, and the difference between the amounts of dividends, interest, and foreign withholding taxes recorded on the Funds’ books and the U.S. dollar equivalent of the amounts actually received or paid. Net unrealized foreign exchange gains and losses arise from changes in the fair values of assets and liabilities, other than investments in securities at fiscal period end, resulting from changes in exchange rates.
Allocation of Income, Expenses and Gains/Losses – Income, expenses (other than those deemed attributable to a specific share class), and gains and losses of the Funds are allocated daily to each class of shares based upon the ratio of net assets represented by each class as a percentage of the net assets of each Fund. Expenses deemed directly attributable to a class of shares are recorded by the specific class. Most Fund expenses are allocated by class based on relative net assets. Shareholder servicing fees are expensed at an annual rate up to 0.10% of Institutional
Jackson Square Funds
Notes to the Financial Statements – Continued
October 31, 2020
Class and Investor Class shares and 12b-1 fees are expensed at annual rate of 0.25% of average daily net assets of Investor Class shares (See Note 5). Expenses associated with a specific Fund in the Trust are charged to that Fund. Common Trust expenses are typically allocated evenly between the Funds of the Trust, or by other equitable means.
Use of Estimates – The preparation of financial statements in conformity with GAAP requires management to make estimates and assumptions that affect the reported amounts of assets and liabilities and disclosure of contingent assets and liabilities at the date of the financial statements and the reported amounts of income and expenses during the reporting period. Actual results could differ from those estimates.
3. SECURITIES VALUATION
The Funds have adopted authoritative fair value accounting standards which establish an authoritative definition of fair value and set out a hierarchy for measuring fair value. These standards require additional disclosures about the various inputs and valuation techniques used to develop the measurements of fair value, a discussion in changes in valuation techniques and related inputs during the period and expanded disclosure of valuation Levels for major security types. These inputs are summarized in the three broad Levels listed below:
| Level 1 – | Unadjusted quoted prices in active markets for identical assets or liabilities that the Funds have the ability to access. |
| | |
| Level 2 – | Observable inputs other than quoted prices included in Level 1 that are observable for the asset or liability, either directly or indirectly. These inputs may include quoted prices for the identical instrument on an inactive market, prices for similar instruments, interest rates, prepayment speeds, credit risk, yield curves, default rates and similar data. |
| | |
| Level 3 – | Unobservable inputs for the asset or liability, to the extent relevant observable inputs are not available, representing the Funds’ own assumptions about the assumptions a market participant would use in valuing the asset or liability, and would be based on the best information available. |
Following is a description of the valuation techniques applied to each Fund’s major categories of assets and liabilities measured at fair value on a recurring basis. Each Fund’s investments are carried at fair value.
Equity Securities – Equity securities that are primarily traded on a national securities exchange shall be valued at the last sale price on the exchange on which they are primarily traded on the day of valuation or, if there has been no sale on such day, at the mean between the bid and ask prices. Securities traded primarily in the Nasdaq Global Market System for which market quotations are readily available shall be valued using the Nasdaq Official Closing Price (“NOCP”). If the NOCP is not available, such securities shall be valued at the last sale price on the day of valuation, or if there has been no sale on such day, at the mean between the bid and ask prices. To the extent these securities are actively traded and valuation adjustments are not applied, they are categorized in Level 1 of the fair value hierarchy. If the market for a particular security is not active, and the mean between bid and ask prices is used, these securities are categorized in Level 2 of the fair value hierarchy.
In the case of foreign securities, the occurrence of events after the close of foreign markets, but prior to the time the Funds’ NAV is calculated will result in an adjustment to the trading prices of foreign securities when foreign markets open on the following business day. The Funds will value foreign securities at fair value, taking into account such events in calculating the NAV. In such cases, use of fair valuation can reduce an investor’s ability to seek to profit by estimating the Funds’ NAV in advance of the time the NAV is calculated. In such cases, these securities are categorized in Level 2 of the fair value hierarchy.
Jackson Square Funds
Notes to the Financial Statements – Continued
October 31, 2020
Short-Term Investments – Investments in other mutual funds, including money market funds, are valued at their NAV per share. Deposit accounts are valued at acquisition cost, which approximates fair value. To the extent these securities are actively traded and valuation adjustments are not applied, they are categorized in Level 1 of the fair value hierarchy.
U.S. government securities are normally valued using a model that incorporates market observable data such as reported sales of similar securities, broker quotes, yields, bids, offers, and reference data. These securities are valued principally using dealer quotations. U.S. government securities are categorized in Level 2 of the fair value hierarchy depending on the inputs used and market activity levels for specific securities.
Securities for which market quotations are not readily available, or if the closing price does not represent fair value, are valued following procedures approved by the Board. These procedures consider many factors, including the type of security, size of holding, trading volume and news events. There can be no assurance that the Funds could obtain the fair value assigned to a security if they were to sell the security at approximately the time at which the Funds determine their net asset values per share. The Board has established a Valuation Committee to administer, implement, and oversee the fair valuation process, and to make fair value decisions when necessary. The Board regularly reviews reports of the Valuation Committee that describe any fair value determinations and methods.
The inputs or methodology used for valuing securities are not an indication of the risk associated with investing in those securities. The following tables are a summary of the inputs used to value each Fund’s securities as of October 31, 2020:
| All-Cap Growth Fund | | Level 1 | | | Level 2 | | | Level 3 | | | Total | |
| Common Stocks | | $ | 6,279,714 | | | $ | 750,761 | | | $ | — | | | $ | 7,030,475 | |
| Short-Term Investment | | | 139,025 | | | | — | | | | — | | | | 139,025 | |
| Total Investments in Securities | | $ | 6,418,739 | | | $ | 750,761 | | | $ | — | | | $ | 7,169,500 | |
| | | | | | | | | | | | | |
| Global Growth Fund | | Level 1 | | | Level 2 | | | Level 3 | | | Total | |
| Common Stocks | | $ | 9,078,671 | | | $ | 4,035,769 | | | $ | — | | | $ | 13,114,440 | |
| Short-Term Investment | | | 216,715 | | | | — | | | | — | | | | 216,715 | |
| Total Investments in Securities | | $ | 9,295,386 | | | $ | 4,035,769 | | | $ | — | | | $ | 13,331,155 | |
| | | | | | | | | | | | | | | | | |
| Large-Cap Growth Fund | | Level 1 | | | Level 2 | | | Level 3 | | | Total | |
| Common Stocks | | $ | 80,762,744 | | | $ | — | | | $ | — | | | $ | 80,762,744 | |
| Short-Term Investment | | | 525,096 | | | | — | | | | — | | | | 525,096 | |
| Total Investments in Securities | | $ | 81,287,840 | | | $ | — | | | $ | — | | | $ | 81,287,840 | |
| | | | | | | | | | | | | | | | | |
| Select 20 Growth Fund | | Level 1 | | | Level 2 | | | Level 3 | | | Total | |
| Common Stocks | | $ | 7,037,283 | | | $ | — | | | $ | — | | | $ | 7,037,283 | |
| Short-Term Investment | | | 24,906 | | | | — | | | | — | | | | 24,906 | |
| Total Investments in Securities | | $ | 7,062,189 | | | $ | — | | | $ | — | | | $ | 7,062,189 | |
Jackson Square Funds
Notes to the Financial Statements – Continued
October 31, 2020
| SMID-Cap Growth Fund | | Level 1 | | | Level 2 | | | Level 3 | | | Total | |
| Common Stocks | | $ | 1,369,431,651 | | | $ | — | | | $ | — | | | $ | 1,369,431,651 | |
| Short-Term Investment | | | 97,100,521 | | | | — | | | | — | | | | 97,100,521 | |
| Total Investments in Securities | | $ | 1,466,532,172 | | | $ | — | | | $ | — | | | $ | 1,466,532,172 | |
Refer to the Schedules of Investments for further information on the classification of investments.
4. INVESTMENT ADVISORY FEE AND OTHER TRANSACTIONS WITH AFFILIATES
The Trust has an agreement with Jackson Square Partners, LLC (the “Adviser”) to furnish investment advisory services to the Funds. For its services, the Funds pay the Adviser a monthly management fee based upon the average daily net assets of the Funds at the following annual rates:
| Fund | | |
All-Cap Growth Fund | 0.65% | |
Global Growth Fund | 0.80% | |
Large-Cap Growth Fund | 0.55% | |
Select 20 Growth Fund | 0.65% | |
SMID-Cap Growth Fund | 0.75% | |
The Funds’ Adviser has contractually agreed to waive a portion or all of its management fees and/or reimburse the Funds for their expenses to ensure that total annual operating expenses (excluding Rule 12b-1 fees, shareholder servicing fees, acquired fund fees and expenses, brokerage commissions, leverage, interest, taxes, and extraordinary expenses) do not exceed the following rates (based upon the average daily net assets of the Funds):
| Fund | | |
All-Cap Growth Fund | 0.90% | |
Global Growth Fund | 1.05% | |
Large-Cap Growth Fund | 0.64% | |
Select 20 Growth Fund | 0.87% | |
SMID-Cap Growth Fund | 0.87% | |
Fees waived and expenses reimbursed by the Adviser may be recouped by the Adviser for a period of thirty-six months following the month during which such waiver or reimbursement was made if such recoupment can be achieved without exceeding the expense limit in effect at the time the waiver or reimbursement occurred. The Operating Expense Limitation Agreement is indefinite in term, but cannot be terminated within a year after the effective date of the Funds’ prospectus. After that date, the agreement may be terminated at any time upon 60 days’ written notice by the Board or the Adviser with the consent of the Board. During the year ended October 31, 2020, the Adviser was able to recoup $239,141 from the SMID-Cap Growth Fund, relating to fees waived in prior fiscal years. Waived fees and reimbursed expenses subject to potential recovery by month of expiration are as follows:
| | | November 2020 – | | | November 2021 – | | | November 2022 – | |
| Fund | | October 2021 | | | October 2022 | | | October 2023 | |
All-Cap Growth Fund | | $ | 84,947 | | | $ | 90,835 | | | $ | 97,056 | |
Global Growth Fund | | | 96,571 | | | | 105,833 | | | | 108,254 | |
Large-Cap Growth Fund | | | 171,824 | | | | 178,742 | | | | 160,496 | |
Select 20 Growth Fund | | | 81,765 | | | | 95,542 | | | | 98,873 | |
SMID-Cap Growth Fund | | | 36,019 | | | | 8,310 | | | | — | |
Jackson Square Funds
Notes to the Financial Statements – Continued
October 31, 2020
U.S. Bancorp Fund Services, LLC (the “Administrator”), doing business as U.S. Bank Global Fund Services, acts as the Funds’ Administrator, Transfer Agent, and Fund Accountant. U.S. Bank N.A. (the “Custodian”) serves as the Custodian to the Funds. The Custodian is an affiliate of the Administrator. The Administrator performs various administrative and accounting services for the Funds. The Administrator prepares various federal and state regulatory filings, reports and returns for the Funds; prepares reports and materials to be supplied to the Trustees; monitors the activities of the Custodian; coordinates the payment of the Funds’ expenses and reviews the Funds’ expense accruals. The officers of the Trust, including the Chief Compliance Officer, are employees of the Administrator. As compensation for its services, the Administrator is entitled to a monthly fee at an annual rate based upon the average daily net assets of each Fund, subject to annual minimums. Fees paid by the Funds for administration and fund accounting, transfer agency, custody and compliance services for the year ended October 31, 2020, are disclosed in the Statements of Operations.
Quasar Distributors, LLC (“Quasar”) acts as the Funds’ principal underwriter in a continuous public offering of the Funds’ shares. Effective March 31, 2020, Foreside Financial Group, LLC (“Foreside”) acquired Quasar from U.S. Bancorp. As a result of the acquisition, Quasar became a wholly-owned broker-dealer subsidiary of Foreside and is no longer affiliated with U.S. Bancorp. The Board has approved a new Distribution Agreement to enable Quasar to continue serving as the Funds’ distributor.
5. DISTRIBUTION & SHAREHOLDER SERVICING FEES
The Large-Cap Growth Fund and SMID-Cap Growth Fund have adopted a Distribution Plan pursuant to Rule 12b-1 (the “Plan”) in the Investor Class only. The Plan permits the Funds to pay for distribution and related expenses at an annual rate of 0.25% of the Investor Class average daily net assets. The expenses covered by the Plan may include the cost of preparing and distributing prospectuses and other sales material, advertising and public relations expenses, payments to financial intermediaries and compensation of personnel involved in selling shares of the Funds. For the year ended October 31, 2020, the Investor Class of the Large-Cap Growth Fund and SMID-Cap Growth Fund incurred expenses of $99 and $181,478, respectively, pursuant to the Plan.
The Global Growth Fund, Large-Cap Growth Fund, and SMID-Cap Growth Fund have entered into a shareholder servicing agreement (the “Agreement”) where the Adviser acts as the shareholder agent, under which the Funds may pay servicing fees at an annual rate of up to 0.10% of the average daily net assets of the Institutional Class and Investor Class. Payments to the Adviser, if any, under the Agreement may reimburse the Adviser for payments it makes to selected brokers, dealers and administrators which have entered into service agreements with the Adviser for services provided to shareholders of the Funds. Payments may also be made directly to the intermediaries providing shareholder services. The services provided by such intermediaries are primarily designed to assist shareholders of the Fund and include the furnishing of office space and equipment, telephone facilities, personnel and assistance to the Funds in servicing such shareholders. Services provided by such intermediaries also include the provision of support services to the Funds and include establishing and maintaining shareholders’ accounts and record processing, purchase and redemption transactions, answering routine client inquiries regarding the Funds, and providing such other personal services to shareholders as each Fund may reasonably request. For the year ended October 31, 2020, the Global Growth Fund, Large-Cap Growth Fund, and SMID-Cap Growth Fund incurred shareholder servicing fees of $0, $0, and $499,744, respectively in the Institutional Class. The Large-Cap Growth Fund and SMID-Cap Growth Fund also incurred additional shareholder service fees of $0 and $72,591, respectively, in the Investor Class.
Jackson Square Funds
Notes to the Financial Statements – Continued
October 31, 2020
6. CAPITAL SHARE TRANSACTIONS
Transactions in shares of the Funds were as follows:
| | | All-Cap Growth Fund | | | Global Growth Fund | |
| | | Year Ended | | | Year Ended | | | Year Ended | | | Year Ended | |
| | | October 31, 2020 | | | October 31, 2019 | | | October 31, 2020 | | | October 31, 2019 | |
| IS Class: | | | | | | | | | | | | |
| Shares sold | | | 3,557 | | | | 2,509 | | | | 28,338 | | | | 17,092 | |
| Shares issued in reinvestment | | | | | | | | | | | | | | | | |
| of distributions | | | 8,291 | | | | 22,361 | | | | 8,535 | | | | 26,418 | |
| Shares redeemed | | | (21,885 | ) | | | (957 | ) | | | (44,375 | ) | | | (6,808 | ) |
| Net increase (decrease) | | | | | | | | | | | | | | | | |
| in capital shares | | | (10,037 | ) | | | 23,913 | | | | (7,502 | ) | | | 36,702 | |
| Institutional Class: | | | | | | | | | | | | | | | | |
| Shares sold | | | — | | | | — | | | | 6,688 | | | | — | |
| Shares issued in reinvestment | | | | | | | | | | | �� | | | | | |
| of distributions | | | — | | | | — | | | | — | | | | — | |
| Shares redeemed | | | — | | | | — | | | | — | | | | — | |
| Net increase | | | — | | | | — | | | | 6,688 | | | | — | |
| Net increase (decrease) | | | | | | | | | | | | | | | | |
| in capital shares | | | (10,037 | ) | | | 23,913 | | | | (814 | ) | | | 36,702 | |
| | | | | | | | | | | | | | | | | |
| | | Large-Cap Growth Fund | | | Select 20 Growth Fund | |
| | | Year Ended | | | Year Ended | | | Year Ended | | | Year Ended | |
| | | October 31, 2020 | | | October 31, 2019 | | | October 31, 2020 | | | October 31, 2019 | |
| IS Class: | | | | | | | | | | | | | | | | |
| Shares sold | | | 185,370 | | | | 198,856 | | | | 10,996 | | | | 34,922 | |
| Shares issued in reinvestment | | | | | | | | | | | | | | | | |
| of distributions | | | 1,342,346 | | | | 2,463,691 | | | | 59,729 | | | | — | |
| Shares redeemed | | | (1,232,278 | ) | | | (5,030,337 | ) | | | (7,196 | ) | | | (119 | ) |
| Net increase (decrease) | | | 295,438 | | | | (2,367,790 | ) | | | 63,529 | | | | 34,803 | |
| Institutional Class: | | | | | | | | | | | | | | | | |
| Shares sold | | | — | | | | 52,291 | | | | — | | | | — | |
| Shares issued in reinvestment | | | | | | | | | | | | | | | | |
| of distributions | | | 50,418 | | | | 40,896 | | | | — | | | | — | |
| Shares redeemed | | | — | | | | — | | | | — | | | | — | |
| Net increase | | | 50,418 | | | | 93,187 | | | | — | | | | — | |
| Investor Class: | | | | | | | | | | | | | | | | |
| Shares sold | | | — | | | | — | | | | — | | | | — | |
| Shares issued in reinvestment | | | | | | | | | | | | | | | | |
| of distributions | | | — | | | | — | | | | — | | | | — | |
| Shares redeemed | | | — | | | | — | | | | — | | | | — | |
| Net increase | | | — | | | | — | | | | — | | | | — | |
| Net increase (decrease) | | | | | | | | | | | | | | | | |
| in capital shares | | | 345,856 | | | | (2,274,603 | ) | | | 63,529 | | | | 34,803 | |
Jackson Square Funds
Notes to the Financial Statements – Continued
October 31, 2020
SMID-Cap Growth Fund
| | | Year Ended | | | Year Ended | |
| | | October 31, 2020 | | | October 31, 2019 | |
| IS Class: | | | | | | |
Shares sold | | | 5,903,797 | | | | 11,928,453 | |
Shares issued in reinvestment of distributions | | | 801,951 | | | | 1,080,311 | |
Shares redeemed | | | (4,474,380 | ) | | | (2,354,501 | ) |
| Net increase | | | 2,231,368 | | | | 10,654,263 | |
| Institutional Class: | | | | | | | | |
Shares sold | | | 7,442,741 | | | | 10,096,836 | |
Shares issued in reinvestment of distributions | | | 859,800 | | | | 1,796,740 | |
Shares redeemed | | | (5,614,477 | ) | | | (3,468,849 | ) |
| Net increase | | | 2,688,064 | | | | 8,424,727 | |
| Investor Class: | | | | | | | | |
Shares sold | | | 453,004 | | | | 1,558,415 | |
Shares issued in reinvestment of distributions | | | 137,210 | | | | 423,615 | |
Shares redeemed | | | (1,341,024 | ) | | | (1,546,148 | ) |
| Net increase (decrease) | | | (750,810 | ) | | | 435,882 | |
| Net increase in capital shares | | | 4,168,622 | | | | 19,514,872 | |
7. INVESTMENT TRANSACTIONS
The aggregate purchases and sales, excluding short-term investments, by Fund for the year ended October 31, 2020, were as follows:
| | | U.S. Government Securities | | | Other | |
| Fund | | Purchases | | | Sales | | | Purchases | | | Sales | |
| All-Cap Growth Fund | | $ | — | | | $ | — | | | $ | 3,649,368 | | | $ | 4,081,886 | |
| Global Growth Fund | | | — | | | | — | | | | 5,054,996 | | | | 5,397,170 | |
| Large-Cap Growth Fund | | | — | | | | — | | | | 40,533,341 | | | | 53,643,383 | |
| Select 20 Growth Fund | | | — | | | | — | | | | 3,576,611 | | | | 3,576,506 | |
| SMID-Cap Growth Fund | | | — | | | | — | | | | 585,534,766 | | | | 551,212,598 | |
8. FEDERAL TAX INFORMATION
The aggregate gross unrealized appreciation and depreciation of securities held by the Funds and the total cost of securities for federal income tax purposes at October 31, 2020, were as follows:
| | | Aggregate Gross | | | Aggregate Gross | | | Net | | | Federal Income | |
| Fund | | Appreciation | | | Depreciation | | | Appreciation | | | Tax Cost | |
All-Cap Growth Fund | | $ | 2,236,219 | | | $ (122,597 | )
| | $ | 2,113,622 | | | $ | 5,055,878 | |
Global Growth Fund | | | 4,705,506 | | | | (446,839 | ) | | | 4,258,667 | | | | 9,072,488 | |
Large-Cap Growth Fund | | | 25,167,782 | | | | (1,335,558 | ) | | | 23,832,224 | | | | 57,455,616 | |
Select 20 Growth Fund | | | 2,665,633 | | | | (35,671 | ) | | | 2,629,962 | | | | 4,432,227 | |
SMID-Cap Growth Fund | | | 366,322,370 | | | | (42,619,760 | ) | | | 323,702,610 | | | | 1,142,829,562 | |
Any differences between book-basis and tax-basis unrealized appreciation (depreciation) is attributable primarily to the deferral of wash sale losses.
Jackson Square Funds
Notes to the Financial Statements – Continued
October 31, 2020
At October 31, 2020, the components of distributable earnings on a tax-basis were as follows:
| | | Undistributed | | | Undistributed | | | Other | | | Net | | | Total | |
| | | Ordinary | | | Long-Term | | | Accumulated | | | Unrealized | | | Distributable | |
| Fund | | Income | | | Capital Gains | | | Gains (Losses) | | | Appreciation | | | Earnings | |
All-Cap Growth Fund | | $ | — | | | $ | 380,858 | | | $ | (25,327 | ) | | $ | 2,113,622 | | | $ | 2,469,153 | |
Global Growth Fund | | | 22,802 | | | | 384,618 | | | | (16 | ) | | | 4,258,667 | | | | 4,666,071 | |
Large-Cap Growth Fund | | | 533,293 | | | | 4,228,715 | | | | (80,825 | ) | | | 23,832,224 | | | | 28,513,407 | |
Select 20 Growth Fund | | | — | | | | 88,245 | | | | (6,936 | ) | | | 2,629,962 | | | | 2,711,271 | |
SMID-Cap Growth Fund | | | 7,447,871 | | | | 86,503,309 | | | | 13,663 | | | | 323,702,610 | | | | 417,667,453 | |
As of October 31, 2020, the Funds had no capital loss carryovers. A regulated investment company may elect for any taxable year to treat any portion of any qualified late year loss as arising on the first day of the next taxable year. Qualified late year losses are certain capital, and ordinary losses which occur during the portion of a Fund’s taxable year subsequent to October 31 and December 31, respectively. For the taxable year ended October 31, 2020, the Funds did not defer any post-October losses. The All-Cap Growth Fund, Large-Cap Growth Fund and Select 20 Growth Fund deferred, on a tax basis, qualified late year losses of $25,351, $80,826, and $6,860, respectively.
The tax character of distributions paid during the year ended October 31, 2020 was as follows:
| Fund | | Ordinary Income* | | | Long-Term Capital Gains | | | Total
| |
All-Cap Growth Fund | | $ | 6,141 | | | $ | 236,915 | | | $ | 243,056 | |
Global Growth Fund | | | — | | | | 249,439 | | | | 249,439 | |
Large-Cap Growth Fund | | | 1,648,863 | | | | 12,456,545 | | | | 14,105,408 | |
Select 20 Growth Fund | | | 9,588 | | | | 413,127 | | | | 422,715 | |
SMID-Cap Growth Fund | | | 2,029,405 | | | | 42,814,924 | | | | 44,844,329 | |
The tax character of distributions paid during the year ended October 31, 2019 was as follows:
| Fund | | Ordinary Income* | | | Long-Term Capital Gains | | | Total
| |
All-Cap Growth Fund | | $ | 56,608 | | | $ | 494,536 | | | $ | 551,144 | |
Global Growth Fund | | | — | | | | 620,442 | | | | 620,442 | |
Large-Cap Growth Fund | | | 3,266,521 | | | | 23,974,557 | | | | 27,241,078 | |
Select 20 Growth Fund | | | — | | | | — | | | | — | |
SMID-Cap Growth Fund | | | 13,751,068 | | | | 52,154,134 | | | | 65,905,202 | |
| * | For Federal income tax purposes, distributions of short-term capital gains are treated as ordinary income distributions. |
9. LINE OF CREDIT
The Large-Cap Growth Fund and SMID-Cap Growth Fund (collectively, the “Funds”) have established an unsecured line of credit (“LOC”) in the amount of $25,000,000, 15% of a Fund’s gross market value or 33.33% of the fair value of the Fund’s investments, whichever is less. The LOC matures, unless renewed on July 23, 2021. The LOC is intended to provide short-term financing, if necessary, subject to certain restrictions and covenants, in connection with shareholder redemptions and other short-term liquidity needs of the Funds. The LOC is with the Custodian. Interest is charged at the prime rate which was 3.25% as of October 31, 2020. The interest rate during the year was between 3.25%-4.75%. The Funds have authorized the Custodian to charge any of the accounts of
Jackson Square Funds
Notes to the Financial Statements – Continued
October 31, 2020
the Funds’ accounts for any missed payments. For the year ended October 31, 2020, the Large-Cap Growth Fund did not have any borrowings under the LOC. The weighted average interest rate paid on outstanding borrowings for the SMID-Cap Growth Fund was 4.75%. For the year ended October 31, 2020, the SMID-Cap Growth Fund LOC activity was as follows:
| | | Amount | | | Date of |
| | Average | Outstanding | Interest | Maximum | Maximum |
| LOC Agent | Borrowings | as of October 31, 2020 | Expense | Borrowing | Borrowing |
U.S. Bank N.A. | $1,757 | $— | $85 | $643,000 | 01/16/2020 |
10. SECTOR RISKS
As of October 31, 2020, each Fund had a significant portion of their assets invested in the information technology sector. The information technology sector may be more sensitive to changes in domestic and international competition, economic cycles, financial resources, personnel availability, rapid innovation and intellectual property issues.
As of October 31, 2020, the Global Growth Fund has a significant portion of its assets invested in the industrials sector. The industrials sector may be more sensitive to changes in supply and demand, government regulations, world events, and economic conditions.
11. CONTROL OWNERSHIP
The beneficial ownership, either directly or indirectly, of more than 25% of the voting securities of a fund creates a presumption of control of the fund, under Section 2(a)(9) of the 1940 Act. As of October 31, 2020, each Fund’s percentage of control ownership positions greater than 25% were as follows:
| Fund | Shareholder | Percent of Shares Held |
Global Growth Fund | Charles Schwab | 42.46% |
Select 20 Growth Fund | Charles Schwab | 31.94% |
| | Individual investor | 26.95% |
SMID-Cap Growth Fund | National Financial Services | 35.40% |
12. COVID-19
The global outbreak of COVID-19 (commonly referred to as “coronavirus”) has disrupted economic markets and the prolonged economic impact is uncertain. The ultimate economic fallout from the pandemic, and long-term impact on economies, markets, industries and individual issuers, are not known. The operational and finance performance of the issuers of securities in which the Funds invest depends on future developments, including the duration and spread of the outbreak, and such uncertainty may in turn adversely affect the value and liquidity of the Funds’ investments, impair the Funds’ ability to satisfy redemption requests, and negatively impact the Funds’ performance.
13. REPORT OF THE ALL-CAP GROWTH FUND’S SPECIAL SHAREHOLDER MEETING (UNAUDITED)
A Special Meeting of Shareholders of the All-Cap Growth Fund (the “Fund”) took place on October 14, 2020, to approve a new advisory agreement (the “Advisory Agreement”) between the Trust and the Adviser, as well as a change in the Fund’s classification under the 1940 Act, from diversified to non-diversified (the “Classification Change”). All Fund shareholders of record at the close of business on August 27, 2020, were entitled to vote. As of the record date, the Fund had 252,950 shares outstanding.
Jackson Square Funds
Notes to the Financial Statements – Continued
October 31, 2020
Of the 213,661 shares of the Fund present in person or by proxy at the meeting on October 14, 2020: 213,661, or 100.0% voted in favor of the Advisory Agreement and Classification Change (representing 84.5% of total outstanding shares; 0, or 0.0% voted against the Advisory Agreement and Classification Change; and 0, or 0.0% withheld from voting for the proposed changes. Accordingly, the proposed changes were approved.
14. SUBSEQUENT EVENTS
Effective on or around December 31, 2020, the All-Cap Growth Fund will change the name of the Fund to the Jackson Square International Growth Fund (the “International Growth Fund”), change the Fund’s principal investment strategies such that the Fund would invest at least 80% of its total assets in securities of non-U.S. issuers and make its Institutional Class shares available for purchase (trading under ticker symbol JSSGX). The Fund will increase its annual advisory fee from 0.65% to 0.80% of the Fund’s average daily net assets. In addition, effective on or around December 31, 2020, the Adviser will waive its management fees and pay Fund expenses in order to ensure that Total Annual Fund Operating Expenses (excluding Rule 12b-1 fees, shareholder servicing fees, acquired fund fees and expenses, brokerage commissions, leverage, interest, taxes, and extraordinary expenses) do not exceed 0.99% of the average daily net assets of the International Growth Fund (the “Expense Cap”). The current Expense Cap for the All-Cap Growth Fund is 0.90% of the Fund’s average daily net assets.
Effective December 28, 2020, the investment advisory agreement between the Adviser and the Trust, on behalf of the Global Growth Fund will be amended such that the management fee payable to Jackson Square will be reduced from 0.80% of the Global Growth Fund’s average daily net assets to 0.75% of the Global Growth Fund’s average daily net assets. In addition, effective December 28, 2020, the Adviser will agree to waive its management fees and pay Fund expenses in order to ensure that Total Annual Fund Operating Expenses (excluding Rule 12b-1 fees, shareholder servicing fees, acquired fund fees and expenses, brokerage commissions, leverage, interest, taxes, and extraordinary expenses) do not exceed 0.98% of the average daily net assets of the Global Growth Fund. The current Expense Cap for the Global Growth Fund is 1.05% of the Global Growth Fund’s average daily net assets.
Effective December 28, 2020, the investment advisory agreement between the Adviser and the Trust, on behalf of the Large-Cap Growth Fund will be amended to implement the following breakpoint schedule on the fees payable to the Adviser as a percentage of the average daily net assets of the Large-Cap Growth Fund: 0.55% on assets up to $2.5 billion, 0.525% on the next $2.5 billion, and 0.50% on assets $5 billion or more.
On December 17, 2020, the following Funds paid short-term capital gain distributions in the amount as shown in the table.
| | | Short-Term Capital | | | Short-Term Capital | |
| Fund | | Gain Dollar Amount | | | Gain Per Share Amount | |
Global Growth Fund – Institutional Class | | $ | 477 | | | $ | 0.05033 | |
Global Growth Fund – IS Class | | | 22,326 | | | | 0.05033 | |
Large-Cap Growth Fund – Investor Class | | | 291 | | | | 0.08230 | |
Large-Cap Growth Fund – Institutional Class | | | 22,338 | | | | 0.08230 | |
Large-Cap Growth Fund – IS Class | | | 510,725 | | | | 0.08230 | |
SMID-Cap Growth Fund – Investor Class | | | 412,216 | | | | 0.15370 | |
SMID-Cap Growth Fund – Institutional Class | | | 3,748,686 | | | | 0.15370 | |
SMID-Cap Growth Fund – IS Class | | | 3,287,300 | | | | 0.15370 | |
Jackson Square Funds
Notes to the Financial Statements – Continued
October 31, 2020
On December 17, 2020, the following Funds paid long-term capital gain distributions in the amount as shown in the table.
| | | Long-Term Capital | | | Long-Term Capital | |
| Fund | | Gain Dollar Amount | | | Gain Per Share Amount | |
All-Cap Growth Fund – IS Class | | $ | 381,666 | | | $ | 1.48748 | |
Global Growth Fund – Institutional Class | | | 8,072 | | | | 0.84885 | |
Global Growth Fund – IS Class | | | 376,548 | | | | 0.84885 | |
Large-Cap Growth Fund – Investor Class | | | 2,311 | | | | 0.65252 | |
Large-Cap Growth Fund – Institutional Class | | | 177,105 | | | | 0.65252 | |
Large-Cap Growth Fund – IS Class | | | 4,049,310 | | | | 0.65252 | |
Select 20 Growth Fund – IS Class | | | 88,253 | | | | 0.09096 | |
SMID-Cap Growth Fund – Investor Class | | | 4,787,476 | | | | 1.78507 | |
SMID-Cap Growth Fund – Institutional Class | | | 43,537,329 | | | | 1.78507 | |
SMID-Cap Growth Fund – IS Class | | | 38,178,658 | | | | 1.78507 | |
Management has performed an evaluation of subsequent events through the date the financial statements were issued and has determined that no additional items require recognition or disclosure.
Jackson Square Funds
Report of Independent Registered Public Accounting Firm
To the Shareholders of Jackson Square Funds and
Board of Trustees of Managed Portfolio Series
Opinion on the Financial Statements
We have audited the accompanying statements of assets and liabilities, including the schedules of investments, of Jackson Square Funds comprising Jackson Square All-Cap Growth Fund, Jackson Square Global Growth Fund, Jackson Square Large-Cap Growth Fund, Jackson Square Select 20 Growth Fund, and Jackson Square SMID-Cap Growth Fund (“Jackson Square Funds” or the “Funds”), each a series of Managed Portfolio Series, as of October 31, 2020, the related statements of operations for the year then ended, the statements of changes in net assets for each of the two years in the period then ended, including the related notes, and the financial highlights for each of the five periods in the period then ended (collectively referred to as the “financial statements”). In our opinion, the financial statements present fairly, in all material respects, the financial position of each of the Funds as of October 31, 2020, the results of their operations for the year then ended, the changes in their net assets for each of the two years in the period then ended, and the financial highlights for each of the five periods in the period then ended, in conformity with accounting principles generally accepted in the United States of America.
Basis for Opinion
These financial statements are the responsibility of the Funds’ management. Our responsibility is to express an opinion on the Funds’ financial statements based on our audits. We are a public accounting firm registered with the Public Company Accounting Oversight Board (United States) (“PCAOB”) and are required to be independent with respect to the Funds in accordance with the U.S. federal securities laws and the applicable rules and regulations of the Securities and Exchange Commission and the PCAOB.
We conducted our audits in accordance with the standards of the PCAOB. Those standards require that we plan and perform the audit to obtain reasonable assurance about whether the financial statements are free of material misstatement whether due to error or fraud.
Our audits included performing procedures to assess the risks of material misstatement of the financial statements, whether due to error or fraud, and performing procedures that respond to those risks. Such procedures included examining, on a test basis, evidence regarding the amounts and disclosures in the financial statements. Our procedures included confirmation of securities owned as of October 31, 2020, by correspondence with the custodian and brokers. Our audits also included evaluating the accounting principles used and significant estimates made by management, as well as evaluating the overall presentation of the financial statements. We believe that our audits provide a reasonable basis for our opinion.
We have served as the Funds’ auditor since 2016.
COHEN & COMPANY, LTD.
Cleveland, Ohio
December 23, 2020
Jackson Square Funds
Additional Information (Unaudited)
Approval of Investment Advisory Agreement – Jackson Square Partners, LLC
At the regular meeting of the Board of Trustees of Managed Portfolio Series (“Trust”) on August 18-19, 2020, the Trust’s Board of Trustees (“Board”), each of whom were present in person, including all of the Trustees who are not “interested persons” of the Trust, as that term is defined in Section 2(a)(19) of the Investment Company Act of 1940, as amended, (“Independent Trustees”) considered and approved an amendment to the Investment Advisory Agreement between the Trust and Jackson Square Partners, LLC (“Jackson Square” or the “Adviser”) regarding the Jackson Square All-Cap Growth Fund (the “Fund”) (the “Amended Advisory Agreement”), to go effective on or about December 28, 2020, in connection with the Fund’s conversion to the Jackson Square International Growth Fund.
Before voting to approve the Amended Advisory Agreement, the Board reviewed the draft of the Amended Advisor Agreement, a due diligence questionnaire from Jackson Square, financial statements for Jackson Square and a draft proxy statement ( together, “Support Materials”) with Trust management and with legal counsel to the Independent Trustees and reviewed a memorandum from such counsel discussing the legal standards for the Board’s consideration of the Amended Advisory Agreement. In approving the Amended Advisory Agreement, the Board considered substantially the same factors as it considered in approving the continuation of the current investment advisory agreement (“Current Advisory Agreement”), in addition to new information regarding Jackson Square. This information formed the primary basis for the Board’s determinations.
In determining whether to approve the Amended Advisory Agreement, the Trustees considered all factors they believed relevant, including the following with respect to the Fund: (1) the nature, extent, and quality of the services to be provided by Jackson Square with respect to the Fund; (2) the Fund’s historical performance as managed by Jackson Square under the Current Advisory Agreement; (3) the costs of the services to be provided by Jackson Square and the profits to be realized by Jackson Square from services rendered to the Fund; (4) comparative fee and expense data for the Fund and other investment companies with similar investment objectives; (5) the extent to which economies of scale may be realized as the Fund grows, and whether the advisory fee for the Fund reflects such economies of scale for the Fund’s benefit; and (6) other benefits to Jackson Square resulting from its relationship with the Fund. In their deliberations, the Trustees weighed to varying degrees the importance of the information provided to them and did not identify any particular information that was all-important or controlling.
Based upon the information provided to the Board throughout the course of the year, including at a presentation by representatives of Jackson Square, and the Support Materials, the Board concluded that the overall arrangements between the Trust and Jackson Square set forth in the Amended Advisory Agreement, as it relates to the Fund, are fair and reasonable in light of the services that Jackson Square performs, the investment advisory fees that the Fund will pay, and such other matters as the Trustees considered relevant in the exercise of their reasonable business judgment. The material factors and conclusions that formed the basis of the Trustees’ determination to approve the Amended Advisory Agreement as it relates to the Fund are summarized below.
Nature, Extent and Quality of Services Provided to the Fund. The Trustees considered the scope of services that Jackson Square would provide under the Amended Advisory Agreement with respect to the Fund, noting that such services include, but are not limited to, the following: (1) investing the Fund’s assets consistent with the Fund’s investment objective and investment policies; (2) determining for the Fund the portfolio securities to be purchased, sold, or otherwise disposed of, and the timing of such transactions; (3) voting all proxies with respect to the Fund’s portfolio securities; (4) maintaining the required books and records for transactions that Jackson Square effected on behalf of the Fund; (5) selecting broker-dealers to execute orders on behalf of the Fund; and (6) monitoring and maintaining the Fund’s compliance with policies and procedures of the Trust and with
Jackson Square Funds
Additional Information (Unaudited) – Continued
Approval of Investment Advisory Agreement – Jackson Square Partners, LLC
applicable securities laws. The Trustees noted Jackson Square’s assets under management, which were $22.7 billion as of June 30, 2020, and reviewed Jackson Square’s audited statements of financial condition for the years ended December 31, 2019 and December 31, 2018. In that regard, the Trustees that Jackson Square had sufficient resources to support the portfolio management team in its implementation of the Fund’s principal investment strategies. The Trustees considered the investment philosophy of the Fund’s portfolio managers and their investment analysis and portfolio management experience. In this regard, the Trustees noted that Jackson Square does not manage a composite of separately managed accounts in a strategy similar to the proposed international growth strategy for the Fund; however, the Trustees noted that Jackson Square does manage products with international securities. The Trustees noted that Jackson Square, through the management of the Jackson Square Global Growth Fund, has significant experience managing a fund with an emphasis on investments in the non-U.S. developed markets that would be the focus of the Jackson Square International Growth Fund’s principal investment strategies. The Trustees further considered that Jackson Square had indicated that the Jackson Square International Growth Fund’s principal investment strategy would be an extension of the international component of the Jackson Square Global Growth Fund’s principal investment strategy. The Board also considered that the management fee under the Amended Advisory Agreement is the same as the Jackson Square Global Growth Fund pays to Jackson Square. The Board considered that Jackson Square did not expect the proposed strategy changes to the Fund to materially impact the nature, extent or quality of the services currently provided by Jackson Square to the Fund. The Trustees concluded that they were satisfied with the nature, extent and quality of services that Jackson Square would provide to the Fund under the Amended Advisory Agreement.
Investment Performance of the Fund. In assessing the quality of the portfolio management to be delivered by Jackson Square under the Amended Advisory Agreement, the Trustees would normally review the short-term and longer-term performance of the Fund on both an absolute basis and in comparison to an appropriate securities benchmark index, the Fund’s respective peer funds according to Morningstar classifications. In this regard the Trustees noted that Jackson Square is proposing material amendments to the Fund’s principal investment strategies. Although the Trustees reviewed the prior performance of the Fund relative to its benchmark index and the All-Cap Growth Fund’s Morningstar peer group (Large Growth), the Trustees did not consider that information pertinent for evaluating performance considering the proposed changes to the Fund’s investment strategies. In addition, the Trustees noted that Jackson Square does not manage a composite of separately managed accounts in a strategy that is materially similar to the proposed international growth strategy for the Fund.
Advisory Fee. The Board reviewed and considered the advisory fee payable by the Fund to Jackson Square under the Amended Advisory Agreement. The Board compared the Fund’s proposed contractual advisory fee and total expense ratio to industry data with respect to other mutual funds in the same Morningstar US Fund Foreign Large Growth peer group. The Board noted that the Fund’s proposed contractual management fee was four basis points above the peer group median and average. The Board also considered that the total expenses of the Fund’s IS Class after giving effect to the New Expense Limitation Agreement was above the peer group median and average and in the third quartile of the peer group. The Board also considered that the Fund’s net assets were significantly smaller than the average net assets for other funds in the peer group.
While recognizing that it is difficult to compare advisory fees because the scope of advisory services provided may vary from one investment adviser to another, the Trustees concluded that Jackson Square’s proposed advisory fee with respect to the Fund was reasonable.
Jackson Square Funds
Additional Information (Unaudited) – Continued
Approval of Investment Advisory Agreement – Jackson Square Partners, LLC
Costs and Profitability. The Trustees considered the annual advisory fee that the Fund will pay to Jackson Square under the Amended Advisory Agreement, as well as Jackson Square’s expected profitability from services to be rendered by Jackson Square to the Fund during the first 12-months under the Amended Advisory Agreement, based on pro forma profitability analysis prepared by Jackson Square. The Trustees also considered the anticipated effect of the New Expense Limitation Agreement on Jackson Square’s compensation and that Jackson Square has contractually agreed to reduce its advisory fees and, if necessary, reimburse the Fund for operating expenses. The Trustees concluded that Jackson Square’s service relationship with the Fund was not anticipated to be profitable under the Amended Advisory Agreement. In that regard, the Trustees determined that Jackson Square had adequate resources to support the portfolio management of the Fund and plans to grow assets in the Fund which may lead to the relationship being profitable for Jackson Square. The Trustees also agreed to continue to review the Fund’s profitability as part of its annual review of the investment advisory contract with Jackson Square.
Economies of Scale and Fee Levels Reflecting Those Economies. The Trustees then considered whether the Fund may benefit from any economies of scale, noting that the proposed investment advisory fees for the Fund in the Amended Advisory Agreement do not contain breakpoints. The Trustees additionally took into account the fact that Jackson Square had indicated that it did not believe breakpoints were necessary at present due to the limited assets in the Fund but that Jackson Square agreed to consider break points as the Fund gains assets. The Trustees noted that at current asset levels, it did not appear that there were significant economies of scale being realized by Jackson Square that should be shared with shareholders of the Fund and concluded that it would continue to monitor economies in the future as circumstances and asset levels change.
Other Benefits to Jackson Square. The Trustees considered the direct and indirect benefits that could be realized by Jackson Square from Jackson Square’s relationship with the Fund. The Trustees considered the extent to which Jackson Square utilizes soft dollar arrangements with respect to portfolio transactions, and that Jackson Square does not use affiliated brokers to execute the Fund’s portfolio transactions. The Trustees considered that Jackson Square may receive some form of reputational benefit from services rendered to the Fund, but that such benefits are immaterial and cannot otherwise be quantified. The Trustees concluded that Jackson Square does not receive additional material benefits from its relationship with the Fund.
Jackson Square Funds
Additional Information (Unaudited) – Continued
Statement Regarding the Fund’s Liquidity Risk Management Program
Pursuant to Rule 22e-4 under the Investment Company Act of 1940, the Trust, on behalf of the Jackson Square All-Cap Growth Fund, the Jackson Square Global Growth Fund, the Jackson Square Large-Cap Growth Fund, the Jackson Square Select 20 Growth Fund and the Jackson Square SMID-Cap Growth Fund (each a “Fund” and together, the “Funds”), has adopted and implemented a written liquidity risk management program (the “Program”) that includes policies and procedures reasonably designed to comply with the requirements of Rule 22e-4, including: (i) assessment, management and periodic review of liquidity risk; (ii) classification of portfolio holdings; (iii) establishment of a highly liquid investment minimum (“HLIM”), as applicable; (iv) limitation on illiquid investments; and (v) redemptions in-kind. The Trust’s Board of Trustees (the “Board”) has approved the designation of Jackson Square Partners, LLC (“Jackson Square”) as the administrator of the Program (the “Program Administrator”). Personnel of Jackson Square conduct the day-to-day operation of the Program pursuant to policies and procedures administered by the Program Administrator.
In accordance with Rule 22e-4, the Board reviewed a report prepared by the Program Administrator (the “Report”) regarding the operation of the Program and its adequacy and effectiveness of implementation for the period June 1, 2019, through December 31, 2019 (the “Reporting Period”). No significant liquidity events impacting the Funds during the Reporting Period or material changes to the Program were noted in the Report.
Under the Program, the Program Administrator manages and periodically reviews each Fund’s liquidity risk, including consideration of applicable factors specified in Rule 22e-4 and the Program. Liquidity risk is defined as the risk that a Fund could not meet shareholder redemption requests without significant dilution of remaining shareholders’ interests in the Fund. In general, this risk was managed during the Reporting Period by monitoring the degree of liquidity of each Fund’s investments, limiting the amount of each Fund’s illiquid investments, and utilizing various risk management tools and facilities available to each Fund for meeting shareholder redemptions, among other means. In the Report, Jackson Square provided its assessment that, based on the information considered in its review, the Program remains reasonably designed to manage each Fund’s liquidity risk and each Fund’ s investment strategy remains appropriate for an open-end fund.
Pursuant to the Program, the Program Administrator oversaw the classification of each of the Funds’ portfolio investments as highly liquid, moderately liquid, less liquid or illiquid during the Reporting Period, including in connection with recording investment classifications on Form N-PORT. The process utilized by Jackson Square for determining the degree of liquidity of each Fund’s investments is supported by one or more third-party liquidity assessment vendors.
Each Fund qualified as a “primarily highly liquid fund” as defined in the Program during the Reporting Period. Accordingly, each Fund was not required to establish a HLIM or comply with the related Program provisions during the Reporting Period.
During the Reporting Period, each Fund’s investments were monitored for compliance with the 15% limitation on illiquid investments pursuant to the Program and in accordance with Rule 22e-4.
The Report noted that the Funds’ did not have any redemptions in-kind during the Reporting Period. The Report concluded, with respect to each Fund: (i) the Program was implemented and operated effectively to achieve the goal of assessing and managing the Fund’s liquidity risk during the Reporting Period; and (ii) the Fund was able to meet requests for redemption without significant dilution of remaining investors’ interests in the Fund during the Reporting Period.
Jackson Square Funds
Additional Information (Unaudited) – Continued
October 31, 2020
TRUSTEES AND OFFICERS
| | | Term of | Number of | | Other |
| | | Office and | Portfolios | | Directorships |
| | Position(s) | Length of | in Trust | | Held by |
| Name, Address and | Held with | Time | Overseen | Principal Occupation(s) | Trustee During |
| Year of Birth | the Trust | Served | by Trustee | During the Past Five Years | the Past Five Years |
| | | | | | |
| Independent Trustees | | | | | |
| | | | | | |
Leonard M. Rush, CPA | Lead | Indefinite | 37 | Retired, Chief Financial Officer, | Independent Trustee, |
615 E. Michigan St. | Independent | Term; Since | | Robert W. Baird & Co. Incorporated | ETF Series Solutions |
Milwaukee, WI 53202 | Trustee | April 2011 | | (2000-2011). | (49 Portfolios) |
Year of Birth: 1946 | and Audit | | | | (2012-Present); |
| | Committee | | | | Director, Anchor |
| | Chairman | | | | Bancorp Wisconsin, |
| | | | | | Inc. (2011-2013) |
| | | | | | |
David A. Massart | Trustee | Indefinite | 37 | Co-Founder and Chief Investment | Independent Trustee, |
615 E. Michigan St. | and | Term; Since | | Strategist, Next Generation Wealth | ETF Series Solutions |
Milwaukee, WI 53202 | Valuation | April 2011 | | Management, Inc. (2005-Present). | (49 Portfolios) |
Year of Birth: 1967 | Committee | | | | (2012-Present) |
| | Chairman | | | | |
Jackson Square Funds
Additional Information (Unaudited) – Continued
October 31, 2020
| |
| Term of | | | Other |
| |
| | | | Directorships |
| Position(s) | Length of | in Trust | | Held by |
| Name, Address and | Held with | Time | Overseen | Principal Occupation(s) | Trustee During |
| Year of Birth | the Trust | Served | by Trustee | During the Past Five Years | the Past Five Years |
David M. Swanson | Trustee | Indefinite | 37 | Founder and Managing Principal, | Independent Trustee, |
615 E. Michigan St. | | Term; Since | | SwanDog Strategic Marketing, | ALPS Variable |
Milwaukee, WI 53202 | | April 2011 | | LLC (2006-Present). | Investment Trust |
Year of Birth: 1957 | | | | | (7 Portfolios) |
| | | | | | (2006-Present); |
| | | | | | Independent Trustee, |
| | | | | | Independent Trustee, |
| | | | | | RiverNorth Funds |
| | | | | | (3 Portfolios) |
| | | | | | (2018-Present); |
| | | | | | RiverNorth Managed |
| | | | | | Duration Municipal |
| | | | | | Income Fund Inc. |
| | | | | | (1 Portfolio) |
| | | | | | (2019-Present); |
| | | | | | RiverNorth |
| | | | | | Marketplace Leading |
| | | | | | Corporation |
| | | | | | (1 Portfolio) |
| | | | | | (2018-Present); |
| | | | | | RiverNorth/ |
| | | | | | DoubleLine Strategic |
| | | | | | Opportunity Fund, |
| | | | | | Inc. (1 Portfolio) |
| | | | | | (2018-Present); |
| | | | | | RiverNorth |
| | | | | | Opportunities Fund, |
| | | | | | Inc. (1 Portfolio) |
| | | | | | (2018-Present); |
| | | | | | RiverNorth |
| | | | | | Opportunistic |
| | | | | | Municipal Income |
| | | | | | Fund, Inc. |
| | | | | | (1 Portfolio) |
| | | | | | (2018-Present) |
| | | | | | |
Robert J. Kern* | Chairman, | Indefinite | 37 | Retired, Executive Vice President, | None |
615 E. Michigan St. | and Trustee | Term; Since | | U.S. Bancorp Fund Services, LLC | |
Milwaukee, WI 53202 | | January 2011 | | (1994-2018). | |
Year of Birth: 1958
| * | Mr. Kern became an independent Trustee on July 6, 2020. Previously he was an Interested Trustee. |
Jackson Square Funds
Additional Information (Unaudited) – Continued
October 31, 2020
| |
| Term of | | | Other |
| |
| Office and | Portfolios | | Directorships |
| Position(s) | | in Trust | | Held by |
| Name, Address and | Held with | Time | Overseen | Principal Occupation(s) | Trustee During |
| Year of Birth | the Trust | Served | by Trustee | During the Past Five Years | the Past Five Years |
| Officers | | | | | |
Brian R. Wiedmeyer | President and | Indefinite | N/A | Vice President, U.S. Bancorp Fund | N/A |
615 E. Michigan St. | Principal | Term; Since | | Services, LLC (2005-Present). | |
Milwaukee, WI 53202 | Executive | November 2018 | | | |
Year of Birth: 1973 | Officer | | | | |
| | | | | | |
Deborah Ward | Vice President, | Indefinite | N/A | Senior Vice President, U.S. Bancorp | N/A |
615 E. Michigan St. | Chief | Term; Since | | Fund Services, LLC (2004-Present). | |
Milwaukee, WI 53202 | Compliance | April 2013 | | | |
Year of Birth: 1966 | Officer and | | | | |
| | Anti-Money | | | | |
| | Laundering | | | | |
| | Officer | | | | |
| | | | | | |
Benjamin Eirich | Vice President, | Indefinite | N/A | Assistant Vice President, U.S. Bancorp | N/A |
615 E. Michigan St. | Treasurer, and | Term; Since | | Fund Services, LLC (2008-Present). | |
Milwaukee, WI 53202 | Principal | August 2019 | | | |
Year of Birth: 1981 | Financial | (Treasurer); | | | |
| | Officer | Since | | | |
| | | November 2018 | | | |
| | | (Vice President) | | | |
| | | | | | |
Thomas A. Bausch, Esq. | Secretary | Indefinite | N/A | Assistant Vice President, U.S. Bancorp | N/A |
615 E. Michigan St. | | Term; Since | | Fund Services, LLC (2016-Present); | |
Milwaukee, WI 53202 | | November 2017 | | Associate, Godfrey & Kahn S.C. | |
Year of Birth: 1979 | |
| | (2012-2016). | |
| | | | | | |
Douglas Schafer | Vice President | Indefinite | N/A | Assistant Vice President, U.S. Bancorp | N/A |
615 E. Michigan St. | and | Term; Since | | Fund Services, LLC (2002-Present). | |
Milwaukee, WI 53202 | Assistant | May 2016 | | | |
Year of Birth: 1970 | Treasurer | (Assistant | | | |
| | | Treasurer); | | | |
| | | Since | | | |
| | | November 2018 | | | |
| | | (Vice President) | | | |
| | | | | | |
Michael J. Cyr II, CPA | Vice President | Indefinite | N/A | Assistant Vice President, U.S. Bancorp | N/A |
615 E. Michigan St. | and | Term; Since | | Fund Services, LLC (2013-Present). | |
Milwaukee, WI 53202 | Assistant | August 2019 | | | |
Year of Birth: 1992 | Treasurer | | | | |
Jackson Square Funds
Additional Information (Unaudited) – Continued
October 31, 2020
AVAILABILITY OF FUND PORTFOLIO INFORMATION
Each Fund files complete schedules of portfolio holdings with the SEC for the first and third quarters of each fiscal year on Form N-Q or Part F of Form N-PORT (beginning with filings after March 31, 2020). The Funds’ Form N-Q or Part F of N-PORT are available on the SEC’s website at www.sec.gov and may be reviewed and coped at the SEC’s Public Reference Room in Washington, D.C. For information on the Public Reference Room call 1-800-SEC-0330. In addition, each Fund’s Form N-Q or Part F of Form N-PORT is available without charge upon request by calling 1-844-577-3863.
AVAILABILITY OF FUND PROXY VOTING INFORMATION
A description of the Funds’ Proxy Voting Policies and Procedures is available without charge, upon request, by calling 1-844-577-3863. Information regarding how the Funds voted proxies relating to portfolio securities during the most recent 12 month period ended June 30 is available (1) without charge, upon request, by calling 1-844-577-3863, or (2) on the SEC’s website at www.sec.gov.
QUALIFIED DIVIDEND INCOME/DIVIDENDS RECEIVED DEDUCTION
For the fiscal year ended October 31, 2020, certain dividends paid by the Funds may be reported as qualified dividend income and may be eligible for taxation at capital gain rates. The percentage of dividends declared from ordinary income designated as qualified dividend income was as follows:
| Fund | |
| All-Cap Growth Fund | 0.00% |
| Global Growth Fund | 0.00% |
| Large-Cap Growth Fund | 51.82% |
| Select 20 Growth Fund | 100.00% |
| SMID-Cap Growth Fund | 84.86% |
For corporate shareholders, the percent of ordinary income distributions qualifying for the corporate dividends received deduction for the fiscal year ended October 31, 2020 was as follows:
| Fund | |
| All-Cap Growth Fund | 0.00% |
| Global Growth Fund | 0.00% |
| Large-Cap Growth Fund | 51.78% |
| Select 20 Growth Fund | 100.00% |
| SMID-Cap Growth Fund | 82.78% |
The percentage of taxable ordinary income distributions that are designated as short-term capital gain distributions under Internal Revenue Section 871(k)(2)(C) for each Fund were as follows:
| Fund | |
| All-Cap Growth Fund | 100.00% |
| Global Growth Fund | 0.00% |
| Large-Cap Growth Fund | 89.47% |
| Select 20 Growth Fund | 0.00% |
| SMID-Cap Growth Fund | 58.28% |
Jackson Square Funds
Privacy Notice (Unaudited)
The Funds collect only relevant information about you that the law allows or requires it to have in order to conduct its business and properly service you. The Funds collect financial and personal information about you (“Personal Information”) directly (e.g., information on account applications and other forms, such as your name, address, and social security number, and information provided to access account information or conduct account transactions online, such as password, account number, e-mail address, and alternate telephone number), and indirectly (e.g., information about your transactions with us, such as transaction amounts, account balance and account holdings).
The Funds do not disclose any non-public personal information about its shareholders or former shareholders other than for everyday business purposes such as to process a transaction, service an account, respond to court orders and legal investigations or as otherwise permitted by law. Third parties that may receive this information include companies that provide transfer agency, technology and administrative services to the Funds, as well as the Funds’ investment adviser who is an affiliate of the Funds. If you maintain a retirement/educational custodial account directly with the Funds, we may also disclose your Personal Information to the custodian for that account for shareholder servicing purposes. The Funds limit access to your Personal Information provided to unaffiliated third parties to information necessary to carry out their assigned responsibilities to the Funds. All shareholder records will be disposed of in accordance with applicable law. The Funds maintain physical, electronic and procedural safeguards to protect your Personal Information and requires its third party service providers with access to such information to treat your Personal Information with the same high degree of confidentiality.
In the event that you hold shares of the Funds through a financial intermediary, including, but not limited to, a broker-dealer, credit union, bank or trust company, the privacy policy of your financial intermediary governs how your non-public personal information is shared with unaffiliated third parties.
Jackson Square Funds
Disclosures (Unaudited)
The materials provided herein are for general information purposes only and may not be copied or redistributed without Jackson Square’s prior consent. The views expressed represent Jackson Square’s assessment of the strategy and market environment as of the date identified herein and should not be considered a recommendation to buy, hold, or sell any security, and should not be relied on as research or investment advice. The information in this presentation, including statements concerning financial markets is based on current market conditions, which will fluctuate and may be superseded by subsequent market events or for other reasons.
Opinions expressed are those of Jackson Square Partners, LLC and are subject to change, are not guaranteed and should not be considered investment advice.
Holdings are as of the date provided and subject to change. Please note that where a partial list of holdings has been provided, a full list is available upon request.
Mutual fund investing involves risk. Principal loss is possible. With the exception of the All-Cap Growth Fund and the Global Growth Fund, the Funds are non-diversified meaning they may concentrate their assets in fewer individual holdings than a diversified fund. Therefore these Funds are more exposed to individual stock volatility than a diversified fund. Small- and Mid-capitalization companies tend to have limited liquidity and greater price volatility than large capitalization companies. Investments in foreign securities involve greater volatility and political economic and currency risks and differences in accounting methods. These risks are greater in emerging and frontier markets. Frontier market countries generally have smaller economies and even less developed capital markets than traditional emerging markets, and, as a result, the risks of investing in emerging market countries are magnified in frontier market countries. Investments in Real Estate Investment Trusts (REITs) involve additional risks such as declines in the value of real estate and increased susceptibility to adverse economic or regulatory developments. When the Funds buy or sell securities on a foreign stock exchange, the transaction is undertaken in the local currency rather than in U.S. dollars. The value of the foreign currency may increase or decrease against the value of the U.S. dollar, which may impact the value of the Funds’ portfolio holdings and your investment. Other countries may adopt economic policies and/or currency exchange controls that affect their currency valuations in a manner that is disadvantageous to U.S. investors and companies. From time to time, the trading market for a particular security or type of security in which the Funds invest may become less liquid or even illiquid.
Past performance is no guarantee of future results.
Diversification does not assure a profit, nor does it protect against a loss in a declining market.
For comparison purposes, the indices are fully invested and include the reinvestment of income. Index returns do not reflect management fees, transaction costs, or expenses. The indices are unmanaged, and one cannot invest directly in an index. Benchmark information contained herein has been obtained from third party sources believed to be reliable, but we cannot guarantee its accuracy or completeness. All third-party marks are the property of their respective owners. All performance data regarding the indices are historical and are not indicative of future results, and there can be no assurance that these or comparable results will actually be achieved by the strategies or that the strategies’ investment objectives will be achieved.
The Russell 1000® Growth Index measures the performance of the large-cap growth segment of the U.S. equity universe. It includes those Russell 1000® companies with higher price-to-book ratios and higher forecasted growth values. The index is unmanned and an investment cannot be made into the index.
Jackson Square Funds
Disclosures (Unaudited) – Continued
The Russell 2500® Growth Index measures the performance of the small- to mid-cap growth segment of the U.S. equity universe. It includes those Russell 2500® companies with higher price-to-book ratios and higher forecasted growth values. The index is unmanned and an investment cannot be made into the index.
The Russell 3000® Growth Index measures the performance of the broad growth segment of the U.S. equity universe. It includes those Russell 3000® companies with higher price-to-book ratios and higher forecasted growth values. The index is unmanned and an investment cannot be made into the index.
The MSCI All Country World Index is a free float-adjusted market capitalization weighted index designed to measure equity market performance across developed markets world-wide. Index “net” return reflects minimum possible dividend reinvestment, after deduction of withholding tax at the highest possible rate. The index is unmanned and an investment cannot be made into the index. The index is a service mark of MSCI Barra. MSCI makes no express or implied warranties or representations and shall have no liability whatsoever with respect to any MSCI data contained herein. The MSCI data may not be further redistributed or used as a basis for other indices or any securities or financial products. This report is not approved, reviewed, or produced by MSCI.
The report must be preceded or accompanied by a prospectus.
Jackson Square Partners, LLC is the adviser to the Jackson Square Funds, which are distributed by Quasar Distributors, LLC.
(This Page Intentionally Left Blank.)
Investment Adviser
Jackson Square Partners, LLC
One Letterman Drive
Building A, Suite A3-200
San Francisco, California 94129
Distributor
Quasar Distributors, LLC
111 East Kilbourn Avenue, Suite 2200
Milwaukee, Wisconsin 53202
Custodian
U.S. Bank N.A.
1555 North Rivercenter Drive, Suite 302
Milwaukee, Wisconsin 53212
Administrator, Fund Accountant
And Transfer Agent
U.S. Bancorp Fund Services, LLC
615 East Michigan Street
Milwaukee, Wisconsin 53202
Independent Registered Public Accounting Firm
Cohen & Company, Ltd.
1350 Euclid Avenue, Suite 800
Cleveland, Ohio 44115
Legal Counsel
Stradley Ronon Stevens & Young, LLP
2005 Market Street, Suite 2600
Philadelphia, Pennsylvania 19103
This report should be accompanied or preceded by a prospectus.
The Funds’ Statement of Additional Information contains additional information about the
Funds’ trustees and is available without charge upon request by calling 1-844-577-3863.
Item 2. Code of Ethics.
The Registrant has adopted a code of ethics that applies to the Registrant’s principal executive officer and principal financial officer. The Registrant has not made any substantive amendments to its code of ethics during the period covered by this period.
The Registrant has not granted any waivers from any provisions of the code of ethics during the period covered by this report.
A copy of the Registrant’s code of ethics that applies to the Registrant’s principal executive officer and principal financial officer is filed herewith.
Item 3. Audit Committee Financial Expert.
The Registrant’s Board of Trustees has determined that there is at least one audit committee financial expert serving on its audit committee. Leonard M. Rush is the “audit committee financial expert” and is considered to be “independent” as each term is defined in Item 3 of Form N-CSR.
Item 4. Principal Accountant Fees and Services.
The Registrant has engaged its principal accountant to perform audit services, audit-related services, tax services and other services during the past two fiscal years. “Audit services” refer to performing an audit of the Registrant's annual financial statements or services that are normally provided by the accountant in connection with statutory and regulatory filings or engagements for the past fiscal year. “Audit-related services” refer to the assurance and related services by the principal accountant that are reasonably related to the performance of the audit. “Tax services” refer to professional services rendered by the principal accountant for tax compliance, tax advice, and tax planning, including reviewing the Fund’s tax returns and distribution calculations. There were no “other services” provided by the principal accountant. For the fiscal years ended October 31, 2020 and October 31, 2019, the Funds’ principal accountant was Cohen & Company, Ltd. The following table details the aggregate fees billed or expected to be billed for each of the last fiscal year for audit fees, audit-related fees, tax fees and other fees by the principal accountant.
| | FYE 10/31/2020 | FYE 10/31/2019 |
Audit Fees | $65,500 | $68,000 |
Audit-Related Fees | $0 | $0 |
Tax Fees | $18,000 | $18,000 |
All Other Fees | $0 | $0 |
The audit committee has adopted pre-approval policies and procedures that require the audit committee to pre‑approve all audit and non‑audit services of the Registrant, including services provided to any entity affiliated with the Registrant.
The percentage of fees billed by Cohen & Company, Ltd. applicable to non-audit services pursuant to waiver of pre-approval requirement was as follows:
| | FYE 10/31/2020 | FYE 10/31/2019 |
Audit-Related Fees | 0% | 0% |
Tax Fees | 0% | 0% |
All Other Fees | 0% | 0% |
All of the principal accountant’s hours spent on auditing the Registrant’s financial statements were attributed to work performed by full‑time permanent employees of the principal accountant.
The following table indicates the non-audit fees billed or expected to be billed by the Registrant’s accountant for services to the Registrant and to the Registrant’s investment adviser (and any other controlling entity, etc.—not sub-adviser) for the last two years. The audit committee of the board of trustees/directors has considered whether the provision of non-audit services that were rendered to the Registrant's investment adviser is compatible with maintaining the principal accountant's independence and has concluded that the provision of such non-audit services by the accountant has not compromised the accountant’s independence.
Non-Audit Related Fees | FYE 10/31/2020 | FYE 10/31/2019 |
Registrant | 0% | 0% |
Registrant’s Investment Adviser | 0% | 0% |
Item 5. Audit Committee of Listed Registrants.
Not applicable to Registrants who are not listed issuers (as defined in Rule 10A-3 under the Securities Exchange Act of 1934).
Item 6. Schedule of Investments.
(a) Schedule of Investments is included as part of the report to shareholders filed under Item 1 of this Form.
(b) Not applicable.
Item 7. Disclosure of Proxy Voting Policies and Procedures for Closed-End Management Investment Companies.
Not applicable to open-end investment companies.
Item 8. Portfolio Managers of Closed-End Management Investment Companies.
Not applicable to open-end investment companies.
Item 9. Purchases of Equity Securities by Closed‑End Management Investment Company and Affiliated Purchasers.
Not applicable to open-end investment companies.
Item 10. Submission of Matters to a Vote of Security Holders.
There have been no material changes to the procedures by which shareholders may recommend nominees to the Registrant’s Board of Trustees.
Item 11. Controls and Procedures.
(a) | The Registrant’s President and Treasurer have reviewed the Registrant's disclosure controls and procedures (as defined in Rule 30a-3(c) under the Investment Company Act of 1940 (the “Act”)) as of a date within 90 days of the filing of this report, as required by Rule 30a-3(b) under the Act and Rules 13a-15(b) or 15d‑15(b) under the Securities Exchange Act of 1934. Based on their review, such officers have concluded that the disclosure controls and procedures are effective in ensuring that information required to be disclosed in this report is appropriately recorded, processed, summarized and reported and made known to them by others within the Registrant and by the Registrant’s service provider. |
(b) | There were no significant changes in the Registrant's internal control over financial reporting (as defined in Rule 30a-3(d) under the Act) that occurred during the period covered by this report that has materially affected, or is reasonably likely to materially affect, the Registrant's internal control over financial reporting. |
Item 12. Disclosure of Securities Lending Activities for Closed-End Management Investment Companies
Not applicable to open-end investment companies.
Item 13. Exhibits.
(3) Any written solicitation to purchase securities under Rule 23c‑1 under the Act sent or given during the period covered by the report by or on behalf of the Registrant to 10 or more persons. Not applicable to open-end investment companies.
(4) Change in the Registrant’s independent public accountant. There was no change in the Registrant’s independent public accountant for the period covered by this report.
SIGNATURES
Pursuant to the requirements of the Securities Exchange Act of 1934 and the Investment Company Act of 1940, the Registrant has duly caused this report to be signed on its behalf by the undersigned, thereunto duly authorized.
(Registrant) Managed Portfolio Series
By (Signature and Title) /s/Brian R. Wiedmeyer
Brian R. Wiedmeyer, President
Date January 6, 2021
Pursuant to the requirements of the Securities Exchange Act of 1934 and the Investment Company Act of 1940, this report has been signed below by the following persons on behalf of the Registrant and in the capacities and on the dates indicated.
By (Signature and Title) /s/Brian R. Wiedmeyer
Brian R. Wiedmeyer, President
Date January 6, 2021
By (Signature and Title) /s/Benjamin J. Eirich
Benjamin J. Eirich, Treasurer
Date January 6, 2021