V-Shares US Leadership Diversity ETF
(Ticker: VDNI)
V-Shares MSCI World ESG Materiality
and Carbon Transition ETF
(Ticker: VMAT)
Annual Report
| www.v-shares.com | October 31, 2022 |
(This Page Intentionally Left Blank.)
V-SHARES US LEADERSHIP DIVERSITY ETF
Letter to Shareholders
Dear Fellow Shareholders,
Thank you for this opportunity to report on the strategy, performance and outlook of the V-Shares US Leadership Diversity ETF (the “Fund” or ticker “VDNI”).
VDNI Strategy
The V-Shares US Leadership Diversity ETF (VDNI) invests in domestic companies (US) exhibiting broad ethnic and gender representation for Directors and Named Executive Officers (NEO) as determined by the index provider. The Fund seeks to track the investment results of the ISS ESG U.S. Diversity Index Total Return (Ticker ISSDIVUT).
At V-Square, we believe that Diversification and Diversity have more in common than their Latin root; they both carry value. Human capital is a capital, a key driving force of any business, that too enjoys the benefits of diversification. Diversity at the senior leadership level is a foreteller of a healthy company culture, which in turn strengthens the levers and drivers of sustainable corporate performance.
As such, VDNI’s investment approach focus on constituents exhibiting both broad ethnic and gender representation for board directors and named executive officers (NEOs). Minimum requirements of the investment universe for VDNI include a combined minimum of three distinct ethnically diverse individuals and three distinct women among directors or NEOs, as well as a 35 percent combined minimum of women or ethnically diverse directors. Small-, middle-, and large-capitalization U.S. companies are selected from the ISS ESG Director & Executive Diversity dataset.
VDNI Performance
For the nine calendar months ending September 30, 2022, the V-Shares US Leadership Diversity ETF (ticker VDNI) returned -25.15% while the ISS ESG U.S. Diversity Index Total Return (Ticker ISSDIVUT) returned -25.09%. Since inception, December 21, 2021 to October 31, 2022, VDNI returned -15.68% while the Index returned -15.55%.
The tracking error was maintained tight over the period and the portfolio’s performance was in line with equity markets. The portfolio’s cash was maintained at a minimal level.
The two most underperforming sectors in the portfolio were Communication Services (-33.30%) and Information Technology (-30.54%), in contrast with a surging Energy sector (+41.05%), in line with what happened on the markets over the same period. The Communication Services and the Information Technology combined a weight over 40%, while Energy had a weight of around 3%.
8X8 INC in the Information Technology sector and IHEARTMEDIA INC in the Communication Services sector were the worst performers with respectively a -80.12% and a -64.02% negative performance. On the other side of the return spectrum, Occidental Petroleum Corp. and Marathon Petroleum Corp. posted respectively +102.69% and +59.67%.
During the period, the U.S. Federal Reserve (Fed) kept delivering on their aggressive stance against the inflationary pressures by tightening the headline interest rates. As a result, drastic consecutive 75 basis point hikes took the Fed Funds Rate to the 3.00% - 3.25% range at the end of September.
Equities responded with negative performance returns across the markets, exhibiting a high volatility amid stagflation fears and concerns of a Fed-inflicted recession.
V-SHARES US LEADERSHIP DIVERSITY ETF
The Market Outlook
Fed Chair Jerome Powell has yet to give a serious indication of a pivot to a less hawkish stance in the foreseeable future. Taming inflation is the priority, and we anticipate that core inflation in the U.S. will eventually start receding over the next several months. Nonetheless, while the probability of a recession for the U.S. economy during 2023 is rising, a full-blown recession is not fully certain yet. Still, the currently inverted Treasury yield curve strongly signals for it. As payrolls and wages indicators remain a concern for the Fed, no slowdown is expected in the rate hike campaign despite the increased risk of weakening the economy.
The portfolio is constituted of quality US companies that have shown resilience over multiple market cycles. V-Square believes the Fund is well positioned to capture an eventual market rebound.
V-Square thanks you for your trust and confidence in our stewardship.
Sincerely,
 |  |
| Mamadou-Abou Sarr | Habib Moudachirou |
| President | Chief Investment Officer |
Must be preceded or accompanied by a prospectus.
The ISS ESG U.S. Diversity Index is a free float-adjusted market capitalization weighted equity index designed to reflect the equity performance of U.S. companies that exhibit broad ethnic and gender representation for Directors and Named Executive Officers, as determined by the Index Provider. The Index is calculated, administered, and published by Solactive AG. One cannot invest directly in an index.
Tracking Error refers to the divergence, calculated as standard deviation percentage difference, between the price behavior of a position or portfolio and the price behavior of a benchmark.
A Basis Point is a unit of measure used to describe the percentage change in the value of financial instruments or the rate change in an index or other benchmark. One basis point is equivalent to 0.01% (1/100th of a percent) or 0.0001 in decimal form.
Investing involves risk. Principal loss is possible.
As with all ETFs, shares may be bought and sold in the secondary market at market prices. Although it is expected that the market price of shares will approximate the Fund’s NAV, there may be times when the market price of shares is more than the NAV intra-day (premium) or less than the NAV intra-day (discount) due to supply and demand of shares or during periods of market volatility.
A strategy or emphasis on environmental, social and governance factors ("ESG") may limit the investment opportunities available to a portfolio. Therefore, the portfolio may underperform or perform differently than other portfolios that do not have an ESG investment focus.
Passive Investment Risk. The Fund is not actively managed and therefore the Fund generally will not sell a security due to current or projected underperformance of a security, industry or sector, unless that security is removed from the Underlying Index, or the selling of the security is otherwise required upon a rebalancing of the Underlying Index.
Methodology Risk. The Index Provider relies on various sources of information to assess the criteria of issuers included in the Underlying Index, including information that may be based on assumptions and estimates. Neither the Fund nor the Index Provider can offer assurances that Underlying Index's calculation methodology or sources of information will provide an accurate assessment of included issuers or that the included issuers will provide the Fund with the market exposure it seeks.
Distributed by Quasar Distributors, LLC.
V-SHARES MSCI WORLD ESG MATERIALITY AND CARBON TRANSITION ETF
Letter to Shareholders
Dear Fellow Shareholders,
Thank you for this opportunity to report on the strategy, performance and outlook of the V-Shares MSCI World ESG Materiality and Carbon Transition ETF (the “Fund” or ticker “VMAT”).
VMAT Strategy
The V-Shares MSCI World ESG Materiality and Carbon Transition ETF (VMAT) invests in companies in developed markets countries, including the United States and Canada, that are assessed to be sector leaders based on a set of environmental, social, and governance (“ESG”) key issues that are aligned with the “Materiality Map” of the Sustainability Accounting Standard Board (“SASB”) and in the global transition to low carbon emissions.
V-Square believe that investors increasingly recognize that material environmental, social and governance (ESG) matters may have a direct financial impact on companies’ balance sheets and investment portfolios as vectors of risks and opportunities. Out of the plethora of ESG data, VMAT focuses on financially material ESG issues to seek to drive better performance.
The Fund tracks an index which is designed to represent the performance of companies which are assessed to be sector leaders based on a set of relevant key issues scores that are aligned with SASB’s Materiality Map. The index excludes companies involved in Controversial Weapons, Tobacco-related businesses, Thermal Coal mining, Thermal Coal power generation and unconventional Oil and Gas. Also, it excludes companies that fail to comply with the United Nations Global Compact Principles and companies with Low Carbon Transition (LCT) category of Asset Stranding.
VMAT Performance
For the few months from its inception, June 8, 2022 to September 30, 2022, the V-Shares MSCI World ESG Materiality and Carbon Transition ETF (ticker VMAT) returned -16.07% while the MSCI World ESG Materiality and Carbon Transition Select Index (Ticker MXESGMTN) returned -15.97%. From June 8, 2022, inception, to October 31, 2022, VMAT returned -10.83% while the Index returned -10.87%.
The tracking error was maintained tight over the period and the portfolio’s performance was in line with equity markets. The portfolio does not make any sector bet and looks to be sector neutral vis-à-vis its benchmark. Therefore, the strategy was not adversely affected by this year’s overperformance of the energy sector intensified by the war in Ukraine, and the underperformance of the information technology sector. The portfolio’s cash was maintained at a minimal level.
During that period, the U.S. Federal Reserve (Fed) kept delivering on their aggressive stance against the inflationary pressures by tightening the headline interest rates. As a result, drastic three consecutive 75 basis point over the third quarter hikes took the Fed Funds Rate to the 3.00% - 3.25% range at the end of September.
Equities responded with negative performance returns across the markets, exhibiting a high volatility amid stagflation fears and concerns of a Fed-inflicted recession.
VMAT Outlook
Fed Chair Jerome Powell has yet to give a serious indication of a pivot to a less hawkish stance in the foreseeable future. Taming inflation is the priority, and we anticipate that core inflation in the U.S. will eventually start receding
V-SHARES MSCI WORLD ESG MATERIALITY AND CARBON TRANSITION ETF
over the next several months. Nonetheless, while the probability of a recession for the U.S. economy during 2023 is rising, a full-blown recession is not fully certain yet. Still, the currently inverted Treasury yield curve strongly signals for it. As payrolls and wages indicators remain a concern for the Fed, no slowdown is expected in the rate hike campaign despite the increased risk of weakening the economy.
The portfolio is constituted of the top 40% SASB -aligned ESG-rated stocks per sector, which have generally, in the past, shown resilience over multiple market cycles. V-Square believes the Fund is well positioned to capture an eventual market rebound.
V-Square thanks you for your trust and confidence in our stewardship.
Sincerely,
| |
| Mamadou-Abou Sarr | Habib Moudachirou |
| President | Chief Investment Officer |
Must be preceded or accompanied by a prospectus.
The MSCI World ESG Materiality and Carbon Transition Select Index is designed to invest in developed market countries, including the United States and Canada, and companies that are assessed to be sector leaders based on a set of Environmental, Social and Governance (ESG) key issues that are aligned with the SASB’s Materiality framework and seeks to minimize carbon transition risk and capture opportunities through companies’ operations and business model. One cannot invest directly in an index.
Tracking Error refers to the divergence, calculated as standard deviation percentage difference, between the price behavior of a position or portfolio and the price behavior of a benchmark.
A Basis Point is a unit of measure used to describe the percentage change in the value of financial instruments or the rate change in an index or other benchmark. One basis point is equivalent to 0.01% (1/100th of a percent) or 0.0001 in decimal form.
Investing involves risk. Principal loss is possible.
As with all ETFs, shares may be bought and sold in the secondary market at market prices. Although it is expected that the market price of shares will approximate the Fund’s NAV, there may be times when the market price of shares is more than the NAV intra-day (premium) or less than the NAV intra-day (discount) due to supply and demand of shares or during periods of market volatility.
A strategy or emphasis on environmental, social and governance factors ("ESG") may limit the investment opportunities available to a portfolio. Therefore, the portfolio may underperform or perform differently than other portfolios that do not have an ESG investment focus.
The Fund is classified as “non-diversified”, which means the Fund may invest a larger percentage of its assets in the securities of a smaller number of issuers than a diversified fund.
Passive Investment Risk. The Fund is not actively managed and therefore the Fund generally will not sell a security due to current or projected underperformance of a security, industry or sector, unless that security is removed from the Underlying Index, or the selling of the security is otherwise required upon a rebalancing of the Underlying Index.
Methodology Risk. The Index Provider relies on various sources of information to assess the criteria of issuers included in the Underlying Index, including information that may be based on assumptions and estimates. Neither the Fund nor the Index Provider can offer assurances that Underlying Index's calculation methodology or sources of information will provide an accurate assessment of included issuers or that the included issuers will provide the Fund with the market exposure it seeks.
Distributed by Quasar Distributors, LLC.
V-SHARES US LEADERSHIP DIVERSITY ETF
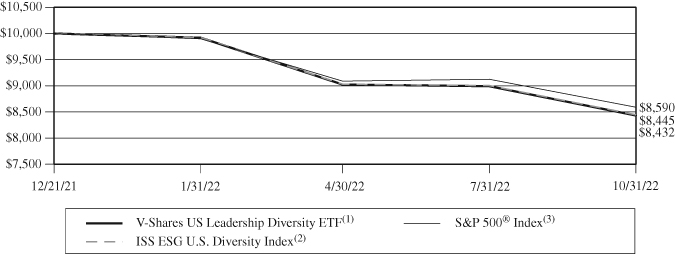
Value of $10,000 Investment (Unaudited)
The chart assumes an initial investment of $10,000. Performance reflects waivers of fee and operating expenses in effect. In the absence of such waivers, total return would be reduced. Performance data quoted represents past performance and does not guarantee future results. Investment returns and principal value will fluctuate, and when sold, may be worth more or less than their original cost. Performance current to the most recent month-end may be lower or higher than the performance quoted and can be obtained by calling 1-312-872-7281. Performance assumes the reinvestment of capital gains and income distributions. The performance does not reflect the deduction of taxes that a shareholder would pay on Fund distributions or the redemption of Fund shares.
Rates of Return (%) – as of October 31, 2022 (Unaudited)
| | Since |
| | Inception(1) |
| V-Shares US Leadership Diversity ETF – Market | -15.66% |
| V-Shares US Leadership Diversity ETF – NAV | -15.68% |
ISS ESG U.S. Diversity Index(2) | -15.55% |
S&P 500® Index(3) | -14.10% |
(1) | The US Leadership Diversity ETF commenced operations on December 21, 2021. |
(2) | The ISS ESG U.S. Diversity Index is a free float-adjusted market capitalization weighted equity index designed to reflect the equity performance of U.S. companies that exhibit broad ethnic and gender representation for Directors and Named Executive Officers, as determined by the Index Provider. The Index is calculated, administered, and published by Solactive AG. One cannot invest directly in an index. |
(3) | The S&P 500® Index is a stock market index based on the market capitalizations of 500 leading companies publicly traded in the U.S. stock market, as determined by Standard & Poor’s. One cannot invest directly in an index. |
V-SHARES MSCI WORLD ESG MATERIALITY AND CARBON TRANSITION ETF
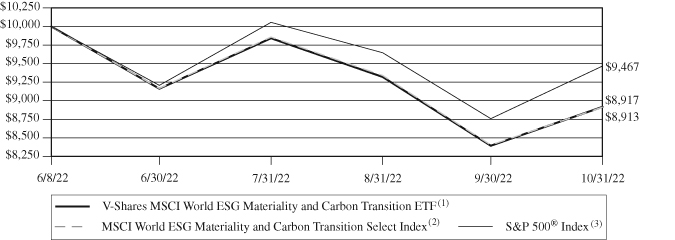
Value of $10,000 Investment (Unaudited)
The chart assumes an initial investment of $10,000. Performance reflects waivers of fee and operating expenses in effect. In the absence of such waivers, total return would be reduced. Performance data quoted represents past performance and does not guarantee future results. Investment returns and principal value will fluctuate, and when sold, may be worth more or less than their original cost. Performance current to the most recent month-end may be lower or higher than the performance quoted and can be obtained by calling 1-312-872-7281. Performance assumes the reinvestment of capital gains and income distributions. The performance does not reflect the deduction of taxes that a shareholder would pay on Fund distributions or the redemption of Fund shares.
Rates of Return (%) – as of October 31, 2022 (Unaudited)
| | Since |
| | Inception(1) |
| V-Shares MSCI World ESG Materiality and Carbon Transition ETF – Market | -10.38% |
| V-Shares MSCI World ESG Materiality and Carbon Transition ETF – NAV | -10.83% |
MSCI World ESG Materiality and Carbon Transition Select Index(2) | -10.87% |
S&P 500® Index(3) | -5.33% |
(1) | The MSCI World ESG ETF commenced operations on June 8, 2022. |
(2) | The MSCI World ESG Materiality and Carbon Transition Select Index is designed to invest in developed market countries, including the United States and Canada, and in companies that are assessed to be sector leaders based on a set of Environmental, Social and Governance (ESG) key issues that are aligned with the SASB’s Materiality framework and seeks to minimize carbon transition risk and capture opportunities through companies' operations and business model. |
(3) | The S&P 500® Index is a stock market index based on the market capitalizations of 500 leading companies publicly traded in the U.S. stock market, as determined by Standard & Poor’s. One cannot invest directly in an index. |
V-SHARES
Expense Examples (Unaudited)
October 31, 2022
As a shareholder of a Fund, you incur two types of costs: (1) transaction costs, including brokerage commission on purchases and sales of Fund shares, and (2) ongoing costs, including management fees and other Fund expenses. This Example is intended to help you understand your ongoing costs (in dollars) of investing in a Fund and to compare these costs with the ongoing costs of investing in other exchange-traded funds. The Examples are based on an investment of $1,000 invested at the beginning of the period and held for the entire period (May 1, 2022 – October 31, 2022 and June 8, 2022 – October 31, 2022 for the US Leadership Diversity ETF and MSCI World ESG ETF, respectively).
ACTUAL EXPENSES
The first line of each table provides information about actual account values and actual expenses. You may use the information in this line, together with the amount you invested, to estimate the expenses that you paid over the period. Simply divide your account value by $1,000 (for example, an $8,600 account value divided by $1,000 = 8.6), then multiply the result by the number in the first line under the heading titled “Expenses Paid During Period” to estimate the expenses you paid on your account during this period.
HYPOTHETICAL EXAMPLES FOR COMPARISON PURPOSES
The second line of each table provides information about hypothetical account values and hypothetical expenses based on the Fund’s actual expense ratio and an assumed rate of return of 5% per year before expenses, which is not the Fund’s actual return. The hypothetical account values and expenses may not be used to estimate the actual ending account balance or expenses you paid for the period. You may use this information to compare the ongoing costs of investing in the Fund and other funds. To do so, compare this 5% hypothetical example with the 5% hypothetical examples that appear in the shareholder reports of the other funds.
Please note that the expenses shown in the table are meant to highlight your ongoing costs only and do not reflect any transactional costs. Therefore, the second line of each table is useful in comparing ongoing costs only and will not help you determine the relative total costs of owning different funds. In addition, if these transactional costs were included, your costs may have been higher.
V-Shares US Leadership Diversity ETF
| | Beginning | Ending | |
| | Account Value | Account Value | Expenses Paid(1) |
| | 05/01/2022 | 10/31/2022 | (05/01/2022 to 10/31/2022) |
Actual(2) | $1,000.00 | $ 934.50 | $1.41 |
| Hypothetical | | | |
| (5% return before expenses) | $1,000.00 | $1,023.74 | $1.48 |
(1) | Expenses are equal to the Fund’s annualized expense ratio for the most recent six-month period of 0.29%, multiplied by the average account value over the period, multiplied by 184/365 to reflect the one-half year period. |
(2) | Based on the actual return for the six-month period ended October 31, 2022 of -6.55%. |
V-Shares MSCI World ESG Materiality and Carbon Transition ETF
| | Beginning | Ending | Expenses Paid |
| | Account Value | Account Value | Since Inception(3) |
| | 06/08/2022 | 10/31/2022 | (06/08/2022 to 10/31/2022) |
Actual(4) | $1,000.00 | $ 891.70 | $1.47 |
| Hypothetical | | | |
| (5% return before expenses) | $1,000.00 | $1,018.31 | $1.56 |
(3) | Inception date for the Fund was June 8, 2022. Expenses are equal to the annualized expense ratio for the period from inception through October 31, 2022 of 0.39%, multiplied by the average account value over the period, multiplied by 145/365 to reflect the period since inception. |
(4) | Based on the actual return for the period since inception through October 31, 2022 of -10.83%. |
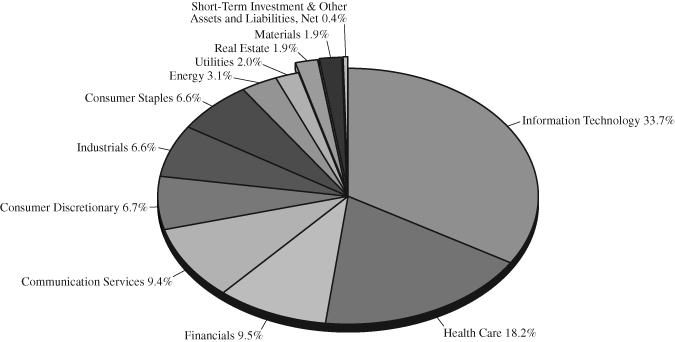
V-SHARES US LEADERSHIP DIVERSITY ETF
Sector Allocation(1) (Unaudited)
as of October 31, 2022
(% of net assets)
Top Ten Equity Holdings(1) (Unaudited)
as of October 31, 2022
(% of net assets)
| Apple, Inc. | 10.0% |
| Microsoft Corp. | 7.5% |
| Alphabet, Inc., Class A & B | 4.7% |
| UnitedHealth Group, Inc. | 2.3% |
| Johnson & Johnson | 2.0% |
| NVIDIA Corp. | 1.6% |
| Chevron Corp. | 1.5% |
| Visa, Inc. | 1.5% |
| Procter and Gamble Co. | 1.4% |
| Eli Lilly & Co. | 1.3% |
(1) | Fund holdings and sector allocations are subject to change at any time and are not recommendations to buy or sell any security. |
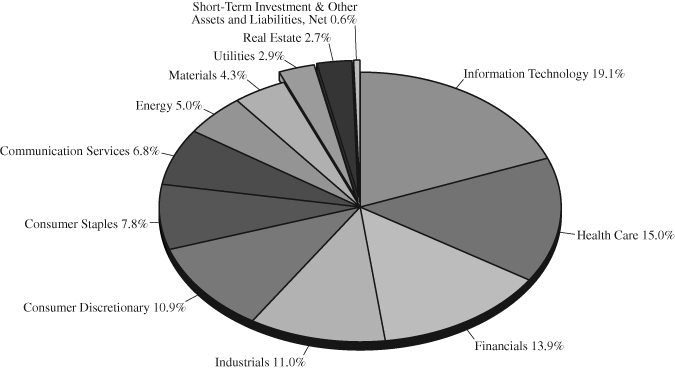
V-SHARES MSCI WORLD ESG MATERIALITY AND CARBON TRANSITION ETF
Sector Allocation(1) (Unaudited)
as of October 31, 2022
(% of net assets)
Top Ten Equity Holdings(1) (Unaudited)
as of October 31, 2022
(% of net assets)
| Microsoft Corp. | 9.7% |
| Amazon.com, Inc. | 5.1% |
| NVIDIA Corp. | 2.4% |
| Procter and Gamble Co. | 1.5% |
| Bank of America Corp. | 1.3% |
| PepsiCo, Inc. | 1.2% |
| Coca-Cola Co. | 1.1% |
| Roche Holding | 1.1% |
| Walt Disney Co. | 1.0% |
| LVMH Moet Hennessy Louis Vuitton | 1.0% |
(1) | Fund holdings and sector allocations are subject to change at any time and are not recommendations to buy or sell any security. |
V-SHARES US LEADERSHIP DIVERSITY ETF
Schedule of Investments
October 31, 2022
| | | Shares | | | Value | |
| COMMON STOCKS — 99.6% | | | | | | |
| | | | | | | |
| Communication Services — 9.4% | | | | | | |
| Alphabet, Inc. – Class A (a) | | | 271 | | | $ | 25,612 | |
| Alphabet, Inc. – Class C (a) | | | 243 | | | | 23,002 | |
| AT&T, Inc. | | | 319 | | | | 5,815 | |
| Cinemark Holdings, Inc. (a) | | | 4 | | | | 42 | |
| Comcast Corp. – Class A | | | 202 | | | | 6,412 | |
| Electronic Arts, Inc. | | | 13 | | | | 1,638 | |
| iHeartMedia, Inc. – Class A (a) | | | 5 | | | | 41 | |
| Live Nation Entertainment, Inc. (a) | | | 7 | | | | 557 | |
| Match Group, Inc. (a) | | | 12 | | | | 518 | |
| MediaAlpha, Inc. (a) | | | 1 | | | | 11 | |
| Meta Platforms, Inc. (a) | | | 102 | | | | 9,502 | |
| New York Times Co. | | | 7 | | | | 203 | |
| Omnicom Group, Inc. | | | 10 | | | | 728 | |
| Paramount Global | | | 26 | | | | 476 | |
| Pinterest, Inc. – Class A (a) | | | 26 | | | | 640 | |
| Playtika Holding Corp. (a) | | | 6 | | | | 57 | |
| Take-Two Interactive Software, Inc. (a) | | | 6 | | | | 711 | |
| TEGNA, Inc. | | | 10 | | | | 209 | |
| T-Mobile US, Inc. (a) | | | 29 | | | | 4,395 | |
| Verizon Communications, Inc. | | | 189 | | | | 7,063 | |
| Walt Disney Co. (a) | | | 82 | | | | 8,736 | |
| Warner Bros Discovery, Inc. (a) | | | 83 | | | | 1,079 | |
| World Wrestling Entertainment, Inc. – Class A | | | 2 | | | | 158 | |
| | | | | | | | 97,605 | |
| Consumer Discretionary — 6.7% | | | | | | | | |
| 2U, Inc. (a) | | | 4 | | | | 25 | |
| Academy Sports & Outdoors, Inc. | | | 3 | | | | 132 | |
| Acushnet Holdings Corp. | | | 1 | | | | 47 | |
| Adtalem Global Education, Inc. (a) | | | 2 | | | | 83 | |
| Airbnb, Inc. (a) | | | 15 | | | | 1,604 | |
| AutoZone, Inc. (a) | | | 1 | | | | 2,533 | |
| Bath & Body Works, Inc. | | | 11 | | | | 367 | |
| Bed Bath & Beyond, Inc. (a) | | | 3 | | | | 14 | |
| Best Buy Co, Inc. | | | 9 | | | | 616 | |
| Burlington Stores, Inc. (a) | | | 3 | | | | 429 | |
| Chewy, Inc. – Class A (a) | | | 4 | | | | 155 | |
| Choice Hotels International, Inc. | | | 2 | | | | 260 | |
| Cracker Barrel Old Country Store, Inc. | | | 2 | | | | 228 | |
| Deckers Outdoor Corp. (a) | | | 2 | | | | 700 | |
See Notes to the Financial Statements
V-SHARES US LEADERSHIP DIVERSITY ETF
Schedule of Investments – Continued
October 31, 2022
| | | Shares | | | Value | |
| Consumer Discretionary — 6.7% (Continued) | | | | | | |
| Denny’s Corp. (a) | | | 2 | | | $ | 23 | |
| Dick’s Sporting Goods, Inc. | | | 2 | | | | 227 | |
| eBay, Inc. | | | 26 | | | | 1,036 | |
| EVgo, Inc. – Class A (a) | | | 4 | | | | 30 | |
| Expedia Group, Inc. – Class A (a) | | | 6 | | | | 561 | |
| Fisker, Inc. – Class A (a) | | | 7 | | | | 57 | |
| Floor & Decor Holdings, Inc. (a) | | | 4 | | | | 293 | |
| Foot Locker, Inc. | | | 4 | | | | 127 | |
| Gap Inc. | | | 12 | | | | 135 | |
| General Motors Co. | | | 60 | | | | 2,355 | |
| G-III Apparel Group Ltd. (a) | | | 1 | | | | 19 | |
| Goodyear Tire & Rubber Co. (a) | | | 13 | | | | 165 | |
| H&R Block, Inc. | | | 8 | | | | 329 | |
| Hanesbrands, Inc. | | | 16 | | | | 109 | |
| Home Depot Inc. | | | 46 | | | | 13,622 | |
| Kohl’s Corp. | | | 6 | | | | 180 | |
| Lear Corp. | | | 2 | | | | 277 | |
| Leggett & Platt, Inc. | | | 6 | | | | 202 | |
| Leslie’s, Inc. (a) | | | 7 | | | | 98 | |
| Levi Strauss & Co. – Class A | | | 4 | | | | 60 | |
| Lowe’s Cos, Inc. | | | 30 | | | | 5,848 | |
| Macy’s, Inc. | | | 13 | | | | 271 | |
| Marriott International Inc. | | | 12 | | | | 1,921 | |
| Mattel, Inc. (a) | | | 16 | | | | 303 | |
| McDonald’s Corp. | | | 33 | | | | 8,998 | |
| MGM Resorts International | | | 17 | | | | 605 | |
| Newell Brands, Inc. | | | 18 | | | | 249 | |
| NIKE, Inc. – Class B | | | 57 | | | | 5,283 | |
| Nordstrom, Inc. | | | 5 | | | | 102 | |
| ODP Corp. (a) | | | 2 | | | | 79 | |
| Papa John’s International, Inc. | | | 1 | | | | 73 | |
| Peloton Interactive, Inc. (a) | | | 13 | | | | 109 | |
| Petco Health & Wellness Co, Inc. – Class A (a) | | | 4 | | | | 42 | |
| Planet Fitness, Inc. – Class A (a) | | | 4 | | | | 262 | |
| Playa Hotels & Resorts (a) | | | 5 | | | | 31 | |
| PowerSchool Holdings, Inc. (a) | | | 1 | | | | 20 | |
| QuantumScape Corp. (a) | | | 9 | | | | 75 | |
| RH (a) | | | 1 | | | | 254 | |
| Shake Shack, Inc. – Class A (a) | | | 2 | | | | 111 | |
| Starbucks Corp. | | | 52 | | | | 4,503 | |
| Steven Madden Ltd. | | | 4 | | | | 119 | |
See Notes to the Financial Statements
V-SHARES US LEADERSHIP DIVERSITY ETF
Schedule of Investments – Continued
October 31, 2022
| | | Shares | | | Value | |
| Consumer Discretionary — 6.7% (Continued) | | | | | | |
| Stitch Fix, Inc. – Class A (a) | | | 4 | | | $ | 16 | |
| Stride, Inc. (a) | | | 2 | | | | 67 | |
| Tapestry, Inc. | | | 12 | | | | 380 | |
| Target Corp. | | | 21 | | | | 3,449 | |
| TJX Cos Inc. | | | 50 | | | | 3,605 | |
| Topgolf Callaway Brands Corp. (a) | | | 6 | | | | 112 | |
| Tractor Supply Co. | | | 5 | | | | 1,099 | |
| Ulta Beauty, Inc. (a) | | | 2 | | | | 839 | |
| Under Armour, Inc. – Class A (a) | | | 8 | | | | 60 | |
| Under Armour, Inc. – Class C (a) | | | 10 | | | | 66 | |
| Whirlpool Corp. | | | 2 | | | | 276 | |
| Williams-Sonoma, Inc. | | | 4 | | | | 495 | |
| Wingstop, Inc. | | | 2 | | | | 317 | |
| WW International, Inc. (a) | | | 2 | | | | 9 | |
| Yum China Holdings, Inc. | | | 19 | | | | 786 | |
| Yum! Brands, Inc. | | | 13 | | | | 1,537 | |
| | | | | | | | 69,469 | |
| Consumer Staples — 6.6% | | | | | | | | |
| Altria Group, Inc. | | | 80 | | | | 3,702 | |
| Archer-Daniels-Midland Co. | | | 25 | | | | 2,425 | |
| Beyond Meat, Inc. (a) | | | 2 | | | | 31 | |
| Bunge Ltd. | | | 6 | | | | 592 | |
| Campbell Soup Co. | | | 10 | | | | 529 | |
| Casey’s General Stores, Inc. | | | 2 | | | | 465 | |
| Clorox Co. | | | 6 | | | | 876 | |
| Coca-Cola Co. | | | 174 | | | | 10,414 | |
| Conagra Brands, Inc. | | | 22 | | | | 807 | |
| Constellation Brands, Inc. – Class A | | | 7 | | | | 1,730 | |
| Coty, Inc. (a) | | | 16 | | | | 107 | |
| Edgewell Personal Care Co. | | | 2 | | | | 78 | |
| e.l.f. Beauty, Inc. (a) | | | 2 | | | | 87 | |
| Energizer Holdings, Inc. | | | 4 | | | | 116 | |
| Estee Lauder Cos, Inc. – Class A | | | 10 | | | | 2,005 | |
| Fresh Del Monte Produce, Inc. – ADR | | | 2 | | | | 52 | |
| General Mills, Inc. | | | 27 | | | | 2,203 | |
| Hormel Foods Corp. | | | 13 | | | | 604 | |
| Ingredion, Inc. | | | 3 | | | | 267 | |
| Kellogg Co. | | | 11 | | | | 845 | |
| Kimberly-Clark Corp. | | | 16 | | | | 1,991 | |
| Kraft Heinz Co. | | | 30 | | | | 1,154 | |
See Notes to the Financial Statements
V-SHARES US LEADERSHIP DIVERSITY ETF
Schedule of Investments – Continued
October 31, 2022
| | | Shares | | | Value | |
| Consumer Staples — 6.6% (Continued) | | | | | | |
| Kroger Co. | | | 30 | | | $ | 1,419 | |
| McCormick & Co Inc. | | | 11 | | | | 865 | |
| Molson Coors Beverage Co. | | | 8 | | | | 404 | |
| Nu Skin Enterprises, Inc. | | | 2 | | | | 76 | |
| PepsiCo, Inc. | | | 62 | | | | 11,258 | |
| Philip Morris International, Inc. | | | 68 | | | | 6,246 | |
| PriceSmart, Inc. | | | 2 | | | | 128 | |
| Procter & Gamble Co. | | | 108 | | | | 14,544 | |
| Tyson Foods, Inc. – Class A | | | 13 | | | | 889 | |
| United Natural Foods, Inc. (a) | | | 2 | | | | 85 | |
| Walgreens Boots Alliance, Inc. | | | 28 | | | | 1,022 | |
| | | | | | | | 68,016 | |
| Energy — 3.1% | | | | | | | | |
| California Resources Corp. | | | 4 | | | | 180 | |
| ChampionX Corp. | | | 10 | | | | 286 | |
| Chevron Corp. | | | 86 | | | | 15,557 | |
| ConocoPhillips | | | 59 | | | | 7,439 | |
| Marathon Petroleum Corp. | | | 25 | | | | 2,841 | |
| Schlumberger | | | 63 | | | | 3,278 | |
| Valero Energy Corp. | | | 19 | | | | 2,386 | |
| | | | | | | | 31,967 | |
| Financials — 9.5% | | | | | | | | |
| Aflac, Inc. | | | 26 | | | | 1,693 | |
| Allstate Corp. | | | 13 | | | | 1,641 | |
| American Equity Investment Life Holding Co. | | | 4 | | | | 172 | |
| American Express Co. | | | 26 | | | | 3,860 | |
| Associated Banc-Corp. | | | 6 | | | | 146 | |
| Assurant, Inc. | | | 2 | | | | 272 | |
| Assured Guaranty Ltd. – ADR | | | 3 | | | | 178 | |
| Bank of America Corp. | | | 316 | | | | 11,389 | |
| Bank of Hawaii Corp. | | | 2 | | | | 152 | |
| Bank of New York Mellon Corp. | | | 33 | | | | 1,390 | |
| BankUnited, Inc. | | | 4 | | | | 144 | |
| Banner Corp. | | | 1 | | | | 75 | |
| BlackRock, Inc. | | | 7 | | | | 4,521 | |
| Brighthouse Financial, Inc. (a) | | | 4 | | | | 228 | |
| Cadence Bank | | | 8 | | | | 221 | |
| Capital One Financial Corp. | | | 18 | | | | 1,908 | |
| Cathay General Bancorp | | | 4 | | | | 182 | |
| Cboe Global Markets, Inc. | | | 5 | | | | 623 | |
See Notes to the Financial Statements
V-SHARES US LEADERSHIP DIVERSITY ETF
Schedule of Investments – Continued
October 31, 2022
| | | Shares | | | Value | |
| Financials — 9.5% (Continued) | | | | | | |
| Charles Schwab Corp. | | | 69 | | | $ | 5,497 | |
| Citigroup, Inc. | | | 87 | | | | 3,990 | |
| Columbia Banking System, Inc. | | | 4 | | | | 134 | |
| Comerica, Inc. | | | 6 | | | | 423 | |
| CVB Financial Corp. | | | 6 | | | | 172 | |
| Discover Financial Services | | | 13 | | | | 1,358 | |
| East West Bancorp, Inc. | | | 6 | | | | 429 | |
| Eastern Bankshares, Inc. | | | 8 | | | | 153 | |
| Employers Holdings, Inc. | | | 2 | | | | 87 | |
| Encore Capital Group, Inc. (a) | | | 1 | | | | 51 | |
| FactSet Research Systems, Inc. | | | 1 | | | | 425 | |
| Fifth Third Bancorp | | | 31 | | | | 1,106 | |
| First Bancorp – ADR | | | 9 | | | | 142 | |
| First Hawaiian, Inc. | | | 6 | | | | 153 | |
| First Horizon Corp. | | | 23 | | | | 564 | |
| First Republic Bank | | | 7 | | | | 841 | |
| Focus Financial Partners, Inc. (a) | | | 2 | | | | 70 | |
| Franklin Resources, Inc. | | | 13 | | | | 305 | |
| Fulton Financial Corp. | | | 8 | | | | 146 | |
| Goldman Sachs Group Inc. | | | 15 | | | | 5,168 | |
| Hartford Financial Services Group Inc. | | | 15 | | | | 1,086 | |
| Hope Bancorp, Inc. | | | 6 | | | | 81 | |
| Huntington Bancshares Inc. | | | 64 | | | | 972 | |
| Independent Bank Corp. | | | 2 | | | | 174 | |
| Intercontinental Exchange, Inc. | | | 25 | | | | 2,389 | |
| Kemper Corp. | | | 2 | | | | 95 | |
| KeyCorp | | | 42 | | | | 751 | |
| Lemonade, Inc. (a) | | | 1 | | | | 24 | |
| Lincoln National Corp. | | | 7 | | | | 377 | |
| Markel Corp. (a) | | | 1 | | | | 1,206 | |
| Marsh & McLennan Cos, Inc. | | | 23 | | | | 3,714 | |
| MetLife, Inc. | | | 27 | | | | 1,977 | |
| Morgan Stanley | | | 62 | | | | 5,095 | |
| Morningstar, Inc. | | | 1 | | | | 232 | |
| MSCI, Inc. | | | 4 | | | | 1,875 | |
| Nasdaq, Inc. | | | 15 | | | | 934 | |
| Northern Trust Corp. | | | 9 | | | | 759 | |
| OFG Bancorp | | | 2 | | | | 56 | |
| Old National Bancorp | | | 13 | | | | 254 | |
| Pacific Premier Bancorp, Inc. | | | 4 | | | | 146 | |
| PNC Financial Services Group, Inc. | | | 19 | | | | 3,075 | |
See Notes to the Financial Statements
V-SHARES US LEADERSHIP DIVERSITY ETF
Schedule of Investments – Continued
October 31, 2022
| | | Shares | | | Value | |
| Financials — 9.5% (Continued) | | | | | | |
| Popular, Inc. – ADR | | | 4 | | | $ | 283 | |
| PRA Group, Inc. (a) | | | 2 | | | | 67 | |
| Primerica, Inc. | | | 2 | | | | 289 | |
| Principal Financial Group, Inc. | | | 12 | | | | 1,058 | |
| ProAssurance Corp. | | | 2 | | | | 44 | |
| PROG Holdings, Inc. (a) | | | 2 | | | | 33 | |
| Prudential Financial, Inc. | | | 15 | | | | 1,578 | |
| Raymond James Financial, Inc. | | | 8 | | | | 945 | |
| Regions Financial Corp. | | | 42 | | | | 922 | |
| Reinsurance Group of America, Inc. | | | 2 | | | | 294 | |
| SiriusPoint Ltd. (a) | | | 3 | | | | 19 | |
| State Street Corp. | | | 16 | | | | 1,184 | |
| Synchrony Financial | | | 23 | | | | 818 | |
| Synovus Financial Corp. | | | 6 | | | | 239 | |
| T Rowe Price Group, Inc. | | | 10 | | | | 1,062 | |
| Triumph Bancorp, Inc. (a) | | | 1 | | | | 52 | |
| Truist Financial Corp. | | | 60 | | | | 2,687 | |
| Umpqua Holdings Corp. | | | 10 | | | | 199 | |
| Unum Group | | | 7 | | | | 319 | |
| Upstart Holdings, Inc. (a) | | | 3 | | | | 70 | |
| U.S. Bancorp | | | 60 | | | | 2,547 | |
| Washington Federal, Inc. | | | 3 | | | | 116 | |
| Webster Financial Corp. | | | 7 | | | | 380 | |
| Wells Fargo & Co. | | | 171 | | | | 7,864 | |
| Zions Bancorporation | | | 7 | | | | 364 | |
| | | | | | | | 98,714 | |
| Health Care — 18.2% | | | | | | | | |
| 10X Genomics, Inc. – Class A (a) | | | 4 | | | | 109 | |
| AbbVie, Inc. | | | 80 | | | | 11,712 | |
| Accolade, Inc. (a) | | | 2 | | | | 22 | |
| Agilent Technologies, Inc. | | | 14 | | | | 1,937 | |
| Align Technology, Inc. (a) | | | 4 | | | | 777 | |
| Allogene Therapeutics, Inc. (a) | | | 4 | | | | 41 | |
| Alnylam Pharmaceuticals, Inc. (a) | | | 6 | | | | 1,244 | |
| AMN Healthcare Services, Inc. (a) | | | 2 | | | | 251 | |
| Amphastar Pharmaceuticals, Inc. (a) | | | 1 | | | | 31 | |
| Apollo Medical Holdings, Inc. (a) | | | 1 | | | | 35 | |
| Arcutis Biotherapeutics, Inc. (a) | | | 2 | | | | 35 | |
| Avantor, Inc. (a) | | | 24 | | | | 484 | |
| Baxter International, Inc. | | | 23 | | | | 1,250 | |
See Notes to the Financial Statements
V-SHARES US LEADERSHIP DIVERSITY ETF
Schedule of Investments – Continued
October 31, 2022
| | | Shares | | | Value | |
| Health Care — 18.2% (Continued) | | | | | | |
| Biogen, Inc. (a) | | | 6 | | | $ | 1,701 | |
| Boston Scientific Corp. (a) | | | 64 | | | | 2,759 | |
| Bridgebio Pharma, Inc. (a) | | | 4 | | | | 42 | |
| Bristol-Myers Squibb Co. | | | 96 | | | | 7,437 | |
| Cardinal Health, Inc. | | | 13 | | | | 987 | |
| CareDx, Inc. (a) | | | 2 | | | | 40 | |
| Centene Corp. (a) | | | 25 | | | | 2,128 | |
| Cerevel Therapeutics Holdings, Inc. (a) | | | 2 | | | | 56 | |
| Cigna Corp. | | | 15 | | | | 4,846 | |
| Community Health Systems, Inc. (a) | | | 6 | | | | 17 | |
| CVS Health Corp. | | | 59 | | | | 5,587 | |
| Danaher Corp. | | | 30 | | | | 7,550 | |
| DaVita, Inc. (a) | | | 3 | | | | 219 | |
| Denali Therapeutics, Inc. (a) | | | 3 | | | | 86 | |
| DENTSPLY SIRONA, Inc. | | | 9 | | | | 277 | |
| Edwards Lifesciences Corp. (a) | | | 27 | | | | 1,956 | |
| Elanco Animal Health, Inc. (a) | | | 20 | | | | 264 | |
| Elevance Health, Inc. | | | 11 | | | | 6,014 | |
| Eli Lilly & Co. | | | 38 | | | | 13,759 | |
| Enovis Corp. (a) | | | 2 | | | | 99 | |
| Envista Holdings Corp. (a) | | | 8 | | | | 264 | |
| Fate Therapeutics, Inc. (a) | | | 4 | | | | 84 | |
| FibroGen, Inc. (a) | | | 3 | | | | 49 | |
| Gilead Sciences, Inc. | | | 56 | | | | 4,394 | |
| Guardant Health, Inc. (a) | | | 4 | | | | 198 | |
| Halozyme Therapeutics, Inc. (a) | | | 6 | | | | 287 | |
| Henry Schein, Inc. (a) | | | 6 | | | | 411 | |
| Hims & Hers Health, Inc. – Class A (a) | | | 5 | | | | 23 | |
| ICU Medical, Inc. (a) | | | 1 | | | | 148 | |
| IDEXX Laboratories, Inc. (a) | | | 4 | | | | 1,439 | |
| Illumina, Inc. (a) | | | 7 | | | | 1,602 | |
| ImmunityBio, Inc. (a) | | | 4 | | | | 22 | |
| Intuitive Surgical, Inc. (a) | | | 16 | | | | 3,944 | |
| IQVIA Holdings, Inc. (a) | | | 8 | | | | 1,677 | |
| iRhythm Technologies, Inc. (a) | | | 1 | | | | 127 | |
| Johnson & Johnson | | | 118 | | | | 20,528 | |
| Laboratory Corp of America Holdings | | | 4 | | | | 887 | |
| Legend Biotech Corp. – ADR (a) | | | 6 | | | | 299 | |
| McKesson Corp. | | | 6 | | | | 2,336 | |
| MEDNAX, Inc. (a) | | | 3 | | | | 58 | |
| Merck & Co, Inc. | | | 113 | | | | 11,436 | |
See Notes to the Financial Statements
V-SHARES US LEADERSHIP DIVERSITY ETF
Schedule of Investments – Continued
October 31, 2022
| | | Shares | | | Value | |
| Health Care — 18.2% (Continued) | | | | | | |
| Mirati Therapeutics, Inc. (a) | | | 2 | | | $ | 135 | |
| Myovant Sciences Ltd. – ADR (a) | | | 2 | | | | 53 | |
| Myriad Genetics, Inc. (a) | | | 4 | | | | 83 | |
| Oak Street Health, Inc. (a) | | | 6 | | | | 121 | |
| Penumbra, Inc. (a) | | | 2 | | | | 343 | |
| Pfizer, Inc. | | | 254 | | | | 11,824 | |
| Regeneron Pharmaceuticals, Inc. (a) | | | 5 | | | | 3,744 | |
| Relay Therapeutics, Inc. (a) | | | 3 | | | | 67 | |
| ResMed, Inc. | | | 6 | | | | 1,342 | |
| Seer, Inc. (a) | | | 2 | | | | 16 | |
| Stryker Corp. | | | 15 | | | | 3,439 | |
| Teladoc Health, Inc. (a) | | | 6 | | | | 178 | |
| Tenet Healthcare Corp. (a) | | | 4 | | | | 177 | |
| Thermo Fisher Scientific, Inc. | | | 18 | | | | 9,251 | |
| United Therapeutics Corp. (a) | | | 2 | | | | 461 | |
| UnitedHealth Group, Inc. | | | 42 | | | | 23,316 | |
| Vertex Pharmaceuticals, Inc. (a) | | | 12 | | | | 3,744 | |
| Vir Biotechnology, Inc. (a) | | | 4 | | | | 88 | |
| Waters Corp. (a) | | | 3 | | | | 898 | |
| Xencor, Inc. (a) | | | 2 | | | | 56 | |
| Zimmer Biomet Holdings, Inc. | | | 10 | | | | 1,133 | |
| Zoetis, Inc. | | | 22 | | | | 3,317 | |
| | | | | | | | 187,751 | |
| Industrials — 6.6% | | | | | | | | |
| 3M Co. | | | 26 | | | | 3,270 | |
| A O Smith Corp. | | | 5 | | | | 274 | |
| ABM Industries, Inc. | | | 3 | | | | 133 | |
| AGCO Corp. | | | 2 | | | | 248 | |
| Alaska Air Group, Inc. (a) | | | 6 | | | | 267 | |
| American Airlines Group, Inc. (a) | | | 29 | | | | 411 | |
| Apogee Enterprises, Inc. | | | 2 | | | | 92 | |
| Arcosa, Inc. | | | 2 | | | | 128 | |
| ASGN, Inc. (a) | | | 2 | | | | 170 | |
| Atlas Air Worldwide Holdings, Inc. (a) | | | 2 | | | | 202 | |
| Axon Enterprise, Inc. (a) | | | 4 | | | | 582 | |
| AZEK Co., Inc. (a) | | | 5 | | | | 88 | |
| Barnes Group, Inc. | | | 2 | | | | 71 | |
| Boeing Co. (a) | | | 27 | | | | 3,848 | |
| Booz Allen Hamilton Holding Corp. | | | 6 | | | | 653 | |
| Chart Industries, Inc. (a) | | | 2 | | | | 446 | |
See Notes to the Financial Statements
V-SHARES US LEADERSHIP DIVERSITY ETF
Schedule of Investments – Continued
October 31, 2022
| | | Shares | | | Value | |
| Industrials — 6.6% (Continued) | | | | | | |
| Cummins, Inc. | | | 6 | | | $ | 1,467 | |
| Deere & Co. | | | 13 | | | | 5,146 | |
| Eaton Corp PLC – ADR | | | 18 | | | | 2,701 | |
| Evoqua Water Technologies Corp. (a) | | | 5 | | | | 196 | |
| FedEx Corp. | | | 11 | | | | 1,763 | |
| Fluence Energy, Inc. (a) | | | 1 | | | | 15 | |
| Fortive Corp. | | | 16 | | | | 1,022 | |
| Fortune Brands Home & Security, Inc. | | | 5 | | | | 302 | |
| Forward Air Corp. | | | 2 | | | | 212 | |
| FTI Consulting, Inc. (a) | | | 2 | | | | 311 | |
| FuelCell Energy, Inc. (a) | | | 16 | | | | 50 | |
| General Electric Co. | | | 48 | | | | 3,735 | |
| GEO Group Inc. (a) | | | 6 | | | | 51 | |
| Granite Construction, Inc. | | | 2 | | | | 67 | |
| Greenbrier Cos Inc. | | | 1 | | | | 35 | |
| Griffon Corp. | | | 2 | | | | 64 | |
| Hillenbrand, Inc. | | | 3 | | | | 132 | |
| Honeywell International, Inc. | | | 30 | | | | 6,121 | |
| Jacobs Solutions, Inc. | | | 6 | | | | 691 | |
| JetBlue Airways Corp. (a) | | | 15 | | | | 121 | |
| Joby Aviation, Inc. (a) | | | 11 | | | | 53 | |
| KBR, Inc. | | | 6 | | | | 299 | |
| Kelly Services, Inc. | | | 1 | | | | 16 | |
| Kennametal, Inc. | | | 4 | | | | 107 | |
| Korn Ferry | | | 2 | | | | 111 | |
| Landstar System, Inc. | | | 1 | | | | 156 | |
| Lincoln Electric Holdings, Inc. | | | 2 | | | | 284 | |
| Lyft, Inc. – Class A (a) | | | 12 | | | | 176 | |
| Matson, Inc. | | | 2 | | | | 147 | |
| Maxar Technologies, Inc. | | | 3 | | | | 67 | |
| Montrose Environmental Group, Inc. (a) | | | 1 | | | | 44 | |
| Norfolk Southern Corp. | | | 11 | | | | 2,509 | |
| Northrop Grumman Corp. | | | 6 | | | | 3,294 | |
| nVent Electric PLC – ADR | | | 8 | | | | 292 | |
| Otis Worldwide Corp. | | | 19 | | | | 1,342 | |
| Owens Corning | | | 4 | | | | 342 | |
| Pentair PLC – ADR | | | 8 | | | | 344 | |
| Regal Rexnord Corp. | | | 4 | | | | 506 | |
| Republic Services, Inc. | | | 9 | | | | 1,194 | |
| Ryder System, Inc. | | | 2 | | | | 161 | |
| Saia, Inc. (a) | | | 2 | | | | 398 | |
See Notes to the Financial Statements
V-SHARES US LEADERSHIP DIVERSITY ETF
Schedule of Investments – Continued
October 31, 2022
| | | Shares | | | Value | |
| Industrials — 6.6% (Continued) | | | | | | |
| Stanley Black & Decker, Inc. | | | 8 | | | $ | 628 | |
| Toro Co. | | | 4 | | | | 422 | |
| Trane Technologies PLC – ADR | | | 11 | | | | 1,756 | |
| TriNet Group, Inc. (a) | | | 2 | | | | 130 | |
| Trinity Industries, Inc. | | | 4 | | | | 114 | |
| TrueBlue, Inc. (a) | | | 2 | | | | 39 | |
| Uber Technologies, Inc. (a) | | | 80 | | | | 2,126 | |
| Union Pacific Corp. | | | 27 | | | | 5,323 | |
| United Parcel Service, Inc. – Class B | | | 33 | | | | 5,536 | |
| United Rentals, Inc. (a) | | | 3 | | | | 947 | |
| Waste Management, Inc. | | | 19 | | | | 3,009 | |
| WW Grainger, Inc. | | | 2 | | | | 1,169 | |
| | | | | | | | 68,126 | |
Information Technology — 33.7%# | | | | | | | | |
| 8x8, Inc. (a) | | | 6 | | | | 25 | |
| Accenture PLC – ADR | | | 30 | | | | 8,517 | |
| ACI Worldwide, Inc. (a) | | | 6 | | | | 146 | |
| ACM Research, Inc. (a) | | | 1 | | | | 6 | |
| Adobe, Inc. (a) | | | 21 | | | | 6,688 | |
| Advanced Micro Devices, Inc. (a) | | | 72 | | | | 4,324 | |
| Affirm Holdings, Inc. (a) | | | 8 | | | | 161 | |
| Akamai Technologies, Inc. (a) | | | 8 | | | | 707 | |
| Ambarella, Inc. (a) | | | 1 | | | | 55 | |
| Amkor Technology, Inc. | | | 3 | | | | 62 | |
| Analog Devices, Inc. | | | 24 | | | | 3,423 | |
| ANSYS, Inc. (a) | | | 4 | | | | 885 | |
| Apple, Inc. | | | 673 | | | | 103,198 | |
| Applied Materials, Inc. | | | 40 | | | | 3,532 | |
| Arista Networks, Inc. (a) | | | 10 | | | | 1,209 | |
| Atlassian Corp. PLC – Class A – ADR (a) | | | 6 | | | | 1,216 | |
| Automatic Data Processing, Inc. | | | 19 | | | | 4,592 | |
| Avnet, Inc. | | | 4 | | | | 161 | |
| Axcelis Technologies, Inc. (a) | | | 2 | | | | 116 | |
| Black Knight, Inc. (a) | | | 7 | | | | 423 | |
| Blackline, Inc. (a) | | | 2 | | | | 112 | |
| Broadcom, Inc. | | | 18 | | | | 8,462 | |
| Broadridge Financial Solutions, Inc. – ADR | | | 6 | | | | 900 | |
| Cadence Design Systems, Inc. (a) | | | 12 | | | | 1,817 | |
| CDW Corp. | | | 6 | | | | 1,037 | |
| Cerence, Inc. (a) | | | 1 | | | | 17 | |
See Notes to the Financial Statements
V-SHARES US LEADERSHIP DIVERSITY ETF
Schedule of Investments – Continued
October 31, 2022
| | | Shares | | | Value | |
Information Technology — 33.7%# (Continued) | | | | | | |
| Cisco Systems Inc. | | | 171 | | | $ | 7,769 | |
| Cognex Corp. | | | 8 | | | | 370 | |
| Cognizant Technology Solutions Corp. | | | 24 | | | | 1,494 | |
| Coherent Corp. (a) | | | 4 | | | | 134 | |
| CommVault Systems, Inc. (a) | | | 2 | | | | 122 | |
| Corning, Inc. | | | 35 | | | | 1,126 | |
| Corsair Gaming, Inc. (a) | | | 1 | | | | 14 | |
| CSG Systems International, Inc. | | | 2 | | | | 129 | |
| Diodes, Inc. (a) | | | 2 | | | | 143 | |
| DocuSign, Inc. (a) | | | 9 | | | | 435 | |
| Dolby Laboratories, Inc. | | | 2 | | | | 134 | |
| Dropbox, Inc. (a) | | | 12 | | | | 261 | |
| DXC Technology Co. (a) | | | 11 | | | | 316 | |
| Elastic (a) | | | 3 | | | | 192 | |
| Envestnet, Inc. (a) | | | 2 | | | | 99 | |
| Evo Payments, Inc. (a) | | | 2 | | | | 67 | |
| ExlService Holdings, Inc. (a) | | | 2 | | | | 364 | |
| F5, Inc. (a) | | | 2 | | | | 286 | |
| Fastly, Inc. (a) | | | 4 | | | | 34 | |
| Fiserv, Inc. (a) | | | 26 | | | | 2,671 | |
| Flex Ltd. – ADR (a) | | | 21 | | | | 411 | |
| Fortinet, Inc. (a) | | | 30 | | | | 1,715 | |
| Genpact Ltd. – ADR | | | 8 | | | | 388 | |
| Global Payments, Inc. | | | 13 | | | | 1,485 | |
| Guidewire Software, Inc. (a) | | | 4 | | | | 238 | |
| Hewlett Packard Enterprise Co. | | | 59 | | | | 842 | |
| HP, Inc. | | | 48 | | | | 1,326 | |
| HubSpot, Inc. (a) | | | 2 | | | | 593 | |
| Insight Enterprises, Inc. (a) | | | 2 | | | | 189 | |
| Intel Corp. | | | 184 | | | | 5,231 | |
| Intuit, Inc. | | | 12 | | | | 5,130 | |
| Jamf Holding Corp. (a) | | | 2 | | | | 47 | |
| Juniper Networks, Inc. | | | 15 | | | | 459 | |
| Keysight Technologies, Inc. (a) | | | 8 | | | | 1,393 | |
| KLA Corp. | | | 7 | | | | 2,215 | |
| Lam Research Corp. | | | 6 | | | | 2,429 | |
| Littelfuse, Inc. | | | 1 | | | | 220 | |
| LiveRamp Holdings, Inc. (a) | | | 3 | | | | 55 | |
| Mastercard, Inc. | | | 39 | | | | 12,799 | |
| Micron Technology, Inc. | | | 50 | | | | 2,705 | |
| Microsoft Corp. | | | 334 | | | | 77,531 | |
See Notes to the Financial Statements
V-SHARES US LEADERSHIP DIVERSITY ETF
Schedule of Investments – Continued
October 31, 2022
| | | Shares | | | Value | |
Information Technology — 33.7%# (Continued) | | | | | | |
| MKS Instruments, Inc. | | | 2 | | | $ | 164 | |
| Momentive Global, Inc. (a) | | | 5 | | | | 39 | |
| NetApp, Inc. | | | 10 | | | | 693 | |
| NETGEAR, Inc. (a) | | | 2 | | | | 39 | |
| NortonLifeLock, Inc. | | | 26 | | | | 586 | |
| NVIDIA Corp. | | | 126 | | | | 17,006 | |
| PagerDuty, Inc. (a) | | | 4 | | | | 100 | |
| Palo Alto Networks, Inc. (a) | | | 12 | | | | 2,059 | |
| Power Integrations, Inc. | | | 2 | | | | 133 | |
| Progress Software Corp. | | | 2 | | | | 102 | |
| QUALCOMM, Inc. | | | 51 | | | | 6,001 | |
| Rambus, Inc. (a) | | | 4 | | | | 121 | |
| Rapid7, Inc. (a) | | | 2 | | | | 91 | |
| Seagate Technology Holdings PLC – ADR | | | 9 | | | | 447 | |
| Semtech Corp. (a) | | | 3 | | | | 83 | |
| ServiceNow, Inc. (a) | | | 9 | | | | 3,787 | |
| Silicon Laboratories, Inc. (a) | | | 1 | | | | 115 | |
| Splunk, Inc. (a) | | | 8 | | | | 665 | |
| Super Micro Computer, Inc. (a) | | | 1 | | | | 70 | |
| Synaptics, Inc. (a) | | | 2 | | | | 177 | |
| Synopsys, Inc. (a) | | | 7 | | | | 2,048 | |
| TD SYNNEX Corp. | | | 2 | | | | 183 | |
| TE Connectivity Ltd. – ADR | | | 15 | | | | 1,833 | |
| Teledyne Technologies, Inc. (a) | | | 2 | | | | 796 | |
| Tenable Holdings, Inc. (a) | | | 4 | | | | 163 | |
| Teradata Corp. (a) | | | 5 | | | | 158 | |
| Texas Instruments, Inc. | | | 42 | | | | 6,746 | |
| Unisys Corp. (a) | | | 3 | | | | 25 | |
| Unity Software, Inc. (a) | | | 8 | | | | 236 | |
| Viasat, Inc. (a) | | | 4 | | | | 164 | |
| Visa, Inc. – Class A | | | 74 | | | | 15,330 | |
| Western Digital Corp. (a) | | | 14 | | | | 481 | |
| Western Union Co. | | | 18 | | | | 243 | |
| WEX, Inc. (a) | | | 2 | | | | 328 | |
| WM Technology, Inc. – Class A (a) | | | 2 | | | | 4 | |
| Workday, Inc. – Class A (a) | | | 8 | | | | 1,247 | |
| Xerox Holdings Corp. | | | 5 | | | | 73 | |
| Zendesk, Inc. (a) | | | 6 | | | | 460 | |
| Zuora, Inc. – Class A (a) | | | 6 | | | | 46 | |
| | | | | | | | 348,394 | |
See Notes to the Financial Statements
V-SHARES US LEADERSHIP DIVERSITY ETF
Schedule of Investments – Continued
October 31, 2022
| | | Shares | | | Value | |
| Materials — 1.9% | | | | | | |
| Air Products and Chemicals, Inc. | | | 10 | | | $ | 2,504 | |
| Albemarle Corp. | | | 6 | | | | 1,679 | |
| Amcor PLC – ADR | | | 67 | | | | 776 | |
| Amyris, Inc. (a) | | | 9 | | | | 25 | |
| AptarGroup, Inc. | | | 3 | | | | 297 | |
| Avery Dennison Corp. | | | 3 | | | | 509 | |
| Ball Corp. | | | 15 | | | | 741 | |
| CF Industries Holdings, Inc. | | | 9 | | | | 956 | |
| Cleveland-Cliffs, Inc. (a) | | | 22 | | | | 286 | |
| Dow, Inc. | | | 33 | | | | 1,542 | |
| International Flavors & Fragrances, Inc. | | | 11 | | | | 1,074 | |
| International Paper Co. | | | 17 | | | | 571 | |
| Livent Corp. (a) | | | 8 | | | | 253 | |
| Martin Marietta Materials, Inc. | | | 3 | | | | 1,008 | |
| Newmont Corp. | | | 36 | | | | 1,524 | |
| Nucor Corp. | | | 12 | | | | 1,577 | |
| PPG Industries, Inc. | | | 11 | | | | 1,256 | |
| Reliance Steel & Aluminum Co. | | | 2 | | | | 403 | |
| Sealed Air Corp. | | | 6 | | | | 286 | |
| Sherwin-Williams Co. | | | 11 | | | | 2,475 | |
| | | | | | | | 19,742 | |
| Real Estate — 1.9% | | | | | | | | |
| Alexander & Baldwin, Inc. – REIT | | | 4 | | | | 78 | |
| American Tower Corp. – REIT | | | 20 | | | | 4,144 | |
| Anywhere Real Estate, Inc. (a) | | | 6 | | | | 45 | |
| Apartment Income REIT Corp. – REIT | | | 7 | | | | 269 | |
| Broadstone Net Lease, Inc. – REIT | | | 8 | | | | 137 | |
| Camden Property Trust – REIT | | | 4 | | | | 462 | |
| CBRE Group, Inc. – Class A (a) | | | 15 | | | | 1,064 | |
| Crown Castle International Corp. – REIT | | | 20 | | | | 2,665 | |
| Cushman & Wakefield PLC – ADR (a) | | | 7 | | | | 81 | |
| DigitalBridge Group, Inc. – Class A – REIT | | | 6 | | | | 77 | |
| Douglas Emmett, Inc. – REIT | | | 7 | | | | 123 | |
| Equity Residential – REIT | | | 17 | | | | 1,071 | |
| Hudson Pacific Properties, Inc. – REIT | | | 6 | | | | 66 | |
| Jones Lang LaSalle, Inc. (a) | | | 2 | | | | 318 | |
| Marcus & Millichap, Inc. | | | 1 | | | | 37 | |
| Prologis, Inc. – REIT | | | 33 | | | | 3,655 | |
| Public Storage – REIT | | | 7 | | | | 2,168 | |
| Realty Income Corp. – REIT | | | 26 | | | | 1,619 | |
See Notes to the Financial Statements
V-SHARES US LEADERSHIP DIVERSITY ETF
Schedule of Investments – Continued
October 31, 2022
| | | Shares | | | Value | |
| Real Estate — 1.9% (Continued) | | | | | | |
| Retail Opportunity Investments Corp. – REIT | | | 5 | | | $ | 73 | |
| RLJ Lodging Trust – REIT | | | 8 | | | | 97 | |
| Ryman Hospitality Properties, Inc. – REIT | | | 2 | | | | 178 | |
| Tanger Factory Outlet Centers, Inc. – REIT | | | 4 | | | | 72 | |
| Veris Residential, Inc. – REIT (a) | | | 4 | | | | 63 | |
| Vornado Realty Trust – REIT | | | 7 | | | | 165 | |
| Welltower, Inc. – REIT | | | 20 | | | | 1,221 | |
| Xenia Hotels & Resorts, Inc. – REIT | | | 5 | | | | 86 | |
| | | | | | | | 20,034 | |
| Utilities — 2.0% | | | | | | | | |
| AES Corp. | | | 30 | | | | 785 | |
| Ameren Corp. | | | 12 | | | | 978 | |
| American Electric Power Co, Inc. | | | 22 | | | | 1,934 | |
| CenterPoint Energy, Inc. | | | 28 | | | | 801 | |
| CMS Energy Corp. | | | 13 | | | | 742 | |
| Consolidated Edison, Inc. | | | 16 | | | | 1,407 | |
| Edison International | | | 18 | | | | 1,081 | |
| Eversource Energy | | | 16 | | | | 1,220 | |
| Exelon Corp. | | | 44 | | | | 1,698 | |
| Hawaiian Electric Industries, Inc. | | | 3 | | | | 114 | |
| NiSource, Inc. | | | 18 | | | | 462 | |
| NRG Energy, Inc. | | | 11 | | | | 488 | |
| PG&E Corp. (a) | | | 91 | | | | 1,359 | |
| Portland General Electric Co. | | | 4 | | | | 180 | |
| PPL Corp. | | | 33 | | | | 874 | |
| Public Service Enterprise Group, Inc. | | | 23 | | | | 1,290 | |
| Sempra Energy | | | 14 | | | | 2,113 | |
| Southwest Gas Holdings, Inc. | | | 2 | | | | 146 | |
| WEC Energy Group, Inc. | | | 14 | | | | 1,279 | |
| Xcel Energy, Inc. | | | 23 | | | | 1,498 | |
| | | | | | | | 20,449 | |
| Total Common Stocks | | | | | | | | |
| (Cost $1,216,783) | | | | | | | 1,030,267 | |
See Notes to the Financial Statements
V-SHARES US LEADERSHIP DIVERSITY ETF
Schedule of Investments – Continued
October 31, 2022
| | | Shares | | | Value | |
| SHORT-TERM INVESTMENT — 0.5% | | | | | | |
| First American Government Obligations Fund, Class X, 2.92% (b) | | | | | | |
| Total Short-Term Investment | | | | | | |
| (Cost $5,071) | | | 5,071 | | | $ | 5,071 | |
| Total Investments — 100.1% | | | | | | | | |
| (Cost $1,221,854) | | | | | | | 1,035,338 | |
| Other Assets and Liabilities, Net — (0.1)% | | | | | | | (796 | ) |
| Total Net Assets — 100.0% | | | | | | $ | 1,034,542 | |
ADR – American Depositary Receipt.
PLC – Public Limited Company.
REIT – Real Estate Investment Trust.
| # | As of October 31, 2022, the Fund had a significant portion of its assets invested in this sector and therefore is subject to additional risks. See Note 8 in Notes to the Financials Statements.” |
| (a) | Non-income producing security. |
| (b) | The rate shown is the annualized seven-day effective yield as of October 31, 2022. |
The Global Industry Classification Standard (“GICS®”) was developed by and/or is the exclusive property of MSCI, Inc. (“MSCI”) and Standard & Poor’s Financial Services LLC (“S&P”). GICS® is a service mark of MSCI and S&P and has been licensed for use.
See Notes to the Financial Statements
V-SHARES MSCI WORLD ESG MATERIALITY AND CARBON TRANSITION ETF
Schedule of Investments
October 31, 2022
| | | Shares | | | Value | |
| COMMON STOCKS — 99.4% | | | | | | |
| | | | | | | |
| Communication Services — 6.8% | | | | | | |
| Activision Blizzard, Inc. | | | 112 | | | $ | 8,154 | |
| AT&T, Inc. | | | 774 | | | | 14,110 | |
| Auto Trader Group PLC (a) | | | 824 | | | | 4,948 | |
| Comcast Corp. – Class A | | | 464 | | | | 14,727 | |
| Deutsche Telekom (a) | | | 390 | | | | 7,387 | |
| Electronic Arts, Inc. | | | 42 | | | | 5,290 | |
| Interpublic Group of Cos Inc. | | | 122 | | | | 3,634 | |
| KDDI Corp. (a) | | | 400 | | | | 11,828 | |
| Koninklijke KPN NV (a) | | | 974 | | | | 2,725 | |
| Nippon Telegraph & Telephone Corp. (a) | | | 200 | | | | 5,509 | |
| Orange SA (a) | | | 210 | | | | 1,999 | |
| Rogers Communications, Inc. (a) | | | 84 | | | | 3,492 | |
| SoftBank Corp. (a) | | | 600 | | | | 5,916 | |
| Telefonica (a) | | | 1,181 | | | | 4,068 | |
| T-Mobile US, Inc. (b) | | | 64 | | | | 9,700 | |
| Verizon Communications, Inc. | | | 428 | | | | 15,994 | |
| Vodafone Group PLC (a) | | | 4,198 | | | | 4,913 | |
| Walt Disney Co. (b) | | | 204 | | | | 21,734 | |
| WPP PLC (a) | | | 394 | | | | 3,475 | |
| | | | | | | | 149,603 | |
| Consumer Discretionary — 10.9% | | | | | | | | |
| adidas (a) | | | 42 | | | | 4,109 | |
| Amazon.com, Inc. (b) | | | 1,088 | | | | 111,455 | |
| Aptiv PLC (b) | | | 28 | | | | 2,550 | |
| Aristocrat Leisure Ltd. (a) | | | 374 | | | | 8,865 | |
| Bayerische Motoren Werke (a) | | | 50 | | | | 3,930 | |
| Booking Holdings, Inc. (b) | | | 6 | | | | 11,217 | |
| Cie Financiere Richemont (a) | | | 70 | | | | 6,851 | |
| Cie Generale des Etablissements Michelin SCA (a) | | | 160 | | | | 4,081 | |
| Expedia Group, Inc. – Class A (b) | | | 32 | | | | 2,991 | |
| Kering (a) | | | 14 | | | | 6,416 | |
| LVMH Moet Hennessy Louis Vuitton (a) | | | 34 | | | | 21,473 | |
| Panasonic Holdings Corp. (a) | | | 600 | | | | 4,297 | |
| Prosus (a) | | | 91 | | | | 3,961 | |
| Sekisui House Ltd. (a) | | | 400 | | | | 6,660 | |
| Sony Group Corp. (a) | | | 200 | | | | 13,440 | |
| Target Corp. | | | 62 | | | | 10,183 | |
| Toyota Motor Corp. (a) | | | 600 | | | | 8,314 | |
See Notes to the Financial Statements
V-SHARES MSCI WORLD ESG MATERIALITY AND CARBON TRANSITION ETF
Schedule of Investments – Continued
October 31, 2022
| | | Shares | | | Value | |
| Consumer Discretionary — 10.9% (Continued) | | | | | | |
| Tractor Supply Co. | | | 26 | | | $ | 5,714 | |
| VF Corp. | | | 116 | | | | 3,277 | |
| | | | | | | | 239,784 | |
| Consumer Staples — 7.8% | | | | | | | | |
| Anheuser-Busch InBev (a) | | | 136 | | | | 6,801 | |
| Archer-Daniels-Midland Co. | | | 78 | | | | 7,565 | |
| Brown-Forman Corp. | | | 80 | | | | 5,440 | |
| Coca-Cola Co. | | | 418 | | | | 25,017 | |
| Danone (a) | | | 98 | | | | 4,876 | |
| Diageo PLC (a) | | | 288 | | | | 11,931 | |
| General Mills, Inc. | | | 92 | | | | 7,505 | |
| Haleon PLC (a)(b) | | | 490 | | | | 1,512 | |
| Kimberly-Clark Corp. | | | 52 | | | | 6,472 | |
| Kirin Holdings Co Ltd. (a) | | | 600 | | | | 8,838 | |
| L’Oreal (a) | | | 32 | | | | 10,061 | |
| McCormick & Co Inc. | | | 50 | | | | 3,932 | |
| PepsiCo, Inc. | | | 140 | | | | 25,421 | |
| Procter & Gamble Co. | | | 240 | | | | 32,321 | |
| Unilever PLC (a) | | | 336 | | | | 15,375 | |
| | | | | | | | 173,067 | |
| Energy — 5.0% | | | | | | | | |
| Baker Hughes Co. | | | 134 | | | | 3,706 | |
| BP PLC (a) | | | 2,310 | | | | 12,761 | |
| Cameco Corp. (a)(b) | | | 128 | | | | 3,032 | |
| Cheniere Energy, Inc. | | | 26 | | | | 4,587 | |
| Enbridge, Inc. (a) | | | 196 | | | | 7,627 | |
| Equinor ASA (a) | | | 172 | | | | 6,292 | |
| Halliburton Co. | | | 136 | | | | 4,953 | |
| Marathon Petroleum Corp. | | | 80 | | | | 9,090 | |
| ONEOK, Inc. | | | 80 | | | | 4,746 | |
| Phillips 66 | | | 70 | | | | 7,300 | |
| Repsol (a) | | | 318 | | | | 4,320 | |
| Schlumberger (a) | | | 178 | | | | 9,261 | |
| TC Energy Corp. (a)(b) | | | 130 | | | | 5,703 | |
| TotalEnergies (a) | | | 262 | | | | 14,268 | |
| Valero Energy Corp. | | | 58 | | | | 7,282 | |
| Woodside Energy Group Ltd. (a) | | | 202 | | | | 4,647 | |
| | | | | | | | 109,575 | |
See Notes to the Financial Statements
V-SHARES MSCI WORLD ESG MATERIALITY AND CARBON TRANSITION ETF
Schedule of Investments – Continued
October 31, 2022
| | | Shares | | | Value | |
| Financials — 13.9% | | | | | | |
| abrdn PLC (a) | | | 4,642 | | | $ | 8,498 | |
| AIA Group Ltd. (a) | | | 1,200 | | | | 9,088 | |
| Allianz (a) | | | 42 | | | | 7,563 | |
| Australia & New Zealand Banking Group Ltd. (a) | | | 376 | | | | 6,146 | |
| AXA (a) | | | 202 | | | | 4,991 | |
| Banco Bilbao Vizcaya Argentaria (a) | | | 1,408 | | | | 7,249 | |
| Banco Santander (a) | | | 2,826 | | | | 7,323 | |
| Bank of America Corp. | | | 804 | | | | 28,976 | |
| Bank of Montreal (a) | | | 58 | | | | 5,336 | |
| Bank of Nova Scotia (a) | | | 110 | | | | 5,310 | |
| Barclays PLC (a) | | | 2,696 | | | | 4,587 | |
| BNP Paribas (a) | | | 162 | | | | 7,605 | |
| Canadian Imperial Bank of Commerce (a) | | | 98 | | | | 4,445 | |
| Citigroup, Inc. | | | 268 | | | | 12,291 | |
| Commonwealth Bank of Australia (a) | | | 176 | | | | 11,781 | |
| DBS Group Holdings Ltd. (a) | | | 400 | | | | 9,667 | |
| Hong Kong Exchanges & Clearing Ltd. (a) | | | 200 | | | | 5,325 | |
| HSBC Holdings PLC (a) | | | 2,066 | | | | 10,640 | |
| ING Groep (a) | | | 696 | | | | 6,847 | |
| Lloyds Banking Group PLC (a) | | | 11,076 | | | | 5,359 | |
| Macquarie Group Ltd. (a) | | | 54 | | | | 5,853 | |
| Manulife Financial Corp. (a) | | | 502 | | | | 8,310 | |
| Marsh & McLennan Cos, Inc. | | | 46 | | | | 7,429 | |
| MetLife, Inc. | | | 92 | | | | 6,735 | |
| Moody’s Corp. | | | 20 | | | | 5,297 | |
| Morgan Stanley | | | 136 | | | | 11,175 | |
| Muenchener Rueckversicherungs-Gesellschaft (a) | | | 24 | | | | 6,343 | |
| National Australia Bank Ltd. (a) | | | 312 | | | | 6,468 | |
| National Bank of Canada (a) | | | 70 | | | | 4,760 | |
| Nordea Bank (a) | | | 614 | | | | 5,863 | |
| Power Corp of Canada (a) | | | 204 | | | | 5,059 | |
| Principal Financial Group, Inc. | | | 72 | | | | 6,345 | |
| Prudential Financial, Inc. | | | 54 | | | | 5,680 | |
| Prudential PLC (a) | | | 410 | | | | 3,827 | |
| Sampo Oyj (a) | | | 124 | | | | 5,672 | |
| Skandinaviska Enskilda Banken (a) | | | 532 | | | | 5,609 | |
| Sun Life Financial, Inc. (a) | | | 102 | | | | 4,327 | |
| Swiss Re (a) | | | 50 | | | | 3,717 | |
| Toronto-Dominion Bank (a) | | | 162 | | | | 10,355 | |
| UBS Group (a) | | | 434 | | | | 6,891 | |
See Notes to the Financial Statements
V-SHARES MSCI WORLD ESG MATERIALITY AND CARBON TRANSITION ETF
Schedule of Investments – Continued
October 31, 2022
| | | Shares | | | Value | |
| Financials — 13.9% (Continued) | | | | | | |
| Westpac Banking Corp. (a) | | | 434 | | | $ | 6,691 | |
| Zurich Insurance Group AG (a) | | | 12 | | | | 5,124 | |
| | | | | | | | 306,557 | |
| Health Care — 15.0% | | | | | | | | |
| Agilent Technologies, Inc. | | | 60 | | | | 8,301 | |
| Alcon, Inc. (a) | | | 74 | | | | 4,506 | |
| Amgen, Inc. | | | 56 | | | | 15,140 | |
| Argenx (a)(b) | | | 12 | | | | 4,682 | |
| Astellas Pharma, Inc. (a) | | | 200 | | | | 2,754 | |
| AstraZeneca PLC (a) | | | 172 | | | | 20,306 | |
| Avantor, Inc. (b) | | | 138 | | | | 2,783 | |
| Biogen, Inc. (b) | | | 26 | | | | 7,369 | |
| Bio-Techne Corp. | | | 14 | | | | 4,148 | |
| Centene Corp. (b) | | | 70 | | | | 5,959 | |
| Cigna Corp. | | | 38 | | | | 12,276 | |
| CSL Ltd. (a) | | | 56 | | | | 10,044 | |
| Daiichi Sankyo Co Ltd. (a) | | | 200 | | | | 6,414 | |
| Danaher Corp. | | | 78 | | | | 19,630 | |
| Dexcom, Inc. (b) | | | 72 | | | | 8,696 | |
| Edwards Lifesciences Corp. (b) | | | 86 | | | | 6,229 | |
| Elevance Health, Inc. | | | 24 | | | | 13,123 | |
| Genmab (a)(b) | | | 22 | | | | 8,482 | |
| Gilead Sciences, Inc. | | | 152 | | | | 11,926 | |
| GSK PLC (a) | | | 392 | | | | 6,449 | |
| HCA Healthcare, Inc. | | | 30 | | | | 6,524 | |
| Horizon Therapeutics PLC (b) | | | 46 | | | | 2,867 | |
| Humana, Inc. | | | 18 | | | | 10,045 | |
| IDEXX Laboratories, Inc. (b) | | | 16 | | | | 5,755 | |
| Illumina, Inc. (b) | | | 22 | | | | 5,034 | |
| Intuitive Surgical, Inc. (b) | | | 48 | | | | 11,831 | |
| IQVIA Holdings, Inc. (b) | | | 30 | | | | 6,290 | |
| Lonza Group (a) | | | 14 | | | | 7,210 | |
| Merck KGaA (a) | | | 20 | | | | 3,262 | |
| Mettler-Toledo International, Inc. (b) | | | 4 | | | | 5,060 | |
| Novo Nordisk (a) | | | 176 | | | | 19,139 | |
| Ono Pharmaceutical Co Ltd. (a) | | | 200 | | | | 4,704 | |
| Ramsay Health Care Ltd. (a) | | | 70 | | | | 2,622 | |
| ResMed, Inc. | | | 28 | | | | 6,263 | |
| Roche Holding (a) | | | 74 | | | | 24,590 | |
| Teleflex, Inc. | | | 18 | | | | 3,862 | |
See Notes to the Financial Statements
V-SHARES MSCI WORLD ESG MATERIALITY AND CARBON TRANSITION ETF
Schedule of Investments – Continued
October 31, 2022
| | | Shares | | | Value | |
| Health Care — 15.0% (Continued) | | | | | | |
| Vertex Pharmaceuticals, Inc. (b) | | | 34 | | | $ | 10,608 | |
| Waters Corp. (b) | | | 14 | | | | 4,188 | |
| West Pharmaceutical Services, Inc. | | | 18 | | | | 4,142 | |
| Zoetis, Inc. | | | 54 | | | | 8,142 | |
| | | | | | | | 331,355 | |
| Industrials — 11.0% | | | | | | | | |
| 3M Co. | | | 70 | | | | 8,805 | |
| ABB Ltd. (a) | | | 158 | | | | 4,395 | |
| Accelleron Industries (a)(b) | | | 7 | | | | 119 | |
| Alstom (a) | | | 172 | | | | 3,546 | |
| BAE Systems PLC (a) | | | 800 | | | | 7,501 | |
| Caterpillar, Inc. | | | 30 | | | | 6,494 | |
| Cie de Saint-Gobain (a) | | | 92 | | | | 3,764 | |
| Cintas Corp. | | | 14 | | | | 5,986 | |
| Copart, Inc. (b) | | | 62 | | | | 7,131 | |
| Cummins, Inc. | | | 34 | | | | 8,313 | |
| Deere & Co. | | | 32 | | | | 12,666 | |
| Deutsche Post (a) | | | 238 | | | | 8,447 | |
| Equifax, Inc. | | | 26 | | | | 4,408 | |
| Experian PLC (a) | | | 176 | | | | 5,621 | |
| Ferguson PLC (a) | | | 34 | | | | 3,723 | |
| Geberit (a) | | | 12 | | | | 5,340 | |
| Hitachi Ltd. (a) | | | 200 | | | | 9,096 | |
| ITOCHU Corp. (a) | | | 400 | | | | 10,358 | |
| Johnson Controls International PLC | | | 104 | | | | 6,015 | |
| Kingspan Group PLC (a) | | | 94 | | | | 4,748 | |
| Komatsu Ltd. (a) | | | 200 | | | | 3,832 | |
| Kuehne + Nagel International (a) | | | 14 | | | | 2,985 | |
| Legrand (a) | | | 66 | | | | 5,032 | |
| Mitsubishi Electric Corp. (a) | | | 600 | | | | 5,288 | |
| NIBE INDUSTRIER (a) | | | 666 | | | | 5,310 | |
| Recruit Holdings Co. Ltd. (a) | | | 200 | | | | 6,176 | |
| RELX PLC (a) | | | 276 | | | | 7,439 | |
| Schneider Electric (a) | | | 122 | | | | 15,465 | |
| SGS SA (a) | | | 2 | | | | 4,415 | |
| Siemens (a) | | | 86 | | | | 9,404 | |
| Siemens Energy (a) | | | 190 | | | | 2,219 | |
| Sumitomo Corp. (a) | | | 400 | | | | 5,101 | |
| TransUnion | | | 54 | | | | 3,201 | |
| Transurban Group (a) | | | 611 | | | | 5,181 | |
See Notes to the Financial Statements
V-SHARES MSCI WORLD ESG MATERIALITY AND CARBON TRANSITION ETF
Schedule of Investments – Continued
October 31, 2022
| | | Shares | | | Value | |
| Industrials — 11.0% (Continued) | | | | | | |
| Vestas Wind Systems (a) | | | 264 | | | $ | 5,201 | |
| Vinci (a) | | | 74 | | | | 6,815 | |
| Waste Management, Inc. | | | 32 | | | | 5,068 | |
| Wolters Kluwer (a) | | | 56 | | | | 5,953 | |
| WW Grainger, Inc. | | | 10 | | | | 5,844 | |
| Yaskawa Electric Corp. (a) | | | 200 | | | | 5,557 | |
| | | | | | | | 241,962 | |
| Information Technology — 19.1% | | | | | | | | |
| Adobe, Inc. (b) | | | 40 | | | | 12,740 | |
| Advanced Micro Devices, Inc. (b) | | | 144 | | | | 8,649 | |
| Applied Materials, Inc. | | | 76 | | | | 6,710 | |
| ASML Holding (a) | | | 32 | | | | 15,118 | |
| Autodesk, Inc. (b) | | | 44 | | | | 9,429 | |
| Automatic Data Processing, Inc. | | | 24 | | | | 5,801 | |
| Cisco Systems Inc. | | | 270 | | | | 12,266 | |
| Infineon Technologies (a) | | | 160 | | | | 3,897 | |
| Intel Corp. | | | 608 | | | | 17,285 | |
| Intuit, Inc. | | | 22 | | | | 9,405 | |
| Lam Research Corp. | | | 14 | | | | 5,667 | |
| Microsoft Corp. | | | 918 | | | | 213,095 | |
| Murata Manufacturing Co Ltd. (a) | | | 200 | | | | 9,823 | |
| NVIDIA Corp. | | | 388 | | | | 52,368 | |
| salesforce.com, Inc. (b) | | | 76 | | | | 12,357 | |
| SAP (a) | | | 166 | | | | 16,024 | |
| Texas Instruments, Inc. | | | 68 | | | | 10,923 | |
| | | | | | | | 421,557 | |
| Materials — 4.3% | | | | | | | | |
| Agnico Eagle Mines Ltd. (a) | | | 92 | | | | 4,042 | |
| Air Liquide (a) | | | 46 | | | | 6,015 | |
| Akzo Nobel (a) | | | 54 | | | | 3,332 | |
| Ball Corp. | | | 36 | | | | 1,778 | |
| Ecolab, Inc. | | | 42 | | | | 6,597 | |
| Givaudan (a) | | | 2 | | | | 5,976 | |
| Holmen (a) | | | 104 | | | | 3,770 | |
| International Flavors & Fragrances, Inc. | | | 48 | | | | 4,685 | |
| International Paper Co. | | | 54 | | | | 1,815 | |
| Linde PLC | | | 50 | | | | 14,868 | |
| Nitto Denko Corp. (a) | | | 200 | | | | 10,536 | |
| Novozymes (a) | | | 100 | | | | 5,253 | |
| Nutrien Ltd. (a) | | | 54 | | | | 4,557 | |
See Notes to the Financial Statements
V-SHARES MSCI WORLD ESG MATERIALITY AND CARBON TRANSITION ETF
Schedule of Investments – Continued
October 31, 2022
| | | Shares | | | Value | |
| Materials — 4.3% (Continued) | | | | | | |
| PPG Industries, Inc. | | | 48 | | | $ | 5,481 | |
| Sherwin-Williams Co. | | | 34 | | | | 7,651 | |
| Svenska Cellulosa (a) | | | 292 | | | | 3,443 | |
| UPM-Kymmene Oyj (a) | | | 104 | | | | 3,486 | |
| Wheaton Precious Metals Corp. (a) | | | 60 | | | | 1,960 | |
| | | | | | | | 95,245 | |
| Real Estate — 2.7% | | | | | | | | |
| Alexandria Real Estate Equities, Inc. – REIT | | | 34 | | | | 4,940 | |
| American Tower Corp. – REIT | | | 48 | | | | 9,945 | |
| Boston Properties, Inc. – REIT | | | 46 | | | | 3,344 | |
| Crown Castle International Corp. – REIT | | | 48 | | | | 6,396 | |
| Digital Realty Trust, Inc. – REIT | | | 40 | | | | 4,010 | |
| Equinix, Inc. – REIT | | | 20 | | | | 11,329 | |
| Iron Mountain, Inc. – REIT | | | 60 | | | | 3,004 | |
| Prologis, Inc. – REIT | | | 82 | | | | 9,082 | |
| Simon Property Group, Inc. – REIT | | | 46 | | | | 5,013 | |
| Ventas, Inc. – REIT | | | 68 | | | | 2,661 | |
| | | | | | | | 59,724 | |
| Utilities — 2.9% | | | | | | | | |
| Edison International | | | 108 | | | | 6,484 | |
| Enel SpA (a) | | | 1,684 | | | | 7,521 | |
| Exelon Corp. | | | 94 | | | | 3,628 | |
| Iberdrola (a) | | | 736 | | | | 7,474 | |
| National Grid PLC (a) | | | 272 | | | | 2,970 | |
| NextEra Energy, Inc. | | | 178 | | | | 13,795 | |
| Northland Power, Inc. (a) | | | 198 | | | | 5,754 | |
| Orsted (a) | | | 64 | | | | 5,280 | |
| Terna – Rete Elettrica Nazionale (a) | | | 1,218 | | | | 8,075 | |
| Verbund (a) | | | 42 | | | | 3,290 | |
| | | | | | | | 64,271 | |
| Total Common Stocks | | | | | | | | |
| (Cost $2,472,131) | | | | | | | 2,192,700 | |
See Notes to the Financial Statements
V-SHARES MSCI WORLD ESG MATERIALITY AND CARBON TRANSITION ETF
Schedule of Investments – Continued
October 31, 2022
| | | Shares | | | Value | |
| SHORT-TERM INVESTMENT — 0.5% | | | | | | |
| First American Government Obligations Fund, Class X, 2.92% (c) | | | | | | |
| Total Short-Term Investment | | | | | | |
| (Cost $9,894) | | | 9,894 | | | $ | 9,894 | |
| Total Investments — 99.9% | | | | | | | | |
| (Cost $2,482,025) | | | | | | | 2,202,594 | |
| Other Assets and Liabilities, Net — 0.1% | | | | | | | 2,672 | |
| Total Net Assets — 100.0% | | | | | | $ | 2,205,266 | |
ADR – American Depositary Receipt.
PLC – Public Limited Company.
REIT – Real Estate Investment Trust.
| (a) | Foreign company. |
| (b) | Non-income producing security. |
| (c) | The rate shown is the annualized seven-day effective yield as of October 31, 2022. |
At October 31, 2022, the country diversification for the Fund was as follows:
| | % of |
| Country | Net Assets |
| United States | | | 57.7 | % | |
| European Union | | | 13.7 | % | |
| Japan | | | 6.5 | % | |
| Great Britain | | | 6.4 | % | |
| Canada | | | 3.8 | % | |
| Switzerland | | | 3.7 | % | |
| Australia | | | 3.1 | % | |
| Denmark | | | 2.0 | % | |
| Sweden | | | 1.1 | % | |
| Hong Kong | | | 0.7 | % | |
| Singapore | | | 0.4 | % | |
| Norway | | | 0.3 | % | |
| Short-Term Investment | | | 0.5 | % | |
| Other Assets and Liabilities, Net | | | 0.1 | % | |
| Total | | | 100.0 | % | |
The Global Industry Classification Standard (“GICS®”) was developed by and/or is the exclusive property of MSCI, Inc. (“MSCI”) and Standard & Poor’s Financial Services LLC (“S&P”). GICS® is a service mark of MSCI and S&P and has been licensed for use.
See Notes to the Financial Statements
V-SHARES
Statement of Assets and Liabilities
October 31, 2022
| | | | | | V-Shares | |
| | | | | | MSCI World ESG | |
| | | V-Shares | | | Materiality | |
| | | US Leadership | | | and Carbon | |
| | | Diversity ETF | | | Transition ETF | |
| ASSETS: | | | | | | |
| Investments, at value | | | | | | |
| (Cost: $1,221,854 & $2,482,025, respectively) | | $ | 1,035,338 | | | $ | 2,202,594 | |
| Dividends and interest receivable | | | 888 | | | | 3,157 | |
| Foreign cash (Cost: $163) | | | — | | | | 163 | |
| Total assets | | | 1,036,226 | | | | 2,205,914 | |
| | | | | | | | | |
| LIABILITIES: | | | | | | | | |
| Payable to investment adviser | | | 185 | | | | 648 | |
| Payable for investment securities purchased | | | 1,499 | | | | — | |
| Total liabilities | | | 1,684 | | | | 648 | |
| | | | | | | | | |
| NET ASSETS | | $ | 1,034,542 | | | $ | 2,205,266 | |
| | | | | | | | | |
| NET ASSETS CONSIST OF: | | | | | | | | |
| Paid-in capital | | $ | 1,235,500 | | | $ | 2,473,000 | |
| Total accumulated loss | | | (200,958 | ) | | | (267,734 | ) |
| Net Assets | | $ | 1,034,542 | | | $ | 2,205,266 | |
| | | | | | | | | |
Shares issued and outstanding(1) | | | 50,000 | | | | 100,000 | |
| Net asset value, redemption price and offering price per share | | $ | 20.69 | | | $ | 22.05 | |
(1) | Unlimited shares authorized, without par value. |
See Notes to the Financial Statements
V-SHARES
Statement of Operations
For the Period Ended October 31, 2022
| | | | | | V-Shares | |
| | | | | | MSCI World ESG | |
| | | V-Shares | | | Materiality | |
| | | US Leadership | | | and Carbon | |
| | | Diversity ETF(1) | | | Transition ETF(2) | |
| INVESTMENT INCOME: | | | | | | |
| Dividend income | | $ | 14,715 | | | $ | 16,157 | |
| Less: foreign taxes withheld | | | (1 | ) | | | (1,014 | ) |
| Interest income | | | 29 | | | | 54 | |
| Total investment income | | | 14,743 | | | | 15,197 | |
| | | | | | | | | |
| EXPENSES: | | | | | | | | |
| Investment adviser fees (See Note 4) | | | 2,794 | | | | 3,510 | |
| Net expenses | | | 2,794 | | | | 3,510 | |
| | | | | | | | | |
| NET INVESTMENT INCOME | | | 11,949 | | | | 11,687 | |
| | | | | | | | | |
| REALIZED AND UNREALIZED | | | | | | | | |
| GAIN (LOSS) ON INVESTMENTS: | | | | | | | | |
| Net realized gain (loss) on investments | | | (19,093 | ) | | | 48 | |
| Net change in unrealized appreciation/depreciation on investments | | | (186,516 | ) | | | (279,469 | ) |
| Net realized and unrealized loss on investments | | | (205,609 | ) | | | (279,421 | ) |
| | | | | | | | | |
| NET DECREASE IN NET ASSETS | | | | | | | | |
| RESULTING FROM OPERATIONS | | $ | (193,660 | ) | | $ | (267,734 | ) |
(1) | Inception date for the Fund was December 21, 2021. |
(2) | Inception date for the Fund was June 8, 2022. |
See Notes to the Financial Statements
V-SHARES US LEADERSHIP DIVERSITY ETF
Statement of Changes in Net Assets
| | | For the Period | |
| | | Since Inception(1) | |
| | | Through | |
| | | October 31, 2022 | |
| OPERATIONS: | | | |
| Net investment income | | $ | 11,949 | |
| Net realized loss on investments | | | (19,093 | ) |
| Net change in unrealized appreciation/depreciation on investments | | | (186,516 | ) |
| Net decrease in net assets resulting from operations | | | (193,660 | ) |
| | | | | |
| CAPITAL SHARE TRANSACTIONS: | | | | |
| Proceeds from shares sold | | | 1,235,500 | |
| Proceeds from reinvestment of distributions | | | — | |
| Payments for shares redeemed | | | — | |
| Net increase in net assets resulting from capital share transactions | | | 1,235,500 | |
| | | | | |
| DISTRIBUTIONS TO SHAREHOLDERS | | | (7,298 | ) |
| | | | | |
| TOTAL INCREASE IN NET ASSETS | | | 1,034,542 | |
| | | | | |
| NET ASSETS: | | | | |
| Beginning of period | | | — | |
| End of period | | $ | 1,034,542 | |
(1) | Inception date for the Fund was December 21, 2021. |
See Notes to the Financial Statements
V-SHARES MSCI WORLD ESG MATERIALITY AND CARBON TRANSITION ETF
Statement of Changes in Net Assets
| | | For the Period | |
| | | Since Inception(1) | |
| | | Through | |
| | | October 31, 2022 | |
| OPERATIONS: | | | |
| Net investment income | | $ | 11,687 | |
| Net realized gain on investments | | | 48 | |
| Net change in unrealized appreciation/depreciation on investments | | | (279,469 | ) |
| Net decrease in net assets resulting from operations | | | (267,734 | ) |
| | | | | |
| CAPITAL SHARE TRANSACTIONS: | | | | |
| Proceeds from shares sold | | | 2,473,000 | |
| Proceeds from reinvestment of distributions | | | — | |
| Payments for shares redeemed | | | — | |
| Net increase in net assets resulting from capital share transactions | | | 2,473,000 | |
| | | | | |
| DISTRIBUTIONS TO SHAREHOLDERS | | | — | |
| | | | | |
| TOTAL INCREASE IN NET ASSETS | | | 2,205,266 | |
| | | | | |
| NET ASSETS: | | | | |
| Beginning of period | | | — | |
| End of period | | $ | 2,205,266 | |
(1) | Inception date for the Fund was June 8, 2022. |
See Notes to the Financial Statements
V-SHARES US LEADERSHIP DIVERSITY ETF
Financial Highlights
For a Fund share outstanding throughout the period.
| | | For the Period | |
| | | Since Inception(1) | |
| | | Through | |
| | | October 31, 2022 | |
| PER SHARE DATA: | | | |
| Net asset value, beginning of period | | $ | 24.71 | |
| | | | | |
| INVESTMENT OPERATIONS: | | | | |
| Net investment income | | | 0.23 | |
| Net realized and unrealized loss on investments | | | (4.11 | ) |
| Total from investment operations | | | (3.88 | ) |
| | | | | |
| LESS DISTRIBUTIONS FROM: | | | | |
| Net investment income | | | (0.14 | ) |
| Net realized gains | | | — | |
| Total distributions | | | (0.14 | ) |
| Net asset value, end of period | | $ | 20.69 | |
| | | | | |
TOTAL RETURN, AT NAV(2) | | | -15.68 | % |
TOTAL RETURN, AT MARKET(2) | | | -15.66 | % |
| | | | | |
| SUPPLEMENTAL DATA AND RATIOS: | | | | |
| Net assets, end of period (in 000’s) | | $ | 1,035 | |
Ratio of expenses to average net assets(3) | | | 0.29 | % |
Ratio of net investment income to average net assets(3) | | | 1.24 | % |
| | | | | |
Portfolio turnover rate(2)(4) | | | 13 | % |
(1) | Inception date for the Fund was December 21, 2021. |
(2) | Not annualized for period less than one year. |
(3) | Annualized for period less than one year. |
(4) | Excludes impact of in-kind transactions. |
See Notes to the Financial Statements
V-SHARES MSCI WORLD ESG MATERIALITY AND CARBON TRANSITION ETF
Financial Highlights
For a Fund share outstanding throughout the period.
| | | For the Period | |
| | | Since Inception(1) | |
| | | Through | |
| | | October 31, 2022 | |
| PER SHARE DATA: | | | |
| Net asset value, beginning of period | | $ | 24.73 | |
| | | | | |
| INVESTMENT OPERATIONS: | | | | |
| Net investment income | | | 0.12 | |
| Net realized and unrealized loss on investments | | | (2.80 | ) |
| Total from investment operations | | | (2.68 | ) |
| | | | | |
| LESS DISTRIBUTIONS FROM: | | | | |
| Net investment income | | | — | |
| Net realized gains | | | — | |
| Total distributions | | | — | |
| Net asset value, end of period | | $ | 22.05 | |
| | | | | |
TOTAL RETURN, AT NAV(2) | | | -10.83 | % |
TOTAL RETURN, AT MARKET(2) | | | -10.38 | % |
| | | | | |
| SUPPLEMENTAL DATA AND RATIOS: | | | | |
| Net assets, end of period (in 000’s) | | $ | 2,205 | |
Ratio of expenses to average net assets(3) | | | 0.39 | % |
Ratio of net investment income to average net assets(3) | | | 1.30 | % |
| | | | | |
Portfolio turnover rate(2)(4) | | | 0 | % |
(1) | Inception date for the Fund was June 8, 2022. |
(2) | Not annualized for period less than one year. |
(3) | Annualized for period less than one year. |
(4) | Excludes impact of in-kind transactions. |
See Notes to the Financial Statements
V-SHARES
Notes to the Financial Statements
October 31, 2022
1. ORGANIZATION
Managed Portfolio Series (the “Trust”) was organized as a Delaware statutory trust on January 27, 2011. The Trust is registered under the Investment Company Act of 1940, as amended (the “1940 Act”), as an open-end management investment company. The V-Shares US Leadership Diversity ETF (“US Leadership Diversity ETF” or the “Fund”) is a diversified series with its own investment objectives and policies within the Trust. The investment objective of the Fund is to track the investment results of the ISS ESG U.S. Diversity Index, which is composed of U.S. large, mid, and small capitalization stocks of companies exhibiting broad ethnic and gender representation for Directors and Named Executive Officers, as determined by Institutional Shareholder Services, Inc. (the “Index Provider” or “ISS”). The V-Shares MSCI World ESG Materiality and Carbon Transition ETF (“MSCI World ESG ETF” or the “Fund”) is a non-diversified series with its own investment objectives and policies within the Trust. The investment objective of the Fund is to track the investment results of the MSCI World Index. The Trust has evaluated the structure, objective and activities of the Funds and determined that they meet the characteristics of an investment company. As such, the Funds follow the investment company accounting and reporting guidance of the Financial Accounting Standards Board (“FASB”) Accounting Standards Codification Topic 946, Financial Services – Investment Companies.
Shares of the US Leadership Diversity ETF are listed and traded on the NYSE Arca, Inc. (the “NYSE”) and shares of the MSCI World ESG ETF are listed and traded on the CBOE BZX Exchange, Inc. (the “CBOE”). The market prices for shares may be different from their net asset value (“NAV”). The Funds issue and redeem shares on a continuous basis at NAV only in blocks of 50,000 shares, called “Creation Units”. Creation Units are issued and redeemed principally in-kind for securities included in a specified universe, with cash included to balance to the Creation Unit total. Once created, shares generally trade in the secondary market at market prices that change throughout the day in amounts less than a Creation Unit. Except when aggregated in Creation Units, shares are not redeemable securities of the Funds. Shares of the Funds may only be purchased or redeemed by certain financial institutions (“Authorized Participants”). An Authorized Participant is either (i) a broker-dealer or other participant in the clearing process through the Continuous Net Settlement System of the National Securities Clearing Corporation or (ii) a Depository Trust Company participant and, in each case, must have executed a Participation Agreement with Quasar Distributors, LLC (the “Distributor”). Most retail investors do not qualify as Authorized Participants nor have the resources to buy and sell whole Creation Units. Therefore, they are unable to purchase or redeem the shares directly from the Funds. Rather, most retail investors may purchase shares in the secondary market with the assistance of a broker and are subject to customary brokerage commissions or fees.
The Funds currently offer only one class of shares, which have no front-end sales loads, no deferred sales charges, and no redemption fees. A purchase (i.e. creation) transaction fee is imposed for the transfer and other transaction costs associated with the purchase of Creation Units. The standard fixed creation transaction fee for each Fund is $500, which is payable by V-Square Quantitative Management, LLC (the “Adviser”) or Authorized Participant. In addition, a variable fee may be charged on all cash transactions or substitutes for Creation Units of up to a maximum of 2% as a percentage of the value of the Creation Units subject to the transaction. Variable fees are imposed to compensate the Funds for the transaction costs associated with the cash transactions. Variable fees received by the Funds are displayed in the capital shares transaction section of the Statement of Changes in Net Assets. The Funds may issue an unlimited number of shares of beneficial interest, with no par value. All shares of the Funds have equal rights and privileges. Organizational costs that were incurred to establish the Funds to enable them to legally do business were paid for by the Adviser. These payments are not recoupable by the Adviser.
V-SHARES
Notes to the Financial Statements – Continued
October 31, 2022
2. SIGNIFICANT ACCOUNTING POLICIES
The following is a summary of significant accounting policies consistently followed by the Funds in preparation of their financial statements. These policies are in conformity with generally accepted accounting principles in the United States of America (“GAAP”).
Security Valuation – All investments in securities are recorded at their estimated fair value, as described in Note 3.
Federal Income Taxes – The Funds comply with the requirements of subchapter M of the Internal Revenue Code of 1986, as amended, necessary to qualify as regulated investment companies and distribute substantially all net taxable investment income and net realized gains to shareholders in a manner which results in no tax cost to the Funds. Therefore, no federal income tax provision is required. As of and during the period ended October 31, 2022, the Funds did not have any tax positions that did not meet the “more-likely-than-not” threshold of being sustained by the applicable tax authority. The Funds recognize interest and penalties, if any, related to unrecognized tax benefits on uncertain tax positions as income tax expense in the Statements of Operations. As of and during the period ended October 31, 2022, the Funds did not have any liabilities for unrecognized tax benefits. The Funds are not subject to examination by U.S. tax authorities for tax years prior to the periods ended October 31, 2022.
Security Transactions, Income, and Distributions – The Funds follow industry practice and record security transactions on the trade date. Realized gains and losses on sales of securities are calculated on the basis of identified cost. Dividend income is recorded on the ex-dividend date and interest income is recorded on an accrual basis. Withholding taxes on foreign dividends have been provided for in accordance with each Fund’s understanding of the applicable country’s tax rules and regulations. Discounts and premiums on securities purchased are amortized over the expected life of the respective securities using the constant yield method.
The Funds distribute substantially all net investment income, if any, semi-annually, and net realized capital gains, if any, annually. Distributions to shareholders are recorded on the ex-dividend date. The treatment for financial reporting purposes of distributions made to shareholders during the year from net investment income or net realized capital gains may differ from their treatment for federal income tax purposes. These differences are caused primarily by differences in the timing of the recognition of certain components of income, expense or realized capital gain for federal income tax purposes. Where such differences are permanent in nature, GAAP requires that they be reclassified in the components of the net assets based on their ultimate characterization for federal income tax purposes. Any such reclassifications will have no effect on net assets, results of operations or net asset values per share of the Funds. For the year or period ended October 31, 2022, there were no reclassifications needed.
Use of Estimates – The preparation of financial statements in conformity with GAAP requires management to make estimates and assumptions that affect the reported amounts of assets and liabilities and disclosure of contingent assets and liabilities at the date of the financial statements and the reported amounts of revenues and expenses during the reporting period. Actual results could differ from those estimates. For the period ended October 31, 2022, there were no reclassifications needed.
3. SECURITIES VALUATION
The Funds have adopted authoritative fair value accounting standards which establish an authoritative definition of fair value and set out a hierarchy for measuring fair value. These standards require additional disclosures about the various inputs and valuation techniques used to develop the measurements of fair value, a discussion of changes in
V-SHARES
Notes to the Financial Statements – Continued
October 31, 2022
valuation techniques and related inputs during the period and expanded disclosure of valuation Levels for major security types. These inputs are summarized in the three broad Levels listed below:
| Level 1 – | Unadjusted quoted prices in active markets for identical assets or liabilities that the Funds have the ability to access. |
| | |
| Level 2 – | Observable inputs other than quoted prices included in Level 1 that are observable for the asset or liability, either directly or indirectly. These inputs may include quoted prices for the identical instrument on an inactive market, prices for similar instruments, interest rates, prepayment speeds, credit risk, yield curves, default rates and similar data. |
| | |
| Level 3 – | Unobservable inputs for the asset or liability, to the extent relevant observable inputs are not available, representing a Fund’s own assumptions about the assumptions a market participant would use in valuing the asset or liability, and would be based on the best information available. |
Following is a description of the valuation techniques applied to the Funds’ major categories of assets and liabilities measured at fair value on a recurring basis. Each Fund’s investments are carried at fair value.
Short-Term Investments – Investments in other mutual funds, including money market funds, are valued at their net asset value per share. To the extent these securities are actively traded and valuation adjustments are not applied, they are categorized in Level 1 of the fair value hierarchy.
Equity Securities – Equity securities, including common stocks, preferred stocks, exchange traded funds (“ETF”s) and real estate investment trusts (“REIT”s), that are primarily traded on a national securities exchange are valued at the last sale price on the exchange on which they are primarily traded on the day of valuation or, if there has been no sale on such day, at the mean between the bid and ask prices. Securities traded primarily in the Nasdaq Global Market System for which market quotations are readily available are valued using the Nasdaq Official Closing Price (“NOCP”). If the NOCP is not available, such securities are valued at the last sale price on the day of valuation, or if there has been no sale on such day, at the mean between the bid and ask prices. To the extent these securities are actively traded and valuation adjustments are not applied, they are categorized in Level 1 of the fair value hierarchy.
The Board of Trustees (the “Board”) has adopted a pricing and valuation policy for use by the Funds and their Valuation Designee (as defined below) in calculating each Fund’s NAV. Pursuant to Rule 2a-5 under the 1940 Act, the Funds have designated V-Square Quantitative Management, LLC (the “Adviser”) as its “Valuation Designee” to perform all of the fair value determinations as well as to perform all of the responsibilities that may be performed by the Valuation Designee in accordance with Rule 2a-5. The Valuation Designee is authorized to make all necessary determinations of the fair values of portfolio securities and other assets for which market quotations are not readily available or if it is deemed that the prices obtained from brokers, dealers or independent pricing services are unreliable.
The inputs or methodology used for valuing securities are not an indication of the risk associated with investing in those securities. The following is a summary of the inputs used to value the Funds’ securities as of October 31, 2022:
US Leadership Diversity ETF
| | | Level 1 | | | Level 2 | | | Level 3 | | | Total | |
| Common Stocks | | $ | 1,030,267 | | | $ | — | | | $ | — | | | $ | 1,030,267 | |
| Short-Term Investment | | | 5,071 | | | | — | | | | — | | | | 5,071 | |
| Total Investments in Securities | | $ | 1,035,338 | | | $ | — | | | $ | — | | | $ | 1,035,338 | |
V-SHARES
Notes to the Financial Statements – Continued
October 31, 2022
MSCI World ESG ETF
| | | Level 1 | | | Level 2 | | | Level 3 | | | Total | |
| Common Stocks | | $ | 2,192,700 | | | $ | — | | | $ | — | | | $ | 2,192,700 | |
| Short-Term Investment | | | 9,894 | | | | — | | | | — | | | | 9,894 | |
| Total Investments in Securities | | $ | 2,202,594 | | | $ | — | | | $ | — | | | $ | 2,202,594 | |
Refer to each Fund’s Schedule of Investments for further information on the classification of investments.
4. INVESTMENT ADVISORY FEE AND OTHER TRANSACTIONS WITH AFFILIATES
The Trust has an agreement with the Adviser to furnish investment advisory services to the Funds. Pursuant to an Investment Advisory Agreement between the Trust and the Adviser, the Adviser is entitled to receive a monthly management fee based upon the average daily net assets of the Funds at the following annual rates:
| US Leadership Diversity ETF | 0.29% | |
| MSCI World ESG ETF | 0.39% | |
Under the investment advisory agreement, the Adviser has agreed to pay all expenses incurred by the Funds except for the advisory fee, interest, taxes, brokerage expenses and other fees, charges, taxes, levies or expenses (such as stamp taxes) incurred in connection with the execution of portfolio transactions or in connection with creation and redemption transactions (including without limitation any fees, charges, taxes, levies or expenses related to the purchase or sale of an amount of any currency, or the patriation or repatriation of any security or other asset, related to the execution of portfolio transactions or any creation or redemption transactions), legal fees or expenses in connection with any arbitration, litigation or pending or threatened arbitration or litigation, acquired fund fees and expenses, any fees and expenses related to the provision of securities lending services, extraordinary expenses, and distribution fees and expenses paid by the Trust.
The Adviser has engaged Vident Investment Advisory, LLC (the “Sub-Adviser”) as the Sub-Adviser to the Funds.
U.S. Bancorp Fund Services, LLC (the “Administrator”), doing business as U.S. Bank Global Fund Services, acts as the Funds’ Administrator, Transfer Agent, and Fund Accountant. U.S. Bank N.A. (the “Custodian”) serves as the Custodian to the Funds. The Custodian is an affiliate of the Administrator. The Administrator performs various administrative and accounting services for the Funds. The Administrator prepares various federal and state regulatory filings, reports and returns for the Funds; prepares reports and materials to be supplied to the Trustees; monitors the activities of the Funds’ Custodian; coordinates the payment of the Funds’ expenses and reviews the Funds’ expense accruals. The officers of the Trust, including the Chief Compliance Officer, are employees of the Administrator. As compensation for its services, the Administrator is entitled to a monthly fee at an annual rate based upon the average daily net assets of the Funds, subject to annual minimums and payable by the Adviser.
V-SHARES
Notes to the Financial Statements – Continued
October 31, 2022
5. CAPITAL SHARE TRANSACTIONS
Transactions in shares of the Funds were as follows:
US Leadership Diversity ETF
| | | Period Ended | |
| | | October 31, 2022 | |
| Shares sold | | | 50,000 | |
| Shares issued to holders in reinvestment of distributions | | | — | |
| Shares redeemed | | | — | |
| Net increase in shares outstanding | | | 50,000 | |
MSCI World ESG ETF
| | | Period Ended | |
| | | October 31, 2022 | |
| Shares sold | | | 100,000 | |
| Shares issued to holders in reinvestment of distributions | | | — | |
| Shares redeemed | | | — | |
| Net increase in shares outstanding | | | 100,000 | |
6. INVESTMENT TRANSACTIONS
The aggregate purchases and sales, excluding short-term investments, by the Funds for the period ended October 31, 2022, were as follows:
| | | U.S. Government Securities | | | Other Securities | |
| | | Purchases | | | Sales | | | Purchases* | | | Sales | |
| US Leadership Diversity ETF | | $ | — | | | $ | — | | | $ | 132,927 | | | $ | 131,240 | |
| MSCI World ESG ETF | | | — | | | | — | | | | 4,994 | | | | 81 | |
| * | Purchases exclude subscriptions in-kind of $1,234,352 and $2,467,364 for the US Leadership Diversity ETF and MSCI World ESG ETF, respectively. |
7. FEDERAL TAX INFORMATION
The aggregate gross unrealized appreciation and depreciation of securities held by the Funds and the total cost of securities for federal income tax purposes at October 31, 2022, were as follows:
| | | Aggregate Gross | | | Aggregate Gross | | | Net Unrealized | | | Federal Income | |
Fund | | Appreciation | | | Depreciation | | | Depreciation | | | Tax Cost | |
| US Leadership Diversity ETF | | $ | 44,599 | | | $ | (231,181 | ) | | $ | (186,582 | ) | | $ | 1,221,920 | |
| MSCI World ESG ETF | | | 39,680 | | | | (319,111 | ) | | | (279,431 | ) | | | 2,482,025 | |
Any differences between book-basis and tax-basis unrealized appreciation (depreciation) is attributable primarily to the deferral of wash sale losses.
V-SHARES
Notes to the Financial Statements – Continued
October 31, 2022
At October 31, 2022, the components of distributable earnings on a tax-basis were as follows:
| | | Undistributed | | | Undistributed | | | Other | | | Net | | | Total | |
| | | Ordinary | | | Long-Term | | | Accumulated | | | Unrealized | | | Accumulated | |
Fund | | Income | | | Capital Gains | | | Gains (Losses) | | | Depreciation | | | Loss | |
| US Leadership Diversity ETF | | $ | 4,651 | | | $ | — | | | $ | (19,027 | ) | | $ | (186,582 | ) | | $ | (200,958 | ) |
| MSCI World ESG ETF | | | 11,541 | | | | 194 | | | | (38 | ) | | | (279,431 | ) | | | (267,734 | ) |
As of October 31, 2022, the US Leadership Diversity ETF had a non-expiring short-term capital loss carryover of $19,027 and the MSCI World ESG ETF had no capital loss carryover. A regulated investment company may elect for any taxable year to treat any portion of any qualified late year loss as arising on the first day of the next taxable year. Qualified late year losses are certain capital, and ordinary losses which occur during the portion of the Fund’s taxable year subsequent to October 31 and December 31, respectively. For the taxable period ended October 31, 2022, the Funds did not defer any post-October losses.
The tax character of distributions paid during the period ended October 31, 2022, were as follows:
| | | Ordinary* | | | Long-Term | | | | |
Fund | | Income | | | Capital Gains | | | Total | |
| US Leadership Diversity ETF | | $ | 7,298 | | | $ | — | | | $ | 7,298 | |
| MSCI World ESG ETF | | | — | | | | — | | | | — | |
| * | For federal income tax purposes, distributions of short-term capital gains are treated as ordinary income. |
8. SECTOR RISK
As of October 31, 2022, the US Leadership Diversity ETF had a significant portion of its assets invested in the information technology sector. The information technology sector may be more sensitive to changes in domestic and international competition, economic cycles, financial resources, personnel availability, rapid innovation and intellectual property issues.
9. GENERAL RISK
The global outbreak of COVID-19 has disrupted economic markets and the prolonged economic impact is uncertain. The operational and financial performance of the issuers of securities in which each Fund invests depends on future developments, including the duration and spread of the outbreak, and such uncertainty may in turn impact the value of the Funds’ investments.
On February 24, 2022, Russia commenced a military attack on Ukraine. The outbreak of hostilities between the two countries could result in more widespread conflict and could have a severe adverse effect on the region and the markets. In addition, sanctions imposed on Russia by the United States and other countries, and any sanctions imposed in the future could have a significant adverse impact on the Russian economy and related markets. The price and liquidity of investments may fluctuate widely as a result of the conflict and related events. How long such conflict and related events will last and whether it will escalate further cannot be predicted, nor its effect on the Funds.
10. SUBSEQUENT EVENT
On December 28, 2022, the US Leadership Diversity ETF declared an income distribution of $7,747, or $0.15494 per share, payable on January 3, 2023.
On December 28, 2022, the MSCI World ESG ETF declared an income distribution of $17,243, or $0.17243 per share and a long-term capital gain of $194, or $0.00194 per share, payable on January 3, 2023.
Management has performed an evaluation of subsequent events through the date the financial statements were issued and has determined that no additional items require recognition or disclosure.
V-SHARES
Report of Independent Registered Public Accounting Firm
To the Shareholders of V-Shares ETFs and
Board of Trustees of Managed Portfolio Series
Opinion on the Financial Statements
We have audited the accompanying statements of assets and liabilities, including the schedules of investments, of the funds listed below (“V-Shares ETFs” or the “Funds”), each a series of Managed Portfolio Series, as of October 31, 2022, the related statements of operations, the statements of changes in net assets, the related notes, and the financial highlights for each of the periods indicated below (collectively referred to as the “financial statements”). In our opinion, the financial statements present fairly, in all material respects, the financial position of each of the Funds as of October 31, 2022, the results of their operations, the changes in net assets, and the financial highlights for each of the periods indicated below in conformity with accounting principles generally accepted in the United States of America.
| | Statements of | Statements of | |
| Fund Name | Operations | Changes in Net Assets | Financial Highlights |
| V-Shares US Leadership Diversity ETF | For the period from December 21, 2021 (commencement of operations) |
| | through October 31, 2022 |
| V-Shares MSCI World ESG Materiality | For the period from June 8, 2022 (commencement of operations) |
| & Carbon Transition ETF | through October 31, 2022 |
Basis for Opinion
These financial statements are the responsibility of the Funds’ management. Our responsibility is to express an opinion on the Funds’ financial statements based on our audits. We are a public accounting firm registered with the Public Company Accounting Oversight Board (United States) (“PCAOB”) and are required to be independent with respect to the Funds in accordance with the U.S. federal securities laws and the applicable rules and regulations of the Securities and Exchange Commission and the PCAOB.
We conducted our audits in accordance with the standards of the PCAOB. Those standards require that we plan and perform the audit to obtain reasonable assurance about whether the financial statements are free of material misstatement whether due to error or fraud.
Our audits included performing procedures to assess the risks of material misstatement of the financial statements, whether due to error or fraud, and performing procedures that respond to those risks. Such procedures included examining, on a test basis, evidence regarding the amounts and disclosures in the financial statements. Our procedures included confirmation of securities owned as of October 31, 2022, by correspondence with the custodians and brokers; when replies were not received from brokers, we performed other auditing procedures. Our audits also included evaluating the accounting principles used and significant estimates made by management, as well as evaluating the overall presentation of the financial statements. We believe that our audits provide a reasonable basis for our opinion.
We have served as the Funds’ auditor since 2021.
COHEN & COMPANY, LTD.
Milwaukee, Wisconsin
December 30, 2022
V-SHARES MSCI WORLD ESG MATERIALITY AND CARBON TRANSITION ETF
Approval of Investment Advisory Agreement (Unaudited)
At regular meetings of the Board of Trustees of Managed Portfolio Series (“Trust”) on February 22-23, 2022 and May 17-18, 2022, the Trust’s Board of Trustees (“Board”), including all of the Trustees who are not “interested persons” of the Trust, as that term is defined in Section 2(a)(19) of the Investment Company Act of 1940, as amended (“Independent Trustees”), considered and approved the Investment Advisory Agreement between the Trust and V-Square Quantitative Management, LLC (“V-Square” or “Adviser”) regarding the V-Shares MSCI World ESG Materiality and Carbon Transition ETF (the “Fund”) (the “Advisory Agreement”) and the Investment Sub-Advisory Agreement between V-Square and Vident Investment Advisory, LLC (“Vident” or “Sub-Adviser”) regarding the Fund (the “Sub-Advisory Agreement”), each for an initial two-year term.
Prior to the meetings and at the meetings, the Trustees received and considered information from the Adviser, the Sub-Adviser, and the Trust’s administrator designed to provide the Trustees with the information necessary to evaluate the approval of the Advisory Agreement and the Sub-Advisory Agreement (“Support Materials”). The Independent Trustees then reviewed the Support Materials with regard to V-Square, Vident and the Fund. They discussed initial SEC filings for the Fund. They reviewed and considered the Fund’s investment strategy, services that V-Square and Vident proposed to provide to the Fund, proposed management fee and the profitability that V-Square expects to realize from its management of the Fund, any additional benefits that V-Square or Vident expect to realize from their management of the Fund, and other matters that the Trustees deemed relevant. The Trustees also reviewed analyses which were prepared by the Fund’s administrator of the Fund’s proposed and projected expenses relative to other funds in the same Morningstar category. Before voting to approve the Advisory Agreement and Sub-Advisory Agreement, the Trustees reviewed the Support Materials with Trust management and with counsel to the Independent Trustees, and received a summary from such counsel discussing the legal standards for the Trustees’ consideration of the approval of the Advisory Agreement and Sub-Advisory Agreement. This information, together with the information provided to the Board throughout the course of the year, formed the primary (but not exclusive) basis for the Board’s determinations.
In determining whether to approve the Advisory Agreement and Sub-Advisory Agreement, the Trustees considered all factors they believed relevant, including the following with respect to the Fund: (1) the nature, extent, and quality of the services to be provided by V-Square and Vident with respect to the Fund; (2) the cost of the services to be provided and the profits to be realized by V-Square, and the revenue received, from services rendered to the Fund; (3) comparative fee and expense data for the Fund and other investment companies with similar investment objectives; (4) the extent to which economies of scale may be realized as the Fund grows, and whether the proposed advisory fee for the Fund reflects such economies of scale for the Fund’s benefit; and (5) other benefits to V-Square or Vident resulting from services rendered to the Fund. In their deliberations, the Trustees did not identify any particular information that was all-important or controlling.
Nature, Extent and Quality of Services Provided. The Trustees considered the scope of services that V-Square and Vident will provide under the Advisory Agreement and Sub-Advisory Agreement with respect to the Fund, noting that such services include but are not limited to the following: (1) investing the Fund’s assets consistent with the Fund’s investment objectives and investment policies; (2) determining the portfolio securities to be purchased, sold, or otherwise disposed of and the timing of such transactions; (3) voting all proxies with respect to the Fund’s portfolio securities; (4) maintaining the required books and records for transactions effected by V-Square or Vident on behalf of the Fund; and (5) selecting broker-dealers to execute orders on behalf of the Fund. The Trustees noted that V-Square and Vident are well capitalized. The Trustees also considered V-Square’s and Vident’s assets under management. The Trustees considered the experience of the proposed portfolio managers from V-Square and Vident in managing similar funds.
V-SHARES MSCI WORLD ESG MATERIALITY AND CARBON TRANSITION ETF
Approval of Investment Advisory Agreement (Unaudited) – Continued
Cost of Advisory Services and Profitability. The Trustees considered the proposed management fee that the Fund will pay to V-Square under the Advisory Agreement in the amount of 0.39% of the Fund’s average annual daily net assets. They also considered V-Square’s profitability analysis for services that V-Square and Vident will render to the Fund. The Trustees noted that because the sub-advisory fees will be paid by V-Square, the overall advisory fee to be paid by the Fund is not directly affected by the sub-advisory fees to be paid to Vident. Consequently, the Trustees did not consider the costs of services to be provided by Vident or the profitability of its relationship with the Fund to be material factors for consideration given that Vident is not affiliated with V-Square and, therefore, the sub-advisory fees were negotiated on an arm’s length basis.
Comparative Fee and Expense Data. The Trustees considered an analysis that the Trust’s administrator had prepared, comparing the contractual expenses that the Fund will bear to those of funds in the same Morningstar category.
| | • | V-Shares MSCI World ESG Materiality and Carbon Transition ETF. The Trustees noted that the Fund’s total contractual expenses, which consist of the Fund’s contractual unified management fee of 0.39%, are at the peer group median and below the peer group average |
While recognizing that it is difficult to compare advisory fees because the scope of advisory services provided may vary from one investment adviser to another, the Trustees concluded that V-Square’s proposed advisory fee and the portion of such fee that it intends to allocate to Vident was reasonable.
Economies of Scale. The Trustees considered whether the Fund would benefit from any economies of scale, noting that the proposed investment advisory fee for the Fund does not contain breakpoints. The Trustees took into account the fact that V-Square had agreed to consider breakpoints in the future in response to asset growth in the Fund. The Trustees concluded that it is not necessary to consider the implementation of fee breakpoints at this time, but committed to revisit this issue in the future as circumstances change and asset levels increase.
Other Benefits. The Trustees considered the direct and indirect benefits that could be realized by V-Square and Vident from their relationships with the Fund. The Trustees noted that V-Square will not use affiliated brokers to execute the Fund’s portfolio transactions. The Trustees considered that V-Square may receive some form of reputational benefit from services rendered to the Fund, but that such benefits are immaterial and cannot otherwise be quantified. The Trustees concluded that V-Square does not receive additional material benefits from its relationship with the Fund.
Based upon V-Square’s presentation at the Board meeting and information from V-Square, Vident and the Trust’s administrator designed to provide the Trustees with the information necessary to evaluate the terms of the proposed Advisory Agreement, the Board concluded that the overall arrangements between the Trust, V-Square and Vident as set forth in the Advisory Agreement and Sub-Advisory Agreement are fair and reasonable in light of the services that V-Square and Vident will perform, the investment advisory fees that each will receive for such services, and such other matters as the Trustees considered relevant in the exercise of their reasonable business judgment.
V-SHARES
Additional Information (Unaudited)
October 31, 2022
TRUSTEES & OFFICERS
| | | | Number of | | Other |
| | | | Portfolios | | Directorships |
| | Position(s) | Term of Office | in Trust | | Held by Trustee |
| Name, Address and | Held with | and Length of | Overseen | Principal Occupation(s) | During the |
Year of Birth | the Trust | Time Served | by Trustee | During the Past Five Years | Past Five Years |
| | | | | | |
| Independent Trustees | | | | | |
| | | | | | |
| Leonard M. Rush, CPA | Chairman, | Indefinite | 35 | Retired, Chief Financial Officer, | Independent Trustee, |
| 615 E. Michigan St. | Trustee | Term; Since | | Robert W. Baird & Co. Incorporated | ETF Series Solutions |
| Milwaukee, WI 53202 | and Audit | April 2011 | | (2000-2011). | (60 Portfolios) |
| Year of Birth: 1946 | Committee | | | | (2012-Present). |
| | Chairman | | | | |
| | | | | | |
| David A. Massart | Trustee | Indefinite | 35 | Partner and Managing Director, | Independent Trustee, |
| 615 E. Michigan St. | | Term; Since | | Beacon Pointe Advisors, LLC | ETF Series Solutions |
| Milwaukee, WI 53202 | | April 2011 | | (since 2022); Co-Founder and Chief | (60 Portfolios) |
| Year of Birth: 1967 | | | | Investment Strategist; Next Generation | (2012-Present). |
| | | | | Wealth Management, Inc. (2005-Present). | |
V-SHARES
Additional Information (Unaudited) – Continued
October 31, 2022
| | | | Number of | | Other |
| | | | Portfolios | | Directorships |
| | Position(s) | Term of Office | in Trust | | Held by Trustee |
| Name, Address and | Held with | and Length of | Overseen | Principal Occupation(s) | During the |
Year of Birth | the Trust | Time Served | by Trustee | During the Past Five Years | Past Five Years |
| David M. Swanson | Trustee and | Indefinite | 35 | Founder and Managing Principal, | Independent Trustee, |
| 615 E. Michigan St. | Nominating & | Term; Since | | SwanDog Strategic Marketing, LLC | ALPS Variable |
| Milwaukee, WI 53202 | Governance | April 2011 | | (2006-Present). | Investment Trust |
| Year of Birth: 1957 | Committee | | | | (7 Portfolios) |
| | Chairman | | | | (2006-Present); |
| | | | | | Independent Trustee, |
| | | | | | RiverNorth Funds |
| | | | | | (3 Portfolios) |
| | | | | | (2018-Present); |
| | | | | | RiverNorth Managed |
| | | | | | Duration Municipal |
| | | | | | Income Fund Inc. |
| | | | | | (1 Portfolio) |
| | | | | | (2019-Present); |
| | | | | | RiverNorth Specialty |
| | | | | | Finance Corporation |
| | | | | | (1 Portfolio) |
| | | | | | (2018-Present); |
| | | | | | RiverNorth/ |
| | | | | | DoubleLine |
| | | | | | Strategic |
| | | | | | Opportunity Fund, |
| | | | | | Inc. (1 Portfolio) |
| | | | | | (2018-Present); |
| | | | | | RiverNorth |
| | | | | | Opportunities Fund, |
| | | | | | Inc. (1 Portfolio) |
| | | | | | (2015-Present); |
| | | | | | RiverNorth |
| | | | | | Opportunistic |
| | | | | | Municipal Income |
| | | | | | Fund, Inc. |
| | | | | | (1 Portfolio) |
| | | | | | (2018-Present); |
| | | | | | RiverNorth Flexible |
| | | | | | Municipal Income |
| | | | | | Fund (2020-Present). |
| | | | | | |
| Robert J. Kern | Trustee | Indefinite | 35 | Retired (July 2018-Present); | None |
| 615 E. Michigan St. | | Term; Since | | Executive Vice President, | |
| Milwaukee, WI 53202 | | January 2011 | | U.S. Bancorp Fund Services, LLC | |
| Year of Birth: 1958 | | | | (1994-2018). | |
V-SHARES
Additional Information (Unaudited) – Continued
October 31, 2022
| | | | Number of | | Other |
| | | | Portfolios | | Directorships |
| | Position(s) | Term of Office | in Trust | | Held by Trustee |
| Name, Address and | Held with | and Length of | Overseen | Principal Occupation(s) | During the |
Year of Birth | the Trust | Time Served | by Trustee | During the Past Five Years | Past Five Years |
| | | | | | |
| Officers | | | | | |
| | | | | | |
| Brian R. Wiedmeyer | President | Indefinite | N/A | Vice President, U.S. Bancorp Fund | N/A |
| 615 E. Michigan St. | and Principal | Term; Since | | Services, LLC (2005-Present). | |
| Milwaukee, WI 53202 | Executive | November 2018 | | | |
| Year of Birth: 1973 | Officer | | | | |
| | | | | | |
| Deborah Ward | Vice President, | Indefinite | N/A | Senior Vice President, U.S. Bancorp | N/A |
| 615 E. Michigan St. | Chief | Term; Since | | Fund Services, LLC (2004-Present). | |
| Milwaukee, WI 53202 | Compliance | April 2013 | | | |
| Year of Birth: 1966 | Officer and | | | | |
| | Anti-Money | | | | |
| | Laundering | | | | |
| | Officer | | | | |
| | | | | | |
| Benjamin Eirich | Treasurer, | Indefinite | N/A | Assistant Vice President, | N/A |
| 615 E. Michigan St. | Principal | Term; Since | | U.S. Bancorp Fund Services, LLC | |
| Milwaukee, WI 53202 | Financial | August 2019 | | (2008-Present). | |
| Year of Birth: 1981 | Officer and | (Treasurer); | | | |
| | Vice President | Since | | | |
| | | November 2018 | | | |
| | | (Vice President) | | | |
| | | | | | |
| John Hadermayer | Secretary | Indefinite | N/A | Vice President, U.S. Bancorp Fund | N/A |
| 615 E. Michigan St. | | Term; Since | | Services, LLC (2022-Present); | |
| Milwaukee, WI 53202 | | May 2022 | | Executive Director, AQR Capital | |
| Year of Birth: 1977 | |
| | Management, LLC | |
| | |
| | (2013-2022). | |
| | | | | | |
| Douglas Schafer | Assistant | Indefinite | N/A | Assistant Vice President, | N/A |
| 615 E. Michigan St. | Treasurer and | Term; Since | | U.S. Bancorp Fund Services, LLC | |
| Milwaukee, WI 53202 | Vice President | May 2016 | | (2002-Present). | |
| Year of Birth: 1970 | | (Assistant | | | |
| | | Treasurer); | | | |
| | | Since | | | |
| | | November 2018 | | | |
| | | (Vice President) | | | |
| | | | | | |
| Sara J. Bollech | Assistant | Indefinite | N/A | Officer, U.S. Bancorp Fund | N/A |
| 615 E. Michigan St. | Treasurer and | Term; Since | | Services, LLC (2007-Present). | |
| Milwaukee, WI 53202 | Vice President | November 2021 | | | |
| Year of Birth: 1977 | | | | | |
| | | | | | |
| Peter A. Walker, CPA | Assistant | Indefinite | N/A | Officer, U.S. Bancorp Fund | N/A |
| 615 E. Michigan St. | Treasurer and | Term; Since | | Services, LLC (2016-Present). | |
| Milwaukee, WI 53202 | Vice President | November 2021 | | | |
| Year of Birth: 1993 | | | | | |
V-SHARES
Additional Information (Unaudited) – Continued
October 31, 2022
AVAILABILITY OF FUND PORTFOLIO INFORMATION
The Funds file complete schedules of portfolio holdings with the SEC for the first and third quarters of each fiscal year on Part F of Form N-PORT. Each Fund’s Part F of Form N-PORT is available on the SEC’s website at www.sec.gov and may be reviewed and copied at the SEC’s Public Reference Room in Washington, D.C. For information on the Public Reference Room call 1-800-SEC-0330. In addition, the Fund’s Part F of Form N-PORT is available without charge upon request by calling 1-312-872-7281.
AVAILABILITY OF PROXY VOTING INFORMATION
A description of the Funds’ Proxy Voting Policies and Procedures is available without charge, upon request, by calling 1-312-872-7281. Information regarding how the Funds voted proxies relating to portfolio securities during the most recent 12-month period ended October 31, is available (1) without charge, upon request, by calling 1-312-872-7281, or (2) on the SEC’s website at www.sec.gov.
FREQUENCY DISTRIBUTION OF PREMIUMS AND DISCOUNTS
Information regarding how often shares of the Funds trade on an exchange at a premium or discount to the NAV of the Funds is available, free of charge, on the Funds’ website at https://www.v-shares.com.
FUND DISTRIBUTION INFORMATION
For the fiscal period ended October 31, 2022, certain dividends paid by the Funds may be reported as qualified dividend income and may be eligible for taxation at capital gain rates. The percentage of dividends declared from ordinary income designated as qualified dividend income was 100.00% and 0.00% for the US Leadership Diversity ETF and MSCI World ESG ETF, respectively. For corporate shareholders, the percent of ordinary income distributions qualifying for the corporate dividends received deduction for the period ended October 31, 2022 was 100.00% and 0.00% for the US Leadership Diversity ETF and MSCI World ESG ETF, respectively. The percentage of taxable ordinary income distributions that are designated as short-term capital gain distributions under Internal Revenue Section 871(k)(2)(c) was 0.00% and 0.00% for the US Leadership Diversity ETF and MSCI World ESG ETF, respectively.
V-SHARES
Privacy Notice (Unaudited)
The Funds collect only relevant information about you that the law allows or requires it to have in order to conduct its business and properly service you. The Funds collect financial and personal information about you (“Personal Information”) directly (e.g., information on account applications and other forms, such as your name, address, and social security number, and information provided to access account information or conduct account transactions online, such as password, account number, e-mail address, and alternate telephone number), and indirectly (e.g., information about your transactions with us, such as transaction amounts, account balance and account holdings).
The Funds do not disclose any non-public personal information about its shareholders or former shareholders other than for everyday business purposes such as to process a transaction, service an account, respond to court orders and legal investigations or as otherwise permitted by law. Third parties that may receive this information include companies that provide transfer agency, technology and administrative services to the Funds, as well as the Funds’ investment adviser who is an affiliate of the Funds. If you maintain a retirement/educational custodial account directly with a Fund, we may also disclose your Personal Information to the custodian for that account for shareholder servicing purposes. The Funds limit access to your Personal Information provided to unaffiliated third parties to information necessary to carry out their assigned responsibilities to the Funds. All shareholder records will be disposed of in accordance with applicable law. The Funds maintain physical, electronic and procedural safeguards to protect your Personal Information and requires its third-party service providers with access to such information to treat your Personal Information with the same high degree of confidentiality.
In the event that you hold shares of a Fund through a financial intermediary, including, but not limited to, a broker-dealer, credit union, bank or trust company, the privacy policy of your financial intermediary governs how your non-public personal information is shared with unaffiliated third parties.
With respect to the Funds, issues and redemptions of their shares at net asset value (“NAV”) occur only in large aggregations of a specified number of shares (e.g., 50,000) called “Creation Units.” Only Authorized Participants (“APs”) may acquire shares directly from an ETF, and only APs may tender their ETF shares for redemption directly to the ETF, at NAV. APs must be (i) a broker-dealer or other participant in the clearing process through the Continuous Net Settlement System of the NSCC, a clearing agency that is registered with the SEC; or (ii) a DTC participant. In addition, each AP must execute a Participant Agreement that has been agreed to by the Funds’ distributor, and that has been accepted by the Funds’ transfer agent, with respect to purchases and redemptions of Creation Units.
Because of this structure, the Funds do not have any information regarding any “consumers” as defined in Rule 3 of Regulation S-P with respect to any ETFs, and consequently is not required by Regulation S-P to deliver a notice of the Funds’ privacy policy to any ETF shareholders.
(This Page Intentionally Left Blank.)
INVESTMENT ADVISER
V-Square Quantitative Management, LLC
875 North Michigan Avenue Suite 3216
Chicago, IL, 60611
INVESTMENT SUB-ADVISER
Vident Investment Advisory, LLC
1125 Sanctuary Parkway, Suite 515
Alpharetta, GA, 30009
INDEX PROVIDER
ISS ESG
702 King Farm Boulevard, Suite 400
Rockville, MD, 20850
DISTRIBUTOR
Quasar Distributors, LLC
111 East Kilbourn Avenue, Suite 2200
Milwaukee, WI, 53202
CUSTODIAN
U.S. Bank N.A.
1555 North Rivercenter Drive, Suite 202
Milwaukee, WI, 53212
ADMINISTRATOR, FUND ACCOUNTANT
AND TRANSFER AGENT
U.S. Bancorp Fund Services, LLC
615 East Michigan Street
Milwaukee, WI, 53202
INDEPENDENT REGISTERED PUBLIC ACCOUNTING FIRM
Cohen & Company, Ltd.
342 North Water Street, Suite 830
Milwaukee, WI, 53202
LEGAL COUNSEL
Stradley Ronon Stevens & Young, LLP
2005 Market Street, Suite 2600
Philadelphia, PA, 19103
This report should be accompanied or preceded by a prospectus.
The Funds’ Statement of Additional Information contains additional information about the
Funds’ trustees and is available without charge upon request by calling 1-312-872-7281.
(b) Not Applicable.
Item 2. Code of Ethics.
The Registrant has adopted a code of ethics that applies to the Registrant’s principal executive officer and principal financial officer. The Registrant has not made any substantive amendments to its code of ethics during the period covered by this period.
The Registrant has not granted any waivers from any provisions of the code of ethics during the period covered by this report.
A copy of the Registrant’s code of ethics that applies to the Registrant’s principal executive officer and principal financial officer is filed herewith.
Item 3. Audit Committee Financial Expert.
The Registrant’s Board of Trustees has determined that there is at least one audit committee financial expert serving on its audit committee. Leonard M. Rush is the “audit committee financial expert” and is considered to be “independent” as each term is defined in Item 3 of Form N-CSR.
Item 4. Principal Accountant Fees and Services.
The Registrant has engaged its principal accountant to perform audit services, audit-related services, tax services and other services during the past two fiscal years. “Audit services” refer to performing an audit of the Registrant's annual financial statements or services that are normally provided by the accountant in connection with statutory and regulatory filings or engagements for the past fiscal year. “Audit-related services” refer to the assurance and related services by the principal accountant that are reasonably related to the performance of the audit. “Tax services” refer to professional services rendered by the principal accountant for tax compliance, tax advice, and tax planning, including reviewing the Fund’s tax returns and distribution calculations. There were no “other services” provided by the principal accountant. For the fiscal years ended October 31, 2022, and October 31, 2021, the Funds’ principal accountant was Cohen & Company, Ltd. The following table details the aggregate fees billed or expected to be billed for each of the last fiscal year for audit fees, audit-related fees, tax fees and other fees by the principal accountant.
| | FYE 10/31/2022 | FYE 10/31/2021 |
(a) Audit Fees | $30,000 | $0 |
(b) Audit-Related Fees | $0 | $0 |
(c) Tax Fees | $7,000 | $0 |
(d) All Other Fees | $0 | $0 |
(e)(1) The audit committee has adopted pre-approval policies and procedures that require the audit committee to pre‑approve all audit and non‑audit services of the Registrant, including services provided to any entity affiliated with the Registrant.
(e)(2) The percentage of fees billed by Cohen & Company, Ltd. applicable to non-audit services pursuant to waiver of pre-approval requirement was as follows:
| | FYE 10/31/2022 | FYE 10/31/2021 |
| Audit-Related Fees | 0% | 0% |
| Tax Fees | 0% | 0% |
| All Other Fees | 0% | 0% |
(f) All of the principal accountant’s hours spent on auditing the Registrant’s financial statements were attributed to work performed by full‑time permanent employees of the principal accountant.
(g) The following table indicates the non-audit fees billed or expected to be billed by the Registrant’s accountant for services to the Registrant and to the Registrant’s investment adviser (and any other controlling entity, etc.—not sub-adviser) for the last two years.
| Non-Audit Related Fees | FYE 10/31/2022 | FYE 10/31/2021 |
| Registrant | $0 | $0 |
| Registrant’s Investment Adviser | $0 | $0 |
(h) The audit committee of the board of trustees/directors has considered whether the provision of non-audit services that were rendered to the Registrant's investment adviser is compatible with maintaining the principal accountant's independence and has concluded that the provision of such non-audit services by the accountant has not compromised the accountant’s independence.
(i) Not applicable.
(j) Not applicable.
Item 5. Audit Committee of Listed Registrants.
Not applicable to Registrants who are not listed issuers (as defined in Rule 10A-3 under the Securities Exchange Act of 1934).
Item 6. Schedule of Investments.
(a) Schedule of Investments is included as part of the report to shareholders filed under Item 1 of this Form.
(b) Not applicable.
Item 7. Disclosure of Proxy Voting Policies and Procedures for Closed-End Management Investment Companies.
Not applicable to open-end investment companies.
Item 8. Portfolio Managers of Closed-End Management Investment Companies.
Not applicable to open-end investment companies.
Item 9. Purchases of Equity Securities by Closed‑End Management Investment Company and Affiliated Purchasers.
Not applicable to open-end investment companies.
Item 10. Submission of Matters to a Vote of Security Holders.
There have been no material changes to the procedures by which shareholders may recommend nominees to the Registrant’s Board of Trustees.
Item 11. Controls and Procedures.
| (a) | The Registrant’s President and Treasurer have reviewed the Registrant's disclosure controls and procedures (as defined in Rule 30a-3(c) under the Investment Company Act of 1940 (the “Act”)) as of a date within 90 days of the filing of this report, as required by Rule 30a-3(b) under the Act and Rules 13a-15(b) or 15d‑15(b) under the Securities Exchange Act of 1934. Based on their review, such officers have concluded that the disclosure controls and procedures are effective in ensuring that information required to be disclosed in this report is appropriately recorded, processed, summarized and reported and made known to them by others within the Registrant and by the Registrant’s service provider. |
| (b) | There were no significant changes in the Registrant's internal control over financial reporting (as defined in Rule 30a-3(d) under the Act) that occurred during the period covered by this report that has materially affected, or is reasonably likely to materially affect, the Registrant's internal control over financial reporting. |
Item 12. Disclosure of Securities Lending Activities for Closed-End Management Investment Companies
Not applicable to open-end investment companies.
Item 13. Exhibits.
(3) Any written solicitation to purchase securities under Rule 23c‑1 under the Act sent or given during the period covered by the report by or on behalf of the Registrant to 10 or more persons. Not applicable to open-end investment companies.
(4) Change in the Registrant’s independent public accountant. There was no change in the Registrant’s independent public accountant for the period covered by this report.
SIGNATURES
Pursuant to the requirements of the Securities Exchange Act of 1934 and the Investment Company Act of 1940, the Registrant has duly caused this report to be signed on its behalf by the undersigned, thereunto duly authorized.
(Registrant) Managed Portfolio Series
By (Signature and Title) /s/Brian R. Wiedmeyer
Brian R. Wiedmeyer, President
Date January 9, 2023
Pursuant to the requirements of the Securities Exchange Act of 1934 and the Investment Company Act of 1940, this report has been signed below by the following persons on behalf of the Registrant and in the capacities and on the dates indicated.
By (Signature and Title) /s/Brian R. Wiedmeyer
Brian R. Wiedmeyer, President
Date January 9, 2023
By (Signature and Title) /s/Benjamin J. Eirich
Benjamin J. Eirich, Treasurer
Date January 9, 2023