Nuance Concentrated Value Fund
Investor Class Shares – NCAVX
Institutional Class Shares – NCVLX
Annual Report
| www.nuanceinvestments.com | April 30, 2023 |
NUANCE CONCENTRATED VALUE FUND
April 30, 2023
Dear Fellow Shareholders:
We are pleased to write our annual shareholder letter for the Nuance Concentrated Value Fund (the “Fund”). The Fund is a classic value investment product investing primarily in the equity or equity-linked securities of United States based companies. The Fund will typically maintain 15-35 positions in the securities of companies that, in the opinion of the Nuance Investments team, have leading and sustainable market share positions, above average financial strength, and are trading at prices below our internally derived view of intrinsic value. Although the strategy will invest primarily in the equity securities of U.S. companies, the strategy may invest up to 25% of its assets in equity securities of foreign companies that are classified as “developed” by MSCI. The primary benchmark for the Fund is the Russell 3000® Value Index. Clients may also be interested in comparing the Fund to the S&P 500® Index.
Average Annual Rates of Return as of April 30, 2023:
| | 6 Months | 1 Year | 3 Year | 5 Year | 10 Year | Since Inception(1) |
| Institutional Class | 15.53% | 7.78% | 11.20% | 7.97% | 8.94% | 9.61% |
Russell 3000® Value Index(2) | 3.86% | 0.67% | 14.46% | 7.48% | 8.98% | 9.42% |
S&P 500® Index(3) | 8.63% | 2.66% | 14.52% | 11.45% | 12.20% | 12.14% |
| | | | | | | |
| | 6 Months | 1 Year | 3 Year | 5 Year | 10 Year | Since Inception(4) |
| Investor Class, no load | 15.35% | 7.47% | 10.90% | 7.68% | 8.64% | 10.19% |
| Investor Class with load | 9.58% | 2.09% | 9.01% | 6.58% | 8.08% | 9.67% |
Russell 3000® Value Index(2) | 3.86% | 0.67% | 14.46% | 7.48% | 8.98% | 9.42% |
S&P 500® Index(3) | 8.63% | 2.66% | 14.52% | 11.45% | 12.20% | 12.14% |
Performance data quoted represents past performance. Past performance does not guarantee future results. The investment return and principal value of an investment will fluctuate so that an investor’s shares, when redeemed, may be worth more or less than their original cost. Current performance of the Fund may be lower or higher than the performance quoted. Investor Class performance data shown reflects both performance with the maximum sales charge of 5.75% (for periods prior to September 17, 2015) or 5.00% (for period September 17, 2015 and after) and without it. Performance data current to the most recent month end may be obtained by calling 1-855-682-6233.
The Adviser has contractually agreed to reduce its management fees, and may reimburse the Fund for its operating expenses, in order to ensure that Total Annual Fund Operating Expenses (excluding any front-end or contingent deferred loads, acquired fund fees and expenses, leverage/borrowing interest, interest expense, dividends paid on short sales, taxes brokerage commissions and extraordinary expenses) do not exceed 1.28% of the average daily net assets of the Investor Class and 1.03% of the average daily net assets of the Institutional Class through at least August 28, 2023.
| Institutional Class Gross Expense Ratio – 1.09% | Net Expense Ratio – 1.04% |
| Investor Class Gross Expense Ratio – 1.34% | Net Expense Ratio – 1.29% |
| (1) | May 31, 2011 |
| (2) | The Russell 3000® Value Index measures performance of those Russell 3000 Index companies with lower price-to-book ratios and lower forecasted growth values. This index cannot be invested in directly. |
| (3) | The Standard & Poor’s 500® Index (S&P 500) is an unmanaged, capitalization-weighted index generally representative of the U.S. Market for large capitalization stocks. This Index cannot be invested in directly. |
| (4) | July 31, 2012 |
In terms of performance, since its inception on May 31, 2011 thru April 30, 2023, the Institutional Class is up 9.61 percent (annualized) versus its primary index – the Russell 3000® Value Index – up 9.42 percent (annualized) and
NUANCE CONCENTRATED VALUE FUND
the S&P 500® Index up 12.14 percent (annualized). For more perspective on our longer-term performance please refer to your prospectus. Nuance has offered the strategy in a separate account vehicle since November 13, 2008. While our Nuance Concentrated Value Fund outperformed the primary benchmark over the 12-month time horizon, Nuance cautions clients regarding the use of short-term performance as a tool to make investment decisions. As we remind our clients, your team continues to try and find leading business franchises with sustainable competitive positions that are trading below our internally derived view of fair or intrinsic value. We believe that our time-tested process of finding what we consider best of breed businesses with better than the market downside support and better than the market upside potential over the long-term should lead to solid risk adjusted returns versus our peers and benchmarks.
At Nuance, our team and our processes are designed to emphasize consistency and what we believe is thorough fundamental analysis of companies that have the potential to lead to investment returns that will be acceptable for our shareholders over the long term. To do this, we focus our attention on studying one company at a time using the Nuance approach. Part of that approach is to ensure that each company we own has a sound and solid competitive position and that the companies are undervalued based on our internally derived view of sustainable cash flows, earnings and valuation. We believe in a thorough fundamental valuation analysis and that focusing simply on the value of a business is not enough. Rather, we spend considerable time studying the down-side potential of each company we own. As such, we believe that we understand the potential upside and the potential downside risks to our investments. This approach is critical to our goal of trying to provide shareholders with not only above-average returns over time, but above-average risk-adjusted returns as well.
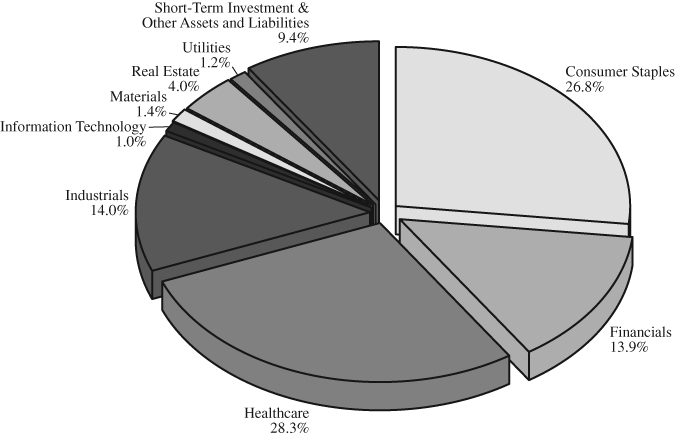
The largest overweight positions, relative to the index, remain the Consumer Staples and Health Care sectors. Within the Consumer Staples sector, we are continuing to see input cost inflation-related under-earning in a number of leaders across the Household & Personal Products industry group. Our view is that earnings in this industry group have been negatively impacted by rising raw material costs. We believe these costs can ultimately be mostly offset by price increases which generally lag the raw material price increases. We are also seeing some one-off opportunities within the Food Products industry. Our overweight position in the Health Care sector is primarily in the Health Care Equipment & Supplies industry as we wait patiently for elective procedure volumes to normalize following this prolonged disruption. We believe these companies are manufacturing critical, advanced medical products and display the traits we look for in competitively advantaged businesses. They sell into end markets that have been severely disrupted for more than two years as patient visits and procedures of all kinds have run well below normal due to the impacts of Covid-19, including high cancellation rates, procedure delays, and insufficient care provider staffing to meet demand. We believe the magnitude and duration of this disruption has created a large backlog of procedures that will need to be made up over the next 1-2 years. More recently, we believe raw material availability and input cost inflation in items including resins and metals have also squeezed margins at these companies. Offsetting price actions can take 1-2 years to implement in this industry, which is prolonging the period of under-earning, in our opinion. Nevertheless, this remains a high conviction, under-earning group of excellent businesses, in our view. We have continued to add slightly to our Industrials holdings and remain overweight the sector as select leaders have started to look modestly attractive. While we are underweight the Financials sector, we continue to find attractive risk rewards, in our opinion, primarily in the Insurance and Capital Markets industries. We maintain positions in the Utilities and Real Estate sectors but are slightly underweight relative to the benchmark. We continue to be underweight the Information Technology sector as we look for more attractive risk rewards. We remain underweight in the Energy sector where we believe the sector is facing a multi-year period of competitive transition. We remain underweight in the Consumer Discretionary and Communication Services sectors primarily due to a combination of competitive uncertainty and valuation concerns.
Thank you for your interest and your continued support.
Scott A. Moore, CFA
NUANCE CONCENTRATED VALUE FUND
Please visit our website at www.nuanceinvestments.com for more information about our team, our process, and value investing. You can also get real-time access to the Nuance Investment website updates and information via traditional mail or e-mail. Simply contact us at client.services@nuanceinvestments.com or call 816-743-7080 to sign-up.
This report should be preceded or accompanied by a prospectus.
Mutual fund investing involves risk. Principal loss is possible. Investments in small and mid-capitalization companies involve additional risk such as limited liquidity and greater volatility than larger capitalization companies. Investments in foreign securities involve political, economic and currency risks, greater volatility and differences in accounting methods. The Fund is non-diversified, meaning it may concentrate its assets in fewer individual holdings than a diversified fund. Therefore, the Fund is more exposed to individual stock volatility than a diversified fund.
Past performance does not guarantee future results.
Opinions expressed are subject to change, are not guaranteed and should not be considered investment advice or recommendations to buy or sell any security.
A Cash Flow is a revenue or expense stream that changes an account over a given period.
Nuance Investments, LLC is the adviser to the Nuance Concentrated Value Fund which is distributed by Quasar Distributors, LLC.
NUANCE CONCENTRATED VALUE FUND
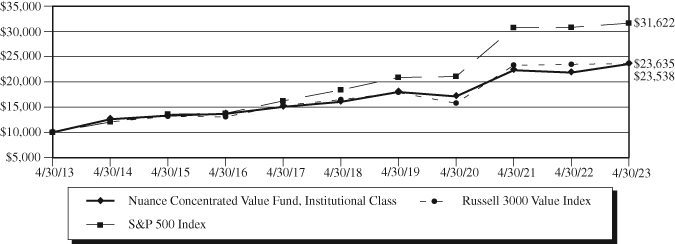
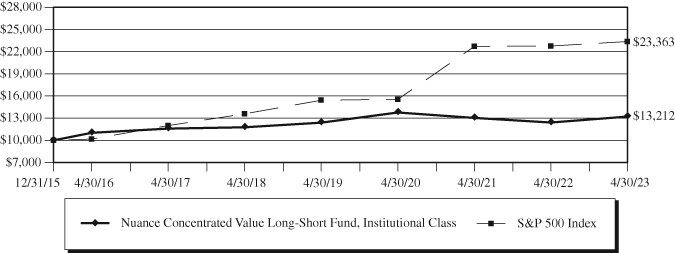
Value of $10,000 Investment (Unaudited)
The chart assumes an initial investment of $10,000. Performance reflects waivers of fee and operating expenses in effect. In the absence of such waivers, total return would be reduced. Performance data quoted represents past performance and does not guarantee future results. Investment returns and principal value will fluctuate, and when sold, may be worth more or less than their original cost. Performance current to the most recent month-end may be lower or higher than the performance quoted and can be obtained by calling 1-855-682-6233. Performance assumes the reinvestment of capital gains and income distributions. The performance does not reflect the deduction of taxes that a shareholder would pay on Fund distributions or the redemption of Fund shares.
Average Annual Rates of Return (%) As of April 30, 2023
| | | | | | Since |
| | 1 Year | 3 Years | 5 Years | 10 Years | Inception(1) |
| Investor Class (without sales load) | 7.47% | 10.90% | 7.68% | 8.64% | 9.32% |
Investor Class (with sales load)(2) | 2.09% | 9.01% | 6.58% | 8.08% | 8.85% |
| Institutional Class | 7.78% | 11.20% | 7.97% | 8.94% | 9.61% |
Russell 3000 Value Index(3) | 0.67% | 14.46% | 7.48% | 8.98% | 9.42% |
S&P 500 Index(4) | 2.66% | 14.52% | 11.45% | 12.20% | 12.14% |
| (1) | Period from Fund inception through April 30, 2023. The Institutional Class shares commenced operations on May 31, 2011 and Investor Class shares commenced operations on July 31, 2012. Performance shown for the Investor Class prior to inception of the Investor Class shares is based on the performance of the Institutional Class shares, adjusted for the higher expenses applicable to Investor Class shares. |
| (2) | Returns reflect a sales load of 5.00%. |
| (3) | The Russell 3000 Value Index measures performance of those Russell 3000 Index companies with lower price-to-book ratios and lower forecasted growth values. This Index cannot be invested in directly. |
| (4) | The Standard & Poor’s 500 Index (S&P 500) is an unmanaged, capitalization-weighted index generally representative of the U.S. market for large capitalization stocks. This Index cannot be invested in directly. |
The following is expense information for the Nuance Concentrated Value Fund as disclosed in the Fund’s most recent prospectus dated August 28, 2022:
| Investor Class Gross Expenses – 1.34% | Investor Class Net Expenses – 1.29% |
| Institutional Class Gross Expenses – 1.09% | Institutional Class Net Expenses – 1.04% |
NUANCE CONCENTRATED VALUE FUND
Nuance Investments, LLC (the “Adviser”) has contractually agreed to waive its management fees and pay Fund expenses, in order to ensure that Total Annual Fund Operating Expenses (excluding any front-end or contingent deferred loads, acquired fund fees and expenses, leverage/borrowing, interest, interest expense, dividends paid on short sales, taxes, brokerage commissions and extraordinary expenses) do not exceed 1.28% of the average daily net assets of the Investor Class and 1.03% of the average daily net assets of the Institutional Class. Fees waived and expenses paid by the Adviser may be recouped by the Adviser for a period of 36 months following the month during which such fee waiver and/or expense payment was made if such recoupment can be achieved without exceeding the expense limit in effect at the time the fee waiver and/or expense payment occurred and the expense limit in place at the time of recoupment. The Operating Expenses Limitation Agreement is indefinite but cannot be terminated through at least August 28, 2023. Thereafter, the agreement may be terminated at any time upon 60 days’ written notice by the Trust’s Board of Trustees (the “Board”) or the Adviser, with consent of the Board.
NUANCE CONCENTRATED VALUE FUND
Expense Example (Unaudited)
April 30, 2023
As a shareholder of the Fund, you incur two types of costs: (1) transaction costs, which may include but are not limited to, sales charges (loads) on purchases; and (2) ongoing costs, including management fees, distribution and service (12b-1) fees, shareholder servicing fees, and other Fund expenses. This Example is intended to help you understand your ongoing costs (in dollars) of investing in the Fund and to compare these costs with the ongoing costs of investing in other mutual funds. The Example is based on an investment of $1,000 invested at the beginning of the period and held for the entire period (November 1, 2022 – April 30, 2023).
ACTUAL EXPENSES
For each class, the first line of the table below provides information about actual account values and actual expenses. You may use the information in this line, together with the amount you invested, to estimate the expenses that you paid over the period. Simply divide your account value by $1,000 (for example, an $8,600 account value divided by $1,000 = 8.6), then multiply the result by the number in the first line under the heading entitled “Expenses Paid During Period” to estimate the expenses you paid on your account during this period.
HYPOTHETICAL EXAMPLE FOR COMPARISON PURPOSES
For each class, the second line of the table below provides information about hypothetical account values and hypothetical expenses based on the Fund’s actual expense ratio and an assumed rate of return of 5% per year before expenses, which is not the Fund’s actual return. The hypothetical account values and expenses may not be used to estimate the actual ending account balance or expenses you paid for the period. You may use this information to compare the ongoing costs of investing in the Fund and other funds. To do so, compare this 5% hypothetical example with the 5% hypothetical examples that appear in the shareholder reports of the other funds.
Please note that the expenses shown in the table are meant to highlight your ongoing costs only and do not reflect any transactional costs. Therefore, the second line of the table is useful in comparing ongoing costs only, and will not help you determine the relative total costs of owning different funds. In addition, if transactional costs were included, your costs may have been higher.
| | | | Expenses Paid |
| | Beginning Account | Ending Account | During Period(1) |
| | Value (11/1/22) | Value (4/30/23) | (11/1/22 to 4/30/23) |
Investor Class | | | |
Actual(2) | $1,000.00 | $1,153.50 | $6.83 |
Hypothetical (5% return before expenses) | $1,000.00 | $1,018.45 | $6.41 |
| | | | |
Institutional Class | | | |
Actual(2) | $1,000.00 | $1,155.30 | $5.50 |
Hypothetical (5% return before expenses) | $1,000.00 | $1,019.69 | $5.16 |
| (1) | Expenses are equal to the Fund’s annualized expense ratio for the most recent six-month period of 1.28% and 1.03% for the Investor Class and Institutional Class, respectively, multiplied by the average account value over the period, multiplied by 181/365 to reflect the one-half year period. |
| (2) | Based on the actual returns for the six-month period ended April 30, 2023 of 15.35% and 15.53% for the Investor Class and Institutional Class, respectively. |
NUANCE CONCENTRATED VALUE FUND
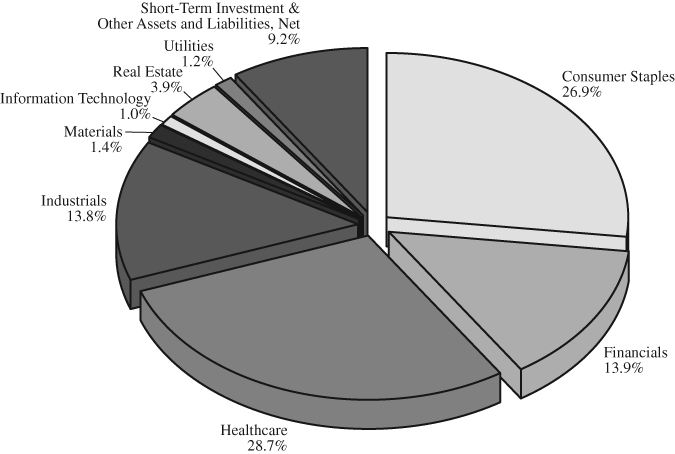
Allocation of Portfolio(1) (% of Net Assets) (Unaudited)
April 30, 2023
Top Ten Equity Holdings(1) (Unaudited)
as of April 30, 2023
(% of Net Assets)
| | Henkel AG & Co. KGaA – ADR | | | 8.3 | % |
| | Smith & Nephew – ADR | | | 7.5 | % |
| | Kimberly-Clark Corp. | | | 7.3 | % |
| | Dentsply Sirona, Inc. | | | 7.0 | % |
| | 3M Co. | | | 6.3 | % |
| | Clorox Co. | | | 4.6 | % |
| | Northern Trust Corp. | | | 4.5 | % |
| | Medtronic PLC | | | 4.3 | % |
| | Universal Health Services, Inc. – Class B | | | 4.3 | % |
| | Knorr-Bremse AG – ADR | | | 4.0 | % |
| (1) | Fund holdings and sector allocations are subject to change at any time and are not recommendations to buy or sell any security. |
ADR – American Depository Receipt
NUANCE CONCENTRATED VALUE FUND
Schedule of Investments
April 30, 2023
| | | Shares | | | Value | |
| COMMON STOCKS – 90.8% | | | | | | |
| | | | | | | |
Consumer Staples# – 26.9% | | | | | | |
Beiersdorf AG – ADR | | | 265,683 | | | $ | 7,391,301 | |
Calavo Growers, Inc. | | | 134,852 | | | | 4,309,870 | |
Cal-Maine Foods, Inc. | | | 28,177 | | | | 1,338,408 | |
Clorox Co. | | | 79,683 | | | | 13,197,098 | |
Diageo PLC – ADR | | | 8,125 | | | | 1,507,188 | |
Henkel AG & Co. KGaA – ADR | | | 1,290,794 | | | | 23,815,149 | |
Kimberly-Clark Corp. | | | 144,916 | | | | 20,996,879 | |
Mission Produce, Inc.* | | | 381,937 | | | | 4,350,262 | |
| | | | | | | | 76,906,155 | |
| | | | | | | | | |
| Financials – 13.9% | | | | | | | | |
Charles Schwab Corp. | | | 81,172 | | | | 4,240,425 | |
Chubb Ltd. | | | 17,639 | | | | 3,555,317 | |
Independent Bank Corp. | | | 25,376 | | | | 1,421,056 | |
Northern Trust Corp. | | | 163,623 | | | | 12,788,774 | |
Reinsurance Group of America, Inc. | | | 45,462 | | | | 6,470,152 | |
Travelers Companies, Inc. | | | 61,552 | | | | 11,149,529 | |
| | | | | | | | 39,625,253 | |
| | | | | | | | | |
Healthcare+ – 28.7% | | | | | | | | |
Dentsply Sirona, Inc. | | | 480,102 | | | | 20,130,677 | |
Globus Medical, Inc. – Class A* | | | 109,925 | | | | 6,391,039 | |
ICU Medical, Inc.* | | | 19,816 | | | | 3,747,998 | |
Medtronic PLC | | | 136,682 | | | | 12,431,228 | |
Smith & Nephew – ADR | | | 653,827 | | | | 21,380,143 | |
Universal Health Services, Inc. – Class B | | | 82,082 | | | | 12,341,029 | |
Zimmer Biomet Holdings, Inc. | | | 42,081 | | | | 5,825,694 | |
| | | | | | | | 82,247,808 | |
| | | | | | | | | |
| Industrials – 13.8% | | | | | | | | |
3M Co. | | | 170,496 | | | | 18,110,085 | |
Knorr-Bremse AG – ADR | | | 663,582 | | | | 11,552,963 | |
Mueller Water Products, Inc. – Class A | | | 724,052 | | | | 9,702,297 | |
| | | | | | | | 39,365,345 | |
| | | | | | | | | |
| Information Technology – 1.0% | | | | | | | | |
Amphenol Corp. – Class A | | | 37,589 | | | | 2,836,842 | |
| | | | | | | | | |
| Materials – 1.4% | | | | | | | | |
AptarGroup, Inc. | | | 35,090 | | | | 4,158,516 | |
See Notes to the Financial Statements
NUANCE CONCENTRATED VALUE FUND
Schedule of Investments – Continued
April 30, 2023
| | | Shares | | | Value | |
| | | | | | | |
| Real Estate – 3.9% | | | | | | |
Equity Commonwealth | | | 67,438 | | | $ | 1,397,315 | |
Healthcare Realty Trust, Inc. | | | 489,996 | | | | 9,692,121 | |
| | | | | | | | 11,089,436 | |
| | | | | | | | | |
| Utilities – 1.2% | | | | | | | | |
United Utilities Group PLC – ADR | | | 128,938 | | | | 3,468,432 | |
| Total Common Stocks | | | | | | | | |
| (Cost $234,748,230) | | | | | | | 259,697,787 | |
| | | | | | | | | |
| SHORT-TERM INVESTMENT – 9.0% | | | | | | | | |
First American Government Obligations Fund, Class X, 4.73%^ | | | | | | | | |
| (Cost $25,891,268) | | | 25,891,268 | | | | 25,891,268 | |
| Total Investments – 99.8% | | | | | | | | |
| (Cost $260,639,498) | | | | | | | 285,589,055 | |
| Other Assets and Liabilities, Net – 0.2% | | | | | | | 462,262 | |
| Total Net Assets – 100.0% | | | | | | $ | 286,051,317 | |
| # | The Fund is significantly invested in this sector and therefore is subject to additional risks. Changes in domestic and international economies, interest rates, competition, consumer confidence, consumer spending, government regulation, marketing, and supply and demand may affect companies in this sector. |
| + | The Fund is significantly invested in this sector and therefore is subject to additional risks. Companies in this sector are subject to litigation, intellectual property issues, competition, government regulation, product approval or rejection, and product obsolescence. |
| * | Non-income producing security |
| ^ | The rate shown is the annualized seven day effective yield as of April 30, 2023. |
ADR – American Depositary Receipt
See Notes to the Financial Statements
NUANCE CONCENTRATED VALUE FUND
Statement of Assets and Liabilities
April 30, 2023
| ASSETS: | | | |
Investments, at value | | | |
(cost $260,639,498) | | $ | 285,589,055 | |
Receivable for investment securities sold | | | 948,152 | |
Receivable for capital shares sold | | | 123,964 | |
Dividends & interest receivable | | | 1,433,592 | |
Prepaid expenses | | | 29,129 | |
Total assets | | | 288,123,892 | |
| | | | | |
| LIABILITIES: | | | | |
Payable for investment securities purchased | | | 1,565,625 | |
Payable for capital shares redeemed | | | 184,296 | |
Payable to investment adviser | | | 188,044 | |
Payable for fund services fees | | | 25,849 | |
Payable for trustee fees | | | 4,368 | |
Accrued distribution & shareholder service fees | | | 54,669 | |
Accrued expenses | | | 49,724 | |
Total liabilities | | | 2,072,575 | |
| | | | | |
| NET ASSETS | | $ | 286,051,317 | |
| | | | | |
| NET ASSETS CONSIST OF: | | | | |
Paid-in capital | | $ | 278,423,047 | |
Total distributable earnings | | | 7,628,270 | |
Net Assets | | $ | 286,051,317 | |
| | | Investor | | | Institutional | |
| | | Class | | | Class | |
Net Assets | | $ | 15,356,834 | | | $ | 270,694,483 | |
Shares issued and outstanding(1) | | | 1,207,377 | | | | 21,272,600 | |
Net asset value, redemption price and minimum offering price per share | | $ | 12.72 | | | $ | 12.73 | |
Maximum offering price per share ($12.72/0.95)(2) | | $ | 13.39 | | | | N/A | |
| (1) | Unlimited shares authorized with no par value. |
| (2) | Reflects a maximum sales charge of 5.00%. |
See Notes to the Financial Statements
NUANCE CONCENTRATED VALUE FUND
Statement of Operations
For the Year Ended April 30, 2023
| INVESTMENT INCOME: | | | |
Dividend income | | $ | 6,946,050 | |
Less: Foreign taxes withheld | | | (126,294 | ) |
Interest income | | | 642,889 | |
Total investment income | | | 7,462,645 | |
| | | | | |
| EXPENSES: | | | | |
Investment adviser fees (See Note 4) | | | 2,818,894 | |
Fund services fees (See Note 4) | | | 193,399 | |
Federal & state registration fees | | | 46,531 | |
Postage & printing fees | | | 28,484 | |
Trustee fees | | | 18,456 | |
Audit fees | | | 17,710 | |
Legal fees | | | 11,820 | |
Other | | | 8,741 | |
Insurance fees | | | 4,285 | |
Distribution & shareholder service fees (See Note 5): | | | | |
Investor Class | | | 62,204 | |
Institutional Class | | | 358,251 | |
Total expenses before waiver | | | 3,568,775 | |
Less: waiver from investment adviser (See Note 4) | | | (114,061 | ) |
Net expenses | | | 3,454,714 | |
| | | | | |
| NET INVESTMENT INCOME | | | 4,007,931 | |
| | | | | |
| REALIZED AND UNREALIZED GAIN (LOSS) ON INVESTMENTS: | | | | |
Net realized loss on investments | | | (12,310,188 | ) |
Net change in unrealized appreciation/depreciation on investments | | | 24,736,397 | |
| | | | | |
Net realized and unrealized gain on investments | | | 12,426,209 | |
| | | | | |
| NET INCREASE IN NET ASSETS RESULTING FROM OPERATIONS | | $ | 16,434,140 | |
See Notes to the Financial Statements
NUANCE CONCENTRATED VALUE FUND
Statements of Changes in Net Assets
| | | Year Ended | | | Year Ended | |
| | | April 30, 2023 | | | April 30, 2022 | |
| OPERATIONS: | | | | | | |
Net investment income | | $ | 4,007,931 | | | $ | 4,654,961 | |
Net realized gain (loss) on investments | | | (12,310,188 | ) | | | 53,918,103 | |
Net change in unrealized appreciation/depreciation on investments | | | 24,736,397 | | | | (68,017,925 | ) |
Net increase (decrease) in net assets resulting from operations | | | 16,434,140 | | | | (9,444,861 | ) |
| | | | | | | | | |
| CAPITAL SHARE TRANSACTIONS: | | | | | | | | |
Investor Class: | | | | | | | | |
| Proceeds from shares sold | | | 871,339 | | | | 3,475,675 | |
| Proceeds from reinvestment of distributions | | | 1,879,907 | | | | 3,716,908 | |
| Payments for shares redeemed | | | (3,921,892 | ) | | | (13,301,354 | ) |
Decrease in net assets resulting from Investor Class transactions | | | (1,170,646 | ) | | | (6,108,771 | ) |
Institutional Class: | | | | | | | | |
Proceeds from shares sold | | | 40,417,652 | | | | 84,047,520 | |
| Proceeds from reinvestment of distributions | | | 28,464,378 | | | | 53,030,998 | |
| Payments for shares redeemed | | | (183,776,950 | ) | | | (141,538,203 | ) |
Decrease in net assets resulting from Institutional Class transactions | | | (114,894,920 | ) | | | (4,459,685 | ) |
Net decrease in net assets resulting from capital share transactions | | | (116,065,566 | ) | | | (10,568,456 | ) |
| | | | | | | | | |
| DISTRIBUTIONS TO SHAREHOLDERS: | | | | | | | | |
| Investor Class | | | (1,915,852 | ) | | | (3,785,668 | ) |
| Institutional Class | | | (36,466,421 | ) | | | (68,051,501 | ) |
Total distributions to shareholders | | | (38,382,273 | ) | | | (71,837,169 | ) |
| TOTAL DECREASE IN NET ASSETS | | | (138,013,699 | ) | | | (91,850,486 | ) |
| | | | | | | | | |
| NET ASSETS: | | | | | | | | |
Beginning of year | | | 424,065,016 | | | | 515,915,502 | |
End of year | | $ | 286,051,317 | | | $ | 424,065,016 | |
See Notes to the Financial Statements
NUANCE CONCENTRATED VALUE FUND
Financial Highlights
For a Fund share outstanding throughout the year.
| | | Year Ended | | | Year Ended | | | Year Ended | | | Year Ended | | | Year Ended | |
| | | April 30, | | | April 30, | | | April 30, | | | April 30, | | | April 30, | |
| | | 2023 | | | 2022 | | | 2021 | | | 2020 | | | 2019 | |
| Investor Class | | | | | | | | | | | | | | | |
| | | | | | | | | | | | | | | | |
| PER SHARE DATA: | | | | | | | | | | | | | | | |
Net asset value, beginning of year | | $ | 13.48 | | | $ | 16.18 | | | $ | 12.49 | | | $ | 14.17 | | | $ | 14.35 | |
| | | | | | | | | | | | | | | | | | | | | |
| INVESTMENT OPERATIONS: | | | | | | | | | | | | | | | | | | | | |
Net investment income | | | 0.13 | | | | 0.14 | | | | 0.05 | | | | 0.13 | | | | 0.10 | |
Net realized and unrealized | | | | | | | | | | | | | | | | | | | | |
gain (loss) on investments | | | 0.73 | | | | (0.50 | ) | | | 3.68 | | | | (0.70 | ) | | | 1.32 | |
Total from investment operations | | | 0.86 | | | | (0.36 | ) | | | 3.73 | | | | (0.57 | ) | | | 1.42 | |
| | | | | | | | | | | | | | | | | | | | | |
| LESS DISTRIBUTIONS: | | | | | | | | | | | | | | | | | | | | |
Distributions from net investment income | | | (0.08 | ) | | | (0.08 | ) | | | (0.04 | ) | | | (0.12 | ) | | | (0.10 | ) |
Distributions from net realized gains | | | (1.54 | ) | | | (2.26 | ) | | | — | | | | (0.99 | ) | | | (1.50 | ) |
Total distributions | | | (1.62 | ) | | | (2.34 | ) | | | (0.04 | ) | | | (1.11 | ) | | | (1.60 | ) |
| | | | | | | | | | | | | | | | | | | | | |
Net asset value, end of year | | $ | 12.72 | | | $ | 13.48 | | | $ | 16.18 | | | $ | 12.49 | | | $ | 14.17 | |
| | | | | | | | | | | | | | | | | | | | | |
TOTAL RETURN(1) | | | 7.47 | % | | | (2.35 | )% | | | 29.96 | % | | | (5.02 | )% | | | 11.76 | % |
| | | | | | | | | | | | | | | | | | | | | |
| SUPPLEMENTAL DATA AND RATIOS: | | | | | | | | | | | | | | | | | | | | |
Net assets, end of year (in millions) | | $ | 15.4 | | | $ | 17.4 | | | $ | 27.7 | | | $ | 52.4 | | | $ | 89.1 | |
| | | | | | | | | | | | | | | | | | | | | |
Ratio of expenses to average net assets: | | | | | | | | | | | | | | | | | | | | |
| Before expense waiver/recoupment | | | 1.35 | % | | | 1.33 | % | | | 1.33 | % | | | 1.34 | % | | | 1.38 | % |
| After expense waiver/recoupment | | | 1.28 | % | | | 1.28 | % | | | 1.28 | % | | | 1.28 | % | | | 1.38 | %(2) |
| | | | | | | | | | | | | | | | | | | | | |
Ratio of net investment income | | | | | | | | | | | | | | | | | | | | |
to average net assets: | | | | | | | | | | | | | | | | | | | | |
| Before expense waiver/recoupment | | | 0.90 | % | | | 0.67 | % | | | 0.16 | % | | | 0.84 | % | | | 0.64 | % |
| After expense waiver/recoupment | | | 0.97 | % | | | 0.72 | % | | | 0.21 | % | | | 0.90 | % | | | 0.64 | % |
| | | | | | | | | | | | | | | | | | | | | |
Portfolio turnover rate | | | 67 | % | | | 68 | % | | | 87 | % | | | 130 | % | | | 93 | % |
| (1) | Total return does not reflect sales charges. |
| (2) | On April 30, 2019, the Adviser lowered the limit of annual operating expenses from 1.40% to 1.28% of average daily net assets. |
See Notes to the Financial Statements
NUANCE CONCENTRATED VALUE FUND
Financial Highlights
For a Fund share outstanding throughout the year.
| | | Year Ended | | | Year Ended | | | Year Ended | | | Year Ended | | | Year Ended | |
| | | April 30, | | | April 30, | | | April 30, | | | April 30, | | | April 30, | |
| | | 2023 | | | 2022 | | | 2021 | | | 2020 | | | 2019 | |
| Institutional Class | | | | | | | | | | | | | | | |
| | | | | | | | | | | | | | | | |
| PER SHARE DATA: | | | | | | | | | | | | | | | |
Net asset value, beginning of year | | $ | 13.50 | | | $ | 16.21 | | | $ | 12.53 | | | $ | 14.23 | | | $ | 14.39 | |
| | | | | | | | | | | | | | | | | | | | | |
| INVESTMENT OPERATIONS: | | | | | | | | | | | | | | | | | | | | |
Net investment income | | | 0.17 | | | | 0.15 | | | | 0.07 | | | | 0.16 | | | | 0.14 | |
Net realized and unrealized | | | | | | | | | | | | | | | | | | | | |
gain (loss) on investments | | | 0.72 | | | | (0.47 | ) | | | 3.71 | | | | (0.71 | ) | | | 1.34 | |
Total from investment operations | | | 0.89 | | | | (0.32 | ) | | | 3.78 | | | | (0.55 | ) | | | 1.48 | |
| | | | | | | | | | | | | | | | | | | | | |
| LESS DISTRIBUTIONS: | | | | | | | | | | | | | | | | | | | | |
Distributions from net investment income | | | (0.12 | ) | | | (0.13 | ) | | | (0.10 | ) | | | (0.16 | ) | | | (0.14 | ) |
Distributions from net realized gains | | | (1.54 | ) | | | (2.26 | ) | | | — | | | | (0.99 | ) | | | (1.50 | ) |
Total distributions | | | (1.66 | ) | | | (2.39 | ) | | | (0.10 | ) | | | (1.15 | ) | | | (1.64 | ) |
| | | | | | | | | | | | | | | | | | | | | |
Net asset value, end of year | | $ | 12.73 | | | $ | 13.50 | | | $ | 16.21 | | | $ | 12.53 | | | $ | 14.23 | |
| | | | | | | | | | | | | | | | | | | | | |
| TOTAL RETURN | | | 7.78 | % | | | (2.09 | )% | | | 30.30 | % | | | (4.85 | )% | | | 12.14 | % |
| | | | | | | | | | | | | | | | | | | | | |
| SUPPLEMENTAL DATA AND RATIOS: | | | | | | | | | | | | | | | | | | | | |
Net assets, end of year (in millions) | | $ | 270.7 | | | $ | 406.6 | | | $ | 488.2 | | | $ | 381.3 | | | $ | 343.4 | |
| | | | | | | | | | | | | | | | | | | | | |
Ratio of expenses to average net assets: | | | | | | | | | | | | | | | | | | | | |
| Before expense waiver/recoupment | | | 1.06 | % | | | 1.04 | % | | | 1.04 | % | | | 1.05 | % | | | 1.07 | % |
| After expense waiver/recoupment | | | 1.03 | % | | | 1.03 | % | | | 1.03 | % | | | 1.03 | % | | | 1.07 | %(1) |
| | | | | | | | | | | | | | | | | | | | | |
Ratio of net investment income | | | | | | | | | | | | | | | | | | | | |
to average net assets: | | | | | | | | | | | | | | | | | | | | |
| Before expense waiver/recoupment | | | 1.19 | % | | | 0.97 | % | | | 0.45 | % | | | 1.13 | % | | | 0.95 | % |
| After expense waiver/recoupment | | | 1.22 | % | | | 0.98 | % | | | 0.46 | % | | | 1.15 | % | | | 0.95 | % |
| | | | | | | | | | | | | | | | | | | | | |
Portfolio turnover rate | | | 67 | % | | | 68 | % | | | 87 | % | | | 130 | % | | | 93 | % |
| | | | | | | | | | | | | | | | | | | | | |
| (1) | On April 30, 2019, the Adviser lowered the limit of annual operating expenses from 1.15% to 1.03% of average daily net assets. |
See Notes to the Financial Statements
NUANCE CONCENTRATED VALUE FUND
Notes to the Financial Statements
April 30, 2023
1. ORGANIZATION
Managed Portfolio Series (the “Trust”) was organized as a Delaware statutory trust on January 27, 2011. The Trust is registered under the Investment Company Act of 1940, as amended (the “1940 Act”), as an open-end management investment company. The Nuance Concentrated Value Fund (the “Fund”) is a non-diversified series with its own investment objectives and policies within the Trust. The investment objective of the Fund is long-term capital appreciation. The Fund is an investment company and accordingly follows the investment company accounting and reporting guidance of the Financial Accounting Standards Board (“FASB”) Accounting Standards Codification Topic 946 Financial Services – Investment Companies. The Fund commenced operations on May 31, 2011. The Fund currently offers two classes, the Investor Class and the Institutional Class. Investor Class shares are subject to a 0.25% of average daily net assets distribution and servicing fee and each class of shares is subject to a shareholder servicing fee of up to 0.15% of average daily net assets. Each class of shares has identical rights and privileges with respect to voting on matters affecting a single share class. The Fund may issue an unlimited number of shares of beneficial interest, with no par value.
2. SIGNIFICANT ACCOUNTING POLICIES
The following is a summary of significant accounting policies consistently followed by the Fund in the preparation of its financial statements. These policies are in conformity with generally accepted accounting principles in the United States of America (“GAAP”).
Security Valuation – All investments in securities are recorded at their estimated fair value, as described in Note 3.
Federal Income Taxes – The Fund complies with the requirements of Subchapter M of the Internal Revenue Code of 1986, as amended, necessary to qualify as a regulated investment company and distributes substantially all net taxable investment income and net realized gains to shareholders in a manner which results in no tax cost to the Fund. Therefore, no federal income or excise tax provision is required. As of and during the year ended April 30, 2023, the Fund did not have any tax positions that did not meet the “more-likely-than-not” threshold of being sustained by the applicable tax authority. The Fund recognizes interest and penalties, if any, related to unrecognized tax benefits on uncertain tax positions as income tax expense in the Statement of Operations. During the year ended April 30, 2023, the Fund did not incur any interest or penalties. The Fund is subject to examination by U.S. taxing authorities for the tax years ended April 30, 2020 through 2023.
Security Transactions, Income and Distributions – The Fund follows industry practice and records security transactions on the trade date. Realized gains and losses on sales of securities are calculated on the basis of identified cost. Dividend income is recorded on the ex-dividend date and interest income is recorded on an accrual basis. Withholding taxes on foreign dividends have been provided for in accordance with the Fund’s understanding of the applicable country’s tax rules and regulations. Discounts and premiums on securities purchased are amortized over the expected life of the respective securities using the constant yield method of calculation.
The Fund will make distributions, if any, of net investment income quarterly. The Fund will also distribute net realized capital gains, if any, annually. Distributions to shareholders are recorded on the ex-dividend date. The treatment for financial reporting purposes of distributions made to shareholders during the year from net investment income or net realized capital gains may differ from their treatment for federal income tax purposes. These differences are caused primarily by differences in the timing of the recognition of certain components of income, expense or realized capital gain for federal income tax purposes. Where such differences are permanent in nature,
NUANCE CONCENTRATED VALUE FUND
Notes to the Financial Statements – Continued
April 30, 2023
GAAP requires that they be reclassified in the components of the net assets based on their ultimate characterization for federal income tax purposes. Any such reclassifications will have no effect on net assets, results of operations or net asset values per share of the Fund. For the year ended April 30, 2023, there were no reclassifications.
Use of Estimates – The preparation of financial statements in conformity with GAAP requires management to make estimates and assumptions that affect the reported amounts of assets and liabilities and disclosure of contingent assets and liabilities at the date of the financial statements and the reported amounts of revenues and expenses during the reporting period. Actual results could differ from those estimates.
Allocation of Income, Expenses and Gains/Losses – Income, expenses (other than those deemed attributable to a specific share class), and gains and losses of the Fund are allocated daily to each class of shares based upon the ratio of net assets represented by each class as a percentage of the net assets of the Fund. Expenses deemed directly attributable to a class of shares are recorded by the specific class. Most Fund expenses are allocated by class based on relative net assets. 12b-1 fees are expensed at 0.25% of average daily net assets of Investor Class shares. Shareholder service fees are expensed at up to 0.15% of average daily net assets for each class of shares. Expenses associated with a specific fund in the Trust are charged to that fund. Common Trust expenses are typically allocated evenly between the funds of the Trust, or by other equitable means.
3. SECURITIES VALUATION
The Fund has adopted authoritative fair value accounting standards which establish an authoritative definition of fair value and set out a hierarchy for measuring fair value. These standards require additional disclosures about the various inputs and valuation techniques used to develop the measurements of fair value, a discussion in changes in valuation techniques and related inputs during the period and expanded disclosure of valuation levels for major security types. These inputs are summarized in the three broad levels listed below:
| Level 1 – | Unadjusted quoted prices in active markets for identical assets or liabilities that the Fund has the ability to access. |
| | |
| Level 2 – | Observable inputs other than quoted prices included in Level 1 that are observable for the asset or liability, either directly or indirectly. These inputs may include quoted prices for the identical instrument on an inactive market, prices for similar instruments, interest rates, prepayment speeds, credit risk, yield curves, default rates and similar data. |
| | |
| Level 3 – | Unobservable inputs for the asset or liability, to the extent relevant observable inputs are not available, representing the Fund’s own assumptions about the assumptions a market participant would use in valuing the asset or liability, and would be based on the best information available. |
Following is a description of the valuation techniques applied to the Fund’s major categories of assets and liabilities measured at fair value on a recurring basis. The Fund’s investments are carried at fair value.
Equity Securities – Securities that are primarily traded on a national securities exchange are valued at the last sale price on the exchange on which they are primarily traded on the day of valuation or, if there has been no sale on such day, at the mean between the bid and ask prices. Securities traded primarily in the Nasdaq Global Market System for which market quotations are readily available are valued using the Nasdaq Official Closing Price (“NOCP”). If the NOCP is not available, such securities are valued at the last sale price on the day of valuation, or if there has been no sale on such day, at the mean between the bid and ask prices. To the extent these securities are actively traded and valuation adjustments are not applied, they are categorized in Level 1 of the fair value hierarchy.
NUANCE CONCENTRATED VALUE FUND
Notes to the Financial Statements – Continued
April 30, 2023
Short-Term Investments – Investments in other mutual funds, including money market funds are valued at their net asset value per share and are categorized in Level 1 of the fair value hierarchy. To the extent these securities are actively traded and valuation adjustments are not applied, they are categorized in Level 1 of the fair value hierarchy.
The Board of Trustees (the “Board”) has adopted a pricing and valuation policy for use by the Fund and its Valuation Designee (as defined below) in calculating the Fund’s NAV. Pursuant to Rule 2a-5 under the 1940 Act, the Fund has designated Nuance Investments, LLC (the “Adviser”) as its “Valuation Designee” to perform all of the fair value determinations as well as to perform all of the responsibilities that may be performed by the Valuation Designee in accordance with Rule 2a-5. The Valuation Designee is authorized to make all necessary determinations of the fair values of portfolio securities and other assets for which market quotations are not readily available or if it is deemed that the prices obtained from brokers and dealers or independent pricing services are unreliable.
The inputs or methodology used for valuing securities are not an indication of the risk associated with investing in those securities. The following is a summary of the inputs used to value the Fund’s securities as of April 30, 2023:
| | | Level 1 | | | Level 2 | | | Level 3 | | | Total | |
Common Stocks | | $ | 259,697,787 | | | $ | — | | | $ | — | | | $ | 259,697,787 | |
Short-Term Investment | | | 25,891,268 | | | | — | | | | — | | | | 25,891,268 | |
Total Investments in Securities | | $ | 285,589,055 | | | $ | — | | | $ | — | | | $ | 285,589,055 | |
Refer to the Schedule of Investments for further information on the classification of investments.
4. INVESTMENT ADVISORY FEE AND OTHER TRANSACTIONS WITH AFFILIATES
The Trust has an agreement with Nuance Investments, LLC (the “Adviser”) to furnish investment advisory services to the Fund. Pursuant to an Investment Advisory Agreement between the Trust and the Adviser, the Adviser is entitled to receive, on a monthly basis, an annual advisory fee equal to 0.85% of the Fund’s average daily net assets.
The Fund’s Adviser has contractually agreed to waive a portion or all of its management fees and reimburse the Fund for its expenses to ensure that total annual operating expenses (excluding any front-end or contingent deferred loads, acquired fund fees and expenses, leverage/borrowing interest, interest expense, dividends paid on short sales, taxes brokerage commissions and extraordinary expenses) for the Fund do not exceed 1.28% and 1.03% of average daily net assets of the Fund’s Investor Class and Institutional Class, respectively. Fees waived and expenses reimbursed by the Adviser may be recouped by the Adviser for a period of thirty-six months following the month during which such waiver or reimbursement was made if such recoupment can be achieved without exceeding the expense limit in effect at the time the waiver and reimbursement occurred. The Operating Expense Limitation Agreement is intended to be continual in nature and cannot be terminated within a year after the effective date of the Fund’s prospectus. After that date, the agreement may be terminated at any time upon 60 days’ written notice by the Trust’s Board or the Adviser, with the consent of the Board. Waived fees and reimbursed expenses subject to potential recovery by year of expiration are as follows:
| Expiration | | Amount | |
May 2023 – April 2024 | | $ | 83,078 | |
May 2024 – April 2025 | | $ | 64,815 | |
May 2025 – April 2026 | | $ | 114,061 | |
NUANCE CONCENTRATED VALUE FUND
Notes to the Financial Statements – Continued
April 30, 2023
U.S. Bancorp Fund Services, LLC, doing business as U.S. Bank Global Fund Services, (“Fund Services” or the “Administrator”), acts as the Fund’s Administrator, Transfer Agent, and Fund Accountant. U.S. Bank N.A. (the “Custodian”) serves as the custodian to the Fund. The Custodian is an affiliate of the Administrator. The Administrator performs various administrative and accounting services for the Fund. The Administrator prepares various federal and state regulatory filings, reports and returns for the Fund; prepares reports and materials to be supplied to the Trustees; monitors the activities of the Fund’s custodian; coordinates the payment of the Fund’s expenses and reviews the Fund’s expense accruals. The officers of the Trust, including the Chief Compliance Officer are employees of the Administrator. As compensation for its services, the Administrator is entitled to a monthly fee at an annual rate based upon the average daily net assets of the Fund, subject to annual minimums. Fees paid by the Fund for administration and accounting, transfer agency, custody and compliance services for the year ended April 30, 2023, are disclosed in the Statement of Operations as fund services fees.
5. DISTRIBUTION & SHAREHOLDER SERVICING FEES
The Fund has adopted a Distribution Plan pursuant to Rule 12b-1 (the “Plan”) in the Investor Class only. The Plan permits the Fund to pay for distribution and related expenses at an annual rate of 0.25% of the Investor Class average daily net assets. The expenses covered by the Plan may include the cost of preparing and distributing prospectuses and other sales material, advertising and public relations expenses, payments to financial intermediaries and compensation of personnel involved in selling shares of the Fund. Payments made pursuant to the Plan will represent compensation for distribution and service activities, not reimbursements for specific expenses incurred. For the year ended April 30, 2023, the Investor Class incurred expenses of $38,877 pursuant to the Plan.
The Fund has entered into a shareholder servicing agreement (the “Agreement”) where the Adviser acts as the shareholder agent, under which the Fund may pay servicing fees at an annual rate of up to 0.15% of the average daily net assets of each class. Payments, if any, to the Adviser under the Agreement may reimburse the Adviser for payments it makes to selected brokers, dealers and administrators which have entered into service agreements with the Adviser for services provided to shareholders of the Fund. Payments may also be made directly to the intermediaries providing shareholder services. Services provided by such intermediaries also include the provision of support services to the Fund and includes establishing and maintaining shareholders’ accounts and record processing, purchase and redemption transactions, answering routine client inquiries regarding the Fund, and providing such other personal services to shareholders as the Fund may reasonably request. For the year ended April 30, 2023, the Investor and Institutional Class incurred $23,327 and $358,251, respectively, of shareholder servicing fees under the Agreement.
NUANCE CONCENTRATED VALUE FUND
Notes to the Financial Statements – Continued
April 30, 2023
6. CAPITAL SHARE TRANSACTIONS
Transactions in shares of the Fund were as follows:
| | | Year Ended | | | Year Ended | |
| | | April 30, 2023 | | | April 30, 2022 | |
Investor Class: | | | | | | |
| Shares sold | | | 69,656 | | | | 233,522 | |
| Shares issued to holders in reinvestment of distributions | | | 160,457 | | | | 271,987 | |
| Shares redeemed | | | (315,486 | ) | | | (923,523 | ) |
Net decrease in Investor Class shares | | | (85,373 | ) | | | (418,014 | ) |
Institutional Class: | | | | | | | | |
| Shares sold | | | 3,214,931 | | | | 5,715,034 | |
| Shares issued to holders in reinvestment of distributions | | | 2,424,323 | | | | 3,871,397 | |
| Shares redeemed | | | (14,479,189 | ) | | | (9,596,330 | ) |
Net decrease in Institutional Class shares | | | (8,839,935 | ) | | | (9,899 | ) |
Net decrease in shares outstanding | | | (8,925,308 | ) | | | (427,913 | ) |
7. INVESTMENT TRANSACTIONS
The aggregate purchases and sales, excluding short-term investments, by the Fund for the year ended April 30, 2023, were as follows:
| | | Purchases | | | Sales | |
U.S. Government | | $ | — | | | $ | — | |
Other | | $ | 204,845,825 | | | $ | 334,532,447 | |
8. FEDERAL TAX INFORMATION
The aggregate gross unrealized appreciation and depreciation of securities held by the Fund and the total cost of securities for federal income tax purposes at April 30, 2023, the Fund’s most recent fiscal year end, were as follows:
| Unrealized | Unrealized | Net | | |
| Aggregate Gross | Aggregate Gross | Unrealized | Federal Income | |
| Appreciation | Depreciation | Appreciation | Tax Cost | |
| $33,379,331 | $(17,368,236) | $16,011,095 | $269,577,960 | |
The difference between book-basis and tax-basis unrealized appreciation is attributable primarily to the deferral of wash sale losses. At April 30, 2023, components of distributable earnings on a tax-basis were as follows:
| | Undistributed | Other | Net | Total |
| Undistributed | Long-Term | Accumulated | Unrealized | Distributable |
| Ordinary Income | Capital Gains | Losses | Appreciation | Earnings |
| $1,686,181 | $— | $(10,069,006) | $16,011,095 | $7,628,270 |
NUANCE CONCENTRATED VALUE FUND
Notes to the Financial Statements – Continued
April 30, 2023
As of April 30, 2023, the Fund’s most recent fiscal year end, the Fund had $7,013,997 in short term and $3,055,009 in long term capital loss carryovers. A regulated investment company may elect for any taxable year to treat any portion of any qualified late year loss as arising on the first day of the next taxable year. Qualified late year losses are certain capital, and ordinary losses which occur during the portion of the Fund’s taxable year subsequent to October 31. For the taxable year ended April 30, 2023, the Fund does not plan to defer any qualified later year losses.
The tax character of distributions paid during the year ended April 30, 2023, were as follows:
| Ordinary | Long-Term | | | |
| Income* | Capital Gains | Total | | |
| $4,771,234 | $33,611,039 | $38,382,273 | | |
The tax character of distributions paid during the year ended April 30, 2022, were as follows:
| Ordinary | Long-Term | | | |
| Income* | Capital Gains | Total | | |
| $19,400,974 | $52,436,195 | $71,837,169 | | |
| * | For federal income tax purposes, distributions of short-term capital gains are treated as ordinary income distributions. |
The Fund designated as long-term capital gain dividend, pursuant to Internal Revenue Code Section 852(b)(3), the amount necessary to reduce the earnings and profits of the Fund related to net capital gain to zero for the tax year ended April 30, 2023.
9. CONTROL OWNERSHIP
The beneficial ownership, either directly or indirectly, of more than 25% of the voting securities of a fund creates a presumption of control of the fund, under Section 2(a)(9) of the Investment Company Act of 1940. As of April 30, 2023, Charles Schwab & Co., Inc. and National Financial Services, LLC, for the benefit of their customers, owned 49.10% and 38.54% of the Fund, respectively.
NUANCE CONCENTRATED VALUE FUND
Report of Independent Registered Public Accounting Firm
To the Shareholders of Nuance Concentrated Value Fund and
Board of Trustees of Managed Portfolio Series
Opinion on the Financial Statements
We have audited the accompanying statement of assets and liabilities, including the schedule of investments, of Nuance Concentrated Value Fund (the “Fund”), a series of Managed Portfolio Series, as of April 30, 2023, the related statement of operations for the year then ended, the statements of changes in net assets for each of the two years in the period then ended, the related notes, and the financial highlights for each of the five years in the period then ended (collectively referred to as the “financial statements”). In our opinion, the financial statements present fairly, in all material respects, the financial position of the Fund as of April 30, 2023, the results of its operations for the year then ended, the changes in net assets for each of the two years in the period then ended, and the financial highlights for each of the five years in the period then ended, in conformity with accounting principles generally accepted in the United States of America.
Basis for Opinion
These financial statements are the responsibility of the Fund’s management. Our responsibility is to express an opinion on the Fund’s financial statements based on our audits. We are a public accounting firm registered with the Public Company Accounting Oversight Board (United States) (“PCAOB”) and are required to be independent with respect to the Fund in accordance with the U.S. federal securities laws and the applicable rules and regulations of the Securities and Exchange Commission and the PCAOB.
We conducted our audits in accordance with the standards of the PCAOB. Those standards require that we plan and perform the audit to obtain reasonable assurance about whether the financial statements are free of material misstatement whether due to error or fraud.
Our audits included performing procedures to assess the risks of material misstatement of the financial statements, whether due to error or fraud, and performing procedures that respond to those risks. Such procedures included examining, on a test basis, evidence regarding the amounts and disclosures in the financial statements. Our procedures included confirmation of securities owned as of April 30, 2023, by correspondence with the custodian and brokers; when replies were not received from brokers, we performed other auditing procedures. Our audits also included evaluating the accounting principles used and significant estimates made by management, as well as evaluating the overall presentation of the financial statements. We believe that our audits provide a reasonable basis for our opinion.
We have served as the auditor of one or more of Nuance Investments, LLC’s investment companies since 2011.
COHEN & COMPANY, LTD.
Milwaukee, Wisconsin
June 28, 2023
NUANCE CONCENTRATED VALUE FUND
Additional Information (Unaudited)
April 30, 2023
TRUSTEES AND OFFICERS
| | | Term of | | | |
| | | Office | Number of | | Other |
| Name, | | and | Portfolios | Principal | Directorships |
| Address | Position(s) | Length | in Trust | Occupation(s) | Held by Trustee |
| and Year | Held with | of Time | Overseen | During the Past | During the Past |
| of Birth | the Trust | Served | by Trustee | Five Years | Five Years |
| Independent Trustees |
| | | | | | |
Leonard M. Rush, CPA | Chairman, | Indefinite | 31 | Retired, Chief Financial | Independent Trustee, |
615 E. Michigan St. | Trustee and | Term; Since | | Officer, Robert W. Baird | ETF Series Solutions |
Milwaukee, WI 53202 | Audit | April 2011 | | & Co. Incorporated | (55 Portfolios) |
Year of Birth: 1946 | Committee | | | (2000-2011). | (2012-Present). |
| | Chairman | | | | |
| | | | | | |
David A. Massart | Trustee | Indefinite | 31 | Partner and Managing | Independent Trustee, |
615 E. Michigan St. | | Term; Since | | Director, Beacon Pointe | ETF Series Solutions |
Milwaukee, WI 53202 | | April 2011 | | Advisors, LLC | (56 Portfolios) |
Year of Birth: 1967 | | | | (since 2022); Co-Founder | (2012-Present). |
| | | | | and Chief Investment | |
| | | | | Strategist, Next Generation | |
| | | | | Wealth Management, Inc. | |
| | | | | (2005-2021). | |
NUANCE CONCENTRATED VALUE FUND
Additional Information (Unaudited) – Continued
April 30, 2023
| | | Term of | | | |
| | | Office | Number of | | Other |
| Name, | | and | Portfolios | Principal | Directorships |
| Address | Position(s) | Length | in Trust | Occupation(s) | Held by Trustee |
| and Year | Held with | of Time | Overseen | During the Past | During the Past |
| of Birth | the Trust | Served | by Trustee | Five Years | Five Years |
| Independent Trustees |
| | | | | | |
David M. Swanson | Trustee and | Indefinite | 31 | Founder and Managing | Independent Trustee, |
615 E. Michigan St. | Nominating | Term; Since | | Principal, SwanDog | ALPS Variable |
Milwaukee, WI 53202 | & Governance | April 2011 | | Strategic Marketing, LLC | Investment Trust |
Year of Birth: 1957 | Committee | | | (2006-Present) | (7 Portfolios) (2006- |
| | Chairman | | | | Present); Independent |
| | | | | | Trustee, RiverNorth |
| | | | | | Funds (3 Portfolios) |
| | | | | | (2018-Present); |
| | | | | | RiverNorth Managed |
| | | | | | Duration Municipal |
| | | | | | Income Fund Inc. |
| | | | | | (1 Portfolio) (2019- |
| | | | | | Present); RiverNorth |
| | | | | | Specialty Finance |
| | | | | | Corporation (1 Portfolio) |
| | | | | | (2018-Present); |
| | | | | | RiverNorth/DoubleLine |
| | | | | | Strategic Opportunity |
| | | | | | Fund, Inc. (1 Portfolio) |
| | | | | | (2018-Present); |
| | | | | | RiverNorth |
| | | | | | Opportunities Fund, Inc. |
| | | | | | (1 Portfolio) (2015- |
| | | | | | Present); RiverNorth |
| | | | | | Opportunistic |
| | | | | | Municipal Income |
| | | | | | Fund, Inc. (1 Portfolio) |
| | | | | | (2018-Present); |
| | | | | | RiverNorth Flexible |
| | | | | | Municipal Income |
| | | | | | Fund, Inc. (1 Portfolio) |
| | | | | | (2020-Present). |
| | | | | | RiverNorth Flexible |
| | | | | | Municipal Income |
| | | | | | Fund II, Inc. |
| | | | | | (1 Portfolio) (2021- |
| | | | | | Present); RiverNorth |
| | | | | | Managed Duration |
| | | | | | Income Fund II, Inc. |
| | | | | | (1 Portfolio) |
| | | | | | (2022-Present). |
NUANCE CONCENTRATED VALUE FUND
Additional Information (Unaudited) – Continued
April 30, 2023
| | | Term of | | | |
| | | Office | Number of | | Other |
| Name, | | and | Portfolios | Principal | Directorships |
| Address | Position(s) | Length | in Trust | Occupation(s) | Held by Trustee |
| and Year | Held with | of Time | Overseen | During the Past | During the Past |
| of Birth | the Trust | Served | by Trustee | Five Years | Five Years |
| Independent Trustees |
| | | | | | |
Robert J. Kern | Trustee | Indefinite | 31 | Retired (July 2018- | None |
615 E. Michigan St. | | Term; Since | | Present); Executive | |
Milwaukee, WI 53202 | | January 2011 | | Vice President, | |
Year of Birth: 1958 | | | | U.S. Bancorp Fund | |
| | | | | Services, LLC | |
| | | | | (1994-2018). | |
| | | | | | |
| Officers | | | | | |
| | | | | | |
Brian R. Wiedmeyer | President and | Indefinite | N/A | Vice President, | N/A |
615 E. Michigan St. | Principal | Term, Since | | U.S. Bancorp Fund | |
Milwaukee, WI 53202 | Executive | November | | Services, LLC (2005-Present). | |
Year of Birth: 1973 | Officer | 2018 | | | |
| | | | | | |
Deborah Ward | Vice President, | Indefinite | N/A | Senior Vice President, | N/A |
615 E. Michigan St. | Chief | Term; Since | | U.S. Bancorp Fund | |
Milwaukee, WI 53202 | Compliance | April 2013 | | Services, LLC (2004-Present). | |
Year of Birth: 1966 | Officer and | | | | |
| | Anti-Money | | | | |
| | Laundering | | | | |
| | Officer | | | | |
| | | | | | |
Benjamin Eirich | Treasurer, | Indefinite | N/A | Assistant Vice President, | N/A |
615 E. Michigan St. | Principal | Term; Since | | U.S. Bancorp Fund | |
Milwaukee, WI 53202 | Financial | August 2019 | | Services, LLC (2008-Present). | |
Year of Birth: 1981 | Officer and | (Treasurer); | | | |
| | Vice President | Since | | | |
| | | November | | | |
| | | 2018 (Vice | | | |
| | | President) | | | |
| | | | | | |
John Hadermayer | Secretary | Indefinite | N/A | Vice President, | N/A |
615 E. Michigan St. | | Term; Since | | U.S. Bancorp Fund | |
Milwaukee, WI 53202 | | May 2022 | | Services, LLC (2022-Present); | |
Year of Birth: 1977 | | | | Executive Director, AQR Capital | |
| | | | | Management, LLC (2013-Present). | |
NUANCE CONCENTRATED VALUE FUND
Additional Information (Unaudited) – Continued
April 30, 2023
| | | Term of | | | |
| | | Office | Number of | | Other |
| Name, | | and | Portfolios | Principal | Directorships |
| Address | Position(s) | Length | in Trust | Occupation(s) | Held by Trustee |
| and Year | Held with | of Time | Overseen | During the Past | During the Past |
| of Birth | the Trust | Served | by Trustee | Five Years | Five Years |
| Officers |
| | | | | | |
Douglas Schafer | Assistant | Indefinite | N/A | Assistant Vice President, | N/A |
615 E. Michigan St. | Treasurer | Term; Since | | U.S. Bancorp Fund | |
Milwaukee, WI 53202 | and Vice | May 2016 | | Services, LLC | |
Year of Birth: 1970 | President | (Assistant | | (2002-Present). | |
| | | Treasurer); | | | |
| | | Indefinite | | | |
| | | Term; Since | | | |
| | | November | | | |
| | | 2018 (Vice | | | |
| | | President) | | | |
| | | | | | |
Sara J. Bollech | Assistant | Indefinite | N/A | Officer, U.S. Bancorp | N/A |
615 E. Michigan St. | Treasurer | Term; Since | | Fund Services, LLC | |
Milwaukee, WI 53202 | and Vice | November | | (2007-Present). | |
Year of Birth: 1977 | President | 2021 | | | |
| | | | | | |
Peter A. Walker, CPA | Assistant | Indefinite | N/A | Officer, U.S. Bancorp | N/A |
615 E. Michigan St. | Treasurer | Term; Since | | Fund Services, LLC | |
Milwaukee, WI 53202 | and Vice | November | | (2016-Present). | |
Year of Birth: 1993 | President | 2021 | | | |
NUANCE CONCENTRATED VALUE FUND
Additional Information (Unaudited) – Continued
April 30, 2023
AVAILABILITY OF FUND PORTFOLIO INFORMATION
The Fund files complete schedules of portfolio holdings with the U.S. Securities and Exchange Commission (the “SEC”) for the first and third quarters of each fiscal year on Part F of Form N-PORT. The Fund’s Part F of Form N-PORT is available on the SEC’s website at www.sec.gov and may be reviewed and copied at the SEC’s Public Reference Room in Washington, D.C. Information on the operation of the Public Reference Room may be obtained by calling 1-800-732-0330. The Fund’s Part F of Form N-PORT may also be obtained by calling 1-855-682-6233.
AVAILABILITY OF PROXY VOTING INFORMATION
A description of the Fund’s Proxy Voting Policies and Procedures is available without charge, upon request, by calling 1-855-682-6233. Information regarding how the Fund voted proxies relating to portfolio securities during the most recent 12 month period ended June 30, is available (1) without charge, upon request, by calling 1-888-621-9258, or (2) on the SEC’s website at www.sec.gov.
QUALIFIED DIVIDEND INCOME/DIVIDENDS RECEIVED DEDUCTION
For the fiscal year ended April 30, 2023, certain dividends paid by the Fund may be reported as qualified dividend income and may be eligible for taxation at capital gains rates. The percentage of dividends declared from ordinary income designated as qualified dividend income was 100.00% for the Fund.
For corporate shareholders, the percent of ordinary income distributions qualifying for the corporate dividends received deduction for the fiscal year ended April 30, 2023 was 73.40% for the Fund.
The percentage of taxable ordinary income distributions that are designated as short-term capital gain distributions under Internal Revenue Section 871 (k)(2)(c) was 34.39%.
NUANCE CONCENTRATED VALUE FUND
Approval of Investment Advisory Agreement (Unaudited)
At the regular meeting of the Board of Trustees of Managed Portfolio Series (“Trust”) on February 23-24, 2023, the Trust’s Board of Trustees (“Board”), each of whom was present virtually via video conference, including all of the Trustees who are not “interested persons” of the Trust, as that term is defined in Section 2(a)(19) of the Investment Company Act of 1940, as amended, (“Independent Trustees”) considered and approved the continuation of the Investment Advisory Agreement between the Trust and Nuance Investments, LLC (“Nuance” or the “Adviser”) regarding the Nuance Concentrated Value Fund (the “Fund”) (the “Investment Advisory Agreement”) for another annual term.
Prior to the meeting and at a meeting held on January 5, 2023, the Trustees received and considered information from Nuance and the Trust’s administrator designed to provide the Trustees with the information necessary to evaluate the continuance of the Investment Advisory Agreement (“Support Materials”). Before voting to approve the continuance of the Investment Advisory Agreement, the Trustees reviewed the Support Materials with Trust management and with counsel to the Independent Trustees and received a memorandum and advice from such counsel discussing the legal standards for the Trustees’ consideration of the renewal of the Investment Advisory Agreement. This information, together with the information provided to the Board throughout the course of the year, formed the primary (but not exclusive) basis for the Board’s determinations.
In determining whether to continue the Investment Advisory Agreement, the Trustees considered all factors they believed relevant including the following with respect to the Fund: (1) the nature, extent, and quality of the services provided by Nuance with respect to the Fund; (2) the Fund’s historical performance as managed by Nuance; (3) the costs of the services provided by Nuance and the profits realized by Nuance from services rendered to the Fund; (4) comparative fee and expense data for the Fund and other investment companies with similar investment objectives; (5) the extent to which economies of scale may be realized as the Fund grows, and whether the advisory fee for the Fund reflects such economies of scale for the Fund’s benefit; and (6) other benefits to Nuance resulting from its relationship with the Fund. In their deliberations, the Trustees weighed to varying degrees the importance of the information provided to them, and did not identify any particular information that was all-important or controlling.
Based upon the information provided to the Board throughout the course of the year, including a presentation to the Board by representatives from Nuance, and the Support Materials, the Board concluded that the overall arrangements between the Trust and Nuance as set forth in the Investment Advisory Agreement, as the agreement relates to the Fund, continue to be fair and reasonable in light of the services that Nuance performs, the investment advisory fees that the Fund pays Nuance for such services, and such other matters as the Trustees considered relevant in the exercise of their reasonable business judgment. The material factors and conclusions that formed the basis of the Trustees’ determination to approve the continuation of the Investment Advisory Agreement, as it relates to the Fund, are summarized below.
Nature, Extent and Quality of Services Provided. The Trustees considered the scope of services that Nuance provides under the Investment Advisory Agreement with respect to the Fund, noting that such services include, but are not limited to, the following: (1) investing the Fund’s assets consistent with the Fund’s investment objective and investment policies; (2) determining the portfolio securities to be purchased, sold, or otherwise disposed of, and the timing of such transactions; (3) voting all proxies, if any, with respect to the Fund’s portfolio securities; (4) maintaining the required books and records for transactions that Nuance effected on behalf of the Fund; (5) selecting broker-dealers to execute orders on behalf of the Fund; and (6) monitoring and maintaining the Fund’s compliance with policies and procedures of the Trust and with applicable securities laws. The Trustees
NUANCE CONCENTRATED VALUE FUND
Approval of Investment Advisory Agreement (Unaudited) – Continued
reviewed Nuance’s financial statements, assets under management and capitalization. In that regard, the Trustees concluded that Nuance had sufficient resources to support the management of the Fund. The Trustees considered the experience of the Fund’s portfolio managers, one of whom has managed the Fund since its inception date. The Trustees concluded that they were satisfied with the nature, extent and quality of services that Nuance provides to the Fund under the Investment Advisory Agreement.
Fund Historical Performance and the Overall Performance of Nuance. In assessing the quality of the portfolio management delivered by Nuance, the Trustees reviewed the short-term and longer-term performance of the Fund on both an absolute basis and in comparison to an appropriate securities benchmark index, the Fund’s Morningstar category (“Category”) as well as a smaller sub-set of peer funds (“Cohort”), and the composite of separate accounts that Nuance manages utilizing investment strategies similar to those of the Fund. When reviewing the Fund’s performance against its Category and Cohort, the Trustees took into account that the investment objective and strategies of the Fund, as well as the Fund’s level of risk tolerance, may differ significantly from funds in its Category and Cohort.
The Trustees considered that the Fund had outperformed its Category and Cohort averages for the year-to-date period ended September 30, 2022, but underperformed these averages over the one-year, three-year, five-year and ten-year periods ended September 30, 2022. The Trustees also considered that the Fund had outperformed its primary benchmark for the year-to-date period ended September 30, 2022, but had underperformed this index for all other periods presented as of December 31, 2021. The Trustees then observed that the Fund’s performance was consistent with the performance of a composite of similar accounts managed by Nuance over all time periods presented.
Comparative Fee and Expense Data. The Trustees considered a comparative analysis of the contractual expenses borne by the Fund and those of funds in the same Category and Cohort. The Board noted the Fund’s contractual management fee and total expenses (after waivers and expense reimbursements) were each higher than the Category and Cohort averages. The Trustees also considered that the Fund’s asset level was below the average size of the funds comprising the Cohort. While recognizing that it is difficult to compare advisory fees because the scope of advisory services provided may vary from one investment adviser to another, the Trustees concluded that Nuance’s advisory fee with respect to the Fund continues to be reasonable.
Cost of Advisory Services and Profitability. The Trustees considered the annual advisory fee that the Fund pays to Nuance under the Investment Advisory Agreement, as well as Nuance’s profitability from services that Nuance rendered to the Fund under the Investment Advisory Agreement during the 12-month period ended September 30, 2022. The Trustees also noted favorably that Nuance had agreed to continue the expense limitation agreement under which Nuance contractually agreed to reduce its advisory fees and, if necessary, reimburse the Fund for operating expenses, as specified in the Fund’s prospectus, and noted that Nuance had waived a portion of its advisory fee during its most recent fiscal year. The Trustees also considered the management fees Nuance charges to separately managed accounts with investment strategies similar to those of the Fund. They observed that Nuance charges management fees that range above and below the management fee charged to the Fund, depending on assets under management. The Trustees considered the reasonableness of Nuance’s profits from its service relationship with the Fund.
Economies of Scale. The Trustees then considered whether the Fund may benefit from any economies of scale, noting that the investment advisory fee for the Fund in the Investment Advisory Agreement does not contain breakpoints. The Trustees additionally took into account that Nuance continues to express reservations about
NUANCE CONCENTRATED VALUE FUND
Approval of Investment Advisory Agreement (Unaudited) – Continued
adopting breakpoints for the Fund because of concerns about potential capacity constraints associated with the strategy. The Trustees also considered that Nuance has agreed to consider breakpoints in the future should circumstances change.
Other Benefits. The Trustees considered the direct and indirect benefits that could be realized by Nuance from its relationship with the Fund. The Trustees considered that Nuance does not utilize soft dollar arrangements with respect to portfolio transactions, and that Nuance does not use affiliated brokers to execute the Fund’s portfolio transactions. While the Trustees noted that the Fund utilizes Rule 12b-1 fees to pay for shareholder and distribution services related to Investor Class shareholders of the Fund, the Trustees also observed that Nuance was incurring its own distribution expenses on behalf of the Fund. The Trustees considered that Nuance may receive some form of reputational benefit from services rendered to the Fund, but that such benefits are immaterial and cannot otherwise be quantified. The Trustees concluded that Nuance does not receive additional material benefits from its relationship with the Fund.
(This Page Intentionally Left Blank.)
NUANCE CONCENTRATED VALUE FUND
Privacy Notice (Unaudited)
The Fund collects only relevant information about you that the law allows or requires it to have in order to conduct its business and properly service you. The Fund collects financial and personal information about you (“Personal Information”) directly (e.g., information on account applications and other forms, such as your name, address, and social security number, and information provided to access account information or conduct account transactions online, such as password, account number, e-mail address, and alternate telephone number), and indirectly (e.g., information about your transactions with us, such as transaction amounts, account balance and account holdings).
The Fund does not disclose any non-public personal information about its shareholders or former shareholders other than for everyday business purposes such as to process a transaction, service an account, respond to court orders and legal investigations or as otherwise permitted by law. Third parties that may receive this information include companies that provide transfer agency, technology and administrative services to the Fund, as well as the Fund’s investment adviser who is an affiliate of the Fund. If you maintain a retirement/educational custodial account directly with the Fund, we may also disclose your Personal Information to the custodian for that account for shareholder servicing purposes. The Fund limits access to your Personal Information provided to unaffiliated third parties to information necessary to carry out their cable law. The Fund maintains physical, electronic and procedural safeguards to protect your Personal Information and requires its third party service providers with access to such information to treat your Personal Information with the same high degree of confidentiality.
In the event that you hold shares of the Fund through a financial intermediary, including, but not limited to, a broker-dealer, credit union, bank or trust company, the privacy policy of your financial intermediary governs how your non-public personal information is shared with unaffiliated third parties.
INVESTMENT ADVISER
Nuance Investments, LLC
4900 Main Street, Suite 220
Kansas City, MO 64112
DISTRIBUTOR
Quasar Distributors, LLC
111 East Kilbourn Avenue, Suite 2200
Milwaukee, WI 53202
CUSTODIAN
U.S. Bank, N.A.
1555 North Rivercenter Drive
Milwaukee, WI 53212
ADMINISTRATOR, FUND ACCOUNTANT
AND TRANSFER AGENT
U.S. Bancorp Fund Services, LLC
615 East Michigan Street
Milwaukee, WI 53202
INDEPENDENT REGISTERED PUBLIC ACCOUNTING FIRM
Cohen & Company, Ltd.
342 North Water Street, Suite 830
Milwaukee, WI 53202
LEGAL COUNSEL
Stradley Ronon Stevens & Young, LLP
2005 Market Street, Suite 2600
Philadelphia, PA 19103
This report must be accompanied or preceded by a prospectus.
The Fund’s Statement of Additional Information contains additional information about the
Fund’s trustees and is available without charge upon request by calling 1-855-682-6233.

Nuance Mid Cap Value Fund
Investor Class Shares – NMAVX
Z Class Shares – NMVZX
Institutional Class Shares – NMVLX
Annual Report
| www.nuanceinvestments.com | April 30, 2023 |
NUANCE MID CAP VALUE FUND
April 30, 2023
Dear Fellow Shareholders:
We are pleased to write our annual shareholder letter for the Nuance Mid Cap Value Fund (the “Fund”). The Fund is a classic value investment product investing primarily in the equity or equity-linked securities of United States based companies. The Fund seeks long-term capital appreciation primarily through investments in equity securities of companies organized in the United States that the investment team believes are high quality, though temporarily out of favor. The strategy typically invests in a portfolio of 50 to 90 companies with at least 80 percent of the portfolio invested in companies with mid-sized market capitalizations. The Adviser defines mid-capitalization companies as companies within the range of the capitalization of companies constituting the Russell Midcap® Index. The Adviser intends to manage the Fund so that the average weighted market capitalization of its portfolio (excluding short-term investments) falls between the range of the smallest and largest members of the Russell Midcap® Index (defined using a trailing 12 month average of the smallest and largest members on a month to month basis). Although the strategy will invest primarily in the equity securities of U.S. companies, the strategy may invest up to 15% of its assets in equity securities of foreign companies that are classified as “developed” by MSCI. The primary benchmark for the Fund is the Russell Midcap® Value Index. Clients may also be interested in comparing the Fund to the S&P 500® Index.
Average Annual Rates of Return as of April 30, 2023:
| | 6 Months | 1 Year | 3 Year | 5 Year | Since Inception(1) |
| Institutional Class | 10.26% | 4.82% | 10.54% | 8.14% | 9.03% |
Russell Midcap® Value Index(2) | 2.26% | -3.47% | 15.76% | 6.43% | 7.65% |
S&P 500® Index(3) | 8.63% | 2.66% | 14.52% | 11.45% | 11.20% |
| | | | | | |
| | 6 Months | 1 Year | 3 Year | 5 Year | Since Inception(1) |
| Investor Class, no load | 10.06% | 4.51% | 10.20% | 7.84% | 8.74% |
| Investor Class with load | 4.52% | -0.75% | 8.34% | 6.74% | 8.14% |
Russell Midcap® Value Index(2) | 2.26% | -3.47% | 15.76% | 6.43% | 7.65% |
S&P 500® Index(3) | 8.63% | 2.66% | 14.52% | 11.45% | 11.20% |
| | | | | | |
| | 6 Months | 1 Year | 3 Year | 5 Year | Since Inception(4) |
| Z Share Class | 10.23% | 4.87% | 10.66% | 8.26% | 8.48% |
Russell Mid Cap® Value Index(2) | 2.26% | -3.47% | 15.76% | 6.43% | 7.65% |
S&P 500® Index(3) | 8.63% | 2.66% | 14.52% | 11.45% | 11.20% |
Performance data quoted represents past performance. Past performance does not guarantee future results. The investment return and principal value of an investment will fluctuate so that an investor’s shares, when redeemed, may be worth more or less than their original cost. Current performance of the Fund may be lower or higher than the performance quoted. Short term performance, in particular, is not a good indication of the Fund’s future performance, and an investment should not be made solely based on returns. Investor Class performance data shown reflects both performance with the maximum sales charge of 5.75% (for periods prior to September 17, 2015) or 5.00% (for period September 17, 2015 and after) and without it. Performance data current to the most recent month end may be obtained by calling 1-855-682-6233.
The Adviser has contractually agreed to reduce its management fees, and may reimburse the Fund for its operating expenses, in order to ensure that Total Annual Fund Operating Expenses (excluding any front-end or contingent deferred loads, acquired fund fees and expenses, leverage/borrowing interest, interest expense,
NUANCE MID CAP VALUE FUND
dividends paid on short sales, taxes, brokerage commissions and extraordinary expenses) do not exceed 1.18% of the average daily net assets of the Investor Class and 0.93% of the average daily net assets of the Institutional Class and 0.78% of the Z Class through at least August 28, 2023.
| Institutional Class Gross Expense Ratio – 0.97% | Net Expense Ratio – 0.93% |
| Investor Class Gross Expense Ratio – 1.22% | Net Expense Ratio – 1.18% |
| Z Class Gross Expense Ratio – 0.82% | Net Expense Ratio – 0.78% |
| (1) | December 31, 2013 |
| (2) | The Russell Midcap® Value Index measures the performance of those Russell Midcap companies with lower price-to-book ratios and lower forecasted growth values. This Index cannot be invested in directly. |
| (3) | The Standard & Poor’s 500® Index (S&P 500) is an unmanaged, capitalization-weighted index generally representative of the U.S. Market for large capitalization stocks. This Index cannot be invested in directly. |
| (4) | May 8, 2017 |
In terms of performance, since its inception on December 31, 2013 through April 30, 2023, the Institutional Class is up 9.03 percent (annualized) versus its primary index –the Russell Midcap® Value Index – up 7.65 percent and the S&P 500® Index up 11.20 percent. For more perspective on our long-term performance, please refer to your prospectus. Nuance has offered the strategy in a separate account vehicle since November 3, 2008. While our Nuance Mid Cap Value Fund outperformed the benchmark over the 12-month time horizon, Nuance cautions clients regarding the use of short-term performance as a tool to make investment decisions. As we remind our clients, your team continues to try and find leading business franchises with sustainable competitive positions that are trading below our internally derived view of fair or intrinsic value. We believe that our time-tested process of finding what we consider best of breed businesses with better than the market downside support and better than the market upside potential over the long term should lead to solid risk adjusted returns versus our peers and benchmarks.
At Nuance, our team and our processes are designed to emphasize consistency and what we believe is thorough fundamental analysis of companies that have the potential to lead to investment returns that will be acceptable for our shareholders over the long term. To do this, we focus our attention on studying one company at a time using the Nuance approach. Part of that approach is to ensure that each company we own has a sound and solid competitive position and that the companies are undervalued based on our internally derived view of sustainable cash flows, earnings and valuation. We believe in a thorough fundamental valuation analysis and that focusing simply on the value of a business is not enough. Rather, we spend considerable time studying the downside potential of each company we own. As such, we believe that we understand the potential upside and the potential downside risks to our investments. This approach is critical to our goal of trying to provide shareholders with not only above-average returns over time, but above-average risk-adjusted returns as well.
The largest overweight positions, relative to the index, remain the Consumer Staples and Health Care sectors. Within the Consumer Staples sector, we are continuing to see input cost inflation-related under-earning in a number of leaders across the Household & Personal Products industry group. Our view is that earnings in this industry group have been negatively impacted by rising raw material costs. We believe these costs can ultimately be mostly offset by price increases which generally lag the raw material price increases. Our overweight position in the Health Care sector is primarily in the Health Care Equipment & Supplies industry as we wait patiently for elective procedure volumes to normalize following this prolonged disruption. We believe these companies are manufacturing critical, advanced medical products and display the traits we look for in competitively advantaged businesses. They sell into end markets that have been severely disrupted for more than two years as patient visits and procedures of all kinds have run well below normal due to the impacts of Covid-19, including high cancellation rates, procedure delays, and insufficient care provider staffing to meet demand. We believe the magnitude and duration of this disruption has created a large backlog of procedures that will need to be made up
NUANCE MID CAP VALUE FUND
over the next 1-2 years. More recently, we believe raw material availability and input cost inflation in items including resins and metals have also squeezed margins at these companies. Offsetting price actions can take 1-2 years to implement in this industry, which is prolonging the period of under-earning, in our opinion. Nevertheless, this remains a high conviction, under-earning group of excellent businesses, in our view. The Financials sector continues to be a slight overweight position. Our overweight position within the sector continues to be made up primarily of stocks in the Insurance and Capital Markets industries. While we remain underweight the Industrials sector, we did add slightly to our weight during the period as select leaders have started to look modestly attractive, in our view. We maintain positions in the Utilities and Real Estate sectors but are slightly underweight relative to the benchmark. We also remain underweight the Information Technology sector. We remain underweight the Energy sector where we believe the sector is facing a multi-year period of competitive transition. Lastly, we remain underweight the Consumer Discretionary, Communication Services, and Materials sectors primarily due to competitive uncertainty and valuation concerns.
Thank you for your interest and your continued support.
Scott Moore, CFA
Please visit our website at www.nuanceinvestments.com for more information about our team, our process, and value investing. You can also get real-time access to the Nuance Investment website updates and information via e-mail. Simply contact us at client.services@nuanceinvestments.com or call 816-743-7080 to sign-up.
This report must be preceded or accompanied by a current prospectus.
Mutual fund investing involves risk. Principal loss is possible. Investments in small and mid-capitalization companies involve additional risk such as limited liquidity and greater volatility than larger capitalization companies. Investments in foreign securities involve political, economic and currency risks, greater volatility and differences in accounting methods.
Past performance does not guarantee future results.
Weighted Market Capitalization: The average market capitalization of all companies in a fund – with each company weighted according to its percent held in the fund.
A Cash Flow is a revenue or expense stream that changes an account over a given period.
Opinions expressed are subject to change, are not guaranteed and should not be considered investment advice or recommendations to buy or sell any security.
Nuance Investments, LLC is the adviser to the Nuance Mid Cap Value Fund which is distributed by Quasar Distributors, LLC.
NUANCE MID CAP VALUE FUND
Value of $10,000 Investment (Unaudited)
The chart assumes an initial investment of $10,000. Performance reflects waivers of fee and operating expenses in effect. In the absence of such waivers, total return would be reduced. Performance data quoted represents past performance and does not guarantee future results. Investment returns and principal value will fluctuate, and when sold, may be worth more or less than their original cost. Performance current to the most recent month-end may be lower or higher than the performance quoted and can be obtained by calling 1-855-682-6233. Performance assumes the reinvestment of capital gains and income distributions. The performance does not reflect the deduction of taxes that a shareholder would pay on Fund distributions or the redemption of Fund shares.
Average Annual Rates of Return (%) As of April 30, 2023
| | | | | Since |
| | 1 Year | 3 Year | 5 Year | Inception(1) |
| Investor Class (without sales load) | 4.51% | 10.20% | 7.84% | 8.74% |
Investor Class (with sales load)(2) | -0.75% | 8.34% | 6.74% | 8.14% |
| Z Class | 4.87% | 10.66% | 8.26% | 9.12% |
| Institutional Class | 4.82% | 10.54% | 8.14% | 9.03% |
Russell Midcap Value Index(3) | -3.47% | 15.76% | 6.43% | 7.65% |
S&P 500 Index(4) | 2.66% | 14.52% | 11.45% | 11.20% |
| (1) | Period from Fund inception through April 30, 2023. The Investor Class and Institutional Class commenced operations on December 31, 2013 and Z Class shares commenced operations on May 8, 2017. Performance Shown for the Z Class prior to the inception of the Z Class is based on the performance of the Institutional Class shares, adjusted for the lower expenses applicable to Z Class shares. |
| (2) | Returns reflects a sales load of 5.00%. |
| (3) | The Russell Midcap Value Index measures the performance of the mid-cap value segment of the U.S. equity universe. The Russell Midcap Value Index is a subset of the Russell 1000 Index. It includes approximately 800 of the smallest securities based on a combination of their market cap and current index membership. This Index cannot be invested in directly. |
| (4) | The Standard & Poor’s 500 Index (S&P 500) is an unmanaged, capitalization-weighted index generally representative of the U.S. market for large capitalization stocks. This Index cannot be invested in directly. |
NUANCE MID CAP VALUE FUND
The following is expense information for the Nuance Mid Cap Value Fund as disclosed in the Fund’s most recent prospectus dated August 28, 2022:
| Investor Class Gross Expense Ratio – 1.22% | Net Expense Ratio – 1.18% |
| Z Class Gross Expense Ratio – 0.82% | Net Expense Ratio – 0.78% |
| Institutional Class Gross Expense Ratio – 0.97% | Net Expense Ratio – 0.93% |
Nuance Investments, LLC (the “Adviser”) has contractually agreed to waive its management fees and pay Fund expenses, in order to ensure that Total Annual Fund Operating Expenses (excluding any front-end or contingent deferred loads, acquired fund fees and expenses, leverage/borrowing interest, interest expense, dividends paid on short sales, taxes, brokerage commissions and extraordinary expenses) do not exceed 1.18% of the average daily net assets of the Investor Class, 0.93% of the average daily net assets of the Institutional Class and 0.78% of the average daily net assets of the Z Class. Fees waived and expenses paid by the Adviser may be recouped by the Adviser for a period of 36 months following the month during which such fee waiver and/or expense payment was made if such recoupment can be achieved without exceeding the expense limit in effect at the time the fee waiver and/or expense payment occurred and the expense limit in place at the time of recoupment. The Operating Expenses Limitation Agreement is indefinite but cannot be terminated through at least August 28, 2023. Thereafter, the agreement may be terminated at any time upon 60 days’ written notice by the Trust’s Board of Trustees (the “Board”) or the Adviser, with consent of the Board.
NUANCE MID CAP VALUE FUND
Expense Example (Unaudited)
April 30, 2023
As a shareholder of the Fund, you incur two types of costs: (1) transaction costs, which may include but are not limited to, sales charges (loads) on purchases; and (2) ongoing costs, including management fees, distribution and service (12b-1) fees, shareholder servicing fees, and other Fund expenses. This Example is intended to help you understand your ongoing costs (in dollars) of investing in the Fund and to compare these costs with the ongoing costs of investing in other mutual funds. The Example is based on an investment of $1,000 invested at the beginning of the period and held for the entire period (November 1, 2022 – April 30, 2023).
ACTUAL EXPENSES
For each class, the first line of the table below provides information about actual account values and actual expenses. You may use the information in this line, together with the amount you invested, to estimate the expenses that you paid over the period. Simply divide your account value by $1,000 (for example, an $8,600 account value divided by $1,000 = 8.6), then multiply the result by the number in the first line under the heading entitled “Expenses Paid During Period” to estimate the expenses you paid on your account during this period.
HYPOTHETICAL EXAMPLE FOR COMPARISON PURPOSES
For each class, the second line of the table below provides information about hypothetical account values and hypothetical expenses based on the Fund’s actual expense ratio and an assumed rate of return of 5% per year before expenses, which is not the Fund’s actual return. The hypothetical account values and expenses may not be used to estimate the actual ending account balance or expenses you paid for the period. You may use this information to compare the ongoing costs of investing in the Fund and other funds. To do so, compare this 5% hypothetical example with the 5% hypothetical examples that appear in the shareholder reports of the other funds.
Please note that the expenses shown in the table are meant to highlight your ongoing costs only and do not reflect any transactional costs. Therefore, the second line of the table is useful in comparing ongoing costs only, and will not help you determine the relative total costs of owning different funds. In addition, if transactional costs were included, your costs may have been higher.
| | | | Expenses Paid |
| | Beginning Account | Ending Account | During Period(1) |
| | Value (11/1/22) | Value (4/30/23) | (11/1/22 to 4/30/23) |
Investor Class | | | |
Actual(2) | $1,000.00 | $1,100.60 | $6.15 |
Hypothetical (5% return before expenses) | $1,000.00 | $1,018.94 | $5.91 |
| | | | |
Z Class | | | |
Actual(2) | $1,000.00 | $1,102.30 | $4.07 |
Hypothetical (5% return before expenses) | $1,000.00 | $1,020.93 | $3.91 |
| | | | |
Institutional Class | | | |
Actual(2) | $1,000.00 | $1,102.60 | $4.64 |
Hypothetical (5% return before expenses) | $1,000.00 | $1,020.38 | $4.46 |
| (1) | Expenses are equal to the Fund’s annualized expense ratio for the most recent six-month period of 1.18%, 0.78% and 0.89% for the Investor Class, Z Class and Institutional Class, respectively, multiplied by the average account value over the period, multiplied by 181/365 to reflect the one-half year period. |
| (2) | Based on the actual returns for the six-month period ended April 30, 2023 of 10.06%, 10.23% and 10.26% for the Investor Class, Z Class and Institutional Class, respectively. |
NUANCE MID CAP VALUE FUND
Allocation of Portfolio(1) (% of Net Assets) (Unaudited)
April 30, 2023
Top Ten Equity Holdings(1) (Unaudited)
as of April 30, 2023
(% of Net Assets)
| | Dentsply Sirona, Inc. | | | 6.1 | % |
| | Kimberly-Clark Corp. | | | 5.9 | % |
| | 3M Co. | | | 5.5 | % |
| | Smith & Nephew – ADR | | | 4.7 | % |
| | Northern Trust Corp. | | | 4.5 | % |
| | Travelers Companies, Inc. | | | 4.2 | % |
| | Henkel AG & Co. KGaA – ADR | | | 3.7 | % |
| | Healthcare Realty Trust, Inc. | | | 3.5 | % |
| | Universal Health Services, Inc. – Class B | | | 3.4 | % |
| | Clorox Co. | | | 3.1 | % |
| (1) | Fund holdings and sector allocations are subject to change at any time and are not recommendations to buy or sell any security. |
ADR – American Depository Receipt
NUANCE MID CAP VALUE FUND
Schedule of Investments
April 30, 2023
| | | Shares | | | Value | |
| COMMON STOCKS – 84.1% | | | | | | |
| | | | | | | |
| Consumer Staples – 14.8% | | | | | | |
Beiersdorf AG – ADR | | | 1,188,397 | | | $ | 33,061,205 | |
Calavo Growers, Inc. (a) | | | 901,788 | | | | 28,821,144 | |
Cal-Maine Foods, Inc. | | | 463,890 | | | | 22,034,775 | |
Clorox Co. | | | 578,732 | | | | 95,849,594 | |
Diageo PLC – ADR | | | 43,649 | | | | 8,096,889 | |
Henkel AG & Co. KGaA – ADR | | | 3,849,832 | | | | 71,029,400 | |
Kimberly-Clark Corp. | | | 1,283,166 | | | | 185,917,922 | |
Mission Produce, Inc. * | | | 1,588,807 | | | | 18,096,512 | |
| | | | | | | | 462,907,441 | |
| | | | | | | | | |
| Financials – 15.9% | | | | | | | | |
Charles Schwab Corp. | | | 265,846 | | | | 13,887,795 | |
Chubb Ltd. | | | 239,533 | | | | 48,280,272 | |
Cullen/Frost Bankers, Inc. | | | 149,129 | | | | 16,441,472 | |
Hartford Financial Services Group Inc. | | | 202,156 | | | | 14,351,054 | |
Independent Bank Corp. | | | 536,323 | | | | 30,034,088 | |
Northern Trust Corp. | | | 1,785,679 | | | | 139,568,671 | |
Reinsurance Group of America, Inc. | | | 496,863 | | | | 70,713,542 | |
TowneBank | | | 1,047,459 | | | | 24,814,304 | |
Travelers Companies, Inc. | | | 725,531 | | | | 131,422,685 | |
W.R. Berkley Corp. | | | 136,213 | | | | 8,025,670 | |
| | | | | | | | 497,539,553 | |
| | | | | | | | | |
| Healthcare – 21.3% | | | | | | | | |
Becton, Dickinson & Co. | | | 32,242 | | | | 8,521,883 | |
Dentsply Sirona, Inc. | | | 4,526,092 | | | | 189,779,037 | |
Globus Medical, Inc. – Class A * | | | 1,353,087 | | | | 78,668,478 | |
ICU Medical, Inc. * | | | 213,948 | | | | 40,466,125 | |
Merit Medical Systems, Inc. * | | | 114,928 | | | | 9,342,497 | |
NuVasive, Inc. * | | | 162,274 | | | | 6,984,273 | |
Smith & Nephew – ADR | | | 4,544,827 | | | | 148,615,843 | |
Universal Health Services, Inc. – Class B | | | 717,239 | | | | 107,836,884 | |
Zimmer Biomet Holdings, Inc. | | | 559,477 | | | | 77,453,996 | |
| | | | | | | | 667,669,016 | |
| | | | | | | | | |
| Industrials – 14.0% | | | | | | | | |
3M Co. | | | 1,616,415 | | | | 171,695,601 | |
Aerojet Rocketdyne Holdings, Inc. * | | | 680,440 | | | | 38,383,620 | |
Graco Inc. | | | 458,066 | | | | 36,320,053 | |
Knorr-Bremse AG – ADR | | | 3,658,735 | | | | 63,698,576 | |
Lindsay Corp. | | | 171,725 | | | | 20,734,077 | |
See Notes to the Financial Statements
NUANCE MID CAP VALUE FUND
Schedule of Investments – Continued
April 30, 2023
| | | Shares | | | Value | |
| | | | | | | |
| Industrials – 14.0% – Continued | | | | | | |
Mueller Water Products, Inc.- Class A | | | 6,892,113 | | | $ | 92,354,314 | |
Werner Enterprises, Inc. | | | 372,232 | | | | 16,813,720 | |
| | | | | | | | 439,999,961 | |
| | | | | | | | | |
| Information Technology – 2.0% | | | | | | | | |
Amphenol Corp. – Class A | | | 812,191 | | | | 61,296,055 | |
| | | | | | | | | |
| Materials – 3.0% | | | | | | | | |
AptarGroup, Inc. | | | 455,473 | | | | 53,978,105 | |
DuPont de Nemours, Inc. | | | 115,556 | | | | 8,056,565 | |
Ecolab Inc. | | | 190,456 | | | | 31,966,135 | |
| | | | | | | | 94,000,805 | |
| | | | | | | | | |
| Real Estate – 6.2% | | | | | | | | |
Equity Commonwealth | | | 1,851,133 | | | | 38,355,476 | |
Healthcare Realty Trust, Inc. | | | 5,593,178 | | | | 110,633,061 | |
Healthpeak Properties, Inc. | | | 2,132,503 | | | | 46,851,091 | |
| | | | | | | | 195,839,628 | |
| | | | | | | | | |
| Utilities – 6.9% | | | | | | | | |
American Water Works Co., Inc. | | | 275,087 | | | | 40,781,648 | |
Avista Corp. | | | 899,173 | | | | 39,626,554 | |
California Water Service Group | | | 556,358 | | | | 31,200,556 | |
Pennon Group PLC | | | 329,897 | | | | 7,254,435 | |
Portland General Electric Co. | | | 919,572 | | | | 46,548,735 | |
SJW Group | | | 566,988 | | | | 43,045,729 | |
United Utilities Group PLC – ADR | | | 312,380 | | | | 8,403,022 | |
| | | | | | | | 216,860,679 | |
| TOTAL COMMON STOCKS | | | | | | | | |
| (Cost $2,487,457,172) | | | | | | | 2,636,113,138 | |
See Notes to the Financial Statements
NUANCE MID CAP VALUE FUND
Schedule of Investments – Continued
April 30, 2023
| | | Shares | | | Value | |
| PREFERRED STOCKS – 8.4% | | | | | | |
| | | | | | | |
| Consumer Staples – 3.7% | | | | | | |
Henkel AG & Co KGaA | | | 5,721,050 | | | $ | 116,080,104 | |
| | | | | | | | | |
| Financials – 4.7% | | | | | | | | |
Charles Schwab Corp., Series D, 5.950% | | | 264,121 | | | | 6,647,926 | |
MetLife, Inc., Series E, 5.625% (Call 06/15/2023 @ $25.00) | | | 1,309,528 | | | | 32,738,200 | |
MetLife, Inc., Series F, 4.750% (Call 03/15/2025 @ $25.00) | | | 1,681,708 | | | | 36,711,686 | |
US Bancorp, 4.000% | | | 493,634 | | | | 8,929,839 | |
US Bancorp, Series B, 3.500% (Call 7/17/2023 @ $25.00) | | | 3,421,918 | | | | 63,784,551 | |
| | | | | | | | 148,812,202 | |
| TOTAL PREFERRED STOCKS | | | | | | | | |
| (Cost $257,633,591) | | | | | | | 264,892,306 | |
| | | | | | | | | |
| SHORT-TERM INVESTMENT – 7.2% | | | | | | | | |
First American Government Obligations Fund, Class X, 4.73% ^ | | | | | | | | |
| (Cost $224,147,787) | | | 224,147,787 | | | | 224,147,787 | |
| Total Investments – 99.7% | | | | | | | | |
| (Cost $2,969,238,550) | | | | | | | 3,125,153,231 | |
| Other Assets and Liabilities, Net – 0.3% | | | | | | | 7,964,761 | |
| Total Net Assets – 100.0% | | | | | | $ | 3,133,117,992 | |
ADR – American Depositary Receipt
| (a) | Represents an affiliated company as defined by the Investment Company Act of 1940. See Note 9 in Notes to Financial Statements. |
| * | Non-income producing security |
| ^ | The rate shown is the annualized seven day effective yield as of April 30, 2023. |
See Notes to the Financial Statements
NUANCE MID CAP VALUE FUND
Statement of Assets and Liabilities
April 30, 2023
| ASSETS: | | | |
Investments, at value | | | |
Unaffiliated Investments (cost $2,923,762,401) | | $ | 3,096,332,087 | |
Affiliated Investments (cost $45,476,149) | | | 28,821,144 | |
Receivable for investment securities sold | | | 14,939,582 | |
Receivable for capital shares sold | | | 2,749,412 | |
Dividends and interest receivable | | | 10,121,179 | |
Prepaid expenses | | | 64,825 | |
Total assets | | | 3,153,028,229 | |
| | | | | |
| LIABILITIES: | | | | |
Payable for investment securities purchased | | | 14,193,130 | |
Payable for capital shares redeemed | | | 3,428,092 | |
Payable to investment adviser | | | 1,903,542 | |
Payable for fund services fees | | | 287,143 | |
Payable for trustee fees | | | 4,685 | |
Accrued distribution & shareholder service fees | | | 44,264 | |
Accrued expenses | | | 49,381 | |
Total liabilities | | | 19,910,237 | |
| | | | | |
| NET ASSETS | | $ | 3,133,117,992 | |
| | | | | |
| NET ASSETS CONSIST OF: | | | | |
Paid-in capital | | $ | 3,067,578,025 | |
Total distributable earnings | | | 65,539,967 | |
Net Assets | | $ | 3,133,117,992 | |
| | | Investor | | | | | | Institutional | |
| | | Class | | | Z Class | | | Class | |
Net assets | | $ | 68,340,541 | | | $ | 362,396,357 | | | $ | 2,702,381,094 | |
Shares issued and outstanding(1) | | | 5,367,820 | | | | 28,368,952 | | | | 212,691,442 | |
Net asset value, redemption price | | | | | | | | | | | | |
and minimum offering price per share | | $ | 12.73 | | | $ | 12.77 | | | $ | 12.71 | |
Maximum offering price per share ($12.73/0.95)(2) | | $ | 13.40 | | | | N/A | | | | N/A | |
| | | | | | | | | | | | | |
| (1) | Unlimited shares authorized with no par value. |
| (2) | Reflects a maximum sales charge of 5.00%. |
See Notes to the Financial Statements
NUANCE MID CAP VALUE FUND
Statement of Operations
For the Year Ended April 30, 2023
| INVESTMENT INCOME: | | | |
Dividend income from unaffiliated common stock | | $ | 63,984,848 | |
Dividend income from affiliated common stock | | | 15,588,627 | |
Less: Foreign taxes withheld | | | (827,636 | ) |
Interest income | | | 6,169,358 | |
Total investment income | | | 84,915,197 | |
| | | | | |
| EXPENSES: | | | | |
Investment adviser fees (See Note 4) | | | 24,393,728 | |
Fund services fees (See Note 4) | | | 1,899,439 | |
Postage & printing fees | | | 161,212 | |
Federal & state registration fees | | | 99,731 | |
Trustee fees | | | 21,132 | |
Insurance fees | | | 20,640 | |
Other | | | 18,775 | |
Audit fees | | | 18,305 | |
Legal fees | | | 12,235 | |
Distribution & shareholder service fees (See Note 5): | | | | |
| Investor Class | | | 285,756 | |
| Institutional Class | | | 1,969,058 | |
Total expenses before waiver | | | 28,900,011 | |
Less: waiver from investment adviser (See Note 4) | | | (173,502 | ) |
Net expenses | | | 28,726,509 | |
| | | | | |
| NET INVESTMENT INCOME | | | 56,188,688 | |
| | | | | |
| REALIZED AND UNREALIZED GAIN (LOSS) ON INVESTMENTS: | | | | |
Net realized loss on unaffiliated investments | | | (67,291,443 | ) |
Net realized loss on affiliated investments | | | (12,446,242 | ) |
Net change in unrealized appreciation/depreciation on unaffiliated investments | | | 134,896,065 | |
Net change in unrealized appreciation/depreciation on affiliated investments | | | 30,320,279 | |
| | | | | |
Net realized and unrealized gain on investments | | | 85,478,659 | |
| | | | | |
| NET INCREASE IN NET ASSETS RESULTING FROM OPERATIONS | | $ | 141,667,347 | |
See Notes to the Financial Statements
NUANCE MID CAP VALUE FUND
Statements of Changes in Net Assets
| | | Year Ended | | | Year Ended | |
| | | April 30, 2023 | | | April 30, 2022 | |
| OPERATIONS: | | | | | | |
Net investment income | | $ | 56,188,688 | | | $ | 40,482,015 | |
Net realized gain (loss) on investments | | | (79,683,589 | ) | | | 396,234,942 | |
Net realized gain (loss) on affiliated investments | | | (54,096 | ) | | | 10,414,425 | |
Net change in unrealized appreciation/depreciation | | | | | | | | |
on unaffiliated investments | | | 134,896,065 | | | | (513,519,851 | ) |
Net change in unrealized appreciation/depreciation | | | | | | | | |
on affiliated investments | | | 30,320,279 | | | | 4,493,183 | |
Net increase (decrease) in net assets resulting from operations | | | 141,667,347 | | | | (61,895,286 | ) |
| | | | | | | | | |
| CAPITAL SHARE TRANSACTIONS: | | | | | | | | |
Investor Class: | | | | | | | | |
| Proceeds from shares sold | | | 17,562,817 | | | | 29,333,767 | |
| Proceeds from reinvestment of distributions | | | 6,453,413 | | | | 9,364,642 | |
| Payments for shares redeemed | | | (29,927,445 | ) | | | (66,873,116 | ) |
Decrease in net assets resulting from Investor Class transactions | | | (5,911,215 | ) | | | (28,174,707 | ) |
Z Class: | | | | | | | | |
| Proceeds from shares sold | | | 94,835,627 | | | | 214,074,245 | |
| Proceeds from reinvestment of distributions | | | 19,937,179 | | | | 29,975,841 | |
| Payments for shares redeemed | | | (130,272,155 | ) | | | (200,319,804 | ) |
Increase (Decrease) in net assets resulting from Z Class transactions | | | (15,499,349 | ) | | | 43,730,282 | |
Institutional Class: | | | | | | | | |
| Proceeds from shares sold | | | 624,394,713 | | | | 900,071,008 | |
| Proceeds from reinvestment of distributions | | | 228,889,609 | | | | 321,263,104 | |
| Payments for shares redeemed | | | (1,045,792,861 | ) | | | (1,060,202,529 | ) |
Increase (Decrease) in net assets resulting | | | | | | | | |
from Institutional Class transactions | | | (192,508,539 | ) | | | 161,131,583 | |
Net increase (decrease) in net assets resulting | | | | | | | | |
from capital share transactions | | | (213,919,103 | ) | | | 176,687,158 | |
| | | | | | | | | |
| DISTRIBUTIONS TO SHAREHOLDERS: | | | | | | | | |
| Investor Class | | | (6,485,015 | ) | | | (9,386,493 | ) |
| Z Class | | | (35,791,916 | ) | | | (52,906,447 | ) |
| Institutional Class | | | (259,544,750 | ) | | | (356,313,138 | ) |
Total distributions to shareholders | | | (301,821,681 | ) | | | (418,606,078 | ) |
| | | | | | | | | |
| TOTAL DECREASE IN NET ASSETS | | | (374,073,437 | ) | | | (303,814,206 | ) |
| | | | | | | | | |
| NET ASSETS: | | | | | | | | |
Beginning of year | | | 3,507,191,429 | | | | 3,811,005,635 | |
End of year | | $ | 3,133,117,992 | | | $ | 3,507,191,429 | |
See Notes to the Financial Statements
NUANCE MID CAP VALUE FUND
Financial Highlights
For a Fund share outstanding throughout the year.
| | | Year Ended | | | Year Ended | | | Year Ended | | | Year Ended | | | Year Ended | |
| | | April 30, | | | April 30, | | | April 30, | | | April 30, | | | April 30, | |
| | | 2023 | | | 2022 | | | 2021 | | | 2020 | | | 2019 | |
| Investor Class | | | | | | | | | | | | | | | |
| | | | | | | | | | | | | | | | |
| PER SHARE DATA: | | | | | | | | | | | | | | | |
Net asset value, beginning of year | | $ | 13.40 | | | $ | 15.36 | | | $ | 11.81 | | | $ | 12.80 | | | $ | 12.33 | |
| | | | | | | | | | | | | | | | | | | | | |
| INVESTMENT OPERATIONS: | | | | | | | | | | | | | | | | | | | | |
Net investment income | | | 0.19 | | | | 0.13 | | | | 0.07 | | | | 0.12 | | | | 0.11 | |
Net realized and unrealized | | | | | | | | | | | | | | | | | | | | |
gain (loss) on investments | | | 0.35 | | | | (0.42 | ) | | | 3.55 | | | | (0.30 | ) | | | 1.15 | |
Total from investment operations | | | 0.54 | | | | (0.29 | ) | | | 3.62 | | | | (0.18 | ) | | | 1.26 | |
| | | | | | | | | | | | | | | | | | | | | |
| LESS DISTRIBUTIONS: | | | | | | | | | | | | | | | | | | | | |
Distributions from net investment income | | | (0.15 | ) | | | (0.08 | ) | | | (0.07 | ) | | | (0.14 | ) | | | (0.10 | ) |
Distributions from net realized gains | | | (1.06 | ) | | | (1.59 | ) | | | — | | | | (0.67 | ) | | | (0.69 | ) |
Total distributions | | | (1.21 | ) | | | (1.67 | ) | | | (0.07 | ) | | | (0.81 | ) | | | (0.79 | ) |
| | | | | | | | | | | | | | | | | | | | | |
Net asset value, end of year | | $ | 12.73 | | | $ | 13.40 | | | $ | 15.36 | | | $ | 11.81 | | | $ | 12.80 | |
| | | | | | | | | | | | | | | | | | | | | |
TOTAL RETURN(1) | | | 4.51 | % | | | (2.07 | )% | | | 30.77 | % | | | (2.12 | )% | | | 11.33 | % |
| | | | | | | | | | | | | | | | | | | | | |
| SUPPLEMENTAL DATA AND RATIOS: | | | | | | | | | | | | | | | | | | | | |
Net assets, end of year (in millions) | | $ | 68.3 | | | $ | 78.1 | | | $ | 117.1 | | | $ | 94.3 | | | $ | 36.3 | |
| | | | | | | | | | | | | | | | | | | | | |
Ratio of expenses to average net assets: | | | | | | | | | | | | | | | | | | | | |
| Before expense waiver/recoupment | | | 1.22 | % | | | 1.22 | % | | | 1.23 | % | | | 1.24 | % | | | 1.27 | % |
| After expense waiver/recoupment | | | 1.18 | % | | | 1.18 | % | | | 1.18 | % | | | 1.18 | % | | | 1.18 | % |
| | | | | | | | | | | | | | | | | | | | | |
Ratio of net investment income | | | | | | | | | | | | | | | | | | | | |
to average net assets: | | | | | | | | | | | | | | | | | | | | |
| Before expense waiver/recoupment | | | 1.39 | % | | | 0.74 | % | | | 0.48 | % | | | 0.96 | % | | | 0.86 | % |
| After expense waiver/recoupment | | | 1.43 | % | | | 0.78 | % | | | 0.53 | % | | | 1.02 | % | | | 0.95 | % |
| | | | | | | | | | | | | | | | | | | | | |
Portfolio turnover rate | | | 62 | % | | | 61 | % | | | 76 | % | | | 124 | % | | | 99 | % |
| (1) | Total return does not reflect sales charges. |
See Notes to the Financial Statements
NUANCE MID CAP VALUE FUND
Financial Highlights
For a Fund share outstanding throughout the year.
| | | Year Ended | | | Year Ended | | | Year Ended | | | Year Ended | | | Year Ended | |
| | | April 30, | | | April 30, | | | April 30, | | | April 30, | | | April 30, | |
| | | 2023 | | | 2022 | | | 2021 | | | 2020 | | | 2019 | |
| Z Class | | | | | | | | | | | | | | | |
| | | | | | | | | | | | | | | | |
| PER SHARE DATA: | | | | | | | | | | | | | | | |
Net asset value, beginning of year | | $ | 13.45 | | | $ | 15.42 | | | $ | 11.84 | | | $ | 12.83 | | | $ | 12.37 | |
| | | | | | | | | | | | | | | | | | | | | |
| INVESTMENT OPERATIONS: | | | | | | | | | | | | | | | | | | | | |
Net investment income | | | 0.24 | | | | 0.17 | | | | 0.12 | | | | 0.18 | | | | 0.16 | |
Net realized and unrealized | | | | | | | | | | | | | | | | | | | | |
gain (loss) on investments | | | 0.34 | | | | (0.40 | ) | | | 3.57 | | | | (0.32 | ) | | | 1.14 | |
Total from investment operations | | | 0.58 | | | | (0.23 | ) | | | 3.69 | | | | (0.14 | ) | | | 1.30 | |
| | | | | | | | | | | | | | | | | | | | | |
| LESS DISTRIBUTIONS: | | | | | | | | | | | | | | | | | | | | |
Distributions from net investment income | | | (0.20 | ) | | | (0.15 | ) | | | (0.11 | ) | | | (0.18 | ) | | | (0.15 | ) |
Distributions from net realized gains | | | (1.06 | ) | | | (1.59 | ) | | | — | | | | (0.67 | ) | | | (0.69 | ) |
Total distributions | | | (1.26 | ) | | | (1.74 | ) | | | (0.11 | ) | | | (0.85 | ) | | | (0.84 | ) |
| | | | | | | | | | | | | | | | | | | | | |
Net asset value, end of year | | $ | 12.77 | | | $ | 13.45 | | | $ | 15.42 | | | $ | 11.84 | | | $ | 12.83 | |
| | | | | | | | | | | | | | | | | | | | | |
| TOTAL RETURN | | | 4.87 | % | | | (1.62 | )% | | | 31.34 | % | | | (1.78 | )% | | | 11.73 | % |
| | | | | | | | | | | | | | | | | | | | | |
| SUPPLEMENTAL DATA AND RATIOS: | | | | | | | | | | | | | | | | | | | | |
Net assets, end of year (in millions) | | $ | 362.4 | | | $ | 395.3 | | | $ | 409.5 | | | $ | 254.2 | | | $ | 130.9 | |
| | | | | | | | | | | | | | | | | | | | | |
Ratio of expenses to average net assets: | | | | | | | | | | | | | | | | | | | | |
| Before expense waiver/recoupment | | | 0.82 | % | | | 0.82 | % | | | 0.83 | % | | | 0.84 | % | | | 0.88 | % |
| After expense waiver/recoupment | | | 0.78 | % | | | 0.78 | % | | | 0.78 | % | | | 0.78 | % | | | 0.78 | % |
| | | | | | | | | | | | | | | | | | | | | |
Ratio of net investment income | | | | | | | | | | | | | | | | | | | | |
to average net assets: | | | | | | | | | | | | | | | | | | | | |
| Before expense waiver/recoupment | | | 1.79 | % | | | 1.15 | % | | | 0.88 | % | | | 1.36 | % | | | 1.25 | % |
| After expense waiver/recoupment | | | 1.83 | % | | | 1.19 | % | | | 0.93 | % | | | 1.42 | % | | | 1.35 | % |
| | | | | | | | | | | | | | | | | | | | | |
Portfolio turnover rate | | | 62 | % | | | 61 | % | | | 76 | % | | | 124 | % | | | 99 | % |
See Notes to the Financial Statements
NUANCE MID CAP VALUE FUND
Financial Highlights
For a Fund share outstanding throughout the year.
| | | Year Ended | | | Year Ended | | | Year Ended | | | Year Ended | | | Year Ended | |
| | | April 30, | | | April 30, | | | April 30, | | | April 30, | | | April 30, | |
| | | 2023 | | | 2022 | | | 2021 | | | 2020 | | | 2019 | |
| Institutional Class | | | | | | | | | | | | | | | |
| | | | | | | | | | | | | | | | |
| PER SHARE DATA: | | | | | | | | | | | | | | | |
Net asset value, beginning of year | | $ | 13.39 | | | $ | 15.36 | | | $ | 11.81 | | | $ | 12.80 | | | $ | 12.35 | |
| | | | | | | | | | | | | | | | | | | | | |
| INVESTMENT OPERATIONS: | | | | | | | | | | | | | | | | | | | | |
Net investment income | | | 0.22 | | | | 0.16 | | | | 0.10 | | | | 0.17 | | | | 0.14 | |
Net realized and unrealized | | | | | | | | | | | | | | | | | | | | |
gain (loss) on investments | | | 0.35 | | | | (0.40 | ) | | | 3.55 | | | | (0.31 | ) | | | 1.14 | |
Total from investment operations | | | 0.57 | | | | (0.24 | ) | | | 3.65 | | | | (0.14 | ) | | | 1.28 | |
| | | | | | | | | | | | | | | | | | | | | |
| LESS DISTRIBUTIONS: | | | | | | | | | | | | | | | | | | | | |
Distributions from net investment income | | | (0.19 | ) | | | (0.14 | ) | | | (0.10 | ) | | | (0.18 | ) | | | (0.14 | ) |
Distributions from net realized gains | | | (1.06 | ) | | | (1.59 | ) | | | — | | | | (0.67 | ) | | | (0.69 | ) |
Total distributions | | | (1.25 | ) | | | (1.73 | ) | | | (0.10 | ) | | | (0.85 | ) | | | (0.83 | ) |
| | | | | | | | | | | | | | | | | | | | | |
Net asset value, end of year | | $ | 12.71 | | | $ | 13.39 | | | $ | 15.36 | | | $ | 11.81 | | | $ | 12.80 | |
| | | | | | | | | | | | | | | | | | | | | |
| TOTAL RETURN | | | 4.82 | % | | | (1.71 | )% | | | 31.09 | % | | | (1.85 | )% | | | 11.57 | % |
| | | | | | | | | | | | | | | | | | | | | |
| SUPPLEMENTAL DATA AND RATIOS: | | | | | | | | | | | | | | | | | | | | |
Net assets, end of year (in millions) | | $ | 2,702.4 | | | $ | 3,033.8 | | | $ | 3,284.4 | | | $ | 1,474.8 | | | $ | 952.0 | |
| | | | | | | | | | | | | | | | | | | | | |
Ratio of expenses to average net assets: | | | | | | | | | | | | | | | | | | | | |
| Before expense waiver/recoupment | | | 0.89 | % | | | 0.88 | % | | | 0.91 | % | | | 0.92 | % | | | 0.95 | % |
| After expense waiver/recoupment | | | 0.89 | % | | | 0.88 | % | | | 0.92 | % | | | 0.93 | % | | | 0.93 | % |
| | | | | | | | | | | | | | | | | | | | | |
Ratio of net investment income | | | | | | | | | | | | | | | | | | | | |
to average net assets: | | | | | | | | | | | | | | | | | | | | |
| Before expense waiver/recoupment | | | 1.72 | % | | | 1.08 | % | | | 0.80 | % | | | 1.29 | % | | | 1.18 | % |
| After expense waiver/recoupment | | | 1.72 | % | | | 1.08 | % | | | 0.79 | % | | | 1.28 | % | | | 1.20 | % |
| | | | | | | | | | | | | | | | | | | | | |
Portfolio turnover rate | | | 62 | % | | | 61 | % | | | 76 | % | | | 124 | % | | | 99 | % |
See Notes to the Financial Statements
NUANCE MID CAP VALUE FUND
Notes to the Financial Statements
April 30, 2023
1. ORGANIZATION
Managed Portfolio Series (the “Trust”) was organized as a Delaware statutory trust on January 27, 2011. The Trust is registered under the Investment Company Act of 1940, as amended (the “1940 Act”), as an open-end management investment company. The Nuance Mid Cap Value Fund (the “Fund”) is a diversified series with its own investment objectives and policies within the Trust. The investment objective of the Fund is long-term capital appreciation. The Fund is an investment company and accordingly follows the investment company accounting and reporting guidance of the Financial Accounting Standards Board (“FASB”) Accounting Standards Codification Topic 946 Financial Services – Investment Companies. The Fund commenced operations on May 31, 2011. The Fund currently offers three classes, the Investor Class, the Institutional Class and the Z Class. Investor Class shares may be subject to a front-end sales charge of up to 5.00%. Investor Class shares are subject to a 0.25% of average daily net assets of distribution and servicing fee and Investor Class and Institutional Class shares are subject to a shareholder servicing fee of up to 0.15% of average daily net assets. Each class of shares has identical rights and privileges with respect to voting on matters affecting a single share class. The Fund may issue an unlimited number of shares of beneficial interest, with no par value.
2. SIGNIFICANT ACCOUNTING POLICIES
The following is a summary of significant accounting policies consistently followed by the Fund in the preparation of its financial statements. These policies are in conformity with generally accepted accounting principles in the United States of America (“GAAP”).
Security Valuation – All investments in securities are recorded at their estimated fair value, as described in Note 3.
Federal Income Taxes – The Fund complies with the requirements of Subchapter M of the Internal Revenue Code of 1986, as amended, necessary to qualify as a regulated investment company and distributes substantially all net taxable investment income and net realized gains to shareholders in a manner which results in no tax cost to the Fund. Therefore, no federal income or excise tax provision is required. As of and during the year ended April 30, 2023, the Fund did not have any tax positions that did not meet the “more-likely-than-not” threshold of being sustained by the applicable tax authority. The Fund recognizes interest and penalties, if any, related to unrecognized tax benefits on uncertain tax positions as income tax expense in the Statement of Operations. During the year ended April 30, 2023, the Fund did not incur any interest or penalties. The Fund is subject to examination by U.S. taxing authorities for the tax years ended April 30, 2020 through 2023.
Security Transactions, Income and Distributions – The Fund follows industry practice and records security transactions on the trade date. Realized gains and losses on sales of securities are calculated on the basis of identified cost. Dividend income is recorded on the ex-dividend date and interest income is recorded on an accrual basis. Withholding taxes on foreign dividends have been provided for in accordance with the Fund’s understanding of the applicable country’s tax rules and regulations. Discounts and premiums on securities purchased are amortized over the expected life of the respective securities using the constant yield method of calculation.
The Fund will make distributions, if any, of net investment income quarterly. The Fund will also distribute net realized capital gains, if any, annually. Distributions to shareholders are recorded on the ex-dividend date. The treatment for financial reporting purposes of distributions made to shareholders during the year from net investment income or net realized capital gains may differ from their treatment for federal income tax purposes.
NUANCE MID CAP VALUE FUND
Notes to the Financial Statements – Continued
April 30, 2023
These differences are caused primarily by differences in the timing of the recognition of certain components of income, expense or realized capital gain for federal income tax purposes. Where such differences are permanent in nature, GAAP requires that they be reclassified in the components of the net assets based on their ultimate characterization for federal income tax purposes. Any such reclassifications will have no effect on net assets, results of operations or net asset values per share of the Fund. For the year ended April 30, 2023, the Fund decreased paid-in capital by $1 and increased distributable earnings by $1.
Use of Estimates – The preparation of financial statements in conformity with GAAP requires management to make estimates and assumptions that affect the reported amounts of assets and liabilities and disclosure of contingent assets and liabilities at the date of the financial statements and the reported amounts of revenues and expenses during the reporting period. Actual results could differ from those estimates.
Allocation of Income, Expenses and Gains/Losses – Income, expenses (other than those deemed attributable to a specific share class), and gains and losses of the Fund are allocated daily to each class of shares based upon the ratio of net assets represented by each class as a percentage of the net assets of the Fund. Expenses deemed directly attributable to a class of shares are recorded by the specific class. Most Fund expenses are allocated by class based on relative net assets. 12b-1 fees are expensed at 0.25% of average daily net assets of Investor Class shares. Shareholder service fees are expensed at up to 0.15% of average daily net assets for Investor and Institutional shares. Expenses associated with a specific fund in the Trust are charged to that fund. Common Trust expenses are typically allocated evenly between the funds of the Trust, or by other equitable means.
3. SECURITIES VALUATION
The Fund has adopted authoritative fair value accounting standards which establish an authoritative definition of fair value and set out a hierarchy for measuring fair value. These standards require additional disclosures about the various inputs and valuation techniques used to develop the measurements of fair value, a discussion in changes in valuation techniques and related inputs during the period and expanded disclosure of valuation levels for major security types. These inputs are summarized in the three broad levels listed below:
| Level 1 – | Unadjusted quoted prices in active markets for identical assets or liabilities that the Fund has the ability to access. |
| | |
| Level 2 – | Observable inputs other than quoted prices included in Level 1 that are observable for the asset or liability, either directly or indirectly. These inputs may include quoted prices for the identical instrument on an inactive market, prices for similar instruments, interest rates, prepayment speeds, credit risk, yield curves, default rates and similar data. |
| | |
| Level 3 – | Unobservable inputs for the asset or liability, to the extent relevant observable inputs are not available, representing the Fund’s own assumptions about the assumptions a market participant would use in valuing the asset or liability, and would be based on the best information available. |
Following is a description of the valuation techniques applied to the Fund’s major categories of assets and liabilities measured at fair value on a recurring basis. The Fund’s investments are carried at fair value.
Equity Securities – Securities that are primarily traded on a national securities exchange are valued at the last sale price on the exchange on which they are primarily traded on the day of valuation or, if there has been no sale
NUANCE MID CAP VALUE FUND
Notes to the Financial Statements – Continued
April 30, 2023
on such day, at the mean between the bid and ask prices. Securities traded primarily in the Nasdaq Global Market System for which market quotations are readily available are valued using the Nasdaq Official Closing Price (“NOCP”). If the NOCP is not available, such securities are valued at the last sale price on the day of valuation, or if there has been no sale on such day, at the mean between the bid and ask prices. To the extent these securities are actively traded and valuation adjustments are not applied, they are categorized in Level 1 of the fair value hierarchy.
Short-Term Investments – Investments in other mutual funds, including money market funds are valued at their net asset value per share and are categorized in Level 1 of the fair value hierarchy. To the extent these securities are actively traded and valuation adjustments are not applied, they are categorized in Level 1 of the fair value hierarchy.
The Board of Trustees (the “Board”) has adopted a pricing and valuation policy for use by the Fund and its Valuation Designee (as defined below) in calculating the Fund’s NAV. Pursuant to Rule 2a-5 under the 1940 Act, the Fund has designated Nuance Investments, LLC (the “Adviser”) as its “Valuation Designee” to perform all of the fair value determinations as well as to perform all of the responsibilities that may be performed by the Valuation Designee in accordance with Rule 2a-5. The Valuation Designee is authorized to make all necessary determinations of the fair values of portfolio securities and other assets for which market quotations are not readily available or if it is deemed that the prices obtained from brokers and dealers or independent pricing services are unreliable.
The inputs or methodology used for valuing securities are not an indication of the risk associated with investing in those securities. The following is a summary of the inputs used to value the Fund’s securities as of April 30, 2023:
| | | Level 1 | | | Level 2 | | | Level 3 | | | Total | |
| Common Stocks | | $ | 2,636,113,138 | | | $ | — | | | $ | — | | | $ | 2,636,113,138 | |
| Preferred Stocks | | | 264,892,306 | | | | — | | | | — | | | | 264,892,306 | |
| Short-Term Investment | | | 224,147,787 | | | | — | | | | — | | | | 224,147,787 | |
| Total Investments in Securities | | $ | 3,125,153,231 | | | $ | — | | | $ | — | | | $ | 3,125,153,231 | |
Refer to the Schedule of Investments for further information on the classification of investments.
4. INVESTMENT ADVISORY FEE AND OTHER TRANSACTIONS WITH AFFILIATES
The Trust has an agreement with Nuance Investments, LLC (the “Adviser”) to furnish investment advisory services to the Fund. Pursuant to an Investment Advisory Agreement between the Trust and the Adviser, the Adviser is entitled to receive, on a monthly basis, an annual advisory fee equal to 0.75% of the Fund’s average daily net assets.
The Fund’s Adviser has contractually agreed to waive a portion or all of its management fees and reimburse the Fund for its expenses to ensure that total annual operating expenses (excluding any front-end or contingent deferred loads, acquired fund fees and expenses, leverage/borrowing interest, interest expense, dividends paid on short sales, taxes, brokerage commissions and extraordinary expenses) for the Fund do not exceed 1.18%, 0.78% and 0.93% of average daily net assets of the Fund’s Investor Class, Z Class and Institutional Class, respectively. Fees waived and expenses reimbursed by the Adviser may be recouped by the Adviser for a period of thirty-six months following the month during which such waiver or reimbursement was made if such recoupment can be
NUANCE MID CAP VALUE FUND
Notes to the Financial Statements – Continued
April 30, 2023
achieved without exceeding the expense limit in effect at the time the waiver and reimbursement occurred. The Operating Expense Limitation Agreement is intended to be continual in nature and cannot be terminated within a year after the effective date of the Fund’s prospectus. After that date, the agreement may be terminated at any time upon 60 days’ written notice by the Trust’s Board or the Adviser, with the consent of the Board. Waived fees and reimbursed expenses subject to potential recovery by year of expiration are as follows:
| Expiration | | Amount | |
| May 2023 – April 2024 | | $ | 208,199 | |
| May 2024 – April 2025 | | $ | 201,565 | |
| May 2025 – April 2026 | | $ | 173,502 | |
U.S. Bancorp Fund Services, LLC, doing business as U.S. Bank Global Fund Services, (“Fund Services” or the “Administrator”), acts as the Fund’s Administrator, Transfer Agent, and Fund Accountant. U.S. Bank N.A. (the “Custodian”) serves as the custodian to the Fund. The Custodian is an affiliate of the Administrator. The Administrator performs various administrative and accounting services for the Fund. The Administrator prepares various federal and state regulatory filings, reports and returns for the Fund; prepares reports and materials to be supplied to the Trustees; monitors the activities of the Fund’s custodian; coordinates the payment of the Fund’s expenses and reviews the Fund’s expense accruals. The officers of the Trust, including the Chief Compliance Officer are employees of the Administrator. As compensation for its services, the Administrator is entitled to a monthly fee at an annual rate based upon the average daily net assets of the Fund, subject to annual minimums. Fees paid by the Fund for administration and accounting, transfer agency, custody and compliance services for the year ended April 30, 2023, are disclosed in the Statement of Operations as fund services fees.
5. DISTRIBUTION & SHAREHOLDER SERVICING FEES
The Fund has adopted a Distribution Plan pursuant to Rule 12b-1 (the “Plan”) in the Investor Class only. The Plan permits the Fund to pay for distribution and related expenses at an annual rate of 0.25% of the Investor Class average daily net assets. The expenses covered by the Plan may include the cost of preparing and distributing prospectuses and other sales material, advertising and public relations expenses, payments to financial intermediaries and compensation of personnel involved in selling shares of the Fund. Payments made pursuant to the Plan will represent compensation for distribution and service activities, not reimbursements for specific expenses incurred. For the year ended April 30, 2023, the Investor Class incurred expenses of $178,597 pursuant to the Plan.
The Fund has entered into a shareholder servicing agreement (the “Agreement”) where the Adviser acts as the shareholder agent, under which the Fund may pay servicing fees at an annual rate of up to 0.15% of the average daily net assets of each class. Payments, if any, to the Adviser under the Agreement may reimburse the Adviser for payments it makes to selected brokers, dealers and administrators which have entered into service agreements with the Adviser for services provided to shareholders of the Fund. Payments may also be made directly to the intermediaries providing shareholder services. The services provided by such intermediaries are primarily designed to assist shareholders of the Fund and include the furnishing of office space and equipment, telephone facilities, personnel and assistance to the Fund in servicing such shareholders. Services provided by such intermediaries also include the provision of support services to the Fund and includes establishing and maintaining shareholders’ accounts and record processing, purchase and redemption transactions, answering routine client inquiries regarding the Fund, and providing such other personal services to shareholders as the Fund may reasonably request. For the year ended April 30, 2023, the Investor and Institutional Class incurred $107,159 and $1,969,058, respectively, of shareholder servicing fees under the Agreement.
NUANCE MID CAP VALUE FUND
Notes to the Financial Statements – Continued
April 30, 2023
6. CAPITAL SHARE TRANSACTIONS
Transactions in shares of the Fund were as follows:
| | | Year Ended | | | Year Ended | |
| | | April 30, 2023 | | | April 30, 2022 | |
| Investor Class: | | | | | | |
| Shares sold | | | 1,377,852 | | | | 1,980,988 | |
| Shares issued to holders in reinvestment of distributions | | | 530,824 | | | | 686,628 | |
| Shares redeemed | | | (2,367,396 | ) | | | (4,464,644 | ) |
| Net decrease in Investor Class shares | | | (458,720 | ) | | | (1,797,028 | ) |
| Z Class: | | | | | | | | |
| Shares sold | | | 7,555,877 | | | | 14,764,339 | |
| Shares issued to holders in reinvestment of distributions | | | 1,634,595 | | | | 2,189,122 | |
| Shares redeemed | | | (10,214,278 | ) | | | (14,117,138 | ) |
| Net increase (decrease) in Z Class shares | | | (1,023,806 | ) | | | 2,836,323 | |
| Institutional Class: | | | | | | | | |
| Shares sold | | | 49,410,158 | | | | 61,607,892 | |
| Shares issued to holders in reinvestment of distributions | | | 18,856,825 | | | | 23,542,559 | |
| Shares redeemed | | | (82,179,369 | ) | | | (72,342,897 | ) |
| Net increase (decrease) in Institutional Class shares | | | (13,912,386 | ) | | | 12,807,554 | |
| Net increase (decrease) in shares outstanding | | | (15,394,912 | ) | | | 13,846,849 | |
7. INVESTMENT TRANSACTIONS
The aggregate purchases and sales, excluding short-term investments, by the Fund for the year ended April 30, 2023, were as follows:
| | | Purchases | | | Sales | | | |
| U.S. Government | | $ | — | | | $ | — | | | |
| Other | | $ | 1,877,269,261 | | | $ | 2,304,300,210 | | | |
8. FEDERAL TAX INFORMATION
The aggregate gross unrealized appreciation and depreciation of securities held by the Fund and the total cost of securities for federal income tax purposes at April 30, 2023, the Fund’s most recent fiscal year end, were as follows:
| Unrealized | Unrealized | Net | | |
| Aggregate Gross | Aggregate Gross | Unrealized | Federal Income | |
| Appreciation | Depreciation | Appreciation | Tax Cost | |
| $329,508,611 | $(199,986,510) | $129,522,101 | $2,995,631,130 | |
NUANCE MID CAP VALUE FUND
Notes to the Financial Statements – Continued
April 30, 2023
The difference between book-basis and tax-basis unrealized appreciation is attributable primarily to the deferral of wash sale losses. At April 30, 2023, components of distributed earnings on a tax-basis were as follows:
| Undistributed | Other | Net | Total |
| Undistributed | Long-Term | Accumulated | Unrealized | Distributable |
| Ordinary Income | Capital Gains | Losses | Appreciation | Earnings |
| $15,365,651 | $— | $(79,347,785) | $129,522,101 | $65,539,967 |
As of April 30, 2023, the Fund’s most recent fiscal year end, the Fund had $57,315,108 in short term and $21,963,574 in long term capital loss carryovers. A regulated investment company may elect for any taxable year to treat any portion of any qualified late year loss as arising on the first day of the next taxable year. Qualified late year losses are certain capital, and ordinary losses which occur during the portion of the Fund’s taxable year subsequent to October 31. For the taxable year ended April 30, 2023, the Fund does not plan to defer any qualified later year losses.
The tax character of distributions paid during the year ended April 30, 2023, were as follows:
| Ordinary | Long-Term | | | |
| Income* | Capital Gains | Total | | |
| $48,410,022 | $253,411,660 | $301,821,682 | | |
The tax character of distributions paid during the year ended April 30, 2022, were as follows:
| Ordinary | Long-Term | | | |
| Income* | Capital Gains | Total | | |
| $161,479,635 | $257,126,443 | $418,606,078 | | |
* | For federal income tax purposes, distributions of short-term capital gains are treated as ordinary income distributions. |
The Fund designated as long-term capital gain dividend, pursuant to Internal Revenue Code Section 852(b)(3), the amount necessary to reduce the earnings of the Fund related to net capital gain to zero for the tax year ended April 30, 2023.
NUANCE MID CAP VALUE FUND
Notes to the Financial Statements – Continued
April 30, 2023
9. TRANSACTIONS WITH AFFILIATES
If the Fund’s holding represents ownership of 5% or more of the voting securities of a company, the company is deemed to be an affiliate as defined by the 1940 Act. The Fund conducted transactions during the year ended April 30, 2023 with affiliated companies as so defined:
| | | | | | Beginning Value | | | Additions | | | Reductions | | | Ending Value | |
| Calavo Growers, Inc. | | | | | $ | 24,378,467 | | | $ | 6,696,008 | | | $ | (817,447 | ) | | $ | 28,821,144 | |
Equity Commonwealth(1) | | | | | | 179,252,741 | | | | — | | | | (129,814,053 | ) | | | 38,355,476 | |
SJW Group(1) | | | | | | 93,297,290 | | | | 4,884,728 | | | | (85,529,422 | ) | | | 43,045,729 | |
| | | | | | | | | | | | | | | | | | | | |
| | | | | | | | | | | | | | | | | | Change in | |
| | | Ending Shares | | | | | | | | | | | | | | | Unrealized | |
| | | as of | | | Dividend | | | Return of | | | Realized | | | Appreciation/ | |
| | | April 30, 2023 | | | Income | | | Capital | | | Gain (Loss) | | | Depreciation | |
| Calavo Growers, Inc. | | | 901,788 | | | $ | 304,240 | | | $ | — | | | $ | (54,097 | ) | | $ | (1,381,787 | ) |
Equity Commonwealth(1) | | | 1,851,133 | | | | 13,265,540 | | | | — | | | | (29,652,882 | ) | | | 18,569,670 | |
SJW Group(1) | | | 566,988 | | | | 2,018,847 | | | | — | | | | 17,260,737 | | | | 13,132,396 | |
| | | | | | | $ | 15,588,627 | | | $ | — | | | $ | (12,446,242 | ) | | $ | 30,320,279 | |
(1) | Security is unaffiliated as of April 30, 2023. |
NUANCE MID CAP VALUE FUND
Report of Independent Registered Public Accounting Firm
To the Shareholders of Nuance Mid Cap Value Fund and
Board of Trustees of Managed Portfolio Series
Opinion on the Financial Statements
We have audited the accompanying statement of assets and liabilities, including the schedule of investments, of Nuance Mid Cap Value Fund (the “Fund”), a series of Managed Portfolio Series, as of April 30, 2023, the related statement of operations for the year then ended, the statements of changes in net assets for each of the two years in the period then ended, the related notes, and the financial highlights for each of the five years in the period then ended (collectively referred to as the “financial statements”). In our opinion, the financial statements present fairly, in all material respects, the financial position of the Fund as of April 30, 2023, the results of its operations for the year then ended, the changes in net assets for each of the two years in the period then ended, and the financial highlights for each of the five years in the period then ended, in conformity with accounting principles generally accepted in the United States of America.
Basis for Opinion
These financial statements are the responsibility of the Fund’s management. Our responsibility is to express an opinion on the Fund’s financial statements based on our audits. We are a public accounting firm registered with the Public Company Accounting Oversight Board (United States) (“PCAOB”) and are required to be independent with respect to the Fund in accordance with the U.S. federal securities laws and the applicable rules and regulations of the Securities and Exchange Commission and the PCAOB.
We conducted our audits in accordance with the standards of the PCAOB. Those standards require that we plan and perform the audit to obtain reasonable assurance about whether the financial statements are free of material misstatement whether due to error or fraud.
Our audits included performing procedures to assess the risks of material misstatement of the financial statements, whether due to error or fraud, and performing procedures that respond to those risks. Such procedures included examining, on a test basis, evidence regarding the amounts and disclosures in the financial statements. Our procedures included confirmation of securities owned as of April 30, 2023, by correspondence with the custodian and brokers; when replies were not received from brokers, we performed other auditing procedures. Our audits also included evaluating the accounting principles used and significant estimates made by management, as well as evaluating the overall presentation of the financial statements. We believe that our audits provide a reasonable basis for our opinion.
We have served as the auditor of one or more of Nuance Investments, LLC’s investment companies since 2011.

COHEN & COMPANY, LTD.
Milwaukee, Wisconsin
June 28, 2023
NUANCE MID CAP VALUE FUND
Additional Information (Unaudited)
April 30, 2023
TRUSTEES AND OFFICERS
| | | Term of | | | |
| | | Office | Number of | | Other |
| Name, | | and | Portfolios | Principal | Directorships |
| Address | Position(s) | Length | in Trust | Occupation(s) | Held by Trustee |
| and Year | Held with | of Time | Overseen | During the Past | During the Past |
| of Birth | the Trust | Served | by Trustee | Five Years | Five Years |
| Independent Trustees | | | | | |
| | | | | | |
Leonard M. Rush, CPA | Chairman, | Indefinite | 31 | Retired, Chief Financial | Independent Trustee, |
615 E. Michigan St. | Trustee and | Term; Since | | Officer, Robert W. Baird | ETF Series Solutions |
Milwaukee, WI 53202 | Audit | April 2011 | | & Co. Incorporated | (55 Portfolios) |
Year of Birth: 1946 | Committee | | | (2000-2011). | (2012-Present). |
| | Chairman | | | | |
| | | | | | |
David A. Massart | Trustee | Indefinite | 31 | Partner and Managing | Independent Trustee, |
615 E. Michigan St. | | Term; Since | | Director, Beacon Pointe | ETF Series Solutions |
Milwaukee, WI 53202 | | April 2011 | | Advisors, LLC | (56 Portfolios) |
Year of Birth: 1967 | | | | (since 2022); Co-Founder | (2012-Present). |
| | | | | and Chief Investment | |
| | | | | Strategist, Next Generation | |
| | | | | Wealth Management, Inc. | |
| | | | | (2005-2021). | |
NUANCE MID CAP VALUE FUND
Additional Information (Unaudited) – Continued
April 30, 2023
| | | Term of | | | |
| | | Office | Number of | | Other |
| Name, | | and | Portfolios | Principal | Directorships |
| Address | Position(s) | Length | in Trust | Occupation(s) | Held by Trustee |
| and Year | Held with | of Time | Overseen | During the Past | During the Past |
| of Birth | the Trust | Served | by Trustee | Five Years | Five Years |
| Independent Trustees | | | | | |
David M. Swanson | Trustee and | Indefinite | 31 | Founder and Managing | Independent Trustee, |
615 E. Michigan St. | Nominating | Term; Since | | Principal, SwanDog | ALPS Variable |
Milwaukee, WI 53202 | & Governance | April 2011 | | Strategic Marketing, LLC | Investment Trust |
Year of Birth: 1957 | Committee | | | (2006-Present) | (7 Portfolios) (2006- |
| | Chairman | | | | Present); Independent |
| | | | | | Trustee, RiverNorth |
| | | | | | Funds (3 Portfolios) |
| | | | | | (2018-Present); |
| | | | | | RiverNorth Managed |
| | | | | | Duration Municipal |
| | | | | | Income Fund Inc. |
| | | | | | (1 Portfolio) (2019- |
| | | | | | Present); RiverNorth |
| | | | | | Specialty Finance |
| | | | | | Corporation (1 Portfolio) |
| | | | | | (2018-Present); |
| | | | | | RiverNorth/DoubleLine |
| | | | | | Strategic Opportunity |
| | | | | | Fund, Inc. (1 Portfolio) |
| | | | | | (2018-Present); |
| | | | | | RiverNorth |
| | | | | | Opportunities Fund, Inc. |
| | | | | | (1 Portfolio) (2015- |
| | | | | | Present); RiverNorth |
| | | | | | Opportunistic |
| | | | | | Municipal Income |
| | | | | | Fund, Inc. (1 Portfolio) |
| | | | | | (2018-Present); |
| | | | | | RiverNorth Flexible |
| | | | | | Municipal Income |
| | | | | | Fund, Inc. (1 Portfolio) |
| | | | | | (2020-Present). |
| | | | | | RiverNorth Flexible |
| | | | | | Municipal Income |
| | | | | | Fund II, Inc. |
| | | | | | (1 Portfolio) (2021- |
| | | | | | Present); RiverNorth |
| | | | | | Managed Duration |
| | | | | | Income Fund II, Inc. |
| | | | | | (1 Portfolio) |
| | | | | | (2022-Present). |
NUANCE MID CAP VALUE FUND
Additional Information (Unaudited) – Continued
April 30, 2023
| | | Term of | | | |
| | | Office | Number of | | Other |
| Name, | | and | Portfolios | Principal | Directorships |
| Address | Position(s) | Length | in Trust | Occupation(s) | Held by Trustee |
| and Year | Held with | of Time | Overseen | During the Past | During the Past |
| of Birth | the Trust | Served | by Trustee | Five Years | Five Years |
| Independent Trustees | | | | | |
| | | | | | |
Robert J. Kern | Trustee | Indefinite | 31 | Retired (July 2018- | None |
615 E. Michigan St. | | Term; Since | | Present); Executive | |
Milwaukee, WI 53202 | | January 2011 | | Vice President, | |
Year of Birth: 1958 | | | | U.S. Bancorp Fund | |
| | | | | Services, LLC | |
| | | | | (1994-2018). | |
| | | | | | |
| Officers | | | | | |
| | | | | | |
Brian R. Wiedmeyer | President and | Indefinite | N/A | Vice President, | N/A |
615 E. Michigan St. | Principal | Term, Since | | U.S. Bancorp Fund | |
Milwaukee, WI 53202 | Executive | November | | Services, LLC (2005-Present). | |
Year of Birth: 1973 | Officer | 2018 | | | |
| | | | | | |
Deborah Ward | Vice President, | Indefinite | N/A | Senior Vice President, | N/A |
615 E. Michigan St. | Chief | Term; Since | | U.S. Bancorp Fund | |
Milwaukee, WI 53202 | Compliance | April 2013 | | Services, LLC (2004-Present). | |
Year of Birth: 1966 | Officer and | | | | |
| | Anti-Money | | | | |
| | Laundering | | | | |
| | Officer | | | | |
| | | | | | |
Benjamin Eirich | Treasurer, | Indefinite | N/A | Assistant Vice President, | N/A |
615 E. Michigan St. | Principal | Term; Since | | U.S. Bancorp Fund | |
Milwaukee, WI 53202 | Financial | August 2019 | | Services, LLC (2008-Present). | |
Year of Birth: 1981 | Officer and | (Treasurer); | | | |
| | Vice President | Since | | | |
| | | November | | | |
| | | 2018 (Vice | | | |
| | | President) | | | |
| | | | | | |
John Hadermayer | Secretary | Indefinite | N/A | Vice President, | N/A |
615 E. Michigan St. | | Term; Since | | U.S. Bancorp Fund | |
Milwaukee, WI 53202 | | May 2022 | | Services, LLC (2022-Present); | |
Year of Birth: 1977 | | | | Executive Director, AQR Capital | |
| | | | | Management, LLC (2013-Present). | |
NUANCE MID CAP VALUE FUND
Additional Information (Unaudited) – Continued
April 30, 2023
| | | Term of | | | |
| | | Office | Number of | | Other |
| Name, | | and | Portfolios | Principal | Directorships |
| Address | Position(s) | Length | in Trust | Occupation(s) | Held by Trustee |
| and Year | Held with | of Time | Overseen | During the Past | During the Past |
| of Birth | the Trust | Served | by Trustee | Five Years | Five Years |
| Officers | | | | | |
| | | | | | |
Douglas Schafer | Assistant | Indefinite | N/A | Assistant Vice President, | N/A |
615 E. Michigan St. | Treasurer | Term; Since | | U.S. Bancorp Fund | |
Milwaukee, WI 53202 | and Vice | May 2016 | | Services, LLC | |
Year of Birth: 1970 | President | (Assistant | | (2002-Present). | |
| | | Treasurer); | | | |
| | | Indefinite | | | |
| | | Term; Since | | �� | |
| | | November | | | |
| | | 2018 (Vice | | | |
| | | President) | | | |
| | | | | | |
Sara J. Bollech | Assistant | Indefinite | N/A | Officer, U.S. Bancorp | N/A |
615 E. Michigan St. | Treasurer | Term; Since | | Fund Services, LLC | |
Milwaukee, WI 53202 | and Vice | November | | (2007-Present). | |
Year of Birth: 1977 | President | 2021 | | | |
| | | | | | |
Peter A. Walker, CPA | Assistant | Indefinite | N/A | Officer, U.S. Bancorp | N/A |
615 E. Michigan St. | Treasurer | Term; Since | | Fund Services, LLC | |
Milwaukee, WI 53202 | and Vice | November | | (2016-Present). | |
Year of Birth: 1993 | President | 2021 | | | |
NUANCE MID CAP VALUE FUND
Additional Information (Unaudited) – Continued
April 30, 2023
AVAILABILITY OF FUND PORTFOLIO INFORMATION
The Fund files complete schedules of portfolio holdings with the U.S. Securities and Exchange Commission (the “SEC”) for the first and third quarters of each fiscal year on Part F of Form N-PORT. The Fund’s Part F of Form N-PORT is available on the SEC’s website at www.sec.gov and may be reviewed and copied at the SEC’s Public Reference Room in Washington, D.C. Information on the operation of the Public Reference Room may be obtained by calling 1-800-732-0330. The Fund’s Part F of Form N-PORT may also be obtained by calling 1-855-682-6233.
AVAILABILITY OF PROXY VOTING INFORMATION
A description of the Fund’s Proxy Voting Policies and Procedures is available without charge, upon request, by calling 1-855-682-6233. Information regarding how the Fund voted proxies relating to portfolio securities during the most recent 12 month period ended June 30, is available (1) without charge, upon request, by calling 1-888-621-9258, or (2) on the SEC’s website at www.sec.gov.
QUALIFIED DIVIDEND INCOME/DIVIDENDS RECEIVED DEDUCTION
For the fiscal year ended April 30, 2023, certain dividends paid by the Fund may be reported as qualified dividend income and may be eligible for taxation at capital gains rates. The percentage of dividends declared from ordinary income designated as qualified dividend income was 100.00% for the Fund.
For corporate shareholders, the percent of ordinary income distributions qualifying for the corporate dividends received deduction for the fiscal year ended April 30, 2023 was 91.84% for the Fund.
The percentage of taxable ordinary income distributions that are designated as short-term capital gain distributions under Internal Revenue Section 871 (k)(2)(c) was 0.00%.
NUANCE MID CAP VALUE FUND
Approval of Investment Advisory Agreement (Unaudited)
At the regular meeting of the Board of Trustees of Managed Portfolio Series (“Trust”) on February 23-24, 2023, the Trust’s Board of Trustees (“Board”), each of whom was present virtually via video conference, including all of the Trustees who are not “interested persons” of the Trust, as that term is defined in Section 2(a)(19) of the Investment Company Act of 1940, as amended, (“Independent Trustees”) considered and approved the continuation of the Investment Advisory Agreement between the Trust and Nuance Investments, LLC (“Nuance” or the “Adviser”) regarding the Nuance Mid Cap Value Fund (the “Fund”) (the “Investment Advisory Agreement”) for another annual term.
Prior to the meeting and at a meeting held on January 5, 2023, the Trustees received and considered information from Nuance and the Trust’s administrator designed to provide the Trustees with the information necessary to evaluate the continuance of the Investment Advisory Agreement (“Support Materials”). Before voting to approve the continuance of the Investment Advisory Agreement, the Trustees reviewed the Support Materials with Trust management and with counsel to the Independent Trustees and received a memorandum and advice from such counsel discussing the legal standards for the Trustees’ consideration of the renewal of the Investment Advisory Agreement. This information, together with the information provided to the Board throughout the course of the year, formed the primary (but not exclusive) basis for the Board’s determinations.
In determining whether to continue the Investment Advisory Agreement, the Trustees considered all factors they believed relevant including the following with respect to the Fund: (1) the nature, extent, and quality of the services provided by Nuance with respect to the Fund; (2) the Fund’s historical performance as managed by Nuance; (3) the costs of the services provided by Nuance and the profits realized by Nuance from services rendered to the Fund; (4) comparative fee and expense data for the Fund and other investment companies with similar investment objectives; (5) the extent to which economies of scale may be realized as the Fund grows, and whether the advisory fee for the Fund reflects such economies of scale for the Fund’s benefit; and (6) other benefits to Nuance resulting from its relationship with the Fund. In their deliberations, the Trustees weighed to varying degrees the importance of the information provided to them, and did not identify any particular information that was all-important or controlling.
Based upon the information provided to the Board throughout the course of the year, including a presentation to the Board by representatives from Nuance, and the Support Materials, the Board concluded that the overall arrangements between the Trust and Nuance as set forth in the Investment Advisory Agreement, as the agreement relates to the Fund, continue to be fair and reasonable in light of the services that Nuance performs, the investment advisory fees that the Fund pays Nuance for such services, and such other matters as the Trustees considered relevant in the exercise of their reasonable business judgment. The material factors and conclusions that formed the basis of the Trustees’ determination to approve the continuation of the Investment Advisory Agreement, as it relates to the Fund, are summarized below.
Nature, Extent and Quality of Services Provided. The Trustees considered the scope of services that Nuance provides under the Investment Advisory Agreement with respect to the Fund, noting that such services include, but are not limited to, the following: (1) investing the Fund’s assets consistent with the Fund’s investment objective and investment policies; (2) determining the portfolio securities to be purchased, sold, or otherwise disposed of, and the timing of such transactions; (3) voting all proxies, if any, with respect to the Fund’s portfolio securities; (4) maintaining the required books and records for transactions that Nuance effected on behalf of the Fund; (5) selecting broker-dealers to execute orders on behalf of the Fund; and (6) monitoring and maintaining the Fund’s compliance with policies and procedures of the Trust and with applicable securities laws. The Trustees
NUANCE MID CAP VALUE FUND
Approval of Investment Advisory Agreement (Unaudited) – Continued
reviewed Nuance’s financial statements, assets under management and capitalization. In that regard, the Trustees concluded that Nuance had sufficient resources to support the management of the Fund. The Trustees considered the experience of the Fund’s portfolio managers, one of whom has managed the Fund since its inception date. The Trustees concluded that they were satisfied with the nature, extent and quality of services that Nuance provides to the Fund under the Investment Advisory Agreement.
Fund Historical Performance and the Overall Performance of Nuance. In assessing the quality of the portfolio management delivered by Nuance, the Trustees reviewed the short-term and longer-term performance of the Fund on both an absolute basis and in comparison to an appropriate securities benchmark index, the Fund’s Morningstar category (“Category”) as well as a smaller sub-set of peer funds (“Cohort”), and the composite of separate accounts that Nuance manages utilizing investment strategies similar to those of the Fund. When reviewing the Fund’s performance against its Category and Cohort, the Trustees took into account that the investment objective and strategies of the Fund, as well as the Fund’s level of risk tolerance, may differ significantly from funds in its Category and Cohort.
The Trustees considered that the Fund outperformed the Cohort averages over the year-to-date and one-year periods ended September 30, 2022, but underperformed for the three-year and five-year periods ended September 30, 2022. The Trustees also considered that the Fund outperformed the Category averages over the year-to-date and five-year periods ended September 30, 2022, but underperformed for the one-year and thee-year periods ended September 30, 2022. The Trustees also considered that the Fund had outperformed its primary benchmark for the year-to-date period ended September 30, 2022, but had underperformed this index for all other periods presented as of December 31, 2021. The Trustees then observed that the Fund’s performance was consistent with the performance of a composite of similar accounts managed by Nuance over all time periods presented.
Comparative Fee and Expense Data. The Trustees considered a comparative analysis of the contractual expenses borne by the Fund and those of funds in the same Category and Cohort. The Trustee’s noted that while the Fund’s advisory fee was higher than the Category and Cohort averages, its total expenses for Z Class (after waivers and expense reimbursements) were below the Cohort average and its total expenses for Institutional Class and Class Z (after waivers and expense reimbursements) were below the Category average. The Trustees took into account that the Fund’s Investor Class has a 12b-1 fee and shareholder servicing fee and the Fund’s Institutional Class has a shareholder servicing fee, which is not necessarily the case for the funds included in the Category and Cohort.
While recognizing that it is difficult to compare advisory fees because the scope of advisory services provided may vary from one investment adviser to another, the Trustees concluded that Nuance’s advisory fee with respect to the Fund continues to be reasonable.
Cost of Advisory Services and Profitability. The Trustees considered the annual advisory fee that the Fund pays to Nuance under the Investment Advisory Agreement, as well as Nuance’s profitability from services that Nuance rendered to the Fund under the Investment Advisory Agreement during the 12-month period ended September 30, 2022. The Trustees also noted favorably that Nuance had agreed to continue the expense limitation agreement under which Nuance contractually agreed to reduce its advisory fees and, if necessary, reimburse the Fund for operating expenses, as specified in the Fund’s prospectus, and noted that Nuance had waived a portion of its advisory fee during its most recent fiscal year. The Trustees also considered the management fees Nuance charges to separately managed accounts with investment strategies similar to those of the Fund. They observed that
NUANCE MID CAP VALUE FUND
Approval of Investment Advisory Agreement (Unaudited) – Continued
Nuance charges management fees that range above, at or below the management fee charged to the Fund, depending on assets under management. The Trustees considered the reasonableness of Nuance’s profits from its service relationship with the Fund.
Economies of Scale. The Trustees then considered whether the Fund may benefit from any economies of scale, noting that the investment advisory fee for the Fund in the Investment Advisory Agreement does not contain breakpoints. The Trustees additionally took into account that Nuance continues to express reservations about adopting breakpoints for the Fund because of concerns about potential capacity constraints associated with the strategy. The Trustees also considered that Nuance has agreed to consider breakpoints in the future should circumstances change.
Other Benefits. The Trustees considered the direct and indirect benefits that could be realized by Nuance from its relationship with the Fund. The Trustees considered that Nuance does not utilize soft dollar arrangements with respect to portfolio transactions, and that Nuance does not use affiliated brokers to execute the Fund’s portfolio transactions. While the Trustees noted that the Fund utilizes Rule 12b-1 fees to pay for shareholder and distribution services related to Investor Class shareholders of the Fund, the Trustees also observed that the Nuance was incurring its own distribution expenses on behalf of the Fund. The Trustees considered that Nuance may receive some form of reputational benefit from services rendered to the Fund, but that such benefits are immaterial and cannot otherwise be quantified. The Trustees concluded that Nuance does not receive additional material benefits from its relationship with the Fund.
NUANCE MID CAP VALUE FUND
Privacy Notice (Unaudited)
The Fund collects only relevant information about you that the law allows or requires it to have in order to conduct its business and properly service you. The Fund collects financial and personal information about you (“Personal Information”) directly (e.g., information on account applications and other forms, such as your name, address, and social security number, and information provided to access account information or conduct account transactions online, such as password, account number, e-mail address, and alternate telephone number), and indirectly (e.g., information about your transactions with us, such as transaction amounts, account balance and account holdings).
The Fund does not disclose any non-public personal information about its shareholders or former shareholders other than for everyday business purposes such as to process a transaction, service an account, respond to court orders and legal investigations or as otherwise permitted by law. Third parties that may receive this information include companies that provide transfer agency, technology and administrative services to the Fund, as well as the Fund’s investment adviser who is an affiliate of the Fund. If you maintain a retirement/educational custodial account directly with the Fund, we may also disclose your Personal Information to the custodian for that account for shareholder servicing purposes. The Fund limits access to your Personal Information provided to unaffiliated third parties to information necessary to carry out their assigned responsibilities to the Fund. All shareholder records will be disposed of in accordance with applicable law. The Fund maintains physical, electronic and procedural safeguards to protect your Personal Information and requires its third party service providers with access to such information to treat your Personal Information with the same high degree of confidentiality.
In the event that you hold shares of the Fund through a financial intermediary, including, but not limited to, a broker-dealer, credit union, bank or trust company, the privacy policy of your financial intermediary governs how your non-public personal information is shared with unaffiliated third parties.
INVESTMENT ADVISER
Nuance Investments, LLC
4900 Main Street, Suite 220
Kansas City, MO 64112
DISTRIBUTOR
Quasar Distributors, LLC
111 East Kilbourn Avenue, Suite 2200
Milwaukee, WI 53202
CUSTODIAN
U.S. Bank, N.A.
1555 North Rivercenter Drive
Milwaukee, WI 53212
ADMINISTRATOR, FUND ACCOUNTANT
AND TRANSFER AGENT
U.S. Bancorp Fund Services, LLC
615 East Michigan Street
Milwaukee, WI 53202
INDEPENDENT REGISTERED PUBLIC ACCOUNTING FIRM
Cohen & Company, Ltd.
342 North Water Street, Suite 830
Milwaukee, WI 53202
LEGAL COUNSEL
Stradley Ronon Stevens & Young, LLP
2005 Market Street, Suite 2600
Philadelphia, PA 19103
This report must be accompanied or preceded by a prospectus.
The Fund’s Statement of Additional Information contains additional information about the
Fund’s trustees and is available without charge upon request by calling 1-855-682-6233.
Nuance Concentrated Value Long-Short Fund
Investor Class Shares – NCLIX
Institutional Class Shares – NCLSX
Annual Report
| www.nuanceinvestments.com | April 30, 2023 |
NUANCE CONCENTRATED VALUE LONG-SHORT FUND
April 30, 2023
Dear Fellow Shareholders:
We are pleased to write our annual shareholder letter for the Nuance Concentrated Value Long-Short Fund (the “Fund”). The Fund seeks long-term capital appreciation by taking long positions in securities priced below, and short positions in securities priced above, our internal view of their estimated intrinsic value. The Fund will typically maintain 15-35 long positions and up to 50 short positions. The primary benchmark for the Fund is the S&P 500® Index.
Average Annual Rates of Return as of April 30, 2023:
| | 6 Months | 1 Year | 3 Year | 5 Year | Since Inception(1) |
| Institutional Class | 13.69% | 6.47% | -1.36% | 2.34% | 3.87% |
S&P 500® Index(2) | 8.63% | 2.66% | 14.52% | 11.45% | 12.27% |
| | | | | | |
| | 6 Months | 1 Year | 3 Year | 5 Year | Since Inception(1) |
| Investor Class | 13.51% | 6.17% | -1.60% | 2.08% | 3.58% |
S&P 500® Index(2) | 8.63% | 2.66% | 14.52% | 11.45% | 12.27% |
Performance data quoted represents past performance. Past performance does not guarantee future results. The investment return and principal value of an investment will fluctuate so that an investor’s shares, when redeemed, may be worth more or less than their original cost. Current performance of the Fund may be lower or higher than the performance quoted. Short term performance, in particular, is not a good indication of the Fund’s future performance, and an investment should not be made solely based on returns. Performance data current to the most recent month end may be obtained by calling 1-855-682-6233.
The Adviser has contractually agreed to reduce its management fees, and may reimburse the Fund for its operating expenses, in order to ensure that Total Annual Fund Operating Expenses (excluding acquired fund fees and expenses, leverage/borrowing interest, interest expense, dividend paid on short sales, taxes, brokerage commissions, and extraordinary expenses) do not exceed 1.55% of the average daily net assets of the Investor Class and 1.30% of the average daily net assets of the Institutional Class through at least August 28, 2023.
| Institutional Class Gross Expense Ratio – 3.32% | Net Expense Ratio – 3.33% |
| Investor Class Gross Expense Ratio – 3.57 % | Net Expense Ratio – 3.58% |
| (1) | December 31, 2015 |
| (2) | The Standard & Poor’s 500® Index (S&P 500) is an unmanaged, capitalization-weighted index generally representative of the U.S. Market for large capitalization stocks. This Index cannot be invested in directly. |
In terms of performance, since its inception on December 31, 2015 through April 30, 2023, the Institutional Class is up 3.87 percent (annualized) versus its primary index –the S&P 500® Index – up 12.27 percent (annualized). Nuance Concentrated Value Long Short Fund outperformed the benchmark over the 1-year period. Nuance cautions clients regarding the use of short-term performance as a tool to make investment decisions. As we remind our clients, your team continues to try and find leading business franchises with sustainable competitive positions that are trading below our internally derived view of fair or intrinsic value. We believe that our time-tested process of finding what we consider best of breed businesses with better than the market downside support and better than the market upside potential over the long-term should lead to solid risk adjusted returns versus our peers and benchmarks.
At Nuance, our team and our processes are designed to emphasize consistency and what we believe is thorough fundamental analysis of companies that have the potential to lead to investment returns that will be acceptable for
NUANCE CONCENTRATED VALUE LONG-SHORT FUND
our shareholders over the long-term. To do this, we focus our attention on studying one company at a time using the Nuance approach.
Nuance employs a bottom-up stock selection process that emphasizes one stock at a time valuation and fundamental work. Sector/industry weightings are a fallout primarily of the emphasis of the team to optimize the risk reward profile of the portfolio. We would note that often specific events will result in an entire industry or sector being out of favor and thus showing positively skewed risk rewards. During those periods, we are likely to be overweight those areas. The reverse is also true and certain sectors or industries can become overvalued at the same time. During those periods we would be underweight. Those decisions are made as a direct result of the time-tested process of studying valuations for leading business franchises one stock at a time as opposed to a top-down view of a space.
The Investment Team believed the opportunity set was healthy for both sides of the Fund’s investment portfolio at the end of April. As of April 30, 2023, the median company in the Nuance proprietary long universe, which consists of companies we view as sub-industry leaders, was trading at around a 20 percent premium to what we would consider fair value. Said another way, our long universe appeared to be overvalued by roughly 20 percent on average, based on our internal estimates. From a downside perspective, according to our company-by-company valuation work, the same universe had more than 60 percent downside potential. This implies that if our list of leading companies were all to trade down to their historic trough valuation multiples, the average stock in our long universe could decline by more than 60 percent.
On the long side of the portfolio, the Investment Team continued to find what we consider to be attractive value investments during a volatile quarter. As of April 30, 2023, the Investment Team believed the long side of the portfolio was invested in a compelling set of long investment ideas with transitory under-earnings and depressed valuations. Sub-industries that we believed were under-earning and undervalued included Household Products, Health Care Equipment, Health Care Supplies, and Industrial Conglomerates. On the short side of the portfolio, the Investment Team believed that over-earning and overvaluation remained widespread, and that abundant short investment opportunities could be found across the majority of the economy including the Automotive Retail, Oil & Gas Refining & Marketing, Environmental & Facilities Services, and Industrial Machinery & Supplies & Components sub-industries.
Thank you for your interest and your continued support.
Chad Baumler, CFA
Please visit our website at www.nuanceinvestments.com for more information about our team, our process, and value investing. You can also get real-time access to the Nuance Investment website updates and information via e-mail. Simply contact us at client.services@nuanceinvestments.com or call 816-743-7080 to sign-up.
This report should be preceded or accompanied by a prospectus.
Mutual fund investing involves risk. Principal loss is possible. Investments in small and mid-capitalization companies involve additional risk such as limited liquidity and greater volatility than larger capitalization companies. Investments in foreign securities involve political, economic and currency risks, greater volatility and differences in accounting methods. The Fund is non-diversified, meaning it may concentrate its assets in fewer individual holdings than a diversified fund. Therefore, the Fund is more exposed to individual stock volatility than a diversified fund. Short sale of securities involves unlimited risk including the possibility that losses may exceed the original amount invested. However, a mutual fund investor’s risk is limited to one’s amount of investment in a mutual fund.
Past performance does not guarantee future results.
Opinions expressed are subject to change, are not guaranteed and should not be considered investment advice or recommendations to buy or sell any security.
Nuance Investments is the adviser to the Nuance Concentrated Value Long-Short Fund which is distributed by Quasar Distributors, LLC.
NUANCE CONCENTRATED VALUE LONG-SHORT FUND
Value of $10,000 Investment (Unaudited)
The chart assumes an initial investment of $10,000. Performance reflects waivers of fee and operating expenses in effect. In the absence of such waivers, total return would be reduced. Performance data quoted represents past performance and does not guarantee future results. Investment returns and principal value will fluctuate, and when sold, may be worth more or less than their original cost. Performance current to the most recent month-end may be lower or higher than the performance quoted and can be obtained by calling 1-855-682-6233. Performance assumes the reinvestment of capital gains and income distributions. The performance does not reflect the deduction of taxes that a shareholder would pay on Fund distributions or the redemption of Fund shares.
Average Annual Rates of Return (%) As of April 30, 2023
| | | | | Since |
| | 1 Year | 3 Year | 5 Year | Inception(1) |
| Investor Class | 6.17% | -1.60% | 2.08% | 3.58% |
| Institutional Class | 6.47% | -1.36% | 2.34% | 3.87% |
S&P 500 Index(2) | 2.66% | 14.52% | 11.45% | 12.27% |
| (1) | December 31, 2015. |
| (2) | The Standard & Poor’s 500 Index (S&P 500) is an unmanaged, capitalization-weighted index generally representative of the U.S. market for large capitalization stocks. This Index cannot be invested in directly. |
The following is expense information for the Nuance Concentrated Value Long-Short Fund as disclosed in the Fund’s most recent prospectus dated August 28, 2022:
| Institutional Class Gross Expense Ratio – 3.32% | Net Expense Ratio – 3.33% |
| Investor Class Gross Expense Ratio – 3.57% | Net Expense Ratio – 3.58% |
Nuance Investments, LLC (the “Adviser”) has contractually agreed to waive its management fees and pay Fund expenses, in order to ensure that Total Annual Fund Operating Expenses (excluding acquired fund fees and expenses, leverage/borrowing interest, interest expense, dividends paid on short sales, taxes, brokerage commissions and extraordinary expenses) do not exceed 1.55% of the average daily net assets of the Investor Class and 1.30% of the average daily net assets of the Institutional Class. Fees waived and expenses paid by the Adviser may be recouped by the Adviser for a period of 36 months following the month during which such fee
NUANCE CONCENTRATED VALUE LONG-SHORT FUND
waiver and/or expense payment was made if such recoupment can be achieved without exceeding the expense limit in effect at the time the fee waiver and/or expense payment occurred and the expense limit in place at the time of recoupment. The Operating Expenses Limitation Agreement is indefinite but cannot be terminated through at least August 28, 2023. Thereafter, the agreement may be terminated at any time upon 60 days’ written notice by the Trust’s Board of Trustees (the “Board”) or the Adviser, with consent of the Board.
NUANCE CONCENTRATED VALUE LONG-SHORT FUND
Expense Example (Unaudited)
April 30, 2023
As a shareholder of the Fund, you incur two types of costs: (1) transaction costs and (2) ongoing costs, including management fees, distribution and service (12b-1) fees, shareholder servicing fees, and other Fund expenses. This Example is intended to help you understand your ongoing costs (in dollars) of investing in the Fund and to compare these costs with the ongoing costs of investing in other mutual funds. The Example is based on an investment of $1,000 invested at the beginning of the period and held for the entire period (November 1, 2022 – April 30, 2023).
ACTUAL EXPENSES
For each class, the first line of the table below provides information about actual account values and actual expenses. You may use the information in this line, together with the amount you invested, to estimate the expenses that you paid over the period. Simply divide your account value by $1,000 (for example, an $8,600 account value divided by $1,000 = 8.6), then multiply the result by the number in the first line under the heading entitled “Expenses Paid During Period” to estimate the expenses you paid on your account during this period.
HYPOTHETICAL EXAMPLE FOR COMPARISON PURPOSES
For each class, the second line of the table below provides information about hypothetical account values and hypothetical expenses based on the Fund’s actual expense ratio and an assumed rate of return of 5% per year before expenses, which is not the Fund’s actual return. The hypothetical account values and expenses may not be used to estimate the actual ending account balance or expenses you paid for the period. You may use this information to compare the ongoing costs of investing in the Fund and other funds. To do so, compare this 5% hypothetical example with the 5% hypothetical examples that appear in the shareholder reports of the other funds.
Please note that the expenses shown in the table are meant to highlight your ongoing costs only and do not reflect any transactional costs. Therefore, the second line of the table is useful in comparing ongoing costs only, and will not help you determine the relative total costs of owning different funds. In addition, if transactional costs were included, your costs may have been higher.
| | | | Expenses Paid |
| | Beginning Account | Ending Account | During Period(1) |
| | Value (11/1/22) | Value (4/30/23) | (11/1/22 to 4/30/23) |
Investor Class | | | |
Actual(2)(3) | $1,000.00 | $1,135.10 | $17.26 |
Hypothetical(4) (5% return before expenses) | $1,000.00 | $1,008.63 | $16.24 |
| | | | |
Institutional Class | | | |
Actual(2)(3) | $1,000.00 | $1,136.90 | $15.74 |
Hypothetical(4) (5% return before expenses) | $1,000.00 | $1,010.07 | $14.80 |
| (1) | Expenses are equal to the Fund’s annualized expense ratio for the six-month period of 3.26% and 2.97% for the Investor Class and Institutional Class, respectively, multiplied by the average account value over the period, multiplied by 181/365 to reflect the one-half year period. |
| (2) | Based on the actual returns for the six-month period of 13.51% and 13.69% for the Investor Class and Institutional Class, respectively. |
| (3) | Excluding dividends and interest on short positions, the actual expenses would be $8.21 and $6.83 for the Investor Class and Institutional Class, respectively. |
| (4) | Excluding dividends and interest on short positions, the hypothetical expenses would be $7.75 and $6.46 for the Investor Class and Institutional Class, respectively. |
NUANCE CONCENTRATED VALUE LONG-SHORT FUND
Allocation of Portfolio(1)(2) (% of Net Assets) (Unaudited)
April 30, 2023
Top Ten Long Positions(1)(2) (Unaudited)
as of April 30, 2023 (% of Net Assets)
| | Henkel AG & Co. KGaA – ADR | | | 8.5 | % |
| | Smith & Nephew – ADR | | | 7.5 | % |
| | Kimberly-Clark Corp. | | | 7.4 | % |
| | Dentsply Sirona, Inc. | | | 7.0 | % |
| | 3M Co. | | | 6.5 | % |
| | Clorox Co. | | | 4.5 | % |
| | Northern Trust Corp. | | | 4.5 | % |
| | Universal Health Services, Inc. – Class B | | | 4.3 | % |
| | Knorr-Bremse AG – ADR | | | 4.1 | % |
| | Medtronic PLC | | | 4.0 | % |
Top Five Short Positions(2) (Unaudited)
as of April 30, 2023 (% of Net Assets)
| | O’Reilly Automotive, Inc. | | | -4.4 | % |
| | Mondelez International, Inc. – Class A | | | -4.1 | % |
| | AutoZone, Inc. | | | -3.9 | % |
| | General Mills, Inc. | | | -3.8 | % |
| | Cintas Corp. | | | -3.8 | % |
| (1) | Excludes short positions. |
| (2) | Fund holdings and sector allocations are subject to change at any time and are not recommendations to buy or sell any security. |
ADR – American Depository Receipt
NUANCE CONCENTRATED VALUE LONG-SHORT FUND
Schedule of Investments
April 30, 2023
| | | Shares | | | Value | |
| COMMON STOCKS – 90.6% | | | | | | |
| | | | | | | |
Consumer Staples# – 26.8% | | | | | | |
Beiersdorf AG – ADR (a) | | | 151,405 | | | $ | 4,212,087 | |
Calavo Growers, Inc. (a) | | | 73,926 | | | | 2,362,675 | |
Cal-Maine Foods, Inc. (a) | | | 16,712 | | | | 793,820 | |
Clorox Co. (a) | | | 45,093 | | | | 7,468,303 | |
Diageo PLC – ADR (a) | | | 4,360 | | | | 808,780 | |
Henkel AG & Co. KGaA – ADR (a) | | | 764,636 | | | | 14,107,534 | |
Kimberly-Clark Corp. (a) | | | 85,523 | | | | 12,391,428 | |
Mission Produce, Inc. (a)* | | | 223,414 | | | | 2,544,685 | |
| | | | | | | | 44,689,312 | |
| | | | | | | | | |
| Financials – 13.9% | | | | | | | | |
Charles Schwab Corp. (a) | | | 46,891 | | | | 2,449,586 | |
Chubb Ltd. – ADR (a) | | | 10,258 | | | | 2,067,602 | |
Independent Bank Corp. (a) | | | 14,788 | | | | 828,128 | |
Northern Trust Corp. (a) | | | 95,311 | | | | 7,449,508 | |
Reinsurance Group of America, Inc. (a) | | | 26,077 | | | | 3,711,279 | |
Travelers Companies, Inc. (a) | | | 36,364 | | | | 6,586,975 | |
| | | | | | | | 23,093,078 | |
| | | | | | | | | |
Healthcare+ – 28.3% | | | | | | | | |
Dentsply Sirona, Inc. (a) | | | 277,788 | | | | 11,647,651 | |
Globus Medical, Inc. – Class A (a)* | | | 64,016 | | | | 3,721,890 | |
ICU Medical, Inc. (a)* | | | 11,465 | | | | 2,168,490 | |
Medtronic PLC �� ADR (a) | | | 73,006 | | | | 6,639,895 | |
Smith & Nephew – ADR (a) | | | 379,854 | | | | 12,421,226 | |
Universal Health Services, Inc. – Class B (a) | | | 47,205 | | | | 7,097,272 | |
Zimmer Biomet Holdings, Inc. (a) | | | 24,018 | | | | 3,325,052 | |
| | | | | | | | 47,021,476 | |
| | | | | | | | | |
| Industrials – 14.0% | | | | | | | | |
3M Co. (a) | | | 101,492 | | | | 10,780,480 | |
Knorr-Bremse AG – ADR (a) | | | 388,525 | | | | 6,764,221 | |
Mueller Water Products, Inc. – Class A (a) | | | 433,345 | | | | 5,806,823 | |
| | | | | | | | 23,351,524 | |
| | | | | | | | | |
| Information Technology – 1.0% | | | | | | | | |
Amphenol Corp. – Class A (a) | | | 21,669 | | | | 1,635,359 | |
| | | | | | | | | |
| Materials – 1.4% | | | | | | | | |
AptarGroup, Inc. (a) | | | 20,295 | | | | 2,405,161 | |
See Notes to the Financial Statements
NUANCE CONCENTRATED VALUE LONG-SHORT FUND
Schedule of Investments – Continued
April 30, 2023
| | | Shares | | | Value | |
| | | | | | | |
| Real Estate – 4.0% | | | | | | |
Equity Commonwealth (a) | | | 38,353 | | | $ | 794,674 | |
Healthcare Realty Trust, Inc. (a) | | | 295,097 | | | | 5,837,019 | |
| | | | | | | | 6,631,693 | |
| | | | | | | | | |
| Utilities – 1.2% | | | | | | | | |
United Utilities Group PLC – ADR (a) | | | 76,736 | | | | 2,064,198 | |
| Total Common Stocks | | | | | | | | |
| (Cost $132,437,630) | | | | | | | 150,891,801 | |
| | | | | | | | | |
| SHORT-TERM INVESTMENT – 9.2% | | | | | | | | |
First American Government Obligations Fund, Class X, 4.73% (a)^ | | | | | | | | |
| (Cost $15,310,784) | | | 15,310,784 | | | | 15,310,784 | |
| Total Investments – 99.8% | | | | | | | | |
| (Cost $147,748,414) | | | | | | | 166,202,585 | |
| Other Assets and Liabilities, Net – 0.2% | | | | | | | 333,515 | |
| Total Net Assets – 100.0% | | | | | | $ | 166,536,100 | |
| # | The Fund is significantly invested in this sector and therefore is subject to additional risks. Changes in domestic and international economies, interest rates, competition, consumer confidence, consumer spending, government regulation, marketing, and supply and demand may affect companies in this sector. |
| (a) | All or a portion of this security is designated as collateral for securities sold short. As of April 30, 2023, the value of the collateral was $166,202,585. |
| * | Non-income producing security |
| + | The Fund is significantly invested in this sector and therefore is subject to additional risks. Companies in this sector are subject to litigation, intellectual property issues, competition, government regulation, product approval or rejection, and product obsolescence. |
| ^ | The rate shown is the annualized seven day effective yield as of April 30, 2023. |
ADR – American Depository Receipt
See Notes to the Financial Statements
NUANCE CONCENTRATED VALUE LONG-SHORT FUND
Schedule of Securities Sold Short
April 30, 2023
| | | Shares | | | Value | |
| COMMON STOCKS – 86.5% | | | | | | |
| | | | | | | |
| Consumer Discretionary – 17.6% | | | | | | |
AutoZone, Inc. * | | | 2,464 | | | $ | 6,562,396 | |
D.R. Horton, Inc. | | | 14,559 | | | | 1,598,869 | |
Dollar General Corp. | | | 11,640 | | | | 2,577,794 | |
Home Depot, Inc. | | | 15,645 | | | | 4,701,948 | |
Lennar Corp. – Class A | | | 11,292 | | | | 1,273,851 | |
Lowe's Companies, Inc. | | | 6,010 | | | | 1,249,058 | |
McDonald's Corp. | | | 4,770 | | | | 1,410,728 | |
O'Reilly Automotive, Inc. * | | | 7,904 | | | | 7,250,418 | |
TJX Companies, Inc. | | | 14,768 | | | | 1,164,014 | |
Yum Brands, Inc. | | | 10,389 | | | | 1,460,486 | |
| | | | | | | | 29,249,562 | |
| | | | | | | | | |
| Consumer Staples – 13.5% | | | | | | | | |
Coca-Cola Co. | | | 49,449 | | | | 3,172,153 | |
Costco Wholesale Corp. | | | 5,820 | | | | 2,928,741 | |
General Mills, Inc. | | | 71,713 | | | | 6,355,923 | |
Mondelez International, Inc. – Class A | | | 88,851 | | | | 6,816,649 | |
PepsiCo, Inc. | | | 16,634 | | | | 3,175,264 | |
| | | | | | | | 22,448,730 | |
| | | | | | | | | |
| Energy – 9.4% | | | | | | | | |
Canadian Natural Resources Ltd. | | | 52,227 | | | | 3,184,280 | |
Chevron Corp. | | | 17,124 | | | | 2,886,764 | |
ConocoPhillips | | | 23,980 | | | | 2,467,303 | |
Marathon Petroleum Corp. | | | 26,639 | | | | 3,249,958 | |
Phillips 66 | | | 11,441 | | | | 1,132,659 | |
Valero Energy Corp. | | | 24,245 | | | | 2,780,174 | |
| | | | | | | | 15,701,138 | |
| | | | | | | | | |
| Financials – 7.9% | | | | | | | | |
Allstate Corp. | | | 10,339 | | | | 1,196,843 | |
Arch Capital Group Ltd. * | | | 17,269 | | | | 1,296,384 | |
JPMorgan Chase & Co. | | | 8,711 | | | | 1,204,209 | |
Marsh & McLennan Companies, Inc. | | | 19,266 | | | | 3,471,540 | |
Progressive Corp. | | | 43,521 | | | | 5,936,264 | |
| | | | | | | | 13,105,240 | |
| | | | | | | | | |
| Healthcare – 1.8% | | | | | | | | |
HCA Healthcare, Inc. | | | 10,740 | | | | 3,085,924 | |
See Notes to the Financial Statements
NUANCE CONCENTRATED VALUE LONG-SHORT FUND
Schedule of Securities Sold Short – Continued
April 30, 2023
| | | Shares | | | Value | |
| | | | | | | |
| Industrials – 27.8% | | | | | | |
Carrier Global Corp. | | | 24,484 | | | $ | 1,023,921 | |
Caterpillar, Inc. | | | 11,268 | | | | 2,465,438 | |
Cintas Corp. | | | 13,926 | | | | 6,347,053 | |
CSX Corp. | | | 83,609 | | | | 2,561,780 | |
Cummins, Inc. | | | 11,406 | | | | 2,680,866 | |
Deere & Co. | | | 14,411 | | | | 5,447,646 | |
Eaton Corporation PLC | | | 15,304 | | | | 2,557,604 | |
Ferguson PLC | | | 8,917 | | | | 1,255,692 | |
Illinois Tool Works, Inc. | | | 12,381 | | | | 2,995,459 | |
Norfolk Southern Corp. | | | 5,353 | | | | 1,086,820 | |
Otis Worldwide Corp. | | | 16,116 | | | | 1,374,695 | |
Parker-Hannifin Corp. | | | 3,523 | | | | 1,144,552 | |
Republic Services, Inc. | | | 22,828 | | | | 3,301,385 | |
Trane Technologies | | | 16,712 | | | | 3,105,257 | |
Union Pacific Corp. | | | 13,901 | | | | 2,720,426 | |
Waste Management, Inc. | | | 37,930 | | | | 6,298,277 | |
| | | | | | | | 46,366,871 | |
| | | | | | | | | |
| Information Technology – 3.4% | | | | | | | | |
Automatic Data Processing, Inc. | | | 12,666 | | | | 2,786,520 | |
Paychex, Inc. | | | 26,282 | | | | 2,887,341 | |
| | | | | | | | 5,673,861 | |
| | | | | | | | | |
| Materials – 2.2% | | | | | | | | |
Avery Dennison Corp. | | | 6,660 | | | | 1,162,037 | |
Sherwin-Williams Co. | | | 10,540 | | | | 2,503,671 | |
| | | | | | | | 3,665,708 | |
| | | | | | | | | |
| Real Estate – 2.9% | | | | | | | | |
Prologis, Inc. | | | 20,611 | | | | 2,581,528 | |
Public Storage | | | 4,190 | | | | 1,235,337 | |
Weyerhaeuser Co. | | | 33,100 | | | | 990,021 | |
| | | | | | | | 4,806,886 | |
| | | | | | | | | |
| Total Securities Sold Short | | | | | | | | |
| (Proceeds $133,322,713) | | | | | | $ | 144,103,920 | |
| * | Non-income producing security |
See Notes to the Financial Statements
NUANCE CONCENTRATED VALUE LONG-SHORT FUND
Statement of Assets and Liabilities
April 30, 2023
| ASSETS: | | | |
Investments, at value | | | |
(cost $147,748,414) | | $ | 166,202,585 | |
Cash(1) | | | 827,975 | |
Deposits at broker(1) | | | 139,861,124 | |
Receivable for investment securities sold | | | 3,982,642 | |
Receivable for capital shares sold | | | 164,193 | |
Dividends & interest receivable | | | 927,889 | |
Prepaid expenses | | | 22,368 | |
Total assets | | | 311,988,776 | |
| | | | | |
| LIABILITIES: | | | | |
Securities sold short, at value (proceeds $133,322,713) | | | 144,103,920 | |
Dividends payable | | | 77,442 | |
Payable for investment securities purchased | | | 1,000,197 | |
Payable for capital shares redeemed | | | 66,513 | |
Payable to investment adviser | | | 134,124 | |
Payable for fund services fees | | | 11,882 | |
Payable for trustee fees | | | 4,531 | |
Accrued distribution & shareholder service fees | | | 16,179 | |
Accrued expenses | | | 37,888 | |
Total liabilities | | | 145,452,676 | |
| | | | | |
| NET ASSETS | | $ | 166,536,100 | |
| | | | | |
| NET ASSETS CONSIST OF: | | | | |
Paid-in capital | | $ | 174,580,964 | |
Total accumulated loss | | | (8,044,864 | ) |
Net Assets | | $ | 166,536,100 | |
| | | Investor | | | Institutional | |
| | | Class | | | Class | |
Net Assets | | $ | 3,477,807 | | | $ | 163,058,293 | |
Shares issued and outstanding(2) | | | 350,911 | | | | 16,098,096 | |
Net asset value, redemption price and offering price per share | | $ | 9.91 | | | $ | 10.13 | |
| (1) | Pledged as collateral for securities sold short. |
| (2) | Unlimited shares authorized with no par value. |
See Notes to the Financial Statements
NUANCE CONCENTRATED VALUE LONG-SHORT FUND
Statement of Operations
For the Year Ended April 30, 2023
| INVESTMENT INCOME: | | | |
Dividend income | | $ | 3,164,805 | |
Less: Foreign taxes withheld | | | (67,830 | ) |
Broker interest income on short positions | | | 3,574,469 | |
Interest income | | | 356,185 | |
Total investment income | | | 7,027,629 | |
| | | | | |
| EXPENSES: | | | | |
Dividends on short positions | | | 2,501,342 | |
Investment adviser fees (See Note 4) | | | 1,417,602 | |
Broker interest expense on short positions | | | 261,567 | |
Fund services fees (See Note 4) | | | 82,904 | |
Federal & state registration fees | | | 43,204 | |
Audit fees | | | 18,800 | |
Trustee fees | | | 18,496 | |
Postage & printing fees | | | 12,879 | |
Legal fees | | | 9,795 | |
Other | | | 5,562 | |
Insurance expense | | | 2,920 | |
Distribution & shareholder service fees (See Note 5): | | | | |
| Investor Class | | | 14,644 | |
| Institutional Class | | | 186,867 | |
Total expenses before recoupment | | | 4,576,582 | |
Fee recoupment (see Note 4) | | | 28,790 | |
Net expenses | | | 4,605,372 | |
| | | | | |
| NET INVESTMENT INCOME | | | 2,422,257 | |
| | | | | |
| REALIZED AND UNREALIZED GAIN (LOSS) ON INVESTMENTS: | | | | |
Net realized gain (loss) on transactions from: | | | | |
| Investments | | | (7,268,864 | ) |
| Securities sold short | | | 4,322,683 | |
Net change in unrealized appreciation/depreciation on: | | | | |
| Investments | | | 18,670,676 | |
| Securities sold short | | | (7,023,527 | ) |
Net realized and unrealized gain on investments | | | 8,700,968 | |
| | | | | |
| NET INCREASE IN NET ASSETS RESULTING FROM OPERATIONS | | $ | 11,123,225 | |
See Notes to the Financial Statements
NUANCE CONCENTRATED VALUE LONG-SHORT FUND
Statements of Changes in Net Assets
| | | Year Ended | | | Year Ended | |
| | | April 30, 2023 | | | April 30, 2022 | |
| OPERATIONS: | | | | | | |
Net investment gain (loss) | | $ | 2,422,257 | | | $ | (1,912,583 | ) |
Net realized gain (loss) on transactions from: | | | | | | | | |
| Investments | | | (7,268,864 | ) | | | 11,680,069 | |
| Securities sold short | | | 4,322,683 | | | | (13,530,609 | ) |
Net change in unrealized appreciation/depreciation on: | | | | | | | | |
| Investments | | | 18,670,676 | | | | (15,579,404 | ) |
| Securities sold short | | | (7,023,527 | ) | | | 11,762,044 | |
Net increase (decrease) in net assets resulting from operations | | | 11,123,225 | | | | (7,580,483 | ) |
| | | | | | | | | |
| CAPITAL SHARE TRANSACTIONS: | | | | | | | | |
Investor Class: | | | | | | | | |
| Proceeds from shares sold | | | 337,405 | | | | 2,472,297 | |
| Proceeds from reinvestment of distributions | | | 95,218 | | | | 113,712 | |
| Payments for shares redeemed | | | (922,377 | ) | | | (2,214,516 | ) |
Increase (decrease) in net assets | | | | | | | | |
resulting from Investor Class transactions | | | (489,754 | ) | | | 371,493 | |
Institutional Class: | | | | | | | | |
| Proceeds from shares sold | | | 58,766,602 | | | | 75,436,601 | |
| Proceeds from reinvestment of distributions | | | 1,969,223 | | | | 2,657,700 | |
| Payments for shares redeemed | | | (31,342,373 | ) | | | (57,273,646 | ) |
Increase in net assets resulting from Institutional Class transactions | | | 29,393,452 | | | | 20,820,655 | |
Net increase in net assets resulting from capital share transactions | | | 28,903,698 | | | | 21,192,148 | |
| | | | | | | | | |
| DISTRIBUTIONS TO SHAREHOLDERS: | | | | | | | | |
| Investor Class | | | (95,260 | ) | | | (115,107 | ) |
| Institutional Class | | | (3,809,886 | ) | | | (4,886,020 | ) |
Total distributions to shareholders | | | (3,905,146 | ) | | | (5,001,127 | ) |
| | | | | | | | | |
| TOTAL INCREASE IN NET ASSETS | | | 36,121,777 | | | | 8,610,538 | |
| | | | | | | | | |
| NET ASSETS: | | | | | | | | |
Beginning of year | | | 130,414,323 | | | | 121,803,785 | |
End of year | | $ | 166,536,100 | | | $ | 130,414,323 | |
See Notes to the Financial Statements
NUANCE CONCENTRATED VALUE LONG-SHORT FUND
Financial Highlights
For a Fund share outstanding throughout the year.
| | | Year Ended | | | Year Ended | | | Year Ended | | | Year Ended | | | Year Ended | |
| | | April 30, | | | April 30, | | | April 30, | | | April 30, | | | April 30, | |
| | | 2023 | | | 2022 | | | 2021 | | | 2020 | | | 2019 | |
| Investor Class | | | | | | | | | | | | | | | |
| | | | | | | | | | | | | | | | |
| PER SHARE DATA: | | | | | | | | | | | | | | | |
Net asset value, beginning of year | | $ | 9.58 | | | $ | 10.50 | | | $ | 11.68 | | | $ | 10.68 | | | $ | 10.90 | |
| | | | | | | | | | | | | | | | | | | | | |
| INVESTMENT OPERATIONS: | | | | | | | | | | | | | | | | | | | | |
Net investment gain (loss) | | | 0.13 | | | | (0.18 | ) | | | (0.28 | ) | | | (0.02 | ) | | | (0.03 | )(1) |
Net realized and unrealized | | | | | | | | | | | | | | | | | | | | |
gain (loss) on investments | | | 0.44 | | | | (0.37 | ) | | | (0.36 | )(2) | | | 1.17 | | | | 0.55 | |
Total from investment operations | | | 0.57 | | | | (0.55 | ) | | | (0.64 | ) | | | 1.15 | | | | 0.52 | |
| | | | | | | | | | | | | | | | | | | | | |
| LESS DISTRIBUTIONS: | | | | | | | | | | | | | | | | | | | | |
Distributions from net realized gains | | | (0.24 | ) | | | (0.37 | ) | | | (0.54 | ) | | | (0.15 | ) | | | (0.74 | ) |
Total distributions | | | (0.24 | ) | | | (0.37 | ) | | | (0.54 | ) | | | (0.15 | ) | | | (0.74 | ) |
| | | | | | | | | | | | | | | | | | | | | |
Net asset value, end of year | | $ | 9.91 | | | $ | 9.58 | | | $ | 10.50 | | | $ | 11.68 | | | $ | 10.68 | |
| | | | | | | | | | | | | | | | | | | | | |
| TOTAL RETURN | | | 6.17 | % | | | (5.04 | )% | | | (5.49 | )% | | | 10.91 | % | | | 4.96 | % |
| | | | | | | | | | | | | | | | | | | | | |
| SUPPLEMENTAL DATA AND RATIOS: | | | | | | | | | | | | | | | | | | | | |
Net assets, end of year (in millions) | | $ | 3.5 | | | $ | 3.9 | | | $ | 3.8 | | | $ | 7.5 | | | $ | 2.6 | |
| | | | | | | | | | | | | | | | | | | | | |
Ratio of expenses to average net assets: | | | | | | | | | | | | | | | | | | | | |
| Before expense waiver/recoupment | | | 3.50 | % | | | 3.57 | % | | | 3.60 | % | | | 3.71 | % | | | 4.16 | % |
| After expense waiver/recoupment | | | 3.51 | % | | | 3.58 | % | | | 3.58 | % | | | 3.59 | % | | | 3.60 | % |
| | | | | | | | | | | | | | | | | | | | | |
Ratio of expenses excluding dividend | | | | | | | | | | | | | | | | | | | | |
expense and broker interest/expense | | | | | | | | | | | | | | | | | | | | |
to average net assets: | | | | | | | | | | | | | | | | | | | | |
| Before expense waiver/recoupment | | | 1.54 | % | | | 1.54 | % | | | 1.57 | % | | | 1.67 | % | | | 2.11 | % |
| After expense waiver/recoupment | | | 1.55 | % | | | 1.55 | % | | | 1.55 | % | | | 1.55 | % | | | 1.55 | % |
| | | | | | | | | | | | | | | | | | | | | |
Ratio of net investment income (loss) | | | | | | | | | | | | | | | | | | | | |
to average net assets: | | | | | | | | | | | | | | | | | | | | |
| Before expense waiver/recoupment | | | 1.45 | % | | | (1.62 | )% | | | (2.14 | )% | | | (0.53 | )% | | | (0.84 | )% |
| After expense waiver/recoupment | | | 1.44 | % | | | (1.63 | )% | | | (2.12 | )% | | | (0.41 | )% | | | (0.28 | )% |
| | | | | | | | | | | | | | | | | | | | | |
Portfolio turnover rate | | | 131 | % | | | 125 | % | | | 154 | % | | | 156 | % | | | 123 | % |
| (1) | Per share amounts calculated using the average shares method. |
| (2) | Realized and unrealized gains (losses) per share in this caption are balancing amounts necessary to reconcile the change in net asset value per share for the period, and may not reconcile with the aggregate gains on the Statement of Operations due to share transactions for the period. |
See Notes to the Financial Statements
NUANCE CONCENTRATED VALUE LONG-SHORT FUND
Financial Highlights
For a Fund share outstanding throughout the year.
| | | Year Ended | | | Year Ended | | | Year Ended | | | Year Ended | | | Year Ended | |
| | | April 30, | | | April 30, | | | April 30, | | | April 30, | | | April 30, | |
| | | 2023 | | | 2022 | | | 2021 | | | 2020 | | | 2019 | |
| Institutional Class | | | | | | | | | | | | | | | |
| | | | | | | | | | | | | | | | |
| PER SHARE DATA: | | | | | | | | | | | | | | | |
Net asset value, beginning of year | | $ | 9.76 | | | $ | 10.66 | | | $ | 11.82 | | | $ | 10.81 | | | $ | 10.99 | |
| | | | | | | | | | | | | | | | | | | | | |
| INVESTMENT OPERATIONS: | | | | | | | | | | | | | | | | | | | | |
Net investment gain (loss) | | | 0.16 | | | | (0.17 | ) | | | (0.17 | ) | | | (0.01 | ) | | | (0.00 | )(1)(2) |
Net realized and unrealized | | | | | | | | | | | | | | | | | | | | |
gain (loss) on investments | | | 0.45 | | | | (0.36 | ) | | | (0.45 | )(3) | | | 1.19 | | | | 0.56 | |
Total from investment operations | | | 0.61 | | | | (0.53 | ) | | | (0.62 | ) | | | 1.18 | | | | 0.56 | |
| | | | | | | | | | | | | | | | | | | | | |
| LESS DISTRIBUTIONS: | | | | | | | | | | | | | | | | | | | | |
Distributions from net investment income | | | — | | | | — | | | | — | | | | (0.02 | ) | | | — | |
Distributions from net realized gains | | | (0.24 | ) | | | (0.37 | ) | | | (0.54 | ) | | | (0.15 | ) | | | (0.74 | ) |
Total distributions | | | (0.24 | ) | | | (0.37 | ) | | | (0.54 | ) | | | (0.17 | ) | | | (0.74 | ) |
| | | | | | | | | | | | | | | | | | | | | |
Net asset value, end of year | | $ | 10.13 | | | $ | 9.76 | | | $ | 10.66 | | | $ | 11.82 | | | $ | 10.81 | |
| | | | | | | | | | | | | | | | | | | | | |
| TOTAL RETURN | | | 6.47 | % | | | (4.77 | )% | | | (5.33 | )% | | | 11.10 | % | | | 5.30 | % |
| | | | | | | | | | | | | | | | | | | | | |
| SUPPLEMENTAL DATA AND RATIOS: | | | | | | | | | | | | | | | | | | | | |
Net assets, end of year (in millions) | | $ | 163.0 | | | $ | 126.5 | | | $ | 118.0 | | | $ | 56.9 | | | $ | 29.5 | |
| | | | | | | | | | | | | | | | | | | | | |
Ratio of expenses to average net assets: | | | | | | | | | | | | | | | | | | | | |
| Before expense waiver/recoupment | | | 3.22 | % | | | 3.30 | % | | | 3.40 | % | | | 3.39 | % | | | 3.69 | % |
| After expense waiver/recoupment | | | 3.24 | % | | | 3.33 | % | | | 3.42 | % | | | 3.33 | % | | | 3.33 | % |
| | | | | | | | | | | | | | | | | | | | | |
Ratio of expenses excluding dividend | | | | | | | | | | | | | | | | | | | | |
expense and broker interest/expense | | | | | | | | | | | | | | | | | | | | |
to average net assets: | | | | | | | | | | | | | | | | | | | | |
| Before expense waiver/recoupment | | | 1.27 | % | | | 1.27 | % | | | 1.28 | % | | | 1.36 | % | | | 1.66 | % |
| After expense waiver/recoupment | | | 1.29 | % | | | 1.30 | % | | | 1.30 | % | | | 1.30 | % | | | 1.30 | % |
| | | | | | | | | | | | | | | | | | | | | |
Ratio of net investment income (loss) | | | | | | | | | | | | | | | | | | | | |
to average net assets: | | | | | | | | | | | | | | | | | | | | |
| Before expense waiver/recoupment | | | 1.74 | % | | | (1.35 | )% | | | (1.94 | )% | | | (0.21 | )% | | | (0.37 | )% |
| After expense waiver/recoupment | | | 1.72 | % | | | (1.38 | )% | | | (1.96 | )% | | | (0.15 | )% | | | (0.01 | )% |
| | | | | | | | | | | | | | | | | | | | | |
Portfolio turnover rate | | | 131 | % | | | 125 | % | | | 154 | % | | | 156 | % | | | 123 | % |
| (1) | Per share amounts calculated using the average shares method. |
| (2) | Amount rounds to less than $(0.01). |
| (3) | Realized and unrealized gains (losses) per share in this caption are balancing amounts necessary to reconcile the change in net asset value per share for the period, and may not reconcile with the aggregate gains on the Statement of Operations due to share transactions for the period. |
See Notes to the Financial Statements
NUANCE CONCENTRATED VALUE LONG-SHORT FUND
Notes to the Financial Statements
April 30, 2023
1. ORGANIZATION
Managed Portfolio Series (the “Trust”) was organized as a Delaware statutory trust on January 27, 2011. The Trust is registered under the Investment Company Act of 1940, as amended (the “1940 Act”), as an open-end management investment company. The Nuance Concentrated Value Long-Short Fund (the “Fund”) is a non-diversified series with its own investment objectives and policies within the Trust. The investment objective of the Fund is long-term capital appreciation. The Fund is an investment company and accordingly follows the investment company accounting and reporting guidance of the Financial Accounting Standards Board (“FASB”) Accounting Standards Codification Topic 946 Financial Services – Investment Companies. The Fund commenced operations on December 31, 2015. The Fund currently offers two classes, the Investor Class and the Institutional Class. Investor Class shares are subject to a 0.25% of average daily net assets distribution and servicing fee and each class of shares is subject to a shareholder servicing fee of up to 0.15% of average daily net assets. Each class of shares has identical rights and privileges with respect to voting on matters affecting a single share class. The Fund may issue an unlimited number of shares of beneficial interest, with no par value.
2. SIGNIFICANT ACCOUNTING POLICIES
The following is a summary of significant accounting policies consistently followed by the Fund in the preparation of its financial statements. These policies are in conformity with generally accepted accounting principles in the United States of America (“GAAP”).
Security Valuation – All investments in securities are recorded at their estimated fair value, as described in Note 3.
Federal Income Taxes – The Fund complies with the requirements of Subchapter M of the Internal Revenue Code of 1986, as amended, necessary to qualify as a regulated investment company and distributes substantially all net taxable investment income and net realized gains to shareholders in a manner which results in no tax cost to the Fund. Therefore, no federal income or excise tax provision is required. As of and during the period ended April 30, 2023, the Fund did not have any tax positions that did not meet the “more-likely-than-not” threshold of being sustained by the applicable tax authority. The Fund recognizes interest and penalties, if any, related to unrecognized tax benefits on uncertain tax positions as income tax expense in the Statement of Operations. During the year ended April 30, 2023, the Fund did not incur any interest or penalties. The Fund is subject to examination by U.S. taxing authorities for the tax years ended April 30, 2020 through 2023.
Security Transactions, Income and Distributions – The Fund follows industry practice and records security transactions on the trade date. Realized gains and losses on sales of securities are calculated on the basis of identified cost. Dividend income and expense is recorded on the ex-dividend date and interest income is recorded on an accrual basis. Withholding taxes on foreign dividends have been provided for in accordance with the Fund’s understanding of the applicable country’s tax rules and regulations. Discounts and premiums on securities purchased are amortized over the expected life of the respective securities using the constant yield method of calculation.
The Fund will make distributions, if any, of net investment income quarterly. The Fund will also distribute net realized capital gains, if any, annually. Distributions to shareholders are recorded on the ex-dividend date. The treatment for financial reporting purposes of distributions made to shareholders during the year from net investment income or net realized capital gains may differ from their treatment for federal income tax purposes. These differences are caused primarily by differences in the timing of the recognition of certain components of income, expense or realized capital gain for federal income tax purposes. Where such differences are permanent in
NUANCE CONCENTRATED VALUE LONG-SHORT FUND
Notes to the Financial Statements – Continued
April 30, 2023
nature, GAAP requires that they be reclassified in the components of the net assets based on their ultimate characterization for federal income tax purposes. Any such reclassifications will have no effect on net assets, results of operations or net asset values per share of the Fund. For the year ended April 30, 2023, there were no reclassifications.
Short Sales – A short sale is the sale by the Fund of a security which they do not own in anticipation of purchasing the same security in the future at a lower price to close the short position. A short sale will be successful if the price of the shorted security decreases. However, if the underlying security goes up in price during the period in which the short position is outstanding, the Fund will realize a loss. The risk on a short sale is unlimited because the Fund must buy the shorted security at the higher price to complete the transaction. Therefore, short sales may be subject to greater risks than investments in long positions. With a long position, the maximum sustainable loss is limited to the amount paid for the security plus the transaction costs, whereas there is no maximum attainable price of the shorted security. The Fund would also incur increased transaction costs associated with selling securities short. In addition, the Fund segregates liquid securities at least equal to the fair value of the securities sold short (not including the proceeds from the short sales). Cash deposits by the Fund are presented as deposits at broker on the Statement of Assets and Liabilities and may exceed federally insured limits.
Use of Estimates – The preparation of financial statements in conformity with GAAP requires management to make estimates and assumptions that affect the reported amounts of assets and liabilities and disclosure of contingent assets and liabilities at the date of the financial statements and the reported amounts of revenues and expenses during the reporting period. Actual results could differ from those estimates.
Allocation of Income, Expenses and Gains/Losses – Income, expenses (other than those deemed attributable to a specific share class), and gains and losses of the Fund are allocated daily to each class of shares based upon the ratio of net assets represented by each class as a percentage of the net assets of the Fund. Expenses deemed directly attributable to a class of shares are recorded by the specific class. Most Fund expenses are allocated by class based on relative net assets. 12b-1 fees are expensed at 0.25% of average daily net assets of Investor Class shares. Shareholder service fees are expensed at up to 0.15% of average daily net assets for each class of shares. Expenses associated with a specific fund in the Trust are charged to that fund. Common Trust expenses are typically allocated evenly between the funds of the Trust, or by other equitable means.
3. SECURITIES VALUATION
The Fund has adopted authoritative fair value accounting standards which establish an authoritative definition of fair value and set out a hierarchy for measuring fair value. These standards require additional disclosures about the various inputs and valuation techniques used to develop the measurements of fair value, a discussion in changes in valuation techniques and related inputs during the period and expanded disclosure of valuation levels for major security types. These inputs are summarized in the three broad levels listed below:
| Level 1 – | Unadjusted quoted prices in active markets for identical assets or liabilities that the Fund has the ability to access. |
| | |
| Level 2 – | Observable inputs other than quoted prices included in Level 1 that are observable for the asset or liability, either directly or indirectly. These inputs may include quoted prices for the identical instrument on an inactive market, prices for similar instruments, interest rates, prepayment speeds, credit risk, yield curves, default rates and similar data. |
NUANCE CONCENTRATED VALUE LONG-SHORT FUND
Notes to the Financial Statements – Continued
April 30, 2023
| Level 3 – | Unobservable inputs for the asset or liability, to the extent relevant observable inputs are not available, representing the Fund’s own assumptions about the assumptions a market participant would use in valuing the asset or liability, and would be based on the best information available. |
Following is a description of the valuation techniques applied to the Fund’s major categories of assets and liabilities measured at fair value on a recurring basis. The Fund’s investments are carried at fair value.
Equity Securities – Securities that are primarily traded on a national securities exchange are valued at the last sale price on the exchange on which they are primarily traded on the day of valuation or, if there has been no sale on such day, at the mean between the bid and ask prices. Securities traded primarily in the Nasdaq Global Market System for which market quotations are readily available are valued using the Nasdaq Official Closing Price (“NOCP”). If the NOCP is not available, such securities are valued at the last sale price on the day of valuation, or if there has been no sale on such day, at the mean between the bid and ask prices. To the extent these securities are actively traded and valuation adjustments are not applied, they are categorized in Level 1 of the fair value hierarchy.
Short-Term Investments – Investments in other mutual funds, including money market funds are valued at their net asset value per share and are categorized in Level 1 of the fair value hierarchy. To the extent these securities are actively traded and valuation adjustments are not applied, they are categorized in Level 1 of the fair value hierarchy.
The Board of Trustees (the “Board”) has adopted a pricing and valuation policy for use by the Fund and its Valuation Designee (as defined below) in calculating the Fund’s NAV. Pursuant to Rule 2a-5 under the 1940 Act, the Fund has designated Nuance Investments, LLC (the “Adviser”) as its “Valuation Designee” to perform all of the fair value determinations as well as to perform all of the responsibilities that may be performed by the Valuation Designee in accordance with Rule 2a-5. The Valuation Designee is authorized to make all necessary determinations of the fair values of portfolio securities and other assets for which market quotations are not readily available or if it is deemed that the prices obtained from brokers and dealers or independent pricing services are unreliable.
The inputs or methodology used for valuing securities are not an indication of the risk associated with investing in those securities. The following is a summary of the inputs used to value the Fund’s securities as of April 30, 2023:
| | | Level 1 | | | Level 2 | | | Level 3 | | | Total | |
| Common Stocks | | $ | 150,891,801 | | | $ | — | | | $ | — | | | $ | 150,891,801 | |
| Short-Term Investment | | | 15,310,784 | | | | — | | | | — | | | | 15,310,784 | |
| Total Investments in Securities | | $ | 166,202,585 | | | $ | — | | | $ | — | | | $ | 166,202,585 | |
| | | | | | | | | | | | | | | | | |
| Securities Sold Short | | | | | | | | | | | | | | | | |
| Common Stocks | | $ | (144,103,920 | ) | | $ | — | | | $ | — | | | $ | (144,103,920 | ) |
| Total Securities Sold Short | | $ | (144,103,920 | ) | | $ | — | | | $ | — | | | $ | (144,103,920 | ) |
Refer to the Schedules of Investment and Securities Sold Short for further information on the classification of investments.
NUANCE CONCENTRATED VALUE LONG-SHORT FUND
Notes to the Financial Statements – Continued
April 30, 2023
4. INVESTMENT ADVISORY FEE AND OTHER TRANSACTIONS WITH AFFILIATES
The Trust has an agreement with Nuance Investments, LLC (the “Adviser”) to furnish investment advisory services to the Fund. Pursuant to an Investment Advisory Agreement between the Trust and the Adviser, the Adviser is entitled to receive, on a monthly basis, an annual advisory fee equal to 1.00% of the Fund’s average daily net assets.
The Fund’s Adviser has contractually agreed to waive a portion or all of its management fees and reimburse the Fund for its expenses to ensure that total annual operating expenses (excluding acquired fund fees and expenses, leverage/borrowing interest, interest expense, dividends paid on short sales, taxes, brokerage commissions, and extraordinary expenses) for the Fund do not exceed 1.55% and 1.30% of average daily net assets of the Fund’s Investor Class and Institutional Class, respectively. Fees waived and expenses reimbursed by the Adviser may be recouped by the Adviser for a period of thirty-six months following the month during which such waiver or reimbursement was made if such recoupment can be achieved without exceeding the expense limit in effect at the time the waiver and reimbursement occurred. The Operating Expense Limitation Agreement is intended to be continual in nature and cannot be terminated within a year after the effective date of the Fund’s prospectus. After that date, the agreement may be terminated at any time upon 60 days’ written notice by the Trust’s Board or the Adviser, with the consent of the Board. For the year ended April 30, 2023, the Adviser recouped expenses of $28,790 relating to fees waived in prior years. Waived fees and reimbursed expenses subject to potential recovery by year of expiration are as follows:
| Expiration | | Amount | |
| May 2023 – April 2024 | | $ | 1,115 | |
| May 2024 – April 2025 | | $ | 35 | |
| May 2025 – April 2026 | | $ | — | |
U.S. Bancorp Fund Services, LLC, doing business as U.S. Bank Global Fund Services, (“Fund Services” or the “Administrator”), acts as the Fund’s Administrator, Transfer Agent, and Fund Accountant. U.S. Bank N.A. (the “Custodian”) serves as the custodian to the Fund. The Custodian is an affiliate of the Administrator. The Administrator performs various administrative and accounting services for the Fund. The Administrator prepares various federal and state regulatory filings, reports and returns for the Fund; prepares reports and materials to be supplied to the Trustees; monitors the activities of the Fund’s custodian; coordinates the payment of the Fund’s expenses and reviews the Fund’s expense accruals. The officers of the Trust, including the Chief Compliance Officer are employees of the Administrator. As compensation for its services, the Administrator is entitled to a monthly fee at an annual rate based upon the average daily net assets of the Fund, subject to annual minimums. Fees paid by the Fund for administration and accounting, transfer agency, custody and compliance services for the year ended April 30, 2023, are disclosed in the Statement of Operations.
5. DISTRIBUTION & SHAREHOLDER SERVICING FEES
The Fund has adopted a Distribution Plan pursuant to Rule 12b-1 (the “Plan”) in the Investor Class only. The Plan permits the Fund to pay for distribution and related expenses at an annual rate of 0.25% of the Investor Class average daily net assets. The expenses covered by the Plan may include the cost of preparing and distributing prospectuses and other sales material, advertising and public relations expenses, payments to financial intermediaries and compensation of personnel involved in selling shares of the Fund. Payments made pursuant to the Plan will represent compensation for distribution and service activities, not reimbursements for specific expenses incurred. For the year ended April 30, 2023, the Investor Class incurred expenses of $9,152 pursuant to the Plan.
NUANCE CONCENTRATED VALUE LONG-SHORT FUND
Notes to the Financial Statements – Continued
April 30, 2023
The Fund has entered into a shareholder servicing agreement (the “Agreement”) where the Adviser acts as the shareholder agent, under which the Fund may pay servicing fees at an annual rate of up to 0.15% of the average daily net assets of each class. Payments, if any, to the Adviser under the Agreement may reimburse the Adviser for payments it makes to selected brokers, dealers and administrators which have entered into service agreements with the Adviser for services provided to shareholders of the Fund. Payments may also be made directly to the intermediaries providing shareholder services. The services provided by such intermediaries are primarily designed to assist shareholders of the Fund and include the furnishing of office space and equipment, telephone facilities, personnel and assistance to the Fund in servicing such shareholders. Services provided by such intermediaries also include the provision of support services to the Fund and includes establishing and maintaining shareholders’ accounts and record processing, purchase and redemption transactions, answering routine client inquiries regarding the Fund, and providing such other personal services to shareholders as the Fund may reasonably request. For the year ended April 30, 2023, the Investor and Institutional Class incurred $5,492 and $186,867, respectively, of shareholder servicing fees under the Agreement.
6. CAPITAL SHARE TRANSACTIONS
Transactions in shares of the Fund were as follows:
| | | Year Ended | | | Year Ended | |
| | | April 30, 2023 | | | April 30, 2022 | |
| Investor Class: | | | | | | |
| Shares sold | | | 35,621 | | | | 258,225 | |
| Shares issued to holders in reinvestment of distributions | | | 10,545 | | | | 12,565 | |
| Shares redeemed | | | (98,909 | ) | | | (229,773 | ) |
| Net increase (decrease) in Investor Class shares | | | (52,743 | ) | | | 41,017 | |
| Institutional Class: | | | | | | | | |
| Shares sold | | | 6,221,242 | | | | 7,515,170 | |
| Shares issued to holders in reinvestment of distributions | | | 213,582 | | | | 228,567 | |
| Shares redeemed | | | (3,301,471 | ) | | | (5,907,072 | ) |
| Net increase in Institutional Class shares | | | 3,133,353 | | | | 1,896,665 | |
| Net increase in shares outstanding | | | 3,080,610 | | | | 1,937,682 | |
7. INVESTMENT TRANSACTIONS
The aggregate purchases and sales, excluding short-term investments and securities sold short, by the Fund for the year ended April 30, 2023, were as follows:
| | | Purchases | | | Sales | | |
| U.S. Government | | $ | — | | | $ | — | | |
| Other | | $ | 196,892,271 | | | $ | 170,622,395 | | |
NUANCE CONCENTRATED VALUE LONG-SHORT FUND
Notes to the Financial Statements – Continued
April 30, 2023
8. FEDERAL TAX INFORMATION
The aggregate gross unrealized appreciation and depreciation of securities and securities sold short held by the Fund and the total cost of securities for federal income tax purposes at April 30, 2023, the Fund’s most recent fiscal year end, were as follows:
| | | | Federal Income | |
| Unrealized | Unrealized | Net | Tax Cost, | |
| Aggregate Gross | Aggregate Gross | Unrealized | Net of Proceeds for | |
| Appreciation | Depreciation | Depreciation | Securities Sold Short | |
| $25,535,987 | $(33,748,776) | $(8,212,789) | $30,311,454 | |
The difference between book-basis and tax-basis unrealized appreciation is attributable primarily to the deferral of wash sale losses. At April 30, 2023, components of accumulated loss on a tax-basis were as follows:
| | Undistributed | Other | Net | Total |
| Undistributed | Long-Term | Accumulated | Unrealized | Accumulated |
| Ordinary Income | Capital Gains | Losses | Depreciation | Loss |
| $328,165 | $— | $(160,240) | $(8,212,789) | $(8,044,864) |
As of April 30, 2023, the Fund did not have any capital loss carryovers. A regulated investment company may elect for any taxable year to treat any portion of any qualified late year loss as arising on the first day of the next taxable year. Qualified late year losses are certain capital, and ordinary losses which occur during the portion of the Fund’s taxable year subsequent to October 31. For the taxable year ended April 30, 2023, the Fund does not plan to defer any qualified later year losses.
The tax character of distributions paid during the year ended April 30, 2023, were as follows:
| Ordinary | Long-Term | | | |
| Income* | Capital Gains | Total | | |
| $3,065,464 | $839,682 | $3,905,146 | | |
The tax character of distributions paid during the year ended April 30, 2022, were as follows:
| Ordinary | Long-Term | | | |
| Income* | Capital Gains | Total | | |
| $— | $5,001,127 | $5,001,127 | | |
| * | For federal income tax purposes, distributions of short-term capital gains are treated as ordinary income distributions. |
The Fund designated as long-term capital gain dividend, pursuant to Internal Revenue Code Section 852(b)(3), the amount necessary to reduce the earnings and profits of the Fund related to net capital gain to zero for the tax year ended April 30, 2023 and April 30, 2022.
9. CONTROL OWNERSHIP
The beneficial ownership, either directly or indirectly, of more than 25% of the voting securities of a fund creates a presumption of control of the fund, under Section 2(a)(9) of the Investment Company Act of 1940. As of April 30, 2023, National Financial Services, LLC, for the benefit of its customers, owned 69.78% of the Fund.
NUANCE CONCENTRATED VALUE LONG-SHORT FUND
Report of Independent Registered Public Accounting Firm
To the Shareholders of Nuance Concentrated Value Long-Short Fund and
Board of Trustees of Managed Portfolio Series
Opinion on the Financial Statements
We have audited the accompanying statement of assets and liabilities, including the schedules of investments and securities sold short, of Nuance Concentrated Value Long-Short Fund (the “Fund”), a series of Managed Portfolio Series, as of April 30, 2023, the related statement of operations for the year then ended, the statements of changes in net assets for each of the two years in the period then ended, the related notes, and the financial highlights for each of the five years in the period then ended (collectively referred to as the “financial statements”). In our opinion, the financial statements present fairly, in all material respects, the financial position of the Fund as of April 30, 2023, the results of its operations for the year then ended, the changes in net assets for each of the two years in the period then ended, and the financial highlights for each of the five years in the period then ended, in conformity with accounting principles generally accepted in the United States of America.
Basis for Opinion
These financial statements are the responsibility of the Fund’s management. Our responsibility is to express an opinion on the Fund’s financial statements based on our audits. We are a public accounting firm registered with the Public Company Accounting Oversight Board (United States) (“PCAOB”) and are required to be independent with respect to the Fund in accordance with the U.S. federal securities laws and the applicable rules and regulations of the Securities and Exchange Commission and the PCAOB.
We conducted our audits in accordance with the standards of the PCAOB. Those standards require that we plan and perform the audit to obtain reasonable assurance about whether the financial statements are free of material misstatement whether due to error or fraud.
Our audits included performing procedures to assess the risks of material misstatement of the financial statements, whether due to error or fraud, and performing procedures that respond to those risks. Such procedures included examining, on a test basis, evidence regarding the amounts and disclosures in the financial statements. Our procedures included confirmation of securities owned as of April 30, 2023, by correspondence with the custodian and brokers; when replies were not received from brokers, we performed other auditing procedures. Our audits also included evaluating the accounting principles used and significant estimates made by management, as well as evaluating the overall presentation of the financial statements. We believe that our audits provide a reasonable basis for our opinion.
We have served as the auditor of one or more of Nuance Investments, LLC’s investment companies since 2011.
COHEN & COMPANY, LTD.
Milwaukee, Wisconsin
June 28, 2023
NUANCE CONCENTRATED VALUE LONG-SHORT FUND
Additional Information (Unaudited)
April 30, 2023
TRUSTEES AND OFFICERS
| | | Term of | | | |
| | | Office | Number of | | Other |
| Name, | | and | Portfolios | Principal | Directorships |
| Address | Position(s) | Length | in Trust | Occupation(s) | Held by Trustee |
| and Year | Held with | of Time | Overseen | During the Past | During the Past |
| of Birth | the Trust | Served | by Trustee | Five Years | Five Years |
| Independent Trustees |
| | | | | | |
Leonard M. Rush, CPA | Chairman, | Indefinite | 31 | Retired, Chief Financial | Independent Trustee, |
615 E. Michigan St. | Trustee and | Term; Since | | Officer, Robert W. Baird | ETF Series Solutions |
Milwaukee, WI 53202 | Audit | April 2011 | | & Co. Incorporated | (55 Portfolios) |
Year of Birth: 1946 | Committee | | | (2000-2011). | (2012-Present). |
| | Chairman | | | | |
| | | | | | |
David A. Massart | Trustee | Indefinite | 31 | Partner and Managing | Independent Trustee, |
615 E. Michigan St. | | Term; Since | | Director, Beacon Pointe | ETF Series Solutions |
Milwaukee, WI 53202 | | April 2011 | | Advisors, LLC | (56 Portfolios) |
Year of Birth: 1967 | | | | (since 2022); Co-Founder | (2012-Present). |
| | | | | and Chief Investment | |
| | | | | Strategist, Next Generation | |
| | | | | Wealth Management, Inc. | |
| | | | | (2005-2021). | |
NUANCE CONCENTRATED VALUE LONG-SHORT FUND
Additional Information (Unaudited) – Continued
April 30, 2023
| | | Term of | | | |
| | | Office | Number of | | Other |
| Name, | | and | Portfolios | Principal | Directorships |
| Address | Position(s) | Length | in Trust | Occupation(s) | Held by Trustee |
| and Year | Held with | of Time | Overseen | During the Past | During the Past |
| of Birth | the Trust | Served | by Trustee | Five Years | Five Years |
| Independent Trustees |
| | | | | | |
David M. Swanson | Trustee and | Indefinite | 31 | Founder and Managing | Independent Trustee, |
615 E. Michigan St. | Nominating | Term; Since | | Principal, SwanDog | ALPS Variable |
Milwaukee, WI 53202 | & Governance | April 2011 | | Strategic Marketing, LLC | Investment Trust |
Year of Birth: 1957 | Committee | | | (2006-Present) | (7 Portfolios) (2006- |
| | Chairman | | | | Present); Independent |
| | | | | | Trustee, RiverNorth |
| | | | | | Funds (3 Portfolios) |
| | | | | | (2018-Present); |
| | | | | | RiverNorth Managed |
| | | | | | Duration Municipal |
| | | | | | Income Fund Inc. |
| | | | | | (1 Portfolio) (2019- |
| | | | | | Present); RiverNorth |
| | | | | | Specialty Finance |
| | | | | | Corporation (1 Portfolio) |
| | | | | | (2018-Present); |
| | | | | | RiverNorth/DoubleLine |
| | | | | | Strategic Opportunity |
| | | | | | Fund, Inc. (1 Portfolio) |
| | | | | | (2018-Present); |
| | | | | | RiverNorth |
| | | | | | Opportunities Fund, Inc. |
| | | | | | (1 Portfolio) (2015- |
| | | | | | Present); RiverNorth |
| | | | | | Opportunistic |
| | | | | | Municipal Income |
| | | | | | Fund, Inc. (1 Portfolio) |
| | | | | | (2018-Present); |
| | | | | | RiverNorth Flexible |
| | | | | | Municipal Income |
| | | | | | Fund, Inc. (1 Portfolio) |
| | | | | | (2020-Present). |
| | | | | | RiverNorth Flexible |
| | | | | | Municipal Income |
| | | | | | Fund II, Inc. |
| | | | | | (1 Portfolio) (2021- |
| | | | | | Present); RiverNorth |
| | | | | | Managed Duration |
| | | | | | Income Fund II, Inc. |
| | | | | | (1 Portfolio) |
| | | | | | (2022-Present). |
NUANCE CONCENTRATED VALUE LONG-SHORT FUND
Additional Information (Unaudited) – Continued
April 30, 2023
| | | Term of | | | |
| | | Office | Number of | | Other |
| Name, | | and | Portfolios | Principal | Directorships |
| Address | Position(s) | Length | in Trust | Occupation(s) | Held by Trustee |
| and Year | Held with | of Time | Overseen | During the Past | During the Past |
| of Birth | the Trust | Served | by Trustee | Five Years | Five Years |
| Independent Trustees |
| | | | | | |
Robert J. Kern | Trustee | Indefinite | 31 | Retired (July 2018- | None |
615 E. Michigan St. | | Term; Since | | Present); Executive | |
Milwaukee, WI 53202 | | January 2011 | | Vice President, | |
Year of Birth: 1958 | | | | U.S. Bancorp Fund | |
| | | | | Services, LLC | |
| | | | | (1994-2018). | |
| | | | | | |
| Officers | | | | | |
| | | | | | |
Brian R. Wiedmeyer | President and | Indefinite | N/A | Vice President, | N/A |
615 E. Michigan St. | Principal | Term, Since | | U.S. Bancorp Fund | |
Milwaukee, WI 53202 | Executive | November | | Services, LLC (2005-Present). | |
Year of Birth: 1973 | Officer | 2018 | | | |
| | | | | | |
Deborah Ward | Vice President, | Indefinite | N/A | Senior Vice President, | N/A |
615 E. Michigan St. | Chief | Term; Since | | U.S. Bancorp Fund | |
Milwaukee, WI 53202 | Compliance | April 2013 | | Services, LLC (2004-Present). | |
Year of Birth: 1966 | Officer and | | | | |
| | Anti-Money | | | | |
| | Laundering | | | | |
| | Officer | | | | |
| | | | | | |
Benjamin Eirich | Treasurer, | Indefinite | N/A | Assistant Vice President, | N/A |
615 E. Michigan St. | Principal | Term; Since | | U.S. Bancorp Fund | |
Milwaukee, WI 53202 | Financial | August 2019 | | Services, LLC (2008-Present). | |
Year of Birth: 1981 | Officer and | (Treasurer); | | | |
| | Vice President | Since | | | |
| | | November | | | |
| | | 2018 (Vice | | | |
| | | President) | | | |
| | | | | | |
John Hadermayer | Secretary | Indefinite | N/A | Vice President, | N/A |
615 E. Michigan St. | | Term; Since | | U.S. Bancorp Fund | |
Milwaukee, WI 53202 | | May 2022 | | Services, LLC (2022-Present); | |
Year of Birth: 1977 | | | | Executive Director, AQR Capital | |
| | | | | Management, LLC (2013-Present). | |
NUANCE CONCENTRATED VALUE LONG-SHORT FUND
Additional Information (Unaudited) – Continued
April 30, 2023
| | | Term of | | | |
| | | Office | Number of | | Other |
| Name, | | and | Portfolios | Principal | Directorships |
| Address | Position(s) | Length | in Trust | Occupation(s) | Held by Trustee |
| and Year | Held with | of Time | Overseen | During the Past | During the Past |
| of Birth | the Trust | Served | by Trustee | Five Years | Five Years |
| Officers |
| | | | | | |
Douglas Schafer | Assistant | Indefinite | N/A | Assistant Vice President, | N/A |
615 E. Michigan St. | Treasurer | Term; Since | | U.S. Bancorp Fund | |
Milwaukee, WI 53202 | and Vice | May 2016 | | Services, LLC | |
Year of Birth: 1970 | President | (Assistant | | (2002-Present). | |
| | | Treasurer); | | | |
| | | Indefinite | | | |
| | | Term; Since | | | |
| | | November | | | |
| | | 2018 (Vice | | | |
| | | President) | | | |
| | | | | | |
Sara J. Bollech | Assistant | Indefinite | N/A | Officer, U.S. Bancorp | N/A |
615 E. Michigan St. | Treasurer | Term; Since | | Fund Services, LLC | |
Milwaukee, WI 53202 | and Vice | November | | (2007-Present). | |
Year of Birth: 1977 | President | 2021 | | | |
| | | | | | |
Peter A. Walker, CPA | Assistant | Indefinite | N/A | Officer, U.S. Bancorp | N/A |
615 E. Michigan St. | Treasurer | Term; Since | | Fund Services, LLC | |
Milwaukee, WI 53202 | and Vice | November | | (2016-Present). | |
Year of Birth: 1993 | President | 2021 | | | |
NUANCE CONCENTRATED VALUE LONG-SHORT FUND
Additional Information (Unaudited) – Continued
April 30, 2023
AVAILABILITY OF FUND PORTFOLIO INFORMATION
The Fund files complete schedules of portfolio holdings with the U.S. Securities and Exchange Commission (the “SEC”) for the first and third quarters of each fiscal year on Part F of Form N-PORT. The Fund’s Part F of Form N-PORT is available on the SEC’s website at www.sec.gov and may be reviewed and copied at the SEC’s Public Reference Room in Washington, D.C. Information on the operation of the Public Reference Room may be obtained by calling 1-800-732-0330. The Fund’s Part F of Form N-PORT may also be obtained by calling 1-855-682-6233.
AVAILABILITY OF PROXY VOTING INFORMATION
A description of the Fund’s Proxy Voting Policies and Procedures is available without charge, upon request, by calling 1-855-682-6233. Information regarding how the Fund voted proxies relating to portfolio securities during the most recent 12 month period ended June 30, is available (1) without charge, upon request, by calling 1-888-621-9258, or (2) on the SEC’s website at www.sec.gov.
QUALIFIED DIVIDEND INCOME/DIVIDENDS RECEIVED DEDUCTION
For the fiscal year ended April 30, 2023, certain dividends paid by the Fund may be reported as qualified dividend income and may be eligible for taxation at capital gains rates. The percentage of dividends declared from ordinary income designated as qualified dividend income was 83.45% for the Fund.
For corporate shareholders, the percent of ordinary income distributions qualifying for the corporate dividends received deduction for the fiscal year ended April 30, 2023 was 57.23% for the Fund.
The percentage of taxable ordinary income distributions that are designated as short-term capital gain distributions under Internal Revenue Section 871 (k)(2)(c) was 51.19%.
NUANCE CONCENTRATED VALUE LONG-SHORT FUND
Approval of Investment Advisory Agreement (Unaudited)
At the regular meeting of the Board of Trustees of Managed Portfolio Series (“Trust”) on February 23-24, 2023, the Trust’s Board of Trustees (“Board”), each of whom was present virtually via video conference, including all of the Trustees who are not “interested persons” of the Trust, as that term is defined in Section 2(a)(19) of the Investment Company Act of 1940, as amended, (“Independent Trustees”) considered and approved the continuation of the Investment Advisory Agreement between the Trust and Nuance Investments, LLC (“Nuance” or the “Adviser”) regarding the Nuance Concentrated Value Long-Short Fund (the “Fund”) (the “Investment Advisory Agreement”) for another annual term.
Prior to the meeting and at a meeting held on January 5, 2023, the Trustees received and considered information from Nuance and the Trust’s administrator designed to provide the Trustees with the information necessary to evaluate the continuance of the Investment Advisory Agreement (“Support Materials”). Before voting to approve the continuance of the Investment Advisory Agreement, the Trustees reviewed the Support Materials with Trust management and with counsel to the Independent Trustees and received a memorandum and advice from such counsel discussing the legal standards for the Trustees’ consideration of the renewal of the Investment Advisory Agreement. This information, together with the information provided to the Board throughout the course of the year, formed the primary (but not exclusive) basis for the Board’s determinations.
In determining whether to continue the Investment Advisory Agreement, the Trustees considered all factors they believed relevant including the following with respect to the Fund: (1) the nature, extent, and quality of the services provided by Nuance with respect to the Fund; (2) the Fund’s historical performance as managed by Nuance; (3) the costs of the services provided by Nuance and the profits realized by Nuance from services rendered to the Fund; (4) comparative fee and expense data for the Fund and other investment companies with similar investment objectives; (5) the extent to which economies of scale may be realized as the Fund grows, and whether the advisory fee for the Fund reflects such economies of scale for the Fund’s benefit; and (6) other benefits to Nuance resulting from its relationship with the Fund. In their deliberations, the Trustees weighed to varying degrees the importance of the information provided to them, and did not identify any particular information that was all-important or controlling.
Based upon the information provided to the Board throughout the course of the year, including a presentation to the Board by representatives from Nuance, and the Support Materials, the Board concluded that the overall arrangements between the Trust and Nuance as set forth in the Investment Advisory Agreement, as the agreement relates to the Fund, continue to be fair and reasonable in light of the services that Nuance performs, the investment advisory fees that the Fund pays Nuance for such services, and such other matters as the Trustees considered relevant in the exercise of their reasonable business judgment. The material factors and conclusions that formed the basis of the Trustees’ determination to approve the continuation of the Investment Advisory Agreement, as it relates to the Fund, are summarized below.
Nature, Extent and Quality of Services Provided. The Trustees considered the scope of services that Nuance provides under the Investment Advisory Agreement with respect to the Fund, noting that such services include, but are not limited to, the following: (1) investing the Fund’s assets consistent with the Fund’s investment objective and investment policies; (2) determining the portfolio securities to be purchased, sold, or otherwise disposed of, and the timing of such transactions; (3) voting all proxies, if any, with respect to the Fund’s portfolio securities; (4) maintaining the required books and records for transactions that Nuance effected on behalf of the Fund; (5) selecting broker-dealers to execute orders on behalf of the Fund; and (6) monitoring and maintaining the Fund’s compliance with policies and procedures of the Trust and with applicable securities laws. The Trustees
NUANCE CONCENTRATED VALUE LONG-SHORT FUND
Approval of Investment Advisory Agreement (Unaudited) – Continued
reviewed Nuance’s financial statements, assets under management and capitalization. In that regard, the Trustees concluded that Nuance had sufficient resources to support the management of the Fund. The Trustees considered the experience of the Fund’s portfolio managers, noting that two of the portfolio managers have managed the Fund since its inception date. The Trustees concluded that they were satisfied with the nature, extent and quality of services that Nuance provides to the Fund under the Investment Advisory Agreement.
Fund Historical Performance and the Overall Performance of Nuance. In assessing the quality of the portfolio management delivered by Nuance, the Trustees reviewed the short-term and longer-term performance of the Fund on both an absolute basis and in comparison to an appropriate securities benchmark index, and the Fund’s Morningstar category (“Category”) as well as a smaller sub-set of peer funds (“Cohort”). When reviewing the Fund’s performance against its Category and Cohort, the Trustees took into account that the investment objective and strategies of the Fund, as well as the Fund’s level of risk tolerance, may differ significantly from funds in its Category and Cohort.
The Trustees considered that the Fund outperformed its Category and Cohort averages over the year-to-date period ended September 30, 2022, but underperformed for the one-year, three-year and five-year periods ended September 30, 2022. The Trustees also considered that the Fund outperformed its primary benchmark index over the year-to-date period ended September 30, 2022, but underperformed this index over all other periods presented as of December 31, 2021. The Trustees noted that Nuance does not manage other accounts or composites with the same or substantially similar strategies as the Fund.
Comparative Fee and Expense Data. The Trustees considered a comparative analysis of the contractual expenses borne by the Fund and those of funds in the same Category and Cohort. The Board noted the Fund’s contractual management fee was below the Category and Cohort averages, while its total expenses were above the Category and Cohort averages. The Trustees noted that the Fund’s Investor Class has a shareholder servicing fee and a Rule 12b-1 fee, and the Fund’s Institutional Class has a shareholder servicing fee, which is not necessarily the case for the funds included in the Category and Cohort.
While recognizing that it is difficult to compare advisory fees because the scope of advisory services provided may vary from one investment adviser to another, the Trustees concluded that Nuance’s advisory fee with respect to the Fund continues to be reasonable.
Cost of Advisory Services and Profitability. The Trustees considered the annual advisory fee that the Fund pays to Nuance under the Investment Advisory Agreement, as well as Nuance’s profitability from services that Nuance rendered to the Fund under the Investment Advisory Agreement during the 12-month period ended September 30, 2022. The Trustees also noted favorably that Nuance had agreed to continue the expense limitation agreement under which Nuance contractually agreed to reduce its advisory fees and, if necessary, reimburse the Fund for operating expenses, as specified in the Fund’s prospectus, and noted that Nuance had waived a portion of its advisory fee during its most recent fiscal year. The Trustees considered the reasonableness of Nuance’s profits from its service relationship with the Fund.
Economies of Scale. The Trustees then considered whether the Fund may benefit from any economies of scale, noting that the investment advisory fee for the Fund in the Investment Advisory Agreement does not contain breakpoints. The Trustees additionally took into account that Nuance continues to express reservations about adopting breakpoints for the Fund because of concerns about potential capacity constraints associated with the strategy. The Trustees also considered that Nuance has agreed to consider breakpoints in the future should circumstances change.
NUANCE CONCENTRATED VALUE LONG-SHORT FUND
Approval of Investment Advisory Agreement (Unaudited) – Continued
Other Benefits. The Trustees considered the direct and indirect benefits that could be realized by Nuance from its relationship with the Fund. The Trustees considered that Nuance does not utilize soft dollar arrangements with respect to portfolio transactions, and that Nuance does not use affiliated brokers to execute the Fund’s portfolio transactions. While the Trustees noted that the Fund utilizes Rule 12b-1 fees to pay for shareholder and distribution services related to Investor Class shareholders of the Fund, the Trustees also observed that the Nuance was incurring its own distribution expenses on behalf of the Fund. The Trustees considered that Nuance may receive some form of reputational benefit from services rendered to the Fund, but that such benefits are immaterial and cannot otherwise be quantified. The Trustees concluded that Nuance does not receive additional material benefits from its relationship with the Fund.
(This Page Intentionally Left Blank.)
NUANCE CONCENTRATED VALUE LONG-SHORT FUND
Privacy Notice (Unaudited)
The Fund collects only relevant information about you that the law allows or requires it to have in order to conduct its business and properly service you. The Fund collects financial and personal information about you (“Personal Information”) directly (e.g., information on account applications and other forms, such as your name, address, and social security number, and information provided to access account information or conduct account transactions online, such as password, account number, e-mail address, and alternate telephone number), and indirectly (e.g., information about your transactions with us, such as transaction amounts, account balance and account holdings).
The Fund does not disclose any non-public personal information about its shareholders or former shareholders other than for everyday business purposes such as to process a transaction, service an account, respond to court orders and legal investigations or as otherwise permitted by law. Third parties that may receive this information include companies that provide transfer agency, technology and administrative services to the Fund, as well as the Fund’s investment adviser who is an affiliate of the Fund. If you maintain a retirement/educational custodial account directly with the Fund, we may also disclose your Personal Information to the custodian for that account for shareholder servicing purposes. The Fund limits access to your Personal Information provided to unaffiliated third parties to information necessary to carry out their assigned responsibilities to the Fund. All shareholder records will be disposed of in accordance with applicable law. The Fund maintains physical, electronic and procedural safeguards to protect your Personal Information and requires its third party service providers with access to such information to treat your Personal Information with the same high degree of confidentiality.
In the event that you hold shares of the Fund through a financial intermediary, including, but not limited to, a broker-dealer, credit union, bank or trust company, the privacy policy of your financial intermediary governs how your non-public personal information is shared with unaffiliated third parties.
INVESTMENT ADVISER
Nuance Investments, LLC
4900 Main Street, Suite 220
Kansas City, MO 64112
DISTRIBUTOR
Quasar Distributors, LLC
111 East Kilbourn Avenue, Suite 2200
Milwaukee, WI 53202
CUSTODIAN
U.S. Bank, N.A.
1555 North Rivercenter Drive
Milwaukee, WI 53212
ADMINISTRATOR, FUND ACCOUNTANT
AND TRANSFER AGENT
U.S. Bancorp Fund Services, LLC
615 East Michigan Street
Milwaukee, WI 53202
INDEPENDENT REGISTERED PUBLIC ACCOUNTING FIRM
Cohen & Company, Ltd.
342 North Water Street, Suite 830
Milwaukee, WI 53202
LEGAL COUNSEL
Stradley Ronon Stevens & Young, LLP
2005 Market Street, Suite 2600
Philadelphia, PA 19103
This report must be accompanied or preceded by a prospectus.
The Fund’s Statement of Additional Information contains additional information about the
Fund’s trustees and is available without charge upon request by calling 1-855-682-6233.
(b) Not Applicable.
Item 2. Code of Ethics.
The registrant has adopted a code of ethics that applies to the Registrant’s principal executive officer and principal financial officer. The registrant has not made any substantive amendments to its code of ethics during the period covered by this report.
The registrant has not granted any waivers from any provisions of the code of ethics during the period covered by this report.
A copy of the registrant’s code of ethics that applies to the registrant’s principal executive officer and principal financial officer is filed herewith.
Item 3. Audit Committee Financial Expert.
The registrant’s board of Trustees has determined that there is at least one audit committee financial expert serving on its audit committee. Leonard M. Rush is the “audit committee financial expert” and is considered to be “independent” as each term is defined in Item 3 of Form N‑CSR.
Item 4. Principal Accountant Fees and Services.
The registrant has engaged its principal accountant to perform audit services, audit-related services, tax services and other services during the past two fiscal years. “Audit services” refer to performing an audit of the registrant's annual financial statements or services that are normally provided by the accountant in connection with statutory and regulatory filings or engagements for those fiscal years. “Audit-related services” refer to the assurance and related services by the principal accountant that are reasonably related to the performance of the audit. “Tax services” refer to professional services rendered by the principal accountant for tax compliance, tax advice, and tax planning; including reviewing the Funds’ tax returns and distribution calculations. There were no “other services” provided by the principal accountant. For the fiscal years ended April 30, 2023 and April 30, 2022, the Funds’ principal accountant was Cohen & Company, Ltd. The following table details the aggregate fees billed or expected to be billed for each of the last two fiscal years for audit fees, audit-related fees, tax fees and other fees by the principal accountant.
| | FYE 4/30/2023 | FYE 4/30/2022 |
Audit Fees | $47,250 | $45,000 |
Audit-Related Fees | $0 | $0 |
Tax Fees | $10,500 | $10,500 |
All Other Fees | $0 | $0 |
The audit committee has adopted pre-approval policies and procedures that require the audit committee to pre‑approve all audit and non‑audit services of the registrant, including services provided to any entity affiliated with the registrant.
The percentage of fees billed by Cohen & Company, Ltd. for the fiscal years ended April 30, 2023 and April 30, 2022, applicable to non-audit services pursuant to waiver of pre-approval requirement were as follows:
| | FYE 4/30/2023 | FYE 4/30/2022 |
Audit-Related Fees | 0% | 0% |
Tax Fees | 0% | 0% |
All Other Fees | 0% | 0% |
All of the principal accountant’s hours spent on auditing the registrant’s financial statements were attributed to work performed by full‑time permanent employees of the principal accountant.
The following table indicates the non-audit fees billed or expected to be billed by the registrant’s accountant for services to the registrant and to the registrant’s investment adviser (and any other controlling entity, etc.—not sub-adviser) for the last two years.
Non-Audit Related Fees | FYE 4/30/2023 | FYE 4/30/2022 |
Registrant | $0 | $0 |
Registrant’s Investment Adviser | $0 | $0 |
The audit committee of the board of trustees/directors has considered whether the provision of non-audit services that were rendered to the registrant's investment adviser is compatible with maintaining the principal accountant's independence and has concluded that the provision of such non-audit services by the accountant has not compromised the accountant’s independence.
(i) Not applicable.
(j) Not applicable.
Item 5. Audit Committee of Listed Registrants.
Not applicable to registrants who are not listed issuers (as defined in Rule 10A-3 under the Securities Exchange Act of 1934).
Item 6. Investments.
| (a) | Schedule of Investments is included as part of the report to shareholders filed under Item 1 of this Form. |
Item 7. Disclosure of Proxy Voting Policies and Procedures for Closed-End Management Investment Companies.
Not applicable to open-end investment companies.
Item 8. Portfolio Managers of Closed-End Management Investment Companies.
Not applicable to open-end investment companies.
Item 9. Purchases of Equity Securities by Closed‑End Management Investment Company and Affiliated Purchasers.
Not applicable to open-end investment companies.
Item 10. Submission of Matters to a Vote of Security Holders.
There have been no material changes to the procedures by which shareholders may recommend nominees to the Registrant’s board of trustees.
Item 11. Controls and Procedures.
| (a) | The Registrant’s [President/Chief Executive Officer] and [Treasurer/Chief Financial Officer] have reviewed the Registrant's disclosure controls and procedures (as defined in Rule 30a-3(c) under the Investment Company Act of 1940 (the “Act”)) as of a date within 90 days of the filing of this report, as required by Rule 30a-3(b) under the Act and Rules 13a-15(b) or 15d‑15(b) under the Securities Exchange Act of 1934. Based on their review, such officers have concluded that the disclosure controls and procedures are effective in ensuring that information required to be disclosed in this report is appropriately recorded, processed, summarized and reported and made known to them by others within the Registrant and by the Registrant’s service provider. |
| (b) | There were no changes in the Registrant's internal control over financial reporting (as defined in Rule 30a-3(d) under the Act) that occurred during the period covered by this report that has materially affected, or is reasonably likely to materially affect, the Registrant's internal control over financial reporting. |
Item 12. Disclosure of Securities Lending Activities for Closed-End Management Investment Companies.
Not applicable to open-end investment companies.
Item 13. Exhibits.
(3) Any written solicitation to purchase securities under Rule 23c‑1 under the Act sent or given during the period covered by the report by or on behalf of the registrant to 10 or more persons. Not applicable to open-end investment companies.
(4) Change in the registrant’s independent public accountant. There was no change in the registrant’s independent public accountant for the period covered by this report.
SIGNATURES
Pursuant to the requirements of the Securities Exchange Act of 1934 and the Investment Company Act of 1940, the registrant has duly caused this report to be signed on its behalf by the undersigned, thereunto duly authorized.
(Registrant) Managed Portfolio Series
By (Signature and Title) * /s/Brian R. Wiedmeyer
Brian R. Wiedmeyer, President
Date July 5, 2023
Pursuant to the requirements of the Securities Exchange Act of 1934 and the Investment Company Act of 1940, this report has been signed below by the following persons on behalf of the registrant and in the capacities and on the dates indicated.
By (Signature and Title) * /s/Brian R. Wiedmeyer
Brian R. Wiedmeyer, President
Date July 5, 2023
By (Signature and Title)* /s/Benjamin J. Eirich
Benjamin J. Eirich, Treasurer
Date July 5, 2023
* Print the name and title of each signing officer under his or her signature.