Reinhart Mid Cap PMV Fund
Investor Class Shares – RPMMX
Advisor Class Shares – RPMVX
Institutional Class Shares – RPMNX
Reinhart Genesis PMV Fund
Investor Class Shares – RPMAX
Advisor Class Shares – RPMFX
Reinhart International PMV Fund
Advisor Class Shares – RPMYX
Annual Report
| www.ReinhartFunds.com | May 31, 2023 |
Reinhart Mid Cap PMV Fund (Unaudited)
June 23, 2023
Fellow Shareholders,
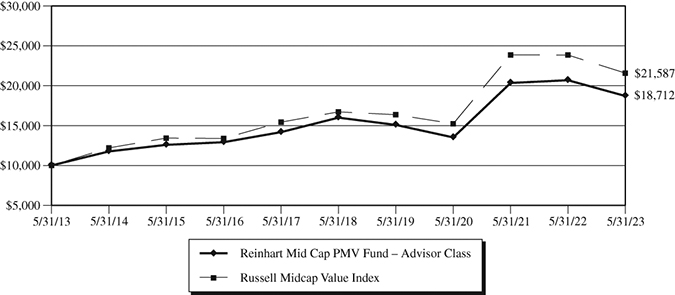
The Reinhart Mid Cap PMV Fund – Advisor Class (the “Fund”) returned -9.56% for the twelve-month period ended May 31, 2023, roughly in line with the Russell Midcap Value Index’s return of -9.49%. After a strong year of performance in calendar 2022, the performance during the period was frustrating and largely due to our position in Signature Bank (SBNY), which was put into receivership by regulators on Sunday, March 12th. We were exceedingly disappointed in the FDIC’s decision to close the bank. The outcome struck us as somewhat arbitrary and unnecessarily reactionary. Given the significant impact it had on our performance, we will provide a higher level of detail on our thinking behind the position.
SBNY got caught up in the current panic surrounding banks that brought down Silicon Valley Bank (SIVB) a few days prior. Investors looked for the next bank to go under, unfortunately, and we believe unfairly, keyed in on SBNY despite the bank being materially different from SIVB. SBNY did not have near the levels of held-to-maturity securities on its balance sheet as compared with SIVB, nor did it have severe securities losses with which to contend. SBNY had also released an intra-quarter update on the Wednesday prior to being put into receivership (March 8th) that showed growth in deposits year to date. Unlike SIVB, which had already been seeing massive deposit outflows, SBNY’s deposits were stable.
What SBNY did have was a high concentration (90%+) of large (>$250K) and therefore uninsured deposits – mostly commercial – which has become the hot button issue in this banking crisis. We have always known this about SBNY but understood this aspect of their unique and commercially focused business model. Historically we have looked for banks with diverse retail deposit bases and a significant portion of smaller, sticky checking accounts where the switching costs are high, and the customers are slower to chase yield. Not because we thought the lack thereof would become an existential risk for any bank, but because it had historically been a more profitable approach. But once we researched Signature extensively, we liked its unique, lean business model of focusing on commercial customers, keeping an efficient cost base without the expense-heavy retail branch network, and luring elite bankers away from competitors with attractive compensation packages structured to align incentives with shareholders. The proof was in the pudding, as SBNY had consistently delivered return on equity and book value growth well above peers, not to mention a pristine credit underwriting track record over multiple cycles.
Despite many misleading media headlines, Signature’s digital currency practice did not hold any digital currency assets on its balance sheet and made zero digital currency loans. But with the stock price falling and short sellers and internet chat rooms conspiring to push SBNY under, depositors got spooked and perception became reality over the few days following SIVB’s failure – deposits flowed out that Friday afternoon and into the weekend such that regulators felt it was enough to step in. We should note that the other banks in our portfolio are well diversified in their deposit bases and have also managed their securities books prudently over the last several years. Nevertheless, we will remain diligent in assessing all financial risks in our holdings, knowing this mistake is an opportunity to learn and improve the process.
Moving aside from Financials, Communication Services were a positive contributor driven by strong results from Live Nation Entertainment and Interpublic Group. Live Nation is a newer position for us and one that we view as right in our “wheelhouse.” This is a company with a rock-solid competitive advantage driven by scale and network effects in the live-music ecosystem such that it has 75% market share in the U.S. We were able to purchase this normally expensive name when it was temporarily out of favor due to misdirected frustration over the Taylor
Reinhart Mid Cap PMV Fund (Unaudited)
Swift ticketing firestorm. Ultimately, we expect any resulting governmental action to have minimal (or even positive) impact on LYV’s business. In addition, National Instruments Corporation was a positive standout, driven by Emerson’s attractive buyout offer above our Private Market Value estimate.
We remain confident in our long-term, quality-oriented discipline and expect to achieve attractive results going forward and over the long term. This is especially true as uncertainty and volatility continue to manifest in the stock market.
Thank you for your confidence in Reinhart Partners.
Sincerely,
Josh Wheeler
Portfolio Manager, Reinhart Partners, LLC
Must be preceded or accompanied by a prospectus.
Past performance is not a guarantee of future results.
Mutual fund investing involves risk. There can be no guarantee that any strategy will be successful. Principal loss is possible. Investing in medium-sized companies involves greater risk than those associated with investing in large company stocks, such as business risk, significant stock price fluctuations and illiquidity. The Fund’s value investments are subject to the risk that their intrinsic values may not be recognized by the broad market or that their prices may decline.
Opinions expressed are those of the fund manager and are subject to change, are not guaranteed and should not be considered a recommendation to buy or sell any security.
| • | Russell Midcap Value Index: an unmanaged equity index which measures the performance of mid-sized U.S. companies classified by Russell as ‘value’. It is not possible to invest directly into an index. |
| | |
| • | Private Market Value (PMV): the estimated price per share of a stock that a corporate buyer or private equity firm would be willing to pay to buyout and control the entire company. |
Fund holdings and sector allocations are subject to change at any time and should not be considered recommendations to buy or sell any security. Please refer to the Schedule of Investments in this report for a complete list of fund holdings.
Quasar Distributors, LLC, Distributor.
Reinhart Mid Cap PMV Fund
Value of $10,000 Investment (Unaudited)
The chart assumes an initial investment of $10,000. Performance reflects waivers of fee and operating expenses in effect. In the absence of such waivers, total return would be reduced. Performance data quoted represents past performance and does not guarantee future results. Investment returns and principal value will fluctuate, and when sold, may be worth more or less than their original cost. Performance current to the most recent month-end may be lower or higher than the performance quoted and can be obtained by calling 855-774-3863. Performance assumes the reinvestment of capital gains and income distributions. The performance does not reflect the deduction of taxes that a shareholder would pay on Fund distributions or the redemption of Fund shares.
Annualized Rates of Return as of May 31, 2023
| | 1-Year | 3-Year | 5-Year | 10-Year | Since Inception(1) |
| Investor Class | -9.77% | 11.18% | 2.93% | 6.20% | 8.03% |
| Advisor Class | -9.56% | 11.45% | 3.19% | 6.47% | 8.29% |
| Institutional Class | -9.54% | 11.58% | 3.31% | 6.61% | 8.44% |
Russell Midcap Value Index(2) | -9.49% | 12.31% | 5.24% | 8.00% | 10.13% |
| (1) | Period from Fund inception through May 31, 2023. The Advisor and Investor Class commenced operations on June 1, 2012, and the Institutional Class commenced operations on September 29, 2017. Performance shown for the Institutional Class prior to the inception of the Institutional Class is based on the performance of the Advisor Class, adjusted for the lower expenses applicable to the Institutional Class. |
| (2) | The Russell Midcap Value Index measures the performance of those Russell Midcap companies with lower price-to-book ratios and lower forecasted growth values. This index cannot be invested in directly. |
The following is expense information for the Reinhart Mid Cap PMV Fund as disclosed in the Fund’s most recent prospectus dated September 28, 2022:
| Investor Class Gross Expense Ratio – 1.52% | Net Expense Ratio – 1.30% |
| Advisor Class Gross Expense Ratio – 1.27% | Net Expense Ratio – 1.05% |
| Institutional Class Gross Expense Ratio – 1.12% | Net Expense Ratio – 0.90% |
Reinhart Mid Cap PMV Fund
Reinhart Partners, LLC (the “Adviser” or “Reinhart”) has contractually agreed to waive its management fees and pay Fund expenses in order to ensure that Total Annual Fund Operating Expenses (excluding acquired fund fees and expenses (“AFFE”), leverage/borrowing interest, interest expense, taxes, brokerage commissions, and extraordinary expenses) do not exceed 1.30% of the average daily net assets of the Investor Class, 1.05% of the average daily net assets of the Advisor Class and 0.90% of the average daily net assets of the Institutional Class. Fees waived and expenses paid by the Adviser may be recouped by the Adviser for a period of 36 months following the month during which such fee waiver and expense payment was made, if such recoupment can be achieved without exceeding the expense limit in effect at the time the fee waiver and expense payment occurred and the expense limit in effect at the time of recoupment. The Operating Expenses Limitation Agreement is indefinite in term and cannot be terminated through at least September 28, 2028. Thereafter, the agreement may be terminated at any time upon 60 days’ written notice by the Trust’s Board of Trustees (the “Board”) or the Adviser, with the consent of the Board.
The actual net expense ratios applicable to investors, as disclosed in the Financial Highlights for the year ended May 31, 2023, was 1.30%, 1.05% and 0.90% for the Investor Class, Advisor Class and Institutional Class, respectively.
Reinhart Mid Cap PMV Fund
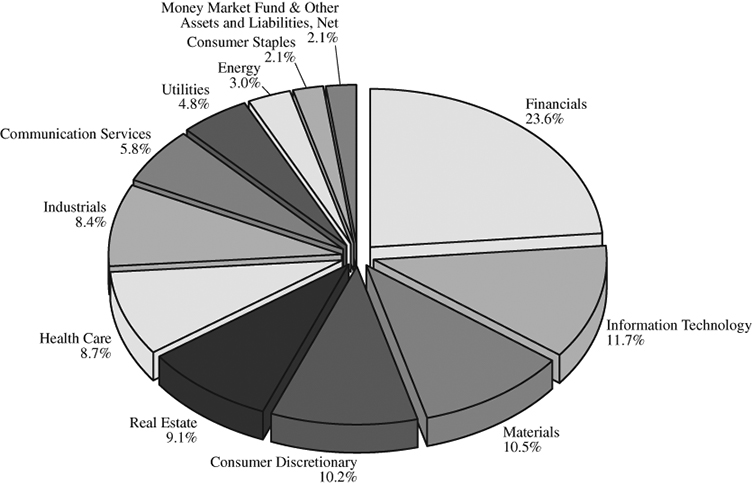
Allocation of Portfolio Net Assets(1) (Unaudited)
May 31, 2023
(% of Net Assets)
Top Ten Equity Holdings(1) (Unaudited)
May 31, 2023
(% of Net Assets)
| SS&C Technologies Holdings | 3.8% |
| TransUnion | 3.5% |
| Live Nation Entertainment | 3.5% |
| Charles River Laboratories International | 3.1% |
| Intercontinental Exchange | 3.1% |
| Affiliated Managers Group | 3.1% |
| White Mountains Insurance Group | 3.1% |
| Global Payments | 3.0% |
| Baker Hughes, Class A | 3.0% |
| Encompass Health | 2.9% |
| (1) | Fund Holdings and Sector allocations are subject to change at any time and are not recommendations to buy or sell any security. |
Reinhart Genesis PMV Fund (Unaudited)
June 23, 2023
Fellow Shareholders,
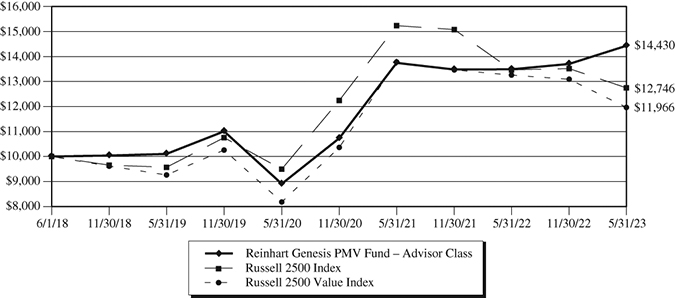
The Reinhart Genesis PMV Fund – Advisor Class (the “Fund”) generated a return of +6.97% for the twelve-month period ended May 31, 2023. Meanwhile, the portfolio’s Russell 2500 benchmark declined -5.34% over the same period – equating to outperformance of over 1200 basis points. The Genesis PMV strategy has historically done well during periods of volatility, and the last twelve months were no different as we were pleased to have provided the downside protection. However, two notable M&A events in the period deserve special attention.
In mid-December, private equity firm Advent International offered to acquire Maxar, the largest holding in the portfolio, for a 130% premium to its prior close. The stock has been one of the most volatile in the portfolio over the last few years due to delays in the launch of its satellite constellation. We had substantial conviction in the long-term value of Maxar but also understood there was an above-average level of risk in the path toward realizing that value. While we believe Advent is getting a bargain in this deal (and Advent, with significant expertise in this industry, surely agrees), we also believe the price is reasonable given the risks inherent in Maxar’s crucial upcoming satellite launch. In any event, this was a positive outcome and contributed significantly to the outperformance during the period.
The next event worth highlighting is the banking crisis which unfolded in early March. While the significant weight in bank stocks was a detractor from results in aggregate, we are pleased that each of the portfolio’s bank holdings performed in-line with or better than the average bank stock within the benchmark.
Given our focus on high-quality businesses, we are often asked why we invest in banks at all – aren’t they highly competitive, commodity businesses? Contrary to popular opinion, we believe banking can be a good business. Unlike most any other business, we believe the competitive advantage of high-quality banks tends to rest on the liability side of the balance sheet. The inconvenience of changing banks drives switching costs. A good deposit base, with a strong core of small and sticky consumer checking accounts, takes decades to build and is difficult to replicate. Such a deposit base tends to be stable and carry a low cost of funds which allows the bank to achieve its desired loan spreads without taking too much credit risk. Speaking of credit risk, we also focus deeply on the underwriting ethos that exists within the banks in the portfolio. How do we get comfortable with a bank’s underwriting skill? Bank credit underwriting culture is extremely difficult to change. We look for banks that have weathered previous downturns well, particularly the Great Financial Crisis.
A good example of a bank that epitomizes the above advantages is long-time holding First Citizens (FCNCA). Based in North Carolina with its founding traced back to the late 1800s, FCNCA has many branches spread out across North and South Carolina. The company has built a granular, robust deposit base with a disproportionate percentage of noninterest-bearing checking accounts and a cost of funds half that of its peers. Conservative underwriting has produced a track record of low credit losses across cycles, including a pristine record in 2008-09. The bank has grown tangible book value at a compound annual growth rate of 11% over the past 15 years. As a result of their uniquely robust deposit base, strong credit quality and a history of astutely executing FDIC-assisted acquisitions, First Citizens was able to take advantage of the challenging banking environment when competitors were unable. In late March, First Citizens announced a definitive agreement to acquire the most attractive pieces of the former Silicon Valley Bank with terms (e.g., FDIC backstops) and a valuation so compelling that the stock price increased materially following the announcement of the deal.
On the downside, the Healthcare sector was the only notably difficult area for the portfolio. Sotera Health was a significant detractor as it lost a key lawsuit related to chemical emissions from one of its plants in Illinois. While this outcome was within our range of possibilities, we did not believe it was a likely conclusion. Unsurprisingly
Reinhart Genesis PMV Fund (Unaudited)
market participants seemed to assume this worst-case scenario is upheld. While a second case on this issue went in the company’s favor, the damage was done. In addition, contract research organization Syneos Health reported shockingly poor book-to-bill numbers in early November.
Thank you for your confidence in Reinhart Partners.
Sincerely,
Matt Martinek, CFA
Portfolio Manager, Reinhart Partners, LLC
Must be preceded or accompanied by a prospectus.
Past performance is not a guarantee of future results.
Mutual fund investing involves risk. There can be no guarantee that any strategy will be successful. Principal loss is possible. Investing in medium-sized companies involves greater risk than those associated with investing in large company stocks, such as business risk, significant stock price fluctuations and illiquidity. The Fund’s value investments are subject to the risk that their intrinsic values may not be recognized by the broad market or that their prices may decline.
Opinions expressed are those of the fund manager and are subject to change, are not guaranteed and should not be considered a recommendation to buy or sell any security.
Basis point (bp) is a unit equal to 1/100th of 1% and is used to denote the change in a financial instrument.
| • | Russell 2500 Index: an unmanaged equity index which measures the performance of the 2,500 smallest companies in the Russell 3000 Index. It is not possible to invest directly into an index. |
| | |
| • | Russell 2500 Value Index: an unmanaged equity index which measures the performance of smid-cap companies classified by Russell as ‘value’. It is not possible to invest directly into an index. |
| | |
| • | Private Market Value (PMV): the estimated price per share of a stock that a corporate buyer or private equity firm would be willing to pay to buyout and control the entire company. |
Fund holdings and sector allocations are subject to change at any time and should not be considered recommendations to buy or sell any security. Please refer to the Schedule of Investments in this report for a complete list of fund holdings.
Quasar Distributors, LLC, Distributor.
Reinhart Genesis PMV Fund
Value of $10,000 Investment (Unaudited)
The chart assumes an initial investment of $10,000. Performance reflects waivers of fee and operating expenses in effect. In the absence of such waivers, total return would be reduced. Performance data quoted represents past performance and does not guarantee future results. Investment returns and principal value will fluctuate, and when sold, may be worth more or less than their original cost. Performance current to the most recent month-end may be lower or higher than the performance quoted and can be obtained by calling 855-774-3863. Performance assumes the reinvestment of capital gains and income distributions. The performance does not reflect the deduction of taxes that a shareholder would pay on Fund distributions or the redemption of Fund shares.
Annualized Rates of Return as of May 31, 2023
| | 1-Year | 3-Year | 5-Year | Since Inception(1) |
| Investor Class | 6.73% | 17.14% | 7.33% | 7.33% |
| Advisor Class | 6.97% | 17.45% | 7.61% | 7.61% |
Russell 2500 Index(2) | -5.34% | 10.31% | 4.97% | 4.97% |
Russell 2500 Value Index(3) | -9.73% | 13.52% | 3.65% | 3.65% |
| (1) | Inception date of the Fund was June 1, 2018. |
| (2) | The Russell 2500 Index measures the performance of the small to mid-cap segment of the U.S. equity universe, commonly referred to as “smid” cap. The Russell 2500 Index is a subset of the Russell 3000 Index. It includes approximately 2,500 of the smallest securities based on a combination of their market cap and current index membership. This index cannot be invested in directly. |
| (3) | The Russell 2500 Value Index measures the performance of the small to mid-cap value segment of the U.S. equity universe. It includes those Russell 2500 companies that are considered more value oriented relative to the overall market as defined by Russell’s leading style methodology. This index cannot be invested in directly. |
The following is expense information for the Reinhart Genesis PMV Fund as disclosed in the Fund’s most recent prospectus dated September 28, 2022:
| Investor Class Gross Expense Ratio – 1.52% | Net Expense Ratio – 1.20% |
| Advisor Class Gross Expense Ratio – 1.27% | Net Expense Ratio – 0.95% |
Reinhart Genesis PMV Fund
Reinhart Partners, LLC (the “Adviser” or “Reinhart”) has contractually agreed to waive its management fees and pay Fund expenses in order to ensure that Total Annual Fund Operating Expenses (excluding AFFE, leverage/borrowing interest, interest expense, taxes, brokerage commissions, and extraordinary expenses) do not exceed 1.20% of the average daily net assets of the Investor Class and 0.95% of the average daily net assets of the Advisor Class. Fees waived and expenses paid by the Adviser may be recouped by the Adviser for a period of 36 months following the month during which such fee waiver and expense payment was made, if such recoupment can be achieved without exceeding the expense limit in effect at the time the fee waiver and expense payment occurred and the expense limit in effect at the time of recoupment. The Operating Expenses Limitation Agreement is indefinite in term and cannot be terminated through at least September 28, 2025. Thereafter, the agreement may be terminated at any time upon 60 days’ written notice by the Trust’s Board of Trustees (the “Board”) or the Adviser, with the consent of the Board.
The actual net expense ratios applicable to investors, as disclosed in the Financial Highlights for the year ended May 31, 2023, was 1.20% and 0.95% for the Investor Class and Advisor Class, respectively.
Reinhart Genesis PMV Fund
Allocation of Portfolio Net Assets(1) (Unaudited)
May 31, 2023
(% of Net Assets)
Top Ten Equity Holdings(1) (Unaudited)
May 31, 2023
(% of Net Assets)
| First Citizens BancShares, Class A | 5.9% |
| Insperity | 4.9% |
| Lantheus Holdings | 4.8% |
| frontdoor | 4.1% |
| Hillman Solutions | 3.8% |
| Air Lease, Class A | 3.7% |
| ACI Worldwide | 3.6% |
| Grand Canyon Education | 3.5% |
| U-Haul Holding, Series N | 3.3% |
| Assured Guaranty | 3.2% |
| (1) | Fund Holdings and Sector allocations are subject to change at any time and are not recommendations to buy or sell any security. |
Reinhart International PMV Fund (Unaudited)
June 23, 2023
Fellow Shareholders,
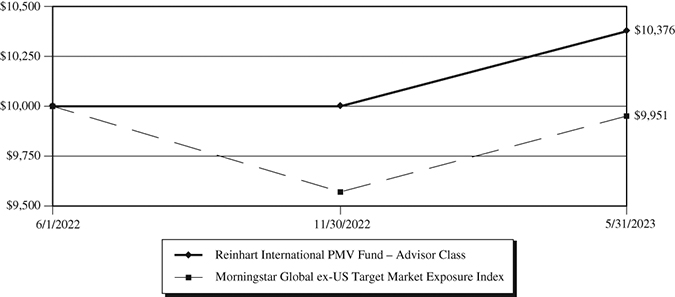
The Reinhart International PMV Fund – Advisor Class (the “Fund”) was up 3.76% for the twelve-months ended May 31, 2023, handily outperforming the -0.49% return for the Morningstar Global ex-US Target Market Exposure Index benchmark. Overall, as we conclude the first year of the Fund’s existence, we are pleased to have provided the downside protection. Outperformance for the fiscal year was achieved amidst a volatile global stock market punctuated by high inflation, economic choppiness, a geopolitical-based economic stand-off with China and, of course, the war in Ukraine which has severely impacted the supply and cost of energy for much of Europe. Periods of elevated volatility have historically been a time during which our Private Market Value (PMV) investment philosophy has tended to shine for our U.S.-focused funds. We are happy to see a similar outcome with our new International PMV strategy.
Moving onto the specific performance drivers, portfolio results were led by the Consumer Discretionary and Financial sectors. Within Consumer, Boyd Group, Mercari and B&M European Value Retail were positive standouts. One of three large players in the North American auto collision service center market, Boyd (Canada) has been able to meet strong demand by utilizing its labor supply advantages. This has also enabled the company to raise prices to recoup costs increases and defend profitability. Expectations for Mercari’s earnings results were low given the difficult economic backdrop. But the Japanese online marketplace operator effectively managed costs in the quarter, highlighted emerging success with its fledgling payments ecosystem venture and pointed to improving end market demand for the rest of the year. B&M, a U.K.-based discount retailer, is gaining share and benefitting from consumers trading down as inflation pressures household budgets.
The Financial sector was boosted by Bank of Ireland (benefitting from higher interest rates), France-based Human Resources and Payments servicer Edenred (strong labor market, inflation beneficiary) and Canadian company Element Fleet Management (reopening, pent-up demand, recovering auto production).
On the flip side, the Real Estate, Healthcare and Consumer Staples sectors were detractors over the period – each largely due to one stock. Cushman & Wakefield, a U.K. based commercial real estate broker, declined sharply as market participants reacted to a significant decline in the company’s margins and earnings as higher interest rates caused a sharp slowdown in property sales. We are confident Cushman’s reputation, relationships and scale will allow it to win market share from smaller competitors when the market turns around.
Within the Healthcare sector, Germany-based lab test provider SYNLAB was a detractor as the company had several disappointing quarters in a row with head-scratching (non) explanations from management that caused us to lose faith in the quality of the business. Hence, we sold the position. As always, there will be inevitability be mistakes along the way, and our goal is to recognize those as quickly as possible and minimize the impact on the portfolio. Speaking of mistakes, China Feihe – a leading Chinese infant formula seller – has been a headache ever since we invested at the inception of the fund due to unanticipated inventory destocking mixed with fierce price competition from lower-priced products. We are sticking with the holding for now, as we like the company’s leading market position in a growth industry and the stock’s compelling valuation.
The elevated stock market volatility of the past twelve months has presented an opportunity to invest in great businesses at favorable prices. We have continued to reallocate capital across the portfolio to take advantage of the day-to-day swings in market prices. We never attempt to predict market direction, but we are confident the durability of the businesses in the International PMV portfolio will continue to shine through in a still uncertain global economic environment.
Reinhart International PMV Fund (Unaudited)
Thank you for your confidence in Reinhart Partners.
Sincerely,
Matt Martinek, CFA
Portfolio Manager, Reinhart Partners, LLC
Must be preceded or accompanied by a prospectus.
Past performance is not a guarantee of future results.
Mutual fund investing involves risk. There can be no guarantee that any strategy will be successful. Principal loss is possible. Investing in small and medium-sized companies involves greater risk than those associated with investing in large company stocks, such as business risk, significant stock price fluctuations and illiquidity. The Fund’s value investments are subject to the risk that their intrinsic values may not be recognized by the broad market or that their prices may decline. Investments in securities of foreign issuers involve risks not ordinarily associated with investments insecurities and instruments of U.S. issuers, including risks relating to political, social, and economic developments abroad, differences between U.S. and foreign regulatory and accounting requirements, tax risks, and market practices, as well as fluctuations in foreign currencies.
Opinions expressed are those of the fund manager and are subject to change, are not guaranteed and should not be considered a recommendation to buy or sell any security.
| • | Morningstar Global ex-US Target Market Exposure Index is a rules based, float market capitalization-weighted index designed to cover 85% of the equity float-adjusted market capitalization of the Global equity markets. This Index does not incorporate Environmental, Social, or Governance (ESG) criteria. It is not possible to invest directly into an index. |
| | |
| • | Private Market Value (PMV): the estimated price per share of a stock that a corporate buyer or private equity firm would be willing to pay to buyout and control the entire company. |
Fund holdings and sector allocations are subject to change at any time and should not be considered recommendations to buy or sell any security. Please refer to the Schedule of Investments in this report for a complete list of fund holdings.
Quasar Distributors, LLC, Distributor.
Reinhart International PMV Fund
Value of $10,000 Investment (Unaudited)
The chart assumes an initial investment of $10,000. Performance reflects waivers of fee and operating expenses in effect. In the absence of such waivers, total return would be reduced. Performance data quoted represents past performance and does not guarantee future results. Investment returns and principal value will fluctuate, and when sold, may be worth more or less than their original cost. Performance current to the most recent month-end may be lower or higher than the performance quoted and can be obtained by calling 855-774-3863. Performance assumes the reinvestment of capital gains and income distributions. The performance does not reflect the deduction of taxes that a shareholder would pay on Fund distributions or the redemption of Fund shares.
Annualized Rates of Return as of May 31, 2023
| | Since Inception(1) |
| Advisor Class | 3.76% |
Morningstar Global ex-US Target Market Exposure Index(2) | -0.49% |
| (1) | Inception date of the Fund was June 1, 2022. |
| (2) | Morningstar Global ex-US Target Market Exposure Index is a rules based, float market capitalization-weighted index designed to cover 85% of the equity float-adjusted market capitalization of the Global equity markets. This Index does not incorporate Environmental, Social, or Governance (ESG) criteria. This index cannot be invested in directly. |
The following is expense information for the Reinhart International PMV Fund as disclosed in the Fund’s most recent prospectus dated May 20, 2022:
| Advisor Class Gross Expense Ratio – 5.96% | Net Expense Ratio – 0.95% |
Reinhart Partners, LLC (the “Adviser” or “Reinhart”) has contractually agreed to waive its management fees and pay Fund expenses in order to ensure that Total Annual Fund Operating Expenses (excluding front-end or contingent deferred loads, taxes, leverage/borrowing interest, interest expense, dividends paid on short sales, brokerage commissions, AFFE, expenses incurred in connection with any merger or reorganization, or extraordinary expenses such as litigation) do not exceed 0.95% of the average daily net assets of the Advisor Class. Fees waived and expenses paid by the Adviser may be recouped by the Adviser for a period of 36 months following the date such fee waiver and expense payment was made, if such recoupment can be achieved without
Reinhart International PMV Fund
exceeding the expense limit in effect at the time the fee waiver and expense payment occurred and the expense limit in effect at the time of recoupment. The Operating Expenses Limitation Agreement is indefinite in term and cannot be terminated through at least September 28, 2025. Thereafter, the agreement may be terminated at any time upon 60 days’ written notice by the Trust’s Board of Trustees (the “Board”) or the Adviser, with the consent of the Board.
The actual net expense ratio applicable to investors, as disclosed in the Financial Highlights for the year ended May 31, 2023, was 0.95%.
Reinhart International PMV Fund
Allocation of Portfolio Net Assets(1) (Unaudited)
May 31, 2023
(% of Net Assets)
Top Ten Equity Holdings(1) (Unaudited)
May 31, 2023
(% of Net Assets)
| Mercari | 4.3% |
| B&M European Value Retail SA | 4.3% |
| Capgemini SE | 3.7% |
| Edenred | 3.6% |
| Jeronimo Martins SGPS SA | 3.4% |
| Element Fleet Management | 3.2% |
| Taiwan Semiconductor Manufacturing – ADR | 3.1% |
| Coway | 3.1% |
| London Stock Exchange Group plc | 3.0% |
| Bank of Ireland Group plc | 3.0% |
| (1) | Fund Holdings and Sector allocations are subject to change at any time and are not recommendations to buy or sell any security. |
Reinhart Funds
Expense Examples (Unaudited)
May 31, 2023
As a shareholder of a Fund, you incur two types of costs: (1) transaction costs, which may include but are not limited to, sales charges (loads) on purchases; and (2) ongoing costs, including management fees, distribution (12b-1) fees, shareholder servicing fees and other Fund expenses. This Example is intended to help you understand your ongoing costs (in dollars) of investing in a Fund and to compare these costs with the ongoing costs of investing in other mutual funds. The Example is based on an investment of $1,000 invested at the beginning of the period and held for the entire period (December 1, 2022 – May 31, 2023).
ACTUAL EXPENSES
For each class, the first line of the table provides information about actual account values and actual expenses. You may use the information in this line, together with the amount you invested, to estimate the expenses that you paid over the period. Simply divide your account value by $1,000 (for example, an $8,600 account value divided by $1,000 = 8.6), then multiply the result by the number in the first line under the heading entitled “Expenses Paid During Period” to estimate the expenses you paid on your account during this period.
HYPOTHETICAL EXAMPLE FOR COMPARISON PURPOSES
For each class, the second line of the table below provides information about hypothetical account values and hypothetical expenses based on the Fund’s actual expense ratio and an assumed rate of return of 5% per year before expenses, which is not the Fund’s actual return. The hypothetical account values and expenses may not be used to estimate the actual ending account balance or expenses you paid for the period. You may use this information to compare the ongoing costs of investing in the Fund and other funds. To do so, compare this 5% hypothetical example with the 5% hypothetical examples that appear in the shareholder reports of the other funds.
Please note that the expenses shown in the table are meant to highlight your ongoing costs only and do not reflect any transactional costs. Therefore, the second line of the table is useful in comparing ongoing costs only, and will not help you determine the relative total costs of owning different funds. In addition, if transactional costs were included, your costs may have been higher.
Reinhart Mid Cap PMV Fund
| | Beginning | Ending | Expenses Paid |
| | Account Value | Account Value | During Period(1) |
| | (12/1/2022) | (5/31/2023) | (12/1/2022 – 5/31/2023) |
Investor Class Actual(2) | $1,000.00 | $ 905.30 | $6.18 |
| Investor Class Hypothetical | | | |
| (5% return before expenses) | $1,000.00 | $1,018.45 | $6.54 |
| | | | |
Advisor Class Actual(2) | $1,000.00 | $ 905.90 | $4.99 |
| Advisor Class Hypothetical | | | |
| (5% return before expenses) | $1,000.00 | $1,019.70 | $5.29 |
| | | | |
Institutional Class Actual(2) | $1,000.00 | $ 907.00 | $4.28 |
| Institutional Class Hypothetical | | | |
| (5% return before expenses) | $1,000.00 | $1,020.44 | $4.53 |
| (1) | Expenses are equal to the Fund’s annualized expense ratio for most recent six-month period of 1.30%, 1.05%, 0.90%, for the Investor Class, Advisor Class and Institutional Class, respectively, multiplied by the average account value over the period, multiplied by 182/365 to reflect the one-half year period. |
| (2) | Based on the actual returns for the six-month period ended May 31, 2023, of -9.47%, -9.41% and -9.30% for the Investor Class, Advisor Class and Institutional Class, respectively. |
Reinhart Funds
Expense Examples (Unaudited) – Continued
May 31, 2023
Reinhart Genesis PMV Fund
| | Beginning | Ending | Expenses Paid |
| | Account Value | Account Value | During Period(1) |
| | (12/1/2022) | (5/31/2023) | (12/1/2022 – 5/31/2023) |
Investor Class Actual(2) | $1,000.00 | $1,052.20 | $6.14 |
| Investor Class Hypothetical | | | |
| (5% return before expenses) | $1,000.00 | $1,018.95 | $6.04 |
| | | | |
Advisor Class Actual(2) | $1,000.00 | $1,053.00 | $4.86 |
| Advisor Class Hypothetical | | | |
| (5% return before expenses) | $1,000.00 | $1,020.19 | $4.78 |
| (1) | Expenses are equal to the Fund’s annualized expense ratio for most recent six-month period of 1.20% and 0.95% for the Investor Class and Advisor Class, respectively, multiplied by the average account value over the period, multiplied by 182/365 to reflect the one-half year period. |
| (2) | Based on the actual returns for the six-month period ended May 31, 2023, of 5.22% and 5.30% for the Investor Class and Advisor Class, respectively. |
Reinhart International PMV Fund
| | Beginning | Ending | Expenses Paid |
| | Account Value | Account Value | During Period(3) |
| | (12/1/2022) | (5/31/2023) | (12/1/2022 – 5/31/2023) |
Advisor Class Actual(4) | $1,000.00 | $1,037.60 | $4.83 |
| Advisor Class Hypothetical | | | |
| (5% return before expenses) | $1,000.00 | $1,020.19 | $4.78 |
| (3) | Expenses are equal to the Fund’s annualized expense ratio for most recent six-month period of 0.95%, multiplied by the average account value over the period, multiplied by 182/365 to reflect the one-half year period. |
| (4) | Based on the actual returns for the six-month period ended May 31, 2023, of 3.76%. |
Reinhart Mid Cap PMV Fund
Schedule of Investments
May 31, 2023
Description | | Shares | | | Value | |
| COMMON STOCKS – 97.9% | | | | | | |
| | | | | | | |
| Communication Services – 5.8% | | | | | | |
| Interpublic Group of Companies | | | 88,145 | | | $ | 3,278,112 | |
| Live Nation Entertainment* | | | 61,805 | | | | 4,940,692 | |
| | | | | | | | 8,218,804 | |
| Consumer Discretionary – 10.2% | | | | | | | | |
| Allison Transmission Holdings | | | 75,340 | | | | 3,563,582 | |
| Leslie’s* | | | 274,460 | | | | 2,601,881 | |
| LKQ | | | 64,660 | | | | 3,410,815 | |
| TransUnion | | | 69,870 | | | | 5,029,242 | |
| | | | | | | | 14,605,520 | |
| Consumer Staples – 2.1% | | | | | | | | |
| BJ’s Wholesale Club Holdings* | | | 48,940 | | | | 3,066,091 | |
| | | | | | | | | |
| Energy – 3.0% | | | | | | | | |
| Baker Hughes, Class A | | | 155,170 | | | | 4,228,383 | |
| | | | | | | | | |
| Financials – 23.6% | | | | | | | | |
| Affiliated Managers Group | | | 31,840 | | | | 4,428,626 | |
| American Financial Group | | | 27,320 | | | | 3,067,216 | |
| BOK Financial | | | 46,341 | | | | 3,768,450 | |
| Global Payments | | | 44,455 | | | | 4,342,809 | |
| Intercontinental Exchange | | | 41,915 | | | | 4,440,894 | |
| Loews | | | 33,365 | | | | 1,868,440 | |
| M&T Bank Corp. | | | 25,775 | | | | 3,071,349 | |
| Northern Trust | | | 31,505 | | | | 2,265,840 | |
| Progressive | | | 16,110 | | | | 2,060,630 | |
| White Mountains Insurance Group | | | 3,233 | | | | 4,378,096 | |
| | | | | | | | 33,692,350 | |
| Health Care – 8.7% | | | | | | | | |
| Charles River Laboratories International* | | | 22,970 | | | | 4,441,938 | |
| Encompass Health | | | 67,687 | | | | 4,197,948 | |
| Zimmer Biomet Holdings | | | 29,170 | | | | 3,714,508 | |
| | | | | | | | 12,354,394 | |
| Industrials – 8.4% | | | | | | | | |
| Insperity | | | 25,255 | | | | 2,796,233 | |
| Snap-on | | | 12,985 | | | | 3,231,447 | |
| Stanley Black & Decker | | | 25,500 | | | | 1,911,735 | |
| U-Haul Holding, Series N | | | 86,885 | | | | 4,021,907 | |
| | | | | | | | 11,961,322 | |
See Notes to the Financial Statements
Reinhart Mid Cap PMV Fund
Schedule of Investments – Continued
May 31, 2023
Description | | Shares | | | Value | |
| COMMON STOCKS – 97.9% (Continued) | | | | | | |
| | | | | | | |
| Information Technology – 11.7% | | | | | | |
| Cognizant Technology Solutions, Class A | | | 65,545 | | | $ | 4,095,907 | |
| Fidelity National Financial | | | 108,490 | | | | 3,703,849 | |
| Sensata Technologies Holding plc | | | 80,680 | | | | 3,349,834 | |
| SS&C Technologies Holdings | | | 99,815 | | | | 5,485,832 | |
| | | | | | | | 16,635,422 | |
| Materials – 10.5% | | | | | | | | |
| Avantor* | | | 188,230 | | | | 3,753,306 | |
| Eagle Materials | | | 25,150 | | | | 4,097,689 | |
| FMC | | | 33,960 | | | | 3,534,557 | |
| Sealed Air | | | 95,555 | | | | 3,616,757 | |
| | | | | | | | 15,002,309 | |
| Real Estate – 9.1% | | | | | | | | |
| Americold Realty Trust – REIT | | | 141,970 | | | | 4,159,721 | |
| Camden Property Trust – REIT | | | 33,125 | | | | 3,460,568 | |
| Ventas – REIT | | | 68,020 | | | | 2,934,383 | |
| Weyerhaeuser – REIT | | | 85,730 | | | | 2,457,022 | |
| | | | | | | | 13,011,694 | |
| Utilities – 4.8% | | | | | | | | |
| UGI | | | 102,670 | | | | 2,871,680 | |
| Vistra | | | 168,410 | | | | 4,036,788 | |
| | | | | | | | 6,908,468 | |
| TOTAL COMMON STOCKS | | | | | | | | |
| (Cost $126,622,085) | | | | | | | 139,684,757 | |
| | | | | | | | | |
| MONEY MARKET FUND – 2.1% | | | | | | | | |
| First American Treasury Obligations Fund, Class X, 5.01%^ | | | | | | | | |
| (Cost $3,035,376) | | | 3,035,376 | | | | 3,035,376 | |
| Total Investments – 100.0% | | | | | | | | |
| (Cost $129,657,461) | | | | | | | 142,720,133 | |
| Other Assets and Liabilities, Net – 0.0% | | | | | | | (49,218 | ) |
| Total Net Assets – 100.0% | | | | | | $ | 142,670,915 | |
| * | Non-income producing security. |
| ^ | The rate shown is the annualized seven-day effective yield as of May 31, 2023. |
REIT – Real Estate Investment Trust
The Global Industry Classification Standard (“GICS”®) was developed by and is the exclusive property of MSCI, Inc. (“MSCI”) and Standard & Poor’s Financial Services LLC (“S&P”). GICS is a service mark of MSCI and S&P and has been licensed for use.
See Notes to the Financial Statements
Reinhart Genesis PMV Fund
Schedule of Investments
May 31, 2023
Description | | Shares | | | Value | |
| COMMON STOCKS – 96.7% | | | | | | |
| | | | | | | |
| Consumer Discretionary – 17.4% | | | | | | |
| Carter’s | | | 120,250 | | | $ | 7,475,942 | |
| frontdoor* | | | 390,105 | | | | 12,026,937 | |
| Gentex | | | 199,430 | | | | 5,237,032 | |
| Grand Canyon Education* | | | 99,400 | | | | 10,413,144 | |
| Hillman Solutions* | | | 1,368,000 | | | | 11,080,800 | |
| Thor Industries | | | 63,680 | | | | 4,984,234 | |
| | | | | | | | 51,218,089 | |
Financials# – 25.7% | | | | | | | | |
| 1st Source | | | 42,860 | | | | 1,762,832 | |
| Air Lease, Class A | | | 287,980 | | | | 10,949,000 | |
| Assured Guaranty | | | 182,000 | | | | 9,418,500 | |
| First American Financial | | | 105,000 | | | | 5,767,650 | |
| First Citizens BancShares, Class A | | | 14,030 | | | | 17,498,216 | |
| First Hawaiian | | | 430,490 | | | | 7,098,780 | |
| International Bancshares | | | 112,520 | | | | 4,806,854 | |
| LPL Financial Holdings | | | 11,500 | | | | 2,239,970 | |
| White Mountains Insurance Group | | | 5,100 | | | | 6,906,369 | |
| Wintrust Financial | | | 145,100 | | | | 9,224,007 | |
| | | | | | | | 75,672,178 | |
| Health Care – 12.1% | | | | | | | | |
| AdaptHealth* | | | 703,000 | | | | 7,367,440 | |
| Encompass Health | | | 93,920 | | | | 5,824,918 | |
| Lantheus Holdings* | | | 162,000 | | | | 14,027,580 | |
| Premier, Class A | | | 212,310 | | | | 5,307,750 | |
| Syneos Health, Class A* | | | 76,000 | | | | 3,161,600 | |
| | | | | | | | 35,689,288 | |
| Industrials – 17.5% | | | | | | | | |
| GMS* | | | 115,562 | | | | 7,318,541 | |
| GXO Logistics* | | | 165,000 | | | | 9,226,800 | |
| Insperity | | | 130,830 | | | | 14,485,498 | |
| MAXIMUS | | | 40,000 | | | | 3,238,400 | |
| TriNet Group* | | | 88,000 | | | | 7,820,560 | |
| U-Haul Holding, Series N | | | 208,187 | | | | 9,636,976 | |
| | | | | | | | 51,726,775 | |
See Notes to the Financial Statements
Reinhart Genesis PMV Fund
Schedule of Investments – Continued
May 31, 2023
Description | | Shares | | | Value | |
| COMMON STOCKS – 96.7% (Continued) | | | | | | |
| | | | | | | |
| Information Technology – 13.2% | | | | | | |
| ACI Worldwide* | | | 459,000 | | | $ | 10,469,790 | |
| ASGN* | | | 106,000 | | | | 6,935,580 | |
| Euronet Worldwide* | | | 75,000 | | | | 8,355,000 | |
| FormFactor* | | | 190,000 | | | | 5,945,100 | |
| PAR Technology* | | | 209,375 | | | | 7,238,094 | |
| | | | | | | | 38,943,564 | |
| Materials – 2.3% | | | | | | | | |
| Element Solutions | | | 374,000 | | | | 6,705,820 | |
| | | | | | | | | |
| Real Estate – 8.5% | | | | | | | | |
| Alexander & Baldwin – REIT | | | 486,836 | | | | 8,918,836 | |
| Marcus & Millichap | | | 286,060 | | | | 8,395,861 | |
| Ryman Hospitality Properties – REIT | | | 85,440 | | | | 7,837,411 | |
| | | | | | | | 25,152,108 | |
| TOTAL COMMON STOCKS | | | | | | | | |
| (Cost $265,563,135) | | | | | | | 285,107,822 | |
| | | | | | | | | |
| MONEY MARKET FUND – 3.5% | | | | | | | | |
| First American Treasury Obligations Fund, Class X, 5.01%^ | | | | | | | | |
| (Cost $10,358,754) | | | 10,358,754 | | | | 10,358,754 | |
| Total Investments – 100.2% | | | | | | | | |
| (Cost $275,921,889) | | | | | | | 295,466,576 | |
| Other Assets and Liabilities, Net – (0.2)% | | | | | | | (571,641 | ) |
| Total Net Assets – 100.0% | | | | | | $ | 294,894,935 | |
| * | Non-income producing security. |
| # | As of May 31, 2023, the Fund had a significant portion of its assets invested in the financials sector. See Note 9 in the Notes to the Financial Statements. |
| ^ | The rate shown is the annualized seven-day effective yield as of May 31, 2023. |
REIT – Real Estate Investment Trust
The Global Industry Classification Standard (“GICS”®) was developed by and is the exclusive property of MSCI, Inc. (“MSCI”) and Standard & Poor’s Financial Services LLC (“S&P”). GICS is a service mark of MSCI and S&P and has been licensed for use.
See Notes to the Financial Statements
Reinhart International PMV Fund
Schedule of Investments
May 31, 2023
Description | | Shares | | | Value | |
| COMMON STOCKS – 96.2% | | | | | | |
| | | | | | | |
| Austria – 2.6% | | | | | | |
| BAWAG Group AG | | | 840 | | | $ | 36,673 | |
| | | | | | | | | |
| Canada – 14.9% | | | | | | | | |
| Boyd Group Services | | | 200 | | | | 36,246 | |
| CCL Industries | | | 600 | | | | 27,956 | |
| Constellation Software | | | 20 | | | | 40,781 | |
| Dollarama | | | 400 | | | | 24,333 | |
| Element Fleet Management | | | 3,000 | | | | 45,503 | |
| Granite Real Estate Investment Trust – REIT | | | 600 | | | | 35,209 | |
| Lumine Group* | | | 81 | | | | 1,193 | |
| | | | | | | | 211,221 | |
| Cayman Islands – 9.2% | | | | | | | | |
| China Feihe | | | 35,000 | | | | 20,356 | |
| JD Logistics* | | | 25,000 | | | | 39,993 | |
| NetEase – ADR | | | 400 | | | | 34,032 | |
| Silicon Motion Technology – ADR | | | 585 | | | | 35,826 | |
| | | | | | | | 130,207 | |
| France – 9.8% | | | | | | | | |
| Capgemini SE | | | 300 | | | | 52,337 | |
| Edenred | | | 800 | | | | 51,495 | |
| La Francaise des Jeux SAEM | | | 900 | | | | 34,795 | |
| | | | | | | | 138,627 | |
| Ireland – 3.0% | | | | | | | | |
| Bank of Ireland Group plc | | | 4,500 | | | | 42,524 | |
| | | | | | | | | |
| Italy – 2.9% | | | | | | | | |
| Buzzi Unicem SpA | | | 1,800 | | | | 41,236 | |
| | | | | | | | | |
| Japan – 7.0% | | | | | | | | |
| Hoya | | | 300 | | | | 37,611 | |
| Mercari* | | | 3,000 | | | | 61,201 | |
| | | | | | | | 98,812 | |
| Luxembourg – 4.2% | | | | | | | | |
| B&M European Value Retail SA | | | 9,500 | | | | 60,350 | |
| | | | | | | | | |
| Mexico – 2.8% | | | | | | | | |
| Bolsa Mexicana de Valores SAB de CV | | | 19,000 | | | | 39,946 | |
| | | | | | | | | |
| Netherlands – 1.9% | | | | | | | | |
| Euronext NV | | | 400 | | | | 26,690 | |
See Notes to the Financial Statements
Reinhart International PMV Fund
Schedule of Investments – Continued
May 31, 2023
Description | | Shares | | | Value | |
| COMMON STOCKS – 96.2% (Continued) | | | | | | |
| | | | | | | |
| Norway – 2.2% | | | | | | |
| Adevinta ASA* | | | 4,500 | | | $ | 31,490 | |
| | | | | | | | | |
| Portugal – 3.4% | | | | | | | | |
| Jeronimo Martins SGPS SA | | | 2,000 | | | | 48,333 | |
| | | | | | | | | |
| Republic of Korea – 3.1% | | | | | | | | |
| Coway | | | 1,200 | | | | 43,528 | |
| | | | | | | | | |
| Spain – 2.8% | | | | | | | | |
| Aena SME SA | | | 250 | | | | 39,227 | |
| | | | | | | | | |
| Sweden – 2.5% | | | | | | | | |
| Svenska Handelsbanken AB | | | 4,400 | | | | 34,836 | |
| | | | | | | | | |
| Taiwan, Province of China – 3.1% | | | | | | | | |
| Taiwan Semiconductor Manufacturing – ADR | | | 450 | | | | 44,366 | |
| | | | | | | | | |
| United Kingdom – 14.0% | | | | | | | | |
| Compass Group plc | | | 1,200 | | | | 32,885 | |
| Cushman & Wakefield plc* | | | 4,200 | | | | 33,306 | |
| International Distributions Services plc | | | 10,000 | | | | 24,546 | |
| London Stock Exchange Group plc | | | 400 | | | | 42,642 | |
| Nomad Foods* | | | 1,500 | | | | 25,575 | |
| UNITE Group plc – REIT | | | 3,600 | | | | 40,163 | |
| | | | | | | | 199,117 | |
| United States – 4.4% | | | | | | | | |
| Booking Holdings* | | | 10 | | | | 25,088 | |
| Euronet Worldwide* | | | 340 | | | | 37,876 | |
| | | | | | | | 62,964 | |
| Vietnam – 2.4% | | | | | | | | |
| Vietnam Dairy Products JSC | | | 12,200 | | | | 34,310 | |
| TOTAL COMMON STOCKS | | | | | | | | |
| (Cost $1,312,554) | | | | | | | 1,364,457 | |
See Notes to the Financial Statements
Reinhart International PMV Fund
Schedule of Investments – Continued
May 31, 2023
Description | | Shares | | | Value | |
| MONEY MARKET FUND – 5.6% | | | | | | |
| First American Treasury Obligations Fund, Class X, 5.01%^ | | | | | | |
| (Cost $79,228) | | | 79,228 | | | $ | 79,228 | |
| Total Investments – 101.8% | | | | | | | | |
| (Cost $1,391,782) | | | | | | | 1,443,685 | |
| Other Assets and Liabilities, Net – (1.8)% | | | | | | | (25,658 | ) |
| Total Net Assets – 100.0% | | | | | | $ | 1,418,027 | |
| * | Non-income producing security. |
ADR – American Depositary Receipt
REIT – Real Estate Investment Trust
| ^ | The rate shown is the annualized seven-day effective yield as of May 31, 2023. |
The Global Industry Classification Standard (“GICS”®) was developed by and is the exclusive property of MSCI, Inc. (“MSCI”) and Standard & Poor’s Financial Services LLC (“S&P”). GICS is a service mark of MSCI and S&P and has been licensed for use.
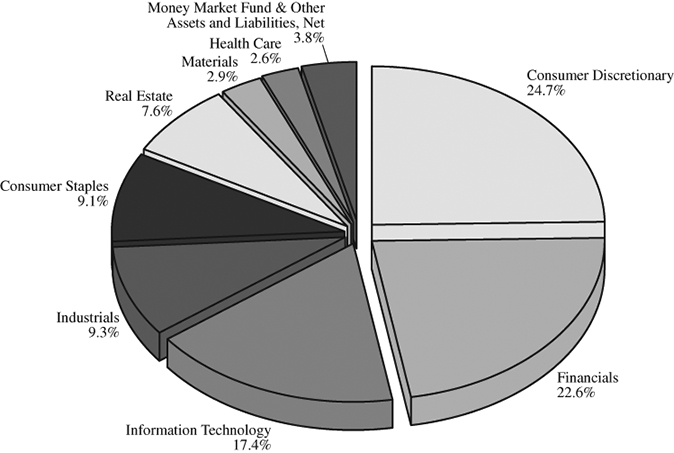
At May 31, 2023, the sector diversification for the Fund was as follows:
| | % of | |
| Sector | Net Assets | |
| Consumer Discretionary | | | 24.7 | % | | |
| Financials | | | 22.6 | % | | |
| Information Technology | | | 17.4 | % | | |
| Industrials | | | 9.3 | % | | |
| Consumer Staples | | | 9.1 | % | | |
| Real Estate | | | 7.6 | % | | |
| Materials | | | 2.9 | % | | |
| Health Care | | | 2.6 | % | | |
| Money Market Fund | | | 5.6 | % | | |
| Other Assets and Liabilities, Net | | | (1.8 | )% | | |
| Total | | | 100.0 | % | | |
See Notes to the Financial Statements
Reinhart Funds
Statements of Assets and Liabilities
May 31, 2023
| | | Mid Cap | | | Genesis | | | International | |
| | | PMV Fund | | | PMV Fund | | | PMV Fund | |
| ASSETS: | | | | | | | | | |
| Investments, at value | | | | | | | | | |
| (cost $129,657,461, $275,921,889, and $1,391,782) | | $ | 142,720,133 | | | $ | 295,466,576 | | | $ | 1,443,685 | |
| Dividends & interest receivable | | | 144,290 | | | | 340,428 | | | | 2,355 | |
| Receivable for capital shares sold | | | 142,582 | | | | 557,960 | | | | — | |
| Foreign Currencies (cost $143) | | | — | | | | — | | | | 143 | |
| Receivable for foreign withholding tax reclaim | | | 1,357 | | | | — | | | | 610 | |
| Receivable due from investment adviser | | | — | | | | — | | | | 13,600 | |
| Prepaid expenses | | | 21,383 | | | | 29,204 | | | | 3,152 | |
| Total assets | | | 143,029,745 | | | | 296,394,168 | | | | 1,463,545 | |
| | | | | | | | | | | | | |
| LIABILITIES: | | | | | | | | | | | | |
| Payable for investment securities purchased | | | — | | | | 1,080,966 | | | | — | |
| Payable for capital shares redeemed | | | 128,550 | | | | 54,074 | | | | 155 | |
| Payable to investment adviser | | | 85,987 | | | | 184,700 | | | | — | |
| Payable for fund administration & accounting fees | | | 42,712 | | | | 65,588 | | | | 16,041 | |
| Payable for compliance fees | | | 2,921 | | | | 2,921 | | | | 2,921 | |
| Payable for transfer agent fees & expenses | | | 20,511 | | | | 13,326 | | | | 1,214 | |
| Payable for trustee fees | | | 66 | | | | 88 | | | | — | |
| Payable for custody fees | | | 1,900 | | | | 2,828 | | | | 1,700 | |
| Accrued distribution & shareholder service fees | | | 42,800 | | | | 59,671 | | | | 152 | |
| Accrued other fees | | | 33,383 | | | | 35,071 | | | | 23,335 | |
| Total liabilities | | | 358,830 | | | | 1,499,233 | | | | 45,518 | |
| NET ASSETS | | $ | 142,670,915 | | | $ | 294,894,935 | | | $ | 1,418,027 | |
| | | | | | | | | | | | | |
| NET ASSETS CONSIST OF: | | | | | | | | | | | | |
| Paid-in capital | | $ | 127,551,433 | | | $ | 269,684,870 | | | $ | 1,360,439 | |
| Total distributable earnings | | | 15,119,482 | | | | 25,210,065 | | | | 57,588 | |
| Net Assets | | $ | 142,670,915 | | | $ | 294,894,935 | | | $ | 1,418,027 | |
| | | | | | | | | | | | | |
| Investor Class | | | | | | | | | | | | |
| Net Assets | | $ | 22,740,379 | | | $ | 19,283,987 | | | | — | |
Shares issued and outstanding(1) | | | 1,442,719 | | | | 1,547,297 | | | | — | |
| Net asset value, redemption price and offering price per share | | $ | 15.76 | | | $ | 12.46 | | | | — | |
| | | | | | | | | | | | | |
| Advisor Class | | | | | | | | | | | | |
| Net Assets | | $ | 116,102,812 | | | $ | 275,610,948 | | | $ | 1,418,027 | |
Shares issued and outstanding(1) | | | 7,369,272 | | | | 21,970,291 | | | | 138,214 | |
| Net asset value, redemption price and offering price per share | | $ | 15.75 | | | $ | 12.54 | | | $ | 10.26 | |
| | | | | | | | | | | | | |
| Institutional Class | | | | | | | | | | | | |
| Net Assets | | $ | 3,827,724 | | | | — | | | | — | |
Shares issued and outstanding(1) | | | 241,912 | | | | — | | | | — | |
| Net asset value, redemption price and offering price per share | | $ | 15.82 | | | | — | | | | — | |
| (1) | Unlimited shares authorized without par value. |
See Notes to the Financial Statements
Reinhart Funds
Statements of Operations
For the Year Ended May 31, 2023
| | | Mid Cap | | | Genesis | | | International | |
| | | PMV Fund | | | PMV Fund | | | PMV Fund | |
| INVESTMENT INCOME: | | | | | | | | | |
| Dividend income | | $ | 3,143,707 | | | $ | 3,176,495 | | | $ | 27,978 | |
| Interest income | | | 207,554 | | | | 458,437 | | | | 3,166 | |
| Less: foreign taxes withheld | | | — | | | | — | | | | (3,146 | ) |
| Total investment income | | | 3,351,261 | | | | 3,634,932 | | | | 27,998 | |
| | | | | | | | | | | | | |
| EXPENSES: | | | | | | | | | | | | |
| Investment adviser fees (See Note 4) | | | 1,599,594 | | | | 2,595,883 | | | | 10,415 | |
| Fund administration & accounting fees (See Note 4) | | | 191,807 | | | | 248,246 | | | | 111,524 | |
| Transfer agent fees & expenses (See Note 4) | | | 85,008 | | | | 53,848 | | | | 10,089 | |
| Federal & state registration fees | | | 50,647 | | | | 39,401 | | | | 3,522 | |
| Custody fees (See Note 4) | | | 22,903 | | | | 23,161 | | | | 12,231 | |
| Trustee fees | | | 19,450 | | | | 19,530 | | | | 19,064 | |
| Audit fees | | | 18,761 | | | | 21,248 | | | | 20,254 | |
| Postage & printing fees | | | 17,744 | | | | 26,139 | | | | 1,002 | |
| Legal fees | | | 13,707 | | | | 13,707 | | | | 6,491 | |
| Compliance fees (See Note 4) | | | 11,665 | | | | 11,665 | | | | 11,672 | |
| Other fees | | | 6,305 | | | | 5,362 | | | | 4,422 | |
| Insurance fees | | | 3,308 | | | | 3,642 | | | | 570 | |
| Distribution & shareholder service fees (See Note 5): | | | | | | | | | | | | |
| Investor Class | | | 64,387 | | | | 44,978 | | | | — | |
| Advisor Class | | | 72,457 | | | | 182,093 | | | | 821 | |
| Total expenses before waivers | | | 2,177,743 | | | | 3,288,903 | | | | 212,077 | |
| Less: waiver from investment adviser (See Note 4) | | | (260,979 | ) | | | (648,042 | ) | | | (153,512 | ) |
| Less: waiver from administrator, | | | | | | | | | | | | |
| transfer agent and custodian (See Note 4) | | | — | | | | — | | | | (48,150 | ) |
| Net expenses | | | 1,916,764 | | | | 2,640,861 | | | | 10,415 | |
| NET INVESTMENT INCOME | | | 1,434,497 | | | | 994,071 | | | | 17,583 | |
| | | | | | | | | | | | | |
| REALIZED AND UNREALIZED | | | | | | | | | | | | |
| GAIN (LOSS) ON INVESTMENTS: | | | | | | | | | | | | |
| Net realized gain on: | | | | | | | | | | | | |
| Investments | | | 11,160,850 | | | | 15,731,419 | | | | 800 | |
| Payments from investment adviser on the | | | | | | | | | | | | |
| disposal of investments due to trade error | | | 546,665 | | | | — | | | | — | |
| Foreign currency translation | | | — | | | | — | | | | 305 | |
| Net change in unrealized | | | | | | | | | | | | |
| appreciation/depreciation on investments | | | | | | | | | | | | |
| Investments | | | (32,800,213 | ) | | | 1,458,186 | | | | 51,903 | |
| Foreign currency translation | | | — | | | | — | | | | (46 | ) |
| Net realized and unrealized gain (loss) on investments | | | (21,092,698 | ) | | | 17,189,605 | | | | 52,962 | |
| NET INCREASE (DECREASE) IN NET ASSETS | | | | | | | | | | | | |
| RESULTING FROM OPERATIONS | | $ | (19,658,201 | ) | | $ | 18,183,676 | | | $ | 70,545 | |
See Notes to the Financial Statements
Reinhart Mid Cap PMV Fund
Statements of Changes in Net Assets
| | | Year Ended | | | Year Ended | |
| | | May 31, 2023 | | | May 31, 2022 | |
| OPERATIONS: | | | | | | |
| Net investment income | | $ | 1,434,497 | | | $ | 2,287,134 | |
| Net realized gain on investments and payments from | | | | | | | | |
| investment adviser on the disposal of investments due to trade error | | | 11,707,515 | | | | 18,784,497 | |
| Net change in unrealized appreciation/depreciation on investments | | | (32,800,213 | ) | | | (17,249,632 | ) |
| Net increase (decrease) in net assets resulting from operations | | | (19,658,201 | ) | | | 3,821,999 | |
| | | | | | | | | |
| CAPITAL SHARE TRANSACTIONS: | | | | | | | | |
| Investor Class: | | | | | | | | |
| Proceeds from shares sold | | | 2,097,930 | | | | 6,805,015 | |
| Proceeds from reinvestment of distributions | | | 1,226,913 | | | | 164,757 | |
| Payments for shares redeemed | | | (2,762,638 | ) | | | (2,237,535 | ) |
| Increase in net assets from Investor Class transactions | | | 562,205 | | | | 4,732,237 | |
| Advisor Class: | | | | | | | | |
| Proceeds from shares sold | | | 12,673,968 | | | | 35,075,397 | |
| Proceeds from reinvestment of distributions | | | 6,875,088 | | | | 1,747,128 | |
| Payments for shares redeemed | | | (53,881,921 | ) | | | (32,268,119 | ) |
| Increase (decrease) in net assets from Advisor Class transactions | | | (34,332,865 | ) | | | 4,554,406 | |
| Institutional Class: | | | | | | | | |
| Proceeds from shares sold | | | 785,905 | | | | 12,598,242 | |
| Proceeds from reinvestment of distributions | | | 180,406 | | | | 437,449 | |
| Payments for shares redeemed | | | (28,676,877 | ) | | | (17,782,304 | ) |
| Decrease in net assets from Institutional Class transactions | | | (27,710,566 | ) | | | (4,746,613 | ) |
| Net increase (decrease) in net assets resulting from capital share transactions | | | (61,481,226 | ) | | | 4,540,030 | |
| | | | | | | | | |
| DISTRIBUTIONS TO SHAREHOLDERS: | | | | | | | | |
| Net distributions to shareholders – Investor Class | | | (1,227,874 | ) | | | (165,916 | ) |
| Net distributions to shareholders – Advisor Class | | | (7,310,232 | ) | | | (1,885,093 | ) |
| Net distributions to shareholders – Institutional Class | | | (201,175 | ) | | | (461,132 | ) |
| Total distributions to shareholders | | | (8,739,281 | ) | | | (2,512,141 | ) |
| | | | | | | | | |
| TOTAL INCREASE (DECREASE) IN NET ASSETS | | | (89,878,708 | ) | | | 5,849,888 | |
| | | | | | | | | |
| NET ASSETS: | | | | | | | | |
| Beginning of year | | | 232,549,623 | | | | 226,699,735 | |
| End of year | | $ | 142,670,915 | | | $ | 232,549,623 | |
See Notes to the Financial Statements
Reinhart Genesis PMV Fund
Statements of Changes in Net Assets
| | | Year Ended | | | Year Ended | |
| | | May 31, 2023 | | | May 31, 2022 | |
| OPERATIONS: | | | | | | |
| Net investment income | | $ | 994,071 | | | $ | 1,080,835 | |
| Net realized gain on investments | | | 15,731,419 | | | | 22,011,459 | |
| Net change in unrealized appreciation/depreciation on investments | | | 1,458,186 | | | | (28,764,118 | ) |
| Net increase (decrease) in net assets resulting from operations | | | 18,183,676 | | | | (5,671,824 | ) |
| | | | | | | | | |
| CAPITAL SHARE TRANSACTIONS: | | | | | | | | |
| Investor Class: | | | | | | | | |
| Proceeds from shares sold | | | 800,000 | | | | 2,020 | |
| Proceeds from reinvestment of distributions | | | 1,179,222 | | | | 750,468 | |
| Payments for shares redeemed | | | — | | | | (669 | ) |
| Increase in net assets from Investor Class transactions | | | 1,979,222 | | | | 751,819 | |
| Advisor Class: | | | | | | | | |
| Proceeds from shares sold | | | 76,161,974 | | | | 135,146,060 | |
| Proceeds from reinvestment of distributions | | | 16,463,865 | | | | 10,433,243 | |
| Payments for shares redeemed | | | (79,868,292 | ) | | | (58,412,524 | ) |
| Increase in net assets from Advisor Class transactions | | | 12,757,547 | | | | 87,166,779 | |
| Net increase in net assets resulting from capital share transactions | | | 14,736,769 | | | | 87,918,598 | |
| | | | | | | | | |
| DISTRIBUTIONS TO SHAREHOLDERS: | | | | | | | | |
| Net distributions to shareholders – Investor Class | | | (1,179,223 | ) | | | (750,468 | ) |
| Net distributions to shareholders – Advisor Class | | | (17,199,714 | ) | | | (10,801,957 | ) |
| Total distributions to shareholders | | | (18,378,937 | ) | | | (11,552,425 | ) |
| | | | | | | | | |
| TOTAL INCREASE IN NET ASSETS | | | 14,541,508 | | | | 70,694,349 | |
| | | | | | | | | |
| NET ASSETS: | | | | | | | | |
| Beginning of year | | | 280,353,427 | | | | 209,659,078 | |
| End of year | | $ | 294,894,935 | | | $ | 280,353,427 | |
See Notes to the Financial Statements
Reinhart International PMV Fund
Statement of Changes in Net Assets
| | | Year Ended | |
| | | May 31, 2023 | |
| OPERATIONS: | | | |
| Net investment income | | $ | 17,583 | |
| Net realized gain on: | | | | |
| Investments | | | 800 | |
| Foreign currency translation | | | 305 | |
| Net change in unrealized appreciation/depreciation on investments | | | | |
| Investments | | | 51,903 | |
| Foreign currency translation | | | (46 | ) |
| Net increase in net assets resulting from operations | | | 70,545 | |
| | | | | |
| CAPITAL SHARE TRANSACTIONS: | | | | |
| Advisor Class: | | | | |
| Proceeds from shares sold | | | 1,354,518 | |
| Proceeds from reinvestment of distributions | | | 13,313 | |
| Payments for shares redeemed | | | (7,036 | ) |
| Net increase in net assets resulting from capital share transactions | | | 1,360,795 | |
| | | | | |
| DISTRIBUTIONS TO SHAREHOLDERS: | | | | |
| Total distributions to shareholders | | | (13,313 | ) |
| | | | | |
| TOTAL INCREASE IN NET ASSETS | | | 1,418,027 | |
| | | | | |
| NET ASSETS: | | | | |
| Beginning of year | | | — | |
| End of year | | $ | 1,418,027 | |
See Notes to the Financial Statements
Reinhart Mid Cap PMV Fund
Financial Highlights
For a Fund share outstanding throughout each year.
| | | Year Ended | | | Year Ended | | | Year Ended | | | Year Ended | | | Year Ended | |
| | | May 31, 2023 | | | May 31, 2022 | | | May 31, 2021 | | | May 31, 2020 | | | May 31, 2019 | |
| Investor Class | | | | | | | | | | | | | | | |
| | | | | | | | | | | | | | | | |
| PER SHARE DATA: | | | | | | | | | | | | | | | |
| Net asset value, beginning of year | | $ | 18.35 | | | $ | 18.23 | | | $ | 12.23 | | | $ | 13.76 | | | $ | 16.02 | |
| | | | | | | | | | | | | | | | | | | | | |
| INVESTMENT OPERATIONS: | | | | | | | | | | | | | | | | | | | | |
| Net investment income | | | 0.10 | (1) | | | 0.12 | | | | 0.10 | | | | 0.09 | | | | 0.05 | |
| Net realized and unrealized gain (loss) | | | | | | | | | | | | | | | | | | | | |
| on investments and payments from | | | | | | | | | | | | | | | | | | | | |
| investment adviser on the disposal of | | | | | | | | | | | | | | | | | | | | |
| investments due to trade error | | | (1.84 | ) | | | 0.14 | | | | 6.01 | | | | (1.54 | ) | | | (1.12 | ) |
| Total from investment operations | | | (1.74 | ) | | | 0.26 | | | | 6.11 | | | | (1.45 | ) | | | (1.07 | ) |
| | | | | | | | | | | | | | | | | | | | | |
| LESS DISTRIBUTIONS FROM: | | | | | | | | | | | | | | | | | | | | |
| Net investment income | | | (0.12 | ) | | | (0.14 | ) | | | (0.11 | ) | | | (0.08 | ) | | | (0.02 | ) |
| Net realized gains | | | (0.73 | ) | | | — | | | | — | | | | — | | | | (1.17 | ) |
| Total distributions | | | (0.85 | ) | | | (0.14 | ) | | | (0.11 | ) | | | (0.08 | ) | | | (1.19 | ) |
| | | | | | | | | | | | | | | | | | | | | |
| Net asset value, end of year | | $ | 15.76 | | | $ | 18.35 | | | $ | 18.23 | | | $ | 12.23 | | | $ | 13.76 | |
| | | | | | | | | | | | | | | | | | | | | |
| TOTAL RETURN | | | -9.77 | %(2) | | | 1.43 | % | | | 50.16 | % | | | -10.67 | % | | | -5.89 | % |
| | | | | | | | | | | | | | | | | | | | | |
| SUPPLEMENTAL DATA AND RATIOS: | | | | | | | | | | | | | | | | | | | | |
| Net assets, end of year (in millions) | | $ | 22.7 | | | $ | 25.8 | | | $ | 21.0 | | | $ | 14.4 | | | $ | 17.0 | |
| | | | | | | | | | | | | | | | | | | | | |
| Ratio of expenses to average net assets: | | | | | | | | | | | | | | | | | | | | |
| Before expense waiver | | | 1.41 | % | | | 1.48 | % | | | 1.57 | % | | | 1.58 | % | | | 1.52 | % |
| After expense waiver | | | 1.30 | % | | | 1.30 | % | | | 1.30 | % | | | 1.30 | % | | | 1.30 | % |
| | | | | | | | | | | | | | | | | | | | | |
| Ratio of net investment income | | | | | | | | | | | | | | | | | | | | |
| to average net assets: | | | | | | | | | | | | | | | | | | | | |
| Before expense waiver | | | 0.47 | % | | | 0.57 | % | | | 0.38 | % | | | 0.33 | % | | | 0.18 | % |
| After expense waiver | | | 0.58 | % | | | 0.75 | % | | | 0.65 | % | | | 0.61 | % | | | 0.40 | % |
| | | | | | | | | | | | | | | | | | | | | |
| Portfolio turnover rate | | | 42 | % | | | 31 | % | | | 38 | % | | | 53 | % | | | 54 | % |
| (1) | Per share amounts calculated using the average shares method. |
| (2) | Net increase from payments by investment adviser on the disposal of investments due to trade error added 0.22% to this return (See Note 4). |
See Notes to the Financial Statements
Reinhart Mid Cap PMV Fund
Financial Highlights
For a Fund share outstanding throughout each year.
| | | Year Ended | | | Year Ended | | | Year Ended | | | Year Ended | | | Year Ended | |
| | | May 31, 2023 | | | May 31, 2022 | | | May 31, 2021 | | | May 31, 2020 | | | May 31, 2019 | |
| Advisor Class | | | | | | | | | | | | | | | |
| | | | | | | | | | | | | | | | |
| PER SHARE DATA: | | | | | | | | | | | | | | | |
| Net asset value, beginning of year | | $ | 18.32 | | | $ | 18.22 | | | $ | 12.22 | | | $ | 13.75 | | | $ | 16.05 | |
| | | | | | | | | | | | | | | | | | | | | |
| INVESTMENT OPERATIONS: | | | | | | | | | | | | | | | | | | | | |
| Net investment income | | | 0.14 | (1) | | | 0.19 | | | | 0.15 | | | | 0.12 | | | | 0.10 | |
| Net realized and unrealized gain (loss) | | | | | | | | | | | | | | | | | | | | |
| on investments and payments from | | | | | | | | | | | | | | | | | | | | |
| investment adviser on the disposal of | | | | | | | | | | | | | | | | | | | | |
| investments due to trade error | | | (1.84 | ) | | | 0.12 | | | | 6.00 | | | | (1.53 | ) | | | (1.15 | ) |
| Total from investment operations | | | (1.70 | ) | | | 0.31 | | | | 6.15 | | | | (1.41 | ) | | | (1.05 | ) |
| | | | | | | | | | | | | | | | | | | | | |
| LESS DISTRIBUTIONS FROM: | | | | | | | | | | | | | | | | | | | | |
| Net investment income | | | (0.14 | ) | | | (0.21 | ) | | | (0.15 | ) | | | (0.12 | ) | | | (0.08 | ) |
| Net realized gains | | | (0.73 | ) | | | — | | | | — | | | | — | | | | (1.17 | ) |
| Total distributions | | | (0.87 | ) | | | (0.21 | ) | | | (0.15 | ) | | | (0.12 | ) | | | (1.25 | ) |
| | | | | | | | | | | | | | | | | | | | | |
| Net asset value, end of year | | $ | 15.75 | | | $ | 18.32 | | | $ | 18.22 | | | $ | 12.22 | | | $ | 13.75 | |
| | | | | | | | | | | | | | | | | | | | | |
| TOTAL RETURN | | | -9.56 | %(2) | | | 1.68 | % | | | 50.56 | % | | | -10.41 | % | | | -5.69 | % |
| | | | | | | | | | | | | | | | | | | | | |
| SUPPLEMENTAL DATA AND RATIOS: | | | | | | | | | | | | | | | | | | | | |
| Net assets, end of year (in millions) | | $ | 116.1 | | | $ | 172.6 | | | $ | 167.3 | | | $ | 123.8 | | | $ | 157.9 | |
| | | | | | | | | | | | | | | | | | | | | |
| Ratio of expenses to average net assets: | | | | | | | | | | | | | | | | | | | | |
| Before expense waiver | | | 1.20 | % | | | 1.16 | % | | | 1.24 | % | | | 1.25 | % | | | 1.22 | % |
| After expense waiver | | | 1.05 | % | | | 1.05 | % | | | 1.05 | % | | | 1.05 | % | | | 1.05 | % |
| | | | | | | | | | | | | | | | | | | | | |
| Ratio of net investment income | | | | | | | | | | | | | | | | | | | | |
| to average net assets: | | | | | | | | | | | | | | | | | | | | |
| Before expense waiver | | | 0.69 | % | | | 0.89 | % | | | 0.71 | % | | | 0.65 | % | | | 0.48 | % |
| After expense waiver | | | 0.84 | % | | | 1.00 | % | | | 0.90 | % | | | 0.86 | % | | | 0.65 | % |
| | | | | | | | | | | | | | | | | | | | | |
| Portfolio turnover rate | | | 42 | % | | | 31 | % | | | 38 | % | | | 53 | % | | | 54 | % |
| (1) | Per share amounts calculated using the average shares method. |
| (2) | Net increase from payments by investment adviser on the disposal of investments due to trade error added 0.22% to this return (See Note 4). |
See Notes to the Financial Statements
Reinhart Mid Cap PMV Fund
Financial Highlights
For a Fund share outstanding throughout each year.
| | | Year Ended | | | Year Ended | | | Year Ended | | | Year Ended | | | Year Ended | |
| | | May 31, 2023 | | | May 31, 2022 | | | May 31, 2021 | | | May 31, 2020 | | | May 31, 2019 | |
| Institutional Class | | | | | | | | | | | | | | | |
| | | | | | | | | | | | | | | | |
| PER SHARE DATA: | | | | | | | | | | | | | | | |
| Net asset value, beginning of year | | $ | 18.40 | | | $ | 18.27 | | | $ | 12.25 | | | $ | 13.77 | | | $ | 16.06 | |
| | | | | | | | | | | | | | | | | | | | | |
| INVESTMENT OPERATIONS: | | | | | | | | | | | | | | | | | | | | |
| Net investment income | | | 0.17 | (1) | | | 0.21 | | | | 0.16 | | | | 0.15 | | | | 0.12 | |
| Net realized and unrealized gain (loss) | | | | | | | | | | | | | | | | | | | | |
| on investments and payments from | | | | | | | | | | | | | | | | | | | | |
| investment adviser on the disposal of | | | | | | | | | | | | | | | | | | | | |
| investments due to trade error | | | (1.88 | ) | | | 0.13 | | | | 6.02 | | | | (1.54 | ) | | | (1.15 | ) |
| Total from investment operations | | | (1.71 | ) | | | 0.34 | | | | 6.18 | | | | (1.39 | ) | | | (1.03 | ) |
| | | | | | | | | | | | | | | | | | | | | |
| LESS DISTRIBUTIONS FROM: | | | | | | | | | | | | | | | | | | | | |
| Net investment income | | | (0.14 | ) | | | (0.21 | ) | | | (0.16 | ) | | | (0.13 | ) | | | (0.09 | ) |
| Net realized gains | | | (0.73 | ) | | | — | | | | — | | | | — | | | | (1.17 | ) |
| Total distributions | | | (0.87 | ) | | | (0.21 | ) | | | (0.16 | ) | | | (0.13 | ) | | | (1.26 | ) |
| | | | | | | | | | | | | | | | | | | | | |
| Net asset value, end of year | | $ | 15.82 | | | $ | 18.40 | | | $ | 18.27 | | | $ | 12.25 | | | $ | 13.77 | |
| | | | | | | | | | | | | | | | | | | | | |
| TOTAL RETURN | | | -9.54 | %(2) | | | 1.87 | % | | | 50.75 | % | | | -10.28 | % | | | -5.57 | % |
| | | | | | | | | | | | | | | | | | | | | |
| SUPPLEMENTAL DATA AND RATIOS: | | | | | | | | | | | | | | | | | | | | |
| Net assets, end of year (in millions) | | $ | 3.8 | | | $ | 34.1 | | | $ | 38.4 | | | $ | 30.5 | | | $ | 44.9 | |
| | | | | | | | | | | | | | | | | | | | | |
| Ratio of expenses to average net assets: | | | | | | | | | | | | | | | | | | | | |
| Before expense waiver | | | 1.09 | % | | | 1.12 | % | | | 1.18 | % | | | 1.17 | % | | | 1.16 | % |
| After expense waiver | | | 0.90 | % | | | 0.90 | % | | | 0.90 | % | | | 0.90 | % | | | 0.90 | % |
| | | | | | | | | | | | | | | | | | | | | |
| Ratio of net investment income | | | | | | | | | | | | | | | | | | | | |
| to average net assets: | | | | | | | | | | | | | | | | | | | | |
| Before expense waiver | | | 0.80 | % | | | 0.93 | % | | | 0.77 | % | | | 0.73 | % | | | 0.54 | % |
| After expense waiver | | | 0.99 | % | | | 1.15 | % | | | 1.05 | % | | | 1.01 | % | | | 0.80 | % |
| | | | | | | | | | | | | | | | | | | | | |
| Portfolio turnover rate | | | 42 | % | | | 31 | % | | | 38 | % | | | 53 | % | | | 54 | % |
| (1) | Per share amounts calculated using the average shares method. |
| (2) | Net increase from payments by investment adviser on the disposal of investments due to trade error added 0.22% to this return (See Note 4). |
See Notes to the Financial Statements
Reinhart Genesis PMV Fund
Financial Highlights
For a Fund share outstanding throughout each year.
| | | Year Ended | | | Year Ended | | | Year Ended | | | Year Ended | | | Year Ended | |
| | | May 31, 2023 | | | May 31, 2022 | | | May 31, 2021 | | | May 31, 2020 | | | May 31, 2019 | |
| Investor Class | | | | | | | | | | | | | | | |
| | | | | | | | | | | | | | | | |
| PER SHARE DATA: | | | | | | | | | | | | | | | |
| Net asset value, beginning of year | | $ | 12.55 | | | $ | 13.39 | | | $ | 8.71 | | | $ | 9.94 | | | $ | 10.00 | |
| | | | | | | | | | | | | | | | | | | | | |
| INVESTMENT OPERATIONS: | | | | | | | | | | | | | | | | | | | | |
| Net investment income | | | 0.02 | | | | 0.03 | | | | 0.04 | | | | 0.02 | | | | 0.03 | |
| Net realized and unrealized | | | | | | | | | | | | | | | | | | | | |
| gain (loss) on investments | | | 0.74 | | | | (0.30 | ) | | | 4.65 | | | | (1.20 | ) | | | 0.03 | (1) |
| Total from investment operations | | | 0.76 | | | | (0.27 | ) | | | 4.69 | | | | (1.18 | ) | | | 0.06 | |
| | | | | | | | | | | | | | | | | | | | | |
| LESS DISTRIBUTIONS FROM: | | | | | | | | | | | | | | | | | | | | |
| Net investment income | | | (0.02 | ) | | | (0.06 | ) | | | (0.01 | ) | | | (0.01 | ) | | | (0.02 | ) |
| Net realized gains | | | (0.83 | ) | | | (0.51 | ) | | | — | | | | (0.04 | ) | | | (0.10 | ) |
| Total distributions | | | (0.85 | ) | | | (0.57 | ) | | | (0.01 | ) | | | (0.05 | ) | | | (0.12 | ) |
| | | | | | | | | | | | | | | | | | | | | |
| Net asset value, end of year | | $ | 12.46 | | | $ | 12.55 | | | $ | 13.39 | | | $ | 8.71 | | | $ | 9.94 | |
| | | | | | | | | | | | | | | | | | | | | |
| TOTAL RETURN | | | 6.73 | % | | | -2.09 | % | | | 53.82 | % | | | -12.00 | % | | | 0.69 | % |
| | | | | | | | | | | | | | | | | | | | | |
| SUPPLEMENTAL DATA AND RATIOS: | | | | | | | | | | | | | | | | | | | | |
| Net assets, end of year (in millions) | | $ | 19.3 | | | $ | 17.3 | | | $ | 17.7 | | | $ | 10.3 | | | $ | 10.6 | |
| | | | | | | | | | | | | | | | | | | | | |
| Ratio of expenses to average net assets: | | | | | | | | | | | | | | | | | | | | |
| Before expense reimbursement/waiver | | | 1.37 | % | | | 1.37 | % | | | 1.49 | % | | | 1.99 | % | | | 3.13 | % |
| After expense reimbursement/waiver | | | 1.20 | % | | | 1.20 | % | | | 1.20 | % | | | 1.20 | % | | | 1.20 | % |
| | | | | | | | | | | | | | | | | | | | | |
| Ratio of net investment income (loss) | | | | | | | | | | | | | | | | | | | | |
| to average net assets: | | | | | | | | | | | | | | | | | | | | |
| Before expense reimbursement/waiver | | | (0.04 | )% | | | 0.01 | % | | | 0.09 | % | | | (0.60 | )% | | | (1.67 | )% |
| After expense reimbursement/waiver | | | 0.13 | % | | | 0.18 | % | | | 0.38 | % | | | 0.19 | % | | | 0.26 | % |
| | | | | | | | | | | | | | | | | | | | | |
| Portfolio turnover rate | | | 47 | % | | | 33 | % | | | 32 | % | | | 46 | % | | | 31 | % |
| (1) | Realized and unrealized gain on investments per share in this caption are balancing amounts necessary to reconcile the change in net asset value per share for the year, and may not reconcile with the aggregate gains and losses in the Statements of Operations due to share transactions for the year. |
See Notes to the Financial Statements
Reinhart Genesis PMV Fund
Financial Highlights
For a Fund share outstanding throughout each year.
| | | Year Ended | | | Year Ended | | | Year Ended | | | Year Ended | | | Year Ended | |
| | | May 31, 2023 | | | May 31, 2022 | | | May 31, 2021 | | | May 31, 2020 | | | May 31, 2019 | |
| Advisor Class | | | | | | | | | | | | | | | |
| | | | | | | | | | | | | | | | |
| PER SHARE DATA: | | | | | | | | | | | | | | | |
| Net asset value, beginning of year | | $ | 12.61 | | | $ | 13.45 | | | $ | 8.73 | | | $ | 9.96 | | | $ | 10.00 | |
| | | | | | | | | | | | | | | | | | | | | |
| INVESTMENT OPERATIONS: | | | | | | | | | | | | | | | | | | | | |
| Net investment income | | | 0.05 | | | | 0.05 | | | | 0.05 | | | | 0.03 | | | | 0.04 | |
| Net realized and unrealized | | | | | | | | | | | | | | | | | | | | |
| gain (loss) on investments | | | 0.74 | | | | (0.29 | ) | | | 4.69 | | | | (1.20 | ) | | | 0.05 | (1) |
| Total from investment operations | | | 0.79 | | | | (0.24 | ) | | | 4.74 | | | | (1.17 | ) | | | 0.09 | |
| | | | | | | | | | | | | | | | | | | | | |
| LESS DISTRIBUTIONS FROM: | | | | | | | | | | | | | | | | | | | | |
| Net investment income | | | (0.03 | ) | | | (0.09 | ) | | | (0.02 | ) | | | (0.02 | ) | | | (0.03 | ) |
| Net realized gains | | | (0.83 | ) | | | (0.51 | ) | | | — | | | | (0.04 | ) | | | (0.10 | ) |
| Total distributions | | | (0.86 | ) | | | (0.60 | ) | | | (0.02 | ) | | | (0.06 | ) | | | (0.13 | ) |
| | | | | | | | | | | | | | | | | | | | | |
| Net asset value, end of year | | $ | 12.54 | | | $ | 12.61 | | | $ | 13.45 | | | $ | 8.73 | | | $ | 9.96 | |
| | | | | | | | | | | | | | | | | | | | | |
| TOTAL RETURN | | | 6.97 | % | | | -1.86 | % | | | 54.33 | % | | | -11.85 | % | | | 1.04 | % |
| | | | | | | | | | | | | | | | | | | | | |
| SUPPLEMENTAL DATA AND RATIOS: | | | | | | | | | | | | | | | | | | | | |
| Net assets, end of year (in millions) | | $ | 275.6 | | | $ | 263.1 | | | $ | 192.0 | | | $ | 57.7 | | | $ | 5.9 | |
| | | | | | | | | | | | | | | | | | | | | |
| Ratio of expenses to average net assets: | | | | | | | | | | | | | | | | | | | | |
| Before expense reimbursement/waiver | | | 1.19 | % | | | 1.16 | % | | | 1.27 | % | | | 1.66 | % | | | 2.87 | % |
| After expense reimbursement/waiver | | | 0.95 | % | | | 0.95 | % | | | 0.95 | % | | | 0.95 | % | | | 0.95 | % |
| | | | | | | | | | | | | | | | | | | | | |
| Ratio of net investment income (loss) | | | | | | | | | | | | | | | | | | | | |
| to average net assets: | | | | | | | | | | | | | | | | | | | | |
| Before expense reimbursement/waiver | | | 0.15 | % | | | 0.22 | % | | | 0.32 | % | | | (0.27 | )% | | | (1.35 | )% |
| After expense reimbursement/waiver | | | 0.39 | % | | | 0.43 | % | | | 0.64 | % | | | 0.44 | % | | | 0.57 | % |
| | | | | | | | | | | | | | | | | | | | | |
| Portfolio turnover rate | | | 47 | % | | | 33 | % | | | 32 | % | | | 46 | % | | | 31 | % |
| (1) | Realized and unrealized gain on investments per share in this caption are balancing amounts necessary to reconcile the change in net asset value per share for the year, and may not reconcile with the aggregate gains and losses in the Statements of Operations due to share transactions for the year. |
See Notes to the Financial Statements
Reinhart International PMV Fund
Financial Highlights
For a Fund share outstanding throughout the year.
| | | Year Ended | |
| | | May 31, 2023 | |
| Advisor Class | | | |
| | | | |
| PER SHARE DATA: | | | |
| Net asset value, beginning of year | | $ | 10.00 | |
| | | | | |
| INVESTMENT OPERATIONS: | | | | |
| Net investment income | | | 0.13 | |
| Net realized and unrealized gain on investments | | | 0.24 | |
| Total from investment operations | | | 0.37 | |
| | | | | |
| LESS DISTRIBUTIONS FROM: | | | | |
| Net investment income | | | (0.06 | ) |
| Net realized gains | | | (0.05 | ) |
| Total distributions | | | (0.11 | ) |
| | | | | |
| Net asset value, end of year | | $ | 10.26 | |
| | | | | |
| TOTAL RETURN | | | 3.76 | % |
| | | | | |
| SUPPLEMENTAL DATA AND RATIOS: | | | | |
| Net assets, end of year (in millions) | | $ | 1.4 | |
| | | | | |
| Ratio of expenses to average net assets: | | | | |
| Before expense reimbursement/waiver | | | 19.29 | % |
| After expense reimbursement/waiver | | | 0.95 | % |
| | | | | |
| Ratio of net investment loss to average net assets: | | | | |
| Before expense reimbursement/waiver | | | (16.74 | )% |
| After expense reimbursement/waiver | | | 1.60 | % |
| | | | | |
| Portfolio turnover rate | | | 11 | % |
See Notes to the Financial Statements
Reinhart Funds
Notes to the Financial Statements
May 31, 2023
1. ORGANIZATION
Managed Portfolio Series (the “Trust”) was organized as a Delaware statutory trust under a Declaration of Trust dated January 27, 2011. The Trust is registered under the Investment Company Act of 1940, as amended (the “1940 Act”), as an open-end management investment company. The Reinhart Mid Cap PMV Fund (the “Mid Cap Fund”), Reinhart Genesis PMV Fund (the “Genesis Fund”) and Reinhart International PMV Fund (the “International Fund”) (each a “Fund” and collectively, the “Funds”) are each a diversified series with their own investment objectives and policies within the Trust. The investment objective of the Funds is long-term capital appreciation. The Funds are investment companies and accordingly follow the investment company accounting and reporting guidance of the Financial Accounting Standards Board (“FASB”) Accounting Standards Board Codification Topic 946 Financial Services – Investment Companies. The Mid Cap Fund commenced operations on June 1, 2012, the Genesis Fund commenced operations on June 1, 2018 and the International Fund commenced operations on June 1, 2022. Costs incurred by the International Fund in connection with the organization, registration, and the initial public offering of shares were paid by Reinhart Partners, LLC (the “Adviser”). These costs are not eligible for recoupment by the Adviser. The Mid Cap Fund currently offers three classes of shares, the Investor Class, Advisor Class and the Institutional Class. The Mid Cap Fund Institutional Class commenced operations on September 29, 2017. The Genesis Fund currently offers two classes of shares, the Investor Class and the Advisor Class. The International Fund currently offers one class of shares, the Advisor Class. Investor Class shares are subject to a 0.25% Rule 12b-1 distribution and servicing fee. The Investor Class and Advisor Class shares are subject to a maximum 0.15% shareholder servicing fee. Each class of shares has identical rights and privileges except with respect to the distribution fees and voting rights on matters affecting a single share class. The Funds may issue an unlimited number of shares of beneficial interest, with no par value.
2. SIGNIFICANT ACCOUNTING POLICIES
The following is a summary of significant accounting policies consistently followed by the Fund in preparation of its financial statements. These policies are in conformity with generally accepted accounting principles in the United States of America (“GAAP”).
Security Valuation – All investments in securities are recorded at their estimated fair value, as described in Note 3.
Federal Income Taxes – The Funds comply with the requirements of subchapter M of the Internal Revenue Code of 1986, as amended, necessary to qualify as a regulated investment company and distributes substantially all net taxable investment income and net realized gains to shareholders in a manner which results in no tax cost to the Funds. Therefore, no federal income tax provision is required. As of and during the year ended May 31, 2023, the Funds did not have any tax positions that did not meet the “more-likely-than-not” threshold of being sustained by the applicable tax authority. The Funds recognize interest and penalties, if any, related to unrecognized tax benefits on uncertain tax positions as income tax expense in the Statements of Operations. As of and during the year ended May 31, 2023, the Funds did not incur any interest or penalties. The Funds are not subject to examination by U.S. tax authorities for tax years prior to the year ended May 31, 2020.
Foreign Taxes – The Funds may be subject to foreign taxes (a portion of which may be reclaimable) on income, stock dividends, realized and unrealized capital gains on investments, or certain foreign currency transactions. Foreign taxes are recorded in accordance with Management’s understanding of the applicable foreign tax regulations and rates that exist in the foreign jurisdictions in which the Funds invest. These foreign taxes, if any, are paid by the Funds and are reflected in the Statements of Operations, if applicable. Foreign taxes payable or deferred as of May 31, 2023, if any, are disclosed in the Funds’ Statements of Assets and Liabilities.
Reinhart Funds
Notes to the Financial Statements – Continued
May 31, 2023
Security Transactions and Investment Income – The Funds follow industry practice and record security transactions on the trade date. Realized gains and losses on sales of securities are calculated on the basis of identified cost. Dividend income is recorded on the ex-dividend date and interest income is recorded on an accrual basis. Withholding taxes on foreign dividends have been provided for in accordance with the Funds’ understanding of the applicable country’s tax rules and regulations. Discounts and premiums on securities purchased are amortized over the expected life of the respective securities using the constant yield method.
The Funds distribute all net investment income, if any, and net realized capital gains, if any, annually. Distributions to shareholders are recorded on the ex-dividend date. The Funds may utilize earnings and profits distributed to shareholders on redemptions of shares as part of the dividends paid deduction. The treatment for financial reporting purposes of distributions made to shareholders during the year from net investment income or net realized capital gains may differ from their ultimate treatment for federal income tax purposes. These differences are caused primarily by differences in the timing of the recognition of certain components of income, expense or realized capital gain for federal income tax purposes. Where such differences are permanent in nature, GAAP requires that they be reclassified in the components of the net assets based on their ultimate characterization for federal income tax purposes. Any such reclassifications will have no effect on net assets, results of operations or net asset values per share of the Funds. For the year ended May 31, 2023, the Mid Cap Fund increased paid-in-capital and decreased distributable earnings by $1,874,433. The Genesis Fund increased paid-in-capital and decreased distributable earnings by $2,305,796. The International Fund decreased paid-in-capital and increased distributable earnings by $356. The permanent differences are primarily due to the usage of tax equalization.
Foreign Currency – Investment securities and other assets and liabilities denominated in foreign currencies are translated into U.S. dollar amounts at the date of valuation. Purchases and sales of investment securities and income and expense items denominated in foreign currencies are translated into U.S. dollar amounts on the respective dates of such transactions. The Funds do not isolate that portion of the results of operations resulting from changes in foreign exchange rates on investments from the fluctuations arising from changes in market prices of securities held. Such fluctuations are included with the net realized and unrealized gain or loss from investments and translations of foreign currency. The Funds report net realized foreign exchange gains or losses that arise from sales of foreign currencies, currency gains or losses realized between the trade and settlement dates on securities transactions, and the difference between the amounts of dividends, interest, and foreign withholding taxes recorded on the Funds’ books and the U.S. dollar equivalent of the amounts actually received or paid. Net unrealized foreign exchange gains and losses arise from changes in the fair values of assets and liabilities, other than investments in securities at fiscal period end, resulting from changes in exchange rates.
Use of Estimates – The preparation of financial statements in conformity with GAAP requires management to make estimates and assumptions that affect the reported amounts of assets and liabilities and disclosure of contingent assets and liabilities at the date of the financial statements and the reported amounts of revenues and expenses during the reporting period. Actual results could differ from those estimates.
Allocation of Income, Expenses and Gains/Losses – Income, expenses (other than those deemed attributable to a specific share class), and gains and losses of the Funds are allocated daily to each class of shares based upon the ratio of net assets represented by each class as a percentage of the net assets of each Fund. Expenses deemed directly attributable to a class of shares are recorded by the specific class. Most Fund expenses are allocated by class based on relative net assets. Shareholder servicing fees are expensed at an annual rate up to 0.15% of Investor Class and Advisor Class shares and 12b-1 fees are expensed at 0.25% of average daily net assets of Investor Class shares (See Note 5). Expenses associated with a specific fund in the Trust are charged to that fund. Common Trust expenses are typically allocated evenly between the funds of the Trust, or by other equitable means.
Reinhart Funds
Notes to the Financial Statements – Continued
May 31, 2023
3. SECURITIES VALUATION
The Funds have adopted authoritative fair value accounting standards which establish an authoritative definition of fair value and set out a hierarchy for measuring fair value. These standards require additional disclosures about the various inputs and valuation techniques used to develop the measurements of fair value, a discussion of changes in valuation techniques and related inputs during the period and expanded disclosure of valuation levels for major security types. These inputs are summarized in the three broad levels listed below:
| Level 1 – | Unadjusted quoted prices in active markets for identical assets or liabilities that the Funds have the ability to access. |
| | |
| Level 2 – | Observable inputs other than quoted prices included in Level 1 that are observable for the asset or liability, either directly or indirectly. These inputs may include quoted prices for the identical instrument on an inactive market, prices for similar instruments, interest rates, prepayment speeds, credit risk, yield curves, default rates and similar data. |
| | |
| Level 3 – | Unobservable inputs for the asset or liability, to the extent relevant observable inputs are not available, representing the Funds’ own assumptions about the assumptions a market participant would use in valuing the asset or liability, and would be based on the best information available. |
Following is a description of the valuation techniques applied to each Funds’ major categories of assets and liabilities measured at fair value on a recurring basis. The Funds’ investments are carried at fair value.
Equity Securities – Equity securities, including common stocks, preferred stocks, exchange-traded funds (“ETFs”) and real estate investment trusts (“REITs”) that are primarily traded on a national securities exchange are valued at the last sale price on the exchange on which they are primarily traded on the day of valuation or, if there has been no sale on such day, at the mean between the bid and ask prices. Securities traded primarily in the Nasdaq Global Market System for which market quotations are readily available are valued using the Nasdaq Official Closing Price (“NOCP”). If the NOCP is not available, such securities are valued at the last sale price on the day of valuation, or if there has been no sale on such day, at the mean between the bid and ask prices. To the extent these securities are actively traded and valuation adjustments are not applied, they are categorized in Level 1 of the fair value hierarchy.
In the case of foreign securities, the occurrence of events after the close of foreign markets, but prior to the time the Funds’ NAV is calculated will result in an adjustment to the trading prices of foreign securities when foreign markets open on the following business day. The Funds will value foreign securities at fair value, taking into account such events in calculating the NAV. In such cases, use of fair valuation can reduce an investor’s ability to seek to profit by estimating the Funds’ NAV in advance of the time the NAV is calculated. All foreign securities, with the exception of Canadian and Mexican securities and those listed on a U.S. exchange, have an adjustment applied to their trade price and therefore are automatically deemed to be in Level 2 of the fair value hierarchy.
Short-Term Investments – Investments in other mutual funds, including money market funds, are valued at their net asset value per share. To the extent these securities are actively traded and valuation adjustments are not applied, they are categorized in Level 1 of the fair value hierarchy.
The Board of Trustees (the “Board”) has adopted a pricing and valuation policy for use by the Funds and their Valuation Designee (as defined below) in calculating the Funds’ NAV. Pursuant to Rule 2a-5 under the 1940 Act, the Funds have designated Reinhart Partners, LLC (the “Adviser”) as their “Valuation Designee” to perform all of the fair value determinations as well as to perform all of the responsibilities that may be performed by the Valuation
Reinhart Funds
Notes to the Financial Statements – Continued
May 31, 2023
Designee in accordance with Rule 2a-5. The Valuation Designee is authorized to make all necessary determinations of the fair values of portfolio securities and other assets for which market quotations are not readily available or if it is deemed that the prices obtained from brokers and dealers or independent pricing services are unreliable.
The inputs or methodology used for valuing securities are not an indication of the risk associated with investing in those securities. The following is a summary of the inputs used to value the Funds’ securities as of May 31, 2023:
| Mid Cap Fund | | Level 1 | | | Level 2 | | | Level 3 | | | Total | |
| Common Stocks | | $ | 139,684,757 | | | $ | — | | | $ | — | | | $ | 139,684,757 | |
| Money Market Fund | | | 3,035,376 | | | | — | | | | — | | | | 3,035,376 | |
| Total Investments in Securities | | $ | 142,720,133 | | | $ | — | | | $ | — | | | $ | 142,720,133 | |
| | | | | | | | | | | | | |
| Genesis Fund | | Level 1 | | | Level 2 | | | Level 3 | | | Total | |
| Common Stocks | | $ | 285,107,822 | | | $ | — | | | $ | — | | | $ | 285,107,822 | |
| Money Market Fund | | | 10,358,754 | | | | — | | | | — | | | | 10,358,754 | |
| Total Investments in Securities | | $ | 295,466,576 | | | $ | — | | | $ | — | | | $ | 295,466,576 | |
| | | | | | | | | | | | | |
| International Fund | | Level 1 | | | Level 2 | | | Level 3 | | | Total | |
| Common Stocks | | $ | 487,236 | | | $ | 877,221 | | | $ | — | | | $ | 1,364,457 | |
| Money Market Fund | | | 79,228 | | | | — | | | | — | | | | 79,228 | |
| Total Investments in Securities | | $ | 566,464 | | | $ | 877,221 | | | $ | — | | | $ | 1,443,685 | |
Refer to the Schedule of Investments for further information on the classification of investments.
On February 24, 2022, Russia commenced a military attack on Ukraine. The outbreak of hostilities between the two countries could result in more widespread conflict and could have a severe adverse effect on the region and the markets. In addition, sanctions imposed on Russia by the United States and other countries, and any sanctions imposed in the future could have a significant adverse impact on the Russian economy and related markets. The price and liquidity of investments may fluctuate widely as a result of the conflict and related events. How long such conflict and related events will last and whether it will escalate further cannot be predicted, nor its effect on the Funds.
4. INVESTMENT ADVISORY FEE AND OTHER TRANSACTIONS WITH AFFILIATES
The Trust has an agreement with Reinhart Partners, LLC (the “Adviser”) to furnish investment advisory services to the Funds. Prior to January 4, 2023, the Adviser was named Reinhart Partners, Inc. The name change did not result in a change in control. For its services, the Funds pay the Adviser a monthly management fee based upon the average daily net assets of the Funds at the following rates:
| Fund | | |
| Mid Cap Fund | 0.90% | |
| Genesis Fund | 0.95% | |
| International Fund | 0.95% | |
Reinhart Funds
Notes to the Financial Statements – Continued
May 31, 2023
The Funds’ Adviser has contractually agreed to waive its management fees and pay Fund expenses in order to ensure that Total Annual Fund Operating Expenses (excluding AFFE, leverage/borrowing interest, interest expense, taxes, brokerage commissions, and extraordinary expenses) do not exceed the following rates (based upon the average daily net assets of the Funds):
| Fund | Investor Class | | Advisor Class | | Institutional Class | |
| Mid Cap Fund | 1.30% | | 1.05% | | 0.90% | |
| Genesis Fund | 1.20% | | 0.95% | | N/A | |
| International Fund | N/A | | 0.95% | | N/A | |
Fees waived and expenses paid by the Adviser may be recouped by the Adviser for a period of thirty-six months following the month during which such fee waiver and expense payment was made, if such recoupment can be achieved without exceeding the expense limit in effect at the time the fee waiver and expense payment occurred and the expense limit in effect at the time of recoupment. The Operating Expenses Limitation Agreements are indefinite in term and cannot be terminated through at least September 28, 2028, for the Mid Cap Fund, and September 28, 2025, for the Genesis Fund and the International Fund. Thereafter, the agreements may be terminated at any time upon 60 days’ written notice by the Trust’s Board or the Adviser, with the consent of the Board. Waived fees and reimbursed expenses subject to potential recovery by month of expiration are as follows:
| Fund | Expiration | | Amount | |
| Mid Cap Fund | June 2023 – May 2024 | | $399,577 | |
| | June 2024 – May 2025 | | $300,293 | |
| | June 2025 – May 2026 | | $260,979 | |
| | | | | |
| Genesis Fund | June 2023 – May 2024 | | $405,777 | |
| | June 2024 – May 2025 | | $550,093 | |
| | June 2025 – May 2026 | | $648,042 | |
| | | | | |
| International Fund | June 2025 – May 2026 | | $153,512 | |
During the year ended May 31, 2023, the Mid Cap Fund had a trade error. The error was caused by incorrect data in the Adviser’s software which caused the Fund to purchase too many shares of a certain security, of which the Fund sold upon realization of the error. The security had depreciated since the purchase made in error. This resulted in a loss to the Mid Cap Fund of $546,665, which was subsequently reimbursed to the Mid Cap Fund by the Adviser.
U.S. Bancorp Fund Services, LLC (the “Administrator”), doing business as U.S. Bank Global Fund Services, acts as the Funds’ Administrator, Transfer Agent, and Fund Accountant. U.S. Bank, N.A. (the “Custodian”) serves as the custodian to the Funds. The Custodian is an affiliate of the Administrator. The Administrator performs various administrative and accounting services for the Funds. The Administrator prepares various federal and state regulatory filings, reports and returns for the Funds; prepares reports and materials to be supplied to the Trustees; monitors the activities of the Funds’ custodian; coordinates the payment of the Funds’ expenses and reviews the Funds’ expense accruals. The officers of the Trust, including the Chief Compliance Officer, are employees of the Administrator. As compensation for its services, the Administrator is entitled to a monthly fee at an annual rate based upon the average daily net assets of the Funds, subject to annual minimums. Fees paid by the Funds for administration and accounting, transfer agency, custody and chief compliance officer services for the year ended May 31, 2023, are disclosed in the Statements of Operations. For the International Fund, the Administrator waived $45,750 in fund administration and transfer agent fees; and the Custodian waived $2,400 in custody fees.
Reinhart Funds
Notes to the Financial Statements – Continued
May 31, 2023
5. DISTRIBUTION & SHAREHOLDER SERVICE FEES
The Funds have adopted a Distribution Plan pursuant to Rule 12b-1 (the “Plan”) in the Investor Class only. The Plan permits the Funds to pay for distribution and related expenses at an annual rate of 0.25% of the average daily net assets of the Investor Class. The expenses covered by the Plan may include the cost of preparing and distributing prospectuses and other sales material, advertising and public relations expenses, payments to financial intermediaries and compensation of personnel involved in selling shares of the Funds. Payments made pursuant to the Plan will represent compensation for distribution and service activities, not reimbursements for specific expenses incurred. For the year ended May 31, 2023, the Funds incurred the following expenses pursuant to the Plan:
| Fund | | Amount | | |
| Mid Cap Fund | | $ | 61,911 | | |
| Genesis Fund | | | 44,978 | | |
| International Fund | | | N/A | | |
The Funds have entered into a shareholder servicing agreement (the “Agreement”) where the Adviser acts as the shareholder agent, under which the Funds may pay a servicing fee at an annual rate up to 0.15% of the average daily net assets of the Investor Class and Advisor Class. Payments, if any, to the Adviser under the Agreement may reimburse the Adviser for payments it makes to selected brokers, dealers and administrators which have entered into service agreements with the Adviser for services provided to shareholders of the Funds. Payments may also be made directly to the intermediaries providing shareholder services. The services provided by such intermediaries are primarily designed to assist shareholders of the Funds and include the furnishing of office space and equipment, telephone facilities, personnel and assistance to the Funds in servicing such shareholders. Services provided by such intermediaries also include the provision of support services to the Funds and includes establishing and maintaining shareholders’ accounts and record processing, purchase and redemption transactions, answering routine client inquiries regarding the Funds, and providing such other personal services to shareholders as the Funds may reasonably request. For the year ended May 31, 2023, the Funds incurred the following expenses pursuant to the Plan:
| Fund | | Investor Class | | | Advisor Class | | |
| Mid Cap Fund | | $ | 2,476 | | | $ | 72,457 | | |
| Genesis Fund | | | — | | | | 182,093 | | |
| International Fund | | | N/A | | | | 821 | | |
Reinhart Funds
Notes to the Financial Statements – Continued
May 31, 2023
6. CAPITAL SHARE TRANSACTIONS
Transactions in shares of the Funds were as follows:
| | | Mid Cap Fund | | | Genesis Fund | | International Fund |
| | | Year Ended | | | Year Ended | | | Year Ended | | | Year Ended | | | Year Ended | |
| | | May 31, 2023 | | | May 31, 2022 | | | May 31, 2023 | | | May 31, 2022 | | | May 31, 2023 | |
| Investor Class: | | | | | | | | | | | | | | | |
| Shares sold | | | 124,160 | | | | 365,740 | | | | 64,379 | | | | 153 | | | | — | |
| Shares issued | | | | | | | | | | | | | | | | | | | | |
| in reinvestment | | | | | | | | | | | | | | | | | | | | |
| of distributions | | | 73,556 | | | | 8,930 | | | | 104,913 | | | | 58,814 | | | | — | |
| Shares redeemed | | | (159,707 | ) | | | (121,639 | ) | | | — | | | | (49 | ) | | | — | |
| Net increase in | | | | | | | | | | | | | | | | | | | | |
| Investor Class shares | | | 38,009 | | | | 253,031 | | | | 169,292 | | | | 58,918 | | | | — | |
| Advisor Class: | | | | | | | | | | | | | | | | | | | | |
| Shares sold | | | 740,670 | | | | 1,908,787 | | | | 6,224,051 | | | | 10,239,651 | | | | 137,635 | |
| Shares issued | | | | | | | | | | | | | | | | | | | | |
| in reinvestment | | | | | | | | | | | | | | | | | | | | |
| of distributions | | | 412,918 | | | | 94,953 | | | | 1,456,979 | | | | 815,097 | | | | 1,373 | |
| Shares redeemed | | | (3,207,863 | ) | | | (1,762,775 | ) | | | (6,568,243 | ) | | | (4,471,990 | ) | | | (794 | ) |
| Net increase (decrease) | | | | | | | | | | | | | | | | | | | | |
| in Advisor Class shares | | | (2,054,275 | ) | | | 240,965 | | | | 1,112,787 | | | | 6,582,758 | | | | 138,214 | |
| Institutional Class: | | | | | | | | | | | | | | | | | | | | |
| Shares sold | | | 45,266 | | | | 677,209 | | | | — | | | | — | | | | — | |
| Shares issued | | | | | | | | | | | | | | | | | | | | |
| in reinvestment | | | | | | | | | | | | | | | | | | | | |
| of distributions | | | 10,796 | | | | 23,684 | | | | — | | | | — | | | | — | |
| Shares redeemed | | | (1,669,330 | ) | | | (949,012 | ) | | | — | | | | — | | | | — | |
| Net decrease in | | | | | | | | | | | | | | | | | | | | |
| Institutional Class shares | | | (1,613,268 | ) | | | (248,119 | ) | | | — | | | | — | | | | — | |
| Net increase (decrease) | | | | | | | | | | | | | | | | | | | | |
| in shares outstanding | | | (3,629,534 | ) | | | 245,877 | | | | 1,282,079 | | | | 6,641,676 | | | | 138,214 | |
7. INVESTMENT TRANSACTIONS
The aggregate purchases and sales, excluding short-term investments, by the Funds for the year ended May 31, 2023, were as follows:
| | | U.S. Government Securities | | | Other | |
| Fund | | Purchases | | | Sales | | | Purchases | | | Sales | |
| Mid Cap Fund | | $ | — | | | $ | — | | | $ | 71,878,996 | | | $ | 130,830,623 | |
| Genesis Fund | | $ | — | | | $ | — | | | $ | 123,236,200 | | | $ | 124,268,125 | |
| International Fund | | $ | — | | | $ | — | | | $ | 1,416,461 | | | $ | 105,478 | |
Reinhart Funds
Notes to the Financial Statements – Continued
May 31, 2023
8. FEDERAL TAX INFORMATION
The aggregate gross unrealized appreciation and depreciation of securities held by the Funds and the total cost of securities for federal income tax purposes at May 31, 2023, the Funds’ most recent fiscal year, were as follows:
| | | Aggregate | | | Aggregate | | | | | | Federal | |
| | | Gross | | | Gross | | | Net | | | Income | |
| Fund | | Appreciation | | | Depreciation | | | Appreciation | | | Tax Cost | |
| Mid Cap Fund | | $ | 25,235,730 | | | $ | (14,284,416 | ) | | $ | 10,951,314 | | | $ | 131,768,819 | |
| Genesis Fund | | | 46,870,301 | | | | (31,300,806 | ) | | | 15,569,495 | | | | 279,897,081 | |
| International Fund | | | 152,417 | | | | (110,962 | ) | | | 41,455 | | | | 1,402,184 | |
The difference between book-basis and tax basis unrealized appreciation is attributable primarily to the differences in tax treatment of wash sales and passive foreign investment companies.
At May 31, 2023, the Funds’ most recent fiscal year end, components of accumulated loss on a tax-basis were as follows:
| | | Undistributed | | | Undistributed | | | | | | Total | |
| | | Ordinary | | | Long-Term | | | Net | | | Distributable | |
| Fund | | Income | | | Capital Gains | | | Appreciation | | | Earnings | |
| Mid Cap Fund | | $ | 377,523 | | | $ | 3,790,645 | | | $ | 10,951,314 | | | $ | 15,119,482 | |
| Genesis Fund | | | 5,542,442 | | | | 4,098,128 | | | | 15,569,495 | | | | 25,210,065 | |
| International Fund | | | 16,133 | | | | — | | | | 41,455 | | | | 57,588 | |
As of May 31, 2023, the Funds’ most recent fiscal year end, the Funds did not have any capital loss carryovers. A regulated investment company may elect for any taxable year to treat any portion of any qualified late year loss as arising on the first day of the next taxable year. Qualified late year losses are certain capital, and ordinary losses which occur during the portion of the Funds’ taxable year subsequent to October 31 and December 31, respectively. The Funds do not plan to defer any qualified late-year losses.
The tax character of distributions paid during the year ended May 31, 2023, were as follows:
| | | Ordinary | | | Long-Term | | | | | |
| Fund | | Income* | | | Capital Gains | | | Total | | |
| Mid Cap Fund | | $ | 1,353,077 | | | $ | 7,386,204 | | | $ | 8,739,281 | | |
| Genesis Fund | | | 2,203,333 | | | | 16,175,604 | | | | 18,378,937 | | |
| International Fund | | | 13,313 | | | | — | | | | 13,313 | | |
The tax character of distributions paid during the year ended May 31, 2022, were as follows:
| | | Ordinary | | | Long-Term | | | | | |
| Fund | | Income* | | | Capital Gains | | | Total | | |
| Mid Cap Fund | | $ | 2,512,141 | | | $ | — | | | $ | 2,512,141 | | |
| Genesis Fund | | | 3,926,903 | | | | 7,625,522 | | | | 11,552,425 | | |
* For Federal income tax purposes, distributions of short-term capital gains are treated as ordinary income.
Reinhart Funds
Notes to the Financial Statements – Continued
May 31, 2023
9. SECTOR RISK
As of May 31, 2023, the Reinhart Genesis PMV Fund had a significant portion of its assets invested in the financials sector. Changes in governmental regulation, interest rates, domestic and international economics, loan losses, price competition and industry consolidation may affect companies in this sector.
10. CONTROL OWNERSHIP
The beneficial ownership, either directly or indirectly, of more than 25% of the voting securities of a fund creates a presumption of control of the fund, under Section 2(a)(9) of the 1940 Act. As of May 31, 2023, each Fund’s percentage of control ownership positions greater than 25% are as follows:
| | | Percent of | Type of | |
| Fund | Shareholder | Shares Held | Ownership | |
| Mid Cap Fund | Wells Fargo Clearing Services, LLC | 25.24% | Record | |
| | | | | |
| Genesis Fund | Morgan Stanley Smith Barney, LLC | 47.27% | Record | |
| | | | | |
| International Fund | National Financial Services, LLC | 41.46% | Record | |
| | James Reinhart | 36.59% | Beneficial | |
11. RESULTS OF SPECIAL SHAREHOLDER MEETING (UNAUDITED)
At a special meeting of the shareholders of the Funds (the “Special Meeting”) held on April 18, 2023, the shareholders approved a new investment advisory agreement (the “New Advisory Agreement”) between the Adviser and the Trust, on behalf of the Funds. The New Advisory Agreement was approved by the Board of Trustees and by shareholders of the Funds in anticipation of a change in ownership of the Adviser that would result in the termination of the previously effective investment advisory agreement between the Adviser and the Trust, on behalf of the Funds. Each Fund’s shareholders of record as of January 31, 2023, were entitled to vote at the Special Meeting.
As of the record date, the Mid Cap Fund had 10,085,686 shares outstanding. Of the 5,632,163 shares present in person or by proxy at the Special Meeting: 5,604,861, or 99.5%, voted to approve the New Advisory Agreement (representing 55.6% of total outstanding shares), 19,017, or 0.3% voted against, and 8,285, or 0.2% withheld from voting. Accordingly, the New Advisory Agreement was approved.
As of the record date, the Genesis Fund had 22,866,814 shares outstanding. Of the 13,947,728 shares present in person or by proxy at the Special Meeting: 13,911,879, or 99.7%, voted to approve the New Advisory Agreement (representing 60.8% of total outstanding shares), 845, or 0.0% voted against, and 35,004, or 0.3% withheld from voting. Accordingly, the New Advisory Agreement was approved.
As of the record date, the International Fund had 122,657 shares outstanding. Of the 80,906 shares present in person or by proxy at the Special Meeting: 80,906, or 100.0%, voted to approve the New Advisory Agreement (representing 66.0% of total outstanding shares). There were no abstentions or votes against approving the New Advisory Agreement. Accordingly, the New Advisory Agreement was approved.
Subsequent to the shareholder meeting, on June 30, 2023, Reinhart Partners, LLC (the “Adviser”) terminated its agreement with Spouting Rock Asset Management, LLC (“SRAM”), whereby SRAM would acquire approximately 70% of the Adviser in a multi-step transaction over a period of two years (the “Acquisition”). As a
Reinhart Funds
Notes to the Financial Statements – Continued
May 31, 2023
result, the anticipated change in control of the Adviser due to the Acquisition, as disclosed in the prospectus supplement dated January 9, 2023 and the proxy statement dated February 10, 2023, will not occur and therefore there will be no technical “assignment” of the existing investment advisory agreement between the Adviser and the Trust, on behalf of the Fund. Reinhart Partners, LLC will continue to serve as investment adviser to the Fund in the same capacity as before.
12. SUBSEQUENT EVENTS
Management has performed an evaluation of subsequent events through the date the financial statements were issued and has determined that no additional items require recognition or disclosure.
Reinhart Funds
Report of Independent Registered Public Accounting Firm
To the Shareholders of Reinhart Funds
and Board of Trustees of Managed Portfolio Series
Opinion on the Financial Statements
We have audited the accompanying statements of assets and liabilities, including the schedules of investments, of Reinhart Funds comprising the funds listed below (“Reinhart Funds” or the “Funds”), each a series of Managed Portfolio Series, as of May 31, 2023, the related statements of operations, the statements of changes in net assets, the related notes, and the financial highlights for each of the periods indicated below (collectively referred to as the “financial statements”). In our opinion, the financial statements present fairly, in all material respects, the financial position of each of the Funds as of May 31, 2023, the results of their operations, the changes in net assets, and the financial highlights for each of the periods indicated below in conformity with accounting principles generally accepted in the United States of America.
| | Statements | Statements of | |
| Fund Name | of Operations | Changes in Net Assets | Financial Highlights |
| Reinhart Mid Cap PMV Fund | For the year ended | For the years ended | For the years ended |
| Reinhart Genesis PMV Fund | May 31, 2023 | May 31, 2023 and 2022 | May 31, 2023, 2022, |
| | | | 2021, 2020, and 2019 |
| Reinhart International PMV Fund | For the year ended May 31, 2023 | | |
Basis for Opinion
These financial statements are the responsibility of the Funds’ management. Our responsibility is to express an opinion on the Funds’ financial statements based on our audits. We are a public accounting firm registered with the Public Company Accounting Oversight Board (United States) (“PCAOB”) and are required to be independent with respect to the Funds in accordance with the U.S. federal securities laws and the applicable rules and regulations of the Securities and Exchange Commission and the PCAOB.
We conducted our audits in accordance with the standards of the PCAOB. Those standards require that we plan and perform the audit to obtain reasonable assurance about whether the financial statements are free of material misstatement whether due to error or fraud.
Our audits included performing procedures to assess the risks of material misstatement of the financial statements, whether due to error or fraud, and performing procedures that respond to those risks. Such procedures included examining, on a test basis, evidence regarding the amounts and disclosures in the financial statements. Our procedures included confirmation of securities owned as of May 31, 2023, by correspondence with the custodian and brokers. Our audits also included evaluating the accounting principles used and significant estimates made by management, as well as evaluating the overall presentation of the financial statements. We believe that our audits provide a reasonable basis for our opinion.
We have served as the Funds’ auditor since 2012.
COHEN & COMPANY, LTD.
Milwaukee, Wisconsin
July 28, 2023
Reinhart Funds
Approval of Investment Advisory Agreement (Unaudited)
At a meeting of the Board of Trustees of Managed Portfolio Series (“Trust”) on February 23-24, 2023, the Trust’s Board of Trustees (“Board”), including all of the Trustees who are not “interested persons” of the Trust, as that term is defined in Section 2(a)(19) of the Investment Company Act of 1940, as amended (“Independent Trustees”), considered and approved the continuation of the Investment Advisory Agreement between the Trust, on behalf of each of the Reinhart Mid Cap PMV Fund and Reinhart Genesis PMV Fund (each a “Fund”, collectively the “Funds”) and Reinhart Partners, LLC (“Reinhart” or the “Adviser”) (the “Investment Advisory Agreement”) for another annual term.
The Investment Advisory Agreement was considered and renewed with the understanding at the time that Reinhart had recently entered into an agreement whereby Spouting Rock Asset Management, LLC (“SRAM”) would acquire a controlling interest in Reinhart in a transaction that would close during the first half of 2023 (the “Transaction”) and would cause the automatic termination of the Investment Advisory Agreement following its renewal. The Board noted that at a meeting of the Board of Trustees of the Trust on January 5, 2023, the Board had approved both an interim investment advisory agreement to take effect upon the closing of the Transaction and related termination of the Investment Advisory Agreement, as well as a new investment advisory agreement which would also take effect for each Fund, including the Reinhart International PMV Fund, after the closing of the Transaction, and only upon its approval by shareholders of the Fund. Prior to the Transaction closing, the Adviser terminated its agreement with SRAM. As a result, the termination of the Investment Advisory Agreement did not occur and the interim and new investment advisory agreements approved at the January 5, 2023 meeting did not take effect.
Prior to the meeting and at the meeting held on January 5, 2023, the Trustees received and considered information from Reinhart and the Trust’s administrator designed to provide the Trustees with the information necessary to evaluate the continuance of the Investment Advisory Agreement (“Support Materials”). Before voting to approve the continuance of the Investment Advisory Agreement, the Trustees reviewed the Support Materials with Trust management and with counsel to the Independent Trustees, and received a memorandum and advice from such counsel discussing the legal standards for their consideration of the renewal of the Investment Advisory Agreement. This information, together with the information provided to the Board throughout the course of the year, formed the primary (but not exclusive) basis for the Board’s determinations.
In determining whether to approve the Investment Advisory Agreement, the Trustees considered all factors they believed relevant including the following with respect to each Fund: (1) the nature, extent, and quality of the services to be provided by Reinhart with respect to the Fund; (2) the Fund’s historical performance and the performance of other investment accounts managed by Reinhart; (3) the costs of the services provided by Reinhart and the profits expected to be realized by Reinhart from services rendered to the Trust with respect to each Fund; (4) comparative fee and expense data for each Fund and other investment companies with similar investment objectives; (5) the extent to which economies of scale may be realized as each Fund grows, and whether the advisory fee for each Fund reflects such economies of scale for the Fund’s benefit; and (6) other financial benefits to Reinhart resulting from services rendered to the Fund. In their deliberations, the Trustees weighed to varying degrees the importance of the information provided to them, did not identify any particular information that was all-important or controlling, and considered the information and made its determinations for each Fund separately and independently of the other Fund.
Based upon the information provided to the Board throughout the course of the year, including a presentation to the Board by representatives of Reinhart, and the Support Materials, the Board concluded that the overall arrangements between the Trust and Reinhart set forth in the Investment Advisory Agreement, as it relates to each Fund, are fair and reasonable in light of the services Reinhart performs, the investment advisory fees that each
Reinhart Funds
Approval of Investment Advisory Agreement (Unaudited) – Continued
Fund pays, and such other matters as the Trustees considered relevant in the exercise of their reasonable business judgment. The material factors and conclusions that formed the basis of the Trustees’ determination to approve the Investment Advisory Agreement, as it relates to each Fund, are summarized below.
Nature, Extent and Quality of Services Provided. The Trustees considered the scope of services that Reinhart would provide under the Investment Advisory Agreement, noting that such services include but are not limited to the following for each Fund: (1) investing the Fund’s assets consistent with the Fund’s investment objective and investment policies; (2) determining the portfolio securities to be purchased, sold, or otherwise disposed of and the timing of such transactions; (3) voting all proxies, if any, with respect to the Fund’s portfolio securities; (4) maintaining the required books and records for transactions that Reinhart effects on behalf of the Fund; (5) selecting broker-dealers to execute orders on behalf of the Fund; and (6) monitoring and maintaining the Fund’s compliance with policies and procedures of the Trust and with applicable securities laws. The Trustees considered the qualifications, experience and responsibilities of the portfolio managers to each Fund. The Trustees also considered Reinhart’s resources and compliance structure, including information regarding its compliance program, its chief compliance officer and Reinhart’s compliance record and disaster recovery/business continuity plan. The Trustees also considered Reinhart’s ongoing business plans for the Funds. The Trustees concluded that Reinhart has the quality and depth of personnel, resources, investment methods and compliance policies and procedures essential to performing its duties under the Investment Advisory Agreement and that the nature, overall quality and extent of such management services would be satisfactory.
Fund Historical Performance and the Overall Performance of Reinhart. In assessing the quality of the portfolio management delivered by Reinhart, the Trustees reviewed the performance of the Reinhart Mid Cap PMV Fund and Reinhart Genesis PMV Fund on both an absolute basis and in comparison to an appropriate benchmark index, each Fund’s Morningstar category (“Category”) as well as a smaller sub-set of peer funds (“Cohort”), and the composite of separate accounts that Reinhart manages utilizing a similar investment strategy as that of each Fund. When comparing each Fund’s performance against its respective Category and Cohort, the Trustees took into account that the investment objective and strategies of each Fund, as well as the Fund’s level of risk tolerance, may differ significantly from funds in the Category and Cohort.
| | • | Reinhart Mid Cap PMV Fund. The Trustees noted that the Fund had outperformed both the Category and Cohort averages for the year-to-date and one-year periods ended September 30, 2022, but had underperformed for the three-year and five-year periods ended September 30, 2022. The Trustees also considered that the Fund had outperformed its benchmark index for the year-to-date period ended September 30, 2022, but had underperformed for the one-year, three-year, five-year and since inception periods ended December 31, 2021. The Trustees took into account that as of December 31, 2022, the Fund had achieved an overall positive return since its inception. The Trustees also considered that the Fund’s performance was consistent with, but slightly trailed, the returns of the Adviser’s composite for accounts with a similar strategy over all relevant time periods. |
| | | |
| | • | Reinhart Genesis PMV Fund. The Trustees noted that the Fund had outperformed both the Category and Cohort averages for the year-to-date and one-year periods ended September 30, 2022 but had underperformed for the three-year period ended September 30, 2022. The Trustees also noted that the Fund had outperformed its primary benchmark index for the year-to-date period ended September 30, 2022 and the one-year period ended December 31, 2021, but had underperformed for the three-year and since inception periods ended December 31, 2021. The Trustees took into account that as of December 31, 2022 the Fund had achieved an overall positive return since its inception. The Trustees also considered that the Fund’s performance was consistent with, but slightly trailed, the returns of the Adviser’s composite for accounts with a similar strategy over all relevant time periods. |
Reinhart Funds
Approval of Investment Advisory Agreement (Unaudited) – Continued
Cost of Advisory Services and Profitability. The Trustees considered the annual advisory fee that each Fund pays to Reinhart under the Investment Advisory Agreement, as well as Reinhart’s profitability from services that it rendered to each Fund during the 12-month period ended September 30, 2022. The Trustees also noted favorably the expense limitation agreement under which Reinhart contractually agreed to reduce its advisory fees and, if necessary, reimburse each Fund for operating expenses, as specified in the Funds’ prospectus. The Trustees further considered that the management fees Reinhart charges to separately managed accounts with strategies and asset levels similar to those of the Reinhart Mid Cap PMV Fund and Reinhart Genesis PMV Fund are lower than the advisory fee for each Fund, respectively. They also noted, however, that Reinhart has additional responsibilities with respect to the Funds, including the preparation of Board and shareholder materials, that justify the higher fee. The Trustees considered the reasonableness of Reinhart’s profits from its service relationship with each Fund.
Comparative Fee and Expense Data. The Trustees considered a comparative analysis of contractual expenses borne by each Fund and those of funds within the same Category and Cohort.
| | • | Reinhart Mid Cap PMV Fund. The Trustees noted that while the Fund’s advisory fee was higher than the Category and Cohort averages, the total expenses of the Fund’s Institutional Class (after waivers and expense reimbursements) were below the Category and Cohort averages. Regarding the Fund’s Advisor Class and Investor Class, the Trustees noted that the total expenses (after waivers and expense reimbursements) for each were above the Category and Cohort averages, but that these classes include shareholder servicing and/or Rule 12b-1 fees, which is not necessarily the case for the funds included in the Category and Cohort. |
| | | |
| | • | Reinhart Genesis PMV Fund. The Trustees noted that while the Fund’s advisory fee was higher than the Category and Cohort averages, the total expenses of the Fund’s Advisor Class (after waivers and expense reimbursements) were below the Category and Cohort averages. Regarding the Fund’s Investor Class, the Trustees noted that the total expenses (after waivers and expense reimbursements) were above the Category and Cohort averages, but that this class includes shareholder servicing and Rule 12b-1 fees, which is not necessarily the case for the funds included in the Category and Cohort. |
While recognizing that it is difficult to compare advisory fees because the scope of advisory services provided may vary from one investment adviser to another, the Trustees concluded that Reinhart’s advisory fee with respect to each Fund continues to be reasonable.
Economies of Scale. The Trustees considered whether the Funds would benefit from any economies of scale, noting that the investment advisory fees for the Funds do not contain breakpoints. The Trustees noted that at current asset levels, it was not necessary to consider the implementation of fee breakpoints but agreed to revisit the issue in the future as circumstances change and asset levels increase.
Other Benefits. The Trustees considered the direct and indirect benefits that could be realized by the Adviser from its relationship with the Funds. The Trustees considered the extent to which Reinhart utilizes soft dollar arrangements with respect to portfolio transactions and considered that Reinhart does not utilize any affiliated brokers to execute the Funds’ portfolio transactions. While the Trustees noted Rule 12b-1 fees may be paid for shareholder and distribution services performed on behalf of the Funds, the Trustees also observed that the Adviser was incurring its own distribution expenses on behalf of the Funds. The Trustees considered that Reinhart may receive some form of reputational benefit from services rendered to the Funds, but that such benefits are immaterial and cannot otherwise be quantified. The Trustees concluded that Reinhart does not receive additional material benefits from its relationship with the Funds.
Reinhart Funds
Statement Regarding the Funds’ Liquidity Risk Management Program (Unaudited)
Pursuant to Rule 22e-4 under the Investment Company Act of 1940, Managed Portfolio Series (the “Trust”), on behalf of the Reinhart Mid Cap PMV Fund, the Reinhart Genesis PMV Fund and the Reinhart International PMV Fund (each a “Fund” and together, the “Funds”), has adopted and implemented a written liquidity risk management program (the “Program”) that includes policies and procedures reasonably designed to comply with the requirements of Rule 22e-4, including: (i) assessment, management and periodic review of liquidity risk; (ii) classification of portfolio holdings; (iii) establishment of a highly liquid investment minimum (“HLIM”), as applicable; (iv) limitation on illiquid investments; and (v) redemptions in-kind. The Trust’s Board of Trustees (the “Board”) has approved the designation of Reinhart Partners, LLC (“Reinhart”) as the administrator of the Program (the “Program Administrator”). Personnel of Reinhart conduct the day-to-day operation of the Program pursuant to policies and procedures administered by the Reinhart Risk Committee.
In accordance with Rule 22e-4, the Board reviewed a report prepared by the Program Administrator (the “Report”) regarding the operation of the Program and its adequacy and effectiveness of implementation for the period January 1, 2022, through December 31, 2022 (the “Reporting Period”). No significant liquidity events impacting the Funds during the Reporting Period or material changes to the Program were noted in the Report.
Under the Program, Reinhart manages and periodically reviews each Fund’s liquidity risk, including consideration of applicable factors specified in Rule 22e-4 and the Program. Liquidity risk is defined as the risk that a Fund could not meet shareholder redemption requests without significant dilution of remaining shareholders’ interests in the Fund. In general, this risk was managed during the Reporting Period by monitoring the degree of liquidity of each Fund’s investments, limiting the amount of each Fund’s illiquid investments, and utilizing various risk management tools and facilities available to each Fund for meeting shareholder redemptions, among other means. In the Report, Reinhart provided its assessment that, based on the information considered in its review, the Program remains reasonably designed to manage each Fund’s liquidity risk and each Fund’ s investment strategy remains appropriate for an open-end fund.
Pursuant to the Program, the Reinhart Risk Committee oversaw the classification of each Fund’s portfolio investments as highly liquid, moderately liquid, less liquid or illiquid during the Reporting Period, including in connection with recording investment classifications on Form N-PORT. Reinhart’s process of determining the degree of liquidity of each Fund’s investments is supported by one or more third-party liquidity assessment vendors.
Each Fund qualified as a “primarily highly liquid fund” as defined in the Program during the Reporting Period. Accordingly, each Fund was not required to establish a HLIM or comply with the related Program provisions during the Reporting Period.
During the Reporting Period, each Fund’s investments were monitored for compliance with the 15% limitation on illiquid investments pursuant to the Program and in accordance with Rule 22e-4.
While there were no redemptions in-kind during the Reporting Period, the Report noted that such transactions would be in compliance with the Trust’s Redemption in Kind Policy. The Report concluded, with respect to each Fund: (i) the Program was implemented and operated effectively to achieve the goal of assessing and managing the Fund’s liquidity risk during the Reporting Period; and (ii) the Fund was able to meet requests for redemption without significant dilution of remaining investors’ interests in the Fund during the Reporting Period.
Reinhart Funds
Additional Information (Unaudited)
May 31, 2023
TRUSTEES & OFFICERS
| | | | | | Other |
| | | | Number of | | Directorships |
| | | Term of | Portfolios | | Held by |
| | Position(s) | Office and | in Trust | | Trustee |
| Name, Address | Held with | Length of | Overseen | Principal Occupation(s) | During the |
| and Year of Birth | the Trust | Time Served | by Trustee | During the Past Five Years | Past Five Years |
| Independent Trustees | | | | | |
| | | | | | |
| Leonard M. Rush, CPA | Chairman, | Indefinite | 31 | Retired; Chief Financial Officer, | Independent |
| 615 E. Michigan St. | Trustee | Term; | | Robert W. Baird & Co. | Trustee, ETF |
| Milwaukee, WI 53202 | and Audit | Since | | Incorporated, (2000-2011). | Series Solutions |
| Year of Birth: 1946 | Committee | April 2011 | | | (56 Portfolios) |
| | Chairman | | | | (2012-Present). |
| | | | | | |
| David A. Massart | Trustee | Indefinite | 31 | Partner and Managing Director, | Independent |
| 615 E. Michigan St. | | Term; | | Beacon Pointe Advisors, LLC | Trustee, ETF |
| Milwaukee, WI 53202 | | Since | | (since 2022); Co-Founder and | Series Solutions |
| Year of Birth: 1967 | | April 2011 | | Chief Investment Strategist, | (56 Portfolios) |
| | | | | Next Generation Wealth | (2012-Present). |
| | | | | Management, Inc. (2005-2021). | |
| | | | | | |
| David M. Swanson | Trustee and | Indefinite | 31 | Founder and Managing Principal, | Independent |
| 615 E. Michigan St. | Nominating | Term; | | SwanDog Strategic Marketing, LLC | Trustee, ALPS |
| Milwaukee, WI 53202 | & | Since | | (2006-Present). | Variable |
| Year of Birth: 1957 | Governance | April 2011 | | | Investment Trust |
| | Committee | | | | (7 Portfolios) |
| | Chairman | | | | (2006-Present); |
| | | | | | Independent |
| | | | | | Trustee, |
| | | | | | RiverNorth Funds |
| | | | | | (3 Portfolios) |
| | | | | | (2018-Present); |
| | | | | | RiverNorth |
| | | | | | Managed Duration |
| | | | | | Municipal Income |
| | | | | | Fund, Inc. |
| | | | | | (1 Portfolio) |
| | | | | | (2019-Present); |
| | | | | | RiverNorth |
| | | | | | Opportunistic |
| | | | | | Municipal Income |
| | | | | | Fund, Inc. |
| | | | | | (1 Portfolio) |
| | | | | | (2018-Present); |
| | | | | | RiverNorth Capital |
| | | | | | and Income Fund |
| | | | | | (1 Portfolio) |
| | | | | | (2018-Present); |
| | | | | | RiverNorth |
| | | | | | Opportunities |
| | | | | | Fund (1 Portfolio) |
| | | | | | (2015-Present); |
Reinhart Funds
Additional Information (Unaudited) – Continued
May 31, 2023
| | | | | | Other |
| | | | Number of | | Directorships |
| | | Term of | Portfolios | | Held by |
| | Position(s) | Office and | in Trust | | Trustee |
| Name, Address | Held with | Length of | Overseen | Principal Occupation(s) | During the |
| and Year of Birth | the Trust | Time Served | by Trustee | During the Past Five Years | Past Five Years |
| Independent Trustees | | | | | |
| | | | | | |
| David M. Swanson | | | | | RiverNorth/ |
| (Continued) | | | | | DoubleLine |
| | | | | | Strategic |
| | | | | | Opportunity Fund, |
| | | | | | Inc. (1 Portfolio) |
| | | | | | (2019-Present); |
| | | | | | RiverNorth |
| | | | | | Flexible Municipal |
| | | | | | Income Fund, Inc. |
| | | | | | (1 Portfolio) |
| | | | | | (2020-Present); |
| | | | | | RiverNorth |
| | | | | | Flexible Municipal |
| | | | | | Income Fund II, |
| | | | | | Inc. (1 Portfolio) |
| | | | | | (2021-Present); |
| | | | | | RiverNorth |
| | | | | | Managed Duration |
| | | | | | Municipal Income |
| | | | | | Fund II, Inc. |
| | | | | | (1 Portfolio) |
| | | | | | (2022-Present). |
| | | | | | |
| Robert J. Kern | Trustee | Indefinite | 31 | Retired (2018-Present); | None |
| 615 E. Michigan St. | | Term; | | Executive Vice President, | |
| Milwaukee, WI 53202 | | Since | | U.S. Bancorp Fund Services, | |
| Year of Birth: 1958 | | January | | LLC (1994-2018). | |
| | | 2011 | | | |
Reinhart Funds
Additional Information (Unaudited) – Continued
May 31, 2023
| | | | | | Other |
| | | | Number of | | Directorships |
| | | Term of | Portfolios | | Held by |
| | Position(s) | Office and | in Trust | | Trustee |
| Name, Address | Held with | Length of | Overseen | Principal Occupation(s) | During the |
| and Year of Birth | the Trust | Time Served | by Trustee | During the Past Five Years | Past Five Years |
| Officers | | | | | |
| | | | | | |
| Brian R. Wiedmeyer | President | Indefinite | N/A | Vice President, U.S. Bancorp Fund | N/A |
| 615 E. Michigan St. | and | Term; | | Services, LLC (2005-Present). | |
| Milwaukee, WI 53202 | Principal | Since | | | |
| Year of Birth: 1973 | Executive | November | | | |
| | Officer | 2018 | | | |
| | | | | | |
| Deborah Ward | Vice | Indefinite | N/A | Senior Vice President, U.S. | N/A |
| 615 E. Michigan St. | President, | Term; | | Bancorp Fund Services, LLC | |
| Milwaukee, WI 53202 | Chief | Since | | (2004-Present). | |
| Year of Birth: 1966 | Compliance | April 2013 | | | |
| | Officer and | | | | |
| | Anti-Money | | | | |
| | Laundering | | | | |
| | Officer | | | | |
| | | | | | |
| Benjamin Eirich | Treasurer, | Indefinite | N/A | Assistant Vice President, U.S. | N/A |
| 615 E. Michigan St. | Principal | Term; | | Bancorp Fund Services, LLC | |
| Milwaukee, WI 53202 | Financial | Since | | (2008-Present). | |
| Year of Birth: 1981 | Officer and | August 2019 | | | |
| | Vice | (Treasurer); | | | |
| | President | Indefinite | | | |
| | | Term; | | | |
| | | Since | | | |
| | | November 2018 | | | |
| | | (Vice President) | | | |
| | | | | | |
| John Hadermayer | Secretary | Indefinite | N/A | Vice President, U.S. Bancorp Fund | N/A |
| 615 E. Michigan St. | | Term; | | Services, LLC (2022-Present); | |
| Milwaukee, WI 53202 | | Since | | Executive Director, AQR Capital | |
| Year of Birth: 1977 | | May 2022 | | Management, LLC (2013-2022). | |
| | | | | | |
| Douglas Schafer | Assistant | Indefinite | N/A | Assistant Vice President, U.S. | N/A |
| 615 E. Michigan St. | Treasurer | Term; | | Bancorp Fund Services, LLC | |
| Milwaukee, WI 53202 | and Vice | Since | | (2002-Present). | |
| Year of Birth: 1970 | President | May 2016 | | | |
| | | (Assistant | | | |
| | | Treasurer); | | | |
| | | Indefinite | | | |
| | | Term; | | | |
| | | Since | | | |
| | | November 2018 | | | |
| | | (Vice President) | | | |
Reinhart Funds
Additional Information (Unaudited) – Continued
May 31, 2023
| | | | | | Other |
| | | | Number of | | Directorships |
| | | Term of | Portfolios | | Held by |
| | Position(s) | Office and | in Trust | | Trustee |
| Name, Address | Held with | Length of | Overseen | Principal Occupation(s) | During the |
| and Year of Birth | the Trust | Time Served | by Trustee | During the Past Five Years | Past Five Years |
| Officers | | | | | |
| | | | | | |
| Sara J. Bollech | Assistant | Indefinite | N/A | Officer, U.S. Bancorp Fund | N/A |
| 615 E. Michigan St. | Treasurer | Term: | | Services, LLC (2007-Present). | |
| Milwaukee, WI 53202 | and Vice | Since | | | |
| Year of Birth: 1977 | President | November 2021 | | | |
| | | | | | |
| Peter A. Walker, CPA | Assistant | Indefinite | N/A | Officer, U.S. Bancorp Fund | N/A |
| 615 E. Michigan St. | Treasurer | Term: | | Services, LLC (2016-Present). | |
| Milwaukee, WI 53202 | and Vice | Since | | | |
| Year of Birth: 1993 | President | November 2021 | | | |
Reinhart Funds
Additional Information (Unaudited) – Continued
May 31, 2023
AVAILABILITY OF FUND PORTFOLIO INFORMATION
Each Fund files complete schedules of portfolio holdings with the SEC for the first and third quarters of each fiscal year on Part F of Form N-PORT. The Funds’ Part F of Form N-PORT are each available on the SEC’s website at www.sec.gov and may be reviewed and copied at the SEC’s Public Reference Room in Washington, D.C. For information on the Public Reference Room call 1-800-SEC-0330. In addition, each Fund’s Part F of Form N-PORT is available without charge upon request by calling 1-855-774-3863.
AVAILABILITY OF PROXY VOTING INFORMATION
A description of the Funds' Proxy Voting Policies and Procedures is available without charge, upon request, by calling 1-855-774-3863. Information regarding how the Funds voted proxies relating to portfolio securities during the most recent 12-month period ended June 30, is available (1) without charge, upon request, by calling 1-855-774-3863, or (2) on the SEC’s website at www.sec.gov.
QUALIFIED DIVIDEND INCOME/DIVIDENDS RECEIVED DEDUCTION
For the fiscal year ended May 31, 2023, certain dividends paid by the Funds may be reported as qualified dividend income and may be eligible for taxation at capital gain rates. The percentage of dividends declared from ordinary income designated as qualified dividend income was as follows:
| Fund | | |
| Mid Cap Fund | 100.00% | |
| Genesis Fund | 59.43% | |
| International Fund | 78.68% | |
For corporate shareholders, the percent of ordinary income distributions qualifying for the corporate dividends received deduction for the fiscal year ended May 31, 2023, was as follows:
| Fund | | |
| Mid Cap Fund | 100.00% | |
| Genesis Fund | 59.44% | |
| International Fund | 0.00% | |
The percentage of taxable ordinary income distributions that are designated as short-term capital gain distributions under Internal Revenue Section 871(k)(2)(c) were as follows:
| Fund | | |
| Mid Cap Fund | 0.00% | |
| Genesis Fund | 72.90% | |
| International Fund | 12.00% | |
Reinhart Funds
Additional Information (Unaudited) – Continued
May 31, 2023
FOREIGN TAX CREDIT PASS THROUGH
Pursuant to Section 853 of the Internal Revenue code, the Funds designate the following amounts as foreign taxes paid for the period ended May 31, 2023. Foreign taxes paid for purposes of Section 853 may be less than actual foreign taxes paid for financial statement purposes.
| Fund | Gross Foreign Income | Foreign tax Paid | |
| International Fund | $27,978 | $2,970 | |
Foreign taxes paid or withheld should be included in taxable income with an offsetting deduction from gross income or as a credit for taxes paid to foreign governments. Above figures may differ from those cited elsewhere in this report due to difference in the calculation of income and gains under GAAP purposes and Internal Revenue Service purposes. Shareholders are strongly advised to consult their own tax advisers with respect to the tax consequences of their investments in the Funds.
Reinhart Funds
Privacy Notice
The Funds collect only relevant information about you that the law allows or requires it to have in order to conduct its business and properly service you. The Funds collect financial and personal information about you (“Personal Information”) directly (e.g., information on account applications and other forms, such as your name, address, and social security number, and information provided to access account information or conduct account transactions online, such as password, account number, e-mail address, and alternate telephone number), and indirectly (e.g., information about your transactions with us, such as transaction amounts, account balance and account holdings).
The Funds do not disclose any non-public personal information about its shareholders or former shareholders other than for everyday business purposes such as to process a transaction, service an account, respond to court orders and legal investigations or as otherwise permitted by law. Third parties that may receive this information include companies that provide transfer agency, technology and administrative services to the Funds, as well as the Funds’ investment adviser who is an affiliate of the Funds. If you maintain a retirement/educational custodial account directly with the Funds, we may also disclose your Personal Information to the custodian for that account for shareholder servicing purposes. The Funds limit access to your Personal Information provided to unaffiliated third parties to information necessary to carry out their assigned responsibilities to the Funds. All shareholder records will be disposed of in accordance with applicable law. The Funds maintain physical, electronic and procedural safeguards to protect your Personal Information and requires its third-party service providers with access to such information to treat your Personal Information with the same high degree of confidentiality.
In the event that you hold shares of the Funds through a financial intermediary, including, but not limited to, a broker-dealer, credit union, bank or trust company, the privacy policy of your financial intermediary governs how your non-public personal information is shared with unaffiliated third parties.
INVESTMENT ADVISER
Reinhart Partners, LLC
11090 North Weston Drive
Mequon, WI 53092
DISTRIBUTOR
Quasar Distributors, LLC
111 East Kilbourn Avenue, Suite 2200
Milwaukee, WI 53202
CUSTODIAN
U.S. Bank, N.A.
1555 North River Center Drive, Suite 302
Milwaukee, WI 53212
ADMINISTRATOR, FUND ACCOUNTANT
AND TRANSFER AGENT
U.S. Bancorp Fund Services, LLC
615 East Michigan Street
Milwaukee, WI 53202
INDEPENDENT REGISTERED PUBLIC ACCOUNTING FIRM
Cohen & Company, Ltd.
342 North Water Street, Suite 830
Milwaukee, WI 53202
LEGAL COUNSEL
Stradley Ronon Stevens & Young, LLP
2005 Market Street, Suite 2600
Philadelphia, PA 19103
This report must be accompanied or preceded by a prospectus.
The Funds’ Statement of Additional Information contains additional information about the Funds’ trustees and is
available without charge upon request by calling 1-855-774-3863.
RH-RPANNUAL
Item 2. Code of Ethics.
The registrant has adopted a code of ethics that applies to the Registrant’s principal executive officer and principal financial officer. The registrant has not made any substantive amendments to its code of ethics during the period covered by this report.
The registrant has not granted any waivers from any provisions of the code of ethics during the period covered by this report.
A copy of the registrant’s code of ethics that applies to the registrant’s principal executive officer and principal financial officer is filed herewith.
Item 3. Audit Committee Financial Expert.
The registrant’s Board of Trustees has determined that there is at least one audit committee financial expert serving on its audit committee. Leonard M. Rush is the “audit committee financial expert” and is considered to be “independent” as each term is defined in Item 3 of Form N-CSR.
Item 4. Principal Accountant Fees and Services.
The registrant has engaged its principal accountant to perform audit services, audit-related services, tax services and other services during the past two fiscal years. “Audit services” refer to performing an audit of the registrant's annual financial statements or services that are normally provided by the accountant in connection with statutory and regulatory filings or engagements for those fiscal years. “Audit-related services” refer to the assurance and related services by the principal accountant that are reasonably related to the performance of the audit. “Tax services” refer to professional services rendered by the principal accountant for tax compliance, tax advice, and tax planning. There were no “other services” provided by the principal accountant. For the fiscal years ended May 31, 2023, and May 31, 2022, the Funds’ principal accountant was Cohen & Company, Ltd. The following table details the aggregate fees billed or expected to be billed for each of the last two fiscal years for audit fees, audit-related fees, tax fees and other fees by the principal accountant.
| | FYE 5/31/2023 | FYE 5/31/2022 |
| ( a ) Audit Fees | $44,750 | $28,500 |
| ( b ) Audit-Related Fees | $0 | $0 |
| ( c ) Tax Fees | $10,500 | $7,000 |
| ( d ) All Other Fees | $0 | $0 |
(e)(1) The audit committee has adopted pre-approval policies and procedures that require the audit committee to pre‑approve all audit and non‑audit services of the registrant, including services provided to any entity affiliated with the registrant.
(e)(2) The percentage of fees billed by Cohen & Company, Ltd. for the fiscal years ended May 31, 2023, and May 31, 2022, applicable to non-audit services pursuant to waiver of pre-approval requirement was as follows:
| | FYE 5/31/2023 | FYE 5/31/2022 |
Audit-Related Fees | 0% | 0% |
Tax Fees | 0% | 0% |
All Other Fees | 0% | 0% |
(f) All of the principal accountant’s hours spent on auditing the registrant’s financial statements were attributed to work performed by full‑time permanent employees of the principal accountant.
(g) The following table indicates the non-audit fees billed or expected to be billed by the registrant’s accountant for services to the registrant and to the registrant’s investment adviser (and any other controlling entity, etc.—not sub-adviser) for the last two years.
Non-Audit Related Fees | FYE 5/31/2023 | FYE 5/31/2022 |
Registrant | $0 | $0 |
Registrant’s Investment Adviser | $0 | $0 |
(h) The audit committee of the board of trustees/directors has considered whether the provision of non-audit services that were rendered to the registrant's investment adviser is compatible with maintaining the principal accountant's independence and has concluded that the provision of such non-audit services by the accountant has not compromised the accountant’s independence.
(i) Not applicable
(j) Not applicable
Item 5. Audit Committee of Listed Registrants.
Not applicable to registrants who are not listed issuers (as defined in Rule 10A-3 under the Securities Exchange Act of 1934).
Item 6. Investments.
| (a) | Schedule of Investments is included as part of the report to shareholders filed under Item 1 of this Form. |
Item 7. Disclosure of Proxy Voting Policies and Procedures for Closed-End Management Investment Companies.
Not applicable to open-end investment companies.
Item 8. Portfolio Managers of Closed-End Management Investment Companies.
Not applicable to open-end investment companies.
Item 9. Purchases of Equity Securities by Closed‑End Management Investment Company and Affiliated Purchasers.
Not applicable to open-end investment companies.
Item 10. Submission of Matters to a Vote of Security Holders.
There have been no material changes to the procedures by which shareholders may recommend nominees to the registrant’s board of trustees.
Item 11. Controls and Procedures.
| (a) | The Registrant’s President and Treasurer have reviewed the Registrant's disclosure controls and procedures (as defined in Rule 30a-3(c) under the Investment Company Act of 1940 (the “Act”)) as of a date within 90 days of the filing of this report, as required by Rule 30a-3(b) under the Act and Rules 13a-15(b) or 15d‑15(b) under the Securities Exchange Act of 1934. Based on their review, such officers have concluded that the disclosure controls and procedures are effective in ensuring that information required to be disclosed in this report is appropriately recorded, processed, summarized and reported and made known to them by others within the Registrant and by the Registrant’s service provider. |
| (b) | There were no changes in the Registrant's internal control over financial reporting (as defined in Rule 30a-3(d) under the Act) that occurred during the period covered by this report that have materially affected, or are reasonably likely to materially affect, the Registrant's internal control over financial reporting. |
Item 12. Disclosure of Securities Lending Activities for Closed-End Management Investment Companies
Not applicable to open-end investment companies.
Item 13. Exhibits.
(3) Any written solicitation to purchase securities under Rule 23c‑1 under the Act sent or given during the period covered by the report by or on behalf of the registrant to 10 or more persons. Not applicable to open-end investment companies.
(4) Change in the registrant’s independent public accountant. There was no change in the registrant’s independent public accountant for the period by this report.
SIGNATURES
Pursuant to the requirements of the Securities Exchange Act of 1934 and the Investment Company Act of 1940, the registrant has duly caused this report to be signed on its behalf by the undersigned, thereunto duly authorized.
(Registrant) Managed Portfolio Series
By (Signature and Title)* /s/Brian R. Wiedmeyer
Brian R. Wiedmeyer, President
Date August 2, 2023
Pursuant to the requirements of the Securities Exchange Act of 1934 and the Investment Company Act of 1940, this report has been signed below by the following persons on behalf of the registrant and in the capacities and on the dates indicated.
By (Signature and Title)* /s/Brian R. Wiedmeyer
Brian R. Wiedmeyer, President
Date August 2, 2023
By (Signature and Title)* /s/Benjamin J. Eirich
Benjamin J. Eirich, Treasurer
Date August 2, 2023
* Print the name and title of each signing officer under his or her signature.