Brian R. Wiedmeyer, President
c/o U.S. Bancorp Fund Services, LLC
Principal Street High Income Municipal Fund
A Class Shares — GSTFX
Institutional Class Shares — GSTAX
Investor Class Shares — GSTEX
Principal Street Short Term Municipal Fund
Institutional Class Shares — PSTYX
Investor Class Shares — PSTEX
Annual Report
| https://principalstreetfunds.com | August 31, 2023 |
(This Page Intentionally Left Blank.)
PRINCIPAL STREET FUNDS
Dear Investors,
We are pleased to present you with our Principal Street High Income Municipal Fund (“High Income Fund”) (share classes GSTAX/GSTEX/GSTFX) and Principal Street Short Term Municipal Fund (“Short Term Fund”) (share classes PSTYX/PSTEX) annual shareholder report for the fiscal year ended August 31, 2023 (hereafter: the reporting period).
MARKET UPDATE
Inflation and Rising7 Interest Rates Continue to Drive Performance
Municipal bond performance so far in 2023 has been a bit listless with rates continuing to rise – but at a much slower pace. Interest rates have risen an additional 50-100 basis points over the reporting period. Importantly, inflation has moderated and continues to decline. This should lead to a moderation of interest rate fluctuations at least to some of the volatility of the last few years. Once inflation expectations have embedded themselves within a market, they are difficult to shake off, the process takes time. Outflows were significant across the board as municipal bond funds continue to see outflows, but again at a much more moderated pace than the prior year.
Fears of a potentially severe economic downturn are receding and the fundamentals of underlying municipal credit remains strong. State and local governments continue to reap the rewards of Federal pandemic stimulus programs. We expect the financial strength of municipalities to remain supported over the next several years, and we are focusing on credits that will endure any downturn in the economic cycle. One of the many benefits of most municipal credits is that they are not highly correlated to the general business cycle. This does not mean the market is immune to volatility or defaults, but that volatility may present the best buying opportunities, and we constantly strive to position the fund properly in order to take advantage of such opportunities. This is where we concentrate our efforts.
HIGH INCOME FUND PORTFOLIO UPDATE
The High Income Fund delivered on its primary goal of providing high levels of tax-exempt income and strong relative performance, while operating in a challenging market environment for US fixed income in general, and municipal bonds specifically, during the reporting period.
The high yield municipal bond market had continued net outflows as has the High Income Fund. The outflows were minor, but a bit disappointing. We believe overall volatility has been greatly mitigated and that the Fund is poised to gain assets as our longer term performance track record continues to be repaired. At the end of the reporting period, the High Income Fund’s AUM was approximately $275 million.
For the reporting period, the High Income Fund’s total return was -2.94% (GSTAX). As of August 31, 2023, the Institutional Class had a one-year distribution yield of 6.32%, which we view as very strong compared to our peers.
Performance, Yields & Expense Ratios as of August 31, 2023
| | | | Annualized | | |
| | | | Since | | Expense |
| | 1-Year | 5-Year | Inception | Distribution | Ratio(5) |
| Share Class | Return | Return | (9/15/17) | Yield | (Gross/Net) |
Institutional (GSTAX)(1) | -2.94% | -0.93% | 0.74% | 6.32% | 1.04% / 1.00% |
Investor (GSTEX)(2) | -3.81% | -1.64% | 0.27% | 5.77% | 1.54% / 1.50% |
A Class (GSTFX)(3)(4) | | | | | |
| (with sales load) | -6.16% | -1.90% | -0.12% | 6.09% | 1.27% / 1.23% |
A Class (GSTFX)(3) | | | | | |
| (without sales load) | -4.02% | -1.45% | 0.26% | 6.09% | 1.27% / 1.23% |
| Bloomberg High Yield | | | | | |
| Municipal Bond Index | 0.52% | 2.37% | 3.05% | N/A | N/A |
PRINCIPAL STREET FUNDS
Performance reflects waivers of fee and operating expenses in effect. In the absence of such waivers, total return would be reduced. Performance data quoted represents past performance and does not guarantee future results. Investment returns and principal value will fluctuate, and when sold, may be worth more or less than their original cost. Performance current to the most recent month-end may be lower or higher than the performance quoted and can be obtained by calling 1-877-914-7343. Performance assumes the reinvestment of capital gains and income distributions. The performance does not reflect the deduction of taxes that a shareholder would pay on Fund distributions or the redemption of Fund shares.
Distribution Yield is the latest monthly dividend rate times 12, divided by the latest month-end NAV.
| (1) | Inception date for the Institutional Class was September 15, 2017. |
| (2) | Inception date for the Investor Class was March 23, 2020. Performance for the Investor Class prior to the inception of the class is based on the performance of the Institutional Class, adjusted for the higher expenses applicable to the Investor Class. |
| (3) | Inception date for the A Class was February 15, 2022. Performance for the A Class prior to the inception of the class is based on the performance of the Institutional Class, adjusted for the higher expenses applicable to the A Class. |
| (4) | Reflects the maximum front-end sales load of 2.25%. |
| (5) | As of December 29, 2022, the date of the High Income Fund’s most recent prospectus, expense ratios for the Fund were as follows: |
| | Institutional Class | Gross Expenses: 0.93%; Net Expenses: 0.90% |
| | Investor Class | Gross Expenses: 1.45%; Net Expenses: 1.42% |
| | A Class | Gross Expenses: 1.34%; Net Expenses: 1.27% |
Principal Street Partners, LLC (the “Adviser”) has contractually agreed to reduce its management fees, and may reimburse the Fund for its operating expenses, in order to ensure that Total Annual Fund Operating Expenses (excluding certain expenses such as Rule 12b-1 fees, taxes, leverage/borrowing interest, interest expense, dividends paid on short sales, brokerage commissions and other transactional expenses, acquired fund fees and expenses (“AFFE”), or extraordinary expenses (“Excluded Expenses”)) do not exceed 0.80% of the Fund’s average daily net assets. Fees waived and expenses paid by the Adviser may be recouped by the Adviser for a period of 36 months following the month during which such fee waiver and/or expense payment was made, if such recoupment can be achieved without exceeding the expense limit in effect at the time the fee waiver and/or expense payment occurred and the expense limit in place at the time of recoupment. The Operating Expenses Limitation Agreement is indefinite, but cannot be terminated through at least December 29, 2023. Thereafter, the agreement may be terminated at any time upon 60 days’ written notice by the Trust’s Board of Trustees (the “Board”) or the Adviser.
SHORT TERM FUND PORTFOLIO UPDATE
The Short Term Fund was launched on April 27, 2022 and compliments the high yield strategy of the High Income Fund in that it is a short duration (< 3 years) and high grade (90% investment grade or greater) offering. The Fund is designed to minimize price volatility both in the absolute and relative to its peers. During the reporting period the Adviser is satisfied that the Short Term Fund performed as designed.
For the reporting period, the Fund’s total return was 2.36% (PSTYX), while the Fund’s benchmark, the Bloomberg 3-Year Municipal Bond Index returned 1.12%. As of August 31, 2023, the Institutional Class had a one-year distribution yield of 3.42%, which we view as very strong compared to our peers.
In the brief time since inception the Short Term Fund has existed in what is best described as a challenging market environment. Over the last 18 months the municipal bond market has seen significant rate and flow volatility. Short term municipal rates have increased 50-100 basis points over the last 12 months and that is after a period where rates already rose 100-200 basis points with some sectors widening even further (e.g. Diversified Financials, and AMT Airports). The relative performance of the Short Term Fund has met our expectations. The Fund has seen AUM grow from $28 million to $53 million as of period end, which is encouraging considering the degree of outflows from municipal bond mutual funds during that time.
PRINCIPAL STREET FUNDS
Performance, Yields & Expense Ratios as of August 31, 2023
| | | Annualized | | |
| | | Since | | Expense |
| | 1-Year | Inception | Distribution | Ratio(1) |
| Share Class | Return | (4/27/22) | Yield | (Gross/Net) |
| Institutional (PSTYX) | 2.36% | 2.52% | 3.61% | 1.09% / 0.71% |
| Investor (PSTEX) | 1.87% | 2.09% | 3.37% | 1.37% / 0.95% |
| Bloomberg 3-Year Municipal Bond Index | 1.12% | 1.45% | N/A | N/A |
Performance reflects waivers of fee and operating expenses in effect. In the absence of such waivers, total return would be reduced. Performance data quoted represents past performance and does not guarantee future results. Investment returns and principal value will fluctuate, and when sold, may be worth more or less than their original cost. Performance current to the most recent month-end may be lower or higher than the performance quoted and can be obtained by calling 1-877-914-7343. Performance assumes the reinvestment of capital gains and income distributions. The performance does not reflect the deduction of taxes that a shareholder would pay on Fund distributions or the redemption of Fund shares.
Distribution Yield is the latest monthly dividend rate times 12, divided by the latest month-end NAV.
SEC Yield is based on the hypothetical annualized earning power (investment income only) of the Fund’s portfolio securities during the period indicated. Subsidized yields reflect fee waivers in effect. Without such waivers, yields would be reduced. Unsubsidized yields do not reflect fee waivers in effect.
| (1) | As of December 29, 2022, the date of the Short Term Fund’s most recent prospectus, expense ratios for the Fund were as follows: |
| | Institutional Class | Gross Expenses: 4.41%; Net Expenses: 0.70% |
| | Investor Class | Gross Expenses: 5.60%; Net Expenses: 0.95% |
Principal Street Partners, LLC (the “Adviser”) has contractually agreed to reduce its management fees, and may reimburse the Fund for its operating expenses, in order to ensure that Total Annual Fund Operating Expenses (excluding certain expenses such as Rule 12b-1 fees, taxes, leverage/borrowing interest, interest expense, dividends paid on short sales, brokerage commissions and other transactional expenses, acquired fund fees and expenses, or extraordinary expenses) do not exceed 0.70% of the Fund’s average daily net assets. Fees waived and expenses paid by the Adviser may be recouped by the Adviser for a period of 36 months following the month during which such fee waiver and/or expense payment was made, if such recoupment can be achieved without exceeding the expense limit in effect at the time the fee waiver and/or expense payment occurred and the expense limit in place at the time of recoupment. The Operating Expense Limitation Agreement is indefinite but cannot be terminated through at least December 29, 2023. Thereafter, the agreement may be terminated at any time upon 60 days’ written notice by the Trust’s Board of Trustees (the “Board”) or the Adviser.
LOOKING AHEAD
We believe the volatility in the fixed income markets is quieting down, bonds in general are looking more attractive based on the income levels now available. Our relative performance continues to get better as we work out of prior defaulted bonds and continue to work to diversify the portfolio. We expect these conditions are ripe for strong performance to increase assets and drive better absolute performance in the asset class. Again, we thought that might have been 2023, but looks like those days are moving to 2024. We maintain our focus and flexibility to take advantage of the opportunities the markets present for our investors.
Sincerely,
Troy Willis, Charlie Pulire
PRINCIPAL STREET FUNDS
Must be preceded or accompanied by a prospectus.
Opinions expressed are subject to change, are not intended to be a forecast of future events, a guarantee of future results, nor investment advice. Fund holdings and sector allocations are subject to change and should not be considered a recommendation to buy or sell any security.
Diversification does not assure a profit or protect against a loss in a declining market.
The Principal Street High Income Municipal Fund’s and Principal Street Short Term Municipal Fund’s primary investment objectives are to provide current income exempt from regular federal income tax. Income may be subject to state or local tax.
The Bloomberg High Yield Municipal Bond Index covers the high yield portion of the USD-denominated long-term tax-exempt bond market. The index has four main sectors: state and local general obligation bonds, revenue bonds, insured bonds, and pre-refunded bonds. One cannot invest directly in an Index.
The Bloomberg 3-Year Municipal Bond Index measures the performance of USD-denominated long-term, tax-exempt bond market with maturities of 1-3 years, including state and local general obligation bonds, revenue bonds, insured bonds, and pre-refunded bonds. One cannot invest directly in an Index.
Basis Points are a unit of measure used to describe the percentage change in the value of financial instruments or the rate change in an index or other benchmark. One basis point is equivalent to 0.01% (1/100th of a percent) or 0.0001 in decimal form.
High-yield fixed income securities or “junk bonds” are fixed-income securities held by the Fund that are rated below investment grade are subject to additional risk factors such as increased possibility of default, illiquidity of the security, and changes in value based on public perception of the issuer. The municipal market is volatile and can be significantly affected by adverse tax, legislative or political changes and the financial condition of the issuers of municipal securities. Income from tax-exempt funds may be subject to state and local taxes and a portion of income may be subject to the federal and/or state alternative minimum tax for certain investors. Federal income tax rules will apply to any capital gains distribution.
Distributions are not guaranteed and a company’s future ability to make distributions may be limited.
Mutual Fund investing involves risk. Principal loss is possible. Variable and floating rate securities provide for a periodic adjustment in the interest rate paid on the obligations. Fixed-income securities may be subject to interest rate, credit, liquidity, prepayment and extension risks. Interest rates may go up resulting in a decrease in the value of the fixed-income securities held by the Funds.
Principal Street Partners, LLC is the Investment Adviser to the Principal Street High Income Municipal Fund and the Principal Street Short Term Municipal Fund, which are distributed by Quasar Distributors, LLC.
PRINCIPAL STREET HIGH INCOME MUNICIPAL FUND
Value of $25,000 Investment (Unaudited)
The chart assumes an initial investment of $25,000. Performance reflects waivers of fee and operating expenses in effect. In the absence of such waivers, total return would be reduced. Performance data quoted represents past performance and does not guarantee future results. Investment returns and principal value will fluctuate, and when sold, may be worth more or less than their original cost. Performance current to the most recent month-end may be lower or higher than the performance quoted and can be obtained by calling 1-877-914-7343. Performance assumes the reinvestment of capital gains and income distributions. The performance does not reflect the deduction of taxes that a shareholder would pay on Fund distributions or the redemption of Fund shares.
Annualized Rates of Return as of August 31, 2023
| | 1-Year | 3-Year | 5-Year | Since Inception(1) |
| Institutional Class | -2.94% | -2.00% | -0.93% | 0.74% |
| Investor Class | -3.81% | -2.64% | -1.39% | 0.27% |
A Class (with sales load)(2) | -6.16% | -3.43% | -1.90% | -0.12% |
| A Class (without sales load) | -4.02% | -2.69% | -1.45% | 0.26% |
Bloomberg High Yield Municipal Bond Index(3) | 0.52% | 0.47% | 2.37% | 3.05% |
| (1) | Period since the Fund’s inception. The Institutional Class, Investor Class, and A Class commenced operations on September 15, 2017, March 23, 2020, and February 16, 2022, respectively. Performance for the Investor Class and A Class prior to the inception of the Investor Class and A Class is based on the performance of the Institutional Class, adjusted for the higher expenses applicable to the Investor Class and A Class. |
| (2) | Reflects a sales load of 2.25%. |
| (3) | The Bloomberg High Yield Municipal Bond Index covers the high yield portion of the USD-denominated long-term tax-exempt bond market. The Index has four main sectors: state and local general obligation bonds, revenue bonds, insured bonds, and pre-refunded bonds. One cannot invest directly in an Index. |
PRINCIPAL STREET HIGH INCOME MUNICIPAL FUND
The following is expense information for the Principal Street High Income Municipal Fund as disclosed in the Fund’s most recent prospectus dated December 29, 2022:
| Institutional Class | Gross Expenses: 0.93%; Net Expenses: 0.90%. |
| Investor Class | Gross Expenses: 1.45%; Net Expenses: 1.42%. |
| A Class | Gross Expenses: 1.34%; Net Expenses: 1.27%. |
Principal Street Partners, LLC (the “Adviser”) has contractually agreed to reduce its management fees, and may reimburse the Fund for its operating expenses, in order to ensure that Total Annual Fund Operating Expenses (excluding certain expenses such as Rule 12b-1 fees, taxes, leverage/borrowing interest, interest expense, dividends paid on short sales, brokerage commissions and other transactional expenses, acquired fund fees and expenses, or extraordinary expenses) do not exceed 0.80% of the Fund’s average daily net assets. Fees waived and expenses paid by the Adviser may be recouped by the Adviser for a period of 36 months following the month during which such fee waiver and/or expense payment was made, if such recoupment can be achieved without exceeding the expense limit in effect at the time the fee waiver and/or expense payment occurred and the expense limit in place at the time of recoupment. The Operating Expense Limitation Agreement is indefinite but cannot be terminated through at least December 29, 2023. Thereafter, the agreement may be terminated at any time upon 60 days’ written notice by the Trust’s Board of Trustees (the “Board”) or the Adviser.
PRINCIPAL STREET SHORT TERM MUNICIPAL FUND
Value of $25,000 Investment (Unaudited)
The chart assumes an initial investment of $25,000. Performance reflects waivers of fee and operating expenses in effect. In the absence of such waivers, total return would be reduced. Performance data quoted represents past performance and does not guarantee future results. Investment returns and principal value will fluctuate, and when sold, may be worth more or less than their original cost. Performance current to the most recent month-end may be lower or higher than the performance quoted and can be obtained by calling 1-877-914-7343. Performance assumes the reinvestment of capital gains and income distributions. The performance does not reflect the deduction of taxes that a shareholder would pay on Fund distributions or the redemption of Fund shares.
Annualized Rates of Return as of August 31, 2023
| | 1-Year | Since Inception(1) |
| Institutional Class | 2.36% | 2.52% |
| Investor Class | 1.87% | 2.09% |
Bloomberg 3-Year Municipal Bond Index(2) | 1.12% | 1.45% |
| (1) | Period since the Fund’s inception. The Institutional Class and Investor Class both commenced operations on April 27, 2022. |
| (2) | The Bloomberg 3-Year Municipal Bond Index measures the performance of USD-denominated long-term, tax-exempt bond market with maturities of 1-3 years, including state and local general obligation bonds, revenue bonds, insured bonds, and pre-refunded bonds. One cannot invest directly in an Index. |
PRINCIPAL STREET SHORT TERM MUNICIPAL FUND
The following is expense information for the Principal Street Short Term Municipal Fund as disclosed in the Fund’s most recent prospectus dated December 29, 2022:
| Institutional Class | Gross Expenses: 4.41%; Net Expenses: 0.70%. |
| Investor Class | Gross Expenses: 5.60%; Net Expenses: 0.95%. |
Principal Street Partners, LLC (the “Adviser”) has contractually agreed to reduce its management fees, and may reimburse the Fund for its operating expenses, in order to ensure that Total Annual Fund Operating Expenses (excluding certain expenses such as Rule 12b-1 fees, taxes, leverage/borrowing interest, interest expense, dividends paid on short sales, brokerage commissions and other transactional expenses, acquired fund fees and expenses, or extraordinary expenses) do not exceed 0.70% of the Fund’s average daily net assets. Fees waived and expenses paid by the Adviser may be recouped by the Adviser for a period of 36 months following the month during which such fee waiver and/or expense payment was made, if such recoupment can be achieved without exceeding the expense limit in effect at the time the fee waiver and/or expense payment occurred and the expense limit in place at the time of recoupment. The Operating Expense Limitation Agreement is indefinite but cannot be terminated through at least December 29, 2023. Thereafter, the agreement may be terminated at any time upon 60 days’ written notice by the Trust’s Board of Trustees (the “Board”) or the Adviser.
PRINCIPAL STREET HIGH INCOME MUNICIPAL FUND
Allocation of Portfolio(1) (Unaudited)
As of August 31, 2023
(% of Net Assets)
Top Ten Holdings(1) (Unaudited)
As of August 31, 2023
(% of Net Assets)
| | Sunland Medical Foundation, 12.000%, 10/20/2024 | 3.6% | |
| | Wisconsin Public Finance Authority, 7.050%, 9/1/2046 | 3.3% | |
| | Wisconsin Public Finance Authority, 7.375%, 1/1/2050 | 3.2% | |
| | Falmouth Solid Waste Disposal Facilities Revenue, 8.500%, 6/1/2040 | 3.0% | |
| | Angelina & Neches River Authority, 7.500%, 12/1/2045 | 2.9% | |
| | Atoka Industrial Development Authority, 8.000%, 8/1/2039 | 2.5% | |
| | Port Beaumont Navigation District, 8.000%, 2/1/2039 | 2.5% | |
| | Erie Tobacco Asset Securitization Corp., 0.000%, 6/1/2060 | 2.4% | |
| | Children’s Trust Fund, 0.000%, 5/15/2057 | 2.4% | |
| | South Carolina Jobs-Economic Development Authority, 7.750%, 10/1/2057 | 2.4% | |
| | (1) | Fund holdings and allocations are subject to change at any time and are not recommendations to buy or sell any security. |
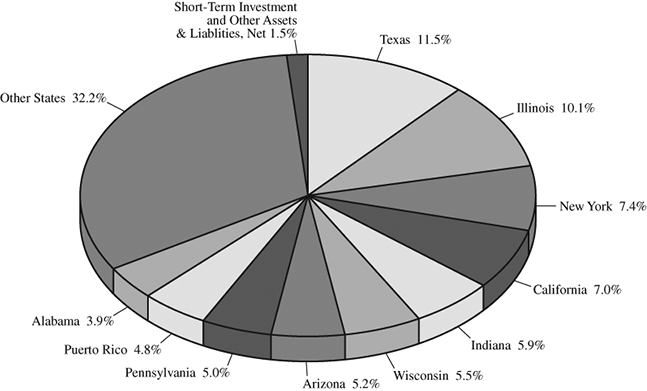
PRINCIPAL STREET SHORT TERM MUNICIPAL FUND
Allocation of Portfolio(1) (Unaudited)
As of August 31, 2023
(% of Net Assets)
Top Ten Holdings(1) (Unaudited)
As of August 31, 2023
(% of Net Assets)
| | Metropolitan Pier & Exposition Authority, 7.000%, 7/1/2026 | 3.3% | |
| | Port Authority of New York & New Jersey, 5.000%, 7/15/2027 | 2.6% | |
| | Wisconsin Public Finance Authority, 5.750%, 6/1/2025 | 2.5% | |
| | Texas Municipal Gas Acquisition and Supply Corp. I, 6.250%, 12/15/2026 | 2.3% | |
| | Metropolitan Transportation Authority, 5.000%, 11/15/2030 | 1.9% | |
| | Black Belt Energy Gas District, 5.250%, 02/01/2053 | 1.9% | |
| | Tennessee Energy Acquisition Corp., 5.250%, 9/1/2024 | 1.9% | |
| | Indiana Finance Authority, 4.50%, 12/15/2046 | 1.9% | |
| | Build NYC Resource Corp., 7.625%, 2/1/2026 | 1.9% | |
| | Maricopa County Industrial Development Authority, 4.000%, 7/1/2029 | 1.8% | |
| | (1) | Fund holdings and allocations are subject to change at any time and are not recommendations to buy or sell any security. |
PRINCIPAL STREET FUNDS
Expense Example (Unaudited)
August 31, 2023
As a shareholder of a Fund, you incur two types of costs: (1) transaction costs, including brokerage commissions on purchases and sales of Fund shares, and (2) ongoing costs, including management fees, distribution and/or service (12b-1) fees, interest expense, and other Fund expenses. This Example is intended to help you understand your ongoing costs (in dollars) of investing in a Fund and to compare these costs with the ongoing costs of investing in other mutual funds. The Example is based on an investment of $1,000 invested at the beginning of the period and held for the entire period (March 1, 2023 – August 31, 2023).
ACTUAL EXPENSES
For each class, the first line of each table provides information about actual account values and actual expenses. You may use the information in this line, together with the amount you invested, to estimate the expenses that you paid over the period. Simply divide your account value by $1,000 (for example, an $8,600 account value divided by $1,000 = 8.6), then multiply the result by the number in the first line under the heading entitled “Expenses Paid During Period” to estimate the expenses you paid on your account during this period.
HYPOTHETICAL EXAMPLE FOR COMPARISON PURPOSES
For each class, the second line of each table below provides information about hypothetical account values and hypothetical expenses based on the Fund’s actual expense ratio and an assumed rate of return of 5% per year before expenses, which is not the Fund’s actual return. The hypothetical account values and expenses may not be used to estimate the actual ending account balance or expenses you paid for the period. You may use this information to compare the ongoing costs of investing in the Fund and other funds. To do so, compare this 5% hypothetical example with the 5% hypothetical examples that appear in the shareholder reports of the other funds.
Please note that the expenses shown in the tables are meant to highlight your ongoing costs only and do not reflect any transactional costs. Therefore, the second line of each table for each class is useful in comparing ongoing costs only and will not help you determine the relative total costs of owning different funds. In addition, if transactional costs were included, your costs may have been higher.
HIGH INCOME MUNICIPAL FUND
| | Beginning | Ending | Expenses Paid |
| | Account Value | Account Value | During Period(1) |
| | (03/01/2023) | (08/31/2023) | (03/01/2023 to 08/31/2023) |
Institutional Actual(2)(3) | $1,000.00 | $1,016.40 | $4.88 |
Institutional Hypothetical(4) (5% return before expenses) | $1,000.00 | $1,020.37 | $4.89 |
(1) | Expenses for the Institutional Class are equal to the annualized expense ratio for the most recent six-month period of 0.96%, multiplied by the average account value over the period, multiplied by 184/365 to reflect the one-half year period. |
(2) | Based on the actual Institutional Class return for the six-month period ended August 31, 2023 of 1.64%. |
(3) | Excluding interest expense, the actual expenses would be $4.07. |
(4) | Excluding interest expense, the hypothetical expenses would be $4.08. |
PRINCIPAL STREET FUNDS
Expense Example (Unaudited) – Continued
August 31, 2023
| | Beginning | Ending | Expenses Paid |
| | Account Value | Account Value | During Period(5) |
| | (03/01/2023) | (08/31/2023) | (03/01/2023 to 08/31/2023) |
Investor Actual(6)(7) | $1,000.00 | $1,010.90 | $7.40 |
Investor Hypothetical(8) (5% return before expenses) | $1,000.00 | $1,017.85 | $7.43 |
(5) | Expenses for the Investor Class are equal to the annualized expense ratio for the most recent six-month period of 1.46%, multiplied by the average account value over the period, multiplied by 184/365 to reflect the one-half year period. |
(6) | Based on the actual Investor Class return for the six-month period ended August 31, 2023 of 1.09%. |
(7) | Excluding interest expense, the actual expenses would be $6.59. |
(8) | Excluding interest expense, the hypothetical expenses would be $6.61. |
| | Beginning | Ending | Expenses Paid |
| | Account Value | Account Value | During Period(9) |
| | (03/01/2023) | (08/31/2023) | (03/01/2023 to 08/31/2023) |
A Class Actual(10)(11) | $1,000.00 | $1,005.30 | $6.12 |
A Class Hypothetical(12) (5% return before expenses) | $1,000.00 | $1,019.11 | $6.16 |
(9) | Expenses for the A Class are equal to the annualized expense ratio for the most recent six-month period of 1.21%, multiplied by the average account value over the period, multiplied by 184/365 to reflect the one-half year period. |
(10) | Based on the actual A Class return for the six-month period ended August 31, 2023 of 0.53%. |
(11) | Excluding interest expense, the actual expenses would be $5.31. |
(12) | Excluding interest expense, the hypothetical expenses would be $5.35. |
SHORT TERM MUNICIPAL FUND
| | Beginning | Ending | Expenses Paid |
| | Account Value | Account Value | During Period(1) |
| | (03/01/2023) | (08/31/2023) | (03/01/2023 to 08/31/2023) |
Institutional Actual(2)(3) | $1,000.00 | $1,014.80 | $3.55 |
Institutional Hypothetical(4) (5% return before expenses) | $1,000.00 | $1,021.68 | $3.57 |
(1) | Expenses for the Institutional Class are equal to the annualized expense ratio for the most recent six-month period of 0.70%, multiplied by the average account value over the period, multiplied by 184/365 to reflect the one-half year period. |
(2) | Based on the actual Institutional Class return for the six-month period ended August 31, 2023 of 1.48%. |
(3) | Excluding interest expense, the actual expenses would be $3.55. |
(4) | Excluding interest expense, the hypothetical expenses would be $3.57. |
| | Beginning | Ending | Expenses Paid |
| | Account Value | Account Value | During Period(5) |
| | (03/01/2023) | (08/31/2023) | (03/01/2023 to 08/31/2023) |
Investor Actual(6)(7) | $1,000.00 | $1,013.50 | $4.82 |
Investor Hypothetical(8) (5% return before expenses) | $1,000.00 | $1,020.42 | $4.84 |
(5) | Expenses for the Investor Class are equal to the annualized expense ratio for the most recent six-month period of 0.95%, multiplied by the average account value over the period, multiplied by 184/365 to reflect the one-half year period. |
(6) | Based on the actual Investor Class return for the six-month period ended August 31, 2023 of 1.35%. |
(7) | Excluding interest expense, the actual expenses would be $4.82. |
(8) | Excluding interest expense, the hypothetical expenses would be $4.84. |
PRINCIPAL STREET HIGH INCOME MUNICIPAL FUND
Schedule of Investments
August 31, 2023
Description | | Par | | | Value | |
| MUNICIPAL BONDS — 91.1% | | | | | | |
| | | | | | | |
| Arizona — 3.2% | | | | | | |
| Arizona Industrial Development Authority | | | | | | |
| (Obligor: Empower College Prep) | | | | | | |
| 6.000%, 07/01/2049 | | $ | 1,000,000 | | | $ | 960,642 | |
| (Obligor: Legacy Cares, Inc.) | | | | | | | | |
7.750%, Series A, 07/01/2050 (3) | | | 1,600,000 | | | | 160,000 | |
6.000%, Series A, 07/01/2051 (3) | | | 540,000 | | | | 54,000 | |
6.750%, Series C, 07/01/2030 (3) | | | 2,000,000 | | | | 200,000 | |
| La Paz County Industrial Development Authority | | | | | | | | |
| (Obligor: Imperial Valley Gateway Center) | | | | | | | | |
| 7.000%, 12/01/2040 | | | 1,535,000 | | | | 549,666 | |
| Maricopa County Industrial Development Authority | | | | | | | | |
| (Obligor: Christian Care Surprise) | | | | | | | | |
| 6.000%, 01/01/2048 | | | 1,595,000 | | | | 1,122,016 | |
| Pima County Industrial Development Authority | | | | | | | | |
| (Obligor: La Posada Park Centre) | | | | | | | | |
6.625%, 05/15/2031 (1) | | | 2,000,000 | | | | 1,977,859 | |
| Sierra Vista Industrial Development Authority | | | | | | | | |
| (Obligor: Georgetown Community Development Authority) | | | | | | | | |
0.000%, Series A, 10/01/2056 (1),(4),(5) | | | 1,000,000 | | | | 874,927 | |
0.000%, Series A, 10/01/2056 (1),(4),(5) | | | 2,200,000 | | | | 1,557,243 | |
| 6.250%, Series B, 10/01/2036 | | | 1,500,000 | | | | 1,210,252 | |
| | | | | | | | 8,666,605 | |
| California — 0.4% | | | | | | | | |
| California Pollution Control Financing Authority | | | | | | | | |
| (Obligor: CalPlant I) | | | | | | | | |
7.000%, 10/31/2023 (3),(8) | | | 1,000,000 | | | | 50,000 | |
7.500%, 07/01/2032 (3),(8) | | | 5,065,000 | | | | 658,450 | |
8.000%, 07/01/2039 (3),(8) | | | 3,845,000 | | | | 192,250 | |
7.500%, 12/01/2039 (3),(8) | | | 2,500,000 | | | | 125,000 | |
| | | | | | | | 1,025,700 | |
| Colorado — 7.0% | | | | | | | | |
| Aurora Highlands Community Authority Board | | | | | | | | |
| 5.750%, 12/01/2051 | | | 4,000,000 | | | | 3,563,614 | |
| Banning Lewis Ranch Metropolitan District No. 8 | | | | | | | | |
| 4.875%, 12/01/2051 | | | 2,500,000 | | | | 1,869,670 | |
| Canyon Pines Metropolitan District | | | | | | | | |
| 5.250%, Series A-1, 12/01/2051 | | | 2,000,000 | | | | 1,693,576 | |
| Cascade Ridge Metropolitan District | | | | | | | | |
| 5.000%, 12/01/2051 | | | 1,000,000 | | | | 821,361 | |
See Notes to the Financial Statements
PRINCIPAL STREET HIGH INCOME MUNICIPAL FUND
Schedule of Investments – Continued
August 31, 2023
Description | | Par | | | Value | |
| MUNICIPAL BONDS — 91.1% (Continued) | | | | | | |
| | | | | | | |
| Colorado — 7.0% (Continued) | | | | | | |
| Cottonwood Hollow Residential Metropolitan District | | | | | | |
| 5.000%, 12/01/2051 | | $ | 750,000 | | | $ | 598,672 | |
| Four Corners Business Improvement District | | | | | | | | |
| 6.000%, 12/01/2052 | | | 1,000,000 | | | | 904,122 | |
| Grandview Reserve Metropolitan District No. 3 | | | | | | | | |
| 6.250%, Series A, 12/01/2052 | | | 1,500,000 | | | | 1,395,653 | |
| 9.000%, Series B, 12/15/2052 | | | 1,000,000 | | | | 955,893 | |
| Ledge Rock Center Commercial Metropolitan District | | | | | | | | |
7.000%, Series A, 11/01/2052 (1) | | | 1,000,000 | | | | 982,796 | |
7.375%, Series A, 11/01/2052 (1) | | | 1,000,000 | | | | 983,393 | |
| Legato Community Authority | | | | | | | | |
| 8.250%, Series B, 12/15/2051 | | | 2,000,000 | | | | 1,782,006 | |
| Peak Metropolitan District No. 3 | | | | | | | | |
| 7.500%, Series A-1, 12/01/2052 | | | 1,500,000 | | | | 1,480,498 | |
| Verve Metropolitan District No. 1 | | | | | | | | |
| 6.750%, 12/01/2052 | | | 1,500,000 | | | | 1,373,778 | |
| Waters’ Edge Metropolitan District No. 2 | | | | | | | | |
| 5.000%, 12/01/2051 | | | 1,000,000 | | | | 818,993 | |
| | | | | | | | 19,224,025 | |
| Florida — 7.2% | | | | | | | | |
| Capital Trust Agency, Inc. | | | | | | | | |
| (Obligor: Tallahassee NHHI) | | | | | | | | |
7.000%, Series A, 12/01/2045 (3) | | | 150,000 | | | | 49,125 | |
7.125%, Series A, 12/01/2050 (3) | | | 2,000,000 | | | | 655,000 | |
| (Obligor: Tapestry Senior Housing Walden) | | | | | | | | |
7.000%, Series A, 07/01/2052 (3) | | | 2,200,000 | | | | 484,000 | |
| (Obligor: Tuscan Gardens of Palm Coast Obligated Group) | | | | | | | | |
6.500%, Series A, 10/01/2032 (3) | | | 1,090,000 | | | | 577,700 | |
6.750%, Series A, 10/01/2037 (3) | | | 1,290,000 | | | | 683,700 | |
7.000%, Series A, 10/01/2040 (3) | | | 1,525,000 | | | | 808,250 | |
7.000%, Series A, 10/01/2049 (3) | | | 1,700,000 | | | | 901,000 | |
| (Obligor: Voans SW Florida Healthcare) | | | | | | | | |
10.000%, 06/30/2024 (3) | | | 7,950,000 | | | | 5,803,500 | |
| Florida Development Finance Corp. | | | | | | | | |
| (Obligor: Cabana at Jensen Dunes) | | | | | | | | |
12.000%, Series B, 11/15/2056 (1),(2) | | | 5,025,000 | | | | 5,273,738 | |
| Lake County | | | | | | | | |
| (Obligor: Village Veranda at Lady Lake Obligated Group) | | | | | | | | |
7.125%, Series A1, 01/01/2052 (3) | | | 5,800,000 | | | | 4,524,000 | |
| | | | | | | | 19,760,013 | |
See Notes to the Financial Statements
PRINCIPAL STREET HIGH INCOME MUNICIPAL FUND
Schedule of Investments – Continued
August 31, 2023
Description | | Par | | | Value | |
| MUNICIPAL BONDS — 91.1% (Continued) | | | | | | |
| | | | | | | |
| Illinois — 2.1% | | | | | | |
| Illinois Finance Authority | | | | | | |
| (Obligor: Aim Art in Motion) | | | | | | |
| 5.000%, Series A, 07/01/2051 | | $ | 3,000,000 | | | $ | 2,112,694 | |
| 5.000%, Series B, 07/01/2024 | | | 305,000 | | | | 294,309 | |
| (Obligor: Plymouth Place) | | | | | | | | |
| 6.500%, Series A, 05/15/2047 | | | 1,000,000 | | | | 1,008,821 | |
| (Obligor: Roosevelt University) | | | | | | | | |
6.125%, Series A, 04/01/2049 (1) | | | 2,500,000 | | | | 2,302,222 | |
| | | | | | | | 5,718,046 | |
| Indiana — 4.0% | | | | | | | | |
| Anderson Industrial Economic Development Revenue | | | | | | | | |
| (Obligor: Anderson University, Inc.) | | | | | | | | |
| 6.000%, 10/01/2042 | | | 1,000,000 | | | | 908,220 | |
| Evansville Manufacturing Housing Revenue | | | | | | | | |
| (Obligor: Evansville RCF LP) | | | | | | | | |
5.450%, 01/01/2038 (3) | | | 1,500,000 | | | | 1,195,645 | |
| Goshen Manufacturing Housing Revenue | | | | | | | | |
| (Obligor: Green Oaks Of Goshen, LLC) | | | | | | | | |
| 5.000%, Series A, 08/01/2041 | | | 1,500,000 | | | | 1,188,585 | |
| Indiana Finance Authority | | | | | | | | |
| (Obligor: Brightmark Plastics Renewal) | | | | | | | | |
7.000%, 03/01/2039 (8) | | | 6,160,000 | | | | 4,595,197 | |
| Indiana Housing & Community Development Authority | | | | | | | | |
| (Obligor: Vita Of New Whiteland, LLC) | | | | | | | | |
| 6.750%, 01/01/2043 | | | 500,000 | | | | 485,773 | |
| Valparaiso Manufactured Housing Revenue | | | | | | | | |
| (Obligor: Green Oaks of Valparaiso) | | | | | | | | |
| 5.375%, 12/01/2041 | | | 3,500,000 | | | | 2,672,546 | |
| | | | | | | | 11,045,966 | |
| Iowa — 1.2% | | | | | | | | |
| Iowa Finance Authority | | | | | | | | |
| (Obligor: Riserville Holdings) | | | | | | | | |
5.000%, 12/01/2051 (8) | | | 3,575,000 | | | | 2,682,008 | |
| (Obligor: Sunrise Manor) | | | | | | | | |
| 5.000%, 09/01/2051 | | | 1,000,000 | | | | 726,348 | |
| | | | | | | | 3,408,356 | |
See Notes to the Financial Statements
PRINCIPAL STREET HIGH INCOME MUNICIPAL FUND
Schedule of Investments – Continued
August 31, 2023
Description | | Par | | | Value | |
| MUNICIPAL BONDS — 91.1% (Continued) | | | | | | |
| | | | | | | |
| Kentucky — 3.0% | | | | | | |
| Falmouth Solid Waste Disposal Facilities Revenue | | | | | | |
| (Obligor: Texas Bluegrass Biofuels, LLC) | | | | | | |
8.500%, 06/01/2040 (1) | | $ | 8,875,000 | | | $ | 8,163,886 | |
| | | | | | | | | |
| Louisiana — 0.8% | | | | | | | | |
| Louisiana Public Facilities Authority | | | | | | | | |
| (Obligor: Grambling High Foundation) | | | | | | | | |
6.375%, Series A, 06/01/2052 (1) | | | 770,000 | | | | 732,534 | |
| (Obligor: Jefferson Rise Charter School) | | | | | | | | |
6.000%, Series A, 06/01/2037 (1) | | | 480,000 | | | | 455,016 | |
6.250%, Series A, 06/01/2052 (1) | | | 1,000,000 | | | | 932,013 | |
| | | | | | | | 2,119,563 | |
| Maine — 1.3% | | | | | | | | |
| Maine Finance Authority | | | | | | | | |
| (Obligor: Go Lab Madison, LLC) | | | | | | | | |
8.000%, 12/01/2051 (8) | | | 5,500,000 | | | | 3,577,066 | |
| | | | | | | | | |
| Maryland — 0.2% | | | | | | | | |
| Maryland Economic Development | | | | | | | | |
| (Obligor: Consol Marine Terminals) | | | | | | | | |
| 5.750%, 09/01/2025 | | | 500,000 | | | | 504,167 | |
| | | | | | | | | |
| Massachusetts — 0.4% | | | | | | | | |
| Massachusetts Development Finance Agency | | | | | | | | |
| (Obligor: Ascentria Care Alliance) | | | | | | | | |
| 5.000%, 07/01/2051 | | | 1,250,000 | | | | 975,625 | |
| | | | | | | | | |
| Michigan — 0.4% | | | | | | | | |
| Michigan Finance Authority | | | | | | | | |
| (Obligor: Aquinas College) | | | | | | | | |
| 5.000%, 05/01/2046 | | | 1,435,000 | | | | 1,165,449 | |
| | | | | | | | | |
| Mississippi — 1.6% | | | | | | | | |
| Mississippi Development Bank | | | | | | | | |
| 3.625%, 11/01/2036 | | | 1,000,000 | | | | 892,640 | |
| Tunica County | | | | | | | | |
| 6.000%, 10/01/2040 | | | 4,055,000 | | | | 3,575,849 | |
| | | | | | | | 4,468,489 | |
| New Jersey — 0.0% | | | | | | | | |
| New Jersey Economic Development Authority | | | | | | | | |
| (Obligor: Kintock Obligated Group) | | | | | | | | |
| 7.000%, 09/01/2047 | | | 65,000 | | | | 63,597 | |
See Notes to the Financial Statements
PRINCIPAL STREET HIGH INCOME MUNICIPAL FUND
Schedule of Investments – Continued
August 31, 2023
Description | | Par | | | Value | |
| MUNICIPAL BONDS — 91.1% (Continued) | | | | | | |
| | | | | | | |
| New York — 5.4% | | | | | | |
| Build NYC Resource Corp. | | | | | | |
| (Obligor: Voices of Community Activists) | | | | | | |
| 7.625%, Series A-1, 02/01/2053 | | $ | 1,815,000 | | | $ | 1,782,471 | |
7.625%, Series A-2, 02/01/2026 (1) | | | 1,690,000 | | | | 1,684,165 | |
| 8.125%, Series B, 02/01/2026 | | | 300,000 | | | | 296,950 | |
| Erie Tobacco Asset Securitization Corp. | | | | | | | | |
0.000%, 06/01/2055 (4) | | | 6,000,000 | | | | 411,965 | |
0.000%, 06/01/2060 (4) | | | 115,000,000 | | | | 6,628,290 | |
| New York Counties Tobacco Trust IV | | | | | | | | |
0.000%, Series F, 06/01/2060 (4) | | | 50,000,000 | | | | 3,082,110 | |
| Ulster County Capital Resource Corp. | | | | | | | | |
| (Obligor: Woodland Pond) | | | | | | | | |
| 5.250%, 09/15/2047 | | | 550,000 | | | | 404,420 | |
| 5.250%, 09/15/2053 | | | 920,000 | | | | 650,234 | |
| | | | | | | | 14,940,605 | |
| Ohio — 1.4% | | | | | | | | |
| Southern Ohio Port Authority | | | | | | | | |
| (Obligor: PureCycle Ohio) | | | | | | | | |
7.000%, Series A, 12/01/2042 (8) | | | 2,600,000 | | | | 1,921,299 | |
| Washington County Hospital Revenue | | | | | | | | |
| (Obligor: Marietta Area Healthcare) | | | | | | | | |
| 6.375%, 12/01/2037 | | | 1,000,000 | | | | 986,877 | |
| 6.625%, 12/01/2042 | | | 1,000,000 | | | | 1,000,213 | |
| | | | | | | | 3,908,389 | |
| Oklahoma — 2.8% | | | | | | | | |
| Atoka Industrial Development Authority | | | | | | | | |
| (Obligor: Gladieux Metals Recycling) | | | | | | | | |
8.000%, 08/01/2039 (8) | | | 6,900,000 | | | | 6,924,823 | |
| 8.000%, Series A, 08/01/2039 | | | 750,000 | | | | 752,698 | |
| | | | | | | | 7,677,521 | |
| Pennsylvania — 2.4% | | | | | | | | |
| Pennsylvania Economic Development Financing Authority | | | | | | | | |
| (Obligor: Consol Energy) | | | | | | | | |
9.000%, Series A, 04/01/2051 (8),(9) | | | 4,000,000 | | | | 4,429,050 | |
| (Obligor: Tapestry Moon) | | | | | | | | |
6.500%, Series A, 12/01/2038 (3) | | | 2,950,000 | | | | 1,124,688 | |
6.750%, Series A, 12/01/2053 (3) | | | 2,650,000 | | | | 1,010,313 | |
| | | | | | | | 6,564,051 | |
See Notes to the Financial Statements
PRINCIPAL STREET HIGH INCOME MUNICIPAL FUND
Schedule of Investments – Continued
August 31, 2023
Description | | Par | | | Value | |
| MUNICIPAL BONDS — 91.1% (Continued) | | | | | | |
| | | | | | | |
| Puerto Rico — 3.8% | | | | | | |
| Children’s Trust Fund | | | | | | |
0.000%, 05/15/2057 (4) | | $ | 42,000,000 | | | $ | 2,921,083 | |
0.000%, Series B, 05/15/2057 (4) | | | 120,000,000 | | | | 6,602,016 | |
| Commonwealth of Puerto Rico | | | | | | | | |
0.000%, 11/01/2051 (4) | | | 2,397,090 | | | | 997,789 | |
| | | | | | | | 10,520,888 | |
| South Carolina — 5.5% | | | | | | | | |
| City of Hardeeville | | | | | | | | |
| 4.000%, 05/01/2052 | | | 900,000 | | | | 618,826 | |
| South Carolina Jobs-Economic Development Authority | | | | | | | | |
| (Obligor: AAC East) | | | | | | | | |
7.000%, Series A, 05/01/2039 (8) | | | 3,500,000 | | | | 2,758,030 | |
| (Obligor: CR River Park) | | | | | | | | |
| 7.750%, Series A, 10/01/2057 | | | 6,150,000 | | | | 6,542,968 | |
| (Obligor: Jasper Pellets) | | | | | | | | |
7.000%, Series A, 11/01/2038 (3), (8) | | | 1,500,000 | | | | 1,425,000 | |
| (Obligor: Last Step Recycling, LLC) | | | | | | | | |
6.500%, Series A, 06/01/2051 (3),(8) | | | 2,000,000 | | | | 1,478,185 | |
| (Obligor: Repower S. Berkeley) | | | | | | | | |
6.000%, 02/01/2035 (3),(8) | | | 1,000,000 | | | | 400,000 | |
| (Obligor: Upstate Senior Living Obligated Group) | | | | | | | | |
| 4.000%, 11/15/2027 | | | 50,000 | | | | 48,254 | |
| (Obligor: Virtus Academy) | | | | | | | | |
| 5.000%, Series A, 06/15/2051 | | | 1,330,000 | | | | 1,011,076 | |
| 5.000%, Series A, 06/15/2056 | | | 1,100,000 | | | | 817,443 | |
| | | | | | | | 15,099,782 | |
| Tennessee — 1.2% | | | | | | | | |
| Knox County Industrial Development Board | | | | | | | | |
| (Obligor: TomPaul Knoxville, LLC) | | | | | | | | |
9.500%, 11/01/2052 (1),(8) | | | 1,000,000 | | | | 994,092 | |
| Metropolitan Government Nashville & | | | | | | | | |
| Davidson County Health & Educational Facilities Board | | | | | | | | |
| (Obligor: Trousdale Foundation Obligated Group) | | | | | | | | |
7.500%, Series B-1, 04/01/2049 (3) | | | 1,140,000 | | | | 11,400 | |
| Shelby County Health Educational & Housing Facilities Board | | | | | | | | |
| (Obligor: Luke Obligated Group) | | | | | | | | |
| 5.750%, Series A, 10/01/2059 | | | 3,000,000 | | | | 2,171,122 | |
| | | | | | | | 3,176,614 | |
See Notes to the Financial Statements
PRINCIPAL STREET HIGH INCOME MUNICIPAL FUND
Schedule of Investments – Continued
August 31, 2023
Description | | Par | | | Value | |
| MUNICIPAL BONDS — 91.1% (Continued) | | | | | | |
| | | | | | | |
| Texas — 18.2% | | | | | | |
| Angelina & Neches River Authority | | | | | | |
| (Obligor: Jefferson Enterprises Energy) | | | | | | |
7.500%, 12/01/2045 (8) | | $ | 11,900,000 | | | $ | 8,055,983 | |
| Arlington Higher Education Finance Corp. | | | | | | | | |
| (Obligor: Odyssey 2020 Academy) | | | | | | | | |
| 6.125%, 02/15/2053 | | | 500,000 | | | | 478,668 | |
| (Obligor: The Magellan School) | | | | | | | | |
6.375%, 06/01/2062 (1) | | | 1,000,000 | | | | 1,012,222 | |
| Brazoria County Industrial Development Corp. | | | | | | | | |
| (Obligor: Gladieux Metals Recycling) | | | | | | | | |
9.000%, 03/01/2039 (8) | | | 4,275,000 | | | | 4,477,264 | |
9.000%, Series A, 03/01/2039 (8) | | | 3,330,000 | | | | 3,487,553 | |
7.000%, Series B, 03/01/2039 (8) | | | 1,250,000 | | | | 1,148,380 | |
| Calhoun County Navigation Industrial Development Authority | | | | | | | | |
| (Obligor: Max Midstream Texas, LLC) | | | | | | | | |
3.625%, Series A, 07/01/2026 (8) | | | 1,500,000 | | | | 1,373,330 | |
| 6.500%, Series B, 07/01/2026 | | | 1,000,000 | | | | 936,238 | |
| Jefferson County Industrial Development Corp. | | | | | | | | |
| (Obligor: TRP Crude Marketing) | | | | | | | | |
| 7.750%, 04/01/2039 | | | 900,000 | | | | 790,325 | |
| Kountze Economic Development Corp. | | | | | | | | |
| (Obligor: Allegiant Industrial) | | | | | | | | |
15.000%, 11/01/2027 (1) | | | 3,550,000 | | | | 4,082,697 | |
| New Hope Cultural Education Facilities Finance Corp. | | | | | | | | |
| (Obligor: Buckingham Senior Living Obligated Group) | | | | | | | | |
2.000%, Series B, 11/15/2061 (5) | | | 2,341,998 | | | | 926,302 | |
| (Obligor: Outlook at Windhaven) | | | | | | | | |
| 6.500%, Series A, 10/01/2033 | | | 1,500,000 | | | | 1,449,478 | |
| (Obligor: Sanctuary LTC, LLC) | | | | | | | | |
| 6.500%, Series A-2, 01/01/2031 | | | 2,500,000 | | | | 1,913,033 | |
| Port Beaumont Navigation District | | | | | | | | |
| (Obligor: Allegiant Industrial Island) | | | | | | | | |
8.000%, 02/01/2039 (1),(8) | | | 7,285,000 | | | | 6,902,865 | |
| San Antonio Education Facilities Corp. | | | | | | | | |
| (Obligor: Hallmark University) | | | | | | | | |
| 5.000%, Series A, 10/01/2041 | | | 840,000 | | | | 700,079 | |
| 5.000%, Series A, 10/01/2051 | | | 1,000,000 | | | | 770,645 | |
| 5.250%, Series B, 10/01/2028 | | | 350,000 | | | | 340,545 | |
See Notes to the Financial Statements
PRINCIPAL STREET HIGH INCOME MUNICIPAL FUND
Schedule of Investments – Continued
August 31, 2023
Description | | Par | | | Value | |
| MUNICIPAL BONDS — 91.1% (Continued) | | | | | | |
| | | | | | | |
| Texas — 18.2% (Continued) | | | | | | |
| Tarrant County Cultural Education Facilities Finance Corp. | | | | | | |
| (Obligor: MRC Senior Living Fort Worth) | | | | | | |
| 6.875%, 11/15/2055 | | $ | 2,600,000 | | | $ | 2,348,321 | |
| 6.750%, Series A, 11/15/2051 | | | 5,000,000 | | | | 4,481,855 | |
| (Obligor: CC Young Memorial Home) | | | | | | | | |
6.375%, Series B, 02/15/2041 (3) | | | 550,000 | | | | 302,500 | |
| Woodloch Health Facilities Development Corp. | | | | | | | | |
| (Obligor: Senior Care Living VII) | | | | | | | | |
6.750%, Series A1, 12/01/2051 (1),(3) | | | 6,375,000 | | | | 3,825,000 | |
| | | | | | | | 49,803,283 | |
| Utah — 0.8% | | | | | | | | |
| Utah Charter School Finance Authority | | | | �� | | | | |
| (Obligor: Rockwell Charter High School) | | | | | | | | |
| 5.375%, Series A, 07/15/2042 | | | 905,000 | | | | 765,820 | |
| 5.500%, Series A, 07/15/2047 | | | 1,460,000 | | | | 1,225,938 | |
| 6.625%, Series B, 07/15/2047 | | | 300,000 | | | | 259,679 | |
| | | | | | | | 2,251,437 | |
| Washington — 0.8% | | | | | | | | |
| Washington State Housing Finance Commission | | | | | | | | |
| (Obligor: Eliseo Obligated Group) | | | | | | | | |
| 4.000%, Series A, 01/01/2057 | | | 2,000,000 | | | | 1,331,776 | |
| (Obligor: Lutheran Retirement Home Obligated Group) | | | | | | | | |
| 5.000%, Series A, 07/01/2038 | | | 1,075,000 | | | | 864,063 | |
| | | | | | | | 2,195,839 | |
| West Virginia — 2.3% | | | | | | | | |
| West Virginia Economic Development Authority | | | | | | | | |
| (Obligor: Entsorga West Virginia) | | | | | | | | |
8.750%, 02/01/2036 (3),(8) | | | 1,000,000 | | | | 800,000 | |
| (Obligor: Empire Trimodal Terminal) | | | | | | | | |
| 7.625%, 12/01/2040 | | | 6,800,000 | | | | 5,422,974 | |
| | | | | | | | 6,222,974 | |
| Wisconsin — 13.7% | | | | | | | | |
| Wisconsin Health & Educational Facilities Authority | | | | | | | | |
| (Obligor: Chiara Communities, Inc.) | | | | | | | | |
| 7.000%, Series C, 07/01/2043 | | | 505,000 | | | | 362,906 | |
| 7.500%, Series C, 07/01/2053 | | | 2,500,000 | | | | 1,813,793 | |
See Notes to the Financial Statements
PRINCIPAL STREET HIGH INCOME MUNICIPAL FUND
Schedule of Investments – Continued
August 31, 2023
Description | | Par | | | Value | |
| MUNICIPAL BONDS — 91.1% (Continued) | | | | | | |
| | | | | | | |
| Wisconsin — 13.7% (Continued) | | | | | | |
| Wisconsin Public Finance Authority | | | | | | |
| (Obligor: Austin FBO LLC) | | | | | | |
7.050%, Series A, 09/01/2046 (8) | | $ | 9,250,000 | | | $ | 8,975,185 | |
| (Obligor: Cedars Obligated Group) | | | | | | | | |
| 5.500%, 05/01/2039 | | | 1,210,000 | | | | 1,019,582 | |
| 5.750%, 05/01/2054 | | | 7,950,000 | | | | 6,375,572 | |
| (Obligor: Coral Academy of Science) | | | | | | | | |
5.875%, Series A, 06/01/2052 (1) | | | 600,000 | | | | 575,471 | |
| (Obligor: Discovery Charter School) | | | | | | | | |
6.625%, Series A, 06/01/2052 (1) | | | 900,000 | | | | 850,914 | |
| (Obligor: Dreamhouse ‘Ewa Beach) | | | | | | | | |
5.750%, Series A, 06/01/2025 (1) | | | 675,000 | | | | 675,463 | |
7.500%, Series A, 06/01/2025 (1) | | | 1,000,000 | | | | 970,411 | |
| (Obligor: Explore Academy) | | | | | | | | |
| 6.125%, Series A, 02/01/2048 | | | 1,550,000 | | | | 1,331,240 | |
| (Obligor: Million Air Two Obligated Group) | | | | | | | | |
7.125%, Series B, 06/01/2041 (8) | | | 2,885,000 | | | | 2,522,409 | |
| (Obligor: Noorda College of Osteopathic Medicine) | | | | | | | | |
6.500%, 06/01/2045 (1) | | | 2,745,000 | | | | 2,333,627 | |
| (Obligor: Proton International Alabama LLC) | | | | | | | | |
6.850%, Series A, 10/01/2047 (3) | | | 400,000 | | | | 240,000 | |
| (Obligor: Shining Rock Classical) | | | | | | | | |
| 6.000%, Series A, 06/15/2052 | | | 900,000 | | | | 821,036 | |
| (Obligor: Trinity Regional Hospital) | | | | | | | | |
7.375%, Series A-1, 01/01/2050 (2),(3) | | | 12,425,000 | | | | 8,753,413 | |
| | | | | | | | 37,621,022 | |
| Total Municipal Bonds | | | | | | | | |
| (Cost $309,920,676) | | | | | | | 249,868,958 | |
| | | | | | | | | |
| CORPORATE BONDS — 5.2% | | | | | | | | |
| CalPlant I, LLC | | | | | | | | |
9.500%, 08/21/2024 (1),(2),(3) | | | 3,000,000 | | | | 3,000,000 | |
| LSC Estero Prime | | | | | | | | |
12.000%, 04/30/2024 (2) | | | 1,250,000 | | | | 1,250,000 | |
| Sunland Medical Foundation | | | | | | | | |
12.000%, 10/20/2024 (2),(3) | | | 10,000,000 | | | | 10,000,000 | |
| Total Corporate Bonds | | | | | | | | |
| (Cost $14,156,544) | | | | | | | 14,250,000 | |
See Notes to the Financial Statements
PRINCIPAL STREET HIGH INCOME MUNICIPAL FUND
Schedule of Investments – Continued
August 31, 2023
Description | | Shares | | | Value | |
| CONVERTIBLE PREFERRED STOCK — 1.8% | | | | | | |
Next Renewable Fuels, Series A (2) | | | 7 | | | $ | 5,083,502 | |
| Total Convertible Preferred Stock | | | | | | | | |
| (Cost $5,083,650) | | | | | | | 5,083,502 | |
| | | | | | | | | |
| SHORT TERM INVESTMENT — 0.1% | | | | | | | | |
First American Government Obligations Fund, Class X, 5.25% (6) | | | 443,310 | | | | 443,310 | |
| Total Short Term Investment | | | | | | | | |
| (Cost $443,310) | | | | | | | 443,310 | |
Total Investments(7) — 98.2% | | | | | | | | |
| (Cost $329,604,180) | | | | | | | 269,645,770 | |
| Other Assets & Liabilities, Net — 1.8% | | | | | | | 5,129,432 | |
| Total Net Assets — 100.0% | | | | | | $ | 274,775,202 | |
| (1) | Security purchased within the terms of a private placement memorandum, exempt from registration under Rule 144A of the Securities Act of 1933, as amended, and may be sold only to dealers in that program or other “qualified institutional buyers.” As of August 31, 2023, the total value of these investments was $51,142,724 or 18.6% of total net assets. |
| (2) | Security is categorized in Level 3 of the fair value hierarchy. These Level 3 securities have a total fair value of $33,360,653, which represents 12.1% of total net assets. See Note 3 in Notes to the Financial Statements. |
| (3) | Security in default at August 31, 2023. |
| (4) | Zero coupon bonds make no periodic interest payments, but are issued at discounts from par value. |
| (5) | Step-up bond; the interest rate shown is the rate in effect as of August 31, 2023. |
| (6) | The rate shown is the annualized seven day effective yield as of August 31, 2023. |
| (7) | All securities in this Fund have been pledged as collateral for a secured line of credit. |
| (8) | Security subject to the Alternative Minimum Tax (“AMT”). As of August 31, 2023, the total value of securities subject to the AMT was $72,818,519 or 26.5% of net assets. |
| (9) | Adjustable rate security. The rate shown represents the rate in effect as of August 31, 2023. |
See Notes to the Financial Statements
PRINCIPAL STREET SHORT TERM MUNICIPAL FUND
Schedule of Investments
August 31, 2023
Description | | Par | | | Value | |
| MUNICIPAL BONDS — 98.5% | | | | | | |
| | | | | | | |
| Alabama — 3.9% | | | | | | |
| Black Belt Energy Gas District | | | | | | |
5.250%, Series C-1, 02/01/2053 (6) | | $ | 500,000 | | | $ | 518,627 | |
| 5.250%, Series F, 12/01/2025 | | | 1,000,000 | | | | 1,021,236 | |
| Houston County Health Care Authority | | | | | | | | |
| 5.000%, Series A, 10/01/2030 | | | 100,000 | | | | 101,158 | |
| Russell County Public Building Authority | | | | | | | | |
| 4.500%, 01/01/2033 | | | 425,000 | | | | 425,265 | |
| | | | | | | | 2,066,286 | |
| Arizona — 5.2% | | | | | | | | |
| Maricopa County Industrial Development Authority | | | | | | | | |
4.000%, Series B, 07/01/2029 (1) | | | 1,000,000 | | | | 950,937 | |
| Maricopa County Union High School District No. 210 | | | | | | | | |
| 4.000%, Series A, 07/01/2026 | | | 150,000 | | | | 150,059 | |
| Pima County | | | | | | | | |
| 4.000%, 07/01/2024 | | | 205,000 | | | | 205,102 | |
| Pima County Industrial Development Authority | | | | | | | | |
| (Obligor: La Posada Park Centre) | | | | | | | | |
5.125%, Series B-3, 11/15/2029 (1) | | | 500,000 | | | | 492,027 | |
5.625%, Series B-3, 11/15/2030 (1) | | | 500,000 | | | | 494,576 | |
| (Obligor: PLC Charter Schools) | | | | | | | | |
| 5.250%, 12/01/2026 | | | 475,000 | | | | 470,232 | |
| | | | | | | | 2,762,933 | |
| California — 7.0% | | | | | | | | |
| California Community Choice Financing Authority | | | | | | | | |
| 5.000%, Series A-1, 12/01/2053 | | | 900,000 | | | | 927,289 | |
| California Enterprise Development Authority | | | | | | | | |
| (Obligor: Rocklin Academy) | | | | | | | | |
4.000%, Series A, 06/01/2036 (1) | | | 500,000 | | | | 445,442 | |
| California Health Facilities Financing Authority | | | | | | | | |
| (Obligor: City of Hope) | | | | | | | | |
| 5.000%, Series A, 11/15/2023 | | | 175,000 | | | | 175,166 | |
| California Municipal Finance Authority | | | | | | | | |
4.000%, 07/15/2029 (5) | | | 100,000 | | | | 98,762 | |
| California School Finance Authority | | | | | | | | |
| (Obligor: Hawking STEAM Charter Schools) | | | | | | | | |
5.000%, 07/01/2025 (1) | | | 400,000 | | | | 403,158 | |
| California Statewide Communities Development Authority | | | | | | | | |
| 4.250%, Series C, 09/02/2032 | | | 500,000 | | | | 488,965 | |
See Notes to the Financial Statements
PRINCIPAL STREET SHORT TERM MUNICIPAL FUND
Schedule of Investments – Continued
August 31, 2023
Description | | Par | | | Value | |
| MUNICIPAL BONDS — 98.5% (Continued) | | | | | | |
| | | | | | | |
| California — 7.0% (Continued) | | | | | | |
| Merced Wastewater System Revenue | | | | | | |
| 5.000%, 10/01/2023 | | $ | 125,000 | | | $ | 125,153 | |
| North Natomas Community Facilities District No. 4 | | | | | | | | |
| 5.250%, Series E, 09/01/2024 | | | 150,000 | | | | 150,755 | |
| Palomar Community College District | | | | | | | | |
0.000%, Series B, 08/01/2029 (2) | | | 100,000 | | | | 80,608 | |
| San Ysidro School District | | | | | | | | |
| 4.000%, 08/01/2029 | | | 130,000 | | | | 130,076 | |
| Santa Barbara County | | | | | | | | |
| 4.500%, Series A-2, 12/01/2023 | | | 400,000 | | | | 400,338 | |
| Southern California Logistics Airport Authority | | | | | | | | |
| 4.500%, 12/01/2031 | | | 300,000 | | | | 302,194 | |
| | | | | | | | 3,727,906 | |
| Colorado — 1.3% | | | | | | | | |
| Board of Water Commissioners City & County of Denver | | | | | | | | |
| 4.000%, Series A, 12/15/2025 | | | 175,000 | | | | 175,066 | |
| Denver City & County Airport Revenue | | | | | | | | |
5.000%, Series A, 12/01/2032 (5) | | | 300,000 | | | | 316,742 | |
6.125%, Series C, 11/15/2025 (5) | | | 190,000 | | | | 198,207 | |
| | | | | | | | 690,015 | |
| Connecticut — 0.3% | | | | | | | | |
| West Haven Public Housing Authority | | | | | | | | |
| (Obligor: Meadow Landing I) | | | | | | | | |
5.300%, Series A, 01/01/2024 (5) | | | 140,000 | | | | 139,559 | |
| | | | | | | | | |
| Florida — 2.0% | | | | | | | | |
| Capital Trust Agency, Inc. | | | | | | | | |
| (Obligor: Voans SW Florida Healthcare) | | | | | | | | |
10.000%, 06/30/2024 (1),(3) | | | 750,000 | | | | 547,500 | |
| Miami-Dade County Industrial Development Authority | | | | | | | | |
| (Obligor: Pinecrest Academy) | | | | | | | | |
| 5.000%, 09/15/2024 | | | 450,000 | | | | 450,877 | |
| (Obligor: Academir Charter Schools) | | | | | | | | |
| 6.750%, 07/01/2029 | | | 100,000 | | | | 96,014 | |
| | | | | | | | 1,094,391 | |
| Georgia — 1.1% | | | | | | | | |
| Augusta Water & Sewer Revenue | | | | | | | | |
| 4.000%, 10/01/2031 | | | 580,000 | | | | 580,097 | |
See Notes to the Financial Statements
PRINCIPAL STREET SHORT TERM MUNICIPAL FUND
Schedule of Investments – Continued
August 31, 2023
Description | | Par | | | Value | |
| MUNICIPAL BONDS — 98.5% (Continued) | | | | | | |
| | | | | | | |
| Idaho — 1.6% | | | | | | |
| Kootenai County School District No. 271 Coeur d’Alene | | | | | | |
| 4.000%, Series B, 09/15/2024 | | $ | 850,000 | | | $ | 850,415 | |
| | | | | | | | | |
| Illinois — 10.1% | | | | | | | | |
| Blue Island | | | | | | | | |
| 4.750%, 12/01/2024 | | | 100,000 | | | | 100,048 | |
| Chicago Board of Education | | | | | | | | |
| 5.250%, 12/01/2023 | | | 135,000 | | | | 135,348 | |
| Chicago O’Hare International Airport | | | | | | | | |
| 5.250%, 01/01/2033 | | | 650,000 | | | | 650,646 | |
| 5.000%, Series A, 01/01/2032 | | | 500,000 | | | | 500,326 | |
5.000%, Series B, 01/01/2031 (5) | | | 240,000 | | | | 240,068 | |
4.000%, Series B, 01/01/2027 (5) | | | 250,000 | | | | 249,999 | |
| Illinois | | | | | | | | |
| 6.000%, 11/01/2026 | | | 350,000 | | | | 364,325 | |
| Illinois Finance Authority | | | | | | | | |
| (Obligor: Plymouth Place) | | | | | | | | |
| 5.250%, Series B-2, 11/15/2027 | | | 500,000 | | | | 497,547 | |
| Illinois Sales Tax Revenue | | | | | | | | |
| 5.000%, 06/15/2025 | | | 325,000 | | | | 325,271 | |
| Metropolitan Pier & Exposition Authority | | | | | | | | |
| 7.000%, 07/01/2026 | | | 1,665,000 | | | | 1,758,695 | |
| Sales Tax Securitization Corp. | | | | | | | | |
| 5.000%, Series A, 01/01/2030 | | | 200,000 | | | | 217,606 | |
| Villa Park | | | | | | | | |
| 4.000%, 12/15/2028 | | | 350,000 | | | | 350,122 | |
| | | | | | | | 5,390,001 | |
| Indiana — 5.9% | | | | | | | | |
| GCS School Building Corp. One | | | | | | | | |
| 4.000%, 07/15/2025 | | | 800,000 | | | | 800,178 | |
| Indiana Finance Authority | | | | | | | | |
| (Obligor: Earlham College) | | | | | | | | |
| 5.000%, 10/01/2032 | | | 765,000 | | | | 765,210 | |
| (Obligor: Fulcrum Centerpoint, LLC) | | | | | | | | |
4.500%, 12/15/2046 (5) | | | 1,000,000 | | | | 998,582 | |
| University of Southern Indiana Foundation | | | | | | | | |
| 4.500%, 10/01/2024 | | | 575,000 | | | | 575,807 | |
| | | | | | | | 3,139,777 | |
See Notes to the Financial Statements
PRINCIPAL STREET SHORT TERM MUNICIPAL FUND
Schedule of Investments – Continued
August 31, 2023
Description | | Par | | | Value | |
| MUNICIPAL BONDS — 98.5% (Continued) | | | | | | |
| | | | | | | |
| Iowa — 1.2% | | | | | | |
| PEFA, Inc. | | | | | | |
| 5.000%, 09/01/2049 | | $ | 630,000 | | | $ | 636,139 | |
| | | | | | | | | |
| Kansas — 0.7% | | | | | | | | |
| Johnson County Park & Recreation District | | | | | | | | |
| 4.000%, Series A, 09/01/2024 | | | 110,000 | | | | 110,016 | |
| Topeka | | | | | | | | |
| (Obligor: Congregational Home) | | | | | | | | |
| 5.125%, Series B, 12/01/2026 | | | 250,000 | | | | 246,902 | |
| | | | | | | | 356,918 | |
| Massachusetts — 0.8% | | | | | | | | |
| Massachusetts Development Finance Agency | | | | | | | | |
| (Obligor: Provident Commonwealth) | | | | | | | | |
| 5.000%, 10/01/2029 | | | 150,000 | | | | 153,203 | |
| Massachusetts Educational Financing Authority | | | | | | | | |
4.375%, 07/01/2024 (5) | | | 175,000 | | | | 175,021 | |
| North Reading | | | | | | | | |
| 5.000%, 05/15/2030 | | | 120,000 | | | | 120,161 | |
| | | | | | | | 448,385 | |
| Michigan — 1.3% | | | | | | | | |
| Detroit School District | | | | | | | | |
| 5.250%, Series C, 05/01/2025 | | | 490,000 | | | | 500,266 | |
| Healthsource Saginaw, Inc. | | | | | | | | |
| 4.000%, 05/01/2027 | | | 80,000 | | | | 80,041 | |
| Michigan Finance Authority | | | | | | | | |
| (Obligor: Trinity Health Corp.) | | | | | | | | |
| 5.000%, Series MI-2, 12/01/2044 | | | 100,000 | | | | 102,091 | |
| | | | | | | | 682,398 | |
| Mississippi — 1.0% | | | | | | | | |
| Natchez | | | | | | | | |
| 4.500%, 09/01/2025 | | | 545,000 | | | | 549,958 | |
| | | | | | | | | |
| Missouri — 2.2% | | | | | | | | |
| Jackson County | | | | | | | | |
| 4.250%, 12/01/2023 | | | 595,000 | | | | 595,336 | |
| Missouri Development Finance Board | | | | | | | | |
| 5.000%, Series A, 06/01/2024 | | | 400,000 | | | | 400,520 | |
| 5.000%, Series A, 06/01/2027 | | | 200,000 | | | | 200,153 | |
| | | | | | | | 1,196,009 | |
See Notes to the Financial Statements
PRINCIPAL STREET SHORT TERM MUNICIPAL FUND
Schedule of Investments – Continued
August 31, 2023
Description | | Par | | | Value | |
| MUNICIPAL BONDS — 98.5% (Continued) | | | | | | |
| | | | | | | |
| New Jersey — 2.9% | | | | | | |
| New Jersey Economic Development Authority | | | | | | |
| 5.000%, Series UU, 06/15/2034 | | $ | 755,000 | | | $ | 762,423 | |
| New Jersey Housing & Mortgage Finance Agency | | | | | | | | |
| 4.000%, Series I, 04/01/2033 | | | 785,000 | | | | 786,037 | |
| | | | | | | | 1,548,460 | |
| New Mexico — 0.7% | | | | | | | | |
| Dona Ana County | | | | | | | | |
| 4.000%, 05/01/2028 | | | 395,000 | | | | 395,100 | |
| | | | | | | | | |
| New York — 7.4% | | | | | | | | |
| Build NYC Resource Corp. | | | | | | | | |
| (Obligor: Voices of Community Activists) | | | | | | | | |
7.625%, Series A-2, 02/01/2026 (1) | | | 1,000,000 | | | | 996,547 | |
| Hudson | | | | | | | | |
| 4.000%, 04/15/2028 | | | 95,000 | | | | 95,055 | |
| Metropolitan Transportation Authority | | | | | | | | |
| 4.000%, Series B, 11/15/2028 | | | 125,000 | | | | 125,014 | |
| 5.000%, Series C-1, 11/15/2030 | | | 1,000,000 | | | | 1,031,819 | |
| New York State Dormitory Authority | | | | | | | | |
| (Obligor: St John’s University) | | | | | | | | |
| 4.000%, Series A, 07/01/2033 | | | 100,000 | | | | 103,674 | |
| Port Authority of New York & New Jersey | | | | | | | | |
5.000%, Series 223, 07/15/2027 (5) | | | 1,320,000 | | | | 1,381,763 | |
| Schenectady Metroplex Development Authority | | | | | | | | |
| 5.000%, 09/15/2023 | | | 200,000 | | | | 200,086 | |
| | | | | | | | 3,933,958 | |
| North Carolina — 2.1% | | | | | | | | |
| North Carolina Capital Facilities Finance Agency | | | | | | | | |
| (Obligor: Arc of North Carolina) | | | | | | | | |
| 5.000%, Series A, 10/01/2027 | | | 100,000 | | | | 100,062 | |
| North Carolina Medical Care Commission | | | | | | | | |
| (Obligor: Lutheran Aging Services) | | | | | | | | |
| 5.000%, Series C, 03/01/2024 | | | 395,000 | | | | 394,656 | |
| (Obligor: Wake Forest Baptist) | | | | | | | | |
| 5.000%, Series B, 12/01/2024 | | | 650,000 | | | | 650,570 | |
| | | | | | | | 1,145,288 | |
See Notes to the Financial Statements
PRINCIPAL STREET SHORT TERM MUNICIPAL FUND
Schedule of Investments – Continued
August 31, 2023
Description | | Par | | | Value | |
| MUNICIPAL BONDS — 98.5% (Continued) | | | | | | |
| | | | | | | |
| North Dakota — 0.7% | | | | | | |
| Williston | | | | | | |
| 4.000%, Series B, 05/01/2024 | | $ | 365,000 | | | $ | 365,049 | |
| | | | | | | | | |
| Ohio — 0.3% | | | | | | | | |
| Riversouth Authority | | | | | | | | |
| 5.000%, Series A, 06/01/2024 | | | 185,000 | | | | 185,215 | |
| | | | | | | | | |
| Oklahoma — 0.9% | | | | | | | | |
| Norman Regional Hospital Authority | | | | | | | | |
| (Obligor: Norman Regional Hospital Authority) | | | | | | | | |
| 5.000%, 09/01/2025 | | | 235,000 | | | | 234,782 | |
| Tulsa County Industrial Authority | | | | | | | | |
| (Obligor: Montereau Obligated Group) | | | | | | | | |
| 5.000%, 11/15/2023 | | | 230,000 | | | | 230,263 | |
| | | | | | | | 465,045 | |
| Oregon — 0.7% | | | | | | | | |
| Portland Water Revenue | | | | | | | | |
| 5.000%, 10/01/2024 | | | 350,000 | | | | 350,258 | |
| | | | | | | | | |
| Pennsylvania — 5.0% | | | | | | | | |
| Butler County Hospital Authority | | | | | | | | |
| (Obligor: Butler Health System) | | | | | | | | |
| 5.000%, 07/01/2028 | | | 300,000 | | | | 294,279 | |
| Lycoming County Authority | | | | | | | | |
| (Obligor: Lycoming College) | | | | | | | | |
| 4.500%, Series S2, 11/01/2035 | | | 500,000 | | | | 495,792 | |
| Montgomery County Higher Education and Health Authority | | | | | | | | |
| (Obligor: Gwynedd Mercy University) | | | | | | | | |
| 5.000%, Series UU1, 05/01/2029 | | | 240,000 | | | | 244,888 | |
| Montgomery County Industrial Development Authority | | | | | | | | |
| (Obligor: Foulkeways at Gwynedd) | | | | | | | | |
| 5.000%, 12/01/2025 | | | 230,000 | | | | 233,387 | |
| Northeastern Pennsylvania Hospital and Education Authority | | | | | | | | |
| (Obligor: Kings College) | | | | | | | | |
| 5.000%, 05/01/2025 | | | 600,000 | | | | 600,026 | |
| Philadelphia Authority for Industrial Development | | | | | | | | |
| (Obligor: Russell Byers Charter School) | | | | | | | | |
| 5.000%, Series A, 05/01/2030 | | | 770,000 | | | | 774,469 | |
| | | | | | | | 2,642,841 | |
See Notes to the Financial Statements
PRINCIPAL STREET SHORT TERM MUNICIPAL FUND
Schedule of Investments – Continued
August 31, 2023
Description | | Par | | | Value | |
| MUNICIPAL BONDS — 98.5% (Continued) | | | | | | |
| | | | | | | |
| Puerto Rico — 4.8% | | | | | | |
| Children’s Trust Fund | | | | | | |
| 5.500%, 05/15/2039 | | $ | 620,000 | | | $ | 620,072 | |
| Commonwealth of Puerto Rico | | | | | | | | |
0.000%, Series A, 07/01/2024 (2) | | | 487,180 | | | | 469,488 | |
| Puerto Rico Electric Power Authority | | | | | | | | |
5.000%, Series PP, 07/01/2024 (3) | | | 140,000 | | | | 140,022 | |
5.000%, Series PP, 07/01/2025 (3) | | | 385,000 | | | | 385,061 | |
5.000%, Series UU, 07/01/2024 (3) | | | 745,000 | | | | 749,436 | |
5.250%, Series VV, 07/01/2026 (3) | | | 200,000 | | | | 197,289 | |
| | | | | | | | 2,561,368 | |
| Rhode Island — 0.4% | | | | | | | | |
| Rhode Island Health and Educational Building Corp. | | | | | | | | |
| (Obligor: Providence College) | | | | | | | | |
| 5.000%, Series B, 11/01/2023 | | | 200,000 | | | | 200,212 | |
| | | | | | | | | |
| South Carolina — 1.2% | | | | | | | | |
| South Carolina Jobs-Economic Development Authority | | | | | | | | |
| (Obligor: Kiawah Life Plan Village, Inc.) | | | | | | | | |
| 5.250%, Series B-2, 11/15/2028 | | | 500,000 | | | | 499,061 | |
| (Obligor: Upstate Senior Living) | | | | | | | | |
| 4.000%, 11/15/2027 | | | 175,000 | | | | 168,890 | |
| | | | | | | | 667,951 | |
| Tennessee — 3.2% | | | | | | | | |
| Greeneville | | | | | | | | |
| 4.000%, 06/01/2029 | | | 165,000 | | | | 173,321 | |
| Tennessee Energy Acquisition Corp. | | | | | | | | |
| 5.250%, Series A, 09/01/2024 | | | 1,000,000 | | | | 1,008,805 | |
| 5.000%, Series C, 02/01/2027 | | | 500,000 | | | | 500,797 | |
| | | | | | | | 1,682,923 | |
| Texas — 11.5% | | | | | | | | |
| Arlington Higher Education Finance Corp. | | | | | | | | |
| (Obligor: Wayside Schools) | | | | | | | | |
| 5.000%, Series A, 08/15/2027 | | | 200,000 | | | | 200,065 | |
| Bacliff Municipal Utility District | | | | | | | | |
| 4.500%, 09/01/2029 | | | 340,000 | | | | 340,183 | |
| Converse | | | | | | | | |
| 4.000%, 02/01/2032 | | | 550,000 | | | | 544,929 | |
| Dallas Housing Finance Corp. | | | | | | | | |
| (Obligor: Ash Creek Housing, LLC) | | | | | | | | |
5.000%, 07/01/2026 (6) | | | 500,000 | | | | 510,227 | |
See Notes to the Financial Statements
PRINCIPAL STREET SHORT TERM MUNICIPAL FUND
Schedule of Investments – Continued
August 31, 2023
Description | | Par | | | Value | |
| MUNICIPAL BONDS — 98.5% (Continued) | | | | | | |
| | | | | | | |
| Texas — 11.5% (Continued) | | | | | | |
| Denton County Fresh Water Supply District No. 7 | | | | | | |
| 4.000%, 02/15/2028 | | $ | 135,000 | | | $ | 135,015 | |
| Georgetown | | | | | | | | |
| 4.000%, 08/15/2025 | | | 175,000 | | | | 175,056 | |
| Gray County | | | | | | | | |
| (Obligor: Clarendon College) | | | | | | | | |
| 5.000%, 09/01/2023 | | | 235,000 | | | | 235,000 | |
| Harris County Cultural Education Facilities Finance Corp. | | | | | | | | |
| (Obligor: Brazos Presbyterian Obligated Group) | | | | | | | | |
| 5.000%, Series A, 01/01/2033 | | | 285,000 | | | | 260,090 | |
| Harris County Municipal Utility District No. 167 | | | | | | | | |
| 4.000%, 09/01/2031 | | | 100,000 | | | | 99,999 | |
| Harris County Municipal Utility District No. 278 | | | | | | | | |
| 4.000%, 09/01/2037 | | | 200,000 | | | | 193,805 | |
| Katy Independent School District | | | | | | | | |
| 4.000%, 02/15/2025 | | | 160,000 | | | | 160,085 | |
| Kountze Economic Development Corp. | | | | | | | | |
| (Obligor: Allegiant Industrial, LLC) | | | | | | | | |
15.000%, 11/01/2027 (1) | | | 100,000 | | | | 115,006 | |
| Liberty Community Development Corp. | | | | | | | | |
| 4.000%, 03/01/2028 | | | 200,000 | | | | 200,008 | |
| Mansfield Independent School District | | | | | | | | |
| 4.000%, 02/15/2024 | | | 300,000 | | | | 300,128 | |
| Port Beaumont Navigation District | | | | | | | | |
| (Obligor: Allegiant Industrial Island) | | | | | | | | |
8.000%, 02/01/2039 (1), (5) | | | 280,000 | | | | 265,313 | |
| San Antonio | | | | | | | | |
| 5.000%, 02/01/2027 | | | 140,000 | | | | 140,160 | |
| San Antonio Education Facilities Corp. | | | | | | | | |
| (Obligor: Hallmark University, Inc.) | | | | | | | | |
| 5.250%, Series B, 10/01/2028 | | | 100,000 | | | | 97,299 | |
| Tarrant County Cultural Education Facilities Finance Corp. | | | | | | | | |
| (Obligor: Cumberland Rest, Inc.) | | | | | | | | |
| 5.000%, 10/01/2034 | | | 750,000 | | | | 753,115 | |
| Texas Municipal Gas Acquisition and Supply Corp. I | | | | | | | | |
| 6.250%, 12/15/2026 | | | 1,185,000 | | | | 1,227,158 | |
| Wise County | | | | | | | | |
| 5.000%, 08/15/2026 | | | 200,000 | | | | 206,960 | |
| | | | | | | | 6,159,601 | |
See Notes to the Financial Statements
PRINCIPAL STREET SHORT TERM MUNICIPAL FUND
Schedule of Investments – Continued
August 31, 2023
Description | | Par | | | Value | |
| MUNICIPAL BONDS — 98.5% (Continued) | | | | | | |
| | | | | | | |
| Washington — 3.4% | | | | | | |
| Tobacco Settlement Authority | | | | | | |
5.000%, 06/01/2024 (3) | | $ | 480,000 | | | $ | 480,248 | |
| Washington Health Care Facilities Authority | | | | | | | | |
| (Obligor: Providence St. Joseph Health Care) | | | | | | | | |
| 5.000%, Series A, 10/01/2026 | | | 290,000 | | | | 290,074 | |
| Washington State Housing Finance Commission | | | | | | | | |
| (Obligor: Heron’s Key Obligation Group) | | | | | | | | |
6.000%, Series A, 07/01/2025 (1) | | | 555,000 | | | | 568,571 | |
| 4.750%, Series B-1, 07/01/2027 | | | 500,000 | | | | 499,622 | |
| | | | | | | | 1,838,515 | |
| Washington D.C. — 1.3% | | | | | | | | |
| District of Columbia Housing Finance Agency | | | | | | | | |
| (Obligor: Tyler House Associates) | | | | | | | | |
| 4.450%, 06/15/2031 | | | 700,000 | | | | 700,134 | |
| | | | | | | | | |
| West Virginia — 0.9% | | | | | | | | |
| Monongalia County Building Commission | | | | | | | | |
| (Obligor: Vandalia Health Obligation Group) | | | | | | | | |
| 5.000%, 07/01/2028 | | | 455,000 | | | | 456,592 | |
| | | | | | | | | |
| Wisconsin — 5.5% | | | | | | | | |
| McFarland | | | | | | | | |
| 4.500%, 12/01/2023 | | | 305,000 | | | | 305,231 | |
| Wisconsin Center District | | | | | | | | |
| 5.250%, 12/15/2023 | | | 395,000 | | | | 396,521 | |
| Wisconsin Health & Educational Facilities Authority | | | | | | | | |
| (Obligor: Aspirus, Inc. Obligated Group) | | | | | | | | |
| 5.000%, 08/15/2025 | | | 100,000 | | | | 100,062 | |
| Wisconsin Public Finance Authority | | | | | | | | |
| (Obligor: Dreamhouse ‘Ewa Beach) | | | | | | | | |
5.750%, Series A, 06/01/2025 (1) | | | 1,325,000 | | | | 1,325,907 | |
| (Obligor: Noorda College of Osteopathic) | | | | | | | | |
6.500%, 06/01/2045 (1) | | | 200,000 | | | | 170,027 | |
| (Obligor: Prime Healthcare Foundation) | | | | | | | | |
| 5.000%, Series A, 12/01/2027 | | | 650,000 | | | | 656,580 | |
| | | | | | | | 2,954,328 | |
| Total Municipal Bonds | | | | | | | | |
| (Cost $52,613,989) | | | | | | | 52,564,025 | |
See Notes to the Financial Statements
PRINCIPAL STREET SHORT TERM MUNICIPAL FUND
Schedule of Investments – Continued
August 31, 2023
Description | | Shares | | | Value | |
| SHORT TERM INVESTMENT — 0.5% | | | | | | |
First American Government Obligations Fund, Class X, 5.25% (4) | | | 246,599 | | | $ | 246,599 | |
| Total Short Term Investment | | | | | | | | |
| (Cost $246,599) | | | | | | | 246,599 | |
| Total Investments — 99.0% | | | | | | | | |
| (Cost $52,860,588) | | | | | | | 52,810,624 | |
| Other Assets & Liabilities, Net — 1.0% | | | | | | | 527,191 | |
| Total Net Assets — 100.0% | | | | | | $ | 53,337,815 | |
| (1) | Security purchased within the terms of a private placement memorandum, exempt from registration under Rule 144A of the Securities Act of 1933, as amended, and may be sold only to dealers in that program or other “qualified institutional buyers.” As of August 31, 2023, the total value of these investments was $6,775,011 or 12.7% of total net assets. |
| (2) | Zero coupon bonds make no periodic interest payments, but are issued at discounts from par value. |
| (3) | Security in default at August 31, 2023. |
| (4) | The rate shown is the annualized seven day effective yield as of August 31, 2023. |
| (5) | Security subject to the Alternative Minimum Tax (“AMT”). As of August 31, 2023, the total value of securities subject to the AMT was $4,064,016 or 7.6% of net assets. |
| (6) | Adjustable rate security. The rate shown represents the rate in effect as of August 31, 2023. |
See Notes to the Financial Statements
PRINCIPAL STREET FUNDS
(This Page Intentionally Left Blank.)
PRINCIPAL STREET FUNDS
Statement of Assets and Liabilities
August 31, 2023
| | | High Income | | | Short Term | |
| | | Municipal Fund | | | Municipal Fund | |
| ASSETS: | | | | | | |
| Investments, at value (Cost: $329,604,180 | | | | | | |
| and $52,860,588, respectively) | | $ | 269,645,770 | | | $ | 52,810,624 | |
| Interest receivable | | | 8,068,083 | | | | 661,432 | |
| Receivable for capital shares sold | | | 852,612 | | | | 44,640 | |
Receivable for shareholder reprocessing(1) | | | 598,845 | | | | — | |
| Prepaid expenses | | | 33,187 | | | | 19,110 | |
| Total Assets | | | 279,198,497 | | | | 53,535,806 | |
| | | | | | | | | |
| LIABILITIES: | | | | | | | | |
| Payable for bank overdraft | | | 3,025,000 | | | | — | |
| Payable for capital shares redeemed | | | 976,926 | | | | 122,064 | |
| Payable to investment adviser | | | 122,547 | | | | 767 | |
| Payable for distributions to shareholders | | | 116,234 | | | | 1,586 | |
| Payable for fund administration & accounting fees | | | 56,471 | | | | 24,754 | |
| Payable for distribution fees | | | 29,774 | | | | 126 | |
| Payable for audit fees | | | 29,253 | | | | 22,244 | |
| Payable for transfer agent fees & expenses | | | 17,999 | | | | 7,732 | |
| Payable for custody fees | | | 5,690 | | | | 1,258 | |
| Payable for compliance fees | | | 2,089 | | | | 2,087 | |
| Accrued expenses | | | 41,312 | | | | 15,373 | |
| Total Liabilities | | | 4,423,295 | | | | 197,991 | |
| | | | | | | | | |
| NET ASSETS | | $ | 274,775,202 | | | $ | 53,337,815 | |
| | | | | | | | | |
| NET ASSETS CONSIST OF: | | | | | | | | |
| Paid-in capital | | $ | 363,522,884 | | | $ | 53,717,302 | |
| Total accumulated loss | | | (88,747,682 | ) | | | (379,487 | ) |
| Net Assets | | $ | 274,775,202 | | | $ | 53,337,815 | |
(1) | Estimated recovery from shareholders due to reprocessing shareholder trades. In the event the receivable is partially or not recovered, the Adviser will be responsible for paying the receivable to the Fund. Please see Note 10 for additional details. |
See Notes to the Financial Statements
PRINCIPAL STREET FUNDS
Statements of Assets and Liabilities – Continued
August 31, 2023
| | | High Income | | | Short Term | |
| | | Municipal Fund | | | Municipal Fund | |
| A Class: | | | | | | |
| Net Assets | | $ | 5,738,732 | | | $ | — | |
Shares issued and outstanding(1) | | | 806,965 | | | | — | |
Net asset value, redemption price, and offering price per share(2) | | $ | 7.11 | | | $ | — | |
Maximum offering price per share(2)(3) | | $ | 7.28 | | | $ | — | |
| | | | | | | | | |
| Institutional Class: | | | | | | | | |
| Net Assets | | $ | 240,235,380 | | | $ | 53,210,462 | |
Shares issued and outstanding(1) | | | 33,330,554 | | | | 12,613,754 | |
| Net asset value, redemption price, and offering price per share | | $ | 7.21 | | | $ | 4.22 | |
| | | | | | | | | |
| Investor Class: | | | | | | | | |
| Net Assets | | $ | 28,801,090 | | | $ | 127,353 | |
Shares issued and outstanding(1) | | | 3,981,552 | | | | 30,226 | |
| Net asset value, redemption price, and offering price per share | | $ | 7.23 | | | $ | 4.21 | |
(1) | Unlimited shares authorized without par value. |
(2) | May be subject to a contingent deferred sales charge of 1.00% on certain shares redeemed within 12 months of purchase. |
(3) | The offering price is calculated by dividing the net asset value by 1 minus the maximum front-end sales charge of 2.25%. |
See Notes to the Financial Statements
PRINCIPAL STREET FUNDS
Statements of Operations
For the Year Ended August 31, 2023
| | | High Income | | | Short Term | |
| | | Municipal Fund | | | Municipal Fund | |
| INVESTMENT INCOME: | | | | | | |
| Interest income | | $ | 18,649,301 | | | $ | 2,113,792 | |
| Total investment income | | | 18,649,301 | | | | 2,113,792 | |
| | | | | | | | | |
| EXPENSES: | | | | | | | | |
| Investment adviser fees (See Note 4) | | | 1,519,505 | | | | 230,317 | |
| Fund administration & accounting fees (See Note 4) | | | 340,407 | | | | 149,810 | |
| Transfer agent fees & expenses (See Note 4) | | | 106,932 | | | | 31,064 | |
| Legal fees | | | 78,823 | | | | 26,526 | |
| Federal & state registration fees | | | 58,402 | | | | 50,506 | |
| Audit fees | | | 39,622 | | | | 22,248 | |
| Custody fees (See Note 4) | | | 35,585 | | | | 7,688 | |
| Trustee fees | | | 20,386 | | | | 20,232 | |
| Postage & printing fees | | | 14,158 | | | | 1,416 | |
| Compliance fees (See Note 4) | | | 12,509 | | | | 12,501 | |
| Other expenses | | | 6,525 | | | | 3,279 | |
| Insurance expense | | | 3,735 | | | | 1,294 | |
| Distribution and shareholder servicing fees – | | | | | | | | |
| A Class (See Note 5) | | | 7,969 | | | | — | |
| Investor Class (See Note 5) | | | 127,282 | | | | 123 | |
| Total expense before interest expense | | | 2,371,840 | | | | 557,004 | |
| Interest expense (See Note 9) | | | 636,556 | | | | 2,747 | |
| Total expenses before recoupment/waiver | | | 3,008,396 | | | | 559,751 | |
| Adviser recoupment (See Note 4) | | | 1,993 | | | | — | |
| Less: waiver from investment adviser (See Note 4) | | | (118,256 | ) | | | (198,611 | ) |
| Net expenses | | | 2,892,133 | | | | 361,140 | |
| | | | | | | | | |
| NET INVESTMENT INCOME | | | 15,757,168 | | | | 1,752,652 | |
| | | | | | | | | |
| REALIZED AND UNREALIZED | | | | | | | | |
| GAIN (LOSS) ON INVESTMENTS | | | | | | | | |
| Net realized loss on investments | | | (14,501,142 | ) | | | (395,830 | ) |
| Net change in unrealized appreciation/depreciation on investments | | | (11,030,242 | ) | | | (52,691 | ) |
| Net realized and unrealized loss on investments | | | (25,531,384 | ) | | | (448,521 | ) |
| | | | | | | | | |
| NET INCREASE (DECREASE) IN | | | | | | | | |
| NET ASSETS RESULTING FROM OPERATIONS | | $ | (9,774,216 | ) | | $ | 1,304,131 | |
See Notes to the Financial Statements
PRINCIPAL STREET HIGH INCOME MUNICIPAL FUND
Statements of Changes in Net Assets
| | | For the | | | For the | |
| | | Year Ended | | | Year Ended | |
| | | August 31, 2023 | | | August 31, 2022 | |
| OPERATIONS: | | | | | | |
| Net investment income | | $ | 15,757,168 | | | $ | 15,978,738 | |
| Net realized loss on investments | | | (14,501,142 | ) | | | (8,568,252 | ) |
| Net change in unrealized appreciation/depreciation on investments | | | (11,030,242 | ) | | | (39,622,565 | ) |
| Net decrease in net assets resulting from operations | | | (9,774,216 | ) | | | (32,212,079 | ) |
| | | | | | | | | |
| CAPITAL SHARE TRANSACTIONS: | | | | | | | | |
A Class(1): | | | | | | | | |
| Proceeds from shares sold | | | 5,512,512 | | | | 403,822 | |
| Proceeds from reinvestment of distributions | | | 157,461 | | | | 5,154 | |
| Payments for shares redeemed | | | (116,320 | ) | | | (25,153 | ) |
| Net increase in net assets resulting from A Class transactions | | | 5,553,653 | | | | 383,823 | |
| | | | | | | | | |
| Institutional Class: | | | | | | | | |
| Proceeds from shares sold | | | 130,446,143 | | | | 167,030,518 | |
| Proceeds from reinvestment of distributions | | | 14,883,107 | | | | 14,563,484 | |
| Payments for shares redeemed | | | (153,392,207 | ) | | | (153,096,733 | ) |
| Net increase (decrease) in net assets | | | | | | | | |
| resulting from Institutional Class transactions | | | (8,062,957 | ) | | | 28,497,269 | |
| | | | | | | | | |
| Investor Class: | | | | | | | | |
| Proceeds from shares sold | | | 13,182,731 | | | | 15,139,397 | |
| Proceeds from reinvestment of distributions | | | 571,576 | | | | 336,266 | |
| Payments for shares redeemed | | | (3,484,484 | ) | | | (4,054,537 | ) |
| Net increase in net assets resulting from Investor Class transactions | | | 10,269,823 | | | | 11,421,126 | |
| Net increase in net assets from capital share transactions | | | 7,760,519 | | | | 40,302,218 | |
| | | | | | | | | |
| DISTRIBUTIONS TO SHAREHOLDERS | | | | | | | | |
A Class(1) | | | (189,908 | ) | | | (5,154 | ) |
| Institutional Class | | | (15,335,281 | ) | | | (15,281,351 | ) |
| Investor Class | | | (1,440,870 | ) | | | (906,463 | ) |
| Total distributions to shareholders | | | (16,966,059 | ) | | | (16,192,968 | ) |
| | | | | | | | | |
| TOTAL DECREASE IN NET ASSETS | | | (18,979,756 | ) | | | (8,102,829 | ) |
| | | | | | | | | |
| NET ASSETS: | | | | | | | | |
| Beginning of year | | | 293,754,958 | | | | 301,857,787 | |
| End of year | | $ | 274,775,202 | | | $ | 293,754,958 | |
(1) | Inception date of the A Class was February 16, 2022. |
See Notes to the Financial Statements
PRINCIPAL STREET SHORT TERM MUNICIPAL FUND
Statements of Changes in Net Assets
| | | | | | For the Period | |
| | | For the | | | Inception(1) | |
| | | Year Ended | | | Through | |
| | | August 31, 2023 | | | August 31, 2022 | |
| OPERATIONS: | | | | | | |
| Net investment income | | $ | 1,752,652 | | | $ | 87,177 | |
| Net realized loss on investments | | | (395,830 | ) | | | (4,690 | ) |
| Net change in unrealized appreciation/depreciation on investments | | | (52,691 | ) | | | 2,727 | |
| Net increase in net assets resulting from operations | | | 1,304,131 | | | | 85,214 | |
| | | | | | | | | |
| CAPITAL SHARE TRANSACTIONS: | | | | | | | | |
| Institutional Class: | | | | | | | | |
| Proceeds from shares sold | | | 48,683,163 | | | | 30,260,834 | |
| Proceeds from reinvestment of distributions | | | 1,678,005 | | | | 4,270 | |
| Payments for shares redeemed | | | (26,736,332 | ) | | | (300,618 | ) |
| Net increase in net assets resulting from Institutional Class transactions | | | 23,624,836 | | | | 29,964,486 | |
| | | | | | | | | |
| Investor Class: | | | | | | | | |
| Proceeds from shares sold | | | 101,225 | | | | 27,500 | |
| Proceeds from reinvestment of distributions | | | 1,573 | | | | 176 | |
| Payments for shares redeemed | | | (2,494 | ) | | | — | |
| Net increase in net assets resulting from Investor Class transactions | | | 100,304 | | | | 27,676 | |
| Net increase in net assets from capital share transactions | | | 23,725,140 | | | | 29,992,162 | |
| | | | | | | | | |
| DISTRIBUTIONS TO SHAREHOLDERS | | | | | | | | |
| Institutional Class | | | (1,688,232 | ) | | | (78,851 | ) |
| Investor Class | | | (1,573 | ) | | | (176 | ) |
| Total distributions to shareholders | | | (1,689,805 | ) | | | (79,027 | ) |
| | | | | | | | | |
| TOTAL INCREASE IN NET ASSETS | | | 23,339,466 | | | | 29,998,349 | |
| | | | | | | | | |
| NET ASSETS: | | | | | | | | |
| Beginning of period | | | 29,998,349 | | | | — | |
| End of period | | $ | 53,337,815 | | | $ | 29,998,349 | |
(1) | Inception date of the Fund was April 27, 2022. |
See Notes to the Financial Statements
PRINCIPAL STREET HIGH INCOME MUNICIPAL FUND
Statement of Cash Flows
| | | For the | |
| | | Year Ended | |
| | | August 31, 2023 | |
| Increase (Decrease) in Cash: | | | |
| Cash flows provided by (used for) operating activities: | | | |
| Net decrease in net assets resulting from operations | | $ | (9,774,216 | ) |
| Adjustments to reconcile net decrease in net assets from | | | | |
| operations to net cash used for operating activities: | | | | |
| Purchases of investments | | | (59,461,965 | ) |
| Proceeds from sales of investments | | | 63,332,919 | |
| Purchases and sales of short-term investments, net | | | (2,541,396 | ) |
| Amortization (accretion) of market premium (discount), net | | | (1,661,848 | ) |
| Changes in operating assets and liabilities | | | | |
| Decrease in payable for investment securities purchased | | | (2,130,267 | ) |
| Increase in receivable for shareholder reprocessing | | | (598,845 | ) |
| Increase in interest receivable | | | (1,077,112 | ) |
| Increase in prepaid expenses | | | (1,288 | ) |
| Increase in payable to investment adviser | | | 13,319 | |
| Increase in accrued distributions payable | | | 11,257 | |
| Decrease in other expenses | | | (3,995 | ) |
| Net change in unrealized appreciation of investments | | | 11,030,242 | |
| Net realized loss | | | 14,501,142 | |
| Net cash provided by operating activities | | | 11,637,947 | |
| Cash flows provided by (used for) financing activities: | | | | |
| Proceeds from shares sold(a) | | | 149,046,345 | |
| Cost of shares redeemed(b) | | | (157,009,377 | ) |
| Loan borrowings | | | 125,507,000 | |
| Loan repayments | | | (130,853,000 | ) |
| Dividends paid to shareholders, net of reinvestments | | | (1,353,915 | ) |
| Net cash used for financing activities | | | (14,662,947 | ) |
| Net change in cash | | | (3,025,000 | ) |
| | | | | |
| Cash: | | | | |
| Beginning of period | | | — | |
| End of period | | $ | (3,025,000 | ) |
| Supplemental disclosure of cash flow and non-cash information: | | | | |
| Interest paid | | $ | 636,556 | |
| Reinvested distributions | | $ | 15,612,144 | |
(a) | Includes an increase in receivable for capital shares sold of $95,041. |
(b) | Includes a decrease in payable for capital shares redeemed of $16,366. |
See Notes to the Financial Statements
PRINCIPAL STREET HIGH INCOME MUNICIPAL FUND
Financial Highlights
For a Fund share outstanding throughout the periods.
A Class
| | | | | | For the Period | |
| | | | | | Inception(1) | |
| | | Year Ended | | | Through | |
| | | August 31, 2023 | | | August 31, 2022 | |
| PER SHARE DATA: | | | | | | |
| Net asset value, beginning of period | | $ | 7.87 | | | $ | 8.74 | |
| | | | | | | | | |
| Investment operations: | | | | | | | | |
| Net investment income | | | 0.43 | | | | 0.24 | |
| Net realized and unrealized loss on investments | | | (0.74 | ) | | | (0.87 | ) |
| Total from investment operations | | | (0.31 | ) | | | (0.63 | ) |
| | | | | | | | | |
| Less distributions from: | | | | | | | | |
| Net investment income | | | (0.45 | ) | | | (0.24 | ) |
| Net realized gains | | | — | | | | — | |
| Total distributions | | | (0.45 | ) | | | (0.24 | ) |
| Net asset value, end of period | | $ | 7.11 | | | $ | 7.87 | |
| | | | | | | | | |
TOTAL RETURN(2)(3) | | | -4.02 | % | | | -7.27 | % |
| | | | | | | | | |
| SUPPLEMENTAL DATA AND RATIOS: | | | | | | | | |
| Net assets, end of period (in 000’s) | | $ | 5,739 | | | $ | 375 | |
| Ratio of expenses to average net assets: | | | | | | | | |
Before expense waiver(4) | | | 1.27 | % | | | 1.27 | % |
After expense waiver(4) | | | 1.23 | % | | | 1.20 | % |
| Ratio of expenses excluding interest expense to average net assets: | | | | | | | | |
Before expense waiver(4) | | | 1.07 | % | | | 1.06 | % |
After expense waiver(4) | | | 1.03 | % | | | 0.98 | % |
| Ratio of net investment income to average net assets: | | | | | | | | |
After expense waiver(4) | | | 5.52 | % | | | 5.44 | % |
Portfolio turnover rate(2)(5) | | | 21 | % | | | 53 | % |
(1) | Inception date for the A Class was February 16, 2022. |
(2) | Not annualized for period less than one year. |
(3) | Return does not include sales load. |
(4) | Annualized for period less than one year. |
(5) | Portfolio turnover disclosed is for the Fund as a whole. |
See Notes to the Financial Statements
PRINCIPAL STREET HIGH INCOME MUNICIPAL FUND
Financial Highlights
For a Fund share outstanding throughout the years.
Institutional Class
| | | Year | | | Year | | | Year | | | Year | | | Year | |
| | | Ended | | | Ended | | | Ended | | | Ended | | | Ended | |
| | | August 31, | | | August 31, | | | August 31, | | | August 31, | | | August 31, | |
| | | 2023 | | | 2022 | | | 2021 | | | 2020 | | | 2019 | |
| PER SHARE DATA: | | | | | | | | | | | | | | | |
| Net asset value, beginning of year | | $ | 7.91 | | | $ | 9.27 | | | $ | 9.12 | | | $ | 10.36 | | | $ | 10.34 | |
| | | | | | | | | | | | | | | | | | | | | |
| Investment operations: | | | | | | | | | | | | | | | | | | | | |
| Net investment income | | | 0.43 | | | | 0.46 | | | | 0.51 | | | | 0.60 | | | | 0.60 | |
| Net realized and unrealized | | | | | | | | | | | | | | | | | | | | |
| gain (loss) on investments | | | (0.67 | ) | | | (1.35 | ) | | | 0.15 | | | | (1.24 | ) | | | 0.22 | |
| Total from investment operations | | | (0.24 | ) | | | (0.89 | ) | | | 0.66 | | | | (0.64 | ) | | | 0.82 | |
| | | | | | | | | | | | | | | | | | | | | |
| Less distributions from: | | | | | | | | | | | | | | | | | | | | |
| Net investment income | | | (0.46 | ) | | | (0.47 | ) | | | (0.51 | ) | | | (0.56 | ) | | | (0.60 | ) |
| Net realized gains | | | — | | | | — | | | | — | | | | (0.04 | ) | | | (0.20 | ) |
| Total distributions | | | (0.46 | ) | | | (0.47 | ) | | | (0.51 | ) | | | (0.60 | ) | | | (0.80 | ) |
| Net asset value, end of year | | $ | 7.21 | | | $ | 7.91 | | | $ | 9.27 | | | $ | 9.12 | | | $ | 10.36 | |
| | | | | | | | | | | | | | | | | | | | | |
| TOTAL RETURN | | | -2.94 | % | | | -9.88 | % | | | 7.49 | % | | | -6.34 | % | | | 8.36 | % |
| | | | | | | | | | | | | | | | | | | | | |
| SUPPLEMENTAL DATA AND RATIOS: | | | | | | | | | | | | | | | | | | | | |
| Net assets, end of year (in 000’s) | | $ | 240,235 | | | $ | 272,640 | | | $ | 289,438 | | | $ | 201,763 | | | $ | 155,658 | |
| Ratio of expenses to average net assets: | | | | | | | | | | | | | | | | | | | | |
| Before expense waiver | | | 1.04 | % | | | 0.86 | % | | | 0.78 | % | | | 0.80 | % | | | 0.83 | % |
| After expense waiver | | | 1.00 | % | | | 0.83 | % | | | 0.73 | % | | | 0.74 | % | | | 0.74 | % |
| Ratio of expenses excluding interest | | | | | | | | | | | | | | | | | | | | |
| expense to average net assets: | | | | | | | | | | | | | | | | | | | | |
| Before expense waiver | | | 0.81 | % | | | 0.76 | % | | | 0.77 | % | | | 0.79 | % | | | 0.82 | % |
| After expense waiver | | | 0.77 | % | | | 0.73 | % | | | 0.73 | % | | | 0.73 | % | | | 0.73 | % |
| Ratio of net investment income | | | | | | | | | | | | | | | | | | | | |
| to average net assets: | | | | | | | | | | | | | | | | | | | | |
| After expense waiver | | | 5.75 | % | | | 5.35 | % | | | 5.70 | % | | | 6.28 | % | | | 5.82 | % |
Portfolio turnover rate(1) | | | 21 | % | | | 53 | % | | | 64 | % | | | 41 | % | | | 33 | % |
(1) | Portfolio turnover disclosed is for the Fund as a whole. |
See Notes to the Financial Statements
PRINCIPAL STREET HIGH INCOME MUNICIPAL FUND
Financial Highlights
For a Fund share outstanding throughout the periods.
Investor Class
| | | | | | | | | | | | For the Period | |
| | | Year | | | Year | | | Year | | | Inception(1) | |
| | | Ended | | | Ended | | | Ended | | | Through | |
| | | August 31, | | | August 31, | | | August 31, | | | August 31, | |
| | | 2023 | | | 2022 | | | 2021 | | | 2020 | |
| PER SHARE DATA: | | | | | | | | | | | | |
| Net asset value, beginning of period | | $ | 7.96 | | | $ | 9.32 | | | $ | 9.18 | | | $ | 8.66 | |
| | | | | | | | | | | | | | | | | |
| Investment operations: | | | | | | | | | | | | | | | | |
| Net investment income | | | 0.40 | | | | 0.41 | | | | 0.48 | | | | 0.22 | |
| Net realized and unrealized gain (loss) on investments | | | (0.70 | ) | | | (1.35 | ) | | | 0.13 | | | | 0.51 | (5) |
| Total from investment operations | | | (0.30 | ) | | | (0.94 | ) | | | 0.61 | | | | 0.73 | |
| | | | | | | | | | | | | | | | | |
| Less distributions from: | | | | | | | | | | | | | | | | |
| Net investment income | | | (0.43 | ) | | | (0.42 | ) | | | (0.47 | ) | | | (0.21 | ) |
| Net realized gains | | | — | | | | — | | | | — | | | | — | |
| Total distributions | | | (0.43 | ) | �� | | (0.42 | ) | | | (0.47 | ) | | | (0.21 | ) |
| Net asset value, end of period | | $ | 7.23 | | | $ | 7.96 | | | $ | 9.32 | | | $ | 9.18 | |
| | | | | | | | | | | | | | | | | |
TOTAL RETURN(2) | | | -3.81 | % | | | -10.28 | % | | | 6.82 | % | | | 8.56 | % |
| | | | | | | | | | | | | | | | | |
| SUPPLEMENTAL DATA AND RATIOS: | | | | | | | | | | | | | | | | |
| Net assets, end of period (in 000’s) | | $ | 28,801 | | | $ | 20,740 | | | $ | 12,420 | | | $ | 278 | |
| Ratio of expenses to average net assets: | | | | | | | | | | | | | | | | |
Before expense waiver(3) | | | 1.54 | % | | | 1.38 | % | | | 1.28 | % | | | 1.32 | % |
After expense waiver(3) | | | 1.50 | % | | | 1.35 | % | | | 1.24 | % | | | 1.23 | % |
| Ratio of expenses excluding interest | | | | | | | | | | | | | | | | |
| expense to average net assets: | | | | | | | | | | | | | | | | |
Before expense waiver(3) | | | 1.31 | % | | | 1.26 | % | | | 1.27 | % | | | 1.32 | % |
After expense waiver(3) | | | 1.27 | % | | | 1.23 | % | | | 1.23 | % | | | 1.23 | % |
| Ratio of net investment income | | | | | | | | | | | | | | | | |
| to average net assets: | | | | | | | | | | | | | | | | |
After expense waiver(3) | | | 5.25 | % | | | 4.89 | % | | | 5.20 | % | | | 6.21 | % |
Portfolio turnover rate(2)(4) | | | 21 | % | | | 53 | % | | | 64 | % | | | 41 | % |
(1) | Inception date for the Investor Class was March 23, 2020. |
(2) | Not annualized for period less than one year. |
(3) | Annualized for period less than one year. |
(4) | Portfolio turnover disclosed is for the Fund as a whole. |
(5) | The realized and unrealized gain per share in this caption is a balancing amount necessary to reconcile the change in net asset value per share for the period, and may not reconcile with the aggregate gains on the Statement of Operations due to share transactions for the period. |
See Notes to the Financial Statements
PRINCIPAL STREET SHORT TERM MUNICIPAL FUND
Financial Highlights
For a Fund share outstanding throughout the periods.
Institutional Class
| | | | | | For the Period | |
| | | Year | | | Inception(1) | |
| | | Ended | | | Through | |
| | | August 31, | | | August 31, | |
| | | 2023 | | | 2022 | |
| PER SHARE DATA: | | | | | | |
| Net asset value, beginning of period | | $ | 4.26 | | | $ | 4.25 | |
| | | | | | | | | |
| Investment operations: | | | | | | | | |
| Net investment income | | | 0.14 | | | | 0.03 | |
| Net realized and unrealized gain (loss) on investments | | | (0.04 | ) | | | 0.01 | (5) |
| Total from investment operations | | | 0.10 | | | | 0.04 | |
| | | | | | | | | |
| Less distributions from: | | | | | | | | |
| Net investment income | | | (0.14 | ) | | | (0.03 | ) |
| Net realized gains | | | — | | | | — | |
| Total distributions | | | (0.14 | ) | | | (0.03 | ) |
| Net asset value, end of period | | $ | 4.22 | | | $ | 4.26 | |
| | | | | | | | | |
TOTAL RETURN(2) | | | 2.36 | % | | | 1.02 | % |
| | | | | | | | | |
| SUPPLEMENTAL DATA AND RATIOS: | | | | | | | | |
| Net assets, end of period (in 000’s) | | $ | 53,211 | | | $ | 29,970 | |
| Ratio of expenses to average net assets: | | | | | | | | |
Before expense waiver(3) | | | 1.09 | % | | | 4.41 | % |
After expense waiver(3) | | | 0.71 | % | | | 0.70 | % |
| Ratio of expenses excluding interest expense to average net assets: | | | | | | | | |
Before expense waiver(3) | | | 1.09 | % | | | 4.41 | % |
After expense waiver(3) | | | 0.70 | % | | | 0.70 | % |
| Ratio of net investment income to average net assets: | | | | | | | | |
After expense waiver(3) | | | 3.42 | % | | | 2.52 | % |
Portfolio turnover rate(2)(4) | | | 75 | % | | | 24 | % |
(1) | Inception date for the Fund was April 27, 2022. |
(2) | Not annualized for period less than one year. |
(3) | Annualized for period less than one year. |
(4) | Portfolio turnover disclosed is for the Fund as a whole. |
(5) | The realized and unrealized gain per share in this caption is a balancing amount necessary to reconcile the change in net asset value per share for the period, and may not reconcile with the aggregate gains on the Statement of Operations due to share transactions for the period. |
See Notes to the Financial Statements
PRINCIPAL STREET SHORT TERM MUNICIPAL FUND
Financial Highlights
For a Fund share outstanding throughout the periods.
Investor Class
| | | | | | For the Period | |
| | | Year | | | Inception(1) | |
| | | Ended | | | Through | |
| | | August 31, | | | August 31, | |
| | | 2023 | | | 2022 | |
| PER SHARE DATA: | | | | | | |
| Net asset value, beginning of period | | $ | 4.26 | | | $ | 4.25 | |
| | | | | | | | | |
| Investment operations: | | | | | | | | |
| Net investment income | | | 0.13 | | | | 0.03 | |
| Net realized and unrealized gain (loss) on investments | | | (0.05 | ) | | | 0.01 | (5) |
| Total from investment operations | | | 0.08 | | | | 0.04 | |
| | | | | | | | | |
| Less distributions from: | | | | | | | | |
| Net investment income | | | (0.13 | ) | | | (0.03 | ) |
| Net realized gains | | | — | | | | — | |
| Total distributions | | | (0.13 | ) | | | (0.03 | ) |
| Net asset value, end of period | | $ | 4.21 | | | $ | 4.26 | |
| | | | | | | | | |
TOTAL RETURN(2) | | | 1.87 | % | | | 0.94 | % |
| | | | | | | | | |
| SUPPLEMENTAL DATA AND RATIOS: | | | | | | | | |
| Net assets, end of period (in 000’s) | | $ | 127 | | | $ | 28 | |
| Ratio of expenses to average net assets: | | | | | | | | |
Before expense waiver(3) | | | 1.37 | % | | | 5.60 | % |
After expense waiver(3) | | | 0.95 | % | | | 0.96 | % |
| Ratio of expenses excluding interest expense to average net assets: | | | | | | | | |
Before expense waiver(3) | | | 1.36 | % | | | 5.59 | % |
After expense waiver(3) | | | 0.95 | % | | | 0.95 | % |
| Ratio of net investment income to average net assets: | | | | | | | | |
After expense waiver(3) | | | 3.18 | % | | | 2.27 | % |
Portfolio turnover rate(2)(4) | | | 75 | % | | | 24 | % |
(1) | Inception date for the Fund was April 27, 2022. |
(2) | Not annualized for period less than one year. |
(3) | Annualized for period less than one year. |
(4) | Portfolio turnover disclosed is for the Fund as a whole. |
(5) | The realized and unrealized gain per share in this caption is a balancing amount necessary to reconcile the change in net asset value per share for the period, and may not reconcile with the aggregate gains on the Statement of Operations due to share transactions for the period. |
See Notes to the Financial Statements
PRINCIPAL STREET FUNDS
Notes to the Financial Statements
August 31, 2023
1. ORGANIZATION
Managed Portfolio Series (the “Trust”) was organized as a Delaware statutory trust on January 27, 2011. The Trust is registered under the Investment Company Act of 1940, as amended (the “1940 Act”), as an open-end management investment company. The Principal Street High Income Municipal Fund (the “High Income Fund”) is a diversified series with its own investment objectives and policies within the Trust. The Principal Street Short Term Municipal Fund (the “Short Term Fund”) is a non-diversified series with its own investment objectives and policies within the Trust. Each series is considered a “Fund” and collectively, the “Funds”. Prior to October 15, 2019, the High Income Fund was known as the Green Square High Income Municipal Fund. The investment objective of both Funds is to provide current income exempt from regular federal income tax. The Funds are investment companies and accordingly follow the investment company accounting and reporting guidance of the Financial Accounting Standards Board (“FASB”) Accounting Standards Codification Topic 946, Financial Services – Investment Companies. The High Income Fund currently offers three classes of shares for purchase. The High Income Fund’s Institutional Class commenced operations on September 15, 2017, the Investor Class commenced operations on March 23, 2020, and the A Class commenced operations on February 16, 2022. The Short Term Fund commenced operations on April 27, 2022 and currently offers two classes of shares, Institutional Class and Investor Class. Each class of shares for the Funds has identical rights and privileges except with respect to 12b-1 fees and voting rights on matters affecting a single share class. For the High Income Fund, the Investor Class and A Class shares are subject to a 0.50% and 0.25% Rule 12b-1 distribution and servicing fee, respectively. For the Short Term Fund, the Investor Class shares are subject to a 0.25% Rule 12b-1 distribution and servicing fee. The Funds may issue an unlimited number of shares of beneficial interest, with no par value.
2. SIGNIFICANT ACCOUNTING POLICIES
The following is a summary of significant accounting policies consistently followed by the Funds in preparation of its financial statements. These policies are in conformity with generally accepted accounting principles in the United States of America (“GAAP”).
Security Valuation – All investments in securities are recorded at their estimated fair value, as described in Note 3.
Federal Income Taxes – The Funds comply with the requirements of subchapter M of the Internal Revenue Code of 1986, as amended, necessary to qualify as a regulated investment companies and distribute substantially all net taxable investment income and net realized gains to shareholders in a manner which results in no tax cost to the Funds. Therefore, no federal income or excise tax provision is required. As of and during the year ended August 31, 2023, the Funds did not have any tax positions that did not meet the “more-likely-than-not” threshold of being sustained by the applicable tax authority. The Funds recognize interest and penalties, if any, related to unrecognized tax benefits on uncertain tax positions as income tax expense in the Statement of Operations. As of and during the year ended August 31, 2023, the Funds did not incur any interest or penalties. The High Income Fund is not subject to examination by U.S. tax authorities for tax years prior to the year ended August 31, 2020. The Short Term fund is not subject to examination by U.S. Tax Authorities prior to the year ended August 31, 2022.
Security Transactions, Income, and Distributions – The Funds follow industry practice and record security transactions on the trade date. Realized gains and losses on sales of securities are calculated on the basis of identified cost. Dividend income is recorded on the ex-dividend date and interest income is recorded on an accrual basis. Withholding taxes on foreign dividends have been provided for in accordance with the Funds’ understanding of the applicable country’s tax rules and regulations. Discounts and premiums on securities purchased are amortized over the expected life of the respective securities using the constant yield method.
PRINCIPAL STREET FUNDS
Notes to the Financial Statements – Continued
August 31, 2023
The Funds will declare daily and pay monthly distributions of net investment income. The Funds will also distribute net realized capital gains, if any, at least annually. Distributions to shareholders are recorded on the ex-dividend date. The treatment for financial reporting purposes of distributions made to shareholders during the year from net investment income or net realized capital gains may differ from their ultimate treatment for federal income tax purposes. These differences are caused primarily by differences in the timing of the recognition of certain components of income, expense or realized capital gain for federal income tax purposes. Where such differences are permanent in nature, GAAP requires that they be reclassified in the components of the net assets based on their ultimate characterization for federal income tax purposes. Any such reclassifications will have no effect on net assets, results of operations or net asset values per share of the Funds. For the fiscal year ended August 31, 2023, the High Income Fund decreased accumulated loss by $146,299 and decreased paid-in capital by $146,299. These adjustments were largely due to excess distributions by the Fund. The Short Term Fund did not require any adjustments for the fiscal year ended August 31, 2023.
Allocation of Expenses – Income, expenses (other than those deemed attributable to a specific share class), and gains and losses of the Funds are allocated daily to each class of shares based upon the ratio of net assets represented by each class as a percentage of the net assets of the Funds. Expenses deemed directly attributable to a class of shares are recorded by the specific class. Most Fund expenses are allocated by class based on relative net assets. For the High Income Fund, 12b-1 fees are expensed at annual rates of 0.50% and 0.25% of average daily net assets of the Investor Class and A Class shares, respectively (See Note 5). For the Short Term Fund, 12b-1 fees are expensed at an annual rate 0.25% of average daily net assets of the Investor Class (See Note 5). Expenses associated with a specific fund in the Trust are charged to that fund. Common Trust expenses are typically allocated evenly between the funds of the Trust, or by other equitable means.
Use of Estimates – The preparation of financial statements in conformity with GAAP requires management to make estimates and assumptions that affect the reported amounts of assets and liabilities and disclosure of contingent assets and liabilities at the date of the financial statements and the reported amounts of revenues and expenses during the reporting period. Actual results could differ from those estimates.
3. SECURITIES VALUATION
The Funds have adopted authoritative fair value accounting standards which establish an authoritative definition of fair value and set out a hierarchy for measuring fair value. These standards require additional disclosures about the various inputs and valuation techniques used to develop the measurements of fair value, a discussion of changes in valuation techniques and related inputs during the period and expanded disclosure of valuation Levels for major security types. These inputs are summarized in the three broad Levels listed below:
| Level 1 – | Unadjusted quoted prices in active markets for identical assets or liabilities that the Funds have the ability to access. |
| | |
| Level 2 – | Observable inputs other than quoted prices included in Level 1 that are observable for the asset or liability, either directly or indirectly. These inputs may include quoted prices for the identical instrument on an inactive market, prices for similar instruments, interest rates, prepayment speeds, credit risk, yield curves, default rates and similar data. |
| | |
| Level 3 – | Unobservable inputs for the asset or liability, to the extent relevant observable inputs are not available, representing the Funds’ own assumptions about the assumptions a market participant would use in valuing the asset or liability and would be based on the best information available. |
PRINCIPAL STREET FUNDS
Notes to the Financial Statements – Continued
August 31, 2023
Following is a description of the valuation techniques applied to the Funds’ major categories of assets and liabilities measured at fair value on a recurring basis. The Funds’ investments are carried at fair value.
Short-Term Investments – Investments in other mutual funds, including money market funds, are valued at their net asset value per share. To the extent these securities are actively traded and valuation adjustments are not applied, they are categorized in Level 1 of the fair value hierarchy.
Fixed Income Securities – Municipal and corporate bonds are valued on the basis of valuations furnished by an independent pricing service which utilizes both dealer-supplied valuations and formula-based techniques. The pricing service may consider recently executed transactions in securities of the issuer or comparable issuer, market price quotations (where observable), bond spreads, and fundamental data relating to the issuer. Fixed income securities are categorized in the Level 2 of the fair value hierarchy.
The Board of Trustees (the “Board”) has adopted a pricing and valuation policy for use by the Funds and their Valuation Designee (as defined below) in calculating each Fund’s NAV. Pursuant to Rule 2a-5 under the 1940 Act, the Funds have designated Principal Street Partners, LLC. (the “Adviser”) as its “Valuation Designee” to perform all of the fair value determinations as well as to perform all of the responsibilities that may be performed by the Valuation Designee in accordance with Rule 2a-5. The Valuation Designee is authorized to make all necessary determinations of the fair values of portfolio securities and other assets for which market quotations are not readily available or if it is deemed the prices obtained from brokers, dealers or independent pricing services are unreliable.
The inputs or methodology used for valuing securities are not an indication of the risk associated with investing in those securities. The following is a summary of the inputs used to value the Funds’ securities as of August 31, 2023:
| High Income Fund | | | | | | | | | | | | |
| | | Level 1 | | | Level 2 | | | Level 3 | | | Total | |
| Municipal Bonds | | $ | — | | | $ | 235,841,808 | | | $ | 14,027,150 | | | $ | 249,868,958 | |
| Corporate Bonds | | | — | | | | — | | | | 14,250,000 | | | | 14,250,000 | |
| Convertible Preferred Stock | | | — | | | | — | | | | 5,083,502 | | | | 5,083,502 | |
| Short-Term Investment | | | 443,310 | | | | — | | | | — | | | | 443,310 | |
| Total Investments in Securities* | | $ | 443,310 | | | $ | 235,841,808 | | | $ | 33,360,652 | | | $ | 269,645,770 | |
| | | | | | | | | | | | | | | | | |
| Short Term Fund | | | | | | | | | | | | | | | | |
| | | Level 1 | | | Level 2 | | | Level 3 | | | Total | |
| Municipal Bonds | | $ | — | | | $ | 52,564,025 | | | $ | — | | | $ | 52,564,025 | |
| Short-Term Investment | | | 246,599 | | | | — | | | | — | | | | 246,599 | |
| Total Investments in Securities* | | $ | 246,599 | | | $ | 52,564,025 | | | $ | — | | | $ | 52,810,624 | |
| * | Refer to the Schedule of Investments for further information on the classification of investments. |
PRINCIPAL STREET FUNDS
Notes to the Financial Statements – Continued
August 31, 2023
The following is a reconciliation of Level 3 assets in the High Income Fund for which significant unobservable inputs were used to determine fair value:
| | | Investments | |
| | | in Securities | |
| Balance as of August 31, 2022 | | $ | 9,923,737 | |
| Accrued discounts/premiums | | | 26,544 | |
| Realized gain (loss) | | | — | |
| Change in net unrealized appreciation/depreciation | | | (207,192 | ) |
Bond Restructuring
| | | 5,083,650 | |
| Net purchases | | | 12,584,000 | |
| Transfers into and/or out of Level 3 | | | 5,949,913 | |
| Balance as of August 31, 2023 | | $ | 33,360,652 | |
| Change in unrealized appreciation/depreciation during the | | | | |
| period for Level 3 investments as of August 31, 2023 | | $ | (1,888,496 | ) |
The Level 3 investments as of August 31, 2023 for the High Income Fund represented 12.2% of the Fund’s net assets. One security with a value of $5,803,500 was transferred from Level 3 to Level 2 due to an increase in relevant market data and it started to be valued by an independent pricing service during the period. Two securities with a combined value of $11,753,413 were transferred from Level 2 to Level 3 due to a decrease in relevant market data and there were no independent pricing services providing daily values.
The following provides information regarding the valuation techniques, unobservable inputs used, and other information related to the fair value of Level 3 investments for the High Income Fund as of August 31, 2023:
| |
| Security | | Fair Value as of | Valuation | | Unobservable | | Range |
| Security Description | | Type | | August 31, 2023 | Technique | | Input* | | (Weighted Average) |
| CalPlant I, LLC, | | | | | | | | | | |
| 9.500%, 10/31/2023 | | Corporate Bond | | 3,000,000 | | Liquidation Approach | | Recovery Rate | | 100% (100%) |
| Florida Development | | | | | | | | | | |
| Finance Corp., Series B, | | | | | | | | | | |
| 12.000%, 11/15/2056 | | Municipal Bond | | 5,273,737 | | Discounted Cash Flow | | Discount Rate | | 11.4% (100%) |
| LSC Estero Prime, | | | | | | | | | | |
| 12.000%, 04/30/2024 | | Corporate Bond | | 1,250,000 | | Refinance Approach | | Recovery Rate | | 100% (100%) |
| Next Renewable Fuels, | | Convertible | | | | Recent | | | | |
| Series A | | Preferred Stock | | 5,083,502 | | Acquisition Cost | | Recovery Rate | | 100% (100%) |
| Sunland Medical Foundation, | | | | | | | | | | |
| 12.000%, 10/20/2024 | | Corporate Bond | | 10,000,000 | | Liquidation Approach | | Recovery Rate | | 100% (100%) |
| Wisconsin Public Finance | | | | | | | | | | |
| Authority, Series A-1, | | | | | | | | | | |
| 7.375%, 01/01/2050 | | Municipal Bond | | 8,753,413 | | Liquidation Approach | | Recovery Rate | | 70.5% (100%) |
| * | Significant increases and decreases in the unobservable inputs used to determine fair value of Level 3 assets could result in significantly higher or lower fair value measurements. An increase to the unobservable input would result in an increase to the fair value. A decrease to the unobservable input would have the opposite effect. |
4. INVESTMENT ADVISORY FEE AND OTHER TRANSACTIONS WITH AFFILIATES
The Trust has an agreement with the Adviser to furnish investment advisory services to the Funds. Pursuant to the Investment Advisory Agreement between the Trust and the Adviser, the Adviser is entitled to receive, on a monthly basis, an annual advisory fee equal to 0.55% and 0.45% of the High Income Fund and Short Term Fund average daily net assets, respectively.
PRINCIPAL STREET FUNDS
Notes to the Financial Statements – Continued
August 31, 2023
The Funds’ Adviser has contractually agreed to reduce its management fees, and may reimburse the Funds for their operating expenses in order to ensure that Total Annual Fund Operating Expenses (excluding certain expenses such as Rule 12b-1 fees, taxes, leverage/borrowing interest, interest expense, dividends paid on short sales, brokerage commissions and other transactional expenses, acquired fund fees and expenses, or extraordinary expenses) for the Funds do not exceed 0.80% and 0.70% of the High Income Fund and Short Term Fund average daily net assets, respectively. Prior to February 15, 2023, the rate was 0.73% for the High Income Fund.
Fees waived and expenses reimbursed by the Adviser may be recouped by the Adviser for a period of thirty-six months following the month during which such waiver or reimbursement was made if such recoupment can be achieved without exceeding the expense limit in effect at the time the waiver or reimbursement occurred and at the time of recoupment. The Operating Expenses Limitation Agreement is indefinite in term but cannot be terminated within a year after the effective date of the Funds’ prospectuses. After that date, the agreement may be terminated at any time upon 60 days’ written notice by the Board or the Adviser. Total fee recoupment for the High Income Fund in the fiscal year ended August 31, 2023, was $1,993, all of which represents fee waivers occurring during the current fiscal year. The Short Term Fund did not recoup any fee waivers in the current fiscal year. Additional waived fees and reimbursed expenses subject to potential recovery by month of expiration for the Funds are as follows:
| | High Income Fund | | Short Term Fund |
| Expiration | | Amount | | | | Amount | |
| September 2023 – August 2024 | | $ | 102,942 | | | | $ | — | |
| September 2024 – August 2025 | | $ | 89,955 | | | | $ | 128,142 | * |
| September 2025 – August 2026 | | $ | 116,263 | | | | $ | 198,611 | |
| * | The potential recovery by month of expiration for this amount is April 2025 – August 2025. |
U.S. Bancorp Fund Services, LLC (the “Administrator”), doing business as U.S. Bank Global Fund Services, acts as the Funds’ Administrator, Transfer Agent, and Fund Accountant. U.S. Bank N.A. (the “Custodian”) serves as the Custodian to the Funds. The Custodian is an affiliate of the Administrator. The Administrator performs various administrative and accounting services for the Funds. The Administrator prepares various federal and state regulatory filings, reports and returns for the Funds; prepares reports and materials to be supplied to the Trustees; monitors the activities of the Custodian; coordinates the payment of the Funds’ expenses and reviews the Funds’ expense accruals. The officers of the Trust, including the Chief Compliance Officer, are employees of the Administrator. As compensation for its services, the Administrator is entitled to a monthly fee at an annual rate based upon the average daily net assets of the Funds, subject to annual minimums. Fees paid by the Funds for administration and accounting, transfer agency, custody and compliance services for the year ended August 31, 2023, are disclosed in the Statements of Operations.
5. DISTRIBUTION & SHAREHOLDER SERVICING FEES
The Funds have adopted a Distribution Plan pursuant to Rule 12b-1 (the “Plan”) in both the Investor Class and A Class. For the High Income Fund, the Plan permits the Fund to pay for distribution and related expenses at an annual rate of 0.50% and 0.25% of the Investor Class and A Class average daily net assets, respectively. For the Short Term Fund, the Plan permits the Fund to pay for distribution and related expenses at an annual rate of 0.25% of the Investor Class average daily net assets. The expenses covered by the Plan may include the cost of preparing and distributing prospectuses and other sales material, advertising and public relations expenses, payments to financial intermediaries and compensation of personnel involved in selling shares of the Funds. For the year ended August 31, 2023, the High Income Fund’s Investor and A Class incurred expenses of $127,282 and $7,969, respectively, pursuant to the Plan. For the year ended August 31, 2023, the Short Term Fund’s Investor Class incurred expenses of $123 pursuant to the Plan.
PRINCIPAL STREET FUNDS
Notes to the Financial Statements – Continued
August 31, 2023
6. CAPITAL SHARE TRANSACTIONS
Transactions in shares of the Funds were as follows:
High Income Fund
| | | Year Ended | | | Year Ended | |
| | | August 31, 2023 | | | August 31, 2022 | |
A Class:(1) | | | | | | |
| Shares sold | | | 753,758 | | | | 50,111 | |
| Shares issued to holders in reinvestment of distributions | | | 21,255 | | | | 649 | |
| Shares redeemed | | | (15,644 | ) | | | (3,164 | ) |
| Net increase in A Class shares | | | 759,369 | | | | 47,596 | |
| | | | | | | | | |
| Institutional Class: | | | | | | | | |
| Shares sold | | | 17,435,877 | | | | 19,672,629 | |
| Shares issued to holders in reinvestment of distributions | | | 2,002,632 | | | | 1,709,461 | |
| Shares redeemed | | | (20,581,450 | ) | | | (18,140,279 | ) |
| Net increase (decrease) in Institutional Class shares | | | (1,142,941 | ) | | | 3,241,811 | |
| | | | | | | | | |
| Investor Class: | | | | | | | | |
| Shares sold | | | 1,763,934 | | | | 1,707,484 | |
| Shares issued to holders in reinvestment of distributions | | | 76,413 | | | | 39,596 | |
| Shares redeemed | | | (465,309 | ) | | | (473,741 | ) |
| Net increase in Investor Class shares | | | 1,375,038 | | | | 1,273,339 | |
| Net increase in capital shares | | | 991,466 | | | | 4,562,746 | |
(1) | Inception date of the A Class was February 16, 2022. |
Short Term Fund
| | | | | | Since Inception(2) | |
| | | Year Ended | | | through | |
| | | August 31, 2023 | | | August 31, 2022 | |
| Institutional Class: | | | | | | |
| Shares sold | | | 11,495,466 | | | | 7,106,474 | |
| Shares issued to holders in reinvestment of distributions | | | 396,536 | | | | 1,001 | |
| Shares redeemed | | | (6,315,320 | ) | | | (70,403 | ) |
| Net increase in Institutional Class shares | | | 5,576,682 | | | | 7,037,072 | |
| | | | | | | | | |
| Investor Class: | | | | | | | | |
| Shares sold | | | 23,930 | | | | 6,469 | |
| Shares issued to holders in reinvestment of distributions | | | 373 | | | | 41 | |
| Shares redeemed | | | (587 | ) | | | — | |
| Net increase in Investor Class shares | | | 23,716 | | | | 6,510 | |
| Net increase in capital shares | | | 5,600,398 | | | | 7,043,582 | |
(2) | Inception date of the Fund was April 27, 2022. |
PRINCIPAL STREET FUNDS
Notes to the Financial Statements – Continued
August 31, 2023
7. INVESTMENT TRANSACTIONS
The aggregate purchases and sales, excluding short-term investments, by the Funds for the year ended August 31, 2023, were as follows:
| | | High Income Fund | | | Short Term Fund | |
| | | Purchases | | | Sales | | | Purchases | | | Sales | |
| U.S. Government Securities | | $ | — | | | $ | — | | | $ | — | | | $ | — | |
| Other Securities | | $ | 59,461,965 | | | $ | 63,646,814 | | | $ | 70,573,956 | | | $ | 34,245,912 | |
During the fiscal year ended August 31, 2023, the High Income Fund sold securities to the Short Term Fund. These transactions occurred at the current market prices as provided by an independent pricing service at the time and complied with Rule 17a-7 under the 1940 Act. Details of these 17a-7 transactions are as follows:
| Date | Selling Fund | Purchasing Fund | Net Proceeds | Net Gain |
| 05/15/2023 | High Income Fund | Short Term Fund | $772,166 | $2,400 |
8. FEDERAL TAX INFORMATION
The aggregate gross unrealized appreciation and depreciation of securities held by the Funds and the total cost of securities for federal income tax purposes at August 31, 2023, were as follows:
| | | Aggregate | | | Aggregate | | | Net Unrealized | | | Federal | |
| | | Gross | | | Gross | | | Appreciation | | | Income | |
| | | Appreciation | | | Depreciation | | | (Depreciation) | | | Tax Cost | |
| High Income Fund | | $ | 2,798,699 | | | $ | (63,623,379 | ) | | $ | (60,824,680 | ) | | $ | 330,470,450 | |
| Short Term Fund | | $ | 153,315 | | | $ | (203,279 | ) | | $ | (49,964 | ) | | $ | 52,860,588 | |
Any difference between book-basis and tax-basis unrealized appreciation (depreciation) would be attributable primarily to the tax deferral of losses on wash sales.
At August 31, 2023, components of distributable earnings on a tax-basis were as follows:
| | | Undistributed | | | Undistributed | | | Other | | | Net Unrealized | | | | |
| | | Ordinary | | | Long-Term | | | Accumulated | | | Appreciation | | | Total | |
| | | Income | | | Capital Gains | | | Losses | | | (Depreciation) | | | Accumulated Loss | |
| High Income Fund | | $ | — | | | $ | — | | | $ | (27,923,002 | ) | | $ | (60,824,680 | ) | | $ | (88,747,682 | ) |
| Short Term Fund | | $ | 72,583 | | | $ | — | | | $ | (402,106 | ) | | $ | (49,964 | ) | | $ | (379,487 | ) |
As of August 31, 2023, the High Income Fund and Short Term Fund had long-term capital loss carryovers of $19,431,618 and $32,572, respectively, and short-term capital loss carryovers of $8,375,150 and $367,948 respectively. A regulated investment company may elect for any taxable year to treat any portion of any qualified late year loss as arising on the first day of the next taxable year. Qualified late year losses are certain capital, and ordinary losses which occur during the portion of a Fund’s taxable year subsequent to October 31 and December 31, respectively. For the taxable period ended August 31, 2023, the Funds did not defer any qualified late year losses.
PRINCIPAL STREET FUNDS
Notes to the Financial Statements – Continued
August 31, 2023
The tax character of distributions paid for the year ended August 31, 2023, were as follows:
| | | Ordinary | | | Tax Exempt | | | Long Term | | | | |
| | | Income* | | | Income | | | Capital Gains | | | Total | |
| High Income Fund | | $ | 1,978,091 | | | $ | 14,987,968 | | | $ | — | | | $ | 16,966,059 | |
| Short Term Fund | | $ | 72,132 | | | $ | 1,617,673 | | | $ | — | | | $ | 1,689,805 | |
The tax character of distributions paid for the year ended August 31, 2022, were as follows:
| | | Ordinary | | | Tax Exempt | | | Long Term | | | | |
| | | Income* | | | Income | | | Capital Gains | | | Total | |
| High Income Fund | | $ | 1,056,711 | | | $ | 15,136,257 | | | $ | — | | | $ | 16,192,968 | |
| Short Term Fund | | $ | 5,717 | | | $ | 73,310 | | | $ | — | | | $ | 79,027 | |
| * | For federal income tax purposes, distributions of short-term capital gains are treated as ordinary income distributions. |
9. LINE OF CREDIT
The High Income Fund has established a secured line of credit (“LOC”) in the amount of $30,000,000, 10% of gross market value of the Fund, or 33.33% of the gross market value of the Fund’s unencumbered assets, whichever is less. The LOC matures unless renewed on July 19, 2024. This LOC is intended for investment purposes. The LOC is with the Custodian. Interest is charged at the prime rate minus 1.50% on any used portion of the LOC, which was 7.00% as of August 31, 2023. The interest rate during the period was between 4.00% and 7.00%. The weighted average interest rate paid on outstanding borrowings during the period for the High Income Fund was 5.81%. Interest is also charged at 0.25% on any unused portion of this LOC. All securities for the High Income Fund have been pledged as collateral at August 31, 2023.
The High Income Fund has established an unsecured line of credit (“LOC”) in the amount of $30,000,000, 15% of gross market value of the Fund, or 33.33% of the market value of the Fund’s unencumbered assets, whichever is less. The LOC matures unless renewed on July 19, 2024. This LOC is intended to provide short-term financing, if necessary, subject to certain restrictions and covenants in connection with shareholder redemptions and other short-term liquidity needs of the Fund. The LOC is with the Custodian. Interest is charged at the prime rate which was 8.50% as of August 31, 2023. The interest rate during the period was between 5.50% and 8.50%. The weighted average interest rate paid on outstanding borrowings during the period for the Fund was 7.50%.
The Short Term Fund has established an unsecured line of credit (“LOC”) in the amount of $10,000,000, 10% of gross market value of the Fund, or 33.33% of the market value of the Fund’s unencumbered assets, whichever is less. The LOC matures unless renewed on July 19, 2024. This LOC is intended to provide short-term financing, if necessary, subject to certain restrictions and covenants in connection with shareholder redemptions and other short-term liquidity needs of the Fund. The LOC is with the Custodian. Interest is charged at the prime rate which was 8.50% as of August 31, 2023. The interest rate during the period was between 5.50% and 8.50%. The weighted average interest rate paid on outstanding borrowings during the period for the Fund was 7.20%. Prior to July 21, 2023, the LOC was accessible to the Short Term Fund in the amount of $1,000,000.
PRINCIPAL STREET FUNDS
Notes to the Financial Statements – Continued
August 31, 2023
The Funds have authorized the Custodian to charge any of the Funds’ accounts for any missed payments. For the year ended, August 31, 2023, LOC activity for the Funds was as follows:
| | | | | | | | Amount | | | | | | | | |
| | | | | | | | Outstanding | | | | | | | | Date of |
| | | | | Average | | | as of | | | Interest | | | Maximum | | Maximum |
| Fund | Loan Type | LOC Agent | | Borrowings | | | August 31, 2023 | | | Expense | | | Borrowing | | Borrowing |
| High Income | Secured | U.S. Bank N.A. | | $ | 9,942,016 | | | $ | — | | | $ | 636,639 | | | $ | 27,487,000 | | 01/03-05/2023 |
| High Income | Unsecured | U.S. Bank N.A. | | $ | 11,740 | | | $ | — | | | $ | 893 | | | $ | 2,413,000 | | 01/03/2023 |
| Short Term | Unsecured | U.S. Bank N.A. | | $ | 37,649 | | | $ | — | | | $ | 2,747 | | | $ | 754,000 | | 09/26/2022 |
10. REPROCESSING OF SHAREHOLDER TRADES
It has been determined that several of the High Income Fund’s securities were mispriced beginning January 25, 2023 resulting in an overstatement of the Fund’s net assets and net asset value (NAV) per share for each class. Since the amount of the overstatement was concluded to be material, the Fund’s daily net assets and NAV per share will be revised for the period January 25, 2023 through October 27, 2023 to account for the mispriced securities. In accordance with the Fund’s NAV correction policy, the Fund will reprocess shareholder transactions. The estimated receivable as a result of reprocessing is $598,845 and is included on the Statement of Assets & Liabilities. The Fund’s Adviser will be responsible for any shortfall in the collection of this receivable and will additionally reimburse the Fund for any additional expenses as a result of reprocessing. The financial statements reflect an estimate by share class of the additional shares to be issued for the reprocessing of shareholder transactions through August 31, 2023.
11. CONTROL OWNERSHIP
The beneficial ownership, either directly or indirectly, of more than 25% of the voting securities of a fund creates a presumption of control of that fund, under Section 2(a)(9) of the Investment Company Act of 1940. As of August 31, 2023, Charles Schwab & Co., Inc. and National Financial Services LLC, for the benefit of their customers, owned 37.76% and 36.89% of the outstanding shares of the High Income Fund, respectively. As of August 31, 2023 National Financial Services LLC and Charles Schwab & Co., Inc., for the benefit of their customers, owned 55.80% and 42.64% of the outstanding shares of the Short Term Fund, respectively.
PRINCIPAL STREET FUNDS
Report of Independent Registered Public Accounting Firm
To the Shareholders of Principal Street Funds and
Board of Trustees of Managed Portfolio Series
Opinion on the Financial Statements
We have audited the accompanying statements of assets and liabilities, including the schedules of investments, of Principal Street High Income Municipal Fund and Principal Street Short Term Municipal Fund (“Principal Street Funds” or the “Funds”), each a series of Managed Portfolio Series, as of August 31, 2023, the related statements of operations and cash flows (as applicable), the statements of changes in net assets, the related notes, and the financial highlights for each of the periods indicated below (collectively referred to as the “financial statements”). In our opinion, the financial statements present fairly, in all material respects, the financial position of each of the Funds as of August 31, 2023, the results of their operations and their cash flows (as applicable), the changes in net assets, and the financial highlights for each of the periods indicated below in conformity with accounting principles generally accepted in the United States of America.
| | Statements of Operations and | Statements of Changes | |
| Fund Name | Cash Flows (as applicable) | in Net Assets | Financial Highlights |
| Principal Street High | For the year ended | For the years ended | For the years ended August 31, |
| Income Municipal Fund | August 31, 2023 | August 31, 2023 | 2023, 2022, 2021, 2020, 2019. |
| | | and 2022 | |
| Principal Street Short | For the year ended | For the year ended August 31, 2023 and the for the | |
| Term Municipal Fund | August 31, 2023 | period from April 27, 2022 (commencement of | |
| | | operations) through August 31, 2022 | |
Basis for Opinion
These financial statements are the responsibility of the Funds’ management. Our responsibility is to express an opinion on the Funds’ financial statements based on our audits. We are a public accounting firm registered with the Public Company Accounting Oversight Board (United States) (“PCAOB”) and are required to be independent with respect to the Funds in accordance with the U.S. federal securities laws and the applicable rules and regulations of the Securities and Exchange Commission and the PCAOB.
We conducted our audits in accordance with the standards of the PCAOB. Those standards require that we plan and perform the audit to obtain reasonable assurance about whether the financial statements are free of material misstatement whether due to error or fraud.
Our audits included performing procedures to assess the risks of material misstatement of the financial statements, whether due to error or fraud, and performing procedures that respond to those risks. Such procedures included examining, on a test basis, evidence regarding the amounts and disclosures in the financial statements. Our procedures included confirmation of securities owned as of August 31, 2023, by correspondence with the custodian. Our audits also included evaluating the accounting principles used and significant estimates made by management, as well as evaluating the overall presentation of the financial statements. We believe that our audits provide a reasonable basis for our opinion.
We have served as the Funds’ auditor since 2017.
COHEN & COMPANY, LTD.
Milwaukee, Wisconsin
November 22, 2023
PRINCIPAL STREET FUNDS
Additional Information (Unaudited)
August 31, 2023
TRUSTEES & OFFICERS
| | | Term of | | | |
| | | Office | Number of | | Other |
| Name, | | and | Portfolios | Principal | Directorships |
| Address | Position(s) | Length | in Trust | Occupation(s) | Held by Trustee |
| and Year | Held with | of Time | Overseen | During the Past | During the Past |
| of Birth | the Trust | Served | by Trustee | Five Years | Five Years |
| Independent Trustees | | | | | |
| | | | | | |
| Leonard M. Rush, CPA | Chairman, | Indefinite | 31 | Retired; Chief Financial | Independent |
| 615 E. Michigan St. | Trustee | Term; | | Officer, Robert W. Baird | Trustee, |
| Milwaukee, WI 53202 | and Audit | Since | | & Co. Incorporated, | ETF Series |
| Year of Birth: 1946 | Committee | April 2011 | | (2000-2011). | Solutions |
| | Chairman | | | | (57 Portfolios) |
| | | | | | (2012-Present). |
| | | | | | |
| David A. Massart | Trustee | Indefinite | 31 | Partner and Managing | Independent |
| 615 E. Michigan St. | | Term; | | Director, Beacon Pointe | Trustee, |
| Milwaukee, WI 53202 | | Since | | Advisors, LLC (since 2022); | ETF Series |
| Year of Birth: 1967 | | April 2011 | | Co-Founder and Chief | Solutions |
| | | | | Investment Strategist, | (57 Portfolios) |
| | | | | Next Generation Wealth | (2012-Present). |
| | | | | Management Inc. | |
| | | | | (2005-2021). | |
| | | | | | |
| David M. Swanson | Trustee | Indefinite | 31 | Founder and Managing | Independent Trustee, |
| 615 E. Michigan St. | and | Term; | | Principal, SwanDog | ALPS Variable |
| Milwaukee, WI 53202 | Nominating | Since | | Strategic Marketing, LLC | Investment Trust |
| Year of Birth: 1957 | & | April 2011 | | (2006-Present). | (7 Portfolios) |
| | Governance | | | | (2006-Present); |
| | Committee | | | | Independent |
| | Chairman | | | | Trustee, RiverNorth |
| | | | | | Funds (3 Portfolios) |
| | | | | | (2018-Present); |
| | | | | | RiverNorth |
| | | | | | Managed Duration |
| | | | | | Municipal Income |
| | | | | | Fund Inc. (1 Portfolio) |
| | | | | | (2019-Present); |
| | | | | | RiverNorth |
| | | | | | Opportunistic |
| | | | | | Municipal Income |
| | | | | | Fund, Inc. |
| | | | | | (1 Portfolio) |
| | | | | | (2018-Present); |
| | | | | | RiverNorth Capital |
| | | | | | and Income Fund |
| | | | | | (1 Portfolio) |
| | | | | | (2018-Present); |
PRINCIPAL STREET FUNDS
Additional Information (Unaudited) – Continued
August 31, 2023
| | | Term of | | | |
| | | Office | Number of | | Other |
| Name, | | and | Portfolios | Principal | Directorships |
| Address | Position(s) | Length | in Trust | Occupation(s) | Held by Trustee |
| and Year | Held with | of Time | Overseen | During the Past | During the Past |
| of Birth | the Trust | Served | by Trustee | Five Years | Five Years |
| Independent Trustees | | | | | |
| | | | | | |
| David M. Swanson | | | | | RiverNorth |
| (Continued) | | | | | Opportunities Fund |
| | | | | | (1 Portfolio) |
| | | | | | (2015-Present); |
| | | | | | RiverNorth/ |
| | | | | | DoubleLine Strategic |
| | | | | | Opportunity |
| | | | | | Fund, Inc. |
| | | | | | (1 Portfolio) |
| | | | | | (2019-Present); |
| | | | | | RiverNorth Flexible |
| | | | | | Municipal Income |
| | | | | | Fund (1 Portfolio) |
| | | | | | (2020-Present); |
| | | | | | RiverNorth Flexible |
| | | | | | Municipal Income |
| | | | | | Fund II, Inc. |
| | | | | | (1 Portfolio) |
| | | | | | (2021 to Present); |
| | | | | | RiverNorth Managed |
| | | | | | Duration Municipal |
| | | | | | Income Fund II, Inc. |
| | | | | | (1 Portfolio) |
| | | | | | (2022 to Present). |
| | | | | | |
| Robert J. Kern | Trustee | Indefinite | 31 | Retired (July 2018- | None |
| 615 E. Michigan St. | | Term; | | Present); Executive Vice | |
| Milwaukee, WI 53202 | | Since | | President, U.S. Bancorp | |
| Year of Birth: 1958 | | January 2011 | | Fund Services, LLC | |
| | | | | (1994-2018). | |
PRINCIPAL STREET FUNDS
Additional Information (Unaudited) – Continued
August 31, 2023
| | | Term of | | | |
| | | Office | Number of | | Other |
| Name, | | and | Portfolios | Principal | Directorships |
| Address | Position(s) | Length | in Trust | Occupation(s) | Held by Trustee |
| and Year | Held with | of Time | Overseen | During the Past | During the Past |
| of Birth | the Trust | Served | by Trustee | Five Years | Five Years |
| Officers | | | | | |
| | | | | | |
| Brian R. Wiedmeyer | President | Indefinite | N/A | Vice President, | N/A |
| 615 E. Michigan St. | and | Term; | | U.S. Bancorp Fund | |
| Milwaukee, WI 53202 | Principal | Since | | Services, LLC | |
| Year of Birth: 1973 | Executive | November 2018 | | (2005-Present). | |
| | Officer | | | | |
| | | | | | |
| Deborah Ward | Vice | Indefinite | N/A | Senior Vice President, | N/A |
| 615 E. Michigan St. | President, | Term; | | U.S. Bancorp Fund | |
| Milwaukee, WI 53202 | Chief | Since | | Services, LLC | |
| Year of Birth: 1966 | Compliance | April 2013 | | (2004-Present). | |
| | Officer and | | | | |
| | Anti-Money | | | | |
| | Laundering | | | | |
| | Officer | | | | |
| | | | | | |
| Benjamin Eirich | Treasurer, | Indefinite | N/A | Assistant Vice President, | N/A |
| 615 E. Michigan St. | Principal | Term; | | U.S. Bancorp Fund | |
| Milwaukee, WI 53202 | Financial | Since | | Services, LLC | |
| Year of Birth: 1981 | Officer | August 2019 | | (2008-Present). | |
| | and Vice | (Treasurer); | | | |
| | President | Indefinite | | | |
| | | Term; | | | |
| | | Since | | | |
| | | November 2018 | | | |
| | | (Vice President) | | | |
| | | | | | |
| John Hadermayer | Secretary | Indefinite | N/A | Vice President, | N/A |
| 615 E. Michigan St. | | Term; | | U.S. Bancorp Fund | |
| Milwaukee, WI 53202 | | Since | | Services, LLC | |
| Year of Birth: 1977 | | May 2022 | | (2022-Present); Executive | |
| | | | | Director, AQR Capital | |
| | | | | Management, LLC | |
| | | | | (2013-2022). | |
PRINCIPAL STREET FUNDS
Additional Information (Unaudited) – Continued
August 31, 2023
| | | Term of | | | |
| | | Office | Number of | | Other |
| Name, | | and | Portfolios | Principal | Directorships |
| Address | Position(s) | Length | in Trust | Occupation(s) | Held by Trustee |
| and Year | Held with | of Time | Overseen | During the Past | During the Past |
| of Birth | the Trust | Served | by Trustee | Five Years | Five Years |
| Officers | | | | | |
| | | | | | |
| Douglas Schafer* | Assistant | Indefinite | N/A | Assistant Vice President, | N/A |
| 615 E. Michigan St. | Treasurer | Term; | | U.S. Bancorp Fund | |
| Milwaukee, WI 53202 | and Vice | Since | | Services, LLC | |
| Year of Birth: 1970 | President | May 2016 | | (2002-Present). | |
| | | (Assistant | | | |
| | | Treasurer); | | | |
| | | Indefinite | | | |
| | | Term; | | | |
| | | Since | | | |
| | | November 2018 | | | |
| | | (Vice President) | | | |
| | | | | | |
| Sara J. Bollech | Assistant | Indefinite | N/A | Officer, U.S. Bancorp | N/A |
| 615 E. Michigan St. | Treasurer | Term: | | Fund Services, LLC | |
| Milwaukee, WI 53202 | and Vice | Since | | (2007-Present). | |
| Year of Birth: 1977 | President | November 2021 | | | |
| | | | | | |
| Peter A. Walker, CPA | Assistant | Indefinite | N/A | Officer, U.S. Bancorp | N/A |
| 615 E. Michigan St. | Treasurer | Term: | | Fund Services, LLC | |
| Milwaukee, WI 53202 | and Vice | Since | | (2016-Present). | |
| Year of Birth: 1993 | President | November 2021 | | | |
| | | | | | |
Silanapha Saycocie* 615 E. Michigan St. Milwaukee, WI 53202 Year of Birth: 1998 | Assistant Treasurer and Vice President | Indefinite Term; Since November 2023 | N/A | Officer, U.S. Bancorp Fund Services, LLC (2020-Present) | N/A |
* Subsequent to the Funds’ fiscal year-end, in November 2023 Mr. Schafer resigned from his positions with the Trust and was replaced by Ms. Saycocie.
PRINCIPAL STREET FUNDS
Additional Information (Unaudited) – Continued
August 31, 2023
LIQUIDITY RISK MANAGEMENT PROGRAM
Pursuant to Rule 22e-4 under the Investment Company Act of 1940, Managed Portfolio Series (the “Trust”), on behalf of the Principal Street High Income Municipal Fund and Principal Street Short Term Municipal Fund (each a “Fund,” together the “Funds”), has adopted and implemented a written liquidity risk management program (the “Program”) that includes policies and procedures reasonably designed to comply with the requirements of Rule 22e-4, including: (i) assessment, management and periodic review of liquidity risk; (ii) classification of portfolio holdings; (iii) establishment of a highly liquid investment minimum (“HLIM”), as applicable; (iv) limitation on illiquid investments; and (v) redemptions in-kind. The Trust’s Board of Trustees (the “Board”) has approved the designation of Principal Street Partners, LLC (“Principal Street”) as the administrator of the Program (the “Program Administrator”). Personnel of Principal Street conduct the day-to-day operation of the Program pursuant to policies and procedures administered by the Principal Street Liquidity Committee.
In accordance with Rule 22e-4, the Board reviewed a report prepared by the Program Administrator (the “Report”) regarding the operation of the Program and its adequacy and effectiveness of implementation for the period January 1, 2022, through December 31, 2022 (the “Reporting Period”). No significant liquidity events impacting the Funds during the Reporting Period or material changes to the Program were noted in the Report.
Under the Program, Principal Street manages and periodically reviews each Fund’s liquidity risk, including consideration of applicable factors specified in Rule 22e-4 and the Program. Liquidity risk is defined as the risk that a Fund could not meet shareholder redemption requests without significant dilution of remaining shareholders’ interests in the Fund. In general, this risk was managed during the Reporting Period by monitoring the degree of liquidity of a Fund’s investments, limiting the amount of the Fund’s illiquid investments, and utilizing various risk management tools and facilities available to the Fund for meeting shareholder redemptions, among other means. In the Report, Principal Street provided its assessment that, based on the information considered in its review, the Program remains reasonably designed to manage each Fund’s liquidity risk and each Fund’s investment strategy remains appropriate for an open-end fund.
Pursuant to the Program, the Program Administrator oversaw the classification of each of the Fund’s portfolio investments as highly liquid, moderately liquid, less liquid or illiquid during the Reporting Period, including in connection with recording investment classifications on Form N-PORT. Principal Street’s process of determining the degree of liquidity of the Funds’ investments is supported by one or more third-party liquidity assessment vendors.
Each Fund qualified as a “primarily highly liquid fund” as defined in the Program during the Reporting Period. Accordingly, each Fund was not required to establish a HLIM or comply with the related Program provisions during the Reporting Period.
During the Reporting Period, each Fund’s investments were monitored for compliance with the 15% limitation on illiquid investments pursuant to the Program and in accordance with Rule 22e-4. The Report noted that the Funds did not effect redemptions in-kind during the Reporting Period.
The Report concluded, with respect to each Fund: (i) the Program was implemented and operated effectively to achieve the goal of assessing and managing the Fund’s liquidity risk during the Reporting Period; and (ii) the Fund was able to meet requests for redemption without significant dilution of remaining investors’ interests in the Fund during the Reporting Period.
PRINCIPAL STREET FUNDS
Additional Information (Unaudited) – Continued
August 31, 2023
AVAILABILITY OF FUND PORTFOLIO INFORMATION
The Funds file complete schedules of portfolio holdings with the SEC for the first and third quarters of each fiscal year on Part F of Form N-PORT. The Funds’ Part F of Form N-PORT is available on the SEC’s website at https://www.sec.gov/ and may be reviewed and copied at the SEC’s Public Reference Room in Washington, D.C. For information on the Public Reference Room call 1-800-SEC-0330. In addition, the Funds’ Part F of Form N-PORT is available without charge upon request by calling 1-877-914-7343.
AVAILABILITY OF PROXY VOTING INFORMATION
A description of the Funds’ Proxy Voting Policies and Procedures is available without charge, upon request, by calling 1-877-914-7343. Information regarding how the Fund voted proxies relating to portfolio securities during the most recent 12 month period ended June 30, is available (1) without charge, upon request, by calling 1-877-914-7343, or (2) on the SEC’s website at https://www.sec.gov/.
QUALIFIED DIVIDEND INCOME/DIVIDENDS RECEIVED DEDUCTION
For the fiscal year ended August 31, 2023, certain dividends paid by the Funds may be reported as qualified dividend income and may be eligible for taxation at capital gain rates. The percentage of dividends declared from ordinary income designated as qualified dividend income was 0.00% and 0.00% for the High Income Fund and Short Term Fund, respectively.
For corporate shareholders, the percent of ordinary income distributions qualifying for the corporate dividends received deduction for the year ended August 31, 2023 was 0.00% and 0.00% for the High Income Fund and Short Term Fund, respectively.
The percentage of taxable ordinary income distributions that are designated as short-term capital gain distributions under Internal Revenue Section 871(k)(2)(C) was 0.00% and 0.00% for the High Income Fund and Short Term Fund, respectively.
PRINCIPAL STREET FUNDS
Privacy Notice (Unaudited)
The Funds collect only relevant information about you that the law allows or requires it to have in order to conduct its business and properly service you. The Funds collect financial and personal information about you (“Personal Information”) directly (e.g., information on account applications and other forms, such as your name, address, and social security number, and information provided to access account information or conduct account transactions online, such as password, account number, e-mail address, and alternate telephone number), and indirectly (e.g., information about your transactions with us, such as transaction amounts, account balance and account holdings).
The Funds do not disclose any non-public personal information about its shareholders or former shareholders other than for everyday business purposes such as to process a transaction, service an account, respond to court orders and legal investigations or as otherwise permitted by law. Third parties that may receive this information include companies that provide transfer agency, technology and administrative services to the Funds, as well as the Funds’ investment adviser who is an affiliate of the Funds. If you maintain a retirement/educational custodial account directly with the Funds, we may also disclose your Personal Information to the custodian for that account for shareholder servicing purposes. The Funds limit access to your Personal Information provided to unaffiliated third parties to information necessary to carry out their assigned responsibilities to the Funds. All shareholder records will be disposed of in accordance with applicable law. The Funds maintain physical, electronic and procedural safeguards to protect your Personal Information and requires its third-party service providers with access to such information to treat your Personal Information with the same high degree of confidentiality.
In the event that you hold shares of the Funds through a financial intermediary, including, but not limited to, a broker-dealer, credit union, bank or trust company, the privacy policy of your financial intermediary governs how your non-public personal information is shared with unaffiliated third parties.
INVESTMENT ADVISER
Principal Street Partners, LLC
949 South Shady Grove Road, Suite 402
Memphis, TN 38120
DISTRIBUTOR
Quasar Distributors, LLC
111 East Kilbourn Avenue, Suite 2200
Milwaukee, WI 53202
CUSTODIAN
U.S. Bank N.A.
1555 North Rivercenter Drive, Suite 302
Milwaukee, WI 53212
ADMINISTRATOR, FUND ACCOUNTANT
AND TRANSFER AGENT
U.S. Bancorp Fund Services, LLC
615 East Michigan Street
Milwaukee, WI 53202
INDEPENDENT REGISTERED PUBLIC ACCOUNTING FIRM
Cohen & Company, Ltd.
342 North Water Street, Suite 830
Milwaukee, WI 53202
LEGAL COUNSEL
Stradley Ronon Stevens & Young, LLP
2005 Market Street, Suite 2600
Philadelphia, PA 19103
This report should be accompanied or preceded by a prospectus.
The Funds’ Statements of Additional Information contain additional information about the
Funds’ trustees and is available without charge upon request by calling 1-877-914-7343.
Item 2. Code of Ethics.
The Registrant has adopted a code of ethics that applies to the Registrant’s principal executive officer and principal financial officer. The Registrant has not made any substantive amendments to its code of ethics during the year covered by this report.
The Registrant has not granted any waivers from any provisions of the code of ethics during the year covered by this report.
A copy of the Registrant’s code of ethics that applies to the Registrant’s principal executive officer and principal financial officer is filed herewith.
Item 3. Audit Committee Financial Expert.
The Registrant’s Board of Trustees has determined that there is at least one audit committee financial expert serving on its audit committee. Leonard M. Rush is the “audit committee financial expert” and is considered to be “independent” as each term is defined in Item 3 of Form N-CSR.
Item 4. Principal Accountant Fees and Services.
The Registrant has engaged its principal accountant to perform audit services, audit-related services, tax services and other services during the past two fiscal years. “Audit services” refer to performing an audit of the Registrant's annual financial statements or services that are normally provided by the accountant in connection with statutory and regulatory filings or engagements for those fiscal years. “Audit-related services” refer to the assurance and related services by the principal accountant that are reasonably related to the performance of the audit. “Tax services” refer to professional services rendered by the principal accountant for tax compliance, tax advice, and tax planning; including reviewing the Fund’s tax returns and distribution calculations. There were no “other services” provided by the principal accountant. For the fiscal years ended August 31, 2023 and August 31, 2022, the Fund’s principal accountant was Cohen & Company, Ltd. The following table details the aggregate fees billed or expected to be billed for each of the last two fiscal years audit fees, audit-related fees, tax fees and other fees by the principal accountant.
| | FYE 8/31/2023 | FYE 8/31/2022 |
(a) Audit Fees | $139,870 | $36,473 |
(b) Audit-Related Fees | $0 | $0 |
(c) Tax Fees | $8,000 | $8,000 |
(d) All Other Fees | $0 | $0 |
(e)(1) The audit committee has adopted pre-approval policies and procedures that require the audit committee to pre‑approve all audit and non‑audit services of the Registrant, including services provided to any entity affiliated with the Registrant.
(e)(2) The percentage of fees billed by Cohen & Company, Ltd. applicable to non-audit services pursuant to waiver of pre-approval requirement was as follows:
| | FYE 8/31/2023 | FYE 8/31/2022 |
Audit-Related Fees | 0% | 0% |
Tax Fees | 0% | 0% |
All Other Fees | 0% | 0% |
(f) All of the principal accountant’s hours spent on auditing the Registrant’s financial statements were attributed to work performed by full‑time permanent employees of the principal accountant.
(g) The following table indicates the non-audit fees billed or expected to be billed by the Registrant’s accountant for services to the Registrant and to the Registrant’s investment adviser (and any other controlling entity, etc.—not sub-adviser) for the last two years.
Non-Audit Related Fees | FYE 8/31/2023 | FYE 8/31/2022 |
Registrant | $0 | $0 |
Registrant’s Investment Adviser | $0 | $0 |
(h) The audit committee of the board of trustees/directors has considered whether the provision of non-audit services that were rendered to the Registrant's investment adviser is compatible with maintaining the principal accountant's independence and has concluded that the provision of such non-audit services by the accountant has not compromised the accountant’s independence.
(i) Not applicable.
(j) Not applicable.
Item 5. Audit Committee of Listed Registrants.
Not applicable to Registrants who are not listed issuers (as defined in Rule 10A-3 under the Securities Exchange Act of 1934).
Item 6. Schedule of Investments.
(a) Schedule of Investments is included as part of the report to shareholders filed under Item 1 of this Form.
(b) Not applicable.
Item 7. Disclosure of Proxy Voting Policies and Procedures for Closed-End Management Investment Companies.
Not applicable to open-end investment companies.
Item 8. Portfolio Managers of Closed-End Management Investment Companies.
Not applicable to open-end investment companies.
Item 9. Purchases of Equity Securities by Closed‑End Management Investment Company and Affiliated Purchases.
Not applicable to open-end investment companies.
Item 10. Submission of Matters to a Vote of Security Holders.
There have been no material changes to the procedures by which shareholders may recommend nominees to the Registrant’s Board of Trustees.
Item 11. Controls and Procedures.
| (a) | The Registrant’s President and Treasurer have reviewed the Registrant's disclosure controls and procedures (as defined in Rule 30a-3(c) under the Investment Company Act of 1940 (the “Act”)) as of a date within 90 days of the filing of this report, as required by Rule 30a-3(b) under the Act and Rules 13a-15(b) or 15d‑15(b) under the Securities Exchange Act of 1934. Based on their review, such officers have concluded that the disclosure controls and procedures are effective in ensuring that information required to be disclosed in this report is appropriately recorded, processed, summarized and reported and made known to them by others within the Registrant and by the Registrant’s service provider. |
| (b) | There were no significant changes in the Registrant's internal control over financial reporting (as defined in Rule 30a-3(d) under the Act) that occurred during the period covered by this report that has materially affected, or is reasonably likely to materially affect, the Registrant's internal control over financial reporting. |
Item 12. Disclosure of Securities Lending Activities for Closed-End Management Investment Companies
Not applicable to open-end investment companies.
Item 13. Exhibits.
(3) Any written solicitation to purchase securities under Rule 23c‑1 under the Act sent or given during the period covered by the report by or on behalf of the Registrant to 10 or more persons. Not applicable to open-end investment companies.
(4) Change in the Registrant’s independent public accountant. There was no change in the Registrant’s independent public accountant for the period covered by this report.
SIGNATURES
Pursuant to the requirements of the Securities Exchange Act of 1934 and the Investment Company Act of 1940, the Registrant has duly caused this report to be signed on its behalf by the undersigned, thereunto duly authorized.
(Registrant) Managed Portfolio Series
By (Signature and Title) /s/Brian R. Wiedmeyer
Brian R. Wiedmeyer, President
Date 11/24/2023
Pursuant to the requirements of the Securities Exchange Act of 1934 and the Investment Company Act of 1940, this report has been signed below by the following persons on behalf of the Registrant and in the capacities and on the dates indicated.
By (Signature and Title) /s/Brian R. Wiedmeyer
Brian R. Wiedmeyer, President
Date 11/24/2023
By (Signature and Title) /s/Benjamin J. Eirich
Benjamin J. Eirich, Treasurer
Date 11/24/2023