Brian R. Wiedmeyer, President
c/o U.S. Bancorp Fund Services, LLC
| | | Ticker Symbols | |
| | Investor Class | Institutional Class | IS Class |
| Jackson Square | | | |
| Large-Cap Growth Fund | JSPJX | JSPIX | DPLGX |
| | | | |
| Jackson Square | | | |
| SMID-Cap Growth Fund | JSMVX | JSMTX | DCGTX |
Annual Report
| www.jspfunds.com | October 31, 2023 |
(This Page Intentionally Left Blank.)
Jackson Square Funds
October 31, 2023
Dear Shareholders:
Jackson Square Partners, LLC (“Jackson Square”), a U.S. registered investment adviser, is the adviser to the Jackson Square Large-Cap Growth Fund and Jackson Square SMID-Cap Growth Fund.
While the market continues to grapple with the direction of both interest rates and economic growth, we are confident in the risk management enhancements we made last year to ensure stock-specific risk will drive future relative performance. As we have said for the last year, we see potential scenarios in which (1) the economy remains strong and nominal rates hold firm or (2) the lag from the rate hike cycle eventually catches up with the economy and forces the Federal Reserve Board to pivot towards prioritizing financial stability. However, simultaneous market concerns of a hard landing in conjunction with ever-increasing rates to fight inflation did not, and do not, seem likely to us. It is our belief that at some point this year the path towards one of those outcomes will become clear, which will further incent capital on the sidelines to engage with the market. We may be seeing early signs of this now.
For our SMID-Cap Growth Fund, we believe we may be on the verge of a significant rotation into small and mid-caps, as relative underperformance vs. large-caps over the past several years is at an all-time high. Regardless of the timing and outcome of these developments, we will maintain our focus on finding generational growth potential early in its life cycle, identifying positive idiosyncratic change unfolding at companies, and constructively engaging management teams to drive shareholder value.
For Large-Cap Growth, volatile sentiment and a still wide range of economic outcomes reinforce the value of our all-weather mission and justify the significant portfolio actions we took last year to rebalance. Regardless of the market and macro path forward, we believe the portfolio’s superior growth and business quality (ROIC), as well as our focus on idiosyncratic fundamental change, will help us generate alpha in both good and bad markets.
At Jackson Square, we remain focused on the three-to-five year potential for our portfolio companies and optimizing upside/downside capture over the long term. Regardless of policy outcomes and oscillating investor sentiment, we remain consistent in our long-term investment philosophy: owning what we view as strong secular-growth companies with compelling competitive positions with the potential to grow market share and deliver shareholder value in a variety of market environments.
Jackson Square Large-Cap Growth Fund
Within the Fund
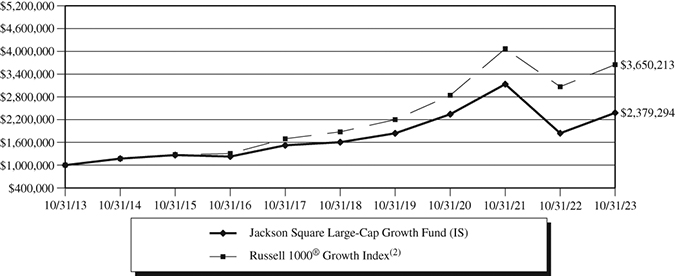
For the fiscal year ended October 31, 2023, Jackson Square Large-Cap Growth Fund IS, Institutional and Investor Classes shares returned 29.20%, 29.08%, and 28.84%, respectively. These figures reflect all distributions reinvested. During the same period, the Fund’s benchmark, the Russell 1000® Growth Index, returned 18.95%. For complete, annualized performance of Large-Cap Growth Fund, please see the table on page 8.
The Fund outperformed its benchmark, the Russell 1000 Growth Index, which generated strong returns for the period. From a sector perspective, industrials, consumer discretionary, and information technology contributed to performance while communication services, health care, and materials detracted. During the 3rd quarter of 2023, the Fund received proceeds from a class action settlement from a company it no longer owns. This settlement had a material impact on the Fund’s investment performance. This is a one-time event that is not likely to be repeated.
We substantially diversified and de-risked the Portfolio heading into the period, reducing style exposure and allowing stock selection to drive performance. Benchmark returns were once again driven by mega-cap stocks during the period. Amidst this dynamic, our portfolio remains approximately 60% the size of the Russell 1000 Growth Index by weighted average market cap with ~68% active share. We therefore feel well-positioned should the mega-cap stranglehold on the benchmark alleviate. As ever, we are not making an explicit or implicit macro call and have purposefully designed the portfolio to brace for a variety of market environments. The goal remains for stock-specific risk and our idiosyncratic investment theses to drive all-weather performance while neutralizing other factors as much as possible.
Uber Technologies, Align Technology Inc., and Coupa Software, Inc. were the top contributors to the Portfolio’s performance. Uber continues to rationalize its profits and losses by shedding non-core operations and eliminating costs, while Uber Rides continues its strong recovery and Uber Eats gradually proves out compelling unit economics. Align Technology, Inc. (ALGN), the global leader in clear teeth aligners for treating malocclusion, outperformed consensus expectations for its recovery. We exited the position after the outperformance in early 2023 caused it to reach a valuation we felt fully reflected our medium-term growth expectations. Coupa Software, Inc., a cloud-based Software as a Service (“SaaS”) platform for business spend management, generated solid fundamentals despite continued macro headwinds and the company was acquired at a premium by private equity firm Thoma Bravo in the 1st quarter of 2023.
Corteva Inc., Edwards Lifesciences Corporation and Danaher Corporation were the top detractors to the Portfolio’s performance. Corteva (CTVA), a leading player in the agricultural inputs space, underperformed due to headwinds created by transitory destocking trends in agricultural pesticides. CTVA is a ~50/50 split of seeds and crop protection chemicals (CPCs, or pesticides). We believe CTVA has a more substantial margin improvement opportunity than is stated by management and the pipeline opportunity of new products is underappreciated. Edwards, a medical device company focused on structural heart repair devices and critical care monitoring equipment, underperformed as outpatient procedures came in under expectations due to macro headwinds. We believe these issues are transitory and the company is well-positioned heading into a potentially softer economy given the majority of its patient base is covered by Medicare. Danaher Corporation (DHR), a leading global life sciences and diagnostics provider, underperformed alongside other life science tools companies due to destocking trends. The company also completed a spin-off of its water treatment business in October 2023. We feel this positive fundamental change that allows DHR to become a pure-play Life Science Tools story within healthcare, however the spin-off was negative for attribution for DHR as it involved a distribution of stock for the new company, Veralto (VLTO). We believe DHR has managed through the fundamental volatility effectively and represents a high-quality way to gain exposure to a “picks and shovels” provider benefiting from secular growth in life science tools.
Jackson Square SMID-Cap Growth Fund
Within the Fund
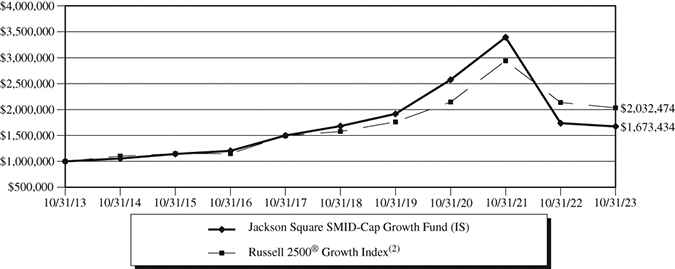
For the fiscal year ended October 31, 2023, SMID-Cap Growth Fund IS, Institutional and Investor Class shares returned -3.65%, -3.78% and -3.99%, respectively. These figures reflect all distributions reinvested. During the same period, the Fund’s benchmark, the Russell 2500® Growth Index, returned -4.80%. For complete, annualized performance of Jackson Square SMID-Cap Growth Fund, please see the table on page 11.
Underperformance was driven by the Fund’s Health Care allocation as well as Disruptor exposure (young challengers reinvesting today to drive scale, attacking large addressable markets with top-tier underlying unit economics) across Consumer Discretionary, Communication Services, Information Technology and Industrials.
The SMID-Cap Growth Fund outperformed the benchmark Russell 2500 Growth Index for the fiscal year against a volatile macro backdrop. We spent significant time in 2022 adjusting portfolio exposures to ensure consistency with our historical footprint – namely, strong stock selection-driven alpha with limited factor and style impacts. Our portfolio construction enhancements have helped to drive an increase in idiosyncratic risk in the portfolio, back to the levels we have historically delivered in the strategy.
Top contributors over the period represent a diverse array of growth paths, sectors, and tenure in the portfolio, and include both consistent outperformers and holdings which saw significant headwinds in prior periods. Top contributors included New York Times (NYT), ABIOMED (ABMD) and Coupa Software (COUP). NYT reported healthy net subscriptions and better than expected ad trends despite a slowdown in ad spending across the media industry. Though total operating costs increased, this was driven by technology and product development with a larger than expected reduction in sales and marketing costs. The market responded positively to this continuation down the path of profit optimization and operating margin leverage for the company. While COUP (a cloud-based Software as a Service platform for business spend management) and ABMD (a cardiovascular products company) appeared expensive if viewed with a short-term lens on near term profitability, they were significantly undervalued when viewed with a longer time horizon and realistic profit growth runway. Both were acquired for significant premiums during 4Q 2022, demonstrating that asset quality matters.
Top detractors over the period included FMC Corporation (FMC), LendingClub Corp (LC), and Masimo Corporation (MASI). In the case of FMC, a manufacturer of pesticides for agricultural use, the company issued a below-consensus update for Q2 and subsequently cut guidance. In addition to drought impacts in the Western hemisphere, the pesticide industry is seeing a general destocking from channel partners in various geographies. Though underlying application by farmers has not changed, the company believes dealers are transitioning away from supply-concern-driven overstocking to a just-in-time inventory system as interest rates remain high and carrying costs have increased. Our initial analysis indicates that the inventory reset is transitory in nature and that there are no competitive or macro issues impacting the company’s long-term volume growth trend though we are actively seeking disconfirming evidence. The company has committed to cost cuts and has a history of meeting efficiency targets. We continue to believe the current agricultural cycle has ample runway ahead, owed to the structural supply/demand imbalance for food (exacerbated by the pandemic) that will drive farmer net incomes and spending on FMC’s indispensable products higher. We believe that, between new product launches (omitted by consensus) and pent-up margin expansion as pricing power catches up with cost inflation, the medium-term cash flow power of FMC should be materially higher than what the market currently fears. LC, a company that provides financial services through an internet-based platform, suffered from a cyclical slowdown in credit origination volume for its marketplace business. This was compounded by regional bank customers selling secondary paper on the open market to recapitalize balance sheets in the wake of the Silicon Valley Bank crisis. We expect this pressure to meaningfully moderate starting in Q1 of ‘24 and reverse to tailwinds in Q3. Throughout this period, we believe LC management has navigated the environment well by focusing on higher
Jackson Square SMID-Cap Growth Fund
credit quality loans, outperforming peers on loss ratios, and maintaining Generally Accepted Accounting Principles profitability. Masimo Corporation (MASI), a medtech company focused on pulse oximetry devices, underperformed after guiding down in July due to a combination of revenue impairment and delay. Impairment came from: 1) de-stocking as patient monitoring due to Covid protocols declined, 2) an end to discounting practices at the company that had driven overstocking, and 3) lower inpatient volumes as hospitals dealt with pent-up outpatient demand and had to redirect resources to that setting. The company expects to work through this trend over the next quarter. The revenue delay resulted from large orders that were delayed to the 2nd half of the year as well as supply chain issues for original equipment manufacturer partners, who comprise 75% of MASI circuit board shipments. The company has committed to cost cuts to help offset the impact. Our diligence process, including detailed customer survey work, does not indicate any market or competitive issues or impairment to our core thesis. We continue to believe the company is positioned to support high growth as well as a corporate governance change that should improve capital allocation.
The materials provided herein are for general information purposes only and may not be copied or redistributed without Jackson Square’s prior consent. The views expressed represent Jackson Square’s assessment of the strategy and market environment as of the date identified herein and should not be considered a recommendation to buy, hold, or sell any security, and should not be relied on as research or investment advice. The information in this presentation, including statements concerning financial markets is based on current market conditions, which will fluctuate and may be superseded by subsequent market events or for other reasons.
Opinions expressed are those of Jackson Square Partners, LLC and are subject to change, are not guaranteed and should not be considered investment advice.
Holdings are as of the date provided and subject to change. Please see the Schedule of Investments in this report for a complete list of fund holdings.
Mutual fund investing involves risk. Principal loss is possible. The Funds are non-diversified meaning they may concentrate their assets in fewer individual holdings than a diversified fund. Therefore these Funds are more exposed to individual stock volatility than a diversified fund. Small- and Mid-capitalization companies tend to have limited liquidity and greater price volatility than large capitalization companies. Investments in foreign securities involve greater volatility and political economic and currency risks and differences in accounting methods. These risks are greater in emerging and frontier markets. Frontier market countries generally have smaller economies and even less developed capital markets than traditional emerging markets, and, as a result, the risks of investing in emerging market countries are magnified in frontier market countries. Investments in Real Estate Investment Trusts (REITs) involve additional risks such as declines in the value of real estate and increased susceptibility to adverse economic or regulatory developments. When the Funds buy or sell securities on a foreign stock exchange, the transaction is undertaken in the local currency rather than in U.S. dollars. The value of the foreign currency may increase or decrease against the value of the U.S. dollar, which may impact the value of the Funds’ portfolio holdings and your investment. Other countries may adopt economic policies and/or currency exchange controls that affect their currency valuations in a manner that is disadvantageous to U.S. investors and companies. From time to time, the trading market for a particular security or type of security in which the Funds invest may become less liquid or even illiquid.
Past performance is no guarantee of future results.
Diversification does not assure a profit, nor does it protect against a loss in a declining market.
For comparison purposes, the indices are fully invested and include the reinvestment of income. Index returns do not reflect management fees, transaction costs, or expenses. The indices are unmanaged, and one cannot invest directly in an index. Benchmark information contained herein has been obtained from third party sources believed to be reliable, but we cannot guarantee its accuracy or completeness. All third-party marks are the property of their respective owners. All performance data regarding the indices are historical and are not indicative of future results, and there can be no assurance that these or comparable results will actually be achieved by the strategies or that the strategies’ investment objectives will be achieved.
Jackson Square Funds
Russell 1000® Growth Index measures the performance of the large-cap growth segment of the U.S. equity universe. It includes those Russell 1000® companies with higher price-to-book ratios and higher forecasted growth values. The index is unmanned and an investment cannot be made into the index.
Russell 2500® Growth Index. The Russell 2500® Growth Index measures the performance of the small- to mid-cap growth segment of the U.S. equity universe. It includes those Russell 2500® companies with higher price-to-book ratios and higher forecasted growth values. The index is unmanned and an investment cannot be made into the index.
Alpha is a measure of performance, indicating when a strategy, trader, or portfolio manager has managed to beat the market return or other benchmark over some period.
Basis Points: One basis point is equivalent to 0.01%.
Return on Invested Capital (ROIC) is a profitability ratio that aims to measure the percentage return that a company earns on invested capital. It is calculated by dividing net operating profit after tax by invested capital.
Free Cash Flow represents the cash a company generates after accounting for cash outflows to support operations and maintain its capital assets.
The report must be preceded or accompanied by a prospectus.
Jackson Square Partners, LLC is the adviser to the Jackson Square Funds, which are distributed by Quasar Distributors, LLC.
Jackson Square Large-Cap Growth Fund
Value of $1,000,000 Investment (Unaudited)
The chart assumes an initial investment of $1,000,000. Performance reflects waivers of fee and operating expenses in effect. In the absence of such waivers, total return would be reduced. Past performance is not predictive of future performance. Investment return and principal value will fluctuate, so that your shares, when redeemed may be worth more or less than their original cost. Performance current to the most recent month-end may be lower or higher than the performance quoted and can be obtained by calling 1-844-577-3863. Performance assumes the reinvestment of capital gains and income distributions. The performance does not reflect the deduction of taxes that a shareholder would pay on Fund distributions or the redemption of Fund shares.
Annualized Rates of Return as of October 31, 2023(3)
| | 1-Year | 3-Years | 5-Years | 10-Years | Since Inception(1) |
| IS Class | 29.20% | 0.52% | 8.19% | 9.05% | 8.14% |
| Institutional Class | 29.08% | 0.42% | 8.03% | 8.89% | 8.03% |
| Investor Class | 28.84% | 0.21% | 7.79% | 8.64% | 7.75% |
Russell 1000® Growth Index(2) | 18.95% | 8.70% | 14.22% | 13.82% | 10.10% |
| (1) | The Jackson Square Large-Cap Growth Fund (the “Fund”) acquired the assets and assumed the liabilities of the Delaware U.S. Growth Fund, a series of Delaware Group Adviser Funds (the “Predecessor Fund”), effective at the close of business on April 16, 2021 (the “Reorganization”), and the Predecessor Fund is the accounting and performance history survivor of the Reorganization. The performance information shown for the Fund’s Investor Class Shares represent the performance of the Predecessor Fund’s Class A shares, performance for the Fund’s Institutional Class Shares represent the performance of the Predecessor Fund’s Institutional Class shares, and performance for the Fund’s IS Class Shares represent the performance of the Predecessor Fund’s Class R6 shares. Prior to April 16, 2021, the Adviser served as sub-adviser to the Predecessor Fund. The IS Class performance has not been restated to reflect any differences in expenses paid by the Predecessor Fund and those paid by the Fund. The performance shown for the Investor Class Shares has been adjusted so that it does not reflect the Predecessor Fund’s 5.75% sales charge for its Class A shares, which does not apply to Investor Class shares. Performance shown for the periods prior to the inception of the Institutional Class and IS Class is based on the performance of the Investor Class shares, adjusted for the lower expenses applicable to the Institutional and IS classes. The Investor Class commenced operations on December 3, 1993, the Institutional Class commenced operations on February 3, 1994 and the IS Class commenced operations on May 2, 2016. |
| (2) | The Russell 1000® Growth Index measures the performance of the large cap growth segment of the U.S. equity universe. It includes those Russell 1000® Index companies with higher price-to-book ratios and higher forecasted growth values. One cannot invest directly in an Index.
|
| (3) | During the 3rd quarter of 2023, the Large-Cap Growth Fund received proceeds from a class action settlement from a company it no longer owns. This settlement had a material impact on the Fund's investment performance. On the day the proceeds were received, the IS Class, Institutional Class, and Investor Class had their NAV positively impacted by 5.81%, 5.79%, and 5.84% respectively. This is a one-time event that is not likely to be repeated. |
Jackson Square Large-Cap Growth Fund
The following is expense information for the Large-Cap Growth Fund (the “Fund”) as disclosed in the most recent prospectus dated February 28, 2023:
| IS Class Gross Expense Ratio: 0.80% | Net Expense Ratio: 0.64% |
| Institutional Class Gross Expense Ratio: 0.90% | Net Expense Ratio: 0.74% |
| Investor Class Gross Expense Ratio: 1.15% | Net Expense Ratio: 0.99% |
Jackson Square Partners, LLC (the “Adviser”) has contractually agreed to waive its management fees and pay Fund expenses in order to ensure the Total Annual Fund Operating Expenses (excluding Rule 12b-1 fees, Shareholder Servicing Plan fees, leverage/borrowing interest, interest expense, dividends paid on short sales, brokerage and other transactional expenses, including but not limited to litigation expenses and judgements and indemnification expense) do not exceed 0.64% of the average daily net assets of the Fund. Fees waived and expenses paid by the Adviser may be recouped by the Adviser for a period of thirty-six months following the month during which such fee waiver and/or expense payment was made, if such recoupment can be achieved without exceeding the expense limit in effect at the time the fee waiver and/or expense payment occurred and the expense limit in place at the time of recoupment. Expenses that were waived prior to April 16, 2021, may not be recouped. The Operating Expenses Limitation Agreement is indefinite, but cannot be terminated through at least February 28, 2024. Thereafter, the agreement may be terminated at any time upon 60 days’ written notice by the Board of Trustees (the “Board”) or the Adviser.
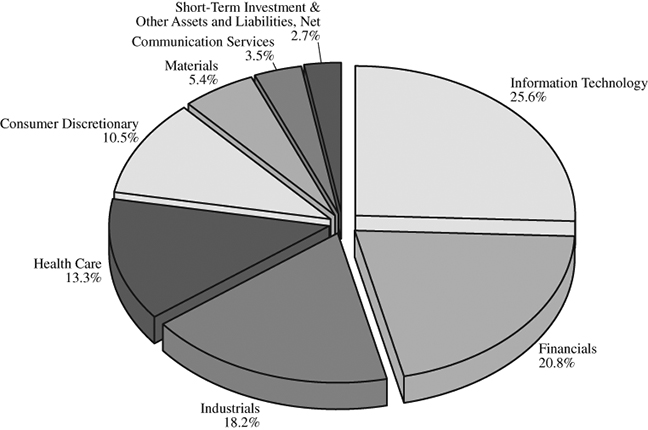
Jackson Square Large-Cap Growth Fund
Sector Allocation(1) (Unaudited)
As of October 31, 2023
(% of Net Assets)
Top Ten Equity Holdings(1) (Unaudited)
As of October 31, 2023
(% of Net Assets)
| Microsoft | 13.1% |
| Amazon.com | 7.9% |
| CME Group | 5.4% |
| Mastercard – Class A | 5.3% |
| Visa – Class A | 4.9% |
| NVIDIA | 4.6% |
| Canadian Pacific Kansas City | 4.2% |
| Boeing | 4.1% |
| Waste Management | 4.0% |
| ServiceNow | 3.9% |
| (1) | Fund holdings and sector allocations are subject to change at any time and are not recommendations to buy or sell any security. |
Jackson Square SMID-Cap Growth Fund
Value of $1,000,000 Investment (Unaudited)
The chart assumes an initial investment of $1,000,000. Performance reflects waivers of fee and operating expenses in effect. In the absence of such waivers, total return would be reduced. Past performance is not predictive of future performance. Investment return and principal value will fluctuate, so that your shares, when redeemed may be worth more or less than their original cost. Performance current to the most recent month-end may be lower or higher than the performance quoted and can be obtained by calling 1-844-577-3863. Performance assumes the reinvestment of capital gains and income distributions. The performance does not reflect the deduction of taxes that a shareholder would pay on Fund distributions or the redemption of Fund shares.
Annualized Rates of Return as of October 31, 2023
| | 1-Year | 5-Years | 10-Years | Since Inception(1) |
| IS Class | -3.65% | -0.08% | 5.28% | 8.16% |
| Institutional Class | -3.78% | -0.17% | 5.20% | 8.06% |
| Investor Class | -3.99% | -0.43% | 4.92% | 7.79% |
Russell 2500® Growth Index(2) | -4.80% | 5.22% | 7.35% | 8.37% |
| (1) | The IS Class commenced operations on December 1, 2003, the Institutional Class commenced operations on September 16, 2016 and the Investor Class commenced operations on September 19, 2016. Performance of the Institutional Class and Investor Class prior to inception of each class is based on the performance of the IS Class, adjusted for the higher expenses applicable to each class’s shares. |
| (2) | The Russell 2500® Growth Index measures the performance of the small to mid-cap growth segment of the U.S. equity universe. It includes those Russell 2500® companies with higher price-to-book ratios and higher forecasted growth values. One cannot invest directly in an Index. |
The following is expense information for the SMID-Cap Growth Fund (the “Fund”) as disclosed in the most recent prospectus dated February 28, 2023:
IS Class Gross Expense Ratio: 0.83%
Institutional Class Gross Expense Ratio: 0.93%
Investor Class Gross Expense Ratio: 1.18%
Jackson Square SMID-Cap Growth Fund
Jackson Square Partners, LLC (the “Adviser”) has contractually agreed to waive its management fees and pay Fund expenses in order to ensure the Total Annual Fund Operating Expenses (excluding Rule 12b-1 fees, Shareholder Servicing Plan fees, leverage/borrowing interest, interest expense, dividends paid on short sales, brokerage and other transactional expenses, acquired fund fees and expenses, expenses incurred in connection with any merger or reorganization, or extraordinary expenses, including but not limited to litigation expenses and judgements and indemnification expenses) do not exceed 0.87% of the average daily net assets of the Fund. Fees waived and expenses paid by the Adviser may be recouped by the Adviser for a period of thirty-six months following the month during which such fee waiver and/or expense payment was made, if such recoupment can be achieved without exceeding the expense limit in effect at the time the fee waiver and/or expense payment occurred and the expense limit in place at the time of recoupment. The Operating Expenses Limitation Agreement is indefinite, but cannot be terminated through at least February 28, 2024. Thereafter, the agreement may be terminated at any time upon 60 days’ written notice by the Board of Trustees (the “Board”) or the Adviser.
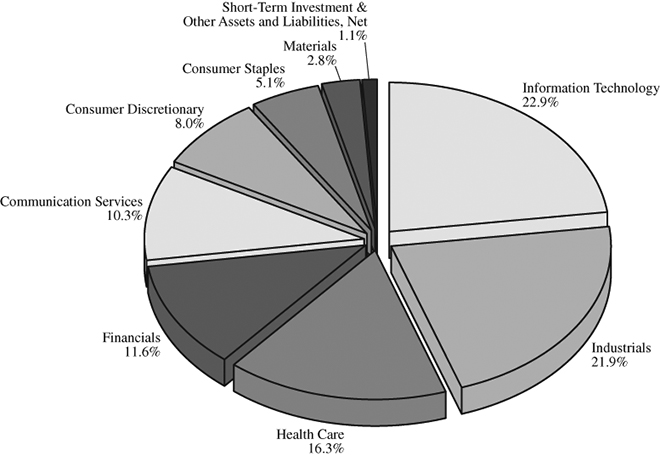
Jackson Square SMID-Cap Growth Fund
Sector Allocation(1) (Unaudited)
As of October 31, 2023
(% of Net Assets)
Top Ten Equity Holdings(1) (Unaudited)
As of October 31, 2023
(% of Net Assets)
| New York Times – Class A | 6.0% |
| Grocery Outlet Holding | 5.1% |
| Wyndham Hotels & Resorts | 5.1% |
| Wix.com | 4.6% |
| Clean Harbors | 4.5% |
| Warner Music Group | 4.3% |
| MarketAxess Holdings | 4.1% |
| Aspen Technology | 4.1% |
| Graco | 4.0% |
| Molina Healthcare | 4.0% |
| (1) | Fund holdings and sector allocations are subject to change at any time and are not recommendations to buy or sell any security. |
Jackson Square Funds
Expense Examples (Unaudited)
October 31, 2023
As a shareholder of a Fund, you incur two types of costs: (1) transactions costs, including brokerage commissions on purchases and sales of Fund shares, and (2) ongoing costs, including management fees; distribution and/or service (12b-1) fees, Shareholder Servicing Plan fees, and other Fund expenses. This Example is intended to help you understand your ongoing costs (in dollars) of investing in the Fund and to compare these costs with the ongoing costs of investing in other mutual funds. The Example is based on an investment of $1,000 invested at the beginning of the period and held for the entire period (May 1, 2023 – October 31, 2023).
ACTUAL EXPENSES
For each class, the first line of the table below provides information about actual account values and actual expenses. You may use the information in this line, together with the amount you invested, to estimate the expenses that you paid over the period. Simply divide your account value by $1,000 (for example, an $8,600 account value divided by $1,000 = 8.6), then multiply the result by the number in the first line under the heading entitled, “Expenses Paid During Period” to estimate the expenses you paid on your account during this period.
HYPOTHETICAL EXAMPLE FOR COMPARISON PURPOSES
For each class, the second line of the table below provides information about hypothetical account values and hypothetical expenses based on the Fund’s actual expense ratio and an assumed rate of return of 5% per year before expenses, which is not the Fund’s actual return. The hypothetical account values and expenses may not be used to estimate the actual ending account balance or expenses you paid for the period. You may use this information to compare the ongoing costs of investing in the Fund and other funds. To do so, compare this 5% hypothetical example with the 5% hypothetical examples that appear in the shareholder reports of the other funds.
Please note that the expenses shown in the table are meant to highlight your ongoing costs only and do not reflect any transactional costs. Therefore, the second line of the table is useful in comparing ongoing costs only, and will not help you determine the relative total costs of owning different funds. In addition, if transactional costs were included, your costs may have been higher.
Large-Cap Growth Fund
| | Beginning | Ending | Expenses Paid |
| | Account Value | Account Value | During Period(1) |
| | (5/1/2023) | (10/31/2023) | (5/1/2023 to 10/31/2023) |
IS Class Actual(2) | $1,000.00 | $1,107.60 | $3.40 |
| IS Class Hypothetical | | | |
| (5% return before expenses) | $1,000.00 | $1,021.98 | $3.26 |
| | | | |
Institutional Class Actual(2) | $1,000.00 | $1,106.90 | $3.93 |
| Institutional Class Hypothetical | | | |
| (5% return before expenses) | $1,000.00 | $1,021.48 | $3.77 |
| | | | |
Investor Class Actual(2) | $1,000.00 | $1,106.20 | $5.04 |
| Investor Class Hypothetical | | | |
| (5% return before expenses) | $1,000.00 | $1,020.42 | $4.84 |
| (1) | Expenses are equal to the Fund’s annualized expense ratio for the most recent six-month period of 0.64%, 0.74% and 0.95% for the IS Class, Institutional Class and Investor Class, respectively, multiplied by the average account value over the period, multiplied by 184/365 to reflect the one-half year period. |
| (2) | Based on the actual returns for the six-month period ended October 31, 2023 of 10.76%, 10.69% and 10.62% for the IS Class, Institutional Class and Investor Class, respectively. |
Jackson Square Funds
Expense Examples (Unaudited) – Continued
October 31, 2023
SMID-Cap Growth Fund
| | Beginning | Ending | Expenses Paid |
| | Account Value | Account Value | During Period(1) |
| | (5/1/2023) | (10/31/2023) | (5/1/2023 to 10/31/2023) |
IS Class Actual(2)(3) | $1,000.00 | $ 904.40 | $4.22 |
IS Class Hypothetical(4) | | | |
| (5% return before expenses) | $1,000.00 | $1,020.77 | $4.48 |
| | | | |
Institutional Class Actual(2)(3) | $1,000.00 | $ 903.50 | $4.70 |
Institutional Class Hypothetical(4) | | | |
| (5% return before expenses) | $1,000.00 | $1,020.27 | $4.99 |
| | | | |
Investor Class Actual(2)(3) | $1,000.00 | $ 902.60 | $5.90 |
Investor Class Hypothetical(4) | | | |
| (5% return before expenses) | $1,000.00 | $1,019.00 | $6.26 |
| (1) | Expenses are equal to the Fund’s annualized expense ratio for the most recent six-month period of 0.88%, 0.98% and 1.23% for the IS Class, Institutional Class and Investor Class, respectively, multiplied by the average account value over the period, multiplied by 184/365 to reflect the one-half year period. |
| (2) | Based on the actual returns for the six-month period ended October 31, 2023 of -9.56%, -9.65% and -9.74% for the IS Class, Institutional Class and Investor Class, respectively. |
| (3) | Excluding interest expense, the actual expenses would be $4.13, $4.61, and $5.85 for the IS Class, Institutional, and Investor Class, respectively. |
| (4) | Excluding interest expense, the hypothetical expenses would be $4.38, $4.89, and $6.21 for the IS Class, Institutional, and Investor Class, respectively. |
Jackson Square Large-Cap Growth Fund
Schedule of Investments
October 31, 2023
Description | | Shares | | | Value | |
| COMMON STOCKS – 97.3% | | | | | | |
| | | | | | | |
| Communication Services – 3.5% | | | | | | |
| Alphabet – Class A* | | | 52,866 | | | $ | 6,559,613 | |
| | | | | | | | | |
| Consumer Discretionary – 10.5% | | | | | | | | |
| Amazon.com* | | | 111,539 | | | | 14,844,726 | |
| NIKE – Class B | | | 47,742 | | | | 4,906,445 | |
| | | | | | | | 19,751,171 | |
| Financials – 20.8% | | | | | | | | |
| CME Group | | | 47,488 | | | | 10,136,789 | |
| KKR & Co. – Class A | | | 67,016 | | | | 3,712,686 | |
| Mastercard – Class A | | | 26,488 | | | | 9,968,759 | |
| S&P Global | | | 17,030 | | | | 5,948,749 | |
| Visa – Class A | | | 39,228 | | | | 9,222,503 | |
| | | | | | | | 38,989,486 | |
| Health Care – 13.3% | | | | | | | | |
| Danaher | | | 22,155 | | | | 4,254,203 | |
| Edwards Lifesciences* | | | 88,155 | | | | 5,617,237 | |
| Intuitive Surgical* | | | 18,935 | | | | 4,965,136 | |
| IQVIA Holdings* | | | 19,444 | | | | 3,516,059 | |
| Veeva Systems – Class A* | | | 34,695 | | | | 6,686,072 | |
| | | | | | | | 25,038,707 | |
| Industrials – 18.2% | | | | | | | | |
| Boeing* | | | 40,794 | | | | 7,621,135 | |
| Canadian Pacific Kansas City | | | 110,056 | | | | 7,810,674 | |
| Copart* | | | 102,515 | | | | 4,461,453 | |
| Uber Technologies* | | | 156,401 | | | | 6,769,035 | |
| Waste Management | | | 45,328 | | | | 7,448,750 | |
| | | | | | | | 34,111,047 | |
Information Technology – 25.6%# | | | | | | | | |
| Advanced Micro Devices* | | | 49,773 | | | | 4,902,641 | |
| Datadog – Class A* | | | 31,856 | | | | 2,595,308 | |
| Microsoft | | | 72,778 | | | | 24,606,969 | |
| NVIDIA | | | 21,181 | | | | 8,637,612 | |
| ServiceNow* | | | 12,709 | | | | 7,394,732 | |
| | | | | | | | 48,137,262 | |
| Materials – 5.4% | | | | | | | | |
| Corteva | | | 104,083 | | | | 5,010,556 | |
| Linde | | | 13,429 | | | | 5,132,027 | |
| | | | | | | | 10,142,583 | |
| TOTAL COMMON STOCKS | | | | | | | | |
| (Cost $150,831,080) | | | | | | | 182,729,869 | |
See Notes to the Financial Statements
Jackson Square Large-Cap Growth Fund
Schedule of Investments – Continued
October 31, 2023
Description | | Shares | | | Value | |
| SHORT-TERM INVESTMENT – 2.1% | | | | | | |
| | | | | | | |
| Money Market Deposit Account – 2.1% | | | | | | |
| U.S. Bank N.A., 3.27%^ | | | | | | |
| Total Money Market Deposit Account | | | 3,958,198 | | | $ | 3,958,198 | |
| TOTAL SHORT-TERM INVESTMENT | | | | | | | | |
| (Cost $3,958,198) | | | | | | | 3,958,198 | |
| Total Investments – 99.4% | | | | | | | | |
| (Cost $154,789,278) | | | | | | | 186,688,067 | |
| Other Assets and Liabilities, Net – 0.6% | | | | | | | 1,156,022 | |
| Total Net Assets – 100.0% | | | | | | $ | 187,844,089 | |
| * | Non-income producing security. |
| # | As of October 31, 2023, the Fund has a significant portion of its assets invested in this sector and therefore is subject to additional risks. See Note 10 in Notes to the Financial Statements. |
| ^ | The Money Market Deposit Account (the “MMDA”) is a short-term investment vehicle in which the Fund holds cash balances. The MMDA will bear interest at a variable rate that is determined based on conditions and may change daily and by any amount. The rate shown is as of October 31, 2023. |
The Global Industry Classification Standard (“GICS®”) was developed by and/or is the exclusive property of MSCI, Inc. (“MSCI”) and Standard & Poor’s Financial Services LLC (“S&P”). GICS® is a service mark of MSCI and S&P and has been licensed for use.
See Notes to the Financial Statements
Jackson Square SMID-Cap Growth Fund
Schedule of Investments
October 31, 2023
Description | | Shares | | | Value | |
| COMMON STOCKS – 98.9% | | | | | | |
| | | | | | | |
| Communication Services – 10.3% | | | | | | |
| New York Times – Class A | | | 905,143 | | | $ | 36,486,314 | |
| Warner Music Group | | | 839,619 | | | | 26,280,075 | |
| | | | | | | | 62,766,389 | |
| Consumer Discretionary – 8.0% | | | | | | | | |
| Peloton Interactive* | | | 1,464,615 | | | | 6,971,567 | |
| VF | | | 688,527 | | | | 10,142,003 | |
| Wyndham Hotels & Resorts | | | 431,691 | | | | 31,254,429 | |
| | | | | | | | 48,367,999 | |
| Consumer Staples – 5.1% | | | | | | | | |
| Grocery Outlet Holding* | | | 1,130,294 | | | | 31,275,235 | |
| | | | | | | | | |
| Financials – 11.6% | | | | | | | | |
| LendingClub* | | | 1,987,082 | | | | 10,312,956 | |
| LPL Financial Holdings | | | 81,750 | | | | 18,354,510 | |
| MarketAxess Holdings | | | 117,690 | | | | 25,156,237 | |
| Ryan Specialty Holdings* | | | 387,472 | | | | 16,738,790 | |
| | | | | | | | 70,562,493 | |
| Health Care – 16.3% | | | | | | | | |
| Bio-Techne | | | 311,296 | | | | 17,006,100 | |
| Charles River Laboratories International* | | | 66,176 | | | | 11,141,391 | |
| Masimo* | | | 211,578 | | | | 17,165,323 | |
| Molina Healthcare* | | | 72,817 | | | | 24,244,421 | |
| Pacific Biosciences of California* | | | 1,568,303 | | | | 9,692,113 | |
| STAAR Surgical* | | | 468,582 | | | | 19,596,099 | |
| | | | | | | | 98,845,447 | |
| Industrials – 21.9% | | | | | | | | |
| Clean Harbors* | | | 179,648 | | | | 27,606,508 | |
| Graco | | | 331,223 | | | | 24,626,430 | |
| Hexcel | | | 265,553 | | | | 16,443,042 | |
| Howmet Aerospace | | | 504,586 | | | | 22,252,243 | |
| SiteOne Landscape Supply* | | | 145,232 | | | | 20,008,613 | |
| Westinghouse Air Brake Technologies | | | 213,538 | | | | 22,639,299 | |
| | | | | | | | 133,576,135 | |
See Notes to the Financial Statements
Jackson Square SMID-Cap Growth Fund
Schedule of Investments – Continued
October 31, 2023
Description | | Shares | | | Value | |
| COMMON STOCKS – 98.9% (Continued) | | | | | | |
| | | | | | | |
| Information Technology – 22.9% | | | | | | |
| Aspen Technology* | | | 139,637 | | | $ | 24,820,478 | |
| Bill.com Holdings* | | | 168,173 | | | | 15,352,513 | |
| Dolby Laboratories – Class A | | | 168,095 | | | | 13,605,609 | |
| Elastic* | | | 309,771 | | | | 23,245,216 | |
| Entegris | | | 141,683 | | | | 12,473,771 | |
| Lattice Semiconductor* | | | 123,745 | | | | 6,881,459 | |
| Okta* | | | 226,328 | | | | 15,256,770 | |
| Wix.com* | | | 347,135 | | | | 27,736,086 | |
| | | | | | | | 139,371,902 | |
| Materials – 2.8% | | | | | | | | |
| FMC | | | 318,454 | | | | 16,941,753 | |
| TOTAL COMMON STOCKS | | | | | | | | |
| (Cost $653,586,141) | | | | | | | 601,707,353 | |
| | | | | | | | | |
| SHORT-TERM INVESTMENT – 2.0% | | | | | | | | |
| | | | | | | | | |
| Money Market Deposit Account – 2.0% | | | | | | | | |
| U.S. Bank N.A., 3.27%^ | | | | | | | | |
| Total Money Market Deposit Account | | | 11,954,536 | | | | 11,954,536 | |
| TOTAL SHORT-TERM INVESTMENT | | | | | | | | |
| (Cost $11,954,536) | | | | | | | 11,954,536 | |
| Total Investments – 100.9% | | | | | | | | |
| (Cost $665,540,677) | | | | | | | 613,661,889 | |
| Other Assets and Liabilities, Net – (0.9)% | | | | | | | (5,550,965 | ) |
| Total Net Assets – 100.0% | | | | | | $ | 608,110,924 | |
| * | Non-income producing security. |
| ^ | The Money Market Deposit Account (the “MMDA”) is a short-term investment vehicle in which the Fund holds cash balances. The MMDA will bear interest at a variable rate that is determined based on conditions and may change daily and by any amount. The rate shown is as of October 31, 2023. |
The Global Industry Classification Standard (“GICS®”) was developed by and/or is the exclusive property of MSCI, Inc. (“MSCI”) and Standard & Poor’s Financial Services LLC (“S&P”). GICS® is a service mark of MSCI and S&P and has been licensed for use.
See Notes to the Financial Statements
Jackson Square Funds
Statements of Assets and Liabilities
October 31, 2023
| | | Large-Cap | | | SMID-Cap | |
| | | Growth Fund | | | Growth Fund | |
| ASSETS: | | | | | | |
| Investment securities: | | | | | | |
| At cost | | $ | 154,789,278 | | | $ | 665,540,677 | |
| At value | | $ | 186,688,067 | | | $ | 613,661,889 | |
| Dividends & interest receivable | | | 28,906 | | | | 149,335 | |
| Dividend tax reclaim receivable | | | 66,122 | | | | 86,412 | |
| Receivable for investment securities sold | | | 1,390,517 | | | | 1,809,018 | |
| Receivable for capital shares sold | | | 4,131 | | | | 113,116 | |
| Prepaid expenses | | | 27,160 | | | | 24,480 | |
| Total Assets | | | 188,204,903 | | | | 615,844,250 | |
| LIABILITIES: | | | | | | | | |
| Payable for investment securities purchased | | | — | | | | 3,951,714 | |
| Payable for capital shares redeemed | | | 84,969 | | | | 3,090,037 | |
| Payable to investment adviser | | | 74,913 | | | | 412,044 | |
| Payable for fund administration & accounting fees | | | 36,929 | | | | 102,930 | |
| Payable for compliance fees | | | 3,125 | | | | 3,122 | |
| Payable for transfer agent fees & expenses | | | 27,596 | | | | 47,101 | |
| Payable for custody fees | | | 2,802 | | | | 8,403 | |
| Accrued distribution and/or shareholder service fees | | | 82,415 | | | | 66,696 | |
| Payable for audit fees | | | 20,753 | | | | 20,753 | |
| Accrued expenses | | | 27,312 | | | | 30,526 | |
| Total Liabilities | | | 360,814 | | | | 7,733,326 | |
| NET ASSETS | | $ | 187,844,089 | | | $ | 608,110,924 | |
| NET ASSETS CONSIST OF: | | | | | | | | |
| Paid-in capital | | | 172,882,258 | | | | 1,154,729,473 | |
| Total distributable earnings (accumulated loss) | | | 14,961,831 | | | | (546,618,549 | ) |
| Total net assets | | $ | 187,844,089 | | | $ | 608,110,924 | |
| IS Class Shares: | | | | | | | | |
| Net Assets | | $ | 17,979,180 | | | $ | 392,931,645 | |
Shares issued and outstanding(1) | | | 1,015,671 | | | | 25,637,894 | |
| Net asset value, offering price, and redemption price per share | | $ | 17.70 | | | $ | 15.33 | |
| Institutional Class Shares: | | | | | | | | |
| Net Assets | | $ | 94,143,511 | | | $ | 186,024,539 | |
Shares issued and outstanding(1) | | | 5,409,082 | | | | 12,188,275 | |
| Net asset value, offering price, and redemption price per share | | $ | 17.40 | | | $ | 15.26 | |
| Investor Class Shares: | | | | | | | | |
| Net Assets | | $ | 75,721,398 | | | $ | 29,154,740 | |
Shares issued and outstanding(1) | | | 5,469,152 | | | | 1,954,504 | |
| Net asset value, offering price, and redemption price per share | | $ | 13.85 | | | $ | 14.92 | |
| (1) | Unlimited shares authorized without par value. |
See Notes to the Financial Statements
Jackson Square Funds
Statements of Operations
For the Year Ended October 31, 2023
| | | Large-Cap | | | SMID-Cap | |
| | | Growth Fund | | | Growth Fund | |
| INVESTMENT INCOME: | | | | | | |
| Dividend income | | $ | 1,422,298 | | | $ | 5,290,109 | |
| Less: Foreign taxes withheld | | | — | | | | (17,172 | ) |
| Interest income | | | 93,072 | | | | 537,362 | |
| Total investment income | | | 1,515,370 | | | | 5,810,299 | |
| | | | | | | | | |
| EXPENSES: | | | | | | | | |
| Investment advisory fees (See Note 4) | | | 1,127,999 | | | | 6,352,734 | |
| Fund administration & accounting fees (See Note 4) | | | 151,213 | | | | 469,680 | |
| Transfer agent fees & expenses (See Note 4) | | | 84,243 | | | | 204,489 | |
| Federal & state registration fees | | | 52,081 | | | | 62,597 | |
| Legal fees | | | 21,327 | | | | 20,563 | |
| Audit fees | | | 21,285 | | | | 19,729 | |
| Trustee fees | | | 21,188 | | | | 22,252 | |
| Custody fees (See Note 4) | | | 17,299 | | | | 51,841 | |
| Postage & printing fees | | | 16,664 | | | | 26,749 | |
| Compliance fees (See Note 4) | | | 11,773 | | | | 10,480 | |
| Other expenses | | | 10,023 | | | | 15,178 | |
| Insurance fees | | | 5,199 | | | | 8,040 | |
| Distribution and/or shareholder service fees (See Note 5) | | | | | | | | |
| Institutional Class | | | 61,842 | | | | 277,997 | |
| Investor Class | | | 210,655 | | | | 131,101 | |
| Total expenses before interest expense and reimbursement/waiver/recoupment | | | 1,812,791 | | | | 7,673,430 | |
| Interest expense (See Note 9) | | | 2,163 | | | | 57,807 | |
| Total expenses before reimbursement/waiver/recoupment | | | 1,814,954 | | | | 7,731,237 | |
| Plus: Adviser recoupment (See Note 4) | | | — | | | | 23,584 | |
| Less: reimbursement/waiver from adviser (See Note 4) | | | (227,714 | ) | | | (668 | ) |
| Total net expenses | | | 1,587,240 | | | | 7,754,153 | |
| NET INVESTMENT LOSS | | | (71,870 | ) | | | (1,943,854 | ) |
| | | | | | | | | |
| REALIZED AND UNREALIZED GAIN (LOSS) ON INVESTMENTS | | | | | | | | |
| AND TRANSLATIONS OF FOREIGN CURRENCY | | | | | | | | |
| Net realized loss on: | | | | | | | | |
| Investments, including foreign currency gain (loss) | | | (29,096,403 | ) | | | (269,312,092 | ) |
| Securities Litigation | | | 12,954,950 | | | | 636,746 | |
| Net change in unrealized appreciation/depreciation of investments | | | | | | | | |
| and translations of foreign currency | | | 68,952,407 | | | | 265,949,147 | |
| Net realized and unrealized gain (loss) on investments | | | 52,810,954 | | | | (2,726,199 | ) |
| | | | | | | | | |
| NET INCREASE (DECREASE) IN ASSETS RESULTING FROM OPERATIONS | | $ | 52,739,084 | | | $ | (4,670,053 | ) |
See Notes to the Financial Statements
Jackson Square Large-Cap Growth Fund
Statements of Changes in Net Assets
| | | For the | | | For the | |
| | | Year Ended | | | Year Ended | |
| | | October 31, 2023 | | | October 31, 2022 | |
| OPERATIONS: | | | | | | |
| Net investment loss | | $ | (71,870 | ) | | $ | (3,177,543 | ) |
| Net realized gain (loss) on investments, including | | | | | | | | |
| foreign currency loss and securities litigation | | | (16,141,453 | ) | | | 448,891,006 | |
| Net change in unrealized appreciation/depreciation on | | | | | | | | |
| investments and translations of foreign currency | | | 68,952,407 | | | | (931,234,611 | ) |
| Net increase (decrease) in net assets resulting from operations | | | 52,739,084 | | | | (485,521,148 | ) |
| | | | | | | | | |
| CAPITAL SHARE TRANSACTIONS: | | | | | | | | |
| IS Class : | | | | | | | | |
| Proceeds from shares sold | | | 743,490 | | | | 96,337,923 | |
| Proceeds from reinvestment of distributions | | | — | | | | 226,234,969 | |
| Payments for shares redeemed | | | (32,568,138 | ) | | | (80,198,416 | ) |
Payment for redemption in-kind(1) | | | — | | | | (650,546,364 | ) |
| Decrease in net assets resulting from IS Class transactions | | | (31,824,648 | ) | | | (408,171,888 | ) |
| Institutional Class: | | | | | | | | |
| Proceeds from shares sold | | | 9,764,895 | | | | 35,836,230 | |
| Proceeds from reinvestment of distributions | | | — | | | | 121,353,186 | |
| Payments for shares redeemed | | | (45,710,644 | ) | | | (1,066,863,744 | ) |
| Decrease in net assets resulting from Institutional Class transactions | | | (35,945,749 | ) | | | (909,674,328 | ) |
| Investor Class: | | | | | | | | |
| Proceeds from shares sold | | | 3,067,693 | | | | 2,160,777 | |
| Proceeds from reinvestment of distributions | | | — | | | | 43,714,844 | |
| Payments for shares redeemed | | | (17,240,296 | ) | | | (36,354,620 | ) |
| Increase (decrease) in net assets resulting from Investor Class transactions | | | (14,172,603 | ) | | | 9,521,001 | |
| Net decrease in net assets resulting from capital share transactions | | | (81,943,000 | ) | | | (1,308,325,215 | ) |
| | | | | | | | | |
| DISTRIBUTIONS TO SHAREHOLDERS: | | | | | | | | |
| IS Class | | | — | | | | (226,388,707 | ) |
| Institutional Class | | | — | | | | (122,858,298 | ) |
| Investor Class | | | — | | | | (47,708,539 | ) |
| Total distributions to shareholders | | | — | | | | (396,955,544 | ) |
| TOTAL DECREASE IN NET ASSETS | | | (29,203,916 | ) | | | (2,190,801,907 | ) |
| | | | | | | | | |
| NET ASSETS: | | | | | | | | |
| Beginning of year | | | 217,048,005 | | | | 2,407,849,912 | |
| End of year | | $ | 187,844,089 | | | $ | 217,048,005 | |
| (1) | A redemption in-kind occurred on April 25, 2022 for the IS Class, which consisted of $631,793,017 in securities and $18,753,347 in cash. |
See Notes to the Financial Statements
Jackson Square SMID-Cap Growth Fund
Statements of Changes in Net Assets
| | | For the | | | For the | |
| | | Year Ended | | | Year Ended | |
| | | October 31, 2023 | | | October 31, 2022 | |
| OPERATIONS: | | | | | | |
| Net investment loss | | $ | (1,943,854 | ) | | $ | (6,553,314 | ) |
| Net realized loss on investments, including foreign currency gain (loss) | | | (268,675,346 | ) | | | (220,803,949 | ) |
| Net change in unrealized appreciation/depreciation on | | | | | | | | |
| investments and translations of foreign currency | | | 265,949,147 | | | | (765,969,373 | ) |
| Net decrease in net assets resulting from operations | | | (4,670,053 | ) | | | (993,326,636 | ) |
| | | | | | | | | |
| CAPITAL SHARE TRANSACTIONS: | | | | | | | | |
| IS Class: | | | | | | | | |
| Proceeds from shares sold | | | 26,721,279 | | | | 186,086,454 | |
| Proceeds from reinvestment of distributions | | | — | | | | 147,698,829 | |
| Payments for shares redeemed | | | (182,278,555 | ) | | | (144,072,426 | ) |
| Increase (decrease) in net assets resulting from IS Class transactions | | | (155,557,276 | ) | | | 189,712,857 | |
| Institutional Class: | | | | | | | | |
| Proceeds from shares sold | | | 57,470,881 | | | | 253,353,654 | |
| Proceeds from reinvestment of distributions | | | — | | | | 139,315,673 | |
| Payments for shares redeemed | | | (191,967,505 | ) | | | (517,174,844 | ) |
| Decrease in net assets resulting from Institutional Class transactions | | | (134,496,624 | ) | | | (124,505,517 | ) |
| Investor Class: | | | | | | | | |
| Proceeds from shares sold | | | 2,822,848 | | | | 8,480,345 | |
| Proceeds from reinvestment of distributions | | | — | | | | 16,161,227 | |
| Payments for shares redeemed | | | (12,271,602 | ) | | | (31,219,296 | ) |
| Decrease in net assets resulting from Investor Class transactions | | | (9,448,754 | ) | | | (6,577,724 | ) |
| Net increase (decrease) in net assets resulting from capital share transactions | | | (299,502,654 | ) | | | 58,629,616 | |
| | | | | | | | | |
| DISTRIBUTIONS TO SHAREHOLDERS: | | | | | | | | |
| IS Class | | | — | | | | (154,578,237 | ) |
| Institutional Class | | | — | | | | (145,233,908 | ) |
| Investor Class | | | — | | | | (16,179,692 | ) |
| Total distributions to shareholders | | | — | | | | (315,991,837 | ) |
| TOTAL DECREASE IN NET ASSETS | | | (304,172,707 | ) | | | (1,250,688,857 | ) |
| | | | | | | | | |
| NET ASSETS: | | | | | | | | |
| Beginning of year | | | 912,283,631 | | | | 2,162,972,488 | |
| End of year | | $ | 608,110,924 | | | $ | 912,283,631 | |
See Notes to the Financial Statements
Jackson Square Large-Cap Growth Fund
Financial Highlights
For a Fund share outstanding throughout the years.
IS Class(1)
| | | Year Ended | | | Year Ended | | | Year Ended | | | Year Ended | | | Year Ended | |
| | | October 31, | | | October 31, | | | October 31, | | | October 31, | | | October 31, | |
| | | 2023 | | | 2022 | | | 2021 | | | 2020 | | | 2019 | |
| Per Share Data | | | | | | | | | | | | | | | |
| | | | | | | | | | | | | | | | |
| Net asset value, beginning of year | | $ | 13.70 | | | $ | 31.69 | | | $ | 28.72 | | | $ | 24.91 | | | $ | 26.72 | |
| | | | | | | | | | | | | | | | | | | | | |
| Investment operations: | | | | | | | | | | | | | | | | | | | | |
Net investment income (loss)(2) | | | 0.02 | | | | (0.07 | ) | | | (0.10 | ) | | | 0.01 | | | | 0.05 | |
| Net realized and unrealized | | | | | | | | | | | | | | | | | | | | |
| gain (loss) on investments | | | 3.98 | | | | (10.23 | ) | | | 9.16 | | | | 6.25 | | | | 2.59 | |
| Total from investment operations | | | 4.00 | | | | (10.30 | ) | | | 9.06 | | | | 6.26 | | | | 2.64 | |
| | | | | | | | | | | | | | | | | | | | | |
| Less distributions from: | | | | | | | | | | | | | | | | | | | | |
| Net investment income | | | — | | | | — | | | | — | | | | — | | | | — | |
| Net realized gains | | | — | | | | (7.69 | ) | | | (6.09 | ) | | | (2.45 | ) | | | (4.45 | ) |
| Total distributions | | | — | | | | (7.69 | ) | | | (6.09 | ) | | | (2.45 | ) | | | (4.45 | ) |
| Net asset value, end of year | | $ | 17.70 | | | $ | 13.70 | | | $ | 31.69 | | | $ | 28.72 | | | $ | 24.91 | |
| | | | | | | | | | | | | | | | | | | | | |
| Total Return | | | 29.20 | %(3) | | | -41.26 | % | | | 33.81 | %(4) | | | 27.39 | %(4) | | | 14.60 | %(4) |
| | | | | | | | | | | | | | | | | | | | | |
| Supplemental Data and Ratios | | | | | | | | | | | | | | | | | | | | |
| Net assets, end of year (in 000’s) | | $ | 17,979 | | | $ | 40,436 | | | $ | 945,973 | | | $ | 4,539 | | | $ | 3,408 | |
| | | | | | | | | | | | | | | | | | | | | |
| Ratio of expenses to average net assets: | | | | | | | | | | | | | | | | | | | | |
| Before expense reimbursement/waiver/recoupment | | | 0.75 | % | | | 0.63 | % | | | 0.61 | % | | | 0.65 | % | | | 0.67 | % |
| After expense reimbursement/waiver/recoupment | | | 0.64 | % | | | 0.63 | % | | | 0.61 | %(5) | | | 0.62 | % | | | 0.63 | % |
| | | | | | | | | | | | | | | | | | | | | |
| Ratio of net investment income (loss) | | | | | | | | | | | | | | | | | | | | |
| to average net assets: | | | | | | | | | | | | | | | | | | | | |
| After expense reimbursement/waiver/recoupment | | | 0.10 | % | | | (0.31 | )% | | | (0.17 | )% | | | 0.02 | % | | | 0.16 | % |
| | | | | | | | | | | | | | | | | | | | | |
Portfolio Turnover(6) | | | 37 | % | | | 35 | %(7) | | | 28 | % | | | 54 | % | | | 35 | % |
| (1) | Prior to April 16, 2021, the IS Class was known as Class R6. See Note 1 in Notes to Financial Statements. |
| (2) | Per share amounts calculated using the average shares method. |
| (3) | During the fiscal year 2023, the Large-Cap Growth Fund received proceeds from a class action settlement from a company it no longer owns. This settlement had a material impact on the Fund's investment performance. On the day the proceeds were received, the IS Class had its NAV positively impacted by 5.81%. This is a one-time event that is not likely to be repeated. |
| (4) | Total return during the period reflects a waiver by the manager. Performance would have been lower had the waiver not been in effect. |
| (5) | Prior to April 16, 2021, the annual expense limitation was 0.62% of the average daily net assets of the Fund. Thereafter, it was 0.64%. |
| (6) | Portfolio turnover disclosed is for the Fund as a whole. |
| (7) | Excludes the value of securities delivered as a result of an in-kind redemption of the Fund’s capital shares on April 25, 2022. |
See Notes to the Financial Statements
Jackson Square Large-Cap Growth Fund
Financial Highlights
For a Fund share outstanding throughout the years.
Institutional Class
| | | Year Ended | | | Year Ended | | | Year Ended | | | Year Ended | | | Year Ended | |
| | | October 31, | | | October 31, | | | October 31, | | | October 31, | | | October 31, | |
| | | 2023 | | | 2022 | | | 2021 | | | 2020 | | | 2019 | |
| Per Share Data | | | | | | | | | | | | | | | |
| | | | | | | | | | | | | | | | |
| Net asset value, beginning of year | | $ | 13.48 | | | $ | 31.32 | | | $ | 28.49 | | | $ | 24.78 | | | $ | 26.66 | |
| | | | | | | | | | | | | | | | | | | | | |
| Investment operations: | | | | | | | | | | | | | | | | | | | | |
Net investment income (loss)(1) | | | 0.01 | | | | (0.08 | ) | | | (0.16 | ) | | | (0.04 | ) | | | (0.01 | ) |
| Net realized and unrealized | | | | | | | | | | | | | | | | | | | | |
| gain (loss) on investments | | | 3.91 | | | | (10.07 | ) | | | 9.08 | | | | 6.20 | | | | 2.58 | |
| Total from investment operations | | | 3.92 | | | | (10.15 | ) | | | 8.92 | | | | 6.16 | | | | 2.57 | |
| | | | | | | | | | | | | | | | | | | | | |
| Less distributions from: | | | | | | | | | | | | | | | | | | | | |
| Net investment income | | | — | | | | — | | | | — | | | | — | | | | — | |
| Net realized gains | | | — | | | | (7.69 | ) | | | (6.09 | ) | | | (2.45 | ) | | | (4.45 | ) |
| Total distributions | | | — | | | | (7.69 | ) | | | (6.09 | ) | | | (2.45 | ) | | | (4.45 | ) |
| Net asset value, end of year | | $ | 17.40 | | | $ | 13.48 | | | $ | 31.32 | | | $ | 28.49 | | | $ | 24.78 | |
| | | | | | | | | | | | | | | | | | | | | |
| Total Return | | | 29.08 | %(2) | | | -41.27 | % | | | 33.56 | %(3) | | | 27.10 | %(3) | | | 14.33 | %(3) |
| | | | | | | | | | | | | | | | | | | | | |
| Supplemental Data and Ratios | | | | | | | | | | | | | | | | | | | | |
| Net assets, end of year (in 000’s) | | $ | 94,144 | | | $ | 105,097 | | | $ | 1,292,470 | | | $ | 2,268,085 | | | $ | 2,231,134 | |
| | | | | | | | | | | | | | | | | | | | | |
| Ratio of expenses to average net assets: | | | | | | | | | | | | | | | | | | | | |
| Before expense reimbursement/waiver/recoupment | | | 0.82 | % | | | 0.70 | % | | | 0.81 | % | | | 0.89 | % | | | 0.90 | % |
| After expense reimbursement/waiver/recoupment | | | 0.70 | % | | | 0.70 | % | | | 0.79 | %(4) | | | 0.84 | % | | | 0.86 | % |
| | | | | | | | | | | | | | | | | | | | | |
| Ratio of net investment income (loss) | | | | | | | | | | | | | | | | | | | | |
| to average net assets: | | | | | | | | | | | | | | | | | | | | |
| After expense reimbursement/waiver/recoupment | | | 0.03 | % | | | (0.39 | )% | | | (0.52 | )% | | | (0.17 | )% | | | (0.07 | )% |
| | | | | | | | | | | | | | | | | | | | | |
Portfolio Turnover(5) | | | 37 | % | | | 35 | %(6) | | | 28 | % | | | 54 | % | | | 35 | % |
| (1) | Per share amounts calculated using the average shares method. |
| (2) | During the fiscal year 2023, the Large-Cap Growth Fund received proceeds from a class action settlement from a company it no longer owns. This settlement had a material impact on the Fund's investment performance. On the day the proceeds were received, the Institutional Class had its NAV positively impacted by 5.79%. This is a one-time event that is not likely to be repeated. |
| (3) | Total return during the period reflects a waiver by the manager. Performance would have been lower had the waiver not been in effect. |
| (4) | Prior to April 16, 2021, the annual expense limitation was 0.84% of the average daily net assets of the Fund. Thereafter, it was 0.64%, excluding Shareholder Servicing Plan fees. See Note 1 in the Notes to Financial Statements. |
| (5) | Portfolio turnover disclosed is for the Fund as a whole. |
| (6) | Excludes the value of securities delivered as a result of an in-kind redemption of the Fund’s capital shares on April 25, 2022. |
See Notes to the Financial Statements
Jackson Square Large-Cap Growth Fund
Financial Highlights
For a Fund share outstanding throughout the years.
Investor Class(1)
| | | Year Ended | | | Year Ended | | | Year Ended | | | Year Ended | | | Year Ended | |
| | | October 31, | | | October 31, | | | October 31, | | | October 31, | | | October 31, | |
| | | 2023 | | | 2022 | | | 2021 | | | 2020 | | | 2019 | |
| Per Share Data | | | | | | | | | | | | | | | |
| | | | | | | | | | | | | | | | |
| Net asset value, beginning of year | | $ | 10.75 | | | $ | 26.71 | | | $ | 25.09 | | | $ | 22.15 | | | $ | 24.41 | |
| | | | | | | | | | | | | | | | | | | | | |
| Investment operations: | | | | | | | | | | | | | | | | | | | | |
Net investment loss(2) | | | (0.02 | ) | | | (0.09 | ) | | | (0.19 | ) | | | (0.10 | ) | | | (0.06 | ) |
| Net realized and unrealized | | | | | | | | | | | | | | | | | | | | |
| gain (loss) on investments | | | 3.12 | | | | (8.18 | ) | | | 7.90 | | | | 5.49 | | | | 2.25 | |
| Total from investment operations | | | 3.10 | | | | (8.27 | ) | | | 7.71 | | | | 5.39 | | | | 2.19 | |
| | | | | | | | | | | | | | | | | | | | | |
| Less distributions from: | | | | | | | | | | | | | | | | | | | | |
| Net investment income | | | — | | | | — | | | | — | | | | — | | | | — | |
| Net realized gains | | | — | | | | (7.69 | ) | | | (6.09 | ) | | | (2.45 | ) | | | (4.45 | ) |
| Total distributions | | | — | | | | (7.69 | ) | | | (6.09 | ) | | | (2.45 | ) | | | (4.45 | ) |
| Net asset value, end of year | | $ | 13.85 | | | $ | 10.75 | | | $ | 26.71 | | | $ | 25.09 | | | $ | 22.15 | |
| | | | | | | | | | | | | | | | | | | | | |
| Total Return | | | 28.84 | %(3) | | | -41.38 | % | | | 33.25 | %(4) | | | 26.82 | %(4) | | | 14.04 | %(4) |
| | | | | | | | | | | | | | | | | | | | | |
| Supplemental Data and Ratios | | | | | | | | | | | | | | | | | | | | |
| Net assets, end of year (in 000’s) | | $ | 75,721 | | | $ | 71,515 | | | $ | 169,407 | | | $ | 137,135 | | | $ | 116,986 | |
| | | | | | | | | | | | | | | | | | | | | |
| Ratio of expenses to average net assets: | | | | | | | | | | | | | | | | | | | | |
| Before expense reimbursement/waiver/recoupment | | | 1.04 | % | | | 0.91 | % | | | 1.04 | % | | | 1.14 | % | | | 1.15 | % |
| After expense reimbursement/waiver/recoupment | | | 0.93 | % | | | 0.90 | % | | | 1.03 | %(5) | | | 1.09 | % | | | 1.11 | % |
| | | | | | | | | | | | | | | | | | | | | |
| Ratio of net investment loss to average net assets: | | | | | | | | | | | | | | | | | | | | |
| After expense reimbursement/waiver/recoupment | | | (0.19 | )% | | | (0.59 | )% | | | (0.75 | )% | | | (0.42 | )% | | | (0.32 | )% |
| | | | | | | | | | | | | | | | | | | | | |
Portfolio Turnover(6) | | | 37 | % | | | 35 | %(7) | | | 28 | % | | | 54 | % | | | 35 | % |
| (1) | Prior to April 16, 2021, the Investor class was known as Class A. See Note 1 in Notes to the Financial Statements. |
| (2) | Per share amounts calculated using the average shares method. |
| (3) | During the fiscal year 2023, the Large-Cap Growth Fund received proceeds from a class action settlement from a company it no longer owns. This settlement had a material impact on the Fund's investment performance. On the day the proceeds were received, the Investor Class had its NAV positively impacted by 5.84%. This is a one-time event that is not likely to be repeated. |
| (4) | Total return during the period reflects a waiver by the manager. Performance would have been lower had the waiver not been in effect. |
| (5) | Prior to April 16, 2021, the annual expense limitation was 0.84% of the average daily net assets of the Fund. Thereafter, it was 0.64%, excluding 12b-1 fees and Shareholder Servicing Plan fees. |
| (6) | Portfolio turnover disclosed is for the Fund as a whole. |
| (7) | Excludes the value of securities delivered as a result of an in-kind redemption of the Fund’s capital shares on April 25, 2022. |
See Notes to the Financial Statements
Jackson Square SMID-Cap Growth Fund
Financial Highlights
For a Fund share outstanding throughout the years.
IS Class
| | | Year Ended | | | Year Ended | | | Year Ended | | | Year Ended | | | Year Ended | |
| | | October 31, | | | October 31, | | | October 31, | | | October 31, | | | October 31, | |
| | | 2023 | | | 2022 | | | 2021 | | | 2020 | | | 2019 | |
| Per Share Data | | | | | | | | | | | | | | | |
| | | | | | | | | | | | | | | | |
| Net asset value, beginning of year | | $ | 15.91 | | | $ | 38.53 | | | $ | 30.75 | | | $ | 23.88 | | | $ | 23.83 | |
| | | | | | | | | | | | | | | | | | | | | |
| Investment operations: | | | | | | | | | | | | | | | | | | | | |
Net investment income (loss)(1) | | | (0.03 | ) | | | (0.09 | ) | | | (0.26 | ) | | | (0.08 | ) | | | 0.01 | (2) |
| Net realized and unrealized | | | | | | | | | | | | | | | | | | | | |
| gain (loss) on investments | | | (0.55 | )(2) | | | (16.44 | ) | | | 9.98 | | | | 7.99 | | | | 2.70 | |
| Total from investment operations | | | (0.58 | ) | | | (16.53 | ) | | | 9.72 | | | | 7.91 | | | | 2.71 | |
| | | | | | | | | | | | | | | | | | | | | |
| Less distributions from: | | | | | | | | | | | | | | | | | | | | |
| Net investment income | | | — | | | | — | | | | — | | | | (0.02 | ) | | | (0.06 | ) |
| Net realized gains | | | — | | | | (6.09 | ) | | | (1.94 | ) | | | (1.02 | ) | | | (2.60 | ) |
| Total distributions | | | — | | | | (6.09 | ) | | | (1.94 | ) | | | (1.04 | ) | | | (2.66 | ) |
| Net asset value, end of year | | $ | 15.33 | | | $ | 15.91 | | | $ | 38.53 | | | $ | 30.75 | | | $ | 23.88 | |
| | | | | | | | | | | | | | | | | | | | | |
| Total Return | | | -3.65 | % | | | -48.81 | % | | | 31.80 | % | | | 34.36 | % | | | 14.02 | % |
| | | | | | | | | | | | | | | | | | | | | |
| Supplemental Data and Ratios | | | | | | | | | | | | | | | | | | | | |
| Net assets, end of year (in 000’s) | | $ | 392,932 | | | $ | 552,794 | | | $ | 1,016,051 | | | $ | 650,845 | | | $ | 452,234 | |
| | | | | | | | | | | | | | | | | | | | | |
| Ratio of expenses to average net assets: | | | | | | | | | | | | | | | | | | | | |
| Before expense waiver/recoupment | | | 0.86 | % | | | 0.83 | % | | | 0.82 | % | | | 0.85 | % | | | 0.87 | % |
| After expense waiver/recoupment | | | 0.87 | % | | | 0.82 | % | | | 0.82 | % | | | 0.87 | % | | | 0.87 | % |
| | | | | | | | | | | | | | | | | | | | | |
| Ratio of expenses excluding interest | | | | | | | | | | | | | | | | | | | | |
| expense to average net assets: | | | | | | | | | | | | | | | | | | | | |
| Before expense waiver/recoupment | | | 0.86 | % | | | 0.83 | % | | | 0.82 | % | | | 0.85 | % | | | 0.87 | % |
| After expense waiver/recoupment | | | 0.86 | % | | | 0.82 | % | | | 0.82 | % | | | 0.87 | % | | | 0.87 | % |
| | | | | | | | | | | | | | | | | | | | | |
| Ratio of net investment loss to average net assets: | | | | | | | | | | | | | | | | | | | | |
| After expense waiver/recoupment | | | (0.18 | )% | | | (0.46 | )% | | | (0.84 | )% | | | (0.30 | )% | | | 0.04 | % |
| | | | | | | | | | | | | | | | | | | | | |
Portfolio Turnover(3) | | | 49 | % | | | 78 | % | | | 56 | % | | | 49 | % | | | 35 | % |
| (1) | Per share amounts calculated using the average shares method. |
| (2) | Net realized and unrealized loss per share in this caption is a balancing amount necessary to reconcile the change in net asset value per share for the year, and may not reconcile with the aggregate gain on the Statement of Operations due to share transactions for the year. |
| (3) | Portfolio turnover disclosed is for the Fund as a whole. |
See Notes to the Financial Statements
Jackson Square SMID-Cap Growth Fund
Financial Highlights
For a Fund share outstanding throughout the years.
Institutional Class
| | | Year Ended | | | Year Ended | | | Year Ended | | | Year Ended | | | Year Ended | |
| | | October 31, | | | October 31, | | | October 31, | | | October 31, | | | October 31, | |
| | | 2023 | | | 2022 | | | 2021 | | | 2020 | | | 2019 | |
| Per Share Data | | | | | | | | | | | | | | | |
| | | | | | | | | | | | | | | | |
| Net asset value, beginning of year | | $ | 15.86 | | | $ | 38.48 | | | $ | 30.73 | | | $ | 23.89 | | | $ | 23.81 | |
| | | | | | | | | | | | | | | | | | | | | |
| Investment operations: | | | | | | | | | | | | | | | | | | | | |
Net investment income (loss)(1) | | | (0.05 | ) | | | (0.12 | ) | | | (0.29 | ) | | | (0.10 | ) | | | (0.01 | ) |
| Net realized and unrealized | | | | | | | | | | | | | | | | | | | | |
| gain (loss) on investments | | | (0.55 | )(2) | | | (16.41 | ) | | | 9.98 | | | | 7.98 | | | | 2.74 | |
| Total from investment operations | | | (0.60 | ) | | | (16.53 | ) | | | 9.69 | | | | 7.88 | | | | 2.73 | |
| | | | | | | | | | | | | | | | | | | | | |
| Less distributions from: | | | | | | | | | | | | | | | | | | | | |
| Net investment income | | | — | | | | — | | | | — | | | | (0.02 | ) | | | (0.05 | ) |
| Net realized gains | | | — | | | | (6.09 | ) | | | (1.94 | ) | | | (1.02 | ) | | | (2.60 | ) |
| Total distributions | | | — | | | | (6.09 | ) | | | (1.94 | ) | | | (1.04 | ) | | | (2.65 | ) |
| Net asset value, end of year | | $ | 15.26 | | | $ | 15.86 | | | $ | 38.48 | | | $ | 30.73 | | | $ | 23.89 | |
| | | | | | | | | | | | | | | | | | | | | |
| Total Return | | | -3.78 | % | | | -48.89 | % | | | 31.71 | % | | | 34.20 | % | | | 14.08 | % |
| | | | | | | | | | | | | | | | | | | | | |
| Supplemental Data and Ratios | | | | | | | | | | | | | | | | | | | | |
| Net assets, end of year (in 000’s) | | $ | 186,025 | | | $ | 320,392 | | | $ | 1,039,786 | | | $ | 725,204 | | | $ | 499,461 | |
| | | | | | | | | | | | | | | | | | | | | |
| Ratio of expenses to average net assets: | | | | | | | | | | | | | | | | | | | | |
| Before expense waiver/recoupment | | | 0.96 | % | | | 0.92 | % | | | 0.91 | % | | | 0.93 | % | | | 0.95 | % |
| After expense waiver/recoupment | | | 0.96 | % | | | 0.91 | % | | | 0.91 | % | | | 0.95 | % | | | 0.95 | % |
| | | | | | | | | | | | | | | | | | | | | |
| Ratio of expenses excluding interest | | | | | | | | | | | | | | | | | | | | |
| expense to average net assets: | | | | | | | | | | | | | | | | | | | | |
| Before expense waiver/recoupment | | | 0.95 | % | | | 0.92 | % | | | 0.91 | % | | | 0.93 | % | | | 0.95 | % |
| After expense waiver/recoupment | | | 0.96 | % | | | 0.91 | % | | | 0.91 | % | | | 0.95 | % | | | 0.95 | % |
| | | | | | | | | | | | | | | | | | | | | |
| Ratio of net investment income (loss) | | | | | | | | | | | | | | | | | | | | |
| to average net assets: | | | | | | | | | | | | | | | | | | | | |
| After expense waiver/recoupment | | | (0.28 | )% | | | (0.55 | )% | | | (0.76 | )% | | | (0.39 | )% | | | (0.04 | )% |
| | | | | | | | | | | | | | | | | | | | | |
Portfolio Turnover(3) | | | 49 | % | | | 78 | % | | | 56 | % | | | 49 | % | | | 35 | % |
| (1) | Per share amounts calculated using the average shares method. |
| (2) | Net realized and unrealized loss per share in this caption is a balancing amount necessary to reconcile the change in net asset value per share for the year, and may not reconcile with the aggregate gain on the Statement of Operations due to share transactions for the year. |
| (3) | Portfolio turnover disclosed is for the Fund as a whole. |
See Notes to the Financial Statements
Jackson Square SMID-Cap Growth Fund
Financial Highlights
For a Fund share outstanding throughout the years.
Investor Class
| | | Year Ended | | | Year Ended | | | Year Ended | | | Year Ended | | | Year Ended | |
| | | October 31, | | | October 31, | | | October 31, | | | October 31, | | | October 31, | |
| | | 2023 | | | 2022 | | | 2021 | | | 2020 | | | 2019 | |
| Per Share Data | | | | | | | | | | | | | | | |
| | | | | | | | | | | | | | | | |
| Net asset value, beginning of year | | $ | 15.54 | | | $ | 37.93 | | | $ | 30.39 | | | $ | 23.68 | | | $ | 23.67 | |
| | | | | | | | | | | | | | | | | | | | | |
| Investment operations: | | | | | | | | | | | | | | | | | | | | |
Net investment loss(1) | | | (0.09 | ) | | | (0.17 | ) | | | (0.38 | ) | | | (0.17 | ) | | | (0.07 | ) |
| Net realized and unrealized | | | | | | | | | | | | | | | | | | | | |
| gain (loss) on investments | | | (0.53 | )(2) | | | (16.13 | ) | | | 9.86 | | | | 7.91 | | | | 2.70 | |
| Total from investment operations | | | (0.62 | ) | | | (16.30 | ) | | | 9.48 | | | | 7.74 | | | | 2.63 | |
| | | | | | | | | | | | | | | | | | | | | |
| Less distributions from: | | | | | | | | | | | | | | | | | | | | |
| Net investment income | | | — | | | | — | | | | — | | | | (0.01 | ) | | | (0.02 | ) |
| Net realized gains | | | — | | | | (6.09 | ) | | | (1.94 | ) | | | (1.02 | ) | | | (2.60 | ) |
| Total distributions | | | — | | | | (6.09 | ) | | | (1.94 | ) | | | (1.03 | ) | | | (2.62 | ) |
| Net asset value, end of year | | $ | 14.92 | | | $ | 15.54 | | | $ | 37.93 | | | $ | 30.39 | | | $ | 23.68 | |
| | | | | | | | | | | | | | | | | | | | | |
| Total Return | | | -3.99 | % | | | -49.01 | % | | | 31.36 | % | | | 33.88 | % | | | 13.69 | % |
| | | | | | | | | | | | | | | | | | | | | |
| Supplemental Data and Ratios | | | | | | | | | | | | | | | | | | | | |
| Net assets, end of year (in 000’s) | | $ | 29,155 | | | $ | 39,098 | | | $ | 107,135 | | | $ | 78,325 | | | $ | 78,819 | |
| | | | | | | | | | | | | | | | | | | | | |
| Ratio of expenses to average net assets: | | | | | | | | | | | | | | | | | | | | |
| Before expense waiver/recoupment | | | 1.22 | % | | | 1.17 | % | | | 1.17 | % | | | 1.20 | % | | | 1.22 | % |
| After expense waiver/recoupment | | | 1.22 | % | | | 1.17 | % | | | 1.17 | % | | | 1.22 | % | | | 1.22 | % |
| | | | | | | | | | | | | | | | | | | | | |
| Ratio of expenses excluding interest | | | | | | | | | | | | | | | | | | | | |
| expense to average net assets: | | | | | | | | | | | | | | | | | | | | |
| Before expense waiver/recoupment | | | 1.21 | % | | | 1.17 | % | | | 1.17 | % | | | 1.20 | % | | | 1.22 | % |
| After expense waiver/recoupment | | | 1.21 | % | | | 1.17 | % | | | 1.17 | % | | | 1.22 | % | | | 1.22 | % |
| | | | | | | | | | | | | | | | | | | | | |
| Ratio of net investment loss to average net assets: | | | | | | | | | | | | | | | | | | | | |
| After expense waiver/recoupment | | | (0.53 | )% | | | (0.80 | )% | | | (1.02 | )% | | | (0.65 | )% | | | (0.31 | )% |
| | | | | | | | | | | | | | | | | | | | | |
Portfolio Turnover(3) | | | 49 | % | | | 78 | % | | | 56 | % | | | 49 | % | | | 35 | % |
| (1) | Per share amounts calculated using the average shares method. |
| (2) | Net realized and unrealized loss per share in this caption is a balancing amount necessary to reconcile the change in net asset value per share for the year, and may not reconcile with the aggregate gain on the Statement of Operations due to share transactions for the year. |
| (3) | Portfolio turnover disclosed is for the Fund as a whole. |
See Notes to the Financial Statements
Jackson Square Funds
Notes to the Financial Statements
October 31, 2023
1. ORGANIZATION
Managed Portfolio Series (the “Trust”) was organized as a Delaware statutory trust on January 27, 2011. The Trust is registered under the Investment Company Act of 1940, as amended (the “1940 Act”), as an open-end management investment company. The Jackson Square Large-Cap Growth Fund (“Large-Cap Growth Fund”), and Jackson Square SMID-Cap Growth Fund (“SMID-Cap Growth Fund”) (each a “Fund” and collectively, the “Funds”) are investment companies and therefore follow the investment company accounting and reporting guidance of the Financial Accounting Standards Board (“FASB”) Accounting Standards Codification Topic 946, Financial Services – Investment Companies. The Large-Cap Growth Fund, and SMID-Cap Growth Fund are each a non-diversified series with their own investment objectives and policies within the Trust. The investment objective of each Fund is long-term capital appreciation. The Funds offer three different share classes – Investor Class, Institutional Class, and IS Class. The Large-Cap Growth Fund currently offers the IS Class shares (previously known as Class R6, prior to April 16, 2021), which commenced operations on May 2, 2016, the Institutional Class shares which commenced operations on February 3, 1994, and the Investor Class shares (previously known as Class A shares before April 16, 2021), which commenced operations on December 3, 1993. Effective April 16, 2021, the Large-Cap Growth Fund ceased offering Class C and Class R shares. The remaining Class C and Class R shares were converted to Investor Class shares at the close of business on April 16, 2021. The SMID-Cap Growth Fund currently offers the IS Class shares, which commenced operations on December 1, 2003, the Institutional Class shares which commenced operations on September 16, 2016, and the Investor Class shares, which commenced operations on September 19, 2016. Each class of shares has identical rights and privileges except with respect to Shareholder Servicing Plan fees, 12b-1 fees, and voting rights on matters affecting a single share class. Institutional Class shares are subject to a maximum 0.10% Shareholder Servicing Plan fee. Investor Class shares are subject to a 0.25% Rule 12b-1 distribution and servicing fee and a maximum 0.10% Shareholder Servicing Plan fee. The Funds may issue an unlimited number of shares of beneficial interest with no par value.
2. SIGNIFICANT ACCOUNTING POLICIES
The following is a summary of significant accounting policies consistently followed by the Funds in preparation of its financial statements. These policies are in conformity with generally accepted accounting principles in the United States of America (“GAAP”).
Security Valuation – All investments in securities are recorded at their estimated fair value, as described in Note 3.
Federal Income Taxes – The Funds comply with the requirements of subchapter M of the Internal Revenue Code of 1986, as amended, necessary to qualify as regulated investment companies and distribute substantially all net taxable investment income and net realized gains to shareholders in a manner which results in no tax cost to the Funds. Therefore, no federal income or excise tax provision is required. As of and during the period ended October 31, 2023, the Funds did not have any tax positions that did not meet the “more-likely-than-not” threshold of being sustained by the applicable tax authority. As of and during the period ended October 31, 2023, the Funds did not have liabilities for any unrecognized tax benefits. The Funds recognize interest and penalties, if any, related to unrecognized tax benefits on uncertain tax positions as income tax expense in the Statement of Operations. As of and during the period ended October 31, 2023, the Funds did not incur any interest or penalties. The Funds are not subject to examination by U.S. tax authorities for tax years prior to the fiscal year ended October 31, 2020.
Jackson Square Funds
Notes to the Financial Statements – Continued
October 31, 2023
Security Transactions, Investment Income and Distributions – The Funds follow industry practice and record security transactions on the trade date. Realized gains and losses on sales of securities are calculated on the basis of identified cost. Dividend income is recorded on the ex-dividend date and interest income is recorded on an accrual basis. Withholding taxes on foreign dividends have been provided for in accordance with the Funds’ understanding of the applicable country’s tax rules and regulations. Discounts and premiums on securities purchased are amortized over the expected life of the respective securities using the constant yield method.
The Funds distribute substantially all net investment income and net realized capital gains, if any, at least annually. Distributions to shareholders are recorded on the ex-dividend date. The treatment for financial reporting purposes of distributions made to shareholders during the year from net investment income or net realized capital gains may differ from their treatment for federal income tax purposes. These differences are caused primarily by differences in the timing of the recognition of certain components of income, expense, or realized capital gain for federal income tax purposes. Where such differences are permanent in nature, GAAP requires that they be reclassified in the components of the net assets based on their ultimate characterization for federal income tax purposes. Any such reclassifications will have no effect on net assets, results of operations or net asset value (“NAV”) per share of the Funds. For the year ended October 31, 2023, the following reclassifications were made:
| Fund | Distributable Earnings | | Paid-in Capital | |
| Large-Cap Growth Fund | $1,968,686 | | $(1,968,686) | |
| SMID-Cap Growth Fund | $4,793,029 | | $(4,793,029) | |
These adjustments were due to net operating loss reclassifications for the Funds.
Foreign Currency – Investment securities and other assets and liabilities denominated in foreign currencies are translated into U.S. dollar amounts at the date of valuation. Purchases and sales of investment securities and income and expense items denominated in foreign currencies are translated into U.S. dollar amounts on the respective dates of such transactions. The Funds do not isolate that portion of the results of operations resulting from changes in foreign exchange rates on investments from the fluctuations arising from changes in market prices of securities held. Such fluctuations are included with the net realized and unrealized gain or loss from investments and translations of foreign currency. The Funds report net realized foreign exchange gains or losses that arise from sales of foreign currencies, currency gains or losses realized between the trade and settlement dates on securities transactions, and the difference between the amounts of dividends, interest, and foreign withholding taxes recorded on the Funds’ books and the U.S. dollar equivalent of the amounts actually received or paid. Net unrealized foreign exchange gains and losses arise from changes in the fair values of assets and liabilities, other than investments in securities at fiscal period end, resulting from changes in exchange rates.
Allocation of Income, Expenses and Gains/Losses – Income, expenses (other than those deemed attributable to a specific share class), and gains and losses of the Funds are allocated daily to each class of shares based upon the ratio of net assets represented by each class as a percentage of the net assets of each Fund. Expenses deemed directly attributable to a class of shares are recorded by the specific class. Most Fund expenses are allocated by class based on relative net assets. Shareholder Servicing Plan fees are expensed at an annual rate up to 0.10% of Institutional Class and Investor Class shares and 12b-1 fees are expensed at annual rate of 0.25% of average daily net assets of Investor Class shares (See Note 5). Expenses associated with a specific Fund in the Trust are charged to that Fund. Common Trust expenses are typically allocated evenly between the Funds of the Trust, or by other equitable means.
Securities Litigation – Proceeds received from securities litigation are recorded for a reduction of cost if the Fund holds the security. If a Fund does not still hold the security, then proceeds received from securities litigation are recorded as a realized gain.
Jackson Square Funds
Notes to the Financial Statements – Continued
October 31, 2023
Use of Estimates – The preparation of financial statements in conformity with GAAP requires management to make estimates and assumptions that affect the reported amounts of assets and liabilities and disclosure of contingent assets and liabilities at the date of the financial statements and the reported amounts of revenues and expenses during the reporting period. Actual results could differ from those estimates.
3. SECURITIES VALUATION
The Funds have adopted authoritative fair value accounting standards which establish an authoritative definition of fair value and set out a hierarchy for measuring fair value. These standards require additional disclosures about the various inputs and valuation techniques used to develop the measurements of fair value, a discussion in changes in valuation techniques and related inputs during the period and expanded disclosure of valuation Levels for major security types. These inputs are summarized in the three broad Levels listed below:
| Level 1 – | Unadjusted quoted prices in active markets for identical assets or liabilities that the Funds have the ability to access. |
| | |
| Level 2 – | Observable inputs other than quoted prices included in Level 1 that are observable for the asset or liability, either directly or indirectly. These inputs may include quoted prices for the identical instrument on an inactive market, prices for similar instruments, interest rates, prepayment speeds, credit risk, yield curves, default rates and similar data. |
| | |
| Level 3 – | Unobservable inputs for the asset or liability, to the extent relevant observable inputs are not available, representing the Funds’ own assumptions about the assumptions a market participant would use in valuing the asset or liability, and would be based on the best information available. |
Following is a description of the valuation techniques applied to each Fund’s major categories of assets and liabilities measured at fair value on a recurring basis. Each Fund’s investments are carried at fair value.
Equity Securities – Equity securities that are primarily traded on a national securities exchange shall be valued at the last sale price on the exchange on which they are primarily traded on the day of valuation or, if there has been no sale on such day, at the mean between the bid and ask prices. Securities traded primarily in the Nasdaq Global Market System for which market quotations are readily available shall be valued using the Nasdaq Official Closing Price (“NOCP”). If the NOCP is not available, such securities shall be valued at the last sale price on the day of valuation, or if there has been no sale on such day, at the mean between the bid and ask prices. To the extent these securities are actively traded and valuation adjustments are not applied, they are categorized in Level 1 of the fair value hierarchy. If the market for a particular security is not active, and the mean between bid and ask prices is used, these securities are categorized in Level 2 of the fair value hierarchy.
In the case of foreign securities, the occurrence of events after the close of foreign markets, but prior to the time the Funds’ NAV is calculated will result in an adjustment to the trading prices of foreign securities when foreign markets open on the following business day. The Fund will value foreign securities at fair value, taking into account such events in calculating the NAV. In such cases, use of fair valuation can reduce an investor’s ability to seek to profit by estimating the Funds’ NAV in advance of the time the NAV is calculated. All foreign securities, with the exception of Canadian securities and those listed on a U.S. exchange, have an adjustment applied to their trade price and therefore are automatically deemed to be in Level 2 of the fair value hierarchy.
Jackson Square Funds
Notes to the Financial Statements – Continued
October 31, 2023
Short-Term Investments – Investments in other mutual funds, including money market funds, are valued at their NAV per share. Deposit accounts are valued at acquisition cost, which approximates fair value. To the extent these securities are actively traded and valuation adjustments are not applied, they are categorized in Level 1 of the fair value hierarchy.
U.S. government securities are normally valued using a model that incorporates market observable data such as reported sales of similar securities, broker quotes, yields, bids, offers, and reference data. These securities are valued principally using dealer quotations. U.S. government securities are categorized in Level 2 of the fair value hierarchy depending on the inputs used and market activity levels for specific securities.
The Board of Trustees (the “Board”) has adopted a pricing and valuation policy for use by the Funds and their Valuation Designee (as defined below) in calculating the Funds NAV. Pursuant to Rule 2a-5 under the 1940 Act, the Funds have designated Jackson Square Partners, LLC (the “Adviser”) as its “Valuation Designee” to perform all the fair value determinations as well as to perform all of the responsibilities that may be performed by the Valuation Designee in accordance with Rule 2a-5. The Valuation Designee is authorized to make all necessary determinations of the fair values of portfolio securities and other assets for which market quotations are not readily available or if it is deemed that the prices obtained from brokers and dealers, or independent pricing services are unreliable.
The inputs or methodology used for valuing securities are not an indication of the risk associated with investing in those securities. The following tables are a summary of the inputs used to value each Fund’s securities as of October 31, 2023:
| Large-Cap Growth Fund | | Level 1 | | | Level 2 | | | Level 3 | | | Total | |
| Common Stocks | | $ | 182,729,869 | | | $ | — | | | $ | — | | | $ | 182,729,869 | |
| Short-Term Investment | | | 3,958,198 | | | | — | | | | — | | | | 3,958,198 | |
| Total Investment in Securities | | $ | 186,688,067 | | | $ | — | | | $ | — | | | $ | 186,688,067 | |
| | | | | | | | | | | | | | | | | |
| SMID-Cap Growth Fund | | Level 1 | | | Level 2 | | | Level 3 | | | Total | |
| Common Stocks | | $ | 601,707,353 | | | $ | — | | | $ | — | | | $ | 601,707,353 | |
| Short-Term Investment | | | 11,954,536 | | | | — | | | | — | | | | 11,954,536 | |
| Total Investment in Securities | | $ | 613,661,889 | | | $ | — | | | $ | — | | | $ | 613,661,889 | |
Refer to the Schedules of Investments for further information on the classification of investments.
4. INVESTMENT ADVISORY FEE AND OTHER TRANSACTIONS WITH AFFILIATES
The Trust has an agreement with the Adviser to furnish investment advisory services to the Funds. For its services, the Funds pay the Adviser a monthly management fee based upon the average daily net assets of the Funds at the following annual rates:
| Fund | | |
| Large-Cap Growth Fund | 0.55% on assets up to $2.5 billion | |
| | 0.525% on assets between $2.5 billion and $5 billion | |
| | 0.50% on assets greater than $5 billion | |
| SMID-Cap Growth Fund | 0.75% | |
Jackson Square Funds
Notes to the Financial Statements – Continued
October 31, 2023
The Funds’ Adviser has contractually agreed to waive a portion or all of its management fees and/or reimburse the Funds for their expenses to ensure that total annual operating expenses (excluding Rule 12b-1 fees, Shareholder Servicing Plan fees, acquired fund fees and expenses, brokerage commissions, leverage, interest, taxes, and extraordinary expenses) do not exceed the following rates (based upon the average daily net assets of the Funds):
| Fund | | |
| Large-Cap Growth Fund | 0.64% | |
| SMID-Cap Growth Fund | 0.87% | |
Fees waived and expenses reimbursed by the Adviser may be recouped by the Adviser for a period of thirty-six months following the month during which such waiver or reimbursement was made if such recoupment can be achieved without exceeding the expense limit in effect at the time the waiver or reimbursement occurred. The Operating Expense Limitation Agreement is indefinite in term, but cannot be terminated within a year after the effective date of the Funds’ prospectus. After that date, the agreement may be terminated at any time upon 60 days’ written notice by the Board or the Adviser. During the year ended October 31, 2023 the Adviser was able to recoup $23,584 from the SMID-Cap Growth Fund, relating to fees waived in the prior fiscal year. Waived fees and reimbursed expenses subject to potential recovery by month of expiration are as follows:
| | | November 2023 – | | | November 2024 – | | | November 2025 – | |
| Fund | | October 2024 | | | October 2025 | | | October 2026 | |
| Large-Cap Growth Fund | | $ | — | | | $ | 27,417 | | | $ | 227,714 | |
| SMID-Cap Growth Fund | | | — | | | | — | | | | — | |
U.S. Bancorp Fund Services, LLC (the “Administrator”), doing business as U.S. Bank Global Fund Services, acts as the Funds’ Administrator, Transfer Agent, and Fund Accountant. U.S. Bank N.A. (the “Custodian”) serves as the Custodian to the Funds. The Custodian is an affiliate of the Administrator. The Administrator performs various administrative and accounting services for the Funds. The Administrator prepares various federal and state regulatory filings, reports and returns for the Funds; prepares reports and materials to be supplied to the Trustees; monitors the activities of the Custodian; coordinates the payment of the Funds’ expenses and reviews the Funds’ expense accruals. The officers of the Trust, including the Chief Compliance Officer, are employees of the Administrator. As compensation for its services, the Administrator is entitled to a monthly fee at an annual rate based upon the average daily net assets of the Fund, subject to annual minimums. Fees paid by the Funds for administration and fund accounting, transfer agency, custody and compliance services for the year ended October 31, 2023, are disclosed in the Statements of Operations.
5. DISTRIBUTION & SHAREHOLDER SERVICING FEES
The Funds have adopted a Distribution Plan pursuant to Rule 12b-1 (the “Plan”) in the Investor Class only. The Plan permits the Funds to pay for distribution and related expenses at an annual rate of 0.25% of the Investor Class average daily net assets. The expenses covered by the Plan may include the cost of preparing and distributing prospectuses and other sales material, advertising and public relations expenses, payments to financial intermediaries and compensation of personnel involved in selling shares of the Funds. For the year ended October 31, 2023, the Investor Class of the Funds incurred expenses pursuant to the Plan as follows:
| Fund | | |
| Large-Cap Growth Fund | $184,361 | |
| SMID-Cap Growth Fund | 93,644 | |
Jackson Square Funds
Notes to the Financial Statements – Continued
October 31, 2023
The Funds have entered into a Shareholder Servicing Plan agreement (the “Agreement”) with the Adviser, where the Adviser acts as the shareholder agent, under which the Funds may pay servicing fees at an annual rate of up to 0.10% of the average daily net assets of the Institutional Class and Investor Class. Payments, if any, to the Adviser under the Agreement may reimburse the Adviser for payments it makes to selected brokers, dealers and administrators which have entered into service agreements with the Adviser for services provided to shareholders of the Funds. Payments may also be made directly to the intermediaries providing shareholder services. The services provided by such intermediaries are primarily designed to assist shareholders of the Fund and include the furnishing of office space and equipment, telephone facilities, personnel and assistance to the Funds in servicing such shareholders. Services provided by such intermediaries also include the provision of support services to the Funds and include establishing and maintaining shareholders’ accounts and record processing, purchase and redemption transactions, answering routine client inquiries regarding the Funds, and providing such other personal services to shareholders as the Funds may reasonably request. For the year ended October 31, 2023, the Funds incurred Shareholder Servicing Plan fees as follows:
| Fund | Institutional Class | Investor Class | |
| Large-Cap Growth Fund | 61,842 | 26,294 | |
| SMID-Cap Growth Fund | 277,997 | 37,457 | |
6. CAPITAL SHARE TRANSACTIONS
| | | Large-Cap Growth Fund | |
| | | Year Ended | | | Year Ended | |
| | | October 31, 2023 | | | October 31, 2022 | |
| IS Class: | | | | | | |
| Shares sold | | | 45,830 | | | | 4,594,166 | |
| Shares issued in reinvestment of distributions | | | — | | | | 10,561,857 | |
| Shares redeemed | | | (1,980,739 | ) | | | (3,974,538 | ) |
| Shares redeemed in-kind | | | — | | | | (38,083,289 | ) |
| Net decrease | | | (1,934,909 | ) | | | (26,901,804 | ) |
| Institutional Class: | | | | | | | | |
| Shares sold | | | 642,187 | | | | 1,796,378 | |
| Shares issued in reinvestment of distributions | | | — | | | | 5,756,792 | |
| Shares redeemed | | | (3,027,688 | ) | | | (41,019,288 | ) |
| Net decrease | | | (2,385,501 | ) | | | (33,466,118 | ) |
| Investor Class: | | | | | | | | |
| Shares sold | | | 233,481 | | | | 156,020 | |
| Shares issued in reinvestment of distributions | | | — | | | | 2,595,893 | |
| Shares redeemed | | | (1,417,238 | ) | | | (2,441,001 | ) |
| Net increase (decrease) | | | (1,183,757 | ) | | | 310,912 | |
| Net decrease in capital shares | | | (5,504,167 | ) | | | (60,057,010 | ) |
Jackson Square Funds
Notes to the Financial Statements – Continued
October 31, 2023
| | | SMID-Cap Growth Fund | |
| | | Year Ended | | | Year Ended | |
| | | October 31, 2023 | | | October 31, 2022 | |
| IS Class: | | | | | | |
| Shares sold | | | 1,573,393 | | | | 9,374,834 | |
| Shares issued in reinvestment of distributions | | | — | | | | 5,810,339 | |
| Shares redeemed | | | (10,672,124 | ) | | | (6,817,863 | ) |
| Net increase (decrease) | | | (9,098,731 | ) | | | 8,367,310 | |
| Institutional Class: | | | | | | | | |
| Shares sold | | | 3,349,706 | | | | 12,188,922 | |
| Shares issued in reinvestment of distributions | | | — | | | | 5,491,354 | |
| Shares redeemed | | | (11,358,962 | ) | | | (24,506,324 | ) |
| Net decrease | | | (8,009,256 | ) | | | (6,826,048 | ) |
| Investor Class: | | | | | | | | |
| Shares sold | | | 171,585 | | | | 426,809 | |
| Shares issued in reinvestment of distributions | | | — | | | | 648,785 | |
| Shares redeemed | | | (732,535 | ) | | | (1,384,702 | ) |
| Net decrease | | | (560,950 | ) | | | (309,108 | ) |
| Net increase (decrease) in capital shares | | | (17,668,937 | ) | | | 1,232,154 | |
7. INVESTMENT TRANSACTIONS
The aggregate purchases and sales, excluding short-term investments, by Fund for the year ended October 31, 2023, were as follows:
| | | U.S. Government Securities | | | Other Securities | |
| Fund | | Purchases | | | Sales | | | Purchases | | | Sales | |
| Large-Cap Growth Fund | | $ | — | | | $ | — | | | $ | 74,541,038 | �� | | $ | 143,861,940 | |
| SMID-Cap Growth Fund | | | — | | | | — | | | | 403,882,230 | | | | 687,810,606 | |
8. FEDERAL TAX INFORMATION
The aggregate gross unrealized appreciation and depreciation of securities held by the Funds and the total cost of securities for federal income tax purposes at October 31, 2023, were as follows:
| | | | | | | | | Net Unrealized | | | | |
| | | Aggregate Gross | | | Aggregate Gross | | | Appreciation | | | Federal Income | |
| Fund | | Appreciation | | | Depreciation | | | (Depreciation) | | | Tax Cost | |
| Large-Cap Growth Fund | | $ | 43,288,588 | | | $ | (12,307,267 | ) | | $ | 30,981,321 | | | $ | 155,706,746 | |
| SMID-Cap Growth Fund | | | 62,037,338 | | | | (122,546,430 | ) | | | (60,509,092 | ) | | | 674,170,981 | |
Any differences between book-basis and tax-basis unrealized appreciation (depreciation) is attributable primarily to the deferral of wash sale losses.
Jackson Square Funds
Notes to the Financial Statements – Continued
October 31, 2023
At October 31, 2023, the components of distributable earnings on a tax-basis were as follows:
| | | Undistributed | | | Undistributed | | | Other | | | Net Unrealized | | | Total | |
| | | Ordinary | | | Long-Term | | | Accumulated | | | Appreciation | | | Distributable | |
| Fund | | Income | | | Capital Gains | | | Losses | | | (Depreciation) | | | Earnings | |
| Large-Cap Growth Fund | | $ | — | | | $ | — | | | $ | (16,019,490 | ) | | $ | 30,981,321 | | | $ | 14,961,831 | |
| SMID-Cap Growth Fund | | | — | | | | — | | | | (486,109,457 | ) | | | (60,509,092 | ) | | | (546,618,549 | ) |
As of October 31, 2023, the Large-Cap Growth Fund had a long-term capital loss carryforward of $15,749,504. The SMID-Cap Growth Fund had a short-term capital loss carryforward of $245,299,248 and a long-term capital loss carryforward of $238,914,490. A regulated investment company may elect for any taxable year to treat any portion of any qualified late year loss as arising on the first day of the next taxable year. Qualified late year losses are certain capital, and ordinary losses which occur during the portion of the Fund’s taxable year subsequent to October 31 and December 31, respectively. For the taxable year ended October 31, 2023, the Funds did not defer any post-October losses. The Large-Cap Growth Fund deferred, on a tax basis, qualified late year losses of $269,986. The SMID-Cap Growth Fund deferred, on a tax basis, qualified late year losses of $1,626,220.
The Funds did not pay a distribution during the year ended October 31, 2023.
The tax character of distributions paid during the year ended October 31, 2022, was as follows:
| Fund | Ordinary* Income | | Long-Term Capital Gains | | Total |
| Large-Cap Growth Fund | | $ | 21,477,448 | | | | $ | 375,478,096 | | | | $ | 396,955,544 | |
| SMID-Cap Growth Fund | | | — | | | | | 315,991,837 | | | | | 315,991,837 | |
| * | For Federal income tax purposes, distributions of short-term capital gains are treated as ordinary income distributions. |
9. LINE OF CREDIT
The Large-Cap Growth Fund and SMID-Cap Growth Fund (collectively, the “Funds”) have established an unsecured line of credit (“LOC”) in the amount of $75,000,000, 15% of a Fund’s gross market value or 33.33% of the fair value of the Fund’s investments, whichever is less. The LOC matures, unless renewed on July 19, 2024. The LOC is intended to provide short-term financing, if necessary, subject to certain restrictions and covenants, in connection with shareholder redemptions and other short-term liquidity needs of the Funds. The LOC is with the Custodian. Interest is charged at the prime rate which was 8.50% as of October 31, 2023. The interest rate during the period was between 6.25% and 8.50%. The weighted interest paid on outstanding borrowings was 8.47% and 8.30% for the Large-Cap Growth Fund and SMID-Cap Growth Fund respectively. The Funds have authorized the Custodian. to charge any of the accounts of the Funds for any missed payments. For the year ended October 31, 2023, the Fund’s LOC activity was as follows:
| | | | Amount | | | |
| | | | Outstanding | | | Date of |
| | | Average | as of | Interest | Maximum | Maximum |
| Fund | LOC Agent | Borrowings | October 31, 2023 | Expense | Borrowing | Borrowing |
| Large-Cap | | | | | | |
| Growth Fund | U.S. Bank N.A. | $ 25,178 | — | $ 2,163 | $ 8,872,000 | September 28, 2023 |
| SMID-Cap | | | | | | |
| Growth Fund | U.S. Bank N.A. | $687,096 | — | $57,807 | $42,332,000 | May 12-14, 2023 |
Jackson Square Funds
Notes to the Financial Statements – Continued
October 31, 2023
10. SECTOR RISKS
As of October 31, 2023, the Large-Cap Growth Fund had a significant portion of their assets invested in the information technology sector. The information technology sector may be more sensitive to changes in domestic and international competition, economic cycles, financial resources, personnel availability, rapid innovation and intellectual property issues.
11. CONTROL OWNERSHIP
The beneficial ownership, either directly or indirectly, of more than 25% of the voting securities of a fund creates a presumption of control of the fund, under Section 2(a)(9) of the 1940 Act. As of October 31, 2023, each Fund’s percentage of control ownership positions greater than 25% are as follows:
| Fund | Shareholder | Percent of Shares Held |
| SMID-Cap Growth Fund | National Financial Services | 25.47% |
12. OTHER REGULATORY MATTERS
In October 2022, the Securities and Exchange Commission (the “SEC”) adopted a final rule relating to Tailored Shareholder Reports for Mutual Funds and Exchange-Traded Funds; Fee Information in Investment Company Advertisements. The rule and form amendments will, among other things, require the Fund to transmit concise and visually engaging shareholder reports that highlight key information. The amendments will require that funds tag information in a structured data format and that certain more in-depth information be made available online and available for delivery free of charge to investors on request. The amendments became effective January 24, 2023. There is an 18-month transition period after the effective date of the amendment.
Jackson Square Funds
Report of Independent Registered Public Accounting Firm
To the Shareholders of Jackson Square Funds and
Board of Trustees of Managed Portfolio Series
Opinion on the Financial Statements
We have audited the accompanying statements of assets and liabilities, including the schedules of investments, of the funds listed below (“Jackson Square Funds” or the “Funds”), each a series of Managed Portfolio Series, as of October 31, 2023, the related statements of operations, the statements of changes in net assets, the related notes, and the financial highlights for each of the periods indicated below (collectively referred to as the “financial statements”). In our opinion, the financial statements present fairly, in all material respects, the financial position of each of the Funds as of October 31, 2023, the results of their operations, the changes in net assets, and the financial highlights for each of the periods indicated below in conformity with accounting principles generally accepted in the United States of America.
| | | Statements of | |
| | Statements | Changes in | |
Fund Name | of Operations | Net Assets | Financial Highlights |
| Jackson Square Large-Cap Growth Fund | For the year ended | For the years ended | For the years ended |
| | October 31, 2023 | October 31, 2023 | October 31, 2023, 2022, |
| | | and 2022 | and 2021 |
| | | | |
| Jackson Square SMID-Cap Growth Fund | For the year ended | For the years ended | For the years ended |
| | October 31, 2023 | October 31, 2023 | October 31, 2023, 2022, |
| | | and 2022 | 2021, 2020, and 2019 |
The Delaware U.S. Growth Fund, predecessor fund to the Jackson Square Large-Cap Growth Fund, financial highlights for the years ended October 31, 2020, and prior, were audited by other auditors whose report dated December 21, 2020, expressed an unqualified opinion on those financial highlights.
Basis for Opinion
These financial statements are the responsibility of the Funds’ management. Our responsibility is to express an opinion on the Funds’ financial statements based on our audits. We are a public accounting firm registered with the Public Company Accounting Oversight Board (United States) (“PCAOB”) and are required to be independent with respect to the Funds in accordance with the U.S. federal securities laws and the applicable rules and regulations of the Securities and Exchange Commission and the PCAOB.
We conducted our audits in accordance with the standards of the PCAOB. Those standards require that we plan and perform the audit to obtain reasonable assurance about whether the financial statements are free of material misstatement whether due to error or fraud.
Our audits included performing procedures to assess the risks of material misstatement of the financial statements, whether due to error or fraud, and performing procedures that respond to those risks. Such procedures included examining, on a test basis, evidence regarding the amounts and disclosures in the financial statements. Our procedures included confirmation of securities owned as of October 31, 2023, by correspondence with the custodian and brokers. Our audits also included evaluating the accounting principles used and significant estimates made by management, as well as evaluating the overall presentation of the financial statements. We believe that our audits provide a reasonable basis for our opinion.
We have served as the auditor of one or more investment companies advised by Jackson Square Partners, LLC since 2016.
COHEN & COMPANY, LTD.
Milwaukee, Wisconsin
December 27, 2023
Jackson Square Funds
Additional Information (Unaudited)
Statement Regarding the Funds’ Liquidity Risk Management Program
Pursuant to Rule 22e-4 under the Investment Company Act of 1940, Managed Portfolio Series (the “Trust”), on behalf of the Jackson Square Large-Cap Growth Fund and the Jackson Square SMID-Cap Growth Fund (each a “Fund” and together, the “Funds”), has adopted and implemented a written liquidity risk management program (the “Program”) that includes policies and procedures reasonably designed to comply with the requirements of Rule 22e-4, including: (i) assessment, management and periodic review of liquidity risk; (ii) classification of portfolio holdings; (iii) establishment of a highly liquid investment minimum (“HLIM”), as applicable; (iv) limitation on illiquid investments; and (v) redemptions in-kind. The Trust’s Board of Trustees (the “Board”) has approved the designation of Jackson Square Partners, LLC (“Jackson Square”) as the administrator of the Program (the “Program Administrator”). Personnel of Jackson Square conduct the day-to-day operation of the Program pursuant to policies and procedures administered by the Program Administrator.
In accordance with Rule 22e-4, the Board reviewed a report prepared by the Program Administrator (the “Report”) regarding the operation of the Program and its adequacy and effectiveness of implementation for the period January 1, 2022, through December 31, 2022 (the “Reporting Period”). No significant liquidity events impacting the Funds during the Reporting Period or material changes to the Program were noted in the Report.
Under the Program, the Program Administrator manages and periodically reviews each Fund’s liquidity risk, including consideration of applicable factors specified in Rule 22e-4 and the Program. Liquidity risk is defined as the risk that a Fund could not meet shareholder redemption requests without significant dilution of remaining shareholders’ interests in the Fund. In general, this risk was managed during the Reporting Period by monitoring the degree of liquidity of each Fund’s investments, limiting the amount of each Fund’s illiquid investments, and utilizing various risk management tools and facilities available to each Fund for meeting shareholder redemptions, among other means. In the Report, Jackson Square provided its assessment that, based on the information considered in its review, the Program remains reasonably designed to manage each Fund’s liquidity risk and each Fund’s investment strategy remains appropriate for an open-end fund.
Pursuant to the Program, the Program Administrator oversaw the classification of each of the Funds’ portfolio investments as highly liquid, moderately liquid, less liquid or illiquid during the Reporting Period, including in connection with recording investment classifications on Form N-PORT. The process utilized by Jackson Square for determining the degree of liquidity of each Fund’s investments is supported by one or more third-party liquidity assessment vendors.
Each Fund qualified as a “primarily highly liquid fund” as defined in the Program during the Reporting Period. Accordingly, each Fund was not required to establish a HLIM or comply with the related Program provisions during the Reporting Period.
During the Reporting Period, each Fund’s investments were monitored for compliance with the 15% limitation on illiquid investments pursuant to the Program and in accordance with Rule 22e-4. The Report noted that all redemptions in-kind during the Reporting Period were effected in accordance with the Trust’s Redemption in Kind Policy.
The Report concluded, with respect to each Fund: (i) the Program was implemented and operated effectively to achieve the goal of assessing and managing the Fund’s liquidity risk during the Reporting Period; and (ii) the Fund was able to meet requests for redemption without significant dilution of remaining investors’ interests in the Fund during the Reporting Period.
Jackson Square Funds
Additional Information (Unaudited)
October 31, 2023
TRUSTEES & OFFICERS
| | | Term of | Number of | | Other |
| | | Office and | Portfolios | | Directorships |
| | Position(s) | Length of | in Trust | | Held by |
| Name, Address and | Held with | Time | Overseen | Principal Occupation(s) | Trustee During |
Year of Birth | the Trust | Served | by Trustee | During the Past Five Years | the Past Five Years |
| Independent Trustees | | | | | |
| | | | | | |
| Leonard M. Rush, CPA | Chairman, | Indefinite | 31 | Retired, Chief Financial Officer, | Independent Trustee, |
| 615 E. Michigan St. | Trustee | Term; Since | | Robert W. Baird & Co. Incorporated | ETF Series Solutions |
| Milwaukee, WI 53202 | and Audit | April 2011 | | (2000-2011). | (57 Portfolios) |
| Year of Birth: 1946 | Committee | | | | (2012-Present). |
| | Chairman | | | | |
| | | | | | |
| David A. Massart | Trustee | Indefinite | 31 | Partner and Managing Director, Beacon | Independent Trustee, |
| 615 E. Michigan St. | | Term; Since | | Pointe Advisors, LLC (since 2022); | ETF Series Solutions |
| Milwaukee, WI 53202 | | April 2011 | | Co-Founder and Chief Investment | (57 Portfolios) |
| Year of Birth: 1967 | | | | Strategist, Next Generation Wealth | (2012-Present). |
| | | | | Management, Inc. (2005-2021). | |
Jackson Square Funds
Additional Information (Unaudited) – Continued
October 31, 2023
| | | Term of | Number of | | Other |
| | | Office and | Portfolios | | Directorships |
| | Position(s) | Length of | in Trust | | Held by |
| Name, Address and | Held with | Time | Overseen | Principal Occupation(s) | Trustee During |
Year of Birth | the Trust | Served | by Trustee | During the Past Five Years | the Past Five Years |
| David M. Swanson | Trustee and | Indefinite | 31 | Founder and Managing Principal, | Independent Trustee, |
| 615 E. Michigan St. | Nominating & | Term; Since | | SwanDog Strategic Marketing, LLC | ALPS Variable |
| Milwaukee, WI 53202 | Governance | April 2011 | | (2006-present) | Investment Trust |
| Year of Birth: 1957 | Committee | | | | (7 Portfolios) |
| | Chairman | | | | (2006 to Present); |
| | | | | | Independent Trustee, |
| | | | | | RiverNorth Funds |
| | | | | | (3 Portfolios) |
| | | | | | (2018 to Present); |
| | | | | | RiverNorth Managed |
| | | | | | Duration Municipal |
| | | | | | Income Fund, Inc. |
| | | | | | (1 Portfolio) |
| | | | | | (2019 to Present); |
| | | | | | RiverNorth |
| | | | | | Opportunistic |
| | | | | | Municipal Income |
| | | | | | Fund, Inc. |
| | | | | | (1 Portfolio) |
| | | | | | (2018 to Present); |
| | | | | | RiverNorth Capital |
| | | | | | and Income Fund |
| | | | | | (1 Portfolio) |
| | | | | | (2018 to Present); |
| | | | | | RiverNorth |
| | | | | | Opportunities Fund |
| | | | | | (1 Portfolio) |
| | | | | | (2015 to Present); |
| | | | | | RiverNorth/ |
| | | | | | DoubleLine Strategic |
| | | | | | Opportunity Fund, |
| | | | | | Inc. (1 Portfolio) |
| | | | | | (2019 to Present); |
| | | | | | RiverNorth Flexible |
| | | | | | Municipal Income |
| | | | | | Fund, Inc. |
| | | | | | (1 Portfolio) |
| | | | | | (2020 to Present); |
| | | | | | RiverNorth Flexible |
| | | | | | Municipal Income |
| | | | | | Fund II, Inc. |
| | | | | | (1 Portfolio) |
| | | | | | (2021 to Present); |
| | | | | | RiverNorth Managed |
| | | | | | Duration Municipal |
| | | | | | Income Fund II, Inc. |
| | | | | | (1 Portfolio) |
| | | | | | (2022 to Present). |
Jackson Square Funds
Additional Information (Unaudited) – Continued
October 31, 2023
| | | Term of | Number of | | Other |
| | | Office and | Portfolios | | Directorships |
| | Position(s) | Length of | in Trust | | Held by |
| Name, Address and | Held with | Time | Overseen | Principal Occupation(s) | Trustee During |
Year of Birth | the Trust | Served | by Trustee | During the Past Five Years | the Past Five Years |
| Robert J. Kern | Trustee | Indefinite | 31 | Retired (July 2018 – present); Executive | None |
| 615 E. Michigan St. | | Term; Since | | Vice President, U.S. Bancorp Fund | |
| Milwaukee, WI 53202 | | January 2011 | | Services, LLC (1994-2018). | |
| Year of Birth: 1958 | | | | | |
| | | | | | |
| Officers | | | | | |
| | | | | | |
| Brian R. Wiedmeyer | President and | Indefinite | N/A | Vice President, U.S. Bancorp Fund | N/A |
| 615 E. Michigan St. | Principal | Term, Since | | Services, LLC (2005-present). | |
| Milwaukee, WI 53202 | Executive | November 2018 | | | |
| Year of Birth: 1973 | Officer | | | | |
| | | | | | |
| Deborah Ward | Vice President, | Indefinite | N/A | Senior Vice President, U.S. Bancorp | N/A |
| 615 E. Michigan St. | Chief | Term; Since | | Fund Services, LLC (2004-present). | |
| Milwaukee, WI 53202 | Compliance | April 2013 | | | |
| Year of Birth: 1966 | Officer and | | | | |
| | Anti-Money | | | | |
| | Laundering | | | | |
| | Officer | | | | |
| | | | | | |
| Benjamin Eirich | Treasurer, | Indefinite | N/A | Assistant Vice President, U.S. Bancorp | N/A |
| 615 E. Michigan St. | Principal | Term; Since | | Fund Services, LLC (2008-present). | |
| Milwaukee, WI 53202 | Financial | August 2019 | | | |
| Year of Birth: 1981 | Officer and | (Treasurer); | | | |
| | Vice President | Since | | | |
| | | November 2018 | | | |
| | | (Vice President) | | | |
| | | | | | |
| John Hadermayer | Secretary | Indefinite | N/A | U.S. Bancorp Fund Services, LLC | N/A |
| 615 E. Michigan St. | | Term; Since | | (2022-present); Executive Director, | |
| Milwaukee, WI 53202 | | May 2022 | | AQR Capital Management, LLC | |
| Year of Birth: 1977 | | | | (2013-present). | |
| | | | | | |
| Silinapha Saycocie | Assistant | Indefinite | N/A | Officer, U.S. Bancorp Fund Services, | N/A |
| 615 E. Michigan St. | Treasurer | Term; Since | | LLC (2020-present). | |
| Milwaukee, WI 53202 | and Vice | May Since | | | |
| Year of Birth: 1998 | President | November 2023 | | | |
| | | | | | |
| Sara J. Bollech | Assistant | Indefinite | N/A | Officer, U.S. Bancorp Fund Services, | N/A |
| 615 E. Michigan St. | Treasurer | Term; Since | | LLC (2007-present). | |
| Milwaukee, WI 53202 | and Vice | November 2021 | | | |
| Year of Birth: 1977 | President | | | | |
| | | | | | |
| Peter A. Walker, CPA | Assistant | Indefinite | N/A | Officer, U.S. Bancorp Fund Services, | N/A |
| 615 E. Michigan St. | Treasurer | Term; Since | | LLC (2016-present). | |
| Milwaukee, WI 53202 | and Vice | November 2021 | | | |
| Year of Birth: 1993 | President | | | | |
Jackson Square Funds
Additional Information (Unaudited) – Continued
October 31, 2023
AVAILABILITY OF FUND PORTFOLIO INFORMATION
Each Fund files complete schedules of portfolio holdings with the SEC for the first and third quarters of each fiscal year on Part F of Form N-PORT. The Funds’ Part F of N-PORT are available on the SEC’s website at www.sec.gov and may be reviewed and coped at the SEC’s Public Reference Room in Washington, D.C. For information on the Public Reference Room call 1-800-SEC-0330. In addition, each Funds’ Part F of Form N-PORT is available without charge upon request by calling 1-844-577-3863.
AVAILABILITY OF FUND PROXY VOTING INFORMATION
A description of the Funds’ Proxy Voting Policies and Procedures is available without charge, upon request, by calling 1-844-577-3863. Information regarding how the Funds voted proxies relating to portfolio securities during the most recent 12-month period ended June 30 is available (1) without charge, upon request, by calling 1-844-577-3863, or (2) on the SEC’s website at www.sec.gov.
QUALIFIED DIVIDEND INCOME/DIVIDENDS RECEIVED DEDUCTION
For the fiscal year ended October 31, 2023, certain dividends paid by the Funds may be reported as qualified dividend income and may be eligible for taxation at capital gains rates. The percentage of dividends declared from ordinary income designated as qualified dividend income was as follows:
| Fund | | |
| Large-Cap Growth Fund | 0.00% | |
| SMID-Cap Growth Fund | 0.00% | |
For corporate shareholders, the percent of ordinary income distributions qualifying for the corporate dividends received deduction for the fiscal year ended October 31,2023 was as follows:
| Fund | | |
| Large-Cap Growth Fund | 0.00% | |
| SMID-Cap Growth Fund | 0.00% | |
The percentage of taxable ordinary income distributions that are designated as short-term capital gain distributions under the Internal Revenue Section 871(k)(2)(C) for each Fund were as follows:
| Fund | | |
| Large-Cap Growth Fund | 0.00% | |
| SMID-Cap Growth Fund | 0.00% | |
Jackson Square Funds
Privacy Notice (Unaudited)
The Funds collect only relevant information about you that the law allows or requires it to have in order to conduct its business and properly service you. The Funds collect financial and personal information about you (“Personal Information”) directly (e.g., information on account applications and other forms, such as your name, address, and social security number, and information provided to access account information or conduct account transactions online, such as password, account number, e-mail address, and alternate telephone number), and indirectly (e.g., information about your transactions with us, such as transaction amounts, account balance and account holdings).
The Funds do not disclose any non-public personal information about its shareholders or former shareholders other than for everyday business purposes such as to process a transaction, service an account, respond to court orders and legal investigations or as otherwise permitted by law. Third parties that may receive this information include companies that provide transfer agency, technology and administrative services to the Funds, as well as the Funds’ investment adviser who is an affiliate of the Funds. If you maintain a retirement/educational custodial account directly with the Funds, we may also disclose your Personal Information to the custodian for that account for shareholder servicing purposes. The Funds limit access to your Personal Information provided to unaffiliated third parties to information necessary to carry out their assigned responsibilities to the Funds. All shareholder records will be disposed of in accordance with applicable law. The Funds maintain physical, electronic and procedural safeguards to protect your Personal Information and requires its third-party service providers with access to such information to treat your Personal Information with the same high degree of confidentiality.
In the event that you hold shares of the Funds through a financial intermediary, including, but not limited to, a broker-dealer, credit union, bank or trust company, the privacy policy of your financial intermediary governs how your non-public personal information is shared with unaffiliated third parties.
Jackson Square Funds
Disclosures (Unaudited)
The materials provided herein are for general information purposes only and may not be copied or redistributed without Jackson Square’s prior consent. The views expressed represent Jackson Square’s assessment of the strategy and market environment as of the date identified herein and should not be considered a recommendation to buy, hold, or sell any security, and should not be relied on as research or investment advice. The information in this presentation, including statements concerning financial markets is based on current market conditions, which will fluctuate and may be superseded by subsequent market events or for other reasons.
Opinions expressed are those of Jackson Square Partners, LLC and are subject to change, are not guaranteed and should not be considered investment advice.
Holdings are as of the date provided and subject to change. Please note that where a partial list of holdings has been provided, a full list is available upon request.
Mutual fund investing involves risk. Principal loss is possible. The Funds are non-diversified meaning they may concentrate their assets in fewer individual holdings than a diversified fund. Therefore, each Fund is more exposed to individual stock volatility than a diversified fund. Small- and Mid-capitalization companies tend to have limited liquidity and greater price volatility than large capitalization companies. Investments in foreign securities involve greater volatility and political economic and currency risks and differences in accounting methods. These risks are greater in emerging and frontier markets. Frontier market countries generally have smaller economies and even less developed capital markets than traditional emerging markets, and, as a result, the risks of investing in emerging market countries are magnified in frontier market countries. Investments in Real Estate Investment Trusts (REITs) involve additional risks such as declines in the value of real estate and increased susceptibility to adverse economic or regulatory developments. When the Fund buys or sells securities on a foreign stock exchange, the transaction is undertaken in the local currency rather than in U.S. dollars. The value of the foreign currency may increase or decrease against the value of the U.S. dollar, which may impact the value of the Fund’s portfolio holdings and your investment. Other countries may adopt economic policies and/or currency exchange controls that affect their currency valuations in a manner that is disadvantageous to U.S. investors and companies. From time to time, the trading market for a particular security or type of security in which the Funds invest may become less liquid or even illiquid.
Past performance is no guarantee of future results.
Diversification does not assure a profit, nor does it protect against a loss in a declining market.
For comparison purposes, the indices are fully invested and include the reinvestment of income. Index returns do not reflect management fees, transaction costs, or expenses. The indices are unmanaged, and one cannot invest directly in an index. Benchmark information contained herein has been obtained from third party sources believed to be reliable, but we cannot guarantee its accuracy or completeness. All third-party marks are the property of their respective owners. All performance data regarding the indices are historical and are not indicative of future results, and there can be no assurance that these or comparable results will actually be achieved by the strategies or that the strategies’ investment objectives will be achieved.
Russell 1000® Growth Index measures the performance of the large-cap growth segment of the U.S. equity universe. It includes those Russell 1000® companies with higher price-to-book ratios and higher forecasted growth values. The index is unmanned and an investment cannot be made into the index.
Russell 2500® Growth Index. The Russell 2500® Growth Index measures the performance of the small- to mid-cap growth segment of the U.S. equity universe. It includes those Russell 2500® companies with higher price-to-book ratios and higher forecasted growth values. The index is unmanned and an investment cannot be made into the index.
The report must be preceded or accompanied by a prospectus.
Jackson Square Partners, LLC is the adviser to the Jackson Square Partner Funds, which are distributed by Quasar Distributors, LLC.
(This Page Intentionally Left Blank.)
Investment Adviser
Jackson Square Partners, LLC
One Letterman Drive
Building A, Suite A3-200
San Francisco, California 94129
Distributor
Quasar Distributors, LLC
111 East Kilbourn Avenue, Suite 2200
Milwaukee, Wisconsin 53202
Custodian
U.S. Bank N.A.
1555 North Rivercenter Drive, Suite 302
Milwaukee, Wisconsin 53212
Administrator, Fund Accountant
And Transfer Agent
U.S. Bancorp Fund Services, LLC
615 East Michigan Street
Milwaukee, Wisconsin 53202
Independent Registered Public Accounting Firm
Cohen & Company, Ltd.
342 North Water Street, Suite 830
Milwaukee, Wisconsin 53202
Legal Counsel
Stradley Ronon Stevens & Young, LLP
2005 Market Street, Suite 2600
Philadelphia, Pennsylvania 19103
This report should be accompanied or preceded by a prospectus.
The Funds’ Statement of Additional Information contains additional information about the
Funds’ trustees and is available without charge upon request by calling 1-844-577-3863.
(b) Not Applicable.
Item 2. Code of Ethics.
The Registrant has adopted a code of ethics that applies to the Registrant’s principal executive officer and principal financial officer. The Registrant has not made any substantive amendments to its code of ethics during the period covered by this period.
The Registrant has not granted any waivers from any provisions of the code of ethics during the period covered by this report.
A copy of the Registrant’s code of ethics that applies to the Registrant’s principal executive officer and principal financial officer is filed herewith.
Item 3. Audit Committee Financial Expert.
The Registrant’s Board of Trustees has determined that there is at least one audit committee financial expert serving on its audit committee. Leonard M. Rush is the “audit committee financial expert” and is considered to be “independent” as each term is defined in Item 3 of Form N-CSR.
Item 4. Principal Accountant Fees and Services.
The Registrant has engaged its principal accountant to perform audit services, audit-related services, tax services and other services during the past two fiscal years. “Audit services” refer to performing an audit of the Registrant's annual financial statements or services that are normally provided by the accountant in connection with statutory and regulatory filings or engagements for the past fiscal year. “Audit-related services” refer to the assurance and related services by the principal accountant that are reasonably related to the performance of the audit. “Tax services” refer to professional services rendered by the principal accountant for tax compliance, tax advice, and tax planning, including reviewing the Fund’s tax returns and distribution calculations. There were no “other services” provided by the principal accountant. For the fiscal years ended October 31, 2023 and October 31, 2022, the Funds’ principal accountant was Cohen & Company, Ltd. The following table details the aggregate fees billed or expected to be billed for each of the last fiscal year for audit fees, audit-related fees, tax fees and other fees by the principal accountant.
| | FYE 10/31/2023 | FYE 10/31/2022 |
(a) Audit Fees | $31,500 | $28,000 |
(b) Audit-Related Fees | $0 | $0 |
(c) Tax Fees | $7,000 | $8,500 |
(d) All Other Fees | $0 | $0 |
(e)(1) The audit committee has adopted pre-approval policies and procedures that require the audit committee to pre‑approve all audit and non‑audit services of the Registrant, including services provided to any entity affiliated with the Registrant.
(e)(2) The percentage of fees billed by Cohen & Company, Ltd. applicable to non-audit services pursuant to waiver of pre-approval requirement was as follows:
| | FYE 10/31/2023 | FYE 10/31/2022 |
Audit-Related Fees | 0% | 0% |
Tax Fees | 0% | 0% |
All Other Fees | 0% | 0% |
(f) All of the principal accountant’s hours spent on auditing the Registrant’s financial statements were attributed to work performed by full‑time permanent employees of the principal accountant.
(g) The following table indicates the non-audit fees billed or expected to be billed by the Registrant’s accountant for services to the Registrant and to the Registrant’s investment adviser (and any other controlling entity, etc.—not sub-adviser) for the last two years.
(h) The audit committee of the board of trustees/directors has considered whether the provision of non-audit services that were rendered to the Registrant's investment adviser is compatible with maintaining the principal accountant's independence and has concluded that the provision of such non-audit services by the accountant has not compromised the accountant’s independence.
Non-Audit Related Fees | FYE 10/31/2023 | FYE 10/31/2022 |
Registrant | $0 | $0 |
Registrant’s Investment Adviser | $0 | $0 |
(i) Not applicable.
(j) Not applicable.
Item 5. Audit Committee of Listed Registrants.
Not applicable to Registrants who are not listed issuers (as defined in Rule 10A-3 under the Securities Exchange Act of 1934).
Item 6. Schedule of Investments.
(a) Schedule of Investments is included as part of the report to shareholders filed under Item 1 of this Form.
(b) Not applicable.
Item 7. Disclosure of Proxy Voting Policies and Procedures for Closed-End Management Investment Companies.
Not applicable to open-end investment companies.
Item 8. Portfolio Managers of Closed-End Management Investment Companies.
Not applicable to open-end investment companies.
Item 9. Purchases of Equity Securities by Closed‑End Management Investment Company and Affiliated Purchasers.
Not applicable to open-end investment companies.
Item 10. Submission of Matters to a Vote of Security Holders.
There have been no material changes to the procedures by which shareholders may recommend nominees to the Registrant’s Board of Trustees.
Item 11. Controls and Procedures.
| (a) | The Registrant’s President and Treasurer have reviewed the Registrant's disclosure controls and procedures (as defined in Rule 30a-3(c) under the Investment Company Act of 1940 (the “Act”)) as of a date within 90 days of the filing of this report, as required by Rule 30a-3(b) under the Act and Rules 13a-15(b) or 15d‑15(b) under the Securities Exchange Act of 1934. Based on their review, such officers have concluded that the disclosure controls and procedures are effective in ensuring that information required to be disclosed in this report is appropriately recorded, processed, summarized and reported and made known to them by others within the Registrant and by the Registrant’s service provider. |
| (b) | There were no significant changes in the Registrant's internal control over financial reporting (as defined in Rule 30a-3(d) under the Act) that occurred during the period covered by this report that has materially affected, or is reasonably likely to materially affect, the Registrant's internal control over financial reporting. |
Item 12. Disclosure of Securities Lending Activities for Closed-End Management Investment Companies
Not applicable to open-end investment companies.
Item 13. Exhibits.
(3) Any written solicitation to purchase securities under Rule 23c‑1 under the Act sent or given during the period covered by the report by or on behalf of the Registrant to 10 or more persons. Not applicable to open-end investment companies.
(4) Change in the registrant’s independent public accountant. There was no change in the registrant's independent public accountant for the period covered by this report.
SIGNATURES
Pursuant to the requirements of the Securities Exchange Act of 1934 and the Investment Company Act of 1940, the Registrant has duly caused this report to be signed on its behalf by the undersigned, thereunto duly authorized.
(Registrant) Managed Portfolio Series
By (Signature and Title) /s/Brian R. Wiedmeyer
Brian R. Wiedmeyer, President
Date 1/5/24
Pursuant to the requirements of the Securities Exchange Act of 1934 and the Investment Company Act of 1940, this report has been signed below by the following persons on behalf of the Registrant and in the capacities and on the dates indicated.
By (Signature and Title) /s/Brian R. Wiedmeyer
Brian R. Wiedmeyer, President
Date 1/5/24
By (Signature and Title) /s/Benjamin J. Eirich
Benjamin J. Eirich, Treasurer
Date 1/8/24