UNITED STATES
SECURITIES AND EXCHANGE COMMISSION
Washington, D.C. 20549
FORM N-CSR
CERTIFIED SHAREHOLDER REPORT OF REGISTERED
MANAGEMENT INVESTMENT COMPANIES
Investment Company Act file number 811-22525
Managed Portfolio Series
(Exact name of registrant as specified in charter)
615 East Michigan Street
Milwaukee, WI 53202
(Address of principal executive offices) (Zip code)
Brian R. Wiedmeyer, President
Managed Portfolio Series
c/o U.S. Bancorp Fund Services, LLC
777 East Wisconsin Ave, 5th Fl
Milwaukee, WI 53202
(Name and address of agent for service)
(414) 765-6844
Registrant’s telephone number, including area code
Date of fiscal year end: November 30, 2023
Date of reporting period: November 30, 2023
Updated August 1, 2011
Item 1. Reports to Stockholders.
Tortoise
2023 Annual Report
Table of Contents
2023 Annual Report | November 30, 2023
Sector allocations
| Name/Ticker | | Primary focus | | Total assets
($ Millions)1 | | By asset type1 | | By ownership structure1 |
| | | | | | | | | |
Tortoise North American Pipeline Fund NYSE Arca: TPYP Inception: 6/29/2015 | | North American pipeline companies | | $570.5 | | 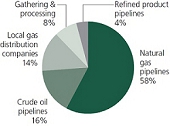 | | 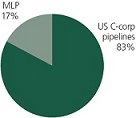 |
| Name/Ticker | | Primary focus | | Total assets
($ Millions)1 | | By sector1 | | By geography1 |
| | | | | | | | | |
Ecofin Global Water ESG Fund NYSE Arca: EBLU Inception: 2/14/2017 | | Water companies | | $47.4 | |  | | 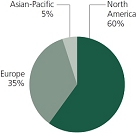 |
| | | | | | | | | |
(unaudited)
Letter to shareholders
Dear shareholder,
The 2023 fiscal year offered energy investors significant opportunity with record levels of production, growing export demand, along with some regulatory clarity. Overall, performance ended the year mixed with midstream higher and both broader energy and utilities lower. Higher interest rates clearly impacted relative performance. And cash flow proved to be king. Notable events influencing performance included geopolitical tensions in Ukraine and Israel and OPEC+ decisions around crude oil supply and demand. Effects of the Inflation Reduction Act also started to surface. Finally, the U.S. energy complex remained ever important to supporting the global economy. The water sector was one of those that was negatively impacted by the high interest rate environment.
Energy and power infrastructure
The broad energy sector returned -4.3% for the annual fiscal period (as measured by the S&P 500 Energy Index). Energy was generally rangebound during the year, bottoming down 15% in March following the regional banking crisis, and peaking higher by 5% in September following the Organization of Petroleum Exporting Countries plus Russia’s (OPEC+) announcement to curtail crude oil supplies to the global market. The war between Russian and Ukraine remained in focus and geopolitically was magnified when the Israel and Hamas conflict intensified in October. That raised concerns about a broader Middle East conflict. The allocation for free cash flow remained an energy investor focus with lower debt, dividend growth, and share buybacks being a cornerstone of management’s playbook. These policies, along with disciplined mergers & acquisitions (M&A), were favored in the higher interest environment and in front of concerns about a slowing economy in 2024.
Global crude oil supply and demand led energy market sentiment. In the first quarter the Organization for Economic Cooperation and Development (OECD) commercial inventories built up marginally partly due to slower Chinese demand than expected coming out of COVID lockdowns. This resulted in a decision by Saudi Arabia in the summer to voluntarily reduce its oil output by 1 million barrels per day (bpd) for the month of July, with the potential for this cut to be extended. Consequently, oil stocks declined, and crude oil prices rallied in the third quarter. Though Saudi Arabia consistently extended their cuts in the second half, concerns about a global economic slowdown along with growing production in the United States and Guyana weighed on prices late in the year. To better balance the market, in November OPEC+ agreed to 2 million bpd of cuts to start 2024, leaving the oil market in a constructive position on supply and demand.
U.S. crude oil production growth exceeded expectations, growing nearly 1 million bpd in 2023 to 13.2 million bpd. That level eclipsed the previous record high of 13.0 million bpd achieved in November of 2019. The growth resulted despite rig counts and well completions falling as the year progressed. Simply, producers did more with less. Drilling laterals lengthened, completion times shortened and even the application of artificial intelligence positively impacted efficiencies. The Permian basin, the largest U.S. oilfield, remained the primary driver of growth reaching six million bpd. Aiding producer returns, oilfield service and material costs declined, resulting in lower break-even costs. The Energy Information Agency (EIA) forecasts production in 2024 to remain steady, partly due to the lower rig count and completion activity trend transpiring in 2023.
U.S. natural gas production grew as well in 2023 as the U.S. exported more liquefied natural gas (LNG) than any other country in the first half. U.S. LNG production reached nearly 12 billion cubic feet per day (bcf/d). The war in Ukraine continued to present a long-term opportunity for U.S. liquefied natural gas. LNG exports to Europe accelerated in 2022 and remained elevated in 2023. These exports, lower industrial demand, and a relatively warm winter in 2022/23 kept European natural gas storage inventories full throughout 2023 and well positioned to keep Europe adequately supplied for the 2024 winter. U.S. natural gas storage inventories also entered year-end 2023 well supplied at just above the five-year average partly due to a warm winter a year ago. Also helping inventories is growing U.S. production, that improved from 102 bcf/d to 105 bcf/d over the year. That production will help supply LNG export facilities set to come on-line starting in the second half of 2024 through year-end 2027. In that short timeframe U.S. LNG export capacity will nearly double to 25 bcf/d. The EIA forecasts natural gas production to be mostly flat in 2024 due partly to limited visibility to near-term demand improvement and, like the drilling cadence for oil, declining service activity.
Natural gas liquids (NGLs) do not receive as much attention as crude oil or natural gas because they are less visible to consumers. Nonetheless, that does not diminish their importance as NGLs are the key components in making plastics along with being a source of heat. And, at 6.8 million bpd, the U.S. is the world’s largest producer of NGLs. Growth in 2023 surpassed 600 thousand bpd with most marginal production exported to meet growing Asian petrochemical demand. The EIA forecasts NGL production to be stable in 2024.
The midstream energy sector returned 7.6% for the fiscal year (as measured by the Alerian Midstream Energy Index or AMNA), topping broader energy. Growing production volumes and inflation passed through via higher tariff rates benefitted revenues. Further, the sector’s elevated and higher free cash flow, declining leverage, attractive valuation, and share buybacks supported performance. Finally, disciplined M&A activity with synergies largely accruing to buyers offered a favorable environment for those seeking acquisition led growth.
(unaudited)
2023 Annual Report | November 30, 2023
Cash flow improved for midstream companies in 2023 following volumes and tariff increases and cost and capital expenditure discipline. Management teams targeted cash flow increasingly toward shareholders in the form of debt paydown, dividend and distribution growth, and share repurchases. Leverage targets are now generally between 3.0x – 4.0x earnings before interest, taxes, depreciation and amortization (EBITDA) with leverage being a full “turn” lower versus levels prior to 2020. And in addition to dividend and distribution growth, companies opportunistically repurchased shares, as buybacks topped $4 billion from the fourth quarter of 2022 through the third quarter of 2023. With leverage targets now largely achieved, 2024 sets up for incrementally more cash flow earmarked for dividends and buybacks.
Following hawkish interest rate actions from the Federal Reserve, the prospects of an economic recession weighed on investor psyche during much of the fiscal year. While multiple recessions occurred in the last 40 years, energy demand still increased in 38 out of the last 41 years (2008 and 2020 decreased). Due to actions taken during the recent 2020 recession that reduced capital expenditures and focused on debt paydown, we believe the energy sector, and specifically midstream, is well prepared to deal with another potential recession. With the world remaining undersupplied energy over the long-term and sector balance sheets now less levered than in past recent recessions (2001, 2008 and 2020), we believe energy is well positioned should lower economic growth materialize.
Broader market concerns about higher interest rates boosted midstream’s relative attractiveness. As higher rates due to inflation were passed through, companies generated significant free cash flow that led to little to no debt or equity capital market access requirements even for maturing debt. Additionally, the good economic growth resulted in higher energy demand. Looking at history, good performance in a higher rate environment is not surprising. In the 18 time periods when the 10-year Treasury yield increased by 50 basis points or more since 2001, midstream energy, represented by the Tortoise North American Pipeline Index, returned an average of 7.4%, compared to a S&P 500 Index average return of 5.9%, and bond returns of -2.6% represented by the Bloomberg U.S. Aggregate Bond Index.
With inflation continuing to increase in 2023, midstream provided investors inflation protection. Pipelines typically benefit from long-term contracts with inflation protection from regulated tariff escalators. Additionally, tariffs on regulated liquid pipelines include an inflation escalator aligned with the Producer Price Index (PPI). Federal Energy Regulatory Commission (FERC) indexing allowed for a tariff increase of over 13% beginning on July 1, 2023. In fact, we estimate that the cumulative total allowable tariff increase since 2020 through year-end 2024 will eclipse 26%. This contract feature serves as protection against higher operating costs.
Midstream companies remained active in M&A with many discrete assets changing hands along with a handful of corporate transactions. The commonality among all the transactions was buyer discipline. The buyers only purchased complementary assets to existing footprints where synergies were obvious and paid a price that made the transaction immediately accretive. Even in the corporate transactions, premiums paid were constructive. In the largest corporate transaction, ONEOK acquired Magellan Midstream Partners at a 22% premium. Synergies and diversification drove the rationale as both Tulsa companies transport petroleum products, with ONEOK mostly natural gas liquids and Magellan refined products and crude oil. ONEOK also estimated a tax benefit of $1.5 billion.
One major new pipeline received regulatory help with the signing of the Fiscal Responsibility Act (FRA) that resolved the mid-summer debt ceiling scuffle. That Act approved all construction and operational permits and authorizations required for the Mountain Valley Pipeline (MVP). MVP would transport 2 bcf/d of natural gas from the Marcellus through West Virginia and into Virginia. Equitrans Midstream (ETRN), MVP’s operator, now estimates pipeline completion in the first quarter of 2024. In addition, the FRA reformed the way the National Environmental Policy Act (NEPA) interacts with agencies to approve energy projects so that project developers have more confidence in permitting processes. Now, when two or more agencies are involved in review, one will be designated lead agency to reduce delays. Further, the timeframe for an Environmental Impact Statement is limited to two years and an Environmental Assessment to one year, and there are limits on the number of pages for each. Despite the improved regulatory efficiency, attaining project approvals remained challenging. For example, Navigator CO2 Ventures cancelled its proposed $3.5 billion, 1,300-mile carbon capture pipeline due to an unpredictable regulatory and government process. The pipeline concept involved transporting carbon dioxide emissions from ethanol plants to sites where the greenhouse gas would be sequestered deep underground.
Sustainable water
Fiscal year 2023 was a volatile, yet positive period for risk-assets, as concerns regarding bank liquidity, continued inflation, high interest rates and timing of potential economic slowdowns kept markets in flux. In March, concerns regarding bank liquidity arose as fears of widespread collapse in regional banks dominated headlines. Quick action from the Fed and Treasury stemmed major financial impacts and ensured depositors, which led to a recovery in equities. Subsequently, broad markets performed well, as an AI-fueled rally brought tech back in favor despite higher interest rates. During this period, growth equities recovered, but sectors impacted by higher interest rates (including utilities in the water space) did not benefit nearly as much.
(unaudited)
The second half of the year began with a continuation of the AI rally and shifted the focus to improving economic data and potential for lower interest rates. However, by September, sentiment waned with the Fed maintaining its hawkish stance as inflation remained sticky despite other economic metrics improving. As a result, markets declined again until sentiment regarding a potential “soft landing” for the economy gained favor. This occurred when inflation data appeared tamer and expectations for further rate hikes plummeted. In October and November, the market began to anticipate that interest rates would be held flat and eventually decrease. Until this shift in sentiment, infrastructure names in the water space languished, but both infrastructure names and equipment and services benefitted from the shift to more dovish rhetoric. From a water value chain standpoint, engineering & construction, filtration, treatment & test, and pipes, pumps & valves sectors were positive performers, while agriculture equipment & services and utilities were negative over the fiscal year.
Concluding thoughts
Energy infrastructure remains essential for the U.S. to continue as the leading global energy producer and to meet the energy demands of consumers, both domestically and abroad. Geopolitical events further highlighted this reality. We believe that indispensable nature offers compelling opportunities for 2024 and beyond. In addition, water sector companies continue to be well positioned for growth in 2024.
The S&P 500® Index is an unmanaged market-value weighted index of stocks, which is widely regarded as the standard for measuring large-cap U.S. stock market performance. The S&P Energy Select Sector® Index is |a capitalization-weighted index of S&P 500® Index companies in the energy sector involved in the development or production of energy products. The Tortoise North American Pipeline IndexSM is a float adjusted, capitalization-weighted index of energy pipeline companies domiciled in the United States and Canada. The Tortoise MLP Index® is a float-adjusted, capitalization-weighted index of energy master limited partnerships. The Ecofin Global Water ESG IndexSM is a proprietary, rules-based, modified capitalization-weighted, float-adjusted index comprised of companies that are materially engaged in the water infrastructure or water management industries.
TIS Advisors has contracted with S&P Opco, LLC (a subsidiary of S&P Dow Jones Indices LLC) to calculate and maintain the Tortoise MLP Index®, Tortoise North American Pipeline IndexSM and Ecofin Global Water ESG IndexSM. These Indices are not sponsored by S&P Dow Jones Indices or its affiliates or its third party licensors (collectively, “S&P Dow Jones Indices LLC”). S&P Dow Jones Indices will not be liable for any errors or omission in calculating these Indices. “Calculated by S&P Dow Jones Indices” and its related stylized mark(s) are service marks of S&P Dow Jones Indices and have been licensed for use by TIS Advisors and its affiliates. S&P® is a registered trademark of Standard & Poor’s Financial Services LLC (“SPFS”), and Dow Jones® is a registered trademark of Dow Jones Trademark Holdings LLC (“Dow Jones”).
Tortoise Indices are the exclusive property of TIS Advisors.
Free cash flow is the cash a company produces through its operations, less the cost of total capital expenditures (growth and maintenance).
The Producer Price Index (PPI) measures the average change over time in the selling prices received by domestic producers for their output. The prices included in the PPI are from the first commercial transaction for many products and some services.
It is not possible to invest directly in an index.
Performance data quoted represents past performance; past performance does not guarantee future results. Like any other stock, total return and market value will fluctuate so that an investment, when sold, may be worth more or less than its original cost.
2023 Annual Report | November 30, 2023
Tortoise North American Pipeline Fund
| Top ten holdings (as of November 30, 2023) | | |
| 1. | The Williams Companies, Inc. | | 7.9% |
| 2. | Cheniere Energy, Inc. | | 7.7% |
| 3. | ONEOK, Inc. | | 7.5% |
| 4. | TC Energy Corp. | | 7.4% |
| 5. | Enbridge, Inc. | | 7.3% |
| 6. | Kinder Morgan, Inc. | | 7.0% |
| 7. | Pembina Pipeline Corporation | | 4.2% |
| 8. | Energy Transfer LP | | 4.1% |
| 9. | Targa Resources Corp. | | 4.1% |
| 10. | Atmos Energy Corporation | | 3.9% |
TPYP key benefits
| ● | Access to the sizable pipeline network of one of the world’s largest consumers of energy |
| ● | Attractive total return potential in a historically defensive sector |
| ● | Flow-through structure allows for tax-efficient access to the pipeline sector |
| ● | Exposure to Tortoise North American Pipeline IndexSM |
| | – | Effectively represents the characteristics of the market |
| | – | A leading benchmark for analysis of the pipeline sector |
| | – | Proprietary, research-driven and rules-based methodology |
| | – | Constituent caps to allow for broader representation of the market and investability |
Value of $10,000 vs. Tortoise North American Pipeline IndexSM
Since inception on June 29, 2015 through November 30, 2023
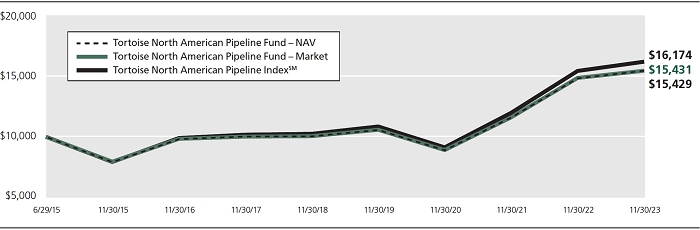
This chart illustrates the performance of a hypothetical $10,000 investment made on June 29, 2015 and is not intended to imply any future performance. The returns shown do not reflect the deduction of taxes that a shareholder would pay on the fund’s distributions or the redemption of fund shares. The chart assumes reinvestment of capital gains and dividends for the fund and dividends for the index.
The performance data quoted above represents past performance since June 29, 2015 through November 30, 2023. Past performance is no guarantee of future results. The investment return and value of an investment will fluctuate so that an investor’s shares, when redeemed, may be worth more or less than their original cost. Current performance of the fund may be obtained through the most recent month-end by calling 844-TR-INDEX (844-874-6339). Future performance may be lower or higher than the performance stated above.
The Tortoise North American Pipeline IndexSM is a float-adjusted, capitalization weighted index of pipeline companies headquartered in the United States and Canada.
Returns include reinvested dividends. You cannot invest directly in an index.
(unaudited)
Tortoise North American Pipeline Fund (continued)
Total returns (as of November 30, 2023)
| Ticker | | 1 year | | 3 year | | 5 year | | Since inception(1) | | Gross expense ratio |
| TPYP @ Market | | | 4.06 | % | | | 20.09 | % | | | 8.95 | % | | | 5.29 | % | | | 0.40 | % |
| TPYP @ NAV | | | 4.21 | % | | | 20.13 | % | | | 8.98 | % | | | 5.28 | % | | | 0.40 | % |
| S&P 500® Index(2) | | | 13.84 | % | | | 9.76 | % | | | 12.51 | % | | | 11.99 | % | | | — | |
| TNAPT(3) | | | 4.92 | % | | | 21.01 | % | | | 9.57 | % | | | 5.88 | % | | | — | |
| (1) | Reflects period from fund inception on June 29, 2015 through November 30, 2023. |
| (2) | The S&P 500® Index is an unmanaged market-value weighted index of stocks, which is widely regarded as the standard for measuring large-cap U.S. stock market performance. Returns include reinvested dividends. You cannot invest directly in an index. |
| (3) | The Tortoise North American Pipeline IndexSM is a float-adjusted, capitalization weighted index of pipeline companies headquartered in the United States and Canada. You cannot invest directly in an index. |
Note: For periods over 1 year, performance reflected is for the average annual returns.
Performance data quoted represents past performance; past performance does not guarantee future results. The investment return and principal value of an investment will fluctuate so that an investor’s shares, when redeemed, may be worth more or less than their original cost. Current performance of the portfolio may be lower or higher than the performance quoted. Performance data current to the most recent month end may be obtained by calling 844-TR-INDEX (844-874-6339).
(unaudited)
2023 Annual Report | November 30, 2023
Ecofin Global Water ESG Fund
Top ten holdings (as of November 30, 2023)
| 1. | Ferguson PLC | 7.8% |
| 2. | Xylem, Inc. | 7.8% |
| 3. | Ecolab Inc. | 7.6% |
| 4. | American Water Works Co., Inc. | 7.0% |
| 5. | Veolia Environnement SA | 6.1% |
| 6. | Geberit AG | 5.9% |
| 7. | United Utilities Group PLC | 4.1% |
| 8. | A.O. Smith Corporation | 4.0% |
| 9. | Essential Utilities, Inc. | 3.8% |
| 10. | Tetra Tech, Inc. | 3.6% |
EBLU key benefits
| ● | Provides access to the water infrastructure, management and treatment companies that we believe appear poised to benefit from the expected and much needed investment in rebuilding existing infrastructure, constructing new infrastructure and better managing this vital, but finite resource |
| ● | Flow-through ETF structure provides tax-efficient access to the water sector |
| ● | Purest exposure to the water industry by incorporating a fundamental weighting aspect |
| ● | Continuous liquidity |
| ● | Exposure to the Ecofin Global Water ESG Index® |
| | – | Proprietary, rules-based, research-driven methodology |
| | – | Fundamental weighting technique provides significant direct exposure to the water industry |
| | – | A leading benchmark for analysis of the water sector |
| | – | Backed by Tortoise’s proprietary fundamental research and index generation process |
Value of $10,000 vs. Ecofin Global Water ESG Index®
Since inception on February 14, 2017 through November 30, 2023
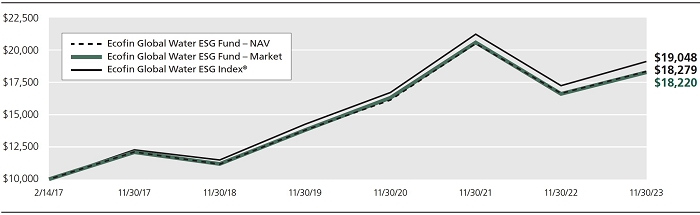
This chart illustrates the performance of a hypothetical $10,000 investment made on February 14, 2017 and is not intended to imply any future performance. The returns shown do not reflect the deduction of taxes that a shareholder would pay on the fund’s distributions or the redemption of fund shares. The chart assumes reinvestment of capital gains and dividends for the fund and dividends for the index.
The performance data quoted above represents past performance since February 14, 2017 through November 30, 2023. Past performance is no guarantee of future results. The investment return and value of an investment will fluctuate so that an investor’s shares, when redeemed, may be worth more or less than their original cost. Current performance of the fund may be obtained through the most recent month-end by calling 844-TR-INDEX (844-874-6339). Future performance may be lower or higher than the performance stated above.
The Ecofin Global Water ESG Index® is a proprietary, rules-based, modified capitalization-weighted, float-adjusted index comprised of companies that are materially engaged in the water infrastructure or water management industries. Water infrastructure companies’ principal business is providing public water distribution or supporting water distribution infrastructure via equipment or engineering and construction. Water management companies’ primary business is providing technologies or products that manage or facilitate water distribution and usage, including the fields of water efficiency, water treatment and irrigation. You cannot invest directly in an index.
(unaudited)
Ecofin Global Water ESG Fund (continued)
Total returns (as of November 30, 2023)
| Ticker | | 1 year | | 3 year | | 5 year | | Since inception(1) | | Gross expense ratio |
| EBLU @ Market | | | 10.03 | % | | | 3.87 | % | | | 10.27 | % | | | 9.24 | % | | | 0.40 | % |
| EBLU @ NAV | | | 10.13 | % | | | 4.36 | % | | | 10.38 | % | | | 9.29 | % | | | 0.40 | % |
| S&P 500® Index(2) | | | 13.84 | % | | | 9.76 | % | | | 12.51 | % | | | 12.35 | % | | | — | |
| Ecofin Global Water ESG Index®(3) | | | 10.81 | % | | | 4.56 | % | | | 10.66 | % | | | 9.95 | % | | | — | |
| (1) | Reflects period from fund inception on February 14, 2017 through November 30, 2023. |
| (2) | The S&P 500® Index is an unmanaged market-value weighted index of stocks, which is widely regarded as the standard for measuring large-cap U.S. stock market performance. Returns include reinvested dividends. You cannot invest directly in an index. |
| (3) | The Ecofin Global Water ESG Index® is a proprietary, rules-based, modified capitalization-weighted, float-adjusted index comprised of companies that are materially engaged in the water infrastructure or water management industries. Water infrastructure companies’ principal business is providing public water distribution or supporting water distribution infrastructure via equipment or engineering and construction. Water management companies’ primary business is providing technologies or products that manage or facilitate water distribution and usage, including the fields of water efficiency, water treatment and irrigation. You cannot invest directly in an index. |
Note: For periods over 1 year, performance reflected is for the average annual returns.
Performance data quoted represents past performance; past performance does not guarantee future results. The investment return and principal value of an investment will fluctuate so that an investor’s shares, when redeemed, may be worth more or less than their original cost. Current performance of the portfolio may be lower or higher than the performance quoted. Performance data current to the most recent month end may be obtained by calling 844-TR-INDEX (844-874-6339).
(unaudited)
2023 Annual Report | November 30, 2023
Tortoise North American Pipeline Fund
Investing involves risk. Principal loss is possible. The Fund has the same risks as the underlying securities traded on the exchange throughout the day. Redemptions are limited and often commissions are charged on each trade, and ETFs may trade at a premium or discount to their net asset value. The Fund is non-diversified, meaning it may concentrate its assets in fewer individual holdings than a diversified fund. Therefore, the Fund is more exposed to individual stock volatility than a diversified fund. The Fund may experience tracking error to a greater extent than a fund that seeks to replicate an index. The Fund is not actively managed and may be affected by a general decline in market segments related to the index. Unlike mutual funds, ETFs may trade at a premium or discount to their net asset value. Investing in specific sectors such as energy infrastructure may involve greater risk and volatility than less concentrated investments. Risks include, but are not limited to, risks associated with companies owning and/or operating pipelines and complementary assets, as well as Master Limited Partnerships (MLPs), MLP affiliates, capital markets, terrorism, natural disasters, climate change, operating, regulatory, environmental, supply and demand, and price volatility risks. The tax benefits received by an investor investing in the portfolio differs from that of a direct investment in an MLP by an investor. The value of the portfolio’s investment in an MLP will depend largely on the MLP’s treatment as a partnership for U.S. federal income tax purposes. If the MLP is deemed to be a corporation then its income would be subject to federal taxation, reducing the amount of cash available for distribution to the portfolio which could result in a reduction of the portfolio’s value. Investments in foreign issuers involve risk not ordinarily associated with investments in securities and instruments of U.S. issuers, including risks related to political, social and economic developments abroad, differences between U.S. and foreign regulatory and accounting requirements, tax risk and market practices, as well as fluctuations in foreign currencies. The portfolio invests in small and mid-cap companies, which involve additional risks such as limited liquidity and greater volatility than larger companies. Investments in debt securities typically decrease in value when interest rates rise. This risk is usually greater for longer-term debt securities. Investment in lower-rated and non-rated securities presents a greater risk of loss to principal and interest than higher-rated securities. The portfolio may also write call options which may limit the portfolio’s ability to profit from increases in the market value of a security, but cause it to retain the risk of loss should the price of the security decline.
Ecofin Global Water ESG Fund
Investment in the water infrastructure and management industry may significantly affect the value of the shares of the Fund. Companies in the water industry are subject to environmental considerations, taxes, government regulation, price and supply fluctuations, competition and water conservation influences. Investments in non-U.S. companies (including Canadian issuers) involve risk not ordinarily associated with investments in securities and instruments of U.S. issuers, including risks related to political, social and economic developments abroad, differences between U.S. and foreign regulatory and accounting requirements, tax risk and market practices, as well as fluctuations in foreign currencies. The Fund invests in small and mid-cap companies, which involve additional risks such as limited liquidity and greater volatility than larger companies. The Fund is not actively managed, and therefore the Fund generally will not sell a security due to current or projected underperformance of a security, industry or sector, unless that security is removed from the index or the selling of the security is otherwise required upon a rebalancing of the index. There is no guarantee that the Fund will achieve a high degree of correlation to the index and therefore achieve its investment objective. The Fund has elected to be, and intends to qualify each year for treatment as, a regulated investment company (RIC). To maintain the Fund’s qualification for federal income tax treatment as a RIC, the Fund must meet certain source of income, asset diversification and annual distribution requirements. If for any taxable year the Fund fails to qualify for the special federal income tax treatment afforded to RICs, all of the Fund’s taxable income will be subject to federal income tax at regular corporate rates (without any deduction for distributions to its shareholders) and its income available for distribution will be reduced. Derivatives involve risks different from, and in certain cases, greater than the risks presented by more traditional investments. The Fund is non-diversified, meaning it may concentrate its assets in fewer individual holdings than a diversified fund. Therefore, the Fund is more exposed to individual stock volatility than a diversified fund.
Cash flow is the total amount of money moving into and out of a business.
Nothing contained on this communication constitutes tax, legal, or investment advice. Investors must consult their tax advisor or legal counsel for advice and information concerning their particular situation.
This report reflects our views and opinions as of the date herein, which are subject to change at any time based on market and other conditions. We disclaim any responsibility to update these views. The views should not be relied on as investment advice or an indication of trading intent on behalf of the fund.
Portfolio holdings and sector allocations are subject to change at any time and should not be considered recommendations to buy or sell any security. For a complete list of fund holdings, please refer to the Schedule of Investments in this report.
(unaudited)
Expense example
As a shareholder of the Fund, you incur two types of costs: (1) transaction costs, including brokerage commissions on purchases and sales of Fund shares, and (2) ongoing costs, including management fees and other Fund expenses. This example is intended to help you understand your ongoing costs (in dollars) of investing in the Fund and to compare these costs with the ongoing costs of investing in other funds. The example is based on an investment of $1,000 invested at the beginning of the period and held for the entire period (June 1, 2023 - November 30, 2023).
Actual expenses
The first line of the table below provides information about actual account values based on actual returns and actual expenses. You may use the information in this line, together with the amount you invested, to estimate the expenses that you paid over the period. Simply divide your account value by $1,000 (for example, an $8,600 account value divided by $1,000 = 8.6), then multiply the result by the number in the first line under the heading entitled “Expenses Paid During Period” to estimate the expenses you paid on your account during this period.
Hypothetical example for comparison purposes
The second line of the table below provides information about hypothetical account values and hypothetical expenses based on the Fund’s actual expense ratio and an assumed rate of return of 5% per year before expenses, which is not the Fund’s actual return. The hypothetical account values and expenses may not be used to estimate the actual ending account balance or expenses you paid for the period. You may use this information to compare the ongoing costs of investing in the Fund and other funds. To do so, compare this 5% hypothetical example with the 5% hypothetical examples that appear in the shareholder reports of the other funds.
Please note that the expenses shown in the table are meant to highlight your ongoing costs only and do not reflect any transactional costs, such as redemption fees or exchange fees. Therefore, the second line of the table is useful in comparing ongoing costs only and will not help you determine the relative total costs of owning different funds. In addition, if these transactional costs were included, your costs would have been higher.
Tortoise North American Pipeline Fund
| | Beginning
Account Value
(06/01/2023) | Ending
Account Value
(11/30/2023) | Expenses Paid
During Period(1)
(06/01/2023 – 11/30/2023) |
| Actual(2) | $1,000.00 | $1,139.10 | $2.14 |
| Hypothetical (5% annual return before expenses) | $1,000.00 | $1,023.06 | $2.03 |
| (1) | EExpenses are equal to the Fund’s annualized expense ratio for the most recent six-month period of 0.40%, multiplied by the average account value over the period, multiplied by 183/365 to reflect the one-half year period. |
| (2) | Based on the actual returns for the six-month period ended November 30, 2023 of 13.91%. |
Ecofin Global Water ESG Fund
| | Beginning
Account Value
(06/01/2023) | Ending
Account Value
(11/30/2023) | Expenses Paid
During Period(1)
(06/01/2023 – 11/30/2023) |
| Actual(2) | $1,000.00 | $1,072.80 | $2.08 |
| Hypothetical (5% annual return before expenses) | $1,000.00 | $1,023.06 | $2.03 |
| (1) | Expenses are equal to the Fund’s annualized expense ratio for the most recent six-month period of 0.40%, multiplied by the average account value over the period, multiplied by 183/365 to reflect to reflect the one-half year period. |
| (2) | Based on the actual returns for the six-month period ended November 30, 2023 of 7.28%. |
(unaudited)
2023 Annual Report | November 30, 2023
Tortoise North American Pipeline Fund
Schedule of Investments
November 30, 2023
| | | Shares | | | Fair Value | |
| Common Stocks — 83.0% | | | | | | | | |
| Canada Crude Oil Pipelines — 12.4% | | | | | | | | |
| Enbridge, Inc. | | | 1,109,096 | | | $ | 38,674,178 | |
| Gibson Energy, Inc. | | | 318,825 | | | | 4,811,921 | |
| Pembina Pipeline Corporation | | | 673,473 | | | | 22,527,683 | |
| | | | | | | | 66,013,782 | |
| | | | | | | | | |
| Canada Natural Gas/Natural Gas Liquids Pipelines — 11.7% | | | | | | | | |
| AltaGas Ltd. | | | 555,694 | | | | 11,302,667 | |
| Keyera Corp. | | | 452,014 | | | | 11,382,379 | |
| TC Energy Corp. | | | 1,052,103 | | | | 39,474,904 | |
| | | | | | | | 62,159,950 | |
| | | | | | | | | |
| United States Crude Oil Pipelines — 0.7% | | | | | | | | |
| Plains GP Holdings LP | | | 241,091 | | | | 3,896,031 | |
| | | | | | | | | |
| United States Local Distribution Companies — 14.1% | | | | | | | | |
| Atmos Energy Corporation | | | 184,193 | | | | 20,963,006 | |
| Chesapeake Utilities Corporation | | | 42,719 | | | | 4,083,936 | |
| New Jersey Resources Corporation | | | 192,445 | | | | 8,121,179 | |
| NiSource Inc. | | | 765,044 | | | | 19,615,728 | |
| Northwest Natural Holding Co. | | | 71,125 | | | | 2,604,598 | |
| ONE Gas, Inc. | | | 109,361 | | | | 6,302,474 | |
| Southwest Gas Corporation | | | 118,431 | | | | 7,000,456 | |
| Spire Inc. | | | 103,761 | | | | 6,330,459 | |
| | | | | | | | 75,021,836 | |
| | | | | | | | | |
| United States Natural Gas Gathering/Processing — 6.0% | | | | | | | | |
| Antero Midstream Corp. | | | 671,788 | | | | 8,948,216 | |
| Archrock, Inc. | | | 271,647 | | | | 3,936,165 | |
| EnLink Midstream LLC | | | 473,361 | | | | 6,470,845 | |
| Equitrans Midstream Corp. | | | 854,616 | | | | 8,016,298 | |
| Hess Midstream LP | | | 82,255 | | | | 2,676,578 | |
| Kinetik Holdings, Inc. | | | 29,729 | | | | 1,080,946 | |
| Kodiak Gas Services, Inc. | | | 19,995 | | | | 352,512 | |
| | | | | | | | 31,481,560 | |
| | | | | | | | | |
| United States Natural Gas/Natural Gas Liquids Pipelines — 38.1% | | | | | | | | |
| Cheniere Energy, Inc. | | | 224,041 | | | | 40,809,068 | |
| DT Midstream, Inc. | | | 119,222 | | | | 6,830,228 | |
| Excelerate Energy, Inc. | | | 21,948 | | | | 366,971 | |
| Kinder Morgan, Inc. | | | 2,107,700 | | | | 37,032,289 | |
| National Fuel Gas Company | | | 181,114 | | | | 9,198,780 | |
| New Fortress Energy, Inc. | | | 129,398 | | | | 4,979,235 | |
| ONEOK, Inc. | | | 578,414 | | | | 39,823,804 | |
| Targa Resources Corp. | | | 241,813 | | | | 21,871,986 | |
| The Williams Companies, Inc. | | | 1,138,786 | | | | 41,895,936 | |
| | | | | | | | 202,808,297 | |
Total Common Stocks
(Cost $404,952,783) | | | | | | | 441,381,456 | |
| | | | | | | |
| | | Units/Shares | | | Fair Value | |
| Master Limited Partnerships — 16.6% | | | | | | | | |
| United States Crude Oil Pipelines — 2.6% | | | | | | | | |
| Delek Logistics Partners LP | | | 10,719 | | | $ | 548,384 | |
| Genesis Energy L.P. | | | 137,236 | | | | 1,723,684 | |
| NuStar Energy L.P. | | | 139,354 | | | | 2,653,300 | |
| Plains All American Pipeline L.P. | | | 558,507 | | | | 8,869,092 | |
| | | | | | | | 13,794,460 | |
| | | | | | | | | |
| United States Natural Gas Gathering/Processing — 1.7% | | | | | | | | |
| USA Compression Partners LP | | | 72,544 | | | | 1,727,273 | |
| Western Midstream Partners LP | | | 236,595 | | | | 7,055,263 | |
| | | | | | | | 8,782,536 | |
| | | | | | | | | |
| United States Natural Gas/Natural Gas Liquids Pipelines — 8.3% | | | | | | | | |
| Cheniere Energy Partners L.P. | | | 44,455 | | | | 2,744,652 | |
| Energy Transfer LP | | | 1,579,911 | | | | 21,944,963 | |
| Enterprise Products Partners L.P. | | | 745,492 | | | | 19,964,276 | |
| | | | | | | | 44,653,891 | |
| | | | | | | | | |
| United States Refined Product Pipelines — 4.0% | | | | | | | | |
| CrossAmerica Partners LP | | | 22,422 | | | | 532,074 | |
| Global Partners LP | | | 33,875 | | | | 1,234,066 | |
| MPLX LP | | | 431,133 | | | | 15,719,109 | |
| Sunoco LP | | | 68,250 | | | | 3,730,545 | |
| | | | | | | | 21,215,794 | |
Total Master Limited Partnerships
(Cost $62,841,417) | | | | | | | 88,446,681 | |
| | | | | | | | | |
| Short-Term Investments — 0.2% | | | | | | | | |
| Money Market Funds — 0.2% | | | | | | | | |
Invesco Government & Agency
Portfolio — Class Institutional, 5.28%(a) | | | 804,890 | | | | 804,890 | |
Total Short-Term Investments
(Cost $804,890) | | | | | | | 804,890 | |
| | | | | | | | | |
Total Investments — 99.8%
(Cost $468,599,090) | | | | | | $ | 530,633,027 | |
| Other Assets in Excess of Liabilities — 0.2% | | | | | | | 874,213 | |
| Total Net Assets — 100.0% | | | | | | $ | 531,507,240 | |
| | | | | | | | | |
Percentages are stated as a percent of net assets.
| (a) | The rate shown represents the 7-day effective yield as of November 30, 2023. |
See accompanying Notes to Financial Statements.
Ecofin Global Water ESG Fund
Schedule of Investments
November 30, 2023
| | | Shares | | | Fair Value | |
| Common Stocks — 99.4% | | | | | | | | |
| Canada Water Infrastructure — 3.6% | | | | | | | | |
| Stantec, Inc. | | | 22,797 | | | $ | 1,698,834 | |
| | | | | | | | | |
| France Water Infrastructure — 6.1% | | | | | | | | |
| Veolia Environnement SA | | | 91,526 | | | | 2,880,175 | |
| | | | | | | | | |
| Hong Kong Water Equipment/Services — 0.2% | | | | | | | | |
| China Lesso Group Holdings Ltd. | | | 204,000 | | | | 112,821 | |
| Hong Kong Water Infrastructure — 0.0%(a) | | | | | | | | |
| CT Environmental Group Limited(b)(c) | | | 113,060 | | | | 0 | |
| | | | | | | | | |
| Japan Water Equipment/Services — 4.2% | | | | | | | | |
| Kurita Water Industries Ltd. | | | 22,000 | | | | 777,256 | |
| Lixil Corp. | | | 59,000 | | | | 718,498 | |
| Rinnai Corp. | | | 24,400 | | | | 494,550 | |
| | | | | | | | 1,990,304 | |
| | | | | | | | | |
| Japan Water Infrastructure — 0.6% | | | | | | | | |
| METAWATER Co, Ltd. | | | 4,600 | | | | 63,573 | |
| Organo Corp. | | | 5,300 | | | | 216,633 | |
| | | | | | | | 280,206 | |
| | | | | | | | | |
| Switzerland Water Equipment/Services — 10.2% | | | | | | | | |
| Ferguson PLC | | | 21,972 | | | | 3,711,420 | |
| Georg Fischer AG | | | 16,851 | | | | 1,102,618 | |
| | | | | | | | 4,814,038 | |
| | | | | | | | | |
| Switzerland Water Management — 5.9% | | | | | | | | |
| Geberit AG | | | 5,032 | | | | 2,812,220 | |
| | | | | | | | | |
| United Kingdom Water Equipment/Services — 4.0% | | | | | | | | |
| Genuit Group PLC | | | 51,192 | | | | 209,070 | |
| Pentair PLC | | | 26,243 | | | | 1,693,723 | |
| | | | | | | | 1,902,793 | |
| | | | | | | | | |
| United Kingdom Water Infrastructure — 8.7% | | | | | | | | |
| Pennon Group PLC | | | 53,688 | | | | 479,194 | |
| Severn Trent PLC | | | 52,423 | | | | 1,721,380 | |
| United Utilities Group PLC | | | 140,095 | | | | 1,929,576 | |
| | | | | | | | 4,130,150 | |
| | | | | | | | | |
| United States Equipment/Services — 17.2% | | | | | | | | |
| Advanced Drainage Systems, Inc. | | | 14,227 | | | | 1,723,032 | |
| Aris Water Solutions, Inc. — Class A | | | 5,128 | | | | 41,434 | |
| Energy Recovery Inc.(c) | | | 11,589 | | | | 220,886 | |
| Franklin Electric Co., Inc. | | | 8,174 | | | | 727,486 | |
| IDEX Corporation | | | 8,200 | | | | 1,653,776 | |
| Select Water Solutions, Inc. | | | 16,631 | | | | 124,067 | |
| Xylem, Inc. | | | 35,029 | | | | 3,682,599 | |
| | | | | | | | 8,173,280 | |
| United States Water Infrastructure — 4.6% | | | | | | | | |
| Mueller Water Products, Inc. — Class A | | | 32,150 | | | | 427,274 | |
| Tetra Tech, Inc. | | | 10,940 | | | | 1,730,161 | |
| | | | | | | | 2,157,435 | |
| | | | | | | | | |
| United States Water Management — 10.6% | | | | | | | | |
| A.O. Smith Corporation | | | 25,432 | | | | 1,916,556 | |
| Badger Meter, Inc. | | | 6,023 | | | | 887,610 | |
| Lindsay Corporation | | | 2,262 | | | | 269,879 | |
| Watts Water Technologies, Inc. — Class A | | | 5,626 | | | | 1,083,061 | |
| Zurn Elkay Water Solutions Corp. | | | 29,137 | | | | 857,793 | |
| | | | | | | | 5,014,899 | |
| | | | | | | | | |
| United States Water Treatment — 7.6% | | | | | | | | |
| Ecolab Inc. | | | 18,865 | | | | 3,616,986 | |
| | | | | | | | | |
| United States Water Utilities — 15.9% | | | | | | | | |
| American States Water Company | | | 7,597 | | | | 607,000 | |
| American Water Works Co., Inc. | | | 25,243 | | | | 3,328,037 | |
| California Water Service Group | | | 11,855 | | | | 599,507 | |
| Core & Main, Inc. — Class A(c) | | | 18,419 | | | | 645,218 | |
| Essential Utilities, Inc. | | | 49,996 | | | | 1,780,358 | |
| Montrose Environmental Group, Inc.(c) | | | 5,700 | | | | 178,239 | |
| SJW Group | | | 5,940 | | | | 389,902 | |
| | | | | | | | 7,528,261 | |
Total Common Stocks
(Cost $45,824,662) | | | | | | | 47,112,402 | |
| | | | | | | | | |
| Short-Term Investments — 0.2% | | | | | | | | |
| Money Market Funds — 0.2% | | | | | | | | |
| First American Government Obligations | | | | | | | | |
| Fund — Class X, 5.29%(d) | | | 107,075 | | | | 107,075 | |
Total Short-Term Investments
(Cost $107,075) | | | | | | | 107,075 | |
| | | | | | | | | |
Total Investments — 99.6%
(Cost $45,931,737) | | | | | | $ | 47,219,477 | |
| Other Assets in Excess of Liabilities — 0.4% | | | | | | | 194,208 | |
| Total Net Assets — 100.0% | | | | | | $ | 47,413,685 | |
Percentages are stated as a percent of net assets.
PLC – Public Limited Company
| (a) | Represents less than 0.05% of net assets. |
| (b) | Fair value determined using significant unobservable inputs in accordance with procedures established by and under the supervision of the Adviser, acting through its Valuation Committee. These securities represented $0 or 0.0% of net assets as of November 30, 2023. |
| (c) | Non-income producing security. |
| (d) | The rate shown represents the 7-day effective yield as of November 30, 2023. |
See accompanying Notes to Financial Statements.
2023 Annual Report | November 30, 2023
Statements of Assets & Liabilities
November 30, 2023
| | | | | | | |
| | | Tortoise
North American
Pipeline Fund | | | Ecofin
Global Water
ESG Fund | |
| Assets: | | | | | | | | |
| Investments, at fair value (cost $468,599,090, and $45,931,737, respectively) | | $ | 530,633,027 | | | $ | 47,219,477 | |
| Receivable for investment securities sold | | | 1,141,953 | | | | — | |
| Foreign Cash (cost $481) | | | 485 | | | | — | |
| Dividends & interest receivable | | | 849,021 | | | | 204,206 | |
| Receivable for capital shares sold | | | 37,830,995 | | | | — | |
| Total assets | | | 570,455,481 | | | | 47,423,683 | |
| | | | | | | | | |
| Liabilities: | | | | | | | | |
| Payable for investment securities purchased | | | 38,796,209 | | | | — | |
| Payable to Adviser | | | 152,032 | | | | 9,998 | |
| Total liabilities | | | 38,948,241 | | | | 9,998 | |
| Net Assets | | $ | 531,507,240 | | | $ | 47,413,685 | |
| | | | | | | | | |
| Net Assets Consist of: | | | | | | | | |
| Capital Stock | | $ | 494,472,183 | | | $ | 50,840,076 | |
| Total distributable earnings (loss) | | | 37,035,057 | | | | (3,426,391 | ) |
| Net Assets | | $ | 531,507,240 | | | $ | 47,413,685 | |
| | | | | | | | | |
| Net Assets | | $ | 531,507,240 | | | $ | 47,413,685 | |
| Shares issued and outstanding(1) | | | 20,300,000 | | | | 1,150,000 | |
| Net asset value, redemption price and offering price per share | | $ | 26.18 | | | $ | 41.23 | |
| | |
| (1) | Unlimited shares authorized. |
See accompanying Notes to Financial Statements.
Statements of Operations
For the Year Ended November 30, 2023
| | | | | | | |
| | | Tortoise
North American
Pipeline Fund | | | Ecofin
Global Water
ESG Fund | |
| Investment Income: | | | | | | | | |
| Dividends and distributions from common stock | | $ | 20,769,027 | | | $ | 1,052,609 | |
| Distributions from master limited partnerships | | | 7,763,039 | | | | — | |
| Less: return of capital on distributions(1) | | | (10,876,716 | ) | | | — | |
| Less: foreign taxes withheld | | | (1,144,288 | ) | | | (46,024 | ) |
| Net dividends and distributions from investments | | | 16,511,062 | | | | 1,006,585 | |
| Dividends from money market mutual funds | | | 50,701 | | | | 5,427 | |
| Total investment income | | | 16,561,763 | | | | 1,012,012 | |
| | | | | | | | | |
| Expenses: | | | | | | | | |
| Advisory fees (See Note 5) | | | 2,044,440 | | | | 199,435 | |
| Total expenses | | | 2,044,440 | | | | 199,435 | |
| Net Investment Income | | | 14,517,323 | | | | 812,577 | |
| Realized and Unrealized Gain (Loss) on Investments and Translations of Foreign Currency: | | | | | | | | |
| Net realized gain on investments, including foreign currency gain (loss) | | | 55,002,763 | | | | 1,010,264 | |
| Net change in unrealized appreciation or depreciation of investments and translation of foreign currency | | | (54,222,554 | ) | | | 3,058,465 | |
| Net Realized and Unrealized Gain on Investments and Translations of Foreign Currency: | | | 780,209 | | | | 4,068,729 | |
| Net Increase in Net Assets Resulting from Operations | | $ | 15,297,532 | | | $ | 4,881,306 | |
| | |
| (1) | Return of capital may be in excess of current year distributions due to prior year adjustments. See Note 2 to the financial statements for further disclosure. |
See accompanying Notes to Financial Statements.
2023 Annual Report | November 30, 2023
Statements of Changes in Net Assets
| | | Tortoise North American Pipeline Fund | | | Ecofin Global Water ESG Fund | |
| | | Year Ended
November 30,
2023 | | | Year Ended
November 30,
2022 | | | Year Ended
November 30,
2023 | | | Year Ended
November 30,
2022 | |
| Operations | | | | | | | | | | | | | | | | |
| Net investment income | | $ | 14,517,323 | | | $ | 11,912,961 | | | $ | 812,577 | | | $ | 889,106 | |
| Net realized gain (loss) on investments, including foreign currency gain (loss) | | | 55,002,763 | | | | 19,391,183 | | | | 1,010,264 | | | | (1,549,661 | ) |
| Net change in unrealized appreciation or depreciation of investments and translations of foreign currency | | | (54,222,554 | ) | | | 86,421,188 | | | | 3,058,465 | | | | (10,934,143 | ) |
| Net increase (decrease) in net assets resulting from operations | | | 15,297,532 | | | | 117,725,332 | | | | 4,881,306 | | | | (11,594,698 | ) |
| Capital Share Transactions | | | | | | | | | | | | | | | | |
| Proceeds from shares sold | | | 152,730,499 | | | | 103,555,969 | | | | — | | | | 17,971,310 | |
| Payments for shares redeemed | | | (170,866,090 | ) | | | (59,626,315 | ) | | | (17,487,715 | ) | | | (8,774,660 | ) |
| Net increase (decrease) in net assets resulting from capital share transactions | | | (18,135,591 | ) | | | 43,929,654 | | | | (17,487,715 | ) | | | 9,196,650 | |
| Distributions to Shareholders | | | | | | | | | | | | | | | | |
| From distributable earnings | | | (17,271,051 | ) | | | (11,182,243 | ) | | | (1,016,406 | ) | | | (1,033,125 | ) |
| From tax return of capital | | | (8,411,109 | ) | | | (12,160,551 | ) | | | — | | | | — | |
| Total distributions to shareholders | | | (25,682,160 | ) | | | (23,342,794 | ) | | | (1,016,406 | ) | | | (1,033,125 | ) |
| Total Increase (Decrease) in Net Assets | | | (28,520,219 | ) | | | 138,312,192 | | | | (13,622,815 | ) | | | (3,431,173 | ) |
| Net Assets | | | | | | | | | | | | | | | | |
| Beginning of year | | | 560,027,459 | | | | 421,715,267 | | | | 61,036,500 | | | | 64,467,673 | |
| End of year | | $ | 531,507,240 | | | $ | 560,027,459 | | | $ | 47,413,685 | | | $ | 61,036,500 | |
| Transactions in Shares | | | | | | | | | | | | | | | | |
| Shares sold | | | 6,000,000 | | | | 4,150,000 | | | | — | | | | 450,000 | |
| Shares redeemed | | | (6,900,000 | ) | | | (2,450,000 | ) | | | (450,000 | ) | | | (200,000 | ) |
| Net increase (decrease) | | | (900,000 | ) | | | 1,700,000 | | | | (450,000 | ) | | | 250,000 | |
See accompanying Notes to Financial Statements.
Tortoise North American Pipeline Fund
Financial Highlights
| | | Year Ended
November 30,
2023 | | | Year Ended
November 30,
2022 | | | Year Ended
November 30,
2021 | | | Year Ended
November 30,
2020 | | | Year Ended
November 30,
2019 | |
| Per Common Share Data(1) | | | | | | | | | | | | | | | | | | | | |
| Net asset value, beginning of year | | $ | 26.42 | | | $ | 21.63 | | | $ | 17.50 | | | $ | 22.18 | | | $ | 21.99 | |
| Investment operations: | | | | | | | | | | | | | | | | | | | | |
| Net investment income(2) | | | 0.65 | | | | 0.62 | | | | 0.43 | | | | 0.48 | | | | 0.62 | |
| Net realized and unrealized gain (loss) on investments and translations of foreign currency(2) | | | 0.34 | | | | 5.28 | | | | 4.74 | | | | (4.12 | ) | | | 0.55 | |
| Total from investment operations | | | 0.99 | | | | 5.90 | | | | 5.17 | | | | (3.64 | ) | | | 1.17 | |
| Less distributions from: | | | | | | | | | | | | | | | | | | | | |
| Net investment income | | | (0.77 | ) | | | (0.51 | ) | | | (0.46 | ) | | | (0.42 | ) | | | (0.45 | ) |
| Net realized gains | | | (0.06 | ) | | | — | | | | — | | | | — | | | | — | |
| Return of capital | | | (0.40 | ) | | | (0.60 | ) | | | (0.58 | ) | | | (0.62 | ) | | | (0.53 | ) |
| Total distributions | | | (1.23 | ) | | | (1.11 | ) | | | (1.04 | ) | | | (1.04 | ) | | | (0.98 | ) |
| Net asset value, end of year | | $ | 26.18 | | | $ | 26.42 | | | $ | 21.63 | | | $ | 17.50 | | | $ | 22.18 | |
| | | | | | | | | | | | | | | | | | | | | |
| Total Return | | | 4.21 | % | | | 27.89 | % | | | 30.10 | % | | | (15.74 | )% | | | 5.22 | % |
| Supplemental Data and Ratios | | | | | | | | | | | | | | | | | | | | |
| Net assets, end of year (in 000’s) | | $ | 531,507 | | | $ | 560,027 | | | $ | 421,715 | | | $ | 359,713 | | | $ | 413,585 | |
| Ratios to average net assets: | | | | | | | | | | | | | | | | | | | | |
| Expenses | | | 0.40 | % | | | 0.40 | % | | | 0.40 | % | | | 0.40 | % | | | 0.40 | % |
| Net investment income | | | 2.84 | % | | | 2.27 | % | | | 2.20 | % | | | 2.34 | % | | | 2.01 | % |
| Portfolio turnover rate | | | 19 | % | | | 12 | % | | | 17 | % | | | 28 | % | | | 13 | % |
| | |
| (1) | For a Fund share outstanding for the entire period. |
| (2) | The per common share data for the years ended November 30, 2022, 2021, 2020, and 2019 does not reflect the change in estimate of investment income and return of capital. See Note 2 to the financial statements for further disclosure. |
See accompanying Notes to Financial Statements.
2023 Annual Report | November 30, 2023
Ecofin Global Water ESG Fund
Financial Highlights
| | | Year Ended
November 30,
2023 | | | Year Ended
November 30,
2022 | | | Year Ended
November 30,
2021 | | | Year Ended
November 30,
2020 | | | Year Ended
November 30,
2019 | |
| Per Common Share Data(1) | | | | | | | | | | | | | | | | | | | | |
| Net asset value, beginning of year | | $ | 38.15 | | | $ | 47.75 | | | $ | 38.05 | | | $ | 33.06 | | | $ | 27.27 | |
| Investment operations: | | | | | | | | | | | | | | | | | | | | |
| Net investment income | | | 0.68 | | | | 0.59 | | | | 0.77 | | | | 0.57 | | | | 0.56 | |
| Net realized and unrealized gain (loss) on investments and translations of foreign currency | | | 3.14 | | | | (9.44 | ) | | | 9.42 | | | | 4.88 | | | | 5.76 | |
| Total from investment operations | | | 3.82 | | | | (8.85 | ) | | | 10.19 | | | | 5.45 | | | | 6.32 | |
| Less distributions from: | | | | | | | | | | | | | | | | | | | | |
| Net investment income | | | (0.74 | ) | | | (0.75 | ) | | | (0.49 | ) | | | (0.46 | ) | | | (0.53 | ) |
| Net realized gains | | | — | | | | — | | | | — | | | | — | | | | — | |
| Total distributions | | | (0.74 | ) | | | (0.75 | ) | | | (0.49 | ) | | | (0.46 | ) | | | (0.53 | ) |
| Net asset value, end of year | | $ | 41.23 | | | $ | 38.15 | | | $ | 47.75 | | | $ | 38.05 | | | $ | 33.06 | |
| Total Return | | | 10.13 | % | | | (18.73 | )% | | | 26.98 | % | | | 16.80 | % | | | 23.42 | % |
| Supplemental Data and Ratios | | | | | | | | | | | | | | | | | | | | |
| Net assets, end of year (in 000’s) | | $ | 47,414 | | | $ | 61,037 | | | $ | 64,468 | | | $ | 20,927 | | | $ | 14,875 | |
| Ratios to average net assets: | | | | | | | | | | | | | | | | | | | | |
| Expenses | | | 0.40 | % | | | 0.40 | % | | | 0.40 | % | | | 0.40 | % | | | 0.40 | % |
| Net investment income | | | 1.63 | % | | | 1.52 | % | | | 2.22 | % | | | 1.74 | % | | | 2.01 | % |
| Portfolio turnover rate | | | 19 | % | | | 26 | % | | | 21 | % | | | 19 | % | | | 16 | % |
| (1) | For a Fund share outstanding for the entire period. |
See accompanying Notes to Financial Statements.
Notes to Financial Statements
November 30, 2023
1. Organization
Managed Portfolio Series (the “Trust”) was organized as a Delaware statutory trust on January 27, 2011. The Trust is registered under the Investment Company Act of 1940, as amended (the “1940 Act”), as an open-end management investment company. The Tortoise North American Pipeline Fund (the “North American Pipeline Fund”) and the Ecofin Global Water ESG Fund (the “Global Water ESG Fund”) (or collectively, “the Funds”) are each a non-diversified series with their own investment objectives and policies within the Trust. The Trust has evaluated the structure, objective and activities of the Funds and determined that they meet the characteristics of an investment company. As such, these financial statements have applied the guidance as set forth in the Accounting Standards Codifications (“ASC”) 946, Financial Services Investment Companies.
The investment objective of the North American Pipeline Fund seeks investment results that correspond generally to the price and distribution rate (total return) performance of the Tortoise North American Pipeline IndexSM (the “North American Pipeline Index”). The North American Pipeline Fund commenced operations on June 29, 2015.
The investment objective of the Global Water ESG Fund seeks investment results that correspond (before fees and expenses) generally to the price and distribution rate (total return) performance of the Ecofin Global Water ESG IndexSM (the “Water Index”). The Global Water ESG Fund commenced operations on February 14, 2017.
Shares of the North American Pipeline Fund and Global Water ESG Fund are listed and traded on the NYSE Arca, Inc. (the “NYSE”). Market prices for the shares may be different from their net asset value (“NAV”). The Funds issue and redeem shares on a continuous basis at NAV only in blocks of 50,000 shares, called “Creation Units.” Creation Units are issued and redeemed principally in-kind for securities included in a specified universe, with cash included to balance to the Creation Unit total. Once created, shares generally trade in the secondary market at market prices that change throughout the day in amounts less than a Creation Unit. Except when aggregated in Creation Units, shares are not redeemable securities of the Funds. Shares of the Funds may only be purchased or redeemed by certain financial institutions (“Authorized Participants”). An Authorized Participant is either (i) a broker-dealer or other participant in the clearing process through the Continuous Net Settlement System of the National Securities Clearing Corporation or (ii) a Depository Trust Company participant and, in each case, must have executed a Participation Agreement with the Distributor. Most retail investors do not qualify as Authorized Participants nor have the resources to buy and sell whole Creation Units. Therefore, they are unable to purchase or redeem the shares directly from the Funds. Rather, most retail investors may purchase shares in the secondary market with the assistance of a broker and are subject to customary brokerage commissions or fees.
The Funds currently offer one class of shares, which have no front-end sales load, no deferred sales charge, and no redemption fee. A purchase (i.e. creation) transaction fee is imposed for the transfer and other transaction costs associated with the purchase of Creation Units. The standard fixed creation transaction fee for each Fund is $500, which is payable by the Advisor. In addition, a variable fee may be charged on all cash transactions or substitutes for Creation Units of up to a maximum of 2% as a percentage of the value of the Creation Units subject to the transaction. Variable fees are imposed to compensate the Funds for the transaction costs associated with the cash transactions. Variable fees received by the Funds are displayed in the capital shares transaction section of the Statement of Changes in Net Assets. The Funds may issue an unlimited number of shares of beneficial interest, with no par value. All shares of the Funds have equal rights and privileges.
2. Significant Accounting Policies
The Funds are investment companies and follows accounting and reporting guidance under Financial Accounting Standards Board Accounting Standards Codification (“ASC”) Topic 946, “Financial Services-Investment Companies. The following is a summary of significant accounting policies followed by the Fund in the preparation of its financial statements. These policies are in conformity with generally accepted accounting principles in the United States of America (“GAAP”).
Securities Valuation — All investments in securities are recorded at their estimated fair value, as described in Note 3.
Foreign Currency Translation — The books and records relating to the Funds’ non-U.S. dollar denominated investments are maintained in U.S. dollars on the following bases: (1) market value of investment securities, assets, and liabilities are translated at the current rate of exchange; and (2) purchases and sales of investment securities, income, and expenses are translated at the relevant rates of exchange prevailing on the respective dates of such transactions. The Funds do not isolate the portion of gains and losses on investments in equity securities that is due to changes in the foreign exchange rates from that which is due to changes in market prices of equity securities. The Funds report certain foreign currency-related transactions as components of realized gains for financial reporting purposes, whereas such components are treated as ordinary income for federal income tax purposes.
Federal Income Taxes — The Funds intend to meet the requirements of subchapter M of the Internal Revenue Code applicable to regulated investment companies and to distribute substantially all net taxable investment income and net realized gains to shareholders in a manner which results in no tax cost to the Funds. Therefore, no federal income or excise tax provision is required. As of November 30, 2023, the Funds did not have any tax positions that did not meet the “more-likely-than-not” threshold of being sustained by the applicable tax authority. The Funds recognize interest and penalties, if any, related to unrecognized tax benefits on uncertain tax positions as income tax expense in the
2023 Annual Report | November 30, 2023
Notes to Financial Statements (continued)
Statement of Operations. During the period ended November 30, 2023, the Funds did not incur any interest or penalties. Each of the tax years in the four-year period ended November 30, 2023 remain subject to examination by taxing authorities for the North American Pipeline Fund and Global Water ESG Fund.
Securities Transactions, Income and Distributions — Security transactions are accounted for on the date the securities are purchased or sold (trade date). Realized gains and losses are reported on a specific identified cost basis. Interest income is recognized on an accrual basis, including amortization of premiums and accretion of discounts. Dividend income and distributions are recorded on the ex-dividend date. Withholding taxes on foreign dividends have been provided for in accordance with the Funds’ understanding of the applicable country’s tax rules and regulations. Distributions received from the Funds’ investments generally are comprised of ordinary income and return of capital. The Funds allocate distributions between investment income and return of capital based on estimates made at the time such distributions are received. Such estimates are based on information provided by each portfolio company and other industry sources. These estimates may subsequently be revised based on actual allocations received from the portfolio companies after their tax reporting periods are concluded, as the actual character of these distributions is not known until after the fiscal year end of the Funds.
During the year ended November 30, 2023, the North American Pipeline Fund reallocated the amount of return of capital recognized based on the 2022 tax reporting information received. The impact of this adjustment is a decrease to return of capital on distributions of approximately $42,214.
The North American Pipeline Fund will make distributions of net investment income, if any, quarterly. The Global Water ESG Fund will make distributions of net investment income, if any, semiannually. The Funds will also distribute net realized capital gains, if any, annually. Distributions to shareholders are recorded on the ex-dividend date. The treatment for financial reporting purposes of distributions made to shareholders during the year from net investment income or net realized capital gains may differ from their ultimate treatment for federal income tax purposes. These differences are caused primarily by differences in the timing of the recognition of certain components of income, expense or realized capital gain for federal income tax purposes. Where such differences are permanent in nature, GAAP requires that they be reclassified in the components of the net assets based on their ultimate characterization for federal income tax purposes. Any such reclassifications will have no effect on net assets, results of operations or net asset values per share of the Funds. These differences are primarily due to redemptions in kind, return of capital distributions and book/tax differences from underlying investments.
| Fund | | Distributable
Earnings (Losses) | | | Paid-in Capital | |
| North American Pipeline Fund | | | $(49,000,696 | ) | | | $49,000,696 | |
| Global Water ESG Fund | | | (2,272,415 | ) | | | 2,272,415 | |
Use of Estimates — The preparation of financial statements in conformity with GAAP requires management to make estimates and assumptions that affect the reported amounts of assets and liabilities and disclosure of contingent assets and liabilities at the date of the financial statements and the reported amounts of revenues and expenses during the reporting period. Actual results could differ from those estimates.
Share Valuation — The NAV per share of the Funds are calculated by dividing the sum of the value of the securities held by the Funds, plus cash and other assets, minus all liabilities (including estimated accrued expenses) by the total number of shares outstanding for the Funds, rounded to the nearest cent. The North American Pipeline Fund’s shares and Ecofin Global Water ESG Fund’s shares will not be priced on the days on which the NYSE is closed for trading. The offering and redemption price per share for the Funds are equal to the Funds’ net asset value per share.
Indemnifications — Under the Trust’s organizational documents, its officers and trustees are indemnified against certain liabilities arising out of the performance of their duties to the Trust. In addition, in the normal course of business, the Trust may enter into contracts that provide general indemnification to other parties. The Trust’s maximum exposure under these arrangements is unknown, as this would involve future claims that may be made against the Trust that have not yet occurred and may not occur. However, the Trust has not had prior claims or losses pursuant to these contracts and expects the risk of loss to be remote.
Cash and Cash Equivalents — Cash and cash equivalents include short-term, liquid investments with an original maturity of three months or less and include money market fund accounts.
Illiquid Securities — A security may be considered illiquid if it lacks a readily available market. Securities are generally considered liquid if they can be sold or disposed of in the ordinary course of business within seven days at approximately the price at which the security is valued by the Fund. Illiquid securities may be valued under methods approved by the Board of Trustees (the “Board”) as reflecting fair value. The Funds will not hold more than 15% of the value of its net assets in illiquid securities. At November 30, 2023, the Global Water ESG Fund had investments in illiquid securities with a total value of $0 or 0.0% of total net assets. At November 30, 2023, the North American Pipeline Fund did not hold any illiquid securities.
| Fund | | Security | | Shares | | Date Acquired | | Cost Basis | |
| Global Water ESG Fund | | CT Environmental Group Limited | | 113,060 | | 6/2018 | | $ | 15,150 | |
Notes to Financial Statements (continued)
3. Securities Valuation
The Funds have adopted fair value accounting standards, which establish an authoritative definition of fair value and set out a hierarchy for measuring fair value. These standards require additional disclosures about the various inputs and valuation techniques used to develop the measurements of fair value, a discussion in changes in valuation techniques and related inputs during the period and expanded disclosure of valuation levels for major security types. These inputs are summarized in the three broad levels listed below:
| Level 1 — | Quoted prices in active markets for identical assets or liabilities. |
| | |
| Level 2 — | Observable inputs other than quoted prices included in Level 1. These inputs may include quoted prices for similar instruments, interest rates, prepayment speeds, credit risk, yield curves, default rates and similar data. |
| | |
| Level 3 — | Significant unobservable inputs for the asset or liability, representing the Fund’s view of assumptions a market participant would use in valuing the asset or liability. |
Following is a description of the valuation techniques applied to each Fund’s major categories of assets and liabilities measured at fair value on a recurring basis. Each Fund’s investments are carried at fair value.
Common stock (including MLPs) — Securities that are primarily traded on a national securities exchange are valued at the last sale price on the exchange on which they are primarily traded on the day of valuation or, if there has been no sale on such day, at the mean between the bid and ask prices. Securities traded primarily on the Nasdaq Global Market System for which market quotations are readily available are valued using the Nasdaq Official Closing Price (“NOCP”). If the NOCP is not available, such securities are valued at the last sale price on the day of valuation, or if there has been no sale on such day, at the mean between the bid and ask prices. To the extent these securities are actively traded and valuation adjustments are not applied, they are categorized in Level 1 of the fair value hierarchy.
Investment Companies — Investments in other mutual funds, including money market funds, are valued at their net asset value per share. To the extent these securities are actively traded and valuation adjustments are not applied, they are categorized in Level 1 of the fair value hierarchy.
The Board of Trustees (the “Board”) has adopted a pricing and valuation policy for use by the Funds and their Valuation Designee (as defined below) in calculating the Funds’ NAV. Pursuant to Rule 2a-5 under the 1940 Act, the Funds have designated Tortoise Index Solutions, LLC (the “Adviser”) as their “Valuation Designee” to perform all of the fair value determinations as well as to perform all of the responsibilities that may be performed by the Valuation Designee in accordance with Rule 2a-5. The Valuation Designee is authorized to make all necessary determinations of the fair values of portfolio securities and other assets for which market quotations are not readily available or if it is deemed that the prices obtained from brokers and dealers or independent pricing services are unreliable.
The inputs or methodology used for valuing securities are not an indication of the risk associated with investing in those securities.
The following table is a summary of the inputs used to value each Fund’s securities by level within the fair value hierarchy as of November 30, 2023:
| North American Pipeline Fund | | Level 1 | | | Level 2 | | | Level 3 | | | Total | |
| Common stock | | $ | 441,381,456 | | | $ | — | | | $ | — | | | $ | 441,381,456 | |
| Master limited partnerships | | | 88,446,681 | | | | — | | | | — | | | | 88,446,681 | |
| Short-term investment | | | 804,890 | | | | — | | | | — | | | | 804,890 | |
| Total investments in securities | | $ | 530,633,027 | | | $ | — | | | $ | — | | | $ | 530,633,027 | |
| | | | | | | | | | | | | | | | | |
| Global Water ESG Fund | | | Level 1 | | | | Level 2 | | | | Level 3 | | | | Total | |
| Common stock | | $ | 47,112,402 | | | $ | — | | | $ | — | | | $ | 47,112,402 | |
| Short-term investment | | | 107,075 | | | | — | | | | — | | | | 107,075 | |
| Total investments in securities | | $ | 47,219,477 | | | $ | — | | | $ | — | | | $ | 47,219,477 | |
Refer to each Fund’s Schedule of Investments for additional industry information.
2023 Annual Report | November 30, 2023
Notes to Financial Statements (continued)
The following is a reconciliation of Level 3 assets for which significant unobservable inputs were used to determine fair value.
| Global Water ESG Fund | | Investments in
Securities | |
| Balance as of 11/30/2022 | | $ | — | |
| Accrued discounts/ premiums | | | — | |
| Realized gain (loss) | | | — | |
| Change in net unrealized appreciation (depreciation) | | | — | |
| Net purchases (sales) | | | — | |
| Transfers into and/or out of Level 3 | | | — | |
| Balance as of 11/30/2023 | | $ | — | |
| Net unrealized depreciation of Level 3 Securities as of November 30, 2023 | | $ | (15,150 | ) |
4. Concentration Risk and General Risk
Because the North American Pipeline Fund’s assets are concentrated in the energy pipeline industry and the Global Water ESG Fund’s assets are concentrated in the water industry, the Funds are subject to loss due to adverse occurrences that may affect those industries. Funds that primarily invest in a particular industry may experience greater volatility than funds investing in a broad range of industries.
5. Investment Advisory Fee and Other Transactions with Affiliates
The Trust has an agreement with Tortoise Index Solutions, L.L.C. (the “Adviser”) to furnish investment advisory services to the Funds. Pursuant to an Investment Advisory Agreement between the Trust and the Adviser, the Adviser is entitled to receive, on a monthly basis, an annual advisory fee equal to 0.40% of each Fund’s average daily net assets. The Adviser bears the cost of all advisor and non-advisory services required to operate each Fund.
The Adviser has engaged Exchange Traded Concepts, LLC (the “Sub-Adviser”) as the Sub-Adviser to the Funds. Subject to the supervision of the Adviser, the Sub-Adviser is primarily responsible for the day-to-day management of the Funds’ portfolio, including purchase, retention and sale of securities. Fees associated with these services are paid to the Sub-Adviser by the Adviser.
U.S. Bancorp Fund Services, LLC, doing business as U.S. Bank Global Fund Services (“Fund Services” or the “Administrator”) acts as the Funds’ Administrator, Transfer Agent and Fund Accountant. U.S. Bank, N.A. (the “Custodian”) serves as the custodian to the Funds. The Custodian is an affiliate of the Administrator. The Administrator performs various administrative and accounting services for the Funds. The Administrator prepares various federal and state regulatory filings, reports and returns for the Funds; prepares reports and materials to be supplied to the Trustees and monitors the activities of the Funds’ custodian, transfer agent and accountants. The officers of the Trust including the Chief Compliance Officer are employees of the Administrator. As compensation for its services, the Administrator is entitled to a monthly fee at an annual rate based upon the average daily net assets of the Funds, subject to annual minimums.
Notes to Financial Statements (continued)
6. Investment Transactions
The aggregate purchases and sales, excluding U.S. government securities, short-term investments and in-kind transactions, by each Fund for the period ended November 30, 2023, were as follows:
| | | Purchases | | | Sales | |
| North American Pipeline Fund | | $ | 96,175,477 | | | $ | 95,131,192 | |
| Global Water ESG Fund | | | 9,201,528 | | | | 9,429,858 | |
During the period ended November 30, 2023, in-kind transactions associated with creation and redemptions were as follows:
| | | Purchases | | | Sales | |
| North American Pipeline Fund | | $ | 152,325,490 | | | $ | 168,293,268 | |
| Global Water ESG Fund | | | — | | | | 17,404,540 | |
During the period ended November 30, 2023, net capital gains resulting from in-kind redemptions were as follows:
| North American Pipeline Fund | | $ | 55,446,999 | | | | | |
| Global Water ESG Fund | | | 2,724,834 | | | | | |
7. Federal Tax Information
As of November 30, 2023, the Funds’ most recently completed fiscal year end, the cost basis of investments for federal income tax purposes and the components of accumulated losses on a tax basis were as follows:
| | | North American
Pipeline Fund | | | Global Water
ESG Fund | |
| Cost of investments | | $ | 478,788,713 | | | $ | 46,765,417 | |
| Gross unrealized appreciation | | | 82,703,868 | | | | 4,934,516 | |
| Gross unrealized depreciation | | | (45,668,811 | ) | | | (4,476,155 | ) |
| Net unrealized appreciation (depreciation) | | | 37,035,057 | | | | 458,361 | |
| Undistributed ordinary income | | | — | | | | 258,629 | |
| Undistributed long-term capital gain | | | — | | | | — | |
| Total distributable earnings | | | — | | | | 258,629 | |
| Other accumulated losses | | | | | | | (4,143,381 | ) |
| Total accumulated gain (loss) | | $ | 37,035,057 | | | $ | (3,426,391 | ) |
The difference between book and tax-basis cost is attributable primarily to wash sales and master limited partnership (“MLP”) adjustments.
As of November 30, 2023, the Global Water ESG Fund had a short-term capital loss carryforward of $1,251,121 and a long-term capital loss carryforward of $2,892,260 which may be carried forward for an unlimited period under the Regulated Investment Company Modernization Act of 2010. To the extent Funds realize future net capital gains, those gains will be offset by any unused capital loss carryforwards. Capital loss carryforwards will retain their character as either short-term or long-term capital losses. Thus, such losses must be used first to offset gains of the same character; for example, long-term loss carryforwards will first offset long-term gains, before they can be used to offset short-term gains. The capital gains and losses have been estimated based on information currently available and are subject to revision upon receipt of the 2023 tax reporting information from the individual MLPs. As of November 30, 2023, the Tortoise North American Pipeline Fund utilized $4,195,627 of capital loss carryforwards in the current year.
In order to meet certain excise tax distribution requirements, the Funds are required to measure and distribute annually net capital gains realized during a twelve month period ending November 30 and net investment income earned during a twelve month period ending December 31. In connection with this, the Funds are permitted for tax purposes to defer into its next fiscal year qualified late year ordinary losses. Qualified late year ordinary losses are generally losses incurred between January 1 and the end of its fiscal year, November 30, 2023. The Funds did not defer any late year ordinary losses for the taxable year ended November 30, 2023.
2023 Annual Report | November 30, 2023
Notes to Financial Statements (continued)
During the period ended November 30, 2023 the Funds paid the following distributions to shareholders:
| | | North American
Pipeline Fund | | | Global Water
ESG Fund | |
| Ordinary income* | | $ | 15,996,596 | | | $ | 1,016,406 | |
| Long-term capital gains** | | | 1,274,455 | | | | — | |
| Return of capital | | | 8,411,109 | | | | — | |
| Total distributions | | $ | 25,682,160 | | | $ | 1,016,406 | |
During the year ended November 30, 2022, the Funds paid the following distributions to shareholders:
| | | North American
Pipeline Fund | | | Global Water
ESG Fund | |
| Ordinary income* | | $ | 11,182,243 | | | $ | 1,033,125 | |
| Long-term capital gains** | | | — | | | | — | |
| Return of capital | | | 12,160,551 | | | | — | |
| Total distributions | | $ | 23,342,794 | | | $ | 1,033,125 | |
| | |
| * | For federal income tax purposes, distributions of short-term capital gains are treated as ordinary income distributions. |
| ** | The Fund designates as long-term capital gain distributions, pursuant to Internal Revenue Code Section 852(b)(3)(c). |
8. Other Regulatory Matters
In October 2022, the Securities and Exchange Commission (the “SEC”) adopted a final rule relating to Tailored Shareholder Reports for Mutual Funds and Exchange-Traded Funds; Fee Information in Investment Company Advertisements. The rule and form amendments will, among other things, require the Fund to transmit concise and visually engaging shareholder reports that highlight key information. The amendments will require that funds tag information in a structured data format and that certain more in-depth information be made available online and available for delivery free of charge to investors on request. The amendments became effective January 24, 2023. There is an 18-month transition period after the effective date of the amendment.
9. Subsequent Events
On December 28, 2023, the North American Pipeline Fund paid an income distribution to shareholders in the amount of $6,138,800, or $0.29800000 per share.
On December 28, 2023, the Global Water ESG Fund paid an income distribution to shareholders in the amount of $304,224, or $0.26454262 per share.
Management has performed an evaluation of subsequent events through the date the financial statements were issued and has determined that no items require recognition or disclosure.
Report of Independent Registered Public Accounting Firm
To the Shareholders of Tortoise North American Pipeline Fund
and Ecofin Global Water ESG Fund and
the Board of Trustees of Managed Portfolio Series
Opinion on the Financial Statements
We have audited the accompanying statements of assets and liabilities of Tortoise North American Pipeline Fund and Ecofin Global Water ESG Fund (collectively referred to as the “Funds”), (two of the Funds constituting the Managed Portfolio Series (the “Trust”)), including the schedules of investments, as of November 30, 2023, and the related statements of operations for the year then ended, the statements changes in net assets for each of the two years in the period then ended, the financial highlights for each of the five years in the period then ended and the related notes (collectively referred to as the “financial statements”). In our opinion, the financial statements present fairly, in all material respects, the financial position of each of the Funds (two of the funds constituting Managed Portfolio Series) at November 30, 2023, the results of their operations for the year then ended, the changes in their net assets for each of the two years in the period then ended and their financial highlights for each of the five years in the period then ended, in conformity with U.S. generally accepted accounting principles.
Basis for Opinion
These financial statements are the responsibility of the Trust’s management. Our responsibility is to express an opinion on each of the Funds’ financial statements based on our audits. We are a public accounting firm registered with the Public Company Accounting Oversight Board (United States) (“PCAOB”) and are required to be independent with respect to the Trust in accordance with the U.S. federal securities laws and the applicable rules and regulations of the Securities and Exchange Commission and the PCAOB.
We conducted our audits in accordance with the standards of the PCAOB. Those standards require that we plan and perform the audit to obtain reasonable assurance about whether the financial statements are free of material misstatement, whether due to error or fraud. The Trust is not required to have, nor were we engaged to perform, an audit of the Trust’s internal control over financial reporting. As part of our audits, we are required to obtain an understanding of internal control over financial reporting but not for the purpose of expressing an opinion on the effectiveness of the Trust’s internal control over financial reporting. Accordingly, we express no such opinion.
Our audits included performing procedures to assess the risks of material misstatement of the financial statements, whether due to error or fraud, and performing procedures that respond to those risks. Such procedures included examining, on a test basis, evidence regarding the amounts and disclosures in the financial statements. Our procedures included confirmation of securities owned as of November 30, 2023, by correspondence with the custodian and brokers. Our audits also included evaluating the accounting principles used and significant estimates made by management, as well as evaluating the overall presentation of the financial statements. We believe that our audits provide a reasonable basis for our opinion.

We have served as the auditor of one or more of the portfolios that comprise the Managed Portfolio Series since 2011.
Minneapolis, Minnesota
January 26, 2024
2023 Annual Report | November 30, 2023
Trustees & Officers (unaudited)
November 30, 2023
Name, Address
and Year of Birth | | Position(s) Held
with the Trust | | Term of Office
and Length of
Time Served | | Number of
Portfolios
in Trust
Overseen
by Trustee | |
Principal Occupation(s)
During the Past Five Years | | Other Directorships
Held by Trustee During
the Past Five Years |
| Independent Trustees | | | | | | | | | | |
Leonard M. Rush, CPA
615 E. Michigan St.
Milwaukee, WI 53202
Year of Birth: 1946 | | Chairman, Trustee and Audit Committee Chairman | | Indefinite Term; Since April 2011 | | 31 | | Retired, Chief Financial Officer, Robert W. Baird & Co. Incorporated (2000-2011). | | Independent Trustee, ETF Series Solutions (57 Portfolios) (2012-present). |
David A. Massart
615 E. Michigan St.
Milwaukee, WI 53202
Year of Birth: 1967 | | Trustee | | Indefinite Term; Since April 2011 | | 31 | | Partner and Managing Director, Beacon Pointe Advisors, LLC (since 2022); Co-Founder and Chief Investment Strategist, Next Generation Wealth Management, Inc. (2005-2021). | | Independent Trustee, ETF Series Solutions (57 Portfolios) (2012-present). |
David M. Swanson
615 E. Michigan St.
Milwaukee, WI 53202
Year of Birth: 1957 | | Trustee and Nominating & Governance Committee Chairman | | Indefinite Term; Since April 2011 | | 31 | | Founder and Managing Principal, SwanDog Strategic Marketing, LLC (2006-present). | | Independent Trustee, ALPS Variable Investment Trust (7 Portfolios) (2006 to Present); Independent Trustee, RiverNorth Funds (3 Portfolios) (2018 to Present); RiverNorth Managed Duration Municipal Income Fund, Inc. (1 Portfolio) (2019 to Present); RiverNorth Opportunistic Municipal Income Fund, Inc. (1 Portfolio) (2018 to Present); RiverNorth Capital and Income Fund (1 Portfolio) (2018 to Present); RiverNorth Opportunities Fund (1 Portfolio) (2015 to Present); RiverNorth/ DoubleLine Strategic Opportunity Fund, Inc. (1 Portfolio) (2019 to Present); RiverNorth Flexible Municipal Income Fund, Inc. (1 Portfolio) (2020 to Present); RiverNorth Flexible Municipal Income Fund II, Inc. (1 Portfolio) (2021 to Present); RiverNorth Managed Duration Municipal Income Fund II, Inc. (1 Portfolio) (2022 to Present). |
Robert J. Kern
615 E. Michigan St.
Milwaukee, WI 53202
Year of Birth: 1958 | | Trustee | | Indefinite Term; Since January 2011 | | 31 | | Retired (2018-present); Executive Vice President, U.S. Bancorp Fund Services, LLC (1994-2018). | | None |
Trustees & Officers (unaudited) (continued)
November 30, 2023
Name, Address
and Year of Birth | | Position(s) Held
with the Trust | | Term of Office
and Length of
Time Served | | Number of
Portfolios
in Trust
Overseen
by Trustee | | Principal Occupation(s)
During the Past Five Years | | Other Directorships
Held by Trustee During
the Past Five Years |
| Officers | | | | | | | | | | |
Brian R. Wiedmeyer
615 E. Michigan St.
Milwaukee, WI 53202
Year of Birth: 1973 | | President and Principal Executive Officer | | Indefinite Term; Since November 2018 | | N/A | | Vice President, U.S. Bancorp Fund Services, LLC (2005-present). | | N/A |
Deborah Ward
615 E. Michigan St.
Milwaukee, WI 53202
Year of Birth: 1966 | | Vice President, Chief Compliance Officer and Anti-Money Laundering Officer | | Indefinite Term; Since April 2013 | | N/A | | Senior Vice President, U.S. Bancorp Fund Services, LLC (2004-present). | | N/A |
Benjamin Eirich
615 E. Michigan St.
Milwaukee, WI 53202
Year of Birth: 1981 | | Treasurer, Principal Financial Officer and Vice President | | Indefinite Term; Since August 2019 (Treasurer); Indefinite Term; Since November 2018 (Vice President) | | N/A | | Assistant Vice President, U.S. Bancorp Fund Services, LLC (2008-present). | | N/A |
John Hadermayer
615 E. Michigan St.
Milwaukee, WI 53202
Year of Birth: 1977 | | Secretary | | Indefinite Term; Since May 2022 | | N/A | | U.S. Bancorp Fund Services, LLC (2022-present); Executive Director, AQR Capital Management, LLC (2013-present). | | N/A |
Silinapha Saycocie
615 E. Michigan St.
Milwaukee, WI 53202
Year of Birth: 1998 | | Assistant Treasurer and Vice President | | Indefinite Term; Since November 2023 | | N/A | | Officer, U.S. Bancorp Fund Services, LLC (2020-present). | | N/A |
Sara Bollech
615 E. Michigan St.
Milwaukee, WI 53202
Year of Birth: 1977 | | Assistant Treasurer and Vice President | | Indefinite Term: Since November 2021 | | N/A | | Officer, U.S. Bancorp Fund Services, LLC (2007-present). | | N/A |
Peter Walker, CPA
615 E. Michigan St.
Milwaukee, WI 53202
Year of Birth: 1993 | | Assistant Treasurer and Vice President | | Indefinite Term: Since November 2021 | | N/A | | Officer, U.S. Bancorp Fund Services, LLC (2016-present). | | N/A |
2023 Annual Report | November 30, 2023
Additional Information (unaudited)
Availability of Fund Portfolio Information
The Fund files complete schedules of portfolio holdings with the SEC for the first and third quarters of each fiscal year on Part F of Form N-PORT. The Funds’ Part F of Form N-PORT are available on the SEC’s website at www.sec.gov and may be reviewed and copied at the SEC’s Public Reference Room in Washington, D.C. Information on the operation of the Public Reference Room may be obtained by calling 1-800-732-0330. The Funds’ Part F of Form N-PORT may also be obtained by calling toll-free 1-844-TR-INDEX or 1-844-874-6339.
Availability of Proxy Voting Information
A description of the Fund’s Proxy Voting Policies and Procedures is available without charge, upon request, by calling 1-844-TR-INDEX or 1-844-874-6339. Information regarding how the Fund voted proxies relating to portfolio securities during the most recent 12 month period ended June 30, is available (1) without charge, upon request, by calling 1-844-TR-INDEX or 1-844-874-6339, or (2) on the SEC’s website at www.sec.gov.
Qualified Dividend Income/Dividends Received Deduction
For the fiscal year ended November 30, 2023, certain dividends paid by the Funds may be reported as qualified dividend income and may be eligible for taxation at capital gain rates. The percentage of dividends declared from ordinary income designated as qualified dividend income was 100.00% and 100.00% for the North American Pipeline Fund and Global Water ESG Fund, respectively.
For corporate shareholders, the percent of ordinary income distributions qualifying for the corporate dividends received deduction for the fiscal year ended November 30, 2023 was 67.14% and 45.80% for the North American Pipeline Fund and Global Water ESG Fund, respectively.
The percentage of taxable ordinary income distributions that are designated as short-term capital gain distributions under Internal Revenue Section 871(k)(2)(C) was 9.56% and 0.00% for the North American Pipeline Fund and Global Water ESG Fund, respectively.
Additional Information (unaudited) (continued)
Privacy Notice
The Funds collect only relevant information about you that the law allows or requires us to have in order to conduct our business and properly service you. The Funds collect financial and personal information about you (“Personal Information”) directly (e.g., information on account applications and other forms, such as your name, address, and social security number, and information provided to access account information or conduct account transactions online, such as password, account number, e-mail address, and alternate telephone number), and indirectly (e.g., information about your transactions with us, such as transaction amounts, account balance and account holdings).
The Funds do not disclose any non-public personal information about its shareholders or former shareholders other than for everyday business purposes such as to process a transaction, service an account, to respond to court orders and legal investigations or as otherwise permitted by law. Third parties that may receive this information include companies that provide transfer agency, technology and administrative services to the Funds, as well as the Funds’ investment adviser who is an affiliate of the Funds. If you maintain a retirement/educational custodial account directly with the Funds, we may also disclose your Personal Information to the custodian for that account for shareholder servicing purposes. We limit access to your Personal Information provided to unaffiliated third parties to information necessary to carry out their assigned responsibilities to the Funds. All shareholder records will be disposed of in accordance with applicable law.
The Trust maintains physical, electronic and procedural safeguards to protect Personal Information and requires its third parties service provides with access to such information to treat the Personal Information with the same high degree of confidentiality.
In the event that you hold shares of a Fund through a financial intermediary, including, but not limited to, a broker-dealer, bank, credit union or trust company, the privacy policy of the your financial intermediary would govern how their non-public personal information would be shared with unaffiliated third parties.
With respect to the Funds, issues and redemptions of their shares at net asset value (“NAV”) occur only in large aggregations of a specified number of shares (e.g., 50,000) called “Creation Units.” Only Authorized Participants (“APs”) may acquire shares directly from an ETF, and only APs may tender their ETF shares for redemption directly to the ETF, at NAV. APs must be (i) a broker-dealer or other participant in the clearing process through the Continuous Net Settlement System of the NSCC, a clearing agency that is registered with the SEC; or (ii) a DTC participant. In addition, each AP must execute a Participant Agreement that has been agreed to by the Funds’ distributor, and that has been accepted by the Funds’ transfer agent, with respect to purchases and redemptions of Creation Units.
Because of this structure, the Funds do not have any information regarding any “consumers” as defined in Rule 3 of Regulation S-P with respect to any ETFs, and consequently are not required by Regulation S-P to deliver a notice of the Funds’ privacy policy to any ETF shareholders.

Contacts
Board of Trustees
David Massart
Leonard Rush, CPA
David Swanson
Robert Kern
Investment Adviser
Tortoise Index Solutions, L.L.C.
d/b/a TIS Advisors
6363 College Boulevard, Suite 100A
Overland Park, KS 66211
Independent Registered Public Accounting Firm
Ernst & Young LLP
700 Nicollet Mall, Suite 500
Minneapolis, MN 55402
Transfer Agent, Fund Accountant and Fund Administrator
U.S. Bancorp Fund Services, LLC
615 E. Michigan Street
Milwaukee, WI 53202
Distributor
Quasar Distributors, LLC
111 E. Kilbourn Avenue, Suite 2200
Milwaukee, WI 53202
Custodian
U.S. Bank, N.A.
1555 North Rivercenter Drive
Milwaukee, WI 53212
Fund Counsel
Stradley Ronon Stevens & Young LLP
2005 Market Street
Suite 2600
Philadelphia, PA 19103
844-TR-INDEX
(844-874-6339)
This report must be accompanied or preceded by a prospectus.
The Fund’s Statement of Additional Information contains additional information about the Fund’s trustees and is available without charge upon request by calling 1-844-TR-INDEX or 1-844-874-6339.

6363 College Boulevard
Overland Park, KS 66211
www.TortoiseEcofin.com
(b) Not applicable.
Item 2. Code of Ethics.
The registrant has adopted a code of ethics that applies to the registrant’s principal executive officer and principal financial officer. The registrant has not made any substantive amendments to its code of ethics during the period covered by this period.
The registrant has not granted any waivers from any provisions of the code of ethics during the period covered by this report.
A copy of the registrant’s code of ethics that applies to the registrant’s principal executive officer and principal financial officer is filed herewith.
Item 3. Audit Committee Financial Expert.
The registrant’s Board of Trustees has determined that there is at least one audit committee financial expert serving on its audit committee. Leonard M. Rush is the “audit committee financial expert” and is considered to be “independent” as each term is defined in Item 3 of Form N-CSR.
Item 4. Principal Accountant Fees and Services.
The registrant has engaged its principal accountant to perform audit services, audit-related services, tax services and other services during the past fiscal year. “Audit services” refer to performing an audit of the registrant’s annual financial statements or services that are normally provided by the accountant in connection with statutory and regulatory filings or engagements for the past fiscal year. “Audit-related services” refer to the assurance and related services by the principal accountant that are reasonably related to the performance of the audit. “Tax services” refer to professional services rendered by the principal accountant for tax compliance, tax advice, and tax planning, including reviewing the Fund’s tax returns and distribution calculations. There were no “other services” provided by the principal accountant. For the fiscal years ended November 30, 2023 and November 30, 2022, the Fund’s principal accountant was Ernst & Young. The following table details the aggregate fees billed or expected to be billed for each of the last fiscal year for audit fees, audit-related fees, tax fees and other fees by the principal accountant.
| | FYE 11/30/2023 | FYE 11/30/2022 |
| (a) Audit Fees | $139,200 | $173,800 |
| (b) Audit-Related Fees | $0 | $0 |
| (c) Tax Fees | $87,960 | $88,200 |
| (d) All Other Fees | $0 | $0 |
(e)(1) The audit committee has adopted pre-approval policies and procedures that require the audit committee to pre-approve all audit and non-audit services of the Registrant, including services provided to any entity affiliated with the Registrant.
(e)(2) The percentage of fees billed by Ernst & Young applicable to non-audit services pursuant to waiver of pre-approval requirement were as follows:
| | FYE 11/30/2023 | FYE 11/30/2022 |
| Audit-Related Fees | 0% | 0% |
| Tax Fees | 0% | 0% |
| All Other Fees | 0% | 0% |
(f) All of the principal accountant’s hours spent on auditing the registrant’s financial statements were attributed to work performed by full-time permanent employees of the principal accountant.
(g) The following table indicates the non-audit fees, other than the tax services as noted above, billed or expected to be billed by the registrant’s accountant for services to the registrant and to the registrant’s investment adviser (and any other controlling entity, etc.—not sub-adviser) for the last two years.
(h) The audit committee of the board of trustees/directors has considered whether the provision of non-audit services that were rendered to the registrant’s investment adviser is compatible with maintaining the principal accountant’s independence and has concluded that the provision of such non-audit services by the accountant has not compromised the accountant’s independence.
| Non-Audit Related Fees | FYE 11/30/2023 | FYE 11/30/2022 |
| Registrant | $0 | $0 |
| Registrant’s Investment Adviser | $33,850 | $45,100 |
(i) Not applicable.
(j) Not applicable.
Item 5. Audit Committee of Listed Registrants.
(a) The Registrant is an issuer as defined in Rule 10A-3 under the Securities Exchange Act of 1934, (the “Act”) and has a separately designated standing audit committee established in accordance with Section 3(a)(58)(A) of the Act. The members of the audit committee, all Independent Trustees, are as follows: Leonard Rush, David Massart, Dave Swanson and Robert Kern.
(b) Not applicable
Item 6. Investments.
(a) Schedule of Investments is included as part of the report to shareholders filed under Item 1 of this Form.
(b) Not applicable.
Item 7. Disclosure of Proxy Voting Policies and Procedures for Closed-End Management Investment Companies.
Not applicable to open-end investment companies.
Item 8. Portfolio Managers of Closed-End Management Investment Companies.
Not applicable to open-end investment companies.
Item 9. Purchases of Equity Securities by Closed-End Management Investment Company and Affiliated Purchasers.
Not applicable to open-end investment companies.
Item 10. Submission of Matters to a Vote of Security Holders.
There have been no material changes to the procedures by which shareholders may recommend nominees to the registrant’s board of trustees.
Item 11. Controls and Procedures.
| (a) | The Registrant’s President and Treasurer have reviewed the Registrant’s disclosure controls and procedures (as defined in Rule 30a-3(c) under the Investment Company Act of 1940 (the “Act”)) as of a date within 90 days of the filing of this report, as required by Rule 30a-3(b) under the Act and Rules 13a-15(b) or 15d-15(b) under the Securities Exchange Act of 1934. Based on their review, such officers have concluded that the disclosure controls and procedures are effective in ensuring that information required to be disclosed in this report is appropriately recorded, processed, summarized and reported and made known to them by others within the Registrant and by the Registrant’s service provider. |
| | |
| (b) | There were no significant changes in the Registrant’s internal control over financial reporting (as defined in Rule 30a-3(d) under the Act) that occurred during the period covered by this report that has materially affected, or is reasonably likely to materially affect, the Registrant’s internal control over financial reporting. |
Item 12. Disclosure of Securities Lending Activities for Closed-End Management Investment Companies
Not applicable to open-end investment companies.
Item 13. Exhibits.
SIGNATURES
Pursuant to the requirements of the Securities Exchange Act of 1934 and the Investment Company Act of 1940, the registrant has duly caused this report to be signed on its behalf by the undersigned, thereunto duly authorized.
| | (Registrant) | Managed Portfolio Series | |
| | | |
| | By (Signature and Title)* | /s/ Brian R. Wiedmeyer |
| | | Brian R. Wiedmeyer, President |
| | | |
Pursuant to the requirements of the Securities Exchange Act of 1934 and the Investment Company Act of 1940, this report has been signed below by the following persons on behalf of the registrant and in the capacities and on the dates indicated.
| | By (Signature and Title)* | /s/ Brian R. Wiedmeyer |
| | | Brian R. Wiedmeyer, President |
| | | |
| | By (Signature and Title)* | /s/ Benjamin J. Eirich | |
| | | Benjamin J. Eirich, Treasurer |
| | | |
* Print the name and title of each signing officer under his or her signature.