Annual Report
December 31, 2023
| Kensington Active Advantage Fund |
Class A Shares (KADAX)
Class C Shares (KADCX)
Institutional Class Shares (KADIX)
| Kensington Managed Income Fund |
Class A Shares (KAMAX)
Class C Shares (KAMCX)
Institutional Class Shares (KAMIX)
| Kensington Dynamic Growth Fund |
Class A Shares (KAGAX)
Class C Shares (KAGCX)
Institutional Class Shares (KAGIX)
Institutional Class Shares (DFNDX)
1-855-375-3060
www.kensingtonassetmanagement.com
Distributed by Quasar Distributors, LLC
KENSINGTON FUNDS
January 2024
Reflection on 2023
The year 2023 was marked by significant geopolitical upheaval, including persistent armed conflicts, notably a de facto proxy war between Russia and Western nations, escalating tensions and trade protectionism between the U.S. and China, and instability in the Middle East impacting crucial global shipping routes. Such events traditionally have limited direct impacts on the private sector; in fact, historically, conflict has often coincided with economic gain. However, the global unrest post-pandemic raises concerns that the current situation may diverge from historical trends. On the domestic front, demographic shifts, particularly the rise in influence of younger generations like Millennials, Gen X, and Gen Z, are reshaping priorities and potentially altering market dynamics.
The stock market concluded 2023 on a strong note. The S&P 500 reported gains of 4.54% for the month, 11.69% for the quarter, and 26.29% annually. The Nasdaq 100 demonstrated remarkable growth, especially in technology-focused mega-caps, known as the “Magnificent Seven,” which surged by 111% due to their significant potential in leveraging advancements in artificial intelligence. However, this performance was not uniformly seen across the board, with the remaining companies in the index showing more modest gains. International markets also witnessed substantial growth, adding to the global positive sentiment in equity sectors.
The fixed income sector saw a resurgence at the year’s end, overturning losses from earlier in the year. This resurgence was fueled by favorable conditions such as successful Treasury auctions, encouraging inflation data, and a general economic slowdown, which led investors to believe that the prolonged bearish trend in bonds was concluding. Various bond indices, including government and corporate bonds, reported positive returns, reflecting renewed investor confidence in the fixed income market.
Market Outlook: The decline in key inflation indicators, such as the PCE Deflator and Core PCE inflation rate, has instilled optimism in the market. The expectation of continued downward pressure on inflation, particularly from housing costs, suggests that the current downward inflation trend is likely to persist. However, the bond market faces challenges ahead, including managing the U.S. fiscal deficit and refinancing a significant volume of corporate bonds. The national deficit, now nearing $34 trillion, poses a significant challenge, with projections showing a potential rise to over 120% of GDP, as per Fitch Ratings Service. The market is anticipating a potential shift in Federal Reserve policies in the first half of 2024, signaling the end of the tightening phase initiated in early 2022. The Federal Reserve will need to carefully manage market expectations, considering the substantial easing of financial conditions since early 2023.
Past performance is no guarantee of future results.
Investors may not invest in an index directly; unlike the Funds’ returns, an index does not reflect any fees or expenses.
Opinions expressed are those of the Investment Manager, are subject to change, are not guaranteed, and should not be considered investment advice.
Investing in a mutual fund involves risk, including loss of principal. There is no guarantee that a Fund will meet its investment objectives. Risks specific to each Fund are detailed in the prospectus and include Management Risk, Market Risk, Underlying Funds Risk, Non- Diversification Risk, Turnover Risk, U.S. Government Securities Risk, and Models and Data Risk. Additional risks that may apply include High- Yield Bond Risk, Fixed-Income Securities Risk, Equity Securities Risk, Foreign Investment Risk, Loans
KENSINGTON FUNDS
Risk, Small and Mid-Capitalization Companies Risk, LIBOR Risk, and Limited History of Operations Risk. For details regarding each risk, please see the Fund’s prospectus.
The S&P 500 Index is an unmanaged market capitalization-weighted index which is comprised of 500 of the largest U.S. domiciled companies and includes the reinvestment of all dividends.
The NASDAQ 100 Index is a modified capitalization-weighted index which is comprised of 102 equity securities issued by 101 of the largest non-financial companies listed on the NASDAQ stock exchange.
The Magnificent Seven stocks are a group of high-performing and influential companies in the U.S. stock market: Alphabet, Amazon, Apple, Meta Platforms, Microsoft, NVIDIA, and Tesla.
Personal consumption expenditures (PCE), also known as consumer spending, is a measure of the spending on goods and services by people of the United States.
Gross domestic product (GDP) is the total monetary or market value of all the finished goods and services produced within a country’s borders in a specific time period.
Fund holdings and sector allocations are subject to change at any time and should not be considered a recommendation to buy or sell any security.
This report must be preceded or accompanied by a current prospectus.
Kensington Asset Management, LLC is the adviser to the Funds, distributed by Quasar Distributors, LLC. Member FINRA/SIPC. Kensington Asset Management, LLC is not affiliated with Quasar.
KENSINGTON ACTIVE ADVANTAGE FUND
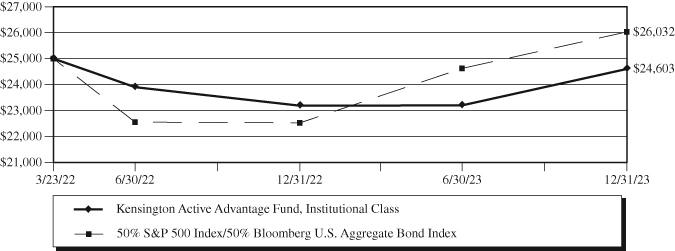
Value of $25,000 Investment (Unaudited)
The chart assumes an initial investment of $25,000. Performance reflects waivers of fee and operating expenses in effect. In the absence of such waivers, total return would be reduced. Performance data quoted represents past performance and does not guarantee future results. Investment returns and principal value will fluctuate, and when sold, may be worth more or less than their original cost. Performance current to the most recent month-end may be lower or higher than the performance quoted and can be obtained by calling 855-375-3060. Performance assumes the reinvestment of capital gains and income distributions. The performance does not reflect the deduction of taxes that a shareholder would pay on Fund distributions or the redemption of Fund shares.
Average Annual Rates of Return as of December 31, 2023
| | | Since |
| | 1 Year | Inception(1) |
| Class A | 5.92% | -1.14% |
Class A with load(2) | 0.88% | -3.82% |
| Class C | 5.02% | -1.89% |
Class C with load(3) | 4.02% | -1.89% |
| Institutional Class | 6.12% | -0.90% |
50% S&P 500 Index/50% Bloomberg U.S. Aggregate Bond Index(4) | 15.58% | 2.31% |
| (1) | March 23, 2022. |
| (2) | Performance data shown with load reflects the Class A maximum sales charge of 4.75%. |
| (3) | Performance data shown with load reflects the Class C 1.00% contingent deferred sales charge on shares redeemed prior to the first 12 months after purchase. |
| (4) | The Standard & Poor’s 500 Index (S&P 500) is an unmanaged, capitalization-weighted index generally representative of the U.S. market for large capitalization stocks. The Bloomberg U.S. Aggregate Bond Index is an unmanaged index comprised of U.S. investment grade, fixed rate bond market securities, including government, government agency, corporate and mortgage-backed securities. Investors cannot invest directly in an index. |
The following is expense information for the Kensington Active Advantage Fund as disclosed in the Fund’s most recent prospectus dated April 30, 2023:
| Class A Gross Expense Ratio – 3.96% | Net Expense Ratio – 1.67% |
| Class C Gross Expense Ratio – 4.71% | Net Expense Ratio – 2.42% |
| Institutional Class Gross Expense Ratio – 3.71% | Net Expense Ratio – 1.42% |
KENSINGTON ACTIVE ADVANTAGE FUND
Kensington Asset Management, LLC (the “Adviser”) has contractually agreed to waive its management fee and pay Fund expenses to ensure that Total Annual Fund Operating Expenses (excluding Acquired Fund Fees and Expenses (“AFFE”), leverage/borrowing interest, interest expense, dividends paid on short sales, taxes, brokerage commissions, extraordinary expenses, and distribution (12b-1) fees and expenses) do not exceed 1.35% of the average net assets of the applicable share class. Fees waived and expenses paid by the Adviser may be recouped by the Adviser for a period of 36 months following the month during which such fee waiver and expense payment was made if such recoupment can be achieved without exceeding the expense limit in effect at the time the fee waiver and expense payment occurred and the expense limit in effect at the time of recoupment. The Operating Expense Limitation Agreement is indefinite in term and cannot be terminated through at least June 30, 2024. Thereafter, the agreement may be terminated at any time upon 60 days’ written notice by the Trust’s Board of Trustees (the “Board”) or the Adviser.
The actual net expense ratio applicable to investors, as disclosed in the Financial Highlights for the period ended December 31, 2023, was 1.61%, 2.36% and 1.36% for the Class A, Class C and Institutional Class, respectively.
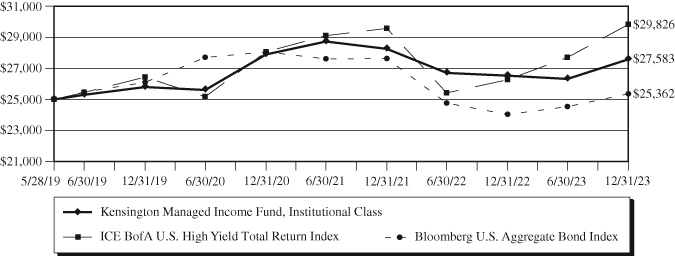
KENSINGTON MANAGED INCOME FUND
Value of $25,000 Investment (Unaudited)
The chart assumes an initial investment of $25,000. Performance reflects waivers of fee and operating expenses in effect. In the absence of such waivers, total return would be reduced. Performance data quoted represents past performance and does not guarantee future results. Investment returns and principal value will fluctuate, and when sold, may be worth more or less than their original cost. Performance current to the most recent month-end may be lower or higher than the performance quoted and can be obtained by calling 855-375-3060. Performance assumes the reinvestment of capital gains and income distributions. The performance does not reflect the deduction of taxes that a shareholder would pay on Fund distributions or the redemption of Fund shares.
Average Annual Rates of Return as of December 31, 2023
| | | | Since |
| | 1 Year | 3 Year | Inception(1) |
| Class A | 3.67% | -0.62% | 1.91% |
Class A with load(2) | -1.24% | -2.22% | 0.83% |
| Class C | 2.92% | -1.33% | 0.87% |
Class C with load(3) | 1.92% | -1.33% | 0.87% |
| Institutional Class | 3.97% | -0.38% | 2.16% |
ICE BofA U.S. High Yield Total Return Index(4) | 13.46% | 2.00% | 3.89% |
Bloomberg U.S. Aggregate Bond Index(5) | 5.53% | -3.31% | 0.31% |
| (1) | May 28, 2019 for the Class A and Institutional Class and August 27, 2019 for the Class C. Performance shown for the Class C prior to the inception of the Class C is based on the performance of the Institutional Class shares, adjusted for the lower expenses applicable to Class C shares. |
| (2) | Performance data shown with load reflects the Class A maximum sales charge of 4.75%. |
| (3) | Performance data shown with load reflects the Class C 1.00% contingent deferred sales charge on shares redeemed prior to the first 12 months after purchase. |
| (4) | ICE BofA U.S. High Yield Total Return Index measures the performance of below investment grade U.S.-denominated corporate bonds publicly issued in the U.S. market. The index is unmanaged; includes net reinvested dividends; does not reflect fees or expenses; and is not available for direct investment. Investors cannot invest directly in an index. |
| (5) | The Bloomberg U.S. Aggregate Bond Index is an unmanaged index comprised of U.S. investment grade, fixed rate bond market securities, including government, government agency, corporate and mortgage-backed securities. Investors cannot invest directly in an index. |
KENSINGTON MANAGED INCOME FUND
The following is expense information for the Kensington Managed Income Fund as disclosed in the Fund’s most recent prospectus dated April 30, 2023:
| Class A Gross Expense Ratio – 1.70% | Net Expense Ratio – 1.67% |
| Class C Gross Expense Ratio – 2.45% | Net Expense Ratio – 2.42% |
| Institutional Class Gross Expense Ratio – 1.45% | Net Expense Ratio – 1.42% |
Kensington Asset Management, LLC (the “Adviser”) has contractually agreed to waive its management fee and pay Fund expenses to ensure that Total Annual Fund Operating Expenses (excluding AFFE, leverage/borrowing interest, interest expense, dividends paid on short sales, taxes, brokerage commissions, extraordinary expenses, and distribution (12b-1) fees and expenses) do not exceed 1.35% of the average net assets of the applicable share class. Fees waived and expenses paid by the Adviser may be recouped by the Adviser for a period of 36 months following the month during which such fee waiver and expense payment was made if such recoupment can be achieved without exceeding the expense limit in effect at the time the fee waiver and expense payment occurred and the expense limit in effect at the time of recoupment. The Operating Expense Limitation Agreement is indefinite in term and cannot be terminated through at least June 30, 2024. Thereafter, the agreement may be terminated at any time upon 60 days’ written notice by the Trust’s Board of Trustees (the “Board”) or the Adviser.
The actual net expense ratio applicable to investors, as disclosed in the Financial Highlights for the period ended December 31, 2023, was 1.60%, 2.35% and 1.35% for the Class A, Class C and Institutional Class, respectively.
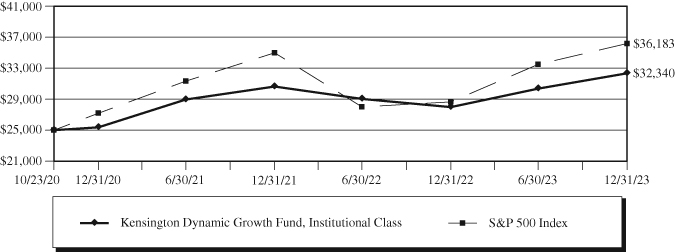
KENSINGTON DYNAMIC GROWTH FUND
Value of $25,000 Investment (Unaudited)
The chart assumes an initial investment of $25,000. Performance reflects waivers of fee and operating expenses in effect. In the absence of such waivers, total return would be reduced. Performance data quoted represents past performance and does not guarantee future results. Investment returns and principal value will fluctuate, and when sold, may be worth more or less than their original cost. Performance current to the most recent month-end may be lower or higher than the performance quoted and can be obtained by calling 855-375-3060. Performance assumes the reinvestment of capital gains and income distributions. The performance does not reflect the deduction of taxes that a shareholder would pay on Fund distributions or the redemption of Fund shares.
Average Annual Rates of Return as of December 31, 2023
| |
|
| Since |
| | 1 Year | 3 Year | Inception(1) |
| Class A | 15.29% | 8.14% | 8.09% |
Class A with load(2) | 9.78% | 6.41% | 6.45% |
| Class C | 14.49% | 7.34% | 7.35% |
Class C with load(3) | 13.49% | 7.34% | 7.35% |
| Institutional Class | 15.59% | 8.43% | 8.41% |
S&P 500 Index(4) | 26.29% | 10.00% | 12.29% |
| (1) | October 23, 2020. |
| (2) | Performance data shown with load reflects the Class A maximum sales charge of 4.75%. |
| (3) | Performance data shown with load reflects the Class C 1.00% contingent deferred sales charge on shares redeemed prior to the first 12 months after purchase. |
| (4) | The S&P 500 Index is an unmanaged market capitalization-weighted index which is comprised of 500 of the largest U.S. domiciled companies and includes the reinvestment of all dividends. Investors cannot invest directly in an index. |
The following is expense information for the Kensington Dynamic Growth Fund as disclosed in the Fund’s most recent prospectus dated April 30, 2023:
| Class A Gross Expense Ratio – 1.68% | Net Expense Ratio – 1.67% |
| Class C Gross Expense Ratio – 2.43% | Net Expense Ratio – 2.42% |
| Institutional Class Gross Expense Ratio – 1.43% | Net Expense Ratio – 1.42% |
KENSINGTON DYNAMIC GROWTH FUND
Kensington Asset Management, LLC (the “Adviser”) has contractually agreed to waive its management fee and pay Fund expenses to ensure that Total Annual Fund Operating Expenses (excluding AFFE, leverage/borrowing interest, interest expense, dividends paid on short sales, taxes, brokerage commissions, extraordinary expenses, and distribution (12b-1) fees and expenses) do not exceed 1.38% of the average net assets of the applicable share class. Fees waived and expenses paid by the Adviser may be recouped by the Adviser for a period of 36 months following the month during which such fee waiver and expense payment was made if such recoupment can be achieved without exceeding the expense limit in effect at the time the fee waiver and expense payment occurred and the expense limit in effect at the time of recoupment. The Operating Expense Limitation Agreement is indefinite in term and cannot be terminated through at least June 30, 2024. Thereafter, the agreement may be terminated at any time upon 60 days’ written notice by the Trust’s Board of Trustees (the “Board”) or the Adviser.
The actual net expense ratio applicable to investors, as disclosed in the Financial Highlights for the period ended December 31, 2023, was 1.63%, 2.38% and 1.38% for the Class A, Class C and Institutional Class, respectively.
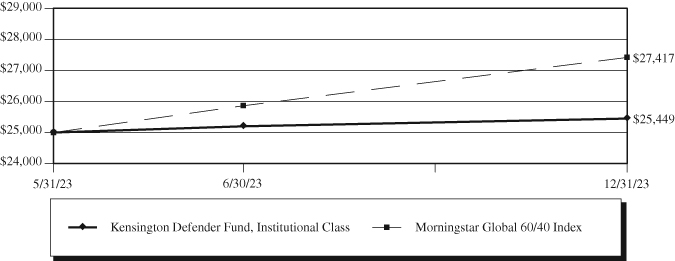
KENSINGTON DEFENDER FUND
Value of $25,000 Investment (Unaudited)
The chart assumes an initial investment of $25,000. Performance reflects waivers of fee and operating expenses in effect. In the absence of such waivers, total return would be reduced. Performance data quoted represents past performance and does not guarantee future results. Investment returns and principal value will fluctuate, and when sold, may be worth more or less than their original cost. Performance current to the most recent month-end may be lower or higher than the performance quoted and can be obtained by calling 855-375-3060. Performance assumes the reinvestment of capital gains and income distributions. The performance does not reflect the deduction of taxes that a shareholder would pay on Fund distributions or the redemption of Fund shares.
Rates of Return as of December 31, 2023
| | Since |
| | Inception(1) |
| Institutional Class | 1.80% |
Morningstar Global 60/40 Index(2) | 9.67% |
| (1) | May 31, 2023. |
| (2) | The Morningstar Global 60/40 Index is a blended benchmark of 60% Morningstar Global Markets Net Return USD / 40% Morningstar Global Core Bond Gross Return USD, rebalanced to target weights of 60% equity and 40% fixed income on monthly basis. This Index does not incorporate Environmental, Social, or Governance (ESG) criteria. Investors cannot invest directly in an index. |
The following is expense information for the Kensington Defender Fund as disclosed in the Fund’s most recent prospectus dated May 30, 2023:
| Institutional Class Gross Expense Ratio – 2.48% | Net Expense Ratio – 1.72% |
Kensington Asset Management, LLC (the “Adviser”) has contractually agreed to waive its management fee and pay Fund expenses to ensure that Total Annual Fund Operating Expenses (excluding AFFE, leverage/borrowing interest, interest expense, dividends paid on short sales, taxes, brokerage commissions, extraordinary expenses, and distribution (12b-1) fees and expenses) do not exceed 1.49% of the average net assets of the Fund. Fees waived and expenses paid by the Adviser may be recouped by the Adviser for a period of 36 months following the month during which such fee waiver and expense payment was made if such recoupment can be achieved without
KENSINGTON DEFENDER FUND
exceeding the expense limit in effect at the time the fee waiver and expense payment occurred and the expense limit in effect at the time of recoupment. The Operating Expense Limitation Agreement is indefinite in term and cannot be terminated through at least May 30, 2024. Thereafter, the agreement may be terminated at any time upon 60 days’ written notice by the Trust’s Board of Trustees (the “Board”) or the Adviser.
The actual net expense ratio applicable to shareholders, as disclosed in the Financial Highlights for the period ended December 31, 2023, was 1.49%.
KENSINGTON FUNDS
Expense Examples (Unaudited)
December 31, 2023
As a shareholder of the Fund, you incur two types of costs: (1) transaction costs, including sales charges (loads) on purchase payments, reinvested dividends, or other distributions; exchange fees; and (2) ongoing costs, including management fees; distribution (12b-1) fees; and other Fund expenses. This example is intended to help you understand your ongoing costs (in dollars) of investing in the Fund and to compare these costs with the ongoing costs of investing in other mutual funds. The example is based on an investment of $1,000 invested at the beginning of the period and held for the entire period (July 1, 2023 – December 31, 2023).
ACTUAL EXPENSES
For each class, the first line of the table provides information about actual account values and actual expenses. You may use the information in this line, together with the amount you invested, to estimate the expenses that you paid over the period. Simply divide your account value by $1,000 (for example, an $8,600 account value divided by $1,000 = 8.6), then multiply the result by the number in the first line under the heading entitled “Expenses Paid During Period” to estimate the expenses you paid on your account during this period.
HYPOTHETICAL EXAMPLE FOR COMPARISON PURPOSES
For each class, the second line of the table below provides information about hypothetical account values and hypothetical expenses based on the Fund’s actual expense ratio and an assumed rate of return of 5% per year before expenses, which is not the Fund’s actual return. The hypothetical account values and expenses may not be used to estimate the actual ending account balance or expenses you paid for the period. You may use this information to compare the ongoing costs of investing in the Fund and other funds. To do so, compare this 5% hypothetical example with the 5% hypothetical examples that appear in the shareholder reports of the other funds.
Please note that the expenses shown in the table are meant to highlight your ongoing costs only and do not reflect any transactional costs, such as redemption fees or exchange fees. Therefore, the second line of the table is useful in comparing ongoing costs only, and will not help you determine the relative total costs of owning different funds. In addition, if these transactional costs were included, your costs would have been higher.
Kensington Active Advantage Fund
| | Beginning | Ending | Expenses Paid |
| | Account Value | Account Value | During Period(1) |
| | (7/1/23) | (12/31/23) | (7/1/23 to 12/31/23) |
Institutional Class | | | |
Actual(2)(3) | $1,000.00 | $1,060.60 | $ 7.06 |
Hypothetical (5% return before expenses)(4) | $1,000.00 | $1,018.35 | $ 6.92 |
| | | | |
A Class | | | |
Actual(2)(3) | $1,000.00 | $1,059.30 | $ 8.36 |
Hypothetical (5% return before expenses)(4) | $1,000.00 | $1,017.09 | $ 8.19 |
| | | | |
C Class | | | |
Actual(2)(3) | $1,000.00 | $1,054.60 | $12.22 |
Hypothetical (5% return before expenses)(4) | $1,000.00 | $1,013.31 | $11.98 |
| (1) | Expenses are equal to the fund’s annualized expense ratio for the most recent six-month period of 1.36%, 1.61% and 2.36% for the Institutional Class, A Class and C Class, respectively, multiplied by the average account value over the period, multiplied 184/365 to reflect the one-half year period. |
| (2) | Based on the actual returns for the six-month period ended December 31, 2023, of 6.06%, 5.93% and 5.46% for the Institutional Class, A Class, and C Class, respectively. |
| (3) | Excluding interest expense, the actual expenses would be $7.01, $8.30 and $12.17 for the Institutional Class, A Class and C Class, respectively. |
| (4) | Excluding interest expense, the hypothetical expenses would be $6.87, $8.13 and $11.93 for the Institutional Class, A Class and C Class, respectively. |
KENSINGTON FUNDS
Expense Examples (Unaudited) – Continued
December 31, 2023
Kensington Managed Income Fund
| | Beginning | Ending | Expenses Paid |
| | Account Value | Account Value | During Period(1) |
| | (7/1/23) | (12/31/23) | (7/1/23 to 12/31/23) |
Institutional Class | | | |
Actual(2) | $1,000.00 | $1,048.00 | $ 6.97 |
Hypothetical (5% return before expenses) | $1,000.00 | $1,018.40 | $ 6.87 |
| | | | |
A Class | | | |
Actual(2) | $1,000.00 | $1,046.70 | $ 8.25 |
Hypothetical (5% return before expenses) | $1,000.00 | $1,017.14 | $ 8.13 |
| | | | |
C Class | | | |
Actual(2) | $1,000.00 | $1,042.90 | $12.10 |
Hypothetical (5% return before expenses) | $1,000.00 | $1,013.36 | $11.93 |
| (1) | Expenses are equal to the fund’s annualized expense ratio for the most recent six-month period of 1.35%, 1.60% and 2.35% for the Institutional Class, A Class and C Class, respectively, multiplied by the average account value over the period, multiplied 184/365 to reflect the one-half year period. |
| (2) | Based on the actual returns for the six-month period ended December 31, 2023, of 4.80%, 4.67% and 4.29% for the Institutional Class, A Class, and C Class, respectively. |
Kensington Dynamic Growth Fund
| | Beginning | Ending | Expenses Paid |
| | Account Value | Account Value | During Period(1) |
| | (7/1/23) | (12/31/23) | (7/1/23 to 12/31/23) |
Institutional Class | | | |
Actual(2) | $1,000.00 | $1,065.10 | $ 7.18 |
Hypothetical (5% return before expenses) | $1,000.00 | $1,018.25 | $ 7.02 |
| | | | |
A Class | | | |
Actual(2) | $1,000.00 | $1,063.00 | $ 8.48 |
Hypothetical (5% return before expenses) | $1,000.00 | $1,016.99 | $ 8.29 |
| | | | |
C Class | | | |
Actual(2) | $1,000.00 | $1,059.10 | $12.35 |
Hypothetical (5% return before expenses) | $1,000.00 | $1,013.21 | $12.08 |
| (1) | Expenses are equal to the fund’s annualized expense ratio for the most recent six-month period of 1.38%, 1.63% and 2.38% for the Institutional Class, A Class and C Class, respectively, multiplied by the average account value over the period, multiplied 184/365 to reflect the one-half year period. |
| (2) | Based on the actual returns for the six-month period ended December 31, 2023, of 6.51%, 6.30% and 5.91% for the Institutional Class, A Class, and C Class, respectively. |
Kensington Defender Fund
| | Beginning | Ending | Expenses Paid |
| | Account Value | Account Value | During Period(1) |
| | (7/1/23) | (12/31/23) | (7/1/23 to 12/31/23) |
Institutional Class | | | |
Actual(2) | $1,000.00 | $1,009.90 | $ 7.55 |
Hypothetical (5% return before expenses) | $1,000.00 | $1,017.69 | $ 7.58 |
| (1) | Expenses are equal to the fund’s annualized expense ratio for the most recent six-month period of 1.49%, multiplied by the average account value over the period, multiplied 184/365 to reflect the one-half year period. |
| (2) | Based on the actual returns for the six-month period ended December 31, 2023, of 0.99%. |
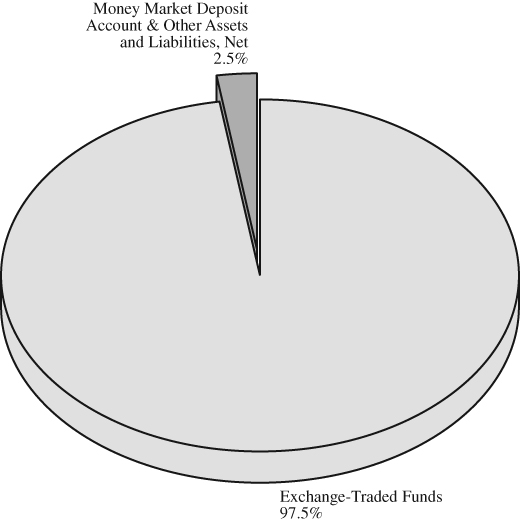
KENSINGTON ACTIVE ADVANTAGE FUND
Allocation of Portfolio(1) (% of Net Assets) (Unaudited)
December 31, 2023
Top Holdings(1) (Unaudited)
as of December 31, 2023
(% of Net Assets)
| | iShares Broad USD High Yield Corporate Bond ETF | | | 32.9 | % |
| | Vanguard S&P 500 ETF | | | 25.2 | % |
| | iShares Core U.S. Aggregate Bond ETF | | | 17.7 | % |
| | Invesco QQQ Trust Series 1 | | | 15.5 | % |
| | Vanguard Total Stock Market ETF | | | 6.2 | % |
| (1) | Fund holdings and sector allocations are subject to change at any time and are not recommendations to buy or sell any security. |
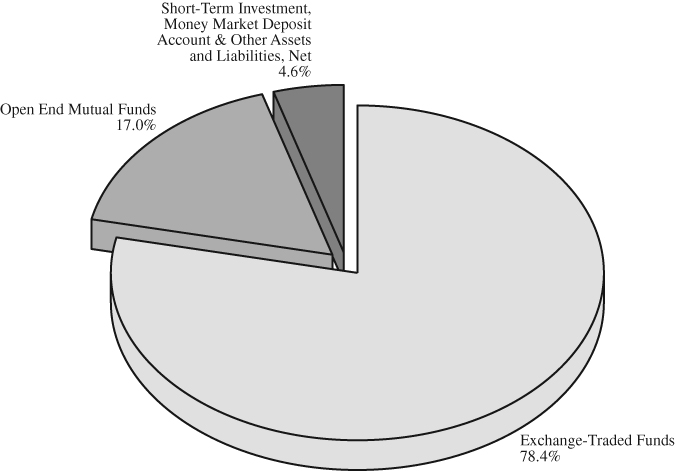
KENSINGTON MANAGED INCOME FUND
Allocation of Portfolio(1) (% of Net Assets) (Unaudited)
December 31, 2023
Top Ten Holdings(1)(2) (Unaudited)
as of December 31, 2023
(% of Net Assets)
| | iShares Broad USD High Yield Corporate Bond ETF | | | 22.4 | % |
| | SPDR Bloomberg High Yield Bond ETF | | | 19.2 | % |
| | Fidelity Capital & Income Fund | | | 10.3 | % |
| | VanEck Fallen Angel High Yield Bond ETF | | | 6.5 | % |
| | SPDR Portfolio High Yield Bond ETF | | | 6.4 | % |
| | SPDR Bloomberg Short Term High Yield Bond ETF | | | 6.3 | % |
| | Invesco Senior Loan ETF | | | 5.0 | % |
| | SPDR Blackstone Senior Loan ETF | | | 4.9 | % |
| | Xtrackers USD High Yield Corporate Bond ETF | | | 4.5 | % |
| | Pioneer Strategic Income Fund – Class K | | | 3.7 | % |
| (1) | Fund holdings and sector allocations are subject to change at any time and are not recommendations to buy or sell any security. |
| (2) | Excludes short-term investments. |
KENSINGTON DYNAMIC GROWTH FUND
Allocation of Portfolio(1) (% of Net Assets) (Unaudited)
December 31, 2023
Top Holdings(1)(2) (Unaudited)
as of December 31, 2023
(% of Net Assets)
| | Invesco QQQ Trust Series 1 | | | 33.7 | % |
| | Vanguard S&P 500 ETF | | | 33.1 | % |
| | Vanguard Growth ETF | | | 9.6 | % |
| | Vanguard Mega Cap Growth ETF | | | 9.6 | % |
| | Vanguard Total Stock Market ETF | | | 9.5 | % |
| (1) | Fund holdings and sector allocations are subject to change at any time and are not recommendations to buy or sell any security. |
| (2) | Excludes short-term investments. |
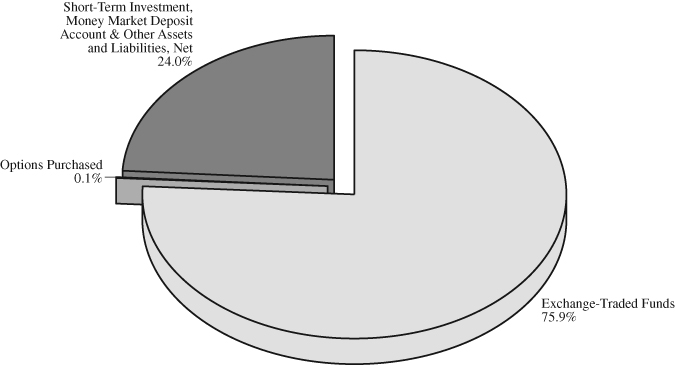
KENSINGTON DEFENDER FUND
Allocation of Portfolio(1) (% of Net Assets) (Unaudited)
December 31, 2023
Top Holdings(1) (Unaudited)
as of December 31, 2023
(% of Net Assets)
| | iShares Short Treasury Bond ETF | | | 23.5 | % |
| | Invesco QQQ Trust Series 1 | | | 8.9 | % |
| | Vanguard FTSE Europe ETF | | | 8.8 | % |
| | SPDR Portfolio S&P 500 ETF | | | 8.8 | % |
| | iShares iBoxx High Yield Corporate Bond ETF | | | 8.7 | % |
| | Franklin FTSE Japan ETF | | | 8.7 | % |
| | abrdn Physical Gold Shares ETF | | | 8.5 | % |
| (1) | Fund holdings and sector allocations are subject to change at any time and are not recommendations to buy or sell any security. |
KENSINGTON ACTIVE ADVANTAGE FUND
Schedule of Investments
December 31, 2023
Description | | Shares | | | Value | |
| EXCHANGE-TRADED FUNDS – 97.5% | | | | | | |
Invesco QQQ Trust Series 1 | | | 4,030 | | | $ | 1,650,366 | |
iShares Broad USD High Yield Corporate Bond ETF (a) | | | 96,700 | | | | 3,515,045 | |
iShares Core U.S. Aggregate Bond ETF | | | 19,100 | | | | 1,895,675 | |
Vanguard S&P 500 ETF (a) | | | 6,170 | | | | 2,695,056 | |
Vanguard Total Stock Market ETF | | | 2,770 | | | | 657,099 | |
| TOTAL EXCHANGE-TRADED FUNDS | | | | | | | | |
| (Cost $9,734,029) | | | | | | | 10,413,241 | |
| TOTAL INVESTMENTS – 97.5% | | | | | | | | |
| (Cost $9,734,029) | | | | | | | 10,413,241 | |
Money Market Deposit Account – 2.7% (b) | | | | | | | 289,887 | |
Liabilities in Excess of Other Assets – (0.2)% | | | | | | | (18,647 | ) |
| TOTAL NET ASSETS – 100.0% | | | | | | $ | 10,684,481 | |
Percentages are stated as a percent of net assets.
| (a) | Fair value of this security exceeds 25% of the Fund’s net assets. Additional information for this security, including the financial statements, is available from the SEC’s EDGAR database at www.sec.gov. |
| (b) | The U.S. Bank Money Market Deposit Account (the “MMDA”) is a short-term vehicle in which the Fund holds cash balances. The MMDA will bear interest at a variable rate that is determined based on conditions and is subject to change daily. The rate shown as of December 31, 2023, was 5.27%. |
See Notes to the Financial Statements
KENSINGTON MANAGED INCOME FUND
Schedule of Investments
December 31, 2023
Description | | Shares | | | Value | |
| EXCHANGE-TRADED FUNDS – 78.4% | | | | | | |
FlexShares High Yield Value-Scored Bond Index Fund | | | 635,400 | | | $ | 25,968,798 | |
Invesco Senior Loan ETF | | | 1,903,300 | | | | 40,311,894 | |
iShares Broad USD High Yield Corporate Bond ETF | | | 5,012,800 | | | | 182,215,280 | |
SPDR Blackstone Senior Loan ETF | | | 960,400 | | | | 40,269,572 | |
SPDR Bloomberg High Yield Bond ETF | | | 1,651,300 | | | | 156,427,649 | |
SPDR Bloomberg Short Term High Yield Bond ETF | | | 2,048,700 | | | | 51,504,318 | |
SPDR Portfolio High Yield Bond ETF | | | 2,224,800 | | | | 52,015,824 | |
VanEck Fallen Angel High Yield Bond ETF | | | 1,828,500 | | | | 52,624,230 | |
Xtrackers USD High Yield Corporate Bond ETF | | | 1,028,200 | | | | 36,552,510 | |
| TOTAL EXCHANGE-TRADED FUNDS | | | | | | | | |
| (Cost $615,095,335) | | | | | | | 637,890,075 | |
| | | | | | | | | |
| OPEN-END FUNDS – 17.0% | | | | | | | | |
Fidelity Advisor High Income Advantage Fund – Class Z | | | 999,001 | | | | 10,489,510 | |
Fidelity Capital & Income Fund | | | 8,686,211 | | | | 83,821,933 | |
Manning & Napier High Yield Bond Series – Class Z | | | 1,788,079 | | | | 13,839,735 | |
Pioneer Strategic Income Fund – Class K (a) | | | 3,151,261 | | | | 29,905,462 | |
| TOTAL OPEN-END FUNDS | | | | | | | | |
| (Cost $133,484,125) | | | | | | | 138,056,640 | |
| | | | | | | | | |
| | | Par | | | | | |
| SHORT-TERM INVESTMENTS – 3.1% | | | | | | | | |
| | | | | | | | | |
| U.S. Treasury Bills – 3.1% | | | | | | | | |
4.69%, 01/18/2024 (b) | | | 25,000,000 | | | | 24,941,374 | |
| TOTAL SHORT-TERM INVESTMENTS | | | | | | | | |
| (Cost $24,937,313) | | | | | | | 24,941,374 | |
| TOTAL INVESTMENTS – 98.5% | | | | | | | | |
| (Cost $773,516,773) | | | | | | | 800,888,089 | |
Money Market Deposit Account – 1.1% (c) | | | | | | | 9,178,517 | |
Other Assets in Excess of Liabilities – 0.4% | | | | | | | 3,208,887 | |
| TOTAL NET ASSETS – 100.0% | | | | | | $ | 813,275,493 | |
Percentages are stated as a percent of net assets.
| (a) | Represents an affiliated company as defined by the Investment Company Act of 1940. See Note 8 in Notes to Financial Statements. |
| (b) | The rate shown is the effective yield as of December 31, 2023. |
| (c) | The U.S. Bank Money Market Deposit Account (the “MMDA”) is a short-term vehicle in which the Fund holds cash balances. The MMDA will bear interest at a variable rate that is determined based on conditions and is subject to change daily. The rate shown as of December 31, 2023, was 5.27%. |
See Notes to the Financial Statements
KENSINGTON DYNAMIC GROWTH FUND
Schedule of Investments
December 31, 2023
Description | | Shares | | | Value | |
| EXCHANGE-TRADED FUNDS – 95.5% | | | | | | |
Invesco QQQ Trust Series 1 (a) | | | 986,000 | | | $ | 403,786,720 | |
Vanguard Growth ETF | | | 370,300 | | | | 115,118,864 | |
Vanguard Mega Cap Growth ETF | | | 441,700 | | | | 114,625,567 | |
Vanguard S&P 500 ETF (a) | | | 906,000 | | | | 395,740,800 | |
Vanguard Total Stock Market ETF | | | 479,900 | | | | 113,841,878 | |
| TOTAL EXCHANGE-TRADED FUNDS | | | | | | | | |
| (Cost $1,036,735,409) | | | | | | | 1,143,113,829 | |
| | | | | | | | | |
| | | Par | | | | | |
| SHORT-TERM INVESTMENTS – 0.2% | | | | | | | | |
| | | | | | | | | |
| U.S. Treasury Bills – 0.2% | | | | | | | | |
4.94%, 01/30/2024 (b)(c) | | | 1,526,000 | | | | 1,519,723 | |
5.07%, 03/28/2024 (b)(c) | | | 1,027,000 | | | | 1,014,263 | |
| | | | | | | | 2,533,986 | |
| TOTAL SHORT-TERM INVESTMENTS | | | | | | | | |
| (Cost $2,533,484) | | | | | | | 2,533,986 | |
| TOTAL INVESTMENTS – 95.7% | | | | | | | | |
| (Cost $1,039,268,893) | | | | | | | 1,145,647,815 | |
Money Market Deposit Account – 3.9% (d) | | | | | | | 46,345,307 | |
Other Assets in Excess of Liabilities – 0.4% | | | | | | | 4,966,068 | |
| TOTAL NET ASSETS – 100.0% | | | | | | $ | 1,196,959,190 | |
Percentages are stated as a percent of net assets.
| (a) | Fair value of this security exceeds 25% of the Fund’s net assets. Additional information for this security, including the financial statements, is available from the SEC’s EDGAR database at www.sec.gov. |
| (b) | The rate shown is the effective yield as of December 31, 2023. |
| (c) | All or a portion of this security is designated as collateral for futures contracts. As of December 31, 2023, the fair value of the collateral was $2,533,986. |
| (d) | The U.S. Bank Money Market Deposit Account (the “MMDA”) is a short-term vehicle in which the Fund holds cash balances. The MMDA will bear interest at a variable rate that is determined based on conditions and is subject to change daily. The rate shown as of December 31, 2023, was 5.27%. |
See Notes to the Financial Statements
KENSINGTON DYNAMIC GROWTH FUND
Schedule of Open Futures Contracts
December 31, 2023
| | | | | | | | | | Value/Unrealized | |
| | | Contracts | | Expiration | | | | | Appreciation | |
Description | | Purchased | | Date | | Notional | | | (Depreciation) | |
E-mini S&P 500 Index | | | 115 | | March 15, 2024 | | $ | 27,715,000 | | | $ | 783,405 | |
| Total Unrealized Appreciation (Depreciation) | | | | | | | | | | | $ | 783,405 | |
See Notes to the Financial Statements
KENSINGTON DEFENDER FUND
Schedule of Investments
December 31, 2023
Description | | | | | Shares | | | Value | |
| EXCHANGE-TRADED FUNDS – 75.9% | | | | | | | | | |
abrdn Physical Gold Shares ETF (a) | | | | | | 193,458 | | | $ | 3,818,861 | |
Franklin FTSE Japan ETF | | | | | | 138,093 | | | | 3,865,223 | |
Invesco QQQ Trust Series 1 | | | | | | 9,745 | | | | 3,990,772 | |
iShares iBoxx High Yield Corporate Bond ETF | | | | | | 50,123 | | | | 3,879,019 | |
iShares Short Treasury Bond ETF (b) | | | | | | 95,297 | | | | 10,495,059 | |
SPDR Portfolio S&P 500 ETF | | | | | | 70,450 | | | | 3,938,155 | |
Vanguard FTSE Europe ETF | | | | | | 61,255 | | | | 3,949,722 | |
| TOTAL EXCHANGE-TRADED FUNDS | | | | | | | | | | | |
| (Cost $32,946,061) | | | | | | | | | | 33,936,811 | |
| | | | | | | | | | | | |
| | | Notional | | | Contracts | | | | | |
| OPTIONS PURCHASED – 0.1% | | | | | | | | | | | |
| | | | | | | | | | | | |
| Put Options – 0.1% (c) | | | | | | | | | | | |
CBOE S&P 500 Index (d) | | | | | | | | | | | |
Expires January 12, 2024 at $4,610.00 | | | 10,970,609 | | | | 23 | | | | 10,396 | |
Expires January 16, 2024 at $4,610.00 | | | 10,493,626 | | | | 22 | | | | 11,550 | |
Expires January 17, 2024 at $4,610.00 | | | 10,970,609 | | | | 23 | | | | 13,938 | |
Expires January 19, 2024 at $4,610.00 | | | 10,493,626 | | | | 22 | | | | 18,744 | |
| Total Put Options | | | | | | | | | | | 54,628 | |
| TOTAL OPTIONS | | | | | | | | | | | | |
| (Cost $51,479) | | | | | | | | | | | 54,628 | |
| TOTAL INVESTMENTS – 76.0% | | | | | | | | | | | | |
| (Cost $32,997,540) | | | | | | | | | | | 33,991,439 | |
Money Market Deposit Account – 20.8% (e) | | | | | | | | | | | 9,309,638 | |
Other Assets in Excess of Liabilities – 3.2% | | | | | | | | | | | 1,429,805 | |
| TOTAL NET ASSETS – 100.0% | | | | | | | | | | $ | 44,730,882 | |
Percentages are stated as a percent of net assets.
| (a) | Non-income producing security. |
| (b) | All or a portion of this security is designated as collateral for options contracts. As of December 31, 2023, the fair value of collateral was $2,202,600. |
| (c) | Exchange-traded. |
| (d) | Held in connection with written option contracts. See Schedule of Written Options for further information. |
| (e) | The U.S. Bank Money Market Deposit Account (the “MMDA”) is a short-term vehicle in which the Fund holds cash balances. The MMDA will bear interest at a variable rate that is determined based on conditions and is subject to change daily. The rate shown as of December 31, 2023, was 5.27%. |
See Notes to the Financial Statements
KENSINGTON DEFENDER FUND
Schedule of Written Options
December 31, 2023
| | | Notional | | | Contracts | | | Value | |
| | | | | | | | | | |
| OPTIONS WRITTEN – (0.5)% (a) | | | | | | | | | |
| | | | | | | | | | |
| Put Options – (0.5)% | | | | | | | | | |
CBOE S&P 500 Index (b) | | | | | | | | | |
Expires January 12, 2024 at $4,750.00 | | $ | (10,970,609 | ) | | | (23 | ) | | $ | (58,880 | ) |
Expires January 16, 2024 at $4,750.00 | | | (10,493,626 | ) | | | (22 | ) | | | (62,216 | ) |
Expires January 17, 2024 at $4,750.00 | | | (10,970,609 | ) | | | (23 | ) | | | (64,538 | ) |
Expires January 19, 2024 at $4,750.00 | | | (10,493,626 | ) | | | (22 | ) | | | (72,160 | ) |
| Total Put Options | | | | | | | | | | | (257,794 | ) |
| Total Options Written | | | | | | | | | | | | |
| (Premiums received $244,212) | | | | | | | | | | $ | (257,794 | ) |
| (a) | Exchange-traded. |
| (b) | Held in connection with purchased option contracts. See Schedule of Investments for further information. |
See Notes to the Financial Statements
KENSINGTON FUNDS
Statement of Assets and Liabilities
December 31, 2023
| | | Kensington | | | Kensington | | | Kensington | | | Kensington | |
| | | Active Advantage | | | Managed Income | | | Dynamic Growth | | | Defender | |
| | | Fund | | | Fund | | | Fund | | | Fund | |
| ASSETS: | | | | | | | | | | | | |
| Unaffiliated investments, at fair value | | | | | | | | | | | | |
| (cost $9,734,029, $743,516,773, | | | | | | | | | | | | |
| $1,039,268,893 and | | | | | | | | | | | | |
| $32,997,540, respectively) | | $ | 10,413,241 | | | $ | 770,982,627 | | | $ | 1,145,647,815 | | | $ | 33,991,439 | |
| Affiliated investments (cost $0, | | | | | | | | | | | | | | | | |
| $30,000,000, $0 and $0, respectively) | | | — | | | | 29,905,462 | | | | — | | | | — | |
| Cash & Cash Equivalents | | | 289,887 | | | | 9,185,841 | | | | 46,345,307 | | | | 9,309,638 | |
| Cash held as collateral for options | | | — | | | | — | | | | — | | | | 571,478 | |
| Deposits at the broker for | | | | | | | | | | | | | | | | |
| futures contracts | | | — | | | | — | | | | 2,295,675 | | | | — | |
| Dividends & interest receivable | | | 1,863 | | | | 594,454 | | | | 410,926 | | | | 47,280 | |
| Receivable for investment securities sold | | | — | | | | — | | | | — | | | | 244,212 | |
| Receivable for capital shares sold | | | — | | | | 5,095,838 | | | | 4,643,357 | | | | 945,549 | |
| Receivable for investment adviser | | | | | | | | | | | | | | | | |
| expense reimbursement | | | 8,937 | | | | — | | | | — | | | | — | |
| Prepaid expenses and other assets | | | 8,342 | | | | 37,046 | | | | 49,511 | | | | 23,247 | |
| Total assets | | | 10,722,270 | | | | 815,801,268 | | | | 1,199,392,591 | | | | 45,132,843 | |
| | | | | | | | | | | | | | | | | |
| LIABILITIES: | | | | | | | | | | | | | | | | |
| Written option contracts, at value | | | | | | | | | | | | | | | | |
| (premiums received $0, $0, $0 | | | | | | | | | | | | | | | | |
| and $244,212, respectively) | | | — | | | | — | | | | — | | | | 257,794 | |
| Payable for investment | | | | | | | | | | | | | | | | |
| securities purchased | | | — | | | | — | | | | — | | | | 51,479 | |
| Payable for capital shares redeemed | | | — | | | | 1,493,868 | | | | 980,309 | | | | 7,434 | |
| Payable to investment adviser, net | | | — | | | | 837,778 | | | | 1,253,833 | | | | 33,694 | |
| Payable for fund administration | | | | | | | | | | | | | | | | |
| & accounting fees | | | 2,163 | | | | 36,592 | | | | 58,093 | | | | 3,716 | |
| Payable for compliance fees | | | 1,585 | | | | 1,586 | | | | 1,585 | | | | 1,588 | |
| Payable for custody fees | | | 1,366 | | | | 24,860 | | | | 26,864 | | | | 1,229 | |
| Payable for audit & tax fees | | | 18,751 | | | | 18,750 | | | | 18,750 | | | | 24,500 | |
| Payable for transfer agent fees & expenses | | | 5,987 | | | | 54,601 | | | | 57,802 | | | | 5,015 | |
| Payable for legal fees | | | 5,432 | | | | 5,433 | | | | 5,432 | | | | 7,845 | |
| Accrued expenses | | | 1,115 | | | | 27,028 | | | | 6,580 | | | | 7,667 | |
| Accrued distribution fees | | | 1,390 | | | | 25,279 | | | | 24,153 | | | | — | |
| Total liabilities | | | 37,789 | | | | 2,525,775 | | | | 2,433,401 | | | | 401,961 | |
| Net Assets | | $ | 10,684,481 | | | $ | 813,275,493 | | | $ | 1,196,959,190 | | | $ | 44,730,882 | |
| | | | | | | | | | | | | | | | | |
| NET ASSETS CONSIST OF: | | | | | | | | | | | | | | | | |
| Capital stock | | $ | 11,525,525 | | | $ | 894,032,350 | | | $ | 1,137,177,887 | | | $ | 43,341,230 | |
| Total accumulated gain (loss) | | | (841,044 | ) | | | (80,756,857 | ) | | | 59,781,303 | | | | 1,389,652 | |
| Net Assets | | $ | 10,684,481 | | | $ | 813,275,493 | | | $ | 1,196,959,190 | | | $ | 44,730,882 | |
See Notes to the Financial Statements
KENSINGTON FUNDS
Statement of Assets and Liabilities – Continued
December 31, 2023
| | | Kensington | | | Kensington | | | Kensington | | | Kensington | |
| | | Active Advantage | | | Managed Income | | | Dynamic Growth | | | Defender | |
| | | Fund | | | Fund | | | Fund | | | Fund | |
| Institutional Class | | | | | | | | | | | | |
Net assets | | $ | 9,703,074 | | | $ | 775,311,673 | | | $ | 1,143,770,152 | | | $ | 44,730,882 | |
Shares issued and outstanding(1) | | | 1,013,559 | | | | 78,840,646 | | | | 98,050,644 | | | | 4,441,361 | |
Net asset value, redemption price | | | | | | | | | | | | | | | | |
and minimum offering price per share | | $ | 9.57 | | | $ | 9.83 | | | $ | 11.67 | | | $ | 10.07 | |
| | | | | | | | | | | | | | | | | |
| A Class | | | | | | | | | | | | | | | | |
Net Assets | | $ | 483,881 | | | $ | 28,049,870 | | | $ | 36,707,530 | | | $ | — | |
Shares issued and outstanding(1) | | | 50,622 | | | | 2,858,193 | | | | 3,169,383 | | | | — | |
Net asset value, redemption price | | | | | | | | | | | | | | | | |
and minimum offering price per share | | $ | 9.56 | | | $ | 9.81 | | | $ | 11.58 | | | $ | — | |
Maximum offering price per share(2) | | $ | 10.04 | | | $ | 10.30 | | | $ | 12.16 | | | $ | — | |
| | | | | | | | | | | | | | | | | |
| C Class | | | | | | | | | | | | | | | | |
Net Assets | | $ | 497,526 | | | $ | 9,913,950 | | | $ | 16,481,508 | | | $ | — | |
Shares issued and outstanding(1) | | | 52,377 | | | | 1,020,145 | | | | 1,448,744 | | | | — | |
Net asset value, redemption price | | | | | | | | | | | | | | | | |
and minimum offering price per share | | $ | 9.50 | | | $ | 9.72 | | | $ | 11.38 | | | $ | — | |
| (1) | Unlimited shares authorized. |
| (2) | The offering price is calculated by dividing the net asset value by 1 minus the maximum sales charge of 4.75%. |
See Notes to the Financial Statements
KENSINGTON FUNDS
Statements of Operations
For the Year or Period Ended December 31, 2023
| | | Kensington | | | Kensington | | | Kensington | | | Kensington | |
| | | Active Advantage | | | Managed Income | | | Dynamic Growth | | | Defender | |
| | | Fund | | | Fund | | | Fund | | | Fund(1) | |
| INVESTMENT INCOME: | | | | | | | | | | | | |
Dividend income from unaffiliated investments | | $ | 201,475 | | | $ | 28,675,309 | | | $ | 8,923,818 | | | $ | 343,717 | |
Dividend income from affiliated investments | | | — | | | | 7,324 | | | | — | | | | — | |
Interest income | | | 320,691 | | | | 21,087,279 | | | | 21,228,770 | | | | 230,868 | |
Total investment income | | | 522,166 | | | | 49,769,912 | | | | 30,152,588 | | | | 574,585 | |
| | | | | | | | | | | | | | | | | |
| EXPENSES: | | | | | | | | | | | | | | | | |
Advisory fees (See Note 5) | | | 187,751 | | | | 11,473,466 | | | | 13,113,598 | | | | 136,405 | |
Registration fees | | | 57,297 | | | | 102,210 | | | | 156,989 | | | | 12,963 | |
Transfer agent fees & expenses (See Note 5) | | | 40,989 | | | | 381,928 | | | | 372,163 | | | | 16,603 | |
Legal fees | | | 22,884 | | | | 21,035 | | | | 19,824 | | | | 8,002 | |
Trustee fees | | | 20,906 | | | | 17,466 | | | | 17,996 | | | | 14,502 | |
Audit & tax fees | | | 18,759 | | | | 18,749 | | | | 18,749 | | | | 25,876 | |
Fund administration & accounting | | | | | | | | | | | | | | | | |
fees (See Note 5) | | | 16,427 | | | | 378,556 | | | | 431,507 | | | | 14,351 | |
Compliance fees (See Note 5) | | | 9,152 | | | | 9,042 | | | | 9,159 | | | | 5,546 | |
Other fees | | | 7,100 | | | | 13,951 | | | | 14,072 | | | | 3,156 | |
Custody fees (See Note 5) | | | 5,727 | | | | 95,911 | | | | 107,173 | | | | 3,421 | |
Postage and printing fees | | | 3,000 | | | | 87,580 | | | | 69,999 | | | | 1,000 | |
Insurance fees | | | 1,996 | | | | 7,588 | | | | 6,886 | | | | — | |
Distribution fees (See Note 7): | | | | | | | | | | | | | | | | |
A Class | | | 975 | | | | 107,092 | | | | 81,860 | | | | — | |
C Class | | | 3,511 | | | | 125,636 | | | | 203,202 | | | | — | |
Total expenses before interest expense | | | | | | | | | | | | | | | | |
and recoupment/reimbursement | | | 396,474 | | | | 12,840,210 | | | | 14,623,177 | | | | 241,825 | |
Interest expense (See Note 9) | | | 631 | | | | 7,663 | | | | — | | | | — | |
Total expenses before | | | | | | | | | | | | | | | | |
recoupment/reimbursement | | | 397,105 | | | | 12,847,873 | | | | 14,623,177 | | | | 241,825 | |
Fee recoupment | | | — | | | | — | | | | 139,052 | | | | 4,332 | |
Less: expense reimbursement by | | | | | | | | | | | | | | | | |
investment adviser | | | (189,217 | ) | | | (214,930 | ) | | | (1,621 | ) | | | (83,562 | ) |
Net expenses | | | 207,888 | | | | 12,632,943 | | | | 14,760,608 | | | | 162,595 | |
| NET INVESTMENT INCOME | | | 314,278 | | | | 37,136,969 | | | | 15,391,980 | | | | 411,990 | |
See Notes to the Financial Statements
KENSINGTON FUNDS
Statements of Operations – Continued
For the Year or Period Ended December 31, 2023
| | | Kensington | | | Kensington | | | Kensington | | | Kensington | |
| | | Active Advantage | | | Managed Income | | | Dynamic Growth | | | Defender | |
| | | Fund | | | Fund | | | Fund | | | Fund(1) | |
| REALIZED AND UNREALIZED | | | | | | | | | | | | |
| GAIN (LOSS) ON INVESTMENTS | | | | | | | | | | | | |
Net realized gain (loss) on: | | | | | | | | | | | | |
| Unaffiliated investments | | $ | (465,701 | ) | | $ | (34,121,691 | ) | | $ | 33,001,060 | | | $ | (164,771 | ) |
| Futures | | | — | | | | — | | | | (862,828 | ) | | | — | |
| Purchased options | | | — | | | | — | | | | — | | | | (749,674 | ) |
| Written options | | | — | | | | — | | | | — | | | | 1,320,385 | |
Net change in unrealized appreciation/ | | | | | | | | | | | | | | | | |
depreciation of: | | | | | | | | | | | | | | | | |
| Unaffiliated investments | | | 679,212 | | | | 27,465,854 | | | | 106,378,922 | | | | 990,750 | |
| Affiliated investments | | | — | | | | (94,538 | ) | | | — | | | | — | |
| Futures | | | — | | | | — | | | | 783,405 | | | | — | |
| Purchased options | | | — | | | | — | | | | — | | | | 3,149 | |
| Written options | | | — | | | | — | | | | — | | | | (13,582 | ) |
Net realized and unrealized | | | | | | | | | | | | | | | | |
gain (loss) on investments | | | 213,511 | | | | (6,750,375 | ) | | | 139,300,559 | | | | 1,386,257 | |
| NET INCREASE IN NET ASSETS | | | | | | | | | | | | | | | | |
| RESULTING FROM OPERATIONS | | $ | 527,789 | | | $ | 30,386,594 | | | $ | 154,692,539 | | | $ | 1,798,247 | |
| (1) | For the period May 31, 2023 (inception date of the Fund) through December 31, 2023. |
See Notes to the Financial Statements
KENSINGTON FUNDS
Statements of Changes in Net Assets
| | | Kensington | | | Kensington | |
| | | Active Advantage Fund | | | Managed Income Fund | |
| | | | | | Since Inception(1) | | | | | | | |
| | | Year Ended | | | through | | | Year Ended | | | Year Ended | |
| | | December 31, | | | December 31, | | | December 31, | | | December 31, | |
| | | 2023 | | | 2022 | | | 2023 | | | 2022 | |
| OPERATIONS: | | | | | | | | | | | | |
Net investment income | | $ | 314,278 | | | $ | 98,125 | | | $ | 37,136,969 | | | $ | 7,091,585 | |
Net realized loss on unaffiliated investments | | | (465,701 | ) | | | (1,056,889 | ) | | | (34,121,691 | ) | | | (74,457,529 | ) |
Net realized loss on affiliated investments | | | — | | | | — | | | | — | | | | (4,013,651 | ) |
Capital gain distributions from | | | | | | | | | | | | | | | | |
underlying investment companies | | | — | | | | — | | | | — | | | | 5,559,843 | |
Net change in unrealized appreciation/ | | | | | | | | | | | | | | | | |
depreciation of unaffiliated investments | | | 679,212 | | | | — | | | | 27,465,854 | | | | 5,100,259 | |
Net change in unrealized appreciation/ | | | | | | | | | | | | | | | | |
depreciation of affiliated investments | | | — | | | | — | | | | (94,538 | ) | | | — | |
Net increase (decrease) in net assets | | | | | | | | | | | | | | | | |
resulting from operations | | | 527,789 | | | | (958,764 | ) | | | 30,386,594 | | | | (60,719,493 | ) |
| CAPITAL SHARE TRANSACTIONS: | | | | | | | | | | | | | | | | |
Institutional Class: | | | | | | | | | | | | | | | | |
| Proceeds from shares sold | | | 7,512,421 | | | | 24,327,003 | | | | 480,317,985 | | | | 688,576,129 | |
| Proceeds from reinvestment of distributions | | | 238,794 | | | | 93,718 | | | | 30,146,665 | | | | 5,875,858 | |
| Payments for shares redeemed | | | (19,530,437 | ) | | | (2,051,041 | ) | | | (625,699,214 | ) | | | (459,176,586 | ) |
Increase (decrease) in net assets from | | | | | | | | | | | | | | | | |
Institutional Class transactions | | | (11,779,222 | ) | | | 22,369,680 | | | | (115,234,564 | ) | | | 235,275,401 | |
A Class: | | | | | | | | | | | | | | | | |
Proceeds from shares sold(2) | | | 565,531 | | | | 1,095 | | | | 4,936,056 | | | | 58,427,602 | |
| Proceeds from reinvestment of distributions | | | 5,482 | | | | — | | | | 1,287,014 | | | | 381,465 | |
| Payments for shares redeemed | | | (109,545 | ) | | | — | | | | (49,349,815 | ) | | | (42,545,640 | ) |
Increase (decrease) in net assets from | | | | | | | | | | | | | | | | |
A Class transactions | | | 461,468 | | | | 1,095 | | | | (43,126,745 | ) | | | 16,263,427 | |
C Class: | | | | | | | | | | | | | | | | |
| Proceeds from shares sold | | | 440,000 | | | | 31,000 | | | | 1,799,934 | | | | 5,827,693 | |
| Proceeds from reinvestment of distributions | | | 6,006 | | | | 16 | | | | 339,261 | | | | 50,730 | |
Payments for shares redeemed(2) | | | (4,518 | ) | | | — | | | | (7,359,207 | ) | | | (6,142,117 | ) |
Increase (decrease) in net assets from | | | | | | | | | | | | | | | | |
C Class transactions | | | 441,488 | | | | 31,016 | | | | (5,220,012 | ) | | | (263,694 | ) |
Net increase (decrease) in net assets resulting | | | | | | | | | | | | | | | | |
from capital share transactions | | | (10,876,266 | ) | | | 22,401,791 | | | | (163,581,321 | ) | | | 251,275,134 | |
| DISTRIBUTIONS TO SHAREHOLDERS: | | | | | | | | | | | | | | | | |
From distributable earnings | | | | | | | | | | | | | | | | |
| Institutional Class | | | (297,068 | ) | | | (97,873 | ) | | | (34,578,148 | ) | | | (6,656,393 | ) |
| A Class | | | (9,025 | ) | | | (3 | ) | | | (1,344,199 | ) | | | (391,530 | ) |
| C Class | | | (6,051 | ) | | | (49 | ) | | | (363,215 | ) | | | (53,306 | ) |
Total distributions to shareholders | | | (312,144 | ) | | | (97,925 | ) | | | (36,285,562 | ) | | | (7,101,229 | ) |
| TOTAL INCREASE (DECREASE) | | | | | | | | | | | | | | | | |
| IN NET ASSETS | | | (10,660,621 | ) | | | 21,345,102 | | | | (169,480,289 | ) | | | 183,454,412 | |
See Notes to the Financial Statements
KENSINGTON FUNDS
Statements of Changes in Net Assets – Continued
| | | Kensington | | | Kensington | |
| | | Active Advantage Fund | | | Managed Income Fund | |
| | | | | | Since | | | | | | | |
| | | | | | Inception(1) | | | | | | | |
| | | Year Ended | | | through | | | Year Ended | | | Year Ended | |
| | | December 31, | | | December 31, | | | December 31, | | | December 31, | |
| | | 2023 | | | 2022 | | | 2023 | | | 2022 | |
| NET ASSETS: | | | | | | | | | | | | |
Beginning of period | | $ | 21,345,102 | | | $ | — | | | $ | 982,755,782 | | | $ | 799,301,370 | |
End of period | | $ | 10,684,481 | | | $ | 21,345,102 | | | $ | 813,275,493 | | | $ | 982,755,782 | |
| TRANSACTIONS IN SHARES: | | | | | | | | | | | | | | | | |
Institutional Class: | | | | | | | | | | | | | | | | |
| Shares sold | | | 818,138 | | | | 2,517,646 | | | | 49,336,333 | | | | 67,300,002 | |
| Shares issued to holders in | | | | | | | | | | | | | | | | |
| reinvestment of dividends | | | 25,949 | | | | 10,139 | | | | 3,119,313 | | | | 595,084 | |
| Shares redeemed | | | (2,139,157 | ) | | | (219,156 | ) | | | (64,433,309 | ) | | | (45,271,897 | ) |
Increase (decrease) in | | | | | | | | | | | | | | | | |
Institutional Class shares outstanding | | | (1,295,070 | ) | | | 2,308,629 | | | | (11,977,663 | ) | | | 22,623,189 | |
A Class: | | | | | | | | | | | | | | | | |
Shares sold(2) | | | 62,144 | | | | 110 | | | | 507,937 | | | | 5,642,866 | |
| Shares issued to holders in | | | | | | | | | | | | | | | | |
| reinvestment of dividends | | | 593 | | | | — | | | | 133,304 | | | | 38,767 | |
| Shares redeemed | | | (12,225 | ) | | | — | | | | (5,069,594 | ) | | | (4,184,070 | ) |
Increase (decrease) in | | | | | | | | | | | | | | | | |
A Class shares outstanding | | | 50,512 | | | | 110 | | | | (4,428,353 | ) | | | 1,497,563 | |
C Class: | | | | | | | | | | | | | | | | |
| Shares sold | | | 49,019 | | | | 3,200 | | | | 186,635 | | | | 571,436 | |
| Shares issued to holders in | | | | | | | | | | | | | | | | |
| reinvestment of dividends | | | 653 | | | | 2 | | | | 35,527 | | | | 5,203 | |
Shares redeemed(2) | | | (497 | ) | | | — | | | | (766,165 | ) | | | (603,051 | ) |
Increase (decrease) in | | | | | | | | | | | | | | | | |
| C Class shares outstanding | | | 49,175 | | | | 3,202 | | | | (544,003 | ) | | | (26,412 | ) |
| Net increase (decrease) in | | | | | | | | | | | | | | | | |
| shares outstanding | | | (1,195,383 | ) | | | 2,311,941 | | | | (16,950,019 | ) | | | 24,094,340 | |
| (1) | March 23, 2022. |
| (2) | Includes exchanges between share classes of the fund. |
See Notes to the Financial Statements
KENSINGTON FUNDS
Statements of Changes in Net Assets – Continued
| | | Kensington | | | Kensington | |
| | | Dynamic Growth Fund | | | Defender Fund | |
| | | | | | | | | Since | |
| | | | | | | | | Inception(1) | |
| | | Year Ended | | | Year Ended | | | through | |
| | | December 31, | | | December 31, | | | December 31, | |
| | | 2023 | | | 2022 | | | 2023 | |
| OPERATIONS: | | | | | | | | | |
Net investment income (loss) | | $ | 15,391,980 | | | $ | (354,251 | ) | | $ | 411,990 | |
Net realized gain (loss) on: | | | | | | | | | | | | |
| Unaffiliated investments | | | 33,001,060 | | | | (82,593,602 | ) | | | (164,771 | ) |
| Futures | | | (862,828 | ) | | | — | | | | — | |
| Purchased options | | | — | | | | — | | | | (749,674 | ) |
| Written options | | | — | | | | — | | | | 1,320,385 | |
Net change in unrealized appreciation/depreciation of: | | | | | | | | | | | | |
| Unaffiliated investments | | | 106,378,922 | | | | 4,544,612 | | | | 990,750 | |
| Futures | | | 783,405 | | | | — | | | | — | |
| Purchased options | | | — | | | | — | | | | 3,149 | |
| Written options | | | — | | | | — | | | | (13,582 | ) |
Net increase (decrease) in net assets | | | | | | | | | | | | |
resulting from operations | | | 154,692,539 | | | | (78,403,241 | ) | | | 1,798,247 | |
| CAPITAL SHARE TRANSACTIONS: | | | | | | | | | | | | |
Institutional Class: | | | | | | | | | | | | |
| Proceeds from shares sold | | | 580,911,068 | | | | 974,697,042 | | | | 45,838,218 | |
| Proceeds from reinvestment of distributions | | | 10,910,308 | | | | 8,152,939 | | | | 400,252 | |
| Payments for shares redeemed | | | (469,235,558 | ) | | | (354,416,549 | ) | | | (2,897,240 | ) |
| Proceeds from redemption fees | | | 816 | | | | — | | | | — | |
Increase in net assets from Institutional Class transactions | | | 122,586,634 | | | | 628,433,432 | | | | 43,341,230 | |
A Class: | | | | | | | | | | | | |
Proceeds from shares sold(2) | | | 17,148,333 | | | | 23,975,548 | | | | — | |
| Proceeds from reinvestment of distributions | | | 318,470 | | | | 269,781 | | | | — | |
| Payments for shares redeemed | | | (13,804,921 | ) | | | (12,834,776 | ) | | | — | |
| Proceeds from redemption fees | | | 27 | | | | — | | | | — | |
Increase in net assets from A Class transactions | | | 3,661,909 | | | | 11,410,553 | | | | — | |
C Class: | | | | | | | | | | | | |
| Proceeds from shares sold | | | 3,377,086 | | | | 14,587,548 | | | | — | |
| Proceeds from reinvestment of distributions | | | 98,726 | | | | 166,475 | | | | — | |
Payments for shares redeemed(2) | | | (10,428,301 | ) | | | (2,797,240 | ) | | | — | |
| Proceeds from redemption fees | | | 17 | | | | — | | | | — | |
Increase (decrease) in net assets from C Class transactions | | | (6,952,472 | ) | | | 11,956,783 | | | | — | |
Net increase in net assets resulting from | | | | | | | | | | | | |
capital share transactions | | | 119,296,071 | | | | 651,800,768 | | | | 43,341,230 | |
See Notes to the Financial Statements
KENSINGTON FUNDS
Statements of Changes in Net Assets – Continued
| | | Kensington | | | Kensington | |
| | | Dynamic Growth Fund | | | Defender Fund | |
| | | | | | | | | Since | |
| | | | | | | | | Inception(1) | |
| | | Year Ended | | | Year Ended | | | through | |
| | | December 31, | | | December 31, | | | December 31, | |
| | | 2023 | | | 2022 | | | 2023 | |
| DISTRIBUTIONS TO SHAREHOLDERS: | | | | | | | | | |
From distributable earnings | | | | | | | | | |
| Institutional Class | | $ | (11,860,387 | ) | | $ | — | | | $ | (408,595 | ) |
| A Class | | | (331,155 | ) | | | — | | | | — | |
| C Class | | | (126,092 | ) | | | — | | | | — | |
From net realized gains | | | | | | | | | | | | |
| Institutional Class | | | — | | | | (8,635,460 | ) | | | — | |
| A Class | | | — | | | | (279,507 | ) | | | — | |
| C Class | | | — | | | | (209,684 | ) | | | — | |
Total distributions to shareholders | | | (12,317,634 | ) | | | (9,124,651 | ) | | | (408,595 | ) |
| TOTAL INCREASE IN NET ASSETS | | | 261,670,976 | | | | 564,272,876 | | | | 44,730,882 | |
| NET ASSETS: | | | | | | | | | | | | |
Beginning of period | | | 935,288,214 | | | | 371,015,338 | | | | — | |
End of period | | $ | 1,196,959,190 | | | $ | 935,288,214 | | | $ | 44,730,882 | |
| TRANSACTIONS IN SHARES: | | | | | | | | | | | | |
Institutional Class: | | | | | | | | | | | | |
| Shares sold | | | 53,966,547 | | | | 88,890,176 | | | | 4,697,550 | |
| Shares issued to holders in reinvestment of dividends | | | 1,032,580 | | | | 797,744 | | | | 39,766 | |
| Shares redeemed | | | (43,628,308 | ) | | | (33,035,251 | ) | | | (295,955 | ) |
Increase in Institutional Class shares outstanding | | | 11,370,819 | | | | 56,652,669 | | | | 4,441,361 | |
A Class: | | | | | | | | | | | | |
Shares sold(2) | | | 1,608,115 | | | | 2,175,317 | | | | — | |
| Shares issued to holders in reinvestment of dividends | | | 30,347 | | | | 26,579 | | | | — | |
| Shares redeemed | | | (1,284,214 | ) | | | (1,200,173 | ) | | | — | |
Increase in A Class shares outstanding | | | 354,248 | | | | 1,001,723 | | | | — | |
C Class: | | | | | | | | | | | | |
| Shares sold | | | 326,458 | | | | 1,335,947 | | | | — | |
| Shares issued to holders in reinvestment of dividends | | | 9,619 | | | | 16,648 | | | | — | |
Shares redeemed(2) | | | (988,449 | ) | | | (260,725 | ) | | | — | |
Increase (decrease) in C Class shares outstanding | | | (652,372 | ) | | | 1,091,870 | | | | — | |
| Net increase in shares outstanding | | | 11,072,695 | | | | 58,746,262 | | | | 4,441,361 | |
| (1) | May 31, 2023. |
| (2) | Includes exchanges between share classes of the fund. |
See Notes to the Financial Statements
KENSINGTON ACTIVE ADVANTAGE FUND
Financial Highlights
Institutional Class
| | | Year | | | Since Inception(1) | |
| | | Ended | | | through | |
| | | December 31, | | | December 31, | |
| | | 2023 | | | 2022 | |
PER COMMON SHARE DATA(2): | | | | | | |
Net asset value, beginning of period | | $ | 9.23 | | | $ | 10.00 | |
| | | | | | | | | |
| INVESTMENT OPERATIONS: | | | | | | | | |
Net investment income(3) | | | 0.22 | | | | 0.04 | |
| Net realized and unrealized income (loss) on investments | | | 0.33 | | | | (0.77 | ) |
Total from investment operations | | | 0.55 | | | | (0.73 | ) |
| | | | | | | | | |
| LESS DISTRIBUTIONS FROM: | | | | | | | | |
| Net investment income | | | (0.21 | ) | | | (0.04 | ) |
| Net realized gains | | | — | | | | — | |
Total distributions | | | (0.21 | ) | | | (0.04 | ) |
| | | | | | | | | |
Net asset value, end of period | | $ | 9.57 | | | $ | 9.23 | |
| | | | | | | | | |
TOTAL RETURN(4) | | | 6.12 | % | | | -7.26 | % |
| | | | | | | | | |
| SUPPLEMENTAL DATA AND RATIOS: | | | | | | | | |
Net assets, end of period (in 000’s) | | $ | 9,703 | | | $ | 21,315 | |
Ratio of expenses to average net assets(5)(6): | | | | | | | | |
| Before expense waiver | | | 2.60 | % | | | 3.64 | % |
| After expense waiver | | | 1.36 | % | | | 1.35 | % |
Ratio of expenses excluding interest expense to average net assets(5)(6): | | | | | | | | |
| Before expense waiver | | | 2.59 | % | | | 3.64 | % |
| After expense waiver | | | 1.35 | % | | | 1.35 | % |
Ratio of net investment gain to average net assets(6) | | | 2.12 | % | | | 1.46 | % |
Portfolio turnover rate(4) | | | 944 | % | | | 1,515 | % |
| (1) | March 23, 2022. |
| (2) | For an Institutional Class Share outstanding for the entire period. |
| (3) | Recognition of net investment income by the Fund is affected by the timing of the declaration of dividends by the underlying investment companies in which the Fund invests. |
| (4) | Not annualized for periods less than one year. |
| (5) | Does not include expenses of investment companies in which the Fund invests. |
| (6) | Annualized for periods less than one year. |
See Notes to the Financial Statements
KENSINGTON ACTIVE ADVANTAGE FUND
Financial Highlights – Continued
A Class
| | | Year | | | Since Inception(1) | |
| | | Ended | | | through | |
| | | December 31, | | | December 31, | |
| | | 2023 | | | 2022 | |
PER COMMON SHARE DATA(2): | | | | | | |
Net asset value, beginning of period | | $ | 9.22 | | | $ | 10.00 | |
| | | | | | | | | |
| INVESTMENT OPERATIONS: | | | | | | | | |
Net investment income(3) | | | 0.10 | | | | 0.09 | |
| Net realized and unrealized loss on investments | | | 0.44 | | | | (0.84 | ) |
Total from investment operations | | | 0.54 | | | | (0.75 | ) |
| | | | | | | | | |
| LESS DISTRIBUTIONS FROM: | | | | | | | | |
| Net investment income | | | (0.20 | ) | | | (0.03 | ) |
| Net realized gains | | | — | | | | — | |
Total distributions | | | (0.20 | ) | | | (0.03 | ) |
| | | | | | | | | |
Net asset value, end of period | | $ | 9.56 | | | $ | 9.22 | |
| | | | | | | | | |
TOTAL RETURN(4)(5) | | | 5.92 | % | | | -7.49 | % |
| | | | | | | | | |
| SUPPLEMENTAL DATA AND RATIOS: | | | | | | | | |
Net assets, end of period (in 000’s) | | $ | 484 | | | $ | 1 | |
Ratio of expenses to average net assets(6)(7): | | | | | | | | |
| Before expense waiver | | | 3.24 | % | | | 255.94 | % |
| After expense waiver | | | 1.61 | % | | | 1.60 | % |
Ratio of expenses excluding interest expense to average net assets(6)(7): | | | | | | | | |
| Before expense waiver | | | 3.23 | % | | | 255.94 | % |
| After expense waiver | | | 1.60 | % | | | 1.60 | % |
Ratio of net investment income to average net assets(7) | | | 1.86 | % | | | 1.20 | % |
Portfolio turnover rate(6) | | | 944 | % | | | 1,515 | % |
| (1) | March 23, 2022. |
| (2) | For an A Class Share outstanding for the entire period. |
| (3) | Recognition of net investment income by the Fund is affected by the timing of the declaration of dividends by the underlying investment companies in which the Fund invests. |
| (4) | Total return does not reflect sales charges. |
| (5) | Not annualized for periods less than one year. |
| (6) | Does not include expenses of investment companies in which the Fund invests. |
| (7) | Annualized for periods less than one year. |
See Notes to the Financial Statements
KENSINGTON ACTIVE ADVANTAGE FUND
Financial Highlights – Continued
C Class
| | | Year | | | Since Inception(1) | |
| | | Ended | | | through | |
| | | December 31, | | | December 31, | |
| | | 2023 | | | 2022 | |
PER COMMON SHARE DATA(2): | | | | | | |
Net asset value, beginning of period | | $ | 9.19 | | | $ | 10.00 | |
| | | | | | | | | |
| INVESTMENT OPERATIONS: | | | | | | | | |
Net investment income(3) | | | 0.11 | | | | 0.02 | |
| Net realized and unrealized gain (loss) on investments | | | 0.35 | | | | (0.81 | ) |
Total from investment operations | | | 0.46 | | | | (0.79 | ) |
| | | | | | | | | |
| LESS DISTRIBUTIONS FROM: | | | | | | | | |
| Net investment income | | | (0.15 | ) | | | (0.02 | ) |
| Net realized gains | | | — | | | | — | |
Total distributions | | | (0.15 | ) | | | (0.02 | ) |
| | | | | | | | | |
Net asset value, end of period | | $ | 9.50 | | | $ | 9.19 | |
| | | | | | | | | |
TOTAL RETURN(4)(5) | | | 5.02 | % | | | -7.95 | % |
| | | | | | | | | |
| SUPPLEMENTAL DATA AND RATIOS: | | | | | | | | |
Net assets, end of period (in 000’s) | | $ | 498 | | | $ | 29 | |
Ratio of expenses to average net assets(6)(7): | | | | | | | | |
| Before expense waiver | | | 4.03 | % | | | 23.83 | % |
| After expense waiver | | | 2.36 | % | | | 2.35 | % |
Ratio of expenses excluding interest expense to average net assets(6)(7): | | | | | | | | |
| Before expense waiver | | | 4.02 | % | | | 23.83 | % |
| After expense waiver | | | 2.35 | % | | | 2.35 | % |
Ratio of net investment income to average net assets(7) | | | 1.11 | % | | | 0.46 | % |
Portfolio turnover rate(5) | | | 944 | % | | | 1,515 | % |
| (1) | March 23, 2022. |
| (2) | For a C Class Share outstanding for the entire period. |
| (3) | Recognition of net investment income by the Fund is affected by the timing of the declaration of dividends by the underlying investment companies in which the Fund invests. |
| (4) | Total return does not reflect sales charges. |
| (5) | Not annualized for periods less than one year. |
| (6) | Does not include expenses of investment companies in which the Fund invests. |
| (7) | Annualized for periods less than one year. |
See Notes to the Financial Statements
KENSINGTON MANAGED INCOME FUND
Financial Highlights
Institutional Class
| | | Year | | | Year | | | Year | | | Year | | | Since Inception(1) | |
| | | Ended | | | Ended | | | Ended | | | Ended | | | through | |
| | | December 31, | | | December 31, | | | December 31, | | | December 31, | | | December 31, | |
| | | 2023 | | | 2022 | | | 2021 | | | 2020 | | | 2019 | |
PER COMMON SHARE DATA(2): | | | | | | | | | | | | | | | |
Net asset value, beginning of period | | $ | 9.86 | | | $ | 10.58 | | | $ | 10.80 | | | $ | 10.21 | | | $ | 10.00 | |
| | | | | | | | | | | | | | | | | | | | | |
| INVESTMENT OPERATIONS: | | | | | | | | | | | | | | | | | | | | |
Net investment income(3) | | | 0.42 | | | | 0.07 | | | | 0.28 | (4) | | | 0.32 | (4) | | | 0.17 | (4) |
| Net realized and unrealized | | | | | | | | | | | | | | | | | | | | |
| gain (loss) on investments | | | (0.04 | ) | | | (0.72 | ) | | | (0.13 | ) | | | 0.51 | | | | 0.15 | |
Total from investment operations | | | 0.38 | | | | (0.65 | ) | | | 0.15 | | | | 0.83 | | | | 0.32 | |
| | | | | | | | | | | | | | | | | | | | | |
| LESS DISTRIBUTIONS FROM: | | | | | | | | | | | | | | | | | | | | |
| Net investment income | | | (0.41 | ) | | | (0.07 | ) | | | (0.27 | ) | | | (0.21 | ) | | | (0.11 | ) |
| Net realized gains | | | — | | | | — | | | | (0.10 | ) | | | (0.02 | ) | | | — | |
| Return of capital | | | — | | | | — | | | | — | | | | (0.01 | ) | | | — | |
Total distributions | | | (0.41 | ) | | | (0.07 | ) | | | (0.37 | ) | | | (0.24 | ) | | | (0.11 | ) |
| | | | | | | | | | | | | | | | | | | | | |
Net asset value, end of period | | $ | 9.83 | | | $ | 9.86 | | | $ | 10.58 | | | $ | 10.80 | | | $ | 10.21 | |
| | | | | | | | | | | | | | | | | | | | | |
TOTAL RETURN(5) | | | 3.97 | % | | | -6.11 | % | | | 1.29 | % | | | 8.13 | % | | | 3.20 | % |
| | | | | | | | | | | | | | | | | | | | | |
| SUPPLEMENTAL DATA AND RATIOS: | | | | | | | | | | | | | | | | | | | | |
Net assets, end of period (in 000’s) | | $ | 775,312 | | | $ | 895,811 | | | $ | 721,445 | | | $ | 296,660 | | | $ | 54,723 | |
Ratio of expenses to | | | | | | | | | | | | | | | | | | | | |
average net assets(6)(7)(8): | | | | | | | | | | | | | | | | | | | | |
| Before expense waiver/recoupment | | | 1.37 | % | | | 1.38 | % | | | 1.41 | % | | | 1.59 | % | | | 2.20 | % |
| After expense waiver/recoupment | | | 1.35 | % | | | 1.36 | % | | | 1.41 | % | | | 1.61 | % | | | 1.99 | % |
Ratio of expenses excluding interest | | | | | | | | | | | | | | | | | | | | |
expense to average net assets(6)(7)(8): | | | | | | | | | | | | | | | | | | | | |
| Before expense waiver/recoupment | | | 1.37 | % | | | 1.38 | % | | | 1.41 | % | | | 1.59 | % | | | 2.20 | % |
| After expense waiver/recoupment | | | 1.35 | % | | | 1.36 | % | | | 1.41 | % | | | 1.61 | % | | | 1.99 | % |
Ratio of net investment income to | | | | | | | | | | | | | | | | | | | | |
average net assets(7) | | | 4.07 | % | | | 0.79 | % | | | 2.54 | % | | | 3.06 | % | | | 2.83 | % |
Portfolio turnover rate(5) | | | 600 | % | | | 1,244 | % | | | 220 | % | | | 233 | % | | | 61 | % |
| (1) | May 28, 2019. |
| (2) | For an Institutional Class Share outstanding for the entire period. |
| (3) | Recognition of net investment income by the Fund is affected by the timing of the declaration of dividends by the underlying investment companies in which the Fund invests. |
| (4) | Per share amounts calculated using average shares method. |
| (5) | Not annualized for periods less than one year. |
| (6) | Does not include expenses of investment companies in which the Fund invests. |
| (7) | Annualized for periods less than one year. |
| (8) | On June 24, 2022, the Adviser lowered the limit of annual operating expenses from 1.45% to 1.35%. |
See Notes to the Financial Statements
KENSINGTON MANAGED INCOME FUND
Financial Highlights – Continued
A Class
| | | Year | | | Year | | | Year | | | Year | | | Since Inception(1) | |
| | | Ended | | | Ended | | | Ended | | | Ended | | | through | |
| | | December 31, | | | December 31, | | | December 31, | | | December 31, | | | December 31, | |
| | | 2023 | | | 2022 | | | 2021 | | | 2020 | | | 2019 | |
PER COMMON SHARE DATA(2): | | | | | | | | | | | | | | | |
Net asset value, beginning of period | | $ | 9.84 | | | $ | 10.56 | | | $ | 10.78 | | | $ | 10.20 | | | $ | 10.00 | |
| | | | | | | | | | | | | | | | | | | | | |
| INVESTMENT OPERATIONS: | | | | | | | | | | | | | | | | | | | | |
Net investment income(3) | | | 0.49 | | | | 0.05 | | | | 0.25 | (4) | | | 0.31 | (4) | | | 0.15 | (4) |
| Net realized and unrealized | | | | | | | | | | | | | | | | | | | | |
| gain (loss) on investments | | | (0.14 | ) | | | (0.72 | ) | | | (0.13 | ) | | | 0.49 | | | | 0.15 | |
Total from investment operations | | | 0.35 | | | | (0.67 | ) | | | 0.12 | | | | 0.80 | | | | 0.30 | |
| | | | | | | | | | | | | | | | | | | | | |
| LESS DISTRIBUTIONS FROM: | | | | | | | | | | | | | | | | | | | | |
| Net investment income | | | (0.38 | ) | | | (0.05 | ) | | | (0.24 | ) | | | (0.19 | ) | | | (0.10 | ) |
| Net realized gains | | | — | | | | — | | | | (0.10 | ) | | | (0.02 | ) | | | — | |
| Return of capital | | | — | | | | — | | | | — | | | | (0.01 | ) | | | — | |
| Total distributions | | | (0.38 | ) | | | (0.05 | ) | | | (0.34 | ) | | | (0.22 | ) | | | (0.10 | ) |
| | | | | | | | | | | | | | | | | | | | | |
Net asset value, end of period | | $ | 9.81 | | | $ | 9.84 | | | $ | 10.56 | | | $ | 10.78 | | | $ | 10.20 | |
| | | | | | | | | | | | | | | | | | | | | |
TOTAL RETURN(5)(6) | | | 3.67 | % | | | -6.31 | % | | | 1.05 | % | | | 7.87 | % | | | 3.01 | % |
| | | | | | | | | | | | | | | | | | | | | |
| SUPPLEMENTAL DATA | | | | | | | | | | | | | | | | | | | | |
| AND RATIOS: | | | | | | | | | | | | | | | | | | | | |
Net assets, end of period (in 000’s) | | $ | 28,050 | | | $ | 71,700 | | | $ | 61,130 | | | $ | 38,110 | | | $ | 4,867 | |
Ratio of expenses to | | | | | | | | | | | | | | | | | | | | |
average net assets(7)(8)(9): | | | | | | | | | | | | | | | | | | | | |
| Before expense waiver/recoupment | | | 1.62 | % | | | 1.63 | % | | | 1.66 | % | | | 1.77 | % | | | 2.42 | % |
| After expense waiver/recoupment | | | 1.60 | % | | | 1.61 | % | | | 1.66 | % | | | 1.79 | % | | | 2.39 | % |
Ratio of expenses excluding interest | | | | | | | | | | | | | | | | | | | | |
expense to average net assets(7)(8)(9): | | | | | | | | | | | | | | | | | | | | |
| Before expense waiver/recoupment | | | 1.62 | % | | | 1.63 | % | | | 1.66 | % | | | 1.77 | % | | | 2.42 | % |
| After expense waiver/recoupment | | | 1.60 | % | | | 1.61 | % | | | 1.66 | % | | | 1.79 | % | | | 2.39 | % |
Ratio of net investment income to | | | | | | | | | | | | | | | | | | | | |
average net assets(8) | | | 3.83 | % | | | 0.54 | % | | | 2.31 | % | | | 2.93 | % | | | 2.44 | % |
Portfolio turnover rate(6) | | | 600 | % | | | 1,244 | % | | | 220 | % | | | 233 | % | | | 61 | % |
| (1) | May 28, 2019. |
| (2) | For an A Class Share outstanding for the entire period. |
| (3) | Recognition of net investment income by the Fund is affected by the timing of the declaration of dividends by the underlying investment companies in which the Fund invests. |
| (4) | Per share amounts calculated using average shares method. |
| (5) | Total return does not reflect sales charges. |
| (6) | Not annualized for periods less than one year. |
| (7) | Does not include expenses of investment companies in which the Fund invests. |
| (8) | Annualized for periods less than one year. |
| (9) | On June 24, 2022, the Adviser lowered the limit of annual operating expenses from 2.05% to 1.60%. |
See Notes to the Financial Statements
KENSINGTON MANAGED INCOME FUND
Financial Highlights – Continued
C Class
| | | Year | | | Year | | | Year | | | Year | | | Since Inception(1) | |
| | | Ended | | | Ended | | | Ended | | | Ended | | | through | |
| | | December 31, | | | December 31, | | | December 31, | | | December 31, | | | December 31, | |
| | | 2023 | | | 2022 | | | 2021 | | | 2020 | | | 2019 | |
PER COMMON SHARE DATA(2): | | | | | | | | | | | | | | | |
Net asset value, beginning of period | | $ | 9.75 | | | $ | 10.52 | | | $ | 10.74 | | | $ | 10.19 | | | $ | 10.17 | |
| | | | | | | | | | | | | | | | | | | | | |
| INVESTMENT OPERATIONS: | | | | | | | | | | | | | | | | | | | | |
Net investment income (loss)(3) | | | 0.30 | | | | (0.03 | ) | | | 0.17 | (4) | | | 0.22 | (4) | | | 0.06 | (4) |
| Net realized and unrealized | | | | | | | | | | | | | | | | | | | | |
| gain (loss) on investments | | | (0.02 | ) | | | (0.71 | )(5) | | | (0.13 | ) | | | 0.49 | | | | 0.05 | |
Total from investment operations | | | 0.28 | | | | (0.74 | ) | | | 0.04 | | | | 0.71 | | | | 0.11 | |
| | | | | | | | | | | | | | | | | | | | | |
| LESS DISTRIBUTIONS FROM: | | | | | | | | | | | | | | | | | | | | |
| Net investment income | | | (0.31 | ) | | | (0.03 | ) | | | (0.16 | ) | | | (0.13 | ) | | | (0.09 | ) |
| Net realized gains | | | — | | | | — | | | | (0.10 | ) | | | (0.02 | ) | | | — | |
| Return of capital | | | — | | | | — | | | | — | | | | (0.01 | ) | | | — | |
Total distributions | | | (0.31 | ) | | | (0.03 | ) | | | (0.26 | ) | | | (0.16 | ) | | | (0.09 | ) |
| | | | | | | | | | | | | | | | | | | | | |
Net asset value, end of period | | $ | 9.72 | | | $ | 9.75 | | | $ | 10.52 | | | $ | 10.74 | | | $ | 10.19 | |
| | | | | | | | | | | | | | | | | | | | | |
TOTAL RETURN(6)(7) | | | 2.92 | % | | | -7.00 | % | | | 0.35 | % | | | 6.95 | % | | | 1.09 | % |
| | | | | | | | | | | | | | | | | | | | | |
| SUPPLEMENTAL DATA | | | | | | | | | | | | | | | | | | | | |
| AND RATIOS: | | | | | | | | | | | | | | | | | | | | |
Net assets, end of period (in 000’s) | | $ | 9,914 | | | $ | 15,245 | | | $ | 16,727 | | | $ | 11,749 | | | $ | 2,156 | |
Ratio of expenses to | | | | | | | | | | | | | | | | | | | | |
average net assets(8)(9)(10): | | | | | | | | | | | | | | | | | | | | |
| Before expense waiver/recoupment | | | 2.37 | % | | | 2.38 | % | | | 2.41 | % | | | 2.55 | % | | | 3.03 | % |
| After expense waiver/recoupment | | | 2.35 | % | | | 2.36 | % | | | 2.41 | % | | | 2.57 | % | | | 2.99 | % |
Ratio of expenses excluding interest | | | | | | | | | | | | | | | | | | | | |
expense to average net assets(8)(9)(10): | | | | | | | | | | | | | | | | | | | | |
| Before expense waiver/recoupment | | | 2.37 | % | | | 2.38 | % | | | 2.41 | % | | | 2.55 | % | | | 3.03 | % |
| After expense waiver/recoupment | | | 2.35 | % | | | 2.36 | % | | | 2.41 | % | | | 2.57 | % | | | 2.99 | % |
Ratio of net investment income (loss) | | | | | | | | | | | | | | | | | | | | |
to average net assets(9) | | | 3.07 | % | | | -0.21 | % | | | 1.59 | % | | | 2.07 | % | | | 2.22 | % |
Portfolio turnover rate(7) | | | 600 | % | | | 1,244 | % | | | 220 | % | | | 233 | % | | | 61 | % |
| (1) | August 27, 2019. |
| (2) | For a C Class Share outstanding for the entire period. |
| (3) | Recognition of net investment income by the Fund is affected by the timing of the declaration of dividends by the underlying investment companies in which the Fund invests. |
| (4) | Per share amounts calculated using average shares method. |
| (5) | Realized and unrealized gains (losses) per share in this caption are balancing amounts necessary to reconcile the change in net asset value per share for the year, and may not reconcile with the aggregate gains on the Statement of Operations due to share transactions for the year. |
| (6) | Total return does not reflect sales charges. |
| (7) | Not annualized for periods less than one year. |
| (8) | Does not include expenses of investment companies in which the Fund invests. |
| (9) | Annualized for periods less than one year. |
| (10) | On June 24, 2022, the Adviser lowered the limit of annual operating expenses from 2.99% to 2.35%. |
See Notes to the Financial Statements
KENSINGTON DYNAMIC GROWTH FUND
Financial Highlights
Institutional Class
| | | Year | | | Year | | | Year | | | Since Inception(1) | |
| | | Ended | | | Ended | | | Ended | | | through | |
| | | December 31, | | | December 31, | | | December 31, | | | December 31, | |
| | | 2023 | | | 2022 | | | 2021 | | | 2020 | |
PER COMMON SHARE DATA(2): | | | | | | | | | | | | |
Net asset value, beginning of period | | $ | 10.22 | | | $ | 11.30 | | | $ | 10.11 | | | | 10.00 | |
| | | | | | | | | | | | | | | | | |
| INVESTMENT OPERATIONS: | | | | | | | | | | | | | | | | |
Net investment income (loss)(3) | | | 0.16 | | | | — | (4) | | | (0.09 | )(5) | | | 0.04 | (5) |
| Net realized and unrealized | | | | | | | | | | | | | | | | |
| gain (loss) on investments | | | 1.42 | | | | (0.98 | ) | | | 2.19 | | | | 0.11 | |
Total from investment operations | | | 1.58 | | | | (0.98 | ) | | | 2.10 | | | | 0.15 | |
| | | | | | | | | | | | | | | | | |
| LESS DISTRIBUTIONS FROM: | | | | | | | | | | | | | | | | |
| Net investment income | | | (0.13 | ) | | | — | | | | — | | | | (0.04 | ) |
| Net realized gains | | | — | | | | (0.10 | ) | | | (0.91 | ) | | | — | |
Total distributions | | | (0.13 | ) | | | (0.10 | ) | | | (0.91 | ) | | | (0.04 | ) |
| | | | | | | | | | | | | | | | | |
Net asset value, end of period | | $ | 11.67 | | | $ | 10.22 | | | $ | 11.30 | | | | 10.11 | |
| | | | | | | | | | | | | | | | | |
TOTAL RETURN(6) | | | 15.59 | % | | | -8.67 | % | | | 20.76 | % | | | 1.47 | % |
| | | | | | | | | | | | | | | | | |
| SUPPLEMENTAL DATA AND RATIOS: | | | | | | | | | | | | | | | | |
Net assets, end of period (in 000’s) | | $ | 1,143,770 | | | $ | 885,688 | | | $ | 339,324 | | | | 58,914 | |
Ratio of expenses to average net assets(7)(8)(9): | | | | | | | | | | | | | | | | |
| Before expense waiver/recoupment | | | 1.37 | % | | | 1.39 | % | | | 1.45 | % | | | 2.12 | % |
| After expense waiver/recoupment | | | 1.38 | % | | | 1.37 | % | | | 1.47 | % | | | 1.64 | % |
Ratio of net investment income (loss) | | | | | | | | | | | | | | | | |
to average net assets(8) | | | 1.49 | % | | | -0.01 | % | | | -0.73 | % | | | 2.20 | % |
Portfolio turnover rate(6) | | | 1,100 | % | | | 1,127 | % | | | 786 | % | | | 277 | % |
| (1) | October 23, 2020. |
| (2) | For an Institutional Class Share outstanding for the entire period. |
| (3) | Recognition of net investment income by the Fund is affected by the timing of the declaration of dividends by the underlying investment companies in which the Fund invests. |
| (4) | Amount per share rounds to $0.00. |
| (5) | Per share amounts calculated using average shares method. |
| (6) | Not annualized for periods less than one year. |
| (7) | Does not include expenses of investment companies in which the Fund invests. |
| (8) | Annualized for periods less than one year. |
| (9) | On June 24, 2022, the Adviser lowered the limit of annual operating expenses from 1.64% to 1.38%. |
See Notes to the Financial Statements
KENSINGTON DYNAMIC GROWTH FUND
Financial Highlights – Continued
A Class
| | | Year | | | Year | | | Year | | | Since Inception(1) | |
| | | Ended | | | Ended | | | Ended | | | through | |
| | | December 31, | | | December 31, | | | December 31, | | | December 31, | |
| | | 2023 | | | 2022 | | | 2021 | | | 2020 | |
PER COMMON SHARE DATA(2): | | | | | | | | | | | | |
Net asset value, beginning of period | | $ | 10.15 | | | $ | 11.26 | | | $ | 10.10 | | | $ | 10.00 | |
| | | | | | | | | | | | | | | | | |
| INVESTMENT OPERATIONS: | | | | | | | | | | | | | | | | |
Net investment income (loss)(3) | | | 0.14 | | | | (0.04 | ) | | | (0.13 | )(4) | | | 0.05 | (4) |
| Net realized and unrealized | | | | | | | | | | | | | | | | |
| gain (loss) on investments | | | 1.40 | | | | (0.97 | ) | | | 2.20 | | | | 0.08 | |
Total from investment operations | | | 1.54 | | | | (1.01 | ) | | | 2.07 | | | | 0.13 | |
| | | | | | | | | | | | | | | | | |
| LESS DISTRIBUTIONS FROM: | | | | | | | | | | | | | | | | |
| Net investment income | | | (0.11 | ) | | | — | | | | — | | | | (0.03 | ) |
| Net realized gains | | | — | | | | (0.10 | ) | | | (0.91 | ) | | | — | |
Total distributions | | | (0.11 | ) | | | (0.10 | ) | | | (0.91 | ) | | | (0.03 | ) |
| | | | | | | | | | | | | | | | | |
Net asset value, end of period | | $ | 11.58 | | | $ | 10.15 | | | $ | 11.26 | | | $ | 10.10 | |
| | | | | | | | | | | | | | | | | |
TOTAL RETURN(5)(6) | | | 15.29 | % | | | -8.96 | % | | | 20.48 | % | | | 1.35 | % |
| | | | | | | | | | | | | | | | | |
| SUPPLEMENTAL DATA AND RATIOS: | | | | | | | | | | | | | | | | |
Net assets, end of period (in 000’s) | | $ | 36,708 | | | $ | 28,582 | | | $ | 20,413 | | | $ | 3,588 | |
Ratio of expenses to average net assets(7)(8)(9): | | | | | | | | | | | | | | | | |
| Before expense waiver/recoupment | | | 1.62 | % | | | 1.64 | % | | | 1.70 | % | | | 2.36 | % |
| After expense waiver/recoupment | | | 1.63 | % | | | 1.62 | % | | | 1.72 | % | | | 2.04 | % |
Ratio of net investment income (loss) | | | | | | | | | | | | | | | | |
to average net assets(8) | | | 1.24 | % | | | -0.26 | % | | | -1.06 | % | | | 2.71 | % |
Portfolio turnover rate(6) | | | 1,100 | % | | | 1,127 | % | | | 786 | % | | | 277 | % |
| | | | | | | | | | | | | | | | | |
| (1) | October 23, 2020. |
| (2) | For an A Class Share outstanding for the entire period. |
| (3) | Recognition of net investment income by the Fund is affected by the timing of the declaration of dividends by the underlying investment companies in which the Fund invests. |
| (4) | Per share amounts calculated using average shares method. |
| (5) | Total return does not reflect sales charges. |
| (6) | Not annualized for periods less than one year. |
| (7) | Does not include expenses of investment companies in which the Fund invests. |
| (8) | Annualized for periods less than one year. |
| (9) | On June 24, 2022, the Adviser lowered the limit of annual operating expenses from 2.04% to 1.63%. |
See Notes to the Financial Statements
KENSINGTON DYNAMIC GROWTH FUND
Financial Highlights – Continued
C Class
| | | Year | | | Year | | | Year | | | Since Inception(1) | |
| | | Ended | | | Ended | | | Ended | | | through | |
| | | December 31, | | | December 31, | | | December 31, | | | December 31, | |
| | | 2023 | | | 2022 | | | 2021 | | | 2020 | |
PER COMMON SHARE DATA(2): | | | | | | | | | | | | |
Net asset value, beginning of period | | $ | 10.00 | | | $ | 11.18 | | | $ | 10.11 | | | $ | 10.00 | |
| | | | | | | | | | | | | | | | | |
| INVESTMENT OPERATIONS: | | | | | | | | | | | | | | | | |
Net investment income (loss)(3) | | | 0.01 | | | | (0.10 | ) | | | (0.21 | )(4) | | | 0.05 | (4) |
| Net realized and unrealized | | | | | | | | | | | | | | | | |
| gain (loss) on investments | | | 1.43 | | | | (0.98 | ) | | | 2.19 | | | | 0.09 | |
Total from investment operations | | | 1.44 | | | | (1.08 | ) | | | 1.98 | | | | 0.14 | |
| | | | | | | | | | | | | | | | | |
| LESS DISTRIBUTIONS FROM: | | | | | | | | | | | | | | | | |
| Net investment income | | | (0.06 | ) | | | — | | | | — | | | | (0.03 | ) |
| Net realized gains | | | — | | | | (0.10 | ) | | | (0.91 | ) | | | — | |
Total distributions | | | (0.06 | ) | | | (0.10 | ) | | | (0.91 | ) | | | (0.03 | ) |
| | | | | | | | | | | | | | | | | |
Net asset value, end of period | | $ | 11.38 | | | $ | 10.00 | | | $ | 11.18 | | | $ | 10.11 | |
| | | | | | | | | | | | | | | | | |
TOTAL RETURN(5)(6) | | | 14.49 | % | | | -9.65 | % | | | 19.57 | % | | | 1.39 | % |
| | | | | | | | | | | | | | | | | |
| SUPPLEMENTAL DATA AND RATIOS: | | | | | | | | | | | | | | | | |
Net assets, end of period (in 000’s) | | $ | 16,482 | | | $ | 21,018 | | | $ | 11,279 | | | $ | 2,086 | |
Ratio of expenses to average net assets(7)(8)(9): | | | | | | | | | | | | | | | | |
| Before expense waiver/recoupment | | | 2.37 | % | | | 2.39 | % | | | 2.44 | % | | | 2.96 | % |
| After expense waiver/recoupment | | | 2.38 | % | | | 2.37 | % | | | 2.47 | % | | | 2.64 | % |
Ratio of net investment income (loss) | | | | | | | | | | | | | | | | |
to average net assets(8) | | | 0.50 | % | | | -1.01 | % | | | -1.77 | % | | | 2.50 | % |
Portfolio turnover rate(6) | | | 1,100 | % | | | 1,127 | % | | | 786 | % | | | 277 | % |
| (1) | October 23, 2020. |
| (2) | For a C Class Share outstanding for the entire period. |
| (3) | Recognition of net investment income by the Fund is affected by the timing of the declaration of dividends by the underlying investment companies in which the Fund invests. |
| (4) | Per share amounts calculated using average shares method. |
| (5) | Total return does not reflect sales charges. |
| (6) | Not annualized for periods less than one year. |
| (7) | Does not include expenses of investment companies in which the Fund invests. |
| (8) | Annualized for periods less than one year. |
| (9) | On June 24, 2022, the Adviser lowered the limit of annual operating expenses from 2.64% to 2.38%. |
See Notes to the Financial Statements
KENSINGTON DEFENDER FUND
Financial Highlights – Continued
Institutional Class
| | | Since | |
| | | Inception(1) | |
| | | through | |
| | | December 31, | |
| | | 2023 | |
PER COMMON SHARE DATA(2): | | | |
Net asset value, beginning of period | | $ | 10.00 | |
| | | | | |
| INVESTMENT OPERATIONS: | | | | |
Net investment income(3) | | | 0.11 | |
| Net realized and unrealized gain on investments | | | 0.07 | |
Total from investment operations | | | 0.18 | |
| | | | | |
| LESS DISTRIBUTIONS FROM: | | | | |
| Net investment income | | | (0.11 | ) |
| Net realized gains | | | — | |
Total distributions | | | (0.11 | ) |
| | | | | |
Net asset value, end of period | | $ | 10.07 | |
| | | | | |
TOTAL RETURN(4) | | | 1.80 | % |
| | | | | |
| SUPPLEMENTAL DATA AND RATIOS: | | | | |
Net assets, end of year (in 000’s) | | $ | 44,731 | |
Ratio of expenses to average net assets(5)(6): | | | | |
| Before expense waiver | | | 2.22 | % |
| After expense waiver | | | 1.49 | % |
Ratio of net investment income to average net assets(6) | | | 3.78 | % |
Portfolio turnover rate(4) | | | 182 | % |
| (1) | May 31, 2023. |
| (2) | For an Institutional Class Share outstanding for the entire period. |
| (3) | Recognition of net investment income by the Fund is affected by the timing of the declaration of dividends by the underlying investment companies in which the Fund invests. |
| (4) | Not annualized. |
| (5) | Does not include expenses of investment companies in which the Fund invests. |
| (6) | Annualized. |
See Notes to the Financial Statements
KENSINGTON FUNDS
Notes to the Financial Statements
December 31, 2023
Managed Portfolio Series (the “Trust”) was organized as a Delaware statutory trust on January 27, 2011. The Trust is registered under the Investment Company Act of 1940, as amended (the “1940 Act”), as an open-end management investment company. The Kensington Active Advantage Fund (“Active Advantage Fund”), the Kensington Managed Income Fund (“Managed Income Fund”), the Kensington Dynamic Growth Fund (“Dynamic Growth Fund”), and the Kensington Defender Fund (“Defender Fund”) (or collectively, “the Funds”) are each a non-diversified series with their own investment objectives and policies within the Trust. The Trust has evaluated the structure, objective and activities of the Funds and determined that they meet the characteristics of an investment company. As such, these financial statements have applied the guidance as set forth in the Accounting Standards Codifications (“ASC”) 946, Financial Services Investment Companies.
The investment objective of the Active Advantage Fund is total return. The Active Advantage Fund seeks to achieve its objective by utilizing a proprietary trend-following process which seeks to benefit from longer-term trends in equity and fixed income markets. The Active Advantage Fund commenced operations on March 23, 2022.
The investment objective of the Managed Income Fund is total return, which consists of income and capital appreciation. The Managed Income Fund seeks to achieve its objective by investing the Fund’s assets to gain exposure to (i) higher-yielding, fixed income securities, or to (ii) cash, cash equivalents, and U.S. Treasury securities, based on a proprietary “Managed Income Model” that looks at trends and patterns in the high-yield fixed income market. The Managed Income Fund commenced operations on May 28, 2019. On June 24, 2022, the Kensington Managed Income Fund, a series of Advisors Preferred Trust (the “Acquired Fund”), reorganized into the Managed Income Fund, a series of the Trust. All shares of the Acquired Fund were exchanged for shares of the Managed Income Fund on a pro rata basis immediately after the closing date. This qualified as a tax-free reorganization under Section 368(a)(1)(C) of the Internal Revenue Code.
The investment objective of the Dynamic Growth Fund is capital gains. The Dynamic Growth Fund seeks to achieve its objective by investing the Fund’s assets to gain exposure to (i) domestic equity securities or (ii) cash, cash equivalents, and U.S. Treasury securities based on a proprietary “Dynamic Growth Model” that looks at trends in the U.S. equity market. The Dynamic Growth Fund commenced operations on October 23, 2020. On June 24, 2022, the Kensington Dynamic Growth Fund, a series of Advisors Preferred Trust (the “Acquired Fund”), reorganized into the Dynamic Growth Fund, a series of the Trust. All shares of the Acquired Fund were exchanged for shares of the Dynamic Growth Fund on a pro rata basis immediately after the closing date. This qualified as a tax-free reorganization under Section 368(a)(1)(C) of the Internal Revenue Code.
The investment objective of the Defender Fund is capital preservation and total return, which consists of capital appreciation and income. The Defender Fund seeks to achieve its objective by utilizing varying investment strategies, including (i) Liquid Strategies, LLC’s (the “Sub-Adviser”) Defender Model, (ii) an options overlay strategy to generate income, and (iii) a total return swap strategy intended to provide exposures with reduced correlation to the other strategies. The Defender Fund commenced operations on May 31, 2023.
The Active Advantage, Managed Income and Dynamic Growth Funds offer three classes of shares: the Institutional Class, the A Class and the C Class. The Defender Fund offers one class of shares, the Institutional Class. Institutional Class shares have no sales charge and are offered only to qualifying institutional investors and certain other qualifying accounts. A Class shares may be subject to a front-end sales charge of up to 4.75%. C Class shares may be subject to a deferred sales charge of up to 1.00%. The Active Advantage, Managed Income
KENSINGTON FUNDS
Notes to the Financial Statements – Continued
December 31, 2023
and Dynamic Growth Funds have adopted a Distribution Plan pursuant to Rule 12b-1 in the A Class and C Class. The Plan permits each Fund to pay for distribution and related expenses at an annual rate of 0.25% of the A Class and 1.00% of the C Class.
| 2. | SIGNIFICANT ACCOUNTING POLICIES |
The following is a summary of significant accounting policies followed by the Funds in the preparation of their financial statements. These policies are in conformity with generally accepted accounting principles in the United States of America (“GAAP”).
Securities Valuation – All investments in securities are recorded at their estimated fair value, as described in Note 3.
Federal Income Taxes – The Funds intend to meet the requirements of subchapter M of the Internal Revenue Code applicable to regulated investment companies and to distribute substantially all net taxable investment income and net realized gains to shareholders in a manner which results in no tax cost to the Funds. Therefore, no federal income or excise tax provision is required. As of December 31, 2023, the Funds did not have any tax positions that did not meet the “more-likely-than-not” threshold of being sustained by the applicable tax authority. The Funds recognize interest and penalties, if any, related to unrecognized tax benefits on uncertain tax positions as income tax expense in the Statements of Operations. During the year ended December 31, 2023, the Funds did not incur any interest or penalties. The Funds are subject to examination by U.S. taxing authorities for the tax period since the commencement of operations.
Securities Transactions, Income and Distributions – Securities transactions are accounted for on the date the securities are purchased or sold (trade date). Realized gains and losses are reported on a specific identified cost basis. Interest income is recognized on an accrual basis, including amortization of premiums and accretion of discounts. Dividend income and distributions are recorded on the ex-dividend date. Withholding taxes on foreign dividends have been provided for in accordance with the Funds’ understanding of the applicable country’s tax rules and regulations. Distributions received from the Funds’ investments generally are comprised of ordinary income, capital gains and return of capital. The Funds allocate distributions between investment income and return of capital based on estimates made at the time such distributions are received. Such estimates are based on information provided by each portfolio company and other industry sources. These estimates may subsequently be revised based on actual allocations received from the portfolio companies after their tax reporting periods are concluded, as the actual character of these distributions is not known until after the fiscal year end of the Funds.
The Funds will make distributions of net investment income, if any, quarterly and net realized capital gains, if any, annually. Distributions to shareholders are recorded on the ex-dividend date. The treatment for financial reporting purposes of distributions made to shareholders during the year from net investment income or net realized capital gains may differ from their ultimate treatment for federal income tax purposes. These differences are caused primarily by differences in the timing of the recognition of certain components of income, expense or realized capital gain for federal income tax purposes. Where such differences are permanent in nature, GAAP requires that they be reclassified in the components of the net assets based on their ultimate characterization for federal income tax purposes. Any such reclassifications will have no effect on net assets, results of operations or net asset values per share of the Funds. For the year ended December 31, 2023, the Managed Income Fund decreased paid-in capital by $158,386 and increased accumulated gain by $158,386. The reclassifications were primarily due to reclassification of dividends.
KENSINGTON FUNDS
Notes to the Financial Statements – Continued
December 31, 2023
Use of Estimates – The preparation of financial statements in conformity with GAAP requires management to make estimates and assumptions that affect the reported amounts of assets and liabilities and disclosure of contingent assets and liabilities at the date of the financial statements and the reported amounts of revenues and expenses during the reporting period. Actual results could differ from those estimates.
Allocation of Income, Expenses and Gains/Losses – Income, expenses (other than those deemed attributable to a specific share class), and gains and losses of the Funds are allocated daily to each class of shares based upon the ratio of net assets represented by each class as a percentage of the net assets of each Fund. Expenses deemed directly attributable to a class of shares are recorded by the specific class. Most Fund expenses are allocated by class based on relative net assets. 12b-1 fees are expensed at 0.25% and 1.00% of average daily net assets of A Class shares and C Class shares, respectively. Trust expenses associated with a specific fund in the Trust are charged to that fund. Common Trust expenses are typically allocated evenly between the funds of the Trust, or by other equitable means.
Futures Contracts and Option Contracts – The Funds are subject to equity price risk, interest rate risk, and foreign currency exchange risk in the normal course of pursuing their investment objectives. The Funds use futures contracts and options on futures contracts to gain exposure to, or hedge against, changes in the value of equities, interest rates or foreign currencies. A futures contract represents a commitment for the future purchase or sale of an asset at a specified price on a specified date. Upon entering into such contracts, the Funds are required to deposit with the broker, either in cash or securities, an initial margin deposit in an amount equal to a certain percentage of the contract amount. In addition, the Fund segregates liquid securities when purchasing or selling futures contracts to comply with Trust policies. Subsequent payments (variation margin) are made or received by the Funds each day, depending on the daily fluctuations in the value of the contract, and are recorded for financial statement purposes as unrealized gains or losses by the Funds. Upon entering into such contracts, the Funds bear the risk of interest or exchange rates or securities prices moving unexpectedly, in which case, the Funds may not achieve the anticipated benefits of the futures contracts and may realize a loss. With futures, there is minimal counterparty credit risk to the Funds since futures are exchange traded and the exchange’s clearinghouse, as counterparty to all exchange-traded futures, guarantees the futures against default. The use of futures contracts, and options on futures contracts, involves the risk of imperfect correlation in movements in the price of futures contracts and options thereon, interest rates and the underlying hedged assets.
The Funds may use purchased option contracts and written option contracts to hedge against the changes in the value of equities or to meet their investment objectives. The Funds may write put and call options only if they (i) own an offsetting position in the underlying security or (ii) maintain cash or other liquid assets in an amount equal to or greater than its obligation under the option.
When the Funds write a call or put option, an amount equal to the premium received is included in the Statements of Assets and Liabilities as a liability. The amount of the liability is subsequently adjusted to reflect the current fair value of the option. If an option expires on its stipulated expiration date or if the Funds enter into a closing purchase transaction, a gain or loss is realized. If a written call option is exercised, a gain or loss is realized for the sale of the underlying security and the proceeds from the sale are increased by the premium originally received. If a written put option is exercised, the cost of the security acquired is decreased by the premium originally received. As the writer of an option, the Funds have no control over whether the underlying securities are subsequently sold (call) or purchased (put) and, as a result, bear the market risk of an unfavorable change in the price of the security underlying the written option.
KENSINGTON FUNDS
Notes to the Financial Statements – Continued
December 31, 2023
The Funds may purchase call and put options. When the Funds purchase a call or put option, an amount equal to the premium paid is included in the Statements of Assets and Liabilities as an investment and is subsequently adjusted to reflect the fair value of the option. If an option expires on the stipulated expiration date or if the Funds enter into a closing sale transaction, a gain or loss is realized. If the Funds exercise a call option, the cost of the security acquired is increased by the premium paid for the call. If the Funds exercise a put option, a gain or loss is realized from the sale of the underlying security, and the proceeds from such a sale are decreased by the premium originally paid. Written and purchased options are non-income producing securities. Written and purchased options expose the Funds to minimal counterparty risk since they are exchange traded and the exchange’s clearinghouse guarantees the options against default. Please refer to Note 4 for more information on derivatives.
Indemnifications – Under the Trust’s organizational documents, its officers and trustees are indemnified against certain liabilities arising out of the performance of their duties to the Trust. In addition, in the normal course of business, the Trust may enter into contracts that provide general indemnification to other parties. The Trust’s maximum exposure under these arrangements is unknown, as this would involve future claims that may be made against the Trust that have not yet occurred and may not occur. However, the Trust has not had prior claims or losses pursuant to these contracts and expects the risk of loss to be remote.
Cash and Cash Equivalents – Cash and cash equivalents include short-term, liquid investments with an original maturity of three months or less and include money market fund accounts. These balances may exceed FDIC insured limits.
Organizational and Offering Costs – All organization and offering costs for the Funds were covered by the Adviser, Kensington Asset Management, LLC.
Temporary Investments – To respond to adverse market, economic, political, or other conditions, a Fund may invest 100% of its total assets, without limitation, in high-quality short-term debt securities and money market instruments. A Fund may be invested in these instruments for extended periods, depending on the Adviser’s assessment of market conditions. These short-term debt securities and money market instruments may include shares of other mutual funds, commercial paper, certificates of deposit, bankers’ acceptances, U.S. Government securities and repurchase agreements. While a Fund is in a defensive position, the opportunity to achieve its investment objective will be limited. Furthermore, to the extent that a Fund invests in money market mutual funds for its cash position, there will be some duplication of expenses because the Fund would bear its pro rata portion of such money market funds’ advisory and operational fees.
The Funds have adopted fair value accounting standards, which establish an authoritative definition of fair value and set out a hierarchy for measuring fair value. These standards require additional disclosures about the various inputs and valuation techniques used to develop the measurements of fair value, a discussion of changes in valuation techniques and related inputs during the period and expanded disclosure of valuation levels for major security types. These inputs are summarized in the three broad levels listed below:
| Level 1 – | Quoted prices in active markets for identical assets or liabilities. |
| | |
| Level 2 – | Observable inputs other than quoted prices included in Level 1. These inputs may include quoted prices for similar instruments, interest rates, prepayment speeds, credit risk, yield curves, default rates and similar data. |
KENSINGTON FUNDS
Notes to the Financial Statements – Continued
December 31, 2023
| Level 3 – | Significant unobservable inputs for the asset or liability, representing the Fund’s view of assumptions a market participant would use in valuing the asset or liability. |
Following is a description of the valuation techniques applied to each Fund’s major categories of assets and liabilities measured at fair value on a recurring basis. Each Fund’s investments are carried at fair value.
Short-Term Investments – U.S. government securities are normally valued using a model that incorporates market observable data such as reported sales of similar securities, broker quotes, yields, bids, offers, and reference data. These securities are valued principally using dealer quotations. U.S. government securities are categorized in Level 2 of the fair value hierarchy depending on the inputs used and market activity levels for specific securities.
Exchange-Traded Funds – Exchange-traded funds (“ETFs”) are valued at the last reported sale price on the exchange on which the security is principally traded. If, on a particular day, an ETF does not trade, then the mean between the most recent quoted bid and asked prices will be used. To the extent these securities are actively traded and valuation adjustments are not applied, they are categorized in Level 1 of the fair value hierarchy.
Registered Investment Companies – Investments in other mutual funds, including money market funds, are valued at their net asset value per share. To the extent these securities are actively traded and valuation adjustments are not applied, they are categorized in Level 1 of the fair value hierarchy.
Common Stock — Securities that are primarily traded on a national securities exchange are valued at the last sale price on the exchange on which they are primarily traded on the day of valuation or, if there has been no sale on such day, at the mean between the bid and ask prices. Securities traded primarily on the Nasdaq Global Market System for which market quotations are readily available are valued using the Nasdaq Official Closing Price (“NOCP”). If the NOCP is not available, such securities are valued at the last sale price on the day of valuation, or if there has been no sale on such day, at the mean between the bid and ask prices. To the extent these securities are actively traded and valuation adjustments are not applied, they are categorized in Level 1 of the fair value hierarchy.
Derivative Instruments – Listed derivatives, including options, rights, swaps, warrants and futures that are actively traded are valued based on quoted prices from the exchange and categorized in Level 1 of the fair value hierarchy.
The Board of Trustees (the “Board”) has adopted a pricing and valuation policy for use by the Funds and their Valuation Designee (as defined below) in calculating the Fund’s NAV. Pursuant to Rule 2a-5 under the 1940 Act, the Funds have designated Kensington Asset Management, LLC (the “Adviser”) as its “Valuation Designee” to perform all of the fair value determinations as well as to perform all of the responsibilities that may be performed by the Valuation Designee in accordance with Rule 2a-5. The Valuation Designee is authorized to make all necessary determinations of the fair values of portfolio securities and other assets for which market quotations are not readily available or if it is deemed that the prices obtained from brokers and dealers or independent pricing services are unreliable.
The inputs or methodology used for valuing securities are not an indication of the risk associated with investing in those securities.
KENSINGTON FUNDS
Notes to the Financial Statements – Continued
December 31, 2023
The following table is a summary of the inputs used to value each Fund’s securities by level within the fair value hierarchy as of December 31, 2023:
| Active Advantage Fund | | Level 1 | | | Level 2 | | | Level 3 | | | Total | |
Exchange-Traded Funds | | $ | 10,413,241 | | | $ | — | | | $ | — | | | $ | 10,413,241 | |
Total Investments | | $ | 10,413,241 | | | $ | — | | | $ | — | | | $ | 10,413,241 | |
| | | | | | | | | | | | | |
| Managed Income Fund | | Level 1 | | | Level 2 | | | Level 3 | | | Total | |
Exchange-Traded Funds | | $ | 637,890,075 | | | $ | — | | | $ | — | | | $ | 637,890,075 | |
Open-End Funds | | | 138,056,640 | | | | — | | | | — | | | | 138,056,640 | |
U.S Treasury Bills | | | — | | | | 24,941,374 | | | | — | | | | 24,941,374 | |
Total Investments | | $ | 775,946,715 | | | $ | 24,941,374 | | | $ | — | | | $ | 800,888,089 | |
| | | | | | | | | | | | | |
| Dynamic Growth Fund | | Level 1 | | | Level 2 | | | Level 3 | | | Total | |
Exchange-Traded Funds | | $ | 1,143,113,829 | | | $ | — | | | $ | — | | | $ | 1,143,113,829 | |
U.S. Treasury Bills | | | — | | | | 2,533,986 | | | | — | | | | 2,533,986 | |
Total Investments | | $ | 1,143,113,829 | | | $ | 2,533,986 | | | $ | — | | | $ | 1,145,647,815 | |
As of December 31, 2023, the Fund’s investments in other financial instruments* were classified as follows:
Long Futures Contracts | | $ | 783,405 | | | $ | — | | | $ | — | | | $ | 783,405 | |
Total Other Financial Instruments | | $ | 783,405 | | | $ | — | | | $ | — | | | $ | 783,405 | |
| | | | | | | | | | | | | | | | | |
| Defender Fund | | Level 1 | | | Level 2 | | | Level 3 | | | Total | |
Exchange-Traded Funds | | $ | 33,936,811 | | | $ | — | | | $ | — | | | $ | 33,936,811 | |
Put Options Purchased | | | 54,628 | | | | — | | | | — | | | | 54,628 | |
Total Investments | | $ | 33,991,439 | | | $ | — | | | $ | — | | | $ | 33,991,439 | |
As of December 31, 2023, the Fund’s investments in other financial instruments* were classified as follows:
Put Options Written | | $ | (257,794 | ) | | $ | — | | | $ | — | | | $ | (257,794 | ) |
Total Other Financial Instruments | | $ | (257,794 | ) | | $ | — | | | $ | — | | | $ | (257,794 | ) |
| * | Other financial instruments are derivative instruments not reflected in the Schedule of Investments, such as futures, swap contracts and written options. Futures contracts are presented at the unrealized appreciation (depreciation) on the instruments. |
Refer to each Fund’s Schedule of Investments for industry classifications.
| 4. | DERIVATIVES TRANSACTIONS |
The Funds may use derivatives for different purposes, such as a substitute for taking a position in the underlying asset and/or as part of a strategy designed to reduce exposure to other risks, such as interest rate or currency risk. The various derivative instruments that the Funds may use are options, futures contracts and options on futures contracts and other derivative securities. The Funds may also use derivatives for leverage, in which case their use would involve leveraging risk and equity risk. A Fund investing in a derivative instrument could lose more than the principal amount invested.
KENSINGTON FUNDS
Notes to the Financial Statements – Continued
December 31, 2023
FASB Accounting Standards Codification 815, Derivatives and Hedging (“ASC 815”) requires enhanced disclosures about each Fund’s use of, and accounting for, derivative instruments and the effect of derivative instruments on each Fund’s results of operations and financial position. Tabular disclosure regarding derivative fair value and gain/loss by contract type (e.g., interest rate contracts, foreign exchange contracts, credit contracts, etc.) is required and derivatives accounted for as hedging instruments under ASC 815 must be disclosed separately from those that do not qualify for hedge accounting. Even though the Funds may use derivatives in an attempt to achieve an economic hedge, the Funds’ derivatives are not accounted for as hedging instruments under ASC 815 because investment companies account for their derivatives at fair value and record any changes in fair value in current period earnings.
For the year ended December 31, 2023, the Funds’ average quarterly notional values are as follows:
| | | Long Futures | | | Purchased Option | | | Written Option | | |
| Fund | | Contracts | | | Contracts | | | Contracts | | |
Dynamic Growth Fund | | $ | 5,543,000 | | | $ | — | | | $ | — | | |
Defender Fund | | | — | | | | 8,585,694 | | | | (8,585,694 | ) | |
The locations on the Statements of Assets and Liabilities of the Funds’ derivative positions by type of exposure, all of which are not accounted for as hedging instruments under ASC 815, are as follows:
Values of Derivative Instruments as of December 31, 2023. On the Statement of Assets and Liabilities:
Dynamic Growth Fund
| | |
| Assets | | Liabilities | |
| Derivatives not accounted | | | | | | | | | |
| for as hedging instruments | | | | | | | | | |
| under ASC 815 | | Location | | Fair Value | | Location | | Fair Value | |
| Equity Contracts – | | Net Assets – | | | | Net Assets – | | | |
| Futures | | unrealized appreciation | | | | unrealized depreciation | | | |
| | | | on futures contracts** | | $ | 783,405 | | on futures contracts** | | $ | — | |
| Total | | | | $ | 783,405 | | | | $ | — | |
| ** | Includes cumulative appreciation/depreciation on futures contracts as reported in the Schedules of Open Futures Contracts. |
Defender Fund
| | |
| Assets | | Liabilities | |
| Derivatives not accounted | | | | | | | | | |
| for as hedging instruments | | | | | | | | | |
| under ASC 815 | | Location | | Fair Value | | Location | | Fair Value | |
| Equity Contracts – | | | | | | | | | |
| Purchased Options | | Investments, at fair value | | $ | 54,628 | | Investments, at fair value | | $ | — | |
| Equity Contracts – | | Written option contracts, | | | | | Written option contracts, | | | | |
| Written Options | | at fair value | | | — | | at fair value | | | (257,794 | ) |
| Total | | | | $ | 54,628 | | | | $ | (257,794 | ) |
KENSINGTON FUNDS
Notes to the Financial Statements – Continued
December 31, 2023
The effect of Derivative Instruments on the Statements of Operations for the year ended December 31, 2023:
Amount of Realized Gain (Loss) on Derivatives
| | | Dynamic Growth Fund | | | Defender Fund | | |
| Derivatives not accounted for as | | | | | | | | | | |
| hedging instruments under ASC 815 | | Futures | | | Purchased Options | | | Written Options | | |
| Equity Contracts | | $ | (862,828 | ) | | $ | (749,674 | ) | | $ | 1,320,385 | | |
| Total | | $ | (862,828 | ) | | $ | (749,674 | ) | | $ | 1,320,385 | | |
Change in Unrealized Appreciation or (Depreciation) on Derivatives
| | | Dynamic Growth Fund | | | Defender Fund | | |
| Derivatives not accounted for as | | | | | | | | | | |
| hedging instruments under ASC 815 | | Futures | | | Purchased Options* | | | Written Options | | |
| Equity Contracts | | $ | 783,405 | | | $ | 3,149 | | | $ | (13,582 | ) | |
| Total | | $ | 783,405 | | | $ | 3,149 | | | $ | (13,582 | ) | |
| * | Included in net change in unrealized appreciation on unaffiliated investments as reported on the Statements of Operations. |
Balance Sheet Offsetting Information
The following table provides a summary of offsetting financial liabilities and derivatives and the effect of derivative instruments on the Statements of Assets and Liabilities as of December 31, 2023.
Dynamic Growth Fund
| | | | | | | | | | Net Amounts | | | Gross Amounts Not Offset in | |
| | | | | | | Gross Amounts | | | of Assets | | | Statement of Assets and Liabilities |
| | | | | | | Offset | | | Presented | | | | | | | | | | |
| | | | | | | in Statement | | | in Statement | | | | | | Cash | | | | |
| | | | Gross Amounts | | | of Assets | | | of Assets | | | Financial | | | Collateral | | | | |
| Assets: | | | Recognized | | | and Liabilities | | | and Liabilities | | | Instruments | | | Received | | | Net Amount | |
| Futures Contracts** | | | $ | 783,405 | | | $ | — | | | $ | 783,405 | | | $ | — | | | $ | — | | | $ | — | |
|
|
|
| $ | 783,405 |
|
| | — |
|
| $ | 783,405 |
| | | — |
|
| $ | — |
|
| $ | — | |
| Defender Fund | | | | | | | | | | | | | | | | | | | | | | | | | |
| | | | | | | | | | | | | Net Amounts | | | Gross Amounts Not Offset in | |
| | | | | | | | | Gross Amounts | | | of Assets | | | Statement of Assets and Liabilities | |
| | | | | | | | | Offset | | | Presented | | | | | | | | | | | | | |
| | | | | | | | | in Statement | | | in Statement | | | | | | | Cash | | | | | |
| | | | | Gross Amounts | | | of Assets | | | of Assets | | | Financial | | | Collateral | | | | | |
| Liabilities: | | | Recognized | | | and Liabilities | | | and Liabilities | | | Instruments | | | Pledged | | | Net Amount | |
| Written Option | | | | | | | | | | | | | | | | | | | | | | | | | |
| Contracts | | | $ | 257,794 | | | $ | — | | | $ | 257,794 | | | $ | — | | | $ | 257,794 | | | $ | — | |
| | | | | $ | 257,794 | | | $ | — | | | $ | 257,794 | | | $ | — | | | $ | 257,794 | | | $ | — | |
| ** | Cumulative appreciation/depreciation on futures contracts is reported in the Schedules of Open Futures Contracts. |
KENSINGTON FUNDS
Notes to the Financial Statements – Continued
December 31, 2023
During the ordinary course of business, the Funds may enter into transactions subject to enforceable netting agreements or other similar arrangements (“netting agreements”). Generally, the right to offset in netting agreements allows the Funds to offset any exposure to a specific counterparty with any collateral received or delivered to that counterparty based on the terms of the agreement. Generally, each fund manages its cash collateral and securities collateral on a counterparty basis. As of December 31, 2023, the Funds did not enter into any netting agreements which would require any portfolio securities to be netted.
| 5. | OTHER REGULATORY MATTERS |
In October 2022, the Securities and Exchange Commission (the “SEC”) adopted a final rule relating to Tailored Shareholder Reports for Mutual Funds and Exchange-Traded Funds; Fee Information in Investment Company Advertisements. The rule and form amendments will, among other things, require the Funds to transmit concise and visually engaging shareholder reports that highlight key information. The amendments will require that funds tag information in a structured data format and that certain more in-depth information be made available online and available for delivery free of charge to investors on request. The amendments became effective January 24, 2023. There is an 18-month transition period after the effective date of the amendment.
| 6. | INVESTMENT ADVISORY FEE AND OTHER TRANSACTIONS WITH AFFILIATES |
The Trust has an agreement with Kensington Asset Management LLC (the “Adviser”) to furnish investment advisory services to the Funds. For its services, the Funds pay the Adviser a monthly management fee based on each Fund’s average daily net assets at the following annual rates:
| Fund | |
| Active Advantage Fund | 1.25% |
| | |
| Managed Income Fund | 1.25% on assets up to $1.0 billion |
| | 1.225% on assets between $1.0 billion and $2 billion |
| | 1.20% on assets greater than $2 billion |
| | |
| Dynamic Growth Fund | 1.25% on assets up to $2.5 billion |
| | 1.225% on assets between $2.5 billion and $5 billion |
| | 1.20% on assets greater than $5 billion |
| | |
| Defender Fund | 1.25% |
The Adviser has engaged Liquid Strategies, LLC as the Sub-Adviser (the “Sub-Adviser) to the Defender Fund. Subject to the supervision of the Adviser, the Sub-Adviser is primarily responsible for the day-to-day management of that Defender Fund's portfolio, including purchase, retention and sale of securities. Fees associated with these services are paid to the Sub-Adviser by the Adviser.
The Funds’ Adviser has contractually agreed to reimburse each Fund for its expenses to ensure that total annual operating expenses (excluding acquired fund fees and expenses, leverage/borrowing interest, interest expense, dividends paid on short sales, taxes, brokerage commissions, extraordinary expenses, and distribution (12b-1) fees and expenses) for each Fund do not exceed 1.35% of the average daily net assets of the Active Advantage Fund and Managed Income Fund, 1.38% of the average daily net assets of the Dynamic Growth Fund and 1.49% of the average daily net assets of the Defender Fund. Expenses reimbursed by the Adviser may be recouped by the Adviser for a period of thirty-six months following the date on which such reimbursement was made if such recoupment can be achieved without exceeding the expense limit in effect at the time the expense reimbursement occurred and at the
KENSINGTON FUNDS
Notes to the Financial Statements – Continued
December 31, 2023
time of recoupment. The Operating Expense Limitation Agreement is intended to be continual in nature and cannot be terminated within a year after the effective date of the Funds’ prospectus. During the year ended December 31, 2023, the Dynamic Growth Fund and the Defender Fund recouped $139,052 and $4,332 respectively, of previously waived expenses. Reimbursed expenses subject to potential recovery by month of expiration are as follows:
Active Advantage Fund | | |
March 2025 – December 2025 | $158,334 | |
January 2026 – December 2026 | $189,217 | |
| | | |
Managed Income Fund | | |
June 2025 – December 2025 | $187,135 | |
January 2026 – December 2026 | $214,930 | |
| | | |
Dynamic Growth Fund | | |
June 2025 – December 2025 | $1,320 | |
January 2026 – December 2026 | $1,621 | |
| | | |
Defender Fund | | |
May 2026 – December 2026 | $79,230 | |
U.S. Bancorp Fund Services, LLC, doing business as U.S. Bank Global Fund Services (“Fund Services” or the “Administrator”) acts as the Funds’ Administrator, Transfer Agent and fund accountant. U.S. Bank, N.A. (the “Custodian”) serves as the custodian to the Funds. The Custodian is an affiliate of the Administrator. The Administrator performs various administrative and accounting services for the Funds. The Administrator prepares various federal and state regulatory filings, reports and returns for the Funds; prepares reports and materials to be supplied to the Trustees; monitors the activities of the Funds’ custodian; coordinates the payment of the Funds’ expenses and reviews the Funds’ expense accruals. The officers of the Trust including the Chief Compliance Officer are employees of the Administrator. As compensation for its services, the Administrator is entitled to a monthly fee at an annual rate based on the average daily net assets of the Funds, subject to annual minimums. Fees paid by the Funds for administration and accounting, transfer agency, custody and compliance services for the year ended December 31, 2023, are disclosed in the Statements of Operations.
The Funds have adopted a Distribution Plan pursuant to Rule 12b-1 (the “Plan”) in the A Class and the C Class. The Plan permits each Fund to pay for distribution and related expenses at an annual rate of 0.25% of the A Class and 1.00% of the C Class average daily net assets. The expenses covered by the Plan may include the cost of preparing and distributing prospectuses and other sales material, advertising and public relations expenses, payments to financial intermediaries and compensation of personnel involved in selling shares of the Funds. For the year ended December 31, 2023, expenses incurred by the A Class and C Class pursuant to the Plan were as follows:
| Fund | | A Class | | | C Class | |
Active Advantage Fund | | $ | 975 | | | $ | 3,511 | |
Managed Income Fund | | | 107,092 | | | | 125,636 | |
Dynamic Growth Fund | | | 81,860 | | | | 203,202 | |
KENSINGTON FUNDS
Notes to the Financial Statements – Continued
December 31, 2023
| 8. | AFFILIATED COMPANY TRANSACTIONS |
If the Fund's holding represents ownership of 5% or more of the voting securities of a company, the company is deemed to be an affiliate as defined by the 1940 Act. The Fund conducted transactions during the period ended December 31, 2023 with affiliated companies as so defined:
Managed Income Fund
| | | | | | | | | Net Change |
| | 12/31/22 | | | Realized | | 12/31/23 | | in Unrealized |
| Investment | Share | Gross | Gross | Gain | Distributions | Share | 12/31/23 | Appreciation/ |
| Security | Balance | Additions | Reductions | (Loss) | Received | Balance | Value | Depreciation |
| Pioneer Strategic Income | | | | | | | | |
| Fund – Class K | — | $30,000,000 | $— | $— | $7,324 | 3,151,261 | $29,905,462 | $(94,538) |
| 9. | INVESTMENT TRANSACTIONS |
The aggregate purchases and sales, excluding U.S. government securities and short-term investments, by the Funds for the year ended December 31, 2023, were as follows:
| Fund | | Purchases | | | Sales | |
Active Advantage Fund | | $ | 67,400,640 | | | $ | 57,200,910 | |
Managed Income Fund | | | 3,328,540,959 | | | | 2,544,423,623 | |
Dynamic Growth Fund | | | 7,829,380,014 | | | | 6,825,645,665 | |
Defender Fund | | | 50,796,782 | | | | 17,683,375 | |
| 10. | FEDERAL TAX INFORMATION |
As of December 31, 2023, the Funds’ most recent fiscal year end, the cost basis of investments for federal income tax purposes and the components of accumulated losses on a tax basis were as follows:
| | | Aggregate Gross | | | Aggregate Gross | | | Net | | | Federal Income | |
| Fund | | Appreciation | | | Depreciation | | | Appreciation | | | Tax Cost | |
| Active Advantage Fund | | $ | 679,212 | | | $ | (34,548 | ) | | $ | 644,664 | | | $ | 9,768,577 | |
| Managed Income Fund | | | 27,465,854 | | | | (94,538 | ) | | | 27,371,316 | | | | 773,516,773 | |
| Dynamic Growth Fund | | | 106,378,922 | | | | (36,628,120 | ) | | | 69,750,802 | | | | 1,075,897,013 | |
| Defender Fund | | | 1,005,233 | | | | (13,962 | ) | | | 991,271 | | | | 33,000,168 | |
At December 31, 2023, the Funds’ most recent fiscal year end, components of distributable earnings on a tax-basis were as follows:
| | | Undistributed | | | Undistributed | | | Other | | | | | | | |
| | | Ordinary | | | Long-Term | | | Accumulated | | | Unrealized | | | Accumulated | |
| Fund | | Income | | | Capital Gains | | | Losses | | | Appreciation | | | Gain (Loss) | |
| Active Advantage Fund | | $ | 2,334 | | | $ | — | | | $ | (1,488,042 | ) | | $ | 644,664 | | | $ | (841,044 | ) |
| Managed Income Fund | | | 1,009,793 | | | | — | | | | (109,137,966 | ) | | | 27,371,316 | | | | (80,756,857 | ) |
| Dynamic Growth Fund | | | 3,074,346 | | | | — | | | | (13,043,845 | ) | | | 69,750,802 | | | | 59,781,303 | |
| Defender Fund | | | 61,400 | | | | 336,981 | | | | — | | | | 991,271 | | | | 1,389,652 | |
As of December 31, 2023, the Funds’ most recent fiscal year end, the Active Advantage Fund, Managed Income Fund and Dynamic Growth Fund had short-term capital loss carryovers of $1,488,042, $109,137,966, and
KENSINGTON FUNDS
Notes to the Financial Statements – Continued
December 31, 2023
$12,966,191, respectively, and the Dynamic Growth Fund had $47,654 in long-term capital loss carryovers, which may be carried over for an unlimited period. The Dynamic Growth Fund utilized $69,597,411 of capital loss carryover from the prior year. A regulated investment company may elect for any taxable year to treat any portion of any qualified late year loss as arising on the first day of the next taxable year. Qualified late year losses are certain capital, and ordinary losses which occur during the portion of the Fund’s taxable year subsequent to October 31. For the taxable year ended December 31, 2023, the Funds do not plan to defer any qualified late year losses.
During the year ended December 31, 2023, the Funds paid the following distributions to shareholders:
| | | | | | Short-Term | | | Long-Term | | | | |
| Fund | | Ordinary Income* | | | Capital Gains | | | Capital Gains** | | | Total | |
| Active Advantage Fund | | $ | 312,144 | | | $ | — | | | $ | — | | | $ | 312,144 | |
| Managed Income Fund | | | 36,285,562 | | | | — | | | | — | | | | 36,285,562 | |
| Dynamic Growth Fund | | | 12,317,634 | | | | — | | | | — | | | | 12,317,634 | |
| Defender Fund | | | 408,595 | | | | — | | | | — | | | | 408,595 | |
During the year ended December 31, 2022, the Funds paid the following distributions to shareholders:
| | | | | | Short-Term | | | Long-Term | | | | |
| Fund | | Ordinary Income* | | | Capital Gains | | | Capital Gains** | | | Total | |
| Active Advantage Fund | | $ | 97,925 | | | $ | — | | | $ | — | | | $ | 97,925 | |
| Managed Income Fund | | | 7,101,229 | | | | — | | | | — | | | | 7,101,229 | |
| Dynamic Growth Fund | | | 9,124,651 | | | | — | | | | — | | | | 9,124,651 | |
| * | For federal income tax purposes, distributions of short-term capital gains are treated as ordinary income distributions. |
| ** | The Funds designate as long-term capital gain distributions, pursuant to Internal Revenue Code Section 852(b)(3)(c). |
The Active Advantage Fund, Managed Income Fund and Dynamic Growth Fund have each established an unsecured line of credit (“LOC”) in the amount of $100,000,000, 20% of a Fund's gross market value (10% for the Active Advantage Fund), or 33.33% of the fair value of the Fund’s investments, whichever is less. The LOC matures, unless renewed, on July 19, 2024. The LOC is intended to provide short-term financing, if necessary, subject to certain restrictions and covenants, in connection with shareholder redemptions and other short-term liquidity needs of the Funds. The LOC is with the Custodian. Interest is charged at the prime rate which was 8.50% as of December 31, 2023. The interest rate during the period was between 7.50% and 8.50%. The Funds have authorized the Custodian. to charge any of the accounts of the Funds for any missed payments. For the year ended December 31, 2023, the Funds’ LOC activity was as follows:
| | | | | | | Amount | | | Weighted- | | | | | | | | Date of |
| | | | Average | | | Outstanding as of | | | Average | | | Interest | | | Maximum | | Maximum |
| Fund | LOC Agent | | Borrowings | | | December 31, 2023 | | | Interest Rate | | | Expense | | | Borrowing | | Borrowing |
| Active | | | | | | | | | | | | | | | | | |
| Advantage Fund | U.S. Bank N.A. | | $ | 7,540 | | | $ | — | | | | 8.25 | % | | $ | 631 | | | $ | 1,153,000 | | 5/16/2023 |
| Managed | | | | | | | | | | | | | | | | | | | | | | |
| Income Fund | U.S. Bank N.A. | | | 88,923 | | | | — | | | | 8.50 | % | | | 7,663 | | | | 8,539,000 | | 8/18/2023 |
KENSINGTON FUNDS
Notes to the Financial Statements – Continued
December 31, 2023
The beneficial ownership, either directly or indirectly, of more than 25% of the voting securities of a fund creates a presumption of control of the fund, under Section 2(a)(9) of the Investment Company Act of 1940. As of December 31, 2023, each Fund’s percentage of control ownership positions greater than 25% are as follows:
| Fund | Shareholder | Percent of Shares Held | Type of Ownership |
| Active Advantage Fund | Charles Schwab & Co., Inc. | 51.07% | Record |
| | | | |
| Managed Income Fund | Charles Schwab & Co., Inc. | 35.84% | Record |
| | National Financial Services, LLC | 26.68% | Record |
| | | | |
| Dynamic Growth Fund | Charles Schwab & Co., Inc. | 49.55% | Record |
| | | | |
| Defender Fund | Charles Schwab & Co., Inc. | 79.54% | Record |
| 13. | REORGANIZATION OF MANAGED INCOME FUND AND DYNAMIC GROWTH FUND |
On June 24, 2022, as the result of a tax-free reorganization, the Kensington Managed Income Fund and the Kensington Dynamic Growth Fund (the “Predecessor Funds”), each a series in Advisors Preferred Trust, were reorganized into the Trust by transferring all of the Predecessor Funds’ assets to the Managed Income Fund and Dynamic Growth Fund in the Trust. The Predecessor Funds were deemed to be the accounting survivors for financial reporting purposes. The Reorganizations enabled Kensington Asset Management, LLC (“Kensington”), the investment sub-adviser of the Predecessor Funds and the investment adviser of the Funds, to serve as the sole investment adviser. The Reorganizations provided Kensington with the opportunity to create future economies of scale that could benefit shareholders if certain fixed costs can be spread across a larger asset base.
As a tax-free reorganization, any unrealized appreciation or depreciation on the securities on the date of reorganization was treated as a non-taxable event, thus the cost basis of the securities held reflect the historical cost basis as of the date of reorganization. Immediately prior to the reorganization, the net assets, fair value of investments, and net unrealized appreciation of the Kensington Managed Income Fund was $961,547,791, $960,064,142 and $(6,237,046), respectively and the net assets, fair value of investments, and net unrealized appreciation of the Kensington Dynamic Growth Fund was $640,424,705, $640,221,327, and $0, respectively.
At the date of reorganization, fund shares outstanding for the Predecessor Managed Income Fund were 8,376,485, 86,567,926 and 1,507,096 for the Class A, Institutional Class and Class C, respectively, and shares outstanding for the Predecessor Dynamic Growth Fund were 2,861,838, 55,338,259 and 1,725,787 for the Class A, Institutional Class and Class C, respectively.
Management has performed an evaluation of subsequent events through the date the financial statements were issued and has determined that no additional items require recognition or disclosure.
KENSINGTON FUNDS
Report of Independent Registered Public Accounting Firm
To the Shareholders of Kensington Funds and
Board of Trustees of Managed Portfolio Series
Opinion on the Financial Statements
We have audited the accompanying statements of assets and liabilities, including the schedules of investments, open futures contracts (Kensington Dynamic Growth Fund), and written options (Kensington Defender Fund), of the funds listed below (“Kensington Funds” or the “Funds”), each a series of Managed Portfolio Series, as of December 31, 2023, the related statements of operations, the statements of changes in net assets, the related notes, and the financial highlights for each of the periods indicated below (collectively referred to as the “financial statements”). In our opinion, the financial statements present fairly, in all material respects, the financial position of each of the Funds as of December 31, 2023, the results of their operations, the changes in net assets, and the financial highlights for each of the periods indicated below in conformity with accounting principles generally accepted in the United States of America.
| Statements of | Statements of | |
| Fund Name | Operations | Changes in Net Assets | Financial Highlights |
Kensington Active | For the year ended | For the year ended December 31, 2023, and for the period |
Advantage Fund | December 31, 2023 | from March 23, 2022 (commencement of operations) |
| | | through December 31, 2022 | |
| | | | |
Kensington Managed | For the year ended | For the years ended | For the years ended December 31, |
Income Fund | December 31, 2023 | December 31, 2023 | 2023, 2022 and 2020, and for the |
| | | and 2022 | period from May 28, 2019 |
| | | | (commencement of operations) |
| | | | through December 31, 2019 |
| | | | |
Kensington Dynamic | For the year ended | For the years ended | For the years ended December 31, |
Growth Fund | December 31, 2023 | December 31, 2023 | 2023 and 2022, and for the period |
| | | and 2022 | from October 23, 2020 |
| | | | (commencement of operations) |
| | | | through December 31, 2020 |
| | | | |
Kensington Defender Fund | For the period from May 31, 2023 (commencement of operations) through |
| | December 31, 2023 | | |
The Kensington Managed Income Fund and Kensington Dynamic Growth Fund financial highlights for the period ended December 31, 2021, were audited by other auditors whose report dated February 25, 2022, expressed an unqualified opinion on those financial statements and financial highlights.
Basis for Opinion
These financial statements are the responsibility of the Funds’ management. Our responsibility is to express an opinion on the Funds’ financial statements based on our audits. We are a public accounting firm registered with the Public Company Accounting Oversight Board (United States) (“PCAOB”) and are required to be independent with respect to the Funds in accordance with the U.S. federal securities laws and the applicable rules and regulations of the Securities and Exchange Commission and the PCAOB.
KENSINGTON FUNDS
Report of Independent Registered Public Accounting Firm – Continued
We conducted our audits in accordance with the standards of the PCAOB. Those standards require that we plan and perform the audit to obtain reasonable assurance about whether the financial statements are free of material misstatement whether due to error or fraud.
Our audits included performing procedures to assess the risks of material misstatement of the financial statements, whether due to error or fraud, and performing procedures that respond to those risks. Such procedures included examining, on a test basis, evidence regarding the amounts and disclosures in the financial statements. Our procedures included confirmation of securities owned as of December 31, 2023, by correspondence with the custodian and brokers. Our audits also included evaluating the accounting principles used and significant estimates made by management, as well as evaluating the overall presentation of the financial statements. We believe that our audits provide a reasonable basis for our opinion.
We have consecutively served as the Funds’ auditor since 2022. In addition, we served as the Funds’ auditor from 2019 through 2020.
COHEN & COMPANY, LTD.
Milwaukee, Wisconsin
February 29, 2024
KENSINGTON FUNDS
Additional Information (Unaudited)
December 31, 2023
TRUSTEES AND OFFICERS
| | | Term of | | | |
| | | Office | Number of | | Other |
| Name, | | and | Portfolios | Principal | Directorships |
| Address | Position(s) | Length | in Trust | Occupation(s) | Held by Trustee |
| and Year | Held with | of Time | Overseen | During the Past | During the Past |
| of Birth | the Trust | Served | by Trustee | Five Years | Five Years |
| Independent Trustees | | | | | |
| | | | | | |
Leonard M. Rush, CPA | Chairman, | Indefinite | 31 | Retired, Chief Financial | Independent Trustee, |
615 E. Michigan St. | Trustee | Term; Since | | Officer, Robert W. Baird | ETF Series Solutions |
Milwaukee, WI 53202 | and Audit | April 2011 | | & Co. Incorporated | (57 Portfolios) |
Year of Birth: 1946 | Committee | | | (2000-2011). | (2012-Present). |
Chairman | | | | | |
| | | | | | |
David A. Massart | Trustee | Indefinite | 31 | Partner and Managing | Independent Trustee, |
615 E. Michigan St. | | Term; Since | | Director, Beacon Pointe | ETF Series Solutions |
Milwaukee, WI 53202 | | April 2011 | | Advisors, LLC | (57 Portfolios) |
Year of Birth: 1967 | | | | (since 2022); Co-Founder | (2012-Present). |
| | | | | and Chief Investment | |
| | | | | Strategist, Next Generation | |
| | | | | Wealth Management, Inc. | |
| | | | | (2005-2021). | |
| | | | | | |
David M. Swanson | Trustee and | Indefinite | 31 | Founder and Managing | Independent Trustee, |
615 E. Michigan St. | Nominating | Term; Since | | Principal, SwanDog | ALPS Variable |
Milwaukee, WI 53202 | & Governance | April 2011 | | Strategic Marketing, LLC | Investment Trust |
Year of Birth: 1957 | Committee | | | (2006-Present). | (7 Portfolios) |
Chairman | | | | | (2006-Present); |
| | | | | | Independent Trustee, |
| | | | | | RiverNorth Funds |
| | | | | | (3 Portfolios) |
| | | | | | (2018-Present); |
| | | | | | RiverNorth Managed |
| | | | | | Duration Municipal |
| | | | | | Income Fund, Inc. |
| | | | | | (1 Portfolio) |
| | | | | | (2019-Present); |
| | | | | | RiverNorth |
| | | | | | Opportunistic |
| | | | | | Municipal Income |
| | | | | | Fund, Inc. (1 Portfolio) |
| | | | | | (2018-Present); |
| | | | | | RiverNorth Capital |
| | | | | | and Income Fund |
| | | | | | (1 Portfolio) |
| | | | | | (2018-Present); |
| | | | | | |
| | | | | | |
KENSINGTON FUNDS
Additional Information (Unaudited) – Continued
December 31, 2023
| | | Term of | | | |
| | | Office | Number of | | Other |
| Name, | | and | Portfolios | Principal | Directorships |
| Address | Position(s) | Length | in Trust | Occupation(s) | Held by Trustee |
| and Year | Held with | of Time | Overseen | During the Past | During the Past |
| of Birth | the Trust | Served | by Trustee | Five Years | Five Years |
| Independent Trustees | | | | | |
| | | | | | |
David M. Swanson | | | | | RiverNorth |
(Continued) | | | | | Opportunities |
| | | | | | Funds, Inc. (1 portfolio) |
| | | | | | (2015-Present); |
| | | | | | RiverNorth/ |
| | | | | | DoubleLine Strategic |
| | | | | | Opportunity Fund, Inc. |
| | | | | | (1 Portfolio) |
| | | | | | (2019-Present); |
| | | | | | RiverNorth Flexible |
| | | | | | Municipal Income |
| | | | | | Fund, Inc. (1 Portfolio) |
| | | | | | (2020-Present); |
| | | | | | RiverNorth Flexible |
| | | | | | Municipal Income |
| | | | | | Fund II, Inc. |
| | | | | | (1 Portfolio) |
| | | | | | (2021-Present); |
| | | | | | RiverNorth Managed |
| | | | | | Duration Municipal |
| | | | | | Income Fund II, Inc. |
| | | | | | (1 Portfolio) |
| | | | | | (2022-Present). |
| | | | | | |
Robert J. Kern | Trustee | Indefinite | 31 | Retired (July 2018- | None |
615 E. Michigan St. | | Term; Since | | Present); Executive | |
Milwaukee, WI 53202 | | January 2011 | | Vice President, | |
Year of Birth: 1958 | | | | U.S. Bancorp Fund | |
| | | | | Services, LLC | |
| | | | | (1994-2018). | |
KENSINGTON FUNDS
Additional Information (Unaudited) – Continued
December 31, 2023
| | | Term of | | | |
| | | Office | Number of | | Other |
| Name, | | and | Portfolios | Principal | Directorships |
| Address | Position(s) | Length | in Trust | Occupation(s) | Held by Trustee |
| and Year | Held with | of Time | Overseen | During the Past | During the Past |
| of Birth | the Trust | Served | by Trustee | Five Years | Five Years |
| Officers | | | | | |
| | | | | | |
Brian R. Wiedmeyer | President | Indefinite | N/A | Vice President, | N/A |
615 E. Michigan St. | and Principal | Term, Since | | U.S. Bancorp Fund | |
Milwaukee, WI 53202 | Executive | November | | Services, LLC | |
Year of Birth: 1973 | Officer | 2018 | | (2005-Present). | |
| | | | | | |
Deborah Ward | Vice President, | Indefinite | N/A | Senior Vice President, | N/A |
615 E. Michigan St. | Chief | Term; Since | | U.S. Bancorp Fund | |
Milwaukee, WI 53202 | Compliance | April 2013 | | Services, LLC | |
Year of Birth: 1966 | Officer and | | | (2004-Present). | |
| | Anti-Money | | | | |
| | Laundering | | | | |
| | Officer | | | | |
| | | | | | |
Benjamin Eirich | Treasurer, | Indefinite | N/A | Assistant Vice President, | N/A |
615 E. Michigan St. | Principal | Term; Since | | U.S. Bancorp Fund | |
Milwaukee, WI 53202 | Financial | August 2019 | | Services, LLC | |
Year of Birth: 1981 | Officer and | (Treasurer); | | (2008-Present). | |
| | Vice President | Since | | | |
| | | November | | | |
| | | 2018 (Vice | | | |
| | | President) | | | |
| | | | | | |
John Hadermayer | Secretary | Indefinite | N/A | U.S. Bancorp Fund Services, | N/A |
615 E. Michigan St. | | Term; Since | | LLC (2022-Present); Executive | |
Milwaukee, WI 53202 | | May 2022 | | Director, AQR Capital | |
Year of Birth: 1977 | | | | Management, LLC (2013-Present). | |
KENSINGTON FUNDS
Additional Information (Unaudited) – Continued
December 31, 2023
| | | Term of | | | |
| | | Office | Number of | | Other |
| Name, | | and | Portfolios | Principal | Directorships |
| Address | Position(s) | Length | in Trust | Occupation(s) | Held by Trustee |
| and Year | Held with | of Time | Overseen | During the Past | During the Past |
| of Birth | the Trust | Served | by Trustee | Five Years | Five Years |
| Officers | | | | | |
| | | | | | |
Sara J. Bollech | Assistant | Indefinite | N/A | Officer, U.S. Bancorp Fund | N/A |
615 E. Michigan St. | Treasurer | Term; Since | | Services, LLC | |
Milwaukee, WI 53202 | and Vice | November | | (2007-Present). | |
Year of Birth: 1977 | President | 2021 | | | |
| | | | | | |
Peter A. Walker, CPA | Assistant | Indefinite | N/A | Officer, U.S. Bancorp Fund | N/A |
615 E. Michigan St. | Treasurer | Term; Since | | Services, LLC | |
Milwaukee, WI 53202 | and Vice | November | | (2016-Present). | |
Year of Birth: 1993 | President | 2021 | | | |
| | | | | | |
Silinapha Saycocie | Assistant | Indefinite | N/A | Officer, U.S. Bancorp Fund | N/A |
615 E. Michigan St. | Treasurer | Term; Since | | Services, LLC | |
Milwaukee, WI 53202 | and Vice | November | | (2020-Present). | |
Year of Birth: 1998 | President | 2023 | | | |
| | | | | | |
KENSINGTON FUNDS
Additional Information (Unaudited) – Continued
December 31, 2023
AVAILABILITY OF FUND PORTFOLIO INFORMATION
The Funds file complete schedules of portfolio holdings with the SEC for the first and third quarters of each fiscal year on Part F of Form N-PORT. The Funds’ Part F of Form N-PORT is available on the SEC’s website at www.sec.gov and may be reviewed and copied at the SEC’s Public Reference Room in Washington, D.C. Information on the operation of the Public Reference Room may be obtained by calling 1-800-732-0330. The Funds’ Part F of Form N-PORT may also be obtained by calling toll-free 1-855-375-3060.
AVAILABILITY OF PROXY VOTING INFORMATION
A description of the Funds’ Proxy Voting Policies and Procedures is available without charge, upon request, by calling 1-855-375-3060. Information regarding how the Funds voted proxies relating to portfolio securities during the most recent 12-month period ended June 30, is available (1) without charge, upon request, by calling 1-855-375-3060, or (2) on the SEC’s website at www.sec.gov.
QUALIFIED DIVIDEND INCOME/DIVIDENDS RECEIVED DEDUCTION
For the fiscal year ended December 31, 2023, certain dividends paid by the Funds may be reported as qualified dividend income and may be eligible for taxation at capital gain rates. The percentage of dividends declared from ordinary income designated as qualified dividend income was as follows:
Fund | | | | |
Active Advantage Fund | | | 7.47 | % | |
Managed Income Fund | | | 0.00 | % | |
Dynamic Growth Fund | | | 37.72 | % | |
Defender Fund | | | 11.43 | % | |
For corporate shareholders, the percent of ordinary income distributions qualifying for the corporate dividends received deduction for the fiscal year ended December 31, 2023, was as follows:
Fund | | | | |
Active Advantage Fund | | | 0.00 | % | |
Managed Income Fund | | | 0.00 | % | |
Dynamic Growth Fund | | | 0.00 | % | |
Defender Fund | | | 0.00 | % | |
The percentage of taxable ordinary income distributions that are designated as short-term capital gain distributions under Internal Revenue Section 871(k)(2)(C) for each Fund were as follows:
Fund | | | | |
Active Advantage Fund | | | 0.00 | % | |
Managed Income Fund | | | 0.00 | % | |
Dynamic Growth Fund | | | 0.00 | % | |
Defender Fund | | | 0.00 | % | |
(This Page Intentionally Left Blank.)
KENSINGTON FUNDS
Privacy Notice (Unaudited)
The Funds collect only relevant information about you that the law allows or requires it to have in order to conduct its business and properly service you. The Funds collect financial and personal information about you (“Personal Information”) directly (e.g., information on account applications and other forms, such as your name, address, and social security number, and information provided to access account information or conduct account transactions online, such as password, account number, e-mail address, and alternate telephone number), and indirectly (e.g., information about your transactions with us, such as transaction amounts, account balance and account holdings).
The Funds do not disclose any non-public personal information about its shareholders or former shareholders other than for everyday business purposes such as to process a transaction, service an account, respond to court orders and legal investigations or as otherwise permitted by law. Third parties that may receive this information include companies that provide transfer agency, technology and administrative services to the Funds, as well as the Funds’ investment adviser who is an affiliate of the Funds. If you maintain a retirement/educational custodial account directly with the Funds, we may also disclose your Personal Information to the custodian for that account for shareholder servicing purposes. The Funds limit access to your Personal Information provided to unaffiliated third parties to information necessary to carry out their assigned responsibilities to the Funds. All shareholder records will be disposed of in accordance with applicable law. The Funds maintain physical, electronic and procedural safeguards to protect your Personal Information and requires its third-party service providers with access to such information to treat your Personal Information with the same high degree of confidentiality.
In the event that you hold shares of the Funds through a financial intermediary, including, but not limited to, a broker-dealer, credit union, bank or trust company, the privacy policy of your financial intermediary governs how your non-public personal information is shared with unaffiliated third parties.
CONTACTS
BOARD OF TRUSTEES
David Massart
Leonard Rush, CPA
David Swanson
Robert Kern
INVESTMENT ADVISER
Kensington Asset Management LLC
901 South Mopac Expressway, Suite 225
Austin, TX 78746
INDEPENDENT REGISTERED PUBLIC ACCOUNTING FIRM
Cohen & Company, Ltd.
342 North Water Street, Suite 830
Milwaukee, WI 53202
TRANSFER AGENT, FUND ACCOUNTANT AND FUND ADMINISTRATOR
U.S. Bancorp Fund Services, LLC
777 East Wisconsin Avenue
Milwaukee, WI 53202
DISTRIBUTOR
Quasar Distributors, LLC
111 East Kilbourn Avenue, Suite 2200
Milwaukee, WI 53202
CUSTODIAN
U.S. Bank, N.A.
1555 North Rivercenter Drive
Milwaukee, WI 53212
FUND COUNSEL
Stradley Ronon Stevens & Young, LLP
2005 Market Street, Suite 2600
Philadelphia, PA 19103-7096
855-375-3060
This report must be accompanied or preceded by a prospectus.
The Fund’s Statement of Additional Information contains additional information about the
Fund’s trustees and is available without charge upon request by calling 1-855-375-3060.
(b) Not applicable.
Item 2. Code of Ethics.
The Registrant has adopted a code of ethics that applies to the Registrant’s principal executive officer and principal financial officer. The Registrant has not made any substantive amendments to its code of ethics during the period covered by this report. The Registrant has not granted any waivers from any provisions of the code of ethics during the period covered by this report.
A copy of the Registrant’s Code of Ethics that applies to the Registrant’s principal executive officer and principal financial officer is filed herewith.
Item 3. Audit Committee Financial Expert.
The Registrant’s board of trustees has determined that there is at least one audit committee financial expert serving on its audit committee. Leonard M. Rush is the “audit committee financial expert” and is considered to be “independent” as each term is defined in Item 3 of Form N‑CSR.
Item 4. Principal Accountant Fees and Services.
The Registrant has engaged its principal accountant to perform audit services, audit-related services, tax services and other services during the past two fiscal years. “Audit services” refer to performing an audit of the Registrant's annual financial statements or services that are normally provided by the accountant in connection with statutory and regulatory filings or engagements for those fiscal years. “Audit-related services” refer to the assurance and related services by the principal accountant that are reasonably related to the performance of the audit. “Tax services” refer to professional services rendered by the principal accountant for tax compliance, tax advice, and tax planning; including reviewing the Fund’s tax returns and distributions calculations. There were no “other services” provided by the principal accountant. For the fiscal years ended December 31, 2023, and December 31, 2022, the Funds’ principal accountant was Cohen & Company, Ltd. The following table details the aggregate fees billed or expected to be billed for each of the last two fiscal years for audit fees, audit-related fees, tax fees and other fees by the principal accountant.
| | FYE 12/31/2023 | FYE 12/31/2022 |
(a) Audit Fees | $65,250 | $43,500 |
(b) Audit-Related Fees | $0 | $0 |
(c) Tax Fees | $15,500 | $10,500 |
(d) All Other Fees | $0 | $0 |
(e)(1) The audit committee has adopted pre-approval policies and procedures that require the audit committee to pre‑approve all audit and non‑audit services of the Registrant, including services provided to any entity affiliated with the Registrant.
(e)(2) The percentage of fees billed by Cohen & Company, Ltd. for the fiscal years ended December 31, 2023, and December 31, 2022, applicable to non-audit services pursuant to waiver of pre-approval requirement were as follows:
.
| | FYE 12/31/2023 | FYE 12/31/2022 |
Audit-Related Fees | 0% | 0% |
Tax Fees | 0% | 0% |
All Other Fees | 0% | 0% |
(f) All of the principal accountant’s hours spent on auditing the Registrant’s financial statements were attributed to work performed by full‑time permanent employees of the principal accountant.
(g) The following table indicates the non-audit fees billed or expected to be billed by the Registrant’s accountant for services to the Registrant and to the Registrant’s investment adviser (and any other controlling entity, etc.—not sub-adviser) for the last two years.
Non-Audit Related Fees | FYE 12/31/2023 | FYE 12/31/2022 |
Registrant | N/A | N/A |
Registrant’s Investment Adviser | N/A | N/A |
(h) The audit committee of the board of trustees/directors has considered whether the provision of non-audit services that were rendered to the Registrant's investment adviser is compatible with maintaining the principal accountant's independence and has concluded that the provision of such non-audit services by the accountant has not compromised the accountant’s independence.
Item 5. Audit Committee of Listed Registrants.
Not applicable to Registrants who are not listed as issuers (as defined in Rule 10A-3 under the Securities Exchange Act of 1934).
Item 6. Schedule of Investments.
| (a) | Schedule of Investments is included as part of the report to shareholders filed under Item 1 of this Form. |
Item 7. Disclosure of Proxy Voting Policies and Procedures for Closed-End Management Investment Companies.
Not applicable to open-end investment companies.
Item 8. Portfolio Managers of Closed-End Management Investment Companies.
Not applicable to open-end investment companies.
Item 9. Purchases of Equity Securities by Closed‑End Management Investment Company and Affiliated Purchases.
Not applicable to open-end investment companies.
Item 10. Submission of Matters to a Vote of Security Holders.
There have been no material changes to the procedures by which shareholders may recommend nominees to the Registrant’s Board of Trustees.
Item 11. Controls and Procedures.
| (a) | The Registrant’s President and Treasurer have reviewed the Registrant's disclosure controls and procedures (as defined in Rule 30a-3(c) under the Investment Company Act of 1940 (the “Act”)) as of a date within 90 days of the filing of this report, as required by Rule 30a-3(b) under the Act and Rules 13a-15(b) or 15d‑15(b) under the Securities Exchange Act of 1934. Based on their review, such officers have concluded that the disclosure controls and procedures are effective in ensuring that information required to be disclosed in this report is appropriately recorded, processed, summarized and reported and made known to them by others within the Registrant and by the Registrant’s service provider. |
| (b) | There were no significant changes in the Registrant's internal control over financial reporting (as defined in Rule 30a-3(d) under the Act) that occurred during the period covered by this report that has materially affected, or is reasonably likely to materially affect, the Registrant's internal control over financial reporting. |
Item 12. Disclosure of Securities Lending Activities for Closed-End Management Investment Companies
Not applicable to open-end investment companies.
Item 13. Exhibits.
(3) Any written solicitation to purchase securities under Rule 23c‑1 under the Act sent or given during the period covered by the report by or on behalf of the Registrant to 10 or more persons. Not applicable to open-end investment companies.
(4) Change in the Registrant’s independent public accountant. There was no change in the registrant’s independent public accountant for the period by this report.
SIGNATURES
Pursuant to the requirements of the Securities Exchange Act of 1934 and the Investment Company Act of 1940, the Registrant has duly caused this report to be signed on its behalf by the undersigned, thereunto duly authorized.
(Registrant) Managed Portfolio Series
By (Signature and Title) /s/ Brian R. Wiedmeyer
Brian R. Wiedmeyer, President
Date 3/4/2024
Pursuant to the requirements of the Securities Exchange Act of 1934 and the Investment Company Act of 1940, this report has been signed below by the following persons on behalf of the Registrant and in the capacities and on the dates indicated.
By (Signature and Title) /s/ Brian R. Wiedmeyer
Brian R. Wiedmeyer, President
Date 3/4/2024
By (Signature and Title) /s/ Benjamin J. Eirich
Benjamin J. Eirich, Treasurer
Date 3/5/2024