Exhibit 99.23
Management's Discussion and Analysis
Year ended December 31, 2019
| | |
 | 1 |
FORWARD LOOKING STATEMENTS
Certain statements in this Management's Discussion & Analysis ("MD&A"), and in particular the "Business Highlights and Growth Initiatives" section and "Outlook" subsection, contain forward-looking information (collectively referred to herein as the "Forward-Looking Statements") within the meaning of applicable securities laws. The use of any of the words "expect", "anticipate", "continue", "estimate", "may", "will", "project", "should", "believe", "plans", "intends" and similar expressions are intended to identify Forward-Looking Statements. In particular, but without limiting the forgoing, this MD&A contains Forward-Looking Statements pertaining to: (i) expectations regarding an increasingly constructive gold and silver pricing environment; (ii) expectations regarding deployment of capital called into our lending LPs; (iii) anticipation of flat year-over-year performance in the Brokerage segment; (iv) anticipation of higher year-over-year operating costs (primarily relating to higher SG&A on increased U.S. operating activities) and lower EBITDA contribution from non-reportable segments; (v) the impact to the Managed Equities segment of the Tocqueville gold strategies asset management business; (vi) the performance of the co-investments in the lending LPs; (vii) gold accumulation and new highs as insurance and protection assets; and (viii) the declaration, payment and designation of dividends.
Although the Company believes that the Forward-Looking Statements are reasonable, they are not guarantees of future results, performance or achievements. A number of factors or assumptions have been used to develop the Forward-Looking Statements, including: (i) the impact of increasing competition in each business in which the Company operates will not be material; (ii) quality management will be available; (iii) the effects of regulation and tax laws of governmental agencies will be consistent with the current environment; and (iv) those assumptions disclosed herein under the heading "Significant Accounting Judgments, Estimates and Changes in Accounting Policies". Actual results, performance or achievements could vary materially from those expressed or implied by the Forward-Looking Statements should assumptions underlying the Forward-Looking Statements prove incorrect or should one or more risks or other factors materialize, including: (i) difficult market conditions; (ii) poor investment performance; (iii) failure to continue to retain and attract quality staff; (iv) employee errors or misconduct resulting in regulatory sanctions or reputational harm; (v) performance fee fluctuations; (vi) a business segment or another counterparty failing to pay its financial obligation; (vii) failure of the Company to meet its demand for cash or fund obligations as they come due; (viii) changes in the investment management industry; (ix) failure to implement effective information security policies, procedures and capabilities; (x) lack of investment opportunities; (xi) risks related to regulatory compliance; (xii) failure to manage risks appropriately; (xiii) failure to deal appropriately with conflicts of interest; (xiv) competitive pressures; (xv) corporate growth which may be difficult to sustain and may place significant demands on existing administrative, operational and financial resources; (xvi) failure to comply with privacy laws; (xvii) failure to successfully implement succession planning; (xviii) foreign exchange risk relating to the relative value of the U.S. dollar; (xix) litigation risk; (xx) failure to develop effective business resiliency plans; (xxi) failure to obtain or maintain sufficient insurance coverage on favourable economic terms; (xxii) historical financial information being not necessarily indicative of future performance; (xxiii) the market price of common shares of the Company may fluctuate widely and rapidly; (xxiv) risks relating to the Company’s investment products; (xxv) risks relating to the Company's proprietary investments; (xxvi) risks relating to the Company's lending business; (xxvii) risks relating to the Company’s merchant bank and advisory business; (xxviii) those risks described under the heading "Risk Factors" in the Company’s annual information form dated February 27, 2020; and (xxix) those risks described under the headings "Managing Risk: Financial" and "Managing Risk: Non-Financial" in this MD&A. In addition, the payment of dividends is not guaranteed and the amount and timing of any dividends payable by the Company will be at the discretion of the Board of Directors of the Company and will be established on the basis of the Company’s earnings, the satisfaction of solvency tests imposed by applicable corporate law for the declaration and payment of dividends, and other relevant factors. As a result of the foregoing, readers should not place undue reliance on the forward-looking statements contained in this MD&A concerning the completion of the acquisition or the timing thereof. The Forward-Looking Statements speak only as of the date hereof, unless otherwise specifically noted, and the Company does not assume any obligation to publicly update any Forward-Looking Statements, whether as a result of new information, future events or otherwise, except as may be expressly required by applicable Canadian securities laws.
MANAGEMENT'S DISCUSSION AND ANALYSIS
This MD&A of financial condition and results of operations, dated February 27, 2020, presents an analysis of the consolidated financial condition of the Company and its subsidiaries as at December 31, 2019, compared with December 31, 2018, and the consolidated results of operations for the three and twelve months ended December 31, 2019, compared with the three and twelve months ended December 31, 2018. The Board of Directors approved this MD&A on February 27, 2020. All note references in this MD&A are to the notes to the Company's December 31, 2019 audited annual consolidated financial statements ("annual financial statements"), unless otherwise noted. The Company was incorporated under the Business Corporations Act (Ontario) on February 13, 2008.
PRESENTATION OF FINANCIAL INFORMATION
The financial statements, including the required comparative information, have been prepared in accordance with International Financial Reporting Standards ("IFRS"), as issued by the International Accounting Standards Board ("IASB"). Financial results, including related historical comparatives contained in this MD&A, unless otherwise specified herein, are based on the annual financial statements. The Canadian dollar is the Company's functional and reporting currency for purposes of preparing the annual financial statements. Accordingly, all dollar references in this MD&A are in Canadian dollars, unless otherwise specified. The use of the term "prior period" refers to the three and twelve months ended December 31, 2018.
While the Company’s functional currency is the Canadian dollar, its presentation currency will switch to US dollars effective January 1, 2020. Going forward, we believe the US dollar will better reflect the Company’s consolidated financial position and results of operations given the significance of its subsidiaries that have the US market as their primary economic environment. The proportion of the Company’s subsidiaries that have the US market as their primary economic environment has further increased in 2020 with the January 17, 2020 close of the Tocqueville Asset Management gold strategies acquisition.
| | |
| | 2 |
KEY PERFORMANCE INDICATORS (NON-IFRS FINANCIAL MEASURES)
The Company measures the success of its business using a number of key performance indicators that are not measurements in accordance with IFRS and should not be considered as an alternative to net income (loss) or any other measure of performance under IFRS. Non-IFRS financial measures do not have a standardized meaning prescribed by IFRS and are therefore unlikely to be comparable to similar measures presented by other issuers. Our key performance indicators are discussed below:
Assets Under Management
Assets Under Management ("AUM") refers to the total net assets managed by the Company through its various investment product offerings, managed accounts and managed companies.
Net Inflows
Net Inflows (consisting of net sales, capital calls and fee earning capital commitments) result in changes to AUM and are described individually below:
Net Sales
Fund sales (net of redemptions), including 'at-the-market' transactions and secondary offerings of our physical trusts and new 'creations' of ETF units, are a key performance indicator as new assets being managed will lead to higher management fees and can potentially lead to increased carried interest and performance fee generation (as applicable) given that AUM is also the basis upon which carried interest and performance fees are calculated.
Capital calls and commitments
Capital calls into our lending LPs are a key source of AUM creation, and ultimately, earnings for the Company. Once capital is called into our lending LPs, it is included within the AUM of the Company as it will now earn a management fee (NOTE: it is possible for some forms of committed capital to earn a commitment fee despite being uncalled, in which case, it will also be included in AUM at that time). Conversely, once loans in our lending LPs are repaid, capital may be returned to investors in the form of a distribution, thereby reducing our AUM ("capital distributions").
Net Fees
Management fees (net of trailer and sub-advisor fees) and carried interest and performance fees (net of carried interest and performance fee payouts) are key revenue indicators as they represent the net revenue contribution after directly associated costs that we generate from our AUM.
Net Commissions
Commissions, net of commission expenses, arise primarily from the transaction based service offerings of our brokerage segment.
Compensation
Compensation excludes commissions, carried interest and performance fee payouts, which are presented net of their related revenues in this MD&A, and severance and new hire accruals which are non-recurring.
Investable Capital
Investable capital includes: 1) cash, net of syndicate cash holdings; 2) proprietary investments, net of any obligations for securities sold short; and 3) balance sheet loans.
| | |
| | 3 |
EBITDA, Adjusted EBITDA and Adjusted base EBITDA
EBITDA in its most basic form is defined as earnings before interest expense, income taxes, depreciation and amortization. EBITDA is a measure commonly used in the investment industry by management, investors and investment analysts in understanding and comparing results by factoring out the impact of different financing methods, capital structures, amortization techniques and income tax rates between companies in the same industry. While other companies, investors or investment analysts may not utilize the same method of calculating EBITDA (or adjustments thereto), the Company believes its adjusted base EBITDA metric, in particular, results in a better comparison of the Company's underlying operations against its peers and a better indicator of recurring results from operations as compared to other non-IFRS financial measures.
Neither EBITDA, adjusted EBITDA or adjusted base EBITDA have standardized meaning under IFRS. Consequently, they should not be considered in isolation, nor should they be used in substitute for measures of performance prepared in accordance with IFRS.
The following table outlines how our EBITDA, Adjusted EBITDA and Adjusted base EBITDA measures are determined:
| | | 3 months ended | | | 12 months ended | |
| (in thousands $) | | Dec. 31, 2019 | | | Dec. 31, 2018 | | | Dec. 31, 2019 | | | Dec. 31, 2018 | |
| Net income (loss) for the periods | | | 1,909 | | | | 9,831 | | | | 13,532 | | | | 31,379 | |
| Adjustments: | | | | | | | | | | | | | | | | |
| Interest expense | | | 354 | | | | 312 | | | | 1,373 | | | | 419 | |
| Provision (recovery) for income taxes | | | 1,251 | | | | 3,383 | | | | 3,619 | | | | 1,278 | |
| Depreciation and amortization | | | 1,655 | | | | 598 | | | | 5,033 | | | | 2,199 | |
| EBITDA | | | 5,169 | | | | 14,124 | | | | 23,557 | | | | 35,275 | |
| | | | | | | | | | | | | | | | | |
| Other adjustments: | | | | | | | | | | | | | | | | |
| (Gains) losses on net investments (1) | | | 1,879 | | | | (3,912 | ) | | | 1,401 | | | | 5,782 | |
| (Gains) losses on foreign exchange | | | 478 | | | | (2,026 | ) | | | 1,960 | | | | (2,310 | ) |
| Non-cash stock-based compensation | | | 854 | | | | 1,738 | | | | 5,120 | | | | 5,199 | |
| Net proceeds from sale transaction | | | — | | | | — | | | | — | | | | (4,200 | ) |
| Unamortized placement fees (2) | | | — | | | | (279 | ) | | | — | | | | (1,093 | ) |
| Other expenses(3) | | | 2,525 | | | | 447 | | | | 7,509 | | | | 2,746 | |
| Adjusted EBITDA | | | 10,905 | | | | 10,092 | | | | 39,547 | | | | 41,399 | |
| | | | | | | | | | | | | | | | | |
| Other adjustments: | | | | | | | | | | | | | | | | |
| Carried interest and performance fees | | | (2,391 | ) | | | — | | | | (2,391 | ) | | | (1,802 | ) |
| Carried interest and performance fee related expenses | | | 1,310 | | | | — | | | | 1,310 | | | | 915 | |
| Adjusted base EBITDA | | | 9,824 | | | | 10,092 | | | | 38,466 | | | | 40,512 | |
| (1) | This adjustment removes the income effects of certain gains or losses on proprietary and long-term investments to ensure the reporting objectives of our EBITDA metric as described above are met. |
| (2) | The prior period comparative figures contained a placement fee amortization adjustment to ensure the 2018 results were comparable to 2017 in light of the 2018 adoption of IFRS 15. |
| (3) | See Other expenses in Note 7 of the annual financial statements. In addition to the items outlined in Note 7, Other expenses also includes severance and new hire accruals of $0.2 million for the 3 months ended (3 months ended December 31, 2018 - $Nil) and $1.4 million for the 12 months ended (12 months ended December 31, 2018 - $0.5 million). |
| | |
| | 4 |
BUSINESS OVERVIEW
Our reportable operating segments are as follows:
Exchange Listed Products
| • | The Company's closed-end physical trusts and exchange traded funds ("ETFs"). |
Lending
| • | The Company's lending activities primarily occur through limited partnership vehicles ("lending LPs"). |
Managed Equities
| • | The Company's alternative investment strategies (open-end, closed-end, etc.) managed in-house and on a sub-advised basis. Prior to Q1 2019, the Company's fixed-term LP vehicles formed part of the "global segment" (which historically housed all of our U.S. business activities). Effective Q1 2019, the global segment no longer satisfied the qualitative tests of IFRS 8, Operating Segments ("IFRS 8") as the geographic location of the U.S. businesses is no longer a relevant consideration by management in the allocation of resources and assessment of product and service performance. Consequently, the global segment has been deconstructed and its fixed-term LP assets and earnings reallocated to the managed equities segment given that it is now at the managed equities level that the allocation of resources and assessment of product and service performance occurs by management. |
Brokerage
| • | Formerly "Merchant Banking & Advisory Services", this segment has been renamed to reflect the inclusion of our U.S. broker-dealer alongside our Canada based broker-dealer as the Company's "brokerage segment". Prior to Q1 2019 , the Company's U.S. broker-dealer formed part of the "global segment" (which historically housed all of our U.S. business activities). Effective Q1 2019, the global segment no longer satisfied the qualitative tests of IFRS 8 as the geographic location of the U.S. businesses is no longer a relevant consideration by management in the allocation of resources and assessment of product and service performance. Consequently, the global segment has been deconstructed and its U.S. broker-dealer assets and earnings reallocated to the brokerage segment given that it is now at the brokerage level (independent of geography) that the allocation of resources and assessment of product and service performance occurs by management. |
Corporate
| • | Provides the Company's various operating segments with capital, balance sheet management and other shared services. |
All Other Segments
| • | Contains all non-reportable segments as per IFRS 8. See Note 14 of the annual financial statements for further details. |
For a detailed account of the underlying principal subsidiaries within our reportable business segments, refer to the Company's Annual Information Form and Note 2 of the annual financial statements.
| | |
| | 5 |
BUSINESS HIGHLIGHTS AND GROWTH INITIATIVES
Investment Performance
Market value appreciation was $174 million during the quarter and $957 million on a full year basis as the Company benefited from stronger precious metals prices throughout the year.
Product and Business Line Expansion
| • | Subsequent to year-end, on January 17, 2020, the Company successfully closed on the acquisition of Tocqueville Asset Management's gold strategies. Based on AUM valuations as at January 17, 2020, this transaction will add approximately $2.3 billion (US$1.8 billion) to the Company's total AUM. The transaction cost is US$15 million (US$12.5 million in cash and Sprott Inc. common shares valued at US$2.5 million). Contingent consideration valued up to an additional US$35 million in cash and Sprott Inc. shares is payable subject to the achievement of certain financial performance conditions over two years following the closing of the transaction. |
| • | AUM in our lending LPs stood at $1 billion (US$784 million) as of December 31 2019. The $521 million (US$419 million) increase in the year was primarily due to additional new AUM arising from fee earning committed capital in a new lending LP and new capital calls into existing lending LPs. |
| • | On January 11, 2019, the Company launched a new Korean co-managed private equity fund with KB Securities (KB Solar fund), raising $75 million in commitment fee earning AUM in the process. |
Other Matters
While the Company’s functional currency is the Canadian dollar, its presentation currency will switch to US dollars effective January 1, 2020. Going forward, we believe the US dollar will better reflect the Company’s consolidated financial position and results of operations given the significance of its subsidiaries that have the US market as their primary economic environment. The proportion of the Company’s subsidiaries that have the US market as their primary economic environment has further increased in 2020 with the January 17, 2020 close of the Tocqueville Asset Management gold strategies acquisition.
| | |
| | 6 |
OUTLOOK
Exchange Listed Products
| • | We expect this segment to benefit from an increasingly constructive gold and silver pricing environment in 2020 as more than 98% of this segment’s AUM is directly or indirectly impacted by gold and silver price changes, net of redemptions. |
Lending
| • | Interest income from balance sheet loans (included in finance income) will no longer be earned in 2020 as we have successfully transitioned to co-investments in our lending fund strategies instead. Effective 2020, this segment’s revenues will be generated primarily from two sources: management fees and co-investment income (included in finance income). |
| • | Our lending strategies had a total of approximately $1 billion in AUM at the end of 2019, earning a blended net management fee rate of approximately 1%. We expect capital calls (net of capital distributions) in 2020 to be in the range of US$100 million to US$200 million, based on our lending team's current view of the loan market and their expectations of possible repayments. |
| • | At the end of 2019, approximately $40 million of co-investments accounted for 4% of total segment AUM. These co-investments accounted for approximately 57% of finance income earned in this segment in 2019. NOTE: co-investment income is included in the finance income line given that it is largely interest income earned from lending LPs we are invested in alongside our clients. |
Managed Equities
| • | The purchase of Tocqueville Asset Management’s gold fund strategies (which closed on January 17, 2020) will increase AUM in this segment by approximately $2.3 billion. |
Brokerage
| • | We anticipate flat year-over-year performance in this segment. |
Corporate & Other Non-reportable Segments
| • | We anticipate higher year-over-year operating costs (primarily relating to higher SG&A on increased U.S. operating activities) and lower EBITDA contribution from non-reportable segments. (see “Elimination and all other segments” column of the segment table in Note 14 of the annual financial statements). |
| | |
| | 7 |
SUMMARY FINANCIAL INFORMATION
| (In thousands $) | | Q4
2019 | | | Q3
2019 | | | Q2
2019 | | | Q1
2019 | | | Q4
2018 | | | Q3
2018 | | | Q2
2018 | | | Q1
2018 | |
| SUMMARY INCOME STATEMENT | | | | | | | | | | | | | | | | | | | | | | | | | | | | | | | | |
| Management fees | | | 14,106 | | | | 13,964 | | | | 13,329 | | | | 13,558 | | | | 13,182 | | | | 13,722 | | | | 14,559 | | | | 14,056 | |
| Carried interest and performance fees | | | 2,391 | | | | — | | | | — | | | | — | | | | — | | | | — | | | | 685 | | | | 1,117 | |
| less: Trailer and sub-advisor fees | | | 1,275 | | | | 65 | | | | 89 | | | | — | | | | 38 | | | | 45 | | | | 49 | | | | 47 | |
| less: Carried interest and performance fee payouts | | | 114 | | | | — | | | | — | | | | — | | | | — | | | | — | | | | 356 | | | | 559 | |
| Net Fees | | | 15,108 | | | | 13,899 | | | | 13,240 | | | | 13,558 | | | | 13,144 | | | | 13,677 | | | | 14,839 | | | | 14,567 | |
| Commissions | | | 8,712 | | | | 7,995 | | | | 4,406 | | | | 4,409 | | | | 6,414 | | | | 4,573 | | | | 7,516 | | | | 8,857 | |
| less: Commission expense | | | 3,508 | | | | 3,505 | | | | 1,814 | | | | 1,844 | | | | 2,704 | | | | 2,447 | | | | 2,701 | | | | 3,667 | |
| Net Commissions | | | 5,204 | | | | 4,490 | | | | 2,592 | | | | 2,565 | | | | 3,710 | | | | 2,126 | | | | 4,815 | | | | 5,190 | |
| Finance income (1) | | | 3,276 | | | | 3,381 | | | | 4,595 | | | | 3,918 | | | | 4,244 | | | | 4,824 | | | | 3,293 | | | | 3,066 | |
| Gains (losses) on net investments | | | (1,652 | ) | | | 791 | | | | (546 | ) | | | 6 | | | | 6,919 | | | | (4,916 | ) | | | (3,122 | ) | | | (1,823 | ) |
| Other income (loss) | | | 161 | | | | 604 | | | | (559 | ) | | | (644 | ) | | | 2,453 | | | | (275 | ) | | | 3,683 | | | | 6,242 | |
| Total Net Revenues | | | 22,097 | | | | 23,165 | | | | 19,322 | | | | 19,403 | | | | 30,470 | | | | 15,436 | | | | 23,508 | | | | 27,242 | |
| | | | | | | | | | | | | | | | | | | | | | | | | | | | | | | | | |
| Compensation (2) | | | 9,731 | | | | 9,098 | | | | 7,317 | | | | 8,387 | | | | 11,163 | | | | 8,167 | | | | 10,634 | | | | 9,485 | |
| Compensation - severance and new hire accruals | | | 204 | | | | 222 | | | | 855 | | | | 146 | | | | 38 | | | | 359 | | | | — | | | | 149 | |
| Placement and referral fees | | | 572 | | | | 150 | | | | 336 | | | | 78 | | | | 368 | | | | 223 | | | | 148 | | | | 204 | |
| Selling, general and administrative | | | 3,942 | | | | 4,191 | | | | 4,354 | | | | 4,069 | | | | 4,171 | | | | 3,404 | | | | 4,905 | | | | 4,586 | |
| Interest expense | | | 354 | | | | 393 | | | | 302 | | | | 324 | | | | 312 | | | | 26 | | | | 15 | | | | 66 | |
| Amortization and impairment charges (3) | | | 1,655 | | | | 1,180 | | | | 1,097 | | | | 1,101 | | | | 598 | | | | 457 | | | | 456 | | | | 688 | |
| Other expenses | | | 2,479 | | | | 263 | | | | 3,399 | | | | 637 | | | | 606 | | | | 790 | | | | 802 | | | | 1,179 | |
| Total Expenses | | | 18,937 | | | | 15,497 | | | | 17,660 | | | | 14,742 | | | | 17,256 | | | | 13,426 | | | | 16,960 | | | | 16,357 | |
| | | | | | | | | | | | | | | | | | | | | | | | | | | | | | | | | |
| Net Income (Loss) | | | 1,909 | | | | 5,723 | | | | 2,116 | | | | 3,784 | | | | 9,831 | | | | 1,975 | | | | 5,916 | | | | 13,657 | |
| Net Income (Loss) per share | | | 0.01 | | | | 0.02 | | | | 0.01 | | | | 0.02 | | | | 0.04 | | | | 0.01 | | | | 0.02 | | | | 0.06 | |
| Adjusted base EBITDA | | | 9,824 | | | | 10,049 | | | | 9,409 | | | | 9,184 | | | | 10,092 | | | | 9,707 | | | | 10,686 | | | | 10,027 | |
| Adjusted base EBITDA per share | | | 0.04 | | | | 0.04 | | | | 0.04 | | | | 0.04 | | | | 0.04 | | | | 0.04 | | | | 0.04 | | | | 0.04 | |
| | | | | | | | | | | | | | | | | | | | | | | | | | | | | | | | | |
| SUMMARY BALANCE SHEET | | | | | | | | | | | | | | | | | | | | | | | | | | | | | | | | |
| Total Assets | | | 424,344 | | | | 431,178 | | | | 445,776 | | | | 444,325 | | | | 428,215 | | | | 401,366 | | | | 403,985 | | | | 407,177 | |
| Total Liabilities | | | 69,622 | | | | 68,596 | | | | 79,019 | | | | 72,172 | | | | 55,094 | | | | 36,486 | | | | 36,372 | | | | 42,417 | |
| Cash | | | 71,495 | | | | 89,431 | | | | 60,593 | | | | 48,193 | | | | 47,252 | | | | 41,452 | | | | 37,974 | | | | 52,097 | |
| less: syndicate cash holdings | | | (569 | ) | | | (154 | ) | | | (10,119 | ) | | | (12,218 | ) | | | (10,421 | ) | | | (967 | ) | | | (796 | ) | | | (932 | ) |
| Net cash | | | 70,926 | | | | 89,277 | | | | 50,474 | | | | 35,975 | | | | 36,831 | | | | 40,485 | | | | 37,178 | | | | 51,165 | |
| Proprietary and long-term investments | | | 120,147 | | | | 110,699 | | | | 122,607 | | | | 134,681 | | | | 129,271 | | | | 115,744 | | | | 120,853 | | | | 96,352 | |
| less: obligations related to securities sold short | | | — | | | | — | | | | — | | | | — | | | | (255 | ) | | | — | | | | (2,927 | ) | | | (8,543 | ) |
| Net investments | | | 120,147 | | | | 110,699 | | | | 122,607 | | | | 134,681 | | | | 129,016 | | | | 115,744 | | | | 117,926 | | | | 87,809 | |
| Loans receivable | | | — | | | | 2,871 | | | | 32,011 | | | | 32,360 | | | | 36,021 | | | | 36,532 | | | | 40,208 | | | | 50,467 | |
| Investable Capital | | | 191,073 | | | | 202,847 | | | | 205,092 | | | | 203,016 | | | | 201,868 | | | | 192,761 | | | | 195,312 | | | | 189,441 | |
| | | | | | | | | | | | | | | | | | | | | | | | | | | | | | | | | |
| Total Enterprise AUM | | | 12,082,468 | | | | 11,326,546 | | | | 10,670,982 | | | | 10,569,449 | | | | 10,578,426 | | | | 10,066,112 | | | | 11,126,042 | | | | 11,591,213 | |
| (1) | Finance income includes: (1) interest income from on-balance sheet loans and brokerage client accounts; (2) co-investment income from lending LP units held as part of our long-term investments portfolio; and (3) ancillary income earned directly or indirectly from lending activities. |
| (2) | See 'Compensation' in the key performance indicators (non-IFRS financial measures) section of this MD&A. |
| (3) | Starting Q1 2019, in order to comply with the new IFRS 16 Leases accounting standard ("IFRS 16"), certain lease assets have now been capitalized and depreciated over their expected lease terms. See Note 2, Changes in Accounting Policies of the annual financial statements. |
| | |
| | 8 |
SUMMARY MANAGEMENT FEE BREAKDOWN
Below is a detailed list of management fee rates on our fund products as at December 31, 2019 (in millions $):
| FUND | | AUM | | | BLENDED NET
MANAGEMENT FEE
RATE | | | CARRIED INTEREST AND PERFORMANCE
FEE CRITERIA |
| Exchange Listed Products | | | | | | | | | | |
| Sprott Physical Gold and Silver Trust | | | 3,843 | | | | 0.40 | % | | N/A (1) |
| Sprott Physical Gold Trust | | | 3,197 | | | | 0.35 | % | | N/A (1) |
| Sprott Physical Silver Trust | | | 1,399 | | | | 0.45 | % | | N/A (1) |
| Sprott Gold Miner's ETF | | | 251 | | | | 0.35 | % | | N/A (1) |
| Sprott Physical Platinum & Palladium Trust | | | 153 | | | | 0.50 | % | | N/A (1) |
| Sprott Jr. Gold Miner's ETF | | | 79 | | | | 0.35 | % | | N/A (1) |
| | | | | | | | | | | |
| Total | | | 8,922 | | | | 0.39 | % | | |
| | | | | | | | | | | |
| Lending | | | | | | | | | | |
| Sprott private resource lending LPs | | | 1,019 | | | | 1.00 | % | | 15-70% of net profits over preferred return |
| | | | | | | | | | | |
| Managed Equities: In-house | | | | | | | | | | |
| Sprott U.S. Value Strategies | | | 306 | | | | 1.00 | % | | N/A |
| Fixed Term Limited Partnerships | | | 242 | | | | 1.70 | % | | 15-30% over preferred return |
| Separately Managed Accounts (2) | | | 59 | | | | 1.00 | % | | N/A |
| Sprott Hathaway Special Situations Fund (3) | | | 49 | | | | 0.75 | % | | 20% of net profits over preferred return |
| Total | | | 656 | | | | 1.24 | % | | |
| | | | | | | | | | | |
| Managed Equities: Sub-advised | | | | | | | | | | |
| Bullion Funds (3) | | | 332 | | | | 0.51 | % | | 5% excess over applicable benchmark indices |
| Corporate Class Funds (3) | | | 162 | | | | 0.75 | % | | 5% excess over applicable benchmark indices |
| Flow-through LPs (3) | | | 93 | | | | 0.70 | % | | 10% of all net profits in excess of the HWM |
| | | | | | | | | | | |
| Total | | | 587 | | | | 0.61 | % | | |
| | | | | | | | | | | |
| Other | | | | | | | | | | |
| Managed Companies (4) | | | 622 | | | | 0.50 | % | | 20% of net profits over preferred return |
| Separately Managed Accounts (5) | | | 276 | | | | 0.61 | % | | 20% of net profits over preferred return |
| | | | | | | | | | | |
| Total | | | 898 | | | | 0.53 | % | | |
| | | | | | | | | | | |
| Total AUM | | | 12,082 | | | | 0.51 | % | | |
| (1) | Exchange listed products do not generate performance fees, however the management fees they generate are closely correlated to precious metals prices. |
| (2) | Institutional managed accounts. |
| (3) | Management fee rate represents the net amount received by the Company. |
| (4) | Includes Sprott Resource Holdings Inc. and Sprott Korea Corp. |
| (5) | Includes our private equity strategy in Sprott Asia and high net worth discretionary managed accounts in the U.S. |
| | |
| | 9 |
RESULTS OF OPERATIONS
AUM SUMMARY
AUM was $12.1 billion as at December 31, 2019, up $0.8 billion (7%) from September 30, 2019 and up $1.5 billion (14%) from December 31, 2018. On a three and twelve months ended basis we benefited from strong precious metals price appreciation in our exchange listed products and managed equities segments. We also benefited from capital calls and new commitment fee earning assets being added to our lending LPs throughout the year, which more than offset capital distributions.
3 months results
| (In millions $) | | AUM
Sep. 30, 2019 | | Net
Inflows (1) | | Market
Value
Changes | | Other (2) | | AUM
Dec. 31, 2019 | |
| Exchange Listed Products | | | | | | | | | | | | | | | | | |
| - Physical Trusts | | | 8,376 | | | 71 | | | 145 | | | — | | | 8,592 | | |
| - ETFs | | | 314 | | | (7 | ) | | 23 | | | — | | | 330 | | |
| | | | 8,690 | | | 64 | | | 168 | | | — | | | 8,922 | | |
| | | | | | | | | | | | | | | | | | |
| Lending | | | 586 | | | 474 | | | (38 | ) | | (3 | ) | | 1,019 | (3 | ) |
| | | | | | | | | | | | | | | | | | |
| Managed Equities | | | | | | | | | | | | | | | | | |
| - In-house | | | 592 | | | 35 | | | 29 | | | — | | | 656 | | |
| - Sub-advised | | | 535 | | | 11 | | | 41 | | | — | | | 587 | | |
| | | | 1,127 | | | 46 | | | 70 | | | — | | | 1,243 | | |
| | | | | | | | | | | | | | | | | | |
| Other | | | 924 | | | — | | | (26 | ) | | — | | | 898 | | |
| | | | | | | | | | | | | | | | | | |
| Total | | | 11,327 | | | 584 | | | 174 | | | (3 | ) | | 12,082 | | |
12 months results
| (In millions $) | | AUM
Dec. 31, 2018 | | Net Inflows (1) | | Market
Value
Changes | | Other (2) | | AUM
Dec. 31, 2019 | |
| Exchange Listed Products | | | | | | | | | | | | | | | | | |
| - Physical Trusts | | | 7,927 | | | (177 | ) | | 842 | | | — | | | 8,592 | | |
| - ETFs | | | 237 | | | 11 | | | 82 | | | — | | | 330 | | |
| | | | 8,164 | | | (166 | ) | | 924 | | | — | | | 8,922 | | |
| | | | | | | | | | | | | | | | | | |
| Lending | | | 498 | | | 858 | | | (55 | ) | | (282 | ) | | 1,019 | (3 | ) |
| | | | | | | | | | | | | | | | | | |
| Managed Equities | | | | | | | | | | | | | | | | | |
| - In-house | | | 538 | | | 66 | | | 52 | | | — | | | 656 | | |
| - Sub-advised | | | 505 | | | 3 | | | 79 | | | — | | | 587 | | |
| | | | 1,043 | | | 69 | | | 131 | | | — | | | 1,243 | | |
| | | | | | | | | | | | | | | | | | |
| Other | | | 873 | | | 68 | | | (43 | ) | | — | | | 898 | | |
| | | | | | | | | | | | | | | | | | |
| Total | | | 10,578 | | | 829 | | | 957 | | | (282 | ) | | 12,082 | | |
| (1) | See 'Net Inflows' in the key performance indicators (non-IFRS financial measures) section of this MD&A. |
| (2) | Includes new AUM from fund acquisitions and lost AUM from fund divestitures and capital distributions of our lending LPs. |
| (3) | $1.7 billion (US$1.3 billion) of committed capital remains uncalled, of which $697 million (US$536 million) earns a commitment fee (AUM), and $980 million (US$754 million) does not (future AUM). |
| | |
| | 10 |
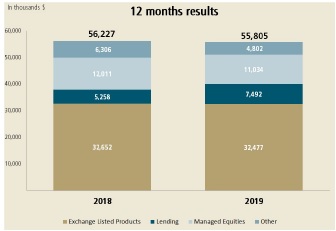
KEY REVENUE LINES
Net Fees in the quarter were $15.1 million, up $2 million (15%) from the prior period and were $55.8 million on a full year basis, down $0.4 million (1%).
Net fees increased in the quarter due to higher average AUM in our exchange listed products and managed equities segments given strong precious metals price appreciation and improved mining equities stock performance. We also benefited from higher fees in our lending segment as we continue to grow AUM in this area. Additionally, our managed equities segment generated higher net performance fees from the prior period.
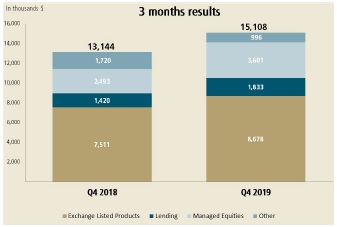
Net fees decreased on a full year basis despite strong precious metals price appreciation in the second half of the year as redemptions of our exchange listed products throughout last year and the first half of this year, led to lower average AUM on a full year basis from this segment. In addition, we experienced lower average AUM in the fixed-term LPs of our managed equities segment. These declines more than offset increased fee generation in our lending segment and higher performance fees generated in our managed equities segment.
Finance Income in the quarter was $3.3 million, down $1 million (23%) from the prior period and was $15.2 million on a full year basis, down $0.3 million (2%).
Finance income primarily includes interest income from legacy loans, co-investment income from LP units and other ancillary income earned directly or indirectly from lending activities. The decrease in finance income in the quarter and on a full year basis was primarily due to legacy loan repayments. The resultant lower finance income was partially offset by increased co-investment income earned in our lending LPs.
Net Commissions in the quarter were $5.2 million, up $1.5 million from the prior period and were $14.9 million on a full year basis, down $1 million.
The increase in the quarter was due to improved equity origination activity in our brokerage segment. The decrease on a full year basis was due to lower equity origination activity in the first half of the year that over shadowed the increase in origination activity in the second half of the year.
| | |
| | 11 |
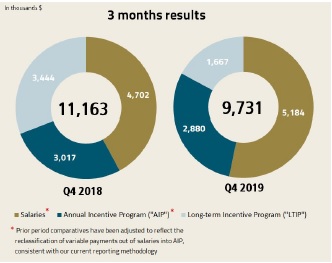
KEY EXPENSE LINES
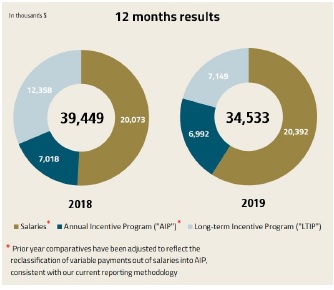
Compensation, excluding commissions, carried interest and performance fee payouts, which are presented net of their related revenues in this MD&A, and severance and new hire accruals which are non-recurring, was $9.7 million, down $1.4 million (13%) from the prior period and was $34.5 million on a full year basis, down $4.9 million (12%). The decrease in the quarter and on a full year basis was primarily due to lower LTIP amortization.
SG&A was $3.9 million in the quarter, down $0.2 million (5%) from the prior period and was $16.6 million on a full year basis, down $0.5 million (3%).
The decrease was largely due to the adoption of IFRS 16 and our ongoing cost containment program.
ADJUSTED BASED EBITDA
Adjusted base EBITDA in the quarter was $9.8 million, down $0.3 million (3%) from the prior period and was $38.5 million on a full year basis, down $2 million (5%).
On an aggregate basis, our reportable segments had improved quarterly performance, however, their results were more than offset by lower earnings from our non-reportable segments.
Our full year results were primarily impacted by lower fee income in our exchange listed products segment due to last year's redemption experience that continued through to the first half of this year and lower AUM valuations in our managed equities segment. We also encountered legacy loans being repaid in full by the end of the third quarter in our lending segment, resulting in lower full year finance income.
| | |
| | 12 |
ADDITIONAL REVENUES AND EXPENSES
Net investments losses were mainly due to market value depreciation of certain equity holdings and long-term investments.
Other income was lower in the quarter and on a full year basis.The decrease was primarily due to FX translation losses in the current periods (USD-to-CAD) compared to FX translation gains in the prior periods, net sales proceeds received on last year's sale transaction in the first quarter of 2018 and income earned on the early settlement of a loan last year.
Placement and referral fees were higher in the quarter and on a full year basis. They mainly include referral fees paid in our brokerage segment.
Interest expense was higher in the quarter and on a full year basis due to interest accruals on leases from the adoption of IFRS 16 and the draw down of our loan facility in the first quarter of this year (see Note 15 of the annual financial statements).
Amortization of intangibles did not change in the quarter and was lower on a full year basis due to finite life fund management contracts related to fixed term LPs in our managed equities segment being fully amortized by the end of the first quarter of the prior period.
Amortization of property and equipment was higher in the quarter and on a full year basis mainly due to increased depreciation expense related to leasehold improvements and leases that were capitalized on the adoption of IFRS 16.
Other expenses were higher in the quarter and on a full year basis due to higher non-recurring professional fees and transaction costs.
BALANCE SHEET
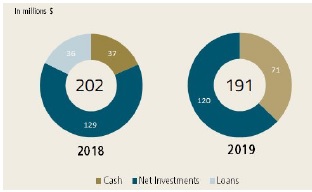
Investable Capital was $191 million, down $11 million from December 31, 2018.
Total Assets were $424 million, down $4 million (1%) from December 31, 2018. The slight decrease was primarily due to a combination of loan repayments, investment exits and FX losses on goodwill valuation.
Total Liabilities were $70 million, up $15 million (26%) from December 31, 2018. The increase was primarily due to the draw down of our loan facility to help fund anticipated investment activities of the Company over the next 12-18 months. The increase was also due to the recording of a lease liability on adoption of IFRS 16. These increases were partially offset by the payment of prior year's accrued liabilities.
Total Shareholder's Equity was $355 million, down $18 million (5%) from December 31, 2018.
| | |
| | 13 |
REPORTABLE OPERATING SEGMENTS
Exchange Listed Products
| | | 3 months ended | | | 12 months ended | |
| (In thousands $) | | Dec. 31, 2019 | | | Dec. 31, 2018 | | | Dec. 31, 2019 | | | Dec. 31, 2018 | |
| SUMMARY INCOME STATEMENT | | | | | | | | | | | | | | | | |
| Management fees | | | 8,678 | | | | 7,511 | | | | 32,477 | | | | 32,652 | |
| Other income (loss) | | | (395 | ) | | | 719 | | | | (811 | ) | | | 827 | |
| Total Revenues | | | 8,283 | | | | 8,230 | | | | 31,666 | | | | 33,479 | |
| | | | | | | | | | | | | | | | | |
| Compensation | | | 1,481 | | | | 1,047 | | | | 5,052 | | | | 4,473 | |
| Selling, general and administrative | | | 1,240 | | | | 802 | | | | 4,025 | | | | 3,295 | |
| Interest expense | | | 265 | | | | — | | | | 1,093 | | | | — | |
| Amortization and impairment charges | | | 315 | | | | 316 | | | | 1,263 | | | | 1,259 | |
| Other expenses | | | — | | | | — | | | | — | | | | 30 | |
| Total Expenses | | | 3,301 | | | | 2,165 | | | | 11,433 | | | | 9,057 | |
| | | | | | | | | | | | | | | | | |
| Net Income before income taxes | | | 4,982 | | | | 6,065 | | | | 20,233 | | | | 24,422 | |
| Adjusted base EBITDA | | | 6,039 | | | | 5,675 | | | | 23,863 | | | | 24,924 | |
| Total AUM | | | 8,922,030 | | | | 8,164,136 | | | | 8,922,030 | | | | 8,164,136 | |
3 and 12 months ended
Adjusted base EBITDA in the quarter was $6 million, up $0.4 million (6%) from the prior period and was $23.9 million on a full year basis, down $1.1 million (4%).
Our three months ended results were positively impacted by higher average AUM given strong precious metals price appreciation this quarter which more than offset higher compensation and SG&A. However on a full year basis, the strong pricing environment was more than offset by the redemption experience we encountered last year which continued through to the first half of this year. Additionally we also incurred higher compensation and SG&A in this segment.
Non-EBITDA highlights:
| • | Other losses was due to FX translation movements (USD-to-CAD). |
| • | Interest expense relates to the draw down of our loan facility in the first quarter of this year (see Note 15 of the annual financial statements). |
| | |
| | 14 |
Lending
| | | 3 months ended | | | 12 months ended | |
| (In thousands $) | | Dec. 31, 2019 | | | Dec. 31, 2018 | | | Dec. 31, 2019 | | | Dec. 31, 2018 | |
| SUMMARY INCOME STATEMENT | | | | | | | | | | | | | | | | |
| Management fees | | | 1,833 | | | | 1,420 | | | | 7,492 | | | | 4,929 | |
| Carried interest and performance fees | | | — | | | | — | | | | — | | | | 685 | |
| less: Carried interest and performance fee payouts | | | — | | | | — | | | | — | | | | 356 | |
| Net Fees | | | 1,833 | | | | 1,420 | | | | 7,492 | | | | 5,258 | |
| Finance income (1) | | | 2,985 | | | | 3,619 | | | | 13,229 | | | | 13,884 | |
| Gains (losses) on net investments | | | (134 | ) | | | 3,515 | | | | (1,542 | ) | | | 1,914 | |
| Other income (loss) | | | (219 | ) | | | 1,666 | | | | (1,069 | ) | | | 6,290 | |
| Total Net Revenues | | | 4,465 | | | | 10,220 | | | | 18,110 | | | | 27,346 | |
| | | | | | | | | | | | | | | | | |
| Compensation | | | 1,658 | | | | 1,291 | | | | 6,643 | | | | 5,173 | |
| Placement and referral fees | | | 20 | | | | 49 | | | | 58 | | | | 157 | |
| Selling, general and administrative | | | 293 | | | | 595 | | | | 1,032 | | | | 1,522 | |
| Interest expense | | | 39 | | | | — | | | | 80 | | | | — | |
| Amortization and impairment charges | | | 36 | | | | 37 | | | | 143 | | | | 78 | |
| Other expenses | | | 1,509 | | | | — | | | | 1,509 | | | | 30 | |
| Total Expenses | | | 3,555 | | | | 1,972 | | | | 9,465 | | | | 6,960 | |
| | | | | | | | | | | | | | | | | |
| Net Income before income taxes | | | 910 | | | | 8,248 | | | | 8,645 | | | | 20,386 | |
| Adjusted base EBITDA | | | 3,247 | | | | 3,300 | | | | 14,236 | | | | 15,437 | |
| Total AUM (2) | | | 1,019,030 | | | | 498,231 | | | | 1,019,030 | | | | 498,231 | |
(1) Includes: (1) interest income from on-balance sheet loans; and (2) co-investment income from lending LP units held as part of our long-term investments portfolio.
(2) $1.7 billion (US$1.3 billion) of committed capital remains uncalled, of which $697 million (US$536 million) earns a commitment fee (AUM), and $980 million (US$754 million) does not (future AUM).
3 and 12 months ended
Adjusted base EBITDA in the quarter was $3.2 million, down $0.1 million (2%) from the prior period and was $14.2 million on a full year basis, down $1.2 million (8%).
Our three months ended and full year results were primarily impacted by legacy loans repaid in full by the end of the third quarter, which led to lower interest income over the periods. This more than offset increased management fees and co-investment income as we continue to grow AUM in this segment.
Non-EBITDA highlights:
| • | Net investment losses were due to equity kicker valuations. |
| • | Other losses was due to FX translation movements (USD-to-CAD). |
| • | Other expenses related primarily to non-recurring professional fees. |
| | |
| | 15 |
Managed Equities*
| | | 3 months ended | | | 12 months ended | |
| (In thousands $) | | Dec. 31, 2019 | | | Dec. 31, 2018 | | | Dec. 31, 2019 | | | Dec. 31, 2018 | |
| SUMMARY INCOME STATEMENT | | | | | | | | | | | | | | | | |
| Management fees | | | 2,641 | | | | 2,573 | | | | 10,356 | | | | 11,867 | |
| Carried interest and performance fees | | | 2,391 | | | | — | | | | 2,391 | | | | 1,061 | |
| less: Trailer and sub-advisor fees | | | 1,317 | | | | 80 | | | | 1,599 | | | | 358 | |
| less: Carried interest and performance fee payouts | | | 114 | | | | — | | | | 114 | | | | 559 | |
| Net Fees | | | 3,601 | | | | 2,493 | | | | 11,034 | | | | 12,011 | |
| Gains (losses) on net investments | | | 1,553 | | | | (164 | ) | | | 4,721 | | | | (395 | ) |
| Other income (loss) | | | 454 | | | | 179 | | | | 1,239 | | | | 65 | |
| Total Net Revenues | | | 5,608 | | | | 2,508 | | | | 16,994 | | | | 11,681 | |
| | | | | | | | | | | | | | | | | |
| Compensation | | | 1,378 | | | | 1,462 | | | | 6,052 | | | | 6,104 | |
| Selling, general and administrative | | | 809 | | | | 596 | | | | 2,485 | | | | 2,081 | |
| Amortization and impairment charges | | | 67 | | | | 73 | | | | 280 | | | | 540 | |
| Other expenses | | | 1 | | | | 140 | | | | 339 | | | | 500 | |
| Total Expenses | | | 2,255 | | | | 2,271 | | | | 9,156 | | | | 9,225 | |
| | | | | | | | | | | | | | | | | |
| Net Income before income taxes | | | 3,353 | | | | 237 | | | | 7,838 | | | | 2,456 | |
| Adjusted base EBITDA | | | 1,043 | | | | 1,094 | | | | 4,201 | | | | 4,571 | |
| Total AUM | | | 1,243,100 | | | | 1,043,294 | | | | 1,243,100 | | | | 1,043,294 | |
*See "Managed Equities" in the business overview section on page 7 of this MD&A.
3 and 12 months ended
Adjusted base EBITDA in the quarter was $1 million, down $0.1 million (5%) from the prior period, and was $4.2 million on a full year basis, down $0.4 million (8%).
Our three months ended results were primarily impacted by higher SG&A which more than offset lower compensation and higher management fees. On a full year basis, the impact of lower average AUM on fixed-term LPs was more pronounced.
Non-EBITDA highlights:
| • | Net investments gains were due to market value appreciation of certain holdings. |
| | |
| | 16 |
Brokerage*
| | | 3 months ended | | | 12 months ended | |
| (In thousands $) | | Dec. 31, 2019 | | | Dec. 31, 2018 | | | Dec. 31, 2019 | | | Dec. 31, 2018 | |
| SUMMARY INCOME STATEMENT | | | | | | | | | | | | | | | | |
| Commissions | | | 8,266 | | | | 5,766 | | | | 24,487 | | | | 26,120 | |
| less: Commission expense | | | 3,498 | | | | 2,823 | | | | 10,632 | | | | 11,964 | |
| Net Commissions | | | 4,768 | | | | 2,943 | | | | 13,855 | | | | 14,156 | |
| Management fees | | | 473 | | | | 445 | | | | 1,723 | | | | 1,746 | |
| Finance income | | | 291 | | | | 625 | | | | 1,941 | | | | 1,543 | |
| Gains (losses) on net investments | | | 218 | | | | (829 | ) | | | (149 | ) | | | (1,701 | ) |
| Other income (loss) | | | (1 | ) | | | (167 | ) | | | 121 | | | | 4,474 | |
| Total Net Revenues | | | 5,749 | | | | 3,017 | | | | 17,491 | | | | 20,218 | |
| | | | | | | | | | | | | | | | | |
| Compensation (1) | | | 2,234 | | | | 2,501 | | | | 9,157 | | | | 10,342 | |
| Placement and referral fees | | | 468 | | | | 300 | | | | 893 | | | | 666 | |
| Selling, general and administrative | | | 1,102 | | | | 1,625 | | | | 5,705 | | | | 6,238 | |
| Interest expense | | | 17 | | | | — | | | | 77 | | | | — | |
| Amortization and impairment charges | | | 179 | | | | 25 | | | | 651 | | | | 76 | |
| Other expenses | | | 2 | | | | — | | | | 9 | | | | 344 | |
| Total Expenses | | | 4,002 | | | | 4,451 | | | | 16,492 | | | | 17,666 | |
| | | | | | | | | | | | | | | | | |
| Net Income (Loss) before income taxes | | | 1,747 | | | | (1,434 | ) | | | 999 | | | | 2,552 | |
| Adjusted base EBITDA | | | 2,319 | | | | 547 | | | | 4,413 | | | | 4,033 | |
*See "Brokerage" in the business overview section on page 7 of this MD&A.
(1) Compensation is presented excluding commission expense, which is reported net of commission revenue.
3 and 12 months ended
Adjusted base EBITDA in the quarter was $2.3 million, up $1.8 million from the prior period, and was $4.4 million on a full year basis, up $0.4 million.
Our three and twelve months ended results were positively impacted by a combination of lower compensation and SG&A expense and higher net commissions on improved equity origination in the second half of the year. However, the weak equity origination environment encountered in the first half of the year weighed down our full year results.
Non-EBITDA highlights:
| • | Net investment gains in the quarter and losses on a full year basis were the result of equity kicker valuations. |
| • | Other income in the prior period was primarily related to net sales proceeds received on last year's sale transaction in the first quarter of 2018. See Note 7 of the annual financial statements. |
| | |
| | 17 |
Corporate
This segment is primarily a cost centre that provides capital, balance sheet management and shared services to the Company's subsidiaries.
| | | 3 months ended | | | 12 months ended | |
| (In thousands $) | | Dec. 31, 2019 | | | Dec. 31, 2018 | | | Dec. 31, 2019 | | | Dec. 31, 2018 | |
| SUMMARY INCOME STATEMENT | | | | | | | | | | | | | | | | |
| Gains (losses) on net investments | | | (2,786 | ) | | | 5,348 | | | | (3,531 | ) | | | 2,334 | |
| Other income (loss) | | | 422 | | | | (149 | ) | | | 795 | | | | 138 | |
| Total Revenues | | | (2,364 | ) | | | 5,199 | | | | (2,736 | ) | | | 2,472 | |
| | | | | | | | | | | | | | | | | |
| Compensation | | | 2,580 | | | | 4,022 | | | | 7,651 | | | | 10,308 | |
| Selling, general and administrative | | | 483 | | | | 328 | | | | 2,553 | | | | 2,630 | |
| Interest expense | | | 33 | | | | 12 | | | | 123 | | | | 93 | |
| Amortization and impairment charges | | | 1,049 | | | | 59 | | | | 2,660 | | | | 142 | |
| Other expenses | | | 119 | | | | 159 | | | | 861 | | | | 1,355 | |
| Total Expenses | | | 4,264 | | | | 4,580 | | | | 13,848 | | | | 14,528 | |
| | | | | | | | | | | | | | | | | |
| Net Income (Loss) before income taxes | | | (6,628 | ) | | | 619 | | | | (16,584 | ) | | | (12,056 | ) |
| Adjusted base EBITDA | | | (2,699 | ) | | | (1,020 | ) | | | (9,674 | ) | | | (8,982 | ) |
3 and 12 months ended
| • | Net investments losses were due to market value depreciation of certain equity holdings and long-term investments. |
| • | Compensation decreased due to lower LTIP amortization and lower incentive accruals. |
| • | SG&A increased in the quarter due to lower than normal operating expenses this time last year. The decrease on a full year basis was primarily due to the adoption of IFRS 16 which was partially offset by lower than normal operating expenses in the second half of last year. |
| • | Higher amortization was due to increased depreciation expense related to leasehold improvements and leases that were capitalized on the adoption of IFRS 16. |
| | |
| | 18 |
Dividends
The following dividends were declared by the Company during the year ended December 31, 2019:
| Record date | | Payment Date | | Cash dividend per share ($) | | Total dividend amount (in thousands $) | |
| March 08, 2019 - Regular Dividend Q4 - 2018 | | March 25, 2019 | | | 0.03 | | | 7,602 | |
| May 21, 2019 - Regular Dividend Q1 - 2019 | | June 5, 2019 | | | 0.03 | | | 7,605 | |
| August 19, 2019 - Regular Dividend Q2 - 2019 | | September 3, 2019 | | | 0.03 | | | 7,614 | |
| November 18, 2019 - Regular Dividend Q3 - 2019 | | December 3, 2019 | | | 0.03 | | | 7,614 | |
| Dividends (1) | | | | | | | | 30,435 | |
| | | | | | | | | | |
(1) Subsequent to year-end, on February 27, 2020, a regular dividend of $0.03 per common share was declared for the quarter ended December 31, 2019. This dividend is payable on March 24, 2020 to shareholders of record at the close of business on March 9, 2020.
Capital Stock
Including the 9 million unvested common shares currently held in the EPSP Trust (December 31, 2018 - 9.9 million), total capital stock issued and outstanding was 253.1 million (December 31, 2018 - 253 million).
Earnings per share for the current and prior periods have been calculated using the weighted average number of shares outstanding during the respective periods. Basic earnings per share were $0.01 and $0.06 for the quarter and twelve months ended respectively, compared to $0.04 and $0.13 in the respective prior periods. Diluted earnings per share were $0.01 and $0.05 for the quarter and twelve months ended respectively, compared to $0.04 and $0.12 in the respective prior periods. Diluted earnings per share reflects the dilutive effect of in-the-money stock options, unvested shares held in the EPSP Trust and outstanding restricted stock units.
A total of 3.3 million stock options are outstanding pursuant to our stock option plan, of which 2.6 million are exercisable.
| | |
| | 19 |
Liquidity and Capital Resources
As at December 31, 2019, the Company had $20 million (December 31, 2018 - $Nil) outstanding on its credit facility, $5 million of which is due within 12 months and $15 million is due after 12 months (December 31, 2018 - $Nil and $Nil respectively).
The Company has a 5 year, $90 million credit facility with a major Canadian schedule I chartered bank. The facility consists of a $25 million term loan and a $65 million revolving line of credit. Amounts may be borrowed under the facility through prime rate loans or bankers’ acceptances. Amounts may also be borrowed in U.S. dollars through base rate loans. In the first quarter, the Company drew $25 million on the term loan portion of the credit facility to avoid its expiry and to partially fund anticipated growth in the business over the next 12-18 months. As at December 31, 2019, the Company was in compliance with all covenants, terms and conditions under the credit facility. Key terms under the credit facility are noted below:
Structure
| ◦ | 5-year, $65 million revolver with "bullet maturity" December 31, 2022 |
| ◦ | 5-year, $25 million term loan with 5% of principal amortizing quarterly, with the remaining balance maturing on December 31, 2022 |
Interest Rate
| ◦ | Banker Acceptance Rate + 170 bps |
Covenant Terms
| ◦ | Minimum AUM: $8.2 billion |
| ◦ | Debt to EBITDA less than 2.5:1 |
| ◦ | EBITDA to interest expense more than 2.5:1 |
Commitments
Besides the Company's long-term lease agreements, there may be commitments to make co-investments in lending LPs arising from our lending segment or commitments to make investments in the net investments portfolio of the Company. As at December 31, 2019, the Company had $8.6 million in co-investment commitments from the lending segment (December 31, 2018 - $38.7 million).
| | |
| | 20 |
Significant Accounting Judgments, Estimates and Changes in Accounting Policies
The key assumptions concerning the future and other key sources of estimation uncertainty at the reporting date that have a significant risk of causing a material adjustment to the carrying amounts of assets and liabilities are described below. The Company based its assumptions and estimates on parameters available when the annual financial statements were prepared. Existing circumstances and assumptions about future developments may change due to market changes or circumstances arising beyond the control of the Company. Such changes are reflected in the assumptions and estimates as they occur.
Fair value of financial instruments
When the fair value of financial assets and financial liabilities recorded in the consolidated balance sheets cannot be derived from active markets, they are determined using valuation techniques and models. Model inputs are taken from observable markets where possible, but where this is not feasible, unobservable inputs may be used. The use of unobservable inputs can involve significant judgment and materially affect the reported fair value of financial instruments.
Share-based payments
The Company measures the cost of share-based payments to employees by reference to the fair value of the equity instruments at the date on which they are granted. Estimating fair value for share-based payments requires determining the most appropriate valuation model for a grant of equity instruments, which is dependent on the terms and conditions of the grant. This also requires determining the most appropriate inputs to the valuation model including (in the case of options grants) the expected life of the option, expected volatility, and expected dividend yields, and in the case of performance-based equity grants, the probability of a subsidiary or executive attaining certain performance targets, the future stock price of the Company and the future employment of a senior employee.
Deferred tax assets
Deferred tax assets are recognized for unused tax losses to the extent it is probable that sufficient taxable profit will be generated in order to utilize the losses. In addition, taxable income is subject to estimation as a portion of performance fee and carried interest revenue is an allocation of partnership income. Such allocations involve a certain degree of estimation and income tax estimates could change as a result of: (i) changes in tax laws and regulations, both domestic and foreign; (ii) an amendment to the calculation of partnership income allocation; or (iii) a change in foreign affiliate rules. Significant management judgment is required to determine the amount of deferred tax assets that can be recognized based on the likely timing and the level of future taxable profits together with future tax planning strategies.
Investments in other entities
IFRS 10 Consolidated Financial Statements ("IFRS 10") and IAS 28 Investments in Associates and Joint Ventures ("IAS 28") provide for the use of judgment in determining whether an investee should be included within the annual financial statements of the Company and on what basis (subsidiary, joint venture or associate). Significant judgment is applied in evaluating facts and circumstances relevant to the Company and investee, including: (1) the extent of the Company's direct and indirect interests in the investee; (2) the level of compensation to be received from the investee for management and other services provided to it; (3) "kick out rights" available to other investors in the investee; and (4) other indicators of the extent of power that the Company has over the investee.
Impairment of goodwill and intangible assets
All indefinite life intangible assets and goodwill are assessed for impairment, however, finite life intangibles are only tested for impairment to the extent indications of impairment exist at time of a quarterly assessment. In the case of goodwill and indefinite life intangibles, an annual test for impairment augments the quarterly impairment indicator assessments. Values associated with goodwill and intangibles involve estimates and assumptions, including those with respect to future cash inflows and outflows, discount rates and asset lives. These estimates require significant judgment regarding market growth rates, fund flow assumptions, expected margins and costs which could affect the Company's future results if estimates of future performance and fair value change.
| | |
| | 21 |
Change in accounting policies
On January 1, 2019, the Company adopted IFRS 16 and IFRIC 23 Uncertainty over Income Tax Treatments ("IFRIC 23"). As a result, the Company changed its accounting policies. As permitted by the transition provision of IFRS 16, the Company elected not to restate comparative period results. Accordingly, all comparative period information is presented in accordance with previous accounting policies. For a summary of the impact of the adoption of IFRS 16, see Note 2 of the annual financial statements. The adoption of IFRIC 23 did not have a material impact on the Company's annual financial statements.
Managing Risk: Financial
Market risk
The Company separates market risk into three categories: price risk, interest rate risk and foreign currency risk.
Price risk
Price risk arises from the possibility that changes in the price of the Company's on and off-balance sheet assets and liabilities will result in changes in carrying value or recoverable amounts. The Company's revenues are also exposed to price risk since management fees, carried interests and performance fees are correlated with AUM, which fluctuates with changes in the market values of the assets in the funds and managed accounts managed by the Company.
Interest rate risk
Interest rate risk arises from the possibility that changes in interest rates will adversely affect the value of, or cash flows from, financial instrument assets. The Company’s earnings, particularly through its lending segment, are exposed to volatility as a result of sudden changes in interest rates. Management takes into account a number of factors and is committed to several processes to ensure that this risk is appropriately managed.
Foreign currency risk
Foreign currency risk arises from foreign exchange rate movements that could negatively impact either the carrying value of financial assets and liabilities or the related cash flows when translating those balances into Canadian dollars. The Company's primary foreign currency is the United States Dollar ("USD"). The Company may employ certain hedging strategies to mitigate foreign currency risk.
Credit risk
Credit risk is the risk that a borrower will not honor its commitments and a loss to the Company may result. Credit risk generally arises in the Company's legacy loan book and co-investments in lending LPs and its net investments portfolio.
Loans receivable
The Company incurs credit risk primarily in the on-balance sheet loans of its lending segment and through co-investments made in the lending LPs of the lending segment. In addition to the relative default probability of borrowers (both directly via on balance sheet loans and indirectly via borrowers of the lending LPs we co-invest with), credit risk is also dependent on loss given default, which can increase credit risk if the values of the underlying assets securing the Company's loans and co-investments decline to levels approaching or below the loan amounts. A decrease in commodity prices may delay the development of the underlying security or business plans of the borrower and could adversely affect the value of the Company's security against a loan. Additionally, the value of the Company's underlying security in a loan can be negatively affected if the actual amount or quality of the commodity proves to be less than originally estimated, or the ability to extract the commodity proves to be more difficult or more costly than originally estimated. During the loan origination process, management takes into account a number of factors and is committed to several processes to ensure that this risk is appropriately managed.
| | |
| | 22 |
Collectability of loans
Besides the above noted measures we take to manage credit risk, the Company will report on credit risk in the notes to the annual financial statements and records expected credit loss provisions to ensure that on-balance sheet loans are recorded at their estimated recoverable amount (i.e. net of impairment risk we believe to exist as at the balance sheet date and in accordance with IFRS). Actual losses incurred in the on-balance sheet loan portfolio could differ materially from our provisions. Management takes into account a number of factors and is committed to several processes to ensure that this risk is appropriately managed.
Net investments
The Company incurs credit risk when entering into, settling and financing transactions with counterparties. Management takes into account a number of factors and is committed to several processes to ensure that this risk is appropriately managed.
Other
The majority of accounts receivable relate to management fees, carried interest and performance fees receivable from the funds, managed accounts and managed companies managed by the Company. These receivables are short-term in nature and any credit risk associated with them is managed by dealing with counterparties that the Company believes to be creditworthy and by actively monitoring credit exposure and the financial health of the counterparties.
Liquidity risk
Liquidity risk is the risk that the Company cannot meet a demand for cash or fund its obligations as they come due. The Company's exposure to liquidity risk is minimal as it maintains sufficient levels of liquid assets to meet its obligations as they come due. Additionally, the Company has access to a $90 million committed line of credit with a major Canadian schedule I chartered bank. As part of its cash management program, the Company primarily invests in short-term debt securities issued by the Government of Canada with maturities of less than three months.
The Company's exposure to liquidity risk as it relates to our co-investments in lending LPs arises from fluctuations in cash flows from making capital calls and receiving capital distributions. The Company manages its loan co-investment liquidity risk through the ongoing monitoring of scheduled capital calls and distributions ("match funding") and through its broader treasury risk management program and enterprise capital budgeting.
Financial liabilities, including accounts payable and accrued liabilities and compensation and employee bonuses payable, are short-term in nature and are generally due within a year.
The Company's management team is responsible for reviewing resources to ensure funds are readily available to meet its financial obligations (e.g. dividend payments) as they come due, as well as ensuring adequate funds exist to support business strategies and operations growth. The Company manages liquidity risk by monitoring cash balances on a daily basis and through its broader treasury risk management program. To meet any liquidity shortfalls, actions taken by the Company could include: syndicating a portion of its loans; slowing its lending activities; cutting its dividend; drawing on the line of credit; liquidating net investments; and/or issuing common shares.
Concentration risk
A significant portion of the Company's AUM as well as its net investments and loans are focused on the natural resource sector, and in particular, precious metals related investments and transactions. In addition, from time-to-time, certain net investment and loan positions may be concentrated to a material degree in a single position or group of positions. Management takes into account a number of factors and is committed to several processes to ensure that this risk is appropriately managed.
| | |
| | 23 |
Disclosure Controls and Procedures ("DC&P") and Internal Control over Financial Reporting ("ICFR")
Management is responsible for the design and operational effectiveness of DC&P and ICFR in order to provide reasonable assurance regarding the disclosure of material information relating to the Company. This includes information required to be disclosed in the Company's annual filings, interim filings and other reports filed under securities legislation, as well as the reliability of financial reporting and the preparation of financial statements for external purposes in accordance with IFRS.
Consistent with National Instrument 52-109, the Company's CEO and CFO evaluate quarterly the DC&P and ICFR. As at December 31, 2019, the Company's CEO and CFO concluded that the Company's DC&P and ICFR were properly designed and were operating effectively. In addition, there were no material changes to ICFR during the quarter.
Managing Risk: Non-financial
Managing Risk: Non-financial
Confidentiality of Information
Confidentiality is essential to the success of the Company's business, and it strives to consistently maintain the highest standards of trust, integrity and professionalism. Account information is kept under strict control in compliance with all applicable laws, and physical, procedural, and electronic safeguards are maintained in order to protect this information from access by unauthorized parties. The Company keeps the affairs of its clients confidential and does not disclose the identities of clients (absent expressed client consent to do so). If a prospective client requests a reference, the Company will not provide the name of an existing client before receiving permission from that client to do so.
Conflicts of Interest
The Company established a number of policies with respect to employee personal trading. Employees may not trade any of the securities held or being considered for investment by any of the Company's funds without prior approval. In addition, employees must receive prior approval before they are permitted to buy or sell securities. Speculative trading is strongly discouraged. All employees must comply with the Company's Code of Ethics. The code establishes strict rules for professional conduct including the management of conflicts of interest.
Independent Review Committee
National Instrument 81-107 - Independent Review Committee for Investment Funds (“NI 81-107”) requires all publicly offered investment funds to establish an independent review committee ("IRC") to whom all conflicts of interest matters must be referred for review and approval. The Company established an IRC for its public funds. As required by NI 81-107, the Company established written policies and procedures for dealing with conflict of interest matters and maintains records in respect of these matters and provides assistance to the IRC in carrying out its functions. The IRC is comprised of three independent members, and is subject to requirements to conduct regular assessments and provide reports to the Company and to the holders of interests in public mutual funds in respect of its functions.
Insurance
The Company maintains appropriate insurance coverage for general business and liability risks as well as insurance coverage required by regulation. Insurance coverage is reviewed periodically to ensure continued adequacy.
Internal Controls and Procedures
Several of the Company's subsidiaries operate in regulated environments and are subject to business conduct rules and other rules and regulations. The Company has internal control policies related to business conduct. They include controls required to ensure compliance with the rules and regulations of relevant regulatory bodies including the OSC, IIROC, FINRA and the U.S. Securities and Exchange Commission ("SEC").
Additional information relating to the Company, including the Company's Annual Information Form is available on SEDAR at www.sedar.com
| | |
| | 24 |