Exhibit 99.29
Management's Discussion and Analysis
Three months ended March 31, 2020
 | | | 1 |
FORWARD LOOKING STATEMENTS
Certain statements in this Management's Discussion & Analysis ("MD&A"), and in particular the "Business Highlights and Growth Initiatives" section and "Outlook" subsection, contain forward-looking information (collectively referred to herein as the "Forward-Looking Statements") within the meaning of applicable securities laws. The use of any of the words "expect", "anticipate", "continue", "estimate", "may", "will", "project", "should", "believe", "plans", "intends" and similar expressions are intended to identify Forward-Looking Statements. In particular, but without limiting the forgoing, this MD&A contains Forward-Looking Statements pertaining to: (i) outperform general markets and is firmly on an upward trajectory, (ii) gold’s role in investor portfolios will continue to gain broader acceptance, (iii) gold equities will reach new highs over the mid-term; (iv) expectations regarding an increasingly constructive gold and silver pricing environment; (v) expectations regarding deployment of capital called into our lending LPs; (vi) anticipation of flat year-over-year performance in the Brokerage segment; (vii) anticipation of higher year-over-year operating costs (primarily relating to higher SG&A and compensation expense on increased U.S. operating activities) and lower EBITDA contribution from non-reportable segments; (viii) the impact to the Managed Equities segment of the Tocqueville gold strategies asset management business; (ix) the performance of the co-investments in the lending LPs; (x) gold accumulation and new highs as insurance and protection assets; and (xi) the declaration, payment and designation of dividends.
Although the Company believes that the Forward-Looking Statements are reasonable, they are not guarantees of future results, performance or achievements. A number of factors or assumptions have been used to develop the Forward-Looking Statements, including: (i) the impact of increasing competition in each business in which the Company operates will not be material; (ii) quality management will be available; (iii) the effects of regulation and tax laws of governmental agencies will be consistent with the current environment; and (iv) those assumptions disclosed herein under the heading "Significant Accounting Judgments, Estimates and Changes in Accounting Policies". Actual results, performance or achievements could vary materially from those expressed or implied by the Forward-Looking Statements should assumptions underlying the Forward-Looking Statements prove incorrect or should one or more risks or other factors materialize, including: (i) difficult market conditions; (ii) poor investment performance; (iii) failure to continue to retain and attract quality staff; (iv) employee errors or misconduct resulting in regulatory sanctions or reputational harm; (v) performance fee fluctuations; (vi) a business segment or another counterparty failing to pay its financial obligation; (vii) failure of the Company to meet its demand for cash or fund obligations as they come due; (viii) changes in the investment management industry; (ix) failure to implement effective information security policies, procedures and capabilities; (x) lack of investment opportunities; (xi) risks related to regulatory compliance; (xii) failure to manage risks appropriately; (xiii) failure to deal appropriately with conflicts of interest; (xiv) competitive pressures; (xv) corporate growth which may be difficult to sustain and may place significant demands on existing administrative, operational and financial resources; (xvi) failure to comply with privacy laws; (xvii) failure to successfully implement succession planning; (xviii) foreign exchange risk relating to the relative value of the U.S. dollar; (xix) litigation risk; (xx) failure to develop effective business resiliency plans; (xxi) failure to obtain or maintain sufficient insurance coverage on favourable economic terms; (xxii) historical financial information being not necessarily indicative of future performance; (xxiii) the market price of common shares of the Company may fluctuate widely and rapidly; (xxiv) risks relating to the Company’s investment products; (xxv) risks relating to the Company's proprietary investments; (xxvi) risks relating to the Company's lending business; (xxvii) risks relating to the Company’s merchant bank and advisory business; (xxviii) those risks described under the heading "Risk Factors" in the Company’s annual information form dated February 27, 2020; and (xxix) those risks described under the headings "Managing Risk: Financial" and "Managing Risk: Non-Financial" in this MD&A. In addition, the payment of dividends is not guaranteed and the amount and timing of any dividends payable by the Company will be at the discretion of the Board of Directors of the Company and will be established on the basis of the Company’s earnings, the satisfaction of solvency tests imposed by applicable corporate law for the declaration and payment of dividends, and other relevant factors. As a result of the foregoing, readers should not place undue reliance on the forward-looking statements contained in this MD&A concerning the completion of the acquisition or the timing thereof. The Forward-Looking Statements speak only as of the date hereof, unless otherwise specifically noted, and the Company does not assume any obligation to publicly update any Forward-Looking Statements, whether as a result of new information, future events or otherwise, except as may be expressly required by applicable Canadian securities laws.
MANAGEMENT'S DISCUSSION AND ANALYSIS
This MD&A of financial condition and results of operations, dated May 7, 2020, presents an analysis of the consolidated financial condition of the Company and its subsidiaries as at March 31, 2020, compared with December 31, 2019, and the consolidated results of operations for the three months ended March 31, 2020, compared with the three months ended March 31, 2019. The Board of Directors approved this MD&A on May 7, 2020. All note references in this MD&A are to the notes to the Company's March 31, 2020 unaudited interim condensed consolidated financial statements ("interim financial statements"), unless otherwise noted. The Company was incorporated under the Business Corporations Act (Ontario) on February 13, 2008.
PRESENTATION OF FINANCIAL INFORMATION
The financial statements, including the required comparative information, have been prepared in accordance with International Financial Reporting Standards ("IFRS"), as issued by the International Accounting Standards Board ("IASB"). Financial results, including related historical comparatives contained in this MD&A, unless otherwise specified herein, are based on the interim financial statements. While the Company’s functional currency is the Canadian dollar, its presentation currency has switched to US dollars effective January 1, 2020, with the prior period figures restated accordingly. We believe the US dollar better reflects the Company’s consolidated financial position and results of operations given the significance of our revenues denominated in US dollars that further increased in 2020 with the January 17, 2020 close of the Tocqueville Asset Management gold strategies acquisition. Accordingly, all dollar references in this MD&A are in US dollars, unless otherwise specified. The use of the term "prior period" refers to the three months ended March 31, 2019.
| | | 2 |
KEY PERFORMANCE INDICATORS (NON-IFRS FINANCIAL MEASURES)
The Company measures the success of its business using a number of key performance indicators that are not measurements in accordance with IFRS and should not be considered as an alternative to net income (loss) or any other measure of performance under IFRS. Non-IFRS financial measures do not have a standardized meaning prescribed by IFRS and are therefore unlikely to be comparable to similar measures presented by other issuers. Our key performance indicators are discussed below:
Assets Under Management
Assets Under Management ("AUM") refers to the total net assets managed by the Company through its various investment product offerings, managed accounts and managed companies.
Net Inflows
Net Inflows (consisting of net sales, capital calls and fee earning capital commitments) result in changes to AUM and are described individually below:
Net Sales
Fund sales (net of redemptions), including 'at-the-market' transactions and secondary offerings of our physical trusts and new 'creations' of ETF units, are a key performance indicator as new assets being managed will lead to higher management fees and can potentially lead to increased carried interest and performance fee generation (as applicable) given that AUM is also the basis upon which carried interest and performance fees are calculated.
Capital calls and commitments
Capital calls into our lending LPs are a key source of AUM creation, and ultimately, earnings for the Company. Once capital is called into our lending LPs, it is included within the AUM of the Company as it will now earn a management fee (NOTE: it is possible for some forms of committed capital to earn a commitment fee despite being uncalled, in which case, it will also be included in AUM at that time). Conversely, once loans in our lending LPs are repaid, capital may be returned to investors in the form of a distribution, thereby reducing our AUM ("capital distributions").
Net Fees
Management fees (net of trailer and sub-advisor fees) and carried interest and performance fees (net of carried interest and performance fee payouts) are key revenue indicators as they represent the net revenue contribution after directly associated costs that we generate from our AUM.
Net Commissions
Commissions, net of commission expenses, arise primarily from the transaction based service offerings of our brokerage segment.
Compensation
Compensation excludes commissions, carried interest and performance fee payouts, which are presented net of their related revenues in this MD&A, and severance and new hire accruals which are non-recurring.
| | | 3 |
EBITDA, Adjusted EBITDA, Adjusted base EBITDA and Operating margin
EBITDA in its most basic form is defined as earnings before interest expense, income taxes, depreciation and amortization. EBITDA is a measure commonly used in the investment industry by management, investors and investment analysts in understanding and comparing results by factoring out the impact of different financing methods, capital structures, amortization techniques and income tax rates between companies in the same industry. While other companies, investors or investment analysts may not utilize the same method of calculating EBITDA (or adjustments thereto), the Company believes its adjusted base EBITDA metric, in particular, results in a better comparison of the Company's underlying operations against its peers and a better indicator of recurring results from operations as compared to other non-IFRS financial measures.
Neither EBITDA, adjusted EBITDA or adjusted base EBITDA have standardized meaning under IFRS. Consequently, they should not be considered in isolation, nor should they be used in substitute for measures of performance prepared in accordance with IFRS.
The following table outlines how our EBITDA, Adjusted EBITDA and Adjusted base EBITDA measures are determined:
| | | 3 months ended | |
| (in thousands $) | | Mar. 31,
2020 | | | Mar. 31,
2019 | |
| Net income for the periods | | | 1,062 | | | | 2,847 | |
| Adjustments: | | | | | | | | |
| Interest expense | | | 236 | | | | 244 | |
| Provision (recovery) for income taxes | | | 1,865 | | | | 659 | |
| Depreciation and amortization | | | 988 | | | | 829 | |
| EBITDA | | | 4,151 | | | | 4,579 | |
| | | | | | | | | |
| Other adjustments: | | | | | | | | |
| (Gains) losses on investments (1) | | | 4,352 | | | | (55 | ) |
| Non-cash stock-based compensation | | | 98 | | | | 1,247 | |
| Other expenses (2) | | | (414 | ) | | | 1,147 | |
| Adjusted EBITDA | | | 8,187 | | | | 6,918 | |
| | | | | | | | | |
| Other adjustments: | | | | | | | | |
| Carried interest and performance fees | | | — | | | | — | |
| Carried interest and performance fee related expenses | | | — | | | | — | |
| Adjusted base EBITDA | | | 8,187 | | | | 6,918 | |
| Operating margin (3) | | | 43 | % | | | 39 | % |
| (1) | This adjustment removes the income effects of certain gains or losses on short-term investments, co-investments and digital gold strategies to ensure the reporting objectives of our EBITDA metric as described above are met. |
| (2) | See Other expenses in Note 6 of the interim financial statements. In addition to the items outlined in Note 6, Other expenses also includes severance and new hire accruals of $0.7 million for the 3 months ended (3 months ended March 31, 2019 - $0.1 million). |
| (3) | Calculated as adjusted base EBITDA inclusive of depreciation and amortization, and excluding income related to legacy balance sheet loans. This figure is then divided by revenues, net of direct costs as applicable. |
| | | 4 |
BUSINESS OVERVIEW
Our reportable operating segments are as follows:

Exchange Listed Products
| • | The Company's closed-end physical trusts and exchange traded funds ("ETFs"). |
Managed Equities
| • | The Company's alternative investment strategies (open-end, closed-end) managed in-house and on a sub-advised basis. |
Lending
| • | The Company's lending activities primarily occur through limited partnership vehicles ("lending LPs"). |
Brokerage
| • | The Company's regulated broker-dealer activities (primarily equity origination, corporate advisory, sales and trading activities), in the U.S. and Canada. |
Corporate
| • | Provides the Company's various operating segments with capital, balance sheet management and other shared services. |
All Other Segments
| • | Contains all non-reportable segments as per IFRS 8, Operating Segments ("IFRS 8"). See Note 12 of the interim financial statements for further details. |
| | | 5 |
For a detailed account of the underlying principal subsidiaries within our reportable business segments, refer to the Company's Annual Information Form and Note 2 of the annual financial statements.
| | | 6 |
BUSINESS HIGHLIGHTS AND GROWTH INITIATIVES
Investment Performance
Market value depreciation was $885 million during the quarter. The Company was impacted by lower silver prices in our exchange listed products and weak equity market valuations in our managed equities fund products that occurred during the last two weeks of March. Subsequent to quarter end, the Company recovered these unrealized losses as silver and global equity markets rebounded from their March lows.
Product and Business Line Expansion
On January 17, 2020, the Company successfully closed on the acquisition of Tocqueville Asset Management's gold strategies ("the Acquisition"). Based on AUM valuations as at January 17, 2020, the Acquisition added approximately $1.7 billion to the Company's total AUM. The Acquisition cost was $15 million ($12.5 million in cash and Sprott Inc. common shares valued at $2.5 million). Contingent consideration valued up to an additional $35 million in cash and Sprott Inc. shares is payable subject to the achievement of certain financial performance conditions over the two years following the closing of the Acquisition.
Other Matters
While the Company’s functional currency is the Canadian dollar, its presentation currency has switched to US dollars effective January 1, 2020, with the prior period figures restated accordingly. We believe the US dollar better reflects the Company’s consolidated financial position and results of operations given the significance of our revenues denominated in US dollars that further increased in 2020 with the January 17, 2020 close of the Acquisition.
| | | 7 |
OUTLOOK
Exchange Listed Products
We expect this segment to benefit from an increasingly constructive gold and silver pricing environment in 2020 as more than 98% of this segment’s AUM is directly or indirectly impacted by gold and silver price changes, net of redemptions.
Managed Equities
The Acquisition contributed approximately $1.7 billion of AUM to this segment as at quarter-end. We anticipate the Acquisition AUM to be immediately accretive to operating margins, net of anticipated near-term redemptions.
Lending
| • | Effective 2020, this segment’s revenues will be generated primarily from two sources: management fees and co-investment income (included in finance income). |
| • | Our lending strategies had approximately $839 million in AUM at the end of first quarter, earning a blended net management fee rate of approximately 94bps. We expect capital calls (net of capital distributions) in 2020 to be in the range of $100 million to $200 million, based on our lending team's current view of the loan market and their expectations of possible repayments. |
Brokerage
We anticipate flat year-over-year performance in this segment.
Corporate & Other Non-reportable Segments
We anticipate higher year-over-year operating costs (primarily relating to higher SG&A and compensation expense on increased U.S. operating activities) and lower EBITDA contribution from non-reportable segments. (see “Elimination and all other segments” column of the segment table in Note 12 of the interim financial statements).
COVID-19
The changing economic and market climate as a result of COVID-19 has led to the Company implementing its business continuity plan. Our portfolio managers, brokerage professionals, enterprise shared services teams and key outsource service providers are fully operational. While the exact impacts of COVID-19 over the short and long-term are undeterminable at the date of this report, management believes the effects of COVID-19 we have witnessed thus far, and in particular, world government responses thereto via fiscal and monetary policy, will continue to be highly constructive to precious metals markets.
| | | 8 |
SUMMARY FINANCIAL INFORMATION
| (In thousands $) | | Q1
2020 | | | Q4
2019 | | | Q3
2019 | | | Q2
2019 | | | Q1
2019 | | | Q4
2018 | | | Q3
2018 | | | Q2
2018 | |
| SUMMARY INCOME STATEMENT | | | | | | | | | | | | | | | | | | | | | | | | | | | | | | | | |
| Management fees | | | 15,125 | | | | 10,685 | | | | 10,577 | | | | 9,962 | | | | 10,195 | | | | 9,979 | | | | 10,498 | | | | 11,279 | |
| Carried interest and performance fees | | | — | | | | 1,811 | | | | — | | | | — | | | | — | | | | — | | | | — | | | | 531 | |
| less: Trailer and sub-advisor fees | | | 154 | | | | 966 | | | | 50 | | | | 67 | | | | — | | | | 29 | | | | 34 | | | | 38 | |
| less: Carried interest and performance fee payouts | | | — | | | | 86 | | | | — | | | | — | | | | — | | | | — | | | | — | | | | 276 | |
| Net Fees | | | 14,971 | | | | 11,444 | | | | 10,527 | | | | 9,895 | | | | 10,195 | | | | 9,950 | | | | 10,464 | | | | 11,496 | |
| Commissions | | | 5,179 | | | | 6,599 | | | | 6,056 | | | | 3,293 | | | | 3,315 | | | | 4,855 | | | | 3,499 | | | | 5,823 | |
| less: Commission expense | | | 1,870 | | | | 2,658 | | | | 2,654 | | | | 1,356 | | | | 1,386 | | | | 2,047 | | | | 1,872 | | | | 2,092 | |
| Net Commissions | | | 3,309 | | | | 3,941 | | | | 3,402 | | | | 1,937 | | | | 1,929 | | | | 2,808 | | | | 1,627 | | | | 3,731 | |
| Finance income (1) | | | 914 | | | | 2,481 | | | | 2,561 | | | | 3,435 | | | | 2,946 | | | | 3,213 | | | | 3,691 | | | | 2,551 | |
| Gains (losses) on investments | | | (4,352 | ) | | | (1,252 | ) | | | 600 | | | | (408 | ) | | | 5 | | | | 5,238 | | | | (3,761 | ) | | | (2,419 | ) |
| Other income (loss) | | | 113 | | | | 623 | | | | 91 | | | | (194 | ) | | | 77 | | | | 173 | | | | 209 | | | | 2,389 | |
| Total Net Revenues | | | 14,955 | | | | 17,237 | | | | 17,181 | | | | 14,665 | | | | 15,152 | | | | 21,382 | | | | 12,230 | | | | 17,748 | |
| | | | | | | | | | | | | | | | | | | | | | | | | | | | | | | | | |
| Compensation (2) | | | 7,588 | | | | 7,371 | | | | 6,891 | | | | 5,468 | | | | 6,306 | | | | 8,450 | | | | 6,248 | | | | 8,238 | |
| Compensation - severance and new hire accruals | | | 667 | | | | 154 | | | | 169 | | | | 639 | | | | 109 | | | | 29 | | | | 275 | | | | — | |
| Placement and referral fees | | | 86 | | | | 434 | | | | 114 | | | | 251 | | | | 58 | | | | 279 | | | | 171 | | | | 115 | |
| Selling, general and administrative | | | 3,544 | | | | 2,986 | | | | 3,175 | | | | 3,256 | | | | 3,062 | | | | 3,157 | | | | 2,604 | | | | 3,800 | |
| Interest expense | | | 236 | | | | 269 | | | | 297 | | | | 226 | | | | 244 | | | | 236 | | | | 20 | | | | 12 | |
| Amortization and impairment charges | | | 988 | | | | 1,254 | | | | 893 | | | | 819 | | | | 829 | | | | 453 | | | | 350 | | | | 353 | |
| Other expenses | | | (1,081 | ) | | | 2,376 | | | | (167 | ) | | | 2,764 | | | | 1,038 | | | | (1,225 | ) | | | 1,024 | | | | 157 | |
| Total Expenses | | | 12,028 | | | | 14,844 | | | | 11,372 | | | | 13,423 | | | | 11,646 | | | | 11,379 | | | | 10,692 | | | | 12,675 | |
| | | | | | | | | | | | | | | | | | | | | | | | | | | | | | | | | |
| Net Income | | | 1,062 | | | | 1,445 | | | | 4,336 | | | | 1,581 | | | | 2,847 | | | | 7,442 | | | | 1,511 | | | | 4,583 | |
| Net Income per share | | | 0.01 | | | | 0.01 | | | | 0.02 | | | | 0.01 | | | | 0.01 | | | | 0.03 | | | | 0.01 | | | | 0.02 | |
| Adjusted base EBITDA | | | 8,187 | | | | 7,441 | | | | 7,612 | | | | 7,032 | | | | 6,918 | | | | 7,639 | | | | 7,426 | | | | 8,279 | |
| Adjusted base EBITDA per share | | | 0.03 | | | | 0.03 | | | | 0.03 | | | | 0.03 | | | | 0.03 | | | | 0.03 | | | | 0.03 | | | | 0.03 | |
| Operating margin | | | 43 | % | | | 38 | % | | | 36 | % | | | 39 | % | | | 39 | % | | | 38 | % | | | 36 | % | | | 39 | % |
| | | | | | | | | | | | | | | | | | | | | | | | | | | | | | | | | |
| SUMMARY BALANCE SHEET | | | | | | | | | | | | | | | | | | | | | | | | | | | | | | | | |
| Total Assets | | | 318,318 | | | | 324,943 | | | | 325,442 | | | | 338,530 | | | | 332,504 | | | | 313,895 | | | | 310,055 | | | | 314,214 | |
| Total Liabilities | | | 65,945 | | | | 53,313 | | | | 51,774 | | | | 68,008 | | | | 54,009 | | | | 40,386 | | | | 28,185 | | | | 28,290 | |
| | | | | | | | | | | | | | | | | | | | | | | | | | | | | | | | | |
| Total AUM | | | 10,734,831 | | | | 9,252,515 | | | | 8,548,982 | | | | 8,103,723 | | | | 7,909,488 | | | | 7,756,582 | | | | 7,776,062 | | | | 8,653,684 | |
| Average AUM | | | 11,007,781 | | | | 8,932,651 | | | | 8,608,001 | | | | 7,898,334 | | | | 7,887,089 | | | | 7,599,173 | | | | 7,964,464 | | | | 8,715,059 | |
| (1) | Finance income includes: (1) interest income from on-balance sheet loans and brokerage client accounts; (2) co-investment income from lending LP units; and (3) ancillary income earned directly or indirectly from lending activities. |
| (2) | See 'Compensation' in the key performance indicators (non-IFRS financial measures) section of this MD&A. |
| | | 9 |
SUMMARY MANAGEMENT FEE BREAKDOWN
Below is a detailed list of management fee rates on our fund products as at March 31, 2020 (in millions $):
| FUND | | AUM | | | BLENDED NET
MANAGEMENT
FEE RATE | | | CARRIED INTEREST &
PERFORMANCE FEE
CRITERIA |
| Exchange Listed Products | | | | | | | | | | |
| Sprott Physical Gold Trust | | | 2,954 | | | | 0.35 | % | | N/A (1) |
| Sprott Physical Gold and Silver Trust | | | 2,809 | | | | 0.40 | % | | N/A (1) |
| Sprott Physical Silver Trust | | | 914 | | | | 0.45 | % | | N/A (1) |
| Sprott Gold Miner's ETF | | | 146 | | | | 0.35 | % | | N/A (1) |
| Sprott Physical Platinum & Palladium Trust | | | 121 | | | | 0.50 | % | | N/A (1) |
| Sprott Jr. Gold Miner's ETF | | | 41 | | | | 0.35 | % | | N/A (1) |
| Total | | | 6,985 | | | | 0.39 | % | | |
| | | | | | | | | | | |
| Managed Equities: Precious Metals Strategies | | | | | | | | | | |
| Sprott Gold Equity Fund | | | 781 | | | | 0.75 | % | | N/A |
| Institutional Accounts | | | 603 | | | | 0.31 | % | | 0-20% of all net profits in excess of the HWM |
| Fixed Term Limited Partnerships | | | 195 | | | | 1.70 | % | | 15-30% over preferred return |
| Bullion Funds (2) | | | 155 | | | | 0.33 | % | | N/A |
| Corporate Class Funds (2) | | | 86 | | | | 0.75 | % | | 5% excess over applicable benchmark indices |
| Gold and Precious Minerals Fund (2) | | | 71 | | | | 1.00 | % | | 5% excess over applicable benchmark indices |
| Sprott Hathaway Special Situations Fund | | | 28 | | | | 1.50 | % | | 20% of net profits over preferred return |
| Total | | | 1,919 | | | | 0.69 | % | | |
| | | | | | | | | | | |
| Managed Equities: Other | | | | | | | | | | |
| Sprott U.S. Value Strategies | | | 166 | | | | 1.00 | % | | N/A |
| Flow-through LPs (2) | | | 34 | | | | 0.70 | % | | 10% of all net profits in excess of the HWM |
| Legacy Managed Accounts (3) | | | 9 | | | | 1.00 | % | | N/A |
| Total | | | 209 | | | | 0.95 | % | | |
| | | | | | | | | | | |
| Lending | | | | | | | | | | |
| Sprott private resource lending LPs | | | 839 | | | | 0.94 | % | | 15-70% of net profits over preferred return |
| | | | | | | | | | | |
| Other | | | | | | | | | | |
| Managed Companies (4) | | | 586 | | | | 0.50 | % | | 20% of net profits over preferred return |
| Separately Managed Accounts (5) | | | 197 | | | | 0.61 | % | | 20% of net profits over preferred return |
| Total | | | 783 | | | | 0.53 | % | | |
| | | | | | | | | | | |
| Total AUM | | | 10,735 | | | | 0.51 | % | | |
| (1) Exchange listed products do not generate performance fees, however the management fees they generate are closely correlated to precious metals prices. |
| (2) Management fee rate represents the net amount received by the Company. |
| (3) Institutional managed accounts. |
| (4) Includes Sprott Korea Corp. |
| (5) Includes our private equity strategy in Sprott Asia and high net worth discretionary managed accounts in the U.S. |
| | | 10 |
RESULTS OF OPERATIONS
AUM SUMMARY
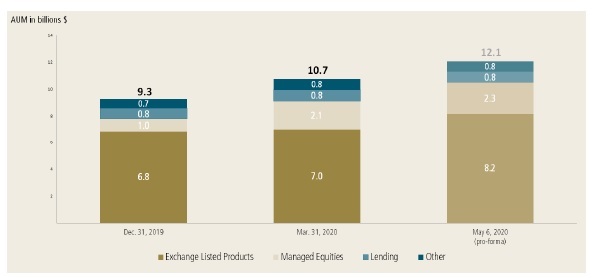
AUM was $10.7 billion as at March 31, 2020, up $1.5 billion (16%) from December 31, 2019. On a three months ended basis, we benefited from the Acquisition, which added $1.7 billion to our precious metals strategies. We also benefited from strong inflows to our physical trusts and private equity strategies in Asia (see "Other" in the table below). Additionally, we benefited from new capital calls and commitment fee earning assets being added to our lending platform. These increases were partially offset by market value depreciation from lower silver prices and weak equity market valuations that occurred during the last two weeks of March. Subsequent to quarter end, the Company recovered these unrealized losses as silver and global equity markets rebounded from their March lows.
3 months results
| (In millions $) | | AUM
Dec 31, 2019 | | | Net
Inflows (1) | | | Market
Value
Changes | | | Other (2) | | | AUM
Mar. 31, 2020 | |
| Exchange Listed Products | | | | | | | | | | | | | | | | | | | | |
| - Physical Trusts | | | 6,579 | | | | 474 | | | | (255 | ) | | | — | | | | 6,798 | |
| - ETFs | | | 252 | | | | (9 | ) | | | (56 | ) | | | — | | | | 187 | |
| | | | 6,831 | | | | 465 | | | | (311 | ) | | | — | | | | 6,985 | |
| | | | | | | | | | | | | | | | | | | | | |
| Managed Equities | | | | | | | | | | | | | | | | | | | | |
| - Precious Metals Strategies | | | 601 | | | | (30 | ) | | | (393 | ) | | | 1,741 | | | | 1,919 | |
| - Other | | | 350 | | | | (4 | ) | | | (137 | ) | | | — | | | | 209 | |
| | | | 951 | | | | (34 | ) | | | (530 | ) | | | 1,741 | | | | 2,128 | |
| | | | | | | | | | | | | | | | | | | | | |
| Lending | | | 783 | | | | 63 | | | | (6 | ) | | | (1 | ) | | | 839 | (3) |
| | | | | | | | | | | | | | | | | | | | | |
| Other | | | 688 | | | | 133 | | | | (38 | ) | | | — | | | | 783 | |
| | | | | | | | | | | | | | | | | | | | | |
| Total | | | 9,253 | | | | 627 | | | | (885 | ) | | | 1,740 | | | | 10,735 | |
| (1) See 'Net Inflows' in the key performance indicators (non-IFRS financial measures) section of this MD&A. |
| (2) Includes new AUM from fund acquisitions and lost AUM from fund divestitures and capital distributions of our lending LPs. |
| (3) $1.3 billion of committed capital remains uncalled, of which $506 million earns a commitment fee (AUM), and $748 million does not (future AUM). |
| | | 11 |
| KEY REVENUE LINES Management fees in the quarter were $15.1 million, up $4.9 million (48%) from the prior period. Net fees were $15 million, up $4.8 million (47%) from the prior period. Net fees increased in the quarter due to the Acquisition in our managed equities segment and strong net inflows in our exchange listed products segment. We also benefited from higher fees in our lending segment as we continue to grow AUM in this area. 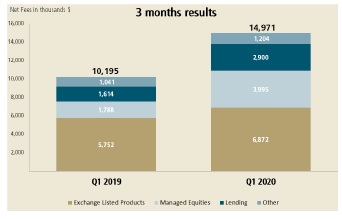
Finance Income in the quarter was $0.9 million, down $2 million (69%) from the prior period. Finance income primarily includes interest income from legacy loans, interest income from our co-investments in LP units and other ancillary income earned directly or indirectly from lending activities. Lower finance income in the quarter was primarily due to the repayment of legacy balance sheet loans and higher capital distribution levels in our lending LPs in 2019. Commission revenues in the quarter were $5.2 million, up $1.9 million (56%) from the prior period. Net Commissions in the quarter were $3.3 million, up $1.4 million (72%) from the prior period. The increase in the quarter was due to improved equity origination, sales and trading activities in our brokerage segment. | KEY EXPENSE LINES Compensation was $7.6 million, up $1.3 million (20%) from the prior period. The increase in the quarter was primarily due to higher salaries from new hires related to the Acquisition and higher AIP on increased revenues across the Company. These increases were partially offset by lower LTIP amortization. 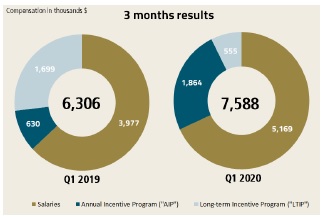
SG&A was $3.5 million in the quarter, up $0.5 million (16%) from the prior period. The increase was largely from the expansion of our managed equities segment related to the Acquisition. EARNINGS Net income in the quarter was $1.1 million, down $1.8 million (63%). Adjusted base EBITDA in the quarter was $8.2 million, up $1.3 million (18%) from the prior period. Net income was negatively impacted by unrealized losses on our investments. Adjusted base EBITDA benefited from the Acquisition in our managed equities segment and increased fees from strong net flows in our exchange listed products segment. We also benefited from increased commission revenues in our brokerage segment. These increases were partially offset by lower finance income in our lending segment given the repayment of legacy balance sheet loans and higher capital distribution levels in our lending LPs in 2019. |
| | | 12 |
| ADDITIONAL REVENUES AND EXPENSES Investments losses were mainly due to unrealized market value depreciation of certain equity holdings, co-investments and digital gold strategies. Other income, placement and referral fees were nominal for the quarter and interest expense was largely flat year-over-year. Amortization of intangibles was flat for the quarter and amortization of property and equipment was higher in the quarter mainly due to increased depreciation expense related to a new lease attributable to the Acquisition. Other expenses were lower in the quarter primarily due to FX translation gains in the current period. | |
| | BALANCE SHEET Total Assets were $318 million, down $7 million (2%) from December 31, 2019. The decrease was primarily due to a decline in the value of certain investments. Total Liabilities were $66 million, up $13 million (24%) from December 31, 2019. The increase was primarily due to an accrual of contingent consideration related to the Acquisition. Total Shareholder's Equity was $252 million, down $19 million (7%) from December 31, 2019. |
| | | 13 |
REPORTABLE OPERATING SEGMENTS
Exchange Listed Products
| | | 3 months ended | |
| (In thousands $) | | Mar. 31, 2020 | | | Mar. 31, 2019 | |
| SUMMARY INCOME STATEMENT | | | | | | | | |
| Management fees | | | 6,872 | | | | 5,752 | |
| Other income (loss) | | | 5 | | | | — | |
| Total Revenues | | | 6,877 | | | | 5,752 | |
| | | | | | | | | |
| Compensation | | | 1,004 | | | | 790 | |
| Selling, general and administrative | | | 607 | | | | 677 | |
| Interest expense | | | 116 | | | | 206 | |
| Amortization and impairment charges | | | 233 | | | | 239 | |
| Other expenses | | | (1,026 | ) | | | 268 | |
| Total Expenses | | | 934 | | | | 2,180 | |
| | | | | | | | | |
| Income before income taxes | | | 5,943 | | | | 3,572 | |
| Adjusted base EBITDA | | | 5,282 | | | | 4,285 | |
| Operating margin | | | 75 | % | | | 74 | % |
| | | | | | | | | |
| Total AUM | | | 6,985,240 | | | | 5,799,618 | |
| Average AUM | | | 7,069,230 | | | | 5,932,553 | |
3 months ended
Income before income taxes in the quarter was $5.9 million, up $2.4 million (66%) from the prior period. Adjusted base EBITDA in the quarter was $5.3 million, up $1 million (23%) from the prior period. Our three months ended results were positively impacted by higher average AUM given strong inflows this quarter which more than offset higher compensation.
| | | 14 |
Managed Equities
| | | 3 months ended | |
| (In thousands $) | | Mar. 31, 2020 | | | Mar. 31, 2019 | |
| SUMMARY INCOME STATEMENT | | | | | | | | |
| Management fees | | | 4,181 | | | | 1,819 | |
| less: Trailer and sub-advisor fees | | | 186 | | | | 31 | |
| Net Fees | | | 3,995 | | | | 1,788 | |
| Gains (losses) on investments | | | (2,700 | ) | | | 454 | |
| Other income (loss) | | | 71 | | | | 107 | |
| Total Net Revenues | | | 1,366 | | | | 2,349 | |
| | | | | | | | | |
| Compensation | | | 1,464 | | | | 1,642 | |
| Selling, general and administrative | | | 647 | | | | 428 | |
| Interest expense | | | 82 | | | | — | |
| Amortization and impairment charges | | | 50 | | | | 55 | |
| Other expenses | | | (1,147 | ) | | | (52 | ) |
| Total Expenses | | | 1,096 | | | | 2,073 | |
| | | | | | | | | |
| Income before income taxes | | | 270 | | | | 276 | |
| Adjusted base EBITDA | | | 2,053 | | | | 688 | |
| Operating margin | | | 49 | % | | | 33 | % |
| | | | | | | | | |
| Total AUM | | | 2,128,134 | | | | 836,048 | |
| Average AUM | | | 2,416,764 | | | | 807,073 | |
3 months ended
Income before income taxes was $0.3 million, largely flat for the quarter. Higher management fees related to the Acquisition were largely offset by unrealized market value losses on our co-investments that occurred primarily during the last two weeks of March. Subsequent to quarter end, the Company recovered these unrealized losses as global equity markets rebounded from their March lows. Adjusted base EBITDA in the quarter was $2.1 million, up $1.4 million from the prior period. Adjusted base EBITDA was higher in the quarter as a result of increased management fees from the Acquisition, partially offset by higher SG&A.
| | | 15 |
Lending
| | | 3 months ended | |
| (In thousands $) | | Mar. 31, 2020 | | | Mar. 31, 2019 | |
| SUMMARY INCOME STATEMENT | | | | | | | | |
| Management fees | | | 2,900 | | | | 1,614 | |
| Finance income (1) | | | 800 | | | | 2,489 | |
| Gains (losses) on investments | | | 1,437 | | | | (1,076 | ) |
| Other income (loss) | | | 38 | | | | 8 | |
| Total Revenues | | | 5,175 | | | | 3,035 | |
| | | | | | | | | |
| Compensation | | | 1,570 | | | | 1,022 | |
| Placement and referral fees | | | 8 | | | | 6 | |
| Selling, general and administrative | | | 194 | | | | 89 | |
| Interest expense | | | 3 | | | | — | |
| Amortization and impairment charges | | | 26 | | | | 27 | |
| Other expenses | | | (2,324 | ) | | | 490 | |
| Total Expenses | | | (523 | ) | | | 1,634 | |
| | | | | | | | | |
| Income before income taxes | | | 5,698 | | | | 1,401 | |
| Adjusted base EBITDA | | | 2,038 | | | | 3,042 | |
| Operating margin | | | 61 | % | | | 63 | % |
| | | | | | | | | |
| Total AUM (2) | | | 839,478 | | | | 547,210 | |
| Average AUM | | | 807,882 | | | | 425,784 | |
| (1) | Includes: (1) co-investment income from lending LP units held as part of our co-investment portfolio; and (2) interest income from on-balance sheet loans in the prior period. |
| (2) | $1.3 billion of committed capital remains uncalled, of which $506 million earns a commitment fee (AUM), and $748 million does not (future AUM). |
3 months ended
Income before income taxes was $5.7 million, up $4.3 million from the prior period. Adjusted base EBITDA in the quarter was $2 million, down $1 million (33%) from the prior period. Higher income before income taxes was primarily due to unrealized market value appreciation of co-investments and FX translation gains in the current period. However, Adjusted base EBITDA was primarily impacted by lower finance income on higher capital distribution levels in 2019 and the full repayment of legacy loans in the third quarter of 2019. Lower finance income more than offset increased management fees in the period.
| | | 16 |
Brokerage
| | | 3 months ended | |
| (In thousands $) | | Mar. 31, 2020 | | | Mar. 31, 2019 | |
| SUMMARY INCOME STATEMENT | | | | | | | | |
| Commissions | | | 4,771 | | | | 3,238 | |
| less: Commission expense | | | 1,870 | | | | 1,401 | |
| Net Commissions | | | 2,901 | | | | 1,837 | |
| Management fees | | | 400 | | | | 280 | |
| Finance income | | | 114 | | | | 457 | |
| Gains (losses) on investments | | | (217 | ) | | | 223 | |
| Other income | | | 28 | | | | 16 | |
| Total Net Revenues | | | 3,226 | | | | 2,813 | |
| | | | | | | | | |
| Compensation (1) | | | 1,701 | | | | 1,810 | |
| Placement and referral fees | | | — | | | | 44 | |
| Selling, general and administrative | | | 1,186 | | | | 1,119 | |
| Interest expense | | | 12 | | | | 16 | |
| Amortization and impairment charges | | | 130 | | | | 140 | |
| Other expenses | | | 37 | | | | (33 | ) |
| Total Expenses | | | 3,066 | | | | 3,096 | |
| | | | | | | | | |
| Income (loss) before income taxes | | | 160 | | | | (283 | ) |
| Adjusted base EBITDA | | | 953 | | | | 2 | |
| Operating margin | | | 26 | % | | | (7 | )% |
| (1) | Compensation is presented excluding commission expense, which is reported net of commission revenue. |
3 months ended
Income before income taxes was $0.2 million, up $0.4 million from the prior period. Adjusted base EBITDA in the quarter was $1 million, up $1 million from the prior period. Our three months ended results were positively impacted by improved equity origination, sales and trading activities.
| | | 17 |
Corporate
This segment is primarily a cost centre that provides capital, balance sheet management and shared services to the Company's subsidiaries.
| | | 3 months ended | |
| (In thousands $) | | Mar. 31, 2020 | | | Mar. 31, 2019 | |
| SUMMARY INCOME STATEMENT | | | | | | | | |
| Gains (losses) on investments | | | (2,214 | ) | | | (203 | ) |
| Other income (loss) | | | 12 | | | | 13 | |
| Total Revenues | | | (2,202 | ) | | | (190 | ) |
| | | | | | | | | |
| Compensation | | | 2,152 | | | | 667 | |
| Selling, general and administrative | | | 575 | | | | 604 | |
| Interest expense | | | 23 | | | | 22 | |
| Amortization and impairment charges | | | 543 | | | | 363 | |
| Other expenses | | | 488 | | | | 175 | |
| Total Expenses | | | 3,781 | | | | 1,831 | |
| | | | | | | | | |
| Income (loss) before income taxes | | | (5,983 | ) | | | (2,021 | ) |
| Adjusted base EBITDA | | | (2,555 | ) | | | (1,272 | ) |
3 months ended
| • | Net investments losses were due to market value depreciation of certain equity holdings. |
| • | Compensation increased due to the Acquisition, increased executive involvement in our US businesses and higher AIP accruals on higher revenues across the Company. |
| • | SG&A decreased in the quarter due to our ongoing multi-year cost containment program. |
| • | Higher amortization was due to increased depreciation expense due to a new lease. |
| • | Other expenses was primarily due to FX translation movements (CAD-to-USD). |
| | | 18 |
Dividends
The following dividends were declared by the Company during the three months ended March 31, 2020:
| Record date | | Payment Date | | Cash dividend per share
(CAD $) | | | Total dividend
amount (in
thousands $) | |
| March 09, 2020 - Regular Dividend Q4 - 2019 | | March 24, 2020 | | | 0.03 | | | | 5,387 | |
| Dividends (1) | | | | | | | | | 5,387 | |
| (1) | Subsequent to quarter-end, on May 7, 2020, a regular dividend of CAD$0.03 per common share was declared for the quarter ended March 31, 2020. This dividend is payable on June 3, 2020 to shareholders of record at the close of business on May 19, 2020. |
Capital Stock
Including the 10 million unvested common shares currently held in the EPSP Trust (December 31, 2019 - 9 million), total capital stock issued and outstanding was 253.7 million (December 31, 2019 - 253.1 million).
Earnings per share for the current and prior periods have been calculated using the weighted average number of shares outstanding during the respective periods. Basic and diluted earnings per share were $0.01 for the quarter compared to $0.01 in the prior period. Diluted earnings per share reflects the dilutive effect of in-the-money stock options, unvested shares held in the EPSP Trust and outstanding restricted stock units.
A total of 3.3 million stock options are outstanding pursuant to our stock option plan, all of which are exercisable.
| | | 19 |
Liquidity and Capital Resources
As at March 31, 2020, the Company had $18.2 million (December 31, 2019 - $15.3 million) outstanding on its credit facility, $3.5 million of which is due within 12 months and $14.7 million is due after 12 months (December 31, 2019 - $3.8 million and $11.5 million respectively).
The Company has a 5 year, CAD$90 million credit facility with a major Canadian schedule I chartered bank. The facility consists of a CAD$25 million term loan and a CAD$65 million revolving line of credit. Amounts may be borrowed under the facility through prime rate loans or bankers’ acceptances. Amounts may also be borrowed in U.S. dollars through base rate loans. In 2019, the Company drew CAD$25 million on the term loan portion of the credit facility to avoid its expiry and to partially fund anticipated growth in the business over the next 12-18 months. As at March 31, 2020, the Company was in compliance with all covenants, terms and conditions under the credit facility. Key terms under the credit facility are noted below:
Structure
| • | 5-year, CAD$65 million revolver with "bullet maturity" December 31, 2022 |
| • | 5-year, CAD $25 million term loan with 5% of principal amortizing quarterly, with the remaining balance maturing on December 31, 2022 |
Interest Rate
| • | Banker Acceptance Rate + 170 bps |
Covenant Terms
| • | Minimum AUM: CAD$8.2 billion |
| • | Debt to EBITDA less than 2.5:1 |
| • | EBITDA to interest expense more than 2.5:1 |
Commitments
Besides the Company's long-term lease agreements, there are commitments to make co-investments in lending LPs arising from our lending segment or commitments to make investments in the net investments portfolio of the Company. As at March 31, 2020, the Company had $3.5 million in co-investment commitments from the lending segment (December 31, 2019 - $6.6 million).
| | | 20 |
Significant Accounting Judgments, Estimates and Changes in Accounting Policies
The interim financial statements have been prepared in accordance with IFRS standards in effect as at March 31, 2020, specifically, IAS 34 Interim Financial Reporting.
Compliance with IFRS requires the Company to exercise judgment, make estimates and assumptions that affect the reported amount of assets and liabilities and disclosure of contingent assets and liabilities at the date of the financial statements and the reported amounts of revenues and expenses during the reporting period. Actual results may vary. Except as otherwise noted, significant accounting judgments and estimates are described in Note 2 of the December 31, 2019 annual audited financial statements and have been applied consistently to the interim financial statements as at and for the three months ended March 31, 2020.
Change in presentation currency
Effective January 1, 2020, the Company changed its presentation currency from Canadian to US dollars to better reflect the Company's business activities, given the significance of our revenues denominated in US dollars that further increased in 2020 with the January 17, 2020 close of the Acquisition.
The Company followed the guidance of IAS 21 Effects of Changes in Foreign Exchange Rates ("IAS 21") and have applied the change retroactively. As a result, the Company has restated prior year comparatives, including the January 1 opening balance sheet as required by IFRS 1. The change in presentation currency had the following effect:
| • | Assets and liabilities have been translated at the exchange rate on the respective reporting dates; |
| • | Equity transactions have been translated at the historical exchange rate at the date of the transaction; |
| • | The statements of operations has been translated at the average exchange rate on the respective reporting dates; |
| • | Exchange differences arising on translation are presented in the Accumulated other comprehensive income line in shareholders' equity on the balance sheet. |
Contingent consideration
The Acquisition necessitated the recognition of contingent consideration for the amounts payable in cash and shares under the terms of the purchase agreement. The cash settled portion of the contingent consideration has been measured at the closing date fair value, based on management’s estimate of the level of future revenue obtained from the contracts over the contingent consideration measurement period. The equity settled portion of the contingent consideration has been measured at its grant date fair value in accordance with the requirements of IFRS 2 Share-based Payment. The key judgments utilized in the estimation of the contingent consideration were fund flow assumptions. As at March 31, 2020, there was no change to the estimate of the contingent consideration.
| | | 21 |
Managing Risk: Financial
COVID-19 risk
The changing economic and market climate as a result of COVID-19 has led to the Company implementing its business continuity plan. Our portfolio managers, brokerage professionals, enterprise shared services teams and key outsource service providers are fully operational. While the exact impacts of COVID-19 over the short and long-term are undeterminable at the date of this report, management believes the effects of COVID-19 we have witnessed thus far, and in particular, world government responses thereto via fiscal and monetary policy, will continue to be highly constructive to precious metals markets.
Market risk
The Company separates market risk into three categories: price risk, interest rate risk and foreign currency risk.
Price risk
Price risk arises from the possibility that changes in the price of the Company's on and off-balance sheet assets and liabilities will result in changes in carrying value or recoverable amounts. The Company's revenues are also exposed to price risk since management fees, carried interests and performance fees are correlated with AUM, which fluctuates with changes in the market values of the assets in the funds and managed accounts managed by the Company.
Interest rate risk
Interest rate risk arises from the possibility that changes in interest rates will adversely affect the value of, or cash flows from, financial instrument assets. The Company’s earnings, particularly through its lending segment, are exposed to volatility as a result of sudden changes in interest rates. Management takes into account a number of factors and is committed to several processes to ensure that this risk is appropriately managed.
Foreign currency risk
The Company enters into transactions that are denominated primarily in U.S. dollar and Canadian dollar. Foreign currency risk arises from foreign exchange rate movements that could negatively impact either the carrying value of financial assets and liabilities or the related cash flows which are denominated in currencies other than the functional currency of the Company and its subsidiaries. The Company may employ certain hedging strategies to mitigate foreign currency risk.
Credit risk
Credit risk is the risk that a borrower will not honor its commitments and a loss to the Company may result. Credit risk generally arises in the Company's investments portfolio.
Investments
The Company incurs credit risk when entering into, settling and financing transactions with counterparties. Management takes into account a number of factors and is committed to several processes to ensure that this risk is appropriately managed.
Other
The majority of accounts receivable relate to management fees, carried interest and performance fees receivable from the funds, managed accounts and managed companies managed by the Company. These receivables are short-term in nature and any credit risk associated with them is managed by dealing with counterparties that the Company believes to be creditworthy and by actively monitoring credit exposure and the financial health of the counterparties.
| | | 22 |
Liquidity risk
Liquidity risk is the risk that the Company cannot meet a demand for cash or fund its obligations as they come due. The Company's exposure to liquidity risk is minimal as it maintains sufficient levels of liquid assets to meet its obligations as they come due. Additionally, the Company has access to a CAD$90 million committed line of credit with a major Canadian schedule I chartered bank. As part of its cash management program, the Company primarily invests in short-term debt securities issued by the Government of Canada with maturities of less than three months.
The Company's exposure to liquidity risk as it relates to our co-investments in lending LPs arises from fluctuations in cash flows from making capital calls and receiving capital distributions. The Company manages its loan co-investment liquidity risk through the ongoing monitoring of scheduled capital calls and distributions ("match funding") and through its broader treasury risk management program and enterprise capital budgeting.
Financial liabilities, including accounts payable and accrued liabilities and compensation and employee bonuses payable, are short-term in nature and are generally due within a year.
The Company's management team is responsible for reviewing resources to ensure funds are readily available to meet its financial obligations (e.g. dividend payments) as they come due, as well as ensuring adequate funds exist to support business strategies and operations growth. The Company manages liquidity risk by monitoring cash balances on a daily basis and through its broader treasury risk management program. To meet any liquidity shortfalls, actions taken by the Company could include: syndicating a portion of its loans; slowing its lending activities; cutting its dividend; drawing on the line of credit; liquidating net investments; and/or issuing common shares.
Concentration risk
A significant portion of the Company's AUM as well as its investments are focused on the natural resource sector, and in particular, precious metals related investments and transactions. In addition, from time-to-time, certain investment may be concentrated to a material degree in a single position or group of positions. Management takes into account a number of factors and is committed to several processes to ensure that this risk is appropriately managed.
Disclosure Controls and Procedures ("DC&P") and Internal Control over Financial Reporting ("ICFR")
Management is responsible for the design and operational effectiveness of DC&P and ICFR in order to provide reasonable assurance regarding the disclosure of material information relating to the Company. This includes information required to be disclosed in the Company's annual filings, interim filings and other reports filed under securities legislation, as well as the reliability of financial reporting and the preparation of financial statements for external purposes in accordance with IFRS.
Consistent with National Instrument 52-109, the Company's CEO and CFO evaluate quarterly the DC&P and ICFR. As at March 31, 2020, the Company's CEO and CFO concluded that the Company's DC&P and ICFR were properly designed and were operating effectively. In addition, there were no material changes to ICFR during the quarter, and the implementation of our business continuity plan as a result of COVID-19 has not prevented the normal function of our internal controls.
| | | 23 |
Managing Risk: Non-financial
For details around other risks managed by the Company (e.g. confidentiality of information, conflicts of interest, etc.) refer to the Company's annual report as well as the Annual Information Form available on SEDAR at www.sedar.com.
Additional information relating to the Company, including the Company's Annual Information Form is available on SEDAR at www.sedar.com
| | | 24 |