Exhibit (c)(5)
|

Project Apple Project Update 2 February 2016 Project Apple Discussion Materials 160202 v1.pptx\27 Morgan Stanley
|
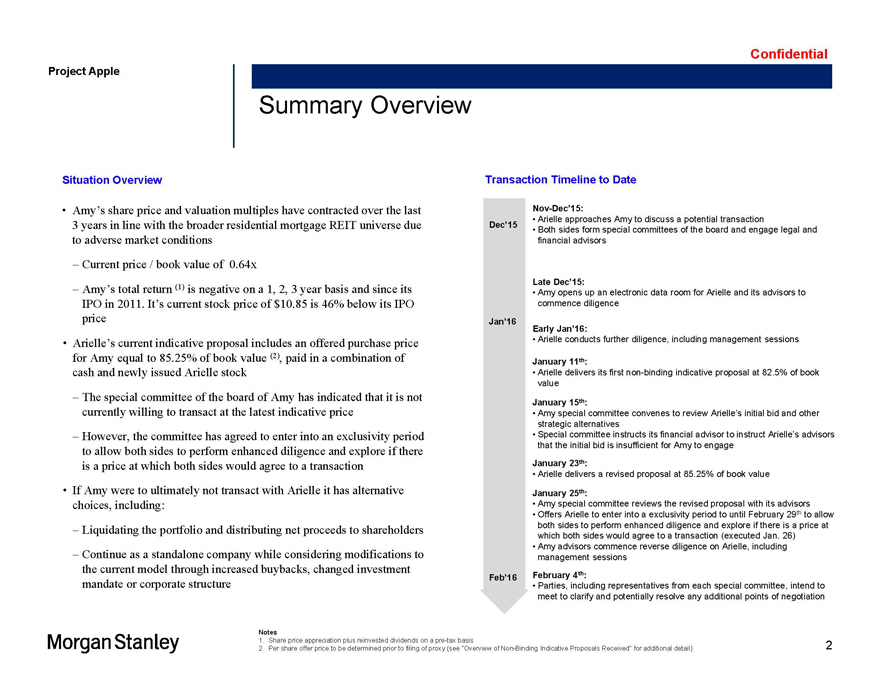
Confidential Summary Overview Project Apple 2 Dec 15 Jan 16 Feb 16 Nov-Dec 15: Arielle approaches Amy to discuss a potential transaction Both sides form special committees of the board and engage legal and financial advisors Late Dec 15: Amy opens up an electronic data room for Arielle and its advisors to commence diligence Early Jan 16: Arielle conducts further diligence, including management sessions January 11th: Arielle delivers its first non-binding indicative proposal at 82.5% of book value Transaction Timeline to Date January 15th: Amy special committee convenes to review Arielle s initial bid and other strategic alternatives Special committee instructs its financial advisor to instruct Arielle s advisors that the initial bid is insufficient for Amy to engage January 23th: Arielle delivers a revised proposal at 85.25% of book value January 25th: Amy special committee reviews the revised proposal with its advisors Offers Arielle to enter into a exclusivity period to until February 29th to allow both sides to perform enhanced diligence and explore if there is a price at which both sides would agree to a transaction (executed Jan. 26) Amy advisors commence reverse diligence on Arielle, including management sessions February 4th: Parties, including representatives from each special committee, intend to meet to clarify and potentially resolve any additional points of negotiation Situation Overview Amy s share price and valuation multiples have contracted over the last 3 years in line with the broader residential mortgage REIT universe due to adverse market conditions Current price / book value of 0.64x Amy s total return (1) is negative on a 1, 2, 3 year basis and since its IPO in 2011. It s current stock price of $10.85 is 46% below its IPO price Arielle s current indicative proposal includes an offered purchase price for Amy equal to 85.25% of book value (2), paid in a combination of cash and newly issued Arielle stock The special committee of the board of Amy has indicated that it is not currently willing to transact at the latest indicative price However, the committee has agreed to enter into an exclusivity period to allow both sides to perform enhanced diligence and explore if there is a price at which both sides would agree to a transaction If Amy were to ultimately not transact with Arielle it has alternative choices, including: Liquidating the portfolio and distributing net proceeds to shareholders Continue as a standalone company while considering modifications to the current model through increased buybacks, changed investment mandate or corporate structure Notes 1. Share price appreciation plus reinvested dividends on a pre-tax basis 2. Per share offer price to be determined prior to filing of proxy (see Overview of Non-Binding Indicative Proposals Received for additional detail) Morgan Stanley
|
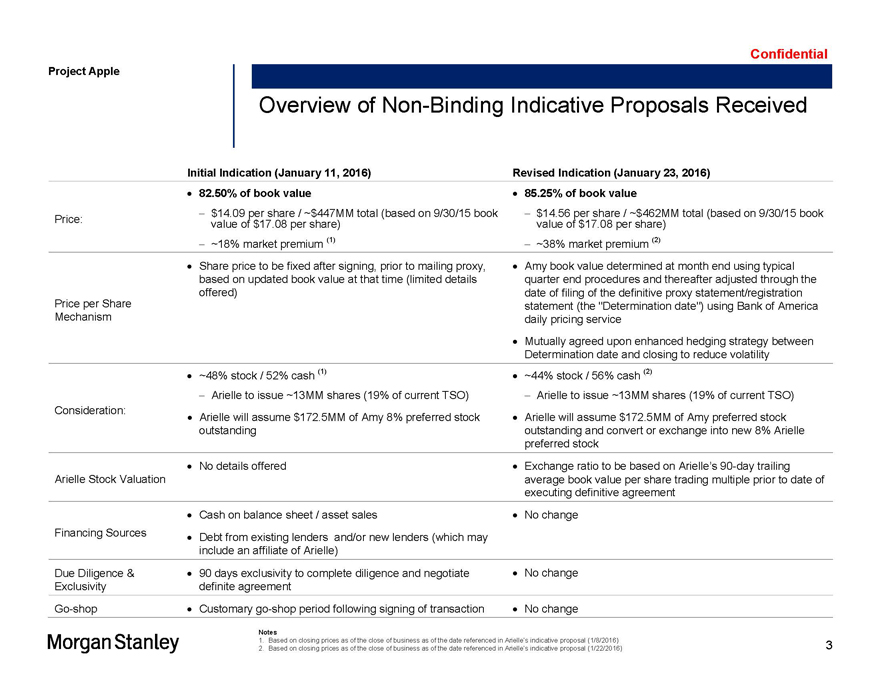
Confidential Overview of Non-Binding Indicative Proposals Received Project Apple 3 Notes 1. Based on closing prices as of the close of business as of the date referenced in Arielle s indicative proposal (1/8/2016) 2. Based on closing prices as of the close of business as of the date referenced in Arielle s indicative proposal (1/22/2016) Initial Indication (January 11, 2016) Revised Indication (January 23, 2016) Price: 82.50% of book value $14.09 per share / ~$447MM total (based on 9/30/15 book value of $17.08 per share) ~18% market premium (1) 85.25% of book value $14.56 per share / ~$462MM total (based on 9/30/15 book value of $17.08 per share) ~38% market premium (2) Price per Share Mechanism Share price to be fixed after signing, prior to mailing proxy, based on updated book value at that time (limited details offered) Amy book value determined at month end using typical quarter end procedures and thereafter adjusted through the date of filing of the definitive proxy statement/registration statement (the “Determination date”) using Bank of America daily pricing service Mutually agreed upon enhanced hedging strategy between Determination date and closing to reduce volatility Consideration: ~48% stock / 52% cash (1) Arielle to issue ~13MM shares (19% of current TSO) Arielle will assume $172.5MM of Amy 8% preferred stock outstanding ~44% stock / 56% cash (2) Arielle to issue ~13MM shares (19% of current TSO) Arielle will assume $172.5MM of Amy preferred stock outstanding and convert or exchange into new 8% Arielle preferred stock Arielle Stock Valuation No details offered Exchange ratio to be based on Arielle s 90-day trailing average book value per share trading multiple prior to date of executing definitive agreement Financing Sources Cash on balance sheet / asset sales Debt from existing lenders and/or new lenders (which may include an affiliate of Arielle) No change Due Diligence & Exclusivity 90 days exclusivity to complete diligence and negotiate definite agreement No change Go-shop Customary go-shop period following signing of transaction No change Morgan Stanley
|
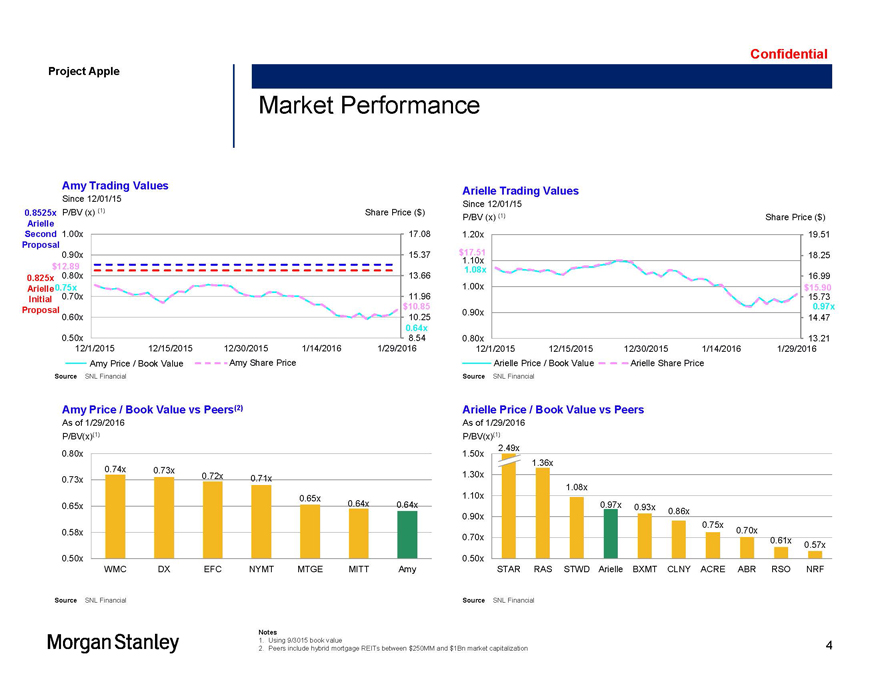
Confidential Market Performance 4 Project Apple 8.54 10.25 11.96 13.66 15.37 17.08 0.50x 0.60x 0.70x 0.80x 0.90x 1.00x 12/1/2015 12/15/2015 12/30/2015 1/14/2016 1/29/2016 Amy Price / Book Value Amy Share Price Amy Trading Values Since 12/01/15 P/BV (x) (1) Share Price ($) Source SNL Financial Notes 1. Using 9/3015 book value 2. Peers include hybrid mortgage REITs between $250MM and $1Bn market capitalization 0.825x Arielle Initial Proposal 0.8525x Arielle Second Proposal 0.64x $10.85 0.75x $12.89 13.21 14.47 15.73 16.99 18.25 19.51 0.80x 0.90x 1.00x 1.10x 1.20x 12/1/2015 12/15/2015 12/30/2015 1/14/2016 1/29/2016 Arielle Price / Book Value Arielle Share Price Arielle Trading Values Since 12/01/15 P/BV (x) (1) Share Price ($) 1.36x 1.08x 0.97x 0.93x 0.86x 0.75x 0.70x 0.61x 0.57x 0.50x 0.70x 0.90x 1.10x 1.30x 1.50x STAR RAS STWD Arielle BXMT CLNY ACRE ABR RSO NRF Arielle Price / Book Value vs Peers As of 1/29/2016 P/BV(x)(1) 0.74x 0.73x 0.72x 0.71x 0.65x 0.64x 0.64x 0.50x 0.58x 0.65x 0.73x 0.80x WMC DX EFC NYMT MTGE MITT Amy Amy Price / Book Value vs Peers(2) As of 1/29/2016 P/BV(x)(1) Source SNL Financial 0.97x $15.90 1.08x $17.51 Source SNL Financial Source SNL Financial 2.49x Morgan Stanley
|
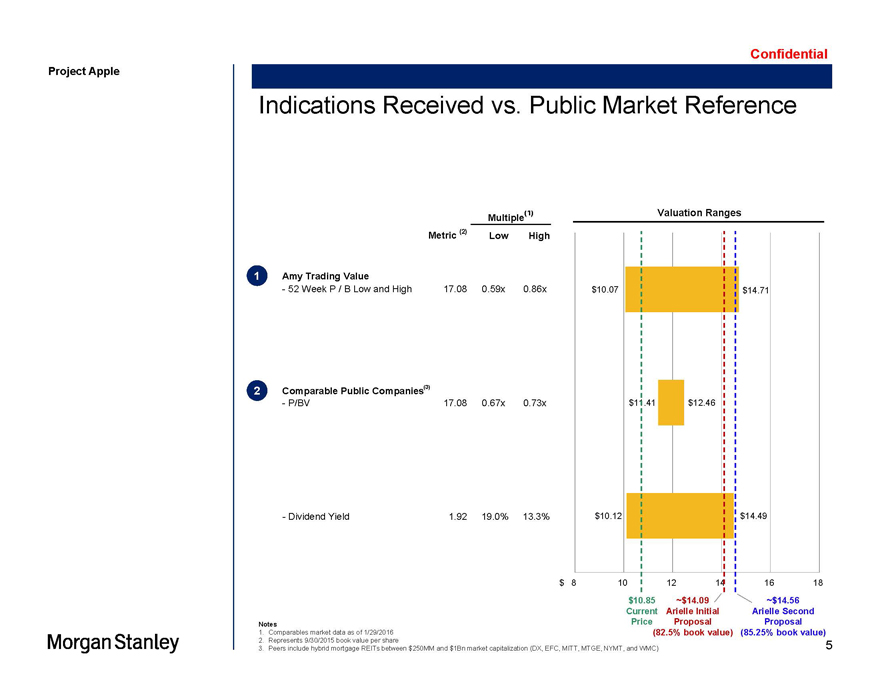
Confidential $10.07 $11.41 $10.12 $14.71 $12.46 $14.49 8 10 12 14 16 18 Indications Received vs. Public Market Reference Project Apple 5 2 1 ~$14.09 Arielle Initial Proposal (82.5% book value) Notes 1. Comparables market data as of 1/29/2016 2. Represents 9/30/2015 book value per share 3. Peers include hybrid mortgage REITs between $250MM and $1Bn market capitalization (DX, EFC, MITT, MTGE, NYMT, and WMC) $10.85 Current Price $ ~$14.56 Arielle Second Proposal (85.25% book value) Multiple(1) Valuation Ranges Metric (2) Low High Amy Trading Value —52 Week P / B Low and High 17.08 0.59x 0.86x Comparable Public Companies —P/BV 17.08 0.67x 0.73x —Dividend Yield 1.92 19.0% 13.3% (3) Morgan Stanley
|
Project Apple
Preliminary & Confidential
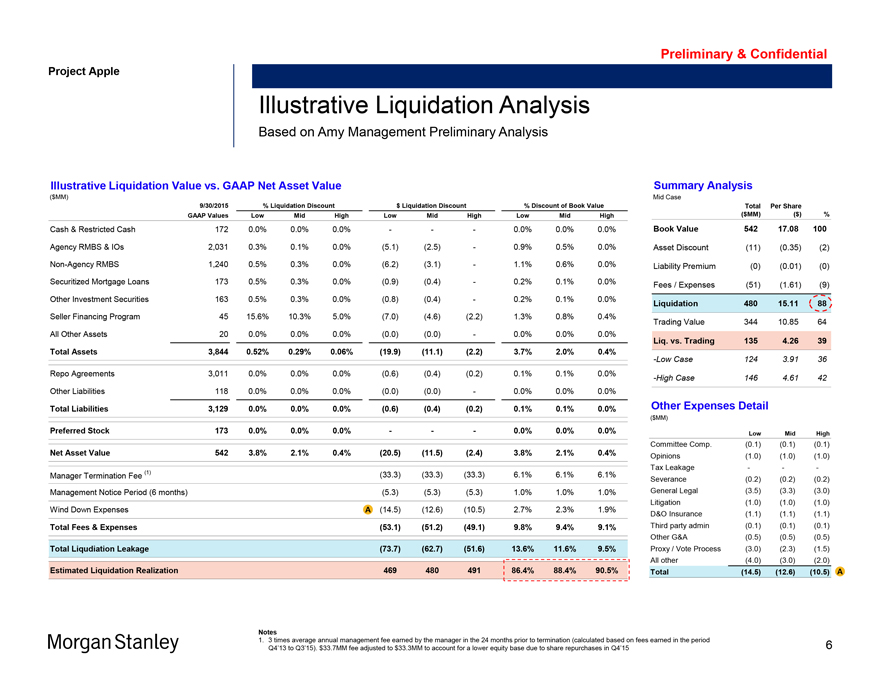
Illustrative Liquidation Analysis
Based on Amy Management Preliminary Analysis
Illustrative Liquidation Value vs. GAAP Net Asset Value
($MM)
9/30/2015 % Liquidation Discount $ Liquidation Discount % Discount of Book Value
GAAP Values Low Mid High Low Mid High Low Mid High
Cash & Restricted Cash 172 0.0% 0.0% 0.0% - - - 0.0% 0.0% 0.0%
Agency RMBS & IOs 2,031 0.3% 0.1% 0.0% (5.1) (2.5) - 0.9% 0.5% 0.0%
Non-Agency RMBS 1,240 0.5% 0.3% 0.0% (6.2) (3.1) - 1.1% 0.6% 0.0%
Securitized Mortgage Loans 173 0.5% 0.3% 0.0% (0.9) (0.4) - 0.2% 0.1% 0.0%
Other Investment Securities 163 0.5% 0.3% 0.0% (0.8) (0.4) - 0.2% 0.1% 0.0%
Seller Financing Program 45 15.6% 10.3% 5.0% (7.0) (4.6) (2.2) 1.3% 0.8% 0.4%
All Other Assets 20 0.0% 0.0% 0.0% (0.0) (0.0) - 0.0% 0.0% 0.0%
Total Assets 3,844 0.52% 0.29% 0.06% (19.9) (11.1) (2.2) 3.7% 2.0% 0.4%
Repo Agreements 3,011 0.0% 0.0% 0.0% (0.6) (0.4) (0.2) 0.1% 0.1% 0.0%
Other Liabilities 118 0.0% 0.0% 0.0% (0.0) (0.0) - 0.0% 0.0% 0.0%
Total Liabilities 3,129 0.0% 0.0% 0.0% (0.6) (0.4) (0.2) 0.1% 0.1% 0.0%
Preferred Stock 173 0.0% 0.0% 0.0% - - - 0.0% 0.0% 0.0%
Net Asset Value 542 3.8% 2.1% 0.4% (20.5) (11.5) (2.4) 3.8% 2.1% 0.4%
Manager Termination Fee (1) (33.3) (33.3) (33.3) 6.1% 6.1% 6.1%
Management Notice Period (6 months) (5.3) (5.3) (5.3) 1.0% 1.0% 1.0%
Wind Down Expenses A (14.5) (12.6) (10.5) 2.7% 2.3% 1.9%
Total Fees & Expenses (53.1) (51.2) (49.1) 9.8% 9.4% 9.1%
Total Liqudiation Leakage (73.7) (62.7) (51.6) 13.6% 11.6% 9.5%
Estimated Liquidation Realization 469 480 491 86.4% 88.4% 90.5%
Summary Analysis
Mid Case
Total Per Share
($MM) ($) %
Book Value 542 17.08 100
Asset Discount (11) (0.35) (2)
Liability Premium (0) (0.01) (0)
Fees / Expenses (51) (1.61) (9)
Liquidation 480 15.11 88
Trading Value 344 10.85 64
Liq. vs. Trading 135 4.26 39
-Low Case 124 3.91 36
-High Case 146 4.61 42
Other Expenses Detail
($MM)
Low Mid High
Committee Comp. (0.1) (0.1) (0.1)
Opinions (1.0) (1.0) (1.0)
Tax Leakage - - -
Severance (0.2) (0.2) (0.2)
General Legal (3.5) (3.3) (3.0)
Litigation (1.0) (1.0) (1.0)
D&O Insurance (1.1) (1.1) (1.1)
Third party admin (0.1) (0.1) (0.1)
Other G&A (0.5) (0.5) (0.5)
Proxy / Vote Process (3.0) (2.3) (1.5)
All other (4.0) (3.0) (2.0)
Total (14.5) (12.6) (10.5) A
Notes
1. 3 times average annual management fee earned by the manager in the 24 months prior to termination (calculated based on fees earned in the period Q4’13 to Q3’15). $33.7MM fee adjusted to $33.3MM to account for a lower equity base due to share repurchases in Q4’15
6
|
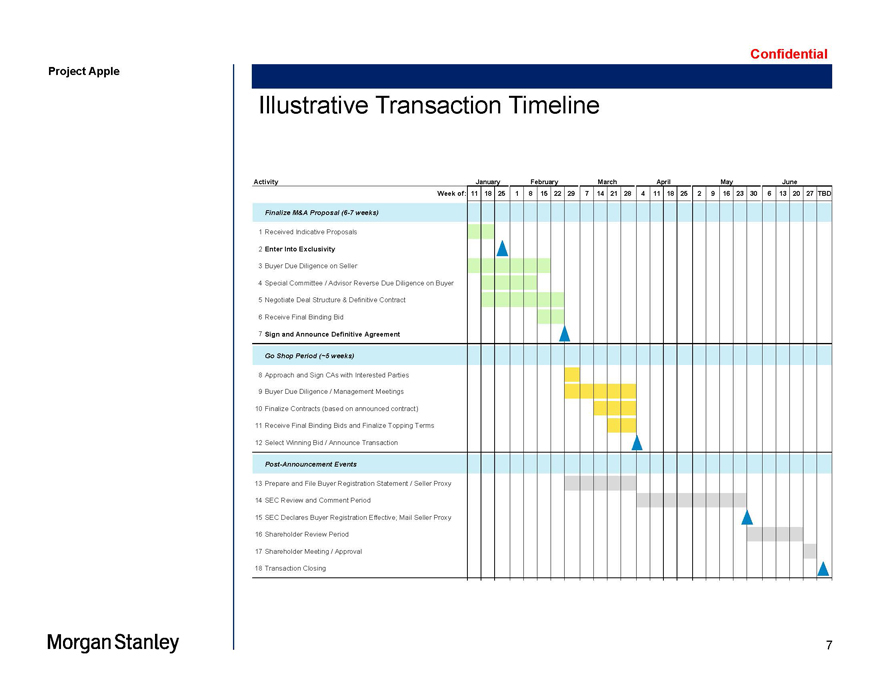
Confidential Illustrative Transaction Timeline 6 Project Apple Activity Week of: 11 18 25 1 8 15 22 29 7 14 21 28 4 11 18 25 2 9 16 23 30 6 13 20 27 TBD Finalize M&A Proposal (6-7 weeks) 1 Received Indicative Proposals 2 Enter Into Exclusivity 3 Buyer Due Diligence on Seller 4 Special Committee / Advisor Reverse Due Diligence on Buyer 5 Negotiate Deal Structure & Definitive Contract 6 Receive Final Binding Bid 7 Sign and Announce Definitive Agreement Go Shop Period (~5 weeks) 8 Approach and Sign CAs with Interested Parties 9 Buyer Due Diligence / Management Meetings 10 Finalize Contracts (based on announced contract) 11 Receive Final Binding Bids and Finalize Topping Terms 12 Select Winning Bid / Announce Transaction Post-Announcement Events 13 Prepare and File Buyer Registration Statement / Seller Proxy 14 SEC Review and Comment Period 15 SEC Declares Buyer Registration Effective; Mail Seller Proxy 16 Shareholder Review Period 17 Shareholder Meeting / Approval 18 Transaction Closing January February March April May June Morgan Stanley
|
Disclaimer Project Apple Discussion Materials 160202 v1.pptx\27 JAN 2016\3:51 PM\7 Project Apple 7 We have prepared this document solely for informational purposes. You should not definitively rely upon it or use it to form the definitive basis for any decision, contract, commitment or action whatsoever, with respect to any proposed transaction or otherwise. You and your directors, officers, employees, agents and affiliates must hold this document and any oral information provided in connection with this document in strict confidence and may not communicate, reproduce, distribute or disclose it to any other person, or refer to it publicly, in whole or in part at any time except with our prior written consent. If you are not the intended recipient of this document, please delete and destroy all copies immediately. We have prepared this document and the analyses contained in it based, in part, on certain assumptions and information obtained by us from the recipient, its directors, officers, employees, agents, affiliates and/or from other sources. Our use of such assumptions and information does not imply that we have independently verified or necessarily agree with any of such assumptions or information, and we have assumed and relied upon the accuracy and completeness of such assumptions and information for purposes of this document. Neither we nor any of our affiliates, or our or their respective officers, employees or agents, make any representation or warranty, express or implied, in relation to the accuracy or completeness of the information contained in this document or any oral information provided in connection herewith, or any data it generates and accept no responsibility, obligation or liability (whether direct or indirect, in contract, tort or otherwise) in relation to any of such information. We and our affiliates and our and their respective officers, employees and agents expressly disclaim any and all liability which may be based on this document and any errors therein or omissions therefrom. Neither we nor any of our affiliates, or our or their respective officers, employees or agents, make any representation or warranty, express or implied, that any transaction has been or may be effected on the terms or in the manner stated in this document, or as to the achievement or reasonableness of future projections, management targets, estimates, prospects or returns, if any. Any views or terms contained herein are preliminary only, and are based on financial, economic, market and other conditions prevailing as of the date of this document and are therefore subject to change. We undertake no obligation or responsibility to update any of the information contained in this document. Past performance does not guarantee or predict future performance. This document and the information contained herein do not constitute an offer to sell or the solicitation of an offer to buy any security, commodity or instrument or related derivative, nor do they constitute an offer or commitment to lend, syndicate or arrange a financing, underwrite or purchase or act as an agent or advisor or in any other capacity with respect to any transaction, or commit capital, or to participate in any trading strategies, and do not constitute legal, regulatory, accounting or tax advice to the recipient. We recommend that the recipient seek independent third party legal, regulatory, accounting and tax advice regarding the contents of this document. This document does not constitute and should not be considered as any form of financial opinion or recommendation by us or any of our affiliates. This document is not a research report and was not prepared by the research department of Morgan Stanley or any of its affiliates. Notwithstanding anything herein to the contrary, each recipient hereof (and their employees, representatives, and other agents) may disclose to any and all persons, without limitation of any kind from the commencement of discussions, the U.S. federal and state income tax treatment and tax structure of the proposed transaction and all materials of any kind (including opinions or other tax analyses) that are provided relating to the tax treatment and tax structure. For this purpose, “tax structure” is limited to facts relevant to the U.S. federal and state income tax treatment of the proposed transaction and does not include information relating to the identity of the parties, their affiliates, agents or advisors. This document is provided by Morgan Stanley & Co. LLC and/or certain of its affiliates or other applicable entities, which may include Morgan Stanley Realty Incorporated, Morgan Stanley Senior Funding, Inc., Morgan Stanley Bank, N.A., Morgan Stanley & Co. International plc, Morgan Stanley Securities Limited, Morgan Stanley Bank AG, Morgan Stanley MUFG Securities Co., Ltd., Mitsubishi UFJ Morgan Stanley Securities Co., Ltd., Morgan Stanley Asia Limited, Morgan Stanley Australia Securities Limited, Morgan Stanley Australia Limited, Morgan Stanley Asia (Singapore) Pte., Morgan Stanley Services Limited, Morgan Stanley & Co. International plc Seoul Branch and/or Morgan Stanley Canada Limited Unless governing law permits otherwise, you must contact an authorized Morgan Stanley entity in your jurisdiction regarding this document or any of the information contained herein. Morgan Stanley and/or certain of its affiliates. All rights reserved. Morgan Stanley
|
PRELIMINARY DRAFT HIGHLY CONFIDENTIAL
Project Apple
Public Company Profile
February 2, 2016
|
PRELIMINARY DRAFT HIGHLY CONFIDENTIAL
Project Apple
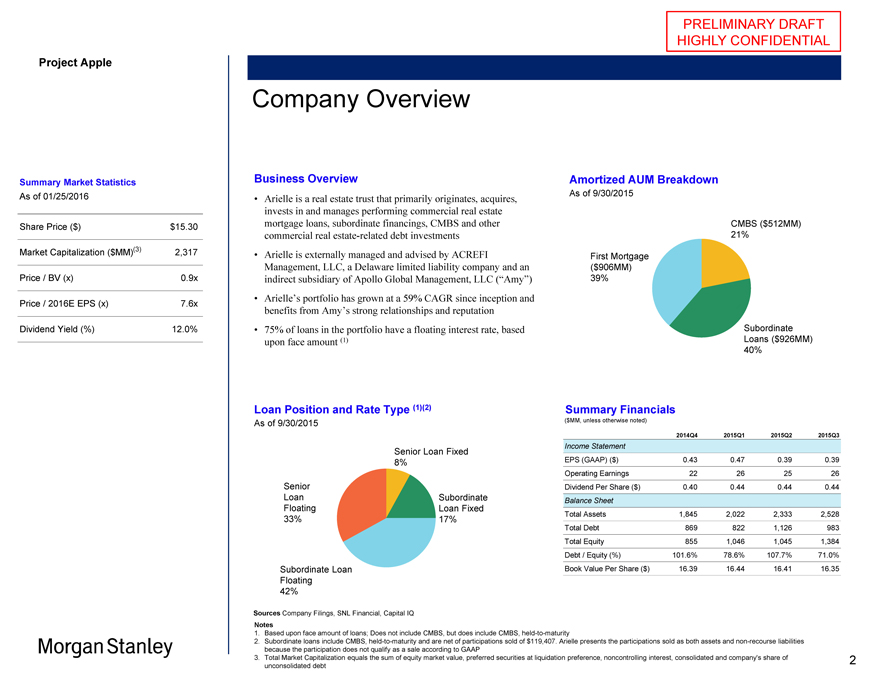
Summary Market Statistics
As of 01/25/2016
Share Price ($) $15.30
Market Capitalization ($MM)(3) 2,317
Price / BV (x) 0.9x
Price / 2016E EPS (x) 7.6x
Dividend Yield (%) 12.0%
Company Overview
Business Overview
Arielle is a real estate trust that primarily originates, acquires, invests in and manages performing commercial real estate mortgage loans, subordinate financings, CMBS and other commercial real estate-related debt investments Arielle is externally managed and advised by ACREFI Management, LLC, a Delaware limited liability company and an indirect subsidiary of Apollo Global Management, LLC (“Amy”) Arielle’s portfolio has grown at a 59% CAGR since inception and benefits from Amy’s strong relationships and reputation 75% of loans in the portfolio have a floating interest rate, based upon face amount (1)
Amortized AUM Breakdown
As of 9/30/2015
CMBS ($512MM) 21%
Subordinate Loans ($926MM) 40%
First Mortgage
($906MM) 39%
Loan Position and Rate Type (1)(2)
As of 9/30/2015
Senior Loan Fixed 8%
Subordinate Loan Fixed 17%
Senior Loan Floating 33%
Subordinate Loan Floating 42%
Sources Company Filings, SNL Financial, Capital IQ
Notes
1. Based upon face amount of loans; Does not include CMBS, but does include CMBS, held-to-maturity
2. Subordinate loans include CMBS, held-to-maturity and are net of participations sold of $119,407. Arielle presents the participations sold as both assets and non-recourse liabilities because the participation does not qualify as a sale according to GAAP
3. Total Market Capitalization equals the sum of equity market value, preferred securities at liquidation preference, noncontrolling interest, consolidated and company’s share of unconsolidated debt
Summary Financials
($MM, unless otherwise noted)
2014Q4 2015Q1 2015Q2 2015Q3
Income Statement
EPS (GAAP) ($) 0.43 0.47 0.39 0.39
Operating Earnings 22 26 25 26
Dividend Per Share ($) 0.40 0.44 0.44 0.44
Balance Sheet
Total Assets 1,845 2,022 2,333 2,528
Total Debt 869 822 1,126 983
Total Equity 855 1,046 1,045 1,384
Debt / Equity (%) 101.6% 78.6% 107.7% 71.0%
Book Value Per Share ($) 16.39 16.44 16.41 16.35
2
|
PRELIMINARY DRAFT HIGHLY CONFIDENTIAL
Project Apple
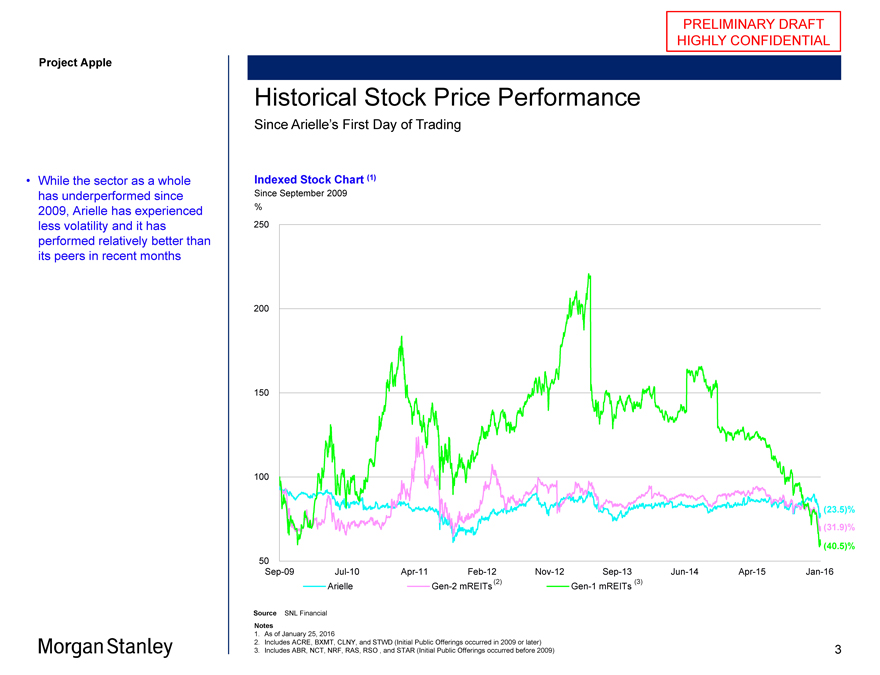
While the sector as a whole has underperformed since 2009, Arielle has experienced less volatility and it has performed relatively better than its peers in recent months
Historical Stock Price Performance
Since Arielle’s First Day of Trading
Indexed Stock Chart (1)
Since September 2009 %
250
200
150
100
(23.5)%
(31.9)%
(40.5)%
50
Sep-09 Jul-10 Apr-11 Feb-12 Nov-12 Sep-13 Jun-14 Apr-15 Jan-16
Arielle Gen-2 mREITs (2) Gen-1 mREITs (3)
Source SNL Financial
Notes
1. As of January 25, 2016
2. Includes ACRE, BXMT, CLNY, and STWD (Initial Public Offerings occurred in 2009 or later)
3. Includes ABR, NCT, NRF, RAS, RSO , and STAR (Initial Public Offerings occurred before 2009)
3
|
PRELIMINARY DRAFT HIGHLY CONFIDENTIAL
Project Apple
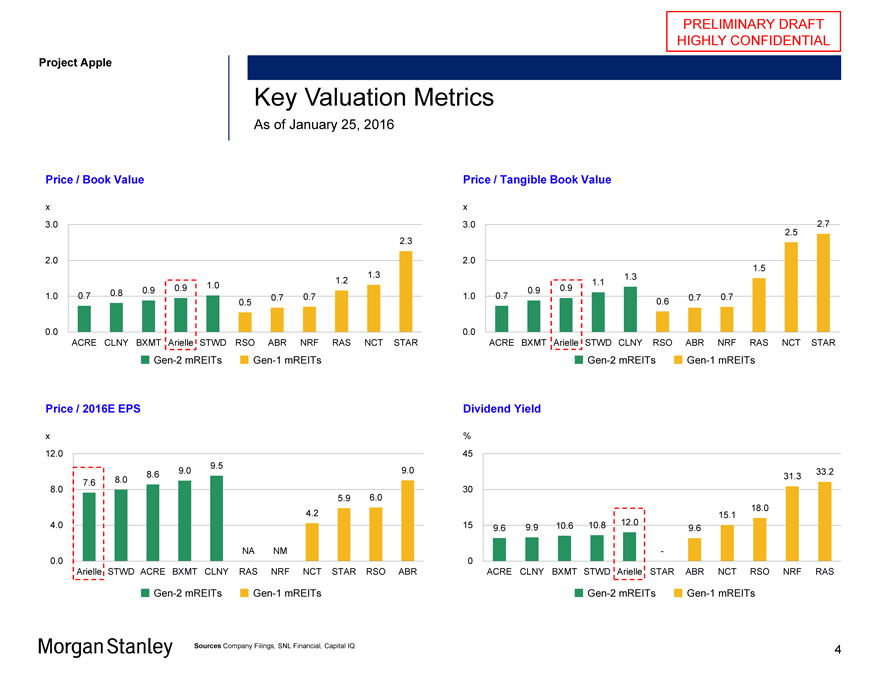
Key Valuation Metrics
As of January 25, 2016
Price / Book Value Price / Tangible Book Value
x x
3.0 3.0 2.7
2.5
2.3
2.0 2.0
1.5
1.3 1.3
0 1.2 0.9 1.1
0.7 0.8 0.9 0.9 1. 0.9
1.0 0.7 0.7 1.0 0.7 0.7 0.7
0.5 0.6
0.0 0.0
ACRE CLNY BXMT Arielle STWD RSO ABR NRF RAS NCT STAR ACRE BXMT Arielle STWD CLNY RSO ABR NRF RAS NCT STAR
Gen-2 mREITs Gen-1 mREITs Gen-2 mREITs Gen-1 mREITs
Price / 2016E EPS Dividend Yield
x %
12.0 45
9.5
8.6 9.0 9.0 31.3 33.2
7.6 8.0
8.0 30
5.9 6.0
4.2 15.1 18.0
4.0 15 9.6 9.9 10.6 10.8 12.0 9.6
NA NM —
0.0 0
Arielle STWD ACRE BXMT CLNY RAS NRF NCT STAR RSO ABR ACRE CLNY BXMT STWD Arielle STAR ABR NCT RSO NRF RAS
Gen-2 mREITs Gen-1 mREITs Gen-2 mREITs Gen-1 mREITs
Sources Company Filings, SNL Financial, Capital IQ
4
|
PRELIMINARY DRAFT HIGHLY CONFIDENTIAL
Project Apple
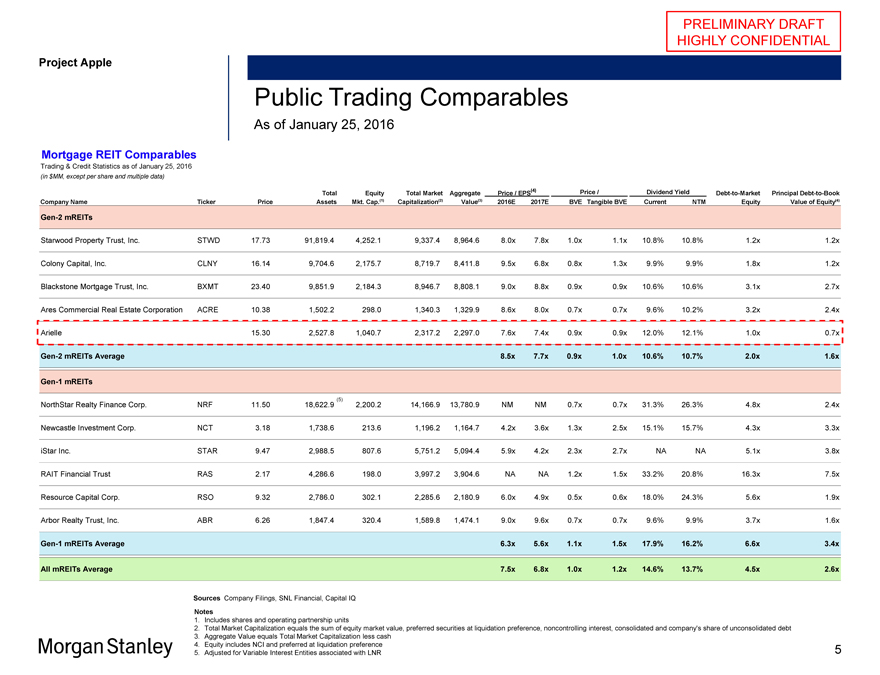
Public Trading Comparables
As of January 25, 2016
Mortgage REIT Comparables
Trading & Credit Statistics as of January 25, 2016
(in $MM, except per share and multiple data)
Total Equity Total Market Aggregate Price / EPS(4) Price / Dividend Yield Debt-to-Market Principal Debt-to-Book
Company Name Ticker Price Assets Mkt. Cap.(1) Capitalization(2) Value(3) 2016E 2017E BVE Tangible BVE Current NTM Equity Value of Equity(4)
Gen-2 mREITs
Starwood Property Trust, Inc. STWD 17.73 91,819.4 4,252.1 9,337.4 8,964.6 8.0x 7.8x 1.0x 1.1x 10.8% 10.8% 1.2x 1.2x
Colony Capital, Inc. CLNY 16.14 9,704.6 2,175.7 8,719.7 8,411.8 9.5x 6.8x 0.8x 1.3x 9.9% 9.9% 1.8x 1.2x
Blackstone Mortgage Trust, Inc. BXMT 23.40 9,851.9 2,184.3 8,946.7 8,808.1 9.0x 8.8x 0.9x 0.9x 10.6% 10.6% 3.1x 2.7x
Ares Commercial Real Estate Corporation ACRE 10.38 1,502.2 298.0 1,340.3 1,329.9 8.6x 8.0x 0.7x 0.7x 9.6% 10.2% 3.2x 2.4x
Arielle 15.30 2,527.8 1,040.7 2,317.2 2,297.0 7.6x 7.4x 0.9x 0.9x 12.0% 12.1% 1.0x 0.7x
Gen-2 mREITs Average 8.5x 7.7x 0.9x 1.0x 10.6% 10.7% 2.0x 1.6x
Gen-1 mREITs
NorthStar Realty Finance Corp. NRF 11.50 18,622.9 (5) 2,200.2 14,166.9 13,780.9 NM NM 0.7x 0.7x 31.3% 26.3% 4.8x 2.4x
Newcastle Investment Corp. NCT 3.18 1,738.6 213.6 1,196.2 1,164.7 4.2x 3.6x 1.3x 2.5x 15.1% 15.7% 4.3x 3.3x
iStar Inc. STAR 9.47 2,988.5 807.6 5,751.2 5,094.4 5.9x 4.2x 2.3x 2.7x NA NA 5.1x 3.8x
RAIT Financial Trust RAS 2.17 4,286.6 198.0 3,997.2 3,904.6 NA NA 1.2x 1.5x 33.2% 20.8% 16.3x 7.5x
Resource Capital Corp. RSO 9.32 2,786.0 302.1 2,285.6 2,180.9 6.0x 4.9x 0.5x 0.6x 18.0% 24.3% 5.6x 1.9x
Arbor Realty Trust, Inc. ABR 6.26 1,847.4 320.4 1,589.8 1,474.1 9.0x 9.6x 0.7x 0.7x 9.6% 9.9% 3.7x 1.6x
Gen-1 mREITs Average 6.3x 5.6x 1.1x 1.5x 17.9% 16.2% 6.6x 3.4x
All mREITs Average 7.5x 6.8x 1.0x 1.2x 14.6% 13.7% 4.5x 2.6x
Sources Company Filings, SNL Financial, Capital IQ
Notes
1. Includes shares and operating partnership units
2. Total Market Capitalization equals the sum of equity market value, preferred securities at liquidation preference, noncontrolling interest, consolidated and company’s share of unconsolidated debt
3. Aggregate Value equals Total Market Capitalization less cash
4. Equity includes NCI and preferred at liquidation preference
5. Adjusted for Variable Interest Entities associated with LNR
5
|
PRELIMINARY DRAFT HIGHLY CONFIDENTIAL
Project Apple
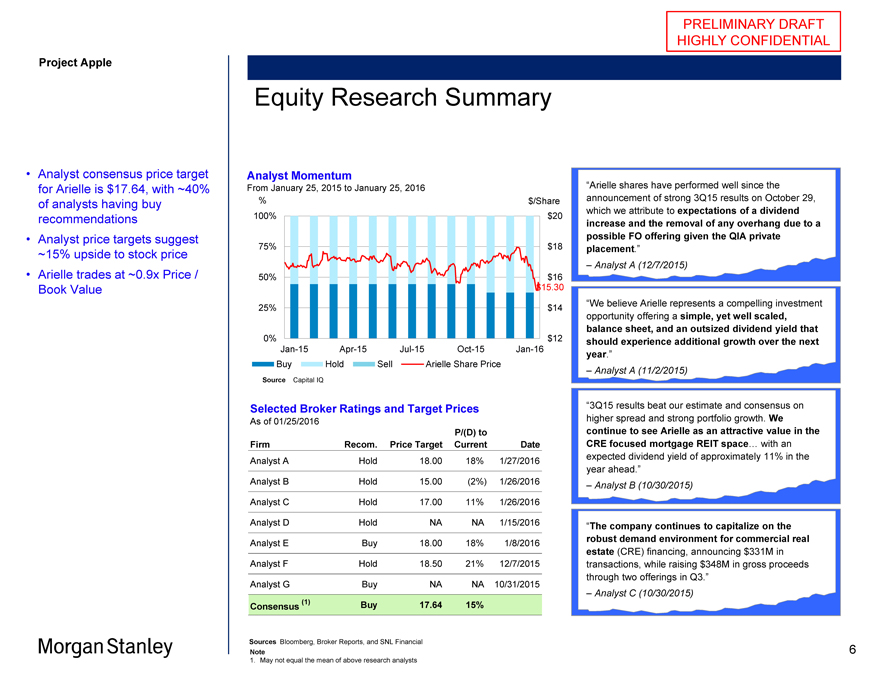
Analyst consensus price target for Arielle is $17.64, with ~40% of analysts having buy recommendations Analyst price targets suggest ~15% upside to stock price Arielle trades at ~0.9x Price / Book Value
Equity Research Summary
Analyst Momentum
From January 25, 2015 to January 25, 2016
% $/Share
100% $20
75% $18
50% $16
$15.30
25% $14
0% $12
Jan-15 Apr-15 Jul-15 Oct-15 Jan-16
Buy Hold Sell Arielle Share Price
Source Capital IQ
Selected Broker Ratings and Target Prices
As of 01/25/2016
P/(D) to
Firm Recom. Price Target Current Date
Analyst A Hold 18.00 18% 1/27/2016
Analyst B Hold 15.00 (2%) 1/26/2016
Analyst C Hold 17.00 11% 1/26/2016
Analyst D Hold NA NA 1/15/2016
Analyst E Buy 18.00 18% 1/8/2016
Analyst F Hold 18.50 21% 12/7/2015
Analyst G Buy NA NA 10/31/2015
Consensus (1) Buy 17.64 15%
“Arielle shares have performed well since the
announcement of strong 3Q15 results on October 29,
which we attribute to expectations of a dividend
increase and the removal of any overhang due to a
possible FO offering given the QIA private
placement.”
– Analyst A (12/7/2015)
“We believe Arielle represents a compelling investment
opportunity offering a simple, yet well scaled,
balance sheet, and an outsized dividend yield that
should experience additional growth over the next
year.”
– Analyst A (11/2/2015)
“3Q15 results beat our estimate and consensus on
higher spread and strong portfolio growth. We
continue to see Arielle as an attractive value in the
CRE focused mortgage REIT space… with an
expected dividend yield of approximately 11% in the
year ahead.”
– Analyst B (10/30/2015)
“The company continues to capitalize on the
robust demand environment for commercial real
estate (CRE) financing, announcing $331M in
transactions, while raising $348M in gross proceeds
through two offerings in Q3.”
– Analyst C (10/30/2015)
Sources Bloomberg, Broker Reports, and SNL Financial
Note
1. May not equal the mean of above research analysts
6
|
Project Apple
PRELIMINARY DRAFT HIGHLY CONFIDENTIAL
Select Mortgage REITs Price / Book Over Time
Four Periods of Importance
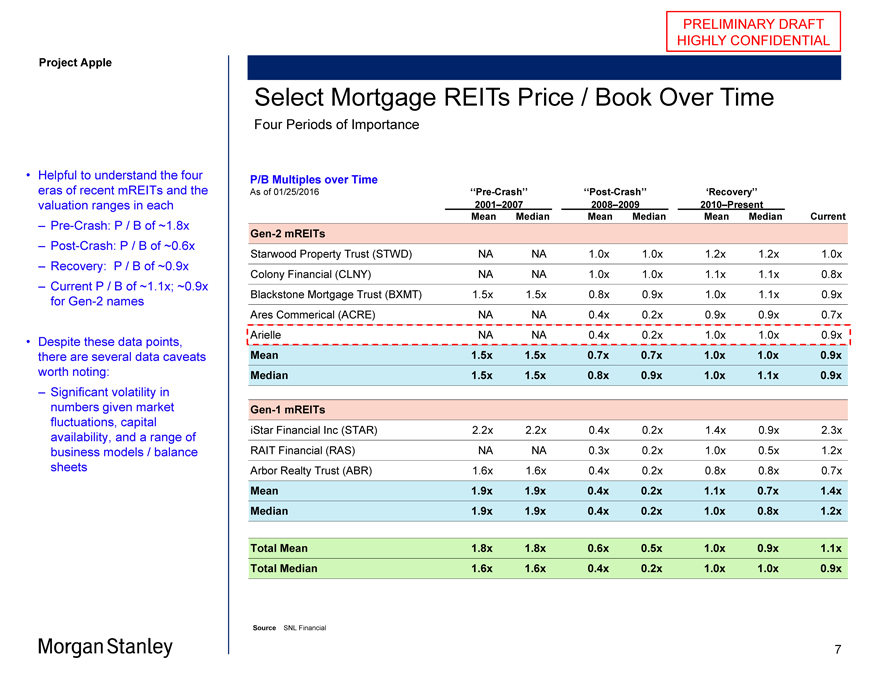
Helpful to understand the four eras of recent mREITs and the valuation ranges in each
Pre-Crash: P / B of ~1.8x
Post-Crash: P / B of ~0.6x
Recovery: P / B of ~0.9x
Current P / B of ~1.1x; ~0.9x for Gen-2 names
Despite these data points, there are several data caveats worth noting:
Significant volatility in numbers given market fluctuations, capital availability, and a range of business models / balance sheets
P/B Multiples over Time
As of 01/25/2016 ‘‘Pre-Crash’’ ‘‘Post-Crash’’ ‘Recovery’’
2001–2007 2008–2009 2010–Present
Mean Median Mean Median Mean Median Current
Gen-2 mREITs
Starwood Property Trust (STWD) NA NA 1.0x 1.0x 1.2x 1.2x 1.0x
Colony Financial (CLNY) NA NA 1.0x 1.0x 1.1x 1.1x 0.8x
Blackstone Mortgage Trust (BXMT) 1.5x 1.5x 0.8x 0.9x 1.0x 1.1x 0.9x
Ares Commerical (ACRE) NA NA 0.4x 0.2x 0.9x 0.9x 0.7x
Arielle NA NA 0.4x 0.2x 1.0x 1.0x 0.9x
Mean 1.5x 1.5x 0.7x 0.7x 1.0x 1.0x 0.9x
Median 1.5x 1.5x 0.8x 0.9x 1.0x 1.1x 0.9x
Gen-1 mREITs
iStar Financial Inc (STAR) 2.2x 2.2x 0.4x 0.2x 1.4x 0.9x 2.3x
RAIT Financial (RAS) NA NA 0.3x 0.2x 1.0x 0.5x 1.2x
Arbor Realty Trust (ABR) 1.6x 1.6x 0.4x 0.2x 0.8x 0.8x 0.7x
Mean 1.9x 1.9x 0.4x 0.2x 1.1x 0.7x 1.4x
Median 1.9x 1.9x 0.4x 0.2x 1.0x 0.8x 1.2x
Total Mean 1.8x 1.8x 0.6x 0.5x 1.0x 0.9x 1.1x
Total Median 1.6x 1.6x 0.4x 0.2x 1.0x 1.0x 0.9x
Source SNL Financial
7
|
PRELIMINARY DRAFT HIGHLY CONFIDENTIAL
Appendix A
Appendix
8
|
PRELIMINARY DRAFT HIGHLY CONFIDENTIAL
Project Apple
Mortgage REIT Valuation Focused on Two Primary Metrics
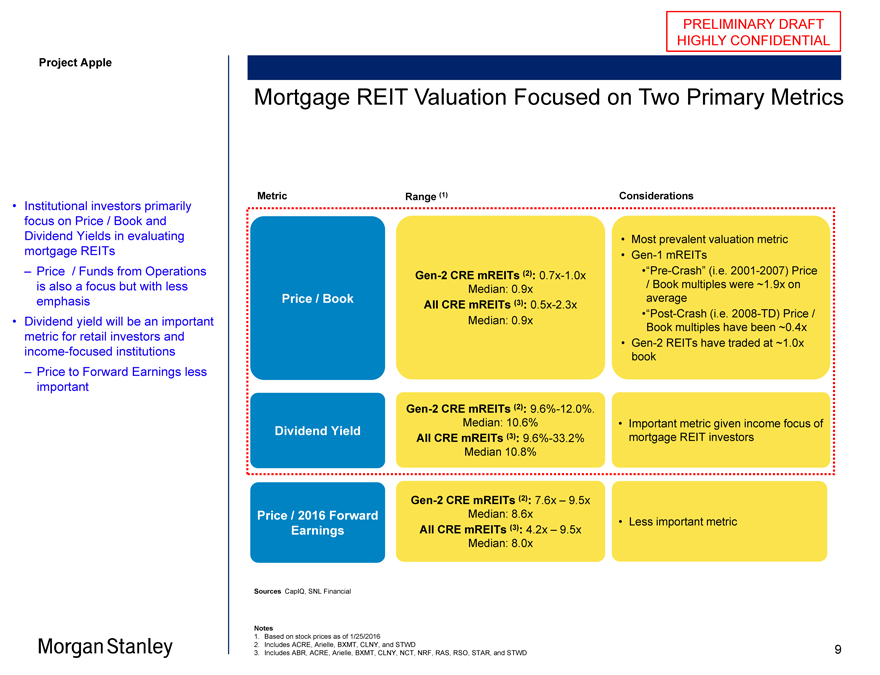
Institutional investors primarily focus on Price / Book and Dividend Yields in evaluating mortgage REITs
Price / Funds from Operations is also a focus but with less emphasis
Dividend yield will be an important metric for retail investors and income-focused institutions
Price to Forward Earnings less important
Metric Range (1) Considerations
Most prevalent valuation metric
Gen-1 mREITs
Gen-2 CRE mREITs (2): 0.7x-1.0x “Pre-Crash” (i.e. 2001-2007) Price
Median: 0.9x / Book multiples were ~1.9x on
Price / Book All CRE mREITs (3): 0.5x-2.3x average
“Post-Crash (i.e. 2008-TD) Price /
Median: 0.9x Book multiples have been ~0.4x
Gen-2 REITs have traded at ~1.0x
book
Gen-2 CRE mREITs (2): 9.6%-12.0%.
Median: 10.6% Important metric given income focus of
Dividend Yield All CRE mREITs (3): 9.6%-33.2% mortgage REIT investors
Median 10.8%
Gen-2 CRE mREITs (2): 7.6x – 9.5x
Price / 2016 Forward Median: 8.6x Less important metric
Earnings All CRE mREITs (3): 4.2x – 9.5x
Median: 8.0x
Sources CapIQ, SNL Financial
Notes
1. Based on stock prices as of 1/25/2016
2. Includes ACRE, Arielle, BXMT, CLNY, and STWD
3. Includes ABR, ACRE, Arielle, BXMT, CLNY, NCT, NRF, RAS, RSO, STAR, and STWD
9
|
PRELIMINARY DRAFT HIGHLY CONFIDENTIAL
Project Apple
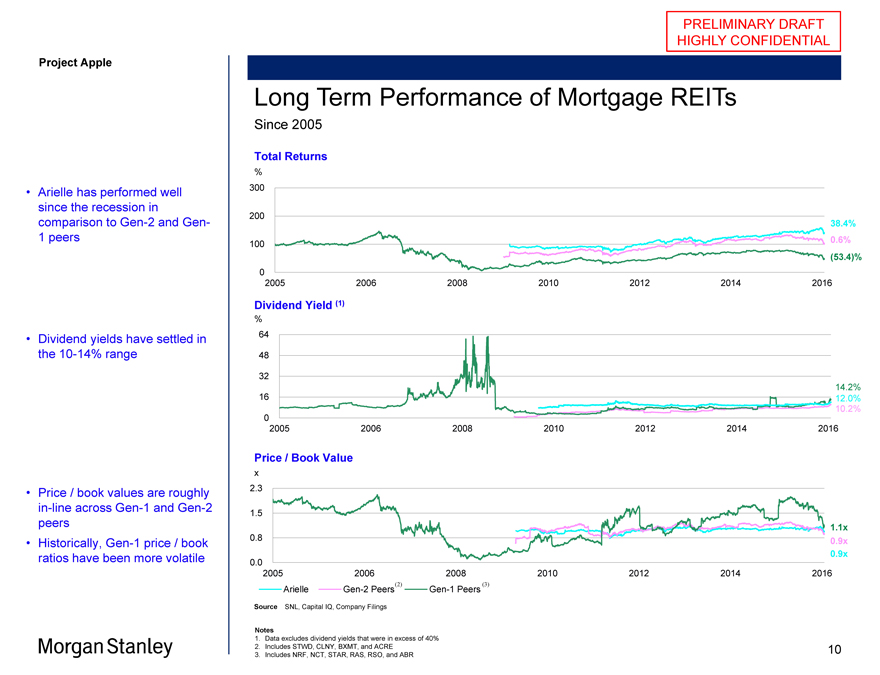
Arielle has performed well since the recession in comparison to Gen-2 and Gen-1 peers
Dividend yields have settled in the 10-14% range
Price / book values are roughly in-line across Gen-1 and Gen-2 peers Historically, Gen-1 price / book ratios have been more volatile
Long Term Performance of Mortgage REITs
Since 2005
Total Returns
%
300
200
38.4%
100 0.6%
(53.4)%
0
2005 2006 2008 2010 2012 2014 2016
Dividend Yield (1)
%
64
48
32
14.2%
16 12.0%
10.2%
0
2005 2006 2008 2010 2012 2014 2016
Price / Book Value
x
2.3
1.5
1.1x
0.8 0.9x
0.9x
0.0
2005 2006 2008 2010 2012 2014 2016
Arielle Gen-2 Peers(2) Gen-1 Peers (3)
Source SNL, Capital IQ, Company Filings
Notes
1. Data excludes dividend yields that were in excess of 40%
2. Includes STWD, CLNY, BXMT, and ACRE
3. Includes NRF, NCT, STAR, RAS, RSO, and ABR
10
|
Project Apple
PRELIMINARY DRAFT HIGHLY CONFIDENTIAL
Disclaimer
We have prepared this document solely for informational purposes. You should not definitively rely upon it or use it to form the definitive basis for any decision, contract, commitment or action whatsoever, with respect to any proposed transaction or otherwise. You and your directors, officers, employees, agents and affiliates must hold this document and any oral information provided in connection with this document in strict confidence and may not communicate, reproduce, distribute or disclose it to any other person, or refer to it publicly, in whole or in part at any time except with our prior written consent. If you are not the intended recipient of this document, please delete and destroy all copies immediately.
We have prepared this document and the analyses contained in it based, in part, on certain assumptions and information obtained by us from the recipient, its directors, officers, employees, agents, affiliates and/or from other sources. Our use of such assumptions and information does not imply that we have independently verified or necessarily agree with any of such assumptions or information, and we have assumed and relied upon the accuracy and completeness of such assumptions and information for purposes of this document. Neither we nor any of our affiliates, or our or their respective officers, employees or agents, make any representation or warranty, express or implied, in relation to the accuracy or completeness of the information contained in this document or any oral information provided in connection herewith, or any data it generates and accept no responsibility, obligation or liability (whether direct or indirect, in contract, tort or otherwise) in relation to any of such information. We and our affiliates and our and their respective officers, employees and agents expressly disclaim any and all liability which may be based on this document and any errors therein or omissions therefrom. Neither we nor any of our affiliates, or our or their respective officers, employees or agents, make any representation or warranty, express or implied, that any transaction has been or may be effected on the terms or in the manner stated in this document, or as to the achievement or reasonableness of future projections, management targets, estimates, prospects or returns, if any. Any views or terms contained herein are preliminary only, and are based on financial, economic, market and other conditions prevailing as of the date of this document and are therefore subject to change. We undertake no obligation or responsibility to update any of the information contained in this document. Past performance does not guarantee or predict future performance.
This document and the information contained herein do not constitute an offer to sell or the solicitation of an offer to buy any security, commodity or instrument or related derivative, nor do they constitute an offer or commitment to lend, syndicate or arrange a financing, underwrite or purchase or act as an agent or advisor or in any other capacity with respect to any transaction, or commit capital, or to participate in any trading strategies, and do not constitute legal, regulatory, accounting or tax advice to the recipient. We recommend that the recipient seek independent third party legal, regulatory, accounting and tax advice regarding the contents of this document. This document does not constitute and should not be considered as any form of financial opinion or recommendation by us or any of our affiliates. This document is not a research report and was not prepared by the research department of Morgan Stanley or any of its affiliates.
Notwithstanding anything herein to the contrary, each recipient hereof (and their employees, representatives, and other agents) may disclose to any and all persons, without limitation of any kind from the commencement of discussions, the U.S. federal and state income tax treatment and tax structure of the proposed transaction and all materials of any kind (including opinions or other tax analyses) that are provided relating to the tax treatment and tax structure. For this purpose, “tax structure” is limited to facts relevant to the U.S. federal and state income tax treatment of the proposed transaction and does not include information relating to the identity of the parties, their affiliates, agents or advisors.
This document is provided by Morgan Stanley & Co. LLC and/or certain of its affiliates or other applicable entities, which may include Morgan Stanley Realty Incorporated, Morgan Stanley Senior Funding, Inc., Morgan Stanley Bank, N.A., Morgan Stanley & Co. International plc, Morgan Stanley Securities Limited, Morgan Stanley Bank AG, Morgan Stanley MUFG Securities Co., Ltd., Mitsubishi UFJ Morgan Stanley Securities Co., Ltd., Morgan Stanley Asia Limited, Morgan Stanley Australia Securities Limited, Morgan Stanley Australia Limited, Morgan Stanley Asia (Singapore) Pte., Morgan Stanley Services Limited, Morgan Stanley & Co. International plc Seoul Branch and/or Morgan Stanley Canada Limited Unless governing law permits otherwise, you must contact an authorized Morgan Stanley entity in your jurisdiction regarding this document or any of the information contained herein.
© Morgan Stanley and/or certain of its affiliates. All rights reserved.
11