Exhibit (c)(8)
|
Confidential Project Apple Presentation to the Board of Directors 25 February 2016 Morgan Stanley
|
Confidential Apple MS Fairness Presentation —02.25.2016.pptx\25 FEB 2016\1:07 AM\2 Project Apple Table of Contents Section 1 Transaction Summary Section 2 Amy Valuation Analysis Section 3 Arielle Stock Considerations Appendix A Amy Overview & Historical Performance Appendix B Arielle Overview Appendix C Additional Valuation Materials Morgan Stanley
|
Confidential Apple MS Fairness Presentation —02.25.2016.pptx\25 FEB 2016\1:07 AM\3 Project Apple Disclaimer We have prepared this document solely for informational purposes. You should not definitively rely upon it or use it to form the definitive basis for any decision, contract, commitment or action whatsoever, with respect to any proposed transaction or otherwise. You and your directors, officers, employees, agents and affiliates must hold this document and any oral information provided in connection with this document in strict confidence and may not communicate, reproduce, distribute or disclose it to any other person, or refer to it publicly, in whole or in part at any time except with our prior written consent. If you are not the intended recipient of this document, please delete and destroy all copies immediately. We have prepared this document and the analyses contained in it based, in part, on certain assumptions and information obtained by us from the recipient, its directors, officers, employees, agents, affiliates and/or from other sources. Our use of such assumptions and information does not imply that we have independently verified or necessarily agree with any of such assumptions or information, and we have assumed and relied upon the accuracy and completeness of such assumptions and information for purposes of this document. Neither we nor any of our affiliates, or our or their respective officers, employees or agents, make any representation or warranty, express or implied, in relation to the accuracy or completeness of the information contained in this document or any oral information provided in connection herewith, or any data it generates and accept no responsibility, obligation or liability (whether direct or indirect, in contract, tort or otherwise) in relation to any of such information. We and our affiliates and our and their respective officers, employees and agents expressly disclaim any and all liability which may be based on this document and any errors therein or omissions therefrom. Neither we nor any of our affiliates, or our or their respective officers, employees or agents, make any representation or warranty, express or implied, that any transaction has been or may be effected on the terms or in the manner stated in this document, or as to the achievement or reasonableness of future projections, management targets, estimates, prospects or returns, if any. Any views or terms contained herein are based on financial, economic, market and other conditions prevailing as of the date of this document and are therefore subject to change. We undertake no obligation or responsibility to update any of the information contained in this document. Past performance does not guarantee or predict future performance. We have (i) assumed that any forecasted financial information contained herein reflects the best available estimates of future financial performance, and (ii) not made any independent valuation or appraisal of the assets or liabilities of any company involved in any proposed transaction, nor have we been furnished with any such valuations or appraisals other than those provided by the target s advisers, upon which we have relied without independent verification. The purpose of this document is to provide the recipient with an explanation of the basis upon which Morgan Stanley is issuing a financial opinion letter in relation to the proposed transaction. This document should be read in conjunction with and is subject to the terms of such financial opinion. This document supersedes any previous documents or presentations delivered by Morgan Stanley to the recipient in connection with the proposed transaction. This document and the information contained herein do not constitute an offer to sell or the solicitation of an offer to buy any security, commodity or instrument or related derivative, nor do they constitute an offer or commitment to lend, syndicate or arrange a financing, underwrite or purchase or act as an agent or advisor or in any other capacity with respect to any transaction, or commit capital, or to participate in any trading strategies, and do not constitute legal, regulatory, accounting or tax advice to the recipient. We recommend that the recipient seek independent third party legal, regulatory, accounting and tax advice regarding the contents of this document. This document is not a research report and was not prepared by the research department of Morgan Stanley or any of its affiliates. Notwithstanding anything herein to the contrary, each recipient hereof (and their employees, representatives, and other agents) may disclose to any and all persons, without limitation of any kind from the commencement of discussions, the U.S. federal and state income tax treatment and tax structure of the proposed transaction and all materials of any kind (including opinions or other tax analyses) that are provided relating to the tax treatment and tax structure. For this purpose, “tax structure” is limited to facts relevant to the U.S. federal and state income tax treatment of the proposed transaction and does not include information relating to the identity of the parties, their affiliates, agents or advisors. This document is provided by Morgan Stanley & Co. LLC and/or certain of its affiliates, which may include Morgan Stanley Realty Incorporated, Morgan Stanley Senior Funding, Inc., Morgan Stanley Bank, N.A., Morgan Stanley & Co. International plc, Morgan Stanley & Co. Limited, Morgan Stanley Bank International (Milan Branch), Morgan Stanley Saudi Arabia, Morgan Stanley South Africa (PTY) Limited, Morgan Stanley Securities Limited, Morgan Stanley Bank AG, Morgan Stanley MUFG Securities Co., Ltd, Mitsubishi UFJ Morgan Stanley Securities Co., Ltd, Morgan Stanley India Company Private Limited, Morgan Stanley Asia Limited, Morgan Stanley Australia Limited, Morgan Stanley Asia (Singapore) Pte., Morgan Stanley Services Limited, Morgan Stanley & Co. International plc, Seoul Branch, Morgan Stanley Canada Limited, Banco Morgan Stanley S.A. and/or Morgan Stanley, SV, SAU. Unless governing law permits otherwise, you must contact an authorized Morgan Stanley entity in your jurisdiction regarding this document or any of the information contained herein. Morgan Stanley Morgan Stanley and/or certain of its affiliates. All rights reserved. 3
|
Confidential Apple MS Fairness Presentation —02.25.2016.pptx\25 FEB 2016\1:07 AM\4 Project Apple Section 1 Transaction Summary 4 Morgan Stanley
|
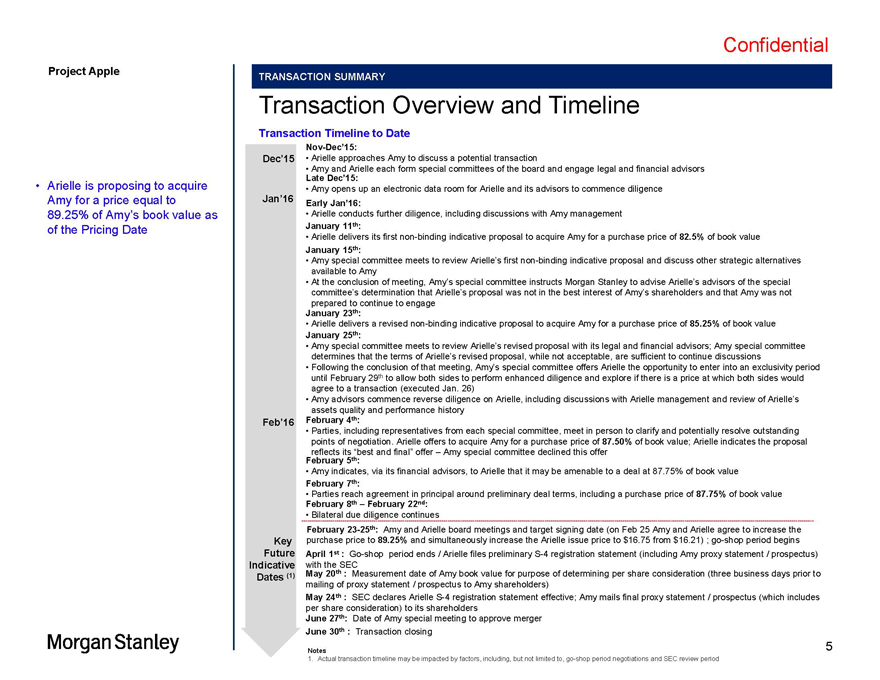
Confidential Project Apple TRANSACTION SUMMARY Transaction Overview and Timeline Transaction Timeline to Date Nov-Dec 15: Dec 15 Arielle approaches Amy to discuss a potential transaction Amy and Arielle each form special committees of the board and engage legal and financial advisors Late Dec 15: Arielle is proposing to acquire Amy opens up an electronic data room for Arielle and its advisors to commence diligence Amy for a price equal to Jan 16 Early Jan 16: 89.25% of Amy s book value as Arielle conducts further diligence, including discussions with Amy management of the Pricing Date January 11th: Arielle delivers its first non-binding indicative proposal to acquire Amy for a purchase price of 82.5% of book value January 15th: Amy special committee meets to review Arielle s first non-binding indicative proposal and discuss other strategic alternatives available to Amy At the conclusion of meeting, Amy s special committee instructs Morgan Stanley to advise Arielle s advisors of the special committee s determination that Arielle s proposal was not in the best interest of Amy s shareholders and that Amy was not prepared to continue to engage January 23th: Arielle delivers a revised non-binding indicative proposal to acquire Amy for a purchase price of 85.25% of book value January 25th: Amy special committee meets to review Arielle s revised proposal with its legal and financial advisors; Amy special committee determines that the terms of Arielle s revised proposal, while not acceptable, are sufficient to continue discussions Following the conclusion of that meeting, Amy s special committee offers Arielle the opportunity to enter into an exclusivity period until February 29th to allow both sides to perform enhanced diligence and explore if there is a price at which both sides would agree to a transaction (executed Jan. 26) Amy advisors commence reverse diligence on Arielle, including discussions with Arielle management and review of Arielle s assets quality and performance history Feb 16 February 4th: Parties, including representatives from each special committee, meet in person to clarify and potentially resolve outstanding points of negotiation. Arielle offers to acquire Amy for a purchase price of 87.50% of book value; Arielle indicates the proposal February reflects its 5 th best : and final offer Amy special committee declined this offer Amy indicates, via its financial advisors, to Arielle that it may be amenable to a deal at 87.75% of book value February 7th: Parties reach agreement in principal around preliminary deal terms, including a purchase price of 87.75% of book value February 8th February 22nd: Bilateral due diligence continues February 23-25th: Amy and Arielle board meetings and target signing date (on Feb 25 Amy and Arielle agree to increase the Key purchase price to 89.25% and simultaneously increase the Arielle issue price to $16.75 from $16.21) ; go-shop period begins Future April 1st : Go-shop period ends / Arielle files preliminary S-4 registration statement (including Amy proxy statement / prospectus) Indicative with the SEC May 20th : Measurement date of Amy book value for purpose of determining per share consideration (three business days prior to Dates (1) mailing of proxy statement / prospectus to Amy shareholders) May 24th : SEC declares Arielle S-4 registration statement effective; Amy mails final proxy statement / prospectus (which includes per share consideration) to its shareholders June 27th: Date of Amy special meeting to approve merger June 30th : Transaction closing Notes 5 1. Actual transaction timeline may be impacted by factors, including, but not limited to, go-shop period negotiations and SEC review period Morgan Stanley
|
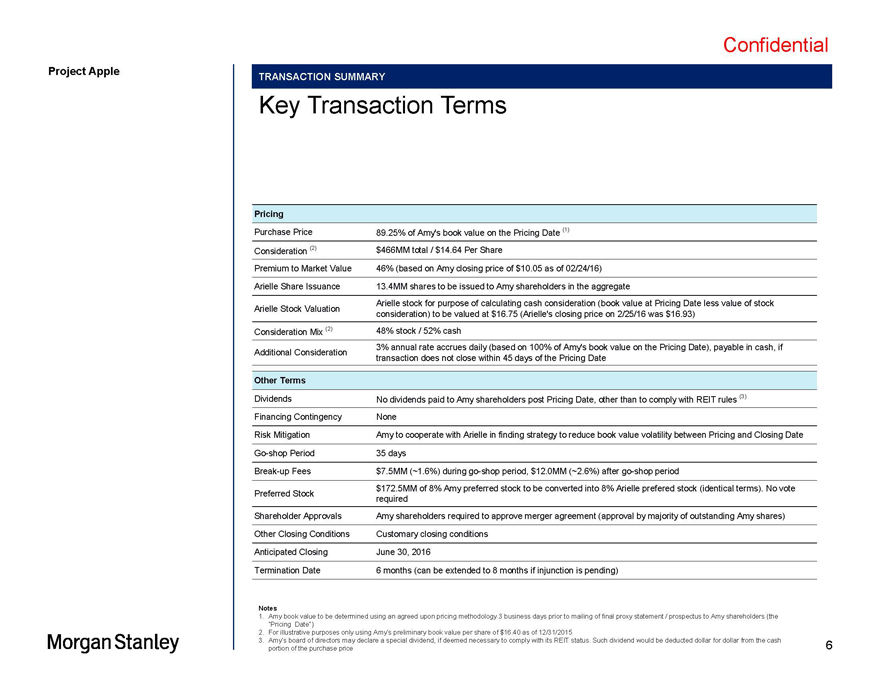
Confidential Project Apple TRANSACTION SUMMARY Key Transaction Terms Pricing Purchase Price 89.25% of Amy’s book value on the Pricing Date (1) Consideration (2) $466MM total / $14.64 Per Share Premium to Market Value 46% (based on Amy closing price of $10.05 as of 02/24/16) Arielle Share Issuance 13.4MM shares to be issued to Amy shareholders in the aggregate Arielle stock for purpose of calculating cash consideration (book value at Pricing Date less value of stock Arielle Stock Valuation consideration) to be valued at $16.75 (Arielle’s closing price on 2/25/16 was $16.93) Consideration Mix (2) 48% stock / 52% cash 3% annual rate accrues daily (based on 100% of Amy’s book value on the Pricing Date), payable in cash, if Additional Consideration transaction does not close within 45 days of the Pricing Date Other Terms Dividends No dividends paid to Amy shareholders post Pricing Date, other than to comply with REIT rules (3) Financing Contingency None Risk Mitigation Amy to cooperate with Arielle in finding strategy to reduce book value volatility between Pricing and Closing Date Go-shop Period 35 days Break-up Fees $7.5MM (~1.6%) during go-shop period, $12.0MM (~2.6%) after go-shop period $172.5MM of 8% Amy preferred stock to be converted into 8% Arielle prefered stock (identical terms). No vote Preferred Stock required Shareholder Approvals Amy shareholders required to approve merger agreement (approval by majority of outstanding Amy shares) Other Closing Conditions Customary closing conditions Anticipated Closing June 30, 2016 Termination Date 6 months (can be extended to 8 months if injunction is pending) Notes 1. Amy book value to be determined using an agreed upon pricing methodology 3 business days prior to mailing of final proxy statement / prospectus to Amy shareholders (the Pricing Date ) 2. For illustrative purposes only using Amy s preliminary book value per share of $16.40 as of 12/31/2015 3. Amy s board of directors may declare a special dividend, if deemed necessary to comply with its REIT status. Such dividend would be deducted dollar for dollar from the cash 6 portion of the purchase price Morgan Stanley
|
Confidential Apple MS Fairness Presentation —02.25.2016.pptx\25 FEB 2016\1:07 AM\7 Project Apple Section 2 Amy Valuation Analysis Morgan Stanley 7
|
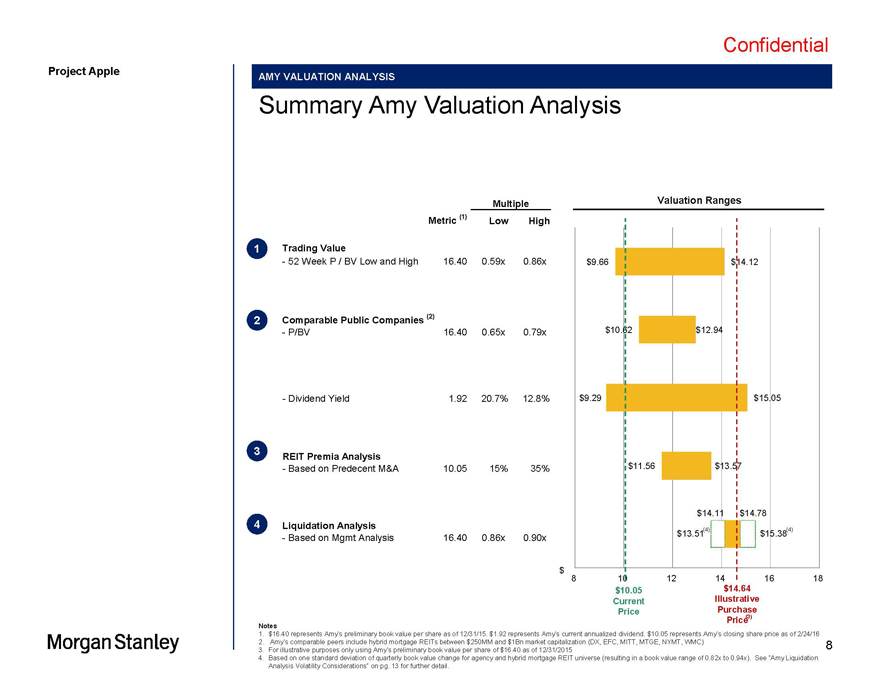
Confidential Apple MS Fairness Presentation —02.25.2016.pptx\25 FEB 2016\1:07 AM\8 Project Apple AMY VALUATION ANALYSIS Summary Amy Valuation Analysis Multiple Valuation Ranges Metric (1) Low High 1 Trading Value—52 Week P / BV Low and High 16.40 0.59x 0.86x $9.66 $14.12 2 Comparable Public Companies (2)—P/BV 16.40 0.65x 0.79x $10.62 $12.94—Dividend Yield 1.92 20.7% 12.8% $9.29 $15.05 3 REIT Premia Analysis—Based on Predecent M&A 10.05 15% 35% $11.56 $13.57 $14.11 $14.78 4 Liquidation Analysis $13.51(4) $15.38(4)—Based on Mgmt Analysis 16.40 0.86x 0.90x $ 8 1012141618 $10.05 $14.64 Current Illustrative Price Purchase Price (3) Notes 1. $16.40 represents Amy s preliminary book value per share as of 12/31/15. $1.92 represents Amy s current annualized dividend. $10.05 represents Amy s closing share price as of 2/24/16 2. Amy s comparable peers include hybrid mortgage REITs between $250MM and $1Bn market capitalization (DX, EFC, MITT, MTGE, NYMT, WMC) 8 3. For illustrative purposes only using Amy s preliminary book value per share of $16.40 as of 12/31/2015 4. Based on one standard deviation of quarterly book value change for agency and hybrid mortgage REIT universe (resulting in a book value range of 0.82x to 0.94x). See Amy Liquidation Analysis Volatility Considerations on pg. 13 for further detail. Morgan Stanley
|
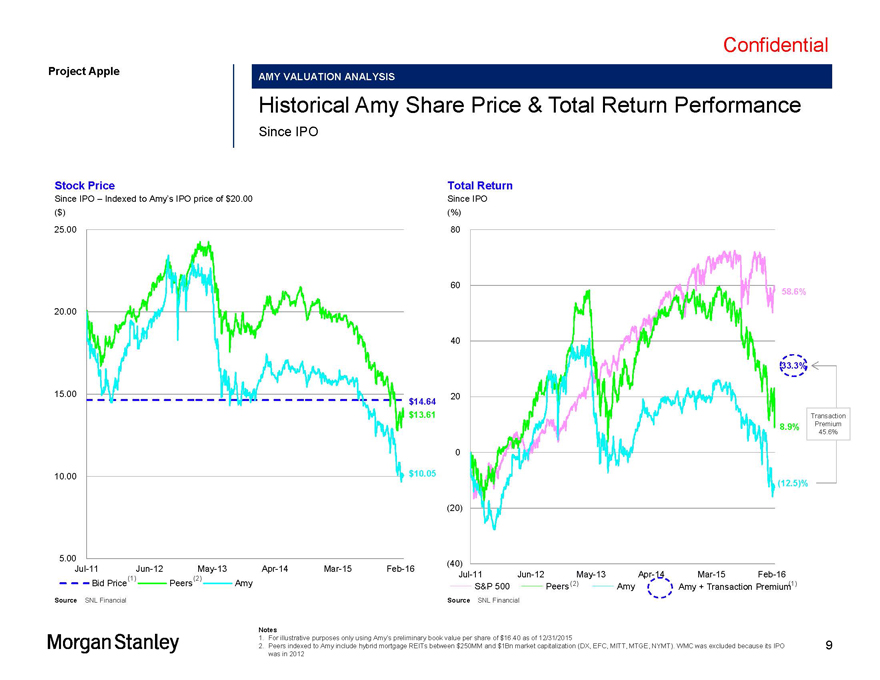
Confidential Apple MS Fairness Presentation —02.25.2016.pptx\25 FEB 2016\1:07 AM\9 Project Apple AMY VALUATION ANALYSIS Historical Amy Share Price & Total Return Performance Since IPO Stock Price Total Return Since IPO Indexed to Amy s IPO price of $20.00 Since IPO ($) (%) 25.00 80 60 58.6% 20.00 40 33.3% 15.00 $14.64 20 $13.61 Transaction 8.9% Premium 45.6% 0 10.00 $10.05 (12.5)% (20) 5.00 (40) Jul-11 Jun-12 May-13 Apr-14 Mar-15 Feb-16 Jul-11 Jun-12 May-13 Apr-14 Mar-15 Feb-16 (1) (2) Bid Price Peers Amy S&P 500 Peers (2) Amy Amy + Transaction Premium (1) Source SNL Financial Source SNL Financial Notes 1. For illustrative purposes only using Amy s preliminary book value per share of $16.40 as of 12/31/2015 2. Peers indexed to Amy include hybrid mortgage REITs between $250MM and $1Bn market capitalization (DX, EFC, MITT, MTGE, NYMT). WMC was excluded because its IPO 9 was in 2012 Morgan Stanley
|
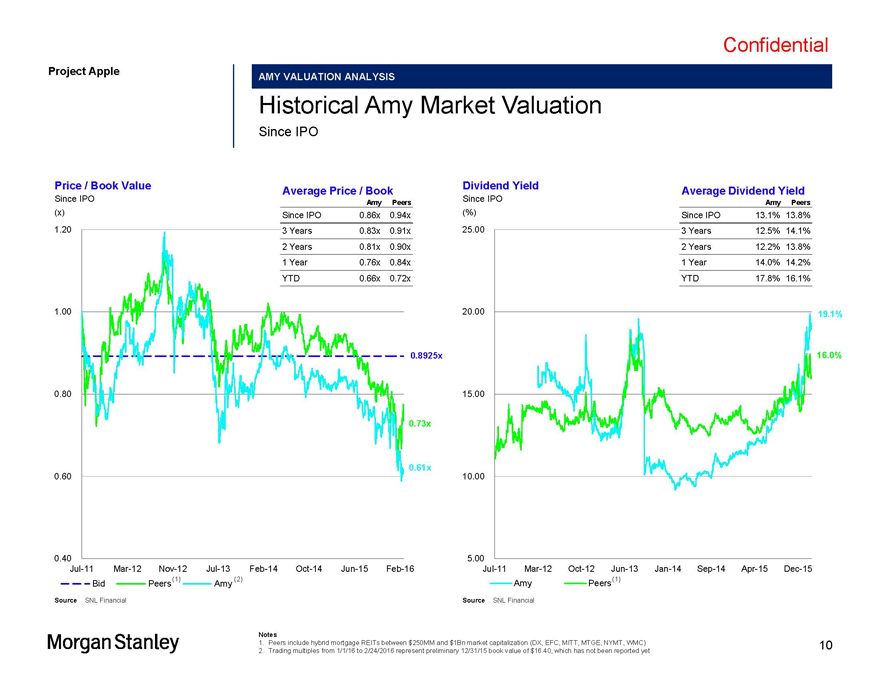
Confidential Project Apple AMY VALUATION ANALYSIS Historical Amy Market Valuation Since IPO Price / Book Value Dividend Yield Average Price / Book Average Dividend Yield Since IPO Amy Peers Since IPO Amy Peers (x) Since IPO 0.86x 0.94x (%) Since IPO 13.1% 13.8% 1.20 3 Years 0.83x 0.91x 25.00 3 Years 12.5% 14.1% 2 Years 0.81x 0.90x 2 Years 12.2% 13.8% 1 Year 0.76x 0.84x 1 Year 14.0% 14.2% YTD 0.66x 0.72x YTD 17.8% 16.1% 1.00 20.00 19.1% 0.8925x 16.0% 0.80 15.00 0.73x 0.61x 0.60 10.00 0.40 5.00 Jul-11 Mar-12 Nov-12 Jul-13 Feb-14 Oct-14 Jun-15 Feb-16 Jul-11 Mar-12 Oct-12 Jun-13 Jan-14 Sep-14 Apr-15 Dec-15 (1) (2) Amy Peers(1) Bid Peers Amy Source SNL Financial Source SNL Financial Notes 1. Peers include hybrid mortgage REITs between $250MM and $1Bn market capitalization (DX, EFC, MITT, MTGE, NYMT, WMC) 10 2. Trading multiples from 1/1/16 to 2/24/2016 represent preliminary 12/31/15 book value of $16.40, which has not been reported yet Morgan Stanley
|
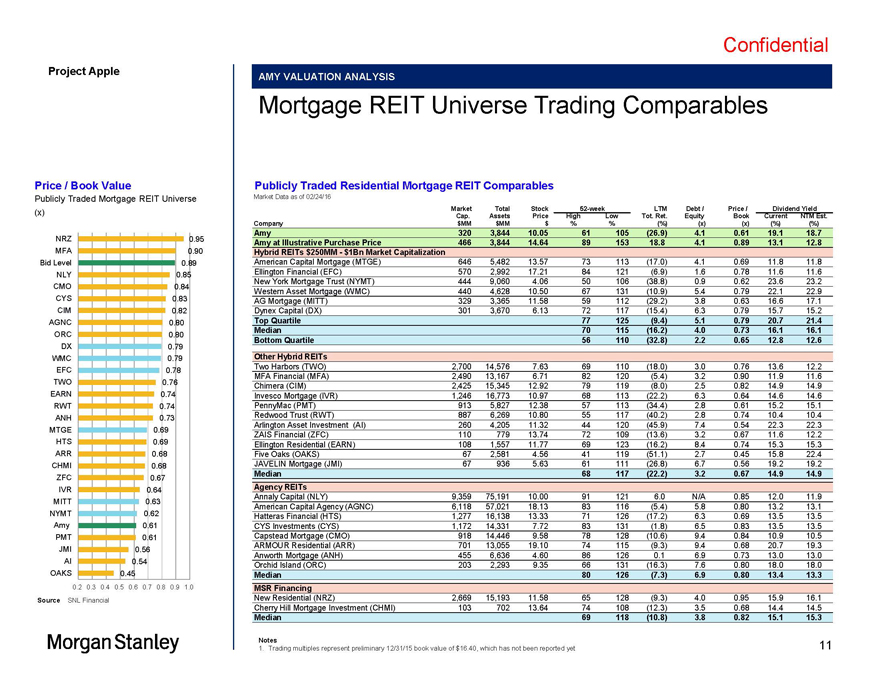
Confidential Apple MS Fairness Presentation —02.25.2016.pptx\25 FEB 2016\1:07 AM\11 Project Apple AMY VALUATION ANALYSIS Mortgage REIT Universe Trading Comparables Price / Book Value Publicly Traded Residential Mortgage REIT Comparables Publicly Traded Mortgage REIT Universe Market Data as of 02/24/16 (x) Market Total Stock 52-week LTM Debt / Price / Dividend Yield Cap. Assets Price High Low Tot. Ret. Equity Book Current NTM Est. Company $MM $MM $ % % (%) (x) (x) (%) (%) Amy 320 3,844 10.05 61 105 (26.9) 4.1 0.61 (1) 19.1 18.7 NRZ 0.95 (1) Amy at Illustrative Purchase Price 466 3,844 14.64 89 153 18.8 4.1 0.89 13.1 12.8 MFA 0.90 Hybrid REITs $250MM—$1Bn Market Capitalization Bid Level 0.89 American Capital Mortgage (MTGE) 646 5,482 13.57 73 113 (17.0) 4.1 0.69 11.8 11.8 NLY 0.85 Ellington Financial (EFC) 570 2,992 17.21 84 121 (6.9) 1.6 0.78 11.6 11.6 New York Mortgage Trust (NYMT) 444 9,060 4.06 50 106 (38.8) 0.9 0.62 23.6 23.2 CMO 0.84 CYS 0.83 Western Asset Mortgage (WMC) 440 4,628 10.50 67 131 (10.9) 5.4 0.79 22.1 22.9 AG Mortgage (MITT) 329 3,365 11.58 59 112 (29.2) 3.8 0.63 16.6 17.1 CIM 0.82 Dynex Capital (DX) 301 3,670 6.13 72 117 (15.4) 6.3 0.79 15.7 15.2 AGNC 0.80 Top Quartile 77 125 (9.4) 5.1 0.79 20.7 21.4 Median 70 115 (16.2) 4.0 0.73 16.1 16.1 ORC 0.80 Bottom Quartile 56 110 (32.8) 2.2 0.65 12.8 12.6 DX 0.79 WMC 0.79 Other Hybrid REITs Two Harbors (TWO) 2,700 14,576 7.63 69 110 (18.0) 3.0 0.76 13.6 12.2 EFC 0.78 MFA Financial (MFA) 2,490 13,167 6.71 82 120 (5.4) 3.2 0.90 11.9 11.6 TWO 0.76 Chimera (CIM) 2,425 15,345 12.92 79 119 (8.0) 2.5 0.82 14.9 14.9 EARN 0.74 Invesco Mortgage (IVR) 1,246 16,773 10.97 68 113 (22.2) 6.3 0.64 14.6 14.6 RWT 0.74 PennyMac (PMT) 913 5,827 12.38 57 113 (34.4) 2.8 0.61 15.2 15.1 ANH 0.73 Redwood Trust (RWT) 887 6,269 10.80 55 117 (40.2) 2.8 0.74 10.4 10.4 Arlington Asset Investment (AI) 260 4,205 11.32 44 120 (45.9) 7.4 0.54 22.3 22.3 MTGE 0.69 HTS 0.69 ZAIS Financial (ZFC) 110 779 13.74 72 109 (13.6) 3.2 0.67 11.6 12.2 Ellington Residential (EARN) 108 1,557 11.77 69 123 (16.2) 8.4 0.74 15.3 15.3 ARR 0.68 Five Oaks (OAKS) 67 2,581 4.56 41 119 (51.1) 2.7 0.45 15.8 22.4 CHMI 0.68 JAVELIN Mortgage (JMI) 67 936 5.63 61 111 (26.8) 6.7 0.56 19.2 19.2 Median 68 117 (22.2) 3.2 0.67 14.9 14.9 ZFC 0.67 IVR 0.64 Agency REITs Annaly Capital (NLY) 9,359 75,191 10.00 91 121 6.0 N/A 0.85 12.0 11.9 MITT 0.63 NYMT 0.62 American Capital Agency (AGNC) 6,118 57,021 18.13 83 116 (5.4) 5.8 0.80 13.2 13.1 Hatteras Financial (HTS) 1,277 16,138 13.33 71 126 (17.2) 6.3 0.69 13.5 13.5 Amy 0.61 CYS Investments (CYS) 1,172 14,331 7.72 83 131 (1.8) 6.5 0.83 13.5 13.5 PMT 0.61 Capstead Mortgage (CMO) 918 14,446 9.58 78 128 (10.6) 9.4 0.84 10.9 10.5 ARMOUR Residential (ARR) 701 13,055 19.10 74 115 (9.3) 9.4 0.68 20.7 19.3 JMI 0.56 Anworth Mortgage (ANH) 455 6,636 4.60 86 126 0.1 6.9 0.73 13.0 13.0 AI 0.54 Orchid Island (ORC) 203 2,293 9.35 66 131 (16.3) 7.6 0.80 18.0 18.0 OAKS 0.45 Median 80 126 (7.3) 6.9 0.80 13.4 13.3 0.2 0.3 0.4 0.5 0.6 0.7 0.8 0.9 1.0 MSR Financing Source SNL Financial New Residential (NRZ) 2,669 15,193 11.58 65 128 (9.3) 4.0 0.95 15.9 16.1 Cherry Hill Mortgage Investment (CHMI) 103 702 13.64 74 108 (12.3) 3.5 0.68 14.4 14.5 Median 69 118 (10.8) 3.8 0.82 15.1 15.3 Notes 11 1. Trading multiples represent preliminary 12/31/15 book value of $16.40, which has not been reported yet
|
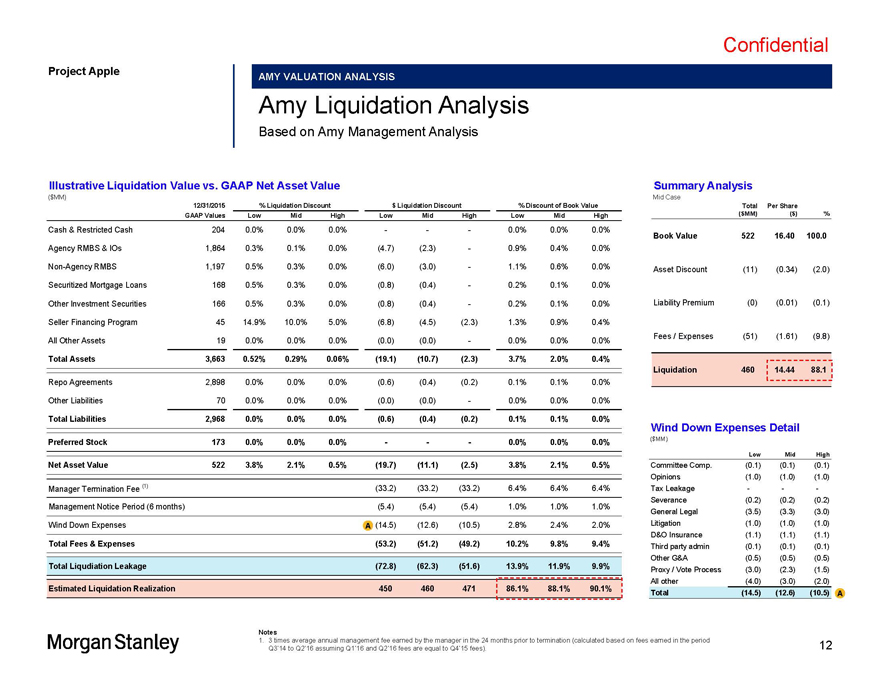
Confidential Project Apple AMY VALUATION ANALYSIS Amy Liquidation Analysis Based on Amy Management Analysis Illustrative Liquidation Value vs. GAAP Net Asset Value Summary Analysis ($MM) Mid Case 12/31/2015 % Liquidation Discount $ Liquidation Discount % Discount of Book Value Total Per Share GAAP Values Low Mid High Low Mid High Low Mid High ($MM) ($) % Cash & Restricted Cash 204 0.0% 0.0% 0.0% ——0.0% 0.0% 0.0% Book Value 522 16.40 100.0 Agency RMBS & IOs 1,864 0.3% 0.1% 0.0% (4.7) (2.3)—0.9% 0.4% 0.0% Non-Agency RMBS 1,197 0.5% 0.3% 0.0% (6.0) (3.0)—1.1% 0.6% 0.0% Asset Discount (11) (0.34) (2.0) Securitized Mortgage Loans 168 0.5% 0.3% 0.0% (0.8) (0.4)—0.2% 0.1% 0.0% Other Investment Securities 166 0.5% 0.3% 0.0% (0.8) (0.4)—0.2% 0.1% 0.0% Liability Premium (0) (0.01) (0.1) Seller Financing Program 45 14.9% 10.0% 5.0% (6.8) (4.5) (2.3) 1.3% 0.9% 0.4% Fees / Expenses (51) (1.61) (9.8) All Other Assets 19 0.0% 0.0% 0.0% (0.0) (0.0)—0.0% 0.0% 0.0% Total Assets 3,663 0.52% 0.29% 0.06% (19.1) (10.7) (2.3) 3.7% 2.0% 0.4% Liquidation 460 14.44 88.1 Repo Agreements 2,898 0.0% 0.0% 0.0% (0.6) (0.4) (0.2) 0.1% 0.1% 0.0% Other Liabilities 70 0.0% 0.0% 0.0% (0.0) (0.0)—0.0% 0.0% 0.0% Total Liabilities 2,968 0.0% 0.0% 0.0% (0.6) (0.4) (0.2) 0.1% 0.1% 0.0% Wind Down Expenses Detail Preferred Stock 173 0.0% 0.0% 0.0% ——0.0% 0.0% 0.0% ($MM) Low Mid High Net Asset Value 522 3.8% 2.1% 0.5% (19.7) (11.1) (2.5) 3.8% 2.1% 0.5% Committee Comp. (0.1) (0.1) (0.1) Opinions (1.0) (1.0) (1.0) Manager Termination Fee (1) (33.2) (33.2) (33.2) 6.4% 6.4% 6.4% Tax Leakage — — -Management Notice Period (6 months) (5.4) (5.4) (5.4) 1.0% 1.0% 1.0% Severance (0.2) (0.2) (0.2) General Legal (3.5) (3.3) (3.0) Wind Down Expenses A (14.5) (12.6) (10.5) 2.8% 2.4% 2.0% Litigation (1.0) (1.0) (1.0) D&O Insurance (1.1) (1.1) (1.1) Total Fees & Expenses (53.2) (51.2) (49.2) 10.2% 9.8% 9.4% Third party admin (0.1) (0.1) (0.1) Other G&A (0.5) (0.5) (0.5) Total Liqudiation Leakage (72.8) (62.3) (51.6) 13.9% 11.9% 9.9% Proxy / Vote Process (3.0) (2.3) (1.5) Estimated Liquidation Realization 450 460 471 86.1% 88.1% 90.1% All other (4.0) (3.0) (2.0) Total (14.5) (12.6) (10.5) A Notes 1. 3 times average annual management fee earned by the manager in the 24 months prior to termination (calculated based on fees earned in the period 12 Q3 14 to Q2 16 assuming Q1 16 and Q2 16 fees are equal to Q4 15 fees).
|

Confidential Project Apple AMY VALUATION ANALYSIS Amy Liquidation Analysis Volatility Considerations Liquidation Realization Exposed to Market Volatility during Liquidation Decision and Execution Process Liquidation Analysis with Volatility Overlay Mortgage REIT Book Value Volatility % of book value Mortgage REIT Quarterly Book Value Volatility over Time A. 105.2% Base case plus estimated biggest one week move based on 2009 2015 105% 10 years of trading data (~$89.4MM swing up or down) (1) QoQ Change in Book Value (%) 15 B. 10 100% 5 B. 97.3% Base case plus Amy s best quarterly book value result to 0 date (5) (10) 95% Base case plus one standard deviation for mortgage (15) C. 93.8% REITs historical book value change distribution B. (20) Q1 Q2 Q3 Q4 Q1 Q2 Q3 Q4 Q1 Q2 Q3 Q4 Q1 Q2 Q3 Q4 Q1 Q2 Q3 Q4 Q1 Q2 Q3 Q4 Q1 Q2 Q3 Q4 2009 2010 2011 2012 2013 2014 2015 90% 90.1% (2) (2) Amy Hybrid REITs Agency REITs 88.1% Static liquidation analysis; high, medium and low case Mortgage REIT Universe Quarterly Book Value Change Distribution 86.1% Since 2009 (4) 85% (%): 11.4% 21: (5.7%) C. C.: 5.7% Base case less one standard deviation for mortgage C. 82.4% 18 REITs historical book value change distribution 80% 15 12 9 75% 6 B. 73.8% Base case plus Amy s worst quarterly book value result to 3 date 0 A. Base case less estimated biggest one week move based on 71.0% <(20)(18) (16) (14) (12) (10) (8) (6) (4) (2) 2 4 6 8 10 12 14 16 18 >20 10 years of trading data (~$89.4MM swing up or down) (1) 70% Book Value Increase / (Decline)—% Source SNL Financial Notes 1. Based on management analysis 2. Includes AI, AMTG, CIM, DX, EARN, EFC, IVR, JMI, MFA, MITT, MTGE, NYMT, OAKS, PMT, RWT, TWO, WMC and ZFC 3. Includes AGNC, ANH, ARR, CMO, CYS, HTS and NLY 13 4. Includes all hybrid and agency mortgage REIT reported quarterly change in book value per share since 2009 (527 observations)
|
Confidential Apple MS Fairness Presentation —02.25.2016.pptx\25 FEB 2016\1:07 AM\14 Project Apple Section 3 Arielle Stock Considerations 14
|
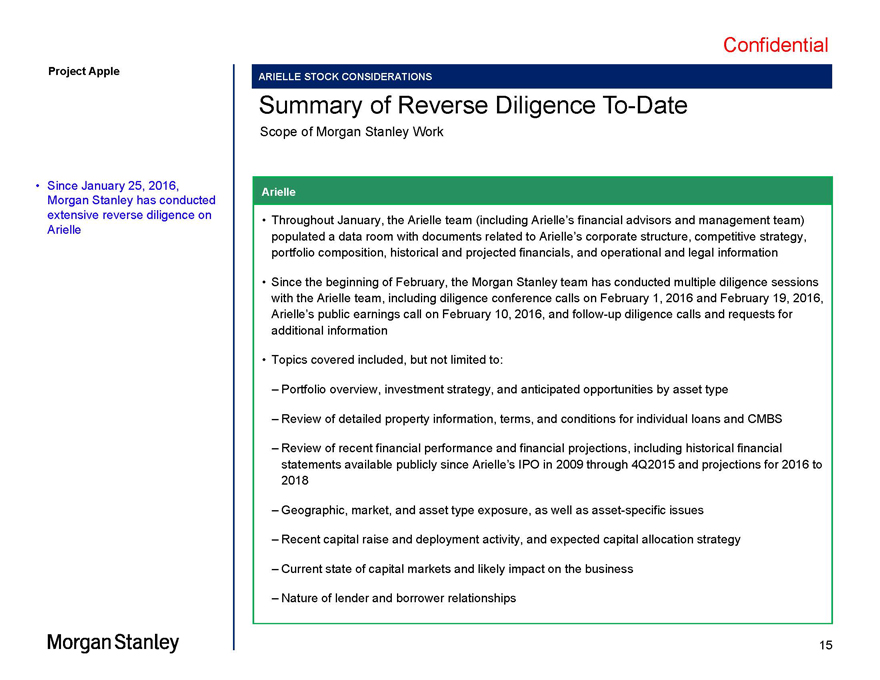
Confidential Project Apple ARIELLE STOCK CONSIDERATIONS Summary of Reverse Diligence To-Date Scope of Morgan Stanley Work Since January 25, 2016, Arielle Morgan Stanley has conducted extensive reverse diligence on Throughout January, the Arielle team (including Arielle s financial advisors and management team) Arielle populated a data room with documents related to Arielle s corporate structure, competitive strategy, portfolio composition, historical and projected financials, and operational and legal information Since the beginning of February, the Morgan Stanley team has conducted multiple diligence sessions with the Arielle team, including diligence conference calls on February 1, 2016 and February 19, 2016, Arielle s public earnings call on February 10, 2016, and follow-up diligence calls and requests for additional information Topics covered included, but not limited to: Portfolio overview, investment strategy, and anticipated opportunities by asset type Review of detailed property information, terms, and conditions for individual loans and CMBS Review of recent financial performance and financial projections, including historical financial statements available publicly since Arielle s IPO in 2009 through 4Q2015 and projections for 2016 to 2018 Geographic, market, and asset type exposure, as well as asset-specific issues Recent capital raise and deployment activity, and expected capital allocation strategy Current state of capital markets and likely impact on the business Nature of lender and borrower relationships 15
|
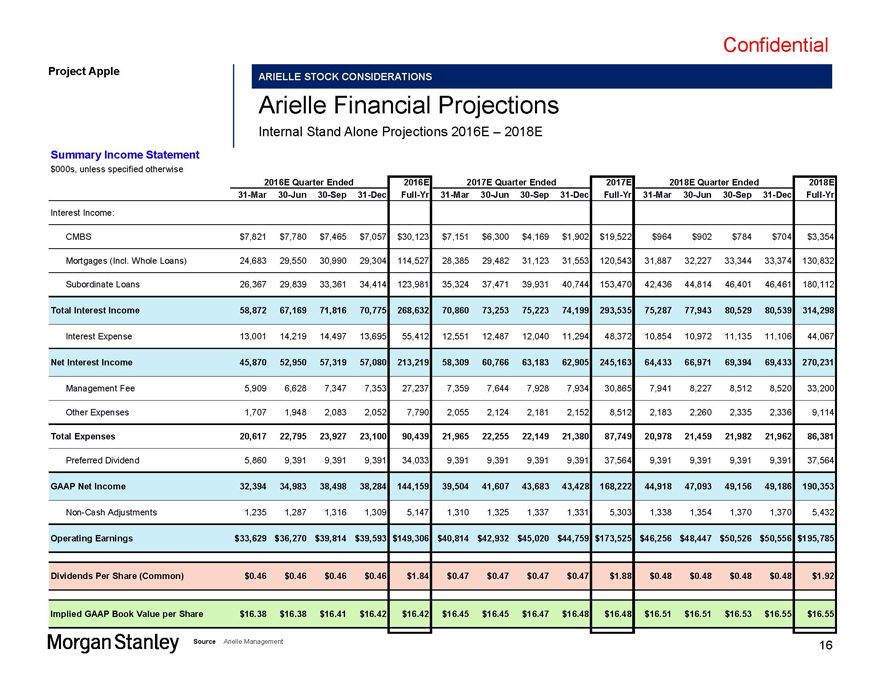
Confidential Apple MS Fairness Presentation —02.25.2016.pptx\25 FEB 2016\1:07 AM\16 Project Apple ARIELLE STOCK CONSIDERATIONS Arielle Financial Projections Internal Stand Alone Projections 2016E 2018E Summary Income Statement $000s, unless specified otherwise 2016E Quarter Ended 2016E 2017E Quarter Ended 2017E 2018E Quarter Ended 2018E 31-Mar 30-Jun 30-Sep 31-Dec Full-Yr 31-Mar 30-Jun 30-Sep 31-Dec Full-Yr 31-Mar 30-Jun 30-Sep 31-Dec Full-Yr Interest Income: CMBS $7,821 $7,780 $7,465 $7,057 $30,123 $7,151 $6,300 $4,169 $1,902 $19,522 $964 $902 $784 $704 $3,354 Mortgages (Incl. Whole Loans) 24,683 29,550 30,990 29,304 114,527 28,385 29,482 31,123 31,553 120,543 31,887 32,227 33,344 33,374 130,832 Subordinate Loans 26,367 29,839 33,361 34,414 123,981 35,324 37,471 39,931 40,744 153,470 42,436 44,814 46,401 46,461 180,112 Total Interest Income 58,872 67,169 71,816 70,775 268,632 70,860 73,253 75,223 74,199 293,535 75,287 77,943 80,529 80,539 314,298 Interest Expense 13,001 14,219 14,497 13,695 55,412 12,551 12,487 12,040 11,294 48,372 10,854 10,972 11,135 11,106 44,067 Net Interest Income 45,870 52,950 57,319 57,080 213,219 58,309 60,766 63,183 62,905 245,163 64,433 66,971 69,394 69,433 270,231 Management Fee 5,909 6,628 7,347 7,353 27,237 7,359 7,644 7,928 7,934 30,865 7,941 8,227 8,512 8,520 33,200 Other Expenses 1,707 1,948 2,083 2,052 7,790 2,055 2,124 2,181 2,152 8,512 2,183 2,260 2,335 2,336 9,114 Total Expenses 20,617 22,795 23,927 23,100 90,439 21,965 22,255 22,149 21,380 87,749 20,978 21,459 21,982 21,962 86,381 Preferred Dividend 5,860 9,391 9,391 9,391 34,033 9,391 9,391 9,391 9,391 37,564 9,391 9,391 9,391 9,391 37,564 GAAP Net Income 32,394 34,983 38,498 38,284 144,159 39,504 41,607 43,683 43,428 168,222 44,918 47,093 49,156 49,186 190,353 Non-Cash Adjustments 1,235 1,287 1,316 1,309 5,147 1,310 1,325 1,337 1,331 5,303 1,338 1,354 1,370 1,370 5,432 Operating Earnings $33,629 $36,270 $39,814 $39,593 $149,306 $40,814 $42,932 $45,020 $44,759 $173,525 $46,256 $48,447 $50,526 $50,556 $195,785 Dividends Per Share (Common) $0.46 $0.46 $0.46 $0.46 $1.84 $0.47 $0.47 $0.47 $0.47 $1.88 $0.48 $0.48 $0.48 $0.48 $1.92 Implied GAAP Book Value per Share $16.38 $16.38 $16.41 $16.42 $16.42 $16.45 $16.45 $16.47 $16.48 $16.48 $16.51 $16.51 $16.53 $16.55 $16.55 Source Arielle Management 16
|
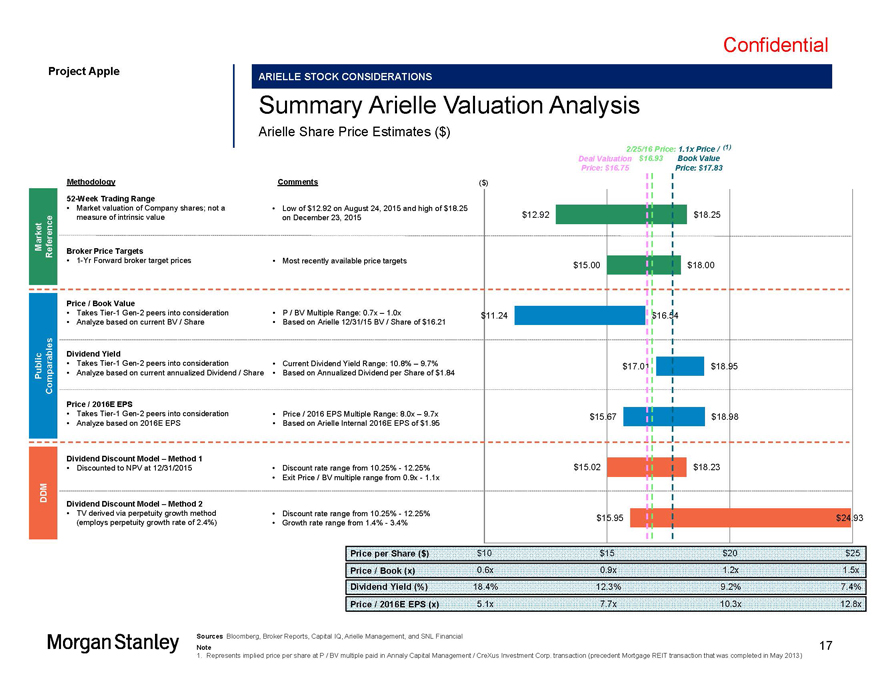
Confidential Apple MS Fairness Presentation —02.25.2016.pptx\25 FEB 2016\1:07 AM\17 Project Apple ARIELLE STOCK CONSIDERATIONS Summary Arielle Valuation Analysis Arielle Share Price Estimates ($) 2/25/16 Price: 1.1x Price / (1) Deal Valuation $16.93 Book Value Price: $16.75 Price: $17.83 Methodology Comments ($) 52-Week Trading Range Market valuation of Company shares; not a Low of $12.92 on August 24, 2015 and high of $18.25 measure of intrinsic value on December 23, 2015 $12.92 $18.25 Market Reference Broker Price Targets 1-Yr Forward broker target prices Most recently available price targets $15.00 $18.00 Price / Book Value Takes Tier-1 Gen-2 peers into consideration P / BV Multiple Range: 0.7x 1.0x $11.24 $16.54 Analyze based on current BV / Share Based on Arielle 12/31/15 BV / Share of $16.21 Dividend Yield Takes Tier-1 Gen-2 peers into consideration Current Dividend Yield Range: 10.8% 9.7% $17.01 $18.95 Public Comparables Analyze based on current annualized Dividend / Share Based on Annualized Dividend per Share of $1.84 Price / 2016E EPS Takes Tier-1 Gen-2 peers into consideration Price / 2016 EPS Multiple Range: 8.0x 9.7x $15.67 $18.98 Analyze based on 2016E EPS Based on Arielle Internal 2016E EPS of $1.95 Dividend Discount Model Method 1 Discounted to NPV at 12/31/2015 Discount rate range from 10.25%—12.25% $15.02 $18.23 Exit Price / BV multiple range from 0.9x—1.1x DDM Dividend Discount Model Method 2 TV derived via perpetuity growth method Discount rate range from 10.25%—12.25% $15.95 $24.93 (employs perpetuity growth rate of 2.4%) Growth rate range from 1.4%—3.4% Price per Share ($) Price / Book (x) 0.6x 0.9x 1.2x 1.5x Dividend Yield (%) 18.4% 12.3% 9.2% 7.4% Price / 2016E EPS (x) 5.1x 7.7x 10.3x 12.8x Sources Bloomberg, Broker Reports, Capital IQ, Arielle Management, and SNL Financial 17 Note 1. Represents implied price per share at P / BV multiple paid in Annaly Capital Management / CreXus Investment Corp. transaction (precedent Mortgage REIT transaction that was completed in May 2013)
|
Confidential Apple MS Fairness Presentation —02.25.2016.pptx\25 FEB 2016\1:07 AM\18 Project Apple Appendix A Amy Overview & Historical Performance 18
|
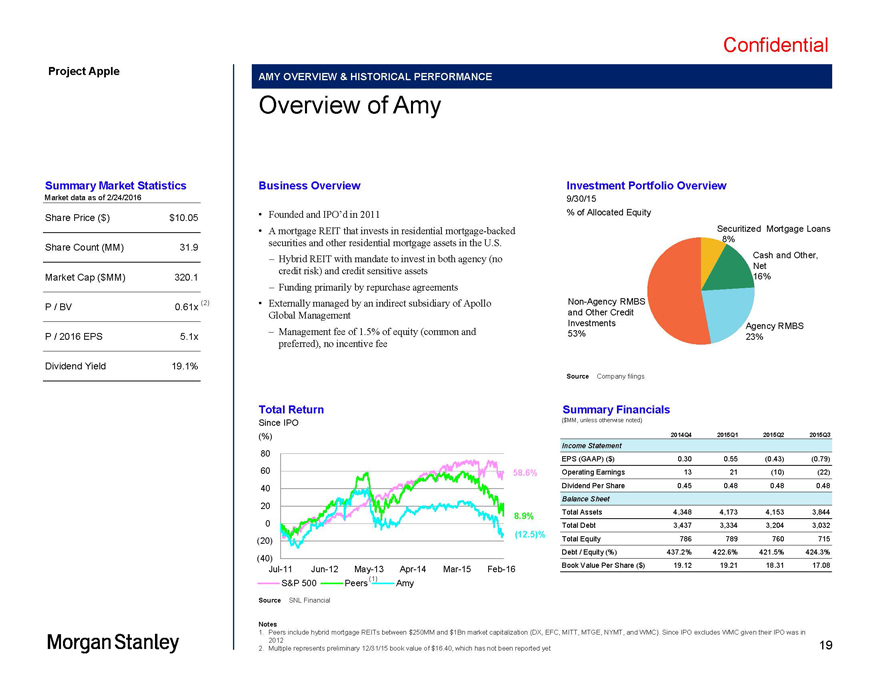
Confidential Apple MS Fairness Presentation —02.25.2016.pptx\25 FEB 2016\1:07 AM\19 Project Apple AMY OVERVIEW & HISTORICAL PERFORMANCE Overview of Amy Summary Market Statistics Business Overview Investment Portfolio Overview Market data as of 2/24/2016 9/30/15 Founded and IPO d in 2011 % of Allocated Equity Share Price ($) $10.05 A mortgage REIT that invests in residential mortgage-backed Securitized Mortgage Loans Share Count (MM) 31.9 securities and other residential mortgage assets in the U.S. 8% Hybrid REIT with mandate to invest in both agency (no Cash and Other, Net credit risk) and credit sensitive assets Market Cap ($MM) 320.1 16% Funding primarily by repurchase agreements (2) Externally managed by an indirect subsidiary of Apollo Non-Agency RMBS P / BV 0.61x Global Management and Other Credit Management fee of 1.5% of equity (common and Investments Agency RMBS P / 2016 EPS 5.1x 53% 23% preferred), no incentive fee Dividend Yield 19.1% Source Company filings Total Return Summary Financials Since IPO ($MM, unless otherwise noted) (%) 2014Q4 2015Q1 2015Q2 2015Q3 80 Income Statement EPS (GAAP) ($) 0.30 0.55 (0.43) (0.79) 60 58.6% Operating Earnings 13 21 (10) (22) 40 Dividend Per Share 0.45 0.48 0.48 0.48 20 Balance Sheet 8.9% Total Assets 4,348 4,173 4,153 3,844 0 Total Debt 3,437 3,334 3,204 3,032 (12.5)% (20) Total Equity 786 789 760 715 Debt / Equity (%) 437.2% 422.6% 421.5% 424.3% (40) Book Value Per Share ($) 19.12 19.21 18.31 17.08 Jul-11 Jun-12 May-13 Apr-14 Mar-15 Feb-16 (1) S&P 500 Peers Amy Source SNL Financial Notes 1. Peers include hybrid mortgage REITs between $250MM and $1Bn market capitalization (DX, EFC, MITT, MTGE, NYMT, and WMC). Since IPO excludes WMC given their IPO was in 2012 19 2. Multiple represents preliminary 12/31/15 book value of $16.40, which has not been reported yet
|
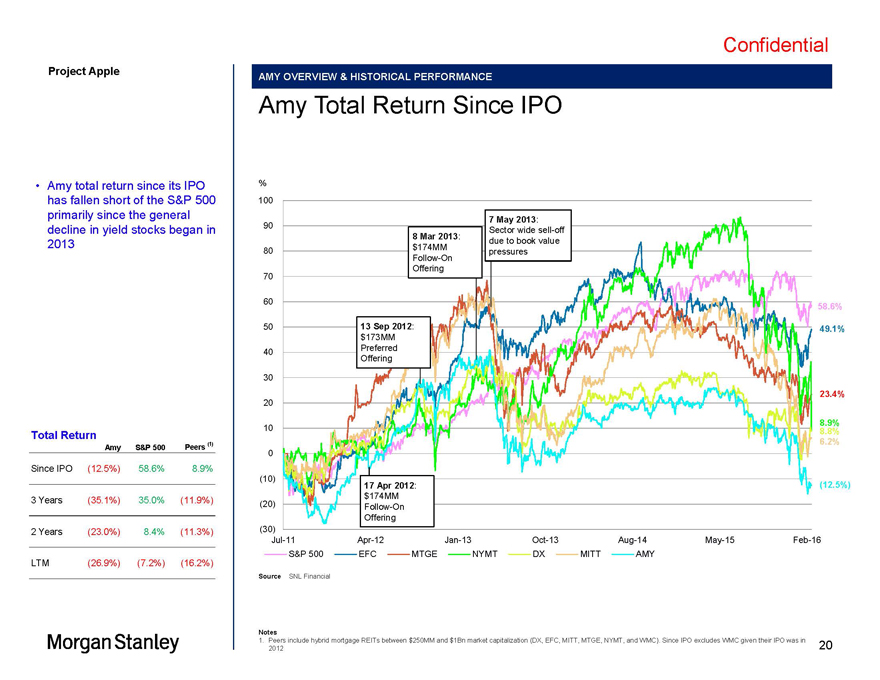
Confidential Project Apple AMY OVERVIEW & HISTORICAL PERFORMANCE Amy Total Return Since IPO Amy total return since its IPO % has fallen short of the S&P 500 100 primarily since the general 7 May 2013: 90 decline in yield stocks began in Sector wide sell-off 8 Mar 2013: 2013 due to book value 80 $174MM pressures Follow-On 70 Offering 60 58.6% 50 13 Sep 2012: 49.1% $173MM Preferred 40 Offering 30 20 23.4% 8.9% 10 8.8% Total Return (1) 6.2% Amy S&P 500 Peers 0 Since IPO (12.5%) 58.6% 8.9% (10) 17 Apr 2012: (12.5%) 3 Years (35.1%) 35.0% (11.9%) (20) $174MM Follow-On Offering 2 Years (23.0%) 8.4% (11.3%) (30) Jul-11 Apr-12 Jan-13 Oct-13 Aug-14 May-15 Feb-16 S&P 500 EFC MTGE NYMT DX MITT AMY LTM (26.9%) (7.2%) (16.2%) Source SNL Financial Notes 1. Peers include hybrid mortgage REITs between $250MM and $1Bn market capitalization (DX, EFC, MITT, MTGE, NYMT, and WMC). Since IPO excludes WMC given their IPO was in 20 2012
|
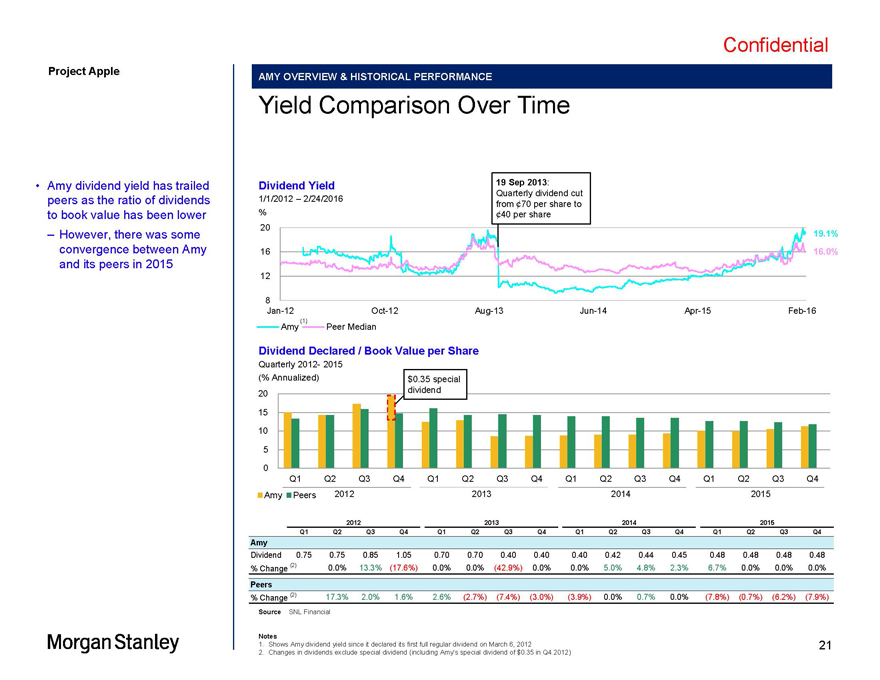
Confidential Project Apple AMY OVERVIEW & HISTORICAL PERFORMANCE Yield Comparison Over Time Amy dividend yield has trailed Dividend Yield 19 Sep 2013: Quarterly dividend cut peers as the ratio of dividends 1/1/2012 2/24/2016 % from 70 per share to to book value has been lower 40 per share 20 However, there was some 19.1% convergence between Amy 16 16.0% and its peers in 2015 12 8 Jan-12 Oct-12 Aug-13 Jun-14 Apr-15 Feb-16 (1) Amy Peer Median Dividend Declared / Book Value per Share Quarterly 2012- 2015 (% Annualized) $0.35 special 20 dividend 15 10 5 0 Q1 Q2 Q3 Q4 Q1 Q2 Q3 Q4 Q1 Q2 Q3 Q4 Q1 Q2 Q3 Q4 Amy Peers 2012 2013 2014 2015 2012201320142015 Q1 Q2 Q3 Q4 Q1 Q2 Q3 Q4 Q1 Q2 Q3 Q4 Q1 Q2 Q3 Q4 Amy Dividend 0.75 0.75 0.85 1.05 0.70 0.70 0.40 0.40 0.40 0.42 0.44 0.45 0.48 0.48 0.48 0.48 % Change (2) 0.0% 13.3% (17.6%) 0.0% 0.0% (42.9%) 0.0% 0.0% 5.0% 4.8% 2.3% 6.7% 0.0% 0.0% 0.0% Peers % Change (2) 17.3% 2.0% 1.6% 2.6% (2.7%) (7.4%) (3.0%) (3.9%) 0.0% 0.7% 0.0% (7.8%) (0.7%) (6.2%) (7.9%) Source SNL Financial Notes 1. Shows Amy dividend yield since it declared its first full regular dividend on March 6, 2012 21 2. Changes in dividends exclude special dividend (including Amy s special dividend of $0.35 in Q4 2012)
|
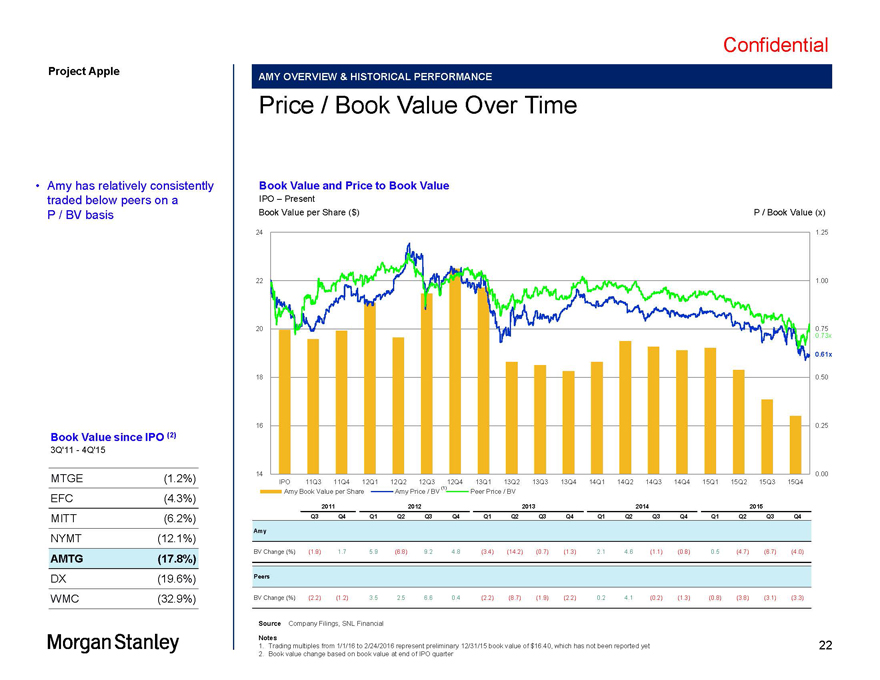
Confidential Project Apple AMY OVERVIEW & HISTORICAL PERFORMANCE Price / Book Value Over Time Amy has relatively consistently Book Value and Price to Book Value traded below peers on a IPO Present P / BV basis Book Value per Share ($) P / Book Value (x) 24 1.25 22 1.00 20 0.75 0.73x 0.61x 18 0.50 16 0.25 Book Value since IPO (2) 3Q’11—4Q’15 MTGE (1.2%) 14 0.00 IPO 11Q3 11Q4 12Q1 12Q2 12Q3 12Q4 13Q1 13Q2 13Q3 13Q4 14Q1 14Q2 14Q3 14Q4 15Q1 15Q2 15Q3 15Q4 (1) Amy Book Value per Share Amy Price / BV Peer Price / BV EFC (4.3%) 2011 2012 2013 2014 2015 MITT (6.2%) Q3 Q4 Q1 Q2 Q3 Q4 Q1 Q2 Q3 Q4 Q1 Q2 Q3 Q4 Q1 Q2 Q3 Q4 NYMT (12.1%) Amy BV Change (%) (1.9) 1.7 5.9 (6.8) 9.2 4.8 (3.4) (14.2) (0.7) (1.3) 2.1 4.6 (1.1) (0.8) 0.5 (4.7) (6.7) (4.0) AMTG (17.8%) DX (19.6%) Peers WMC (32.9%) BV Change (%) (2.2) (1.2) 3.5 2.5 6.6 0.4 (2.2) (8.7) (1.9) (2.2) 0.2 4.1 (0.2) (1.3) (0.8) (3.8) (3.1) (3.3) Source Company Filings, SNL Financial Notes 1. Trading multiples from 1/1/16 to 2/24/2016 represent preliminary 12/31/15 book value of $16.40, which has not been reported yet 22 2. Book value change based on book value at end of IPO quarter
|
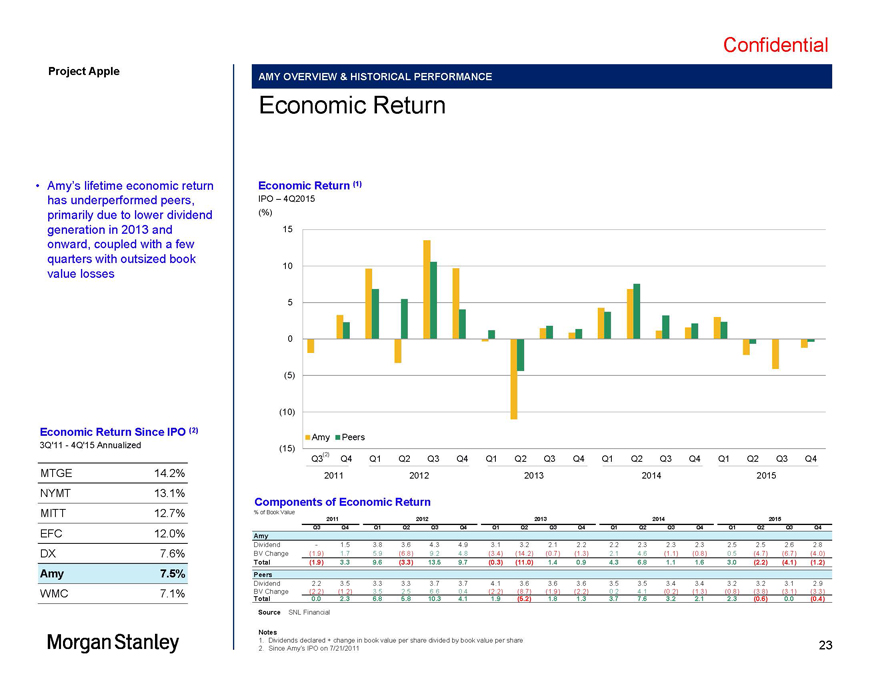
Confidential Project Apple AMY OVERVIEW & HISTORICAL PERFORMANCE Economic Return Amy s lifetime economic return Economic Return (1) has underperformed peers, IPO 4Q2015 primarily due to lower dividend (%) generation in 2013 and 15 onward, coupled with a few quarters with outsized book 10 value losses 5 0 (5) (10) Economic Return Since IPO (2) Amy Peers 3Q’11—4Q’15 Annualized (15) (2) Q3 Q4 Q1 Q2 Q3 Q4 Q1 Q2 Q3 Q4 Q1 Q2 Q3 Q4 Q1 Q2 Q3 Q4 MTGE 14.2% 2011 2012 2013 2014 2015 NYMT 13.1% Components of Economic Return MITT 12.7% % of Book Value 2011 2012 2013 2014 2015 Q3 Q4 Q1 Q2 Q3 Q4 Q1 Q2 Q3 Q4 Q1 Q2 Q3 Q4 Q1 Q2 Q3 Q4 EFC 12.0% Amy Dividend—1.5 3.8 3.6 4.3 4.9 3.1 3.2 2.1 2.2 2.2 2.3 2.3 2.3 2.5 2.5 2.6 2.8 DX 7.6% BV Change (1.9) 1.7 5.9 (6.8) 9.2 4.8 (3.4) (14.2) (0.7) (1.3) 2.1 4.6 (1.1) (0.8) 0.5 (4.7) (6.7) (4.0) Total (1.9) 3.3 9.6 (3.3) 13.5 9.7 (0.3) (11.0) 1.4 0.9 4.3 6.8 1.1 1.6 3.0 (2.2) (4.1) (1.2) Amy 7.5% Peers Dividend 2.2 3.5 3.3 3.3 3.7 3.7 4.1 3.6 3.6 3.6 3.5 3.5 3.4 3.4 3.2 3.2 3.1 2.9 WMC 7.1% BV Change (2.2) (1.2) 3.5 2.5 6.6 0.4 (2.2) (8.7) (1.9) (2.2) 0.2 4.1 (0.2) (1.3) (0.8) (3.8) (3.1) (3.3) Total 0.0 2.3 6.8 5.8 10.3 4.1 1.9 (5.2) 1.8 1.3 3.7 7.6 3.2 2.1 2.3 (0.6) 0.0 (0.4) Source SNL Financial Notes 1. Dividends declared + change in book value per share divided by book value per share 23 2. Since Amy s IPO on 7/21/2011
|
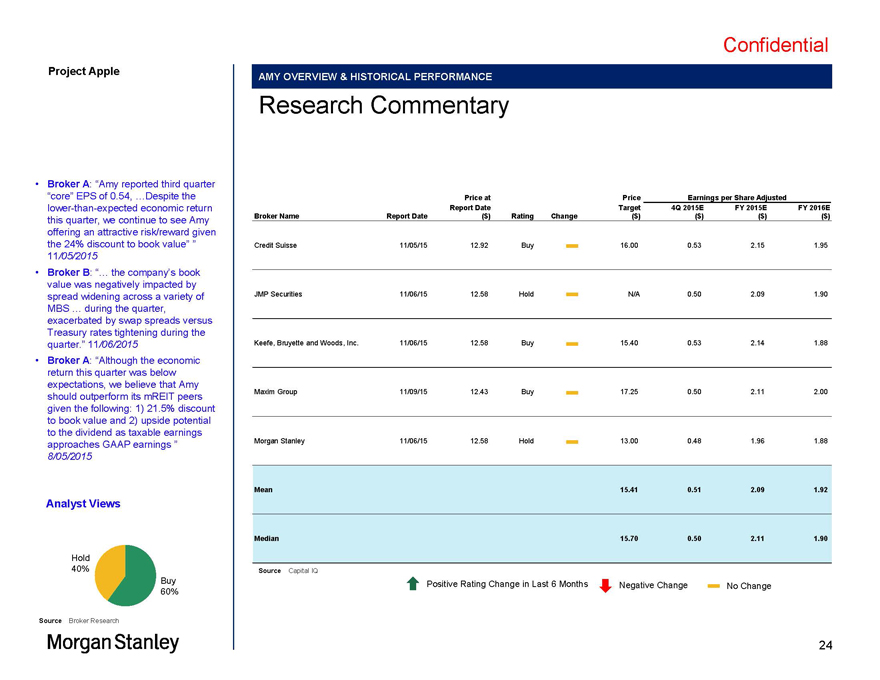
Confidential Project Apple AMY OVERVIEW & HISTORICAL PERFORMANCE Research Commentary Broker A: Amy reported third quarter core EPS of 0.54, Despite the Price at Price Earnings per Share Adjusted lower-than-expected economic return Report Date Target 4Q 2015E FY 2015E FY 2016E this quarter, we continue to see Amy Broker Name Report Date ($) Rating Change ($) ($) ($) ($) offering an attractive risk/reward given the 24% discount to book value Credit Suisse 11/05/15 12.92 Buy—16.00 0.53 2.15 1.95 11/05/2015 Broker B: the company s book value was negatively impacted by spread widening across a variety of JMP Securities 11/06/15 12.58 Hold—N/A 0.50 2.09 1.90 MBS during the quarter, exacerbated by swap spreads versus Treasury rates tightening during the quarter. 11/06/2015 Keefe, Bruyette and Woods, Inc. 11/06/15 12.58 Buy—15.40 0.53 2.14 1.88 Broker A: Although the economic return this quarter was below expectations, we believe that Amy Maxim Group 11/09/15 12.43 Buy 17.25 0.50 2.11 2.00 should outperform its mREIT peers -given the following: 1) 21.5% discount to book value and 2) upside potential to the dividend as taxable earnings approaches GAAP earnings Morgan Stanley 11/06/15 12.58 Hold—13.00 0.48 1.96 1.88 8/05/2015 Mean 15.41 0.51 2.09 1.92 Analyst Views Median 15.70 0.50 2.11 1.90 Hold 40% Source Capital IQ Buy Positive Rating Change in Last 6 Months Negative Change No Change 60%—Source Broker Research 24
|
Confidential Apple MS Fairness Presentation —02.25.2016.pptx\25 FEB 2016\1:07 AM\25 Project Apple Appendix B Arielle Overview 25
|
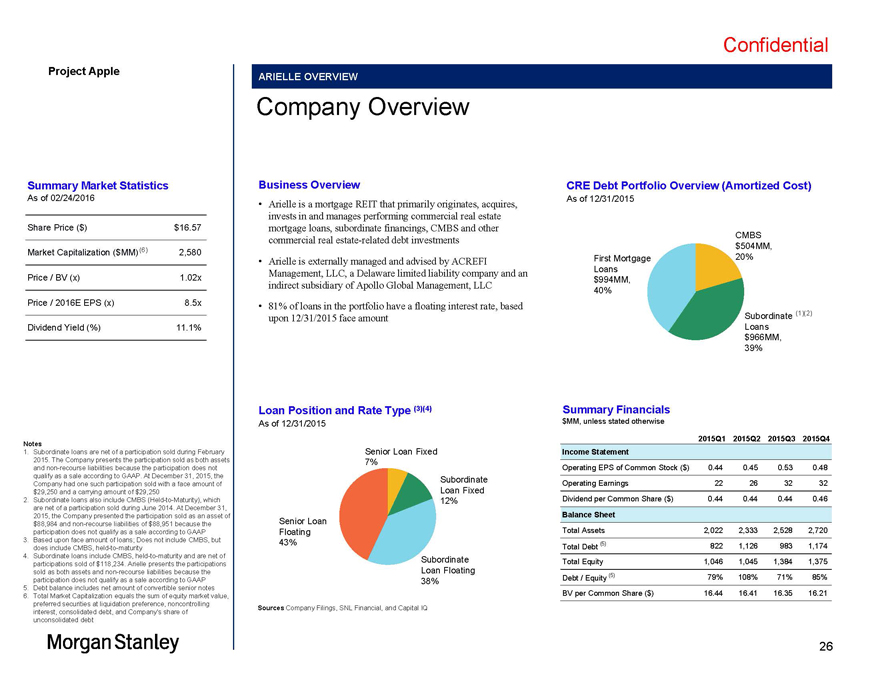
Confidential Project Apple ARIELLE OVERVIEW Company Overview Summary Market Statistics Business Overview CRE Debt Portfolio Overview (Amortized Cost) As of 02/24/2016 As of 12/31/2015 Arielle is a mortgage REIT that primarily originates, acquires, invests in and manages performing commercial real estate Share Price ($) $16.57 mortgage loans, subordinate financings, CMBS and other CMBS commercial real estate-related debt investments $504MM, Market Capitalization ($MM)(6) 2,580 Arielle is externally managed and advised by ACREFI First Mortgage 20% Price / BV (x) 1.02x Management, LLC, a Delaware limited liability company and an Loans $994MM, indirect subsidiary of Apollo Global Management, LLC 40% Price / 2016E EPS (x) 8.5x 81% of loans in the portfolio have a floating interest rate, based Subordinate (1)(2) upon 12/31/2015 face amount Loans Dividend Yield (%) 11.1% $966MM, 39% Loan Position and Rate Type (3)(4) Summary Financials As of 12/31/2015 $MM, unless stated otherwise 2015Q1 2015Q2 2015Q3 2015Q4 Notes 1. Subordinate loans are net of a participation sold during February Senior Loan Fixed Income Statement 2015. The Company presents the participation sold as both assets 7% and non-recourse liabilities because the participation does not Operating EPS of Common Stock ($) 0.44 0.45 0.53 0.48 qualify as a sale according to GAAP. At December 31, 2015, the Subordinate Company had one such participation sold with a face amount of Operating Earnings 22 26 32 32 $29,250 and a carrying amount of $29,250 Loan Fixed 2. Subordinate loans also include CMBS (Held-to-Maturity), which 12% Dividend per Common Share ($) 0.44 0.44 0.44 0.46 are net of a participation sold during June 2014. At December 31, Balance Sheet 2015, the Company presented the participation sold as an asset of $88,984 and non-recourse liabilities of $88,951 because the Senior Loan participation does not qualify as a sale according to GAAP Floating Total Assets 2,022 2,333 2,528 2,720 3. Based upon face amount of loans; Does not include CMBS, but 43% Total Debt (5) 822 1,126 983 1,174 does include CMBS, held-to-maturity 4. Subordinate loans include CMBS, held-to-maturity and are net of Subordinate participations sold of $118,234. Arielle presents the participations Total Equity 1,046 1,045 1,384 1,375 sold as both assets and non-recourse liabilities because the Loan Floating Debt / Equity (5) 79% 108% 71% 85% participation does not qualify as a sale according to GAAP 38% 5. Debt balance includes net amount of convertible senior notes 6. Total Market Capitalization equals the sum of equity market value, BV per Common Share ($) 16.44 16.41 16.35 16.21 preferred securities at liquidation preference, noncontrolling Sources Company Filings, SNL Financial, and Capital IQ interest, consolidated debt, and Company’s share of unconsolidated debt 26
|
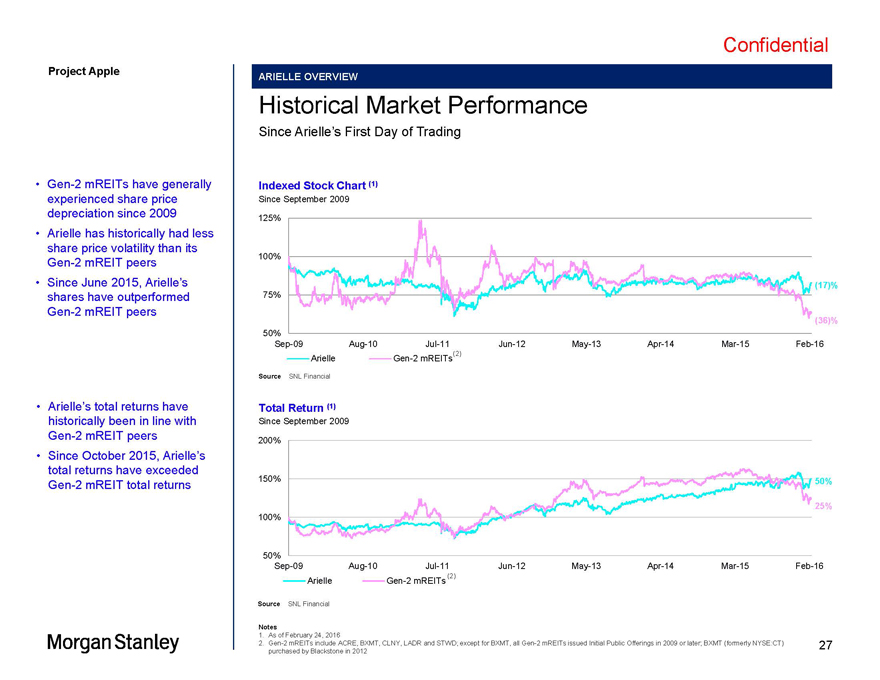
Confidential Project Apple ARIELLE OVERVIEW Historical Market Performance Since Arielle s First Day of Trading Gen-2 mREITs have generally Indexed Stock Chart (1) experienced share price Since September 2009 depreciation since 2009 125% Arielle has historically had less share price volatility than its 100% Gen-2 mREIT peers Since June 2015, Arielle s (17)% shares have outperformed 75% Gen-2 mREIT peers (36)% 50% Sep-09 Aug-10 Jul-11 Jun-12 May-13 Apr-14 Mar-15 Feb-16 (2) Arielle Gen-2 mREITs Source SNL Financial Arielle s total returns have Total Return (1) historically been in line with Since September 2009 Gen-2 mREIT peers 200% Since October 2015, Arielle s total returns have exceeded 150% 50% Gen-2 mREIT total returns 25% 100% 50% Sep-09 Aug-10 Jul-11 Jun-12 May-13 Apr-14 Mar-15 Feb-16 (2) Arielle Gen-2 mREITs Source SNL Financial Notes 1. As of February 24, 2016 2. Gen-2 mREITs include ACRE, BXMT, CLNY, LADR and STWD; except for BXMT, all Gen-2 mREITs issued Initial Public Offerings in 2009 or later; BXMT (formerly NYSE:CT) 27 purchased by Blackstone in 2012
|
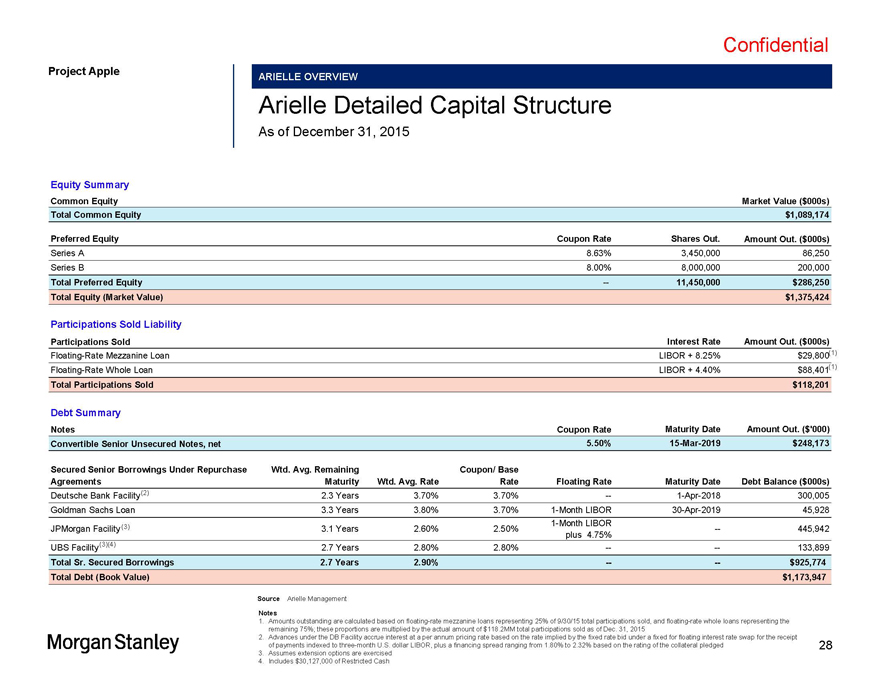
Confidential Apple MS Fairness Presentation —02.25.2016.pptx\25 FEB 2016\1:07 AM\28 Project Apple ARIELLE OVERVIEW Arielle Detailed Capital Structure As of December 31, 2015 Equity Summary Common Equity Market Value ($000s) Total Common Equity $1,089,174 Preferred Equity Coupon Rate Shares Out. Amount Out. ($000s) Series A 8.63% 3,450,000 86,250 Series B 8.00% 8,000,000 200,000 Total Preferred Equity — 11,450,000 $286,250 Total Equity (Market Value) $1,375,424 Participations Sold Liability Participations Sold Interest Rate Amount Out. ($000s) Floating-Rate Mezzanine Loan LIBOR + 8.25% $29,800(1) Floating-Rate Whole Loan LIBOR + 4.40% $88,401(1) Total Participations Sold $118,201 Debt Summary Notes Coupon Rate Maturity Date Amount Out. ($‘000) Convertible Senior Unsecured Notes, net 5.50% 15-Mar-2019 $248,173 Secured Senior Borrowings Under Repurchase Wtd. Avg. Remaining Coupon/ Base Agreements Maturity Wtd. Avg. Rate Rate Floating Rate Maturity Date Debt Balance ($000s) Deutsche Bank Facility(2) 2.3 Years 3.70% 3.70% — 1-Apr-2018 300,005 Goldman Sachs Loan 3.3 Years 3.80% 3.70% 1-Month LIBOR 30-Apr-2019 45,928 (3) 1-Month LIBOR JPMorgan Facility 3.1 Years 2.60% 2.50% — 445,942 plus 4.75% UBS Facility(3)(4) 2.7 Years 2.80% 2.80% — — 133,899 Total Sr. Secured Borrowings 2.7 Years 2.90% — — $925,774 Total Debt (Book Value) $1,173,947 Source Arielle Management Notes 1. Amounts outstanding are calculated based on floating-rate mezzanine loans representing 25% of 9/30/15 total participations sold, and floating-rate whole loans representing the remaining 75%; these proportions are multiplied by the actual amount of $118.2MM total participations sold as of Dec. 31, 2015 2. Advances under the DB Facility accrue interest at a per annum pricing rate based on the rate implied by the fixed rate bid under a fixed for floating interest rate swap for the receipt of payments indexed to three-month U.S. dollar LIBOR, plus a financing spread ranging from 1.80% to 2.32% based on the rating of the collateral pledged 28 3. Assumes extension options are exercised 4. Includes $30,127,000 of Restricted Cash
|
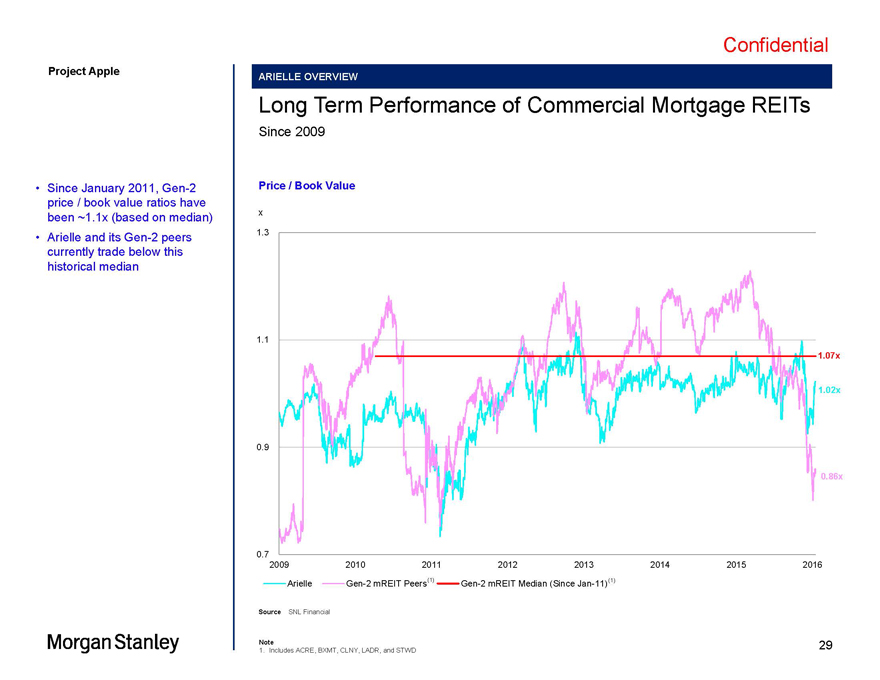
Confidential Project Apple ARIELLE OVERVIEW Long Term Performance of Commercial Mortgage REITs Since 2009 Since January 2011, Gen-2 Price / Book Value price / book value ratios have x been ~1.1x (based on median) Arielle and its Gen-2 peers 1.3 currently trade below this historical median 1.1 1.07x 1.02x 0.9 0.86x 0.7 2009 2010 2011 2012 2013 2014 2015 2016 Arielle Gen-2 mREIT Peers(1) Gen-2 mREIT Median (Since Jan-11)(1) Source SNL Financial Note 29 1. Includes ACRE, BXMT, CLNY, LADR, and STWD
|
Confidential Apple MS Fairness Presentation —02.25.2016.pptx\25 FEB 2016\1:07 AM\30 Project Apple Appendix C Additional Valuation Materials 30
|
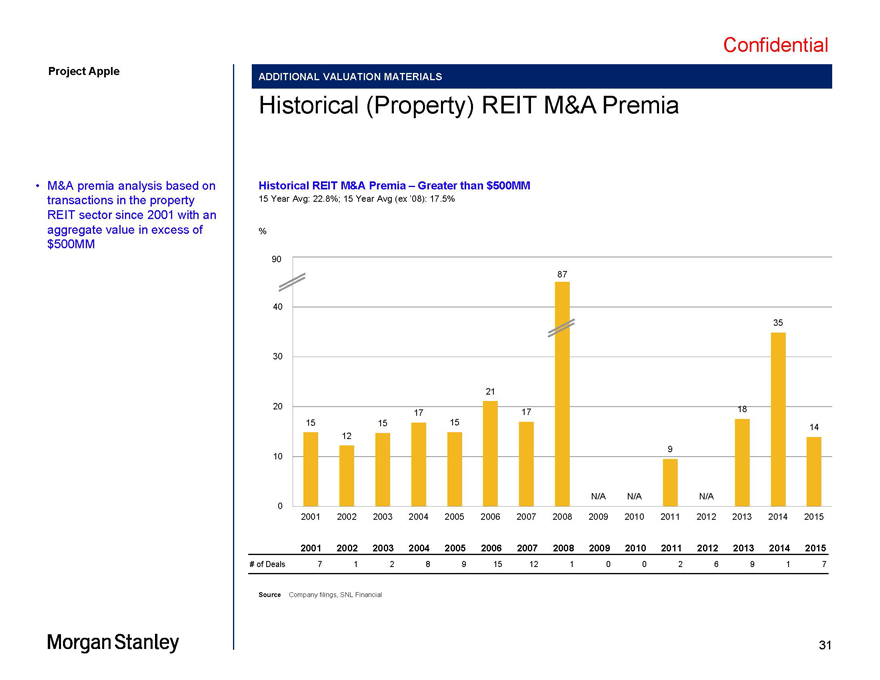
Confidential Apple MS Fairness Presentation —02.25.2016.pptx\25 FEB 2016\1:07 AM\31 Project Apple ADDITIONAL VALUATION MATERIALS Historical (Property) REIT M&A Premia M&A premia analysis based on Historical REIT M&A Premia Greater than $500MM transactions in the property 15 Year Avg: 22.8%; 15 Year Avg (ex 08): 17.5% REIT sector since 2001 with an aggregate value in excess of % $500MM 90 87 40 35 30 21 20 18 17 17 15 15 15 14 12 9 10 N/A N/A N/A 0 2001 2002 2003 2004 2005 2006 2007 2008 2009 2010 2011 2012 2013 2014 2015 2001 2002 2003 2004 2005 2006 2007 2008 2009 2010 2011 2012 2013 2014 2015 # of Deals 7 1 2 8 9 15 12 1 0 0 2 6 9 1 7 Source Company filings, SNL Financial 31
|
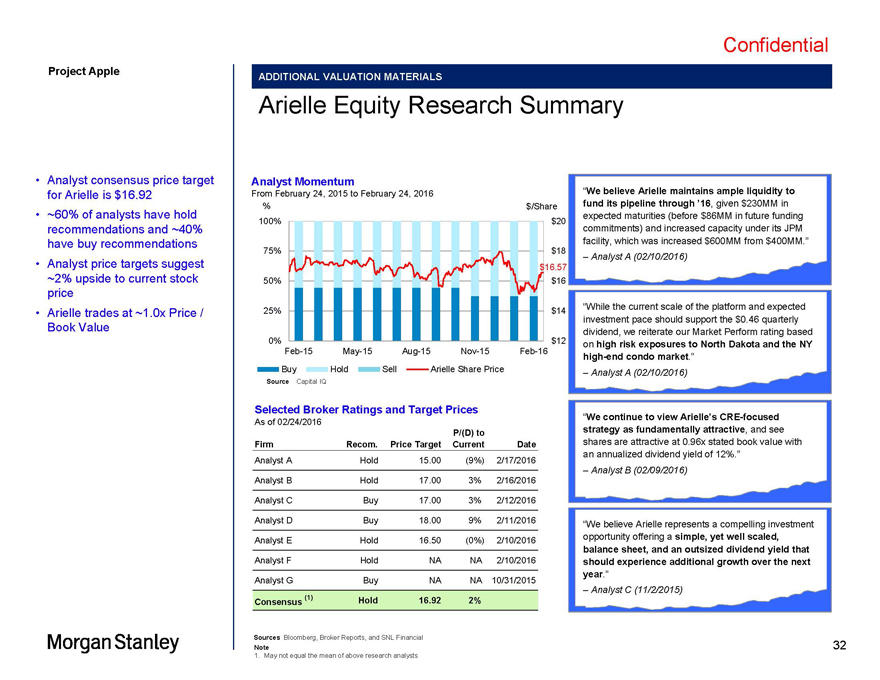
Confidential Project Apple ADDITIONAL VALUATION MATERIALS Arielle Equity Research Summary Analyst consensus price target Analyst Momentum for Arielle is $16.92 From February 24, 2015 to February 24, 2016 We believe Arielle maintains ample liquidity to % $/Share fund its pipeline through 16, given $230MM in ~60% of analysts have hold expected maturities (before $86MM in future funding 100% $20 recommendations and ~40% commitments) and increased capacity under its JPM have buy recommendations facility, which was increased $600MM from $400MM. 75% $18 Analyst A (02/10/2016) Analyst price targets suggest $16.57 ~2% upside to current stock 50% $16 price 25% $14 While the current scale of the platform and expected Arielle trades at ~1.0x Price / investment pace should support the $0.46 quarterly Book Value dividend, we reiterate our Market Perform rating based 0% $12 on high risk exposures to North Dakota and the NY Feb-15 May-15 Aug-15 Nov-15 Feb-16 high-end condo market. Buy Hold Sell Arielle Share Price Analyst A (02/10/2016) Source Capital IQ Selected Broker Ratings and Target Prices We continue to view Arielle s CRE-focused As of 02/24/2016 P/(D) to strategy as fundamentally attractive, and see Firm Recom. Price Target Current Date shares are attractive at 0.96x stated book value with an annualized dividend yield of 12%. Analyst A Hold 15.00 (9%) 2/17/2016 Analyst B (02/09/2016) Analyst B Hold 17.00 3% 2/16/2016 Analyst C Buy 17.00 3% 2/12/2016 Analyst D Buy 18.00 9% 2/11/2016 We believe Arielle represents a compelling investment Analyst E Hold 16.50 (0%) 2/10/2016 opportunity offering a simple, yet well scaled, balance sheet, and an outsized dividend yield that Analyst F Hold NA NA 2/10/2016 should experience additional growth over the next year. Analyst G Buy NA NA 10/31/2015 (1) Analyst C (11/2/2015) Consensus Hold 16.92 2% Sources Bloomberg, Broker Reports, and SNL Financial Note 32 1. May not equal the mean of above research analysts
|
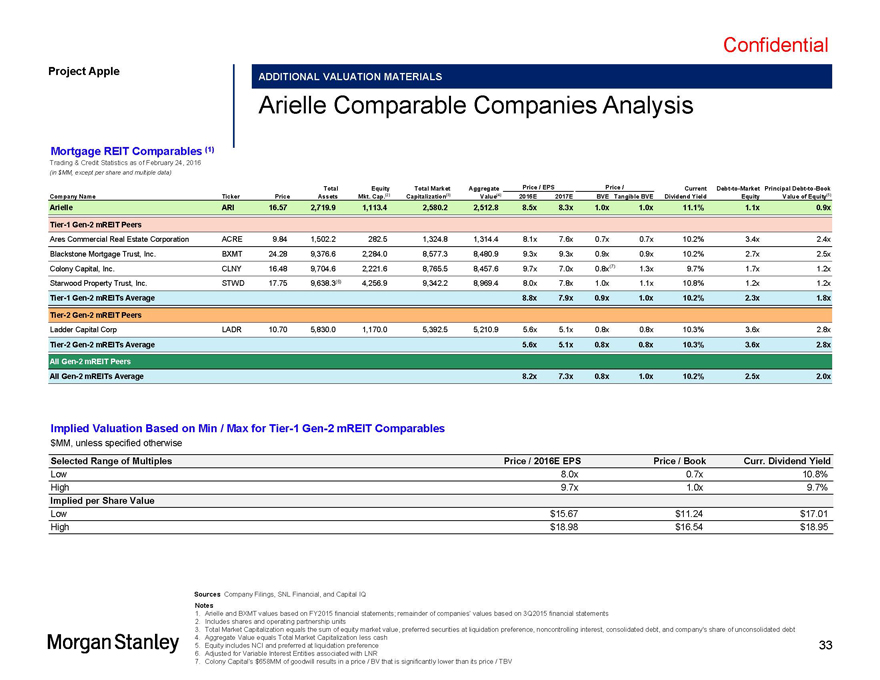
Confidential Apple MS Fairness Presentation —02.25.2016.pptx\25 FEB 2016\1:07 AM\33 Project Apple ADDITIONAL VALUATION MATERIALS Arielle Comparable Companies Analysis Mortgage REIT Comparables (1) Trading & Credit Statistics as of February 24, 2016 (in $MM, except per share and multiple data) Total Equity Total Market Aggregate Price / EPS Price / Current Debt-to-Market Principal Debt-to-Book Company Name Ticker Price Assets Mkt. Cap.(2) Capitalization(3) Value(4) 2016E 2017E BVE Tangible BVE Dividend Yield Equity Value of Equity(5) Arielle ARI 16.57 2,719.9 1,113.4 2,580.2 2,512.8 8.5x 8.3x 1.0x 1.0x 11.1% 1.1x 0.9x Tier-1 Gen-2 mREIT Peers Ares Commercial Real Estate Corporation ACRE 9.84 1,502.2 282.5 1,324.8 1,314.4 8.1x 7.6x 0.7x 0.7x 10.2% 3.4x 2.4x Blackstone Mortgage Trust, Inc. BXMT 24.28 9,376.6 2,284.0 8,577.3 8,480.9 9.3x 9.3x 0.9x 0.9x 10.2% 2.7x 2.5x Colony Capital, Inc. CLNY 16.48 9,704.6 2,221.6 8,765.5 8,457.6 9.7x 7.0x 0.8x(7) 1.3x 9.7% 1.7x 1.2x Starwood Property Trust, Inc. STWD 17.75 9,638.3(6) 4,256.9 9,342.2 8,969.4 8.0x 7.8x 1.0x 1.1x 10.8% 1.2x 1.2x Tier-1 Gen-2 mREITs Average 8.8x 7.9x 0.9x 1.0x 10.2% 2.3x 1.8x Tier-2 Gen-2 mREIT Peers Ladder Capital Corp LADR 10.70 5,830.0 1,170.0 5,392.5 5,210.9 5.6x 5.1x 0.8x 0.8x 10.3% 3.6x 2.8x Tier-2 Gen-2 mREITs Average 5.6x 5.1x 0.8x 0.8x 10.3% 3.6x 2.8x All Gen-2 mREIT Peers All Gen-2 mREITs Average 8.2x 7.3x 0.8x 1.0x 10.2% 2.5x 2.0x Implied Valuation Based on Min / Max for Tier-1 Gen-2 mREIT Comparables $MM, unless specified otherwise Selected Range of Multiples Price / 2016E EPS Price / Book Curr. Dividend Yield Low 8.0x 0.7x 10.8% High 9.7x 1.0x 9.7% Implied per Share Value Low $15.67 $11.24 $17.01 High $18.98 $16.54 $18.95 Sources Company Filings, SNL Financial, and Capital IQ Notes 1. Arielle and BXMT values based on FY2015 financial statements; remainder of companies values based on 3Q2015 financial statements 2. Includes shares and operating partnership units 3. Total Market Capitalization equals the sum of equity market value, preferred securities at liquidation preference, noncontrolling interest, consolidated debt, and company’s share of unconsolidated debt 4. Aggregate Value equals Total Market Capitalization less cash 5. Equity includes NCI and preferred at liquidation preference 33 6. Adjusted for Variable Interest Entities associated with LNR 7. Colony Capital s $658MM of goodwill results in a price / BV that is significantly lower than its price / TBV
|
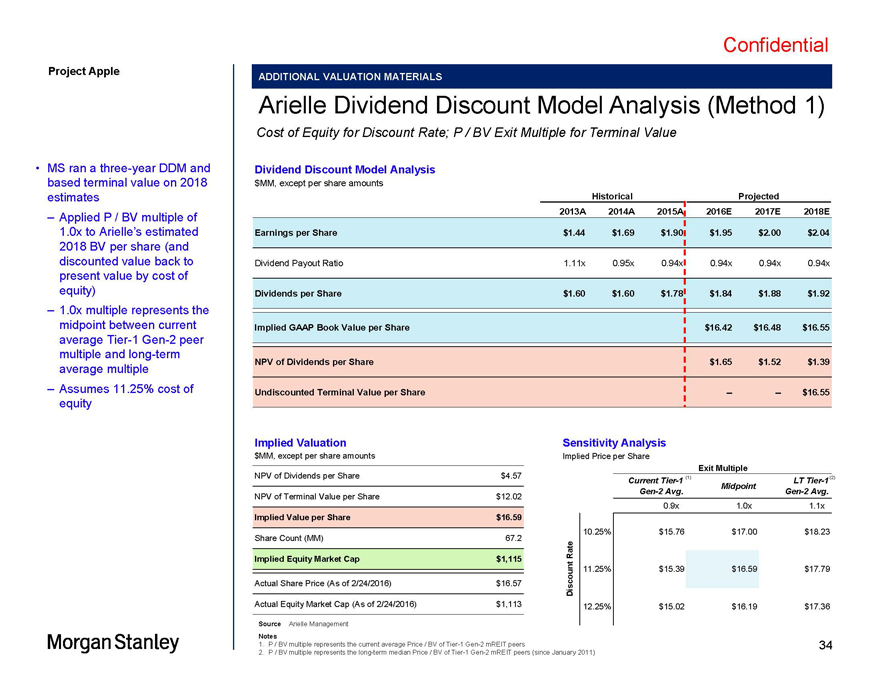
Confidential Apple MS Fairness Presentation —02.25.2016.pptx\25 FEB 2016\1:07 AM\34 Project Apple ADDITIONAL VALUATION MATERIALS Arielle Dividend Discount Model Analysis (Method 1) Cost of Equity for Discount Rate; P / BV Exit Multiple for Terminal Value MS ran a three-year DDM and Dividend Discount Model Analysis based terminal value on 2018 $MM, except per share amounts estimates Historical Projected Applied P / BV multiple of 2013A 2014A 2015A 2016E 2017E 2018E 1.0x to Arielle s estimated Earnings per Share $1.44 $1.69 $1.90 $1.95 $2.00 $2.04 2018 BV per share (and discounted value back to Dividend Payout Ratio 1.11x 0.95x 0.94x 0.94x 0.94x 0.94x present value by cost of equity) Dividends per Share $1.60 $1.60 $1.78 $1.84 $1.88 $1.92 1.0x multiple represents the midpoint between current Implied GAAP Book Value per Share $16.42 $16.48 $16.55 average Tier-1 Gen-2 peer multiple and long-term NPV of Dividends per Share $1.65 $1.52 $1.39 average multiple Assumes 11.25% cost of Undiscounted Terminal Value per Share — — $16.55 equity Implied Valuation Sensitivity Analysis $MM, except per share amounts Implied Price per Share NPV of Dividends per Share $4.57 Exit Multiple Current Tier-1 (1) LT Tier-1 (2) Midpoint Gen-2 Avg. Gen-2 Avg. NPV of Terminal Value per Share $12.02 $16.59 0.9x 1.0x 1.1x Implied Value per Share $16.59 10.25% $15.76 $17.00 $18.23 Share Count (MM) 67.2 Rate Implied Equity Market Cap $1,115 11.25% $15.39 $16.59 $17.79 Actual Share Price (As of 2/24/2016) $16.57 Discount Actual Equity Market Cap (As of 2/24/2016) $1,113 12.25% $15.02 $16.19 $17.36 Source Arielle Management Notes 1. P / BV multiple represents the current average Price / BV of Tier-1 Gen-2 mREIT peers 34 2. P / BV multiple represents the long-term median Price / BV of Tier-1 Gen-2 mREIT peers (since January 2011)
|
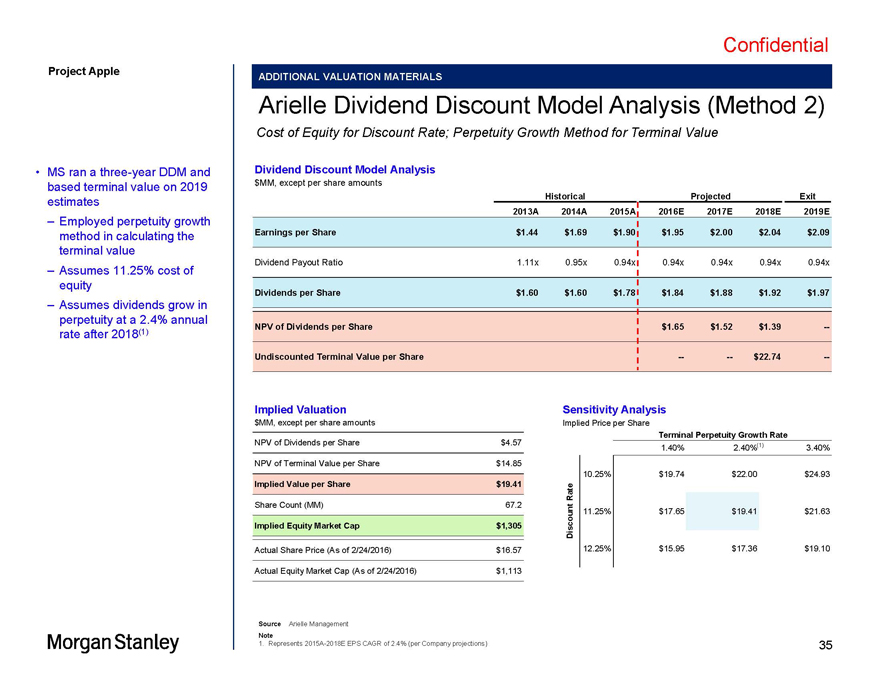
Confidential Apple MS Fairness Presentation —02.25.2016.pptx\25 FEB 2016\1:07 AM\35 Project Apple ADDITIONAL VALUATION MATERIALS Arielle Dividend Discount Model Analysis (Method 2) Cost of Equity for Discount Rate; Perpetuity Growth Method for Terminal Value MS ran a three-year DDM and Dividend Discount Model Analysis based terminal value on 2019 $MM, except per share amounts estimates Historical Projected Exit Employed perpetuity growth 2013A 2014A 2015A 2016E 2017E 2018E 2019E method in calculating the Earnings per Share $1.44 $1.69 $1.90 $1.95 $2.00 $2.04 $2.09 terminal value Dividend Payout Ratio 1.11x 0.95x 0.94x 0.94x 0.94x 0.94x 0.94x Assumes 11.25% cost of equity Dividends per Share $1.60 $1.60 $1.78 $1.84 $1.88 $1.92 $1.97 Assumes dividends grow in perpetuity at a 2.4% annual NPV of Dividends per Share $1.65 $1.52 $1.39 — rate after 2018(1) Undiscounted Terminal Value per Share — — $22.74 — Implied Valuation Sensitivity Analysis $MM, except per share amounts Implied Price per Share NPV of Dividends per Share $4.57 Terminal Perpetuity Growth Rate 1.40% 2.40%(1) 3.40% $19.41 NPV of Terminal Value per Share $14.85 10.25% $19.74 $22.00 $24.93 Implied Value per Share $19.41 Rate Share Count (MM) 67.2 11.25% $17.65 $19.41 $21.63 Implied Equity Market Cap $1,305 Discount Actual Share Price (As of 2/24/2016) $16.57 12.25% $15.95 $17.36 $19.10 Actual Equity Market Cap (As of 2/24/2016) $1,113 Source Arielle Management Note 1. Represents 2015A-2018E EPS CAGR of 2.4% (per Company projections) 35
|
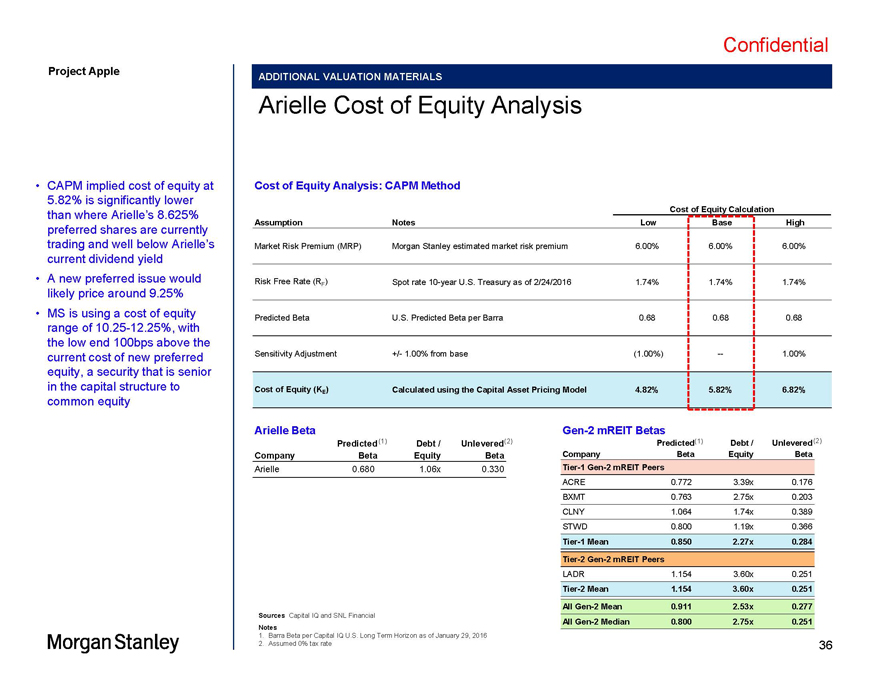
Confidential Apple MS Fairness Presentation —02.25.2016.pptx\25 FEB 2016\1:07 AM\36 Project Apple ADDITIONAL VALUATION MATERIALS Arielle Cost of Equity Analysis CAPM implied cost of equity at Cost of Equity Analysis: CAPM Method 5.82% is significantly lower Cost of Equity Calculation than where Arielle s 8.625% Assumption Notes Low Base High preferred shares are currently trading and well below Arielle s Market Risk Premium (MRP) Morgan Stanley estimated market risk premium 6.00% 6.00% 6.00% current dividend yield A new preferred issue would Risk Free Rate (R ) Spot rate 10-year U.S. Treasury as of 2/24/2016 1.74% 1.74% 1.74% likely price around 9.25% F MS is using a cost of equity Predicted Beta U.S. Predicted Beta per Barra 0.68 0.68 0.68 range of 10.25-12.25%, with the low end 100bps above the current cost of new preferred Sensitivity Adjustment +/- 1.00% from base (1.00%) — 1.00% equity, a security that is senior in the capital structure to Cost of Equity (K ) Calculated using the Capital Asset Pricing Model 4.82% 5.82% 6.82% common equity E Arielle Beta Gen-2 mREIT Betas Predicted(1) Debt / Unlevered(2) Predicted(1) Debt / Unlevered(2) Company Beta Equity Beta Company Beta Equity Beta Arielle 0.680 1.06x 0.330 Tier-1 Gen-2 mREIT Peers ACRE 0.772 3.39x 0.176 BXMT 0.763 2.75x 0.203 CLNY 1.064 1.74x 0.389 STWD 0.800 1.19x 0.366 Tier-1 Mean 0.850 2.27x 0.284 Tier-2 Gen-2 mREIT Peers LADR 1.154 3.60x 0.251 Tier-2 Mean 1.154 3.60x 0.251 All Gen-2 Mean 0.911 2.53x 0.277 Sources Capital IQ and SNL Financial All Gen-2 Median 0.800 2.75x 0.251 Notes 1. Barra Beta per Capital IQ U.S. Long Term Horizon as of January 29, 2016 2. Assumed 0% tax rate 36