Exhibit (c)(9)
|

HOULIHAN LOKEY Project Apple Discussion Materials
January 6, 2016
Confidential
CORPORATE FINANCE
FINANCIAL ADVISORY SERVICES FINANCIAL RESTRUCTURING STRATEGIC CONSULTING
HL.com
|

Project Apple Disclaimer Discussion Materials
These materials are preliminary and subject to revision, further due diligence and updated perspectives on the proposed transaction, ARROW, AMY and other potential transaction parties, including with respect to ARROW management’s financial forecasts and estimates reflected or utilized herein, which forecasts and estimates have not yet been finalized and are subject to further review and discussion. Accordingly, information included in these materials may require substantial revision to reflect further diligence, input of the Special Committee regarding such financial forecasts and estimates (assumptions, sensitivities or otherwise), changes in market conditions and other factors as ARROW management, the Special Committee and/or Houlihan Lokey may deem appropriate.
In addition, certain illustrative scenarios or implied data reflected herein are for informational or indicative purposes only. Houlihan Lokey expresses no view or opinion as to the likelihood of achieving any future results indicated by these illustrative scenarios or otherwise. Actual future results are affected by many factors, which may be significantly more or less favorable than the results indicated by such illustrative scenarios or the methodologies utilized herein.
HOULIHAN LOKEY 1
|
Project Apple Table of Contents
Discussion Materials
Tab Agenda 1 Summary of Proposed Transaction 2 Target Preliminary Portfolio Overview 3 Industry Trends and Information 4 Illustrative Pro Forma Financial Overview 5 Appendix 6 Additional Information A
Disclaimer B
HOULIHAN LOKEY 2
|

Agenda
|

Agenda Agenda
Overview of Proposed Transaction
Illustrative Alternative Capital Raise Options Preliminary Target Portfolio Overview Industry Trends Illustrative Pro Forma Financial Considerations Deal Dynamics Preparing for Reverse Due Diligence
HOULIHAN LOKEY 4
|

Summary of Proposed Transaction
|
Summary of Transaction Overview
Proposed Transaction
Preliminary Transaction Overview
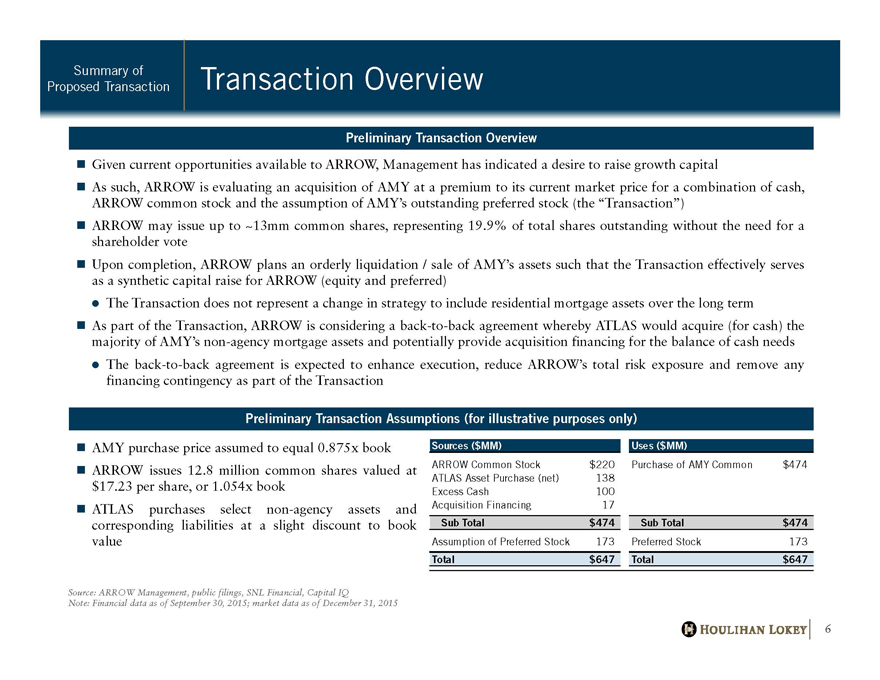
Given current opportunities available to ARROW, Management has indicated a desire to raise growth capital
As such, ARROW is evaluating an acquisition of AMY at a premium to its current market price for a combination of cash, ARROW common stock and the assumption of AMY’s outstanding preferred stock (the “Transaction”) ARROW may issue up to ~13mm common shares, representing 19.9% of total shares outstanding without the need for a shareholder vote Upon completion, ARROW plans an orderly liquidation / sale of AMY’s assets such that the Transaction effectively serves as a synthetic capital raise for ARROW (equity and preferred) The Transaction does not represent a change in strategy to include residential mortgage assets over the long term As part of the Transaction, ARROW is considering a back-to-back agreement whereby ATLAS would acquire (for cash) the majority of AMY’s non-agency mortgage assets and potentially provide acquisition financing for the balance of cash needs The back-to-back agreement is expected to enhance execution, reduce ARROW’s total risk exposure and remove any financing contingency as part of the Transaction
Preliminary Transaction Assumptions (for illustrative purposes only)
AMY purchase price assumed to equal 0.875x book ARROW issues 12.8 million common shares valued at
$17.23 per share, or 1.054x book
ATLAS purchases select non-agency assets and corresponding liabilities at a slight discount to book value
Source: ARROW Management, public filings, SNL Financial, Capital IQ
Note: Financial data as of September 30, 2015; market data as of December 31, 2015
Sources ($MM)
ARROW Common Stock $220 ATLAS Asset Purchase (net) 138 Excess Cash 100 Acquisition Financing 17
Sub Total $474
Assumption of Preferred Stock 173
Total $647
Uses ($MM)
Purchase of AMY Common $474
Sub Total $474
Preferred Stock 173
Total $647
HOULIHAN LOKEY 6
|
Summary of Illustrative Alternative Capital Raise Scenarios
Proposed Transaction
Issuance Type
Issuance Cost
Certain Considerations
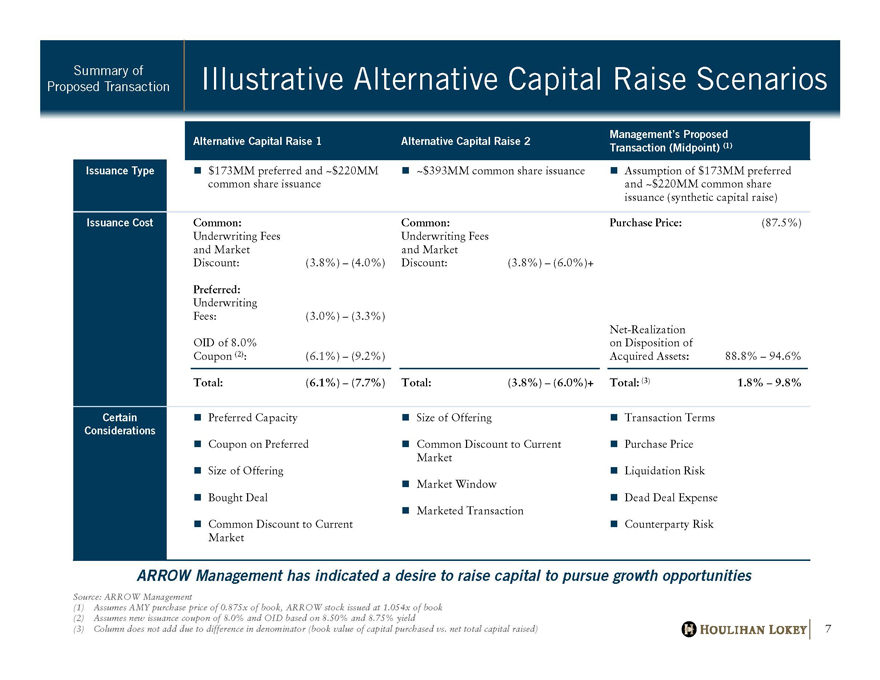
Management’s Proposed Alternative Capital Raise 1 Alternative Capital Raise 2 Transaction (Midpoint) (1)
$173MM preferred and ~$220MM ~$393MM common share issuance Assumption of $173MM preferred common share issuance and ~$220MM common share issuance (synthetic capital raise)
Common: Common: Purchase Price: (87.5%) Underwriting Fees Underwriting Fees and Market and Market Discount: (3.8%) – (4.0%) Discount: (3.8%) – (6.0%)+
Preferred:
Underwriting
Fees: (3.0%) – (3.3%)
Net-Realization OID of 8.0% on Disposition of
Coupon (2): (6.1%) – (9.2%) Acquired Assets: 88.8% – 94.6%
Total: (6.1%) – (7.7%) Total: (3.8%) – (6.0%)+ Total: (3) 1.8% – 9.8%
Preferred Capacity Size of Offering Transaction Terms
Coupon on Preferred Common Discount to Current Purchase Price Market Size of Offering Liquidation Risk Market Window Bought Deal Dead Deal Expense Marketed Transaction Common Discount to Current Counterparty Risk Market
ARROW Management has indicated a desire to raise capital to pursue growth opportunities
Source: ARROW Management
(1) Assumes AMY purchase price of 0.875x of book, ARROW stock issued at 1.054x of book (2) Assumes new issuance coupon of 8.0% and OID based on 8.50% and 8.75% yield
(3) Column does not add due to difference in denominator (book value of capital purchased vs. net total capital raised) HOULIHAN LOKEY 7
|

Target Preliminary Portfolio Overview
|
Target Preliminary
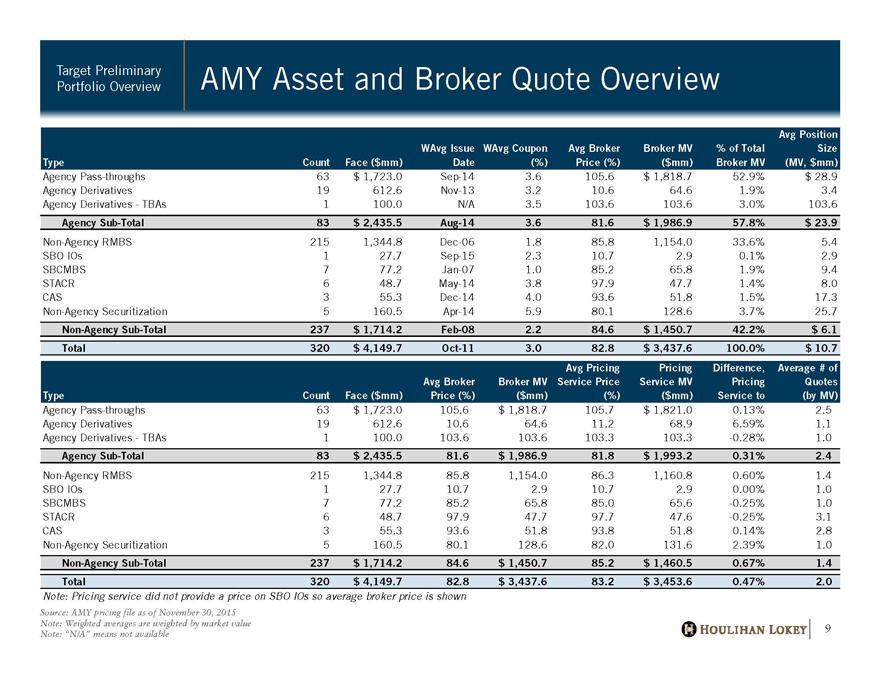
Portfolio Overview AMY Asset and Broker Quote Overview
Avg Position
WAvg Issue WAvg Coupon Avg Broker Broker MV% of Total Size
Type Count Face ($mm) Date(%) Price (%)($mm) Broker MV(MV, $mm)
Agency Pass-throughs 63 $ 1,723.0 Sep-14 3.6 105.6 $ 1,818.7 52.9% $ 28.9
Agency Derivatives 19 612.6 Nov-13 3.2 10.6 64.6 1.9% 3.4
Agency Derivatives—TBAs 1 100.0 N/A 3.5 103.6 103.6 3.0% 103.6
Agency Sub-Total 83 $ 2,435.5 Aug-14 3.6 81.6 $ 1,986.9 57.8% $ 23.9
Non-Agency RMBS 215 1,344.8 Dec-06 1.8 85.8 1,154.0 33.6% 5.4
SBO IOs 1 27.7 Sep-15 2.3 10.7 2.9 0.1% 2.9
SBCMBS 7 77.2 Jan-07 1.0 85.2 65.8 1.9% 9.4
STACR 6 48.7 May-14 3.8 97.9 47.7 1.4% 8.0
CAS 3 55.3 Dec-14 4.0 93.6 51.8 1.5% 17.3
Non-Agency Securitization 5 160.5 Apr-14 5.9 80.1 128.6 3.7% 25.7
Non-Agency Sub-Total 237 $ 1,714.2 Feb-08 2.2 84.6 $ 1,450.7 42.2% $ 6.1
Total 320 $ 4,149.7 Oct-11 3.0 82.8 $ 3,437.6 100.0% $ 10.7
Avg Pricing Pricing Difference, Average # of
Avg Broker Broker MV Service Price Service MV Pricing Quotes
Type Count Face ($mm) Price (%)($mm)(%)($mm) Service to(by MV)
Agency Pass-throughs 63 $ 1,723.0 105.6 $ 1,818.7 105.7 $ 1,821.0 0.13% 2.5
Agency Derivatives 19 612.6 10.6 64.6 11.2 68.9 6.59% 1.1
Agency Derivatives—TBAs 1 100.0 103.6 103.6 103.3 103.3 -0.28% 1.0
Agency Sub-Total 83 $ 2,435.5 81.6 $ 1,986.9 81.8 $ 1,993.2 0.31% 2.4
Non-Agency RMBS 215 1,344.8 85.8 1,154.0 86.3 1,160.8 0.60% 1.4
SBO IOs 1 27.7 10.7 2.9 10.7 2.9 0.00% 1.0
SBCMBS 7 77.2 85.2 65.8 85.0 65.6 -0.25% 1.0
STACR 6 48.7 97.9 47.7 97.7 47.6 -0.25% 3.1
CAS 3 55.3 93.6 51.8 93.8 51.8 0.14% 2.8
Non-Agency Securitization 5 160.5 80.1 128.6 82.0 131.6 2.39% 1.0
Non-Agency Sub-Total 237 $ 1,714.2 84.6 $ 1,450.7 85.2 $ 1,460.5 0.67% 1.4
Total 320 $ 4,149.7 82.8 $ 3,437.6 83.2 $ 3,453.6 0.47% 2.0
Note: Pricing service did not provide a price on SBO IOs so average broker price is shown
Source: AMY pricing file as of November 30, 2015 Note: Weighted averages are weighted by market value Note: “N/A” means not available
HOULIHAN LOKEY 9
|
Target Preliminary AMY Broker Quote & Pricing Vendor Volumes
Portfolio Overview
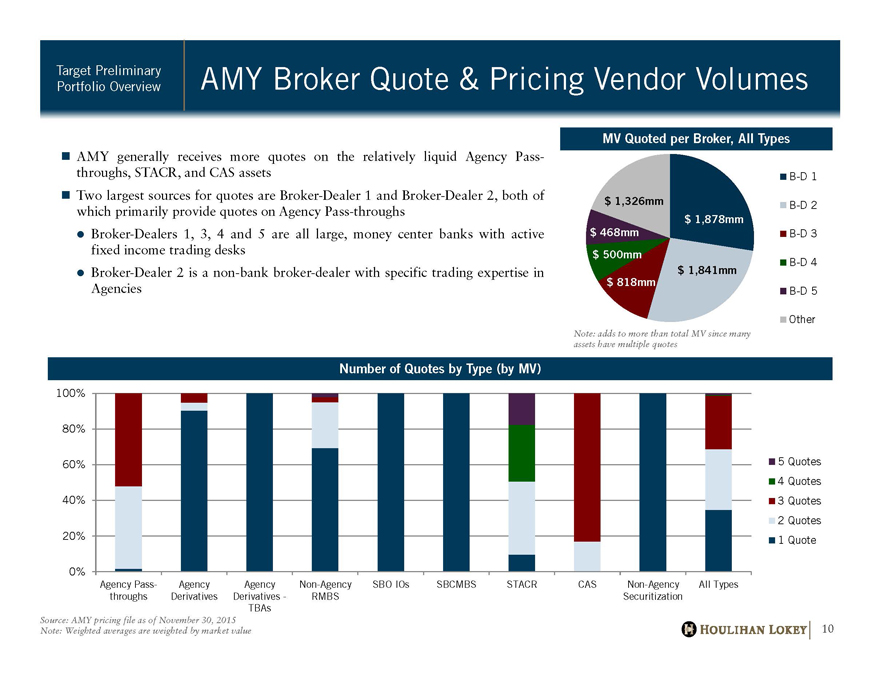
AMY generally receives more quotes on the relatively liquid Agency Pass-throughs, STACR, and CAS assets Two largest sources for quotes are Broker-Dealer 1 and Broker-Dealer 2, both of which primarily provide quotes on Agency Pass-throughs Broker-Dealers 1, 3, 4 and 5 are all large, money center banks with active fixed income trading desks Broker-Dealer 2 is a non-bank broker-dealer with specific trading expertise in Agencies
MV Quoted per Broker, All Types
B-D 1
$ 1,326mm B-D 2 $ 1,878mm $ 468mm B-D 3
$ 500mm B-D 4 $ 1,841mm $ 818mm
B-D 5
Other
Note: adds to more than total MV since many assets have multiple quotes
assets have multiple quotes
Number of Quotes by Type (by MV)
100%
80%
60% 5 Quotes
4 |
| Quotes 40% 3 Quotes |
2 |
| Quotes 20% |
1 |
| Quote |
0%
Agency Pass- Agency Agency Non-Agency SBO IOs SBCMBS STACR CAS Non-Agency All Types throughs Derivatives Derivatives—RMBS Securitization
Source: AMY pricing file as of November 30, 2015 Note: Weighted averages are weighted by market value HOULIHAN LOKEY 10
|
Target Preliminary Pricing Service vs. Broker Quotes
Portfolio Overview
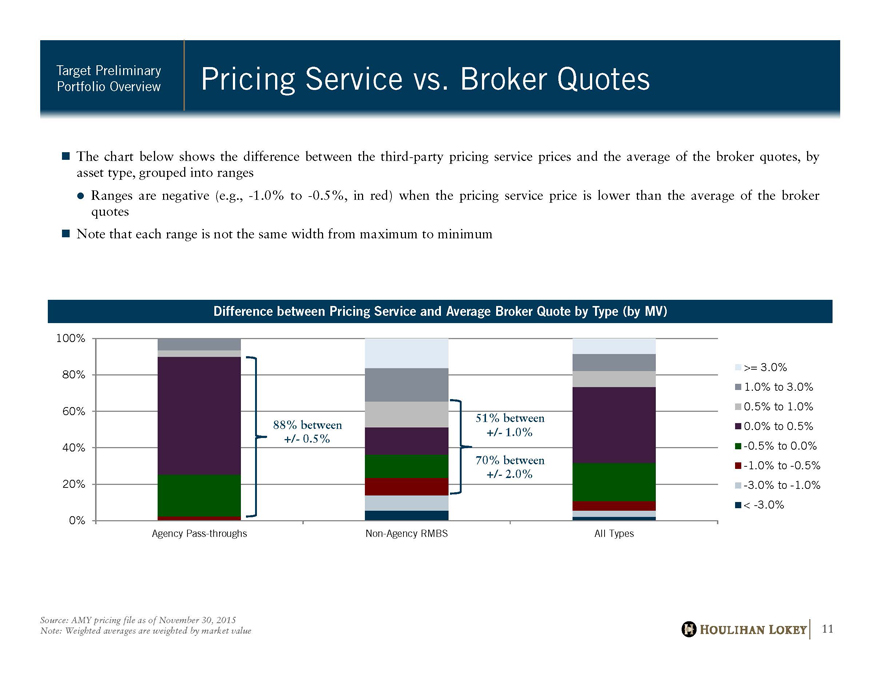
The chart below shows the difference between the third-party pricing service prices and the average of the broker quotes, by asset type, grouped into ranges Ranges are negative (e.g., -1.0% to -0.5%, in red) when the pricing service price is lower than the average of the broker quotes Note that each range is not the same width from maximum to minimum
Difference between Pricing Service and Average Broker Quote by Type (by MV)
100% 80% 60% 40% 20% 0%
88% between
+/- 0.5%
51% between
+/- 1.0%
70% between
+/- 2.0%
Agency Pass-throughs Non-Agency RMBS All Types
>= 3.0% 1.0% to 3.0% 0.5% to 1.0% 0.0% to 0.5% -0.5% to 0.0% -1.0% to -0.5% -3.0% to -1.0%
< -3.0%
Source: AMY pricing file as of November 30, 2015 Note: Weighted averages are weighted by market value HOULIHAN LOKEY 11
|
Target Preliminary Agency Pass-Through Sell Price vs. Prior
Portfolio Overview Month-End Mark
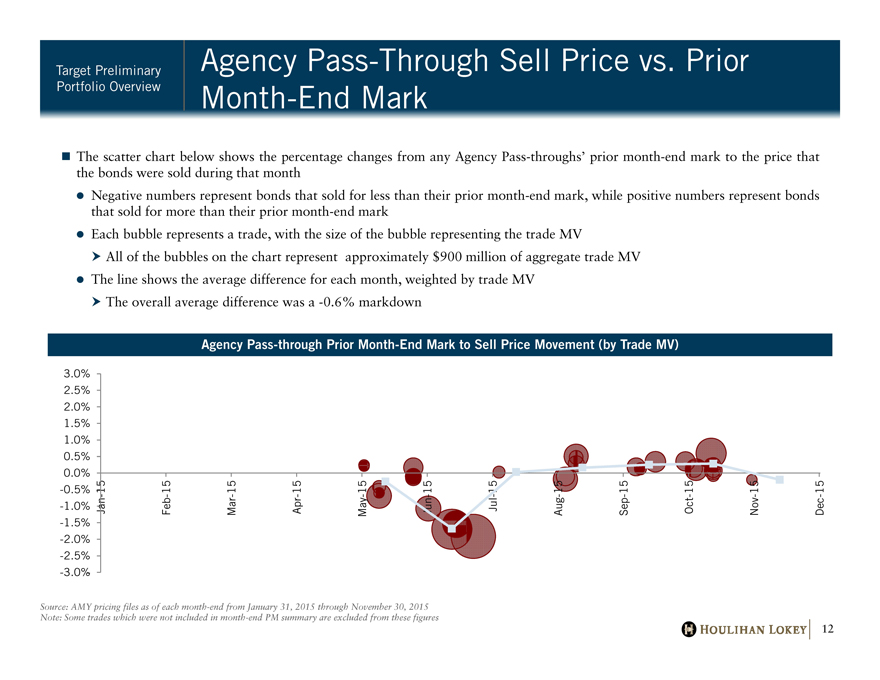
The scatter chart below shows the percentage changes from any Agency Pass-throughs’ prior month-end mark to the price that the bonds were sold during that month Negative numbers represent bonds that sold for less than their prior month-end mark, while positive numbers represent bonds that sold for more than their prior month-end mark Each bubble represents a trade, with the size of the bubble representing the trade MV
All of the bubbles on the chart represent approximately $900 million of aggregate trade MV The line shows the average difference for each month, weighted by trade MV
The overall average difference was a -0.6% markdown
Agency Pass-through Prior Month-End Mark to Sell Price Movement (by Trade MV)
3.0% 2.5% 2.0% 1.5% 1.0% 0.5% 0.0% -0.5% -1.0% -1.5% -2.0% -2.5% -3.0% -
Jan-15 Feb-15 Mar-15 Apr-15 May-15 Jun -15 Jul -15 Aug-15 Sep- 15 Oct-15 Nov-15 Dec-15
Source: AMY pricing files as of each month-end from January 31, 2015 through November 30, 2015 Note: Some trades which were not included in month-end PM summary are excluded from these figures
HOULIHAN LOKEY 12
|
Target Preliminary Non-Agency RMBS Sell Price vs. Prior Month-
Portfolio Overview End Mark
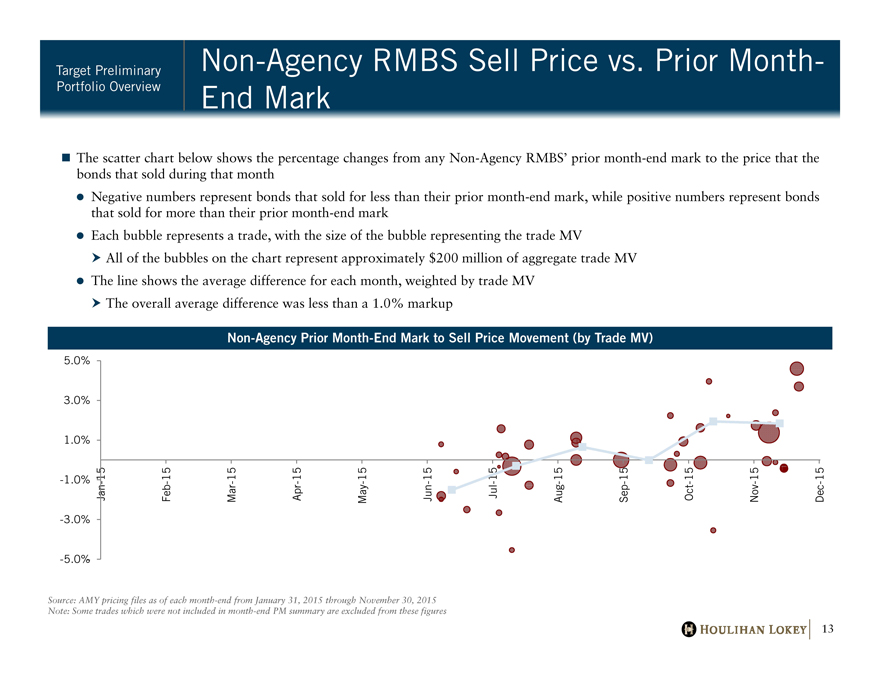
The scatter chart below shows the percentage changes from any Non-Agency RMBS’ prior month-end mark to the price that the bonds that sold during that month Negative numbers represent bonds that sold for less than their prior month-end mark, while positive numbers represent bonds that sold for more than their prior month-end mark Each bubble represents a trade, with the size of the bubble representing the trade MV
All of the bubbles on the chart represent approximately $200 million of aggregate trade MV The line shows the average difference for each month, weighted by trade MV
The overall average difference was less than a 1.0% markup
Non-Agency Prior Month-End Mark to Sell Price Movement (by Trade MV)
5.0% 3.0% 1.0% -1.0% -3.0% -5.0% -
Jan-15 Feb-15 Mar-15 Apr-15 May-15 Jun -15 Jul -15 Aug-15 Sep- 15 Oct-15 Nov-15 Dec-15
Source: AMY pricing files as of each month-end from January 31, 2015 through November 30, 2015 Note: Some trades which were not included in month-end PM summary are excluded from these figures HOULIHAN LOKEY 13
|
Target Preliminary Non-Agency Subprime Liquidity
Portfolio Overview
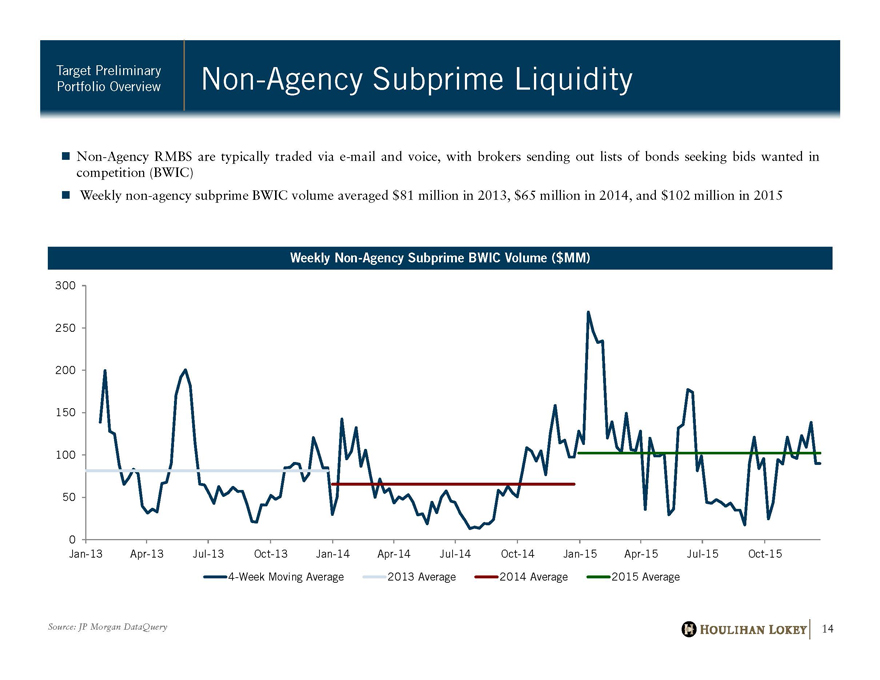
Non-Agency RMBS are typically traded via e-mail and voice, with brokers sending out lists of bonds seeking bids wanted in competition (BWIC) Weekly non-agency subprime BWIC volume averaged $81 million in 2013, $65 million in 2014, and $102 million in 2015
Weekly Non-Agency Subprime BWIC Volume ($MM)
300 250 200 150 100 50 0
0
Jan-13 Apr-13 Jul-13 Oct-13 Jan-14 Apr-14 Jul-14 Oct-14 Jan-15 Apr-15 Jul-15 Oct-15
4-Week Moving Average 2013 Average 2014 Average 2015 Average
Source: JP Morgan DataQuery HOULIHAN LOKEY 13
|

Industry Trends and Information
|
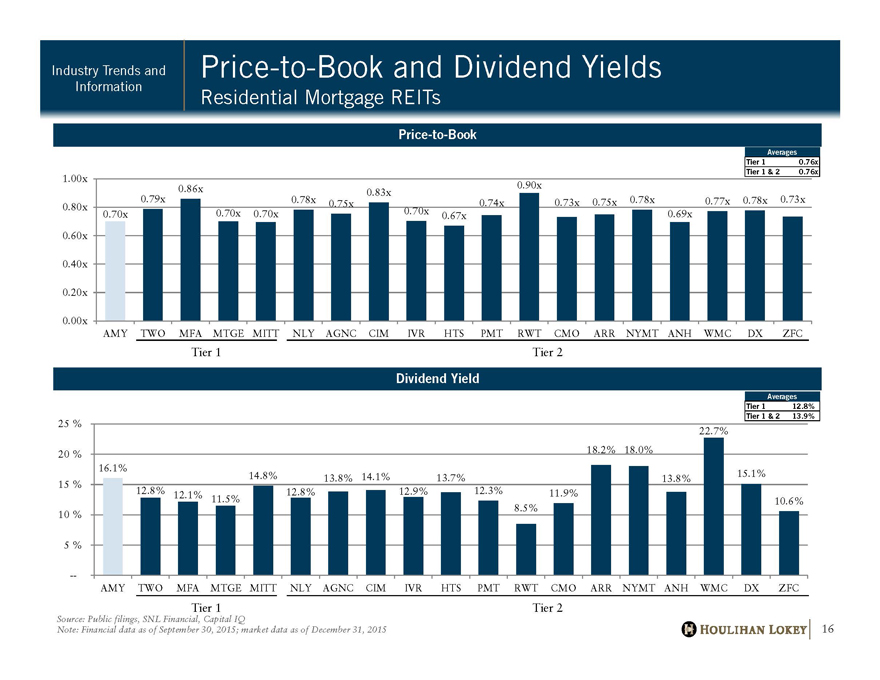
Industry Trends and Price-to-Book and Dividend Yields
Information
Residential Mortgage REITs
Price-to-Book
Averages Tier 1 0.76x Tier 1 & 2 0.76x
1.00x Tier 1 & 2 0.76x
0.90x
0.86x 0.83x
0.79x 0.78x 0.73x 0.75x 0.78x 0.77x 0.78x 0.73x
0.75x 0.74x
0.80x
0.70x 0.70x 0.70x 0.70x 0.69x
0.67x
0.60x
0.40x
0.20x
0.00x
AMY TWO MFA MTGE MITT NLY AGNC CIM IVR HTS PMT RWT CMO ARR NYMT ANH WMC DX ZFC
Tier 1 Tier 2
Dividend Yield
Averages Tier 1 12.8% Tier 1 & 2 13.9%
Tier 1 & 2 13.9%
25%
22.7%
20% 18.2% 18.0%
16.1%
15% 14.8% 13.8% 14.1% 13.7% 13.8% 15.1%
12.8% 12.1% 12.8% 12.9% 12.3% 11.9%
11.5% 10.6% 8.5%
10%
5%
AMY TWO MFA MTGE MITT NLY AGNC CIM IVR HTS PMT RWT CMO ARR NYMT ANH WMC DX ZFC
Tier 1 Tier 2
6 Source: Public filings, SNL Financial, Capital IQ
7 Note: Financial data as of September 30, 2015; market data as of December 31, 2015
8
9 HOULIHAN LOKEY 16
|
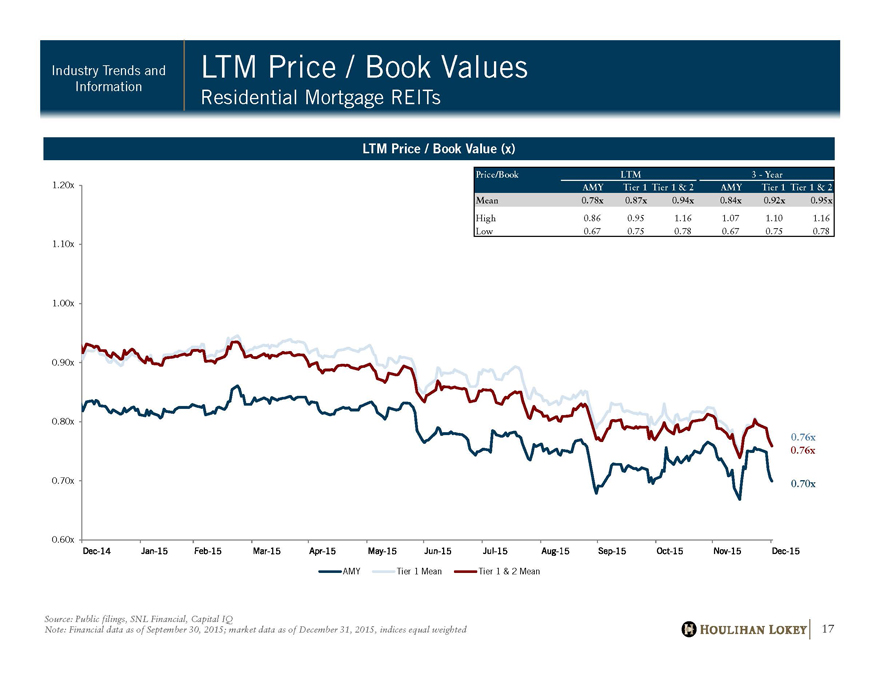
Industry Trends and LTM Price / Book Values
Information
Residential Mortgage REITs
LTM Price / Book Value (x)
Price/Book LTM 3—Year
AMY Tier 1 Tier 1 & 2 AMY Tier 1 Tier 1 & 2 Mean 0.78x 0.87x 0.94x 0.84x 0.92x 0.95x
High 0.86 0.95 1.16 1.07 1.10 1.16 Low 0.67 0.75 0.78 0.67 0.75 0.78
1.20x
1.10x
1.00x
0.90x
0.80x
0.70x
0.60x
0.76x
0.76x
0.70x
Dec-14 Jan-15 Feb-15 Mar-15 Apr-15 May-15 Jun-15 Jul-15 Aug-15 Sep-15 Oct-15 Nov-15 Dec-15
Source: Public filings, SNL Financial, Capital IQ
Note: Financial data as of September 30, 2015; market data as of December 31, 2015, indices equal weighted
HOULIHAN LOKEY 17
|
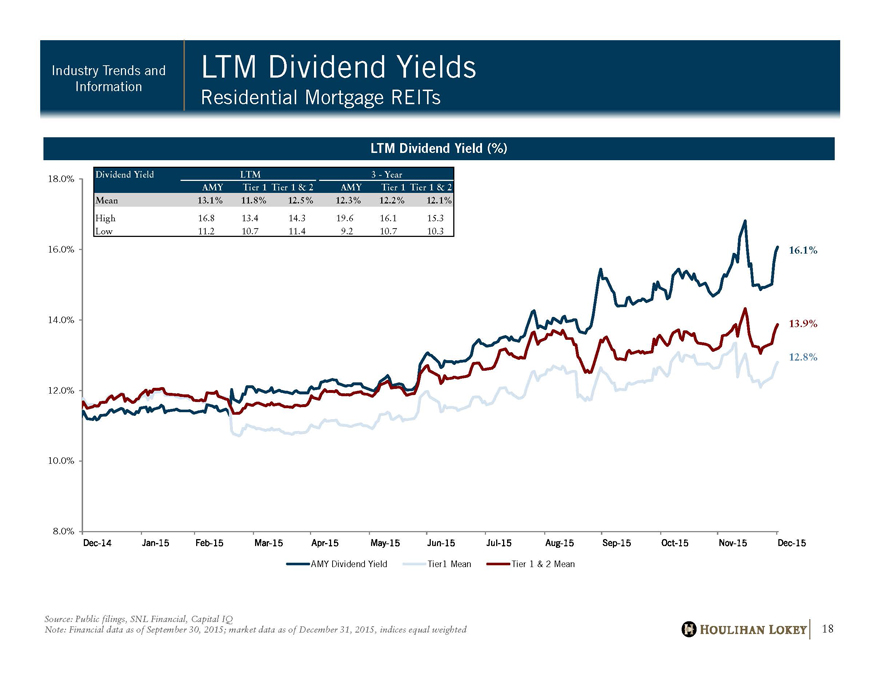
Industry Trends and LTM Dividend Yields Information
Residential Mortgage REITs
LTM Dividend Yield (%)
18.0%
16.0%
14.0%
12.0%
10.0%
8.0%
16.1%
13.9%
12.8%
Dec-14 Jan-15 Feb-15 Mar-15 Apr-15 May-15 Jun-15 Jul-15 Aug-15 Sep-15 Oct-15 Nov-15 Dec-15
AMY Dividend Yield Tier1 Mean Tier 1 & 2 Mean
Source: Public filings, SNL Financial, Capital IQ
Note: Financial data as of September 30, 2015; market data as of December 31, 2015, indices equal weighted
5 HOULIHAN LOKEY 18
|
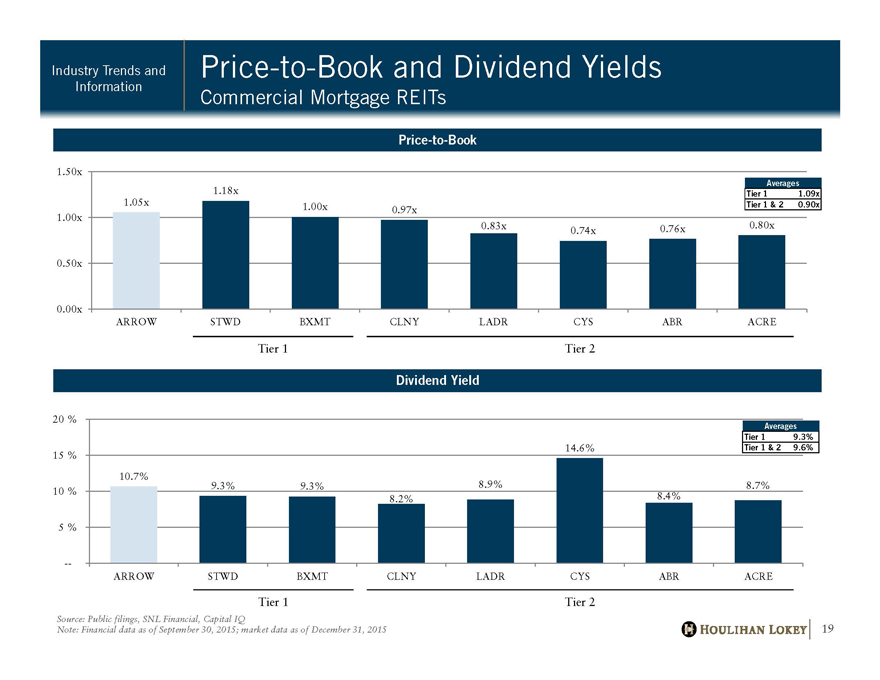
Price-to-Book and Dividend Yields
Commercial Mortgage REITs
Industry Trends and
Information
Price-to-Book
Dividend Yield
Tier 1 Tier 2
Tier 1 Tier 2
Averages
Tier 1 9.3%
Tier 1 & 2 9.6%
Averages
Tier 1 1.09x
1.05x Tier 1 & 2 0.90x
1.18x
1.00x 0.97x
0.83x 0.74x 0.76x 0.80x
0.00x
0.50x
1.00x
1.50x
ARROW STWD BXMT CLNY LADR CYS ABR ACRE
10.7%
9.3% 9.3%
8.2%
8.9%
14.6%
8.4%
8.7%
—
5 |
| % |
10 %
15 %
20 %
ARROW STWD BXMT CLNY LADR CYS ABR ACRE
HOULIHAN LOKEY 19
Source: Public filings, SNL Financial, Capital IQ
Note: Financial data as of September 30, 2015; market data as of December 31, 2015
|
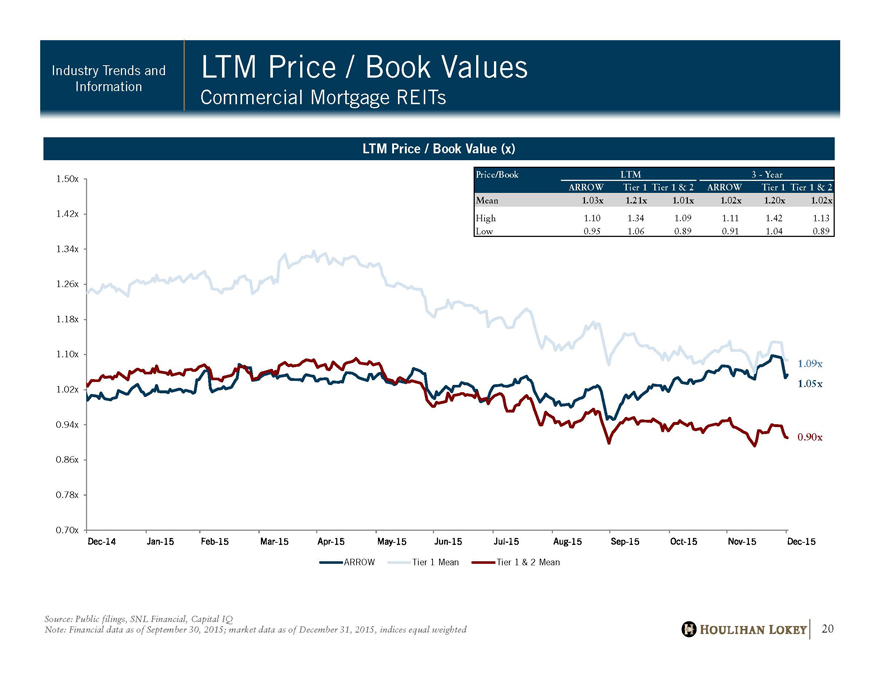
0.70x
0.78x
0.86x
0.94x
1.02x
1.10x
1.18x
1.26x
1.34x
1.42x
1.50x
ARROW Tier 1 Mean Tier 1 & 2 Mean
Price/Book LTM 3—Year
ARROW Tier 1 Tier 1 & 2 ARROW Tier 1 Tier 1 & 2
Mean 1.03x 1.21x 1.01x 1.02x 1.20x 1.02x
High 1.10 1.34 1.09 1.11 1.42 1.13
Low 0.95 1.06 0.89 0.91 1.04 0.89
LTM Price / Book Values
Commercial Mortgage REITs
Industry Trends and
Information
LTM Price / Book Value (x)
1.05x
0.90x
1.09x
Source: Public filings, SNL Financial, Capital IQ
Note: Financial data as of September 30, 2015; market data as of December 31, 2015, indices equal weighted HOULIHAN LOKEY 20
|
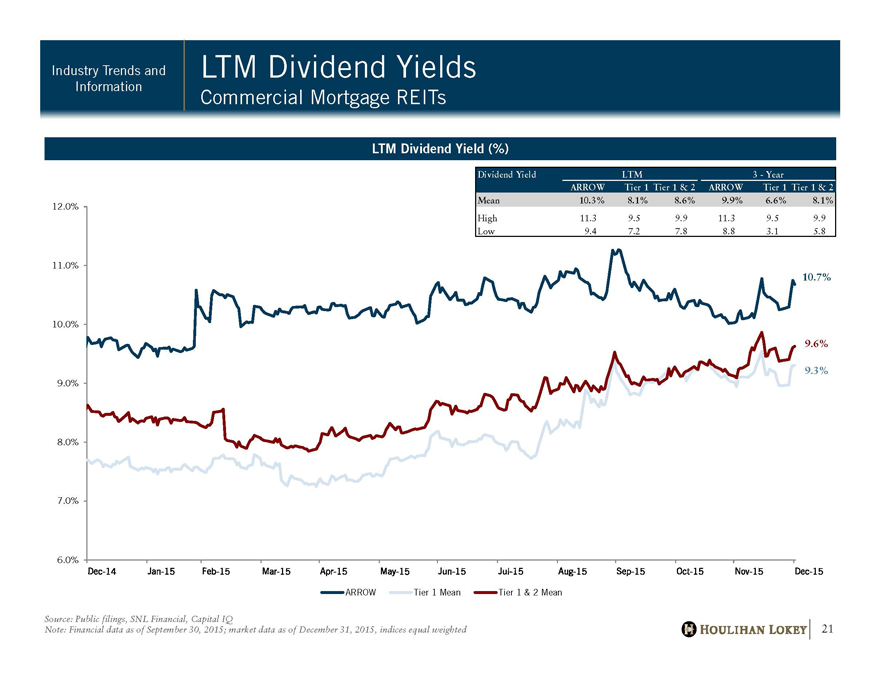
6.0%
7.0%
8.0%
9.0%
10.0%
11.0%
12.0%
ARROW Tier 1 Mean Tier 1 & 2 Mean
LTM Dividend Yields
Commercial Mortgage REITs
Industry Trends and
Information
HOULIHAN LOKEY 21
LTM Dividend Yield (%)
10.7%
9.6%
9.3%
Source: Public filings, SNL Financial, Capital IQ
Note: Financial data as of September 30, 2015; market data as of December 31, 2015, indices equal weighted
Dividend Yield LTM 3—Year
ARROW Tier 1 Tier 1 & 2 ARROW Tier 1 Tier 1 & 2
Mean 10.3% 8.1% 8.6% 9.9% 6.6% 8.1%
High 11.3 9.5 9.9 11.3 9.5 9.9
Low 9.4 7.2 7.8 8.8 3.1 5.8
|
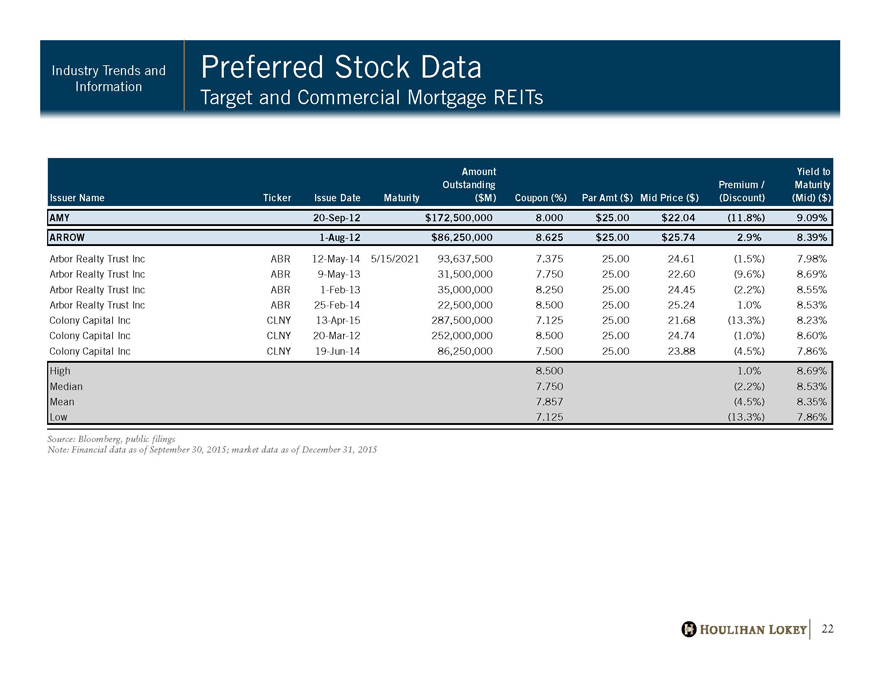
Preferred Stock Data
Target and Commercial Mortgage REITs
Industry Trends and
Information
HOULIHAN LOKEY 22
Source: Bloomberg, public filings
Note: Financial data as of September 30, 2015; market data as of December 31, 2015
Issuer Name Ticker Issue Date Maturity
Amount
Outstanding
($M) Coupon (%) Par Amt ($) Mid Price ($)
Premium /
(Discount)
Yield to
Maturity
(Mid) ($)
AMY 20-Sep-12 $172,500,000 8.000 $25.00 $22.04 (11.8%) 9.09%
ARROW 1-Aug-12 $86,250,000 8.625 $25.00 $25.74 2.9% 8.39%
Arbor Realty Trust Inc ABR 12-May-14 5/15/2021 93,637,500 7.375 25.00 24.61 (1.5%) 7.98%
Arbor Realty Trust Inc ABR 9-May-13 31,500,000 7.750 25.00 22.60 (9.6%) 8.69%
Arbor Realty Trust Inc ABR 1-Feb-13 35,000,000 8.250 25.00 24.45 (2.2%) 8.55%
Arbor Realty Trust Inc ABR 25-Feb-14 22,500,000 8.500 25.00 25.24 1.0% 8.53%
Colony Capital Inc CLNY 13-Apr-15 287,500,000 7.125 25.00 21.68 (13.3%) 8.23%
Colony Capital Inc CLNY 20-Mar-12 252,000,000 8.500 25.00 24.74 (1.0%) 8.60%
Colony Capital Inc CLNY 19-Jun-14 86,250,000 7.500 25.00 23.88 (4.5%) 7.86%
High 8.500 1.0% 8.69%
Median 7.750 (2.2%) 8.53%
Mean 7.857 (4.5%) 8.35%
Low 7.125 (13.3%) 7.86%
|

Illustrative Pro Forma Financial Overview
|
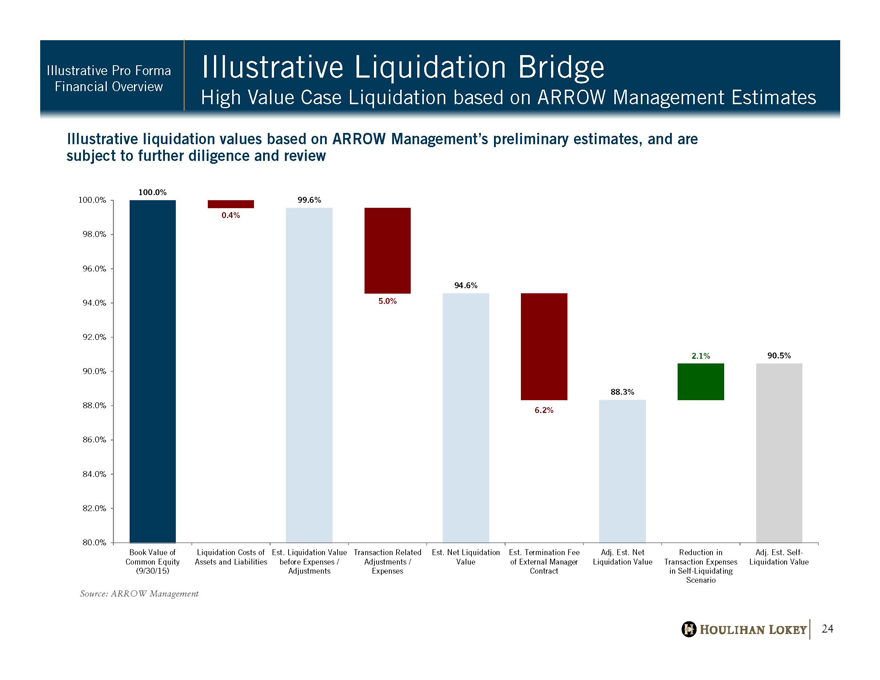
Illustrative Liquidation Bridge
High Value Case Liquidation based on ARROW Management Estimates
Illustrative Pro Forma
Financial Overview
HOULIHAN LOKEY 24
Illustrative liquidation values based on ARROW Management’s preliminary estimates, and are
subject to further diligence and review
Source: ARROW Management
0.4%
5.0%
6.2%
2.1%
100.0%
99.6%
94.6%
88.3%
90.5%
80.0%
82.0%
84.0%
86.0%
88.0%
90.0%
92.0%
94.0%
96.0%
98.0%
100.0%
Book Value of
Common Equity
(9/30/15)
Liquidation Costs of
Assets and Liabilities
Est. Liquidation Value
before Expenses /
Adjustments
Transaction Related
Adjustments /
Expenses
Est. Net Liquidation
Value
Est. Termination Fee
of External Manager
Contract
Adj. Est. Net
Liquidation Value
Reduction in
Transaction Expenses
in Self-Liquidating
Scenario
Adj. Est. Self-
Liquidation Value
|
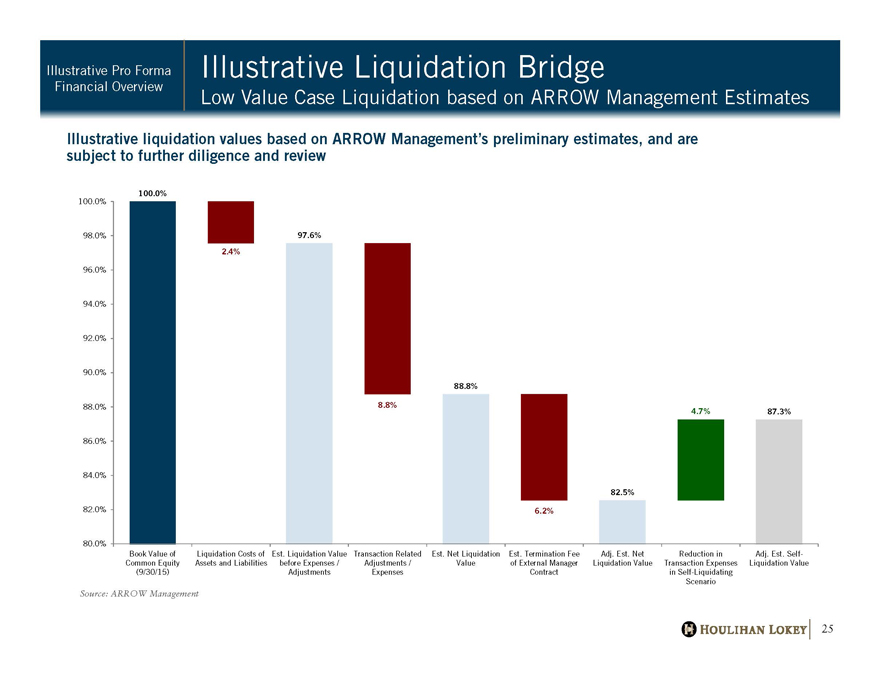
Illustrative Liquidation Bridge
Low Value Case Liquidation based on ARROW Management Estimates
Illustrative Pro Forma
Financial Overview
HOULIHAN LOKEY 25
Source: ARROW Management
Illustrative liquidation values based on ARROW Management’s preliminary estimates, and are
subject to further diligence and review
2.4%
8.8%
6.2%
4.7%
100.0%
97.6%
88.8%
82.5%
87.3%
80.0%
82.0%
84.0%
86.0%
88.0%
90.0%
92.0%
94.0%
96.0%
98.0%
100.0%
Book Value of
Common Equity
(9/30/15)
Liquidation Costs of
Assets and Liabilities
Est. Liquidation Value
before Expenses /
Adjustments
Transaction Related
Adjustments /
Expenses
Est. Net Liquidation
Value
Est. Termination Fee
of External Manager
Contract
Adj. Est. Net
Liquidation Value
Reduction in
Transaction Expenses
in Self-Liquidating
Scenario
Adj. Est. Self-
Liquidation Value
|
0.65x
0.70x
0.75x
0.80x
0.85x
0.90x
0.95x
1.00x
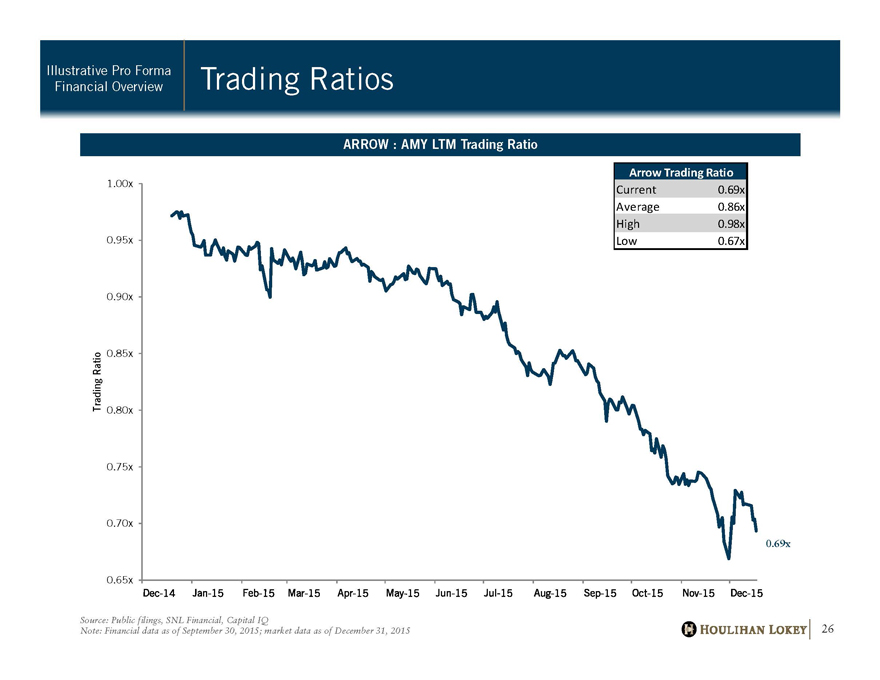
Trading Ratio Trading Ratios Illustrative Pro Forma
Financial Overview
HOULIHAN LOKEY 26
ARROW : AMY LTM Trading Ratio
0.69x
Source: Public filings, SNL Financial, Capital IQ
Note: Financial data as of September 30, 2015; market data as of December 31, 2015
Arrow Trading Ratio
Current 0.69x
Average 0.86x
High 0.98x
Low 0.67x
|
Illustrative Post Adjustment AMY Segments
$ millions
AMY
9/30/15
ATLAS
Adjustment
for Select Non-
Agency
AMY Pro
Forma
Acquired
Assets Agency
Non-
Agency
Other
Mortgage Corporate
Total cash $171.5 $171.5 $171.5
Residential mortgage-backed securities 3,271.6 (1,100.0) 2,171.6 2 ,031.4 140.2
Securitized mortgage loans 173.3 1 73.3 173.3
Other investment securities 162.7 1 62.7 162.7
Other investments 4 4.8 44.8 4 4.8
Total investments $3,652.4 ($1,100.0) $2,552.4 $2,031.4 $140.2 $380.8 $0.0
Other assets 1 9.5 19.5 1 9.5
Total assets $3,843.5 ($1,100.0) $2,743.5 $2,031.4 $140.2 $380.8 $191.1
Borrowings under repurchase agreements $3,011.0 ($956.8) $2,054.3 $1,809.9 $121.9 $122.5 $0.0
Other debt 2 1.2 2 1.2
Other liabilities 96.5 96.5 9 6.5
Total liabilities $3,128.8 ($956.8) $2,172.1 $1,809.9 $121.9 $143.7 $96.5
Preferred stock $172.5 $172.5 $0.0 $0.0 $0.0 $172.5
Common equity 5 42.2 (143.2) 3 99.0 221.6 18.3 2 37.1 ( 78.0)
Total equity $714.7 ($143.2) $571.5 $221.6 $18.3 $237.1 $94.5
Total liabilities and equity $3,843.5 $2,743.5 $2,031.4 $140.2 $380.8 $191.1
Total equity / total assets 18.6% 13.0% 20.8% 10.9% 13.0% 62.3% 49.5%
Debt / common equity 5.6x NM 5.1x 8.2x 6.7x 0.6x NM
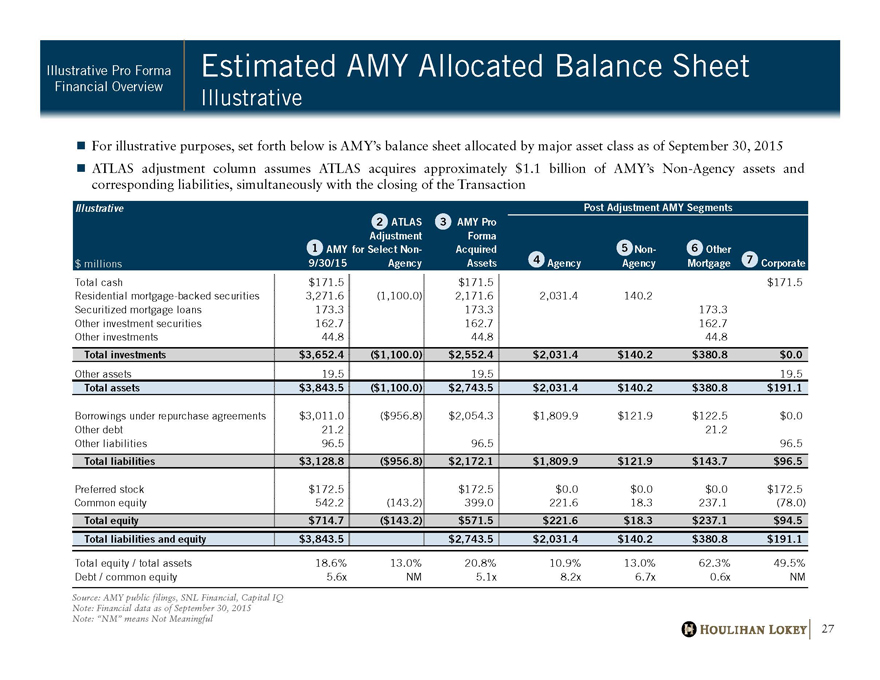
n For illustrative purposes, set forth below is AMY’s balance sheet allocated by major asset class as of September 30, 2015
n ATLAS adjustment column assumes ATLAS acquires approximately $1.1 billion of AMY’s Non-Agency assets and
corresponding liabilities, simultaneously with the closing of the Transaction
Estimated AMY Allocated Balance Sheet
Illustrative
Illustrative Pro Forma
Financial Overview
HOULIHAN LOKEY 27
Source: AMY public filings, SNL Financial, Capital IQ
Note: Financial data as of September 30, 2015
Note: “NM” means Not Meaningful
1
2 3
4
5 6
7
|
Illustrative Simultaneous Upon Closing Post-Closing
ARROW Acquisition of AMY
$ millions
Reported
9/30/2015
ATLAS Forward
Purchase &
Acquisition
Financing
Pro Forma
ARROW #1
Acquired
Assets &
Liabilities
Cash &
Equity
Consideration
ATLAS
Forward Sale of
Select Non-
Agency
Pro Forma
ARROW #2
Liquidation of
AMY Net Assets
and Portfolio
Rebalancing (2)
Pro Forma
ARROW #3
Total cash $50.3 $154.6 $204.9 $171.5 ($254.6) $121.8 ($67.8) $54.0
Residential mortgage-backed securities — 3 ,271.6 (1,094.5) 2 ,177.1 ( 2,177.1) -
Securitized mortgage loans — 1 73.3 1 73.3 ( 173.3) -
Other investment securities 666.3 6 66.3 1 62.7 8 29.0 ( 162.7) 666.3
Loans 1,767.5 1 ,767.5 1,767.5 6 93.0 2,460.5
Other investments 20.2 2 0.2 4 4.8 6 5.0 ( 44.8) 20.2
Total investments $2,454.0 $0.0 $2,454.0 $3,652.4 $0.0 ($1,094.5) $5,011.9 ($1,864.9) $3,147.0
Purchase accounting adjustment (3) (67.8) (67.8) 67.8 0.0
Other assets 23.6 2 3.6 1 9.5 4 3.1 43.1
Total assets $2,527.8 $154.6 $2,682.4 $3,775.7 ($254.6) ($1,094.5) $5,109.0 ($1,864.9) $3,244.1
Borrowings under repurchase agreements $735.4 $735.4 $3,011.0 ($956.8) $2,789.7 ($1,730.2) $1,059.5
Temporary forward sale liability 137.7 1 37.7 ( 137.7) —
Acquisition financing 16.9 1 6.9 16.9 ( 16.9) -
Convertible notes 247.7 2 47.7 247.7 2 47.7
Other borrowings 119.4 1 19.4 2 1.2 140.7 ( 21.2) 119.4
Other liabilities 40.8 4 0.8 9 6.5 137.4 (96.5) 40.8
Total liabilities $1,143.4 $154.6 $1,298.0 $3,128.8 $0.0 ($1,094.5) $3,332.3 ($1,864.9) $1,467.4
Preferred stock (4) 286.3 286.3 1 72.5 458.8 458.8
Common equity 1,098.1 1,098.1 219.8 1 ,318.0—1 ,318.0
Total equity $1,384.4 $0.0 $1,384.4 $0.0 $392.3 $0.0 $1,776.7 $0.0 $1,776.7
Total liabilities and equity $2,527.8 $154.6 $2,682.4 $3,128.8 $392.3 ($1,094.5) $5,109.0 ($1,864.9) $3,244.1
Equity / assets 54.8% 51.6% 34.8% 54.8%
Shares Outstanding 67.1 6 7.1 1 2.8 79.9 79.9
BVPS $16.35 $16.35 $16.49 $16.49
Accretion / (Dilution) 0.9% 0.9%
Illustrative Pro Forma Balance Sheet Illustrative Pro Forma
Financial Overview
HOULIHAN LOKEY 28
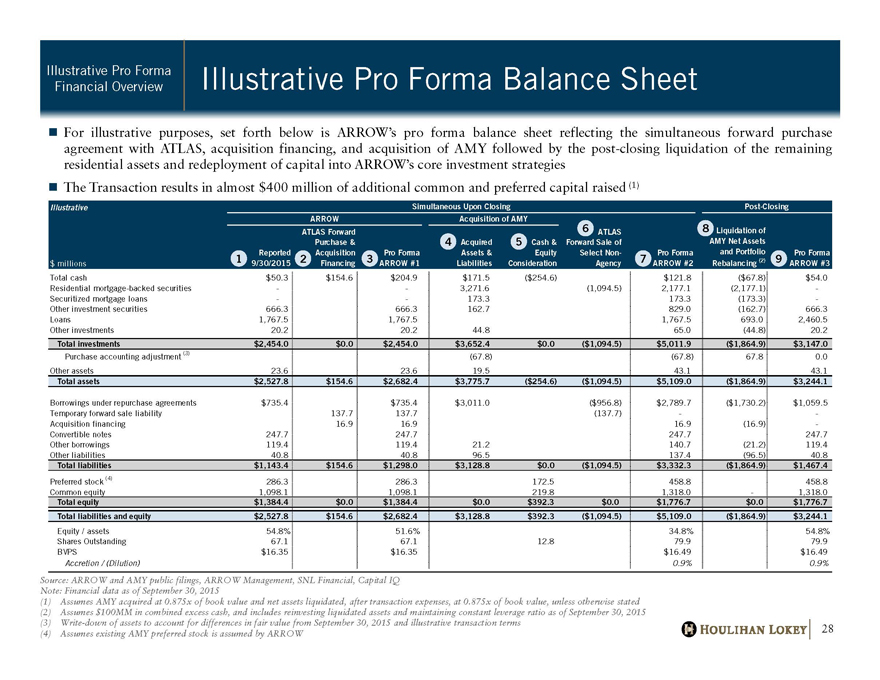
n For illustrative purposes, set forth below is ARROW’s pro forma balance sheet reflecting the simultaneous forward purchase
agreement with ATLAS, acquisition financing, and acquisition of AMY followed by the post-closing liquidation of the remaining
residential assets and redeployment of capital into ARROW’s core investment strategies
n The Transaction results in almost $400 million of additional common and preferred capital raised (1)
Source: ARROW and AMY public filings, ARROW Management, SNL Financial, Capital IQ
Note: Financial data as of September 30, 2015
(1) Assumes AMY acquired at 0.875x of book value and net assets liquidated, after transaction expenses, at 0.875x of book value, unless otherwise stated
(2) Assumes $100MM in combined excess cash, and includes reinvesting liquidated assets and maintaining constant leverage ratio as of September 30, 2015
(3) Write-down of assets to account for differences in fair value from September 30, 2015 and illustrative transaction terms
(4) Assumes existing AMY preferred stock is assumed by ARROW
1 2 3
4 5
6
7
8
9
|
Illustrative Sensitivities Illustrative Pro Forma
Financial Overview
HOULIHAN LOKEY 29
Source: ARROW and AMY public filings, ARROW Management, SNL Financial, Capital IQ
Note: Financial data as of September 30, 2015; market data as of December 31, 2015
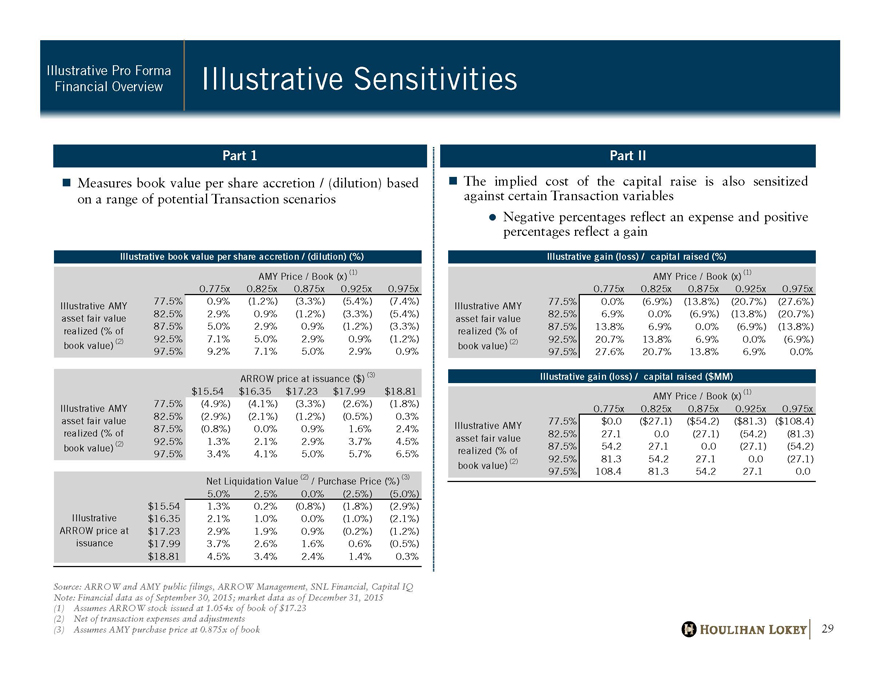
(1) Assumes ARROW stock issued at 1.054x of book of $17.23
(2) Net of transaction expenses and adjustments
(3) Assumes AMY purchase price at 0.875x of book
n Measures book value per share accretion / (dilution) based
on a range of potential Transaction scenarios
n The implied cost of the capital raise is also sensitized
against certain Transaction variables
? Negative percentages reflect an expense and positive
percentages reflect a gain
Part 1 Part II
Illustrative book value per share accretion / (dilution) (%)
AMY Price / Book (x) (1)
0.775x 0.825x 0.875x 0.925x 0.975x
77.5% 0.9% (1.2%) (3.3%) (5.4%) (7.4%)
82.5% 2.9% 0.9% (1.2%) (3.3%) (5.4%)
87.5% 5.0% 2.9% 0.9% (1.2%) (3.3%)
92.5% 7.1% 5.0% 2.9% 0.9% (1.2%)
97.5% 9.2% 7.1% 5.0% 2.9% 0.9%
ARROW price at issuance ($) (3)
$15.54 $16.35 $17.23 $17.99 $18.81
77.5% (4.9%) (4.1%) (3.3%) (2.6%) (1.8%)
82.5% (2.9%) (2.1%) (1.2%) (0.5%) 0.3%
87.5% (0.8%) 0.0% 0.9% 1.6% 2.4%
92.5% 1.3% 2.1% 2.9% 3.7% 4.5%
97.5% 3.4% 4.1% 5.0% 5.7% 6.5%
Net Liquidation Value (2) / Purchase Price (%) (3)
5.0% 2.5% 0.0% (2.5%) (5.0%)
$15.54 1.3% 0.2% (0.8%) (1.8%) (2.9%)
$16.35 2.1% 1.0% 0.0% (1.0%) (2.1%)
$17.23 2.9% 1.9% 0.9% (0.2%) (1.2%)
$17.99 3.7% 2.6% 1.6% 0.6% (0.5%)
$18.81 4.5% 3.4% 2.4% 1.4% 0.3%
Illustrative
ARROW price at
issuance
Illustrative AMY
asset fair value
realized (% of
book value) (2)
Illustrative AMY
asset fair value
realized (% of
book value) (2)
Illustrative gain (loss) / capital raised (%)
AMY Price / Book (x) (1)
0.775x 0.825x 0.875x 0.925x 0.975x
77.5% 0.0% (6.9%) (13.8%) (20.7%) (27.6%)
82.5% 6.9% 0.0% (6.9%) (13.8%) (20.7%)
87.5% 13.8% 6.9% 0.0% (6.9%) (13.8%)
92.5% 20.7% 13.8% 6.9% 0.0% (6.9%)
97.5% 27.6% 20.7% 13.8% 6.9% 0.0%
Illustrative gain (loss) / capital raised ($MM)
AMY Price / Book (x) (1)
0.775x 0.825x 0.875x 0.925x 0.975x
77.5% $0.0 ($27.1) ($54.2) ($81.3) ($108.4)
82.5% 27.1 0.0 (27.1) (54.2) (81.3)
87.5% 54.2 27.1 0.0 (27.1) (54.2)
92.5% 81.3 54.2 27.1 0.0 (27.1)
97.5% 108.4 81.3 54.2 27.1 0.0
Illustrative AMY
asset fair value
realized (% of
book value) (2)
Illustrative AMY
asset fair value
realized (% of
book value) (2)
|
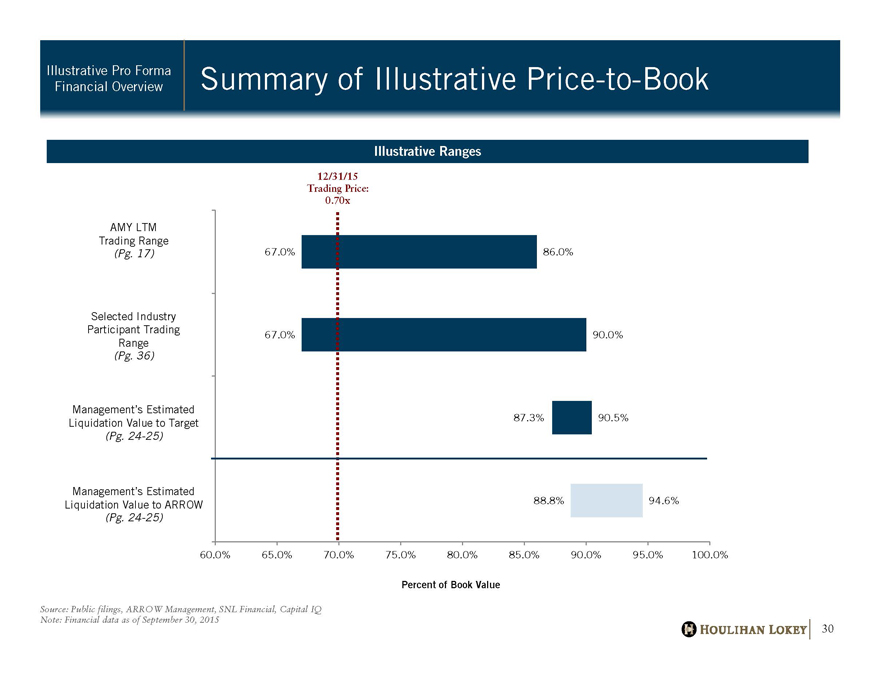
88.8%
87.3%
67.0%
67.0%
94.6%
90.5%
90.0%
86.0%
60.0% 65.0% 70.0% 75.0% 80.0% 85.0% 90.0% 95.0% 100.0%
Percent of Book Value
Summary of Illustrative Price-to-Book Illustrative Pro Forma
Financial Overview
HOULIHAN LOKEY 30
Source: Public filings, ARROW Management, SNL Financial, Capital IQ
Note: Financial data as of September 30, 2015
12/31/15
Trading Price:
0.70x
AMY LTM
Trading Range
(Pg. 17)
Selected Industry
Participant Trading
Range
(Pg. 36)
Management’s Estimated
Liquidation Value to Target
(Pg. 24-25)
Management’s Estimated
Liquidation Value to ARROW
(Pg. 24-25)
Illustrative Ranges
|

Appendix
|

Appendix
Additional Information
|
AMY Shareholder Summary Additional
Information
HOULIHAN LOKEY 33
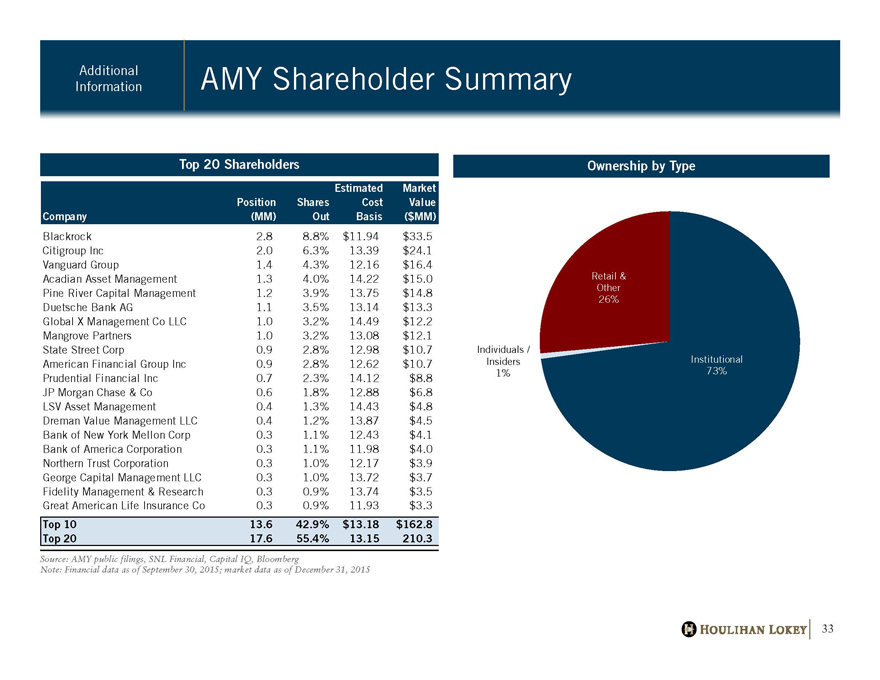
Top 20 Shareholders Ownership by Type
Institutional
73%
Individuals /
Insiders
1%
Retail &
Other
26%
Source: AMY public filings, SNL Financial, Capital IQ, Bloomberg
Note: Financial data as of September 30, 2015; market data as of December 31, 2015
Company
Position
(MM)
Shares
Out
Estimated
Cost
Basis
Market
Value
($MM)
Blackrock 2.8 8.8% $11.94 $33.5
Citigroup Inc 2.0 6.3% 13.39 $24.1
Vanguard Group 1.4 4.3% 12.16 $16.4
Acadian Asset Management 1.3 4.0% 14.22 $15.0
Pine River Capital Management 1.2 3.9% 13.75 $14.8
Duetsche Bank AG 1.1 3.5% 13.14 $13.3
Global X Management Co LLC 1.0 3.2% 14.49 $12.2
Mangrove Partners 1.0 3.2% 13.08 $12.1
State Street Corp 0.9 2.8% 12.98 $10.7
American Financial Group Inc 0.9 2.8% 12.62 $10.7
Prudential Financial Inc 0.7 2.3% 14.12 $8.8
JP Morgan Chase & Co 0.6 1.8% 12.88 $6.8
LSV Asset Management 0.4 1.3% 14.43 $4.8
Dreman Value Management LLC 0.4 1.2% 13.87 $4.5
Bank of New York Mellon Corp 0.3 1.1% 12.43 $4.1
Bank of America Corporation 0.3 1.1% 11.98 $4.0
Northern Trust Corporation 0.3 1.0% 12.17 $3.9
George Capital Management LLC 0.3 1.0% 13.72 $3.7
Fidelity Management & Research 0.3 0.9% 13.74 $3.5
Great American Life Insurance Co 0.3 0.9% 11.93 $3.3
Top 10 13.6 42.9% $13.18 $162.8
Top 20 17.6 55.4% 13.15 210.3
|
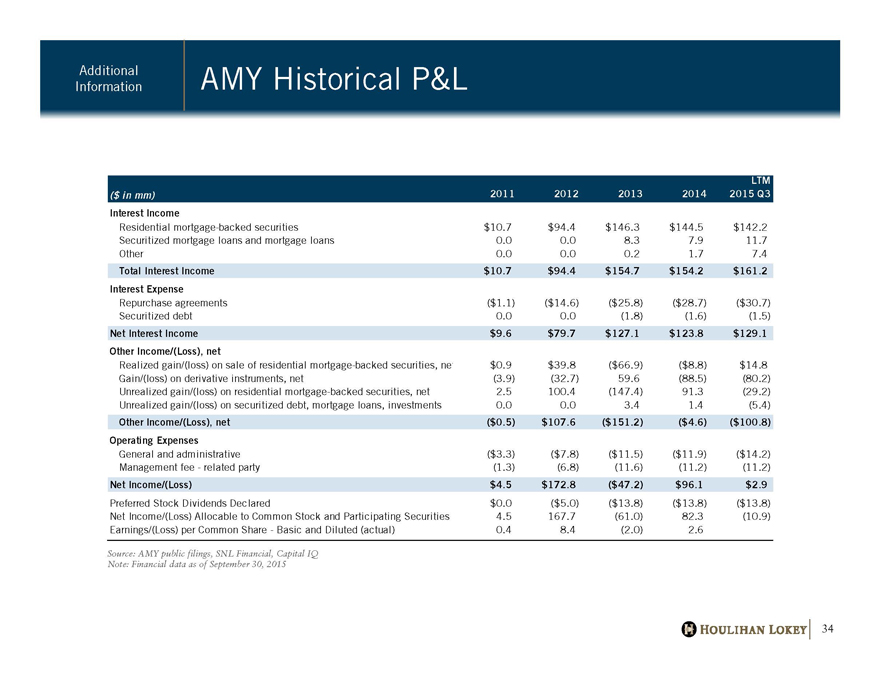
AMY Historical P&L Additional
Information
HOULIHAN LOKEY 34
Source: AMY public filings, SNL Financial, Capital IQ
Note: Financial data as of September 30, 2015
($ in mm) 2011 2012 2013 2014
LTM
2015 Q3
Interest Income
Residential mortgage-backed securities $10.7 $94.4 $146.3 $144.5 $142.2
Securitized mortgage loans and mortgage loans 0.0 0.0 8.3 7.9 11.7
Other 0.0 0.0 0.2 1.7 7.4
Total Interest Income $10.7 $94.4 $154.7 $154.2 $161.2
Interest Expense
Repurchase agreements ($1.1) ($14.6) ($25.8) ($28.7) ($30.7)
Securitized debt 0.0 0.0 (1.8) (1.6) (1.5)
Net Interest Income $9.6 $79.7 $127.1 $123.8 $129.1
Other Income/(Loss), net
Realized gain/(loss) on sale of residential mortgage-backed securities, net $0.9 $39.8 ($66.9) ($8.8) $14.8
Gain/(loss) on derivative instruments, net (3.9) (32.7) 59.6 (88.5) (80.2)
Unrealized gain/(loss) on residential mortgage-backed securities, net 2.5 100.4 (147.4) 91.3 (29.2)
Unrealized gain/(loss) on securitized debt, mortgage loans, investments 0.0 0.0 3.4 1.4 (5.4)
Other Income/(Loss), net ($0.5) $107.6 ($151.2) ($4.6) ($100.8)
Operating Expenses
General and administrative ($3.3) ($7.8) ($11.5) ($11.9) ($14.2)
Management fee—related party (1.3) (6.8) (11.6) (11.2) (11.2)
Net Income/(Loss) $4.5 $172.8 ($47.2) $96.1 $2.9
Preferred Stock Dividends Declared $0.0 ($5.0) ($13.8) ($13.8) ($13.8)
Net Income/(Loss) Allocable to Common Stock and Participating Securities 4.5 167.7 (61.0) 82.3 (10.9)
Earnings/(Loss) per Common Share—Basic and Diluted (actual) 0.4 8.4 (2.0) 2.6
|
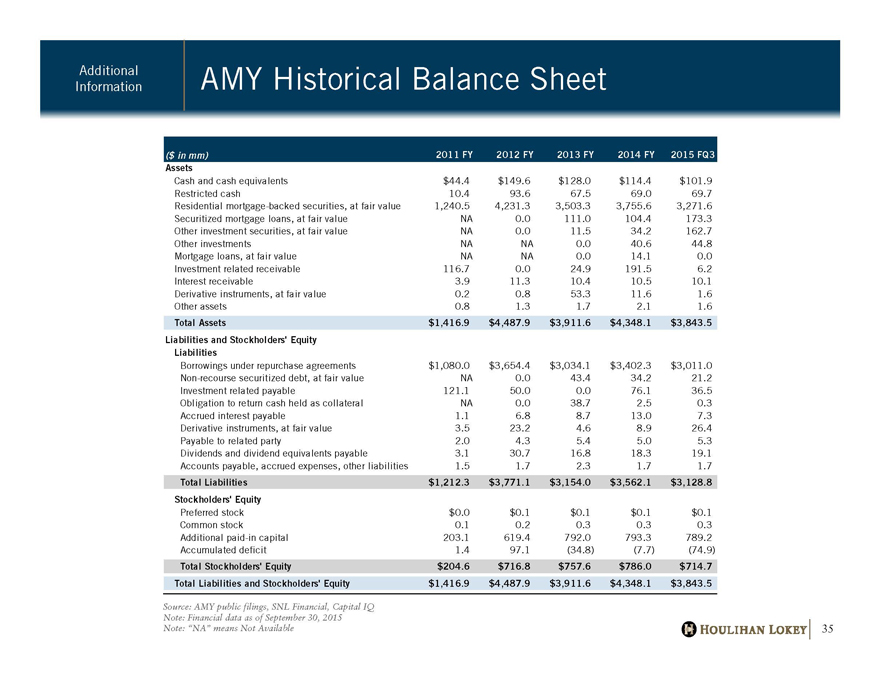
AMY Historical Balance Sheet Additional
Information
HOULIHAN LOKEY 35
Source: AMY public filings, SNL Financial, Capital IQ
Note: Financial data as of September 30, 2015
Note: “NA” means Not Available
($ in mm) 2011 FY 2012 FY 2013 FY 2014 FY 2015 FQ3
Assets
Cash and cash equivalents $44.4 $149.6 $128.0 $114.4 $101.9
Restricted cash 10.4 93.6 67.5 69.0 69.7
Residential mortgage-backed securities, at fair value 1,240.5 4,231.3 3,503.3 3,755.6 3,271.6
Securitized mortgage loans, at fair value NA 0.0 111.0 104.4 173.3
Other investment securities, at fair value NA 0.0 11.5 34.2 162.7
Other investments NA NA 0.0 40.6 44.8
Mortgage loans, at fair value NA NA 0.0 14.1 0.0
Investment related receivable 116.7 0.0 24.9 191.5 6.2
Interest receivable 3.9 11.3 10.4 10.5 10.1
Derivative instruments, at fair value 0.2 0.8 53.3 11.6 1.6
Other assets 0.8 1.3 1.7 2.1 1.6
Total Assets $1,416.9 $4,487.9 $3,911.6 $4,348.1 $3,843.5
Liabilities and Stockholders’ Equity
Liabilities
Borrowings under repurchase agreements $1,080.0 $3,654.4 $3,034.1 $3,402.3 $3,011.0
Non-recourse securitized debt, at fair value NA 0.0 43.4 34.2 21.2
Investment related payable 121.1 50.0 0.0 76.1 36.5
Obligation to return cash held as collateral NA 0.0 38.7 2.5 0.3
Accrued interest payable 1.1 6.8 8.7 13.0 7.3
Derivative instruments, at fair value 3.5 23.2 4.6 8.9 26.4
Payable to related party 2.0 4.3 5.4 5.0 5.3
Dividends and dividend equivalents payable 3.1 30.7 16.8 18.3 19.1
Accounts payable, accrued expenses, other liabilities 1.5 1.7 2.3 1.7 1.7
Total Liabilities $1,212.3 $3,771.1 $3,154.0 $3,562.1 $3,128.8
Stockholders’ Equity
Preferred stock $0.0 $0.1 $0.1 $0.1 $0.1
Common stock 0.1 0.2 0.3 0.3 0.3
Additional paid-in capital 203.1 619.4 792.0 793.3 789.2
Accumulated deficit 1.4 97.1 (34.8) (7.7) (74.9)
Total Stockholders’ Equity $204.6 $716.8 $757.6 $786.0 $714.7
Total Liabilities and Stockholders’ Equity $1,416.9 $4,487.9 $3,911.6 $4,348.1 $3,843.5
|
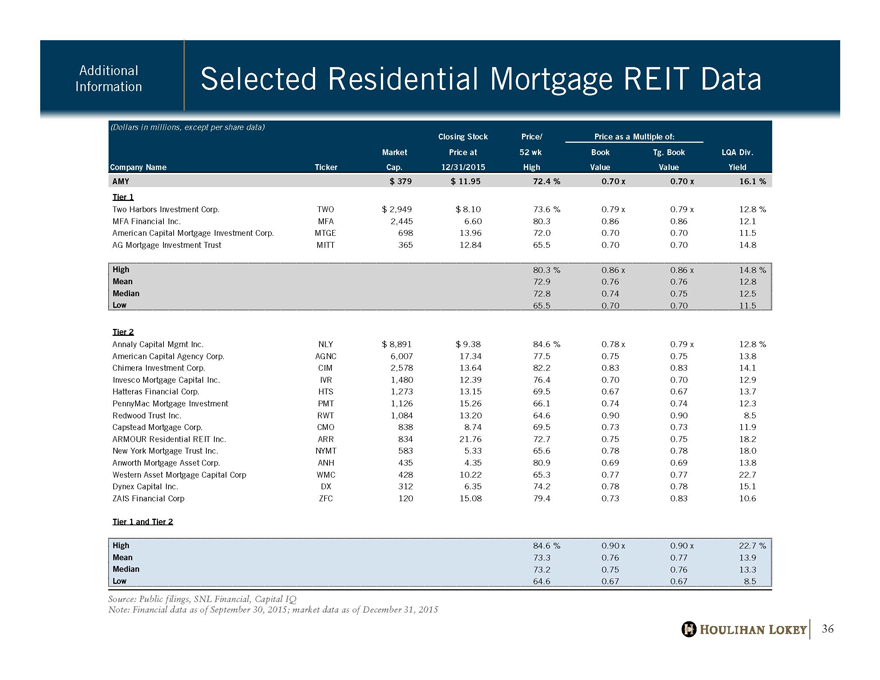
Selected Residential Mortgage REIT Data Additional
Information
HOULIHAN LOKEY 36
Source: Public filings, SNL Financial, Capital IQ
Note: Financial data as of September 30, 2015; market data as of December 31, 2015
(Dollars in millions, except per share data)
Closing Stock Price/ Price as a Multiple of:
Market Price at 52 wk Book Tg. Book LQA Div.
Company Name Ticker Cap. 12/31/2015 High Value Value Yield
AMY $ 379 $ 11.95 72.4 % 0.70 x 0.70 x 16.1 %
Tier 1
Two Harbors Investment Corp. TWO $ 2,949 $ 8.10 73.6 % 0.79 x 0.79 x 12.8 %
MFA Financial Inc. MFA 2,445 6.60 80.3 0.86 0.86 12.1
American Capital Mortgage Investment Corp. MTGE 698 13.96 72.0 0.70 0.70 11.5
AG Mortgage Investment Trust MITT 365 12.84 65.5 0.70 0.70 14.8
High 80.3 % 0.86 x 0.86 x 14.8 %
Mean 72.9 0.76 0.76 12.8
Median 72.8 0.74 0.75 12.5
Low 65.5 0.70 0.70 11.5
Tier 2
Annaly Capital Mgmt Inc. NLY $ 8,891 $ 9.38 84.6 % 0.78 x 0.79 x 12.8 %
American Capital Agency Corp. AGNC 6,007 17.34 77.5 0.75 0.75 13.8
Chimera Investment Corp. CIM 2,578 13.64 82.2 0.83 0.83 14.1
Invesco Mortgage Capital Inc. IVR 1,480 12.39 76.4 0.70 0.70 12.9
Hatteras Financial Corp. HTS 1,273 13.15 69.5 0.67 0.67 13.7
PennyMac Mortgage Investment PMT 1,126 15.26 66.1 0.74 0.74 12.3
Redwood Trust Inc. RWT 1,084 13.20 64.6 0.90 0.90 8.5
Capstead Mortgage Corp. CMO 838 8.74 69.5 0.73 0.73 11.9
ARMOUR Residential REIT Inc. ARR 834 21.76 72.7 0.75 0.75 18.2
New York Mortgage Trust Inc. NYMT 583 5.33 65.6 0.78 0.78 18.0
Anworth Mortgage Asset Corp. ANH 435 4.35 80.9 0.69 0.69 13.8
Western Asset Mortgage Capital Corp WMC 428 10.22 65.3 0.77 0.77 22.7
Dynex Capital Inc. DX 312 6.35 74.2 0.78 0.78 15.1
ZAIS Financial Corp ZFC 120 15.08 79.4 0.73 0.83 10.6
Tier 1 and Tier 2
High 84.6 % 0.90 x 0.90 x 22.7 %
Mean 73.3 0.76 0.77 13.9
Median 73.2 0.75 0.76 13.3
Low 64.6 0.67 0.67 8.5
|
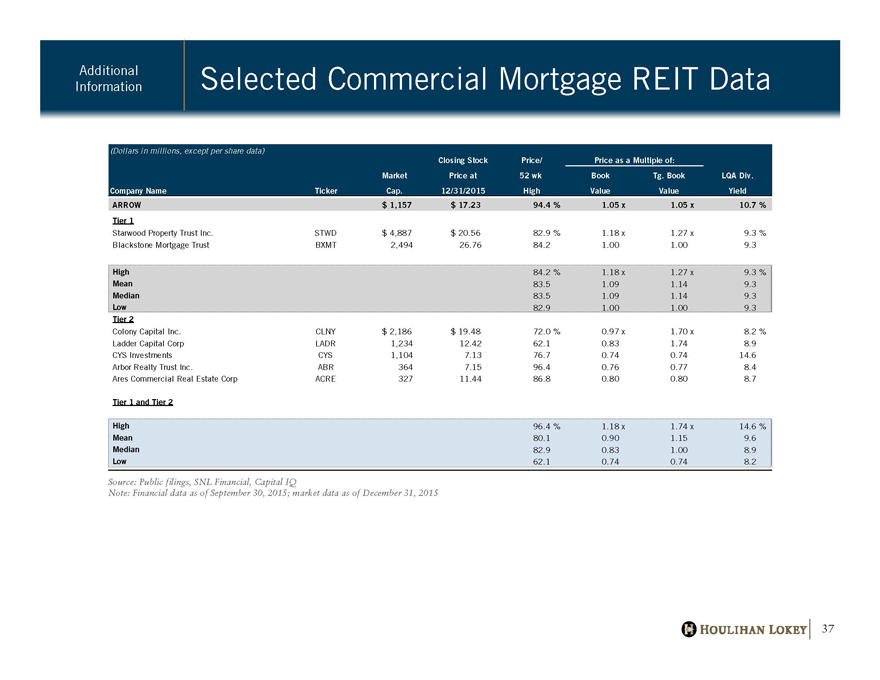
Selected Commercial Mortgage REIT Data Additional
Information
HOULIHAN LOKEY 37
Source: Public filings, SNL Financial, Capital IQ
Note: Financial data as of September 30, 2015; market data as of December 31, 2015
(Dollars in millions, except per share data)
Closing Stock Price/ Price as a Multiple of:
Market Price at 52 wk Book Tg. Book LQA Div.
Company Name Ticker Cap. 12/31/2015 High Value Value Yield
ARROW $ 1,157 $ 17.23 94.4 % 1.05 x 1.05 x 10.7 %
Tier 1
Starwood Property Trust Inc. STWD $ 4,887 $ 20.56 82.9 % 1.18 x 1.27 x 9.3 %
Blackstone Mortgage Trust BXMT 2,494 26.76 84.2 1.00 1.00 9.3
High 84.2 % 1.18 x 1.27 x 9.3 %
Mean 83.5 1.09 1.14 9.3
Median 83.5 1.09 1.14 9.3
Low 82.9 1.00 1.00 9.3
Tier 2
Colony Capital Inc. CLNY $ 2,186 $ 19.48 72.0 % 0.97 x 1.70 x 8.2 %
Ladder Capital Corp LADR 1,234 12.42 62.1 0.83 1.74 8.9
CYS Investments CYS 1,104 7.13 76.7 0.74 0.74 14.6
Arbor Realty Trust Inc. ABR 364 7.15 96.4 0.76 0.77 8.4
Ares Commercial Real Estate Corp ACRE 327 11.44 86.8 0.80 0.80 8.7
Tier 1 and Tier 2
High 96.4 % 1.18 x 1.74 x 14.6 %
Mean 80.1 0.90 1.15 9.6
Median 82.9 0.83 1.00 8.9
Low 62.1 0.74 0.74 8.2
|

Appendix
Disclaimer
|
Disclaimer Disclaimer
HOULIHAN LOKEY 39
This presentation, and any supplemental information (written or oral) or other documents provided in connection therewith (collectively, the “materials”), are provided solely for the information of the Special Committee (the “Committee”)
of the Board of Directors (the “Board”) of Apollo Commercial Real Estate Finance, Inc. (“ARROW” or the “Company”) by Houlihan Lokey in connection with the Committee’s consideration of a potential transaction (the “Transaction”)
involving the Company. This presentation is incomplete without reference to, and should be considered in conjunction with, any supplemental information provided by and discussions with Houlihan Lokey in connection therewith. Any
defined terms used herein shall have the meanings set forth herein, even if such defined terms have been given different meanings elsewhere in the materials.
The materials are for discussion purposes only. Houlihan Lokey expressly disclaims any and all liability which may be based on the materials and any errors therein or omissions therefrom. The materials were prepared for specific persons
familiar with the business and affairs of the Company for use in a specific context and were not prepared with a view to public disclosure or to conform with any disclosure standards under any state, federal or international securities laws or
other laws, rules or regulations, and none of the Committee, the Company or Houlihan Lokey takes any responsibility for the use of the materials by persons other than the Committee. The materials are provided on a confidential basis
solely for the information of the Committee and may not be disclosed, summarized, reproduced, disseminated or quoted or otherwise referred to, in whole or in part, without Houlihan Lokey’s express prior written consent.
Notwithstanding any other provision herein, the Company (and each employee, representative or other agent of the Company) may disclose to any and all persons without limitation of any kind, the tax treatment and tax structure of any
transaction and all materials of any kind (including opinions or other tax analyses, if any) that are provided to the Company relating to such tax treatment and structure. However, any information relating to the tax treatment and tax
structure shall remain confidential (and the foregoing sentence shall not apply) to the extent necessary to enable any person to comply with securities laws. For this purpose, the tax treatment of a transaction is the purported or claimed U.S.
income or franchise tax treatment of the transaction and the tax structure of a transaction is any fact that may be relevant to understanding the purported or claimed U.S. income or franchise tax treatment of the transaction. If the Company
plans to disclose information pursuant to the first sentence of this paragraph, the Company shall inform those to whom it discloses any such information that they may not rely upon such information for any purpose without Houlihan
Lokey’s prior written consent. Houlihan Lokey is not an expert on, and nothing contained in the materials should be construed as advice with regard to, legal, accounting, regulatory, insurance, tax or other specialist matters. Houlihan
Lokey’s role in reviewing any information is limited solely to performing such a review as it shall deem necessary to support its own advice and analysis and shall not be on behalf of the Committee.
The materials necessarily are based on financial, economic, market and other conditions as in effect on, and the information available to Houlihan Lokey as of, the date of the materials. Although subsequent developments may affect the
contents of the materials, Houlihan Lokey has not undertaken, and is under no obligation, to update, revise or reaffirm the materials, except as may be expressly contemplated by Houlihan Lokey’s engagement letter. The materials are not
intended to provide the sole basis for evaluation of the Transaction and do not purport to contain all information that may be required. The materials do not address the underlying business decision of the Company or any other party to
proceed with or effect the Transaction, or the relative merits of the Transaction as compared to any alternative business strategies or transactions that might be available for the Company or any other party. The materials do not constitute
any opinion, nor do the materials constitute a recommendation to the Board, the Committee, the Company, any security holder of the Company or any other party as to how to vote or act with respect to any matter relating to the
Transaction or otherwise or whether to buy or sell any assets or securities of any company. Houlihan Lokey’s only opinion is the opinion, if any, that is actually delivered to the Committee. The materials may not reflect information known
to other professionals in other business areas of Houlihan Lokey and its affiliates.
The preparation of the materials was a complex process involving quantitative and qualitative judgments and determinations with respect to the financial, comparative and other analytic methods employed and the adaption and application
of these methods to the unique facts and circumstances presented and, therefore, is not readily susceptible to partial analysis or summary description. Furthermore, Houlihan Lokey did not attribute any particular weight to any analysis or
factor considered by it, but rather made qualitative judgments as to the significance and relevance of each analysis and factor. Each analytical technique has inherent strengths and weaknesses, and the nature of the available information may
further affect the value of particular techniques. Accordingly, the analyses contained in the materials must be considered as a whole. Selecting portions of the analyses, analytic methods and factors without considering all analyses and
factors could create a misleading or incomplete view. The materials reflect judgments and assumptions with regard to industry performance, general business, economic, regulatory, market and financial conditions and other matters, many
of which are beyond the control of the participants in the Transaction. Any estimates of value contained in the materials are not necessarily indicative of actual value or predictive of future results or values, which may be significantly more
or less favorable. Any analyses relating to the value of assets, businesses or securities do not purport to be appraisals or to reflect the prices at which any assets, businesses or securities may actually be sold. The materials do not constitute a
valuation opinion or credit rating. In preparing the materials, Houlihan Lokey has not conducted any physical inspection or independent appraisal or evaluation of any of the assets, properties or liabilities (contingent or otherwise) of the
Company or any other party and has no obligation to evaluate the solvency of the Company or any other party under any law.
All budgets, projections, estimates, financial analyses, reports and other information with respect to operations (including estimates of potential cost savings and expenses) reflected in the materials have been prepared by management of the
relevant party or are derived from such budgets, projections, estimates, financial analyses, reports and other information or from other sources, which involve numerous and significant subjective determinations made by management of the
relevant party and/or which such management has reviewed and found reasonable. The budgets, projections and estimates contained in the materials may or may not be achieved and differences between projected results and those actually
achieved may be material. Houlihan Lokey has relied upon representations made by management of the Company and other participants in the Transaction that such budgets, projections and estimates have been reasonably prepared in
good faith on bases reflecting the best currently available estimates and judgments of such management (or, with respect to information obtained from public sources, represent reasonable estimates), and Houlihan Lokey expresses no
opinion with respect to such budgets, projections or estimates or the assumptions on which they are based. The scope of the financial analysis contained herein is based on discussions with the Company (including, without limitation,
regarding the methodologies to be utilized), and Houlihan Lokey does not make any representation, express or implied, as to the sufficiency or adequacy of such financial analysis or the scope thereof for any particular purpose.
Houlihan Lokey has assumed and relied upon the accuracy and completeness of the financial and other information provided to, discussed with or reviewed by it without (and without assuming responsibility for) independent verification of
such information, makes no representation or warranty (express or implied) in respect of the accuracy or completeness of such information and has further relied upon the assurances of the Company and other participants in the
Transaction that they are not aware of any facts or circumstances that would make such information inaccurate or misleading. In addition, Houlihan Lokey has relied upon and assumed, without independent verification, that there has been
no change in the business, assets, liabilities, financial condition, results of operations, cash flows or prospects of the Company or any other participant in the Transaction since the respective dates of the most recent financial statements and
other information, financial or otherwise, provided to Houlihan Lokey that would be material to its analyses , and that the final forms of any draft documents reviewed by Houlihan Lokey will not differ in any material respect from such
draft documents.
The materials are not an offer to sell or a solicitation of an indication of interest to purchase any security, option, commodity, future, loan or currency. The materials do not constitute a commitment by Houlihan Lokey or any of its affiliates
to underwrite, subscribe for or place any securities, to extend or arrange credit, or to provide any other services. In the ordinary course of business, certain of Houlihan Lokey’s affiliates and employees, as well as investment funds in which
they may have financial interests or with which they may co-invest, may acquire, hold or sell, long or short positions, or trade or otherwise effect transactions, in debt, equity, and other securities and financial instruments (including loans
and other obligations) of, or investments in, one or more parties that may be involved in the Transaction and their respective affiliates or any currency or commodity that may be involved in the Transaction. Houlihan Lokey provides
mergers and acquisitions, restructuring and other advisory and consulting services to clients. Houlihan Lokey’s personnel may make statements or provide advice that is contrary to information contained in the materials. Houlihan Lokey’s
or its affiliates’ proprietary interests may conflict with the Company’s interests. Houlihan Lokey may have advised, may seek to advise and may in the future advise one or more participants in the Transaction and/or other companies
mentioned in the materials.