UNITED STATES
SECURITIES AND EXCHANGE COMMISSION
Washington, D.C. 20549
FORM N-CSR
CERTIFIED SHAREHOLDER REPORT OF REGISTERED
MANAGEMENT INVESTMENT COMPANIES
Investment Company Act file number: 811-22542
SSGA ACTIVE ETF TRUST
(Exact name of registrant as specified in charter)
One Lincoln Street, Boston, Massachusetts 02111
(Address of principal executive offices) (zip code)
Ryan M. Louvar, Esq.
State Street Bank and Trust Company
One Lincoln Street/CPH0326
Boston, Massachusetts 02111
(Name and address of agent for service)
Copy to:
W. John McGuire, Esq.
Bingham McCutchen LLP
2020 K Street, N.W.
Washington, DC 20006
Registrant’s telephone number, including area code: (866) 787-2257
Date of fiscal year end: June 30
Date of reporting period: December 31, 2012
Item 1. Reports to Shareholders.

SSgA Active ETF Trust
Semi-Annual Report December 31, 2012
Precise in a world that isn’t.SM
TABLE OF CONTENTS
[This Page Intentionally Left Blank]

SPDR SSGA MULTI-ASSET REAL RETURN ETF — PERFORMANCE SUMMARY
The following performance chart of the Fund’s total return at net asset value, the total return based on market price and its benchmark index is provided for comparative purposes only and represents the periods noted. The Fund’s per share net asset value (“NAV”) is the value of one share of the Fund and is calculated by dividing the value of total assets less total liabilities by the number of shares outstanding. The NAV return is based on the NAV of the Fund and the market return is based on the market price per share of the Fund. The market price used to calculate the market return is determined by using the midpoint between the highest bid and the lowest offer on the exchange on which the shares of the Fund are listed for trading, as of the time that the Fund’s NAV is calculated. Since shares of the Fund did not trade in the secondary market until one day after the Fund’s inception, for the period from inception to the first day of secondary market trading in shares of the Fund (4/25/12, 4/26/12, respectively), the NAV of the Fund is used as a proxy for the secondary market trading price to calculate market returns. NAV and market returns assume that dividends and capital gain distributions have been reinvested in the Fund at NAV. Market returns do not include brokerage commissions that may be payable on secondary market transactions. If brokerage commissions were included market returns would be lower.
An index is a statistical measure of a specified financial market or sector. An index does not actually hold a portfolio of securities and therefore does not reflect deductions for fees or expenses. In comparison, the Fund’s performance is negatively impacted by these deductions.
Performance quoted represents past performance, which is no guarantee of future results. Investment return and principal value will fluctuate, so you may have a gain or loss when shares are sold. Current performance may be higher or lower than that quoted. Visit www.spdrs.com for most recent month-end performance. The returns do not reflect the deduction of taxes that a shareholder would pay on Fund distributions or on the redemption or sale of Fund shares. The total expense ratio for SPDR SSgA Multi-Asset Real Return ETF as stated in the Fees and Expenses table of the prospectus dated October 31, 2012 is 0.70%.
PERFORMANCE AS OF DECEMBER 31, 2012
| | | | | | | | | | | | | | | | | | | | |
| | | | | | | | | | | | | | | | | |
| | | | | CUMULATIVE TOTAL RETURN | | | |
| | | | | NET ASSET
VALUE | | | MARKET
VALUE | | | PRIMARY BENCHMARK:
BARCLAYS U.S. GOVERNMENT
INFLATION-LINKED BOND INDEX | | | SECONDARY BENCHMARK:
SSgA MULTI-ASSET REAL RETURN
COMPOSITE INDEX | | | |
| | | SIX MONTHS | | | 7.63% | | | | 7.66% | | | | 0.72% | | | | 8.33% | | | |
| | | SINCE INCEPTION (1) | | | 3.93% | | | | 3.88% | | | | 4.60% | | | | 4.38% | | | |
| | | | | | | | | | | | | | | | | |
| | (1) | For the period April 25, 2012 to December 31, 2012 |
1
SPDR SSGA MULTI-ASSET REAL RETURN ETF — PERFORMANCE SUMMARY (CONTINUED)
COMPARISON OF CHANGE IN VALUE OF A $10,000 INVESTMENT (BASED ON NET ASSET VALUE)
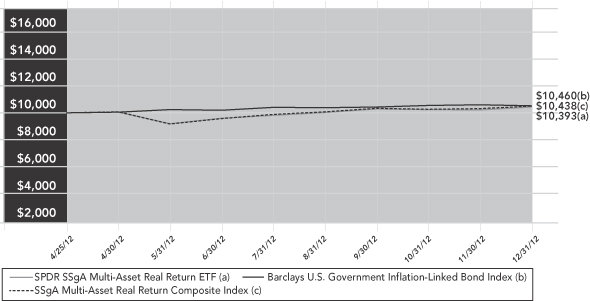
Past performance is not a guarantee of future results
2
SPDR SSGA INCOME ALLOCATION ETF — PERFORMANCE SUMMARY
The following performance chart of the Fund’s total return at net asset value, the total return based on market price and its benchmark index is provided for comparative purposes only and represents the periods noted. The Fund’s per share net asset value (“NAV”) is the value of one share of the Fund and is calculated by dividing the value of total assets less total liabilities by the number of shares outstanding. The NAV return is based on the NAV of the Fund and the market return is based on the market price per share of the Fund. The market price used to calculate the market return is determined by using the midpoint between the highest bid and the lowest offer on the exchange on which the shares of the Fund are listed for trading, as of the time that the Fund’s NAV is calculated. Since shares of the Fund did not trade in the secondary market until one day after the Fund’s inception, for the period from inception to the first day of secondary market trading in shares of the Fund (4/25/12, 4/26/12, respectively), the NAV of the Fund is used as a proxy for the secondary market trading price to calculate market returns. NAV and market returns assume that dividends and capital gain distributions have been reinvested in the Fund at NAV. Market returns do not include brokerage commissions that may be payable on secondary market transactions. If brokerage commissions were included market returns would be lower.
An index is a statistical measure of a specified financial market or sector. An index does not actually hold a portfolio of securities and therefore does not reflect deductions for fees or expenses. In comparison, the Fund’s performance is negatively impacted by these deductions.
Performance quoted represents past performance, which is no guarantee of future results. Investment return and principal value will fluctuate, so you may have a gain or loss when shares are sold. Current performance may be higher or lower than that quoted. Visit www.spdrs.com for most recent month-end performance. The returns do not reflect the deduction of taxes that a shareholder would pay on Fund distributions or on the redemption or sale of Fund shares. The total expense ratio for SPDR SSgA Income Allocation ETF as stated in the Fees and Expenses table of the prospectus dated October 31, 2012 is 0.70%.
PERFORMANCE AS OF DECEMBER 31, 2012
| | | | | | | | | | | | | | | | | | | | |
| | | | | | | | | | | | | | | | | |
| | | | | CUMULATIVE TOTAL RETURN | | | |
| | | | | NET ASSET
VALUE | | | MARKET
VALUE | | | PRIMARY BENCHMARK:
MSCI WORLD INDEX | | | SECONDARY BENCHMARK:
SSgA INCOME ALLOCATION
COMPOSITE INDEX | | | |
| | | SIX MONTHS | | | 5.97% | | | | 5.99% | | | | 2.49% | | | | 6.71% | | | |
| | | SINCE INCEPTION (1) | | | 6.89% | | | | 6.94% | | | | 5.76% | | | | 7.12% | | | |
| | | | | | | | | | | | | | | | | |
| | (1) | For the period April 25, 2012 to December 31, 2012 |
3
SPDR SSGA INCOME ALLOCATION ETF — PERFORMANCE SUMMARY (CONTINUED)
COMPARISON OF CHANGE IN VALUE OF A $10,000 INVESTMENT (BASED ON NET ASSET VALUE)
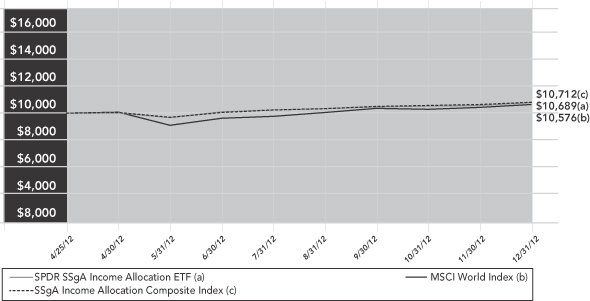
Past performance is not a guarantee of future results
4
SPDR SSGA GLOBAL ALLOCATION ETF — PERFORMANCE SUMMARY
The following performance chart of the Fund’s total return at net asset value, the total return based on market price and its benchmark index is provided for comparative purposes only and represents the periods noted. The Fund’s per share net asset value (“NAV”) is the value of one share of the Fund and is calculated by dividing the value of total assets less total liabilities by the number of shares outstanding. The NAV return is based on the NAV of the Fund and the market return is based on the market price per share of the Fund. The market price used to calculate the market return is determined by using the midpoint between the highest bid and the lowest offer on the exchange on which the shares of the Fund are listed for trading, as of the time that the Fund’s NAV is calculated. Since shares of the Fund did not trade in the secondary market until one day after the Fund’s inception, for the period from inception to the first day of secondary market trading in shares of the Fund (4/25/12, 4/26/12, respectively), the NAV of the Fund is used as a proxy for the secondary market trading price to calculate market returns. NAV and market returns assume that dividends and capital gain distributions have been reinvested in the Fund at NAV. Market returns do not include brokerage commissions that may be payable on secondary market transactions. If brokerage commissions were included market returns would be lower.
An index is a statistical measure of a specified financial market or sector. An index does not actually hold a portfolio of securities and therefore does not reflect deductions for fees or expenses. In comparison, the Fund’s performance is negatively impacted by these deductions.
Performance quoted represents past performance, which is no guarantee of future results. Investment return and principal value will fluctuate, so you may have a gain or loss when shares are sold. Current performance may be higher or lower than that quoted. Visit www.spdrs.com for most recent month-end performance. The returns do not reflect the deduction of taxes that a shareholder would pay on Fund distributions or on the redemption or sale of Fund shares. The total expense ratio for SPDR SSgA Global Allocation ETF as stated in the Fees and Expenses table of the prospectus dated October 31, 2012 is 0.35%.
PERFORMANCE AS OF DECEMBER 31, 2012
| | | | | | | | | | | | | | | | | | | | |
| | | | | | | | | | | | | | | | | |
| | | | | CUMULATIVE TOTAL RETURN | | | |
| | | | | NET ASSET
VALUE | | | MARKET
VALUE | | | PRIMARY BENCHMARK:
MSCI ACWI IMI INDEX | | | SECONDARY BENCHMARK:
SSgA GLOBAL ALLOCIATION
COMPOSITE INDEX | | | |
| | | SIX MONTHS | | | 7.83% | | | | 7.98% | | | | 2.99% | | | | 7.99% | | | |
| | | SINCE INCEPTION (1) | | | 5.86% | | | | 5.90% | | | | 5.83% | | | | 6.01% | | | |
| | | | | | | | | | | | | | | | | |
| | (1) | For the period April 25, 2012 to December 31, 2012 |
5
SPDR SSGA GLOBAL ALLOCATION ETF — PERFORMANCE SUMMARY (CONTINUED)
COMPARISON OF CHANGE IN VALUE OF A $10,000 INVESTMENT (BASED ON NET ASSET VALUE)
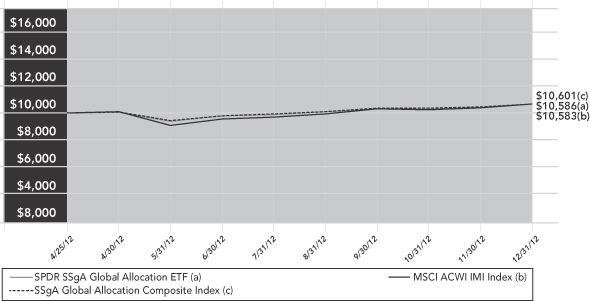
Past performance is not a guarantee of future results
6
SSgA ACTIVE ETF TRUST
STATEMENTS OF ASSETS AND LIABILITIES
December 31, 2012 (Unaudited)
| | | | | | | | | | | | |
| | | SPDR SSgA
Multi-Asset
Real Return
ETF | | | SPDR SSgA
Income
Allocation
ETF | | | SPDR SSgA
Global
Allocation
ETF | |
ASSETS | | | | | | | | | | | | |
Investments in corresponding Portfolio, at market value (Note 1) | | $ | 73,987,708 | | | $ | 51,698,297 | | | $ | 14,105,017 | |
Receivable for fund shares sold | | | — | | | | 15,355 | | | | — | |
Due from Advisor | | | — | | | | — | | | | 1,524 | |
| | | | | | | | | | | | |
TOTAL ASSETS | | | 73,987,708 | | | | 51,713,652 | | | | 14,106,541 | |
| | | | | | | | | | | | |
LIABILITIES | | | | | | | | | | | | |
Income distributions payable | | | 505,988 | | | | 596,049 | | | | 135,837 | |
Accrued Advisory fees | | | 1,110 | | | | 5,373 | | | | — | |
Accrued trustees’ fees and expenses | | | 34 | | | | 55 | | | | 30 | |
| | | | | | | | | | | | |
TOTAL LIABILITIES | | | 507,132 | | | | 601,477 | | | | 135,867 | |
| | | | | | | | | | | | |
NET ASSETS | | $ | 73,480,576 | | | $ | 51,112,175 | | | $ | 13,970,674 | |
| | | | | | | | | | | | |
NET ASSETS CONSIST OF: | | | | | | | | | | | | |
Paid-in capital (Note 4) | | $ | 72,995,748 | | | $ | 50,424,189 | | | $ | 13,655,529 | |
Undistributed (distributions in excess of) net investment income | | | (43,902 | ) | | | (158,016 | ) | | | (20,039 | ) |
Accumulated net realized gain (loss) on investments | | | (32,571 | ) | | | (21,851 | ) | | | (47,578 | ) |
Net unrealized appreciation (depreciation) on investments | | | 561,301 | | | | 867,853 | | | | 382,762 | |
| | | | | | | | | | | | |
NET ASSETS | | $ | 73,480,576 | | | $ | 51,112,175 | | | $ | 13,970,674 | |
| | | | | | | | | | | | |
NET ASSET VALUE PER SHARE | | | | | | | | | | | | |
Net asset value per share | | $ | 30.60 | | | $ | 30.96 | | | $ | 30.97 | |
| | | | | | | | | | | | |
Shares outstanding (unlimited amount authorized, $0.00 par value) | | | 2,401,111 | | | | 1,651,111 | | | | 451,111 | |
| | | | | | | | | | | | |
See Notes to Financial Statements and Financial Statements of the Master Portfolios.
7
SSgA ACTIVE ETF TRUST
STATEMENTS OF OPERATIONS
For the Six Months Ended December 31, 2012 (Unaudited)
| | | | | | | | | | | | |
| | | SPDR SSgA
Multi-Asset
Real Return
ETF | | | SPDR SSgA
Income
Allocation
ETF | | | SPDR SSgA
Global
Allocation
ETF | |
INCOME AND EXPENSES ALLOCATED FROM PORTFOLIO | | | | | | | | | | | | |
Dividend income allocated from Portfolio (Note 2) | | $ | 503,205 | | | $ | 749,957 | | | $ | 164,485 | |
Expenses allocated from Portfolio (Note 2) | | | (14,574 | ) | | | (25,931 | ) | | | (8,255 | ) |
| | | | | | | | | | | | |
TOTAL INCOME | | | 488,631 | | | | 724,026 | | | | 156,230 | |
| | | | | | | | | | | | |
EXPENSES | | | | | | | | | | | | |
Advisory fees (Note 3) | | | 3,165 | | | | 19,389 | | | | — | |
Trustee Fees | | | 34 | | | | 55 | | | | 30 | |
| | | | | | | | | | | | |
TOTAL EXPENSES | | | 3,199 | | | | 19,444 | | | | 30 | |
| | | | | | | | | | | | |
Fees reimbursed by Adviser | | | — | | | | — | | | | (6,197 | ) |
| | | | | | | | | | | | |
NET INVESTMENT INCOME | | $ | 485,432 | | | $ | 704,582 | | | $ | 162,397 | |
| | | | | | | | | | | | |
REALIZED AND UNREALIZED GAIN (LOSS)
ON INVESTMENTS | | | | | | | | | | | | |
Net realized gain (loss) allocated from Portfolio | | | 19,033 | | | | (3,950 | ) | | | (3,574 | ) |
Net change in unrealized appreciation (depreciation) allocated from Portfolio | | | 791,968 | | | | 820,220 | | | | 470,348 | |
| | | | | | | | | | | | |
NET REALIZED AND UNREALIZED GAIN (LOSS) ON INVESTMENTS | | | 811,001 | | | | 816,270 | | | | 466,774 | |
| | | | | | | | | | | | |
NET INCREASE (DECREASE) IN NET ASSETS RESULTING FROM OPERATIONS | | $ | 1,296,433 | | | $ | 1,520,852 | | | $ | 629,171 | |
| | | | | | | | | | | | |
See Notes to Financial Statements and Financial Statements of the Master Portfolios.
8
[This Page Intentionally Left Blank]
9
SSgA ACTIVE ETF TRUST
STATEMENTS OF CHANGES IN NET ASSETS
| | | | | | | | | | | | | | | | |
| | | SPDR SSgA Multi-Asset Real Return ETF | | | SPDR SSgA Income Allocation ETF | |
| | | Six Months
Ended 12/31/12
(Unaudited) | | | For the Period
4/25/12* -
6/30/12 | | | Six Months
Ended 12/31/12
(Unaudited) | | | For the Period
4/25/12* -
6/30/12 | |
INCREASE (DECREASE) IN NET ASSETS FROM OPERATIONS: | | | | | | | | | | | | | | | | |
Net investment income (loss) | | $ | 485,432 | | | $ | 40,831 | | | $ | 704,582 | | | $ | 97,347 | |
Net realized gain (loss) on
investments | | | 19,033 | | | | (6,834 | ) | | | (3,950 | ) | | | (17,901 | ) |
Net change in unrealized appreciation (depreciation) on investments | | | 791,968 | | | | (230,667 | ) | | | 820,220 | | | | 47,633 | |
| | | | | | | | | | | | | | | | |
Net increase (decrease) in net assets resulting from operations | | | 1,296,433 | | | | (196,670 | ) | | | 1,520,852 | | | | 127,079 | |
| | | | | | | | | | | | | | | | |
Net equalization credits and charges | | | 47,822 | | | | (1,313 | ) | | | 128,245 | | | | 25,031 | |
| | | | | | | | | | | | | | | | |
DISTRIBUTIONS TO
SHAREHOLDERS FROM: | | | | | | | | | | | | | | | | |
Net investment income | | | (530,513 | ) | | | (39,652 | ) | | | (837,380 | ) | | | (122,565 | ) |
| | | | | | | | | | | | | | | | |
FROM BENEFICIAL INTEREST TRANSACTIONS: | | | | | | | | | | | | | | | | |
Proceeds from sale of shares | | | 68,412,836 | | | | 7,426,281 | | | | 41,439,613 | | | | 8,984,576 | |
Cost of shares redeemed | | | (1,483,943 | ) | | | (1,404,196 | ) | | | — | | | | — | |
Net income equalization (Note 2) | | | (47,822 | ) | | | 1,313 | | | | (128,245 | ) | | | (25,031 | ) |
| | | | | | | | | | | | | | | | |
Net increase (decrease) in net assets from beneficial interest transactions | | | 66,881,071 | | | | 6,023,398 | | | | 41,311,368 | | | | 8,959,545 | |
| | | | | | | | | | | | | | | | |
Net increase (decrease) in net assets during the period | | | 67,694,813 | | | | 5,785,763 | | | | 42,123,085 | | | | 8,989,090 | |
Net assets at beginning of period | | | 5,785,763 | | | | — | | | | 8,989,090 | | | | — | |
| | | | | | | | | | | | | | | | |
NET ASSETS END OF PERIOD (1) | | $ | 73,480,576 | | | $ | 5,785,763 | | | $ | 51,112,175 | | | $ | 8,989,090 | |
| | | | | | | | | | | | | | | | |
SHARES OF BENEFICIAL INTEREST: | | | | | | | | | | | | | | | | |
Shares sold | | | 2,250,000 | | | | 251,111 | | | | 1,350,000 | | | | 301,111 | |
Shares redeemed | | | (50,000 | ) | | | (50,000 | ) | | | — | | | | — | |
| | | | | | | | | | | | | | | | |
Net increase in shares | | | 2,200,000 | | | | 201,111 | | | | 1,350,000 | | | | 301,111 | |
| | | | | | | | | | | | | | | | |
(1) Undistributed (distributions in excess of) net investment income | | $ | (43,902 | ) | | $ | 1,179 | | | $ | (158,016 | ) | | $ | (25,218 | ) |
| | | | | | | | | | | | | | | | |
| * | Commencement of operations |
See Notes to Financial Statements and Financial Statements of the Master Portfolios.
10
| | | | | | |
| SPDR SSgA Global Allocation ETF | |
Six Months
Ended 12/31/12
(Unaudited) | | | For the Period
4/25/12*-
6/30/12 | |
| | | | | | |
| $ | 162,397 | | | $ | 42,385 | |
| (3,574 | ) | | | (140,394 | ) |
| 470,348 | | | | (87,586 | ) |
| | | | | | |
| 629,171 | | | | (185,595 | ) |
| | | | | | |
| | 21,099 | | | | (3,002 | ) |
| | | | | | |
| | | | | | |
| | (185,515 | ) | | | (39,306 | ) |
| | | | | | |
| | | | | | |
| | 9,115,987 | | | | 6,033,333 | |
| | — | | | | (1,397,401 | ) |
| | (21,099 | ) | | | 3,002 | |
| | | | | | |
| | 9,094,888 | | | | 4,638,934 | |
| | | | | | |
| | 9,559,643 | | | | 4,411,031 | |
| | 4,411,031 | | | | — | |
| | | | | | |
| $ | 13,970,674 | | | $ | 4,411,031 | |
| | | | | | |
| | | | | | |
| | 300,000 | | | | 201,111 | |
| | — | | | | (50,000 | ) |
| | | | | | |
| | 300,000 | | | | 151,111 | |
| | | | | | |
| $ | (20,039 | ) | | $ | 3,079 | |
| | | | | | |
11
SSgA ACTIVE ETF TRUST
FINANCIAL HIGHLIGHTS
Selected data for a share of beneficial interest outstanding throughout each period is presented below (1):
| | | | | | | | | | | | | | | | | | | | | | | | |
| | | SPDR SSgA
Multi-Asset Real
Return ETF | | | SPDR SSgA
Income
Allocation ETF | | | SPDR SSgA
Global
Allocation ETF | |
| | | Six Months
Ended
12/31/12
(Unaudited) | | | For the
Period
4/25/12* -
6/30/12 | | | Six Months
Ended
12/31/12
(Unaudited) | | | For the
Period
4/25/12* -
6/30/12 | | | Six Months
Ended
12/31/12
(Unaudited) | | | For the
Period
4/25/12* -
6/30/12 | |
Net asset value, beginning of period | | $ | 28.77 | | | $ | 30.00 | | | $ | 29.85 | | | $ | 30.00 | | | $ | 29.19 | | | $ | 30.00 | |
| | | | | | | | | | | | | | | | | | | | | | | | |
Income (loss) from investment operations: | | | | | | | | | | | | | | | | | | | | | | | | |
Net investment income (loss) (2) | | | 1.02 | | | | 0.20 | | | | 0.84 | | | | 0.44 | | | | 0.61 | | | | 0.24 | |
Net realized and unrealized gain (loss) on investments (3) | | | 1.07 | | | | (1.22 | ) | | | 0.79 | | | | (0.29 | ) | | | 1.59 | | | | (0.77 | ) |
| | | | | | | | | | | | | | | | | | | | | | | | |
Total from investment operations | | | 2.09 | | | | (1.02 | ) | | | 1.63 | | | | 0.15 | | | | 2.20 | | | | (0.53 | ) |
| | | | | | | | | | | | | | | | | | | | | | | | |
Net equalization credits and charges (2) | | | 0.10 | | | | (0.01 | ) | | | 0.15 | | | | 0.11 | | | | 0.08 | | | | (0.02 | ) |
| | | | | | | | | | | | | | | | | | | | | | | | |
Distributions to shareholders from: | | | | | | | | | | | | | | | | | | | | | | | | |
Net investment income | | | (0.36 | ) | | | (0.20 | ) | | | (0.67 | ) | | | (0.41 | ) | | | (0.50 | ) | | | (0.26 | ) |
| | | | | | | | | | | | | | | | | | | | | | | | |
Total distributions | | | (0.36 | ) | | | (0.20 | ) | | | (0.67 | ) | | | (0.41 | ) | | | (0.50 | ) | | | (0.26 | ) |
| | | | | | | | | | | | | | | | | | | | | | | | |
Net asset value, end of period | | $ | 30.60 | | | $ | 28.77 | | | $ | 30.96 | | | $ | 29.85 | | | $ | 30.97 | | | $ | 29.19 | |
| | | | | | | | | | | | | | | | | | | | | | | | |
Total Return (4) | | | 7.63 | % | | | (3.44 | )% | | | 5.97 | % | | | 0.87 | % | | | 7.83 | % | | | (1.82 | )% |
Ratios and Supplemental Data: | | | | | | | | | | | | | | | | | | | | | | | | |
Net Assets, End of Period (000s) | | $ | 73,481 | | | $ | 5,786 | | | $ | 51,112 | | | $ | 8,989 | | | $ | 13,971 | | | $ | 4,411 | |
Ratios to average net assets: | | | | | | | | | | | | | | | | | | | | | | | | |
Total expenses (5) | | | 0.24 | % | | | 0.27 | % | | | 0.35 | % | | | 0.36 | % | | | 0.20 | % | | | 0.20 | % |
Net operating expenses (5) | | | 0.24 | % | | | 0.27 | % | | | 0.35 | % | | | 0.36 | % | | | 0.05 | % | | | 0.05 | % |
Net investment income (5) | | | 6.69 | % | | | 3.77 | % | | | 5.46 | % | | | 8.24 | % | | | 3.96 | % | | | 4.48 | % |
| * | Commencement of operations |
| (1) | The per share amounts and percentages include each Fund’s proportionate share of income and expenses of their respective Portfolio. |
| (2) | Per share numbers have been calculated using average shares outstanding. |
| (3) | Amounts shown in this caption for a share outstanding may not accord with the change in aggregate gains and losses in securities for the fiscal period because of the timing of sales and repurchases of Fund shares in relation to fluctuating market values for the Fund. |
| (4) | Total return is calculated assuming a purchase of shares at net asset value on the first day and a sale at net asset value on the last day of each period reported. Distributions are assumed, for the purpose of this calculation, to be reinvested at net asset value per share on the respective payment dates of each Fund. Total return for periods of less than one year is not annualized. Broker commission charges are not included in this calculation. |
See Notes to Financial Statements and Financial Statements of the Master Portfolios.
12
SSgA ACTIVE ETF TRUST
NOTES TO FINANCIAL STATEMENTS
December 31, 2012 (Unaudited)
SSgA Active ETF Trust (the “Trust”), which is registered under the Investment Company Act of 1940, as amended (“1940 Act”), is an open-end investment management company that was organized as a Massachusetts business trust on March 30, 2011.
As of December 31, 2012, the Trust offered three (3) portfolios, each of which represents a separate series of beneficial interest in the Trust (each referred to as a “Fund”, collectively as the “Funds”). The financial statements herein relate to the following three (3) Funds: SPDR SSgA Multi-Asset Real Return ETF, SPDR SSgA Income Allocation ETF and SPDR SSgA Global Allocation ETF.
The Trust is part of a master-feeder structure and each Fund invests substantially all of its assets in interests of its respective master portfolio; the SSgA Multi-Asset Real Return Portfolio, SSgA Income Allocation Portfolio and SSgA Global Allocation Portfolio (each referred to as a “Portfolio”; collectively as “Portfolios”), each of which is a series of a separately registered investment company called SSgA Master Trust (“Master Trust”). The investment objective and policies of each Fund are substantially similar to those of its respective Portfolio. The value of each Fund’s investment in its respective Portfolio reflects the Fund’s proportionate interest in the net assets of that Portfolio (99.99% for SPDR SSgA Multi-Asset Real Return ETF, 99.99% for SPDR SSgA Income Allocation ETF and 99.99% for SPDR SSgA Global Allocation ETF, at December 31, 2012). The performance of each Fund is directly affected by the performance of its respective Portfolio. The financial statements of the Portfolios, including their Schedules of Investments, are attached to this report and should be read in conjunction with the Funds’ financial statements.
Under the Trust’s organizational documents, its officers and trustees are indemnified against certain liabilities arising out of the performance of their duties to the Trust. Additionally, in the normal course of business, the Trust enters into contracts with service providers that contain general indemnification clauses. The Trust’s maximum exposure under these arrangements is unknown as this could involve future claims that may be made against the Trust that have not yet occurred. However, based on experience, the Trust expects the risk of loss to be remote.
| 2. | Summary of Significant Accounting Policies |
The following is a summary of significant accounting policies followed by the Trust in the preparation of its financial statements:
The preparation of financial statements in accordance with U.S. generally accepted accounting principles requires management to make estimates and assumptions that affect the reported amounts and disclosures in the financial statements. Actual results could differ from those estimates. These financial statements are presented in United States dollars.
Security Valuation
Each Fund records its investments in its respective Portfolio at value each business day. The valuation policies of the Portfolios are discussed in Note 2 of the Portfolios’ Notes to Financial Statements, which are attached to this report.
The Portfolios adopted provisions surrounding fair value measurements and disclosures that define fair value, establish a framework for measuring fair value in generally accepted accounting principles and expand disclosures about fair value measurements. This applies to fair value measurements that are already required or permitted by other accounting standards and is intended to increase consistency of those measurements and applies broadly to securities and other types of assets and liabilities. The summary of the inputs used for each Portfolio, as of December 31, 2012, in valuing each Portfolio’s securities carried at fair value are discussed in Note 2 of the Portfolio’s Notes to Financial Statements, which are attached to this report.
Investment Income
Net investment income consists of a Fund’s pro-rata share of the net investment income of its respective Portfolio, less expenses of the Fund.
13
SSgA ACTIVE ETF TRUST
NOTES TO FINANCIAL STATEMENTS (continued)
December 31, 2012 (Unaudited)
Advisory fees and other expenses, which are directly identifiable to a specific Fund, are applied to that Fund. Trustees’ fees and other expenses which cannot be attributed to a specific Fund are allocated in such a manner as deemed equitable, taking into consideration the nature and type of expense and the relative net assets of the Funds.
Equalization
The Funds follow the accounting practice known as “Equalization” by which a portion of the proceeds from sales and costs of reacquiring Fund shares, equivalent on a per share basis to the amount of distributable net investment income on the date of the transaction, is credited or charged to undistributed net investment income. As a result, undistributed net investment income per share is unaffected by sales or reacquisition of Fund shares. Amounts related to Equalization can be found on the Statements of Changes in Net Assets.
Investment Transactions
Investment transactions are recorded as of the trade date. Realized gains and losses from security transactions consist of the Fund’s pro-rata share of its respective Portfolio’s realized gains and losses. Realized gains and losses from security transactions are recorded on the identified cost basis. Corporate actions (including cash dividends) are recorded net of foreign tax withholdings on the ex-dividend date.
Federal Income Tax
The Funds have qualified and intend to continue to qualify for and elect treatment as “regulated investment companies” under Subchapter M of the Internal Revenue Code of 1986, as amended. By so qualifying and electing, each Fund will not be subject to federal income taxes to the extent it distributes its taxable income, including any net realized capital gains, for each fiscal year. In addition, by distributing during each calendar year substantially all of their net investment income and capital gains, if any, the Funds will not be subject to federal excise tax. Income and capital gain distributions are determined in accordance with income tax regulations which may differ from U.S. generally accepted accounting principles. These book-tax differences are primarily due to differing treatments for in-kind transactions for financial statement purposes and losses deferred due to wash sales.
Additionally, based on the Funds’ understanding of the tax rules and rates related to income, gains and transactions for the foreign jurisdictions in which the applicable Funds invest, the Funds will provide for foreign taxes and, where appropriate, deferred foreign taxes. The Funds have reviewed the tax positions for the open tax years as of June 30, 2012 and have determined that no provision for income tax is required in the Funds’ Financial Statements. The Funds’ federal tax returns are subject to examination by the Funds’ major tax jurisdictions, which include the United States of America and the Commonwealth of Massachusetts. The Funds recognized interest and penalties, if any, related to tax liabilities as income tax expense in the Statements of Operations.
For the period ended December 31, 2012, the following Funds reclassified non-taxable security gains and losses realized on the in-kind redemption of Creation Units (Note 4) as an increase or decrease to paid in capital in the Statements of Assets and Liabilities as follows:
| | | | |
| | | Net Gain (Loss)
Reclassified
to Paid in Capital | |
SPDR SSgA Multi-Asset Real Return ETF | | $ | 31,276 | |
At June 30, 2012, the Funds had capital loss carryforwards which may be utilized to offset any net short term realized capital gains. These losses will not expire and are treated as though the losses were incurred on the first day of the next fiscal year:
| | | | |
| | | Short Term | |
SPDR SSgA Multi-Asset Real Return ETF | | $ | (8,072 | ) |
SPDR SSgA Global Allocation ETF | | | (38,360 | ) |
14
SSgA ACTIVE ETF TRUST
NOTES TO FINANCIAL STATEMENTS (continued)
December 31, 2012 (Unaudited)
Distributions
Each Fund declares and distributes dividends from net investment income, if any, to its shareholders quarterly. Each Fund declares and distributes net realized capital gains, if any, at least annually. Distributions are recorded on the ex-dividend date. Income and capital gain distributions are determined in accordance with income tax regulations, which may differ from U.S. generally accepted accounting principles.
| 3. | Fees and Compensation Paid to Affiliates and Other Related Party Transactions |
Advisory Fee
Each Fund has entered into an Investment Advisory Agreement with SSgA Funds Management, Inc. (the “Adviser” or “SSgA FM”). As compensation for the services rendered, facilities furnished, and expenses borne by the Adviser, each Fund pays the Adviser a fee accrued daily and paid monthly, based on a percentage of each Fund’s average daily net assets as shown in the following table:
| | | | |
| | | Annual Rate* | |
SPDR SSgA Multi-Asset Real Return ETF | | | 0.70 | % |
SPDR SSgA Income Allocation ETF | | | 0.70 | |
SPDR SSgA Global Allocation ETF | | | 0.35 | |
| * | The Adviser fee is reduced by the proportional amount of the advisory fee, as well as acquired fund fees and expenses, of each Fund’s respective Portfolio. For the period ended December 31, 2012, the net annualized advisory fee was 0.05%, 0.15% and (0.15)% for the SPDR SSgA Multi-Asset Real Return ETF, SPDR SSgA Income Allocation ETF and SPDR SSgA Global Allocation ETF, respectively. For the SPDR SSgA Global Allocation ETF the reduction resulted in a fee reimbursement which is identified on the Statement of Operations. |
The Adviser pays all operating expenses of each Fund other than management fee, distribution fee pursuant to each Fund’s Distribution and Service Plan, if any, brokerage, taxes, interest, fees and expenses of the Independent Trustees (including any Trustees’ counsel fees), litigation expenses, and other extraordinary expenses.
State Street Bank and Trust Company (“State Street”), an affiliate of the Adviser, receives fees for its services as Custodian, Administrator and Transfer Agent from the Adviser.
State Street Global Markets, LLC (the “Distributor”), an affiliate of the Adviser, serves as the distributor of the shares of each Fund. Pursuant to a Distribution and Service Plan adopted in accordance with Rule 12b-1 under the 1940 Act, each Fund is authorized to pay an amount of up to 0.25% of its average daily net assets for certain distribution-related activities. However, the Board of Trustees has determined that no such payments will be made through at least October 31, 2013 and therefore no such payments have been made.
The Distributor has established an assisted trading program to aid Authorized Participants in certain creation and redemption activity for which the Distributor receives commissions from Authorized Participants. In addition, the Distributor receives compensation from State Street associated with on-line creation and redemption activity of Authorized Participants.
Trustees’ Fees
The Trust, SSgA Master Trust, SPDR Series Trust and SPDR Index Shares Funds pay, in the aggregate, each Independent Trustee an annual fee of $150,000 plus $10,000 per in-person meeting attended and $1,250 for each telephonic or video conference meeting attended. The Chairman of the Board receives an additional annual fee of $50,000 and the Chairman of the Audit Committee receives an additional annual fee of $20,000. The Trust also reimburses each Independent Trustee for travel and other out-of-pocket expenses incurred by him/her in connection with attending such meetings and in connection with attending industry seminars and meetings. Trustee fees are allocated among the Trusts and each of their respective series in such a manner as deemed equitable, taking into consideration the relative net assets of the series.
15
SSgA ACTIVE ETF TRUST
NOTES TO FINANCIAL STATEMENTS (continued)
December 31, 2012 (Unaudited)
| 4. | Shareholder Transactions |
Shares are issued and redeemed by a Fund only in Creation Unit size aggregations of 50,000 shares. Such transactions are generally permitted on an in-kind basis, with a separate cash payment, which is a balancing cash component to equate the transaction to the net asset value per unit of the Fund on the transaction date. Transaction fees ranging from $100 to $400 per Creation Unit for each Fund, regardless of the number of Creation Units that are created or redeemed on the same day, are charged to those persons creating or redeeming Creation Units. An additional variable fee may be charged for certain transactions. Transaction fees are received by the Trust and/or Custodian and are used to defray related expenses. The Custodian also receives amounts earned on cash collateral provided by Authorized Participants pending delivery of missing deposit securities.
| 5. | Recent Accounting Pronouncements |
In December 2011, FASB issued ASU No. 2011-11 “Disclosures about Offsetting Assets and Liabilities.” These common disclosure requirements are intended to help investors and other financial statement users to better assess the effect or potential effect of offsetting arrangements on a portfolio’s financial position. They also improve transparency in the reporting of how companies mitigate credit risk, including disclosure of related collateral pledged or received. In addition, ASU 2011-11 facilitates comparison between those entities that prepare their financial statements on the basis of U.S. GAAP and those entities that prepare their financial statements on the basis of International Financial Reporting Standards. ASU 2011-11 requires entities to disclose both gross and net information about both instruments and transactions eligible for offset in the financial position; and disclose instruments and transactions subject to an agreement similar to a master netting agreement. ASU 2011-11 is effective for fiscal years beginning on or after January 1, 2013, and interim periods within those annual periods. Management is currently evaluating the implications of ASU 2011-11 and its impact on financial statement disclosures.
16
SSgA ACTIVE ETF TRUST
OTHER INFORMATION
December 31, 2012 (Unaudited)
Shareholder Expense Example
As a shareholder of a Fund, you incur two types of costs: (1) transaction costs, which may include creation and redemption fees or brokerage charges and (2) ongoing costs, including management fees, trustee fees, and other Fund expenses. This Example is intended to help you understand your ongoing costs (in dollars) of investing in a Fund and to compare these costs with the ongoing costs of investing in other funds. It is based on an investment of $1,000 invested on July 1, 2012 and held for the six months ended December 31, 2012.
Actual Expenses
The first table below provides information about actual account values and actual expenses. You may use the information in this table, together with the amount you invested, to estimate the expenses that you incurred over the period. Simply divide your account value by $1,000 (for example, an $8,600 account value divided by $1,000 = 8.6), then multiply the result by the number in the first table under the heading entitled “Expenses Paid During Period” to estimate the expenses attributable to your investment during this period.
Hypothetical Example for Comparison Purposes
The second table below provides information about hypothetical account values and hypothetical expenses based on a Fund’s actual expense ratio and an assumed rate of return of 5% per year before expenses, which is not a Fund’s actual return. Thus, you should not use the hypothetical account values and expenses to estimate the actual ending account balance or your expenses for the period. Rather, these figures are provided to enable you to compare the ongoing costs of investing in a Fund and other funds. To do so, compare this 5% hypothetical example with the 5% hypothetical examples that appear in the shareholder reports of the other funds. The Funds charge transaction fees at scheduled amounts ranging from $100 to $400 per Creation Unit to those persons creating or redeeming Creation Units. If you buy or sell the Funds’ shares in the secondary market, you will incur customary brokerage commissions and charges.
Please note that the expenses shown in the table are meant to highlight your ongoing costs only and do not reflect any transaction costs, such as creation and redemption fees, or brokerage charges. Therefore, the second table is useful in comparing ongoing costs only, and will not help you determine the relative total costs of owning different funds. In addition, if these transaction costs were included, your costs would have been higher.
| | | | | | | | | | | | | | | | |
Actual | | Annualized
Expense Ratio | | | Beginning Account
Value
7/1/12 | | | Ending Account
Value
12/31/12 | | | Expenses Paid
During Period*
7/1/12 to 12/31/12 | |
SPDR SSgA Multi-Asset Real Return ETF | | | 0.24 | % | | $ | 1,000 | | | $ | 1,076.30 | | | $ | 1.26 | |
SPDR SSgA Income Allocation ETF | | | 0.35 | | | | 1,000 | | | | 1,059.70 | | | | 1.82 | |
SPDR SSgA Global Allocation ETF | | | 0.05 | | | | 1,000 | | | | 1,078.30 | | | | 0.26 | |
| | | | |
| Hypothetical | | | | | | | | | | | | |
| (assuming a 5% return before expenses) | | | | | | | | | | | | |
SPDR SSgA Multi-Asset Real Return ETF | | | 0.24 | | | | 1,000 | | | | 1,024.00 | | | | 1.22 | |
SPDR SSgA Income Allocation ETF | | | 0.35 | | | | 1,000 | | | | 1,023.44 | | | | 1.79 | |
SPDR SSgA Global Allocation ETF | | | 0.05 | | | | 1,000 | | | | 1,024.95 | | | | 0.26 | |
| * | Expenses are equal to the Fund’s annualized net expense ratio which includes each Fund’s proportionate share of the expenses of its respective Portfolio multiplied by the average account value of the period, multiplied by the number of days in the most recent six month period, then divided by 365. |
Premium/Discount Information
Information regarding how often the Shares of each Fund traded on the Exchange at a price above (i.e. at a premium) or below (i.e. at a discount) the net asset value of the Fund for the past calendar year can be found on the Funds’ website at www.spdrs.com.
17
SSgA ACTIVE ETF TRUST
OTHER INFORMATION (continued)
December 31, 2012 (Unaudited)
Proxy Voting Policies and Procedures and Records
A description of the Trust’s proxy voting policies and procedures that are used by the Funds’ investment adviser to vote proxies relating to the Funds’ portfolio of securities are available (i) without charge, upon request by calling 1-866-787-2257 (toll free) or (ii) on the website of the Securities and Exchange Commission, at www.sec.gov. Information regarding how the investment advisor voted for the prior 12-months period ended June 30 is available by August 31 of each year by calling the same number and on the SEC’s website, at www.sec.gov, and on the Funds’ website at www.spdrs.com.
Quarterly Portfolio Schedule
The Funds file a complete schedule of portfolio holdings with the SEC for the first and third quarters of each fiscal year on Form N-Q. The Fund’s Forms N-Q are available on the SEC’s website at www.sec.gov and may be reviewed and copied at the SEC’s Public Reference Room in Washington DC. Information on the operation of the Public Reference Room may be obtained by calling 1-800-SEC-0330. The information on the Form N-Q is available upon request, without charge, by calling 1-866-787-2257 (toll free) and on the Funds’ website at www.spdrs.com.
18
The SPDR® Family of Exchange Traded Funds
The following is a list of SPDR ETFs being offered, along with their respective exchange trading symbols. Please call 1-866-787-2257 to obtain a prospectus for any SPDR ETF. The prospectus contains more complete information, including charges, expenses, investment objectives and risk factors that should be carefully considered to determine if the Fund(s) are an appropriate investment for you. Read the prospectus(es) carefully before investing. Investing involves risk, including possible loss of principal.
SPDR Series Trust
SPDR Dow Jones Total Market ETF (TMW)
SPDR Dow Jones Large Cap ETF (ELR)
SPDR S&P 500 Growth ETF (SPYG)
SPDR S&P 500 Value ETF (SPYV)
SPDR Dow Jones Mid Cap ETF (EMM)
SPDR S&P 400 Mid Cap Growth ETF (MDYG)
SPDR S&P 400 Mid Cap Value ETF (MDYV)
SPDR S&P 600 Small Cap ETF (SLY)
SPDR S&P 600 Small Cap Growth ETF (SLYG)
SPDR S&P 600 Small Cap Value ETF (SLYV)
SPDR Global Dow ETF (DGT)
SPDR Dow Jones REIT ETF (RWR)
SPDR S&P Bank ETF (KBE)
SPDR S&P Capital Markets ETF (KCE)
SPDR S&P Insurance ETF (KIE)
SPDR S&P Mortgage Finance ETF (KME)
SPDR S&P Regional Banking ETF (KRE)
SPDR Morgan Stanley Technology ETF (MTK)
SPDR S&P Dividend ETF (SDY)
SPDR S&P Aerospace & Defense ETF (XAR)
SPDR S&P Biotech ETF (XBI)
SPDR S&P Health Care Equipment ETF (XHE)
SPDR S&P Health Care Services ETF (XHS)
SPDR S&P Homebuilders ETF (XHB)
SPDR S&P Metals & Mining ETF (XME)
SPDR S&P Oil & Gas Equipment & Services ETF (XES)
SPDR S&P Oil & Gas Exploration & Production ETF (XOP)
SPDR S&P Pharmaceuticals ETF (XPH)
SPDR S&P Retail ETF (XRT)
SPDR S&P Semiconductor ETF (XSD)
SPDR S&P Software & Services ETF (XSW)
SPDR S&P Telecom ETF (XTL)
SPDR S&P Transportation ETF (XTN)
SPDR S&P 1500 Value Tilt ETF (VLU)
SPDR S&P 1500 Momentum Tilt ETF (MMTM)
SPDR Russell 1000 Low Volatility ETF (LGLV)
SPDR Russell 2000 Low Volatility ETF (SMLV)
SPDR Wells Fargo Preferred Stock ETF (PSK)
SPDR Barclays 1-3 Month T-Bill ETF (BIL)
SPDR Barclays TIPS ETF (IPE)
SPDR Barclays Short Term Treasury ETF (SST)
SPDR Barclays Intermediate Term Treasury ETF (ITE)
SPDR Barclays Long Term Treasury ETF (TLO)
SPDR Barclays Short Term Corporate Bond ETF (SCPB)
SPDR Barclays Intermediate Term Corporate Bond ETF (ITR)
SPDR Barclays Long Term Corporate Bond ETF (LWC)
SPDR Barclays Issuer Scored Corporate Bond ETF (CBND)
SPDR Barclays Convertible Securities ETF (CWB)
SPDR Barclays Mortgage Backed Bond ETF (MBG)
SPDR Barclays Aggregate Bond ETF (LAG)
SPDR Nuveen Barclays Capital Municipal Bond ETF (TFI)
SPDR Nuveen Barclays California Municipal Bond ETF (CXA)
SPDR Nuveen Barclays New York Municipal Bond ETF (INY)
SPDR Nuveen Barclays Short Term Municipal Bond ETF (SHM)
SPDR Nuveen S&P VRDO Municipal Bond ETF (VRD)
SPDR Nuveen S&P High Yield Municipal Bond ETF (HYMB)
SPDR Nuveen Barclays Build America Bond ETF (BABS)
SPDR DB International Government Inflation-Protected Bond ETF (WIP)
SPDR Barclays Short Term International Treasury Bond ETF (BWZ)
SPDR Barclays International Treasury Bond ETF (BWX)
SPDR Barclays International Corporate Bond ETF (IBND)
SPDR Barclays Emerging Markets Local Bond ETF (EBND)
SPDR Barclays High Yield Bond ETF (JNK)
SPDR Barclays Short Term High Yield Bond ETF (SJNK)
SPDR Barclays Investment Grade Floating Rate ETF (FLRN)
SPDR BofA Merrill Lynch Emerging Markets Corporate Bond ETF (EMCD)
SPDR BofA Merrill Lynch Crossover Corporate Bond ETF (XOVR)
SPDR Index Shares Funds
SPDR STOXX Europe 50 ETF (FEU)
SPDR EURO STOXX 50 ETF (FEZ)
SPDR S&P Emerging Asia Pacific ETF (GMF)
SPDR S&P Small Cap Emerging Asia Pacific ETF (GMFS)
SPDR S&P Russia ETF (RBL)
SPDR S&P China ETF (GXC)
SPDR S&P Emerging Markets ETF (GMM)
SPDR S&P Emerging Markets Dividend ETF (EDIV)
SPDR S&P BRIC 40 ETF (BIK)
SPDR S&P Emerging Europe ETF (GUR)
SPDR S&P Emerging Latin America ETF (GML)
SPDR S&P Emerging Middle East & Africa ETF (GAF)
SPDR S&P World ex-US ETF (GWL)
SPDR S&P International Small Cap ETF (GWX)
SPDR Dow Jones International Real Estate ETF (RWX)
SPDR FTSE/Macquarie Global Infrastructure 100 ETF (GII)
SPDR S&P Global Natural Resources ETF (GNR)
SPDR MSCI ACWI ex-US ETF (CWI)
SPDR MSCI ACWI IMI ETF (ACIM)
SPDR MSCI EM 50 ETF (EMFT)
SPDR Russell/Nomura PRIME Japan ETF (JPP)
SPDR Russell/Nomura Small Cap Japan ETF (JSC)
SPDR S&P International Dividend ETF (DWX)
SPDR S&P International Mid Cap ETF (MDD)
SPDR S&P Emerging Markets Small Cap ETF (EWX)
SPDR Dow Jones Global Real Estate ETF (RWO)
SPDR S&P International Consumer Discretionary Sector ETF (IPD)
SPDR S&P International Consumer Staples Sector ETF (IPS)
SPDR S&P International Energy Sector ETF (IPW)
SPDR S&P International Financial Sector ETF (IPF)
SPDR S&P International Health Care Sector ETF (IRY)
SPDR S&P International Industrial Sector ETF (IPN)
SPDR S&P International Materials Sector ETF (IRV)
SPDR S&P International Technology Sector ETF (IPK)
SPDR S&P International Telecommunications Sector ETF (IST)
SPDR S&P International Utilities Sector ETF (IPU)
The Select Sectors SPDR Trust
The Consumer Discretionary Select Sector SPDR Fund (XLY)
The Consumer Staples Select Sector SPDR Fund (XLP)
The Energy Select Sector SPDR Fund (XLE)
The Financial Select Sector SPDR Fund (XLF)
The Health Care Select Sector SPDR Fund (XLV)
The Industrial Select Sector SPDR Fund (XLI)
The Materials Select Sector SPDR Fund (XLB)
The Technology Select Sector SPDR Fund (XLK)
The Utilities Select Sector SPDR Fund (XLU)
SSgA Active ETF Trust
SPDR SSgA Multi-Asset Real Return ETF (RLY)
SPDR SSgA Income Allocation ETF (INKM)
SPDR SSgA Global Allocation ETF (GAL)
SPDR Dow Jones Industrial Average ETF Trust (DIA)
SPDR S&P 500 ETF Trust (SPY)
State Street Global Markets, LLC, member FINRA, SIPC, is distributor for all investment portfolios of SPDR Series Trust, SPDR Index Shares Funds, and SSgA Active ETF Trust. ALPS Distributors, Inc., a registered broker-dealer, is distributor for SPDR S&P 500 ETF Trust (SPY) and SPDR Dow Jones Industrial Average ETF Trust (DIA), both unit investment trusts, and all investment portfolios of The Select Sector SPDR Trust.
SSgA Active ETF Trust
TRUSTEES
Bonny E. Boatman
Dwight D. Churchill
David M. Kelly
Frank Nesvet, Chairman
James E. Ross
Carl G. Verboncoeur
OFFICERS
Ellen M. Needham, President
Michael P. Riley, Vice President
Chad C. Hallett, Treasurer
Matthew W. Flaherty, Assistant Treasurer
Laura F. Dell, Assistant Treasurer
Ryan M. Louvar, Secretary
Mark E. Tuttle, Assistant Secretary
Scott E. Habeeb, Assistant Secretary
Jacqueline Angell, Chief Compliance Officer
INVESTMENT MANAGER
SSgA Funds Management, Inc.
State Street Financial Center
One Lincoln Street
Boston, MA 02111
DISTRIBUTOR
State Street Global Markets, LLC
One Lincoln Street
Boston, MA 02111
CUSTODIAN, ADMINISTRATORAND TRANSFER AGENT
State Street Bank and Trust Company
One Lincoln Street
Boston, MA 02111
LEGAL COUNSEL
Bingham McCutchen LLP
2020 K Street, NW
Washington, DC 20006
INDEPENDENT REGISTERED PUBLIC ACCOUNTING FIRM
Ernst & Young LLP
200 Clarendon Street
Boston, MA 02116
Fund Shares are distributed by State Street Global Markets, LLC, a wholly-owned subsidiary of State Street
Corporation. State Street Global Markets, LLC; member FINRA, SIPC.
The information contained in this report is intended for the general information of shareholders of the Trust. This report is not authorized for distribution to prospective investors unless preceded or accompanied by a current Trust prospectus which contains important information concerning the Trust. You may obtain a current prospectus and SAI from the Distributor by calling 1-866-787-2257 or visiting www.spdrs.com Please read the prospectus carefully before you invest.
SSgA Master Trust
Semi-Annual Report December 31, 2012
TABLE OF CONTENTS
SSGA MULTI-ASSET REAL RETURN PORTFOLIO — PORTFOLIO SUMMARY
TOP FIVE HOLDINGS AS OF DECEMBER 31, 2012
| | | | | | | | | | | | | | |
| | | | | | | | | | | | | | | |
| | | DESCRIPTION | | SPDR S&P GLOBAL
NATURAL
RESOURCES ETF | | SPDR BARCLAYS TIPS ETF | | POWERSHARES DB
COMMODITY INDEX
TRACKING FUND | | SPDR DOW JONES
REIT ETF | | SPDR DOW JONES
INTERNATIONAL REAL ESTATE ETF | | |
| | | MARKET VALUE | | $21,960,384 | | 9,199,566 | | 8,477,178 | | 6,655,740 | | 6,509,151 | | |
| | | % OF NET ASSETS | | 29.7 | | 12.4 | | 11.5 | | 9.0 | | 8.8 | | |
| | | | | | | | | | | | | | | |
(The five largest holdings are subject to change, and there are no guarantees the Portfolio will continue to remain invested in a particular Fund.)
ASSET ALLOCATION AS OF DECEMBER 31, 2012*
| | | | | | | | |
| | | | | PERCENT OF NET ASSETS | | | |
| | Natural Resources | | | 44.6 | % | | |
| | Inflation Linked | | | 20.3 | | | |
| | Real Estate | | | 17.8 | | | |
| | Commodities | | | 16.4 | | | |
| | Short Term Investment | | | 0.3 | | | |
| | | Other Assets & Liabilities | | | 0.6 | | | |
| | | TOTAL | | | 100.0 | % | | |
| | * | The Portfolio’s asset allocation is expressed as a percentage of net assets and may change over time. |
1
SSGA INCOME ALLOCATION PORTFOLIO — PORTFOLIO SUMMARY
TOP FIVE HOLDINGS AS OF DECEMBER 31, 2012
| | | | | | | | | | | | | | |
| | | | | | | | | | | | | | | |
| | | DESCRIPTION | | SPDR BARCLAYS LONG TERM
CORPORATE
BOND ETF | | SPDR S&P DIVIDEND ETF | | SPDR WELLS
FARGO PREFERRED
STOCK ETF | | SPDR S&P
EMERGING MARKETS
DIVIDEND ETF | | SPDR S&P
INTERNATIONAL
DIVIDEND ETF | | |
| | | MARKET VALUE | | $7,272,729 | | 6,822,982 | | 4,258,347 | | 4,244,030 | | 4,017,316 | | |
| | | % OF NET ASSETS | | 14.1 | | 13.2 | | 8.2 | | 8.2 | | 7.8 | | |
| | | | | | | | | | | | | | | |
(The five largest holdings are subject to change, and there are no guarantees the Portfolio will continue to remain invested in a particular Fund.)
ASSET ALLOCATION AS OF DECEMBER 31, 2012*
| | | | | | | | |
| | | | | PERCENT OF
NET ASSETS | | | |
| | Domestic Fixed Income | | | 31.7 | % | | |
| | International Equity | | | 30.6 | | | |
| | Domestic Equity | | | 21.4 | | | |
| | Real Estate | | | 5.5 | | | |
| | International Fixed Income | | | 5.1 | | | |
| | Inflation Linked | | | 4.4 | | | |
| | Short Term Investment | | | 0.5 | | | |
| | | Other Assets & Liabilities | | | 0.8 | | | |
| | | TOTAL | | | 100.0 | % | | |
| | * | The Portfolio’s asset allocation is expressed as a percentage of net assets and may change over time. |
2
SSGA GLOBAL ALLOCATION PORTFOLIO — PORTFOLIO SUMMARY
TOP FIVE HOLDINGS AS OF DECEMBER 31, 2012
| | | | | | | | | | | | | | |
| | | DESCRIPTION | | SPDR S&P 500 ETF TRUST | | SPDR S&P WORLD EX-US ETF | | SPDR BARCLAYS
INTERMEDIATE TERM
CORPORATE
BOND ETF | | SPDR BARCLAYS HIGH
YIELD BOND ETF | | SPDR S&P
EMERGING
MARKETS ETF | | |
| | | MARKET VALUE | | $2,171,862 | | 2,124,655 | | 1,381,902 | | 1,111,069 | | 721,526 | | |
| | | % OF NET ASSETS | | 15.4 | | 15.1 | | 9.8 | | 7.9 | | 5.1 | | |
| | | | | | | | | | | | | | | |
(The five largest holdings are subject to change, and there are no guarantees the Portfolio will continue to remain invested in a particular Fund.)
ASSET ALLOCATION AS OF DECEMBER 31, 2012*
| | | | | | | | |
| | | | | PERCENT OF NET ASSETS | | | |
| | International Equity | | | 31.5 | % | | |
| | Domestic Equity | | | 28.0 | | | |
| | Domestic Fixed Income | | | 26.4 | | | |
| | Real Estate | | | 4.0 | | | |
| | International Fixed Income | | | 3.0 | | | |
| | Inflation Linked | | | 3.0 | | | |
| | Commodities | | | 2.4 | | | |
| | Short Term Investment | | | 0.0 | ** | | |
| | | Other Assets & Liabilities | | | 1.7 | | | |
| | | TOTAL | | | 100.0 | % | | |
| | * | The Portfolio’s asset allocation is expressed as a percentage of net assets and may change over time. |
| | ** | Amount represents less than 0.05% of net assets. |
3
SSgA MULTI-ASSET REAL RETURN PORTFOLIO
SCHEDULE OF INVESTMENTS
December 31, 2012 (Unaudited)
| | | | | | | | |
Security Description | | Shares | | | Value | |
|
EXCHANGE TRADED PRODUCTS — 99.1% | |
COMMODITIES — 16.4% | |
PowerShares DB Commodity Index Tracking Fund (a) | | | 305,154 | | | $ | 8,477,178 | |
PowerShares DB Gold Fund (a) | | | 49,728 | | | | 2,851,901 | |
PowerShares DB Oil Fund (a) | | | 29,599 | | | | 767,798 | |
| | | | | | | | |
| | | | 12,096,877 | |
| | | | | | | | |
INFLATION LINKED — 20.3% | | | | | | | | |
SPDR Barclays TIPS ETF (b) | | | 151,508 | | | | 9,199,566 | |
SPDR DB International Government Inflation-Protected Bond ETF (b) | | | 92,138 | | | | 5,854,448 | |
| | | | | | | | |
| | | | 15,054,014 | |
| | | | | | | | |
NATURAL RESOURCES — 44.6% | | | | | | | | |
Market Vectors Gold Miners ETF | | | 30,817 | | | | 1,429,601 | |
PowerShares Global Agriculture Portfolio | | | 72,435 | | | | 2,225,928 | |
SPDR S&P Global Natural Resources ETF (b) | | | 425,919 | | | | 21,960,384 | |
SPDR S&P International Energy Sector ETF (b) | | | 58,826 | | | | 1,468,238 | |
SPDR S&P Metals & Mining ETF (b) | | | 49,881 | | | | 2,251,628 | |
The Energy Select Sector SPDR Fund (b) | | | 51,123 | | | | 3,652,227 | |
| | | | | | | | |
| | | | 32,988,006 | |
| | | | | | | | |
REAL ESTATE — 17.8% | | | | | | | | |
SPDR Dow Jones International Real Estate ETF (b) | | | 157,416 | | | | 6,509,151 | |
SPDR Dow Jones REIT ETF (b) | | | 91,212 | | | | 6,655,740 | |
| | | | | | | | |
| | | | 13,164,891 | |
| | | | | | | | |
TOTAL EXCHANGE TRADED PRODUCTS
(Cost $72,742,470) | | | | | | | 73,303,788 | |
| | | | | | | | |
SHORT TERM INVESTMENT — 0.3% | | | | | |
MONEY MARKET FUND — 0.3% | | | | | |
State Street Institutional Liquid Reserves Fund 0.17% (b) (c)
(Cost $260,893) | | | 260,893 | | | | 260,893 | |
| | | | | | | | |
TOTAL INVESTMENTS — 99.4% (d)
(Cost $73,003,363) | | | | | | | 73,564,681 | |
OTHER ASSETS &
LIABILITIES — 0.6% | | | | | | | 424,270 | |
| | | | | | | | |
NET ASSETS — 100.0% | | | | | | $ | 73,988,951 | |
| | | | | | | | |
| (a) | Qualified Publicly Traded Partnerships. |
| (b) | Affiliated Fund managed by SSgA Funds Management, Inc. (Note 3) |
| (c) | The rate shown is the annualized seven-day yield at period end. |
| (d) | Unless otherwise indicated, the values of the securities of the Portfolio are determined based on Level 1 inputs. (Note 2) |
See accompanying notes to financial statements.
4
SSgA INCOME ALLOCATION PORTFOLIO
SCHEDULE OF INVESTMENTS
December 31, 2012 (Unaudited)
| | | | | | | | |
Security Description | | Shares | | | Value | |
|
EXCHANGE TRADED PRODUCTS — 98.7% | |
DOMESTIC EQUITY — 21.4% | |
SPDR S&P Dividend ETF (a) | | | 117,314 | | | $ | 6,822,982 | |
SPDR Wells Fargo Preferred Stock ETF (a) | | | 94,672 | | | | 4,258,347 | |
| | | | | | | | |
| | | | 11,081,329 | |
| | | | | | | | |
DOMESTIC FIXED INCOME — 31.7% | |
SPDR Barclays Convertible Securities ETF (a) | | | 7,175 | | | | 289,153 | |
SPDR Barclays High Yield Bond ETF (a) | | | 94,020 | | | | 3,826,614 | |
SPDR Barclays Long Term Corporate Bond ETF (a) | | | 176,780 | | | | 7,272,729 | |
SPDR Barclays Long Term Treasury ETF (a) | | | 56,866 | | | | 3,986,875 | |
SPDR Barclays Short Term High Yield Bond ETF (a) | | | 16,539 | | | | 505,266 | |
SPDR Nuveen Barclays Build American Bond ETF (a) | | | 8,185 | | | | 503,787 | |
| | | | | | | | |
| | | | 16,384,424 | |
| | | | | | | | |
INFLATION LINKED — 4.4% | | | | | | | | |
SPDR Barclays TIPS ETF (a) | | | 37,228 | | | | 2,260,484 | |
| | | | | | | | |
INTERNATIONAL EQUITY — 30.6% | | | | | | | | |
SPDR EURO STOXX 50 ETF (a) | | | 16,003 | | | | 554,664 | |
SPDR FTSE/Macquarie Global Infrastructure 100 ETF (a) | | | 89,920 | | | | 3,620,179 | |
SPDR S&P Emerging Markets Dividend ETF (a) | | | 89,954 | | | | 4,244,030 | |
SPDR S&P International Dividend ETF (a) | | | 83,607 | | | | 4,017,316 | |
SPDR S&P International Telecommunications Sector ETF (a) | | | 33,304 | | | | 732,688 | |
SPDR STOXX Europe 50 ETF (a) | | | 79,167 | | | | 2,661,595 | |
| | | | | | | | |
| | | | 15,830,472 | |
| | | | | | | | |
INTERNATIONAL FIXED INCOME — 5.1% | |
SPDR Barclays Emerging Markets Local Bond ETF (a) | | | 43,924 | | | | 1,418,306 | |
SPDR Barclays International Corporate Bond ETF (a) | | | 33,767 | | | | 1,195,352 | |
| | | | | | | | |
| | | | 2,613,658 | |
| | | | | | | | |
REAL ESTATE — 5.5% | | | | | | | | |
SPDR Dow Jones International Real Estate ETF (a) | | | 24,890 | | | | 1,029,201 | |
SPDR Dow Jones REIT ETF (a) | | | 24,642 | | | | 1,798,127 | |
| | | | | | | | |
| | | | 2,827,328 | |
| | | | | | | | |
TOTAL EXCHANGE TRADED PRODUCTS
(Cost $50,129,807) | | | | | | | 50,997,695 | |
| | | | | | | | |
| | | | | | | | |
Security Description | | Shares | | | Value | |
|
SHORT TERM INVESTMENT — 0.5% | |
MONEY MARKET FUND — 0.5% | |
State Street Institutional Liquid Reserves Fund 0.17% (a) (b)
(Cost $270,006) | | | 270,006 | | | $ | 270,006 | |
| | | | | | | | |
TOTAL INVESTMENTS — 99.2% (c)
(Cost $50,399,813) | | | | | | | 51,267,701 | |
OTHER ASSETS &
LIABILITIES — 0.8% | | | | | | | 431,620 | |
| | | | | | | | |
NET ASSETS — 100.0% | | | $ | 51,699,321 | |
| | | | | | | | |
| (a) | Affiliated Fund managed by SSgA Funds Management, Inc. (Note 3) |
| (b) | The rate shown is the annualized seven-day yield at period end. |
| (c) | Unless otherwise indicated, the values of the securities of the Portfolio are determined based on Level 1 inputs. (Note 2) |
See accompanying notes to financial statements.
5
SSgA GLOBAL ALLOCATION PORTFOLIO
SCHEDULE OF INVESTMENTS
December 31, 2012 (Unaudited)
| | | | | | | | |
Security Description | | Shares | | | Value | |
|
EXCHANGE TRADED PRODUCTS — 98.3% | |
COMMODITIES — 2.4% | |
PowerShares DB Gold Fund (a) | | | 5,921 | | | $ | 339,569 | |
| | | | | | | | |
DOMESTIC EQUITY — 28.0% | |
SPDR S&P 500 ETF Trust (b) | | | 15,239 | | | | 2,171,862 | |
SPDR S&P 600 Small Cap ETF (b) | | | 5,642 | | | | 423,771 | |
SPDR S&P Dividend ETF (b) | | | 11,478 | | | | 667,561 | |
SPDR S&P MidCap 400 ETF Trust (b) | | | 1,507 | | | | 279,865 | |
SPDR Wells Fargo Preferred Stock ETF (b) | | | 9,091 | | | | 408,913 | |
| | | | | | | | |
| | | | 3,951,972 | |
| | | | | | | | |
DOMESTIC FIXED INCOME — 26.4% | |
SPDR Barclays Aggregate Bond ETF (b) | | | 7,051 | | | | 414,387 | |
SPDR Barclays High Yield Bond ETF (b) | | | 27,299 | | | | 1,111,069 | |
SPDR Barclays Intermediate Term Corporate Bond ETF (b) | | | 39,687 | | | | 1,381,902 | |
SPDR Barclays Long Term Corporate Bond ETF (b) | | | 16,595 | | | | 682,718 | |
SPDR Barclays Short Term High Yield Bond ETF (b) | | | 4,514 | | | | 137,903 | |
| | | | | | | | |
| | | | 3,727,979 | |
| | | | | | | | |
INFLATION LINKED — 3.0% | |
SPDR Barclays TIPS ETF (b) | | | 4,504 | | | | 273,483 | |
SPDR DB International Government Inflation-Protected Bond ETF (b) | | | 2,214 | | | | 140,678 | |
| | | | | | | | |
| | | | 414,161 | |
| | | | | | | | |
INTERNATIONAL EQUITY — 31.5% | |
SPDR EURO STOXX 50 ETF (b) | | | 16,756 | | | | 580,763 | |
SPDR S&P Emerging Markets ETF (b) | | | 10,753 | | | | 721,526 | |
SPDR S&P International Dividend ETF (b) | | | 3,257 | | | | 156,499 | |
SPDR S&P International Small Cap ETF (b) | | | 14,899 | | | | 423,876 | |
SPDR S&P World ex-US ETF (b) | | | 83,879 | | | | 2,124,655 | |
SPDR STOXX Europe 50 ETF (b) | | | 13,001 | | | | 437,094 | |
| | | | | | | | |
| | | | 4,444,413 | |
| | | | | | | | |
INTERNATIONAL FIXED INCOME — 3.0% | |
SPDR Barclays Emerging Markets Local Bond ETF (b) | | | 4,459 | | | | 143,981 | |
SPDR Barclays International Corporate Bond ETF (b) | | | 7,998 | | | | 283,129 | |
| | | | | | | | |
| | | | 427,110 | |
| | | | | | | | |
REAL ESTATE — 4.0% | |
SPDR Dow Jones International Real Estate ETF (b) | | | 6,647 | | | | 274,853 | |
SPDR Dow Jones REIT ETF (b) | | | 3,844 | | | | 280,497 | |
| | | | | | | | |
| | | | 555,350 | |
| | | | | | | | |
TOTAL EXCHANGE TRADED PRODUCTS
(Cost $13,477,726) | | | | | | | 13,860,554 | |
| | | | | | | | |
| | | | | | | | |
Security Description | | Shares | | | Value | |
|
SHORT TERM INVESTMENT — 0.0% (c) | |
MONEY MARKET FUND — 0.0% (c) | |
State Street Institutional Liquid Reserves Fund 0.17% (b) (d)
(Cost $6,163) | | | 6,163 | | | $ | 6,163 | |
| | | | | | | | |
TOTAL INVESTMENTS — 98.3% (e)
(Cost $13,483,889) | | | | | | | 13,866,717 | |
OTHER ASSETS &
LIABILITIES — 1.7% | | | | | | | 239,357 | |
| | | | | | | | |
NET ASSETS — 100.0% | | | | | | $ | 14,106,074 | |
| | | | | | | | |
| (a) | Qualified Publicly Traded Partnerships. |
| (b) | Affiliated Fund managed by SSgA Funds Management, Inc. (Note 3) |
| (c) | Amount shown represents less than 0.05% of net assets. |
| (d) | The rate shown is the annualized seven-day yield at period end. |
| (e) | Unless otherwise indicated, the values of the securities of the Portfolio are determined based on Level 1 inputs. (Note 2) |
See accompanying notes to financial statements.
6
SSgA MASTER TRUST
STATEMENTS OF ASSETS AND LIABILITIES
December 31, 2012 (Unaudited)
| | | | | | | | | | | | |
| | | SSgA Multi-Asset
Real Return
Portfolio | | | SSgA Income
Allocation
Portfolio | | | SSgA Global
Allocation
Portfolio | |
ASSETS | | | | | | | | | | | | |
Investments in securities of unaffiliated issuers, at value | | $ | 15,752,406 | | | $ | — | | | $ | 339,569 | |
Investments in securities of affiliated issuers, at value | | | 57,812,275 | | | | 51,267,701 | | | | 13,527,148 | |
| | | | | | | | | | | | |
Total investments | | | 73,564,681 | | | | 51,267,701 | | | | 13,866,717 | |
Receivable for investment securities sold | | | — | | | | — | | | | 136,095 | |
Dividends receivable from affiliates (Note 3) | | | 431,756 | | | | 439,466 | | | | 105,314 | |
| | | | | | | | | | | | |
TOTAL ASSETS | | | 73,996,437 | | | | 51,707,167 | | | | 14,108,126 | |
| | | | | | | | | | | | |
LIABILITIES | | | | | | | | | | | | |
Accrued advisory fees (Note 3) | | | 7,467 | | | | 7,807 | | | | 2,035 | |
Accrued trustees’ fees and expenses (Note 3) | | | 19 | | | | 39 | | | | 17 | |
| | | | | | | | | | | | |
TOTAL LIABILITIES | | | 7,486 | | | | 7,846 | | | | 2,052 | |
| | | | | | | | | | | | |
NET ASSETS | | $ | 73,988,951 | | | $ | 51,699,321 | | | $ | 14,106,074 | |
| | | | | | | | | | | | |
COST OF INVESTMENTS | | | | | | | | | | | | |
Unaffiliated issuers | | $ | 15,791,820 | | | $ | — | | | $ | 346,213 | |
Affiliated issuers | | | 57,211,543 | | | | 50,399,813 | | | | 13,137,676 | |
| | | | | | | | | | | | |
Total cost of investments | | $ | 73,003,363 | | | $ | 50,399,813 | | | $ | 13,483,889 | |
| | | | | | | | | | | | |
See notes to financial statements.
7
SSgA MASTER TRUST
STATEMENTS OF OPERATIONS
For the Six Months Ended December 31, 2012 (Unaudited)
| | | | | | | | | | | | |
| | | SSgA Multi-Asset
Real Return
Portfolio | | | SSgA Income
Allocation
Portfolio | | | SSgA Global
Allocation
Portfolio | |
INVESTMENT INCOME | | | | | | | | | | | | |
Dividend income on securities of unaffiliated issuers (Note 2) | | $ | 16,012 | | | $ | — | | | $ | — | |
Dividend income on securities of affiliated issuers (Note 3) | | | 487,206 | | | | 749,980 | | | | 164,502 | |
| | | | | | | | | | | | |
TOTAL INVESTMENT INCOME | | | 503,218 | | | | 749,980 | | | | 164,502 | |
| | | | | | | | | | | | |
EXPENSES | | | | | | | | | | | | |
Advisory fees (Note 3) | | | 14,527 | | | | 25,862 | | | | 8,213 | |
Trustees’ fees (Note 3) | | | 48 | | | | 116 | | | | 43 | |
| | | | | | | | | | | | |
TOTAL EXPENSES | | | 14,575 | | | | 25,978 | | | | 8,256 | |
| | | | | | | | | | | | |
NET INVESTMENT INCOME | | | 488,643 | | | | 724,002 | | | | 156,246 | |
| | | | | | | | | | | | |
REALIZED AND UNREALIZED GAIN (LOSS) ON INVESTMENTS | | | | | | | | | | | | |
Net realized gain (loss) on investments in securities of unaffiliated issuers | | | 9,480 | | | | — | | | | 3,210 | |
Net realized gain (loss) on investments in securities of affiliated issuers | | | 9,558 | | | | (3,948 | ) | | | (6,786 | ) |
Net change in unrealized appreciation (depreciation) on investments | | | 792,025 | | | | 820,258 | | | | 470,410 | |
| | | | | | | | | | | | |
NET REALIZED AND UNREALIZED GAIN ON INVESTMENTS | | | 811,063 | | | | 816,310 | | | | 466,834 | |
| | | | | | | | | | | | |
NET INCREASE IN NET ASSETS RESULTING FROM OPERATIONS | | $ | 1,299,706 | | | $ | 1,540,312 | | | $ | 623,080 | |
| | | | | | | | | | | | |
See notes to financial statements.
8
[This Page Intentionally Left Blank]
9
SSgA MASTER TRUST
STATEMENTS OF CHANGES IN NET ASSETS
| | | | | | | | | | | | | | | | |
| | | SSgA Multi-Asset Real Return Portfolio | | | SSgA Income Allocation Portfolio | |
| | | Six Months
Ended 12/31/12
(Unaudited) | | | For the Period
4/25/12*-
6/30/12 | | | Six Months
Ended 12/31/12
(Unaudited) | | | For the Period
4/25/12*-
6/30/12 | |
INCREASE (DECREASE) IN NET ASSETS FROM OPERATIONS: | | | | | | | | | | | | | | | | |
Net investment income (loss) | | $ | 488,643 | | | $ | 41,553 | | | $ | 724,002 | | | $ | 99,208 | |
Net realized gain (loss) on investments | | | 19,038 | | | | (6,835 | ) | | | (3,948 | ) | | | (17,903 | ) |
Net change in unrealized appreciation (depreciation) on investments | | | 792,025 | | | | (230,707 | ) | | | 820,258 | | | | 47,630 | |
| | | | | | | | | | | | | | | | |
Net increase (decrease) in net assets resulting from operations | | | 1,299,706 | | | | (195,989 | ) | | | 1,540,312 | | | | 128,935 | |
| | | | | | | | | | | | | | | | |
CAPITAL TRANSACTIONS | | | | | | | | | | | | | | | | |
Contributions | | | 68,346,424 | | | | 7,426,949 | | | | 41,045,400 | | | | 8,984,674 | |
Withdrawals | | | (1,483,943 | ) | | | (1,404,196 | ) | | | — | | | | — | |
| | | | | | | | | | | | | | | | |
Net increase in net assets from capital transactions | | | 66,862,481 | | | | 6,022,753 | | | | 41,045,400 | | | | 8,984,674 | |
| | | | | | | | | | | | | | | | |
Net increase in net assets during the period | | | 68,162,187 | | | | 5,826,764 | | | | 42,585,712 | | | | 9,113,609 | |
NET ASSETS | | | | | | | | | | | | | | | | |
Net assets at beginning of period | | | 5,826,764 | | | | — | | | | 9,113,609 | | | | — | |
| | | | | | | | | | | | | | | | |
NET ASSETS END OF PERIOD | | $ | 73,988,951 | | | $ | 5,826,764 | | | $ | 51,699,321 | | | $ | 9,113,609 | |
| | | | | | | | | | | | | | | | |
| * | Commencement of operations |
See notes to financial statements.
10
| | | | | | |
| SSgA Global Allocation Portfolio | |
Six Months
Ended 12/31/12
(Unaudited) | | | For the Period
4/25/12*-
6/30/12 | |
| | | | | | |
| $ | 156,246 | | | $ | 40,985 | |
| | (3,576 | ) | | | (140,424 | ) |
| 470,410 | | | | (87,582 | ) |
| | | | | | |
| 623,080 | | | | (187,021 | ) |
| | | | | | |
| | | | | | |
| | 9,032,243 | | | | 6,035,173 | |
| | — | | | | (1,397,401 | ) |
| | | | | | |
| 9,032,243 | | | | 4,637,772 | |
| | | | | | |
| | 9,655,323 | | | | 4,450,751 | |
| | | | | | |
| | 4,450,751 | | | | — | |
| | | | | | |
| $ | 14,106,074 | | | $ | 4,450,751 | |
| | | | | | |
11
SSgA MASTER TRUST
FINANCIAL HIGHLIGHTS
The following table includes selected supplemental data and ratios to average net assets:
| | | | | | | | | | | | | | | | | | | | | | | | |
| | | SSgA Multi-Asset Real
Return Portfolio | | | SSgA Income Allocation
Portfolio | | | SSgA Global Allocation
Portfolio | |
| | | Six Months
Ended
12/31/12
(Unaudited) | | | For the Period
4/25/12*-
6/30/12 | | | Six Months
Ended
12/31/12
(Unaudited) | | | For the Period
4/25/12*-
6/30/12 | | | Six Months
Ended
12/31/12
(Unaudited) | | | For the Period
4/25/12*-
6/30/12 | |
Supplemental Data and Ratios: | | | | | | | | | | | | | | | | | | | | | | | | |
Net assets, end of period (000s) | | $ | 73,989 | | | $ | 5,827 | | | $ | 51,699 | | | $ | 9,114 | | | $ | 14,106 | | | $ | 4,451 | |
| | | | | | | | | | | | | | | | | | | | | | | | |
Ratios to average net assets: | | | | | | | | | | | | | | | | | | | | | | | | |
Operating expenses (1) | | | 0.20 | % | | | 0.20 | % | | | 0.20 | % | | | 0.20 | % | | | 0.20 | % | | | 0.20 | % |
Net investment income (1) | | | 6.73 | % | | | 3.84 | % | | | 5.61 | % | | | 8.39 | % | | | 3.80 | % | | | 4.34 | % |
Portfolio turnover rate | | | 11 | % | | | 10 | % | | | 26 | % | | | 15 | % | | | 43 | % | | | 25 | % |
Total return | | | 7.66 | % | | | (3.42 | )% | | | 6.04 | % | | | 0.92 | % | | | 7.78 | % | | | (1.82 | )% |
| * | Commencement of operations |
See notes to financial statements.
12
SSgA MASTER TRUST
NOTES TO FINANCIAL STATEMENTS
December 31, 2012 (Unaudited)
SSgA Master Trust (the “Trust”), which is registered under the Investment Company Act of 1940, as amended (“1940 Act”), is an open-end investment management company that was organized as a Massachusetts business trust on March 30, 2011.
As of December 31, 2012, the Trust offered three (3) portfolios, each of which represents a separate series of beneficial interest in the Trust (each referred to as a “Portfolio”, collectively as the “Portfolios”). The financial statements herein relate to the following three (3) Portfolios: SSgA Multi-Asset Real Return Portfolio, SSgA Income Allocation Portfolio and SSgA Global Allocation Portfolio. Each Portfolio serves as a master fund in a master feeder structure.
Under the Trust’s organizational documents, its officers and trustees are indemnified against certain liabilities arising out of the performance of their duties to the Trust. Additionally, in the normal course of business, the Trust enters into contracts with service providers that contain general indemnification clauses. The Trust’s maximum exposure under these arrangements is unknown as this could involve future claims that may be made against the Trust that have not yet occurred. However, based on experience, the Trust expects the risk of loss to be remote.
The Trust invests in various investments which are exposed to risks, such as market risk. Due to the level of risk associated with certain investments it is at least reasonably possible that changes in the values of investment securities will occur in the near term and that such changes could be material.
Each Portfolio invests its assets in other exchange-traded products (referred to as “underlying Funds”). The underlying Funds, in turn, may engage in a number of investment techniques and practices, which involve certain risks. Certain underlying Funds invest their portfolios in debt securities. Investments in debt securities may increase or decrease as a result of the following: market fluctuations, increases in interest rates, inability of issuers to repay principal and interest or illiquidity in the debt securities markets; the risk of low rates of return due to reinvestment of securities during periods of falling interest rates or repayment by issuers with higher coupon or interest rates; and/or the risk of low income due to falling interest rates. Certain underlying Funds invest their portfolios in foreign securities including emerging markets. Foreign investments involve certain risks that are greater than those associated with investments in securities of U.S. issuers. Returns on investments in foreign securities could be more volatile than, or trail the returns on, investments in U.S. securities. Investments in securities issued by entities based outside the United States pose distinct risks since political and economic events unique to a country or region will affect those markets and their issuers. Investment in emerging markets involves greater risk of loss than investments in a developed market. This is due to, among other things, greater market volatility, lower trading volume, political and economic instability, high levels of inflation, deflation or currency devaluation, greater risk of market shut down, and more governmental limitations on foreign investment policy than those typically found in a developed market. Certain underlying Funds invest their portfolios in commodities markets. Commodities are subject to substantial price fluctuations over short periods of time and may be affected by unpredictable economic, political and environmental events. Factors that may significantly affect the prices of commodities include, but are not limited to: global supply and demand; domestic and international interest rates and investors’ expectations of interest rates; inflation rates and investors’ expectations of inflation rates; the investment and trading activities of commodity futures contracts; political, economic, or financial events, both globally and regionally.
| 2. | Summary of Significant Accounting Policies |
The following is a summary of significant accounting policies followed by the Trust in the preparation of its financial statements:
The preparation of financial statements in accordance with U.S. generally accepted accounting principles requires management to make estimates and assumptions that affect the reported amounts and disclosures in the financial statements. Actual results could differ from those estimates. These financial statements are presented in United States dollars.
Security Valuation
The value of each Portfolio’s portfolio securities and other financial instruments is based on the market price of the securities, which generally means a valuation obtained from an exchange or other market (or based on a price quotation
13
SSgA MASTER TRUST
NOTES TO FINANCIAL STATEMENTS (continued)
December 31, 2012 (Unaudited)
or other equivalent indication of value supplied by an exchange or other market) or a valuation obtained from an independent pricing service. Investments in underlying funds are valued at their net asset value each business day. If a security’s market price is not readily available or does not otherwise accurately reflect the fair value of the security, the security will be valued by another method that the Board of Trustees of the Trust (the “Board”) believes will better reflect fair value in accordance with the Trust’s valuation policies and procedures. The Board has delegated the process of valuing securities for which market quotations are not readily available or do not otherwise accurately reflect the fair value of the security to the Pricing and Investment Committee (the “Committee”). The Committee, subject to oversight by the Board, may use fair value pricing in a variety of circumstances, including but not limited to, situations when trading in a security has been suspended or halted. Accordingly, a Portfolio’s net asset value may reflect certain portfolio securities’ fair values rather than their market prices. Fair value pricing involves subjective judgments and it is possible that the fair value determination for a security is materially different than the value that could be received on the sale of the security.
The Portfolios follow the authoritative guidance for fair value measurements and the fair value option for financial assets and financial liabilities. The guidance for the fair value option for financial assets and financial liabilities provides Portfolios the irrevocable option to measure many financial assets and liabilities at fair value with changes in fair value recognized in earnings. The guidance also establishes a hierarchy for inputs used in measuring fair value that maximizes the use of observable inputs and minimizes the use of unobservable inputs by requiring that the most observable inputs be used when available. The guidance establishes three levels of inputs that may be used to measure fair value:
| • | | Level 1 — quoted prices in active markets for identical investments. |
| • | | Level 2 — other significant observable inputs (including, but not limited to, quoted prices for similar investments, interest rates, prepayment speeds, credit risk, etc.) |
| • | | Level 3 — significant unobservable inputs (including the Portfolios’ own assumptions in determining the fair value of investments) |
Investments that use Level 2 or Level 3 inputs may include, but are not limited to: (i) an unlisted security related to corporate actions; (ii) a restricted security (e.g., one that may not be publicly sold without registration under the Securities Act of 1933, as amended); (iii) a security whose trading has been suspended or which has been de-listed from its primary trading exchange; (iv) a security that is thinly traded; (v) a security in default or bankruptcy proceedings for which there is no current market quotation; (vi) a security affected by currency controls or restrictions; and (vii) a security affected by a significant event (e.g., an event that occurs after the close of the markets on which the security is traded but before the time as of which the Portfolios’ net assets are computed and that may materially affect the value of the Portfolios’ investments). Examples of events that may be “significant events” are government actions, natural disasters, armed conflict, acts of terrorism, and significant market fluctuations.
Fair value pricing could result in a difference between the prices used to calculate a Portfolio’s net asset value and the prices used by the Portfolio’s benchmark index, which, in turn, could result in a difference between the Portfolio’s performance and the performance of the Portfolio’s benchmark index. The inputs or methodology used for valuation are not necessarily an indication of the risk associated with investing in those investments.
The type of inputs used to value each security is identified in the Schedule of Investments, which also includes a breakdown of the Portfolio’s investments by category.
The following table summarizes the inputs used in valuing the Portfolios’ investments as of December 31, 2012:
| | | | | | | | | | | | | | | | |
| | Level 1 —
Quoted
Prices | | | Level 2 —
Other Significant
Observable
Inputs | | | Level 3 —
Significant
Unobservable
Inputs | | | Total | |
SSgA Multi-Asset Real Return Portfolio | | $ | 73,564,681 | | | $ | — | | | $ | — | | | $ | 73,564,681 | |
SSgA Income Allocation Portfolio | | | 51,267,701 | | | | — | | | | — | | | | 51,267,701 | |
SSgA Global Allocation Portfolio | | | 13,866,717 | | | | — | | | | — | | | | 13,866,717 | |
14
SSgA MASTER TRUST
NOTES TO FINANCIAL STATEMENTS (continued)
December 31, 2012 (Unaudited)
Investment Income
Interest income is recorded on the accrual basis. Dividend income is recorded on the ex-dividend date. The value of additional securities received as dividend payments is recorded as income and as an increase to the cost basis of such securities.
Expenses
Advisory fees and other expenses, which are directly identifiable to a specific Portfolio, are applied to that Portfolio. Trustees’ fees and other expenses which cannot be attributed to a specific Portfolio are allocated in such a manner as deemed equitable, taking into consideration the nature and type of expense and the relative net assets of the Portfolios.
Investment Transactions
Investment transactions are recorded as of the trade date. Realized gains and losses from the sale or disposition of securities are recorded on the identified cost basis. Corporate actions (including cash dividends) are recorded net of foreign tax withholdings on the ex-dividend date.
Federal Income Tax
The Portfolios are not required to pay federal income taxes on their net investment income and net capital gains because they are treated as partnerships for federal income tax purposes. All interest, gains and losses of the Portfolios are deemed to have been “passed through” to the Portfolios’ partners in proportion to their holdings in the respective Portfolio, regardless of whether such items have been distributed by the Portfolios. Each partner is responsible for tax liability based on its distributive share; therefore, no provision has been made for federal income taxes. The Portfolios have reviewed the tax positions for the open tax years as of June 30, 2012 and have determined that no provision for income tax is required in the Portfolios’ Financial Statements. The Portfolios’ federal tax returns are subject to examination by the Portfolios’ major tax jurisdictions, which include the United States of America and the Commonwealth of Massachusetts. The Portfolios’ recognized interest and penalties, if any, related to tax liabilities as income tax expense in the Statements of Operations.
| 3. | Fees and Compensation Paid to Affiliates and Other Related Party Transactions |
Advisory Fee
Each Portfolio has entered into an Investment Advisory Agreement with SSgA Funds Management, Inc. (the “Adviser” or “SSgA FM”). As compensation for the services rendered, facilities furnished, and expenses borne by the Adviser, each Portfolio pays the Adviser a fee accrued daily and paid monthly, based on a percentage of each Portfolio’s average daily net assets as shown in the following table:
| | | | |
| | | Annual Rate | |
SSgA Multi-Asset Real Return Portfolio | | | 0.20 | % |
SSgA Income Allocation Portfolio | | | 0.20 | |
SSgA Global Allocation Portfoilo | | | 0.20 | |
The Adviser pays all operating expenses of each Portfolio other than management fee, distribution fee pursuant to each Portfolio’s Distribution and Service Plan, if any, brokerage, taxes, interest, fees and expenses of the Independent Trustees (including any Trustees’ counsel fees), litigation expenses, acquired fund fees and expenses and other extraordinary expenses.
State Street Bank and Trust Company (“State Street”), an affiliate of the Adviser, receives fees for its services as Custodian, Administrator and Transfer Agent from the Adviser.
Trustees’ Fees
The Trust, SSgA Active Trust, SPDR Series Trust and SPDR Index Shares Funds pay, in the aggregate, each Independent Trustee an annual fee of $150,000 plus $10,000 per in-person meeting attended and $1,250 for each telephonic or video
15
SSgA MASTER TRUST
NOTES TO FINANCIAL STATEMENTS (continued)
December 31, 2012 (Unaudited)
conference meeting attended. The Chairman of the Board receives an additional annual fee of $50,000 and the Chairman of the Audit Committee receives an additional annual fee of $20,000. The Trust also reimburses each Independent Trustee for travel and other out-of-pocket expenses incurred by him/her in connection with attending such meetings and in connection with attending industry seminars and meetings. Trustee fees are allocated among the Trusts and each of their respective series in such a manner as deemed equitable, taking into consideration the relative net assets of the series.
Transactions with Affiliates
Each Portfolio may invest in certain money market funds and underlying Funds affiliated with the Adviser. Amounts related to investments in affiliated underlying Funds at December 31, 2012, and for the period then ended are:
| | | | | | | | | | | | | | | | | | | | | | | | | | | | | | | | | | | | | | | | |
| | | Number of
Shares Held
at 6/30/12 | | | Value at
6/30/12 | | | Purchased | | | Sold | | | Number of
Shares Held
at 12/31/12 | | | Value at
12/31/12 | | | Dividend
Income | | | Realized
Gain (Loss) | |
SSgA Multi-Asset Real Return Portfolio | | | | Cost | | | Shares | | | Proceeds | | | Shares | | | | | |
SPDR Barclays TIPS ETF | | | 15,983 | | | $ | 952,587 | | | $ | 8,884,053 | | | | 145,949 | | | $ | 628,403 | | | | 10,424 | | | | 151,508 | | | $ | 9,199,566 | | | $ | 22,097 | | | $ | 118 | |
SPDR DB International Government Inflation-Protected Bond ETF | | | 6,282 | | | | 369,884 | | | | 5,810,020 | | | | 92,113 | | | | 379,618 | | | | 6,257 | | | | 92,138 | | | | 5,854,448 | | | | 51,316 | | | | (160 | ) |
SPDR S&P Global Natural Resources ETF | | | 29,315 | | | | 1,394,690 | | | | 20,947,957 | | | | 413,355 | | | | 841,856 | | | | 16,751 | | | | 425,919 | | | | 21,960,384 | | | | 142,412 | | | | 8,389 | |
SPDR S&P International Energy Sector ETF | | | 4,935 | | | | 115,479 | | | | 1,367,566 | | | | 55,119 | | | | 30,872 | | | | 1,228 | | | | 58,826 | | | | 1,468,238 | | | | 12,829 | | | | 423 | |
SPDR S&P Metals & Mining ETF | | | 4,199 | | | | 174,007 | | | | 2,056,617 | | | | 47,007 | | | | 55,509 | | | | 1,325 | | | | 49,881 | | | | 2,251,628 | | | | 8,093 | | | | (1,540 | ) |
The Energy Select Sector SPDR Fund | | | 4,377 | | | | 290,501 | | | | 3,437,174 | | | | 48,081 | | | | 96,286 | | | | 1,335 | | | | 51,123 | | | | 3,652,227 | | | | 15,166 | | | | 2,592 | |
SPDR Dow Jones International Real Estate ETF | | | 12,828 | | | | 471,814 | | | | 6,422,140 | | | | 156,456 | | | | 469,953 | | | | 11,868 | | | | 157,416 | | | | 6,509,151 | | | | 186,213 | | | | 7,430 | |
SPDR Dow Jones REIT ETF | | | 12,160 | | | | 886,342 | | | | 6,319,860 | | | | 87,748 | | | | 629,700 | | | | 8,696 | | | | 91,212 | | | | 6,655,740 | | | | 48,904 | | | | (7,694 | ) |
State Street Institutional Liquid Reserves Fund | | | 41,023 | | | | 41,023 | | | | 1,483,038 | | | | 1,483,038 | | | | 1,263,168 | | | | 1,263,168 | | | | 260,893 | | | | 260,893 | | | | 176 | | | | — | |
| | | | | | | | |
| | | Number of
Shares Held
at 6/30/12 | | | Value at
6/30/12 | | | Purchased | | | Sold | | | Number of
Shares Held
at 12/31/12 | | | Value at
12/31/12 | | | Dividend
Income | | | Realized
Gain (Loss) | |
SSgA Income Allocation Portfolio | | | | Cost | | | Shares | | | Proceeds | | | Shares | | | | | |
SPDR S&P Dividend ETF | | | 30,590 | | | $ | 1,702,334 | | | $ | 6,493,325 | | | | 112,462 | | | $ | 1,486,132 | | | | 25,738 | | | | 117,314 | | | $ | 6,822,982 | | | $ | 93,622 | | | $ | (4,453 | ) |
SPDR Wells Fargo Preferred Stock ETF | | | 11,963 | | | | 541,326 | | | | 3,787,618 | | | | 82,709 | | | | — | | | | — | | | | 94,672 | | | | 4,258,347 | | | | 101,169 | | | | — | |
SPDR Barclays Convertible Securities ETF | | | 4,649 | | | | 174,616 | | | | 350,509 | | | | 8,961 | | | | 250,517 | | | | 6,435 | | | | 7,175 | | | | 289,153 | | | | 5,847 | | | | 1,077 | |
SPDR Barclays High Yield Bond ETF | | | 22,084 | | | | 871,435 | | | | 3,929,168 | | | | 97,692 | | | | 1,044,914 | | | | 25,756 | | | | 94,020 | | | | 3,826,614 | | | | 85,781 | | | | 4,672 | |
SPDR Barclays Long Term Corporate Bond ETF | | | 31,334 | | | | 1,278,427 | | | | 6,374,842 | | | | 152,277 | | | | 284,714 | | | | 6,831 | | | | 176,780 | | | | 7,272,729 | | | | 82,512 | | | | 25,091 | |
SPDR Barclays Long Term Treasury Bond ETF | | | 11,918 | | | | 861,195 | | | | 3,422,706 | | | | 47,650 | | | | 199,055 | | | | 2,702 | | | | 56,866 | | | | 3,986,875 | | | | 28,456 | | | | 2,241 | |
SPDR Barclays Short Term High Yield Bond | | | — | | | | — | | | | 502,276 | | | | 16,539 | | | | — | | | | — | | | | 16,539 | | | | 505,266 | | | | 4,479 | | | | — | |
SPDR Nuveen Barclays Build America Bond ETF | | | 3,008 | | | | 180,528 | | | | 767,207 | | | | 12,509 | | | | 457,397 | | | | 7,332 | | | | 8,185 | | | | 503,787 | | | | 10,735 | | | | 3,837 | |
SPDR Barclays TIPS ETF | | | 7,366 | | | | 439,013 | | | | 2,858,113 | | | | 47,002 | | | | 1,054,082 | | | | 17,140 | | | | 37,228 | | | | 2,260,484 | | | | 13,192 | | | | 4,401 | |
SPDR EURO STOXX 50 ETF | | | — | | | | — | | | | 517,316 | | | | 16,003 | | | | — | | | | — | | | | 16,003 | | | | 554,664 | | | | 3,703 | | | | — | |
SPDR FTSE/Macquarie Global Infrastructure 100 ETF | | | 11,312 | | | | 448,973 | | | | 3,132,321 | | | | 78,608 | | | | — | | | | — | | | | 89,920 | | | | 3,620,179 | | | | 42,914 | | | | — | |
SPDR S&P Emerging Markets Dividend ETF | | | 10,804 | | | | 488,017 | | | | 3,668,071 | | | | 83,187 | | | | 178,200 | | | | 4,037 | | | | 89,954 | | | | 4,244,030 | | | | 77,703 | | | | (19,290 | ) |
SPDR S&P International Dividend ETF | | | 13,900 | | | | 619,106 | | | | 3,170,649 | | | | 69,707 | | | | — | | | | — | | | | 83,607 | | | | 4,017,316 | | | | 55,143 | | | | — | |
SPDR S&P International Telecommunications Sector ETF | | | 8,217 | | | | 179,541 | | | | 863,045 | | | | 38,405 | | | | 301,292 | | | | 13,318 | | | | 33,304 | | | | 732,688 | | | | 8,652 | | | | (3,411 | ) |
SPDR STOXX Europe 50 ETF | | | 14,518 | | | | 429,733 | | | | 2,528,907 | | | | 79,505 | | | | 473,376 | | | | 14,856 | | | | 79,167 | | | | 2,661,595 | | | | 19,446 | | | | (3,862 | ) |
SPDR Barclays Emerging Markets Local Bond ETF | | | 2,864 | | | | 89,214 | | | | 1,374,732 | | | | 42,472 | | | | 43,962 | | | | 1,412 | | | | 43,924 | | | | 1,418,306 | | | | 43,339 | | | | (3 | ) |
16
SSgA MASTER TRUST
NOTES TO FINANCIAL STATEMENTS (continued)
December 31, 2012 (Unaudited)
| | | | | | | | | | | | | | | | | | | | | | | | | | | | | | | | | | | | | | | | |
| | | Number of
Shares Held
at 6/30/12 | | | Value at
6/30/12 | | | Purchased | | | Sold | | | Number of
Shares Held
at 12/31/12 | | | Value at
12/31/12 | | | Dividend
Income | | | Realized
Gain (Loss) | |
SSgA Income Allocation Portfolio | | | | Cost | | | Shares | | | Proceeds | | | Shares | | | | | |
SPDR Barclays International Corporate Bond ETF | | | 191 | | | $ | 6,188 | | | $ | 1,160,092 | | | | 33,576 | | | $ | — | | | | — | | | | 33,767 | | | $ | 1,195,352 | | | $ | 6,090 | | | $ | 770 | |
SPDR Dow Jones International Real Estate ETF | | | 9,970 | | | | 366,697 | | | | 1,114,315 | | | | 27,979 | | | | 510,220 | | | | 13,059 | | | | 24,890 | | | | 1,029,201 | | | | 43,873 | | | | (897 | ) |
SPDR Dow Jones REIT ETF | | | 4,398 | | | | 320,570 | | | | 1,754,006 | | | | 24,137 | | | | 276,497 | | | | 3,893 | | | | 24,642 | | | | 1,798,127 | | | | 23,196 | | | | (14,119 | ) |
State Street Institutional Liquid Reserves Fund | | | 117,900 | | | | 117,900 | | | | 777,208 | | | | 777,208 | | | | 625,102 | | | | 625,102 | | | | 270,006 | | | | 270,006 | | | | 128 | | | | — | |
| | | | | | | | |
| | | Number of
Shares Held
at 6/30/12 | | | Value at
6/30/12 | | | Purchased | | | Sold | | | Number of
Shares Held
at 12/31/12 | | | Value at
12/31/12 | | | Dividend
Income | | | Realized
Gain (Loss) | |
SSgA Global Allocation Portfolio | | | | Cost | | | Shares | | | Proceeds | | | Shares | | | | | |
SPDR S&P 500 ETF Trust | | | 6,882 | | | $ | 937,810 | | | $ | 1,587,943 | | | | 11,229 | | | $ | 401,348 | | | | 2,872 | | | | 15,239 | | | $ | 2,171,862 | | | $ | 21,418 | | | $ | (4,969 | ) |
SPDR S&P 600 Small Cap ETF | | | 2,533 | | | | 178,653 | | | | 305,722 | | | | 4,183 | | | | 80,602 | | | | 1,074 | | | | 5,642 | | | | 423,771 | | | | 3,529 | | | | 2,311 | |
SPDR S&P Dividend ETF | | | 5,525 | | | | 307,466 | | | | 571,353 | | | | 9,905 | | | | 231,065 | | | | 3,952 | | | | 11,478 | | | | 667,561 | | | | 10,489 | | | | 1,269 | |
SPDR S&P MidCap 400 ETF Trust | | | 507 | | | | 86,849 | | | | 180,643 | | | | 1,005 | | | | 924 | | | | 5 | | | | 1,507 | | | | 279,865 | | | | 1,439 | | | | 4 | |
SPDR Wells Fargo Preferred Stock ETF | | | — | | | | — | | | | 415,675 | | | | 9,091 | | | | — | | | | — | | | | 9,091 | | | | 408,913 | | | | 6,913 | | | | — | |
SPDR Barclays Aggregate Bond ETF | | | 2,963 | | | | 173,750 | | | | 430,650 | | | | 7,293 | | | | 188,910 | | | | 3,205 | | | | 7,051 | | | | 414,387 | | | | 1,758 | | | | 2,721 | |
SPDR Barclays High Yield Bond ETF | | | 7,815 | | | | 308,380 | | | | 940,219 | | | | 23,373 | | | | 157,220 | | | | 3,889 | | | | 27,299 | | | | 1,111,069 | | | | 24,404 | | | | 208 | |
SPDR Barclays Intermediate Term Corporate Bond ETF | | | 11,454 | | | | 390,925 | | | | 1,076,648 | | | | 30,973 | | | | 94,767 | | | | 2,740 | | | | 39,687 | | | | 1,381,902 | | | | 13,286 | | | | 2,747 | |
SPDR Barclays Long Term Corporate Bond ETF | | | 4,332 | | | | 176,745 | | | | 512,460 | | | | 12,263 | | | | — | | | | — | | | | 16,595 | | | | 682,718 | | | | 9,134 | | | | 1,989 | |
SPDR Barclays Short Term High Yield Bond ETF | | | — | | | | — | | | | 136,904 | | | | 4,514 | | | | — | | | | — | | | | 4,514 | | | | 137,903 | | | | 1,193 | | | | — | |
SPDR Barclays TIPS ETF | | | 2,866 | | | | 170,814 | | | | 283,395 | | | | 4,658 | | | | 183,025 | | | | 3,020 | | | | 4,504 | | | | 273,483 | | | | 1,865 | | | | 1,042 | |
SPDR DB International Government Inflation-Protected Bond ETF | | | — | | | | — | | | | 226,033 | | | | 3,727 | | | | 93,908 | | | | 1,513 | | | | 2,214 | | | | 140,678 | | | | 3,031 | | | | 2,027 | |
SPDR EURO STOXX 50 ETF | | | — | | | | — | | | | 542,901 | | | | 16,756 | | | | — | | | | — | | | | 16,756 | | | | 580,763 | | | | 3,337 | | | | — | |
SPDR S&P Emerging Markets ETF | | | 5,132 | | | | 307,869 | | | | 619,319 | | | | 9,784 | | | | 260,677 | | | | 4,163 | | | | 10,753 | | | | 721,526 | | | | 7,430 | | | | (8,228 | ) |
SPDR S&P International Dividend ETF | | | 3,983 | | | | 177,403 | | | | 295,822 | | | | 6,571 | | | | 316,708 | | | | 7,297 | | | | 3,257 | | | | 156,499 | | | | 3,951 | | | | (7,640 | ) |
SPDR S&P International Small Cap ETF | | | 1,693 | | | | 43,696 | | | | 362,373 | | | | 13,385 | | | | 5,013 | | | | 179 | | | | 14,899 | | | | 423,876 | | | | 6,528 | | | | (17 | ) |
SPDR S&P World ex-US ETF | | | 23,954 | | | | 536,809 | | | | 1,670,990 | | | | 70,026 | | | | 239,230 | | | | 10,101 | | | | 83,879 | | | | 2,124,655 | | | | 19,643 | | | | (174 | ) |
SPDR STOXX Europe 50 ETF | | | — | | | | — | | | | 568,073 | | | | 18,046 | | | | 157,956 | | | | 5,045 | | | | 13,001 | | | | 437,094 | | | | 2,711 | | | | 546 | |
SPDR Barclays Emerging Markets Local Bond ETF | | | — | | | | — | | | | 145,711 | | | | 4,459 | | | | — | | | | — | | | | 4,459 | | | | 143,981 | | | | 3,313 | | | | 46 | |
SPDR Barclays International Corporate Bond ETF | | | 5,377 | | | | 174,215 | | | | 255,136 | | | | 7,480 | | | | 159,239 | | | | 4,859 | | | | 7,998 | | | | 283,129 | | | | 2,100 | | | | (4,002 | ) |
SPDR Dow Jones International Real Estate ETF | | | 1,230 | | | | 45,239 | | | | 530,629 | | | | 13,496 | | | | 327,795 | | | | 8,079 | | | | 6,647 | | | | 274,853 | | | | 12,300 | | | | 5,979 | |
SPDR Dow Jones REIT ETF | | | 3,098 | | | | 225,813 | | | | 463,149 | | | | 6,414 | | | | 407,144 | | | | 5,668 | | | | 3,844 | | | | 280,497 | | | | 4,596 | | | | (2,647 | ) |
State Street Institutional Liquid Reserves Fund | | | 158,815 | | | | 158,815 | | | | 458,847 | | | | 458,847 | | | | 611,499 | | | | 611,499 | | | | 6,163 | | | | 6,163 | | | | 134 | | | | — | |
| 4. | Aggregate Unrealized Appreciation and Depreciation |
The identified cost of investments in securities owned by each Portfolio for federal income tax purposes and the gross unrealized appreciation and depreciation at December 31, 2012, was as follows:
| | | | | | | | | | | | | | | | |
| | | Identified
Cost | | | Gross
Unrealized
Appreciation | | | Gross
Unrealized
Depreciation | | | Net Unrealized
Appreciation
(Depreciation) | |
SSgA Multi-Asset Real Return Portfolio | | $ | 73,003,363 | | | $ | 673,348 | | | $ | 112,030 | | | $ | 561,318 | |
SSgA Income Allocation Portfolio | | | 50,399,813 | | | | 1,072,285 | | | | 204,397 | | | | 867,888 | |
SSgA Global Allocation Portfolio | | | 13,483,889 | | | | 399,806 | | | | 16,978 | | | | 382,828 | |
17
SSgA MASTER TRUST
NOTES TO FINANCIAL STATEMENTS (continued)
December 31, 2012 (Unaudited)
| 5. | Investment Transactions |
For the period ended December 31, 2012, the Portfolios had purchases and sales of investment securities as follows:
| | | | | | | | | | | | |
| | | SSgA Multi-Asset
Real Return
Portfolio | | | SSgA Income
Allocation
Portfolio | | | SSgA Global
Allocation
Portfolio | |
Purchases | | | | | | | | | | | | |
Short Term | | $ | 1,483,038 | | | $ | 777,208 | | | $ | 458,848 | |
Long Term | | | 70,345,115 | | | | 47,769,219 | | | | 12,679,085 | |
| | | |
| Sales | | | | | | | | | |
Short Term | | | 40,457 | | | | 625,102 | | | | 611,499 | |
Long Term | | | 2,050,440 | | | | 6,560,359 | | | | 3,566,523 | |
For the period ended December 31, 2012, the Trust did not pay any commissions to an affiliate of the Adviser for investment transactions.
Although the Portfolios do not intend to concentrate their investments in any particular industry, if a Portfolio focuses in a single industry, group of industries or type of instrument, it may be more susceptible to any single economic, market, political or regulatory occurrence affecting that industry, group of industries or type of instrument.
| 7. | Recent Accounting Pronouncements |
In December 2011, FASB issued ASU No. 2011-11 “Disclosures about Offsetting Assets and Liabilities.” These common disclosure requirements are intended to help investors and other financial statement users to better assess the effect or potential effect of offsetting arrangements on a portfolio’s financial position. They also improve transparency in the reporting of how companies mitigate credit risk, including disclosure of related collateral pledged or received. In addition, ASU 2011-11 facilitates comparison between those entities that prepare their financial statements on the basis of U.S. GAAP and those entities that prepare their financial statements on the basis of International Financial Reporting Standards. ASU 2011-11 requires entities to disclose both gross and net information about both instruments and transactions eligible for offset in the financial position; and disclose instruments and transactions subject to an agreement similar to a master netting agreement. ASU 2011-11 is effective for fiscal years beginning on or after January 1, 2013, and interim periods within those annual periods. Management is currently evaluating the implications of ASU 2011-11 and its impact on financial statement disclosures.
18
SSgA MASTER TRUST
OTHER INFORMATION
December 31, 2012 (Unaudited)
Proxy Voting Policies and Procedures and Records
A description of the Trust’s proxy voting policies and procedures that are used by the Funds’ investment adviser to vote proxies relating to the Funds’ portfolio of securities are available (i) without charge, upon request by calling 1-866-787-2257 (toll free) or (ii) on the website of the Securities and Exchange Commission, at www.sec.gov. Information regarding how the investment advisor voted for the prior 12-months period ended June 30 is available by August 31 of each year by calling the same number and on the SEC’s website, at www.sec.gov, and on the Funds’ website at www.spdrs.com.
Quarterly Portfolio Schedule
The Funds file a complete schedule of portfolio holdings with the SEC for the first and third quarters of each fiscal year on Form N-Q. The Fund’s Forms N-Q are available on the SEC’s website at www.sec.gov and may be reviewed and copied at the SEC’s Public Reference Room in Washington DC. Information on the operation of the Public Reference Room may be obtained by calling 1-800-SEC-0330. The information on the Form N-Q is available upon request, without charge, by calling 1-866-787-2257 (toll free) and on the Funds’ website at www.spdrs.com.
19
The SPDR® Family of Exchange Traded Funds
The following is a list of SPDR ETFs being offered, along with their respective exchange trading symbols. Please call 1-866-787-2257 to obtain a prospectus for any SPDR ETF. The prospectus contains more complete information, including charges, expenses, investment objectives and risk factors that should be carefully considered to determine if the Fund(s) are an appropriate investment for you. Read the prospectus(es) carefully before investing. Investing involves risk, including possible loss of principal.
SPDR Series Trust
SPDR Dow Jones Total Market ETF (TMW)
SPDR Dow Jones Large Cap ETF (ELR)
SPDR S&P 500 Growth ETF (SPYG)
SPDR S&P 500 Value ETF (SPYV)
SPDR Dow Jones Mid Cap ETF (EMM)
SPDR S&P 400 Mid Cap Growth ETF (MDYG)
SPDR S&P 400 Mid Cap Value ETF (MDYV)
SPDR S&P 600 Small Cap ETF (SLY)
SPDR S&P 600 Small Cap Growth ETF (SLYG)
SPDR S&P 600 Small Cap Value ETF (SLYV)
SPDR Global Dow ETF (DGT)
SPDR Dow Jones REIT ETF (RWR)
SPDR S&P Bank ETF (KBE)
SPDR S&P Capital Markets ETF (KCE)
SPDR S&P Insurance ETF (KIE)
SPDR S&P Mortgage Finance ETF (KME)
SPDR S&P Regional Banking ETF (KRE)
SPDR Morgan Stanley Technology ETF (MTK)
SPDR S&P Dividend ETF (SDY)
SPDR S&P Aerospace & Defense ETF (XAR)
SPDR S&P Biotech ETF (XBI)
SPDR S&P Health Care Equipment ETF (XHE)
SPDR S&P Health Care Services ETF (XHS)
SPDR S&P Homebuilders ETF (XHB)
SPDR S&P Metals & Mining ETF (XME)
SPDR S&P Oil & Gas Equipment & Services ETF (XES)
SPDR S&P Oil & Gas Exploration & Production ETF (XOP)
SPDR S&P Pharmaceuticals ETF (XPH)
SPDR S&P Retail ETF (XRT)
SPDR S&P Semiconductor ETF (XSD)
SPDR S&P Software & Services ETF (XSW)
SPDR S&P Telecom ETF (XTL)
SPDR S&P Transportation ETF (XTN)
SPDR S&P 1500 Value Tilt ETF (VLU)
SPDR S&P 1500 Momentum Tilt ETF (MMTM)
SPDR Russell 1000 Low Volatility ETF (LGLV)
SPDR Russell 2000 Low Volatility ETF (SMLV)
SPDR Wells Fargo Preferred Stock ETF (PSK)
SPDR Barclays 1-3 Month T-Bill ETF (BIL)
SPDR Barclays TIPS ETF (IPE)
SPDR Barclays Short Term Treasury ETF (SST)
SPDR Barclays Intermediate Term Treasury ETF (ITE)
SPDR Barclays Long Term Treasury ETF (TLO)
SPDR Barclays Short Term Corporate Bond ETF (SCPB)
SPDR Barclays Intermediate Term Corporate Bond ETF (ITR)
SPDR Barclays Long Term Corporate Bond ETF (LWC)
SPDR Barclays Issuer Scored Corporate Bond ETF (CBND)
SPDR Barclays Convertible Securities ETF (CWB)
SPDR Barclays Mortgage Backed Bond ETF (MBG)
SPDR Barclays Aggregate Bond ETF (LAG)
SPDR Nuveen Barclays Capital Municipal Bond ETF (TFI)
SPDR Nuveen Barclays California Municipal Bond ETF (CXA)
SPDR Nuveen Barclays New York Municipal Bond ETF (INY)
SPDR Nuveen Barclays Short Term Municipal Bond ETF (SHM)
SPDR Nuveen S&P VRDO Municipal Bond ETF (VRD)
SPDR Nuveen S&P High Yield Municipal Bond ETF (HYMB)
SPDR Nuveen Barclays Build America Bond ETF (BABS)
SPDR DB International Government Inflation-Protected Bond ETF (WIP)
SPDR Barclays Short Term International Treasury Bond ETF (BWZ)
SPDR Barclays International Treasury Bond ETF (BWX)
SPDR Barclays International Corporate Bond ETF (IBND)
SPDR Barclays Emerging Markets Local Bond ETF (EBND)
SPDR Barclays High Yield Bond ETF (JNK)
SPDR Barclays Short Term High Yield Bond ETF (SJNK)
SPDR Barclays Investment Grade Floating Rate ETF (FLRN)
SPDR BofA Merrill Lynch Emerging Markets Corporate Bond ETF (EMCD)
SPDR BofA Merrill Lynch Crossover Corporate Bond ETF (XOVR)
SPDR Index Shares Funds
SPDR STOXX Europe 50 ETF (FEU)
SPDR EURO STOXX 50 ETF (FEZ)
SPDR S&P Emerging Asia Pacific ETF (GMF)
SPDR S&P Small Cap Emerging Asia Pacific ETF (GMFS)
SPDR S&P Russia ETF (RBL)
SPDR S&P China ETF (GXC)
SPDR S&P Emerging Markets ETF (GMM)
SPDR S&P Emerging Markets Dividend ETF (EDIV)
SPDR S&P BRIC 40 ETF (BIK)
SPDR S&P Emerging Europe ETF (GUR)
SPDR S&P Emerging Latin America ETF (GML)
SPDR S&P Emerging Middle East & Africa ETF (GAF)
SPDR S&P World ex-US ETF (GWL)
SPDR S&P International Small Cap ETF (GWX)
SPDR Dow Jones International Real Estate ETF (RWX)
SPDR FTSE/Macquarie Global Infrastructure 100 ETF (GII)
SPDR S&P Global Natural Resources ETF (GNR)
SPDR MSCI ACWI ex-US ETF (CWI)
SPDR MSCI ACWI IMI ETF (ACIM)
SPDR MSCI EM 50 ETF (EMFT)
SPDR Russell/Nomura PRIME Japan ETF (JPP)
SPDR Russell/Nomura Small Cap Japan ETF (JSC)
SPDR S&P International Dividend ETF (DWX)
SPDR S&P International Mid Cap ETF (MDD)
SPDR S&P Emerging Markets Small Cap ETF (EWX)
SPDR Dow Jones Global Real Estate ETF (RWO)
SPDR S&P International Consumer Discretionary Sector ETF (IPD)
SPDR S&P International Consumer Staples Sector ETF (IPS)
SPDR S&P International Energy Sector ETF (IPW)
SPDR S&P International Financial Sector ETF (IPF)
SPDR S&P International Health Care Sector ETF (IRY)
SPDR S&P International Industrial Sector ETF (IPN)
SPDR S&P International Materials Sector ETF (IRV)
SPDR S&P International Technology Sector ETF (IPK)
SPDR S&P International Telecommunications Sector ETF (IST)
SPDR S&P International Utilities Sector ETF (IPU)
The Select Sectors SPDR Trust
The Consumer Discretionary Select Sector SPDR Fund (XLY)
The Consumer Staples Select Sector SPDR Fund (XLP)
The Energy Select Sector SPDR Fund (XLE)
The Financial Select Sector SPDR Fund (XLF)
The Health Care Select Sector SPDR Fund (XLV)
The Industrial Select Sector SPDR Fund (XLI)
The Materials Select Sector SPDR Fund (XLB)
The Technology Select Sector SPDR Fund (XLK)
The Utilities Select Sector SPDR Fund (XLU)
SSgA Active ETF Trust
SPDR SSgA Multi-Asset Real Return ETF (RLY)
SPDR SSgA Income Allocation ETF (INKM)
SPDR SSgA Global Allocation ETF (GAL)
SPDR Dow Jones Industrial Average ETF Trust (DIA)
SPDR S&P 500 ETF Trust (SPY)
State Street Global Markets, LLC, member FINRA, SIPC, is distributor for all investment portfolios of SPDR Series Trust, SPDR Index Shares Funds, and SSgA Active ETF Trust. ALPS Distributors, Inc., a registered broker-dealer, is distributor for SPDR S&P 500 ETF Trust (SPY) and SPDR Dow Jones Industrial Average ETF Trust (DIA), both unit investment trusts, and all investment portfolios of The Select Sector SPDR Trust.
SSgA Master Trust
TRUSTEES
Bonny E. Boatman
Dwight D. Churchill
David M. Kelly
Frank Nesvet, Chairman
James E. Ross
Carl G. Verboncoeur
OFFICERS
Ellen M. Needham, President
Michael P. Riley, Vice President
Chad C. Hallett, Treasurer
Matthew W. Flaherty, Assistant Treasurer
Laura F. Dell, Assistant Treasurer
Ryan M. Louvar, Secretary
Mark E. Tuttle, Assistant Secretary
Scott E. Habeeb, Assistant Secretary
Jacqueline Angell, Chief Compliance Officer
INVESTMENT MANAGER
SSgA Funds Management, Inc.
State Street Financial Center
One Lincoln Street
Boston, MA 02111
CUSTODIAN, ADMINISTRATORAND TRANSFER AGENT
State Street Bank and Trust Company
One Lincoln Street
Boston, MA 02111
LEGAL COUNSEL
Bingham McCutchen LLP
2020 K Street, NW
Washington, DC 20006
INDEPENDENT REGISTERED PUBLIC ACCOUNTING FIRM
Ernst & Young LLP
200 Clarendon Street
Boston, MA 02116

State Street Global Advisors
State Street Financial Center
One Lincoln Street
Boston, MA 02111
ETFs trade like stocks, are subject to investment risk, fluctuate in market value and may trade at prices above or below the ETFs net asset value. Brokerage commissions and ETF expenses will reduce returns.
Because the SPDR SSgA Active Asset Allocation ETFs are actively managed, they are therefore subject to the risk that the investments selected by SSgA may cause the ETFs to underperform relative to their benchmarks or other funds with similar investment objectives. Actively managed ETFs do not seek to replicate the performance of a specified index.
Foreign investments involve greater risks than U.S. investments, including political and economic risks and the risk of currency fluctuations, all of which may be magnified in emerging markets.
Bond funds contain interest rate risk (as interest rates rise bond prices usually fall); the risk of issuer default; issuer credit risk; liquidity risk; and inflation risk.
Commodities investing entail significant risk as commodity prices can be extremely volatile due to wide range of factors.
“SPDR” is a registered trademark of Standard & Poor Financial Services LLC (“S&P”) and has been licensed for use by State Street Corporation. No financial product offered by State Street Corporation or its affiliates is sponsored, endorsed, sold or promoted by S&P or its Affiliates, and S&P and its affiliates make no representation, warranty or condition regarding the advisability of buying, selling or holding units/shares in such products. Further limitations and important information that could affect investors’ rights are described in the prospectus for the applicable product.
Before investing, consider the fund’s investment objectives, risks, charges and expenses. To obtain a prospectus or summary prospectus which contains this and other information, call 866.787.2257 or visit www.spdrs.com. Read it carefully.
IBG - 8115
For more complete information, please call 866.787.2257 or visit www.spdrs.com today SPDRACTSAR
Item 2. Code of Ethics.
Not applicable to the registrant; this Form N-CSR is a Semi-Annual Report.
Item 3. Audit Committee Financial Expert.
Not applicable to the registrant; this Form N-CSR is a Semi-Annual Report.
Item 4. Principal Accountant Fees and Services.
Not applicable to the registrant; this Form N-CSR is a Semi-Annual Report.
Item 5. Disclosure of Audit Committees for Listed Companies.
Not applicable to the registrant; this Form N-CSR is a Semi-Annual Report.
Item 6. Schedule of Investments.
A Schedule of Investments for each series of the registrant is included as a part of the semi-annual reports to shareholders filed under Item 1 of this Form N-CSR.
Item 7. Disclosure of Proxy Voting Policies and Procedures for Closed-End Management Investment Companies.
Not applicable to the registrant.
Item 8. Portfolio Managers of Closed-End Management Investment Companies.
Not applicable to the registrant.
Item 9. Purchases of Equity Securities by Closed-End Management Investment Company and Affiliated Purchasers.
Not applicable to the registrant.
Item 10. Submission of Matters to a Vote of Security Holders.
Registrant has not adopted any material changes to the procedures by which shareholders may recommend nominees to the registrant’s Board.
Item 11. Controls and Procedures.
(a) Within 90 days of the filing date of this Form N-CSR, Ellen M. Needham, the registrant’s President and Principal Executive Officer, and Chad C. Hallett, the registrant’s Treasurer and Principal Financial Officer, reviewed the registrant’s disclosure controls and procedures and evaluated their effectiveness. Based on their review, Ms. Needham and Mr. Hallett determined that the disclosure controls and procedures adequately ensure that information required to be disclosed by the registrant in its periodic reports is recorded, processed, summarized and reported within the time periods required by the Securities and Exchange Commission.
(b) There were no significant changes in the registrant’s internal controls or in other factors that have
materially affected, or are reasonably likely to materially affect, its controls over financial reporting subsequent to the date of their evaluation, including any corrective actions with regard to significant deficiencies and material weaknesses.
Item 12. Exhibits.
(a)(1) Not applicable to the registrant; this Form N-CSR is a Semi-Annual Report.
(a)(2) Separate certifications required by Rule 30a-2(a) under the Investment Company Act of 1940 for each principal executive officer and principal financial officer of the registrant are attached.
(a)(3) Not applicable
(b) A single certification required by Rule 30a-2(b) under the Investment Company Act of 1940, Rule 13a-14(b) or Rule 15d-14(b) under the Securities Exchange Act of 1934 and Section 1350 of Chapter 63 of Title 18 of the United States Code for the principal executive officer and principal financial officer of the registrant is attached.
SIGNATURES
Pursuant to the requirements of the Securities Exchange Act of 1934 and the Investment Company Act of 1940, the registrant has duly caused this report to be signed on its behalf by the undersigned, thereunto duly authorized.
| | |
| SSgA Active ETF Trust |
| |
| By: | | /s/ Ellen M. Needham |
| | Ellen M. Needham |
| | President and Principal Executive Officer |
| |
| Date: | | March 7, 2013 |
Pursuant to the requirements of the Securities Exchange Act of 1934 and the Investment Company Act of 1940, this report has been signed below by the following persons on behalf of the registrant and in the capacities and on the dates indicated.
| | |
| By: | | /s/ Ellen M. Needham |
| | Ellen M. Needham |
| | President and Principal Executive Officer |
| |
| Date: | | March 7, 2013 |
| |
| By: | | /s/ Chad C. Hallett |
| | Chad C. Hallett |
| | Treasurer and Principal Financial Officer |
| |
| Date: | | March 7, 2013 |