Table of Contents
UNITED STATES
SECURITIES AND EXCHANGE COMMISSION
Washington, D.C. 20549
FORM N-CSR
CERTIFIED SHAREHOLDER REPORT OF REGISTERED
MANAGEMENT INVESTMENT COMPANIES
Investment Company Act file number: 811-22542
SSGA ACTIVE TRUST
(Exact name of registrant as specified in charter)
One Lincoln Street, Boston, Massachusetts 02111
(Address of principal executive offices) (zip code)
Christopher A. Madden, Esq.
State Street Bank and Trust Company
One Lincoln Street/CPH0326
Boston, Massachusetts 02111
(Name and address of agent for service)
Copy to:
W. John McGuire, Esq.
Morgan, Lewis & Bockius LLP
2020 K Street, N.W.
Washington, DC 20006
Registrant’s telephone number, including area code: (866) 787-2257
Date of fiscal year end: June 30
Date of reporting period: December 31, 2014
Table of Contents
Item 1. Reports to Shareholders.
Table of Contents
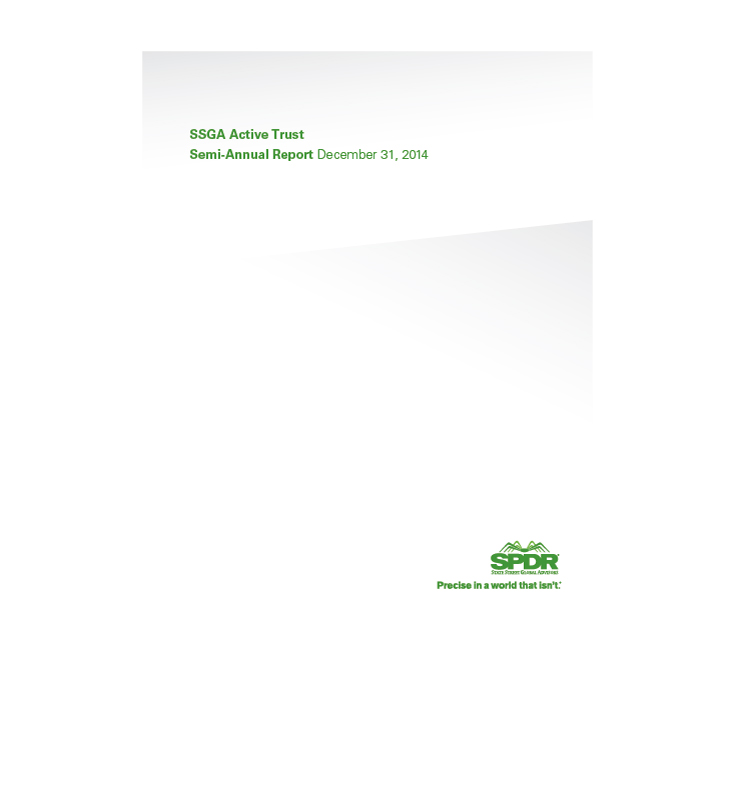
Table of Contents
Table of Contents
Performance Summary | ||||
| 1 | ||||
| 3 | ||||
| 5 | ||||
| 7 | ||||
| 9 | ||||
| 11 | ||||
| 13 | ||||
| 15 | ||||
| 17 | ||||
| 18 | ||||
| 26 | ||||
| 32 | ||||
| 36 |
Table of Contents

SPDR SSGA MULTI-ASSET REAL RETURN ETF —
PERFORMANCE SUMMARY
The following performance chart of the Fund’s total return at net asset value, the total return based on market price and its benchmark index is provided for comparative purposes only and represents the periods noted. The Fund’s per share net asset value (“NAV”) is the value of one share of the Fund and is calculated by dividing the value of total assets less total liabilities by the number of shares outstanding. The NAV return is based on the NAV of the Fund and the market return is based on the market price per share of the Fund. The market price used to calculate the market return is determined by using the midpoint between the highest bid and the lowest offer on the exchange on which the shares of the Fund are listed for trading, as of the time that the Fund’s NAV is calculated. Since shares of the Fund did not trade in the secondary market until one day after the Fund’s inception, for the period from inception to the first day of secondary market trading in shares of the Fund (4/25/12, 4/26/12, respectively), the NAV of the Fund is used as a proxy for the secondary market trading price to calculate market returns. NAV and market returns assume that dividends and capital gain distributions have been reinvested in the Fund at NAV. Market returns do not include brokerage commissions that may be payable on secondary market transactions. If brokerage commissions were included market returns would be lower.
An index is a statistical measure of a specified financial market or sector. An index does not actually hold a portfolio of securities and therefore does not reflect deductions for fees or expenses. In comparison, the Fund’s performance is negatively impacted by these deductions.
Performance quoted represents past performance, which is no guarantee of future results. Investment return and principal value will fluctuate, so you may have a gain or loss when shares are sold. Current performance may be higher or lower than that quoted. Visit www.spdrs.com for most recent month-end performance. The returns do not reflect the deduction of taxes that a shareholder would pay on Fund distributions or on the redemption or sale of Fund shares. The total expense ratio for SPDR SSGA Multi-Asset Real Return ETF as stated in the Fees and Expenses table of the prospectus dated October 31, 2014 is 0.70%.
PERFORMANCE AS OF DECEMBER 31, 2014
| CUMULATIVE TOTAL RETURN | AVERAGE ANNUAL TOTAL RETURN | |||||||||||||||||||||||||||||||||||||
NET ASSET VALUE | MARKET VALUE | PRIMARY
BARCLAYS US | SECONDARY
DBIQ OPTIMUM | NET ASSET VALUE | MARKET VALUE | PRIMARY
BARCLAYS US | SECONDARY
DBIQ OPTIMUM | |||||||||||||||||||||||||||||||
| SIX MONTHS | –12.91% | –13.00% | –1.81% | –29.20% | N/A | N/A | N/A | N/A | ||||||||||||||||||||||||||||||
| ONE YEAR | –6.52% | –6.52% | 4.43% | –26.45% | –6.52% | –6.52% | 4.43% | –26.45% | ||||||||||||||||||||||||||||||
| SINCE INCEPTION (1) | –5.85% | –5.85% | –0.88% | –31.91% | –2.22% | –2.22% | –0.33% | –13.34% | ||||||||||||||||||||||||||||||
| (1) | For the period April 25, 2012 to December 31, 2014. |
1
Table of Contents
SPDR SSGA MULTI-ASSET REAL RETURN ETF —
PERFORMANCE SUMMARY (CONTINUED)
COMPARISON OF CHANGE IN VALUE OF A $10,000 INVESTMENT (BASED ON NET ASSET VALUE)
Past performance is not a guarantee of future results.
Index returns are unmanaged and do not reflect the deduction of any fees or expenses. Index returns reflect all items of income, gain and loss and the reinvestment of dividends and other income.
2
Table of Contents
SPDR SSGA INCOME ALLOCATION ETF —
PERFORMANCE SUMMARY
The following performance chart of the Fund’s total return at net asset value, the total return based on market price and its benchmark index is provided for comparative purposes only and represents the periods noted. The Fund’s per share net asset value (“NAV”) is the value of one share of the Fund and is calculated by dividing the value of total assets less total liabilities by the number of shares outstanding. The NAV return is based on the NAV of the Fund and the market return is based on the market price per share of the Fund. The market price used to calculate the market return is determined by using the midpoint between the highest bid and the lowest offer on the exchange on which the shares of the Fund are listed for trading, as of the time that the Fund’s NAV is calculated. Since shares of the Fund did not trade in the secondary market until one day after the Fund’s inception, for the period from inception to the first day of secondary market trading in shares of the Fund (4/25/12, 4/26/12, respectively), the NAV of the Fund is used as a proxy for the secondary market trading price to calculate market returns. NAV and market returns assume that dividends and capital gain distributions have been reinvested in the Fund at NAV. Market returns do not include brokerage commissions that may be payable on secondary market transactions. If brokerage commissions were included market returns would be lower.
An index is a statistical measure of a specified financial market or sector. An index does not actually hold a portfolio of securities and therefore does not reflect deductions for fees or expenses. In comparison, the Fund’s performance is negatively impacted by these deductions.
Performance quoted represents past performance, which is no guarantee of future results. Investment return and principal value will fluctuate, so you may have a gain or loss when shares are sold. Current performance may be higher or lower than that quoted. Visit www.spdrs.com for most recent month-end performance. The returns do not reflect the deduction of taxes that a shareholder would pay on Fund distributions or on the redemption or sale of Fund shares. The total expense ratio for SPDR SSGA Income Allocation ETF as stated in the Fees and Expenses table of the prospectus dated October 31, 2014 is 0.70%.
PERFORMANCE AS OF DECEMBER 31, 2014
| CUMULATIVE TOTAL RETURN | AVERAGE ANNUAL TOTAL RETURN | |||||||||||||||||||||||||||||||||||||
NET ASSET VALUE | MARKET VALUE | PRIMARY
| SECONDARY
BARCLAYS US | NET ASSET VALUE | MARKET VALUE | PRIMARY
| SECONDARY
BARCLAYS US | |||||||||||||||||||||||||||||||
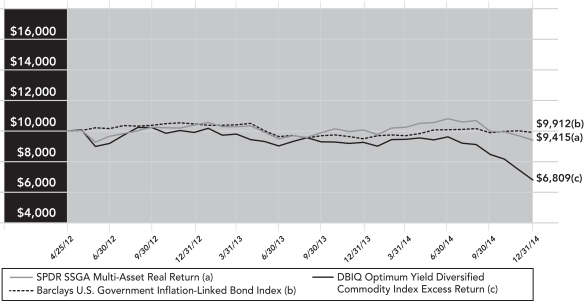
| SIX MONTHS | 0.01% | –0.06% | –1.17% | 6.70% | N/A | N/A | N/A | N/A | ||||||||||||||||||||||||||||||
| ONE YEAR | 8.45% | 8.50% | 4.94% | 19.31% | 8.45% | 8.50% | 4.94% | 19.31% | ||||||||||||||||||||||||||||||
| SINCE INCEPTION (1) | 19.41% | 19.33% | 40.59% | 17.91% | 6.82% | 6.80% | 13.54% | 6.33% | ||||||||||||||||||||||||||||||
| (1) | For the period April 25, 2012 to December 31, 2014. |
3
Table of Contents
SPDR SSGA INCOME ALLOCATION ETF —
PERFORMANCE SUMMARY (CONTINUED)
COMPARISON OF CHANGE IN VALUE OF A $10,000 INVESTMENT (BASED ON NET ASSET VALUE)
Past performance is not a guarantee of future results.
Index returns are unmanaged and do not reflect the deduction of any fees or expenses. Index returns reflect all items of income, gain and loss and the reinvestment of dividends and other income.
4
Table of Contents
SPDR SSGA GLOBAL ALLOCATION ETF —
PERFORMANCE SUMMARY
The following performance chart of the Fund’s total return at net asset value, the total return based on market price and its benchmark index is provided for comparative purposes only and represents the periods noted. The Fund’s per share net asset value (“NAV”) is the value of one share of the Fund and is calculated by dividing the value of total assets less total liabilities by the number of shares outstanding. The NAV return is based on the NAV of the Fund and the market return is based on the market price per share of the Fund. The market price used to calculate the market return is determined by using the midpoint between the highest bid and the lowest offer on the exchange on which the shares of the Fund are listed for trading, as of the time that the Fund’s NAV is calculated. Since shares of the Fund did not trade in the secondary market until one day after the Fund’s inception, for the period from inception to the first day of secondary market trading in shares of the Fund (4/25/12, 4/26/12, respectively), the NAV of the Fund is used as a proxy for the secondary market trading price to calculate market returns. NAV and market returns assume that dividends and capital gain distributions have been reinvested in the Fund at NAV. Market returns do not include brokerage commissions that may be payable on secondary market transactions. If brokerage commissions were included market returns would be lower.
An index is a statistical measure of a specified financial market or sector. An index does not actually hold a portfolio of securities and therefore does not reflect deductions for fees or expenses. In comparison, the Fund’s performance is negatively impacted by these deductions.
Performance quoted represents past performance, which is no guarantee of future results. Investment return and principal value will fluctuate, so you may have a gain or loss when shares are sold. Current performance may be higher or lower than that quoted. Visit www.spdrs.com for most recent month-end performance. The returns do not reflect the deduction of taxes that a shareholder would pay on Fund distributions or on the redemption or sale of Fund shares. The total expense ratio for SPDR SSGA Global Allocation ETF as stated in the Fees and Expenses table of the prospectus dated October 31, 2014 is 0.35%.
PERFORMANCE AS OF DECEMBER 31, 2014
| CUMULATIVE TOTAL RETURN | AVERAGE ANNUAL TOTAL RETURN | |||||||||||||||||||||||||||||||||||||
NET ASSET VALUE | MARKET VALUE | PRIMARY
| SECONDARY
BARCLAYS US | NET ASSET VALUE | MARKET VALUE | PRIMARY
| SECONDARY
BARCLAYS US | |||||||||||||||||||||||||||||||
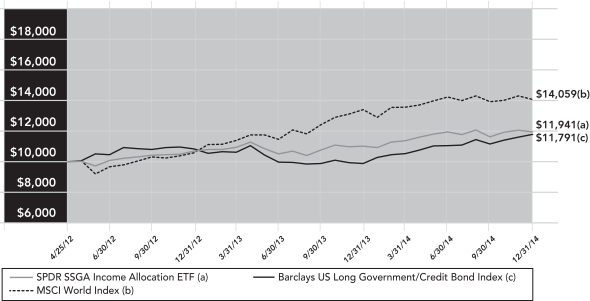
| SIX MONTHS | –0.42% | –0.34% | –2.25% | 1.96% | N/A | N/A | N/A | N/A | ||||||||||||||||||||||||||||||
| ONE YEAR | 5.23% | 5.35% | 3.84% | 5.97% | 5.23% | 5.35% | 3.84% | 5.97% | ||||||||||||||||||||||||||||||
| SINCE INCEPTION (1) | 25.52% | 25.63% | 35.77% | 6.94% | 8.82% | 8.86% | 12.07% | 2.53% | ||||||||||||||||||||||||||||||
| (1) | For the period April 25, 2012 to December 31, 2014. |
5
Table of Contents
SPDR SSGA GLOBAL ALLOCATION ETF —
PERFORMANCE SUMMARY (CONTINUED)
COMPARISON OF CHANGE IN VALUE OF A $10,000 INVESTMENT (BASED ON NET ASSET VALUE)
Past performance is not a guarantee of future results.
Index returns are unmanaged and do not reflect the deduction of any fees or expenses. Index returns reflect all items of income, gain and loss and the reinvestment of dividends and other income.
6
Table of Contents
SPDR BLACKSTONE/GSO SENIOR LOAN ETF —
PERFORMANCE SUMMARY
The following performance chart of the Fund’s total return at net asset value, the total return based on market price and its benchmark index is provided for comparative purposes only and represents the periods noted. The Fund’s per share net asset value (“NAV”) is the value of one share of the Fund and is calculated by dividing the value of total assets less total liabilities by the number of shares outstanding. The NAV return is based on the NAV of the Fund and the market return is based on the market price per share of the Fund. The market price used to calculate the market return is determined by using the midpoint between the highest bid and the lowest offer on the exchange on which the shares of the Fund are listed for trading, as of the time that the Fund’s NAV is calculated. Since shares of the Fund did not trade in the secondary market until one day after the Fund’s inception, for the period from inception to the first day of secondary market trading in shares of the Fund (4/3/13, 4/4/13, respectively), the NAV of the Fund is used as a proxy for the secondary market trading price to calculate market returns. NAV and market returns assume that dividends and capital gain distributions have been reinvested in the Fund at NAV. Market returns do not include brokerage commissions that may be payable on secondary market transactions. If brokerage commissions were included market returns would be lower.
An index is a statistical measure of a specified financial market or sector. An index does not actually hold a portfolio of securities and therefore does not reflect deductions for fees or expenses. In comparison, the Fund’s performance is negatively impacted by these deductions.
Performance quoted represents past performance, which is no guarantee of future results. Investment return and principal value will fluctuate, so you may have a gain or loss when shares are sold. Current performance may be higher or lower than that quoted. Visit www.spdrs.com for most recent month-end performance. The returns do not reflect the deduction of taxes that a shareholder would pay on Fund distributions or on the redemption or sale of Fund shares. The total expense ratio for SPDR Blackstone/GSO Senior Loan ETF as stated in the Fees and Expenses table of the prospectus dated October 31, 2014 is 0.70%.
PERFORMANCE AS OF DECEMBER 31, 2014
| CUMULATIVE TOTAL RETURN | AVERAGE ANNUAL TOTAL RETURN | |||||||||||||||||||||||||||||||||||||
NET ASSET VALUE | MARKET VALUE | PRIMARY
MARKIT IBOXX | SECONDARY
| NET ASSET VALUE | MARKET VALUE | PRIMARY
MARKIT IBOXX | SECONDARY
| |||||||||||||||||||||||||||||||
| SIX MONTHS | –0.55% | –0.42% | 0.03% | –0.47% | N/A | N/A | N/A | N/A | ||||||||||||||||||||||||||||||
| ONE YEAR | 0.90% | 0.84% | 1.10% | 0.99% | 0.90% | 0.84% | 1.10% | 0.99% | ||||||||||||||||||||||||||||||
| SINCE INCEPTION (1) | 2.70% | 2.83% | 3.79% | 3.79% | 1.54% | 1.61% | 2.16% | 2.16% | ||||||||||||||||||||||||||||||
| (1) | For the period April 3, 2013 to December 31, 2014. |
7
Table of Contents
SPDR BLACKSTONE/GSO SENIOR LOAN ETF —
PERFORMANCE SUMMARY (CONTINUED)
COMPARISON OF CHANGE IN VALUE OF A $10,000 INVESTMENT (BASED ON NET ASSET VALUE)
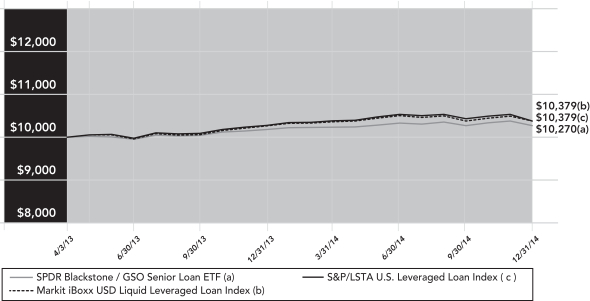
Past performance is not a guarantee of future results.
Index returns are unmanaged and do not reflect the deduction of any fees or expenses. Index returns reflect all items of income, gain and loss and the reinvestment of dividends and other income.
8
Table of Contents
SPDR SSGA ULTRA SHORT TERM BOND ETF —
PERFORMANCE SUMMARY
The following performance chart of the Fund’s total return at net asset value, the total return based on market price and its benchmark index is provided for comparative purposes only and represents the periods noted. The Fund’s per share net asset value (“NAV”) is the value of one share of the Fund and is calculated by dividing the value of total assets less total liabilities by the number of shares outstanding. The NAV return is based on the NAV of the Fund and the market return is based on the market price per share of the Fund. The market price used to calculate the market return is determined by using the midpoint between the highest bid and the lowest offer on the exchange on which the shares of the Fund are listed for trading, as of the time that the Fund’s NAV is calculated. Since shares of the Fund did not trade in the secondary market until one day after the Fund’s inception, for the period from inception to the first day of secondary market trading in shares of the Fund (10/9/13, 10/10/13, respectively), the NAV of the Fund is used as a proxy for the secondary market trading price to calculate market returns. NAV and market returns assume that dividends and capital gain distributions have been reinvested in the Fund at NAV. Market returns do not include brokerage commissions that may be payable on secondary market transactions. If brokerage commissions were included market returns would be lower.
An index is a statistical measure of a specified financial market or sector. An index does not actually hold a portfolio of securities and therefore does not reflect deductions for fees or expenses. In comparison, the Fund’s performance is negatively impacted by these deductions.
Performance quoted represents past performance, which is no guarantee of future results. Investment return and principal value will fluctuate, so you may have a gain or loss when shares are sold. Current performance may be higher or lower than that quoted. Visit www.spdrs.com for most recent month-end performance. The returns do not reflect the deduction of taxes that a shareholder would pay on Fund distributions or on the redemption or sale of Fund shares. The total expense ratio for SPDR SSGA Ultra Short Term Bond ETF as stated in the Fees and Expenses table of the prospectus dated October 31, 2014 is 0.20%.
PERFORMANCE AS OF DECEMBER 31, 2014
| CUMULATIVE TOTAL RETURN | AVERAGE ANNUAL TOTAL RETURN | |||||||||||||||||||||||||||||
NET ASSET VALUE | MARKET VALUE | BARCLAYS US TREASURY BELLWETHER 3 MONTH INDEX | NET ASSET VALUE | MARKET VALUE | BARCLAYS US TREASURY BELLWETHER 3 MONTH INDEX | |||||||||||||||||||||||||
| SIX MONTHS | 0.00% | 0.05% | 0.02% | N/A | N/A | N/A | ||||||||||||||||||||||||
| ONE YEAR | 0.28% | 0.16% | 0.05% | 0.28% | 0.16% | 0.05% | ||||||||||||||||||||||||
| SINCE INCEPTION (1) | 0.46% | 0.43% | 0.08% | 0.37% | 0.35% | 0.06% | ||||||||||||||||||||||||
| (1) | For the period October 9, 2013 to December 31, 2014. |
9
Table of Contents
SPDR SSGA ULTRA SHORT TERM BOND ETF —
PERFORMANCE SUMMARY (CONTINUED)
COMPARISON OF CHANGE IN VALUE OF A $10,000 INVESTMENT (BASED ON NET ASSET VALUE)
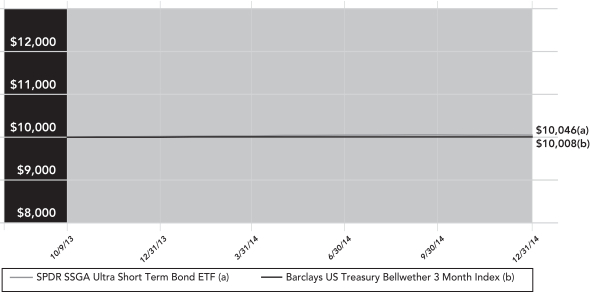
Past performance is not a guarantee of future results.
Index returns are unmanaged and do not reflect the deduction of any fees or expenses. Index returns reflect all items of income, gain and loss and the reinvestment of dividends and other income.
10
Table of Contents
SPDR MFS SYSTEMATIC CORE EQUITY ETF —
PERFORMANCE SUMMARY
The following performance chart of the Fund’s total return at net asset value, the total return based on market price and its benchmark index is provided for comparative purposes only and represents the periods noted. The Fund’s per share net asset value (“NAV”) is the value of one share of the Fund and is calculated by dividing the value of total assets less total liabilities by the number of shares outstanding. The NAV return is based on the NAV of the Fund and the market return is based on the market price per share of the Fund. The market price used to calculate the market return is determined by using the midpoint between the highest bid and the lowest offer on the exchange on which the shares of the Fund are listed for trading, as of the time that the Fund’s NAV is calculated. Since shares of the Fund did not trade in the secondary market until one day after the Fund’s inception, for the period from inception to the first day of secondary market trading in shares of the Fund (1/8/14, 1/9/14, respectively), the NAV of the Fund is used as a proxy for the secondary market trading price to calculate market returns. NAV and market returns assume that dividends and capital gain distributions have been reinvested in the Fund at NAV. Market returns do not include brokerage commissions that may be payable on secondary market transactions. If brokerage commissions were included market returns would be lower.
An index is a statistical measure of a specified financial market or sector. An index does not actually hold a portfolio of securities and therefore does not reflect deductions for fees or expenses. In comparison, the Fund’s performance is negatively impacted by these deductions.
Performance quoted represents past performance, which is no guarantee of future results. Investment return and principal value will fluctuate, so you may have a gain or loss when shares are sold. Current performance may be higher or lower than that quoted. Visit www.spdrs.com for most recent month-end performance. The returns do not reflect the deduction of taxes that a shareholder would pay on Fund distributions or on the redemption or sale of Fund shares. The total expense ratio for SPDR MFS Systematic Core Equity ETF as stated in the Fees and Expenses table of the prospectus dated October 31, 2014 is 0.60%.
PERFORMANCE AS OF DECEMBER 31, 2014
| CUMULATIVE TOTAL RETURN | AVERAGE ANNUAL TOTAL RETURN | |||||||||||||||||||||||||||||
NET ASSET VALUE | MARKET VALUE | S&P 500 INDEX | NET ASSET VALUE | MARKET VALUE | S&P 500 INDEX | |||||||||||||||||||||||||
| SIX MONTHS | 9.67% | 9.46% | 6.12% | N/A | N/A | N/A | ||||||||||||||||||||||||
| SINCE INCEPTION (1) | 18.23% | 18.00% | 14.30% | N/A | N/A | N/A | ||||||||||||||||||||||||
| (1) | For the period January 8, 2014 to December 31, 2014. |
11
Table of Contents
SPDR MFS SYSTEMATIC CORE EQUITY ETF —
PERFORMANCE SUMMARY (CONTINUED)
COMPARISON OF CHANGE IN VALUE OF A $10,000 INVESTMENT (BASED ON NET ASSET VALUE)
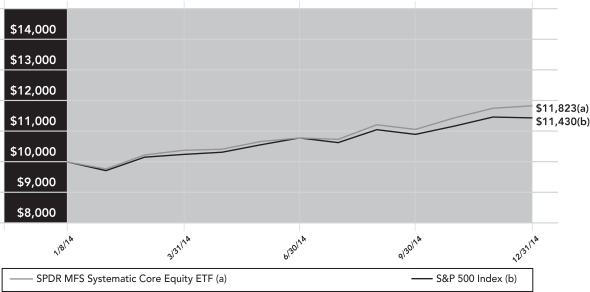
Past performance is not a guarantee of future results.
Index returns are unmanaged and do not reflect the deduction of any fees or expenses. Index returns reflect all items of income, gain and loss and the reinvestment of dividends and other income.
12
Table of Contents
SPDR MFS SYSTEMATIC GROWTH EQUITY ETF —
PERFORMANCE SUMMARY
The following performance chart of the Fund’s total return at net asset value, the total return based on market price and its benchmark index is provided for comparative purposes only and represents the periods noted. The Fund’s per share net asset value (“NAV”) is the value of one share of the Fund and is calculated by dividing the value of total assets less total liabilities by the number of shares outstanding. The NAV return is based on the NAV of the Fund and the market return is based on the market price per share of the Fund. The market price used to calculate the market return is determined by using the midpoint between the highest bid and the lowest offer on the exchange on which the shares of the Fund are listed for trading, as of the time that the Fund’s NAV is calculated. Since shares of the Fund did not trade in the secondary market until one day after the Fund’s inception, for the period from inception to the first day of secondary market trading in shares of the Fund (1/8/14, 1/9/14, respectively), the NAV of the Fund is used as a proxy for the secondary market trading price to calculate market returns. NAV and market returns assume that dividends and capital gain distributions have been reinvested in the Fund at NAV. Market returns do not include brokerage commissions that may be payable on secondary market transactions. If brokerage commissions were included market returns would be lower.
An index is a statistical measure of a specified financial market or sector. An index does not actually hold a portfolio of securities and therefore does not reflect deductions for fees or expenses. In comparison, the Fund’s performance is negatively impacted by these deductions.
Performance quoted represents past performance, which is no guarantee of future results. Investment return and principal value will fluctuate, so you may have a gain or loss when shares are sold. Current performance may be higher or lower than that quoted. Visit www.spdrs.com for most recent month-end performance. The returns do not reflect the deduction of taxes that a shareholder would pay on Fund distributions or on the redemption or sale of Fund shares. The total expense ratio for SPDR MFS Systematic Growth Equity ETF as stated in the Fees and Expenses table of the prospectus dated October 31, 2014 is 0.60%.
PERFORMANCE AS OF DECEMBER 31, 2014
| CUMULATIVE TOTAL RETURN | AVERAGE ANNUAL TOTAL RETURN | |||||||||||||||||||||||||||||
NET ASSET VALUE | MARKET VALUE | RUSSELL 1000 GROWTH INDEX | NET ASSET VALUE | MARKET VALUE | RUSSELL 1000 GROWTH INDEX | |||||||||||||||||||||||||
| SIX MONTHS | 11.36% | 11.24% | 6.34% | N/A | N/A | N/A | ||||||||||||||||||||||||
| SINCE INCEPTION (1) | 19.92% | 19.72% | 13.82% | N/A | N/A | N/A | ||||||||||||||||||||||||
| (1) | For the period January 8, 2014 to December 31, 2014. |
13
Table of Contents
SPDR MFS SYSTEMATIC GROWTH EQUITY ETF —
PERFORMANCE SUMMARY (CONTINUED)
COMPARISON OF CHANGE IN VALUE OF A $10,000 INVESTMENT (BASED ON NET ASSET VALUE)
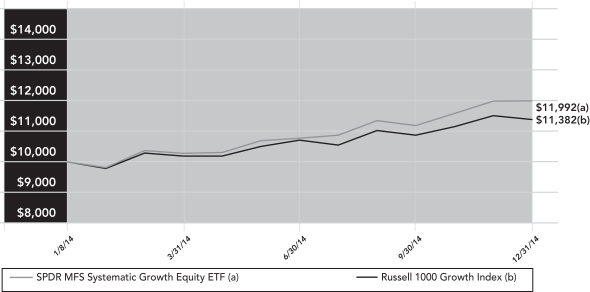
Past performance is not a guarantee of future results.
Index returns are unmanaged and do not reflect the deduction of any fees or expenses. Index returns reflect all items of income, gain and loss and the reinvestment of dividends and other income.
14
Table of Contents
SPDR MFS SYSTEMATIC VALUE EQUITY ETF —
PERFORMANCE SUMMARY
The following performance chart of the Fund’s total return at net asset value, the total return based on market price and its benchmark index is provided for comparative purposes only and represents the periods noted. The Fund’s per share net asset value (“NAV”) is the value of one share of the Fund and is calculated by dividing the value of total assets less total liabilities by the number of shares outstanding. The NAV return is based on the NAV of the Fund and the market return is based on the market price per share of the Fund. The market price used to calculate the market return is determined by using the midpoint between the highest bid and the lowest offer on the exchange on which the shares of the Fund are listed for trading, as of the time that the Fund’s NAV is calculated. Since shares of the Fund did not trade in the secondary market until one day after the Fund’s inception, for the period from inception to the first day of secondary market trading in shares of the Fund (1/8/14, 1/9/14, respectively), the NAV of the Fund is used as a proxy for the secondary market trading price to calculate market returns. NAV and market returns assume that dividends and capital gain distributions have been reinvested in the Fund at NAV. Market returns do not include brokerage commissions that may be payable on secondary market transactions. If brokerage commissions were included market returns would be lower.
An index is a statistical measure of a specified financial market or sector. An index does not actually hold a portfolio of securities and therefore does not reflect deductions for fees or expenses. In comparison, the Fund’s performance is negatively impacted by these deductions.
Performance quoted represents past performance, which is no guarantee of future results. Investment return and principal value will fluctuate, so you may have a gain or loss when shares are sold. Current performance may be higher or lower than that quoted. Visit www.spdrs.com for most recent month-end performance. The returns do not reflect the deduction of taxes that a shareholder would pay on Fund distributions or on the redemption or sale of Fund shares. The total expense ratio for SPDR MFS Systematic Value Equity ETF as stated in the Fees and Expenses table of the prospectus dated October 31, 2014 is 0.60%.
PERFORMANCE AS OF DECEMBER 31, 2014
| CUMULATIVE TOTAL RETURN | AVERAGE ANNUAL TOTAL RETURN | |||||||||||||||||||||||||||||
NET ASSET VALUE | MARKET VALUE | RUSSELL 1000 VALUE INDEX | NET ASSET VALUE | MARKET VALUE | RUSSELL 1000 VALUE INDEX | |||||||||||||||||||||||||
| SIX MONTHS | 7.72% | 7.63% | 4.78% | N/A | N/A | N/A | ||||||||||||||||||||||||
| SINCE INCEPTION (1) | 14.23% | 14.11% | 13.76% | N/A | N/A | N/A | ||||||||||||||||||||||||
| (1) | For the period January 8, 2014 to December 31, 2014. |
15
Table of Contents
SPDR MFS SYSTEMATIC VALUE EQUITY ETF —
PERFORMANCE SUMMARY (CONTINUED)
COMPARISON OF CHANGE IN VALUE OF A $10,000 INVESTMENT (BASED ON NET ASSET VALUE)
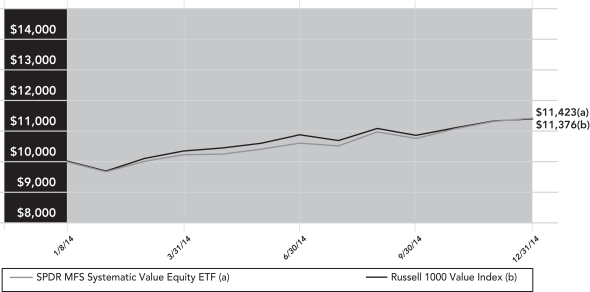
Past performance is not a guarantee of future results.
Index returns are unmanaged and do not reflect the deduction of any fees or expenses. Index returns reflect all items of income, gain and loss and the reinvestment of dividends and other income.
16
Table of Contents
PERFORMANCE SUMMARY
The Fund had less than six months of operations at reporting period end and therefore does not have performance history to provide in this report.
17
Table of Contents
SSGA ACTIVE TRUST
STATEMENTS OF ASSETS AND LIABILITIES
December 31, 2014 (Unaudited)
| SPDR SSGA Multi-Asset Real Return ETF | SPDR SSGA Income Allocation ETF | SPDR SSGA Global Allocation ETF | ||||||||||
ASSETS | ||||||||||||
Investments in corresponding Portfolio, at market value (Note 1) | $ | 166,212,060 | $ | 118,558,491 | $ | 135,451,742 | ||||||
Cash | — | — | 1,046 | |||||||||
Receivable for fund shares sold | 4,057,587 | — | — | |||||||||
Due from Advisor | — | — | 18,302 | |||||||||
|
|
|
|
|
| |||||||
TOTAL ASSETS | 170,269,647 | 118,558,491 | 135,471,090 | |||||||||
|
|
|
|
|
| |||||||
LIABILITIES | ||||||||||||
Payable for Fund shares repurchased | 2,724,595 | — | — | |||||||||
Due to Custodian | 367 | 84 | — | |||||||||
Distributions payable | 888,625 | 1,413,875 | 2,190,373 | |||||||||
Accrued advisory fees | 3,839 | 15,302 | — | |||||||||
Accrued trustees’ fees and expenses | 129 | 85 | 80 | |||||||||
|
|
|
|
|
| |||||||
TOTAL LIABILITIES | 3,617,555 | 1,429,346 | 2,190,453 | |||||||||
|
|
|
|
|
| |||||||
NET ASSETS | $ | 166,652,092 | $ | 117,129,145 | $ | 133,280,637 | ||||||
|
|
|
|
|
| |||||||
NET ASSETS CONSIST OF: | ||||||||||||
Paid-in capital (Note 4) | $ | 189,409,257 | $ | 118,345,121 | $ | 129,624,230 | ||||||
Undistributed (distributions in excess of) net investment income | (268,017 | ) | (301,031 | ) | (243,220 | ) | ||||||
Accumulated net realized gain (loss) on investments | (6,776,465 | ) | (3,716,422 | ) | 575,173 | |||||||
Net unrealized appreciation (depreciation) on investments | (15,712,683 | ) | 2,801,477 | 3,324,454 | ||||||||
|
|
|
|
|
| |||||||
NET ASSETS | $ | 166,652,092 | $ | 117,129,145 | $ | 133,280,637 | ||||||
|
|
|
|
|
| |||||||
NET ASSET VALUE PER SHARE | ||||||||||||
Net asset value per share | $ | 26.66 | $ | 32.08 | $ | 34.61 | ||||||
|
|
|
|
|
| |||||||
Shares outstanding (unlimited amount authorized, $0.00 par value) | 6,251,111 | 3,651,111 | 3,851,111 | |||||||||
|
|
|
|
|
| |||||||
See Notes to Financial Statements and Financial Statements of the Master Portfolios.
18
Table of Contents
| SPDR Blackstone/ GSO Senior Loan ETF | SPDR SSGA Ultra Short Term Bond ETF | SPDR MFS Systematic Core Equity ETF | SPDR MFS Systematic Growth Equity ETF | SPDR MFS Systematic Value Equity ETF | SPDR SSGA Risk Aware ETF | |||||||||||||||||
| $ | 566,198,408 | $ | 16,013,173 | $ | 2,929,135 | $ | 2,974,791 | $ | 2,827,810 | $ | 1,969,835 | |||||||||||
| — | 371 | — | — | — | 441 | |||||||||||||||||
| — | — | — | — | — | — | |||||||||||||||||
| — | — | — | — | — | — | |||||||||||||||||
|
|
|
|
|
|
|
|
|
|
|
| |||||||||||
| 566,198,408 | 16,013,544 | 2,929,135 | 2,974,791 | 2,827,810 | 1,970,276 | |||||||||||||||||
|
|
|
|
|
|
|
|
|
|
|
| |||||||||||
| — | — | — | — | — | — | |||||||||||||||||
| 1,416 | — | — | — | — | — | |||||||||||||||||
| 2,225,518 | 4,842 | 84,626 | 103,899 | 57,667 | 7,355 | |||||||||||||||||
| 193,391 | — | 741 | 753 | 715 | 415 | |||||||||||||||||
| 479 | 14 | 46 | 46 | 46 | 2 | |||||||||||||||||
|
|
|
|
|
|
|
|
|
|
|
| |||||||||||
| 2,420,804 | 4,856 | 85,413 | 104,698 | 58,428 | 7,772 | |||||||||||||||||
|
|
|
|
|
|
|
|
|
|
|
| |||||||||||
| $ | 563,777,604 | $ | 16,008,688 | $ | 2,843,722 | $ | 2,870,093 | $ | 2,769,382 | $ | 1,962,504 | |||||||||||
|
|
|
|
|
|
|
|
|
|
|
| |||||||||||
| $ | 580,977,747 | $ | 16,028,373 | $ | 2,477,851 | $ | 2,458,213 | $ | 2,491,011 | $ | 2,182,299 | |||||||||||
| (552,840 | ) | (1,145 | ) | 18 | (14 | ) | (14 | ) | (4 | ) | ||||||||||||
| (3,679,922 | ) | (3,538 | ) | 24,125 | 22,564 | 18,554 | (290,160 | ) | ||||||||||||||
| (12,967,381 | ) | (15,002 | ) | 341,728 | 389,330 | 259,831 | 70,369 | |||||||||||||||
|
|
|
|
|
|
|
|
|
|
|
| |||||||||||
| $ | 563,777,604 | $ | 16,008,688 | $ | 2,843,722 | $ | 2,870,093 | $ | 2,769,382 | $ | 1,962,504 | |||||||||||
|
|
|
|
|
|
|
|
|
|
|
| |||||||||||
| $ | 48.60 | $ | 40.02 | $ | 56.87 | $ | 57.40 | $ | 55.39 | $ | 39.25 | |||||||||||
|
|
|
|
|
|
|
|
|
|
|
| |||||||||||
| 11,600,000 | 400,000 | 50,000 | 50,000 | 50,000 | 50,000 | |||||||||||||||||
|
|
|
|
|
|
|
|
|
|
|
| |||||||||||
19
Table of Contents
SSGA ACTIVE TRUST
STATEMENTS OF OPERATIONS
For the Six Months Ended December 31, 2014 (Unaudited)
| SPDR SSGA Multi-Asset Real Return ETF | SPDR SSGA Income Allocation ETF | SPDR SSGA Global Allocation ETF | ||||||||||
INCOME AND EXPENSES ALLOCATED FROM PORTFOLIO | ||||||||||||
Dividend income allocated from Portfolio (Note 2) | $ | 1,456,888 | $ | 2,340,372 | $ | 1,847,455 | ||||||
Foreign taxes withheld | — | — | — | |||||||||
Expenses allocated from Portfolio (Note 2) | (164,628 | ) | (107,912 | ) | (113,783 | ) | ||||||
|
|
|
|
|
| |||||||
| 1,292,260 | 2,232,460 | 1,733,672 | ||||||||||
|
|
|
|
|
| |||||||
EXPENSES | ||||||||||||
Advisory fees (Note 3) | 28,379 | 87,588 | — | |||||||||
Trustees’ Fees (Note 3) | 2,017 | 926 | 1,104 | |||||||||
Miscellaneous expenses | — | — | — | |||||||||
|
|
|
|
|
| |||||||
TOTAL EXPENSES | 30,396 | 88,514 | 1,104 | |||||||||
|
|
|
|
|
| |||||||
Fees reimbursed by Adviser | — | — | (79,176 | ) | ||||||||
|
|
|
|
|
| |||||||
NET INVESTMENT INCOME | $ | 1,261,864 | $ | 2,143,946 | $ | 1,811,744 | ||||||
|
|
|
|
|
| |||||||
REALIZED AND UNREALIZED GAIN (LOSS) ON INVESTMENTS | ||||||||||||
Net realized gain (loss) allocated from Portfolio | (2,517,903 | ) | 286,700 | 1,190,835 | ||||||||
Net change in unrealized appreciation (depreciation) from corresponding Portfolio | (21,237,256 | ) | (2,449,912 | ) | (3,091,058 | ) | ||||||
|
|
|
|
|
| |||||||
NET REALIZED AND UNREALIZED GAIN (LOSS) ON INVESTMENTS | (23,755,159 | ) | (2,163,212 | ) | (1,900,223 | ) | ||||||
|
|
|
|
|
| |||||||
NET INCREASE (DECREASE) IN NET ASSETS RESULTING FROM OPERATIONS | $ | (22,493,295 | ) | $ | (19,266 | ) | $ | (88,479 | ) | |||
|
|
|
|
|
| |||||||
| * | For the period September 9, 2014 (commencement of operations) to December 31, 2014. |
See Notes to Financial Statements and Financial Statements of the Master Portfolios.
20
Table of Contents
| SPDR Blackstone/ GSO Senior Loan ETF | SPDR SSGA Ultra Short Term Bond ETF | SPDR MFS Systematic Core Equity ETF | SPDR MFS Systematic Growth Equity ETF | SPDR MFS Systematic Value Equity ETF | SPDR SSGA Risk Aware ETF* | |||||||||||||||||
| $ | 14,212,712 | $ | 42,637 | $ | 31,185 | $ | 25,632 | $ | 29,455 | $ | 16,059 | |||||||||||
| — | (33 | ) | — | — | — | — | ||||||||||||||||
| (910,185 | ) | (16,523 | ) | (4,938 | ) | (4,993 | ) | (4,810 | ) | (2,063 | ) | |||||||||||
|
|
|
|
|
|
|
|
|
|
|
| |||||||||||
| 13,302,527 | 26,081 | 26,247 | 20,639 | 24,645 | 13,996 | |||||||||||||||||
|
|
|
|
|
|
|
|
|
|
|
| |||||||||||
| 1,206,367 | — | 4,864 | 4,918 | 4,736 | 2,018 | |||||||||||||||||
| 5,085 | 229 | 80 | 80 | 78 | 22 | |||||||||||||||||
| 17,756 | — | — | — | — | — | |||||||||||||||||
|
|
|
|
|
|
|
|
|
|
|
| |||||||||||
| 1,229,208 | 229 | 4,944 | 4,998 | 4,814 | 2,040 | |||||||||||||||||
|
|
|
|
|
|
|
|
|
|
|
| |||||||||||
| — | — | — | — | — | — | |||||||||||||||||
|
|
|
|
|
|
|
|
|
|
|
| |||||||||||
| $ | 12,073,319 | $ | 25,852 | $ | 21,303 | $ | 15,641 | $ | 19,831 | $ | 11,956 | |||||||||||
|
|
|
|
|
|
|
|
|
|
|
| |||||||||||
| (893,668 | ) | (4,253 | ) | 228,444 | 311,630 | 211,102 | (290,160 | ) | ||||||||||||||
| | (14,584,355 | ) | (25,481 | ) | 51,391 | 45,396 | (2,337 | ) | 70,369 | |||||||||||||
|
|
|
|
|
|
|
|
|
|
|
| |||||||||||
| | (15,478,023 | ) | (29,734 | ) | 279,835 | 357,026 | 208,765 | (219,791 | ) | |||||||||||||
|
|
|
|
|
|
|
|
|
|
|
| |||||||||||
| $ | (3,404,704) | $ | (3,882) | $ | 301,138 | $ | 372,667 | $ | 228,596 | $ | (207,835) | |||||||||||
|
|
|
|
|
|
|
|
|
|
|
| |||||||||||
21
Table of Contents
SSGA ACTIVE TRUST
STATEMENTS OF CHANGES IN NET ASSETS
| SPDR SSGA Multi-Asset Real Return ETF | SPDR SSGA Income Allocation ETF | |||||||||||||||
| Six Months Ended 12/31/14 (Unaudited) | Year Ended 6/30/14 | Six Months Ended 12/31/14 (Unaudited) | Year Ended 6/30/14 | |||||||||||||
INCREASE (DECREASE) IN NET ASSETS FROM OPERATIONS: | ||||||||||||||||
Net investment income (loss) | $ | 1,261,864 | $ | 2,541,102 | $ | 2,143,946 | $ | 3,930,594 | ||||||||
Net realized gain (loss) on investments | (2,517,903 | ) | (2,207,376 | ) | 286,700 | (1,346,776 | ) | |||||||||
Net change in unrealized appreciation (depreciation) on investments | (21,237,256 | ) | 16,133,379 | (2,449,912 | ) | 11,409,099 | ||||||||||
|
|
|
|
|
|
|
| |||||||||
Net increase (decrease) in net assets resulting from operations | (22,493,295 | ) | 16,467,105 | (19,266 | ) | 13,992,917 | ||||||||||
|
|
|
|
|
|
|
| |||||||||
Net equalization credits and charges | 41,508 | 44,917 | 56,292 | (85,229 | ) | |||||||||||
|
|
|
|
|
|
|
| |||||||||
DISTRIBUTIONS TO SHAREHOLDERS FROM: | ||||||||||||||||
Net investment income | (1,312,538 | ) | (2,582,680 | ) | (2,180,749 | ) | (3,845,121 | ) | ||||||||
Net realized gain (loss) on investments | — | — | — | — | ||||||||||||
|
|
|
|
|
|
|
| |||||||||
| (1,312,538 | ) | (2,582,680 | ) | (2,180,749 | ) | (3,845,121 | ) | |||||||||
|
|
|
|
|
|
|
| |||||||||
FROM BENEFICIAL INTEREST TRANSACTIONS: | ||||||||||||||||
Proceeds from sale of shares | 47,753,317 | 91,367,609 | 19,439,975 | 7,804,637 | ||||||||||||
Cost of shares redeemed | (20,875,745 | ) | (62,105,980 | ) | (3,145,648 | ) | (86,894,211 | ) | ||||||||
Net income equalization (Note 2) | (41,508 | ) | (44,917 | ) | (56,292 | ) | 85,229 | |||||||||
Other capital (Note 4) | — | — | — | — | ||||||||||||
|
|
|
|
|
|
|
| |||||||||
Net increase (decrease) in net assets from beneficial interest transactions | 26,836,064 | 29,216,712 | 16,238,035 | (79,004,345 | ) | |||||||||||
|
|
|
|
|
|
|
| |||||||||
Net increase (decrease) in net assets during the period | 3,071,739 | 43,146,054 | 14,094,312 | (68,941,778 | ) | |||||||||||
Net assets at beginning of period | 163,580,353 | 120,434,299 | 103,034,833 | 171,976,611 | ||||||||||||
|
|
|
|
|
|
|
| |||||||||
NET ASSETS END OF PERIOD (1) | $ | 166,652,092 | $ | 163,580,353 | $ | 117,129,145 | $ | 103,034,833 | ||||||||
|
|
|
|
|
|
|
| |||||||||
SHARES OF BENEFICIAL INTEREST | ||||||||||||||||
Shares sold | 1,700,000 | 3,100,000 | 600,000 | 250,000 | ||||||||||||
Shares redeemed | (750,000 | ) | (2,150,000 | ) | (100,000 | ) | (2,850,000 | ) | ||||||||
|
|
|
|
|
|
|
| |||||||||
Net increase (decrease) in shares | 950,000 | 950,000 | 500,000 | (2,600,000 | ) | |||||||||||
|
|
|
|
|
|
|
| |||||||||
(1) Undistributed (distributions in excess of) net investment income | $ | (268,017 | ) | $ | (217,343 | ) | $ | (301,031 | ) | $ | (264,228 | ) | ||||
|
|
|
|
|
|
|
| |||||||||
| * | Commencement of operations |
See Notes to Financial Statements and Financial Statements of the Master Portfolios.
22
Table of Contents
| SPDR SSGA Global Allocation ETF | SPDR Blackstone/GSO Senior Loan ETF | SPDR SSGA Ultra Short Term Bond ETF | ||||||||||||||||||||
| Six Months Ended 12/31/14 (Unaudited) | Year Ended 6/30/14 | �� | Six Months Ended 12/31/14 (Unaudited) | Year Ended 6/30/14 | Six Months Ended 12/31/14 (Unaudited) | For the Period 10/9/13* - 6/30/14 | ||||||||||||||||
| $ 1,811,744 | $ | 1,975,944 | $ | 12,073,319 | $ | 17,299,298 | $ | 25,852 | $ | 32,273 | ||||||||||||
| 1,190,835 | 1,718,544 | (893,668 | ) | (2,767,908 | ) | (4,253 | ) | 888 | ||||||||||||||
| | (3,091,058 | ) | 6,937,749 | (14,584,355 | ) | 4,689,705 | (25,481 | ) | 10,479 | |||||||||||||
|
|
|
|
|
|
|
|
|
|
|
| |||||||||||
| | (88,479 | ) | 10,632,237 | (3,404,704 | ) | 19,221,095 | (3,882 | ) | 43,640 | |||||||||||||
|
|
|
|
|
|
|
|
|
|
|
| |||||||||||
| 137,490 | 45,650 | (60,886 | ) | 381,936 | 166 | 134 | ||||||||||||||||
|
|
|
|
|
|
|
|
|
|
|
| |||||||||||
| (1,941,839 | ) | (2,021,720 | ) | (13,872,946 | ) | (16,478,270 | ) | (30,437 | ) | (28,118 | ) | |||||||||||
| (713,037 | ) | — | — | — | (715 | ) | — | |||||||||||||||
|
|
|
|
|
|
|
|
|
|
|
| |||||||||||
| (2,654,876 | ) | (2,021,720 | ) | (13,872,946 | ) | (16,478,270 | ) | (31,152 | ) | (28,118 | ) | |||||||||||
|
|
|
|
|
|
|
|
|
|
|
| |||||||||||
| 41,962,193 | 47,337,163 | 14,857,682 | 286,897,792 | 6,012,276 | 16,009,331 | |||||||||||||||||
| (3,527,069 | ) | (9,842,556 | ) | (44,217,792 | ) | (12,480,635 | ) | (4,007,078 | ) | (2,005,142 | ) | |||||||||||
| (137,490 | ) | (45,650 | ) | 60,886 | (381,936 | ) | (166 | ) | (134 | ) | ||||||||||||
| — | — | 140,085 | 461,547 | 3,607 | 15,206 | |||||||||||||||||
|
|
|
|
|
|
|
|
|
|
|
| |||||||||||
| | 38,297,634 | | 37,448,957 | (29,159,139 | ) | 274,496,768 | 2,008,639 | 14,019,261 | ||||||||||||||
|
|
|
|
|
|
|
|
|
|
|
| |||||||||||
| | 35,691,769 | | 46,105,124 | (46,497,675 | ) | 277,621,529 | 1,973,771 | 14,034,917 | ||||||||||||||
| 97,588,868 | 51,483,744 | 610,275,279 | 332,653,750 | 14,034,917 | — | |||||||||||||||||
|
|
|
|
|
|
|
|
|
|
|
| |||||||||||
| $133,280,637 | $ | 97,588,868 | $ | 563,777,604 | $ | 610,275,279 | $ | 16,008,688 | $ | 14,034,917 | ||||||||||||
|
|
|
|
|
|
|
|
|
|
|
| |||||||||||
| 1,200,000 | 1,400,000 | 300,000 | 5,750,000 | 150,000 | 400,000 | |||||||||||||||||
| (100,000 | ) | (300,000 | ) | (900,000 | ) | (250,000 | ) | (100,000 | ) | (50,000 | ) | |||||||||||
|
|
|
|
|
|
|
|
|
|
|
| |||||||||||
| 1,100,000 | 1,100,000 | (600,000 | ) | 5,500,000 | 50,000 | 350,000 | ||||||||||||||||
|
|
|
|
|
|
|
|
|
|
|
| |||||||||||
| | $ (243,220) | | $ | (113,125 | ) | $ | (552,840 | ) | $ | 1,246,787 | $ | (1,145 | ) | $ | 4,155 | |||||||
|
|
|
|
|
|
|
|
|
|
|
| |||||||||||
23
Table of Contents
SSGA ACTIVE TRUST
STATEMENTS OF CHANGES IN NET ASSETS (continued)
| SPDR MFS Systematic Core Equity ETF | SPDR MFS Systematic Growth Equity ETF | |||||||||||||||
| Six Months Ended 12/31/14 (Unaudited) | For the Period 1/8/14* - 6/30/14 | Six Months Ended 12/31/14 (Unaudited) | For the Period 1/8/14* - 6/30/14 | |||||||||||||
INCREASE (DECREASE) IN NET ASSETS FROM OPERATIONS: | ||||||||||||||||
Net investment income (loss) | $ | 21,303 | $ | 30,668 | $ | 15,641 | $ | 28,394 | ||||||||
Net realized gain (loss) on investments | 228,444 | 68,567 | 311,630 | 10,974 | ||||||||||||
Net change in unrealized appreciation (depreciation) on investments | 51,391 | 290,337 | 45,396 | 343,934 | ||||||||||||
|
|
|
|
|
|
|
| |||||||||
Net increase (decrease) in net assets resulting from operations | 301,138 | 389,572 | 372,667 | 383,302 | ||||||||||||
|
|
|
|
|
|
|
| |||||||||
Net equalization credits and charges | (2,028 | ) | — | (1,097 | ) | — | ||||||||||
|
|
|
|
|
|
|
| |||||||||
DISTRIBUTIONS TO SHAREHOLDERS FROM: | ||||||||||||||||
Net investment income | (21,995 | ) | (29,958 | ) | (16,622 | ) | (27,427 | ) | ||||||||
Net realized gain (loss) on investments | (72,014 | ) | — | (94,899 | ) | — | ||||||||||
|
|
|
|
|
|
|
| |||||||||
| (94,009 | ) | (29,958 | ) | (111,521 | ) | (27,427 | ) | |||||||||
|
|
|
|
|
|
|
| |||||||||
FROM BENEFICIAL INTEREST TRANSACTIONS: | ||||||||||||||||
Proceeds from sale of shares | — | 5,000,000 | — | 5,000,000 | ||||||||||||
Cost of shares redeemed | (2,723,021 | ) | — | (2,746,928 | ) | — | ||||||||||
Net income equalization (Note 2) | 2,028 | — | 1,097 | — | ||||||||||||
Other capital (Note 4) | — | — | — | — | ||||||||||||
|
|
|
|
|
|
|
| |||||||||
Net increase (decrease) in net assets from beneficial interest transactions | (2,720,993 | ) | 5,000,000 | (2,745,831 | ) | 5,000,000 | ||||||||||
|
|
|
|
|
|
|
| |||||||||
Net increase (decrease) in net assets during the period | (2,515,892 | ) | 5,359,614 | (2,485,782 | ) | 5,355,875 | ||||||||||
Net assets at beginning of period | 5,359,614 | — | 5,355,875 | — | ||||||||||||
|
|
|
|
|
|
|
| |||||||||
NET ASSETS END OF PERIOD (1) | $ | 2,843,722 | $ | 5,359,614 | $ | 2,870,093 | $ | 5,355,875 | ||||||||
|
|
|
|
|
|
|
| |||||||||
SHARES OF BENEFICIAL INTEREST | ||||||||||||||||
Shares sold | — | 100,000 | — | 100,000 | ||||||||||||
Shares redeemed | (50,000 | ) | — | (50,000 | ) | — | ||||||||||
|
|
|
|
|
|
|
| |||||||||
Net increase (decrease) in shares | (50,000 | ) | 100,000 | (50,000 | ) | 100,000 | ||||||||||
|
|
|
|
|
|
|
| |||||||||
(1) Undistributed (distributions in excess of) net investment income | $ | 18 | $ | 710 | $ | (14 | ) | $ | 967 | |||||||
|
|
|
|
|
|
|
| |||||||||
| * | Commencement of operations |
See Notes to Financial Statements and Financial Statements of the Master Portfolios.
24
Table of Contents
| SPDR MFS Systematic Value Equity ETF | SPDR SSGA Risk Aware ETF | |||||||||
| Six Months Ended 12/31/14 (Unaudited) | For the Period 1/8/14* - 6/30/14 | For the Period 9/9/14* - 12/31/14 (Unaudited) | ||||||||
| $ | 19,831 | $ | 34,487 | $ | 11,956 | |||||
| 211,102 | 4,237 | (290,160 | ) | |||||||
| | (2,337 | ) | 262,168 | 70,369 | ||||||
|
|
|
|
|
| |||||
| | 228,596 | | 300,892 | (207,835 | ) | |||||
|
|
|
|
|
| |||||
| (1,662 | ) | — | (437 | ) | ||||||
|
|
|
|
|
| |||||
| (20,524 | ) | (33,808 | ) | (11,960 | ) | |||||
| (45,876 | ) | — | — | |||||||
|
|
|
|
|
| |||||
| (66,400 | ) | (33,808 | ) | (11,960 | ) | |||||
|
|
|
|
|
| |||||
| — | 5,000,000 | 4,000,000 | ||||||||
| (2,659,898 | ) | — | (1,817,701 | ) | ||||||
| 1,662 | — | 437 | ||||||||
| — | — | — | ||||||||
|
|
|
|
|
| |||||
| | (2,658,236 | ) | 5,000,000 | 2,182,736 | ||||||
|
|
|
|
|
| |||||
| | (2,497,702 | ) | 5,267,084 | 1,962,504 | ||||||
| 5,267,084 | — | — | ||||||||
|
|
|
|
|
| |||||
| $ | 2,769,382 | $ | 5,267,084 | $ | 1,962,504 | |||||
|
|
|
|
|
| |||||
| — | 100,000 | 100,000 | ||||||||
| (50,000 | ) | — | (50,000 | ) | ||||||
|
|
|
|
|
| |||||
| (50,000 | ) | 100,000 | 50,000 | |||||||
|
|
|
|
|
| |||||
| $ | (14 | ) | $ | 679 | $ | (4 | ) | |||
|
|
|
|
|
| |||||
25
Table of Contents
SSGA ACTIVE TRUST
Selected data for a share of beneficial interest outstanding throughout each period is presented below (1):
| SPDR SSGA Multi-Asset Real Return ETF | ||||||||||||||||
| Six Months Ended 12/31/14 (Unaudited) | Year Ended 6/30/14 | Year Ended 6/30/13 | For the Period 4/25/12* - 6/30/12 | |||||||||||||
Net asset value, beginning of period | $ | 30.86 | $ | 27.68 | $ | 28.77 | $ | 30.00 | ||||||||
|
|
|
|
|
|
|
| |||||||||
Income (loss) from investment operations: | ||||||||||||||||
Net investment income (loss) (2) | 0.23 | 0.57 | 0.86 | 0.20 | ||||||||||||
Net realized and unrealized gain (loss) on investments (3) | (4.22 | ) | 3.22 | (1.33 | ) | (1.22 | ) | |||||||||
|
|
|
|
|
|
|
| |||||||||
Total from investment operations | (3.99 | ) | 3.79 | (0.47 | ) | (1.02 | ) | |||||||||
|
|
|
|
|
|
|
| |||||||||
Net equalization credits and charges (2) | 0.01 | 0.01 | 0.03 | (0.01 | ) | |||||||||||
|
|
|
|
|
|
|
| |||||||||
Other capital | — | — | — | — | ||||||||||||
|
|
|
|
|
|
|
| |||||||||
Distributions to shareholders from: | ||||||||||||||||
Net investment income | (0.22 | ) | (0.62 | ) | (0.65 | ) | (0.20 | ) | ||||||||
Net realized gains | — | — | — | — | ||||||||||||
|
|
|
|
|
|
|
| |||||||||
Total distributions | (0.22 | ) | (0.62 | ) | (0.65 | ) | (0.20 | ) | ||||||||
|
|
|
|
|
|
|
| |||||||||
Net asset value, end of period | $ | 26.66 | $ | 30.86 | $ | 27.68 | $ | 28.77 | ||||||||
|
|
|
|
|
|
|
| |||||||||
Total Return (4) | (12.91 | )% | 13.85 | % | (1.67 | )% | (3.44 | )% | ||||||||
Ratios and Supplemental Data: | ||||||||||||||||
Net Assets, End of Period (000s) | $ | 166,652 | $ | 163,580 | $ | 120,434 | $ | 5,786 | ||||||||
Ratios to average net assets: | ||||||||||||||||
Total expenses | 0.24 | %(5) | 0.24 | % | 0.25 | % | 0.27 | %(5) | ||||||||
Net operating expenses | 0.24 | %(5) | 0.24 | % | 0.25 | % | 0.27 | %(5) | ||||||||
Net investment income | 1.55 | %(5) | 1.97 | % | 2.86 | % | 3.77 | %(5) | ||||||||
Portfolio turnover rate (6) | 21 | % | 40 | % | 31 | % | 10 | % | ||||||||
| * | Commencement of operations |
| (1) | The per share amounts and percentages include each Fund’s proportionate share of income and expenses of their respective Portfolio. |
| (2) | Per share numbers have been calculated using average shares outstanding, which more appropriately presents the per share data for the period. |
| (3) | Amounts shown in this caption for a share outstanding may not accord with the change in aggregate gains and losses in securities for the fiscal period because of the timing of sales and repurchases of Fund shares in relation to fluctuating market values for the Fund. |
| (4) | Total return is calculated assuming a purchase of shares at net asset value on the first day and a sale at net asset value on the last day of each period reported. Distributions are assumed, for the purpose of this calculation, to be reinvested at net asset value per share on the respective payment dates of each Fund. Total return for periods of less than one year is not annualized. Broker commission charges are not included in this calculation. |
| (5) | Annualized. |
| (6) | Portfolio turnover rate is from their respective Portfolio. |
See Notes to Financial Statements and Financial Statements of the Master Portfolios.
26
Table of Contents
| SPDR SSGA Income Allocation ETF | SPDR SSGA Global Allocation ETF | |||||||||||||||||||||||||||||
| Six Months Ended 12/31/14 (Unaudited) | Year Ended 6/30/14 | Year Ended 6/30/13 | For the Period 4/25/12* - 6/30/12 | Six Months Ended 12/31/14 (Unaudited) | Year Ended 6/30/14 | Year Ended 6/30/13 | For the Period 4/25/12* - 6/30/12 | |||||||||||||||||||||||
| $ | 32.70 | $ | 29.90 | $ | 29.85 | $ | 30.00 | $ | 35.47 | $ | 31.18 | $ | 29.19 | $ | 30.00 | |||||||||||||||
|
|
|
|
|
|
|
|
|
|
|
|
|
|
|
| |||||||||||||||
| 0.65 | 1.16 | 1.41 | 0.44 | 0.57 | 0.98 | 1.03 | 0.24 | |||||||||||||||||||||||
| (0.67 | ) | 2.86 | (0.25 | ) | (0.29 | ) | (0.75 | ) | 4.20 | 1.77 | (0.77 | ) | ||||||||||||||||||
|
|
|
|
|
|
|
|
|
|
|
|
|
|
|
| |||||||||||||||
| (0.02 | ) | 4.02 | 1.16 | 0.15 | (0.18 | ) | 5.18 | 2.80 | (0.53 | ) | ||||||||||||||||||||
|
|
|
|
|
|
|
|
|
|
|
|
|
|
|
| |||||||||||||||
| 0.02 | (0.03 | ) | 0.12 | 0.11 | 0.04 | 0.02 | 0.09 | (0.02 | ) | |||||||||||||||||||||
|
|
|
|
|
|
|
|
|
|
|
|
|
|
|
| |||||||||||||||
| — | — | — | — | — | — | — | — | |||||||||||||||||||||||
|
|
|
|
|
|
|
|
|
|
|
|
|
|
|
| |||||||||||||||
| (0.62 | ) | (1.19 | ) | (1.23 | ) | (0.41 | ) | (0.53 | ) | (0.91 | ) | (0.90 | ) | (0.26 | ) | |||||||||||||||
| — | — | — | — | (0.19 | ) | — | — | — | ||||||||||||||||||||||
|
|
|
|
|
|
|
|
|
|
|
|
|
|
|
| |||||||||||||||
| (0.62 | ) | (1.19 | ) | (1.23 | ) | (0.41 | ) | (0.72 | ) | (0.91 | ) | (0.90 | ) | (0.26 | ) | |||||||||||||||
|
|
|
|
|
|
|
|
|
|
|
|
|
|
|
| |||||||||||||||
| $ | 32.08 | $ | 32.70 | $ | 29.90 | $ | 29.85 | $ | 34.61 | $ | 35.47 | $ | 31.18 | $ | 29.19 | |||||||||||||||
|
|
|
|
|
|
|
|
|
|
|
|
|
|
|
| |||||||||||||||
| 0.01 | % | 13.57 | % | 4.22 | % | 0.87 | % | (0.42 | )% | 16.81 | % | 9.91 | % | (1.82 | )% | |||||||||||||||
| $ | 117,129 | $ | 103,035 | $ | 171,977 | $ | 8,989 | $ | 133,281 | $ | 97,589 | $ | 51,484 | $ | 4,411 | |||||||||||||||
| 0.37 | %(5) | 0.36 | % | 0.35 | % | 0.36 | %(5) | 0.20 | %(5) | 0.20 | % | 0.20 | % | 0.20 | %(5) | |||||||||||||||
| 0.37 | %(5) | 0.36 | % | 0.35 | % | 0.36 | %(5) | 0.06 | %(5) | 0.05 | % | 0.04 | % | 0.05 | %(5) | |||||||||||||||
| 4.00 | %(5) | 3.73 | % | 4.50 | % | 8.24 | %(5) | 3.21 | %(5) | 2.91 | % | 3.23 | % | 4.48 | %(5) | |||||||||||||||
| 29 | % | 63 | % | 80 | % | 15 | % | 54 | % | 89 | % | 123 | % | 25 | % | |||||||||||||||
27
Table of Contents
SSGA ACTIVE TRUST
FINANCIAL HIGHLIGHTS
Selected data for a share of beneficial interest outstanding throughout each period is presented below (1):
| SPDR Blackstone/GSO Senior Loan ETF | ||||||||||||
| Six Months Ended 12/31/14 (Unaudited) | Year Ended 6/30/14 | For the Period 4/3/13* - 6/30/13 | ||||||||||
Net asset value, beginning of period | $ | 50.02 | $ | 49.65 | $ | 50.00 | ||||||
|
|
|
|
|
| |||||||
Income (loss) from investment operations: | ||||||||||||
Net investment income (loss) (2) | 1.00 | 1.54 | 0.24 | |||||||||
Net realized and unrealized gain (loss) on investments (3) | (1.27 | ) | 0.24 | (0.65 | ) | |||||||
|
|
|
|
|
| |||||||
Total from investment operations | (0.27 | ) | 1.78 | (0.41 | ) | |||||||
|
|
|
|
|
| |||||||
Net equalization credits and charges (2) | (0.01 | ) | 0.03 | 0.06 | ||||||||
|
|
|
|
|
| |||||||
Other capital | 0.01 | 0.04 | 0.10 | |||||||||
|
|
|
|
|
| |||||||
Distributions to shareholders from: | ||||||||||||
Net investment income | (1.15 | ) | (1.48 | ) | (0.10 | ) | ||||||
Net realized gains | — | — | — | |||||||||
|
|
|
|
|
| |||||||
Total distributions | (1.15 | ) | (1.48 | ) | (0.10 | ) | ||||||
|
|
|
|
|
| |||||||
Net asset value, end of period | $ | 48.60 | $ | 50.02 | $ | 49.65 | ||||||
|
|
|
|
|
| |||||||
Total Return (4) | (0.55 | )% | 3.77 | % | (0.48 | )% | ||||||
Ratios and Supplemental Data: | ||||||||||||
Net Assets, End of Period (000s) | $ | 563,778 | $ | 610,275 | $ | 332,654 | ||||||
Ratios to average net assets: | ||||||||||||
Total expenses | 0.71 | %(5) | 0.85 | % | 0.90 | %(5) | ||||||
Net operating expenses | 0.71 | %(5) | 0.85 | % | 0.90 | %(5) | ||||||
Net investment income | 4.01 | %(5) | 3.09 | % | 1.97 | %(5) | ||||||
Portfolio turnover rate (6) | 31 | % | 77 | % | 4 | % | ||||||
| * | Commencement of operations |
| (1) | The per share amounts and percentages include each Fund’s proportionate share of income and expenses of their respective Portfolio. |
| (2) | Per share numbers have been calculated using average shares outstanding, which more appropriately presents the per share data for the period. |
| (3) | Amounts shown in this caption for a share outstanding may not accord with the change in aggregate gains and losses in securities for the fiscal period because of the timing of sales and repurchases of Fund shares in relation to fluctuating market values for the Fund. |
| (4) | Total return is calculated assuming a purchase of shares at net asset value on the first day and a sale at net asset value on the last day of each period reported. Distributions are assumed, for the purpose of this calculation, to be reinvested at net asset value per share on the respective payment dates of each Fund. Total return for periods of less than one year is not annualized. Broker commission charges are not included in this calculation. |
| (5) | Annualized. |
| (6) | Portfolio turnover rate is from their respective Portfolio. |
| (7) | Amount is less that $0.005 per share. |
See Notes to Financial Statements and Financial Statements of the Master Portfolios.
28
Table of Contents
| SPDR SSGA Ultra Short Term Bond ETF | SPDR MFS Systematic Core Equity ETF | |||||||||||||
| Six Months Ended 12/31/14 (Unaudited) | For the Period 10/9/13* - 6/30/14 | Six Months Ended 12/31/14 (Unaudited) | For the Period 1/8/14* - 6/30/14 | |||||||||||
| $ | 40.10 | $ | 40.00 | $ | 53.60 | $ | 50.00 | |||||||
|
|
|
|
|
|
|
| |||||||
| 0.06 | 0.10 | 0.37 | 0.31 | |||||||||||
| (0.07 | ) | 0.03 | 4.81 | 3.59 | ||||||||||
|
|
|
|
|
|
|
| |||||||
| (0.01 | ) | 0.13 | 5.18 | 3.90 | ||||||||||
|
|
|
|
|
|
|
| |||||||
| 0.00 | (7) | 0.00 | (7) | (0.03 | ) | — | ||||||||
|
|
|
|
|
|
|
| |||||||
| 0.01 | 0.05 | — | — | |||||||||||
|
|
|
|
|
|
|
| |||||||
| (0.08 | ) | (0.08 | ) | (0.44 | ) | (0.30 | ) | |||||||
| (0.00 | )(7) | — | (1.44 | ) | — | |||||||||
|
|
|
|
|
|
|
| |||||||
| (0.08 | ) | (0.08 | ) | (1.88 | ) | (0.30 | ) | |||||||
|
|
|
|
|
|
|
| |||||||
| $ | 40.02 | $ | 40.10 | $ | 56.87 | $ | 53.60 | |||||||
|
|
|
|
|
|
|
| |||||||
| (0.05 | )% | 0.46 | % | 9.67 | % | 7.81 | % | |||||||
| $ | 16,009 | $ | 14,035 | $ | 2,844 | $ | 5,360 | |||||||
| 0.20 | %(5) | 0.20 | %(5) | 0.61 | %(5) | 0.60 | %(5) | |||||||
| 0.20 | %(5) | 0.20 | %(5) | 0.61 | %(5) | 0.60 | %(5) | |||||||
| 0.32 | %(5) | 0.34 | %(5) | 1.31 | %(5) | 1.25 | %(5) | |||||||
| 46 | % | 39 | % | 27 | % | 27 | % | |||||||
29
Table of Contents
SSGA ACTIVE TRUST
FINANCIAL HIGHLIGHTS
Selected data for a share of beneficial interest outstanding throughout each period is presented below (1):
| SPDR MFS Systematic Growth Equity ETF | ||||||||
| Six Months Ended 12/31/14 (Unaudited) | For the Period 1/8/14* - 6/30/14 | |||||||
Net asset value, beginning of period | $ | 53.56 | $ | 50.00 | ||||
|
|
|
| |||||
Income (loss) from investment operations: | ||||||||
Net investment income (loss) (2) | 0.27 | 0.28 | ||||||
Net realized and unrealized gain (loss) on investments (3) | 5.82 | 3.55 | ||||||
|
|
|
| |||||
Total from investment operations | 6.09 | 3.83 | ||||||
|
|
|
| |||||
Net equalization credits and charges (2) | (0.02 | ) | — | |||||
|
|
|
| |||||
Other capital | — | — | ||||||
|
|
|
| |||||
Distributions to shareholders from: | ||||||||
Net investment income | (0.33 | ) | (0.27 | ) | ||||
Net realized gains | (1.90 | ) | — | |||||
|
|
|
| |||||
Total distributions | (2.23 | ) | (0.27 | ) | ||||
|
|
|
| |||||
Net asset value, end of period | $ | 57.40 | $ | 53.56 | ||||
|
|
|
| |||||
Total Return (4) | 11.36 | % | 7.68 | % | ||||
Ratios and Supplemental Data: | ||||||||
Net Assets, End of Period (000s) | $ | 2,870 | $ | 5,356 | ||||
Ratios to average net assets: | ||||||||
Total expenses | 0.61 | %(5) | 0.60 | %(5) | ||||
Net operating expenses | 0.61 | %(5) | 0.60 | %(5) | ||||
Net investment income | 0.95 | %(5) | 1.16 | %(5) | ||||
Portfolio turnover rate (6) | 34 | % | 20 | % | ||||
| * | Commencement of operations |
| (1) | The per share amounts and percentages include each Fund’s proportionate share of income and expenses of their respective Portfolio. |
| (2) | Per share numbers have been calculated using average shares outstanding, which more appropriately presents the per share data for the period. |
| (3) | Amounts shown in this caption for a share outstanding may not accord with the change in aggregate gains and losses in securities for the fiscal period because of the timing of sales and repurchases of Fund shares in relation to fluctuating market values for the Fund. |
| (4) | Total return is calculated assuming a purchase of shares at net asset value on the first day and a sale at net asset value on the last day of each period reported. Distributions are assumed, for the purpose of this calculation, to be reinvested at net asset value per share on the respective payment dates of each Fund. Total return for periods of less than one year is not annualized. Broker commission charges are not included in this calculation. |
| (5) | Annualized. |
| (6) | Portfolio turnover rate is from their respective Portfolio. |
See Notes to Financial Statements and Financial Statements of the Master Portfolios.
30
Table of Contents
| SPDR MFS Systematic Value Equity ETF | SPDR SSGA Risk Aware ETF | |||||||||
| Six Months Ended 12/31/14 (Unaudited) | For the Period 1/8/14* - 6/30/14 | For the Period 9/9/14* - 12/31/14 (Unaudited) | ||||||||
| $ | 52.67 | $ | 50.00 | $ | 40.00 | |||||
|
|
|
|
|
| |||||
| 0.34 | 0.34 | 0.18 | ||||||||
| 3.74 | 2.67 | (0.73 | ) | |||||||
|
|
|
|
|
| |||||
| 4.08 | 3.01 | (0.55 | ) | |||||||
|
|
|
|
|
| |||||
| (0.03 | ) | — | (0.01 | ) | ||||||
|
|
|
|
|
| |||||
| — | — | — | ||||||||
|
|
|
|
|
| |||||
| (0.41 | ) | (0.34 | ) | (0.19 | ) | |||||
| (0.92 | ) | — | — | |||||||
|
|
|
|
|
| |||||
| (1.33 | ) | (0.34 | ) | (0.19 | ) | |||||
|
|
|
|
|
| |||||
| $ | 55.39 | $ | 52.67 | $ | 39.25 | |||||
|
|
|
|
|
| |||||
| 7.72 | % | 6.04 | % | (1.38 | )% | |||||
| $ | 2,769 | $ | 5,267 | $ | 1,963 | |||||
| 0.61 | %(5) | 0.60 | %(5) | 0.51 | %(5) | |||||
| 0.61 | %(5) | 0.60 | %(5) | 0.51 | %(5) | |||||
| 1.26 | %(5) | 1.43 | %(5) | 1.49 | %(5) | |||||
| 34 | % | 23 | % | 16 | % | |||||
31
Table of Contents
SSGA ACTIVE TRUST
December 31, 2014 (Unaudited)
| 1. | Organization |
SSGA Active Trust (the “Trust”), which is registered under the Investment Company Act of 1940, as amended (“1940 Act”), is an open-end investment management company that was organized as a Massachusetts business trust on March 30, 2011.
As of December 31, 2014, the Trust offered nine (9) portfolios, each of which represents a separate series of beneficial interest in the Trust (each, a “Fund” and collectively, the “Funds”). The financial statements herein relate to the following nine (9) Funds: SPDR SSGA Multi-Asset Real Return ETF, SPDR SSGA Income Allocation ETF, SPDR SSGA Global Allocation ETF, SPDR Blackstone/GSO Senior Loan ETF, SPDR SSGA Ultra Short Term Bond ETF, SPDR MFS Systematic Core Equity ETF, SPDR MFS Systematic Growth Equity ETF, SPDR MFS Systematic Value Equity ETF and SPDR SSGA Risk Aware ETF.
The Trust is part of a master-feeder structure and each Fund invests substantially all of its assets in interests of its respective master portfolio; the SSGA Multi-Asset Real Return Portfolio, SSGA Income Allocation Portfolio, SSGA Global Allocation Portfolio, Blackstone/GSO Senior Loan Portfolio, SSGA Ultra Short Term Bond Portfolio, SSGA MFS Systematic Core Equity Portfolio, SSGA MFS Systematic Growth Equity Portfolio, SSGA MFS Systematic Value Equity Portfolio and SSGA Risk Aware Portfolio (each a “Portfolio” and collectively, the “Portfolios”), each Portfolio is a series of a separately registered investment company called SSGA Master Trust (“Master Trust”). The investment objective and policies of each Fund are substantially similar to those of its respective Portfolio. The value of each Fund’s investment in its respective Portfolio reflects the Fund’s proportionate interest in the net assets of that Portfolio (99.99% for SPDR SSGA Multi-Asset Real Return ETF, 99.99% for SPDR SSGA Income Allocation ETF, 99.99% for SPDR SSGA Global Allocation ETF, 99.99% for SPDR Blackstone/GSO Senior Loan ETF, 99.99% for SPDR SSGA Ultra Short Term Bond ETF, 99.96% for SPDR MFS Systematic Core Equity ETF, 99.96% for SPDR MFS Systematic Growth Equity ETF, 99.96% for SPDR MFS Systematic Value Equity ETF and 99.96% for SPDR SSGA Risk Aware Portfolio at December 31, 2014). The performance of each Fund is directly affected by the performance of its respective Portfolio. The financial statements of the Portfolios, including their Schedules of Investments, are attached to this report and should be read in conjunction with the Fund’s financial statements.
Under the Trust’s organizational documents, its officers and trustees are indemnified against certain liabilities arising out of the performance of their duties to the Trust. Additionally, in the normal course of business, the Trust enters into contracts with service providers that contain general indemnification clauses. The Trust’s maximum exposure under these arrangements is unknown as this could involve future claims that may be made against the Trust that have not yet occurred. However, based on experience, the Trust expects the risk of loss to be remote.
| 2. | Summary of Significant Accounting Policies |
The following is a summary of significant accounting policies followed by the Trust in the preparation of its financial statements:
The preparation of financial statements in accordance with U.S. generally accepted accounting principles requires management to make estimates and assumptions that affect the reported amounts and disclosures in the financial statements. Actual results could differ from those estimates. These financial statements are presented in United States dollars.
Security Valuation
Each Fund records its investments in its respective Portfolio at fair value each business day. The valuation policies of the Portfolios are discussed in Note 2 of the Portfolios’ Notes to Financial Statements, which are attached to this report.
The Portfolios adopted provisions surrounding fair value measurements and disclosures that define fair value, establish a framework for measuring fair value in generally accepted accounting principles and expand disclosures about fair value measurements. This applies to fair value measurements that are already required or permitted by other accounting standards and is intended to increase consistency of those measurements and applies broadly to securities and other types of assets and liabilities. The summary of the inputs used for each Portfolio, as of December 31, 2014, in valuing each Portfolio’s securities carried at fair value are discussed in Note 2 of the Portfolio’s Notes to Financial Statements, which are attached to this report.
32
Table of Contents
SSGA ACTIVE TRUST
NOTES TO FINANCIAL STATEMENTS (continued)
December 31, 2014 (Unaudited)
Investment Income
Net investment income consists of a Fund’s pro-rata share of the net investment income of its respective Portfolio less expenses of the Fund.
Expenses
Advisory fees and other expenses, which are directly identifiable to a specific Fund, are applied to that Fund. Trustees’ fees and other expenses which cannot be attributed to a specific Fund are allocated in such a manner as deemed equitable, taking into consideration the nature and type of expense and the relative net assets of the Funds. The Funds are allocated a pro-rata share of the expense of its respective Portfolio.
Equalization
The Funds follow the accounting practice known as “Equalization” by which a portion of the proceeds from sales and costs of reacquiring Fund shares, equivalent on a per share basis to the amount of distributable net investment income on the date of the transaction, is credited or charged to undistributed net investment income. As a result, undistributed net investment income per share is unaffected by sales or reacquisition of Fund shares. Amounts related to Equalization can be found on the Statements of Changes in Net Assets.
Investment Transactions
Investment transactions are recorded as of the trade date. Realized gains and losses from security transactions consist of a Fund’s pro-rata share of its respective Portfolio’s realized gains and losses. Realized gains and losses from security transactions are recorded on the identified cost basis. Corporate actions (including cash dividends) are recorded net of foreign tax withholdings on the ex-dividend date.
Federal Income Tax
The Funds have qualified and intend to continue to qualify for and elect treatment as “regulated investment companies” under Subchapter M of the Internal Revenue Code of 1986, as amended. By so qualifying and electing, each Fund will not be subject to federal income taxes to the extent it distributes its taxable income, including any net realized capital gains, for each fiscal year. In addition, by distributing during each calendar year substantially all of their net investment income and capital gains, if any, the Funds will not be subject to federal excise tax. Income and capital gain distributions are determined in accordance with income tax regulations which may differ from U.S. generally accepted accounting principles. These book-tax differences are primarily due to differing treatments for tax equalization, in-kind transactions for financial statement purposes and losses deferred due to wash sales.
Additionally, based on the Funds’ understanding of the tax rules and rates related to income, gains and transactions for the foreign jurisdictions in which the applicable Funds invest, the Funds will provide for foreign taxes and, where appropriate, deferred foreign taxes. The Funds have reviewed the tax positions for the open tax years as of June 30, 2014 and have determined that no provision for income tax is required in the Funds’ Financial Statements. The Funds’ federal tax returns are subject to examination by the Funds’ major tax jurisdictions, which include the United States of America and the Commonwealth of Massachusetts. The Funds recognized interest and penalties, if any, related to tax liabilities as income tax expense in the Statements of Operations.
For the period ended December 31, 2014, the following Funds reclassified non-taxable security gains and losses realized on the in-kind redemption of Creation Units (Note 4) as an increase or decrease to paid in capital in the Statements of Assets and Liabilities as follows:
| Net Gain (Loss) Reclassified to Paid in Capital | ||||
SPDR SSGA Multi-Asset Real Return ETF | $ | (127,245 | ) | |
SPDR SSGA Income Allocation ETF | 172,704 | |||
SPDR SSGA Global Allocation ETF | 459,733 | |||
33
Table of Contents
SSGA ACTIVE TRUST
NOTES TO FINANCIAL STATEMENTS (continued)
December 31, 2014 (Unaudited)
| Net Gain (Loss) Reclassified to Paid in Capital | ||||
SPDR Blackstone/GSO Senior Loan ETF | $ | — | ||
SPDR SSGA Ultra Short Term Bond ETF | — | |||
SPDR MFS Systematic Core Equity ETF | 200,872 | |||
SPDR MFS Systematic Growth Equity ETF | 205,141 | |||
SPDR MFS Systematic Value Equity ETF | 150,909 | |||
SPDR SSGA Risk Aware ETF | — | |||
At December 31, 2014, the Funds had capital loss carryforwards which may be utilized to offset any net short-term realized capital gains. These losses will not expire and are treated as though the losses were incurred on the first day of the next fiscal year:
| Short Term | Long Term | |||||||
SPDR SSGA Multi-Asset Real Return ETF | $ | 2,983,519 | $ | 2,241,562 | ||||
SPDR SSGA Income Allocation ETF | 3,138,967 | 554,763 | ||||||
SPDR SSGA Global Allocation ETF | — | — | ||||||
SPDR Blackstone/GSO Senior Loan ETF | 2,647,283 | 136,659 | ||||||
SPDR SSGA Ultra Short Term Bond ETF | — | — | ||||||
SPDR MFS Systematic Core Equity ETF | — | — | ||||||
SPDR MFS Systematic Growth Equity ETF | — | — | ||||||
SPDR MFS Systematic Value Equity ETF | — | — | ||||||
SPDR SSGA Risk Aware ETF | — | — | ||||||
Distributions
Each Fund declares and distributes dividends from net investment income, if any, to its shareholders quarterly (monthly for SPDR Blackstone/GSO Senior Loan ETF and SPDR SSGA Ultra Short Term Bond ETF). Each Fund declares and distributes net realized capital gains, if any, at least annually. Distributions are recorded on the ex-dividend date. Income and capital gain distributions are determined in accordance with income tax regulations, which may differ from U.S. generally accepted accounting principles.
| 3. | Fees and Compensation Paid to Affiliates and Other Related Party Transactions |
Advisory Fee
Each Fund has entered into an Investment Advisory Agreement with SSGA Funds Management, Inc. (the “Adviser” or “SSGA FM”). As compensation for the services rendered, facilities furnished, and expenses borne by the Adviser, each Fund pays the Adviser a fee accrued daily and paid monthly, based on a percentage of each Fund’s average daily net assets as shown in the following table:
| Annual Rate* | ||||
SPDR SSGA Multi-Asset Real Return ETF | 0.70 | % | ||
SPDR SSGA Income Allocation ETF | 0.70 | |||
SPDR SSGA Global Allocation ETF | 0.35 | |||
SPDR Blackstone/GSO Senior Loan ETF | 0.70 | |||
SPDR SSGA Ultra Short Term Bond ETF | 0.20 | |||
SPDR MFS Systematic Core Equity ETF | 0.60 | |||
SPDR MFS Systematic Growth Equity ETF | 0.60 | |||
SPDR MFS Systematic Value Equity ETF | 0.60 | |||
SPDR SSGA Risk Aware ETF | 0.50 | |||
| * | The Advisory fee is reduced by the proportional amount of the advisory fee, as well as for SPDR SSGA Multi-Asset Real Return ETF, SPDR SSGA Income Allocation ETF and SPDR SSGA Global Allocation ETF acquired fund fees and expenses of each Fund’s |
34
Table of Contents
SSGA ACTIVE TRUST
NOTES TO FINANCIAL STATEMENTS (continued)
December 31, 2014 (Unaudited)
| respective Portfolio. For the period ended December 31, 2014, the net annualized advisory fee was 0.04%, 0.17%, (0.14)%, 0.40%, 0.00%, 0.30%, 0.30%, 0.30% and 0.25% for the SPDR SSGA Multi-Asset Real Return ETF, SPDR SSGA Income Allocation ETF, SPDR SSGA Global Allocation ETF, SPDR Blackstone/GSO Senior Loan ETF, SPDR SSGA Ultra Short Term Bond ETF, SPDR MFS Systematic Core Equity ETF, SPDR MFS Systematic Growth Equity ETF, SPDR MFS Systematic Value Equity ETF and SPDR SSGA Risk Aware ETF, respectively. For the SPDR SSGA Global Allocation ETF the reduction resulted in a fee reimbursement which is identified on the Statements of Operations. |
The Adviser pays all operating expenses of each Fund other than management fee, distribution fee pursuant to each Fund’s Distribution and Service Plan, if any, brokerage, taxes, interest, fees and expenses of the Independent Trustees (including any Trustees’ counsel fees), litigation expenses, and other extraordinary expenses.
State Street Bank and Trust Company (“State Street”), an affiliate of the Adviser, receives fees for its services as Custodian, Administrator and Transfer Agent from the Adviser.
State Street Global Markets, LLC (the “Distributor”), an affiliate of the Adviser, serves as the distributor of the shares of each Fund. Pursuant to a Distribution and Service Plan adopted in accordance with Rule 12b-1 under the 1940 Act, each Fund is authorized to pay an amount of up to 0.25% of its average daily net assets for certain distribution-related activities. However, the Board of Trustees has determined that no such payments will be made through at least October 31, 2015 and therefore no such payments have been made.
The Distributor has established an assisted trading program to aid Authorized Participants in certain creation and redemption activity for which the Distributor receives commissions from Authorized Participants. In addition, the Distributor receives compensation from State Street associated with on-line creation and redemption activity of Authorized Participants.
Trustees’ Fees
The Trust, SSGA Master Trust, SPDR Series Trust and SPDR Index Shares Funds pay, in the aggregate, each Independent Trustee an annual fee of $185,000 plus $10,000 per in-person meeting attended and $1,250 for each telephonic or video conference meeting attended. The Chairman of the Board receives an additional annual fee of $50,000 and the Chairman of the Audit Committee receives an additional annual fee of $20,000. The Trust also reimburses each Independent Trustee for travel and other out-of-pocket expenses incurred by him/her in connection with attending such meetings and in connection with attending industry seminars and meetings. Independent Trustee fees are allocated among the Trusts and each of their respective series in such a manner as deemed equitable, taking into consideration the relative net assets of the series.
| 4. | Shareholder Transactions |
Shares are issued and redeemed by a Fund only in Creation Unit size aggregations of 50,000 shares. Such transactions are generally permitted on an in-kind basis, with a separate cash payment, which is a balancing cash component to equate the transaction to the net asset value per unit of the Fund on the transaction date. Transaction fees ranging from of $50 to $1,350 per Creation Unit for each Fund, regardless of the number of Creation Units that are created or redeemed on the same day, are charged to those persons creating or redeeming Creation Units. An additional variable fee may be charged for certain transactions. Transaction fees are received by the Trust and/or Custodian and are used to defray related expenses. The Custodian also receives amounts earned on cash collateral provided by Authorized Participants pending delivery of missing deposit securities. The amounts are included in Other Capital on the Statements of Changes in Net Assets.
35
Table of Contents
SSGA ACTIVE TRUST
December 31, 2014 (Unaudited)
Shareholder Expense Example
As a shareholder of a Fund, you incur two types of costs: (1) transaction costs, which may include creation and redemption fees or brokerage charges and (2) ongoing costs, including management fees, trustee fees, and other Fund expenses. The following examples are intended to help you understand your ongoing costs (in dollars) of investing in a Fund and to compare these costs with the ongoing costs of investing in other funds. It is based on an investment of $1,000 invested on July 1, 2014 and held for the six months ended December 31, 2014.
Actual Expenses
The first table below provides information about actual account values and actual expenses. You may use the information in this table, together with the amount you invested, to estimate the expenses that you incurred over the period. Simply divide your account value by $1,000 (for example, an $8,600 account value divided by $1,000 = 8.6), then multiply the result by the number in the first table under the heading entitled “Expenses Paid During Period” to estimate the expenses attributable to your investment during this period.
Hypothetical Example for Comparison Purposes
The second table below provides information about hypothetical account values and hypothetical expenses based on a Fund’s actual expense ratio and an assumed rate of return of 5% per year before expenses, which is not a Fund’s actual return. Thus, you should not use the hypothetical account values and expenses to estimate the actual ending account balance or your expenses for the period. Rather, these figures are provided to enable you to compare the ongoing costs of investing in a Fund and other funds. To do so, compare this 5% hypothetical example with the 5% hypothetical examples that appear in the shareholder reports of the other funds. The Funds charge transaction fees at scheduled amounts ranging from $50 to $1,350 per Creation Unit to those persons creating or redeeming Creation Units. If you buy or sell the Funds’ shares in the secondary market, you will incur customary brokerage commissions and charges.
Please note that the expenses shown in the table are meant to highlight your ongoing costs only and do not reflect any transaction costs, such as creation and redemption fees, or brokerage charges. Therefore, the second table is useful in comparing ongoing costs only, and will not help you determine the relative total costs of owning different funds. In addition, if these transaction costs were included, your costs would have been higher.
Actual | Annualized Expense Ratio | Beginning Account Value 7/1/14 | Ending Account Value 12/31/14 | Expenses Paid During Period* 7/1/14 to 12/31/14 | ||||||||||||
SPDR SSGA Multi-Asset Real Return ETF | 0.24 | % | $ | 1,000 | $ | 870.90 | $ | 1.13 | ||||||||
SPDR SSGA Income Allocation ETF | 0.37 | 1,000 | 1,000.10 | 1.87 | ||||||||||||
SPDR SSGA Global Allocation ETF | 0.06 | 1,000 | 995.80 | 0.30 | ||||||||||||
SPDR Blackstone/GSO Senior Loan ETF | 0.71 | 1,000 | 994.50 | 3.57 | ||||||||||||
SPDR SSGA Ultra Short Term Bond ETF | 0.20 | 1,000 | 1,000.00 | 1.01 | ||||||||||||
SPDR MFS Systematic Core Equity ETF | 0.61 | 1,000 | 1,096.70 | 3.22 | ||||||||||||
SPDR MFS Systematic Growth Equity ETF | 0.61 | 1,000 | 1,113.60 | 3.25 | ||||||||||||
SPDR MFS Systematic Value Equity ETF | 0.61 | 1,000 | 1,077.20 | 3.19 | ||||||||||||
SPDR SSGA Risk Aware ETF** | 0.51 | 1,000 | 986.20 | 1.57 | ||||||||||||
Hypothetical | ||||||||||||||||
SPDR SSGA Multi-Asset Real Return ETF | 0.24 | 1,000 | 1,023.99 | 1.22 | ||||||||||||
SPDR SSGA Income Allocation ETF | 0.37 | 1,000 | 1,023.33 | 1.89 | ||||||||||||
SPDR SSGA Global Allocation ETF | 0.06 | 1,000 | 1,024.90 | 0.31 | ||||||||||||
SPDR Blackstone / GSO Senior Loan ETF | 0.71 | 1,000 | 1,021.62 | 3.62 | ||||||||||||
SPDR SSGA Ultra Short Term Bond ETF | 0.20 | 1,000 | 1,024.19 | 1.02 | ||||||||||||
SPDR MFS Systematic Core Equity ETF | 0.61 | 1,000 | 1,022.12 | 3.11 | ||||||||||||
36
Table of Contents
SSGA ACTIVE TRUST
OTHER INFORMATION (continued)
December 31, 2014 (Unaudited)
Hypothetical | Annualized Expense Ratio | Beginning Account Value 7/1/14 | Ending Account Value 12/31/14 | Expenses Paid During Period* 7/1/14 to 12/31/14 | ||||||||||||
SPDR MFS Systematic Growth Equity ETF | 0.61 | % | $ | 1,000 | $ | 1,022.12 | $ | 3.11 | ||||||||
SPDR MFS Systematic Value Equity ETF | 0.61 | 1,000 | 1,022.12 | 3.11 | ||||||||||||
SPDR SSGA Risk Aware ETF** | 0.51 | 1,000 | 1,022.63 | 2.60 | ||||||||||||
| * | Expenses are equal to the Fund’s annualized net expense ratio multiplied by the average account value of the period, multiplied by the number of days in the most recent six month period, then divided by 365. |
| ** | Actual period is from commencement of operations 9/9/14. Hypothetical period is from 7/1/14. |
37
Table of Contents
SSGA ACTIVE TRUST
OTHER INFORMATION
December 31, 2014 (Unaudited)
Premium/Discount Information
Information regarding how often the Shares of each Fund traded on the Exchange at a price above (i.e. at a premium) or below (i.e. at a discount) the net asset value of the Fund for the past calendar year can be found on the Funds’ website at www.spdrs.com.
Proxy Voting Policies and Procedures and Records
A description of the Trust’s proxy voting policies and procedures that are used by the Funds’ investment adviser to vote proxies relating to the Funds’ portfolio of securities are available (i) without charge, upon request by calling 1-866-787-2257 (toll free) or (ii) on the website of the U.S. Securities and Exchange Commission, at www.sec.gov. Information regarding how the investment advisor voted for the prior 12-months period ended June 30 is available by August 31 of each year by calling the same number and on the SEC’s website, at www.sec.gov, and on the Funds’ website at www.spdrs.com.
Quarterly Portfolio Schedule
The Funds file a complete schedule of portfolio holdings with the SEC for the first and third quarters of each fiscal year on Form N-Q. The Fund’s Forms N-Q are available on the SEC’s website at www.sec.gov and may be reviewed and copied at the SEC’s Public Reference Room in Washington DC. Information on the operation of the Public Reference Room may be obtained by calling 1-800-SEC-0330. The information on the Form N-Q is available upon request, without charge, by calling 1-866-787-2257 (toll free) and on the Funds’ website at www.spdrs.com.
Approval of Advisory Agreements
At in-person meetings held prior to December 31, 2014, the Board of Trustees of the Trusts (the “Board”) evaluated proposals (1) to continue the separate Investment Advisory Agreements (the “Current Agreements”) between each Trust and SSgA Funds Management, Inc. (the “Adviser”) with respect to the operational series of SSgA Active Trust (the “Current ETFs”) and SSgA Master Trust (together with the Current ETFs, the “Current Funds”), and (2) to approve separate Investment Advisory Agreements (together, the “New Agreements” and, collectively with the Current Agreements, the “Agreements”) between the Adviser and (a) the SSgA Active Trust with respect to the SPDR SSgA Risk Aware ETF, a new series of the SSgA Active Trust (the “New ETF” and, together with the Current ETFs, the “ETFs”), and (b) SSgA Master Trust with respect to the New ETF’s corresponding master fund, the State Street Risk Aware Portfolio (together with the New ETF, the “New Funds”) (with the Current Funds and New Funds collectively being referred to hereafter as the “Funds”). The Trustees who are not “interested persons” of the Trust within the meaning of the Investment Company Act of 1940, as amended (the “Independent Trustees”) also met separately with their independent legal counsel to consider the Agreements.
In evaluating the Agreements, the Board drew on materials provided to them by the Adviser and on other materials provided by State Street Bank and Trust Company, the Trust’s Administrator, Transfer Agent and Custodian (“State Street”). In deciding whether to approve the Agreements, the Board considered various factors, including (i) the nature, extent and quality of services provided by or expected to be provided by the Adviser with respect to the Funds under the Agreements, (ii) the investment performance of the Current Funds, (iii) the costs to the Adviser of its services and profits realized by the Adviser and its affiliates from its relationship with the Trusts, and (iv) the extent to which economies of scale would be realized if and as the Funds grow and whether the fee levels in the Agreements reflect these economies of scale.
The Board considered the nature, extent and quality of services provided or expected to be provided by the Adviser. In doing so, the Trustees relied on their prior experience in overseeing the management of the Trusts and materials provided prior to and at the meeting. The Board reviewed the Agreements and the Adviser’s responsibilities for managing investment operations of each of the Funds in accordance with each Fund’s investment objectives and policies, and applicable legal and regulatory requirements. The Board appreciated the relatively unique nature of the ETFs as exchange-traded funds in a master-feeder structure and the experience and expertise of the Adviser with exchange-traded funds. The Board considered the background and experience of the Adviser’s senior management, including those individuals responsible for portfolio management, oversight of sub-advisers and regulatory compliance of the Funds. The Board also considered the portfolio management and oversight resources, structures and practices of the Adviser, including those associated with monitoring and securing each Fund’s compliance with its investment
38
Table of Contents
SSGA ACTIVE TRUST
OTHER INFORMATION
December 31, 2014 (Unaudited)
objectives and policies and with applicable laws and regulations. The Board also considered information about the Adviser’s best execution procedures and overall investment management business, noting that the Adviser serves a wide range of clients across a broad spectrum of asset classes. The Board looked at the Adviser’s general knowledge of the investment business and that of its affiliates which make up State Street Global Advisors, through which the Adviser shares all of its senior personnel. The Board considered that the Adviser and its affiliates constitute one of the world’s largest investment management enterprises for exchange-traded funds. The Board also considered the Adviser’s experience in active management, managing exchange-traded funds in master-feeder structures and overseeing third-party sub-advisers, as applicable.
The Board then reviewed the Current Funds’ performance. The Board compared each Current Fund’s investment performance to the performance of an appropriate benchmark and universe of comparable funds, noting that the performance of each Current Fund was satisfactory.
The Board considered the profitability of the advisory arrangement with the Funds to the Adviser, including data on the Current Funds’ historical profitability to the Adviser. The Independent Trustees, through their counsel, had the opportunity to discuss, with representatives of the Adviser and State Street, methodologies used in computing costs that formed the bases of profitability calculations and determined that these methodologies were reasonable.
The Board considered whether the Adviser or its affiliates benefited in other ways from its relationship with the Trusts, noting that the Adviser does not maintain soft-dollar arrangements in connection with the Trusts’ brokerage transactions.
The Board reviewed information regarding economies of scale or other efficiencies that may result as each Fund’s assets grow in size. The Board noted that the Agreements did not provide for breakpoints in each Fund’s advisory fee rates as assets of a Fund increase. However, the Board further noted the Adviser’s assertion that future economies of scale (among several factors) had been taken into consideration for the Funds by fixing relatively low advisory fees, effectively sharing the benefits of lower fees with the Funds from inception. The Adviser also asserted that one of the benefits of the unitary fee was to provide an unvarying expense structure, which could be lost or diluted with the addition of breakpoints. The Board noted that it intends to continue to monitor fees as the Funds grow in size and assess whether fee breakpoints may be warranted.
The Board evaluated the Funds’ unitary fee through review of comparative information with respect to fees paid by similar funds — i.e., exchange-traded funds that are actively managed, as applicable. The Board reviewed the universe of similar exchange-traded funds for the ETFs based upon data obtained from Lipper Analytical Services and related comparative information for similar exchange-traded funds. The Board also reviewed the fee structure of the Funds in connection with the master-feeder structure, the estimated expense ratio for the New Funds and the historical expense ratios of the Current Funds. In doing so, the Board used a fund by fund analysis of the data.
The Board, including the Independent Trustees voting separately, approved the Agreements for each Fund after weighing the foregoing factors, none of which was dispositive in itself and may have been weighed differently by each Trustee. The Board’s conclusions with respect to each Agreement were as follows: (a) the nature and extent of the services provided or expected to be provided by the Adviser with respect to the Funds were appropriate; (b) the performance of each Current Fund had been satisfactory; (c) the Adviser’s fee for each Fund and the unitary fee, considered in relation to services provided or expected to be provided, were fair and reasonable; (d) profitability of the Trusts’ relationship with the Adviser was not excessive; (e) any additional benefits to the Adviser or its affiliates were not of a magnitude to materially affect the Board’s conclusions; and (f) fees paid or expected to be paid to the Adviser shared economies of scale with respect to the Funds by way of the relatively low fee structure of the Trusts.
Approval of GSO / Blackstone Debt Funds Management LLC Sub-Advisory Agreement
At an in-person meeting held prior to December 31, 2014, the Board also evaluated proposals to continue the separate Sub-Advisory Agreements (the “GSO / Blackstone Sub-Advisory Agreements”) between the Adviser and GSO / Blackstone Debt Funds Management LLC (“GSO / Blackstone”) with respect to the SPDR Blackstone / GSO Senior Loan ETF, a series of the SSgA Active Trust, and Blackstone / GSO Senior Loan Portfolio, a series of the SSgA Master Trust, each sub-advised by GSO / Blackstone (the “GSO / Blackstone Funds”). The Trustees who are not “interested persons” of the Trusts within the meaning of the Investment Company Act of 1940, as amended (the “Independent
39
Table of Contents
SSGA ACTIVE TRUST
OTHER INFORMATION
December 31, 2014 (Unaudited)
Trustees”) also met separately with their independent legal counsel to consider the GSO / Blackstone Sub-Advisory Agreements.
In evaluating the GSO / Blackstone Sub-Advisory Agreements, the Board drew on materials provided to them by GSO / Blackstone and the Adviser. In deciding whether to approve the GSO / Blackstone Sub-Advisory Agreements, the Board considered various factors, including (i) the nature, extent and quality of services provided by GSO / Blackstone with respect to the GSO / Blackstone Funds under the GSO / Blackstone Sub-Advisory Agreements and (ii) the investment performance of the GSO / Blackstone Funds. The Board was apprised of the portion of the current advisory fee that the Adviser would pay to GSO / Blackstone under the GSO / Blackstone Sub-Advisory Agreements and also considered that such fees would be paid directly by the Adviser and would not result in increased fees payable by the GSO / Blackstone Funds.
The Board considered the background and experience of GSO / Blackstone’s senior management and, in particular, GSO / Blackstone’s experience in investing in senior loan securities. The Board reviewed the GSO / Blackstone Funds’ performance, noting that that the performance of the GSO / Blackstone Funds was satisfactory. The Board also considered the unitary fee paid to the Adviser by each the GSO / Blackstone Fund and GSO / Blackstone’s fees paid by the Adviser.
The Board, including the Independent Trustees voting separately, approved the GSO / Blackstone Sub-Advisory Agreements for each GSO / Blackstone Fund after weighing the foregoing factors, none of which was dispositive in itself and may have been weighed differently by each Trustee. The Board’s conclusions with respect to each GSO / Blackstone Sub-Advisory Agreement were as follows: (a) the nature and extent of the services expected provided by GSO / Blackstone to the GSO / Blackstone Funds were appropriate; (b) the performance of the GSO / Blackstone Funds had been satisfactory; (c) GSO / Blackstone’s fees for the GSO / Blackstone Funds and the unitary fee, considered in relation to the services provided, were fair and reasonable; (d) any additional benefits to GSO / Blackstone were not of a magnitude to materially affect the Board’s conclusions; and (e) fees paid to GSO / Blackstone adequately shared the economies of scale with the GSO / Blackstone Funds by way of the relatively low fee structure of the Trusts.
40
Table of Contents
The SPDR® Family of Exchange Traded Funds
The following is a list of SPDR ETFs being offered, along with their respective exchange trading symbols. Please call 1-866-787-2257 to obtain a prospectus for any SPDR ETF. The prospectus contains more complete information, including charges, expenses, investment objectives and risk factors that should be carefully considered to determine if the Fund(s) are an appropriate investment for you. Read the prospectus(es) carefully before investing. Investing involves risk, including possible loss of principal.
SPDR Series Trust
SPDR Russell 3000® ETF (THRK)
SPDR Russell 1000® ETF (ONEK)
SPDR Russell 2000® ETF (TWOK)
SPDR S&P 500 Buyback ETF (SPYB)
SPDR S&P 500 Growth ETF (SPYG)
SPDR S&P 500 Value ETF (SPYV)
SPDR Russell Small Cap Completeness ETF (RSCO)
SPDR S&P 400 Mid Cap Growth ETF (MDYG)
SPDR S&P 400 Mid Cap Value ETF (MDYV)
SPDR S&P 600 Small Cap ETF (SLY)
SPDR S&P 600 Small Cap Growth ETF (SLYG)
SPDR S&P 600 Small Cap Value ETF (SLYV)
SPDR Global Dow ETF (DGT)
SPDR Dow Jones REIT ETF (RWR)
SPDR S&P Bank ETF (KBE)
SPDR S&P Capital Markets ETF (KCE)
SPDR S&P Insurance ETF (KIE)
SPDR S&P Mortgage Finance ETF (KME)
SPDR S&P Regional Banking ETF (KRE)
SPDR Morgan Stanley Technology ETF (MTK)
SPDR S&P Dividend ETF (SDY)
SPDR S&P Aerospace & Defense ETF (XAR)
SPDR S&P Biotech ETF (XBI)
SPDR S&P Health Care Equipment ETF (XHE)
SPDR S&P Health Care Services ETF (XHS)
SPDR S&P Homebuilders ETF (XHB)
SPDR S&P Metals & Mining ETF (XME)
SPDR S&P Oil & Gas Equipment & Services ETF (XES)
SPDR S&P Oil & Gas Exploration & Production ETF (XOP)
SPDR S&P Pharmaceuticals ETF (XPH)
SPDR S&P Retail ETF (XRT)
SPDR S&P Semiconductor ETF (XSD)
SPDR S&P Software & Services ETF (XSW)
SPDR S&P Telecom ETF (XTL)
SPDR S&P Transportation ETF (XTN)
SPDR S&P 1500 Value Tilt ETF (VLU)
SPDR S&P 1500 Momentum Tilt ETF (MMTM)
SPDR Russell 1000 Low Volatility ETF (LGLV)
SPDR Russell 2000 Low Volatility ETF (SMLV)
SPDR Wells Fargo Preferred Stock ETF (PSK)
SPDR Barclays 1-3 Month T-Bill ETF (BIL)
SPDR Barclays TIPS ETF (IPE)
SPDR Barclays 0-5 Year TIPS ETF (SIPE)
SPDR Barclays 1-10 Year TIPS ETF (TIPX)
SPDR Barclays Short Term Treasury ETF (SST)
SPDR Barclays Intermediate Term Treasury ETF (ITE)
SPDR Barclays Long Term Treasury ETF (TLO)
SPDR Barclays Short Term Corporate Bond ETF (SCPB)
SPDR Barclays Intermediate Term Corporate Bond ETF (ITR)
SPDR Barclays Long Term Corporate Bond ETF (LWC)
SPDR Barclays Issuer Scored Corporate Bond ETF (CBND)
Table of Contents
SPDR Barclays Convertible Securities ETF (CWB)
SPDR Barclays Mortgage Backed Bond ETF (MBG)
SPDR Barclays Aggregate Bond ETF (LAG)
SPDR Nuveen Barclays Municipal Bond ETF (TFI)
SPDR Nuveen Barclays California Municipal Bond ETF (CXA)
SPDR Nuveen Barclays New York Municipal Bond ETF (INY)
SPDR Nuveen Barclays Short Term Municipal Bond ETF (SHM)
SPDR Nuveen S&P VRDO Municipal Bond ETF (VRD)
SPDR Nuveen S&P High Yield Municipal Bond ETF (HYMB)
SPDR Nuveen Barclays Build America Bond ETF (BABS)
SPDR DB International Government Inflation-Protected Bond ETF (WIP)
SPDR Barclays Short Term International Treasury Bond ETF (BWZ)
SPDR Barclays International Treasury Bond ETF (BWX)
SPDR Barclays International Corporate Bond ETF (IBND)
SPDR Barclays Emerging Markets Local Bond ETF (EBND)
SPDR Barclays International High Yield Bond ETF (IJNK)
SPDR Barclays High Yield Bond ETF (JNK)
SPDR Barclays Short Term High Yield Bond ETF (SJNK)
SPDR Barclays Investment Grade Floating Rate ETF (FLRN)
SPDR BofA Merrill Lynch Emerging Markets Corporate Bond ETF (EMCD)
SPDR BofA Merrill Lynch Crossover Corporate Bond ETF (XOVR)
SPDR Index Shares Funds
SPDR STOXX Europe 50 ETF (FEU)
SPDR EURO STOXX 50 ETF (FEZ)
SPDR EURO STOXX Small Cap ETF (SMEZ)
SPDR S&P Emerging Asia Pacific ETF (GMF)
SPDR S&P Small Cap Emerging Asia Pacific ETF (GMFS)
SPDR S&P Russia ETF (RBL)
SPDR S&P China ETF (GXC)
SPDR S&P Emerging Markets ETF (GMM)
SPDR S&P Emerging Markets Dividend ETF (EDIV)
SPDR S&P BRIC 40 ETF (BIK)
SPDR S&P Emerging Europe ETF (GUR)
SPDR S&P Emerging Latin America ETF (GML)
SPDR S&P Emerging Middle East & Africa ETF (GAF)
SPDR S&P World ex-US ETF (GWL)
SPDR S&P International Small Cap ETF (GWX)
SPDR Dow Jones International Real Estate ETF (RWX)
SPDR S&P Global Infrastructure ETF (GII)
SPDR S&P Global Natural Resources ETF (GNR)
SPDR MSCI ACWI ex-US ETF (CWI)
SPDR MSCI ACWI IMI ETF (ACIM)
SPDR MSCI ACWI Low Carbon Target ETF (LOWC)
SPDR MSCI China A Shares IMI ETF (XINA)
SPDR MSCI EM 50 ETF (EMFT)
SPDR MSCI EM Beyond BRIC ETF (EMBB)
SPDR MSCI EAFE Quality Mix ETF (QEFA)
SPDR MSCI Emerging Markets Quality Mix ETF (QEMM)
SPDR MSCI World Quality Mix ETF (QWLD)
SPDR MSCI Australia Quality Mix ETF (QAUS)
SPDR MSCI Canada Quality Mix ETF (QCAN)
SPDR MSCI Germany Quality Mix ETF (QDEU)
SPDR MSCI Japan Quality Mix ETF (QJPN)
SPDR MSCI Mexico Quality Mix ETF (QMEX)
SPDR MSCI South Korea Quality Mix ETF (QKOR)
SPDR MSCI Spain Quality Mix ETF (QESP)
SPDR MSCI Taiwan Quality Mix ETF (QTWN)
SPDR MSCI United Kingdom Quality Mix ETF (QGBR)
Table of Contents
SPDR Russell/Nomura PRIMETM Japan ETF (JPP)
SPDR Russell/Nomura Small CapTM Japan ETF (JSC)
SPDR S&P Global Dividend ETF (WDIV)
SPDR S&P International Dividend ETF (DWX)
SPDR S&P International Mid Cap ETF (MDD)
SPDR S&P Emerging Markets Small Cap ETF (EWX)
SPDR Dow Jones Global Real Estate ETF (RWO)
SPDR S&P International Consumer Discretionary Sector ETF (IPD)
SPDR S&P International Consumer Staples Sector ETF (IPS)
SPDR S&P International Energy Sector ETF (IPW)
SPDR S&P International Financial Sector ETF (IPF)
SPDR S&P International Health Care Sector ETF (IRY)
SPDR S&P International Industrial Sector ETF (IPN)
SPDR S&P International Materials Sector ETF (IRV)
SPDR S&P International Technology Sector ETF (IPK)
SPDR S&P International Telecommunications Sector ETF (IST)
SPDR S&P International Utilities Sector ETF (IPU)
The Select Sector SPDR Trust
The Consumer Discretionary Select Sector SPDR Fund (XLY)
The Consumer Staples Select Sector SPDR Fund (XLP)
The Energy Select Sector SPDR Fund (XLE)
The Financial Select Sector SPDR Fund (XLF)
The Health Care Select Sector SPDR Fund (XLV)
The Industrial Select Sector SPDR Fund (XLI)
The Materials Select Sector SPDR Fund (XLB)
The Technology Select Sector SPDR Fund (XLK)
The Utilities Select Sector SPDR Fund (XLU)
SSGA Active Trust
SPDR SSGA Multi-Asset Real Return ETF (RLY)
SPDR SSGA Income Allocation ETF (INKM)
SPDR SSGA Global Allocation ETF (GAL)
SPDR Blackstone/GSO Senior Loan ETF (SRLN)
SPDR SSGA Ultra Short Term Bond ETF (ULST)
SPDR MFS Systematic Core Equity ETF (SYE)
SPDR MFS Systematic Growth Equity ETF (SYG)
SPDR MFS Systematic Value Equity ETF (SYV)
SPDR SSGA Risk Aware ETF (RORO)
SPDR Dow Jones Industrial Average ETF Trust (DIA)
SPDR S&P 500 ETF Trust (SPY)
State Street Global Markets, LLC, member FINRA, SIPC, is distributor for all investment portfolios of SPDR Series Trust, SPDR Index Shares Funds, and SSGA Active Trust. ALPS Distributors, Inc., a registered broker-dealer, is distributor for SPDR S&P 500 ETF Trust (SPY) and SPDR Dow Jones Industrial Average ETF Trust (DIA), both unit investment trusts. ALPS Portfolio Solutions Distributor, Inc. is the distributor for all investment portfolios of The Select Sector SPDR Trust.
Table of Contents
SSGA Active Trust
TRUSTEES
Bonny E. Boatman
Dwight D. Churchill
David M. Kelly
Frank Nesvet, Chairman
James E. Ross
Carl G. Verboncoeur
OFFICERS
Ellen M. Needham, President
Ann Carpenter, Vice President
Michael P. Riley, Vice President
Chad C. Hallett, Treasurer
Matthew W. Flaherty, Assistant Treasurer
Laura F. Dell, Assistant Treasurer
Christopher A. Madden, Secretary
Brian Harris, Chief Compliance Officer
INVESTMENT MANAGER
SSGA Funds Management, Inc.
State Street Financial Center
One Lincoln Street
Boston, MA 02111
DISTRIBUTOR
State Street Global Markets, LLC
One Lincoln Street
Boston, MA 02111
CUSTODIAN, ADMINISTRATORAND TRANSFER AGENT
State Street Bank and Trust Company
One Lincoln Street
Boston, MA 02111
LEGAL COUNSEL
Morgan, Lewis & Bockius LLP
2020 K Street, NW
Washington, DC 20006
INDEPENDENT REGISTERED PUBLIC ACCOUNTING FIRM
Ernst & Young LLP
200 Clarendon Street
Boston, MA 02116
Fund Shares are distributed by State Street Global Markets, LLC, a wholly-owned subsidiary of State Street Corporation. State Street Global Markets, LLC; member FINRA, SIPC.
The information contained in this report is intended for the general information of shareholders of the Trust. This report is not authorized for distribution to prospective investors unless preceded or accompanied by a current Trust prospectus which contains important information concerning the Trust. You may obtain a current prospectus and SAI from the Distributor by calling 1-866-787-2257 or visiting www.spdrs.com Please read the prospectus carefully before you invest.
Table of Contents
SSGA Master Trust
Semi-Annual Report December 31, 2014
Table of Contents
Portfolio Summary | ||||
| 1 | ||||
| 2 | ||||
| 3 | ||||
| 4 | ||||
| 5 | ||||
| 6 | ||||
| 7 | ||||
| 8 | ||||
| 9 | ||||
Schedules of Investments | ||||
| 10 | ||||
| 11 | ||||
| 12 | ||||
| 13 | ||||
| 18 | ||||
| 20 | ||||
| 21 | ||||
| 23 | ||||
| 24 | ||||
| 26 | ||||
| 34 | ||||
| 40 | ||||
| 49 |
Table of Contents
SSGA MULTI-ASSET REAL RETURN PORTFOLIO
PORTFOLIO SUMMARY
TOP FIVE HOLDINGS AS OF DECEMBER 31, 2014
| DESCRIPTION | SPDR S&P GLOBAL NATURAL RESOURCES ETF | SPDR BARCLAYS TIPS ETF | POWERSHARES DB COMMODITY INDEX TRACKING FUND | SPDR DOW JONES REIT ETF | SPDR DOW JONES INTERNATIONAL REAL ESTATE ETF | |||||||||
| MARKET VALUE | $52,519,456 | 24,633,104 | 21,676,776 | 17,437,801 | 13,615,173 | |||||||||
| % OF NET ASSETS | 31.6 | 14.8 | 13.0 | 10.5 | 8.2 | |||||||||
(The five largest holdings are subject to change, and there are no guarantees the Portfolio will continue to remain invested in any particular Fund.)
ASSET ALLOCATION AS OF DECEMBER 31, 2014*
PERCENT OF NET ASSETS | ||||||||
Natural Resources | 44.1 | % | ||||||
Inflation Linked | 19.4 | |||||||
Real Estate | 18.7 | |||||||
Commodities | 13.0 | |||||||
Short Term Investments | 5.2 | |||||||
Other Assets & Liabilities | (0.4 | ) | ||||||
TOTAL | 100.0 | % | ||||||
| * | The Portfolio’s asset allocation is expressed as a percentage of net assets and may change over time. |
1
Table of Contents
SSGA INCOME ALLOCATION PORTFOLIO
PORTFOLIO SUMMARY
TOP FIVE HOLDINGS AS OF DECEMBER 31, 2014
| DESCRIPTION | SPDR BARCLAYS LONG TERM CORPORATE BOND ETF | SPDR S&P DIVIDEND ETF | SPDR BARCLAYS HIGH YIELD BOND ETF | SPDR DOW JONES REIT ETF | SPDR BARCLAYS LONG TERM TREASURY ETF | |||||||||
| MARKET VALUE | $18,020,061 | 17,919,672 | 10,581,727 | 9,363,336 | 7,303,068 | |||||||||
| % OF NET ASSETS | 15.2 | 15.1 | 8.9 | 7.9 | 6.2 | |||||||||
(The five largest holdings are subject to change, and there are no guarantees the Portfolio will continue to remain invested in any particular Fund.)
ASSET ALLOCATION AS OF DECEMBER 31, 2014*
PERCENT OF NET ASSETS | ||||||||
Domestic Fixed Income | 35.0 | % | ||||||
Domestic Equity | 26.0 | |||||||
International Equity | 16.3 | |||||||
Real Estate | 12.7 | |||||||
International Fixed Income | 5.0 | |||||||
Short Term Investments | 3.9 | |||||||
Inflation Linked | 0.5 | |||||||
Other Assets & Liabilities | 0.6 | |||||||
TOTAL | 100.0 | % | ||||||
| * | The Portfolio’s asset allocation is expressed as a percentage of net assets and may change over time. |
2
Table of Contents
SSGA GLOBAL ALLOCATION PORTFOLIO
PORTFOLIO SUMMARY
TOP FIVE HOLDINGS AS OF DECEMBER 31, 2014
| DESCRIPTION | SPDR S&P 500 ETF TRUST | SPDR S&P WORLD EX-US ETF | SPDR BARCLAYS LONG TERM CORPORATE BOND ETF | SPDR DOW JONES REIT ETF | SPDR BARCLAYS HIGH YIELD BOND ETF | |||||||||
| MARKET VALUE | $32,485,029 | 22,901,019 | 13,819,199 | 10,838,916 | 8,050,069 | |||||||||
| % OF NET ASSETS | 24.0 | 16.9 | 10.2 | 8.0 | 5.9 | |||||||||
(The five largest holdings are subject to change, and there are no guarantees the Portfolio will continue to remain invested in any particular Fund.)
ASSET ALLOCATION AS OF DECEMBER 31, 2014*
PERCENT OF NET ASSETS | ||||||||
Domestic Equity | 33.9 | % | ||||||
International Equity | 21.8 | |||||||
Domestic Fixed Income | 19.2 | |||||||
Real Estate | 11.0 | |||||||
Short Term Investments | 10.3 | |||||||
International Fixed Income | 2.0 | |||||||
Inflation Linked | 1.0 | |||||||
Other Assets & Liabilities | 0.8 | |||||||
TOTAL | 100.0 | % | ||||||
| * | The Portfolio’s asset allocation is expressed as a percentage of net assets and may change over time. |
3
Table of Contents
BLACKSTONE/GSO SENIOR LOAN PORTFOLIO
PORTFOLIO SUMMARY
TOP FIVE HOLDINGS AS OF DECEMBER 31, 2014
| DESCRIPTION | SGMS ESCROW CORP. | DELL, INC. | iHEARTCOMMUNICATIONS, INC. | BMC SOFTWARE FINANCE, INC. | CAESARS ENTERTAINMENT RESORT PROPERTIES LLC | |||||||||
| MARKET VALUE | $12,787,500 | 11,962,519 | 11,820,000 | 10,402,219 | 8,058,115 | |||||||||
| % OF NET ASSETS | 2.3 | 2.1 | 2.1 | 1.8 | 1.4 | |||||||||
(The five largest holdings are subject to change, and there are no guarantees the Portfolio will continue to remain invested in any particular Fund.)
ASSET ALLOCATION AS OF DECEMBER 31, 2014*
PERCENT OF NET ASSETS | ||||||||
Hotels, Restaurants & Leisure | 11.4 | % | ||||||
Media | 7.4 | |||||||
Software | 5.4 | |||||||
Commercial Services & Supplies | 4.4 | |||||||
Specialty Retail | 3.4 | |||||||
Food & Staples Retailing | 3.3 | |||||||
Health Care Equipment & Supplies | 3.2 | |||||||
Wireless Telecommunication Services | 3.1 | |||||||
Health Care Providers & Services | 3.0 | |||||||
Machinery | 2.9 | |||||||
Energy Equipment & Services | 2.8 | |||||||
Chemicals | 2.6 | |||||||
Technology Hardware, Storage & Peripherals | 2.5 | |||||||
Food Products | 2.4 | |||||||
Internet Software & Services | 2.4 | |||||||
Oil, Gas & Consumable Fuels | 2.4 | |||||||
IT Services | 2.3 | |||||||
Semiconductors & Semiconductor Equipment | 2.1 | |||||||
Auto Components | 2.0 | |||||||
Diversified Telecommunication Services | 1.9 | |||||||
Diversified Consumer Services | 1.8 | |||||||
Containers & Packaging | 1.7 | |||||||
Life Sciences Tools & Services | 1.7 | |||||||
Electronic Equipment, Instruments & Components | 1.6 | |||||||
PERCENT OF NET ASSETS | ||||||||
Insurance | 1.6 | % | ||||||
Communications Equipment | 1.5 | |||||||
Diversified Financial Services | 1.5 | |||||||
Pharmaceuticals | 1.4 | |||||||
Independent Power & Renewable Electricity Producers | 1.3 | |||||||
Airlines | 1.2 | |||||||
Multiline Retail | 1.2 | |||||||
Metals & Mining | 1.1 | |||||||
Building Products | 1.0 | |||||||
Electric Utilities | 1.0 | |||||||
Personal Products | 1.0 | |||||||
Health Care Technology | 0.8 | |||||||
Short Term Investments | 0.8 | |||||||
Automobiles | 0.7 | |||||||
Household Durables | 0.7 | |||||||
Marine | 0.7 | |||||||
Multi-utilities | 0.5 | |||||||
Leisure Products | 0.4 | |||||||
Professional Services | 0.4 | |||||||
Real Estate Management & Development | 0.3 | |||||||
Distributors | 0.1 | |||||||
Other Assets & Liabilities | 3.1 | |||||||
TOTAL | 100.0 | % | ||||||
| * | The Portfolio’s asset allocation is expressed as a percentage of net assets and may change over time. |
4
Table of Contents
SSGA ULTRA SHORT TERM BOND PORTFOLIO
PORTFOLIO SUMMARY
TOP FIVE HOLDINGS AS OF DECEMBER 31, 2014
| DESCRIPTION | NISSAN AUTO LEASE TRUST | FORD CREDIT AUTO LEASE TRUST | DIAGEO FINANCE BV | HARLEY-DAVIDSON FINANCIAL SERVICES, INC. | BANK OF AMERICA NA | |||||||||
| MARKET VALUE | $599,793 | 550,651 | 502,784 | 401,092 | 399,338 | |||||||||
| % OF NET ASSETS | 3.8 | 3.4 | 3.1 | 2.5 | 2.5 | |||||||||
(The five largest holdings are subject to change, and there are no guarantees the Portfolio will continue to remain invested in any particular Fund.)
ASSET ALLOCATION AS OF DECEMBER 31, 2014*
PERCENT OF NET ASSETS | ||||||||
Automobiles | 31.6 | % | ||||||
Banks | 23.4 | |||||||
Diversified Financial Services | 12.4 | |||||||
Beverages | 6.2 | |||||||
Credit Card Receivables | 5.3 | |||||||
Chemicals | 2.8 | |||||||
Metals & Mining | 2.5 | |||||||
Media | 2.2 | |||||||
Regional (state/province) | 2.2 | |||||||
Student Loan ABS | 1.8 | |||||||
Communications Equipment | 1.6 | |||||||
Aerospace & Defense | 1.5 | |||||||
Oil, Gas & Consumable Fuels | 1.5 | |||||||
U.S. Treasury Obligations | 1.2 | |||||||
Internet Software & Services | 1.0 | |||||||
Health Care Providers & Services | 0.9 | |||||||
Consumer Finance | 0.8 | |||||||
Road & Rail | 0.7 | |||||||
Short Term Investments | 0.2 | |||||||
Other Assets & Liabilities | 0.2 | |||||||
TOTAL | 100.0 | % | ||||||
| * | The Portfolio’s asset allocation is expressed as a percentage of net assets and may change over time. |
5
Table of Contents
SSGA MFS SYSTEMATIC CORE EQUITY PORTFOLIO
PORTFOLIO SUMMARY
TOP FIVE HOLDINGS AS OF DECEMBER 31, 2014
| DESCRIPTION | APPLE, INC. | JPMORGAN CHASE & CO. | FACEBOOK, INC. (CLASS A) | HEWLETT-PACKARD CO. | THE KROGER CO. | |||||||||
| MARKET VALUE | $144,267 | 121,718 | 119,527 | 112,163 | 111,725 | |||||||||
| % OF NET ASSETS | 4.9 | 4.2 | 4.1 | 3.8 | 3.8 | |||||||||
(The five largest holdings are subject to change, and there are no guarantees the Portfolio will continue to remain invested in any particular Fund.)
ASSET ALLOCATION AS OF DECEMBER 31, 2014*
PERCENT OF NET ASSETS | ||||||||
Health Care Providers & Services | 11.3 | % | ||||||
Insurance | 8.8 | |||||||
Technology Hardware, Storage & Peripherals | 8.8 | |||||||
Oil, Gas & Consumable Fuels | 7.7 | |||||||
Banks | 7.3 | |||||||
Software | 6.2 | |||||||
Internet Software & Services | 6.0 | |||||||
Pharmaceuticals | 4.4 | |||||||
Aerospace & Defense | 4.0 | |||||||
Food & Staples Retailing | 3.8 | |||||||
Hotels, Restaurants & Leisure | 3.7 | |||||||
Tobacco | 3.6 | |||||||
Specialty Retail | 3.4 | |||||||
Real Estate Investment Trusts | 3.1 | |||||||
Chemicals | 2.6 | |||||||
Diversified Telecommunication Services | 2.3 | |||||||
Independent Power & Renewable Electricity Producers | 2.3 | |||||||
Media | 2.3 | |||||||
Biotechnology | 1.8 | |||||||
Household Products | 1.5 | |||||||
Consumer Finance | 1.4 | |||||||
Electric Utilities | 1.2 | |||||||
Food Products | 1.0 | |||||||
Internet & Catalog Retail | 0.9 | |||||||
Short Term Investments | 0.5 | |||||||
Other Assets & Liabilities | 0.1 | |||||||
TOTAL | 100.0 | % | ||||||
| * | The Portfolio’s asset allocation is expressed as a percentage of net assets and may change over time. |
6
Table of Contents
SSGA MFS SYSTEMATIC VALUE EQUITY PORTFOLIO
PORTFOLIO SUMMARY
TOP FIVE HOLDINGS AS OF DECEMBER 31, 2014
| DESCRIPTION | JPMORGAN CHASE & CO. | WELLS FARGO & CO. | HEWLETT-PACKARD CO. | EXXON MOBIL CORP. | ELECTRONIC ARTS, INC. | |||||||||
| MARKET VALUE | $140,054 | 132,610 | 118,303 | 115,470 | 102,070 | |||||||||
| % OF NET ASSETS | 4.9 | 4.7 | 4.2 | 4.1 | 3.6 | |||||||||
(The five largest holdings are subject to change, and there are no guarantees the Portfolio will continue to remain invested in any particular Fund.)
ASSET ALLOCATION AS OF DECEMBER 31, 2014*
PERCENT OF NET ASSETS | ||||||||
Banks | 13.0 | % | ||||||
Insurance | 12.0 | |||||||
Oil, Gas & Consumable Fuels | 10.2 | |||||||
Health Care Providers & Services | 9.8 | |||||||
Pharmaceuticals | 6.1 | |||||||
Software | 4.9 | |||||||
Real Estate Investment Trusts | 4.7 | |||||||
Technology Hardware, Storage & Peripherals | 4.2 | |||||||
Hotels, Restaurants & Leisure | 3.3 | |||||||
Semiconductors & Semiconductor Equipment | 3.2 | |||||||
Chemicals | 3.0 | |||||||
Independent Power & Renewable Electricity Producers | 2.7 | |||||||
Aerospace & Defense | 2.3 | |||||||
Food Products | 2.2 | |||||||
Electric Utilities | 2.1 | |||||||
Food & Staples Retailing | 2.0 | |||||||
Household Durables | 2.0 | |||||||
Specialty Retail | 1.9 | |||||||
Consumer Finance | 1.6 | |||||||
Internet Software & Services | 1.4 | |||||||
Beverages | 1.2 | |||||||
Machinery | 1.0 | |||||||
Multiline Retail | 1.0 | |||||||
Diversified Telecommunication Services | 0.9 | |||||||
Short Term Investments | 0.9 | |||||||
Auto Components | 0.8 | |||||||
Capital Markets | 0.8 | |||||||
Health Care Equipment & Supplies | 0.7 | |||||||
Other Assets & Liabilities | 0.1 | |||||||
TOTAL | 100.0 | % | ||||||
| * | The Portfolio’s asset allocation is expressed as a percentage of net assets and may change over time. |
7
Table of Contents
SSGA MFS SYSTEMATIC GROWTH EQUITY PORTFOLIO
PORTFOLIO SUMMARY
TOP FIVE HOLDINGS AS OF DECEMBER 31, 2014
| DESCRIPTION | FACEBOOK, INC. | ORACLE CORP. | THE KROGER CO. | COMCAST CORP. | APPLE, INC. | |||||||||
| MARKET VALUE | $134,819 | 127,265 | 118,146 | 115,730 | 113,360 | |||||||||
| % OF NET ASSETS | 4.5 | 4.3 | 4.0 | 3.9 | 3.8 | |||||||||
(The five largest holdings are subject to change, and there are no guarantees the Portfolio will continue to remain invested in any particular Fund.)
ASSET ALLOCATION AS OF DECEMBER 31, 2014*
PERCENT OF NET ASSETS | ||||||||
Software | 10.4 | % | ||||||
Internet Software & Services | 8.6 | |||||||
Health Care Providers & Services | 8.4 | |||||||
Food & Staples Retailing | 5.5 | |||||||
Media | 5.2 | |||||||
Real Estate Investment Trusts | 4.5 | |||||||
Specialty Retail | 4.4 | |||||||
IT Services | 4.3 | |||||||
Tobacco | 4.3 | |||||||
Hotels, Restaurants & Leisure | 4.2 | |||||||
Oil, Gas & Consumable Fuels | 4.1 | |||||||
Technology Hardware, Storage & Peripherals | 3.8 | |||||||
Insurance | 3.5 | |||||||
Chemicals | 3.3 | |||||||
Pharmaceuticals | 3.0 | |||||||
Diversified Telecommunication Services | 2.8 | |||||||
Biotechnology | 2.4 | |||||||
Beverages | 2.2 | |||||||
Machinery | 2.2 | |||||||
Aerospace & Defense | 2.1 | |||||||
Health Care Equipment & Supplies | 2.1 | |||||||
Communications Equipment | 1.3 | |||||||
Textiles, Apparel & Luxury Goods | 1.3 | |||||||
Household Durables | 1.2 | |||||||
Road & Rail | 1.1 | |||||||
Food Products | 0.9 | |||||||
Short Term Investments | 0.8 | |||||||
Auto Components | 0.7 | |||||||
Multiline Retail | 0.7 | |||||||
Internet & Catalog Retail | 0.6 | |||||||
Other Assets & Liabilities | 0.1 | |||||||
TOTAL | 100.0 | % | ||||||
| * | The Portfolio’s asset allocation is expressed as a percentage of net assets and may change over time. |
8
Table of Contents
PORTFOLIO SUMMARY
TOP FIVE HOLDINGS AS OF DECEMBER 31, 2014
| DESCRIPTION | THE PROCTER & GAMBLE CO. | VERISK ANALYTICS, INC. | DR PEPPER SNAPPLE GROUP, INC. | MCDONALD’S CORP. | CAPITAL BANK FINANCIAL CORP. | |||||||||
| MARKET VALUE | $103,114 | 84,610 | 73,687 | 71,025 | 69,653 | |||||||||
| % OF NET ASSETS | 5.2 | 4.3 | 3.8 | 3.6 | 3.5 | |||||||||
(The five largest holdings are subject to change, and there are no guarantees the Portfolio will continue to remain invested in any particular Fund.)
ASSET ALLOCATION AS OF DECEMBER 31, 2014*
PERCENT OF NET ASSETS | ||||||||
Pharmaceuticals | 12.0 | % | ||||||
Beverages | 8.5 | |||||||
Real Estate Investment Trusts | 8.3 | |||||||
Banks | 7.6 | |||||||
Hotels, Restaurants & Leisure | 6.9 | |||||||
Multi-utilities | 6.4 | |||||||
Chemicals | 5.9 | |||||||
Professional Services | 5.9 | |||||||
Household Products | 5.2 | |||||||
Insurance | 4.3 | |||||||
Commercial Services & Supplies | 3.5 | |||||||
Diversified Telecommunication Services | 3.5 | |||||||
Multiline Retail | 2.6 | |||||||
Semiconductors & Semiconductor Equipment | 2.6 | |||||||
Food Products | 2.4 | |||||||
Food & Staples Retailing | 2.1 | |||||||
Internet & Catalog Retail | 2.0 | |||||||
Biotechnology | 1.2 | |||||||
Media | 1.2 | |||||||
Specialty Retail | 1.0 | |||||||
Diversified Financial Services | 0.9 | |||||||
Auto Components | 0.7 | |||||||
Construction & Engineering | 0.7 | |||||||
Short Term Investments | 0.7 | |||||||
Thrifts & Mortgage Finance | 0.6 | |||||||
Electrical Equipment | 0.5 | |||||||
Automobiles | 0.4 | |||||||
Communications Equipment | 0.4 | |||||||
Containers & Packaging | 0.4 | |||||||
Electric Utilities | 0.4 | |||||||
Aerospace & Defense | 0.2 | |||||||
Consumer Finance | 0.2 | |||||||
Paper & Forest Products | 0.2 | |||||||
Capital Markets | 0.1 | |||||||
Energy Equipment & Services | 0.1 | |||||||
Oil, Gas & Consumable Fuels | 0.1 | |||||||
Textiles, Apparel & Luxury Goods | 0.1 | |||||||
Air Freight & Logistics | — | ** | ||||||
Software | — | ** | ||||||
Wireless Telecommunication Services | — | ** | ||||||
Other Assets & Liabilities | 0.2 | |||||||
TOTAL | 100.0 | % | ||||||
| * | The Portfolio’s asset allocation is expressed as a percentage of net assets and may change over time. |
| ** | Amount shown represents less than 0.05% of net assets. |
9
Table of Contents
SSGA Multi-Asset Real Return Portfolio
SCHEDULE OF INVESTMENTS
December 31, 2014 (Unaudited)
Security Description | Shares | Value | ||||||
EXCHANGE TRADED PRODUCTS — 95.2% |
| |||||||
COMMODITIES — 13.0% |
| |||||||
PowerShares DB Commodity Index Tracking Fund (a) | 1,174,893 | $ | 21,676,776 | |||||
PowerShares DB Oil Fund (a) | 898 | 14,098 | ||||||
|
| |||||||
| 21,690,874 | ||||||||
|
| |||||||
INFLATION LINKED — 19.4% |
| |||||||
SPDR Barclays TIPS ETF (b) | 440,034 | 24,633,104 | ||||||
SPDR DB International Government Inflation-Protected Bond ETF (b) | 133,154 | 7,583,120 | ||||||
|
| |||||||
| 32,216,224 | ||||||||
|
| |||||||
NATURAL RESOURCES — 44.1% |
| |||||||
Market Vectors Gold Miners ETF | 38,770 | 712,593 | ||||||
PowerShares Global Agriculture Portfolio | 175,668 | 5,148,829 | ||||||
SPDR S&P Global Natural Resources ETF (b) | 1,193,624 | 52,519,456 | ||||||
SPDR S&P International Energy Sector ETF (b) | 155,927 | 3,215,215 | ||||||
SPDR S&P Metals & Mining ETF (b) | 158,558 | 4,893,100 | ||||||
The Energy Select Sector SPDR Fund (b) | 86,122 | 6,817,417 | ||||||
|
| |||||||
| 73,306,610 | ||||||||
|
| |||||||
REAL ESTATE — 18.7% |
| |||||||
SPDR Dow Jones International Real Estate ETF (b) | 327,524 | 13,615,173 | ||||||
SPDR Dow Jones REIT ETF (b) | 191,835 | 17,437,801 | ||||||
|
| |||||||
| 31,052,974 | ||||||||
|
| |||||||
TOTAL EXCHANGE TRADED PRODUCTS | $ | 158,266,682 | ||||||
|
| |||||||
SHORT TERM INVESTMENTS — 5.2% |
| |||||||
MONEY MARKET FUND — 5.2% |
| |||||||
State Street Institutional Liquid Reserves Fund 0.07% (b) (c) | 8,548,874 | 8,548,874 | ||||||
|
| |||||||
TOTAL INVESTMENTS — 100.4% (d) | 166,815,556 | |||||||
OTHER ASSETS & | (603,126 | ) | ||||||
|
| |||||||
NET ASSETS — 100.0% | $ | 166,212,430 | ||||||
|
| |||||||
| (a) | Qualified Publicly Traded Partnerships |
| (b) | Affiliated Fund managed by SSGA Funds Management, Inc. (Note 3). |
| (c) | The rate shown is the annualized seven-day yield at period end. |
| (d) | Unless otherwise indicated, the values of the securities of the Portfolio are determined based on Level 1 inputs (Note 2). |
See accompanying notes to financial statements.
10
Table of Contents
SSGA Income Allocation Portfolio
SCHEDULE OF INVESTMENTS
December 31, 2014 (Unaudited)
Security Description | Shares | Value | ||||||
EXCHANGE TRADED PRODUCTS — 95.5% |
| |||||||
DOMESTIC EQUITY — 26.0% |
| |||||||
SPDR S&P Dividend ETF (a) | 227,407 | $ | 17,919,672 | |||||
SPDR Wells Fargo Preferred Stock ETF (a) | 134,219 | 5,876,108 | ||||||
The Financial Select Sector SPDR Fund (a) | 97,707 | 2,416,294 | ||||||
The Health Care Select Sector SPDR Fund (a) | 33,340 | 2,279,789 | ||||||
The Technology Select Sector SPDR Fund (a) | 57,420 | 2,374,317 | ||||||
|
| |||||||
| 30,866,180 | ||||||||
|
| |||||||
DOMESTIC FIXED INCOME — 35.0% |
| |||||||
SPDR Barclays Convertible Securities ETF (a) | 119,178 | 5,588,256 | ||||||
SPDR Barclays High Yield Bond ETF (a) | 274,067 | 10,581,727 | ||||||
SPDR Barclays Long Term Corporate Bond ETF (a) | 434,323 | 18,020,061 | ||||||
SPDR Barclays Long Term Treasury ETF (a) | 100,226 | 7,303,068 | ||||||
|
| |||||||
| 41,493,112 | ||||||||
|
| |||||||
INFLATION LINKED — 0.5% |
| |||||||
SPDR Barclays TIPS ETF (a) | 10,572 | 591,820 | ||||||
|
| |||||||
INTERNATIONAL EQUITY — 16.3% |
| |||||||
SPDR EURO STOXX 50 ETF (a) | 30,308 | 1,117,153 | ||||||
SPDR S&P Emerging Markets Dividend ETF (a) | 99,028 | 3,377,845 | ||||||
SPDR S&P Global Infrastructure ETF (a) | 72,493 | 3,517,361 | ||||||
SPDR S&P International Dividend ETF (a) | 162,412 | 6,824,552 | ||||||
SPDR STOXX Europe 50 ETF (a) | 130,287 | 4,458,421 | ||||||
|
| |||||||
| 19,295,332 | ||||||||
|
| |||||||
INTERNATIONAL FIXED INCOME — 5.0% |
| |||||||
SPDR Barclays Emerging Markets Local Bond ETF (a) | 124,047 | 3,526,656 | ||||||
SPDR Barclays International Corporate Bond ETF (a) | 68,364 | 2,349,671 | ||||||
|
| |||||||
| 5,876,327 | ||||||||
|
| |||||||
REAL ESTATE — 12.7% |
| |||||||
SPDR Dow Jones International Real Estate ETF (a) | 138,326 | 5,750,212 | ||||||
SPDR Dow Jones REIT ETF (a) | 103,007 | 9,363,336 | ||||||
|
| |||||||
| 15,113,548 | ||||||||
|
| |||||||
TOTAL EXCHANGE TRADED PRODUCTS | 113,236,319 | |||||||
|
| |||||||
Security Description | Shares | Value | ||||||
SHORT TERM INVESTMENTS — 3.9% |
| |||||||
MONEY MARKET FUND — 3.9% |
| |||||||
State Street Institutional Liquid Reserves Fund 0.07% (a) (b) | 4,658,484 | $ | 4,658,484 | |||||
|
| |||||||
TOTAL INVESTMENTS — 99.4% (c) | 117,894,803 | |||||||
OTHER ASSETS & | 664,119 | |||||||
|
| |||||||
NET ASSETS — 100.0% | $ | 118,558,922 | ||||||
|
| |||||||
| (a) | Affiliated Fund managed by SSGA Funds Management, Inc. (Note 3). |
| (b) | The rate shown is the annualized seven-day yield at period end. |
| (c) | Unless otherwise indicated, the values of the securities of the Portfolio are determined based on Level 1 inputs (Note 2). |
See accompanying notes to financial statements.
11
Table of Contents
SSGA Global Allocation Portfolio
SCHEDULE OF INVESTMENTS
December 31, 2014 (Unaudited)
Security Description | Shares | Value | ||||||
EXCHANGE TRADED PRODUCTS — 88.9% |
| |||||||
DOMESTIC EQUITY — 33.9% |
| |||||||
SPDR S&P 500 ETF Trust (a) | 158,078 | $ | 32,485,029 | |||||
SPDR S&P 500 Growth ETF (a) | 27,707 | 2,677,605 | ||||||
SPDR S&P MidCap 400 ETF Trust (a) | 10,388 | 2,742,120 | ||||||
The Financial Select Sector SPDR Fund (a) | 109,381 | 2,704,992 | ||||||
The Health Care Select Sector SPDR Fund (a) | 38,259 | 2,616,150 | ||||||
The Technology Select Sector SPDR Fund (a) | 65,988 | 2,728,604 | ||||||
|
| |||||||
| 45,954,500 | ||||||||
|
| |||||||
DOMESTIC FIXED INCOME — 19.2% |
| |||||||
SPDR Barclays High Yield Bond ETF (a) | 208,497 | 8,050,069 | ||||||
SPDR Barclays Long Term Corporate Bond ETF (a) | 333,073 | 13,819,199 | ||||||
SPDR Barclays Long Term Treasury ETF (a) | 56,664 | 4,128,879 | ||||||
|
| |||||||
| 25,998,147 | ||||||||
|
| |||||||
INFLATION LINKED — 1.0% |
| |||||||
SPDR Barclays TIPS ETF (a) | 24,301 | 1,360,370 | ||||||
|
| |||||||
INTERNATIONAL EQUITY — 21.8% |
| |||||||
SPDR S&P International Small Cap ETF (a) | 131,500 | 3,599,155 | ||||||
SPDR S&P World ex-US ETF (a) | 851,339 | 22,901,019 | ||||||
WisdomTree Japan Hedged Equity Fund | 60,778 | 2,992,101 | ||||||
|
| |||||||
| 29,492,275 | ||||||||
|
| |||||||
INTERNATIONAL FIXED INCOME — 2.0% |
| |||||||
SPDR Barclays International Corporate Bond ETF (a) | 39,207 | 1,347,545 | ||||||
SPDR Barclays International Treasury Bond ETF (a) | 24,395 | 1,349,775 | ||||||
|
| |||||||
| 2,697,320 | ||||||||
|
| |||||||
REAL ESTATE — 11.0% |
| |||||||
SPDR Dow Jones International Real Estate ETF (a) | 98,018 | 4,074,608 | ||||||
SPDR Dow Jones REIT ETF (a) | 119,240 | 10,838,916 | ||||||
|
| |||||||
| 14,913,524 | ||||||||
|
| |||||||
TOTAL EXCHANGE TRADED PRODUCTS | $ | 120,416,136 | ||||||
|
| |||||||
SHORT TERM INVESTMENTS — 10.3% |
| |||||||
MONEY MARKET FUND — 10.3% |
| |||||||
State Street Institutional Liquid Reserves Fund 0.07% (a) (b) | 13,994,187 | 13,994,187 | ||||||
|
| |||||||
TOTAL INVESTMENTS — 99.2% (c) | 134,410,323 | |||||||
OTHER ASSETS & | 1,041,957 | |||||||
|
| |||||||
NET ASSETS — 100.0% | $ | 135,452,280 | ||||||
|
| |||||||
| (a) | Affiliated Fund managed by SSGA Funds Management, Inc. (Note 3). |
| (b) | The rate shown is the annualized seven-day yield at period end. |
| (c) | Unless otherwise indicated, the values of the securities of the Portfolio are determined based on Level 1 inputs (Note 2). |
See accompanying notes to financial statements.
12
Table of Contents
Blackstone/GSO Senior Loan Portfolio
SCHEDULE OF INVESTMENTS
December 31, 2014 (Unaudited)
Security Description | Principal | Value | ||||||
SENIOR FLOATING RATE LOANS* — 88.6% |
| |||||||
AIRLINES — 1.2% |
| |||||||
American Airlines, Inc., Senior Secured Term Loan B, 4.25%, 10/10/21 | $ | 3,750,000 | $ | 3,758,025 | ||||
US Airways Group, Inc., Senior Secured Term Loan B1, 3.50%, 5/23/19 | 3,254,528 | 3,195,246 | ||||||
|
| |||||||
| 6,953,271 | ||||||||
|
| |||||||
AUTO COMPONENTS — 2.0% |
| |||||||
Allison Transmission, Inc., Senior Secured Term Loan B3, 3.75%, 8/23/19 | 3,936,488 | 3,901,335 | ||||||
Federal-Mogul Holdings Corp., Senior Secured Term Loan C, 4.75%, 4/15/21 | 4,987,500 | 4,961,315 | ||||||
Harbor Freight Tools USA, Inc., Senior Secured First Lien Term Loan, 4.75%, 7/26/19 | 2,648,062 | 2,644,090 | ||||||
|
| |||||||
| 11,506,740 | ||||||||
|
| |||||||
AUTOMOBILES — 0.7% |
| |||||||
Chrysler Group LLC, Senior Secured Term Loan B, 3.25%, 12/31/18 | 4,135,417 | 4,104,401 | ||||||
|
| |||||||
BUILDING PRODUCTS — 1.0% |
| |||||||
Quikrete Holdings, Inc., Senior Secured First Lien Term Loan, 4.00%, 9/28/20 | 5,674,442 | 5,607,768 | ||||||
|
| |||||||
CHEMICALS — 2.6% |
| |||||||
Axalta Coating Systems US Holdings, Inc., Senior Secured Term Loan, 3.75%, 2/1/20 | 5,418,481 | 5,292,339 | ||||||
Ineos US Finance LLC, Senior Secured 6 Year Term Loan, 3.75%, 5/4/18 | 6,893,161 | 6,702,048 | ||||||
Univar, Inc., Senior Secured Term Loan B, 5.00%, 6/30/17 | 2,961,508 | 2,873,477 | ||||||
|
| |||||||
| 14,867,864 | ||||||||
|
| |||||||
COMMERCIAL SERVICES & SUPPLIES — 4.2% |
| |||||||
Acosta Holdco, Inc., Senior Secured Term Loan, 5.00%, 9/26/21 | 1,849,711 | 1,852,680 | ||||||
ADS Waste Holdings, Inc., Senior Secured Term Loan, 3.75%, 10/9/19 | 3,901,303 | 3,798,893 | ||||||
Aramark Services, Inc. | ||||||||
Senior Secured Term Loan E, 3.25%, 9/7/19 | 1,940,000 | 1,915,149 | ||||||
Senior Secured Term Loan F, 3.25%, 2/24/21 | 1,985,000 | 1,958,332 | ||||||
Asurion LLC | ||||||||
Senior Secured Term Loan B1, 5.00%, 5/24/19 | 3,078,966 | 3,045,436 | ||||||
Senior Secured Second Lien Term Loan, 8.50%, 3/3/21 | 4,276,596 | 4,262,333 | ||||||
EnergySolutions LLC, Senior Secured Term Loan, 6.75%, 5/29/20 (a) | 1,990,000 | 1,989,373 | ||||||
Lineage Logistics Holdings LLC, Senior Secured Term Loan, 4.50%, 4/7/21 (a) | 3,053,846 | 2,974,965 | ||||||
West Corp., Senior Secured Term Loan B10, 3.25%, 6/30/18 | 1,734,560 | 1,707,241 | ||||||
|
| |||||||
| 23,504,402 | ||||||||
|
| |||||||
Security Description | Principal | Value | ||||||
COMMUNICATIONS EQUIPMENT — 1.1% |
| |||||||
Blue Coat Systems, Inc., Senior Secured First Lien Term Loan, 4.00%, 5/31/19 | $ | 5,000,113 | $ | 4,881,361 | ||||
Penton Media, Inc., Senior Secured First Lien Term Loan, 5.50%, 10/3/19 | 1,580,000 | 1,573,095 | ||||||
|
| |||||||
| 6,454,456 | ||||||||
|
| |||||||
CONTAINERS & PACKAGING — 1.5% |
| |||||||
Berry Plastics Holding Corp. | ||||||||
Senior Secured Term Loan D, 3.50%, 2/8/20 | 2,949,962 | 2,863,558 | ||||||
Senior Secured Term Loan E, 3.75%, 1/6/21 | 1,105,503 | 1,078,855 | ||||||
Multi Packaging Solutions, Inc., Senior Secured Term Loan B, 4.25%, 9/30/20 (a) | 1,985,000 | 1,950,262 | ||||||
Reynolds Group Issuer, Inc., Senior Secured New Dollar Term Loan, 4.00%, 12/1/18 | 2,462,563 | 2,424,947 | ||||||
|
| |||||||
| 8,317,622 | ||||||||
|
| |||||||
DISTRIBUTORS — 0.1% |
| |||||||
Exopack Holdings SA, Senior Secured Term Loan B, 5.25%, 5/8/19 | 742,500 | 742,734 | ||||||
|
| |||||||
DIVERSIFIED CONSUMER SERVICES — 1.1% |
| |||||||
ServiceMaster Co., Senior Secured Term Loan B, 4.25%, 7/1/21 | 6,131,422 | 6,031,786 | ||||||
|
| |||||||
DIVERSIFIED FINANCIAL SERVICES — 1.5% |
| |||||||
AlixPartners LLP, Senior Secured Term Loan B2, 4.00%, 7/10/20 | 2,463,800 | 2,436,083 | ||||||
Opal Acquisition, Inc., Senior Secured First Lien Term Loan, 5.00%, 11/27/20 | 1,650,765 | 1,638,384 | ||||||
TransUnion LLC, Senior Secured Term Loan, 4.00%, 4/9/21 | 4,543,976 | 4,492,856 | ||||||
|
| |||||||
| 8,567,323 | ||||||||
|
| |||||||
DIVERSIFIED TELECOMMUNICATION SERVICES — 1.9% |
| |||||||
Intelsat Jackson Holdings, Ltd., Senior Secured Term Loan B2, 3.75%, 6/30/19 | 4,141,243 | 4,090,512 | ||||||
Telesat Canada, Senior Secured Term Loan B2, 3.50%, 3/28/19 | 1,965,000 | 1,942,904 | ||||||
Virgin Media Bristol LLC, Senior Secured Term Loan B, 3.50%, 6/7/20 | 2,000,000 | 1,967,470 | ||||||
Zayo Group LLC, Senior Secured Term Loan B, 4.00%, 7/2/19 | 2,516,082 | 2,496,054 | ||||||
|
| |||||||
| 10,496,940 | ||||||||
|
| |||||||
ELECTRIC UTILITIES — 1.0% |
| |||||||
Calpine Construction Finance Company LP, Senior Secured Term Loan B2, 3.25%, 1/31/22 | 1,989,929 | 1,924,430 | ||||||
La Frontera Generation LLC, Senior Secured Term Loan, 4.50%, 9/30/20 | 3,538,779 | 3,494,545 | ||||||
|
| |||||||
| 5,418,975 | ||||||||
|
| |||||||
See accompanying notes to financial statements.
13
Table of Contents
Blackstone/GSO Senior Loan Portfolio
SCHEDULE OF INVESTMENTS (continued)
December 31, 2014 (Unaudited)
Security Description | Principal | Value | ||||||
ELECTRONIC EQUIPMENT, INSTRUMENTS & COMPONENTS — 1.6% |
| |||||||
CDW LLC, Senior Secured Term Loan, | $ | 4,091,881 | $ | 3,978,004 | ||||
Pelican Products, Inc., Senior Secured Term Loan, 5.25%, 4/10/20 (a) | 373,969 | 372,099 | ||||||
Zebra Technologies Corp., Senior Secured Term Loan B, 4.75%, 10/27/21 | 4,597,701 | 4,631,034 | ||||||
|
| |||||||
| 8,981,137 | ||||||||
|
| |||||||
ENERGY EQUIPMENT & SERVICES — 2.8% |
| |||||||
Expro FinServices S.A.R.L., Senior Secured Term Loan, 5.75%, 9/2/21 (a) | 5,610,938 | 4,629,023 | ||||||
Granite Acquisition, Inc. | ||||||||
Senior Secured Term Loan B, 5.00%, 10/15/21 | 7,043,047 | 7,098,793 | ||||||
Senior Secured Term Loan C, 5.00%, 10/15/21 | 309,894 | 312,347 | ||||||
Sandy Creek Energy Associates LP, Senior Secured Term Loan B, 5.00%, 11/6/20 | 3,666,506 | 3,601,426 | ||||||
|
| |||||||
| 15,641,589 | ||||||||
|
| |||||||
FOOD & STAPLES RETAILING — 3.3% |
| |||||||
Albertson’s Holdings LLC | ||||||||
Senior Secured Term Loan B4, 4.50%, 8/25/21 | 2,727,273 | 2,731,827 | ||||||
Senior Secured Term Loan B4, 4.50%, 8/25/21 | 2,685,455 | 2,689,939 | ||||||
Albertson’s LLC, Senior Secured Term Loan B2, 4.75%, 3/21/19 | 3,975,070 | 3,961,157 | ||||||
Supervalu, Inc., Senior Secured Term Loan B, 4.50%, 3/21/19 | 2,943,978 | 2,901,261 | ||||||
US Foods, Inc., Senior Secured Term Loan, 4.50%, 3/31/19 | 6,612,821 | 6,579,757 | ||||||
|
| |||||||
| 18,863,941 | ||||||||
|
| |||||||
FOOD PRODUCTS — 1.7% |
| |||||||
Dole Food Co., Inc., Senior Secured Term Loan B, 4.50%, 11/1/18 | 2,275,183 | 2,253,376 | ||||||
H.J. Heinz Co., Senior Secured Term Loan B2, 3.50%, 6/5/20 | 1,688,543 | 1,681,307 | ||||||
New HB Acquisition LLC, Senior Secured Term Loan, 6.75%, 4/9/20 (a) | 3,970,000 | 4,039,475 | ||||||
Pinnacle Foods Finance LLC, Senior Secured Term Loan G, 3.00%, 4/29/20 | 1,733,936 | 1,686,799 | ||||||
|
| |||||||
| 9,660,957 | ||||||||
|
| |||||||
HEALTH CARE EQUIPMENT & SUPPLIES — 3.2% |
| |||||||
Accellent, Inc., Senior Secured First Lien Term Loan, 4.50%, 3/12/21 | 2,420,732 | 2,374,326 | ||||||
Immucor, Inc., Senior Secured Term Loan B2, 5.00%, 8/17/18 (a) | 3,439,831 | 3,405,432 | ||||||
Kinetic Concepts, Inc., Senior Secured Term Loan E1, 4.00%, 5/4/18 | 5,496,366 | 5,429,942 | ||||||
Ortho-Clinical Diagnostics, Inc., Senior Secured Term Loan B, 4.75%, 6/30/21 | 6,835,878 | 6,740,176 | ||||||
|
| |||||||
| 17,949,876 | ||||||||
|
| |||||||
Security Description | Principal | Value | ||||||
HEALTH CARE PROVIDERS & SERVICES — 3.0% |
| |||||||
Air Medical Group Holdings, Inc., Senior Unsecured Term Loan, 5.00%, 6/30/18 (a) | $ | 3,046,803 | $ | 3,054,420 | ||||
CHG Healthcare Services, Inc., Senior Secured Term Loan, 4.25%, 11/19/19 | 828,883 | 821,113 | ||||||
Community Health Systems, Inc., Senior Secured Term Loan D, 4.25%, 1/27/21 | 4,000,000 | 3,997,080 | ||||||
FHC Health Systems, Inc., Senior Secured Term Loan, 5.00%, 12/23/21 (a) | 2,500,000 | 2,481,250 | ||||||
MPH Acquisition Holdings LLC, Senior Secured Term Loan, 3.75%, 3/31/21 | 2,972,894 | 2,899,315 | ||||||
National Mentor Holdings, Inc., Senior Secured Term Loan B, 4.25%, 1/31/21 (a) | 719,948 | 707,349 | ||||||
Truven Health Analytics, Inc., Senior Secured Term Loan B, 4.50%, 6/6/19 | 2,838,691 | 2,767,723 | ||||||
|
| |||||||
| 16,728,250 | ||||||||
|
| |||||||
HEALTH CARE TECHNOLOGY — 0.8% |
| |||||||
IMS Health, Inc., Senior Secured Term Loan, 3.50%, 3/17/21 | 4,462,643 | 4,372,452 | ||||||
|
| |||||||
HOTELS, RESTAURANTS & LEISURE — 10.5% |
| |||||||
Alpha Topco (Delta 2 (LUX) S.A.R.L.) | ||||||||
Senior Secured Second Lien Term Loan, 7.75%, 7/31/22 | 1,944,444 | 1,900,694 | ||||||
Senior Secured Term Loan B3, 4.75%, 7/30/21 | 6,518,093 | 6,380,953 | ||||||
Burger King 1011778 B.C. Unlimited Liability Co., Senior Secured Term Loan B, 4.50%, 12/12/21 | 7,905,882 | 7,896,000 | ||||||
Caesars Entertainment Operating Co., Inc. | ||||||||
Senior Secured Extended Term Loan B5, 5.99%, 3/1/17 | 2,392,225 | 2,098,939 | ||||||
Senior Secured Extended Term Loan B6, 6.99%, 3/1/17 | 6,508,462 | 5,720,060 | ||||||
Caesars Entertainment Resort Properties LLC, Senior Secured Term Loan B, 7.00%, 10/11/20 | 8,587,674 | 8,058,115 | ||||||
CEC Entertainment, Inc., Senior Secured Term Loan, 4.00%, 2/14/21 | 3,398,234 | 3,310,457 | ||||||
Hilton Worldwide Finance LLC, Senior Secured Term Loan B2, 3.50%, 10/26/20 | 4,166,667 | 4,125,854 | ||||||
PGA Holdings, Inc., Senior Secured First Lien Term Loan, 4.25%, 4/20/18 | 4,191,118 | 4,155,766 | ||||||
PRA Holdings, Inc., Senior Secured First Lien Term Loan, 4.50%, 9/23/20 | 2,797,498 | 2,766,026 | ||||||
SGMS Escrow Corp., Senior Secured Incremental Term Loan B2, 6.00%, 10/1/21 | 12,941,176 | 12,787,500 | ||||||
|
| |||||||
| 59,200,364 | ||||||||
|
| |||||||
See accompanying notes to financial statements.
14
Table of Contents
Blackstone/GSO Senior Loan Portfolio
SCHEDULE OF INVESTMENTS (continued)
December 31, 2014 (Unaudited)
Security Description | Principal | Value | ||||||
HOUSEHOLD DURABLES — 0.7% |
| |||||||
Spin Holdco, Inc., Senior Secured Term Loan B, 4.25%, 11/14/19 | $ | 3,890,700 | $ | 3,837,222 | ||||
|
| |||||||
INDEPENDENT POWER & RENEWABLE ELECTRICITY PRODUCERS — 0.8% |
| |||||||
Calpine Corp. | ||||||||
Senior Secured Term Loan B1, 4.00%, 4/1/18 | 2,456,613 | 2,438,189 | ||||||
Senior Secured Term Loan B3, 4.00%, 10/9/19 | 2,363,728 | 2,341,284 | ||||||
|
| |||||||
| 4,779,473 | ||||||||
|
| |||||||
INSURANCE — 1.6% |
| |||||||
Alliant Holdings I, Inc., Senior Secured Term Loan B, 4.25%, 12/20/19 | 2,916,664 | 2,880,206 | ||||||
AmWINS Group LLC, Senior Secured Second Lien Term Loan, 9.50%, 9/6/20 (a) | 3,071,429 | 3,010,000 | ||||||
National Financial Partners Corp., Senior Secured Term Loan B, 4.50%, 7/1/20 | 3,368,604 | 3,343,340 | ||||||
|
| |||||||
| 9,233,546 | ||||||||
|
| |||||||
INTERNET SOFTWARE & SERVICES — 2.4% |
| |||||||
Go Daddy Operating Co. LLC, Senior Secured Term Loan B, 4.75%, 5/13/21 | 3,366,417 | 3,348,188 | ||||||
Inmar, Inc., Senior Secured First Lien Term Loan, 4.25%, 1/27/21 | 3,165,909 | 3,082,962 | ||||||
Sabre, Inc., Senior Secured Term Loan B, 4.00%, 2/19/19 | 5,415,870 | 5,332,682 | ||||||
SurveyMonkey.com LLC, Senior Secured Term Loan B, 5.50%, 2/5/19 | 1,927,382 | 1,922,564 | ||||||
|
| |||||||
| 13,686,396 | ||||||||
|
| |||||||
IT SERVICES — 2.3% |
| |||||||
First Data Corp. | ||||||||
Senior Secured Extended Term Loan, 3.67%, 3/23/18 | 6,487,969 | 6,372,418 | ||||||
Senior Secured Term Loan, 3.67%, 9/24/18 | 1,960,401 | 1,922,174 | ||||||
Information Resources, Inc., Senior Secured Term Loan B, 4.75%, 9/30/20 | 3,036,290 | 3,028,699 | ||||||
SunGard Data Systems, Inc., Senior Secured Term Loan E, 4.00%, 3/8/20 | 1,745,566 | 1,732,474 | ||||||
|
| |||||||
| 13,055,765 | ||||||||
|
| |||||||
LIFE SCIENCES TOOLS & SERVICES — 1.7% |
| |||||||
Pharmaceutical Product Development, Inc., Senior Secured Term Loan B, 4.00%, 12/5/18 | 2,948,603 | 2,932,636 | ||||||
Quintiles Transnational Corp., Senior Secured Term Loan B3, 3.75%, 6/8/18 | 6,897,586 | 6,834,370 | ||||||
|
| |||||||
| 9,767,006 | ||||||||
|
| |||||||
Security Description | Principal | Value | ||||||
MACHINERY — 2.9% |
| |||||||
Doosan Infracore International, Inc., Senior Secured Term Loan B, 4.50%, 5/28/21 | $ | 2,578,868 | $ | 2,565,973 | ||||
Gardner Denver, Inc., Senior Secured Term Loan, 4.25%, 7/30/20 | 2,969,925 | 2,787,557 | ||||||
Gates Global, Inc., Senior Secured Term Loan B, 4.25%, 7/5/21 | 6,034,875 | 5,891,547 | ||||||
Rexnord LLC, Senior Secured First Lien Term Loan B, 4.00%, 8/21/20 | 5,360,714 | 5,262,881 | ||||||
|
| |||||||
| 16,507,958 | ||||||||
|
| |||||||
MARINE — 0.7% |
| |||||||
Drillships Ocean Ventures, Inc., Senior Secured Term Loan B, 5.50%, 7/25/21 | 5,024,720 | 4,070,023 | ||||||
|
| |||||||
MEDIA — 5.1% |
| |||||||
AMC Entertainment, Inc., Senior Secured Term Loan, 3.50%, 4/30/20 | 3,023,519 | 2,981,946 | ||||||
Cengage Learning Acquisitions, Inc., Senior Secured First Lien Term Loan, 7.00%, 3/31/20 | 3,000,000 | 2,976,255 | ||||||
Clear Channel Communications, Inc., Senior Secured Term Loan D, 6.92%, 1/30/19 | 5,000,000 | 4,725,875 | ||||||
Cumulus Media Holdings, Inc., Senior Secured Term Loan, 4.25%, 12/23/20 | 5,915,423 | 5,755,203 | ||||||
Interactive Data Corp., Senior Secured Term Loan, 4.75%, 5/2/21 | 7,502,157 | 7,466,522 | ||||||
Univision Communications, Inc. | ||||||||
Senior Secured Term Loan C3, 4.00%, 3/1/20 | 1,991,364 | 1,951,537 | ||||||
Senior Secured Term Loan C4, 4.00%, 3/1/20 | 2,957,320 | 2,898,174 | ||||||
|
| |||||||
| 28,755,512 | ||||||||
|
| |||||||
METALS & MINING — 1.1% |
| |||||||
Fairmount Minerals, Ltd., Senior Secured Term Loan B2, 4.50%, 9/5/19 | 2,962,500 | 2,701,430 | ||||||
FMG Resources August 2006 Pty, Ltd., Senior Secured Term Loan B, 3.75%, 6/30/19 | 4,109,194 | 3,746,044 | ||||||
|
| |||||||
| 6,447,474 | ||||||||
|
| |||||||
MULTI-UTILITIES — 0.5% |
| |||||||
Power Team Services LLC | ||||||||
Senior Secured First Lien Term Loan, 4.25%, 5/6/20 (a) | 2,761,606 | 2,697,178 | ||||||
Senior Secured Delayed Draw Term Loan, 4.25%, 5/6/20 (a) | 147,458 | 144,018 | ||||||
|
| |||||||
| 2,841,196 | ||||||||
|
| |||||||
MULTILINE RETAIL — 1.2% |
| |||||||
The Neiman Marcus Group, Inc., Senior Secured Term Loan, 4.25%, 10/25/20 | 6,904,427 | 6,767,063 | ||||||
|
| |||||||
See accompanying notes to financial statements.
15
Table of Contents
Blackstone/GSO Senior Loan Portfolio
SCHEDULE OF INVESTMENTS (continued)
December 31, 2014 (Unaudited)
Security Description | Principal | Value | ||||||
OIL, GAS & CONSUMABLE FUELS — 2.4% |
| |||||||
Arch Coal, Inc., Senior Secured Term Loan B, 6.25%, 5/16/18 | $ | 6,964,367 | $ | 5,789,130 | ||||
EMG Utica LLC, Senior Secured Term Loan, 4.75%, 3/27/20 (a) | 3,000,000 | 2,973,750 | ||||||
Fieldwood Energy LLC, Senior Secured Second Lien Term Loan, 8.38%, 9/30/20 | 6,389,590 | 4,716,317 | ||||||
|
| |||||||
| 13,479,197 | ||||||||
|
| |||||||
PERSONAL PRODUCTS — 1.0% |
| |||||||
Revlon Consumer Products Corp., Senior Secured Acquisition Term Loan, 4.00%, 10/8/19 | 5,948,684 | 5,859,454 | ||||||
|
| |||||||
PHARMACEUTICALS — 1.4% |
| |||||||
CCC Information Services, Inc., Senior Secured Term Loan, 4.00%, 12/20/19 | 2,949,837 | 2,920,339 | ||||||
Par Pharmaceutical Cos., Inc., Senior Secured Term Loan B2, 4.00%, 9/30/19 | 1,396,644 | 1,361,728 | ||||||
Valeant Pharmaceuticals International, Inc., Senior Secured Term Loan B, 3.50%, 8/5/20 | 3,454,684 | 3,428,773 | ||||||
|
| |||||||
| 7,710,840 | ||||||||
|
| |||||||
PROFESSIONAL SERVICES — 0.4% |
| |||||||
Advantage Sales & Marketing, Inc. | ||||||||
Senior Secured First Lien Term Loan, 4.25%, 7/23/21 | 2,358,040 | 2,338,881 | ||||||
Senior Secured Delayed Draw Term Loan, 4.25%, 7/23/21 | 78,601 | 77,962 | ||||||
|
| |||||||
| 2,416,843 | ||||||||
|
| |||||||
REAL ESTATE MANAGEMENT & DEVELOPMENT — 0.3% |
| |||||||
Realogy Corp., Senior Secured Term Loan B, 3.75%, 3/5/20 | 1,965,150 | 1,930,760 | ||||||
|
| |||||||
SEMICONDUCTORS & SEMICONDUCTOR EQUIPMENT — 2.1% |
| |||||||
Avago Technologies, Ltd., Senior Secured Term Loan B, 3.75%, 5/6/21 | 6,413,086 | 6,403,755 | ||||||
Freescale Semiconductor, Inc. | ||||||||
Senior Secured Term Loan B4, 4.25%, 2/28/20 | 2,957,588 | 2,895,671 | ||||||
Senior Secured Term Loan B5, 5.00%, 1/15/21 | 2,468,750 | 2,469,984 | ||||||
|
| |||||||
| 11,769,410 | ||||||||
|
| |||||||
SOFTWARE — 5.4% |
| |||||||
Applied Systems, Inc., Senior Secured First Lien Term Loan, 4.25%, 1/25/21 | 1,650,000 | 1,628,352 | ||||||
Aspect Software, Inc., Senior Secured Term Loan B, 7.25%, 5/7/16 (a) | 973,684 | 954,211 | ||||||
BMC Software Finance, Inc., Senior Secured Term Loan, 5.00%, 9/10/20 | 10,658,666 | 10,402,219 | ||||||
Epicor Software Corp. (Eagle Parent, Inc.), Senior Secured Term Loan, 4.00%, 5/16/18 | 1,897,184 | 1,877,026 | ||||||
Security Description | Principal | Value | ||||||
Infor (US), Inc. | ||||||||
Senior Secured Term Loan B3, 3.75%, 6/3/20 | $ | 1,690,781 | $ | 1,642,644 | ||||
Senior Secured Term Loan B5, 3.75%, 6/3/20 | 2,691,980 | 2,617,412 | ||||||
MA FinanceCo. LLC, Senior Secured Term Loan B, 5.25%, 10/7/21 | 4,980,237 | 4,832,399 | ||||||
Magic Newco LLC, Senior Secured First Lien Term Loan, 5.00%, 12/12/18 | 722,388 | 721,485 | ||||||
Mitchell International, Inc., Senior Secured First Lien Term Loan, 4.50%, 10/12/20 | 2,846,217 | 2,813,372 | ||||||
Vertafore, Inc., Senior Secured First Lien Term Loan, 4.25%, 10/3/19 | 3,369,096 | 3,341,301 | ||||||
|
| |||||||
| 30,830,421 | ||||||||
|
| |||||||
SPECIALTY RETAIL — 3.4% |
| |||||||
J Crew Group, Inc., Senior Secured Term Loan B, 4.00%, 3/5/21 | 4,857,239 | 4,590,091 | ||||||
Michaels Stores, Inc., Senior Secured Term Loan B, 3.75%, 1/28/20 | 1,970,000 | 1,935,929 | ||||||
Party City Holdings, Inc., Senior Secured Term Loan, 4.00%, 7/27/19 | 5,912,657 | 5,797,360 | ||||||
Serta Simmons Holdings LLC, Senior Secured Term Loan, 4.25%, 10/1/19 | 3,216,919 | 3,172,686 | ||||||
The Men’s Wearhouse, Inc., Senior Secured Term Loan B, 4.50%, 6/18/21 | 3,892,683 | 3,882,951 | ||||||
|
| |||||||
| 19,379,017 | ||||||||
|
| |||||||
TECHNOLOGY HARDWARE, STORAGE & PERIPHERALS — 2.5% |
| |||||||
BWAY Holding Co., Inc., Senior Secured Term Loan B, 5.50%, 8/14/20 | 2,132,143 | 2,129,477 | ||||||
Dell, Inc., Senior Secured Term Loan B, 4.50%, 4/29/20 | 11,970,000 | 11,962,519 | ||||||
|
| |||||||
| 14,091,996 | ||||||||
|
| |||||||
WIRELESS TELECOMMUNICATION SERVICES — 1.9% |
| |||||||
Avaya, Inc., Senior Secured Term Loan B6, 6.50%, 3/30/18 | 5,929,968 | 5,853,352 | ||||||
Syniverse Holdings, Inc. | ||||||||
Senior Secured Term Loan, 4.00%, 4/23/19 | 1,967,079 | 1,915,444 | ||||||
Senior Secured Term Loan B, 4.00%, 4/23/19 | 2,908,564 | 2,835,850 | ||||||
|
| |||||||
| 10,604,646 | ||||||||
|
| |||||||
TOTAL SENIOR FLOATING RATE LOANS |
| 501,794,066 | ||||||
|
| |||||||
CORPORATE BONDS & NOTES — 7.5% |
| |||||||
COMMERCIAL SERVICES & SUPPLIES — 0.2% |
| |||||||
Aramark Services, Inc., 5.75%, 3/15/20 | 1,000,000 | 1,032,500 | ||||||
|
| |||||||
COMMUNICATIONS EQUIPMENT — 0.4% |
| |||||||
Alcatel-Lucent USA, Inc., | 2,000,000 | 2,020,000 | ||||||
|
| |||||||
See accompanying notes to financial statements.
16
Table of Contents
Blackstone/GSO Senior Loan Portfolio
SCHEDULE OF INVESTMENTS (continued)
December 31, 2014 (Unaudited)
Security Description | Principal | Value | ||||||
CONTAINERS & PACKAGING — 0.2% |
| |||||||
Beverage Packaging Holdings Luxembourg II SA/Beverage Packaging Holdings II Is, 6.00%, 6/15/17 (b) | $ | 1,000,000 | $ | 975,000 | ||||
|
| |||||||
DIVERSIFIED CONSUMER SERVICES — 0.7% |
| |||||||
Reynolds Group Issuer, Inc./Reynolds Group Issuer LLC/Reynolds Group Issuer Lu | ||||||||
7.13%, 4/15/19 | 2,000,000 | 2,067,500 | ||||||
9.00%, 4/15/19 | 2,000,000 | 2,070,000 | ||||||
|
| |||||||
| 4,137,500 | ||||||||
|
| |||||||
FOOD PRODUCTS — 0.7% |
| |||||||
Big Heart Pet Brands, 7.63%, 2/15/19 | 4,000,000 | 3,930,000 | ||||||
|
| |||||||
HOTELS, RESTAURANTS & LEISURE — 0.9% |
| |||||||
Caesars Entertainment Resort Properties LLC, 8.00%, 10/1/20 (b) | 5,465,000 | 5,355,700 | ||||||
|
| |||||||
INDEPENDENT POWER & RENEWABLE ELECTRICITY PRODUCERS — 0.5% |
| |||||||
AES Corp., 3.23%, 6/1/19 | 3,000,000 | 2,925,000 | ||||||
|
| |||||||
LEISURE PRODUCTS — 0.4% |
| |||||||
Cedar Fair LP/Canada’s Wonderland Co./Magnum Management Corp., 5.25%, 3/15/21 (a) | 2,000,000 | 2,010,000 | ||||||
|
| |||||||
MEDIA — 2.3% | ||||||||
iHeartCommunications, Inc., 9.00%, 12/15/19 | 12,000,000 | 11,820,000 | ||||||
Univision Communications, Inc., 6.88%, 5/15/19 (b) | 1,000,000 | 1,041,250 | ||||||
|
| |||||||
| 12,861,250 | ||||||||
|
| |||||||
WIRELESS TELECOMMUNICATION SERVICES — 1.2% |
| |||||||
Avaya, Inc. | ||||||||
7.00%, 4/1/19 (b) | 3,000,000 | 2,925,000 | ||||||
9.00%, 4/1/19 (b) | 4,000,000 | 4,090,000 | ||||||
|
| |||||||
| 7,015,000 | ||||||||
|
| |||||||
TOTAL CORPORATE BONDS & NOTES | 42,261,950 | |||||||
|
| |||||||
SHORT TERM INVESTMENTS — 0.8% |
| |||||||
MONEY MARKET FUNDS — 0.8% |
| |||||||
State Street Institutional Liquid Reserves Fund 0.07% (c) (d) (e) | 4,725,025 | 4,725,025 | ||||||
|
| |||||||
TOTAL SHORT TERM INVESTMENTS | 4,725,025 | |||||||
|
| |||||||
TOTAL INVESTMENTS — 96.9% (f) | 548,781,041 | |||||||
OTHER ASSETS & | 17,413,612 | |||||||
|
| |||||||
NET ASSETS — 100.0% | $ | 566,194,653 | ||||||
|
| |||||||
| * | The interest rate shown represents the rate at period end. |
| (a) | Securities are valued at fair value as determined in good faith by the Trust’s Oversight Committee in accordance with procedures approved by the Board of Trustees (Note 2). |
| (b) | Securities purchased pursuant to Rule 144A of the Securities Act of 1933. These securities, which represent 2.9% of net assets as of December 31, 2014, are considered liquid and may be resold in transactions exempt from registration, normally to qualified institutional buyers. |
| (c) | Affiliated Fund managed by SSGA Funds Management, Inc. (Note 3). |
| (d) | The rate shown is the annualized seven-day yield at period end. |
| (e) | Value is determined based on Level 1 inputs (Note 2). |
| (f) | Unless otherwise indicated, the values of the securities of the Portfolio are determined based on Level 2 inputs (Note 2). |
See accompanying notes to financial statements.
17
Table of Contents
SSGA Ultra Short Term Bond Portfolio
SCHEDULE OF INVESTMENTS
December 31, 2014 (Unaudited)
Security Description | Principal | Value | ||||||
ASSET BACKED SECURITIES — 29.4% |
| |||||||
AUTOMOBILES — 22.3% | ||||||||
BMW Vehicle Lease Trust, | $ | 147,801 | $ | 147,825 | ||||
Chrysler Capital Auto Receivables Trust, 0.61%, 11/15/16 (a) | 89,434 | 89,447 | ||||||
Ford Credit Auto Lease Trust | ||||||||
1.10%, 12/15/15 (a) | 550,000 | 550,651 | ||||||
0.76%, 9/15/16 | 250,000 | 250,158 | ||||||
Ford Credit Auto Owner Trust, | 144,792 | 144,778 | ||||||
Ford Credit Floorplan Master Owner Trust, 0.56%, 2/15/19 (b) | 200,000 | 200,100 | ||||||
GE Dealer Floorplan Master Note Trust | ||||||||
0.64%, 6/20/17 (b) | 200,000 | 200,086 | ||||||
0.55%, 7/20/19 (b) | 250,000 | 249,758 | ||||||
Honda Auto Receivables Owner Trust, | 88,914 | 88,950 | ||||||
John Deere Owner Trust, | 400,000 | 399,162 | ||||||
Nissan Auto Lease Trust, | 600,000 | 599,793 | ||||||
Santander Drive Auto Receivables Trust, | 380,000 | 380,224 | ||||||
Toyota Auto Receivables Owner Trust, | 66,320 | 66,353 | ||||||
World Omni Auto Receivables Trust, | 200,000 | 199,748 | ||||||
|
| |||||||
| 3,567,033 | ||||||||
|
| |||||||
CREDIT CARD RECEIVABLES — 5.3% |
| |||||||
BA Credit Card Trust, | 300,000 | 299,946 | ||||||
Barclays Dryrock Issuance Trust | ||||||||
0.52%, 12/16/19 (b) | 200,000 | 199,748 | ||||||
0.50%, 3/16/20 (b) | 100,000 | 99,885 | ||||||
Citibank Credit Card Issuance Trust, | 250,000 | 249,944 | ||||||
|
| |||||||
| 849,523 | ||||||||
|
| |||||||
STUDENT LOAN — 1.8% | ||||||||
SLM Student Loan Trust, | 287,659 | 287,595 | ||||||
|
| |||||||
TOTAL ASSET BACKED SECURITIES | $ | 4,704,151 | ||||||
|
| |||||||
CORPORATE BONDS & NOTES — 66.8% |
| |||||||
AEROSPACE & DEFENSE — 1.5% |
| |||||||
The Boeing Co., | 250,000 | 249,751 | ||||||
|
| |||||||
AUTOMOBILES — 9.3% | ||||||||
American Honda Finance Corp., | 100,000 | 99,807 | ||||||
Daimler Finance North America LLC | ||||||||
0.91%, 8/1/16 (a) (b) | 160,000 | 160,852 | ||||||
1.25%, 1/11/16 (a) | 350,000 | 350,952 | ||||||
Harley-Davidson Financial Services, Inc., 1.15%, 9/15/15 (a) | 400,000 | 401,092 | ||||||
Volkswagen International Finance NV | ||||||||
1.63%, 3/22/15 (a) | 225,000 | 225,458 | ||||||
1.15%, 11/20/15 (a) | 250,000 | 250,957 | ||||||
|
| |||||||
| 1,489,118 | ||||||||
|
| |||||||
Security Description | Principal | Value | ||||||
BANKS — 23.4% | ||||||||
American Express Centurion Bank, | $ | 60,000 | $ | 60,106 | ||||
Bank of America NA | ||||||||
0.70%, 2/14/17 (b) | 125,000 | 124,633 | ||||||
0.65%, 5/8/17 (b) | 400,000 | 399,338 | ||||||
Bank of Montreal, | 175,000 | 175,799 | ||||||
Cooperatieve Centrale Raiffeisen-Boerenleenbank BA/NY, | 225,000 | 225,673 | ||||||
JPMorgan Chase & Co. | ||||||||
0.68%, 11/18/16 (b) | 225,000 | 224,910 | ||||||
2.60%, 1/15/16 | 250,000 | 254,285 | ||||||
Lloyds Bank PLC, | 110,000 | 110,078 | ||||||
National Australia Bank, Ltd., | 250,000 | 249,876 | ||||||
Nederlandse Waterschapsbank NV, | 200,000 | 200,569 | ||||||
Royal Bank of Canada | ||||||||
0.61%, 3/8/16 (b) | 150,000 | 150,259 | ||||||
0.48%, 6/16/17 (b) | 320,000 | 319,595 | ||||||
Svenska Handelsbanken AB, | 250,000 | 250,798 | ||||||
The Toronto-Dominion Bank, | 380,000 | 379,028 | ||||||
US Bancorp, | 150,000 | 150,512 | ||||||
US Bank NA, | 100,000 | 101,297 | ||||||
Wells Fargo & Co., | 150,000 | 149,350 | ||||||
Westpac Banking Corp., | 220,000 | 220,571 | ||||||
|
| |||||||
| 3,746,677 | ||||||||
|
| |||||||
BEVERAGES — 6.2% | ||||||||
Anheuser-Busch InBev Worldwide, Inc., | 250,000 | 252,201 | ||||||
Diageo Finance BV, | 485,000 | 502,784 | ||||||
PepsiCo, Inc., | 240,000 | 240,451 | ||||||
|
| |||||||
| 995,436 | ||||||||
|
| |||||||
CHEMICALS — 2.8% | ||||||||
EI du Pont de Nemours & Co., | 240,000 | 241,993 | ||||||
Praxair, Inc., | 200,000 | 203,792 | ||||||
|
| |||||||
| 445,785 | ||||||||
|
| |||||||
COMMUNICATIONS EQUIPMENT — 1.6% |
| |||||||
Cisco Systems, Inc., | 250,000 | 250,044 | ||||||
|
| |||||||
CONSUMER FINANCE — 0.8% |
| |||||||
Caterpillar Financial Services Corp., | 125,000 | 125,135 | ||||||
|
| |||||||
See accompanying notes to financial statements.
18
Table of Contents
SSGA Ultra Short Term Bond Portfolio
SCHEDULE OF INVESTMENTS (continued)
December 31, 2014 (Unaudited)
Security Description | Principal | Value | ||||||
DIVERSIFIED FINANCIAL SERVICES — 12.4% |
| |||||||
American Express Credit Corp., | $ | 250,000 | $ | 248,578 | ||||
American Honda Finance Corp., | 220,000 | 220,417 | ||||||
BP Capital Markets PLC, 0.56%, 11/6/15 (b) | 150,000 | 150,136 | ||||||
General Electric Capital Corp. 0.61%, 7/10/15 (b) | 70,000 | 70,122 | ||||||
1.10%, 5/9/16 (b) | 150,000 | 151,348 | ||||||
0.43%, 5/11/16 (b) | 300,000 | 300,076 | ||||||
JPMorgan Chase & Co., | 140,000 | 140,235 | ||||||
PACCAR Financial Corp., 0.50%, 2/8/16 (b) | 200,000 | 200,224 | ||||||
Toyota Motor Credit Corp. 0.43%, 5/16/17 (b) | 400,000 | 398,951 | ||||||
0.35%, 9/23/16 (b) | 100,000 | 99,892 | ||||||
|
| |||||||
| 1,979,979 | ||||||||
|
| |||||||
HEALTH CARE PROVIDERS & SERVICES — 0.9% |
| |||||||
UnitedHealth Group, Inc., | 140,000 | 141,196 | ||||||
|
| |||||||
INTERNET SOFTWARE & SERVICES — 1.0% |
| |||||||
eBay, Inc., | 160,000 | 156,938 | ||||||
|
| |||||||
MEDIA — 2.2% |
| |||||||
NBCUniversal Enterprise, Inc. | 200,000 | 200,361 | ||||||
0.92%, 4/15/18 (a) (b) | 150,000 | 151,248 | ||||||
|
| |||||||
| 351,609 | ||||||||
|
| |||||||
METALS & MINING — 2.5% |
| |||||||
Rio Tinto Finance USA PLC | 200,000 | 200,213 | ||||||
1.08%, 6/17/16 (b) | 200,000 | 200,726 | ||||||
|
| |||||||
| 400,939 | ||||||||
|
| |||||||
OIL, GAS & CONSUMABLE FUELS — 1.5% |
| |||||||
Statoil ASA, | 250,000 | 249,500 | ||||||
|
| |||||||
ROAD & RAIL — 0.7% | ||||||||
Canadian National Railway Co., 0.43%, 11/6/15 (b) | 119,000 | 119,038 | ||||||
|
| |||||||
TOTAL CORPORATE BONDS & NOTES | $ | 10,701,145 | ||||||
|
| |||||||
FOREIGN GOVERNMENT OBLIGATIONS — 2.2% |
| |||||||
Province of Ontario Canada, | 350,000 | 350,105 | ||||||
|
| |||||||
TOTAL FOREIGN GOVERNMENT OBLIGATIONS | $ | 350,105 | ||||||
|
| |||||||
U.S. TREASURY OBLIGATIONS — 1.2% |
| |||||||
Treasury Note, | 200,000 | 200,094 | ||||||
|
| |||||||
TOTAL U.S. TREASURY OBLIGATIONS | $ | 200,094 | ||||||
|
| |||||||
Security Description | Principal | Value | ||||||
SHORT TERM INVESTMENTS — 0.2% |
| |||||||
MONEY MARKET FUNDS — 0.2% |
| |||||||
State Street Institutional Liquid Reserve | $ | 26,091 | $ | 26,091 | ||||
|
| |||||||
TOTAL INVESTMENTS — 99.8% (f) | 15,981,586 | |||||||
OTHER ASSETS & | 32,551 | |||||||
|
| |||||||
NET ASSETS — 100.0% | $ | 16,014,137 | ||||||
|
| |||||||
| (a) | Securities purchased pursuant to Rule 144A of the Securities Act of 1933. These securities, which represent 19.7% of net assets as of December 31, 2014, are considered liquid and may be resold in transactions exempt from registration, normally to qualified institutional buyers. |
| (b) | Variable rate security. Rate shown is rate in effect at December 31, 2014. Maturity date disclosed is the ultimate maturity. |
| (c) | Affiliated Fund managed by SSGA Funds Management, Inc. (Note 3). |
| (d) | The rate shown is the annualized seven-day yield at period end. |
| (e) | Value is determined based on Level 1 inputs (Note 2). |
| (f) | Unless otherwise indicated, the values of the securities of the Portfolio are determined based on Level 2 inputs (Note 2). |
See accompanying notes to financial statements.
19
Table of Contents
SSGA MFS Systematic Core Equity Portfolio
SCHEDULE OF INVESTMENTS
December 31, 2014 (Unaudited)
Security Description | Shares | Value | ||||||
COMMON STOCKS — 99.4% | ||||||||
AEROSPACE & DEFENSE — 4.0% |
| |||||||
General Dynamics Corp. | 680 | $ | 93,582 | |||||
Precision Castparts Corp. | 97 | 23,365 | ||||||
|
| |||||||
| 116,947 | ||||||||
|
| |||||||
BANKS — 7.3% |
| |||||||
Citigroup, Inc. | 297 | 16,071 | ||||||
JPMorgan Chase & Co. | 1,945 | 121,718 | ||||||
Wells Fargo & Co. | 1,410 | 77,296 | ||||||
|
| |||||||
| 215,085 | ||||||||
|
| |||||||
BIOTECHNOLOGY — 1.8% |
| |||||||
Amgen, Inc. | 339 | 53,999 | ||||||
|
| |||||||
CHEMICALS — 2.6% |
| |||||||
LyondellBasell Industries NV (Class A) | 954 | 75,738 | ||||||
|
| |||||||
CONSUMER FINANCE — 1.4% |
| |||||||
Discover Financial Services | 636 | 41,652 | ||||||
|
| |||||||
DIVERSIFIED TELECOMMUNICATION SERVICES — 2.3% |
| |||||||
Verizon Communications, Inc. | 1,461 | 68,346 | ||||||
|
| |||||||
ELECTRIC UTILITIES — 1.2% |
| |||||||
Edison International | 524 | 34,312 | ||||||
|
| |||||||
FOOD & STAPLES RETAILING — 3.8% |
| |||||||
The Kroger Co. | 1,740 | 111,725 | ||||||
|
| |||||||
FOOD PRODUCTS — 1.0% |
| |||||||
Mondelez International, Inc. (Class A) | 791 | 28,733 | ||||||
|
| |||||||
HEALTH CARE PROVIDERS & SERVICES — 11.3% |
| |||||||
Aetna, Inc. | 502 | 44,593 | ||||||
Anthem, Inc. | 817 | 102,672 | ||||||
Cardinal Health, Inc. | 1,057 | 85,332 | ||||||
McKesson Corp. | 475 | 98,600 | ||||||
|
| |||||||
| 331,197 | ||||||||
|
| |||||||
HOTELS, RESTAURANTS & LEISURE — 3.7% |
| |||||||
Royal Caribbean Cruises, Ltd. | 1,301 | 107,241 | ||||||
|
| |||||||
HOUSEHOLD PRODUCTS — 1.5% |
| |||||||
The Procter & Gamble Co. | 480 | 43,723 | ||||||
|
| |||||||
INDEPENDENT POWER & RENEWABLE ELECTRICITY PRODUCERS — 2.3% |
| |||||||
AES Corp. | 4,870 | 67,060 | ||||||
|
| |||||||
INSURANCE — 8.8% |
| |||||||
Everest Re Group, Ltd. | 158 | 26,907 | ||||||
MetLife, Inc. | 1,060 | 57,335 | ||||||
Prudential Financial, Inc. | 1,041 | 94,169 | ||||||
Validus Holdings, Ltd. | 1,935 | 80,419 | ||||||
|
| |||||||
| 258,830 | ||||||||
|
| |||||||
INTERNET & CATALOG RETAIL — 0.9% |
| |||||||
Expedia, Inc. | 316 | 26,974 | ||||||
|
| |||||||
INTERNET SOFTWARE & SERVICES — 6.0% |
| |||||||
Facebook, Inc. (Class A) (a) | 1,532 | 119,527 | ||||||
Google, Inc. (Class A) (a) | 79 | 41,922 | ||||||
Google, Inc. (Class C) (a) | 29 | 15,265 | ||||||
|
| |||||||
| 176,714 | ||||||||
|
| |||||||
Security Description | Shares | Value | ||||||
MEDIA — 2.3% |
| |||||||
Comcast Corp. (Class A) | 496 | $ | 28,773 | |||||
Time Warner Cable, Inc. | 244 | 37,103 | ||||||
|
| |||||||
| 65,876 | ||||||||
|
| |||||||
OIL, GAS & CONSUMABLE FUELS — 7.7% |
| |||||||
Chevron Corp. | 247 | 27,708 | ||||||
Exxon Mobil Corp. | 1,207 | 111,587 | ||||||
Valero Energy Corp. | 1,769 | 87,566 | ||||||
|
| |||||||
| 226,861 | ||||||||
|
| |||||||
PHARMACEUTICALS — 4.4% |
| |||||||
Johnson & Johnson | 922 | 96,414 | ||||||
Merck & Co., Inc. | 588 | 33,392 | ||||||
|
| |||||||
| 129,806 | ||||||||
|
| |||||||
REAL ESTATE INVESTMENT TRUSTS — 3.1% |
| |||||||
Iron Mountain, Inc. | 2,330 | 90,078 | ||||||
|
| |||||||
SOFTWARE — 6.2% |
| |||||||
Electronic Arts, Inc. (a) | 2,214 | 104,091 | ||||||
Oracle Corp. | 1,751 | 78,743 | ||||||
|
| |||||||
| 182,834 | ||||||||
|
| |||||||
SPECIALTY RETAIL — 3.4% |
| |||||||
Best Buy Co., Inc. | 2,522 | 98,308 | ||||||
|
| |||||||
TECHNOLOGY HARDWARE, STORAGE & PERIPHERALS — 8.8% |
| |||||||
Apple, Inc. | 1,307 | 144,267 | ||||||
Hewlett-Packard Co. | 2,795 | 112,163 | ||||||
|
| |||||||
| 256,430 | ||||||||
|
| |||||||
TOBACCO — 3.6% |
| |||||||
Altria Group, Inc. | 632 | 31,139 | ||||||
Philip Morris International, Inc. | 912 | 74,282 | ||||||
|
| |||||||
| 105,421 | ||||||||
|
| |||||||
TOTAL COMMON STOCKS | $ | 2,913,890 | ||||||
|
| |||||||
SHORT TERM INVESTMENTS — 0.5% | ||||||||
MONEY MARKET FUND — 0.5% | ||||||||
State Street Institutional Liquid Reserves Fund 0.07% (b) (c) | 14,163 | 14,163 | ||||||
|
| |||||||
TOTAL INVESTMENTS — 99.9% (d) | 2,928,053 | |||||||
OTHER ASSETS & | 2,277 | |||||||
|
| |||||||
NET ASSETS — 100.0% | $ | 2,930,330 | ||||||
|
| |||||||
| (a) | Non-income producing security |
| (b) | Affiliated Fund managed by SSGA Funds Management, Inc. (Note 3). |
| (c) | The rate shown is the annualized seven-day yield at period end. |
| (d) | Unless otherwise indicated, the values of the securities of the Portfolio are determined based on Level 1 inputs (Note 2). |
See accompanying notes to financial statements.
20
Table of Contents
SSGA MFS Systematic Growth Equity Portfolio
SCHEDULE OF INVESTMENTS
December 31, 2014 (Unaudited)
Security Description | Shares | Value | ||||||
COMMON STOCKS — 99.1% | ||||||||
AEROSPACE & DEFENSE — 2.1% | ||||||||
General Dynamics Corp. | 245 | $ | 33,717 | |||||
Huntington Ingalls Industries, Inc. | 248 | 27,890 | ||||||
|
| |||||||
| 61,607 | ||||||||
|
| |||||||
AUTO COMPONENTS — 0.7% |
| |||||||
Lear Corp. | 228 | 22,362 | ||||||
|
| |||||||
BEVERAGES — 2.2% |
| |||||||
The Coca-Cola Co. | 1,549 | 65,399 | ||||||
|
| |||||||
BIOTECHNOLOGY — 2.4% |
| |||||||
Amgen, Inc. | 411 | 65,468 | ||||||
Gilead Sciences, Inc. (a) | 69 | 6,504 | ||||||
|
| |||||||
| 71,972 | ||||||||
|
| |||||||
CHEMICALS — 3.3% |
| |||||||
LyondellBasell Industries NV (Class A) | 1,231 | 97,729 | ||||||
|
| |||||||
COMMUNICATIONS EQUIPMENT — 1.3% |
| |||||||
Juniper Networks, Inc. | 1,028 | 22,945 | ||||||
QUALCOMM, Inc. | 214 | 15,907 | ||||||
|
| |||||||
| 38,852 | ||||||||
|
| |||||||
DIVERSIFIED TELECOMMUNICATION SERVICES — 2.8% |
| |||||||
Verizon Communications, Inc. | 1,792 | 83,830 | ||||||
|
| |||||||
FOOD & STAPLES RETAILING — 5.5% |
| |||||||
CVS Health Corp. | 463 | 44,592 | ||||||
The Kroger Co. | 1,840 | 118,146 | ||||||
|
| |||||||
| 162,738 | ||||||||
|
| |||||||
FOOD PRODUCTS — 0.9% |
| |||||||
Ingredion, Inc. | 330 | 27,997 | ||||||
|
| |||||||
HEALTH CARE EQUIPMENT & SUPPLIES — 2.1% |
| |||||||
Edwards Lifesciences Corp. (a) | 485 | 61,779 | ||||||
|
| |||||||
HEALTH CARE PROVIDERS & SERVICES — 8.4% |
| |||||||
Cardinal Health, Inc. | 545 | 43,998 | ||||||
HCA Holdings, Inc. (a) | 1,401 | 102,819 | ||||||
McKesson Corp. | 500 | 103,790 | ||||||
|
| |||||||
| 250,607 | ||||||||
|
| |||||||
HOTELS, RESTAURANTS & LEISURE — 4.2% |
| |||||||
Carnival Corp. | 380 | 17,225 | ||||||
Royal Caribbean Cruises, Ltd. | 1,294 | 106,665 | ||||||
|
| |||||||
| 123,890 | ||||||||
|
| |||||||
HOUSEHOLD DURABLES — 1.2% |
| |||||||
PulteGroup, Inc. | 1,675 | 35,945 | ||||||
|
| |||||||
INSURANCE — 3.5% |
| |||||||
Prudential Financial, Inc. | 301 | 27,229 | ||||||
Validus Holdings, Ltd. | 1,818 | 75,556 | ||||||
|
| |||||||
| 102,785 | ||||||||
|
| |||||||
INTERNET & CATALOG RETAIL — 0.6% |
| |||||||
The Priceline Group, Inc. (a) | 16 | 18,243 | ||||||
|
| |||||||
INTERNET SOFTWARE & SERVICES — 8.6% |
| |||||||
Facebook, Inc. (Class A) (a) | 1,728 | 134,819 | ||||||
Google, Inc. (Class A) (a) | 64 | 33,962 | ||||||
VeriSign, Inc. (a) | 1,521 | 86,697 | ||||||
|
| |||||||
| 255,478 | ||||||||
|
| |||||||
Security Description | Shares | Value | ||||||
IT SERVICES — 4.3% |
| |||||||
Cognizant Technology Solutions Corp. (a) | 1,363 | $ | 71,776 | |||||
FleetCor Technologies, Inc. (a) | 378 | 56,212 | ||||||
|
| |||||||
| 127,988 | ||||||||
|
| |||||||
MACHINERY — 2.2% |
| |||||||
Caterpillar, Inc. | 701 | 64,163 | ||||||
|
| |||||||
MEDIA — 5.2% | ||||||||
Comcast Corp. (Class A) | 1,995 | 115,730 | ||||||
Time Warner Cable, Inc. | 252 | 38,319 | ||||||
|
| |||||||
| 154,049 | ||||||||
|
| |||||||
MULTILINE RETAIL — 0.7% |
| |||||||
Macy’s, Inc. | 317 | 20,843 | ||||||
|
| |||||||
OIL, GAS & CONSUMABLE FUELS — 4.1% |
| |||||||
EOG Resources, Inc. | 172 | 15,836 | ||||||
Marathon Petroleum Corp. | 977 | 88,184 | ||||||
Valero Energy Corp. | 381 | 18,860 | ||||||
|
| |||||||
| 122,880 | ||||||||
|
| |||||||
PHARMACEUTICALS — 3.0% |
| |||||||
Bristol-Myers Squibb Co. | 737 | 43,505 | ||||||
Johnson & Johnson | 425 | 44,442 | ||||||
|
| |||||||
| 87,947 | ||||||||
|
| |||||||
REAL ESTATE INVESTMENT TRUSTS — 4.5% |
| |||||||
Iron Mountain, Inc. | 2,406 | 93,016 | ||||||
Simon Property Group, Inc. | 221 | 40,246 | ||||||
|
| |||||||
| 133,262 | ||||||||
|
| |||||||
ROAD & RAIL — 1.1% |
| |||||||
Union Pacific Corp. | 283 | 33,714 | ||||||
|
| |||||||
SOFTWARE — 10.4% |
| |||||||
Electronic Arts, Inc. (a) | 2,390 | 112,366 | ||||||
Microsoft Corp. | 1,528 | 70,976 | ||||||
Oracle Corp. | 2,830 | 127,265 | ||||||
|
| |||||||
| 310,607 | ||||||||
|
| |||||||
SPECIALTY RETAIL — 4.4% |
| |||||||
Best Buy Co., Inc. | 2,506 | 97,684 | ||||||
The Home Depot, Inc. | 330 | 34,640 | ||||||
|
| |||||||
| 132,324 | ||||||||
|
| |||||||
TECHNOLOGY HARDWARE, STORAGE & PERIPHERALS — 3.8% |
| |||||||
Apple, Inc. | 1,027 | 113,360 | ||||||
|
| |||||||
TEXTILES, APPAREL & LUXURY GOODS — 1.3% |
| |||||||
Hanesbrands, Inc. | 346 | 38,620 | ||||||
|
| |||||||
TOBACCO — 4.3% |
| |||||||
Altria Group, Inc. | 906 | 44,639 | ||||||
Philip Morris International, Inc. | 1,019 | 82,997 | ||||||
|
| |||||||
| 127,636 | ||||||||
|
| |||||||
TOTAL COMMON STOCKS | $ | 2,948,606 | ||||||
|
| |||||||
See accompanying notes to financial statements.
21
Table of Contents
SSGA MFS Systematic Growth Equity Portfolio
SCHEDULE OF INVESTMENTS (continued)
December 31, 2014 (Unaudited)
Security Description | Shares | Value | ||||||
MONEY MARKET FUND — 0.8% |
| |||||||
State Street Institutional Liquid Reserves | 25,211 | $ | 25,211 | |||||
|
| |||||||
TOTAL INVESTMENTS — 99.9% (d) | 2,973,817 | |||||||
OTHER ASSETS & | 2,186 | |||||||
|
| |||||||
NET ASSETS — 100.0% | $ | 2,976,003 | ||||||
|
| |||||||
| (a) | Non-income producing security |
| (b) | Affiliated Fund managed by SSGA Funds Management, Inc. (Note 3). |
| (c) | The rate shown is the annualized seven-day yield at period end. |
| (d) | Unless otherwise indicated, the values of the securities of the Portfolio are determined based on Level 1 inputs (Note 2). |
See accompanying notes to financial statements.
22
Table of Contents
SSGA MFS Systematic Value Equity Portfolio
SCHEDULE OF INVESTMENTS
December 31, 2014 (Unaudited)
Security Description | Shares | Value | ||||||
COMMON STOCKS — 99.0% | ||||||||
AEROSPACE & DEFENSE — 2.3% |
| |||||||
Northrop Grumman Corp. | 437 | $ | 64,409 | |||||
|
| |||||||
AUTO COMPONENTS — 0.8% |
| |||||||
Gentex Corp. | 659 | 23,810 | ||||||
|
| |||||||
BANKS — 13.0% |
| |||||||
Citigroup, Inc. | 1,137 | 61,523 | ||||||
JPMorgan Chase & Co. | 2,238 | 140,054 | ||||||
The Pnc Financial Services Group, Inc. | 384 | 35,032 | ||||||
Wells Fargo & Co. | 2,419 | 132,610 | ||||||
|
| |||||||
| 369,219 | ||||||||
|
| |||||||
BEVERAGES — 1.2% |
| |||||||
Molson Coors Brewing Co. (Class B) | 444 | 33,087 | ||||||
|
| |||||||
CAPITAL MARKETS — 0.8% |
| |||||||
The Goldman Sachs Group, Inc. | 123 | 23,841 | ||||||
|
| |||||||
CHEMICALS — 3.0% |
| |||||||
LyondellBasell Industries NV (Class A) | 1,080 | 85,741 | ||||||
|
| |||||||
CONSUMER FINANCE — 1.6% |
| |||||||
Discover Financial Services | 684 | 44,795 | ||||||
|
| |||||||
DIVERSIFIED TELECOMMUNICATION SERVICES — 0.9% |
| |||||||
Verizon Communications, Inc. | 534 | 24,981 | ||||||
|
| |||||||
ELECTRIC UTILITIES — 2.1% |
| |||||||
Edison International | 928 | 60,765 | ||||||
|
| |||||||
FOOD & STAPLES RETAILING — 2.0% |
| |||||||
The Kroger Co. | 904 | 58,046 | ||||||
|
| |||||||
FOOD PRODUCTS — 2.2% |
| |||||||
Mondelez International, Inc. (Class A) | 1,712 | 62,188 | ||||||
|
| |||||||
HEALTH CARE EQUIPMENT & SUPPLIES — 0.7% |
| |||||||
Abbott Laboratories | 440 | 19,809 | ||||||
|
| |||||||
HEALTH CARE PROVIDERS & SERVICES — 9.8% |
| |||||||
Aetna, Inc. | 880 | 78,170 | ||||||
Anthem, Inc. | 771 | 96,892 | ||||||
Cardinal Health, Inc. | 333 | 26,883 | ||||||
McKesson Corp. | 359 | 74,521 | ||||||
|
| |||||||
| 276,466 | ||||||||
|
| |||||||
HOTELS, RESTAURANTS & LEISURE — 3.3% |
| |||||||
Royal Caribbean Cruises, Ltd. | 1,119 | 92,239 | ||||||
|
| |||||||
HOUSEHOLD DURABLES — 2.0% |
| |||||||
PulteGroup, Inc. | 2,611 | 56,032 | ||||||
|
| |||||||
INDEPENDENT POWER & RENEWABLE ELECTRICITY PRODUCERS |
| |||||||
AES Corp. | 5,535 | 76,217 | ||||||
|
| |||||||
INSURANCE — 12.0% |
| |||||||
Everest Re Group Ltd. | 437 | 74,421 | ||||||
MetLife, Inc. | 1,740 | 94,117 | ||||||
Prudential Financial, Inc. | 1,073 | 97,063 | ||||||
The Travelers Cos., Inc. | 289 | 30,591 | ||||||
Validus Holdings Ltd. | 1,010 | 41,976 | ||||||
|
| |||||||
| 338,168 | ||||||||
|
| |||||||
INTERNET SOFTWARE & SERVICES — 1.4% |
| |||||||
VeriSign, Inc. (a) | 677 | 38,589 | ||||||
|
| |||||||
MACHINERY — 1.0% |
| |||||||
Caterpillar, Inc. | 314 | 28,740 | ||||||
|
| |||||||
Security Description | Shares | Value | ||||||
MULTILINE RETAIL — 1.0% |
| |||||||
Macy’s, Inc. | 416 | $ | 27,352 | |||||
|
| |||||||
OIL, GAS & CONSUMABLE FUELS — 10.2% |
| |||||||
Chesapeake Energy Corp. | 624 | 12,212 | ||||||
Chevron Corp. | 417 | 46,779 | ||||||
Exxon Mobil Corp. | 1,249 | 115,470 | ||||||
Marathon Petroleum Corp. | 529 | 47,747 | ||||||
Valero Energy Corp. | 1,364 | 67,518 | ||||||
|
| |||||||
| 289,726 | ||||||||
|
| |||||||
PHARMACEUTICALS — 6.1% |
| |||||||
Johnson & Johnson | 601 | 62,847 | ||||||
Merck & Co., Inc. | 1,098 | 62,355 | ||||||
Pfizer, Inc. | 1,537 | 47,878 | ||||||
|
| |||||||
| 173,080 | ||||||||
|
| |||||||
REAL ESTATE INVESTMENT TRUSTS — 4.7% |
| |||||||
AvalonBay Communities, Inc. | 190 | 31,044 | ||||||
Host Hotels & Resorts, Inc. | 873 | 20,751 | ||||||
Iron Mountain, Inc. | 1,260 | 48,712 | ||||||
Washington Prime Group, Inc. | 1,820 | 31,340 | ||||||
|
| |||||||
| 131,847 | ||||||||
|
| |||||||
SEMICONDUCTORS & SEMICONDUCTOR EQUIPMENT — 3.2% |
| |||||||
Broadcom Corp. (Class A) | 2,100 | 90,993 | ||||||
|
| |||||||
SOFTWARE — 4.9% |
| |||||||
Citrix Systems, Inc. (a) | 590 | 37,642 | ||||||
Electronic Arts, Inc. (a) | 2,171 | 102,070 | ||||||
|
| |||||||
| 139,712 | ||||||||
|
| |||||||
SPECIALTY RETAIL — 1.9% | ||||||||
Best Buy Co., Inc. | 1,370 | 53,403 | ||||||
|
| |||||||
TECHNOLOGY HARDWARE, STORAGE & PERIPHERALS — 4.2% |
| |||||||
Hewlett-Packard Co. | 2,948 | 118,303 | ||||||
|
| |||||||
TOTAL COMMON STOCKS (Cost $2,541,678) | $ | 2,801,558 | ||||||
|
| |||||||
SHORT TERM INVESTMENTS — 0.9% |
| |||||||
MONEY MARKET FUND — 0.9% |
| |||||||
State Street Institutional Liquid Reserves | 25,223 | 25,223 | ||||||
|
| |||||||
TOTAL INVESTMENTS — 99.9% (d) (Cost $2,566,901) | 2,826,781 | |||||||
OTHER ASSETS & | 2,184 | |||||||
|
| |||||||
NET ASSETS — 100.0% | $ | 2,828,965 | ||||||
|
| |||||||
| (a) | Non-income producing security |
| (b) | Affiliated Fund managed by SSGA Funds Management, Inc. (Note 3). |
| (c) | The rate shown is the annualized seven-day yield at period end. |
| (d) | Unless otherwise indicated, the values of the securities of the Portfolio are determined based on Level 1 inputs (Note 2). |
See accompanying notes to financial statements.
23
Table of Contents
SCHEDULE OF INVESTMENTS
December 31, 2014 (Unaudited)
Security Description | Shares | Value | ||||||
COMMON STOCKS — 99.1% | ||||||||
AEROSPACE & DEFENSE — 0.2% |
| |||||||
American Science & Engineering, Inc. | 60 | $ | 3,114 | |||||
|
| |||||||
AIR FREIGHT & LOGISTICS — 0.0% (a) |
| |||||||
Air Transport Services Group, Inc. (b) | 74 | 633 | ||||||
|
| |||||||
AUTO COMPONENTS — 0.7% |
| |||||||
Cooper Tire & Rubber Co. | 342 | 11,850 | ||||||
Standard Motor Products, Inc. | 34 | 1,296 | ||||||
|
| |||||||
| 13,146 | ||||||||
|
| |||||||
AUTOMOBILES — 0.4% |
| |||||||
Ford Motor Co. | 503 | 7,797 | ||||||
|
| |||||||
BANKS — 7.6% |
| |||||||
Associated Banc-Corp. | 1,544 | 28,765 | ||||||
Bank of America Corp. | 2,063 | 36,907 | ||||||
Capital Bank Financial Corp. (b) | 2,599 | 69,653 | ||||||
First Financial Bankshares, Inc. | 94 | 2,809 | ||||||
National Penn Bancshares, Inc. | 682 | 7,178 | ||||||
OFG Bancorp | 55 | 916 | ||||||
Pinnacle Financial Partners, Inc. | 25 | 988 | ||||||
S&T Bancorp, Inc. | 63 | 1,878 | ||||||
|
| |||||||
| 149,094 | ||||||||
|
| |||||||
BEVERAGES — 8.5% |
| |||||||
Dr Pepper Snapple Group, Inc. | 1,028 | 73,687 | ||||||
PepsiCo., Inc. | 535 | 50,590 | ||||||
The Coca-Cola Co. | 1,011 | 42,684 | ||||||
|
| |||||||
| 166,961 | ||||||||
|
| |||||||
BIOTECHNOLOGY — 1.2% |
| |||||||
Amgen, Inc. | 153 | 24,371 | ||||||
|
| |||||||
CAPITAL MARKETS — 0.1% |
| |||||||
Calamos Asset Management, Inc. | 143 | 1,905 | ||||||
GAMCO Investors, Inc. | 8 | 711 | ||||||
|
| |||||||
| 2,616 | ||||||||
|
| |||||||
CHEMICALS — 5.9% |
| |||||||
Ashland, Inc. | 427 | 51,137 | ||||||
The Dow Chemical Co. | 900 | 41,049 | ||||||
The Scotts Miracle-gro Co. | 121 | 7,541 | ||||||
WR Grace & Co. (b) | 169 | 16,121 | ||||||
|
| |||||||
| 115,848 | ||||||||
|
| |||||||
COMMERCIAL SERVICES & SUPPLIES — 3.5% |
| |||||||
Rollins, Inc. | 210 | 6,951 | ||||||
Stericycle, Inc. (b) | 473 | 62,001 | ||||||
|
| |||||||
| 68,952 | ||||||||
|
| |||||||
COMMUNICATIONS EQUIPMENT — 0.4% |
| |||||||
Emulex Corp. (b) | 149 | 845 | ||||||
Finisar Corp. (b) | 355 | 6,890 | ||||||
|
| |||||||
| 7,735 | ||||||||
|
| |||||||
CONSTRUCTION & ENGINEERING — 0.7% |
| |||||||
Granite Construction, Inc. | 378 | 14,372 | ||||||
|
| |||||||
CONSUMER FINANCE — 0.2% |
| |||||||
Encore Capital Group, Inc. (b) | 83 | 3,685 | ||||||
|
| |||||||
CONTAINERS & PACKAGING — 0.4% |
| |||||||
Graphic Packaging Holding Co. (b) | 598 | 8,145 | ||||||
|
| |||||||
Security Description | Shares | Value | ||||||
DIVERSIFIED FINANCIAL SERVICES — 0.9% |
| |||||||
Berkshire Hathaway, Inc. (b) | 123 | $ | 18,468 | |||||
|
| |||||||
DIVERSIFIED TELECOMMUNICATION SERVICES — 3.5% |
| |||||||
AT&T, Inc. | 1,925 | 64,661 | ||||||
Verizon Communications, Inc. | 86 | 4,023 | ||||||
|
| |||||||
| 68,684 | ||||||||
|
| |||||||
ELECTRIC UTILITIES — 0.4% |
| |||||||
PPL Corp. | 234 | 8,501 | ||||||
|
| |||||||
ELECTRICAL EQUIPMENT — 0.5% |
| |||||||
Enphase Energy, Inc. (b) | 741 | 10,589 | ||||||
|
| |||||||
ENERGY EQUIPMENT & SERVICES — 0.1% |
| |||||||
Helix Energy Solutions Group, Inc. (b) | 121 | 2,626 | ||||||
|
| |||||||
FOOD & STAPLES RETAILING — 2.1% |
| |||||||
Rite Aid Corp. (b) | 1,170 | 8,798 | ||||||
Wal-Mart Stores, Inc. | 380 | 32,635 | ||||||
|
| |||||||
| 41,433 | ||||||||
|
| |||||||
FOOD PRODUCTS — 2.4% | ||||||||
General Mills, Inc. | 524 | 27,945 | ||||||
The Hershey Co. | 180 | 18,707 | ||||||
|
| |||||||
| 46,652 | ||||||||
|
| |||||||
HOTELS, RESTAURANTS & LEISURE — 6.9% |
| |||||||
McDonald’s Corp. | 758 | 71,025 | ||||||
Ruby Tuesday, Inc. (b) | 264 | 1,806 | ||||||
Ruth’s Hospitality Group, Inc. | 122 | 1,830 | ||||||
Wyndham Worldwide Corp. | 706 | 60,546 | ||||||
|
| |||||||
| 135,207 | ||||||||
|
| |||||||
HOUSEHOLD PRODUCTS — 5.2% |
| |||||||
The Procter & Gamble Co. | 1,132 | 103,114 | ||||||
|
| |||||||
INSURANCE — 4.3% |
| |||||||
American International Group, Inc. | 477 | 26,717 | ||||||
CNO Financial Group, Inc. | 205 | 3,530 | ||||||
Genworth Financial, Inc. (b) | 2,000 | 17,000 | ||||||
Principal Financial Group, Inc. | 515 | 26,749 | ||||||
Protective Life Corp. | 123 | 8,567 | ||||||
XL Group PLC | 78 | 2,681 | ||||||
|
| |||||||
| 85,244 | ||||||||
|
| |||||||
INTERNET & CATALOG RETAIL — 2.0% |
| |||||||
HSN, Inc. | 78 | 5,928 | ||||||
Liberty Interactive Corp. (b) | 974 | 28,655 | ||||||
Liberty Ventures, (b) | 138 | 5,205 | ||||||
|
| |||||||
| 39,788 | ||||||||
|
| |||||||
MEDIA — 1.2% | ||||||||
Carmike Cinemas, Inc. (b) | 101 | 2,653 | ||||||
Live Nation Entertainment, Inc. (b) | 235 | 6,136 | ||||||
Starz (b) | 493 | 14,642 | ||||||
|
| |||||||
| 23,431 | ||||||||
|
| |||||||
MULTI-UTILITIES — 6.4% |
| |||||||
Dominion Resources, Inc. | 525 | 40,372 | ||||||
PG&E Corp. | 682 | 36,310 | ||||||
Public Service Enterprise Group, Inc. | 1,209 | 50,065 | ||||||
|
| |||||||
| 126,747 | ||||||||
|
| |||||||
MULTILINE RETAIL — 2.6% |
| |||||||
Dillard’s, Inc. | 34 | 4,256 | ||||||
See accompanying notes to financial statements.
24
Table of Contents
SSGA Risk Aware Portfolio
SCHEDULE OF INVESTMENTS (continued)
December 31, 2014 (Unaudited)
Security Description | Shares | Value | ||||||
Dollar General Corp. (b) | 190 | $ | 13,433 | |||||
Dollar Tree, Inc. (b) | 433 | 30,475 | ||||||
Tuesday Morning Corp. (b) | 110 | 2,387 | ||||||
|
| |||||||
| 50,551 | ||||||||
|
| |||||||
OIL, GAS & CONSUMABLE FUELS — 0.1% |
| |||||||
CVR Energy, Inc. | 53 | 2,052 | ||||||
Resolute Energy Corp. (b) | 250 | 330 | ||||||
|
| |||||||
| 2,382 | ||||||||
|
| |||||||
PAPER & FOREST PRODUCTS — 0.2% |
| |||||||
Clearwater Paper Corp. (b) | 43 | 2,948 | ||||||
|
| |||||||
PHARMACEUTICALS — 12.0% |
| |||||||
Actavis PLC (b) | 223 | 57,402 | ||||||
Bristol-Myers Squibb Co. | 1,025 | 60,506 | ||||||
Johnson & Johnson | 442 | 46,220 | ||||||
Merck & Co., Inc. | 661 | 37,538 | ||||||
Perrigo Co. PLC | 204 | 34,101 | ||||||
TherapeuticsMD, Inc. (b) | 110 | 489 | ||||||
|
| |||||||
| 236,256 | ||||||||
|
| |||||||
PROFESSIONAL SERVICES — 5.9% |
| |||||||
The Advisory Board Co. (b) | 646 | 31,641 | ||||||
Verisk Analytics, Inc. (b) | 1,321 | 84,610 | ||||||
|
| |||||||
| 116,251 | ||||||||
|
| |||||||
REAL ESTATE INVESTMENT TRUSTS — 8.3% |
| |||||||
Brandywine Realty Trust REIT | 240 | 3,835 | ||||||
CBL & Associates Properties, Inc. REIT | 1,028 | 19,964 | ||||||
Cedar Realty Trust, Inc. REIT | 150 | 1,101 | ||||||
DDR Corp. REIT | 2,080 | 38,189 | ||||||
Host Hotels & Resorts, Inc. REIT | 1,899 | 45,139 | ||||||
LaSalle Hotel Properties REIT | 105 | 4,249 | ||||||
The Macerich Co. REIT | 612 | 51,047 | ||||||
|
| |||||||
| 163,524 | ||||||||
|
| |||||||
SEMICONDUCTORS & SEMICONDUCTOR EQUIPMENT — 2.6% |
| |||||||
Diodes, Inc. (b) | 35 | 965 | ||||||
Photronics, Inc. (b) | 115 | 956 | ||||||
RF Micro Devices, Inc. (b) | 1,275 | 21,152 | ||||||
TriQuint Semiconductor, Inc. (b) | 497 | 13,692 | ||||||
Ultratech, Inc. (b) | 272 | 5,048 | ||||||
Veeco Instruments, Inc. (b) | 179 | 6,244 | ||||||
Xcerra Corp. (b) | 247 | 2,263 | ||||||
|
| |||||||
| 50,320 | ||||||||
|
| |||||||
SOFTWARE — 0.0% (a) |
| |||||||
Epiq Systems, Inc. | 49 | 837 | ||||||
|
| |||||||
SPECIALTY RETAIL — 1.0% |
| |||||||
AutoZone, Inc. (b) | 10 | 6,191 | ||||||
Select Comfort Corp. (b) | 489 | 13,218 | ||||||
|
| |||||||
| 19,409 | ||||||||
|
| |||||||
TEXTILES, APPAREL & LUXURY GOODS — 0.1% |
| |||||||
Perry Ellis International, Inc. (b) | 36 | 934 | ||||||
Unifi, Inc. (b) | 25 | 743 | ||||||
|
| |||||||
| 1,677 | ||||||||
|
| |||||||
THRIFTS & MORTGAGE FINANCE — 0.6% |
| |||||||
People’s United Financial, Inc. | 759 | 11,522 | ||||||
|
| |||||||
Security Description | Shares | Value | ||||||
WIRELESS TELECOMMUNICATION SERVICES — 0.0% (a) |
| |||||||
Shenandoah Telecommunications Co. | 22 | $ | 688 | |||||
|
| |||||||
TOTAL COMMON STOCKS (Cost $1,882,892) | $ | 1,953,318 | ||||||
|
| |||||||
SHORT TERM INVESTMENTS — 0.7% |
| |||||||
MONEY MARKET FUND — 0.7% |
| |||||||
State Street Institutional Liquid Reserves | 14,204 | 14,204 | ||||||
|
| |||||||
TOTAL INVESTMENTS — 99.8% (e) | 1,967,522 | |||||||
OTHER ASSETS & | 3,296 | |||||||
|
| |||||||
NET ASSETS — 100.0% | $ | 1,970,818 | ||||||
|
| |||||||
| (a) | Amount shown represents less than 0.05% of net assets. |
| (b) | Non-income producing security |
| (c) | Affiliated Fund managed by SSGA Funds Management, Inc. (Note 3). |
| (d) | The rate shown is the annualized seven-day yield at period end. |
| (e) | Unless otherwise indicated, the values of the securities of the Portfolio are determined based on Level 1 inputs (Note 2). |
REIT = Real Estate Investment Trust
See accompanying notes to financial statements.
25
Table of Contents
SSGA MASTER TRUST
STATEMENTS OF ASSETS AND LIABILITIES
December 31, 2014 (Unaudited)
| SSGA Multi-Asset Real Return Portfolio | SSGA Income Allocation Portfolio | SSGA Global Allocation Portfolio | Blackstone / GSO Senior Loan Portfolio | |||||||||||||
ASSETS | ||||||||||||||||
Investments in securities of unaffiliated issuers, at value | $ | 27,552,296 | $ | — | $ | 2,992,101 | $ | 544,056,016 | ||||||||
Investments in securities of affiliated issuers, at value | 139,263,260 | 117,894,803 | 131,418,222 | 4,725,025 | ||||||||||||
|
|
|
|
|
|
|
| |||||||||
Total investments | 166,815,556 | 117,894,803 | 134,410,323 | 548,781,041 | ||||||||||||
Cash | — | 364 | 371 | — | ||||||||||||
Receivable for investment securities sold | — | — | — | 35,495,038 | ||||||||||||
Dividends receivable from affiliated issuers (Note 3) | 688,938 | 683,005 | 1,063,306 | — | ||||||||||||
Dividends receivable from unaffiliated issuers | — | — | — | — | ||||||||||||
Interest receivable from unaffiliated issuers | — | — | — | 3,367,009 | ||||||||||||
|
|
|
|
|
|
|
| |||||||||
TOTAL ASSETS | 167,504,494 | 118,578,172 | 135,474,000 | 587,643,088 | ||||||||||||
|
|
|
|
|
|
|
| |||||||||
LIABILITIES | ||||||||||||||||
Payable for investments purchased | 1,265,890 | — | — | 21,302,619 | ||||||||||||
Due to Custodian | 12 | — | — | 78 | ||||||||||||
Accrued advisory fees (Note 3) | 26,045 | 19,169 | 21,631 | 145,259 | ||||||||||||
Accrued trustees’ fees and expenses (Note 3) | 117 | 81 | 89 | 479 | ||||||||||||
|
|
|
|
|
|
|
| |||||||||
TOTAL LIABILITIES | 1,292,064 | 19,250 | 21,720 | 21,448,435 | ||||||||||||
|
|
|
|
|
|
|
| |||||||||
NET ASSETS | $ | 166,212,430 | $ | 118,558,922 | $ | 135,452,280 | $ | 566,194,653 | ||||||||
|
|
|
|
|
|
|
| |||||||||
COST OF INVESTMENTS | ||||||||||||||||
Unaffiliated issuers | $ | 34,851,682 | $ | — | $ | 3,350,214 | $ | 557,023,423 | ||||||||
Affiliated issuers | 147,676,633 | 115,093,230 | 127,735,509 | 4,725,025 | ||||||||||||
|
|
|
|
|
|
|
| |||||||||
Total cost of investments | $ | 182,528,315 | $ | 115,093,230 | $ | 131,085,723 | $ | 561,748,448 | ||||||||
|
|
|
|
|
|
|
| |||||||||
See accompanying notes to financial statements.
26
Table of Contents
| SSGA Ultra Short Term Bond Portfolio | SSGA MFS Systematic Core Equity Portfolio | SSGA MFS Systematic Growth Equity Portfolio | SSGA MFS Systematic Value Equity Portfolio | SSGA Risk Aware Portfolio | ||||||||||||||
| $ | 15,955,495 | $ | 2,913,890 | $ | 2,948,606 | $ | 2,801,558 | $ | 1,953,318 | |||||||||
| 26,091 | 14,163 | 25,211 | 25,223 | 14,204 | ||||||||||||||
|
|
|
|
|
|
|
|
|
| |||||||||
| 15,981,586 | 2,928,053 | 2,973,817 | 2,826,781 | 1,967,522 | ||||||||||||||
| — | 12 | 12 | 12 | 5 | ||||||||||||||
| — | — | — | — | — | ||||||||||||||
| — | 2 | 2 | 2 | — | ||||||||||||||
| — | 3,050 | 2,971 | 2,932 | 3,718 | ||||||||||||||
| 35,241 | — | — | — | — | ||||||||||||||
|
|
|
|
|
|
|
|
|
| |||||||||
| 16,016,827 | 2,931,117 | 2,976,802 | 2,829,727 | 1,971,245 | ||||||||||||||
|
|
|
|
|
|
|
|
|
| |||||||||
| — | — | — | — | — | ||||||||||||||
| — | — | — | — | — | ||||||||||||||
| 2,677 | 743 | 755 | 717 | 415 | ||||||||||||||
| 13 | 44 | 44 | 45 | 12 | ||||||||||||||
|
|
|
|
|
|
|
|
|
| |||||||||
| 2,690 | 787 | 799 | 762 | 427 | ||||||||||||||
|
|
|
|
|
|
|
|
|
| |||||||||
| $ | 16,014,137 | $ | 2,930,330 | $ | 2,976,003 | $ | 2,828,965 | $ | 1,970,818 | |||||||||
|
|
|
|
|
|
|
|
|
| |||||||||
| $ | 15,970,498 | $ | 2,572,099 | $ | 2,559,199 | $ | 2,541,678 | $ | 1,882,892 | |||||||||
| 26,091 | 14,163 | 25,211 | 25,223 | 14,204 | ||||||||||||||
|
|
|
|
|
|
|
|
|
| |||||||||
| $ | 15,996,589 | $ | 2,586,262 | $ | 2,584,410 | $ | 2,566,901 | $ | 1,897,096 | |||||||||
|
|
|
|
|
|
|
|
|
| |||||||||
27
Table of Contents
SSGA MASTER TRUST
STATEMENTS OF OPERATIONS
For the Six Months Ended December 31, 2014 (Unaudited)
| SSGA Multi-Asset Real Return Portfolio | SSGA Income Allocation Portfolio | SSGA Global Allocation Portfolio | Blackstone/GSO Senior Loan Portfolio | |||||||||||||
INVESTMENT INCOME | ||||||||||||||||
Dividend and interest income on securities of unaffiliated issuers (Note 2) | $ | 6,949 | $ | — | $ | 2,614 | $ | 14,203,755 | ||||||||
Dividend income on securities of affiliated issuers (Note 3) | 1,449,947 | 2,340,395 | 1,844,860 | 8,984 | ||||||||||||
|
|
|
|
|
|
|
| |||||||||
TOTAL INVESTMENT INCOME | 1,456,896 | 2,340,395 | 1,847,474 | 14,212,739 | ||||||||||||
|
|
|
|
|
|
|
| |||||||||
EXPENSES | ||||||||||||||||
Advisory fees (Note 3) | 163,392 | 107,223 | 113,137 | 906,054 | ||||||||||||
Trustees’ fees (Note 3) | 1,501 | 919 | 947 | 5,428 | ||||||||||||
|
|
|
|
|
|
|
| |||||||||
TOTAL EXPENSES | 164,893 | 108,142 | 114,084 | 911,482 | ||||||||||||
|
|
|
|
|
|
|
| |||||||||
NET INVESTMENT INCOME | 1,292,003 | 2,232,253 | 1,733,390 | 13,301,257 | ||||||||||||
|
|
|
|
|
|
|
| |||||||||
REALIZED AND UNREALIZED GAIN (LOSS) ON INVESTMENTS | ||||||||||||||||
Net realized gain (loss) on investments in securities of unaffiliated issuers | (1,860,432 | ) | (1 | ) | 1,635 | (893,671 | ) | |||||||||
Net realized gain (loss) on investments in securities of affiliated issuers | (693,418 | ) | (73,432 | ) | 898,076 | — | ||||||||||
Net change in unrealized appreciation (depreciation) on investments | (21,237,388 | ) | (2,449,938 | ) | (3,091,096 | ) | (14,584,381 | ) | ||||||||
|
|
|
|
|
|
|
| |||||||||
NET REALIZED AND UNREALIZED GAIN (LOSS) ON INVESTMENTS | (23,791,238 | ) | (2,523,371 | ) | (2,191,385 | ) | (15,478,052 | ) | ||||||||
|
|
|
|
|
|
|
| |||||||||
NET INCREASE (DECREASE) IN NET ASSETS RESULTING FROM OPERATIONS | $ | (22,499,235 | ) | $ | (291,118 | ) | $ | (457,995 | ) | $ | (2,176,795 | ) | ||||
|
|
|
|
|
|
|
| |||||||||
| * | For the period September 9, 2014 (commencement of operations) to December 31, 2014. |
See accompanying notes to financial statements.
28
Table of Contents
| SSGA Ultra Short Term Bond Portfolio | SSGA MFS Systematic Core Equity Portfolio | SSGA MFS Systematic Growth Equity Portfolio | SSGA MFS Systematic Value Equity Portfolio | SSGA Risk Aware Portfolio* | ||||||||||||||
$ | 42,487 |
| $ | 31,186 | $ | 25,631 | $ | 29,454 | $ | 16,059 | ||||||||
| 121 |
| 11 | 10 | 12 | 4 | ||||||||||||
|
|
|
|
|
|
|
|
|
| |||||||||
| 42,608 | 31,197 | 25,641 | 29,466 | 16,063 | ||||||||||||||
|
|
|
|
|
|
|
|
|
| |||||||||
| 16,429 | 4,871 | 4,925 | 4,742 | 2,045 | ||||||||||||||
| 140 | 69 | 69 | 69 | 18 | ||||||||||||||
|
|
|
|
|
|
|
|
|
| |||||||||
| 16,569 | 4,940 | 4,994 | 4,811 | 2,063 | ||||||||||||||
|
|
|
|
|
|
|
|
|
| |||||||||
| 26,039 | 26,257 | 20,647 | 24,655 | 14,000 | ||||||||||||||
|
|
|
|
|
|
|
|
|
| |||||||||
| (4,254 | ) | 228,535 | 311,739 | 211,179 | (290,239 | ) | |||||||||||
| — |
| — | — | — | — | ||||||||||||
| (25,482 | ) | 51,396 | 45,404 | (2,340 | ) | 70,426 | |||||||||||
|
|
|
|
|
|
|
|
|
| |||||||||
| (29,736 | ) | 279,931 | 357,143 | 208,839 | (219,813 | ) | |||||||||||
|
|
|
|
|
|
|
|
|
| |||||||||
$ | (3,697 | ) | $ | 306,188 | $ | 377,790 | $ | 233,494 | $ | (205,813 | ) | |||||||
|
|
|
|
|
|
|
|
|
| |||||||||
29
Table of Contents
SSGA MASTER TRUST
STATEMENTS OF CHANGES IN NET ASSETS
| SSGA Multi-Asset Real Return Portfolio | SSGA Income Allocation Portfolio | |||||||||||||||
| Six Months Ended 12/31/14 (Unaudited) | Year Ended 6/30/14 | Six Months Ended 12/31/14 (Unaudited) | Year Ended 6/30/14 | |||||||||||||
INCREASE (DECREASE) IN NET ASSETS FROM OPERATIONS: | ||||||||||||||||
Net investment income (loss) | $ | 1,292,003 | $ | 2,587,021 | $ | 2,232,253 | $ | 4,096,865 | ||||||||
Net realized gain (loss) on investments | (2,553,850 | ) | (2,207,394 | ) | (73,433 | ) | (1,346,791 | ) | ||||||||
Net change in unrealized appreciation (depreciation) on investments | (21,237,388 | ) | 16,133,508 | (2,449,938 | ) | 11,409,215 | ||||||||||
|
|
|
|
|
|
|
| |||||||||
Net increase (decrease) in net assets resulting from operations | (22,499,235 | ) | 16,513,135 | (291,118 | ) | 14,159,289 | ||||||||||
|
|
|
|
|
|
|
| |||||||||
CAPITAL TRANSACTIONS | ||||||||||||||||
Contributions | 47,753,317 | 91,367,610 | 19,439,975 | 7,804,636 | ||||||||||||
Withdrawals | (23,676,639 | ) | (64,829,742 | ) | (4,620,313 | ) | (92,188,375 | ) | ||||||||
Other capital | — | — | — | — | ||||||||||||
|
|
|
|
|
|
|
| |||||||||
Net increase (decrease) in net assets from capital transactions | 24,076,678 | 26,537,868 | 14,819,662 | (84,383,739 | ) | |||||||||||
|
|
|
|
|
|
|
| |||||||||
Net increase (decrease) in net assets during the period | 1,577,443 | 43,051,003 | 14,528,544 | (70,224,450 | ) | |||||||||||
NET ASSETS | ||||||||||||||||
Net assets at beginning of period | 164,634,987 | 121,583,984 | 104,030,378 | 174,254,828 | ||||||||||||
|
|
|
|
|
|
|
| |||||||||
NET ASSETS END OF PERIOD | $ | 166,212,430 | $ | 164,634,987 | $ | 118,558,922 | $ | 104,030,378 | ||||||||
|
|
|
|
|
|
|
| |||||||||
| * | Commencement of operations |
See accompanying notes to financial statements.
30
Table of Contents
| SSGA Global Allocation Portfolio | Blackstone / GSO Senior Loan Portfolio | SSGA Ultra Short Term Bond Portfolio | ||||||||||||||||||||
| Six Months Ended 12/31/14 (Unaudited) | Year Ended 6/30/14 | Six Months Ended 12/31/14 (Unaudited) | Year Ended 6/30/14 | Six Months Ended 12/31/14 (Unaudited) | For the Period 10/9/13* - 6/30/14 | |||||||||||||||||
| $ | 1,733,390 | $ | 1,874,897 | $ | 13,301,257 | $ | 20,364,761 | $ | 26,039 | $ | 32,351 | |||||||||||
| 899,711 | 1,718,573 | (893,671 | ) | (2,767,913 | ) | (4,254 | ) | 888 | ||||||||||||||
| (3,091,096 | ) | 6,937,869 | (14,584,381 | ) | 4,689,730 | (25,482 | ) | 10,479 | |||||||||||||
|
|
|
|
|
|
|
|
|
|
|
| |||||||||||
| (457,995 | ) | 10,531,339 | (2,176,795 | ) | 22,286,578 | (3,697 | ) | 43,718 | |||||||||||||
|
|
|
|
|
|
|
|
|
|
|
| |||||||||||
| 41,962,193 | 47,337,163 | 14,857,682 | 286,897,792 | 6,012,276 | 16,010,331 | |||||||||||||||||
| (4,543,525 | ) | (11,312,504 | ) | (57,103,281 | ) | (31,961,441 | ) | (4,033,981 | ) | (2,033,325 | ) | |||||||||||
| — | — | 140,085 | 461,549 | 3,608 | 15,207 | |||||||||||||||||
|
|
|
|
|
|
|
|
|
|
|
| |||||||||||
| 37,418,668 |
| 36,024,659 | (42,105,514 | ) | 255,397,900 | 1,981,903 | 13,992,213 | ||||||||||||||
|
|
|
|
|
|
|
|
|
|
|
| |||||||||||
| 36,960,673 |
| 46,555,998 | (44,282,309 | ) | 277,684,478 | 1,978,206 | 14,035,931 | ||||||||||||||
| 98,491,607 | 51,935,609 | 610,476,962 | 332,792,484 | 14,035,931 | — | |||||||||||||||||
|
|
|
|
|
|
|
|
|
|
|
| |||||||||||
| $ | 135,452,280 | $ | 98,491,607 | $ | 566,194,653 | $ | 610,476,962 | $ | 16,014,137 | $ | 14,035,931 | |||||||||||
|
|
|
|
|
|
|
|
|
|
|
| |||||||||||
31
Table of Contents
SSGA MASTER TRUST
STATEMENTS OF CHANGES IN NET ASSETS (continued)
| SSGA MFS Systematic Core Equity Portfolio | SSGA MFS Systematic Growth Equity Portfolio | |||||||||||||||
| Six Months Ended 12/31/14 (Unaudited) | For the Period 1/8/14* - 6/30/14 | Six Months Ended 12/31/14 (Unaudited) | For the Period 1/8/14* - 6/30/14 | |||||||||||||
INCREASE (DECREASE) IN NET ASSETS FROM OPERATIONS: | ||||||||||||||||
Net investment income (loss) | $ | 26,257 | $ | 38,006 | $ | 20,647 | $ | 35,730 | ||||||||
Net realized gain (loss) on investments | 228,535 | 68,581 | 311,739 | 10,976 | ||||||||||||
Net change in unrealized appreciation (depreciation) on investments | 51,396 | 290,395 | 45,404 | 344,003 | ||||||||||||
|
|
|
|
|
|
|
| |||||||||
Net increase (decrease) in net assets resulting from operations | 306,188 | 396,982 | 377,790 | 390,709 | ||||||||||||
|
|
|
|
|
|
|
| |||||||||
CAPITAL TRANSACTIONS | ||||||||||||||||
Contributions | — | 5,001,000 | — | 5,001,000 | ||||||||||||
Withdrawals | (2,753,841 | ) | (19,999 | ) | (2,774,367 | ) | (19,129 | ) | ||||||||
Other capital | — | — | — | — | ||||||||||||
|
|
|
|
|
|
|
| |||||||||
Net increase (decrease) in net assets from capital transactions | (2,753,841 | ) | 4,981,001 | (2,774,367 | ) | 4,981,871 | ||||||||||
|
|
|
|
|
|
|
| |||||||||
Net increase (decrease) in net assets during the period | (2,447,653 | ) | 5,377,983 | (2,396,577 | ) | 5,372,580 | ||||||||||
NET ASSETS | ||||||||||||||||
Net assets at beginning of period | 5,377,983 | — | 5,372,580 | — | ||||||||||||
|
|
|
|
|
|
|
| |||||||||
NET ASSETS END OF PERIOD | $ | 2,930,330 | $ | 5,377,983 | $ | 2,976,003 | $ | 5,372,580 | ||||||||
|
|
|
|
|
|
|
| |||||||||
| * | Commencement of operations |
See accompanying notes to financial statements.
32
Table of Contents
| SSGA MFS Systematic Value Equity Portfolio | SSGA Risk Aware Portfolio | |||||||||
| Six Months Ended 12/31/14 (Unaudited) | For the Period 1/8/14* - 6/30/14 | For the Period 9/9/14* - 12/31/14 (Unaudited) | ||||||||
| $ | 24,655 | $ | 41,704 | $ | 14,000 | |||||
| 211,179 | 4,238 | (290,239 | ) | |||||||
| (2,340 | ) | 262,220 | 70,426 | ||||||
|
|
|
|
|
| |||||
| 233,494 |
| 308,162 | (205,813 | ) | |||||
|
|
|
|
|
| |||||
| — | 5,001,000 | 4,000,000 | ||||||||
| (2,690,853 | ) | (22,838 | ) | (1,823,369 | ) | |||||
| — | — | — | ||||||||
|
|
|
|
|
| |||||
| (2,690,853 | ) | 4,978,162 | 2,176,631 | ||||||
|
|
|
|
|
| |||||
| (2,457,359 | ) | 5,286,324 | 1,970,818 | ||||||
| 5,286,324 | — | — | ||||||||
|
|
|
|
|
| |||||
| $ | 2,828,965 | $ | 5,286,324 | $ | 1,970,818 | |||||
|
|
|
|
|
| |||||
33
Table of Contents
SSGA MASTER TRUST
The following table includes selected supplemental data and ratios to average net assets:
| SSGA Multi-Asset Real Return Portfolio* | ||||||||||||||||
| Six Months Ended 12/31/14 (Unaudited) | Year Ended 6/30/14 | Year Ended 6/30/13 | For the Period 4/25/12** - 6/30/12 | |||||||||||||
Supplemental Data and Ratios: | ||||||||||||||||
Net assets, end of period (000s) | $ | 166,212 | $ | 164,635 | $ | 121,584 | $ | 5,827 | ||||||||
|
|
|
|
|
|
|
| |||||||||
Ratios to average net assets: | ||||||||||||||||
Operating expenses | 0.20 | %(1) | 0.20 | % | 0.20 | % | 0.20 | %(1) | ||||||||
Net investment income | 1.58 | %(1) | 2.01 | % | 2.91 | % | 3.84 | %(1) | ||||||||
Portfolio turnover rate | 21 | % | 40 | % | 31 | % | 10 | % | ||||||||
Total return | (12.90 | )%(2) | 13.93 | % | (1.63 | )% | (3.42 | )%(2) | ||||||||
| * | The Portfolio invests in other underlying Portfolios and indirectly bears its proportionate share of fees and expenses incurred by such Portfolios. The ratios presented do not reflect the indirect expenses of the underlying Portfolios in which the Portfolio invests. |
| ** | Commencement of operations |
| (1) | Annualized. |
| (2) | Total return for periods of less than one year is not annualized. |
See accompanying notes to financial statements.
34
Table of Contents
| SSGA Income Allocation Portfolio* | SSGA Global Allocation Portfolio* | |||||||||||||||||||||||||||||
| Six Months Ended 12/31/14 (Unaudited) | Year Ended 6/30/14 | Year Ended 6/30/13 | For the Period 4/25/12** - 6/30/12 | Six Months Ended 12/31/14 (Unaudited) | Year Ended 6/30/14 | Year Ended 6/30/13 | For the Period 4/25/12** - 6/30/12 | |||||||||||||||||||||||
| $ | 118,559 | $ | 104,030 | $ | 174,255 | $ | 9,114 | $ | 135,452 | $ | 98,492 | $ | 51,936 | $ | 4,451 | |||||||||||||||
|
|
|
|
|
|
|
|
|
|
|
|
|
|
|
| |||||||||||||||
| 0.20 | %(1) | 0.20 | % | 0.20 | % | 0.20 | %(1) | 0.20 | %(1) | 0.20 | % | 0.20 | % | 0.20 | %(1) | |||||||||||||||
| 4.16 | %(1) | 3.89 | % | 4.65 | % | 8.39 | %(1) | 3.06 | %(1) | 2.76 | % | 3.07 | % | 4.34 | %(1) | |||||||||||||||
| 29 | % | 63 | % | 80 | % | 15 | % | 54 | % | 89 | % | 123 | % | 25 | % | |||||||||||||||
| 0.12 | %(2) | 13.84 | % | 4.39 | % | 0.92 | %(2) | (0.48 | )%(2) | 16.80 | % | 9.92 | % | (1.82 | )%(2) | |||||||||||||||
35
Table of Contents
SSGA MASTER TRUST
FINANCIAL HIGHLIGHTS
The following table includes selected supplemental data and ratios to average net assets:
| Blackstone / GSO Senior Loan Portfolio | ||||||||||||
| Six Months Ended 12/31/14 (Unaudited) | Year Ended 6/30/14 | For the Period 4/3/13* - 6/30/13 | ||||||||||
Supplemental Data and Ratios: | ||||||||||||
Net assets, end of period (000s) | $ | 566,195 | $ | 610,477 | $ | 332,792 | ||||||
|
|
|
|
|
| |||||||
Ratios to average net assets: | ||||||||||||
Operating expenses | 0.30 | %(1) | 0.30 | % | 0.30 | %(1) | ||||||
Net investment income | 4.40 | %(1) | 3.63 | % | 2.57 | %(1) | ||||||
Portfolio turnover rate | 31 | % | 77 | % | 4 | % | ||||||
Total return | (0.35 | )%(2) | 4.00 | % | (0.31 | )%(2) | ||||||
| * | Commencement of operations |
| (1) | Annualized. |
| (2) | Total return for periods of less than one year is not annualized. |
| (3) | Less than 0.05% of average net assets. |
See accompanying notes to financial statements.
36
Table of Contents
| SSGA Ultra Short Term Bond Portfolio | SSGA MFS Systematic Core Equity Portfolio | |||||||||||||
| Six Months Ended 12/31/14 (Unaudited) | For the Period 10/9/13* - 6/30/14 | Six Months Ended 12/31/14 (Unaudited) | For the Period 1/8/14* - 6/30/14 | |||||||||||
| $ | 16,014 | $ | 14,036 | $ | 2,930 | $ | 5,378 | |||||||
|
|
|
|
|
|
|
| |||||||
| 0.20 | %(1) | 0.20 | %(1) | 0.30 | %(1) | 0.30 | %(1) | |||||||
| 0.32 | %(1) | 0.34 | %(1) | 1.62 | %(1) | 1.55 | %(1) | |||||||
| 46 | % | 39 | % | 27 | % | 27 | % | |||||||
| 0.00 | %(2)(3) | 0.47 | %(2) | 9.82 | %(2) | 7.92 | %(2) | |||||||
37
Table of Contents
SSGA MASTER TRUST
FINANCIAL HIGHLIGHTS
The following table includes selected supplemental data and ratios to average net assets:
| SSGA MFS Systematic Growth Equity Portfolio | ||||||||
| Six Months Ended 12/31/14 (Unaudited) | For the Period 1/8/14* - 6/30/14 | |||||||
Supplemental Data and Ratios: | ||||||||
Net assets, end of period (000s) | $ | 2,976 | $ | 5,373 | ||||
|
|
|
| |||||
Ratios to average net assets: | ||||||||
Operating expenses | 0.30 | %(1) | 0.30 | %(1) | ||||
Net investment income | 1.26 | %(1) | 1.46 | %(1) | ||||
Portfolio turnover rate | 44 | % | 20 | % | ||||
Total return | 11.53 | %(2) | 7.85 | % | ||||
| * | Commencement of operations |
| (1) | Annualized. |
| (2) | Total return for periods of less than one year is not annualized. |
See accompanying notes to financial statements.
38
Table of Contents
| SSGA MFS Systematic Value Equity Portfolio | SSGA Risk Aware Portfolio | |||||||||
| Six Months Ended 12/31/14 (Unaudited) | For the Period 1/8/14** - 6/30/14 | For the Period 9/9/14* - 12/31/14 (Unaudited) | ||||||||
| $ | 2,829 | $ | 5,286 | $ | 1,971 | |||||
|
|
|
|
|
| |||||
| 0.30 | %(1) | 0.30 | %(1) | 0.26 | %(1) | |||||
| 1.56 | %(1) | 1.73 | %(1) | 1.74 | %(1) | |||||
| 34 | % | 23 | % | 16 | % | |||||
| 7.87 | %(2) | 6.20 | %(2) | (1.31 | )%(2) | |||||
39
Table of Contents
SSGA MASTER TRUST
December 31, 2014 (Unaudited)
| 1. | Organization |
SSGA Master Trust (the “Trust”), which is registered under the Investment Company Act of 1940, as amended (“1940 Act”), is an open-end investment management company that was organized as a Massachusetts business trust on March 30, 2011.
As of December 31, 2014, the Trust offered nine (9) portfolios, each of which represents a separate series of beneficial interest in the Trust (each a “Portfolio” and collectively; the “Portfolios”). The financial statements herein relate to the following nine (9) Portfolios: SSGA Multi-Asset Real Return Portfolio, SSGA Income Allocation Portfolio, SSGA Global Allocation Portfolio, Blackstone/GSO Senior Loan Portfolio, SSGA Ultra Short Term Bond Portfolio, SSGA MFS Systematic Core Equity Portfolio, SSGA MFS Systematic Growth Equity Portfolio, SSGA MFS Systematic Value Equity Portfolio and SSGA Risk Aware Portfolio. Each Portfolio serves as a master fund in a master feeder structure.
Under the Trust’s organizational documents, its officers and trustees are indemnified against certain liabilities arising out of the performance of their duties to the Trust. Additionally, in the normal course of business, the Trust enters into contracts with service providers that contain general indemnification clauses. The Trust’s maximum exposure under these arrangements is unknown as this could involve future claims that may be made against the Trust that have not yet occurred. However, based on experience, the Trust expects the risk of loss to be remote.
The Trust invests in various investments which are exposed to risks, such as market risk. Due to the level of risk associated with certain investments it is at least reasonably possible that changes in the values of investment securities will occur in the near term and that such changes could be material.
SSGA Multi-Asset Real Return Portfolio, SSGA Income Allocation Portfolio and SSGA Global Allocation Portfolio invest their assets in other exchange-traded products (referred to as “underlying Funds”). The underlying Funds, in turn, may engage in a number of investment techniques and practices, which involve certain risks. Certain underlying Funds invest their portfolios in debt securities. Investments in debt securities may increase or decrease as a result of the following: market fluctuations, increases in interest rates, inability of issuers to repay principal and interest or illiquidity in the debt securities markets; the risk of low rates of return due to reinvestment of securities during periods of falling interest rates or repayment by issuers with higher coupon or interest rates; and/or the risk of low income due to falling interest rates. Certain underlying Funds invest their portfolios in foreign securities including emerging markets. Foreign investments involve certain risks that are greater than those associated with investments in securities of U.S. issuers. Returns on investments in foreign securities could be more volatile than, or trail the returns on, investments in U.S. securities. Investments in securities issued by entities based outside the United States pose distinct risks since political and economic events unique to a country or region will affect those markets and their issuers. Investment in emerging markets involves greater risk of loss than investments in a developed market. This is due to, among other things, greater market volatility, lower trading volume, political and economic instability, high levels of inflation, deflation or currency devaluation, greater risk of market shut down, and more governmental limitations on foreign investment policy than those typically found in a developed market. Certain underlying Funds invest their portfolios in commodities markets. Commodities are subject to substantial price fluctuations over short periods of time and may be affected by unpredictable economic, political and environmental events. Factors that may significantly affect the prices of commodities include, but are not limited to: global supply and demand; domestic and international interest rates and investors’ expectations of interest rates; inflation rates and investors’ expectations of inflation rates; the investment and trading activities of commodity futures contracts; political, economic, or financial events, both globally and regionally.
The Blackstone/GSO Senior Loan Portfolio invests its assets in senior loans. Investments in senior loans are subject to credit risks which may include delay in receiving payments of principal and interest paid by the borrower to the agent or by the agent to the lender or offsets against payments received from the borrower.
SSGA Ultra Short Term Bond Portfolio invests primarily in investment grade debt securities with varying maturities. Investments in debt securities may increase or decrease as a result of the following: market fluctuations, increases in interest rates, inability of issuers to repay principal and interest or illiquidity in the debt securities markets; the risk of low rates of return due to reinvestment of securities during periods of falling interest rates or repayment by issuers with higher coupon or interest rates; and/or the risk of low income due to falling interest rates.
SSGA MFS Systematic Core Equity ETF, SSGA MFS Systematic Growth Equity ETF, SSGA MFS Systematic Value Equity ETF and SSGA Risk Aware Portfolio invest in various investments which are exposed to risks, such as market risk. Due to the level of risk
40
Table of Contents
SSGA MASTER TRUST
NOTES TO FINANCIAL STATEMENTS (continued)
December 31, 2014 (Unaudited)
associated with certain investments it is at least reasonably possible that changes in the values of investment securities will occur in the near term and that such changes could be material.
An investment in a Fund involves risks similar to those of investing in any fund, such as market fluctuations caused by such factors as economic and political developments, changes in interest rates and perceived trends in security prices. The values of securities could decline generally or could underperform other investments. Different types of securities tend to go through cycles of out-performance and underperformance in comparison to the general securities market. In addition, securities may decline in value due to factors affecting a specific issuer, market or securities markets generally.
| 2. | Summary of Significant Accounting Policies |
The following is a summary of significant accounting policies followed by the Trust in the preparation of its financial statements:
The preparation of financial statements in accordance with U.S. generally accepted accounting principles requires management to make estimates and assumptions that affect the reported amounts and disclosures in the financial statements. Actual results could differ from those estimates. These financial statements are presented in United States dollars.
Security Valuation
The fair value of each Portfolio’s portfolio securities and other financial instruments is based on the market price of the securities, which generally means a valuation obtained from an exchange or other market (or based on a price quotation or other equivalent indication of value supplied by an exchange or other market) or a valuation obtained from an independent pricing service. Investments in underlying funds are valued at their market price each business day. Loans are primarily valued by using a composite loan price from a loan pricing service. The methodology used by the Portfolios’ loan pricing provider for composite loan prices is to value loans at the mean of the bid and ask prices from one or more brokers or dealers. U.S. fixed income securities may be valued as of the announced closing time for trading in fixed income instruments on any day that the Securities Industry and Financial Markets Association announces an early closing time. If a security’s market price is not readily available or does not otherwise accurately reflect the fair value of the security, the security will be valued by another method that the Board of Trustees of the Trust (the “Board”) believes will better reflect fair value in accordance with the Trust’s valuation policies and procedures. The Board has adopted procedures concerning securities valuation, under which an Oversight Committee makes determinations as to whether market quotations are not readily available or do not otherwise accurately reflect the fair value of the security. The Oversight Committee, or a subgroup thereof, subject to oversight by the Board, may use fair value pricing in a variety of circumstances, including but not limited to, situations when trading in a security has been suspended or halted. Fair value pricing involves subjective judgments and it is possible that the fair value determination for a security is materially different than the value that could be received on the sale of the security.
The Portfolios follow the authoritative guidance for fair value measurements and the fair value option for financial assets and financial liabilities. The guidance establishes a hierarchy for inputs used in measuring fair value that maximizes the use of observable inputs and minimizes the use of unobservable inputs by requiring that the most observable inputs be used when available. The guidance establishes three levels of inputs that may be used to measure fair value:
| • | Level 1 — quoted prices in active markets for identical investments |
| • | Level 2 — other significant observable inputs (including, but not limited to, quoted prices for similar investments, interest rates, prepayment speeds, credit risk, etc.) |
| • | Level 3 — significant unobservable inputs (including the Portfolios’ own assumptions in determining the fair value of investments) |
Investments that use Level 2 or Level 3 inputs may include, but are not limited to: (i) an unlisted security related to corporate actions; (ii) a restricted security (e.g., one that may not be publicly sold without registration under the Securities Act of 1933, as amended); (iii) a security whose trading has been suspended or which has been de-listed from its primary trading exchange; (iv) a security that is thinly traded; (v) a security in default or bankruptcy proceedings for
41
Table of Contents
SSGA MASTER TRUST
NOTES TO FINANCIAL STATEMENTS (continued)
December 31, 2014 (Unaudited)
which there is no current market quotation; (vi) a security affected by currency controls or restrictions; and (vii) a security affected by a significant event (e.g., an event that occurs after the close of the markets on which the security is traded but before the time as of which the Portfolios’ net assets are computed and that may materially affect the value of the Portfolios’ investments). Examples of events that may be “significant events” are government actions, natural disasters, armed conflicts, acts of terrorism, and significant market fluctuations. The valuation of senior floating rate loans held by the Funds are obtained from an independent loan pricing service and categorized as Level 2 based on the use of other significant observable inputs.
Fair value pricing could result in a difference between the prices used to calculate a Portfolio’s net asset value and the prices used by such Portfolio’s benchmark index, which, in turn, could result in a difference between a Portfolio’s performance and the performance of the Portfolio’s benchmark index. The inputs or methodology used for valuation are not necessarily an indication of the risk associated with investing in those investments.
The type of inputs used to value each security is identified in the Schedule of Investments, which also includes a breakdown of a Portfolio’s investments by category.
The following table summarizes the inputs used in valuing the Portfolios’ investments as of December 31, 2014:
| Level 1 — Quoted Prices | Level 2 — Other Significant Observable Inputs | Level 3 — Significant Unobservable Inputs | Total | ||||||||||||
SSGA Multi-Asset Real Return Portfolio | $ | 166,815,556 | $ | — | $ | — | $ | 166,815,556 | ||||||||
SSGA Income Allocation Portfolio | 117,894,803 | — | — | 117,894,803 | ||||||||||||
SSGA Global Allocation Portfolio | 134,410,323 | — | — | 134,410,323 | ||||||||||||
Blackstone/GSO Senior Loan Portfolio | 4,725,025 | 544,056,016 | — | 548,781,041 | ||||||||||||
SSGA Ultra Short Term Bond Portfolio | 26,091 | 15,955,495 | — | 15,981,586 | ||||||||||||
SSGA MFS Systematic Core Equity Portfolio | 2,928,053 | — | — | 2,928,053 | ||||||||||||
SSGA MFS Systematic Growth Equity Portfolio | 2,973,817 | — | — | 2,973,817 | ||||||||||||
SSGA MFS Systematic Value Equity Portfolio | 2,826,781 | — | — | 2,826,781 | ||||||||||||
SSGA Risk Aware Portfolio | 1,967,522 | — | — | 1,967,522 | ||||||||||||
There were no transfers between levels for the period ended December 31, 2014.
Investment Income
Interest income is recorded on the accrual basis. Dividend income is recorded on the ex-dividend date. The value of additional securities received as dividend payments is recorded as income and as an increase to the cost basis of such securities.
Expenses
Advisory fees and other expenses, which are directly identifiable to a specific Portfolio, are applied to that Portfolio. Trustees’ fees and other expenses which cannot be attributed to a specific Portfolio are allocated in such a manner as deemed equitable, taking into consideration the nature and type of expense and the relative net assets of the Portfolios. In addition to the these direct expenses, the Portfolios bear certain expenses indirectly, such as fees of underlying Portfolios in which the Portfolio invest that are reflected in the reported value of such Portfolios.
Investment Transactions
Investment transactions are recorded as of the trade date. Realized gains and losses from the sale or disposition of securities are recorded on the identified cost basis. Corporate actions (including cash dividends) are recorded net of foreign tax withholdings on the ex-dividend date.
42
Table of Contents
SSGA MASTER TRUST
NOTES TO FINANCIAL STATEMENTS (continued)
December 31, 2014 (Unaudited)
Federal Income Tax
The Portfolios are not required to pay federal income taxes on their net investment income and net capital gains because they are treated as partnerships for federal income tax purposes. All interest, gains and losses of the Portfolios are deemed to have been “passed through” to the Portfolios’ partners in proportion to their holdings in the respective Portfolio, regardless of whether such items have been distributed by the Portfolios. Each partner is responsible for tax liability based on its distributive share; therefore, no provision has been made for federal income taxes. The Portfolios have reviewed the tax positions for the open tax years as of June 30, 2014 and have determined that no provision for income tax is required in the Portfolios’ Financial Statements. The Portfolios’ federal tax returns are subject to examination by the Portfolios’ major tax jurisdictions, which include the United States of America and the Commonwealth of Massachusetts. The Portfolios’ recognized interest and penalties, if any, related to tax liabilities as income tax expense in the Statements of Operations.
| 3. | Fees and Compensation Paid to Affiliates and Other Related Party Transactions |
Advisory Fee
Each Portfolio has entered into an Investment Advisory Agreement with SSGA Funds Management, Inc. (the “Adviser” or “SSGA FM”). As compensation for the services rendered, facilities furnished, and expenses borne by the Adviser, each Portfolio pays the Adviser a fee accrued daily and paid monthly, based on a percentage of each Portfolio’s average daily net assets as shown in the following table:
| Annual Rate | ||||
SSGA Multi-Asset Real Return Portfolio | 0.20 | % | ||
SSGA Income Allocation Portfolio | 0.20 | |||
SSGA Global Allocation Portfolio | 0.20 | |||
Blackstone/GSO Senior Loan Portfolio | 0.30 | |||
SSGA Ultra Short Term Bond Portfolio | 0.20 | |||
SSGA MFS Systematic Core Equity Portfolio | 0.30 | |||
SSGA MFS Systematic Growth Equity Portfolio | 0.30 | |||
SSGA MFS Systematic Value Equity Portfolio | 0.30 | |||
SSGA Risk Aware Portfolio | 0.20 | |||
The Adviser pays all operating expenses of each Portfolio other than management fee, brokerage, taxes, interest, fees and expenses of the Independent Trustees (including any Trustees’ counsel fees), litigation expenses, acquired fund fees and expenses and other extraordinary expenses.
GSO / Blackstone Debt Funds Management LLC receives fees for its services as the sub-adviser to the SPDR Blackstone/GSO Senior Loan Portfolio from the Adviser.
Massachusetts Financial Services Company receives fees for its services as sub-adviser to the SSGA MFS Systematic Core Equity Portfolio, SSGA MFS Systematic Growth Equity Portfolio and SSGA Systematic Value Equity Portfolio from the Adviser.
State Street Bank and Trust Company (“State Street”), an affiliate of the Adviser, receives fees for its services as Custodian, Administrator and Transfer Agent from the Adviser.
Trustees’ Fees
The Trust, SSGA Master Trust, SPDR Series Trust and SPDR Index Shares Funds pay, in the aggregate, each Independent Trustee an annual fee of $185,000 plus $10,000 per in-person meeting attended and $1,250 for each telephonic or video conference meeting attended. The Chairman of the Board receives an additional annual fee of $50,000 and the Chairman of the Audit Committee receives an additional annual fee of $20,000. The Trust also reimburses each Independent Trustee for travel and other out-of-pocket expenses incurred by him/her in connection with attending such meetings and in connection with attending industry seminars and meetings. Independent Trustee fees are allocated among the Trusts and each of their respective series in such a manner as deemed equitable, taking into consideration the relative net assets of the series.
43
Table of Contents
SSGA MASTER TRUST
NOTES TO FINANCIAL STATEMENTS (continued)
December 31, 2014 (Unaudited)
Transactions with Affiliates
Each Portfolio may invest in certain money market funds and underlying Funds affiliated with the Adviser. Amounts related to investments in affiliated underlying Funds at December 31, 2014, and for the period then ended are:
SPDR SSGA Multi-Asset Real | Number of Shares Held at 6/30/14 | Value at 6/30/14 | Purchased | Sold | Number of Shares Held at 12/31/14 | Value at 12/31/14 | Dividend Income | Realized Gain (Loss) | ||||||||||||||||||||||||||||||||
| Cost | Shares | Proceeds | Shares | |||||||||||||||||||||||||||||||||||||
SPDR Barclays TIPS ETF | 243,141 | $ | 13,941,705 | $ | 14,832,277 | 260,240 | $ | 3,569,129 | 63,347 | 440,034 | $ | 24,633,104 | $ | 131,187 | $ | (68,069 | ) | |||||||||||||||||||||||
SPDR DB International Government Inflation-Protected Bond ETF | 39,783 | 2,466,944 | 6,764,452 | 111,364 | 1,060,487 | 17,993 | 133,154 | 7,583,120 | 75,496 | (14,343 | ) | |||||||||||||||||||||||||||||
SPDR S&P Global Natural Resources ETF | 971,968 | 51,368,509 | 21,420,237 | 443,000 | 10,503,549 | 221,344 | 1,193,624 | 52,519,456 | 510,834 | (769,990 | ) | |||||||||||||||||||||||||||||
SPDR S&P International Energy Sector ETF | 114,255 | 3,376,235 | 1,252,652 | 54,943 | 323,073 | 13,271 | 155,927 | 3,215,215 | 56,349 | (4,790 | ) | |||||||||||||||||||||||||||||
SPDR S&P Metals & Mining ETF | 118,602 | 5,010,934 | 2,080,630 | 60,243 | 766,240 | 20,287 | 158,558 | 4,893,100 | 62,759 | (23,871 | ) | |||||||||||||||||||||||||||||
The Energy Select Sector SPDR Fund | 67,060 | 6,712,706 | 5,088,958 | 59,289 | 3,508,896 | 40,227 | 86,122 | 6,817,417 | 75,433 | (150,372 | ) | |||||||||||||||||||||||||||||
SPDR Dow Jones International Real Estate ETF | 418,421 | 18,510,945 | 5,056,765 | 117,210 | 8,878,184 | 208,107 | 327,524 | 13,615,173 | 210,436 | (184,953 | ) | |||||||||||||||||||||||||||||
SPDR Dow Jones REIT ETF | 242,545 | 20,131,235 | 6,225,424 | 72,103 | 10,495,289 | 122,813 | 191,835 | 17,437,801 | 326,357 | 522,970 | ||||||||||||||||||||||||||||||
State Street Institutional Liquid Reserves Fund | 334,186 | 334,186 | 25,185,607 | 25,185,607 | 16,970,919 | 16,970,919 | 8,548,874 | 8,548,874 | 1,096 | — | ||||||||||||||||||||||||||||||
SPDR SSGA Income Allocation | Number of Shares Held at 6/30/14 | Value at 6/30/14 | Purchased | Sold | Number of Shares Held at 12/31/14 | Value at 12/31/14 | Dividend Income | Realized Gain (Loss) | ||||||||||||||||||||||||||||||||
| Cost | Shares | Proceeds | Shares | |||||||||||||||||||||||||||||||||||||
SPDR S&P Dividend ETF | 208,856 | $ | 15,996,281 | $ | 4,245,690 | 54,804 | $ | 2,793,495 | 36,253 | 227,407 | $ | 17,919,672 | $ | 650,626 | $ | 128,088 | ||||||||||||||||||||||||
SPDR Wells Fargo Preferred Stock ETF | 118,540 | 5,174,271 | 978,365 | 22,275 | 287,444 | 6,596 | 134,219 | 5,876,108 | 192,577 | (5,309 | ) | |||||||||||||||||||||||||||||
The Financial Select Sector SPDR Fund | — | — | 4,636,711 | 194,768 | 2,236,370 | 97,061 | 97,707 | 2,416,294 | 21,426 | (25,605 | ) | |||||||||||||||||||||||||||||
The Health Care Select Sector SPDR Fund | 34,459 | 2,096,141 | 392,740 | 5,849 | 457,248 | 6,968 | 33,340 | 2,279,789 | 16,439 | 21,155 | ||||||||||||||||||||||||||||||
The Industrial Select Sector SPDR Fund | 37,178 | 2,009,843 | 2,179,956 | 41,946 | 4,304,210 | 79,124 | — | — | — | 246,424 | ||||||||||||||||||||||||||||||
The Material Select SPDR Fund | — | — | 2,105,540 | 42,763 | 2,125,650 | 42,763 | — | — | — | 20,110 | ||||||||||||||||||||||||||||||
The Technology Select Sector SPDR Fund | 53,943 | 2,068,714 | 397,656 | 9,735 | 250,445 | 6,258 | 57,420 | 2,374,317 | 21,760 | 7,477 | ||||||||||||||||||||||||||||||
SPDR Barclays Convertible Securities ETF | 51,996 | 2,625,798 | 3,555,222 | 71,113 | 191,037 | 3,931 | 119,178 | 5,588,256 | 334,376 | 19,547 | ||||||||||||||||||||||||||||||
SPDR Barclays High Yield Bond ETF | 183,915 | 7,674,773 | 6,193,702 | 155,707 | 2,672,217 | 65,555 | 274,067 | 10,581,727 | 246,815 | 26,508 | ||||||||||||||||||||||||||||||
SPDR Barclays Long Term Corporate Bond ETF | 348,105 | 14,133,063 | 6,192,067 | 152,286 | 2,696,025 | 66,068 | 434,323 | 18,020,061 | 395,087 | (1,740 | ) | |||||||||||||||||||||||||||||
SPDR Barclays Long Term Treasury Bond ETF | 110,934 | 7,354,924 | 2,170,320 | 30,736 | 2,793,797 | 41,444 | 100,226 | 7,303,068 | 103,003 | (48,273 | ) | |||||||||||||||||||||||||||||
SPDR Barclays TIPS ETF | 64,001 | 3,669,817 | 160,946 | 2,861 | 3,188,494 | 56,290 | 10,572 | 591,820 | 27,583 | 31,854 | ||||||||||||||||||||||||||||||
SPDR EURO STOXX 50 ETF | 34,566 | 1,495,671 | 450,093 | 11,480 | 589,586 | 15,738 | 30,308 | 1,117,153 | 12,164 | (4,426 | ) | |||||||||||||||||||||||||||||
SPDR S&P Emerging Markets Dividend ETF | 101,157 | 4,055,384 | 2,906,115 | 74,280 | 2,785,967 | 76,409 | 99,028 | 3,377,845 | 132,299 | (439,622 | ) | |||||||||||||||||||||||||||||
44
Table of Contents
SSGA MASTER TRUST
NOTES TO FINANCIAL STATEMENTS (continued)
December 31, 2014 (Unaudited)
SPDR SSGA Income Allocation | Number of Shares Held at 6/30/14 | Value at 6/30/14 | Purchased | Sold | Number of Shares Held at 12/31/14 | Value at 12/31/14 | Dividend Income | Realized Gain (Loss) | ||||||||||||||||||||||||||||||||
| Cost | Shares | Proceeds | Shares | |||||||||||||||||||||||||||||||||||||
SPDR S&P Global Infrastructure 100 ETF | 81,481 | $ | 4,145,753 | $ | 665,300 | 13,494 | $ | 1,114,384 | 22,482 | 72,493 | $ | 3,517,361 | $ | 50,595 | $ | 149,803 | ||||||||||||||||||||||||
SPDR S&P International Dividend ETF | 118,992 | 6,104,290 | 2,156,478 | 47,318 | 172,993 | 3,898 | 162,412 | 6,824,552 | 164,226 | (10,680 | ) | |||||||||||||||||||||||||||||
SPDR STOXX Europe 50 ETF | 154,452 | 6,080,775 | 1,310,250 | 35,927 | 2,265,704 | 60,092 | 130,287 | 4,458,421 | 46,059 | (29,317 | ) | |||||||||||||||||||||||||||||
SPDR Barclays Emerging Markets Local Bond ETF | 99,028 | 3,091,654 | 1,818,377 | 59,839 | 1,002,058 | 34,820 | 124,047 | 3,526,656 | — | (116,433 | ) | |||||||||||||||||||||||||||||
SPDR Barclays International Corporate Bond ETF | 55,214 | 2,087,090 | 526,865 | 14,918 | 62,817 | 1,768 | 68,364 | 2,349,671 | 20,921 | 2,060 | ||||||||||||||||||||||||||||||
SPDR Dow Jones International Real Estate ETF | 136,457 | 6,036,858 | 2,037,457 | 47,623 | 1,913,162 | 45,754 | 138,326 | 5,750,212 | 92,473 | (82,146 | ) | |||||||||||||||||||||||||||||
SPDR Barclays Intermediate Term Corporate Bond ETF | — | — | 1,050,240 | 30,490 | 1,039,765 | 30,490 | — | — | 2,196 | (10,474 | ) | |||||||||||||||||||||||||||||
SPDR Dow Jones REIT ETF | 86,378 | 7,169,374 | 4,008,248 | 46,262 | 2,506,257 | 29,633 | 103,007 | 9,363,336 | 169,154 | 47,567 | ||||||||||||||||||||||||||||||
State Street Institutional Liquid Reserves Fund | 519,279 | 519,279 | 11,286,300 | 11,286,300 | 7,147,095 | 7,147,095 | 4,658,484 | 4,658,484 | 751 | — | ||||||||||||||||||||||||||||||
SPDR SSGA Global Allocation | Number of Shares Held at 6/30/14 | Value at 6/30/14 | Purchased | Sold | Number of Shares Held at 12/31/14 | Value at 12/31/14 | Dividend Income | Realized Gain (Loss) | ||||||||||||||||||||||||||||||||
| Cost | Shares | Proceeds | Shares | |||||||||||||||||||||||||||||||||||||
SPDR S&P 500 ETF Trust | 100,138 | $ | 19,599,009 | $ | 19,983,380 | 101,265 | $ | 8,848,425 | 43,325 | 158,078 | $ | 32,485,029 | $ | 322,275 | $ | 394,170 | ||||||||||||||||||||||||
SPDR S&P 500 Growth ETF | 21,483 | 1,954,309 | 2,753,830 | 28,647 | 2,041,836 | 22,423 | 27,707 | 2,677,605 | 10,311 | 120,846 | ||||||||||||||||||||||||||||||
SPDR S&P 500 Value ETF | — | — | 1,001,342 | 10,229 | 987,607 | 10,229 | — | — | 2 | (13,735 | ) | |||||||||||||||||||||||||||||
SPDR S&P MidCap 400 ETF Trust | 7,604 | 1,981,298 | 2,853,182 | 10,932 | 2,049,659 | 8,148 | 10,388 | 2,742,120 | 10,427 | 231,876 | ||||||||||||||||||||||||||||||
The Financial Select Sector SPDR Fund | — | — | 5,006,653 | 209,848 | 2,322,830 | 100,467 | 109,381 | 2,704,992 | 22,170 | (24,931 | ) | |||||||||||||||||||||||||||||
The Health Care Select Sector SPDR Fund | 32,724 | 1,990,601 | 899,586 | 13,873 | 555,485 | 8,338 | 38,259 | 2,616,150 | 17,486 | 22,653 | ||||||||||||||||||||||||||||||
The Industrial Select Sector SPDR Fund | 35,237 | 1,904,912 | 2,507,174 | 48,258 | 4,546,345 | 83,495 | — | — | — | 248,409 | ||||||||||||||||||||||||||||||
The Material Select SPDR Fund | — | — | 2,139,726 | 43,420 | 2,155,966 | 43,420 | — | — | 348 | 16,240 | ||||||||||||||||||||||||||||||
The Technology Select Sector SPDR Fund | 51,139 | 1,961,181 | 901,179 | 22,518 | 309,487 | 7,669 | 65,988 | 2,728,604 | 23,200 | 12,506 | ||||||||||||||||||||||||||||||
SPDR Barclays Aggregate Bond ETF | 50,949 | 2,953,004 | 427,983 | 7,418 | 3,383,570 | 58,367 | — | — | 21,062 | 60,375 | ||||||||||||||||||||||||||||||
SPDR Barclays High Yield Bond ETF | 47,109 | 1,965,858 | 8,513,491 | 214,653 | 2,167,778 | 53,265 | 208,497 | 8,050,069 | 90,818 | 55,414 | ||||||||||||||||||||||||||||||
SPDR Barclays Intermediate Term Corporate Bond ETF | — | — | 1,072,229 | 31,132 | 1,061,850 | 31,132 | — | — | 2,315 | (10,379 | ) | |||||||||||||||||||||||||||||
SPDR Barclays Long Term Corporate Bond ETF | 146,578 | 5,951,067 | 11,012,961 | 269,788 | 3,389,787 | 83,293 | 333,073 | 13,819,199 | 247,729 | (934 | ) | |||||||||||||||||||||||||||||
SPDR Barclays Long Term Treasury ETF | — | — | 4,120,205 | 57,400 | 53,007 | 736 | 56,664 | 4,128,879 | 9,224 | 236 | ||||||||||||||||||||||||||||||
SPDR Barclays TIPS ETF | 60,632 | 3,476,639 | 773,064 | 13,660 | 2,815,614 | 49,991 | 24,301 | 1,360,370 | 28,701 | 1,005 | ||||||||||||||||||||||||||||||
SPDR DB International Government Inflation-Protected Bond ETF | 23,868 | 1,480,055 | 161,046 | 2,619 | 1,594,025 | 26,487 | — | — | 6,627 | 11,937 | ||||||||||||||||||||||||||||||
SPDR EURO STOXX 50 ETF | 65,373 | 2,828,690 | 369,489 | 9,103 | 3,000,462 | 74,476 | — | — | 1,278 | (96,012 | ) | |||||||||||||||||||||||||||||
SPDR Russell/Nomura PRIME Japan ETF | 86,174 | 4,002,782 | 883,218 | 19,785 | 4,746,518 | 105,959 | — | — | — | 170,431 | ||||||||||||||||||||||||||||||
SPDR S&P Emerging Markets ETF | 72,046 | 4,871,390 | 2,190,030 | 31,438 | 6,841,816 | 103,484 | — | — | — | (69,286 | ) | |||||||||||||||||||||||||||||
SPDR S&P Emerging Markets Small Cap ETF | — | — | 1,137,450 | 22,783 | 1,090,796 | 22,783 | — | — | — | (46,654 | ) | |||||||||||||||||||||||||||||
45
Table of Contents
SSGA MASTER TRUST
NOTES TO FINANCIAL STATEMENTS (continued)
December 31, 2014 (Unaudited)
SPDR SSGA Global Allocation | Number of Shares Held at 6/30/14 | Value at 6/30/14 | Purchased | Sold | Number of Shares Held at 12/31/14 | Value at 12/31/14 | Dividend Income | Realized Gain (Loss) | ||||||||||||||||||||||||||||||||
| Cost | Shares | Proceeds | Shares | |||||||||||||||||||||||||||||||||||||
SPDR S&P International Small Cap ETF | 84,669 | $ | 2,990,509 | $ | 1,621,602 | 51,340 | $ | 144,956 | 4,509 | 131,500 | $ | 3,599,155 | $ | 437,418 | $ | 9,200 | ||||||||||||||||||||||||
SPDR S&P World ex-US ETF | 638,099 | 19,315,257 | 8,862,466 | 314,268 | 2,791,579 | 101,028 | 851,339 | 22,901,019 | 303,961 | (145,989 | ) | |||||||||||||||||||||||||||||
SPDR STOXX Europe 50 ETF | 73,112 | 2,878,419 | 377,847 | 9,807 | 3,127,970 | 82,919 | — | — | 365 | 92,946 | ||||||||||||||||||||||||||||||
SPDR Barclays Emerging Markets Local Bond ETF | — | — | 1,334,965 | 43,371 | 1,243,385 | 43,371 | — | — | — | (91,580 | ) | |||||||||||||||||||||||||||||
SPDR Barclays International Corporate Bond ETF | 26,163 | 988,961 | 556,859 | 15,675 | 92,882 | 2,631 | 39,207 | 1,347,545 | 11,230 | (3,081 | ) | |||||||||||||||||||||||||||||
SPDR Barclays International Treasury Bond ETF | 16,302 | 990,999 | 1,521,774 | 26,250 | 1,086,942 | 18,157 | 24,395 | 1,349,775 | 13,787 | 39,223 | ||||||||||||||||||||||||||||||
SPDR Dow Jones International Real Estate ETF | 120,691 | 5,339,370 | 4,155,709 | 96,691 | 4,968,543 | 119,364 | 98,018 | 4,074,608 | 83,865 | (198,983 | ) | |||||||||||||||||||||||||||||
SPDR Dow Jones REIT ETF | 76,299 | 6,332,817 | 7,117,437 | 81,830 | 3,334,942 | 38,889 | 119,240 | 10,838,916 | 177,617 | 112,173 | ||||||||||||||||||||||||||||||
State Street Institutional Liquid Reserves Fund | 2,055,704 | 2,055,704 | 21,283,264 | 21,283,264 | 9,344,781 | 9,344,781 | 13,994,187 | 13,994,187 | 2,644 | — | ||||||||||||||||||||||||||||||
Blackstone/GSO Senior Loan | Number of Shares Held at 6/30/14 | Value at 6/30/14 | Purchased | Sold | Number of Shares Held at 12/31/14 | Value at 12/31/14 | Dividend Income | Realized Gain (Loss) | ||||||||||||||||||||||||||||||||
| Cost | Shares | Proceeds | Shares | |||||||||||||||||||||||||||||||||||||
State Street Institutional Liquid Reserves Fund | 39,685,659 | $ | 39,685,659 | $ | 111,824,161 | 111,824,161 | $ | 146,784,795 | 146,784,795 | 4,725,025 | $ | 4,725,025 | $ | 8,984 | $ | — | ||||||||||||||||||||||||
SSGA Ultra Short Term Bond Portfolio | Number of Shares Held at 6/30/14 | Value at 6/30/14 | Purchased | Sold | Number of Shares Held at 12/31/14 | Value at 12/31/14 | Dividend Income | Realized Gain (Loss) | ||||||||||||||||||||||||||||||||
| Cost | Shares | Proceeds | Shares | |||||||||||||||||||||||||||||||||||||
State Street Institutional Liquid Reserves Fund | 518,551 | $ | 518,551 | $ | 5,721,195 | 5,721,195 | $ | 6,213,655 | 6,213,655 | 26,091 | $ | 26,091 | $ | 121 | $ | — | ||||||||||||||||||||||||
SSGA MFS Systematic Core Equity Portfolio | Number of Shares Held at 6/30/14 | Value at 6/30/14 | Purchased | Sold | Number of Shares Held at 12/31/14 | Value at 12/31/14 | Dividend Income | Realized Gain (Loss) | ||||||||||||||||||||||||||||||||
| Cost | Shares | Proceeds | Shares | |||||||||||||||||||||||||||||||||||||
State Street Institutional Liquid Reserves Fund | 58,605 | $ | 58,605 | $ | 31,399 | 31,399 | $ | 75,841 | 75,841 | 14,163 | $ | 14,163 | $ | 11 | $ | — | ||||||||||||||||||||||||
SSGA MFS Systematic Growth Equity Portfolio | Number of Shares Held at 6/30/14 | Value at 6/30/14 | Purchased | Sold | Number of Shares Held at 12/31/14 | Value at 12/31/14 | Dividend Income | Realized Gain (Loss) | ||||||||||||||||||||||||||||||||
| Cost | Shares | Proceeds | Shares | |||||||||||||||||||||||||||||||||||||
State Street Institutional Liquid Reserves Fund | 75,976 | $ | 75,976 | $ | 23,079 | 23,079 | $ | 73,844 | 73,844 | 25,211 | $ | 25,211 | $ | 10 | $ | — | ||||||||||||||||||||||||
SSGA MFS Systematic Value Equity Portfolio | Number of Shares Held at 6/30/14 | Value at 6/30/14 | Purchased | Sold | Number of Shares Held at 12/31/14 | Value at 12/31/14 | Dividend Income | Realized Gain (Loss) | ||||||||||||||||||||||||||||||||
| Cost | Shares | Proceeds | Shares | |||||||||||||||||||||||||||||||||||||
State Street Institutional Liquid Reserves Fund | 81,360 | $ | 81,360 | $ | 30,310 | 30,310 | $ | 86,447 | 86,447 | 25,223 | $ | 25,223 | $ | 12 | $ | — | ||||||||||||||||||||||||
SSGA Risk Aware Portfolio | Number of Shares Held at 6/30/14 | Value at 6/30/14 | Purchased | Sold | Number of Shares Held at 12/31/14 | Value at 12/31/14 | Dividend Income | Realized Gain (Loss) | ||||||||||||||||||||||||||||||||
| Cost | Shares | Proceeds | Shares | |||||||||||||||||||||||||||||||||||||
State Street Institutional Liquid Reserves Fund | — | $ | — | $ | 64,783 | 64,783 | $ | 50,579 | 50,579 | 14,204 | $ | 14,204 | $ | 4 | $ | — | ||||||||||||||||||||||||
46
Table of Contents
SSGA MASTER TRUST
NOTES TO FINANCIAL STATEMENTS (continued)
December 31, 2014 (Unaudited)
| 4. | Aggregate Unrealized Appreciation and Depreciation |
The identified cost of investments in securities owned by each Portfolio for federal income tax purposes and the gross unrealized appreciation and depreciation at December 31, 2014, was as follows:
| Identified Cost | Gross Unrealized Appreciation | Gross Unrealized Depreciation | Net Unrealized Appreciation (Depreciation) | |||||||||||||
SSGA Multi-Asset Real Return Portfolio | $ | 182,528,315 | $ | 2,387,719 | $ | 18,100,478 | $ | (15,712,759 | ) | |||||||
SSGA Income Allocation Portfolio | 115,093,230 | 5,535,326 | 2,733,753 | 2,801,573 | ||||||||||||
SSGA Global Allocation Portfolio | 131,085,723 | 5,201,061 | 1,876,461 | 3,324,600 | ||||||||||||
Blackstone/GSO Senior Loan Portfolio | 561,748,448 | 687,694 | 13,655,101 | (12,967,407) | ||||||||||||
SSGA Ultra Short Term Bond Portfolio | 15,996,589 | 5,131 | 20,134 | (15,003 | ) | |||||||||||
SSGA MFS Systematic Core Equity Portfolio | 2,586,262 | 395,280 | 53,489 | 341,791 | ||||||||||||
SSGA MFS Systematic Growth Equity Portfolio | 2,584,410 | 422,992 | 33,585 | 389,407 | ||||||||||||
SSGA MFS Systematic Value Equity Portfolio | 2,566,901 | 314,757 | 54,877 | 259,880 | ||||||||||||
SSGA Risk Aware Portfolio | 1,897,096 | 102,833 | 32,407 | 70,426 | ||||||||||||
| 5. | Investment Transactions |
For the period ended December 31, 2014, the Portfolios had purchases and sales of investment securities as follows:
| Purchases | Sales | |||||||||||||||
| Short Term | Long Term | Short Term | Long Term | |||||||||||||
SSGA Multi-Asset Real Return Portfolio | $ | 25,185,607 | $ | 76,465,248 | $ | 16,970,919 | $ | 57,958,569 | ||||||||
SSGA Income Allocation Portfolio | 11,286,300 | 50,138,338 | 7,147,095 | 37,449,124 | ||||||||||||
SSGA Global Allocation Portfolio | 21,283,265 | 97,647,803 | 9,344,781 | 70,797,409 | ||||||||||||
Blackstone/GSO Senior Loan Portfolio | 111,824,161 | 241,356,506 | 146,784,795 | 273,351,777 | ||||||||||||
SSGA Ultra Short Term Bond Portfolio | 2,635,078 | 12,588,989 | 3,327,572 | 9,107,203 | ||||||||||||
SSGA MFS Systematic Core Equity Portfolio | 31,399 | 858,383 | 75,841 | 3,538,932 | ||||||||||||
SSGA MFS Systematic Growth Equity Portfolio | 23,079 | 1,420,692 | 73,844 | 4,120,604 | ||||||||||||
SSGA MFS Systematic Value Equity Portfolio | 30,310 | 1,054,337 | 86,447 | 3,662,980 | ||||||||||||
SSGA Risk Aware Portfolio | 64,783 | 5,481,671 | 50,579 | 3,308,540 | ||||||||||||
For the period ended December 31, 2014, the Portfolios had purchases and sales of U.S. Government obligations as follows:
| Purchases | Sales | |||||||||||||||
| Short Term | Long Term | Short Term | Long Term | |||||||||||||
SSGA Ultra Short Term Bond Portfolio | $ | 3,086,117 | $ | — | $ | 2,886,083 | $ | — | ||||||||
For the period ended December 31, 2014, the Trust did not pay any commissions to an affiliate of the Adviser for investment transactions.
| 6. | Concentration of Risk |
Although the Portfolios do not intend to concentrate their investments in any particular industry, if a Portfolio concentrates in a single industry, group of industries or type of instrument, it may be more susceptible to any single economic, market, political or regulatory occurrence affecting that industry, group of industries or type of instrument.
47
Table of Contents
SSGA MASTER TRUST
NOTES TO FINANCIAL STATEMENTS (continued)
December 31, 2014 (Unaudited)
| 7. | Line of Credit |
Blackstone / GSO Senior Loan Portfolio and other affiliated funds (each a “Participant” and, collectively, the “Participants”) share in a $300 million revolving credit facility provided by a syndication of banks. Blackstone / GSO Senior Loan Portfolio has exclusive access to $100 million of the total credit facility. The Participants may borrow for the purpose of meeting shareholder redemption requests that otherwise might require the untimely disposition of securities. The Participants are charged an annual commitment fee which is calculated based on the unused portion of the shared credit line. Blackstone / GSO Senior Loan Portfolio pays the commitment fee for its exclusive portion of the credit line. Commitment fees on the shared credit line are allocated among each of the Participants based on net assets. Commitment fees are ordinary fund operating expenses and are paid by the Adviser. A Participant incurs and pays the interest expense related to its borrowing. Interest is calculated at a rate per annum equal to the sum of the Federal Funds Rate plus 1%. Blackstone / GSO Senior Loan Portfolio may borrow up to a maximum of 25 percent of its assets. Blackstone / GSO Senior Loan Portfolio had no outstanding loans during the period ended December 31, 2014.
48
Table of Contents
SSGA MASTER TRUST
December 31, 2014 (Unaudited)
Proxy Voting Policies and Procedures and Records
A description of the Trust’s proxy voting policies and procedures that are used by the Funds’ investment adviser to vote proxies relating to the Funds’ portfolio of securities are available (i) without charge, upon request by calling 1-866-787-2257 (toll free) or (ii) on the website of the U.S. Securities and Exchange Commission, at www.sec.gov. Information regarding how the investment advisor voted for the prior 12-months period ended June 30 is available by August 31 of each year by calling the same number and on the SEC’s website, at www.sec.gov, and on the Funds’ website at www.spdrs.com.
Quarterly Portfolio Schedule
The Funds file a complete schedule of portfolio holdings with the SEC for the first and third quarters of each fiscal year on Form N-Q. The Fund’s Forms N-Q are available on the SEC’s website at www.sec.gov and may be reviewed and copied at the SEC’s Public Reference Room in Washington DC. Information on the operation of the Public Reference Room may be obtained by calling 1-800-SEC-0330. The information on the Form N-Q is available upon request, without charge, by calling 1-866-787-2257 (toll free) and on the Funds’ website at www.spdrs.com.
Approval of Advisory Agreements
At in-person meetings held prior to December 31, 2014, the Board of Trustees of the Trusts (the “Board”) evaluated proposals (1) to continue the separate Investment Advisory Agreements (the “Current Agreements”) between each Trust and SSGA Funds Management, Inc. (the “Adviser”) with respect to the operational series of SSGA Active Trust (the “Current ETFs”) and SSGA Master Trust (together with the Current ETFs, the “Current Funds”), and (2) to approve separate Investment Advisory Agreements (together, the “New Agreements” and, collectively with the Current Agreements, the “Agreements”) between the Adviser and (a) the SSGA Active Trust with respect to the SPDR SSGA Risk Aware ETF, a new series of the SSGA Active Trust (the “New ETF” and, together with the Current ETFs, the “ETFs”), and (b) SSGA Master Trust with respect to the New ETF’s corresponding master fund, the State Street Risk Aware Portfolio (together with the New ETF, the “New Funds”) (with the Current Funds and New Funds collectively being referred to hereafter as the “Funds”). The Trustees who are not “interested persons” of the Trust within the meaning of the Investment Company Act of 1940, as amended (the “Independent Trustees”) also met separately with their independent legal counsel to consider the Agreements.
In evaluating the Agreements, the Board drew on materials provided to them by the Adviser and on other materials provided by State Street Bank and Trust Company, the Trust’s Administrator, Transfer Agent and Custodian (“State Street”). In deciding whether to approve the Agreements, the Board considered various factors, including (i) the nature, extent and quality of services provided by or expected to be provided by the Adviser with respect to the Funds under the Agreements, (ii) the investment performance of the Current Funds, (iii) the costs to the Adviser of its services and profits realized by the Adviser and its affiliates from its relationship with the Trusts, and (iv) the extent to which economies of scale would be realized if and as the Funds grow and whether the fee levels in the Agreements reflect these economies of scale.
The Board considered the nature, extent and quality of services provided or expected to be provided by the Adviser. In doing so, the Trustees relied on their prior experience in overseeing the management of the Trusts and materials provided prior to and at the meeting. The Board reviewed the Agreements and the Adviser’s responsibilities for managing investment operations of each of the Funds in accordance with each Fund’s investment objectives and policies, and applicable legal and regulatory requirements. The Board appreciated the relatively unique nature of the ETFs as exchange-traded funds in a master-feeder structure and the experience and expertise of the Adviser with exchange-traded funds. The Board considered the background and experience of the Adviser’s senior management, including those individuals responsible for portfolio management, oversight of sub-advisers and regulatory compliance of the Funds. The Board also considered the portfolio management and oversight resources, structures and practices of the Adviser, including those associated with monitoring and securing each Fund’s compliance with its investment objectives and policies and with applicable laws and regulations. The Board also considered information about the Adviser’s best execution procedures and overall investment management business, noting that the Adviser serves a wide range of clients across a broad spectrum of asset classes. The Board looked at the Adviser’s general knowledge of the investment business and that of its affiliates which make up State Street Global Advisors, through which the Adviser
49
Table of Contents
SSGA MASTER TRUST
OTHER INFORMATION (continued)
December 31, 2014 (Unaudited)
shares all of its senior personnel. The Board considered that the Adviser and its affiliates constitute one of the world’s largest investment management enterprises for exchange-traded funds. The Board also considered the Adviser’s experience in active management, managing exchange-traded funds in master-feeder structures and overseeing third-party sub-advisers, as applicable.
The Board then reviewed the Current Funds’ performance. The Board compared each Current Fund’s investment performance to the performance of an appropriate benchmark and universe of comparable funds, noting that the performance of each Current Fund was satisfactory.
The Board considered the profitability of the advisory arrangement with the Funds to the Adviser, including data on the Current Funds’ historical profitability to the Adviser. The Independent Trustees, through their counsel, had the opportunity to discuss, with representatives of the Adviser and State Street, methodologies used in computing costs that formed the bases of profitability calculations and determined that these methodologies were reasonable.
The Board considered whether the Adviser or its affiliates benefited in other ways from its relationship with the Trusts, noting that the Adviser does not maintain soft-dollar arrangements in connection with the Trusts’ brokerage transactions.
The Board reviewed information regarding economies of scale or other efficiencies that may result as each Fund’s assets grow in size. The Board noted that the Agreements did not provide for breakpoints in each Fund’s advisory fee rates as assets of a Fund increase. However, the Board further noted the Adviser’s assertion that future economies of scale (among several factors) had been taken into consideration for the Funds by fixing relatively low advisory fees, effectively sharing the benefits of lower fees with the Funds from inception. The Adviser also asserted that one of the benefits of the unitary fee was to provide an unvarying expense structure, which could be lost or diluted with the addition of breakpoints. The Board noted that it intends to continue to monitor fees as the Funds grow in size and assess whether fee breakpoints may be warranted.
The Board evaluated the Funds’ unitary fee through review of comparative information with respect to fees paid by similar funds — i.e., exchange-traded funds that are actively managed, as applicable. The Board reviewed the universe of similar exchange-traded funds for the ETFs based upon data obtained from Lipper Analytical Services and related comparative information for similar exchange-traded funds. The Board also reviewed the fee structure of the Funds in connection with the master-feeder structure, the estimated expense ratio for the New Funds and the historical expense ratios of the Current Funds. In doing so, the Board used a fund by fund analysis of the data.
The Board, including the Independent Trustees voting separately, approved the Agreements for each Fund after weighing the foregoing factors, none of which was dispositive in itself and may have been weighed differently by each Trustee. The Board’s conclusions with respect to each Agreement were as follows: (a) the nature and extent of the services provided or expected to be provided by the Adviser with respect to the Funds were appropriate; (b) the performance of each Current Fund had been satisfactory; (c) the Adviser’s fee for each Fund and the unitary fee, considered in relation to services provided or expected to be provided, were fair and reasonable; (d) profitability of the Trusts’ relationship with the Adviser was not excessive; (e) any additional benefits to the Adviser or its affiliates were not of a magnitude to materially affect the Board’s conclusions; and (f) fees paid or expected to be paid to the Adviser shared economies of scale with respect to the Funds by way of the relatively low fee structure of the Trusts.
Approval of GSO / Blackstone Debt Funds Management LLC Sub-Advisory Agreement
At an in-person meeting held prior to December 31, 2014, the Board also evaluated proposals to continue the separate Sub-Advisory Agreements (the “GSO / Blackstone Sub-Advisory Agreements”) between the Adviser and GSO / Blackstone Debt Funds Management LLC (“GSO / Blackstone”) with respect to the SPDR Blackstone / GSO Senior Loan ETF, a series of the SSGA Active Trust, and Blackstone / GSO Senior Loan Portfolio, a series of the SSGA Master Trust, each sub-advised by GSO / Blackstone (the “GSO / Blackstone Funds”). The Trustees who are not “interested persons” of the Trusts within the meaning of the Investment Company Act of 1940, as amended (the “Independent Trustees”) also met separately with their independent legal counsel to consider the GSO / Blackstone Sub-Advisory Agreements.
In evaluating the GSO / Blackstone Sub-Advisory Agreements, the Board drew on materials provided to them by GSO / Blackstone and the Adviser. In deciding whether to approve the GSO / Blackstone Sub-Advisory Agreements, the Board
50
Table of Contents
SSGA MASTER TRUST
OTHER INFORMATION (continued)
December 31, 2014 (Unaudited)
considered various factors, including (i) the nature, extent and quality of services provided by GSO / Blackstone with respect to the GSO / Blackstone Funds under the GSO / Blackstone Sub-Advisory Agreements and (ii) the investment performance of the GSO / Blackstone Funds. The Board was apprised of the portion of the current advisory fee that the Adviser would pay to GSO / Blackstone under the GSO / Blackstone Sub-Advisory Agreements and also considered that such fees would be paid directly by the Adviser and would not result in increased fees payable by the GSO / Blackstone Funds.
The Board considered the background and experience of GSO / Blackstone’s senior management and, in particular, GSO / Blackstone’s experience in investing in senior loan securities. The Board reviewed the GSO / Blackstone Funds’ performance, noting that the performance of the GSO / Blackstone Funds was satisfactory. The Board also considered the unitary fee paid to the Adviser by each the GSO / Blackstone Fund and GSO / Blackstone’s fees paid by the Adviser.
The Board, including the Independent Trustees voting separately, approved the GSO / Blackstone Sub-Advisory Agreements for each GSO / Blackstone Fund after weighing the foregoing factors, none of which was dispositive in itself and may have been weighed differently by each Trustee. The Board’s conclusions with respect to each GSO / Blackstone Sub-Advisory Agreement were as follows: (a) the nature and extent of the services expected provided by GSO / Blackstone to the GSO / Blackstone Funds were appropriate; (b) the performance of the GSO / Blackstone Funds had been satisfactory; (c) GSO / Blackstone’s fees for the GSO / Blackstone Funds and the unitary fee, considered in relation to the services provided, were fair and reasonable; (d) any additional benefits to GSO / Blackstone were not of a magnitude to materially affect the Board’s conclusions; and (e) fees paid to GSO / Blackstone adequately shared the economies of scale with the GSO / Blackstone Funds by way of the relatively low fee structure of the Trusts.
51
Table of Contents
The SPDR® Family of Exchange Traded Funds
The following is a list of SPDR ETFs being offered, along with their respective exchange trading symbols. Please call 1-866-787-2257 to obtain a prospectus for any SPDR ETF. The prospectus contains more complete information, including charges, expenses, investment objectives and risk factors that should be carefully considered to determine if the Fund(s) are an appropriate investment for you. Read the prospectus(es) carefully before investing. Investing involves risk, including possible loss of principal.
SPDR Series Trust
SPDR Russell 3000® ETF (THRK)
SPDR Russell 1000® ETF (ONEK)
SPDR Russell 2000® ETF (TWOK)
SPDR S&P 500 Buyback ETF (SPYB)
SPDR S&P 500 Growth ETF (SPYG)
SPDR S&P 500 Value ETF (SPYV)
SPDR Russell Small Cap Completeness ETF (RSCO)
SPDR S&P 400 Mid Cap Growth ETF (MDYG)
SPDR S&P 400 Mid Cap Value ETF (MDYV)
SPDR S&P 600 Small Cap ETF (SLY)
SPDR S&P 600 Small Cap Growth ETF (SLYG)
SPDR S&P 600 Small Cap Value ETF (SLYV)
SPDR Global Dow ETF (DGT)
SPDR Dow Jones REIT ETF (RWR)
SPDR S&P Bank ETF (KBE)
SPDR S&P Capital Markets ETF (KCE)
SPDR S&P Insurance ETF (KIE)
SPDR S&P Mortgage Finance ETF (KME)
SPDR S&P Regional Banking ETF (KRE)
SPDR Morgan Stanley Technology ETF (MTK)
SPDR S&P Dividend ETF (SDY)
SPDR S&P Aerospace & Defense ETF (XAR)
SPDR S&P Biotech ETF (XBI)
SPDR S&P Health Care Equipment ETF (XHE)
SPDR S&P Health Care Services ETF (XHS)
SPDR S&P Homebuilders ETF (XHB)
SPDR S&P Metals & Mining ETF (XME)
SPDR S&P Oil & Gas Equipment & Services ETF (XES)
SPDR S&P Oil & Gas Exploration & Production ETF (XOP)
SPDR S&P Pharmaceuticals ETF (XPH)
SPDR S&P Retail ETF (XRT)
SPDR S&P Semiconductor ETF (XSD)
SPDR S&P Software & Services ETF (XSW)
SPDR S&P Telecom ETF (XTL)
SPDR S&P Transportation ETF (XTN)
SPDR S&P 1500 Value Tilt ETF (VLU)
SPDR S&P 1500 Momentum Tilt ETF (MMTM)
SPDR Russell 1000 Low Volatility ETF (LGLV)
SPDR Russell 2000 Low Volatility ETF (SMLV)
SPDR Wells Fargo Preferred Stock ETF (PSK)
SPDR Barclays 1-3 Month T-Bill ETF (BIL)
SPDR Barclays TIPS ETF (IPE)
SPDR Barclays 0-5 Year TIPS ETF (SIPE)
SPDR Barclays 1-10 Year TIPS ETF (TIPX)
SPDR Barclays Short Term Treasury ETF (SST)
SPDR Barclays Intermediate Term Treasury ETF (ITE)
SPDR Barclays Long Term Treasury ETF (TLO)
SPDR Barclays Short Term Corporate Bond ETF (SCPB)
SPDR Barclays Intermediate Term Corporate Bond ETF (ITR)
SPDR Barclays Long Term Corporate Bond ETF (LWC)
SPDR Barclays Issuer Scored Corporate Bond ETF (CBND)
Table of Contents
SPDR Barclays Convertible Securities ETF (CWB)
SPDR Barclays Mortgage Backed Bond ETF (MBG)
SPDR Barclays Aggregate Bond ETF (LAG)
SPDR Nuveen Barclays Municipal Bond ETF (TFI)
SPDR Nuveen Barclays California Municipal Bond ETF (CXA)
SPDR Nuveen Barclays New York Municipal Bond ETF (INY)
SPDR Nuveen Barclays Short Term Municipal Bond ETF (SHM)
SPDR Nuveen S&P VRDO Municipal Bond ETF (VRD)
SPDR Nuveen S&P High Yield Municipal Bond ETF (HYMB)
SPDR Nuveen Barclays Build America Bond ETF (BABS)
SPDR DB International Government Inflation-Protected Bond ETF (WIP)
SPDR Barclays Short Term International Treasury Bond ETF (BWZ)
SPDR Barclays International Treasury Bond ETF (BWX)
SPDR Barclays International Corporate Bond ETF (IBND)
SPDR Barclays Emerging Markets Local Bond ETF (EBND)
SPDR Barclays International High Yield Bond ETF (IJNK)
SPDR Barclays High Yield Bond ETF (JNK)
SPDR Barclays Short Term High Yield Bond ETF (SJNK)
SPDR Barclays Investment Grade Floating Rate ETF (FLRN)
SPDR BofA Merrill Lynch Emerging Markets Corporate Bond ETF (EMCD)
SPDR BofA Merrill Lynch Crossover Corporate Bond ETF (XOVR)
SPDR Index Shares Funds
SPDR STOXX Europe 50 ETF (FEU)
SPDR EURO STOXX 50 ETF (FEZ)
SPDR EURO STOXX Small Cap ETF (SMEZ)
SPDR S&P Emerging Asia Pacific ETF (GMF)
SPDR S&P Small Cap Emerging Asia Pacific ETF (GMFS)
SPDR S&P Russia ETF (RBL)
SPDR S&P China ETF (GXC)
SPDR S&P Emerging Markets ETF (GMM)
SPDR S&P Emerging Markets Dividend ETF (EDIV)
SPDR S&P BRIC 40 ETF (BIK)
SPDR S&P Emerging Europe ETF (GUR)
SPDR S&P Emerging Latin America ETF (GML)
SPDR S&P Emerging Middle East & Africa ETF (GAF)
SPDR S&P World ex-US ETF (GWL)
SPDR S&P International Small Cap ETF (GWX)
SPDR Dow Jones International Real Estate ETF (RWX)
SPDR S&P Global Infrastructure ETF (GII)
SPDR S&P Global Natural Resources ETF (GNR)
SPDR MSCI ACWI ex-US ETF (CWI)
SPDR MSCI ACWI IMI ETF (ACIM)
SPDR MSCI ACWI Low Carbon Target ETF (LOWC)
SPDR MSCI China A Shares IMI ETF (XINA)
SPDR MSCI EM 50 ETF (EMFT)
SPDR MSCI EM Beyond BRIC ETF (EMBB)
SPDR MSCI EAFE Quality Mix ETF (QEFA)
SPDR MSCI Emerging Markets Quality Mix ETF (QEMM)
SPDR MSCI World Quality Mix ETF (QWLD)
SPDR MSCI Australia Quality Mix ETF (QAUS)
SPDR MSCI Canada Quality Mix ETF (QCAN)
SPDR MSCI Germany Quality Mix ETF (QDEU)
SPDR MSCI Japan Quality Mix ETF (QJPN)
SPDR MSCI Mexico Quality Mix ETF (QMEX)
SPDR MSCI South Korea Quality Mix ETF (QKOR)
SPDR MSCI Spain Quality Mix ETF (QESP)
SPDR MSCI Taiwan Quality Mix ETF (QTWN)
SPDR MSCI United Kingdom Quality Mix ETF (QGBR)
Table of Contents
SPDR Russell/Nomura PRIMETM Japan ETF (JPP)
SPDR Russell/Nomura Small CapTM Japan ETF (JSC)
SPDR S&P Global Dividend ETF (WDIV)
SPDR S&P International Dividend ETF (DWX)
SPDR S&P International Mid Cap ETF (MDD)
SPDR S&P Emerging Markets Small Cap ETF (EWX)
SPDR Dow Jones Global Real Estate ETF (RWO)
SPDR S&P International Consumer Discretionary Sector ETF (IPD)
SPDR S&P International Consumer Staples Sector ETF (IPS)
SPDR S&P International Energy Sector ETF (IPW)
SPDR S&P International Financial Sector ETF (IPF)
SPDR S&P International Health Care Sector ETF (IRY)
SPDR S&P International Industrial Sector ETF (IPN)
SPDR S&P International Materials Sector ETF (IRV)
SPDR S&P International Technology Sector ETF (IPK)
SPDR S&P International Telecommunications Sector ETF (IST)
SPDR S&P International Utilities Sector ETF (IPU)
The Select Sector SPDR Trust
The Consumer Discretionary Select Sector SPDR Fund (XLY)
The Consumer Staples Select Sector SPDR Fund (XLP)
The Energy Select Sector SPDR Fund (XLE)
The Financial Select Sector SPDR Fund (XLF)
The Health Care Select Sector SPDR Fund (XLV)
The Industrial Select Sector SPDR Fund (XLI)
The Materials Select Sector SPDR Fund (XLB)
The Technology Select Sector SPDR Fund (XLK)
The Utilities Select Sector SPDR Fund (XLU)
SSGA Active Trust
SPDR SSGA Multi-Asset Real Return ETF (RLY)
SPDR SSGA Income Allocation ETF (INKM)
SPDR SSGA Global Allocation ETF (GAL)
SPDR Blackstone/GSO Senior Loan ETF (SRLN)
SPDR SSGA Ultra Short Term Bond ETF (ULST)
SPDR MFS Systematic Core Equity ETF (SYE)
SPDR MFS Systematic Growth Equity ETF (SYG)
SPDR MFS Systematic Value Equity ETF (SYV)
SPDR SSGA Risk Aware ETF (RORO)
SPDR Dow Jones Industrial Average ETF Trust (DIA)
SPDR S&P 500 ETF Trust (SPY)
State Street Global Markets, LLC, member FINRA, SIPC, is distributor for all investment portfolios of SPDR Series Trust, SPDR Index Shares Funds, and SSGA Active Trust. ALPS Distributors, Inc., a registered broker-dealer, is distributor for SPDR S&P 500 ETF Trust (SPY) and SPDR Dow Jones Industrial Average ETF Trust (DIA), both unit investment trusts. ALPS Portfolio Solutions Distributor, Inc. is the distributor for all investment portfolios of The Select Sector SPDR Trust. Distributor: State Street Global Markets, LLC is the distributor for all registered products on behalf of the advisor. SSGA Funds Management has retained GSO Capital Partners & Nuveen Asset Management, Massachusetts Financial Services Company as the sub-advisor.
Table of Contents
SSGA Master Trust
TRUSTEES
Bonny E. Boatman
Dwight D. Churchill
David M. Kelly
Frank Nesvet, Chairman
James E. Ross
Carl G. Verboncoeur
OFFICERS
Ellen M. Needham, President
Ann Carpenter, Vice President
Michael P. Riley, Vice President
Chad C. Hallett, Treasurer
Matthew W. Flaherty, Assistant Treasurer
Laura F. Dell, Assistant Treasurer
Christopher A. Madden, Secretary
Brian Harris, Chief Compliance Officer
INVESTMENT MANAGER
SSGA Funds Management, Inc.
State Street Financial Center
One Lincoln Street
Boston, MA 02111
CUSTODIAN, ADMINISTRATORAND TRANSFER AGENT
State Street Bank and Trust Company
One Lincoln Street
Boston, MA 02111
LEGAL COUNSEL
Morgan, Lewis & Bockius LLP
2020 K Street, NW
Washington, DC 20006
INDEPENDENT REGISTERED PUBLIC ACCOUNTING FIRM
Ernst & Young LLP
200 Clarendon Street
Boston, MA 02116
Table of Contents
State Street Global Advisors
State Street Financial Center
One Lincoln Street
Boston, MA 02111
ETFs trade like stocks, are subject to investment risk, fluctuate in market value and may trade at prices above or below the ETFs net asset value. Brokerage commissions and ETF expenses will reduce returns.
Because the SPDR SSGA Active Asset Allocation ETFs are actively managed, they are therefore subject to the risk that the investments selected by SSGA may cause the ETFs to underperform relative to their benchmarks or other funds with similar investment objectives. Actively managed ETFs do not seek to replicate the performance of a specified index.
Foreign investments involve greater risks than U.S. investments, including political and economic risks and the risk of currency fluctuations, all of which may be magnified in emerging markets.
Bonds generally present less short-term risk and volatility than stocks, but contain interest rate risk (as interest rates rise bond values and yields usually fall); issuer default risk; issuer credit risk; liquidity risk; and inflation risk. These effects are usually pronounced for longer-term securities. Any fixed income security sold or redeemed prior to maturity may be subject to a substantial gain or loss.
Investing in commodities entail significant risk and is not appropriate for all investors. Commodities investing entail significant risk as commodity prices can be extremely volatile due to wide range of factors. A few such factors include overall market movements, real or perceived inflationary trends, commodity index volatility, international, economic and political changes, change in interest and currency exchange rates.
Past performance is no guarantee of future results. It is not possible to invest directly in an index. Index performance does not reflect charges and expenses associated with the fund or brokerage commissions associated with buying and selling a fund. Index performance is not meant to represent that of any particular fund.
”SPDR” is a product of S&P Dow Jones Indices LLC (SPDJI), and has been licensed for use by State Street Corporation. Standard & Poors and S&P are registered trademarks of Standard & Poors Financial Services LLC (S&P); Dow Jones is a registered trademark of Dow Jones Trademark Holdings LLC (Dow Jones); SPDR is a trademark of the SPDJI; and these trademarks have been licensed for use by SPDJI and sublicensed for certain purposes by State Street Corporation. State Street Corporation’s financial products are not sponsored, endorsed, sold or promoted by SPDJI, Dow Jones, S&P, their respective affiliates and none of such parties make any representation regarding the advisability of investing in such product(s) nor do they have any liability for any errors, omissions, or interruptions of SPDR.
Before investing, consider the fund’s investment objectives, risks, charges and expenses. To obtain a prospectus or summary prospectus which contains this and other information, call 866.787.2257 or visit www.spdrs.com. Read it carefully.
© 2015 State Street Corporation SPDRACTSAR Exp Date - 02/29/2016 IBG-14266
Not FDIC Insured — No Bank Guarantee — May Lose Value
| For more complete information, please call 866.787.2257 or visit www.spdrs.com today. |
Table of Contents
Item 2. Code of Ethics.
Not applicable to the registrant; this Form N-CSR is a Semi-Annual Report.
Item 3. Audit Committee Financial Expert.
Not applicable to the registrant; this Form N-CSR is a Semi-Annual Report.
Item 4. Principal Accountant Fees and Services.
Not applicable to the registrant; this Form N-CSR is a Semi-Annual Report.
Item 5. Disclosure of Audit Committees for Listed Companies.
Not applicable to the registrant; this Form N-CSR is a Semi-Annual Report.
Item 6. Schedule of Investments.
| (a) | A Schedule of Investments for each series of the registrant is included as a part of the reports to shareholders filed under Item 1 of this Form N-CSR. |
| (b) | Not applicable to the registrant. |
Item 7. Disclosure of Proxy Voting Policies and Procedures for Closed-End Management Investment Companies.
Not applicable to the registrant.
Item 8. Portfolio Managers of Closed-End Management Investment Companies.
Not applicable to the registrant.
Item 9. Purchases of Equity Securities by Closed-End Management Investment Company and Affiliated Purchasers.
Not applicable to the registrant.
Item 10. Submission of Matters to a Vote of Security Holders.
The registrant has not adopted any material changes to the procedures by which shareholders may recommend nominees to the registrant’s Board.
Item 11. Controls and Procedures.
(a) Within 90 days of the filing date of this Form N-CSR, Ellen M. Needham, the registrant’s President and Principal Executive Officer, and Chad C. Hallett, the registrant’s Treasurer and Principal Financial Officer, reviewed the registrant’s disclosure controls and procedures and evaluated their effectiveness. Based on their review, Ms. Needham and Mr. Hallett determined that the disclosure controls and procedures adequately ensure that information required to be disclosed by the registrant in its periodic reports is recorded, processed, summarized and reported within the time periods required by the Securities and Exchange Commission.
Table of Contents
(b) In the registrant’s second fiscal quarter covered by this form N-CSR filing, there were no significant changes in the registrant’s internal controls or in other factors that have materially affected, or are reasonably likely to materially affect, its controls over financial reporting subsequent to the date of their evaluation, including any corrective actions with regard to significant deficiencies and material weaknesses.
Item 12. Exhibits.
(a)(1) Not applicable to the registrant; this Form N-CSR is a Semi-Annual Report.
(a)(2) Separate certifications required by Rule 30a-2(a) under the Investment Company Act of 1940 for each principal executive officer and principal financial officer of the registrant are attached.
(a)(3) Not applicable to the registrant.
(b) A single certification required by Rule 30a-2(b) under the Investment Company Act of 1940, Rule 13a-14(b) or Rule 15d-14(b) under the Securities Exchange Act of 1934 and Section 1350 of Chapter 63 of Title 18 of the United States Code for the principal executive officer and principal financial officer of the registrant is attached.
Table of Contents
SIGNATURES
Pursuant to the requirements of the Securities Exchange Act of 1934, as amended, and the Investment Company Act of 1940, as amended, the registrant has duly caused this report to be signed on its behalf by the undersigned, thereunto duly authorized.
SSgA Active Trust
| By: | /s/ Ellen M. Needham | |
| Ellen M. Needham | ||
| President and Principal Executive Officer | ||
Date: | March 9, 2015 | |
Pursuant to the requirements of the Securities Exchange Act of 1934, as amended, and the Investment Company Act of 1940, as amended, this report has been signed below by the following persons on behalf of the registrant and in the capacities and on the dates indicated.
| By: | /s/ Ellen M. Needham | |
| Ellen M. Needham | ||
| President and Principal Executive Officer | ||
| Date: | March 9, 2015 | |
| By: | /s/ Chad C. Hallett | |
| Chad C. Hallett | ||
| Treasurer and Principal Financial Officer | ||
| Date: | March 9, 2015 | |