0001516212ssga:C000164160Member2020-05-310001516212ssga:SPDRETFsIndexMSCIACWIIMIIndex12129BroadBasedIndexMember2019-05-310001516212ssga:SPDRETFsIndexDBIQOptimumYieldDiversifiedCommodityIndexExcessReturn12126AdditionalIndexMember2022-12-31
UNITED STATES
SECURITIES AND EXCHANGE COMMISSION
Washington, D.C. 20549
FORM N-CSR
CERTIFIED SHAREHOLDER REPORT OF REGISTERED
MANAGEMENT INVESTMENT COMPANIES
Investment Company Act file number: 811-22542
SSGA ACTIVE TRUST
(Exact name of registrant as specified in charter)
One Iron Street, Boston, Massachusetts 02210
(Address of principal executive offices) (zip code)
Sean O’Malley, Esq.
Senior Vice President and General Counsel
c/o SSGA Funds Management, Inc.
One Iron Street
Boston, Massachusetts 02210
(Name and address of agent for service)
Copy to:
W. John McGuire, Esq.
Morgan, Lewis & Bockius LLP
1111 Pennsylvania Avenue, NW
Washington, DC 20004
Registrant’s telephone number, including area code: (617) 664-1465
Date of fiscal year end: June 30
Date of reporting period: June 30, 2024
Item 1. Report to Shareholders.
(a) The Reports to Shareholders are attached herewith.
SPDR Blackstone High Income ETF
Principal Listing Exchange: Cboe BZX Exchange, Inc.
Annual Shareholder Report
June 30, 2024
This annual shareholder report contains important information about the SPDR Blackstone High Income ETF (the "Fund") for the year ended June 30, 2024. You can find additional information about the Fund, including the Prospectus, Statement of Additional Information, financial statements and other information at www.ssga.com/us/en/institutional/fund-finder?tab=documents&type=etfs. You can also request this information about the Fund by contacting us at 1-866-787-2257.
What were the Fund costs for the last year?
| Fund Name | Cost of a $10,000 investment | Costs paid as a percentage of a $10,000 investment |
|---|
| SPDR Blackstone High Income ETF | $72 | 0.68% |
How did the Fund perform last year and what affected its performance?
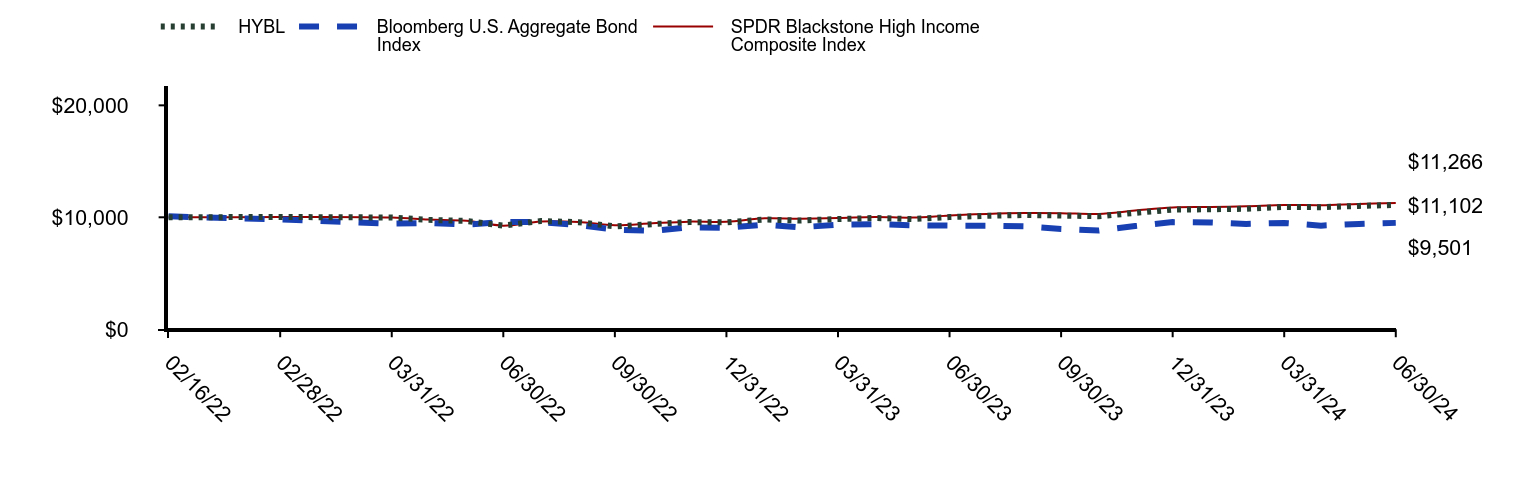
The Fund's allocation to shorter duration assets coupled with the contribution from its credit risk exposure were contributors to the Fund's outperformance vs. the Primary Index during the reporting period. The Fund's asset allocation, especially its allocation to CLOs, was the largest contributor to the Fund's outperformance relative to the Secondary Index during the reporting period. This was augmented by the Fund’s credit selection within loans. On an issuer level, the top contributors to the Fund’s total return during the reporting period were Point Au Roche Park CLO, SPDR Blackstone Senior Loan ETF, and Asurion. The top detractors from the Fund’s total return during the reporting period were iHeartCommunications, Hughes Satellite Systems, and Realogy Group / Realogy Co-Issuer.
The Fund's benchmarks are unmanaged indices used as a general measure of market performance. Calculations assume dividends and capital gains.
Comparison of Change in Value of a $10,000 Investment
(Based on Net Asset Value)
| HYBL | Bloomberg U.S. Aggregate Bond Index | SPDR Blackstone High Income Composite Index |
|---|
| 02/16/22 | $10,000 | $10,085 | $10,000 |
| 02/28/22 | $10,028 | $9,804 | $10,017 |
| 03/31/22 | $9,982 | $9,432 | $9,974 |
| 04/30/22 | $9,769 | $9,493 | $9,802 |
| 05/31/22 | $9,674 | $9,344 | $9,689 |
| 06/30/22 | $9,259 | $9,572 | $9,254 |
| 07/31/22 | $9,665 | $9,573 | $9,632 |
| 08/31/22 | $9,563 | $9,302 | $9,589 |
| 09/30/22 | $9,185 | $8,901 | $9,288 |
| 10/31/22 | $9,388 | $8,785 | $9,466 |
| 11/30/22 | $9,570 | $9,108 | $9,611 |
| 12/31/22 | $9,551 | $9,067 | $9,595 |
| 01/31/23 | $9,803 | $9,346 | $9,910 |
| 02/28/23 | $9,709 | $9,105 | $9,875 |
| 03/31/23 | $9,846 | $9,336 | $9,928 |
| 04/30/23 | $9,935 | $9,392 | $10,026 |
| 05/31/23 | $9,844 | $9,290 | $9,972 |
| 06/30/23 | $10,022 | $9,257 | $10,166 |
| 07/31/23 | $10,128 | $9,251 | $10,304 |
| 08/31/23 | $10,209 | $9,191 | $10,380 |
| 09/30/23 | $10,159 | $8,958 | $10,369 |
| 10/31/23 | $10,091 | $8,817 | $10,303 |
| 11/30/23 | $10,398 | $9,216 | $10,601 |
| 12/31/23 | $10,682 | $9,569 | $10,884 |
| 01/31/24 | $10,716 | $9,542 | $10,922 |
| 02/29/24 | $10,764 | $9,407 | $10,987 |
| 03/31/24 | $10,926 | $9,494 | $11,100 |
| 04/30/24 | $10,905 | $9,255 | $11,078 |
| 05/31/24 | $11,017 | $9,411 | $11,192 |
| 06/30/24 | $11,102 | $9,501 | $11,266 |
Average Annual Total Returns (%)
| Name | 1 Year | Since Inception 2/16/22 |
|---|
| HYBL | 10.95% | 4.43% |
| Bloomberg U.S. Aggregate Bond Index | 2.63% | (2.14%) |
| SPDR Blackstone High Income Composite Index | 10.82% | 5.16% |
The Fund’s past performance is not necessarily an indication of how the Fund will perform in the future. The returns do not reflect the deduction of taxes that a shareholder would pay on Fund distributions or on the redemption or sale of Fund shares. Updated performance information is available by calling 1-866-787-2257 or visiting our website at www.ssga.com/us/en/institutional/fund-finder?tab=documents&type=etfs.
| Statistic | Value |
|---|
| Total Net Assets | $149,593,840 |
| # of Portfolio Holdings | 530 |
| Portfolio Turnover Rate | 137% |
| Total Advisory Fees Paid | $911,236 |
What did the Fund invest in?
| Maturity Duration | % Value of Total Net Assets |
| 0 to 1 Year | 3.9% |
| 1 to 2 Years | 0.2% |
| 2 to 3 Years | 2.8% |
| 3 to 5 Years | 43.0% |
| 5 to 10 Years | 45.2% |
| 10 to 20 Years | 5.1% |
| 20 to 30 Years | 0.2% |
| Holdings | % Value of Total Net Assets |
| SPDR Blackstone Senior Loan ETF | 3.5% |
| Point Au Roche Park CLO Ltd., 11.69%, due 07/20/34 | 1.0% |
| Allison Transmission, Inc., 3.75%, due 01/30/31 | 0.6% |
| DaVita, Inc., 4.63%, due 06/01/30 | 0.6% |
| Ally Financial, Inc., 6.70%, due 02/14/33 | 0.6% |
| Xerox Holdings Corp., 5.50%, due 08/15/28 | 0.5% |
| Fertitta Entertainment LLC, 9.08%, due 01/27/29 | 0.5% |
| ARES LXVIII CLO Ltd., 13.87%, due 04/25/35 | 0.5% |
| Garda World Security Corp., 9.59%, due 02/01/29 | 0.5% |
| Sunoco LP/Sunoco Finance Corp., 4.50%, due 05/15/29 | 0.5% |
SPDR Blackstone Senior Loan ETF
Principal Listing Exchange: NYSEArca
Annual Shareholder Report
June 30, 2024
This annual shareholder report contains important information about the SPDR Blackstone Senior Loan ETF (the "Fund") for the year ended June 30, 2024. You can find additional information about the Fund, including the Prospectus, Statement of Additional Information, financial statements and other information at www.ssga.com/us/en/institutional/fund-finder?tab=documents&type=etfs. You can also request this information about the Fund by contacting us at 1-866-787-2257.
What were the Fund costs for the last year?
| Fund Name | Cost of a $10,000 investment | Costs paid as a percentage of a $10,000 investment |
|---|
| SPDR Blackstone Senior Loan ETF | $73 | 0.70% |
How did the Fund perform last year and what affected its performance?
The Fund’s performance, which was in line with the Primary Index during the reporting period, was positively impacted by its underweight exposure to BB rated assets, while its allocation to high yield bonds detracted from performance relative to the Primary Index. The Fund’s credit selection within its loan allocation was the primary driver of underperformance during the reporting period relative to the Secondary Index. This headwind was partially offset by the positive impact of an underweight allocation to Telecommunication Services during the reporting period. On an issuer level, the top contributors to the Fund’s total return during the reporting period were Asurion, Cloud Software Group, and Neptune Bidco US. The top detractors from the Fund’s total return during the reporting period were Ivanti Software, Numericable US, and Newfold Digital Holdings Group.
The Fund's benchmarks are unmanaged indices used as a general measure of market performance. Calculations assume dividends and capital gains.
Comparison of Change in Value of a $10,000 Investment
(Based on Net Asset Value)
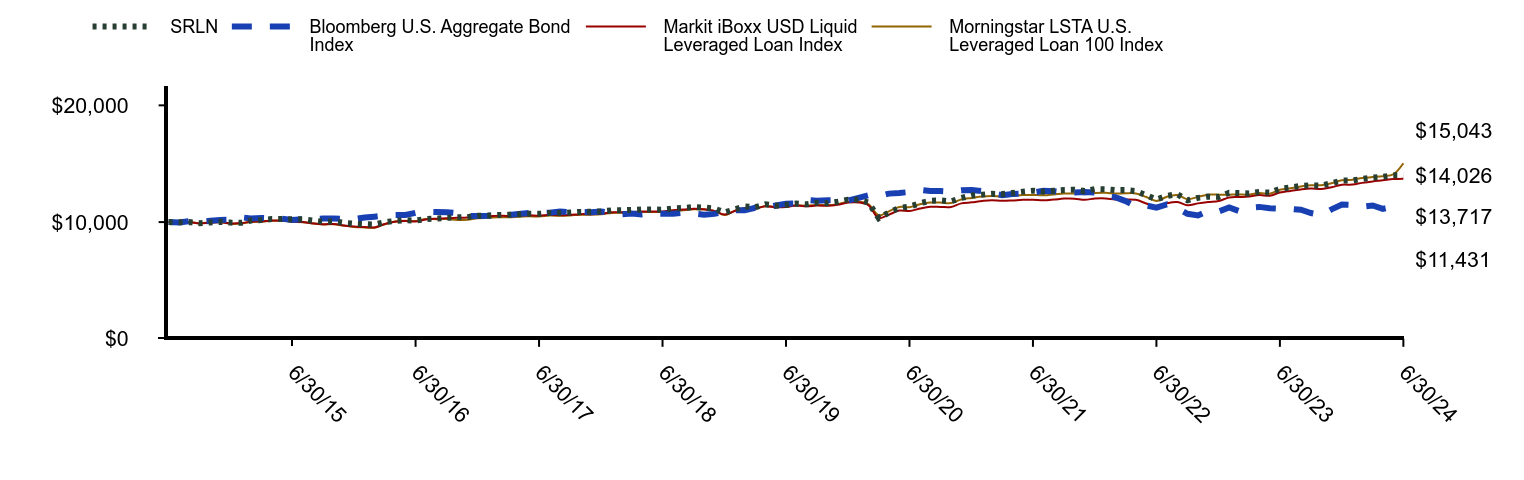
| SRLN | Bloomberg U.S. Aggregate Bond Index | Markit iBoxx USD Liquid Leveraged Loan Index | Morningstar LSTA U.S. Leveraged Loan 100 Index |
|---|
| 6/30/14 | $10,000 | $10,000 | $10,000 | $10,000 |
| 7/31/14 | $9,979 | $9,975 | $9,961 | $9,975 |
| 8/31/14 | $9,998 | $10,085 | $9,992 | $9,998 |
| 9/30/14 | $9,911 | $10,017 | $9,878 | $9,902 |
| 10/31/14 | $9,975 | $10,115 | $9,944 | $9,962 |
| 11/30/14 | $10,019 | $10,187 | $9,990 | $9,998 |
| 12/31/14 | $9,957 | $10,196 | $9,881 | $9,855 |
| 1/31/15 | $9,937 | $10,410 | $9,918 | $9,875 |
| 2/28/15 | $10,133 | $10,312 | $10,038 | $10,018 |
| 3/31/15 | $10,171 | $10,360 | $10,055 | $10,037 |
| 4/30/15 | $10,256 | $10,323 | $10,140 | $10,110 |
| 5/31/15 | $10,258 | $10,298 | $10,130 | $10,116 |
| 6/30/15 | $10,239 | $10,186 | $10,055 | $10,028 |
| 7/31/15 | $10,238 | $10,257 | $10,003 | $9,993 |
| 8/31/15 | $10,121 | $10,242 | $9,884 | $9,900 |
| 9/30/15 | $10,044 | $10,311 | $9,815 | $9,804 |
| 10/31/15 | $10,061 | $10,313 | $9,841 | $9,805 |
| 11/30/15 | $9,938 | $10,286 | $9,714 | $9,703 |
| 12/31/15 | $9,853 | $10,252 | $9,615 | $9,584 |
| 1/31/16 | $9,819 | $10,393 | $9,577 | $9,543 |
| 2/29/16 | $9,799 | $10,467 | $9,537 | $9,522 |
| 3/31/16 | $9,994 | $10,564 | $9,841 | $9,822 |
| 4/30/16 | $10,097 | $10,604 | $10,036 | $10,052 |
| 5/31/16 | $10,167 | $10,607 | $10,083 | $10,114 |
| 6/30/16 | $10,133 | $10,798 | $10,045 | $10,098 |
| 7/31/16 | $10,260 | $10,866 | $10,221 | $10,264 |
| 8/31/16 | $10,307 | $10,854 | $10,290 | $10,253 |
| 9/30/16 | $10,367 | $10,847 | $10,337 | $10,259 |
| 10/31/16 | $10,411 | $10,765 | $10,362 | $10,181 |
| 11/30/16 | $10,427 | $10,510 | $10,391 | $10,199 |
| 12/31/16 | $10,547 | $10,524 | $10,499 | $10,331 |
| 1/31/17 | $10,556 | $10,546 | $10,482 | $10,366 |
| 2/28/17 | $10,606 | $10,616 | $10,553 | $10,418 |
| 3/31/17 | $10,626 | $10,611 | $10,514 | $10,412 |
| 4/30/17 | $10,665 | $10,693 | $10,555 | $10,454 |
| 5/31/17 | $10,708 | $10,775 | $10,595 | $10,500 |
| 6/30/17 | $10,708 | $10,764 | $10,552 | $10,477 |
| 7/31/17 | $10,779 | $10,810 | $10,632 | $10,558 |
| 8/31/17 | $10,772 | $10,908 | $10,580 | $10,536 |
| 9/30/17 | $10,816 | $10,855 | $10,615 | $10,570 |
| 10/31/17 | $10,875 | $10,862 | $10,681 | $10,630 |
| 11/30/17 | $10,877 | $10,848 | $10,677 | $10,637 |
| 12/31/17 | $10,910 | $10,898 | $10,709 | $10,671 |
| 1/31/18 | $11,011 | $10,772 | $10,846 | $10,785 |
| 2/28/18 | $11,007 | $10,670 | $10,844 | $10,792 |
| 3/31/18 | $11,041 | $10,738 | $10,866 | $10,821 |
| 4/30/18 | $11,080 | $10,659 | $10,913 | $10,864 |
| 5/31/18 | $11,078 | $10,734 | $10,911 | $10,865 |
| 6/30/18 | $11,060 | $10,722 | $10,912 | $10,866 |
| 7/31/18 | $11,160 | $10,724 | $11,022 | $10,962 |
| 8/31/18 | $11,213 | $10,793 | $11,070 | $11,017 |
| 9/30/18 | $11,282 | $10,724 | $11,151 | $11,091 |
| 10/31/18 | $11,243 | $10,639 | $11,103 | $11,072 |
| 11/30/18 | $11,157 | $10,702 | $10,961 | $10,950 |
| 12/31/18 | $10,833 | $10,899 | $10,641 | $10,605 |
| 1/31/19 | $11,104 | $11,015 | $10,972 | $10,982 |
| 2/28/19 | $11,346 | $11,008 | $11,187 | $11,202 |
| 3/31/19 | $11,272 | $11,220 | $11,153 | $11,148 |
| 4/30/19 | $11,518 | $11,223 | $11,365 | $11,381 |
| 5/31/19 | $11,405 | $11,422 | $11,265 | $11,305 |
| 6/30/19 | $11,471 | $11,565 | $11,293 | $11,325 |
| 7/31/19 | $11,582 | $11,591 | $11,416 | $11,443 |
| 8/31/19 | $11,522 | $11,891 | $11,351 | $11,396 |
| 9/30/19 | $11,661 | $11,828 | $11,422 | $11,476 |
| 10/31/19 | $11,612 | $11,863 | $11,391 | $11,453 |
| 11/30/19 | $11,739 | $11,857 | $11,478 | $11,539 |
| 12/31/19 | $11,921 | $11,849 | $11,669 | $11,734 |
| 1/31/20 | $11,905 | $12,077 | $11,684 | $11,760 |
| 2/29/20 | $11,685 | $12,294 | $11,460 | $11,532 |
| 3/31/20 | $10,331 | $12,222 | $10,349 | $10,575 |
| 4/30/20 | $10,815 | $12,439 | $10,642 | $10,921 |
| 5/31/20 | $11,218 | $12,497 | $10,985 | $11,295 |
| 6/30/20 | $11,329 | $12,576 | $10,945 | $11,273 |
| 7/31/20 | $11,614 | $12,764 | $11,162 | $11,520 |
| 8/31/20 | $11,827 | $12,661 | $11,316 | $11,671 |
| 9/30/20 | $11,851 | $12,654 | $11,299 | $11,672 |
| 10/31/20 | $11,783 | $12,597 | $11,289 | $11,627 |
| 11/30/20 | $12,062 | $12,721 | $11,602 | $11,940 |
| 12/31/20 | $12,287 | $12,739 | $11,694 | $12,067 |
| 1/31/21 | $12,353 | $12,647 | $11,813 | $12,186 |
| 2/28/21 | $12,420 | $12,465 | $11,877 | $12,226 |
| 3/31/21 | $12,408 | $12,309 | $11,821 | $12,191 |
| 4/30/21 | $12,496 | $12,406 | $11,852 | $12,245 |
| 5/31/21 | $12,610 | $12,447 | $11,909 | $12,314 |
| 6/30/21 | $12,689 | $12,534 | $11,914 | $12,329 |
| 7/31/21 | $12,609 | $12,674 | $11,862 | $12,298 |
| 8/31/21 | $12,693 | $12,650 | $11,926 | $12,371 |
| 9/30/21 | $12,756 | $12,541 | $12,012 | $12,449 |
| 10/31/21 | $12,772 | $12,537 | $12,008 | $12,449 |
| 11/30/21 | $12,655 | $12,574 | $11,915 | $12,391 |
| 12/31/21 | $12,833 | $12,542 | $12,017 | $12,494 |
| 1/31/22 | $12,814 | $12,272 | $12,025 | $12,511 |
| 2/28/22 | $12,735 | $12,135 | $11,937 | $12,443 |
| 3/31/22 | $12,744 | $11,798 | $11,937 | $12,471 |
| 4/30/22 | $12,660 | $11,350 | $11,905 | $12,455 |
| 5/31/22 | $12,298 | $11,423 | $11,596 | $12,144 |
| 6/30/22 | $11,937 | $11,244 | $11,285 | $11,809 |
| 7/31/22 | $12,245 | $11,519 | $11,606 | $12,171 |
| 8/31/22 | $12,388 | $11,193 | $11,727 | $12,313 |
| 9/30/22 | $11,874 | $10,710 | $11,440 | $11,961 |
| 10/31/22 | $12,075 | $10,571 | $11,604 | $12,158 |
| 11/30/22 | $12,186 | $10,960 | $11,719 | $12,348 |
| 12/31/22 | $12,156 | $10,910 | $11,803 | $12,348 |
| 1/31/23 | $12,510 | $11,246 | $12,113 | $12,348 |
| 2/28/23 | $12,491 | $10,955 | $12,148 | $12,363 |
| 3/31/23 | $12,459 | $11,234 | $12,192 | $12,352 |
| 4/30/23 | $12,571 | $11,302 | $12,323 | $12,494 |
| 5/31/23 | $12,524 | $11,179 | $12,256 | $12,436 |
| 6/30/23 | $12,848 | $11,139 | $12,529 | $12,765 |
| 7/31/23 | $12,962 | $11,131 | $12,672 | $12,901 |
| 8/31/23 | $13,103 | $11,060 | $12,796 | $13,054 |
| 9/30/23 | $13,146 | $10,779 | $12,873 | $13,159 |
| 10/31/23 | $13,133 | $10,609 | $12,844 | $13,158 |
| 11/30/23 | $13,323 | $11,089 | $12,984 | $13,322 |
| 12/31/23 | $13,561 | $11,514 | $13,197 | $13,584 |
| 1/31/24 | $13,570 | $11,482 | $13,214 | $13,628 |
| 2/29/24 | $13,700 | $11,320 | $13,360 | $13,780 |
| 3/31/24 | $13,823 | $11,424 | $13,485 | $13,854 |
| 4/30/24 | $13,875 | $11,136 | $13,579 | $13,933 |
| 5/31/24 | $14,018 | $11,324 | $13,686 | $14,089 |
| 6/30/24 | $14,026 | $11,431 | $13,717 | $15,043 |
Average Annual Total Returns (%)
| Name | 1 Year | 5 Years | 10 Years |
|---|
| SRLN | 9.45% | 4.12% | 3.46% |
| Bloomberg U.S. Aggregate Bond Index | 2.63% | (0.23%) | 1.35% |
| Markit iBoxx USD Liquid Leveraged Loan Index | 9.45% | 3.96% | 3.21% |
| Morningstar LSTA U.S. Leveraged Loan 100 Index | 10.78% | 5.24% | 4.17% |
The Fund’s past performance is not necessarily an indication of how the Fund will perform in the future. The returns do not reflect the deduction of taxes that a shareholder would pay on Fund distributions or on the redemption or sale of Fund shares. Updated performance information is available by calling 1-866-787-2257 or visiting our website at www.ssga.com/us/en/institutional/fund-finder?tab=documents&type=etfs.
| Statistic | Value |
|---|
| Total Net Assets | $6,276,214,724 |
| # of Portfolio Holdings | 533 |
| Portfolio Turnover Rate | 176% |
| Total Advisory Fees Paid | $35,911,436 |
What did the Fund invest in?
| Industry | % Value of Total Net Assets |
| Software | 18.8% |
| Insurance | 7.8% |
| Retail | 7.0% |
| Commercial Services | 6.0% |
| Entertainment | 4.0% |
| Health Care Providers & Services | 3.8% |
| Diversified Financial Services | 3.5% |
| Health Care Equipment & Supplies | 3.1% |
| Commercial Services & Supplies | 3.1% |
| Internet & Telecom | 2.6% |
| Holdings | % Value of Total Net Assets |
| Cloud Software Group, Inc., 9.33% | 1.8% |
| McAfee LLC, 8.58%, due 03/01/29 | 1.5% |
| Sedgwick Claims Management Services, Inc., 9.09%, due 02/24/28 | 1.4% |
| AthenaHealth Group, Inc., 8.59%, due 02/15/29 | 1.4% |
| Neptune Bidco U.S., Inc., 10.41%, due 04/11/29 | 1.4% |
| Allied Universal Holdco LLC, 9.19%, due 05/12/28 | 1.4% |
| Peraton Corp., 9.19%, due 02/01/28 | 1.4% |
| Polaris Newco LLC, 9.59%, due 06/02/28 | 1.3% |
| RealPage, Inc., 8.46%, due 04/24/28 | 1.2% |
| Gainwell Acquisition Corp., 9.43%, due 10/01/27 | 1.2% |
SPDR DoubleLine Emerging Markets Fixed Income ETF
Principal Listing Exchange: Cboe BZX Exchange, Inc.
Annual Shareholder Report
June 30, 2024
This annual shareholder report contains important information about the SPDR DoubleLine Emerging Markets Fixed Income ETF (the "Fund") for the year ended June 30, 2024. You can find additional information about the Fund, including the Prospectus, Statement of Additional Information, financial statements and other information at www.ssga.com/us/en/institutional/fund-finder?tab=documents&type=etfs. You can also request this information about the Fund by contacting us at 1-866-787-2257.
What were the Fund costs for the last year?
| Fund Name | Cost of a $10,000 investment | Costs paid as a percentage of a $10,000 investment |
|---|
| SPDR DoubleLine Emerging Markets Fixed Income ETF | $68 | 0.65% |
How did the Fund perform last year and what affected its performance?
Over the reporting period, Emerging Markets sovereigns and corporates generated strong returns driven by credit spread tightening despite the continued rise in U.S. Treasury yields. The primary driver of the Fund’s relative underperformance was asset allocation. The Fund maintained an underweight to high yield credits relative to the Index which detracted from performance.
Over the 12-month period, high yield credits significantly outperformed their investment grade counterparts due to material spread compression within frontier market economies. The Fund’s allocation to sovereigns and quasi-sovereign debt also detracted from performance as their longer duration profile was keenly impacted by the rise in rates. In terms of regional allocation, the Fund lacked exposure to Europe, the best performing region within the Index, detracting from relative performance. In contrast, the Fund benefited from its underweight to the Middle East and Asia which were the weakest regions within the Index. The Fund ended the period with a slightly shorter duration than the Index and did not invest in derivatives during the reporting period.
The Fund's benchmarks are unmanaged indices used as a general measure of market performance. Calculations assume dividends and capital gains.
Comparison of Change in Value of a $10,000 Investment
(Based on Net Asset Value)
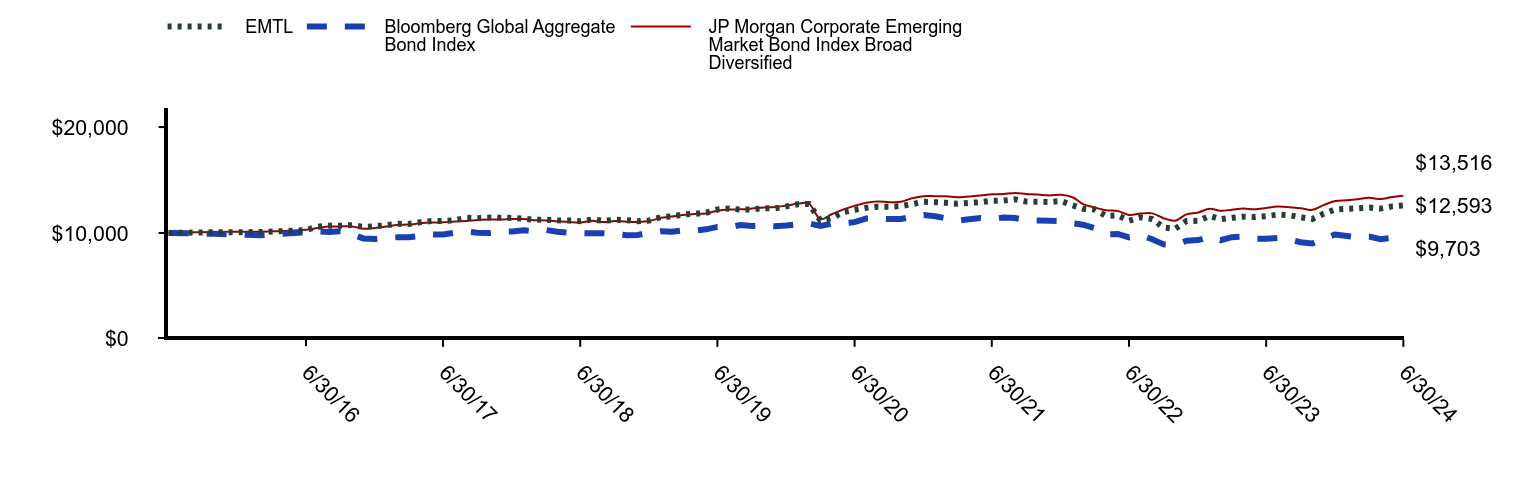
| EMTL | Bloomberg Global Aggregate Bond Index | JP Morgan Corporate Emerging Market Bond Index Broad Diversified |
|---|
| 3/31/16 | $10,000 | $10,000 | $10,000 |
| 4/30/16 | $10,064 | $9,921 | $10,097 |
| 5/31/16 | $10,082 | $9,788 | $10,118 |
| 6/30/16 | $10,267 | $10,074 | $10,299 |
| 7/31/16 | $10,586 | $10,150 | $10,462 |
| 8/31/16 | $10,681 | $10,100 | $10,600 |
| 9/30/16 | $10,691 | $10,156 | $10,616 |
| 10/31/16 | $10,739 | $9,874 | $10,615 |
| 11/30/16 | $10,575 | $9,482 | $10,395 |
| 12/31/16 | $10,631 | $9,438 | $10,476 |
| 1/31/17 | $10,742 | $9,545 | $10,606 |
| 2/28/17 | $10,864 | $9,590 | $10,754 |
| 3/31/17 | $10,845 | $9,604 | $10,788 |
| 4/30/17 | $11,005 | $9,713 | $10,909 |
| 5/31/17 | $11,132 | $9,863 | $10,979 |
| 6/30/17 | $11,131 | $9,854 | $11,001 |
| 7/31/17 | $11,204 | $10,020 | $11,088 |
| 8/31/17 | $11,429 | $10,119 | $11,126 |
| 9/30/17 | $11,400 | $10,028 | $11,233 |
| 10/31/17 | $11,452 | $9,990 | $11,271 |
| 11/30/17 | $11,425 | $10,101 | $11,275 |
| 12/31/17 | $11,423 | $10,136 | $11,311 |
| 1/31/18 | $11,361 | $10,257 | $11,319 |
| 2/28/18 | $11,238 | $10,166 | $11,204 |
| 3/31/18 | $11,259 | $10,274 | $11,183 |
| 4/30/18 | $11,191 | $10,110 | $11,109 |
| 5/31/18 | $11,167 | $10,033 | $11,032 |
| 6/30/18 | $11,108 | $9,988 | $10,985 |
| 7/31/18 | $11,268 | $9,972 | $11,144 |
| 8/31/18 | $11,143 | $9,982 | $11,024 |
| 9/30/18 | $11,242 | $9,896 | $11,129 |
| 10/31/18 | $11,209 | $9,786 | $11,062 |
| 11/30/18 | $11,104 | $9,816 | $11,045 |
| 12/31/18 | $11,175 | $10,015 | $11,124 |
| 1/31/19 | $11,493 | $10,167 | $11,426 |
| 2/28/19 | $11,557 | $10,109 | $11,549 |
| 3/31/19 | $11,741 | $10,235 | $11,697 |
| 4/30/19 | $11,804 | $10,205 | $11,788 |
| 5/31/19 | $11,908 | $10,343 | $11,846 |
| 6/30/19 | $12,212 | $10,572 | $12,106 |
| 7/31/19 | $12,311 | $10,543 | $12,215 |
| 8/31/19 | $12,202 | $10,757 | $12,230 |
| 9/30/19 | $12,225 | $10,648 | $12,307 |
| 10/31/19 | $12,337 | $10,719 | $12,412 |
| 11/30/19 | $12,312 | $10,637 | $12,459 |
| 12/31/19 | $12,508 | $10,700 | $12,580 |
| 1/31/20 | $12,717 | $10,836 | $12,773 |
| 2/29/20 | $12,726 | $10,909 | $12,772 |
| 3/31/20 | $11,174 | $10,665 | $11,300 |
| 4/30/20 | $11,408 | $10,874 | $11,763 |
| 5/31/20 | $11,964 | $10,922 | $12,223 |
| 6/30/20 | $12,186 | $11,019 | $12,560 |
| 7/31/20 | $12,372 | $11,370 | $12,851 |
| 8/31/20 | $12,484 | $11,353 | $12,967 |
| 9/30/20 | $12,479 | $11,312 | $12,905 |
| 10/31/20 | $12,530 | $11,323 | $12,938 |
| 11/30/20 | $12,725 | $11,529 | $13,282 |
| 12/31/20 | $12,944 | $11,683 | $13,477 |
| 1/31/21 | $12,909 | $11,581 | $13,468 |
| 2/28/21 | $12,843 | $11,381 | $13,455 |
| 3/31/21 | $12,762 | $11,162 | $13,369 |
| 4/30/21 | $12,839 | $11,303 | $13,449 |
| 5/31/21 | $12,898 | $11,409 | $13,536 |
| 6/30/21 | $13,046 | $11,309 | $13,649 |
| 7/31/21 | $13,057 | $11,459 | $13,679 |
| 8/31/21 | $13,170 | $11,412 | $13,775 |
| 9/30/21 | $12,960 | $11,209 | $13,683 |
| 10/31/21 | $12,950 | $11,182 | $13,620 |
| 11/30/21 | $12,919 | $11,149 | $13,545 |
| 12/31/21 | $13,013 | $11,134 | $13,600 |
| 1/31/22 | $12,612 | $10,905 | $13,372 |
| 2/28/22 | $12,282 | $10,776 | $12,725 |
| 3/31/22 | $12,220 | $10,448 | $12,400 |
| 4/30/22 | $11,617 | $9,875 | $12,145 |
| 5/31/22 | $11,657 | $9,902 | $12,073 |
| 6/30/22 | $11,154 | $9,584 | $11,704 |
| 7/31/22 | $11,470 | $9,788 | $11,827 |
| 8/31/22 | $11,311 | $9,402 | $11,848 |
| 9/30/22 | $10,514 | $8,919 | $11,395 |
| 10/31/22 | $10,398 | $8,858 | $11,161 |
| 11/30/22 | $11,123 | $9,274 | $11,751 |
| 12/31/22 | $11,151 | $9,325 | $11,932 |
| 1/31/23 | $11,620 | $9,631 | $12,295 |
| 2/28/23 | $11,296 | $9,310 | $12,098 |
| 3/31/23 | $11,433 | $9,605 | $12,199 |
| 4/30/23 | $11,538 | $9,647 | $12,306 |
| 5/31/23 | $11,502 | $9,459 | $12,235 |
| 6/30/23 | $11,587 | $9,458 | $12,367 |
| 7/31/23 | $11,739 | $9,523 | $12,488 |
| 8/31/23 | $11,668 | $9,393 | $12,432 |
| 9/30/23 | $11,489 | $9,119 | $12,335 |
| 10/31/23 | $11,312 | $9,010 | $12,185 |
| 11/30/23 | $11,810 | $9,464 | $12,628 |
| 12/31/23 | $12,221 | $9,857 | $13,016 |
| 1/31/24 | $12,287 | $9,721 | $13,092 |
| 2/29/24 | $12,322 | $9,599 | $13,186 |
| 3/31/24 | $12,401 | $9,652 | $13,318 |
| 4/30/24 | $12,302 | $9,408 | $13,200 |
| 5/31/24 | $12,511 | $9,532 | $13,392 |
| 6/30/24 | $12,593 | $9,703 | $13,516 |
Average Annual Total Returns (%)
| Name | 1 Year | 5 Years | Since Inception 4/13/16 |
|---|
| EMTL | 8.87% | 0.63% | 2.82% |
| Bloomberg Global Aggregate Bond Index | 0.93% | (2.02%) | (0.37%) |
| JP Morgan Corporate Emerging Market Bond Index Broad Diversified | 9.30% | 2.23% | 3.74% |
The Fund’s past performance is not necessarily an indication of how the Fund will perform in the future. The returns do not reflect the deduction of taxes that a shareholder would pay on Fund distributions or on the redemption or sale of Fund shares. Updated performance information is available by calling 1-866-787-2257 or visiting our website at www.ssga.com/us/en/institutional/fund-finder?tab=documents&type=etfs.
| Statistic | Value |
|---|
| Total Net Assets | $87,506,798 |
| # of Portfolio Holdings | 125 |
| Portfolio Turnover Rate | 56% |
| Total Advisory Fees Paid | $526,833 |
What did the Fund invest in?
| Maturity Duration | % Value of Total Net Assets |
| 0 to 1 Year | 12.0% |
| 1 to 2 Years | 2.1% |
| 2 to 3 Years | 7.0% |
| 3 to 5 Years | 15.9% |
| 5 to 10 Years | 41.5% |
| 10 to 20 Years | 15.2% |
| 20 to 30 Years | 4.2% |
| Greater than 30 Years | 1.2% |
| Holdings | % Value of Total Net Assets |
| Guara Norte SARL, 5.20%, due 06/15/34 | 2.4% |
| Oversea-Chinese Banking Corp. Ltd., 1.83%, due 09/10/30 | 2.3% |
| Minejesa Capital BV, 5.63%, due 08/10/37 | 2.3% |
| Bharti Airtel Ltd., 4.38%, due 06/10/25 | 2.3% |
| JBS USA Holding Lux SARL/ JBS USA Food Co./ JBS Lux Co. SARL, 5.13%, due 02/01/28 | 2.3% |
| DBS Group Holdings Ltd., 1.82%, due 03/10/31 | 2.2% |
| Pertamina Persero PT, 1.40%, due 02/09/26 | 2.1% |
| Banco Internacional del Peru SAA Interbank, 4.00%, due 07/08/30 | 2.1% |
| Cometa Energia SA de CV, 6.38%, due 04/24/35 | 2.0% |
| BBVA Bancomer SA, 5.88%, due 09/13/34 | 2.0% |
SPDR DoubleLine Short Duration Total Return Tactical ETF
Principal Listing Exchange: Cboe BZX Exchange, Inc.
Annual Shareholder Report
June 30, 2024
This annual shareholder report contains important information about the SPDR DoubleLine Short Duration Total Return Tactical ETF (the "Fund") for the year ended June 30, 2024. You can find additional information about the Fund, including the Prospectus, Statement of Additional Information, financial statements and other information at www.ssga.com/us/en/institutional/fund-finder?tab=documents&type=etfs. You can also request this information about the Fund by contacting us at 1-866-787-2257.
What were the Fund costs for the last year?
| Fund Name | Cost of a $10,000 investment | Costs paid as a percentage of a $10,000 investment |
|---|
| SPDR DoubleLine Short Duration Total Return Tactical ETF | $46 | 0.45% |
How did the Fund perform last year and what affected its performance?
The primary driver of outperformance was asset allocation as the portfolio maintained a higher credit allocation than the Index, with roughly sixty-six percent weighting to credit risk sectors compared to approximately thirty percent in the Index. This contributed positively to performance as credit spreads tightened materially during the period. The Fund maintained a slightly shorter duration position than the Index.
The Fund’s best performing sector was emerging market bonds as these credits significantly outperformed their investment grade counterparts because of material credit spread tightening within frontier market economies. Shorter-duration structured credit sectors such as collateralized loan obligations (CLOs), commercial MBS, and asset backed securities also delivered strong performance as these assets are less rate sensitive but still provide high levels of monthly income.
Every sector within the portfolio generated a positive return. The top positive contributor to the Fund’s performance during the period was U.S. Treasurys. Agency MBS contributed the least to performance during the period, though the sector still generated a positive return.
The Fund's benchmarks are unmanaged indices used as a general measure of market performance. Calculations assume dividends and capital gains.
Comparison of Change in Value of a $10,000 Investment
(Based on Net Asset Value)
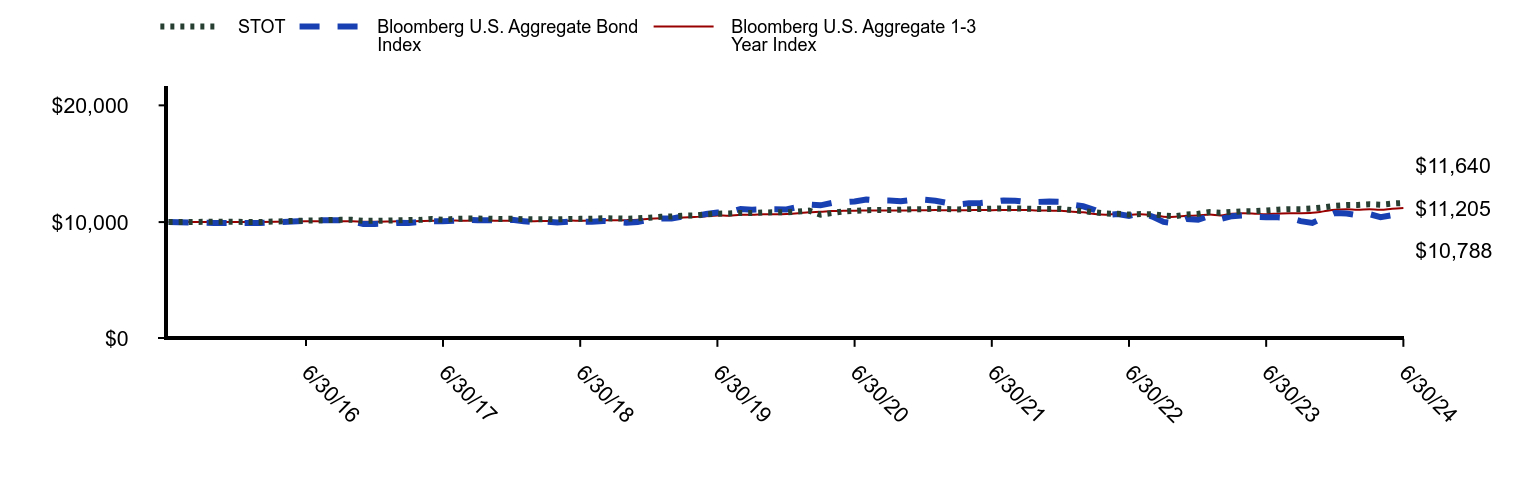
| STOT | Bloomberg U.S. Aggregate Bond Index | Bloomberg U.S. Aggregate 1-3 Year Index |
|---|
| 3/31/16 | $10,000 | $10,000 | $10,000 |
| 4/30/16 | $10,026 | $9,921 | $10,010 |
| 5/31/16 | $10,012 | $9,924 | $10,004 |
| 6/30/16 | $10,131 | $10,103 | $10,064 |
| 7/31/16 | $10,140 | $10,166 | $10,066 |
| 8/31/16 | $10,173 | $10,155 | $10,056 |
| 9/30/16 | $10,190 | $10,149 | $10,068 |
| 10/31/16 | $10,194 | $10,072 | $10,065 |
| 11/30/16 | $10,101 | $9,833 | $10,025 |
| 12/31/16 | $10,110 | $9,847 | $10,031 |
| 1/31/17 | $10,126 | $9,867 | $10,050 |
| 2/28/17 | $10,158 | $9,933 | $10,066 |
| 3/31/17 | $10,176 | $9,928 | $10,072 |
| 4/30/17 | $10,190 | $10,004 | $10,090 |
| 5/31/17 | $10,273 | $10,081 | $10,107 |
| 6/30/17 | $10,191 | $10,071 | $10,103 |
| 7/31/17 | $10,272 | $10,114 | $10,129 |
| 8/31/17 | $10,307 | $10,205 | $10,117 |
| 9/30/17 | $10,304 | $10,156 | $10,138 |
| 10/31/17 | $10,283 | $10,163 | $10,136 |
| 11/30/17 | $10,271 | $10,149 | $10,114 |
| 12/31/17 | $10,283 | $10,196 | $10,117 |
| 1/31/18 | $10,236 | $10,079 | $10,090 |
| 2/28/18 | $10,234 | $9,983 | $10,081 |
| 3/31/18 | $10,247 | $10,047 | $10,097 |
| 4/30/18 | $10,230 | $9,973 | $10,087 |
| 5/31/18 | $10,273 | $10,043 | $10,125 |
| 6/30/18 | $10,276 | $10,031 | $10,123 |
| 7/31/18 | $10,290 | $10,034 | $10,129 |
| 8/31/18 | $10,327 | $10,098 | $10,165 |
| 9/30/18 | $10,311 | $10,033 | $10,158 |
| 10/31/18 | $10,290 | $9,954 | $10,168 |
| 11/30/18 | $10,319 | $10,013 | $10,198 |
| 12/31/18 | $10,380 | $10,197 | $10,277 |
| 1/31/19 | $10,449 | $10,306 | $10,319 |
| 2/28/19 | $10,482 | $10,300 | $10,335 |
| 3/31/19 | $10,554 | $10,497 | $10,403 |
| 4/30/19 | $10,567 | $10,500 | $10,426 |
| 5/31/19 | $10,658 | $10,687 | $10,499 |
| 6/30/19 | $10,718 | $10,821 | $10,557 |
| 7/31/19 | $10,737 | $10,845 | $10,553 |
| 8/31/19 | $10,781 | $11,126 | $10,636 |
| 9/30/19 | $10,788 | $11,066 | $10,631 |
| 10/31/19 | $10,824 | $11,100 | $10,667 |
| 11/30/19 | $10,838 | $11,094 | $10,668 |
| 12/31/19 | $10,832 | $11,086 | $10,692 |
| 1/31/20 | $10,903 | $11,300 | $10,752 |
| 2/29/20 | $10,983 | $11,503 | $10,840 |
| 3/31/20 | $10,644 | $11,435 | $10,884 |
| 4/30/20 | $10,771 | $11,639 | $10,943 |
| 5/31/20 | $10,905 | $11,693 | $10,964 |
| 6/30/20 | $10,956 | $11,766 | $10,979 |
| 7/31/20 | $11,020 | $11,942 | $10,996 |
| 8/31/20 | $11,041 | $11,846 | $10,997 |
| 9/30/20 | $11,038 | $11,839 | $10,997 |
| 10/31/20 | $11,060 | $11,786 | $10,996 |
| 11/30/20 | $11,099 | $11,902 | $11,007 |
| 12/31/20 | $11,113 | $11,918 | $11,021 |
| 1/31/21 | $11,155 | $11,833 | $11,026 |
| 2/28/21 | $11,115 | $11,662 | $11,019 |
| 3/31/21 | $11,089 | $11,516 | $11,013 |
| 4/30/21 | $11,116 | $11,607 | $11,022 |
| 5/31/21 | $11,129 | $11,645 | $11,035 |
| 6/30/21 | $11,152 | $11,727 | $11,019 |
| 7/31/21 | $11,178 | $11,858 | $11,038 |
| 8/31/21 | $11,168 | $11,836 | $11,038 |
| 9/30/21 | $11,146 | $11,733 | $11,029 |
| 10/31/21 | $11,114 | $11,730 | $10,993 |
| 11/30/21 | $11,115 | $11,765 | $10,984 |
| 12/31/21 | $11,132 | $11,735 | $10,967 |
| 1/31/22 | $11,014 | $11,482 | $10,889 |
| 2/28/22 | $10,939 | $11,354 | $10,840 |
| 3/31/22 | $10,835 | $11,038 | $10,692 |
| 4/30/22 | $10,737 | $10,619 | $10,633 |
| 5/31/22 | $10,706 | $10,688 | $10,698 |
| 6/30/22 | $10,644 | $10,520 | $10,624 |
| 7/31/22 | $10,687 | $10,777 | $10,681 |
| 8/31/22 | $10,674 | $10,473 | $10,595 |
| 9/30/22 | $10,565 | $10,020 | $10,465 |
| 10/31/22 | $10,511 | $9,890 | $10,451 |
| 11/30/22 | $10,646 | $10,254 | $10,538 |
| 12/31/22 | $10,711 | $10,208 | $10,559 |
| 1/31/23 | $10,857 | $10,522 | $10,645 |
| 2/28/23 | $10,799 | $10,250 | $10,565 |
| 3/31/23 | $10,870 | $10,510 | $10,718 |
| 4/30/23 | $10,927 | $10,574 | $10,755 |
| 5/31/23 | $10,937 | $10,459 | $10,723 |
| 6/30/23 | $10,988 | $10,422 | $10,680 |
| 7/31/23 | $11,058 | $10,414 | $10,725 |
| 8/31/23 | $11,106 | $10,348 | $10,765 |
| 9/30/23 | $11,106 | $10,085 | $10,758 |
| 10/31/23 | $11,167 | $9,926 | $10,793 |
| 11/30/23 | $11,259 | $10,375 | $10,918 |
| 12/31/23 | $11,395 | $10,772 | $11,050 |
| 1/31/24 | $11,454 | $10,743 | $11,093 |
| 2/29/24 | $11,466 | $10,591 | $11,055 |
| 3/31/24 | $11,525 | $10,689 | $11,100 |
| 4/30/24 | $11,494 | $10,419 | $11,062 |
| 5/31/24 | $11,584 | $10,595 | $11,143 |
| 6/30/24 | $11,640 | $10,788 | $11,205 |
Average Annual Total Returns (%)
| Name | 1 Year | 5 Years | Since Inception 4/13/16 |
|---|
| STOT | 6.14% | 1.74% | 1.88% |
| Bloomberg U.S. Aggregate Bond Index | 2.63% | (0.23%) | 0.93% |
| Bloomberg U.S. Aggregate 1-3 Year Index | 4.92% | 1.20% | 1.40% |
The Fund’s past performance is not necessarily an indication of how the Fund will perform in the future. The returns do not reflect the deduction of taxes that a shareholder would pay on Fund distributions or on the redemption or sale of Fund shares. Updated performance information is available by calling 1-866-787-2257 or visiting our website at www.ssga.com/us/en/institutional/fund-finder?tab=documents&type=etfs.
| Statistic | Value |
|---|
| Total Net Assets | $147,821,835 |
| # of Portfolio Holdings | 334 |
| Portfolio Turnover Rate | 117% |
| Total Advisory Fees Paid | $669,708 |
What did the Fund invest in?
| Maturity Duration | % Value of Total Net Assets |
| 0 to 1 Year | 4.2% |
| 1 to 2 Years | 12.2% |
| 2 to 3 Years | 22.3% |
| 3 to 5 Years | 5.6% |
| 5 to 10 Years | 16.0% |
| 10 to 20 Years | 26.9% |
| 20 to 30 Years | 6.8% |
| Greater than 30 Years | 5.3% |
| Holdings | % Value of Total Net Assets |
| U.S. Treasury Notes, 0.63%, due 07/31/26 | 11.8% |
| U.S. Treasury Notes, 0.38%, due 01/31/26 | 7.5% |
| U.S. Treasury Notes, 0.63%, due 03/31/27 | 4.1% |
| Citigroup Mortgage Loan Trust, Inc., 2A1A, 5.15%, due 07/25/37 | 1.6% |
| Regatta XXIII Funding Ltd., A1, 6.74%, due 01/20/35 | 1.5% |
| Luminent Mortgage Trust, 1A1, 5.78%, due 11/25/36 | 1.5% |
| Marble Point CLO XXI Ltd., A1, 6.82%, due 10/17/34 | 1.4% |
| Federal Home Loan Mortgage Corp. STACR REMICS Trust, M1, 6.59%, due 03/25/44 | 1.1% |
| Anchorage Capital CLO 19 Ltd., A, 6.80%, due 10/15/34 | 1.0% |
| CQS U.S. CLO Ltd., A, 6.81%, due 01/20/35 | 1.0% |
SPDR DoubleLine Total Return Tactical ETF
Principal Listing Exchange: NYSEArca
Annual Shareholder Report
June 30, 2024
This annual shareholder report contains important information about the SPDR DoubleLine Total Return Tactical ETF (the "Fund") for the year ended June 30, 2024. You can find additional information about the Fund, including the Prospectus, Statement of Additional Information, financial statements and other information at www.ssga.com/us/en/institutional/fund-finder?tab=documents&type=etfs. You can also request this information about the Fund by contacting us at 1-866-787-2257. This report describes changes to the Fund that occurred during the reporting period.
What were the Fund costs for the last year?
| Fund Name | Cost of a $10,000 investment | Costs paid as a percentage of a $10,000 investment |
|---|
| SPDR DoubleLine Total Return Tactical ETF | $56 | 0.55% |
How did the Fund perform last year and what affected its performance?
The primary drivers of Fund performance were asset allocation and duration positioning. The Fund maintained a roughly forty-five percent weighting to credit risk sectors compared to approximately thirty percent in the Index, which contributed positively to outperformance as credit spreads tightened materially over the period. In terms of duration positioning, the Fund maintained a slightly shorter duration than the Index, which bolstered relative performance as U.S. Treasury yields rose significantly during the period.
The best performance generally came from the shorter duration credit sectors. The top performing sector was collateralized loan obligations (CLOs) as these assets benefit from considerable monthly income and credit spread tightening. U.S. Treasurys were the lowest performing sector as rates rose across the curve during the period.
Every credit sector in the portfolio generated a positive return. The greatest contribution to the Fund’s performance during the period was Agency MBS U.S. Treasury's was the only sector to detract from performance during the period.
The Fund's benchmarks are unmanaged indices used as a general measure of market performance. Calculations assume dividends and capital gains.
Comparison of Change in Value of a $10,000 Investment
(Based on Net Asset Value)
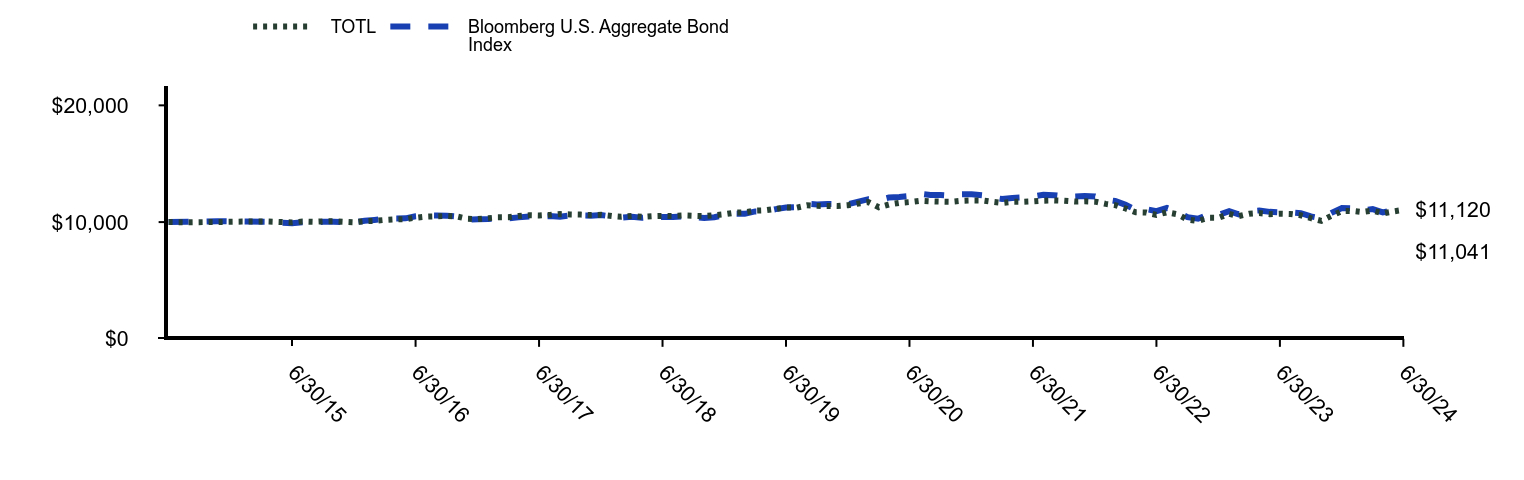
| TOTL | Bloomberg U.S. Aggregate Bond Index |
|---|
| 1/31/15 | $10,000 | $10,000 |
| 2/28/15 | $9,986 | $10,033 |
| 3/31/15 | $10,012 | $10,080 |
| 4/30/15 | $10,041 | $10,043 |
| 5/31/15 | $10,048 | $10,019 |
| 6/30/15 | $9,974 | $9,910 |
| 7/31/15 | $10,047 | $9,979 |
| 8/31/15 | $10,019 | $9,965 |
| 9/30/15 | $10,062 | $10,032 |
| 10/31/15 | $10,071 | $10,034 |
| 11/30/15 | $10,027 | $10,007 |
| 12/31/15 | $9,987 | $9,975 |
| 1/31/16 | $10,078 | $10,112 |
| 2/29/16 | $10,108 | $10,184 |
| 3/31/16 | $10,187 | $10,277 |
| 4/30/16 | $10,230 | $10,316 |
| 5/31/16 | $10,254 | $10,319 |
| 6/30/16 | $10,379 | $10,505 |
| 7/31/16 | $10,465 | $10,571 |
| 8/31/16 | $10,496 | $10,560 |
| 9/30/16 | $10,523 | $10,553 |
| 10/31/16 | $10,479 | $10,473 |
| 11/30/16 | $10,285 | $10,225 |
| 12/31/16 | $10,255 | $10,239 |
| 1/31/17 | $10,334 | $10,260 |
| 2/28/17 | $10,407 | $10,328 |
| 3/31/17 | $10,413 | $10,323 |
| 4/30/17 | $10,522 | $10,403 |
| 5/31/17 | $10,581 | $10,483 |
| 6/30/17 | $10,566 | $10,472 |
| 7/31/17 | $10,618 | $10,517 |
| 8/31/17 | $10,687 | $10,467 |
| 9/30/17 | $10,657 | $10,561 |
| 10/31/17 | $10,641 | $10,567 |
| 11/30/17 | $10,602 | $10,554 |
| 12/31/17 | $10,621 | $10,602 |
| 1/31/18 | $10,518 | $10,480 |
| 2/28/18 | $10,460 | $10,381 |
| 3/31/18 | $10,532 | $10,447 |
| 4/30/18 | $10,456 | $10,370 |
| 5/31/18 | $10,512 | $10,444 |
| 6/30/18 | $10,532 | $10,431 |
| 7/31/18 | $10,524 | $10,433 |
| 8/31/18 | $10,570 | $10,501 |
| 9/30/18 | $10,539 | $10,433 |
| 10/31/18 | $10,511 | $10,351 |
| 11/30/18 | $10,583 | $10,412 |
| 12/31/18 | $10,674 | $10,604 |
| 1/31/19 | $10,812 | $10,716 |
| 2/28/19 | $10,835 | $10,710 |
| 3/31/19 | $10,979 | $10,916 |
| 4/30/19 | $11,008 | $10,918 |
| 5/31/19 | $11,132 | $11,112 |
| 6/30/19 | $11,261 | $11,252 |
| 7/31/19 | $11,235 | $11,277 |
| 8/31/19 | $11,433 | $11,569 |
| 9/30/19 | $11,390 | $11,507 |
| 10/31/19 | $11,387 | $11,542 |
| 11/30/19 | $11,374 | $11,536 |
| 12/31/19 | $11,444 | $11,528 |
| 1/31/20 | $11,597 | $11,750 |
| 2/29/20 | $11,715 | $11,961 |
| 3/31/20 | $11,274 | $11,891 |
| 4/30/20 | $11,508 | $12,102 |
| 5/31/20 | $11,648 | $12,159 |
| 6/30/20 | $11,715 | $12,235 |
| 7/31/20 | $11,824 | $12,418 |
| 8/31/20 | $11,776 | $12,318 |
| 9/30/20 | $11,753 | $12,311 |
| 10/31/20 | $11,742 | $12,256 |
| 11/30/20 | $11,828 | $12,376 |
| 12/31/20 | $11,855 | $12,393 |
| 1/31/21 | $11,852 | $12,304 |
| 2/28/21 | $11,743 | $12,127 |
| 3/31/21 | $11,645 | $11,975 |
| 4/30/21 | $11,734 | $12,070 |
| 5/31/21 | $11,734 | $12,109 |
| 6/30/21 | $11,772 | $12,194 |
| 7/31/21 | $11,836 | $12,331 |
| 8/31/21 | $11,856 | $12,307 |
| 9/30/21 | $11,823 | $12,201 |
| 10/31/21 | $11,759 | $12,197 |
| 11/30/21 | $11,783 | $12,233 |
| 12/31/21 | $11,750 | $12,202 |
| 1/31/22 | $11,559 | $11,939 |
| 2/28/22 | $11,453 | $11,806 |
| 3/31/22 | $11,167 | $11,478 |
| 4/30/22 | $10,835 | $11,043 |
| 5/31/22 | $10,818 | $11,114 |
| 6/30/22 | $10,618 | $10,939 |
| 7/31/22 | $10,837 | $11,207 |
| 8/31/22 | $10,665 | $10,890 |
| 9/30/22 | $10,223 | $10,419 |
| 10/31/22 | $10,091 | $10,285 |
| 11/30/22 | $10,372 | $10,663 |
| 12/31/22 | $10,372 | $10,615 |
| 1/31/23 | $10,710 | $10,941 |
| 2/28/23 | $10,513 | $10,658 |
| 3/31/23 | $10,714 | $10,929 |
| 4/30/23 | $10,772 | $10,995 |
| 5/31/23 | $10,681 | $10,876 |
| 6/30/23 | $10,712 | $10,837 |
| 7/31/23 | $10,689 | $10,829 |
| 8/31/23 | $10,584 | $10,760 |
| 9/30/23 | $10,332 | $10,487 |
| 10/31/23 | $10,110 | $10,321 |
| 11/30/23 | $10,538 | $10,789 |
| 12/31/23 | $10,954 | $11,202 |
| 1/31/24 | $10,961 | $11,171 |
| 2/29/24 | $10,866 | $11,013 |
| 3/31/24 | $10,987 | $11,115 |
| 4/30/24 | $10,743 | $10,834 |
| 5/31/24 | $10,915 | $11,017 |
| 6/30/24 | $11,041 | $11,120 |
Average Annual Total Returns (%)
| Name | 1 Year | 5 Years | Since Inception 2/23/15 |
|---|
| TOTL | 3.27% | (0.34%) | 1.06% |
| Bloomberg U.S. Aggregate Bond Index | 2.63% | (0.23%) | 1.14% |
The Fund’s past performance is not necessarily an indication of how the Fund will perform in the future. The returns do not reflect the deduction of taxes that a shareholder would pay on Fund distributions or on the redemption or sale of Fund shares. Updated performance information is available by calling 1-866-787-2257 or visiting our website at www.ssga.com/us/en/institutional/fund-finder?tab=documents&type=etfs.
| Statistic | Value |
|---|
| Total Net Assets | $2,918,069,885 |
| # of Portfolio Holdings | 1,370 |
| Portfolio Turnover Rate | 120% |
| Total Advisory Fees Paid | $16,685,752 |
What did the Fund invest in?
| Maturity Duration | % Value of Total Net Assets |
| 0 to 1 Year | 2.4% |
| 1 to 2 Years | 5.1% |
| 2 to 3 Years | 4.5% |
| 3 to 5 Years | 10.5% |
| 5 to 10 Years | 21.2% |
| 10 to 20 Years | 20.3% |
| 20 to 30 Years | 27.7% |
| Greater than 30 Years | 7.4% |
| Holdings | % Value of Total Net Assets |
| U.S. Treasury Notes, 0.75%, due 01/31/28 | 6.1% |
| U.S. Treasury Notes, 0.88%, due 09/30/26 | 3.0% |
| U.S. Treasury Notes, 0.63%, due 08/15/30 | 3.0% |
| U.S. Treasury Notes, 0.75%, due 05/31/26 | 2.1% |
| U.S. Treasury Notes, 0.88%, due 11/15/30 | 2.0% |
| U.S. Treasury Notes, 0.38%, due 11/30/25 | 1.9% |
| U.S. Treasury Notes, 0.38%, due 04/30/25 | 1.7% |
| Federal National Mortgage Association REMICS, VZ, 3.00%, due 01/25/43 | 1.0% |
| Federal Home Loan Mortgage Corp. REMICS, ZX, 4.00%, due 07/15/44 | 0.8% |
| Progress Residential Trust, B, 3.50%, due 06/17/41 | 0.8% |
Effective on April 1, 2024, changes were made to the Fund’s principal investment strategy to reflect the Fund’s ability to invest in futures contracts and to clarify the types of TBA Transactions the Fund engages in.
SPDR Loomis Sayles Opportunistic Bond ETF
Principal Listing Exchange: Cboe BZX Exchange, Inc.
Annual Shareholder Report
June 30, 2024
This annual shareholder report contains important information about the SPDR Loomis Sayles Opportunistic Bond ETF (the "Fund") for the year ended June 30, 2024. You can find additional information about the Fund, including the Prospectus, Statement of Additional Information, financial statements and other information at www.ssga.com/us/en/institutional/fund-finder?tab=documents&type=etfs. You can also request this information about the Fund by contacting us at 1-866-787-2257.
What were the Fund costs for the last year?
| Fund Name | Cost of a $10,000 investment | Costs paid as a percentage of a $10,000 investment |
|---|
| SPDR Loomis Sayles Opportunistic Bond ETF | $54 | 0.52% |
How did the Fund perform last year and what affected its performance?
U.S. investment grade bond spreads tightened over the period. The sector was broadly aided by conservative issuer financial policies, solid appetite for risk, and an overall strong consumer. Within the portfolio, investment grade corporates contributed to absolute performance with financial, particularly banking, names being mostly responsible.
U.S. high yield corporate bond spreads tightened over the period, largely remaining range-bound as of late. Within the portfolio, our allocation to the sector positively contributed to absolute performance. Consumer cyclical, energy, and technology names were mostly responsible for the positive impact.
For the bank loan market, continued appetite for risk was supportive and the sector showed strong overall performance. The sector also benefitted as stubborn inflation caused policy rates to remain higher for longer than the market initially expected. For the portfolio, our allocation to bank loans aided absolute performance, with individual technology, consumer, and financial issues adding in particular.
The use of derivatives instruments within the fund had a modest negative impact over the period. The majority of this effect is attributed to long exposure in interest rate futures.
The Fund's benchmarks are unmanaged indices used as a general measure of market performance. Calculations assume dividends and capital gains.
Comparison of Change in Value of a $10,000 Investment
(Based on Net Asset Value)
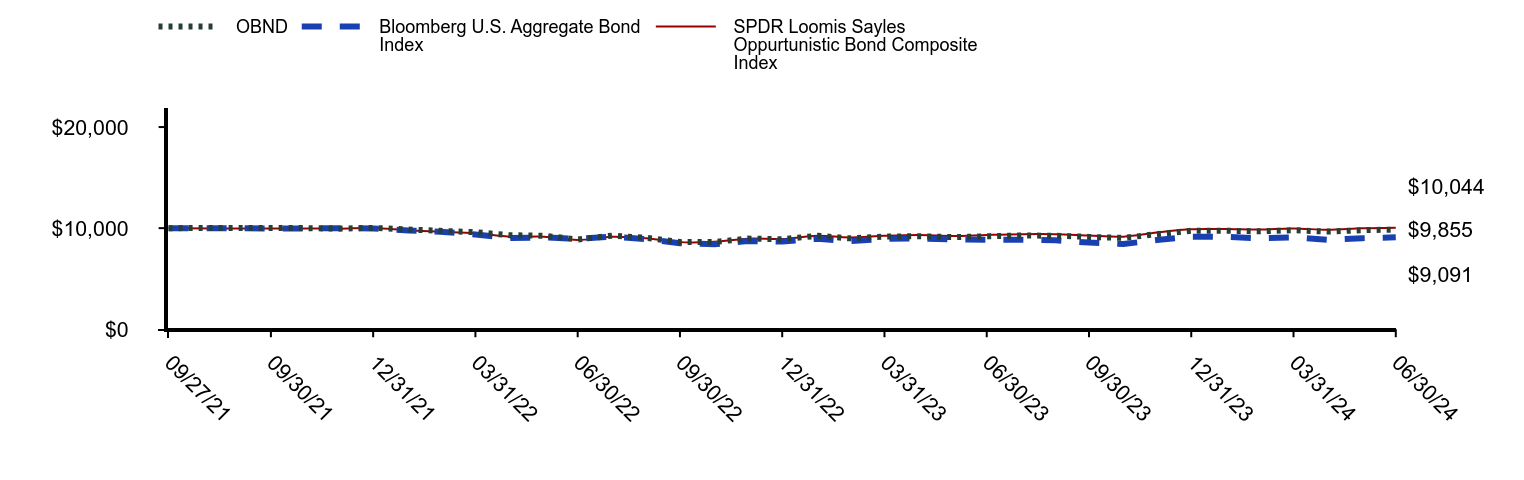
| OBND | Bloomberg U.S. Aggregate Bond Index | SPDR Loomis Sayles Oppurtunistic Bond Composite Index |
|---|
| 09/27/21 | $10,000 | $10,000 | $10,000 |
| 09/30/21 | $10,018 | $9,973 | $9,961 |
| 10/31/21 | $10,005 | $9,970 | $9,976 |
| 11/30/21 | $9,948 | $10,000 | $9,952 |
| 12/31/21 | $10,027 | $9,974 | $10,011 |
| 01/31/22 | $9,864 | $9,759 | $9,781 |
| 02/28/22 | $9,735 | $9,650 | $9,645 |
| 03/31/22 | $9,601 | $9,382 | $9,497 |
| 04/30/22 | $9,308 | $9,026 | $9,159 |
| 05/31/22 | $9,247 | $9,084 | $9,157 |
| 06/30/22 | $8,881 | $8,942 | $8,826 |
| 07/31/22 | $9,258 | $9,160 | $9,149 |
| 08/31/22 | $9,034 | $8,902 | $8,989 |
| 09/30/22 | $8,631 | $8,517 | $8,617 |
| 10/31/22 | $8,634 | $8,407 | $8,652 |
| 11/30/22 | $8,967 | $8,716 | $8,954 |
| 12/31/22 | $8,903 | $8,677 | $8,930 |
| 01/31/23 | $9,243 | $8,943 | $9,247 |
| 02/28/23 | $8,994 | $8,712 | $9,079 |
| 03/31/23 | $9,165 | $8,934 | $9,237 |
| 04/30/23 | $9,203 | $8,988 | $9,315 |
| 05/31/23 | $9,117 | $8,890 | $9,223 |
| 06/30/23 | $9,195 | $8,858 | $9,327 |
| 07/31/23 | $9,272 | $8,852 | $9,403 |
| 08/31/23 | $9,251 | $8,795 | $9,398 |
| 09/30/23 | $9,134 | $8,572 | $9,266 |
| 10/31/23 | $9,036 | $8,437 | $9,159 |
| 11/30/23 | $9,405 | $8,819 | $9,566 |
| 12/31/23 | $9,746 | $9,156 | $9,895 |
| 01/31/24 | $9,748 | $9,131 | $9,906 |
| 02/29/24 | $9,687 | $9,002 | $9,855 |
| 03/31/24 | $9,794 | $9,085 | $9,970 |
| 04/30/24 | $9,661 | $8,856 | $9,836 |
| 05/31/24 | $9,797 | $9,006 | $9,979 |
| 06/30/24 | $9,855 | $9,091 | $10,044 |
Average Annual Total Returns (%)
| Name | 1 Year | Since Inception 9/27/21 |
|---|
| OBND | 7.06% | (0.58%) |
| Bloomberg U.S. Aggregate Bond Index | 2.63% | (3.40%) |
| SPDR Loomis Sayles Oppurtunistic Bond Composite Index | 7.72% | 0.16% |
The Fund’s past performance is not necessarily an indication of how the Fund will perform in the future. The returns do not reflect the deduction of taxes that a shareholder would pay on Fund distributions or on the redemption or sale of Fund shares. Updated performance information is available by calling 1-866-787-2257 or visiting our website at www.ssga.com/us/en/institutional/fund-finder?tab=documents&type=etfs.
| Statistic | Value |
|---|
| Total Net Assets | $37,253,353 |
| # of Portfolio Holdings | 474 |
| Portfolio Turnover Rate | 77% |
| Total Advisory Fees Paid | $182,659 |
What did the Fund invest in?
| Maturity Duration | % Value of Total Net Assets |
| 0 to 1 Year | 9.8% |
| 1 to 2 Years | 6.2% |
| 2 to 3 Years | 5.0% |
| 3 to 5 Years | 31.5% |
| 5 to 10 Years | 40.4% |
| 10 to 20 Years | 6.0% |
| 20 to 30 Years | 1.7% |
| Greater than 30 Years | 0.8% |
| Holdings | % Value of Total Net Assets |
| SPDR Blackstone Senior Loan ETF | 4.6% |
| UniCredit SpA, 7.30%, due 04/02/34 | 1.1% |
| OneMain Direct Auto Receivables Trust, A, 0.87%, due 07/14/28 | 0.9% |
| EW Scripps Co., 8.02%, due 05/01/26 | 0.8% |
| Bank of America Corp., 6.68%, due 04/02/26 | 0.8% |
| CHG Healthcare Services, Inc., 8.69%, due 09/29/28 | 0.8% |
| GTCR W Merger Sub LLC, due 01/31/31 | 0.7% |
| GTCR W Merger Sub LLC, 8.33%, due 01/31/31 | 0.7% |
| CBAM Ltd., B2R, 7.69%, due 01/15/31 | 0.7% |
| Post CLO Ltd., B1, 7.82%, due 04/20/36 | 0.7% |
SPDR Nuveen Municipal Bond ESG ETF
Principal Listing Exchange: Cboe BZX Exchange, Inc.
Annual Shareholder Report
June 30, 2024
This annual shareholder report contains important information about the SPDR Nuveen Municipal Bond ESG ETF (the "Fund") for the year ended June 30, 2024. You can find additional information about the Fund, including the Prospectus, Statement of Additional Information, financial statements and other information at www.ssga.com/us/en/institutional/fund-finder?tab=documents&type=etfs. You can also request this information about the Fund by contacting us at 1-866-787-2257. This report describes changes to the Fund that occurred during the reporting period.
What were the Fund costs for the last year?
| Fund Name | Cost of a $10,000 investment | Costs paid as a percentage of a $10,000 investment |
|---|
| SPDR Nuveen Municipal Bond ESG ETF | $44 | 0.43% |
How did the Fund perform last year and what affected its performance?
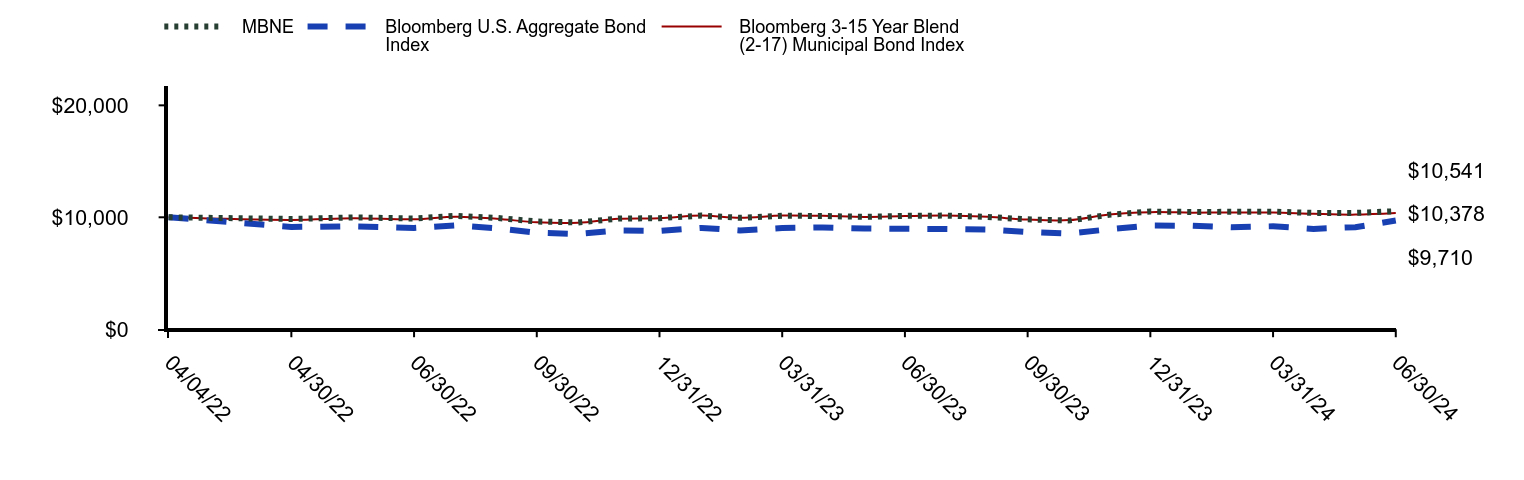
The reporting period was a period of shifting markets, as interest rates expectations moved drastically during the period. Initially, we saw a large sell off, before a significant rally at the end of 2023. 2024 saw a slight sell off in the first half. Despite this, performance held in due to higher income. Spreads tightened in 2024, providing better performance for high yield municipals. The yield curve became barbelled, with yields on the short and long ends providing more yield than the belly of the curve.
Despite the fund’s longer duration positioning, resulting curve exposure aided performance as an underweight in bonds with durations between 2 and 8 years aided performance, as did an overweight in greater than 8 years. Rating allocation was the largest driver of performance, as an overweight in unrated bonds, bonds rated BB and BBB as well as underweights in bonds rated AAA and AA aided performance.
Selection was also a strong positive contributor to returns. Top contributors include Wisconsin Acts Retirement Community & Black Belt Gas. Top detractors include Dallas General Obligation & California State Various Purpose bonds – all of which were sold before the rally that occurred in the late fall of 2023.
The Fund's benchmarks are unmanaged indices used as a general measure of market performance. Calculations assume dividends and capital gains.
Comparison of Change in Value of a $10,000 Investment
(Based on Net Asset Value)
| MBNE | Bloomberg U.S. Aggregate Bond Index | Bloomberg 3-15 Year Blend (2-17) Municipal Bond Index |
|---|
| 04/04/22 | $10,000 | $10,000 | $10,000 |
| 04/30/22 | $9,850 | $9,137 | $9,768 |
| 05/31/22 | $9,991 | $9,196 | $9,912 |
| 06/30/22 | $9,893 | $9,052 | $9,820 |
| 07/31/22 | $10,130 | $9,273 | $10,057 |
| 08/31/22 | $9,942 | $9,011 | $9,873 |
| 09/30/22 | $9,624 | $8,621 | $9,552 |
| 10/31/22 | $9,535 | $8,510 | $9,510 |
| 11/30/22 | $9,882 | $8,823 | $9,868 |
| 12/31/22 | $9,924 | $8,783 | $9,920 |
| 01/31/23 | $10,154 | $9,053 | $10,158 |
| 02/28/23 | $9,951 | $8,819 | $9,956 |
| 03/31/23 | $10,134 | $9,043 | $10,158 |
| 04/30/23 | $10,121 | $9,098 | $10,130 |
| 05/31/23 | $10,034 | $8,999 | $10,033 |
| 06/30/23 | $10,126 | $8,967 | $10,111 |
| 07/31/23 | $10,152 | $8,961 | $10,153 |
| 08/31/23 | $10,034 | $8,903 | $10,039 |
| 09/30/23 | $9,815 | $8,677 | $9,795 |
| 10/31/23 | $9,709 | $8,540 | $9,747 |
| 11/30/23 | $10,223 | $8,927 | $10,252 |
| 12/31/23 | $10,509 | $9,269 | $10,460 |
| 01/31/24 | $10,480 | $9,243 | $10,416 |
| 02/29/24 | $10,485 | $9,113 | $10,425 |
| 03/31/24 | $10,505 | $9,197 | $10,425 |
| 04/30/24 | $10,391 | $8,964 | $10,308 |
| 05/31/24 | $10,393 | $9,116 | $10,239 |
| 06/30/24 | $10,541 | $9,710 | $10,378 |
Average Annual Total Returns (%)
| Name | 1 Year | Since Inception 4/4/22 |
|---|
| MBNE | 4.18% | 2.38% |
| Bloomberg U.S. Aggregate Bond Index | 2.63% | (1.31%) |
| Bloomberg 3-15 Year Blend (2-17) Municipal Bond Index | 2.64% | 1.67% |
The Fund’s past performance is not necessarily an indication of how the Fund will perform in the future. The returns do not reflect the deduction of taxes that a shareholder would pay on Fund distributions or on the redemption or sale of Fund shares. Updated performance information is available by calling 1-866-787-2257 or visiting our website at www.ssga.com/us/en/institutional/fund-finder?tab=documents&type=etfs.
| Statistic | Value |
|---|
| Total Net Assets | $40,124,549 |
| # of Portfolio Holdings | 100 |
| Portfolio Turnover Rate | 33% |
| Total Advisory Fees Paid | $165,396 |
What did the Fund invest in?
| State | % Value of Total Net Assets |
| New York | 9.2% |
| Texas | 8.4% |
| Florida | 7.9% |
| Wisconsin | 6.7% |
| Washington | 6.5% |
| Pennsylvania | 6.2% |
| Connecticut | 6.1% |
| California | 4.9% |
| Illinois | 4.9% |
| Oregon | 4.1% |
| Holdings | % Value of Total Net Assets |
| Idaho Housing & Finance Association Revenue, ID, 4.00%, due 08/15/48 | 2.4% |
| New York City Transitional Finance Authority Future Tax Secured Revenue, NY, 5.00%, due 11/01/26 | 2.3% |
| Pennsylvania Turnpike Commission Revenue, PA, 6.00%, due 12/01/30 | 2.2% |
| City of Dallas, General Obligation, TX, 3.13%, due 02/15/35 | 2.2% |
| South Carolina Jobs-Economic Development Authority Revenue, SC, 5.00%, due 11/01/39 | 2.1% |
| Medford Hospital Facilities Authority Revenue, OR, 5.00%, due 08/15/37 | 2.0% |
| Wisconsin Health & Educational Facilities Authority Revenue, WI, 4.00%, due 04/01/39 | 1.9% |
| Pennsylvania Economic Development Financing Authority Revenue, PA, 4.60%, due 10/01/46 | 1.9% |
| Michigan State Housing Development Authority Revenue, MI, 4.70%, due 12/01/43 | 1.9% |
| Port of Seattle Revenue, WA, 5.00%, due 04/01/35 | 1.9% |
Effective on July 31, 2024, changes will be made to the Fund’s principal investment strategy from Rules-based to Full fundamental active with no constraints to securities in the benchmark.
SPDR Nuveen Municipal Bond ETF
Principal Listing Exchange: Cboe BZX Exchange, Inc.
Annual Shareholder Report
June 30, 2024
This annual shareholder report contains important information about the SPDR Nuveen Municipal Bond ETF (the "Fund") for the year ended June 30, 2024. You can find additional information about the Fund, including the Prospectus, Statement of Additional Information, financial statements and other information at www.ssga.com/us/en/institutional/fund-finder?tab=documents&type=etfs. You can also request this information about the Fund by contacting us at 1-866-787-2257. This report describes changes to the Fund that occurred during the reporting period.
What were the Fund costs for the last year?
| Fund Name | Cost of a $10,000 investment | Costs paid as a percentage of a $10,000 investment |
|---|
| SPDR Nuveen Municipal Bond ETF | $41 | 0.40% |
How did the Fund perform last year and what affected its performance?
The reporting period was a period of shifting markets, as interest rates expectations moved drastically during the period. Initially, we saw a large sell off, before a significant rally at the end of 2023. 2024 saw a slight sell off in the first half. Despite this municipal performance held in due to higher income. Spreads tightened in 2024, providing better performance for high yield municipals. The yield curve became barbelled, with yields on the short and long ends providing more yield than the belly of the curve.
Despite the fund’s longer duration positioning, resulting curve exposure aided performance as an underweight in bonds with durations between 2 and 8 years aided performance, as did an overweight in greater than 8 years. Rating allocation was the largest driver of performance, as an overweight in unrated bonds, bonds rated double-B and triple-B as well as underweights in bonds rated triple-A and double-A aided performance.
Selection was also a strong positive contributor to returns. Top contributors include New Hope Sanctuary LTC, Florida Brightline and Duluth St Lukes Hospital. Largest detractors include Idaho Housing and San Francisco Wastewater bonds – both of which were sold before the rally in the late fall.
The Fund's benchmarks are unmanaged indices used as a general measure of market performance. Calculations assume dividends and capital gains.
Comparison of Change in Value of a $10,000 Investment
(Based on Net Asset Value)
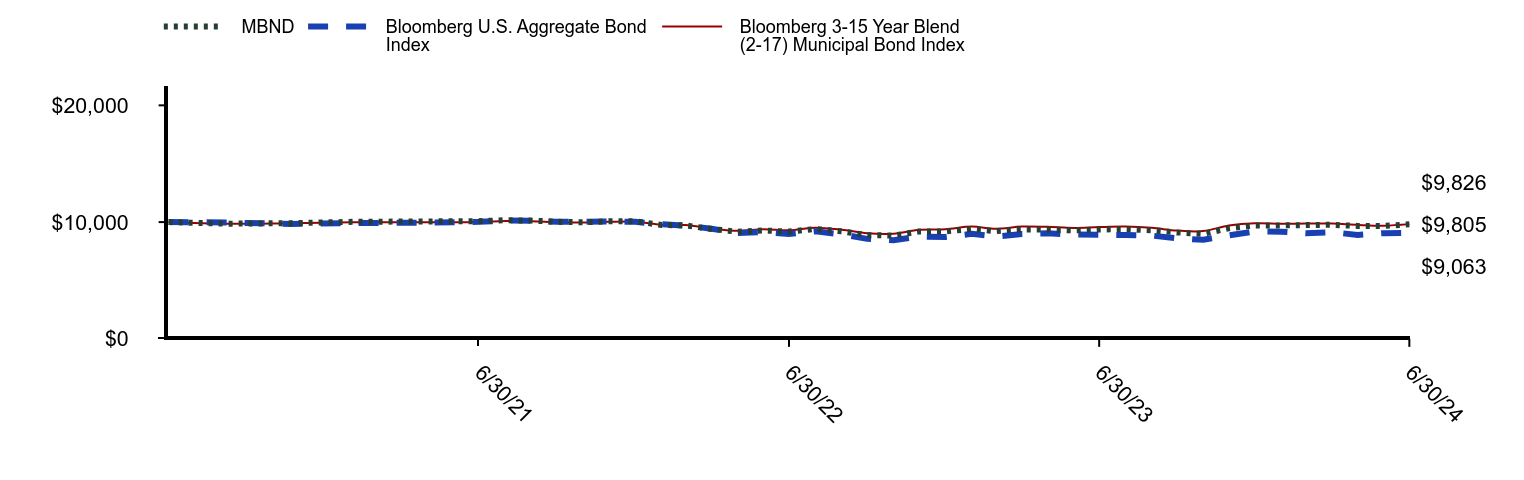
| MBND | Bloomberg U.S. Aggregate Bond Index | Bloomberg 3-15 Year Blend (2-17) Municipal Bond Index |
|---|
| 1/31/21 | $10,000 | $10,000 | $10,000 |
| 2/28/21 | $9,863 | $9,965 | $9,860 |
| 3/31/21 | $9,910 | $9,841 | $9,910 |
| 4/30/21 | $10,019 | $9,918 | $9,977 |
| 5/31/21 | $10,056 | $9,951 | $9,991 |
| 6/30/21 | $10,076 | $10,021 | $10,005 |
| 7/31/21 | $10,161 | $10,133 | $10,085 |
| 8/31/21 | $10,129 | $10,113 | $10,063 |
| 9/30/21 | $10,024 | $10,026 | $9,996 |
| 10/31/21 | $9,988 | $10,023 | $9,964 |
| 11/30/21 | $10,066 | $10,053 | $10,022 |
| 12/31/21 | $10,069 | $10,027 | $10,038 |
| 1/31/22 | $9,757 | $9,811 | $9,774 |
| 2/28/22 | $9,714 | $9,702 | $9,742 |
| 3/31/22 | $9,412 | $9,432 | $9,464 |
| 4/30/22 | $9,179 | $9,074 | $9,249 |
| 5/31/22 | $9,279 | $9,133 | $9,385 |
| 6/30/22 | $9,185 | $8,989 | $9,298 |
| 7/31/22 | $9,407 | $9,209 | $9,522 |
| 8/31/22 | $9,213 | $8,949 | $9,348 |
| 9/30/22 | $8,884 | $8,562 | $9,044 |
| 10/31/22 | $8,847 | $8,451 | $9,004 |
| 11/30/22 | $9,189 | $8,762 | $9,343 |
| 12/31/22 | $9,202 | $8,722 | $9,392 |
| 1/31/23 | $9,412 | $8,991 | $9,618 |
| 2/28/23 | $9,232 | $8,758 | $9,426 |
| 3/31/23 | $9,378 | $8,981 | $9,618 |
| 4/30/23 | $9,368 | $9,035 | $9,591 |
| 5/31/23 | $9,290 | $8,937 | $9,499 |
| 6/30/23 | $9,368 | $8,905 | $9,574 |
| 7/31/23 | $9,391 | $8,899 | $9,613 |
| 8/31/23 | $9,301 | $8,842 | $9,505 |
| 9/30/23 | $9,113 | $8,617 | $9,274 |
| 10/31/23 | $8,996 | $8,481 | $9,229 |
| 11/30/23 | $9,475 | $8,865 | $9,707 |
| 12/31/23 | $9,718 | $9,205 | $9,903 |
| 1/31/24 | $9,715 | $9,179 | $9,862 |
| 2/29/24 | $9,746 | $9,050 | $9,871 |
| 3/31/24 | $9,767 | $9,133 | $9,871 |
| 4/30/24 | $9,669 | $8,903 | $9,760 |
| 5/31/24 | $9,669 | $9,054 | $9,694 |
| 6/30/24 | $9,805 | $9,063 | $9,826 |
Average Annual Total Returns (%)
| Name | 1 Year | Since Inception 2/3/21 |
|---|
| MBND | 4.59% | (0.58%) |
| Bloomberg U.S. Aggregate Bond Index | 2.63% | (2.85%) |
| Bloomberg 3-15 Year Blend (2-17) Municipal Bond Index | 2.64% | (0.52%) |
The Fund’s past performance is not necessarily an indication of how the Fund will perform in the future. The returns do not reflect the deduction of taxes that a shareholder would pay on Fund distributions or on the redemption or sale of Fund shares. Updated performance information is available by calling 1-866-787-2257 or visiting our website at www.ssga.com/us/en/institutional/fund-finder?tab=documents&type=etfs.
| Statistic | Value |
|---|
| Total Net Assets | $49,406,398 |
| # of Portfolio Holdings | 113 |
| Portfolio Turnover Rate | 34% |
| Total Advisory Fees Paid | $186,192 |
What did the Fund invest in?
| State | % Value of Total Net Assets |
| California | 7.7% |
| Illinois | 7.2% |
| Texas | 6.7% |
| Oregon | 5.5% |
| Michigan | 5.4% |
| New York | 4.9% |
| Florida | 4.8% |
| Pennsylvania | 4.5% |
| New Jersey | 3.5% |
| Louisiana | 3.5% |
| Holdings | % Value of Total Net Assets |
| Southfield Public Schools, 5.00%, due 05/01/46 | 2.2% |
| New Jersey Economic Development Authority, 5.00%, due 06/15/31 | 2.2% |
| City of New York, 4.00%, due 08/01/37 | 2.1% |
| Port of Portland Airport Revenue, 4.65%, due 07/01/26 | 2.0% |
| New Mexico Hospital Equipment Loan Council, 4.00%, due 08/01/39 | 2.0% |
| Medford Hospital Facilities Authority, 5.00%, due 08/15/32 | 2.0% |
| Park Hill School District of Platte County, 3.00%, due 03/01/32 | 1.9% |
| State of Hawaii, 5.00%, due 10/01/27 | 1.9% |
| Louisiana Stadium & Exposition District, 5.00%, due 07/01/39 | 1.8% |
| South Carolina Jobs-Economic Development Authority, 5.00%, due 11/01/39 | 1.7% |
Effective on July 31, 2024, changes will be made to the Fund’s principal investment strategy from Rules-based to Full- fundamental active with no constraints to securities in the benchmark.
SPDR SSGA Fixed Income Sector Rotation ETF
Principal Listing Exchange: NYSEArca
Annual Shareholder Report
June 30, 2024
This annual shareholder report contains important information about the SPDR SSGA Fixed Income Sector Rotation ETF (the "Fund") for the year ended June 30, 2024. You can find additional information about the Fund, including the Prospectus, Statement of Additional Information, financial statements and other information at www.ssga.com/us/en/institutional/fund-finder?tab=documents&type=etfs. You can also request this information about the Fund by contacting us at 1-866-787-2257.
What were the Fund costs for the last year?
| Fund Name | Cost of a $10,000 investment | Costs paid as a percentage of a $10,000 investment |
|---|
| SPDR SSGA Fixed Income Sector Rotation ETF | $36 | 0.36% |
How did the Fund perform last year and what affected its performance?
The 12-month period ended June 30, 2024 was characterized by central banks’ restrictive monetary policies to return price stability in the world economies. Although the market continued to battle with sticky and inconsistent progress against inflation and an interest rate scare in the fall which was exacerbated by elevated levels of Treasury issuance, the U.S. Federal Reserve discussed the possibility of rate cuts in late 2024 during its Federal Open Market Committee meeting in March, and the European Central Bank has already reversed the restrictive policy leading to a rate cut in June. Among the developed markets’ central banks, the Bank of Japan’s decision to raise the short-term policy rate from -0.1% to between 0% and 0.1% in March was the exception, but its elevated spread relative to the U.S. Treasury yield continued to put pressure on the Japanese Yen and detracted the Fund’s performance with its allocation to international sovereign bond. However, the Fund’s high-yield bond position benefited from an easing financial condition coupled with a robust lender’s participation in the credit market and issuing companies’ sustainable cashflow to repay interests.
The Fund's benchmarks are unmanaged indices used as a general measure of market performance. Calculations assume dividends and capital gains.
Comparison of Change in Value of a $10,000 Investment
(Based on Net Asset Value)
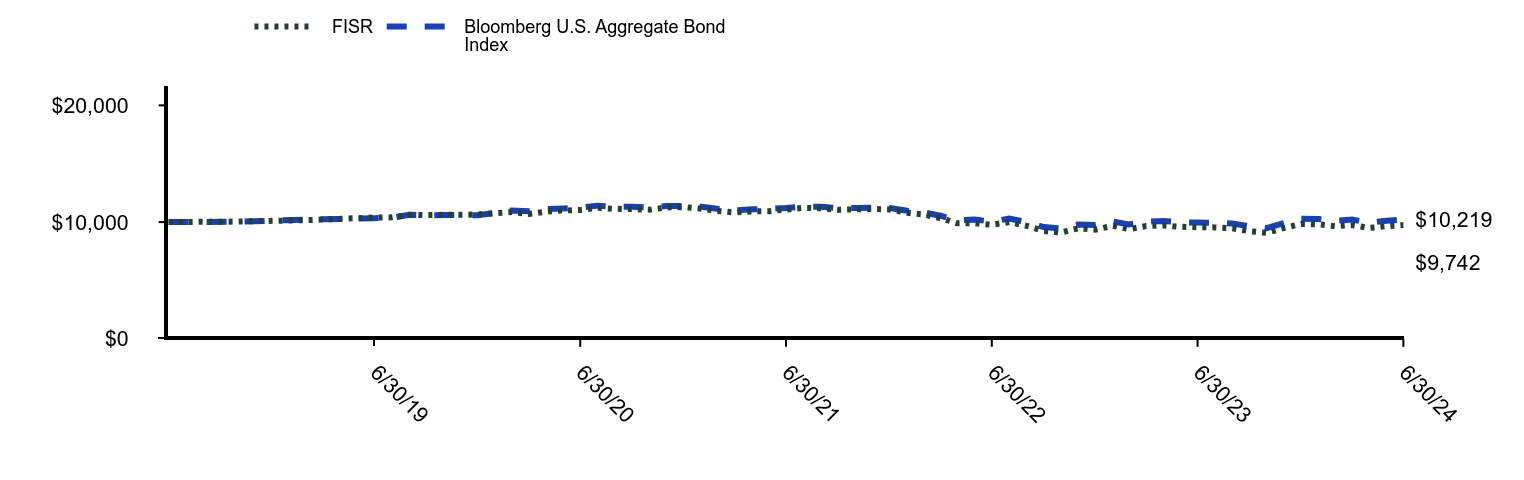
| FISR | Bloomberg U.S. Aggregate Bond Index |
|---|
| 3/31/19 | $10,000 | $10,000 |
| 4/30/19 | $10,045 | $10,032 |
| 5/31/19 | $10,166 | $10,209 |
| 6/30/19 | $10,393 | $10,338 |
| 7/31/19 | $10,405 | $10,361 |
| 8/31/19 | $10,618 | $10,629 |
| 9/30/19 | $10,601 | $10,572 |
| 10/31/19 | $10,622 | $10,604 |
| 11/30/19 | $10,620 | $10,599 |
| 12/31/19 | $10,656 | $10,592 |
| 1/31/20 | $10,762 | $10,795 |
| 2/29/20 | $10,859 | $10,990 |
| 3/31/20 | $10,691 | $10,925 |
| 4/30/20 | $10,897 | $11,119 |
| 5/31/20 | $10,989 | $11,171 |
| 6/30/20 | $11,042 | $11,241 |
| 7/31/20 | $11,221 | $11,409 |
| 8/31/20 | $11,137 | $11,317 |
| 9/30/20 | $11,111 | $11,311 |
| 10/31/20 | $11,063 | $11,260 |
| 11/30/20 | $11,254 | $11,371 |
| 12/31/20 | $11,279 | $11,387 |
| 1/31/21 | $11,145 | $11,305 |
| 2/28/21 | $10,959 | $11,142 |
| 3/31/21 | $10,824 | $11,003 |
| 4/30/21 | $10,914 | $11,090 |
| 5/31/21 | $10,937 | $11,126 |
| 6/30/21 | $11,076 | $11,204 |
| 7/31/21 | $11,220 | $11,329 |
| 8/31/21 | $11,181 | $11,308 |
| 9/30/21 | $11,058 | $11,210 |
| 10/31/21 | $11,098 | $11,207 |
| 11/30/21 | $11,123 | $11,240 |
| 12/31/21 | $11,085 | $11,211 |
| 1/31/22 | $10,795 | $10,969 |
| 2/28/22 | $10,661 | $10,847 |
| 3/31/22 | $10,346 | $10,546 |
| 4/30/22 | $9,894 | $10,146 |
| 5/31/22 | $9,898 | $10,211 |
| 6/30/22 | $9,777 | $10,051 |
| 7/31/22 | $9,995 | $10,296 |
| 8/31/22 | $9,678 | $10,005 |
| 9/30/22 | $9,233 | $9,573 |
| 10/31/22 | $9,112 | $9,449 |
| 11/30/22 | $9,459 | $9,797 |
| 12/31/22 | $9,347 | $9,752 |
| 1/31/23 | $9,690 | $10,052 |
| 2/28/23 | $9,398 | $9,793 |
| 3/31/23 | $9,664 | $10,041 |
| 4/30/23 | $9,715 | $10,102 |
| 5/31/23 | $9,598 | $9,992 |
| 6/30/23 | $9,562 | $9,957 |
| 7/31/23 | $9,547 | $9,950 |
| 8/31/23 | $9,472 | $9,886 |
| 9/30/23 | $9,217 | $9,635 |
| 10/31/23 | $9,081 | $9,483 |
| 11/30/23 | $9,483 | $9,912 |
| 12/31/23 | $9,838 | $10,292 |
| 1/31/24 | $9,815 | $10,263 |
| 2/29/24 | $9,656 | $10,118 |
| 3/31/24 | $9,737 | $10,212 |
| 4/30/24 | $9,496 | $9,954 |
| 5/31/24 | $9,652 | $10,123 |
| 6/30/24 | $9,742 | $10,219 |
Average Annual Total Returns (%)
| Name | 1 Year | 5 Years | Since Inception 4/2/19 |
|---|
| FISR | 1.87% | (1.26%) | (0.49%) |
| Bloomberg U.S. Aggregate Bond Index | 2.63% | (0.23%) | 0.41% |
The Fund’s past performance is not necessarily an indication of how the Fund will perform in the future. The returns do not reflect the deduction of taxes that a shareholder would pay on Fund distributions or on the redemption or sale of Fund shares. Updated performance information is available by calling 1-866-787-2257 or visiting our website at www.ssga.com/us/en/institutional/fund-finder?tab=documents&type=etfs.
| Statistic | Value |
|---|
| Total Net Assets | $237,952,463 |
| # of Portfolio Holdings | 9 |
| Portfolio Turnover Rate | 100% |
| Total Advisory Fees Paid | $702,489 |
What did the Fund invest in?
| Asset | % Value of Total Net Assets |
| Mutual Funds and Exchange Traded Products | 100.0% |
| Short-Term Investments | 9.1% |
| Holdings | % Value of Total Net Assets |
| SPDR Portfolio Intermediate Term Treasury ETF | 36.9% |
| SPDR Portfolio Mortgage-Backed Bond ETF | 33.0% |
| SPDR Portfolio Long Term Treasury ETF | 15.0% |
| SPDR Bloomberg High Yield Bond ETF | 9.4% |
| SPDR Portfolio Long Term Corporate Bond ETF | 4.9% |
| SPDR Portfolio Intermediate Term Corporate Bond ETF | 0.7% |
| SPDR Bloomberg 1-3 Month T-Bills ETF | 0.2% |
SPDR SSGA Global Allocation ETF
Principal Listing Exchange: NYSEArca
Annual Shareholder Report
June 30, 2024
This annual shareholder report contains important information about the SPDR SSGA Global Allocation ETF (the "Fund") for the year ended June 30, 2024. You can find additional information about the Fund, including the Prospectus, Statement of Additional Information, financial statements and other information at www.ssga.com/us/en/institutional/fund-finder?tab=documents&type=etfs. You can also request this information about the Fund by contacting us at 1-866-787-2257.
What were the Fund costs for the last year?
| Fund Name | Cost of a $10,000 investment | Costs paid as a percentage of a $10,000 investment |
|---|
| SPDR SSGA Global Allocation ETF | $16 | 0.15% |
How did the Fund perform last year and what affected its performance?
The 12-month period ended June 30, 2024 was characterized by positive returns for most asset classes and a strong equity market rally. In that environment, the multi-asset exposure of the Fund led to underperformance when measured against an all-equity benchmark such as the MSCI ACWI IMI Index. Although markets continued to battle with sticky and inconsistent progress against inflation and an interest rate scare in the fall, a broad easing of financial conditions contributed to a favorable environment for risk-taking in the Fund. As a result, overweight allocations were held in equities to varying degrees which contributed favorably to performance. The Fund’s investment in gold was another positive contributor during the reporting period. Strong technical indicators supported holding gold which performed well. An aspect of the Fund’s strategy which detracted was investments across U.S. equity sectors. The negative impact from performance here came from both sector selection, including an allocation to the energy sector, as well as from tracking error of certain sector ETFs.
The Fund's benchmarks are unmanaged indices used as a general measure of market performance. Calculations assume dividends and capital gains.
Comparison of Change in Value of a $10,000 Investment
(Based on Net Asset Value)
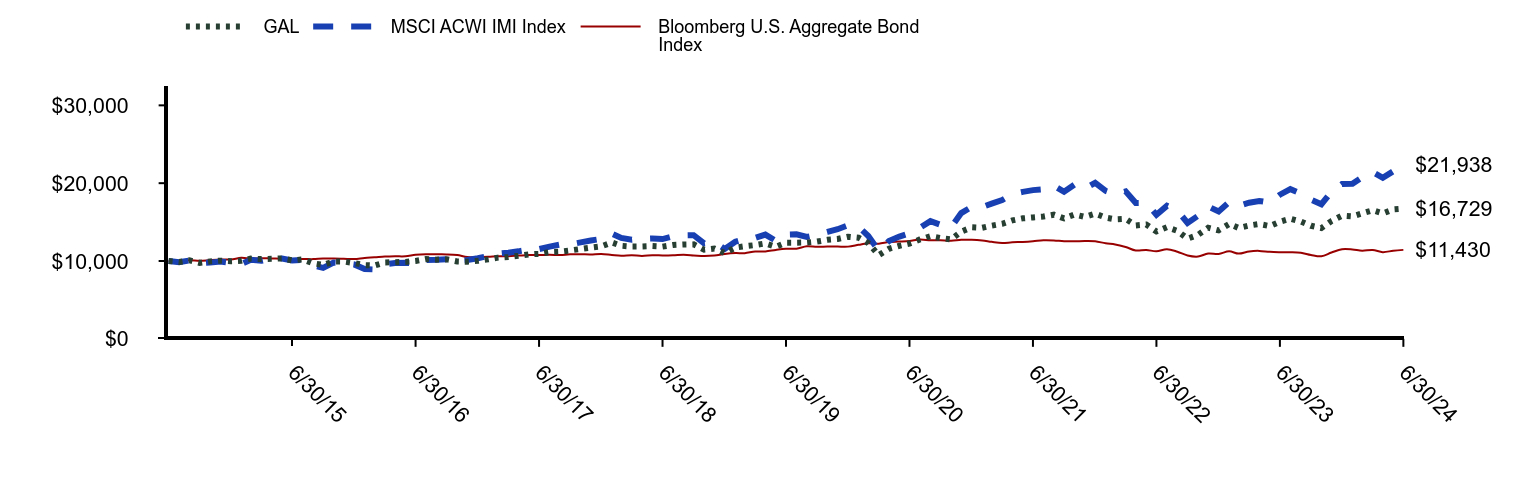
| GAL | MSCI ACWI IMI Index | Bloomberg U.S. Aggregate Bond Index |
|---|
| 6/30/14 | $10,000 | $10,000 | $10,000 |
| 7/31/14 | $9,876 | $9,846 | $9,975 |
| 8/31/14 | $10,082 | $10,074 | $10,085 |
| 9/30/14 | $9,756 | $9,717 | $10,017 |
| 10/31/14 | $9,952 | $9,794 | $10,115 |
| 11/30/14 | $10,043 | $9,939 | $10,187 |
| 12/31/14 | $9,966 | $9,775 | $10,196 |
| 1/31/15 | $10,023 | $9,623 | $10,410 |
| 2/28/15 | $10,311 | $10,161 | $10,312 |
| 3/31/15 | $10,251 | $10,027 | $10,360 |
| 4/30/15 | $10,283 | $10,302 | $10,323 |
| 5/31/15 | $10,329 | $10,309 | $10,298 |
| 6/30/15 | $10,075 | $10,081 | $10,186 |
| 7/31/15 | $10,211 | $10,139 | $10,257 |
| 8/31/15 | $9,713 | $9,459 | $10,242 |
| 9/30/15 | $9,491 | $9,114 | $10,311 |
| 10/31/15 | $9,937 | $9,803 | $10,313 |
| 11/30/15 | $9,934 | $9,743 | $10,286 |
| 12/31/15 | $9,738 | $9,561 | $10,252 |
| 1/31/16 | $9,471 | $8,962 | $10,393 |
| 2/29/16 | $9,411 | $8,915 | $10,467 |
| 3/31/16 | $9,815 | $9,590 | $10,563 |
| 4/30/16 | $9,848 | $9,741 | $10,603 |
| 5/31/16 | $9,881 | $9,761 | $10,607 |
| 6/30/16 | $10,005 | $9,690 | $10,797 |
| 7/31/16 | $10,251 | $10,122 | $10,866 |
| 8/31/16 | $10,167 | $10,156 | $10,854 |
| 9/30/16 | $10,210 | $10,230 | $10,847 |
| 10/31/16 | $9,951 | $10,032 | $10,765 |
| 11/30/16 | $9,909 | $10,141 | $10,509 |
| 12/31/16 | $10,027 | $10,359 | $10,524 |
| 1/31/17 | $10,210 | $10,640 | $10,545 |
| 2/28/17 | $10,431 | $10,933 | $10,616 |
| 3/31/17 | $10,521 | $11,062 | $10,611 |
| 4/30/17 | $10,671 | $11,241 | $10,692 |
| 5/31/17 | $10,852 | $11,465 | $10,775 |
| 6/30/17 | $10,918 | $11,533 | $10,764 |
| 7/31/17 | $11,148 | $11,849 | $10,810 |
| 8/31/17 | $11,199 | $12,103 | $10,758 |
| 9/30/17 | $11,361 | $12,145 | $10,855 |
| 10/31/17 | $11,540 | $12,390 | $10,862 |
| 11/30/17 | $11,720 | $12,633 | $10,847 |
| 12/31/17 | $11,887 | $12,839 | $10,897 |
| 1/31/18 | $12,383 | $13,531 | $10,772 |
| 2/28/18 | $11,957 | $12,967 | $10,670 |
| 3/31/18 | $11,856 | $12,724 | $10,738 |
| 4/30/18 | $11,864 | $12,843 | $10,659 |
| 5/31/18 | $11,914 | $12,893 | $10,734 |
| 6/30/18 | $11,850 | $12,815 | $10,721 |
| 7/31/18 | $12,054 | $13,170 | $10,724 |
| 8/31/18 | $12,120 | $13,291 | $10,793 |
| 9/30/18 | $12,139 | $13,313 | $10,723 |
| 10/31/18 | $11,451 | $12,271 | $10,639 |
| 11/30/18 | $11,601 | $12,445 | $10,702 |
| 12/31/18 | $11,021 | $11,544 | $10,899 |
| 1/31/19 | $11,721 | $12,483 | $11,014 |
| 2/28/19 | $11,895 | $12,831 | $11,008 |
| 3/31/19 | $12,045 | $12,963 | $11,219 |
| 4/30/19 | $12,255 | $13,392 | $11,222 |
| 5/31/19 | $11,821 | $12,590 | $11,422 |
| 6/30/19 | $12,353 | $13,400 | $11,564 |
| 7/31/19 | $12,357 | $13,440 | $11,589 |
| 8/31/19 | $12,375 | $13,101 | $11,890 |
| 9/30/19 | $12,495 | $13,376 | $11,826 |
| 10/31/19 | $12,719 | $13,744 | $11,862 |
| 11/30/19 | $12,829 | $14,087 | $11,856 |
| 12/31/19 | $13,126 | $14,586 | $11,848 |
| 1/31/20 | $12,994 | $14,393 | $12,076 |
| 2/29/20 | $12,290 | $13,215 | $12,293 |
| 3/31/20 | $10,752 | $11,313 | $12,221 |
| 4/30/20 | $11,564 | $12,559 | $12,438 |
| 5/31/20 | $11,956 | $13,137 | $12,496 |
| 6/30/20 | $12,245 | $13,557 | $12,575 |
| 7/31/20 | $12,769 | $14,261 | $12,762 |
| 8/31/20 | $13,190 | $15,125 | $12,659 |
| 9/30/20 | $12,943 | $14,656 | $12,652 |
| 10/31/20 | $12,774 | $14,339 | $12,596 |
| 11/30/20 | $13,776 | $16,154 | $12,720 |
| 12/31/20 | $14,333 | $16,957 | $12,737 |
| 1/31/21 | $14,269 | $16,927 | $12,646 |
| 2/28/21 | $14,541 | $17,377 | $12,463 |
| 3/31/21 | $14,779 | $17,828 | $12,308 |
| 4/30/21 | $15,218 | $18,601 | $12,405 |
| 5/31/21 | $15,482 | $18,879 | $12,445 |
| 6/30/21 | $15,599 | $19,107 | $12,533 |
| 7/31/21 | $15,711 | $19,203 | $12,673 |
| 8/31/21 | $15,948 | $19,679 | $12,649 |
| 9/30/21 | $15,477 | $18,894 | $12,539 |
| 10/31/21 | $15,982 | $19,813 | $12,536 |
| 11/30/21 | $15,669 | $19,281 | $12,573 |
| 12/31/21 | $16,088 | $20,047 | $12,541 |
| 1/31/22 | $15,577 | $19,007 | $12,271 |
| 2/28/22 | $15,348 | $18,572 | $12,134 |
| 3/31/22 | $15,407 | $18,951 | $11,797 |
| 4/30/22 | $14,571 | $17,446 | $11,349 |
| 5/31/22 | $14,692 | $17,456 | $11,422 |
| 6/30/22 | $13,793 | $15,950 | $11,243 |
| 7/31/22 | $14,340 | $17,089 | $11,518 |
| 8/31/22 | $13,868 | $16,483 | $11,192 |
| 9/30/22 | $12,871 | $14,892 | $10,709 |
| 10/31/22 | $13,359 | $15,808 | $10,570 |
| 11/30/22 | $14,278 | $17,011 | $10,959 |
| 12/31/22 | $13,934 | $16,357 | $10,909 |
| 1/31/23 | $14,751 | $17,562 | $11,245 |
| 2/28/23 | $14,244 | $17,074 | $10,954 |
| 3/31/23 | $14,563 | $17,494 | $11,232 |
| 4/30/23 | $14,752 | $17,717 | $11,300 |
| 5/31/23 | $14,485 | $17,503 | $11,177 |
| 6/30/23 | $15,049 | $18,524 | $11,137 |
| 7/31/23 | $15,442 | $19,232 | $11,130 |
| 8/31/23 | $15,073 | $18,680 | $11,059 |
| 9/30/23 | $14,529 | $17,894 | $10,778 |
| 10/31/23 | $14,230 | $17,298 | $10,607 |
| 11/30/23 | $15,143 | $18,897 | $11,088 |
| 12/31/23 | $15,821 | $19,888 | $11,512 |
| 1/31/24 | $15,725 | $19,933 | $11,481 |
| 2/29/24 | $16,118 | $20,767 | $11,318 |
| 3/31/24 | $16,523 | $21,424 | $11,423 |
| 4/30/24 | $16,110 | $20,698 | $11,134 |
| 5/31/24 | $16,630 | $21,538 | $11,323 |
| 6/30/24 | $16,729 | $21,938 | $11,430 |
Average Annual Total Returns (%)
| Name | 1 Year | 5 Years | 10 Years |
|---|
| GAL | 11.15% | 6.25% | 5.28% |
| MSCI ACWI IMI Index | 18.40% | 10.36% | 8.17% |
| Bloomberg U.S. Aggregate Bond Index | 2.63% | (0.23%) | 1.35% |
The Fund’s past performance is not necessarily an indication of how the Fund will perform in the future. The returns do not reflect the deduction of taxes that a shareholder would pay on Fund distributions or on the redemption or sale of Fund shares. Updated performance information is available by calling 1-866-787-2257 or visiting our website at www.ssga.com/us/en/institutional/fund-finder?tab=documents&type=etfs.
| Statistic | Value |
|---|
| Total Net Assets | $238,127,862 |
| # of Portfolio Holdings | 20 |
| Portfolio Turnover Rate | 119% |
| Total Advisory Fees Paid | $346,186 |
What did the Fund invest in?
| Asset | % Value of Total Net Assets |
| Mutual Funds and Exchange Traded Products | 96.0% |
| Short-Term Investments | 19.1% |
| Holdings | % Value of Total Net Assets |
| SPDR S&P 500 ETF Trust | 19.3% |
| SPDR Portfolio Developed World ex-U.S. ETF | 18.2% |
| SPDR Portfolio Emerging Markets ETF | 11.1% |
| SPDR Portfolio Aggregate Bond ETF | 8.1% |
| SPDR Bloomberg High Yield Bond ETF | 6.6% |
| SPDR Portfolio S&P 600 Small Cap ETF | 4.6% |
| SPDR Bloomberg 1-10 Year TIPS ETF | 4.1% |
| SPDR S&P International Small Cap ETF | 3.0% |
| SPDR Bloomberg International Corporate Bond ETF | 3.0% |
| SPDR Bloomberg Emerging Markets Local Bond ETF | 3.0% |
SPDR SSGA Income Allocation ETF
Principal Listing Exchange: NYSEArca
Annual Shareholder Report
June 30, 2024
This annual shareholder report contains important information about the SPDR SSGA Income Allocation ETF (the "Fund") for the year ended June 30, 2024. You can find additional information about the Fund, including the Prospectus, Statement of Additional Information, financial statements and other information at www.ssga.com/us/en/institutional/fund-finder?tab=documents&type=etfs. You can also request this information about the Fund by contacting us at 1-866-787-2257.
What were the Fund costs for the last year?
| Fund Name | Cost of a $10,000 investment | Costs paid as a percentage of a $10,000 investment |
|---|
| SPDR SSGA Income Allocation ETF | $19 | 0.18% |
How did the Fund perform last year and what affected its performance?
The 12-month period ended June 30, 2024 was characterized by positive returns for most asset classes and a strong equity market rally. In that environment, the multi-asset exposure of the Fund led to underperformance when measured against an all-equity benchmark such as the MSCI World Index. Although markets continued to battle with sticky and inconsistent progress against inflation and an interest rate scare in the fall, a broad easing of financial conditions contributed to a favorable environment for risk-taking in the Fund. As a result, overweight allocations were held to equities to varying degrees throughout the year which contributed favorably to performance – particularly in early 2024 when stock markets rallied as bond markets struggled with expectations that the Federal Reserve would keep interest rates higher for longer. However, the Fund’s focus on dividend-paying equities detracted from performance especially when compared against market-cap weighted benchmarks like the MSCI World Index which benefited from the strong performance of more growth-oriented stocks.
The Fund's benchmarks are unmanaged indices used as a general measure of market performance. Calculations assume dividends and capital gains.
Comparison of Change in Value of a $10,000 Investment
(Based on Net Asset Value)
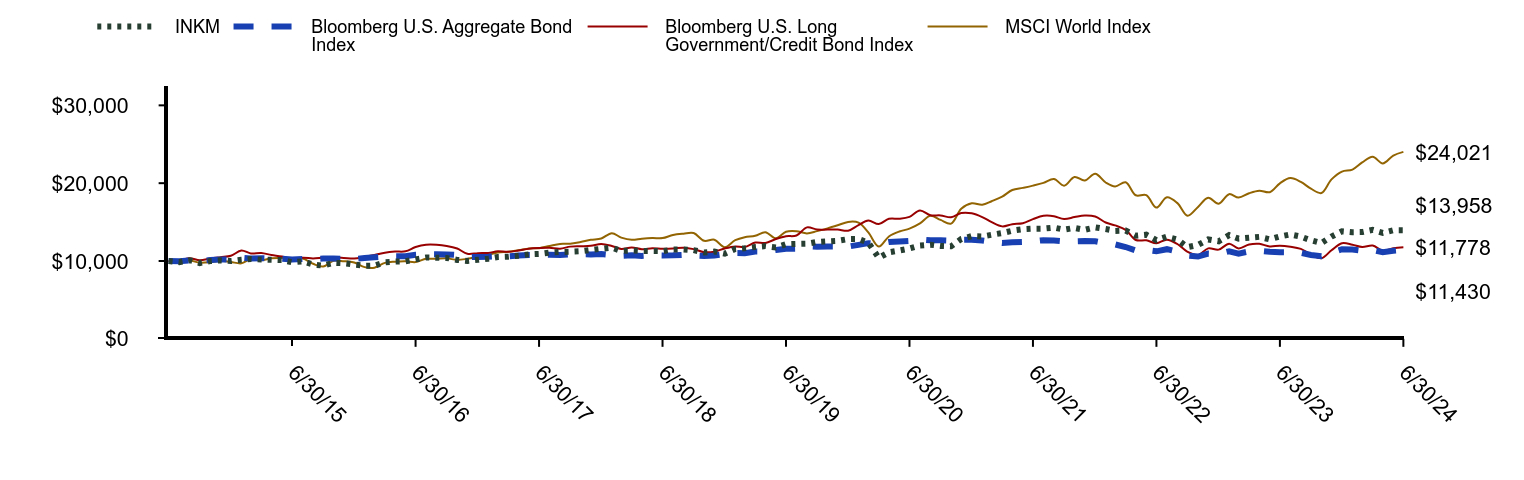
| INKM | Bloomberg U.S. Aggregate Bond Index | Bloomberg U.S. Long Government/Credit Bond Index | MSCI World Index |
|---|
| 6/30/14 | $10,000 | $10,000 | $10,000 | $10,000 |
| 7/31/14 | $9,853 | $9,975 | $10,035 | $9,840 |
| 8/31/14 | $10,101 | $10,085 | $10,365 | $10,057 |
| 9/30/14 | $9,737 | $10,017 | $10,104 | $9,784 |
| 10/31/14 | $9,996 | $10,115 | $10,326 | $9,848 |
| 11/30/14 | $10,089 | $10,187 | $10,499 | $10,045 |
| 12/31/14 | $9,995 | $10,196 | $10,670 | $9,883 |
| 1/31/15 | $10,169 | $10,410 | $11,353 | $9,704 |
| 2/28/15 | $10,262 | $10,312 | $10,970 | $10,272 |
| 3/31/15 | $10,180 | $10,360 | $11,029 | $10,112 |
| 4/30/15 | $10,158 | $10,323 | $10,763 | $10,349 |
| 5/31/15 | $10,126 | $10,298 | $10,583 | $10,384 |
| 6/30/15 | $9,837 | $10,186 | $10,194 | $10,143 |
| 7/31/15 | $9,959 | $10,257 | $10,416 | $10,325 |
| 8/31/15 | $9,545 | $10,242 | $10,332 | $9,642 |
| 9/30/15 | $9,406 | $10,311 | $10,416 | $9,286 |
| 10/31/15 | $9,776 | $10,313 | $10,458 | $10,022 |
| 11/30/15 | $9,713 | $10,286 | $10,400 | $9,972 |
| 12/31/15 | $9,539 | $10,252 | $10,318 | $9,797 |
| 1/31/16 | $9,378 | $10,393 | $10,535 | $9,211 |
| 2/29/16 | $9,407 | $10,467 | $10,766 | $9,142 |
| 3/31/16 | $9,844 | $10,563 | $11,071 | $9,763 |
| 4/30/16 | $9,928 | $10,603 | $11,207 | $9,917 |
| 5/31/16 | $9,961 | $10,606 | $11,243 | $9,973 |
| 6/30/16 | $10,213 | $10,797 | $11,796 | $9,861 |
| 7/31/16 | $10,448 | $10,865 | $12,097 | $10,277 |
| 8/31/16 | $10,406 | $10,853 | $12,093 | $10,285 |
| 9/30/16 | $10,394 | $10,847 | $11,941 | $10,340 |
| 10/31/16 | $10,141 | $10,764 | $11,602 | $10,139 |
| 11/30/16 | $10,016 | $10,509 | $10,926 | $10,285 |
| 12/31/16 | $10,154 | $10,524 | $11,005 | $10,531 |
| 1/31/17 | $10,300 | $10,545 | $11,039 | $10,785 |
| 2/28/17 | $10,507 | $10,616 | $11,241 | $11,084 |
| 3/31/17 | $10,555 | $10,611 | $11,179 | $11,202 |
| 4/30/17 | $10,677 | $10,692 | $11,352 | $11,368 |
| 5/31/17 | $10,857 | $10,775 | $11,581 | $11,609 |
| 6/30/17 | $10,906 | $10,764 | $11,669 | $11,653 |
| 7/31/17 | $11,084 | $10,810 | $11,699 | $11,932 |
| 8/31/17 | $11,155 | $10,758 | $11,587 | $12,199 |
| 9/30/17 | $11,192 | $10,855 | $11,848 | $12,216 |
| 10/31/17 | $11,255 | $10,862 | $11,895 | $12,447 |
| 11/30/17 | $11,417 | $10,847 | $11,958 | $12,717 |
| 12/31/17 | $11,570 | $10,897 | $12,184 | $12,889 |
| 1/31/18 | $11,717 | $10,772 | $11,935 | $13,569 |
| 2/28/18 | $11,295 | $10,670 | $11,557 | $13,008 |
| 3/31/18 | $11,356 | $10,738 | $11,748 | $12,724 |
| 4/30/18 | $11,287 | $10,659 | $11,520 | $12,870 |
| 5/31/18 | $11,282 | $10,734 | $11,652 | $12,951 |
| 6/30/18 | $11,264 | $10,721 | $11,579 | $12,945 |
| 7/31/18 | $11,469 | $10,724 | $11,608 | $13,349 |
| 8/31/18 | $11,487 | $10,793 | $11,707 | $13,514 |
| 9/30/18 | $11,395 | $10,723 | $11,525 | $13,590 |
| 10/31/18 | $11,095 | $10,639 | $11,139 | $12,592 |
| 11/30/18 | $11,218 | $10,702 | $11,201 | $12,735 |
| 12/31/18 | $10,937 | $10,899 | $11,615 | $11,766 |
| 1/31/19 | $11,543 | $11,014 | $11,875 | $12,682 |
| 2/28/19 | $11,632 | $11,008 | $11,810 | $13,063 |
| 3/31/19 | $11,805 | $11,219 | $12,365 | $13,235 |
| 4/30/19 | $11,911 | $11,222 | $12,315 | $13,704 |
| 5/31/19 | $11,742 | $11,422 | $12,823 | $12,913 |
| 6/30/19 | $12,160 | $11,564 | $13,179 | $13,764 |
| 7/31/19 | $12,195 | $11,589 | $13,275 | $13,833 |
| 8/31/19 | $12,217 | $11,890 | $14,321 | $13,550 |
| 9/30/19 | $12,441 | $11,826 | $14,047 | $13,838 |
| 10/31/19 | $12,524 | $11,862 | $14,039 | $14,190 |
| 11/30/19 | $12,586 | $11,856 | $14,050 | $14,585 |
| 12/31/19 | $12,812 | $11,848 | $13,890 | $15,022 |
| 1/31/20 | $12,831 | $12,076 | $14,616 | $14,931 |
| 2/29/20 | $12,362 | $12,293 | $15,202 | $13,669 |
| 3/31/20 | $10,400 | $12,221 | $14,753 | $11,860 |
| 4/30/20 | $11,118 | $12,438 | $15,418 | $13,155 |
| 5/31/20 | $11,352 | $12,496 | $15,432 | $13,791 |
| 6/30/20 | $11,607 | $12,575 | $15,672 | $14,156 |
| 7/31/20 | $11,989 | $12,762 | $16,503 | $14,833 |
| 8/31/20 | $12,100 | $12,659 | $15,885 | $15,824 |
| 9/30/20 | $11,938 | $12,652 | $15,862 | $15,278 |
| 10/31/20 | $11,886 | $12,596 | $15,612 | $14,809 |
| 11/30/20 | $12,826 | $12,720 | $16,161 | $16,703 |
| 12/31/20 | $13,198 | $12,737 | $16,129 | $17,411 |
| 1/31/21 | $13,157 | $12,646 | $15,649 | $17,238 |
| 2/28/21 | $13,367 | $12,463 | $14,993 | $17,680 |
| 3/31/21 | $13,591 | $12,308 | $14,450 | $18,268 |
| 4/30/21 | $13,898 | $12,405 | $14,733 | $19,118 |
| 5/31/21 | $14,082 | $12,445 | $14,852 | $19,394 |
| 6/30/21 | $14,150 | $12,533 | $15,380 | $19,683 |
| 7/31/21 | $14,160 | $12,673 | $15,808 | $20,035 |
| 8/31/21 | $14,287 | $12,649 | $15,760 | $20,534 |
| 9/30/21 | $14,030 | $12,539 | $15,392 | $19,681 |
| 10/31/21 | $14,256 | $12,536 | $15,643 | $20,796 |
| 11/30/21 | $14,006 | $12,573 | $15,853 | $20,340 |
| 12/31/21 | $14,324 | $12,541 | $15,723 | $21,210 |
| 1/31/22 | $14,109 | $12,271 | $14,952 | $20,088 |
| 2/28/22 | $13,866 | $12,134 | $14,573 | $19,580 |
| 3/31/22 | $13,908 | $11,797 | $14,001 | $20,117 |
| 4/30/22 | $13,252 | $11,349 | $12,699 | $18,446 |
| 5/31/22 | $13,382 | $11,422 | $12,659 | $18,460 |
| 6/30/22 | $12,676 | $11,243 | $12,282 | $16,861 |
| 7/31/22 | $13,120 | $11,518 | $12,744 | $18,199 |
| 8/31/22 | $12,759 | $11,192 | $12,184 | $17,438 |
| 9/30/22 | $11,784 | $10,709 | $11,173 | $15,817 |
| 10/31/22 | $12,062 | $10,570 | $10,751 | $16,953 |
| 11/30/22 | $12,771 | $10,959 | $11,625 | $18,132 |
| 12/31/22 | $12,527 | $10,909 | $11,464 | $17,362 |
| 1/31/23 | $13,319 | $11,245 | $12,219 | $18,590 |
| 2/28/23 | $12,875 | $10,954 | $11,613 | $18,144 |
| 3/31/23 | $12,991 | $11,232 | $12,124 | $18,704 |
| 4/30/23 | $13,102 | $11,300 | $12,210 | $19,032 |
| 5/31/23 | $12,779 | $11,177 | $11,877 | $18,842 |
| 6/30/23 | $13,154 | $11,137 | $11,967 | $19,982 |
| 7/31/23 | $13,414 | $11,130 | $11,838 | $20,653 |
| 8/31/23 | $13,136 | $11,059 | $11,564 | $20,160 |
| 9/30/23 | $12,657 | $10,778 | $10,846 | $19,290 |
| 10/31/23 | $12,301 | $10,607 | $10,358 | $18,730 |
| 11/30/23 | $13,136 | $11,088 | $11,382 | $20,486 |
| 12/31/23 | $13,822 | $11,512 | $12,281 | $21,492 |
| 1/31/24 | $13,704 | $11,481 | $12,093 | $21,750 |
| 2/29/24 | $13,715 | $11,318 | $11,798 | $22,673 |
| 3/31/24 | $14,002 | $11,423 | $11,986 | $23,403 |
| 4/30/24 | $13,622 | $11,134 | $11,331 | $22,534 |
| 5/31/24 | $13,955 | $11,323 | $11,651 | $23,542 |
| 6/30/24 | $13,958 | $11,430 | $11,778 | $24,021 |
Average Annual Total Returns (%)
| Name | 1 Year | 5 Years | 10 Years |
|---|
| INKM | 6.11% | 2.80% | 3.39% |
| Bloomberg U.S. Aggregate Bond Index | 2.63% | (0.23%) | 1.35% |
| Bloomberg U.S. Long Government/Credit Bond Index | (1.58%) | (2.22%) | 1.65% |
| MSCI World Index | 20.19% | 11.78% | 9.16% |
The Fund’s past performance is not necessarily an indication of how the Fund will perform in the future. The returns do not reflect the deduction of taxes that a shareholder would pay on Fund distributions or on the redemption or sale of Fund shares. Updated performance information is available by calling 1-866-787-2257 or visiting our website at www.ssga.com/us/en/institutional/fund-finder?tab=documents&type=etfs.
| Statistic | Value |
|---|
| Total Net Assets | $69,928,131 |
| # of Portfolio Holdings | 19 |
| Portfolio Turnover Rate | 73% |
| Total Advisory Fees Paid | $131,349 |
What did the Fund invest in?
| Asset | % Value of Total Net Assets |
| Mutual Funds and Exchange Traded Products | 99.8% |
| Short-Term Investments | 19.4% |
| Holdings | % Value of Total Net Assets |
| SPDR Portfolio Long Term Treasury ETF | 14.9% |
| SPDR Bloomberg High Yield Bond ETF | 12.6% |
| SPDR Portfolio S&P 500 High Dividend ETF | 8.1% |
| Schwab U.S. Dividend Equity ETF | 8.0% |
| SPDR S&P Global Infrastructure ETF | 7.9% |
| SPDR S&P International Dividend ETF | 6.9% |
| SPDR Bloomberg Emerging Markets Local Bond ETF | 6.1% |
| SPDR ICE Preferred Securities ETF | 6.0% |
| SPDR Bloomberg Emerging Markets USD Bond ETF | 6.0% |
| SPDR Blackstone Senior Loan ETF | 6.0% |
SPDR SSGA Multi-Asset Real Return ETF
Principal Listing Exchange: NYSEArca
Annual Shareholder Report
June 30, 2024
This annual shareholder report contains important information about the SPDR SSGA Multi-Asset Real Return ETF (the "Fund") for the year ended June 30, 2024. You can find additional information about the Fund, including the Prospectus, Statement of Additional Information, financial statements and other information at www.ssga.com/us/en/institutional/fund-finder?tab=documents&type=etfs. You can also request this information about the Fund by contacting us at 1-866-787-2257.
What were the Fund costs for the last year?
| Fund Name | Cost of a $10,000 investment | Costs paid as a percentage of a $10,000 investment |
|---|
| SPDR SSGA Multi-Asset Real Return ETF | $13 | 0.13% |
How did the Fund perform last year and what affected its performance?
The 12-month period ended June 30, 2024, was characterized by positive returns for most asset classes, particularly gold and the equity-oriented assets. In that environment, the multi-asset exposure of the Fund led to outperformance when measured against an all-fixed income benchmark such as the Bloomberg U.S. Government Inflation-Linked Bond Index and a broad commodity Index such as the DBIQ Optimum Yield Diversified Commodity Index. Against a backdrop of sticky and inconsistent progress against inflation, a favorable environment for risk-taking and supportive forecasts, the Fund held overweight allocations to global infrastructure and global natural resource equities, including a targeted allocation to energy. These positions were funded from underweight allocations to real estate and global inflation-linked bonds. This allocation contributed favorably to performance. The Fund’s investment in gold was another positive contributor. Although real interest rates were higher than in the recent past, two factors that typically lead to a difficult environment for gold, strong technical indicators and support from other fundamental factors supported holding gold. An underweight to U.S. REITs during the fourth quarter of 2023 detracted.
The Fund's benchmarks are unmanaged indices used as a general measure of market performance. Calculations assume dividends and capital gains.
Comparison of Change in Value of a $10,000 Investment
(Based on Net Asset Value)

| RLY | Bloomberg U.S. Aggregate Bond Index | Bloomberg U.S. Government Inflation-Linked Bond Index | DBIQ Optimum Yield Diversified Commodity Index Excess Return |
|---|
| 6/30/14 | $10,000 | $10,000 | $10,000 | $10,000 |
| 7/31/14 | $9,799 | $9,975 | $10,011 | $9,574 |
| 8/31/14 | $9,877 | $10,085 | $10,066 | $9,476 |
| 9/30/14 | $9,217 | $10,017 | $9,795 | $8,816 |
| 10/31/14 | $9,195 | $10,115 | $9,890 | $8,488 |
| 11/30/14 | $8,965 | $10,187 | $9,920 | $7,759 |
| 12/31/14 | $8,700 | $10,196 | $9,819 | $7,080 |
| 1/31/15 | $8,641 | $10,410 | $10,144 | $6,750 |
| 2/28/15 | $8,879 | $10,312 | $10,012 | $7,033 |
| 3/31/15 | $8,566 | $10,360 | $9,963 | $6,593 |
| 4/30/15 | $8,866 | $10,323 | $10,032 | $7,061 |
| 5/31/15 | $8,713 | $10,298 | $9,940 | $6,849 |
| 6/30/15 | $8,504 | $10,186 | $9,832 | $6,970 |
| 7/31/15 | $8,126 | $10,257 | $9,862 | $6,121 |
| 8/31/15 | $7,797 | $10,242 | $9,778 | $6,113 |
| 9/30/15 | $7,487 | $10,311 | $9,712 | $5,862 |
| 10/31/15 | $7,819 | $10,313 | $9,742 | $5,904 |
| 11/30/15 | $7,621 | $10,286 | $9,734 | $5,515 |
| 12/31/15 | $7,378 | $10,252 | $9,651 | $5,189 |
| 1/31/16 | $7,159 | $10,393 | $9,799 | $4,981 |
| 2/29/16 | $7,268 | $10,467 | $9,915 | $4,952 |
| 3/31/16 | $7,718 | $10,564 | $10,101 | $5,175 |
| 4/30/16 | $8,011 | $10,604 | $10,140 | $5,662 |
| 5/31/16 | $7,895 | $10,607 | $10,064 | $5,744 |
| 6/30/16 | $8,146 | $10,798 | $10,284 | $5,966 |
| 7/31/16 | $8,216 | $10,866 | $10,387 | $5,581 |
| 8/31/16 | $8,146 | $10,854 | $10,342 | $5,614 |
| 9/30/16 | $8,260 | $10,847 | $10,394 | $5,868 |
| 10/31/16 | $8,072 | $10,765 | $10,344 | $5,837 |
| 11/30/16 | $8,105 | $10,509 | $10,135 | $5,961 |
| 12/31/16 | $8,267 | $10,524 | $10,120 | $6,182 |
| 1/31/17 | $8,393 | $10,545 | $10,208 | $6,146 |
| 2/28/17 | $8,386 | $10,616 | $10,263 | $6,154 |
| 3/31/17 | $8,306 | $10,611 | $10,258 | $5,953 |
| 4/30/17 | $8,243 | $10,692 | $10,320 | $5,806 |
| 5/31/17 | $8,232 | $10,775 | $10,316 | $5,708 |
| 6/30/17 | $8,188 | $10,764 | $10,215 | $5,652 |
| 7/31/17 | $8,463 | $10,810 | $10,258 | $5,869 |
| 8/31/17 | $8,504 | $10,758 | $10,190 | $5,903 |
| 9/30/17 | $8,616 | $10,855 | $10,307 | $6,019 |
| 10/31/17 | $8,722 | $10,862 | $10,330 | $6,256 |
| 11/30/17 | $8,803 | $10,847 | $10,349 | $6,315 |
| 12/31/17 | $9,113 | $10,897 | $10,453 | $6,502 |
| 1/31/18 | $9,361 | $10,772 | $10,361 | $6,685 |
| 2/28/18 | $8,923 | $10,670 | $10,249 | $6,482 |
| 3/31/18 | $8,988 | $10,738 | $10,364 | $6,616 |
| 4/30/18 | $9,233 | $10,659 | $10,358 | $6,861 |
| 5/31/18 | $9,361 | $10,734 | $10,400 | $7,028 |
| 6/30/18 | $9,271 | $10,721 | $10,446 | $6,891 |
| 7/31/18 | $9,283 | $10,724 | $10,392 | $6,723 |
| 8/31/18 | $9,144 | $10,793 | $10,468 | $6,755 |
| 9/30/18 | $9,277 | $10,723 | $10,350 | $6,972 |
| 10/31/18 | $8,727 | $10,639 | $10,188 | $6,597 |
| 11/30/18 | $8,460 | $10,702 | $10,242 | $5,939 |
| 12/31/18 | $7,929 | $10,899 | $10,299 | $5,663 |
| 1/31/19 | $8,726 | $11,014 | $10,443 | $6,070 |
| 2/28/19 | $8,830 | $11,008 | $10,440 | $6,245 |
| 3/31/19 | $8,937 | $11,219 | $10,642 | $6,214 |
| 4/30/19 | $8,963 | $11,222 | $10,676 | $6,278 |
| 5/31/19 | $8,600 | $11,422 | $10,868 | $5,913 |
| 6/30/19 | $9,040 | $11,564 | $10,955 | $6,133 |
| 7/31/19 | $8,942 | $11,589 | $10,998 | $6,080 |
| 8/31/19 | $8,775 | $11,890 | $11,283 | $5,767 |
| 9/30/19 | $8,911 | $11,826 | $11,117 | $5,818 |
| 10/31/19 | $9,008 | $11,862 | $11,144 | $5,937 |
| 11/30/19 | $9,016 | $11,856 | $11,164 | $5,906 |
| 12/31/19 | $9,324 | $11,848 | $11,199 | $6,263 |
| 1/31/20 | $8,972 | $12,076 | $11,451 | $5,719 |
| 2/29/20 | $8,383 | $12,293 | $11,622 | $5,325 |
| 3/31/20 | $7,014 | $12,221 | $11,415 | $4,418 |
| 4/30/20 | $7,452 | $12,438 | $11,748 | $4,272 |
| 5/31/20 | $7,735 | $12,496 | $11,777 | $4,635 |
| 6/30/20 | $7,882 | $12,575 | $11,912 | $4,825 |
| 7/31/20 | $8,163 | $12,762 | $12,214 | $5,076 |
| 8/31/20 | $8,387 | $12,659 | $12,337 | $5,298 |
| 9/30/20 | $8,112 | $12,652 | $12,291 | $5,141 |
| 10/31/20 | $7,964 | $12,596 | $12,207 | $4,981 |
| 11/30/20 | $8,798 | $12,720 | $12,352 | $5,484 |
| 12/31/20 | $9,246 | $12,737 | $12,492 | $5,770 |
| 1/31/21 | $9,280 | $12,646 | $12,527 | $5,978 |
| 2/28/21 | $9,826 | $12,463 | $12,297 | $6,598 |
| 3/31/21 | $9,996 | $12,308 | $12,264 | $6,529 |
| 4/30/21 | $10,447 | $12,405 | $12,446 | $7,066 |
| 5/31/21 | $10,823 | $12,445 | $12,599 | $7,329 |
| 6/30/21 | $10,808 | $12,533 | $12,688 | $7,601 |
| 7/31/21 | $10,899 | $12,673 | $13,044 | $7,726 |
| 8/31/21 | $10,854 | $12,649 | $13,017 | $7,603 |
| 9/30/21 | $10,861 | $12,539 | $12,915 | $7,987 |
| 10/31/21 | $11,381 | $12,536 | $13,068 | $8,463 |
| 11/30/21 | $10,828 | $12,573 | $13,199 | $7,707 |
| 12/31/21 | $11,390 | $12,541 | $13,241 | $8,224 |
| 1/31/22 | $11,704 | $12,271 | $12,947 | $8,876 |
| 2/28/22 | $12,169 | $12,134 | $13,054 | $9,457 |
| 3/31/22 | $13,008 | $11,797 | $12,802 | $10,364 |
| 4/30/22 | $12,801 | $11,349 | $12,522 | $11,009 |
| 5/31/22 | $13,240 | $11,422 | $12,370 | $11,391 |
| 6/30/22 | $11,954 | $11,243 | $11,961 | $10,592 |
| 7/31/22 | $12,320 | $11,518 | $12,504 | $10,406 |
| 8/31/22 | $12,153 | $11,192 | $12,167 | $10,270 |
| 9/30/22 | $11,133 | $10,709 | $11,332 | $9,496 |
| 10/31/22 | $11,927 | $10,570 | $11,475 | $9,975 |
| 11/30/22 | $12,619 | $10,959 | $11,695 | $10,042 |
| 12/31/22 | $12,259 | $10,909 | $11,572 | $9,771 |
| 1/31/23 | $12,820 | $11,245 | $11,794 | $9,805 |
| 2/28/23 | $12,246 | $10,954 | $11,631 | $9,388 |
| 3/31/23 | $12,333 | $11,232 | $11,971 | $9,331 |
| 4/30/23 | $12,389 | $11,300 | $11,979 | $9,218 |
| 5/31/23 | $11,596 | $11,177 | $11,836 | $8,621 |
| 6/30/23 | $12,047 | $11,137 | $11,802 | $8,830 |
| 7/31/23 | $12,673 | $11,130 | $11,809 | $9,546 |
| 8/31/23 | $12,359 | $11,059 | $11,698 | $9,487 |
| 9/30/23 | $12,202 | $10,778 | $11,472 | $9,583 |
| 10/31/23 | $11,881 | $10,607 | $11,378 | $9,373 |
| 11/30/23 | $12,324 | $11,088 | $11,696 | $9,171 |
| 12/31/23 | $12,583 | $11,512 | $12,017 | $8,786 |
| 1/31/24 | $12,260 | $11,481 | $12,035 | $8,886 |
| 2/29/24 | $12,260 | $11,318 | $11,907 | $8,711 |
| 3/31/24 | $12,919 | $11,423 | $12,004 | $9,062 |
| 4/30/24 | $12,891 | $11,134 | $11,794 | $9,194 |
| 5/31/24 | $13,284 | $11,323 | $12,005 | $9,098 |
| 6/30/24 | $12,959 | $11,430 | $12,096 | $9,069 |
Average Annual Total Returns (%)
| Name | 1 Year | 5 Years | 10 Years |
|---|
| RLY | 7.63% | 7.50% | 2.64% |
| Bloomberg U.S. Aggregate Bond Index | 2.63% | (0.23%) | 1.35% |
| Bloomberg U.S. Government Inflation-Linked Bond Index | 2.48% | 2.00% | 1.92% |
| DBIQ Optimum Yield Diversified Commodity Index Excess Return | 2.70% | 8.14% | (0.97%) |
The Fund’s past performance is not necessarily an indication of how the Fund will perform in the future. The returns do not reflect the deduction of taxes that a shareholder would pay on Fund distributions or on the redemption or sale of Fund shares. Updated performance information is available by calling 1-866-787-2257 or visiting our website at www.ssga.com/us/en/institutional/fund-finder?tab=documents&type=etfs.
| Statistic | Value |
|---|
| Total Net Assets | $512,125,883 |
| # of Portfolio Holdings | 13 |
| Portfolio Turnover Rate | 19% |
| Total Advisory Fees Paid | $684,361 |
What did the Fund invest in?
| Asset | % Value of Total Net Assets |
| Mutual Funds and Exchange Traded Products | 100.0% |
| Short-Term Investments | 6.8% |
| Holdings | % Value of Total Net Assets |
| SPDR S&P Global Natural Resources ETF | 28.4% |
| SPDR S&P Global Infrastructure ETF | 24.5% |
| Invesco Optimum Yield Diversified Commodity Strategy No. K-1 ETF | 17.1% |
| SPDR Bloomberg 1-10 Year TIPS ETF | 8.2% |
| Energy Select Sector SPDR Fund | 6.7% |
| SPDR Bloomberg 1-3 Month T-Bills ETF | 5.7% |
| SPDR FTSE International Government Inflation-Protected Bond ETF | 5.1% |
| SPDR S&P Metals & Mining ETF | 3.1% |
| SPDR Dow Jones REIT ETF | 0.5% |
| SPDR Dow Jones International Real Estate ETF | 0.5% |
SPDR SSGA Ultra Short Term Bond ETF
Principal Listing Exchange: NYSEArca
Annual Shareholder Report
June 30, 2024
This annual shareholder report contains important information about the SPDR SSGA Ultra Short Term Bond ETF (the "Fund") for the year ended June 30, 2024. You can find additional information about the Fund, including the Prospectus, Statement of Additional Information, financial statements and other information at www.ssga.com/us/en/institutional/fund-finder?tab=documents&type=etfs. You can also request this information about the Fund by contacting us at 1-866-787-2257.
What were the Fund costs for the last year?
| Fund Name | Cost of a $10,000 investment | Costs paid as a percentage of a $10,000 investment |
|---|
| SPDR SSGA Ultra Short Term Bond ETF | $21 | 0.20% |
How did the Fund perform last year and what affected its performance?
The economy’s continued strength in the context of a significant improvement in inflation led to a modest decline in short-term interest rates and a tightening of investment-grade credit spreads during the reporting period. The Fund’s over-weight allocation to investment grade corporate credit, commercial mortgage-backed securities (“CMBS”), and asset-backed securities (“ABS”), were the primary drivers of the Fund’s out-performance of the Index during the reporting period, while duration detracted from Fund performance. The Fund maintained a duration profile in the range of 0.65 - 0.90 during the reporting period.
The Fund used treasury futures to actively manage duration during the reporting period. The Fund’s use of treasury futures detracted from Fund performance relative to the Index.
The Fund's benchmarks are unmanaged indices used as a general measure of market performance. Calculations assume dividends and capital gains.
Comparison of Change in Value of a $10,000 Investment
(Based on Net Asset Value)
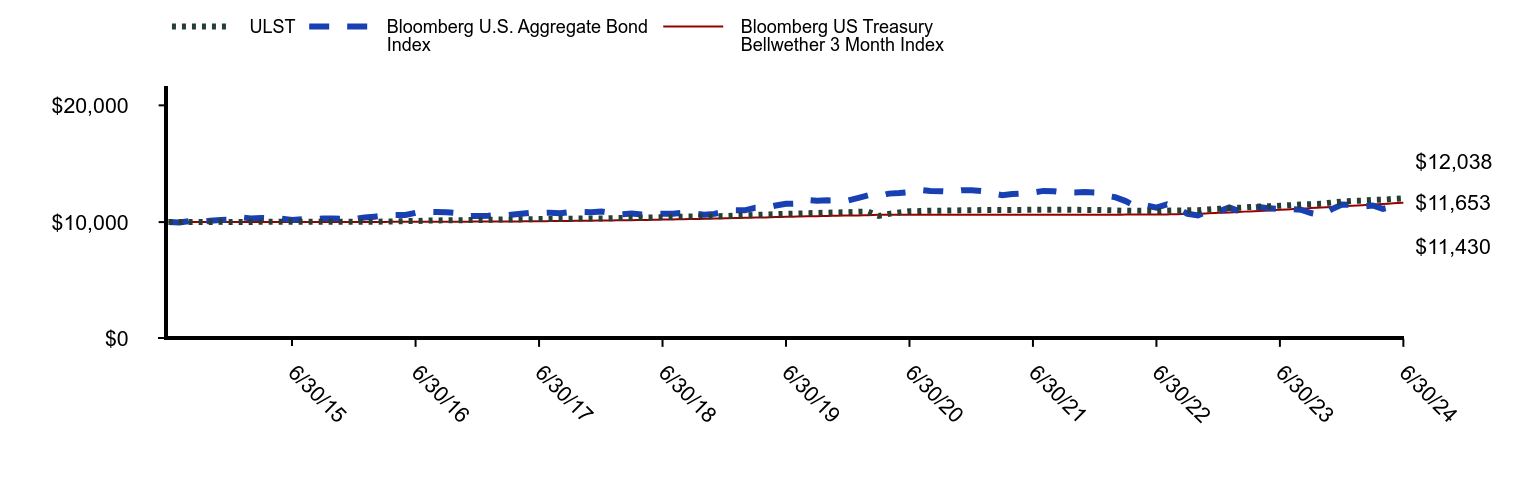
| ULST | Bloomberg U.S. Aggregate Bond Index | Bloomberg US Treasury Bellwether 3 Month Index |
|---|
| 6/30/14 | $10,000 | $10,000 | $10,000 |
| 7/31/14 | $10,016 | $9,975 | $10,001 |
| 8/31/14 | $10,016 | $10,085 | $10,001 |
| 9/30/14 | $10,018 | $10,017 | $10,001 |
| 10/31/14 | $10,016 | $10,115 | $10,002 |
| 11/30/14 | $10,019 | $10,187 | $10,002 |
| 12/31/14 | $10,005 | $10,196 | $10,002 |
| 1/31/15 | $10,017 | $10,410 | $10,003 |
| 2/28/15 | $10,017 | $10,312 | $10,003 |
| 3/31/15 | $10,023 | $10,360 | $10,002 |
| 4/30/15 | $10,031 | $10,323 | $10,003 |
| 5/31/15 | $10,033 | $10,298 | $10,003 |
| 6/30/15 | $10,029 | $10,186 | $10,003 |
| 7/31/15 | $10,027 | $10,257 | $10,003 |
| 8/31/15 | $10,030 | $10,242 | $10,004 |
| 9/30/15 | $10,030 | $10,311 | $10,006 |
| 10/31/15 | $10,031 | $10,313 | $10,005 |
| 11/30/15 | $10,019 | $10,286 | $10,006 |
| 12/31/15 | $10,021 | $10,252 | $10,009 |
| 1/31/16 | $10,029 | $10,393 | $10,008 |
| 2/29/16 | $10,021 | $10,467 | $10,011 |
| 3/31/16 | $10,050 | $10,564 | $10,017 |
| 4/30/16 | $10,063 | $10,604 | $10,020 |
| 5/31/16 | $10,090 | $10,607 | $10,021 |
| 6/30/16 | $10,091 | $10,798 | $10,025 |
| 7/31/16 | $10,123 | $10,866 | $10,027 |
| 8/31/16 | $10,142 | $10,854 | $10,029 |
| 9/30/16 | $10,155 | $10,847 | $10,034 |
| 10/31/16 | $10,165 | $10,765 | $10,037 |
| 11/30/16 | $10,171 | $10,509 | $10,039 |
| 12/31/16 | $10,181 | $10,524 | $10,043 |
| 1/31/17 | $10,199 | $10,545 | $10,048 |
| 2/28/17 | $10,213 | $10,616 | $10,052 |
| 3/31/17 | $10,226 | $10,611 | $10,053 |
| 4/30/17 | $10,230 | $10,692 | $10,060 |
| 5/31/17 | $10,243 | $10,775 | $10,065 |
| 6/30/17 | $10,257 | $10,764 | $10,074 |
| 7/31/17 | $10,266 | $10,810 | $10,083 |
| 8/31/17 | $10,278 | $10,758 | $10,091 |
| 9/30/17 | $10,290 | $10,855 | $10,101 |
| 10/31/17 | $10,301 | $10,862 | $10,110 |
| 11/30/17 | $10,311 | $10,847 | $10,119 |
| 12/31/17 | $10,310 | $10,897 | $10,130 |
| 1/31/18 | $10,335 | $10,772 | $10,143 |
| 2/28/18 | $10,342 | $10,670 | $10,153 |
| 3/31/18 | $10,348 | $10,738 | $10,167 |
| 4/30/18 | $10,372 | $10,659 | $10,181 |
| 5/31/18 | $10,402 | $10,734 | $10,197 |
| 6/30/18 | $10,417 | $10,721 | $10,213 |
| 7/31/18 | $10,445 | $10,724 | $10,230 |
| 8/31/18 | $10,462 | $10,793 | $10,247 |
| 9/30/18 | $10,477 | $10,723 | $10,263 |
| 10/31/18 | $10,498 | $10,639 | $10,282 |
| 11/30/18 | $10,507 | $10,702 | $10,302 |
| 12/31/18 | $10,513 | $10,899 | $10,322 |
| 1/31/19 | $10,553 | $11,014 | $10,344 |
| 2/28/19 | $10,583 | $11,008 | $10,362 |
| 3/31/19 | $10,617 | $11,219 | $10,384 |
| 4/30/19 | $10,646 | $11,222 | $10,404 |
| 5/31/19 | $10,678 | $11,422 | $10,427 |
| 6/30/19 | $10,704 | $11,564 | $10,451 |
| 7/31/19 | $10,727 | $11,589 | $10,471 |
| 8/31/19 | $10,757 | $11,890 | $10,491 |
| 9/30/19 | $10,778 | $11,826 | $10,510 |
| 10/31/19 | $10,807 | $11,862 | $10,532 |
| 11/30/19 | $10,826 | $11,856 | $10,544 |
| 12/31/19 | $10,851 | $11,848 | $10,559 |
| 1/31/20 | $10,884 | $12,076 | $10,573 |
| 2/29/20 | $10,896 | $12,293 | $10,589 |
| 3/31/20 | $10,530 | $12,221 | $10,621 |
| 4/30/20 | $10,705 | $12,438 | $10,622 |
| 5/31/20 | $10,821 | $12,496 | $10,622 |
| 6/30/20 | $10,920 | $12,575 | $10,623 |
| 7/31/20 | $10,945 | $12,762 | $10,626 |
| 8/31/20 | $10,976 | $12,659 | $10,626 |
| 9/30/20 | $10,979 | $12,652 | $10,627 |
| 10/31/20 | $10,995 | $12,596 | $10,628 |
| 11/30/20 | $11,006 | $12,720 | $10,629 |
| 12/31/20 | $11,012 | $12,737 | $10,631 |
| 1/31/21 | $11,035 | $12,646 | $10,632 |
| 2/28/21 | $11,035 | $12,463 | $10,633 |
| 3/31/21 | $11,031 | $12,308 | $10,633 |
| 4/30/21 | $11,042 | $12,405 | $10,634 |
| 5/31/21 | $11,045 | $12,445 | $10,634 |
| 6/30/21 | $11,052 | $12,533 | $10,633 |
| 7/31/21 | $11,052 | $12,673 | $10,634 |
| 8/31/21 | $11,053 | $12,649 | $10,634 |
| 9/30/21 | $11,060 | $12,539 | $10,635 |
| 10/31/21 | $11,049 | $12,536 | $10,634 |
| 11/30/21 | $11,040 | $12,573 | $10,635 |
| 12/31/21 | $11,037 | $12,541 | $10,635 |
| 1/31/22 | $11,019 | $12,271 | $10,635 |
| 2/28/22 | $10,996 | $12,134 | $10,636 |
| 3/31/22 | $10,970 | $11,797 | $10,640 |
| 4/30/22 | $10,965 | $11,349 | $10,641 |
| 5/31/22 | $10,966 | $11,422 | $10,649 |
| 6/30/22 | $10,931 | $11,243 | $10,651 |
| 7/31/22 | $10,973 | $11,518 | $10,657 |
| 8/31/22 | $10,996 | $11,192 | $10,676 |
| 9/30/22 | $11,005 | $10,709 | $10,700 |
| 10/31/22 | $11,020 | $10,570 | $10,719 |
| 11/30/22 | $11,078 | $10,959 | $10,755 |
| 12/31/22 | $11,136 | $10,909 | $10,796 |
| 1/31/23 | $11,200 | $11,245 | $10,832 |
| 2/28/23 | $11,224 | $10,954 | $10,869 |
| 3/31/23 | $11,283 | $11,232 | $10,916 |
| 4/30/23 | $11,327 | $11,300 | $10,954 |
| 5/31/23 | $11,363 | $11,177 | $11,000 |
| 6/30/23 | $11,399 | $11,137 | $11,050 |
| 7/31/23 | $11,449 | $11,130 | $11,097 |
| 8/31/23 | $11,505 | $11,059 | $11,148 |
| 9/30/23 | $11,537 | $10,778 | $11,197 |
| 10/31/23 | $11,574 | $10,607 | $11,249 |
| 11/30/23 | $11,673 | $11,088 | $11,299 |
| 12/31/23 | $11,761 | $11,512 | $11,352 |
| 1/31/24 | $11,824 | $11,481 | $11,401 |
| 2/29/24 | $11,836 | $11,318 | $11,448 |
| 3/31/24 | $11,894 | $11,423 | $11,500 |
| 4/30/24 | $11,918 | $11,134 | $11,550 |
| 5/31/24 | $11,985 | $11,323 | $11,606 |
| 6/30/24 | $12,038 | $11,430 | $11,653 |
Average Annual Total Returns (%)
| Name | 1 Year | 5 Years | 10 Years |
|---|
| ULST | 5.65% | 2.38% | 1.87% |
| Bloomberg U.S. Aggregate Bond Index | 2.63% | (0.23%) | 1.35% |
| Bloomberg US Treasury Bellwether 3 Month Index | 5.46% | 2.20% | 1.54% |
The Fund’s past performance is not necessarily an indication of how the Fund will perform in the future. The returns do not reflect the deduction of taxes that a shareholder would pay on Fund distributions or on the redemption or sale of Fund shares. Updated performance information is available by calling 1-866-787-2257 or visiting our website at www.ssga.com/us/en/institutional/fund-finder?tab=documents&type=etfs.
| Statistic | Value |
|---|
| Total Net Assets | $577,813,014 |
| # of Portfolio Holdings | 147 |
| Portfolio Turnover Rate | 65% |
| Total Advisory Fees Paid | $1,184,885 |
What did the Fund invest in?
| Asset | % Value of Total Net Assets |
| Corporate Bonds & Notes | 54.5% |
| U.S. Treasury Obligations | 20.0% |
| Short-Term Investments | 12.5% |
| Asset-Backed Securities | 9.5% |
| Commercial Mortgage Backed Securities | 2.1% |
| Mortgage-Backed Securities | 0.5% |
| Holdings | % Value of Total Net Assets |
| U.S. Treasury Notes, 4.75%, due 07/31/25 | 3.5% |
| American Express Credit Account Master Trust, A, 3.39%, due 05/15/27 | 3.1% |
| Sumitomo Mitsui Financial Group, Inc., 5.46%, due 01/13/26 | 1.7% |
| Hyundai Auto Lease Securitization Trust, A3, 5.05%, due 01/15/26 | 1.7% |
| U.S. Bancorp, 3.60%, due 09/11/24 | 1.7% |
| Mercedes-Benz Auto Lease Trust, A3, 4.74%, due 01/15/27 | 1.7% |
| Huntington Bancshares, Inc., 2.63%, due 08/06/24 | 1.3% |
| Charles Schwab Corp., 5.88%, due 08/24/26 | 1.2% |
| Citigroup, Inc., 6.05%, due 10/30/24 | 1.2% |
| PepsiCo, Inc., 5.76%, due 11/12/24 | 1.2% |
SPDR SSGA US Sector Rotation ETF
Principal Listing Exchange: NYSEArca
Annual Shareholder Report
June 30, 2024
This annual shareholder report contains important information about the SPDR SSGA US Sector Rotation ETF (the "Fund") for the year ended June 30, 2024. You can find additional information about the Fund, including the Prospectus, Statement of Additional Information, financial statements and other information at www.ssga.com/us/en/institutional/fund-finder?tab=documents&type=etfs. You can also request this information about the Fund by contacting us at 1-866-787-2257.
What were the Fund costs for the last year?
| Fund Name | Cost of a $10,000 investment | Costs paid as a percentage of a $10,000 investment |
|---|
| SPDR SSGA US Sector Rotation ETF | $62 | 0.57% |
How did the Fund perform last year and what affected its performance?
During the 12-month period ended June 30, 2024, the S&P 500 Index was a standout performer amongst global equity markets outpacing both the MSCI World ex USA Index of developed markets and the MSCI Emerging Markets Index both measured in USD. Driven by stellar performers, NVIDIA Corp. and Microsoft Corp., the information technology sector returned close to 42% contributing almost half of the overall Index return. Similarly strong performance of Meta Platforms Inc. and Alphabet Inc. powered the communication services sector to a whopping 44.7% return with returns across all other sectors struggling to keep up with the torrid pace set by the front runners. While producing a healthy return over the period, the Fund finished the period behind its benchmark. The largest detractor to the performance of the Fund over the period has been underperformance within both the Technology and Communication Services Select Sector SPDR Funds relative to their respective S&P 500 sectors. From a sector allocation perspective, while overweights to Consumer Staples and Energy hampered results in Q3 and Q4 of 2023, underweights to Real Estate and overweights to Communication Services helped to buoy results in 2024.
The Fund's benchmarks are unmanaged indices used as a general measure of market performance. Calculations assume dividends and capital gains.
Comparison of Change in Value of a $10,000 Investment
(Based on Net Asset Value)
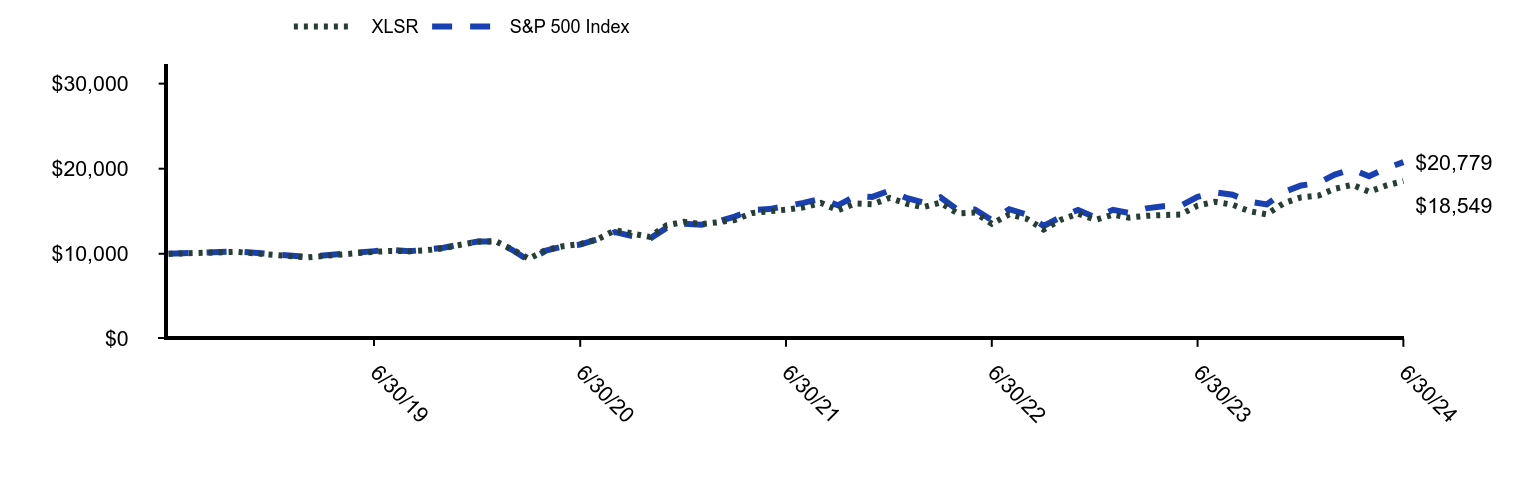
| XLSR | S&P 500 Index |
|---|
| 3/31/19 | $10,000 | $10,000 |
| 4/30/19 | $10,219 | $10,285 |
| 5/31/19 | $9,576 | $9,632 |
| 6/30/19 | $10,237 | $10,310 |
| 7/31/19 | $10,332 | $10,459 |
| 8/31/19 | $10,301 | $10,293 |
| 9/30/19 | $10,408 | $10,486 |
| 10/31/19 | $10,644 | $10,713 |
| 11/30/19 | $11,057 | $11,102 |
| 12/31/19 | $11,419 | $11,437 |
| 1/31/20 | $11,485 | $11,432 |
| 2/29/20 | $10,546 | $10,491 |
| 3/31/20 | $9,416 | $9,195 |
| 4/30/20 | $10,461 | $10,374 |
| 5/31/20 | $10,895 | $10,868 |
| 6/30/20 | $11,139 | $11,084 |
| 7/31/20 | $11,712 | $11,709 |
| 8/31/20 | $12,764 | $12,551 |
| 9/30/20 | $12,387 | $12,074 |
| 10/31/20 | $11,988 | $11,753 |
| 11/30/20 | $13,331 | $13,039 |
| 12/31/20 | $13,750 | $13,541 |
| 1/31/21 | $13,482 | $13,404 |
| 2/28/21 | $13,693 | $13,774 |
| 3/31/21 | $13,972 | $14,377 |
| 4/30/21 | $14,776 | $15,144 |
| 5/31/21 | $15,001 | $15,250 |
| 6/30/21 | $15,184 | $15,606 |
| 7/31/21 | $15,451 | $15,977 |
| 8/31/21 | $15,976 | $16,462 |
| 9/30/21 | $15,116 | $15,697 |
| 10/31/21 | $15,909 | $16,797 |
| 11/30/21 | $15,813 | $16,680 |
| 12/31/21 | $16,567 | $17,428 |
| 1/31/22 | $15,865 | $16,526 |
| 2/28/22 | $15,472 | $16,031 |
| 3/31/22 | $15,999 | $16,626 |
| 4/30/22 | $14,753 | $15,176 |
| 5/31/22 | $14,845 | $15,204 |
| 6/30/22 | $13,521 | $13,949 |
| 7/31/22 | $14,629 | $15,235 |
| 8/31/22 | $14,113 | $14,614 |
| 9/30/22 | $12,857 | $13,268 |
| 10/31/22 | $14,006 | $14,342 |
| 11/30/22 | $14,714 | $15,144 |
| 12/31/22 | $13,984 | $14,271 |
| 1/31/23 | $14,609 | $15,168 |
| 2/28/23 | $14,248 | $14,798 |
| 3/31/23 | $14,460 | $15,341 |
| 4/30/23 | $14,558 | $15,581 |
| 5/31/23 | $14,615 | $15,649 |
| 6/30/23 | $15,656 | $16,683 |
| 7/31/23 | $16,101 | $17,218 |
| 8/31/23 | $15,774 | $16,944 |
| 9/30/23 | $15,008 | $16,136 |
| 10/31/23 | $14,634 | $15,797 |
| 11/30/23 | $15,929 | $17,240 |
| 12/31/23 | $16,632 | $18,023 |
| 1/31/24 | $16,838 | $18,326 |
| 2/29/24 | $17,637 | $19,304 |
| 3/31/24 | $18,113 | $19,926 |
| 4/30/24 | $17,296 | $19,112 |
| 5/31/24 | $18,033 | $20,059 |
| 6/30/24 | $18,549 | $20,779 |
Average Annual Total Returns (%)
| Name | 1 Year | 5 Years | Since Inception 4/2/19 |
|---|
| XLSR | 18.45% | 12.59% | 12.50% |
| S&P 500 Index | 24.56% | 15.05% | 14.96% |
The Fund’s past performance is not necessarily an indication of how the Fund will perform in the future. The returns do not reflect the deduction of taxes that a shareholder would pay on Fund distributions or on the redemption or sale of Fund shares. Updated performance information is available by calling 1-866-787-2257 or visiting our website at www.ssga.com/us/en/institutional/fund-finder?tab=documents&type=etfs.
| Statistic | Value |
|---|
| Total Net Assets | $555,446,399 |
| # of Portfolio Holdings | 8 |
| Portfolio Turnover Rate | 194% |
| Total Advisory Fees Paid | $2,376,030 |
What did the Fund invest in?
| Asset | % Value of Total Net Assets |
| Mutual Funds and Exchange Traded Products | 99.9% |
| Short-Term Investments | 13.0% |
| Holdings | % Value of Total Net Assets |
| Technology Select Sector SPDR Fund | 42.6% |
| Industrial Select Sector SPDR Fund | 19.5% |
| Financial Select Sector SPDR Fund | 15.4% |
| Communication Services Select Sector SPDR Fund | 11.6% |
| Energy Select Sector SPDR Fund | 7.0% |
| Consumer Staples Select Sector SPDR Fund | 3.7% |
(b) Not applicable.
Item 2. Code of Ethics.
As of the end of the period covered by this report, the registrant has adopted a code of ethics that applies to the registrant’s principal executive officer, principal financial officer, principal accounting officer or controller, or persons performing similar functions, regardless of whether these individuals are employed by the registrant or a third party (the “Code of Ethics”). During the period covered by this report, no substantive amendments were made to the Code of Ethics. During the period covered by this report, the registrant did not grant any waivers, including any implicit waivers, from any provision of the Code of Ethics.
The Code of Ethics is attached hereto as Exhibit 19(a)(1).
Item 3. Audit Committee Financial Expert.
(a)(1) The Board of Trustees of the registrant has determined that the registrant has four Board members serving on the Audit Committee that possess the attributes identified in Instructions 2(b) of Item 3 to Form N-CSR to qualify as an “audit committee financial expert.”
(2) Dwight Churchill, Clare Richer, Kristi Rowsell, Sandra Sponem and Carl Verboncoeur are the registrant’s audit committee financial experts. The Board also determined that each of the foregoing persons are not “interested person(s)” of the registrant as that term is defined in Section 2(a)(19) of the Investment Company Act of 1940, as amended (the “1940 Act”).
Item 4. Principal Accountant Fees and Services.
(a) Audit Fees.
For the fiscal years ending June 30, 2024 and June 30, 2023, the aggregate audit fees billed for professional services rendered by the principal accountant were $411,862 and $397,862, respectively. Audit fees include the performance of the annual audits and routine regulatory filings (one for each SEC registrant).
(b) Audit-Related Fees.
For the fiscal years ending June 30, 2024 and June 30, 2023, the principal accountant did not bill the registrant any fees for assurances and related services that are reasonably related to the performance of the audit of the registrant’s financial statements and are not reported under paragraph (a) of this Item.
(c) Tax Fees.
For the fiscal years ending June 30, 2024 and June 30, 2023, the aggregate tax fees billed for professional services rendered by the principal accountant were $38,065 and $38,065, respectively. Tax fees represent services related to the review of year-end distribution requirements.
(d) All Other Fees.
For the fiscal years ended June 30, 2024 and June 30, 2023, there were no fees billed for professional services rendered by E&Y for products and services provided by E&Y to the Trust, other than the services reported in paragraphs (a) through (c).
For the fiscal years ended June 30, 2024 and June 30, 2023, the aggregate fees for professional services rendered by E&Y for products and services provided by E&Y to the Adviser and any entity controlling, controlled by, or under common control with the Adviser that provides ongoing services to the Trust that (i) relate directly to the operations and financial reporting of the Trust and (ii) were pre-approved by the Audit Committee were approximately $9,387,702 and $9,540,002, respectively.
(e)(1) Audit Committee Pre-Approval Policies and Procedures.
The registrant’s Audit Committee Charter states the following with respect to pre-approval procedures:
Before the independent auditors are engaged by the Trust to render audit, audit-related or permissible non-audit services, either:
| | (a) | The Audit Committee shall pre-approve all audit, audit-related and permissible non-audit services provided to the Trust. The Audit Committee may delegate to one or more of its members the authority to grant pre-approvals. Any decision of any member to whom authority is delegated under this section shall be presented to the full Audit Committee at its next regularly scheduled meeting; |
or
| | (b) | The engagement to render the audit, audit-related or permissible non-audit service is entered into pursuant to pre-approval policies and procedures established by the Audit Committee. Any such policies and procedures must (1) be detailed as to the particular service and (2) not involve any delegation of the Audit Committee’s responsibilities to the investment adviser. The Audit Committee must be informed of each service entered into pursuant to the policies and procedures. A copy of any such policies and procedures shall be attached as an exhibit to the Audit Committee Charter. |
| | (c) | Pre-Approval for a service provided to the Trust other than audit or audit-related services is not required if: (1) the aggregate amount of all such permissible non-audit services provided to the Trust constitutes not more than five percent (5%) of the total amount of revenues paid by the Trust to the independent auditors during the fiscal year in which the permissible non-audit services are provided; (2) such services were not recognized by the Trust at the time of the engagement to be permissible non-audit services; and (3) such services are promptly brought to the attention of the Audit Committee and are approved by the Audit Committee or by one or more members of the Audit Committee to whom authority to grant such approvals has been delegated by the Audit Committee prior to the completion of the audit. |
| | (d) | The Audit Committee shall pre-approve any permissible non-audit services proposed to be provided by the independent auditors to (a) the investment adviser and (b) any entity controlling, controlled by, or under common control with the investment adviser that provides ongoing services to the Trust, if the independent auditors’ engagement with the investment adviser or any such control persons relates directly to the operations and financial reporting of the Trust. It shall be the responsibility of the independent auditors to notify the Audit Committee of any permissible non-audit services that need to be pre-approved. |
Notwithstanding the above, Pre-Approval for any permissible non-audit services under this Sub-section is not required if: (1) the aggregate amount of all such permissible non-audit services constitutes not more than five percent (5%) of the total amount of revenues paid to the independent auditors by the Trust and any other entity that has its services approved under this Section (i.e., the investment adviser or any control person) during the fiscal year in which the permissible non-audit services are provided; (2) such services
were not recognized by the Trust at the time of the engagement to be permissible non-audit services; and (3) such services are promptly brought to the attention of the Audit Committee and are approved by the Audit Committee or by one or more members of the Audit Committee to whom authority to grant such approvals has been delegated by the Audit Committee prior to the completion of the audit.
(e)(2) Percentage of Services.
One hundred percent of the services described in each of paragraphs (b) through (d) of this Item were approved by the registrant’s Audit Committee pursuant to paragraph (c)(7)(i)(C) of Rule 2-01 of Regulation S-X.
(f) Not applicable.
(g) The aggregate non-audit fees billed for by the registrant’s accountant for services rendered to the registrant, and rendered to the registrant’s investment adviser (not including any sub-adviser whose role is primarily portfolio management and is subcontracted with or overseen by another investment adviser), and any entity controlling, controlled by, or under common control with the adviser were as follows:
| | | | | | | | |
| | | FY 2024
(in millions) | | | FY 2023
(in millions) | |
Non audit services billed to: | | | | | | | | |
Registrant: | | | See Item 4(c) | | | | See Item 4(c) | |
Investment Adviser: | | | — | | | | — | |
Other entities in the Investment Company Complex (1)(2): | | | | | | | | |
Audit Related Fees | | $ | 18.3 | | | $ | 17.9 | |
Tax Fees | | $ | 3.1 | | | $ | 5.6 | |
All Other Fees | | $ | 15 | | | $ | 15.5 | |
| (1) | Information is for the calendar years 2024 and 2023, respectively. |
| (2) | Services under the caption Audit-Related Fees consisted principally of reports on the processing of transactions by servicing organizations, audits of employee benefit plan, non-statutory audits and due diligence procedures. Services under the caption Tax Fees consisted principally of expatriate, compliance and corporate tax advisory services. Services under the caption All Other Fees primarily related to statutory and financial statement audits and the requirement to opine on the design and operating effectiveness of internal control over financial reporting. |
(h) The registrant’s principal accountant notified the registrant’s Audit Committee of all non-audit services that were rendered by the principal accountant to the Adviser and any entity controlling, controlled by, or under common control with the Adviser that provides services to the registrant, which services were not required to be pre-approved pursuant to paragraph (c)(7)(ii) of Rule 2-01 of Regulation S-X, allowing the registrant’s Audit Committee to consider whether such services were compatible with maintaining the principal accountant’s independence.
(i) Not applicable.
(j) Not applicable.
Item 5. Audit Committees of Listed Registrants.
The registrant has an audit committee which was established by the Board of Trustees of the Trust in accordance with Section 3(a)(58)(A) of the Securities Exchange Act of 1934, as amended (the “1934 Act”). The members of the registrant’s Audit Committee are Dwight Churchill, Carolyn Clancy, Clare Richer, James Ross, Kristi Rowsell, Sandra Sponem and Carl Verboncoeur.
Item 6. Investments.
(a) Schedules of Investments are included as part of the reports to shareholders filed under Item 7(a) of this Form N-CSR.
(b) Not applicable to the registrant.
Item 7. Financial Statements and Financial Highlights for Open-End Management Investment Companies
(a) The registrant’s Financial Statements are attached herewith.
(b) The registrant’s Financial Highlights are included as part of the Financial Statements filed under Item 7(a) of this Form.
Annual Financial Statements and Other Information
June 30, 2024
SSGA Active Trust
| SPDR SSGA Multi-Asset Real Return ETF |
| SPDR SSGA Income Allocation ETF |
| SPDR SSGA Global Allocation ETF |
| SPDR SSGA Ultra Short Term Bond ETF |
| SPDR Loomis Sayles Opportunistic Bond ETF |
| SPDR Nuveen Municipal Bond ETF |
| SPDR Nuveen Municipal Bond ESG ETF |
| SPDR SSGA Fixed Income Sector Rotation ETF |
| SPDR SSGA US Sector Rotation ETF |
| SPDR DoubleLine Emerging Markets Fixed Income ETF |
| SPDR DoubleLine Short Duration Total Return Tactical ETF |
| SPDR DoubleLine Total Return Tactical ETF |
The information contained in this report is intended for the general information of shareholders of the Trust. This report is not authorized for distribution to prospective investors unless preceded or accompanied by a current Trust prospectus which contains important information concerning the Trust. You may obtain a current prospectus and SAI from the Distributor by calling 1-866-787-2257 or visiting https://www.ssga.com/spdrs. Please read the prospectus carefully before you invest.
TABLE OF CONTENTS
Changes in and Disagreements with Accountants for Open-End Management Investment Companies (N-CSR Item 8) - Not Applicable
Proxy Disclosures for Open-End Management Investment Companies (N-CSR Item 9) - Not applicable
Remuneration Paid to Directors, Officers, and Others of Open-End Management Investment Companies (N-CSR Item 10) - Please see Statement of Operations in the Financial Statements under Item 7 above
SPDR SSGA MULTI-ASSET REAL RETURN ETF
SCHEDULE OF INVESTMENTS
June 30, 2024
| Security Description | | | Shares | | Value |
| MUTUAL FUNDS AND EXCHANGE TRADED PRODUCTS — 100.0% | | | |
| COMMODITIES — 17.2% | |
Invesco Optimum Yield Diversified Commodity Strategy No. K-1 ETF
| | | 6,249,685 | | $87,808,074 |
| DOMESTIC EQUITY — 6.7% | |
The Energy Select Sector SPDR Fund (a)(b)
| | | 374,042 | | 34,093,928 |
| DOMESTIC FIXED INCOME — 5.7% | |
SPDR Bloomberg 1-3 Month T-Bills ETF (a)(b)
| | | 319,476 | | 29,321,507 |
| INFLATION LINKED — 8.2% | |
SPDR Bloomberg 1-10 Year TIPS ETF (a)
| | | 2,266,917 | | 41,892,626 |
| INTERNATIONAL EQUITY — 24.7% | |
SPDR S&P Global Infrastructure ETF (a)(b)
| | | 2,294,111 | | 125,373,166 |
VanEck Agribusiness ETF (b)
| | | 17,865 | | 1,252,694 |
| | | | | | 126,625,860 |
| INTERNATIONAL FIXED INCOME — 5.1% | |
SPDR FTSE International Government Inflation-Protected Bond ETF (a)(b)
| | | 675,635 | | 26,018,704 |
| NATURAL RESOURCES — 31.4% | |
SPDR S&P Global Natural Resources ETF (a)(b)
| | | 2,601,163 | | 145,274,954 |
SPDR S&P Metals & Mining ETF (a)(b)
| | | 265,529 | | 15,753,836 |
| | | | | | 161,028,790 |
| REAL ESTATE — 1.0% | |
SPDR Dow Jones International Real Estate ETF (a)(b)
| | | 103,331 | | 2,479,944 |
SPDR Dow Jones REIT ETF REIT (a)(b)
| | | 29,278 | | 2,725,782 |
| | | | | | 5,205,726 |
TOTAL MUTUAL FUNDS AND EXCHANGE TRADED PRODUCTS
(Cost $529,416,782)
| | 511,995,215 | |
| Security Description | | | Shares | | Value |
| SHORT-TERM INVESTMENTS — 6.8% | | | |
State Street Institutional U.S. Government Money Market Fund, Class G Shares 5.29% (c)(d)
| | | 717,914 | | $717,914 |
State Street Navigator Securities Lending Portfolio II (e)(f)
| | | 34,075,823 | | 34,075,823 |
TOTAL SHORT-TERM INVESTMENTS
(Cost $34,793,737)
| | | | | $34,793,737 |
TOTAL INVESTMENTS — 106.8%
(Cost $564,210,519)
| | | | | 546,788,952 |
LIABILITIES IN EXCESS OF OTHER ASSETS — (6.8)%
| | | | | (34,663,069) |
NET ASSETS — 100.0%
| | | | | $512,125,883 |
| The Fund invests in other funds and financial statements of underlying funds can be found at www.sec.gov. |
| |
| (a) | Affiliated fund managed by SSGA Funds Management, Inc. Amounts related to these investments during the year ended June 30, 2024 are shown in the Affiliate Table below. |
| (b) | All or a portion of the shares of the security are on loan at June 30, 2024. |
| (c) | The Fund invested in certain money market funds managed by SSGA Funds Management, Inc. Amounts related to these investments during the year ended June 30, 2024 are shown in the Affiliate Table below. |
| (d) | The rate shown is the annualized seven-day yield at June 30, 2024. |
| (e) | The Fund invested in an affiliated entity. Amounts related to these investments during the year ended June 30, 2024 are shown in the Affiliate Table below. |
| (f) | Investment of cash collateral for securities loaned. |
See accompanying notes to financial statements.
1
SPDR SSGA MULTI-ASSET REAL RETURN ETF
SCHEDULE OF INVESTMENTS (continued)
June 30, 2024
The following table summarizes the value of the Fund's investments according to the fair value hierarchy as of June 30, 2024.
| Description | | Level 1 –
Quoted Prices | | Level 2 –
Other Significant
Observable Inputs | | Level 3 –
Significant
Unobservable Inputs | | Total |
| ASSETS: | | | | | | | | |
| INVESTMENTS: | | | | | | | | |
Mutual Funds and Exchange Traded Products
| | $511,995,215 | | $— | | $— | | $511,995,215 |
Short-Term Investments
| | 34,793,737 | | — | | — | | 34,793,737 |
TOTAL INVESTMENTS
| | $546,788,952 | | $— | | $— | | $546,788,952 |
Affiliate Table
| | Number of
Shares Held
at
6/30/23 | | Value at
6/30/23 | | Cost of
Purchases | | Proceeds
from
Shares Sold | | Realized
Gain (Loss) | | Change in
Unrealized
Appreciation/
Depreciation | | Number of
Shares Held
at
6/30/24 | | Value at
6/30/24 | | Dividend
Income |
SPDR Bloomberg 1-10 Year TIPS ETF
| 2,108,232 | | $38,917,963 | | $28,486,204 | | $25,612,096 | | $(655,785) | | $756,340 | | 2,266,917 | | $41,892,626 | | $1,625,528 |
SPDR Bloomberg 1-3 Month T-Bills ETF
| — | | — | | 36,793,628 | | 7,546,518 | | 2,757 | | 71,640 | | 319,476 | | 29,321,507 | | 455,716 |
SPDR Dow Jones International Real Estate ETF
| 106,095 | | 2,627,973 | | 1,469,910 | | 1,572,436 | | (58,965) | | 13,462 | | 103,331 | | 2,479,944 | | 90,887 |
SPDR Dow Jones REIT ETF
| 118,899 | | 10,753,226 | | 1,589,641 | | 9,731,556 | | (513,642) | | 628,113 | | 29,278 | | 2,725,782 | | 128,545 |
SPDR FTSE International Government Inflation-Protected Bond ETF
| 327,586 | | 13,679,991 | | 22,979,044 | | 9,425,295 | | 3,269 | | (1,218,305) | | 675,635 | | 26,018,704 | | 1,120,464 |
SPDR Gold MiniShares Trust
| 276,756 | | 10,541,636 | | 11,149,513 | | 24,740,069 | | 2,948,994 | | 99,926 | | — | | — | | — |
SPDR S&P Global Infrastructure ETF
| 2,501,429 | | 133,501,265 | | 68,578,959 | | 80,651,921 | | 327,479 | | 3,617,384 | | 2,294,111 | | 125,373,166 | | 5,063,011 |
SPDR S&P Global Natural Resources ETF
| 2,741,886 | | 147,815,074 | | 84,828,238 | | 93,342,252 | | 161,393 | | 5,812,501 | | 2,601,163 | | 145,274,954 | | 5,360,222 |
SPDR S&P Metals & Mining ETF
| 332,119 | | 16,878,288 | | 7,757,357 | | 11,545,164 | | 1,531,758 | | 1,131,597 | | 265,529 | | 15,753,836 | | 132,607 |
State Street Institutional U.S. Government Money Market Fund, Class G Shares
| 21,584,135 | | 21,584,135 | | 36,130,859 | | 56,997,080 | | — | | — | | 717,914 | | 717,914 | | 958,788 |
State Street Navigator Securities Lending Portfolio II
| 32,724,798 | | 32,724,798 | | 848,601,159 | | 847,250,134 | | — | | — | | 34,075,823 | | 34,075,823 | | 218,432 |
The Energy Select Sector SPDR Fund
| 395,864 | | 32,132,281 | | 20,131,860 | | 22,204,516 | | 2,385,917 | | 1,648,386 | | 374,042 | | 34,093,928 | | 1,120,078 |
Total
| | | $461,156,630 | | $1,168,496,372 | | $1,190,619,037 | | $6,133,175 | | $12,561,044 | | | | $457,728,184 | | $16,274,278 |
See accompanying notes to financial statements.
2
SPDR SSGA INCOME ALLOCATION ETF
SCHEDULE OF INVESTMENTS
June 30, 2024
| Security Description | | | Shares | | Value |
| MUTUAL FUNDS AND EXCHANGE TRADED PRODUCTS — 99.8% | | | |
| DOMESTIC EQUITY — 24.1% | |
iShares Mortgage Real Estate ETF (a)
| | | 63,507 | | $1,407,314 |
Schwab U.S. Dividend Equity ETF (a)
| | | 72,023 | | 5,600,509 |
SPDR ICE Preferred Securities ETF (a)(b)
| | | 124,504 | | 4,224,421 |
SPDR Portfolio S&P 500 High Dividend ETF (a)(b)
| | | 140,018 | | 5,632,924 |
| | | | | | 16,865,168 |
| DOMESTIC FIXED INCOME — 43.8% | |
SPDR Blackstone Senior Loan ETF (b)
| | | 100,053 | | 4,182,215 |
SPDR Bloomberg 1-3 Month T-Bills ETF (a)(b)
| | | 23,157 | | 2,125,350 |
SPDR Bloomberg Convertible Securities ETF (a)(b)
| | | 38,603 | | 2,781,732 |
SPDR Bloomberg High Yield Bond ETF (b)
| | | 93,393 | | 8,804,158 |
SPDR Portfolio Intermediate Term Corporate Bond ETF (b)
| | | 9,353 | | 304,534 |
SPDR Portfolio Long Term Treasury ETF (b)
| | | 382,133 | | 10,401,660 |
SPDR Portfolio Short Term Treasury ETF (b)
| | | 70,237 | | 2,027,742 |
| | | | | | 30,627,391 |
| INFLATION LINKED — 3.0% | |
SPDR Bloomberg 1-10 Year TIPS ETF (b)
| | | 112,866 | | 2,085,764 |
| INTERNATIONAL EQUITY — 14.8% | |
SPDR S&P Global Infrastructure ETF (a)(b)
| | | 101,473 | | 5,545,500 |
SPDR S&P International Dividend ETF (b)
| | | 139,817 | | 4,813,899 |
| | | | | | 10,359,399 |
| INTERNATIONAL FIXED INCOME — 12.1% | |
SPDR Bloomberg Emerging Markets Local Bond ETF (a)(b)
| | | 213,357 | | 4,243,671 |
SPDR Bloomberg Emerging Markets USD Bond ETF (a)(b)
| | | 175,800 | | 4,188,364 |
| | | | | | 8,432,035 |
| Security Description | | | Shares | | Value |
| REAL ESTATE — 2.0% | |
SPDR Dow Jones REIT ETF REIT (a)(b)
| | | 15,392 | | $1,432,995 |
TOTAL MUTUAL FUNDS AND EXCHANGE TRADED PRODUCTS
(Cost $71,565,139)
| | 69,802,752 | |
| SHORT-TERM INVESTMENTS — 19.4% | | | |
State Street Institutional U.S. Government Money Market Fund, Class G Shares 5.29% (c)(d)
| | | 40,290 | | 40,290 |
State Street Navigator Securities Lending Portfolio II (e)(f)
| | | 13,527,077 | | 13,527,077 |
TOTAL SHORT-TERM INVESTMENTS
(Cost $13,567,367)
| | | | | $13,567,367 |
TOTAL INVESTMENTS — 119.2%
(Cost $85,132,506)
| | | | | 83,370,119 |
LIABILITIES IN EXCESS OF OTHER ASSETS — (19.2)%
| | | | | (13,441,988) |
NET ASSETS — 100.0%
| | | | | $69,928,131 |
| The Fund invests in other funds and financial statements of underlying funds can be found at www.sec.gov. |
| |
| (a) | All or a portion of the shares of the security are on loan at June 30, 2024. |
| (b) | Affiliated fund managed by SSGA Funds Management, Inc. Amounts related to these investments during the year ended June 30, 2024 are shown in the Affiliate Table below. |
| (c) | The Fund invested in certain money market funds managed by SSGA Funds Management, Inc. Amounts related to these investments during the year ended June 30, 2024 are shown in the Affiliate Table below. |
| (d) | The rate shown is the annualized seven-day yield at June 30, 2024. |
| (e) | The Fund invested in an affiliated entity. Amounts related to these investments during the year ended June 30, 2024 are shown in the Affiliate Table below. |
| (f) | Investment of cash collateral for securities loaned. |
See accompanying notes to financial statements.
3
SPDR SSGA INCOME ALLOCATION ETF
SCHEDULE OF INVESTMENTS (continued)
June 30, 2024
The following table summarizes the value of the Fund's investments according to the fair value hierarchy as of June 30, 2024.
| Description | | Level 1 –
Quoted Prices | | Level 2 –
Other Significant
Observable Inputs | | Level 3 –
Significant
Unobservable Inputs | | Total |
| ASSETS: | | | | | | | | |
| INVESTMENTS: | | | | | | | | |
Mutual Funds and Exchange Traded Products
| | $69,802,752 | | $— | | $— | | $69,802,752 |
Short-Term Investments
| | 13,567,367 | | — | | — | | 13,567,367 |
TOTAL INVESTMENTS
| | $83,370,119 | | $— | | $— | | $83,370,119 |
Affiliate Table
| | Number of
Shares Held
at
6/30/23 | | Value at
6/30/23 | | Cost of
Purchases | | Proceeds
from
Shares Sold | | Realized
Gain (Loss) | | Change in
Unrealized
Appreciation/
Depreciation | | Number of
Shares Held
at
6/30/24 | | Value at
6/30/24 | | Dividend
Income |
SPDR Blackstone Senior Loan ETF
| 173,309 | | $7,256,448 | | $1,567,809 | | $4,639,228 | | $(338,874) | | $336,060 | | 100,053 | | $4,182,215 | | $537,308 |
SPDR Bloomberg 1-10 Year TIPS ETF
| — | | — | | 2,497,735 | | 463,404 | | 7,055 | | 44,378 | | 112,866 | | 2,085,764 | | 57,334 |
SPDR Bloomberg 1-3 Month T-Bills ETF
| — | | — | | 5,490,551 | | 3,371,167 | | 401 | | 5,565 | | 23,157 | | 2,125,350 | | 78,061 |
SPDR Bloomberg Convertible Securities ETF
| 52,305 | | 3,658,735 | | 689,935 | | 1,677,947 | | (66,912) | | 177,921 | | 38,603 | | 2,781,732 | | 68,804 |
SPDR Bloomberg Emerging Markets Local Bond ETF
| 406,911 | | 8,610,237 | | 1,810,406 | | 5,923,741 | | (1,169,069) | | 915,838 | | 213,357 | | 4,243,671 | | 371,987 |
SPDR Bloomberg Emerging Markets USD Bond ETF
| — | | — | | 4,961,150 | | 748,728 | | (3,044) | | (21,014) | | 175,800 | | 4,188,364 | | 99,596 |
SPDR Bloomberg High Yield Bond ETF
| 93,779 | | 8,630,481 | | 7,927,285 | | 7,802,094 | | (138,379) | | 186,865 | | 93,393 | | 8,804,158 | | 525,150 |
SPDR Bloomberg International Corporate Bond ETF
| 50,932 | | 1,445,450 | | 12,392 | | 1,484,866 | | 60,894 | | (33,870) | | — | | — | | 2,463 |
SPDR Dow Jones REIT ETF
| 15,848 | | 1,433,293 | | 434,693 | | 486,075 | | 16,137 | | 34,947 | | 15,392 | | 1,432,995 | | 56,463 |
SPDR ICE Preferred Securities ETF
| 127,166 | | 4,256,246 | | 1,055,094 | | 1,159,974 | | (78,088) | | 151,143 | | 124,504 | | 4,224,421 | | 279,858 |
SPDR Portfolio Intermediate Term Corporate Bond ETF
| — | | — | | 368,895 | | 68,119 | | 650 | | 3,108 | | 9,353 | | 304,534 | | 2,667 |
SPDR Portfolio Long Term Treasury ETF
| 307,978 | | 9,208,542 | | 7,081,040 | | 5,011,788 | | (873,957) | | (2,177) | | 382,133 | | 10,401,660 | | 329,106 |
SPDR Portfolio S&P 500 High Dividend ETF
| 134,956 | | 5,004,168 | | 6,930,661 | | 6,965,078 | | (42,469) | | 705,642 | | 140,018 | | 5,632,924 | | 309,508 |
SPDR Portfolio Short Term Corporate Bond ETF
| — | | — | | 2,354,140 | | 2,350,381 | | (3,759) | | — | | — | | — | | 8,721 |
SPDR Portfolio Short Term Treasury ETF
| — | | — | | 4,166,759 | | 2,110,396 | | (16,403) | | (12,218) | | 70,237 | | 2,027,742 | | 59,133 |
SPDR S&P Global Infrastructure ETF
| 107,500 | | 5,737,275 | | 1,443,792 | | 1,794,742 | | 22,026 | | 137,149 | | 101,473 | | 5,545,500 | | 224,217 |
SPDR S&P International Dividend ETF
| 163,925 | | 5,637,381 | | 4,767,999 | | 5,568,068 | | 140,959 | | (164,372) | | 139,817 | | 4,813,899 | | 145,120 |
State Street Institutional U.S. Government Money Market Fund, Class G Shares
| 814,508 | | 814,508 | | 8,966,843 | | 9,741,061 | | — | | — | | 40,290 | | 40,290 | | 81,193 |
State Street Navigator Securities Lending Portfolio II
| 5,978,695 | | 5,978,695 | | 206,673,127 | | 199,124,745 | | — | | — | | 13,527,077 | | 13,527,077 | | 118,919 |
Total
| | | $67,671,459 | | $269,200,306 | | $260,491,602 | | $(2,482,832) | | $2,464,965 | | | | $76,362,296 | | $3,355,608 |
See accompanying notes to financial statements.
4
SPDR SSGA GLOBAL ALLOCATION ETF
SCHEDULE OF INVESTMENTS
June 30, 2024
| Security Description | | | Shares | | Value |
| MUTUAL FUNDS AND EXCHANGE TRADED PRODUCTS — 96.0% | | | |
| DOMESTIC EQUITY — 32.0% | |
SPDR Portfolio S&P 600 Small Cap ETF (a)(b)
| | | 263,022 | | $10,923,304 |
SPDR S&P 500 ETF Trust (a)
| | | 84,357 | | 45,908,767 |
SPDR S&P MidCap 400 ETF Trust (a)(b)
| | | 8,965 | | 4,796,992 |
The Energy Select Sector SPDR Fund (a)
| | | 52,854 | | 4,817,642 |
The Industrial Select Sector SPDR Fund (a)(b)
| | | 39,158 | | 4,772,185 |
The Technology Select Sector SPDR Fund (a)(b)
| | | 21,698 | | 4,908,738 |
| | | | | | 76,127,628 |
| DOMESTIC FIXED INCOME — 20.1% | |
SPDR Blackstone Senior Loan ETF (a)
| | | 86,601 | | 3,619,922 |
SPDR Bloomberg High Yield Bond ETF (a)
| | | 165,808 | | 15,630,720 |
SPDR Bloomberg International Treasury Bond ETF (a)(b)
| | | 111,791 | | 2,395,681 |
SPDR Portfolio Aggregate Bond ETF (a)
| | | 763,776 | | 19,163,140 |
SPDR Portfolio Long Term Treasury ETF (a)
| | | 259,443 | | 7,062,038 |
| | | | | | 47,871,501 |
| INFLATION LINKED — 4.0% | |
SPDR Bloomberg 1-10 Year TIPS ETF (a)
| | | 521,839 | | 9,643,585 |
| INTERNATIONAL EQUITY — 32.3% | |
SPDR Portfolio Developed World ex-U.S. ETF (a)(b)
| | | 1,234,623 | | 43,310,575 |
SPDR Portfolio Emerging Markets ETF (a)(b)
| | | 702,417 | | 26,460,048 |
SPDR S&P International Small Cap ETF (a)(b)
| | | 228,092 | | 7,239,640 |
| | | | | | 77,010,263 |
| INTERNATIONAL FIXED INCOME — 7.6% | |
SPDR Bloomberg Emerging Markets Local Bond ETF (a)(b)
| | | 361,677 | | 7,193,756 |
| Security Description | | | Shares | | Value |
SPDR Bloomberg Emerging Markets USD Bond ETF (a)
| | | 150,361 | | $3,582,291 |
SPDR Bloomberg International Corporate Bond ETF (a)
| | | 250,826 | | 7,202,469 |
| | | | | | 17,978,516 |
TOTAL MUTUAL FUNDS AND EXCHANGE TRADED PRODUCTS
(Cost $208,070,065)
| | 228,631,493 | |
| SHORT-TERM INVESTMENTS — 19.1% | | | |
State Street Institutional U.S. Government Money Market Fund, Class G Shares 5.29% (c)(d)
| | | 9,255,976 | | 9,255,976 |
State Street Navigator Securities Lending Portfolio II (e)(f)
| | | 36,137,931 | | 36,137,931 |
TOTAL SHORT-TERM INVESTMENTS
(Cost $45,393,907)
| | | | | $45,393,907 |
TOTAL INVESTMENTS — 115.1%
(Cost $253,463,972)
| | | | | 274,025,400 |
LIABILITIES IN EXCESS OF OTHER ASSETS — (15.1)%
| | | | | (35,897,538) |
NET ASSETS — 100.0%
| | | | | $238,127,862 |
| The Fund invests in other funds and financial statements of underlying funds can be found at www.sec.gov. |
| |
| (a) | Affiliated fund managed by SSGA Funds Management, Inc. Amounts related to these investments during the year ended June 30, 2024 are shown in the Affiliate Table below. |
| (b) | All or a portion of the shares of the security are on loan at June 30, 2024. |
| (c) | The Fund invested in certain money market funds managed by SSGA Funds Management, Inc. Amounts related to these investments during the year ended June 30, 2024 are shown in the Affiliate Table below. |
| (d) | The rate shown is the annualized seven-day yield at June 30, 2024. |
| (e) | The Fund invested in an affiliated entity. Amounts related to these investments during the year ended June 30, 2024 are shown in the Affiliate Table below. |
| (f) | Investment of cash collateral for securities loaned. |
See accompanying notes to financial statements.
5
SPDR SSGA GLOBAL ALLOCATION ETF
SCHEDULE OF INVESTMENTS (continued)
June 30, 2024
The following table summarizes the value of the Fund's investments according to the fair value hierarchy as of June 30, 2024.
| Description | | Level 1 –
Quoted Prices | | Level 2 –
Other Significant
Observable Inputs | | Level 3 –
Significant
Unobservable Inputs | | Total |
| ASSETS: | | | | | | | | |
| INVESTMENTS: | | | | | | | | |
Mutual Funds and Exchange Traded Products
| | $228,631,493 | | $— | | $— | | $228,631,493 |
Short-Term Investments
| | 45,393,907 | | — | | — | | 45,393,907 |
TOTAL INVESTMENTS
| | $274,025,400 | | $— | | $— | | $274,025,400 |
Affiliate Table
| | Number of
Shares Held
at
6/30/23 | | Value at
6/30/23 | | Cost of
Purchases | | Proceeds
from
Shares Sold | | Realized
Gain (Loss) | | Change in
Unrealized
Appreciation/
Depreciation | | Number of
Shares Held
at
6/30/24 | | Value at
6/30/24 | | Dividend
Income |
SPDR Blackstone Senior Loan ETF
| 83,240 | | $3,485,259 | | $929,215 | | $787,619 | | $(2,065) | | $(4,868) | | 86,601 | | $3,619,922 | | $312,097 |
SPDR Bloomberg 1-10 Year TIPS ETF
| 740,764 | | 13,674,503 | | 3,007,043 | | 7,050,537 | | (520,740) | | 533,316 | | 521,839 | | 9,643,585 | | 459,492 |
SPDR Bloomberg Emerging Markets Local Bond ETF
| 325,324 | | 6,883,856 | | 1,897,674 | | 1,242,608 | | (16,013) | | (329,153) | | 361,677 | | 7,193,756 | | 267,509 |
SPDR Bloomberg Emerging Markets USD Bond ETF
| — | | — | | 3,796,285 | | 196,916 | | 633 | | (17,711) | | 150,361 | | 3,582,291 | | 81,551 |
SPDR Bloomberg High Yield Bond ETF
| 50,020 | | 4,603,341 | | 19,130,172 | | 7,959,756 | | (165,887) | | 22,850 | | 165,808 | | 15,630,720 | | 500,364 |
SPDR Bloomberg International Corporate Bond ETF
| 244,384 | | 6,935,618 | | 1,550,737 | | 1,348,705 | | 12,403 | | 52,416 | | 250,826 | | 7,202,469 | | 172,503 |
SPDR Bloomberg International Treasury Bond ETF
| 507,878 | | 11,452,649 | | 8,976,489 | | 17,981,065 | | 31,173 | | (83,565) | | 111,791 | | 2,395,681 | | 103,078 |
SPDR Gold Shares
| 37,649 | | 6,711,687 | | 3,374,427 | | 10,992,428 | | 866,861 | | 39,453 | | — | | — | | — |
SPDR Portfolio Aggregate Bond ETF
| 270,297 | | 6,857,435 | | 54,567,034 | | 42,279,008 | | (34,732) | | 52,411 | | 763,776 | | 19,163,140 | | 507,937 |
SPDR Portfolio Developed World ex-U.S. ETF
| 1,116,902 | | 36,343,991 | | 28,065,367 | | 23,410,995 | | 1,953,627 | | 358,585 | | 1,234,623 | | 43,310,575 | | 1,154,997 |
SPDR Portfolio Emerging Markets ETF
| 462,602 | | 15,904,257 | | 13,477,830 | | 4,972,906 | | (13,858) | | 2,064,725 | | 702,417 | | 26,460,048 | | 642,370 |
SPDR Portfolio Europe ETF
| 384,632 | | 14,812,178 | | 2,741,323 | | 17,370,706 | | 1,273,915 | | (1,456,710) | | — | | — | | — |
SPDR Portfolio Intermediate Term Treasury ETF
| — | | — | | 5,989,795 | | 6,131,355 | | 141,560 | | — | | — | | — | | 50,916 |
SPDR Portfolio Long Term Treasury ETF
| 154,046 | | 4,605,975 | | 11,009,134 | | 8,118,589 | | (573,492) | | 139,010 | | 259,443 | | 7,062,038 | | 51,819 |
SPDR Portfolio S&P 600 Small Cap ETF
| 148,000 | | 5,748,320 | | 12,740,850 | | 7,846,647 | | 74,101 | | 206,680 | | 263,022 | | 10,923,304 | | 203,348 |
SPDR S&P 500 ETF Trust
| 125,343 | | 55,562,045 | | 37,098,228 | | 58,849,557 | | 8,866,981 | | 3,231,070 | | 84,357 | | 45,908,767 | | 802,792 |
SPDR S&P International Small Cap ETF
| 220,444 | | 6,725,747 | | 1,709,156 | | 1,473,109 | | (6,600) | | 284,446 | | 228,092 | | 7,239,640 | | 181,482 |
SPDR S&P MidCap 400 ETF Trust
| 9,792 | | 4,689,487 | | 969,035 | | 1,391,243 | | 329,637 | | 200,076 | | 8,965 | | 4,796,992 | | 60,348 |
State Street Institutional U.S. Government Money Market Fund, Class G Shares
| 10,331,839 | | 10,331,839 | | 34,876,427 | | 35,952,290 | | — | | — | | 9,255,976 | | 9,255,976 | | 750,293 |
State Street Navigator Securities Lending Portfolio II
| 41,508,999 | | 41,508,999 | | 1,793,408,746 | | 1,798,779,814 | | — | | — | | 36,137,931 | | 36,137,931 | | 281,947 |
The Communication Services Select Sector SPDR Fund
| — | | — | | 14,386,544 | | 15,018,180 | | 631,636 | | — | | — | | — | | 24,269 |
The Consumer Discretionary Select Sector SPDR Fund
| 28,532 | | 4,845,019 | | 2,543,790 | | 7,177,879 | | (21,964) | | (188,966) | | — | | — | | 8,266 |
The Consumer Staples Select Sector SPDR Fund
| — | | — | | 4,776,907 | | 4,587,682 | | (189,225) | | — | | — | | — | | — |
The Energy Select Sector SPDR Fund
| — | | — | | 10,680,160 | | 5,274,628 | | (463,969) | | (123,921) | | 52,854 | | 4,817,642 | | 117,368 |
The Financial Select Sector SPDR Fund
| — | | — | | 9,394,129 | | 9,748,306 | | 354,177 | | — | | — | | — | | 61 |
The Health Care Select Sector SPDR Fund
| 35,191 | | 4,670,901 | | — | | 4,583,236 | | (8,069) | | (79,596) | | — | | — | | — |
The Industrial Select Sector SPDR Fund
| 44,587 | | 4,785,077 | | 12,441,168 | | 12,464,876 | | 268,148 | | (257,332) | | 39,158 | | 4,772,185 | | 50,102 |
The Materials Select Sector SPDR Fund
| — | | — | | 7,023,471 | | 6,964,560 | | (58,911) | | — | | — | | — | | — |
The Technology Select Sector SPDR Fund
| — | | — | | 9,664,672 | | 5,668,279 | | 740,083 | | 172,262 | | 21,698 | | 4,908,738 | | 27,009 |
Total
| | | $271,138,183 | | $2,110,225,808 | | $2,125,623,479 | | $13,469,410 | | $4,815,478 | | | | $274,025,400 | | $6,811,918 |
See accompanying notes to financial statements.
6
SPDR SSGA ULTRA SHORT TERM BOND ETF
SCHEDULE OF INVESTMENTS
June 30, 2024
| Security Description | | | Principal
Amount | | Value |
| CORPORATE BONDS & NOTES — 54.5% | | | | | |
| AEROSPACE & DEFENSE — 2.2% | |
BAE Systems PLC
5.00%, 3/26/2027 (a)
| | | $2,500,000 | | $2,480,850 |
| Boeing Co.: | | | | | |
4.88%, 5/1/2025
| | | 5,000,000 | | 4,947,150 |
6.26%, 5/1/2027 (a)
| | | 270,000 | | 271,957 |
Howmet Aerospace, Inc.
5.13%, 10/1/2024
| | | 3,264,000 | | 3,264,000 |
L3Harris Technologies, Inc.
5.40%, 1/15/2027
| | | 1,000,000 | | 1,003,890 |
RTX Corp.
5.75%, 11/8/2026
| | | 750,000 | | 758,040 |
| | | | | | 12,725,887 |
| AGRICULTURE — 1.7% | |
| Imperial Brands Finance PLC: | | | | | |
3.13%, 7/26/2024 (a)
| | | 408,000 | | 407,311 |
4.25%, 7/21/2025 (a)
| | | 1,090,000 | | 1,073,323 |
| Philip Morris International, Inc.: | | | | | |
4.75%, 2/12/2027
| | | 3,420,000 | | 3,392,845 |
5.13%, 11/15/2024
| | | 2,500,000 | | 2,494,675 |
Reynolds American, Inc.
4.45%, 6/12/2025
| | | 2,500,000 | | 2,470,700 |
| | | | | | 9,838,854 |
| APPAREL — 0.1% | |
Tapestry, Inc.
7.05%, 11/27/2025
| | | 625,000 | | 635,531 |
| AUTO MANUFACTURERS — 4.9% | |
| American Honda Finance Corp.: | | | | | |
Series GMTN, 5.80%, 10/3/2025
| | | 3,000,000 | | 3,015,240 |
SOFR + 0.92%, 6.28%, 1/12/2026 (b)
| | | 2,915,000 | | 2,932,374 |
| Daimler Truck Finance North America LLC: | | | | | |
5.00%, 1/15/2027 (a)
| | | 2,500,000 | | 2,481,650 |
5.20%, 1/17/2025 (a)
| | | 1,500,000 | | 1,495,695 |
SOFR + 0.75%, 6.12%, 12/13/2024 (a) (b)
| | | 1,000,000 | | 1,001,860 |
Ford Motor Credit Co. LLC
2.30%, 2/10/2025
| | | 1,680,000 | | 1,642,082 |
| General Motors Financial Co., Inc.: | | | | | |
3.80%, 4/7/2025
| | | 2,000,000 | | 1,969,560 |
5.40%, 4/6/2026
| | | 925,000 | | 923,011 |
| Mercedes-Benz Finance North America LLC: | | | | | |
5.50%, 11/27/2024 (a)
| | | 5,000,000 | | 4,992,150 |
SOFR + 0.93%, 6.31%, 3/30/2025 (a) (b)
| | | 4,000,000 | | 4,017,840 |
Nissan Motor Acceptance Co. LLC
6.95%, 9/15/2026 (a)
| | | 500,000 | | 511,915 |
| Security Description | | | Principal
Amount | | Value |
Toyota Motor Credit Corp.
SOFR + 0.56%, 5.91%, 1/10/2025 (b)
| | | $3,335,000 | | $3,338,202 |
| | | | | | 28,321,579 |
| BANKS — 15.9% | |
Bank of America NA
SOFR + 0.78%, 6.15%, 8/18/2025 (b)
| | | 5,000,000 | | 5,022,350 |
Canadian Imperial Bank of Commerce
5.93%, 10/2/2026
| | | 2,500,000 | | 2,531,950 |
Citibank NA
5.86%, 9/29/2025
| | | 1,880,000 | | 1,889,419 |
Citigroup, Inc.
SOFR + 0.69%, 6.05%, 10/30/2024 (b)
| | | 7,000,000 | | 7,005,180 |
Discover Bank
2.45%, 9/12/2024
| | | 2,000,000 | | 1,986,120 |
| Goldman Sachs Group, Inc.: | | | | | |
3.85%, 1/26/2027
| | | 1,400,000 | | 1,353,016 |
5.70%, 11/1/2024
| | | 5,000,000 | | 4,997,350 |
SOFR + 0.49%, 5.85%, 10/21/2024 (b)
| | | 1,500,000 | | 1,499,760 |
SOFR + 0.51%, 5.88%, 9/10/2024 (b)
| | | 5,000,000 | | 5,001,100 |
HSBC Holdings PLC
SOFR + 1.43%, 6.80%, 3/10/2026 (b)
| | | 1,000,000 | | 1,004,890 |
HSBC USA, Inc.
5.63%, 3/17/2025
| | | 3,000,000 | | 3,000,180 |
Huntington Bancshares, Inc.
2.63%, 8/6/2024
| | | 7,333,000 | | 7,307,701 |
KeyBank NA
4.15%, 8/8/2025
| | | 770,000 | | 755,146 |
Macquarie Group Ltd.
SOFR + 0.71%, 6.07%, 10/14/2025 (a) (b)
| | | 1,000,000 | | 1,000,090 |
Mitsubishi UFJ Financial Group, Inc.
1 yr. CMT + 1.70%, 4.79%, 7/18/2025 (b)
| | | 5,000,000 | | 4,997,150 |
Morgan Stanley
Series GMTN, SOFR + 0.51%, 5.87%, 1/22/2025 (b)
| | | 1,500,000 | | 1,500,990 |
Morgan Stanley Bank NA
5.88%, 10/30/2026
| | | 5,000,000 | | 5,059,750 |
National Australia Bank Ltd.
1.39%, 1/12/2025 (a)
| | | 1,500,000 | | 1,468,275 |
NatWest Markets PLC
SOFR + 0.53%, 5.89%, 8/12/2024 (a) (b)
| | | 2,125,000 | | 2,125,510 |
Royal Bank of Canada
Series GMTN, SOFR + 0.53%, 5.88%, 1/20/2026 (b)
| | | 500,000 | | 499,470 |
| Sumitomo Mitsui Financial Group, Inc.: | | | | | |
5.46%, 1/13/2026
| | | 10,000,000 | | 9,998,900 |
See accompanying notes to financial statements.
7
SPDR SSGA ULTRA SHORT TERM BOND ETF
SCHEDULE OF INVESTMENTS (continued)
June 30, 2024
| Security Description | | | Principal
Amount | | Value |
SOFR + 1.43%, 6.78%, 1/13/2026 (b)
| | | $2,000,000 | | $2,026,520 |
| Sumitomo Mitsui Trust Bank Ltd.: | | | | | |
0.80%, 9/16/2024 (a)
| | | 2,500,000 | | 2,472,975 |
SOFR + 0.44%, 5.81%, 9/16/2024 (a) (b)
| | | 1,500,000 | | 1,500,360 |
Toronto-Dominion Bank
Series MTN, SOFR + 0.35%, 5.72%, 9/10/2024 (b)
| | | 1,515,000 | | 1,515,182 |
U.S. Bancorp
Series MTN, 3.60%, 9/11/2024
| | | 10,000,000 | | 9,952,500 |
Wells Fargo & Co.
Series MTN, 3 mo. USD Term SOFR + 1.09%, 2.41%, 10/30/2025 (b)
| | | 4,500,000 | | 4,448,745 |
| | | | | | 91,920,579 |
| BEVERAGES — 1.4% | |
Constellation Brands, Inc.
5.00%, 2/2/2026
| | | 1,000,000 | | 997,450 |
PepsiCo, Inc.
SOFR + 0.40%, 5.76%, 11/12/2024 (b)
| | | 7,000,000 | | 7,001,610 |
| | | | | | 7,999,060 |
| BIOTECHNOLOGY — 0.1% | |
Amgen, Inc.
5.51%, 3/2/2026
| | | 500,000 | | 499,985 |
| CHEMICALS — 1.0% | |
Chevron Phillips Chemical Co. LLC/Chevron Phillips Chemical Co. LP
3.40%, 12/1/2026 (a)
| | | 3,226,000 | | 3,079,507 |
| Nutrien Ltd.: | | | | | |
5.20%, 6/21/2027
| | | 1,085,000 | | 1,083,893 |
5.90%, 11/7/2024
| | | 830,000 | | 829,917 |
Sherwin-Williams Co.
4.05%, 8/8/2024
| | | 875,000 | | 873,259 |
| | | | | | 5,866,576 |
| COMMERCIAL SERVICES — 0.1% | |
Cintas Corp. No. 2
3.45%, 5/1/2025
| | | 585,000 | | 574,932 |
| CONSTRUCTION MATERIALS — 0.1% | |
Owens Corning
5.50%, 6/15/2027
| | | 700,000 | | 706,300 |
| COSMETICS/PERSONAL CARE — 0.2% | |
Kenvue, Inc.
5.50%, 3/22/2025
| | | 1,040,000 | | 1,040,052 |
| DIVERSIFIED FINANCIAL SERVICES — 3.3% | |
AerCap Ireland Capital DAC/AerCap Global Aviation Trust
6.45%, 4/15/2027
| | | 915,000 | | 936,530 |
Ally Financial, Inc.
5.13%, 9/30/2024
| | | 3,000,000 | | 2,993,250 |
| Security Description | | | Principal
Amount | | Value |
Charles Schwab Corp.
5.88%, 8/24/2026
| | | $7,000,000 | | $7,079,240 |
Nasdaq, Inc.
5.65%, 6/28/2025
| | | 645,000 | | 645,348 |
Stifel Financial Corp.
4.25%, 7/18/2024
| | | 1,000,000 | | 998,530 |
Synchrony Financial
4.25%, 8/15/2024
| | | 6,597,000 | | 6,578,924 |
| | | | | | 19,231,822 |
| ELECTRIC — 1.4% | |
DTE Energy Co.
4.22%, 11/1/2024 (c)
| | | 1,250,000 | | 1,242,762 |
National Rural Utilities Cooperative Finance Corp.
Series D, SOFR + 0.33%, 5.69%, 10/18/2024 (b)
| | | 2,500,000 | | 2,499,450 |
| NextEra Energy Capital Holdings, Inc.: | | | | | |
4.26%, 9/1/2024
| | | 1,250,000 | | 1,246,100 |
5.75%, 9/1/2025
| | | 500,000 | | 501,120 |
6.05%, 3/1/2025
| | | 875,000 | | 876,295 |
Tampa Electric Co.
3.88%, 7/12/2024
| | | 1,670,000 | | 1,668,831 |
| | | | | | 8,034,558 |
| ENTERTAINMENT — 0.3% | |
| Warnermedia Holdings, Inc.: | | | | | |
3.64%, 3/15/2025
| | | 1,000,000 | | 983,980 |
6.41%, 3/15/2026
| | | 1,000,000 | | 999,780 |
| | | | | | 1,983,760 |
| FOOD — 0.1% | |
Campbell Soup Co.
5.30%, 3/20/2026
| | | 830,000 | | 828,083 |
| HAND & MACHINE TOOLS — 0.4% | |
Stanley Black & Decker, Inc.
6.27%, 3/6/2026
| | | 2,500,000 | | 2,499,025 |
| HEALTH CARE PRODUCTS — 0.4% | |
GE HealthCare Technologies, Inc.
5.55%, 11/15/2024
| | | 1,000,000 | | 998,930 |
Revvity, Inc.
0.85%, 9/15/2024
| | | 1,000,000 | | 989,740 |
Smith & Nephew PLC
5.15%, 3/20/2027
| | | 525,000 | | 523,184 |
| | | | | | 2,511,854 |
| INSURANCE — 1.9% | |
Athene Global Funding
5.62%, 5/8/2026 (a)
| | | 2,500,000 | | 2,501,650 |
Corebridge Global Funding
5.75%, 7/2/2026 (a)
| | | 2,500,000 | | 2,508,975 |
Pacific Life Global Funding II
SOFR + 0.62%, 5.99%, 6/4/2026 (a) (b)
| | | 4,168,000 | | 4,167,250 |
See accompanying notes to financial statements.
8
SPDR SSGA ULTRA SHORT TERM BOND ETF
SCHEDULE OF INVESTMENTS (continued)
June 30, 2024
| Security Description | | | Principal
Amount | | Value |
Pricoa Global Funding I
2.40%, 9/23/2024 (a)
| | | $1,500,000 | | $1,488,585 |
| | | | | | 10,666,460 |
| INVESTMENT COMPANY SECURITY — 0.7% | |
ARES Capital Corp.
7.00%, 1/15/2027
| | | 500,000 | | 508,355 |
Blackstone Private Credit Fund
2.35%, 11/22/2024
| | | 1,000,000 | | 984,690 |
Blue Owl Credit Income Corp.
5.50%, 3/21/2025
| | | 2,500,000 | | 2,484,300 |
| | | | | | 3,977,345 |
| IT SERVICES — 0.3% | |
Apple, Inc.
4.42%, 5/8/2026
| | | 1,785,000 | | 1,774,201 |
| LODGING — 0.4% | |
Las Vegas Sands Corp.
5.90%, 6/1/2027
| | | 385,000 | | 386,956 |
Sands China Ltd.
5.13%, 8/8/2025
| | | 2,000,000 | | 1,983,700 |
| | | | | | 2,370,656 |
| MACHINERY, CONSTRUCTION & MINING — 1.0% | |
| Caterpillar Financial Services Corp.: | | | | | |
4.80%, 1/6/2026
| | | 2,500,000 | | 2,487,700 |
5.15%, 8/11/2025
| | | 3,500,000 | | 3,493,875 |
| | | | | | 5,981,575 |
| MACHINERY-DIVERSIFIED — 1.2% | |
| John Deere Capital Corp.: | | | | | |
Series MTN, 3.40%, 6/6/2025
| | | 1,390,000 | | 1,364,466 |
Series MTN, 4.05%, 9/8/2025
| | | 2,000,000 | | 1,972,660 |
Series MTN, 4.80%, 1/9/2026
| | | 2,000,000 | | 1,987,480 |
Series MTN, SOFR + 0.20%, 5.55%, 10/11/2024 (b)
| | | 1,500,000 | | 1,499,490 |
| | | | | | 6,824,096 |
| MINING — 1.8% | |
BHP Billiton Finance USA Ltd.
4.88%, 2/27/2026
| | | 4,000,000 | | 3,971,120 |
Glencore Funding LLC
4.00%, 4/16/2025 (a)
| | | 5,000,000 | | 4,930,500 |
Newmont Corp./Newcrest Finance Pty. Ltd.
5.30%, 3/15/2026 (a)
| | | 1,390,000 | | 1,389,208 |
| | | | | | 10,290,828 |
| MISCELLANEOUS MANUFACTURER — 1.4% | |
| Siemens Financieringsmaatschappij NV: | | | | | |
3.40%, 3/16/2027 (a)
| | | 5,000,000 | | 4,795,050 |
6.13%, 8/17/2026 (a)
| | | 3,000,000 | | 3,057,090 |
| | | | | | 7,852,140 |
| Security Description | | | Principal
Amount | | Value |
| OIL & GAS — 1.0% | |
Chevron USA, Inc.
3.90%, 11/15/2024
| | | $1,000,000 | | $993,970 |
Diamondback Energy, Inc.
5.20%, 4/18/2027
| | | 500,000 | | 500,210 |
Occidental Petroleum Corp.
6.95%, 7/1/2024
| | | 2,500,000 | | 2,500,000 |
| Pioneer Natural Resources Co.: | | | | | |
1.13%, 1/15/2026
| | | 1,000,000 | | 938,390 |
5.10%, 3/29/2026
| | | 795,000 | | 793,553 |
| | | | | | 5,726,123 |
| OIL & GAS SERVICES — 0.4% | |
Schlumberger Holdings Corp.
5.00%, 5/29/2027 (a)
| | | 2,500,000 | | 2,492,350 |
| PACKAGING & CONTAINERS — 0.3% | |
Sonoco Products Co.
1.80%, 2/1/2025
| | | 1,470,000 | | 1,435,014 |
| PHARMACEUTICALS — 3.0% | |
AbbVie, Inc.
4.80%, 3/15/2027
| | | 3,245,000 | | 3,230,398 |
Bristol-Myers Squibb Co.
4.90%, 2/22/2027
| | | 835,000 | | 832,871 |
Cigna Group
5.69%, 3/15/2026
| | | 5,000,000 | | 4,995,550 |
Eli Lilly & Co.
5.00%, 2/27/2026
| | | 3,555,000 | | 3,551,658 |
Pfizer Investment Enterprises Pte. Ltd.
4.65%, 5/19/2025
| | | 2,240,000 | | 2,224,678 |
Viatris, Inc.
1.65%, 6/22/2025
| | | 2,500,000 | | 2,402,200 |
| | | | | | 17,237,355 |
| PIPELINES — 0.9% | |
| Energy Transfer LP: | | | | | |
5.75%, 4/1/2025
| | | 3,000,000 | | 2,993,520 |
6.05%, 12/1/2026
| | | 1,500,000 | | 1,520,130 |
Sabine Pass Liquefaction LLC
5.63%, 3/1/2025
| | | 400,000 | | 399,216 |
| | | | | | 4,912,866 |
| REAL ESTATE INVESTMENT TRUSTS — 2.8% | |
Kilroy Realty LP
3.45%, 12/15/2024
| | | 1,953,000 | | 1,928,216 |
Kite Realty Group Trust
4.00%, 3/15/2025
| | | 3,000,000 | | 2,954,790 |
Omega Healthcare Investors, Inc.
4.50%, 1/15/2025
| | | 1,500,000 | | 1,487,475 |
Realty Income Corp.
5.05%, 1/13/2026
| | | 6,889,000 | | 6,851,455 |
VICI Properties LP/VICI Note Co., Inc.
3.50%, 2/15/2025 (a)
| | | 3,243,000 | | 3,199,868 |
| | | | | | 16,421,804 |
See accompanying notes to financial statements.
9
SPDR SSGA ULTRA SHORT TERM BOND ETF
SCHEDULE OF INVESTMENTS (continued)
June 30, 2024
| Security Description | | | Principal
Amount | | Value |
| RETAIL — 1.1% | |
Dollar General Corp.
4.25%, 9/20/2024
| | | $6,484,000 | | $6,458,648 |
| SEMICONDUCTORS — 1.0% | |
Intel Corp.
4.88%, 2/10/2026
| | | 5,565,000 | | 5,531,944 |
| SOFTWARE — 0.8% | |
Intuit, Inc.
5.25%, 9/15/2026
| | | 2,500,000 | | 2,507,650 |
Microsoft Corp.
3.40%, 9/15/2026
| | | 2,250,000 | | 2,178,248 |
| | | | | | 4,685,898 |
| TELECOMMUNICATIONS — 0.7% | |
AT&T, Inc.
5.54%, 2/20/2026
| | | 4,000,000 | | 4,000,320 |
| TRANSPORTATION — 0.2% | |
Canadian Pacific Railway Co.
1.35%, 12/2/2024
| | | 1,000,000 | | 982,060 |
TOTAL CORPORATE BONDS & NOTES
(Cost $314,917,995)
| | | | | 314,840,120 |
| ASSET-BACKED SECURITIES — 9.5% | | | | | |
| AUTOMOBILE — 6.5% | | | | | |
Honda Auto Receivables Owner Trust
Series 2023-4, Class A2, 5.87%, 6/22/2026
| | | 5,917,598 | | 5,925,017 |
Hyundai Auto Lease Securitization Trust
Series 2023-A, Class A3, 5.05%, 1/15/2026 (a)
| | | 10,000,000 | | 9,976,670 |
Mercedes-Benz Auto Lease Trust
Series 2023-A, Class A3, 4.74%, 1/15/2027
| | | 10,000,000 | | 9,929,170 |
Nissan Auto Lease Trust
Series 2024-A, Class A2A, 5.11%, 10/15/2026
| | | 5,607,000 | | 5,586,727 |
Toyota Auto Receivables Owner Trust
Series 2023-D, Class A2A, 5.80%, 11/16/2026
| | | 5,913,250 | | 5,917,807 |
| | | | | | 37,335,391 |
| CREDIT CARD — 3.0% | | | | | |
American Express Credit Account Master Trust
Series 2022-2, Class A, 3.39%, 5/15/2027
| | | 18,000,000 | | 17,680,927 |
TOTAL ASSET-BACKED SECURITIES
(Cost $54,554,672)
| | | | | 55,016,318 |
| Security Description | | | Principal
Amount | | Value |
| U.S. TREASURY OBLIGATIONS — 20.0% | | | | | |
| U.S. Treasury Bills: | | | | | |
4.75%, 7/9/2024
| | | $40,000,000 | | $39,953,504 |
5.04%, 7/18/2024
| | | 45,000,000 | | 44,888,542 |
| U.S. Treasury Notes: | | | | | |
4.00%, 6/30/2028
| | | 6,746,000 | | 6,643,756 |
4.75%, 7/31/2025
| | | 20,183,100 | | 20,111,355 |
5.00%, 9/30/2025
| | | 3,738,000 | | 3,736,540 |
TOTAL U.S. TREASURY OBLIGATIONS
(Cost $115,336,998)
| | | | | 115,333,697 |
| MORTGAGE-BACKED SECURITIES — 0.5% | | | | | |
BHMS Mortgage Trust Series 2018-ATLS, Class A, 1 mo. USD Term SOFR + 1.55%, 6.88%, 7/15/2035 (a) (b)
(Cost $2,869,552)
| | | 2,870,000 | | 2,862,554 |
| COMMERCIAL MORTGAGE BACKED SECURITIES — 2.1% | | | | | |
BPR Trust Series 2022-OANA, Class A, 1 mo. USD Term SOFR + 1.90%, 7.23%, 4/15/2037 (a) (b)
| | | 1,800,000 | | 1,800,625 |
BX Mortgage Trust Series 2021-PAC, Class B, 1 mo. USD Term SOFR + 1.01%, 6.34%, 10/15/2036 (a) (b)
| | | 2,500,000 | | 2,450,491 |
| Cold Storage Trust: | | | | | |
Series 2020-ICE5, Class A, 1 mo. USD Term SOFR + 1.01%, 6.34%, 11/15/2037 (a) (b)
| | | 3,178,991 | | 3,168,926 |
Series 2020-ICE5, Class B, 1 mo. USD Term SOFR + 1.41%, 6.74%, 11/15/2037 (a) (b)
| | | 4,914,953 | | 4,895,647 |
TOTAL COMMERCIAL MORTGAGE BACKED SECURITIES
(Cost $12,335,086)
| | | | | 12,315,689 |
See accompanying notes to financial statements.
10
SPDR SSGA ULTRA SHORT TERM BOND ETF
SCHEDULE OF INVESTMENTS (continued)
June 30, 2024
| Security Description | | | Shares | | Value |
| SHORT-TERM INVESTMENT — 12.5% | | | |
State Street Institutional U.S. Government Money Market Fund, Class G Shares 5.29% (d) (e)
(Cost $72,098,882)
| | 72,098,882 | | $72,098,882 |
TOTAL INVESTMENTS — 99.1%
(Cost $572,113,185)
| | 572,467,260 | |
OTHER ASSETS IN EXCESS OF LIABILITIES — 0.9%
| | 5,345,754 | |
NET ASSETS — 100.0%
| | $577,813,014 | |
| (a) | Securities purchased pursuant to Rule 144A of the Securities Act of 1933, as amended. These securities, which represent 14.9% of net assets as of June 30, 2024, are considered liquid and may be resold in transactions exempt from registration, normally to qualified institutional buyers. |
| (b) | Variable Rate Security - Interest rate shown is rate in effect at June 30, 2024. For securities based on a published reference rate and spread, the reference rate and spread are indicated in the description above. |
| (c) | Step-up bond - Coupon rate increases in increments to maturity. Rate shown as of June 30, 2024. Maturity date shown is the final maturity. |
| (d) | The Fund invested in certain money market funds managed by SSGA Funds Management, Inc. Amounts related to these investments during the year ended June 30, 2024 are shown in the Affiliate Table below. |
| (e) | The rate shown is the annualized seven-day yield at June 30, 2024. |
| CMT | Constant Maturity Treasury |
| GMTN | Global Medium Term Note |
| MTN | Medium Term Note |
| SOFR | Secured Overnight Financing Rate |
At June 30, 2024, open futures contracts were as follows:
| Description | | Number of
Contracts | | Expiration
Date | | Notional
Amount | | Value | | Unrealized
Appreciation
(Depreciation) |
| 2 Yr. U.S. Treasury Note Futures (long) | | 185 | | 09/30/2024 | | $37,813,984 | | $37,779,835 | | $(34,149) |
| 5 Yr. U.S. Treasury Note Futures (long) | | 171 | | 09/30/2024 | | 18,072,563 | | 18,224,860 | | 152,297 |
| | | | | | | | | | | $118,148 |
During the year ended June 30, 2024, the average notional value related to long futures contracts was $26,476,167 and short futures contracts was $10,448,431.
See accompanying notes to financial statements.
11
SPDR SSGA ULTRA SHORT TERM BOND ETF
SCHEDULE OF INVESTMENTS (continued)
June 30, 2024
The following table summarizes the value of the Fund's investments according to the fair value hierarchy as of June 30, 2024.
| Description | | Level 1 –
Quoted Prices | | Level 2 –
Other Significant
Observable Inputs | | Level 3 –
Significant
Unobservable Inputs | | Total |
| ASSETS: | | | | | | | | |
| INVESTMENTS: | | | | | | | | |
Corporate Bonds & Notes
| | $— | | $314,840,120 | | $— | | $314,840,120 |
Asset-Backed Securities
| | — | | 55,016,318 | | — | | 55,016,318 |
U.S. Treasury Obligations
| | — | | 115,333,697 | | — | | 115,333,697 |
Mortgage-Backed Securities
| | — | | 2,862,554 | | — | | 2,862,554 |
Commercial Mortgage Backed Securities
| | — | | 12,315,689 | | — | | 12,315,689 |
Short-Term Investment
| | 72,098,882 | | — | | — | | 72,098,882 |
TOTAL INVESTMENTS
| | $72,098,882 | | $500,368,378 | | $— | | $572,467,260 |
| OTHER FINANCIAL INSTRUMENTS: | | | | | | | | |
Futures Contracts - Unrealized Appreciation
| | $118,148 | | $— | | $— | | $118,148 |
TOTAL OTHER FINANCIAL INSTRUMENTS:
| | $118,148 | | $— | | $— | | $118,148 |
Affiliate Table
| | Number of
Shares Held
at
6/30/23 | | Value at
6/30/23 | | Cost of
Purchases | | Proceeds
from
Shares Sold | | Realized
Gain (Loss) | | Change in
Unrealized
Appreciation/
Depreciation | | Number of
Shares Held
at
6/30/24 | | Value at
6/30/24 | | Dividend
Income |
State Street Institutional U.S. Government Money Market Fund, Class G Shares
| 49,808,408 | | $49,808,408 | | $549,149,430 | | $526,858,956 | | $— | | $— | | 72,098,882 | | $72,098,882 | | $3,238,034 |
See accompanying notes to financial statements.
12
SPDR LOOMIS SAYLES OPPORTUNISTIC BOND ETF
SCHEDULE OF INVESTMENTS
June 30, 2024
| Security Description | | | Principal
Amount | | Value |
| CORPORATE BONDS & NOTES — 58.1% | | | | | |
| AUSTRALIA — 0.5% | | | | |
FMG Resources August 2006 Pty. Ltd.
5.88%, 4/15/2030 (a)
| | | $36,000 | | $35,202 |
Infrabuild Australia Pty. Ltd.
14.50%, 11/15/2028 (a)
| | | 39,000 | | 40,287 |
Northern Star Resources Ltd.
6.13%, 4/11/2033 (a)
| | | 126,000 | | 127,196 |
| | | | | | 202,685 |
| BRAZIL — 0.3% | | | | |
Petrobras Global Finance BV
6.50%, 7/3/2033
| | | 105,000 | | 104,062 |
| CANADA — 1.0% | | | | |
| Bombardier, Inc.: | | | | | |
7.00%, 6/1/2032 (a)
| | | 35,000 | | 35,478 |
7.25%, 7/1/2031 (a)
| | | 30,000 | | 30,800 |
Enerflex Ltd.
9.00%, 10/15/2027 (a)
| | | 91,000 | | 92,373 |
Garda World Security Corp.
9.50%, 11/1/2027 (a)
| | | 33,000 | | 33,196 |
goeasy Ltd.
7.63%, 7/1/2029 (a)
| | | 57,000 | | 58,123 |
Magna International, Inc.
5.98%, 3/21/2026
| | | 68,000 | | 68,004 |
Saturn Oil & Gas, Inc.
9.63%, 6/15/2029 (a)
| | | 52,000 | | 52,482 |
| | | | | | 370,456 |
| CHINA — 0.7% | | | | |
Alibaba Group Holding Ltd.
3.15%, 2/9/2051
| | | 129,000 | | 82,123 |
NXP BV/NXP Funding LLC/NXP USA, Inc.
5.00%, 1/15/2033
| | | 44,000 | | 42,923 |
Prosus NV
4.19%, 1/19/2032 (a)
| | | 165,000 | | 145,289 |
| | | | | | 270,335 |
| FRANCE — 0.4% | | | | |
BNP Paribas SA 5 yr. CMT + 3.20%,
4.63%, 1/12/2027 (a) (b)
| | | 165,000 | | 148,198 |
| GERMANY — 1.1% | | | | |
| Deutsche Bank AG: | | | | | |
5 yr. USD ICE Swap + 5.00%, 7.50%, 4/30/2025 (b)
| | | 200,000 | | 197,136 |
SOFR + 1.72%, 3.04%, 5/28/2032 (b)
| | | 90,000 | | 75,527 |
SOFR + 1.87%, 2.13%, 11/24/2026 (b)
| | | 125,000 | | 118,636 |
| | | | | | 391,299 |
| Security Description | | | Principal
Amount | | Value |
| IRELAND — 0.7% | | | | |
AerCap Ireland Capital DAC/AerCap Global Aviation Trust
3.30%, 1/30/2032
| | | $90,000 | | $77,341 |
Bank of Ireland Group PLC 1 yr. CMT + 2.65%,
6.25%, 9/16/2026 (a) (b)
| | | 165,000 | | 165,749 |
| | | | | | 243,090 |
| ITALY — 1.8% | | | | |
Intesa Sanpaolo SpA 1 yr. CMT + 4.40%,
8.25%, 11/21/2033 (a) (b)
| | | 200,000 | | 221,498 |
Telecom Italia Capital SA
7.72%, 6/4/2038
| | | 31,000 | | 30,239 |
UniCredit SpA 5 yr. USD ICE Swap + 4.91%,
7.30%, 4/2/2034 (a) (b)
| | | 406,000 | | 415,009 |
| | | | | | 666,746 |
| JAPAN — 1.0% | | | | |
| NTT Finance Corp.: | | | | | |
4.14%, 7/26/2024 (a)
| | | 165,000 | | 164,815 |
5.14%, 7/2/2031 (a) (c)
| | | 200,000 | | 198,646 |
| | | | | | 363,461 |
| NETHERLANDS — 0.5% | | | | |
ING Groep NV SOFR + 1.56%,
6.93%, 9/11/2027 (b)
| | | 200,000 | | 202,948 |
| SOUTH AFRICA — 0.5% | | | | |
Anglo American Capital PLC
5.75%, 4/5/2034 (a)
| | | 200,000 | | 199,074 |
| SPAIN — 1.6% | | | | |
| Banco Bilbao Vizcaya Argentaria SA: | | | | | |
1 yr. CMT + 1.95%, 6.03%, 3/13/2035 (b)
| | | 200,000 | | 199,438 |
Series 9, 5 yr. CMT + 5.19%, 6.50%, 3/5/2025 (b)
| | | 200,000 | | 199,190 |
CaixaBank SA SOFR + 2.26%,
6.04%, 6/15/2035 (a) (b)
| | | 200,000 | | 200,666 |
| | | | | | 599,294 |
| SWITZERLAND — 0.7% | | | | |
UBS Group AG SOFR + 3.70%,
6.44%, 8/11/2028 (a) (b)
| | | 214,000 | | 219,438 |
| VistaJet Malta Finance PLC/Vista Management Holding, Inc.: | | | | | |
6.38%, 2/1/2030 (a)
| | | 11,000 | | 8,591 |
7.88%, 5/1/2027 (a)
| | | 21,000 | | 18,553 |
9.50%, 6/1/2028 (a)
| | | 31,000 | | 27,220 |
| | | | | | 273,802 |
| UNITED KINGDOM — 1.6% | | | | |
Avianca Midco 2 PLC
9.00%, 12/1/2028 (a)
| | | 38,000 | | 36,720 |
See accompanying notes to financial statements.
13
SPDR LOOMIS SAYLES OPPORTUNISTIC BOND ETF
SCHEDULE OF INVESTMENTS (continued)
June 30, 2024
| Security Description | | | Principal
Amount | | Value |
Barclays PLC 5 yr. CMT + 3.41%,
4.38%, 3/15/2028 (b)
| | | $284,000 | | $239,426 |
British Telecommunications PLC
9.63%, 12/15/2030
| | | 95,000 | | 115,998 |
Standard Chartered PLC 1 yr. CMT + 0.95%,
1.82%, 11/23/2025 (a) (b)
| | | 165,000 | | 162,328 |
TechnipFMC PLC
6.50%, 2/1/2026 (a)
| | | 36,000 | | 35,855 |
| | | | | | 590,327 |
| UNITED STATES — 45.7% | | | | |
Adtalem Global Education, Inc.
5.50%, 3/1/2028 (a)
| | | 91,000 | | 87,465 |
Advanced Drainage Systems, Inc.
6.38%, 6/15/2030 (a)
| | | 5,000 | | 5,011 |
Advantage Sales & Marketing, Inc.
6.50%, 11/15/2028 (a)
| | | 55,000 | | 49,786 |
Ahead DB Holdings LLC
6.63%, 5/1/2028 (a)
| | | 23,000 | | 21,770 |
Amazon.com, Inc.
3.10%, 5/12/2051
| | | 85,000 | | 58,407 |
AMC Networks, Inc.
4.25%, 2/15/2029
| | | 50,000 | | 33,749 |
American Builders & Contractors Supply Co., Inc.
4.00%, 1/15/2028 (a)
| | | 24,000 | | 22,478 |
American Express Co.
5.85%, 11/5/2027
| | | 35,000 | | 35,844 |
American International Group, Inc. Series A-9, 3 mo. USD Term SOFR + 2.87%,
5.75%, 4/1/2048 (b)
| | | 17,000 | | 16,634 |
American Tower Corp.
2.30%, 9/15/2031
| | | 145,000 | | 118,265 |
Ameriprise Financial, Inc.
4.50%, 5/13/2032
| | | 44,000 | | 42,354 |
AmeriTex HoldCo Intermediate LLC
10.25%, 10/15/2028 (a)
| | | 46,000 | | 48,422 |
Amgen, Inc.
4.20%, 3/1/2033
| | | 90,000 | | 83,366 |
Antero Midstream Partners LP/Antero Midstream Finance Corp.
5.75%, 1/15/2028 (a)
| | | 31,000 | | 30,510 |
APi Group DE, Inc.
4.13%, 7/15/2029 (a)
| | | 13,000 | | 11,828 |
APX Group, Inc.
5.75%, 7/15/2029 (a)
| | | 55,000 | | 52,765 |
Arches Buyer, Inc.
6.13%, 12/1/2028 (a)
| | | 38,000 | | 31,539 |
Arcosa, Inc.
4.38%, 4/15/2029 (a)
| | | 24,000 | | 22,260 |
Ares Capital Corp.
5.95%, 7/15/2029
| | | 85,000 | | 83,519 |
Aretec Group, Inc.
7.50%, 4/1/2029 (a)
| | | 31,000 | | 29,876 |
| Security Description | | | Principal
Amount | | Value |
Armor Holdco, Inc.
8.50%, 11/15/2029 (a)
| | | $28,000 | | $26,688 |
Arthur J Gallagher & Co.
6.50%, 2/15/2034
| | | 95,000 | | 100,511 |
ASGN, Inc.
4.63%, 5/15/2028 (a)
| | | 71,000 | | 67,015 |
AT&T, Inc.
3.80%, 12/1/2057
| | | 7,000 | | 4,888 |
Athene Global Funding
5.62%, 5/8/2026 (a)
| | | 140,000 | | 140,092 |
Avnet, Inc.
5.50%, 6/1/2032
| | | 42,000 | | 40,615 |
Bain Capital Specialty Finance, Inc.
2.55%, 10/13/2026
| | | 153,000 | | 140,309 |
| Bank of America Corp.: | | | | | |
SOFR + 1.99%, 6.20%, 11/10/2028 (b)
| | | 130,000 | | 133,822 |
Series MTN, SOFR + 1.33%, 6.68%, 4/2/2026 (b)
| | | 295,000 | | 296,883 |
Bath & Body Works, Inc.
6.75%, 7/1/2036
| | | 17,000 | | 16,911 |
BellRing Brands, Inc.
7.00%, 3/15/2030 (a)
| | | 19,000 | | 19,458 |
BGC Group, Inc.
4.38%, 12/15/2025
| | | 127,000 | | 123,868 |
BlackRock TCP Capital Corp.
2.85%, 2/9/2026
| | | 124,000 | | 117,051 |
BlackRock, Inc.
2.10%, 2/25/2032
| | | 63,000 | | 51,319 |
Blackstone Mortgage Trust, Inc.
3.75%, 1/15/2027 (a)
| | | 50,000 | | 45,076 |
Blackstone Private Credit Fund
2.35%, 11/22/2024
| | | 200,000 | | 196,938 |
| Blackstone Secured Lending Fund: | | | | | |
2.75%, 9/16/2026
| | | 130,000 | | 120,362 |
2.85%, 9/30/2028
| | | 46,000 | | 40,320 |
Block, Inc.
0.13%, 3/1/2025
| | | 20,000 | | 19,264 |
Blue Owl Capital Corp. II
8.45%, 11/15/2026 (a)
| | | 55,000 | | 56,701 |
Blue Owl Credit Income Corp.
5.50%, 3/21/2025
| | | 100,000 | | 99,372 |
Blue Owl Finance LLC
6.25%, 4/18/2034 (a)
| | | 80,000 | | 80,276 |
BlueLinx Holdings, Inc.
6.00%, 11/15/2029 (a)
| | | 45,000 | | 41,877 |
| Boeing Co.: | | | | | |
6.53%, 5/1/2034 (a)
| | | 10,000 | | 10,238 |
6.86%, 5/1/2054 (a)
| | | 10,000 | | 10,253 |
Boise Cascade Co.
4.88%, 7/1/2030 (a)
| | | 103,000 | | 95,507 |
Brand Industrial Services, Inc.
10.38%, 8/1/2030 (a)
| | | 23,000 | | 24,858 |
Bread Financial Holdings, Inc.
9.75%, 3/15/2029 (a)
| | | 96,000 | | 100,885 |
See accompanying notes to financial statements.
14
SPDR LOOMIS SAYLES OPPORTUNISTIC BOND ETF
SCHEDULE OF INVESTMENTS (continued)
June 30, 2024
| Security Description | | | Principal
Amount | | Value |
Brinker International, Inc.
8.25%, 7/15/2030 (a)
| | | $47,000 | | $49,358 |
Bristow Group, Inc.
6.88%, 3/1/2028 (a)
| | | 51,000 | | 50,088 |
| Broadcom, Inc.: | | | | | |
3.50%, 2/15/2041 (a)
| | | 204,000 | | 156,305 |
4.15%, 4/15/2032 (a)
| | | 116,000 | | 106,867 |
Brookfield Property REIT, Inc./BPR Cumulus LLC/BPR Nimbus LLC/GGSI Sellco LLC
4.50%, 4/1/2027 (a)
| | | 64,000 | | 59,546 |
Buckeye Partners LP
6.88%, 7/1/2029 (a)
| | | 112,000 | | 112,392 |
Cable One, Inc.
4.00%, 11/15/2030 (a)
| | | 12,000 | | 8,952 |
California Resources Corp.
8.25%, 6/15/2029 (a)
| | | 25,000 | | 25,515 |
Caterpillar Financial Services Corp. Series MTN,
3.65%, 8/12/2025
| | | 85,000 | | 83,476 |
| CCO Holdings LLC/CCO Holdings Capital Corp.: | | | | | |
4.25%, 1/15/2034 (a)
| | | 12,000 | | 9,103 |
4.50%, 8/15/2030 (a)
| | | 85,000 | | 71,877 |
4.50%, 6/1/2033 (a)
| | | 30,000 | | 23,599 |
4.75%, 2/1/2032 (a)
| | | 32,000 | | 26,205 |
CenterPoint Energy Houston Electric LLC
5.30%, 4/1/2053
| | | 16,000 | | 15,316 |
Central Garden & Pet Co.
4.13%, 10/15/2030
| | | 84,000 | | 74,946 |
Century Communities, Inc.
3.88%, 8/15/2029 (a)
| | | 67,000 | | 59,701 |
Clean Harbors, Inc.
5.13%, 7/15/2029 (a)
| | | 9,000 | | 8,647 |
CNX Midstream Partners LP
4.75%, 4/15/2030 (a)
| | | 55,000 | | 49,534 |
CNX Resources Corp.
6.00%, 1/15/2029 (a)
| | | 80,000 | | 78,451 |
Coeur Mining, Inc.
5.13%, 2/15/2029 (a)
| | | 25,000 | | 23,492 |
| Coinbase Global, Inc.: | | | | | |
3.38%, 10/1/2028 (a)
| | | 37,000 | | 31,716 |
3.63%, 10/1/2031 (a)
| | | 32,000 | | 25,636 |
| Comcast Corp.: | | | | | |
2.94%, 11/1/2056
| | | 155,000 | | 93,513 |
2.99%, 11/1/2063
| | | 80,000 | | 46,931 |
Consolidated Communications, Inc.
6.50%, 10/1/2028 (a)
| | | 63,000 | | 53,980 |
Continental Resources, Inc.
2.27%, 11/15/2026 (a)
| | | 58,000 | | 53,831 |
COPT Defense Properties LP
2.75%, 4/15/2031
| | | 17,000 | | 14,058 |
Cornerstone Building Brands, Inc.
6.13%, 1/15/2029 (a)
| | | 28,000 | | 23,024 |
| Security Description | | | Principal
Amount | | Value |
Crowdstrike Holdings, Inc.
3.00%, 2/15/2029
| | | $111,000 | | $99,992 |
Crown Castle, Inc.
5.80%, 3/1/2034
| | | 50,000 | | 50,498 |
CVR Energy, Inc.
5.75%, 2/15/2028 (a)
| | | 55,000 | | 51,119 |
CVS Health Corp.
5.25%, 2/21/2033
| | | 89,000 | | 86,888 |
CyberArk Software Ltd.
Zero Coupon, 11/15/2024
| | | 11,000 | | 19,115 |
| DaVita, Inc.: | | | | | |
3.75%, 2/15/2031 (a)
| | | 45,000 | | 38,412 |
4.63%, 6/1/2030 (a)
| | | 37,000 | | 33,481 |
Diamondback Energy, Inc.
6.25%, 3/15/2033
| | | 85,000 | | 88,913 |
Directv Financing LLC
8.88%, 2/1/2030 (a)
| | | 23,000 | | 22,523 |
Directv Financing LLC/Directv Financing Co.-Obligor, Inc.
5.88%, 8/15/2027 (a)
| | | 107,000 | | 100,691 |
Discover Financial Services SOFR + 3.37%,
7.96%, 11/2/2034 (b)
| | | 175,000 | | 196,796 |
DISH DBS Corp.
5.88%, 11/15/2024
| | | 180,000 | | 171,704 |
Dominion Energy, Inc. Series A, 5 yr. CMT + 2.39%,
6.88%, 2/1/2055 (b)
| | | 80,000 | | 81,755 |
Domtar Corp.
6.75%, 10/1/2028 (a)
| | | 57,000 | | 50,846 |
DraftKings Holdings, Inc.
Zero Coupon, 3/15/2028
| | | 35,000 | | 28,959 |
DT Midstream, Inc.
4.13%, 6/15/2029 (a)
| | | 119,000 | | 110,024 |
Duke Energy Corp.
5.80%, 6/15/2054
| | | 70,000 | | 68,044 |
Eco Material Technologies, Inc.
7.88%, 1/31/2027 (a)
| | | 39,000 | | 39,096 |
Eli Lilly & Co.
4.70%, 2/27/2033
| | | 73,000 | | 71,727 |
EMRLD Borrower LP/Emerald Co.-Issuer, Inc.
6.75%, 7/15/2031 (a) (c)
| | | 15,000 | | 15,189 |
Energizer Holdings, Inc.
4.75%, 6/15/2028 (a)
| | | 13,000 | | 12,174 |
| Energy Transfer LP: | | | | | |
5.95%, 5/15/2054
| | | 125,000 | | 121,087 |
6.40%, 12/1/2030
| | | 140,000 | | 147,120 |
EnLink Midstream LLC
6.50%, 9/1/2030 (a)
| | | 10,000 | | 10,227 |
Enova International, Inc.
11.25%, 12/15/2028 (a)
| | | 48,000 | | 51,318 |
Enstar Group Ltd.
3.10%, 9/1/2031
| | | 22,000 | | 18,173 |
Entegris, Inc.
3.63%, 5/1/2029 (a)
| | | 37,000 | | 33,310 |
See accompanying notes to financial statements.
15
SPDR LOOMIS SAYLES OPPORTUNISTIC BOND ETF
SCHEDULE OF INVESTMENTS (continued)
June 30, 2024
| Security Description | | | Principal
Amount | | Value |
Entergy Arkansas LLC
5.75%, 6/1/2054
| | | $40,000 | | $39,674 |
Enterprise Products Operating LLC
5.05%, 1/10/2026
| | | 65,000 | | 64,843 |
Enviri Corp.
5.75%, 7/31/2027 (a)
| | | 53,000 | | 50,367 |
EQM Midstream Partners LP
4.00%, 8/1/2024
| | | 82,000 | | 81,721 |
| Fair Isaac Corp.: | | | | | |
4.00%, 6/15/2028 (a)
| | | 60,000 | | 56,114 |
5.25%, 5/15/2026 (a)
| | | 45,000 | | 44,504 |
Fidelity National Financial, Inc.
2.45%, 3/15/2031
| | | 34,000 | | 27,735 |
Fiserv, Inc.
5.45%, 3/15/2034
| | | 145,000 | | 144,062 |
Foot Locker, Inc.
4.00%, 10/1/2029 (a)
| | | 82,000 | | 68,446 |
Forestar Group, Inc.
3.85%, 5/15/2026 (a)
| | | 57,000 | | 54,591 |
Fortress Transportation & Infrastructure Investors LLC
7.00%, 6/15/2032 (a)
| | | 65,000 | | 65,973 |
Foundation Building Materials, Inc.
6.00%, 3/1/2029 (a)
| | | 26,000 | | 23,097 |
Freedom Mortgage Holdings LLC
9.25%, 2/1/2029 (a)
| | | 15,000 | | 15,003 |
| Frontier Communications Holdings LLC: | | | | | |
5.88%, 11/1/2029
| | | 14,000 | | 12,191 |
6.75%, 5/1/2029 (a)
| | | 85,000 | | 77,958 |
FS KKR Capital Corp.
6.88%, 8/15/2029
| | | 65,000 | | 64,426 |
Full House Resorts, Inc.
8.25%, 2/15/2028 (a)
| | | 27,000 | | 25,845 |
| Gap, Inc.: | | | | | |
3.63%, 10/1/2029 (a)
| | | 39,000 | | 33,727 |
3.88%, 10/1/2031 (a)
| | | 21,000 | | 17,523 |
Garrett Motion Holdings, Inc./Garrett LX I SARL
7.75%, 5/31/2032 (a)
| | | 45,000 | | 45,698 |
Gartner, Inc.
3.63%, 6/15/2029 (a)
| | | 29,000 | | 26,550 |
| General Motors Financial Co., Inc.: | | | | | |
2.90%, 2/26/2025
| | | 57,000 | | 55,919 |
5.00%, 4/9/2027
| | | 68,000 | | 67,317 |
5.40%, 4/6/2026
| | | 125,000 | | 124,731 |
Global Infrastructure Solutions, Inc.
5.63%, 6/1/2029 (a)
| | | 33,000 | | 31,064 |
Global Partners LP/GLP Finance Corp.
8.25%, 1/15/2032 (a)
| | | 48,000 | | 49,284 |
Global Payments, Inc.
5.40%, 8/15/2032
| | | 35,000 | | 34,312 |
| Security Description | | | Principal
Amount | | Value |
Go Daddy Operating Co. LLC/GD Finance Co., Inc.
3.50%, 3/1/2029 (a)
| | | $77,000 | | $69,538 |
Goldman Sachs Group, Inc. Series X, 5 yr. CMT + 2.81%,
7.50%, 5/10/2029 (b)
| | | 140,000 | | 144,147 |
GPS Hospitality Holding Co. LLC/GPS Finco, Inc.
7.00%, 8/15/2028 (a)
| | | 28,000 | | 20,460 |
Graham Packaging Co., Inc.
7.13%, 8/15/2028 (a)
| | | 30,000 | | 28,342 |
Grand Canyon University
4.13%, 10/1/2024
| | | 60,000 | | 59,610 |
Graphic Packaging International LLC
6.38%, 7/15/2032 (a)
| | | 34,000 | | 34,008 |
Gray Television, Inc.
4.75%, 10/15/2030 (a)
| | | 54,000 | | 32,395 |
Great Lakes Dredge & Dock Corp.
5.25%, 6/1/2029 (a)
| | | 22,000 | | 19,593 |
Griffon Corp.
5.75%, 3/1/2028
| | | 55,000 | | 53,095 |
GrubHub Holdings, Inc.
5.50%, 7/1/2027 (a)
| | | 56,000 | | 50,791 |
Guidewire Software, Inc.
1.25%, 3/15/2025
| | | 10,000 | | 12,517 |
GYP Holdings III Corp.
4.63%, 5/1/2029 (a)
| | | 32,000 | | 29,651 |
Hasbro, Inc.
6.05%, 5/14/2034
| | | 60,000 | | 59,888 |
Hawaiian Brand Intellectual Property Ltd./HawaiianMiles Loyalty Ltd.
5.75%, 1/20/2026 (a)
| | | 59,072 | | 56,197 |
Helix Energy Solutions Group, Inc.
9.75%, 3/1/2029 (a)
| | | 51,000 | | 54,368 |
Hess Midstream Operations LP
6.50%, 6/1/2029 (a)
| | | 63,000 | | 63,844 |
Hilton Domestic Operating Co., Inc.
5.88%, 4/1/2029 (a)
| | | 135,000 | | 135,090 |
HLF Financing SARL LLC/Herbalife International, Inc.
4.88%, 6/1/2029 (a)
| | | 41,000 | | 28,383 |
HubSpot, Inc.
0.38%, 6/1/2025
| | | 5,000 | | 10,494 |
Insight Enterprises, Inc.
6.63%, 5/15/2032 (a)
| | | 10,000 | | 10,160 |
Interface, Inc.
5.50%, 12/1/2028 (a)
| | | 53,000 | | 50,128 |
International Business Machines Corp.
4.40%, 7/27/2032
| | | 80,000 | | 76,062 |
Iron Mountain, Inc.
4.88%, 9/15/2029 (a)
| | | 150,000 | | 141,223 |
ITT Holdings LLC
6.50%, 8/1/2029 (a)
| | | 17,000 | | 15,419 |
See accompanying notes to financial statements.
16
SPDR LOOMIS SAYLES OPPORTUNISTIC BOND ETF
SCHEDULE OF INVESTMENTS (continued)
June 30, 2024
| Security Description | | | Principal
Amount | | Value |
Jabil, Inc.
5.45%, 2/1/2029
| | | $11,000 | | $10,992 |
Jackson Financial, Inc.
3.13%, 11/23/2031
| | | 165,000 | | 138,313 |
Jane Street Group/JSG Finance, Inc.
7.13%, 4/30/2031 (a)
| | | 80,000 | | 82,042 |
| JPMorgan Chase & Co.: | | | | | |
SOFR + 1.46%, 3.16%, 4/22/2042 (b)
| | | 80,000 | | 59,382 |
SOFR + 2.08%, 4.91%, 7/25/2033 (b)
| | | 110,000 | | 106,857 |
Series HH, 3 mo. USD Term SOFR + 3.13%, 4.60%, 2/1/2025 (b)
| | | 90,000 | | 88,816 |
Series II, 3 mo. USD Term SOFR + 2.75%, 4.00%, 4/1/2025 (b)
| | | 130,000 | | 126,461 |
Kaiser Aluminum Corp.
4.63%, 3/1/2028 (a)
| | | 108,000 | | 101,016 |
| KB Home: | | | | | |
4.00%, 6/15/2031
| | | 8,000 | | 7,060 |
4.80%, 11/15/2029
| | | 68,000 | | 64,062 |
Kinder Morgan, Inc.
4.80%, 2/1/2033
| | | 85,000 | | 80,554 |
Landsea Homes Corp.
8.88%, 4/1/2029 (a)
| | | 49,000 | | 48,571 |
LFS Topco LLC
5.88%, 10/15/2026 (a)
| | | 40,000 | | 36,976 |
Liberty Mutual Group, Inc.
4.30%, 2/1/2061 (a)
| | | 100,000 | | 62,288 |
Lions Gate Capital Holdings LLC
5.50%, 4/15/2029 (a)
| | | 35,000 | | 22,672 |
Louisiana-Pacific Corp.
3.63%, 3/15/2029 (a)
| | | 86,000 | | 78,081 |
Lowe's Cos., Inc.
2.80%, 9/15/2041
| | | 95,000 | | 65,149 |
M/I Homes, Inc.
4.95%, 2/1/2028
| | | 71,000 | | 68,369 |
Madison IAQ LLC
5.88%, 6/30/2029 (a)
| | | 38,000 | | 35,381 |
Martin Midstream Partners LP/Martin Midstream Finance Corp.
11.50%, 2/15/2028 (a)
| | | 18,000 | | 19,468 |
Maxim Crane Works Holdings Capital LLC
11.50%, 9/1/2028 (a)
| | | 22,000 | | 22,726 |
McAfee Corp.
7.38%, 2/15/2030 (a)
| | | 17,000 | | 15,697 |
McCormick & Co., Inc.
4.95%, 4/15/2033
| | | 73,000 | | 71,214 |
Medtronic Global Holdings SCA
4.25%, 3/30/2028
| | | 47,000 | | 45,915 |
| Micron Technology, Inc.: | | | | | |
3.37%, 11/1/2041
| | | 58,000 | | 42,437 |
5.30%, 1/15/2031
| | | 60,000 | | 59,856 |
| Security Description | | | Principal
Amount | | Value |
6.75%, 11/1/2029
| | | $80,000 | | $85,067 |
MicroStrategy, Inc.
6.13%, 6/15/2028 (a)
| | | 13,000 | | 12,598 |
Millennium Escrow Corp.
6.63%, 8/1/2026 (a)
| | | 28,000 | | 14,511 |
Moody's Corp.
2.00%, 8/19/2031
| | | 56,000 | | 45,484 |
Moog, Inc.
4.25%, 12/15/2027 (a)
| | | 90,000 | | 85,339 |
| Morgan Stanley: | | | | | |
SOFR + 1.36%, 2.48%, 9/16/2036 (b)
| | | 140,000 | | 110,797 |
SOFR + 1.58%, 5.83%, 4/19/2035 (b)
| | | 30,000 | | 30,787 |
Series MTN, SOFR + 1.59%, 5.16%, 4/20/2029 (b)
| | | 68,000 | | 67,764 |
Series MTN, SOFR + 1.88%, 5.42%, 7/21/2034 (b)
| | | 50,000 | | 49,734 |
MPLX LP
4.95%, 9/1/2032
| | | 60,000 | | 57,389 |
MPT Operating Partnership LP/MPT Finance Corp.
5.00%, 10/15/2027
| | | 88,000 | | 73,397 |
MSCI, Inc.
3.63%, 11/1/2031 (a)
| | | 25,000 | | 21,909 |
Mueller Water Products, Inc.
4.00%, 6/15/2029 (a)
| | | 10,000 | | 9,161 |
Nationstar Mortgage Holdings, Inc.
7.13%, 2/1/2032 (a)
| | | 42,000 | | 42,236 |
NCL Corp. Ltd.
5.88%, 3/15/2026 (a)
| | | 54,000 | | 53,392 |
| Nestle Holdings, Inc.: | | | | | |
2.50%, 9/14/2041 (a)
| | | 95,000 | | 65,735 |
4.13%, 10/1/2027 (a)
| | | 125,000 | | 122,182 |
New Fortress Energy, Inc.
6.50%, 9/30/2026 (a)
| | | 61,000 | | 55,887 |
New Home Co., Inc.
9.25%, 10/1/2029 (a)
| | | 15,000 | | 15,121 |
Newfold Digital Holdings Group, Inc.
6.00%, 2/15/2029 (a)
| | | 37,000 | | 26,512 |
Newmark Group, Inc.
7.50%, 1/12/2029 (a)
| | | 90,000 | | 92,523 |
News Corp.
3.88%, 5/15/2029 (a)
| | | 97,000 | | 89,336 |
| NextEra Energy Capital Holdings, Inc.: | | | | | |
4.26%, 9/1/2024
| | | 50,000 | | 49,844 |
6.05%, 3/1/2025
| | | 31,000 | | 31,046 |
| NextEra Energy Operating Partners LP: | | | | | |
3.88%, 10/15/2026 (a)
| | | 36,000 | | 34,258 |
7.25%, 1/15/2029 (a)
| | | 70,000 | | 71,815 |
| NGL Energy Operating LLC/NGL Energy Finance Corp.: | | | | | |
8.13%, 2/15/2029 (a)
| | | 9,000 | | 9,178 |
See accompanying notes to financial statements.
17
SPDR LOOMIS SAYLES OPPORTUNISTIC BOND ETF
SCHEDULE OF INVESTMENTS (continued)
June 30, 2024
| Security Description | | | Principal
Amount | | Value |
8.38%, 2/15/2032 (a)
| | | $43,000 | | $43,651 |
NMG Holding Co., Inc./Neiman Marcus Group LLC
7.13%, 4/1/2026 (a)
| | | 28,000 | | 27,714 |
Noble Finance II LLC
8.00%, 4/15/2030 (a)
| | | 48,000 | | 49,882 |
| NRG Energy, Inc.: | | | | | |
3.38%, 2/15/2029 (a)
| | | 80,000 | | 71,166 |
3.63%, 2/15/2031 (a)
| | | 43,000 | | 36,892 |
5.25%, 6/15/2029 (a)
| | | 12,000 | | 11,529 |
Oncor Electric Delivery Co. LLC
4.30%, 5/15/2028
| | | 94,000 | | 91,648 |
OneMain Finance Corp.
7.50%, 5/15/2031
| | | 80,000 | | 80,988 |
Osaic Holdings, Inc.
10.75%, 8/1/2027 (a)
| | | 25,000 | | 25,720 |
Oscar AcquisitionCo LLC/Oscar Finance, Inc.
9.50%, 4/15/2030 (a)
| | | 25,000 | | 23,742 |
Panther Escrow Issuer LLC
7.13%, 6/1/2031 (a)
| | | 41,000 | | 41,468 |
Park-Ohio Industries, Inc.
6.63%, 4/15/2027
| | | 28,000 | | 26,940 |
Patrick Industries, Inc.
4.75%, 5/1/2029 (a)
| | | 42,000 | | 38,775 |
PHH Mortgage Corp.
7.88%, 3/15/2026 (a)
| | | 40,000 | | 39,040 |
Phinia, Inc.
6.75%, 4/15/2029 (a)
| | | 15,000 | | 15,228 |
Pike Corp.
5.50%, 9/1/2028 (a)
| | | 24,000 | | 23,006 |
| Pitney Bowes, Inc.: | | | | | |
6.88%, 3/15/2027 (a)
| | | 19,000 | | 17,952 |
7.25%, 3/15/2029 (a)
| | | 39,000 | | 35,033 |
PM General Purchaser LLC
9.50%, 10/1/2028 (a)
| | | 19,000 | | 19,380 |
Premier Entertainment Sub LLC/Premier Entertainment Finance Corp.
5.63%, 9/1/2029 (a)
| | | 15,000 | | 10,754 |
Provident Funding Associates LP/PFG Finance Corp.
6.38%, 6/15/2025 (a)
| | | 10,000 | | 9,712 |
Prudential Financial, Inc. 5 yr. CMT + 3.23%,
6.00%, 9/1/2052 (b)
| | | 45,000 | | 44,376 |
Public Storage Operating Co.
2.25%, 11/9/2031
| | | 44,000 | | 36,366 |
QUALCOMM, Inc.
5.40%, 5/20/2033
| | | 130,000 | | 134,629 |
Rain Carbon, Inc.
12.25%, 9/1/2029 (a)
| | | 45,000 | | 48,496 |
Rayonier AM Products, Inc.
7.63%, 1/15/2026 (a)
| | | 27,000 | | 25,315 |
Republic Services, Inc.
5.00%, 4/1/2034
| | | 21,000 | | 20,556 |
| Security Description | | | Principal
Amount | | Value |
Resideo Funding, Inc.
4.00%, 9/1/2029 (a)
| | | $107,000 | | $94,934 |
Rockies Express Pipeline LLC
4.95%, 7/15/2029 (a)
| | | 65,000 | | 61,192 |
| Royal Caribbean Cruises Ltd.: | | | | | |
5.38%, 7/15/2027 (a)
| | | 7,000 | | 6,895 |
5.50%, 4/1/2028 (a)
| | | 10,000 | | 9,875 |
7.50%, 10/15/2027
| | | 7,000 | | 7,353 |
| Sabre GLBL, Inc.: | | | | | |
8.63%, 6/1/2027 (a)
| | | 14,000 | | 12,936 |
11.25%, 12/15/2027 (a)
| | | 32,000 | | 31,096 |
Santander Holdings USA, Inc. SOFR + 1.25%,
2.49%, 1/6/2028 (b)
| | | 110,000 | | 101,363 |
Scripps Escrow, Inc.
5.88%, 7/15/2027 (a)
| | | 40,000 | | 24,178 |
| Seagate HDD Cayman: | | | | | |
8.50%, 7/15/2031
| | | 61,000 | | 65,628 |
9.63%, 12/1/2032
| | | 47,000 | | 53,572 |
Sealed Air Corp.
6.50%, 7/15/2032 (a)
| | | 36,000 | | 35,830 |
Sempra
3.70%, 4/1/2029
| | | 22,000 | | 20,595 |
Sinclair Television Group, Inc.
4.13%, 12/1/2030 (a)
| | | 43,000 | | 28,810 |
SK Invictus Intermediate II SARL
5.00%, 10/30/2029 (a)
| | | 56,000 | | 50,706 |
Smyrna Ready Mix Concrete LLC
6.00%, 11/1/2028 (a)
| | | 59,000 | | 57,638 |
Solaris Midstream Holdings LLC
7.63%, 4/1/2026 (a)
| | | 50,000 | | 50,238 |
Southern Co.
5.15%, 10/6/2025
| | | 175,000 | | 174,235 |
Southwestern Public Service Co.
6.00%, 6/1/2054
| | | 25,000 | | 24,939 |
Spirit AeroSystems, Inc.
4.60%, 6/15/2028
| | | 49,000 | | 45,895 |
| Standard Industries, Inc.: | | | | | |
3.38%, 1/15/2031 (a)
| | | 18,000 | | 15,154 |
4.38%, 7/15/2030 (a)
| | | 50,000 | | 45,170 |
5.00%, 2/15/2027 (a)
| | | 13,000 | | 12,633 |
Starwood Property Trust, Inc.
4.38%, 1/15/2027 (a)
| | | 145,000 | | 137,401 |
Steelcase, Inc.
5.13%, 1/18/2029
| | | 101,000 | | 95,886 |
Stem, Inc.
0.50%, 12/1/2028 (a)
| | | 176,000 | | 73,033 |
StoneMor, Inc.
8.50%, 5/15/2029 (a)
| | | 22,000 | | 18,283 |
SunCoke Energy, Inc.
4.88%, 6/30/2029 (a)
| | | 23,000 | | 20,850 |
Sunoco LP/Sunoco Finance Corp.
4.50%, 5/15/2029
| | | 94,000 | | 88,040 |
Surgery Center Holdings, Inc.
7.25%, 4/15/2032 (a)
| | | 10,000 | | 10,128 |
Synchrony Financial
7.25%, 2/2/2033
| | | 63,000 | | 62,861 |
See accompanying notes to financial statements.
18
SPDR LOOMIS SAYLES OPPORTUNISTIC BOND ETF
SCHEDULE OF INVESTMENTS (continued)
June 30, 2024
| Security Description | | | Principal
Amount | | Value |
Talen Energy Supply LLC
8.63%, 6/1/2030 (a)
| | | $95,000 | | $101,370 |
| Tallgrass Energy Partners LP/Tallgrass Energy Finance Corp.: | | | | | |
5.50%, 1/15/2028 (a)
| | | 99,000 | | 94,790 |
6.00%, 3/1/2027 (a)
| | | 5,000 | | 4,926 |
Taylor Morrison Communities, Inc.
5.75%, 1/15/2028 (a)
| | | 83,000 | | 82,278 |
TEGNA, Inc.
5.00%, 9/15/2029
| | | 36,000 | | 31,766 |
| Tempur Sealy International, Inc.: | | | | | |
3.88%, 10/15/2031 (a)
| | | 55,000 | | 46,485 |
4.00%, 4/15/2029 (a)
| | | 54,000 | | 48,766 |
Tenneco, Inc.
8.00%, 11/17/2028 (a)
| | | 26,000 | | 23,649 |
Texas Instruments, Inc.
4.90%, 3/14/2033
| | | 94,000 | | 93,780 |
Thor Industries, Inc.
4.00%, 10/15/2029 (a)
| | | 12,000 | | 10,598 |
TMS International Corp.
6.25%, 4/15/2029 (a)
| | | 26,000 | | 23,831 |
TopBuild Corp.
3.63%, 3/15/2029 (a)
| | | 63,000 | | 56,842 |
| TransDigm, Inc.: | | | | | |
6.88%, 12/15/2030 (a)
| | | 63,000 | | 64,326 |
7.13%, 12/1/2031 (a)
| | | 35,000 | | 36,125 |
Tri Pointe Homes, Inc.
5.70%, 6/15/2028
| | | 94,000 | | 92,007 |
TriNet Group, Inc.
3.50%, 3/1/2029 (a)
| | | 46,000 | | 40,952 |
Tronox, Inc.
4.63%, 3/15/2029 (a)
| | | 56,000 | | 50,618 |
Tutor Perini Corp.
11.88%, 4/30/2029 (a)
| | | 22,000 | | 23,635 |
Uber Technologies, Inc.
8.00%, 11/1/2026 (a)
| | | 41,000 | | 41,344 |
Unisys Corp.
6.88%, 11/1/2027 (a)
| | | 49,000 | | 43,229 |
| United Airlines Pass-Through Trust: | | | | | |
Series 2020-1, Class A, 5.88%, 4/15/2029
| | | 22,589 | | 22,650 |
Series 2020-1, Class B, 4.88%, 7/15/2027
| | | 77,616 | | 76,544 |
United Parcel Service, Inc.
4.88%, 3/3/2033
| | | 104,000 | | 102,461 |
Upbound Group, Inc.
6.38%, 2/15/2029 (a)
| | | 47,000 | | 45,127 |
Urban One, Inc.
7.38%, 2/1/2028 (a)
| | | 37,000 | | 28,281 |
USI, Inc.
7.50%, 1/15/2032 (a)
| | | 24,000 | | 24,397 |
Veritas U.S., Inc./Veritas Bermuda Ltd.
7.50%, 9/1/2025 (a)
| | | 35,000 | | 30,277 |
| Security Description | | | Principal
Amount | | Value |
| Verizon Communications, Inc.: | | | | | |
2.10%, 3/22/2028
| | | $136,000 | | $122,329 |
2.85%, 9/3/2041
| | | 24,000 | | 16,815 |
3.55%, 3/22/2051
| | | 61,000 | | 43,902 |
Vertiv Group Corp.
4.13%, 11/15/2028 (a)
| | | 105,000 | | 98,035 |
Viasat, Inc.
7.50%, 5/30/2031 (a)
| | | 39,000 | | 25,888 |
Victoria's Secret & Co.
4.63%, 7/15/2029 (a)
| | | 51,000 | | 42,287 |
Victra Holdings LLC/Victra Finance Corp.
7.75%, 2/15/2026 (a)
| | | 47,000 | | 46,718 |
Virtusa Corp.
7.13%, 12/15/2028 (a)
| | | 28,000 | | 26,042 |
| Vistra Operations Co. LLC: | | | | | |
4.38%, 5/1/2029 (a)
| | | 15,000 | | 13,974 |
5.00%, 7/31/2027 (a)
| | | 99,000 | | 95,787 |
5.63%, 2/15/2027 (a)
| | | 38,000 | | 37,363 |
Warnermedia Holdings, Inc.
6.41%, 3/15/2026
| | | 58,000 | | 57,987 |
Waste Pro USA, Inc.
5.50%, 2/15/2026 (a)
| | | 24,000 | | 23,637 |
| Wells Fargo & Co.: | | | | | |
SOFR + 2.02%, 5.39%, 4/24/2034 (b)
| | | 73,000 | | 72,204 |
Series MTN, SOFR + 1.07%, 6.43%, 4/22/2028 (b)
| | | 140,000 | | 140,692 |
Werner FinCo LP/Werner FinCo, Inc.
11.50%, 6/15/2028 (a)
| | | 7,000 | | 7,608 |
Western Midstream Operating LP
6.15%, 4/1/2033
| | | 11,000 | | 11,239 |
White Cap Buyer LLC
6.88%, 10/15/2028 (a)
| | | 26,000 | | 25,103 |
World Acceptance Corp.
7.00%, 11/1/2026 (a)
| | | 16,000 | | 15,250 |
Xerox Holdings Corp.
5.50%, 8/15/2028 (a)
| | | 65,000 | | 55,954 |
XPO, Inc.
7.13%, 6/1/2031 (a)
| | | 101,000 | | 103,424 |
Zebra Technologies Corp.
6.50%, 6/1/2032 (a)
| | | 10,000 | | 10,114 |
| | | | | | 17,024,591 |
TOTAL CORPORATE BONDS & NOTES
(Cost $21,838,865)
| | | | | 21,650,368 |
| ASSET-BACKED SECURITIES — 8.8% | | | | | |
AMMC CLO 15 Ltd. Series 2014-15A, Class BR3, 3 mo. USD Term SOFR + 1.91%,
7.24%, 1/15/2032 (a) (b)
| | | 250,000 | | 249,775 |
See accompanying notes to financial statements.
19
SPDR LOOMIS SAYLES OPPORTUNISTIC BOND ETF
SCHEDULE OF INVESTMENTS (continued)
June 30, 2024
| Security Description | | | Principal
Amount | | Value |
Anchorage Capital CLO 9 Ltd. Series 2016-9A, Class AR2, 3 mo. USD Term SOFR + 1.40%,
6.73%, 7/15/2032 (a) (b)
| | | $250,000 | | $250,259 |
CBAM Ltd. Series 2018-6A, Class B2R, ABS, 3 mo. USD Term SOFR + 2.36%,
7.69%, 1/15/2031 (a) (b)
| | | 255,000 | | 255,268 |
Clover CLO LLC Series 2018-1A, Class B1RR, 3 mo. USD Term SOFR + 1.95%,
7.27%, 4/20/2037 (a) (b)
| | | 250,000 | | 250,275 |
Elmwood CLO V Ltd. Series 2020-2A, Class AR, 3 mo. USD Term SOFR + 1.41%,
6.74%, 10/20/2034 (a) (b)
| | | 250,000 | | 249,775 |
Generate CLO 2 Ltd. Series 2A, Class BR, 3 mo. USD Term SOFR + 1.71%,
7.04%, 1/22/2031 (a) (b)
| | | 250,000 | | 249,600 |
Greywolf CLO VI Ltd. Series 2018-1A, Class A1, 3 mo. USD Term SOFR + 1.29%,
6.61%, 4/26/2031 (a) (b)
| | | 184,331 | | 184,202 |
Hayfin U.S. XII Ltd. Series 2018-8A, Class B, ABS, 3 mo. USD Term SOFR + 1.74%,
7.07%, 4/20/2031 (a) (b)
| | | 250,000 | | 249,625 |
KKR CLO 22 Ltd. Series 22A, Class B, 3 mo. USD Term SOFR + 1.86%,
7.19%, 7/20/2031 (a) (b)
| | | 250,000 | | 250,100 |
OHA Credit Funding 6 Ltd. Series 2020-6A, Class AR, 3 mo. USD Term SOFR + 1.40%,
6.73%, 7/20/2034 (a) (b)
| | | 250,000 | | 250,208 |
OneMain Direct Auto Receivables Trust Series 2021-1A, Class A, ABS,
0.87%, 7/14/2028 (a)
| | | 329,726 | | 320,053 |
OZLM Funding IV Ltd. Series 2013-4A, Class A2R, 3 mo. USD Term SOFR + 1.96%,
7.29%, 10/22/2030 (a) (b)
| | | 250,000 | | 249,775 |
Post CLO Ltd. Series 2023-1A, Class B1, 3 mo. USD Term SOFR + 2.50%,
7.82%, 4/20/2036 (a) (b)
| | | 250,000 | | 252,409 |
TOTAL ASSET-BACKED SECURITIES
(Cost $3,222,945)
| | | | | 3,261,324 |
| | | Shares | |
| CONVERTIBLE BONDS — 1.1% | | |
| DENMARK — 0.0% (d) | | |
Ascendis Pharma AS
2.25%, 4/1/2028
| | 15,000 | 16,753 |
| Security Description | | | Shares | | Value |
| UNITED STATES — 1.1% | | | | |
Axon Enterprise, Inc.
0.50%, 12/15/2027
| | | 10,000 | | $13,746 |
Cloudflare, Inc.
8/15/2026
| | | 36,000 | | 32,690 |
Datadog, Inc.
0.13%, 6/15/2025
| | | 15,000 | | 21,681 |
Dexcom, Inc.
0.38%, 5/15/2028
| | | 15,000 | | 14,646 |
Fluor Corp.
1.13%, 8/15/2029 (a)
| | | 15,000 | | 17,126 |
Freshpet, Inc.
3.00%, 4/1/2028
| | | 9,000 | | 17,811 |
Liberty Media Corp.
3.75%, 3/15/2028
| | | 15,000 | | 15,636 |
Liberty Media Corp.-Liberty Formula One
2.25%, 8/15/2027
| | | 20,000 | | 21,035 |
Liberty TripAdvisor Holdings, Inc.
0.50%, 6/30/2051 (a)
| | | 30,000 | | 27,894 |
MKS Instruments, Inc.
1.25%, 6/1/2030 (a)
| | | 15,000 | | 15,986 |
Nutanix, Inc.
0.25%, 10/1/2027
| | | 10,000 | | 11,661 |
Royal Caribbean Cruises Ltd.
6.00%, 8/15/2025
| | | 5,000 | | 16,149 |
Sarepta Therapeutics, Inc.
1.25%, 9/15/2027
| | | 10,000 | | 12,891 |
Seagate HDD Cayman
3.50%, 6/1/2028 (a)
| | | 10,000 | | 13,663 |
Super Micro Computer, Inc.
3/1/2029 (a)
| | | 15,000 | | 15,098 |
Tetra Tech, Inc.
2.25%, 8/15/2028 (a)
| | | 15,000 | | 17,578 |
TransMedics Group, Inc.
1.50%, 6/1/2028
| | | 10,000 | | 17,626 |
Uber Technologies, Inc.
0.88%, 12/1/2028 (a)
| | | 35,000 | | 41,628 |
Western Digital Corp.
3.00%, 11/15/2028 (a)
| | | 10,000 | | 15,970 |
Workiva, Inc.
1.25%, 8/15/2028 (a)
| | | 20,000 | | 17,718 |
Zscaler, Inc.
0.13%, 7/1/2025
| | | 10,000 | | 13,454 |
| | | | | | 391,687 |
TOTAL CONVERTIBLE BONDS
(Cost $386,072)
| | | | | 408,440 |
| CONVERTIBLE FOREIGN BONDS — 0.0% (d) | | | | |
| UNITED STATES — 0.0% (d) | | | | |
Carnival Corp.
5.75%, 12/1/2027
| | | 10,000 | | 16,305 |
TOTAL CONVERTIBLE FOREIGN BONDS
(Cost $14,289)
| | | | | 16,305 |
See accompanying notes to financial statements.
20
SPDR LOOMIS SAYLES OPPORTUNISTIC BOND ETF
SCHEDULE OF INVESTMENTS (continued)
June 30, 2024
| Security Description | | | Principal
Amount | | Value |
| SENIOR FLOATING RATE LOANS — 23.0% | | | | | |
| ADVERTISING SERVICES — 0.7% | | | | | |
Clear Channel Outdoor Holdings, Inc., 2024 Term Loan, 1 mo. USD Term SOFR + 4.00%, 9.46%, 8/23/2028 (b)
| | | $28,144 | | $28,220 |
CMG Media Corp., 2021 Term Loan, 3 mo. USD Term SOFR + 3.50%, 8.93%, 12/17/2026 (b)
| | | 145,477 | | 115,988 |
Neptune Bidco U.S., Inc., 2022 USD Term Loan B, 3 mo. USD Term SOFR + 5.00%, 10.41%, 4/11/2029 (b)
| | | 129,023 | | 121,765 |
| | | | | | 265,973 |
| AEROSPACE & DEFENSE — 0.1% | | | | | |
TransDigm, Inc., 2023 Term Loan J, 3 mo. USD Term SOFR + 3.25%, 7.84%, 2/28/2031 (b)
| | | 39,900 | | 40,030 |
| AIR FREIGHT & LOGISTICS — 0.5% | | | | | |
Rand Parent LLC, 2023 Term Loan B, 3 mo. USD Term SOFR + 4.25%, 9.58%, 3/17/2030 (b)
| | | 189,600 | | 190,187 |
| AIRLINES — 0.7% | | | | | |
| American Airlines, Inc.: | | | | | |
2021 Term Loan, 3 mo. USD Term SOFR + 4.75%, 10.34%, 4/20/2028 (b)
| | | 88,000 | | 91,025 |
2023 1st Lien Term Loan, 3 mo. USD Term SOFR + 2.50%, 8.77%, 6/4/2029 (b)
| | | 115,000 | | 114,957 |
SkyMiles IP Ltd., 2020 Skymiles Term Loan B, 3 mo. USD Term SOFR + 3.75%, 9.07%, 10/20/2027 (b)
| | | 46,362 | | 47,539 |
| | | | | | 253,521 |
| AUTO COMPONENTS — 0.3% | | | | | |
| USI, Inc.: | | | | | |
2024 Term Loan (2029) (e)
| | | 98,259 | | 98,382 |
2024 Term Loan (2030), 3 mo. USD Term SOFR + 2.75%, 8.08%, 9/27/2030 (b)
| | | 21,835 | | 21,863 |
| | | | | | 120,245 |
| AUTO PARTS & EQUIPMENT — 0.6% | | | | | |
| First Brands Group LLC: | | | | | |
2021 Term Loan, 3 mo. USD Term SOFR + 5.00%, 10.59%, 3/30/2027 (b)
| | | 63,381 | | 63,074 |
2022 Incremental Term Loan, 3 mo. USD Term SOFR + 5.00%, 10.59%, 3/30/2027 (b)
| | | 49,060 | | 48,845 |
| Security Description | | | Principal
Amount | | Value |
Wheel Pros LLC, 2023 FILO Term Loan, 3 mo. USD Term SOFR + 8.88%, 14.46%, 2/10/2028 (b)
| | | $94,000 | | $101,379 |
| | | | | | 213,298 |
| BROADCAST SERV/PROGRAM — 0.8% | | | | | |
EW Scripps Co., 2019 Term Loan B2, 1 mo. USD Term SOFR + 2.56%, 8.02%, 5/1/2026 (b)
| | | 320,518 | | 303,290 |
| BUILDING MATERIALS — 0.6% | | | | | |
MI Windows and Doors LLC, 2024 Term Loan B2, 1 mo. USD Term SOFR + 3.50%, 8.84%, 3/28/2031 (b)
| | | 222,000 | | 223,619 |
| BUILDING PRODUCTS — 0.6% | | | | | |
ACProducts, Inc., 2021 Term Loan B, 3 mo. USD Term SOFR + 4.25%, 9.85%, 5/17/2028 (b)
| | | 57 | | 49 |
EMRLD Borrower LP, Term Loan B, 1 mo. USD Term SOFR + 2.50%, 7.84%, 5/31/2030 (b)
| | | 189,849 | | 190,066 |
Oscar AcquisitionCo LLC, Term Loan B (e)
| | | 30,457 | | 30,488 |
| | | | | | 220,603 |
| CHEMICALS — 0.9% | | | | | |
Aruba Investments Holdings LLC, 2020 USD Term Loan, 1 mo. USD Term SOFR + 4.00%, 9.44%, 11/24/2027 (b)
| | | 128,025 | | 127,225 |
Bakelite U.S. Holdco, Inc., 2024 Term Loan, 3 mo. USD Term SOFR + 3.50%, 8.83%, 5/29/2029 (b)
| | | 32,498 | | 32,671 |
LSF11 A5 HoldCo LLC, Term Loan, 3 mo. USD Term SOFR + 3.50%, 8.94%, 10/15/2028 (b)
| | | 108,979 | | 109,092 |
Olympus Water U.S. Holding Corp., 2024 USD Term Loan B (e)
| | | 48,812 | | 48,964 |
| | | | | | 317,952 |
| COMMERCIAL SERVICES — 2.5% | | | | | |
Albion Financing 3 SARL, USD Term Loan, 3 mo. USD Term SOFR + 5.25%, 10.84%, 8/17/2026 (b)
| | | 103,040 | | 103,556 |
Camelot U.S. Acquisition LLC, 2024 Term Loan B, 1 mo. USD Term SOFR + 2.75%, 8.09%, 1/31/2031 (b)
| | | 111,519 | | 111,854 |
| GTCR W Merger Sub LLC: | | | | | |
2024 USD Term Loan B (e)
| | | 266,000 | | 266,702 |
USD Term Loan B, 3 mo. USD Term SOFR + 3.00%, 8.33%, 1/31/2031 (b)
| | | 266,000 | | 266,702 |
See accompanying notes to financial statements.
21
SPDR LOOMIS SAYLES OPPORTUNISTIC BOND ETF
SCHEDULE OF INVESTMENTS (continued)
June 30, 2024
| Security Description | | | Principal
Amount | | Value |
Kingpin Intermediate Holdings LLC, 2023 Term Loan B, 1 mo. USD Term SOFR + 3.50%, 8.84%, 2/8/2028 (b)
| | | $96,418 | | $96,554 |
Mckissock Investment Holdings LLC, Incremental Term Loan, 3 mo. USD Term SOFR + 5.00%, 10.33%, 3/12/2029 (b)
| | | 93,530 | | 94,007 |
| | | | | | 939,375 |
| COMMERCIAL SERVICES & SUPPLIES — 0.4% | | | | | |
McGraw-Hill Global Education Holdings LLC, 2021 Term Loan, 3 mo. USD Term SOFR + 4.75%, 10.35%, 7/28/2028 (b)
| | | 155,806 | | 156,271 |
| COMMUNICATIONS EQUIPMENT — 0.3% | | | | | |
CommScope, Inc., 2019 Term Loan B, 1 mo. USD Term SOFR + 3.25%, 8.71%, 4/6/2026 (b)
| | | 102,618 | | 92,832 |
| COMPUTERS — 1.1% | | | | | |
Fortress Intermediate 3, Inc, Term Loan B (e)
| | | 156,000 | | 156,390 |
Genuine Financial Holdings LLC, 2023 Term Loan B, 1 mo. USD Term SOFR + 4.00%, 9.35%, 9/27/2030 (b)
| | | 120,092 | | 119,852 |
NCR Atleos LLC, 2023 Term Loan B, 3 mo. USD Term SOFR + 4.75%, 10.18%, 3/27/2029 (b)
| | | 138,027 | | 139,666 |
| | | | | | 415,908 |
| CONSTRUCTION & ENGINEERING — 0.2% | | | | | |
VM Consolidated, Inc., 2024 Term Loan B, 1 mo. USD Term SOFR + 2.75%, 8.09%, 3/24/2028 (b)
| | | 77,852 | | 78,403 |
| CONTAINERS & PACKAGING — 0.3% | | | | | |
Graham Packaging Co., Inc., 2021 Term Loan, 1 mo. USD Term SOFR + 3.00%, 8.46%, 8/4/2027 (b)
| | | 115,730 | | 116,042 |
| DISTRIBUTION/WHOLESALE — 0.2% | | | | | |
Gates Global LLC, 2024 Term Loan B5, 1 mo. USD Term SOFR + 2.25%, 7.59%, 6/4/2031 (b)
| | | 88,428 | | 88,672 |
| DIVERSIFIED FINANCIAL SERVICES — 0.4% | | | | | |
Paysafe Holdings U.S. Corp., USD Term Loan B1, 1 mo. USD Term SOFR + 2.75%, 8.21%, 6/28/2028 (b)
| | | 155,539 | | 155,442 |
| Security Description | | | Principal
Amount | | Value |
| DIVERSIFIED TELECOMMUNICATION SERVICES — 0.7% | | | | | |
| Crown Subsea Communications Holding, Inc.: | | | | | |
2024 Term Loan B, 3 mo. USD Term SOFR + 4.75%, 10.08%, 1/30/2031 (b)
| | | $72,727 | | $73,015 |
2024 Term Loan B, 3 mo. USD Term SOFR + 4.75%, 10.08%, 1/30/2031 (b)
| | | 72,727 | | 73,193 |
Lorca Holdco Ltd., 2024 USD Term Loan (e)
| | | 121,847 | | 122,304 |
| | | | | | 268,512 |
| ELECTRIC — 0.6% | | | | | |
Kohler Energy Co. LLC, USD Term Loan B, 3 mo. USD Term SOFR + 4.75%, 10.08%, 5/1/2031 (b)
| | | 210,000 | | 211,149 |
| ENERGY-ALTERNATE SOURCES — 0.2% | | | | | |
Array Technologies, Inc., Term Loan B, 3 mo. USD Term SOFR + 3.25%, 8.84%, 10/14/2027 (b)
| | | 86,390 | | 86,509 |
| HEALTH CARE EQUIPMENT & SUPPLIES — 0.7% | | | | | |
Agiliti Health, Inc., 2023 Term Loan, 3 mo. USD Term SOFR + 3.00%, 8.30%, 5/1/2030 (b)
| | | 155,349 | | 154,912 |
Bausch & Lomb Corp., 2023 Incremental Term Loan, 1 mo. USD Term SOFR + 4.00%, 9.34%, 9/29/2028 (b)
| | | 62,528 | | 62,489 |
Medline Borrower LP, 2024 Term Loan B, 1 mo. USD Term SOFR + 2.75%, 8.09%, 10/23/2028 (b)
| | | 49,943 | | 50,100 |
| | | | | | 267,501 |
| HEALTH CARE PROVIDERS & SERVICES — 1.1% | | | | | |
CHG Healthcare Services, Inc., 2021 Term Loan, 1 mo. USD Term SOFR + 3.25%, 8.69%, 9/29/2028 (b)
| | | 291,750 | | 292,539 |
LifePoint Health, Inc., 2024 Term Loan B, 3 mo. USD Term SOFR + 4.75%, 10.06%, 11/16/2028 (b)
| | | 119,678 | | 120,479 |
| | | | | | 413,018 |
| HOTELS, RESTAURANTS & LEISURE — 0.5% | | | | | |
19th Holdings Golf LLC, 2022 Term Loan B, 1 mo. USD Term SOFR + 3.25%, 8.68%, 2/7/2029 (b)
| | | 153,648 | | 152,112 |
See accompanying notes to financial statements.
22
SPDR LOOMIS SAYLES OPPORTUNISTIC BOND ETF
SCHEDULE OF INVESTMENTS (continued)
June 30, 2024
| Security Description | | | Principal
Amount | | Value |
Caesars Entertainment, Inc., Term Loan B, 3 mo. USD Term SOFR + 2.75%, 8.10%, 2/6/2030 (b)
| | | $42,626 | | $42,709 |
| | | | | | 194,821 |
| INSURANCE — 1.2% | | | | | |
| Sedgwick Claims Management Services, Inc.: | | | | | |
2023 Term Loan B, 1 mo. USD Term SOFR + 3.75%, 9.09%, 2/24/2028 (b)
| | | 217,290 | | 217,803 |
2023 Term Loan B, 1 mo. USD Term SOFR + 3.75%, 9.09%, 6/27/2031 (b)
| | | 216,337 | | 216,607 |
| | | | | | 434,410 |
| INTERNET & TELECOM — 1.1% | | | | | |
Arches Buyer, Inc., 2021 Term Loan B, 1 mo. USD Term SOFR + 3.25%, 8.69%, 12/6/2027 (b)
| | | 101,834 | | 97,641 |
Endure Digital, Inc., Term Loan, 1 mo. USD Term SOFR + 3.50%, 8.94%, 2/10/2028 (b)
| | | 98,325 | | 91,566 |
MH Sub I LLC, 2023 Term Loan, 1 mo. USD Term SOFR + 4.25%, 9.59%, 5/3/2028 (b)
| | | 107,910 | | 107,932 |
Proofpoint, Inc., 2024 Term Loan, 1 mo. USD Term SOFR + 3.00%, 8.34%, 8/31/2028 (b)
| | | 73,523 | | 73,675 |
Uber Technologies, Inc., 2023 Term Loan B, 3 mo. USD Term SOFR + 2.75%, 8.09%, 3/3/2030 (b)
| | | 32,221 | | 32,413 |
| | | | | | 403,227 |
| IT SERVICES — 0.1% (d) | | | | | |
Access CIG LLC, 2023 Term Loan, 3 mo. USD Term SOFR + 5.00%, 10.33%, 8/18/2028 (b)
| | | 6,965 | | 7,018 |
CoreLogic, Inc., Term Loan, 1 mo. USD Term SOFR + 3.50%, 8.96%, 6/2/2028 (b)
| | | 23,311 | | 23,003 |
| | | | | | 30,021 |
| LEISURE TIME — 0.3% | | | | | |
Carnival Corp., 2024 Term Loan B2, 1 mo. USD Term SOFR + 2.75%, 8.09%, 8/8/2027 (b)
| | | 110,984 | | 111,678 |
| MEDIA — 0.4% | | | | | |
Cengage Learning, Inc., 2024 Term Loan B, 6 mo. USD Term SOFR + 4.25%, 9.54%, 3/22/2031 (b)
| | | 55,739 | | 55,965 |
Directv Financing LLC, 2024 Term Loan, 1 mo. USD Term SOFR + 5.25%, 10.71%, 8/2/2029 (b)
| | | 107,645 | | 107,309 |
| | | | | | 163,274 |
| Security Description | | | Principal
Amount | | Value |
| PHARMACEUTICALS — 0.9% | | | | | |
IVC Acquisition Ltd., 2024 USD Term Loan B (e)
| | | $77,610 | | $77,853 |
| Jazz Financing Lux SARL: | | | | | |
2024 Term Loan B (e)
| | | 91,689 | | 91,861 |
2024 Term Loan B , 5/5/2028 (b)
| | | 91,689 | | 91,861 |
Organon & Co., 2024 USD Term Loan B, 1 mo. USD Term SOFR + 2.50%, 7.83%, 5/19/2031 (b)
| | | 75,713 | | 75,854 |
| | | | | | 337,429 |
| PROFESSIONAL SERVICES — 0.3% | | | | | |
Dun & Bradstreet Corp., 2024 Term Loan B, 3 mo. USD Term SOFR + 2.75%, 8.10%, 1/18/2029 (b)
| | | 124,704 | | 124,938 |
| RETAIL — 0.3% | | | | | |
CWGS Group LLC, 2021 Term Loan B, 1 mo. USD Term SOFR + 2.50%, 7.96%, 6/3/2028 (b)
| | | 119,383 | | 115,876 |
| SEMICONDUCTORS & SEMICONDUCTOR EQUIPMENT — 0.4% | | | | | |
Altar Bidco, Inc., 2021 Term Loan, 1 yr. USD Term SOFR + 3.10%, 7.95%, 2/1/2029 (b)
| | | 130,011 | | 129,962 |
| SOFTWARE — 1.8% | | | | | |
Modena Buyer LLC, Term Loan (e)
| | | 195,000 | | 190,582 |
Open Text Corp., 2023 Term Loan B, 1 mo. USD Term SOFR + 2.25%, 7.59%, 1/31/2030 (b)
| | | 110,841 | | 111,449 |
Project Alpha Intermediate Holding, Inc., 2024 Term Loan B, 3 mo. USD Term SOFR + 3.75%, 9.07%, 10/28/2030 (b)
| | | 142,767 | | 143,382 |
| Sabre GLBL, Inc.: | | | | | |
2021 Term Loan B1, 1 mo. USD Term SOFR + 3.50%, 8.96%, 12/17/2027 (b)
| | | 45,086 | | 40,738 |
2021 Term Loan B2, 1 mo. USD Term SOFR + 3.50%, 8.96%, 12/17/2027 (b)
| | | 70,658 | | 63,845 |
UKG, Inc., 2024 Term Loan B, 1 mo. USD Term SOFR + 3.25%, 8.58%, 2/10/2031 (b)
| | | 100,126 | | 100,618 |
| | | | | | 650,614 |
| SPECIALTY RETAIL — 0.9% | | | | | |
Michaels Cos., Inc., 2021 Term Loan B, 3 mo. USD Term SOFR + 4.25%, 9.85%, 4/15/2028 (b)
| | | 125,150 | | 112,806 |
PetSmart, Inc., 2021 Term Loan B, 1 mo. USD Term SOFR + 3.75%, 9.19%, 2/11/2028 (b)
| | | 218,628 | | 218,263 |
| | | | | | 331,069 |
See accompanying notes to financial statements.
23
SPDR LOOMIS SAYLES OPPORTUNISTIC BOND ETF
SCHEDULE OF INVESTMENTS (continued)
June 30, 2024
| Security Description | | | Principal
Amount | | Value |
| TRANSPORT-SERVICES — 0.3% | | | | | |
PODS LLC, 2021 Term Loan B, 3 mo. USD Term SOFR + 3.00%, 8.59%, 3/31/2028 (b)
| | | $118,391 | | $112,339 |
TOTAL SENIOR FLOATING RATE LOANS
(Cost $8,625,270)
| | | | | 8,578,010 |
| | | Shares | |
| MUTUAL FUNDS AND EXCHANGE TRADED PRODUCTS — 4.6% | | | |
SPDR Blackstone Senior Loan ETF (f)
(Cost $ 1,687,776)
| | 40,506 | $1,693,151 |
| | | Principal
Amount | |
| COMMERCIAL MORTGAGE BACKED SECURITIES — 0.2% | | | |
COMM Mortgage Trust Series 2012-CR3, Class B, 3.92%, 10/15/2045 (a)
(Cost $95,267)
| | $96,229 | 83,644 |
| | | Shares | |
| SHORT-TERM INVESTMENT — 5.7% | | | |
State Street Institutional U.S. Government Money Market Fund, Class G Shares 5.29% (g) (h)
(Cost $2,127,724)
| | 2,127,724 | 2,127,724 |
TOTAL INVESTMENTS — 101.5%
(Cost $37,998,208)
| | | 37,818,966 |
LIABILITIES IN EXCESS OF OTHER ASSETS — (1.5)%
| | | (565,613) |
NET ASSETS — 100.0%
| | | $37,253,353 |
| (a) | Securities purchased pursuant to Rule 144A of the Securities Act of 1933, as amended. These securities, which represent 40.4% of net assets as of June 30, 2024, are considered liquid and may be resold in transactions exempt from registration, normally to qualified institutional buyers. |
| (b) | Variable Rate Security - Interest rate shown is rate in effect at June 30, 2024. For securities based on a published reference rate and spread, the reference rate and spread are indicated in the description above. |
| (c) | When-issued security. |
| (d) | Amount is less than 0.05% of net assets. |
| (e) | Position is unsettled. Contract rate was not determined at June 30, 2024 and does not take effect until settlement date. Maturity date is not finalized until settlement date. |
| (f) | Affiliated fund managed by SSGA Funds Management, Inc. Amounts related to these investments during the year ended June 30, 2024 are shown in the Affiliate Table below. |
| (g) | The Fund invested in certain money market funds managed by SSGA Funds Management, Inc. Amounts related to these investments during the year ended June 30, 2024 are shown in the Affiliate Table below. |
| (h) | The rate shown is the annualized seven-day yield at June 30, 2024. |
| ABS | Asset-Backed Security |
| CLO | Collateralized Loan Obligation |
| CMT | Constant Maturity Treasury |
| MTN | Medium Term Note |
| REIT | Real Estate Investment Trust |
| SOFR | Secured Overnight Financing Rate |
See accompanying notes to financial statements.
24
SPDR LOOMIS SAYLES OPPORTUNISTIC BOND ETF
SCHEDULE OF INVESTMENTS (continued)
June 30, 2024
At June 30, 2024, open futures contracts were as follows:
| Description | | Number of
Contracts | | Expiration
Date | | Notional
Amount | | Value | | Unrealized
Appreciation
(Depreciation) |
| 2 Yr. U.S. Treasury Note Futures (long) | | 29 | | 09/30/2024 | | $5,904,581 | | $5,922,343 | | $17,762 |
| Ultra U.S. Treasury Bond Futures (long) | | 2 | | 09/19/2024 | | 251,938 | | 250,688 | | (1,250) |
| U.S. Treasury Bond Futures (long) | | 19 | | 09/19/2024 | | 2,218,607 | | 2,247,938 | | 29,331 |
| 10 Yr. U.S. Treasury Ultra Futures (long) | | 18 | | 09/19/2024 | | 2,044,907 | | 2,043,562 | | (1,345) |
| 5 Yr. U.S. Treasury Note Futures (long) | | 35 | | 09/30/2024 | | 3,702,891 | | 3,730,037 | | 27,146 |
| | | | | | | | | | | $71,644 |
During the year ended June 30, 2024, the average notional value related to futures contracts and swap contracts was $10,756,790 and $2,025,769, respectively.
The following table summarizes the value of the Fund's investments according to the fair value hierarchy as of June 30, 2024.
| Description | | Level 1 –
Quoted Prices | | Level 2 –
Other Significant
Observable Inputs | | Level 3 –
Significant
Unobservable Inputs | | Total |
| ASSETS: | | | | | | | | |
| INVESTMENTS: | | | | | | | | |
Corporate Bonds & Notes
| | $— | | $21,650,368 | | $— | | $21,650,368 |
Asset-Backed Securities
| | — | | 3,261,324 | | — | | 3,261,324 |
Commercial Mortgage Backed Securities
| | — | | 83,644 | | — | | 83,644 |
Convertible Bonds
| | — | | 408,440 | | — | | 408,440 |
Convertible Foreign Bonds
| | — | | 16,305 | | — | | 16,305 |
Mutual Funds and Exchange Traded Products
| | 1,693,151 | | — | | — | | 1,693,151 |
Senior Floating Rate Loans
| | — | | 8,578,010 | | — | | 8,578,010 |
Short-Term Investment
| | 2,127,724 | | — | | — | | 2,127,724 |
TOTAL INVESTMENTS
| | $3,820,875 | | $33,998,091 | | $— | | $37,818,966 |
| OTHER FINANCIAL INSTRUMENTS: | | | | | | | | |
Futures Contracts - Unrealized Appreciation
| | $74,239 | | $— | | $— | | $74,239 |
Futures Contracts - Unrealized Depreciation
| | (2,595) | | — | | — | | (2,595) |
TOTAL OTHER FINANCIAL INSTRUMENTS:
| | $71,644 | | $— | | $— | | $71,644 |
Affiliate Table
| | Number of
Shares Held
at
6/30/23 | | Value at
6/30/23 | | Cost of
Purchases | | Proceeds
from
Shares Sold | | Realized
Gain (Loss) | | Change in
Unrealized
Appreciation/
Depreciation | | Number of
Shares Held
at
6/30/24 | | Value at
6/30/24 | | Dividend
Income |
SPDR Blackstone Senior Loan ETF
| 23,140 | | $968,872 | | $727,005 | | $— | | $— | | $(2,726) | | 40,506 | | $1,693,151 | | $135,622 |
State Street Institutional U.S. Government Money Market Fund, Class G Shares
| 585,448 | | 585,448 | | 16,918,702 | | 15,376,426 | | — | | — | | 2,127,724 | | 2,127,724 | | 88,540 |
Total
| | | $1,554,320 | | $17,645,707 | | $15,376,426 | | $— | | $(2,726) | | | | $3,820,875 | | $224,162 |
See accompanying notes to financial statements.
25
SPDR NUVEEN MUNICIPAL BOND ETF
SCHEDULE OF INVESTMENTS
June 30, 2024
| Security Description | | | Principal
Amount | | Value |
| MUNICIPAL BONDS & NOTES — 98.0% | | | |
| ALABAMA — 2.5% | | | | |
Black Belt Energy Gas District Revenue, AL
Series B, 4.00%, 10/1/2052 (a)
| | $500,000 | | $501,126 |
County of Jefferson Sewer Revenue, AL
5.25%, 10/1/2040
| | 200,000 | | 221,757 |
Southeast Energy Authority A Cooperative District Revenue, AL
Series B, 4.00%, 12/1/2051 (a)
| | 500,000 | | 497,029 |
| | | | | | 1,219,912 |
| ARIZONA — 1.1% | | | | |
Maricopa County Industrial Development Authority Revenue, AZ
AMT, 4.00%, 10/15/2047 (b)
| | 100,000 | | 91,074 |
Maricopa County Pollution Control Corp. Revenue, AZ
Series B, 0.88%, 6/1/2043 (a)
| | 500,000 | | 461,750 |
| | | | | | 552,824 |
| ARKANSAS — 1.1% | | | | |
Arkansas Development Finance Authority Revenue, AR
AMT, 5.45%, 9/1/2052
| | 525,000 | | 539,886 |
| CALIFORNIA — 7.7% | | | | |
Anaheim Public Financing Authority Revenue, CA
Series C, AGM, Zero Coupon, 9/1/2036 (c)
| | 320,000 | | 212,946 |
California Community Choice Financing Authority Revenue, CA
Series E-1, 5.00%, 2/1/2054 (a)
| | 500,000 | | 529,915 |
California Housing Finance Agency Revenue, CA
Series 2021-1, 3.50%, 11/20/2035
| | 171,154 | | 163,578 |
City & County of San Francisco Special Tax District No., Special Tax Revenue, CA
Series B, 5.75%, 9/1/2053 (b)
| | 350,000 | | 376,884 |
City of Long Beach Marina System Revenue, CA
5.00%, 5/15/2040
| | 750,000 | | 752,294 |
Municipal Improvement Corp. of Los Angeles Revenue, CA
Series A, 1.45%, 11/1/2027
| | 540,000 | | 481,941 |
Norman Y Mineta San Jose International Airport SJC Revenue, CA
Series A, AMT, 5.00%, 3/1/2037
| | 210,000 | | 215,634 |
Orange County Community Facilities District, Special Tax Revenue, CA
Series A, 5.00%, 8/15/2037
| | 250,000 | | 266,164 |
| Security Description | | | Principal
Amount | | Value |
Palomar Health, General Obligation, CA
Series A, AGC, Zero Coupon, 8/1/2027 (c)
| | $100,000 | | $88,488 |
San Francisco City & County Airport Comm-San Francisco International Airport Revenue, CA
Series H, AMT, 5.00%, 5/1/2028
| | 175,000 | | 182,747 |
University of California Revenue, CA
Series BI, 1.37%, 5/15/2028
| | 595,000 | | 525,497 |
| | | | | | 3,796,088 |
| COLORADO — 3.2% | | | | |
City & County of Denver Airport System Revenue, CO
Series B2, AMT, 5.00%, 11/15/2031 (a)
| | 400,000 | | 405,452 |
Colorado Health Facilities Authority Revenue, CO
Series A-1, 4.00%, 8/1/2037
| | 200,000 | | 200,165 |
Denver Convention Center Hotel Authority Revenue, CO
5.00%, 12/1/2030
| | 400,000 | | 408,764 |
Park Creek Metropolitan District Revenue, CO
Series A, 5.00%, 12/1/2024
| | 575,000 | | 576,617 |
| | | | | | 1,590,998 |
| CONNECTICUT — 1.6% | | | | |
South Central Connecticut Regional Water Authority Revenue, CT
Series B, 5.00%, 8/1/2037
| | 125,000 | | 129,002 |
State of Connecticut, General Obligation, CT
Series F, 5.00%, 11/15/2041
| | 610,000 | | 674,863 |
| | | | | | 803,865 |
| DISTRICT OF COLUMBIA — 0.6% | | | | |
Metropolitan Washington Airports Authority Dulles Toll Road Revenue, DC
Series B, 4.00%, 10/1/2038
| | 305,000 | | 307,114 |
| FLORIDA — 4.8% | | | | |
County of Miami-Dade Aviation Revenue, FL
Series A, AMT, 5.00%, 10/1/2029
| | 210,000 | | 210,250 |
County of Miami-Dade Seaport Department Revenue, FL
Series A, AMT, 5.00%, 10/1/2038
| | 375,000 | | 401,403 |
County of Miami-Dade Water & Sewer System Revenue, FL
3.00%, 10/1/2036
| | 530,000 | | 472,423 |
Crosswinds East Community Development District, Special Assessment, FL
5.50%, 5/1/2044
| | 135,000 | | 137,355 |
| Florida Development Finance Corp. Revenue, FL: | | | | |
AMT, 6.13%, 7/1/2032 (a) (b)
| | 300,000 | | 307,899 |
See accompanying notes to financial statements.
26
SPDR NUVEEN MUNICIPAL BOND ETF
SCHEDULE OF INVESTMENTS (continued)
June 30, 2024
| Security Description | | | Principal
Amount | | Value |
Series C, AMT, 8.25%, 7/1/2057 (a) (b)
| | $525,000 | | $544,368 |
Preserve at South Branch Community Development District, Special Assessment, FL
4.00%, 11/1/2039
| | 300,000 | | 282,519 |
| | | | | | 2,356,217 |
| GEORGIA — 3.2% | | | | |
Main Street Natural Gas, Inc. Revenue, GA
Series E-1, 5.00%, 12/1/2053 (a)
| | 600,000 | | 641,412 |
Municipal Electric Authority of Georgia Revenue, GA
Series B, 5.00%, 1/1/2048
| | 605,000 | | 613,110 |
Richmond County Hospital Authority Revenue, GA
3.00%, 1/1/2033
| | 345,000 | | 317,086 |
| | | | | | 1,571,608 |
| GUAM — 0.6% | | | | |
Territory of Guam Revenue, GU
Series A, 5.00%, 11/1/2035
| | 300,000 | | 313,574 |
| HAWAII — 1.9% | | | | |
State of Hawaii, General Obligation, HI
Series EY, 5.00%, 10/1/2027
| | 905,000 | | 921,946 |
| IDAHO — 0.2% | | | | |
Spring Valley Community Infrastructure District No. 1, Special Assessment, ID
6.25%, 9/1/2053 (b)
| | 100,000 | | 103,674 |
| ILLINOIS — 7.2% | | | | |
| Chicago Board of Education, General Obligation, IL: | | | | |
Series A, 5.00%, 12/1/2035
| | 300,000 | | 313,083 |
Series A, 5.00%, 12/1/2036
| | 300,000 | | 311,667 |
| Chicago O'Hare International Airport Revenue, IL: | | | | |
BAM, 5.00%, 1/1/2038 (c)
| | 250,000 | | 273,810 |
Series B, 5.00%, 1/1/2029
| | 160,000 | | 160,871 |
Illinois Finance Authority Revenue, IL
5.00%, 7/1/2039
| | 230,000 | | 247,180 |
Northern Illinois Municipal Power Agency Revenue, IL
Series A, 5.00%, 12/1/2029
| | 360,000 | | 372,515 |
Northern Illinois University Revenue, IL
Series B, BAM, 4.00%, 4/1/2037 (c)
| | 345,000 | | 343,539 |
State of Illinois Sales Tax Revenue, IL
Series C, 5.00%, 6/15/2026
| | 565,000 | | 578,490 |
| State of Illinois, General Obligation, IL: | | | | |
Series D, 3.25%, 11/1/2026
| | 100,000 | | 98,106 |
Series A, 4.00%, 3/1/2038
| | 730,000 | | 720,221 |
| Security Description | | | Principal
Amount | | Value |
Series A, 5.00%, 12/1/2031
| | $150,000 | | $156,040 |
| | | | | | 3,575,522 |
| IOWA — 0.4% | | | | |
Iowa Finance Authority Revenue, IA
4.00%, 12/1/2050 (a)
| | 200,000 | | 209,605 |
| KANSAS — 0.6% | | | | |
City of Olathe, General Obligation, KS
Series 234, 3.00%, 10/1/2031
| | 300,000 | | 276,827 |
| KENTUCKY — 0.9% | | | | |
Kentucky Economic Development Finance Authority Revenue, KY
Series A-P3, 4.25%, 7/1/2035
| | 450,000 | | 441,997 |
| LOUISIANA — 3.5% | | | | |
Louisiana Local Government Environmental Facilities & Community Development Authority Revenue, LA
Series B, 5.00%, 8/15/2025
| | 250,000 | | 254,124 |
Louisiana Offshore Terminal Authority Revenue, LA
Series 2007A, 4.15%, 9/1/2027
| | 250,000 | | 249,785 |
Louisiana Public Facilities Authority Revenue, LA
Series A, 4.00%, 4/1/2039
| | 320,000 | | 320,920 |
Louisiana Stadium & Exposition District Revenue, LA
Series A, 5.00%, 7/1/2039
| | 800,000 | | 883,286 |
| | | | | | 1,708,115 |
| MARYLAND — 1.0% | | | | |
| State of Maryland Department of Transportation Revenue, MD: | | | | |
Series B, AMT, 5.00%, 8/1/2030
| | 200,000 | | 213,572 |
Series B, AMT, 5.00%, 8/1/2031
| | 250,000 | | 269,393 |
| | | | | | 482,965 |
| MICHIGAN — 5.4% | | | | |
| Michigan Finance Authority Revenue, MI: | | | | |
5.00%, 11/1/2034
| | 110,000 | | 116,567 |
5.50%, 12/1/2026
| | 700,000 | | 711,284 |
Michigan State Housing Development Authority Revenue, MI
Series A, 4.70%, 12/1/2043
| | 750,000 | | 758,068 |
Southfield Public Schools, General Obligation, MI
5.00%, 5/1/2046
| | 1,000,000 | | 1,083,163 |
| | | | | | 2,669,082 |
| MINNESOTA — 1.0% | | | | |
Duluth Economic Development Authority Revenue, MN
Series A, 4.00%, 6/15/2037
| | 380,000 | | 390,919 |
See accompanying notes to financial statements.
27
SPDR NUVEEN MUNICIPAL BOND ETF
SCHEDULE OF INVESTMENTS (continued)
June 30, 2024
| Security Description | | | Principal
Amount | | Value |
State of Minnesota, General Obligation, MN
Series A, 5.00%, 8/1/2035
| | $100,000 | | $106,508 |
| | | | | | 497,427 |
| MISSOURI — 3.3% | | | | |
City of Kansas City Sanitary Sewer System Revenue, MO
Series A, 4.00%, 1/1/2036
| | 600,000 | | 595,026 |
City of St. Louis Airport Revenue, MO
Series C, 5.00%, 7/1/2029
| | 100,000 | | 108,118 |
Park Hill School District of Platte County, General Obligation, MO
3.00%, 3/1/2032
| | 1,000,000 | | 929,448 |
| | | | | | 1,632,592 |
| NEBRASKA — 0.6% | | | | |
Central Plains Energy Project Revenue, NE
Series A, 5.00%, 5/1/2054 (a)
| | 275,000 | | 289,673 |
| NEVADA — 1.0% | | | | |
Las Vegas Valley Water District, General Obligation, NV
5.00%, 6/1/2039
| | 500,000 | | 501,806 |
| NEW JERSEY — 3.5% | | | | |
New Jersey Economic Development Authority Revenue, NJ
5.00%, 6/15/2031
| | 1,000,000 | | 1,078,710 |
| New Jersey Transportation Trust Fund Authority Revenue, NJ: | | | | |
Series A, 5.00%, 6/15/2025
| | 245,000 | | 248,242 |
Series BB, 5.00%, 6/15/2040
| | 380,000 | | 419,966 |
| | | | | | 1,746,918 |
| NEW MEXICO — 2.0% | | | | |
New Mexico Hospital Equipment Loan Council Revenue, NM
Series A, 4.00%, 8/1/2039
| | 1,000,000 | | 981,196 |
| NEW YORK — 4.9% | | | | |
City of New York, General Obligation, NY
Series A-1, 4.00%, 8/1/2037
| | 1,020,000 | | 1,040,641 |
New York City Industrial Development Agency Revenue, NY
Series A, AGM, 3.00%, 3/1/2036 (c)
| | 795,000 | | 725,474 |
New York State Dormitory Authority Revenue, NY
Series B, 5.00%, 2/15/2034
| | 300,000 | | 301,994 |
New York Transportation Development Corp. Revenue, NY
AMT, 6.00%, 4/1/2035
| | 250,000 | | 282,556 |
| Security Description | | | Principal
Amount | | Value |
Triborough Bridge & Tunnel Authority Revenue, NY
Series A, 5.00%, 11/1/2025
| | $85,000 | | $86,990 |
| | | | | | 2,437,655 |
| OHIO — 2.0% | | | | |
| State of Ohio Revenue, OH: | | | | |
Series A, 3.25%, 1/1/2035
| | 580,000 | | 543,712 |
Series B, 4.20%, 1/15/2045 (a)
| | 320,000 | | 320,000 |
Series C, 4.40%, 1/15/2045 (a)
| | 100,000 | | 100,000 |
| | | | | | 963,712 |
| OKLAHOMA — 1.7% | | | | |
Oklahoma County Finance Authority Revenue, OK
4.00%, 9/1/2038
| | 500,000 | | 507,985 |
Oklahoma Development Finance Authority Revenue, OK
Series B, 5.00%, 8/15/2038
| | 300,000 | | 306,886 |
| | | | | | 814,871 |
| OREGON — 5.5% | | | | |
Medford Hospital Facilities Authority Revenue, OR
Series A, 5.00%, 8/15/2032
| | 900,000 | | 970,348 |
Port of Portland Airport Revenue, OR
AMT, 4.65%, 7/1/2026 (a)
| | 1,000,000 | | 1,000,000 |
Washington & Clackamas Counties School District No. 23J Tigard-Tualatin, General Obligation, OR
Series A, 5.00%, 6/15/2038
| | 695,000 | | 744,451 |
| | | | | | 2,714,799 |
| PENNSYLVANIA — 4.5% | | | | |
City of Philadelphia Airport Revenue, PA
Series B, AMT, 5.00%, 7/1/2032
| | 750,000 | | 772,198 |
Commonwealth Financing Authority Revenue, PA
AGM, 4.00%, 6/1/2039 (c)
| | 550,000 | | 553,363 |
Pennsylvania Economic Development Financing Authority Revenue, PA
Series C, 5.25%, 12/1/2037 (a)
| | 100,000 | | 100,979 |
Pennsylvania Turnpike Commission Revenue, PA
Series B, 5.00%, 12/1/2031
| | 800,000 | | 812,696 |
| | | | | | 2,239,236 |
| SOUTH CAROLINA — 1.7% | | | | |
South Carolina Jobs-Economic Development Authority Revenue, SC
Series A, 5.00%, 11/1/2039
| | 750,000 | | 838,929 |
| TENNESSEE — 1.0% | | | | |
New Memphis Arena Public Building Authority Revenue, TN
Zero Coupon, 4/1/2030 (d)
| | 530,000 | | 482,414 |
See accompanying notes to financial statements.
28
SPDR NUVEEN MUNICIPAL BOND ETF
SCHEDULE OF INVESTMENTS (continued)
June 30, 2024
| Security Description | | | Principal
Amount | | Value |
| TEXAS — 6.7% | | | | |
Central Texas Turnpike System Revenue, TX
Series B, 5.00%, 8/15/2037
| | $525,000 | | $525,204 |
Forney Independent School District, General Obligation, TX
Series B, 5.00%, 8/15/2039 (c)
| | 425,000 | | 469,203 |
Fort Bend Independent School District, General Obligation, TX
Series B, 4.00%, 2/15/2033
| | 610,000 | | 622,465 |
Harris County-Houston Sports Authority Revenue, TX
Series A, 5.00%, 11/15/2029
| | 505,000 | | 506,482 |
New Hope Cultural Education Facilities Finance Corp. Revenue, TX
Series A1, 5.50%, 1/1/2057
| | 465,000 | | 434,432 |
Texas Municipal Power Agency Revenue, TX
AGM, 3.00%, 9/1/2039 (c)
| | 250,000 | | 215,604 |
Texas Private Activity Bond Surface Transportation Corp. Revenue, TX
AMT, 5.50%, 12/31/2058
| | 500,000 | | 542,080 |
| | | | | | 3,315,470 |
| UTAH — 3.1% | | | | |
City of Salt Lake City Airport Revenue, UT
Series A, AMT, 5.25%, 7/1/2038
| | 375,000 | | 419,277 |
Utah Telecommunication Open Infrastructure Agency Revenue, UT
4.38%, 6/1/2040
| | 750,000 | | 764,057 |
Vineyard Redevelopment Agency, Special Obligation, UT
AGM, 5.00%, 5/1/2027 (c)
| | 325,000 | | 338,920 |
| | | | | | 1,522,254 |
| VIRGINIA — 2.8% | | | | |
FHLMC Multifamily VRD Certificates Revenue, VA
Series M017, 4.66%, 9/15/2050 (a) (b)
| | 500,000 | | 500,000 |
Isle Wight County Industrial Development Authority Revenue, VA
AGM, 5.25%, 7/1/2048 (c)
| | 345,000 | | 373,292 |
| Virginia Small Business Financing Authority Revenue, VA: | | | | |
AMT, 5.00%, 6/30/2039
| | 125,000 | | 132,456 |
AMT, 5.00%, 12/31/2039
| | 355,000 | | 376,176 |
| | | | | | 1,381,924 |
| WASHINGTON — 2.9% | | | | |
Energy Northwest Revenue, WA
Series A, 5.00%, 7/1/2039
| | 300,000 | | 338,345 |
Port of Seattle Revenue, WA
Series C, AMT, 5.00%, 4/1/2035
| | 750,000 | | 750,990 |
| Security Description | | | Principal
Amount | | Value |
State of Washington, General Obligation, WA
Series 2017-A, 5.00%, 8/1/2029
| | $150,000 | | $155,038 |
Washington Health Care Facilities Authority Revenue, WA
5.00%, 8/15/2037
| | 200,000 | | 202,848 |
| | | | | | 1,447,221 |
| WISCONSIN — 2.3% | | | | |
Public Finance Authority Revenue, WI
Series A, 6.00%, 6/15/2052
| | 250,000 | | 246,987 |
Wisconsin Health & Educational Facilities Authority Revenue, WI
Series A, 3.00%, 10/15/2037
| | 425,000 | | 364,454 |
Wisconsin Housing & Economic Development Authority Housing Revenue, WI
Series A, 2.05%, 11/1/2036
| | 700,000 | | 543,955 |
| | | | | | 1,155,396 |
TOTAL MUNICIPAL BONDS & NOTES
(Cost $49,132,069)
| | 48,405,312 | |
| | | Shares | |
| SHORT-TERM INVESTMENT — 1.0% | |
State Street Institutional U.S. Government Money Market Fund, Class G Shares 5.29% (e) (f)
(Cost $483,301)
| 483,301 | 483,301 |
TOTAL INVESTMENTS — 99.0%
(Cost $49,615,370)
| 48,888,613 |
OTHER ASSETS IN EXCESS OF LIABILITIES — 1.0%
| 517,785 |
NET ASSETS — 100.0%
| $49,406,398 |
| (a) | Variable Rate Security - Interest rate shown is rate in effect at June 30, 2024. For securities based on a published reference rate and spread, the reference rate and spread are indicated in the description above. |
| (b) | Securities purchased pursuant to Rule 144A of the Securities Act of 1933, as amended. These securities, which represent 3.9% of net assets as of June 30, 2024, are considered liquid and may be resold in transactions exempt from registration, normally to qualified institutional buyers. |
| (c) | Bond is insured by the following: |
| | % of
Net Assets |
Assured Guaranty Municipal Corp.
| 4.9% |
Build America Mutual Assurance Company
| 1.3% |
Permanent School Fund Guaranteed
| 1.0% |
Assured Guaranty Corp.
| 0.2% |
See accompanying notes to financial statements.
29
SPDR NUVEEN MUNICIPAL BOND ETF
SCHEDULE OF INVESTMENTS (continued)
June 30, 2024
| (d) | Step-up bond - Coupon rate increases in increments to maturity. Rate shown as of June 30, 2024. Maturity date shown is the final maturity. |
| (e) | The Fund invested in certain money market funds managed by SSGA Funds Management, Inc. Amounts related to these investments during the year ended June 30, 2024 are shown in the Affiliate Table below. |
| (f) | The rate shown is the annualized seven-day yield at June 30, 2024. |
| AMT | Alternative Minimum Tax |
| FHLMC | Federal Home Loan Mortgage Corporation |
The following table summarizes the value of the Fund's investments according to the fair value hierarchy as of June 30, 2024.
| Description | | Level 1 –
Quoted Prices | | Level 2 –
Other Significant
Observable Inputs | | Level 3 –
Significant
Unobservable Inputs | | Total |
| ASSETS: | | | | | | | | |
| INVESTMENTS: | | | | | | | | |
Municipal Bonds & Notes
| | $— | | $48,405,312 | | $— | | $48,405,312 |
Short-Term Investment
| | 483,301 | | — | | — | | 483,301 |
TOTAL INVESTMENTS
| | $483,301 | | $48,405,312 | | $— | | $48,888,613 |
Affiliate Table
| | Number of
Shares Held
at
6/30/23 | | Value at
6/30/23 | | Cost of
Purchases | | Proceeds
from
Shares Sold | | Realized
Gain (Loss) | | Change in
Unrealized
Appreciation/
Depreciation | | Number of
Shares Held
at
6/30/24 | | Value at
6/30/24 | | Dividend
Income |
State Street Institutional U.S. Government Money Market Fund, Class G Shares
| 167,594 | | $167,594 | | $14,167,241 | | $13,851,534 | | $— | | $— | | 483,301 | | $483,301 | | $24,990 |
See accompanying notes to financial statements.
30
SPDR NUVEEN MUNICIPAL BOND ESG ETF
SCHEDULE OF INVESTMENTS
June 30, 2024
| Security Description | | | Principal
Amount | | Value |
| MUNICIPAL BONDS & NOTES — 98.6% | | | |
| ALABAMA — 2.1% | | | | |
Black Belt Energy Gas District Revenue, AL
Series C, 5.50%, 10/1/2054 (a)
| | $600,000 | | $657,084 |
County of Jefferson Sewer Revenue, AL
5.25%, 10/1/2040
| | 180,000 | | 199,582 |
| | | | | | 856,666 |
| ARIZONA — 0.6% | | | | |
City of Phoenix Civic Improvement Corp. Revenue, AZ
Series D, 5.00%, 7/1/2030
| | 215,000 | | 225,342 |
| CALIFORNIA — 4.9% | | | | |
California Community Choice Financing Authority Revenue, CA
Series D, 5.50%, 5/1/2054 (a)
| | 600,000 | | 640,483 |
Compton Unified School District, General Obligation, CA
Series B, BAM, 4.00%, 6/1/2032 (b)
| | 175,000 | | 177,576 |
Folsom Ranch Financing Authority, Special Tax Revenue, CA
5.00%, 9/1/2029
| | 145,000 | | 153,236 |
Los Angeles Department of Water & Power Revenue, CA
Series E, 5.00%, 7/1/2039
| | 600,000 | | 600,000 |
Orange County Community Facilities District, Special Tax Revenue, CA
Series A, 5.00%, 8/15/2052
| | 200,000 | | 204,128 |
San Mateo Foster City Public Financing Authority Revenue, CA
4.00%, 8/1/2035
| | 175,000 | | 181,551 |
| | | | | | 1,956,974 |
| COLORADO — 1.3% | | | | |
Regional Transportation District Revenue, CO
Series A, 5.00%, 7/15/2027
| | 500,000 | | 517,375 |
| CONNECTICUT — 6.1% | | | | |
Connecticut State Health & Educational Facilities Authority Revenue, CT
Series L, 5.00%, 7/1/2047
| | 600,000 | | 624,803 |
State of Connecticut Special Tax Revenue, CT
Series A, 4.00%, 5/1/2039
| | 460,000 | | 466,642 |
State of Connecticut, General Obligation, CT
Series F, 5.00%, 11/15/2041
| | 610,000 | | 674,863 |
Steel Point Infrastructure Improvement District, Special Obligation, CT
4.00%, 4/1/2031 (c)
| | 300,000 | | 288,897 |
| Security Description | | | Principal
Amount | | Value |
University of Connecticut Revenue, CT
Series A, 5.00%, 4/15/2026
| | $380,000 | | $392,204 |
| | | | | | 2,447,409 |
| DELAWARE — 0.5% | | | | |
Delaware Transportation Authority Revenue, DE
3.25%, 7/1/2025
| | 180,000 | | 179,572 |
| DISTRICT OF COLUMBIA — 1.8% | | | | |
District of Columbia Revenue, DC
Series A, AMT, 5.00%, 8/31/2026
| | 700,000 | | 713,482 |
| FLORIDA — 7.9% | | | | |
City of Gainesville Utilities System Revenue, FL
Series A, 5.00%, 10/1/2025
| | 290,000 | | 295,947 |
City of Pompano Beach Revenue, FL
3.50%, 9/1/2030
| | 250,000 | | 243,619 |
City of Tallahassee Utility System Revenue, FL
5.00%, 10/1/2037
| | 560,000 | | 561,444 |
| Florida Development Finance Corp. Revenue, FL: | | | | |
Series A, 4.00%, 6/15/2042
| | 500,000 | | 468,055 |
Series C, AMT, 8.25%, 7/1/2057 (a) (c)
| | 290,000 | | 300,699 |
Hobe-St. Lucie Conservancy District, Special Assessment, FL
5.60%, 5/1/2044
| | 100,000 | | 103,092 |
Lake Hideaway Community Development District, Special Assessment, FL
5.65%, 5/1/2044
| | 100,000 | | 100,368 |
Miami-Dade County Expressway Authority Revenue, FL
Series A, 5.00%, 7/1/2025
| | 100,000 | | 100,071 |
Orlando Utilities Commission Revenue, FL
Series A, 5.00%, 10/1/2027
| | 150,000 | | 158,724 |
Palm Beach County Health Facilities Authority Revenue, FL
5.00%, 11/15/2032
| | 100,000 | | 102,693 |
Saltleaf Community Development District, Special Assessment, FL
5.63%, 5/1/2044
| | 110,000 | | 110,689 |
| Somerset Community Development District, Special Assessment, FL: | | | | |
4.00%, 5/1/2032
| | 200,000 | | 193,785 |
4.20%, 5/1/2037
| | 200,000 | | 189,265 |
Westside Haines City Community Development District, Special Assessment, FL
6.00%, 5/1/2054
| | 250,000 | | 253,685 |
| | | | | | 3,182,136 |
See accompanying notes to financial statements.
31
SPDR NUVEEN MUNICIPAL BOND ESG ETF
SCHEDULE OF INVESTMENTS (continued)
June 30, 2024
| Security Description | | | Principal
Amount | | Value |
| IDAHO — 2.4% | | | | |
Idaho Housing & Finance Association Revenue, ID
Series A, 4.00%, 8/15/2048
| | $1,000,000 | | $962,097 |
| ILLINOIS — 4.9% | | | | |
Chicago O'Hare International Airport Revenue, IL
BAM, 5.00%, 1/1/2038 (b)
| | 250,000 | | 273,810 |
City of Chicago, General Obligation, IL
Series A, 5.50%, 1/1/2039
| | 275,000 | | 299,026 |
Cook County Community College District No. 508, General Obligation, IL
BAM, 5.00%, 12/1/2040 (b)
| | 500,000 | | 540,088 |
| Illinois Finance Authority Revenue, IL: | | | | |
5.00%, 7/1/2036
| | 270,000 | | 299,281 |
Series C, 5.00%, 8/15/2035
| | 410,000 | | 412,966 |
Illinois State Toll Highway Authority Revenue, IL
Series B, 5.00%, 1/1/2027
| | 140,000 | | 145,975 |
| | | | | | 1,971,146 |
| IOWA — 0.8% | | | | |
Iowa Finance Authority Revenue, IA
4.00%, 12/1/2050 (a)
| | 300,000 | | 314,408 |
| MARYLAND — 2.6% | | | | |
Maryland Economic Development Corp. Revenue, MD
Series B, AMT, 5.00%, 12/31/2036
| | 425,000 | | 449,944 |
State of Maryland, General Obligation, MD
Series B, 5.00%, 8/1/2027
| | 400,000 | | 423,036 |
Washington Suburban Sanitary Commission Revenue, MD
5.00%, 6/1/2027
| | 150,000 | | 158,147 |
| | | | | | 1,031,127 |
| MASSACHUSETTS — 0.7% | | | | |
Massachusetts Development Finance Agency Revenue, MA
Series A-2, 5.00%, 7/1/2027
| | 250,000 | | 262,996 |
| MICHIGAN — 1.9% | | | | |
Michigan State Housing Development Authority Revenue, MI
Series A, 4.70%, 12/1/2043
| | 750,000 | | 758,068 |
| MINNESOTA — 1.9% | | | | |
City of Minneapolis/St. Paul Housing & Redevelopment Authority Revenue, MN
Series A, 5.00%, 11/15/2026
| | 435,000 | | 449,756 |
| Security Description | | | Principal
Amount | | Value |
Minneapolis-St. Paul Metropolitan Airports Commission Revenue, MN
Series B, AMT, 5.00%, 1/1/2034
| | $300,000 | | $324,818 |
| | | | | | 774,574 |
| MONTANA — 0.5% | | | | |
Cascade County Elementary School District No. 1 Great Falls, General Obligation, MT
3.00%, 7/1/2029
| | 205,000 | | 200,105 |
| NEVADA — 2.6% | | | | |
City of Las Vegas Special Improvement District No. 613, Special Assessment, NV
5.25%, 12/1/2047
| | 550,000 | | 550,932 |
Las Vegas Valley Water District, General Obligation, NV
5.00%, 6/1/2039
| | 500,000 | | 501,806 |
| | | | | | 1,052,738 |
| NEW JERSEY — 3.3% | | | | |
Hudson County Improvement Authority Revenue, NJ
3.00%, 10/1/2034
| | 160,000 | | 149,269 |
| New Jersey Economic Development Authority Revenue, NJ: | | | | |
Series MMM, 5.00%, 6/15/2033
| | 180,000 | | 193,955 |
Series QQQ, 5.00%, 6/15/2033
| | 275,000 | | 300,817 |
New Jersey Transportation Trust Fund Authority Revenue, NJ
Series CC, 5.25%, 6/15/2036
| | 300,000 | | 342,127 |
State of New Jersey, General Obligation, NJ
Series A, 5.00%, 6/1/2027
| | 330,000 | | 346,407 |
| | | | | | 1,332,575 |
| NEW YORK — 9.2% | | | | |
| City of New York, General Obligation, NY: | | | | |
Series E1, 5.00%, 4/1/2039
| | 300,000 | | 336,734 |
Series A, 5.00%, 8/1/2025
| | 105,000 | | 106,915 |
Hudson Yards Infrastructure Corp. Revenue, NY
Series A, 5.00%, 2/15/2030
| | 300,000 | | 312,897 |
Metropolitan Transportation Authority Revenue, NY
Series A, 5.00%, 11/15/2037
| | 575,000 | | 648,287 |
New York City Transitional Finance Authority Building Aid Revenue, NY
Series S1A, 5.00%, 7/15/2038
| | 475,000 | | 509,905 |
New York City Transitional Finance Authority Future Tax Secured Revenue, NY
Series A, 5.00%, 11/1/2026
| | 880,000 | | 916,057 |
See accompanying notes to financial statements.
32
SPDR NUVEEN MUNICIPAL BOND ESG ETF
SCHEDULE OF INVESTMENTS (continued)
June 30, 2024
| Security Description | | | Principal
Amount | | Value |
| New York Transportation Development Corp. Revenue, NY: | | | | |
AMT, 5.00%, 12/1/2036
| | $250,000 | | $267,765 |
AMT, 5.00%, 12/1/2037
| | 300,000 | | 319,972 |
AMT, 6.00%, 4/1/2035
| | 250,000 | | 282,556 |
| | | | | | 3,701,088 |
| OKLAHOMA — 3.0% | | | | |
Carter County Public Facilities Authority Revenue, OK
5.00%, 9/1/2028
| | 200,000 | | 206,101 |
Grand River Dam Authority Revenue, OK
Series A, 5.00%, 6/1/2039
| | 700,000 | | 700,436 |
Muskogee Industrial Trust Revenue, OK
4.00%, 9/1/2032
| | 100,000 | | 98,068 |
Norman Regional Hospital Authority Revenue, OK
4.00%, 9/1/2037
| | 230,000 | | 200,172 |
| | | | | | 1,204,777 |
| OREGON — 4.1% | | | | |
Medford Hospital Facilities Authority Revenue, OR
Series A, 5.00%, 8/15/2037
| | 745,000 | | 797,381 |
Port of Portland Airport Revenue, OR
AMT, 4.65%, 7/1/2026 (a)
| | 175,000 | | 175,000 |
Warm Springs Reservation Confederated Tribe Revenue, OR
Series B, 5.00%, 11/1/2039 (c)
| | 650,000 | | 690,489 |
| | | | | | 1,662,870 |
| PENNSYLVANIA — 6.2% | | | | |
| Pennsylvania Economic Development Financing Authority Revenue, PA: | | | | |
Series A-2, 4.00%, 5/15/2053
| | 250,000 | | 231,942 |
Series A-2, 4.60%, 10/1/2046 (a)
| | 750,000 | | 760,756 |
Series C, 5.25%, 12/1/2037 (a)
| | 100,000 | | 100,978 |
| Pennsylvania Turnpike Commission Revenue, PA: | | | | |
5.00%, 6/1/2027
| | 500,000 | | 509,125 |
Series E, 6.00%, 12/1/2030 (a)
| | 820,000 | | 892,824 |
| | | | | | 2,495,625 |
| SOUTH CAROLINA — 3.5% | | | | |
| South Carolina Jobs-Economic Development Authority Revenue, SC: | | | | |
Series B, 4.22%, 5/1/2061 (a)
| | 550,000 | | 550,000 |
Series A, 5.00%, 11/1/2039
| | 750,000 | | 838,929 |
| | | | | | 1,388,929 |
| TENNESSEE — 0.6% | | | | |
Tennessee Housing Development Agency Revenue, TN
Series 2A, 4.15%, 7/1/2038
| | 250,000 | | 252,390 |
| Security Description | | | Principal
Amount | | Value |
| TEXAS — 8.4% | | | | |
City of Dallas, General Obligation, TX
AGM, 3.13%, 2/15/2035 (b)
| | $950,000 | | $868,551 |
Love Field Airport Modernization Corp. Revenue, TX
AMT, 5.00%, 11/1/2034
| | 105,000 | | 106,731 |
Lower Colorado River Authority Revenue, TX
Series B, 5.00%, 5/15/2039 (a)
| | 590,000 | | 615,153 |
Tarrant County Cultural Education Facilities Finance Corp. Revenue, TX
Series A, 4.00%, 11/15/2035
| | 600,000 | | 596,772 |
Texas Private Activity Bond Surface Transportation Corp. Revenue, TX
AMT, 5.50%, 12/31/2058
| | 500,000 | | 542,080 |
Texas Woman's University Revenue, TX
Series A, 5.00%, 7/1/2037
| | 585,000 | | 650,306 |
| | | | | | 3,379,593 |
| UTAH — 1.1% | | | | |
City of Salt Lake City Airport Revenue, UT
Series A, AMT, 5.25%, 7/1/2038
| | 375,000 | | 419,277 |
| VIRGINIA — 2.5% | | | | |
Isle Wight County Industrial Development Authority Revenue, VA
AGM, 5.25%, 7/1/2048 (b)
| | 345,000 | | 373,292 |
Virginia Beach Development Authority Revenue, VA
Series A, 7.00%, 9/1/2053
| | 100,000 | | 114,375 |
Virginia Small Business Financing Authority Revenue, VA
AMT, 5.00%, 1/1/2037
| | 500,000 | | 531,101 |
| | | | | | 1,018,768 |
| WASHINGTON — 6.5% | | | | |
Central Puget Sound Regional Transit Authority Revenue, WA
Series S-1, 5.00%, 11/1/2045
| | 105,000 | | 107,414 |
King County Public Hospital District No. 1, General Obligation, WA
5.00%, 12/1/2036
| | 590,000 | | 617,295 |
Port of Seattle Revenue, WA
Series C, AMT, 5.00%, 4/1/2035
| | 750,000 | | 750,990 |
State of Washington, General Obligation, WA
Series A, 5.00%, 8/1/2033
| | 250,000 | | 262,776 |
Washington Health Care Facilities Authority Revenue, WA
5.00%, 8/15/2037
| | 300,000 | | 304,272 |
Washington State Housing Finance Commission Revenue, WA
5.50%, 7/1/2044
| | 500,000 | | 544,485 |
| | | | | | 2,587,232 |
See accompanying notes to financial statements.
33
SPDR NUVEEN MUNICIPAL BOND ESG ETF
SCHEDULE OF INVESTMENTS (continued)
June 30, 2024
| Security Description | | | Principal
Amount | | Value |
| WISCONSIN — 6.7% | | | | |
Public Finance Authority Revenue, WI
Series A, 4.00%, 11/15/2037
| | $600,000 | | $596,290 |
Public Finance Authority, Special Obligation, WI
Series A, 5.00%, 6/1/2041 (c)
| | 100,000 | | 101,211 |
State of Wisconsin, General Obligation, WI
Series 1, 5.00%, 5/1/2038
| | 600,000 | | 690,674 |
Wisconsin Health & Educational Facilities Authority Revenue, WI
Series A, 4.00%, 4/1/2039
| | 800,000 | | 780,426 |
Wisconsin Housing & Economic Development Authority Housing Revenue, WI
Series A, 2.05%, 11/1/2036
| | 675,000 | | 524,529 |
| | | | | | 2,693,130 |
TOTAL MUNICIPAL BONDS & NOTES
(Cost $39,481,009)
| | 39,542,469 | |
| | | Shares | |
| SHORT-TERM INVESTMENT — 0.3% | |
State Street Institutional U.S. Government Money Market Fund, Class G Shares 5.29% (d) (e)
(Cost $129,735)
| 129,735 | 129,735 |
TOTAL INVESTMENTS — 98.9%
(Cost $39,610,744)
| 39,672,204 |
OTHER ASSETS IN EXCESS OF LIABILITIES — 1.1%
| 452,345 |
NET ASSETS — 100.0%
| $40,124,549 |
| (a) | Variable Rate Security - Interest rate shown is rate in effect at June 30, 2024. For securities based on a published reference rate and spread, the reference rate and spread are indicated in the description above. |
| (b) | Bond is insured by the following: |
| | % of
Net Assets |
Assured Guaranty Municipal Corp.
| 3.1% |
Build America Mutual Assurance Company
| 2.5% |
| (c) | Securities purchased pursuant to Rule 144A of the Securities Act of 1933, as amended. These securities, which represent 3.4% of net assets as of June 30, 2024, are considered liquid and may be resold in transactions exempt from registration, normally to qualified institutional buyers. |
| (d) | The Fund invested in certain money market funds managed by SSGA Funds Management, Inc. Amounts related to these investments during the year ended June 30, 2024 are shown in the Affiliate Table below. |
| (e) | The rate shown is the annualized seven-day yield at June 30, 2024. |
| AMT | Alternative Minimum Tax |
The following table summarizes the value of the Fund's investments according to the fair value hierarchy as of June 30, 2024.
| Description | | Level 1 –
Quoted Prices | | Level 2 –
Other Significant
Observable Inputs | | Level 3 –
Significant
Unobservable Inputs | | Total |
| ASSETS: | | | | | | | | |
| INVESTMENTS: | | | | | | | | |
Municipal Bonds & Notes
| | $— | | $39,542,469 | | $— | | $39,542,469 |
Short-Term Investment
| | 129,735 | | — | | — | | 129,735 |
TOTAL INVESTMENTS
| | $129,735 | | $39,542,469 | | $— | | $39,672,204 |
See accompanying notes to financial statements.
34
SPDR NUVEEN MUNICIPAL BOND ESG ETF
SCHEDULE OF INVESTMENTS (continued)
June 30, 2024
Affiliate Table
| | Number of
Shares Held
at
6/30/23 | | Value at
6/30/23 | | Cost of
Purchases | | Proceeds
from
Shares Sold | | Realized
Gain (Loss) | | Change in
Unrealized
Appreciation/
Depreciation | | Number of
Shares Held
at
6/30/24 | | Value at
6/30/24 | | Dividend
Income |
State Street Institutional U.S. Government Money Market Fund, Class G Shares
| 263,694 | | $263,694 | | $11,876,606 | | $12,010,565 | | $— | | $— | | 129,735 | | $129,735 | | $18,704 |
See accompanying notes to financial statements.
35
SPDR SSGA FIXED INCOME SECTOR ROTATION ETF
SCHEDULE OF INVESTMENTS
June 30, 2024
| Security Description | | | Shares | | Value |
| MUTUAL FUNDS AND EXCHANGE TRADED PRODUCTS — 100.0% | | | |
| DOMESTIC FIXED INCOME — 100.0% | |
SPDR Bloomberg 1-3 Month T-Bills ETF (a)(b)
| | | 4,506 | | $413,561 |
SPDR Bloomberg High Yield Bond ETF (a)
| | | 236,395 | | 22,284,956 |
SPDR Portfolio Intermediate Term Corporate Bond ETF (a)
| | | 50,776 | | 1,653,266 |
SPDR Portfolio Intermediate Term Treasury ETF (a)(b)
| | | 3,135,688 | | 87,861,978 |
SPDR Portfolio Long Term Corporate Bond ETF (a)(b)
| | | 513,343 | | 11,575,885 |
SPDR Portfolio Long Term Treasury ETF (a)
| | | 1,306,700 | | 35,568,374 |
SPDR Portfolio Mortgage-Backed Bond ETF (a)(b)
| | | 3,643,054 | | 78,580,675 |
TOTAL MUTUAL FUNDS AND EXCHANGE TRADED PRODUCTS
(Cost $240,589,963)
| | 237,938,695 | |
| SHORT-TERM INVESTMENTS — 9.1% | | | |
State Street Institutional U.S. Government Money Market Fund, Class G Shares 5.29% (c)(d)
| | | 71,028 | | 71,028 |
State Street Navigator Securities Lending Portfolio II (e)(f)
| | | 21,612,719 | | 21,612,719 |
TOTAL SHORT-TERM INVESTMENTS
(Cost $21,683,747)
| | | | | $21,683,747 |
TOTAL INVESTMENTS — 109.1%
(Cost $262,273,710)
| | | | | 259,622,442 |
LIABILITIES IN EXCESS OF OTHER ASSETS — (9.1)%
| | | | | (21,669,979) |
NET ASSETS — 100.0%
| | | | | $237,952,463 |
| The Fund invests in other funds and financial statements of underlying funds can be found at www.sec.gov. |
| |
| (a) | Affiliated fund managed by SSGA Funds Management, Inc. Amounts related to these investments during the year ended June 30, 2024 are shown in the Affiliate Table below. |
| (b) | All or a portion of the shares of the security are on loan at June 30, 2024. |
| (c) | The Fund invested in certain money market funds managed by SSGA Funds Management, Inc. Amounts related to these investments during the year ended June 30, 2024 are shown in the Affiliate Table below. |
| (d) | The rate shown is the annualized seven-day yield at June 30, 2024. |
| (e) | The Fund invested in an affiliated entity. Amounts related to these investments during the year ended June 30, 2024 are shown in the Affiliate Table below. |
| (f) | Investment of cash collateral for securities loaned. |
The following table summarizes the value of the Fund's investments according to the fair value hierarchy as of June 30, 2024.
| Description | | Level 1 –
Quoted Prices | | Level 2 –
Other Significant
Observable Inputs | | Level 3 –
Significant
Unobservable Inputs | | Total |
| ASSETS: | | | | | | | | |
| INVESTMENTS: | | | | | | | | |
Mutual Funds and Exchange Traded Products
| | $237,938,695 | | $— | | $— | | $237,938,695 |
Short-Term Investments
| | 21,683,747 | | — | | — | | 21,683,747 |
TOTAL INVESTMENTS
| | $259,622,442 | | $— | | $— | | $259,622,442 |
See accompanying notes to financial statements.
36
SPDR SSGA FIXED INCOME SECTOR ROTATION ETF
SCHEDULE OF INVESTMENTS (continued)
June 30, 2024
Affiliate Table
| | Number of
Shares Held
at
6/30/23 | | Value at
6/30/23 | | Cost of
Purchases | | Proceeds
from
Shares Sold | | Realized
Gain (Loss) | | Change in
Unrealized
Appreciation/
Depreciation | | Number of
Shares Held
at
6/30/24 | | Value at
6/30/24 | | Dividend
Income |
SPDR Bloomberg 1-3 Month T-Bills ETF
| 127,586 | | $11,714,947 | | $36,164,357 | | $47,414,769 | | $(19,957) | | $(31,017) | | 4,506 | | $413,561 | | $460,570 |
SPDR Bloomberg High Yield Bond ETF
| 98,180 | | 9,035,505 | | 31,366,118 | | 18,073,190 | | (58,940) | | 15,463 | | 236,395 | | 22,284,956 | | 756,613 |
SPDR Bloomberg International Treasury Bond ETF
| 558,817 | | 12,601,323 | | 25,206,872 | | 37,213,515 | | (446,678) | | (148,002) | | — | | — | | 167,295 |
SPDR Portfolio Intermediate Term Corporate Bond ETF
| 434,649 | | 13,956,579 | | 24,944,945 | | 37,483,759 | | 171,116 | | 64,385 | | 50,776 | | 1,653,266 | | 557,413 |
SPDR Portfolio Intermediate Term Treasury ETF
| 1,951,784 | | 55,215,969 | | 99,102,600 | | 66,008,005 | | (641,935) | | 193,349 | | 3,135,688 | | 87,861,978 | | 2,470,087 |
SPDR Portfolio Long Term Corporate Bond ETF
| 265,123 | | 6,166,761 | | 16,968,276 | | 11,221,294 | | (67,623) | | (270,235) | | 513,343 | | 11,575,885 | | 354,971 |
SPDR Portfolio Long Term Treasury ETF
| 623,115 | | 18,631,139 | | 49,160,147 | | 30,891,690 | | (2,424,239) | | 1,093,017 | | 1,306,700 | | 35,568,374 | | 505,834 |
SPDR Portfolio Mortgage Backed Bond ETF
| 2,371,611 | | 51,961,997 | | 72,052,126 | | 44,410,341 | | (1,439,757) | | 416,650 | | 3,643,054 | | 78,580,675 | | 2,050,496 |
State Street Institutional U.S. Government Money Market Fund, Class G Shares
| 300,805 | | 300,805 | | 2,847,621 | | 3,077,398 | | — | | — | | 71,028 | | 71,028 | | 14,671 |
State Street Navigator Securities Lending Portfolio II
| 48,283,244 | | 48,283,244 | | 1,075,117,862 | | 1,101,788,387 | | — | | — | | 21,612,719 | | 21,612,719 | | 438,335 |
Total
| | | $227,868,269 | | $1,432,930,924 | | $1,397,582,348 | | $(4,928,013) | | $1,333,610 | | | | $259,622,442 | | $7,776,285 |
See accompanying notes to financial statements.
37
SPDR SSGA US SECTOR ROTATION ETF
SCHEDULE OF INVESTMENTS
June 30, 2024
| Security Description | | | Shares | | Value |
| MUTUAL FUNDS AND EXCHANGE TRADED PRODUCTS — 99.9% | | | |
| DOMESTIC EQUITY — 99.9% | |
The Communication Services Select Sector SPDR Fund (a)(b)
| | | 753,484 | | $64,543,440 |
The Consumer Staples Select Sector SPDR Fund (a)(b)
| | | 265,704 | | 20,347,612 |
The Energy Select Sector SPDR Fund (a)
| | | 428,327 | | 39,042,006 |
The Financial Select Sector SPDR Fund (a)(b)
| | | 2,078,862 | | 85,462,017 |
The Industrial Select Sector SPDR Fund (a)(b)
| | | 890,217 | | 108,490,746 |
The Technology Select Sector SPDR Fund (a)(b)
| | | 1,046,741 | | 236,804,216 |
TOTAL MUTUAL FUNDS AND EXCHANGE TRADED PRODUCTS
(Cost $485,951,874)
| | 554,690,037 | |
| SHORT-TERM INVESTMENTS — 13.0% | | | |
State Street Institutional U.S. Government Money Market Fund, Class G Shares 5.29% (c)(d)
| | | 1,002,267 | | 1,002,267 |
State Street Navigator Securities Lending Portfolio II (e)(f)
| | | 71,204,113 | | 71,204,113 |
TOTAL SHORT-TERM INVESTMENTS
(Cost $72,206,380)
| | | | | $72,206,380 |
TOTAL INVESTMENTS — 112.9%
(Cost $558,158,254)
| | | | | 626,896,417 |
LIABILITIES IN EXCESS OF OTHER ASSETS — (12.9)%
| | | | | (71,450,018) |
NET ASSETS — 100.0%
| | | | | $555,446,399 |
| The Fund invests in other funds and financial statements of underlying funds can be found at www.sec.gov. |
| |
| (a) | Affiliated fund managed by SSGA Funds Management, Inc. Amounts related to these investments during the year ended June 30, 2024 are shown in the Affiliate Table below. |
| (b) | All or a portion of the shares of the security are on loan at June 30, 2024. |
| (c) | The Fund invested in certain money market funds managed by SSGA Funds Management, Inc. Amounts related to these investments during the year ended June 30, 2024 are shown in the Affiliate Table below. |
| (d) | The rate shown is the annualized seven-day yield at June 30, 2024. |
| (e) | The Fund invested in an affiliated entity. Amounts related to these investments during the year ended June 30, 2024 are shown in the Affiliate Table below. |
| (f) | Investment of cash collateral for securities loaned. |
The following table summarizes the value of the Fund's investments according to the fair value hierarchy as of June 30, 2024.
| Description | | Level 1 –
Quoted Prices | | Level 2 –
Other Significant
Observable Inputs | | Level 3 –
Significant
Unobservable Inputs | | Total |
| ASSETS: | | | | | | | | |
| INVESTMENTS: | | | | | | | | |
Mutual Funds and Exchange Traded Products
| | $554,690,037 | | $— | | $— | | $554,690,037 |
Short-Term Investments
| | 72,206,380 | | — | | — | | 72,206,380 |
TOTAL INVESTMENTS
| | $626,896,417 | | $— | | $— | | $626,896,417 |
See accompanying notes to financial statements.
38
SPDR SSGA US SECTOR ROTATION ETF
SCHEDULE OF INVESTMENTS (continued)
June 30, 2024
Affiliate Table
| | Number of
Shares Held
at
6/30/23 | | Value at
6/30/23 | | Cost of
Purchases | | Proceeds
from
Shares Sold | | Realized
Gain (Loss) | | Change in
Unrealized
Appreciation/
Depreciation | | Number of
Shares Held
at
6/30/24 | | Value at
6/30/24 | | Dividend
Income |
State Street Institutional U.S. Government Money Market Fund, Class G Shares
| 385,530 | | $385,530 | | $8,280,518 | | $7,663,781 | | $— | | $— | | 1,002,267 | | $1,002,267 | | $29,930 |
State Street Navigator Securities Lending Portfolio II
| 91,543,951 | | 91,543,951 | | 2,642,260,659 | | 2,662,600,497 | | — | | — | | 71,204,113 | | 71,204,113 | | 278,344 |
The Communication Services Select Sector SPDR Fund
| 96,107 | | 6,254,643 | | 176,024,779 | | 133,325,726 | | 6,923,477 | | 8,666,267 | | 753,484 | | 64,543,440 | | 603,562 |
The Consumer Discretionary Select Sector SPDR Fund
| 295,657 | | 50,205,515 | | 95,163,745 | | 145,036,216 | | 4,367,036 | | (4,700,080) | | — | | — | | 303,612 |
The Consumer Staples Select Sector SPDR Fund
| 421,950 | | 31,296,031 | | 116,329,157 | | 128,307,028 | | 674,739 | | 354,713 | | 265,704 | | 20,347,612 | | 641,698 |
The Energy Select Sector SPDR Fund
| 167,682 | | 13,610,748 | | 54,073,118 | | 28,981,774 | | 754,434 | | (414,520) | | 428,327 | | 39,042,006 | | 722,794 |
The Financial Select Sector SPDR Fund
| — | | — | | 146,491,194 | | 71,056,632 | | 3,007,273 | | 7,020,182 | | 2,078,862 | | 85,462,017 | | 926,362 |
The Health Care Select Sector SPDR Fund
| 462,115 | | 61,336,524 | | 105,224,374 | | 168,757,167 | | 3,306,567 | | (1,110,298) | | — | | — | | 416,127 |
The Industrial Select Sector SPDR Fund
| 649,374 | | 69,690,818 | | 131,977,677 | | 98,744,145 | | 6,087,939 | | (521,543) | | 890,217 | | 108,490,746 | | 887,432 |
The Materials Select Sector SPDR Fund
| — | | — | | 41,177,550 | | 40,394,490 | | (783,060) | | — | | — | | — | | 50,090 |
The Technology Select Sector SPDR Fund
| 382,122 | | 66,435,731 | | 209,802,125 | | 81,053,574 | | 9,867,041 | | 31,752,893 | | 1,046,741 | | 236,804,216 | | 1,176,877 |
Total
| | | $390,759,491 | | $3,726,804,896 | | $3,565,921,030 | | $34,205,446 | | $41,047,614 | | | | $626,896,417 | | $6,036,828 |
See accompanying notes to financial statements.
39
SSGA ACTIVE TRUST
SPDR DOUBLELINE EMERGING MARKETS FIXED INCOME ETF
SCHEDULE OF INVESTMENTS
June 30, 2024
| Security Description | | | Principal
Amount | | Value |
| CORPORATE BONDS & NOTES — 92.6% | | | |
| AUSTRALIA — 0.2% | | | |
AngloGold Ashanti Holdings PLC 3.75%, 10/1/2030
| | | $200,000 | | $174,812 |
| BRAZIL — 9.1% | | | |
Acu Petroleo Luxembourg SARL 7.50%, 7/13/2035
| | | 1,066,670 | | 1,026,264 |
Banco do Brasil SA 10 yr. CMT + 4.40%, 8.75%, 10/15/2024 (a)
| | | 500,000 | | 509,510 |
Braskem Netherlands Finance BV 7.25%, 2/13/2033
| | | 1,200,000 | | 1,129,848 |
CSN Resources SA 5.88%, 4/8/2032
| | | 400,000 | | 333,872 |
Guara Norte SARL 5.20%, 6/15/2034
| | | 2,244,287 | | 2,068,200 |
Itau Unibanco Holding SA 5 yr. CMT + 3.22%, 4.63%, 2/27/2025 (a)
| | | 200,000 | | 194,364 |
Minerva Luxembourg SA 8.88%, 9/13/2033
| | | 200,000 | | 206,762 |
MV24 Capital BV 6.75%, 6/1/2034
| | | 315,320 | | 299,961 |
Prumo Participacoes e Investimentos SA 7.50%, 12/31/2031
| | | 629,489 | | 625,152 |
Simpar Europe SA 5.20%, 1/26/2031
| | | 200,000 | | 164,868 |
Suzano International Finance BV 4.00%, 1/14/2025
| | | 1,350,000 | | 1,335,906 |
Unigel Luxembourg SA 8.75%, 10/1/2026 (b)
| | | 200,000 | | 56,616 |
| | | | | | 7,951,323 |
| CHILE — 7.3% | | | |
Agrosuper SA 4.60%, 1/20/2032
| | | 1,350,000 | | 1,179,806 |
Banco del Estado de Chile 5 yr. CMT + 3.23%, 7.95%, 5/2/2029 (a) (c)
| | | 400,000 | | 412,888 |
CAP SA 3.90%, 4/27/2031 (c)
| | | 2,100,000 | | 1,678,404 |
Chile Electricity PEC SpA Zero Coupon, 1/25/2028 (c)
| | | 1,981,629 | | 1,581,142 |
Empresa Electrica Angamos SA 4.88%, 5/25/2029
| | | 86,900 | | 78,016 |
Empresa Electrica Cochrane SpA 5.50%, 5/14/2027
| | | 821,160 | | 797,379 |
GNL Quintero SA 4.63%, 7/31/2029
| | | 647,200 | | 631,913 |
| | | | | | 6,359,548 |
| COLOMBIA — 8.3% | | | |
| AI Candelaria Spain SA: | | | | | |
5.75%, 6/15/2033 (c)
| | | 1,975,000 | | 1,594,615 |
7.50%, 12/15/2028
| | | 191,666 | | 188,368 |
Banco Davivienda SA 10 yr. CMT + 5.10%, 6.65%, 4/22/2031 (a) (c)
| | | 400,000 | | 289,132 |
| Security Description | | | Principal
Amount | | Value |
| Bancolombia SA: | | | | | |
5 yr. CMT + 4.32%, 8.63%, 12/24/2034 (a)
| | | $400,000 | | $408,812 |
5 yr. CMT + 2.94%, 4.63%, 12/18/2029 (a)
| | | 400,000 | | 386,780 |
Canacol Energy Ltd. 5.75%, 11/24/2028
| | | 1,100,000 | | 585,255 |
| Ecopetrol SA: | | | | | |
4.63%, 11/2/2031
| | | 1,500,000 | | 1,227,795 |
5.88%, 5/28/2045
| | | 100,000 | | 71,563 |
5.88%, 11/2/2051
| | | 250,000 | | 173,457 |
| Empresas Publicas de Medellin ESP: | | | | | |
4.25%, 7/18/2029
| | | 1,500,000 | | 1,292,820 |
4.38%, 2/15/2031
| | | 500,000 | | 410,710 |
Fideicomiso PA Pacifico Tres 8.25%, 1/15/2035
| | | 171,860 | | 168,968 |
Oleoducto Central SA 4.00%, 7/14/2027
| | | 500,000 | | 463,110 |
| | | | | | 7,261,385 |
| DOMINICAN REPUBLIC — 0.2% | | | |
Aeropuertos Dominicanos Siglo XXI SA 7.00%, 6/30/2034 (c) (d)
| | | 200,000 | | 201,894 |
| GUATEMALA — 0.2% | | | |
Banco Industrial SA 5 yr. CMT + 4.44%, 4.88%, 1/29/2031 (a)
| | | 200,000 | | 192,142 |
| INDIA — 11.8% | | | |
Adani Electricity Mumbai Ltd. 3.95%, 2/12/2030
| | | 611,000 | | 524,348 |
Adani International Container Terminal Pvt Ltd. 3.00%, 2/16/2031 (c)
| | | 1,204,000 | | 1,007,520 |
| Adani Ports & Special Economic Zone Ltd.: | | | | | |
3.10%, 2/2/2031
| | | 1,000,000 | | 792,130 |
4.20%, 8/4/2027
| | | 200,000 | | 185,702 |
4.38%, 7/3/2029
| | | 700,000 | | 626,920 |
| Adani Transmission Step-One Ltd.: | | | | | |
4.00%, 8/3/2026
| | | 1,400,000 | | 1,326,251 |
4.25%, 5/21/2036
| | | 604,000 | | 501,416 |
Bharti Airtel Ltd. 4.38%, 6/10/2025
| | | 2,000,000 | | 1,977,680 |
JSW Hydro Energy Ltd. 4.13%, 5/18/2031
| | | 152,000 | | 134,178 |
| Reliance Industries Ltd.: | | | | | |
3.67%, 11/30/2027
| | | 500,000 | | 474,485 |
4.13%, 1/28/2025
| | | 1,500,000 | | 1,487,040 |
| UPL Corp. Ltd.: | | | | | |
4.50%, 3/8/2028
| | | 200,000 | | 174,528 |
4.63%, 6/16/2030
| | | 900,000 | | 741,375 |
Vedanta Resources Ltd. 13.88%, 12/9/2028
| | | 376,000 | | 359,633 |
| | | | | | 10,313,206 |
See accompanying notes to financial statements.
40
SSGA ACTIVE TRUST
SPDR DOUBLELINE EMERGING MARKETS FIXED INCOME ETF
SCHEDULE OF INVESTMENTS (continued)
June 30, 2024
| Security Description | | | Principal
Amount | | Value |
| INDONESIA — 12.6% | | | |
Adaro Indonesia PT 4.25%, 10/31/2024
| | | $1,500,000 | | $1,486,440 |
| Freeport Indonesia PT: | | | | | |
4.76%, 4/14/2027
| | | 900,000 | | 881,415 |
5.32%, 4/14/2032 (c)
| | | 1,200,000 | | 1,159,500 |
| Indonesia Asahan Aluminium PT/Mineral Industri Indonesia Persero PT: | | | | | |
4.75%, 5/15/2025
| | | 1,700,000 | | 1,683,170 |
5.45%, 5/15/2030
| | | 363,000 | | 355,755 |
LLPL Capital Pte. Ltd. 6.88%, 2/4/2039 (c)
| | | 1,625,820 | | 1,627,462 |
Minejesa Capital BV 5.63%, 8/10/2037
| | | 2,200,000 | | 1,993,112 |
Pertamina Persero PT 1.40%, 2/9/2026
| | | 2,000,000 | | 1,869,140 |
| | | | | | 11,055,994 |
| JAMAICA — 0.0% (e) | | | |
Digicel Group Holdings Ltd. Series 2A, Zero Coupon, 12/31/2030 (c) (f)
| | | 96,183 | | 12,095 |
| KUWAIT — 1.1% | | | |
MEGlobal Canada ULC 5.00%, 5/18/2025
| | | 1,000,000 | | 989,624 |
| MEXICO — 12.7% | | | |
Banco Mercantil del Norte SA 10 yr. CMT + 5.47%, 7.50%, 6/27/2029 (a)
| | | 800,000 | | 778,248 |
Banco Santander Mexico SA Institucion de Banca Multiple Grupo Financiero Santand 5 yr. CMT + 3.00%, 7.53%, 10/1/2028 (a)
| | | 500,000 | | 519,795 |
| BBVA Bancomer SA: | | | | | |
5 yr. CMT + 4.66%, 8.45%, 6/29/2038 (a)
| | | 202,000 | | 208,561 |
5 yr. CMT + 4.31%, 5.88%, 9/13/2034 (a)
| | | 1,870,000 | | 1,726,029 |
Braskem Idesa SAPI 6.99%, 2/20/2032
| | | 200,000 | | 151,592 |
Buffalo Energy Mexico Holdings/Buffalo Energy Infrastructure/Buffalo Energy 7.88%, 2/15/2039 (c)
| | | 700,000 | | 726,075 |
Cometa Energia SA de CV 6.38%, 4/24/2035
| | | 1,796,300 | | 1,740,884 |
| Comision Federal de Electricidad: | | | | | |
3.35%, 2/9/2031
| | | 600,000 | | 494,424 |
4.75%, 2/23/2027
| | | 1,000,000 | | 965,630 |
Electricidad Firme de Mexico Holdings SA de CV 4.90%, 11/20/2026
| | | 400,000 | | 376,668 |
Fermaca Enterprises S de Real de CV 6.38%, 3/30/2038
| | | 367,488 | | 360,683 |
KUO SAB de CV 5.75%, 7/7/2027
| | | 200,000 | | 193,132 |
| Security Description | | | Principal
Amount | | Value |
Mexarrend SAPI de CV 10.25%, 7/24/2024 (c)
| | | $300,000 | | $39,417 |
Mexico Generadora de Energia S de Real 5.50%, 12/6/2032
| | | 1,674,197 | | 1,631,153 |
Petroleos Mexicanos 6.75%, 9/21/2047
| | | 650,000 | | 427,017 |
Southern Copper Corp. 3.88%, 4/23/2025
| | | 100,000 | | 98,430 |
Tierra Mojada Luxembourg II SARL 5.75%, 12/1/2040
| | | 701,343 | | 631,510 |
| | | | | | 11,069,248 |
| PANAMA — 1.1% | | | |
Empresa de Transmision Electrica SA 5.13%, 5/2/2049
| | | 246,000 | | 178,057 |
Global Bank Corp. 3 mo. USD Term SOFR + 3.30%, 5.25%, 4/16/2029 (a)
| | | 800,000 | | 735,992 |
| | | | | | 914,049 |
| PARAGUAY — 0.8% | | | |
Bioceanico Sovereign Certificate Ltd. Zero Coupon, 6/5/2034
| | | 380,207 | | 284,429 |
Frigorifico Concepcion SA 7.70%, 7/21/2028
| | | 200,000 | | 137,700 |
Rutas 2 & 7 Finance Ltd. Zero Coupon, 9/30/2036
| | | 416,667 | | 285,196 |
| | | | | | 707,325 |
| PERU — 14.8% | | | |
| Banco de Credito del Peru SA: | | | | | |
5 yr. CMT + 2.45%, 3.25%, 9/30/2031 (a)
| | | 1,000,000 | | 929,410 |
5 yr. CMT + 3.00%, 3.13%, 7/1/2030 (a)
| | | 1,300,000 | | 1,253,460 |
Banco Internacional del Peru SAA Interbank 5 yr. CMT + 3.71%, 4.00%, 7/8/2030 (a)
| | | 1,900,000 | | 1,842,544 |
Cia de Minas Buenaventura SAA 5.50%, 7/23/2026
| | | 400,000 | | 385,876 |
Fenix Power Peru SA 4.32%, 9/20/2027
| | | 900,059 | | 859,610 |
Inkia Energy Ltd. 5.88%, 11/9/2027
| | | 400,000 | | 398,428 |
InRetail Consumer 3.25%, 3/22/2028
| | | 500,000 | | 451,740 |
InRetail Shopping Malls 5.75%, 4/3/2028
| | | 1,250,000 | | 1,218,988 |
Intercorp Financial Services, Inc. 4.13%, 10/19/2027
| | | 1,019,000 | | 950,635 |
Intercorp Peru Ltd. 3.88%, 8/15/2029
| | | 400,000 | | 355,536 |
Kallpa Generacion SA 4.13%, 8/16/2027
| | | 500,000 | | 476,300 |
| Lima Metro Line 2 Finance Ltd.: | | | | | |
4.35%, 4/5/2036
| | | 508,977 | | 463,393 |
5.88%, 7/5/2034
| | | 1,497,780 | | 1,474,071 |
Minsur SA 4.50%, 10/28/2031
| | | 1,300,000 | | 1,144,832 |
See accompanying notes to financial statements.
41
SSGA ACTIVE TRUST
SPDR DOUBLELINE EMERGING MARKETS FIXED INCOME ETF
SCHEDULE OF INVESTMENTS (continued)
June 30, 2024
| Security Description | | | Principal
Amount | | Value |
Orazul Energy Peru SA 5.63%, 4/28/2027
| | | $252,000 | | $238,573 |
| Petroleos del Peru SA: | | | | | |
4.75%, 6/19/2032
| | | 500,000 | | 370,565 |
5.63%, 6/19/2047
| | | 200,000 | | 126,492 |
| | | | | | 12,940,453 |
| SINGAPORE — 6.9% | | | |
DBS Group Holdings Ltd. Series GMTN, 5 yr. CMT + 1.10%, 1.82%, 3/10/2031 (a)
| | | 2,050,000 | | 1,925,991 |
Oversea-Chinese Banking Corp. Ltd. 5 yr. CMT + 1.58%, 1.83%, 9/10/2030 (a) (c)
| | | 2,100,000 | | 2,007,600 |
| United Overseas Bank Ltd.: | | | | | |
5 yr. CMT + 1.23%, 2.00%, 10/14/2031 (a)
| | | 1,200,000 | | 1,107,876 |
Series GMTN, 5 yr. CMT + 1.52%, 1.75%, 3/16/2031 (a)
| | | 1,100,000 | | 1,031,862 |
| | | | | | 6,073,329 |
| SOUTH AFRICA — 0.6% | | | |
Sasol Financing USA LLC 5.50%, 3/18/2031
| | | 600,000 | | 504,534 |
| SOUTH KOREA — 0.4% | | | |
KT Corp. 2.50%, 7/18/2026
| | | 400,000 | | 378,100 |
| UNITED STATES — 4.5% | | | |
| Freeport-McMoRan, Inc.: | | | | | |
4.38%, 8/1/2028
| | | 700,000 | | 676,053 |
4.63%, 8/1/2030
| | | 1,300,000 | | 1,251,471 |
JBS USA Holding Lux SARL/ JBS USA Food Co./ JBS Lux Co. SARL 5.13%, 2/1/2028
| | | 2,000,000 | | 1,976,320 |
| | | | | | 3,903,844 |
TOTAL CORPORATE BONDS & NOTES
(Cost $83,116,272)
| | 81,002,905 | |
| FOREIGN GOVERNMENT OBLIGATIONS — 5.9% | | | |
| COLOMBIA — 2.0% | | | |
| Colombia Government International Bonds: | | | | | |
3.88%, 4/25/2027
| | | 800,000 | | 752,560 |
4.13%, 5/15/2051
| | | 950,000 | | 566,643 |
5.00%, 6/15/2045
| | | 700,000 | | 490,543 |
| | | | | | 1,809,746 |
| MEXICO — 1.8% | | | |
| Mexico Government International Bonds: | | | | | |
4.40%, 2/12/2052
| | | 1,100,000 | | 799,869 |
6.34%, 5/4/2053
| | | 800,000 | | 752,612 |
| | | | | | 1,552,481 |
| Security Description | | | Principal
Amount | | Value |
| PANAMA — 1.3% | | | |
| Panama Government International Bonds: | | | | | |
3.87%, 7/23/2060
| | | $1,800,000 | | $1,024,535 |
4.30%, 4/29/2053
| | | 200,000 | | 127,941 |
| | | | | | 1,152,476 |
| SOUTH KOREA — 0.8% | | | |
Korea East-West Power Co. Ltd. 1.75%, 5/6/2025
| | | 700,000 | | 678,552 |
TOTAL FOREIGN GOVERNMENT OBLIGATIONS
(Cost $7,022,206)
| | 5,193,255 | |
| | | Shares | |
| SHORT-TERM INVESTMENT — 0.7% | |
State Street Institutional U.S. Government Money Market Fund, Class G Shares 5.29% (g) (h)
(Cost $589,301)
| 589,301 | 589,301 |
TOTAL INVESTMENTS — 99.2%
(Cost $90,727,779)
| 86,785,461 |
OTHER ASSETS IN EXCESS OF
LIABILITIES — 0.8%
| 721,337 |
NET ASSETS — 100.0%
| $87,506,798 |
| (a) | Variable Rate Security - Interest rate shown is rate in effect at June 30, 2024. For securities based on a published reference rate and spread, the reference rate and spread are indicated in the description above. |
| (b) | Security is currently in default and/or issuer is in bankruptcy. |
| (c) | Securities purchased pursuant to Rule 144A of the Securities Act of 1933, as amended. These securities, which represent 6.4% of net assets as of June 30, 2024, are considered liquid and may be resold in transactions exempt from registration, normally to qualified institutional buyers. |
| (d) | When-issued security. |
| (e) | Amount is less than 0.05% of net assets. |
| (f) | Fair valued as determined in good faith by the Trust's Oversight Committee in accordance with policy and procedures approved by the Board of Trustees. Security value is determined based on Level 3 inputs. As of June 30, 2024, total aggregate fair value of the securities is $12,095, representing less than 0.05% of the Fund's net assets. |
| (g) | The Fund invested in certain money market funds managed by SSGA Funds Management, Inc. Amounts related to these investments during the year ended June 30, 2024 are shown in the Affiliate Table below. |
| (h) | The rate shown is the annualized seven-day yield at June 30, 2024. |
| CMT | Constant Maturity Treasury |
| GMTN | Global Medium Term Note |
| SOFR | Secured Overnight Financing Rate |
See accompanying notes to financial statements.
42
SSGA ACTIVE TRUST
SPDR DOUBLELINE EMERGING MARKETS FIXED INCOME ETF
SCHEDULE OF INVESTMENTS (continued)
June 30, 2024
The following table summarizes the value of the Fund's investments according to the fair value hierarchy as of June 30, 2024.
| Description | | Level 1 –
Quoted Prices | | Level 2 –
Other Significant
Observable Inputs | | Level 3 –
Significant
Unobservable Inputs | | Total |
| ASSETS: | | | | | | | | |
| INVESTMENTS: | | | | | | | | |
Corporate Bonds & Notes
| | $— | | $80,990,810 | | $12,095 | | $81,002,905 |
Foreign Government Obligations
| | — | | 5,193,255 | | — | | 5,193,255 |
Short-Term Investment
| | 589,301 | | — | | — | | 589,301 |
TOTAL INVESTMENTS
| | $589,301 | | $86,184,065 | | $12,095 | | $86,785,461 |
Affiliate Table
| | Number of
Shares Held
at
6/30/23 | | Value at
6/30/23 | | Cost of
Purchases | | Proceeds
from
Shares Sold | | Realized
Gain (Loss) | | Change in
Unrealized
Appreciation/
Depreciation | | Number of
Shares Held
at
6/30/24 | | Value at
6/30/24 | | Dividend
Income |
State Street Institutional U.S. Government Money Market Fund, Class G Shares
| 2,452,803 | | $2,452,803 | | $42,779,600 | | $44,643,102 | | $— | | $— | | 589,301 | | $589,301 | | $75,857 |
See accompanying notes to financial statements.
43
SSGA ACTIVE TRUST
SPDR DOUBLELINE SHORT DURATION TOTAL RETURN TACTICAL ETF
SCHEDULE OF INVESTMENTS
June 30, 2024
| Security Description | | | Principal
Amount | | Value |
| CORPORATE BONDS & NOTES — 16.1% | | | | | |
| AEROSPACE & DEFENSE — 0.2% | |
Boeing Co.
4.88%, 5/1/2025
| | | $364,000 | | $360,153 |
| AUTO MANUFACTURERS — 0.5% | |
Ford Motor Co.
4.35%, 12/8/2026
| | | 365,000 | | 354,397 |
General Motors Financial Co., Inc.
5.25%, 3/1/2026
| | | 355,000 | | 353,001 |
| | | | | | 707,398 |
| BANKS — 4.0% | |
Banco Bilbao Vizcaya Argentaria Colombia SA
4.88%, 4/21/2025
| | | 200,000 | | 197,598 |
Banco de Bogota SA
6.25%, 5/12/2026
| | | 200,000 | | 197,332 |
Banco de Credito del Peru SA
5 yr. CMT + 3.00%, 3.13%, 7/1/2030 (a)
| | | 150,000 | | 144,630 |
Banco Industrial SA
5 yr. CMT + 4.44%, 4.88%, 1/29/2031 (a)
| | | 150,000 | | 144,106 |
Banco Internacional del Peru SAA Interbank
5 yr. CMT + 3.71%, 4.00%, 7/8/2030 (a)
| | | 150,000 | | 145,464 |
Banco Nacional de Comercio Exterior SNC
5 yr. CMT + 2.00%, 2.72%, 8/11/2031 (a)
| | | 200,000 | | 177,252 |
Bank of Montreal
Series MTN, 1.50%, 1/10/2025
| | | 363,000 | | 355,195 |
Bank of Nova Scotia
4.75%, 2/2/2026
| | | 361,000 | | 357,325 |
BBVA Bancomer SA
5 yr. CMT + 3.00%, 5.35%, 11/12/2029 (a)
| | | 200,000 | | 197,868 |
Commonwealth Bank of Australia
SOFR + 0.63%, 6.00%, 9/12/2025 (a) (b)
| | | 318,000 | | 318,735 |
DBS Group Holdings Ltd.
Series GMTN, 5 yr. CMT + 1.10%, 1.82%, 3/10/2031 (a)
| | | 200,000 | | 187,902 |
Global Bank Corp.
3 mo. USD Term SOFR + 3.30%, 5.25%, 4/16/2029 (a)
| | | 200,000 | | 183,998 |
Goldman Sachs Bank USA
SOFR + 0.77%, 6.14%, 3/18/2027 (a)
| | | 225,000 | | 225,074 |
| JPMorgan Chase & Co.: | | | | | |
SOFR + 0.49%, 0.77%, 8/9/2025 (a)
| | | 168,000 | | 167,079 |
3.90%, 7/15/2025
| | | 360,000 | | 354,503 |
| Security Description | | | Principal
Amount | | Value |
SOFR + 0.92%, 6.28%, 4/22/2028 (a)
| | | $314,000 | | $315,171 |
Morgan Stanley
Series GMTN, 3.88%, 1/27/2026
| | | 365,000 | | 356,798 |
Multibank, Inc.
7.75%, 2/3/2028 (b)
| | | 200,000 | | 200,152 |
Oversea-Chinese Banking Corp. Ltd.
5 yr. CMT + 1.58%, 1.83%, 9/10/2030 (a)
| | | 200,000 | | 191,200 |
PNC Financial Services Group, Inc.
SOFR + 1.32%, 5.81%, 6/12/2026 (a)
| | | 170,000 | | 170,177 |
Toronto-Dominion Bank
Series MTN, 0.70%, 9/10/2024
| | | 364,000 | | 360,513 |
Truist Financial Corp.
Series MTN, SOFR + 1.46%, 4.26%, 7/28/2026 (a)
| | | 359,000 | | 353,127 |
| Wells Fargo & Co.: | | | | | |
Series MTN, 3 mo. USD Term SOFR + 1.09%, 2.41%, 10/30/2025 (a)
| | | 360,000 | | 355,900 |
Series MTN, SOFR + 1.07%, 6.43%, 4/22/2028 (a)
| | | 269,000 | | 270,329 |
| | | | | | 5,927,428 |
| BIOTECHNOLOGY — 0.5% | |
Amgen, Inc.
5.51%, 3/2/2026
| | | 355,000 | | 354,989 |
Royalty Pharma PLC
1.75%, 9/2/2027
| | | 400,000 | | 359,300 |
| | | | | | 714,289 |
| CHEMICALS — 0.3% | |
Sasol Financing USA LLC
4.38%, 9/18/2026
| | | 200,000 | | 188,156 |
Sociedad Quimica y Minera de Chile SA
4.38%, 1/28/2025
| | | 200,000 | | 198,196 |
| | | | | | 386,352 |
| COMMERCIAL SERVICES — 0.3% | |
Adani International Container Terminal Pvt Ltd.
3.00%, 2/16/2031
| | | 172,000 | | 143,884 |
Adani Ports & Special Economic Zone Ltd.
4.00%, 7/30/2027
| | | 200,000 | | 184,758 |
Prumo Participacoes e Investimentos SA
7.50%, 12/31/2031
| | | 157,372 | | 156,288 |
| | | | | | 484,930 |
See accompanying notes to financial statements.
44
SSGA ACTIVE TRUST
SPDR DOUBLELINE SHORT DURATION TOTAL RETURN TACTICAL ETF
SCHEDULE OF INVESTMENTS (continued)
June 30, 2024
| Security Description | | | Principal
Amount | | Value |
| DIVERSIFIED FINANCIAL SERVICES — 1.0% | |
AerCap Ireland Capital DAC/AerCap Global Aviation Trust
1.65%, 10/29/2024
| | | $366,000 | | $361,055 |
American Express Co.
SOFR + 1.00%, 6.37%, 2/16/2028 (a)
| | | 358,000 | | 359,550 |
Aviation Capital Group LLC
1.95%, 1/30/2026 (b)
| | | 381,000 | | 358,525 |
Avolon Holdings Funding Ltd.
2.13%, 2/21/2026 (b)
| | | 385,000 | | 361,950 |
| | | | | | 1,441,080 |
| ELECTRIC — 1.4% | |
Algonquin Power & Utilities Corp.
5.37%, 6/15/2026 (c)
| | | 55,000 | | 54,738 |
American Electric Power Co., Inc.
5.20%, 1/15/2029
| | | 357,000 | | 355,215 |
Comision Federal de Electricidad
4.75%, 2/23/2027
| | | 200,000 | | 193,126 |
Entergy Louisiana LLC
0.95%, 10/1/2024
| | | 360,000 | | 355,785 |
Exelon Corp.
5.15%, 3/15/2029
| | | 180,000 | | 179,384 |
Fenix Power Peru SA
4.32%, 9/20/2027
| | | 251,765 | | 240,450 |
LLPL Capital Pte. Ltd.
6.88%, 2/4/2039
| | | 154,840 | | 154,996 |
Mexico Generadora de Energia S de Real
5.50%, 12/6/2032
| | | 120,968 | | 117,858 |
| Pacific Gas & Electric Co.: | | | | | |
2.10%, 8/1/2027
| | | 186,000 | | 167,982 |
4.95%, 6/8/2025
| | | 195,000 | | 193,247 |
| | | | | | 2,012,781 |
| ENGINEERING & CONSTRUCTION — 0.1% | |
Bioceanico Sovereign Certificate Ltd.
Zero Coupon, 6/5/2034
| | | 126,736 | | 94,810 |
| ENVIRONMENTAL CONTROL — 0.5% | |
Republic Services, Inc.
2.50%, 8/15/2024
| | | 356,000 | | 354,505 |
Veralto Corp.
5.50%, 9/18/2026 (b)
| | | 357,000 | | 356,886 |
| | | | | | 711,391 |
| FOOD — 0.2% | |
BRF GmbH
4.35%, 9/29/2026
| | | 200,000 | | 191,298 |
Campbell Soup Co.
5.20%, 3/19/2027
| | | 141,000 | | 141,203 |
| Security Description | | | Principal
Amount | | Value |
JBS USA Holding Lux SARL/ JBS USA Food Co./ JBS Lux Co. SARL
3.00%, 2/2/2029
| | | $50,000 | | $44,586 |
| | | | | | 377,087 |
| FOREST PRODUCTS & PAPER — 0.1% | |
Suzano International Finance BV
4.00%, 1/14/2025
| | | 100,000 | | 98,956 |
| GAS — 0.2% | |
NiSource, Inc.
5.20%, 7/1/2029
| | | 261,000 | | 260,068 |
| HEALTH CARE PRODUCTS — 0.2% | |
Zimmer Biomet Holdings, Inc.
1.45%, 11/22/2024
| | | 361,000 | | 355,206 |
| HEALTH CARE SERVICES — 0.6% | |
| Elevance Health, Inc.: | | | | | |
3.50%, 8/15/2024
| | | 362,000 | | 360,795 |
5.15%, 6/15/2029
| | | 190,000 | | 190,513 |
HCA, Inc.
5.38%, 2/1/2025
| | | 362,000 | | 360,693 |
| | | | | | 912,001 |
| INSURANCE — 0.5% | |
| Athene Global Funding: | | | | | |
1.72%, 1/7/2025 (b)
| | | 91,000 | | 89,045 |
SOFR + 0.85%, 6.21%, 5/8/2026 (a) (b)
| | | 496,000 | | 496,119 |
F&G Global Funding
5.88%, 6/10/2027 (b)
| | | 145,000 | | 144,338 |
| | | | | | 729,502 |
| INTERNET — 0.2% | |
Expedia Group, Inc.
6.25%, 5/1/2025 (b)
| | | 358,000 | | 358,920 |
| MACHINERY-DIVERSIFIED — 0.1% | |
AGCO Corp.
5.45%, 3/21/2027
| | | 90,000 | | 90,196 |
| MINING — 0.7% | |
Freeport-McMoRan, Inc.
4.13%, 3/1/2028
| | | 50,000 | | 47,983 |
| Glencore Funding LLC: | | | | | |
1.63%, 9/1/2025 (b)
| | | 373,000 | | 355,827 |
SOFR + 1.06%, 6.41%, 4/4/2027 (a) (b)
| | | 288,000 | | 288,176 |
Industrias Penoles SAB de CV
4.15%, 9/12/2029
| | | 200,000 | | 185,000 |
Southern Copper Corp.
3.88%, 4/23/2025
| | | 100,000 | | 98,430 |
| | | | | | 975,416 |
| OIL & GAS — 0.2% | |
ONGC Videsh Ltd.
4.63%, 7/15/2024
| | | 200,000 | | 199,888 |
See accompanying notes to financial statements.
45
SSGA ACTIVE TRUST
SPDR DOUBLELINE SHORT DURATION TOTAL RETURN TACTICAL ETF
SCHEDULE OF INVESTMENTS (continued)
June 30, 2024
| Security Description | | | Principal
Amount | | Value |
Petrobras Global Finance BV
7.38%, 1/17/2027
| | | $70,000 | | $72,139 |
| | | | | | 272,027 |
| OIL & GAS SERVICES — 0.1% | |
Guara Norte SARL
5.20%, 6/15/2034
| | | 165,630 | | 152,635 |
| PACKAGING & CONTAINERS — 0.1% | |
Packaging Corp. of America
3.65%, 9/15/2024
| | | 200,000 | | 199,000 |
| PHARMACEUTICALS — 0.1% | |
Bristol-Myers Squibb Co.
SOFR + 0.49%, 5.86%, 2/20/2026 (a)
| | | 198,000 | | 198,507 |
| PIPELINES — 0.9% | |
AI Candelaria Spain SA
7.50%, 12/15/2028
| | | 191,666 | | 188,368 |
Enbridge, Inc.
5.90%, 11/15/2026
| | | 353,000 | | 357,024 |
Energy Transfer LP
6.05%, 12/1/2026
| | | 345,000 | | 349,630 |
GNL Quintero SA
4.63%, 7/31/2029
| | | 258,880 | | 252,765 |
Transportadora de Gas del Peru SA
4.25%, 4/30/2028
| | | 160,000 | | 154,267 |
| | | | | | 1,302,054 |
| REAL ESTATE — 0.1% | |
InRetail Shopping Malls
5.75%, 4/3/2028
| | | 100,000 | | 97,519 |
| REAL ESTATE INVESTMENT TRUSTS — 0.5% | |
VICI Properties LP/VICI Note Co., Inc.
4.25%, 12/1/2026 (b)
| | | 368,000 | | 355,168 |
Welltower OP LLC
4.00%, 6/1/2025
| | | 359,000 | | 353,202 |
| | | | | | 708,370 |
| RETAIL — 0.2% | |
Dollar Tree, Inc.
4.00%, 5/15/2025
| | | 366,000 | | 360,645 |
| SEMICONDUCTORS — 0.7% | |
Broadcom, Inc.
3.15%, 11/15/2025
| | | 371,000 | | 359,558 |
| Microchip Technology, Inc.: | | | | | |
0.98%, 9/1/2024
| | | 240,000 | | 237,953 |
4.25%, 9/1/2025
| | | 127,000 | | 125,022 |
NXP BV/NXP Funding LLC/NXP USA, Inc.
4.40%, 6/1/2027
| | | 342,000 | | 334,449 |
| | | | | | 1,056,982 |
| SOFTWARE — 0.5% | |
Oracle Corp.
5.80%, 11/10/2025
| | | 352,000 | | 353,739 |
| Security Description | | | Principal
Amount | | Value |
Take-Two Interactive Software, Inc.
4.95%, 3/28/2028
| | | $357,000 | | $353,655 |
| | | | | | 707,394 |
| TELECOMMUNICATIONS — 0.2% | |
Millicom International Cellular SA
5.13%, 1/15/2028
| | | 180,000 | | 170,170 |
Telefonica Celular del Paraguay SA
5.88%, 4/15/2027
| | | 200,000 | | 195,530 |
| | | | | | 365,700 |
| TRANSPORTATION — 0.7% | |
Canadian Pacific Railway Co.
1.35%, 12/2/2024
| | | 362,000 | | 355,506 |
Lima Metro Line 2 Finance Ltd.
5.88%, 7/5/2034
| | | 171,665 | | 168,948 |
MV24 Capital BV
6.75%, 6/1/2034
| | | 157,660 | | 149,980 |
Ryder System, Inc.
Series MTN, 5.25%, 6/1/2028
| | | 328,000 | | 328,679 |
| | | | | | 1,003,113 |
| TRUCKING & LEASING — 0.2% | |
Penske Truck Leasing Co. LP/PTL Finance Corp.
4.40%, 7/1/2027 (b)
| | | 343,000 | | 333,808 |
TOTAL CORPORATE BONDS & NOTES
(Cost $23,759,326)
| | | | | 23,755,718 |
| ASSET-BACKED SECURITIES — 26.8% | | | | | |
| AUTOMOBILE — 2.5% | | | | | |
Bridgecrest Lending Auto Securitization Trust
Series 2024-2, Class A2, 5.78%, 2/16/2027
| | | 500,000 | | 499,736 |
Carvana Auto Receivables Trust
Series 2023-P5, Class A2, 5.77%, 4/12/2027 (b)
| | | 499,513 | | 499,128 |
Citizens Auto Receivables Trust
Series 2023-2, Class A2A, 6.09%, 10/15/2026 (b)
| | | 185,290 | | 185,570 |
CPS Auto Receivables Trust
Series 2021-A, Class D, 1.16%, 12/15/2026 (b)
| | | 250,962 | | 246,563 |
Exeter Automobile Receivables Trust
Series 2023-5A, Class A2, 6.20%, 4/15/2026
| | | 250,532 | | 250,737 |
| GLS Auto Receivables Issuer Trust: | | | | | |
Series 2021-2A, Class C, 1.08%, 6/15/2026 (b)
| | | 70,719 | | 70,441 |
Series 2023-4A, Class A2, 6.40%, 12/15/2026 (b)
| | | 389,442 | | 390,216 |
See accompanying notes to financial statements.
46
SSGA ACTIVE TRUST
SPDR DOUBLELINE SHORT DURATION TOTAL RETURN TACTICAL ETF
SCHEDULE OF INVESTMENTS (continued)
June 30, 2024
| Security Description | | | Principal
Amount | | Value |
Hertz Vehicle Financing LLC
Series 2021-1A, Class B, 1.56%, 12/26/2025 (b)
| | | $350,000 | | $345,187 |
Santander Drive Auto Receivables Trust
Series 2020-4, Class D, 1.48%, 1/15/2027
| | | 271,883 | | 268,517 |
| Westlake Automobile Receivables Trust: | | | | | |
Series 2023-2A, Class A3, 5.80%, 2/16/2027 (b)
| | | 400,000 | | 399,780 |
Series 2023-4A, Class A2, 6.23%, 1/15/2027 (b)
| | | 484,085 | | 484,901 |
| | | | | | 3,640,776 |
| COMMERCIAL MORTGAGE-BACKED SECURITIES — 4.7% | | | | | |
ACREC Ltd.
Series 2021-FL1, Class A, 1 mo. USD Term SOFR + 1.26%, 6.60%, 10/16/2036 (a) (b)
| | | 125,168 | | 124,741 |
Arbor Realty Commercial Real Estate Notes Ltd.
Series 2022-FL1, Class A, 30 day USD SOFR Average + 1.45%, 6.78%, 1/15/2037 (a) (b)
| | | 250,000 | | 248,952 |
BDS LLC
Series 2022-FL11, Class ATS, 1 mo. USD Term SOFR + 1.80%, 7.14%, 3/19/2039 (a) (b)
| | | 249,998 | | 249,295 |
| BDS Ltd.: | | | | | |
Series 2021-FL8, Class A, 1 mo. USD Term SOFR + 1.03%, 6.37%, 1/18/2036 (a) (b)
| | | 21,063 | | 21,045 |
Series 2021-FL9, Class A, 1 mo. USD Term SOFR + 1.18%, 6.52%, 11/16/2038 (a) (b)
| | | 103,752 | | 103,048 |
BRSP Ltd.
Series 2021-FL1, Class A, 1 mo. USD Term SOFR + 1.26%, 6.60%, 8/19/2038 (a) (b)
| | | 276,117 | | 272,872 |
| BSPRT Issuer Ltd.: | | | | | |
Series 2021-FL7, Class A, 1 mo. USD Term SOFR + 1.43%, 6.76%, 12/15/2038 (a) (b)
| | | 171,854 | | 170,826 |
Series 2022-FL8, Class A, 30 day USD SOFR Average + 1.50%, 6.83%, 2/15/2037 (a) (b)
| | | 288,173 | | 287,518 |
| Security Description | | | Principal
Amount | | Value |
Series 2021-FL6, Class A, 1 mo. USD Term SOFR + 1.21%, 6.54%, 3/15/2036 (a) (b)
| | | $169,443 | | $168,364 |
| FS Rialto Issuer LLC: | | | | | |
Series 2021-FL3, Class A, 1 mo. USD Term SOFR + 1.36%, 6.69%, 11/16/2036 (a) (b)
| | | 276,382 | | 275,114 |
Series 2022-FL4, Class AS, 30 day USD SOFR Average + 2.40%, 7.73%, 1/19/2039 (a) (b)
| | | 250,000 | | 249,998 |
Series 2021-FL2, Class A, 1 mo. USD Term SOFR + 1.33%, 6.66%, 5/16/2038 (a) (b)
| | | 288,978 | | 286,203 |
Greystone CRE Notes Ltd.
Series 2021-FL3, Class A, 1 mo. USD Term SOFR + 1.13%, 6.46%, 7/15/2039 (a) (b)
| | | 150,000 | | 149,701 |
| KREF Ltd.: | | | | | |
Series 2021-FL2, Class AS, 1 mo. USD Term SOFR + 1.41%, 6.74%, 2/15/2039 (a) (b)
| | | 250,000 | | 241,641 |
Series 2022-FL3, Class A, 1 mo. USD Term SOFR + 1.45%, 6.79%, 2/17/2039 (a) (b)
| | | 200,000 | | 199,113 |
Series 2021-FL2, Class A, 1 mo. USD Term SOFR + 1.18%, 6.51%, 2/15/2039 (a) (b)
| | | 199,595 | | 196,510 |
| LCCM Trust: | | | | | |
Series 2021-FL3, Class A, 1 mo. USD Term SOFR + 1.56%, 6.89%, 11/15/2038 (a) (b)
| | | 161,720 | | 159,947 |
Series 2021-FL2, Class A, 1 mo. USD Term SOFR + 1.31%, 6.64%, 12/13/2038 (a) (b)
| | | 117,218 | | 114,853 |
LFT CRE Ltd.
Series 2021-FL1, Class A, 1 mo. USD Term SOFR + 1.28%, 6.61%, 6/15/2039 (a) (b)
| | | 329,935 | | 329,275 |
| LoanCore Issuer Ltd.: | | | | | |
Series 2021-CRE6, Class A, 1 mo. USD Term SOFR + 1.41%, 6.74%, 11/15/2038 (a) (b)
| | | 225,474 | | 223,718 |
Series 2022-CRE7, Class A, 30 day USD SOFR Average + 1.55%, 6.88%, 1/17/2037 (a) (b)
| | | 498,361 | | 495,847 |
See accompanying notes to financial statements.
47
SSGA ACTIVE TRUST
SPDR DOUBLELINE SHORT DURATION TOTAL RETURN TACTICAL ETF
SCHEDULE OF INVESTMENTS (continued)
June 30, 2024
| Security Description | | | Principal
Amount | | Value |
| MF1 Ltd.: | | | | | |
Series 2022-FL8, Class A, 1 mo. USD Term SOFR + 1.35%, 6.69%, 2/19/2037 (a) (b)
| | | $336,126 | | $333,769 |
Series 2021-FL7, Class A, 1 mo. USD Term SOFR + 1.19%, 6.53%, 10/16/2036 (a) (b)
| | | 249,238 | | 247,847 |
Series 2021-FL6, Class A, 1 mo. USD Term SOFR + 1.21%, 6.55%, 7/16/2036 (a) (b)
| | | 202,642 | | 201,541 |
PFP Ltd.
Series 2021-8, Class A, 1 mo. USD Term SOFR + 1.11%, 6.44%, 8/9/2037 (a) (b)
| | | 176,567 | | 175,700 |
Ready Capital Mortgage Financing LLC
Series 2021-FL6, Class A, 1 mo. USD Term SOFR + 1.06%, 6.41%, 7/25/2036 (a) (b)
| | | 20,652 | | 20,498 |
Retained Vantage Data Centers Issuer LLC
Series 2023-1A, Class A2A, 5.00%, 9/15/2048 (b)
| | | 250,000 | | 241,379 |
Starwood Ltd.
Series 2022-FL3, Class A, 30 day USD SOFR Average + 1.35%, 6.68%, 11/15/2038 (a) (b)
| | | 220,000 | | 217,611 |
TRTX Issuer Ltd.
Series 2022-FL5, Class A, 1 mo. USD Term SOFR + 1.65%, 6.98%, 2/15/2039 (a) (b)
| | | 316,563 | | 313,391 |
VMC Finance LLC
Series 2022-FL5, Class A, 30 day USD SOFR Average + 1.90%, 7.23%, 2/18/2039 (a) (b)
| | | 590,238 | | 588,398 |
| | | | | | 6,908,715 |
| HOME EQUITY ABS — 0.3% | | | | | |
Credit-Based Asset Servicing & Securitization LLC
Series 2004-CB7, Class M1, 1 mo. USD Term SOFR + 1.12%, 3.74%, 10/25/2034 (a)
| | | 475,181 | | 409,630 |
Washington Mutual Asset-Backed Certificates WMABS Trust
Series 2006-HE5, Class 2A2, 1 mo. USD Term SOFR + 0.47%, 4.48%, 10/25/2036 (a)
| | | 259,102 | | 80,317 |
| | | | | | 489,947 |
| Security Description | | | Principal
Amount | | Value |
| OTHER ABS — 18.5% | | | | | |
ACHV ABS Trust
Series 2023-4CP, Class A, 6.81%, 11/25/2030 (b)
| | | $86,107 | | $86,154 |
| Affirm Asset Securitization Trust: | | | | | |
Series 2024-X1, Class A, 6.27%, 5/15/2029 (b)
| | | 693,205 | | 694,221 |
Series 2023-X1, Class A, 7.11%, 11/15/2028 (b)
| | | 376,456 | | 377,819 |
Anchorage Capital CLO 19 Ltd.
Series 2021-19A, Class A, 3 mo. USD Term SOFR + 1.47%, 6.80%, 10/15/2034 (a) (b)
| | | 1,500,000 | | 1,499,250 |
Carlyle U.S. CLO Ltd.
Series 2021-1A, Class A1, 3 mo. USD Term SOFR + 1.40%, 6.73%, 4/15/2034 (a) (b)
| | | 1,000,000 | | 1,002,137 |
CarVal CLO IV Ltd.
Series 2021-1A, Class A1A, 3 mo. USD Term SOFR + 1.44%, 6.77%, 7/20/2034 (a) (b)
| | | 500,000 | | 499,750 |
CarVal CLO IX-C Ltd.
Series 2024-1A, Class A, 3 mo. USD Term SOFR + 1.68%, 7.00%, 4/20/2037 (a) (b)
| | | 500,000 | | 503,245 |
CQS U.S. CLO Ltd.
Series 2021-1A, Class A, 3 mo. USD Term SOFR + 1.48%, 6.81%, 1/20/2035 (a) (b)
| | | 1,500,000 | | 1,498,650 |
Diamond Resorts Owner Trust
Series 2021-1A, Class A, 1.51%, 11/21/2033 (b)
| | | 288,725 | | 275,211 |
Domino's Pizza Master Issuer LLC
Series 2017-1A, Class A23, 4.12%, 7/25/2047 (b)
| | | 846,000 | | 807,329 |
HalseyPoint CLO 3 Ltd.
Series 2020-3A, Class A1A, 3 mo. USD Term SOFR + 1.71%, 7.04%, 11/30/2032 (a) (b)
| | | 1,150,000 | | 1,149,770 |
Katayma CLO II Ltd.
Series 2024-2A, Class A1, 3 mo. USD Term SOFR + 1.65%, 6.94%, 4/20/2037 (a) (b)
| | | 500,000 | | 502,300 |
Loanpal Solar Loan Ltd.
Series 2021-1GS, Class A, 2.29%, 1/20/2048 (b)
| | | 297,654 | | 231,961 |
Marble Point CLO XXI Ltd.
Series 2021-3A, Class A1, 3 mo. USD Term SOFR + 1.50%, 6.82%, 10/17/2034 (a) (b)
| | | 2,000,000 | | 2,001,454 |
See accompanying notes to financial statements.
48
SSGA ACTIVE TRUST
SPDR DOUBLELINE SHORT DURATION TOTAL RETURN TACTICAL ETF
SCHEDULE OF INVESTMENTS (continued)
June 30, 2024
| Security Description | | | Principal
Amount | | Value |
Marble Point CLO XXII Ltd.
Series 2021-2A, Class A, 3 mo. USD Term SOFR + 1.46%, 6.79%, 7/25/2034 (a) (b)
| | | $1,000,000 | | $1,000,677 |
| Marlette Funding Trust: | | | | | |
Series 2022-3A, Class B, 5.95%, 11/15/2032 (b)
| | | 500,000 | | 499,866 |
Series 2024-1A, Class A, 5.95%, 7/17/2034 (b)
| | | 600,000 | | 600,279 |
MP CLO VIII Ltd.
Series 2015-2A, Class ARR, 3 mo. USD Term SOFR + 1.46%, 6.79%, 4/28/2034 (a) (b)
| | | 1,300,000 | | 1,298,700 |
Northwoods Capital XVI Ltd.
Series 2017-16A, Class A, 3 mo. USD Term SOFR + 1.53%, 6.85%, 11/15/2030 (a) (b)
| | | 753,602 | | 754,883 |
Octagon Investment Partners 51 Ltd.
Series 2021-1A, Class A, 3 mo. USD Term SOFR + 1.41%, 6.74%, 7/20/2034 (a) (b)
| | | 1,000,000 | | 1,000,820 |
Pagaya AI Debt Selection Trust
Series 2021-5, Class B, 2.63%, 8/15/2029 (b)
| | | 412,110 | | 409,759 |
| Pagaya AI Debt Trust: | | | | | |
Series 2023-5, Class A, 7.18%, 4/15/2031 (b)
| | | 146,912 | | 147,204 |
Series 2023-7, Class A, 7.23%, 7/15/2031 (b)
| | | 258,341 | | 258,917 |
Series 2023-8, Class A, 7.30%, 6/16/2031 (b)
| | | 568,009 | | 574,175 |
Series 2023-1, Class A, 7.56%, 7/15/2030 (b)
| | | 152,163 | | 152,543 |
Peace Park CLO Ltd.
Series 2021-1A, Class A, 3 mo. USD Term SOFR + 1.39%, 6.72%, 10/20/2034 (a) (b)
| | | 1,000,000 | | 1,004,012 |
Regatta VI Funding Ltd.
Series 2016-1A, Class AR2, 3 mo. USD Term SOFR + 1.42%, 6.75%, 4/20/2034 (a) (b)
| | | 1,000,000 | | 999,800 |
Regatta XXIII Funding Ltd.
Series 2021-4A, Class A1, 3 mo. USD Term SOFR + 1.41%, 6.74%, 1/20/2035 (a) (b)
| | | 2,265,000 | | 2,266,812 |
Rockford Tower CLO Ltd.
Series 2024-1A, Class A1, 3 mo. USD Term SOFR + 1.61%, 6.94%, 4/20/2037 (a) (b)
| | | 1,000,000 | | 1,006,123 |
| Security Description | | | Principal
Amount | | Value |
Sapphire Aviation Finance II Ltd.
Series 2020-1A, Class A, 3.23%, 3/15/2040 (b)
| | | $306,654 | | $281,398 |
Shackleton CLO Ltd.
Series 2013-3A, Class AR, 3 mo. USD Term SOFR + 1.38%, 6.71%, 7/15/2030 (a) (b)
| | | 195,412 | | 195,393 |
Sound Point CLO 38 Ltd.
Series 2024-38A, Class A1, 3 mo. USD Term SOFR + 1.60%, 6.92%, 2/20/2037 (a) (b)
| | | 1,000,000 | | 1,002,127 |
Sound Point CLO XXVI Ltd.
Series 2020-1A, Class AR, 3 mo. USD Term SOFR + 1.43%, 6.76%, 7/20/2034 (a) (b)
| | | 1,000,000 | | 1,001,344 |
Vibrant CLO IV Ltd.
Series 2016-4A, Class A1RR, 3 mo. USD Term SOFR + 1.38%, 6.71%, 7/20/2032 (a) (b)
| | | 500,000 | | 499,800 |
Vibrant CLO VIII Ltd.
Series 2018-8A, Class A1A, 3 mo. USD Term SOFR + 1.40%, 6.73%, 1/20/2031 (a) (b)
| | | 239,785 | | 240,028 |
Wellfleet CLO Ltd.
Series 2020-2A, Class AR, 3 mo. USD Term SOFR + 1.48%, 6.81%, 7/15/2034 (a) (b)
| | | 1,000,000 | | 999,400 |
| | | | | | 27,323,311 |
| STUDENT LOAN ABS — 0.1% | | | | | |
Commonbond Student Loan Trust
Series 2018-BGS, Class B, 3.99%, 9/25/2045 (b)
| | | 82,734 | | 77,045 |
Laurel Road Prime Student Loan Trust
Series 2019-A, Class A1FX, 2.34%, 10/25/2048 (b)
| | | 11,967 | | 11,794 |
| | | | | | 88,839 |
| WL COLLATERAL CMO — 0.7% | | | | | |
VOLT C LLC
Series 2021-NPL9, Class A1, 4.99%, 5/25/2051 (b) (c)
| | | 260,004 | | 254,695 |
VOLT CI LLC
Series 2021-NP10, Class A1, 4.99%, 5/25/2051 (b) (c)
| | | 851,769 | | 836,493 |
| | | | | | 1,091,188 |
TOTAL ASSET-BACKED SECURITIES
(Cost $39,541,695)
| | | | | 39,542,776 |
See accompanying notes to financial statements.
49
SSGA ACTIVE TRUST
SPDR DOUBLELINE SHORT DURATION TOTAL RETURN TACTICAL ETF
SCHEDULE OF INVESTMENTS (continued)
June 30, 2024
| Security Description | | | Principal
Amount | | Value |
| FOREIGN GOVERNMENT OBLIGATIONS — 0.3% | | | | | |
| COLOMBIA — 0.1% | | | | | |
Colombia Government International Bonds
4.50%, 1/28/2026
| | | $200,000 | | $195,747 |
| DOMINICAN REPUBLIC — 0.1% | | | | | |
Dominican Republic International Bonds
5.50%, 1/27/2025
| | | 100,000 | | 99,904 |
| SOUTH AFRICA — 0.1% | | | | | |
Republic of South Africa Government International Bonds
4.88%, 4/14/2026
| | | 200,000 | | 194,805 |
TOTAL FOREIGN GOVERNMENT OBLIGATIONS
(Cost $507,760)
| | | | | 490,456 |
| U.S. GOVERNMENT AGENCY OBLIGATIONS — 5.0% | | | | | |
| Federal Home Loan Mortgage Corp. REMICS: | | | | | |
Series 4990, Class FN, 30 day USD SOFR Average + 0.46%, 5.80%, 5/25/2050 (a)
| | | 766,068 | | 734,726 |
Series 4461, Class BA, CMO, 2.00%, 12/15/2043
| | | 377,751 | | 348,738 |
Series 5179, Class GD, CMO, 2.00%, 12/25/2047
| | | 822,247 | | 692,855 |
Series 4030, Class AN, CMO, REMIC, 1.75%, 4/15/2027
| | | 110,989 | | 108,197 |
Federal Home Loan Mortgage Corp. STACR REMICS Trust Series 2024-HQA1, Class M1, 30 day USD SOFR Average + 1.25%, 6.59%, 3/25/2044 (a) (b)
| | | 1,555,900 | | 1,557,107 |
| Federal National Mortgage Association: | | | | | |
3.00%, 11/1/2033
| | | 516,869 | | 487,388 |
3.00%, 11/1/2036
| | | 136,195 | | 125,486 |
5.00%, 8/1/2043
| | | 761,768 | | 749,110 |
6.00%, 10/1/2053
| | | 381,630 | | 383,509 |
| Federal National Mortgage Association REMICS: | | | | | |
Series 2008-9, Class FA, 30 day USD SOFR Average + 0.61%, 5.95%, 2/25/2038 (a)
| | | 820,951 | | 814,916 |
Series 2010-141, Class FB, CMO, REMIC, 30 day USD SOFR Average + 0.58%, 5.92%, 12/25/2040 (a)
| | | 113,201 | | 112,393 |
| Security Description | | | Principal
Amount | | Value |
Series 2016-8, Class FA, CMO, REMIC, 30 day USD SOFR Average + 0.56%, 5.90%, 3/25/2046 (a)
| | | $195,842 | | $192,845 |
Series 2018-27, Class FJ, CMO, REMIC, 30 day USD SOFR Average + 0.41%, 5.75%, 12/25/2047 (a)
| | | 139,246 | | 136,005 |
Series 2018-45, Class FA, CMO, REMIC, 30 day USD SOFR Average + 0.41%, 5.75%, 6/25/2048 (a)
| | | 154,517 | | 150,817 |
Federal National Mortgage Association-ACES Series 2020-M49, Class 1A1, VRN, 1.30%, 11/25/2030 (a)
| | | 984,390 | | 871,242 |
TOTAL U.S. GOVERNMENT AGENCY OBLIGATIONS
(Cost $7,842,334)
| | | | | 7,465,334 |
| U.S. TREASURY OBLIGATIONS — 23.4% | | | | | |
| U.S. Treasury Notes: | | | | | |
0.38%, 1/31/2026
| | | 11,900,000 | | 11,089,777 |
0.63%, 7/31/2026
| | | 18,950,000 | | 17,432,520 |
0.63%, 3/31/2027
| | | 6,800,000 | | 6,116,281 |
TOTAL U.S. TREASURY OBLIGATIONS
(Cost $34,582,996)
| | | | | 34,638,578 |
| MORTGAGE-BACKED SECURITIES — 14.0% | | | | | |
BLP Commercial Mortgage Trust Series 2024-IND2, Class A, 1 mo. USD Term SOFR + 1.34%, 6.67%, 3/15/2041 (a) (b)
| | | 250,000 | | 248,128 |
BX Trust Series 2019-CALM, Class A, 1 mo. USD Term SOFR + 0.99%, 6.32%, 11/15/2032 (a) (b)
| | | 1,091,231 | | 1,089,235 |
Citigroup Commercial Mortgage Trust Series 2016-P3, Class A4, 3.33%, 4/15/2049
| | | 270,000 | | 258,329 |
Citigroup Mortgage Loan Trust, Inc. Series 2007-AR8, Class 2A1A, CMO, 5.15%, 7/25/2037 (a)
| | | 2,916,605 | | 2,294,348 |
Compass Datacenters Issuer II LLC Series 2024-1A, Class A1, 5.25%, 2/25/2049 (b)
| | | 500,000 | | 492,607 |
| Countrywide Alternative Loan Trust: | | | | | |
Series 2006-J7, Class 1A3, 6.25%, 11/25/2036
| | | 414,759 | | 201,672 |
Series 2006-41CB, Class 1A3, CMO, 6.00%, 1/25/2037
| | | 227,654 | | 119,333 |
See accompanying notes to financial statements.
50
SSGA ACTIVE TRUST
SPDR DOUBLELINE SHORT DURATION TOTAL RETURN TACTICAL ETF
SCHEDULE OF INVESTMENTS (continued)
June 30, 2024
| Security Description | | | Principal
Amount | | Value |
CSMC Trust Series 2020-RPL3, Class A1, CMO, 4.08%, 3/25/2060 (a) (b)
| | | $727,161 | | $724,115 |
Federal Home Loan Mortgage Corp. REMICS Series 4981, Class GF, 30 day USD SOFR Average + 0.51%, 5.85%, 6/25/2050 (a)
| | | 863,710 | | 848,194 |
Federal National Mortgage Association REMICS Series 2016-83, Class FK, 30 day USD SOFR Average + 0.61%, 5.95%, 11/25/2046 (a)
| | | 756,949 | | 748,738 |
Great Wolf Trust Series 2024-WOLF, Class A, 1 mo. USD Term SOFR + 1.54%, 6.87%, 3/15/2039 (a) (b)
| | | 200,000 | | 199,551 |
GS Mortgage Securities Trust Series 2013-GC13, Class AS, 3.98%, 7/10/2046 (a) (b)
| | | 184,518 | | 176,574 |
| Legacy Mortgage Asset Trust: | | | | | |
Series 2021-GS1, Class A1, 4.89%, 10/25/2066 (b) (c)
| | | 341,878 | | 335,986 |
Series 2021-GS2, Class A1, 4.75%, 4/25/2061 (b) (c)
| | | 284,197 | | 278,952 |
Luminent Mortgage Trust Series 2007-1, Class 1A1, CMO, 1 mo. USD Term SOFR + 0.43%, 5.78%, 11/25/2036 (a)
| | | 2,362,490 | | 2,143,421 |
Med Trust Series 2021-MDLN, Class A, 1 mo. USD Term SOFR + 1.06%, 6.39%, 11/15/2038 (a) (b)
| | | 303,543 | | 303,239 |
MFA Trust Series 2023-NQM3, Class A1, 6.62%, 7/25/2068 (b) (c)
| | | 588,895 | | 591,517 |
Morgan Stanley Bank of America Merrill Lynch Trust Series 2015-C23, Class AS, 4.00%, 7/15/2050 (a)
| | | 259,000 | | 252,133 |
OBX Trust Series 2023-NQM10, Class A1, 6.47%, 10/25/2063 (b) (c)
| | | 718,520 | | 721,840 |
PRPM LLC Series 2022-1, Class A1, 3.72%, 2/25/2027 (b) (c)
| | | 1,440,151 | | 1,415,101 |
Residential Asset Securitization Trust Series 2006-A6, Class 1A4, CMO, IO, 6.00%, 7/25/2036
| | | 2,582,026 | | 656,321 |
Residential Mortgage Loan Trust Series 2020-1, Class A1, 2.38%, 1/26/2060 (a) (b)
| | | 528,539 | | 508,870 |
| Verus Securitization Trust: | | | | | |
Series 2022-3, Class A1, 4.13%, 2/25/2067 (b) (c)
| | | 690,936 | | 642,605 |
Series 2023-5, Class A1, 6.48%, 6/25/2068 (b) (c)
| | | 997,304 | | 998,571 |
| Security Description | | | Principal
Amount | | Value |
Series 2023-INV2, Class A1, 6.44%, 8/25/2068 (b) (c)
| | | $1,120,897 | | $1,120,289 |
Series 2024-1, Class A1, 5.71%, 1/25/2069 (b) (c)
| | | 744,641 | | 740,462 |
Series 2024-3, Class A1, 6.34%, 4/25/2069 (b) (c)
| | | 588,732 | | 592,369 |
WaMu Mortgage Pass-Through Certificates Trust Series 2006-AR16, Class 2A1, CMO, 4.36%, 12/25/2036 (a)
| | | 1,638,714 | | 1,441,888 |
Washington Mutual Mortgage Pass-Through Certificates WMALT Trust Series 2005-8, Class 2CB3, CMO, 1 mo. USD Term SOFR + 0.52%, 5.50%, 10/25/2035 (a)
| | | 253,750 | | 230,833 |
Wells Fargo Commercial Mortgage Trust Series 2015-C28, Class A4, 3.54%, 5/15/2048
| | | 270,000 | | 264,538 |
TOTAL MORTGAGE-BACKED SECURITIES
(Cost $21,950,780)
| | | | | 20,639,759 |
| COMMERCIAL MORTGAGE BACKED SECURITIES — 4.8% | | | | | |
Arbor Multifamily Mortgage Securities Trust Series 2021-MF2, Class A2, 2.02%, 6/15/2054 (b)
| | | 139,000 | | 128,488 |
AREIT Trust Series 2022-CRE6, Class A, 30 day USD SOFR Average + 1.25%, 6.58%, 1/20/2037 (a) (b)
| | | 78,584 | | 78,080 |
| Bank: | | | | | |
Series 2017-BNK6, Class XA, IO, 0.90%, 7/15/2060 (a)
| | | 964,239 | | 16,927 |
Series 2020-BN26, Class XA, IO, VRN, 1.32%, 3/15/2063 (a)
| | | 1,281,117 | | 65,353 |
| Benchmark Mortgage Trust: | | | | | |
Series 2018-B1, Class XA, IO, 0.66%, 1/15/2051 (a)
| | | 1,537,613 | | 22,011 |
Series 2019-B15, Class XA, IO, VRN, 0.93%, 12/15/2072 (a)
| | | 4,023,958 | | 127,114 |
| BPR Trust: | | | | | |
Series 2021-TY, Class A, 1 mo. USD Term SOFR + 1.16%, 6.49%, 9/15/2038 (a) (b)
| | | 192,000 | | 190,432 |
Series 2022-OANA, Class A, 1 mo. USD Term SOFR + 1.90%, 7.23%, 4/15/2037 (a) (b)
| | | 250,000 | | 250,087 |
See accompanying notes to financial statements.
51
SSGA ACTIVE TRUST
SPDR DOUBLELINE SHORT DURATION TOTAL RETURN TACTICAL ETF
SCHEDULE OF INVESTMENTS (continued)
June 30, 2024
| Security Description | | | Principal
Amount | | Value |
| BX Commercial Mortgage Trust: | | | | | |
Series 2019-IMC, Class B, 1 mo. USD Term SOFR + 1.35%, 6.68%, 4/15/2034 (a) (b)
| | | $100,000 | | $98,309 |
Series 2021-21M, Class A, 1 mo. USD Term SOFR + 0.84%, 6.17%, 10/15/2036 (a) (b)
| | | 122,160 | | 120,748 |
Series 2021-CIP, Class A, 1 mo. USD Term SOFR + 1.04%, 6.36%, 12/15/2038 (a) (b)
| | | 250,000 | | 247,072 |
BXMT Ltd. Series 2021-FL4, Class A, 1 mo. USD Term SOFR + 1.16%, 6.49%, 5/15/2038 (a) (b)
| | | 132,873 | | 127,741 |
| Citigroup Commercial Mortgage Trust: | | | | | |
Series 2016-P3, Class A3, 3.06%, 4/15/2049
| | | 317,000 | | 306,549 |
Series 2016-GC37, Class XA, IO, 1.81%, 4/10/2049 (a)
| | | 368,622 | | 7,602 |
CLNC Ltd. Series 2019-FL1, Class AS, ABS, 1 mo. USD Term SOFR + 1.66%, 7.00%, 8/20/2035 (a) (b)
| | | 130,442 | | 129,155 |
Cold Storage Trust Series 2020-ICE5, Class A, 1 mo. USD Term SOFR + 1.01%, 6.34%, 11/15/2037 (a) (b)
| | | 221,173 | | 220,473 |
| COMM Mortgage Trust: | | | | | |
Series 2015-DC1, Class A5, 3.35%, 2/10/2048
| | | 200,000 | | 197,329 |
Series 2015-CR25, Class XA, IO, 0.94%, 8/10/2048 (a)
| | | 1,027,943 | | 6,206 |
| CSAIL Commercial Mortgage Trust: | | | | | |
Series 2017-C8, Class XA, IO, 1.21%, 6/15/2050 (a)
| | | 234,182 | | 5,555 |
Series 2017-CX10, Class XA, IO, 0.89%, 11/15/2050 (a)
| | | 835,131 | | 15,019 |
Series 2017-CX9, Class XA, IO, 0.74%, 9/15/2050 (a)
| | | 1,115,838 | | 11,396 |
DBJPM Mortgage Trust Series 2020-C9, Class A2, 1.90%, 8/15/2053
| | | 238,692 | | 228,329 |
EQUS Mortgage Trust Series 2021-EQAZ, Class A, 1 mo. USD Term SOFR + 0.87%, 6.20%, 10/15/2038 (a) (b)
| | | 180,996 | | 179,341 |
Extended Stay America Trust Series 2021-ESH, Class A, 1 mo. USD Term SOFR + 1.19%, 6.52%, 7/15/2038 (a) (b)
| | | 272,338 | | 271,523 |
| Security Description | | | Principal
Amount | | Value |
FS Rialto Issuer LLC Series 2019-FL1, Class A, 1 mo. USD Term SOFR + 1.31%, 6.64%, 12/16/2036 (a) (b)
| | | $277,713 | | $276,549 |
GPMT Ltd. Series 2021-FL3, Class A, 1 mo. USD Term SOFR + 1.36%, 6.70%, 7/16/2035 (a) (b)
| | | 166,475 | | 164,450 |
GS Mortgage Securities Corp. Trust Series 2021-IP, Class A, 1 mo. USD Term SOFR + 1.06%, 6.39%, 10/15/2036 (a) (b)
| | | 181,000 | | 178,831 |
| GS Mortgage Securities Trust: | | | | | |
Series 2015-GC34, Class A4, 3.51%, 10/10/2048
| | | 225,000 | | 215,828 |
Series 2017-GS7, Class XA, IO, 1.22%, 8/10/2050 (a)
| | | 368,596 | | 9,148 |
Series 2020-GC47, Class XA, IO, VRN, 1.24%, 5/12/2053 (a)
| | | 2,106,635 | | 104,340 |
| JP Morgan Chase Commercial Mortgage Securities Trust: | | | | | |
Series 2022-NLP, Class A, 1 mo. USD Term SOFR + 0.60%, 5.93%, 4/15/2037 (a) (b)
| | | 183,541 | | 175,632 |
Series 2016-JP4, Class XA, IO, 0.71%, 12/15/2049 (a)
| | | 1,321,287 | | 14,120 |
JPMBB Commercial Mortgage Securities Trust Series 2014-C25, Class B, VRN, 4.35%, 11/15/2047 (a)
| | | 150,000 | | 139,684 |
JPMCC Commercial Mortgage Securities Trust Series 2019-COR5, Class XA, IO, VRN, 1.62%, 6/13/2052 (a)
| | | 1,054,251 | | 53,045 |
MF1 Multifamily Housing Mortgage Loan Trust Series 2021-FL5, Class AS, 1 mo. USD Term SOFR + 1.31%, 6.64%, 7/15/2036 (a) (b)
| | | 138,000 | | 137,175 |
MHP Trust Series 2022-MHIL, Class A, 1 mo. USD Term SOFR + 0.81%, 6.14%, 1/15/2027 (a) (b)
| | | 143,123 | | 141,091 |
Morgan Stanley Bank of America Merrill Lynch Trust Series 2014-C19, Class LNCX, IO, 0.76%, 12/15/2046 (a) (b)
| | | 1,105,328 | | 54 |
| Morgan Stanley Capital I Trust: | | | | | |
Series 2019-PLND, Class D, 1 mo. USD Term SOFR + 1.86%, 7.19%, 5/15/2036 (a) (b)
| | | 127,000 | | 61,336 |
Series 2021-L6, Class A2, 2.13%, 6/15/2054 (a)
| | | 151,000 | | 132,871 |
See accompanying notes to financial statements.
52
SSGA ACTIVE TRUST
SPDR DOUBLELINE SHORT DURATION TOTAL RETURN TACTICAL ETF
SCHEDULE OF INVESTMENTS (continued)
June 30, 2024
| Security Description | | | Principal
Amount | | Value |
Series 2016-UB12, Class XA, IO, 0.78%, 12/15/2049 (a)
| | | $1,301,280 | | $15,789 |
MSC Trust Series 2021-ILP, Class A, 1 mo. USD Term SOFR + 0.89%, 6.22%, 11/15/2036 (a) (b)
| | | 180,403 | | 178,347 |
Ready Capital Mortgage Financing LLC Series 2021-FL7, Class A, 1 mo. USD Term SOFR + 1.31%, 6.66%, 11/25/2036 (a) (b)
| | | 252,612 | | 251,538 |
SREIT Trust Series 2021-MFP, Class A, 1 mo. USD Term SOFR + 0.85%, 6.17%, 11/15/2038 (a) (b)
| | | 173,192 | | 171,812 |
Starwood Ltd. Series 2019-FL1, Class AS, 1 mo. USD Term SOFR + 1.51%, 6.84%, 7/15/2038 (a) (b)
| | | 100,000 | | 98,717 |
UBS Commercial Mortgage Trust Series 2017-C1, Class XA, IO, 1.66%, 6/15/2050 (a)
| | | 573,852 | | 18,481 |
Velocity Commercial Capital Loan Trust Series 2018-2, Class A, 4.05%, 10/26/2048 (a) (b)
| | | 192,627 | | 183,725 |
| Wells Fargo Commercial Mortgage Trust: | | | | | |
Series 2021-C60, Class A2, 2.04%, 8/15/2054
| | | 151,000 | | 138,485 |
Series 2021-SAVE, Class A, 1 mo. USD Term SOFR + 1.26%, 6.59%, 2/15/2040 (a) (b)
| | | 57,265 | | 56,839 |
Series 2022-ONL, Class A, 3.86%, 12/15/2039 (b)
| | | 500,000 | | 456,397 |
Series 2019-C51, Class XA, IO, VRN, 1.41%, 6/15/2052 (a)
| | | 874,300 | | 44,482 |
Series 2019-C52, Class XA, IO, VRN, 1.74%, 8/15/2052 (a)
| | | 2,768,771 | | 155,727 |
| WFRBS Commercial Mortgage Trust: | | | | | |
Series 2014-C21, Class AS, 3.89%, 8/15/2047
| | | 250,000 | | 245,924 |
Series 2014-C23, Class AS, VRN, 4.21%, 10/15/2057 (a)
| | | 235,000 | | 219,723 |
TOTAL COMMERCIAL MORTGAGE BACKED SECURITIES
(Cost $8,281,155)
| | | | | 7,090,979 |
| Security Description | | | Principal
Amount | | Value |
| SENIOR FLOATING RATE LOANS — 5.3% | | | |
| ADVERTISING SERVICES — 0.1% | | | | |
Lamar Media Corp. 2020 Term Loan B, 1 mo. USD Term SOFR + 1.50%, 6.94%, 2/5/2027 (a)
| | $175,000 | | $175,074 |
| AIRLINES — 0.0% (d) | | | | |
Mileage Plus Holdings LLC 2020 Term Loan B, 3 mo. USD Term SOFR + 5.25%, 10.74%, 6/21/2027 (a)
| | 64,000 | | 65,382 |
| BUILDING PRODUCTS — 0.2% | | | | |
Standard Industries, Inc. 2021 Term Loan B, 1 mo. USD Term SOFR + 2.00%, 7.34%, 9/22/2028 (a)
| | 258,948 | | 259,850 |
| CHEMICALS — 0.5% | | | | |
Axalta Coating Systems U.S. Holdings, Inc. 2024 Term Loan B6 12/20/2029 (a)
| | 270,162 | | 270,974 |
Element Solutions, Inc. 2023 Term Loan B, 1 mo. USD Term SOFR + 2.00%, 7.35%, 12/18/2030 (a)
| | 278,600 | | 279,296 |
HB Fuller Co. 2024 Term Loan B, 1 mo. USD Term SOFR + 2.00%, 7.34%, 2/15/2030 (a)
| | 124,688 | | 124,922 |
| | | | | | 675,192 |
| COMMERCIAL SERVICES — 0.3% | | | | |
APi Group DE, Inc. 2024 Term Loan B, 1 mo. USD Term SOFR + 2.00%, 7.34%, 1/3/2029 (a)
| | 125,000 | | 125,089 |
Trans Union LLC 2019 Term Loan B5, 1 mo. USD Term SOFR + 1.75%, 7.19%, 11/16/2026 (a)
| | 82,433 | | 82,463 |
Trans Union LLC 2024 Term Loan B8, 1 mo. USD Term SOFR + 1.75%, 7.09%, 6/11/2031 (a)
| | 260,000 | | 259,870 |
Vestis Corp. Term Loan, 3 mo. USD Term SOFR + 2.25%, 7.58%, 2/22/2031 (a)
| | 49,875 | | 49,698 |
| | | | | | 517,120 |
| COMMERCIAL SERVICES & SUPPLIES — 0.1% | | | | |
Aramark Services, Inc. 2024 Term Loan B8, 1 mo. USD Term SOFR + 2.00%, 7.34%, 6/22/2030 (a)
| | 79,200 | | 79,427 |
See accompanying notes to financial statements.
53
SSGA ACTIVE TRUST
SPDR DOUBLELINE SHORT DURATION TOTAL RETURN TACTICAL ETF
SCHEDULE OF INVESTMENTS (continued)
June 30, 2024
| Security Description | | | Principal
Amount | | Value |
Aramark Services, Inc. 2024 Term Loan B7, 1 mo. USD Term SOFR + 2.00%, 7.34%, 4/6/2028 (a)
| | $80,000 | | $80,217 |
| | | | | | 159,644 |
| CONTAINERS & PACKAGING — 0.2% | | | | |
Berry Global, Inc. 2023 Term Loan AA, 1 mo. USD Term SOFR + 1.75%, 7.19%, 7/1/2029 (a)
| | 233,237 | | 233,640 |
| DISTRIBUTION/WHOLESALE — 0.2% | | | | |
Resideo Funding, Inc. 2024 M&A Term Loan B (e)
| | 45,000 | | 45,000 |
Resideo Funding, Inc. 2024 Term Loan B, 3 mo. USD Term SOFR + 2.00%, 7.34%, 2/11/2028 (a)
| | 206,197 | | 206,712 |
| | | | | | 251,712 |
| DISTRIBUTORS — 0.2% | | | | |
American Builders & Contractors Supply Co., Inc. 2024 Term Loan B, 1 mo. USD Term SOFR + 2.00%, 7.34%, 1/31/2031 (a)
| | 269,327 | | 270,204 |
| DIVERSIFIED FINANCIAL SERVICES — 0.1% | | | | |
CPI Holdco B LLC Term Loan, 1 mo. USD Term SOFR + 2.00%, 7.34%, 5/17/2031 (a)
| | 15,000 | | 15,002 |
Focus Financial Partners LLC 2021 Term Loan B4, 1 mo. USD Term SOFR + 2.50%, 7.85%, 6/30/2028 (a)
| | 34,121 | | 34,129 |
Walker & Dunlop, Inc. 2021 Term Loan, 1 mo. USD Term SOFR + 2.25%, 7.69%, 12/16/2028 (a)
| | 39,000 | | 39,000 |
| | | | | | 88,131 |
| ENTERTAINMENT — 0.4% | | | | |
Cedar Fair LP 2024 Term Loan B, 1 mo. USD Term SOFR + 2.00%, 7.33%, 5/1/2031 (a)
| | 70,000 | | 69,967 |
Flutter Financing BV Term Loan B, 3 mo. USD Term SOFR + 2.25%, 7.58%, 11/25/2030 (a)
| | 243,613 | | 244,045 |
WMG Acquisition Corp. 2024 Term Loan I, 1 mo. USD Term SOFR + 2.00%, 7.34%, 1/24/2031 (a)
| | 277,767 | | 278,592 |
| | | | | | 592,604 |
| FORESTRY — 0.2% | | | | |
Asplundh Tree Expert LLC 2021 Term Loan B, 1 mo. USD Term SOFR + 1.75%, 7.19%, 9/7/2027 (a)
| | 246,805 | | 247,268 |
| Security Description | | | Principal
Amount | | Value |
| HEALTH CARE EQUIPMENT & SUPPLIES — 0.1% | | | | |
Avantor Funding, Inc. 2024 Term Loan, 1 mo. USD Term SOFR + 2.00%, 7.44%, 11/8/2027 (a)
| | $177,220 | | $178,241 |
| HEALTH CARE PROVIDERS & SERVICES — 0.3% | | | | |
Catalent Pharma Solutions, Inc. 2021 Term Loan B3, 1 mo. USD Term SOFR + 2.00%, 7.46%, 2/22/2028 (a)
| | 172,591 | | 172,720 |
ICON Luxembourg SARL 2024 LUX Term Loan B, 3 mo. USD Term SOFR + 2.00%, 7.33%, 7/3/2028 (a)
| | 71,109 | | 71,469 |
IQVIA, Inc. 2023 USD Term Loan B4, 3 mo. USD Term SOFR + 2.00%, 7.33%, 1/2/2031 (a)
| | 248,750 | | 250,071 |
PRA Health Sciences, Inc. 2024 US Term Loan B, 3 mo. USD Term SOFR + 2.00%, 7.33%, 7/3/2028 (a)
| | 17,717 | | 17,807 |
| | | | | | 512,067 |
| HOTELS, RESTAURANTS & LEISURE — 0.3% | | | | |
1011778 B.C. Unlimited Liability Co. 2024 Term Loan B6, 3 mo. USD Term SOFR + 1.75%, 7.09%, 9/20/2030 (a)
| | 259,350 | | 259,022 |
Wyndham Hotels & Resorts, Inc. 2024 Term Loan, 1 mo. USD Term SOFR + 1.75%, 7.09%, 5/24/2030 (a)
| | 245,000 | | 245,595 |
| | | | | | 504,617 |
| HOUSEHOLD PRODUCTS — 0.3% | | | | |
Energizer Holdings, Inc. 2024 Term Loan B, 1 mo. USD Term SOFR + 2.00%, 7.34%, 12/22/2027 (a)
| | 172,104 | | 172,750 |
Reynolds Consumer Products LLC Term Loan, 1 mo. USD Term SOFR + 1.75%, 7.19%, 2/4/2027 (a)
| | 247,164 | | 247,917 |
| | | | | | 420,667 |
| INDEPENDENT POWER PRODUCERS & ENERGY TRADERS — 0.4% | | | | |
Calpine Corp. Term Loan B9, 1 mo. USD Term SOFR + 2.00%, 7.34%, 1/31/2031 (a)
| | 84,787 | | 84,620 |
Calpine Corp. 2024 Term Loan B10, 1 mo. USD Term SOFR + 2.00%, 7.35%, 1/31/2031 (a)
| | 14,963 | | 14,937 |
See accompanying notes to financial statements.
54
SSGA ACTIVE TRUST
SPDR DOUBLELINE SHORT DURATION TOTAL RETURN TACTICAL ETF
SCHEDULE OF INVESTMENTS (continued)
June 30, 2024
| Security Description | | | Principal
Amount | | Value |
NRG Energy, Inc. 2024 Term Loan, 1 mo. USD Term SOFR + 2.00%, 7.34%, 4/16/2031 (a)
| | $229,425 | | $229,740 |
Vistra Operations Co. LLC 1st Lien Term Loan B3, 1 mo. USD Term SOFR + 2.00%, 7.34%, 12/20/2030 (a)
| | 246,687 | | 247,163 |
| | | | | | 576,460 |
| INTERNET & TELECOM — 0.3% | | | | |
Gen Digital, Inc. 2024 Term Loan B, 1 mo. USD Term SOFR + 1.75%, 7.09%, 9/12/2029 (a)
| | 173,483 | | 173,096 |
Go Daddy Operating Co. LLC 2024 Term Loan B6, 1 mo. USD Term SOFR + 2.00%, 7.34%, 11/9/2029 (a)
| | 263,557 | | 264,251 |
| | | | | | 437,347 |
| IT SERVICES — 0.2% | | | | |
Fleetcor Technologies Operating Co. LLC 2021 Term Loan B4, 1 mo. USD Term SOFR + 1.75%, 7.19%, 4/28/2028 (a)
| | 246,898 | | 247,327 |
| LODGING — 0.2% | | | | |
Hilton Domestic Operating Co., Inc. 2023 Term Loan B4, 1 mo. USD Term SOFR + 1.75%, 7.10%, 11/8/2030 (a)
| | 80,000 | | 80,172 |
Marriott Ownership Resorts, Inc. 2024 Term Loan B, 1 mo. USD Term SOFR + 2.25%, 7.59%, 4/1/2031 (a)
| | 220,000 | | 220,825 |
| | | | | | 300,997 |
| MACHINERY — 0.0% (d) | | | | |
Ali Group North America Corp. 2021 Term Loan B, 1 mo. USD Term SOFR + 2.00%, 7.46%, 7/30/2029 (a)
| | 64,411 | | 64,739 |
| PHARMACEUTICALS — 0.1% | | | | |
Grifols Worldwide Operations USA, Inc. 2019 USD Term Loan B, 1 mo. USD Term SOFR + 2.00%, 7.44%, 11/15/2027 (a)
| | 192,318 | | 189,433 |
| PIPELINES — 0.0% (d) | | | | |
Buckeye Partners LP 2024 Term Loan B3, 1 mo. USD Term SOFR + 2.00%, 7.34%, 11/1/2026 (a)
| | 28,771 | | 28,833 |
| REAL ESTATE INVESTMENT TRUSTS (REITs) — 0.2% | | | | |
Iron Mountain, Inc. 2018 Term Loan B, 1 mo. USD LIBOR + 1.75% 7.21%, 1/2/2026 (a)
| | 247,261 | | 247,811 |
| Security Description | | | Principal
Amount | | Value |
| RETAIL — 0.3% | | | | |
Beacon Roofing Supply, Inc. 2024 Term Loan B, 1 mo. USD Term SOFR + 2.00%, 7.35%, 5/19/2028 (a)
| | $129,350 | | $129,928 |
KFC Holding Co. 2021 Term Loan B 3/15/2028 (a)
| | 269,857 | | 270,146 |
| | | | | | 400,074 |
| SOFTWARE — 0.1% | | | | |
SS&C Technologies, Inc. 2024 Term Loan B8, 1 mo. USD Term SOFR + 2.00%, 7.34%, 5/9/2031 (a)
| | 158,577 | | 158,988 |
TOTAL SENIOR FLOATING RATE LOANS
(Cost $7,776,999)
| | | | | 7,803,422 |
| | | Shares | |
| SHORT-TERM INVESTMENT — 3.4% | |
State Street Institutional U.S. Government Money Market Fund, Class G Shares 5.29% (f) (g)
(Cost $5,024,706)
| 5,024,706 | 5,024,706 |
TOTAL INVESTMENTS — 99.1%
(Cost $149,267,751)
| 146,451,728 |
OTHER ASSETS IN EXCESS OF LIABILITIES — 0.9%
| 1,370,107 |
NET ASSETS — 100.0%
| $147,821,835 |
| (a) | Variable Rate Security - Interest rate shown is rate in effect at June 30, 2024. For securities based on a published reference rate and spread, the reference rate and spread are indicated in the description above. |
| (b) | Securities purchased pursuant to Rule 144A of the Securities Act of 1933, as amended. These securities, which represent 40.2% of net assets as of June 30, 2024, are considered liquid and may be resold in transactions exempt from registration, normally to qualified institutional buyers. |
| (c) | Step-up bond - Coupon rate increases in increments to maturity. Rate shown as of June 30, 2024. Maturity date shown is the final maturity. |
| (d) | Amount is less than 0.05% of net assets. |
| (e) | Position is unsettled. Contract rate was not determined at June 30, 2024 and does not take effect until settlement date. Maturity date is not finalized until settlement date. |
| (f) | The Fund invested in certain money market funds managed by SSGA Funds Management, Inc. Amounts related to these investments during the year ended June 30, 2024 are shown in the Affiliate Table below. |
| (g) | The rate shown is the annualized seven-day yield at June 30, 2024. |
| ABS | Asset-Backed Security |
| CLO | Collateralized Loan Obligation |
| CMO | Collateralized Mortgage Obligation |
See accompanying notes to financial statements.
55
SSGA ACTIVE TRUST
SPDR DOUBLELINE SHORT DURATION TOTAL RETURN TACTICAL ETF
SCHEDULE OF INVESTMENTS (continued)
June 30, 2024
| CMT | Constant Maturity Treasury |
| GMTN | Global Medium Term Note |
| IO | Interest Only |
| LIBOR | London Interbank Offered Rate |
| MTN | Medium Term Note |
| REMIC | Real Estate Mortgage Investment Conduit |
| SOFR | Secured Overnight Financing Rate |
| VRN | Variable Rate Note |
The following table summarizes the value of the Fund's investments according to the fair value hierarchy as of June 30, 2024.
| Description | | Level 1 –
Quoted Prices | | Level 2 –
Other Significant
Observable Inputs | | Level 3 –
Significant
Unobservable Inputs | | Total |
| ASSETS: | | | | | | | | |
| INVESTMENTS: | | | | | | | | |
Corporate Bonds & Notes
| | $— | | $23,755,718 | | $— | | $23,755,718 |
Asset-Backed Securities
| | — | | 39,542,776 | | — | | 39,542,776 |
Foreign Government Obligations
| | — | | 490,456 | | — | | 490,456 |
U.S. Government Agency Obligations
| | — | | 7,465,334 | | — | | 7,465,334 |
U.S. Treasury Obligations
| | — | | 34,638,578 | | — | | 34,638,578 |
Mortgage-Backed Securities
| | — | | 20,639,759 | | — | | 20,639,759 |
Commercial Mortgage Backed Securities
| | — | | 7,090,979 | | — | | 7,090,979 |
Senior Floating Rate Loans
| | — | | 7,803,422 | | — | | 7,803,422 |
Short-Term Investment
| | 5,024,706 | | — | | — | | 5,024,706 |
TOTAL INVESTMENTS
| | $5,024,706 | | $141,427,022 | | $— | | $146,451,728 |
Affiliate Table
| | Number of
Shares Held
at
6/30/23 | | Value at
6/30/23 | | Cost of
Purchases | | Proceeds
from
Shares Sold | | Realized
Gain (Loss) | | Change in
Unrealized
Appreciation/
Depreciation | | Number of
Shares Held
at
6/30/24 | | Value at
6/30/24 | | Dividend
Income |
State Street Institutional U.S. Government Money Market Fund, Class G Shares
| 3,869,754 | | $3,869,754 | | $81,278,286 | | $80,123,334 | | $— | | $— | | 5,024,706 | | $5,024,706 | | $238,532 |
See accompanying notes to financial statements.
56
SPDR DOUBLELINE TOTAL RETURN TACTICAL ETF
SCHEDULE OF INVESTMENTS
June 30, 2024
| Security Description | | | Principal
Amount | | Value |
| CORPORATE BONDS & NOTES — 12.3% | | | | | |
| AUSTRALIA — 0.2% | | | | |
AngloGold Ashanti Holdings PLC
3.75%, 10/1/2030
| | | $200,000 | | $174,812 |
| Glencore Funding LLC: | | | | | |
1.63%, 4/27/2026 (a)
| | | 1,183,000 | | 1,105,963 |
5.37%, 4/4/2029 (a)
| | | 1,885,000 | | 1,875,462 |
Macquarie Group Ltd. SOFR + 1.53%,
2.87%, 1/14/2033 (a) (b)
| | | 1,687,000 | | 1,395,267 |
Westpac Banking Corp. 5 yr. CMT + 1.53%,
3.02%, 11/18/2036 (b)
| | | 2,263,000 | | 1,858,149 |
| | | | | | 6,409,653 |
| BERMUDA — 0.1% | | | | |
Triton Container International Ltd./TAL International Container Corp.
3.25%, 3/15/2032
| | | 2,198,000 | | 1,802,712 |
| BRAZIL — 0.4% | | | | |
Acu Petroleo Luxembourg SARL
7.50%, 7/13/2035
| | | 824,245 | | 793,023 |
Banco do Brasil SA 10 yr. CMT + 4.40%,
8.75%, 10/15/2024 (b)
| | | 400,000 | | 407,608 |
Banco do Estado do Rio Grande do Sul SA VRN, 5 yr. CMT + 4.93%,
5.38%, 1/28/2031 (b)
| | | 500,000 | | 469,730 |
Braskem Netherlands Finance BV 5 yr. CMT + 8.22%,
8.50%, 1/23/2081 (b)
| | | 1,100,000 | | 1,102,123 |
Cosan Overseas Ltd.
8.25%, 8/5/2024
| | | 900,000 | | 915,030 |
CSN Resources SA
5.88%, 4/8/2032
| | | 1,200,000 | | 1,001,616 |
Guara Norte SARL
5.20%, 6/15/2034
| | | 1,076,595 | | 992,125 |
Itau Unibanco Holding SA VRN, 5 yr. CMT + 3.22%,
4.63%, 2/27/2025 (b)
| | | 200,000 | | 194,364 |
MARB BondCo PLC
3.95%, 1/29/2031
| | | 1,300,000 | | 1,078,610 |
| Minerva Luxembourg SA: | | | | | |
4.38%, 3/18/2031
| | | 500,000 | | 412,620 |
8.88%, 9/13/2033 (a)
| | | 1,000,000 | | 1,033,810 |
Movida Europe SA
7.85%, 4/11/2029 (a)
| | | 300,000 | | 282,282 |
MV24 Capital BV
6.75%, 6/1/2034
| | | 1,024,790 | | 974,872 |
Prumo Participacoes e Investimentos SA
7.50%, 12/31/2031
| | | 702,290 | | 697,451 |
| Security Description | | | Principal
Amount | | Value |
Simpar Europe SA
5.20%, 1/26/2031
| | | $600,000 | | $494,604 |
Unigel Luxembourg SA
8.75%, 10/1/2026 (c)
| | | 400,000 | | 113,232 |
Vale Overseas Ltd.
6.40%, 6/28/2054
| | | 367,000 | | 360,967 |
| | | | | | 11,324,067 |
| CANADA — 0.2% | | | | |
1375209 BC Ltd.
9.00%, 1/30/2028 (a)
| | | 79,000 | | 75,969 |
Bank of Montreal 5 yr. CMT + 1.40%,
3.09%, 1/10/2037 (b)
| | | 2,254,000 | | 1,841,676 |
| Bombardier, Inc.: | | | | | |
7.00%, 6/1/2032 (a)
| | | 105,000 | | 106,434 |
8.75%, 11/15/2030 (a)
| | | 470,000 | | 508,136 |
| Garda World Security Corp.: | | | | | |
4.63%, 2/15/2027 (a)
| | | 615,000 | | 588,094 |
6.00%, 6/1/2029 (a)
| | | 350,000 | | 319,434 |
Husky Injection Molding Systems Ltd./Titan Co.-Borrower LLC
9.00%, 2/15/2029 (a)
| | | 650,000 | | 673,107 |
Kronos Acquisition Holdings, Inc.
8.25%, 6/30/2031 (a) (d)
| | | 265,000 | | 265,496 |
Kronos Acquisition Holdings, Inc./KIK Custom Products, Inc.
5.00%, 12/31/2026 (a)
| | | 380,000 | | 389,500 |
Mattamy Group Corp.
4.63%, 3/1/2030 (a)
| | | 490,000 | | 451,809 |
Ontario Gaming GTA LP/OTG Co.-Issuer, Inc.
8.00%, 8/1/2030 (a)
| | | 540,000 | | 554,035 |
Parkland Corp.
4.63%, 5/1/2030 (a)
| | | 285,000 | | 260,100 |
Royal Bank of Canada Series GMTN,
5.15%, 2/1/2034
| | | 459,000 | | 455,805 |
| Telesat Canada/Telesat LLC: | | | | | |
4.88%, 6/1/2027 (a)
| | | 60,000 | | 26,605 |
6.50%, 10/15/2027 (a)
| | | 75,000 | | 23,867 |
| | | | | | 6,540,067 |
| CAYMAN ISLANDS — 0.0% (e) | | | | |
Global Aircraft Leasing Co. Ltd. PIK,
6.50%, 9/15/2024 (a)
| | | 816,346 | | 785,741 |
| CHILE — 0.1% | | | | |
Agrosuper SA
4.60%, 1/20/2032
| | | 1,000,000 | | 873,930 |
Banco del Estado de Chile 5 yr. CMT + 3.23%,
7.95%, 5/2/2029 (a) (b)
| | | 500,000 | | 516,110 |
CAP SA
3.90%, 4/27/2031 (a)
| | | 1,800,000 | | 1,438,632 |
See accompanying notes to financial statements.
57
SPDR DOUBLELINE TOTAL RETURN TACTICAL ETF
SCHEDULE OF INVESTMENTS (continued)
June 30, 2024
| Security Description | | | Principal
Amount | | Value |
Chile Electricity PEC SpA
0.00%, 1/25/2028 (a)
| | | $890,189 | | $710,281 |
Empresa Electrica Cochrane SpA
5.50%, 5/14/2027
| | | 364,960 | | 354,391 |
GNL Quintero SA
4.63%, 7/31/2029
| | | 129,440 | | 126,383 |
| | | | | | 4,019,727 |
| CHINA — 0.0% (e) | | | | |
NXP BV/NXP Funding LLC/NXP USA, Inc.
3.88%, 6/18/2026
| | | 1,415,000 | | 1,374,121 |
| COLOMBIA — 0.3% | | | | |
| AI Candelaria Spain SA: | | | | | |
5.75%, 6/15/2033 (a)
| | | 2,015,000 | | 1,626,911 |
7.50%, 12/15/2028
| | | 383,332 | | 376,735 |
Banco Davivienda SA VRN, 10 yr. CMT + 5.10%,
6.65%, 4/22/2031 (a) (b)
| | | 600,000 | | 433,698 |
Banco de Bogota SA
6.25%, 5/12/2026
| | | 200,000 | | 197,332 |
Banco GNB Sudameris SA 5 yr. CMT + 6.66%,
7.50%, 4/16/2031 (b)
| | | 150,000 | | 134,327 |
| Bancolombia SA: | | | | | |
5 yr. CMT + 4.32%, 8.63%, 12/24/2034 (b)
| | | 600,000 | | 613,218 |
VRN, 5 yr. CMT + 2.94%, 4.63%, 12/18/2029 (b)
| | | 1,300,000 | | 1,257,035 |
Canacol Energy Ltd.
5.75%, 11/24/2028
| | | 1,000,000 | | 532,050 |
| Ecopetrol SA: | | | | | |
5.88%, 5/28/2045
| | | 200,000 | | 143,126 |
5.88%, 11/2/2051
| | | 2,050,000 | | 1,422,351 |
Empresas Publicas de Medellin ESP
4.25%, 7/18/2029
| | | 1,000,000 | | 861,880 |
Fideicomiso PA Pacifico Tres
8.25%, 1/15/2035
| | | 343,720 | | 337,935 |
Gran Tierra Energy, Inc.
9.50%, 10/15/2029 (a)
| | | 400,000 | | 382,664 |
Grupo Aval Ltd.
4.38%, 2/4/2030 (a)
| | | 300,000 | | 256,416 |
| | | | | | 8,575,678 |
| DOMINICAN REPUBLIC — 0.0% (e) | | | | |
Aeropuertos Dominicanos Siglo XXI SA
7.00%, 6/30/2034 (a) (d)
| | | 200,000 | | 201,894 |
| FRANCE — 0.0% (e) | | | | |
Altice France SA
5.50%, 10/15/2029 (a)
| | | 460,000 | | 303,333 |
Vallourec SACA
7.50%, 4/15/2032 (a)
| | | 520,000 | | 538,252 |
| | | | | | 841,585 |
| Security Description | | | Principal
Amount | | Value |
| GERMANY — 0.0% (e) | | | | |
TK Elevator U.S. Newco, Inc.
5.25%, 7/15/2027 (a)
| | | $325,000 | | $315,094 |
ZF North America Capital, Inc.
6.88%, 4/23/2032 (a)
| | | 405,000 | | 418,746 |
| | | | | | 733,840 |
| GUATEMALA — 0.1% | | | | |
Banco Industrial SA 5 yr. CMT + 4.44%,
4.88%, 1/29/2031 (b)
| | | 750,000 | | 720,532 |
CT Trust
5.13%, 2/3/2032
| | | 1,000,000 | | 880,000 |
Energuate Trust
5.88%, 5/3/2027
| | | 200,000 | | 192,484 |
| Millicom International Cellular SA: | | | | | |
6.25%, 3/25/2029
| | | 360,000 | | 346,972 |
6.63%, 10/15/2026
| | | 540,000 | | 537,014 |
| | | | | | 2,677,002 |
| HONG KONG — 0.0% (e) | | | | |
Seaspan Corp.
5.50%, 8/1/2029 (a)
| | | 325,000 | | 287,690 |
| INDIA — 0.3% | | | | |
Adani Electricity Mumbai Ltd.
3.95%, 2/12/2030
| | | 349,000 | | 299,505 |
Adani International Container Terminal Pvt Ltd.
3.00%, 2/16/2031
| | | 688,000 | | 575,536 |
| Adani Ports & Special Economic Zone Ltd.: | | | | | |
4.00%, 7/30/2027
| | | 200,000 | | 184,758 |
4.20%, 8/4/2027
| | | 1,300,000 | | 1,207,063 |
4.38%, 7/3/2029
| | | 400,000 | | 358,240 |
| Adani Transmission Step-One Ltd.: | | | | | |
4.00%, 8/3/2026
| | | 800,000 | | 757,857 |
4.25%, 5/21/2036
| | | 679,500 | | 564,093 |
JSW Hydro Energy Ltd.
4.13%, 5/18/2031 (a)
| | | 1,140,000 | | 1,006,335 |
Network i2i Ltd. 5 yr. CMT + 4.27%,
5.65%, 1/15/2025 (b)
| | | 1,000,000 | | 991,430 |
| Reliance Industries Ltd.: | | | | | |
3.67%, 11/30/2027
| | | 250,000 | | 237,242 |
4.13%, 1/28/2025
| | | 500,000 | | 495,680 |
| UPL Corp. Ltd.: | | | | | |
4.50%, 3/8/2028
| | | 1,300,000 | | 1,134,434 |
4.63%, 6/16/2030
| | | 200,000 | | 164,750 |
Vedanta Resources Finance II PLC
9.25%, 4/23/2026 (a)
| | | 1,000,000 | | 908,400 |
| | | | | | 8,885,323 |
See accompanying notes to financial statements.
58
SPDR DOUBLELINE TOTAL RETURN TACTICAL ETF
SCHEDULE OF INVESTMENTS (continued)
June 30, 2024
| Security Description | | | Principal
Amount | | Value |
| INDONESIA — 0.3% | | | | |
Adaro Indonesia PT
4.25%, 10/31/2024
| | | $1,000,000 | | $990,960 |
Bank Negara Indonesia Persero Tbk. PT Series EMTN,
3.75%, 3/30/2026
| | | 781,000 | | 745,542 |
| Freeport Indonesia PT: | | | | | |
4.76%, 4/14/2027
| | | 200,000 | | 195,870 |
5.32%, 4/14/2032 (a)
| | | 1,100,000 | | 1,062,875 |
| Indonesia Asahan Aluminium PT/Mineral Industri Indonesia Persero PT: | | | | | |
4.75%, 5/15/2025
| | | 600,000 | | 594,060 |
5.45%, 5/15/2030
| | | 400,000 | | 392,016 |
LLPL Capital Pte. Ltd.
6.88%, 2/4/2039
| | | 1,548,400 | | 1,549,964 |
Minejesa Capital BV
5.63%, 8/10/2037
| | | 2,200,000 | | 1,993,112 |
Pertamina Persero PT
1.40%, 2/9/2026
| | | 800,000 | | 747,656 |
| | | | | | 8,272,055 |
| IRELAND — 0.1% | | | | |
Avolon Holdings Funding Ltd.
5.75%, 3/1/2029 (a)
| | | 1,859,000 | | 1,847,865 |
GGAM Finance Ltd.
6.88%, 4/15/2029 (a)
| | | 515,000 | | 524,110 |
| | | | | | 2,371,975 |
| JAMAICA — 0.0% (e) | | | | |
| Digicel Group Holdings Ltd.: | | | | | |
Series 2A, Zero Coupon, 12/31/2030 (a) (f)
| | | 34,459 | | 34,222 |
Series 2B, Zero Coupon, 12/31/2030 (a) (f)
| | | 495,904 | | 100,738 |
Series 4A14, Zero Coupon, 12/31/2030 (a) (f)
| | | 5,415 | | 5,378 |
Series 4B14, Zero Coupon, 12/31/2030 (a) (f)
| | | 614,948 | | 14,558 |
| | | | | | 154,896 |
| KUWAIT — 0.0% (e) | | | | |
MEGlobal Canada ULC
5.00%, 5/18/2025
| | | 200,000 | | 197,925 |
| LUXEMBOURG — 0.1% | | | | |
Altice Financing SA
5.00%, 1/15/2028 (a)
| | | 240,000 | | 182,004 |
Altice France Holding SA
6.00%, 2/15/2028 (a)
| | | 430,000 | | 139,307 |
ArcelorMittal SA
6.00%, 6/17/2034
| | | 506,000 | | 505,702 |
INEOS Finance PLC
7.50%, 4/15/2029 (a)
| | | 565,000 | | 571,277 |
Intelsat Jackson Holdings SA
6.50%, 3/15/2030 (a)
| | | 230,000 | | 214,544 |
| | | | | | 1,612,834 |
| Security Description | | | Principal
Amount | | Value |
| MEXICO — 0.3% | | | | |
| Banco Mercantil del Norte SA: | | | | | |
10 yr. CMT + 5.03%, 6.63%, 1/24/2032 (b)
| | | $200,000 | | $175,716 |
10 yr. CMT + 5.47%, 7.50%, 6/27/2029 (a) (b)
| | | 1,400,000 | | 1,361,934 |
Banco Nacional de Comercio Exterior SNC 5 yr. CMT + 2.00%,
2.72%, 8/11/2031 (b)
| | | 600,000 | | 531,756 |
| BBVA Bancomer SA: | | | | | |
5 yr. CMT + 2.65%, 5.13%, 1/18/2033 (b)
| | | 1,300,000 | | 1,184,807 |
VRN, 5 yr. CMT + 4.31%, 5.88%, 9/13/2034 (b)
| | | 800,000 | | 738,408 |
Braskem Idesa SAPI
6.99%, 2/20/2032
| | | 500,000 | | 378,980 |
Buffalo Energy Mexico Holdings/Buffalo Energy Infrastructure/Buffalo Energy
7.88%, 2/15/2039 (a)
| | | 500,000 | | 518,625 |
| Cemex SAB de CV: | | | | | |
5 yr. CMT + 4.53%, 5.13%, 6/8/2026 (b)
| | | 1,300,000 | | 1,251,679 |
5 yr. CMT + 5.16%, 9.13%, 3/14/2028 (a) (b)
| | | 200,000 | | 213,618 |
Cometa Energia SA de CV
6.38%, 4/24/2035
| | | 390,500 | | 378,453 |
Credito Real SAB de CV SOFOM ER 5 yr. CMT + 7.03%,
9.13%, 11/29/2027 (b) (c)
| | | 500,000 | | 5,055 |
KUO SAB de CV
5.75%, 7/7/2027
| | | 700,000 | | 675,962 |
Mexarrend SAPI de CV
10.25%, 7/24/2024 (a)
| | | 282,000 | | 37,052 |
Mexico Generadora de Energia S de Real
5.50%, 12/6/2032
| | | 604,840 | | 589,290 |
Petroleos Mexicanos
6.75%, 9/21/2047
| | | 700,000 | | 459,865 |
Southern Copper Corp.
3.88%, 4/23/2025
| | | 50,000 | | 49,215 |
Tierra Mojada Luxembourg II SARL
5.75%, 12/1/2040
| | | 175,336 | | 157,877 |
| | | | | | 8,708,292 |
| NETHERLANDS — 0.0% (e) | | | | |
VZ Secured Financing BV
5.00%, 1/15/2032 (a)
| | | 575,000 | | 490,544 |
| PANAMA — 0.0% (e) | | | | |
Empresa de Transmision Electrica SA
5.13%, 5/2/2049
| | | 200,000 | | 144,762 |
See accompanying notes to financial statements.
59
SPDR DOUBLELINE TOTAL RETURN TACTICAL ETF
SCHEDULE OF INVESTMENTS (continued)
June 30, 2024
| Security Description | | | Principal
Amount | | Value |
UEP Penonome II SA
6.50%, 10/1/2038
| | | $172,354 | | $143,914 |
| | | | | | 288,676 |
| PARAGUAY — 0.1% | | | | |
Bioceanico Sovereign Certificate Ltd.
Zero Coupon, 6/5/2034
| | | 844,905 | | 632,065 |
Frigorifico Concepcion SA
7.70%, 7/21/2028
| | | 400,000 | | 275,400 |
Rutas 2 & 7 Finance Ltd.
Zero Coupon, 9/30/2036
| | | 1,291,667 | | 884,107 |
| | | | | | 1,791,572 |
| PERU — 0.3% | | | | |
| Banco de Credito del Peru SA: | | | | | |
5 yr. CMT + 2.45%, 3.25%, 9/30/2031 (b)
| | | 1,000,000 | | 929,410 |
5 yr. CMT + 3.00%, 3.13%, 7/1/2030 (b)
| | | 1,000,000 | | 964,200 |
Banco Internacional del Peru SAA Interbank VRN, 5 yr. CMT + 3.71%,
4.00%, 7/8/2030 (b)
| | | 1,700,000 | | 1,648,592 |
Cia de Minas Buenaventura SAA
5.50%, 7/23/2026
| | | 1,100,000 | | 1,061,159 |
Inkia Energy Ltd.
5.88%, 11/9/2027
| | | 1,131,000 | | 1,126,555 |
InRetail Shopping Malls
5.75%, 4/3/2028
| | | 500,000 | | 487,595 |
Intercorp Financial Services, Inc.
4.13%, 10/19/2027
| | | 600,000 | | 559,746 |
| Lima Metro Line 2 Finance Ltd.: | | | | | |
4.35%, 4/5/2036
| | | 508,977 | | 463,393 |
5.88%, 7/5/2034
| | | 386,247 | | 380,133 |
Minsur SA
4.50%, 10/28/2031
| | | 600,000 | | 528,384 |
Orazul Energy Peru SA
5.63%, 4/28/2027
| | | 400,000 | | 378,688 |
| Petroleos del Peru SA: | | | | | |
4.75%, 6/19/2032
| | | 700,000 | | 518,791 |
5.63%, 6/19/2047
| | | 400,000 | | 252,984 |
SAN Miguel Industrias Pet SA/NG PET R&P Latin America SA
3.50%, 8/2/2028
| | | 200,000 | | 174,560 |
| | | | | | 9,474,190 |
| SINGAPORE — 0.2% | | | | |
Avation Capital SA PIK,
8.25%, 10/31/2026 (a)
| | | 274,193 | | 249,337 |
DBS Group Holdings Ltd. Series GMTN, VRN, 5 yr. CMT + 1.10%,
1.82%, 3/10/2031 (b)
| | | 800,000 | | 751,606 |
| Security Description | | | Principal
Amount | | Value |
Oversea-Chinese Banking Corp. Ltd. VRN, 5 yr. CMT + 1.58%,
1.83%, 9/10/2030 (b)
| | | $1,900,000 | | $1,816,400 |
| United Overseas Bank Ltd.: | | | | | |
5 yr. CMT + 1.23%, 2.00%, 10/14/2031 (b)
| | | 600,000 | | 553,938 |
Series GMTN, VRN, 5 yr. CMT + 1.52%, 1.75%, 3/16/2031 (b)
| | | 1,400,000 | | 1,313,279 |
| | | | | | 4,684,560 |
| SOUTH AFRICA — 0.0% (e) | | | | |
| Sasol Financing USA LLC: | | | | | |
4.38%, 9/18/2026
| | | 200,000 | | 188,156 |
5.50%, 3/18/2031
| | | 400,000 | | 336,356 |
| | | | | | 524,512 |
| SPAIN — 0.1% | | | | |
CaixaBank SA SOFR + 2.26%,
6.04%, 6/15/2035 (a) (b)
| | | 929,000 | | 932,094 |
Grifols SA
4.75%, 10/15/2028 (a)
| | | 620,000 | | 534,719 |
| | | | | | 1,466,813 |
| UNITED KINGDOM — 0.1% | | | | |
Ardonagh Finco Ltd.
7.75%, 2/15/2031 (a)
| | | 555,000 | | 548,567 |
BAT Capital Corp.
4.54%, 8/15/2047
| | | 806,000 | | 619,250 |
| Macquarie Airfinance Holdings Ltd.: | | | | | |
6.40%, 3/26/2029 (a)
| | | 457,000 | | 465,121 |
6.50%, 3/26/2031 (a)
| | | 205,000 | | 211,058 |
Merlin Entertainments Group U.S. Holdings, Inc.
7.38%, 2/15/2031 (a)
| | | 900,000 | | 917,280 |
| | | | | | 2,761,276 |
| UNITED STATES — 9.0% | | | | |
AAR Escrow Issuer LLC
6.75%, 3/15/2029 (a)
| | | 335,000 | | 341,640 |
AbbVie, Inc.
5.50%, 3/15/2064
| | | 976,000 | | 963,195 |
Academy Ltd.
6.00%, 11/15/2027 (a)
| | | 500,000 | | 492,560 |
Acuris Finance U.S., Inc./Acuris Finance SARL
5.00%, 5/1/2028 (a)
| | | 475,000 | | 427,528 |
Acushnet Co.
7.38%, 10/15/2028 (a)
| | | 285,000 | | 295,408 |
AdaptHealth LLC
5.13%, 3/1/2030 (a)
| | | 280,000 | | 245,188 |
Advanced Drainage Systems, Inc.
6.38%, 6/15/2030 (a)
| | | 1,045,000 | | 1,047,205 |
| AEP Texas, Inc.: | | | | | |
5.45%, 5/15/2029
| | | 555,000 | | 557,969 |
See accompanying notes to financial statements.
60
SPDR DOUBLELINE TOTAL RETURN TACTICAL ETF
SCHEDULE OF INVESTMENTS (continued)
June 30, 2024
| Security Description | | | Principal
Amount | | Value |
Series H, 3.45%, 1/15/2050
| | | $1,961,000 | | $1,295,495 |
Aethon United BR LP/Aethon United Finance Corp.
8.25%, 2/15/2026 (a)
| | | 305,000 | | 308,443 |
AGCO Corp.
5.80%, 3/21/2034
| | | 325,000 | | 323,582 |
Agree LP
5.63%, 6/15/2034
| | | 660,000 | | 653,440 |
| Air Lease Corp.: | | | | | |
3.25%, 3/1/2025
| | | 1,496,000 | | 1,469,177 |
Series MTN, 5.20%, 7/15/2031
| | | 701,000 | | 684,940 |
Alexandria Real Estate Equities, Inc.
5.25%, 5/15/2036
| | | 1,423,000 | | 1,369,196 |
Allegion U.S. Holding Co., Inc.
5.60%, 5/29/2034
| | | 795,000 | | 795,374 |
Alliant Holdings Intermediate LLC/Alliant Holdings Co-Issuer
6.75%, 10/15/2027 (a)
| | | 420,000 | | 413,507 |
Allied Universal Holdco LLC
7.88%, 2/15/2031 (a)
| | | 520,000 | | 521,867 |
| Allied Universal Holdco LLC/Allied Universal Finance Corp.: | | | | | |
6.63%, 7/15/2026 (a)
| | | 202,000 | | 201,436 |
9.75%, 7/15/2027 (a)
| | | 355,000 | | 352,902 |
AMC Entertainment Holdings, Inc.
7.50%, 2/15/2029 (a)
| | | 110,000 | | 74,509 |
| American Airlines, Inc.: | | | | | |
7.25%, 2/15/2028 (a)
| | | 565,000 | | 565,000 |
8.50%, 5/15/2029 (a)
| | | 585,000 | | 607,926 |
American Axle & Manufacturing, Inc.
5.00%, 10/1/2029
| | | 155,000 | | 141,943 |
American Express Co.
3.95%, 8/1/2025
| | | 1,773,000 | | 1,743,657 |
American Homes 4 Rent LP
5.50%, 2/1/2034
| | | 1,492,000 | | 1,468,725 |
American Tower Corp.
3.60%, 1/15/2028
| | | 1,160,000 | | 1,094,750 |
Amgen, Inc.
5.75%, 3/2/2063
| | | 719,000 | | 704,929 |
AmWINS Group, Inc.
4.88%, 6/30/2029 (a)
| | | 440,000 | | 409,631 |
Anywhere Real Estate Group LLC/Realogy Co.-Issuer Corp.
5.25%, 4/15/2030 (a)
| | | 290,000 | | 174,394 |
Ardagh Packaging Finance PLC/Ardagh Holdings USA, Inc.
5.25%, 8/15/2027 (a)
| | | 310,000 | | 190,907 |
ARES Capital Corp.
3.25%, 7/15/2025
| | | 973,000 | | 946,145 |
| Security Description | | | Principal
Amount | | Value |
Arizona Public Service Co.
5.70%, 8/15/2034
| | | $875,000 | | $873,460 |
Arrow Electronics, Inc.
3.88%, 1/12/2028
| | | 1,551,000 | | 1,468,440 |
Arsenal AIC Parent LLC
8.00%, 10/1/2030 (a)
| | | 170,000 | | 178,458 |
Artera Services LLC
8.50%, 2/15/2031 (a)
| | | 250,000 | | 257,122 |
Ashton Woods USA LLC/Ashton Woods Finance Co.
4.63%, 4/1/2030 (a)
| | | 335,000 | | 299,239 |
AssuredPartners, Inc.
5.63%, 1/15/2029 (a)
| | | 410,000 | | 383,641 |
AT&T, Inc.
2.25%, 2/1/2032
| | | 2,291,000 | | 1,859,261 |
AthenaHealth Group, Inc.
6.50%, 2/15/2030 (a)
| | | 445,000 | | 409,912 |
Athene Holding Ltd.
6.25%, 4/1/2054
| | | 995,000 | | 995,448 |
Atlassian Corp.
5.25%, 5/15/2029
| | | 661,000 | | 660,894 |
AutoZone, Inc.
5.10%, 7/15/2029
| | | 352,000 | | 350,458 |
Aviation Capital Group LLC
5.38%, 7/15/2029 (a)
| | | 701,000 | | 692,364 |
| Bank of America Corp.: | | | | | |
5 yr. CMT + 1.20%, 2.48%, 9/21/2036 (b)
| | | 3,456,000 | | 2,759,547 |
SOFR + 1.65%, 5.47%, 1/23/2035 (b)
| | | 741,000 | | 740,059 |
Series MTN, SOFR + 1.75%, 4.83%, 7/22/2026 (b)
| | | 553,000 | | 547,608 |
Bausch & Lomb Corp.
8.38%, 10/1/2028 (a)
| | | 695,000 | | 712,431 |
Bausch Health Americas, Inc.
8.50%, 1/31/2027 (a)
| | | 210,000 | | 146,336 |
| Bausch Health Cos., Inc.: | | | | | |
4.88%, 6/1/2028 (a)
| | | 470,000 | | 351,786 |
5.25%, 1/30/2030 (a)
| | | 130,000 | | 60,759 |
14.00%, 10/15/2030 (a)
| | | 28,000 | | 21,790 |
BCPE Empire Holdings, Inc.
7.63%, 5/1/2027 (a)
| | | 545,000 | | 527,527 |
Beacon Roofing Supply, Inc.
6.50%, 8/1/2030 (a)
| | | 540,000 | | 544,261 |
Berry Global, Inc.
5.80%, 6/15/2031 (a)
| | | 945,000 | | 945,151 |
Black Hills Corp.
6.00%, 1/15/2035
| | | 555,000 | | 558,480 |
BlackRock Funding, Inc.
5.25%, 3/14/2054
| | | 560,000 | | 541,038 |
Blackstone Holdings Finance Co. LLC
2.00%, 1/30/2032 (a)
| | | 2,812,000 | | 2,216,193 |
See accompanying notes to financial statements.
61
SPDR DOUBLELINE TOTAL RETURN TACTICAL ETF
SCHEDULE OF INVESTMENTS (continued)
June 30, 2024
| Security Description | | | Principal
Amount | | Value |
Blue Racer Midstream LLC/Blue Racer Finance Corp.
7.25%, 7/15/2032 (a)
| | | $260,000 | | $267,322 |
| Boeing Co.: | | | | | |
6.39%, 5/1/2031 (a)
| | | 243,000 | | 247,352 |
6.86%, 5/1/2054 (a)
| | | 566,000 | | 580,308 |
Boost Newco Borrower LLC
7.50%, 1/15/2031 (a)
| | | 200,000 | | 208,578 |
Boxer Parent Co., Inc.
7.13%, 10/2/2025 (a)
| | | 35,000 | | 35,072 |
| BP Capital Markets America, Inc.: | | | | | |
4.89%, 9/11/2033
| | | 926,000 | | 901,470 |
5.23%, 11/17/2034
| | | 947,000 | | 940,021 |
Brand Industrial Services, Inc.
10.38%, 8/1/2030 (a)
| | | 315,000 | | 340,452 |
| Bristol-Myers Squibb Co.: | | | | | |
5.50%, 2/22/2044
| | | 352,000 | | 347,501 |
5.55%, 2/22/2054
| | | 1,420,000 | | 1,399,595 |
Broadcom, Inc.
3.42%, 4/15/2033 (a)
| | | 2,158,000 | | 1,859,894 |
Brown & Brown, Inc.
2.38%, 3/15/2031
| | | 1,567,000 | | 1,294,796 |
Buckeye Partners LP
6.88%, 7/1/2029 (a)
| | | 730,000 | | 732,555 |
Builders FirstSource, Inc.
6.38%, 3/1/2034 (a)
| | | 520,000 | | 514,722 |
Burlington Northern Santa Fe LLC
5.50%, 3/15/2055
| | | 1,010,000 | | 1,013,000 |
Caesars Entertainment, Inc.
6.50%, 2/15/2032 (a)
| | | 510,000 | | 512,489 |
Calpine Corp.
4.50%, 2/15/2028 (a)
| | | 610,000 | | 580,153 |
Campbell Soup Co.
5.40%, 3/21/2034
| | | 480,000 | | 477,101 |
Cardinal Health, Inc.
4.90%, 9/15/2045
| | | 2,130,000 | | 1,868,351 |
| Carnival Corp.: | | | | | |
5.75%, 3/1/2027 (a)
| | | 345,000 | | 341,098 |
7.00%, 8/15/2029 (a)
| | | 360,000 | | 373,187 |
Castle U.S. Holding Corp.
9.50%, 2/15/2028 (a)
| | | 85,000 | | 40,619 |
Catalent Pharma Solutions, Inc.
3.50%, 4/1/2030 (a)
| | | 130,000 | | 124,383 |
| CCO Holdings LLC/CCO Holdings Capital Corp.: | | | | | |
4.75%, 3/1/2030 (a)
| | | 755,000 | | 653,951 |
4.75%, 2/1/2032 (a)
| | | 375,000 | | 307,095 |
5.13%, 5/1/2027 (a)
| | | 540,000 | | 518,254 |
Cedar Fair LP
5.25%, 7/15/2029
| | | 275,000 | | 263,384 |
Centene Corp.
3.00%, 10/15/2030
| | | 2,157,000 | | 1,845,206 |
| Security Description | | | Principal
Amount | | Value |
Central Parent LLC/CDK Global II LLC/CDK Financing Co., Inc.
8.00%, 6/15/2029 (a)
| | | $445,000 | | $451,826 |
Charter Communications Operating LLC/Charter Communications Operating Capital
6.10%, 6/1/2029
| | | 365,000 | | 366,340 |
Cheniere Energy, Inc.
4.63%, 10/15/2028
| | | 1,909,000 | | 1,853,696 |
Chord Energy Corp.
6.38%, 6/1/2026 (a)
| | | 520,000 | | 519,267 |
| CHS/Community Health Systems, Inc.: | | | | | |
4.75%, 2/15/2031 (a)
| | | 310,000 | | 243,728 |
6.00%, 1/15/2029 (a)
| | | 220,000 | | 193,985 |
6.88%, 4/15/2029 (a)
| | | 130,000 | | 99,562 |
Citigroup, Inc. 3 mo. USD Term SOFR + 1.65%,
3.67%, 7/24/2028 (b)
| | | 3,864,000 | | 3,682,856 |
Citizens Financial Group, Inc. SOFR + 2.33%,
6.65%, 4/25/2035 (b)
| | | 620,000 | | 641,353 |
Civitas Resources, Inc.
8.38%, 7/1/2028 (a)
| | | 340,000 | | 356,735 |
Clarios Global LP/Clarios U.S. Finance Co.
6.75%, 5/15/2028 (a)
| | | 560,000 | | 566,810 |
Clarivate Science Holdings Corp.
4.88%, 7/1/2029 (a)
| | | 205,000 | | 190,550 |
| Clear Channel Outdoor Holdings, Inc.: | | | | | |
7.50%, 6/1/2029 (a)
| | | 180,000 | | 150,386 |
9.00%, 9/15/2028 (a)
| | | 185,000 | | 193,109 |
Clearway Energy Operating LLC
4.75%, 3/15/2028 (a)
| | | 280,000 | | 267,243 |
| Cloud Software Group, Inc.: | | | | | |
6.50%, 3/31/2029 (a)
| | | 320,000 | | 307,408 |
9.00%, 9/30/2029 (a)
| | | 210,000 | | 203,650 |
CNH Industrial Capital LLC
5.10%, 4/20/2029
| | | 377,000 | | 375,605 |
CNX Midstream Partners LP
4.75%, 4/15/2030 (a)
| | | 550,000 | | 495,335 |
CNX Resources Corp.
6.00%, 1/15/2029 (a)
| | | 325,000 | | 318,708 |
Coherent Corp.
5.00%, 12/15/2029 (a)
| | | 255,000 | | 241,439 |
CommScope Technologies LLC
5.00%, 3/15/2027 (a)
| | | 220,000 | | 90,836 |
CommScope, Inc.
4.75%, 9/1/2029 (a)
| | | 155,000 | | 107,446 |
Consolidated Communications, Inc.
5.00%, 10/1/2028 (a)
| | | 290,000 | | 239,937 |
See accompanying notes to financial statements.
62
SPDR DOUBLELINE TOTAL RETURN TACTICAL ETF
SCHEDULE OF INVESTMENTS (continued)
June 30, 2024
| Security Description | | | Principal
Amount | | Value |
Cornerstone Building Brands, Inc.
6.13%, 1/15/2029 (a)
| | | $335,000 | | $275,464 |
Coty, Inc.
5.00%, 4/15/2026 (a)
| | | 540,000 | | 532,575 |
Coty, Inc./HFC Prestige Products, Inc./HFC Prestige International U.S. LLC
6.63%, 7/15/2030 (a)
| | | 400,000 | | 406,216 |
Cougar JV Subsidiary LLC
8.00%, 5/15/2032 (a)
| | | 260,000 | | 268,674 |
CQP Holdco LP/BIP-V Chinook Holdco LLC
5.50%, 6/15/2031 (a)
| | | 1,015,000 | | 961,956 |
Crown Castle, Inc.
4.30%, 2/15/2029
| | | 1,933,000 | | 1,845,319 |
| CSC Holdings LLC: | | | | | |
5.75%, 1/15/2030 (a)
| | | 495,000 | | 186,575 |
6.50%, 2/1/2029 (a)
| | | 445,000 | | 325,544 |
CSX Corp.
3.35%, 9/15/2049
| | | 2,572,000 | | 1,808,862 |
Cummins, Inc.
5.45%, 2/20/2054
| | | 470,000 | | 460,661 |
CVR Partners LP/CVR Nitrogen Finance Corp.
6.13%, 6/15/2028 (a)
| | | 280,000 | | 269,119 |
| CVS Health Corp.: | | | | | |
5.30%, 6/1/2033
| | | 912,000 | | 890,468 |
5.88%, 6/1/2053
| | | 1,374,000 | | 1,315,976 |
| Dana, Inc.: | | | | | |
4.25%, 9/1/2030
| | | 95,000 | | 82,881 |
5.38%, 11/15/2027
| | | 125,000 | | 122,325 |
5.63%, 6/15/2028
| | | 650,000 | | 630,097 |
Dealer Tire LLC/DT Issuer LLC
8.00%, 2/1/2028 (a)
| | | 310,000 | | 299,857 |
Directv Financing LLC/Directv Financing Co.-Obligor, Inc.
5.88%, 8/15/2027 (a)
| | | 430,000 | | 404,647 |
| DISH DBS Corp.: | | | | | |
5.13%, 6/1/2029
| | | 290,000 | | 114,159 |
5.75%, 12/1/2028 (a)
| | | 500,000 | | 344,040 |
Dollar General Corp.
4.25%, 9/20/2024
| | | 940,000 | | 936,325 |
Dollar Tree, Inc.
4.00%, 5/15/2025
| | | 1,679,000 | | 1,654,436 |
Dornoch Debt Merger Sub, Inc.
6.63%, 10/15/2029 (a)
| | | 400,000 | | 340,100 |
DTE Energy Co.
5.85%, 6/1/2034
| | | 1,487,000 | | 1,508,651 |
| Duke Energy Corp.: | | | | | |
2.65%, 9/1/2026
| | | 2,940,000 | | 2,780,270 |
5.00%, 8/15/2052
| | | 292,000 | | 253,830 |
5.45%, 6/15/2034
| | | 914,000 | | 904,019 |
Dun & Bradstreet Corp.
5.00%, 12/15/2029 (a)
| | | 565,000 | | 524,970 |
Elevance Health, Inc.
5.13%, 2/15/2053
| | | 1,948,000 | | 1,792,238 |
| Security Description | | | Principal
Amount | | Value |
Embarq Corp.
8.00%, 6/1/2036
| | | $225,000 | | $29,333 |
| EMRLD Borrower LP/Emerald Co.-Issuer, Inc.: | | | | | |
6.63%, 12/15/2030 (a)
| | | 565,000 | | 569,853 |
6.75%, 7/15/2031 (a) (d)
| | | 270,000 | | 273,399 |
| Encompass Health Corp.: | | | | | |
4.63%, 4/1/2031
| | | 310,000 | | 284,902 |
4.75%, 2/1/2030
| | | 60,000 | | 56,126 |
Energizer Holdings, Inc.
6.50%, 12/31/2027 (a)
| | | 515,000 | | 514,464 |
| Energy Transfer LP: | | | | | |
5.00%, 5/15/2044
| | | 1,039,000 | | 896,938 |
5.95%, 5/15/2054
| | | 975,000 | | 944,482 |
Entergy Arkansas LLC
5.75%, 6/1/2054
| | | 475,000 | | 471,124 |
Entergy Louisiana LLC
4.75%, 9/15/2052
| | | 627,000 | | 539,402 |
| Equinix, Inc.: | | | | | |
2.95%, 9/15/2051
| | | 1,695,000 | | 1,046,493 |
3.90%, 4/15/2032
| | | 1,030,000 | | 936,888 |
Everi Holdings, Inc.
5.00%, 7/15/2029 (a)
| | | 340,000 | | 334,040 |
Eversource Energy
5.50%, 1/1/2034
| | | 478,000 | | 468,913 |
| Expedia Group, Inc.: | | | | | |
3.80%, 2/15/2028
| | | 2,435,000 | | 2,317,633 |
5.00%, 2/15/2026
| | | 1,379,000 | | 1,368,271 |
Extra Space Storage LP
5.40%, 2/1/2034
| | | 951,000 | | 930,810 |
F&G Annuities & Life, Inc.
6.50%, 6/4/2029
| | | 790,000 | | 787,772 |
Ferrellgas LP/Ferrellgas Finance Corp.
5.38%, 4/1/2026 (a)
| | | 430,000 | | 420,553 |
Fertitta Entertainment LLC/Fertitta Entertainment Finance Co., Inc.
6.75%, 1/15/2030 (a)
| | | 405,000 | | 355,558 |
Fiserv, Inc.
5.45%, 3/15/2034
| | | 913,000 | | 907,093 |
Ford Motor Co.
3.25%, 2/12/2032
| | | 1,143,000 | | 945,695 |
Fortrea Holdings, Inc.
7.50%, 7/1/2030 (a)
| | | 580,000 | | 576,764 |
Fortress Transportation & Infrastructure Investors LLC
7.88%, 12/1/2030 (a)
| | | 700,000 | | 733,264 |
| Freeport-McMoRan, Inc.: | | | | | |
4.38%, 8/1/2028
| | | 400,000 | | 386,316 |
4.63%, 8/1/2030
| | | 200,000 | | 192,534 |
5.25%, 9/1/2029
| | | 300,000 | | 298,455 |
| Frontier Communications Holdings LLC: | | | | | |
5.00%, 5/1/2028 (a)
| | | 250,000 | | 235,593 |
5.88%, 10/15/2027 (a)
| | | 125,000 | | 121,964 |
See accompanying notes to financial statements.
63
SPDR DOUBLELINE TOTAL RETURN TACTICAL ETF
SCHEDULE OF INVESTMENTS (continued)
June 30, 2024
| Security Description | | | Principal
Amount | | Value |
5.88%, 11/1/2029
| | | $480,000 | | $417,970 |
Full House Resorts, Inc.
8.25%, 2/15/2028 (a)
| | | 265,000 | | 253,669 |
Gates Corp.
6.88%, 7/1/2029 (a)
| | | 345,000 | | 351,238 |
| General Motors Financial Co., Inc.: | | | | | |
2.40%, 10/15/2028
| | | 1,066,000 | | 942,333 |
3.10%, 1/12/2032
| | | 430,000 | | 361,312 |
Genesee & Wyoming, Inc.
6.25%, 4/15/2032 (a)
| | | 1,005,000 | | 1,001,472 |
Georgia-Pacific LLC
3.60%, 3/1/2025 (a)
| | | 1,863,000 | | 1,837,328 |
Goldman Sachs Group, Inc. 3 mo. USD Term SOFR + 1.43%,
6.75%, 5/15/2026 (b)
| | | 3,661,000 | | 3,685,785 |
Goodyear Tire & Rubber Co.
5.25%, 7/15/2031
| | | 250,000 | | 227,213 |
GrafTech Finance, Inc.
4.63%, 12/15/2028 (a)
| | | 210,000 | | 133,619 |
Gray Television, Inc.
10.50%, 7/15/2029 (a)
| | | 265,000 | | 266,487 |
Griffon Corp.
5.75%, 3/1/2028
| | | 430,000 | | 415,109 |
Group 1 Automotive, Inc.
4.00%, 8/15/2028 (a)
| | | 665,000 | | 613,822 |
Guardian Life Global Funding
1.25%, 5/13/2026 (a)
| | | 2,000,000 | | 1,855,640 |
Gulfport Energy Corp.
8.00%, 5/17/2026 (a)
| | | 175,000 | | 177,104 |
Halliburton Co.
4.85%, 11/15/2035
| | | 748,000 | | 711,625 |
Harvest Midstream I LP
7.50%, 5/15/2032 (a)
| | | 485,000 | | 491,417 |
| HCA, Inc.: | | | | | |
5.13%, 6/15/2039
| | | 974,000 | | 901,476 |
5.25%, 6/15/2049
| | | 1,006,000 | | 896,145 |
Helios Software Holdings, Inc./ION Corporate Solutions Finance SARL
4.63%, 5/1/2028 (a)
| | | 375,000 | | 334,549 |
Hess Midstream Operations LP
5.13%, 6/15/2028 (a)
| | | 365,000 | | 353,502 |
H-Food Holdings LLC/Hearthside Finance Co., Inc.
8.50%, 6/1/2026 (a)
| | | 290,000 | | 21,312 |
Hightower Holding LLC
6.75%, 4/15/2029 (a)
| | | 315,000 | | 294,925 |
| Hilcorp Energy I LP/Hilcorp Finance Co.: | | | | | |
6.25%, 11/1/2028 (a)
| | | 540,000 | | 533,191 |
8.38%, 11/1/2033 (a)
| | | 115,000 | | 122,535 |
Home Depot, Inc.
4.95%, 6/25/2034
| | | 797,000 | | 788,895 |
| Security Description | | | Principal
Amount | | Value |
| Host Hotels & Resorts LP: | | | | | |
5.70%, 7/1/2034
| | | $1,915,000 | | $1,882,368 |
Series I, 3.50%, 9/15/2030
| | | 2,084,000 | | 1,840,276 |
HUB International Ltd.
7.25%, 6/15/2030 (a)
| | | 450,000 | | 461,119 |
Hyatt Hotels Corp.
5.25%, 6/30/2029
| | | 1,930,000 | | 1,914,406 |
Hyundai Capital America
5.30%, 1/8/2029 (a)
| | | 1,840,000 | | 1,834,351 |
Icahn Enterprises LP/Icahn Enterprises Finance Corp.
5.25%, 5/15/2027
| | | 385,000 | | 361,399 |
Illuminate Buyer LLC/Illuminate Holdings IV, Inc.
9.00%, 7/1/2028 (a)
| | | 460,000 | | 464,039 |
Installed Building Products, Inc.
5.75%, 2/1/2028 (a)
| | | 435,000 | | 425,469 |
IQVIA, Inc.
6.25%, 2/1/2029
| | | 622,000 | | 639,323 |
| Iron Mountain, Inc.: | | | | | |
7.00%, 2/15/2029 (a)
| | | 470,000 | | 478,662 |
REIT, 4.50%, 2/15/2031 (a)
| | | 580,000 | | 523,003 |
Jacobs Engineering Group, Inc.
5.90%, 3/1/2033
| | | 1,925,000 | | 1,927,541 |
JELD-WEN, Inc.
4.88%, 12/15/2027 (a)
| | | 590,000 | | 557,184 |
| JPMorgan Chase & Co.: | | | | | |
3 mo. USD Term SOFR + 1.25%, 2.58%, 4/22/2032 (b)
| | | 2,196,000 | | 1,854,127 |
SOFR + 1.26%, 2.96%, 1/25/2033 (b)
| | | 2,176,000 | | 1,854,953 |
SOFR + 1.99%, 4.85%, 7/25/2028 (b)
| | | 943,000 | | 932,872 |
Keurig Dr Pepper, Inc. Series 10,
5.20%, 3/15/2031
| | | 920,000 | | 918,013 |
Kinder Morgan, Inc.
5.20%, 6/1/2033
| | | 1,887,000 | | 1,832,352 |
Kodiak Gas Services LLC
7.25%, 2/15/2029 (a)
| | | 560,000 | | 574,319 |
Kyndryl Holdings, Inc.
4.10%, 10/15/2041
| | | 1,230,000 | | 932,008 |
LBM Acquisition LLC
6.25%, 1/15/2029 (a)
| | | 165,000 | | 145,728 |
Leeward Renewable Energy Operations LLC
4.25%, 7/1/2029 (a)
| | | 425,000 | | 380,587 |
Legacy LifePoint Health LLC
4.38%, 2/15/2027 (a)
| | | 550,000 | | 525,497 |
Legends Hospitality Holding Co. LLC/Legends Hospitality Co.-Issuer, Inc.
5.00%, 2/1/2026 (a)
| | | 340,000 | | 337,056 |
| Level 3 Financing, Inc.: | | | | | |
4.50%, 4/1/2030 (a)
| | | 165,000 | | 90,159 |
See accompanying notes to financial statements.
64
SPDR DOUBLELINE TOTAL RETURN TACTICAL ETF
SCHEDULE OF INVESTMENTS (continued)
June 30, 2024
| Security Description | | | Principal
Amount | | Value |
10.50%, 4/15/2029 (a)
| | | $470,000 | | $468,938 |
LFS Topco LLC
5.88%, 10/15/2026 (a)
| | | 345,000 | | 318,921 |
LifePoint Health, Inc.
10.00%, 6/1/2032 (a)
| | | 650,000 | | 665,691 |
Light & Wonder International, Inc.
7.25%, 11/15/2029 (a)
| | | 505,000 | | 515,145 |
Lions Gate Capital Holdings LLC
5.50%, 4/15/2029 (a)
| | | 140,000 | | 90,686 |
Live Nation Entertainment, Inc.
6.50%, 5/15/2027 (a)
| | | 290,000 | | 292,291 |
Lowe's Cos., Inc.
4.40%, 9/8/2025
| | | 2,139,000 | | 2,111,428 |
LYB International Finance III LLC
5.50%, 3/1/2034
| | | 909,000 | | 899,346 |
M/I Homes, Inc.
4.95%, 2/1/2028
| | | 365,000 | | 351,473 |
Macy's Retail Holdings LLC
5.88%, 4/1/2029 (a)
| | | 310,000 | | 300,390 |
| Madison IAQ LLC: | | | | | |
4.13%, 6/30/2028 (a)
| | | 570,000 | | 531,713 |
5.88%, 6/30/2029 (a)
| | | 220,000 | | 204,840 |
Markel Group, Inc.
6.00%, 5/16/2054
| | | 715,000 | | 707,829 |
Marriott International, Inc. Series HH,
2.85%, 4/15/2031
| | | 2,154,000 | | 1,844,082 |
Marvell Technology, Inc.
1.65%, 4/15/2026
| | | 1,479,000 | | 1,383,930 |
Massachusetts Mutual Life Insurance Co.
3.38%, 4/15/2050 (a)
| | | 2,101,000 | | 1,437,504 |
MasTec, Inc.
5.90%, 6/15/2029
| | | 643,000 | | 646,054 |
Matador Resources Co.
6.50%, 4/15/2032 (a)
| | | 400,000 | | 400,280 |
Match Group Holdings II LLC
5.00%, 12/15/2027 (a)
| | | 775,000 | | 743,109 |
Mativ Holdings, Inc.
6.88%, 10/1/2026 (a)
| | | 515,000 | | 512,049 |
Mavis Tire Express Services Topco Corp.
6.50%, 5/15/2029 (a)
| | | 495,000 | | 461,444 |
McAfee Corp.
7.38%, 2/15/2030 (a)
| | | 165,000 | | 152,349 |
McDonald's Corp.
5.45%, 8/14/2053
| | | 936,000 | | 904,344 |
McGraw-Hill Education, Inc.
5.75%, 8/1/2028 (a)
| | | 265,000 | | 255,595 |
Medline Borrower LP
5.25%, 10/1/2029 (a)
| | | 1,095,000 | | 1,043,601 |
Medline Borrower LP/Medline Co.-Issuer, Inc.
6.25%, 4/1/2029 (a)
| | | 160,000 | | 161,786 |
| Security Description | | | Principal
Amount | | Value |
Merck & Co., Inc.
4.50%, 5/17/2033
| | | $645,000 | | $623,199 |
Meta Platforms, Inc.
5.60%, 5/15/2053
| | | 1,737,000 | | 1,773,043 |
| Michaels Cos., Inc.: | | | | | |
5.25%, 5/1/2028 (a)
| | | 360,000 | | 287,431 |
7.88%, 5/1/2029 (a)
| | | 335,000 | | 216,822 |
Midwest Gaming Borrower LLC/Midwest Gaming Finance Corp.
4.88%, 5/1/2029 (a)
| | | 445,000 | | 414,651 |
Miter Brands Acquisition Holdco, Inc./MIWD Borrower LLC
6.75%, 4/1/2032 (a)
| | | 510,000 | | 513,060 |
ModivCare Escrow Issuer, Inc.
5.00%, 10/1/2029 (a)
| | | 350,000 | | 246,407 |
Motorola Solutions, Inc.
5.40%, 4/15/2034
| | | 920,000 | | 911,656 |
| MPLX LP: | | | | | |
1.75%, 3/1/2026
| | | 797,000 | | 749,308 |
5.50%, 6/1/2034
| | | 953,000 | | 938,448 |
Nabors Industries Ltd.
7.25%, 1/15/2026 (a)
| | | 180,000 | | 182,655 |
Nabors Industries, Inc.
9.13%, 1/31/2030 (a)
| | | 375,000 | | 388,710 |
Nationstar Mortgage Holdings, Inc.
5.75%, 11/15/2031 (a)
| | | 480,000 | | 451,042 |
Navient Corp.
5.00%, 3/15/2027
| | | 285,000 | | 272,332 |
| NCL Corp. Ltd.: | | | | | |
5.88%, 3/15/2026 (a)
| | | 395,000 | | 390,556 |
8.38%, 2/1/2028 (a)
| | | 275,000 | | 287,394 |
NetApp, Inc.
1.88%, 6/22/2025
| | | 1,445,000 | | 1,392,546 |
Netflix, Inc.
5.38%, 11/15/2029 (a)
| | | 846,000 | | 853,656 |
News Corp.
5.13%, 2/15/2032 (a)
| | | 155,000 | | 147,050 |
| NextEra Energy Capital Holdings, Inc.: | | | | | |
4.26%, 9/1/2024
| | | 843,000 | | 840,370 |
5.55%, 3/15/2054
| | | 560,000 | | 537,337 |
5 yr. CMT + 2.46%, 6.75%, 6/15/2054 (b)
| | | 212,000 | | 214,059 |
NGL Energy Operating LLC/NGL Energy Finance Corp.
8.13%, 2/15/2029 (a)
| | | 450,000 | | 458,896 |
NiSource, Inc.
5.35%, 4/1/2034
| | | 920,000 | | 902,456 |
Northrop Grumman Corp.
5.20%, 6/1/2054
| | | 1,885,000 | | 1,764,190 |
NuStar Logistics LP
6.00%, 6/1/2026
| | | 550,000 | | 548,971 |
See accompanying notes to financial statements.
65
SPDR DOUBLELINE TOTAL RETURN TACTICAL ETF
SCHEDULE OF INVESTMENTS (continued)
June 30, 2024
| Security Description | | | Principal
Amount | | Value |
Oglethorpe Power Corp.
5.80%, 6/1/2054 (a)
| | | $141,000 | | $138,111 |
Olympus Water U.S. Holding Corp.
6.25%, 10/1/2029 (a)
| | | 200,000 | | 182,172 |
| OneMain Finance Corp.: | | | | | |
7.13%, 3/15/2026
| | | 324,000 | | 328,928 |
7.50%, 5/15/2031
| | | 630,000 | | 637,780 |
ONEOK, Inc.
6.63%, 9/1/2053
| | | 860,000 | | 918,334 |
| Oracle Corp.: | | | | | |
3.80%, 11/15/2037
| | | 204,000 | | 168,035 |
6.25%, 11/9/2032
| | | 165,000 | | 174,686 |
O'Reilly Automotive, Inc.
5.75%, 11/20/2026
| | | 445,000 | | 449,272 |
Organon & Co./Organon Foreign Debt Co.-Issuer BV
5.13%, 4/30/2031 (a)
| | | 385,000 | | 345,676 |
Outfront Media Capital LLC/Outfront Media Capital Corp.
7.38%, 2/15/2031 (a)
| | | 415,000 | | 433,156 |
Owens & Minor, Inc.
6.63%, 4/1/2030 (a)
| | | 530,000 | | 481,871 |
Owens Corning
5.70%, 6/15/2034
| | | 897,000 | | 905,566 |
| Pacific Gas & Electric Co.: | | | | | |
6.75%, 1/15/2053
| | | 861,000 | | 894,613 |
6.95%, 3/15/2034
| | | 864,000 | | 930,329 |
Pactiv Evergreen Group Issuer, Inc./Pactiv Evergreen Group Issuer LLC
4.00%, 10/15/2027 (a)
| | | 550,000 | | 515,350 |
Panther Escrow Issuer LLC
7.13%, 6/1/2031 (a)
| | | 405,000 | | 409,621 |
Park Intermediate Holdings LLC/PK Domestic Property LLC/PK Finance Co.-Issuer
7.00%, 2/1/2030 (a)
| | | 720,000 | | 728,194 |
PBF Holding Co. LLC/PBF Finance Corp.
6.00%, 2/15/2028
| | | 240,000 | | 234,206 |
PECF USS Intermediate Holding III Corp.
8.00%, 11/15/2029 (a)
| | | 90,000 | | 38,498 |
Penn Entertainment, Inc.
4.13%, 7/1/2029 (a)
| | | 210,000 | | 179,989 |
| PennyMac Financial Services, Inc.: | | | | | |
4.25%, 2/15/2029 (a)
| | | 310,000 | | 281,858 |
7.88%, 12/15/2029 (a)
| | | 340,000 | | 350,486 |
Penske Truck Leasing Co. LP/PTL Finance Corp.
4.20%, 4/1/2027 (a)
| | | 970,000 | | 942,132 |
Permian Resources Operating LLC
7.00%, 1/15/2032 (a)
| | | 560,000 | | 575,529 |
| Security Description | | | Principal
Amount | | Value |
PetSmart, Inc./PetSmart Finance Corp.
7.75%, 2/15/2029 (a)
| | | $1,000,000 | | $972,920 |
Pfizer Investment Enterprises Pte. Ltd.
5.30%, 5/19/2053
| | | 921,000 | | 888,912 |
Philip Morris International, Inc.
5.25%, 2/13/2034
| | | 953,000 | | 935,026 |
| Pike Corp.: | | | | | |
5.50%, 9/1/2028 (a)
| | | 560,000 | | 536,799 |
8.63%, 1/31/2031 (a)
| | | 285,000 | | 301,712 |
Post Holdings, Inc.
5.50%, 12/15/2029 (a)
| | | 140,000 | | 134,966 |
Premier Entertainment Sub LLC/Premier Entertainment Finance Corp.
5.63%, 9/1/2029 (a)
| | | 160,000 | | 114,707 |
Prime Security Services Borrower LLC/Prime Finance, Inc.
6.25%, 1/15/2028 (a)
| | | 220,000 | | 216,478 |
| Qorvo, Inc.: | | | | | |
1.75%, 12/15/2024
| | | 646,000 | | 633,325 |
3.38%, 4/1/2031 (a)
| | | 525,000 | | 449,783 |
Quanta Services, Inc.
2.35%, 1/15/2032
| | | 2,300,000 | | 1,870,337 |
Radiate Holdco LLC/Radiate Finance, Inc.
4.50%, 9/15/2026 (a)
| | | 90,000 | | 68,657 |
| Radiology Partners, Inc.: | | | | | |
7.78%, 1/31/2029 (a)
| | | 145,001 | | 136,050 |
9.78%, 2/15/2030 (a)
| | | 99,906 | | 79,884 |
Realty Income Corp.
5.05%, 1/13/2026
| | | 938,000 | | 932,888 |
Roller Bearing Co. of America, Inc.
4.38%, 10/15/2029 (a)
| | | 555,000 | | 511,116 |
| Royal Caribbean Cruises Ltd.: | | | | | |
5.38%, 7/15/2027 (a)
| | | 807,000 | | 794,903 |
5.50%, 8/31/2026 (a)
| | | 420,000 | | 414,809 |
6.25%, 3/15/2032 (a)
| | | 335,000 | | 337,529 |
7.25%, 1/15/2030 (a)
| | | 70,000 | | 72,483 |
Royalty Pharma PLC
5.15%, 9/2/2029
| | | 1,724,000 | | 1,709,449 |
Sabine Pass Liquefaction LLC
5.00%, 3/15/2027
| | | 1,192,000 | | 1,182,321 |
Schlumberger Holdings Corp.
5.00%, 11/15/2029 (a)
| | | 667,000 | | 662,118 |
Scientific Games Holdings LP/Scientific Games U.S. FinCo, Inc.
6.63%, 3/1/2030 (a)
| | | 330,000 | | 321,687 |
Sealed Air Corp./Sealed Air Corp. U.S.
7.25%, 2/15/2031 (a)
| | | 500,000 | | 515,540 |
Select Medical Corp.
6.25%, 8/15/2026 (a)
| | | 490,000 | | 492,636 |
See accompanying notes to financial statements.
66
SPDR DOUBLELINE TOTAL RETURN TACTICAL ETF
SCHEDULE OF INVESTMENTS (continued)
June 30, 2024
| Security Description | | | Principal
Amount | | Value |
| Service Properties Trust: | | | | | |
5.50%, 12/15/2027
| | | $115,000 | | $106,824 |
8.88%, 6/15/2032
| | | 110,000 | | 102,522 |
Sirius XM Radio, Inc.
5.50%, 7/1/2029 (a)
| | | 1,025,000 | | 963,018 |
Sitio Royalties Operating Partnership LP/Sitio Finance Corp.
7.88%, 11/1/2028 (a)
| | | 280,000 | | 289,467 |
Six Flags Entertainment Corp./Six Flags Theme Parks, Inc.
6.63%, 5/1/2032 (a)
| | | 610,000 | | 619,858 |
Solventum Corp.
5.40%, 3/1/2029 (a)
| | | 930,000 | | 927,126 |
Sonic Automotive, Inc.
4.63%, 11/15/2029 (a)
| | | 515,000 | | 465,205 |
Sotera Health Holdings LLC
7.38%, 6/1/2031 (a)
| | | 1,045,000 | | 1,047,759 |
Southern California Edison Co.
5.45%, 6/1/2031
| | | 1,865,000 | | 1,878,745 |
Southern Co. Series 21-A, VRN, 5 yr. CMT + 2.92%,
3.75%, 9/15/2051 (b)
| | | 1,950,000 | | 1,831,284 |
Southwestern Energy Co.
4.75%, 2/1/2032
| | | 310,000 | | 284,726 |
Spirit AeroSystems, Inc.
9.75%, 11/15/2030 (a)
| | | 195,000 | | 215,067 |
Standard Industries, Inc.
4.38%, 7/15/2030 (a)
| | | 680,000 | | 614,319 |
Staples, Inc.
10.75%, 9/1/2029 (a)
| | | 110,000 | | 104,572 |
Starwood Property Trust, Inc.
7.25%, 4/1/2029 (a)
| | | 330,000 | | 333,580 |
Station Casinos LLC
6.63%, 3/15/2032 (a)
| | | 770,000 | | 766,666 |
Suburban Propane Partners LP/Suburban Energy Finance Corp.
5.00%, 6/1/2031 (a)
| | | 630,000 | | 566,685 |
Sun Communities Operating LP
2.70%, 7/15/2031
| | | 1,115,000 | | 920,912 |
SunCoke Energy, Inc.
4.88%, 6/30/2029 (a)
| | | 470,000 | | 426,064 |
Sunoco LP/Sunoco Finance Corp.
6.00%, 4/15/2027
| | | 170,000 | | 169,973 |
SWF Escrow Issuer Corp.
6.50%, 10/1/2029 (a)
| | | 95,000 | | 49,957 |
Sysco Corp.
3.25%, 7/15/2027
| | | 992,000 | | 939,533 |
Take-Two Interactive Software, Inc.
4.95%, 3/28/2028
| | | 1,849,000 | | 1,831,675 |
| Security Description | | | Principal
Amount | | Value |
Tallgrass Energy Partners LP/Tallgrass Energy Finance Corp.
7.38%, 2/15/2029 (a)
| | | $280,000 | | $281,380 |
| Tenet Healthcare Corp.: | | | | | |
6.13%, 10/1/2028
| | | 230,000 | | 228,765 |
6.13%, 6/15/2030
| | | 565,000 | | 561,491 |
6.25%, 2/1/2027
| | | 245,000 | | 244,887 |
T-Mobile USA, Inc.
5.50%, 1/15/2055
| | | 2,771,000 | | 2,670,080 |
TMS International Corp.
6.25%, 4/15/2029 (a)
| | | 180,000 | | 164,983 |
Townsquare Media, Inc.
6.88%, 2/1/2026 (a)
| | | 445,000 | | 438,365 |
| TransDigm, Inc.: | | | | | |
5.50%, 11/15/2027
| | | 520,000 | | 510,697 |
6.88%, 12/15/2030 (a)
| | | 565,000 | | 576,893 |
Transocean Poseidon Ltd.
6.88%, 2/1/2027 (a)
| | | 224,020 | | 223,700 |
Transocean, Inc.
8.00%, 2/1/2027 (a)
| | | 210,000 | | 209,395 |
Trident TPI Holdings, Inc.
12.75%, 12/31/2028 (a)
| | | 475,000 | | 518,747 |
Triton Water Holdings, Inc.
6.25%, 4/1/2029 (a)
| | | 330,000 | | 318,041 |
U.S. Foods, Inc.
7.25%, 1/15/2032 (a)
| | | 540,000 | | 560,569 |
UKG, Inc.
6.88%, 2/1/2031 (a)
| | | 280,000 | | 283,545 |
United Airlines, Inc.
4.63%, 4/15/2029 (a)
| | | 560,000 | | 521,808 |
United Natural Foods, Inc.
6.75%, 10/15/2028 (a)
| | | 480,000 | | 432,941 |
Uniti Group LP/Uniti Group Finance, Inc./CSL Capital LLC
10.50%, 2/15/2028 (a)
| | | 280,000 | | 275,288 |
Univision Communications, Inc.
4.50%, 5/1/2029 (a)
| | | 325,000 | | 273,705 |
Upbound Group, Inc.
6.38%, 2/15/2029 (a)
| | | 160,000 | | 153,624 |
Vail Resorts, Inc.
6.50%, 5/15/2032 (a)
| | | 205,000 | | 207,472 |
| Venture Global LNG, Inc.: | | | | | |
8.13%, 6/1/2028 (a)
| | | 375,000 | | 386,741 |
8.38%, 6/1/2031 (a)
| | | 245,000 | | 254,038 |
9.88%, 2/1/2032 (a)
| | | 290,000 | | 315,604 |
Veralto Corp.
5.35%, 9/18/2028 (a)
| | | 925,000 | | 928,681 |
Verisk Analytics, Inc.
5.25%, 6/5/2034
| | | 954,000 | | 939,051 |
Verizon Communications, Inc.
5.50%, 2/23/2054
| | | 1,825,000 | | 1,787,095 |
Viatris, Inc.
1.65%, 6/22/2025
| | | 579,000 | | 556,350 |
See accompanying notes to financial statements.
67
SPDR DOUBLELINE TOTAL RETURN TACTICAL ETF
SCHEDULE OF INVESTMENTS (continued)
June 30, 2024
| Security Description | | | Principal
Amount | | Value |
VICI Properties LP/VICI Note Co., Inc.
4.63%, 12/1/2029 (a)
| | | $1,970,000 | | $1,860,586 |
Victra Holdings LLC/Victra Finance Corp.
7.75%, 2/15/2026 (a)
| | | 795,000 | | 790,222 |
| Viking Cruises Ltd.: | | | | | |
5.88%, 9/15/2027 (a)
| | | 875,000 | | 865,856 |
9.13%, 7/15/2031 (a)
| | | 510,000 | | 551,983 |
| Vistra Operations Co. LLC: | | | | | |
6.88%, 4/15/2032 (a)
| | | 305,000 | | 309,636 |
7.75%, 10/15/2031 (a)
| | | 325,000 | | 338,520 |
Vital Energy, Inc.
7.88%, 4/15/2032 (a)
| | | 215,000 | | 218,290 |
VT Topco, Inc.
8.50%, 8/15/2030 (a)
| | | 535,000 | | 561,691 |
Wand NewCo 3, Inc.
7.63%, 1/30/2032 (a)
| | | 330,000 | | 340,870 |
WASH Multifamily Acquisition, Inc.
5.75%, 4/15/2026 (a)
| | | 230,000 | | 225,140 |
Weatherford International Ltd.
8.63%, 4/30/2030 (a)
| | | 510,000 | | 529,110 |
| Wells Fargo & Co.: | | | | | |
Series MTN, 3 mo. USD Term SOFR + 1.57%, 3.58%, 5/22/2028 (b)
| | | 1,936,000 | | 1,843,711 |
Series MTN, SOFR + 1.98%, 4.81%, 7/25/2028 (b)
| | | 752,000 | | 741,088 |
Wheel Pros, Inc.
6.50%, 5/15/2029 (a)
| | | 75,000 | | 13,535 |
Williams Cos., Inc.
5.15%, 3/15/2034
| | | 955,000 | | 931,841 |
Willis North America, Inc.
5.35%, 5/15/2033
| | | 1,870,000 | | 1,832,993 |
Workday, Inc.
3.70%, 4/1/2029
| | | 1,807,000 | | 1,696,159 |
WR Grace Holdings LLC
5.63%, 8/15/2029 (a)
| | | 600,000 | | 551,670 |
WRKCo, Inc.
3.75%, 3/15/2025
| | | 1,867,000 | | 1,840,619 |
Wyndham Hotels & Resorts, Inc.
4.38%, 8/15/2028 (a)
| | | 585,000 | | 544,495 |
| XHR LP: | | | | | |
4.88%, 6/1/2029 (a)
| | | 1,125,000 | | 1,055,149 |
6.38%, 8/15/2025 (a)
| | | 265,000 | | 264,714 |
XPO, Inc.
7.13%, 6/1/2031 (a)
| | | 680,000 | | 696,320 |
| | | | | | 261,717,481 |
| Security Description | | | Principal
Amount | | Value |
| VIETNAM — 0.0% (e) | | | | |
Mong Duong Finance Holdings BV
5.13%, 5/7/2029
| | | $210,820 | | $200,583 |
TOTAL CORPORATE BONDS & NOTES
(Cost $370,657,042)
| | | | | 359,177,284 |
| ASSET-BACKED SECURITIES — 13.3% | | | | | |
AASET Series 2024-1A, Class A1,
6.26%, 5/16/2049 (a)
| | | 3,000,000 | | 3,002,484 |
| ACE Securities Corp. Home Equity Loan Trust: | | | | | |
Series 2006-FM1, Class A2C, ABS, 1 mo. USD Term SOFR + 0.41%, 5.76%, 7/25/2036 (b)
| | | 8,329,987 | | 1,936,414 |
Series 2007-WM2, Class A2C, ABS, 1 mo. USD Term SOFR + 0.39%, 5.74%, 2/25/2037 (b)
| | | 2,683,548 | | 1,040,842 |
ACRE Commercial Mortgage Ltd. Series 2021-FL4, Class B, 1 mo. USD Term SOFR + 1.51%,
6.85%, 12/18/2037 (a) (b)
| | | 3,000,000 | | 2,918,232 |
| Affirm Asset Securitization Trust: | | | | | |
Series 2023-A, Class A, 6.61%, 1/18/2028 (a)
| | | 1,750,000 | | 1,756,155 |
Series 2023-B, Class A, 6.82%, 9/15/2028 (a)
| | | 5,250,000 | | 5,310,729 |
Aligned Data Centers Issuer LLC Series 2023-1A, Class A2,
6.00%, 8/17/2048 (a)
| | | 5,000,000 | | 4,979,650 |
Ameriquest Mortgage Securities, Inc. Asset-Backed Pass-Through Certificates Series 2004-FR1, Class M5,
3.82%, 5/25/2034 (g)
| | | 4,804,032 | | 3,232,675 |
| AMSR Trust: | | | | | |
Series 2021-SFR2, Class E1, ABS, 2.48%, 8/17/2038 (a)
| | | 3,000,000 | | 2,742,979 |
Series 2021-SFR2, Class F1, ABS, 3.28%, 8/17/2038 (a)
| | | 3,000,000 | | 2,770,063 |
Series 2021-SFR2, Class F2, ABS, 3.67%, 8/17/2038 (a)
| | | 2,000,000 | | 1,840,178 |
Series 2023-SFR1, Class B, 4.00%, 4/17/2040 (a)
| | | 12,000,000 | | 11,275,654 |
See accompanying notes to financial statements.
68
SPDR DOUBLELINE TOTAL RETURN TACTICAL ETF
SCHEDULE OF INVESTMENTS (continued)
June 30, 2024
| Security Description | | | Principal
Amount | | Value |
Series 2023-SFR2, Class A, 3.95%, 6/17/2040 (a)
| | | $6,800,000 | | $6,432,116 |
Anchorage Capital CLO 19 Ltd. Series 2021-19A, Class A, ABS, 3 mo. USD Term SOFR + 1.47%,
6.80%, 10/15/2034 (a) (b)
| | | 2,000,000 | | 1,999,000 |
AREIT Trust Series 2021-CRE5, Class B, 1 mo. USD Term SOFR + 1.93%,
7.26%, 11/17/2038 (a) (b)
| | | 300,000 | | 293,304 |
Argent Securities Trust Series 2006-M1, Class A2B, ABS, 1 mo. USD Term SOFR + 0.29%,
5.64%, 7/25/2036 (b)
| | | 17,315,437 | | 4,545,302 |
| Bain Capital Credit CLO Ltd.: | | | | | |
Series 2019-3A, Class DR, ABS, 3 mo. USD Term SOFR + 3.36%, 8.69%, 10/21/2034 (a) (b)
| | | 1,000,000 | | 974,170 |
Series 2021-6A, Class A1, 3 mo. USD Term SOFR + 1.41%, 6.74%, 10/21/2034 (a) (b)
| | | 3,000,000 | | 3,003,300 |
Series 2023-3A, Class C, 3 mo. USD Term SOFR + 3.25%, 8.57%, 7/24/2036 (a) (b)
| | | 2,000,000 | | 2,002,354 |
Blackbird Capital II Aircraft Lease Ltd. Series 2021-1A, Class B, ABS,
3.45%, 7/15/2046 (a)
| | | 3,682,320 | | 3,279,648 |
BNC Mortgage Loan Trust Series 2006-1, Class A1, ABS, 1 mo. USD Term SOFR + 0.47%,
4.49%, 10/25/2036 (b)
| | | 15,805,302 | | 10,286,673 |
BSPRT Issuer Ltd. Series 2021-FL6, Class A, ABS, 1 mo. USD Term SOFR + 1.21%,
6.54%, 3/15/2036 (a) (b)
| | | 412,928 | | 410,299 |
| Canyon Capital CLO Ltd.: | | | | | |
Series 2017-1A, Class DR, ABS, 3 mo. USD Term SOFR + 3.26%, 8.59%, 7/15/2030 (a) (b)
| | | 1,000,000 | | 994,975 |
Series 2021-1A, Class D, ABS, 3 mo. USD Term SOFR + 3.36%, 8.69%, 4/15/2034 (a) (b)
| | | 2,000,000 | | 1,986,056 |
| Carlyle U.S. CLO Ltd.: | | | | | |
Series 2021-1A, Class D, ABS, 3 mo. USD Term SOFR + 6.26%, 11.59%, 4/15/2034 (a) (b)
| | | 1,000,000 | | 999,321 |
| Security Description | | | Principal
Amount | | Value |
Series 2022-2A, Class A2, 3 mo. USD Term SOFR + 2.00%, 7.32%, 4/20/2035 (a) (b)
| | | $2,000,000 | | $2,013,148 |
Series 2023-3A, Class B, 3 mo. USD Term SOFR + 2.60%, 7.93%, 10/15/2036 (a) (b)
| | | 3,000,000 | | 3,027,801 |
Series 2023-3A, Class C, 3 mo. USD Term SOFR + 3.00%, 8.33%, 10/15/2036 (a) (b)
| | | 2,000,000 | | 1,999,820 |
Catamaran CLO Ltd. Series 2018-1A, Class C, 3 mo. USD Term SOFR + 2.76%,
8.09%, 10/25/2031 (a) (b)
| | | 1,000,000 | | 999,593 |
Cathedral Lake VIII Ltd. Series 2021-8A, Class C, 3 mo. USD Term SOFR + 2.88%,
8.21%, 1/20/2035 (a) (b)
| | | 2,550,000 | | 2,544,645 |
| CIFC Funding Ltd.: | | | | | |
Series 2013-1A, Class CR, ABS, 3 mo. USD Term SOFR + 3.81%, 9.14%, 7/16/2030 (a) (b)
| | | 1,000,000 | | 996,700 |
Series 2021-6A, Class B, 3 mo. USD Term SOFR + 1.91%, 7.24%, 10/15/2034 (a) (b)
| | | 1,000,000 | | 1,001,100 |
Series 2022-3A, Class B, 3 mo. USD Term SOFR + 2.00%, 7.32%, 4/21/2035 (a) (b)
| | | 2,000,000 | | 1,998,200 |
Cologix Data Centers U.S. Issuer LLC Series 2021-1A, Class A2,
3.30%, 12/26/2051 (a)
| | | 3,250,000 | | 2,991,534 |
Compass Datacenters Issuer II LLC Series 2024-1A, Class A2,
5.75%, 2/25/2049 (a)
| | | 4,000,000 | | 3,983,216 |
| CyrusOne Data Centers Issuer I LLC: | | | | | |
Series 2023-1A, Class A2, 4.30%, 4/20/2048 (a)
| | | 1,000,000 | | 939,919 |
Series 2024-2A, Class A2, 4.50%, 5/20/2049 (a)
| | | 2,250,000 | | 2,085,279 |
DataBank Issuer LLC Series 2023-1A, Class A2,
5.12%, 2/25/2053 (a)
| | | 4,000,000 | | 3,844,066 |
Drive Auto Receivables Trust Series 2021-3, Class C,
1.47%, 1/15/2027
| | | 1,953,320 | | 1,931,108 |
Dryden 37 Senior Loan Fund Series 2015-37A, Class BR, 3 mo. USD Term SOFR + 1.66%,
6.99%, 1/15/2031 (a) (b)
| | | 1,626,877 | | 1,623,461 |
See accompanying notes to financial statements.
69
SPDR DOUBLELINE TOTAL RETURN TACTICAL ETF
SCHEDULE OF INVESTMENTS (continued)
June 30, 2024
| Security Description | | | Principal
Amount | | Value |
Dryden 68 CLO Ltd. Series 2019-68A, Class DR, ABS, 3 mo. USD Term SOFR + 3.61%,
8.94%, 7/15/2035 (a) (b)
| | | $1,500,000 | | $1,459,167 |
| Exeter Automobile Receivables Trust: | | | | | |
Series 2021-1A, Class D, ABS, 1.08%, 11/16/2026
| | | 633,193 | | 618,127 |
Series 2021-1A, Class E, ABS, 2.21%, 2/15/2028 (a)
| | | 1,500,000 | | 1,427,305 |
Fillmore Park CLO Ltd. Series 2018-1A, Class D, 3 mo. USD Term SOFR + 3.16%,
8.49%, 7/15/2030 (a) (b)
| | | 1,000,000 | | 996,100 |
First Franklin Mortgage Loan Trust Series 2007-FF2, Class A1, ABS, 1 mo. USD Term SOFR + 0.39%,
5.74%, 3/25/2037 (b)
| | | 8,520,282 | | 4,230,064 |
| FirstKey Homes Trust: | | | | | |
Series 2020-SFR2, Class D, ABS, 1.97%, 10/19/2037 (a)
| | | 2,000,000 | | 1,888,644 |
Series 2020-SFR2, Class E, 2.67%, 10/19/2037 (a)
| | | 2,000,000 | | 1,900,226 |
| FMC GMSR Issuer Trust: | | | | | |
Series 2020-GT1, Class A, CMO, VRN, 4.45%, 1/25/2026 (a) (b)
| | | 3,000,000 | | 2,789,281 |
Series 2021-GT2, Class A, 3.85%, 10/25/2026 (a) (b)
| | | 2,650,000 | | 2,374,058 |
FREED ABS Trust Series 2021-2, Class C, ABS,
1.94%, 6/19/2028 (a)
| | | 452,995 | | 452,995 |
FS Rialto Issuer LLC Series 2021-FL2, Class A, ABS, 1 mo. USD Term SOFR + 1.33%,
6.66%, 5/16/2038 (a) (b)
| | | 1,751,382 | | 1,734,563 |
GAIA Aviation Ltd. Series 2019-1, Class A,
3.97%, 12/15/2044 (a) (g)
| | | 1,010,602 | | 929,769 |
Galaxy XXII CLO Ltd. Series 2016-22A, Class CRR, 3 mo. USD Term SOFR + 2.41%,
7.74%, 4/16/2034 (a) (b)
| | | 500,000 | | 498,800 |
Galaxy XXVIII CLO Ltd. Series 2018-28A, Class D, ABS, 3 mo. USD Term SOFR + 3.26%,
8.59%, 7/15/2031 (a) (b)
| | | 2,100,000 | | 2,094,740 |
GLS Auto Receivables Issuer Trust Series 2021-2A, Class C,
1.08%, 6/15/2026 (a)
| | | 565,749 | | 563,524 |
| Security Description | | | Principal
Amount | | Value |
GoldenTree Loan Management U.S. CLO 15 Ltd. Series 2022-15A, Class DR, 3 mo. USD Term SOFR + 4.40%,
9.72%, 10/20/2036 (a) (b)
| | | $1,000,000 | | $1,012,291 |
GoodLeap Sustainable Home Solutions Trust Series 2021-5CS, Class C,
3.50%, 10/20/2048 (a)
| | | 3,166,985 | | 2,437,822 |
Greystone CRE Notes Ltd. Series 2021-FL3, Class B, ABS, 1 mo. USD Term SOFR + 1.76%,
7.09%, 7/15/2039 (a) (b)
| | | 2,925,000 | | 2,884,547 |
| GSAA Home Equity Trust: | | | | | |
Series 2007-10, Class A2A, 6.50%, 11/25/2037
| | | 2,129,351 | | 835,318 |
Series 2007-4, Class A3A, ABS, 1 mo. USD Term SOFR + 0.71%, 6.06%, 3/25/2037 (b)
| | | 5,581,441 | | 2,183,574 |
Hardee's Funding LLC Series 2018-1A, Class A23, ABS,
5.71%, 6/20/2048 (a)
| | | 1,602,250 | | 1,528,380 |
| Invesco U.S. CLO Ltd.: | | | | | |
Series 2023-3A, Class B, 3 mo. USD Term SOFR + 2.65%, 7.98%, 7/15/2036 (a) (b)
| | | 1,000,000 | | 1,007,011 |
Series 2023-3A, Class C, 3 mo. USD Term SOFR + 3.15%, 8.48%, 7/15/2036 (a) (b)
| | | 1,000,000 | | 999,443 |
JOL Air Ltd. Series 2019-1, Class A,
3.97%, 4/15/2044 (a)
| | | 1,865,315 | | 1,734,874 |
Katayma CLO I Ltd. Series 2023-1A, Class D, 3 mo. USD Term SOFR + 5.25%,
10.57%, 10/20/2036 (a) (b)
| | | 5,000,000 | | 5,098,615 |
LCCM Trust Series 2021-FL3, Class A, 1 mo. USD Term SOFR + 1.56%,
6.89%, 11/15/2038 (a) (b)
| | | 2,558,933 | | 2,530,867 |
LCM XVIII LP Series 18A, Class CR, 3 mo. USD Term SOFR + 2.11%,
7.44%, 4/20/2031 (a) (b)
| | | 1,435,000 | | 1,430,121 |
Lendbuzz Securitization Trust Series 2022-1A, Class A,
4.22%, 5/17/2027 (a)
| | | 1,538,283 | | 1,512,742 |
LendingPoint Asset Securitization Trust Series 2021-A, Class C, ABS,
2.75%, 12/15/2028 (a)
| | | 875,886 | | 865,205 |
Lodi Park CLO Ltd. Series 2024-1A, Class D1, 3 mo. USD Term SOFR - 3.00%,
1.00%, 7/21/2037 (a) (b) (d)
| | | 500,000 | | 498,100 |
See accompanying notes to financial statements.
70
SPDR DOUBLELINE TOTAL RETURN TACTICAL ETF
SCHEDULE OF INVESTMENTS (continued)
June 30, 2024
| Security Description | | | Principal
Amount | | Value |
Madison Park Funding XLVIII Ltd. Series 2021-48A, Class D, ABS, 3 mo. USD Term SOFR + 3.26%,
8.59%, 4/19/2033 (a) (b)
| | | $1,000,000 | | $1,001,079 |
Madison Park Funding XVII Ltd. Series 2015-17A, Class DR, 3 mo. USD Term SOFR + 3.86%,
9.19%, 7/21/2030 (a) (b)
| | | 1,000,000 | | 996,500 |
Magnetite XXIX Ltd. Series 2021-29A, Class E, ABS, 3 mo. USD Term SOFR + 6.01%,
11.34%, 1/15/2034 (a) (b)
| | | 500,000 | | 503,579 |
Magnetite XXXI Ltd. Series 2021-31A, Class E, 3 mo. USD Term SOFR + 6.26%,
11.59%, 7/15/2034 (a) (b)
| | | 500,000 | | 496,288 |
Marble Point CLO XI Ltd. Series 2017-2A, Class B, 3 mo. USD Term SOFR + 1.76%,
7.09%, 12/18/2030 (a) (b)
| | | 3,500,000 | | 3,495,450 |
| Merrill Lynch Mortgage Investors Trust: | | | | | |
Series 2006-HE4, Class A2B, 1 mo. USD Term SOFR + 0.31%, 5.66%, 7/25/2037 (b)
| | | 3,709,121 | | 673,793 |
Series 2006-HE4, Class A2C, 1 mo. USD Term SOFR + 0.41%, 5.76%, 7/25/2037 (b)
| | | 5,133,632 | | 934,587 |
Series 2006-WMC2, Class A1, 1 mo. USD Term SOFR + 0.59%, 4.56%, 3/25/2037 (b)
| | | 31,924,542 | | 7,890,721 |
MetroNet Infrastructure Issuer LLC Series 2023-1A, Class A2,
6.56%, 4/20/2053 (a)
| | | 4,000,000 | | 4,059,598 |
MF1 Ltd. Series 2021-FL7, Class A, ABS, 1 mo. USD Term SOFR + 1.19%,
6.53%, 10/16/2036 (a) (b)
| | | 1,345,226 | | 1,337,715 |
MF1 Multifamily Housing Mortgage Loan Trust Series 2024-FL15, Class A, 1 mo. USD Term SOFR + 1.69%,
6.99%, 8/18/2041 (a) (b) (d)
| | | 1,750,000 | | 1,745,625 |
MKS CLO Ltd. Series 2017-1A, Class AR, 3 mo. USD Term SOFR + 1.26%,
6.59%, 7/20/2030 (a) (b)
| | | 198,620 | | 198,500 |
Mosaic Solar Loan Trust Series 2018-1A, Class C, ABS, PO,
0.00%, 6/22/2043 (a)
| | | 90,412 | | 84,786 |
| Security Description | | | Principal
Amount | | Value |
| MVW LLC: | | | | | |
Series 2021-1WA, Class C, ABS, 1.94%, 1/22/2041 (a)
| | | $457,765 | | $428,358 |
Series 2021-1WA, Class D, ABS, 3.17%, 1/22/2041 (a)
| | | 762,942 | | 719,790 |
Neuberger Berman Loan Advisers CLO 40 Ltd. Series 2021-40A, Class D, ABS, 3 mo. USD Term SOFR + 3.01%,
8.34%, 4/16/2033 (a) (b)
| | | 1,500,000 | | 1,484,226 |
Neuberger Berman Loan Advisers CLO 47 Ltd. Series 2022-47A, Class D, ABS, 3 mo. USD Term SOFR + 3.10%,
8.43%, 4/14/2035 (a) (b)
| | | 500,000 | | 497,750 |
Ocean Trails CLO V Series 2014-5A, Class DRR, ABS, 3 mo. USD Term SOFR + 3.71%,
9.04%, 10/13/2031 (a) (b)
| | | 1,000,000 | | 968,041 |
Octagon Investment Partners 27 Ltd. Series 2016-1A, Class DR, ABS, 3 mo. USD Term SOFR + 3.21%,
8.54%, 7/15/2030 (a) (b)
| | | 500,000 | | 488,500 |
Octagon Investment Partners 30 Ltd. Series 2017-1A, Class CR, ABS, 3 mo. USD Term SOFR + 3.56%,
8.89%, 3/17/2030 (a) (b)
| | | 1,000,000 | | 991,850 |
Octagon Investment Partners 40 Ltd. Series 2019-1A, Class DR, ABS, 3 mo. USD Term SOFR + 3.61%,
8.94%, 1/20/2035 (a) (b)
| | | 500,000 | | 482,400 |
Octagon Investment Partners XXI Ltd. Series 2014-1A, Class A2R3, 3 mo. USD Term SOFR + 1.66%,
6.98%, 2/14/2031 (a) (b)
| | | 500,000 | | 499,474 |
| Pagaya AI Debt Trust: | | | | | |
Series 2022-1, Class A, 2.03%, 10/15/2029 (a)
| | | 719,037 | | 715,272 |
Series 2022-1, Class B, ABS, 3.34%, 10/15/2029 (a)
| | | 4,499,405 | | 4,415,704 |
Series 2022-2, Class A, 4.97%, 1/15/2030 (a)
| | | 423,415 | | 421,925 |
Series 2023-1, Class A, 7.56%, 7/15/2030 (a)
| | | 608,653 | | 610,172 |
Series 2023-3, Class A, 7.60%, 12/16/2030 (a)
| | | 2,537,200 | | 2,549,895 |
See accompanying notes to financial statements.
71
SPDR DOUBLELINE TOTAL RETURN TACTICAL ETF
SCHEDULE OF INVESTMENTS (continued)
June 30, 2024
| Security Description | | | Principal
Amount | | Value |
Park Avenue Institutional Advisers CLO Ltd. Series 2018-1A, Class BR, 3 mo. USD Term SOFR + 2.36%,
7.69%, 10/20/2031 (a) (b)
| | | $4,000,000 | | $3,990,400 |
PMT Issuer Trust - FMSR Series 2021-FT1, Class A, ABS, 1 mo. USD Term SOFR + 3.11%,
8.46%, 3/25/2026 (a) (b)
| | | 1,300,000 | | 1,313,178 |
PPM CLO Ltd. Series 2018-1A, Class D, 3 mo. USD Term SOFR + 3.51%,
8.84%, 7/15/2031 (a) (b)
| | | 500,000 | | 497,470 |
| PRET LLC: | | | | | |
Series 2021-NPL5, Class A1, 2.49%, 10/25/2051 (a) (g)
| | | 3,285,037 | | 3,253,984 |
Series 2022-RN1, Class A1, 3.72%, 7/25/2051 (a) (g)
| | | 11,228,015 | | 11,032,680 |
| Progress Residential Trust: | | | | | |
Series 2021-SFR6, Class A, 1.52%, 7/17/2038 (a)
| | | 7,954,476 | | 7,331,284 |
Series 2022-SFR5, Class A, 4.45%, 6/17/2039 (a)
| | | 2,679,439 | | 2,600,512 |
Series 2023-SFR2, Class A, 4.50%, 10/17/2040 (a)
| | | 9,400,000 | | 9,069,331 |
Series 2024-SFR3, Class B, 3.50%, 6/17/2041 (a)
| | | 25,000,000 | | 22,560,385 |
Prosper Marketplace Issuance Trust Series 2023-1A, Class A,
7.06%, 7/16/2029 (a)
| | | 2,585,595 | | 2,594,677 |
Race Point IX CLO Ltd. Series 2015-9A, Class BR, 3 mo. USD Term SOFR + 2.41%,
7.74%, 10/15/2030 (a) (b)
| | | 2,250,000 | | 2,244,600 |
Regatta XXIII Funding Ltd. Series 2021-4A, Class A1, 3 mo. USD Term SOFR + 1.41%,
6.74%, 1/20/2035 (a) (b)
| | | 4,500,000 | | 4,503,600 |
Renaissance Home Equity Loan Trust Series 2006-2, Class AF4, ABS,
6.12%, 8/25/2036 (g)
| | | 8,664,451 | | 3,316,700 |
Retained Vantage Data Centers Issuer LLC Series 2023-1A, Class B,
5.75%, 9/15/2048 (a)
| | | 2,500,000 | | 2,374,023 |
Sapphire Aviation Finance II Ltd. Series 2020-1A, Class A,
3.23%, 3/15/2040 (a)
| | | 919,961 | | 844,193 |
| Security Description | | | Principal
Amount | | Value |
| Securitized Asset-Backed Receivables LLC Trust: | | | | | |
Series 2007-BR4, Class A2A, ABS, 1 mo. USD Term SOFR + 0.20%, 5.55%, 5/25/2037 (b)
| | | $3,369,473 | | $2,026,403 |
Series 2007-BR4, Class A2B, ABS, 1 mo. USD Term SOFR + 0.31%, 5.66%, 5/25/2037 (b)
| | | 23,413,938 | | 14,095,191 |
Series 2007-BR5, Class A2B, 1 mo. USD Term SOFR + 0.29%, 5.64%, 5/25/2037 (b)
| | | 31,446,403 | | 22,541,744 |
Shackleton CLO Ltd. Series 2013-3A, Class DR, 3 mo. USD Term SOFR + 3.28%,
8.61%, 7/15/2030 (a) (b)
| | | 1,080,000 | | 1,072,980 |
Shenton Aircraft Investment I Ltd. Series 2015-1A, Class A, ABS,
4.75%, 10/15/2042 (a)
| | | 1,554,960 | | 1,469,779 |
| Sound Point CLO 36 Ltd.: | | | | | |
Series 2023-36A, Class B, 3 mo. USD Term SOFR + 2.85%, 8.17%, 7/26/2036 (a) (b)
| | | 1,000,000 | | 1,009,300 |
Series 2023-36A, Class C, 3 mo. USD Term SOFR + 3.40%, 8.72%, 7/26/2036 (a) (b)
| | | 500,000 | | 505,200 |
Sound Point CLO II Ltd. Series 2013-1A, Class A1R, 3 mo. USD Term SOFR + 1.33%,
6.66%, 1/26/2031 (a) (b)
| | | 362,979 | | 363,068 |
Sound Point CLO XX Ltd. Series 2018-2A, Class C, 3 mo. USD Term SOFR + 2.21%,
7.54%, 7/26/2031 (a) (b)
| | | 500,000 | | 497,750 |
Sound Point CLO XXIII Ltd. Series 2019-2A, Class ER, 3 mo. USD Term SOFR + 6.73%,
12.06%, 7/15/2034 (a) (b)
| | | 1,000,000 | | 870,435 |
Sound Point CLO XXVI Ltd. Series 2020-1A, Class DR, 3 mo. USD Term SOFR + 3.61%,
8.94%, 7/20/2034 (a) (b)
| | | 500,000 | | 487,402 |
Sound Point CLO XXVIII Ltd. Series 2020-3A, Class D, ABS, 3 mo. USD Term SOFR + 3.91%,
9.24%, 1/25/2032 (a) (b)
| | | 4,000,000 | | 3,905,936 |
See accompanying notes to financial statements.
72
SPDR DOUBLELINE TOTAL RETURN TACTICAL ETF
SCHEDULE OF INVESTMENTS (continued)
June 30, 2024
| Security Description | | | Principal
Amount | | Value |
Sound Point CLO XXXIII Ltd. Series 2022-1A, Class D, ABS, 3 mo. USD Term SOFR + 3.30%,
8.62%, 4/25/2035 (a) (b)
| | | $700,000 | | $662,900 |
Start II Ltd. Series 2019-1, Class A,
4.09%, 3/15/2044 (a)
| | | 415,317 | | 397,728 |
Structured Asset Securities Corp. Mortgage Loan Trust Series 2006-BC4, Class A4, 1 mo. USD Term SOFR + 0.45%,
5.80%, 12/25/2036 (b)
| | | 505,207 | | 496,078 |
Subway Funding LLC Series 2024-1A, Class A23,
6.51%, 7/30/2054 (a)
| | | 1,500,000 | | 1,526,247 |
Sunnova Helios V Issuer LLC Series 2021-A, Class A, ABS,
1.80%, 2/20/2048 (a)
| | | 1,159,635 | | 890,326 |
Sunrun Demeter Issuer LLC Series 2021-2A, Class A,
2.27%, 1/30/2057 (a)
| | | 2,392,997 | | 1,957,664 |
Switch ABS Issuer LLC Series 2024-2A, Class B,
6.20%, 6/25/2054 (a)
| | | 3,000,000 | | 2,899,749 |
Theorem Funding Trust Series 2023-1A, Class A,
7.58%, 4/15/2029 (a)
| | | 2,062,804 | | 2,077,603 |
THL Credit Wind River CLO Ltd. Series 2017-3A, Class AR, ABS, 3 mo. USD Term SOFR + 1.41%,
6.74%, 4/15/2035 (a) (b)
| | | 2,150,000 | | 2,153,010 |
| TIF Funding II LLC: | | | | | |
Series 2021-1A, Class A, ABS, 1.65%, 2/20/2046 (a)
| | | 3,640,625 | | 3,154,359 |
Series 2021-1A, Class B, ABS, 2.54%, 2/20/2046 (a)
| | | 1,456,250 | | 1,266,795 |
Tricon Residential Trust Series 2023-SFR1, Class A,
5.10%, 7/17/2040 (a)
| | | 9,990,776 | | 9,865,126 |
Trimaran Cavu Ltd. Series 2021-3A, Class D, ABS, 3 mo. USD Term SOFR + 4.04%,
9.37%, 1/18/2035 (a) (b)
| | | 1,500,000 | | 1,511,342 |
TRTX Issuer Ltd. Series 2021-FL4, Class A, ABS, 1 mo. USD Term SOFR + 1.31%,
6.64%, 3/15/2038 (a) (b)
| | | 903,963 | | 893,305 |
Upstart Pass-Through Trust Series 2021-ST3, Class A, ABS,
2.00%, 5/20/2027 (a)
| | | 577,223 | | 564,660 |
| Security Description | | | Principal
Amount | | Value |
| Upstart Securitization Trust: | | | | | |
Series 2020-1, Class C, ABS, 4.90%, 4/22/2030 (a)
| | | $32,639 | | $32,587 |
Series 2022-1, Class B, 4.48%, 3/20/2032 (a)
| | | 6,500,000 | | 6,347,311 |
Series 2023-2, Class A, 6.77%, 6/20/2033 (a)
| | | 1,723,168 | | 1,727,940 |
Valley Stream Park CLO Ltd. Series 2022-1A, Class DR, 3 mo. USD Term SOFR + 4.15%,
9.47%, 10/20/2034 (a) (b)
| | | 500,000 | | 503,346 |
VOLT XCVI LLC Series 2021-NPL5, Class A1, CMO,
5.12%, 3/27/2051 (a) (g)
| | | 748,981 | | 742,401 |
| Voya CLO Ltd.: | | | | | |
Series 2013-1A, Class BR, 3 mo. USD Term SOFR + 2.16%, 7.49%, 10/15/2030 (a) (b)
| | | 1,000,000 | | 997,300 |
Series 2014-2A, Class BRR, 3 mo. USD Term SOFR + 2.36%, 7.68%, 4/17/2030 (a) (b)
| | | 1,250,000 | | 1,249,375 |
Series 2017-3A, Class A2AR, 3 mo. USD Term SOFR + 1.81%, 7.14%, 4/20/2034 (a) (b)
| | | 1,005,000 | | 1,003,995 |
Series 2017-3A, Class CR, ABS, 3 mo. USD Term SOFR + 3.41%, 8.74%, 4/20/2034 (a) (b)
| | | 1,000,000 | | 981,382 |
VR Funding LLC Series 2020-1A, Class B,
4.22%, 11/15/2050 (a)
| | | 2,004,906 | | 1,853,834 |
Washington Mutual Asset-Backed Certificates WMABS Trust Series 2007-HE2, Class 2A2, 1 mo. USD Term SOFR + 0.33%,
5.68%, 2/25/2037 (b)
| | | 12,788,151 | | 3,612,578 |
| Wellfleet CLO Ltd.: | | | | | |
Series 2017-3A, Class A2, 3 mo. USD Term SOFR + 1.76%, 7.08%, 1/17/2031 (a) (b)
| | | 1,700,000 | | 1,698,344 |
Series 2020-2A, Class CR, 3 mo. USD Term SOFR + 2.56%, 7.89%, 7/15/2034 (a) (b)
| | | 1,550,000 | | 1,546,235 |
Wellfleet CLO X Ltd. Series 2019-XA, Class A2R, 3 mo. USD Term SOFR + 2.01%,
7.34%, 7/20/2032 (a) (b)
| | | 3,500,000 | | 3,496,496 |
See accompanying notes to financial statements.
73
SPDR DOUBLELINE TOTAL RETURN TACTICAL ETF
SCHEDULE OF INVESTMENTS (continued)
June 30, 2024
| Security Description | | | Principal
Amount | | Value |
Wind River CLO Ltd. Series 2016-2A, Class BR, 3 mo. USD Term SOFR + 2.06%,
7.39%, 11/1/2031 (a) (b)
| | | $3,000,000 | | $3,000,000 |
TOTAL ASSET-BACKED SECURITIES
(Cost $407,298,571)
| | | | | 386,682,235 |
| FOREIGN GOVERNMENT OBLIGATIONS — 0.2% | | | | | |
| COLOMBIA — 0.1% | | | | | |
| Colombia Government International Bonds: | | | | | |
3.88%, 4/25/2027
| | | 200,000 | | 188,140 |
4.13%, 5/15/2051
| | | 1,700,000 | | 1,013,993 |
| | | | | | 1,202,133 |
| GUATEMALA — 0.0% (e) | | | | | |
Guatemala Government Bonds
4.38%, 6/5/2027
| | | 200,000 | | 190,760 |
| MEXICO — 0.1% | | | | | |
Mexico Government International Bonds
6.34%, 5/4/2053
| | | 2,000,000 | | 1,881,528 |
| PANAMA — 0.0% (e) | | | | | |
| Panama Government International Bonds: | | | | | |
3.87%, 7/23/2060
| | | 1,000,000 | | 569,186 |
4.30%, 4/29/2053
| | | 200,000 | | 127,941 |
| | | | | | 697,127 |
| SOUTH AFRICA — 0.0% (e) | | | | | |
Republic of South Africa Government International Bonds
4.30%, 10/12/2028
| | | 650,000 | | 596,433 |
TOTAL FOREIGN GOVERNMENT OBLIGATIONS
(Cost $5,867,576)
| | | | | 4,567,981 |
| | | Shares | |
| COMMON STOCKS — 0.0% (e) | | |
| UNITED STATES — 0.0% (e) | | |
Bright Bidco BV
(f) (h)
| | 710 | 71 |
Envision Healthcare Corp.
(f) (h)
| | 2,187 | 21,688 |
Phoenix Services International LLC (f) (h)
| | 7,665 | 45,532 |
| | | | 67,291 |
TOTAL COMMON STOCKS
(Cost $58,946)
| | | 67,291 |
| Security Description | | | Principal
Amount | | Value |
| SENIOR FLOATING RATE LOANS — 1.9% | | | | | |
| ADVERTISING SERVICES — 0.0% (e) | | | | | |
CMG Media Corp., 2021 Term Loan, 3 mo. USD Term SOFR + 3.50%, 8.93%, 12/17/2026 (b)
| | | $74,406 | | $59,323 |
| AEROSPACE & DEFENSE — 0.0% (e) | | | | | |
| Dynasty Acquisition Co., Inc.: | | | | | |
2024 Term Loan B1, 1 mo. USD Term SOFR + 3.50%, 8.84%, 8/24/2028 (b)
| | | 304,606 | | 306,059 |
2024 Term Loan B2, 1 mo. USD Term SOFR + 3.50%, 8.84%, 8/24/2028 (b)
| | | 117,448 | | 118,009 |
| TransDigm, Inc.: | | | | | |
2023 Term Loan J, 3 mo. USD Term SOFR + 3.25%, 7.84%, 2/28/2031 (b)
| | | 119,700 | | 120,089 |
2024 Term Loan I, 3 mo. USD Term SOFR + 2.75%, 7.84%, 8/24/2028 (b)
| | | 407,000 | | 408,196 |
| | | | | | 952,353 |
| AIR FREIGHT & LOGISTICS — 0.0% (e) | | | | | |
Worldwide Express Operations LLC, 2021 1st Lien Term Loan, 3 mo. USD Term SOFR + 4.00%, 9.85%, 7/26/2028 (b)
| | | 116,841 | | 117,326 |
| AIRLINES — 0.1% | | | | | |
Air Canada, 2024 Term Loan B, 3 mo. USD Term SOFR + 2.50%, 7.85%, 3/21/2031 (b)
| | | 104,738 | | 105,015 |
| American Airlines, Inc.: | | | | | |
2021 Term Loan, 3 mo. USD Term SOFR + 4.75%, 10.34%, 4/20/2028 (b)
| | | 248,000 | | 256,525 |
2023 1st Lien Term Loan, 3 mo. USD Term SOFR + 2.50%, 7.77%, 6/4/2029 (b)
| | | 328,107 | | 327,984 |
Kestrel Bidco, Inc., Term Loan B, 1 mo. USD Term SOFR + 3.00%, 8.44%, 12/11/2026 (b)
| | | 21,764 | | 21,855 |
Mileage Plus Holdings LLC, 2020 Term Loan B, 3 mo. USD Term SOFR + 5.25%, 10.74%, 6/21/2027 (b)
| | | 303,000 | | 309,542 |
See accompanying notes to financial statements.
74
SPDR DOUBLELINE TOTAL RETURN TACTICAL ETF
SCHEDULE OF INVESTMENTS (continued)
June 30, 2024
| Security Description | | | Principal
Amount | | Value |
SkyMiles IP Ltd., 2020 Skymiles Term Loan B, 3 mo. USD Term SOFR + 3.75%, 9.07%, 10/20/2027 (b)
| | | $92,294 | | $94,638 |
United Airlines, Inc., 2024 Term Loan B, 1 mo. USD Term SOFR + 2.75%, 8.09%, 2/22/2031 (b)
| | | 289,275 | | 290,360 |
WestJet Loyalty LP, Term Loan B, 3 mo. USD Term SOFR + 3.75%, 9.05%, 2/14/2031 (b)
| | | 350,000 | | 352,012 |
| | | | | | 1,757,931 |
| APPAREL — 0.0% (e) | | | | | |
ABG Intermediate Holdings 2 LLC, 2024 Add on Delayed Draw Term Loan (i)
| | | 175,000 | | 175,383 |
| AUTO COMPONENTS — 0.0% (e) | | | | | |
DexKo Global, Inc., 2021 USD Term Loan B, 3 mo. USD Term SOFR + 3.75%, 9.35%, 10/4/2028 (b)
| | | 108,979 | | 108,531 |
| AUTO PARTS & EQUIPMENT — 0.0% (e) | | | | | |
Clarios Global LP, 2024 Term Loan B, 1 mo. USD Term SOFR + 3.00%, 8.34%, 5/6/2030 (b)
| | | 408,975 | | 410,445 |
| BEVERAGES — 0.1% | | | | | |
Triton Water Holdings, Inc., Term Loan, 3 mo. USD Term SOFR + 3.25%, 8.85%, 3/31/2028 (b)
| | | 1,158,854 | | 1,160,592 |
| BUILDING MATERIALS — 0.0% (e) | | | | | |
Cornerstone Building Brands, Inc., 2024 Term Loan B, 1 mo. USD Term SOFR + 4.50%, 9.83%, 5/2/2031 (b)
| | | 30,000 | | 29,875 |
MI Windows and Doors LLC, 2024 Term Loan B2, 1 mo. USD Term SOFR + 3.50%, 8.84%, 3/28/2031 (b)
| | | 50,000 | | 50,365 |
Quikrete Holdings, Inc., 2024 Term Loan B, 1 mo. USD Term SOFR + 2.50%, 7.84%, 4/14/2031 (b)
| | | 39,900 | | 40,035 |
Tamko Building Products LLC, 2023 Term Loan, 1 mo. USD Term SOFR + 3.25%, 8.59%, 9/20/2030 (b)
| | | 138,950 | | 139,124 |
| | | | | | 259,399 |
| Security Description | | | Principal
Amount | | Value |
| BUILDING PRODUCTS — 0.0% (e) | | | | | |
Chamberlain Group, Inc., Term Loan B, 1 mo. USD Term SOFR + 3.25%, 8.69%, 11/3/2028 (b)
| | | $197,969 | | $198,093 |
Cornerstone Building Brands, Inc., 2021 Term Loan B, 1 mo. USD Term SOFR + 3.25%, 8.68%, 4/12/2028 (b)
| | | 128,342 | | 125,535 |
| | | | | | 323,628 |
| CAPITAL MARKETS — 0.0% (e) | | | | | |
Focus Financial Partners LLC, 2024 Term Loan B7, 1 mo. USD Term SOFR + 2.75%, 8.09%, 6/30/2028 (b)
| | | 49,626 | | 49,633 |
| CHEMICALS — 0.1% | | | | | |
ECO Services Operations Corp., 2024 Term Loan B , 6/12/2031 (b)
| | | 289,532 | | 289,816 |
Hexion Holdings Corp., 2022 USD Term Loan, 3 mo. USD Term SOFR + 4.50%, 9.98%, 3/15/2029 (b)
| | | 287,952 | | 287,360 |
Illuminate Buyer LLC, 2024 Term Loan B, 1 mo. USD Term SOFR + 3.50%, 8.96%, 12/31/2029 (b)
| | | 197,293 | | 198,279 |
INEOS Quattro Holdings U.K. Ltd., 2023 USD 1st Lien Term Loan B, 1 mo. USD Term SOFR + 4.25%, 9.69%, 4/2/2029 (b)
| | | 284,287 | | 284,110 |
| INEOS U.S. Finance LLC: | | | | | |
2023 USD Term Loan B, 1 mo. USD Term SOFR + 3.50%, 8.60%, 2/18/2030 (b)
| | | 567,625 | | 565,071 |
2024 USD Term Loan B, 1 mo. USD Term SOFR + 3.75%, 9.09%, 2/7/2031 (b)
| | | 75,000 | | 75,281 |
Natgasoline LLC, Term Loan B, 1 mo. USD Term SOFR + 3.50%, 8.96%, 11/14/2025 (b)
| | | 179,511 | | 178,950 |
Nouryon Finance BV, 2024 USD Term Loan B, 3 mo. USD Term SOFR + 3.50%, 8.83%, 4/3/2028 (b)
| | | 243,474 | | 244,417 |
Olympus Water U.S. Holding Corp., 2024 USD Term Loan B (b)
| | | 250,000 | | 250,781 |
Polar U.S. Borrower LLC, 2018 1st Lien Term Loan, 3 mo. USD Term SOFR + 4.75%, 10.18%, 10/15/2025 (b)
| | | 99,390 | | 79,512 |
See accompanying notes to financial statements.
75
SPDR DOUBLELINE TOTAL RETURN TACTICAL ETF
SCHEDULE OF INVESTMENTS (continued)
June 30, 2024
| Security Description | | | Principal
Amount | | Value |
Vantage Specialty Chemicals, Inc., 2023 Term Loan B, 3 mo. USD Term SOFR + 4.75%, 10.08%, 10/26/2026 (b)
| | | $24,625 | | $24,379 |
| | | | | | 2,477,956 |
| COMMERCIAL SERVICES — 0.1% | | | | | |
Allied Universal Holdco LLC, 2021 USD Incremental Term Loan B, 1 mo. USD Term SOFR + 3.75%, 9.19% (i)
| | | 591,319 | | 589,713 |
APi Group DE, Inc., 2024 Term Loan B, 1 mo. USD Term SOFR + 2.00%, 7.34%, 1/3/2029 (b)
| | | 20,000 | | 20,014 |
APX Group, Inc., 2021 Term Loan B, 3 mo. USD Term SOFR + 1.75%, 10.25% (i)
| | | 350,079 | | 350,954 |
Camelot U.S. Acquisition LLC, 2024 Term Loan B, 1 mo. USD Term SOFR + 2.75%, 8.09%, 1/31/2031 (b)
| | | 319,200 | | 320,158 |
Conservice Midco LLC, 2024 Term Loan, 1 mo. USD Term SOFR + 4.00%, 9.34%, 5/13/2027 (b)
| | | 84,575 | | 84,773 |
EAB Global, Inc., 2021 Term Loan (b)
| | | 264,324 | | 264,390 |
Grant Thornton Advisors LLC, Term Loan B, 3 mo. USD Term SOFR + 3.25%, 8.60%, 6/2/2031 (b)
| | | 170,000 | | 170,700 |
GTCR W Merger Sub LLC, USD Term Loan B, 3 mo. USD Term SOFR + 3.00%, 8.33%, 1/31/2031 (b)
| | | 340,000 | | 340,898 |
Homeserve USA Holding Corp., 2024 Term Loan B, 1 mo. USD Term SOFR + 2.50%, 7.84%, 10/21/2030 (b)
| | | 109,451 | | 109,850 |
Mavis Tire Express Services Corp., 2024 Term Loan B, 1 mo. USD Term SOFR + 3.75%, 9.09%, 5/4/2028 (b)
| | | 267,942 | | 268,872 |
PECF USS Intermediate Holding III Corp., Term Loan B, 3 mo. USD Term SOFR + 4.25%, 9.84%, 12/15/2028 (b)
| | | 76,446 | | 51,177 |
Spin Holdco, Inc., 2021 Term Loan, 3 mo. USD Term SOFR + 4.00%, 9.60%, 3/4/2028 (b)
| | | 101,423 | | 86,907 |
| Security Description | | | Principal
Amount | | Value |
Trans Union LLC, 2024 Term Loan B8, 1 mo. USD Term SOFR + 1.75%, 7.09%, 6/11/2031 (b)
| | | 110,000 | | $109,945 |
Vestis Corp., Term Loan, 3 mo. USD Term SOFR + 2.25%, 7.58%, 2/22/2031 (b)
| | | $99,750 | | 99,397 |
Viad Corp., Initial Term Loan, 1 mo. USD Term SOFR + 4.25%, 9.59%, 7/30/2028 (b)
| | | 172,009 | | 172,655 |
VT Topco, Inc., 2024 Term Loan B, 1 mo. USD Term SOFR + 3.50%, 8.84%, 8/9/2030 (b)
| | | 99,501 | | 100,085 |
Wand NewCo 3, Inc., 2024 Term Loan B, 1 mo. USD Term SOFR + 3.75%, 9.09%, 1/30/2031 (b)
| | | 115,000 | | 115,893 |
| | | | | | 3,256,381 |
| COMMERCIAL SERVICES & SUPPLIES — 0.0% (e) | | | | | |
| Asurion LLC: | | | | | |
2021 2nd Lien Term Loan B3, 1 mo. USD Term SOFR + 5.25%, 10.71%, 1/31/2028 (b)
| | | 70,000 | | 65,406 |
2021 Second Lien Term Loan B4, 1 mo. USD Term SOFR + 5.25%, 10.71%, 1/20/2029 (b)
| | | 105,000 | | 97,166 |
2021 Term Loan B9, 1 mo. USD Term SOFR + 3.25%, 8.71%, 7/31/2027 (b)
| | | 376,113 | | 370,296 |
2023 Term Loan B11, 1 mo. USD Term SOFR + 4.25%, 9.69%, 8/19/2028 (b)
| | | 24,749 | | 24,597 |
Garda World Security Corp., 2022 Term Loan B, 3 mo. USD Term SOFR + 4.25%, 9.59%, 2/1/2029 (b)
| | | 321,856 | | 324,270 |
Packers Holdings LLC, 2021 Term Loan, 1 mo. USD Term SOFR + 3.25%, 8.69%, 3/9/2028 (b)
| | | 113,241 | | 63,500 |
| | | | | | 945,235 |
| COMMUNICATIONS EQUIPMENT — 0.0% (e) | | | | | |
CommScope, Inc., 2019 Term Loan B, 1 mo. USD Term SOFR + 3.25%, 8.71%, 4/6/2026 (b)
| | | 59,092 | | 53,457 |
Zayo Group Holdings, Inc., USD Term Loan, 1 mo. USD Term SOFR + 3.00%, 8.46%, 3/9/2027 (b)
| | | 160,000 | | 139,733 |
| | | | | | 193,190 |
See accompanying notes to financial statements.
76
SPDR DOUBLELINE TOTAL RETURN TACTICAL ETF
SCHEDULE OF INVESTMENTS (continued)
June 30, 2024
| Security Description | | | Principal
Amount | | Value |
| CONSTRUCTION & ENGINEERING — 0.1% | | | | | |
Artera Services LLC, 2024 Term Loan, 3 mo. USD Term SOFR + 4.50%, 9.83%, 2/15/2031 (b)
| | | $239,400 | | $240,960 |
Brand Industrial Services, Inc., 2024 Term Loan B, 3 mo. USD Term SOFR + 4.50%, 9.83%, 8/1/2030 (b)
| | | 228,639 | | 229,655 |
Brown Group Holding LLC, Term Loan B, 1 mo. USD Term SOFR + 2.75%, 8.19%, 6/7/2028 (b)
| | | 273,699 | | 273,888 |
| DG Investment Intermediate Holdings 2, Inc.: | | | | | |
2021 2nd Lien Term Loan, 1 mo. USD Term SOFR + 6.75%, 12.21%, 3/30/2029 (b)
| | | 60,000 | | 58,978 |
2021 Term Loan, 1 mo. USD Term SOFR + 3.75%, 9.21%, 3/31/2028 (b)
| | | 252,311 | | 252,364 |
KKR Apple Bidco LLC, 2021 Term Loan, 1 mo. USD Term SOFR + 2.75%, 8.21%, 9/22/2028 (b)
| | | 185,250 | | 185,581 |
Tecta America Corp., 2021 Term Loan, 1 mo. USD Term SOFR + 4.00%, 9.46%, 4/10/2028 (b)
| | | 189,150 | | 190,234 |
| | | | | | 1,431,660 |
| CONSTRUCTION MATERIALS — 0.0% (e) | | | | | |
Emrld Borrower LP, 2024 Term Loan B (i)
| | | 150,000 | | 150,187 |
Quikrete Holdings, Inc., 2024 Term Loan B1, 1 mo. USD Term SOFR + 2.25%, 7.59%, 3/19/2029 (b)
| | | 143,539 | | 143,800 |
Traverse Midstream Partners LLC, 2017 Term Loan, 3 mo. USD Term SOFR + 3.50%, 8.83%, 2/16/2028 (b)
| | | 52,658 | | 52,938 |
| | | | | | 346,925 |
| CONSUMER STAPLES DISTRIBUTION & RETAIL — 0.0% (e) | | | | | |
Monogram Food Solutions LLC, Term Loan B, 1 mo. USD Term SOFR + 4.00%, 9.46%, 8/28/2028 (b)
| | | 253,500 | | 254,134 |
| Security Description | | | Principal
Amount | | Value |
United Natural Foods, Inc., 2024 Term Loan, 1 mo. USD Term SOFR + 4.75%, 10.09%, 5/1/2031 (b)
| | | $115,000 | | $115,527 |
| | | | | | 369,661 |
| CONTAINERS & PACKAGING — 0.1% | | | | | |
Charter NEX U.S., Inc., 2024 Term Loan B, 1 mo. USD Term SOFR + 3.50%, 8.84%, 12/1/2027 (b)
| | | 144,627 | | 145,046 |
Clydesdale Acquisition Holdings, Inc., Term Loan B, 1 mo. USD Term SOFR + 3.68%, 9.12%, 4/13/2029 (b)
| | | 263,655 | | 264,560 |
Graham Packaging Co., Inc., 2021 Term Loan, 1 mo. USD Term SOFR + 3.00%, 8.46%, 8/4/2027 (b)
| | | 298,070 | | 298,874 |
Kloeckner Pentaplast of America, Inc., 2021 Term Loan B, 6 mo. USD Term SOFR + 4.73%, 10.27%, 2/12/2026 (b)
| | | 94,028 | | 88,151 |
Pregis TopCo Corp., 1st Lien Term Loan, 1 mo. USD Term SOFR + 3.75%, 9.34%, 7/31/2026 (b)
| | | 372,613 | | 373,427 |
| Pretium Packaging LLC: | | | | | |
First Out Term Loan A, 3 mo. USD Term SOFR + 5.00%, 10.33%, 10/2/2028 (b)
| | | 55,109 | | 56,818 |
Second Out Term Loan A1, 3 mo. USD Term SOFR + 4.60%, 9.93%, 10/2/2028 (b)
| | | 142,911 | | 124,476 |
Pretium PKG Holdings, Inc., 2021 2nd Lien Term Loan, 3 mo. USD Term SOFR + 6.75%, 12.33%, 10/1/2029 (b)
| | | 45,000 | | 26,444 |
Reynolds Group Holdings, Inc., 2024 Term Loan B3, 3 mo. USD Term SOFR + 2.50%, 7.84%, 9/24/2028 (b)
| | | 259,056 | | 259,661 |
TricorBraun Holdings, Inc., 2021 Term Loan, 1 mo. USD Term SOFR + 3.25%, 8.71%, 3/3/2028 (b)
| | | 191,255 | | 191,196 |
Trident TPI Holdings, Inc., 2021 Term Loan B3, 3 mo. USD Term SOFR + 4.00%, 9.34%, 9/15/2028 (b)
| | | 241,544 | | 242,198 |
| | | | | | 2,070,851 |
See accompanying notes to financial statements.
77
SPDR DOUBLELINE TOTAL RETURN TACTICAL ETF
SCHEDULE OF INVESTMENTS (continued)
June 30, 2024
| Security Description | | | Principal
Amount | | Value |
| COSMETICS & TOILETRIES — 0.0% (e) | | | | | |
Solis IV BV, USD Term Loan B1, 3 mo. USD Term SOFR + 3.50%, 8.84%, 2/26/2029 (b)
| | | $269,278 | | $267,885 |
| DISTRIBUTION/WHOLESALE — 0.0% (e) | | | | | |
BCPE Empire Holdings, Inc., 2024 Term Loan, 1 mo. USD Term SOFR + 4.00%, 9.34% (i)
| | | 585,728 | | 586,571 |
Resideo Funding, Inc., 2024 M&A Term Loan B (i)
| | | 190,000 | | 190,001 |
| | | | | | 776,572 |
| DIVERSIFIED CONSUMER SERVICES — 0.0% (e) | | | | | |
| Ascend Learning LLC: | | | | | |
2021 2nd Lien Term Loan, 1 mo. USD Term SOFR + 5.75%, 11.19%, 12/10/2029 (b)
| | | 84,708 | | 83,353 |
2021 Term Loan, 1 mo. USD Term SOFR + 3.50%, 8.94% (i)
| | | 588,913 | | 589,069 |
Mister Car Wash Holdings, Inc., 2024 Term Loan B, 1 mo. USD Term SOFR + 3.00%, 8.34%, 3/27/2031 (b)
| | | 50,000 | | 50,209 |
| | | | | | 722,631 |
| DIVERSIFIED FINANCIAL SERVICES — 0.1% | | | | | |
AllSpring Buyer LLC, Term Loan B, 3 mo. USD Term SOFR + 3.25%, 8.89%, 11/1/2028 (b)
| | | 386,931 | | 386,585 |
Assetmark Financial Holdings, Inc., 2024 Term Loan (i)
| | | 105,000 | | 105,197 |
Astra Acquisition Corp., 2021 2nd Lien Term Loan, 3 mo. USD Term SOFR + 8.88%, 14.47%, 10/25/2029 (b)
| | | 124,962 | | 32,920 |
Castlelake Aviation Ltd., Term Loan B, 3 mo. USD Term SOFR + 2.50%, 7.84%, 10/22/2026 (b)
| | | 335,063 | | 336,028 |
CPI Holdco B LLC, Term Loan, 1 mo. USD Term SOFR + 2.00%, 7.34%, 5/17/2031 (b)
| | | 80,000 | | 80,013 |
Deerfield Dakota Holding LLC, 2020 USD Term Loan B, 3 mo. USD Term SOFR + 3.75%, 9.08%, 4/9/2027 (b)
| | | 345,162 | | 345,417 |
| Security Description | | | Principal
Amount | | Value |
| Edelman Financial Center LLC: | | | | | |
2024 2nd Lien Term Loan, 1 mo. USD Term SOFR + 5.25%, 10.59%, 10/6/2028 (b)
| | | $115,000 | | $115,431 |
2024 Term Loan B, 3 mo. USD Term SOFR + 3.25%, 8.59%, 4/7/2028 (b)
| | | 489,895 | | 491,159 |
Eisner Advisory Group LLC, 2024 Term Loan B, 1 mo. USD Term SOFR + 4.00%, 9.34%, 2/28/2031 (b)
| | | 199,000 | | 201,198 |
Focus Financial Partners LLC, 2021 Term Loan B4, 1 mo. USD Term SOFR + 2.50%, 7.85%, 6/30/2028 (b)
| | | 445,408 | | 445,513 |
Greystone Select Financial LLC, Term Loan B, 3 mo. USD Term SOFR + 5.00%, 10.59%, 6/16/2028 (b)
| | | 86,400 | | 86,184 |
Hightower Holding LLC, 2021 Term Loan B, 3 mo. USD Term SOFR + 4.00%, 9.59%, 4/21/2028 (b)
| | | 344,482 | | 345,720 |
Walker & Dunlop, Inc., 2021 Term Loan, 1 mo. USD Term SOFR + 2.25%, 7.69%, 12/16/2028 (b)
| | | 112,125 | | 112,125 |
| | | | | | 3,083,490 |
| DIVERSIFIED TELECOMMUNICATION SERVICES — 0.0% (e) | | | | | |
Altice France SA, 2023 USD Term Loan B14, 3 mo. USD Term SOFR + 5.50%, 10.83%, 8/15/2028 (b)
| | | 228,149 | | 168,260 |
Connect Finco Sarl, 2024 Non-Extended Term Loan B, 1 mo. USD Term SOFR + 3.50%, 8.84%, 12/11/2026 (b)
| | | 61,681 | | 61,064 |
Cyxtera DC Holdings, Inc., Term Loan B (b)
| | | 102,389 | | 2,048 |
Frontier Communications Corp., 2024 Term Loan B (i)
| | | 245,000 | | 245,000 |
| Level 3 Financing, Inc.: | | | | | |
2024 Extended Term Loan B1, 1 mo. USD Term SOFR + 6.56%, 11.90%, 4/15/2029 (b)
| | | 48,965 | | 48,054 |
2024 Extended Term Loan B2, 1 mo. USD Term SOFR + 6.56%, 11.90%, 4/15/2030 (b)
| | | 48,965 | | 47,790 |
See accompanying notes to financial statements.
78
SPDR DOUBLELINE TOTAL RETURN TACTICAL ETF
SCHEDULE OF INVESTMENTS (continued)
June 30, 2024
| Security Description | | | Principal
Amount | | Value |
Telesat LLC, Term Loan B5, 3 mo. USD Term SOFR + 2.75%, 8.36%, 12/7/2026 (b)
| | | $47,573 | | $22,464 |
| | | | | | 594,680 |
| ELECTRIC — 0.0% (e) | | | | | |
Hamilton Projects Acquiror LLC, 2024 Term Loan B, 3 mo. USD Term SOFR + 3.75%, 9.09%, 5/22/2031 (b)
| | | 60,000 | | 60,461 |
| ELECTRICAL EQUIPMENT — 0.0% (e) | | | | | |
Gates Global LLC, 2022 Term Loan B4, 1 mo. USD Term SOFR + 2.25%, 7.59%, 11/16/2029 (b)
| | | 58,950 | | 59,124 |
| ELECTRONIC EQUIPMENT, INSTRUMENTS & COMPONENTS — 0.0% (e) | | | | | |
Compass Power Generation LLC, 2022 Term Loan B2, 1 mo. USD Term SOFR + 4.25%, 9.71%, 4/14/2029 (b)
| | | 192,397 | | 194,171 |
| ELECTRONICS — 0.0% (e) | | | | | |
II-VI, Inc., 2024 Term Loan B, 1 mo. USD Term SOFR + 2.50%, 7.84%, 7/2/2029 (b)
| | | 39,161 | | 39,239 |
Mirion Technologies, Inc., 2024 Term Loan, 3 mo. USD Term SOFR + 2.25%, 7.58%, 10/20/2028 (b)
| | | 150,000 | | 150,399 |
| | | | | | 189,638 |
| ENERGY-ALTERNATE SOURCES — 0.0% (e) | | | | | |
Vistra Zero Operating Co. LLC, Term Loan B, 1 mo. USD Term SOFR + 2.75%, 8.09%, 4/30/2031 (b)
| | | 94,762 | | 95,319 |
| ENTERTAINMENT — 0.1% | | | | | |
Bally's Corp., 2021 Term Loan B, 3 mo. USD Term SOFR + 3.25%, 8.84%, 10/2/2028 (b)
| | | 267,259 | | 254,425 |
Cedar Fair LP, 2024 Term Loan B, 1 mo. USD Term SOFR + 2.00%, 7.33%, 5/1/2031 (b)
| | | 85,000 | | 84,960 |
Fertitta Entertainment LLC, 2022 Term Loan B, 1 mo. USD Term SOFR + 3.75%, 9.08%, 1/27/2029 (b)
| | | 1,247,500 | | 1,250,382 |
Flutter Financing BV, Term Loan B, 3 mo. USD Term SOFR + 2.25%, 7.58%, 11/25/2030 (b)
| | | 74,625 | | 74,757 |
| Security Description | | | Principal
Amount | | Value |
Motion Finco SARL, 2024 USD Term Loan B, 3 mo. USD Term SOFR + 3.50%, 8.83%, 11/12/2029 (b)
| | | $329,175 | | $329,669 |
Ontario Gaming GTA LP, Term Loan B, 3 mo. USD Term SOFR + 4.25%, 9.58%, 8/1/2030 (b)
| | | 339,678 | | 341,747 |
OVG Business Services LLC, 2024 Term Loan B, 3 mo. USD Term SOFR + 3.00%, 8.35%, 6/14/2031 (b)
| | | 200,000 | | 199,876 |
PCI Gaming Authority, 2024 Term Loan (i)
| | | 100,000 | | 99,950 |
SMG U.S. Midco 2, Inc., 2020 Term Loan, 3 mo. USD Term SOFR + 2.50%, 7.82%, 1/23/2025 (b)
| | | 339,868 | | 340,040 |
| | | | | | 2,975,806 |
| FOOD PRODUCTS — 0.0% (e) | | | | | |
CHG PPC Parent LLC, 2021 Term Loan, 1 mo. USD Term SOFR + 3.00%, 8.46%, 12/8/2028 (b)
| | | 306,820 | | 307,780 |
| FOOD-MISC/DIVERSIFIED — 0.0% (e) | | | | | |
H-Food Holdings LLC, 2018 Term Loan B, 3 mo. USD Term SOFR + 3.69%, 9.30%, 5/23/2025 (b)
| | | 78,530 | | 57,793 |
| FORESTRY — 0.0% (e) | | | | | |
Asplundh Tree Expert LLC, 2024 Incremental Term Loan B, 3 mo. USD Term SOFR + 1.75%, 7.10%, 5/23/2031 (b)
| | | 310,000 | | 310,155 |
| HEALTH CARE EQUIPMENT & SUPPLIES — 0.1% | | | | | |
| Bausch & Lomb Corp.: | | | | | |
2023 Incremental Term Loan, 1 mo. USD Term SOFR + 4.00%, 9.34%, 9/29/2028 (b)
| | | 143,913 | | 143,823 |
Term Loan, 1 mo. USD Term SOFR + 3.25%, 8.69%, 5/10/2027 (b)
| | | 1,041,350 | | 1,031,588 |
Gainwell Acquisition Corp., Term Loan B, 3 mo. USD Term SOFR + 4.00%, 9.43%, 10/1/2027 (b)
| | | 444,359 | | 431,397 |
Maravai Intermediate Holdings LLC, 2022 Term Loan B, 3 mo. USD Term SOFR + 3.00%, 8.33%, 10/19/2027 (b)
| | | 168,274 | | 166,591 |
See accompanying notes to financial statements.
79
SPDR DOUBLELINE TOTAL RETURN TACTICAL ETF
SCHEDULE OF INVESTMENTS (continued)
June 30, 2024
| Security Description | | | Principal
Amount | | Value |
| Medline Borrower LP: | | | | | |
2024 Term Loan B, 1 mo. USD Term SOFR + 2.75%, 8.09%, 10/23/2028 (b)
| | | $277,530 | | $278,397 |
2024 USD Add-on Term Loan B (i)
| | | 85,000 | | 85,106 |
Sotera Health Holdings LLC, 2024 Term Loan B, 1 mo. USD Term SOFR + 3.25%, 8.59%, 5/30/2031 (b)
| | | 575,000 | | 574,762 |
| | | | | | 2,711,664 |
| HEALTH CARE PROVIDERS & SERVICES — 0.1% | | | | | |
| ADMI Corp.: | | | | | |
2021 Incremental Term Loan B3, 1 mo. USD Term SOFR + 3.75%, 9.21%, 12/23/2027 (b)
| | | 143,524 | | 140,923 |
2023 Term Loan B5, 1 mo. USD Term SOFR + 5.75%, 11.09%, 12/23/2027 (b)
| | | 199,000 | | 200,658 |
| Aveanna Healthcare LLC: | | | | | |
2021 2nd Lien Term Loan, 3 mo. USD Term SOFR + 7.00%, 12.50%, 12/10/2029 (b)
| | | 82,260 | | 75,988 |
2021 Term Loan B, 3 mo. USD Term SOFR + 3.75%, 9.20%, 7/17/2028 (b)
| | | 199,008 | | 191,048 |
CHG Healthcare Services, Inc., 2021 Term Loan, 1 mo. USD Term SOFR + 3.25%, 8.69%, 9/29/2028 (b)
| | | 329,753 | | 330,645 |
Concentra Health Services, Inc., Term Loan B (i)
| | | 130,000 | | 130,650 |
Fortrea Holdings, Inc., Term Loan B, 1 wk. USD Term SOFR + 3.75%, 9.09%, 7/1/2030 (b)
| | | 13,799 | | 13,816 |
| LifePoint Health, Inc.: | | | | | |
2024 Incremental Term Loan B, 3 mo. USD Term SOFR + 4.00%, 9.33%, 5/17/2031 (b)
| | | 45,000 | | 45,120 |
2024 Term Loan B, 3 mo. USD Term SOFR + 4.75%, 10.06%, 11/16/2028 (b)
| | | 394,012 | | 396,648 |
Pacific Dental Services LLC, 2024 Term Loan B, 1 mo. USD Term SOFR + 3.25%, 8.58%, 3/15/2031 (b)
| | | 204,488 | | 205,148 |
Radiology Partners, Inc., 2024 Extended Term Loan B, 3 mo. USD Term SOFR + 3.50%, 9.09% (i)
| | | 246,995 | | 234,892 |
| Security Description | | | Principal
Amount | | Value |
Radnet Management, Inc., 2024 Term Loan B, 3 mo. USD Term SOFR + 2.50%, 7.83%, 4/18/2031 (b)
| | | $75,000 | | $75,141 |
Team Health Holdings, Inc., 2022 Term Loan B, 1 mo. USD Term SOFR + 5.25%, 10.59%, 3/2/2027 (b)
| | | 84,036 | | 78,532 |
| | | | | | 2,119,209 |
| HOME FURNISHINGS — 0.0% (e) | | | | | |
AI Aqua Merger Sub, Inc., 2021 1st Lien Term Loan B, 1 mo. USD Term SOFR + 4.00%, 9.33%, 7/31/2028 (b)
| | | 409,073 | | 410,264 |
| HOTELS, RESTAURANTS & LEISURE — 0.1% (e) | | | | | |
1011778 B.C. Unlimited Liability Co., 2024 Term Loan B6, 3 mo. USD Term SOFR + 1.75%, 7.09%, 9/20/2030 (b)
| | | 120,000 | | 119,848 |
| Caesars Entertainment, Inc.: | | | | | |
2024 Term Loan B1, 3 mo. USD Term SOFR + 2.75%, 8.10%, 2/6/2031 (b)
| | | 249,375 | | 249,881 |
Term Loan B, 3 mo. USD Term SOFR + 2.75%, 8.10%, 2/6/2030 (b)
| | | 61,588 | | 61,708 |
Peraton Corp., Term Loan B, 1 mo. USD Term SOFR + 3.75%, 9.19%, 2/1/2028 (b)
| | | 211,204 | | 211,484 |
Playa Resorts Holding BV, 2022 Term Loan B, 1 mo. USD Term SOFR + 3.25%, 8.09%, 1/5/2029 (b)
| | | 315,806 | | 316,379 |
Travelport Finance Luxembourg SARL, 2020 Super Priority Term Loan, 3 mo. USD Term SOFR + 8.00%, 13.56%, 9/30/2028 (b)
| | | 153,188 | | 139,505 |
Wyndham Hotels & Resorts, Inc., 2024 Term Loan, 1 mo. USD Term SOFR + 1.75%, 7.09%, 5/24/2030 (b)
| | | 325,000 | | 325,790 |
| | | | | | 1,424,595 |
| HOUSEHOLD DURABLES — 0.0% (e) | | | | | |
Springs Windows Fashions LLC, 2021 Term Loan B, 1 mo. USD Term SOFR + 4.00%, 9.46%, 10/6/2028 (b)
| | | 129,941 | | 111,588 |
See accompanying notes to financial statements.
80
SPDR DOUBLELINE TOTAL RETURN TACTICAL ETF
SCHEDULE OF INVESTMENTS (continued)
June 30, 2024
| Security Description | | | Principal
Amount | | Value |
| HOUSEHOLD PRODUCTS — 0.0% (e) | | | | | |
Energizer Holdings, Inc., 2024 Term Loan B, 1 mo. USD Term SOFR + 2.00%, 7.34%, 12/22/2027 (b)
| | | $123,810 | | $124,274 |
| INDEPENDENT POWER PRODUCERS & ENERGY TRADERS — 0.0% (e) | | | | | |
NRG Energy, Inc., 2024 Term Loan, 1 mo. USD Term SOFR + 2.00%, 7.34%, 4/16/2031 (b)
| | | 134,662 | | 134,848 |
Vistra Operations Co. LLC, 1st Lien Term Loan B3, 1 mo. USD Term SOFR + 2.00%, 7.34%, 12/20/2030 (b)
| | | 69,650 | | 69,784 |
| | | | | | 204,632 |
| INSURANCE — 0.1% | | | | | |
| Acrisure LLC: | | | | | |
2020 Term Loan B, 1 mo. USD LIBOR + 3.50%, 8.96%, 2/15/2027 (b)
| | | 240,493 | | 240,743 |
2021 First Lien Term Loan B, 1 mo. USD LIBOR + 4.25%, 9.71%, 2/15/2027 (b)
| | | 136,850 | | 137,364 |
2024 Term Loan B6, 3 mo. USD Term SOFR + 3.25%, 8.59% (i)
| | | 373,591 | | 373,593 |
Alliant Holdings Intermediate LLC, 2023 Term Loan B6, 1 mo. USD Term SOFR + 3.50%, 8.83%, 11/6/2030 (b)
| | | 297,750 | | 298,819 |
AmWINS Group, Inc., 2021 Term Loan B, 1 mo. USD Term SOFR + 2.25%, 7.59%, 2/19/2028 (b)
| | | 54,858 | | 54,879 |
Ardonagh Midco 3 PLC, 2024 USD Term Loan B , 2/17/2031
| | | 295,000 | | 294,816 |
AssuredPartners, Inc., 2024 Incremental Term Loan B5, 1 mo. USD Term SOFR + 3.50%, 8.84%, 2/14/2031 (b)
| | | 324,187 | | 325,403 |
BroadStreet Partners, Inc., 2024 Term Loan B4, 1 mo. USD Term SOFR + 3.25%, 8.59% (i)
| | | 155,000 | | 154,767 |
Cross Financial Corp., 2024 Term Loan B2, 1 mo. USD Term SOFR + 3.50%, 8.84%, 9/15/2027 (b)
| | | 183,596 | | 184,514 |
| Security Description | | | Principal
Amount | | Value |
| OneDigital Borrower LLC: | | | | | |
2021 Term Loan, 1 mo. USD Term SOFR + 4.25%, 9.69%, 11/16/2027 (b)
| | | $327,353 | | $326,944 |
2024 2nd Lien Term Loan (i)
| | | 135,000 | | 134,663 |
2024 Term Loan (i)
| | | 415,000 | | 414,483 |
Sedgwick Claims Management Services, Inc., 2023 Term Loan B, 1 mo. USD Term SOFR + 3.75%, 9.09%, 6/27/2031 (b)
| | | 345,000 | | 345,431 |
| | | | | | 3,286,419 |
| INTERNET & CATALOG RETAIL — 0.0% (e) | | | | | |
Harbor Freight Tools USA, Inc., 2024 Term Loan B , 6/5/2031 (b)
| | | 160,000 | | 159,737 |
| INTERNET & TELECOM — 0.1% | | | | | |
CNT Holdings I Corp., 2020 Term Loan, 3 mo. USD Term SOFR + 3.50%, 8.83%, 11/8/2027 (b)
| | | 131,877 | | 132,353 |
Endure Digital, Inc., Term Loan, 1 mo. USD Term SOFR + 3.50%, 8.94%, 2/10/2028 (b)
| | | 189,637 | | 176,600 |
I-Logic Technologies Bidco Ltd., 2021 USD Term Loan B, 3 mo. USD Term SOFR + 4.00%, 9.48%, 2/16/2028 (b)
| | | 272,500 | | 272,896 |
ION Trading Technologies SARL, 2024 Term Loan, 3 mo. USD Term SOFR + 4.00%, 9.35%, 4/1/2028 (b)
| | | 90,890 | | 90,909 |
Proofpoint, Inc., 2024 Term Loan, 1 mo. USD Term SOFR + 3.00%, 8.34%, 8/31/2028 (b)
| | | 329,904 | | 330,585 |
PUG LLC, 2024 Extended Term Loan B, 1 mo. USD Term SOFR + 4.75%, 10.09%, 3/15/2030 (b)
| | | 206,891 | | 207,215 |
| | | | | | 1,210,558 |
| INVESTMENT COMPANIES — 0.0% (e) | | | | | |
Wec U.S. Holdings Ltd., 2024 Term Loan, 1 mo. USD Term SOFR + 2.75%, 8.09%, 1/27/2031 (b)
| | | 320,000 | | 320,670 |
| IT SERVICES — 0.0% (e) | | | | | |
Access CIG LLC, 2023 Term Loan, 3 mo. USD Term SOFR + 5.00%, 10.33%, 8/18/2028 (b)
| | | 337,450 | | 340,035 |
See accompanying notes to financial statements.
81
SPDR DOUBLELINE TOTAL RETURN TACTICAL ETF
SCHEDULE OF INVESTMENTS (continued)
June 30, 2024
| Security Description | | | Principal
Amount | | Value |
CoreLogic, Inc., Term Loan, 1 mo. USD Term SOFR + 3.50%, 8.96%, 6/2/2028 (b)
| | | $91,589 | | $90,379 |
| | | | | | 430,414 |
| LEISURE TIME — 0.0% (e) | | | | | |
| Alterra Mountain Co.: | | | | | |
2024 Term Loan B4, 1 mo. USD Term SOFR + 3.25%, 8.59%, 8/17/2028 (b)
| | | 265,632 | | 267,052 |
2024 Term Loan B5, 1 mo. USD Term SOFR + 3.50%, 8.84%, 5/31/2030 (b)
| | | 89,325 | | 89,925 |
| Carnival Corp.: | | | | | |
2024 Term Loan B1, 1 mo. USD Term SOFR + 2.75%, 8.09%, 10/18/2028 (b)
| | | 304,331 | | 305,520 |
2024 Term Loan B2, 1 mo. USD Term SOFR + 2.75%, 8.09%, 8/8/2027 (b)
| | | 57,228 | | 57,586 |
ClubCorp Holdings, Inc., 2023 Term Loan B2, 3 mo. USD Term SOFR + 5.26%, 10.60%, 9/18/2026 (b)
| | | 192,715 | | 193,967 |
LC Ahab U.S. Bidco LLC, Term Loan B, 1 mo. USD Term SOFR + 3.50%, 8.84%, 5/1/2031 (b)
| | | 195,000 | | 195,610 |
| | | | | | 1,109,660 |
| LIFE SCIENCES TOOLS & SERVICES — 0.0% (e) | | | | | |
Parexel International Corp., 2021 1st Lien Term Loan, 1 mo. USD Term SOFR + 3.25%, 8.71%, 11/15/2028 (b)
| | | 329,598 | | 330,680 |
| LODGING — 0.0% (e) | | | | | |
Hilton Domestic Operating Co., Inc., 2023 Term Loan B4, 1 mo. USD Term SOFR + 1.75%, 7.10%, 11/8/2030 (b)
| | | 15,000 | | 15,032 |
Hilton Grand Vacations Borrower LLC, 2024 Incremental Term Loan B, 1 mo. USD Term SOFR + 2.75%, 8.09%, 1/17/2031 (b)
| | | 154,612 | | 154,806 |
Station Casinos LLC, 2024 Term Loan B, 1 mo. USD Term SOFR + 2.25%, 7.59%, 3/14/2031 (b)
| | | 84,788 | | 84,852 |
| | | | | | 254,690 |
| Security Description | | | Principal
Amount | | Value |
| MACHINERY — 0.1% | | | | | |
Columbus McKinnon Corp., 2024 Term Loan, 3 mo. USD Term SOFR + 2.50%, 7.83%, 5/14/2028 (b)
| | | $26,483 | | $26,698 |
Crosby U.S. Acquisition Corp., 2024 Term Loan B, 1 mo. USD Term SOFR + 4.00%, 9.34%, 8/16/2029 (b)
| | | 79,600 | | 80,139 |
Eagle Parent Corp., 2022 Term Loan B, 3 mo. USD Term SOFR + 4.25%, 9.58%, 4/2/2029 (b)
| | | 333,473 | | 325,048 |
Madison IAQ LLC, Term Loan, 1 mo. USD Term SOFR + 2.75%, 8.09%, 6/21/2028 (b)
| | | 372,374 | | 373,180 |
Titan Acquisition Ltd., 2024 Term Loan B, 6 mo. USD Term SOFR + 5.00%, 10.33%, 2/15/2029 (b)
| | | 275,000 | | 275,975 |
TK Elevator U.S. Newco, Inc., USD Term Loan B, 3 mo. USD Term SOFR + 3.50%, 8.79%, 4/30/2030 (b)
| | | 368,152 | | 370,510 |
| | | | | | 1,451,550 |
| MEDIA — 0.1% | | | | | |
Cengage Learning, Inc., 2024 Term Loan B, 6 mo. USD Term SOFR + 4.25%, 9.54%, 3/22/2031 (b)
| | | 129,675 | | 130,202 |
CSC Holdings LLC, 2019 Term Loan B5, 1 mo. USD Term SOFR + 2.50%, 7.94%, 4/15/2027 (b)
| | | 253,018 | | 210,915 |
Directv Financing LLC, Term Loan, 1 mo. USD Term SOFR + 5.00%, 10.46%, 8/2/2027 (b)
| | | 126,603 | | 127,015 |
NEP Group, Inc., 2023 Term Loan B, 1 mo. USD Term SOFR + 3.25%, 1.50% (i)
| | | 244,137 | | 232,133 |
United Talent Agency LLC, 2024 Term Loan B, 1 mo. USD Term SOFR + 3.75%, 9.08%, 7/7/2028 (b)
| | | 84,788 | | 85,317 |
Univision Communications, Inc., 2022 First Lien Term Loan B, 3 mo. USD Term SOFR + 4.25%, 9.58%, 6/24/2029 (b)
| | | 177,400 | | 177,621 |
Virgin Media Bristol LLC, 2023 USD Term Loan Y, 6 mo. USD Term SOFR + 3.25%, 8.66%, 3/31/2031 (b)
| | | 385,000 | | 364,443 |
See accompanying notes to financial statements.
82
SPDR DOUBLELINE TOTAL RETURN TACTICAL ETF
SCHEDULE OF INVESTMENTS (continued)
June 30, 2024
| Security Description | | | Principal
Amount | | Value |
Ziggo Financing Partnership, USD Term Loan I, 1 mo. USD Term SOFR + 2.50%, 7.94%, 4/30/2028 (b)
| | | $190,000 | | $184,076 |
| | | | | | 1,511,722 |
| METAL FABRICATE & HARDWARE — 0.0% (e) | | | | | |
Tiger Acquisition LLC, 2021 Term Loan, 1 mo. USD Term SOFR + 3.25%, 8.69%, 6/1/2028 (b)
| | | 124,732 | | 123,904 |
| MORTGAGE REAL ESTATE INVESTMENT TRUSTS (REITs) — 0.0% (e) | | | | | |
Starwood Property Trust, Inc., 2021 Term Loan B3, 1 mo. USD Term SOFR + 3.25%, 8.69%, 7/26/2026 (b)
| | | 94,033 | | 94,503 |
| OIL, GAS & CONSUMABLE FUELS — 0.0% (e) | | | | | |
APRO LLC, 2024 Term Loan B (i)
| | | 220,000 | | 220,275 |
Pacific Gas & Electric Co., 2020 Term Loan B1, 1 mo. USD Term SOFR + 3.00%, 7.84%, 6/23/2027 (b)
| | | 75,000 | | 75,398 |
Par Petroleum LLC, 2024 Term Loan B, 3 mo. USD Term SOFR + 3.75%, 9.05%, 2/28/2030 (b)
| | | 49,375 | | 49,637 |
Waterbridge Midstream Operating LLC, 2024 1st Lien Term Loan B (i)
| | | 75,000 | | 74,625 |
| | | | | | 419,935 |
| PERSONAL PRODUCTS — 0.0% (e) | | | | | |
| Kronos Acquisition Holdings, Inc.: | | | | | |
2021 Term Loan B, 3 mo. USD Term SOFR + 3.75%, 9.36%, 12/22/2026 (b)
| | | 253,607 | | 253,702 |
2024 Term Loan (i)
| | | 95,000 | | 94,525 |
| | | | | | 348,227 |
| PHARMACEUTICALS — 0.1% | | | | | |
Curium BidCo SARL, 2024 USD Term Loan B, 3 mo. USD Term SOFR + 4.00%, 9.33%, 7/31/2029 (b)
| | | 237,605 | | 238,942 |
Grifols Worldwide Operations USA, Inc., 2019 USD Term Loan B, 1 mo. USD Term SOFR + 2.00%, 7.44%, 11/15/2027 (b)
| | | 194,273 | | 191,359 |
| Security Description | | | Principal
Amount | | Value |
Option Care Health, Inc., 2021 Term Loan B, 1 mo. USD Term SOFR + 2.25%, 7.59%, 10/27/2028 (b)
| | | $29,923 | | $30,160 |
Organon & Co., 2024 USD Term Loan B, 1 mo. USD Term SOFR + 2.50%, 7.83%, 5/19/2031 (b)
| | | 119,419 | | 119,643 |
Packaging Coordinators Midco, Inc., 2024 Term Loan B, 3 mo. USD Term SOFR + 3.25%, 8.58%, 11/30/2027 (b)
| | | 350,000 | | 351,605 |
Southern Veterinary Partners LLC, 2024 Term Loan, 1 mo. USD Term SOFR + 3.75%, 9.09%, 10/5/2027 (b)
| | | 445,099 | | 446,584 |
| | | | | | 1,378,293 |
| PIPELINES — 0.1% | | | | | |
BCP Renaissance Parent LLC, 2024 Term Loan B, 3 mo. USD Term SOFR + 3.25%, 8.60%, 10/31/2028 (b)
| | | 195,753 | | 196,456 |
Brazos Delaware II LLC, 2024 Term Loan B, 1 mo. USD Term SOFR + 3.50%, 8.84%, 2/11/2030 (b)
| | | 24,938 | | 25,069 |
Buckeye Partners LP, 2024 Term Loan B3, 1 mo. USD Term SOFR + 2.00%, 7.34%, 11/1/2026 (b)
| | | 104,295 | | 104,518 |
CQP Holdco LP, 2023 4th Amendment Term Loan, 3 mo. USD Term SOFR + 3.00%, 7.58%, 12/31/2030 (b)
| | | 254,362 | | 254,748 |
Freeport LNG Investments LLLP, Term Loan B, 3 mo. USD Term SOFR + 3.50%, 9.09%, 12/21/2028 (b)
| | | 163,861 | | 163,883 |
GIP II Blue Holding LP, Term Loan B, 1 mo. USD Term SOFR + 4.50%, 9.09%, 9/29/2028 (b)
| | | 86,844 | | 87,852 |
GIP Pilot Acquisition Partners LP, 2024 Term Loan B, 3 mo. USD Term SOFR + 2.50%, 7.83%, 10/4/2030 (b)
| | | 119,700 | | 119,999 |
Oryx Midstream Services Permian Basin LLC, 2024 Term Loan B, 1 mo. USD Term SOFR + 3.00%, 8.44%, 10/5/2028 (b)
| | | 258,700 | | 259,185 |
See accompanying notes to financial statements.
83
SPDR DOUBLELINE TOTAL RETURN TACTICAL ETF
SCHEDULE OF INVESTMENTS (continued)
June 30, 2024
| Security Description | | | Principal
Amount | | Value |
WaterBridge Midstream Operating LLC, 2024 Term Loan B, 3 mo. USD Term SOFR + 4.50%, 9.83%, 5/10/2029 (b)
| | | $110,000 | | $110,734 |
WhiteWater DBR HoldCo LLC, Term Loan B, 3 mo. USD Term SOFR + 2.75%, 8.08%, 3/3/2031 (b)
| | | 115,000 | | 115,378 |
| | | | | | 1,437,822 |
| PROFESSIONAL SERVICES — 0.0% (e) | | | | | |
Dun & Bradstreet Corp., 2024 Term Loan B, 3 mo. USD Term SOFR + 2.75%, 8.10%, 1/18/2029 (b)
| | | 168,353 | | 168,669 |
| REAL ESTATE INVESTMENT TRUSTS (REITs) — 0.0% (e) | | | | | |
Iron Mountain, Inc., 2023 Term Loan B, 1 mo. USD Term SOFR + 2.25%, 7.59%, 1/31/2031 (b)
| | | 164,175 | | 163,696 |
| RETAIL — 0.0% (e) | | | | | |
EG Group Ltd., 2023 USD Tranche C Term Loan B, 3 mo. USD Term SOFR + 5.50%, 11.07%, 2/7/2028 (b)
| | | 185,224 | | 183,295 |
LBM Acquisition LLC, 2024 Incremental Term Loan B, 3 mo. USD Term SOFR + 3.75%, 9.18%, 5/30/2031 (b)
| | | 248,102 | | 244,293 |
Restoration Hardware, Inc., Term Loan B, 1 mo. USD Term SOFR + 2.50%, 7.96%, 10/20/2028 (b)
| | | 124,520 | | 120,039 |
Whatabrands LLC, 2024 Term Loan B, 1 mo. USD Term SOFR + 2.75%, 8.10%, 8/3/2028 (b)
| | | 337,453 | | 337,919 |
White Cap Buyer LLC, 2024 Term Loan B, 1 mo. USD Term SOFR + 3.25%, 8.59% (i)
| | | 60,000 | | 60,171 |
| | | | | | 945,717 |
| SEMICONDUCTORS & SEMICONDUCTOR EQUIPMENT — 0.0% (e) | | | | | |
Ultra Clean Holdings, Inc., 2024 Term Loan B, 1 mo. USD Term SOFR + 3.50%, 8.84%, 2/28/2028 (b)
| | | 138,474 | | 139,109 |
| Security Description | | | Principal
Amount | | Value |
| SOFTWARE — 0.2% | | | | | |
| Applied Systems, Inc.: | | | | | |
2024 1st Lien Term Loan, 3 mo. USD Term SOFR + 3.50%, 8.83%, 2/24/2031 (b)
| | | $120,000 | | $121,030 |
2024 2nd Lien Term Loan, 3 mo. USD Term SOFR + 5.25%, 10.58%, 2/23/2032 (b)
| | | 85,000 | | 88,125 |
AthenaHealth Group, Inc., 2022 Term Loan B, 1 mo. USD Term SOFR + 3.25%, 8.59%, 2/15/2029 (b)
| | | 371,287 | | 370,533 |
Banff Merger Sub, Inc., 2023 USD Term Loan, 1 mo. USD Term SOFR + 4.25%, 9.34%, 12/29/2028 (b)
| | | 467,650 | | 469,193 |
Castle U.S. Holding Corp., USD Term Loan B, 3 mo. USD Term SOFR + 3.75%, 9.36%, 1/29/2027 (b)
| | | 76,753 | | 48,115 |
Central Parent, Inc., 2024 Term Loan B, 3 mo. USD Term SOFR + 3.25%, 8.58%, 7/6/2029 (b)
| | | 698,612 | | 690,536 |
Constant Contact, Inc., Term Loan, 3 mo. USD Term SOFR + 4.00%, 9.56%, 2/10/2028 (b)
| | | 232,083 | | 228,940 |
Cornerstone OnDemand, Inc., 2021 Term Loan, 1 mo. USD Term SOFR + 3.75%, 9.21%, 10/16/2028 (b)
| | | 165,270 | | 156,455 |
Cotiviti Corp., 2024 Term Loan, 1 mo. USD Term SOFR + 3.25%, 8.58%, 5/1/2031 (b)
| | | 289,275 | | 288,552 |
| DCert Buyer, Inc.: | | | | | |
2019 Term loan B, 1 mo. USD Term SOFR + 4.00%, 9.34%, 10/16/2026 (b)
| | | 218,386 | | 213,336 |
2021 2nd Lien Term Loan, 1 mo. USD Term SOFR + 7.00%, 12.34%, 2/19/2029 (b)
| | | 55,000 | | 49,362 |
Epicor Software Corp., 2024 Term Loan, 1 mo. USD Term SOFR + 3.25%, 8.58%, 5/23/2031 (b)
| | | 85,024 | | 85,485 |
First Advantage Holdings LLC, 2021 Term Loan B, 1 mo. USD Term SOFR + 2.75%, 8.21%, 1/31/2027 (b)
| | | 275,667 | | 276,068 |
Helios Software Holdings, Inc., 2024 Term Loan, 3 mo. USD Term SOFR + 3.75%, 9.08%, 7/18/2030 (b)
| | | 233,564 | | 234,482 |
See accompanying notes to financial statements.
84
SPDR DOUBLELINE TOTAL RETURN TACTICAL ETF
SCHEDULE OF INVESTMENTS (continued)
June 30, 2024
| Security Description | | | Principal
Amount | | Value |
Informatica LLC, 2024 Term Loan B, 1 mo. USD Term SOFR + 2.25%, 7.59%, 10/27/2028 (b)
| | | $269,311 | | $270,489 |
Ivanti Software, Inc., 2021 Term Loan B, 3 mo. USD Term SOFR + 4.25%, 9.81%, 12/1/2027 (b)
| | | 71,404 | | 56,973 |
| McAfee LLC: | | | | | |
2022 USD Term Loan B, 1 mo. USD Term SOFR + 3.75%, 8.58%, 3/1/2029 (b)
| | | 271,011 | | 271,074 |
2024 USD Term Loan B, 1 mo. USD Term SOFR + 3.25%, 8.58%, 3/1/2029 (b)
| | | 20,000 | | 20,005 |
MedAssets Software Intermediate Holdings, Inc., 2021 Term Loan, 1 mo. USD Term SOFR + 4.00%, 9.61%, 12/18/2028 (b)
| | | 110,671 | | 90,612 |
| Mitchell International, Inc.: | | | | | |
2024 1st Lien Term Loan, 1 mo. USD Term SOFR + 3.25%, 8.59%, 6/17/2031 (b)
| | | 590,000 | | 585,717 |
2024 2nd Lien Term Loan, 3 mo. USD Term SOFR + 5.25%, 10.59% (i)
| | | 130,000 | | 129,919 |
Modena Buyer LLC, Term Loan (i)
| | | 170,000 | | 166,149 |
PointClickCare Technologies, Inc., 2024 Term Loan B, 2 mo. USD Term SOFR + 3.00%, 8.33%, 12/29/2027 (b)
| | | 140,650 | | 141,529 |
Polaris Newco LLC, USD Term Loan B, 3 mo. USD Term SOFR + 4.00%, 9.59%, 6/2/2028 (b)
| | | 200,323 | | 200,482 |
Sophia LP, 2024 Term Loan B, 1 mo. USD Term SOFR + 3.50%, 8.94%, 10/9/2029 (b)
| | | 409,263 | | 411,609 |
SS&C Technologies, Inc., 2024 Term Loan B8, 1 mo. USD Term SOFR + 2.00%, 7.34%, 5/9/2031 (b)
| | | 188,310 | | 188,798 |
UKG, Inc., 2024 Term Loan B, 1 mo. USD Term SOFR + 3.25%, 8.58%, 2/10/2031 (b)
| | | 540,000 | | 542,654 |
| | | | | | 6,396,222 |
| SPECIALTY RETAIL — 0.0% (e) | | | | | |
Great Outdoors Group LLC, 2021 Term Loan B1, 1 mo. USD Term SOFR + 3.75%, 9.21%, 3/6/2028 (b)
| | | 341,517 | | 341,661 |
| Security Description | | | Principal
Amount | | Value |
Michaels Cos., Inc., 2021 Term Loan B, 3 mo. USD Term SOFR + 4.25%, 9.85%, 4/15/2028 (b)
| | | $132,221 | | $119,179 |
PetSmart, Inc., 2021 Term Loan B, 1 mo. USD Term SOFR + 3.75%, 9.19%, 2/11/2028 (b)
| | | 341,115 | | 340,546 |
Rent-A-Center, Inc., 2021 First Lien Term Loan B, 1 mo. USD Term SOFR + 2.75%, 8.09%, 2/17/2028 (b)
| | | 156,376 | | 157,125 |
| | | | | | 958,511 |
| TELECOMMUNICATION EQUIP — 0.0% (e) | | | | | |
GOGO Intermediate Holdings LLC, Term Loan B, 1 mo. USD Term SOFR + 3.75%, 9.21%, 4/30/2028 (b)
| | | 142,334 | | 142,116 |
| TRANSPORT-SERVICES — 0.0% (e) | | | | | |
Echo Global Logistics, Inc., Term Loan, 1 mo. USD Term SOFR + 3.75%, 9.19%, 11/23/2028 (b)
| | | 121,398 | | 120,241 |
| Element Materials Technology Group U.S. Holdings, Inc.: | | | | | |
2022 USD Delayed Draw Term Loan, 3 mo. USD Term SOFR + 4.25%, 9.68%, 7/6/2029 (b)
| | | 40,437 | | 40,647 |
2022 USD Term Loan, 3 mo. USD Term SOFR + 4.25%, 9.68%, 7/6/2029 (b)
| | | 87,613 | | 88,070 |
Everi Holdings, Inc., 2021 Term Loan B, 1 mo. USD Term SOFR + 2.50%, 7.96%, 8/3/2028 (b)
| | | 111,263 | | 111,687 |
Kenan Advantage Group, Inc., 2024 Term Loan B3, 1 mo. USD Term SOFR + 3.75%, 9.09%, 1/25/2029 (b)
| | | 214,462 | | 215,803 |
| LaserShip, Inc.: | | | | | |
2021 2nd Lien Term Loan, 3 mo. USD Term SOFR + 7.50%, 13.10%, 5/7/2029 (b)
| | | 40,000 | | 29,216 |
2021 Term Loan, 3 mo. USD Term SOFR + 4.50%, 10.10%, 5/7/2028 (b)
| | | 66,215 | | 56,605 |
| | | | | | 662,269 |
TOTAL SENIOR FLOATING RATE LOANS
(Cost $57,065,617)
| | | | | 56,713,227 |
See accompanying notes to financial statements.
85
SPDR DOUBLELINE TOTAL RETURN TACTICAL ETF
SCHEDULE OF INVESTMENTS (continued)
June 30, 2024
| Security Description | | | Shares | | Value |
| WARRANTS — 0.0% (e) | | | | | |
| SINGAPORE — 0.0% (e) | | | | | |
Avation PLC (expiring 10/31/26) (h)
(Cost $0)
| | | 4,550 | | $1,582 |
| | | Principal
Amount | |
| U.S. GOVERNMENT AGENCY OBLIGATIONS — 29.0% | | | |
| Federal Home Loan Mortgage Corp.: | | | |
2.00%, 2/1/2052
| | $24,371,793 | 19,164,451 |
30 day USD SOFR Average - 2.15%, 2.14%, 12/1/2051 (b)
| | 11,014,503 | 9,615,900 |
30 day USD SOFR Average + 2.14%, 2.22%, 7/1/2051 (b)
| | 11,468,495 | 9,978,606 |
3.00%, 6/1/2042
| | 9,788,612 | 8,703,416 |
3.00%, 11/1/2042
| | 5,468,462 | 4,857,925 |
3.00%, 12/1/2042
| | 4,656,454 | 4,067,703 |
3.00%, 1/1/2045
| | 628,526 | 551,368 |
3.00%, 4/1/2045
| | 9,029,480 | 7,921,017 |
3.00%, 8/1/2045
| | 4,915,392 | 4,310,358 |
3.00%, 12/1/2046
| | 15,005,426 | 13,158,447 |
3.00%, 7/1/2047
| | 1,746,381 | 1,525,573 |
3.00%, 10/1/2051
| | 14,375,263 | 12,412,344 |
3.00%, 3/1/2052
| | 5,542,861 | 4,720,732 |
3.50%, 2/1/2045
| | 688,818 | 625,778 |
3.50%, 4/1/2045
| | 10,893,166 | 9,812,998 |
3.50%, 6/1/2045
| | 5,441,180 | 4,891,282 |
3.50%, 10/1/2045
| | 5,622,346 | 5,054,139 |
3.50%, 2/1/2046
| | 2,870,214 | 2,589,576 |
4.00%, 4/1/2045
| | 12,597,760 | 11,864,800 |
4.00%, 4/1/2047
| | 7,502,233 | 6,980,651 |
4.00%, 7/1/2047
| | 1,867,056 | 1,737,543 |
4.00%, 7/1/2052
| | 12,906,360 | 11,820,512 |
4.19%, 7/1/2033
| | 16,202,000 | 15,315,580 |
4.30%, 1/1/2033
| | 10,000,000 | 9,561,103 |
4.50%, 6/1/2044
| | 676,523 | 655,018 |
4.80%, 1/1/2030
| | 17,395,000 | 17,178,828 |
5.50%, 4/1/2054
| | 13,354,122 | 13,337,699 |
6.00%, 3/1/2054
| | 15,445,099 | 15,540,402 |
| Federal Home Loan Mortgage Corp. REMICS: | | | |
Series 3852, Class NS, CMO, IO, REMIC, 5.89% - 30 day USD SOFR Average, 0.55%, 5/15/2041 (b)
| | 2,731,711 | 226,511 |
Series 3889, Class VZ, CMO, REMIC, 4.00%, 7/15/2041
| | 1,867,275 | 1,747,790 |
| Security Description | | | Principal
Amount | | Value |
Series 3935, Class SJ, CMO, IO, REMIC, 6.54% - 30 day USD SOFR Average, 1.20%, 5/15/2041 (b)
| | | $299,527 | | $3,674 |
Series 4165, Class ZT, CMO, REMIC, 3.00%, 2/15/2043
| | | 4,548,596 | | 3,601,098 |
Series 4364, Class ZX, CMO, REMIC, 4.00%, 7/15/2044
| | | 25,481,534 | | 23,925,158 |
Series 4444, Class CZ, CMO, REMIC, 3.00%, 2/15/2045
| | | 14,549,343 | | 12,391,651 |
Series 4471, Class BA, CMO, REMIC, 3.00%, 12/15/2041
| | | 424,188 | | 412,933 |
Series 4492, Class GZ, CMO, REMIC, 3.50%, 7/15/2045
| | | 6,839,773 | | 6,202,377 |
Series 4504, Class CA, CMO, REMIC, 3.00%, 4/15/2044
| | | 2,588,042 | | 2,437,600 |
Series 4533, Class AB, CMO, REMIC, 3.00%, 6/15/2044
| | | 2,391,561 | | 2,225,878 |
Series 4543, Class HG, CMO, REMIC, 2.70%, 4/15/2044
| | | 4,332,245 | | 4,036,580 |
Series 4792, Class A, CMO, REMIC, 3.00%, 5/15/2048
| | | 2,623,422 | | 2,286,811 |
Series 4998, Class KF, 30 day USD SOFR Average + 0.35%, 5.69%, 8/25/2050 (b)
| | | 6,602,940 | | 6,348,569 |
Series 5130, Class SD, CMO, IO, 2.60% - 30 day USD SOFR Average, Floor 0.00%, 0.00%, 8/25/2051 (b)
| | | 72,680,734 | | 488,640 |
Series 5243, Class IB, 3.00%, 1/25/2051
| | | 16,283,065 | | 2,767,160 |
| Federal Home Loan Mortgage Corp. STACR REMICS Trust: | | | | | |
Series 2021-HQA4, Class M2, CMO, 30 day USD SOFR Average + 2.35%, 7.69%, 12/25/2041 (a) (b)
| | | 5,000,000 | | 5,058,215 |
Series 2022-DNA2, Class M2, 30 day USD SOFR Average + 3.75%, 9.09%, 2/25/2042 (a) (b)
| | | 9,500,000 | | 9,961,414 |
Series 2022-DNA3, Class M1B, 30 day USD SOFR Average + 2.90%, 8.24%, 4/25/2042 (a) (b)
| | | 20,000,000 | | 20,778,265 |
See accompanying notes to financial statements.
86
SPDR DOUBLELINE TOTAL RETURN TACTICAL ETF
SCHEDULE OF INVESTMENTS (continued)
June 30, 2024
| Security Description | | | Principal
Amount | | Value |
Federal Home Loan Mortgage Corp. STRIPS Series 326, Class 300, CMO, 3.00%, 3/15/2044
| | | $8,582,011 | | $7,531,229 |
| Federal National Mortgage Association: | | | | | |
1.91%, 12/1/2031
| | | 10,000,000 | | 8,194,600 |
1.98%, 10/1/2033
| | | 19,300,319 | | 15,479,256 |
2.50%, 9/1/2046
| | | 1,619,891 | | 1,347,218 |
2.50%, 2/1/2047
| | | 4,313,177 | | 3,650,942 |
2.50%, 6/1/2050
| | | 14,018,055 | | 11,705,360 |
2.50%, 11/1/2050
| | | 6,898,376 | | 5,749,623 |
2.50%, 3/1/2051
| | | 25,086,493 | | 20,957,435 |
2.80%, 11/1/2039
| | | 10,034,000 | | 7,746,549 |
3.00%, 10/1/2041
| | | 8,082,890 | | 7,060,908 |
3.00%, 3/1/2043
| | | 1,983,544 | | 1,752,557 |
3.00%, 7/1/2043
| | | 1,976,615 | | 1,730,564 |
3.00%, 1/1/2045
| | | 66,574 | | 57,559 |
3.00%, 4/1/2045
| | | 1,203,231 | | 1,038,745 |
3.00%, 7/1/2045
| | | 10,358,428 | | 9,152,173 |
3.00%, 10/1/2046
| | | 2,091,110 | | 1,826,715 |
3.00%, 2/1/2047
| | | 7,615,961 | | 6,653,017 |
3.00%, 11/1/2048
| | | 4,639,828 | | 4,053,179 |
3.00%, 10/1/2049
| | | 3,283,014 | | 2,785,439 |
3.00%, 11/1/2051
| | | 23,111,834 | | 19,896,269 |
3.00%, 4/1/2053
| | | 9,632,245 | | 8,171,352 |
3.50%, 12/1/2034
| | | 597,613 | | 565,935 |
3.50%, 2/1/2035
| | | 404,965 | | 383,204 |
3.50%, 1/1/2045
| | | 4,707,771 | | 4,231,261 |
3.50%, 2/1/2045
| | | 1,320,275 | | 1,198,206 |
3.50%, 6/1/2045
| | | 5,494,616 | | 4,932,342 |
3.50%, 11/1/2051
| | | 11,483,274 | | 10,244,416 |
3.88%, 10/1/2030
| | | 11,275,884 | | 10,739,048 |
4.00%, 6/1/2052
| | | 11,070,642 | | 10,130,055 |
4.00%, 12/1/2052
| | | 22,065,482 | | 20,287,198 |
4.10%, 8/1/2032
| | | 10,000,000 | | 9,458,324 |
4.33%, 12/1/2032
| | | 10,400,000 | | 9,972,134 |
4.50%, 3/1/2044
| | | 634,432 | | 613,525 |
4.50%, 6/1/2044
| | | 208,485 | | 201,601 |
4.50%, 7/1/2044
| | | 249,526 | | 241,286 |
4.50%, 2/1/2045
| | | 389,457 | | 376,622 |
30 day USD SOFR Average + 2.28%, 4.55%, 3/1/2053 (b)
| | | 18,871,239 | | 18,227,651 |
5.00%, 9/1/2052
| | | 8,081,384 | | 7,826,588 |
5.00%, 12/1/2052
| | | 10,811,170 | | 10,463,611 |
5.13%, 11/1/2032
| | | 13,371,000 | | 13,205,948 |
3.00%, 6/1/2051
| | | 13,956,429 | | 12,029,911 |
| Federal National Mortgage Association Connecticut Avenue Securities: | | | | | |
Series 2022-R02, Class 2M2, CMO, 30 day USD SOFR Average + 3.00%, 8.34%, 1/25/2042 (a) (b)
| | | 12,000,000 | | 12,331,948 |
| Security Description | | | Principal
Amount | | Value |
Series 2023-R02, Class 1M2, 30 day USD SOFR Average + 3.35%, 8.69%, 1/25/2043 (a) (b)
| | | $13,500,000 | | $14,275,855 |
| Federal National Mortgage Association REMICS: | | | | | |
Series 2010-109, Class N, CMO, REMIC, 3.00%, 10/25/2040
| | | 886,354 | | 821,066 |
Series 2011-51, Class CI, CMO, IO, REMIC, 5.89% - 30 day USD SOFR Average, 0.55%, 6/25/2041 (b)
| | | 1,730,285 | | 123,754 |
Series 2012-127, Class PA, CMO, REMIC, 2.75%, 11/25/2042
| | | 1,300,353 | | 1,186,051 |
Series 2012-148, Class VZ, 3.00%, 1/25/2043
| | | 31,370,666 | | 27,697,092 |
Series 2012-151, Class SB, CMO, REMIC, 5.83% - 1.5 * 30 day USD SOFR Average, Floor 0.00%, 0.00%, 1/25/2043 (b)
| | | 20,907 | | 10,816 |
Series 2013-114, Class HZ, CMO, REMIC, 3.00%, 11/25/2038
| | | 19,646,520 | | 17,848,088 |
Series 2013-18, Class CD, CMO, REMIC, 1.50%, 10/25/2027
| | | 278,014 | | 273,090 |
Series 2013-30, Class PS, CMO, REMIC, 5.83% - 1.5 * 30 day USD SOFR Average, Floor 0.00%, 0.00%, 4/25/2043 (b)
| | | 611,451 | | 384,829 |
Series 2014-21, Class GZ, CMO, REMIC, 3.00%, 4/25/2044
| | | 3,283,013 | | 2,866,150 |
Series 2014-39, Class ZA, CMO, REMIC, 3.00%, 7/25/2044
| | | 4,038,111 | | 3,524,538 |
Series 2016-32, Class LA, CMO, REMIC, 3.00%, 10/25/2044
| | | 2,924,708 | | 2,715,387 |
Series 2016-92, Class A, CMO, REMIC, 3.00%, 4/25/2042
| | | 2,572,626 | | 2,485,290 |
Series 2017-87, Class BA, CMO, REMIC, 3.00%, 12/25/2042
| | | 137,831 | | 136,974 |
Series 2020-1, Class LA, 4.00%, 2/25/2060
| | | 12,839,665 | | 10,609,016 |
Series 2020-47, Class GL, CMO, 2.00%, 5/25/2046
| | | 7,929,998 | | 6,785,885 |
Series 2021-29, Class BA, CMO, 1.25%, 5/25/2041
| | | 8,053,881 | | 6,945,796 |
See accompanying notes to financial statements.
87
SPDR DOUBLELINE TOTAL RETURN TACTICAL ETF
SCHEDULE OF INVESTMENTS (continued)
June 30, 2024
| Security Description | | | Principal
Amount | | Value |
Federal National Mortgage Association-ACES Series 2020-M12, 1.40%, 7/25/2029 (b)
| | | $98,090,240 | | $4,860,625 |
| Government National Mortgage Association: | | | | | |
2.50%, 3/20/2051
| | | 8,181,683 | | 6,811,999 |
3.00%, 2/20/2052
| | | 21,718,666 | | 18,693,063 |
Series 2021-143, IO, VRN, 0.97%, 10/16/2063 (b)
| | | 82,029,540 | | 4,986,015 |
Series 2021-40, IO, VRN, 0.82%, 2/16/2063 (b)
| | | 70,479,929 | | 3,874,781 |
Series 2021-57, Class AI, 2.00%, 2/20/2051
| | | 8,113,487 | | 903,891 |
Series 2021-60, IO, VRN, 0.83%, 5/16/2063 (b)
| | | 55,232,039 | | 3,062,450 |
Series 2021-79, IO, 0.88%, 8/16/2063 (b)
| | | 79,583,419 | | 4,704,556 |
Series 2021-80, IO, VRN, 0.90%, 12/16/2062 (b)
| | | 86,829,399 | | 5,193,983 |
Series 2021-85, IO, VRN, 0.68%, 3/16/2063 (b)
| | | 98,549,764 | | 5,039,622 |
Series 2021-99, IO, VRN, 0.59%, 5/16/2061 (b)
| | | 40,884,340 | | 1,882,340 |
Series 2022-91, 0.43%, 7/16/2064 (b)
| | | 80,591,477 | | 3,747,436 |
| Government National Mortgage Association REMICS: | | | | | |
Series 2013-34, Class PL, CMO, REMIC, 3.00%, 3/20/2042
| | | 771,627 | | 746,965 |
Series 2014-43, Class PS, CMO, IO, REMIC, 6.07% - 1 mo. USD Term SOFR, 0.73%, 7/20/2042 (b)
| | | 982,532 | | 14,436 |
Series 2020-116, Class HS, CMO, IO, 6.09% - 1 mo. USD Term SOFR, 0.75%, 8/20/2050 (b)
| | | 6,525,223 | | 756,802 |
Series 2020-173, Class SY, CMO, IO, 6.19% - 1 mo. USD Term SOFR, 0.85%, 11/20/2050 (b)
| | | 23,888,116 | | 2,946,472 |
Series 2020-173, Class TI, CMO, IO, 2.00%, 11/20/2050
| | | 29,470,181 | | 3,203,347 |
Series 2020-176, Class SL, CMO, IO, 4.89% - 1 mo. USD Term SOFR, Floor 0.00%, 0.00%, 11/20/2050 (b)
| | | 8,098,830 | | 548,386 |
Series 2020-185, Class SE, CMO, IO, 6.19% - 1 mo. USD Term SOFR, 0.85%, 12/20/2050 (b)
| | | 28,921,862 | | 3,501,496 |
Series 2021-1, Class IH, 2.50%, 1/20/2051
| | | 35,901,746 | | 4,975,450 |
| Security Description | | | Principal
Amount | | Value |
Series 2021-118, Class EI, 2.50%, 7/20/2051
| | | $14,362,303 | | $1,447,536 |
Series 2021-125, Class SN, CMO, IO, 4.09% - 1 mo. USD Term SOFR, Floor 0.00%, 0.00%, 1/20/2051 (b)
| | | 7,463,231 | | 239,420 |
Series 2021-137, Class IQ, 3.00%, 8/20/2051
| | | 19,900,484 | | 3,192,983 |
Series 2021-196, Class IM, 3.00%, 11/20/2051
| | | 26,413,103 | | 4,267,859 |
Series 2021-196, Class UI, IO, 3.00%, 11/20/2051
| | | 39,598,955 | | 5,976,425 |
Series 2021-30, Class KI, 3.00%, 2/20/2051
| | | 8,079,003 | | 1,205,995 |
Series 2021-44, Class IQ, 3.00%, 3/20/2051
| | | 14,922,893 | | 2,414,341 |
Series 2021-8, Class KX, 3.00%, 1/20/2051
| | | 10,397,931 | | 1,665,420 |
Series 2022-180, 2.50%, 6/20/2051
| | | 41,165,372 | | 5,585,050 |
Series 2022-61, Class EI, 3.00%, 7/20/2051
| | | 3,480,325 | | 562,309 |
Series 2024-79, Class CI, 3.50%, 2/20/2052
| | | 24,184,953 | | 4,146,396 |
TOTAL U.S. GOVERNMENT AGENCY OBLIGATIONS
(Cost $928,184,720)
| | | | | 846,903,102 |
| U.S. TREASURY OBLIGATIONS — 19.8% | | | | | |
| U.S. Treasury Notes: | | | | | |
0.38%, 4/30/2025
| | | 52,000,000 | | 49,982,969 |
0.38%, 11/30/2025
| | | 58,350,000 | | 54,735,035 |
0.63%, 8/15/2030
| | | 108,150,000 | | 86,672,086 |
0.75%, 5/31/2026
| | | 66,050,000 | | 61,256,215 |
0.75%, 1/31/2028
| | | 202,450,000 | | 177,744,773 |
0.88%, 9/30/2026
| | | 96,500,000 | | 88,817,696 |
0.88%, 11/15/2030
| | | 73,200,000 | | 59,211,938 |
TOTAL U.S. TREASURY OBLIGATIONS
(Cost $578,170,380)
| | | | | 578,420,712 |
| MORTGAGE-BACKED SECURITIES — 16.3% | | | | | |
American Home Mortgage Investment Trust Series 2007-1, Class GA1C, 1 mo. USD Term SOFR + 0.30%, 5.65%, 5/25/2047 (b)
| | | 5,017,803 | | 2,677,444 |
| Banc of America Funding Trust: | | | | | |
Series 2006-8T2, Class A4, CMO, 6.33%, 10/25/2036 (g)
| | | 1,547,272 | | 1,317,581 |
Series 2007-5, Class CA1, CMO, 6.00%, 7/25/2037
| | | 2,945,682 | | 2,359,131 |
See accompanying notes to financial statements.
88
SPDR DOUBLELINE TOTAL RETURN TACTICAL ETF
SCHEDULE OF INVESTMENTS (continued)
June 30, 2024
| Security Description | | | Principal
Amount | | Value |
| BBCMS Mortgage Trust: | | | | | |
Series 2022-C18, Class XD, 2.35%, 12/15/2055 (a) (b)
| | | $12,094,000 | | $1,771,210 |
Series 2023-C19, Class A5, 5.45%, 4/15/2056
| | | 1,700,000 | | 1,714,605 |
BCAP LLC Trust Series 2010-RR4, Class 3212, CMO, 5.81%, 1/26/2037 (a) (b)
| | | 5,158,290 | | 3,850,179 |
| BRAVO Residential Funding Trust: | | | | | |
Series 2022-NQM3, Class A1, 5.11%, 7/25/2062 (a) (b)
| | | 3,177,778 | | 3,153,317 |
Series 2023-NQM4, Class A1, 6.44%, 5/25/2063 (a) (g)
| | | 10,691,276 | | 10,703,557 |
BX Trust Series 2024-VLT4, Class A, 1 mo. USD Term SOFR + 1.49%, 6.81%, 7/15/2029 (a) (b)
| | | 1,169,000 | | 1,164,916 |
ChaseFlex Trust Series 2007-3, Class 1A2, CMO , IO, 1 mo. USD Term SOFR + 0.57%, 5.92%, 7/25/2037 (b)
| | | 7,681,722 | | 2,030,544 |
| CHL Mortgage Pass-Through Trust: | | | | | |
Series 2005-J2, Class 3A14, CMO, 5.50%, 8/25/2035
| | | 640,846 | | 480,070 |
Series 2007-10, Class A4, 5.50%, 7/25/2037
| | | 3,433,660 | | 1,508,246 |
Series 2007-12, Class A9, CMO, 5.75%, 8/25/2037
| | | 2,091,541 | | 1,202,939 |
Series 2007-3, Class A1, 6.00%, 4/25/2037
| | | 2,897,688 | | 1,458,679 |
Series 2007-HYB1, Class 2A1, CMO, 4.07%, 3/25/2037 (b)
| | | 913,874 | | 756,879 |
CIM Trust Series 2023-R4, Class A1, 5.00%, 5/25/2062 (a) (b)
| | | 8,790,857 | | 8,549,882 |
| Citigroup Mortgage Loan Trust, Inc.: | | | | | |
Series 2007-10, Class 2A2A, CMO, 4.56%, 9/25/2037 (b)
| | | 1,868,667 | | 1,464,210 |
Series 2007-AR4, Class 1A1A, CMO, 4.65%, 3/25/2037 (b)
| | | 1,098,915 | | 874,877 |
Series 2007-AR5, Class 1A2A, CMO, 4.89%, 4/25/2037 (b)
| | | 436,791 | | 377,646 |
Series 2021-JL1, Class A, 2.75%, 2/27/2062 (a) (b)
| | | 632,569 | | 596,874 |
| Security Description | | | Principal
Amount | | Value |
| CitiMortgage Alternative Loan Trust: | | | | | |
Series 2007-A1, Class 1A7, CMO, 6.00%, 1/25/2037
| | | $3,212,752 | | $2,678,714 |
Series 2007-A3, Class 1A4, 5.75%, 3/25/2037
| | | 2,579,744 | | 2,073,679 |
| COLT Mortgage Loan Trust: | | | | | |
Series 2022-2, Class A1, 2.99%, 2/25/2067 (a) (g)
| | | 14,608,172 | | 13,360,166 |
Series 2022-3, Class M1, 4.22%, 2/25/2067 (a) (b)
| | | 10,023,000 | | 8,548,183 |
Series 2023-1, Class A1, 6.05%, 4/25/2068 (a) (g)
| | | 7,851,829 | | 7,801,727 |
COMM Mortgage Trust Series 2014-CR18, Class B, 4.46%, 7/15/2047 (b)
| | | 1,829,000 | | 1,803,175 |
| Countrywide Alternative Loan Trust: | | | | | |
Series 2005-21CB, Class A3, CMO, 5.25%, 6/25/2035
| | | 1,475,046 | | 1,103,234 |
Series 2005-54CB, Class 1A1, 1 mo. USD Term SOFR + 0.76%, 5.50%, 11/25/2035 (b)
| | | 4,717,935 | | 3,391,938 |
Series 2005-79CB, Class A4, CMO, 5.50%, 1/25/2036
| | | 2,913,714 | | 1,657,676 |
Series 2006-24CB, Class A9, CMO, 6.00%, 8/25/2036
| | | 2,416,855 | | 1,312,182 |
Series 2006-43CB, Class 1A12, CMO, 5.75%, 2/25/2037
| | | 2,224,381 | | 1,134,897 |
Series 2006-OA2, Class A1, CMO, 1 mo. USD Term SOFR + 0.53%, 5.87%, 5/20/2046 (b)
| | | 1,566,755 | | 1,317,097 |
Series 2007-16CB, Class 2A1, 1 mo. USD Term SOFR + 0.56%, 5.91%, 8/25/2037 (b)
| | | 6,477,681 | | 2,332,573 |
CSMC Mortgage-Backed Trust Series 2006-7, Class 7A7, CMO, 6.00%, 8/25/2036
| | | 1,148,042 | | 1,013,705 |
| CSMC Trust: | | | | | |
Series 2021-JR2, Class A1, 2.22%, 11/25/2061 (a) (b)
| | | 4,276,810 | | 4,193,691 |
Series 2021-RPL9, Class A1, 2.44%, 2/25/2061 (a) (b)
| | | 4,560,494 | | 4,530,186 |
Series 2022-JR1, Class A1, 4.27%, 10/25/2066 (a) (g)
| | | 6,171,575 | | 6,092,194 |
Deephaven Residential Mortgage Trust Series 2022-2, Class A1, 4.30%, 3/25/2067 (a) (b)
| | | 4,107,431 | | 3,893,444 |
See accompanying notes to financial statements.
89
SPDR DOUBLELINE TOTAL RETURN TACTICAL ETF
SCHEDULE OF INVESTMENTS (continued)
June 30, 2024
| Security Description | | | Principal
Amount | | Value |
Deutsche Alt-A Securities, Inc. Mortgage Loan Trust Series 2007-AR3, Class 1A4, 1 mo. USD Term SOFR + 0.75%, 6.10%, 6/25/2037 (b)
| | | $2,904,366 | | $2,389,868 |
Ellington Financial Mortgage Trust Series 2022-3, Class A1, 5.00%, 8/25/2067 (a) (g)
| | | 5,219,254 | | 5,192,311 |
| Federal Home Loan Mortgage Corp. REMICS: | | | | | |
Series 4341, Class AZ, 3.00%, 5/15/2044
| | | 10,317,850 | | 8,990,906 |
Series 4432, Class JZ, 3.00%, 1/15/2045
| | | 4,110,520 | | 3,498,909 |
Series 4795, Class ZM, 3.50%, 6/15/2048
| | | 10,276,150 | | 9,136,456 |
Series 5164, Class J, 2.50%, 5/25/2049
| | | 19,915,702 | | 17,121,395 |
Series 5202, Class NV, 3.00%, 1/25/2037
| | | 7,349,083 | | 6,531,405 |
Series 5226, Class DL, 3.50%, 12/15/2045
| | | 10,784,002 | | 9,103,433 |
Series 5319, 0.00%, 8/25/2050
| | | 10,814,112 | | 7,722,013 |
| Federal Home Loan Mortgage Corp. Seasoned Credit Risk Transfer Trust: | | | | | |
Series 2019-4, Class MV, 3.00%, 2/25/2059
| | | 15,043,710 | | 12,691,942 |
Series 2020-2, Class MT, CMO, 2.00%, 11/25/2059
| | | 5,830,754 | | 4,606,800 |
Series 2020-3, Class MT, CMO, 2.00%, 5/25/2060
| | | 9,518,556 | | 7,535,120 |
| Federal National Mortgage Association REMICS: | | | | | |
Series 2010-152, Class DE, 4.50%, 1/25/2041
| | | 15,499,436 | | 15,020,328 |
Series 2013-110, Class CO, 0.00%, 12/25/2039
| | | 3,175,929 | | 2,445,570 |
Series 2013-110, Class DO, 0.00%, 11/25/2043
| | | 2,652,525 | | 1,990,313 |
Series 2017-90, Class WF, 30 day USD SOFR Average + 0.46%, 5.80%, 11/25/2047 (b)
| | | 7,068,004 | | 6,909,694 |
Series 2018-91, Class PB, 4.00%, 12/25/2048
| | | 6,434,400 | | 5,862,047 |
Series 2021-57, Class EA, 1.00%, 5/25/2046
| | | 6,359,026 | | 5,011,207 |
Series 2021-86, Class MA, 2.50%, 11/25/2047
| | | 10,580,395 | | 9,246,446 |
Series 2021-9, Class CA, 2.00%, 3/25/2051
| | | 11,232,363 | | 9,088,851 |
Series 2023-36, 2.50%, 10/25/2052
| | | 36,564,573 | | 5,185,795 |
Series 2023-43, Class HO, 0.00%, 8/25/2049
| | | 8,474,109 | | 6,114,279 |
| Security Description | | | Principal
Amount | | Value |
Federal National Mortgage Association-ACES Series 2022-M13, Class A1, 2.68%, 4/25/2032 (b)
| | | $20,932,125 | | $19,102,825 |
| First Horizon Alternative Mortgage Securities Trust: | | | | | |
Series 2007-FA4, Class 1A4, 6.25%, 8/25/2037
| | | 2,700,821 | | 1,061,681 |
Series 2007-FA4, Class 1A7, 6.00%, 8/25/2037
| | | 1,890,887 | | 717,257 |
| Government National Mortgage Association REMICS: | | | | | |
Series 2010-158, Class FA, 1 mo. USD Term SOFR + 0.56%, 5.90%, 12/20/2040 (b)
| | | 3,072,528 | | 3,037,061 |
Series 2016-99, Class LA, 2.00%, 11/20/2043
| | | 8,405,340 | | 6,929,978 |
Series 2018-42, Class ML, 3.50%, 3/20/2048
| | | 7,615,943 | | 6,857,481 |
Series 2018-91, Class FC, 1 mo. USD Term SOFR + 0.41%, 5.74%, 7/20/2048 (b)
| | | 2,817,714 | | 2,742,919 |
Series 2019-6, Class LA, 3.50%, 12/20/2048
| | | 5,669,308 | | 5,170,066 |
Series 2020-129, Class YI, 2.50%, 9/20/2050
| | | 10,071,500 | | 1,372,966 |
Series 2020-181, Class QI, 3.00%, 12/20/2050
| | | 7,782,653 | | 1,011,972 |
Series 2020-84, Class NT, 1.25%, 6/20/2050
| | | 4,283,362 | | 3,148,333 |
Series 2021-139, Class IP, 3.00%, 8/20/2051
| | | 24,110,194 | | 3,628,063 |
Series 2021-142, 3.00%, 8/20/2051
| | | 21,219,802 | | 3,423,343 |
GS Mortgage Securities Trust Series 2015-GS1, Class AS, 4.04%, 11/10/2048 (b)
| | | 1,958,000 | | 1,845,414 |
| GSR Mortgage Loan Trust: | | | | | |
Series 2006-OA1, Class 1A1, CMO, 1 mo. USD Term SOFR + 0.55%, 5.90%, 8/25/2046 (b)
| | | 13,876,872 | | 3,003,644 |
Series 2007-AR1, Class 2A1, 4.31%, 3/25/2047 (b)
| | | 4,041,845 | | 2,379,100 |
HOMES Trust Series 2023-NQM1, Class A1, 6.18%, 1/25/2068 (a) (g)
| | | 5,961,243 | | 5,915,696 |
IndyMac IMJA Mortgage Loan Trust Series 2007-A4, Class A1, CMO, 6.25%, 2/25/2038
| | | 21,637,950 | | 5,491,733 |
IndyMac INDX Mortgage Loan Trust Series 2006-AR3, Class 3A1B, CMO, 3.52%, 4/25/2036 (b)
| | | 1,066,992 | | 952,980 |
See accompanying notes to financial statements.
90
SPDR DOUBLELINE TOTAL RETURN TACTICAL ETF
SCHEDULE OF INVESTMENTS (continued)
June 30, 2024
| Security Description | | | Principal
Amount | | Value |
Legacy Mortgage Asset Trust Series 2020-SL1, Class M, 3.25%, 1/25/2060 (a) (b)
| | | $7,785,027 | | $7,663,390 |
Lehman XS Trust Series 2006-GP2, Class 1A4, 1 mo. USD Term SOFR + 0.77%, 6.12%, 6/25/2046 (b)
| | | 5,592,070 | | 3,797,951 |
Luminent Mortgage Trust Series 2007-1, Class 1A1, CMO, 1 mo. USD Term SOFR + 0.43%, 5.78%, 11/25/2036 (b)
| | | 6,445,383 | | 5,847,715 |
MF1 LLC Series 2023-FL12, Class A, 1 mo. USD Term SOFR + 2.07%, 7.40%, 10/19/2038 (a) (b)
| | | 880,000 | | 882,405 |
Morgan Stanley Resecuritization Trust Series 2014-R7, Class B2, CMO, 4.23%, 1/26/2051 (a) (b)
| | | 15,160,582 | | 14,048,268 |
Morgan Stanley Residential Mortgage Loan Trust Series 2020-RPL1, Class A1, CMO, VRN, 5.69%, 10/25/2060 (a) (b)
| | | 586,535 | | 570,357 |
| OBX Trust: | | | | | |
Series 2024-NQM6, Class A1, 6.45%, 2/25/2064 (a) (g)
| | | 6,358,932 | | 6,406,320 |
Series 2024-NQM7, Class A1, 6.24%, 3/25/2064 (a) (g)
| | | 5,017,428 | | 5,048,335 |
PMT Credit Risk Transfer Trust Series 2019-2R, Class A, 1 mo. USD Term SOFR + 3.86%, 9.21%, 5/30/2025 (a) (b)
| | | 1,082,941 | | 1,083,506 |
| PRPM LLC: | | | | | |
Series 2020-6, Class A1, CMO, 5.36%, 11/25/2025 (a) (g)
| | | 2,513,212 | | 2,507,526 |
Series 2022-1, Class A1, 3.72%, 2/25/2027 (a) (g)
| | | 12,961,362 | | 12,735,905 |
RBSGC Mortgage Loan Trust Series 2007-A, Class 2A2, 6.00%, 1/25/2037
| | | 2,473,595 | | 2,147,997 |
| Residential Accredit Loans, Inc. Trust: | | | | | |
Series 2005-QA7, Class A22, CMO, 5.74%, 7/25/2035 (b)
| | | 1,533,391 | | 1,422,617 |
Series 2005-QS13, Class 2A4, 5.75%, 9/25/2035
| | | 2,896,859 | | 2,413,739 |
Residential Asset Securitization Trust Series 2005-A16, Class A3, 6.00%, 2/25/2036
| | | 3,015,043 | | 1,218,039 |
| Security Description | | | Principal
Amount | | Value |
Structured Adjustable Rate Mortgage Loan Trust Series 2006-8, Class 4A3, CMO, 3.25%, 9/25/2036 (b)
| | | $89,698 | | $89,698 |
| Structured Asset Mortgage Investments II Trust: | | | | | |
Series 2004-AR3, Class M, CMO, 1 mo. USD Term SOFR + 0.79%, 6.13%, 7/19/2034 (b)
| | | 719,763 | | 701,232 |
Series 2007-AR3, Class 1A3, 1 mo. USD Term SOFR + 0.53%, 5.88%, 9/25/2047 (b)
| | | 6,279,300 | | 4,437,815 |
TBW Mortgage-Backed Trust Series 2006-6, Class A2B, 6.16%, 1/25/2037 (g)
| | | 10,319,656 | | 2,303,495 |
UBS Commercial Mortgage Trust Series 2018-C8, Class C, 4.84%, 2/15/2051 (b)
| | | 1,969,000 | | 1,767,018 |
| Verus Securitization Trust: | | | | | |
Series 2022-3, Class A1, 4.13%, 2/25/2067 (a) (g)
| | | 15,354,125 | | 14,280,105 |
Series 2023-3, Class A1, 5.93%, 3/25/2068 (a) (g)
| | | 3,932,687 | | 3,912,167 |
Series 2023-4, Class A1, 5.81%, 5/25/2068 (a) (g)
| | | 8,663,187 | | 8,606,650 |
WaMu Mortgage Pass-Through Certificates Trust Series 2006-AR14, Class 1A5, 4.00%, 11/25/2036 (b)
| | | 3,045,646 | | 2,658,057 |
| Washington Mutual Mortgage Pass-Through Certificates WMALT Trust: | | | | | |
Series 2005-8, Class 2CB1, CMO, 5.50%, 10/25/2035
| | | 601,135 | | 573,995 |
Series 2006-1, Class 4CB, 6.50%, 2/25/2036
| | | 4,397,013 | | 3,405,412 |
Series 2006-5, Class 3A2, CMO, 6.50%, 7/25/2036 (g)
| | | 2,471,157 | | 543,063 |
Series 2006-AR9, Class 2A, 1 yr. MTA + 0.84%, 5.99%, 11/25/2046 (b)
| | | 2,699,239 | | 2,012,235 |
Series 2007-2, Class 1A3, CMO, 6.00%, 4/25/2037
| | | 3,475,655 | | 2,769,316 |
Series 2007-HY1, Class A3A, CMO, 1 mo. USD Term SOFR + 0.57%, 5.92%, 2/25/2037 (b)
| | | 3,734,821 | | 2,673,653 |
See accompanying notes to financial statements.
91
SPDR DOUBLELINE TOTAL RETURN TACTICAL ETF
SCHEDULE OF INVESTMENTS (continued)
June 30, 2024
| Security Description | | | Principal
Amount | | Value |
Wells Fargo Mortgage-Backed Securities Trust Series 2007-AR4, Class A1, CMO, 6.20%, 8/25/2037 (b)
| | | $583,994 | | $565,086 |
TOTAL MORTGAGE-BACKED SECURITIES
(Cost $506,494,484)
| | | | | 474,531,914 |
| COMMERCIAL MORTGAGE BACKED SECURITIES — 2.9% | | | | | |
| Bank: | | | | | |
Series 2017-BNK4, Class XA, IO, 1.49%, 5/15/2050 (b)
| | | 24,155,482 | | 725,542 |
Series 2017-BNK6, Class XA, IO, 0.90%, 7/15/2060 (b)
| | | 46,963,395 | | 824,406 |
Series 2021-BN35, Class XA, IO, VRN, 1.14%, 6/15/2064 (b)
| | | 9,126,570 | | 466,812 |
| Benchmark Mortgage Trust: | | | | | |
Series 2018-B2, Class C, VRN, 4.43%, 2/15/2051 (b)
| | | 2,545,000 | | 2,162,231 |
Series 2020-B19, Class XA, IO, VRN, 1.87%, 9/15/2053 (b)
| | | 19,604,109 | | 1,157,944 |
Series 2021-B24, Class XA, IO, VRN, 1.26%, 3/15/2054 (b)
| | | 3,372,683 | | 169,070 |
| BX Commercial Mortgage Trust: | | | | | |
Series 2020-VKNG, Class A, 1 mo. USD Term SOFR + 1.04%, 6.37%, 10/15/2037 (a) (b)
| | | 1,473,360 | | 1,465,072 |
Series 2021-VOLT, Class E, 1 mo. USD Term SOFR + 2.11%, 7.44%, 9/15/2036 (a) (b)
| | | 1,923,000 | | 1,894,770 |
Series 2021-XL2, Class E, 1 mo. USD Term SOFR + 1.96%, 7.29%, 10/15/2038 (a) (b)
| | | 2,028,663 | | 1,994,896 |
BX Trust Series 2019-OC11, Class E, 4.08%, 12/9/2041 (a) (b)
| | | 3,830,000 | | 3,272,316 |
CD Mortgage Trust Series 2017-CD4, Class XA, IO, 1.38%, 5/10/2050 (b)
| | | 13,047,865 | | 342,616 |
CFCRE Commercial Mortgage Trust Series 2016-C4, Class XA, IO, 1.76%, 5/10/2058 (b)
| | | 9,382,054 | | 176,880 |
| Security Description | | | Principal
Amount | | Value |
| Citigroup Commercial Mortgage Trust: | | | | | |
Series 2015-GC27, Class C, VRN, 4.57%, 2/10/2048 (b)
| | | $2,541,000 | | $2,451,251 |
Series 2015-GC27, Class D, 4.57%, 2/10/2048 (a) (b)
| | | 423,700 | | 383,697 |
Series 2015-GC31, Class C, 4.17%, 6/10/2048 (b)
| | | 1,500,000 | | 1,075,065 |
Series 2015-GC33, Class C, 4.73%, 9/10/2058 (b)
| | | 1,500,000 | | 1,208,465 |
Series 2015-P1, Class A5, 3.72%, 9/15/2048
| | | 2,106,000 | | 2,054,591 |
Series 2016-C1, Class A4, 3.21%, 5/10/2049
| | | 1,840,000 | | 1,759,605 |
Series 2016-GC36, Class XA, IO, 1.36%, 2/10/2049 (b)
| | | 18,933,462 | | 272,450 |
Series 2020-555, Class E, 3.62%, 12/10/2041 (a) (b)
| | | 2,047,000 | | 1,699,686 |
| COMM Mortgage Trust: | | | | | |
Series 2013-CR12, Class XA, IO, 0.74%, 10/10/2046 (b)
| | | 1,921,409 | | 6,894 |
Series 2015-CR22, Class XA, IO, 0.95%, 3/10/2048 (b)
| | | 6,981,437 | | 20,937 |
Series 2015-CR26, Class XA, IO, 1.04%, 10/10/2048 (b)
| | | 17,992,224 | | 123,491 |
Series 2015-DC1, Class A5, 3.35%, 2/10/2048
| | | 1,767,000 | | 1,743,403 |
Series 2015-DC1, Class XA, IO, 1.07%, 2/10/2048 (b)
| | | 5,322,994 | | 20,119 |
Series 2016-DC2, Class XA, IO, 1.07%, 2/10/2049 (b)
| | | 13,763,798 | | 138,356 |
Series 2017-PANW, Class E, 4.13%, 10/10/2029 (a) (b)
| | | 2,316,000 | | 2,155,315 |
| CSAIL Commercial Mortgage Trust: | | | | | |
Series 2015-C2, Class AS, 3.85%, 6/15/2057 (b)
| | | 900,000 | | 856,261 |
Series 2015-C4, Class XA, IO, 0.95%, 11/15/2048 (b)
| | | 29,887,164 | | 200,307 |
Series 2017-CX10, Class XA, IO, 0.89%, 11/15/2050 (b)
| | | 54,450,533 | | 979,260 |
Series 2019-C17, Class XA, IO, VRN, 1.46%, 9/15/2052 (b)
| | | 27,898,466 | | 1,465,642 |
| CSMC Trust: | | | | | |
Series 2017-TIME, Class A, 3.65%, 11/13/2039 (a)
| | | 2,977,000 | | 2,421,765 |
Series 2020-NET, Class A, 2.26%, 8/15/2037 (a)
| | | 2,149,905 | | 2,053,797 |
Series 2021-B33, Class A1, 3.05%, 10/10/2043 (a)
| | | 632,000 | | 571,764 |
See accompanying notes to financial statements.
92
SPDR DOUBLELINE TOTAL RETURN TACTICAL ETF
SCHEDULE OF INVESTMENTS (continued)
June 30, 2024
| Security Description | | | Principal
Amount | | Value |
Series 2021-B33, Class A2, 3.17%, 10/10/2043 (a)
| | | $2,250,000 | | $1,894,857 |
DOLP Trust Series 2021-NYC, Class E, VRN, 3.70%, 5/10/2041 (a) (b)
| | | 1,000,000 | | 707,709 |
Grace Trust Series 2020-GRCE, Class D, VRN, 2.77%, 12/10/2040 (a) (b)
| | | 1,147,000 | | 869,465 |
| GS Mortgage Securities Corp. Trust: | | | | | |
Series 2018-TWR, Class A, 1 mo. USD Term SOFR + 1.20%, 6.53%, 7/15/2031 (a) (b)
| | | 283,000 | | 242,510 |
Series 2018-TWR, Class D, 1 mo. USD Term SOFR + 1.90%, 7.23%, 7/15/2031 (a) (b)
| | | 650,000 | | 217,778 |
Series 2018-TWR, Class E, 1 mo. USD Term SOFR + 2.40%, 7.73%, 7/15/2031 (a) (b)
| | | 650,000 | | 175,500 |
Series 2018-TWR, Class F, 1 mo. USD Term SOFR + 3.10%, 8.43%, 7/15/2031 (a) (b)
| | | 650,000 | | 104,000 |
Series 2018-TWR, Class G, 1 mo. USD Term SOFR + 4.22%, 9.55%, 7/15/2031 (a) (b)
| | | 650,000 | | 13,000 |
| GS Mortgage Securities Trust: | | | | | |
Series 2014-GC24, Class XA, IO, 0.68%, 9/10/2047 (b)
| | | 12,560,470 | | 23,792 |
Series 2014-GC26, Class A5, 3.63%, 11/10/2047
| | | 1,749,000 | | 1,733,319 |
Series 2015-GC32, Class XA, IO, 0.83%, 7/10/2048 (b)
| | | 19,732,346 | | 96,031 |
Series 2015-GC34, Class A4, 3.51%, 10/10/2048
| | | 1,880,000 | | 1,803,358 |
Series 2015-GC34, Class XA, IO, 1.35%, 10/10/2048 (b)
| | | 13,992,087 | | 158,764 |
Series 2015-GS1, Class XA, IO, 0.90%, 11/10/2048 (b)
| | | 24,470,102 | | 189,667 |
Series 2016-GS3, Class XA, IO, 1.31%, 10/10/2049 (b)
| | | 23,041,704 | | 441,481 |
Series 2017-GS7, Class XA, IO, 1.22%, 8/10/2050 (b)
| | | 38,269,462 | | 949,747 |
| JP Morgan Chase Commercial Mortgage Securities Trust: | | | | | |
Series 2014-C20, Class B, 4.40%, 7/15/2047 (b)
| | | 853,865 | | 845,218 |
| Security Description | | | Principal
Amount | | Value |
Series 2015-JP1, Class XA, IO, 1.04%, 1/15/2049 (b)
| | | $13,762,546 | | $137,715 |
Series 2016-JP3, Class B, VRN, 3.40%, 8/15/2049 (b)
| | | 2,899,000 | | 2,517,364 |
Series 2022-NLP, Class A, 1 mo. USD Term SOFR + 0.60%, 5.93%, 4/15/2037 (a) (b)
| | | 1,757,303 | | 1,681,584 |
| JPMBB Commercial Mortgage Securities Trust: | | | | | |
Series 2014-C21, Class B, VRN, 4.34%, 8/15/2047 (b)
| | | 1,055,000 | | 1,020,316 |
Series 2014-C25, Class XA, IO, 0.94%, 11/15/2047 (b)
| | | 4,120,259 | | 12,365 |
Series 2015-C28, Class XA, IO, 1.05%, 10/15/2048 (b)
| | | 7,489,617 | | 24,736 |
Series 2015-C30, Class XA, IO, 0.56%, 7/15/2048 (b)
| | | 20,853,194 | | 66,707 |
Series 2015-C31, Class A3, 3.80%, 8/15/2048
| | | 876,109 | | 856,951 |
JPMDB Commercial Mortgage Securities Trust Series 2016-C2, Class XA, IO, 1.63%, 6/15/2049 (b)
| | | 15,187,615 | | 289,352 |
LSTAR Commercial Mortgage Trust Series 2017-5, Class X, IO, 0.99%, 3/10/2050 (a) (b)
| | | 32,521,515 | | 519,304 |
Manhattan West Mortgage Trust Series 2020-1MW, Class C, VRN, 2.41%, 9/10/2039 (a) (b)
| | | 2,462,000 | | 2,151,239 |
Med Trust Series 2021-MDLN, Class G, 1 mo. USD Term SOFR + 5.36%, 10.69%, 11/15/2038 (a) (b)
| | | 2,850,321 | | 2,850,146 |
| Morgan Stanley Bank of America Merrill Lynch Trust: | | | | | |
Series 2015-C20, Class C, 4.57%, 2/15/2048 (b)
| | | 500,000 | | 481,824 |
Series 2016-C28, Class XA, IO, 1.30%, 1/15/2049 (b)
| | | 17,541,913 | | 232,153 |
Series 2016-C30, Class XA, IO, 1.42%, 9/15/2049 (b)
| | | 15,353,437 | | 291,939 |
Series 2016-C31, Class C, 4.40%, 11/15/2049 (b)
| | | 3,358,000 | | 2,813,005 |
| Morgan Stanley Capital I Trust: | | | | | |
Series 2015-UBS8, Class XA, IO, 0.98%, 12/15/2048 (b)
| | | 21,167,506 | | 177,774 |
Series 2016-UB12, Class XA, IO, 0.78%, 12/15/2049 (b)
| | | 46,046,510 | | 558,689 |
See accompanying notes to financial statements.
93
SPDR DOUBLELINE TOTAL RETURN TACTICAL ETF
SCHEDULE OF INVESTMENTS (continued)
June 30, 2024
| Security Description | | | Principal
Amount | | Value |
Series 2016-UBS9, Class A4, 3.59%, 3/15/2049
| | | $913,000 | | $875,802 |
Series 2019-L3, Class XA, IO, 0.73%, 11/15/2052 (b)
| | | 52,367,703 | | 1,428,367 |
One New York Plaza Trust Series 2020-1NYP, Class C, 1 mo. USD Term SOFR + 2.31%, 7.64%, 1/15/2036 (a) (b)
| | | 1,599,000 | | 1,485,085 |
SG Commercial Mortgage Securities Trust Series 2016-C5, Class B, 3.93%, 10/10/2048
| | | 450,000 | | 405,013 |
| SLG Office Trust: | | | | | |
Series 2021-OVA, Class E, 2.85%, 7/15/2041 (a)
| | | 1,989,000 | | 1,520,642 |
Series 2021-OVA, Class F, 2.85%, 7/15/2041 (a)
| | | 1,989,000 | | 1,462,418 |
SREIT Trust Series 2021-MFP, Class D, 1 mo. USD Term SOFR + 1.69%, 7.02%, 11/15/2038 (a) (b)
| | | 2,740,455 | | 2,694,720 |
| UBS Commercial Mortgage Trust: | | | | | |
Series 2017-C1, Class XA, IO, 1.66%, 6/15/2050 (b)
| | | 16,392,308 | | 527,925 |
Series 2017-C4, Class XA, IO, 1.24%, 10/15/2050 (b)
| | | 19,813,358 | | 537,335 |
Velocity Commercial Capital Loan Trust Series 2020-1, Class M3, VRN, 3.19%, 2/25/2050 (a) (b)
| | | 1,866,252 | | 1,560,665 |
Waterfall Commercial Mortgage Trust Series 2015-SBC5, Class A, 4.10%, 9/14/2049 (a) (b)
| | | 511,953 | | 495,113 |
| Wells Fargo Commercial Mortgage Trust: | | | | | |
Series 2015-C26, Class XA, IO, 1.28%, 2/15/2048 (b)
| | | 5,705,752 | | 22,604 |
Series 2015-C27, Class A5, 3.45%, 2/15/2048
| | | 3,836,000 | | 3,769,495 |
Series 2015-C30, Class A4, 3.66%, 9/15/2058
| | | 574,375 | | 560,438 |
Series 2015-LC20, Class XA, IO, 1.42%, 4/15/2050 (b)
| | | 6,005,625 | | 29,915 |
Series 2015-NXS1, Class XA, IO, 1.17%, 5/15/2048 (b)
| | | 5,696,855 | | 24,095 |
Series 2015-NXS2, Class XA, IO, 0.72%, 7/15/2058 (b)
| | | 20,225,888 | | 79,134 |
Series 2015-P2, Class XA, IO, 1.08%, 12/15/2048 (b)
| | | 13,605,047 | | 127,263 |
| Security Description | | | Principal
Amount | | Value |
Series 2016-BNK1, Class XB, IO, VRN, 1.46%, 8/15/2049 (b)
| | | $19,849,000 | | $441,285 |
Series 2016-C33, Class XA, IO, 1.72%, 3/15/2059 (b)
| | | 10,214,228 | | 197,182 |
Series 2017-C38, Class XA, IO, 1.07%, 7/15/2050 (b)
| | | 32,542,807 | | 695,130 |
Series 2017-RC1, Class XA, IO, 1.54%, 1/15/2060 (b)
| | | 15,299,522 | | 456,774 |
WFRBS Commercial Mortgage Trust Series 2014-C21, Class XA, IO, 0.98%, 8/15/2047 (b)
| | | 4,670,888 | | 3,078 |
TOTAL COMMERCIAL MORTGAGE BACKED SECURITIES
(Cost $142,753,308)
| | | | | 84,863,513 |
| | | Shares | |
| SHORT-TERM INVESTMENT — 3.4% | | | |
State Street Institutional U.S. Government Money Market Fund, Class G Shares 5.29% (j) (k)
(Cost $100,256,362)
| | 100,256,362 | 100,256,362 |
TOTAL INVESTMENTS — 99.1%
(Cost $3,096,807,006)
| | | 2,892,185,203 |
OTHER ASSETS IN EXCESS OF LIABILITIES — 0.9%
| | | 25,884,682 |
NET ASSETS — 100.0%
| | | $2,918,069,885 |
| (a) | Securities purchased pursuant to Rule 144A of the Securities Act of 1933, as amended. These securities, which represent 24.0% of net assets as of June 30, 2024, are considered liquid and may be resold in transactions exempt from registration, normally to qualified institutional buyers. |
| (b) | Variable Rate Security - Interest rate shown is rate in effect at June 30, 2024. For securities based on a published reference rate and spread, the reference rate and spread are indicated in the description above. |
| (c) | Security is currently in default and/or issuer is in bankruptcy. |
| (d) | When-issued security. |
| (e) | Amount is less than 0.05% of net assets. |
| (f) | Fair valued as determined in good faith by the Trust's Oversight Committee in accordance with policy and procedures approved by the Board of Trustees. Security value is determined based on Level 3 inputs. As of June 30, 2024, total aggregate fair value of the securities is $222,187, representing less than 0.05% of the Fund's net assets. |
| (g) | Step-up bond - Coupon rate increases in increments to maturity. Rate shown as of June 30, 2024. Maturity date shown is the final maturity. |
See accompanying notes to financial statements.
94
SPDR DOUBLELINE TOTAL RETURN TACTICAL ETF
SCHEDULE OF INVESTMENTS (continued)
June 30, 2024
| (h) | Non-income producing security. |
| (i) | Position is unsettled. Contract rate was not determined at June 30, 2024 and does not take effect until settlement date. Maturity date is not finalized until settlement date. |
| (j) | The Fund invested in certain money market funds managed by SSGA Funds Management, Inc. Amounts related to these investments during the year ended June 30, 2024 are shown in the Affiliate Table below. |
| (k) | The rate shown is the annualized seven-day yield at June 30, 2024. |
| ABS | Asset-Backed Security |
| CLO | Collateralized Loan Obligation |
| CMO | Collateralized Mortgage Obligation |
| CMT | Constant Maturity Treasury |
| EMTN | Euro Medium Term Note |
| GMTN | Global Medium Term Note |
| IO | Interest Only |
| LIBOR | London Interbank Offered Rate |
| MTN | Medium Term Note |
| PIK | Payment in Kind |
| PO | Principal Only |
| REIT | Real Estate Investment Trust |
| REMIC | Real Estate Mortgage Investment Conduit |
| SOFR | Secured Overnight Financing Rate |
| STRIPS | Separate Trading of Registered Interest and Principal of Securities |
| VRN | Variable Rate Note |
At June 30, 2024, the Fund had unfunded loan commitments of $9,976, which could be extended at the option of the borrowers, pursuant to the following loan agreements:
| Borrower | | Unfunded Loan
Commitment ($) | | Value ($) | | Unrealized
Appreciation/(Depreciation) ($) |
| Epicor Software Corp. | | 9,976 | | 10,030 | | 54 |
At June 30, 2024, open futures contracts were as follows:
| Description | | Number of
Contracts | | Expiration
Date | | Notional
Amount | | Value | | Unrealized
Appreciation
(Depreciation) |
| 10 Yr. U.S. Treasury Ultra Futures (short) | | (3,950) | | 09/19/2024 | | $(439,008,147) | | $(448,448,438) | | $(9,440,291) |
| 2 Yr. U.S. Treasury Note Futures (long) | | 5,000 | | 09/30/2024 | | 1,016,995,597 | | 1,021,093,750 | | 4,098,153 |
| Ultra U.S. Treasury Bond Futures (long) | | 50 | | 09/19/2024 | | 6,034,486 | | 6,267,188 | | 232,702 |
| U.S. Treasury Bond Futures (long) | | 5,500 | | 09/19/2024 | | 631,050,618 | | 650,718,750 | | 19,668,132 |
| 5 Yr. U.S. Treasury Note Futures (long) | | 1,700 | | 09/30/2024 | | 179,118,049 | | 181,182,813 | | 2,064,764 |
| | | | | | | | | | | $16,623,460 |
During the year ended June 30,2024, the average notional value related to long futures contracts was $425,029,868 and short future contract was $102,025,841.
See accompanying notes to financial statements.
95
SPDR DOUBLELINE TOTAL RETURN TACTICAL ETF
SCHEDULE OF INVESTMENTS (continued)
June 30, 2024
The following table summarizes the value of the Fund's investments according to the fair value hierarchy as of June 30, 2024.
| Description | | Level 1 –
Quoted Prices | | Level 2 –
Other Significant
Observable Inputs | | Level 3 –
Significant
Unobservable Inputs | | Total |
| ASSETS: | | | | | | | | |
| INVESTMENTS: | | | | | | | | |
Corporate Bonds & Notes
| | $— | | $359,022,388 | | $154,896 | | $359,177,284 |
Asset-Backed Securities
| | — | | 386,682,235 | | — | | 386,682,235 |
Foreign Government Obligations
| | — | | 4,567,981 | | — | | 4,567,981 |
U.S. Government Agency Obligations
| | — | | 846,903,102 | | — | | 846,903,102 |
U.S. Treasury Obligations
| | — | | 578,420,712 | | — | | 578,420,712 |
Mortgage-Backed Securities
| | — | | 474,531,914 | | — | | 474,531,914 |
Commercial Mortgage Backed Securities
| | — | | 84,863,513 | | — | | 84,863,513 |
Common Stocks
| | — | | — | | 67,291 | | 67,291 |
Senior Floating Rate Loans
| | — | | 56,713,227 | | — | | 56,713,227 |
Warrants
| | 1,582 | | — | | — | | 1,582 |
Short-Term Investment
| | 100,256,362 | | — | | — | | 100,256,362 |
TOTAL INVESTMENTS
| | $100,257,944 | | $2,791,705,072 | | $222,187 | | $2,892,185,203 |
| OTHER FINANCIAL INSTRUMENTS: | | | | | | | | |
Unfunded Loans - Unrealized Appreciation
| | $— | | $54 | | $— | | $54 |
Futures Contracts - Unrealized Appreciation
| | 26,063,751 | | — | | — | | 26,063,751 |
Futures Contracts - Unrealized Depreciation
| | (9,440,291) | | — | | — | | (9,440,291) |
TOTAL OTHER FINANCIAL INSTRUMENTS:
| | $16,623,460 | | $54 | | $— | | $16,623,514 |
Affiliate Table
| | Number of
Shares Held
at
6/30/23 | | Value at
6/30/23 | | Cost of
Purchases | | Proceeds
from
Shares Sold | | Realized
Gain (Loss) | | Change in
Unrealized
Appreciation/
Depreciation | | Number of
Shares Held
at
6/30/24 | | Value at
6/30/24 | | Dividend
Income |
State Street Institutional U.S. Government Money Market Fund, Class G Shares
| 30,238,919 | | $30,238,919 | | $1,131,776,097 | | $1,061,758,654 | | $— | | $— | | 100,256,362 | | $100,256,362 | | $3,286,970 |
See accompanying notes to financial statements.
96
SSGA ACTIVE TRUST
STATEMENTS OF ASSETS AND LIABILITIES
June 30, 2024
| | SPDR SSGA Multi-Asset Real Return ETF | | SPDR SSGA Income Allocation ETF | | SPDR SSGA Global Allocation ETF |
| ASSETS | | | | | |
Investments in unaffiliated issuers, at value*
| $89,060,768 | | $7,007,823 | | $— |
Investments in affiliated issuers, at value
| 457,728,184 | | 76,362,296 | | 274,025,400 |
Total Investments
| 546,788,952 | | 83,370,119 | | 274,025,400 |
Foreign currency, at value
| — | | — | | — |
Net cash at broker
| — | | — | | — |
Cash
| — | | 142 | | — |
Receivable from broker — accumulated variation margin on futures contracts
| — | | — | | — |
Receivable for investments sold
| 399,777 | | — | | — |
Receivable for fund shares sold
| — | | 30,623 | | — |
Dividends receivable — unaffiliated issuers
| — | | 58,867 | | — |
Dividends receivable — affiliated issuers
| 6,398 | | 405 | | 65,506 |
Interest receivable — unaffiliated issuers
| — | | — | | 182,750 |
Securities lending income receivable — unaffiliated issuers
| 2,621 | | 555 | | — |
Securities lending income receivable — affiliated issuers
| 20,586 | | 4,450 | | 17,632 |
Receivable from Adviser
| — | | — | | — |
Receivable for foreign taxes recoverable
| — | | — | | — |
TOTAL ASSETS
| 547,218,334 | | 83,465,161 | | 274,291,288 |
| LIABILITIES | | | | | |
Payable upon return of securities loaned
| 34,075,823 | | 13,527,077 | | 36,137,931 |
Payable for investments purchased
| 950,466 | | — | | — |
Payable for fund shares repurchased
| 11,075 | | — | | — |
Advisory fee payable
| 55,039 | | 9,944 | | 25,473 |
Trustees’ fees and expenses payable
| 48 | | 9 | | 22 |
TOTAL LIABILITIES
| 35,092,451 | | 13,537,030 | | 36,163,426 |
NET ASSETS
| $512,125,883 | | $69,928,131 | | $238,127,862 |
| NET ASSETS CONSIST OF: | | | | | |
Paid-in capital
| $601,925,342 | | $92,827,025 | | $223,673,538 |
Total distributable earnings (loss)
| (89,799,459) | | (22,898,894) | | 14,454,324 |
NET ASSETS
| $512,125,883 | | $69,928,131 | | $238,127,862 |
| NET ASSET VALUE PER SHARE | | | | | |
Net asset value per share
| $27.67 | | $30.67 | | $43.22 |
Shares outstanding (unlimited amount authorized, $0.01 par value)
| 18,510,000 | | 2,280,000 | | 5,510,000 |
| COST OF INVESTMENTS: | | | | | |
Investments in unaffiliated issuers
| $105,855,866 | | $6,672,346 | | $— |
Investments in affiliated issuers
| 458,354,653 | | 78,460,160 | | 253,463,972 |
Total cost of investments
| $564,210,519 | | $85,132,506 | | $253,463,972 |
Foreign currency, at cost
| $— | | $— | | $— |
* Includes investments in securities on loan, at value
| $35,995,925 | | $17,444,191 | | $35,541,617 |
See accompanying notes to financial statements.
97
| SPDR SSGA Ultra Short Term Bond ETF | | SPDR Loomis Sayles Opportunistic Bond ETF | | SPDR Nuveen Municipal Bond ETF | | SPDR Nuveen Municipal Bond ESG ETF |
| | | | | | | |
| $500,368,378 | | $33,998,091 | | $48,405,312 | | $39,542,469 |
| 72,098,882 | | 3,820,875 | | 483,301 | | 129,735 |
| 572,467,260 | | 37,818,966 | | 48,888,613 | | 39,672,204 |
| — | | 508 | | — | | — |
| 284,020 | | 602,676 | | — | | — |
| 2,913 | | 18,640 | | — | | — |
| 118,781 | | 71,842 | | — | | — |
| — | | 12,934 | | — | | — |
| — | | — | | — | | — |
| — | | — | | — | | — |
| 237,914 | | 8,315 | | 2,122 | | 359 |
| 4,797,491 | | 412,422 | | 531,827 | | 466,100 |
| — | | — | | — | | — |
| — | | — | | — | | — |
| — | | 1,000 | | — | | — |
| — | | 2,380 | | — | | — |
| 577,908,379 | | 38,949,683 | | 49,422,562 | | 40,138,663 |
| | | | | | | |
| — | | — | | — | | — |
| — | | 1,679,535 | | — | | — |
| — | | — | | — | | — |
| 95,317 | | 16,795 | | 16,164 | | 14,114 |
| 48 | | — | | — | | — |
| 95,365 | | 1,696,330 | | 16,164 | | 14,114 |
| $577,813,014 | | $37,253,353 | | $49,406,398 | | $40,124,549 |
| | | | | | | |
| $576,222,310 | | $42,221,373 | | $51,648,012 | | $40,222,701 |
| 1,590,704 | | (4,968,020) | | (2,241,614) | | (98,152) |
| $577,813,014 | | $37,253,353 | | $49,406,398 | | $40,124,549 |
| | | | | | | |
| $40.48 | | $25.69 | | $27.45 | | $29.72 |
| 14,275,000 | | 1,450,000 | | 1,800,000 | | 1,350,000 |
| | | | | | | |
| $500,014,303 | | $34,182,708 | | $49,132,069 | | $39,481,009 |
| 72,098,882 | | 3,815,500 | | 483,301 | | 129,735 |
| $572,113,185 | | $37,998,208 | | $49,615,370 | | $39,610,744 |
| $— | | $504 | | $— | | $— |
| $— | | $— | | $— | | $— |
SSGA ACTIVE TRUST
STATEMENTS OF ASSETS AND LIABILITIES (continued)
June 30, 2024
| | SPDR SSGA Fixed Income Sector Rotation ETF | | SPDR SSGA US Sector Rotation ETF | | SPDR DoubleLine Emerging Markets Fixed Income ETF |
| ASSETS | | | | | |
Investments in unaffiliated issuers, at value*
| $— | | $— | | $86,196,160 |
Investments in affiliated issuers, at value
| 259,622,442 | | 626,896,417 | | 589,301 |
Total Investments
| 259,622,442 | | 626,896,417 | | 86,785,461 |
Foreign currency, at value
| — | | — | | 710 |
Net cash at broker
| — | | — | | — |
Cash
| — | | — | | 324 |
Receivable from broker — accumulated variation margin on futures contracts
| — | | — | | — |
Receivable for investments sold
| — | | — | | — |
Dividends receivable — affiliated issuers
| 561 | | 1,537 | | 3,565 |
Interest receivable — unaffiliated issuers
| — | | — | | 1,152,900 |
Securities lending income receivable — unaffiliated issuers
| 1,156 | | — | | — |
Securities lending income receivable — affiliated issuers
| 23,953 | | 29,845 | | — |
Unrealized appreciation on unfunded loan commitments
| — | | — | | — |
Receivable from Adviser
| 8,643 | | 35,540 | | — |
TOTAL ASSETS
| 259,656,755 | | 626,963,339 | | 87,942,960 |
| LIABILITIES | | | | | |
Due to custodian
| — | | — | | — |
Payable upon return of securities loaned
| 21,612,719 | | 71,204,113 | | — |
Payable for investments purchased
| — | | — | | 389,866 |
Payable for fund shares repurchased
| 78 | | 31 | | — |
Advisory fee payable
| 91,495 | | 312,796 | | 46,296 |
Trustees’ fees and expenses payable
| — | | — | | — |
TOTAL LIABILITIES
| 21,704,292 | | 71,516,940 | | 436,162 |
NET ASSETS
| $237,952,463 | | $555,446,399 | | $87,506,798 |
| NET ASSETS CONSIST OF: | | | | | |
Paid-in capital
| $264,695,423 | | $489,490,180 | | $100,538,095 |
Total distributable earnings (loss)
| (26,742,960) | | 65,956,219 | | (13,031,297) |
NET ASSETS
| $237,952,463 | | $555,446,399 | | $87,506,798 |
| NET ASSET VALUE PER SHARE | | | | | |
Net asset value per share
| $25.42 | | $50.87 | | $42.17 |
Shares outstanding (unlimited amount authorized, $0.01 par value)
| 9,360,000 | | 10,920,000 | | 2,075,000 |
| COST OF INVESTMENTS: | | | | | |
Investments in unaffiliated issuers
| $— | | $— | | $90,138,478 |
Investments in affiliated issuers
| 262,273,710 | | 558,158,254 | | 589,301 |
Total cost of investments
| $262,273,710 | | $558,158,254 | | $90,727,779 |
Foreign currency, at cost
| $— | | $— | | $631 |
* Includes investments in securities on loan, at value
| $21,688,794 | | $69,356,296 | | $— |
See accompanying notes to financial statements.
99
| SPDR DoubleLine Short Duration Total Return Tactical ETF | | SPDR DoubleLine Total Return Tactical ETF |
| | | |
| $141,427,022 | | $2,791,928,841 |
| 5,024,706 | | 100,256,362 |
| 146,451,728 | | 2,892,185,203 |
| — | | 464 |
| — | | 1,028,227 |
| 1,992 | | — |
| — | | 16,658,642 |
| 571,323 | | 2,542,190 |
| 25,523 | | 387,480 |
| 871,920 | | 15,531,283 |
| — | | — |
| — | | — |
| — | | 54 |
| — | | — |
| 147,922,486 | | 2,928,333,543 |
| | | |
| — | | 11,711 |
| — | | — |
| 45,000 | | 8,936,713 |
| — | | — |
| 55,651 | | 1,314,836 |
| — | | 398 |
| 100,651 | | 10,263,658 |
| $147,821,835 | | $2,918,069,885 |
| | | |
| $156,295,290 | | $3,517,072,298 |
| (8,473,455) | | (599,002,413) |
| $147,821,835 | | $2,918,069,885 |
| | | |
| $46.93 | | $39.70 |
| 3,150,000 | | 73,500,000 |
| | | |
| $144,243,045 | | $2,996,550,644 |
| 5,024,706 | | 100,256,362 |
| $149,267,751 | | $3,096,807,006 |
| $— | | $451 |
| $— | | $— |
SSGA ACTIVE TRUST
STATEMENTS OF OPERATIONS
For the Year Ended June 30, 2024
| | SPDR SSGA Multi-Asset Real Return ETF | | SPDR SSGA Income Allocation ETF | | SPDR SSGA Global Allocation ETF |
| INVESTMENT INCOME | | | | | |
Interest income — unaffiliated issuers
| $541 | | $160 | | $4,803 |
Dividend income — unaffiliated issuers
| 3,489,489 | | 393,790 | | 865 |
Dividend income — affiliated issuers
| 16,055,846 | | 3,236,689 | | 6,529,971 |
Unaffiliated securities lending income
| 15,381 | | 33,471 | | 8,108 |
Affiliated securities lending income
| 218,432 | | 118,919 | | 281,947 |
Foreign taxes withheld
| — | | — | | — |
TOTAL INVESTMENT INCOME (LOSS)
| 19,779,689 | | 3,783,029 | | 6,825,694 |
| EXPENSES | | | | | |
Advisory fee
| 684,361 | | 131,349 | | 346,186 |
Trustees’ fees and expenses
| 5,542 | | 743 | | 2,379 |
Miscellaneous expenses
| 932 | | 133 | | 411 |
TOTAL EXPENSES
| 690,835 | | 132,225 | | 348,976 |
NET INVESTMENT INCOME (LOSS)
| $19,088,854 | | $3,650,804 | | $6,476,718 |
| REALIZED AND UNREALIZED GAIN (LOSS) | | | | | |
| Net realized gain (loss) on: | | | | | |
Investments — unaffiliated issuers
| (5,864,336) | | (919,339) | | (300,554) |
Investments — affiliated issuers
| (4,563,691) | | (2,859,410) | | 7,036,376 |
In-kind redemptions — unaffiliated issuers
| (118,081) | | 137,187 | | 2,196 |
In-kind redemptions — affiliated issuers
| 10,696,866 | | 376,578 | | 6,433,034 |
Foreign currency transactions
| — | | — | | — |
Futures contracts
| — | | — | | — |
Swap contracts
| — | | — | | — |
Net realized gain (loss)
| 150,758 | | (3,264,984) | | 13,171,052 |
| Net change in unrealized appreciation/depreciation on: | | | | | |
Investments — unaffiliated issuers
| 9,251,657 | | 1,519,671 | | — |
Investments — affiliated issuers
| 12,561,044 | | 2,464,965 | | 4,815,478 |
Foreign currency translations
| — | | — | | — |
Futures contracts
| — | | — | | — |
Swap contracts
| — | | — | | — |
Net change in unrealized appreciation/depreciation
| 21,812,701 | | 3,984,636 | | 4,815,478 |
NET REALIZED AND UNREALIZED GAIN (LOSS)
| 21,963,459 | | 719,652 | | 17,986,530 |
NET INCREASE (DECREASE) IN NET ASSETS FROM OPERATIONS
| $41,052,313 | | $4,370,456 | | $24,463,248 |
See accompanying notes to financial statements.
101
| SPDR SSGA Ultra Short Term Bond ETF | | SPDR Loomis Sayles Opportunistic Bond ETF | | SPDR Nuveen Municipal Bond ETF | | SPDR Nuveen Municipal Bond ESG ETF | | SPDR SSGA Fixed Income Sector Rotation ETF | | SPDR SSGA US Sector Rotation ETF | | SPDR DoubleLine Emerging Markets Fixed Income ETF |
| | | | | | | | | | | | | |
| $27,577,808 | | $2,253,752 | | $1,197,928 | | $1,318,298 | | $— | | $— | | $4,764,430 |
| — | | — | | — | | — | | — | | — | | — |
| 3,238,034 | | 224,162 | | 24,990 | | 18,704 | | 7,337,950 | | 5,758,484 | | 75,857 |
| — | | — | | — | | — | | 18,576 | | 22,257 | | — |
| — | | — | | — | | — | | 438,335 | | 278,344 | | — |
| — | | — | | — | | — | | — | | — | | (6,120) |
| 30,815,842 | | 2,477,914 | | 1,222,918 | | 1,337,002 | | 7,794,861 | | 6,059,085 | | 4,834,167 |
| | | | | | | | | | | | | |
| 1,184,885 | | 182,659 | | 186,192 | | 165,396 | | 702,489 | | 2,376,030 | | 526,833 |
| 6,105 | | 417 | | 543 | | 454 | | 1,893 | | 3,674 | | 959 |
| 979 | | 1,601 | | — | | — | | 307 | | 608 | | — |
| 1,191,969 | | 184,677 | | 186,735 | | 165,850 | | 704,689 | | 2,380,312 | | 527,792 |
| $29,623,873 | | $2,293,237 | | $1,036,183 | | $1,171,152 | | $7,090,172 | | $3,678,773 | | $4,306,375 |
| | | | | | | | | | | | | |
| | | | | | | | | | | | | |
| 170,436 | | (210,358) | | (127,735) | | 21,762 | | — | | (19,497,420) | | (3,615,790) |
| — | | — | | — | | — | | (5,776,526) | | 34,205,446 | | — |
| — | | 1,966 | | — | | — | | — | | 19,497,420 | | — |
| — | | — | | — | | — | | 848,513 | | — | | — |
| — | | (71) | | — | | — | | — | | — | | — |
| (958,542) | | (374,990) | | — | | — | | — | | — | | — |
| — | | (31,486) | | — | | — | | — | | — | | — |
| (788,106) | | (614,939) | | (127,735) | | 21,762 | | (4,928,013) | | 34,205,446 | | (3,615,790) |
| | | | | | | | | | | | | |
| 3,648,190 | | 766,183 | | 1,316,187 | | 431,706 | | — | | — | | 6,147,071 |
| — | | (2,726) | | — | | — | | 1,333,610 | | 41,047,614 | | — |
| — | | 14 | | — | | — | | — | | — | | 79 |
| 413,542 | | 62,638 | | — | | — | | — | | — | | — |
| — | | 27,192 | | — | | — | | — | | — | | — |
| 4,061,732 | | 853,301 | | 1,316,187 | | 431,706 | | 1,333,610 | | 41,047,614 | | 6,147,150 |
| 3,273,626 | | 238,362 | | 1,188,452 | | 453,468 | | (3,594,403) | | 75,253,060 | | 2,531,360 |
| $32,897,499 | | $2,531,599 | | $2,224,635 | | $1,624,620 | | $3,495,769 | | $78,931,833 | | $6,837,735 |
SSGA ACTIVE TRUST
STATEMENTS OF OPERATIONS (continued)
For the Year Ended June 30, 2024
| | SPDR DoubleLine Short Duration Total Return Tactical ETF | | SPDR DoubleLine Total Return Tactical ETF |
| INVESTMENT INCOME | | | |
Interest income — unaffiliated issuers
| $7,767,808 | | $155,902,553 |
Dividend income — affiliated issuers
| 238,532 | | 3,286,970 |
Other income
| 5,723 | | — |
Foreign taxes withheld
| (1,035) | | (6,452) |
TOTAL INVESTMENT INCOME (LOSS)
| 8,011,028 | | 159,183,071 |
| EXPENSES | | | |
Advisory fee
| 669,708 | | 16,685,752 |
Trustees’ fees and expenses
| 1,674 | | 31,908 |
Miscellaneous expenses
| — | | 5,231 |
TOTAL EXPENSES
| 671,382 | | 16,722,891 |
NET INVESTMENT INCOME (LOSS)
| $7,339,646 | | $142,460,180 |
| REALIZED AND UNREALIZED GAIN (LOSS) | | | |
| Net realized gain (loss) on: | | | |
Investments — unaffiliated issuers
| (1,391,299) | | (123,695,317) |
Foreign currency transactions
| 31 | | 2 |
Futures contracts
| — | | 1,353,927 |
Net realized gain (loss)
| (1,391,268) | | (122,341,388) |
| Net change in unrealized appreciation/depreciation on: | | | |
Investments — unaffiliated issuers
| 2,869,847 | | 66,961,956 |
Unfunded loan commitments
| — | | 1,297 |
Foreign currency translations
| 2 | | — |
Futures contracts
| — | | 16,623,460 |
Net change in unrealized appreciation/depreciation
| 2,869,849 | | 83,586,713 |
NET REALIZED AND UNREALIZED GAIN (LOSS)
| 1,478,581 | | (38,754,675) |
NET INCREASE (DECREASE) IN NET ASSETS FROM OPERATIONS
| $8,818,227 | | $103,705,505 |
See accompanying notes to financial statements.
103
[This Page Intentionally Left Blank]
SSGA ACTIVE TRUST
STATEMENTS OF CHANGES IN NET ASSETS
| | SPDR SSGA Multi-Asset Real Return ETF | | SPDR SSGA Income Allocation ETF |
| | Year Ended
6/30/24 | | Year Ended
6/30/23 | | Year Ended
6/30/24 | | Year Ended
6/30/23 |
| INCREASE (DECREASE) IN NET ASSETS FROM OPERATIONS: | | | | | | | |
Net investment income (loss)
| $19,088,854 | | $32,244,820 | | $3,650,804 | | $3,969,162 |
Net realized gain (loss)
| 150,758 | | (7,099,501) | | (3,264,984) | | (7,712,792) |
Net change in unrealized appreciation/depreciation
| 21,812,701 | | (21,673,762) | | 3,984,636 | | 6,382,967 |
Net increase (decrease) in net assets resulting from operations
| 41,052,313 | | 3,471,557 | | 4,370,456 | | 2,639,337 |
Net equalization credits and charges
| (462,950) | | (320,063) | | (8,841) | | (50,204) |
Distributions to shareholders
| (18,919,980) | | (32,025,253) | | (3,403,476) | | (4,182,212) |
| FROM BENEFICIAL INTEREST TRANSACTIONS: | | | | | | | |
Proceeds from shares sold
| 213,542,662 | | 282,817,522 | | 10,603,168 | | 21,883,439 |
Cost of shares redeemed
| (257,182,548) | | (188,661,245) | | (12,815,564) | | (44,726,185) |
Net income equalization
| 462,950 | | 320,063 | | 8,841 | | 50,204 |
Other capital
| — | | — | | — | | — |
Net increase (decrease) in net assets from beneficial interest transactions
| (43,176,936) | | 94,476,340 | | (2,203,555) | | (22,792,542) |
Net increase (decrease) in net assets during the period
| (21,507,553) | | 65,602,581 | | (1,245,416) | | (24,385,621) |
Net assets at beginning of period
| 533,633,436 | | 468,030,855 | | 71,173,547 | | 95,559,168 |
NET ASSETS AT END OF PERIOD
| $512,125,883 | | $533,633,436 | | $69,928,131 | | $71,173,547 |
| SHARES OF BENEFICIAL INTEREST: | | | | | | | |
Shares sold
| 7,910,000 | | 10,100,000 | | 350,000 | | 720,000 |
Shares redeemed
| (9,430,000) | | (6,830,000) | | (420,000) | | (1,480,000) |
Net increase (decrease) from share transactions
| (1,520,000) | | 3,270,000 | | (70,000) | | (760,000) |
See accompanying notes to financial statements.
105
| SPDR SSGA Global Allocation ETF | | SPDR SSGA Ultra Short Term Bond ETF | | SPDR Loomis Sayles Opportunistic Bond ETF |
Year Ended
6/30/24 | | Year Ended
6/30/23 | | Year Ended
6/30/24 | | Year Ended
6/30/23 | | Year Ended
6/30/24 | | Year Ended
6/30/23 |
| | | | | | | | | | | |
| $6,476,718 | | $7,250,037 | | $29,623,873 | | $15,375,828 | | $2,293,237 | | $1,788,774 |
| 13,171,052 | | (6,495,520) | | (788,106) | | 1,170,140 | | (614,939) | | (3,090,968) |
| 4,815,478 | | 19,510,144 | | 4,061,732 | | 1,622,725 | | 853,301 | | 2,523,647 |
| 24,463,248 | | 20,264,661 | | 32,897,499 | | 18,168,693 | | 2,531,599 | | 1,221,453 |
| 94,584 | | 73,146 | | 209,764 | | 398,172 | | 2,638 | | (426) |
| (6,567,105) | | (14,220,211) | | (29,406,186) | | (13,852,204) | | (2,326,244) | | (1,679,743) |
| | | | | | | | | | | |
| 27,851,802 | | 27,236,038 | | 170,174,792 | | 366,334,053 | | 7,555,401 | | 7,602,349 |
| (37,510,624) | | (44,224,301) | | (149,304,276) | | (120,141,901) | | — | | (6,390,149) |
| (94,584) | | (73,146) | | (209,764) | | (398,172) | | (2,638) | | 426 |
| — | | 529 | | 80,914 | | 133,928 | | 15,177 | | 20,414 |
| (9,753,406) | | (17,060,880) | | 20,741,666 | | 245,927,908 | | 7,567,940 | | 1,233,040 |
| 8,237,321 | | (10,943,284) | | 24,442,743 | | 250,642,569 | | 7,775,933 | | 774,324 |
| 229,890,541 | | 240,833,825 | | 553,370,271 | | 302,727,702 | | 29,477,420 | | 28,703,096 |
| $238,127,862 | | $229,890,541 | | $577,813,014 | | $553,370,271 | | $37,253,353 | | $29,477,420 |
| | | | | | | | | | | |
| 690,000 | | 710,000 | | 4,225,000 | | 9,150,000 | | 300,000 | | 300,000 |
| (930,000) | | (1,140,000) | | (3,700,000) | | (3,000,000) | | — | | (250,000) |
| (240,000) | | (430,000) | | 525,000 | | 6,150,000 | | 300,000 | | 50,000 |
SSGA ACTIVE TRUST
STATEMENTS OF CHANGES IN NET ASSETS (continued)
| | SPDR Nuveen Municipal Bond ETF | | SPDR Nuveen Municipal Bond ESG ETF |
| | Year Ended
6/30/24 | | Year Ended
6/30/23 | | Year Ended
6/30/24 | | Year Ended
6/30/23 |
| INCREASE (DECREASE) IN NET ASSETS FROM OPERATIONS: | | | | | | | |
Net investment income (loss)
| $1,036,183 | | $759,775 | | $1,171,152 | | $921,669 |
Net realized gain (loss)
| (127,735) | | (1,181,504) | | 21,762 | | (87,678) |
Net change in unrealized appreciation/depreciation
| 1,316,187 | | 1,363,270 | | 431,706 | | 106,461 |
Net increase (decrease) in net assets resulting from operations
| 2,224,635 | | 941,541 | | 1,624,620 | | 940,452 |
Net equalization credits and charges
| 5,130 | | 10,872 | | (1,011) | | 3,028 |
Distributions to shareholders
| (1,010,342) | | (530,211) | | (1,159,558) | | (974,780) |
Return of capital
| (166,316) | | (389,728) | | (31,490) | | — |
Total Distributions to shareholders
| (1,176,658) | | (919,939) | | (1,191,048) | | (974,780) |
| FROM BENEFICIAL INTEREST TRANSACTIONS: | | | | | | | |
Proceeds from shares sold
| 6,657,476 | | 7,988,301 | | 2,900,625 | | 4,356,963 |
Cost of shares redeemed
| (1,376,907) | | — | | — | | — |
Net income equalization
| (5,130) | | (10,872) | | 1,011 | | (3,028) |
Other capital
| 6,464 | | 118 | | 102 | | 2,864 |
Net increase (decrease) in net assets from beneficial interest transactions
| 5,281,903 | | 7,977,547 | | 2,901,738 | | 4,356,799 |
Net increase (decrease) in net assets during the period
| 6,335,010 | | 8,010,021 | | 3,334,299 | | 4,325,499 |
Net assets at beginning of period
| 43,071,388 | | 35,061,367 | | 36,790,250 | | 32,464,751 |
NET ASSETS AT END OF PERIOD
| $49,406,398 | | $43,071,388 | | $40,124,549 | | $36,790,250 |
| SHARES OF BENEFICIAL INTEREST: | | | | | | | |
Shares sold
| 250,000 | | 300,000 | | 100,000 | | 150,000 |
Shares redeemed
| (50,000) | | — | | — | | — |
Net increase (decrease) from share transactions
| 200,000 | | 300,000 | | 100,000 | | 150,000 |
See accompanying notes to financial statements.
107
| SPDR SSGA Fixed Income Sector Rotation ETF | | SPDR SSGA US Sector Rotation ETF | | SPDR DoubleLine Emerging Markets Fixed Income ETF |
Year Ended
6/30/24 | | Year Ended
6/30/23 | | Year Ended
6/30/24 | | Year Ended
6/30/23 | | Year Ended
6/30/24 | | Year Ended
6/30/23 |
| | | | | | | | | | | |
| $7,090,172 | | $3,781,818 | | $3,678,773 | | $3,204,355 | | $4,306,375 | | $3,313,548 |
| (4,928,013) | | (12,530,626) | | 34,205,446 | | (13,285,540) | | (3,615,790) | | (5,095,150) |
| 1,333,610 | | 5,722,938 | | 41,047,614 | | 47,025,282 | | 6,147,150 | | 4,727,940 |
| 3,495,769 | | (3,025,870) | | 78,931,833 | | 36,944,097 | | 6,837,735 | | 2,946,338 |
| (805,567) | | (760,410) | | (1,339,238) | | (400,836) | | 8,895 | | 10,499 |
| (7,036,820) | | (3,737,844) | | (3,767,056) | | (4,093,813) | | (4,169,072) | | (3,330,606) |
| — | | — | | — | | — | | — | | — |
| (7,036,820) | | (3,737,844) | | (3,767,056) | | (4,093,813) | | (4,169,072) | | (3,330,606) |
| | | | | | | | | | | |
| 156,588,311 | | 110,570,222 | | 279,527,434 | | 107,269,046 | | 13,325,342 | | 22,282,311 |
| (94,666,661) | | (42,780,089) | | (98,370,165) | | (44,239,964) | | (8,066,293) | | (16,630,979) |
| 805,567 | | 760,410 | | 1,339,238 | | 400,836 | | (8,895) | | (10,499) |
| — | | — | | — | | — | | 47,519 | | 83,477 |
| 62,727,217 | | 68,550,543 | | 182,496,507 | | 63,429,918 | | 5,297,673 | | 5,724,310 |
| 58,380,599 | | 61,026,419 | | 256,322,046 | | 95,879,366 | | 7,975,231 | | 5,350,541 |
| 179,571,864 | | 118,545,445 | | 299,124,353 | | 203,244,987 | | 79,531,567 | | 74,181,026 |
| $237,952,463 | | $179,571,864 | | $555,446,399 | | $299,124,353 | | $87,506,798 | | $79,531,567 |
| | | | | | | | | | | |
| 6,160,000 | | 4,210,000 | | 6,120,000 | | 2,680,000 | | 325,000 | | 550,000 |
| (3,740,000) | | (1,640,000) | | (2,100,000) | | (1,120,000) | | (200,000) | | (400,000) |
| 2,420,000 | | 2,570,000 | | 4,020,000 | | 1,560,000 | | 125,000 | | 150,000 |
SSGA ACTIVE TRUST
STATEMENTS OF CHANGES IN NET ASSETS (continued)
| | SPDR DoubleLine Short Duration Total Return Tactical ETF | | SPDR DoubleLine Total Return Tactical ETF |
| | Year Ended
6/30/24 | | Year Ended
6/30/23 | | Year Ended
6/30/24 | | Year Ended
6/30/23 |
| INCREASE (DECREASE) IN NET ASSETS FROM OPERATIONS: | | | | | | | |
Net investment income (loss)
| $7,339,646 | | $4,623,179 | | $142,460,180 | | $101,053,600 |
Net realized gain (loss)
| (1,391,268) | | (1,185,399) | | (122,341,388) | | (73,961,637) |
Net change in unrealized appreciation/depreciation
| 2,869,849 | | 522,664 | | 83,586,713 | | (12,300,046) |
Net increase (decrease) in net assets resulting from operations
| 8,818,227 | | 3,960,444 | | 103,705,505 | | 14,791,917 |
Net equalization credits and charges
| 56,304 | | (29,009) | | — | | — |
Distributions to shareholders
| (7,257,475) | | (4,502,769) | | (154,475,171) | | (117,444,339) |
| FROM BENEFICIAL INTEREST TRANSACTIONS: | | | | | | | |
Proceeds from shares sold
| 53,478,868 | | 16,211,354 | | 467,210,576 | | 1,101,213,991 |
Cost of shares redeemed
| (34,963,799) | | (19,702,219) | | (487,208,552) | | (258,273,252) |
Net income equalization
| (56,304) | | 29,009 | | — | | — |
Other capital
| 115,182 | | 51,328 | | 1,397,214 | | 2,456,789 |
Net increase (decrease) in net assets from beneficial interest transactions
| 18,573,947 | | (3,410,528) | | (18,600,762) | | 845,397,528 |
Contribution from affiliate (Note 5)
| — | | 7,309 | | — | | — |
Net increase (decrease) in net assets during the period
| 20,191,003 | | (3,974,553) | | (69,370,428) | | 742,745,106 |
Net assets at beginning of period
| 127,630,832 | | 131,605,385 | | 2,987,440,313 | | 2,244,695,207 |
NET ASSETS AT END OF PERIOD
| $147,821,835 | | $127,630,832 | | $2,918,069,885 | | $2,987,440,313 |
| SHARES OF BENEFICIAL INTEREST: | | | | | | | |
Shares sold
| 1,150,000 | | 350,000 | | 11,900,000 | | 27,100,000 |
Shares redeemed
| (750,000) | | (425,000) | | (12,250,000) | | (6,350,000) |
Net increase (decrease) from share transactions
| 400,000 | | (75,000) | | (350,000) | | 20,750,000 |
See accompanying notes to financial statements.
109
SSGA ACTIVE TRUST
FINANCIAL HIGHLIGHTS
Selected data for a share outstanding throughout each period
| | SPDR SSGA Multi-Asset Real Return ETF |
| | Year
Ended
6/30/24 | | Year
Ended
6/30/23 | | Year
Ended
6/30/22 | | Year
Ended
6/30/21 | | Year
Ended
6/30/20 |
Net asset value, beginning of period
| $26.64 | | $27.93 | | $28.52 | | $21.25 | | $25.18 |
| Income (loss) from investment operations: | | | | | | | | | |
Net investment income (loss) (a)
| 0.97 | | 1.61 | | 2.99 | | 0.65 | | 0.78 |
Net realized and unrealized gain (loss) (b)
| 1.07 | | (1.37) | | (0.44) | | 7.15 | | (3.89) |
Total from investment operations
| 2.04 | | 0.24 | | 2.55 | | 7.80 | | (3.11) |
Net equalization credits and charges (a)
| (0.02) | | (0.02) | | 0.34 | | 0.02 | | (0.02) |
Other capital
| — | | — | | 0.00(c) | | — | | — |
| Distributions to shareholders from: | | | | | | | | | |
Net investment income
| (0.99) | | (1.51) | | (3.48) | | (0.55) | | (0.80) |
Net asset value, end of period
| $27.67 | | $26.64 | | $27.93 | | $28.52 | | $21.25 |
Total return (d)
| 7.63% | | 0.78% | | 10.57% | | 37.12% | | (12.71)% |
| Ratios and Supplemental Data: | | | | | | | | | |
Net assets, end of period (in 000s)
| $512,126 | | $533,633 | | $468,031 | | $130,358 | | $53,750 |
| Ratios to average net assets: | | | | | | | | | |
Total expenses (e)
| 0.13% | | 0.11% | | 0.05% | | 0.08% | | 0.08% |
Net investment income (loss)
| 3.56% | | 5.79% | | 10.09% | | 2.56% | | 3.30% |
Portfolio turnover rate (f)
| 19% | | 30% | | 38% | | 49% | | 30% |
| (a) | Per share numbers have been calculated using average shares outstanding, which more appropriately presents the per share data for the year. |
| (b) | Amounts shown in this caption for a share outstanding may not accord with the change in aggregate gains and losses in securities for the fiscal period because of the timing of sales and repurchases of Fund shares in relation to fluctuating market values for the Fund. |
| (c) | Amount is less than $0.005 per share. |
| (d) | Total return is calculated assuming a purchase of shares at net asset value on the first day and a sale at net asset value on the last day of each period reported. Distributions are assumed, for the purpose of this calculation, to be reinvested at net asset value per share on the respective payment dates of each distribution. Total returns for periods of less than one year are not annualized. Broker commission charges are not included in this calculation. |
| (e) | Does not include expenses of the Underlying Funds in which the Fund invests. |
| (f) | Portfolio turnover rate excludes securities received or delivered from in-kind processing of creations or redemptions. |
See accompanying notes to financial statements.
110
SSGA ACTIVE TRUST
FINANCIAL HIGHLIGHTS (continued)
Selected data for a share outstanding throughout each period
| | SPDR SSGA Income Allocation ETF |
| | Year
Ended
6/30/24 | | Year
Ended
6/30/23 | | Year
Ended
6/30/22 | | Year
Ended
6/30/21 | | Year
Ended
6/30/20 |
Net asset value, beginning of period
| $30.29 | | $30.73 | | $35.62 | | $30.37 | | $33.32 |
| Income (loss) from investment operations: | | | | | | | | | |
Net investment income (loss) (a)
| 1.53 | | 1.45 | | 1.33 | | 1.35 | | 1.43 |
Net realized and unrealized gain (loss) (b)
| 0.28 | | (0.33) | | (4.92) | | 5.18 | | (2.95) |
Total from investment operations
| 1.81 | | 1.12 | | (3.59) | | 6.53 | | (1.52) |
Net equalization credits and charges (a)
| (0.00)(c) | | (0.02) | | (0.01) | | 0.04 | | 0.03 |
| Distributions to shareholders from: | | | | | | | | | |
Net investment income
| (1.43) | | (1.54) | | (1.29) | | (1.32) | | (1.46) |
Net asset value, end of period
| $30.67 | | $30.29 | | $30.73 | | $35.62 | | $30.37 |
Total return (d)
| 6.11% | | 3.79% | | (10.41)% | | 21.90% | | (4.56)% |
| Ratios and Supplemental Data: | | | | | | | | | |
Net assets, end of period (in 000s)
| $69,928 | | $71,174 | | $95,559 | | $125,039 | | $126,039 |
| Ratios to average net assets: | | | | | | | | | |
Total expenses (e)
| 0.18% | | 0.09% | | 0.12% | | 0.16% | | 0.18% |
Net investment income (loss)
| 5.07% | | 4.78% | | 3.85% | | 4.02% | | 4.41% |
Portfolio turnover rate (f)
| 73% | | 89% | | 58% | | 60% | | 38% |
| (a) | Per share numbers have been calculated using average shares outstanding, which more appropriately presents the per share data for the year. |
| (b) | Amounts shown in this caption for a share outstanding may not accord with the change in aggregate gains and losses in securities for the fiscal period because of the timing of sales and repurchases of Fund shares in relation to fluctuating market values for the Fund. |
| (c) | Amount is less than $0.005 per share. |
| (d) | Total return is calculated assuming a purchase of shares at net asset value on the first day and a sale at net asset value on the last day of each period reported. Distributions are assumed, for the purpose of this calculation, to be reinvested at net asset value per share on the respective payment dates of each distribution. Total returns for periods of less than one year are not annualized. Broker commission charges are not included in this calculation. |
| (e) | Does not include expenses of the Underlying Funds in which the Fund invests. |
| (f) | Portfolio turnover rate excludes securities received or delivered from in-kind processing of creations or redemptions. |
See accompanying notes to financial statements.
111
SSGA ACTIVE TRUST
FINANCIAL HIGHLIGHTS (continued)
Selected data for a share outstanding throughout each period
| | SPDR SSGA Global Allocation ETF |
| | Year
Ended
6/30/24 | | Year
Ended
6/30/23 | | Year
Ended
6/30/22 | | Year
Ended
6/30/21 | | Year
Ended
6/30/20 |
Net asset value, beginning of period
| $39.98 | | $38.97 | | $46.04 | | $36.88 | | $38.33 |
| Income (loss) from investment operations: | | | | | | | | | |
Net investment income (loss) (a)
| 1.14 | | 1.21 | | 1.61 | | 0.91 | | 1.07 |
Net realized and unrealized gain (loss) (b)
| 3.24 | | 2.14 | | (6.71) | | 9.16 | | (1.44) |
Total from investment operations
| 4.38 | | 3.35 | | (5.10) | | 10.07 | | (0.37) |
Net equalization credits and charges (a)
| 0.02 | | 0.01 | | 0.00(c) | | (0.00)(c) | | 0.00(c) |
Other capital (a)
| — | | 0.00(c) | | — | | — | | 0.00(c) |
| Distributions to shareholders from: | | | | | | | | | |
Net investment income
| (1.16) | | (1.51) | | (1.62) | | (0.91) | | (1.08) |
Net realized gains
| — | | (0.84) | | (0.35) | | — | | — |
Total distributions
| (1.16) | | (2.35) | | (1.97) | | (0.91) | | (1.08) |
Net asset value, end of period
| $43.22 | | $39.98 | | $38.97 | | $46.04 | | $36.88 |
Total return (d)
| 11.15% | | 9.15% | | (11.58)% | | 27.51% | | (1.00)% |
| Ratios and Supplemental Data: | | | | | | | | | |
Net assets, end of period (in 000s)
| $238,128 | | $229,891 | | $240,834 | | $282,690 | | $237,850 |
| Ratios to average net assets: | | | | | | | | | |
Total expenses (e)
| 0.15% | | 0.11% | | 0.11% | | 0.17% | | 0.09% |
Net investment income (loss)
| 2.78% | | 3.12% | | 3.59% | | 2.16% | | 2.84% |
Portfolio turnover rate (f)
| 119% | | 144% | | 153% | | 110% | | 94% |
| (a) | Per share numbers have been calculated using average shares outstanding, which more appropriately presents the per share data for the year. |
| (b) | Amounts shown in this caption for a share outstanding may not accord with the change in aggregate gains and losses in securities for the fiscal period because of the timing of sales and repurchases of Fund shares in relation to fluctuating market values for the Fund. |
| (c) | Amount is less than $0.005 per share. |
| (d) | Total return is calculated assuming a purchase of shares at net asset value on the first day and a sale at net asset value on the last day of each period reported. Distributions are assumed, for the purpose of this calculation, to be reinvested at net asset value per share on the respective payment dates of each distribution. Total returns for periods of less than one year are not annualized. Broker commission charges are not included in this calculation. |
| (e) | Does not include expenses of the Underlying Funds in which the Fund invests. |
| (f) | Portfolio turnover rate excludes securities received or delivered from in-kind processing of creations or redemptions. |
See accompanying notes to financial statements.
112
SSGA ACTIVE TRUST
FINANCIAL HIGHLIGHTS (continued)
Selected data for a share outstanding throughout each period
| | SPDR SSGA Ultra Short Term Bond ETF |
| | Year
Ended
6/30/24 | | Year
Ended
6/30/23 | | Year
Ended
6/30/22 | | Year
Ended
6/30/21 | | Year
Ended
6/30/20 |
Net asset value, beginning of period
| $40.25 | | $39.83 | | $40.46 | | $40.26 | | $40.41 |
| Income (loss) from investment operations: | | | | | | | | | |
Net investment income (loss) (a)
| 2.02 | | 1.44 | | 0.21 | | 0.27 | | 0.81 |
Net realized and unrealized gain (loss) (b)
| 0.18 | | 0.18 | | (0.63) | | 0.25 | | (0.11) |
Total from investment operations
| 2.20 | | 1.62 | | (0.42) | | 0.52 | | 0.70 |
Net equalization credits and charges (a)
| 0.01 | | 0.04 | | (0.01) | | 0.00(c) | | 0.02 |
Other capital (a)
| 0.01 | | 0.01 | | 0.01 | | 0.01 | | 0.03 |
| Distributions to shareholders from: | | | | | | | | | |
Net investment income
| (1.99) | | (1.25) | | (0.21) | | (0.33) | | (0.90) |
Net asset value, end of period
| $40.48 | | $40.25 | | $39.83 | | $40.46 | | $40.26 |
Total return (d)
| 5.65% | | 4.24% | | (1.05)% | | 1.34% | | 1.86% |
| Ratios and Supplemental Data: | | | | | | | | | |
Net assets, end of period (in 000s)
| $577,813 | | $553,370 | | $302,728 | | $402,603 | | $298,907 |
| Ratios to average net assets: | | | | | | | | | |
Total expenses
| 0.20% | | 0.20% | | 0.20% | | 0.20% | | 0.20% |
Net investment income (loss)
| 5.00% | | 3.59% | | 0.51% | | 0.67% | | 2.02% |
Portfolio turnover rate (e)
| 65% | | 34% | | 68% | | 76% | | 71% |
| (a) | Per share numbers have been calculated using average shares outstanding, which more appropriately presents the per share data for the year. |
| (b) | Amounts shown in this caption for a share outstanding may not accord with the change in aggregate gains and losses in securities for the fiscal period because of the timing of sales and repurchases of Fund shares in relation to fluctuating market values for the Fund. |
| (c) | Amount is less than $0.005 per share. |
| (d) | Total return is calculated assuming a purchase of shares at net asset value on the first day and a sale at net asset value on the last day of each period reported. Distributions are assumed, for the purpose of this calculation, to be reinvested at net asset value per share on the respective payment dates of each distribution. Total returns for periods of less than one year are not annualized. Broker commission charges are not included in this calculation. |
| (e) | Portfolio turnover rate excludes securities received or delivered from in-kind processing of creations or redemptions. |
See accompanying notes to financial statements.
113
SSGA ACTIVE TRUST
FINANCIAL HIGHLIGHTS (continued)
Selected data for a share outstanding throughout each period
| | SPDR Loomis Sayles Opportunistic Bond ETF |
| | Year
Ended
6/30/24 | | Year
Ended
6/30/23 | | For the
Period
9/28/2021*-
6/30/22 |
Net asset value, beginning of period
| $25.63 | | $26.09 | | $30.00 |
| Income (loss) from investment operations: | | | | | |
Net investment income (loss) (a)
| 1.65 | | 1.45 | | 0.67 |
Net realized and unrealized gain (loss) (b)
| 0.09 | | (0.57) | | (4.05) |
Total from investment operations
| 1.74 | | 0.88 | | (3.38) |
Net equalization credits and charges (a)
| 0.00(c) | | (0.00)(c) | | (0.02) |
Other capital (a)
| 0.01 | | 0.02 | | 0.06 |
| Distributions to shareholders from: | | | | | |
Net investment income
| (1.69) | | (1.36) | | (0.57) |
Net asset value, end of period
| $25.69 | | $25.63 | | $26.09 |
Total return (d)
| 7.06% | | 3.58% | | (11.25)% |
| Ratios and Supplemental Data: | | | | | |
Net assets, end of period (in 000s)
| $37,253 | | $29,477 | | $28,703 |
| Ratios to average net assets: | | | | | |
Total expenses
| 0.52% | | 0.53% | | 0.55%(e) |
Net expenses
| 0.52% | | 0.53% | | 0.51%(e) |
Net investment income (loss)
| 6.48% | | 5.62% | | 3.11%(e) |
Portfolio turnover rate (f)
| 77% | | 137% | | 101%(g) |
| * | Commencement of operations. |
| (a) | Per share numbers have been calculated using average shares outstanding, which more appropriately presents the per share data for the year. |
| (b) | Amounts shown in this caption for a share outstanding may not accord with the change in aggregate gains and losses in securities for the fiscal period because of the timing of sales and repurchases of Fund shares in relation to fluctuating market values for the Fund. |
| (c) | Amount is less than $0.005 per share. |
| (d) | Total return is calculated assuming a purchase of shares at net asset value on the first day and a sale at net asset value on the last day of each period reported. Distributions are assumed, for the purpose of this calculation, to be reinvested at net asset value per share on the respective payment dates of each distribution. Total returns for periods of less than one year are not annualized. Broker commission charges are not included in this calculation. |
| (e) | Annualized. |
| (f) | Portfolio turnover rate excludes securities received or delivered from in-kind processing of creations or redemptions. |
| (g) | Not annualized. |
See accompanying notes to financial statements.
114
SSGA ACTIVE TRUST
FINANCIAL HIGHLIGHTS (continued)
Selected data for a share outstanding throughout each period
| | SPDR Nuveen Municipal Bond ETF |
| | Year
Ended
6/30/24 | | Year
Ended
6/30/23 | | Year
Ended
6/30/22 | | For the
Period
2/3/21*-
6/30/21 |
Net asset value, beginning of period
| $26.92 | | $26.97 | | $30.11 | | $30.00 |
| Income (loss) from investment operations: | | | | | | | |
Net investment income (loss) (a)
| 0.60 | | 0.51 | | 0.17 | | 0.07 |
Net realized and unrealized gain (loss) (b)
| 0.62 | | 0.04 | | (2.80) | | 0.11 |
Total from investment operations
| 1.22 | | 0.55 | | (2.63) | | 0.18 |
Net equalization credits and charges (a)
| 0.00(c) | | 0.01 | | (0.00)(c) | | 0.00(c) |
Other capital (a)
| 0.00(c) | | 0.00(c) | | 0.01 | | 0.03 |
| Distributions to shareholders from: | | | | | | | |
Net investment income
| (0.60) | | (0.36) | | (0.30) | | (0.10) |
Net realized gains
| — | | — | | (0.22) | | — |
Return of capital
| (0.09) | | (0.25) | | — | | — |
Total distributions
| (0.69) | | (0.61) | | (0.52) | | (0.10) |
Net asset value, end of period
| $27.45 | | $26.92 | | $26.97 | | $30.11 |
Total return (d)
| 4.59% | | 2.10% | | (8.83)% | | 0.69% |
| Ratios and Supplemental Data: | | | | | | | |
Net assets, end of period (in 000s)
| $49,406 | | $43,071 | | $35,061 | | $45,164 |
| Ratios to average net assets: | | | | | | | |
Total expenses
| 0.40% | | 0.40% | | 0.40% | | 0.40%(e) |
Net investment income (loss)
| 2.23% | | 1.90% | | 0.57% | | 0.57%(e) |
Portfolio turnover rate (f)
| 34% | | 52% | | 49% | | 51%(g) |
| * | Commencement of operations. |
| (a) | Per share numbers have been calculated using average shares outstanding, which more appropriately presents the per share data for the year. |
| (b) | Amounts shown in this caption for a share outstanding may not accord with the change in aggregate gains and losses in securities for the fiscal period because of the timing of sales and repurchases of Fund shares in relation to fluctuating market values for the Fund. |
| (c) | Amount is less than $0.005 per share. |
| (d) | Total return is calculated assuming a purchase of shares at net asset value on the first day and a sale at net asset value on the last day of each period reported. Distributions are assumed, for the purpose of this calculation, to be reinvested at net asset value per share on the respective payment dates of each distribution. Total returns for periods of less than one year are not annualized. Broker commission charges are not included in this calculation. |
| (e) | Annualized. |
| (f) | Portfolio turnover rate excludes securities received or delivered from in-kind processing of creations or redemptions. |
| (g) | Not annualized. |
See accompanying notes to financial statements.
115
SSGA ACTIVE TRUST
FINANCIAL HIGHLIGHTS (continued)
Selected data for a share outstanding throughout each period
| | SPDR Nuveen Municipal Bond ESG ETF |
| | Year
Ended
6/30/24 | | Year
Ended
6/30/23 | | For the
Period
4/5/2022*-
6/30/22 |
Net asset value, beginning of period
| $29.43 | | $29.51 | | $30.00 |
| Income (loss) from investment operations: | | | | | |
Net investment income (loss) (a)
| 0.89 | | 0.77 | | 0.14 |
Net realized and unrealized gain (loss) (b)
| 0.32 | | (0.03) | | (0.57) |
Total from investment operations
| 1.21 | | 0.74 | | (0.43) |
Net equalization credits and charges (a)
| (0.00)(c) | | 0.00(c) | | 0.00(c) |
Other capital (a)
| 0.00(c) | | 0.00(c) | | 0.03 |
| Distributions to shareholders from: | | | | | |
Net investment income
| (0.90) | | (0.82) | | (0.09) |
Return of capital
| (0.02) | | — | | — |
Total distributions
| (0.92) | | (0.82) | | (0.09) |
Net asset value, end of period
| $29.72 | | $29.43 | | $29.51 |
Total return (d)
| 4.18% | | 2.53% | | (1.31)% |
| Ratios and Supplemental Data: | | | | | |
Net assets, end of period (in 000s)
| $40,125 | | $36,790 | | $32,465 |
| Ratios to average net assets: | | | | | |
Total expenses
| 0.43% | | 0.44% | | 0.43%(e) |
Net investment income (loss)
| 3.04% | | 2.62% | | 2.00%(e) |
Portfolio turnover rate (f)
| 33% | | 50% | | 5%(g) |
| * | Commencement of operations. |
| (a) | Per share numbers have been calculated using average shares outstanding, which more appropriately presents the per share data for the year. |
| (b) | Amounts shown in this caption for a share outstanding may not accord with the change in aggregate gains and losses in securities for the fiscal period because of the timing of sales and repurchases of Fund shares in relation to fluctuating market values for the Fund. |
| (c) | Amount is less than $0.005 per share. |
| (d) | Total return is calculated assuming a purchase of shares at net asset value on the first day and a sale at net asset value on the last day of each period reported. Distributions are assumed, for the purpose of this calculation, to be reinvested at net asset value per share on the respective payment dates of each distribution. Total returns for periods of less than one year are not annualized. Broker commission charges are not included in this calculation. |
| (e) | Annualized. |
| (f) | Portfolio turnover rate excludes securities received or delivered from in-kind processing of creations or redemptions. |
| (g) | Not annualized. |
See accompanying notes to financial statements.
116
SSGA ACTIVE TRUST
FINANCIAL HIGHLIGHTS (continued)
Selected data for a share outstanding throughout each period
| | SPDR SSGA Fixed Income Sector Rotation ETF |
| | Year
Ended
6/30/24 | | Year
Ended
6/30/23 | | Year
Ended
6/30/22 | | Year
Ended
6/30/21 | | Year
Ended
6/30/20 |
Net asset value, beginning of period
| $25.87 | | $27.13 | | $31.31 | | $31.98 | | $31.08 |
| Income (loss) from investment operations: | | | | | | | | | |
Net investment income (loss) (a)
| 0.92 | | 0.69 | | 0.52 | | 0.63 | | 0.81 |
Net realized and unrealized gain (loss) (b)
| (0.35) | | (1.14) | | (4.02) | | (0.37) | | 1.31 |
Total from investment operations
| 0.57 | | (0.45) | | (3.50) | | 0.26 | | 2.12 |
Net equalization credits and charges (a)
| (0.10) | | (0.14) | | (0.14) | | (0.16) | | (0.17) |
| Distributions to shareholders from: | | | | | | | | | |
Net investment income
| (0.92) | | (0.67) | | (0.54) | | (0.77) | | (1.05) |
Net asset value, end of period
| $25.42 | | $25.87 | | $27.13 | | $31.31 | | $31.98 |
Total return (c)
| 1.87% | | (2.12)% | | (11.78)% | | 0.29% | | 6.42% |
| Ratios and Supplemental Data: | | | | | | | | | |
Net assets, end of period (in 000s)
| $237,952 | | $179,572 | | $118,545 | | $82,974 | | $47,014 |
| Ratios to average net assets: | | | | | | | | | |
Total expenses (d)
| 0.36% | | 0.36% | | 0.39% | | 0.39% | | 0.31% |
Net investment income (loss)
| 3.63% | | 2.62% | | 1.76% | | 1.99% | | 2.57% |
Portfolio turnover rate (e)
| 100% | | 110% | | 75% | | 79% | | 150% |
| (a) | Per share numbers have been calculated using average shares outstanding, which more appropriately presents the per share data for the period. |
| (b) | Amounts shown in this caption for a share outstanding may not accord with the change in aggregate gains and losses in securities for the fiscal period because of the timing of sales and repurchases of Fund shares in relation to fluctuating market values for the Fund. |
| (c) | Total return is calculated assuming a purchase of shares at net asset value on the first day and a sale at net asset value on the last day of each period reported. Distributions are assumed, for the purpose of this calculation, to be reinvested at net asset value per share on the respective payment dates of each distribution. Total returns for periods of less than one year are not annualized. Broker commission charges are not included in this calculation. |
| (d) | Does not include expenses of the Underlying Funds in which the Fund invests. |
| (e) | Portfolio turnover rate excludes securities received or delivered from in-kind processing of creations or redemptions. |
See accompanying notes to financial statements.
117
SSGA ACTIVE TRUST
FINANCIAL HIGHLIGHTS (continued)
Selected data for a share outstanding throughout each period
| | SPDR SSGA US Sector Rotation ETF |
| | Year
Ended
6/30/24 | | Year
Ended
6/30/23 | | Year
Ended
6/30/22 | | Year
Ended
6/30/21 | | Year
Ended
6/30/20 |
Net asset value, beginning of period
| $43.35 | | $38.06 | | $44.38 | | $32.83 | | $30.73 |
| Income (loss) from investment operations: | | | | | | | | | |
Net investment income (loss) (a)
| 0.41 | | 0.54 | | 0.47 | | 0.36 | | 0.57 |
Net realized and unrealized gain (loss) (b)
| 7.69 | | 5.51 | | (5.07) | | 11.62 | | 1.98 |
Total from investment operations
| 8.10 | | 6.05 | | (4.60) | | 11.98 | | 2.55 |
Net equalization credits and charges (a)
| (0.15) | | (0.07) | | (0.03) | | (0.04) | | 0.03 |
| Distributions to shareholders from: | | | | | | | | | |
Net investment income
| (0.43) | | (0.69) | | (0.46) | | (0.39) | | (0.48) |
Net realized gains
| — | | — | | (1.23) | | — | | — |
Total distributions
| (0.43) | | (0.69) | | (1.69) | | (0.39) | | (0.48) |
Net asset value, end of period
| $50.87 | | $43.35 | | $38.06 | | $44.38 | | $32.83 |
Total return (c)
| 18.45% | | 15.91% | | (11.02)% | | 36.48% | | 8.52% |
| Ratios and Supplemental Data: | | | | | | | | | |
Net assets, end of period (in 000s)
| $555,446 | | $299,124 | | $203,245 | | $174,396 | | $68,617 |
| Ratios to average net assets: | | | | | | | | | |
Total expenses (d)
| 0.57% | | 0.57% | | 0.54% | | 0.52% | | 0.49% |
Net investment income (loss)
| 0.89% | | 1.37% | | 1.06% | | 0.89% | | 1.79% |
Portfolio turnover rate (e)
| 194% | | 203% | | 202% | | 263% | | 154% |
| (a) | Per share numbers have been calculated using average shares outstanding, which more appropriately presents the per share data for the period. |
| (b) | Amounts shown in this caption for a share outstanding may not accord with the change in aggregate gains and losses in securities for the fiscal period because of the timing of sales and repurchases of Fund shares in relation to fluctuating market values for the Fund. |
| (c) | Total return is calculated assuming a purchase of Units at net asset value per Unit on the first day and a sale at net asset value per Unit on the last day of each period reported. Distributions are assumed, for the purposes of this calculation, to be reinvested at the net asset value per Unit on the respective payment dates of the Trust. Broker commission charges are not included in this calculation. |
| (d) | Does not include expenses of the Underlying Funds in which the Fund invests. |
| (e) | Portfolio turnover rate excludes securities received or delivered from in-kind processing of creations or redemptions. |
See accompanying notes to financial statements.
118
SSGA ACTIVE TRUST
FINANCIAL HIGHLIGHTS (continued)
Selected data for a share outstanding throughout each period
| | SPDR DoubleLine Emerging Markets Fixed Income ETF |
| | Year
Ended
6/30/24 | | Year
Ended
6/30/23 | | Year
Ended
6/30/22 | | Year
Ended
6/30/21 | | Year
Ended
6/30/20 |
Net asset value, beginning of period
| $40.79 | | $41.21 | | $50.99 | | $49.09 | | $51.02 |
| Income (loss) from investment operations: | | | | | | | | | |
Net investment income (loss) (a)
| 2.19 | | 1.85 | | 1.49 | | 1.48 | | 1.87 |
Net realized and unrealized gain (loss) (b)
| 1.29 | | (0.47) | | (8.60) | | 1.83 | | (2.06) |
Total from investment operations
| 3.48 | | 1.38 | | (7.11) | | 3.31 | | (0.19) |
Net equalization credits and charges (a)
| 0.00(c) | | 0.01 | | (0.01) | | 0.03 | | 0.04 |
Other capital (a)
| 0.02 | | 0.05 | | 0.03 | | 0.09 | | 0.13 |
| Distributions to shareholders from: | | | | | | | | | |
Net investment income
| (2.12) | | (1.86) | | (1.47) | | (1.53) | | (1.91) |
Net realized gains
| — | | — | | (1.22) | | — | | — |
Total distributions
| (2.12) | | (1.86) | | (2.69) | | (1.53) | | (1.91) |
Net asset value, end of period
| $42.17 | | $40.79 | | $41.21 | | $50.99 | | $49.09 |
Total return (d)
| 8.87% | | 3.63% | | (14.57)% | | 7.09% | | (0.04)% |
| Ratios and Supplemental Data: | | | | | | | | | |
Net assets, end of period (in 000s)
| $87,507 | | $79,532 | | $74,181 | | $123,643 | | $94,494 |
| Ratios to average net assets: | | | | | | | | | |
Total expenses
| 0.65% | | 0.66% | | 0.65% | | 0.72% | | 0.75% |
Net expenses
| 0.65% | | 0.66% | | 0.65% | | 0.65% | | 0.65% |
Net investment income (loss)
| 5.31% | | 4.57% | | 3.12% | | 2.95% | | 3.77% |
Portfolio turnover rate (e)
| 56% | | 48% | | 38% | | 77% | | 54% |
| (a) | Per share numbers have been calculated using average shares outstanding, which more appropriately presents the per share data for the year. |
| (b) | Amounts shown in this caption for a share outstanding may not accord with the change in aggregate gains and losses in securities for the fiscal period because of the timing of sales and repurchases of Fund shares in relation to fluctuating market values for the Fund. |
| (c) | Amount is less than $0.005 per share. |
| (d) | Total return is calculated assuming a purchase of shares at net asset value on the first day and a sale at net asset value on the last day of each period reported. Distributions are assumed, for the purpose of this calculation, to be reinvested at net asset value per share on the respective payment dates of each distribution. Total returns for periods of less than one year are not annualized. Broker commission charges are not included in this calculation. |
| (e) | Portfolio turnover rate excludes securities received or delivered from in-kind processing of creations or redemptions. |
See accompanying notes to financial statements.
119
SSGA ACTIVE TRUST
FINANCIAL HIGHLIGHTS (continued)
Selected data for a share outstanding throughout each period
| | SPDR DoubleLine Short Duration Total Return Tactical ETF |
| | Year
Ended
6/30/24 | | Year
Ended
6/30/23 | | Year
Ended
6/30/22 | | Year
Ended
6/30/21 | | Year
Ended
6/30/20 |
Net asset value, beginning of period
| $46.41 | | $46.59 | | $49.69 | | $49.57 | | $49.53 |
| Income (loss) from investment operations: | | | | | | | | | |
Net investment income (loss) (a)
| 2.30 | | 1.68 | | 0.69 | | 0.68 | | 1.08 |
Net realized and unrealized gain (loss) (b)
| 0.43 | | (0.22) | | (2.96) | | 0.14 | | 0.07 |
Total from investment operations
| 2.73 | | 1.46 | | (2.27) | | 0.82 | | 1.15 |
Net equalization credits and charges (a)
| 0.02 | | (0.01) | | (0.01) | | 0.01 | | 0.00(c) |
Contribution from affiliate (Note 5)
| — | | 0.00(c) | | — | | — | | — |
Other capital (a)
| 0.04 | | 0.02 | | 0.07 | | 0.01 | | 0.03 |
| Distributions to shareholders from: | | | | | | | | | |
Net investment income
| (2.27) | | (1.65) | | (0.73) | | (0.72) | | (1.14) |
Net realized gains
| — | | — | | (0.16) | | — | | — |
Total distributions
| (2.27) | | (1.65) | | (0.89) | | (0.72) | | (1.14) |
Net asset value, end of period
| $46.93 | | $46.41 | | $46.59 | | $49.69 | | $49.57 |
Total return (d)
| 6.14% | | 3.24% | | (4.52)% | | 1.70% | | 2.43% |
| Ratios and Supplemental Data: | | | | | | | | | |
Net assets, end of period (in 000s)
| $147,822 | | $127,631 | | $131,605 | | $160,239 | | $142,519 |
| Ratios to average net assets: | | | | | | | | | |
Total expenses
| 0.45% | | 0.46% | | 0.45% | | 0.49% | | 0.50% |
Net expenses
| 0.45% | | 0.46% | | 0.45% | | 0.45% | | 0.45% |
Net investment income (loss)
| 4.93% | | 3.63% | | 1.41% | | 1.36% | | 2.18% |
Portfolio turnover rate (e)
| 117% | | 34% | | 104% | | 58% | | 43% |
| (a) | Per share numbers have been calculated using average shares outstanding, which more appropriately presents the per share data for the year. |
| (b) | Amounts shown in this caption for a share outstanding may not accord with the change in aggregate gains and losses in securities for the fiscal period because of the timing of sales and repurchases of Fund shares in relation to fluctuating market values for the Fund. |
| (c) | Amount is less than $0.005 per share. |
| (d) | Total return is calculated assuming a purchase of shares at net asset value on the first day and a sale at net asset value on the last day of each period reported. Distributions are assumed, for the purpose of this calculation, to be reinvested at net asset value per share on the respective payment dates of each distribution. Total returns for periods of less than one year are not annualized. Broker commission charges are not included in this calculation. |
| (e) | Portfolio turnover rate excludes securities received or delivered from in-kind processing of creations or redemptions. |
See accompanying notes to financial statements.
120
SSGA ACTIVE TRUST
FINANCIAL HIGHLIGHTS (continued)
Selected data for a share outstanding throughout each period
| | SPDR DoubleLine Total Return Tactical ETF |
| | Year
Ended
6/30/24 | | Year
Ended
6/30/23 | | Year
Ended
6/30/22 | | Year
Ended
6/30/21 | | Year
Ended
6/30/20 |
Net asset value, beginning of period
| $40.45 | | $42.27 | | $48.46 | | $49.40 | | $48.96 |
| Income (loss) from investment operations: | | | | | | | | | |
Net investment income (loss) (a)
| 1.85 | | 1.68 | | 1.30 | | 1.09 | | 1.37 |
Net realized and unrealized gain (loss) (b)
| (0.61) | | (1.55) | | (5.91) | | (0.70) | | 0.59 |
Total from investment operations
| 1.24 | | 0.13 | | (4.61) | | 0.39 | | 1.96 |
Net equalization credits and charges (a)
| — | | — | | (0.00)(c) | | 0.00(c) | | (0.00)(c) |
Contribution from affiliate
| — | | — | | — | | 0.00(c) | | — |
Other capital (a)
| 0.02 | | 0.04 | | 0.01 | | 0.00(c) | | 0.03 |
| Distributions to shareholders from: | | | | | | | | | |
Net investment income
| (2.01) | | (1.99) | | (1.59) | | (1.33) | | (1.55) |
Net asset value, end of period
| $39.70 | | $40.45 | | $42.27 | | $48.46 | | $49.40 |
Total return (d)
| 3.27% | | 0.49% | | (9.75)% | | 0.81%(e) | | 4.13% |
| Ratios and Supplemental Data: | | | | | | | | | |
Net assets, end of period (in 000s)
| $2,918,070 | | $2,987,440 | | $2,244,695 | | $3,188,671 | | $3,191,242 |
| Ratios to average net assets: | | | | | | | | | |
Total expenses
| 0.55% | | 0.56% | | 0.55% | | 0.62% | | 0.65% |
Net expenses
| 0.55% | | 0.56% | | 0.55% | | 0.55% | | 0.55% |
Net investment income (loss)
| 4.70% | | 4.11% | | 2.79% | | 2.22% | | 2.80% |
Portfolio turnover rate (f)
| 120% | | 113% | | 119% | | 82%(f) | | 25% |
| (a) | Per share numbers have been calculated using average shares outstanding, which more appropriately presents the per share data for the year. |
| (b) | Amounts shown in this caption for a share outstanding may not accord with the change in aggregate gains and losses in securities for the fiscal period because of the timing of sales and repurchases of Fund shares in relation to fluctuating market values for the Fund. |
| (c) | Amount is less than $0.005 per share. |
| (d) | Total return is calculated assuming a purchase of shares at net asset value on the first day and a sale at net asset value on the last day of each period reported. Distributions are assumed, for the purpose of this calculation, to be reinvested at net asset value per share on the respective payment dates of each distribution. Total returns for periods of less than one year are not annualized. Broker commission charges are not included in this calculation. |
| (e) | If an affiliate had not made a contribution during the year ended ended June 30, 2021, the total return would have remained 0.81%. |
| (f) | Portfolio turnover rate excludes securities received or delivered from in-kind processing of creations or redemptions. |
See accompanying notes to financial statements.
121
SSGA ACTIVE TRUST
NOTES TO FINANCIAL STATEMENTS
June 30, 2024
1. Organization
SSGA Active Trust (the “Trust”), a Massachusetts business trust registered under the Investment Company Act of 1940, as amended (“1940 Act”), is an open-end management investment company.
As of June 30, 2024, the Trust consists of fourteen (14) series, each of which represents a separate series of beneficial interest in the Trust. The Declaration of Trust permits the Board of Trustees of the Trust (the “Board”) to authorize the issuance of an unlimited number of shares of beneficial interest with no par value. The financial statements herein relate to the following series (each, a “Fund” and collectively, the “Funds”):
| SPDR SSGA Multi-Asset Real Return ETF |
| SPDR SSGA Income Allocation ETF |
| SPDR SSGA Global Allocation ETF |
| SPDR SSGA Ultra Short Term Bond ETF |
| SPDR Loomis Sayles Opportunistic Bond ETF |
| SPDR Nuveen Municipal Bond ETF |
| SPDR Nuveen Municipal Bond ESG ETF |
| SPDR SSGA Fixed Income Sector Rotation ETF |
| SPDR SSGA US Sector Rotation ETF |
| SPDR DoubleLine Emerging Markets Fixed Income ETF |
| SPDR DoubleLine Short Duration Total Return Tactical ETF |
| SPDR DoubleLine Total Return Tactical ETF |
The SPDR SSGA Ultra Short Term Bond ETF, SPDR Loomis Sayles Opportunistic Bond ETF, SPDR Nuveen Municipal Bond ETF and SPDR Nuveen Municipal Bond ESG ETF are each classified as a non-diversified investment company. The remaining Funds are each classified as a diversified investment company under the 1940 Act.
Under the Trust’s organizational documents, its officers and Trustees are indemnified against certain liabilities arising out of the performance of their duties to the Trust. Additionally, in the normal course of business, the Trust enters into contracts with service providers that contain general indemnification clauses. The Trust’s maximum exposure under these arrangements is unknown as this would involve future claims that may be made against the Trust that have not yet occurred.
2. Summary of Significant Accounting Policies
The following is a summary of significant accounting policies followed by the Trust in the preparation of its financial statements:
The preparation of financial statements in accordance with U.S. generally accepted accounting principles (“U.S. GAAP”) requires management to make estimates and assumptions that affect the reported amounts and disclosures in the financial statements. Actual results could differ from those estimates. Each Fund is an investment company under U.S. GAAP and follows the accounting and reporting guidance applicable to investment companies.
Security Valuation
Each Fund's investments are valued at fair value each day that the New York Stock Exchange (“NYSE”) is open and, for financial reporting purposes, as of the report date should the reporting period end on a day that the NYSE is not open. Fair value is generally defined as the price a fund would receive to sell an asset or pay to transfer a liability in an orderly transaction between market participants at the measurement date. By its nature, a fair value price is a good faith estimate of the valuation in a current sale and may not reflect an actual market price. The investments of each Fund are valued pursuant to the policy and procedures developed by the Oversight Committee (the “Committee”) and approved by the Board. The Committee provides oversight of the valuation of investments for the Funds. The Board has responsibility for overseeing the determination of the fair value of investments.
Valuation techniques used to value each Fund’s investments by major category are as follows:
• Equity investments (including preferred stocks and registered investment companies that are exchange-traded funds) traded on a recognized securities exchange for which market quotations are readily available are valued at the last sale price or official closing price, as applicable, on the primary market or exchange on which they trade. Equity investments traded on a recognized exchange for which there were no sales on that day are valued at the last published sale price or at fair value.
• Investments in registered investment companies (including money market funds) or other unitized pooled investment vehicles that are not traded on an exchange are valued at that day’s published net asset value
SSGA ACTIVE TRUST
NOTES TO FINANCIAL STATEMENTS (continued)
June 30, 2024
(“NAV”) per share or unit.
• Government and municipal fixed income securities are generally valued using quotations from independent pricing services or brokers. Certain government inflation-indexed securities may require a calculated fair valuation as the cumulative inflation is contained within the price provided by the pricing service or broker. For these securities, the inflation component of the price is “cleaned” from the pricing service or broker price utilizing the published inflation factors in order to ensure proper accrual of income.
• Debt obligations (including short-term investments and convertible debt securities) are valued using quotations from independent pricing services or brokers or are generally valued at the last reported evaluated prices.
• Exchange-traded futures contracts are valued at the closing settlement price on the primary market on which they are traded most extensively. Exchange-traded futures contracts traded on a recognized exchange for which there were no sales on that day are valued at the last reported sale price obtained from independent pricing services or brokers or at fair value.
• Rights and warrants are valued at the last reported sale price obtained from independent pricing services or brokers on the valuation date. If no price is obtained from pricing services or brokers, valuation will be based upon the intrinsic value, pursuant to the valuation policy and procedures approved by the Board.
• Forward foreign currency exchange contracts are valued based on that day’s prevailing forward exchange rate for the underlying currencies. The rates are obtained from independent pricing services in accordance with the valuation policy and procedures approved by the Board.
• Swap agreements are valued daily based upon prices supplied by Board approved pricing vendors or through brokers. Depending on the product and terms of the transaction, the value of agreements is determined using a series of techniques including valuation models that incorporate a number of market data factors, such as discounted cash flows, yields, curves, trades and values of the underlying reference instruments. In the event the advisor is unable to obtain an independent, third–party valuation the agreements will be fair valued.
• Senior loans or other loans are valued at evaluated bid prices supplied by an independent pricing service, if available. Senior loans and other loans for which the Committee determines that there are no reliable valuations available from pricing services or brokers will be initially valued at cost and adjusted for amortization of principal until remeasurement is warranted due to a credit or economic event or other factors affecting the loan.
In the event prices or quotations are not readily available or that the application of these valuation methods results in a price for an investment that is deemed to be not representative of the fair value of such investment, fair value will be determined in good faith by the Committee, in accordance with the valuation policy and procedures approved by the Board.
Various inputs are used in determining the value of the Funds' investments.
The Funds value their assets and liabilities at fair value using a fair value hierarchy consisting of three broad levels that prioritize the inputs to valuation techniques giving the highest priority to readily available unadjusted quoted prices in active markets for identical assets or liabilities (Level 1 measurements) and the lowest priority to unobservable inputs (Level 3 measurements) when market prices are not readily available or reliable. The categorization of a value determined for an investment within the hierarchy is based upon the pricing transparency of the investment and is not necessarily an indication of the risk associated with investing in it.
The three levels of the fair value hierarchy are as follows:
• Level 1 – Unadjusted quoted prices in active markets for an identical asset or liability;
• Level 2 – Inputs other than quoted prices included within Level 1 that are observable for the asset or liability either directly or indirectly, including quoted prices for similar assets or liabilities in active markets, quoted prices for identical or similar assets or liabilities in markets that are not considered to be active, inputs other than quoted prices that are observable for the asset or liability (such as exchange rates, financing terms, interest rates, yield curves, volatilities, prepayment speeds, loss severities, credit risks and default rates) or other
SSGA ACTIVE TRUST
NOTES TO FINANCIAL STATEMENTS (continued)
June 30, 2024
market-corroborated inputs; and
• Level 3 – Unobservable inputs for the asset or liability, including the Committee’s assumptions used in determining the fair value of investments.
The value of each Fund’s investments, according to the fair value hierarchy as of June 30, 2024, is disclosed in each Fund’s respective Schedule of Investments.
Investment Transactions and Income Recognition
Investment transactions are accounted for on the trade date for financial reporting purposes. Realized gains and losses from the sale and disposition of investments are determined using the identified cost method.
Dividend income and capital gain distributions, if any, are recognized daily on the ex-dividend date, net of any foreign taxes withheld at source, if any. Interest income is recorded daily on an accrual basis. All premiums and discounts are amortized/accreted for financial reporting purposes.
Expenses
Certain expenses, which are directly identifiable to a specific Fund, are applied to that Fund within the Trust. Other expenses which cannot be attributed to a specific Fund are allocated in such a manner as deemed equitable, taking into consideration the nature and type of expense and the relative net assets of the Funds within the Trust.
Foreign Currency Translation
The accounting records of the Funds are maintained in U.S. dollars. Foreign currencies as well as investment securities and other assets and liabilities denominated in a foreign currency are translated to U.S. dollars using exchange rates at period end. Purchases and sales of securities, income receipts and expense payments denominated in foreign currencies are translated into U.S. dollars at the prevailing exchange rate on the respective dates of the transactions.
The effects of exchange rate fluctuations on investments are included with the net realized and unrealized gain (loss) on investment securities. Other foreign currency transactions resulting in realized and unrealized gain (loss) are disclosed separately.
Foreign Taxes
The Funds may be subject to foreign taxes (a portion of which may be reclaimable) on income, stock dividends, realized and unrealized capital gain on investments or certain foreign currency transactions. Foreign taxes are recorded in accordance with SSGA FM’s understanding of the applicable foreign tax regulations and rates that exist in the foreign jurisdictions in which the Funds invest. These foreign taxes, if any, are paid by the Funds and are reflected in the Statements of Operations, if applicable. Foreign taxes payable or deferred as of June 30, 2024, if any, are disclosed in the Funds’ Statements of Assets and Liabilities.
Equalization
The Funds follow the accounting practice known as “Equalization” by which a portion of the proceeds from sales and costs of reacquiring Fund shares, equivalent on a per share basis to the amount of distributable net investment income on the date of the transaction, is credited or charged to undistributed net investment income. As a result, undistributed net investment income per share is unaffected by sales or reacquisition of Fund shares. Amounts related to Equalization can be found on the Statements of Changes in Net Assets.
Distributions
Distributions from net investment income are declared and paid quarterly for SPDR SSGA Multi-Asset Real Return ETF, SPDR SSGA Income Allocation ETF, SPDR SSGA Global Allocation ETF and SPDR SSGA US Sector Rotation ETF and declared and paid monthly for SPDR SSGA Ultra Short Term Bond ETF, SPDR Loomis Sayles Opportunistic Bond ETF, SPDR DoubleLine Total Return Tactical ETF, SPDR DoubleLine Emerging Markets Fixed Income ETF, SPDR DoubleLine Short Duration Total Return Tactical ETF, SPDR SSGA Fixed Income Sector Rotation ETF, SPDR Nuveen Municipal Bond ESG ETF and SPDR Nuveen Municipal Bond ETF.
SSGA ACTIVE TRUST
NOTES TO FINANCIAL STATEMENTS (continued)
June 30, 2024
Net realized capital gains, if any, are distributed annually. Dividends may be declared and paid more frequently or at any other times to improve Index tracking or to comply with the distribution requirements of the Internal Revenue Code of 1986 (the "Internal Revenue Code"), as amended. The amount and character of income and capital gains to be distributed are determined in accordance with applicable tax regulations which may differ from net investment income and realized gains recognized for U.S. GAAP purposes.
3. Securities and Other Investments
Delayed Delivery Transactions
During the year, certain Funds transacted in securities on a delayed delivery or when-issued basis. Payment and delivery may take place after the customary settlement period for that security. The price of the underlying securities and the date when the securities will be delivered and paid for are fixed at the time the transaction is negotiated. The securities purchased on a delayed delivery or when-issued basis are identified as such in each applicable Fund’s Schedule of Investments. The Funds may receive compensation for interest forgone in the purchase of a delayed delivery or when-issued security. With respect to purchase commitments, the Funds identify securities as segregated in their records with a value at least equal to the amount of the commitment. Losses may arise due to changes in the value of the underlying securities or if the counterparty does not perform under the contract’s terms, or if the issuer does not issue the securities due to political, economic or other factors.
Loan Agreements
The SPDR Loomis Sayles Opportunistic Bond ETF, SPDR DoubleLine Short Duration Total Return Tactical ETF and SPDR DoubleLine Total Return Tactical ETF invest in Senior Loans. Senior Loans consist generally of obligations of companies and other entities (collectively, “borrowers”) incurred for the purpose of reorganizing the assets and liabilities of a borrower; acquiring another company; taking over control of a company (leveraged buyout); temporary refinancing; or financing internal growth or other general business purposes. Senior Loans are often obligations of borrowers who have incurred a significant percentage of debt compared to their total assets and thus are highly leveraged. Funds do not treat the banks originating or acting as agents for the lenders, or granting or acting as intermediary in participation interests, in loans held by the Funds as the issuers of such loans.
4. Derivative Financial Instruments
Forward Foreign Currency Exchange Contracts
The SPDR Loomis Sayles Opportunitistic Bond ETF may engage in forward foreign currency exchange contracts to acquire exposure to foreign currencies or to hedge the Fund's investments against currency fluctuations. A forward foreign currency exchange contract is a commitment to purchase or sell a foreign currency at the settlement date at a negotiated rate. Non-deliverable forward foreign currency exchange contracts are settled with the counterparty in cash without the delivery of foreign currency. The contract is marked-to-market daily and the change in market value is recorded by the Fund as an unrealized gain or loss. When the contract is closed, the Fund recognizes a realized gain or loss equal to the difference between the value of the contract at the time it was opened and the value at the time it was closed. Certain risks may arise upon entering into forward foreign currency exchange contracts from the potential inability of counterparties to meet the terms of their contracts and are generally limited to the amount of unrealized gains on appreciated contracts, if any. Additionally, when utilizing forward foreign currency exchange contracts to hedge, the Fund gives up the opportunity to profit from favorable exchange rate movements during the term of the contract. For the year ended June 30, 2024, the Fund entered into forward foreign currency exchange contracts to offset the Fund’s exposure to the component currencies.
Futures Contracts
The Funds may enter into futures contracts to meet the Funds' objectives. A futures contract is a standardized, exchange-traded agreement to buy or sell a financial instrument at a set price on a future date. Upon entering into a futures contract, the Funds are required to deposit with the broker, cash or securities in an amount equal to the minimum initial margin requirements of the clearing house. Securities deposited, if any, are designated on the Schedules of Investments and cash deposited, if any, is included in Net cash at broker on the Statements of Assets and Liabilities. Subsequent payments are made or received by the Funds equal to the daily change in the contract value, accumulated, exchange rates, and or other transactional fees. The accumulation of those payments are recorded as variation margin receivable or payable with a corresponding offset to unrealized gains or losses. The Funds recognize a realized gain or loss when the contract is closed.
SSGA ACTIVE TRUST
NOTES TO FINANCIAL STATEMENTS (continued)
June 30, 2024
Losses may arise if the value of a futures contract decreases due to unfavorable changes in the market rates or values of the underlying instrument during the term of the contract or if the counterparty does not perform under the contract. The use of futures contracts also involves the risk that the movements in the price of the futures contracts do not correlate with the movement of the assets underlying such contracts.
Swaps
Certain Funds may enter into swap agreements, in which a Fund and counterparty agree either to make periodic net payments on a specified notional amount or a net payment upon termination. Swap agreements are privately negotiated in the OTC market and may be entered into as a bilateral contract (“BL OTC”) or centrally cleared (“centrally cleared swaps”). Swaps are marked-to-market daily and changes in value are recorded as unrealized appreciation (depreciation).
A BL OTC swap is a transaction between a fund and dealer counterparty where cash flows are exchanged between the two parties for the life of the swap. For BL OTC swaps, any upfront premiums paid are recorded as assets and any upfront fees received are recorded as liabilities and are shown as credit default swap contracts premiums paid and credit default swap contracts premiums received, respectively, in the Statement of Assets and Liabilities and amortized to realized gain/loss ratably over the term of the BL OTC swap. Payments received or made by the Fund for BL OTC swaps are recorded in the Statement of Operations as realized gains or losses, respectively. When a BL OTC swap is terminated, the Fund will record a realized gain or loss equal to the difference between the proceeds from (or cost of) the closing transaction and a Fund’s basis in the contract, if any. Generally, the basis of the contracts is the premium received or paid.
A centrally cleared OTC swap is a transaction executed between a fund and a dealer counterparty, then cleared by a futures commission merchant (FCM) through a clearinghouse. Once cleared, the clearinghouse serves as a central counterparty (“CCP”), with whom a fund exchanges cash flows for the life of the transaction, similar to transactions in futures contracts.
A Fund is required to interface with the CCP through a broker. Upon entering into a centrally cleared swap, the Fund is required to deposit initial margin with the broker in the form of cash or securities in an amount that varies depending on the size and risk profile of the particular swap. Securities deposited as initial margin if any, are designated on the Schedule of Investments and cash deposited is segregated and recorded on the Statement of Assets and Liabilities as due from broker. The daily change in valuation of centrally cleared swaps is recorded as a receivable or payable for variation margin in the Statement of Assets and Liabilities. Payments received from (paid to) the counterparty, including at termination, are recorded as realized gain (loss) in the Statement of Operations. For both bi-lateral and centrally cleared OTC swaps, payments are exchanged at specified intervals, accrued daily commencing with the effective date of the contract and recorded as realized gain or (loss). Some swaps may be terminated prior to the effective date and realize a gain or loss upon termination.
Interest Rate Swaps
Interest rate swaps involve the exchange by the Fund with another party of their respective commitments to pay or receive interest, such as an exchange of fixed rate payments for floating rate payments. During the fiscal year ended June 30, 2024, the SPDR Loomis Sayles Opportunistic Bond ETF entered into interest rate swaps in order to manage interest rate risk.
Credit Default Swaps
During the year ended June 30, 2024, the SPDR Loomis Sayles Opportunistic Bond ETF engaged in credit default swaps to manage credit risk. When the Fund is the buyer in a credit default swap contract, the Fund is entitled to receive the par (or other agreed upon) value (full notional value) of a referenced debt obligation (or basket of debt obligations) from the counterparty (or central clearing party (“CCP”) in the case of a centrally cleared swap) to the contract if a credit event by a third party, such as a U.S. or foreign corporate issuer or sovereign issuer, on the debt obligation occurs. In return, the Fund pays the counterparty a periodic stream of payments over the term of the contract provided that no credit event has occurred. If no credit event occurs, the Fund loses its investment and recovers nothing. However, if a credit event occurs, the Fund receives full notional value for a referenced debt obligation that may have little or no value. When the Fund is the seller of a credit default swap, it receives a fixed rate of income throughout the term of the contract, provided there is no credit event. If a credit event occurs, the Fund is obligated to pay the notional amount of the swap and in certain instances take delivery of securities of the reference entity upon the occurrence of a credit event, as defined under the terms of that particular swap agreement. Credit events are contract specific but may include bankruptcy, failure to pay, restructuring, obligation acceleration and repudiation/moratorium. If the Fund is a seller of protection and a credit event occurs, the maximum potential amount of future payments that the Fund could be required to make would be an amount equal to the notional amount of the agreement. This potential amount would be partially offset by any recovery value of
SSGA ACTIVE TRUST
NOTES TO FINANCIAL STATEMENTS (continued)
June 30, 2024
the respective referenced obligation, or net amount received from the settlement.
As the seller, the Fund may create economic leverage to its portfolio because, in addition to its total net assets, the Fund is subject to investment exposure on the notional amount of the swap. The interest fee paid or received on the swap, which is based on a specified interest rate on a fixed notional amount, is accrued daily as a component.
The following tables summarize the value of the Fund's derivative instruments as of June 30, 2024, and the related location in the accompanying Statements of Assets and Liabilities and Statements of Operations, presented by primary underlying risk exposure:
| | Asset Derivatives |
| | Interest
Rate
Risk | | Foreign
Exchange
Risk | | Credit
Risk | | Equity
Risk | | Commodity
Risk | | Total |
| SPDR SSGA Ultra Short Term Bond ETF | | | | | | | | | | | |
Futures Contracts
| $118,781 | | $— | | $— | | $— | | $— | | $118,781 |
| SPDR Loomis Sayles Opportunistic Bond ETF | | | | | | | | | | | |
Futures Contracts
| 71,842 | | — | | — | | — | | — | | 71,842 |
| SPDR DoubleLine Total Return Tactical ETF | | | | | | | | | | | |
Futures Contracts
| 16,658,642 | | — | | — | | — | | — | | 16,658,642 |
| | Net Realized Gain (Loss) |
| | Interest
Rate
Risk | | Foreign
Exchange
Risk | | Credit
Risk | | Equity
Risk | | Commodity
Risk | | Total |
| SPDR SSGA Ultra Short Term Bond ETF | | | | | | | | | | | |
Futures Contracts
| $(958,542) | | $— | | $— | | $— | | $— | | $(958,542) |
| SPDR Loomis Sayles Opportunistic Bond ETF | | | | | | | | | | | |
Futures Contracts
| (374,990) | | — | | — | | — | | — | | (374,990) |
Swap Contracts
| (13,204) | | — | | (18,282) | | — | | — | | (31,486) |
| SPDR DoubleLine Total Return Tactical ETF | | | | | | | | | | | |
Futures Contracts
| 1,353,927 | | — | | — | | — | | — | | 1,353,927 |
| | Net Change in Unrealized Appreciation/Depreciation |
| | Interest
Rate
Risk | | Foreign
Exchange
Risk | | Credit
Risk | | Equity
Risk | | Commodity
Risk | | Total |
| SPDR SSGA Ultra Short Term Bond ETF | | | | | | | | | | | |
Futures Contracts
| $413,542 | | $— | | $— | | $— | | $— | | $413,542 |
| SPDR Loomis Sayles Opportunistic Bond ETF | | | | | | | | | | | |
Futures Contracts
| 62,638 | | — | | — | | — | | — | | 62,638 |
Swap Contracts
| 27,192 | | — | | — | | — | | — | | 27,192 |
| SPDR DoubleLine Total Return Tactical ETF | | | | | | | | | | | |
Futures Contracts
| 16,623,460 | | — | | — | | — | | — | | 16,623,460 |
5. Fees and Transactions with Affiliates
Advisory Fee
The Trust on behalf of each Fund, has entered into an Investment Advisory Agreement with SSGA FM. As compensation for services rendered, facilities furnished, and expenses borne by the Adviser, each Fund pays the Adviser a fee (“Management/Advisory fee”) accrued daily and paid monthly, based on a percentage of each Fund’s
SSGA ACTIVE TRUST
NOTES TO FINANCIAL STATEMENTS (continued)
June 30, 2024
average daily net assets as shown in the following table:
| | Annual Rate |
SPDR SSGA Multi-Asset Real Return ETF
| 0.50%* |
SPDR SSGA Income Allocation ETF
| 0.50* |
SPDR SSGA Global Allocation ETF
| 0.35* |
SPDR SSGA Ultra Short Term Bond ETF
| 0.20 |
SPDR Loomis Sayles Opportunistic Bond ETF
| 0.55* |
SPDR Nuveen Municipal Bond ETF
| 0.40 |
SPDR Nuveen Municipal Bond ESG ETF
| 0.43 |
SPDR SSGA Fixed Income Sector Rotation ETF
| 0.50* |
SPDR SSGA US Sector Rotation ETF
| 0.70* |
SPDR DoubleLine Emerging Markets Fixed Income ETF
| 0.65 |
SPDR DoubleLine Short Duration Total Return Tactical ETF
| 0.45 |
SPDR DoubleLine Total Return Tactical ETF
| 0.55 |
| * | The Advisory fees are reduced for SPDR SSGA Multi-Asset Real Return ETF, SPDR SSGA Income Allocation ETF, SPDR SSGA Global Allocation ETF, SPDR Loomis Sayles Opportunistic Bond ETF, SPDR SSGA Fixed Income Sector Rotation ETF and SPDR SSGA US Sector Rotation ETF by the acquired fund fees and expenses and for the year ended June 30, 2024, the net annualized advisory fees were 0.13%, 0.18%, 0.15%, 0.52%, 0.36% and 0.57%, respectively. |
With respect to each Fund, the Management fee is reduced by the acquired fund fees and expenses attributable to the Fund's investments in other investment companies (except acquired fund fees and expenses associated with holdings of acquired funds for cash management purposes).
From time to time, the Adviser may waive all or a portion of it's Management fee. The Adviser pays all expenses of each Fund other than the Management fee, brokerage expenses, taxes, interest, fees and expenses of the Trusts's trustees, who are not “interested persons” of the Trust, as defined in the 1940 Act (“Independent Trustees”) (including any Trustee’s counsel fees), acquired fund fees and expenses, litigation expenses and other extraordinary expenses.
Administrator, Custodian, Sub-Administrator and Transfer Agent Fees
SSGA FM serves as administrator and State Street Bank and Trust Company (“State Street”), an affiliate of the Adviser, serves as custodian, sub-administrator and transfer agent. State Street receives fees for its services as custodian, sub-administrator and transfer agent from the Adviser.
Distributor
State Street Global Advisors Funds Distributors, LLC (“SSGA FD” or the “Distributor”), an affiliate of the Adviser, serves as the Distributor of the Trust.
Other Transactions with Affiliates - Securities Lending
State Street, an affiliate of the Funds, acts as the securities lending agent for the Funds, pursuant to an amended and restated securities lending authorization agreement dated January 6, 2017, as amended.
Net proceeds collected by State Street on investment of cash collateral or any fee income less rebates payable to borrowers, are paid as follows: If the calendar year to date net proceeds are below a specified threshold across SPDR ETFs, each Fund retains eighty five percent (85%) of the net proceeds and fifteen percent (15%) of such net proceeds is payable to State Street. Starting the business day following the date that calendar year to date net proceeds exceeds a specified threshold, each Fund retains ninety percent (90%) of the net proceeds and ten percent (10%) of such net proceeds is payable to State Street.
In addition, cash collateral from lending activities is invested in the State Street Navigator Securities Lending Portfolio II, an affiliated fund, for which SSGA FM serves as investment adviser. See Note 10 for additional information regarding securities lending.
SSGA ACTIVE TRUST
NOTES TO FINANCIAL STATEMENTS (continued)
June 30, 2024
Other Transactions with Affiliates
The Funds may invest in affiliated entities, including securities issued by State Street Corporation, affiliated funds, or entities deemed to be affiliates as a result of the Funds owning more than five percent of the entity’s voting securities or outstanding shares. Amounts relating to these transactions during the year ended June 30, 2024, are disclosed in the Schedules of Investments.
During the fiscal year ended June 30, 2023 State Street made a contribution of $7,309 to the SPDR DoubleLine Short Duration Total Return Tactical ETF related to an accounting matter.
Due to Custodian
In certain circumstances, the Funds may have cash overdrafts with the Custodian due to expense payments, capital transactions, trading of securities, investment operations or derivative transactions. The Due to Custodian amount, if any, reflects cash overdrawn with State Street, as custodian, who is an affiliate of the Funds.
6. Trustees’ Fees
The fees and expenses of the Independent Trustees and one interested, non-management Trustee are paid directly by the Funds. The Independent Trustees and one interested, non-management Trustee are reimbursed for travel and other out-of-pocket expenses in connection with meeting attendance and industry seminars.
7. Investment Transactions
Purchases and sales of investments (excluding in-kind transactions and short term investments) for the year ended June 30, 2024, were as follows:
| | U.S. Government Obligations | | Other Securities |
| | Purchases | | Sales | | Purchases | | Sales |
SPDR SSGA Multi-Asset Real Return ETF
| $— | | $— | | $121,601,674 | | $99,530,232 |
SPDR SSGA Income Allocation ETF
| — | | — | | 52,191,717 | | 51,141,090 |
SPDR SSGA Global Allocation ETF
| — | | — | | 261,611,965 | | 260,616,690 |
SPDR SSGA Ultra Short Term Bond ETF
| 34,488,586 | | 31,769,151 | | 233,187,805 | | 213,354,487 |
SPDR Loomis Sayles Opportunistic Bond ETF
| — | | — | | 32,036,715 | | 25,364,796 |
SPDR Nuveen Municipal Bond ETF
| 500,000 | | — | | 19,213,531 | | 15,375,197 |
SPDR Nuveen Municipal Bond ESG ETF
| — | | — | | 13,415,644 | | 12,414,480 |
SPDR SSGA Fixed Income Sector Rotation ETF
| — | | — | | 198,398,448 | | 198,039,435 |
SPDR SSGA US Sector Rotation ETF
| — | | — | | 805,127,732 | | 805,669,472 |
SPDR DoubleLine Emerging Markets Fixed Income ETF
| — | | — | | 48,596,099 | | 43,418,234 |
SPDR DoubleLine Short Duration Total Return Tactical ETF
| 137,813,381 | | 119,274,372 | | 55,183,630 | | 40,501,144 |
SPDR DoubleLine Total Return Tactical ETF
| 3,089,525,608 | | 3,098,252,611 | | 415,037,698 | | 555,722,455 |
For the year ended June 30, 2024, the following Funds had in-kind contributions, redemptions and net realized gains/losses in the amounts as follows:
| | In-kind
Contributions | | In-kind
Redemptions | | In-kind Net
Realized
Gains/(Losses) |
SPDR SSGA Multi-Asset Real Return ETF
| $206,236,897 | | $249,910,010 | | $10,578,785 |
SPDR SSGA Income Allocation ETF
| 10,334,366 | | 12,489,307 | | 513,765 |
SPDR SSGA Global Allocation ETF
| 25,082,457 | | 34,613,379 | | 6,435,230 |
SPDR Loomis Sayles Opportunistic Bond ETF
| — | | 34,106 | | 1,966 |
SPDR Nuveen Municipal Bond ETF
| 1,279,758 | | — | | — |
SPDR Nuveen Municipal Bond ESG ETF
| 2,876,026 | | — | | — |
SPDR SSGA Fixed Income Sector Rotation ETF
| 156,566,993 | | 94,677,128 | | 848,513 |
SSGA ACTIVE TRUST
NOTES TO FINANCIAL STATEMENTS (continued)
June 30, 2024
| | In-kind
Contributions | | In-kind
Redemptions | | In-kind Net
Realized
Gains/(Losses) |
SPDR SSGA US Sector Rotation ETF
| $271,135,987 | | $89,987,280 | | $19,497,420 |
8. Shareholder Transactions
Each Fund issues and redeems its shares, at NAV, by each Fund only in aggregations of a specified number of shares or multiples thereof (“Creation Units”). Except when aggregated in Creation Units, shares of each Fund are not redeemable. Transactions in capital shares for each Fund are disclosed in detail in the Statements of Changes in Net Assets.
The consideration for the purchase of Creation Units of a Fund may consist of the in-kind deposit of a designated portfolio of securities and a specified amount of cash. Investors purchasing and redeeming Creation Units may pay a purchase transaction fee and a redemption transaction fee directly to the Trust and/or custodian, to offset transfer and other transaction costs associated with the issuance and redemption of Creation Units, including Creation Units for cash. An additional variable fee may be charged for certain transactions. Such variable charges, if any, are included in “Other Capital” on the Statements of Changes in Net Assets.
9. Income Tax Information
The Funds have qualified and intend to continue to qualify as regulated investment companies under Subchapter M of the Internal Revenue Code of 1986, as amended. Each Fund will not be subject to federal income taxes to the extent it distributes its taxable income, including any net realized capital gains, for each fiscal year. Therefore, no provision for federal income tax is required.
The Funds file federal and various state and local tax returns as required. No income tax returns are currently under examination. Generally, the federal returns are subject to examination by the Internal Revenue Service for a period of three years from date of filing, while the state returns may remain open for an additional year depending upon jurisdiction. SSGA FM has analyzed each Fund's tax positions taken on tax returns for all open years and does not believe there are any uncertain tax positions that would require recognition of a tax liability.
Distributions to shareholders are recorded on ex-dividend date. Income dividends and gain distributions are determined in accordance with income tax rules and regulations, which may differ from generally accepted accounting principles.
Certain capital accounts in the financial statements have been adjusted for permanent book-tax differences. These adjustments have no impact on net asset values or results of operations. Temporary book-tax differences will reverse in the future. These book-tax differences are primarily due to differing treatments for in-kind transactions, paydown gain and losses, distributions in excess of current earnings and wash sale loss deferrals. In addition, certain funds claimed a portion of the payments made to redeeming shareholders as a distribution for income tax purposes.
The tax character of distributions paid during the year ended June 30, 2024, was as follows:
| | Ordinary
Income | | Tax Exempt
Income | | Long-Term
Capital Gains | | Tax Return
of Capital | | Total |
SPDR SSGA Multi-Asset Real Return ETF
| $18,919,980 | | $— | | $— | | $— | | $18,919,980 |
SPDR SSGA Income Allocation ETF
| 3,403,476 | | — | | — | | — | | 3,403,476 |
SPDR SSGA Global Allocation ETF
| 6,567,105 | | — | | — | | — | | 6,567,105 |
SPDR SSGA Ultra Short Term Bond ETF
| 29,406,186 | | — | | — | | — | | 29,406,186 |
SPDR Loomis Sayles Opportunistic Bond ETF
| 2,326,244 | | — | | — | | — | | 2,326,244 |
SPDR Nuveen Municipal Bond ETF
| 38,661 | | 971,681 | | — | | 166,316 | | 1,176,658 |
SPDR Nuveen Municipal Bond ESG ETF
| 22,151 | | 1,137,407 | | — | | 31,490 | | 1,191,048 |
SPDR SSGA Fixed Income Sector Rotation ETF
| 7,036,820 | | — | | — | | — | | 7,036,820 |
SPDR SSGA US Sector Rotation ETF
| 3,767,056 | | — | | — | | — | | 3,767,056 |
SPDR DoubleLine Emerging Markets Fixed Income ETF
| 4,169,072 | | — | | — | | — | | 4,169,072 |
SSGA ACTIVE TRUST
NOTES TO FINANCIAL STATEMENTS (continued)
June 30, 2024
| | Ordinary
Income | | Tax Exempt
Income | | Long-Term
Capital Gains | | Tax Return
of Capital | | Total |
SPDR DoubleLine Short Duration Total Return Tactical ETF
| $7,257,475 | | $— | | $— | | $— | | $7,257,475 |
SPDR DoubleLine Total Return Tactical ETF
| 154,475,171 | | — | | — | | — | | 154,475,171 |
The tax character of distributions paid during the year ended June 30, 2023, was as follows:
| | Ordinary
Income | | Tax Exempt
Income | | Long-Term
Capital Gains | | Tax Return
of Capital | | Total |
SPDR SSGA Multi-Asset Real Return ETF
| $ 32,025,253 | | $ — | | $ — | | $ — | | $ 32,025,253 |
SPDR SSGA Income Allocation ETF
| 4,182,212 | | — | | — | | — | | 4,182,212 |
SPDR SSGA Global Allocation ETF
| 9,050,475 | | — | | 5,169,736 | | — | | 14,220,211 |
SPDR SSGA Ultra Short Term Bond ETF
| 13,852,204 | | — | | — | | — | | 13,852,204 |
SPDR Loomis Sayles Opportunistic Bond ETF
| 1,679,743 | | — | | — | | — | | 1,679,743 |
SPDR Nuveen Municipal Bond ETF
| 76,677 | | 453,534 | | — | | 389,728 | | 919,939 |
SPDR Nuveen Municipal Bond ESG ETF
| 5,789 | | 968,991 | | — | | — | | 974,780 |
SPDR SSGA Fixed Income Sector Rotation ETF
| 3,737,844 | | — | | — | | — | | 3,737,844 |
SPDR SSGA US Sector Rotation ETF
| 4,093,813 | | — | | — | | — | | 4,093,813 |
SPDR DoubleLine Emerging Markets Fixed Income ETF
| 3,330,606 | | — | | — | | — | | 3,330,606 |
SPDR DoubleLine Short Duration Total Return Tactical ETF
| 4,502,769 | | — | | — | | — | | 4,502,769 |
SPDR DoubleLine Total Return Tactical ETF
| 117,444,339 | | — | | — | | — | | 117,444,339 |
At June 30, 2024, the components of distributable earnings on a tax basis were as follows:
| | Undistributed
Ordinary Income | | Capital Loss
Carryforwards | | Undistributed
Long-Term
Capital Gains | | Net Unrealized
Gains (Losses) | | Total |
SPDR SSGA Multi-Asset Real Return ETF
| $379,502 | | $(69,223,448) | | $— | | $(20,955,513) | | $(89,799,459) |
SPDR SSGA Income Allocation ETF
| 247,328 | | (20,730,057) | | — | | (2,416,165) | | (22,898,894) |
SPDR SSGA Global Allocation ETF
| — | | (5,069,077) | | — | | 19,523,401 | | 14,454,324 |
SPDR SSGA Ultra Short Term Bond ETF
| 1,891,132 | | (668,356) | | — | | 367,928 | | 1,590,704 |
SPDR Loomis Sayles Opportunistic Bond ETF
| 79,920 | | (4,842,205) | | — | | (205,735) | | (4,968,020) |
SPDR Nuveen Municipal Bond ETF
| — | | (1,540,698) | | — | | (700,916) | | (2,241,614) |
SPDR Nuveen Municipal Bond ESG ETF
| — | | (171,105) | | — | | 72,953 | | (98,152) |
SPDR SSGA Fixed Income Sector Rotation ETF
| 97,326 | | (23,992,993) | | — | | (2,847,293) | | (26,742,960) |
SPDR SSGA US Sector Rotation ETF
| — | | (2,542,738) | | — | | 68,498,957 | | 65,956,219 |
SPDR DoubleLine Emerging Markets Fixed Income ETF
| 253,691 | | (9,267,792) | | — | | (4,017,196) | | (13,031,297) |
SPDR DoubleLine Short Duration Total Return Tactical ETF
| 781,546 | | (6,435,142) | | — | | (2,819,859) | | (8,473,455) |
SPDR DoubleLine Total Return Tactical ETF
| 15,876,313 | | (409,366,142) | | — | | (205,512,584) | | (599,002,413) |
As of June 30, 2024, the following Funds had capital loss carryforwards available to offset future realized capital gains as follows:
| | Non-Expiring
Short Term | | Non-Expiring
Long Term |
SPDR SSGA Multi-Asset Real Return ETF
| $25,185,470 | | $44,037,978 |
SPDR SSGA Income Allocation ETF
| 9,691,891 | | 11,038,166 |
SPDR SSGA Global Allocation ETF
| 5,069,077 | | — |
SPDR SSGA Ultra Short Term Bond ETF
| 84,686 | | 583,670 |
SPDR Loomis Sayles Opportunistic Bond ETF
| 3,017,887 | | 1,824,318 |
SPDR Nuveen Municipal Bond ETF
| — | | 1,540,698 |
SPDR Nuveen Municipal Bond ESG ETF
| 160,923 | | 10,182 |
SSGA ACTIVE TRUST
NOTES TO FINANCIAL STATEMENTS (continued)
June 30, 2024
| | Non-Expiring
Short Term | | Non-Expiring
Long Term |
SPDR SSGA Fixed Income Sector Rotation ETF
| $11,705,994 | | $12,286,999 |
SPDR SSGA US Sector Rotation ETF
| 1,248,724 | | 1,294,014 |
SPDR DoubleLine Emerging Markets Fixed Income ETF
| — | | 9,267,792 |
SPDR DoubleLine Short Duration Total Return Tactical ETF
| 2,914,169 | | 3,520,973 |
SPDR DoubleLine Total Return Tactical ETF
| 183,874,983 | | 225,491,159 |
As of June 30, 2024, gross unrealized appreciation and gross unrealized depreciation of investments and other financial instruments based on cost for federal income tax purposes were as follows:
| | Tax
Cost | | Gross
Unrealized
Appreciation | | Gross
Unrealized
Depreciation | | Net Unrealized
Appreciation
(Depreciation) |
SPDR SSGA Multi-Asset Real Return ETF
| $567,744,465 | | $4,975,053 | | $25,930,566 | | $(20,955,513) |
SPDR SSGA Income Allocation ETF
| 85,786,284 | | 1,265,875 | | 3,682,040 | | (2,416,165) |
SPDR SSGA Global Allocation ETF
| 254,501,999 | | 22,329,643 | | 2,806,242 | | 19,523,401 |
SPDR SSGA Ultra Short Term Bond ETF
| 572,217,480 | | 1,196,217 | | 828,289 | | 367,928 |
SPDR Loomis Sayles Opportunistic Bond ETF
| 38,096,349 | | 502,625 | | 708,364 | | (205,739) |
SPDR Nuveen Municipal Bond ETF
| 49,589,529 | | 694,944 | | 1,395,860 | | (700,916) |
SPDR Nuveen Municipal Bond ESG ETF
| 39,599,252 | | 473,030 | | 400,078 | | 72,952 |
SPDR SSGA Fixed Income Sector Rotation ETF
| 262,469,735 | | 15,222 | | 2,862,515 | | (2,847,293) |
SPDR SSGA US Sector Rotation ETF
| 558,397,460 | | 68,538,846 | | 39,889 | | 68,498,957 |
SPDR DoubleLine Emerging Markets Fixed Income ETF
| 90,802,736 | | 964,185 | | 4,981,460 | | (4,017,275) |
SPDR DoubleLine Short Duration Total Return Tactical ETF
| 149,271,587 | | 641,690 | | 3,461,549 | | (2,819,859) |
SPDR DoubleLine Total Return Tactical ETF
| 3,114,321,301 | | 20,031,842 | | 225,544,480 | | (205,512,638) |
10. Securities Lending
Each Fund may lend securities to qualified broker-dealers or institutional investors. The loans are secured at all times by cash, cash equivalents or U.S. government securities in an amount at least equal to the market value of the securities loaned, plus accrued interest and dividends, determined on a daily basis and adjusted accordingly. The value of the collateral with respect to a loaned security may be temporarily more or less than the value of a security due to market fluctuations of securities values. With respect to each loan, if on any U.S. business day the aggregate market value of securities collateral plus cash collateral is less than the aggregate market value of the securities which are subject to the loan, the borrower will be notified to provide additional collateral on the next business day.
The Funds will regain record ownership of loaned securities to exercise certain beneficial rights; however, the Funds may bear the risk of delay in recovery of, or even loss of rights in the securities loaned should the borrower fail financially. In addition, the Funds will bear the risk of loss of any cash collateral that it may invest. The Funds receives compensation for lending its securities from interest or dividends earned on the cash, cash equivalents or U.S. government securities held as collateral, net of fee rebates paid to the borrower and net of fees paid to State Street as the lending agent. Additionally, the Funds will receive a fee from the borrower for non-cash collateral equal to a percentage of the market value of the loaned securities.
The market value of securities on loan as of June 30, 2024, and the value of the invested cash collateral are disclosed in the Funds' Statements of Assets and Liabilities. Non-cash collateral is not disclosed in the Funds' Statements of Assets and Liabilities as it is held by the lending agent on behalf of the Funds, and the Funds does not have the ability to re-hypothecate those securities. Securities lending income, as disclosed in the Funds' Statements of Operations, represents the income earned from the non-cash collateral and the investment of cash collateral, net of fee rebates paid to the borrower and net of fees paid to State Street as lending agent.
SSGA ACTIVE TRUST
NOTES TO FINANCIAL STATEMENTS (continued)
June 30, 2024
The following is a summary of each Fund's securities lending agreements and related cash and non-cash collateral received as of June 30, 2024:
| Fund | | Market Value of
Securities on Loan | | Cash
Collateral
Received | | Non-Cash
Collateral
Received* | | Total
Collateral
Received |
SPDR SSGA Multi-Asset Real Return ETF
| | $ 35,995,925 | | $ 34,075,823 | | $ 2,554,475 | | $ 36,630,298 |
SPDR SSGA Income Allocation ETF
| | 17,444,191 | | 13,527,077 | | 4,225,775 | | 17,752,852 |
SPDR SSGA Global Allocation ETF
| | 35,541,617 | | 36,137,931 | | 223,450 | | 36,361,381 |
SPDR SSGA Fixed Income Sector Rotation ETF
| | 21,688,794 | | 21,612,719 | | 697,700 | | 22,310,419 |
SPDR SSGA US Sector Rotation ETF
| | 69,356,296 | | 71,204,113 | | — | | 71,204,113 |
| * | The non-cash collateral includes U.S. Treasuries and U.S. Government Agency securities. |
The following table reflects a breakdown of transactions accounted for as secured borrowings, the gross obligation by the type of collateral pledged or securities loaned, and the remaining contractual maturity of those transactions as of June 30, 2024:
| | | | | Remaining Contractual Maturity of the Agreements
as of June 30, 2024 |
| Fund | | Securities
Lending
Transactions | | Overnight
and
Continuous | | <30 Days | | Between
30 & 90
Days | | >90 Days | | Total
Borrowings | | Gross Amount
of Recognized
Liabilities for
Securities Lending Transactions |
SPDR SSGA Multi-Asset Real Return ETF
| | Mutual Funds and Exchange Traded Products | | $34,075,823 | | $— | | $— | | $— | | $34,075,823 | | $34,075,823 |
SPDR SSGA Income Allocation ETF
| | Mutual Funds and Exchange Traded Products | | 13,527,077 | | — | | — | | — | | 13,527,077 | | 13,527,077 |
SPDR SSGA Global Allocation ETF
| | Mutual Funds and Exchange Traded Products | | 36,137,931 | | — | | — | | — | | 36,137,931 | | 36,137,931 |
SPDR SSGA Fixed Income Sector Rotation ETF
| | Mutual Funds and Exchange Traded Products | | 21,612,719 | | — | | — | | — | | 21,612,719 | | 21,612,719 |
SPDR SSGA US Sector Rotation ETF
| | Mutual Funds and Exchange Traded Products | | 71,204,113 | | — | | — | | — | | 71,204,113 | | 71,204,113 |
11. Line of Credit
Certain Funds and other affiliated funds (each a “Participant” and, collectively, the “Participants”) have access to $180 million of a $960 million ($200 million of $1.275 billion prior to October 5, 2023) revolving credit facility provided by a syndication of banks under which the Participants may borrow to fund shareholder redemptions. This agreement expires in October 2024 unless extended or renewed.
The following Funds participate in the credit facility as of June 30, 2024:
| SPDR SSGA Ultra Short Term Bond ETF |
| SPDR Loomis Sayles Opportunistic Bond ETF |
| SPDR Nuveen Municipal Bond ETF |
| SPDR Nuveen Municipal Bond ESG ETF |
| SPDR DoubleLine Emerging Markets Fixed Income ETF |
| SPDR DoubleLine Short Duration Total Return Tactical ETF |
| SPDR DoubleLine Total Return Tactical ETF |
SSGA ACTIVE TRUST
NOTES TO FINANCIAL STATEMENTS (continued)
June 30, 2024
The Participants are charged an annual commitment fee which is calculated based on the unused portion of the shared credit line. Commitment fees are allocated among each of the Participants based on relative net assets. Commitment fees are ordinary fund operating expenses paid by the Adviser. A Participant incurs and pays the interest expense related to its borrowing. Interest is calculated at a rate per annum equal to the sum of 1.00% plus the greater of the New York Fed Bank Rate and the one-month SOFR Rate.
The Funds had no outstanding loans as of June 30, 2024.
12. Risks
Concentration Risk
As a result of the Funds' ability to invest a large percentage of their assets in obligations of issuers within the same country, state, region, currency or economic sector, an adverse economic, business or political development may affect the value of the Funds' investments more than if the were more broadly diversified.
Foreign and Emerging Markets Risk
Investing in foreign markets involves risks and considerations not typically associated with investing in the U.S. Foreign securities may be subject to risk of loss because of government regulation, economic, political and social instability in the countries in which the undefined invests. Foreign markets may be less liquid than investments in the U.S. and may be subject to the risks of currency fluctuations. To the extent that the undefined invests in securities of issuers located in emerging markets, these risks may be even more pronounced.
Market Risk
Each Fund's investments are subject to changes in general economic conditions, and general market fluctuations and the risks inherent in investment in securities markets. Investment markets can be volatile and prices of investments can change substantially due to various factors including, but not limited to, economic growth or recession, changes in interest rates, changes in the actual or perceived creditworthiness of issuers, and general market liquidity. Each Fund is subject to the risk that geopolitical events will disrupt securities markets and adversely affect global economies and markets. Local, regional or global events such as war, acts of terrorism, the spread of infectious illness, such as COVID-19, or other public health issues, or other events could have a significant impact on the Fund and its investments.
Credit Risk
The Funds may be exposed to credit risk in the event that an issuer or guarantor fails to perform or that an institution or entity with which the Funds have unsettled or open transactions defaults.
13. Recent Accounting Pronouncement
In December 2022, the Financial Accounting Standards Board (FASB) issued Accounting Standards Update (ASU) No. 2206 Reference Rate Reform (Topic 848). ASU No. 2022-06 updates and clarifies ASU No. 2020-04, which provides optional, temporary relief with respect to the financial reporting of contracts subject to certain types of modifications due to the planned discontinuation of LIBOR and other interbank-offered reference rates. The temporary relief provided by ASU No. 2022-06 is effective immediately for certain reference rate-related contract modifications that occur through December 31, 2024. Management does not expect ASU No. 2022-06 to have a material impact on the financial statements.
14. Subsequent Events
Management has evaluated the impact of all subsequent events on the Funds through the date the financial statements were issued and has determined that there were no subsequent events requiring adjustment or disclosure in the financial statements.
SSGA ACTIVE TRUST
REPORT OF INDEPENDENT REGISTERED PUBLIC ACCOUNTING FIRM
To the Shareholders of SPDR SSGA Multi-Asset Real Return ETF, SPDR SSGA Income Allocation ETF, SPDR SSGA Global Allocation ETF, SPDR SSGA Ultra Short Term Bond ETF, SPDR Loomis Sayles Opportunistic Bond ETF, SPDR Nuveen Municipal Bond ETF, SPDR Nuveen Municipal Bond ESG ETF, SPDR SSGA Fixed Income Sector Rotation ETF, SPDR SSGA US Sector Rotation ETF, SPDR DoubleLine Emerging Markets Fixed Income ETF, SPDR DoubleLine Short Duration Total Return Tactical ETF and SPDR DoubleLine Total Return Tactical ETF and the Board of Trustees of SSGA Active Trust
Opinion on the Financial Statements
We have audited the accompanying statements of assets and liabilities of SPDR SSGA Multi-Asset Real Return ETF, SPDR SSGA Income Allocation ETF, SPDR SSGA Global Allocation ETF, SPDR SSGA Ultra Short Term Bond ETF, SPDR Loomis Sayles Opportunistic Bond ETF, SPDR Nuveen Municipal Bond ETF, SPDR Nuveen Municipal Bond ESG ETF, SPDR SSGA Fixed Income Sector Rotation ETF, SPDR SSGA US Sector Rotation ETF, SPDR DoubleLine Emerging Markets Fixed Income ETF, SPDR DoubleLine Short Duration Total Return Tactical ETF and SPDR DoubleLine Total Return Tactical ETF (collectively, the “Funds”) (twelve of the funds constituting SSGA Active Trust (the “Trust”)), including the schedules of investments, as of June 30, 2024, and the related statements of operations and changes in net assets, and the financial highlights for each of the periods indicated in the table below and the related notes (collectively referred to as the “financial statements”). In our opinion, the financial statements present fairly, in all material respects, the financial position of each of the Funds (twelve of the funds constituting SSGA Active Trust) at June 30, 2024, and the results of their operations, changes in net assets and financial highlights for each of the periods indicated in the table below, in conformity with U.S. generally accepted accounting principles.
| Individual Fund constituting theSSGA Active Trust | Statement of operations | Statement of changes in net assets | Financial highlights |
SPDR SSGA Multi-Asset Real Return ETF
SPDR SSGA Income Allocation ETF
SPDR SSGA Global Allocation ETF
SPDR SSGA Ultra Short Term Bond ETF
SPDR DoubleLine Emerging Markets Fixed Income ETF
SPDR DoubleLine Short Duration Total Return Tactical ETF
SPDR DoubleLine Total Return Tactical ETF
SPDR SSGA Fixed Income Sector Rotation ETF
SPDR SSGA US Sector Rotation ETF | For the year ended June 30, 2024 | For each of the two years in the period ended June 30, 2024 | For each of the five years in the period ended June 30, 2024 |
| SPDR Loomis Sayles Opportunistic Bond ETF | For the year ended June 30, 2024 | For each of the two years in the period ended June 30, 2024 | For each of the two years in the period ended June 30, 2024 and the period from September 28, 2021 (commencement of operations) through June 30, 2022 |
| SPDR Nuveen Municipal Bond ETF | For the year ended June 30, 2024 | For each of the two years in the period ended June 30, 2024 | For each of the three years in the period ended June 30, 2024 and the period from February 3, 2021 (commencement of operations) through June 30, 2021 |
SSGA ACTIVE TRUST
REPORT OF INDEPENDENT REGISTERED PUBLIC ACCOUNTING FIRM
| Individual Fund constituting theSSGA Active Trust | Statement of operations | Statement of changes in net assets | Financial highlights |
| SPDR Nuveen Municipal Bond ESG ETF | For the year ended June 30, 2024 | For each of the two years in the period ended June 30, 2024 | For each of the two years in the period ended June 30, 2024 and the period from April 4, 2022 (commencement of operations) through June 30, 2022 |
Basis for Opinion
These financial statements are the responsibility of the Trust’s management. Our responsibility is to express an opinion on the Funds’ financial statements based on our audits. We are a public accounting firm registered with the Public Company Accounting Oversight Board (United States) (“PCAOB”) and are required to be independent with respect to the Trust in accordance with the U.S. federal securities laws and the applicable rules and regulations of the Securities and Exchange Commission and the PCAOB.
We conducted our audits in accordance with the standards of the PCAOB. Those standards require that we plan and perform the audit to obtain reasonable assurance about whether the financial statements are free of material misstatement, whether due to error or fraud. The Trust is not required to have, nor were we engaged to perform, an audit of the Trust’s internal control over financial reporting. As part of our audits we are required to obtain an understanding of internal control over financial reporting, but not for the purpose of expressing an opinion on the effectiveness of the Trust’s internal control over financial reporting. Accordingly, we express no such opinion.
Our audits included performing procedures to assess the risks of material misstatement of the financial statements, whether due to error or fraud, and performing procedures that respond to those risks. Such procedures included examining, on a test basis, evidence regarding the amounts and disclosures in the financial statements. Our procedures included confirmation of securities owned as of June 30, 2024, by correspondence with the custodian, brokers and others; when replies from brokers and others were not received, we performed other auditing procedures. Our audits also included evaluating the accounting principles used and significant estimates made by management, as well as evaluating the overall presentation of the financial statements. We believe that our audits provide a reasonable basis for our opinion.
We have served as the auditor of one or more State Street Global Advisors investment companies since 2000.
Boston, Massachusetts
August 29, 2024
SSGA ACTIVE TRUST
OTHER INFORMATION
June 30, 2024 (Unaudited)
Tax Information
For federal income tax purposes, the following information is furnished with respect to the distributions of the Trust for its fiscal year ended June 30, 2024.
Dividends Received Deduction
Each Fund reports the maximum amount allowable of its net taxable income as eligible for the corporate dividends received deduction.
Qualified Business Income Deduction
Each Fund reports the maximum amount allowable of qualified REIT dividends eligible for the qualified business income deduction under Section 199A.
Qualified Dividend Income
A portion of dividends distributed by the Funds during the fiscal year ended June 30, 2024 are considered qualified dividend income and are eligible for reduced tax rates. Each Fund reports the maximum amount allowable of its net taxable income as qualified dividend income as provided in the Jobs and Growth Tax Relief Reconciliation Act of 2003.
Qualified Interest Income
Each Fund reports the maximum amount allowable of its net taxable income and short-term capital gain as qualified interest income.
Interest Dividends
Each Fund reports the maximum amount allowable as Section 163(j) Interest Dividends.
Foreign Tax Credit
For the year ended June 30, 2024, the following Funds have made an election under Internal Revenue Code Section 853 to pass through foreign taxes paid by the Funds to its shareholders and accordingly have earned foreign source income:
SPDR SSGA Multi-Asset Real Return ETF
SPDR SSGA Income Allocation ETF
SPDR SSGA Global Allocation ETF
Foreign Source Income
For the year ended June 30, 2024, the following funds earned foreign source income:
SPDR SSGA Multi-Asset Real Return ETF
SPDR SSGA Income Allocation ETF
SPDR SSGA Global Allocation ETF
Tax-Exempt Income
The percentage of distributions paid by the Funds that are exempt-interest distributions are as follows:
| | Percentage |
SPDR Nuveen Municipal Bond ETF
| 82.58% |
SPDR Nuveen Municipal Bond ESG ETF
| 95.50% |
SSGA ACTIVE TRUST
STATEMENT REGARDING BASIS FOR APPROVAL OF INVESTMENT ADVISORY CONTRACT
June 30, 2024 (Unaudited)
Approval of Advisory Agreement
At a meeting held on May 15-16, 2024, the Board of Trustees of the Trust (the “Board”) evaluated a proposal to approve for an additional one year period the Investment Advisory Agreement (the “Advisory Agreement” or “Agreement”) between the SSGA Active Trust (the “Trust” or “SSAT”) and SSGA Funds Management, Inc. (the “Adviser” or “SSGA FM”) with respect to the series of SSAT (collectively, the “SPDR ETFs”). The Trustees who are not “interested persons” of the Trust within the meaning of the Investment Company Act of 1940, as amended (the “Independent Trustees”), also met separately to consider the Agreement. The Independent Trustees were advised by their independent legal counsel throughout the process.
To evaluate the Advisory Agreement, the Board requested and SSGA FM, the Trust’s adviser and administrator, and State Street Bank and Trust Company, the Trust’s sub-administrator, transfer agent and custodian (“State Street”) provided, such materials as the Board, with the advice of counsel, deemed reasonably necessary. In deciding whether to approve the Advisory Agreement, the Board considered various factors, including the nature, extent and quality of services provided by the Adviser with respect to the SPDR ETFs under the Agreement, the proposed cost of those services in relation to the services provided and in relation to fees charged to comparable funds, other benefits to the Adviser of its relationship with the SPDR ETFs, and extent to which economies of scale would be shared as the SPDR ETFs grow.
Nature, Extent and Quality of Services
The Board considered the nature, extent and quality of services provided by the Adviser. In doing so, the Trustees relied on their prior experience in overseeing the management of the Trust and the materials provided prior to and at the meeting. The Board reviewed the Advisory Agreement and the Adviser’s responsibilities for managing investment operations of each of the SPDR ETFs in accordance with each SPDR ETF’s investment objectives and policies, and applicable legal and regulatory requirements. The Board appreciated the nature of the SPDR ETFs as exchange-traded funds and the experience and expertise of the Adviser in managing exchange-traded funds. The Board considered the background and experience of the Adviser’s senior management, including those individuals responsible for portfolio management, oversight of sub-advisers and regulatory compliance of the SPDR ETFs. The Board also considered the portfolio management resources, structures and practices of the Adviser, including those associated with monitoring and ensuring each SPDR ETF’s compliance with its investment objectives and policies, and applicable laws and regulations. The Board further considered information about the Adviser’s best execution procedures and overall investment management business, noting that the Adviser serves a wide range of clients across a broad spectrum of asset classes. The Board looked at the Adviser’s general knowledge of the investment management business and that of its affiliates which make up State Street Global Advisors, through which the Adviser shares all of its senior personnel. The Board considered that the Adviser and its affiliates constitute one of the world’s largest investment management enterprises for indexed products generally and exchange-traded funds in particular. The Board specifically considered the Adviser’s experience in managing actively-managed exchange-traded funds. The Board also considered the Adviser’s role in overseeing third party sub-advisers, as applicable.
Investment Performance
The Board compared the investment performance of each actively-managed series of SSAT to the performance of a group of comparable funds (net of expenses) (Performance Group) obtained from Broadridge Financial Solutions, Inc. (Broadridge) and/or to the performance of an appropriate benchmark (gross of expenses) provided by the Adviser. Among other information, the Board considered the following performance information over various periods ended December 31, 2023 in its evaluation of each series of SSAT:
SPDR DoubleLine Short Duration Total Return Tactical ETF. The Board considered that the Fund underperformed the median of its Performance Group for the 5-year period, but outperformed the median of its Performance Group for the 1- and 3-year periods. In addition, the Board considered that the Fund outperformed its benchmark for the 1-, 3- and 5-year periods.
SPDR DoubleLine Total Return Tactical ETF. The Board considered that the Fund underperformed the median of its Performance Group for the 1- and 5-year periods, but outperformed the median of its Performance Group for the 3-year period. In addition, the Board considered that the Fund outperformed its benchmark index for the 1- and 3- periods, but underperformed its benchmark index for the 5-year period.
SPDR DoubleLine Emerging Markets Fixed Income ETF. The Board considered that the Fund underperformed the median of its Performance Group for the 1- and 5-year periods but had an annualized total return equal to the median of its Performance Group for the 3-year period. In addition, the Board considered that the Fund underperformed its benchmark index for the 1-, 3- and 5-year periods.
SSGA ACTIVE TRUST
STATEMENT REGARDING BASIS FOR APPROVAL OF INVESTMENT ADVISORY CONTRACT (continued)
June 30, 2024 (Unaudited)
SPDR Loomis Sayles Opportunistic Bond ETF. The Board considered that the Fund commenced operations on September 28, 2021 and that performance information was provided for only a short operating history of the Fund. The Board considered that the Fund outperformed the median of its Performance Group for the 1-year period. In addition, the Board considered that the Fund underperformed its benchmark index for the 1-year period.
SPDR Nuveen Municipal Bond ETF. The Board considered that the Fund commenced operations on February 3, 2021 and that performance information was provided for only a short operating history of the Fund. The Board considered that the Fund’s annualized performance was equal to the median of its Performance Group for the 1-year period. The Board considered that the Fund outperformed its benchmark index for the 1-year period, but underperformed its benchmark for the 3-year period.
SPDR Nuveen Municipal Bond ESG ETF. The Board considered that the Fund commenced operations on April 4, 2022 and that performance information was provided for only a short operating history of the Fund. The Board considered that the Fund underperformed the median of its Performance Group for the 1-year period but outperformed its benchmark index for the 1-year period.
SPDR SSGA Fixed Income Sector Rotation ETF. The Board considered that the Fund underperformed the median of its Performance Group for the 1- and 3-year periods. In addition, the Board considered that the Fund underperformed its benchmark index for the 1- and 3-year periods.
SPDR SSGA Global Allocation ETF. The Board considered that the Fund outperformed the median of its Performance Group for the 1-, 3- and 5-year periods and had an annualized total return equal to the median of its Performance Group for the 10-year period. In addition, the Board considered that the Fund outperformed its benchmark index for the 1-, 3-, 5- and 10-year periods.
SPDR SSGA Income Allocation ETF. The Board considered that the Fund underperformed the median of its Performance Group for the 1- and 3--year periods and had an annualized total return equal to the median of its Performance Group for the 5- and 10-year periods. In addition, the Board considered that the Fund outperformed its benchmark index in the 1-year period and underperformed its benchmark index for 3-, 5- and 10-year periods.
SPDR SSGA Multi-Asset Real Return ETF. The Board considered that the Fund outperformed the median of its Performance Group for the 3- and 5-year periods, underperformed the median of its Performance Group for the 1-year period, but had an annualized total return equal to the median of its Performance Group for the 10-year period. In addition, the Board considered that the Fund outperformed its benchmark index for 1- and 3-year periods, but performed even with its benchmark for the 5- and 10-year periods.
SPDR SSGA Ultra Short Term Bond ETF. The Board considered that the Fund underperformed the median of its Performance Group for the 1-year period, outperformed the median of its Performance Group for the 3- and 5-year periods, and had an annualized total return equal to the median of its Performance Group for the 10-year period. In addition, the Board considered that the Fund underperformed its benchmark index for the 3-year period, but outperformed its benchmark index for the 1-, 5- and 10-year periods.
SPDR SSGA U.S. Sector Rotation ETF. The Board considered that the Fund underperformed the median of its Performance Group for the 3- year period, but had outperformed the median of its Performance Group for the 1- year period. In addition, the Board considered that the Fund underperformed its benchmark index for the 1- and 3-year periods.
In those instances where the Board observed underperformance for an extended period of time, the Trustees discussed with management those factors that contributed to such underperformance and steps being taken in response to such factors, where appropriate.
Profits Realized by Adviser
The Board considered the profitability of the advisory arrangement with the SPDR ETFs to the Adviser and its affiliates, including data on each SPDR ETF’s historical profitability to these entities. The Board, including the Independent Trustees, with their independent legal counsel, had the opportunity to discuss, with representatives of the Adviser and State Street Global Advisors, methodologies used in computing costs that formed the bases of profitability calculations.
Fees Charged to Comparable Funds
The Board evaluated each SPDR ETF’s unitary fee through review of comparative information with respect to fees paid by similar funds – i.e., exchange-traded funds that are actively managed with respect to the remaining series of SSAT. The Board reviewed the universe of similar exchange-traded funds for each SPDR ETF based upon data independently obtained from Broadridge and related comparative information for similar exchange-traded funds. In
SSGA ACTIVE TRUST
STATEMENT REGARDING BASIS FOR APPROVAL OF INVESTMENT ADVISORY CONTRACT (continued)
June 30, 2024 (Unaudited)
doing so, the Board used a fund by fund analysis of the data. In certain instances as considered appropriate by the Board, the Board explored with management the reasons for the differences between a SPDR ETF’s fee and fees paid by similar funds.
Other Benefits
The Board also considered whether the Adviser or its affiliates benefited in other ways from its relationship with the Trust, noting that the Adviser does not maintain soft-dollar arrangements in connection with the Trust’s brokerage transactions.
Economies of Scale
The Board reviewed information regarding economies of scale or other efficiencies that may result as each SPDR ETF’s assets grow in size. The Board noted that the advisory fee rate for each SPDR ETF does not provide for breakpoints as assets of the SPDR ETF increase. However, the Board further noted the Adviser’s assertion that future economies of scale (among several factors) had been taken into consideration for the SPDR ETFs by fixing relatively low advisory fees, effectively sharing the benefits of lower fees with the SPDR ETFs from inception. The Adviser also asserted that one of the benefits of the unitary fee was to provide an unvarying expense structure, which could be lost or diluted with the addition of breakpoints. The Board noted that it intends to continue to monitor fees as the SPDR ETFs grow in size and assess whether fee breakpoints may be warranted.
Conclusion
After weighing the foregoing factors, none of which was dispositive in itself and may have been weighed differently by each Trustee, the Board, including the Independent Trustees voting separately, approved the continuation of the Advisory Agreement for each SPDR ETF. In approving the continuance of the Advisory Agreement, the Board, including the Independent Trustees voting separately, found that the terms of the Advisory Agreement are fair and reasonable and that the continuance of the Advisory Agreement is in the best interests of the applicable SPDR ETF and its shareholders. The Board’s conclusions with respect to the factors were as follows: (a) the nature, extent and quality of the services provided by the Adviser with respect to the SPDR ETFs were appropriate; (b) the performance and, more importantly for those SPDR ETFs measured against an index, the index tracking, of each SPDR ETF had been satisfactory or the Adviser had demonstrated due attention to the remediation of underperformance, where appropriate; (c) the Adviser’s unitary fee for each SPDR ETF considered in relation to the services provided, and in relation to the fees charged to comparable funds, was reasonable; (d) the profitability of the Trust’s relationships with the Adviser and its affiliates was not excessive in view of the nature, extent and quality of the services provided; (e) any additional potential benefits to the Adviser or its affiliates were not of a magnitude to materially affect the Board’s conclusions; and (f) the fees paid to the Adviser adequately shared the economies of scale with respect to the SPDR ETFs by way of the relatively low fee structure of the Trust. The Independent Trustees were advised by their independent counsel throughout the process.
Approval of DoubleLine Capital LP (“DoubleLine”) Sub-Advisory Agreement
At a meeting held on May 15-16, 2024, the Board also considered a proposal to continue the Sub-Advisory Agreement (the “DoubleLine Sub-Advisory Agreement” or the “Sub-Advisory Agreement”) between the Adviser and DoubleLine Capital LP with respect to the following series of SSAT: SPDR DoubleLine Emerging Markets Fixed Income ETF, SPDR DoubleLine Short Duration Total Return Tactical ETF and SPDR DoubleLine Total Return Tactical ETF (the “DoubleLine Funds”), each of which is sub-advised by DoubleLine. The Independent Trustees also met separately to consider the DoubleLine Sub-Advisory Agreement. The Independent Trustees were advised by their independent legal counsel throughout the process.
With respect to the Sub-Advisory Agreement, the Board considered various factors, including the nature, extent and quality of services provided by DoubleLine with respect to each DoubleLine Fund under that sub-advisory agreement and the investment performance of such sub-advised funds. The Board further considered the portion of the current advisory fee that the Adviser would continue to pay to DoubleLine under the Sub-Advisory Agreement and also considered that such fees would continue to be paid directly by the Adviser and would not result in increased fees payable by the sub-advised funds.
The Board considered the background and experience of senior management at DoubleLine and, in particular, DoubleLine’s experience in investing in fixed income securities. The Board reviewed the performance of each DoubleLine Fund, noting that each DoubleLine Fund underperformed between two and four of the last five calendar years, but considered management’s explanation of those factors that contributed to such underperformance and the steps being taken in response to such factors. The Board also considered the unitary fee paid to the Adviser by each DoubleLine Fund and DoubleLine’s fees paid by the Adviser. The Board also considered whether DoubleLine benefited in other ways from its relationship with SSAT.
SSGA ACTIVE TRUST
STATEMENT REGARDING BASIS FOR APPROVAL OF INVESTMENT ADVISORY CONTRACT (continued)
June 30, 2024 (Unaudited)
After weighing the foregoing factors, as well as the relevant factors discussed in relation to the DoubleLine Sub-Advisory Agreement between DoubleLine and the Adviser, none of which was dispositive in itself and may have been weighed differently by each Trustee, the Board, including the Independent Trustees voting separately, approved the continuation of the DoubleLine Sub-Advisory Agreement for each DoubleLine Fund. In approving the continuance of the DoubleLine Sub-Advisory Agreement, the Board, including the Independent Trustees voting separately, found that the terms of the DoubleLine Sub-Advisory Agreement, with respect to each Fund, are fair and reasonable and that the continuance of the DoubleLine Sub-Advisory Agreement is in the best interests of each DoubleLine Fund and its shareholders. The Board’s conclusions with respect to the factors were as follows: (a) the nature, extent and quality of the services provided by DoubleLine with respect to each DoubleLine Fund were adequate and appropriate; (b) the performance of each DoubleLine Fund had been satisfactory; (c) DoubleLine’s fees for each DoubleLine Fund and the unitary fee, considered in relation to the services provided, were reasonable; (d) any additional potential benefits to DoubleLine were not of a magnitude to materially affect the Board’s conclusions; and (e) the fees paid to DoubleLine adequately shared the economies of scale with each Fund by way of the relatively low fee structure of SSAT. The Independent Trustees were advised by their independent counsel throughout the process.
Loomis, Sayles & Company, L.P. (“Loomis”) Sub-Advisory Agreement
At a meeting held on May 15-16, 2024, the Board also considered a proposal to continue the Sub-Advisory Agreement (the “Loomis Sub-Advisory Agreement” or the “Sub-Advisory Agreement”) between the Adviser and Loomis, Sayles & Company, L.P. with respect to the following series of SSAT: SPDR Loomis Sayles Opportunistic Bond ETF (the “Loomis Fund”), which is sub-advised by Loomis. The Independent Trustees also met separately to consider the Loomis Sub-Advisory Agreement. The Independent Trustees were advised by their independent legal counsel throughout the process.
With respect to the Sub-Advisory Agreement, the Board considered various factors, including the nature, extent and quality of services provided by Loomis with respect to the Loomis Fund under that sub-advisory agreement and the investment performance of such sub-advised funds. The Board further considered the portion of the current advisory fee that the Adviser would continue to pay to Loomis under the Sub-Advisory Agreement and also considered that such fees would continue to be paid directly by the Adviser and would not result in increased fees payable by the sub-advised funds.
The Board considered the background and experience of senior management at Loomis and, in particular, Loomis’s experience in investing in fixed income securities. The Board reviewed the performance of the Loomis Fund, noting that it had a short operating history. The Board also considered the unitary fee paid to the Adviser by the Loomis Fund and Loomis’s fees paid by the Adviser. The Board also considered whether Loomis benefited in other ways from its relationship with SSAT.
After weighing the foregoing factors, as well as the relevant factors discussed in relation to the Loomis Sub-Advisory Agreement between Loomis and the Adviser, none of which was dispositive in itself and may have been weighed differently by each Trustee, the Board, including the Independent Trustees voting separately, approved the continuation of the Loomis Sub-Advisory Agreement for the Loomis Fund. In approving the continuance of the Loomis Sub-Advisory Agreement, the Board, including the Independent Trustees voting separately, found that the terms of the Loomis Sub-Advisory Agreement, with respect to the Fund, are fair and reasonable and that the continuance of the Loomis Sub-Advisory Agreement is in the best interests of the Loomis Fund and its shareholders. The Board’s conclusions with respect to the factors were as follows: (a) the nature, extent and quality of the services provided by Loomis with respect to the Loomis Fund were adequate and appropriate; (b) the performance of the Loomis Fund had been satisfactory; (c) Loomis’s fees for the Loomis Fund and the unitary fee, considered in relation to the services provided, were reasonable; (d) any additional potential benefits to Loomis were not of a magnitude to materially affect the Board’s conclusions; and (e) the fees paid to Loomis adequately shared the economies of scale with each Fund by way of the relatively low fee structure of SSAT. The Independent Trustees were advised by their independent counsel throughout the process.
Nuveen Asset Management, LLC (“Nuveen”) Sub-Advisory Agreement
At a meeting held on May 15-16, 2024, the Board also considered a proposal to continue the Sub-Advisory Agreement (the “Nuveen Sub-Advisory Agreement” or the “Sub-Advisory Agreement”) between the Adviser and Nuveen Asset Management, LLC with respect to the following series of SSAT: SPDR Nuveen Municipal Bond ETF and the SPDR Nuveen Municipal Bond ESG ETF (the “Nuveen Funds”), each of which is sub-advised by Nuveen. The Independent Trustees also met separately to consider the Loomis Sub-Advisory Agreement. The Independent Trustees were advised by their independent legal counsel throughout the process.
SSGA ACTIVE TRUST
STATEMENT REGARDING BASIS FOR APPROVAL OF INVESTMENT ADVISORY CONTRACT (continued)
June 30, 2024 (Unaudited)
With respect to the Sub-Advisory Agreement, the Board considered various factors, including the nature, extent and quality of services provided by Nuveen with respect to each Nuveen Fund under that sub-advisory agreement and the investment performance of such sub-advised funds. The Board further considered the portion of the current advisory fee that the Adviser would continue to pay to Nuveen under the Sub-Advisory Agreement and also considered that such fees would continue to be paid directly by the Adviser and would not result in increased fees payable by the sub-advised funds.
The Board considered the background and experience of Nuveen’s senior management and, in particular, Nuveen’s experience in investing in municipal securities. The Board reviewed the performance of each Nuveen Fund. The Board noted that each Nuveen Fund had a short operating history and no action was recommended given this relatively short operating history. The Board also considered the unitary fee paid to the Adviser by each Nuveen Fund and Nuveen’s fees paid by the Adviser. The Board also considered whether Nuveen benefited in other ways from its relationship with the SSAT.
After weighing the foregoing factors, as well as the relevant factors discussed in relation to the Nuveen Sub-Advisory Agreement between Nuveen and the Adviser, none of which was dispositive in itself and may have been weighed differently by each Trustee, the Board, including the independent Trustees voting separately, approved the continuation of the Nuveen Sub-Advisory Agreement for the Nuveen Funds. In approving the continuance of the Nuveen Sub-Advisory Agreement, the Board, including the Independent Trustees voting separately, found that, with respect to each Nuveen Fund, the terms of the Nuveen Sub-Advisory Agreement are fair and reasonable and that the continuance of the Nuveen Sub-Advisory Agreement is in the best interests of each Nuveen Fund and its shareholders. The Board’s conclusions with respect to the factors were as follows: (a) the nature, extent and quality of the services provided by Nuveen with respect to the Nuveen Funds were appropriate; (b) the performance and, more importantly for those Nuveen Funds measured against an index , the index tracking, of the Nuveen Fund had been satisfactory; (c) Nuveen’s fees for each Nuveen Fund and the unitary fee, considered in relation to the services provided, were reasonable; (d) any additional potential benefits to Nuveen were not of a magnitude to materially affect the Board’s conclusions; and (e) the fees paid to Nuveen adequately shared the economies of scale with each applicable Nuveen Fund by way of the relatively low fee structure of SSAT. The Independent Trustees were advised by their independent counsel throughout the process.
Annual Financial Statements and Other Information
June 30, 2024
SSGA Active Trust
| SPDR Blackstone High Income ETF |
| SPDR Blackstone Senior Loan ETF |
The information contained in this report is intended for the general information of shareholders of the Trust. This report is not authorized for distribution to prospective investors unless preceded or accompanied by a current Trust prospectus which contains important information concerning the Trust. You may obtain a current prospectus and SAI from the Distributor by calling 1-866-787-2257 or visiting https://www.ssga.com/spdrs. Please read the prospectus carefully before you invest.
TABLE OF CONTENTS
Changes in and Disagreements with Accountants for Open-End Management Investment Companies (N-CSR Item 8) - Not Applicable
Proxy Disclosures for Open-End Management Investment Companies (N-CSR Item 9) - Not applicable
Remuneration Paid to Directors, Officers, and Others of Open-End Management Investment Companies (N-CSR Item 10) - Please see Statement of Operations in the Financial Statements under Item 7 above
SPDR BLACKSTONE HIGH INCOME ETF
SCHEDULE OF INVESTMENTS
June 30, 2024
| Security Description | | | Principal
Amount | | Value |
| SENIOR FLOATING RATE LOANS — 42.6% | |
| ADVERTISING SERVICES — 0.4% | |
Neptune Bidco U.S., Inc.
2022 USD Term Loan B 3 mo. USD Term SOFR + 5.00%, 10.41%, 4/11/2029 (a)
| | | $282,051 | | $266,185 |
Wood Mackenzie Ltd.
2024 Term Loan B 3 mo. USD Term SOFR + 3.50%, 8.82%, 2/7/2031 (a)
| | | 300,000 | | 302,288 |
| | | | | | 568,473 |
| AEROSPACE & DEFENSE — 0.4% | |
| Dynasty Acquisition Co., Inc.: | | | | | |
2024 Term Loan B1 1 mo. USD Term SOFR + 3.50%, 8.84%, 8/24/2028 (a)
| | | 234,202 | | 235,319 |
2024 Term Loan B2 1 mo. USD Term SOFR + 3.50%, 8.84%, 8/24/2028 (a)
| | | 90,302 | | 90,733 |
Kaman Corp.
2024 Term Loan 3 mo. USD Term SOFR + 3.50%, 8.83%, 4/21/2031 (a)
| | | 260,000 | | 261,625 |
| | | | | | 587,677 |
| AIR FREIGHT & LOGISTICS — 0.3% | |
Worldwide Express Operations LLC
2021 1st Lien Term Loan 3 mo. USD Term SOFR + 4.00%, 9.85%, 7/26/2028 (a)
| | | 468,153 | | 470,096 |
| AIRLINES — 0.0% (b) | |
Kestrel Bidco, Inc.
Term Loan B 1 mo. USD Term SOFR + 3.00%, 8.44%, 12/11/2026 (a)
| | | 7,247 | | 7,277 |
| APPAREL — 0.2% | |
| ABG Intermediate Holdings 2 LLC: | | | | | |
2024 Add on Delayed Draw Term Loan (c)
| | | 115,000 | | 115,252 |
2024 Term Loan B 1 mo. USD Term SOFR + 2.75%, 8.09%, 12/21/2028 (a)
| | | 221,673 | | 222,151 |
S&S Holdings LLC
Term Loan 1 mo. USD Term SOFR + 5.00%, 10.43%, 3/11/2028 (a)
| | | 22,913 | | 22,970 |
| | | | | | 360,373 |
| AUTO COMPONENTS — 0.1% | |
BBB Industries LLC
2022 Term Loan 1 mo. USD Term SOFR + 5.25%, 10.69%, 7/25/2029 (a)
| | | 100,602 | | 97,773 |
| Security Description | | | Principal
Amount | | Value |
| AUTO PARTS & EQUIPMENT — 0.8% | |
Clarios Global LP
2024 USD Term Loan B (c)
| | | $130,000 | | $130,467 |
| First Brands Group LLC: | | | | | |
2021 Term Loan 3 mo. USD Term SOFR + 5.00%, 10.59%, 3/30/2027 (a)
| | | 21,134 | | 21,032 |
2022 Incremental Term Loan 3 mo. USD Term SOFR + 5.00%, 10.59%, 3/30/2027 (a)
| | | 437,110 | | 435,197 |
Tenneco, Inc.
2022 Term Loan B 3 mo. USD Term SOFR + 5.00%, 10.43%, 11/17/2028 (a)
| | | 644,496 | | 619,696 |
| | | | | | 1,206,392 |
| BEVERAGES — 0.5% | |
Triton Water Holdings, Inc.
Term Loan 3 mo. USD Term SOFR + 3.25%, 8.85%, 3/31/2028 (a)
| | | 690,060 | | 691,095 |
| BUILDING MATERIALS — 0.3% | |
LHS Borrower LLC
2022 Term Loan B 1 mo. USD Term SOFR + 4.75%, 10.09%, 2/16/2029 (a)
| | | 292,973 | | 278,032 |
MI Windows and Doors LLC
2024 Term Loan B2 1 mo. USD Term SOFR + 3.50%, 8.84%, 3/28/2031 (a)
| | | 225,000 | | 226,641 |
| | | | | | 504,673 |
| BUILDING PRODUCTS — 0.9% | |
ACProducts, Inc.
2021 Term Loan B 3 mo. USD Term SOFR + 4.25%, 9.85%, 5/17/2028 (a)
| | | 415,724 | | 353,538 |
Chamberlain Group, Inc.
Term Loan B 1 mo. USD Term SOFR + 3.25%, 8.69%, 11/3/2028 (a)
| | | 313,314 | | 313,510 |
Cornerstone Building Brands, Inc.
2021 Term Loan B 1 mo. USD Term SOFR + 3.25%, 8.68%, 4/12/2028 (a)
| | | 378,341 | | 370,064 |
Oscar AcquisitionCo LLC
2024 Term Loan B 3 mo. USD Term SOFR + 4.25%, 9.58%, 4/29/2029 (a)
| | | 377,479 | | 377,745 |
| | | | | | 1,414,857 |
| CAPITAL MARKETS — 0.7% | |
AqGen Island Holdings, Inc.
Term Loan 1 mo. USD Term SOFR + 3.50%, 8.96%, 8/2/2028 (a)
| | | 207,047 | | 207,461 |
See accompanying notes to financial statements.
1
SPDR BLACKSTONE HIGH INCOME ETF
SCHEDULE OF INVESTMENTS (continued)
June 30, 2024
| Security Description | | | Principal
Amount | | Value |
Aretec Group, Inc.
2024 Term Loan B 3 mo. USD Term SOFR + 4.00%, 9.34%, 8/9/2030 (a)
| | | $749,089 | | $752,914 |
| Chrysaor Bidco SARL: | | | | | |
USD Delayed Draw Term Loan (c)
| | | 3,443 | | 3,462 |
USD Term Loan B (c)
| | | 46,557 | | 46,819 |
| | | | | | 1,010,656 |
| CHEMICALS — 0.4% | |
Nouryon Finance BV
2024 USD Term Loan B 3 mo. USD Term SOFR + 3.50%, 8.83%, 4/3/2028 (a)
| | | 429,898 | | 431,564 |
PMHC II, Inc.
2022 Term Loan B 3 mo. USD Term SOFR + 4.25%, 9.71%, 4/23/2029 (a)
| | | 193,677 | | 189,416 |
| | | | | | 620,980 |
| COMMERCIAL SERVICES — 3.3% | |
Allied Universal Holdco LLC
2021 USD Incremental Term Loan B 1 mo. USD Term SOFR + 3.75%, 9.19%, 5/12/2028 (a)
| | | 437,837 | | 436,649 |
Ankura Consulting Group LLC
2024 Term Loan (c)
| | | 164,588 | | 165,239 |
Camelot U.S. Acquisition LLC
2024 Term Loan B 1 mo. USD Term SOFR + 2.75%, 8.09%, 1/31/2031 (a)
| | | 44,620 | | 44,754 |
EAB Global, Inc.
2021 Term Loan (c)
| | | 64,834 | | 64,850 |
Ensemble RCM LLC
2024 Term Loan B (c)
| | | 200,000 | | 199,678 |
Fugue Finance BV
2024 USD Term Loan B 3 mo. USD Term SOFR + 3.75%, 9.10%, 2/26/2031 (a)
| | | 115,000 | | 116,107 |
Grant Thornton Advisors LLC
Term Loan B 3 mo. USD Term SOFR + 3.25%, 8.60%, 6/2/2031 (a)
| | | 350,000 | | 351,440 |
| Groundworks LLC: | | | | | |
2024 Delayed Draw Term Loan 1 mo. USD Term SOFR + 3.50%, 8.83%, 3/14/2031 (a)
| | | 3,731 | | 3,733 |
2024 Term Loan 1 mo. USD Term SOFR + 3.50%, 8.83%, 3/14/2031 (a)
| | | 126,684 | | 126,763 |
GTCR W Merger Sub LLC
2024 USD Term Loan B (c)
| | | 73,005 | | 73,198 |
KUEHG Corp.
2024 Term Loan B 3 mo. USD Term SOFR + 4.50%, 9.83%, 6/12/2030 (a)
| | | 99,750 | | 100,255 |
| Security Description | | | Principal
Amount | | Value |
Mavis Tire Express Services Corp.
2024 Term Loan B 1 mo. USD Term SOFR + 3.75%, 9.09%, 5/4/2028 (a)
| | | $617,980 | | $620,124 |
OMNIA Partners LLC
2024 Term Loan B 3 mo. USD Term SOFR + 3.25%, 8.57%, 7/25/2030 (a)
| | | 397,253 | | 397,935 |
PG Investment Co. 59 SARL
Term Loan B 3 mo. USD Term SOFR + 3.50%, 8.83%, 3/26/2031 (a)
| | | 430,000 | | 433,406 |
Spring Education Group, Inc.
Term Loan 3 mo. USD Term SOFR + 4.00%, 9.33%, 10/4/2030 (a)
| | | 119,400 | | 120,134 |
Thevelia U.S. LLC
2024 USD Term Loan B 3 mo. USD Term SOFR + 3.75%, 9.08%, 6/18/2029 (a)
| | | 502,102 | | 505,556 |
TTF Holdings LLC
2024 Term Loan (c)
| | | 320,000 | | 320,000 |
VT Topco, Inc.
2024 Term Loan B 1 mo. USD Term SOFR + 3.50%, 8.84%, 8/9/2030 (a)
| | | 323,751 | | 325,653 |
Wand NewCo 3, Inc.
2024 Term Loan B 1 mo. USD Term SOFR + 3.75%, 9.09%, 1/30/2031 (a)
| | | 580,000 | | 584,504 |
| | | | | | 4,989,978 |
| COMMERCIAL SERVICES & SUPPLIES — 1.9% | |
| Asurion LLC: | | | | | |
2020 Term Loan B8 1 mo. USD Term SOFR + 3.25%, 8.71%, 12/23/2026 (a)
| | | 34,888 | | 34,645 |
2021 Second Lien Term Loan B4 1 mo. USD Term SOFR + 5.25%, 10.71%, 1/20/2029 (a)
| | | 585,165 | | 541,506 |
2021 Term Loan B9 1 mo. USD Term SOFR + 3.25%, 8.71%, 7/31/2027 (a)
| | | 551,374 | | 542,847 |
2022 Term Loan B10 1 mo. USD Term SOFR + 4.00%, 9.44%, 8/19/2028 (a)
| | | 178,681 | | 176,950 |
Garda World Security Corp.
2022 Term Loan B 3 mo. USD Term SOFR + 4.25%, 9.59%, 2/1/2029 (a)
| | | 775,047 | | 780,860 |
McGraw-Hill Global Education Holdings LLC
2021 Term Loan 3 mo. USD Term SOFR + 4.75%, 10.35%, 7/28/2028 (a)
| | | 689,435 | | 691,493 |
| | | | | | 2,768,301 |
See accompanying notes to financial statements.
2
SPDR BLACKSTONE HIGH INCOME ETF
SCHEDULE OF INVESTMENTS (continued)
June 30, 2024
| Security Description | | | Principal
Amount | | Value |
| COMPUTERS — 0.0% (b) | |
Magenta Buyer LLC
2021 USD 1st Lien Term Loan 3 mo. USD Term SOFR + 5.00%, 10.59%, 7/27/2028 (a)
| | | $131,460 | | $73,700 |
| CONSTRUCTION & ENGINEERING — 0.4% | |
Artera Services LLC
2024 Term Loan 3 mo. USD Term SOFR + 4.50%, 9.83%, 2/15/2031 (a)
| | | 339,150 | | 341,359 |
KKR Apple Bidco LLC
2021 Term Loan 1 mo. USD Term SOFR + 2.75%, 8.21%, 9/22/2028 (a)
| | | 70,731 | | 70,858 |
Radar Bidco SARL
2024 USD Term Loan B 3 mo. USD Term SOFR + 4.25%, 9.56%, 4/4/2031 (a)
| | | 135,000 | | 135,549 |
| | | | | | 547,766 |
| CONSUMER FINANCE — 0.2% | |
Amentum Government Services Holdings LLC
Term Loan B 1 mo. USD Term SOFR + 4.00%, 9.46%, 1/29/2027 (a)
| | | 347,746 | | 349,050 |
| CONTAINERS & PACKAGING — 1.8% | |
Berlin Packaging LLC
2024 Term Loan B 3 mo. USD Term SOFR + 3.75%, 9.19%, 6/9/2031 (a)
| | | 685,312 | | 687,649 |
Charter NEX U.S., Inc.
2024 Term Loan B 1 mo. USD Term SOFR + 3.50%, 8.84%, 12/1/2027 (a)
| | | 173,207 | | 173,709 |
Clydesdale Acquisition Holdings, Inc.
Term Loan B 1 mo. USD Term SOFR + 3.68%, 9.12%, 4/13/2029 (a)
| | | 622,417 | | 624,555 |
Graham Packaging Co., Inc.
2021 Term Loan 1 mo. USD Term SOFR + 3.00%, 8.46%, 8/4/2027 (a)
| | | 49,968 | | 50,102 |
Iris Holding, Inc.
Term Loan 3 mo. USD Term SOFR + 4.75%, 10.18%, 6/28/2028 (a)
| | | 148,279 | | 140,124 |
Proampac PG Borrower LLC
2024 Term Loan 3 mo. USD Term SOFR + 4.00%, 9.32%, 9/15/2028 (a)
| | | 373,288 | | 374,641 |
SupplyOne, Inc.
2024 Term Loan B 1 mo. USD Term SOFR + 4.25%, 9.59%, 4/21/2031 (a)
| | | 229,425 | | 230,071 |
| Security Description | | | Principal
Amount | | Value |
Trident TPI Holdings, Inc.
2024 Term Loan B6 3 mo. USD Term SOFR + 4.00%, 9.30%, 9/15/2028 (a)
| | | $338,501 | | $339,418 |
| | | | | | 2,620,269 |
| DISTRIBUTION/WHOLESALE — 0.6% | |
Fastlane Parent Co., Inc.
2023 Term Loan B 1 mo. USD Term SOFR + 4.50%, 9.84%, 9/29/2028 (a)
| | | 323,695 | | 322,724 |
Windsor Holdings III LLC
2024 USD Term Loan B 1 mo. USD Term SOFR + 4.00%, 9.34%, 8/1/2030 (a)
| | | 501,939 | | 505,829 |
| | | | | | 828,553 |
| DIVERSIFIED CONSUMER SERVICES — 0.3% | |
| Ascend Learning LLC: | | | | | |
2021 2nd Lien Term Loan 1 mo. USD Term SOFR + 5.75%, 11.19%, 12/10/2029 (a)
| | | 144,286 | | 141,977 |
2021 Term Loan 1 mo. USD Term SOFR + 3.50%, 8.94%, 12/11/2028 (a)
| | | 348,214 | | 348,307 |
| | | | | | 490,284 |
| DIVERSIFIED FINANCIAL SERVICES — 2.0% | |
Advisor Group, Inc.
2024 Term Loan 1 mo. USD Term SOFR + 4.00%, 9.34%, 8/17/2028 (a)
| | | 388,047 | | 389,721 |
Apex Group Treasury LLC
USD Term Loan 3 mo. USD Term SOFR + 3.75%, 9.33%, 7/27/2028 (a)
| | | 90,042 | | 90,267 |
Assetmark Financial Holdings, Inc.
2024 Term Loan (c)
| | | 690,000 | | 691,294 |
Deerfield Dakota Holding LLC
2020 USD Term Loan B 3 mo. USD Term SOFR + 3.75%, 9.08%, 4/9/2027 (a)
| | | 482,483 | | 482,840 |
| Edelman Financial Center LLC: | | | | | |
2024 2nd Lien Term Loan 1 mo. USD Term SOFR + 5.25%, 10.59%, 10/6/2028 (a)
| | | 340,000 | | 341,275 |
2024 Term Loan B 3 mo. USD Term SOFR + 3.25%, 8.59%, 4/7/2028 (a)
| | | 260,000 | | 260,671 |
Eisner Advisory Group LLC
2024 Term Loan B 1 mo. USD Term SOFR + 4.00%, 9.34%, 2/28/2031 (a)
| | | 288,550 | | 291,737 |
Kestra Advisor Services Holdings A, Inc.
2024 Term Loan 1 mo. USD Term SOFR + 4.00%, 9.34%, 3/22/2031 (a)
| | | 225,000 | | 226,097 |
See accompanying notes to financial statements.
3
SPDR BLACKSTONE HIGH INCOME ETF
SCHEDULE OF INVESTMENTS (continued)
June 30, 2024
| Security Description | | | Principal
Amount | | Value |
Mermaid Bidco, Inc.
2024 USD Term Loan B (c)
| | | $200,000 | | $200,500 |
| | | | | | 2,974,402 |
| DIVERSIFIED TELECOMMUNICATION SERVICES — 0.9% | |
Altice France SA
2023 USD Term Loan B14 3 mo. USD Term SOFR + 5.50%, 10.83%, 8/15/2028 (a)
| | | 232,649 | | 171,579 |
CCI Buyer, Inc.
Term Loan 3 mo. USD Term SOFR + 4.00%, 9.33%, 12/17/2027 (a)
| | | 572,480 | | 573,776 |
| Delta TopCo, Inc.: | | | | | |
2024 2nd Lien Term Loan 1 mo. USD Term SOFR + 5.25%, 10.60%, 11/30/2029 (a)
| | | 150,000 | | 152,550 |
2024 Term Loan 3 mo. USD Term SOFR + 3.50%, 8.85%, 11/30/2029 (a)
| | | 500,000 | | 500,365 |
| | | | | | 1,398,270 |
| ELECTRIC — 0.2% | |
Kohler Energy Co. LLC
USD Term Loan B 3 mo. USD Term SOFR + 4.75%, 10.08%, 5/1/2031 (a)
| | | 321,541 | | 323,300 |
| ENTERTAINMENT — 1.5% | |
AP Gaming I LLC
2022 Term Loan B 1 mo. USD Term SOFR + 3.75%, 9.09%, 2/15/2029 (a)
| | | 296,013 | | 298,512 |
Bally's Corp.
2021 Term Loan B 3 mo. USD Term SOFR + 3.25%, 8.84%, 10/2/2028 (a)
| | | 227,897 | | 216,953 |
Caesars Entertainment, Inc.
2024 Term Loan B1 3 mo. USD Term SOFR + 2.75%, 8.10%, 2/6/2031 (a)
| | | 39,900 | | 39,981 |
CE Intermediate I LLC
Term Loan B 3 mo. USD Term SOFR + 4.00%, 8.97%, 11/10/2028 (a)
| | | 187,415 | | 188,060 |
Crown Finance U.S., Inc.
2023 Exit Term Loan 1 mo. USD Term SOFR + 1.50%, 6.96%, 7/31/2028 (a)
| | | 42,332 | | 42,934 |
Fertitta Entertainment LLC
2022 Term Loan B 1 mo. USD Term SOFR + 3.75%, 9.08%, 1/27/2029 (a)
| | | 789,308 | | 791,131 |
OVG Business Services LLC
2024 Term Loan B 3 mo. USD Term SOFR + 3.00%, 8.35%, 6/14/2031 (a)
| | | 195,000 | | 194,879 |
| Security Description | | | Principal
Amount | | Value |
Scientific Games Holdings LP
2024 USD Term Loan B 3 mo. USD Term SOFR + 3.00%, 8.31%, 4/4/2029 (a)
| | | $471,376 | | $470,982 |
| | | | | | 2,243,432 |
| FOOD PRODUCTS — 0.2% | |
Fiesta Purchaser, Inc.
2024 Term Loan B 1 mo. USD Term SOFR + 4.00%, 9.34%, 2/12/2031 (a)
| | | 150,000 | | 151,228 |
Solina Bidco
2024 Term Loan B 3 mo. USD Term SOFR + 3.75%, 9.09%, 3/7/2029 (a)
| | | 85,000 | | 85,584 |
| | | | | | 236,812 |
| FOOD-MISC/DIVERSIFIED — 0.1% | |
Skopima Merger Sub, Inc.
Term Loan B 1 mo. USD Term SOFR + 4.00%, 9.46%, 5/12/2028 (a)
| | | 187,042 | | 187,125 |
| HEALTH CARE EQUIPMENT & SUPPLIES — 1.0% | |
Auris Luxembourg III SARL
2024 USD Term Loan B4 6 mo. USD Term SOFR + 4.25%, 9.99%, 2/28/2029 (a)
| | | 495,000 | | 496,856 |
Bausch & Lomb Corp.
Term Loan 1 mo. USD Term SOFR + 3.25%, 8.69%, 5/10/2027 (a)
| | | 244,313 | | 242,023 |
Gainwell Acquisition Corp.
Term Loan B 3 mo. USD Term SOFR + 4.00%, 9.43%, 10/1/2027 (a)
| | | 507,847 | | 493,033 |
Medline Borrower LP
2024 Term Loan B 1 mo. USD Term SOFR + 2.75%, 8.09%, 10/23/2028 (a)
| | | 41,138 | | 41,266 |
Resonetics LLC
2024 Term Loan 3 mo. USD Term SOFR + 3.75%, 9.08%, 6/6/2031 (a)
| | | 230,000 | | 230,719 |
| | | | | | 1,503,897 |
| HEALTH CARE PROVIDERS & SERVICES — 1.9% | |
GHX Ultimate Parent Corp.
2024 Term Loan B 3 mo. USD Term SOFR + 4.00%, 9.33%, 6/30/2027 (a)
| | | 168,930 | | 170,196 |
Global Medical Response, Inc.
2024 PIK Term Loan 1 mo. USD Term SOFR + 5.50%, 10.85%, 10/31/2028 (a)
| | | 671,487 | | 651,678 |
LifePoint Health, Inc.
2024 Term Loan B 3 mo. USD Term SOFR + 4.75%, 10.06%, 11/16/2028 (a)
| | | 674,481 | | 678,994 |
See accompanying notes to financial statements.
4
SPDR BLACKSTONE HIGH INCOME ETF
SCHEDULE OF INVESTMENTS (continued)
June 30, 2024
| Security Description | | | Principal
Amount | | Value |
MED ParentCo LP
2024 Term Loan B 1 mo. USD Term SOFR + 4.00%, 9.34%, 4/15/2031 (a)
| | | $350,000 | | $350,298 |
Midwest Physician Administrative Services LLC
2021 Term Loan 3 mo. USD Term SOFR + 3.25%, 8.85%, 3/12/2028 (a)
| | | 184,161 | | 161,831 |
Outcomes Group Holdings, Inc.
2024 Term Loan 3 mo. USD Term SOFR + 4.25%, 9.59%, 5/6/2031 (a)
| | | 150,000 | | 150,668 |
Radiology Partners, Inc.
2024 Extended Term Loan B 3 mo. USD Term SOFR + 3.50%, 9.09%, 1/31/2029 (a)
| | | 178,629 | | 169,877 |
Team Health Holdings, Inc.
2022 Term Loan B 1 mo. USD Term SOFR + 5.25%, 10.59%, 3/2/2027 (a)
| | | 229,294 | | 214,275 |
U.S. Anesthesia Partners, Inc.
2021 Term Loan 1 mo. USD Term SOFR + 4.25%, 9.69%, 10/1/2028 (a)
| | | 334,855 | | 322,065 |
| | | | | | 2,869,882 |
| HOLDING COMPANIES & DIVERSIFIED — 0.3% | |
Belfor Holdings, Inc.
2023 USD Term Loan B 1 mo. USD Term SOFR + 3.75%, 9.09%, 11/1/2030 (a)
| | | 349,028 | | 351,645 |
Forward Air Corp.
Term Loan B 1 mo. USD Term SOFR + 4.50%, 9.83%, 12/19/2030 (a)
| | | 177,122 | | 165,632 |
| | | | | | 517,277 |
| HOME FURNISHINGS — 0.4% | |
AI Aqua Merger Sub, Inc.
2021 1st Lien Term Loan B 1 mo. USD Term SOFR + 4.00%, 9.33%, 7/31/2028 (a)
| | | 620,291 | | 622,096 |
| HOTELS, RESTAURANTS & LEISURE — 0.3% | |
Peraton Corp.
Term Loan B 1 mo. USD Term SOFR + 3.75%, 9.19%, 2/1/2028 (a)
| | | 414,818 | | 415,367 |
| HOUSEWARES — 0.1% | |
American Greetings Corp.
2024 Term Loan B 1 mo. USD Term SOFR + 5.75%, 11.09%, 10/30/2029 (a)
| | | 100,000 | | 100,719 |
| INSURANCE — 2.1% | |
Alliant Holdings Intermediate LLC
2023 Term Loan B6 1 mo. USD Term SOFR + 3.50%, 8.83%, 11/6/2030 (a)
| | | 358,684 | | 359,972 |
| Security Description | | | Principal
Amount | | Value |
AssuredPartners, Inc.
2024 Incremental Term Loan B5 1 mo. USD Term SOFR + 3.50%, 8.84%, 2/14/2031 (a)
| | | $249,375 | | $250,310 |
BroadStreet Partners, Inc.
2024 Term Loan B4 1 mo. USD Term SOFR + 3.25%, 8.59%, 6/14/2031 (a)
| | | 515,200 | | 514,427 |
Howden Group Holdings Ltd.
2024 USD Term Loan B 1 mo. USD Term SOFR + 3.50%, 8.84%, 2/15/2031 (a)
| | | 447,792 | | 449,321 |
HUB International Ltd.
2024 Term Loan B 3 mo. USD Term SOFR + 3.25%, 8.57%, 6/20/2030 (a)
| | | 249,375 | | 250,207 |
OneDigital Borrower LLC
2024 Term Loan (c)
| | | 225,000 | | 224,720 |
Sedgwick Claims Management Services, Inc.
2023 Term Loan B 1 mo. USD Term SOFR + 3.75%, 9.09%, 2/24/2028 (a)
| | | 635,722 | | 637,222 |
Truist Insurance Holdings LLC
1st Lien Term Loan 3 mo. USD Term SOFR + 3.25%, 8.58%, 5/6/2031 (a)
| | | 380,000 | | 381,288 |
USI, Inc.
2024 Term Loan (2029) 3 mo. USD Term SOFR + 2.75%, 8.08%, 11/22/2029 (a)
| | | 82,376 | | 82,480 |
| | | | | | 3,149,947 |
| INTERNET & TELECOM — 1.0% | |
CNT Holdings I Corp.
2020 Term Loan 3 mo. USD Term SOFR + 3.50%, 8.83%, 11/8/2027 (a)
| | | 169,150 | | 169,761 |
Endure Digital, Inc.
Term Loan 1 mo. USD Term SOFR + 3.50%, 8.94%, 2/10/2028 (a)
| | | 392,519 | | 365,534 |
I-Logic Technologies Bidco Ltd.
2021 USD Term Loan B 3 mo. USD Term SOFR + 4.00%, 9.48%, 2/16/2028 (a)
| | | 177,920 | | 178,179 |
MH Sub I LLC
2023 Term Loan 1 mo. USD Term SOFR + 4.25%, 9.59%, 5/3/2028 (a)
| | | 505,888 | | 505,992 |
PUG LLC
2024 Extended Term Loan B 1 mo. USD Term SOFR + 4.75%, 10.09%, 3/15/2030 (a)
| | | 266,003 | | 266,419 |
| | | | | | 1,485,885 |
See accompanying notes to financial statements.
5
SPDR BLACKSTONE HIGH INCOME ETF
SCHEDULE OF INVESTMENTS (continued)
June 30, 2024
| Security Description | | | Principal
Amount | | Value |
| INVESTMENT COMPANIES — 0.4% | |
AL GCX Holdings LLC
Term Loan B 1 mo. USD Term SOFR + 3.25%, 8.58%, 5/17/2029 (a)
| | | $51,705 | | $51,730 |
BEP Intermediate Holdco LLC
Term Loan B 1 mo. USD Term SOFR + 3.75%, 9.09%, 4/25/2031 (a)
| | | 150,000 | | 150,750 |
CD&R Hydra Buyer, Inc.
2024 Term Loan B 3 mo. USD Term SOFR + 4.00%, 9.44%, 3/25/2031 (a)
| | | 189,676 | | 190,268 |
Truist Insurance Holdings LLC
2nd Lien Term Loan 3 mo. USD Term SOFR + 4.75%, 10.08%, 5/6/2032 (a)
| | | 200,000 | | 204,500 |
| | | | | | 597,248 |
| IT SERVICES — 0.2% | |
Access CIG LLC
2023 Term Loan 3 mo. USD Term SOFR + 5.00%, 10.33%, 8/18/2028 (a)
| | | 247,260 | | 249,154 |
Ahead DB Holdings LLC
2021 Term Loan B 3 mo. USD Term SOFR + 3.75%, 9.08%, 2/1/2031 (a)
| | | 52,127 | | 52,364 |
| | | | | | 301,518 |
| LEISURE TIME — 0.4% | |
Alterra Mountain Co.
2024 Term Loan B4 1 mo. USD Term SOFR + 3.25%, 8.59%, 8/17/2028 (a)
| | | 60,599 | | 60,876 |
Amer Sports Co.
USD Term Loan 3 mo. USD Term SOFR + 3.25%, 8.58%, 2/17/2031 (a)
| | | 284,287 | | 286,420 |
LC Ahab U.S. Bidco LLC
Term Loan B 1 mo. USD Term SOFR + 3.50%, 8.84%, 5/1/2031 (a)
| | | 176,000 | | 176,551 |
| | | | | | 523,847 |
| LIFE SCIENCES TOOLS & SERVICES — 0.0% (b) | |
Parexel International Corp.
2021 1st Lien Term Loan 1 mo. USD Term SOFR + 3.25%, 8.71%, 11/15/2028 (a)
| | | 69,131 | | 69,358 |
| MACHINERY — 1.0% | |
Chart Industries, Inc.
2023 Term Loan 1 mo. USD Term SOFR + 3.25%, 8.68%, 3/15/2030 (a)
| | | 56,668 | | 57,236 |
Madison IAQ LLC
Term Loan 1 mo. USD Term SOFR + 2.75%, 8.09%, 6/21/2028 (a)
| | | 582,552 | | 583,813 |
| Security Description | | | Principal
Amount | | Value |
Pro Mach Group, Inc.
2021 Term Loan B 1 mo. USD Term SOFR + 3.50%, 8.84%, 8/31/2028 (a)
| | | $179,550 | | $180,672 |
SPX Flow, Inc.
2024 Term Loan B 1 mo. USD Term SOFR + 3.50%, 8.84%, 4/5/2029 (a)
| | | 235,000 | | 236,626 |
TK Elevator U.S. Newco, Inc.
USD Term Loan B 3 mo. USD Term SOFR + 3.50%, 8.79%, 4/30/2030 (a)
| | | 492,842 | | 495,999 |
| | | | | | 1,554,346 |
| MEDIA — 1.4% | |
Cengage Learning, Inc.
2024 Term Loan B 6 mo. USD Term SOFR + 4.25%, 9.54%, 3/22/2031 (a)
| | | 683,288 | | 686,065 |
Cogeco Communications Finance USA LP
2023 Incremental Term Loan B 1 mo. USD Term SOFR + 2.50%, 7.96%, 9/1/2028 (a)
| | | 125,671 | | 121,833 |
CSC Holdings LLC
2019 Term Loan B5 1 mo. USD Term SOFR + 2.50%, 7.94%, 4/15/2027 (a)
| | | 308 | | 257 |
Directv Financing LLC
2024 Term Loan 1 mo. USD Term SOFR + 5.25%, 10.71%, 8/2/2029 (a)
| | | 742,465 | | 740,145 |
Fleet Midco I Ltd.
2024 Term Loan B 1 mo. USD Term SOFR + 3.25%, 8.59%, 2/21/2031 (a)
| | | 150,000 | | 150,937 |
Gray Television, Inc.
2021 Term Loan D 1 mo. USD Term SOFR + 3.00%, 8.44%, 12/1/2028 (a)
| | | 57,971 | | 52,445 |
Radiate Holdco LLC
2021 Term Loan B 1 mo. USD Term SOFR + 3.25%, 8.71%, 9/25/2026 (a)
| | | 69,892 | | 56,802 |
Univision Communications, Inc.
2022 Term Loan B 1 mo. USD Term SOFR + 3.25%, 8.71%, 1/31/2029 (a)
| | | 164,523 | | 160,822 |
Virgin Media Bristol LLC
USD Term Loan N 1 mo. USD Term SOFR + 2.50%, 7.94%, 1/31/2028 (a)
| | | 164,749 | | 157,831 |
| | | | | | 2,127,137 |
| METAL FABRICATE & HARDWARE — 0.1% | |
Crosby U.S. Acquisition Corp.
2024 Term Loan B 1 mo. USD Term SOFR + 4.00%, 9.34%, 8/16/2029 (a)
| | | 154,225 | | 155,269 |
See accompanying notes to financial statements.
6
SPDR BLACKSTONE HIGH INCOME ETF
SCHEDULE OF INVESTMENTS (continued)
June 30, 2024
| Security Description | | | Principal
Amount | | Value |
| MISCELLANEOUS MANUFACTUR — 0.3% | |
| Touchdown Acquirer, Inc.: | | | | | |
Delayed Draw Term Loan (c)
| | | $80,838 | | $81,319 |
USD Term Loan 3 mo. USD Term SOFR + 4.00%, 9.33%, 2/21/2031 (a)
| | | 369,162 | | 371,354 |
| | | | | | 452,673 |
| PHARMACEUTICALS — 0.2% | |
Grifols Worldwide Operations USA, Inc.
2019 USD Term Loan B 1 mo. USD Term SOFR + 2.00%, 7.44%, 11/15/2027 (a)
| | | 38,180 | | 37,963 |
HLF Financing SARL LLC
2024 8th Amendment Term Loan B 1 mo. USD Term SOFR + 6.75%, 12.09%, 4/12/2029 (a)
| | | 50,000 | | 48,213 |
Packaging Coordinators Midco, Inc.
2024 Term Loan B 3 mo. USD Term SOFR + 3.25%, 8.58%, 11/30/2027 (a)
| | | 186,699 | | 187,556 |
| | | | | | 273,732 |
| PIPELINES — 0.7% | |
BIP PipeCo Holdings LLC
Term Loan B 3 mo. USD Term SOFR + 2.50%, 7.81%, 12/6/2030 (a)
| | | 160,000 | | 160,525 |
Freeport LNG Investments LLLP
Term Loan B 3 mo. USD Term SOFR + 3.50%, 9.09%, 12/21/2028 (a)
| | | 574,480 | | 574,557 |
Oryx Midstream Services Permian Basin LLC
2024 Term Loan B 1 mo. USD Term SOFR + 3.00%, 8.44%, 10/5/2028 (a)
| | | 136,128 | | 136,384 |
TransMontaigne Operating Co. LP
Term Loan B 1 mo. USD Term SOFR + 3.50%, 8.96%, 11/17/2028 (a)
| | | 150,224 | | 150,774 |
| | | | | | 1,022,240 |
| PROFESSIONAL SERVICES — 0.1% | |
Anticimex International AB
2021 USD Term Loan B1 3 mo. USD Term SOFR + 3.15%, 8.46%, 11/16/2028 (a)
| | | 99,058 | | 99,182 |
| REAL ESTATE — 0.2% | |
CoreLogic, Inc.
Term Loan 1 mo. USD Term SOFR + 3.50%, 8.96%, 6/2/2028 (a)
| | | 283,950 | | 280,198 |
| Security Description | | | Principal
Amount | | Value |
| RETAIL — 2.4% | |
CWGS Group LLC
2021 Term Loan B 1 mo. USD Term SOFR + 2.50%, 7.96%, 6/3/2028 (a)
| | | $102,267 | | $99,263 |
Fogo De Chao, Inc.
2023 Term Loan B 1 mo. USD Term SOFR + 4.75%, 10.09%, 9/30/2030 (a)
| | | 170,475 | | 168,387 |
Gulfside Supply, Inc.
Term Loan B (c)
| | | 200,000 | | 200,375 |
Johnstone Supply LLC
Term Loan 3 mo. USD Term SOFR + 3.00%, 8.33%, 5/16/2031 (a)
| | | 200,000 | | 200,500 |
LBM Acquisition LLC
2024 Incremental Term Loan B 3 mo. USD Term SOFR + 3.75%, 9.18%, 5/30/2031 (a)
| | | 643,521 | | 633,643 |
Medical Solutions Holdings, Inc.
2021 1st Lien Term Loan 1 mo. USD Term SOFR + 3.25%, 8.69%, 11/1/2028 (a)
| | | 171,937 | | 131,071 |
Peer Holding III BV
2024 USD Term Loan B5 (c)
| | | 470,000 | | 471,079 |
Restoration Hardware, Inc.
Term Loan B 1 mo. USD Term SOFR + 2.50%, 7.96%, 10/20/2028 (a)
| | | 182,243 | | 175,685 |
Spencer Spirit IH LLC
2024 Term Loan B (c)
| | | 65,000 | | 65,000 |
Staples, Inc.
2024 Term Loan B 3 mo. USD Term SOFR + 5.75%, 11.08%, 9/4/2029 (a)
| | | 690,000 | | 634,627 |
Tacala LLC
2024 Term Loan 1 mo. USD Term SOFR + 4.00%, 9.34%, 1/31/2031 (a)
| | | 598,500 | | 601,807 |
White Cap Buyer LLC
2024 Term Loan B 1 mo. USD Term SOFR + 3.25%, 8.59%, 10/19/2029 (a)
| | | 165,000 | | 165,469 |
| | | | | | 3,546,906 |
| RETAIL-BUILDING PRODUCTS — 0.2% | |
Park River Holdings, Inc.
Term Loan 3 mo. USD Term SOFR + 3.25%, 8.81%, 12/28/2027 (a)
| | | 331,313 | | 324,594 |
| SHIPBUILDING — 0.2% | |
LSF11 Trinity Bidco, Inc.
2024 Term Loan B 1 mo. USD Term SOFR + 3.50%, 8.84%, 6/14/2030 (a)
| | | 327,677 | | 329,623 |
See accompanying notes to financial statements.
7
SPDR BLACKSTONE HIGH INCOME ETF
SCHEDULE OF INVESTMENTS (continued)
June 30, 2024
| Security Description | | | Principal
Amount | | Value |
| SOFTWARE — 7.8% | |
Applied Systems, Inc.
2024 1st Lien Term Loan 3 mo. USD Term SOFR + 3.50%, 8.83%, 2/24/2031 (a)
| | | $288,762 | | $291,240 |
Apttus Corp.
2021 Term Loan 1 mo. USD Term SOFR + 4.00%, 9.46%, 5/8/2028 (a)
| | | 168,649 | | 168,860 |
AthenaHealth Group, Inc.
2022 Term Loan B 1 mo. USD Term SOFR + 3.25%, 8.59%, 2/15/2029 (a)
| | | 466,575 | | 465,628 |
Banff Merger Sub, Inc.
2023 USD Term Loan 1 mo. USD Term SOFR + 4.25%, 9.34%, 12/29/2028 (a)
| | | 671,007 | | 673,221 |
Cast & Crew Payroll LLC
2021 Incremental Term Loan 1 mo. USD Term SOFR + 3.75%, 9.09%, 12/29/2028 (a)
| | | 199,488 | | 199,844 |
Central Parent, Inc.
2024 Term Loan B 3 mo. USD Term SOFR + 3.25%, 8.58%, 7/6/2029 (a)
| | | 675,451 | | 667,643 |
| Cloud Software Group, Inc.: | | | | | |
2024 Term Loan 3 mo. USD Term SOFR + 4.50%, 9.83%, 3/21/2031 (a)
| | | 160,000 | | 160,638 |
2024 USD Term Loan B 1 mo. USD Term SOFR + 4.00%, 9.33%, 3/30/2029 (a)
| | | 575,457 | | 575,710 |
Cloudera, Inc.
2021 Term Loan 1 mo. USD Term SOFR + 3.75%, 9.19%, 10/8/2028 (a)
| | | 39,543 | | 39,617 |
Cotiviti Corp.
2024 Term Loan 1 mo. USD Term SOFR + 3.25%, 8.58%, 5/1/2031 (a)
| | | 498,750 | | 497,503 |
DCert Buyer, Inc.
2019 Term loan B 1 mo. USD Term SOFR + 4.00%, 9.34%, 10/16/2026 (a)
| | | 196,366 | | 191,825 |
ECI Macola/Max Holding LLC
2024 Term Loan B 3 mo. USD Term SOFR + 3.75%, 9.08%, 5/31/2030 (a)
| | | 244,388 | | 246,170 |
EP Purchaser LLC
2021 Term Loan B 3 mo. USD Term SOFR + 3.50%, 9.10%, 11/6/2028 (a)
| | | 143,914 | | 144,171 |
Epicor Software Corp.
2024 Term Loan 1 mo. USD Term SOFR + 3.25%, 8.58%, 5/23/2031 (a)
| | | 344,414 | | 323,562 |
| Security Description | | | Principal
Amount | | Value |
EverCommerce, Inc.
Term Loan B 1 mo. USD Term SOFR + 3.00%, 8.46%, 7/6/2028 (a)
| | | $135,671 | | $136,123 |
Flexera Software LLC
2024 Term Loan 3 mo. USD Term SOFR + 3.50%, 8.83%, 3/3/2028 (a)
| | | 205,074 | | 206,099 |
Genesys Cloud Services Holdings II LLC
Term Loan B 1 mo. USD Term SOFR + 3.75%, 9.21%, 12/1/2027 (a)
| | | 284,287 | | 286,567 |
Idera, Inc.
2024 Term Loan 1 mo. USD Term SOFR + 3.50%, 8.83%, 3/2/2028 (a)
| | | 165,000 | | 164,072 |
Ivanti Software, Inc.
2021 Term Loan B 3 mo. USD Term SOFR + 4.25%, 9.81%, 12/1/2027 (a)
| | | 204,485 | | 163,157 |
McAfee LLC
2024 USD Term Loan B 1 mo. USD Term SOFR + 3.25%, 8.58%, 3/1/2029 (a)
| | | 487,035 | | 487,150 |
| Mitchell International, Inc.: | | | | | |
2024 1st Lien Term Loan 1 mo. USD Term SOFR + 3.25%, 8.59%, 6/17/2031 (a)
| | | 590,000 | | 585,717 |
2024 2nd Lien Term Loan 3 mo. USD Term SOFR + 5.25%, 10.59%, 6/7/2032 (a)
| | | 75,000 | | 74,953 |
Modena Buyer LLC
Term Loan (c)
| | | 150,000 | | 146,602 |
Particle Investments SARL
2024 Term Loan B 1 mo. USD Term SOFR + 4.00%, 9.32%, 3/28/2031 (a)
| | | 99,750 | | 100,685 |
Polaris Newco LLC
USD Term Loan B 3 mo. USD Term SOFR + 4.00%, 9.59%, 6/2/2028 (a)
| | | 348,646 | | 348,923 |
Project Alpha Intermediate Holding, Inc.
2024 Term Loan B 3 mo. USD Term SOFR + 3.75%, 9.07%, 10/28/2030 (a)
| | | 541,743 | | 544,075 |
Project Leopard Holdings, Inc.
2022 USD Term Loan B 3 mo. USD Term SOFR + 5.25%, 10.68%, 7/20/2029 (a)
| | | 361,284 | | 337,203 |
| Project Ruby Ultimate Parent Corp.: | | | | | |
2021 Term Loan 1 mo. USD Term SOFR + 3.25%, 8.71%, 3/10/2028 (a)
| | | 189,637 | | 190,150 |
2024 Incremental Term Loan 1 mo. USD Term SOFR + 3.50%, 8.96%, 3/10/2028 (a)
| | | 418,950 | | 420,456 |
See accompanying notes to financial statements.
8
SPDR BLACKSTONE HIGH INCOME ETF
SCHEDULE OF INVESTMENTS (continued)
June 30, 2024
| Security Description | | | Principal
Amount | | Value |
Quest Software U.S. Holdings, Inc.
2022 Term Loan 3 mo. USD Term SOFR + 4.25%, 9.73%, 2/1/2029 (a)
| | | $118,487 | | $88,306 |
RealPage, Inc.
1st Lien Term Loan 1 mo. USD Term SOFR + 3.00%, 8.46%, 4/24/2028 (a)
| | | 497,385 | | 484,294 |
Rocket Software, Inc.
2023 USD Term Loan B 1 mo. USD Term SOFR + 4.75%, 10.09%, 11/28/2028 (a)
| | | 299,246 | | 300,864 |
SolarWinds Holdings, Inc.
2024 Term Loan 1 mo. USD Term SOFR + 3.25%, 8.59%, 2/5/2027 (a)
| | | 177,600 | | 178,118 |
Sovos Compliance LLC
2021 Term Loan 1 mo. USD Term SOFR + 4.50%, 9.96%, 8/11/2028 (a)
| | | 125,551 | | 124,751 |
Surf Holdings LLC
USD Term Loan 1 mo. USD Term SOFR + 3.50%, 8.93%, 3/5/2027 (a)
| | | 93,437 | | 93,656 |
Vision Solutions, Inc.
2021 Incremental Term Loan 3 mo. USD Term SOFR + 3.25%, 11.75%, 4/24/2028 (a)
| | | 622,689 | | 614,127 |
VS Buyer LLC
2024 Term Loan B 1 mo. USD Term SOFR + 3.25%, 8.58%, 4/14/2031 (a)
| | | 150,000 | | 150,562 |
| Waystar Technologies, Inc.: | | | | | |
2024 Term Loan B (c)
| | | 396,729 | | 397,721 |
2024 Term Loan B 1 mo. USD Term SOFR + 2.75%, 8.10%, 10/22/2029 (a)
| | | 396,729 | | 397,721 |
| | | | | | 11,667,684 |
| SPECIALTY RETAIL — 0.5% | |
K-Mac Holdings Corp.
2021 Term Loan 1 mo. USD Term SOFR + 3.25%, 8.96%, 7/21/2028 (a)
| | | 345,956 | | 346,410 |
Michaels Cos., Inc.
2021 Term Loan B 3 mo. USD Term SOFR + 4.25%, 9.85%, 4/15/2028 (a)
| | | 331,358 | | 298,674 |
PetSmart, Inc.
2021 Term Loan B 1 mo. USD Term SOFR + 3.75%, 9.19%, 2/11/2028 (a)
| | | 94,411 | | 94,253 |
| | | | | | 739,337 |
| STEEL-PRODUCERS — 0.5% | |
Arsenal AIC Parent LLC
2024 Term Loan B 1 mo. USD Term SOFR + 3.75%, 9.09%, 8/18/2030 (a)
| | | 575,771 | | 579,946 |
| Security Description | | | Principal
Amount | | Value |
Phoenix Services International LLC
2023 Exit PIK Term Loan 1 mo. USD Term SOFR + 6.10%, 11.44%, 6/30/2028 (a)
| | | $211,589 | | $203,125 |
| | | | | | 783,071 |
| TELECOMMUNICATION EQUIP — 0.2% | |
Coral-U.S. Co-Borrower LLC
2021 Term Loan B6 1 mo. USD Term SOFR + 3.00%, 8.44%, 10/15/2029 (a)
| | | 261,333 | | 256,859 |
| TRADING COMPANIES & DISTRIBUTORS — 0.1% | |
Foundation Building Materials Holding Co. LLC
2021 Term Loan 3 mo. USD Term SOFR + 3.25%, 8.84%, 1/31/2028 (a)
| | | 112,600 | | 111,544 |
| TRANSPORT-SERVICES — 0.2% | |
LaserShip, Inc.
2021 Term Loan 3 mo. USD Term SOFR + 4.50%, 10.10%, 5/7/2028 (a)
| | | 296,410 | | 253,391 |
Savage Enterprises LLC
2021 Term Loan B 1 mo. USD Term SOFR + 3.00%, 8.34%, 9/15/2028 (a)
| | | 65,000 | | 65,229 |
| | | | | | 318,620 |
TOTAL SENIOR FLOATING RATE LOANS
(Cost $63,539,442)
| | | | | 63,771,620 |
| ASSET-BACKED SECURITIES — 7.6% | |
| OTHER ABS — 7.6% | |
Apidos CLO XI Ltd.
Series 2012-11A, Class ER3, 3 mo. USD Term SOFR + 6.83%, 12.15%, 4/17/2034 (a) (d)
| | | 500,000 | | 498,300 |
ARES LXII CLO Ltd.
Series 2021-62A, Class E, 3 mo. USD Term SOFR + 6.76%, 12.09%, 1/25/2034 (a) (d)
| | | 650,000 | | 646,880 |
ARES LXVIII CLO Ltd.
Series 2023-68A, Class E, 3 mo. USD Term SOFR + 8.55%, 13.87%, 4/25/2035 (a) (d)
| | | 750,000 | | 786,082 |
Balboa Bay Loan Funding Ltd.
Series 2021-2A, Class E, 3 mo. USD Term SOFR + 6.86%, 12.19%, 1/20/2035 (a) (d)
| | | 500,000 | | 476,600 |
Ballyrock CLO Ltd.
Series 2020-2A, Class DR, 3 mo. USD Term SOFR + 6.41%, 11.74%, 10/20/2031 (a) (d)
| | | 750,000 | | 747,000 |
Barings CLO Ltd.
Series 2019-3A, Class ER, 3 mo. USD Term SOFR + 6.96%, 12.29%, 4/20/2031 (a) (d)
| | | 750,000 | | 753,691 |
See accompanying notes to financial statements.
9
SPDR BLACKSTONE HIGH INCOME ETF
SCHEDULE OF INVESTMENTS (continued)
June 30, 2024
| Security Description | | | Principal
Amount | | Value |
Benefit Street Partners CLO X Ltd.
Series 2016-10A, Class DRR, 3 mo. USD Term SOFR + 7.01%, 12.34%, 4/20/2034 (a) (d)
| | | $500,000 | | $497,800 |
Canyon CLO Ltd.
Series 2020-1A, Class ER, 3 mo. USD Term SOFR + 6.61%, 11.94%, 7/15/2034 (a) (d)
| | | 602,000 | | 598,870 |
Carlyle U.S. CLO Ltd.
Series 2021-9A, Class E, 3 mo. USD Term SOFR + 6.89%, 12.22%, 10/20/2034 (a) (d)
| | | 712,882 | | 691,495 |
CarVal CLO IX-C Ltd.
Series 2024-1A, Class E, 3 mo. USD Term SOFR + 6.75%, 12.07%, 4/20/2037 (a) (d)
| | | 500,000 | | 505,950 |
Galaxy XXIV CLO Ltd.
Series 2017-24A, Class DR, 3 mo. USD Term SOFR + 4.15%, 9.47%, 4/15/2037 (a) (d)
| | | 500,000 | | 501,628 |
GoldenTree Loan Management U.S. CLO 12 Ltd.
Series 2022-12A, Class E, 3 mo. USD Term SOFR + 7.25%, 12.57%, 4/20/2034 (a) (d)
| | | 500,000 | | 497,900 |
Palmer Square CLO Ltd.
Series 2019-1A, Class DR, 3 mo. USD Term SOFR + 6.76%, 12.08%, 11/14/2034 (a) (d)
| | | 500,000 | | 498,800 |
Point Au Roche Park CLO Ltd.
Series 2021-1A, Class E, 3 mo. USD Term SOFR + 6.36%, 11.69%, 7/20/2034 (a) (d)
| | | 1,480,000 | | 1,463,720 |
Rad CLO 10 Ltd.
Series 2021-10A, Class E, 3 mo. USD Term SOFR + 6.11%, 11.44%, 4/23/2034 (a) (d)
| | | 500,000 | | 497,600 |
Rad CLO 15 Ltd.
Series 2021-15A, Class E, 3 mo. USD Term SOFR + 6.46%, 11.79%, 1/20/2034 (a) (d)
| | | 652,349 | | 648,957 |
RR 20 Ltd.
Series 2022-20A, Class D, 3 mo. USD Term SOFR + 7.25%, 12.58%, 7/15/2037 (a) (d)
| | | 500,000 | | 500,852 |
Vibrant CLO XVI Ltd.
Series 2023-16A, Class C, 3 mo. USD Term SOFR + 5.84%, 11.17%, 4/15/2036 (a) (d)
| | | 500,000 | | 512,687 |
| | | | | | 11,324,812 |
TOTAL ASSET-BACKED SECURITIES
(Cost $10,701,933)
| | | | | 11,324,812 |
| Security Description | | | Shares | | Value |
| COMMON STOCKS — 0.2% | |
| AEROSPACE & DEFENSE — 0.2% | |
Flame Newco LLC (e) (f)
| | | 19,856 | | $274,013 |
| ENTERTAINMENT — 0.0% (b) | |
Cineworld Group PLC (e) (f)
| | | 1,834 | | 32,553 |
TOTAL COMMON STOCKS
(Cost $220,840)
| | | | | 306,566 |
| | | | |
| MUTUAL FUNDS AND EXCHANGE TRADED PRODUCTS — 3.5% |
| DOMESTIC FIXED INCOME — 3.5% |
SPDR Blackstone Senior Loan ETF (g)
(Cost $5,272,365)
| | 126,117 | 5,271,691 |
| | | Principal
Amount | |
| CORPORATE BONDS & NOTES — 43.3% |
| ADVERTISING — 0.7% |
Advantage Sales & Marketing, Inc.
6.50%, 11/15/2028 (d)
| | $321,000 | 290,569 |
| Clear Channel Outdoor Holdings, Inc.: | | | |
7.50%, 6/1/2029 (d)
| | 200,000 | 167,096 |
7.75%, 4/15/2028 (d)
| | 560,000 | 490,706 |
Outfront Media Capital LLC/Outfront Media Capital Corp.
4.25%, 1/15/2029 (d)
| | 110,000 | 100,218 |
| AEROSPACE & DEFENSE — 0.8% |
AAR Escrow Issuer LLC
6.75%, 3/15/2029 (d)
| | 30,000 | 30,595 |
Bombardier, Inc.
7.00%, 6/1/2032 (d)
| | 60,000 | 60,820 |
Moog, Inc.
4.25%, 12/15/2027 (d)
| | 60,000 | 56,893 |
| TransDigm, Inc.: | | | |
4.63%, 1/15/2029
| | 547,000 | 511,111 |
4.88%, 5/1/2029
| | 530,000 | 496,567 |
| AGRICULTURE — 0.1% |
Vector Group Ltd.
5.75%, 2/1/2029 (d)
| | 227,000 | 212,713 |
| AIRLINES — 0.0% (b) |
American Airlines, Inc.
7.25%, 2/15/2028 (d)
| | 19,000 | 19,000 |
| APPAREL — 0.1% |
Wolverine World Wide, Inc.
4.00%, 8/15/2029 (d)
| | 270,000 | 225,650 |
| AUTO MANUFACTURERS — 0.6% |
Allison Transmission, Inc.
3.75%, 1/30/2031 (d)
| | 1,070,000 | 938,604 |
Wabash National Corp.
4.50%, 10/15/2028 (d)
| | 10,000 | 9,007 |
See accompanying notes to financial statements.
10
SPDR BLACKSTONE HIGH INCOME ETF
SCHEDULE OF INVESTMENTS (continued)
June 30, 2024
| Security Description | | | Principal
Amount | | Value |
| AUTO PARTS & EQUIPMENT — 0.0% (b) | |
Phinia, Inc.
6.75%, 4/15/2029 (d)
| | | $71,000 | | $72,077 |
| BANKS — 0.3% | |
Intesa Sanpaolo SpA
5.71%, 1/15/2026 (d)
| | | 200,000 | | 198,166 |
Popular, Inc.
7.25%, 3/13/2028
| | | 205,000 | | 210,484 |
| BEVERAGES — 0.3% | |
Primo Water Holdings, Inc.
4.38%, 4/30/2029 (d)
| | | 427,000 | | 393,032 |
| CHEMICALS — 0.8% | |
Ashland, Inc.
3.38%, 9/1/2031 (d)
| | | 430,000 | | 362,426 |
Chemours Co.
5.75%, 11/15/2028 (d)
| | | 120,000 | | 110,867 |
Methanex Corp.
5.25%, 12/15/2029
| | | 330,000 | | 318,473 |
Nufarm Australia Ltd./Nufarm Americas, Inc.
5.00%, 1/27/2030 (d)
| | | 80,000 | | 73,130 |
Tronox, Inc.
4.63%, 3/15/2029 (d)
| | | 323,000 | | 291,960 |
| COAL — 0.1% | |
SunCoke Energy, Inc.
4.88%, 6/30/2029 (d)
| | | 220,000 | | 199,434 |
| COMMERCIAL SERVICES — 1.6% | |
Adtalem Global Education, Inc.
5.50%, 3/1/2028 (d)
| | | 210,000 | | 201,842 |
Deluxe Corp.
8.00%, 6/1/2029 (d)
| | | 110,000 | | 103,172 |
| Sabre GLBL, Inc.: | | | | | |
8.63%, 6/1/2027 (d)
| | | 270,000 | | 249,480 |
11.25%, 12/15/2027 (d)
| | | 400,000 | | 388,700 |
| Service Corp. International: | | | | | |
3.38%, 8/15/2030
| | | 293,000 | | 255,402 |
4.00%, 5/15/2031
| | | 410,000 | | 365,572 |
TriNet Group, Inc.
3.50%, 3/1/2029 (d)
| | | 170,000 | | 151,344 |
United Rentals North America, Inc.
3.75%, 1/15/2032
| | | 250,000 | | 217,410 |
Upbound Group, Inc.
6.38%, 2/15/2029 (d)
| | | 64,000 | | 61,450 |
Valvoline, Inc.
3.63%, 6/15/2031 (d)
| | | 255,000 | | 219,535 |
ZipRecruiter, Inc.
5.00%, 1/15/2030 (d)
| | | 135,000 | | 117,249 |
| COMPUTERS — 0.5% | |
KBR, Inc.
4.75%, 9/30/2028 (d)
| | | 130,000 | | 121,686 |
Science Applications International Corp.
4.88%, 4/1/2028 (d)
| | | 170,000 | | 162,212 |
| Seagate HDD Cayman: | | | | | |
4.09%, 6/1/2029
| | | 300,000 | | 277,701 |
| Security Description | | | Principal
Amount | | Value |
4.13%, 1/15/2031
| | | $292,000 | | $259,127 |
| CONSTRUCTION MATERIALS — 0.3% | |
| Builders FirstSource, Inc.: | | | | | |
5.00%, 3/1/2030 (d)
| | | 120,000 | | 113,580 |
6.38%, 3/1/2034 (d)
| | | 99,000 | | 97,995 |
Griffon Corp.
5.75%, 3/1/2028
| | | 142,000 | | 137,083 |
Louisiana-Pacific Corp.
3.63%, 3/15/2029 (d)
| | | 150,000 | | 136,188 |
| DIVERSIFIED FINANCIAL SERVICES — 4.9% | |
Ally Financial, Inc.
6.70%, 2/14/2033
| | | 830,000 | | 824,439 |
Bread Financial Holdings, Inc.
9.75%, 3/15/2029 (d)
| | | 478,000 | | 502,325 |
| Burford Capital Global Finance LLC: | | | | | |
6.88%, 4/15/2030 (d)
| | | 172,000 | | 168,811 |
9.25%, 7/1/2031 (d)
| | | 250,000 | | 263,168 |
Encore Capital Group, Inc.
8.50%, 5/15/2030 (d)
| | | 191,000 | | 194,216 |
Enova International, Inc.
11.25%, 12/15/2028 (d)
| | | 160,000 | | 171,061 |
| goeasy Ltd.: | | | | | |
7.63%, 7/1/2029 (d)
| | | 360,000 | | 367,092 |
9.25%, 12/1/2028 (d)
| | | 258,000 | | 273,833 |
| Nationstar Mortgage Holdings, Inc.: | | | | | |
5.13%, 12/15/2030 (d)
| | | 160,000 | | 146,914 |
5.50%, 8/15/2028 (d)
| | | 400,000 | | 384,624 |
5.75%, 11/15/2031 (d)
| | | 463,000 | | 435,067 |
7.13%, 2/1/2032 (d)
| | | 200,000 | | 201,124 |
| Navient Corp.: | | | | | |
4.88%, 3/15/2028
| | | 220,000 | | 201,241 |
9.38%, 7/25/2030
| | | 57,000 | | 59,919 |
11.50%, 3/15/2031
| | | 70,000 | | 77,078 |
Series MTN, 5.63%, 8/1/2033
| | | 880,000 | | 701,800 |
| OneMain Finance Corp.: | | | | | |
5.38%, 11/15/2029
| | | 110,000 | | 103,176 |
7.50%, 5/15/2031
| | | 76,000 | | 76,939 |
7.88%, 3/15/2030
| | | 159,000 | | 163,889 |
| PennyMac Financial Services, Inc.: | | | | | |
4.25%, 2/15/2029 (d)
| | | 270,000 | | 245,489 |
5.75%, 9/15/2031 (d)
| | | 530,000 | | 496,796 |
7.88%, 12/15/2029 (d)
| | | 237,000 | | 244,309 |
PHH Mortgage Corp.
7.88%, 3/15/2026 (d)
| | | 15,000 | | 14,640 |
| PRA Group, Inc.: | | | | | |
5.00%, 10/1/2029 (d)
| | | 40,000 | | 34,251 |
8.38%, 2/1/2028 (d)
| | | 50,000 | | 49,967 |
8.88%, 1/31/2030 (d)
| | | 122,000 | | 122,029 |
StoneX Group, Inc.
7.88%, 3/1/2031 (d)
| | | 277,000 | | 285,728 |
Synchrony Financial
7.25%, 2/2/2033
| | | 370,000 | | 369,186 |
See accompanying notes to financial statements.
11
SPDR BLACKSTONE HIGH INCOME ETF
SCHEDULE OF INVESTMENTS (continued)
June 30, 2024
| Security Description | | | Principal
Amount | | Value |
World Acceptance Corp.
7.00%, 11/1/2026 (d)
| | | $132,000 | | $125,815 |
| ELECTRIC — 1.5% | |
DPL, Inc.
4.35%, 4/15/2029
| | | 52,000 | | 48,405 |
| NRG Energy, Inc.: | | | | | |
3.38%, 2/15/2029 (d)
| | | 378,000 | | 336,261 |
3.63%, 2/15/2031 (d)
| | | 680,000 | | 583,406 |
3.88%, 2/15/2032 (d)
| | | 110,000 | | 94,584 |
PG&E Corp.
5.25%, 7/1/2030
| | | 170,000 | | 162,540 |
| Vistra Operations Co. LLC: | | | | | |
4.38%, 5/1/2029 (d)
| | | 499,000 | | 464,864 |
6.88%, 4/15/2032 (d)
| | | 67,000 | | 68,018 |
7.75%, 10/15/2031 (d)
| | | 424,000 | | 441,638 |
| ELECTRONICS — 0.1% | |
Atkore, Inc.
4.25%, 6/1/2031 (d)
| | | 90,000 | | 79,652 |
Coherent Corp.
5.00%, 12/15/2029 (d)
| | | 130,000 | | 123,086 |
| ENGINEERING & CONSTRUCTION — 0.7% | |
Dycom Industries, Inc.
4.50%, 4/15/2029 (d)
| | | 260,000 | | 243,474 |
Great Lakes Dredge & Dock Corp.
5.25%, 6/1/2029 (d)
| | | 171,000 | | 152,293 |
| TopBuild Corp.: | | | | | |
3.63%, 3/15/2029 (d)
| | | 210,000 | | 189,472 |
4.13%, 2/15/2032 (d)
| | | 210,000 | | 184,941 |
Tutor Perini Corp.
11.88%, 4/30/2029 (d)
| | | 212,000 | | 227,756 |
| ENTERTAINMENT — 0.6% | |
Churchill Downs, Inc.
4.75%, 1/15/2028 (d)
| | | 400,000 | | 382,548 |
Cinemark USA, Inc.
5.25%, 7/15/2028 (d)
| | | 257,000 | | 245,530 |
Wynn Resorts Finance LLC/Wynn Resorts Capital Corp.
7.13%, 2/15/2031 (d)
| | | 190,000 | | 197,003 |
| FOOD — 0.6% | |
| Post Holdings, Inc.: | | | | | |
4.50%, 9/15/2031 (d)
| | | 100,000 | | 89,622 |
4.63%, 4/15/2030 (d)
| | | 490,000 | | 450,236 |
5.50%, 12/15/2029 (d)
| | | 390,000 | | 375,976 |
| HEALTH CARE PRODUCTS — 0.5% | |
Avantor Funding, Inc.
3.88%, 11/1/2029 (d)
| | | 80,000 | | 72,582 |
Hologic, Inc.
3.25%, 2/15/2029 (d)
| | | 720,000 | | 646,071 |
| HEALTH CARE SERVICES — 1.9% | |
Acadia Healthcare Co., Inc.
5.00%, 4/15/2029 (d)
| | | 300,000 | | 285,354 |
Charles River Laboratories International, Inc.
4.25%, 5/1/2028 (d)
| | | 100,000 | | 94,468 |
| Security Description | | | Principal
Amount | | Value |
| CHS/Community Health Systems, Inc.: | | | | | |
5.25%, 5/15/2030 (d)
| | | $100,000 | | $82,510 |
6.13%, 4/1/2030 (d)
| | | 10,000 | | 6,976 |
6.88%, 4/15/2029 (d)
| | | 155,000 | | 118,708 |
10.88%, 1/15/2032 (d)
| | | 70,000 | | 72,942 |
| DaVita, Inc.: | | | | | |
3.75%, 2/15/2031 (d)
| | | 240,000 | | 204,864 |
4.63%, 6/1/2030 (d)
| | | 920,000 | | 832,499 |
| Encompass Health Corp.: | | | | | |
4.50%, 2/1/2028
| | | 370,000 | | 352,092 |
4.63%, 4/1/2031
| | | 385,000 | | 353,830 |
| Molina Healthcare, Inc.: | | | | | |
3.88%, 11/15/2030 (d)
| | | 90,000 | | 79,906 |
3.88%, 5/15/2032 (d)
| | | 240,000 | | 208,116 |
Pediatrix Medical Group, Inc.
5.38%, 2/15/2030 (d)
| | | 110,000 | | 97,293 |
| HOME BUILDERS — 1.9% | |
Beazer Homes USA, Inc.
7.25%, 10/15/2029
| | | 207,000 | | 206,998 |
Century Communities, Inc.
3.88%, 8/15/2029 (d)
| | | 540,000 | | 481,172 |
Forestar Group, Inc.
3.85%, 5/15/2026 (d)
| | | 83,000 | | 79,492 |
KB Home
4.00%, 6/15/2031
| | | 353,000 | | 311,519 |
Landsea Homes Corp.
8.88%, 4/1/2029 (d)
| | | 130,000 | | 128,861 |
LGI Homes, Inc.
4.00%, 7/15/2029 (d)
| | | 150,000 | | 130,128 |
| M/I Homes, Inc.: | | | | | |
3.95%, 2/15/2030
| | | 145,000 | | 129,062 |
4.95%, 2/1/2028
| | | 210,000 | | 202,217 |
| Taylor Morrison Communities, Inc.: | | | | | |
5.13%, 8/1/2030 (d)
| | | 480,000 | | 460,056 |
5.75%, 1/15/2028 (d)
| | | 225,000 | | 223,042 |
Thor Industries, Inc.
4.00%, 10/15/2029 (d)
| | | 150,000 | | 132,476 |
Tri Pointe Homes, Inc.
5.70%, 6/15/2028
| | | 290,000 | | 283,852 |
| HOME FURNISHINGS — 0.5% | |
| Tempur Sealy International, Inc.: | | | | | |
3.88%, 10/15/2031 (d)
| | | 80,000 | | 67,614 |
4.00%, 4/15/2029 (d)
| | | 680,000 | | 614,088 |
| HOUSEHOLD PRODUCTS & WARES — 0.4% | |
Central Garden & Pet Co.
4.13%, 10/15/2030
| | | 625,000 | | 557,631 |
| INTERNET — 0.9% | |
Cogent Communications Group, Inc.
7.00%, 6/15/2027 (d)
| | | 39,000 | | 38,639 |
Go Daddy Operating Co. LLC/GD Finance Co., Inc.
3.50%, 3/1/2029 (d)
| | | 500,000 | | 451,545 |
See accompanying notes to financial statements.
12
SPDR BLACKSTONE HIGH INCOME ETF
SCHEDULE OF INVESTMENTS (continued)
June 30, 2024
| Security Description | | | Principal
Amount | | Value |
| Rakuten Group, Inc.: | | | | | |
9.75%, 4/15/2029 (d)
| | | $460,000 | | $475,369 |
11.25%, 2/15/2027 (d)
| | | 416,000 | | 445,569 |
| INVESTMENT COMPANY SECURITY — 0.7% | |
Compass Group Diversified Holdings LLC
5.25%, 4/15/2029 (d)
| | | 300,000 | | 285,069 |
| Icahn Enterprises LP/Icahn Enterprises Finance Corp.: | | | | | |
5.25%, 5/15/2027
| | | 75,000 | | 70,403 |
9.00%, 6/15/2030 (d)
| | | 250,000 | | 248,835 |
9.75%, 1/15/2029 (d)
| | | 490,000 | | 508,644 |
| IRON/STEEL — 0.3% | |
Commercial Metals Co.
4.38%, 3/15/2032
| | | 120,000 | | 108,253 |
Mineral Resources Ltd.
8.00%, 11/1/2027 (d)
| | | 330,000 | | 336,679 |
| IT SERVICES — 0.2% | |
ASGN, Inc.
4.63%, 5/15/2028 (d)
| | | 80,000 | | 75,510 |
Insight Enterprises, Inc.
6.63%, 5/15/2032 (d)
| | | 187,000 | | 189,999 |
Seagate HDD Cayman
9.63%, 12/1/2032
| | | 50,000 | | 56,992 |
| LEISURE TIME — 0.3% | |
NCL Corp. Ltd.
7.75%, 2/15/2029 (d)
| | | 230,000 | | 239,258 |
Royal Caribbean Cruises Ltd.
3.70%, 3/15/2028
| | | 245,000 | | 229,006 |
| LODGING — 1.0% | |
| Hilton Domestic Operating Co., Inc.: | | | | | |
3.63%, 2/15/2032 (d)
| | | 431,000 | | 373,194 |
3.75%, 5/1/2029 (d)
| | | 580,000 | | 531,628 |
4.00%, 5/1/2031 (d)
| | | 150,000 | | 134,245 |
Station Casinos LLC
4.63%, 12/1/2031 (d)
| | | 190,000 | | 169,558 |
Travel & Leisure Co.
4.50%, 12/1/2029 (d)
| | | 180,000 | | 165,557 |
Wyndham Hotels & Resorts, Inc.
4.38%, 8/15/2028 (d)
| | | 200,000 | | 186,152 |
| MACHINERY, CONSTRUCTION & MINING — 0.3% | |
| BWX Technologies, Inc.: | | | | | |
4.13%, 6/30/2028 (d)
| | | 90,000 | | 83,876 |
4.13%, 4/15/2029 (d)
| | | 340,000 | | 313,613 |
| MEDIA — 1.8% | |
AMC Networks, Inc.
4.25%, 2/15/2029
| | | 260,000 | | 175,497 |
| CCO Holdings LLC/CCO Holdings Capital Corp.: | | | | | |
4.25%, 2/1/2031 (d)
| | | 370,000 | | 302,001 |
4.50%, 8/15/2030 (d)
| | | 100,000 | | 84,561 |
4.75%, 3/1/2030 (d)
| | | 490,000 | | 424,419 |
4.75%, 2/1/2032 (d)
| | | 10,000 | | 8,189 |
| Security Description | | | Principal
Amount | | Value |
5.00%, 2/1/2028 (d)
| | | $60,000 | | $56,104 |
| CSC Holdings LLC: | | | | | |
6.50%, 2/1/2029 (d)
| | | 70,000 | | 51,209 |
7.50%, 4/1/2028 (d)
| | | 40,000 | | 21,198 |
11.75%, 1/31/2029 (d)
| | | 350,000 | | 298,855 |
| Gray Television, Inc.: | | | | | |
4.75%, 10/15/2030 (d)
| | | 338,000 | | 202,766 |
5.38%, 11/15/2031 (d)
| | | 212,000 | | 120,325 |
| News Corp.: | | | | | |
3.88%, 5/15/2029 (d)
| | | 300,000 | | 276,297 |
5.13%, 2/15/2032 (d)
| | | 75,000 | | 71,153 |
| Nexstar Media, Inc.: | | | | | |
4.75%, 11/1/2028 (d)
| | | 290,000 | | 257,593 |
5.63%, 7/15/2027 (d)
| | | 93,000 | | 88,328 |
Sinclair Television Group, Inc.
5.50%, 3/1/2030 (d)
| | | 190,000 | | 115,176 |
Sirius XM Radio, Inc.
4.00%, 7/15/2028 (d)
| | | 100,000 | | 90,343 |
| METAL FABRICATE & HARDWARE — 0.1% | |
Park-Ohio Industries, Inc.
6.63%, 4/15/2027
| | | 183,000 | | 176,075 |
| MINING — 1.2% | |
Eldorado Gold Corp.
6.25%, 9/1/2029 (d)
| | | 260,000 | | 249,239 |
| FMG Resources August 2006 Pty. Ltd.: | | | | | |
4.38%, 4/1/2031 (d)
| | | 160,000 | | 143,010 |
4.50%, 9/15/2027 (d)
| | | 80,000 | | 76,387 |
5.88%, 4/15/2030 (d)
| | | 404,000 | | 395,047 |
6.13%, 4/15/2032 (d)
| | | 200,000 | | 197,730 |
IAMGOLD Corp.
5.75%, 10/15/2028 (d)
| | | 225,000 | | 212,117 |
Kaiser Aluminum Corp.
4.50%, 6/1/2031 (d)
| | | 330,000 | | 292,373 |
Taseko Mines Ltd.
8.25%, 5/1/2030 (d)
| | | 249,000 | | 255,464 |
| MISCELLANEOUS MANUFACTURER — 0.2% | |
Hillenbrand, Inc.
3.75%, 3/1/2031
| | | 387,000 | | 336,079 |
| OFFICE & BUSINESS EQUIPMENT — 0.9% | |
| Pitney Bowes, Inc.: | | | | | |
6.88%, 3/15/2027 (d)
| | | 90,000 | | 85,037 |
7.25%, 3/15/2029 (d)
| | | 90,000 | | 80,844 |
| Xerox Holdings Corp.: | | | | | |
5.50%, 8/15/2028 (d)
| | | 940,000 | | 809,180 |
8.88%, 11/30/2029 (d)
| | | 60,000 | | 57,229 |
Zebra Technologies Corp.
6.50%, 6/1/2032 (d)
| | | 247,000 | | 249,804 |
| OFFICE FURNISHINGS — 0.1% | |
Steelcase, Inc.
5.13%, 1/18/2029
| | | 210,000 | | 199,368 |
| OIL & GAS — 2.8% | |
Baytex Energy Corp.
8.50%, 4/30/2030 (d)
| | | 50,000 | | 52,292 |
See accompanying notes to financial statements.
13
SPDR BLACKSTONE HIGH INCOME ETF
SCHEDULE OF INVESTMENTS (continued)
June 30, 2024
| Security Description | | | Principal
Amount | | Value |
California Resources Corp.
8.25%, 6/15/2029 (d)
| | | $230,000 | | $234,738 |
| Calumet Specialty Products Partners LP/Calumet Finance Corp.: | | | | | |
8.13%, 1/15/2027 (d)
| | | 40,000 | | 37,600 |
9.75%, 7/15/2028 (d)
| | | 310,000 | | 293,700 |
| CNX Resources Corp.: | | | | | |
6.00%, 1/15/2029 (d)
| | | 388,000 | | 380,488 |
7.25%, 3/1/2032 (d)
| | | 356,000 | | 362,561 |
| Comstock Resources, Inc.: | | | | | |
5.88%, 1/15/2030 (d)
| | | 216,000 | | 201,332 |
6.75%, 3/1/2029 (d)
| | | 150,000 | | 145,352 |
CVR Energy, Inc.
5.75%, 2/15/2028 (d)
| | | 380,000 | | 353,183 |
EnQuest PLC
11.63%, 11/1/2027 (d)
| | | 76,000 | | 77,202 |
Karoon USA Finance, Inc.
10.50%, 5/14/2029 (d)
| | | 48,000 | | 48,253 |
| Parkland Corp.: | | | | | |
4.50%, 10/1/2029 (d)
| | | 290,000 | | 265,736 |
4.63%, 5/1/2030 (d)
| | | 413,000 | | 376,916 |
Precision Drilling Corp.
6.88%, 1/15/2029 (d)
| | | 200,000 | | 197,852 |
| Sunoco LP/Sunoco Finance Corp.: | | | | | |
4.50%, 5/15/2029
| | | 820,000 | | 768,012 |
4.50%, 4/30/2030
| | | 60,000 | | 55,534 |
Transocean, Inc.
7.50%, 4/15/2031
| | | 136,000 | | 127,280 |
Valaris Ltd.
8.38%, 4/30/2030 (d)
| | | 142,000 | | 146,991 |
| OIL & GAS SERVICES — 0.5% | |
Archrock Partners LP/Archrock Partners Finance Corp.
6.25%, 4/1/2028 (d)
| | | 300,000 | | 297,201 |
Helix Energy Solutions Group, Inc.
9.75%, 3/1/2029 (d)
| | | 155,000 | | 165,235 |
Oceaneering International, Inc.
6.00%, 2/1/2028
| | | 100,000 | | 99,113 |
USA Compression Partners LP/USA Compression Finance Corp.
7.13%, 3/15/2029 (d)
| | | 250,000 | | 251,757 |
| PACKAGING & CONTAINERS — 0.1% | |
Ardagh Metal Packaging Finance USA LLC/Ardagh Metal Packaging Finance PLC
4.00%, 9/1/2029 (d)
| | | 120,000 | | 101,695 |
Ball Corp.
3.13%, 9/15/2031
| | | 30,000 | | 25,374 |
| PHARMACEUTICALS — 0.6% | |
AdaptHealth LLC
5.13%, 3/1/2030 (d)
| | | 250,000 | | 218,917 |
| Security Description | | | Principal
Amount | | Value |
HLF Financing SARL LLC/Herbalife International, Inc.
4.88%, 6/1/2029 (d)
| | | $210,000 | | $145,379 |
| Organon & Co./Organon Foreign Debt Co.-Issuer BV: | | | | | |
6.75%, 5/15/2034 (d)
| | | 149,000 | | 148,802 |
7.88%, 5/15/2034 (d)
| | | 87,000 | | 89,429 |
Prestige Brands, Inc.
3.75%, 4/1/2031 (d)
| | | 260,000 | | 226,460 |
| PIPELINES — 1.8% | |
| Antero Midstream Partners LP/Antero Midstream Finance Corp.: | | | | | |
5.38%, 6/15/2029 (d)
| | | 200,000 | | 194,050 |
6.63%, 2/1/2032 (d)
| | | 168,000 | | 169,482 |
| Delek Logistics Partners LP/Delek Logistics Finance Corp.: | | | | | |
7.13%, 6/1/2028 (d)
| | | 94,000 | | 92,779 |
8.63%, 3/15/2029 (d)
| | | 127,000 | | 130,814 |
| DT Midstream, Inc.: | | | | | |
4.13%, 6/15/2029 (d)
| | | 384,000 | | 355,035 |
4.38%, 6/15/2031 (d)
| | | 311,000 | | 283,853 |
Global Partners LP/GLP Finance Corp.
6.88%, 1/15/2029
| | | 252,000 | | 249,974 |
| Hess Midstream Operations LP: | | | | | |
4.25%, 2/15/2030 (d)
| | | 533,000 | | 489,379 |
5.13%, 6/15/2028 (d)
| | | 182,000 | | 176,267 |
5.50%, 10/15/2030 (d)
| | | 400,000 | | 386,312 |
| NGL Energy Operating LLC/NGL Energy Finance Corp.: | | | | | |
8.13%, 2/15/2029 (d)
| | | 115,000 | | 117,273 |
8.38%, 2/15/2032 (d)
| | | 110,000 | | 111,665 |
| REAL ESTATE — 0.6% | |
| Howard Hughes Corp.: | | | | | |
4.13%, 2/1/2029 (d)
| | | 505,000 | | 452,041 |
4.38%, 2/1/2031 (d)
| | | 105,000 | | 90,606 |
Newmark Group, Inc.
7.50%, 1/12/2029 (d)
| | | 287,000 | | 295,045 |
| REAL ESTATE INVESTMENT TRUSTS — 2.9% | |
Apollo Commercial Real Estate Finance, Inc.
4.63%, 6/15/2029 (d)
| | | 270,000 | | 226,487 |
Brandywine Operating Partnership LP
4.55%, 10/1/2029
| | | 430,000 | | 375,248 |
Hudson Pacific Properties LP
4.65%, 4/1/2029
| | | 80,000 | | 61,687 |
Iron Mountain Information Management Services, Inc.
5.00%, 7/15/2032 (d)
| | | 140,000 | | 127,967 |
| Iron Mountain, Inc.: | | | | | |
5.25%, 3/15/2028 (d)
| | | 290,000 | | 280,708 |
5.25%, 7/15/2030 (d)
| | | 280,000 | | 266,039 |
5.63%, 7/15/2032 (d)
| | | 220,000 | | 208,276 |
See accompanying notes to financial statements.
14
SPDR BLACKSTONE HIGH INCOME ETF
SCHEDULE OF INVESTMENTS (continued)
June 30, 2024
| Security Description | | | Principal
Amount | | Value |
REIT, 4.50%, 2/15/2031 (d)
| | | $200,000 | | $180,346 |
Ladder Capital Finance Holdings LLLP/Ladder Capital Finance Corp.
4.25%, 2/1/2027 (d)
| | | 70,000 | | 66,304 |
| MPT Operating Partnership LP/MPT Finance Corp.: | | | | | |
4.63%, 8/1/2029
| | | 191,000 | | 140,341 |
5.00%, 10/15/2027
| | | 680,000 | | 567,161 |
Rithm Capital Corp.
8.00%, 4/1/2029 (d)
| | | 539,000 | | 523,865 |
Service Properties Trust
3.95%, 1/15/2028
| | | 300,000 | | 251,181 |
| Starwood Property Trust, Inc.: | | | | | |
4.38%, 1/15/2027 (d)
| | | 560,000 | | 530,651 |
7.25%, 4/1/2029 (d)
| | | 185,000 | | 187,007 |
| Uniti Group LP/Uniti Group Finance, Inc./CSL Capital LLC: | | | | | |
6.50%, 2/15/2029 (d)
| | | 350,000 | | 222,940 |
10.50%, 2/15/2028 (d)
| | | 40,000 | | 39,327 |
Vornado Realty LP
3.40%, 6/1/2031
| | | 50,000 | | 39,660 |
| RETAIL — 4.2% | |
1011778 BC ULC/New Red Finance, Inc.
3.50%, 2/15/2029 (d)
| | | 400,000 | | 363,096 |
| Asbury Automotive Group, Inc.: | | | | | |
4.63%, 11/15/2029 (d)
| | | 120,000 | | 111,134 |
5.00%, 2/15/2032 (d)
| | | 270,000 | | 244,509 |
| Bath & Body Works, Inc.: | | | | | |
6.75%, 7/1/2036
| | | 430,000 | | 427,742 |
6.88%, 11/1/2035
| | | 270,000 | | 272,268 |
Brinker International, Inc.
8.25%, 7/15/2030 (d)
| | | 180,000 | | 189,029 |
| FirstCash, Inc.: | | | | | |
4.63%, 9/1/2028 (d)
| | | 320,000 | | 301,219 |
5.63%, 1/1/2030 (d)
| | | 170,000 | | 160,980 |
6.88%, 3/1/2032 (d)
| | | 288,000 | | 287,948 |
Foot Locker, Inc.
4.00%, 10/1/2029 (d)
| | | 162,000 | | 135,223 |
| Gap, Inc.: | | | | | |
3.63%, 10/1/2029 (d)
| | | 513,000 | | 443,637 |
3.88%, 10/1/2031 (d)
| | | 80,000 | | 66,754 |
Group 1 Automotive, Inc.
4.00%, 8/15/2028 (d)
| | | 150,000 | | 138,456 |
Kohl's Corp.
5.55%, 7/17/2045
| | | 470,000 | | 320,610 |
Lithia Motors, Inc.
4.38%, 1/15/2031 (d)
| | | 20,000 | | 17,840 |
| Murphy Oil USA, Inc.: | | | | | |
3.75%, 2/15/2031 (d)
| | | 613,000 | | 540,133 |
4.75%, 9/15/2029
| | | 50,000 | | 47,361 |
Nordstrom, Inc.
5.00%, 1/15/2044
| | | 130,000 | | 105,197 |
| Security Description | | | Principal
Amount | | Value |
Patrick Industries, Inc.
4.75%, 5/1/2029 (d)
| | | $340,000 | | $313,895 |
Sally Holdings LLC/Sally Capital, Inc.
6.75%, 3/1/2032
| | | 80,000 | | 79,029 |
| Sonic Automotive, Inc.: | | | | | |
4.63%, 11/15/2029 (d)
| | | 190,000 | | 171,629 |
4.88%, 11/15/2031 (d)
| | | 190,000 | | 167,122 |
Suburban Propane Partners LP/Suburban Energy Finance Corp.
5.00%, 6/1/2031 (d)
| | | 510,000 | | 458,745 |
Superior Plus LP/Superior General Partner, Inc.
4.50%, 3/15/2029 (d)
| | | 240,000 | | 220,366 |
Victoria's Secret & Co.
4.63%, 7/15/2029 (d)
| | | 319,000 | | 264,502 |
| Yum! Brands, Inc.: | | | | | |
3.63%, 3/15/2031
| | | 130,000 | | 114,774 |
4.63%, 1/31/2032
| | | 102,000 | | 93,897 |
4.75%, 1/15/2030 (d)
| | | 280,000 | | 266,580 |
| SEMICONDUCTORS — 0.2% | |
Entegris, Inc.
3.63%, 5/1/2029 (d)
| | | 270,000 | | 243,070 |
| SOFTWARE — 0.8% | |
Fair Isaac Corp.
4.00%, 6/15/2028 (d)
| | | 703,000 | | 657,474 |
MicroStrategy, Inc.
6.13%, 6/15/2028 (d)
| | | 260,000 | | 251,963 |
PTC, Inc.
4.00%, 2/15/2028 (d)
| | | 260,000 | | 244,889 |
SS&C Technologies, Inc.
6.50%, 6/1/2032 (d)
| | | 46,000 | | 46,411 |
| TELECOMMUNICATIONS — 1.0% | |
Consolidated Communications, Inc.
6.50%, 10/1/2028 (d)
| | | 225,000 | | 192,787 |
| Frontier Communications Holdings LLC: | | | | | |
5.88%, 11/1/2029
| | | 473,000 | | 411,874 |
6.00%, 1/15/2030 (d)
| | | 110,000 | | 95,834 |
6.75%, 5/1/2029 (d)
| | | 458,000 | | 420,055 |
Telecom Italia Capital SA
7.72%, 6/4/2038
| | | 250,000 | | 243,865 |
Viasat, Inc.
6.50%, 7/15/2028 (d)
| | | 40,000 | | 30,488 |
Viavi Solutions, Inc.
3.75%, 10/1/2029 (d)
| | | 190,000 | | 160,694 |
| TRANSPORTATION — 0.0% (b) | |
Danaos Corp.
8.50%, 3/1/2028 (d)
| | | 40,000 | | 40,973 |
TOTAL CORPORATE BONDS & NOTES
(Cost $63,400,101)
| | | | | 64,763,772 |
See accompanying notes to financial statements.
15
SPDR BLACKSTONE HIGH INCOME ETF
SCHEDULE OF INVESTMENTS (continued)
June 30, 2024
| Security Description | | | Shares | | Value |
| SHORT-TERM INVESTMENT — 3.0% | |
State Street Institutional U.S. Government Money Market Fund, Class G Shares 5.29% (h) (i)
(Cost $4,490,445)
| | | 4,490,445 | | $4,490,445 |
TOTAL INVESTMENTS — 100.2%
(Cost $147,625,126)
| | | | | 149,928,906 |
LIABILITIES IN EXCESS OF OTHER ASSETS — (0.2)%
| | | | | (335,066) |
NET ASSETS — 100.0%
| | | | | $149,593,840 |
| (a) | Variable Rate Security - Interest rate shown is rate in effect at June 30, 2024. For securities based on a published reference rate and spread, the reference rate and spread are indicated in the description above. |
| (b) | Amount is less than 0.05% of net assets. |
| (c) | Position is unsettled. Contract rate was not determined at June 30, 2024 and does not take effect until settlement date. Maturity date is not finalized until settlement date. |
| (d) | Securities purchased pursuant to Rule 144A of the Securities Act of 1933, as amended. These securities, which represent 41.2% of net assets as of June 30, 2024, are considered liquid and may be resold in transactions exempt from registration, normally to qualified institutional buyers. |
| (e) | Fair valued as determined in good faith by the Trust's Oversight Committee in accordance with policy and procedures approved by the Board of Trustees. Security value is determined based on Level 3 inputs. As of June 30, 2024, total aggregate fair value of the securities is $306,566, representing 0.20% of the Fund's net assets. |
| (f) | Non-income producing security. |
| (g) | Affiliated fund managed by SSGA Funds Management, Inc. Amounts related to these investments during the period ended June 30, 2024 are shown in the Affiliate Table below. |
| (h) | The Fund invested in certain money market funds managed by SSGA Funds Management, Inc. Amounts related to these investments during the period ended June 30, 2024 are shown in the Affiliate Table below. |
| (i) | The rate shown is the annualized seven-day yield at June 30, 2024. |
| ABS | Asset-Backed Security |
| CLO | Collateralized Loan Obligation |
| MTN | Medium Term Note |
| PIK | Payment in Kind |
| REIT | Real Estate Investment Trust |
| SOFR | Secured Overnight Financing Rate |
At June 30, 2024, the Fund had unfunded loan commitments of $82,590, which could be extended at the option of the borrowers, pursuant to the following loan agreements:
| Borrower | | Unfunded Loan
Commitment ($) | | Value ($) | | Unrealized
Appreciation/(Depreciation) ($) |
| Groundworks, LLC | | 19,585 | | 19,597 | | 12 |
| Epicor Software Corp. | | 63,005 | | 63,346 | | 341 |
| | | $82,590 | | $82,943 | | $353 |
See accompanying notes to financial statements.
16
SPDR BLACKSTONE HIGH INCOME ETF
SCHEDULE OF INVESTMENTS (continued)
June 30, 2024
The following table summarizes the value of the Fund's investments according to the fair value hierarchy as of June 30, 2024.
| Description | | Level 1 –
Quoted Prices | | Level 2 –
Other Significant
Observable Inputs | | Level 3 –
Significant
Unobservable Inputs | | Total |
| ASSETS: | | | | | | | | |
| INVESTMENTS: | | | | | | | | |
Corporate Bonds & Notes
| | $— | | $64,763,772 | | $— | | $64,763,772 |
Asset-Backed Securities
| | — | | 11,324,812 | | — | | 11,324,812 |
Common Stocks
| | — | | — | | 306,566 | | 306,566 |
Mutual Funds and Exchange Traded Products
| | 5,271,691 | | — | | — | | 5,271,691 |
Senior Floating Rate Loans
| | — | | 63,771,620 | | — | | 63,771,620 |
Short-Term Investment
| | 4,490,445 | | — | | — | | 4,490,445 |
TOTAL INVESTMENTS
| | $9,762,136 | | $139,860,204 | | $306,566 | | $149,928,906 |
| OTHER FINANCIAL INSTRUMENTS: | | | | | | | | |
Unfunded Loans - Unrealized Appreciation
| | $— | | $353 | | $— | | $353 |
TOTAL OTHER FINANCIAL INSTRUMENTS:
| | $— | | $353 | | $— | | $353 |
Affiliate Table
| | Number of
Shares Held
at
6/30/23 | | Value at
6/30/23 | | Cost of
Purchases | | Proceeds
from
Shares Sold | | Realized
Gain (Loss) | | Change in
Unrealized
Appreciation/
Depreciation | | Number of
Shares Held
at
6/30/24 | | Value at
6/30/24 | | Dividend
Income |
SPDR Blackstone Senior Loan ETF
| — | | $— | | $11,514,059 | | $6,234,331 | | $(7,363) | | $(674) | | 126,117 | | $5,271,691 | | $293,546 |
State Street Institutional U.S. Government Money Market Fund, Class G Shares
| 6,605,513 | | 6,605,513 | | 71,803,295 | | 73,918,363 | | — | | — | | 4,490,445 | | 4,490,445 | | 299,839 |
Total
| | | $6,605,513 | | $83,317,354 | | $80,152,694 | | $(7,363) | | $(674) | | | | $9,762,136 | | $593,385 |
See accompanying notes to financial statements.
17
SPDR BLACKSTONE SENIOR LOAN ETF
SCHEDULE OF INVESTMENTS
June 30, 2024
| Security Description | | | Principal
Amount | | Value |
| SENIOR FLOATING RATE LOANS — 93.6% | |
| ADVERTISING SERVICES — 1.4% | |
Neptune Bidco U.S., Inc.
2022 USD Term Loan B 3 mo. USD Term SOFR + 5.00%, 10.41%, 4/11/2029 (a)
| | | $94,073,159 | | $88,781,544 |
Wood Mackenzie Ltd.
2024 Term Loan B 3 mo. USD Term SOFR + 3.50%, 8.82%, 2/7/2031 (a)
| | | 1,661,358 | | 1,674,026 |
| | | | | | 90,455,570 |
| AEROSPACE & DEFENSE — 1.2% | |
| Dynasty Acquisition Co., Inc.: | | | | | |
2024 Term Loan B1 1 mo. USD Term SOFR + 3.50%, 8.84%, 8/24/2028 (a)
| | | 17,884,307 | | 17,969,615 |
2024 Term Loan B2 1 mo. USD Term SOFR + 3.50%, 8.84%, 8/24/2028 (a)
| | | 6,895,729 | | 6,928,621 |
Kaman Corp.
2024 Term Loan 3 mo. USD Term SOFR + 3.50%, 8.83%, 4/21/2031 (a)
| | | 6,009,720 | | 6,047,281 |
| TransDigm, Inc.: | | | | | |
2023 Term Loan J 3 mo. USD Term SOFR + 3.25%, 7.84%, 2/28/2031 (a)
| | | 26,302,160 | | 26,387,642 |
2024 Term Loan K 3 mo. USD Term SOFR + 2.75%, 8.08%, 3/22/2030 (a)
| | | 15,877,350 | | 15,925,380 |
| | | | | | 73,258,539 |
| AIR FREIGHT & LOGISTICS — 0.3% | |
Worldwide Express Operations LLC
2021 1st Lien Term Loan 3 mo. USD Term SOFR + 4.00%, 9.85%, 7/26/2028 (a)
| | | 18,855,896 | | 18,934,148 |
| AIRLINES — 0.7% | |
Air Canada
2024 Term Loan B 3 mo. USD Term SOFR + 2.50%, 7.85%, 3/21/2031 (a)
| | | 4,677,964 | | 4,690,384 |
American Airlines, Inc.
2021 Term Loan 3 mo. USD Term SOFR + 4.75%, 10.34%, 4/20/2028 (a)
| | | 13,495,944 | | 13,959,867 |
Mileage Plus Holdings LLC
2020 Term Loan B 3 mo. USD Term SOFR + 5.25%, 10.74%, 6/21/2027 (a)
| | | 6,745,748 | | 6,846,020 |
| Security Description | | | Principal
Amount | | Value |
SkyMiles IP Ltd.
2020 Skymiles Term Loan B 3 mo. USD Term SOFR + 3.75%, 9.07%, 10/20/2027 (a)
| | | $243,400 | | $249,581 |
United Airlines, Inc.
2024 Term Loan B 1 mo. USD Term SOFR + 2.75%, 8.09%, 2/22/2031 (a)
| | | 21,128,543 | | 21,207,775 |
| | | | | | 46,953,627 |
| APPAREL — 0.6% | |
| ABG Intermediate Holdings 2 LLC: | | | | | |
2024 Add on Delayed Draw Term Loan (b)
| | | 5,809,101 | | 5,821,823 |
2024 Term Loan B 1 mo. USD Term SOFR + 2.75%, 8.09%, 12/21/2028 (a)
| | | 29,981,969 | | 30,046,579 |
| | | | | | 35,868,402 |
| AUTO PARTS & EQUIPMENT — 1.5% | |
Clarios Global LP
2024 Term Loan B 1 mo. USD Term SOFR + 3.00%, 8.34%, 5/6/2030 (a)
| | | 3,792,500 | | 3,806,134 |
| First Brands Group LLC: | | | | | |
2021 Term Loan 3 mo. USD Term SOFR + 5.00%, 10.59%, 3/30/2027 (a)
| | | 20,864,532 | | 20,763,548 |
2022 Incremental Term Loan 3 mo. USD Term SOFR + 5.00%, 10.59%, 3/30/2027 (a)
| | | 17,200,766 | | 17,125,512 |
Tenneco, Inc.
2022 Term Loan B 3 mo. USD Term SOFR + 5.00%, 10.43%, 11/17/2028 (a)
| | | 53,033,349 | | 50,992,626 |
| | | | | | 92,687,820 |
| BEVERAGES — 0.9% | |
Triton Water Holdings, Inc.
Term Loan 3 mo. USD Term SOFR + 3.25%, 8.85%, 3/31/2028 (a)
| | | 58,396,962 | | 58,484,558 |
| BUILDING MATERIALS — 1.0% | |
Cornerstone Building Brands, Inc.
2024 Term Loan B 1 mo. USD Term SOFR + 4.50%, 9.83%, 5/2/2031 (a)
| | | 3,555,556 | | 3,540,747 |
LHS Borrower LLC
2022 Term Loan B 1 mo. USD Term SOFR + 4.75%, 10.09%, 2/16/2029 (a)
| | | 23,683,581 | | 22,475,719 |
See accompanying notes to financial statements.
18
SPDR BLACKSTONE SENIOR LOAN ETF
SCHEDULE OF INVESTMENTS (continued)
June 30, 2024
| Security Description | | | Principal
Amount | | Value |
MI Windows and Doors LLC
2024 Term Loan B2 1 mo. USD Term SOFR + 3.50%, 8.84%, 3/28/2031 (a)
| | | $10,302,014 | | $10,377,167 |
Quikrete Holdings, Inc.
2024 Term Loan B 1 mo. USD Term SOFR + 2.50%, 7.84%, 4/14/2031 (a)
| | | 18,769,076 | | 18,832,609 |
Summit Materials LLC
2023 Incremental Term Loan B 3 mo. USD Term SOFR + 2.50%, 7.80%, 1/12/2029 (a)
| | | 3,410,257 | | 3,437,965 |
Tamko Building Products LLC
2023 Term Loan 1 mo. USD Term SOFR + 3.25%, 8.59%, 9/20/2030 (a)
| | | 5,253,295 | | 5,259,862 |
| | | | | | 63,924,069 |
| BUILDING PRODUCTS — 1.6% | |
ACProducts, Inc.
2021 Term Loan B 3 mo. USD Term SOFR + 4.25%, 9.85%, 5/17/2028 (a)
| | | 32,717,835 | | 27,823,738 |
Chamberlain Group, Inc.
Term Loan B 1 mo. USD Term SOFR + 3.25%, 8.69%, 11/3/2028 (a)
| | | 12,048,323 | | 12,055,853 |
Cornerstone Building Brands, Inc.
2021 Term Loan B 1 mo. USD Term SOFR + 3.25%, 8.68%, 4/12/2028 (a)
| | | 45,011,625 | | 44,026,996 |
Oscar AcquisitionCo LLC
2024 Term Loan B 3 mo. USD Term SOFR + 4.25%, 9.58%, 4/29/2029 (a)
| | | 15,779,576 | | 15,790,700 |
| | | | | | 99,697,287 |
| CAPITAL MARKETS — 0.8% | |
AqGen Island Holdings, Inc.
Term Loan 1 mo. USD Term SOFR + 3.50%, 8.96%, 8/2/2028 (a)
| | | 3,220,405 | | 3,226,845 |
Aretec Group, Inc.
2024 Term Loan B 3 mo. USD Term SOFR + 4.00%, 9.34%, 8/9/2030 (a)
| | | 45,733,445 | | 45,966,914 |
| Chrysaor Bidco SARL: | | | | | |
USD Delayed Draw Term Loan (b)
| | | 171,111 | | 172,075 |
USD Term Loan B (b)
| | | 2,313,723 | | 2,326,749 |
| | | | | | 51,692,583 |
| CHEMICALS — 1.5% | |
Axalta Coating Systems U.S. Holdings, Inc.
2024 Term Loan B6 (b)
| | | 5,026,318 | | 5,041,422 |
| Security Description | | | Principal
Amount | | Value |
ECO Services Operations Corp.
2024 Term Loan B (b)
| | | $7,532,666 | | $7,540,048 |
| Nouryon Finance BV: | | | | | |
2024 Incremental Term Loan B 1 mo. USD Term SOFR + 3.50%, 8.83%, 4/3/2028 (a)
| | | 3,337,700 | | 3,358,561 |
2024 USD Term Loan B 3 mo. USD Term SOFR + 3.50%, 8.83%, 4/3/2028 (a)
| | | 15,493,727 | | 15,553,765 |
PMHC II, Inc.
2022 Term Loan B 3 mo. USD Term SOFR + 4.25%, 9.71%, 4/23/2029 (a)
| | | 62,470,455 | | 61,096,104 |
| | | | | | 92,589,900 |
| COMMERCIAL SERVICES — 5.9% | |
Allied Universal Holdco LLC
2021 USD Incremental Term Loan B 1 mo. USD Term SOFR + 3.75%, 9.19%, 5/12/2028 (a)
| | | 87,936,825 | | 87,698,076 |
Ankura Consulting Group LLC
2024 Term Loan (b)
| | | 6,104,700 | | 6,128,875 |
APX Group, Inc.
2021 Term Loan B 3 mo. USD Term SOFR + 2.75%, 10.25%, 7/10/2028 (a)
| | | 11,628,087 | | 11,649,941 |
| Belron Finance U.S. LLC: | | | | | |
2023 1st Lien Term Loan 3 mo. USD Term SOFR + 2.25%, 7.68%, 4/18/2029 (a)
| | | 3,188,483 | | 3,199,771 |
2023 USD Term Loan 3 mo. USD Term SOFR + 2.00%, 7.51%, 4/13/2028 (a)
| | | 2,480,746 | | 2,486,427 |
Camelot U.S. Acquisition LLC
2024 Term Loan B 1 mo. USD Term SOFR + 2.75%, 8.09%, 1/31/2031 (a)
| | | 14,932,503 | | 14,977,300 |
Corporation Service Co.
Term Loan B 1 mo. USD Term SOFR + 2.75%, 8.09%, 11/2/2029 (a)
| | | 759,723 | | 763,521 |
EAB Global, Inc.
2021 Term Loan (b)
| | | 5,195,627 | | 5,196,926 |
Ensemble RCM LLC
2024 Term Loan B (b)
| | | 4,714,286 | | 4,706,696 |
Fugue Finance BV
2024 USD Term Loan B 3 mo. USD Term SOFR + 3.75%, 9.10%, 2/26/2031 (a)
| | | 4,147,500 | | 4,187,420 |
See accompanying notes to financial statements.
19
SPDR BLACKSTONE SENIOR LOAN ETF
SCHEDULE OF INVESTMENTS (continued)
June 30, 2024
| Security Description | | | Principal
Amount | | Value |
Grant Thornton Advisors LLC
Term Loan B 3 mo. USD Term SOFR + 3.25%, 8.60%, 6/2/2031 (a)
| | | $13,740,433 | | $13,796,975 |
| Groundworks LLC: | | | | | |
2024 Delayed Draw Term Loan 1 mo. USD Term SOFR + 3.50%, 8.83%, 3/14/2031 (a)
| | | 292,836 | | 293,020 |
2024 Term Loan 1 mo. USD Term SOFR + 3.50%, 8.83%, 3/14/2031 (a)
| | | 9,944,216 | | 9,950,431 |
GTCR W Merger Sub LLC
2024 USD Term Loan B (b)
| | | 24,137,300 | | 24,198,243 |
HomeServe USA Corp.
2024 Term Loan B 1 mo. USD Term SOFR + 2.50%, 7.84%, 10/21/2030 (a)
| | | 11,030,355 | | 11,070,616 |
KUEHG Corp.
2024 Term Loan B 3 mo. USD Term SOFR + 4.50%, 9.83%, 6/12/2030 (a)
| | | 562,875 | | 565,726 |
Mavis Tire Express Services Corp.
2024 Term Loan B 1 mo. USD Term SOFR + 3.75%, 9.09%, 5/4/2028 (a)
| | | 30,675,528 | | 30,781,972 |
Mister Car Wash Holdings, Inc.
2024 Term Loan B 1 mo. USD Term SOFR + 3.00%, 8.34%, 3/27/2031 (a)
| | | 17,110,171 | | 17,181,948 |
OMNIA Partners LLC
2024 Term Loan B 3 mo. USD Term SOFR + 3.25%, 8.57%, 7/25/2030 (a)
| | | 15,615,040 | | 15,641,820 |
PG Investment Co. 59 SARL
Term Loan B 3 mo. USD Term SOFR + 3.50%, 8.83%, 3/26/2031 (a)
| | | 6,488,371 | | 6,539,759 |
Prime Security Services Borrower LLC
2024 Term Loan B 3 mo. USD Term SOFR + 2.25%, 7.58%, 10/13/2030 (a)
| | | 9,292,654 | | 9,299,159 |
Spring Education Group, Inc.
Term Loan 3 mo. USD Term SOFR + 4.00%, 9.33%, 10/4/2030 (a)
| | | 2,743,225 | | 2,760,082 |
Thevelia U.S. LLC
2024 USD Term Loan B 3 mo. USD Term SOFR + 3.75%, 9.08%, 6/18/2029 (a)
| | | 10,645,161 | | 10,718,399 |
| Trans Union LLC: | | | | | |
2019 Term Loan B5 1 mo. USD Term SOFR + 1.75%, 7.19%, 11/16/2026 (a)
| | | 3,980,650 | | 3,982,063 |
| Security Description | | | Principal
Amount | | Value |
2024 Term Loan B7 1 mo. USD Term SOFR + 2.00%, 7.34%, 12/1/2028 (a)
| | | $980,415 | | $981,900 |
TTF Holdings LLC
2024 Term Loan (b)
| | | 7,542,857 | | 7,542,857 |
VT Topco, Inc.
2024 Term Loan B 1 mo. USD Term SOFR + 3.50%, 8.84%, 8/9/2030 (a)
| | | 13,130,905 | | 13,208,049 |
Wand NewCo 3, Inc.
2024 Term Loan B 1 mo. USD Term SOFR + 3.75%, 9.09%, 1/30/2031 (a)
| | | 48,392,161 | | 48,767,926 |
| | | | | | 368,275,898 |
| COMMERCIAL SERVICES & SUPPLIES — 3.1% | |
| Aramark Services, Inc.: | | | | | |
2023 Term Loan B6 1 mo. USD Term SOFR + 2.00%, 7.35%, 6/22/2030 (a)
| | | 3,020 | | 3,036 |
2024 Term Loan B8 1 mo. USD Term SOFR + 2.00%, 7.34%, 6/22/2030 (a)
| | | 1,195,797 | | 1,199,235 |
| Asurion LLC: | | | | | |
2020 Term Loan B8 1 mo. USD Term SOFR + 3.25%, 8.71%, 12/23/2026 (a)
| | | 49,594,532 | | 49,250,097 |
2021 Second Lien Term Loan B4 1 mo. USD Term SOFR + 5.25%, 10.71%, 1/20/2029 (a)
| | | 57,994,927 | | 53,667,925 |
2022 Term Loan B10 1 mo. USD Term SOFR + 4.00%, 9.44%, 8/19/2028 (a)
| | | 28,390,242 | | 28,115,141 |
2023 Term Loan B11 1 mo. USD Term SOFR + 4.25%, 9.69%, 8/19/2028 (a)
| | | 6,360,443 | | 6,321,390 |
| Covanta Holding Corp.: | | | | | |
2021 Term Loan B 1 mo. USD Term SOFR + 2.50%, 7.84%, 11/30/2028 (a)
| | | 911,501 | | 912,112 |
2021 Term Loan C 1 mo. USD Term SOFR + 2.50%, 7.84%, 11/30/2028 (a)
| | | 69,849 | | 69,896 |
Garda World Security Corp.
2022 Term Loan B 3 mo. USD Term SOFR + 4.25%, 9.59%, 2/1/2029 (a)
| | | 22,249,947 | | 22,416,822 |
See accompanying notes to financial statements.
20
SPDR BLACKSTONE SENIOR LOAN ETF
SCHEDULE OF INVESTMENTS (continued)
June 30, 2024
| Security Description | | | Principal
Amount | | Value |
McGraw-Hill Global Education Holdings LLC
2021 Term Loan 3 mo. USD Term SOFR + 4.75%, 10.35%, 7/28/2028 (a)
| | | $35,268,566 | | $35,373,843 |
| | | | | | 197,329,497 |
| COMMUNICATIONS EQUIPMENT — 0.3% | |
Zayo Group Holdings, Inc.
USD Term Loan 1 mo. USD Term SOFR + 3.00%, 8.46%, 3/9/2027 (a)
| | | 21,124,272 | | 18,448,566 |
| COMPUTERS — 0.5% | |
KBR, Inc.
2024 Term Loan B 1 mo. USD Term SOFR + 2.25%, 7.59%, 1/17/2031 (a)
| | | 1,978,302 | | 1,989,924 |
Magenta Buyer LLC
2021 USD 1st Lien Term Loan 3 mo. USD Term SOFR + 5.00%, 10.59%, 7/27/2028 (a)
| | | 50,494,866 | | 28,308,684 |
Tempo Acquisition LLC
2024 Term Loan B 1 mo. USD Term SOFR + 2.25%, 7.59%, 8/31/2028 (a)
| | | 3,314,386 | | 3,325,341 |
| | | | | | 33,623,949 |
| CONSTRUCTION & ENGINEERING — 0.4% | |
Artera Services LLC
2024 Term Loan 3 mo. USD Term SOFR + 4.50%, 9.83%, 2/15/2031 (a)
| | | 7,042,485 | | 7,088,367 |
| KKR Apple Bidco LLC: | | | | | |
2021 Term Loan 1 mo. USD Term SOFR + 2.75%, 8.21%, 9/22/2028 (a)
| | | 4,022,768 | | 4,029,948 |
2022 Incremental Term Loan 1 mo. USD Term SOFR + 3.50%, 8.84%, 9/22/2028 (a)
| | | 9,546,002 | | 9,580,655 |
Radar Bidco SARL
2024 USD Term Loan B 3 mo. USD Term SOFR + 4.25%, 9.56%, 4/4/2031 (a)
| | | 1,545,000 | | 1,551,280 |
| | | | | | 22,250,250 |
| CONTAINERS & PACKAGING — 2.0% | |
Berlin Packaging LLC
2024 Term Loan B 3 mo. USD Term SOFR + 3.75%, 9.19%, 6/9/2031 (a)
| | | 19,298,372 | | 19,364,179 |
Charter NEX U.S., Inc.
2024 Term Loan B 1 mo. USD Term SOFR + 3.50%, 8.84%, 12/1/2027 (a)
| | | 1,000,000 | | 1,002,900 |
| Security Description | | | Principal
Amount | | Value |
Clydesdale Acquisition Holdings, Inc.
Term Loan B 1 mo. USD Term SOFR + 3.68%, 9.12%, 4/13/2029 (a)
| | | $47,866,637 | | $48,031,059 |
Iris Holding, Inc.
Term Loan 3 mo. USD Term SOFR + 4.75%, 10.18%, 6/28/2028 (a)
| | | 26,840,723 | | 25,364,483 |
Proampac PG Borrower LLC
2024 Term Loan 3 mo. USD Term SOFR + 4.00%, 9.32%, 9/15/2028 (a)
| | | 20,765,562 | | 20,840,838 |
SupplyOne, Inc.
2024 Term Loan B 1 mo. USD Term SOFR + 4.25%, 9.59%, 4/21/2031 (a)
| | | 9,102,378 | | 9,128,001 |
Trident TPI Holdings, Inc.
2024 Term Loan B6 (b)
| | | 4,448,457 | | 4,460,512 |
| | | | | | 128,191,972 |
| DISTRIBUTION/WHOLESALE — 1.1% | |
American Builders & Contractors Supply Co., Inc.
2024 Term Loan B 1 mo. USD Term SOFR + 2.00%, 7.34%, 1/31/2031 (a)
| | | 11,955,132 | | 11,994,046 |
Fastlane Parent Co., Inc.
2023 Term Loan B 1 mo. USD Term SOFR + 4.50%, 9.84%, 9/29/2028 (a)
| | | 2,789,775 | | 2,781,406 |
Fluid-Flow Products, Inc.
Term Loan (b)
| | | 3,475,887 | | 3,480,666 |
Resideo Funding, Inc.
2024 M&A Term Loan B (b)
| | | 13,301,357 | | 13,301,424 |
Windsor Holdings III LLC
2024 USD Term Loan B 1 mo. USD Term SOFR + 4.00%, 9.34%, 8/1/2030 (a)
| | | 40,131,717 | | 40,442,737 |
| | | | | | 72,000,279 |
| DIVERSIFIED CONSUMER SERVICES — 0.3% | |
Ascend Learning LLC
2021 Term Loan 1 mo. USD Term SOFR + 3.50%, 8.94%, 12/11/2028 (a)
| | | 15,270,517 | | 15,274,564 |
Bright Horizons Family Solutions LLC
2021 Term Loan B 1 mo. USD Term SOFR + 2.25%, 7.71%, 11/24/2028 (a)
| | | 2,141,074 | | 2,144,082 |
| | | | | | 17,418,646 |
| DIVERSIFIED FINANCIAL SERVICES — 2.9% | |
Advisor Group, Inc.
2024 Term Loan 1 mo. USD Term SOFR + 4.00%, 9.34%, 8/17/2028 (a)
| | | 31,234,701 | | 31,369,479 |
See accompanying notes to financial statements.
21
SPDR BLACKSTONE SENIOR LOAN ETF
SCHEDULE OF INVESTMENTS (continued)
June 30, 2024
| Security Description | | | Principal
Amount | | Value |
AlixPartners LLP
2021 USD Term Loan B 1 mo. USD Term SOFR + 2.50%, 7.96%, 2/4/2028 (a)
| | | $1,915,352 | | $1,918,943 |
Apex Group Treasury LLC
USD Term Loan 3 mo. USD Term SOFR + 3.75%, 9.33%, 7/27/2028 (a)
| | | 491,162 | | 492,390 |
Assetmark Financial Holdings, Inc.
2024 Term Loan (b)
| | | 14,694,408 | | 14,721,960 |
| Avolon TLB Borrower 1 U.S. LLC: | | | | | |
2023 Term Loan B6 1 mo. USD Term SOFR + 2.00%, 7.34%, 6/22/2028 (a)
| | | 1,029,202 | | 1,031,775 |
Term Loan B4 1 mo. USD Term SOFR + 1.50%, 6.94%, 2/12/2027 (a)
| | | 3,133,334 | | 3,137,078 |
Citadel Securities LP
2024 Term Loan B 1 mo. USD Term SOFR + 2.25%, 7.59%, 7/29/2030 (a)
| | | 23,071,405 | | 23,163,690 |
CPI Holdco B LLC
Term Loan 1 mo. USD Term SOFR + 2.00%, 7.34%, 5/17/2031 (a)
| | | 1,456,812 | | 1,457,045 |
Deerfield Dakota Holding LLC
2020 USD Term Loan B 3 mo. USD Term SOFR + 3.75%, 9.08%, 4/9/2027 (a)
| | | 30,822,366 | | 30,845,175 |
| Edelman Financial Center LLC: | | | | | |
2024 2nd Lien Term Loan 1 mo. USD Term SOFR + 5.25%, 10.59%, 10/6/2028 (a)
| | | 11,331,429 | | 11,373,921 |
2024 Term Loan B 3 mo. USD Term SOFR + 3.25%, 8.59%, 4/7/2028 (a)
| | | 17,694,833 | | 17,740,486 |
Eisner Advisory Group LLC
2024 Term Loan B 1 mo. USD Term SOFR + 4.00%, 9.34%, 2/28/2031 (a)
| | | 10,090,515 | | 10,201,965 |
Focus Financial Partners LLC
2024 Term Loan B7 1 mo. USD Term SOFR + 2.75%, 8.09%, 6/30/2028 (a)
| | | 15,028,375 | | 15,030,554 |
Kestra Advisor Services Holdings A, Inc.
2024 Term Loan 1 mo. USD Term SOFR + 4.00%, 9.34%, 3/22/2031 (a)
| | | 12,406,044 | | 12,466,523 |
Mermaid Bidco, Inc.
2024 USD Term Loan B (b)
| | | 10,317,241 | | 10,343,035 |
| | | | | | 185,294,019 |
| Security Description | | | Principal
Amount | | Value |
| DIVERSIFIED TELECOMMUNICATION SERVICES — 1.9% | |
Altice France SA
2023 USD Term Loan B14 3 mo. USD Term SOFR + 5.50%, 10.83%, 8/15/2028 (a)
| | | $55,377,265 | | $40,840,733 |
CCI Buyer, Inc.
Term Loan 3 mo. USD Term SOFR + 4.00%, 9.33%, 12/17/2027 (a)
| | | 35,645,099 | | 35,725,836 |
| Delta TopCo, Inc.: | | | | | |
2024 2nd Lien Term Loan 1 mo. USD Term SOFR + 5.25%, 10.60%, 11/30/2029 (a)
| | | 6,660,088 | | 6,773,309 |
2024 Term Loan 3 mo. USD Term SOFR + 3.50%, 8.85%, 11/30/2029 (a)
| | | 35,025,193 | | 35,050,761 |
| | | | | | 118,390,639 |
| ELECTRIC — 0.5% | |
Kohler Energy Co. LLC
USD Term Loan B 3 mo. USD Term SOFR + 4.75%, 10.08%, 5/1/2031 (a)
| | | 30,029,768 | | 30,194,031 |
| ELECTRICAL EQUIPMENT — 0.1% | |
Energizer Holdings, Inc.
2024 Term Loan B 1 mo. USD Term SOFR + 2.00%, 7.34%, 12/22/2027 (a)
| | | 3,501,629 | | 3,514,778 |
| ELECTRONICS — 0.3% | |
II-VI, Inc.
2024 Term Loan B 1 mo. USD Term SOFR + 2.50%, 7.84%, 7/2/2029 (a)
| | | 21,470,926 | | 21,513,867 |
| ENTERTAINMENT — 3.7% | |
AP Gaming I LLC
2022 Term Loan B 1 mo. USD Term SOFR + 3.75%, 9.09%, 2/15/2029 (a)
| | | 5,176,882 | | 5,220,575 |
Bally's Corp.
2021 Term Loan B 3 mo. USD Term SOFR + 3.25%, 8.84%, 10/2/2028 (a)
| | | 20,191,272 | | 19,221,687 |
Caesars Entertainment, Inc.
2024 Term Loan B1 3 mo. USD Term SOFR + 2.75%, 8.10%, 2/6/2031 (a)
| | | 14,626,499 | | 14,656,190 |
Crown Finance U.S., Inc.
2023 Exit Term Loan 1 mo. USD Term SOFR + 1.50%, 6.96%, 7/31/2028 (a)
| | | 24,408,516 | | 24,755,605 |
Delta 2 Lux SARL
2022 Term Loan B 3 mo. USD Term SOFR + 2.25%, 7.58%, 1/15/2030 (a)
| | | 500,000 | | 501,875 |
See accompanying notes to financial statements.
22
SPDR BLACKSTONE SENIOR LOAN ETF
SCHEDULE OF INVESTMENTS (continued)
June 30, 2024
| Security Description | | | Principal
Amount | | Value |
Entain Holdings Gibraltar Ltd.
2021 USD Term Loan B4 6 mo. USD Term SOFR + 2.50%, 7.86%, 3/29/2027 (a)
| | | $567,600 | | $569,172 |
Fertitta Entertainment LLC
2022 Term Loan B 1 mo. USD Term SOFR + 3.75%, 9.08%, 1/27/2029 (a)
| | | 61,636,779 | | 61,779,160 |
Flutter Financing BV
Term Loan B 3 mo. USD Term SOFR + 2.25%, 7.58%, 11/25/2030 (a)
| | | 29,289,065 | | 29,341,054 |
GVC Holdings Ltd.
2024 USD Term Loan B 6 mo. USD Term SOFR + 2.75%, 8.01%, 10/31/2029 (a)
| | | 14,196,583 | | 14,237,114 |
Light and Wonder International, Inc.
2024 Term Loan B2 (b)
| | | 2,194,270 | | 2,198,001 |
OVG Business Services LLC
2024 Term Loan B 3 mo. USD Term SOFR + 3.00%, 8.35%, 6/14/2031 (a)
| | | 7,182,950 | | 7,178,497 |
| Scientific Games Holdings LP: | | | | | |
2022 USD Term Loan B 3 mo. USD Term SOFR + 3.25%, 8.56%, 4/4/2029 (a)
| | | 362,374 | | 362,071 |
2024 USD Term Loan B 3 mo. USD Term SOFR + 3.00%, 8.31%, 4/4/2029 (a)
| | | 22,528,505 | | 22,509,694 |
UFC Holdings LLC
2021 Term Loan B 3 mo. USD Term SOFR + 2.75%, 8.34%, 4/29/2026 (a)
| | | 28,107,512 | | 28,203,358 |
| | | | | | 230,734,053 |
| FOOD PRODUCTS — 0.3% | |
Fiesta Purchaser, Inc.
2024 Term Loan B 1 mo. USD Term SOFR + 4.00%, 9.34%, 2/12/2031 (a)
| | | 13,466,867 | | 13,577,094 |
Froneri International Ltd.
2020 USD Term Loan 1 mo. USD Term SOFR + 2.25%, 7.69%, 1/29/2027 (a)
| | | 820,134 | | 820,601 |
Solina Bidco
2024 Term Loan B 3 mo. USD Term SOFR + 3.75%, 9.09%, 3/7/2029 (a)
| | | 2,892,258 | | 2,912,142 |
| | | | | | 17,309,837 |
| Security Description | | | Principal
Amount | | Value |
| FOOD-MISC/DIVERSIFIED — 0.1% | |
Skopima Merger Sub, Inc.
Term Loan B 1 mo. USD Term SOFR + 4.00%, 9.46%, 5/12/2028 (a)
| | | $5,557,054 | | $5,559,527 |
| GAMING & ENTERTAINMENT — 0.1% | |
PCI Gaming Authority
Term Loan 1 mo. USD Term SOFR + 2.50%, 7.84%, 5/29/2026 (a)
| | | 7,528,638 | | 7,524,873 |
| HEALTH CARE EQUIPMENT & SUPPLIES — 3.1% | |
Auris Luxembourg III SARL
2024 USD Term Loan B4 6 mo. USD Term SOFR + 4.25%, 9.99%, 2/28/2029 (a)
| | | 15,864,194 | | 15,923,685 |
Avantor Funding, Inc.
2024 Term Loan 1 mo. USD Term SOFR + 2.00%, 7.44%, 11/8/2027 (a)
| | | 564,603 | | 567,858 |
Bausch & Lomb Corp.
Term Loan 1 mo. USD Term SOFR + 3.25%, 8.69%, 5/10/2027 (a)
| | | 44,647,346 | | 44,228,777 |
Gainwell Acquisition Corp.
Term Loan B 3 mo. USD Term SOFR + 4.00%, 9.43%, 10/1/2027 (a)
| | | 78,404,169 | | 76,117,119 |
Medline Borrower LP
2024 Term Loan B 1 mo. USD Term SOFR + 2.75%, 8.09%, 10/23/2028 (a)
| | | 43,127,732 | | 43,262,506 |
Resonetics LLC
2024 Term Loan 3 mo. USD Term SOFR + 3.75%, 9.08%, 6/6/2031 (a)
| | | 15,686,483 | | 15,735,504 |
| | | | | | 195,835,449 |
| HEALTH CARE PROVIDERS & SERVICES — 3.8% | |
DaVita, Inc.
2020 Term Loan B 1 mo. USD Term SOFR + 1.75%, 7.21%, 8/12/2026 (a)
| | | 786,082 | | 786,739 |
GHX Ultimate Parent Corp.
2024 Term Loan B 3 mo. USD Term SOFR + 4.00%, 9.33%, 6/30/2027 (a)
| | | 5,368,814 | | 5,409,080 |
Global Medical Response, Inc.
2024 PIK Term Loan 1 mo. USD Term SOFR + 5.50%, 10.85%, 10/31/2028 (a)
| | | 72,117,362 | | 69,989,900 |
ICON Luxembourg SARL
2024 LUX Term Loan B 3 mo. USD Term SOFR + 2.00%, 7.33%, 7/3/2028 (a)
| | | 518,456 | | 521,076 |
See accompanying notes to financial statements.
23
SPDR BLACKSTONE SENIOR LOAN ETF
SCHEDULE OF INVESTMENTS (continued)
June 30, 2024
| Security Description | | | Principal
Amount | | Value |
LifePoint Health, Inc.
2024 Term Loan B 3 mo. USD Term SOFR + 4.75%, 10.06%, 11/16/2028 (a)
| | | $22,816,369 | | $22,969,010 |
MED ParentCo LP
2024 Term Loan B 1 mo. USD Term SOFR + 4.00%, 9.34%, 4/15/2031 (a)
| | | 14,101,068 | | 14,113,054 |
Medline Borrower LP
USD Term Loan B (b)
| | | 201,161 | | 201,790 |
Midwest Physician Administrative Services LLC
2021 Term Loan 3 mo. USD Term SOFR + 3.25%, 8.85%, 3/12/2028 (a)
| | | 14,931,141 | | 13,120,740 |
Outcomes Group Holdings, Inc.
2024 Term Loan 3 mo. USD Term SOFR + 4.25%, 9.59%, 5/6/2031 (a)
| | | 12,041,406 | | 12,095,051 |
PRA Health Sciences, Inc.
2024 US Term Loan B 3 mo. USD Term SOFR + 2.00%, 7.33%, 7/3/2028 (a)
| | | 129,174 | | 129,827 |
Radiology Partners, Inc.
2024 Extended Term Loan B 3 mo. USD Term SOFR + 3.50%, 9.09%, 1/31/2029 (a)
| | | 23,366,140 | | 22,221,199 |
Surgery Center Holdings, Inc.
2024 Term Loan B 1 mo. USD Term SOFR + 2.75%, 8.09%, 12/19/2030 (a)
| | | 19,233,832 | | 19,307,209 |
Team Health Holdings, Inc.
2022 Term Loan B 1 mo. USD Term SOFR + 5.25%, 10.59%, 3/2/2027 (a)
| | | 30,576,632 | | 28,573,863 |
U.S. Anesthesia Partners, Inc.
2021 Term Loan 1 mo. USD Term SOFR + 4.25%, 9.69%, 10/1/2028 (a)
| | | 28,707,718 | | 27,611,226 |
| | | | | | 237,049,764 |
| HOLDING COMPANIES & DIVERSIFIED — 0.3% | |
Belfor Holdings, Inc.
2023 USD Term Loan B 1 mo. USD Term SOFR + 3.75%, 9.09%, 11/1/2030 (a)
| | | 4,682,476 | | 4,717,594 |
Forward Air Corp.
Term Loan B 1 mo. USD Term SOFR + 4.50%, 9.83%, 12/19/2030 (a)
| | | 14,397,152 | | 13,463,137 |
| | | | | | 18,180,731 |
| Security Description | | | Principal
Amount | | Value |
| HOME FURNISHINGS — 1.1% | |
| AI Aqua Merger Sub, Inc.: | | | | | |
2021 1st Lien Term Loan B 1 mo. USD Term SOFR + 4.00%, 9.33%, 7/31/2028 (a)
| | | $65,957,322 | | $66,149,258 |
2023 Incremental Term Loan 1 mo. USD Term SOFR + 4.25%, 4.25%, 7/31/2028 (a)
| | | 2,609 | | 2,616 |
| | | | | | 66,151,874 |
| HOTELS, RESTAURANTS & LEISURE — 1.7% | |
Caesars Entertainment, Inc.
Term Loan B 3 mo. USD Term SOFR + 2.75%, 8.10%, 2/6/2030 (a)
| | | 23,003,787 | | 23,048,644 |
Peraton Corp.
Term Loan B 1 mo. USD Term SOFR + 3.75%, 9.19%, 2/1/2028 (a)
| | | 86,416,946 | | 86,531,449 |
| | | | | | 109,580,093 |
| HOUSEHOLD PRODUCTS — 0.0% (c) | |
Reynolds Consumer Products LLC
Term Loan 1 mo. USD Term SOFR + 1.75%, 7.19%, 2/4/2027 (a)
| | | 24,525 | | 24,600 |
| HOUSEWARES — 0.1% | |
American Greetings Corp.
2024 Term Loan B 1 mo. USD Term SOFR + 5.75%, 11.09%, 10/30/2029 (a)
| | | 4,935,982 | | 4,971,472 |
| INDEPENDENT POWER PRODUCERS & ENERGY TRADERS — 0.3% | |
| Calpine Corp.: | | | | | |
2024 Term Loan B5 1 mo. USD Term SOFR + 2.00%, 7.34%, 12/16/2027 (a)
| | | 1,228,102 | | 1,230,951 |
Term Loan B9 1 mo. USD Term SOFR + 2.00%, 7.34%, 1/31/2031 (a)
| | | 1,735,964 | | 1,732,528 |
Vistra Operations Co. LLC
1st Lien Term Loan B3 1 mo. USD Term SOFR + 2.00%, 7.34%, 12/20/2030 (a)
| | | 15,856,756 | | 15,887,359 |
| | | | | | 18,850,838 |
| INSURANCE — 7.8% | |
Acrisure LLC
2024 Term Loan B6 3 mo. USD Term SOFR + 3.25%, 8.59%, 11/6/2030 (a)
| | | 54,665,403 | | 54,665,676 |
See accompanying notes to financial statements.
24
SPDR BLACKSTONE SENIOR LOAN ETF
SCHEDULE OF INVESTMENTS (continued)
June 30, 2024
| Security Description | | | Principal
Amount | | Value |
Alliant Holdings Intermediate LLC
2023 Term Loan B6 1 mo. USD Term SOFR + 3.50%, 8.83%, 11/6/2030 (a)
| | | $19,158,859 | | $19,227,640 |
AmWINS Group, Inc.
2021 Term Loan B 1 mo. USD Term SOFR + 2.25%, 7.59%, 2/19/2028 (a)
| | | 21,949,868 | | 21,958,429 |
AssuredPartners, Inc.
2024 Incremental Term Loan B5 1 mo. USD Term SOFR + 3.50%, 8.84%, 2/14/2031 (a)
| | | 57,296,390 | | 57,511,251 |
Asurion LLC
2021 2nd Lien Term Loan B3 1 mo. USD Term SOFR + 5.25%, 10.71%, 1/31/2028 (a)
| | | 1,848,936 | | 1,727,600 |
| BroadStreet Partners, Inc.: | | | | | |
2020 Term Loan B 3 mo. USD Term SOFR + 3.00%, 8.44%, 1/27/2027 (a)
| | | 9,970,606 | | 9,955,650 |
2024 Term Loan B4 1 mo. USD Term SOFR + 3.25%, 8.59%, 6/14/2031 (a)
| | | 57,133,128 | | 57,052,928 |
Howden Group Holdings Ltd.
2024 USD Term Loan B 1 mo. USD Term SOFR + 3.50%, 8.84%, 2/15/2031 (a)
| | | 37,672,724 | | 37,801,376 |
HUB International Ltd.
2024 Term Loan B 3 mo. USD Term SOFR + 3.25%, 8.57%, 6/20/2030 (a)
| | | 45,260,646 | | 45,411,590 |
OneDigital Borrower LLC
2024 Term Loan (b)
| | | 4,967,857 | | 4,961,672 |
Ryan Specialty Group LLC
Term Loan 1 mo. USD Term SOFR + 2.75%, 8.09%, 9/1/2027 (a)
| | | 205,359 | | 206,668 |
Sedgwick Claims Management Services, Inc.
2023 Term Loan B 1 mo. USD Term SOFR + 3.75%, 9.09%, 2/24/2028 (a)
| | | 89,805,320 | | 90,017,260 |
Truist Insurance Holdings LLC
1st Lien Term Loan 3 mo. USD Term SOFR + 3.25%, 8.58%, 5/6/2031 (a)
| | | 62,335,000 | | 62,546,316 |
| USI, Inc.: | | | | | |
2024 Term Loan (2029) 3 mo. USD Term SOFR + 2.75%, 8.08%, 11/22/2029 (a)
| | | 19,461,194 | | 19,485,618 |
| Security Description | | | Principal
Amount | | Value |
2024 Term Loan (2030) 3 mo. USD Term SOFR + 2.75%, 8.08%, 9/27/2030 (a)
| | | $6,497,374 | | $6,505,496 |
| | | | | | 489,035,170 |
| INTERNET & TELECOM — 2.7% | |
CNT Holdings I Corp.
2020 Term Loan 3 mo. USD Term SOFR + 3.50%, 8.83%, 11/8/2027 (a)
| | | 4,068,530 | | 4,083,238 |
Endure Digital, Inc.
Term Loan 1 mo. USD Term SOFR + 3.50%, 8.94%, 2/10/2028 (a)
| | | 48,549,996 | | 45,212,183 |
Gen Digital, Inc.
2024 Term Loan B 1 mo. USD Term SOFR + 1.75%, 7.09%, 9/12/2029 (a)
| | | 3,702,326 | | 3,702,849 |
Go Daddy Operating Co. LLC
2024 Term Loan B7 1 mo. USD Term SOFR + 1.75%, 7.09%, 5/30/2031 (a)
| | | 7,645,253 | | 7,647,470 |
I-Logic Technologies Bidco Ltd.
2021 USD Term Loan B 3 mo. USD Term SOFR + 4.00%, 9.48%, 2/16/2028 (a)
| | | 763,435 | | 764,546 |
MH Sub I LLC
2023 Term Loan 1 mo. USD Term SOFR + 4.25%, 9.59%, 5/3/2028 (a)
| | | 71,371,080 | | 71,385,711 |
Proofpoint, Inc.
2024 Term Loan 1 mo. USD Term SOFR + 3.00%, 8.34%, 8/31/2028 (a)
| | | 20,441,574 | | 20,483,786 |
PUG LLC
2024 Extended Term Loan B 1 mo. USD Term SOFR + 4.75%, 10.09%, 3/15/2030 (a)
| | | 12,944,889 | | 12,965,148 |
Uber Technologies, Inc.
2023 Term Loan B 3 mo. USD Term SOFR + 2.75%, 8.09%, 3/3/2030 (a)
| | | 913,087 | | 918,533 |
| | | | | | 167,163,464 |
| INVESTMENT COMPANIES — 1.3% | |
AL GCX Holdings LLC
Term Loan B 1 mo. USD Term SOFR + 3.25%, 8.58%, 5/17/2029 (a)
| | | 1,242,043 | | 1,242,626 |
BEP Intermediate Holdco LLC
Term Loan B 1 mo. USD Term SOFR + 3.75%, 9.09%, 4/25/2031 (a)
| | | 3,856,379 | | 3,875,661 |
See accompanying notes to financial statements.
25
SPDR BLACKSTONE SENIOR LOAN ETF
SCHEDULE OF INVESTMENTS (continued)
June 30, 2024
| Security Description | | | Principal
Amount | | Value |
CD&R Hydra Buyer, Inc.
2024 Term Loan B 3 mo. USD Term SOFR + 4.00%, 9.44%, 3/25/2031 (a)
| | | $15,174,062 | | $15,221,481 |
Energize HoldCo LLC
2021 1st Lien Term Loan 1 mo. USD Term SOFR + 3.75%, 9.21%, 12/8/2028 (a)
| | | 7,014,692 | | 7,038,367 |
Truist Insurance Holdings LLC
2nd Lien Term Loan 3 mo. USD Term SOFR + 4.75%, 10.08%, 5/6/2032 (a)
| | | 8,352,692 | | 8,540,628 |
Wec U.S. Holdings Ltd.
2024 Term Loan 1 mo. USD Term SOFR + 2.75%, 8.09%, 1/27/2031 (a)
| | | 43,633,139 | | 43,724,550 |
| | | | | | 79,643,313 |
| IT SERVICES — 0.2% | |
Access CIG LLC
2023 Term Loan 3 mo. USD Term SOFR + 5.00%, 10.33%, 8/18/2028 (a)
| | | 12,593,023 | | 12,689,487 |
Ahead DB Holdings LLC
2021 Term Loan B 3 mo. USD Term SOFR + 3.75%, 9.08%, 2/1/2031 (a)
| | | 173,961 | | 174,750 |
| | | | | | 12,864,237 |
| LEISURE INDUSTRY — 0.0% (c) | |
Carnival Corp.
2023 Term Loan B (b)
| | | 106,084 | | 106,748 |
| LEISURE TIME — 0.3% | |
Alterra Mountain Co.
2024 Term Loan B4 1 mo. USD Term SOFR + 3.25%, 8.59%, 8/17/2028 (a)
| | | 2,382,123 | | 2,393,045 |
Amer Sports Co.
USD Term Loan 3 mo. USD Term SOFR + 3.25%, 8.58%, 2/17/2031 (a)
| | | 1,356,210 | | 1,366,382 |
| Carnival Corp.: | | | | | |
2024 Term Loan B1 1 mo. USD Term SOFR + 2.75%, 8.09%, 10/18/2028 (a)
| | | 2,723,371 | | 2,734,006 |
2024 Term Loan B2 1 mo. USD Term SOFR + 2.75%, 8.09%, 8/8/2027 (a)
| | | 6,231,689 | | 6,270,668 |
LC Ahab U.S. Bidco LLC
Term Loan B 1 mo. USD Term SOFR + 3.50%, 8.84%, 5/1/2031 (a)
| | | 3,277,173 | | 3,287,430 |
| | | | | | 16,051,531 |
| Security Description | | | Principal
Amount | | Value |
| LIFE SCIENCES TOOLS & SERVICES — 0.8% | |
Parexel International Corp.
2021 1st Lien Term Loan 1 mo. USD Term SOFR + 3.25%, 8.71%, 11/15/2028 (a)
| | | $51,763,462 | | $51,933,246 |
| LODGING — 0.3% | |
Hilton Grand Vacations Borrower LLC
2024 Incremental Term Loan B 1 mo. USD Term SOFR + 2.75%, 8.09%, 1/17/2031 (a)
| | | 9,468,418 | | 9,480,254 |
Wyndham Hotels & Resorts, Inc.
2024 Term Loan 1 mo. USD Term SOFR + 1.75%, 7.09%, 5/24/2030 (a)
| | | 9,294,105 | | 9,316,689 |
| | | | | | 18,796,943 |
| MACHINERY — 1.6% | |
Chart Industries, Inc.
2023 Term Loan 1 mo. USD Term SOFR + 3.25%, 8.68%, 3/15/2030 (a)
| | | 3,139,471 | | 3,155,168 |
Clark Equipment Co.
2022 Term Loan B 3 mo. USD Term SOFR + 2.25%, 7.68%, 4/20/2029 (a)
| | | 2,600,371 | | 2,606,871 |
Madison IAQ LLC
Term Loan 1 mo. USD Term SOFR + 2.75%, 8.09%, 6/21/2028 (a)
| | | 37,414,301 | | 37,495,303 |
Pro Mach Group, Inc.
2021 Term Loan B 1 mo. USD Term SOFR + 3.50%, 8.84%, 8/31/2028 (a)
| | | 1,795,219 | | 1,806,439 |
SPX Flow, Inc.
2024 Term Loan B 1 mo. USD Term SOFR + 3.50%, 8.84%, 4/5/2029 (a)
| | | 9,488,598 | | 9,554,260 |
TK Elevator U.S. Newco, Inc.
USD Term Loan B 3 mo. USD Term SOFR + 3.50%, 8.79%, 4/30/2030 (a)
| | | 46,756,535 | | 47,056,011 |
| | | | | | 101,674,052 |
| MEDIA — 2.0% | |
Cengage Learning, Inc.
2024 Term Loan B 6 mo. USD Term SOFR + 4.25%, 9.54%, 3/22/2031 (a)
| | | 26,374,674 | | 26,481,887 |
Charter Communications Operating LLC
2019 Term Loan B2 1 mo. USD Term SOFR + 1.75%, 7.05%, 2/1/2027 (a)
| | | 3,171,612 | | 3,171,311 |
See accompanying notes to financial statements.
26
SPDR BLACKSTONE SENIOR LOAN ETF
SCHEDULE OF INVESTMENTS (continued)
June 30, 2024
| Security Description | | | Principal
Amount | | Value |
| Directv Financing LLC: | | | | | |
2024 Term Loan 1 mo. USD Term SOFR + 5.25%, 10.71%, 8/2/2029 (a)
| | | $46,619,551 | | $46,473,865 |
Term Loan 1 mo. USD Term SOFR + 5.00%, 10.46%, 8/2/2027 (a)
| | | 277,868 | | 278,771 |
Nexstar Broadcasting, Inc.
2019 Term Loan B4 1 mo. USD Term SOFR + 2.50%, 7.96%, 9/18/2026 (a)
| | | 238,038 | | 238,887 |
Radiate Holdco LLC
2021 Term Loan B 1 mo. USD Term SOFR + 3.25%, 8.71%, 9/25/2026 (a)
| | | 26,402,680 | | 21,457,722 |
Sunrise Financing Partnership
2021 USD Term Loan AX 1 mo. USD Term SOFR + 3.00%, 8.44%, 1/31/2029 (a)
| | | 1,000,000 | | 995,900 |
Virgin Media Bristol LLC
USD Term Loan N 1 mo. USD Term SOFR + 2.50%, 7.94%, 1/31/2028 (a)
| | | 29,610,074 | | 28,366,746 |
| | | | | | 127,465,089 |
| METAL FABRICATE & HARDWARE — 0.2% | |
Crosby U.S. Acquisition Corp.
2024 Term Loan B 1 mo. USD Term SOFR + 4.00%, 9.34%, 8/16/2029 (a)
| | | 8,908,009 | | 8,968,317 |
Hillman Group, Inc.
2021 Term Loan B1 1 mo. USD Term SOFR + 2.25%, 7.59%, 7/14/2028 (a)
| | | 1,963,462 | | 1,967,388 |
| | | | | | 10,935,705 |
| MISCELLANEOUS MANUFACTUR — 0.1% | |
Touchdown Acquirer, Inc.
USD Term Loan 3 mo. USD Term SOFR + 4.00%, 9.33%, 2/21/2031 (a)
| | | 6,557,366 | | 6,596,317 |
| OIL, GAS & CONSUMABLE FUELS — 0.0% (c) | |
Pacific Gas & Electric Co.
2020 Term Loan B1 1 mo. USD Term SOFR + 3.00%, 7.84%, 6/23/2027 (a)
| | | 971,875 | | 977,036 |
| PHARMACEUTICALS — 1.1% | |
Elanco Animal Health, Inc.
Term Loan B 1 mo. USD Term SOFR + 1.75%, 7.18%, 8/1/2027 (a)
| | | 19,688,877 | | 19,641,230 |
Grifols Worldwide Operations USA, Inc.
2019 USD Term Loan B 1 mo. USD Term SOFR + 2.00%, 7.44%, 11/15/2027 (a)
| | | 5,485,640 | | 5,403,355 |
| Security Description | | | Principal
Amount | | Value |
HLF Financing SARL LLC
2024 8th Amendment Term Loan B 1 mo. USD Term SOFR + 6.75%, 12.09%, 4/12/2029 (a)
| | | $6,421,429 | | $6,191,959 |
| Jazz Financing Lux SARL: | | | | | |
2024 1st Lien Term Loan B 1 mo. USD Term SOFR + 3.00%, 8.46%, 5/5/2028 (a)
| | | 27,720,995 | | 27,772,972 |
2024 Term Loan B (b)
| | | 3,069,322 | | 3,075,077 |
Organon & Co.
2024 USD Term Loan B 1 mo. USD Term SOFR + 2.50%, 7.83%, 5/19/2031 (a)
| | | 8,538,484 | | 8,554,494 |
| | | | | | 70,639,087 |
| PIPELINES — 0.8% | |
BIP PipeCo Holdings LLC
Term Loan B 3 mo. USD Term SOFR + 2.50%, 7.81%, 12/6/2030 (a)
| | | 6,774,545 | | 6,796,800 |
| Buckeye Partners LP: | | | | | |
2024 Term Loan B2 1 mo. USD Term SOFR + 2.00%, 7.34%, 11/22/2030 (a)
| | | 960,703 | | 961,755 |
2024 Term Loan B3 1 mo. USD Term SOFR + 2.00%, 7.34%, 11/1/2026 (a)
| | | 3,004,782 | | 3,011,213 |
Freeport LNG Investments LLLP
Term Loan B 3 mo. USD Term SOFR + 3.50%, 9.09%, 12/21/2028 (a)
| | | 18,174,074 | | 18,176,527 |
GIP Pilot Acquisition Partners LP
2024 Term Loan B 3 mo. USD Term SOFR + 2.50%, 7.83%, 10/4/2030 (a)
| | | 3,590,344 | | 3,599,319 |
Oryx Midstream Services Permian Basin LLC
2024 Term Loan B 1 mo. USD Term SOFR + 3.00%, 8.44%, 10/5/2028 (a)
| | | 5,428,878 | | 5,439,057 |
TransMontaigne Operating Co. LP
Term Loan B 1 mo. USD Term SOFR + 3.50%, 8.96%, 11/17/2028 (a)
| | | 9,180,168 | | 9,213,767 |
Whitewater Whistler Holdings LLC
2024 Term Loan B (b)
| | | 4,118,915 | | 4,124,929 |
| | | | | | 51,323,367 |
See accompanying notes to financial statements.
27
SPDR BLACKSTONE SENIOR LOAN ETF
SCHEDULE OF INVESTMENTS (continued)
June 30, 2024
| Security Description | | | Principal
Amount | | Value |
| REAL ESTATE — 1.1% | |
CoreLogic, Inc.
Term Loan 1 mo. USD Term SOFR + 3.50%, 8.96%, 6/2/2028 (a)
| | | $68,709,418 | | $67,801,423 |
| REAL ESTATE INVESTMENT TRUSTS (REITs) — 0.1% | |
Iron Mountain, Inc.
2023 Term Loan B 1 mo. USD Term SOFR + 2.25%, 7.59%, 1/31/2031 (a)
| | | 5,740,960 | | 5,724,197 |
| RETAIL — 6.4% | |
| 1011778 B.C. Unlimited Liability Co.: | | | | | |
2023 Term Loan B5 (b)
| | | 10,953,699 | | 10,946,168 |
2024 Term Loan B6 3 mo. USD Term SOFR + 1.75%, 7.09%, 9/20/2030 (a)
| | | 19,989,815 | | 19,942,148 |
CWGS Group LLC
2021 Term Loan B 1 mo. USD Term SOFR + 2.50%, 7.96%, 6/3/2028 (a)
| | | 4,476,132 | | 4,344,645 |
Fogo De Chao, Inc.
2023 Term Loan B 1 mo. USD Term SOFR + 4.75%, 10.09%, 9/30/2030 (a)
| | | 13,632,912 | | 13,465,908 |
Foundation Building Materials Holding Co. LLC
2024 Term Loan B2 1 mo. USD Term SOFR + 4.00%, 9.33%, 1/29/2031 (a)
| | | 19,142,515 | | 19,089,395 |
Gulfside Supply, Inc.
Term Loan B (b)
| | | 4,447,761 | | 4,456,101 |
Harbor Freight Tools USA, Inc.
2024 Term Loan B (b)
| | | 45,200,000 | | 45,125,646 |
IRB Holding Corp.
2024 Term Loan B 1 mo. USD Term SOFR + 2.75%, 8.19%, 12/15/2027 (a)
| | | 69,157,476 | | 69,209,344 |
Johnstone Supply LLC
Term Loan 3 mo. USD Term SOFR + 3.00%, 8.33%, 5/16/2031 (a)
| | | 10,192,325 | | 10,217,806 |
KFC Holding Co.
2021 Term Loan B , 3/15/2028 (b)
| | | 460,642 | | 461,135 |
LBM Acquisition LLC
2024 Incremental Term Loan B 3 mo. USD Term SOFR + 3.75%, 9.18%, 5/30/2031 (a)
| | | 55,767,391 | | 54,715,211 |
Medical Solutions Holdings, Inc.
2021 1st Lien Term Loan 1 mo. USD Term SOFR + 3.25%, 8.69%, 11/1/2028 (a)
| | | 13,712,104 | | 10,453,011 |
| Security Description | | | Principal
Amount | | Value |
| Peer Holding III BV: | | | | | |
2023 USD Term Loan B4 3 mo. USD Term SOFR + 3.25%, 8.58%, 10/28/2030 (a)
| | | $19,278,416 | | $19,344,734 |
2024 USD Term Loan B5 (b)
| | | 11,050,101 | | 11,075,461 |
Restoration Hardware, Inc.
Term Loan B 1 mo. USD Term SOFR + 2.50%, 7.96%, 10/20/2028 (a)
| | | 21,632,100 | | 20,853,668 |
Spencer Spirit IH LLC
2024 Term Loan B (b)
| | | 4,989,167 | | 4,989,167 |
Staples, Inc.
2024 Term Loan B 3 mo. USD Term SOFR + 5.75%, 11.08%, 9/4/2029 (a)
| | | 29,710,000 | | 27,325,773 |
Tacala LLC
2024 Term Loan 1 mo. USD Term SOFR + 4.00%, 9.34%, 1/31/2031 (a)
| | | 12,361,377 | | 12,429,673 |
Whatabrands LLC
2024 Term Loan B 1 mo. USD Term SOFR + 2.75%, 8.10%, 8/3/2028 (a)
| | | 22,124,098 | | 22,154,630 |
White Cap Buyer LLC
2024 Term Loan B 1 mo. USD Term SOFR + 3.25%, 8.59%, 10/19/2029 (a)
| | | 22,493,475 | | 22,557,469 |
| | | | | | 403,157,093 |
| RETAIL-BUILDING PRODUCTS — 0.6% | |
Kodiak Building Partners, Inc.
Term Loan B 3 mo. USD Term SOFR + 3.25%, 8.46%, 3/12/2028 (a)
| | | 6,183,737 | | 6,194,374 |
LBM Acquisition LLC
Term Loan B (b)
| | | 13,473,318 | | 13,467,726 |
Park River Holdings, Inc.
Term Loan 3 mo. USD Term SOFR + 3.25%, 8.81%, 12/28/2027 (a)
| | | 20,226,487 | | 19,816,294 |
| | | | | | 39,478,394 |
| SEMICONDUCTORS & SEMICONDUCTOR EQUIPMENT — 0.7% | |
Clarios Global LP
2024 USD Term Loan B (b)
| | | 28,969,847 | | 29,073,994 |
| MKS Instruments, Inc.: | | | | | |
2023 USD Term Loan B 1 mo. USD Term SOFR + 2.50%, 7.83%, 8/17/2029 (a)
| | | 2,072,695 | | 2,077,442 |
2024 USD Term Loan B (b)
| | | 14,601,310 | | 14,646,627 |
| | | | | | 45,798,063 |
See accompanying notes to financial statements.
28
SPDR BLACKSTONE SENIOR LOAN ETF
SCHEDULE OF INVESTMENTS (continued)
June 30, 2024
| Security Description | | | Principal
Amount | | Value |
| SHIPBUILDING — 0.2% | |
LSF11 Trinity Bidco, Inc.
2024 Term Loan B 1 mo. USD Term SOFR + 3.50%, 8.84%, 6/14/2030 (a)
| | | $10,273,706 | | $10,334,731 |
| SOFTWARE — 18.4% | |
Applied Systems, Inc.
2024 1st Lien Term Loan 3 mo. USD Term SOFR + 3.50%, 8.83%, 2/24/2031 (a)
| | | 4,915,168 | | 4,957,341 |
Apttus Corp.
2021 Term Loan 1 mo. USD Term SOFR + 4.00%, 9.46%, 5/8/2028 (a)
| | | 4,127,987 | | 4,133,147 |
AthenaHealth Group, Inc.
2022 Term Loan B 1 mo. USD Term SOFR + 3.25%, 8.59%, 2/15/2029 (a)
| | | 89,306,290 | | 89,124,998 |
Banff Merger Sub, Inc.
2023 USD Term Loan 1 mo. USD Term SOFR + 4.25%, 9.34%, 12/29/2028 (a)
| | | 73,879,243 | | 74,123,044 |
Cast & Crew Payroll LLC
2021 Incremental Term Loan 1 mo. USD Term SOFR + 3.75%, 9.09%, 12/29/2028 (a)
| | | 4,391,769 | | 4,399,608 |
Central Parent, Inc.
2024 Term Loan B 3 mo. USD Term SOFR + 3.25%, 8.58%, 7/6/2029 (a)
| | | 70,844,711 | | 70,025,746 |
| Cloud Software Group, Inc.: | | | | | |
2024 Term Loan 3 mo. USD Term SOFR + 4.50%, 9.83%, 3/21/2031 (a)
| | | 17,767,727 | | 17,838,532 |
2024 USD Term Loan B 1 mo. USD Term SOFR + 4.00%, 9.33%, 3/30/2029 (a)
| | | 111,612,688 | | 111,661,798 |
| Cloudera, Inc.: | | | | | |
2021 Second Lien Term Loan 1 mo. USD Term SOFR + 6.00%, 11.44%, 10/8/2029 (a)
| | | 5,883,443 | | 5,850,349 |
2021 Term Loan 1 mo. USD Term SOFR + 3.75%, 9.19%, 10/8/2028 (a)
| | | 2,363,541 | | 2,367,973 |
ConnectWise LLC
2021 Term Loan B 3 mo. USD Term SOFR + 3.50%, 9.10%, 9/29/2028 (a)
| | | 3,962,460 | | 3,940,666 |
Cotiviti Corp.
2024 Term Loan 1 mo. USD Term SOFR + 3.25%, 8.58%, 5/1/2031 (a)
| | | 60,016,071 | | 59,866,030 |
| Security Description | | | Principal
Amount | | Value |
| DCert Buyer, Inc.: | | | | | |
2019 Term loan B 1 mo. USD Term SOFR + 4.00%, 9.34%, 10/16/2026 (a)
| | | $8,378,125 | | $8,184,381 |
2021 2nd Lien Term Loan 1 mo. USD Term SOFR + 7.00%, 12.34%, 2/19/2029 (a)
| | | 7,467,875 | | 6,702,418 |
Dun & Bradstreet Corp.
2024 Term Loan B 3 mo. USD Term SOFR + 2.75%, 8.10%, 1/18/2029 (a)
| | | 24,365,736 | | 24,411,422 |
ECI Macola/Max Holding LLC
2024 Term Loan B 3 mo. USD Term SOFR + 3.75%, 9.08%, 5/31/2030 (a)
| | | 57,499 | | 57,918 |
Epicor Software Corp.
2024 Term Loan 1 mo. USD Term SOFR + 3.25%, 8.58%, 5/23/2031 (a)
| | | 8,373,724 | | 8,419,068 |
| Genesys Cloud Services Holdings II LLC: | | | | | |
First Lien Term Loan B 1 mo. USD Term SOFR + 3.50%, 8.84%, 12/1/2027 (a)
| | | 12,918,921 | | 12,995,078 |
Term Loan B 1 mo. USD Term SOFR + 3.75%, 9.21%, 12/1/2027 (a)
| | | 5,562,025 | | 5,606,632 |
Idera, Inc.
2024 Term Loan 1 mo. USD Term SOFR + 3.50%, 8.83%, 3/2/2028 (a)
| | | 23,427,823 | | 23,296,042 |
Informatica LLC
2024 Term Loan B 1 mo. USD Term SOFR + 2.25%, 7.59%, 10/27/2028 (a)
| | | 2,124,613 | | 2,133,908 |
Ivanti Software, Inc.
2021 Term Loan B 3 mo. USD Term SOFR + 4.25%, 9.81%, 12/1/2027 (a)
| | | 17,364,897 | | 13,855,365 |
McAfee LLC
2024 USD Term Loan B 1 mo. USD Term SOFR + 3.25%, 8.58%, 3/1/2029 (a)
| | | 89,548,769 | | 89,545,901 |
Mitchell International, Inc.
2024 1st Lien Term Loan 1 mo. USD Term SOFR + 3.25%, 8.59%, 6/17/2031 (a)
| | | 45,438,979 | | 45,109,092 |
Modena Buyer LLC
Term Loan (b)
| | | 48,110,359 | | 47,020,419 |
Particle Investments SARL
2024 Term Loan B 1 mo. USD Term SOFR + 4.00%, 9.32%, 3/28/2031 (a)
| | | 4,853,252 | | 4,898,751 |
See accompanying notes to financial statements.
29
SPDR BLACKSTONE SENIOR LOAN ETF
SCHEDULE OF INVESTMENTS (continued)
June 30, 2024
| Security Description | | | Principal
Amount | | Value |
Polaris Newco LLC
USD Term Loan B 3 mo. USD Term SOFR + 4.00%, 9.59%, 6/2/2028 (a)
| | | $78,700,873 | | $78,763,441 |
Project Alpha Intermediate Holding, Inc.
2024 Term Loan B 3 mo. USD Term SOFR + 3.75%, 9.07%, 10/28/2030 (a)
| | | 42,539,062 | | 42,722,192 |
Project Leopard Holdings, Inc.
2022 USD Term Loan B 3 mo. USD Term SOFR + 5.25%, 10.68%, 7/20/2029 (a)
| | | 30,318,617 | | 28,297,729 |
| Project Ruby Ultimate Parent Corp.: | | | | | |
2021 Term Loan 1 mo. USD Term SOFR + 3.25%, 8.71%, 3/10/2028 (a)
| | | 3,681,146 | | 3,691,104 |
2024 Incremental Term Loan 1 mo. USD Term SOFR + 3.50%, 8.96%, 3/10/2028 (a)
| | | 5,208,280 | | 5,227,004 |
Quartz Acquireco LLC
2024 Term Loan B 3 mo. USD Term SOFR + 2.75%, 8.08%, 6/28/2030 (a)
| | | 9,898,598 | | 9,917,158 |
Quest Software U.S. Holdings, Inc.
2022 Term Loan 3 mo. USD Term SOFR + 4.25%, 9.73%, 2/1/2029 (a)
| | | 38,277,604 | | 28,527,533 |
RealPage, Inc.
1st Lien Term Loan 1 mo. USD Term SOFR + 3.00%, 8.46%, 4/24/2028 (a)
| | | 78,902,019 | | 76,825,318 |
Rocket Software, Inc.
2023 USD Term Loan B 1 mo. USD Term SOFR + 4.75%, 10.09%, 11/28/2028 (a)
| | | 30,469,625 | | 30,634,313 |
| SolarWinds Holdings, Inc.: | | | | | |
2024 Term Loan (b)
| | | 3,000,000 | | 3,007,500 |
2024 Term Loan 1 mo. USD Term SOFR + 3.25%, 8.59%, 2/5/2027 (a)
| | | 4,032,855 | | 4,042,937 |
SS&C Technologies, Inc.
2024 Term Loan B8 1 mo. USD Term SOFR + 2.00%, 7.34%, 5/9/2031 (a)
| | | 20,948,024 | | 21,002,279 |
| Vision Solutions, Inc.: | | | | | |
2021 2nd Lien Term Loan 3 mo. USD Term SOFR + 7.25%, 12.84%, 4/23/2029 (a)
| | | 1,233,333 | | 1,191,708 |
2021 Incremental Term Loan 3 mo. USD Term SOFR + 3.25%, 11.75%, 4/24/2028 (a)
| | | 60,223,812 | | 59,395,735 |
| Security Description | | | Principal
Amount | | Value |
VS Buyer LLC
2024 Term Loan B 1 mo. USD Term SOFR + 3.25%, 8.58%, 4/14/2031 (a)
| | | $8,700,783 | | $8,733,410 |
Waystar Technologies, Inc.
2024 Term Loan B 1 mo. USD Term SOFR + 2.75%, 8.10%, 10/22/2029 (a)
| | | 9,828,218 | | 9,852,788 |
| | | | | | 1,152,357,776 |
| SPECIALTY RETAIL — 0.4% | |
Michaels Cos., Inc.
2021 Term Loan B 3 mo. USD Term SOFR + 4.25%, 9.85%, 4/15/2028 (a)
| | | 25,287,133 | | 22,792,937 |
| STEEL-PRODUCERS — 0.3% | |
Arsenal AIC Parent LLC
2024 Term Loan B 1 mo. USD Term SOFR + 3.75%, 9.09%, 8/18/2030 (a)
| | | 18,148,395 | | 18,279,970 |
Phoenix Services International LLC
2023 Exit PIK Term Loan 1 mo. USD Term SOFR + 6.10%, 11.44%, 6/30/2028 (a)
| | | 2,451,641 | | 2,353,576 |
| | | | | | 20,633,546 |
| TRADING COMPANIES & DISTRIBUTORS — 0.0% (c) | |
Foundation Building Materials Holding Co. LLC
2021 Term Loan 3 mo. USD Term SOFR + 3.25%, 8.84%, 1/31/2028 (a)
| | | 2,731,277 | | 2,705,671 |
| TRANSPORT-SERVICES — 0.8% | |
Genesee & Wyoming, Inc.
2024 Term Loan B 3 mo. USD Term SOFR + 2.00%, 7.33%, 4/10/2031 (a)
| | | 22,468,438 | | 22,470,572 |
LaserShip, Inc.
2021 Term Loan 3 mo. USD Term SOFR + 4.50%, 10.10%, 5/7/2028 (a)
| | | 27,679,464 | | 23,662,205 |
Savage Enterprises LLC
2021 Term Loan B 1 mo. USD Term SOFR + 3.00%, 8.34%, 9/15/2028 (a)
| | | 1,329,714 | | 1,334,395 |
| | | | | | 47,467,172 |
TOTAL SENIOR FLOATING RATE LOANS
(Cost $5,857,397,347)
| | | | | 5,876,222,313 |
| | | Shares | |
| COMMON STOCKS — 0.4% |
| AEROSPACE & DEFENSE — 0.1% |
Flame Newco LLC (d) (e)
| | 230,071 | 3,174,980 |
See accompanying notes to financial statements.
30
SPDR BLACKSTONE SENIOR LOAN ETF
SCHEDULE OF INVESTMENTS (continued)
June 30, 2024
| Security Description | | | Shares | | Value |
| ENTERTAINMENT — 0.3% | |
Cineworld Group PLC (d) (e)
| | | 1,063,146 | | $18,870,841 |
| HEALTH CARE EQUIPMENT & SUPPLIES — 0.0% (c) | |
Carestream Health, Inc. (d) (e)
| | | 396,286 | | 643,965 |
| HEALTH CARE PROVIDERS & SERVICES — 0.0% (c) | |
Envision Healthcare Corp. (d) (e)
| | | 154,531 | | 1,532,484 |
TOTAL COMMON STOCKS
(Cost $35,744,995)
| | | | | 24,222,270 |
| | | Principal
Amount | |
| CORPORATE BONDS & NOTES — 4.3% |
| AEROSPACE & DEFENSE — 0.1% |
AAR Escrow Issuer LLC
6.75%, 3/15/2029 (f)
| | $310,000 | 316,145 |
Moog, Inc.
4.25%, 12/15/2027 (f)
| | 1,450,000 | 1,374,904 |
| TransDigm, Inc.: | | | |
4.63%, 1/15/2029
| | 3,250,000 | 3,036,767 |
4.88%, 5/1/2029
| | 1,790,000 | 1,677,087 |
| AGRICULTURE — 0.0% (c) |
Vector Group Ltd.
5.75%, 2/1/2029 (f)
| | 1,657,000 | 1,552,708 |
| AIRLINES — 0.0% (c) |
Air Canada
3.88%, 8/15/2026 (f)
| | 867,000 | 825,150 |
American Airlines, Inc.
7.25%, 2/15/2028 (f)
| | 332,000 | 332,000 |
| AUTO MANUFACTURERS — 0.1% |
| Allison Transmission, Inc.: | | | |
3.75%, 1/30/2031 (f)
| | 3,440,000 | 3,017,568 |
4.75%, 10/1/2027 (f)
| | 1,560,000 | 1,507,163 |
Wabash National Corp.
4.50%, 10/15/2028 (f)
| | 70,000 | 63,050 |
| AUTO PARTS & EQUIPMENT — 0.0% (c) |
Phinia, Inc.
6.75%, 4/15/2029 (f)
| | 509,000 | 516,722 |
| BANKS — 0.1% |
Intesa Sanpaolo SpA
5.71%, 1/15/2026 (f)
| | 3,407,000 | 3,375,758 |
| BEVERAGES — 0.0% (c) |
Primo Water Holdings, Inc.
4.38%, 4/30/2029 (f)
| | 1,558,000 | 1,434,061 |
| CHEMICALS — 0.1% |
Ashland, Inc.
3.38%, 9/1/2031 (f)
| | 754,000 | 635,509 |
Chemours Co.
5.75%, 11/15/2028 (f)
| | 200,000 | 184,778 |
CVR Partners LP/CVR Nitrogen Finance Corp.
6.13%, 6/15/2028 (f)
| | 300,000 | 288,342 |
| Security Description | | | Principal
Amount | | Value |
Minerals Technologies, Inc.
5.00%, 7/1/2028 (f)
| | | $10,000 | | $9,490 |
Tronox, Inc.
4.63%, 3/15/2029 (f)
| | | 2,100,000 | | 1,898,190 |
| COAL — 0.0% (c) | |
Alliance Resource Operating Partners LP/Alliance Resource Finance Corp.
8.63%, 6/15/2029 (f)
| | | 1,000,000 | | 1,028,670 |
SunCoke Energy, Inc.
4.88%, 6/30/2029 (f)
| | | 1,450,000 | | 1,314,454 |
| COMMERCIAL SERVICES — 0.1% | |
Adtalem Global Education, Inc.
5.50%, 3/1/2028 (f)
| | | 1,245,000 | | 1,196,632 |
Cimpress PLC
7.00%, 6/15/2026
| | | 1,065,000 | | 1,063,179 |
CoreCivic, Inc.
8.25%, 4/15/2029
| | | 300,000 | | 310,065 |
| Sabre GLBL, Inc.: | | | | | |
8.63%, 6/1/2027 (f)
| | | 1,150,000 | | 1,062,600 |
11.25%, 12/15/2027 (f)
| | | 250,000 | | 242,937 |
TriNet Group, Inc.
3.50%, 3/1/2029 (f)
| | | 600,000 | | 534,156 |
Valvoline, Inc.
3.63%, 6/15/2031 (f)
| | | 1,080,000 | | 929,794 |
| COMPUTERS — 0.1% | |
Conduent Business Services LLC/Conduent State & Local Solutions, Inc.
6.00%, 11/1/2029 (f)
| | | 67,000 | | 62,708 |
KBR, Inc.
4.75%, 9/30/2028 (f)
| | | 760,000 | | 711,398 |
Science Applications International Corp.
4.88%, 4/1/2028 (f)
| | | 1,160,000 | | 1,106,860 |
| Seagate HDD Cayman: | | | | | |
4.09%, 6/1/2029
| | | 2,480,000 | | 2,295,662 |
4.13%, 1/15/2031
| | | 550,000 | | 488,081 |
| CONSTRUCTION MATERIALS — 0.0% (c) | |
Griffon Corp.
5.75%, 3/1/2028
| | | 541,000 | | 522,265 |
Louisiana-Pacific Corp.
3.63%, 3/15/2029 (f)
| | | 1,060,000 | | 962,395 |
| DIVERSIFIED FINANCIAL SERVICES — 0.5% | |
Ally Financial, Inc.
6.70%, 2/14/2033
| | | 2,750,000 | | 2,731,575 |
Bread Financial Holdings, Inc.
9.75%, 3/15/2029 (f)
| | | 2,671,000 | | 2,806,927 |
| Burford Capital Global Finance LLC: | | | | | |
6.88%, 4/15/2030 (f)
| | | 558,000 | | 547,655 |
9.25%, 7/1/2031 (f)
| | | 1,100,000 | | 1,157,937 |
Encore Capital Group, Inc.
8.50%, 5/15/2030 (f)
| | | 871,000 | | 885,668 |
See accompanying notes to financial statements.
31
SPDR BLACKSTONE SENIOR LOAN ETF
SCHEDULE OF INVESTMENTS (continued)
June 30, 2024
| Security Description | | | Principal
Amount | | Value |
Enova International, Inc.
11.25%, 12/15/2028 (f)
| | | $580,000 | | $620,095 |
| goeasy Ltd.: | | | | | |
7.63%, 7/1/2029 (f)
| | | 1,100,000 | | 1,121,670 |
9.25%, 12/1/2028 (f)
| | | 1,856,000 | | 1,969,903 |
| Nationstar Mortgage Holdings, Inc.: | | | | | |
5.13%, 12/15/2030 (f)
| | | 1,700,000 | | 1,560,957 |
5.50%, 8/15/2028 (f)
| | | 240,000 | | 230,774 |
5.75%, 11/15/2031 (f)
| | | 3,130,000 | | 2,941,167 |
| Navient Corp.: | | | | | |
4.88%, 3/15/2028
| | | 940,000 | | 859,846 |
9.38%, 7/25/2030
| | | 457,000 | | 480,403 |
11.50%, 3/15/2031
| | | 1,510,000 | | 1,662,691 |
| OneMain Finance Corp.: | | | | | |
7.50%, 5/15/2031
| | | 346,000 | | 350,273 |
7.88%, 3/15/2030
| | | 1,858,000 | | 1,915,133 |
| PennyMac Financial Services, Inc.: | | | | | |
5.75%, 9/15/2031 (f)
| | | 1,170,000 | | 1,096,699 |
7.88%, 12/15/2029 (f)
| | | 3,284,000 | | 3,385,279 |
PHH Mortgage Corp.
7.88%, 3/15/2026 (f)
| | | 235,000 | | 229,358 |
| PRA Group, Inc.: | | | | | |
5.00%, 10/1/2029 (f)
| | | 70,000 | | 59,939 |
8.38%, 2/1/2028 (f)
| | | 290,000 | | 289,809 |
8.88%, 1/31/2030 (f)
| | | 558,000 | | 558,134 |
Synchrony Financial
7.25%, 2/2/2033
| | | 2,180,000 | | 2,175,204 |
| ELECTRIC — 0.1% | |
| NRG Energy, Inc.: | | | | | |
3.38%, 2/15/2029 (f)
| | | 2,400,000 | | 2,134,992 |
3.63%, 2/15/2031 (f)
| | | 550,000 | | 471,872 |
3.88%, 2/15/2032 (f)
| | | 200,000 | | 171,970 |
| Vistra Operations Co. LLC: | | | | | |
5.00%, 7/31/2027 (f)
| | | 100,000 | | 96,755 |
7.75%, 10/15/2031 (f)
| | | 4,015,000 | | 4,182,024 |
| ELECTRONICS — 0.0% (c) | |
Coherent Corp.
5.00%, 12/15/2029 (f)
| | | 1,630,000 | | 1,543,317 |
Sensata Technologies, Inc.
6.63%, 7/15/2032 (f)
| | | 412,000 | | 414,896 |
| ENGINEERING & CONSTRUCTION — 0.0% (c) | |
Brundage-Bone Concrete Pumping Holdings, Inc.
6.00%, 2/1/2026 (f)
| | | 840,000 | | 830,861 |
| TopBuild Corp.: | | | | | |
3.63%, 3/15/2029 (f)
| | | 260,000 | | 234,585 |
4.13%, 2/15/2032 (f)
| | | 200,000 | | 176,134 |
| ENTERTAINMENT — 0.1% | |
Churchill Downs, Inc.
4.75%, 1/15/2028 (f)
| | | 1,550,000 | | 1,482,374 |
Cinemark USA, Inc.
5.25%, 7/15/2028 (f)
| | | 1,900,000 | | 1,815,203 |
| Security Description | | | Principal
Amount | | Value |
| FOOD — 0.1% | |
Post Holdings, Inc.
4.63%, 4/15/2030 (f)
| | | $4,146,000 | | $3,809,552 |
| FOREST PRODUCTS & PAPER — 0.0% (c) | |
Mercer International, Inc.
5.13%, 2/1/2029
| | | 760,000 | | 669,127 |
| HEALTH CARE SERVICES — 0.2% | |
| CHS/Community Health Systems, Inc.: | | | | | |
5.63%, 3/15/2027 (f)
| | | 100,000 | | 93,045 |
10.88%, 1/15/2032 (f)
| | | 1,300,000 | | 1,354,639 |
| DaVita, Inc.: | | | | | |
3.75%, 2/15/2031 (f)
| | | 900,000 | | 768,240 |
4.63%, 6/1/2030 (f)
| | | 4,400,000 | | 3,981,516 |
| Encompass Health Corp.: | | | | | |
4.50%, 2/1/2028
| | | 3,320,000 | | 3,159,312 |
4.63%, 4/1/2031
| | | 30,000 | | 27,571 |
| HOME BUILDERS — 0.2% | |
Century Communities, Inc.
3.88%, 8/15/2029 (f)
| | | 1,435,000 | | 1,278,671 |
Dream Finders Homes, Inc.
8.25%, 8/15/2028 (f)
| | | 340,000 | | 348,004 |
Forestar Group, Inc.
3.85%, 5/15/2026 (f)
| | | 2,040,000 | | 1,953,769 |
Landsea Homes Corp.
8.88%, 4/1/2029 (f)
| | | 480,000 | | 475,795 |
LGI Homes, Inc.
8.75%, 12/15/2028 (f)
| | | 610,000 | | 635,169 |
| M/I Homes, Inc.: | | | | | |
3.95%, 2/15/2030
| | | 1,543,000 | | 1,373,394 |
4.95%, 2/1/2028
| | | 510,000 | | 491,099 |
Taylor Morrison Communities, Inc.
5.75%, 1/15/2028 (f)
| | | 4,180,000 | | 4,143,634 |
Thor Industries, Inc.
4.00%, 10/15/2029 (f)
| | | 330,000 | | 291,446 |
Tri Pointe Homes, Inc.
5.70%, 6/15/2028
| | | 920,000 | | 900,496 |
| HOME FURNISHINGS — 0.1% | |
| Tempur Sealy International, Inc.: | | | | | |
3.88%, 10/15/2031 (f)
| | | 2,240,000 | | 1,893,203 |
4.00%, 4/15/2029 (f)
| | | 1,370,000 | | 1,237,206 |
| INTERNET — 0.3% | |
| Cogent Communications Group, Inc.: | | | | | |
3.50%, 5/1/2026 (f)
| | | 322,000 | | 308,215 |
7.00%, 6/15/2027 (f)
| | | 499,000 | | 494,384 |
Gen Digital, Inc.
1 mo. USD Term SOFR + 2.00% Zero Coupon, 9/12/2029 (a)
| | | 5,000,000 | | 4,988,825 |
Go Daddy Operating Co. LLC/GD Finance Co., Inc.
3.50%, 3/1/2029 (f)
| | | 1,900,000 | | 1,715,871 |
See accompanying notes to financial statements.
32
SPDR BLACKSTONE SENIOR LOAN ETF
SCHEDULE OF INVESTMENTS (continued)
June 30, 2024
| Security Description | | | Principal
Amount | | Value |
Newfold Digital Holdings Group, Inc.
11.75%, 10/15/2028 (f)
| | | $7,273,000 | | $7,528,137 |
| Rakuten Group, Inc.: | | | | | |
9.75%, 4/15/2029 (f)
| | | 711,000 | | 734,754 |
11.25%, 2/15/2027 (f)
| | | 2,619,000 | | 2,805,159 |
| INVESTMENT COMPANY SECURITY — 0.0% (c) | |
Compass Group Diversified Holdings LLC
5.25%, 4/15/2029 (f)
| | | 1,470,000 | | 1,396,838 |
Icahn Enterprises LP/Icahn Enterprises Finance Corp.
9.00%, 6/15/2030 (f)
| | | 1,144,000 | | 1,138,669 |
| IRON/STEEL — 0.0% (c) | |
| Mineral Resources Ltd.: | | | | | |
8.00%, 11/1/2027 (f)
| | | 760,000 | | 775,382 |
8.13%, 5/1/2027 (f)
| | | 1,100,000 | | 1,110,428 |
| IT SERVICES — 0.0% (c) | |
ASGN, Inc.
4.63%, 5/15/2028 (f)
| | | 1,000,000 | | 943,870 |
| LODGING — 0.0% (c) | |
| Hilton Domestic Operating Co., Inc.: | | | | | |
3.63%, 2/15/2032 (f)
| | | 1,054,000 | | 912,637 |
4.00%, 5/1/2031 (f)
| | | 780,000 | | 698,077 |
| MACHINERY, CONSTRUCTION & MINING — 0.0% (c) | |
| BWX Technologies, Inc.: | | | | | |
4.13%, 6/30/2028 (f)
| | | 2,240,000 | | 2,087,591 |
4.13%, 4/15/2029 (f)
| | | 83,000 | | 76,558 |
| MEDIA — 0.1% | |
AMC Networks, Inc.
4.25%, 2/15/2029
| | | 1,000,000 | | 674,990 |
| CCO Holdings LLC/CCO Holdings Capital Corp.: | | | | | |
4.25%, 2/1/2031 (f)
| | | 170,000 | | 138,758 |
4.75%, 3/1/2030 (f)
| | | 2,100,000 | | 1,818,936 |
5.38%, 6/1/2029 (f)
| | | 800,000 | | 727,704 |
| Gray Television, Inc.: | | | | | |
4.75%, 10/15/2030 (f)
| | | 1,560,000 | | 935,844 |
5.38%, 11/15/2031 (f)
| | | 170,000 | | 96,487 |
| News Corp.: | | | | | |
3.88%, 5/15/2029 (f)
| | | 1,000,000 | | 920,990 |
5.13%, 2/15/2032 (f)
| | | 75,000 | | 71,153 |
| Nexstar Media, Inc.: | | | | | |
4.75%, 11/1/2028 (f)
| | | 400,000 | | 355,300 |
5.63%, 7/15/2027 (f)
| | | 1,932,000 | | 1,834,936 |
| MINING — 0.1% | |
FMG Resources August 2006 Pty. Ltd.
5.88%, 4/15/2030 (f)
| | | 4,000,000 | | 3,911,360 |
Kaiser Aluminum Corp.
4.50%, 6/1/2031 (f)
| | | 450,000 | | 398,691 |
Taseko Mines Ltd.
8.25%, 5/1/2030 (f)
| | | 1,526,000 | | 1,565,615 |
| Security Description | | | Principal
Amount | | Value |
| MISCELLANEOUS MANUFACTURER — 0.0% (c) | |
Hillenbrand, Inc.
3.75%, 3/1/2031
| | | $29,000 | | $25,184 |
| OFFICE & BUSINESS EQUIPMENT — 0.1% | |
Pitney Bowes, Inc.
7.25%, 3/15/2029 (f)
| | | 1,480,000 | | 1,329,439 |
Xerox Holdings Corp.
5.50%, 8/15/2028 (f)
| | | 3,342,000 | | 2,876,894 |
Zebra Technologies Corp.
6.50%, 6/1/2032 (f)
| | | 1,131,000 | | 1,143,837 |
| OFFICE FURNISHINGS — 0.0% (c) | |
Steelcase, Inc.
5.13%, 1/18/2029
| | | 1,300,000 | | 1,234,181 |
| OIL & GAS — 0.3% | |
California Resources Corp.
8.25%, 6/15/2029 (f)
| | | 830,000 | | 847,098 |
Chord Energy Corp.
6.38%, 6/1/2026 (f)
| | | 1,160,000 | | 1,158,364 |
| CNX Resources Corp.: | | | | | |
6.00%, 1/15/2029 (f)
| | | 1,797,000 | | 1,762,210 |
7.25%, 3/1/2032 (f)
| | | 1,122,000 | | 1,142,678 |
| Comstock Resources, Inc.: | | | | | |
5.88%, 1/15/2030 (f)
| | | 410,000 | | 382,157 |
6.75%, 3/1/2029 (f)
| | | 1,390,000 | | 1,346,924 |
| CVR Energy, Inc.: | | | | | |
5.75%, 2/15/2028 (f)
| | | 589,000 | | 547,434 |
8.50%, 1/15/2029 (f)
| | | 1,680,000 | | 1,688,921 |
Northern Oil & Gas, Inc.
8.13%, 3/1/2028 (f)
| | | 1,100,000 | | 1,112,584 |
| Parkland Corp.: | | | | | |
4.50%, 10/1/2029 (f)
| | | 959,000 | | 878,761 |
4.63%, 5/1/2030 (f)
| | | 1,775,000 | | 1,619,918 |
PBF Holding Co. LLC/PBF Finance Corp.
7.88%, 9/15/2030 (f)
| | | 1,047,000 | | 1,071,207 |
Precision Drilling Corp.
6.88%, 1/15/2029 (f)
| | | 1,650,000 | | 1,632,279 |
Sunoco LP/Sunoco Finance Corp.
4.50%, 5/15/2029
| | | 4,830,000 | | 4,523,778 |
Valaris Ltd.
8.38%, 4/30/2030 (f)
| | | 1,260,000 | | 1,304,289 |
| OIL & GAS SERVICES — 0.1% | |
Archrock Partners LP/Archrock Partners Finance Corp.
6.25%, 4/1/2028 (f)
| | | 1,250,000 | | 1,238,338 |
Enerflex Ltd.
9.00%, 10/15/2027 (f)
| | | 1,753,000 | | 1,779,453 |
Helix Energy Solutions Group, Inc.
9.75%, 3/1/2029 (f)
| | | 914,000 | | 974,351 |
USA Compression Partners LP/USA Compression Finance Corp.
7.13%, 3/15/2029 (f)
| | | 1,800,000 | | 1,812,654 |
See accompanying notes to financial statements.
33
SPDR BLACKSTONE SENIOR LOAN ETF
SCHEDULE OF INVESTMENTS (continued)
June 30, 2024
| Security Description | | | Principal
Amount | | Value |
| PHARMACEUTICALS — 0.0% (c) | |
AdaptHealth LLC
5.13%, 3/1/2030 (f)
| | | $1,520,000 | | $1,331,019 |
Herbalife Nutrition Ltd./HLF Financing, Inc.
7.88%, 9/1/2025 (f)
| | | 510,000 | | 500,892 |
HLF Financing SARL LLC/Herbalife International, Inc.
4.88%, 6/1/2029 (f)
| | | 90,000 | | 62,305 |
| Organon & Co./Organon Foreign Debt Co.-Issuer BV: | | | | | |
6.75%, 5/15/2034 (f)
| | | 684,000 | | 683,090 |
7.88%, 5/15/2034 (f)
| | | 396,000 | | 407,056 |
| PIPELINES — 0.2% | |
| Delek Logistics Partners LP/Delek Logistics Finance Corp.: | | | | | |
7.13%, 6/1/2028 (f)
| | | 1,906,000 | | 1,881,241 |
8.63%, 3/15/2029 (f)
| | | 663,000 | | 682,910 |
| DT Midstream, Inc.: | | | | | |
4.13%, 6/15/2029 (f)
| | | 1,766,000 | | 1,632,791 |
4.38%, 6/15/2031 (f)
| | | 92,000 | | 83,969 |
Global Partners LP/GLP Finance Corp.
6.88%, 1/15/2029
| | | 953,000 | | 945,338 |
| Hess Midstream Operations LP: | | | | | |
4.25%, 2/15/2030 (f)
| | | 2,036,000 | | 1,869,374 |
5.13%, 6/15/2028 (f)
| | | 2,148,000 | | 2,080,338 |
NGL Energy Operating LLC/NGL Energy Finance Corp.
8.38%, 2/15/2032 (f)
| | | 900,000 | | 913,626 |
| REAL ESTATE — 0.1% | |
Howard Hughes Corp.
4.13%, 2/1/2029 (f)
| | | 1,630,000 | | 1,459,062 |
Newmark Group, Inc.
7.50%, 1/12/2029 (f)
| | | 1,741,000 | | 1,789,800 |
| REAL ESTATE INVESTMENT TRUSTS — 0.3% | |
Apollo Commercial Real Estate Finance, Inc.
4.63%, 6/15/2029 (f)
| | | 1,460,000 | | 1,224,707 |
Brandywine Operating Partnership LP
8.88%, 4/12/2029
| | | 500,000 | | 521,580 |
Iron Mountain Information Management Services, Inc.
5.00%, 7/15/2032 (f)
| | | 1,820,000 | | 1,663,571 |
| Iron Mountain, Inc.: | | | | | |
4.88%, 9/15/2029 (f)
| | | 1,000,000 | | 941,490 |
5.00%, 7/15/2028 (f)
| | | 70,000 | | 67,073 |
5.63%, 7/15/2032 (f)
| | | 340,000 | | 321,881 |
7.00%, 2/15/2029 (f)
| | | 475,000 | | 483,754 |
REIT, 4.50%, 2/15/2031 (f)
| | | 340,000 | | 306,588 |
| Security Description | | | Principal
Amount | | Value |
Ladder Capital Finance Holdings LLLP/Ladder Capital Finance Corp.
4.25%, 2/1/2027 (f)
| | | $1,450,000 | | $1,373,440 |
| MPT Operating Partnership LP/MPT Finance Corp.: | | | | | |
4.63%, 8/1/2029
| | | 500,000 | | 367,385 |
5.00%, 10/15/2027
| | | 1,200,000 | | 1,000,872 |
Rithm Capital Corp.
8.00%, 4/1/2029 (f)
| | | 3,152,000 | | 3,063,492 |
Service Properties Trust
4.95%, 2/15/2027
| | | 1,080,000 | | 981,774 |
| Starwood Property Trust, Inc.: | | | | | |
3.63%, 7/15/2026 (f)
| | | 540,000 | | 508,183 |
4.38%, 1/15/2027 (f)
| | | 3,840,000 | | 3,638,746 |
7.25%, 4/1/2029 (f)
| | | 288,000 | | 291,125 |
Vornado Realty LP
3.40%, 6/1/2031
| | | 580,000 | | 460,056 |
| RETAIL — 0.6% | |
1011778 BC ULC/New Red Finance, Inc.
4.38%, 1/15/2028 (f)
| | | 2,000,000 | | 1,887,480 |
Bath & Body Works, Inc.
6.88%, 11/1/2035
| | | 290,000 | | 292,436 |
Brinker International, Inc.
8.25%, 7/15/2030 (f)
| | | 1,075,000 | | 1,128,922 |
| FirstCash, Inc.: | | | | | |
4.63%, 9/1/2028 (f)
| | | 3,780,000 | | 3,558,152 |
5.63%, 1/1/2030 (f)
| | | 650,000 | | 615,511 |
6.88%, 3/1/2032 (f)
| | | 384,000 | | 383,931 |
Foot Locker, Inc.
4.00%, 10/1/2029 (f)
| | | 965,000 | | 805,495 |
| Gap, Inc.: | | | | | |
3.63%, 10/1/2029 (f)
| | | 1,118,000 | | 966,835 |
3.88%, 10/1/2031 (f)
| | | 1,930,000 | | 1,610,431 |
Macy's Retail Holdings LLC
5.88%, 3/15/2030 (f)
| | | 580,000 | | 555,147 |
| Murphy Oil USA, Inc.: | | | | | |
3.75%, 2/15/2031 (f)
| | | 1,723,000 | | 1,518,187 |
4.75%, 9/15/2029
| | | 660,000 | | 625,165 |
Nordstrom, Inc.
5.00%, 1/15/2044
| | | 490,000 | | 396,513 |
Patrick Industries, Inc.
4.75%, 5/1/2029 (f)
| | | 1,969,000 | | 1,817,820 |
Staples, Inc.
10.75%, 9/1/2029 (f)
| | | 20,000,000 | | 19,013,000 |
Suburban Propane Partners LP/Suburban Energy Finance Corp.
5.00%, 6/1/2031 (f)
| | | 2,120,000 | | 1,906,940 |
Yum! Brands, Inc.
4.75%, 1/15/2030 (f)
| | | 1,500,000 | | 1,428,105 |
| SEMICONDUCTORS — 0.0% (c) | |
Entegris, Inc.
3.63%, 5/1/2029 (f)
| | | 630,000 | | 567,164 |
See accompanying notes to financial statements.
34
SPDR BLACKSTONE SENIOR LOAN ETF
SCHEDULE OF INVESTMENTS (continued)
June 30, 2024
| Security Description | | | Principal
Amount | | Value |
| SOFTWARE — 0.1% | |
Fair Isaac Corp.
4.00%, 6/15/2028 (f)
| | | $4,064,000 | | $3,800,815 |
MicroStrategy, Inc.
6.13%, 6/15/2028 (f)
| | | 1,520,000 | | 1,473,017 |
PTC, Inc.
4.00%, 2/15/2028 (f)
| | | 1,531,000 | | 1,442,018 |
SS&C Technologies, Inc.
6.50%, 6/1/2032 (f)
| | | 487,000 | | 491,354 |
| TELECOMMUNICATIONS — 0.1% | |
Consolidated Communications, Inc.
6.50%, 10/1/2028 (f)
| | | 700,000 | | 599,781 |
Frontier Communications Holdings LLC
8.63%, 3/15/2031 (f)
| | | 3,420,000 | | 3,523,284 |
Telecom Italia Capital SA
7.72%, 6/4/2038
| | | 300,000 | | 292,638 |
Viavi Solutions, Inc.
3.75%, 10/1/2029 (f)
| | | 1,100,000 | | 930,336 |
| TRANSPORTATION — 0.0% (c) | |
Danaos Corp.
8.50%, 3/1/2028 (f)
| | | 610,000 | | 624,835 |
TOTAL CORPORATE BONDS & NOTES
(Cost $274,277,023)
| | | | | 268,347,147 |
| Security Description | | | Principal
Amount | | Value |
| REPURCHASE AGREEMENTS — 1.6% | |
Barclays Capital, Inc., dated 06/28/2024 (collateralized by U.S. Treasury Notes 3.000% due 08/15/2048, valued at $126,000,000); expected proceeds $105,201,778, 5.32%, 06/15/2025
(Cost $100,000,000)
| | | 100,000,000 | | $100,000,000 |
| | | Shares | |
| SHORT-TERM INVESTMENT — 6.7% |
State Street Institutional U.S. Government Money Market Fund, Class G Shares 5.29% (g) (h)
(Cost $420,966,957)
| | 420,966,957 | 420,966,957 |
TOTAL INVESTMENTS — 106.6%
(Cost $6,688,386,322)
| | | 6,689,758,687 |
LIABILITIES IN EXCESS OF OTHER ASSETS — (6.6)%
| | | (413,543,963) |
NET ASSETS — 100.0%
| | | $6,276,214,724 |
| (a) | Variable Rate Security - Interest rate shown is rate in effect at June 30, 2024. For securities based on a published reference rate and spread, the reference rate and spread are indicated in the description above. |
| (b) | Position is unsettled. Contract rate was not determined at June 30, 2024 and does not take effect until settlement date. Maturity date is not finalized until settlement date. |
| (c) | Amount is less than 0.05% of net assets. |
| (d) | Fair valued as determined in good faith by the Trust's Oversight Committee in accordance with policy and procedures approved by the Board of Trustees. Security value is determined based on Level 3 inputs. As of June 30, 2024, total aggregate fair value of the securities is $24,222,270, representing 0.40% of the Fund's net assets. |
| (e) | Non-income producing security. |
| (f) | Securities purchased pursuant to Rule 144A of the Securities Act of 1933, as amended. These securities, which represent 3.6% of net assets as of June 30, 2024, are considered liquid and may be resold in transactions exempt from registration, normally to qualified institutional buyers. |
| (g) | The Fund invested in certain money market funds managed by SSGA Funds Management, Inc. Amounts related to these investments during the year ended June 30, 2024 are shown in the Affiliate Table below. |
| (h) | The rate shown is the annualized seven-day yield at June 30, 2024. |
| | |
| SOFR | Secured Overnight Financing Rate |
| PIK | Payment in Kind |
| REIT | Real Estate Investment Trust |
See accompanying notes to financial statements.
35
SPDR BLACKSTONE SENIOR LOAN ETF
SCHEDULE OF INVESTMENTS (continued)
June 30, 2024
At June 30, 2024, the Fund had unfunded loan commitments of $3,955,787, which could be extended at the option of the borrowers, pursuant to the following loan agreements:
| Borrower | | Unfunded Loan
Commitment ($) | | Value ($) | | Unrealized
Appreciation/(Depreciation) ($) |
| Touchdown Acquirer Inc | | 1,435,923 | | 1,444,452 | | 8,529 |
| Groundworks, LLC | | 1,537,388 | | 1,538,349 | | 961 |
| Epicor Software Corp. | | 982,476 | | 987,796 | | 5,320 |
| | | $3,955,787 | | $3,970,597 | | $14,810 |
The following table summarizes the value of the Fund's investments according to the fair value hierarchy as of June 30, 2024.
| Description | | Level 1 –
Quoted Prices | | Level 2 –
Other Significant
Observable Inputs | | Level 3 –
Significant
Unobservable Inputs | | Total |
| ASSETS: | | | | | | | | |
| INVESTMENTS: | | | | | | | | |
Corporate Bonds & Notes
| | $— | | $268,347,147 | | $— | | $268,347,147 |
Common Stocks
| | — | | — | | 24,222,270 | | 24,222,270 |
Repurchase Agreements
| | — | | 100,000,000 | | — | | 100,000,000 |
Senior Floating Rate Loans
| | — | | 5,876,222,313 | | — | | 5,876,222,313 |
Short-Term Investment
| | 420,966,957 | | — | | — | | 420,966,957 |
TOTAL INVESTMENTS
| | $420,966,957 | | $6,244,569,460 | | $24,222,270 | | $6,689,758,687 |
| OTHER FINANCIAL INSTRUMENTS: | | | | | | | | |
Unfunded Loans - Unrealized Appreciation
| | $— | | $14,810 | | $— | | $14,810 |
TOTAL OTHER FINANCIAL INSTRUMENTS:
| | $— | | $14,810 | | $— | | $14,810 |
Affiliate Table
| | Number of
Shares Held
at
6/30/23 | | Value at
6/30/23 | | Cost of
Purchases | | Proceeds
from
Shares Sold | | Realized
Gain (Loss) | | Change in
Unrealized
Appreciation/
Depreciation | | Number of
Shares Held
at
6/30/24 | | Value at
6/30/24 | | Dividend
Income |
State Street Institutional U.S. Government Money Market Fund, Class G Shares
| 302,552,338 | | $302,552,338 | | $4,426,300,158 | | $4,307,885,539 | | $— | | $— | | 420,966,957 | | $420,966,957 | | $19,289,446 |
See accompanying notes to financial statements.
36
SSGA ACTIVE TRUST
STATEMENTS OF ASSETS AND LIABILITIES
June 30, 2024
| | SPDR Blackstone High Income ETF | | SPDR Blackstone Senior Loan ETF |
| ASSETS | | | |
Investments in unaffiliated issuers, at value
| $140,166,770 | | $6,168,791,730 |
Investments in affiliated issuers, at value
| 9,762,136 | | 420,966,957 |
Repurchase agreements, at value and amortized cost
| — | | 100,000,000 |
Total Investments
| 149,928,906 | | 6,689,758,687 |
Cash
| — | | 431,069 |
Receivable for investments sold
| 4,394,742 | | 554,481,440 |
Receivable for fund shares sold
| — | | 16,748,301 |
Dividends receivable — affiliated issuers
| 23,077 | | 2,678,501 |
Interest receivable — unaffiliated issuers
| 2,048,916 | | 52,690,634 |
Unrealized appreciation on unfunded loan commitments
| 353 | | 14,810 |
Receivable for foreign taxes recoverable
| 1,369 | | 23,323 |
TOTAL ASSETS
| 156,397,363 | | 7,316,826,765 |
| LIABILITIES | | | |
Due to custodian
| 312,472 | | — |
Payable for investments purchased
| 6,430,421 | | 1,036,919,918 |
Advisory fee payable
| 60,630 | | 3,692,044 |
Trustees’ fees and expenses payable
| — | | 79 |
TOTAL LIABILITIES
| 6,803,523 | | 1,040,612,041 |
NET ASSETS
| $149,593,840 | | $6,276,214,724 |
| NET ASSETS CONSIST OF: | | | |
Paid-in capital
| $157,075,936 | | $7,384,937,597 |
Total distributable earnings (loss)
| (7,482,096) | | (1,108,722,873) |
NET ASSETS
| $149,593,840 | | $6,276,214,724 |
| NET ASSET VALUE PER SHARE | | | |
Net asset value per share
| $28.23 | | $41.87 |
Shares outstanding (unlimited amount authorized, $0.01 par value)
| 5,300,000 | | 149,900,000 |
| COST OF INVESTMENTS: | | | |
Investments in unaffiliated issuers
| $137,862,316 | | $6,167,419,365 |
Investments in affiliated issuers
| 9,762,810 | | 420,966,957 |
Repurchase agreements
| — | | 100,000,000 |
Total cost of investments
| $147,625,126 | | $6,688,386,322 |
See accompanying notes to financial statements.
37
SSGA ACTIVE TRUST
STATEMENTS OF OPERATIONS
For the Year Ended June 30, 2024
| | SPDR Blackstone High Income ETF | | SPDR Blackstone Senior Loan ETF |
| INVESTMENT INCOME | | | |
Interest income — unaffiliated issuers
| $11,210,637 | | $468,093,579 |
Dividend income — affiliated issuers
| 593,385 | | 19,289,446 |
TOTAL INVESTMENT INCOME (LOSS)
| 11,804,022 | | 487,383,025 |
| EXPENSES | | | |
Advisory fee
| 911,236 | | 35,911,436 |
Trustees’ fees and expenses
| 1,307 | | 48,458 |
Miscellaneous expenses
| 226 | | 9,297 |
TOTAL EXPENSES
| 912,769 | | 35,969,191 |
NET INVESTMENT INCOME (LOSS)
| $10,891,253 | | $451,413,834 |
| REALIZED AND UNREALIZED GAIN (LOSS) | | | |
| Net realized gain (loss) on: | | | |
Investments — unaffiliated issuers
| 410,281 | | (41,824,841) |
Investments — affiliated issuers
| (7,363) | | — |
In-kind redemptions — unaffiliated issuers
| 121,626 | | — |
Net realized gain (loss)
| 524,544 | | (41,824,841) |
| Net change in unrealized appreciation/depreciation on: | | | |
Investments — unaffiliated issuers
| 2,262,585 | | 38,316,568 |
Investments — affiliated issuers
| (674) | | — |
Unfunded loan commitments
| 2,823 | | 312,644 |
Net change in unrealized appreciation/depreciation
| 2,264,734 | | 38,629,212 |
NET REALIZED AND UNREALIZED GAIN (LOSS)
| 2,789,278 | | (3,195,629) |
NET INCREASE (DECREASE) IN NET ASSETS FROM OPERATIONS
| $13,680,531 | | $448,218,205 |
See accompanying notes to financial statements.
38
SSGA ACTIVE TRUST
STATEMENTS OF CHANGES IN NET ASSETS
| | SPDR Blackstone High Income ETF | | SPDR Blackstone Senior Loan ETF |
| | Year Ended
6/30/24 | | Year Ended
6/30/23 | | Year Ended
6/30/24 | | Year Ended
6/30/23 |
| INCREASE (DECREASE) IN NET ASSETS FROM OPERATIONS: | | | | | | | |
Net investment income (loss)
| $10,891,253 | | $8,568,207 | | $451,413,834 | | $449,195,588 |
Net realized gain (loss)
| 524,544 | | (8,110,193) | | (41,824,841) | | (618,138,892) |
Net change in unrealized appreciation/depreciation
| 2,264,734 | | 9,380,841 | | 38,629,212 | | 564,280,988 |
Net increase (decrease) in net assets resulting from operations
| 13,680,531 | | 9,838,855 | | 448,218,205 | | 395,337,684 |
Net equalization credits and charges
| 95,912 | | 40,471 | | 690,629 | | (1,905,227) |
Distributions to shareholders
| (11,073,572) | | (8,087,000) | | (448,614,982) | | (419,871,500) |
| FROM BENEFICIAL INTEREST TRANSACTIONS: | | | | | | | |
Proceeds from shares sold
| 28,127,309 | | 16,447,735 | | 3,615,437,062 | | 1,862,640,864 |
Cost of shares redeemed
| (7,044,510) | | (9,655,756) | | (2,015,003,986) | | (5,642,644,491) |
Net income equalization
| (95,912) | | (40,471) | | (690,629) | | 1,905,227 |
Other capital
| 16,173 | | 32,498 | | 3,485,763 | | 16,111,574 |
Net increase (decrease) in net assets from beneficial interest transactions
| 21,003,060 | | 6,784,006 | | 1,603,228,210 | | (3,761,986,826) |
Contribution from affiliate (Note 4)
| — | | — | | 837,000 | | 38,051 |
Net increase (decrease) in net assets during the period
| 23,705,931 | | 8,576,332 | | 1,604,359,062 | | (3,788,387,818) |
Net assets at beginning of period
| 125,887,909 | | 117,311,577 | | 4,671,855,662 | | 8,460,243,480 |
NET ASSETS AT END OF PERIOD
| $149,593,840 | | $125,887,909 | | $6,276,214,724 | | $4,671,855,662 |
| SHARES OF BENEFICIAL INTEREST: | | | | | | | |
Shares sold
| 1,000,000 | | 600,000 | | 86,400,000 | | 44,500,000 |
Shares redeemed
| (250,000) | | (350,000) | | (48,150,000) | | (135,100,000) |
Net increase (decrease) from share transactions
| 750,000 | | 250,000 | | 38,250,000 | | (90,600,000) |
See accompanying notes to financial statements.
39
SSGA ACTIVE TRUST
FINANCIAL HIGHLIGHTS
Selected data for a share outstanding throughout each period
| | SPDR Blackstone High Income ETF |
| | Year
Ended
6/30/24 | | Year
Ended
6/30/23 | | For the
Period
02/17/22*-
6/30/22 |
Net asset value, beginning of period
| $27.67 | | $27.28 | | $30.00 |
| Income (loss) from investment operations: | | | | | |
Net investment income (loss) (a)
| 2.26 | | 2.00 | | 0.50 |
Net realized and unrealized gain (loss) (b)
| 0.59 | | 0.26 | | (2.86) |
Total from investment operations
| 2.85 | | 2.26 | | (2.36) |
Net equalization credits and charges (a)
| 0.02 | | 0.01 | | 0.00(c) |
Other capital (a)
| 0.00(c) | | 0.01 | | 0.00(c) |
| Distributions to shareholders from: | | | | | |
Net investment income
| (2.31) | | (1.89) | | (0.36) |
Net asset value, end of period
| $28.23 | | $27.67 | | $27.28 |
Total return (d)
| 10.95% | | 8.48% | | (7.93)% |
| Ratios and Supplemental Data: | | | | | |
Net assets, end of period (in 000s)
| $149,594 | | $125,888 | | $117,312 |
| Ratios to average net assets: | | | | | |
Total expenses
| 0.68% | | 0.70% | | 0.70%(e) |
Net investment income (loss)
| 8.12% | | 7.26% | | 4.63%(e) |
Portfolio turnover rate
| 137% | | 133% | | 55%(f) |
| * | Commencement of operations. |
| (a) | Per share numbers have been calculated using average shares outstanding, which more appropriately presents the per share data for the year. |
| (b) | Amounts shown in this caption for a share outstanding may not accord with the change in aggregate gains and losses in securities for the fiscal period because of the timing of sales and repurchases of Fund shares in relation to fluctuating market values for the Fund. |
| (c) | Amount is less than $0.005 per share. |
| (d) | Total return is calculated assuming a purchase of shares at net asset value on the first day and a sale at net asset value on the last day of each period reported. Distributions are assumed, for the purpose of this calculation, to be reinvested at net asset value per share on the respective payment dates of each distribution. Total returns for periods of less than one year are not annualized. Broker commission charges are not included in this calculation. |
| (e) | Annualized. |
| (f) | Not annualized. |
See accompanying notes to financial statements.
40
SSGA ACTIVE TRUST
FINANCIAL HIGHLIGHTS (continued)
Selected data for a share outstanding throughout each period
| | SPDR Blackstone Senior Loan ETF |
| | Year
Ended
6/30/24 | | Year
Ended
6/30/23 | | Year
Ended
6/30/22 | | Year
Ended
6/30/21 | | Year
Ended
6/30/20(a) |
Net asset value, beginning of period
| $41.84 | | $41.83 | | $46.30 | | $43.36 | | $46.25 |
| Income (loss) from investment operations: | | | | | | | | | |
Net investment income (loss) (b)
| 3.68 | | 3.01 | | 1.95 | | 1.98 | | 2.34 |
Net realized and unrealized gain (loss) (c)
| 0.04 | | (0.27) | | (4.44) | | 3.02 | | (3.06) |
Total from investment operations
| 3.72 | | 2.74 | | (2.49) | | 5.00 | | (0.72) |
Net equalization credits and charges (b)
| 0.01 | | (0.01) | | 0.01 | | 0.06 | | (0.04) |
Contribution from affiliate (Note 4)
| 0.01 | | 0.00(d) | | — | | 0.00(d) | | 0.01 |
Other capital (b)
| 0.03 | | 0.11 | | 0.06 | | 0.02 | | 0.21 |
| Distributions to shareholders from: | | | | | | | | | |
Net investment income
| (3.74) | | (2.83) | | (2.04) | | (2.14) | | (2.35) |
Return of capital
| — | | — | | (0.01) | | — | | — |
Total distributions
| (3.74) | | (2.83) | | (2.05) | | — | | — |
Net asset value, end of period
| $41.87 | | $41.84 | | $41.83 | | $46.30 | | $43.36 |
Total return (e)
| 9.45%(f) | | 6.95%(f) | | (5.46)% | | 11.97%(f) | | (1.23)%(f) |
| Ratios and Supplemental Data: | | | | | | | | | |
Net assets, end of period (in 000s)
| $6,276,215 | | $4,671,856 | | $8,460,243 | | $6,294,196 | | $1,433,094 |
| Ratios to average net assets: | | | | | | | | | |
Total expenses
| 0.70% | | 0.71% | | 0.70% | | 0.70% | | 0.70% |
Net investment income (loss)
| 8.80% | | 7.19% | | 4.33% | | 4.31% | | 5.17% |
Portfolio turnover rate
| 176% | | 125% | | 140% | | 176% | | 195%(g) |
| (a) | The per share amounts and percentages include the Fund’s proportionate share of income and expenses of the Portfolio prior to discontinuance of the master feeder structure. |
| (b) | Per share numbers have been calculated using average shares outstanding, which more appropriately presents the per share data for the year. |
| (c) | Amounts shown in this caption for a share outstanding may not accord with the change in aggregate gains and losses in securities for the fiscal period because of the timing of sales and repurchases of Fund shares in relation to fluctuating market values for the Fund. |
| (d) | Amount is less than $0.005 per share. |
| (e) | Total return is calculated assuming a purchase of shares at net asset value on the first day and a sale at net asset value on the last day of each period reported. Distributions are assumed, for the purpose of this calculation, to be reinvested at net asset value per share on the respective payment dates of each distribution. Total returns for periods of less than one year are not annualized. Broker commission charges are not included in this calculation. |
| (f) | If an affiliate had not made a contribution during the years ended June 30, 2024, June 30, 2023, June 30, 2021 and June 30, 2020, the total return would have been 9.42%, 6.95%, 11.97% and (1.23)%, respectively. |
| (g) | Portfolio turnover rate is from the the affiliated Portfolio prior to the discontinuance of the master feeder structure. |
See accompanying notes to financial statements.
41
SSGA ACTIVE TRUST
NOTES TO FINANCIAL STATEMENTS
June 30, 2024
1. Organization
SSGA Active Trust (the “Trust”), a Massachusetts business trust registered under the Investment Company Act of 1940, as amended (“1940 Act”), is an open-end management investment company.
As of June 30, 2024, the Trust consists of fourteen (14) series, each of which represents a separate series of beneficial interest in the Trust. The Declaration of Trust permits the Board of Trustees of the Trust (the “Board”) to authorize the issuance of an unlimited number of shares of beneficial interest with no par value. The financial statements herein relate to the following series (each, a “Fund” and collectively, the “Funds”):
| SPDR Blackstone High Income ETF |
| SPDR Blackstone Senior Loan ETF |
The SPDR Blackstone High Income ETF is classified as a non-diversified investment company and the SPDR Blackstone Senior Loan ETF is classified as a diversified investment company under the 1940 Act.
Under the Trust’s organizational documents, its officers and Trustees are indemnified against certain liabilities arising out of the performance of their duties to the Trust. Additionally, in the normal course of business, the Trust enters into contracts with service providers that contain general indemnification clauses. The Trust’s maximum exposure under these arrangements is unknown as this would involve future claims that may be made against the Trust that have not yet occurred.
2. Summary of Significant Accounting Policies
The following is a summary of significant accounting policies followed by the Trust in the preparation of its financial statements:
The preparation of financial statements in accordance with U.S. generally accepted accounting principles (“U.S. GAAP”) requires management to make estimates and assumptions that affect the reported amounts and disclosures in the financial statements. Actual results could differ from those estimates. Each Fund is an investment company under U.S. GAAP and follows the accounting and reporting guidance applicable to investment companies.
Security Valuation
Each Fund's investments are valued at fair value each day that the New York Stock Exchange (“NYSE”) is open and, for financial reporting purposes, as of the report date should the reporting period end on a day that the NYSE is not open. Fair value is generally defined as the price a fund would receive to sell an asset or pay to transfer a liability in an orderly transaction between market participants at the measurement date. By its nature, a fair value price is a good faith estimate of the valuation in a current sale and may not reflect an actual market price. The investments of each Fund are valued pursuant to the policy and procedures developed by the Oversight Committee (the “Committee”) and approved by the Board. The Committee provides oversight of the valuation of investments for the Funds. The Board has responsibility for overseeing the determination of the fair value of investments.
Valuation techniques used to value each Fund’s investments by major category are as follows:
• Equity investments (including preferred stocks and registered investment companies that are exchange-traded funds) traded on a recognized securities exchange for which market quotations are readily available are valued at the last sale price or official closing price, as applicable, on the primary market or exchange on which they trade. Equity investments traded on a recognized exchange for which there were no sales on that day are valued at the last published sale price or at fair value.
• Investments in registered investment companies (including money market funds) or other unitized pooled investment vehicles that are not traded on an exchange are valued at that day’s published net asset value (“NAV”) per share or unit.
• Repurchase agreements are valued at the repurchase price as of valuation date.
• Debt obligations (including short-term investments) are valued using quotations from independent pricing services or brokers or are generally valued at the last reported evaluated prices.
SSGA ACTIVE TRUST
NOTES TO FINANCIAL STATEMENTS (continued)
June 30, 2024
• Senior loans or other loans are valued at evaluated bid prices supplied by an independent pricing service, if available. Senior loans and other loans for which the Committee determines that there are no reliable valuations available from pricing services or brokers will be initially valued at cost and adjusted for amortization of principal until remeasurement is warranted due to a credit or economic event or other factors affecting the loan.
In the event prices or quotations are not readily available or that the application of these valuation methods results in a price for an investment that is deemed to be not representative of the fair value of such investment, fair value will be determined in good faith by the Committee, in accordance with the valuation policy and procedures approved by the Board.
Fair value pricing could result in a difference between the prices used to calculate the Fund's NAV and the prices used by the Fund's underlying benchmark.
Various inputs are used in determining the value of the Funds' investments.
The Funds value their assets and liabilities at fair value using a fair value hierarchy consisting of three broad levels that prioritize the inputs to valuation techniques giving the highest priority to readily available unadjusted quoted prices in active markets for identical assets or liabilities (Level 1 measurements) and the lowest priority to unobservable inputs (Level 3 measurements) when market prices are not readily available or reliable. The categorization of a value determined for an investment within the hierarchy is based upon the pricing transparency of the investment and is not necessarily an indication of the risk associated with investing in it.
The three levels of the fair value hierarchy are as follows:
• Level 1 – Unadjusted quoted prices in active markets for an identical asset or liability;
• Level 2 – Inputs other than quoted prices included within Level 1 that are observable for the asset or liability either directly or indirectly, including quoted prices for similar assets or liabilities in active markets, quoted prices for identical or similar assets or liabilities in markets that are not considered to be active, inputs other than quoted prices that are observable for the asset or liability (such as exchange rates, financing terms, interest rates, yield curves, volatilities, prepayment speeds, loss severities, credit risks and default rates) or other market-corroborated inputs; and
• Level 3 – Unobservable inputs for the asset or liability, including the Committee’s assumptions used in determining the fair value of investments.
The value of each Fund’s investments, according to the fair value hierarchy as of June 30, 2024, is disclosed in each Fund’s respective Schedule of Investments.
Investment Transactions and Income Recognition
Investment transactions are accounted for on the trade date for financial reporting purposes. Realized gains and losses from the sale and disposition of investments are determined using the identified cost method.
Dividend income and capital gain distributions, if any, are recognized on the ex-dividend date, net of any foreign taxes withheld at source, if any. Interest income is recorded on an accrual basis. All premiums and discounts are amortized/accreted for financial reporting purposes. Paydown gains and losses are recorded as an adjustment to interest income. Non-cash dividends, if any, received in the form of stock are recorded as dividend income at fair value.
Expenses
Certain expenses, which are directly identifiable to a specific Fund, are applied to that Fund within the Trust. Other expenses which cannot be attributed to a specific Fund are allocated in such a manner as deemed equitable, taking into consideration the nature and type of expense and the relative net assets of the Funds within the Trust. Class specific expenses are borne by each class.
Equalization
The Funds follow the accounting practice known as “Equalization” by which a portion of the proceeds from sales and costs of reacquiring Fund shares, equivalent on a per share basis to the amount of distributable net investment income on the date of the transaction, is credited or charged to undistributed net investment income.
SSGA ACTIVE TRUST
NOTES TO FINANCIAL STATEMENTS (continued)
June 30, 2024
As a result, undistributed net investment income per share is unaffected by sales or reacquisition of Fund shares. Amounts related to Equalization can be found on the Statements of Changes in Net Assets.
Distributions
Distributions from net investment income, if any, are declared and paid monthly. Net realized capital gains, if any, are distributed annually. Dividends may be declared and paid more frequently or at any other times to improve Index tracking or to comply with the distribution requirements of the Internal Revenue Code of 1986, (the “Internal Revenue Code”) as amended. The amount and character of income and capital gains to be distributed are determined in accordance with applicable tax regulations which may differ from net investment income and realized gains recognized for U.S. GAAP purposes.
3. Securities and Other Investments
Loan Agreements
The Funds invest in Senior Loans. Senior Loans consist generally of obligations of companies and other entities (collectively, “borrowers”) incurred for the purpose of reorganizing the assets and liabilities of a borrower; acquiring another company; taking over control of a company (leveraged buyout); temporary refinancing; or financing internal growth or other general business purposes. Senior Loans are often obligations of borrowers who have incurred a significant percentage of debt compared to their total assets and thus are highly leveraged. Funds do not treat the banks originating or acting as agents for the lenders, or granting or acting as intermediary in participation interests, in loans held by the Funds as the issuers of such loans.
Repurchase Agreements
The Funds may enter into repurchase agreements under the terms of a Master Repurchase Agreement. A repurchase agreement customarily obligates the seller at the time it sells securities to a Fund to repurchase the securities at a mutually agreed upon price and time. During the term of a repurchase agreement, the value of the underlying securities held as collateral on behalf of a Fund including accrued interest, is required to exceed the value of the repurchase agreement, including accrued interest.
The applicable Fund monitors, on a daily basis, the value of the collateral to ensure it is at least equal to the Fund’s principal amount of the repurchase agreement (including accrued interest). The underlying securities are ordinarily United States Government or Government Agency securities, but may consist of other securities. The use of repurchase agreements involves certain risks including counterparty risks. In the event of a default by the counterparty, realization of the collateral proceeds could be delayed, during which the value of the collateral may decline.
As of June 30, 2024, the SPDR Blackstone Senior Loan ETF had invested in repurchase agreements with the gross values (principal) of $100,000,000 and associated collateral equal to $105,201,778.
4. Fees and Transactions with Affiliates
Advisory Fee
The Trust, on behalf of each Fund, has entered into an Investment Advisory Agreement with SSGA Funds Management, Inc. (the “Adviser” or “SSGA FM”). For its advisory services to the Fund, facilities furnished and expenses borne by the Adviser, the Fund pays the Adviser a fee (“Management/Advisory fee”) accrued daily and paid monthly, based on a percentage of the Fund’s average daily net assets as shown in the following table:
| | Annual Rate |
SPDR Blackstone High Income ETF
| 0.70%* |
SPDR Blackstone Senior Loan ETF
| 0.70 |
| * | The Advisory fees are reduced for SPDR Blackstone High Income ETF by the acquired fund fees and expenses and for the year ended June 30, 2024, the net annualized advisory fees were 0.68%. |
With respect to each Fund, the Management fee is reduced by the acquired fund fees and expenses attributable to the Fund's investments in other investment companies (except acquired fund fees and expenses associated with holdings of acquired funds for cash management purposes).
SSGA ACTIVE TRUST
NOTES TO FINANCIAL STATEMENTS (continued)
June 30, 2024
From time to time, the Adviser may waive all or a portion of it's Management fee. The Adviser pays all expenses of each Fund other than the Management fee, brokerage expenses, taxes, interest, fees and expenses of the Trust's Trustees, who are not “interested persons” of the Trust, as defined in the 1940 Act (“Independent Trustees”) (including any Trustee’s counsel fees), acquired fund fees and expenses, litigation expenses and other extraordinary expenses.
Blackstone Liquid Credit Strategies LLC receives fees for its services as the Sub-Adviser to the Funds from the Adviser.
Administrator, Custodian, Sub-Administrator and Transfer Agent Fees
SSGA FM serves as administrator and State Street Bank and Trust Company (“State Street”), an affiliate of the Adviser, serves as custodian, sub-administrator and transfer agent. State Street receives fees for its services as custodian, sub-administrator and transfer agent from the Adviser.
Distributor
State Street Global Advisors Funds Distributors, LLC (“SSGA FD” or the “Distributor”), an affiliate of the Adviser, serves as the Distributor of the Trust.
Other Transactions with Affiliates
The Funds may invest in affiliated entities, including securities issued by State Street Corporation, affiliated funds, or entities deemed to be affiliates as a result of the Funds owning more than five percent of the entity’s voting securities or outstanding shares. Amounts relating to these transactions during the year ended June 30, 2024, are disclosed in the Schedules of Investments.
During the fiscal year ended June 30, 2024, State Street made a contribution of $837,000 to the SPDR Blackstone Senior Loan ETF related to an accounting matter.
During the fiscal year ended June 30, 2023, State Street made contributions of $4,615 and $33,436 to the SPDR Blackstone Senior Loan ETF related to separate accounting matters.
Due to Custodian
In certain circumstances, the Funds may have cash overdrafts with the Custodian due to expense payments, capital transactions, trading of securities, investment operations or derivative transactions. The Due to Custodian amount, if any, reflects cash overdrawn with State Street, as custodian, who is an affiliate of the Funds.
5. Trustees’ Fees
The fees and expenses of the Independent Trustees are paid directly by the Funds. The Independent Trustees are reimbursed for travel and other out-of-pocket expenses in connection with meeting attendance and industry seminars.
6. Investment Transactions
Purchases and sales of investments (excluding in-kind transactions and short term investments) for the year ended June 30, 2024, were as follows:
| | Purchases | | Sales |
SPDR Blackstone High Income ETF
| $193,054,670 | | $180,184,349 |
SPDR Blackstone Senior Loan ETF
| 10,544,378,092 | | 8,867,222,073 |
For the year ended June 30, 2024, the following Funds had in-kind contributions, redemptions and net realized gains/losses in the amounts as follows:
| | In-kind
Contributions | | In-kind
Redemptions | | In-kind Net
Realized
Gains/(Losses) |
SPDR Blackstone High Income ETF
| $9,403,636 | | $3,489,417 | | $121,626 |
SSGA ACTIVE TRUST
NOTES TO FINANCIAL STATEMENTS (continued)
June 30, 2024
7. Shareholder Transactions
Each Fund issues and redeems its shares, at NAV, by each Fund only in aggregations of a specified number of shares or multiples thereof (“Creation Units”). Except when aggregated in Creation Units, shares of each Fund are not redeemable. Transactions in capital shares for each Fund are disclosed in detail in the Statements of Changes in Net Assets.
The consideration for the purchase of Creation Units of a Fund may consist of the in-kind deposit of a designated portfolio of securities and a specified amount of cash. Investors purchasing and redeeming Creation Units may pay a purchase transaction fee and a redemption transaction fee directly to the Trust and/or custodian, to offset transfer and other transaction costs associated with the issuance and redemption of Creation Units, including Creation Units for cash. An additional variable fee may be charged for certain transactions. Such variable charges, if any, are included in “Other Capital” on the Statements of Changes in Net Assets.
8. Income Tax Information
The Funds have qualified and intend to continue to qualify as regulated investment company under Subchapter M of the Internal Revenue Code. The qualify as a regulated investment company under Subchapter M of the Internal Revenue Code.
The Funds file federal and various state and local tax returns as required. No income tax returns are currently under examination. Generally, the federal returns are subject to examination by the Internal Revenue Service for a period of three years from date of filing, while the state returns may remain open for an additional year depending upon jurisdiction. SSGA FM has analyzed the Funds' tax positions taken on tax returns for all open years and does not believe there are any uncertain tax positions that would require recognition of a tax liability.
Distributions to shareholders are recorded on ex-dividend date. Income dividends and gain distributions are determined in accordance with income tax rules and regulations, which may differ from generally accepted accounting principles.
Certain capital accounts in the financial statements have been adjusted for permanent book-tax differences. These adjustments have no impact on net asset values or results of operations. Temporary book-tax differences will reverse in the future. These book-tax differences are primarily due to amortization and accretion of premium and discount for financial statement purposes and differing treatments for wash sales.
The tax character of distributions paid during the year ended June 30, 2024, was as follows:
| | Ordinary
Income | | Long-Term
Capital Gains | | Total |
SPDR Blackstone High Income ETF
| $11,073,572 | | $— | | $11,073,572 |
SPDR Blackstone Senior Loan ETF
| 448,614,982 | | — | | 448,614,982 |
The tax character of distributions paid during the year ended June 30, 2023, was as follows:
| | Ordinary
Income | | Long-Term
Capital Gains | | Total |
SPDR Blackstone High Income ETF
| $ 8,087,000 | | $ — | | $ 8,087,000 |
SPDR Blackstone Senior Loan ETF
| 419,871,500 | | — | | 419,871,500 |
At June 30, 2024, the components of distributable earnings on a tax basis were as follows:
| | Undistributed
Ordinary Income | | Capital Loss
Carryforwards | | Undistributed
Long-Term
Capital Gains | | Net Unrealized
Gains (Losses) | | Total |
SPDR Blackstone High Income ETF
| $894,488 | | $(10,359,912) | | $— | | $1,983,328 | | $(7,482,096) |
SPDR Blackstone Senior Loan ETF
| 32,158,422 | | (1,123,639,919) | | — | | (17,241,376) | | (1,108,722,873) |
SSGA ACTIVE TRUST
NOTES TO FINANCIAL STATEMENTS (continued)
June 30, 2024
As of June 30, 2024, the following Funds had capital loss carryforwards available to offset future realized capital gains as follows:
| | Non-Expiring
Short Term | | Non-Expiring
Long Term |
SPDR Blackstone High Income ETF
| $9,150,439 | | $1,209,473 |
SPDR Blackstone Senior Loan ETF
| 531,251,579 | | 592,388,340 |
As of June 30, 2024, gross unrealized appreciation and gross unrealized depreciation of investments based on cost for federal income tax purposes were as follows:
| | Tax
Cost | | Gross
Unrealized
Appreciation | | Gross
Unrealized
Depreciation | | Net Unrealized
Appreciation
(Depreciation) |
SPDR Blackstone High Income ETF
| $147,945,931 | | $2,695,676 | | $712,701 | | $1,982,975 |
SPDR Blackstone Senior Loan ETF
| 6,707,014,872 | | 49,316,772 | | 66,572,957 | | (17,256,185) |
9. Line of Credit
The Funds and other affiliated funds (each a “Participant” and, collectively, the “Participants”) participate in a $960 million ($1.275 billion prior to October 5, 2023) revolving credit facility provided by a syndication of banks under which the Participants may borrow to fund shareholder redemptions. The SPDR Blackstone Senior Loan ETF has exclusive access to $750 million ($1.05 billion prior to October 5, 2023) and the SPDR Blackstone High Income ETF has exclusive access to $30 million ($25 million prior to October 5, 2023) of the total credit facility. This agreement expires in October 2024 unless extended or renewed.
The Participants are charged an annual commitment fee which is calculated based on the unused portion of the shared credit line. Commitment fees are allocated among each of the Participants based on relative net assets. SPDR Blackstone Senior Loan ETF is allocated the commitment fee for its exclusive portion of the credit line. Commitment fees are ordinary fund operating expenses paid by the Adviser.Interest is calculated at a rate per annum equal to the sum of 1.00% plus the greater of the New York Fed Bank Rate and the one-month SOFR Rate.
The Funds have no outstanding loans as of June 30, 2024.
The SPDR Blackstone Senior Loan ETF also has exclusive access to a $500 million uncommitted line of credit with State Street that may be used solely for temporary or emergency purposes, including to temporarily finance the redemption of shares or for other temporary and emergency purposes consistent with the current investment objectives and investment restrictions of the Fund. The Adviser, on behalf of the Fund, paid an upfront fee to participate in this uncommitted line of credit.
10. Risks
Concentration Risk
As a result of the Funds' ability to invest a large percentage of their assets in obligations of issuers within the same country, state, region, currency or economic sector, an adverse economic, business or political development may affect the value of the Funds' investments more than if they were more broadly diversified.
Foreign and Emerging Markets Risk
Investing in foreign markets involves risks and considerations not typically associated with investing in the U.S. Foreign securities may be subject to risk of loss because of government regulation, economic, political and social instability in the countries in which the Funds' invest. Foreign markets may be less liquid than investments in the U.S. and may be subject to the risks of currency fluctuations. To the extent that the Funds' invest in securities of issuers located in emerging markets, these risks may be even more pronounced.
Credit Risk
The Funds may be exposed to credit risk in the event that an issuer or guarantor fails to perform or that an institution or entity with which the Funds have unsettled or open transactions defaults.
SSGA ACTIVE TRUST
NOTES TO FINANCIAL STATEMENTS (continued)
June 30, 2024
Market Risk
Each Fund’s investments are subject to changes in general economic conditions, general market fluctuations and the risks inherent in investment in securities markets. Investment markets can be volatile and prices of investments can change substantially due to various factors including, but not limited to, economic growth or recession, changes in interest rates, changes in the actual or perceived creditworthiness of issuers, and general market liquidity. Each Fund is subject to the risk that geopolitical events will disrupt securities markets and adversely affect global economies and markets. Local, regional or global events such as war, acts of terrorism, the spread of infectious illness, such as COVID-19, or other public health issues, or other events could have a significant impact on a Fund and its investments.
11. Recent Accounting Pronouncement
In December 2022, the Financial Accounting Standards Board (FASB) issued Accounting Standards Update (ASU) No. 2206 Reference Rate Reform (Topic 848). ASU No. 2022-06 updates and clarifies ASU No. 2020-04, which provides optional, temporary relief with respect to the financial reporting of contracts subject to certain types of modifications due to the planned discontinuation of LIBOR and other interbank-offered reference rates. The temporary relief provided by ASU No. 2022-06 is effective immediately for certain reference rate-related contract modifications that occur through December 31, 2024. Management does not expect ASU No. 2022-06 to have a material impact on the financial statements.
12. Subsequent Events
Management has evaluated the impact of all subsequent events on the Funds through the date the financial statements were issued and has determined that there were no subsequent events requiring adjustment or disclosure in the financial statements.
SSGA ACTIVE TRUST
REPORT OF INDEPENDENT REGISTERED PUBLIC ACCOUNTING FIRM
To the Shareholders of SPDR Blackstone High Income ETF and SPDR Blackstone Senior Loan ETF and the Board of Trustees of SSGA Active Trust
Opinion on the Financial Statements
We have audited the accompanying statements of assets and liabilities of SPDR Blackstone High Income ETF and SPDR Blackstone Senior Loan ETF (collectively, the “Funds”) (two of the funds constituting SSGA Active Trust (the “Trust”)), including the schedules of investments, as of June 30, 2024, and the related statements of operations and changes in net assets, and the financial highlights for each of the periods indicated in the table below and the related notes (collectively referred to as the “financial statements”). In our opinion, the financial statements present fairly, in all material respects, the financial position of each of the Funds (two of the funds constituting SSGA Active Trust) at June 30, 2024, and the results of their operations, changes in net assets and financial highlights for each of the periods indicated in the table below, in conformity with U.S. generally accepted accounting principles.
| Individual Fund constituting theSSGA Active Trust | Statement of operations | Statement of changes in net assets | Financial highlights |
| SPDR Blackstone High Income ETF | For the year ended June 30, 2024 | For each of the two years in the period ended June 30, 2024 | For each of the two years in the period ended June 30, 2024 and the period from February 17, 2022 (commencement of operations) through June 30, 2022 |
| SPDR Blackstone Senior Loan ETF | For the year ended June 30, 2024 | For each of the two years in the period ended June 30, 2024 | For each of the five years in the period ended June 30, 2024 |
Basis for Opinion
These financial statements are the responsibility of the Trust’s management. Our responsibility is to express an opinion on the Funds’ financial statements based on our audits. We are a public accounting firm registered with the Public Company Accounting Oversight Board (United States) (“PCAOB”) and are required to be independent with respect to the Trust in accordance with the U.S. federal securities laws and the applicable rules and regulations of the Securities and Exchange Commission and the PCAOB.
We conducted our audits in accordance with the standards of the PCAOB. Those standards require that we plan and perform the audit to obtain reasonable assurance about whether the financial statements are free of material misstatement, whether due to error or fraud. The Trust is not required to have, nor were we engaged to perform, an audit of the Trust’s internal control over financial reporting. As part of our audits we are required to obtain an understanding of internal control over financial reporting, but not for the purpose of expressing an opinion on the effectiveness of the Trust’s internal control over financial reporting. Accordingly, we express no such opinion.
Our audits included performing procedures to assess the risks of material misstatement of the financial statements, whether due to error or fraud, and performing procedures that respond to those risks. Such procedures included examining, on a test basis, evidence regarding the amounts and disclosures in the financial statements. Our procedures included confirmation of securities owned as of June 30, 2024, by correspondence with the custodian, brokers and others; when replies from brokers and others were not received, we performed other auditing procedures. Our audits also included evaluating the accounting principles used and significant estimates made by management, as well as evaluating the overall presentation of the financial statements. We believe that our audits provide a reasonable basis for our opinion.
We have served as the auditor of one or more State Street Global Advisors investment companies since 2000.
Boston, Massachusetts
August 29, 2024
SSGA ACTIVE TRUST
OTHER INFORMATION
June 30, 2024 (Unaudited)
Tax Information
For federal income tax purposes, the following information is furnished with respect to the distributions of the Trust for its fiscal year ended June 30, 2024.
Qualified Interest Income
Each Fund reports the maximum amount allowable of its net taxable income and short-term capital gain as qualified interest income.
Interest Dividends
Each Fund reports the maximum amount allowable as Section 163(j) Interest Dividends.
SSGA ACTIVE TRUST
STATEMENT REGARDING BASIS FOR APPROVAL OF INVESTMENT ADVISORY CONTRACT
June 30, 2024 (Unaudited)
Approval of Advisory Agreement
At a meeting held on May 15-16, 2024, the Board of Trustees of the Trust (the “Board”) evaluated a proposal to approve for an additional one year period the Investment Advisory Agreement (the “Advisory Agreement” or “Agreement”) between the SSGA Active Trust (the “Trust” or “SSAT”) and SSGA Funds Management, Inc. (the “Adviser” or “SSGA FM”) with respect to the series of SSAT (collectively, the “SPDR ETFs”). The Trustees who are not “interested persons” of the Trust within the meaning of the Investment Company Act of 1940, as amended (the “Independent Trustees”), also met separately to consider the Agreement. The Independent Trustees were advised by their independent legal counsel throughout the process.
To evaluate the Advisory Agreement, the Board requested and SSGA FM, the Trust’s adviser and administrator, and State Street Bank and Trust Company, the Trust’s sub-administrator, transfer agent and custodian (“State Street”) provided, such materials as the Board, with the advice of counsel, deemed reasonably necessary. In deciding whether to approve the Advisory Agreement, the Board considered various factors, including the nature, extent and quality of services provided by the Adviser with respect to the SPDR ETFs under the Agreement, the proposed cost of those services in relation to the services provided and in relation to fees charged to comparable funds, other benefits to the Adviser of its relationship with the SPDR ETFs, and extent to which economies of scale would be shared as the SPDR ETFs grow.
Nature, Extent and Quality of Services
The Board considered the nature, extent and quality of services provided by the Adviser. In doing so, the Trustees relied on their prior experience in overseeing the management of the Trust and the materials provided prior to and at the meeting. The Board reviewed the Advisory Agreement and the Adviser’s responsibilities for managing investment operations of each of the SPDR ETFs in accordance with each SPDR ETF’s investment objectives and policies, and applicable legal and regulatory requirements. The Board appreciated the nature of the SPDR ETFs as exchange-traded funds and the experience and expertise of the Adviser in managing exchange-traded funds. The Board considered the background and experience of the Adviser’s senior management, including those individuals responsible for portfolio management, oversight of sub-advisers and regulatory compliance of the SPDR ETFs. The Board also considered the portfolio management resources, structures and practices of the Adviser, including those associated with monitoring and ensuring each SPDR ETF’s compliance with its investment objectives and policies, and applicable laws and regulations. The Board further considered information about the Adviser’s best execution procedures and overall investment management business, noting that the Adviser serves a wide range of clients across a broad spectrum of asset classes. The Board looked at the Adviser’s general knowledge of the investment management business and that of its affiliates which make up State Street Global Advisors, through which the Adviser shares all of its senior personnel. The Board considered that the Adviser and its affiliates constitute one of the world’s largest investment management enterprises for indexed products generally and exchange-traded funds in particular. The Board specifically considered the Adviser’s experience in managing actively-managed exchange-traded funds. The Board also considered the Adviser’s role in overseeing third party sub-advisers, as applicable.
Investment Performance
The Board compared the investment performance of each actively-managed series of SSAT to the performance of a group of comparable funds (net of expenses) (Performance Group) obtained from Broadridge Financial Solutions, Inc. (Broadridge) and/or to the performance of an appropriate benchmark (gross of expenses) provided by the Adviser. Among other information, the Board considered the following performance information over various periods ended December 31, 2023 in its evaluation of each series of SSAT:
SPDR Blackstone Senior Loan ETF. The Board considered that the Fund underperformed the median of its Performance Group for the 1-, 3-, 5- and 10-year periods. In addition, the Board considered that the Fund underperformed its benchmark index for the 3-year period, but outperformed its benchmark index for the 1-, 5- and 10-year periods.
SPDR Blackstone High Income ETF. The Board considered that the Fund commenced operations on February 17, 2022, thus performance information was provided for only a short operating history of the Fund. The Fund underperformed the median of its Performance Group for the 1-year period. In addition, the Board considered that the Fund underperformed its benchmark index for the 1-year period.
In those instances where the Board observed underperformance for an extended period of time, the Trustees discussed with management those factors that contributed to such underperformance and steps being taken in response to such factors, where appropriate.
SSGA ACTIVE TRUST
STATEMENT REGARDING BASIS FOR APPROVAL OF INVESTMENT ADVISORY CONTRACT (continued)
June 30, 2024 (Unaudited)
Profits Realized by Adviser
The Board considered the profitability of the advisory arrangement with the SPDR ETFs to the Adviser and its affiliates, including data on each SPDR ETF’s historical profitability to these entities. The Board, including the Independent Trustees, with their independent legal counsel, had the opportunity to discuss, with representatives of the Adviser and State Street Global Advisors, methodologies used in computing costs that formed the bases of profitability calculations.
Fees Charged to Comparable Funds
The Board evaluated each SPDR ETF’s unitary fee through review of comparative information with respect to fees paid by similar funds – i.e., exchange-traded funds that are actively managed with respect to the remaining series of SSAT. The Board reviewed the universe of similar exchange-traded funds for each SPDR ETF based upon data independently obtained from Broadridge and related comparative information for similar exchange-traded funds. In doing so, the Board used a fund by fund analysis of the data. In certain instances as considered appropriate by the Board, the Board explored with management the reasons for the differences between a SPDR ETF’s fee and fees paid by similar funds.
Other Benefits
The Board also considered whether the Adviser or its affiliates benefited in other ways from its relationship with the Trust, noting that the Adviser does not maintain soft-dollar arrangements in connection with the Trust’s brokerage transactions.
Economies of Scale
The Board reviewed information regarding economies of scale or other efficiencies that may result as each SPDR ETF’s assets grow in size. The Board noted that the advisory fee rate for each SPDR ETF does not provide for breakpoints as assets of the SPDR ETF increase. However, the Board further noted the Adviser’s assertion that future economies of scale (among several factors) had been taken into consideration for the SPDR ETFs by fixing relatively low advisory fees, effectively sharing the benefits of lower fees with the SPDR ETFs from inception. The Adviser also asserted that one of the benefits of the unitary fee was to provide an unvarying expense structure, which could be lost or diluted with the addition of breakpoints. The Board noted that it intends to continue to monitor fees as the SPDR ETFs grow in size and assess whether fee breakpoints may be warranted.
Conclusion
After weighing the foregoing factors, none of which was dispositive in itself and may have been weighed differently by each Trustee, the Board, including the Independent Trustees voting separately, approved the continuation of the Advisory Agreement for each SPDR ETF. In approving the continuance of the Advisory Agreement, the Board, including the Independent Trustees voting separately, found that the terms of the Advisory Agreement are fair and reasonable and that the continuance of the Advisory Agreement is in the best interests of the applicable SPDR ETF and its shareholders. The Board’s conclusions with respect to the factors were as follows: (a) the nature, extent and quality of the services provided by the Adviser with respect to the SPDR ETFs were appropriate; (b) the performance and, more importantly for those SPDR ETFs measured against an index, the index tracking, of each SPDR ETF had been satisfactory or the Adviser had demonstrated due attention to the remediation of underperformance, where appropriate; (c) the Adviser’s unitary fee for each SPDR ETF considered in relation to the services provided, and in relation to the fees charged to comparable funds, was reasonable; (d) the profitability of the Trust’s relationships with the Adviser and its affiliates was not excessive in view of the nature, extent and quality of the services provided; (e) any additional potential benefits to the Adviser or its affiliates were not of a magnitude to materially affect the Board’s conclusions; and (f) the fees paid to the Adviser adequately shared the economies of scale with respect to the SPDR ETFs by way of the relatively low fee structure of the Trust. The Independent Trustees were advised by their independent counsel throughout the process.
SSGA ACTIVE TRUST
STATEMENT REGARDING BASIS FOR APPROVAL OF INVESTMENT ADVISORY CONTRACT (continued)
June 30, 2024 (Unaudited)
Approval of Blackstone Liquid Credit Strategies LLC(“Blackstone Credit”) Sub-Advisory Agreement
At a meeting held on May 15-16, 2024, the Board also considered a proposal to continue the Sub-Advisory Agreement (the “Blackstone Credit Sub-Advisory Agreement” or the “Sub-Advisory Agreement”) between the Adviser and Blackstone Liquid Credit Strategies LLC with respect to the following series of SSAT: SPDR Blackstone High Income ETF and SPDR Blackstone Senior Loan ETF, each of which is sub-advised by Blackstone Credit (the “Blackstone Funds”). The Independent Trustees also met separately to consider the Blackstone Credit Sub-Advisory Agreement. The Independent Trustees were advised by their independent legal counsel throughout the process.
With respect to the Sub-Advisory Agreement, the Board considered various factors, including the nature, extent and quality of services provided by each sub-adviser with respect to each Blackstone Fund under that Sub-Advisory Agreement and the investment performance of such sub-advised funds. The Board further considered the portion of the current advisory fee that the Adviser would continue to pay to Blackstone Credit under the Sub-Advisory Agreement and also considered that such fees would continue to be paid directly by the Adviser and would not result in increased fees payable by the sub-advised funds.
The Board considered the background and experience of Blackstone Credit’s senior management and, in particular, Blackstone Credit’s experience in investing in senior loan securities. The Board reviewed the performance of the each Blackstone Fund, noting that the SPDR Blackstone Senior Loan ETF underperformed each of the last 5 calendar years, but considered management’s explanation of those factors that contributed to such underperformance and the steps being taken in response to such factors. The Board also noted that the SPDR Blackstone High Income ETF commenced operations on February 17, 2022 and, although it underperformed for the last calendar year, no action was recommended given the short operating history of the Fund. The Board also considered the unitary fee paid to the Adviser by each Blackstone Fund and Blackstone Credit’s fees paid by the Adviser. The Board also considered whether Blackstone Credit benefited in other ways from its relationship with SSAT.
After weighing the foregoing factors, as well as the relevant factors discussed in relation to the Blackstone Credit Sub-Advisory Agreement between Blackstone Credit and the Adviser, none of which was dispositive in itself and may have been weighed differently by each Trustee, the Board, including the Independent Trustees voting separately, approved the continuation of the Blackstone Credit Sub-Advisory Agreement for each Blackstone Fund. In approving the continuance of the Blackstone Credit Sub-Advisory Agreement, the Board, including the Independent Trustees voting separately, found that the terms of the Blackstone Credit Sub-Advisory Agreement are fair and reasonable and that the continuance of the Blackstone Credit Sub-Advisory Agreement is in the best interests of each Blackstone Fund and its shareholders. The Board’s conclusions with respect to the factors were as follows: (a) the nature, extent and quality of the services provided by Blackstone Credit with respect to each Blackstone Fund were appropriate; (b) the performance of each Blackstone Fund had been satisfactory; (c) Blackstone Credit’s fees for each Blackstone Fund and the unitary fee, considered in relation to the services provided, were reasonable; (d) any additional potential benefits to Blackstone Credit were not of a magnitude to materially affect the Board’s conclusions; and (e) the fees paid to Blackstone Credit adequately shared the economies of scale with each Blackstone Fund by way of the relatively low fee structure of SSAT. The Independent Trustees were advised by their independent counsel throughout the process.
Item 8. Changes in and Disagreements with Accountants for Open-End Management Investment Companies
Not applicable.
Item 9. Proxy Disclosures for Open-End Management Investment Companies
Not applicable.
Item 10. Remuneration Paid to Directors, Officers, and Others of Open-End Management Investment Companies
Renumeration Paid to Directors, Officers, and Others of Open-End Investment Companies is included as part of the Financial Statements filed under Item 7(a) of this Form.
Item 11. Statement Regarding Basis for Approval of Investment Advisory Contract
The registrant’s Statement Regarding Basis for Approval of Investment Advisory Contract is included as part of the Financial Statements filed under Item 7(a) of this Form.
Item 12. Disclosure of Proxy Voting Policies and Procedures for Closed-End Management Investment Companies
Not applicable to the registrant.
Item 13. Portfolio Managers of Closed-End Management Investment Companies
Not applicable to the registrant.
Item 14. Purchases of Equity Securities by Closed-End Management Investment Company and Affiliated Purchasers
Not applicable to the registrant.
Item 15. Submission of Matters to a Vote of Security Holders
The registrant has not adopted any material changes to the procedures by which shareholders may recommend nominees to the registrant’s Board.
Item 16. Controls and Procedures
(a) Within 90 days of the filing date of this Form N-CSR, Ann M. Carpenter, the registrant’s President and Principal Executive Officer, and Bruce S. Rosenberg, the registrant’s Treasurer and Principal Financial Officer, reviewed the registrant’s disclosure controls and procedures (as defined in Rule 30a-3(c) under the 1940 Act) and evaluated their effectiveness. Based on their review, Ms. Carpenter and Mr. Rosenberg determined that the disclosure controls and procedures adequately ensure that information required to be disclosed by the registrant in its periodic reports is recorded, processed, summarized and reported within the time periods required by the U.S. Securities and Exchange Commission.
(b) There were no changes in the registrant’s internal control over financial reporting (as defined in Rule 30a-3(d) under the 1940 Act) that occurred during the period covered by this report that have materially affected, or are reasonably likely to materially affect, the registrant’s internal control over financial reporting.
Item 17. Disclosure of Securities Lending Activities for Closed-End Management Investment Companies
(a) Not applicable to the registrant.
(b) Not applicable to the registrant.
Item 18. Recovery of Erroneously Awarded Compensation
Not applicable to the registrant.
Item 19. Exhibits
(a)(1) Code of Ethics referred to in Item 2.
(a)(2) Not applicable to the registrant.
(a)(3) Separate certifications required by Rule 30a-2(a) under the 1940 Act for each principal executive officer and principal financial officer of the registrant are attached.
(a)(4) Not applicable to the registrant.
(a)(5) Not applicable.
(b) A single certification required by Rule 30a-2(b) under the 1940 Act, Rule 13a-14(b) or Rule 15d-14(b) under the 1934 Act, as amended, and Section 1350 of Chapter 63 of Title 18 of the United States Code for the principal executive officer and principal financial officer of the registrant is attached.
(101) Inline Interactive Data File - the instance document does not appear in the Interactive Data File because its XBRL tags are embedded within the inline XBRL document.
SIGNATURES
Pursuant to the requirements of the Securities Exchange Act of 1934, as amended, and the Investment Company Act of 1940, as amended, the registrant has duly caused this report to be signed on its behalf by the undersigned, thereunto duly authorized.
| | |
| SSGA Active Trust |
| |
| By: | | /s/ Ann M. Carpenter |
| | Ann M. Carpenter |
| | President and Principal Executive Officer |
| |
| Date: | | September 6, 2024 |
Pursuant to the requirements of the Securities Exchange Act of 1934, as amended, and the Investment Company Act of 1940, as amended, this report has been signed below by the following persons on behalf of the registrant and in the capacities and on the dates indicated.
| | |
| By: | | /s/ Ann M. Carpenter |
| | Ann M. Carpenter |
| | President and Principal Executive Officer |
| |
Date: | | September 6, 2024 |
| |
| By: | | /s/ Bruce S. Rosenberg |
| | Bruce S. Rosenberg |
| | Treasurer and Principal Financial Officer |
| |
| Date: | | September 6, 2024 |