UNITED STATES
SECURITIES AND EXCHANGE COMMISSION
Washington, D.C. 20549
FORM N-CSR
CERTIFIED SHAREHOLDER REPORT OF REGISTERED
MANAGEMENT INVESTMENT COMPANIES
Investment Company Act file number: 811-22542
SSGA ACTIVE TRUST
(Exact name of registrant as specified in charter)
One Iron Street, Boston, Massachusetts 02210
(Address of principal executive offices) (zip code)
Sean O’Malley, Esq.
Senior Vice President and General Counsel
c/o SSGA Funds Management, Inc.
One Iron Street
Boston, Massachusetts 02210
(Name and address of agent for service)
Copy to:
W. John McGuire, Esq.
Morgan, Lewis & Bockius LLP
1111 Pennsylvania Avenue, NW
Washington, DC 20004
Registrant’s telephone number, including area code: (617) 664-1465
Date of fiscal year end: June 30
Date of reporting period: June 30, 2023
| Item 1. | Reports to Shareholders. |
| (a) | The Reports to Shareholders are attached herewith. |
Annual Report
June 30, 2023
SSGA Active Trust
| SPDR SSGA Multi-Asset Real Return ETF |
| SPDR SSGA Income Allocation ETF |
| SPDR SSGA Global Allocation ETF |
| SPDR SSGA Ultra Short Term Bond ETF |
| SPDR Loomis Sayles Opportunistic Bond ETF |
| SPDR Nuveen Municipal Bond ETF |
| SPDR Nuveen Municipal Bond ESG ETF |
| SPDR SSGA Fixed Income Sector Rotation ETF |
| SPDR SSGA US Sector Rotation ETF |
| SPDR DoubleLine Emerging Markets Fixed Income ETF |
| SPDR DoubleLine Short Duration Total Return Tactical ETF |
| SPDR DoubleLine Total Return Tactical ETF |
The information contained in this report is intended for the general information of shareholders of the Trust. This report is not authorized for distribution to prospective investors unless preceded or accompanied by a current Trust prospectus which contains important information concerning the Trust. You may obtain a current prospectus and SAI from the Distributor by calling 1-866-787-2257 or visiting https://www.ssga.com/spdrs. Please read the prospectus carefully before you invest.
TABLE OF CONTENTS
The information contained in this report is intended for the general information of shareholders of the Trust. This report is not authorized for distribution to prospective investors unless preceded or accompanied by a current Trust prospectus which contains important information concerning the Trust. You may obtain a current prospectus and SAI from the Distributor by calling 1-866-787-2257 or visiting https://www.ssga.com/spdrs. Please read the prospectus carefully before you invest.
[This Page Intentionally Left Blank]
Notes to Performance Summaries (Unaudited)
The performance chart of a Fund’s total return at net asset value (“NAV”), the total return based on market price and its benchmark index is provided for comparative purposes only and represents the periods noted. A Fund’s per share NAV is the value of one share of a Fund and is calculated by dividing the value of total assets less total liabilities by the number of shares outstanding. The NAV return is based on the NAV of a Fund and the market return is based on the market price per share of a Fund. The market price used to calculate the market return is determined by using the midpoint between the highest bid and the lowest offer on the exchange on which the shares of a Fund are listed for trading, as of the time that a Fund’s NAV is calculated. NAV and market returns assume that dividends and capital gain distributions have been reinvested in a Fund at NAV. Market returns do not include brokerage commissions that may be payable on secondary market transactions. If brokerage commissions were included market returns would be lower.
An index is a statistical measure of a specified financial market or sector. An index does not actually hold a portfolio of securities and therefore does not reflect deductions for fees or expenses. In comparison, a Fund’s performance is negatively impacted by these deductions. Index returns reflect all items of income, gain and loss and the reinvestment of dividends and other income.
The Bloomberg U.S. Government Inflation-Linked Bond Index includes publicly issued, U.S. Treasury inflation protected securities that have at least 1 year remaining to maturity on index rebalancing date, with an issue size equal to or in excess of $500 million. Bonds must be capital-indexed and linked to an eligible inflation index. The securities must be denominated in U.S. Dollars and pay coupon and principal in U.S. Dollars. The notional coupon of a bond must be fixed or zero. Bonds must settle on or before the index rebalancing date.
The DBIQ Optimum Yield Diversified Commodity Index Excess Return employs a rule based approach when it rolls from one futures contract to another for each commodity in the index. DBLCI Diversified Index represents 14 commodities drawn from the Energy, Precious Metals, Industrial Metals and Agriculture sectors.
The MSCI World Index is a free float-adjusted market capitalization weighted index that is designed to measure the large and mid-cap equity market performance of developed markets.
The Bloomberg U.S. Long Government/Credit Index measures the investment return of all medium and larger public issues of U.S. Treasury, agency, investment-grade corporate, and investment-grade international dollar-denominated bonds with maturities longer than 10 years. The average maturity is approximately 20 years.
The MSCI ACWI IMI Index is a free float-adjusted market capitalization-weighted index that is designed to measure the combined equity market performance of developed and emerging markets. The index covers approximately 99% of the global equity markets.
The Bloomberg U.S. Treasury Bellwether 3 Month Index is a benchmark tracking the performance and attributes of the on-the-run U.S. Treasury that reflects the most recently issued three month security.
The Bloomberg U.S. Aggregate Bond Index is designed to measure the performance of the U.S. dollar denominated investment grade bond market, which includes investment grade (must be Baa3/BBB- or higher using the middle rating of Moody’s Investor Service, Inc., Standard & Poor’s, and Fitch Inc.) government bonds, investment grade corporate bonds, mortgage pass through securities, commercial mortgage backed securities and other asset backed securities that are publicly for sale in the United States.
The SPDR Loomis Sayles Opportunistic Bond Composite Index is a composite benchmark comprising 50% investment grade corporate bonds, 25% high yield corporate bonds, and 25% senior loans. The investment grade corporate bond portion of the composite benchmark is represented by the Bloomberg U.S. Corporate Bond Index, the high yield corporate bond portion is represented by the Bloomberg U.S. High Yield 2% Issuer Capped Index, and the senior loan portion is represented by the Morningstar LSTA U.S. Leveraged Loan Index.
The Bloomberg 3-15 Year Blend (2-17) Municipal Bond Index is designed to track the U.S. fully tax-exempt bond market. The index includes state and local general obligation bonds, revenue bonds, pre-refunded bonds, insured bonds and municipal lease obligations. The index is comprised of tax-exempt municipal securities issued by states, cities, counties, districts and their respective agencies, authorities and instrumentalities.
The S&P 500® Index is composed of five hundred (500) selected stocks, all of which are listed on national stock exchanges and spans approximately 24 separate industry groups.
The JP Morgan Corporate Emerging Markets Bond Index Broad Diversified is a market capitalization weighted index consisting of U.S. dollar denominated emerging market corporate bonds.
The Bloomberg U.S. Aggregate 1-3 Year Index provides a measure of the performance of the U.S. dollar denominated investment grade bond market that have a remaining maturity of greater than or equal to 1 year and less than 3 years.
See accompanying notes to financial statements.
1
SPDR SSGA Multi-Asset Real Return ETF
MANAGEMENT'S DISCUSSION OF FUND PERFORMANCE (UNAUDITED)
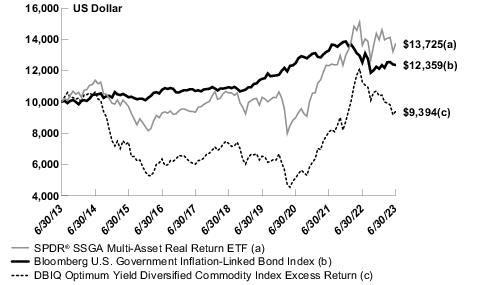
The SPDR SSGA Multi-Asset Real Return ETF (the “Fund”) seeks to achieve real return consisting of capital appreciation and current income. The Fund’s benchmark is the Bloomberg U.S. Government Inflation-Linked Bond Index (the “Index”).
For the 12-month period ended June 30, 2023 (the “Reporting Period”), the total return for the Fund was 0.78%, and the Index was –1.33%. The Fund and Index returns reflect the reinvestment of dividends and other income. The Fund’s performance reflects the expenses of managing the Fund, including brokerage and advisory expenses. The Index is unmanaged and Index returns do not reflect fees and expenses of any kind, which would have a negative impact on returns.
The allocations to global natural resource and infrastructure equities were the primary drivers, with tactical use of cash providing added support, of Fund performance during the Reporting Period relative to the Index.
The performance of financial markets during the Reporting Period continued to be heavily influenced by inflation trends and the related impact on monetary policy and messaging from central banks. While equity markets got off to a good start in mid-2022 from lows reached in June, supported by overly depressed sentiment, stocks would turn lower amidst hawkish central bank messaging and turmoil in long-end UK bonds brought forth by the announcement of that country’s “mini-budget.” The outlook for commodities deteriorated as the U.S. dollar rose and demand destruction fears gripped investors, sending oil and other broad commodities tumbling. Further, real estate came under pressure against the backdrop of higher interest rates and weaker economic growth. The portfolio reduced the overweight to commodities and natural resource equities, moved to a further underweight in real estate, and started building a cash position, By the turn to the fourth quarter of 2022 equity markets began a steady recovery with resilient earnings for the rest of the Reporting Period as longer-term interest rates stabilized. At the close of 2022, the cash was allocated to natural resource equities, both core and energy, and infrastructure. Additionally, the underweight to inflation-linked bonds was reduced as real yields fell and inflation expectations, as measured by break-evens, rose by the end of the year. This recovery progressed in the first half of 2023, despite meaningful risk events including the regional bank crisis in the United States at the end of the first quarter. The inflationary environment shifted from a high and rising regime to a moderating one that might be higher for longer. Commodities faced headwinds and struggled to find a bottom with a short-lived metals rally on hopes of a Chinas recovery and Europe’s uncharacteristically mild winter that sent natural gas priced plummeting. The overweight position to global infrastructure equities, underweight to real estate, cash holdings, and the addition of gold in March helped to buffer the portfolio. Throughout this period, real estate has ranked poorly in our quantitative framework but followed the broader surge in equities and prospects for the successful execution of a soft landing in the US. The underweight to real estate proved to be a drag, compounding the lackluster support from commodity and natural resources. Again, the defensive overweight holdings in global infrastructure equity and cash help to soften the impact. The Reporting Period closed with the portfolio positioned with larger weights in global infrastructure equity, gold, and cash along with holdings in global natural resource equities based on what we believe is a structurally bullish fundamental backdrop that may be unfolding in the second half of 2023 and 2024 for the energy and metals assets.
The Fund did not invest in derivatives during the Reporting Period.
On an individual security level, the top positive contributors to the Fund’s performance on an absolute basis during the Reporting Period were the SPDR S&P Global Natural Resources ETF (GNR), S&P Energy Select Sector SPDR Fund and SPDR S&P Global Infrastructure ETF (GII). The top negative contributor to the Fund’s performance on an absolute basis during the Reporting Period were the Invesco Optimum Yield Diversified Commodity Strategy No K-1 ETF (PDBC), SPDR Dow Jones US REIT ETF (RWR) and SPDR Bloomberg 1-10 Year TIPS ETF (TIPX).
The views expressed above reflect those of the Fund’s portfolio manager only through the Reporting Period, and do not necessarily represent the views of the Adviser as a whole. Any such views are subject to change at any time based upon market or other conditions and the Adviser disclaims any responsibility to update such views. These views may not be relied on as investment advice and, because investment decisions for a fund are based on numerous factors, may not be relied on as an indication of trading intent on behalf of any fund.
See accompanying notes to financial statements.
2
SPDR SSGA Multi-Asset Real Return ETF
Performance Summary (Unaudited)
Performance as of June 30, 2023
| | | Cumulative Total Return | | Average Annual Total Return | |
| | | Net
Asset
Value | Market
Value | Bloomberg U.S. Government Inflation-Linked Bond Index | DBIQ Optimum Yield Diversified Commodity Index Excess Return | | Net
Asset
Value | Market
Value | Bloomberg U.S. Government Inflation-Linked Bond Index | DBIQ Optimum Yield Diversified Commodity Index Excess Return |
| ONE YEAR | | 0.78% | 0.78% | (1.33)% | (16.63)% | | 0.78% | 0.78% | (1.33)% | (16.63)% |
| FIVE YEARS | | 29.78% | 29.95% | 12.99% | 28.14% | | 5.35% | 5.38% | 2.47% | 5.08% |
| TEN YEARS | | 37.25% | 37.26% | 23.59% | (6.06)% | | 3.22% | 3.22% | 2.14% | (0.62)% |
Comparison of Change in Value of a $10,000 Investment
(Based on Net Asset Value)
Line graph is based on cumulative total return.
The total expense ratio for SPDR SSGA Multi-Asset Real Return ETF as stated in the Fees and Expenses table of the most recent prospectus is 0.50%. Please see the financial highlights for the total expense ratio for the fiscal period ended June 30, 2023.
Performance quoted represents past performance, which is no guarantee of future results. Investment return and principal value will fluctuate, so you may have a gain or loss when shares are sold. Current performance may be higher or lower than that quoted. Visit https://www.ssga.com/spdrs for most recent month-end performance. The returns do not reflect the deduction of taxes that a shareholder would pay on Fund distributions or on the redemption or sale of Fund shares. See "Notes to Performance Summaries" on page 1 for more information.
See accompanying notes to financial statements.
3
SPDR SSGA Multi-Asset Real Return ETF
Portfolio Statistics (Unaudited)
Top Five Holdings as of June 30, 2023
| | | |
| | Description | % of Net Assets | |
| | SPDR S&P Global Natural Resources ETF | 27.7% | |
| | SPDR S&P Global Infrastructure ETF | 25.0 | |
| | Invesco Optimum Yield Diversified Commodity Strategy No. K-1 ETF | 19.4 | |
| | SPDR Bloomberg 1-10 Year TIPS ETF | 7.3 | |
| | The Energy Select Sector SPDR Fund | 6.0 | |
| | TOTAL | 85.4% | |
(The five largest holdings are subject to change, and there are no guarantees the Fund will continue to remain invested in any particular company.)
Asset Allocation as of June 30, 2023
| | | |
| | | % of Net Assets | |
| | Natural Resources | 32.8% | |
| | International Equity | 25.3 | |
| | Commodities | 19.4 | |
| | Inflation Linked | 7.3 | |
| | Domestic Equity | 6.0 | |
| | International Fixed Income | 2.6 | |
| | Real Estate | 2.5 | |
| | Short Term Investments | 10.2 | |
| | Liabilities in Excess of Other Assets | (6.1) | |
| | TOTAL | 100.0% | |
(The Fund's asset allocation is expressed as a percentage of net assets and may change over time.)
See accompanying notes to financial statements.
4
SPDR SSGA INCOME ALLOCATION ETF
MANAGEMENT'S DISCUSSION OF FUND PERFORMANCE (UNAUDITED)
The SPDR SSGA Income Allocation ETF (the “Fund”) seeks to provide total return by focusing on investments in income and yield-generating assets. The Fund’s benchmark is the MSCI World Index (the “Index”).
For the 12-month period ended June 30, 2023 (the “Reporting Period”), the total return for the Fund was 3.79%, and the Index was 18.51%. The Fund and Index returns reflect the reinvestment of dividends and other income. The Fund’s performance reflects the expenses of managing the Fund, including brokerage and advisory expenses. The Index is unmanaged and Index returns do not reflect fees and expenses of any kind, which would have a negative impact on returns.
Broad diversification across global asset classes, allocations to several high dividend equity markets as well as underlying ETF performance were primary drivers of Fund performance during the Reporting Period relative to the Index. The performance of financial markets during the Reporting Period continued to be heavily influenced by inflation trends and the related impact on monetary policy and messaging from central banks. While equity markets got off to a good start in mid-2022, likely supported by overly depressed sentiment, stocks would turn lower amidst hawkish central bank messaging and turmoil in long-end UK bonds brought forth by the announcement of that country’s “mini-budget.” But by the turn to the fourth quarter of 2022 equity markets began a steady recovery for the remainder of the Reporting Period as longer-term interest rates stabilized. This recovery progressed despite meaningful risk events including the regional bank crisis in the United States in early 2023. With that context, the multi-asset exposure and broad diversification of the Fund was the primary driver of underperformance relative to the Index (which represents the global developed equity market). Additionally, given the Fund’s focus on both income and total return, its emphasis on dividend paying equity ETFs led to underperformance as dividend equities did not rise as sharply as other equity market strategies – particularly those with more exposure to the technology sector.
The Fund did not invest in derivatives during the Reporting Period.
On an individual security level, the top positive contributors to the Fund’s performance on an absolute basis during the Reporting Period were investments in the SPDR Bloomberg Emerging Markets Local Bond ETF, the SPDR Blackstone Senior Loan ETF and the SPDR S&P International Dividend ETF. The top negative contributors to the Fund’s performance on an absolute basis during the Reporting Period were the SPDR Portfolio Long Term Treasury ETF, the Invesco KBW Premium Yield Equity REIT ETF and the Schwab U.S. Dividend Equity ETF.
The views expressed above reflect those of the Fund’s portfolio manager only through the Reporting Period, and do not necessarily represent the views of the Adviser as a whole. Any such views are subject to change at any time based upon market or other conditions and the Adviser disclaims any responsibility to update such views. These views may not be relied on as investment advice and, because investment decisions for a fund are based on numerous factors, may not be relied on as an indication of trading intent on behalf of any fund.
See accompanying notes to financial statements.
5
SPDR SSGA Income Allocation ETF
Performance Summary (Unaudited)
Performance as of June 30, 2023
| | | Cumulative Total Return | | Average Annual Total Return | |
| | | Net
Asset
Value | Market
Value | MSCI World Index | Bloomberg U.S. Long Government /Credit Bond Index | | Net
Asset
Value | Market
Value | MSCI World Index | Bloomberg U.S. Long Government /Credit Bond Index |
| ONE YEAR | | 3.79% | 3.77% | 18.51% | (2.56)% | | 3.79% | 3.77% | 18.51% | (2.56)% |
| FIVE YEARS | | 16.75% | 16.77% | 54.36% | 3.35% | | 3.15% | 3.15% | 9.07% | 0.66% |
| TEN YEARS | | 49.43% | 49.41% | 147.92% | 32.56% | | 4.10% | 4.10% | 9.50% | 2.86% |
Comparison of Change in Value of a $10,000 Investment
(Based on Net Asset Value)
Line graph is based on cumulative total return.
The total expense ratio for SPDR SSGA Income Allocation ETF as stated in the Fees and Expenses table of the most recent prospectus is 0.50%. Please see the financial highlights for the total expense ratio for the fiscal period ended June 30, 2023.
Performance quoted represents past performance, which is no guarantee of future results. Investment return and principal value will fluctuate, so you may have a gain or loss when shares are sold. Current performance may be higher or lower than that quoted. Visit https://www.ssga.com/spdrs for most recent month-end performance. The returns do not reflect the deduction of taxes that a shareholder would pay on Fund distributions or on the redemption or sale of Fund shares. See "Notes to Performance Summaries" on page 1 for more information.
See accompanying notes to financial statements.
6
SPDR SSGA Income Allocation ETF
Portfolio Statistics (Unaudited)
Top Five Holdings as of June 30, 2023
| | | |
| | Description | % of Net Assets | |
| | SPDR Portfolio Long Term Treasury ETF | 12.9% | |
| | SPDR Bloomberg High Yield Bond ETF | 12.1 | |
| | SPDR Bloomberg Emerging Markets Local Bond ETF | 12.1 | |
| | SPDR Blackstone Senior Loan ETF | 10.2 | |
| | SPDR S&P Global Infrastructure ETF | 8.1 | |
| | TOTAL | 55.4% | |
(The five largest holdings are subject to change, and there are no guarantees the Fund will continue to remain invested in any particular company.)
Asset Allocation as of June 30, 2023
| | | |
| | | % of Net Assets | |
| | Domestic Fixed Income | 40.4% | |
| | Domestic Equity | 26.3 | |
| | International Equity | 16.0 | |
| | International Fixed Income | 14.1 | |
| | Real Estate | 2.0 | |
| | Short Term Investments | 9.6 | |
| | Liabilities in Excess of Other Assets | (8.4) | |
| | TOTAL | 100.0% | |
(The Fund's asset allocation is expressed as a percentage of net assets and may change over time.)
See accompanying notes to financial statements.
7
SPDR SSGA Global Allocation ETF
MANAGEMENT'S DISCUSSION OF FUND PERFORMANCE (UNAUDITED)
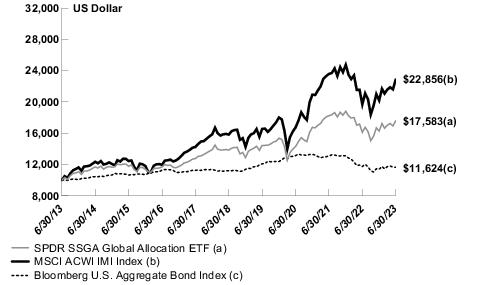
The SPDR SSGA Global Allocation ETF (the “Fund”) seeks to provide capital appreciation. The Fund’s benchmark is the MSCI ACWI IMI Index (the “Index”).
For the 12-month period ended June 30, 2023 (the “Reporting Period”), the total return for the Fund was 9.15%, and the Index was 16.14%. The Fund and Index returns reflect the reinvestment of dividends and other income. The Fund’s performance reflects the expenses of managing the Fund, including brokerage and advisory expenses. The Index is unmanaged and Index returns do not reflect fees and expenses of any kind, which would have a negative impact on returns.
Broad diversification across global asset classes, asset allocation positioning as well as underlying ETF performance were primary drivers of Fund performance during the Reporting Period relative to the Index. The performance of financial markets during the Reporting Period continued to be heavily influenced by inflation trends and the related impact on monetary policy and messaging from central banks. While equity markets got off to a good start in mid-2022, likely supported by overly depressed sentiment, stocks would turn lower amidst hawkish central bank messaging and turmoil in long-end UK bonds brought forth by the announcement of that country’s “mini-budget.” But by the turn to the fourth quarter of 2022 equity markets began a steady recovery for the remainder of the Reporting Period as longer-term interest rates stabilized. This recovery progressed despite meaningful risk events including the regional bank crisis in the United States in early 2023. Directionally, our preference for equities relative to bonds aided performance. Additionally, positioning within equity, a preference for Europe and Pacific with funding from REITs, proved beneficial. After rolling over in October 2022, equities have marched higher on better risk appetite, helped by optimism of peak inflation and near peak interest rates. The resilient consumer and strong labor market have contributed to the positive risk sentiment. REITs have recovered YTD, but rising yields and growth concerns weighed on the asset class in 2022 which lead to underperformance relative to traditional equities. Offsetting some positive performance was our targeted allocations to gold, cash and long government bonds. The speed and magnitude of rate hikes in 2022 along with the repricing of Federal Reserve monetary policy expectations in 2023 have weighed on bonds, including our allocation to long government bonds. Cash offers an attractive yield and provided some downside protection given the numerous risks overhanging markets, but the equity rally has left cash to underperform despite providing a positive absolute return.
The Fund did not invest in derivatives during the Reporting Period.
On an individual security level, the top positive contributors to the Fund’s performance on an absolute basis during the Reporting Period were the SPDR S&P 500 ETF, the SPDR Portfolio Developed World ex-US ETF and the SPDR Portfolio Europe ETF. The top negative contributors to the Fund’s performance on an absolute basis during the Reporting Period were the SPDR Portfolio Long Term Treasury ETF, the Invesco Optimum Yield Diversified Commodity ETF and the Invesco DB Gold ETF.
The views expressed above reflect those of the Fund’s portfolio manager only through the Reporting Period, and do not necessarily represent the views of the Adviser as a whole. Any such views are subject to change at any time based upon market or other conditions and the Adviser disclaims any responsibility to update such views. These views may not be relied on as investment advice and, because investment decisions for a fund are based on numerous factors, may not be relied on as an indication of trading intent on behalf of any fund.
See accompanying notes to financial statements.
8
SPDR SSGA Global Allocation ETF
Performance Summary (Unaudited)
Performance as of June 30, 2023
| | | Cumulative Total Return | | Average Annual Total Return | |
| | | Net
Asset
Value | Market
Value | MSCI ACWI IMI Index | Bloomberg U.S. Aggregate Bond Index | | Net
Asset
Value | Market
Value | MSCI ACWI IMI Index | Bloomberg U.S. Aggregate Bond Index |
| ONE YEAR | | 9.15% | 9.10% | 16.14% | (0.94)% | | 9.15% | 9.10% | 16.14% | (0.94)% |
| FIVE YEARS | | 27.14% | 26.99% | 44.55% | 3.89% | | 4.92% | 4.90% | 7.65% | 0.77% |
| TEN YEARS | | 75.83% | 75.83% | 128.56% | 16.24% | | 5.81% | 5.81% | 8.62% | 1.52% |
Comparison of Change in Value of a $10,000 Investment
(Based on Net Asset Value)
Line graph is based on cumulative total return.
The total expense ratio for SPDR SSGA Global Allocation ETF as stated in the Fees and Expenses table of the most recent prospectus is 0.35%. Please see the financial highlights for the total expense ratio for the fiscal period ended June 30, 2023.
Performance quoted represents past performance, which is no guarantee of future results. Investment return and principal value will fluctuate, so you may have a gain or loss when shares are sold. Current performance may be higher or lower than that quoted. Visit https://www.ssga.com/spdrs for most recent month-end performance. The returns do not reflect the deduction of taxes that a shareholder would pay on Fund distributions or on the redemption or sale of Fund shares. See "Notes to Performance Summaries" on page 1 for more information.
See accompanying notes to financial statements.
9
SPDR SSGA Global Allocation ETF
Portfolio Statistics (Unaudited)
Top Five Holdings as of June 30, 2023
| | | |
| | Description | % of Net Assets | |
| | SPDR S&P 500 ETF Trust | 24.2% | |
| | SPDR Portfolio Developed World ex-U.S. ETF | 15.8 | |
| | SPDR Portfolio Emerging Markets ETF | 6.9 | |
| | SPDR Portfolio Europe ETF | 6.5 | |
| | SPDR Bloomberg 1-10 Year TIPS ETF | 5.9 | |
| | TOTAL | 59.3% | |
(The five largest holdings are subject to change, and there are no guarantees the Fund will continue to remain invested in any particular company.)
Asset Allocation as of June 30, 2023
| | | |
| | | % of Net Assets | |
| | Domestic Equity | 37.9% | |
| | International Equity | 32.1 | |
| | Domestic Fixed Income | 13.5 | |
| | International Fixed Income | 6.0 | |
| | Inflation Linked | 5.9 | |
| | Short Term Investments | 22.5 | |
| | Liabilities in Excess of Other Assets | (17.9) | |
| | TOTAL | 100.0% | |
(The Fund's asset allocation is expressed as a percentage of net assets and may change over time.)
See accompanying notes to financial statements.
10
SPDR SSGA Ultra Short Term Bond ETF
MANAGEMENT'S DISCUSSION OF FUND PERFORMANCE (UNAUDITED)
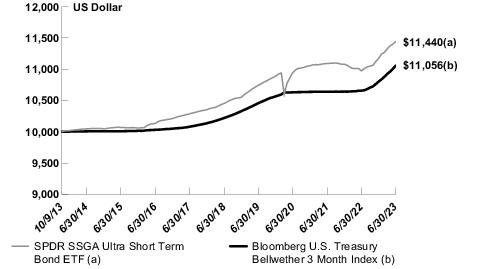
The SPDR SSGA Ultra Short Term Bond ETF (the “Fund”) seeks to maximize current income consistent with preservation of capital and daily liquidity. The Fund’s benchmark is the Bloomberg U.S. Treasury Bellwether 3 Month Index (the “Index”).
For the 12-month period ended June 30, 2023 (the “Reporting Period”), the total return for the Fund was 4.24%, and the Index was 3.74%. The Fund and Index returns reflect the reinvestment of dividends and other income. The Fund’s performance reflects the expenses of managing the Fund, including brokerage and advisory expenses. The Index is unmanaged and Index returns do not reflect fees and expenses of any kind, which would have a negative impact on returns.
The Fund’s over-weight allocation to investment grade corporate credit and commercial mortgage-backed securities were primary drivers of Fund outperformance during the Reporting Period relative to the Index, whereas the Fund’s over-weight allocation to duration detracted from performance. During the Reporting Period, continued strength in the labor market and the economy, in the context of supply-chain disruptions, led to inflation well-above the U.S. Federal Reserve (the “Fed”) inflation target of 2%. During the Reporting Period, the Fed increased the Fed Funds rate from a range of (1.50% - 1.75%) to (5.00% - 5.25%). Also, during the Reporting Period, the Fed’s balance sheet declined from $8.9 trillion to $8.4 trillion. The labor market and the economy’s continued strength in the context of an accelerated pace of monetary policy tightening are the key drivers to the significant increase in short-term interest rates and tightening of investment grade corporate credit spreads observed during the Reporting Period. The Fund maintained a duration profile in the range of 0.25 – 0.65 during the Reporting Period.
As of the June 30, 2023, the Fund’s asset allocation consisted of U.S. Treasuries (19.5%), Credit-Financial (22.6%), Credit-Industrial (32.9%), Credit-Non-Corp (6.6%), ABS (5.6%), CMBS (4.3%) and Cash (8.5%).
The Fund used treasury futures in order to actively manage duration during the Reporting Period. The Fund’s use of treasury futures contributed positively to Fund performance relative to the Index.
The views expressed above reflect those of the Fund’s portfolio manager only through the Reporting Period, and do not necessarily represent the views of the Adviser as a whole. Any such views are subject to change at any time based upon market or other conditions and the Adviser disclaims any responsibility to update such views. These views may not be relied on as investment advice and, because investment decisions for a fund are based on numerous factors, may not be relied on as an indication of trading intent on behalf of any fund.
See accompanying notes to financial statements.
11
SPDR SSGA Ultra Short Term Bond ETF
Performance Summary (Unaudited)
Performance as of June 30, 2023
| | Cumulative Total Return | | Average Annual Total Return |
| | Net
Asset
Value | Market
Value | Bloomberg U.S. Treasury Bellwether 3 Month Index | | Net
Asset
Value | Market
Value | Bloomberg U.S. Treasury Bellwether 3 Month Index |
| ONE YEAR | 4.24% | 4.27% | 3.74% | | 4.24% | 4.27% | 3.74% |
| FIVE YEARS | 9.46% | 9.43% | 8.20% | | 1.82% | 1.82% | 1.59% |
| SINCE INCEPTION(1) | 14.40% | 14.43% | 10.56% | | 1.39% | 1.40% | 1.04% |
| (1) | For the period October 9, 2013 to June 30, 2023. Since shares of the Fund did not trade in the secondary market until one day after the Fund’s inception, for the period from inception to the first day of secondary market trading in shares of the Fund (10/9/13, 10/10/13, respectively), the NAV of the Fund is used as a proxy for the secondary market trading price to calculate market returns. |
Comparison of Change in Value of a $10,000 Investment
(Based on Net Asset Value)
Line graph is based on cumulative total return.
The total expense ratio for SPDR SSGA Ultra Short Term Bond ETF as stated in the Fees and Expenses table of the most recent prospectus is 0.20%. Please see the financial highlights for the total expense ratio for the fiscal period ended June 30, 2023.
Performance quoted represents past performance, which is no guarantee of future results. Investment return and principal value will fluctuate, so you may have a gain or loss when shares are sold. Current performance may be higher or lower than that quoted. Visit https://www.ssga.com/spdrs for most recent month-end performance. The returns do not reflect the deduction of taxes that a shareholder would pay on Fund distributions or on the redemption or sale of Fund shares. See "Notes to Performance Summaries" on page 1 for more information.
See accompanying notes to financial statements.
12
SPDR SSGA Ultra Short Term Bond ETF
Portfolio Statistics (Unaudited)
Top Five Holdings as of June 30, 2023
| | | |
| | Description | % of Net Assets | |
| | U.S. Treasury Bill
4.85% 7/25/2023 | 10.8% | |
| | U.S. Treasury Notes
0.25% 9/30/2023 | 5.0 | |
| | U.S. Treasury Bill
5.23% 7/13/2023 | 3.6 | |
| | Parker-Hannifin Corp.
3.65% 6/15/2024 | 1.9 | |
| | Take-Two Interactive Software, Inc.
3.30% 3/28/2024 | 1.8 | |
| | TOTAL | 23.1% | |
(The five largest holdings are subject to change, and there are no guarantees the Fund will continue to remain invested in any particular company.)
Asset Allocation as of June 30, 2023
| | | |
| | | % of Net Assets | |
| | Corporate Bonds & Notes | 61.2% | |
| | U.S. Treasury Obligations | 19.4 | |
| | Asset-Backed Securities | 5.6 | |
| | Commercial Mortgage Backed Securities | 2.2 | |
| | Mortgage-Backed Securities | 2.1 | |
| | Short-Term Investment | 9.0 | |
| | Other Assets in Excess of Liabilities | 0.5 | |
| | TOTAL | 100.0% | |
(The Fund's asset allocation is expressed as a percentage of net assets and may change over time.)
See accompanying notes to financial statements.
13
SPDR LOOMIS SAYLES OPPORTUNISTIC BOND ETF
MANAGEMENT'S DISCUSSION OF FUND PERFORMANCE (UNAUDITED)
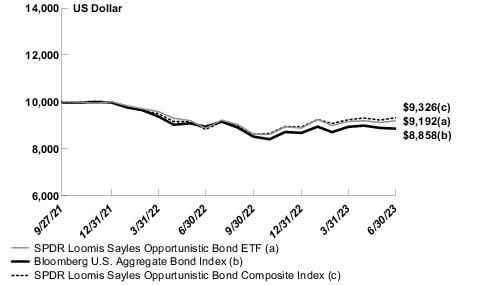
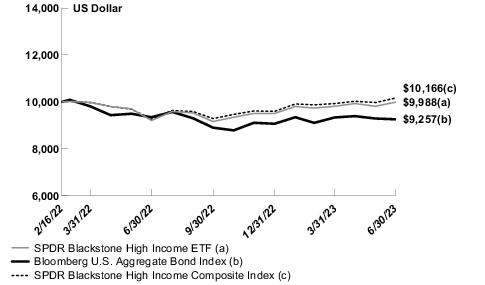
The SPDR Loomis Sayles Opportunistic Bond ETF (the “Fund”) seeks to maximize total return. The Fund’s benchmark is the Bloomberg U.S. Aggregate Bond Index (the “Index”).
For the 12-month period ended June 30, 2023 (the “Reporting Period”), the net total return for the Fund was 3.58%, and the Index was –0.94%. The Fund’s performance reflects the expenses of managing the Fund, including brokerage and advisory expenses. The Index is unmanaged and Index returns do not reflect fees and expenses of any kind, which would have a negative impact on returns.
High yield corporates, bank loans, investment grade corporates, and securitized issues were the primary drivers of Fund’s positive performance during the Reporting Period relative to the Index. Our allocation to FX, duration management, and cash instruments had a negative effect on excess performance.
During the Reporting Period, the Fund used index credit default swaps (“CDX”), forwards, and interest rate future/swap exposures for hedging credit beta, hedging currency exposure, duration/interest rate positioning respectively. On an absolute basis, the Fund’s net use of both interest rate futures and swaps detracted from performance. Our use of forwards slightly contributed, while CDX use detracted from Fund performance.
On an individual security level, the top positive contributors to the Fund’s performance on an absolute basis during the Reporting Period were Unicredit SPA 144A RTS 7.296 USD 4/2/2034, HSBC Holdings PLC 8.113 USD 11/3/2033, and CHG Healthcare TLB L+325 FL50 8.443 USD 9/29/2028. The top negative contributors to the Fund’s performance on an absolute basis during the Reporting Period were Lloyds Banking Group PLC 8.0 USD 6/27/2172, Apple Inc 3.95 USD 8/8/2052 and Kohl’s Corporation 4.625 USD 5/1/2031.
The views expressed above reflect those of the Fund’s portfolio manager only through the Reporting Period, and do not necessarily represent the views of the Adviser as a whole. Any such views are subject to change at any time based upon market or other conditions and the Adviser disclaims any responsibility to update such views. These views may not be relied on as investment advice and, because investment decisions for a fund are based on numerous factors, may not be relied on as an indication of trading intent on behalf of any fund.
See accompanying notes to financial statements.
14
SPDR Loomis Sayles Opportunistic Bond ETF
Performance Summary (Unaudited)
Performance as of June 30, 2023
| | | Cumulative Total Return | | Average Annual Total Return | |
| | | Net
Asset
Value | Market
Value | Bloomberg U.S. Aggregate Bond Index | SPDR Loomis Sayles Opportunistic Bond Composite Index | | Net
Asset
Value | Market
Value | Bloomberg U.S. Aggregate Bond Index | SPDR Loomis Sayles Opportunistic Bond Composite Index |
| ONE YEAR | | 3.58% | 3.54% | (0.94)% | 5.68% | | 3.58% | 3.54% | (0.94)% | 5.68% |
| SINCE INCEPTION(1) | | (8.08)% | (8.05)% | (11.42)% | (6.74)% | | (4.68)% | (4.67)% | (6.67)% | (3.89)% |
| (1) | For the period September 27, 2021 to June 30, 2022. Since shares of the Fund did not trade in the secondary market until one day after the Fund’s inception, for the period from inception to the first day of secondary market trading in shares of the Fund (9/27/21, 9/28/21, respectively), the NAV of the Fund is used as a proxy for the secondary market trading price to calculate market returns. |
Comparison of Change in Value of a $10,000 Investment
(Based on Net Asset Value)
Line graph is based on cumulative total return.
The total expense ratio for SPDR Loomis Sayles Opportunistic Bond ETF as stated in the Fees and Expenses table of the most recent prospectus is 0.55%. Please see the financial highlights for the total expense ratio for the fiscal period ended June 30, 2023.
Performance quoted represents past performance, which is no guarantee of future results. Investment return and principal value will fluctuate, so you may have a gain or loss when shares are sold. Current performance may be higher or lower than that quoted. Visit https://www.ssga.com/spdrs for most recent month-end performance. The returns do not reflect the deduction of taxes that a shareholder would pay on Fund distributions or on the redemption or sale of Fund shares. See "Notes to Performance Summaries" on page 1 for more information.
See accompanying notes to financial statements.
15
SPDR Loomis Sayles Opportunistic Bond ETF
Portfolio Statistics (Unaudited)
Top Five Holdings as of June 30, 2023
| | | |
| | Description | % of Net Assets | |
| | SPDR Blackstone Senior Loan ETF
| 3.3% | |
| | OneMain Direct Auto Receivables Trust ABS
0.87% 7/14/2028 | 1.9 | |
| | Credit Suisse AG
4.75% 8/9/2024 | 1.4 | |
| | UniCredit SpA
7.30% 4/2/2034 | 1.3 | |
| | Standard Chartered PLC
6.17% 1/9/2027 | 1.1 | |
| | TOTAL | 9.0% | |
(The five largest holdings are subject to change, and there are no guarantees the Fund will continue to remain invested in any particular company.)
Industry Breakdown as of June 30, 2023
| | | |
| | | % of Net Assets | |
| | Banks | 16.9% | |
| | Asset-Backed Securities | 11.3 | |
| | Commercial Services | 3.9 | |
| | Media | 3.5 | |
| | Money Market Fund | 3.3 | |
| | Telecommunications | 3.3 | |
| | Internet | 3.1 | |
| | Software | 2.7 | |
| | Investment Company Security | 2.7 | |
| | Semiconductors | 2.7 | |
| | Auto Manufacturers | 2.6 | |
| | Electric | 2.4 | |
| | Retail | 2.3 | |
| | Pipelines | 2.2 | |
| | Pharmaceuticals | 2.1 | |
| | Leisure Time | 2.1 | |
| | Insurance | 2.1 | |
| | Diversified Financial Services | 1.9 | |
| | Home Builders | 1.8 | |
| | Airlines | 1.8 | |
| | Food | 1.7 | |
| | Oil & Gas | 1.7 | |
| | Chemicals | 1.5 | |
| | Real Estate Investment Trusts | 1.3 | |
| | Advertising | 1.1 | |
| | Construction Materials | 1.0 | |
| | Transportation | 0.9 | |
| | Energy-Alternate Sources | 0.9 | |
| | Mining | 0.8 | |
| | Health Care Products | 0.8 | |
| | Entertainment | 0.8 | |
| | Auto Parts & Equipment | 0.7 | |
| | IT Services | 0.6 | |
| | Oil & Gas Services | 0.5 | |
| | Health Care Services | 0.5 | |
| | Iron/Steel | 0.5 | |
| | Packaging & Containers | 0.4 | |
| | Computers | 0.4 | |
| | Aerospace & Defense | 0.4 | |
| | Machinery, Construction & Mining | 0.4 | |
| | Biotechnology | 0.4 | |
| | Household Products | 0.4 | |
| | Environmental Control | 0.3 | |
| | Beverages | 0.3 | |
| | Engineering & Construction | 0.3 | |
| | Miscellaneous Manufacturer | 0.3 | |
| | Electrical Components & Equipment | 0.3 | |
| | Commercial Mortgage Backed Securities | 0.3 | |
| | Electronics | 0.3 | |
| | Office & Business Equipment | 0.2 | |
See accompanying notes to financial statements.
16
SPDR Loomis Sayles Opportunistic Bond ETF
Portfolio Statistics (Unaudited) (continued)
| | | |
| | | % of Net Assets | |
| | Home Furnishings | 0.2% | |
| | Lodging | 0.2 | |
| | Housewares | 0.1 | |
| | Apparel | 0.1 | |
| | Coal | 0.1 | |
| | Forest Products & Paper | 0.1 | |
| | Short-Term Investment | 2.0 | |
| | Other Assets in Excess of Liabilities | 2.5 | |
| | TOTAL | 100.0% | |
(The Fund’s industry breakdown is expressed as a percentage of net assets and may change over time.)
See accompanying notes to financial statements.
17
SPDR Nuveen Municipal Bond ETF
MANAGEMENT'S DISCUSSION OF FUND PERFORMANCE (UNAUDITED)
The SPDR Nuveen Municipal Bond ETF (the ”Fund”) seeks to provide current income that is exempt from regular federal income taxes. Capital appreciation is a secondary objective when consistent with the Fund’s primary objective. The Fund’s benchmark is the Bloomberg 3-15 Year Blend (2-17) Municipal Bond Index (the “Index”).
For the 12-month period ended June 30, 2023 (the “Reporting Period”), the total return for the Fund was 2.10%, and the Index was 2.97%. The Fund and Index returns reflect the reinvestment of dividends and other income. The Fund’s performance reflects the expenses of managing the Fund, including brokerage and advisory expenses. The Index is unmanaged and Index returns do not reflect fees and expenses of any kind, which would have a negative impact on returns.
Selection was the primary drivers of Fund performance during the Reporting Period. The Reporting Period consists of widely different market environments, with the first four months continuing the historic sell off before a considerable rally and remaining volatility throughout the Reporting Period.
Overall, longer positioned bonds outperformed as interest expectations stabilized and additional income was additive to returns. The Fund was hurt from an overweight in bonds maturing in less than two years and underweight in 8 to 17 years. This was somewhat offset by an underweight in bonds maturing in 2 to 4 years and an overweight to bonds maturing in 17 to 22 years.
The Fund did not invest in derivatives during the Reporting Period.
On an individual security level, the top contributors to the Fund’s performance during the Reporting Period were New Jersey Economic Development Authority School Facility Construction, Medford HFA Asante Health and New York City General Obligation bonds. The largest detractors from the Fund’s performance during the Reporting Period were New Hope Sanctuary Long Term Care, New York State Personal Income Tax, and Idaho Housing & Sales Tax bonds.
The views expressed above reflect those of the Fund’s portfolio manager only through the Reporting Period, and do not necessarily represent the views of the Adviser as a whole. Any such views are subject to change at any time based upon market or other conditions and the Adviser disclaims any responsibility to update such views. These views may not be relied on as investment advice and, because investment decisions for a fund are based on numerous factors, may not be relied on as an indication of trading intent on behalf of any fund.
See accompanying notes to financial statements.
18
SPDR Nuveen Municipal Bond ETF
Performance Summary (Unaudited)
Performance as of June 30, 2023
| | Cumulative Total Return | | Average Annual Total Return |
| | Net
Asset
Value | Market
Value | Bloomberg 3-15 Year Blend (2-17) Municipal Bond Index | | Net
Asset
Value | Market
Value | Bloomberg 3-15 Year Blend (2-17) Municipal Bond Index |
| ONE YEAR | 2.10% | 1.99% | 2.97% | | 2.10% | 1.99% | 2.97% |
| SINCE INCEPTION(1) | (6.27)% | (6.32)% | (4.27)% | | (2.66)% | (2.68)% | (1.80)% |
| (1) | For the period February 3, 2021 to June 30, 2023. Since shares of the Fund did not trade in the secondary market until the day after the Fund’s inception, for the period from inception to the first day of secondary market trading in shares of the Fund (02/03/21, 02/04/21, respectively), the NAV of the Fund is used as a proxy for the secondary market trading price to calculate market returns. |
Comparison of Change in Value of a $10,000 Investment
(Based on Net Asset Value)
Line graph is based on cumulative total return.
The total expense ratio for SPDR Nuveen Municipal Bond ETF as stated in the Fees and Expenses table of the most recent prospectus is 0.40%. Please see the financial highlights for the total expense ratio for the fiscal period ended June 30, 2023.
Performance quoted represents past performance, which is no guarantee of future results. Investment return and principal value will fluctuate, so you may have a gain or loss when shares are sold. Current performance may be higher or lower than that quoted. Visit https://www.ssga.com/spdrs for most recent month-end performance. The returns do not reflect the deduction of taxes that a shareholder would pay on Fund distributions or on the redemption or sale of Fund shares. See "Notes to Performance Summaries" on page 1 for more information.
See accompanying notes to financial statements.
19
SPDR Nuveen Municipal Bond ETF
Portfolio Statistics (Unaudited)
Top Five Holdings as of June 30, 2023
| | | |
| | Description | % of Net Assets | |
| | New Jersey Economic Development Authority Revenue, NJ | 2.6% | |
| | Southfield Public Schools, General Obligation, MI | 2.5 | |
| | State of Florida Department of Transportation Revenue, FL | 2.4 | |
| | City of New York, General Obligation, NY | 2.4 | |
| | Medford Hospital Facilities Authority Revenue, OR | 2.3 | |
| | TOTAL | 12.2% | |
(The five largest holdings are subject to change, and there are no guarantees the Fund will continue to remain invested in any particular company.)
Asset Allocation as of June 30, 2023
| | | |
| | | % of Net Assets | |
| | Municipal Bonds & Notes | 98.5% | |
| | Short-Term Investment | 0.4 | |
| | Other Assets in Excess of Liabilities | 1.1 | |
| | TOTAL | 100.0% | |
(The Fund's asset allocation is expressed as a percentage of net assets and may change over time.)
See accompanying notes to financial statements.
20
SPDR NUVEEN MUNICIPAL BOND ESG ETF
MANAGEMENT'S DISCUSSION OF FUND PERFORMANCE (UNAUDITED)
The SPDR Nuveen Municipal Bond ESG ETF (the “Fund”) seeks to provide current income that is exempt from regular federal income taxes by investing in municipal bonds that exhibit certain environmental, social and governance (“ESG”) characteristics. Capital appreciation is a secondary objective when consistent with the Fund’s primary objective. The Fund’s benchmark is the Bloomberg 3-15 Year Blend (2-17) Municipal Bond Index (the “Index”).
For the 12-month period ended June 30, 2023 (the “Reporting Period”), the total return for the Fund was 2.53%, and the Index was 2.97%. The Fund and Index returns reflect the reinvestment of dividends and other income. The Fund’s performance reflects the expenses of managing the Fund, including brokerage and advisory expenses. The Index is unmanaged and Index returns do not reflect fees and expenses of any kind, which would have a negative impact on returns.
Curve positioning was the primary driver of fund performance during the Reporting Period. The Reporting Period consists of widely different market environments, with the first four months continuing the historic sell off before a considerable rally and remaining volatility throughout the remainder of the Reporting Period.
Overall, longer positioned bonds outperformed as interest expectations stabilized and additional income was additive to returns. The portfolio did benefit from an overweight allocation to bonds maturing in 17 to 22 years and an underweight to 4 to 6 years, however was more than offset by the overweight to bonds maturing in less than 2 years, and the underweight to bonds maturing in 8 to 12 years. Curve positioning was the largest detractor from performance. Rating allocation and sector allocation were both positive contributors to performance. An overweight to bonds rated single-A and underweight in bonds rated triple-A aided performance. An underweight in state general obligation and industrial development revenue bonds aided performance. An underweight in local general obligation bonds hurt performance.
The Fund did not invest in derivatives during the Reporting Period.
On an individual security level, the top contributors to the Fund’s performance during the Reporting Period Connecticut Special Tax Transportation, Medford HFA Asante Health and New York City general obligation bonds. The largest detractors from the Fund’s performance during the Reporting Period were Raleigh Durham Airport Revenue, Idaho Housing & Finance Association Sales Tax, and Bexar County Refunding bonds.
The views expressed above reflect those of the Fund’s portfolio manager only through the Reporting Period, and do not necessarily represent the views of the Adviser as a whole. Any such views are subject to change at any time based upon market or other conditions and the Adviser disclaims any responsibility to update such views. These views may not be relied on as investment advice and, because investment decisions for a fund are based on numerous factors, may not be relied on as an indication of trading intent on behalf of any fund.
See accompanying notes to financial statements.
21
SPDR Nuveen Municipal Bond ESG ETF
Performance Summary (Unaudited)
Performance as of June 30, 2023
| | Cumulative Total Return | | Average Annual Total Return |
| | Net
Asset
Value | Market
Value | Bloomberg 3-15 Year Blend (2-17) Municipal Bond Index | | Net
Asset
Value | Market
Value | Bloomberg 3-15 Year Blend (2-17) Municipal Bond Index |
| ONE YEAR | 2.53% | 2.36% | 2.97% | | 2.53% | 2.36% | 2.97% |
| SINCE INCEPTION(1) | 1.18% | 1.26% | 1.11% | | 0.96% | 1.02% | 0.90% |
| (1) | For the period April 5, 2022 to June 30, 2023. Since shares of the Fund did not trade in the secondary market until the day after the Fund’s inception, for the period from inception to the first day of secondary market trading in shares of the Fund (04/05/22, 04/06/22, respectively), the NAV of the Fund is used as a proxy for the secondary market trading price to calculate market returns. |
Comparison of Change in Value of a $10,000 Investment
(Based on Net Asset Value)
Line graph is based on cumulative total return.
The total expense ratio for SPDR Nuveen Municipal Bond ESG ETF as stated in the Fees and Expenses table of the most recent prospectus is 0.43%. Please see the financial highlights for the total expense ratio for the fiscal period ended June 30, 2023.
Performance quoted represents past performance, which is no guarantee of future results. Investment return and principal value will fluctuate, so you may have a gain or loss when shares are sold. Current performance may be higher or lower than that quoted. Visit https://www.ssga.com/spdrs for most recent month-end performance. The returns do not reflect the deduction of taxes that a shareholder would pay on Fund distributions or on the redemption or sale of Fund shares. See "Notes to Performance Summaries" on page 1 for more information.
See accompanying notes to financial statements.
22
SPDR Nuveen Municipal Bond ESG ETF
Portfolio Statistics (Unaudited)
Top Five Holdings as of June 30, 2023
| | | |
| | Description | % of Net Assets | |
| | Idaho Housing & Finance Association Revenue, ID | 2.6% | |
| | City of Dallas, General Obligation, TX AGM | 2.4 | |
| | Medford Hospital Facilities Authority Revenue, OR | 2.2 | |
| | Port of Seattle Revenue, WA AMT | 2.1 | |
| | Michigan State Housing Development Authority Revenue, MI | 2.1 | |
| | TOTAL | 11.4% | |
(The five largest holdings are subject to change, and there are no guarantees the Fund will continue to remain invested in any particular company.)
Asset Allocation as of June 30, 2023
| | | |
| | | % of Net Assets | |
| | Municipal Bonds & Notes | 98.8% | |
| | Short-Term Investment | 0.7 | |
| | Other Assets in Excess of Liabilities | 0.5 | |
| | TOTAL | 100.0% | |
(The Fund's asset allocation is expressed as a percentage of net assets and may change over time.)
See accompanying notes to financial statements.
23
SPDR SSGA FIXED INCOME SECTOR ROTATION ETF
MANAGEMENT'S DISCUSSION OF FUND PERFORMANCE (UNAUDITED)
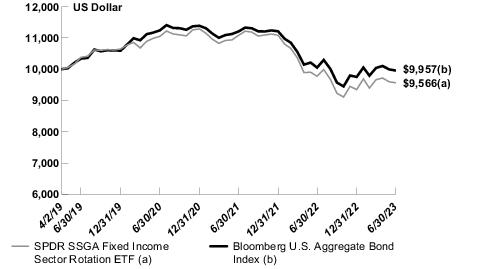
The SPDR SSGA Fixed Income Sector Rotation ETF (the “Fund”) seeks to provide total return by focusing on investments in income and yield-generating assets. The Fund’s benchmark is the Bloomberg U.S. Aggregate Bond Index (the “Index”).
For the 12-month period ended June 30, 2023 (the “Reporting Period”), the total return for the Fund was –2.12%, and the Index was –0.94%. The Fund and Index returns reflect the reinvestment of dividends and other income. The Fund’s performance reflects the expenses of managing the Fund, including brokerage and advisory expenses. The Index is unmanaged and Index returns do not reflect fees and expenses of any kind, which would have a negative impact on returns.
Asset Allocation positioning was the primary driver of Fund performance during the Reporting Period relative to the Index.
The performance of financial markets during the Reporting Period continued to be heavily influenced by inflation trends and the related impact on monetary policy and messaging from central banks. The U.S. Federal Reserve (the “Fed”) raised rates at the fastest pace in recent history pushing treasury yields steadily higher throughout much of 2002 pausing their climb as the fiscal year came to a close. While rates were moving higher the yield curve was flattening and high yield spreads were volatile moving sharply tighter to start the third quarter of 2022 before widening back out to end it. The regional bank crisis in the United States in early 2023 provided one last bout of instability pushing treasury yields lower and spreads wider before the Fed stepped in to prevent further contagion.
The Fund finished lower and underperformed its benchmark largely due to an overweight to long duration U.S. Treasury bonds. While the curve did flatten significantly over the period, the overall move higher in rates across the curve proved detrimental to the Fund’s results. The Fund’s allocation to intermediate-term corporate and high-yield bonds also benefited from tightening of credit spreads over the full Reporting Period as risk appetite gradually improved and the corporate sector continued to demonstrate resilient earnings. As headline inflation abated in the first half of 2023, the market reassessed and lowered the Fed terminal rate. The FX market reacted accordingly and the Fund’s position in the international treasury bond had positive contribution to the relative performance on the backdrop of a weakening U.S. Dollar.
The Fund did not invest in derivatives during the Reporting Period.
On an individual security level, the top positive contributors to the Fund’s performance on an absolute basis during the Reporting Period were SPDR Portfolio Intermediate Term Corporate Bond ETF, SPDR Bloomberg International Treasury Bond ETF and SPDR Bloomberg 1-3 Month T-Bill ETF. The top negative contributors to the Fund’s performance on an absolute basis during the Reporting Period were SPDR Portfolio Long Term Treasury ETF, SPDR Portfolio Intermediate Term Treasury ETF and SPDR Portfolio Mortgage Backed Bond ETF.
The views expressed above reflect those of the Fund’s portfolio manager only through the Reporting Period, and do not necessarily represent the views of the Adviser as a whole. Any such views are subject to change at any time based upon market or other conditions and the Adviser disclaims any responsibility to update such views. These views may not be relied on as investment advice and, because investment decisions for a fund are based on numerous factors, may not be relied on as an indication of trading intent on behalf of any fund.
See accompanying notes to financial statements.
24
SPDR SSGA Fixed Income Sector Rotation ETF
Performance Summary (Unaudited)
Performance as of June 30, 2023
| | Cumulative Total Return | | Average Annual Total Return |
| | Net
Asset
Value | Market
Value | Bloomberg U.S. Aggregate Bond Index | | Net
Asset
Value | Market
Value | Bloomberg U.S. Aggregate Bond Index |
| ONE YEAR | (2.12)% | (2.20)% | (0.94)% | | (2.12)% | (2.20)% | (0.94)% |
| SINCE INCEPTION(1) | (4.34)% | (4.38)% | (0.43)% | | (1.04)% | (1.05)% | (0.10)% |
| (1) | For the period April 2, 2019 to June 30, 2023. Since shares of the Fund did not trade in the secondary market until one day after the Fund’s inception, for the period from inception to the first day of secondary market trading in shares of the Fund (4/2/19, 4/3/19, respectively), the NAV of the Fund is used as a proxy for the secondary market trading price to calculate market returns. |
Comparison of Change in Value of a $10,000 Investment
(Based on Net Asset Value)
Line graph is based on cumulative total return.
The total expense ratio for SPDR SSGA Fixed Income Sector Rotation ETF as stated in the Fees and Expenses table of the most recent prospectus is 0.50%. Please see the financial highlights for the total expense ratio for the fiscal period ended June 30, 2023.
Performance quoted represents past performance, which is no guarantee of future results. Investment return and principal value will fluctuate, so you may have a gain or loss when shares are sold. Current performance may be higher or lower than that quoted. Visit https://www.ssga.com/spdrs for most recent month-end performance. The returns do not reflect the deduction of taxes that a shareholder would pay on Fund distributions or on the redemption or sale of Fund shares. See "Notes to Performance Summaries" on page 1 for more information.
See accompanying notes to financial statements.
25
SPDR SSGA Fixed Income Sector Rotation ETF
Portfolio Statistics (Unaudited)
Top Five Holdings as of June 30, 2023
| | | |
| | Description | % of Net Assets | |
| | SPDR Portfolio Intermediate Term Treasury ETF | 30.8% | |
| | SPDR Portfolio Mortgage-Backed Bond ETF | 28.9 | |
| | SPDR Portfolio Long Term Treasury ETF | 10.4 | |
| | SPDR Portfolio Intermediate Term Corporate Bond ETF | 7.8 | |
| | SPDR Bloomberg International Treasury Bond ETF | 7.0 | |
| | TOTAL | 84.9% | |
(The five largest holdings are subject to change, and there are no guarantees the Fund will continue to remain invested in any particular company.)
Asset Allocation as of June 30, 2023
| | | |
| | | % of Net Assets | |
| | Domestic Fixed Income | 99.8% | |
| | Short Term Investments | 27.1 | |
| | Liabilities in Excess of Other Assets | (26.9) | |
| | TOTAL | 100.0% | |
(The Fund's asset allocation is expressed as a percentage of net assets and may change over time.)
See accompanying notes to financial statements.
26
SPDR SSGA US Sector Rotation ETF
MANAGEMENT'S DISCUSSION OF FUND PERFORMANCE (UNAUDITED)
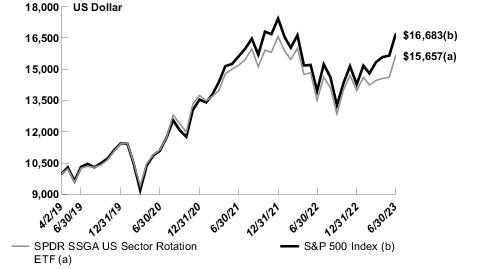
The SPDR SSGA US Sector Rotation ETF (the “Fund”) seeks to provide capital appreciation. The Fund’s benchmark is the S&P 500 Index (the “Index”).
For the 12-month period ended June 30, 2023 (the “Reporting Period”), the total return for the Fund was 15.91%, and the Index was 19.59%. The Fund and Index returns reflect the reinvestment of dividends and other income. The Fund’s performance reflects the expenses of managing the Fund, including brokerage and advisory expenses. The Index is unmanaged and Index returns do not reflect fees and expenses of any kind, which would have a negative impact on returns.
Active allocation across U.S. sectors was the primary driver of Fund performance during the Reporting Period relative to the Index. The performance of financial markets during the Reporting Period continued to be heavily influenced by inflation trends and the related impact on monetary policy and messaging from central banks. While equity markets got off to a good start in mid-2022, likely supported by overly depressed sentiment, stocks would turn lower amidst hawkish central bank messaging and turmoil in long-end UK bonds brought forth by the announcement of that country’s “mini-budget.” But by the turn to the fourth quarter of 2022 equity markets began a steady recovery for the remainder of the Reporting Period as longer-term interest rates stabilized. This recovery progressed despite meaningful risk events including the regional bank crisis in the United States in early 2023. The Fund got off to a good start and outperformed its Index during the second half of 2022 in large part due to an overweight allocation to the energy sector and an underweight allocation to the communication services sector. The energy sector rallied as oil prices recovered and energy firms delivered strong third quarter (2022) earnings results. Meanwhile, heavyweight firms in the communications services meaningfully underperformed amidst weaker than expected earnings. However, the Fund underperformed during the first half of 2023 due to overweight positions in the consumer staples, materials and industrial sectors. Our investment research favored consumer staples due to compelling quality and sentiment characteristics, but the relatively defensive sector was not able to keep pace during the swift technology-led rally. Similarly, materials and industrials exhibited a variety of attractive attributes but lagged the large technology sector and weighed on Fund performance overall.
The Fund did not invest in derivatives during the Reporting Period.
On an individual security level, the top positive contributors to the Fund’s performance on an absolute basis during the Reporting Period were the Technology Select Sector SPDR Fund, the Industrial Select Sector SPDR Fund and the Financial Select Sector SPDR Fund. The top negative contributors to the Fund’s performance on an absolute basis during the Reporting Period were the Consumer Staples Select Sector SPDR Fund, the Utilities Select Sector SPDR Fund and the Materials Select Sector SPDR Fund.
The views expressed above reflect those of the Fund’s portfolio manager only through the Reporting Period, and do not necessarily represent the views of the Adviser as a whole. Any such views are subject to change at any time based upon market or other conditions and the Adviser disclaims any responsibility to update such views. These views may not be relied on as investment advice and, because investment decisions for a fund are based on numerous factors, may not be relied on as an indication of trading intent on behalf of any fund.
See accompanying notes to financial statements.
27
SPDR SSGA US Sector Rotation ETF
Performance Summary (Unaudited)
Performance as of June 30, 2023
| | Cumulative Total Return | | Average Annual Total Return |
| | Net
Asset
Value | Market
Value | S&P 500 Index | | Net
Asset
Value | Market
Value | S&P 500 Index |
| ONE YEAR | 15.91% | 15.80% | 19.59% | | 15.91% | 15.80% | 19.59% |
| SINCE INCEPTION(1) | 56.57% | 56.56% | 66.83% | | 11.14% | 11.14% | 12.82% |
| (1) | For the period April 2, 2019 to June 30, 2023. Since shares of the Fund did not trade in the secondary market until one day after the Fund’s inception, for the period from inception to the first day of secondary market trading in shares of the Fund (4/2/19, 4/3/19, respectively), the NAV of the Fund is used as a proxy for the secondary market trading price to calculate market returns. |
Comparison of Change in Value of a $10,000 Investment
(Based on Net Asset Value)
Line graph is based on cumulative total return.
The total expense ratio for SPDR SSGA US Sector Rotation ETF as stated in the Fees and Expenses table of the most recent prospectus is 0.70%. Please see the financial highlights for the total expense ratio for the fiscal period ended June 30, 2023.
Performance quoted represents past performance, which is no guarantee of future results. Investment return and principal value will fluctuate, so you may have a gain or loss when shares are sold. Current performance may be higher or lower than that quoted. Visit https://www.ssga.com/spdrs for most recent month-end performance. The returns do not reflect the deduction of taxes that a shareholder would pay on Fund distributions or on the redemption or sale of Fund shares. See "Notes to Performance Summaries" on page 1 for more information.
See accompanying notes to financial statements.
28
SPDR SSGA US Sector Rotation ETF
Portfolio Statistics (Unaudited)
Top Five Holdings as of June 30, 2023
| | | |
| | Description | % of Net Assets | |
| | The Industrial Select Sector SPDR Fund | 23.3% | |
| | The Technology Select Sector SPDR Fund | 22.2 | |
| | The Health Care Select Sector SPDR Fund | 20.5 | |
| | The Consumer Discretionary Select Sector SPDR Fund | 16.8 | |
| | The Consumer Staples Select Sector SPDR Fund | 10.5 | |
| | TOTAL | 93.3% | |
(The five largest holdings are subject to change, and there are no guarantees the Fund will continue to remain invested in any particular company.)
Asset Allocation as of June 30, 2023
| | | |
| | | % of Net Assets | |
| | Domestic Equity | 99.9% | |
| | Short Term Investments | 30.7 | |
| | Liabilities in Excess of Other Assets | (30.6) | |
| | TOTAL | 100.0% | |
(The Fund's asset allocation is expressed as a percentage of net assets and may change over time.)
See accompanying notes to financial statements.
29
SPDR DoubleLine Emerging Markets Fixed Income ETF
MANAGEMENT'S DISCUSSION OF FUND PERFORMANCE (UNAUDITED)
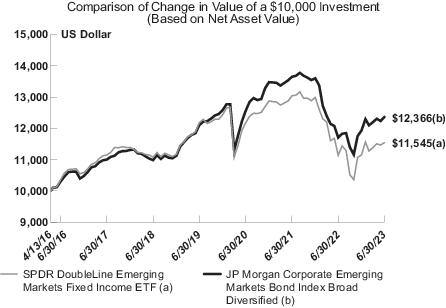
The SPDR DoubleLine Emerging Markets Fixed Income ETF (the “Fund”) seeks to provide high total return from current income and capital appreciation. The Fund’s benchmark is the JP Morgan Corporate Emerging Markets Bond Index Broad Diversified (the “Index”).
For the 12-month period ended June 30, 2023 (the “Reporting Period”), the total return for the Fund was 3.63%, and the Index was 5.66%. The Fund and Index returns reflect the reinvestment of dividends and other income. The Fund’s performance reflects the expenses of managing the Fund, including brokerage and advisory expenses. The Index is unmanaged and Index returns do not reflect fees and expenses of any kind, which would have a negative impact on returns.
The primary drivers of Fund performance during the Reporting Period were duration positioning and asset allocation. In terms of duration positioning, the Fund consistently maintained a longer duration than the Index, which hurt relative performance as U.S. Treasury yields continued to rise. Over the period, U.S. Treasury yields increased across the curve, with 2-year yields higher by 194 bps and 10-year yields higher by 82 bps. In terms of asset allocation, the Fund was hurt by its underweight allocation to Europe. Europe was the best performing region in the Index after experiencing a rebound off the Q1 2022, lows following Russia's invasion of Ukraine and Russia's exclusion from the Index early last year. Additionally, the Fund maintained a large overweight to investment grade credits over the period, which significantly underperformed its high yield counterparts. In contrast, the Fund's overweight to Latin America, the second strongest region in the Index, and overweight Emerging Markets sovereigns contributed to relative performance.
The Fund maintains a longer duration than that of the Index and is overweight Emerging Markets sovereigns versus the Index. Emerging Markets Sovereigns outperformed Emerging Markets Corporate credit despite the longer duration driven in part by significant spread tightening over the 12-month period.
The Fund did not invest in derivatives during the Reporting Period.
On a sector level, the top contributor to the Fund’s performance during the Reporting Period was Emerging Market sovereign credit, which delivered a strong return and outperformed the Index. In contract, the largest detractor of the Fund’s performance on an absolute basis during the Reporting Period was Emerging Market Corporate credit.
The views expressed above reflect those of the Fund’s portfolio manager only through the Reporting Period, and do not necessarily represent the views of the Adviser as a whole. Any such views are subject to change at any time based upon market or other conditions and the Adviser disclaims any responsibility to update such views. These views may not be relied on as investment advice and, because investment decisions for a fund are based on numerous factors, may not be relied on as an indication of trading intent on behalf of any fund.
See accompanying notes to financial statements.
30
SPDR DoubleLine Emerging Markets Fixed Income ETF
Performance Summary (Unaudited)
Performance as of June 30, 2023
| | Cumulative Total Return | | Average Annual Total Return |
| | Net
Asset
Value | Market
Value | JP Morgan Corporate Emerging Markets Bond Index Broad Diversified | | Net
Asset
Value | Market
Value | JP Morgan Corporate Emerging Markets Bond Index Broad Diversified |
| ONE YEAR | 3.63% | 3.88% | 5.66% | | 3.63% | 3.88% | 5.66% |
| FIVE YEARS | 4.23% | 4.31% | 12.57% | | 0.83% | 0.85% | 2.40% |
| SINCE INCEPTION(1) | 15.45% | 15.87% | 23.66% | | 2.01% | 2.06% | 2.99% |
| (1) | For the period April 13, 2016 to June 30, 2023. Since shares of the Fund did not trade in the secondary market until the day after the Fund’s inception, for the period from inception to the first day of secondary market trading in shares of the Fund (4/13/16, 4/14/16, respectively), the NAV of the Fund is used as a proxy for the secondary market trading price to calculate market returns. |
Line graph is based on cumulative total return.
The total expense ratio for SPDR DoubleLine Emerging Markets Fixed Income ETF as stated in the Fees and Expenses table of the most recent prospectus is 0.65%. Please see the financial highlights for the total expense ratio for the fiscal period ended June 30, 2023.
Performance quoted represents past performance, which is no guarantee of future results. Investment return and principal value will fluctuate, so you may have a gain or loss when shares are sold. Current performance may be higher or lower than that quoted. Visit https://www.ssga.com/spdrs for most recent month-end performance. The returns do not reflect the deduction of taxes that a shareholder would pay on Fund distributions or on the redemption or sale of Fund shares. See "Notes to Performance Summaries" on page 1 for more information.
See accompanying notes to financial statements.
31
SPDR DoubleLine Emerging Markets Fixed Income ETF
Portfolio Statistics (Unaudited)
Top Five Holdings as of June 30, 2023
| | | |
| | Description | % of Net Assets | |
| | Chile Electricity PEC SpA
0.01% 1/25/2028 | 2.4% | |
| | Minejesa Capital BV
5.63% 8/10/2037 | 2.3 | |
| | Banco Internacional del Peru SAA Interbank VRN
4.00% 7/8/2030 | 2.2 | |
| | Galaxy Pipeline Assets Bidco Ltd.
2.16% 3/31/2034 | 2.2 | |
| | Hunt Oil Co. of Peru LLC Sucursal Del Peru
6.38% 6/1/2028 | 1.9 | |
| | TOTAL | 11.0% | |
(The five largest holdings are subject to change, and there are no guarantees the Fund will continue to remain invested in any particular company.)
Portfolio Composition as of June 30, 2023
| | | |
| | | % of Net Assets | |
| | Corporate Bonds & Notes | 80.4% | |
| | Foreign Government Obligations | 15.2 | |
| | Short-Term Investment | 3.1 | |
| | Other Assets in Excess of Liabilities | 1.3 | |
| | TOTAL | 100.0% | |
(The Fund's portfolio composition is expressed as a percentage of net assets and may change over time.)
See accompanying notes to financial statements.
32
SPDR DoubleLine Short Duration Total Return Tactical ETF
MANAGEMENT'S DISCUSSION OF FUND PERFORMANCE (UNAUDITED)
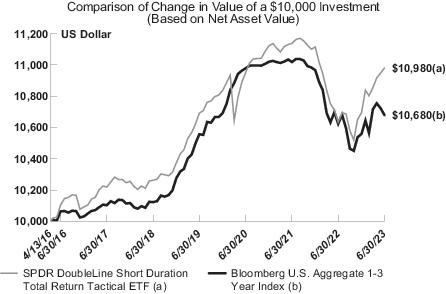
The SPDR DoubleLine Short Duration Total Return Tactical ETF (the “Fund”) seeks to maximize current income with a dollar-weighted average effective duration between one and three years. The Fund’s benchmark is the Bloomberg U.S. Aggregate 1-3 Year Index (the “Index”).
For the 12-month period ended June 30, 2023 (the “Reporting Period”), the Fund outperformed the Index by 272 basis points(bps) with a total return of 3.24% versus the 0.52% returned by the Index. The Fund and Index returns reflect the reinvestment of dividends and other income. The Fund’s performance reflects the expenses of managing the Fund, including brokerage and advisory expenses. The Index is unmanaged and Index returns do not reflect fees and expenses of any kind, which would have a negative impact on returns.
The primary driver of outperformance was asset allocation as the portfolio maintained a higher credit allocation than the Index, with a roughly sixty-five percent weighting to credit risk sectors compared to approximately thirty percent in the Index. This contributed positively to performance as credit spreads tightened materially during the Reporting Period. The Fund maintained a slightly shorter duration position than the Index.
The Fund’s best-performing sectors were collateralized loan obligations (CLOs) and bank loans as spreads tightened and the floating-rate nature of these sectors insulated them from rising rates. The shorter duration structured credit sectors commercial MBS, non-Agency MBS, and asset backed securities also outperformed the Index as they were less negatively impacted by the rise in U.S. Treasury yields. Agency MBS naturally experienced some duration-related price declines during the period and was subsequently the worst performing sector in the portfolio.
The Fund did not invest in derivatives during the Reporting Period.
Every credit sector within the portfolio generated a positive return. The top positive contributor to the Fund’s performance on an absolute basis during the Reporting Period was CLOs. Agency MBS was the only detractor from performance on an absolute basis during the Reporting Period.
The views expressed above reflect those of the Fund’s portfolio manager only through the Reporting Period, and do not necessarily represent the views of the Adviser as a whole. Any such views are subject to change at any time based upon market or other conditions and the Adviser disclaims any responsibility to update such views. These views may not be relied on as investment advice and, because investment decisions for a fund are based on numerous factors, may not be relied on as an indication of trading intent on behalf of any fund.
See accompanying notes to financial statements.
33
SPDR DoubleLine Short Duration Total Return Tactical ETF
Performance Summary (Unaudited)
| | Cumulative Total Return | | Average Annual Total Return |
| | Net
Asset
Value | Market
Value | Bloomberg U.S. Aggregate 1-3 Year Index | | Net
Asset
Value | Market
Value | Bloomberg U.S. Aggregate 1-3 Year Index |
| ONE YEAR | 3.24% | 3.23% | 0.52% | | 3.24% | 3.23% | 0.52% |
| FIVE YEARS | 6.98% | 6.93% | 5.50% | | 1.36% | 1.35% | 1.08% |
| SINCE INCEPTION(1) | 9.80% | 9.88% | 6.80% | | 1.30% | 1.31% | 0.92% |
| (1) | For the period April 13, 2016 to June 30, 2023. Since shares of the Fund did not trade in the secondary market until the day after the Fund’s inception, for the period from inception to the first day of secondary market trading in shares of the Fund (04/13/16, 04/14/16, respectively), the NAV of the Fund is used as a proxy for the secondary market trading price to calculate market returns. |
Line graph is based on cumulative total return.
The total expense ratio for SPDR DoubleLine Short Duration Total Return Tactical ETF as stated in the Fees and Expenses table of the most recent prospectus is 0.45%. Please see the financial highlights for the total expense ratio for the fiscal period ended June 30, 2023.
Performance quoted represents past performance, which is no guarantee of future results. Investment return and principal value will fluctuate, so you may have a gain or loss when shares are sold. Current performance may be higher or lower than that quoted. Visit https://www.ssga.com/spdrs for most recent month-end performance. The returns do not reflect the deduction of taxes that a shareholder would pay on Fund distributions or on the redemption or sale of Fund shares. See "Notes to Performance Summaries" on page 1 for more information.
See accompanying notes to financial statements.
34
SPDR DoubleLine Short Duration Total Return Tactical ETF
Portfolio Statistics (Unaudited)
Top Five Holdings as of June 30, 2023
| | | |
| | Description | % of Net Assets | |
| | U.S. Treasury Bill
5.07% 8/10/2023 | 11.7% | |
| | U.S. Treasury Notes
4.25% 10/15/2025 | 9.3 | |
| | U.S. Treasury Notes
3.00% 7/15/2025 | 3.8 | |
| | U.S. Treasury Bill
4.85% 7/25/2023 | 2.9 | |
| | Citigroup Mortgage Loan Trust, Inc. CMO
4.29% 7/25/2037 | 1.9 | |
| | TOTAL | 29.6% | |
(The five largest holdings are subject to change, and there are no guarantees the Fund will continue to remain invested in any particular company.)
Portfolio Composition as of June 30, 2023
| | | |
| | | % of Net Assets | |
| | U.S. Treasury Obligations | 27.7% | |
| | Asset-Backed Securities | 25.4 | |
| | Corporate Bonds & Notes | 15.2 | |
| | Mortgage-Backed Securities | 9.5 | |
| | U.S. Government Agency Obligations | 6.4 | |
| | Commercial Mortgage Backed Securities | 6.1 | |
| | Senior Floating Rate Loans | 5.6 | |
| | Foreign Government Obligations | 0.6 | |
| | Short-Term Investment | 3.0 | |
| | Other Assets in Excess of Liabilities | 0.5 | |
| | TOTAL | 100.0% | |
(The Fund's portfolio composition is expressed as a percentage of net assets and may change over time.)
See accompanying notes to financial statements.
35
SPDR DoubleLine Total Return Tactical ETF
MANAGEMENT'S DISCUSSION OF FUND PERFORMANCE (UNAUDITED)
The SPDR DoubleLine Total Return Tactical ETF (the “Fund”) seeks to maximize total return. The Fund’s benchmark is the Bloomberg U.S. Aggregate Bond Index (the “Index”).
For the 12-month period ended June 30, 2023 (the “Reporting Period”), the Fund outperformed the Index by 143 basis points(bps), with a total return 0.49% versus the –0.94% returned by the Index. The Fund and Index returns reflect the reinvestment of dividends and other income. The Fund’s performance reflects the expenses of managing the Fund, including brokerage and advisory expenses. The Index is unmanaged and Index returns do not reflect fees and expenses of any kind, which would have a negative impact on returns.
The primary drivers of Fund performance were asset allocation and duration positioning. The Fund maintained a roughly forty-eight percent weighting to credit risk sectors compared to approximately thirty percent in the Index, which contributed positively to outperformance as credit spreads tightened materially over the Reporting Period. In terms of duration positioning, the Fund maintained a slightly shorter duration than the Index, which bolstered relative performance as U.S. Treasury yields rose significantly during the Reporting Period.
Speaking broadly, shorter duration credit sectors tended to outperform longer duration sectors due to the sharp rise in U.S. Treasury yields. The Fund’s best-performing sector was high-yield corporates as the perceived risk of defaults fell during the period and equity markets rallied, causing spread tightening. Collateralized loan obligations (CLOs) and bank loans also performed well as spreads tightened and the floating-rate nature of these sectors insulated them from rising rates. The Agency MBS and U.S. Treasurys in the Fund naturally experienced some duration-related price declines and were subsequently the worst performing sectors over the period.
The Fund did not invest in derivatives during the Reporting Period.
Every credit sector in the portfolio generated a positive return. The top contributors to the Fund’s outperformance during the Reporting Period were the shorter duration credit sectors non-Agency MBS, high yield corporates, and bank loans. The only detractors from the Fund’s performance during the Reporting Period were U.S. Treasurys and Agency MBS.
The views expressed above reflect those of the Fund’s portfolio manager only through the Reporting Period, and do not necessarily represent the views of the Adviser as a whole. Any such views are subject to change at any time based upon market or other conditions and the Adviser disclaims any responsibility to update such views. These views may not be relied on as investment advice and, because investment decisions for a fund are based on numerous factors, may not be relied on as an indication of trading intent on behalf of any fund.
See accompanying notes to financial statements.
36
SPDR DoubleLine Total Return Tactical ETF
Performance Summary (Unaudited)
Performance as of June 30, 2023
| | Cumulative Total Return | | Average Annual Total Return |
| | Net
Asset
Value | Market
Value | Bloomberg U.S. Aggregate Bond Index | | Net
Asset
Value | Market
Value | Bloomberg U.S. Aggregate Bond Index |
| ONE YEAR | 0.49% | 0.88% | (0.94)% | | 0.49% | 0.88% | (0.94)% |
| FIVE YEARS | 1.42% | 1.70% | 3.89% | | 0.28% | 0.34% | 0.77% |
| SINCE INCEPTION(1) | 6.84% | 7.12% | 8.35% | | 0.80% | 0.83% | 0.97% |
| (1) | For the period February 23, 2015 to June 30, 2023. Since shares of the Fund did not trade in the secondary market until the day after the Fund’s inception, for the period from inception to the first day of secondary market trading in shares of the Fund (02/23/15, 02/24/15, respectively), the NAV of the Fund is used as a proxy for the secondary market trading price to calculate market returns. |
Comparison of Change in Value of a $10,000 Investment
(Based on Net Asset Value)
Line graph is based on cumulative total return.
The total expense ratio for SPDR DoubleLine Total Return Tactical ETF as stated in the Fees and Expenses table of the most recent prospectus is 0.55%. Please see the financial highlights for the total expense ratio for the fiscal period ended June 30, 2023.
Performance quoted represents past performance, which is no guarantee of future results. Investment return and principal value will fluctuate, so you may have a gain or loss when shares are sold. Current performance may be higher or lower than that quoted. Visit https://www.ssga.com/spdrs for most recent month-end performance. The returns do not reflect the deduction of taxes that a shareholder would pay on Fund distributions or on the redemption or sale of Fund shares. See "Notes to Performance Summaries" on page 1 for more information.
See accompanying notes to financial statements.
37
SPDR DoubleLine Total Return Tactical ETF
Portfolio Statistics (Unaudited)
Top Five Holdings as of June 30, 2023
| | | |
| | Description | % of Net Assets | |
| | U.S. Treasury Bonds
3.63% 2/15/2053 | 11.2% | |
| | U.S. Treasury Bonds
3.63% 5/15/2053 | 5.3 | |
| | U.S. Treasury Notes
3.38% 5/15/2033 | 2.4 | |
| | Federal National Mortgage Association REMICS
3.00% 1/25/2043 | 1.0 | |
| | Federal Home Loan Mortgage Corp. REMICS CMO, REMIC
4.00% 7/15/2044 | 0.9 | |
| | TOTAL | 20.8% | |
(The five largest holdings are subject to change, and there are no guarantees the Fund will continue to remain invested in any particular company.)
Industry Breakdown as of June 30, 2023
| | | |
| | | % of Net Assets | |
| | U.S. Government Agency Obligations | 31.7% | |
| | U.S. Treasury Obligations | 23.6 | |
| | Mortgage-Backed Securities | 13.7 | |
| | Asset-Backed Securities | 11.7 | |
| | Commercial Mortgage Backed Securities | 3.2 | |
| | Banks | 2.2 | |
| | Electric | 1.0 | |
| | Pipelines | 0.7 | |
| | Retail | 0.7 | |
| | Oil & Gas | 0.7 | |
| | Telecommunications | 0.6 | |
| | Diversified Financial Services | 0.5 | |
| | Commercial Services | 0.5 | |
| | Insurance | 0.5 | |
| | Health Care Services | 0.5 | |
| | Real Estate Investment Trusts | 0.5 | |
| | Media | 0.5 | |
| | Pharmaceuticals | 0.5 | |
| | Software | 0.4 | |
| | Foreign Government Obligations | 0.4 | |
| | Internet | 0.4 | |
| | Entertainment | 0.3 | |
| | Chemicals | 0.3 | |
| | Food | 0.3 | |
| | Semiconductors | 0.2 | |
| | Beverages | 0.2 | |
| | Auto Manufacturers | 0.2 | |
| | Aerospace & Defense | 0.2 | |
| | Mining | 0.2 | |
| | Transportation | 0.2 | |
| | Packaging & Containers | 0.2 | |
| | Leisure Time | 0.2 | |
| | Biotechnology | 0.1 | |
| | Agriculture | 0.1 | |
| | Computers | 0.1 | |
| | Construction Materials | 0.1 | |
| | Lodging | 0.1 | |
| | Airlines | 0.1 | |
| | Engineering & Construction | 0.1 | |
| | Advertising | 0.1 | |
| | Water | 0.1 | |
| | Oil & Gas Services | 0.1 | |
| | Electronics | 0.1 | |
| | Auto Parts & Equipment | 0.1 | |
| | Forest Products & Paper | 0.1 | |
| | Environmental Control | 0.1 | |
| | Machinery-Diversified | 0.1 | |
| | Home Builders | 0.1 | |
| | Household Products | 0.1 | |
See accompanying notes to financial statements.
38
SPDR DoubleLine Total Return Tactical ETF
Portfolio Statistics (Unaudited) (continued)
| | | |
| | | % of Net Assets | |
| | Trucking & Leasing | 0.1% | |
| | Health Care Products | 0.0* | |
| | Investment Company Security | 0.0* | |
| | Household Products & Wares | 0.0* | |
| | Metal Fabricate & Hardware | 0.0* | |
| | Distribution & Wholesale | 0.0* | |
| | Iron/Steel | 0.0* | |
| | Housewares | 0.0* | |
| | Holding Companies-Diversified | 0.0* | |
| | Miscellaneous Manufacturer | 0.0* | |
| | Energy-Alternate Sources | 0.0* | |
| | Coal | 0.0* | |
| | Machinery, Construction & Mining | 0.0* | |
| | Electrical Components & Equipment | 0.0* | |
| | Home Furnishings | 0.0* | |
| | Real Estate | 0.0* | |
| | Short-Term Investment | 1.0 | |
| | Other Assets in Excess of Liabilities | 0.2 | |
| | TOTAL | 100.0% | |
| * | Amount shown represents less than 0.05% of net assets. | |
(The Fund's portfolio composition is expressed as a percentage of net assets and may change over time.)
See accompanying notes to financial statements.
39
SPDR SSGA MULTI-ASSET REAL RETURN ETF
SCHEDULE OF INVESTMENTS
June 30, 2023
| Security Description | | | Shares | | Value |
| MUTUAL FUNDS AND EXCHANGE TRADED PRODUCTS — 95.9% | | | |
| COMMODITIES — 19.4% | |
Invesco Optimum Yield Diversified Commodity Strategy No. K-1 ETF
| | | 7,633,585 | | $ 103,854,924 |
| DOMESTIC EQUITY — 6.0% | |
The Energy Select Sector SPDR Fund (a)(b)
| | | 395,864 | | 32,132,281 |
| INFLATION LINKED — 7.3% | |
SPDR Bloomberg 1-10 Year TIPS ETF (a)
| | | 2,108,232 | | 38,917,963 |
| INTERNATIONAL EQUITY — 25.3% | |
SPDR S&P Global Infrastructure ETF (a)
| | | 2,501,429 | | 133,501,265 |
VanEck Agribusiness ETF (b)
| | | 16,145 | | 1,319,531 |
| | | | | | 134,820,796 |
| INTERNATIONAL FIXED INCOME — 2.6% | |
SPDR FTSE International Government Inflation-Protected Bond ETF (a)
| | | 327,586 | | 13,679,991 |
| NATURAL RESOURCES — 32.8% | |
SPDR Gold MiniShares Trust (a)
| | | 276,756 | | 10,541,636 |
SPDR S&P Global Natural Resources ETF (a)(b)
| | | 2,741,886 | | 147,815,074 |
SPDR S&P Metals & Mining ETF (a)(b)
| | | 332,119 | | 16,878,288 |
| | | | | | 175,234,998 |
| REAL ESTATE — 2.5% | |
SPDR Dow Jones International Real Estate ETF (a)(b)
| | | 106,095 | | 2,627,973 |
SPDR Dow Jones REIT ETF REIT (a)(b)
| | | 118,899 | | 10,753,226 |
| | | | | | 13,381,199 |
TOTAL MUTUAL FUNDS AND EXCHANGE TRADED PRODUCTS
(Cost $551,256,420)
| | 512,022,152 | |
| Security Description | | | Shares | | Value |
| SHORT-TERM INVESTMENTS — 10.2% | | | |
State Street Institutional U.S. Government Money Market Fund, Class G Shares 5.07% (c)(d)
| | | 21,584,135 | | $ 21,584,135 |
State Street Navigator Securities Lending Portfolio II (e)(f)
| | | 32,724,798 | | 32,724,798 |
TOTAL SHORT-TERM INVESTMENTS
(Cost $54,308,933)
| | | | | $ 54,308,933 |
TOTAL INVESTMENTS — 106.1%
(Cost $605,565,353)
| | | | | 566,331,085 |
LIABILITIES IN EXCESS OF OTHER ASSETS — (6.1)%
| | | | | (32,697,649) |
NET ASSETS — 100.0%
| | | | | $ 533,633,436 |
| The Fund invests in other funds and financial statements of underlying funds can be found at www.sec.gov. |
| |
| (a) | Affiliated fund managed by SSGA Funds Management, Inc. Amounts related to these transactions during the period ended June 30, 2023 are shown in the Affiliate Table below. |
| (b) | All or a portion of the shares of the security are on loan at June 30, 2023. |
| (c) | The Fund invested in certain money market funds managed by SSGA Funds Management, Inc. Amounts related to these transactions during the period ended June 30, 2023 are shown in the Affiliate Table below. |
| (d) | The rate shown is the annualized seven-day yield at June 30, 2023. |
| (e) | The Fund invested in an affiliated entity. Amounts related to these transactions during the period ended June 30, 2023 are shown in the Affiliate Table below. |
| (f) | Investment of cash collateral for securities loaned. |
The following table summarizes the value of the Fund's investments according to the fair value hierarchy as of June 30, 2023.
| Description | | Level 1 –
Quoted Prices | | Level 2 –
Other Significant
Observable Inputs | | Level 3 –
Significant
Unobservable Inputs | | Total |
| ASSETS: | | | | | | | | |
| INVESTMENTS: | | | | | | | | |
Mutual Funds and Exchange Traded Products
| | $512,022,152 | | $— | | $— | | $512,022,152 |
Short-Term Investments
| | 54,308,933 | | — | | — | | 54,308,933 |
TOTAL INVESTMENTS
| | $566,331,085 | | $— | | $— | | $566,331,085 |
See accompanying notes to financial statements.
40
SPDR SSGA MULTI-ASSET REAL RETURN ETF
SCHEDULE OF INVESTMENTS (continued)
June 30, 2023
Affiliate Table
| | Number of
Shares Held
at
6/30/22 | | Value at
6/30/22 | | Cost of
Purchases | | Proceeds
from
Shares Sold | | Realized
Gain (Loss) | | Change in
Unrealized
Appreciation/
Depreciation | | Number of
Shares Held
at
6/30/23 | | Value at
6/30/23 | | Dividend
Income |
SPDR Bloomberg 1-10 Year TIPS ETF
| 2,036,829 | | $ 39,636,692 | | $ 49,527,671 | | $ 47,868,832 | | $(2,780,809) | | $ 403,241 | | 2,108,232 | | $ 38,917,963 | | $ 1,937,053 |
SPDR Dow Jones International Real Estate ETF
| 90,476 | | 2,553,233 | | 1,583,278 | | 1,197,822 | | (6,866) | | (303,850) | | 106,095 | | 2,627,973 | | 136,943 |
SPDR Dow Jones REIT ETF
| 369,583 | | 35,139,952 | | 10,137,022 | | 33,367,130 | | (4,715,237) | | 3,558,619 | | 118,899 | | 10,753,226 | | 541,244 |
SPDR FTSE International Government Inflation-Protected Bond ETF
| 55,737 | | 2,521,542 | | 22,815,619 | | 10,964,547 | | (623,060) | | (69,563) | | 327,586 | | 13,679,991 | | 672,703 |
SPDR Gold MiniShares Trust
| — | | — | | 12,139,296 | | 1,583,434 | | 85,700 | | (99,926) | | 276,756 | | 10,541,636 | | — |
SPDR S&P Global Infrastructure ETF
| 2,215,734 | | 118,408,825 | | 86,872,866 | | 73,472,279 | | 764,947 | | 926,906 | | 2,501,429 | | 133,501,265 | | 4,497,546 |
SPDR S&P Global Natural Resources ETF
| 2,278,511 | | 118,687,638 | | 93,577,929 | | 68,137,211 | | 1,679,122 | | 2,007,596 | | 2,741,886 | | 147,815,074 | | 6,205,094 |
SPDR S&P Metals & Mining ETF
| 293,310 | | 12,729,654 | | 11,979,503 | | 10,492,617 | | 992,882 | | 1,668,866 | | 332,119 | | 16,878,288 | | 299,223 |
State Street Institutional U.S. Government Money Market Fund, Class G Shares
| 8,773,651 | | 8,773,651 | | 75,446,529 | | 62,636,045 | | — | | — | | 21,584,135 | | 21,584,135 | | 933,845 |
State Street Navigator Securities Lending Portfolio II
| 48,571,637 | | 48,571,637 | | 1,020,126,667 | | 1,035,973,506 | | — | | — | | 32,724,798 | | 32,724,798 | | 199,469 |
The Energy Select Sector SPDR Fund
| 271,581 | | 19,420,757 | | 29,077,978 | | 18,971,643 | | 3,343,262 | | (738,073) | | 395,864 | | 32,132,281 | | 1,190,855 |
Total
| | | $406,443,581 | | $1,413,284,358 | | $1,364,665,066 | | $(1,260,059) | | $7,353,816 | | | | $461,156,630 | | $16,613,975 |
See accompanying notes to financial statements.
41
SPDR SSGA INCOME ALLOCATION ETF
SCHEDULE OF INVESTMENTS
June 30, 2023
| Security Description | | | Shares | | Value |
| MUTUAL FUNDS AND EXCHANGE TRADED PRODUCTS — 98.8% | | | |
| DOMESTIC EQUITY — 26.3% | |
Invesco KBW Premium Yield Equity REIT ETF
| | | 78,526 | | $ 1,410,327 |
iShares Mortgage Real Estate ETF (a)
| | | 127,025 | | 2,997,790 |
Schwab U.S. Dividend Equity ETF (a)
| | | 69,677 | | 5,059,944 |
SPDR ICE Preferred Securities ETF (b)
| | | 127,166 | | 4,256,246 |
SPDR Portfolio S&P 500 High Dividend ETF (a)(b)
| | | 134,956 | | 5,004,168 |
| | | | | | 18,728,475 |
| DOMESTIC FIXED INCOME — 40.4% | |
SPDR Blackstone Senior Loan ETF (a)(b)
| | | 173,309 | | 7,256,448 |
SPDR Bloomberg Convertible Securities ETF (a)(b)
| | | 52,305 | | 3,658,735 |
SPDR Bloomberg High Yield Bond ETF (a)(b)
| | | 93,779 | | 8,630,481 |
SPDR Portfolio Long Term Treasury ETF (b)
| | | 307,978 | | 9,208,542 |
| | | | | | 28,754,206 |
| INTERNATIONAL EQUITY — 16.0% | |
SPDR S&P Global Infrastructure ETF (a)(b)
| | | 107,500 | | 5,737,275 |
SPDR S&P International Dividend ETF (b)
| | | 163,925 | | 5,637,381 |
| | | | | | 11,374,656 |
| INTERNATIONAL FIXED INCOME — 14.1% | |
SPDR Bloomberg Emerging Markets Local Bond ETF (a)(b)
| | | 406,911 | | 8,610,237 |
SPDR Bloomberg International Corporate Bond ETF (b)
| | | 50,932 | | 1,445,450 |
| | | | | | 10,055,687 |
| REAL ESTATE — 2.0% | |
SPDR Dow Jones REIT ETF REIT (a)(b)
| | | 15,848 | | 1,433,293 |
TOTAL MUTUAL FUNDS AND EXCHANGE TRADED PRODUCTS
(Cost $76,093,340)
| | 70,346,317 | |
| Security Description | | | Shares | | Value |
| SHORT-TERM INVESTMENTS — 9.6% | | | |
State Street Institutional U.S. Government Money Market Fund, Class G Shares 5.07% (c)(d)
| | | 814,508 | | $ 814,508 |
State Street Navigator Securities Lending Portfolio II (e)(f)
| | | 5,978,695 | | 5,978,695 |
TOTAL SHORT-TERM INVESTMENTS
(Cost $6,793,203)
| | | | | $ 6,793,203 |
TOTAL INVESTMENTS — 108.4%
(Cost $82,886,543)
| | | | | 77,139,520 |
LIABILITIES IN EXCESS OF OTHER ASSETS — (8.4)%
| | | | | (5,965,973) |
NET ASSETS — 100.0%
| | | | | $ 71,173,547 |
| The Fund invests in other funds and financial statements of underlying funds can be found at www.sec.gov. |
| |
| (a) | All or a portion of the shares of the security are on loan at June 30, 2023. |
| (b) | Affiliated fund managed by SSGA Funds Management, Inc. Amounts related to these transactions during the period ended June 30, 2023 are shown in the Affiliate Table below. |
| (c) | The Fund invested in certain money market funds managed by SSGA Funds Management, Inc. Amounts related to these transactions during the period ended June 30, 2023 are shown in the Affiliate Table below. |
| (d) | The rate shown is the annualized seven-day yield at June 30, 2023. |
| (e) | The Fund invested in an affiliated entity. Amounts related to these transactions during the period ended June 30, 2023 are shown in the Affiliate Table below. |
| (f) | Investment of cash collateral for securities loaned. |
See accompanying notes to financial statements.
42
SPDR SSGA INCOME ALLOCATION ETF
SCHEDULE OF INVESTMENTS (continued)
June 30, 2023
The following table summarizes the value of the Fund's investments according to the fair value hierarchy as of June 30, 2023.
| Description | | Level 1 –
Quoted Prices | | Level 2 –
Other Significant
Observable Inputs | | Level 3 –
Significant
Unobservable Inputs | | Total |
| ASSETS: | | | | | | | | |
| INVESTMENTS: | | | | | | | | |
Mutual Funds and Exchange Traded Products
| | $70,346,317 | | $— | | $— | | $70,346,317 |
Short-Term Investments
| | 6,793,203 | | — | | — | | 6,793,203 |
TOTAL INVESTMENTS
| | $77,139,520 | | $— | | $— | | $77,139,520 |
Affiliate Table
| | Number of
Shares Held
at
6/30/22 | | Value at
6/30/22 | | Cost of
Purchases | | Proceeds
from
Shares Sold | | Realized
Gain (Loss) | | Change in
Unrealized
Appreciation/
Depreciation | | Number of
Shares Held
at
6/30/23 | | Value at
6/30/23 | | Dividend
Income |
SPDR Blackstone Senior Loan ETF
| 478,391 | | $ 19,920,201 | | $ 5,923,945 | | $ 18,433,189 | | $(1,708,631) | | $1,554,122 | | 173,309 | | $ 7,256,448 | | $ 917,371 |
SPDR Bloomberg 1-10 Year TIPS ETF
| — | | — | | 2,813,734 | | 2,856,252 | | 42,518 | | — | | — | | — | | 11,361 |
SPDR Bloomberg Convertible Securities ETF
| 44,018 | | 2,841,802 | | 2,665,982 | | 2,187,797 | | 74,672 | | 264,076 | | 52,305 | | 3,658,735 | | 68,263 |
SPDR Bloomberg Emerging Markets Local Bond ETF
| 471,277 | | 9,637,615 | | 4,754,808 | | 6,392,213 | | (429,252) | | 1,039,279 | | 406,911 | | 8,610,237 | | 494,846 |
SPDR Bloomberg High Yield Bond ETF
| 20,953 | | 1,900,647 | | 16,220,340 | | 9,120,761 | | (638,157) | | 268,412 | | 93,779 | | 8,630,481 | | 391,946 |
SPDR Bloomberg International Corporate Bond ETF
| — | | — | | 4,684,464 | | 3,340,856 | | 67,972 | | 33,870 | | 50,932 | | 1,445,450 | | 21,083 |
SPDR Dow Jones REIT ETF
| — | | — | | 2,023,971 | | 672,712 | | 29,807 | | 52,227 | | 15,848 | | 1,433,293 | | 24,355 |
SPDR ICE Preferred Securities ETF
| 135,451 | | 4,855,918 | | 2,973,534 | | 3,372,545 | | (176,705) | | (23,956) | | 127,166 | | 4,256,246 | | 281,416 |
SPDR Portfolio Long Term Corporate Bond ETF
| 99,847 | | 2,405,314 | | 3,723,704 | | 6,154,027 | | (503,367) | | 528,376 | | — | | — | | 40,580 |
SPDR Portfolio Long Term Treasury ETF
| 410,560 | | 13,577,219 | | 9,512,638 | | 12,841,104 | | (2,348,299) | | 1,308,088 | | 307,978 | | 9,208,542 | | 291,437 |
SPDR Portfolio S&P 500 High Dividend ETF
| 309,596 | | 12,355,976 | | 12,401,643 | | 19,703,284 | | (221,086) | | 170,919 | | 134,956 | | 5,004,168 | | 248,089 |
SPDR S&P Global Infrastructure ETF
| 144,598 | | 7,727,317 | | 2,613,570 | | 4,627,753 | | 35,961 | | (11,820) | | 107,500 | | 5,737,275 | | 194,983 |
SPDR S&P International Dividend ETF
| 250,835 | | 8,606,149 | | 13,337,225 | | 16,354,433 | | (653,518) | | 701,958 | | 163,925 | | 5,637,381 | | 449,382 |
State Street Institutional U.S. Government Money Market Fund, Class G Shares
| 3,843,857 | | 3,843,857 | | 17,748,752 | | 20,778,101 | | — | | — | | 814,508 | | 814,508 | | 99,549 |
State Street Navigator Securities Lending Portfolio II
| 30,179,720 | | 30,179,720 | | 202,088,941 | | 226,289,966 | | — | | — | | 5,978,695 | | 5,978,695 | | 241,690 |
Total
| | | $117,851,735 | | $303,487,251 | | $353,124,993 | | $(6,428,085) | | $5,885,551 | | | | $67,671,459 | | $3,776,351 |
See accompanying notes to financial statements.
43
SPDR SSGA GLOBAL ALLOCATION ETF
SCHEDULE OF INVESTMENTS
June 30, 2023
| Security Description | | | Shares | | Value |
| MUTUAL FUNDS AND EXCHANGE TRADED PRODUCTS — 95.4% | | | |
| DOMESTIC EQUITY — 37.9% | |
SPDR Gold Shares (a)(b)
| | | 37,649 | | $ 6,711,687 |
SPDR Portfolio S&P 600 Small Cap ETF (a)(c)
| | | 148,000 | | 5,748,320 |
SPDR S&P 500 ETF Trust (a)
| | | 125,343 | | 55,562,045 |
SPDR S&P MidCap 400 ETF Trust (a)(c)
| | | 9,792 | | 4,689,487 |
The Consumer Discretionary Select Sector SPDR Fund (a)(c)
| | | 28,532 | | 4,845,019 |
The Health Care Select Sector SPDR Fund (a)(c)
| | | 35,191 | | 4,670,901 |
The Industrial Select Sector SPDR Fund (a)(c)
| | | 44,587 | | 4,785,077 |
| | | | | | 87,012,536 |
| DOMESTIC FIXED INCOME — 13.5% | |
SPDR Blackstone Senior Loan ETF (a)(c)
| | | 83,240 | | 3,485,259 |
SPDR Bloomberg High Yield Bond ETF (a)
| | | 50,020 | | 4,603,341 |
SPDR Bloomberg International Treasury Bond ETF (a)
| | | 507,878 | | 11,452,649 |
SPDR Portfolio Aggregate Bond ETF (a)(c)
| | | 270,297 | | 6,857,435 |
SPDR Portfolio Long Term Treasury ETF (a)
| | | 154,046 | | 4,605,975 |
| | | | | | 31,004,659 |
| INFLATION LINKED — 5.9% | |
SPDR Bloomberg 1-10 Year TIPS ETF (a)
| | | 740,764 | | 13,674,503 |
| INTERNATIONAL EQUITY — 32.1% | |
SPDR Portfolio Developed World ex-U.S. ETF (a)(c)
| | | 1,116,902 | | 36,343,991 |
SPDR Portfolio Emerging Markets ETF (a)(c)
| | | 462,602 | | 15,904,257 |
SPDR Portfolio Europe ETF (a)(c)
| | | 384,632 | | 14,812,178 |
SPDR S&P International Small Cap ETF (a)
| | | 220,444 | | 6,725,747 |
| | | | | | 73,786,173 |
| INTERNATIONAL FIXED INCOME — 6.0% | |
SPDR Bloomberg Emerging Markets Local Bond ETF (a)(c)
| | | 325,324 | | 6,883,856 |
| Security Description | | | Shares | | Value |
SPDR Bloomberg International Corporate Bond ETF (a)
| | | 244,384 | | $ 6,935,618 |
| | | | | | 13,819,474 |
TOTAL MUTUAL FUNDS AND EXCHANGE TRADED PRODUCTS
(Cost $203,551,395)
| | 219,297,345 | |
| SHORT-TERM INVESTMENTS — 22.5% | | | |
State Street Institutional U.S. Government Money Market Fund, Class G Shares 5.07% (d)(e)
| | | 10,331,839 | | $ 10,331,839 |
State Street Navigator Securities Lending Portfolio II (f)(g)
| | | 41,508,999 | | 41,508,999 |
TOTAL SHORT-TERM INVESTMENTS
(Cost $51,840,838)
| | | | | $ 51,840,838 |
TOTAL INVESTMENTS — 117.9%
(Cost $255,392,233)
| | | | | 271,138,183 |
LIABILITIES IN EXCESS OF OTHER ASSETS — (17.9)%
| | | | | (41,247,642) |
NET ASSETS — 100.0%
| | | | | $ 229,890,541 |
| The Fund invests in other funds and financial statements of underlying funds can be found at www.sec.gov. |
| |
| (a) | Affiliated fund managed by SSGA Funds Management, Inc. Amounts related to these transactions during the period ended June 30, 2023 are shown in the Affiliate Table below. |
| (b) | Non-income producing security. |
| (c) | All or a portion of the shares of the security are on loan at June 30, 2023. |
| (d) | The Fund invested in certain money market funds managed by SSGA Funds Management, Inc. Amounts related to these transactions during the period ended June 30, 2023 are shown in the Affiliate Table below. |
| (e) | The rate shown is the annualized seven-day yield at June 30, 2023. |
| (f) | The Fund invested in an affiliated entity. Amounts related to these transactions during the period ended June 30, 2023 are shown in the Affiliate Table below. |
| (g) | Investment of cash collateral for securities loaned. |
See accompanying notes to financial statements.
44
SPDR SSGA GLOBAL ALLOCATION ETF
SCHEDULE OF INVESTMENTS (continued)
June 30, 2023
The following table summarizes the value of the Fund's investments according to the fair value hierarchy as of June 30, 2023.
| Description | | Level 1 –
Quoted Prices | | Level 2 –
Other Significant
Observable Inputs | | Level 3 –
Significant
Unobservable Inputs | | Total |
| ASSETS: | | | | | | | | |
| INVESTMENTS: | | | | | | | | |
Mutual Funds and Exchange Traded Products
| | $219,297,345 | | $— | | $— | | $219,297,345 |
Short-Term Investments
| | 51,840,838 | | — | | — | | 51,840,838 |
TOTAL INVESTMENTS
| | $271,138,183 | | $— | | $— | | $271,138,183 |
Affiliate Table
| | Number of
Shares Held
at
6/30/22 | | Value at
6/30/22 | | Cost of
Purchases | | Proceeds
from
Shares Sold | | Realized
Gain (Loss) | | Change in
Unrealized
Appreciation/
Depreciation | | Number of
Shares Held
at
6/30/23 | | Value at
6/30/23 | | Dividend
Income |
SPDR Blackstone Senior Loan ETF
| 202,281 | | $ 8,422,981 | | $ 1,866,239 | | $ 6,735,689 | | $ (651,785) | | $ 583,513 | | 83,240 | | $ 3,485,259 | | $ 407,262 |
SPDR Bloomberg 1-10 Year TIPS ETF
| 867,998 | | 16,891,241 | | 5,031,078 | | 7,353,195 | | (543,094) | | (351,527) | | 740,764 | | 13,674,503 | | 692,589 |
SPDR Bloomberg Emerging Markets Local Bond ETF
| 296,971 | | 6,073,057 | | 2,230,347 | | 1,852,153 | | (62,408) | | 495,013 | | 325,324 | | 6,883,856 | | 342,022 |
SPDR Bloomberg High Yield Bond ETF
| — | | — | | 13,178,881 | | 8,307,844 | | (230,235) | | (37,461) | | 50,020 | | 4,603,341 | | 100,739 |
SPDR Bloomberg International Corporate Bond ETF
| — | | — | | 7,756,659 | | 992,310 | | 18,721 | | 152,548 | | 244,384 | | 6,935,618 | | 53,974 |
SPDR Bloomberg International Treasury Bond ETF
| 418,602 | | 9,694,823 | | 16,277,607 | | 14,226,354 | | (1,353,525) | | 1,060,098 | | 507,878 | | 11,452,649 | | 220,190 |
SPDR Dow Jones International Real Estate ETF
| 43,111 | | 1,216,593 | | 1,195,409 | | 2,435,381 | | (191,018) | | 214,397 | | — | | — | | — |
SPDR Dow Jones REIT ETF
| 42 | | 3,993 | | 1,173,554 | | 1,225,766 | | 48,140 | | 79 | | — | | — | | — |
SPDR Gold Shares
| — | | — | | 7,151,272 | | 435,905 | | 35,771 | | (39,451) | | 37,649 | | 6,711,687 | | — |
SPDR Portfolio Aggregate Bond ETF
| 231,832 | | 6,108,773 | | 52,892,458 | | 51,904,926 | | (418,344) | | 179,474 | | 270,297 | | 6,857,435 | | 277,436 |
SPDR Portfolio Developed World ex-US ETF
| 1,740,818 | | 50,205,191 | | 10,016,784 | | 29,321,433 | | 813,333 | | 4,630,116 | | 1,116,902 | | 36,343,991 | | 1,164,484 |
SPDR Portfolio Emerging Markets ETF
| 422,956 | | 14,706,180 | | 8,004,966 | | 6,681,119 | | (844,505) | | 718,735 | | 462,602 | | 15,904,257 | | 481,498 |
SPDR Portfolio Europe ETF
| — | | — | | 20,541,122 | | 7,478,416 | | 292,762 | | 1,456,710 | | 384,632 | | 14,812,178 | | 382,205 |
SPDR Portfolio Intermediate Term Treasury ETF
| 373,341 | | 11,002,359 | | 17,581,279 | | 28,019,957 | | (489,592) | | (74,089) | | — | | — | | 105,173 |
SPDR Portfolio Long Term Treasury ETF
| 443,258 | | 14,658,542 | | 14,593,435 | | 23,180,613 | | (4,181,613) | | 2,716,224 | | 154,046 | | 4,605,975 | | 233,472 |
SPDR Portfolio S&P 600 Small Cap ETF
| 374,403 | | 13,471,020 | | 11,650,400 | | 19,471,214 | | (959,055) | | 1,057,169 | | 148,000 | | 5,748,320 | | 91,140 |
SPDR S&P 500 ETF Trust
| 80,272 | | 30,282,612 | | 50,892,765 | | 33,186,252 | | 1,900,304 | | 5,672,616 | | 125,343 | | 55,562,045 | | 550,886 |
SPDR S&P International Small Cap ETF
| 254,837 | | 7,372,435 | | 1,604,178 | | 2,682,029 | | (186,258) | | 617,421 | | 220,444 | | 6,725,747 | | 197,137 |
SPDR S&P MidCap 400 ETF Trust
| 11,823 | | 4,888,692 | | 1,218,206 | | 2,174,666 | | 327,508 | | 429,747 | | 9,792 | | 4,689,487 | | 62,723 |
State Street Institutional U.S. Government Money Market Fund, Class G Shares
| 11,863,750 | | 11,863,750 | | 74,360,831 | | 75,892,742 | | — | | — | | 10,331,839 | | 10,331,839 | | 473,605 |
State Street Navigator Securities Lending Portfolio II
| 36,578,077 | | 36,578,077 | | 1,345,155,536 | | 1,340,224,614 | | — | | ��� | | 41,508,999 | | 41,508,999 | | 444,225 |
The Communication Services Select Sector SPDR Fund
| — | | — | | 4,554,242 | | 4,914,440 | | 360,198 | | — | | — | | — | | — |
The Consumer Discretionary Select Sector SPDR Fund
| — | | — | | 9,308,866 | | 4,676,631 | | 23,818 | | 188,966 | | 28,532 | | 4,845,019 | | 9,491 |
The Consumer Staples Select Sector SPDR Fund
| — | | — | | 5,288,710 | | 5,021,372 | | (267,337) | | — | | — | | — | | 33,701 |
The Energy Select Sector SPDR Fund
| 68,732 | | 4,915,025 | | 10,099,416 | | 16,101,068 | | 970,086 | | 116,541 | | — | | — | | 116,196 |
The Financial Select Sector SPDR Fund
| — | | — | | 10,520,289 | | 10,687,099 | | 166,810 | | — | | — | | — | | 72,696 |
The Health Care Select Sector SPDR Fund
| — | | — | | 11,798,164 | | 6,924,848 | | (282,011) | | 79,596 | | 35,191 | | 4,670,901 | | 18,992 |
The Industrial Select Sector SPDR Fund
| — | | — | | 4,943,447 | | 419,722 | | 3,855 | | 257,497 | | 44,587 | | 4,785,077 | | 35,946 |
The Materials Select Sector SPDR Fund
| 66,063 | | 4,862,237 | | 9,561,949 | | 14,510,976 | | (729,578) | | 816,368 | | — | | — | | 15,047 |
The Utilities Select Sector SPDR Fund
| 71,668 | | 5,026,077 | | 904,147 | | 6,090,671 | | 20,985 | | 139,462 | | — | | — | | 30,803 |
Total
| | | $258,243,658 | | $1,731,352,236 | | $1,733,129,405 | | $(6,408,067) | | $21,079,762 | | | | $271,138,183 | | $6,613,632 |
See accompanying notes to financial statements.
45
SPDR SSGA ULTRA SHORT TERM BOND ETF
SCHEDULE OF INVESTMENTS
June 30, 2023
| Security Description | | | Principal
Amount | | Value |
| CORPORATE BONDS & NOTES — 61.2% | | | | | |
| AEROSPACE & DEFENSE — 0.2% | |
Boeing Co.
1.43%, 2/4/2024
| | | $ 1,000,000 | | $ 973,460 |
| AGRICULTURE — 0.5% | |
Imperial Brands Finance PLC
3.13%, 7/26/2024 (a)
| | | 408,000 | | 394,206 |
Philip Morris International, Inc.
5.13%, 11/15/2024
| | | 2,500,000 | | 2,489,425 |
| | | | | | 2,883,631 |
| AUTO MANUFACTURERS — 5.6% | |
American Honda Finance Corp.
SOFR + 0.92%, 5.94%, 1/12/2026 (b)
| | | 2,915,000 | | 2,907,100 |
| Daimler Truck Finance North America LLC: | | | | | |
5.20%, 1/17/2025 (a)
| | | 1,500,000 | | 1,487,160 |
SOFR + 0.60%, 5.69%, 12/14/2023 (a) (b)
| | | 1,000,000 | | 998,740 |
SOFR + 0.75%, 5.84%, 12/13/2024 (a) (b)
| | | 1,000,000 | | 997,030 |
| Ford Motor Credit Co. LLC: | | | | | |
2.30%, 2/10/2025
| | | 1,680,000 | | 1,569,087 |
4.38%, 8/6/2023
| | | 1,500,000 | | 1,497,315 |
| General Motors Financial Co., Inc.: | | | | | |
3.80%, 4/7/2025
| | | 2,000,000 | | 1,929,180 |
5.40%, 4/6/2026
| | | 925,000 | | 914,501 |
Hyundai Capital America
0.80%, 1/8/2024 (a)
| | | 1,000,000 | | 973,400 |
| Mercedes-Benz Finance North America LLC: | | | | | |
5.50%, 11/27/2024 (a)
| | | 5,000,000 | | 4,990,850 |
SOFR + 0.93%, 6.02%, 3/30/2025 (a)
| | | 4,000,000 | | 4,000,160 |
| Nissan Motor Acceptance Co. LLC: | | | | | |
COR, 3.88%, 9/21/2023 (a)
| | | 2,326,000 | | 2,311,044 |
3 Month USD LIBOR + 0.64%, 6.15%, 3/8/2024 (a) (b)
| | | 1,000,000 | | 997,090 |
Nissan Motor Co. Ltd.
3.04%, 9/15/2023 (a)
| | | 2,000,000 | | 1,986,080 |
Toyota Motor Credit Corp.
SOFR + 0.56%, 5.57%, 1/10/2025 (b)
| | | 3,335,000 | | 3,334,533 |
| | | | | | 30,893,270 |
| BANKS — 13.9% | |
| Bank of America Corp.: | | | | | |
Series MTN, 3 Month SOFR + 1.20%, 3.86%, 7/23/2024 (b)
| | | 5,000,000 | | 4,993,500 |
Series MTN, SOFR + 0.73%, 5.79%, 10/24/2024 (b)
| | | 1,000,000 | | 999,790 |
| Security Description | | | Principal
Amount | | Value |
Bank of Montreal
SOFR + 0.35%, 5.44%, 12/8/2023 (b)
| | | $ 1,755,000 | | $ 1,752,122 |
Barclays Bank PLC
Series BKNT, 3.75%, 5/15/2024
| | | 2,000,000 | | 1,960,940 |
| Citigroup, Inc.: | | | | | |
SOFR + 0.69%, 0.78%, 10/30/2024 (b)
| | | 7,000,000 | | 6,875,120 |
SOFR + 1.37%, 4.14%, 5/24/2025 (b)
| | | 1,500,000 | | 1,473,630 |
| Goldman Sachs Group, Inc.: | | | | | |
SOFR + 0.51%, 0.66%, 9/10/2024 (b)
| | | 5,000,000 | | 4,942,500 |
SOFR + 0.49%, 5.54%, 10/21/2024 (b)
| | | 1,500,000 | | 1,492,440 |
5.70%, 11/1/2024
| | | 5,000,000 | | 4,993,950 |
| HSBC Holdings PLC: | | | | | |
4.25%, 3/14/2024
| | | 1,000,000 | | 985,420 |
SOFR + 0.58%, 5.67%, 11/22/2024 (b)
| | | 1,250,000 | | 1,241,100 |
SOFR + 1.43%, 6.52%, 3/10/2026 (b)
| | | 1,000,000 | | 1,005,110 |
JPMorgan Chase & Co.
3 Month SOFR + 0.58%, 0.97%, 6/23/2025 (b)
| | | 5,000,000 | | 4,746,400 |
| KeyBank NA: | | | | | |
4.15%, 8/8/2025
| | | 770,000 | | 709,940 |
SOFR + 0.32%, 5.41%, 6/14/2024 (b)
| | | 1,000,000 | | 971,010 |
Macquarie Group Ltd.
SOFR + 0.71%, 5.74%, 10/14/2025 (a) (b)
| | | 1,000,000 | | 990,990 |
| Morgan Stanley: | | | | | |
Series GMTN, SOFR + 0.51%, 0.79%, 1/22/2025 (b)
| | | 1,500,000 | | 1,453,665 |
SOFR + 1.16%, 3.62%, 4/17/2025 (b)
| | | 6,500,000 | | 6,370,390 |
National Australia Bank Ltd.
1.39%, 1/12/2025 (a)
| | | 1,500,000 | | 1,411,560 |
National Securities Clearing Corp.
5.15%, 5/30/2025 (a)
| | | 2,500,000 | | 2,488,150 |
NatWest Markets PLC
SOFR + 0.53%, 5.62%, 8/12/2024 (a) (b)
| | | 2,125,000 | | 2,112,059 |
Royal Bank of Canada
Series GMTN, SOFR + 0.53%, 5.57%, 1/20/2026 (b)
| | | 500,000 | | 494,885 |
| Sumitomo Mitsui Financial Group, Inc.: | | | | | |
3 Month USD LIBOR + 0.80%, 6.06%, 10/16/2023 (b)
| | | 1,000,000 | | 1,000,410 |
3 Month USD LIBOR + 0.86%, 6.13%, 7/19/2023 (b)
| | | 2,000,000 | | 2,000,120 |
See accompanying notes to financial statements.
46
SPDR SSGA ULTRA SHORT TERM BOND ETF
SCHEDULE OF INVESTMENTS (continued)
June 30, 2023
| Security Description | | | Principal
Amount | | Value |
SOFR + 1.43%, 6.44%, 1/13/2026 (b)
| | | $ 3,000,000 | | $ 3,015,510 |
| Sumitomo Mitsui Trust Bank Ltd.: | | | | | |
0.80%, 9/16/2024 (a)
| | | 2,500,000 | | 2,348,950 |
SOFR + 0.44%, 5.53%, 9/16/2024 (a) (b)
| | | 1,500,000 | | 1,491,975 |
| Toronto-Dominion Bank: | | | | | |
Series MTN, SOFR + 0.35%, 5.44%, 9/10/2024 (b)
| | | 1,515,000 | | 1,508,652 |
SOFR + 0.91%, 6.00%, 3/8/2024 (b)
| | | 2,000,000 | | 2,003,480 |
Truist Bank
SOFR + 0.20%, 5.23%, 1/17/2024 (b)
| | | 1,000,000 | | 990,300 |
UBS AG
SOFR + 0.36%, 5.45%, 2/9/2024 (a) (b)
| | | 3,930,000 | | 3,919,114 |
Wells Fargo & Co.
Series MTN, 3 Month SOFR + 1.09%, 2.41%, 10/30/2025 (b)
| | | 4,500,000 | | 4,287,555 |
| | | | | | 77,030,737 |
| BEVERAGES — 0.2% | |
Constellation Brands, Inc.
5.00%, 2/2/2026
| | | 1,000,000 | | 996,510 |
| BIOTECHNOLOGY — 0.6% | |
Amgen, Inc.
5.51%, 3/2/2026
| | | 1,455,000 | | 1,451,464 |
Royalty Pharma PLC
0.75%, 9/2/2023
| | | 2,000,000 | | 1,980,940 |
| | | | | | 3,432,404 |
| CHEMICALS — 0.8% | |
DuPont de Nemours, Inc.
3 Month USD LIBOR + 1.11%, 6.43%, 11/15/2023 (b)
| | | 1,000,000 | | 1,002,190 |
LyondellBasell Industries NV
5.75%, 4/15/2024
| | | 2,000,000 | | 1,995,760 |
Nutrien Ltd.
5.90%, 11/7/2024
| | | 830,000 | | 830,456 |
Sherwin-Williams Co.
4.05%, 8/8/2024
| | | 875,000 | | 860,869 |
| | | | | | 4,689,275 |
| COMMERCIAL SERVICES — 0.1% | |
Cintas Corp. No. 2
3.45%, 5/1/2025
| | | 585,000 | | 566,584 |
| CONSTRUCTION MATERIALS — 0.6% | |
Vulcan Materials Co.
5.80%, 3/1/2026
| | | 3,330,000 | | 3,328,901 |
| Security Description | | | Principal
Amount | | Value |
| DIVERSIFIED FINANCIAL SERVICES — 3.2% | |
| AerCap Ireland Capital DAC/AerCap Global Aviation Trust: | | | | | |
Series 3NC1, 1.75%, 10/29/2024
| | | $ 1,000,000 | | $ 939,430 |
SOFR + 0.68%, 5.77%, 9/29/2023 (b)
| | | 1,000,000 | | 997,990 |
Air Lease Corp.
3.00%, 9/15/2023
| | | 1,500,000 | | 1,489,110 |
Aircastle Ltd.
4.40%, 9/25/2023
| | | 4,281,000 | | 4,258,867 |
Ally Financial, Inc.
1.45%, 10/2/2023
| | | 3,276,000 | | 3,229,088 |
Charles Schwab Corp.
0.75%, 3/18/2024
| | | 5,000,000 | | 4,823,250 |
Nasdaq, Inc.
5.65%, 6/28/2025
| | | 645,000 | | 646,612 |
Synchrony Financial
4.25%, 8/15/2024
| | | 1,452,000 | | 1,398,247 |
| | | | | | 17,782,594 |
| ELECTRIC — 6.5% | |
CenterPoint Energy, Inc.
SOFR + 0.65%, 5.74%, 5/13/2024 (b)
| | | 1,500,000 | | 1,498,215 |
DTE Energy Co.
4.22%, 11/1/2024 (c)
| | | 1,250,000 | | 1,223,050 |
Eversource Energy
4.20%, 6/27/2024
| | | 3,080,000 | | 3,031,860 |
Jersey Central Power & Light Co.
4.70%, 4/1/2024 (a)
| | | 1,888,000 | | 1,868,006 |
National Rural Utilities Cooperative Finance Corp.
Series D, SOFR + 0.33%, 5.36%, 10/18/2024 (b)
| | | 2,500,000 | | 2,495,675 |
| NextEra Energy Capital Holdings, Inc.: | | | | | |
4.26%, 9/1/2024
| | | 1,250,000 | | 1,229,162 |
SOFR + 0.40%, 5.48%, 11/3/2023 (b)
| | | 2,940,000 | | 2,939,618 |
6.05%, 3/1/2025
| | | 875,000 | | 880,101 |
SOFR + 1.02%, 6.11%, 3/21/2024 (b)
| | | 1,500,000 | | 1,500,105 |
Pacific Gas & Electric Co.
3.85%, 11/15/2023
| | | 2,459,000 | | 2,439,205 |
| Southern California Edison Co.: | | | | | |
Series J, 0.70%, 8/1/2023
| | | 3,850,000 | | 3,834,985 |
SOFR + 0.83%, 5.92%, 4/1/2024 (b)
| | | 640,000 | | 639,194 |
Southwestern Public Service Co.
3.30%, 6/15/2024
| | | 6,982,000 | | 6,823,159 |
Tampa Electric Co.
3.88%, 7/12/2024
| | | 1,670,000 | | 1,640,725 |
See accompanying notes to financial statements.
47
SPDR SSGA ULTRA SHORT TERM BOND ETF
SCHEDULE OF INVESTMENTS (continued)
June 30, 2023
| Security Description | | | Principal
Amount | | Value |
Virginia Electric & Power Co.
3.45%, 2/15/2024
| | | $ 4,015,000 | | $ 3,952,125 |
| | | | | | 35,995,185 |
| ELECTRONICS — 0.4% | |
Arrow Electronics, Inc.
6.13%, 3/1/2026
| | | 2,500,000 | | 2,493,775 |
| ENTERTAINMENT — 0.8% | |
| Warnermedia Holdings, Inc.: | | | | | |
3.53%, 3/15/2024
| | | 2,000,000 | | 1,961,620 |
3.64%, 3/15/2025
| | | 1,000,000 | | 964,720 |
6.41%, 3/15/2026
| | | 1,630,000 | | 1,631,190 |
| | | | | | 4,557,530 |
| FOREST PRODUCTS & PAPER — 0.7% | |
Georgia-Pacific LLC
0.63%, 5/15/2024 (a)
| | | 4,000,000 | | 3,836,880 |
| HAND & MACHINE TOOLS — 0.5% | |
Stanley Black & Decker, Inc.
6.27%, 3/6/2026
| | | 2,500,000 | | 2,522,200 |
| HEALTH CARE PRODUCTS — 0.6% | |
GE HealthCare Technologies, Inc.
5.55%, 11/15/2024
| | | 1,000,000 | | 995,210 |
Revvity, Inc.
0.85%, 9/15/2024
| | | 1,000,000 | | 941,040 |
Thermo Fisher Scientific, Inc.
SOFR + 0.53%, 5.56%, 10/18/2024 (b)
| | | 1,135,000 | | 1,134,013 |
| | | | | | 3,070,263 |
| HEALTH CARE SERVICES — 0.4% | |
Roche Holdings, Inc.
SOFR + 0.33%, 5.42%, 9/11/2023 (a) (b)
| | | 2,000,000 | | 2,000,020 |
| HOUSEHOLD PRODUCTS — 0.2% | |
Kenvue, Inc.
5.50%, 3/22/2025 (a)
| | | 1,040,000 | | 1,042,725 |
| INSURANCE — 1.6% | |
Athene Global Funding
SOFR + 0.70%, 5.79%, 5/24/2024 (a) (b)
| | | 1,000,000 | | 989,970 |
Corebridge Global Funding
5.75%, 7/2/2026 (a)
| | | 2,500,000 | | 2,492,025 |
Pacific Life Global Funding II
SOFR + 0.62%, 5.71%, 6/4/2026 (a) (b)
| | | 4,168,000 | | 4,044,127 |
Pricoa Global Funding I
2.40%, 9/23/2024 (a)
| | | 1,500,000 | | 1,435,305 |
| | | | | | 8,961,427 |
| INVESTMENT COMPANY SECURITY — 1.4% | |
Blackstone Private Credit Fund
2.35%, 11/22/2024
| | | 1,000,000 | | 935,070 |
| Security Description | | | Principal
Amount | | Value |
Blackstone Secured Lending Fund
3.65%, 7/14/2023
| | | $ 7,088,000 | | $ 7,071,343 |
| | | | | | 8,006,413 |
| IT SERVICES — 0.3% | |
Apple, Inc.
4.42%, 5/8/2026
| | | 1,785,000 | | 1,776,914 |
| LODGING — 0.3% | |
Hyatt Hotels Corp.
1.30%, 10/1/2023
| | | 1,530,000 | | 1,512,482 |
| MACHINERY, CONSTRUCTION & MINING — 0.5% | |
Caterpillar Financial Services Corp.
4.80%, 1/6/2026
| | | 2,500,000 | | 2,494,250 |
| MACHINERY-DIVERSIFIED — 1.6% | |
| John Deere Capital Corp.: | | | | | |
3.40%, 6/6/2025
| | | 1,390,000 | | 1,346,284 |
4.05%, 9/8/2025
| | | 2,000,000 | | 1,957,020 |
4.80%, 1/9/2026
| | | 3,335,000 | | 3,323,928 |
Series MTN, SOFR + 0.20%, 5.20%, 10/11/2024 (b)
| | | 1,500,000 | | 1,497,120 |
Rockwell Automation, Inc.
0.35%, 8/15/2023
| | | 1,000,000 | | 994,240 |
| | | | | | 9,118,592 |
| MEDIA — 0.2% | |
Discovery Communications LLC
3.80%, 3/13/2024
| | | 1,117,000 | | 1,099,552 |
| MINING — 2.2% | |
BHP Billiton Finance USA Ltd.
4.88%, 2/27/2026
| | | 2,500,000 | | 2,487,100 |
Glencore Funding LLC
4.13%, 3/12/2024 (a)
| | | 5,000,000 | | 4,937,900 |
Kinross Gold Corp.
5.95%, 3/15/2024
| | | 4,938,000 | | 4,924,667 |
| | | | | | 12,349,667 |
| MISCELLANEOUS MANUFACTURER — 3.1% | |
Carlisle Cos., Inc.
0.55%, 9/1/2023
| | | 575,000 | | 570,297 |
Parker-Hannifin Corp.
3.65%, 6/15/2024
| | | 11,000,000 | | 10,781,540 |
| Siemens Financieringsmaatschappij NV: | | | | | |
0.65%, 3/11/2024 (a)
| | | 5,000,000 | | 4,830,400 |
SOFR + 0.43%, 5.52%, 3/11/2024 (a) (b)
| | | 1,000,000 | | 1,000,420 |
| | | | | | 17,182,657 |
| OIL & GAS — 1.1% | |
Chevron USA, Inc.
3.90%, 11/15/2024
| | | 1,000,000 | | 982,710 |
Continental Resources, Inc.
2.27%, 11/15/2026 (a)
| | | 750,000 | | 666,960 |
See accompanying notes to financial statements.
48
SPDR SSGA ULTRA SHORT TERM BOND ETF
SCHEDULE OF INVESTMENTS (continued)
June 30, 2023
| Security Description | | | Principal
Amount | | Value |
Occidental Petroleum Corp.
6.95%, 7/1/2024
| | | $ 2,500,000 | | $ 2,524,250 |
Pioneer Natural Resources Co.
5.10%, 3/29/2026
| | | 795,000 | | 790,771 |
Shell International Finance BV
3 Month USD LIBOR + 0.40%, 5.72%, 11/13/2023 (b)
| | | 1,000,000 | | 1,001,020 |
| | | | | | 5,965,711 |
| PACKAGING & CONTAINERS — 0.4% | |
Graphic Packaging International LLC
0.82%, 4/15/2024 (a)
| | | 1,000,000 | | 960,600 |
Sonoco Products Co.
1.80%, 2/1/2025
| | | 1,470,000 | | 1,380,815 |
| | | | | | 2,341,415 |
| PHARMACEUTICALS — 3.6% | |
Astrazeneca Finance LLC
0.70%, 5/28/2024
| | | 2,000,000 | | 1,915,420 |
Bayer U.S. Finance II LLC
3 Month USD LIBOR + 1.01%, 6.56%, 12/15/2023 (a) (b)
| | | 1,500,000 | | 1,500,120 |
Bristol-Myers Squibb Co.
0.54%, 11/13/2023
| | | 1,640,000 | | 1,610,644 |
| Cigna Group: | | | | | |
5.69%, 3/15/2026
| | | 5,000,000 | | 5,006,050 |
3 Month USD LIBOR + 0.89%, 6.15%, 7/15/2023 (b)
| | | 1,000,000 | | 999,840 |
Eli Lilly & Co.
5.00%, 2/27/2026
| | | 1,555,000 | | 1,557,083 |
Mylan, Inc.
4.20%, 11/29/2023
| | | 2,000,000 | | 1,985,980 |
Pfizer Investment Enterprises Pte. Ltd.
4.65%, 5/19/2025
| | | 2,240,000 | | 2,219,549 |
Shire Acquisitions Investments Ireland DAC
2.88%, 9/23/2023
| | | 2,000,000 | | 1,985,860 |
Viatris, Inc.
1.65%, 6/22/2025
| | | 1,500,000 | | 1,380,825 |
| | | | | | 20,161,371 |
| PIPELINES — 1.5% | |
| Enbridge, Inc.: | | | | | |
0.55%, 10/4/2023
| | | 1,000,000 | | 986,690 |
5.97%, 3/8/2026
| | | 1,820,000 | | 1,822,748 |
Plains All American Pipeline LP/PAA Finance Corp.
3.85%, 10/15/2023
| | | 2,395,000 | | 2,379,720 |
Sabine Pass Liquefaction LLC
5.63%, 3/1/2025
| | | 1,000,000 | | 996,660 |
| Security Description | | | Principal
Amount | | Value |
Williams Cos., Inc.
4.55%, 6/24/2024
| | | $ 2,000,000 | | $ 1,973,300 |
| | | | | | 8,159,118 |
| REAL ESTATE INVESTMENT TRUSTS — 1.1% | |
Omega Healthcare Investors, Inc.
4.38%, 8/1/2023
| | | 5,000,000 | | 4,978,350 |
Realty Income Corp.
5.05%, 1/13/2026
| | | 1,115,000 | | 1,106,671 |
| | | | | | 6,085,021 |
| RETAIL — 0.7% | |
7-Eleven, Inc.
0.80%, 2/10/2024 (a)
| | | 2,000,000 | | 1,937,780 |
Dollar General Corp.
4.25%, 9/20/2024
| | | 1,090,000 | | 1,069,552 |
Genuine Parts Co.
1.75%, 2/1/2025
| | | 660,000 | | 618,169 |
| | | | | | 3,625,501 |
| SEMICONDUCTORS — 0.2% | |
Intel Corp.
4.88%, 2/10/2026
| | | 565,000 | | 563,508 |
NXP BV/NXP Funding LLC
4.88%, 3/1/2024
| | | 750,000 | | 743,910 |
| | | | | | 1,307,418 |
| SOFTWARE — 2.2% | |
Activision Blizzard, Inc.
3.40%, 9/15/2026
| | | 2,250,000 | | 2,143,935 |
Take-Two Interactive Software, Inc.
3.30%, 3/28/2024
| | | 10,000,000 | | 9,817,800 |
| | | | | | 11,961,735 |
| TELECOMMUNICATIONS — 2.0% | |
| AT&T, Inc.: | | | | | |
0.90%, 3/25/2024
| | | 1,500,000 | | 1,448,610 |
5.54%, 2/20/2026
| | | 1,000,000 | | 1,000,220 |
NTT Finance Corp.
0.58%, 3/1/2024 (a)
| | | 2,000,000 | | 1,930,440 |
Sprint LLC
7.88%, 9/15/2023
| | | 5,000,000 | | 5,015,150 |
Verizon Communications, Inc.
SOFR + 0.50%, 5.59%, 3/22/2024 (b)
| | | 1,500,000 | | 1,496,640 |
| | | | | | 10,891,060 |
| TRANSPORTATION — 0.4% | |
Canadian Pacific Railway Co.
1.35%, 12/2/2024
| | | 1,000,000 | | 940,090 |
JB Hunt Transport Services, Inc.
3.85%, 3/15/2024
| | | 1,281,000 | | 1,262,951 |
| | | | | | 2,203,041 |
See accompanying notes to financial statements.
49
SPDR SSGA ULTRA SHORT TERM BOND ETF
SCHEDULE OF INVESTMENTS (continued)
June 30, 2023
| Security Description | | | Principal
Amount | | Value |
| TRUCKING & LEASING — 1.0% | |
GATX Corp.
4.35%, 2/15/2024
| | | $ 5,414,000 | | $ 5,349,736 |
TOTAL CORPORATE BONDS & NOTES
(Cost $341,316,043)
| | | | | 338,649,025 |
| ASSET-BACKED SECURITIES — 5.6% | | | | | |
| ASSET-BACKED - OTHER — 3.0% | | | | | |
| Ford Credit Floorplan Master Owner Trust A: | | | | | |
Series 2019-4, Class A, 2.44%, 9/15/2026
| | | 8,000,000 | | 7,677,432 |
Series 2020-1, Class A2, 1 Month USD LIBOR + 0.50%, 5.69%, 9/15/2025 (b)
| | | 8,780,000 | | 8,780,820 |
| | | | | | 16,458,252 |
| AUTOMOBILE — 0.9% | | | | | |
Nissan Auto Lease Trust
Series 2023-A, Class A3, 4.91%, 1/15/2026
| | | 5,000,000 | | 4,944,223 |
| CREDIT CARD — 1.7% | | | | | |
Master Credit Card Trust
Series 2021-1A, Class A, 0.53%, 11/21/2025 (a)
| | | 10,000,000 | | 9,528,026 |
TOTAL ASSET-BACKED SECURITIES
(Cost $30,940,000)
| | | | | 30,930,501 |
| U.S. TREASURY OBLIGATIONS — 19.4% | | | | | |
| U.S. Treasury Bill: | | | | | |
4.85%, 7/25/2023
| | | 60,000,000 | | 59,816,667 |
5.23%, 7/13/2023
| | | 20,000,000 | | 19,972,187 |
U.S. Treasury Notes 0.25%, 9/30/2023
(Cost $27,978,956)
| | | 27,995,200 | | 27,657,289 |
TOTAL U.S. TREASURY OBLIGATIONS
(Cost $107,748,093)
| | | | | 107,446,143 |
| MORTGAGE-BACKED SECURITIES — 2.1% | | | | | |
BHMS Mortgage Trust Series 2018-ATLS, Class A, 1 Month USD LIBOR + 1.25%, 6.44%, 7/15/2035 (a) (b)
| | | 2,870,000 | | 2,810,150 |
BX Commercial Mortgage Trust Series 2019-XL, Class A, 1 Month USD Term LIBOR + 1.03%, 6.18%, 10/15/2036 (a) (b)
| | | 1,388,480 | | 1,379,279 |
| Security Description | | | Principal
Amount | | Value |
Credit Suisse Mortgage Capital Certificates Series 2019-ICE4, Class A, 1 Month USD LIBOR + 0.98%, 6.17%, 5/15/2036 (a) (b)
| | | $ 7,331,759 | | $ 7,284,648 |
TOTAL MORTGAGE-BACKED SECURITIES
(Cost $11,556,993)
| | | | | 11,474,077 |
| COMMERCIAL MORTGAGE BACKED SECURITIES — 2.2% | | | | | |
BPR Trust Series 2022-OANA, Class A, 1 Month USD Term LIBOR + 1.90%, 7.05%, 4/15/2037 (a) (b)
| | | 1,800,000 | | 1,752,475 |
BX Mortgage Trust Series 2021-PAC, Class B, 1 Month USD LIBOR + 0.90%, 6.09%, 10/15/2036 (a) (b)
| | | 2,500,000 | | 2,401,118 |
| Cold Storage Trust: | | | | | |
Series 2020-ICE5, Class A, 1 Month USD LIBOR + 0.90%, 6.09%, 11/15/2037 (a) (b)
| | | 3,178,991 | | 3,122,643 |
Series 2020-ICE5, Class B, 1 Month USD LIBOR + 1.30%, 6.49%, 11/15/2037 (a) (b)
| | | 4,914,953 | | 4,826,119 |
TOTAL COMMERCIAL MORTGAGE BACKED SECURITIES
(Cost $12,335,087)
| | | | | 12,102,355 |
| | | Shares | |
| SHORT-TERM INVESTMENT — 9.0% | |
State Street Institutional U.S. Government Money Market Fund, Class G Shares 5.07% (d) (e)
(Cost $49,808,408)
| 49,808,408 | 49,808,408 |
TOTAL INVESTMENTS — 99.5%
(Cost $553,704,624)
| 550,410,509 |
OTHER ASSETS IN EXCESS OF LIABILITIES — 0.5%
| 2,959,762 |
NET ASSETS — 100.0%
| $ 553,370,271 |
See accompanying notes to financial statements.
50
SPDR SSGA ULTRA SHORT TERM BOND ETF
SCHEDULE OF INVESTMENTS (continued)
June 30, 2023
| (a) | Securities purchased pursuant to Rule 144A of the Securities Act of 1933, as amended. These securities, which represent 18.5% of net assets as of June 30, 2023, are considered liquid and may be resold in transactions exempt from registration, normally to qualified institutional buyers. |
| (b) | Variable Rate Security - Interest rate shown is rate in effect at June 30, 2023. For securities based on a published reference rate and spread, the reference rate and spread are indicated in the description above. |
| (c) | Step-up bond - Coupon rate increases in increments to maturity. Rate shown as of June 30, 2023. Maturity date shown is the final maturity. |
| (d) | The Fund invested in certain money market funds managed by SSGA Funds Management, Inc. Amounts related to these transactions during the period ended June 30, 2023 are shown in the Affiliate Table below. |
| (e) | The rate shown is the annualized seven-day yield at June 30, 2023. |
| BKNT | Bank Notes |
| GMTN | Global Medium Term Note |
| LIBOR | London Interbank Offered Rate |
| MTN | Medium Term Note |
| SOFR | Secured Overnight Financing Rate |
See accompanying notes to financial statements.
51
SPDR SSGA ULTRA SHORT TERM BOND ETF
SCHEDULE OF INVESTMENTS (continued)
June 30, 2023
At June 30, 2023, open futures contracts were as follows:
| Description | | Number of
Contracts | | Expiration
Date | | Notional
Amount | | Value | | Unrealized
Appreciation
(Depreciation) |
| 2 Yr. U.S. Treasury Note Futures (long) | | 82 | | 09/29/2023 | | $16,885,289 | | $16,673,908 | | $ (211,381) |
| 5 Yr. U.S. Treasury Note Futures (long) | | 76 | | 09/29/2023 | | 8,223,138 | | 8,139,125 | | (84,013) |
| | | | | | | | | | | $(295,394) |
During the period ended June 30, 2023, average notional value related to long futures contracts was $5,546,238 and short futures contracts was $38,454,457.
The following table summarizes the value of the Fund's investments according to the fair value hierarchy as of June 30, 2023.
| Description | | Level 1 –
Quoted Prices | | Level 2 –
Other Significant
Observable Inputs | | Level 3 –
Significant
Unobservable Inputs | | Total |
| ASSETS: | | | | | | | | |
| INVESTMENTS: | | | | | | | | |
Corporate Bonds & Notes
| | $ — | | $338,649,025 | | $— | | $338,649,025 |
Asset-Backed Securities
| | — | | 30,930,501 | | — | | 30,930,501 |
U.S. Treasury Obligations
| | — | | 107,446,143 | | — | | 107,446,143 |
Mortgage-Backed Securities
| | — | | 11,474,077 | | — | | 11,474,077 |
Commercial Mortgage Backed Securities
| | — | | 12,102,355 | | — | | 12,102,355 |
Short-Term Investment
| | 49,808,408 | | — | | — | | 49,808,408 |
TOTAL INVESTMENTS
| | $49,808,408 | | $500,602,101 | | $— | | $550,410,509 |
| OTHER FINANCIAL INSTRUMENTS: | | | | | | | | |
Futures Contracts - Unrealized Depreciation
| | $ (295,394) | | $ — | | $— | | $ (295,394) |
TOTAL OTHER FINANCIAL INSTRUMENTS:
| | $ (295,394) | | $ — | | $— | | $ (295,394) |
Affiliate Table
| | Number of
Shares Held
at
6/30/22 | | Value at
6/30/22 | | Cost of
Purchases | | Proceeds
from
Shares Sold | | Realized
Gain (Loss) | | Change in
Unrealized
Appreciation/
Depreciation | | Number of
Shares Held
at
6/30/23 | | Value at
6/30/23 | | Dividend
Income |
State Street Institutional U.S. Government Money Market Fund, Class G Shares
| 29,493,611 | | $29,493,611 | | $575,672,381 | | $555,357,584 | | $— | | $— | | 49,808,408 | | $49,808,408 | | $1,091,063 |
See accompanying notes to financial statements.
52
SPDR LOOMIS SAYLES OPPORTUNISTIC BOND ETF
SCHEDULE OF INVESTMENTS
June 30, 2023
| Security Description | | | Principal
Amount | | Value |
| CORPORATE BONDS & NOTES — 62.9% | | | | | |
| AUSTRALIA — 0.9% | | | | |
| FMG Resources August 2006 Pty. Ltd.: | | | | | |
4.50%, 9/15/2027 (a)
| | | $ 30,000 | | $ 28,078 |
5.88%, 4/15/2030 (a)
| | | 6,000 | | 5,718 |
6.13%, 4/15/2032 (a)
| | | 33,000 | | 31,367 |
Infrabuild Australia Pty. Ltd.
12.00%, 10/1/2024 (a)
| | | 12,000 | | 11,702 |
| Mineral Resources Ltd.: | | | | | |
8.13%, 5/1/2027 (a)
| | | 29,000 | | 29,050 |
8.50%, 5/1/2030 (a)
| | | 26,000 | | 26,263 |
Northern Star Resources Ltd.
6.13%, 4/11/2033 (a)
| | | 126,000 | | 122,195 |
| | | | | | 254,373 |
| BRAZIL — 0.4% | | | | |
MercadoLibre, Inc.
2.00%, 8/15/2028
| | | 3,000 | | 8,209 |
Petrobras Global Finance BV
6.50%, 7/3/2033
| | | 105,000 | | 102,747 |
| | | | | | 110,956 |
| CANADA — 2.8% | | | | |
Baffinland Iron Mines Corp./Baffinland Iron Mines LP
8.75%, 7/15/2026 (a)
| | | 8,000 | | 7,699 |
| Bombardier, Inc.: | | | | | |
6.00%, 2/15/2028 (a)
| | | 31,000 | | 29,301 |
7.50%, 3/15/2025 (a)
| | | 12,000 | | 12,031 |
| Brookfield Residential Properties, Inc./Brookfield Residential U.S. LLC: | | | | | |
4.88%, 2/15/2030 (a)
| | | 17,000 | | 13,468 |
6.25%, 9/15/2027 (a)
| | | 15,000 | | 13,853 |
Empire Communities Corp.
7.00%, 12/15/2025 (a)
| | | 31,000 | | 29,447 |
Enerflex Ltd.
9.00%, 10/15/2027 (a)
| | | 37,000 | | 36,055 |
Garda World Security Corp.
9.50%, 11/1/2027 (a)
| | | 17,000 | | 16,426 |
Magna International, Inc.
5.98%, 3/21/2026
| | | 183,000 | | 183,069 |
| Methanex Corp.: | | | | | |
5.25%, 12/15/2029
| | | 40,000 | | 36,528 |
5.65%, 12/1/2044
| | | 12,000 | | 9,865 |
New Gold, Inc.
7.50%, 7/15/2027 (a)
| | | 31,000 | | 28,996 |
| Nutrien Ltd.: | | | | | |
4.90%, 3/27/2028
| | | 73,000 | | 71,760 |
5.80%, 3/27/2053
| | | 16,000 | | 16,059 |
Open Text Corp.
3.88%, 12/1/2029 (a)
| | | 73,000 | | 61,034 |
Strathcona Resources Ltd.
6.88%, 8/1/2026 (a)
| | | 30,000 | | 26,379 |
| Security Description | | | Principal
Amount | | Value |
Taseko Mines Ltd.
7.00%, 2/15/2026 (a)
| | | $ 29,000 | | $ 26,471 |
TransCanada PipeLines Ltd.
6.20%, 3/9/2026
| | | 219,000 | | 219,169 |
| | | | | | 837,610 |
| CHINA — 0.9% | | | | |
Alibaba Group Holding Ltd.
3.15%, 2/9/2051
| | | 129,000 | | 83,453 |
Li Auto, Inc.
0.25%, 5/1/2028
| | | 10,000 | | 13,809 |
NXP BV/NXP Funding LLC/NXP USA, Inc.
5.00%, 1/15/2033
| | | 44,000 | | 42,297 |
Prosus NV
4.19%, 1/19/2032 (a)
| | | 165,000 | | 138,943 |
| | | | | | 278,502 |
| FINLAND — 0.0% (b) | | | | |
Nokia Oyj
6.63%, 5/15/2039
| | | 11,000 | | 10,559 |
| FRANCE — 1.0% | | | | |
BNP Paribas SA 5 year CMT + 3.75%,
4.63%, 1/12/2027 (a) (c)
| | | 165,000 | | 130,558 |
Societe Generale SA 5 year USD Swap + 4.98%,
7.88%, 12/18/2023 (a) (c)
| | | 172,000 | | 168,262 |
| | | | | | 298,820 |
| GERMANY — 0.6% | | | | |
| Deutsche Bank AG: | | | | | |
SOFR + 1.72%, 3.04%, 5/28/2032 (c)
| | | 90,000 | | 71,053 |
SOFR + 1.87%, 2.13%, 11/24/2026 (c)
| | | 125,000 | | 110,980 |
| | | | | | 182,033 |
| HONG KONG — 0.1% | | | | |
Seaspan Corp.
5.50%, 8/1/2029 (a)
| | | 30,000 | | 23,583 |
| IRELAND — 0.8% | | | | |
AerCap Ireland Capital DAC/AerCap Global Aviation Trust
3.30%, 1/30/2032
| | | 90,000 | | 73,573 |
Bank of Ireland Group PLC 1 year CMT + 2.65%,
6.25%, 9/16/2026 (a) (c)
| | | 165,000 | | 163,919 |
| | | | | | 237,492 |
| ITALY — 3.2% | | | | |
| Intesa Sanpaolo SpA: | | | | | |
5.02%, 6/26/2024 (a)
| | | 165,000 | | 159,774 |
7.78%, 6/20/2054 (a) (c)
| | | 200,000 | | 198,982 |
1 year CMT + 2.75%, 4.95%, 6/1/2042 (a) (c)
| | | 241,000 | | 158,672 |
See accompanying notes to financial statements.
53
SPDR LOOMIS SAYLES OPPORTUNISTIC BOND ETF
SCHEDULE OF INVESTMENTS (continued)
June 30, 2023
| Security Description | | | Principal
Amount | | Value |
| Telecom Italia Capital SA: | | | | | |
6.00%, 9/30/2034
| | | $ 10,000 | | $ 8,059 |
7.20%, 7/18/2036
| | | 24,000 | | 20,668 |
7.72%, 6/4/2038
| | | 10,000 | | 8,842 |
UniCredit SpA 5 Year US ISDA + 4.91%,
7.30%, 4/2/2034 (a) (c)
| | | 406,000 | | 383,414 |
| | | | | | 938,411 |
| JAPAN — 0.6% | | | | |
NTT Finance Corp.
4.14%, 7/26/2024 (a)
| | | 165,000 | | 162,390 |
| NETHERLANDS — 0.5% | | | | |
ING Groep NV 5 year USD Swap + 4.45%,
6.50%, 4/16/2025 (c)
| | | 172,000 | | 159,638 |
| SINGAPORE — 0.0% (b) | | | | |
Sea Ltd.
2.38%, 12/1/2025
| | | 11,000 | | 11,202 |
| SPAIN — 0.6% | | | | |
Banco Santander SA VRN, 5 Year US ISDA + 4.99%,
7.50%, 2/8/2024 (c)
| | | 172,000 | | 163,830 |
| SWITZERLAND — 2.1% | | | | |
Credit Suisse AG
4.75%, 8/9/2024
| | | 410,000 | | 400,914 |
UBS Group AG SOFR + 3.70%,
6.44%, 8/11/2028 (a) (c)
| | | 214,000 | | 214,788 |
| | | | | | 615,702 |
| UNITED KINGDOM — 4.2% | | | | |
Barclays PLC 5 Year CMT + 3.41%,
4.38%, 3/15/2028 (c)
| | | 284,000 | | 191,490 |
British Telecommunications PLC
9.63%, 12/15/2030
| | | 95,000 | | 116,573 |
HSBC Holdings PLC SOFR + 2.98%,
6.55%, 6/20/2034 (c)
| | | 200,000 | | 199,196 |
NatWest Group PLC 1 year CMT + 1.95%,
5.81%, 9/13/2029 (c)
| | | 200,000 | | 197,198 |
| Standard Chartered PLC: | | | | | |
1 year CMT + 0.95%, 1.82%, 11/23/2025 (a) (c)
| | | 165,000 | | 154,285 |
1 year CMT + 2.05%, 6.17%, 1/9/2027 (a) (c)
| | | 330,000 | | 329,578 |
TechnipFMC PLC
6.50%, 2/1/2026 (a)
| | | 36,000 | | 35,530 |
| | | | | | 1,223,850 |
| UNITED STATES — 44.2% | | | | |
Academy Ltd.
6.00%, 11/15/2027 (a)
| | | 52,000 | | 50,073 |
Advisor Group Holdings, Inc.
10.75%, 8/1/2027 (a)
| | | 18,000 | | 18,186 |
| Security Description | | | Principal
Amount | | Value |
Affinity Interactive
6.88%, 12/15/2027 (a)
| | | $ 30,000 | | $ 26,569 |
Allegiant Travel Co.
7.25%, 8/15/2027 (a)
| | | 55,000 | | 54,803 |
Allied Universal Holdco LLC/Allied Universal Finance Corp.
9.75%, 7/15/2027 (a)
| | | 24,000 | | 21,137 |
Allison Transmission, Inc.
5.88%, 6/1/2029 (a)
| | | 18,000 | | 17,566 |
Alta Equipment Group, Inc.
5.63%, 4/15/2026 (a)
| | | 31,000 | | 28,921 |
Amazon.com, Inc.
3.10%, 5/12/2051
| | | 85,000 | | 63,340 |
American Express Co.
5.85%, 11/5/2027
| | | 35,000 | | 35,857 |
American International Group, Inc. Series A-9, 3 Month USD LIBOR + 2.87%,
5.75%, 4/1/2048 (c)
| | | 17,000 | | 16,472 |
American Tower Corp.
2.30%, 9/15/2031
| | | 145,000 | | 115,411 |
Ameriprise Financial, Inc.
4.50%, 5/13/2032
| | | 44,000 | | 42,140 |
Amgen, Inc.
4.20%, 3/1/2033
| | | 90,000 | | 83,987 |
ANGI Group LLC
3.88%, 8/15/2028 (a)
| | | 34,000 | | 27,806 |
Apple, Inc.
4.00%, 5/10/2028
| | | 120,000 | | 117,965 |
Arches Buyer, Inc.
6.13%, 12/1/2028 (a)
| | | 18,000 | | 15,521 |
Arko Corp.
5.13%, 11/15/2029 (a)
| | | 25,000 | | 20,376 |
Armor Holdco, Inc.
8.50%, 11/15/2029 (a)
| | | 10,000 | | 8,441 |
Arrow Bidco LLC
9.50%, 3/15/2024 (a)
| | | 10,000 | | 10,036 |
Artera Services LLC
9.03%, 12/4/2025 (a)
| | | 19,000 | | 16,633 |
Ashland, Inc.
3.38%, 9/1/2031 (a)
| | | 5,000 | | 3,995 |
Ashton Woods USA LLC/Ashton Woods Finance Co.
4.63%, 4/1/2030 (a)
| | | 34,000 | | 29,049 |
| AT&T, Inc.: | | | | | |
3.55%, 9/15/2055
| | | 44,000 | | 30,804 |
3.65%, 9/15/2059
| | | 56,000 | | 38,955 |
3.80%, 12/1/2057
| | | 7,000 | | 5,063 |
5.40%, 2/15/2034
| | | 0 | | — |
Atkore, Inc.
4.25%, 6/1/2031 (a)
| | | 34,000 | | 29,571 |
Avnet, Inc.
5.50%, 6/1/2032
| | | 42,000 | | 40,000 |
B&G Foods, Inc.
5.25%, 4/1/2025
| | | 19,000 | | 18,127 |
See accompanying notes to financial statements.
54
SPDR LOOMIS SAYLES OPPORTUNISTIC BOND ETF
SCHEDULE OF INVESTMENTS (continued)
June 30, 2023
| Security Description | | | Principal
Amount | | Value |
Bain Capital Specialty Finance, Inc.
2.55%, 10/13/2026
| | | $ 153,000 | | $ 131,044 |
| Bank of America Corp.: | | | | | |
SOFR + 1.33%, 6.42%, 4/2/2026 (c)
| | | 295,000 | | 297,009 |
SOFR + 1.99%, 6.20%, 11/10/2028 (c)
| | | 130,000 | | 133,728 |
| Bath & Body Works, Inc.: | | | | | |
6.75%, 7/1/2036
| | | 12,000 | | 10,814 |
6.88%, 11/1/2035
| | | 30,000 | | 27,457 |
Beauty Health Co.
1.25%, 10/1/2026 (a)
| | | 80,000 | | 62,920 |
Beazer Homes USA, Inc.
7.25%, 10/15/2029
| | | 30,000 | | 29,234 |
BGC Partners, Inc.
4.38%, 12/15/2025
| | | 127,000 | | 117,620 |
BioMarin Pharmaceutical, Inc.
1.25%, 5/15/2027
| | | 11,000 | | 11,122 |
BlackRock TCP Capital Corp.
2.85%, 2/9/2026
| | | 124,000 | | 111,399 |
BlackRock, Inc.
2.10%, 2/25/2032
| | | 63,000 | | 50,836 |
| Blackstone Private Credit Fund: | | | | | |
2.35%, 11/22/2024
| | | 200,000 | | 187,014 |
2.63%, 12/15/2026
| | | 131,000 | | 111,922 |
| Blackstone Secured Lending Fund: | | | | | |
2.75%, 9/16/2026
| | | 130,000 | | 113,551 |
2.85%, 9/30/2028
| | | 46,000 | | 37,725 |
Block, Inc.
0.13%, 3/1/2025
| | | 20,000 | | 18,848 |
BlueLinx Holdings, Inc.
6.00%, 11/15/2029 (a)
| | | 31,000 | | 27,374 |
Booking Holdings, Inc.
0.75%, 5/1/2025
| | | 10,000 | | 15,007 |
| Broadcom, Inc.: | | | | | |
3.50%, 2/15/2041 (a)
| | | 204,000 | | 152,708 |
4.15%, 4/15/2032 (a)
| | | 116,000 | | 105,039 |
Brundage-Bone Concrete Pumping Holdings, Inc.
6.00%, 2/1/2026 (a)
| | | 25,000 | | 23,805 |
| Builders FirstSource, Inc.: | | | | | |
4.25%, 2/1/2032 (a)
| | | 7,000 | | 6,093 |
5.00%, 3/1/2030 (a)
| | | 39,000 | | 36,451 |
C&S Group Enterprises LLC
5.00%, 12/15/2028 (a)
| | | 21,000 | | 16,329 |
Calumet Specialty Products Partners LP/Calumet Finance Corp.
8.13%, 1/15/2027 (a)
| | | 21,000 | | 20,171 |
Carnival Corp.
7.63%, 3/1/2026 (a)
| | | 88,000 | | 86,175 |
Carpenter Technology Corp.
7.63%, 3/15/2030
| | | 31,000 | | 31,546 |
Carriage Purchaser, Inc.
7.88%, 10/15/2029 (a)
| | | 10,000 | | 7,433 |
| Security Description | | | Principal
Amount | | Value |
Cars.com, Inc.
6.38%, 11/1/2028 (a)
| | | $ 25,000 | | $ 23,227 |
Caterpillar Financial Services Corp.
3.65%, 8/12/2025
| | | 85,000 | | 82,511 |
CCO Holdings LLC/CCO Holdings Capital Corp.
4.50%, 8/15/2030 (a)
| | | 85,000 | | 70,806 |
CD&R Smokey Buyer, Inc.
6.75%, 7/15/2025 (a)
| | | 31,000 | | 28,909 |
CenterPoint Energy Houston Electric LLC
5.30%, 4/1/2053
| | | 16,000 | | 16,345 |
Century Communities, Inc.
3.88%, 8/15/2029 (a)
| | | 24,000 | | 20,817 |
Chord Energy Corp.
6.38%, 6/1/2026 (a)
| | | 31,000 | | 30,741 |
Citigroup, Inc. Series Z, 5 year CMT + 3.21%,
7.38%, 5/15/2028 (c)
| | | 58,000 | | 57,626 |
Civitas Resources, Inc.
5.00%, 10/15/2026 (a)
| | | 53,000 | | 50,293 |
Clarios Global LP/Clarios U.S. Finance Co.
8.50%, 5/15/2027 (a)
| | | 30,000 | | 30,079 |
Clean Harbors, Inc.
5.13%, 7/15/2029 (a)
| | | 37,000 | | 35,140 |
CMG Media Corp.
8.88%, 12/15/2027 (a)
| | | 22,000 | | 15,594 |
Coinbase Global, Inc.
3.38%, 10/1/2028 (a)
| | | 41,000 | | 27,497 |
Comcast Corp.
2.99%, 11/1/2063
| | | 80,000 | | 50,687 |
Commercial Metals Co.
4.38%, 3/15/2032
| | | 29,000 | | 25,170 |
Conduent Business Services LLC/Conduent State & Local Solutions, Inc.
6.00%, 11/1/2029 (a)
| | | 21,000 | | 17,272 |
Continental Resources, Inc.
2.27%, 11/15/2026 (a)
| | | 58,000 | | 51,578 |
Cornerstone Building Brands, Inc.
6.13%, 1/15/2029 (a)
| | | 16,000 | | 12,712 |
Corporate Office Properties LP
2.75%, 4/15/2031
| | | 17,000 | | 12,928 |
Coty, Inc.
5.00%, 4/15/2026 (a)
| | | 22,000 | | 21,198 |
Coty, Inc./HFC Prestige Products, Inc./HFC Prestige International U.S. LLC
4.75%, 1/15/2029 (a)
| | | 13,000 | | 11,981 |
CPI CG, Inc.
8.63%, 3/15/2026 (a)
| | | 15,000 | | 14,489 |
Crescent Energy Finance LLC
7.25%, 5/1/2026 (a)
| | | 16,000 | | 15,013 |
CTR Partnership LP/CareTrust Capital Corp.
3.88%, 6/30/2028 (a)
| | | 30,000 | | 26,010 |
See accompanying notes to financial statements.
55
SPDR LOOMIS SAYLES OPPORTUNISTIC BOND ETF
SCHEDULE OF INVESTMENTS (continued)
June 30, 2023
| Security Description | | | Principal
Amount | | Value |
| CVS Health Corp.: | | | | | |
5.25%, 2/21/2033
| | | $ 89,000 | | $ 88,660 |
5.30%, 6/1/2033
| | | 80,000 | | 79,861 |
CyberArk Software Ltd.
Zero Coupon, 11/15/2024
| | | 11,000 | | 12,493 |
Datadog, Inc.
0.13%, 6/15/2025
| | | 11,000 | | 13,653 |
| DaVita, Inc.: | | | | | |
3.75%, 2/15/2031 (a)
| | | 10,000 | | 8,019 |
4.63%, 6/1/2030 (a)
| | | 38,000 | | 32,630 |
Deluxe Corp.
8.00%, 6/1/2029 (a)
| | | 13,000 | | 10,184 |
Diamond BC BV
4.63%, 10/1/2029 (a)
| | | 13,000 | | 13,270 |
Diamondback Energy, Inc.
6.25%, 3/15/2033
| | | 85,000 | | 88,029 |
Directv Financing LLC/Directv Financing Co.-Obligor, Inc.
5.88%, 8/15/2027 (a)
| | | 68,000 | | 61,572 |
| DISH DBS Corp.: | | | | | |
5.13%, 6/1/2029
| | | 10,000 | | 4,665 |
5.88%, 11/15/2024
| | | 180,000 | | 158,279 |
7.38%, 7/1/2028
| | | 12,000 | | 6,428 |
Domtar Corp.
6.75%, 10/1/2028 (a)
| | | 29,000 | | 24,752 |
DraftKings Holdings, Inc.
Zero Coupon, 3/15/2028
| | | 21,000 | | 15,716 |
Eco Material Technologies, Inc.
7.88%, 1/31/2027 (a)
| | | 24,000 | | 22,977 |
Edgewell Personal Care Co.
4.13%, 4/1/2029 (a)
| | | 12,000 | | 10,472 |
Eli Lilly & Co.
4.70%, 2/27/2033
| | | 73,000 | | 73,903 |
Embecta Corp.
5.00%, 2/15/2030 (a)
| | | 10,000 | | 8,309 |
Encino Acquisition Partners Holdings LLC
8.50%, 5/1/2028 (a)
| | | 20,000 | | 18,261 |
Energizer Holdings, Inc.
4.75%, 6/15/2028 (a)
| | | 36,000 | | 32,125 |
EnerSys
4.38%, 12/15/2027 (a)
| | | 56,000 | | 51,830 |
EnLink Midstream LLC
6.50%, 9/1/2030 (a)
| | | 10,000 | | 9,989 |
Enstar Group Ltd.
3.10%, 9/1/2031
| | | 22,000 | | 17,264 |
Enterprise Products Operating LLC
5.05%, 1/10/2026
| | | 65,000 | | 64,945 |
Enviri Corp.
5.75%, 7/31/2027 (a)
| | | 36,000 | | 31,279 |
Enviva Partners LP/Enviva Partners Finance Corp.
6.50%, 1/15/2026 (a)
| | | 24,000 | | 18,905 |
Eversource Energy
4.75%, 5/15/2026
| | | 219,000 | | 214,854 |
| Security Description | | | Principal
Amount | | Value |
Exact Sciences Corp.
0.38%, 3/1/2028
| | | $ 16,000 | | $ 16,385 |
Fair Isaac Corp.
5.25%, 5/15/2026 (a)
| | | 37,000 | | 36,199 |
Fidelity National Financial, Inc.
2.45%, 3/15/2031
| | | 34,000 | | 26,676 |
Foot Locker, Inc.
4.00%, 10/1/2029 (a)
| | | 55,000 | | 41,558 |
Ford Motor Credit Co. LLC
5.58%, 3/18/2024
| | | 225,000 | | 223,321 |
| Forestar Group, Inc.: | | | | | |
3.85%, 5/15/2026 (a)
| | | 16,000 | | 14,709 |
5.00%, 3/1/2028 (a)
| | | 35,000 | | 32,205 |
| Freedom Mortgage Corp.: | | | | | |
7.63%, 5/1/2026 (a)
| | | 13,000 | | 11,840 |
8.25%, 4/15/2025 (a)
| | | 23,000 | | 22,449 |
Full House Resorts, Inc.
8.25%, 2/15/2028 (a)
| | | 12,000 | | 11,236 |
Gannett Holdings LLC
6.00%, 11/1/2026 (a)
| | | 26,000 | | 21,950 |
Gap, Inc.
3.63%, 10/1/2029 (a)
| | | 40,000 | | 28,314 |
| Gartner, Inc.: | | | | | |
3.63%, 6/15/2029 (a)
| | | 36,000 | | 31,747 |
3.75%, 10/1/2030 (a)
| | | 43,000 | | 37,483 |
| General Motors Financial Co., Inc.: | | | | | |
2.90%, 2/26/2025
| | | 57,000 | | 54,151 |
3.80%, 4/7/2025
| | | 215,000 | | 207,387 |
5.00%, 4/9/2027
| | | 68,000 | | 66,212 |
5.40%, 4/6/2026
| | | 125,000 | | 123,581 |
Genworth Holdings, Inc.
6.50%, 6/15/2034
| | | 35,000 | | 30,723 |
Global Partners LP/GLP Finance Corp.
6.88%, 1/15/2029
| | | 25,000 | | 23,250 |
Global Payments, Inc.
5.40%, 8/15/2032
| | | 35,000 | | 34,107 |
GPS Hospitality Holding Co. LLC/GPS Finco, Inc.
7.00%, 8/15/2028 (a)
| | | 14,000 | | 9,043 |
GrubHub Holdings, Inc.
5.50%, 7/1/2027 (a)
| | | 35,000 | | 20,219 |
Guitar Center, Inc.
8.50%, 1/15/2026 (a)
| | | 25,000 | | 22,756 |
GYP Holdings III Corp.
4.63%, 5/1/2029 (a)
| | | 32,000 | | 28,325 |
Haemonetics Corp.
Zero Coupon, 3/1/2026
| | | 15,000 | | 12,805 |
Hertz Corp.
5.00%, 12/1/2029 (a)
| | | 13,000 | | 10,739 |
Hexcel Corp.
4.95%, 8/15/2025
| | | 15,000 | | 14,678 |
HLF Financing SARL LLC/Herbalife International, Inc.
4.88%, 6/1/2029 (a)
| | | 9,000 | | 6,412 |
See accompanying notes to financial statements.
56
SPDR LOOMIS SAYLES OPPORTUNISTIC BOND ETF
SCHEDULE OF INVESTMENTS (continued)
June 30, 2023
| Security Description | | | Principal
Amount | | Value |
Holly Energy Partners LP/Holly Energy Finance Corp.
5.00%, 2/1/2028 (a)
| | | $ 41,000 | | $ 38,239 |
Home Point Capital, Inc.
5.00%, 2/1/2026 (a)
| | | 18,000 | | 16,141 |
| Howmet Aerospace, Inc.: | | | | | |
5.95%, 2/1/2037
| | | 19,000 | | 19,357 |
6.75%, 1/15/2028
| | | 19,000 | | 19,704 |
HSBC USA, Inc.
5.63%, 3/17/2025
| | | 178,000 | | 177,484 |
HubSpot, Inc.
0.38%, 6/1/2025
| | | 10,000 | | 19,116 |
Ingles Markets, Inc.
4.00%, 6/15/2031 (a)
| | | 24,000 | | 20,190 |
International Business Machines Corp.
4.40%, 7/27/2032
| | | 80,000 | | 76,734 |
Iron Mountain, Inc.
5.63%, 7/15/2032 (a)
| | | 23,000 | | 20,612 |
ITT Holdings LLC
6.50%, 8/1/2029 (a)
| | | 17,000 | | 14,288 |
Jabil, Inc.
5.45%, 2/1/2029
| | | 11,000 | | 10,927 |
Jackson Financial, Inc.
3.13%, 11/23/2031
| | | 56,000 | | 43,139 |
Jacobs Entertainment, Inc.
6.75%, 2/15/2029 (a)
| | | 33,000 | | 29,394 |
JB Poindexter & Co., Inc.
7.13%, 4/15/2026 (a)
| | | 30,000 | | 29,333 |
JELD-WEN, Inc.
4.88%, 12/15/2027 (a)
| | | 36,000 | | 31,883 |
| JPMorgan Chase & Co.: | | | | | |
SOFR + 1.46%, 3.16%, 4/22/2042 (c)
| | | 80,000 | | 60,375 |
SOFR + 2.08%, 4.91%, 7/25/2033 (c)
| | | 110,000 | | 107,546 |
SOFR + 2.58%, 5.72%, 9/14/2033 (c)
| | | 60,000 | | 60,879 |
KB Home
6.88%, 6/15/2027
| | | 46,000 | | 46,889 |
Kinder Morgan, Inc.
4.80%, 2/1/2033
| | | 85,000 | | 80,412 |
Lamb Weston Holdings, Inc.
4.88%, 5/15/2028 (a)
| | | 41,000 | | 39,276 |
Las Vegas Sands Corp.
3.90%, 8/8/2029
| | | 49,000 | | 43,768 |
LD Holdings Group LLC
6.50%, 11/1/2025 (a)
| | | 16,000 | | 12,622 |
LGI Homes, Inc.
4.00%, 7/15/2029 (a)
| | | 41,000 | | 34,268 |
| Liberty Mutual Group, Inc.: | | | | | |
4.30%, 2/1/2061 (a)
| | | 100,000 | | 62,632 |
4.57%, 2/1/2029 (a)
| | | 31,000 | | 29,304 |
Lions Gate Capital Holdings LLC
5.50%, 4/15/2029 (a)
| | | 32,000 | | 23,173 |
Lowe's Cos., Inc.
2.80%, 9/15/2041
| | | 95,000 | | 67,190 |
| Security Description | | | Principal
Amount | | Value |
LSF11 A5 HoldCo LLC
6.63%, 10/15/2029 (a)
| | | $ 10,000 | | $ 8,445 |
LSF9 Atlantis Holdings LLC/Victra Finance Corp.
7.75%, 2/15/2026 (a)
| | | 24,000 | | 22,355 |
M/I Homes, Inc.
4.95%, 2/1/2028
| | | 56,000 | | 52,202 |
Manitowoc Co., Inc.
9.00%, 4/1/2026 (a)
| | | 26,000 | | 25,950 |
Mars, Inc. COR,
4.75%, 4/20/2033 (a)
| | | 125,000 | | 123,904 |
Matthews International Corp.
5.25%, 12/1/2025 (a)
| | | 28,000 | | 27,009 |
McCormick & Co., Inc.
4.95%, 4/15/2033
| | | 73,000 | | 71,687 |
Medtronic Global Holdings SCA
4.25%, 3/30/2028
| | | 47,000 | | 45,908 |
| Merck & Co., Inc.: | | | | | |
2.90%, 12/10/2061
| | | 85,000 | | 56,476 |
5.00%, 5/17/2053
| | | 120,000 | | 121,501 |
Meritage Homes Corp.
3.88%, 4/15/2029 (a)
| | | 61,000 | | 54,222 |
| Micron Technology, Inc.: | | | | | |
3.37%, 11/1/2041
| | | 58,000 | | 40,457 |
6.75%, 11/1/2029
| | | 80,000 | | 83,157 |
MicroStrategy, Inc.
6.13%, 6/15/2028 (a)
| | | 31,000 | | 27,778 |
Millennium Escrow Corp.
6.63%, 8/1/2026 (a)
| | | 19,000 | | 13,948 |
MIWD Holdco II LLC/MIWD Finance Corp.
5.50%, 2/1/2030 (a)
| | | 34,000 | | 28,204 |
MongoDB, Inc.
0.25%, 1/15/2026
| | | 11,000 | | 21,892 |
Moody's Corp.
2.00%, 8/19/2031
| | | 56,000 | | 45,096 |
| Morgan Stanley: | | | | | |
SOFR + 1.36%, 2.48%, 9/16/2036 (c)
| | | 95,000 | | 71,905 |
SOFR + 1.59%, 5.16%, 4/20/2029 (c)
| | | 68,000 | | 67,251 |
SOFR + 2.08%, 4.89%, 7/20/2033 (c)
| | | 90,000 | | 86,567 |
Moss Creek Resources Holdings, Inc.
7.50%, 1/15/2026 (a)
| | | 30,000 | | 27,619 |
MPLX LP
4.95%, 9/1/2032
| | | 60,000 | | 57,306 |
| NCL Corp. Ltd.: | | | | | |
3.63%, 12/15/2024 (a)
| | | 17,000 | | 16,339 |
7.75%, 2/15/2029 (a)
| | | 5,000 | | 4,763 |
NCL Finance Ltd.
6.13%, 3/15/2028 (a)
| | | 10,000 | | 9,018 |
| Nestle Holdings, Inc.: | | | | | |
2.50%, 9/14/2041 (a)
| | | 95,000 | | 67,503 |
4.13%, 10/1/2027 (a)
| | | 125,000 | | 122,165 |
See accompanying notes to financial statements.
57
SPDR LOOMIS SAYLES OPPORTUNISTIC BOND ETF
SCHEDULE OF INVESTMENTS (continued)
June 30, 2023
| Security Description | | | Principal
Amount | | Value |
| NextEra Energy Capital Holdings, Inc.: | | | | | |
4.26%, 9/1/2024
| | | $ 50,000 | | $ 49,166 |
6.05%, 3/1/2025
| | | 31,000 | | 31,181 |
NMI Holdings, Inc.
7.38%, 6/1/2025 (a)
| | | 51,000 | | 51,764 |
NRG Energy, Inc.
5.25%, 6/15/2029 (a)
| | | 22,000 | | 19,647 |
NuStar Logistics LP
5.63%, 4/28/2027
| | | 49,000 | | 47,102 |
Oceaneering International, Inc.
6.00%, 2/1/2028
| | | 25,000 | | 23,743 |
OI European Group BV
4.75%, 2/15/2030 (a)
| | | 18,000 | | 16,296 |
Oncor Electric Delivery Co. LLC
4.30%, 5/15/2028 (a)
| | | 94,000 | | 91,548 |
Oscar AcquisitionCo LLC/Oscar Finance, Inc.
9.50%, 4/15/2030 (a)
| | | 17,000 | | 15,612 |
OWL Rock Core Income Corp.
5.50%, 3/21/2025
| | | 100,000 | | 96,376 |
PayPal Holdings, Inc.
5.05%, 6/1/2052
| | | 43,000 | | 42,106 |
PBF Holding Co. LLC/PBF Finance Corp.
6.00%, 2/15/2028
| | | 38,000 | | 35,621 |
PennyMac Financial Services, Inc.
5.38%, 10/15/2025 (a)
| | | 33,000 | | 31,287 |
PepsiCo, Inc.
4.20%, 7/18/2052
| | | 60,000 | | 56,207 |
| PG&E Corp.: | | | | | |
5.00%, 7/1/2028
| | | 25,000 | | 22,949 |
5.25%, 7/1/2030
| | | 29,000 | | 26,005 |
PHH Mortgage Corp.
7.88%, 3/15/2026 (a)
| | | 26,000 | | 23,232 |
Pike Corp.
5.50%, 9/1/2028 (a)
| | | 15,000 | | 13,493 |
| Pitney Bowes, Inc.: | | | | | |
6.88%, 3/15/2027 (a)
| | | 31,000 | | 22,948 |
7.25%, 3/15/2029 (a)
| | | 5,000 | | 3,304 |
PM General Purchaser LLC
9.50%, 10/1/2028 (a)
| | | 19,000 | | 18,665 |
Prime Healthcare Services, Inc.
7.25%, 11/1/2025 (a)
| | | 12,000 | | 11,362 |
Public Storage
2.25%, 11/9/2031
| | | 44,000 | | 36,080 |
QUALCOMM, Inc.
5.40%, 5/20/2033
| | | 130,000 | | 136,830 |
Republic Services, Inc.
5.00%, 4/1/2034
| | | 21,000 | | 20,933 |
| Rockies Express Pipeline LLC: | | | | | |
4.95%, 7/15/2029 (a)
| | | 30,000 | | 27,568 |
6.88%, 4/15/2040 (a)
| | | 13,000 | | 11,744 |
| Royal Caribbean Cruises Ltd.: | | | | | |
5.38%, 7/15/2027 (a)
| | | 5,000 | | 4,688 |
5.50%, 8/31/2026 (a)
| | | 5,000 | | 4,744 |
| Security Description | | | Principal
Amount | | Value |
7.50%, 10/15/2027
| | | $ 13,000 | | $ 13,056 |
11.63%, 8/15/2027 (a)
| | | 103,000 | | 112,060 |
Santander Holdings USA, Inc. SOFR + 1.25%,
2.49%, 1/6/2028 (c)
| | | 110,000 | | 95,127 |
Scientific Games Holdings LP/Scientific Games U.S. FinCo, Inc.
6.63%, 3/1/2030 (a)
| | | 31,000 | | 27,284 |
Seagate HDD Cayman
8.50%, 7/15/2031 (a)
| | | 67,000 | | 70,309 |
Sempra Energy
3.70%, 4/1/2029
| | | 22,000 | | 20,130 |
| Service Properties Trust: | | | | | |
4.75%, 10/1/2026
| | | 26,000 | | 22,570 |
5.25%, 2/15/2026
| | | 17,000 | | 15,415 |
Shift4 Payments LLC/Shift4 Payments Finance Sub, Inc.
4.63%, 11/1/2026 (a)
| | | 59,000 | | 55,660 |
Shift4 Payments, Inc.
Zero Coupon, 12/15/2025
| | | 11,000 | | 11,958 |
Smyrna Ready Mix Concrete LLC
6.00%, 11/1/2028 (a)
| | | 29,000 | | 27,433 |
Southern Co.
5.15%, 10/6/2025
| | | 175,000 | | 174,258 |
Specialty Building Products Holdings LLC/SBP Finance Corp.
6.38%, 9/30/2026 (a)
| | | 31,000 | | 29,328 |
Spirit AeroSystems, Inc.
4.60%, 6/15/2028
| | | 31,000 | | 25,986 |
Splunk, Inc.
1.13%, 6/15/2027
| | | 10,000 | | 8,659 |
Standard Industries, Inc.
4.38%, 7/15/2030 (a)
| | | 45,000 | | 38,997 |
Starwood Property Trust, Inc.
4.38%, 1/15/2027 (a)
| | | 145,000 | | 124,888 |
Stem, Inc.
0.50%, 12/1/2028 (a)
| | | 201,000 | | 116,972 |
SunCoke Energy, Inc.
4.88%, 6/30/2029 (a)
| | | 30,000 | | 25,309 |
Sunoco LP/Sunoco Finance Corp.
4.50%, 5/15/2029
| | | 38,000 | | 33,729 |
Take-Two Interactive Software, Inc.
4.95%, 3/28/2028
| | | 151,000 | | 149,315 |
Tallgrass Energy Partners LP/Tallgrass Energy Finance Corp.
5.50%, 1/15/2028 (a)
| | | 44,000 | | 40,245 |
Taylor Morrison Communities, Inc.
5.75%, 1/15/2028 (a)
| | | 60,000 | | 58,359 |
| Tempur Sealy International, Inc.: | | | | | |
3.88%, 10/15/2031 (a)
| | | 19,000 | | 15,518 |
4.00%, 4/15/2029 (a)
| | | 48,000 | | 41,567 |
See accompanying notes to financial statements.
58
SPDR LOOMIS SAYLES OPPORTUNISTIC BOND ETF
SCHEDULE OF INVESTMENTS (continued)
June 30, 2023
| Security Description | | | Principal
Amount | | Value |
Texas Instruments, Inc.
4.90%, 3/14/2033
| | | $ 94,000 | | $ 96,236 |
Thor Industries, Inc.
4.00%, 10/15/2029 (a)
| | | 10,000 | | 8,491 |
T-Mobile USA, Inc.
4.80%, 7/15/2028
| | | 146,000 | | 143,306 |
TMS International Corp.
6.25%, 4/15/2029 (a)
| | | 12,000 | | 10,080 |
Townsquare Media, Inc.
6.88%, 2/1/2026 (a)
| | | 31,000 | | 29,746 |
TreeHouse Foods, Inc.
4.00%, 9/1/2028
| | | 12,000 | | 10,338 |
Tri Pointe Homes, Inc.
5.25%, 6/1/2027
| | | 57,000 | | 54,226 |
TriNet Group, Inc.
3.50%, 3/1/2029 (a)
| | | 60,000 | | 52,281 |
Trinseo Materials Operating SCA/Trinseo Materials Finance, Inc.
5.38%, 9/1/2025 (a)
| | | 13,000 | | 10,797 |
Truist Financial Corp. SOFR + 2.05%,
6.05%, 6/8/2027 (c)
| | | 110,000 | | 110,058 |
U.S. Acute Care Solutions LLC
6.38%, 3/1/2026 (a)
| | | 13,000 | | 11,130 |
| Uber Technologies, Inc.: | | | | | |
Zero Coupon, 12/15/2025
| | | 7,000 | | 6,417 |
7.50%, 5/15/2025 (a)
| | | 49,000 | | 49,642 |
Unisys Corp.
6.88%, 11/1/2027 (a)
| | | 32,000 | | 23,031 |
| United Airlines Pass-Through Trust: | | | | | |
Series 20-1, Class A, 5.88%, 4/15/2029
| | | 28,341 | | 28,136 |
Series 2020-1, Class B, 4.88%, 7/15/2027
| | | 99,067 | | 95,005 |
United Parcel Service, Inc.
4.88%, 3/3/2033
| | | 104,000 | | 105,187 |
United Rentals North America, Inc.
3.75%, 1/15/2032
| | | 57,000 | | 48,332 |
United Wholesale Mortgage LLC
5.75%, 6/15/2027 (a)
| | | 58,000 | | 52,952 |
UnitedHealth Group, Inc.
5.88%, 2/15/2053
| | | 85,000 | | 94,292 |
Upbound Group, Inc.
6.38%, 2/15/2029 (a)
| | | 36,000 | | 32,072 |
Urban One, Inc.
7.38%, 2/1/2028 (a)
| | | 31,000 | | 27,137 |
USA Compression Partners LP/USA Compression Finance Corp.
6.88%, 4/1/2026
| | | 30,000 | | 29,326 |
USI, Inc.
6.88%, 5/1/2025 (a)
| | | 11,000 | | 10,922 |
| Verizon Communications, Inc.: | | | | | |
2.10%, 3/22/2028
| | | 136,000 | | 119,491 |
| Security Description | | | Principal
Amount | | Value |
2.85%, 9/3/2041
| | | $ 24,000 | | $ 17,076 |
3.55%, 3/22/2051
| | | 61,000 | | 45,554 |
Verscend Escrow Corp.
9.75%, 8/15/2026 (a)
| | | 17,000 | | 17,020 |
Viasat, Inc.
6.50%, 7/15/2028 (a)
| | | 35,000 | | 29,619 |
Vista Outdoor, Inc.
4.50%, 3/15/2029 (a)
| | | 21,000 | | 17,229 |
Vistra Operations Co. LLC
4.38%, 5/1/2029 (a)
| | | 26,000 | | 22,758 |
Wabash National Corp.
4.50%, 10/15/2028 (a)
| | | 33,000 | | 28,620 |
Warnermedia Holdings, Inc.
6.41%, 3/15/2026
| | | 58,000 | | 58,042 |
Waste Pro USA, Inc.
5.50%, 2/15/2026 (a)
| | | 10,000 | | 9,289 |
Watco Cos. LLC/Watco Finance Corp.
6.50%, 6/15/2027 (a)
| | | 17,000 | | 16,202 |
Weatherford International Ltd.
8.63%, 4/30/2030 (a)
| | | 35,000 | | 35,560 |
Weekley Homes LLC/Weekley Finance Corp.
4.88%, 9/15/2028 (a)
| | | 57,000 | | 51,549 |
Wells Fargo & Co. SOFR + 2.02%,
5.39%, 4/24/2034 (c)
| | | 73,000 | | 72,553 |
Western Midstream Operating LP
6.15%, 4/1/2033
| | | 11,000 | | 11,074 |
Windstream Escrow LLC/Windstream Escrow Finance Corp. REGS,
7.75%, 8/15/2028 (a)
| | | 33,000 | | 27,341 |
Winnebago Industries, Inc.
6.25%, 7/15/2028 (a)
| | | 45,000 | | 44,113 |
Wolverine World Wide, Inc.
4.00%, 8/15/2029 (a)
| | | 34,000 | | 27,073 |
World Acceptance Corp.
7.00%, 11/1/2026 (a)
| | | 16,000 | | 13,966 |
WW International, Inc.
4.50%, 4/15/2029 (a)
| | | 31,000 | | 18,598 |
Xerox Holdings Corp.
5.50%, 8/15/2028 (a)
| | | 49,000 | | 41,680 |
XPO CNW, Inc.
6.70%, 5/1/2034
| | | 33,000 | | 32,937 |
Ziff Davis, Inc.
1.75%, 11/1/2026 (a)
| | | 20,000 | | 18,693 |
| | | | | | 13,026,597 |
TOTAL CORPORATE BONDS & NOTES
(Cost $19,346,375)
| | | | | 18,535,548 |
See accompanying notes to financial statements.
59
SPDR LOOMIS SAYLES OPPORTUNISTIC BOND ETF
SCHEDULE OF INVESTMENTS (continued)
June 30, 2023
| Security Description | | | Principal
Amount | | Value |
| ASSET-BACKED SECURITIES — 11.3% | | | | | |
AIG CLO LLC Series 2018-1A, Class BR, 3 Month USD LIBOR + 1.70%,
6.95%, 4/20/2032 (a) (c)
| | | $ 320,000 | | $ 314,016 |
AMMC CLO 15 Ltd. Series 2014-15A, Class BR3, 3 Month USD LIBOR + 1.65%,
6.91%, 1/15/2032 (a) (c)
| | | 250,000 | | 244,075 |
Ballyrock CLO Ltd. Series 2018-1A, Class A1, 3 Month USD LIBOR + 1.00%,
6.25%, 4/20/2031 (a) (c)
| | | 250,000 | | 247,725 |
CBAM Ltd. Series 2018-6A, Class B2R, ABS, 3 Month SOFR + 2.36%,
7.35%, 1/15/2031 (a) (c)
| | | 255,000 | | 251,660 |
Elmwood CLO V Ltd. Series 2020-2A, Class AR, 3 Month USD LIBOR + 1.15%,
6.40%, 10/20/2034 (a) (c)
| | | 250,000 | | 245,925 |
Generate CLO 2 Ltd. Series 2A, Class BR, 3 Month USD LIBOR + 1.45%,
6.72%, 1/22/2031 (a) (c)
| | | 250,000 | | 243,650 |
GREYWOLF CLO VI Ltd. Series 2018-1A, Class A1, 3 Month SOFR + 1.29%,
6.36%, 4/26/2031 (a) (c)
| | | 250,000 | | 246,925 |
Hayfin U.S. XII Ltd. Series 2018-8A, Class B, ABS, 3 Month USD LIBOR + 1.48%,
6.73%, 4/20/2031 (a) (c)
| | | 250,000 | | 243,325 |
OneMain Direct Auto Receivables Trust Series 2021-1A, Class A, ABS,
0.87%, 7/14/2028 (a)
| | | 600,000 | | 566,537 |
OZLM Funding IV Ltd. Series 2013-4A, Class A2R, 3 Month USD LIBOR + 1.70%,
6.97%, 10/22/2030 (a) (c)
| | | 250,000 | | 245,975 |
Post CLO Ltd. Series 2023-1A, Class B1, 3 Month SOFR + 2.50%,
7.38%, 4/20/2036 (a) (c)
| | | 250,000 | | 249,349 |
THL Credit Wind River CLO Ltd. Series 2017-4A, Class B, 3 Month USD LIBOR + 1.45%,
6.83%, 11/20/2030 (a) (c)
| | | 250,000 | | 245,550 |
TOTAL ASSET-BACKED SECURITIES
(Cost $3,367,784)
| | | | | 3,344,712 |
| Security Description | | | Shares | | Value |
| CONVERTIBLE BONDS — 0.5% | | | | |
| UNITED STATES — 0.5% | | | | |
Array Technologies, Inc.
1.00%, 12/1/2028
| | | 13,000 | | $ 14,933 |
Axon Enterprise, Inc.
0.50%, 12/15/2027 (a)
| | | 11,000 | | 11,745 |
Carnival Corp.
5.75%, 12/1/2027 (a)
| | | 13,000 | | 21,676 |
Cloudflare, Inc.
8/15/2026
| | | 36,000 | | 30,542 |
Lantheus Holdings, Inc.
2.63%, 12/15/2027 (a)
| | | 10,000 | | 12,980 |
Liberty Media Corp.-Liberty Formula One
2.25%, 8/15/2027 (a)
| | | 20,000 | | 21,578 |
Liberty TripAdvisor Holdings, Inc.
0.50%, 6/30/2051 (a)
| | | 5,000 | | 3,913 |
Post Holdings, Inc.
2.50%, 8/15/2027 (a)
| | | 12,000 | | 12,144 |
Royal Caribbean Cruises Ltd.
6.00%, 8/15/2025 (a)
| | | 10,000 | | 22,025 |
Sarepta Therapeutics, Inc.
1.25%, 9/15/2027 (a)
| | | 11,000 | | 11,906 |
| | | | | | 163,442 |
TOTAL CONVERTIBLE BONDS
(Cost $149,072)
| | | | | 163,442 |
| | | Principal
Amount | |
| SENIOR FLOATING RATE LOANS — 17.2% | | | |
| ADVERTISING SERVICES — 0.6% | | | |
CMG Media Corp., Senior Secured 2021 Term Loan, 3 Month USD LIBOR + 3.50%, 8.84%, 12/17/2026 (c)
| | $ 146,985 | 132,011 |
Summer Holdco B SARL, Senior Secured 2021 USD Term Loan B2, 3 Month USD LIBOR + 4.50%, 10.00%, 12/4/2026 (c)
| | 34,884 | 32,878 |
| | | | 164,889 |
| AIR FREIGHT & LOGISTICS — 0.3% | | | |
Rand Parent LLC, Senior Secured 2023 Term Loan B, 3 Month USD SOFR + 4.25%, 9.49%, 3/17/2030 (c)
| | 95,760 | 90,493 |
| AUTOMOBILE COMPONENTS — 0.3% | | | |
USI, Inc., Senior Secured 2022 Incremental Term Loan, 3 Month USD SOFR + 3.75%, 8.99%, 11/22/2029 (c)
| | 99,250 | 99,241 |
See accompanying notes to financial statements.
60
SPDR LOOMIS SAYLES OPPORTUNISTIC BOND ETF
SCHEDULE OF INVESTMENTS (continued)
June 30, 2023
| Security Description | | | Principal
Amount | | Value |
| BEVERAGES — 0.1% | | | | | |
City Brewing Co. LLC, Senior Secured Closing Date Term Loan, 3 Month USD LIBOR + 3.50%, 8.76%, 4/5/2028 (c)
| | | $ 55,376 | | $ 36,548 |
| BROADCAST SERV/PROGRAM — 1.1% | | | | | |
EW Scripps Co., Senior Secured 2019 Term Loan B2, 1 Month USD SOFR + 2.56%, 7.78%, 5/1/2026 (c)
| | | 323,883 | | 318,620 |
| BUILDING PRODUCTS — 0.3% | | | | | |
ACProducts, Inc., Senior Secured 2021 Term Loan B, 3 Month USD LIBOR + 4.25%, 9.78%, 5/17/2028 (c)
| | | 58 | | 49 |
Emrld Borrower LP, Term Loan B, 3 Month USD SOFR + 3.00%, 8.26%, 5/31/2030 (c)
| | | 45,917 | | 45,975 |
Oscar AcquisitionCo LLC, Senior Secured Term Loan B, 3 Month USD SOFR + 4.50%, 9.84%, 4/29/2029 (c)
| | | 30,768 | | 30,113 |
| | | | | | 76,137 |
| CHEMICALS — 1.0% | | | | | |
Aruba Investments, Inc., Senior Secured 2020 USD Term Loan, 1 Month USD LIBOR + 4.00%, 9.19%, 11/24/2027 (c)
| | | 129,342 | | 125,354 |
LSF11 A5 Holdco LLC, Senior Secured Term Loan, 1 Month USD SOFR + 3.50%, 8.72%, 10/15/2028 (c)
| | | 110,094 | | 108,701 |
Olympus Water U.S. Holding Corp., Senior Secured 2021 USD Term Loan B, 3 Month USD SOFR + 3.75%, 9.25%, 11/9/2028 (c)
| | | 54,778 | | 52,758 |
| | | | | | 286,813 |
| COMMERCIAL SERVICES — 0.4% | | | | | |
Albion Financing 3 SARL, Senior Secured USD Term Loan, 3 Month USD LIBOR + 5.25%, 10.52%, 8/17/2026 (c)
| | | 104,364 | | 103,973 |
CoreLogic, Inc., Senior Secured Term Loan, 1 Month USD LIBOR + 3.50%, 8.75%, 6/2/2028 (c)
| | | 23,551 | | 21,319 |
| | | | | | 125,292 |
| Security Description | | | Principal
Amount | | Value |
| COMMERCIAL SERVICES & SUPPLIES — 0.4% | | | | | |
McGraw-Hill Global Education Holdings LLC, Senior Secured 2021 Term Loan, 6 Month USD LIBOR + 4.75%, 9.95%, 7/28/2028 (c)
| | | $ 90,408 | | $ 84,984 |
Prime Security Services Borrower LLC, Senior Secured 2021 Term Loan, 3 Month USD LIBOR + 2.75%, 7.94%, 9/23/2026 (c)
| | | 47,092 | | 47,137 |
| | | | | | 132,121 |
| COMMUNICATIONS EQUIPMENT — 0.6% | | | | | |
CommScope, Inc., Senior Secured 2019 Term Loan B, 1 Month USD LIBOR + 3.25%, 8.44%, 4/6/2026 (c)
| | | 183,108 | | 175,806 |
| CONTAINERS & PACKAGING — 0.4% | | | | | |
Graham Packaging Co., Inc., Senior Secured 2021 Term Loan, 1 Month USD SOFR + 3.00%, 8.22%, 8/4/2027 (c)
| | | 116,179 | | 115,607 |
| ELECTRICAL EQUIPMENT — 0.3% | | | | | |
Gates Global LLC, Senior Secured 2021 Term Loan B3, 1 Month USD SOFR + 2.50%, 7.70%, 3/31/2027 (c)
| | | 76,337 | | 76,051 |
| ENERGY EQUIPMENT & SERVICES — 0.5% | | | | | |
Carnival Corp., Senior Secured USD Term Loan B, 1 Month USD SOFR + 3.00%, 8.22%, 6/30/2025 (c)
| | | 141,547 | | 141,480 |
| ENERGY-ALTERNATE SOURCES — 0.4% | | | | | |
Array Technologies, Inc., Senior Secured Term Loan B, 3 Month USD LIBOR + 3.25%, 8.68%, 10/14/2027 (c)
| | | 109,925 | | 109,170 |
| FINANCIAL SERVICES — 0.5% | | | | | |
DirecTV Financing LLC, Senior Secured Term Loan, 1 Month USD LIBOR + 5.00%, 10.22%, 8/2/2027 (c)
| | | 119,078 | | 116,680 |
Paysafe Holdings Corp., Senior Secured USD Term Loan B1, 1 Month USD SOFR + 2.75%, 7.97%, 6/28/2028 (c)
| | | 43,345 | | 42,243 |
| | | | | | 158,923 |
See accompanying notes to financial statements.
61
SPDR LOOMIS SAYLES OPPORTUNISTIC BOND ETF
SCHEDULE OF INVESTMENTS (continued)
June 30, 2023
| Security Description | | | Principal
Amount | | Value |
| HEALTH CARE PROVIDERS & SERVICES — 1.5% | | | | | |
Agiliti Health, Inc., 2023 Term Loan, 1 Month USD SOFR + 3.00%, 8.16%, 5/1/2030 (c)
| | | $ 58,523 | | $ 58,340 |
Avantor Funding, Inc., Senior Secured 2021 Term Loan B5, 1 Month USD SOFR + 2.25%, 7.45%, 11/8/2027 (c)
| | | 24,712 | | 24,733 |
CHG Healthcare Services, Inc., Senior Secured 2021 Term Loan, 1 Month USD LIBOR + 3.25%, 8.44%, 9/29/2028 (c)
| | | 294,750 | | 293,681 |
Medline Borrower LP, Senior Secured USD Term Loan B, 1 Month USD SOFR + 3.25%, 8.35%, 10/23/2028 (c)
| | | 55,388 | | 54,817 |
| | | | | | 431,571 |
| HOTELS, RESTAURANTS & LEISURE — 0.7% | | | | | |
19th Holdings Golf LLC, Senior Secured 2022 Term Loan B, 1 Month USD SOFR + 3.35%, 8.52%, 2/7/2029 (c)
| | | 155,216 | | 151,627 |
Caesars Entertainment Corp., Senior Secured Term Loan B, 1 Month USD SOFR + 3.25%, 8.45%, 2/6/2030 (c)
| | | 44,888 | | 44,946 |
| | | | | | 196,573 |
| INSURANCE — 0.7% | | | | | |
Sedgwick Claims Management Services, Inc., Senior Secured 2023 Term Loan B, 1 Month USD SOFR + 3.75%, 8.85%, 2/17/2028 (c)
| | | 219,490 | | 218,514 |
| INTERNET & TELECOM — 0.5% | | | | | |
Arches Buyer, Inc., Senior Secured 2021 Term Loan B, 1 Month USD SOFR + 3.25%, 8.45%, 12/6/2027 (c)
| | | 102,889 | | 99,481 |
Uber Technologies, Inc., Senior Secured 2023 Term Loan B, 3 Month USD SOFR + 2.75%, 7.99%, 3/3/2030 (c)
| | | 40,795 | | 40,844 |
| | | | | | 140,325 |
| MACHINERY-CONSTRUCTION & MINING — 0.5% | | | | | |
Clear Channel Outdoor Holdings, Inc., Senior Secured Term Loan B, 1 Month USD SOFR + 3.50%, 8.58%, 8/21/2026 (c)
| | | 153,547 | | 146,938 |
| Security Description | | | Principal
Amount | | Value |
| MEDIA — 0.3% | | | | | |
MH Sub I LLC, 2023 Term Loan, 1 Month USD SOFR + 4.25%, 9.35%, 5/3/2028 (c)
| | | $ 109,000 | | $ 104,722 |
| PASSENGER AIRLINES — 1.2% | | | | | |
American Airlines, Inc., Senior Secured 2021 Term Loan, 3 Month USD LIBOR + 4.75%, 10.00%, 4/20/2028 (c)
| | | 110,000 | | 112,495 |
SkyMiles IP Ltd., Senior Secured 2020 Skymiles Term Loan B, 3 Month USD LIBOR + 3.75%, 8.80%, 10/20/2027 (c)
| | | 97,200 | | 101,088 |
United Airlines, Inc., Senior Secured 2021 Term Loan B, 3 Month USD LIBOR + 3.75%, 9.29%, 4/21/2028 (c)
| | | 131,540 | | 131,687 |
| | | | | | 345,270 |
| PHARMACEUTICALS — 0.7% | | | | | |
Jazz Financing Lux SARL, Senior Secured USD Term Loan, 1 Month USD LIBOR + 3.50%, 8.86%, 5/5/2028 (c)
| | | 92,739 | | 92,714 |
Organon & Co., Senior Secured USD Term Loan, 3 Month USD LIBOR + 3.00%, 8.25%, 6/2/2028 (c)
| | | 112,394 | | 112,517 |
| | | | | | 205,231 |
| PROFESSIONAL SERVICES — 0.7% | | | | | |
Dun & Bradstreet Corp., Senior Secured Term Loan, 1 Month USD SOFR + 3.25%, 8.43%, 2/6/2026 (c)
| | | 125,679 | | 125,946 |
Proofpoint, Inc., Senior Secured 1st Lien Term Loan, 3 Month USD LIBOR + 3.25%, 8.44%, 8/31/2028 (c)
| | | 74,273 | | 72,819 |
| | | | | | 198,765 |
| SEMICONDUCTORS & SEMICONDUCTOR EQUIPMENT — 0.4% | | | | | |
Altar Bidco, Inc., Senior Secured 2021 Term Loan, 1 Month USD SOFR + 3.10%, 8.26%, 2/1/2029 (c)
| | | 131,337 | | 129,614 |
| SOFTWARE — 1.5% | | | | | |
Camelot U.S. Acquisition LLC, Senior Secured Term Loan B, 1 Month USD SOFR + 3.00%, 8.22%, 10/30/2026 (c)
| | | 119,430 | | 119,399 |
Cengage Learning, Inc., Senior Secured 2021 Term Loan B, 3 Month USD LIBOR + 4.75%, 9.88%, 7/14/2026 (c)
| | | 60,845 | | 59,754 |
See accompanying notes to financial statements.
62
SPDR LOOMIS SAYLES OPPORTUNISTIC BOND ETF
SCHEDULE OF INVESTMENTS (continued)
June 30, 2023
| Security Description | | | Principal
Amount | | Value |
RealPage, Inc., Senior Secured 1st Lien Term Loan, 1 Month USD LIBOR + 3.00%, 8.19%, 4/24/2028 (c)
| | | $ 58,703 | | $ 57,507 |
| Sabre Global, Inc.: | | | | | |
Senior Secured 2021 Term Loan B1, 1 Month USD SOFR + 3.50%, 8.72%, 12/17/2027 (c)
| | | 45,334 | | 35,746 |
Senior Secured 2021 Term Loan B2, 1 Month USD SOFR + 3.50%, 8.72%, 12/17/2027 (c)
| | | 70,658 | | 55,714 |
Ultimate Software Group, Inc., Senior Secured 2021 Term Loan, 3 Month USD SOFR + 3.25%, 8.27%, 5/4/2026 (c)
| | | 130,338 | | 128,111 |
| | | | | | 456,231 |
| SPECIALTY RETAIL — 1.0% | | | | | |
Michaels Cos., Inc., Senior Secured 2021 Term Loan B, 3 Month USD LIBOR + 4.25%, 9.75%, 4/15/2028 (c)
| | | 73,440 | | 65,252 |
PetSmart, Inc., Senior Secured 2021 Term Loan B, 1 Month USD SOFR + 3.75%, 8.83%, 2/11/2028 (c)
| | | 220,876 | | 220,830 |
| | | | | | 286,082 |
| TRANSPORT-SERVICES — 0.3% | | | | | |
Endure Digital, Inc., Senior Secured Term Loan, 3 Month USD LIBOR + 3.50%, 8.79%, 2/10/2028 (c)
| | | 99,339 | | 92,757 |
TOTAL SENIOR FLOATING RATE LOANS
(Cost $5,174,047)
| | | | | 5,059,784 |
| | | Shares | |
| MUTUAL FUNDS AND EXCHANGE TRADED PRODUCTS — 3.3% | | | |
| UNITED STATES — 3.3% | | | |
SPDR Blackstone Senior Loan ETF (d)
| | 23,140 | 968,872 |
TOTAL MUTUAL FUNDS AND EXCHANGE TRADED PRODUCTS
(Cost $960,771)
| | | 968,872 |
| Security Description | | | Principal
Amount | | Value |
| COMMERCIAL MORTGAGE BACKED SECURITIES — 0.3% | | | | | |
COMM Mortgage Trust Series 2012-CR3, Class B, 3.92%, 10/15/2045 (a)
(Cost $99,000)
| | | $ 100,000 | | $ 81,992 |
| | | Shares | |
| SHORT-TERM INVESTMENT — 2.0% | | | |
State Street Institutional U.S. Government Money Market Fund, Class G Shares 5.07% (e) (f)
(Cost $585,448)
| | 585,448 | 585,448 |
TOTAL INVESTMENTS — 97.5%
(Cost $29,682,497)
| | | 28,739,798 |
OTHER ASSETS IN EXCESS OF LIABILITIES — 2.5%
| | | 737,622 |
NET ASSETS — 100.0%
| | | $ 29,477,420 |
| (a) | Securities purchased pursuant to Rule 144A of the Securities Act of 1933, as amended. These securities, which represent 39.2% of net assets as of June 30, 2023, are considered liquid and may be resold in transactions exempt from registration, normally to qualified institutional buyers. |
| (b) | Amount is less than 0.05% of net assets. |
| (c) | Variable Rate Security - Interest rate shown is rate in effect at June 30, 2023. For securities based on a published reference rate and spread, the reference rate and spread are indicated in the description above. |
| (d) | Affiliated fund managed by SSGA Funds Management, Inc. Amounts related to these transactions during the period ended June 30, 2023 are shown in the Affiliate Table below. |
| (e) | The Fund invested in certain money market funds managed by SSGA Funds Management, Inc. Amounts related to these transactions during the period ended June 30, 2023 are shown in the Affiliate Table below. |
| (f) | The rate shown is the annualized seven-day yield at June 30, 2023. |
| ABS | Asset-Backed Security |
| CLO | Collateralized Loan Obligation |
| CMT | Constant Maturity Treasury |
| ISDA | International Swaps and Derivatives Association |
| LIBOR | London Interbank Offered Rate |
| SOFR | Secured Overnight Financing Rate |
| VRN | Variable Rate Note |
During the year ended June 30, 2023, average notional value related to forward foreign currency exchange contracts was $84,037.
See accompanying notes to financial statements.
63
SPDR LOOMIS SAYLES OPPORTUNISTIC BOND ETF
SCHEDULE OF INVESTMENTS (continued)
June 30, 2023
At June 30, 2023, open futures contracts were as follows:
| Description | | Number of
Contracts | | Expiration
Date | | Notional
Amount | | Value | | Unrealized
Appreciation
(Depreciation) |
| 2 Yr. U.S. Treasury Note Futures (long) | | 10 | | 09/29/2023 | | $2,056,835 | | $2,033,437 | | $(23,398) |
| Ultra U.S. Treasury Bond Futures (long) | | 17 | | 09/20/2023 | | 2,277,226 | | 2,315,655 | | 38,429 |
| 10 Yr. U.S. Treasury Ultra Futures (long) | | 3 | | 09/20/2023 | | 358,874 | | 355,313 | | (3,561) |
| U.S. Treasury Bond Futures (long) | | 2 | | 09/20/2023 | | 256,277 | | 253,813 | | (2,464) |
| | | | | | | | | | | $ 9,006 |
During the year ended June 30, 2023, average notional value related to long futures contracts was $10,065,379 and short futures contract was $310,615.
Centrally Cleared Interest Rate Swaps
| Counterparty | | Notional
Amount
(000s
omitted) | | Fund Pays/
Receives
Fixed Rate/
Payment
Frequency | | Floating
Rate | | Contract
Annual
Fixed
Rate | | Termination
Date | | Market
Value | | Unamortized
Upfront
Payments
Received
(Paid) | | Unrealized
Appreciation
(Depreciation) |
| LCH Limited | | $440 | | Pays/Annually | | 1 month SOFR | | 2.94% | | 01/18/53 | | $ 21,097 | | $— | | $ 21,097 |
| LCH Limited | | 1,870 | | Receives/Annually | | 1 month SOFR | | 3.36% | | 01/18/28 | | (48,289) | | — | | (48,289) |
| | | | | | | | | | | | | | | | | $(27,192) |
During the year ended June 30, 2023, average notional value related to swap contracts was $2,542,577.
The following table summarizes the value of the Fund's investments according to the fair value hierarchy as of June 30, 2023.
| Description | | Level 1 –
Quoted Prices | | Level 2 –
Other Significant
Observable Inputs | | Level 3 –
Significant
Unobservable Inputs | | Total |
| ASSETS: | | | | | | | | |
| INVESTMENTS: | | | | | | | | |
Corporate Bonds & Notes
| | $ — | | $18,535,548 | | $— | | $18,535,548 |
Asset-Backed Securities
| | — | | 3,344,712 | | — | | 3,344,712 |
Commercial Mortgage Backed Securities
| | — | | 81,992 | | — | | 81,992 |
Convertible Bonds
| | — | | 163,442 | | — | | 163,442 |
Mutual Funds and Exchange Traded Products
| | 968,872 | | — | | — | | 968,872 |
Senior Floating Rate Loans
| | — | | 5,059,784 | | — | | 5,059,784 |
Short-Term Investment
| | 585,448 | | — | | — | | 585,448 |
TOTAL INVESTMENTS
| | $1,554,320 | | $27,185,478 | | $— | | $28,739,798 |
| OTHER FINANCIAL INSTRUMENTS: | | | | | | | | |
Centrally Cleared IRS Swap Agreements - Unrealized Appreciation
| | $ — | | $ $21,097 | | $— | | $ 21,097 |
Centrally Cleared IRS Swap Agreements - Unrealized Depreciation
| | — | | (48,289) | | — | | (48,289) |
Futures Contracts - Unrealized Depreciation
| | (29,423) | | — | | — | | (29,423) |
Futures Contracts - Unrealized Appreciation
| | 38,429 | | — | | — | | 38,429 |
TOTAL OTHER FINANCIAL INSTRUMENTS:
| | $ 9,006 | | $ (27,192) | | $— | | $ (18,186) |
See accompanying notes to financial statements.
64
SPDR LOOMIS SAYLES OPPORTUNISTIC BOND ETF
SCHEDULE OF INVESTMENTS (continued)
June 30, 2023
Affiliate Table
| | Number of
Shares Held
at
6/30/22 | | Value at
6/30/22 | | Cost of
Purchases | | Proceeds
from
Shares Sold | | Realized
Gain (Loss) | | Change in
Unrealized
Appreciation/
Depreciation | | Number of
Shares Held
at
6/30/23 | | Value at
6/30/23 | | Dividend
Income |
SPDR Blackstone Senior Loan ETF
| — | | $ — | | $ 3,322,454 | | $ 2,341,912 | | $(19,771) | | $8,101 | | 23,140 | | $ 968,872 | | $ 23,302 |
SPDR Bloomberg High Yield Bond ETF
| — | | — | | 2,020,486 | | 2,021,237 | | 751 | | — | | — | | — | | 17,062 |
State Street Institutional U.S. Government Money Market Fund, Class G Shares
| 1,958,487 | | 1,958,487 | | 37,243,622 | | 38,616,661 | | — | | — | | 585,448 | | 585,448 | | 63,691 |
Total
| | | $1,958,487 | | $42,586,562 | | $42,979,810 | | $(19,020) | | $8,101 | | | | $1,554,320 | | $104,055 |
See accompanying notes to financial statements.
65
SPDR NUVEEN MUNICIPAL BOND ETF
SCHEDULE OF INVESTMENTS
June 30, 2023
| Security Description | | | Principal
Amount | | Value |
| MUNICIPAL BONDS & NOTES — 98.5% | | | |
| ALABAMA — 2.3% | | | | |
Black Belt Energy Gas District Revenue, AL
Series B, 4.00%, 10/1/2052 (a)
| | $ 500,000 | | $ 495,494 |
Southeast Energy Authority A Cooperative District Revenue, AL
Series B, 4.00%, 12/1/2051 (a)
| | 500,000 | | 486,018 |
| | | | | | 981,512 |
| ARIZONA — 1.2% | | | | |
Maricopa County Industrial Development Authority Revenue, AZ
AMT, 4.00%, 10/15/2047 (b)
| | 100,000 | | 85,647 |
Maricopa County Pollution Control Corp. Revenue, AZ
Series B, 0.88%, 6/1/2043 (a)
| | 500,000 | | 441,924 |
| | | | | | 527,571 |
| ARKANSAS — 1.2% | | | | |
Arkansas Development Finance Authority Revenue, AR
AMT, 5.45%, 9/1/2052
| | 500,000 | | 499,961 |
| CALIFORNIA — 7.4% | | | | |
Anaheim Public Financing Authority Revenue, CA
Series C, AGM, Zero Coupon, 9/1/2036 (c)
| | 320,000 | | 203,031 |
California Housing Finance Agency Revenue, CA
Series 2021-1, Class A, 3.50%, 11/20/2035
| | 174,010 | | 162,807 |
Los Angeles Department of Water & Power Revenue, CA
Series E, 5.00%, 7/1/2039
| | 380,000 | | 384,846 |
Municipal Improvement Corp. of Los Angeles Revenue, CA
Series A, 1.45%, 11/1/2027
| | 540,000 | | 466,152 |
Norman Y Mineta San Jose International Airport SJC Revenue, CA
Series A, AMT, 5.00%, 3/1/2037
| | 210,000 | | 217,340 |
Orange County Community Facilities District, Special Tax Revenue, CA
Series A, 5.00%, 8/15/2037
| | 250,000 | | 261,469 |
Palomar Health, General Obligation, CA
Series A, AGC, Zero Coupon, 8/1/2027 (c)
| | 100,000 | | 87,035 |
San Francisco City & County Airport Comm-San Francisco International Airport Revenue, CA
Series H, AMT, 5.00%, 5/1/2028
| | 175,000 | | 186,672 |
| Security Description | | | Principal
Amount | | Value |
San Francisco City & County Public Utilities Commission Wastewater Revenue, CA
Series A, 5.25%, 10/1/2042
| | $ 375,000 | | $ 435,809 |
State of California, General Obligation, CA
5.00%, 9/1/2031
| | 245,000 | | 260,819 |
University of California Revenue, CA
Series BI, 1.37%, 5/15/2028
| | 595,000 | | 508,725 |
| | | | | | 3,174,705 |
| COLORADO — 4.5% | | | | |
City & County of Denver Airport System Revenue, CO
Series B2, AMT, 5.00%, 11/15/2031 (a)
| | 400,000 | | 410,556 |
Denver Convention Center Hotel Authority Revenue, CO
5.00%, 12/1/2030
| | 400,000 | | 412,030 |
Park Creek Metropolitan District Revenue, CO
Series A, Class A, 5.00%, 12/1/2024
| | 575,000 | | 586,806 |
State of Colorado, Certificate Participation, CO
Series A, Class A, 4.00%, 12/15/2036
| | 500,000 | | 515,022 |
| | | | | | 1,924,414 |
| CONNECTICUT — 2.2% | | | | |
Connecticut State Health & Educational Facilities Authority Revenue, CT
Series A, 5.00%, 7/1/2027
| | 120,000 | | 121,626 |
South Central Connecticut Regional Water Authority Revenue, CT
Series B, 5.00%, 8/1/2037
| | 125,000 | | 130,561 |
State of Connecticut, General Obligation, CT
Series F, 5.00%, 11/15/2041
| | 610,000 | | 675,075 |
| | | | | | 927,262 |
| FLORIDA — 6.9% | | | | |
County of Miami-Dade Aviation Revenue, FL
Series A, AMT, 5.00%, 10/1/2029
| | 210,000 | | 211,974 |
County of Miami-Dade Seaport Department Revenue, FL
Series A, AMT, 5.00%, 10/1/2038
| | 375,000 | | 399,343 |
County of Miami-Dade Water & Sewer System Revenue, FL
3.00%, 10/1/2036
| | 520,000 | | 477,975 |
| Florida Development Finance Corp. Revenue, FL: | | | | |
AMT, 6.13%, 7/1/2032 (b)
| | 300,000 | | 301,879 |
Series A, Class A, AMT, VRN, 7.25%, 7/1/2057 (a) (b)
| | 540,000 | | 549,229 |
See accompanying notes to financial statements.
66
SPDR NUVEEN MUNICIPAL BOND ETF
SCHEDULE OF INVESTMENTS (continued)
June 30, 2023
| Security Description | | | Principal
Amount | | Value |
State of Florida Department of Transportation Revenue, FL
Series A, 5.00%, 7/1/2025
| | $ 1,000,000 | | $ 1,037,332 |
| | | | | | 2,977,732 |
| GUAM — 0.7% | | | | |
Territory of Guam Revenue, GU
Series A, 5.00%, 11/1/2035
| | 300,000 | | 312,551 |
| HAWAII — 2.2% | | | | |
State of Hawaii, General Obligation, HI
Series EY, 5.00%, 10/1/2027
| | 905,000 | | 944,151 |
| IDAHO — 2.2% | | | | |
Idaho Housing & Finance Association Revenue, ID
Series A, 4.00%, 8/15/2048
| | 1,000,000 | | 966,527 |
| ILLINOIS — 9.1% | | | | |
| Chicago Board of Education, General Obligation, IL: | | | | |
Series A, 5.00%, 12/1/2035
| | 300,000 | | 311,638 |
Series A, 5.00%, 12/1/2036
| | 300,000 | | 309,199 |
Chicago O'Hare International Airport Revenue, IL
Series B, 5.00%, 1/1/2029
| | 160,000 | | 163,589 |
Chicago Transit Authority Capital Grant Receipts Revenue, IL
5.00%, 6/1/2024
| | 150,000 | | 151,733 |
Illinois Finance Authority Revenue, IL
5.00%, 7/1/2039
| | 230,000 | | 249,707 |
Illinois State Toll Highway Authority Revenue, IL
Series B, 5.00%, 1/1/2036
| | 900,000 | | 906,422 |
Northern Illinois Municipal Power Agency Revenue, IL
Series A, 5.00%, 12/1/2029
| | 360,000 | | 380,416 |
State of Illinois Sales Tax Revenue, IL
Series C, 5.00%, 6/15/2026
| | 565,000 | | 588,080 |
| State of Illinois, General Obligation, IL: | | | | |
Series A, 4.00%, 3/1/2038
| | 730,000 | | 715,461 |
Series A, 5.00%, 12/1/2031
| | 150,000 | | 159,681 |
| | | | | | 3,935,926 |
| IOWA — 0.5% | | | | |
Iowa Finance Authority Revenue, IA
4.00%, 12/1/2050 (a)
| | 200,000 | | 196,759 |
| KENTUCKY — 0.2% | | | | |
Kentucky Economic Development Finance Authority Revenue, KY
Series A, 4.25%, 7/1/2035
| | 100,000 | | 97,607 |
| Security Description | | | Principal
Amount | | Value |
| LOUISIANA — 2.6% | | | | |
Louisiana Local Government Environmental Facilities & Community Development Authority Revenue, LA
Series B, 5.00%, 8/15/2025
| | $ 250,000 | | $ 258,571 |
Louisiana Stadium & Exposition District Revenue, LA
Series A, 5.00%, 7/1/2039
| | 800,000 | | 883,638 |
| | | | | | 1,142,209 |
| MARYLAND — 1.8% | | | | |
| State of Maryland Department of Transportation Revenue, MD: | | | | |
Series B, Class B, AMT, 5.00%, 8/1/2027
| | 250,000 | | 263,476 |
Series B, Class B, AMT, 5.00%, 8/1/2030
| | 200,000 | | 218,828 |
Series B, Class B, AMT, 5.00%, 8/1/2031
| | 250,000 | | 276,474 |
| | | | | | 758,778 |
| MASSACHUSETTS — 3.6% | | | | |
| Massachusetts Clean Water Trust Revenue, MA: | | | | |
Series 18, 5.00%, 2/1/2029
| | 690,000 | | 698,006 |
Series 24B, 5.00%, 2/1/2037
| | 750,000 | | 864,374 |
| | | | | | 1,562,380 |
| MICHIGAN — 6.2% | | | | |
| Michigan Finance Authority Revenue, MI: | | | | |
5.00%, 11/1/2034
| | 110,000 | | 118,579 |
5.50%, 12/1/2026
| | 700,000 | | 725,210 |
Michigan State Housing Development Authority Revenue, MI
Series A, 4.70%, 12/1/2043
| | 750,000 | | 757,023 |
Southfield Public Schools, General Obligation, MI
5.00%, 5/1/2046
| | 1,000,000 | | 1,084,824 |
| | | | | | 2,685,636 |
| MINNESOTA — 0.3% | | | | |
State of Minnesota, General Obligation, MN
Series A, Class A, 5.00%, 8/1/2035
| | 100,000 | | 109,985 |
| MISSOURI — 3.9% | | | | |
City of Kansas City Sanitary Sewer System Revenue, MO
Series A, Class A, 4.00%, 1/1/2036
| | 600,000 | | 604,804 |
City of St. Louis Airport Revenue, MO
Series C, 5.00%, 7/1/2029
| | 100,000 | | 110,532 |
See accompanying notes to financial statements.
67
SPDR NUVEEN MUNICIPAL BOND ETF
SCHEDULE OF INVESTMENTS (continued)
June 30, 2023
| Security Description | | | Principal
Amount | | Value |
Park Hill School District of Platte County, General Obligation, MO
3.00%, 3/1/2032
| | $ 1,000,000 | | $ 950,740 |
| | | | | | 1,666,076 |
| NEVADA — 1.2% | | | | |
Las Vegas Valley Water District, General Obligation, NV
5.00%, 6/1/2039
| | 500,000 | | 508,957 |
| NEW JERSEY — 3.1% | | | | |
New Jersey Economic Development Authority Revenue, NJ
5.00%, 6/15/2031
| | 1,000,000 | | 1,099,647 |
New Jersey Transportation Trust Fund Authority Revenue, NJ
Series A, Class A, 5.00%, 6/15/2025
| | 245,000 | | 252,200 |
| | | | | | 1,351,847 |
| NEW MEXICO — 2.3% | | | | |
New Mexico Hospital Equipment Loan Council Revenue, NM
Series A, 4.00%, 8/1/2039
| | 1,000,000 | | 980,641 |
| NEW YORK — 3.6% | | | | |
City of New York, General Obligation, NY
Series A-1, 4.00%, 8/1/2037
| | 1,000,000 | | 1,021,896 |
| New York City Transitional Finance Authority Future Tax Secured Revenue, NY: | | | | |
Series A-1, 5.00%, 11/1/2023
| | 10,000 | | 10,057 |
Series B1, 5.00%, 8/1/2027
| | 120,000 | | 122,206 |
New York State Dormitory Authority Revenue, NY
Series B, 5.00%, 2/15/2034
| | 300,000 | | 307,478 |
Triborough Bridge & Tunnel Authority Revenue, NY
Series A, 5.00%, 11/1/2025
| | 85,000 | | 88,813 |
| | | | | | 1,550,450 |
| OHIO — 1.1% | | | | |
Indian Hill Exempted Village School District, General Obligation, OH
4.00%, 12/1/2024
| | 480,000 | | 486,097 |
| OREGON — 4.1% | | | | |
Medford Hospital Facilities Authority Revenue, OR
Series A, 5.00%, 8/15/2032
| | 900,000 | | 993,163 |
Washington & Clackamas Counties School District No. 23J Tigard-Tualatin, General Obligation, OR
Series A, 5.00%, 6/15/2038
| | 695,000 | | 757,262 |
| | | | | | 1,750,425 |
| Security Description | | | Principal
Amount | | Value |
| PENNSYLVANIA — 6.6% | | | | |
City of Philadelphia Airport Revenue, PA
Series B, Class B, AMT, 5.00%, 7/1/2032
| | $ 750,000 | | $ 789,848 |
Commonwealth Financing Authority Revenue, PA
AGM, 4.00%, 6/1/2039 (c)
| | 500,000 | | 491,531 |
Pennsylvania Economic Development Financing Authority Revenue, PA
Series A, Class A, 5.00%, 2/1/2025
| | 100,000 | | 101,702 |
Pennsylvania State University Revenue, PA
Series B, 5.00%, 9/1/2033
| | 600,000 | | 633,635 |
Pennsylvania Turnpike Commission Revenue, PA
Series B, Class B, 5.00%, 12/1/2031
| | 800,000 | | 835,723 |
| | | | | | 2,852,439 |
| TENNESSEE — 1.1% | | | | |
New Memphis Arena Public Building Authority Revenue, TN
Zero Coupon, 4/1/2030
| | 530,000 | | 472,499 |
| TEXAS — 5.5% | | | | |
Austin Independent School District, General Obligation, TX
5.00%, 8/1/2036
| | 500,000 | | 580,951 |
Central Texas Turnpike System Revenue, TX
Series B, 5.00%, 8/15/2037
| | 345,000 | | 349,813 |
Forney Independent School District, General Obligation, TX
Series B, 5.00%, 8/15/2039 (c)
| | 425,000 | | 472,001 |
Harris County-Houston Sports Authority Revenue, TX
Series A, 5.00%, 11/15/2029
| | 505,000 | | 514,583 |
New Hope Cultural Education Facilities Finance Corp. Revenue, TX
Series A-1, 5.50%, 1/1/2057
| | 320,000 | | 229,190 |
Plano Independent School District, General Obligation, TX
Series A, 5.00%, 2/15/2027
| | 215,000 | | 225,809 |
| | | | | | 2,372,347 |
| UTAH — 3.5% | | | | |
City of Salt Lake City Airport Revenue, UT
Series A, AMT, 5.00%, 7/1/2024
| | 815,000 | | 823,891 |
| Vineyard Redevelopment Agency, Special Obligation, UT: | | | | |
AGM, 5.00%, 5/1/2024 (c)
| | 350,000 | | 354,918 |
AGM, 5.00%, 5/1/2027 (c)
| | 325,000 | | 347,645 |
| | | | | | 1,526,454 |
See accompanying notes to financial statements.
68
SPDR NUVEEN MUNICIPAL BOND ETF
SCHEDULE OF INVESTMENTS (continued)
June 30, 2023
| Security Description | | | Principal
Amount | | Value |
| VIRGINIA — 1.2% | | | | |
| Virginia Small Business Financing Authority Revenue, VA: | | | | |
AMT, 5.00%, 6/30/2039
| | $ 125,000 | | $ 131,497 |
AMT, 5.00%, 12/31/2039
| | 355,000 | | 373,452 |
| | | | | | 504,949 |
| WASHINGTON — 4.6% | | | | |
Energy Northwest Revenue, WA
Series A, 5.00%, 7/1/2039
| | 300,000 | | 340,739 |
Port of Seattle Revenue, WA
Series C, AMT, 5.00%, 4/1/2035
| | 750,000 | | 757,406 |
| State of Washington, General Obligation, WA: | | | | |
Series D, Class D, 5.00%, 2/1/2036
| | 700,000 | | 706,026 |
Series 2017-A, 5.00%, 8/1/2029
| | 150,000 | | 159,055 |
| | | | | | 1,963,226 |
| WISCONSIN — 1.6% | | | | |
Public Finance Authority Revenue, WI
Series A, 6.00%, 6/15/2052
| | 250,000 | | 231,942 |
State of Wisconsin, General Obligation, WI
Series 2, 5.00%, 11/1/2027
| | 100,000 | | 108,012 |
Wisconsin Health & Educational Facilities Authority Revenue, WI
Series A, 5.00%, 10/15/2027
| | 350,000 | | 369,837 |
| | | | | | 709,791 |
TOTAL MUNICIPAL BONDS & NOTES
(Cost $44,464,808)
| | 42,421,864 | |
| | | Shares | |
| SHORT-TERM INVESTMENT — 0.4% | |
State Street Institutional U.S. Government Money Market Fund, Class G Shares 5.07% (d) (e)
(Cost $167,594)
| 167,594 | 167,594 |
TOTAL INVESTMENTS — 98.9%
(Cost $44,632,402)
| 42,589,458 |
OTHER ASSETS IN EXCESS OF LIABILITIES — 1.1%
| 481,930 |
NET ASSETS — 100.0%
| $ 43,071,388 |
| (a) | Variable Rate Security - Interest rate shown is rate in effect at June 30, 2023. For securities based on a published reference rate and spread, the reference rate and spread are indicated in the description above. |
| (b) | Securities purchased pursuant to Rule 144A of the Securities Act of 1933, as amended. These securities, which represent 2.2% of net assets as of June 30, 2023, are considered liquid and may be resold in transactions exempt from registration, normally to qualified institutional buyers. |
| (c) | Bond is insured by the following: |
| | % of
Net Assets |
Assured Guaranty Municipal Corp.
| 3.2% |
Permanent School Fund Guaranteed
| 1.1% |
Assured Guaranty Corp.
| 0.2% |
| (d) | The Fund invested in certain money market funds managed by SSGA Funds Management, Inc. Amounts related to these transactions during the period ended June 30, 2023 are shown in the Affiliate Table below. |
| (e) | The rate shown is the annualized seven-day yield at June 30, 2023. |
| AMT | Alternative Minimum Tax |
| UT | Unlimited Tax |
| VRN | Variable Rate Note |
See accompanying notes to financial statements.
69
SPDR NUVEEN MUNICIPAL BOND ETF
SCHEDULE OF INVESTMENTS (continued)
June 30, 2023
The following table summarizes the value of the Fund's investments according to the fair value hierarchy as of June 30, 2023.
| Description | | Level 1 –
Quoted Prices | | Level 2 –
Other Significant
Observable Inputs | | Level 3 –
Significant
Unobservable Inputs | | Total |
| ASSETS: | | | | | | | | |
| INVESTMENTS: | | | | | | | | |
Municipal Bonds & Notes
| | $ — | | $42,421,864 | | $— | | $42,421,864 |
Short-Term Investment
| | 167,594 | | — | | — | | 167,594 |
TOTAL INVESTMENTS
| | $167,594 | | $42,421,864 | | $— | | $42,589,458 |
Affiliate Table
| | Number of
Shares Held
at
6/30/22 | | Value at
6/30/22 | | Cost of
Purchases | | Proceeds
from
Shares Sold | | Realized
Gain (Loss) | | Change in
Unrealized
Appreciation/
Depreciation | | Number of
Shares Held
at
6/30/23 | | Value at
6/30/23 | | Dividend
Income |
State Street Institutional U.S. Government Money Market Fund, Class G Shares
| 1,595,897 | | $1,595,897 | | $20,961,484 | | $22,389,787 | | $— | | $— | | 167,594 | | $167,594 | | $72,627 |
See accompanying notes to financial statements.
70
SPDR NUVEEN MUNICIPAL BOND ESG ETF
SCHEDULE OF INVESTMENTS
June 30, 2023
| Security Description | | | Principal
Amount | | Value |
| MUNICIPAL BONDS & NOTES — 98.8% | | | |
| ARIZONA — 0.6% | | | | |
City of Phoenix Civic Improvement Corp. Revenue, AZ
Series D, Class D, 5.00%, 7/1/2030
| | $ 215,000 | | $ 231,752 |
| CALIFORNIA — 11.5% | | | | |
California Community Choice Financing Authority Revenue, CA
Series D, 5.50%, 5/1/2054 (a)
| | 600,000 | | 633,081 |
California Municipal Finance Authority Revenue, CA
Series A, Class A, 5.00%, 11/1/2023
| | 600,000 | | 601,449 |
Compton Unified School District, General Obligation, CA
Series B, Class B, BAM, 4.00%, 6/1/2032 (b)
| | 175,000 | | 181,177 |
Folsom Ranch Financing Authority, Special Tax Revenue, CA
5.00%, 9/1/2029
| | 145,000 | | 152,598 |
| Los Angeles Department of Water & Power Revenue, CA: | | | | |
Series A, 5.00%, 7/1/2028
| | 250,000 | | 275,368 |
Series E, 5.00%, 7/1/2039
| | 600,000 | | 607,652 |
Orange County Community Facilities District, Special Tax Revenue, CA
Series A, Class A, 5.00%, 8/15/2052
| | 200,000 | | 201,940 |
San Francisco City & County Public Utilities Commission Wastewater Revenue, CA
Series A, 5.25%, 10/1/2042
| | 375,000 | | 435,809 |
San Francisco Unified School District, General Obligation, CA
4.00%, 6/15/2026
| | 185,000 | | 190,667 |
San Mateo Foster City Public Financing Authority Revenue, CA
4.00%, 8/1/2035
| | 175,000 | | 183,996 |
| State of California, General Obligation, CA: | | | | |
4.00%, 10/1/2050
| | 650,000 | | 653,005 |
5.00%, 8/1/2024
| | 100,000 | | 102,211 |
| | | | | | 4,218,953 |
| COLORADO — 3.2% | | | | |
Regional Transportation District Revenue, CO
Series A, Class A, 5.00%, 7/15/2027
| | 500,000 | | 527,771 |
State of Colorado, Certificate Participation, CO
Series A, Class A, 4.00%, 12/15/2036
| | 615,000 | | 633,478 |
| | | | | | 1,161,249 |
| Security Description | | | Principal
Amount | | Value |
| CONNECTICUT — 2.9% | | | | |
State of Connecticut, General Obligation, CT
Series F, 5.00%, 11/15/2041
| | $ 610,000 | | $ 675,075 |
University of Connecticut Revenue, CT
Series A, Class A, 5.00%, 4/15/2026
| | 380,000 | | 399,886 |
| | | | | | 1,074,961 |
| DELAWARE — 1.4% | | | | |
Delaware Municipal Electric Corp. Revenue, DE
5.00%, 7/1/2030
| | 300,000 | | 340,885 |
Delaware Transportation Authority Revenue, DE
3.25%, 7/1/2025
| | 180,000 | | 179,364 |
| | | | | | 520,249 |
| DISTRICT OF COLUMBIA — 2.6% | | | | |
District of Columbia Revenue, DC
Series A, Class A, AMT, 5.00%, 8/31/2026
| | 700,000 | | 717,194 |
Washington Metropolitan Area Transit Authority Revenue, DC
5.00%, 7/1/2024
| | 250,000 | | 254,457 |
| | | | | | 971,651 |
| FLORIDA — 9.1% | | | | |
City of Gainesville Utilities System Revenue, FL
Series A, 5.00%, 10/1/2025
| | 290,000 | | 301,778 |
City of Pompano Beach Revenue, FL
3.50%, 9/1/2030
| | 250,000 | | 225,558 |
City of Tallahassee Utility System Revenue, FL
Series A, 5.00%, 10/1/2037
| | 560,000 | | 569,873 |
County of Miami-Dade Aviation Revenue, FL
Series A, Class A, 5.00%, 10/1/2024
| | 370,000 | | 376,749 |
| Florida Development Finance Corp. Revenue, FL: | | | | |
4.00%, 11/15/2034
| | 385,000 | | 388,788 |
Series A, Class A, 4.00%, 6/15/2042
| | 500,000 | | 430,001 |
Series A, Class A, AMT, VRN, 7.25%, 7/1/2057 (a) (c)
| | 300,000 | | 305,127 |
Miami-Dade County Expressway Authority Revenue, FL
Series A, Class A, 5.00%, 7/1/2025
| | 100,000 | | 101,162 |
Orlando Utilities Commission Revenue, FL
Series A, 5.00%, 10/1/2027
| | 150,000 | | 163,399 |
Palm Beach County Health Facilities Authority Revenue, FL
5.00%, 11/15/2032
| | 100,000 | | 101,258 |
See accompanying notes to financial statements.
71
SPDR NUVEEN MUNICIPAL BOND ESG ETF
SCHEDULE OF INVESTMENTS (continued)
June 30, 2023
| Security Description | | | Principal
Amount | | Value |
| Somerset Community Development District, Special Assessment, FL: | | | | |
4.00%, 5/1/2032
| | $ 200,000 | | $ 189,357 |
4.20%, 5/1/2037
| | 200,000 | | 183,407 |
| | | | | | 3,336,457 |
| IDAHO — 2.6% | | | | |
Idaho Housing & Finance Association Revenue, ID
Series A, 4.00%, 8/15/2048
| | 1,000,000 | | 966,527 |
| ILLINOIS — 5.3% | | | | |
Chicago O'Hare International Airport Revenue, IL
AMT, 5.00%, 1/1/2034
| | 400,000 | | 442,207 |
Illinois Finance Authority Revenue, IL
5.00%, 7/1/2036
| | 270,000 | | 303,719 |
| Illinois State Toll Highway Authority Revenue, IL: | | | | |
Series B, 5.00%, 1/1/2036
| | 600,000 | | 604,281 |
Series B, 5.00%, 1/1/2027
| | 140,000 | | 149,369 |
Mount Prospect Park District, General Obligation, IL
Series A, Class A, 5.00%, 11/1/2031
| | 280,000 | | 319,682 |
State of Illinois, General Obligation, IL
5.50%, 1/1/2028
| | 130,000 | | 141,698 |
| | | | | | 1,960,956 |
| IOWA — 0.8% | | | | |
Iowa Finance Authority Revenue, IA
4.00%, 12/1/2050 (a)
| | 300,000 | | 295,139 |
| MAINE — 0.3% | | | | |
City of Auburn, General Obligation, ME
5.00%, 9/1/2024
| | 100,000 | | 102,166 |
| MARYLAND — 2.9% | | | | |
Maryland Economic Development Corp. Revenue, MD
Series B, Class B, AMT, 5.00%, 12/31/2036
| | 425,000 | | 451,837 |
State of Maryland, General Obligation, MD
Series B, Class B, 5.00%, 8/1/2027
| | 400,000 | | 434,354 |
Washington Suburban Sanitary Commission Revenue, MD
5.00%, 6/1/2027
| | 150,000 | | 162,282 |
| | | | | | 1,048,473 |
| MASSACHUSETTS — 0.7% | | | | |
Massachusetts Development Finance Agency Revenue, MA
Series A-2, 5.00%, 7/1/2027
| | 250,000 | | 269,326 |
| Security Description | | | Principal
Amount | | Value |
| MICHIGAN — 2.1% | | | | |
Michigan State Housing Development Authority Revenue, MI
Series A, 4.70%, 12/1/2043
| | $ 750,000 | | $ 757,023 |
| MINNESOTA — 2.2% | | | | |
City of Minneapolis/St. Paul Housing & Redevelopment Authority Revenue, MN
Series A, Class A, 5.00%, 11/15/2026
| | 435,000 | | 459,142 |
Minneapolis-St. Paul Metropolitan Airports Commission Revenue, MN
Series B, Class B, AMT, 5.00%, 1/1/2034
| | 300,000 | | 331,655 |
| | | | | | 790,797 |
| MISSOURI — 1.6% | | | | |
City of Kansas City Sanitary Sewer System Revenue, MO
Series A, Class A, 4.00%, 1/1/2036
| | 600,000 | | 604,804 |
| NEVADA — 1.4% | | | | |
Las Vegas Valley Water District, General Obligation, NV
5.00%, 6/1/2039
| | 500,000 | | 508,957 |
| NEW JERSEY — 4.3% | | | | |
Hudson County Improvement Authority Revenue, NJ
3.00%, 10/1/2034
| | 160,000 | | 152,456 |
| New Jersey Economic Development Authority Revenue, NJ: | | | | |
Series MMM, 5.00%, 6/15/2033
| | 180,000 | | 197,030 |
Series QQQ, 5.00%, 6/15/2033
| | 275,000 | | 305,920 |
| New Jersey Transportation Trust Fund Authority Revenue, NJ: | | | | |
Series AA, Ambac Financial Group, 5.00%, 6/15/2036
| | 250,000 | | 250,000 |
Series CC, 5.25%, 6/15/2036
| | 300,000 | | 338,256 |
State of New Jersey, General Obligation, NJ
Series A, Class A, 5.00%, 6/1/2027
| | 330,000 | | 354,866 |
| | | | | | 1,598,528 |
| NEW YORK — 9.5% | | | | |
| City of New York, General Obligation, NY: | | | | |
Series E1, 5.00%, 4/1/2039
| | 300,000 | | 338,535 |
Series A, 5.00%, 8/1/2025
| | 105,000 | | 109,016 |
Series A-1, 5.00%, 9/1/2034
| | 400,000 | | 466,250 |
Hudson Yards Infrastructure Corp. Revenue, NY
Series A, 5.00%, 2/15/2030
| | 300,000 | | 321,632 |
See accompanying notes to financial statements.
72
SPDR NUVEEN MUNICIPAL BOND ESG ETF
SCHEDULE OF INVESTMENTS (continued)
June 30, 2023
| Security Description | | | Principal
Amount | | Value |
| Metropolitan Transportation Authority Revenue, NY: | | | | |
Series E, Class E, 3.50%, 11/15/2032
| | $ 230,000 | | $ 220,564 |
Series A, 5.00%, 11/15/2037
| | 575,000 | | 648,703 |
New York City Transitional Finance Authority Building Aid Revenue, NY
Series S1A, Class A, 5.00%, 7/15/2038
| | 475,000 | | 517,285 |
New York City Transitional Finance Authority Future Tax Secured Revenue, NY
5.00%, 11/1/2034
| | 250,000 | | 286,960 |
| New York Transportation Development Corp. Revenue, NY: | | | | |
AMT, 5.00%, 12/1/2036
| | 250,000 | | 264,996 |
AMT, 5.00%, 12/1/2037
| | 300,000 | | 315,516 |
| | | | | | 3,489,457 |
| NORTH CAROLINA — 1.0% | | | | |
County of Durham Revenue, NC
Series A, 5.00%, 6/1/2042
| | 320,000 | | 359,953 |
| OKLAHOMA — 3.3% | | | | |
Carter County Public Facilities Authority Revenue, OK
5.00%, 9/1/2028
| | 200,000 | | 210,930 |
Grand River Dam Authority Revenue, OK
Series A, Class A, 5.00%, 6/1/2039
| | 700,000 | | 708,273 |
Muskogee Industrial Trust Revenue, OK
4.00%, 9/1/2032
| | 100,000 | | 99,374 |
Norman Regional Hospital Authority Revenue, OK
4.00%, 9/1/2037
| | 230,000 | | 203,075 |
| | | | | | 1,221,652 |
| OREGON — 4.1% | | | | |
Medford Hospital Facilities Authority Revenue, OR
Series A, 5.00%, 8/15/2037
| | 745,000 | | 797,671 |
Warm Springs Reservation Confederated Tribe Revenue, OR
Series B, 5.00%, 11/1/2039 (c)
| | 650,000 | | 696,810 |
| | | | | | 1,494,481 |
| PENNSYLVANIA — 3.4% | | | | |
Commonwealth of Pennsylvania, General Obligation, PA
2nd Series, 5.00%, 9/15/2023
| | 500,000 | | 501,711 |
Pennsylvania Economic Development Financing Authority Revenue, PA
Series A-2, Class A, 4.00%, 5/15/2053
| | 250,000 | | 229,568 |
| Security Description | | | Principal
Amount | | Value |
Pennsylvania Turnpike Commission Revenue, PA
5.00%, 6/1/2027
| | $ 500,000 | | $ 521,693 |
| | | | | | 1,252,972 |
| TENNESSEE — 0.7% | | | | |
Tennessee Housing Development Agency Revenue, TN
Series 2A, 4.15%, 7/1/2038 (d)
| | 250,000 | | 249,271 |
| TEXAS — 8.7% | | | | |
Board of Regents of the University of Texas System Revenue, TX
Series B, 5.00%, 8/15/2029
| | 425,000 | | 480,228 |
City of Dallas, General Obligation, TX
AGM, 3.13%, 2/15/2035 (b)
| | 900,000 | | 869,733 |
City of Garland Electric Utility System Revenue, TX
5.00%, 3/1/2024
| | 300,000 | | 303,208 |
County of Williamson, General Obligation, TX
5.00%, 2/15/2028
| | 155,000 | | 169,642 |
Love Field Airport Modernization Corp. Revenue, TX
AMT, 5.00%, 11/1/2034
| | 105,000 | | 108,841 |
Lower Colorado River Authority Revenue, TX
Series B, 5.00%, 5/15/2039 (a)
| | 590,000 | | 631,612 |
Texas Woman's University Revenue, TX
Series A, Class A, 5.00%, 7/1/2037
| | 585,000 | | 655,321 |
| | | | | | 3,218,585 |
| VIRGINIA — 2.0% | | | | |
Chesapeake Bay Bridge & Tunnel District Revenue, VA
5.00%, 11/1/2023
| | 610,000 | | 612,318 |
Hampton Roads Transportation Accountability Commission Revenue, VA
Series A, Class A, 5.00%, 7/1/2026
| | 125,000 | | 132,239 |
| | | | | | 744,557 |
| WASHINGTON — 7.3% | | | | |
Central Puget Sound Regional Transit Authority Revenue, WA
Series S-1, Class S1, 5.00%, 11/1/2045
| | 105,000 | | 109,831 |
King County Public Hospital District No. 1, General Obligation, WA
5.00%, 12/1/2036
| | 590,000 | | 620,448 |
| Port of Seattle Revenue, WA: | | | | |
Series B, 5.00%, 6/1/2034
| | 200,000 | | 226,619 |
Series C, AMT, 5.00%, 4/1/2035
| | 750,000 | | 757,405 |
See accompanying notes to financial statements.
73
SPDR NUVEEN MUNICIPAL BOND ESG ETF
SCHEDULE OF INVESTMENTS (continued)
June 30, 2023
| Security Description | | | Principal
Amount | | Value |
| State of Washington, General Obligation, WA: | | | | |
Series D, Class D, 5.00%, 2/1/2036
| | $ 700,000 | | $ 706,026 |
Series A, 5.00%, 8/1/2033
| | 250,000 | | 268,675 |
| | | | | | 2,689,004 |
| WISCONSIN — 3.3% | | | | |
Public Finance Authority Revenue, WI
Series A, Class A, 4.00%, 11/15/2037
| | 600,000 | | 529,981 |
Wisconsin Health & Educational Facilities Authority Revenue, WI
4.00%, 4/1/2039
| | 700,000 | | 686,630 |
| | | | | | 1,216,611 |
TOTAL MUNICIPAL BONDS & NOTES
(Cost $36,724,757)
| | 36,354,511 | |
| | | Shares | |
| SHORT-TERM INVESTMENT — 0.7% | |
State Street Institutional U.S. Government Money Market Fund, Class G Shares 5.07% (e) (f)
(Cost $263,694)
| 263,694 | 263,694 |
TOTAL INVESTMENTS — 99.5%
(Cost $36,988,451)
| 36,618,205 |
OTHER ASSETS IN EXCESS OF LIABILITIES — 0.5%
| 172,045 |
NET ASSETS — 100.0%
| $ 36,790,250 |
| (a) | Variable Rate Security - Interest rate shown is rate in effect at June 30, 2023. For securities based on a published reference rate and spread, the reference rate and spread are indicated in the description above. |
| (b) | Bond is insured by the following: |
| | % of
Net Assets |
Assured Guaranty Municipal Corp
| 2.4% |
Build America Mutual Assurance Company
| 0.5% |
| (c) | Securities purchased pursuant to Rule 144A of the Securities Act of 1933, as amended. These securities, which represent 2.7% of net assets as of June 30, 2023, are considered liquid and may be resold in transactions exempt from registration, normally to qualified institutional buyers. |
| (d) | When-issued security. |
| (e) | The Fund invested in certain money market funds managed by SSGA Funds Management, Inc. Amounts related to these transactions during the period ended June 30, 2023 are shown in the Affiliate Table below. |
| (f) | The rate shown is the annualized seven-day yield at June 30, 2023. |
| AMT | Alternative Minimum Tax |
| VRN | Variable Rate Note |
The following table summarizes the value of the Fund's investments according to the fair value hierarchy as of June 30, 2023.
| Description | | Level 1 –
Quoted Prices | | Level 2 –
Other Significant
Observable Inputs | | Level 3 –
Significant
Unobservable Inputs | | Total |
| ASSETS: | | | | | | | | |
| INVESTMENTS: | | | | | | | | |
Municipal Bonds & Notes
| | $ — | | $36,354,511 | | $— | | $ 36,354,511 |
Short-Term Investment
| | 263,694 | | — | | — | | 263,694 |
TOTAL INVESTMENTS
| | $263,694 | | $36,354,511 | | $— | | $36,618,205 |
| | Number of
Shares Held
at
6/30/22 | | Value at
6/30/22 | | Cost of
Purchases | | Proceeds
from
Shares Sold | | Realized
Gain (Loss) | | Change in
Unrealized
Appreciation/
Depreciation | | Number of
Shares Held
at
6/30/23 | | Value at
6/30/23 | | Dividend
Income |
State Street ESG Liquid Reserves Fund, Premier Class
| 1,543,320 | | $1,543,320 | | $ 2,576,364 | | $ 4,120,138 | | $485 | | $(31) | | — | | $ — | | $ 6,665 |
State Street Institutional U.S. Government Money Market Fund, Class G Shares
| — | | — | | 16,486,391 | | 16,222,697 | | — | | — | | 263,694 | | 263,694 | | 45,296 |
Total
| | | $1,543,320 | | $19,062,755 | | $20,342,835 | | $485 | | $(31) | | | | $263,694 | | $51,961 |
See accompanying notes to financial statements.
74
SPDR SSGA FIXED INCOME SECTOR ROTATION ETF
SCHEDULE OF INVESTMENTS
June 30, 2023
| Security Description | | | Shares | | Value |
| MUTUAL FUNDS AND EXCHANGE TRADED PRODUCTS — 99.8% | | | |
| DOMESTIC FIXED INCOME — 99.8% | |
SPDR Bloomberg 1-3 Month T-Bills ETF (a)
| | | 127,586 | | $ 11,714,947 |
SPDR Bloomberg High Yield Bond ETF (a)(b)
| | | 98,180 | | 9,035,505 |
SPDR Bloomberg International Treasury Bond ETF (a)(b)
| | | 558,817 | | 12,601,323 |
SPDR Portfolio Intermediate Term Corporate Bond ETF (a)(b)
| | | 434,649 | | 13,956,579 |
SPDR Portfolio Intermediate Term Treasury ETF (a)(b)
| | | 1,951,784 | | 55,215,969 |
SPDR Portfolio Long Term Corporate Bond ETF (a)(b)
| | | 265,123 | | 6,166,761 |
SPDR Portfolio Long Term Treasury ETF (a)
| | | 623,115 | | 18,631,139 |
SPDR Portfolio Mortgage-Backed Bond ETF (a)(b)
| | | 2,371,611 | | 51,961,997 |
TOTAL MUTUAL FUNDS AND EXCHANGE TRADED PRODUCTS
(Cost $183,269,098)
| | 179,284,220 | |
| SHORT-TERM INVESTMENTS — 27.1% | | | |
State Street Institutional U.S. Government Money Market Fund, Class G Shares 5.07% (c)(d)
| | | 300,805 | | $ 300,805 |
| Security Description | | | Shares | | Value |
State Street Navigator Securities Lending Portfolio II (e)(f)
| | | 48,283,244 | | $ 48,283,244 |
TOTAL SHORT-TERM INVESTMENTS
(Cost $48,584,049)
| | | | | $ 48,584,049 |
TOTAL INVESTMENTS — 126.9%
(Cost $231,853,147)
| | | | | 227,868,269 |
LIABILITIES IN EXCESS OF OTHER ASSETS — (26.9)%
| | | | | (48,296,405) |
NET ASSETS — 100.0%
| | | | | $ 179,571,864 |
| The Fund invests in other funds and financial statements of underlying funds can be found at www.sec.gov. |
| |
| (a) | Affiliated fund managed by SSGA Funds Management, Inc. Amounts related to these transactions during the period ended June 30, 2023 are shown in the Affiliate Table below. |
| (b) | All or a portion of the shares of the security are on loan at June 30, 2023. |
| (c) | The Fund invested in certain money market funds managed by SSGA Funds Management, Inc. Amounts related to these transactions during the period ended June 30, 2023 are shown in the Affiliate Table below. |
| (d) | The rate shown is the annualized seven-day yield at June 30, 2023. |
| (e) | The Fund invested in an affiliated entity. Amounts related to these transactions during the period ended June 30, 2023 are shown in the Affiliate Table below. |
| (f) | Investment of cash collateral for securities loaned. |
The following table summarizes the value of the Fund's investments according to the fair value hierarchy as of June 30, 2023.
| Description | | Level 1 –
Quoted Prices | | Level 2 –
Other Significant
Observable Inputs | | Level 3 –
Significant
Unobservable Inputs | | Total |
| ASSETS: | | | | | | | | |
| INVESTMENTS: | | | | | | | | |
Mutual Funds and Exchange Traded Products
| | $179,284,220 | | $— | | $— | | $179,284,220 |
Short-Term Investments
| | 48,584,049 | | — | | — | | 48,584,049 |
TOTAL INVESTMENTS
| | $227,868,269 | | $— | | $— | | $227,868,269 |
See accompanying notes to financial statements.
75
SPDR SSGA FIXED INCOME SECTOR ROTATION ETF
SCHEDULE OF INVESTMENTS (continued)
June 30, 2023
Affiliate Table
| | Number of
Shares Held
at
6/30/22 | | Value at
6/30/22 | | Cost of
Purchases | | Proceeds
from
Shares Sold | | Realized
Gain (Loss) | | Change in
Unrealized
Appreciation/
Depreciation | | Number of
Shares Held
at
6/30/23 | | Value at
6/30/23 | | Dividend
Income |
SPDR Bloomberg 1-3 Month T-Bill ETF
| 208,058 | | $ 19,035,227 | | $ 34,144,265 | | $ 41,488,269 | | $ 2,978 | | $ 20,746 | | 127,586 | | $ 11,714,947 | | $ 321,540 |
SPDR Bloomberg High Yield Bond ETF
| — | | — | | 17,032,154 | | 7,769,131 | | (217,362) | | (10,156) | | 98,180 | | 9,035,505 | | 89,322 |
SPDR Bloomberg International Treasury Bond ETF
| 26,869 | | 622,286 | | 17,104,802 | | 5,316,528 | | 42,214 | | 148,549 | | 558,817 | | 12,601,323 | | 88,687 |
SPDR Portfolio Intermediate Term Corporate Bond ETF
| 526,060 | | 17,165,338 | | 21,513,698 | | 24,563,548 | | (1,203,098) | | 1,044,189 | | 434,649 | | 13,956,579 | | 586,140 |
SPDR Portfolio Intermediate Term Treasury ETF
| 628,939 | | 18,534,832 | | 74,451,588 | | 36,146,614 | | (1,784,100) | | 160,263 | | 1,951,784 | | 55,215,969 | | 885,770 |
SPDR Portfolio Long Term Corporate Bond ETF
| 11,160 | | 268,844 | | 22,589,365 | | 16,133,221 | | (628,769) | | 70,542 | | 265,123 | | 6,166,761 | | 179,602 |
SPDR Portfolio Long Term Treasury ETF
| 986,122 | | 32,611,055 | | 30,602,701 | | 42,116,357 | | (5,481,426) | | 3,015,166 | | 623,115 | | 18,631,139 | | 648,652 |
SPDR Portfolio Mortgage Backed Bond ETF
| 1,318,878 | | 30,136,362 | | 52,487,327 | | 28,674,268 | | (3,261,063) | | 1,273,639 | | 2,371,611 | | 51,961,997 | | 1,165,644 |
State Street Institutional U.S. Government Money Market Fund, Class G Shares
| 188,090 | | 188,090 | | 1,117,394 | | 1,004,679 | | — | | — | | 300,805 | | 300,805 | | 9,860 |
State Street Navigator Securities Lending Portfolio II
| 20,836,025 | | 20,836,025 | | 1,073,707,173 | | 1,046,259,954 | | — | | — | | 48,283,244 | | 48,283,244 | | 305,592 |
Total
| | | $139,398,059 | | $1,344,750,467 | | $1,249,472,569 | | $(12,530,626) | | $5,722,938 | | | | $227,868,269 | | $4,280,809 |
See accompanying notes to financial statements.
76
SPDR SSGA US SECTOR ROTATION ETF
SCHEDULE OF INVESTMENTS
June 30, 2023
| Security Description | | | Shares | | Value |
| MUTUAL FUNDS AND EXCHANGE TRADED PRODUCTS — 99.9% | | | |
| DOMESTIC EQUITY — 99.9% | |
The Communication Services Select Sector SPDR Fund (a)(b)
| | | 96,107 | | $ 6,254,643 |
The Consumer Discretionary Select Sector SPDR Fund (a)(b)
| | | 295,657 | | 50,205,515 |
The Consumer Staples Select Sector SPDR Fund (a)(b)
| | | 421,950 | | 31,296,031 |
The Energy Select Sector SPDR Fund (a)
| | | 167,682 | | 13,610,748 |
The Health Care Select Sector SPDR Fund (a)(b)
| | | 462,115 | | 61,336,524 |
The Industrial Select Sector SPDR Fund (a)(b)
| | | 649,374 | | 69,690,818 |
The Technology Select Sector SPDR Fund (a)(b)
| | | 382,122 | | 66,435,731 |
TOTAL MUTUAL FUNDS AND EXCHANGE TRADED PRODUCTS
(Cost $271,139,461)
| | 298,830,010 | |
| SHORT-TERM INVESTMENTS — 30.7% | | | |
State Street Institutional U.S. Government Money Market Fund, Class G Shares 5.07% (c)(d)
| | | 385,530 | | $ 385,530 |
State Street Navigator Securities Lending Portfolio II (e)(f)
| | | 91,543,951 | | 91,543,951 |
TOTAL SHORT-TERM INVESTMENTS
(Cost $91,929,481)
| | | | | $ 91,929,481 |
TOTAL INVESTMENTS — 130.6%
(Cost $363,068,942)
| | | | | 390,759,491 |
LIABILITIES IN EXCESS OF OTHER ASSETS — (30.6)%
| | | | | (91,635,138) |
NET ASSETS — 100.0%
| | | | | $ 299,124,353 |
| The Fund invests in other funds and financial statements of underlying funds can be found at www.sec.gov. |
| |
| (a) | Affiliated fund managed by SSGA Funds Management, Inc. Amounts related to these transactions during the period ended June 30, 2023 are shown in the Affiliate Table below. |
| (b) | All or a portion of the shares of the security are on loan at June 30, 2023. |
| (c) | The Fund invested in certain money market funds managed by SSGA Funds Management, Inc. Amounts related to these transactions during the period ended June 30, 2023 are shown in the Affiliate Table below. |
| (d) | The rate shown is the annualized seven-day yield at June 30, 2023. |
| (e) | The Fund invested in an affiliated entity. Amounts related to these transactions during the period ended June 30, 2023 are shown in the Affiliate Table below. |
| (f) | Investment of cash collateral for securities loaned. |
The following table summarizes the value of the Fund's investments according to the fair value hierarchy as of June 30, 2023.
| Description | | Level 1 –
Quoted Prices | | Level 2 –
Other Significant
Observable Inputs | | Level 3 –
Significant
Unobservable Inputs | | Total |
| ASSETS: | | | | | | | | |
| INVESTMENTS: | | | | | | | | |
Mutual Funds and Exchange Traded Products
| | $298,830,010 | | $— | | $— | | $298,830,010 |
Short-Term Investments
| | 91,929,481 | | — | | — | | 91,929,481 |
TOTAL INVESTMENTS
| | $390,759,491 | | $— | | $— | | $390,759,491 |
See accompanying notes to financial statements.
77
SPDR SSGA US SECTOR ROTATION ETF
SCHEDULE OF INVESTMENTS (continued)
June 30, 2023
Affiliate Table
| | Number of
Shares Held
at
6/30/22 | | Value at
6/30/22 | | Cost of
Purchases | | Proceeds
from
Shares Sold | | Realized
Gain (Loss) | | Change in
Unrealized
Appreciation/
Depreciation | | Number of
Shares Held
at
6/30/23 | | Value at
6/30/23 | | Dividend
Income |
State Street Institutional U.S. Government Money Market Fund, Class G Shares
| 747,558 | | $ 747,558 | | $ 5,253,998 | | $ 5,616,026 | | $ — | | $ — | | 385,530 | | $ 385,530 | | $ 15,519 |
State Street Navigator Securities Lending Portfolio II
| 34,939,526 | | 34,939,526 | | 1,277,258,310 | | 1,220,653,885 | | — | | — | | 91,543,951 | | 91,543,951 | | 229,631 |
The Communication Services Select Sector SPDR Fund
| 71,118 | | 3,859,574 | | 49,272,114 | | 48,917,186 | | 710,936 | | 1,329,205 | | 96,107 | | 6,254,643 | | 29,244 |
The Consumer Discretionary Select Sector SPDR Fund
| 101,186 | | 13,911,051 | | 74,134,425 | | 42,088,895 | | (4,985,908) | | 9,234,842 | | 295,657 | | 50,205,515 | | 207,303 |
The Consumer Staples Select Sector SPDR Fund
| 87,688 | | 6,329,320 | | 97,377,511 | | 69,698,456 | | (2,151,882) | | (560,462) | | 421,950 | | 31,296,031 | | 575,931 |
The Energy Select Sector SPDR Fund
| 177,229 | | 12,673,646 | | 10,324,739 | | 11,862,832 | | 1,179,683 | | 1,295,512 | | 167,682 | | 13,610,748 | | 581,807 |
The Financial Select Sector SPDR Fund
| 748,783 | | 23,549,225 | | 44,906,399 | | 70,445,069 | | (1,975,312) | | 3,964,757 | | — | | — | | 651,172 |
The Health Care Select Sector SPDR Fund
| 246,210 | | 31,573,970 | | 100,418,737 | | 73,006,383 | | 688,152 | | 1,662,048 | | 462,115 | | 61,336,524 | | 633,533 |
The Industrial Select Sector SPDR Fund
| 229,397 | | 20,035,534 | | 76,579,862 | | 32,787,675 | | (1,276,635) | | 7,139,732 | | 649,374 | | 69,690,818 | | 670,097 |
The Materials Select Sector SPDR Fund
| 278,774 | | 20,517,766 | | 52,984,159 | | 72,584,059 | | (4,568,052) | | 3,650,186 | | — | | — | | 219,516 |
The Real Estate Sector SPDR Fund
| 136,665 | | 5,584,133 | | 31,935 | | 5,675,085 | | (803,327) | | 862,344 | | — | | — | | — |
The Technology Select Sector SPDR Fund
| 394,971 | | 50,208,714 | | 64,599,451 | | 67,663,381 | | 1,519,335 | | 17,771,612 | | 382,122 | | 66,435,731 | | 534,311 |
The Utilities Select Sector SPDR Fund
| 204,622 | | 14,350,141 | | 15,248,647 | | 28,651,761 | | (1,622,533) | | 675,506 | | — | | — | | 155,207 |
Total
| | | $238,280,158 | | $1,868,390,287 | | $1,749,650,693 | | $(13,285,543) | | $47,025,282 | | | | $390,759,491 | | $4,503,271 |
See accompanying notes to financial statements.
78
SSGA ACTIVE TRUST
SPDR DOUBLELINE EMERGING MARKETS FIXED INCOME ETF
SCHEDULE OF INVESTMENTS
June 30, 2023
| Security Description | | | Principal
Amount | | Value |
| CORPORATE BONDS & NOTES — 80.4% | | | |
| BRAZIL — 6.5% | | | |
Braskem Netherlands Finance BV 5 Year CMT + 8.22%, 8.50%, 1/23/2081 (a)
| | | $ 600,000 | | $ 611,388 |
BRF SA 4.88%, 1/24/2030
| | | 200,000 | | 161,810 |
| Cosan Luxembourg SA: | | | | | |
7.00%, 1/20/2027
| | | 200,000 | | 200,078 |
7.50%, 6/27/2030 (b)
| | | 200,000 | | 197,906 |
Cosan Overseas Ltd. 8.25%, 8/5/2023
| | | 800,000 | | 795,532 |
Guara Norte SARL 5.20%, 6/15/2034
| | | 1,423,659 | | 1,241,017 |
MC Brazil Downstream Trading SARL 7.25%, 6/30/2031
| | | 869,626 | | 587,711 |
Movida Europe SA 5.25%, 2/8/2031
| | | 300,000 | | 243,669 |
MV24 Capital BV 6.75%, 6/1/2034
| | | 336,236 | | 302,478 |
| NBM U.S. Holdings, Inc.: | | | | | |
6.63%, 8/6/2029
| | | 200,000 | | 182,942 |
7.00%, 5/14/2026
| | | 200,000 | | 194,274 |
Nexa Resources SA Series REGS, 5.38%, 5/4/2027
| | | 277,000 | | 257,715 |
Simpar Europe SA 5.20%, 1/26/2031
| | | 200,000 | | 158,712 |
Unigel Luxembourg SA 8.75%, 10/1/2026
| | | 200,000 | | 65,074 |
| | | | | | 5,200,306 |
| CHILE — 7.9% | | | |
Agrosuper SA 4.60%, 1/20/2032
| | | 350,000 | | 295,949 |
CAP SA 3.90%, 4/27/2031 (b)
| | | 1,400,000 | | 1,017,072 |
Chile Electricity PEC SpA 0.01%, 1/25/2028 (b)
| | | 2,500,000 | | 1,935,400 |
Empresa Electrica Angamos SA Series REGS, 4.88%, 5/25/2029
| | | 104,300 | | 94,468 |
Empresa Electrica Cochrane SpA Series REGS, 5.50%, 5/14/2027
| | | 1,081,440 | | 997,315 |
Inversiones La Construccion SA 4.75%, 2/7/2032
| | | 1,400,000 | | 1,125,558 |
Mercury Chile Holdco LLC 6.50%, 1/24/2027 (b)
| | | 600,000 | | 544,788 |
VTR Comunicaciones SpA 5.13%, 1/15/2028
| | | 200,000 | | 104,016 |
VTR Finance NV Series REGS, 6.38%, 7/15/2028
| | | 500,000 | | 188,340 |
| | | | | | 6,302,906 |
| COLOMBIA — 7.1% | | | |
AI Candelaria Spain SA 5.75%, 6/15/2033 (b)
| | | 1,225,000 | | 909,415 |
| Security Description | | | Principal
Amount | | Value |
Banco Davivienda SA 10 Year CMT + 5.10%, 6.65%, 4/22/2031 (a)(b)
| | | $ 400,000 | | $ 293,996 |
Bancolombia SA 5 Year CMT + 2.94%, 4.63%, 12/18/2029 (a)
| | | 400,000 | | 340,692 |
| Ecopetrol SA: | | | | | |
4.63%, 11/2/2031
| | | 1,500,000 | | 1,151,250 |
5.38%, 6/26/2026
| | | 300,000 | | 286,605 |
5.88%, 5/28/2045
| | | 100,000 | | 68,213 |
5.88%, 11/2/2051
| | | 250,000 | | 165,143 |
| Empresas Publicas de Medellin ESP: | | | | | |
Series REGS, 4.25%, 7/18/2029
| | | 1,500,000 | | 1,185,075 |
Series REGS, 4.38%, 2/15/2031
| | | 500,000 | | 374,770 |
Oleoducto Central SA Series REGS, 4.00%, 7/14/2027
| | | 950,000 | | 836,085 |
| | | | | | 5,611,244 |
| GUATEMALA — 1.7% | | | |
Banco Industrial SA 5 Year CMT + 4.44%, 4.88%, 1/29/2031
| | | 300,000 | | 279,573 |
CT Trust 5.13%, 2/3/2032
| | | 600,000 | | 483,054 |
Millicom International Cellular SA 6.25%, 3/25/2029
| | | 630,000 | | 564,587 |
| | | | | | 1,327,214 |
| INDIA — 7.6% | | | |
| Adani Electricity Mumbai Ltd.: | | | | | |
Series REGS, 3.87%, 7/22/2031
| | | 200,000 | | 140,801 |
Series REGS, 3.95%, 2/12/2030
| | | 700,000 | | 520,037 |
Adani International Container Terminal Pvt Ltd. 3.00%, 2/16/2031 (b)
| | | 1,281,000 | | 1,003,479 |
| Adani Ports & Special Economic Zone Ltd.: | | | | | |
3.10%, 2/2/2031
| | | 1,000,000 | | 706,260 |
Series REGS, 4.38%, 7/3/2029
| | | 700,000 | | 564,368 |
Adani Transmission Step-One Ltd. 4.00%, 8/3/2026
| | | 1,200,000 | | 1,048,804 |
| Network i2i Ltd.: | | | | | |
Series REGS, 5 Year CMT + 3.39%, 3.98%, 12/31/2099
| | | 300,000 | | 268,131 |
5 Year CMT + 4.27%, 5.65%, 1/15/2025 (a)
| | | 200,000 | | 194,336 |
Periama Holdings LLC 5.95%, 4/19/2026
| | | 200,000 | | 192,262 |
| UPL Corp. Ltd.: | | | | | |
4.50%, 3/8/2028
| | | 200,000 | | 179,152 |
4.63%, 6/16/2030
| | | 1,100,000 | | 940,500 |
See accompanying notes to financial statements.
79
SSGA ACTIVE TRUST
SPDR DOUBLELINE EMERGING MARKETS FIXED INCOME ETF
SCHEDULE OF INVESTMENTS (continued)
June 30, 2023
| Security Description | | | Principal
Amount | | Value |
Vedanta Resources Ltd. Series REGS, 6.13%, 8/9/2024
| | | $ 400,000 | | $ 300,180 |
| | | | | | 6,058,310 |
| INDONESIA — 4.8% | | | |
Freeport Indonesia PT 5.32%, 4/14/2032 (b)
| | | 400,000 | | 378,976 |
LLPL Capital Pte. Ltd. 6.88%, 2/4/2039 (b)
| | | 1,736,910 | | 1,565,008 |
Minejesa Capital BV Series REGS, 5.63%, 8/10/2037
| | | 2,400,000 | | 1,887,720 |
| | | | | | 3,831,704 |
| ISRAEL — 3.5% | | | |
Bank Hapoalim BM 5 Year CMT + 2.16%, 3.26%, 1/21/2032 (a)(b)
| | | 1,600,000 | | 1,370,422 |
Bank Leumi Le-Israel BM 5 Year CMT + 1.63%, 3.28%, 1/29/2031 (a)(b)
| | | 1,600,000 | | 1,429,504 |
| | | | | | 2,799,926 |
| JAMAICA — 0.0% (c) | | | |
| Digicel Group Holdings Ltd.: | | | | | |
7.00%, 12/31/2099 (b)
| | | 68,049 | | 7,485 |
8.00%, 4/1/2025 (b)
| | | 45,531 | | 20,021 |
| | | | | | 27,506 |
| KUWAIT — 1.7% | | | |
MEGlobal BV Series REGS, 2.63%, 4/28/2028
| | | 400,000 | | 348,501 |
MEGlobal Canada ULC 5.00%, 5/18/2025
| | | 1,000,000 | | 979,310 |
| | | | | | 1,327,811 |
| MALAYSIA — 0.2% | | | |
TNB Global Ventures Capital Bhd Series EMTN, 3.24%, 10/19/2026
| | | 200,000 | | 185,306 |
| MEXICO — 6.9% | | | |
Banco Mercantil del Norte SA Series REGS, 10 Year CMT + 5.47%, 7.50%, 6/27/2029 (a)
| | | 800,000 | | 696,192 |
Banco Nacional de Comercio Exterior SNC 5 Year CMT + 2.00%, 2.72%, 8/11/2031 (a)
| | | 700,000 | | 587,062 |
Banco Santander Mexico SA Institucion de Banca Multiple Grupo Financiero Santand SOFR + 0.30%, 5.95%, 10/1/2028
| | | 1,000,000 | | 993,730 |
| BBVA Bancomer SA: | | | | | |
Series REGS, 5 Year CMT + 3.00%, 5.35%, 11/12/2029 (a)
| | | 476,000 | | 458,555 |
5 Year CMT + 4.31%, 5.88%, 9/13/2034 (a)
| | | 700,000 | | 626,192 |
| Security Description | | | Principal
Amount | | Value |
Braskem Idesa SAPI 6.99%, 2/20/2032
| | | $ 200,000 | | $ 128,138 |
| Cemex SAB de CV: | | | | | |
5 Year CMT + 4.53%, 5.13%, 6/8/2026 (a)
| | | 800,000 | | 712,768 |
5 Year CMT + 4.91%, 9.13%, 3/14/2028 (a)(b)
| | | 200,000 | | 202,986 |
Mexarrend SAPI de CV 10.25%, 7/24/2024 (b)
| | | 300,000 | | 66,072 |
Mexico Generadora de Energia S de Real Series REGS, 5.50%, 12/6/2032
| | | 657,655 | | 634,071 |
Petroleos Mexicanos 6.75%, 9/21/2047
| | | 550,000 | | 344,399 |
Unifin Financiera SAB de CV Series REGS, 5 Year CMT + 6.31%, 8.88%, 1/29/2025 (d)
| | | 800,000 | | 4,464 |
| | | | | | 5,454,629 |
| PANAMA — 4.4% | | | |
Banco General SA Series REGS, 4.13%, 8/7/2027
| | | 200,000 | | 188,122 |
Banistmo SA 4.25%, 7/31/2027
| | | 1,200,000 | | 1,111,032 |
C&W Senior Financing DAC Series REGS, 6.88%, 9/15/2027
| | | 400,000 | | 349,068 |
Empresa de Transmision Electrica SA 5.13%, 5/2/2049
| | | 246,000 | | 200,101 |
Global Bank Corp. 3 Month USD LIBOR + 3.30%, 5.25%, 4/16/2029 (a)
| | | 1,000,000 | | 910,740 |
Multibank, Inc. 7.75%, 2/3/2028 (b)
| | | 200,000 | | 203,266 |
UEP Penonome II SA 6.50%, 10/1/2038 (b)
| | | 716,971 | | 534,567 |
| | | | | | 3,496,896 |
| PARAGUAY — 1.3% | | | |
Banco Continental SAECA 2.75%, 12/10/2025
| | | 300,000 | | 271,767 |
Bioceanico Sovereign Certificate Ltd. Zero Coupon, 6/5/2034
| | | 445,288 | | 311,715 |
Frigorifico Concepcion SA 7.70%, 7/21/2028
| | | 200,000 | | 156,598 |
Rutas 2 & 7 Finance Ltd. 0.01%, 9/30/2036
| | | 450,000 | | 293,202 |
| | | | | | 1,033,282 |
| PERU — 10.4% | | | |
Banco BBVA Peru SA 5 Year CMT + 2.75%, 5.25%, 9/22/2029 (a)
| | | 200,000 | | 194,774 |
| Banco de Credito del Peru S.A.: | | | | | |
5 Year CMT + 2.45%, 3.25%, 9/30/2031 (a)
| | | 650,000 | | 572,585 |
Series REGS, 5 Year CMT + 3.00%, 3.13%, 7/1/2030 (a)
| | | 1,100,000 | | 1,009,789 |
See accompanying notes to financial statements.
80
SSGA ACTIVE TRUST
SPDR DOUBLELINE EMERGING MARKETS FIXED INCOME ETF
SCHEDULE OF INVESTMENTS (continued)
June 30, 2023
| Security Description | | | Principal
Amount | | Value |
Banco Internacional del Peru SAA Interbank Series REGS, 1 year CMT + 3.71%, 4.00%, 7/8/2030 (a)
| | | $ 1,900,000 | | $ 1,744,504 |
Fenix Power Peru SA Series REGS, 4.32%, 9/20/2027
| | | 776,471 | | 726,971 |
Hunt Oil Co. of Peru LLC Sucursal Del Peru Series REGS, 6.38%, 6/1/2028
| | | 1,622,400 | | 1,559,905 |
Inkia Energy Ltd. Series REGS, 5.88%, 11/9/2027
| | | 400,000 | | 380,088 |
Lima Metro Line 2 Finance Ltd. 5.88%, 7/5/2034
| | | 591,958 | | 578,639 |
Orazul Energy Peru SA 5.63%, 4/28/2027
| | | 252,000 | | 226,987 |
| Petroleos del Peru SA: | | | | | |
4.75%, 6/19/2032
| | | 500,000 | | 375,225 |
5.63%, 6/19/2047
| | | 200,000 | | 129,190 |
Transportadora de Gas del Peru SA Series REGS, 4.25%, 4/30/2028
| | | 800,000 | | 772,168 |
| | | | | | 8,270,825 |
| SAUDI ARABIA — 1.7% | | | |
| EIG Pearl Holdings SARL: | | | | | |
3.55%, 8/31/2036
| | | 900,000 | | 769,005 |
Series REGS, 4.39%, 11/30/2046
| | | 800,000 | | 626,080 |
| | | | | | 1,395,085 |
| SINGAPORE — 8.5% | | | |
DBS Group Holdings Ltd. Series GMTN, 5 Year CMT + 1.10%, 1.82%, 3/10/2031 (a)
| | | 1,550,000 | | 1,385,436 |
Oversea-Chinese Banking Corp. Ltd. 5 Year CMT + 1.58%, 1.83%, 9/10/2030 (a)(b)
| | | 1,900,000 | | 1,730,767 |
SingTel Group Treasury Pte. Ltd. 1.88%, 6/10/2030
| | | 800,000 | | 666,864 |
Temasek Financial I Ltd. 1.00%, 10/6/2030 (b)
| | | 1,500,000 | | 1,189,725 |
| United Overseas Bank Ltd.: | | | | | |
5 Year CMT + 1.23%, 2.00%, 10/14/2031 (a)
| | | 900,000 | | 789,858 |
Series GMTN, 5 Year CMT + 1.52%, 1.75%, 3/16/2031 (a)
| | | 1,100,000 | | 977,972 |
| | | | | | 6,740,622 |
| SOUTH AFRICA — 0.4% | | | |
Sasol Financing USA LLC 5.50%, 3/18/2031
| | | 400,000 | | 314,768 |
| SOUTH KOREA — 1.8% | | | |
| KT Corp.: | | | | | |
1.00%, 9/1/2025
| | | 400,000 | | 362,581 |
| Security Description | | | Principal
Amount | | Value |
Series REGS, 2.50%, 7/18/2026
| | | $ 400,000 | | $ 365,844 |
Shinhan Financial Group Co. Ltd. 5 Year CMT + 2.06%, 2.88%, 5/12/2026 (a)(b)
| | | 550,000 | | 484,225 |
Woori Bank 4.75%, 4/30/2024
| | | 200,000 | | 197,256 |
| | | | | | 1,409,906 |
| UNITED ARAB EMIRATES — 2.2% | | | |
Galaxy Pipeline Assets Bidco Ltd. 2.16%, 3/31/2034 (b)
| | | 2,040,330 | | 1,734,893 |
| UNITED STATES — 1.8% | | | |
| Freeport-McMoRan, Inc.: | | | | | |
4.38%, 8/1/2028
| | | 200,000 | | 188,726 |
4.63%, 8/1/2030
| | | 1,300,000 | | 1,227,824 |
| | | | | | 1,416,550 |
TOTAL CORPORATE BONDS & NOTES
(Cost $70,949,149)
| | | | | 63,939,689 |
| FOREIGN GOVERNMENT OBLIGATIONS — 15.2% | | | |
| CHILE — 1.2% | | | |
| Chile Government International Bonds: | | | | | |
3.10%, 5/7/2041
| | | 400,000 | | 301,488 |
3.10%, 1/22/2061
| | | 200,000 | | 130,906 |
3.50%, 1/25/2050
| | | 700,000 | | 526,729 |
| | | | | | 959,123 |
| COLOMBIA — 1.3% | | | |
| Colombia Government International Bonds: | | | | | |
4.13%, 5/15/2051
| | | 950,000 | | 569,620 |
5.00%, 6/15/2045
| | | 700,000 | | 485,723 |
| | | | | | 1,055,343 |
| INDONESIA — 2.0% | | | |
Indonesia Government International Bonds 3.70%, 10/30/2049
| | | 900,000 | | 717,831 |
Perusahaan Penerbit SBSN Indonesia III 2.55%, 6/9/2031 (b)
| | | 1,000,000 | | 856,550 |
| | | | | | 1,574,381 |
| MEXICO — 4.5% | | | |
| Mexico Government International Bonds: | | | | | |
2.66%, 5/24/2031
| | | 1,400,000 | | 1,165,038 |
4.40%, 2/12/2052
| | | 1,350,000 | | 1,066,662 |
6.34%, 5/4/2053
| | | 1,325,000 | | 1,352,759 |
| | | | | | 3,584,459 |
| PANAMA — 3.3% | | | |
Banco Latinoamericano de Comercio Exterior SA 2.38%, 9/14/2025
| | | 600,000 | | 558,936 |
See accompanying notes to financial statements.
81
SSGA ACTIVE TRUST
SPDR DOUBLELINE EMERGING MARKETS FIXED INCOME ETF
SCHEDULE OF INVESTMENTS (continued)
June 30, 2023
| Security Description | | | Principal
Amount | | Value |
| Panama Government International Bonds: | | | | | |
2.25%, 9/29/2032
| | | $ 300,000 | | $ 229,194 |
3.87%, 7/23/2060
| | | 2,100,000 | | 1,389,381 |
4.30%, 4/29/2053
| | | 600,000 | | 446,724 |
| | | | | | 2,624,235 |
| PHILIPPINES — 0.4% | | | |
| Philippines Government International Bonds: | | | | | |
2.65%, 12/10/2045
| | | 300,000 | | 202,563 |
3.70%, 3/1/2041
| | | 200,000 | | 166,084 |
| | | | | | 368,647 |
| SAUDI ARABIA — 0.5% | | | |
Saudi Government International Bonds Series REGS, 2.25%, 2/2/2033
| | | 500,000 | | 402,370 |
| SOUTH AFRICA — 0.7% | | | |
Republic of South Africa Government International Bonds 4.30%, 10/12/2028
| | | 600,000 | | 529,896 |
| SOUTH KOREA — 1.3% | | | |
Korea East-West Power Co. Ltd. Series REGS, 1.75%, 5/6/2025
| | | 900,000 | | 837,918 |
Korea Electric Power Corp. Series REGS, 1.13%, 6/15/2025
| | | 200,000 | | 183,868 |
| | | | | | 1,021,786 |
TOTAL FOREIGN GOVERNMENT OBLIGATIONS
(Cost $15,200,169)
| | | | | 12,120,240 |
| | | Shares | |
| SHORT-TERM INVESTMENT — 3.1% | |
State Street Institutional U.S. Government Money Market Fund, Class G Shares 5.07% (e)(f)
(Cost $2,452,803)
| 2,452,803 | 2,452,803 |
TOTAL INVESTMENTS — 98.7%
(Cost $88,602,121)
| 78,512,732 |
OTHER ASSETS IN EXCESS OF
LIABILITIES — 1.3%
| 1,018,835 |
NET ASSETS — 100.0%
| $ 79,531,567 |
| (a) | Variable Rate Security - Interest rate shown is rate in effect at June 30, 2023. For securities based on a published reference rate and spread, the reference rate and spread are indicated in the description above. |
| (b) | Securities purchased pursuant to Rule 144A of the Securities Act of 1933, as amended. These securities, which represent 16.7% of net assets as of June 30, 2023, are considered liquid and may be resold in transactions exempt from registration, normally to qualified institutional buyers. |
| (c) | Amount shown represents less than 0.05% of net assets. |
| (d) | Security is currently in default and/or issuer is in bankruptcy. |
| (e) | The Fund invested in certain money market funds managed by SSGA Funds Management, Inc. Amounts related to these transactions during the period ended June 30, 2023 are shown in the Affiliate Table below. |
| (f) | The rate shown is the annualized seven-day yield at June 30, 2023. |
| CMT | Constant Maturity Treasury |
| EMTN | Euro Medium Term Note |
| GMTN | Global Medium Term Note |
| LIBOR | London Interbank Offered Rate |
| SOFR | Secured Overnight Financing Rate |
See accompanying notes to financial statements.
82
SSGA ACTIVE TRUST
SPDR DOUBLELINE EMERGING MARKETS FIXED INCOME ETF
SCHEDULE OF INVESTMENTS (continued)
June 30, 2023
The following table summarizes the value of the Fund's investments according to the fair value hierarchy as of June 30, 2023.
| Description | | Level 1 –
Quoted Prices | | Level 2 –
Other Significant
Observable Inputs | | Level 3 –
Significant
Unobservable Inputs | | Total |
| ASSETS: | | | | | | | | |
| INVESTMENTS: | | | | | | | | |
Corporate Bonds & Notes
| | $ — | | $63,939,689 | | $— | | $63,939,689 |
Foreign Government Obligations
| | — | | 12,120,240 | | — | | 12,120,240 |
Short-Term Investment
| | 2,452,803 | | — | | — | | 2,452,803 |
TOTAL INVESTMENTS
| | $2,452,803 | | $76,059,929 | | $— | | $78,512,732 |
Industry Breakdown as of June 30, 2023
| | |
| | | % of Net Assets |
| | Banks | 23.7% |
| | Electric | 15.9 |
| | Foreign Government Obligations | 15.2 |
| | Oil & Gas | 7.4 |
| | Pipelines | 7.1 |
| | Chemicals | 4.5 |
| | Telecommunications | 4.3 |
| | Commercial Services | 3.5 |
| | Mining | 3.0 |
| | Oil & Gas Services | 1.6 |
| | Iron/Steel | 1.5 |
| | Investment Company Security | 1.5 |
| | Holding Companies-Diversified | 1.4 |
| | Transportation | 1.3 |
| | Construction Materials | 1.1 |
| | Food | 1.0 |
| | Energy-Alternate Sources | 0.7 |
| | Engineering & Construction | 0.4 |
| | Media | 0.2 |
| | Agriculture | 0.2 |
| | Diversified Financial Services | 0.1 |
| | Short-Term Investment | 3.1 |
| | Other Assets in Excess of Liabilities | 1.3 |
| | TOTAL | 100.0% |
(The Fund's industry breakdown is expressed as a percentage of net assets and may change over time.)
Affiliate Table
| | Number of
Shares Held
at
6/30/22 | | Value at
6/30/22 | | Cost of
Purchases | | Proceeds
from
Shares Sold | | Realized
Gain (Loss) | | Change in
Unrealized
Appreciation/
Depreciation | | Number of
Shares Held
at
6/30/23 | | Value at
6/30/23 | | Dividend
Income |
State Street Institutional U.S. Government Money Market Fund, Class G Shares
| 681,102 | | $681,102 | | $35,856,265 | | $34,084,564 | | $— | | $— | | 2,452,803 | | $2,452,803 | | $100,724 |
See accompanying notes to financial statements.
83
SSGA ACTIVE TRUST
SPDR DOUBLELINE SHORT DURATION TOTAL RETURN TACTICAL ETF
SCHEDULE OF INVESTMENTS
June 30, 2023
| Security Description | | | Principal
Amount | | Value |
| CORPORATE BONDS & NOTES — 15.2% | | | | | |
| AEROSPACE & DEFENSE — 0.2% | |
Raytheon Technologies Corp.
5.00%, 2/27/2026
| | | $ 305,000 | | $ 304,640 |
| AGRICULTURE — 0.2% | |
Philip Morris International, Inc.
4.88%, 2/13/2026
| | | 305,000 | | 302,816 |
| AUTO MANUFACTURERS — 0.5% | |
General Motors Financial Co., Inc.
5.25%, 3/1/2026
| | | 305,000 | | 300,254 |
Hyundai Capital America
1.00%, 9/17/2024 (a)
| | | 325,000 | | 305,770 |
| | | | | | 606,024 |
| BANKS — 3.8% | |
Banco BBVA Peru SA
5 Year CMT + 2.75%, 5.25%, 9/22/2029 (b)
| | | 100,000 | | 97,387 |
Banco Bilbao Vizcaya Argentaria Colombia SA
Series REGS, 4.88%, 4/21/2025
| | | 200,000 | | 191,588 |
Banco Internacional del Peru SAA Interbank
Series REGS, 1 year CMT + 3.71%, 4.00%, 7/8/2030 (b)
| | | 150,000 | | 137,724 |
Bank Hapoalim BM
5 Year CMT + 2.16%, 3.26%, 1/21/2032 (a) (b)
| | | 200,000 | | 171,303 |
Bank Leumi Le-Israel BM
5 Year CMT + 1.63%, 3.28%, 1/29/2031 (a) (b)
| | | 200,000 | | 178,688 |
Bank of America Corp.
Series MTN, 3 Month SOFR + 1.23%, 3.46%, 3/15/2025 (b)
| | | 300,000 | | 294,054 |
Bank of Montreal
SOFR + 0.71%, 5.80%, 3/8/2024 (b)
| | | 300,000 | | 299,847 |
Bank of Nova Scotia
4.75%, 2/2/2026
| | | 305,000 | | 300,340 |
BBVA Bancomer SA
Series REGS, 5 Year CMT + 3.00%, 5.35%, 11/12/2029 (b)
| | | 200,000 | | 192,670 |
| Citigroup, Inc.: | | | | | |
SOFR + 1.53%, 3.29%, 3/17/2026 (b)
| | | 130,000 | | 124,396 |
3 Month SOFR + 1.16%, 3.35%, 4/24/2025 (b)
| | | 335,000 | | 327,489 |
Goldman Sachs Group, Inc.
3.50%, 4/1/2025
| | | 310,000 | | 297,575 |
| JPMorgan Chase & Co.: | | | | | |
3 Month SOFR + 1.42%, 3.22%, 3/1/2025 (b)
| | | 150,000 | | 147,143 |
| Security Description | | | Principal
Amount | | Value |
3.90%, 7/15/2025
| | | $ 285,000 | | $ 277,898 |
Morgan Stanley
Series MTN, SOFR + 0.46%, 5.52%, 1/25/2024 (b)
| | | 275,000 | | 274,741 |
Multibank, Inc.
7.75%, 2/3/2028 (a)
| | | 200,000 | | 203,266 |
PNC Financial Services Group, Inc.
SOFR + 1.32%, 5.81%, 6/12/2026 (b)
| | | 155,000 | | 154,186 |
Royal Bank of Canada
3.38%, 4/14/2025
| | | 310,000 | | 298,617 |
Toronto-Dominion Bank
Series MTN, 0.70%, 9/10/2024
| | | 320,000 | | 301,555 |
Truist Financial Corp.
SOFR + 1.46%, 4.26%, 7/28/2026 (b)
| | | 310,000 | | 297,823 |
Wells Fargo & Co.
Series MTN, 3 Month SOFR + 1.09%, 2.41%, 10/30/2025 (b)
| | | 315,000 | | 300,129 |
| | | | | | 4,868,419 |
| BEVERAGES — 0.3% | |
Constellation Brands, Inc.
5.00%, 2/2/2026
| | | 315,000 | | 313,901 |
| BIOTECHNOLOGY — 0.5% | |
Amgen, Inc.
5.51%, 3/2/2026
| | | 300,000 | | 299,271 |
| Royalty Pharma PLC: | | | | | |
0.75%, 9/2/2023
| | | 265,000 | | 262,475 |
1.75%, 9/2/2027
| | | 45,000 | | 38,741 |
| | | | | | 600,487 |
| CHEMICALS — 0.3% | |
Braskem Netherlands Finance BV
5 Year CMT + 8.22%, 8.50%, 1/23/2081 (b)
| | | 200,000 | | 203,796 |
Sasol Financing USA LLC
4.38%, 9/18/2026
| | | 200,000 | | 177,112 |
| | | | | | 380,908 |
| COMMERCIAL SERVICES — 0.5% | |
Adani International Container Terminal Pvt Ltd.
Series REGS, 3.00%, 2/16/2031
| | | 183,000 | | 143,327 |
Adani Ports & Special Economic Zone Ltd.
4.00%, 7/30/2027
| | | 200,000 | | 169,406 |
Triton Container International Ltd.
0.80%, 8/1/2023 (a)
| | | 305,000 | | 303,643 |
| | | | | | 616,376 |
See accompanying notes to financial statements.
84
SSGA ACTIVE TRUST
SPDR DOUBLELINE SHORT DURATION TOTAL RETURN TACTICAL ETF
SCHEDULE OF INVESTMENTS (continued)
June 30, 2023
| Security Description | | | Principal
Amount | | Value |
| DIVERSIFIED FINANCIAL SERVICES — 0.7% | |
American Express Co.
SOFR + 1.00%, 4.99%, 5/1/2026 (b)
| | | $ 300,000 | | $ 296,604 |
Avolon Holdings Funding Ltd.
5.13%, 10/1/2023 (a)
| | | 290,000 | | 288,939 |
Capital One Financial Corp.
SOFR + 2.16%, 4.99%, 7/24/2026 (b)
| | | 285,000 | | 276,176 |
| | | | | | 861,719 |
| ELECTRIC — 1.5% | |
Empresa Electrica Angamos SA
Series REGS, 4.88%, 5/25/2029
| | | 104,300 | | 94,468 |
Entergy Louisiana LLC
0.95%, 10/1/2024
| | | 310,000 | | 292,426 |
Fenix Power Peru SA
Series REGS, 4.32%, 9/20/2027
| | | 282,353 | | 264,353 |
Minejesa Capital BV
Series REGS, 4.63%, 8/10/2030
| | | 400,000 | | 358,960 |
| Pacific Gas & Electric Co.: | | | | | |
3.25%, 2/16/2024
| | | 175,000 | | 171,727 |
4.95%, 6/8/2025
| | | 115,000 | | 111,605 |
Southern California Edison Co.
4.90%, 6/1/2026
| | | 300,000 | | 295,818 |
TNB Global Ventures Capital Bhd
Series EMTN, 3.24%, 10/19/2026
| | | 300,000 | | 277,959 |
| | | | | | 1,867,316 |
| ENGINEERING & CONSTRUCTION — 0.1% | |
Bioceanico Sovereign Certificate Ltd.
Zero Coupon, 6/5/2034
| | | 133,586 | | 93,514 |
| ENTERTAINMENT — 0.3% | |
WarnerMedia Holdings, Inc.
3.79%, 3/15/2025
| | | 325,000 | | 314,054 |
| ENVIRONMENTAL CONTROL — 0.2% | |
Republic Services, Inc.
2.50%, 8/15/2024
| | | 315,000 | | 303,950 |
| HEALTH CARE PRODUCTS — 0.2% | |
Zimmer Biomet Holdings, Inc.
1.45%, 11/22/2024
| | | 320,000 | | 301,590 |
| HEALTH CARE SERVICES — 0.5% | |
Elevance Health, Inc.
3.50%, 8/15/2024
| | | 305,000 | | 297,256 |
HCA, Inc.
5.00%, 3/15/2024
| | | 315,000 | | 312,842 |
| | | | | | 610,098 |
| Security Description | | | Principal
Amount | | Value |
| INSURANCE — 0.2% | |
Athene Global Funding
SOFR + 0.70%, 5.79%, 5/24/2024 (a) (b)
| | | $ 305,000 | | $ 301,941 |
| INTERNET — 0.4% | |
Expedia Group, Inc.
6.25%, 5/1/2025 (a)
| | | 295,000 | | 295,985 |
Meta Platforms, Inc.
4.60%, 5/15/2028
| | | 180,000 | | 178,114 |
| | | | | | 474,099 |
| LODGING — 0.3% | |
Marriott International, Inc.
3.60%, 4/15/2024
| | | 315,000 | | 309,752 |
| MACHINERY, CONSTRUCTION & MINING — 0.2% | |
Caterpillar Financial Services Corp.
4.35%, 5/15/2026
| | | 305,000 | | 300,233 |
| MACHINERY-DIVERSIFIED — 0.2% | |
John Deere Capital Corp.
4.75%, 1/20/2028
| | | 285,000 | | 284,570 |
| MINING — 0.2% | |
Freeport-McMoRan, Inc.
4.13%, 3/1/2028
| | | 50,000 | | 46,949 |
Glencore Funding LLC
1.63%, 9/1/2025 (a)
| | | 245,000 | | 224,971 |
| | | | | | 271,920 |
| MISCELLANEOUS MANUFACTURER — 0.2% | |
Parker-Hannifin Corp.
3.65%, 6/15/2024
| | | 300,000 | | 294,042 |
| OIL & GAS — 0.2% | |
ONGC Videsh Ltd.
4.63%, 7/15/2024
| | | 200,000 | | 197,180 |
Petrobras Global Finance BV
7.38%, 1/17/2027
| | | 100,000 | | 104,052 |
| | | | | | 301,232 |
| PIPELINES — 0.8% | |
AI Candelaria Spain SA
Series REGS, 7.50%, 12/15/2028
| | | 220,833 | | 206,965 |
Energy Transfer LP
5.88%, 1/15/2024
| | | 305,000 | | 304,784 |
GNL Quintero SA
Series REGS, 4.63%, 7/31/2029
| | | 305,920 | | 297,666 |
Transportadora de Gas del Peru SA
Series REGS, 4.25%, 4/30/2028
| | | 200,000 | | 193,042 |
| | | | | | 1,002,457 |
| REAL ESTATE INVESTMENT TRUSTS — 0.3% | |
Welltower OP LLC
REIT, 3.63%, 3/15/2024
| | | 320,000 | | 314,230 |
See accompanying notes to financial statements.
85
SSGA ACTIVE TRUST
SPDR DOUBLELINE SHORT DURATION TOTAL RETURN TACTICAL ETF
SCHEDULE OF INVESTMENTS (continued)
June 30, 2023
| Security Description | | | Principal
Amount | | Value |
| RETAIL — 0.2% | |
Dollar Tree, Inc.
4.00%, 5/15/2025
| | | $ 300,000 | | $ 290,661 |
| SEMICONDUCTORS — 0.7% | |
Broadcom Corp./Broadcom Cayman Finance Ltd.
3.88%, 1/15/2027
| | | 60,000 | | 57,228 |
Broadcom, Inc.
3.15%, 11/15/2025
| | | 255,000 | | 242,327 |
Microchip Technology, Inc.
0.97%, 2/15/2024
| | | 315,000 | | 304,920 |
NXP BV/NXP Funding LLC/NXP USA, Inc.
4.40%, 6/1/2027
| | | 310,000 | | 299,584 |
| | | | | | 904,059 |
| SOFTWARE — 0.2% | |
Oracle Corp.
5.80%, 11/10/2025
| | | 305,000 | | 308,425 |
| TELECOMMUNICATIONS — 0.7% | |
KT Corp.
Series REGS, 2.50%, 7/18/2026
| | | 200,000 | | 182,922 |
Millicom International Cellular SA
Series REGS, 5.13%, 1/15/2028
| | | 180,000 | | 158,031 |
SingTel Group Treasury Pte. Ltd.
Class EMTN, 3.25%, 6/30/2025
| | | 200,000 | | 192,292 |
Verizon Communications, Inc.
3 Month USD LIBOR + 1.10%, 6.42%, 5/15/2025 (b)
| | | 300,000 | | 302,112 |
VTR Comunicaciones SpA
5.13%, 1/15/2028
| | | 200,000 | | 104,016 |
| | | | | | 939,373 |
| TRANSPORTATION — 0.4% | |
Canadian Pacific Railway Co.
1.35%, 12/2/2024
| | | 330,000 | | 310,230 |
MV24 Capital BV
6.75%, 6/1/2034
| | | 168,118 | | 151,239 |
| | | | | | 461,469 |
| TRUCKING & LEASING — 0.2% | |
Penske Truck Leasing Co. LP/PTL Finance Corp.
4.40%, 7/1/2027 (a)
| | | 315,000 | | 297,385 |
TOTAL CORPORATE BONDS & NOTES
(Cost $20,152,113)
| | | | | 19,401,660 |
| Security Description | | | Principal
Amount | | Value |
| ASSET-BACKED SECURITIES — 25.4% | | | | | |
| AUTOMOBILE — 1.8% | | | | | |
CPS Auto Receivables Trust
Series 2021-A, Class D, 1.16%, 12/15/2026 (a)
| | | $ 600,000 | | $ 575,194 |
Exeter Automobile Receivables Trust
Series 2021-1A, Class C, 0.74%, 1/15/2026
| | | 183,460 | | 181,164 |
GLS Auto Receivables Issuer Trust
Series 2021-2A, Class C, 1.08%, 6/15/2026 (a)
| | | 500,000 | | 485,724 |
Hertz Vehicle Financing LLC
Series 2021-1A, Class B, 1.56%, 12/26/2025 (a)
| | | 350,000 | | 327,161 |
Santander Drive Auto Receivables Trust
Series 2020-4, Class D, 1.48%, 1/15/2027
| | | 750,000 | | 724,734 |
| | | | | | 2,293,977 |
| OTHER ABS — 23.5% | | | | | |
ACREC Ltd.
Series 2021-FL1, Class A, 1 Month USD LIBOR + 1.15%, 6.31%, 10/16/2036 (a) (b)
| | | 176,173 | | 173,622 |
Affirm Asset Securitization Trust
Series 2022-A, Class A, 4.30%, 5/17/2027 (a)
| | | 500,000 | | 486,575 |
Anchorage Capital CLO 19 Ltd.
Series 2021-19A, Class A, 3 Month USD LIBOR + 1.21%, 6.47%, 10/15/2034 (a) (b)
| | | 1,500,000 | | 1,460,850 |
Arbor Realty Commercial Real Estate Notes Ltd.
Series 2022-FL1, Class A, SOFR30A + 1.45%, 6.52%, 1/15/2037 (a) (b)
| | | 250,000 | | 245,477 |
Bain Capital Credit CLO Ltd.
Series 2019-1A, Class AR, 3 Month USD LIBOR + 1.13%, 6.40%, 4/19/2034 (a) (b)
| | | 500,000 | | 490,457 |
BDS LLC
Series 2022-FL11, Class ATS, 1 Month USD Term LIBOR + 1.80%, 6.88%, 3/19/2039 (a) (b)
| | | 250,000 | | 246,655 |
BDS Ltd.
Series 2021-FL9, Class A, 1 Month USD LIBOR + 1.07%, 6.23%, 11/16/2038 (a) (b)
| | | 150,000 | | 145,242 |
BRSP Ltd.
Series 2021-FL1, Class A, 1 Month USD Term LIBOR + 1.26%, 6.36%, 8/19/2038 (a) (b)
| | | 151,000 | | 146,817 |
See accompanying notes to financial statements.
86
SSGA ACTIVE TRUST
SPDR DOUBLELINE SHORT DURATION TOTAL RETURN TACTICAL ETF
SCHEDULE OF INVESTMENTS (continued)
June 30, 2023
| Security Description | | | Principal
Amount | | Value |
| BSPRT Issuer Ltd.: | | | | | |
Series 2021-FL7, Class A, 1 Month USD LIBOR + 1.32%, 6.51%, 12/15/2038 (a) (b)
| | | $ 200,000 | | $ 195,646 |
Series 2022-FL8, Class A, SOFR30A + 1.50%, 6.57%, 2/15/2037 (a) (b)
| | | 200,000 | | 195,640 |
Series 2021-FL6, Class A, 1 Month USD LIBOR + 1.10%, 6.29%, 3/15/2036 (a) (b)
| | | 138,000 | | 135,348 |
Carlyle U.S. CLO Ltd.
Series 2021-1A, Class A1, 3 Month USD LIBOR + 1.14%, 6.40%, 4/15/2034 (a) (b)
| | | 1,000,000 | | 982,692 |
CarVal CLO IV Ltd.
Series 2021-1A, Class A1A, 3 Month USD LIBOR + 1.18%, 6.43%, 7/20/2034 (a) (b)
| | | 500,000 | | 491,600 |
CHCP Ltd.
Series 2021-FL1, Class A, 1 Month USD Term LIBOR + 1.16%, 6.27%, 2/15/2038 (a) (b)
| | | 202,476 | | 198,365 |
CQS U.S. CLO Ltd.
Series 2021-1A, Class A, 3 Month USD LIBOR + 1.22%, 6.47%, 1/20/2035 (a) (b)
| | | 1,000,000 | | 973,200 |
Credit-Based Asset Servicing & Securitization LLC
Series 2004-CB7, Class M1, 1 Month USD LIBOR + 1.01%, 3.31%, 10/25/2034 (b)
| | | 533,262 | | 480,287 |
Diamond Resorts Owner Trust
Series 2021-1A, Class A, 1.51%, 11/21/2033 (a)
| | | 420,185 | | 385,152 |
| FS Rialto Issuer LLC: | | | | | |
Series 2021-FL3, Class A, 1 Month USD LIBOR + 1.25%, 6.41%, 11/16/2036 (a) (b)
| | | 181,000 | | 175,150 |
Series 2022-FL5, Class A, 1 Month USD Term LIBOR + 2.30%, 7.39%, 6/19/2037 (a) (b)
| | | 300,000 | | 297,390 |
Series 2022-FL4, Class AS, SOFR30A + 2.40%, 7.47%, 1/19/2039 (a) (b)
| | | 250,000 | | 247,059 |
Series 2021-FL2, Class A, 1 Month USD LIBOR + 1.33%, 6.44%, 5/16/2038 (a) (b)
| | | 147,513 | | 143,985 |
| Security Description | | | Principal
Amount | | Value |
Greystone CRE Notes Ltd.
Series 2021-FL3, Class A, 1 Month USD Term LIBOR + 1.13%, 6.28%, 7/15/2039 (a) (b)
| | | $ 200,000 | | $ 195,275 |
HalseyPoint CLO 3 Ltd.
Series 2020-3A, Class A1A, 3 Month USD LIBOR + 1.45%, 6.75%, 11/30/2032 (a) (b)
| | | 1,150,000 | | 1,138,040 |
Jamestown CLO XV Ltd.
Series 2020-15A, Class A, 3 Month USD LIBOR + 1.34%, 6.60%, 4/15/2033 (a) (b)
| | | 500,000 | | 495,350 |
KREF Ltd.
Series 2021-FL2, Class AS, 1 Month USD LIBOR + 1.30%, 6.46%, 2/15/2039 (a) (b)
| | | 250,000 | | 235,816 |
| LCCM Trust: | | | | | |
Series 2021-FL3, Class A, 1 Month USD LIBOR + 1.56%, 6.71%, 11/15/2038 (a) (b)
| | | 181,000 | | 177,726 |
Series 2021-FL2, Class A, 1 Month USD Term LIBOR + 1.31%, 6.46%, 12/13/2038 (a) (b)
| | | 151,000 | | 147,616 |
LoanCore Issuer Ltd.
Series 2022-CRE7, Class A, SOFR30A + 1.55%, 6.62%, 1/17/2037 (a) (b)
| | | 500,000 | | 490,107 |
Loanpal Solar Loan Ltd.
Series 2021-1GS, Class A, 2.29%, 1/20/2048 (a)
| | | 327,908 | | 262,786 |
Marble Point CLO XXI Ltd.
Series 2021-3A, Class A1, 3 Month USD LIBOR + 1.24%, 6.50%, 10/17/2034 (a) (b)
| | | 2,000,000 | | 1,948,238 |
Marlette Funding Trust
Series 2021-1A, Class C, 1.41%, 6/16/2031 (a)
| | | 650,000 | | 638,011 |
| MF1 Ltd.: | | | | | |
Series 2022-FL8, Class A, SOFR30A + 1.35%, 6.42%, 2/19/2037 (a) (b)
| | | 347,000 | | 338,359 |
Series 2021-FL7, Class A, 1 Month USD LIBOR + 1.08%, 6.24%, 10/16/2036 (a) (b)
| | | 192,000 | | 187,347 |
Series 2021-FL6, Class A, 1 Month USD Term LIBOR + 1.21%, 6.32%, 7/16/2036 (a) (b)
| | | 250,000 | | 245,245 |
MP CLO VIII Ltd.
Series 2015-2A, Class ARR, 3 Month USD LIBOR + 1.20%, 6.47%, 4/28/2034 (a) (b)
| | | 500,000 | | 485,200 |
See accompanying notes to financial statements.
87
SSGA ACTIVE TRUST
SPDR DOUBLELINE SHORT DURATION TOTAL RETURN TACTICAL ETF
SCHEDULE OF INVESTMENTS (continued)
June 30, 2023
| Security Description | | | Principal
Amount | | Value |
Northwoods Capital XVI Ltd.
Series 2017-16A, Class A, 3 Month USD LIBOR + 1.27%, 6.59%, 11/15/2030 (a) (b)
| | | $ 979,684 | | $ 971,160 |
Octagon Investment Partners 51 Ltd.
Series 2021-1A, Class A, 3 Month USD LIBOR + 1.15%, 6.40%, 7/20/2034 (a) (b)
| | | 1,000,000 | | 980,000 |
| Pagaya AI Debt Selection Trust: | | | | | |
Series 2021-3, Class B, 1.74%, 5/15/2029 (a)
| | | 999,946 | | 961,091 |
Series 2021-5, Class B, 2.63%, 8/15/2029 (a)
| | | 999,882 | | 948,957 |
Pagaya AI Debt Trust
Series 2023-1, Class A, 7.56%, 7/15/2030 (a)
| | | 453,939 | | 455,192 |
Peace Park CLO Ltd.
Series 2021-1A, Class A, 3 Month USD LIBOR + 1.13%, 6.38%, 10/20/2034 (a) (b)
| | | 1,000,000 | | 982,635 |
Regatta VI Funding Ltd.
Series 2016-1A, Class AR2, 3 Month USD LIBOR + 1.16%, 6.41%, 4/20/2034 (a) (b)
| | | 1,000,000 | | 980,800 |
Regatta XXIII Funding Ltd.
Series 2021-4A, Class A1, 3 Month USD LIBOR + 1.15%, 6.40%, 1/20/2035 (a) (b)
| | | 2,265,000 | | 2,220,832 |
Sapphire Aviation Finance II Ltd.
Series 2020-1A, Class A, 3.23%, 3/15/2040 (a)
| | | 352,943 | | 296,712 |
Shackleton CLO Ltd.
Series 2013-3A, Class AR, 3 Month USD LIBOR + 1.12%, 6.38%, 7/15/2030 (a) (b)
| | | 411,907 | | 408,200 |
Sound Point CLO XIV Ltd.
Series 2016-3A, Class AR2, 3 Month USD LIBOR + 0.99%, 6.26%, 1/23/2029 (a) (b)
| | | 617,872 | | 615,710 |
Sound Point CLO XXVI Ltd.
Series 2020-1A, Class AR, 3 Month USD LIBOR + 1.17%, 6.42%, 7/20/2034 (a) (b)
| | | 1,000,000 | | 976,679 |
TRTX Issuer Ltd.
Series 2022-FL5, Class A, SOFR30A + 1.65%, 6.72%, 2/15/2039 (a) (b)
| | | 200,000 | | 194,055 |
Vibrant CLO VIII Ltd.
Series 2018-8A, Class A1A, 3 Month SOFR + 1.4%, 6.45%, 1/20/2031 (a) (b)
| | | 466,067 | | 462,702 |
VMC Finance LLC
Series 2022-FL5, Class A, SOFR30A + 1.90%, 6.97%, 2/18/2039 (a) (b)
| | | 640,000 | | 623,117 |
| Security Description | | | Principal
Amount | | Value |
VOLT C LLC
Series 2021-NPL9, Class A1, 1.99%, 5/25/2051 (a) (c)
| | | $ 378,216 | | $ 344,327 |
VOLT CI LLC
Series 2021-NP10, Class A1, 1.99%, 5/25/2051 (a) (c)
| | | 1,337,425 | | 1,217,590 |
Washington Mutual Asset-Backed Certificates WMABS Trust
Series 2006-HE5, Class 2A2, 1 Month USD LIBOR + 0.18%, 3.91%, 10/25/2036 (b)
| | | 273,104 | | 97,704 |
Wellfleet CLO Ltd.
Series 2020-2A, Class AR, 3 Month USD LIBOR + 1.22%, 6.48%, 7/15/2034 (a) (b)
| | | 1,000,000 | | 975,400 |
| | | | | | 29,995,188 |
| STUDENT LOAN ABS — 0.1% | | | | | |
Commonbond Student Loan Trust
Series 2018-BGS, Class B, 3.99%, 9/25/2045 (a)
| | | 116,238 | | 107,426 |
Laurel Road Prime Student Loan Trust
Series 2019-A, Class A1FX, 2.34%, 10/25/2048 (a)
| | | 23,349 | | 22,690 |
| | | | | | 130,116 |
TOTAL ASSET-BACKED SECURITIES
(Cost $33,211,314)
| | | | | 32,419,281 |
| FOREIGN GOVERNMENT OBLIGATIONS — 0.6% | | | | | |
| COLOMBIA — 0.1% | | | | | |
Colombia Government International Bonds
4.50%, 1/28/2026
| | | 200,000 | | 190,352 |
| DOMINICAN REPUBLIC ��� 0.1% | | | | | |
Dominican Republic International Bonds
5.50%, 1/27/2025
| | | 100,000 | | 98,485 |
| PANAMA — 0.2% | | | | | |
Panama Government International Bonds
3.75%, 3/16/2025
| | | 250,000 | | 241,975 |
| SOUTH AFRICA — 0.2% | | | | | |
Republic of South Africa Government International Bonds
4.88%, 4/14/2026
| | | 200,000 | | 191,506 |
TOTAL FOREIGN GOVERNMENT OBLIGATIONS
(Cost $771,931)
| | | | | 722,318 |
See accompanying notes to financial statements.
88
SSGA ACTIVE TRUST
SPDR DOUBLELINE SHORT DURATION TOTAL RETURN TACTICAL ETF
SCHEDULE OF INVESTMENTS (continued)
June 30, 2023
| Security Description | | | Principal
Amount | | Value |
| U.S. GOVERNMENT AGENCY OBLIGATIONS — 6.4% | | | | | |
| Federal Home Loan Mortgage Corp.: | | | | | |
2.00%, 3/1/2036
| | | $ 1,253,554 | | $ 1,111,333 |
2.00%, 11/1/2036
| | | 993,796 | | 884,142 |
| Federal Home Loan Mortgage Corp. REMICS: | | | | | |
Series 4211, Class AP, 1.60%, 3/15/2043
| | | 743,775 | | 678,906 |
Series 4461, Class BA, CMO, 2.00%, 12/15/2043
| | | 479,635 | | 437,473 |
Series 5179, Class GD, CMO, 2.00%, 12/25/2047
| | | 881,267 | | 753,149 |
Series 4030, ClassAN, CMO, REMIC, 1.75%, 4/15/2027
| | | 247,275 | | 237,633 |
Series 4484, ClassCD, CMO, REMIC, 1.75%, 7/15/2030
| | | 60,452 | | 55,979 |
| Federal National Mortgage Association: | | | | | |
1.50%, 5/1/2036
| | | 949,580 | | 822,175 |
2.00%, 9/1/2036
| | | 801,938 | | 710,942 |
3.00%, 11/1/2033
| | | 638,710 | | 602,585 |
3.00%, 11/1/2036
| | | 153,464 | | 142,183 |
| Federal National Mortgage Association REMICS: | | | | | |
Series 2010-141, Class FB, CMO, REMIC, 1 Month USD LIBOR + 0.47%, 5.62%, 12/25/2040 (b)
| | | 131,392 | | 129,825 |
Series 2012-32, Class DA, CMO, REMIC, 2.00%, 11/25/2026
| | | 148,527 | | 146,160 |
Series 2016-8, Class FA, CMO, REMIC, 1 Month USD LIBOR + 0.45%, 5.60%, 3/25/2046 (b)
| | | 217,833 | | 211,881 |
Series 2018-27, Class FJ, CMO, REMIC, 1 Month USD LIBOR + 0.30%, 5.45%, 12/25/2047 (b)
| | | 153,567 | | 147,813 |
Series 2018-45, Class FA, CMO, REMIC, 1 Month USD LIBOR + 0.30%, 5.45%, 6/25/2048 (b)
| | | 170,663 | | 164,288 |
Federal National Mortgage Association-Aces Series 2020-M49, Class 1A1, VRN, 1.30%, 11/25/2030 (b)
| | | 1,051,225 | | 912,331 |
TOTAL U.S. GOVERNMENT AGENCY OBLIGATIONS
(Cost $9,215,716)
| | | | | 8,148,798 |
| U.S. TREASURY OBLIGATIONS — 27.7% | | | | | |
| U.S. Treasury Bill: | | | | | |
4.85%, 7/25/2023
| | | 3,750,000 | | 3,738,542 |
| Security Description | | | Principal
Amount | | Value |
5.07%, 8/10/2023
| | | $ 15,000,000 | | $ 14,918,735 |
| U.S. Treasury Notes: | | | | | |
3.00%, 7/15/2025
| | | 5,000,000 | | 4,818,750 |
4.25%, 10/15/2025
| | | 12,000,000 | | 11,865,938 |
TOTAL U.S. TREASURY OBLIGATIONS
(Cost $35,490,116)
| | | | | 35,341,965 |
| MORTGAGE-BACKED SECURITIES — 9.5% | | | | | |
Citigroup Mortgage Loan Trust, Inc. Series 2007-AR8, Class 2A1A, CMO, 4.29%, 7/25/2037 (b)
| | | 3,081,083 | | 2,446,044 |
| Countrywide Alternative Loan Trust: | | | | | |
Series 2006-J7, Class 1A3, 6.25%, 11/25/2036
| | | 414,884 | | 212,447 |
Series 2006-41CB, Class 1A3, CMO, 6.00%, 1/25/2037
| | | 239,537 | | 135,183 |
CSMC Trust Series 2020-RPL3, Class A1, CMO, 2.69%, 3/25/2060 (a) (b)
| | | 808,234 | | 783,652 |
| Legacy Mortgage Asset Trust: | | | | | |
Series 2021-GS1, Class A1, 1.89%, 10/25/2066 (a) (c)
| | | 380,094 | | 354,353 |
Series 2021-GS2, Class A1, 1.75%, 4/25/2061 (a) (c)
| | | 322,380 | | 298,147 |
Luminent Mortgage Trust Series 2007-1, Class 1A1, CMO, 1 Month USD LIBOR + 0.32%, 5.47%, 11/25/2036 (b)
| | | 2,524,421 | | 2,338,863 |
Preston Ridge Partners Mortgage LLC Series 2022-1, Class A1, 3.72%, 2/25/2027 (a) (c)
| | | 1,637,312 | | 1,551,010 |
Residential Asset Securitization Trust Series 2006-A6, Class 1A4, CMO, IO, 6.00%, 7/25/2036
| | | 2,597,779 | | 642,833 |
Residential Mortgage Loan Trust Series 2020-1, Class A1, 2.38%, 1/26/2060 (a) (b)
| | | 880,052 | | 824,447 |
Verus Securitization Trust Series 2022-3, Class A1, 4.13%, 2/25/2067 (a) (c)
| | | 785,017 | | 716,893 |
WaMu Mortgage Pass-Through Certificates Trust Series 2006-AR16, Class 2A1, CMO, 3.44%, 12/25/2036 (b)
| | | 1,835,844 | | 1,612,810 |
See accompanying notes to financial statements.
89
SSGA ACTIVE TRUST
SPDR DOUBLELINE SHORT DURATION TOTAL RETURN TACTICAL ETF
SCHEDULE OF INVESTMENTS (continued)
June 30, 2023
| Security Description | | | Principal
Amount | | Value |
Washington Mutual Mortgage Pass-Through Certificates WMALT Trust Series 2005-8, Class 2CB3, CMO, 1 Month USD LIBOR + 0.41%, 5.50%, 10/25/2035 (b)
| | | $ 283,499 | | $ 262,684 |
TOTAL MORTGAGE-BACKED SECURITIES
(Cost $13,736,016)
| | | | | 12,179,366 |
| COMMERCIAL MORTGAGE BACKED SECURITIES — 6.1% | | | | | |
ACREC LLC Series 2023-FL2, Class A, 1 Month USD Term LIBOR + 2.23%, 7.32%, 2/19/2038 (a) (b)
| | | 250,000 | | 247,620 |
Arbor Multifamily Mortgage Securities Trust Series 2021-MF2, Class A2, 2.02%, 6/15/2054 (a)
| | | 139,000 | | 122,294 |
AREIT Trust Series 2022-CRE6, Class A, SOFR30A + 1.25%, 6.32%, 1/20/2037 (a) (b)
| | | 93,404 | | 91,027 |
| Bank: | | | | | |
Series 2017-BNK6, Class XA, IO, 0.91%, 7/15/2060 (b)
| | | 996,488 | | 23,470 |
Series 2020-BN26, Class XA, IO, VRN, 1.34%, 3/15/2063 (b)
| | | 1,299,544 | | 75,854 |
| Benchmark Mortgage Trust: | | | | | |
Series 2018-B1, Class XA, IO, 0.68%, 1/15/2051 (b)
| | | 1,618,810 | | 30,970 |
Series 2019-B15, Class XA, IO, VRN, 0.93%, 12/15/2072 (b)
| | | 4,046,926 | | 149,200 |
| BPR Trust: | | | | | |
Series 2021-TY, Class A, 1 Month USD LIBOR + 1.05%, 6.24%, 9/15/2038 (a) (b)
| | | 192,000 | | 182,379 |
Series 2022-OANA, Class A, 1 Month USD Term LIBOR + 1.90%, 7.05%, 4/15/2037 (a) (b)
| | | 250,000 | | 243,399 |
BX Commercial Mortgage Trust Series 2021-21M, Class A, 1 Month USD LIBOR + 0.73%, 5.92%, 10/15/2036 (a) (b)
| | | 134,847 | | 130,474 |
| BX Trust: | | | | | |
Series 2021-VIEW, Class A, 1 Month USD LIBOR + 1.28%, 6.47%, 6/15/2036 (a) (b)
| | | 299,000 | | 275,160 |
| Security Description | | | Principal
Amount | | Value |
Series 2022-PSB, Class A, 1 Month USD Term LIBOR + 2.45%, 7.60%, 8/15/2039 (a) (b)
| | | $ 133,893 | | $ 133,386 |
BXHPP Trust Series 2021-FILM, Class B, 1 Month USD LIBOR + 0.90%, 6.09%, 8/15/2036 (a) (b)
| | | 224,000 | | 207,527 |
BXMT Ltd. Series 2021-FL4, Class A, 1 Month USD Term LIBOR + 1.16%, 6.31%, 5/15/2038 (a) (b)
| | | 138,000 | | 133,487 |
Cantor Commercial Real Estate Lending Series 2019-CF1, Class 65A, 4.41%, 5/15/2052 (a) (b)
| | | 163,000 | | 144,937 |
| Citigroup Commercial Mortgage Trust: | | | | | |
Series 2019-PRM, Class D, 4.35%, 5/10/2036 (a)
| | | 261,000 | | 258,491 |
Series 2016-GC37, Class XA, IO, 1.82%, 4/10/2049 (b)
| | | 377,555 | | 12,761 |
CLNC Ltd. Series 2019-FL1, Class AS, ABS, 1 Month USD Term LIBOR + 1.66%, 6.76%, 8/20/2035 (a) (b)
| | | 131,000 | | 127,288 |
| COMM Mortgage Trust: | | | | | |
Series 2014-UBS5, Class A3, 3.57%, 9/10/2047
| | | 200,000 | | 194,805 |
Series 2015-DC1, Class A5, 3.35%, 2/10/2048
| | | 200,000 | | 190,465 |
Series 2018-HCLV, Class A, 1 Month USD LIBOR + 1.10%, 6.29%, 9/15/2033 (a) (b)
| | | 70,000 | | 64,054 |
Series 2015-CR25, Class XA, IO, 0.95%, 8/10/2048 (b)
| | | 1,069,805 | | 14,487 |
| CSAIL Commercial Mortgage Trust: | | | | | |
Series 2017-C8, Class XA, IO, 1.24%, 6/15/2050 (b)
| | | 241,109 | | 7,976 |
Series 2017-CX10, Class XA, IO, 0.89%, 11/15/2050 (b)
| | | 842,097 | | 19,921 |
Series 2017-CX9, Class XA, IO, 0.79%, 9/15/2050 (b)
| | | 1,250,120 | | 19,601 |
EQUS Mortgage Trust Series 2021-EQAZ, Class A, 1 Month USD LIBOR + 0.75%, 5.95%, 10/15/2038 (a) (b)
| | | 180,996 | | 175,803 |
Extended Stay America Trust Series 2021-ESH, Class A, 1 Month USD LIBOR + 1.08%, 6.27%, 7/15/2038 (a) (b)
| | | 144,561 | | 141,687 |
See accompanying notes to financial statements.
90
SSGA ACTIVE TRUST
SPDR DOUBLELINE SHORT DURATION TOTAL RETURN TACTICAL ETF
SCHEDULE OF INVESTMENTS (continued)
June 30, 2023
| Security Description | | | Principal
Amount | | Value |
FS Rialto Issuer LLC Series 2019-FL1, Class A, 1 Month USD LIBOR + 1.20%, 6.36%, 12/16/2036 (a) (b)
| | | $ 67,021 | | $ 66,774 |
GPMT Ltd. Series 2021-FL3, Class A, 1 Month USD LIBOR + 1.25%, 6.41%, 7/16/2035 (a) (b)
| | | 56,623 | | 55,845 |
GS Mortgage Securities Corportation Trust Series 2021-IP, Class A, 1 Month USD LIBOR + 0.95%, 6.14%, 10/15/2036 (a) (b)
| | | 181,000 | | 170,266 |
| GS Mortgage Securities Trust: | | | | | |
Series 2017-GS7, Class XA, IO, 1.23%, 8/10/2050 (b)
| | | 371,572 | | 12,129 |
Series 2020-GC47, Class XA, IO, VRN, 1.24%, 5/12/2053 (b)
| | | 2,110,415 | | 120,304 |
| JP Morgan Chase Commercial Mortgage Securities Trust: | | | | | |
Series 2019-MFP, Class A, 1 Month USD LIBOR + 0.96% , 6.15%, 7/15/2036 (a) (b)
| | | 32,968 | | 32,747 |
Series 2022-NLP, Class A, 1 Month USD LIBOR + 0.60%, 5.74%, 4/15/2037 (a) (b)
| | | 187,129 | | 171,460 |
Series 2016-JP4, Class XA, IO, 0.71%, 12/15/2049 (b)
| | | 1,346,583 | | 19,731 |
JPMBB Commercial Mortgage Securities Trust Series 2014-C25, Class B, VRN, 4.35%, 11/15/2047 (b)
| | | 150,000 | | 134,888 |
JPMCC Commercial Mortgage Securities Trust Series 2019-COR5, Class XA, IO, VRN, 1.63%, 6/13/2052 (b)
| | | 1,082,408 | | 64,065 |
| LoanCore Issuer Ltd.: | | | | | |
Series 2019-CRE2, Class AS, 1 Month USD LIBOR + 1.50%, 6.69%, 5/15/2036 (a) (b)
| | | 57,252 | | 56,148 |
Series 2019-CRE3, Class AS, 1 Month USD LIBOR + 1.37%, 6.56%, 4/15/2034 (a) (b)
| | | 29,180 | | 29,131 |
MF1 Multifamily Housing Mortgage Loan Trust Series 2021-FL5, Class AS, 1 Month USD Term LIBOR + 1.31%, 6.46%, 7/15/2036 (a) (b)
| | | 138,000 | | 133,911 |
MHP Trust Series 2022-MHIL, Class A, 1 Month USD Term LIBOR + 0.81%, 5.96%, 1/15/2027 (a) (b)
| | | 152,550 | | 147,878 |
| Security Description | | | Principal
Amount | | Value |
| Morgan Stanley Bank of America Merrill Lynch Trust: | | | | | |
Series 2014-C15, Class XA, IO, 0.95%, 4/15/2047 (b)
| | | $ 480,196 | | $ 481 |
Series 2014-C19, Class LNCX, IO, 0.76%, 12/15/2046 (a) (b)
| | | 1,130,145 | | 6,805 |
| Morgan Stanley Capital I Trust: | | | | | |
Series 2019-PLND, Class B, 1 Month USD LIBOR + 1.30%, 6.49%, 5/15/2036 (a) (b)
| | | 163,000 | | 151,775 |
Series 2019-PLND, Class D, 1 Month USD LIBOR + 1.75%, 6.94%, 5/15/2036 (a) (b)
| | | 127,000 | | 108,190 |
Series 2021-L6, Class A2, 2.13%, 6/15/2054 (b)
| | | 151,000 | | 133,276 |
Series 2016-UB12, Class XA, IO, 0.79%, 12/15/2049 (b)
| | | 1,328,985 | | 23,901 |
MSC Trust Series 2021-ILP, Class A, 1 Month USD LIBOR + 0.78%, 5.97%, 11/15/2023 (a) (b)
| | | 180,403 | | 175,401 |
MSCG Trust Series 2018-SELF, Class A, 1 Month USD LIBOR + 0.90%, 6.09%, 10/15/2037 (a) (b)
| | | 72,196 | | 71,239 |
Natixis Commercial Mortgage Securities Trust Series 2018-FL1, Class A, 1 Month USD LIBOR + 0.95%, 6.14%, 6/15/2035 (a) (b)
| | | 32,473 | | 30,649 |
Ready Capital Mortgage Financing LLC Series 2021-FL7, Class A, 1 Month USD LIBOR + 1.20%, 6.35%, 11/25/2036 (a) (b)
| | | 107,944 | | 105,261 |
RIAL Issuer Ltd. Series 2022-FL8, Class A, 1 Month USD Term LIBOR + 2.25%, 7.34%, 1/19/2037 (a) (b)
| | | 250,000 | | 245,556 |
SMR Mortgage Trust Series 2022-IND, Class A, 1 Month USD Term LIBOR + 1.65%, 6.80%, 2/15/2039 (a) (b)
| | | 149,364 | | 142,282 |
SREIT Trust Series 2021-MFP, Class A, 1 Month USD LIBOR + 0.73%, 5.92%, 11/15/2038 (a) (b)
| | | 181,000 | | 175,686 |
Starwood Ltd. Series 2019-FL1, Class AS, 1 Month USD Term LIBOR + 1.51%, 6.62%, 7/15/2038 (a) (b)
| | | 100,000 | | 96,891 |
UBS Commercial Mortgage Trust Series 2017-C1, Class XA, IO, 1.69%, 6/15/2050 (b)
| | | 599,979 | | 26,009 |
See accompanying notes to financial statements.
91
SSGA ACTIVE TRUST
SPDR DOUBLELINE SHORT DURATION TOTAL RETURN TACTICAL ETF
SCHEDULE OF INVESTMENTS (continued)
June 30, 2023
| Security Description | | | Principal
Amount | | Value |
Velocity Commercial Capital Loan Trust Series 2018-2, Class A, 4.05%, 10/26/2048 (a) (b)
| | | $ 249,645 | | $ 236,317 |
| Wells Fargo Commercial Mortgage Trust: | | | | | |
Series 2021-C60, Class A2, 2.04%, 8/15/2054
| | | 151,000 | | 134,136 |
Series 2021-SAVE, Class A, 1 Month USD LIBOR + 1.15%, 6.34%, 2/15/2040 (a) (b)
| | | 90,902 | | 85,494 |
Series 2021-SAVE, Class B, 1 Month USD LIBOR + 1.45%, 6.64%, 2/15/2040 (a) (b)
| | | 90,902 | | 83,093 |
Series 2022-ONL, Class A, 3.86%, 12/15/2039 (a)
| | | 500,000 | | 446,862 |
Series 2019-C51, Class XA, IO, VRN, 1.48%, 6/15/2052 (b)
| | | 977,033 | | 53,655 |
Series 2019-C52, Class XA, IO, VRN, 1.75%, 8/15/2052 (b)
| | | 2,872,560 | | 190,191 |
| WFRBS Commercial Mortgage Trust: | | | | | |
Series 2014-C21, Class AS, 3.89%, 8/15/2047
| | | 250,000 | | 237,852 |
Series 2013-C18, Class XA, IO, 0.88%, 12/15/2046 (b)
| | | 703,122 | | 793 |
Series 2014-C23, Class AS, VRN, 4.21%, 10/15/2057 (b)
| | | 235,000 | | 225,269 |
TOTAL COMMERCIAL MORTGAGE BACKED SECURITIES
(Cost $9,153,327)
| | | | | 7,820,864 |
| SENIOR FLOATING RATE LOANS — 5.6% | | | |
| BROADLINE RETAIL — 0.2% | | | | |
KFC Holding Co. Senior Secured 2021 Term Loan B, 1 Month USD LIBOR + 1.75%, 6.90%, 3/15/2028 (b)
| | 267,621 | | 265,848 |
| BUILDING PRODUCTS — 0.4% | | | | |
Ingersoll-Rand Services Co. Senior Secured 2020 USD Spinco Term Loan, 1 Month USD SOFR + 1.75%, 6.95%, 3/1/2027 (b)
| | 440,886 | | 440,921 |
| CAPITAL MARKETS — 0.0% (d) | | | | |
Focus Financial Partners LLC Senior Secured 2021 Term Loan B4, 1 Month USD SOFR + 2.50%, 7.60%, 6/30/2028 (b)
| | 34,472 | | 34,123 |
| Security Description | | | Principal
Amount | | Value |
| CASINO SERVICES — 0.3% | | | | |
Stars Group Holdings BV Senior Secured 2018 USD Incremental Term Loan, 3 Month USD SOFR + 2.25%, 7.75%, 7/21/2026 (b)
| | $ 358,465 | | $ 358,870 |
| CHEMICALS — 0.2% | | | | |
Axalta Coating Systems U.S. Holdings, Inc. 2022 USD Term Loan B4, 3 Month USD SOFR + 3.00%, 8.22%, 12/20/2029 (b)
| | 106,087 | | 106,444 |
Element Solutions, Inc. Senior Secured 2019 Term Loan B1, 1 Month USD SOFR + 2.00%, 7.10%, 1/31/2026 (b)
| | 129,726 | | 129,847 |
| | | | | | 236,291 |
| COMMERCIAL SERVICES & SUPPLIES — 0.0% (d) | | | | |
Aramark Services, Inc. Senior Secured 2023 Term Loan B6, 1 Week USD SOFR + 2.50%, 7.72%, 6/22/2030
| | 10,000 | | 10,013 |
| DISTRIBUTION/WHOLESALE — 0.2% | | | | |
Resideo Funding, Inc. Senior Secured 2021 Term Loan, 3 Month USD LIBOR + 2.25%, 7.60%, 2/11/2028 (b)
| | 293,985 | | 293,434 |
| ENTERTAINMENT — 0.2% | | | | |
WMG Acquisition Corp. Senior Secured 2021 Term Loan G, 1 Month USD SOFR + 2.13%, 7.33%, 1/20/2028 (b)
| | 277,767 | | 277,358 |
| FINANCIAL SERVICES — 0.7% | | | | |
Fleetcor Technologies Operating Co. LLC Senior Secured 2021 Term Loan B4, 1 Month USD SOFR + 1.75%, 6.95%, 4/28/2028 (b)
| | 416,507 | | 413,956 |
Setanta Aircraft Leasing Designated Activity Co. Senior Secured Term Loan B, 3 Month USD LIBOR + 2.00%, 7.54%, 11/5/2028 (b)
| | 185,000 | | 185,248 |
Trans Union LLC Senior Secured 2019 Term Loan B5, 1 Month USD LIBOR + 1.75%, 6.95%, 11/16/2026 (b)
| | 185,468 | | 185,223 |
Walker & Dunlop, Inc. Senior Secured 2021 Term Loan, 1 Month USD SOFR + 2.25%, 7.45%, 12/16/2028 (b)
| | 39,400 | | 39,105 |
| | | | | | 823,532 |
See accompanying notes to financial statements.
92
SSGA ACTIVE TRUST
SPDR DOUBLELINE SHORT DURATION TOTAL RETURN TACTICAL ETF
SCHEDULE OF INVESTMENTS (continued)
June 30, 2023
| Security Description | | | Principal
Amount | | Value |
| FORESTRY — 0.3% | | | | |
Asplundh Tree Expert LLC Senior Secured 2021 Term Loan B, 1 Month USD LIBOR + 1.75%, 6.95%, 9/7/2027 (b)
| | $ 416,436 | | $ 415,851 |
| HEALTH CARE PROVIDERS & SERVICES — 0.5% | | | | |
Catalent Pharma Solutions, Inc. Senior Secured 2021 Term Loan B3, 1 Month USD LIBOR + 2.00%, 2/22/2028 (b)
| | 34,298 | | 33,666 |
Horizon Therapeutics USA, Inc. Senior Secured 2021 Term Loan B2, 1 Month USD SOFR + 1.75%, 6.95%, 3/15/2028 (b)
| | 416,479 | | 415,773 |
ICON Luxembourg SARL Senior Secured LUX Term Loan, 3 Month USD SOFR + 2.25%, 7.75%, 7/3/2028 (b)
| | 184,474 | | 184,705 |
PRA Health Sciences, Inc. Senior Secured US Term Loan, 3 Month USD SOFR + 2.25%, 7.75%, 7/3/2028 (b)
| | 45,962 | | 46,019 |
| | | | | | 680,163 |
| HOTELS, RESTAURANTS & LEISURE — 0.0% (d) | | | | |
Wyndham Hotels & Resorts, Inc. 2023 Term Loan B, 1 Month USD SOFR + 2.25%, 7.45%, 5/24/2030 (b)
| | 35,000 | | 35,059 |
| HOUSEHOLD PRODUCTS — 0.3% | | | | |
Reynolds Consumer Products LLC Senior Secured Term Loan, 1 Month USD SOFR + 1.75%, 6.83%, 2/4/2027 (b)
| | 405,362 | | 405,409 |
| INDEPENDENT POWER PRODUCERS & ENERGY TRADERS — 0.3% | | | | |
Vistra Operations Co. LLC Senior Secured 1st Lien Term Loan B3, 1 Month USD LIBOR + 1.75%, 6.90%, 12/31/2025 (b)
| | 366,372 | | 365,914 |
| INTERNET & TELECOM — 0.3% | | | | |
Go Daddy Operating Co. LLC Senior Secured 2022 Term Loan B5, 1 Month USD SOFR + 3.25%, 8.08%, 11/9/2029 (b)
| | 306,199 | | 307,142 |
| MACHINERY — 0.1% | | | | |
Ali Group North America Corp. Senior Secured 2021 Term Loan B, 1 Month USD SOFR + 2.00%, 7.08%, 7/30/2029 (b)
| | 71,589 | | 71,669 |
| Security Description | | | Principal
Amount | | Value |
| MEDIA — 0.1% | | | | |
Nexstar Broadcasting, Inc. Senior Secured 2019 Term Loan B4, 1 Month USD SOFR + 2.50%, 7.72%, 9/18/2026 (b)
| | $ 135,800 | | $ 135,824 |
| MRI/MEDICAL DIAG IMAGING — 0.2% | | | | |
IQVIA, Inc. Senior Secured 2018 USD Term Loan B3, 3 Month USD LIBOR + 1.75%, 7.29%, 6/11/2025 (b)
| | 271,862 | | 272,117 |
| PHARMACEUTICALS — 0.3% | | | | |
Grifols Worldwide Operations USA, Inc. Senior Secured USD 2019 Term Loan B, 3 Month USD SOFR + 2.00%, 7.41%, 11/15/2027 (b)
| | 319,481 | | 314,889 |
| PROFESSIONAL SERVICES — 0.1% | | | | |
Trans Union LLC Senior Secured 2021 Term Loan B6, 1 Month USD SOFR + 2.25%, 7.47%, 12/1/2028 (b)
| | 89,250 | | 89,143 |
| REAL ESTATE INVESTMENT TRUSTS (REITs) — 0.3% | | | | |
Iron Mountain, Inc. Senior Secured 2018 Term Loan B, 1 Month USD LIBOR + 1.75% 6.94%, 1/2/2026(b)
| | 416,214 | | 413,355 |
| SOFTWARE — 0.4% | | | | |
NortonLifeLock, Inc. Senior Secured 2022 Term Loan B, 1 Month USD SOFR + 2.00%, 7.20%, 9/12/2029 (b)
| | 246,026 | | 245,104 |
SS&C Technologies, Inc. Senior Secured 2018 Term Loan B5, 1 Month USD LIBOR + 1.75%, 6.97%, 4/16/2025 (b)
| | 310,801 | | 310,853 |
| | | | | | 555,957 |
| SPECIALTY RETAIL — 0.2% | | | | |
Pilot Travel Centers LLC Senior Secured 2021 Term Loan B, 1 Month USD SOFR + 2.00%, 7.20%, 8/4/2028 (b)
| | 273,601 | | 273,551 |
TOTAL SENIOR FLOATING RATE LOANS
(Cost $7,066,022)
| | | | | 7,076,433 |
See accompanying notes to financial statements.
93
SSGA ACTIVE TRUST
SPDR DOUBLELINE SHORT DURATION TOTAL RETURN TACTICAL ETF
SCHEDULE OF INVESTMENTS (continued)
June 30, 2023
| Security Description | | | Shares | | Value |
| SHORT-TERM INVESTMENT — 3.0% | | | |
State Street Institutional U.S. Government Money Market Fund, Class G Shares 5.07% (e) (f)
(Cost $3,869,754)
| | 3,869,754 | | $ 3,869,754 |
TOTAL INVESTMENTS — 99.5%
(Cost $132,666,309)
| | 126,980,439 | |
OTHER ASSETS IN EXCESS OF LIABILITIES — 0.5%
| | 650,393 | |
NET ASSETS — 100.0%
| | $ 127,630,832 | |
| (a) | Securities purchased pursuant to Rule 144A of the Securities Act of 1933, as amended. These securities, which represent 34.3% of net assets as of June 30, 2023, are considered liquid and may be resold in transactions exempt from registration, normally to qualified institutional buyers. |
| (b) | Variable Rate Security - Interest rate shown is rate in effect at June 30, 2023. For securities based on a published reference rate and spread, the reference rate and spread are indicated in the description above. |
| (c) | Step-up bond - Coupon rate increases in increments to maturity. Rate shown as of June 30, 2023. Maturity date shown is the final maturity. |
| (d) | Amount is less than 0.05% of net assets. |
| (e) | The Fund invested in certain money market funds managed by SSGA Funds Management, Inc. Amounts related to these transactions during the period ended June 30, 2023 are shown in the Affiliate Table below. |
| (f) | The rate shown is the annualized seven-day yield at June 30, 2023. |
| ABS | Asset-Backed Security |
| CLO | Collateralized Loan Obligation |
| CMO | Collateralized Mortgage Obligation |
| CMT | Constant Maturity Treasury |
| EMTN | Euro Medium Term Note |
| IO | Interest Only |
| LIBOR | London Interbank Offered Rate |
| MTN | Medium Term Note |
| REIT | Real Estate Investment Trust |
| REMIC | Real Estate Mortgage Investment Conduit |
| SOFR | Secured Overnight Financing Rate |
| VRN | Variable Rate Note |
The following table summarizes the value of the Fund's investments according to the fair value hierarchy as of June 30, 2023.
| Description | | Level 1 –
Quoted Prices | | Level 2 –
Other Significant
Observable Inputs | | Level 3 –
Significant
Unobservable Inputs | | Total |
| ASSETS: | | | | | | | | |
| INVESTMENTS: | | | | | | | | |
Corporate Bonds & Notes
| | $ — | | $ 19,401,660 | | $— | | $ 19,401,660 |
Asset-Backed Securities
| | — | | 32,419,281 | | — | | 32,419,281 |
Foreign Government Obligations
| | — | | 722,318 | | — | | 722,318 |
U.S. Government Agency Obligations
| | — | | 8,148,798 | | — | | 8,148,798 |
U.S. Treasury Obligations
| | — | | 35,341,965 | | — | | 35,341,965 |
Mortgage-Backed Securities
| | — | | 12,179,366 | | — | | 12,179,366 |
Commercial Mortgage Backed Securities
| | — | | 7,820,864 | | — | | 7,820,864 |
Senior Floating Rate Loans
| | — | | 7,076,433 | | — | | 7,076,433 |
Short-Term Investment
| | 3,869,754 | | — | | — | | 3,869,754 |
TOTAL INVESTMENTS
| | $3,869,754 | | $123,110,685 | | $— | | $126,980,439 |
Affiliate Table
| | Number of
Shares Held
at
6/30/22 | | Value at
6/30/22 | | Cost of
Purchases | | Proceeds
from
Shares Sold | | Realized
Gain (Loss) | | Change in
Unrealized
Appreciation/
Depreciation | | Number of
Shares Held
at
6/30/23 | | Value at
6/30/23 | | Dividend
Income |
State Street Institutional U.S. Government Money Market Fund, Class G Shares
| 7,824,635 | | $7,824,635 | | $68,018,930 | | $71,973,811 | | $— | | $— | | 3,869,754 | | $3,869,754 | | $184,641 |
See accompanying notes to financial statements.
94
SPDR DOUBLELINE TOTAL RETURN TACTICAL ETF
SCHEDULE OF INVESTMENTS
June 30, 2023
| Security Description | | | Principal
Amount | | Value |
| CORPORATE BONDS & NOTES — 12.8% | | | | | |
| AUSTRALIA — 0.2% | | | | |
Glencore Funding LLC
1.63%, 4/27/2026 (a)
| | | $ 1,555,000 | | $ 1,401,988 |
Macquarie Group Ltd. SOFR + 1.53%,
2.87%, 1/14/2033 (a) (b)
| | | 3,345,000 | | 2,670,581 |
Westpac Banking Corp. 5 Year CMT + 1.53%,
3.02%, 11/18/2036 (b)
| | | 2,920,000 | | 2,234,764 |
| | | | | | 6,307,333 |
| BELGIUM — 0.1% | | | | |
Anheuser-Busch InBev Worldwide, Inc.
5.55%, 1/23/2049
| | | 2,225,000 | | 2,343,348 |
| BERMUDA — 0.1% | | | | |
Triton Container International Ltd./TAL International Container Corp.
3.25%, 3/15/2032
| | | 2,790,000 | | 2,191,433 |
| BRAZIL — 0.3% | | | | |
Banco do Brasil SA Series REGS, 10 Year CMT + 6.36%,
9.00%, 6/18/2024 (b)
| | | 1,100,000 | | 1,104,400 |
Banco do Estado do Rio Grande do Sul SA Series REGS, VRN, 5 Year CMT + 4.93%,
5.38%, 1/28/2031 (b)
| | | 500,000 | | 450,565 |
Braskem Netherlands Finance BV 5 Year CMT + 8.22%,
8.50%, 1/23/2081 (b)
| | | 1,100,000 | | 1,120,878 |
BRF SA
4.88%, 1/24/2030
| | | 400,000 | | 323,620 |
| Cosan Luxembourg SA: | | | | | |
7.00%, 1/20/2027
| | | 200,000 | | 200,078 |
7.50%, 6/27/2030 (a)
| | | 600,000 | | 593,718 |
Cosan Overseas Ltd.
8.25%, 8/5/2023
| | | 900,000 | | 894,973 |
Guara Norte SARL
5.20%, 6/15/2034
| | | 795,834 | | 693,737 |
MARB BondCo PLC
3.95%, 1/29/2031
| | | 500,000 | | 357,555 |
MC Brazil Downstream Trading SARL
7.25%, 6/30/2031
| | | 579,751 | | 391,807 |
Minerva Luxembourg SA
4.38%, 3/18/2031
| | | 700,000 | | 547,890 |
Movida Europe SA
5.25%, 2/8/2031
| | | 400,000 | | 324,892 |
MV24 Capital BV
6.75%, 6/1/2034
| | | 924,649 | | 831,814 |
| NBM U.S. Holdings, Inc.: | | | | | |
6.63%, 8/6/2029
| | | 200,000 | | 182,942 |
| Security Description | | | Principal
Amount | | Value |
7.00%, 5/14/2026
| | | $ 200,000 | | $ 194,274 |
Nexa Resources SA Series REGS,
5.38%, 5/4/2027
| | | 300,000 | | 279,114 |
Petrobras Global Finance BV
6.75%, 6/3/2050
| | | 1,000,000 | | 902,120 |
Simpar Europe SA
5.20%, 1/26/2031
| | | 200,000 | | 158,712 |
Unigel Luxembourg SA
8.75%, 10/1/2026
| | | 400,000 | | 130,148 |
| | | | | | 9,683,237 |
| CANADA — 0.5% | | | | |
1375209 BC Ltd.
9.00%, 1/30/2028 (a)
| | | 79,000 | | 79,197 |
Air Canada
3.88%, 8/15/2026 (a)
| | | 550,000 | | 509,894 |
Bank of Montreal 5 Year CMT + 1.40%,
3.09%, 1/10/2037 (b)
| | | 2,850,000 | | 2,231,294 |
Bank of Nova Scotia
3.45%, 4/11/2025
| | | 4,515,000 | | 4,350,609 |
Bombardier, Inc.
7.88%, 4/15/2027 (a)
| | | 490,000 | | 488,854 |
| Garda World Security Corp.: | | | | | |
4.63%, 2/15/2027 (a)
| | | 615,000 | | 563,297 |
6.00%, 6/1/2029 (a)
| | | 350,000 | | 287,819 |
GFL Environmental, Inc.
4.00%, 8/1/2028 (a)
| | | 550,000 | | 493,136 |
Kronos Acquisition Holdings, Inc./KIK Custom Products, Inc.
5.00%, 12/31/2026 (a)
| | | 380,000 | | 351,340 |
Mattamy Group Corp.
4.63%, 3/1/2030 (a)
| | | 570,000 | | 493,580 |
| Parkland Corp.: | | | | | |
4.50%, 10/1/2029 (a)
| | | 435,000 | | 377,932 |
4.63%, 5/1/2030 (a)
| | | 300,000 | | 260,241 |
Primo Water Holdings, Inc.
4.38%, 4/30/2029 (a)
| | | 325,000 | | 278,294 |
Superior Plus LP/Superior General Partner, Inc.
4.50%, 3/15/2029 (a)
| | | 395,000 | | 346,759 |
| Telesat Canada/Telesat LLC: | | | | | |
4.88%, 6/1/2027 (a)
| | | 175,000 | | 105,005 |
6.50%, 10/15/2027 (a)
| | | 170,000 | | 71,619 |
Tervita Corp.
11.00%, 12/1/2025 (a)
| | | 237,000 | | 252,106 |
Titan Acquisition Ltd./Titan Co.-Borrower LLC
7.75%, 4/15/2026 (a)
| | | 410,000 | | 372,378 |
Toronto-Dominion Bank
4.69%, 9/15/2027
| | | 2,295,000 | | 2,246,920 |
| | | | | | 14,160,274 |
See accompanying notes to financial statements.
95
SPDR DOUBLELINE TOTAL RETURN TACTICAL ETF
SCHEDULE OF INVESTMENTS (continued)
June 30, 2023
| Security Description | | | Principal
Amount | | Value |
| CAYMAN ISLANDS — 0.0% (c) | | | | |
Global Aircraft Leasing Co. Ltd. PIK,
6.50%, 9/15/2024 (a)
| | | $ 584,188 | | $ 535,064 |
| CHILE — 0.1% | | | | |
Agrosuper SA
4.60%, 1/20/2032
| | | 300,000 | | 253,671 |
CAP SA
3.90%, 4/27/2031 (a)
| | | 1,050,000 | | 762,804 |
Chile Electricity PEC SpA
0.01%, 1/25/2028 (a)
| | | 900,000 | | 696,744 |
Empresa Electrica Cochrane SpA Series REGS,
5.50%, 5/14/2027
| | | 480,640 | | 443,251 |
Inversiones La Construccion SA
4.75%, 2/7/2032
| | | 900,000 | | 723,573 |
VTR Comunicaciones SpA
5.13%, 1/15/2028
| | | 600,000 | | 312,048 |
| | | | | | 3,192,091 |
| CHINA — 0.1% | | | | |
NXP BV/NXP Funding LLC/NXP USA, Inc.
3.88%, 6/18/2026
| | | 1,815,000 | | 1,744,578 |
| COLOMBIA — 0.2% | | | | |
AI Candelaria Spain SA
5.75%, 6/15/2033 (a)
| | | 1,265,000 | | 939,111 |
Banco Davivienda SA VRN, 10 Year CMT + 5.10%,
6.65%, 4/22/2031 (a) (b)
| | | 600,000 | | 440,994 |
| Banco GNB Sudameris SA: | | | | | |
7.05%, 4/3/2027 (b)
| | | 100,000 | | 91,000 |
5 Year CMT + 6.66%, 7.50%, 4/16/2031 (b)
| | | 150,000 | | 121,841 |
Bancolombia SA VRN, 5 Year CMT + 2.94%,
4.63%, 12/18/2029 (b)
| | | 600,000 | | 511,038 |
| Ecopetrol SA: | | | | | |
5.88%, 5/28/2045
| | | 200,000 | | 136,426 |
5.88%, 11/2/2051
| | | 2,050,000 | | 1,354,168 |
Empresas Publicas de Medellin ESP Series REGS,
4.25%, 7/18/2029
| | | 1,400,000 | | 1,106,070 |
Grupo Aval Ltd.
4.38%, 2/4/2030 (a)
| | | 300,000 | | 235,395 |
Oleoducto Central SA Series REGS,
4.00%, 7/14/2027
| | | 500,000 | | 440,045 |
| | | | | | 5,376,088 |
| FRANCE — 0.1% | | | | |
Altice France SA
5.50%, 10/15/2029 (a)
| | | 460,000 | | 330,643 |
| Security Description | | | Principal
Amount | | Value |
TotalEnergies Capital International SA
3.39%, 6/29/2060
| | | $ 1,600,000 | | $ 1,173,904 |
| | | | | | 1,504,547 |
| GERMANY — 0.0% (c) | | | | |
TK Elevator U.S. Newco, Inc.
5.25%, 7/15/2027 (a)
| | | 325,000 | | 300,492 |
| GUATEMALA — 0.1% | | | | |
Banco Industrial SA 5 Year CMT + 4.44%,
4.88%, 1/29/2031 (b)
| | | 600,000 | | 559,146 |
CT Trust
5.13%, 2/3/2032
| | | 800,000 | | 644,072 |
| Millicom International Cellular SA: | | | | | |
6.25%, 3/25/2029
| | | 180,000 | | 161,310 |
6.63%, 10/15/2026
| | | 540,000 | | 519,815 |
Series REGS, 5.13%, 1/15/2028
| | | 360,000 | | 316,062 |
| | | | | | 2,200,405 |
| HONG KONG — 0.0% (c) | | | | |
Seaspan Corp.
5.50%, 8/1/2029 (a)
| | | 325,000 | | 255,479 |
| INDIA — 0.2% | | | | |
| Adani Electricity Mumbai Ltd.: | | | | | |
Series REGS, 3.87%, 7/22/2031
| | | 400,000 | | 281,602 |
Series REGS, 3.95%, 2/12/2030
| | | 400,000 | | 297,164 |
Adani International Container Terminal Pvt Ltd. Series REGS,
3.00%, 2/16/2031
| | | 732,000 | | 573,309 |
| Adani Ports & Special Economic Zone Ltd.: | | | | | |
3.83%, 2/2/2032
| | | 700,000 | | 510,566 |
4.00%, 7/30/2027
| | | 200,000 | | 169,406 |
Series REGS, 4.38%, 7/3/2029
| | | 400,000 | | 322,496 |
Adani Transmission Step-One Ltd.
4.00%, 8/3/2026
| | | 600,000 | | 524,402 |
JSW Hydro Energy Ltd.
4.13%, 5/18/2031 (a)
| | | 588,000 | | 497,172 |
| Network i2i Ltd.: | | | | | |
5 Year CMT + 4.27%, 5.65%, 1/15/2025 (b)
| | | 400,000 | | 388,672 |
Series REGS, 5 Year CMT + 3.39%, 3.98%, 12/31/2099 (b)
| | | 200,000 | | 178,754 |
| UPL Corp. Ltd.: | | | | | |
4.50%, 3/8/2028
| | | 1,300,000 | | 1,164,489 |
4.63%, 6/16/2030
| | | 200,000 | | 171,000 |
See accompanying notes to financial statements.
96
SPDR DOUBLELINE TOTAL RETURN TACTICAL ETF
SCHEDULE OF INVESTMENTS (continued)
June 30, 2023
| Security Description | | | Principal
Amount | | Value |
Vedanta Resources Finance II PLC
9.25%, 4/23/2026 (a)
| | | $ 1,400,000 | | $ 1,046,668 |
| | | | | | 6,125,700 |
| INDONESIA — 0.1% | | | | |
| Freeport Indonesia PT: | | | | | |
5.32%, 4/14/2032 (a)
| | | 400,000 | | 378,976 |
6.20%, 4/14/2052
| | | 200,000 | | 182,106 |
Indonesia Asahan Aluminium PT/Mineral Industri Indonesia Persero PT
5.45%, 5/15/2030
| | | 400,000 | | 389,852 |
LLPL Capital Pte. Ltd.
6.88%, 2/4/2039
| | | 1,075,230 | | 968,814 |
Minejesa Capital BV Series REGS,
5.63%, 8/10/2037
| | | 2,200,000 | | 1,730,410 |
| | | | | | 3,650,158 |
| IRELAND — 0.1% | | | | |
| Avolon Holdings Funding Ltd.: | | | | | |
2.13%, 2/21/2026 (a)
| | | 1,670,000 | | 1,484,062 |
3.25%, 2/15/2027 (a)
| | | 785,000 | | 700,542 |
| | | | | | 2,184,604 |
| ISRAEL — 0.1% | | | | |
Bank Hapoalim BM 5 Year CMT + 2.16%,
3.26%, 1/21/2032 (a) (b)
| | | 1,400,000 | | 1,199,120 |
Bank Leumi Le-Israel BM 5 Year CMT + 1.63%,
3.28%, 1/29/2031 (a) (b)
| | | 1,200,000 | | 1,072,128 |
| | | | | | 2,271,248 |
| JAMAICA — 0.0% (c) | | | | |
| Digicel Group Holdings Ltd.: | | | | | |
PIK, 7.00%, 12/31/2099 (a)
| | | 643,886 | | 70,827 |
PIK, 8.00%, 4/1/2025 (a)
| | | 873,471 | | 384,074 |
| | | | | | 454,901 |
| KUWAIT — 0.0% (c) | | | | |
MEGlobal BV Series REGS,
2.63%, 4/28/2028
| | | 700,000 | | 609,876 |
MEGlobal Canada ULC
5.00%, 5/18/2025
| | | 200,000 | | 195,862 |
| | | | | | 805,738 |
| LUXEMBOURG — 0.0% (c) | | | | |
Altice Financing SA
5.00%, 1/15/2028 (a)
| | | 240,000 | | 191,971 |
Altice France Holding SA
6.00%, 2/15/2028 (a)
| | | 430,000 | | 209,518 |
Intelsat Jackson Holdings SA
6.50%, 3/15/2030 (a)
| | | 240,000 | | 218,054 |
| | | | | | 619,543 |
| Security Description | | | Principal
Amount | | Value |
| MALAYSIA — 0.0% (c) | | | | |
TNB Global Ventures Capital Bhd Series EMTN,
3.24%, 10/19/2026
| | | $ 200,000 | | $ 185,306 |
| MEXICO — 0.2% | | | | |
| Banco Mercantil del Norte SA: | | | | | |
10 year CMT + 5.03%, 6.63%, 12/31/2099 (b)
| | | 200,000 | | 154,536 |
10 year CMT + 5.47%, 7.50%, 6/27/2029 (a) (b)
| | | 1,400,000 | | 1,218,336 |
Banco Nacional de Comercio Exterior SNC 5 Year CMT + 2.00%,
2.72%, 8/11/2031 (b)
| | | 1,000,000 | | 838,660 |
Banco Santander Mexico SA Institucion de Banca Multiple Grupo Financiero Santand SOFR + 0.30%,
5.95%, 10/1/2028 (b)
| | | 700,000 | | 695,611 |
| BBVA Bancomer SA: | | | | | |
VRN, 5 Year CMT + 4.31%, 5.88%, 9/13/2034 (b)
| | | 400,000 | | 357,824 |
Series REGS, 5 Year CMT + 2.65%, 5.13%, 1/18/2033 (b)
| | | 550,000 | | 479,765 |
Series REGS, 5 Year CMT + 3.00%, 5.35%, 11/12/2029 (b)
| | | 200,000 | | 192,670 |
Braskem Idesa SAPI
6.99%, 2/20/2032
| | | 500,000 | | 320,345 |
| Cemex SAB de CV: | | | | | |
5 Year CMT + 4.53%, 5.13%, 6/8/2026 (b)
| | | 1,000,000 | | 890,960 |
5 Year CMT + 4.91%, 9.13%, 3/14/2028 (a) (b)
| | | 200,000 | | 202,986 |
Credito Real SAB de CV SOFOM ER Series REGS, 5 Year CMT + 7.03%,
9.13%, 11/29/2027 (b) (d)
| | | 500,000 | | 5,455 |
Mexarrend SAPI de CV
10.25%, 7/24/2024 (a)
| | | 282,000 | | 62,108 |
Unifin Financiera SAB de CV Series REGS, 5 Year CMT + 6.31%,
8.88%, 1/29/2025 (b) (d)
| | | 1,800,000 | | 10,044 |
| | | | | | 5,429,300 |
| NETHERLANDS — 0.0% (c) | | | | |
VZ Secured Financing BV
5.00%, 1/15/2032 (a)
| | | 575,000 | | 463,738 |
| PANAMA — 0.1% | | | | |
Banco General SA Series REGS,
4.13%, 8/7/2027
| | | 200,000 | | 188,122 |
Banistmo SA
4.25%, 7/31/2027
| | | 700,000 | | 648,102 |
See accompanying notes to financial statements.
97
SPDR DOUBLELINE TOTAL RETURN TACTICAL ETF
SCHEDULE OF INVESTMENTS (continued)
June 30, 2023
| Security Description | | | Principal
Amount | | Value |
C&W Senior Financing DAC Series REGS,
6.88%, 9/15/2027
| | | $ 450,000 | | $ 392,702 |
Empresa de Transmision Electrica SA
5.13%, 5/2/2049
| | | 200,000 | | 162,684 |
Global Bank Corp. 3 Month USD LIBOR + 3.30%,
5.25%, 4/16/2029 (b)
| | | 700,000 | | 637,518 |
Multibank, Inc.
7.75%, 2/3/2028 (a)
| | | 300,000 | | 304,899 |
| UEP Penonome II SA: | | | | | |
6.50%, 10/1/2038 (a)
| | | 317,646 | | 236,833 |
Series REGS, 6.50%, 10/1/2038
| | | 363,023 | | 270,667 |
| | | | | | 2,841,527 |
| PARAGUAY — 0.1% | | | | |
Banco Continental SAECA
2.75%, 12/10/2025
| | | 800,000 | | 724,712 |
Bioceanico Sovereign Certificate Ltd.
Zero Coupon, 6/5/2034
| | | 534,345 | | 374,057 |
Frigorifico Concepcion SA
7.70%, 7/21/2028
| | | 400,000 | | 313,196 |
Rutas 2 & 7 Finance Ltd.
0.01%, 9/30/2036
| | | 675,000 | | 439,803 |
| | | | | | 1,851,768 |
| PERU — 0.2% | | | | |
| Banco de Credito del Peru S.A.: | | | | | |
VRN, 5 Year CMT + 3.00%, 3.13%, 7/1/2030 (a) (b)
| | | 400,000 | | 367,196 |
Series REGS, 5 Year CMT + 3.00%, 3.13%, 7/1/2030 (b)
| | | 700,000 | | 642,593 |
Banco Internacional del Peru SAA Interbank Series REGS, VRN, 1 year CMT + 3.71%,
4.00%, 7/8/2030 (b)
| | | 1,700,000 | | 1,560,872 |
Fenix Power Peru SA Series REGS,
4.32%, 9/20/2027
| | | 282,353 | | 264,353 |
Hunt Oil Co. of Peru LLC Sucursal Del Peru Series REGS,
6.38%, 6/1/2028
| | | 1,319,552 | | 1,268,723 |
Inkia Energy Ltd. Series REGS,
5.88%, 11/9/2027
| | | 531,000 | | 504,567 |
Lima Metro Line 2 Finance Ltd.
5.88%, 7/5/2034
| | | 137,665 | | 134,567 |
| Petroleos del Peru SA: | | | | | |
4.75%, 6/19/2032
| | | 700,000 | | 525,315 |
5.63%, 6/19/2047
| | | 400,000 | | 258,380 |
| Security Description | | | Principal
Amount | | Value |
Transportadora de Gas del Peru SA Series REGS,
4.25%, 4/30/2028
| | | $ 400,000 | | $ 386,084 |
| | | | | | 5,912,650 |
| SAUDI ARABIA — 0.0% (c) | | | | |
| EIG Pearl Holdings SARL: | | | | | |
3.55%, 8/31/2036
| | | 700,000 | | 598,115 |
Series REGS, 4.39%, 11/30/2046
| | | 900,000 | | 704,340 |
| | | | | | 1,302,455 |
| SINGAPORE — 0.2% | | | | |
Avation Capital SA PIK,
8.25%, 10/31/2026 (a)
| | | 270,808 | | 236,015 |
DBS Group Holdings Ltd. Series GMTN, VRN, 5 Year CMT + 1.10%,
1.82%, 3/10/2031 (b)
| | | 1,400,000 | | 1,251,362 |
Oversea-Chinese Banking Corp. Ltd. Series REGS, VRN, 5 Year CMT + 1.58%,
1.83%, 9/10/2030 (b)
| | | 1,500,000 | | 1,366,395 |
Temasek Financial I Ltd.
1.00%, 10/6/2030 (a)
| | | 1,150,000 | | 912,122 |
| United Overseas Bank Ltd.: | | | | | |
5 Year CMT + 1.23%, 2.00%, 10/14/2031 (b)
| | | 400,000 | | 351,048 |
Series GMTN, VRN, 5 Year CMT + 1.52%, 1.75%, 3/16/2031 (b)
| | | 1,200,000 | | 1,066,879 |
| | | | | | 5,183,821 |
| SOUTH AFRICA — 0.0% (c) | | | | |
| Sasol Financing USA LLC: | | | | | |
4.38%, 9/18/2026
| | | 200,000 | | 177,112 |
5.50%, 3/18/2031
| | | 800,000 | | 629,536 |
| | | | | | 806,648 |
| SOUTH KOREA — 0.0% (c) | | | | |
Shinhan Financial Group Co. Ltd. VRN, 5 Year CMT + 2.06%,
2.88%, 5/12/2026 (a) (b)
| | | 500,000 | | 440,205 |
Woori Bank
4.75%, 4/30/2024
| | | 200,000 | | 197,256 |
| | | | | | 637,461 |
| SPAIN — 0.0% (c) | | | | |
Grifols Escrow Issuer SA
4.75%, 10/15/2028 (a)
| | | 640,000 | | 555,488 |
| THAILAND — 0.0% (c) | | | | |
Bangkok Bank PCL VRN, 5 Year CMT + 4.73%,
5.00%, 9/23/2025 (b)
| | | 200,000 | | 189,750 |
See accompanying notes to financial statements.
98
SPDR DOUBLELINE TOTAL RETURN TACTICAL ETF
SCHEDULE OF INVESTMENTS (continued)
June 30, 2023
| Security Description | | | Principal
Amount | | Value |
| UNITED ARAB EMIRATES — 0.0% (c) | | | | |
| Galaxy Pipeline Assets Bidco Ltd.: | | | | | |
1.75%, 9/30/2027
| | | $ 583,497 | | $ 537,689 |
2.16%, 3/31/2034 (a)
| | | 177,420 | | 150,860 |
2.94%, 9/30/2040
| | | 189,970 | | 152,261 |
| | | | | | 840,810 |
| UNITED KINGDOM — 0.1% | | | | |
BAT Capital Corp.
2.73%, 3/25/2031
| | | 2,845,000 | | 2,265,388 |
eG Global Finance PLC
8.50%, 10/30/2025 (a)
| | | 415,000 | | 404,633 |
| | | | | | 2,670,021 |
| UNITED STATES — 9.6% | | | | |
AbbVie, Inc.
3.85%, 6/15/2024
| | | 2,360,000 | | 2,321,272 |
Academy Ltd.
6.00%, 11/15/2027 (a)
| | | 705,000 | | 678,873 |
Acuris Finance U.S., Inc./Acuris Finance SARL
5.00%, 5/1/2028 (a)
| | | 475,000 | | 371,773 |
AdaptHealth LLC
5.13%, 3/1/2030 (a)
| | | 900,000 | | 731,646 |
Advanced Drainage Systems, Inc.
6.38%, 6/15/2030 (a)
| | | 480,000 | | 474,427 |
AEP Texas, Inc. Series H,
3.45%, 1/15/2050
| | | 2,330,000 | | 1,679,231 |
Aethon United BR LP/Aethon United Finance Corp.
8.25%, 2/15/2026 (a)
| | | 305,000 | | 300,221 |
Air Lease Corp.
3.25%, 3/1/2025
| | | 1,905,000 | | 1,818,284 |
Air Methods Corp.
8.00%, 5/15/2025 (a)
| | | 78,000 | | 587 |
Alexandria Real Estate Equities, Inc.
1.88%, 2/1/2033
| | | 2,270,000 | | 1,661,209 |
Alliant Holdings Intermediate LLC/Alliant Holdings Co-Issuer
6.75%, 10/15/2027 (a)
| | | 420,000 | | 394,829 |
| Allied Universal Holdco LLC/Allied Universal Finance Corp.: | | | | | |
6.63%, 7/15/2026 (a)
| | | 490,000 | | 464,834 |
9.75%, 7/15/2027 (a)
| | | 355,000 | | 312,649 |
AMC Entertainment Holdings, Inc.
7.50%, 2/15/2029 (a)
| | | 110,000 | | 77,576 |
American Airlines, Inc./AAdvantage Loyalty IP Ltd.
5.75%, 4/20/2029 (a)
| | | 1,050,000 | | 1,020,442 |
| Security Description | | | Principal
Amount | | Value |
American Axle & Manufacturing, Inc.
5.00%, 10/1/2029
| | | $ 155,000 | | $ 129,017 |
American Express Co.
3.95%, 8/1/2025
| | | 2,210,000 | | 2,144,694 |
| Amgen, Inc.: | | | | | |
5.25%, 3/2/2030
| | | 485,000 | | 486,305 |
5.75%, 3/2/2063
| | | 870,000 | | 884,259 |
AmWINS Group, Inc.
4.88%, 6/30/2029 (a)
| | | 440,000 | | 397,707 |
Antero Midstream Partners LP/Antero Midstream Finance Corp.
5.75%, 3/1/2027 (a)
| | | 370,000 | | 356,440 |
Antero Resources Corp.
5.38%, 3/1/2030 (a)
| | | 330,000 | | 305,676 |
APi Group DE, Inc.
4.75%, 10/15/2029 (a)
| | | 475,000 | | 427,557 |
Arconic Corp.
6.13%, 2/15/2028 (a)
| | | 860,000 | | 871,361 |
Arrow Electronics, Inc.
3.88%, 1/12/2028
| | | 1,987,000 | | 1,839,684 |
Ashton Woods USA LLC/Ashton Woods Finance Co.
4.63%, 4/1/2030 (a)
| | | 225,000 | | 192,233 |
ASP Unifrax Holdings, Inc.
5.25%, 9/30/2028 (a)
| | | 295,000 | | 212,978 |
AssuredPartners, Inc.
5.63%, 1/15/2029 (a)
| | | 410,000 | | 355,470 |
| AT&T, Inc.: | | | | | |
2.25%, 2/1/2032
| | | 2,815,000 | | 2,237,643 |
2.75%, 6/1/2031
| | | 585,000 | | 493,711 |
AthenaHealth Group, Inc.
6.50%, 2/15/2030 (a)
| | | 435,000 | | 365,865 |
Athene Holding Ltd.
3.95%, 5/25/2051
| | | 3,720,000 | | 2,511,595 |
| Bank of America Corp.: | | | | | |
5 Year CMT + 1.20%, 2.48%, 9/21/2036 (b)
| | | 4,530,000 | | 3,459,470 |
SOFR + 1.11%, 3.84%, 4/25/2025 (b)
| | | 555,000 | | 544,488 |
SOFR + 1.75%, 4.83%, 7/22/2026 (b)
| | | 615,000 | | 604,194 |
| Bausch Health Cos., Inc.: | | | | | |
4.88%, 6/1/2028 (a)
| | | 420,000 | | 250,068 |
6.13%, 2/1/2027 (a)
| | | 185,000 | | 118,441 |
11.00%, 9/30/2028 (a)
| | | 141,000 | | 100,303 |
14.00%, 10/15/2030 (a)
| | | 28,000 | | 16,765 |
BCPE Empire Holdings, Inc.
7.63%, 5/1/2027 (a)
| | | 545,000 | | 507,700 |
Becton Dickinson & Co.
4.69%, 2/13/2028
| | | 2,115,000 | | 2,086,024 |
Blackstone Holdings Finance Co. LLC
2.00%, 1/30/2032 (a)
| | | 3,910,000 | | 2,913,263 |
See accompanying notes to financial statements.
99
SPDR DOUBLELINE TOTAL RETURN TACTICAL ETF
SCHEDULE OF INVESTMENTS (continued)
June 30, 2023
| Security Description | | | Principal
Amount | | Value |
Blue Racer Midstream LLC/Blue Racer Finance Corp.
7.63%, 12/15/2025 (a)
| | | $ 235,000 | | $ 237,543 |
Boeing Co.
2.95%, 2/1/2030
| | | 2,795,000 | | 2,431,818 |
Boxer Parent Co., Inc.
7.13%, 10/2/2025 (a)
| | | 35,000 | | 34,974 |
Boyd Gaming Corp.
4.75%, 6/15/2031 (a)
| | | 555,000 | | 496,126 |
BP Capital Markets America, Inc.
4.89%, 9/11/2033
| | | 2,260,000 | | 2,237,445 |
Brighthouse Financial Global Funding
1.00%, 4/12/2024 (a)
| | | 750,000 | | 718,762 |
Broadcom, Inc.
3.42%, 4/15/2033 (a)
| | | 2,779,000 | | 2,326,523 |
Brown & Brown, Inc.
2.38%, 3/15/2031
| | | 2,070,000 | | 1,669,455 |
| Builders FirstSource, Inc.: | | | | | |
4.25%, 2/1/2032 (a)
| | | 400,000 | | 348,156 |
5.00%, 3/1/2030 (a)
| | | 400,000 | | 373,860 |
Bunge Ltd. Finance Corp.
2.75%, 5/14/2031
| | | 1,550,000 | | 1,301,550 |
| Caesars Entertainment, Inc.: | | | | | |
4.63%, 10/15/2029 (a)
| | | 465,000 | | 405,950 |
7.00%, 2/15/2030 (a)
| | | 25,000 | | 25,122 |
Callon Petroleum Co.
7.50%, 6/15/2030 (a)
| | | 430,000 | | 405,937 |
| Calpine Corp.: | | | | | |
4.50%, 2/15/2028 (a)
| | | 265,000 | | 239,907 |
4.63%, 2/1/2029 (a)
| | | 205,000 | | 173,959 |
Capital One Financial Corp. SOFR + 2.16%,
4.99%, 7/24/2026 (b)
| | | 2,305,000 | | 2,233,637 |
| Carnival Corp.: | | | | | |
5.75%, 3/1/2027 (a)
| | | 725,000 | | 666,942 |
9.88%, 8/1/2027 (a)
| | | 595,000 | | 619,383 |
Castle U.S. Holding Corp.
9.50%, 2/15/2028 (a)
| | | 140,000 | | 79,171 |
| CCO Holdings LLC/CCO Holdings Capital Corp.: | | | | | |
4.25%, 1/15/2034 (a)
| | | 380,000 | | 287,299 |
4.50%, 8/15/2030 (a)
| | | 370,000 | | 308,214 |
4.75%, 3/1/2030 (a)
| | | 755,000 | | 646,023 |
4.75%, 2/1/2032 (a)
| | | 375,000 | | 305,190 |
Cedar Fair LP
5.25%, 7/15/2029
| | | 580,000 | | 527,029 |
Charter Communications Operating LLC/Charter Communications Operating Capital
2.30%, 2/1/2032
| | | 3,975,000 | | 3,007,366 |
Cheniere Energy, Inc.
4.63%, 10/15/2028
| | | 2,625,000 | | 2,455,057 |
| Security Description | | | Principal
Amount | | Value |
Chesapeake Energy Corp.
5.88%, 2/1/2029 (a)
| | | $ 515,000 | | $ 489,023 |
Chord Energy Corp.
6.38%, 6/1/2026 (a)
| | | 520,000 | | 515,648 |
| CHS/Community Health Systems, Inc.: | | | | | |
4.75%, 2/15/2031 (a)
| | | 310,000 | | 234,245 |
6.00%, 1/15/2029 (a)
| | | 220,000 | | 187,084 |
Citigroup, Inc. 3 Month SOFR + 1.65%,
3.67%, 7/24/2028 (b)
| | | 5,165,000 | | 4,835,370 |
Civitas Resources, Inc.
8.38%, 7/1/2028 (a)
| | | 700,000 | | 708,134 |
Clarios Global LP/Clarios U.S. Finance Co.
6.75%, 5/15/2028 (a)
| | | 340,000 | | 339,385 |
Clarivate Science Holdings Corp.
4.88%, 7/1/2029 (a)
| | | 205,000 | | 181,866 |
Clean Harbors, Inc.
5.13%, 7/15/2029 (a)
| | | 145,000 | | 137,709 |
Clear Channel Outdoor Holdings, Inc.
7.50%, 6/1/2029 (a)
| | | 180,000 | | 133,364 |
Clearway Energy Operating LLC
4.75%, 3/15/2028 (a)
| | | 375,000 | | 345,836 |
Clydesdale Acquisition Holdings, Inc.
6.63%, 4/15/2029 (a)
| | | 205,000 | | 196,115 |
CNX Midstream Partners LP
4.75%, 4/15/2030 (a)
| | | 550,000 | | 465,267 |
CNX Resources Corp.
6.00%, 1/15/2029 (a)
| | | 375,000 | | 348,139 |
Coherent Corp.
5.00%, 12/15/2029 (a)
| | | 390,000 | | 352,307 |
Comcast Corp.
2.94%, 11/1/2056
| | | 3,646,000 | | 2,375,041 |
CommScope Technologies LLC
5.00%, 3/15/2027 (a)
| | | 230,000 | | 160,512 |
CommScope, Inc.
4.75%, 9/1/2029 (a)
| | | 470,000 | | 371,192 |
Consolidated Communications, Inc.
5.00%, 10/1/2028 (a)
| | | 290,000 | | 217,367 |
| Constellation Brands, Inc.: | | | | | |
2.88%, 5/1/2030
| | | 2,625,000 | | 2,278,894 |
3.15%, 8/1/2029
| | | 560,000 | | 505,602 |
Continental Resources, Inc.
2.27%, 11/15/2026 (a)
| | | 1,330,000 | | 1,182,742 |
Cornerstone Building Brands, Inc.
6.13%, 1/15/2029 (a)
| | | 210,000 | | 166,847 |
| Coty, Inc.: | | | | | |
5.00%, 4/15/2026 (a)
| | | 1,035,000 | | 997,264 |
6.50%, 4/15/2026 (a)
| | | 245,000 | | 242,903 |
See accompanying notes to financial statements.
100
SPDR DOUBLELINE TOTAL RETURN TACTICAL ETF
SCHEDULE OF INVESTMENTS (continued)
June 30, 2023
| Security Description | | | Principal
Amount | | Value |
CQP Holdco LP/BIP-V Chinook Holdco LLC
5.50%, 6/15/2031 (a)
| | | $ 1,015,000 | | $ 912,556 |
Crown Castle, Inc.
4.30%, 2/15/2029
| | | 2,395,000 | | 2,254,773 |
| CSC Holdings LLC: | | | | | |
5.75%, 1/15/2030 (a)
| | | 495,000 | | 233,714 |
6.50%, 2/1/2029 (a)
| | | 445,000 | | 360,735 |
CSI Compressco LP/CSI Compressco Finance, Inc.
7.50%, 4/1/2025 (a)
| | | 285,000 | | 273,059 |
CSX Corp.
3.35%, 9/15/2049
| | | 3,230,000 | | 2,386,776 |
CVR Partners LP/CVR Nitrogen Finance Corp.
6.13%, 6/15/2028 (a)
| | | 280,000 | | 243,922 |
| CVS Health Corp.: | | | | | |
5.13%, 2/21/2030
| | | 540,000 | | 536,544 |
5.30%, 6/1/2033
| | | 1,135,000 | | 1,133,025 |
5.88%, 6/1/2053
| | | 1,160,000 | | 1,191,680 |
| Dana, Inc.: | | | | | |
4.25%, 9/1/2030
| | | 95,000 | | 79,730 |
5.38%, 11/15/2027
| | | 125,000 | | 119,214 |
5.63%, 6/15/2028
| | | 300,000 | | 283,794 |
Dealer Tire LLC/DT Issuer LLC
8.00%, 2/1/2028 (a)
| | | 270,000 | | 247,150 |
Dick's Sporting Goods, Inc.
4.10%, 1/15/2052
| | | 780,000 | | 541,921 |
Directv Financing LLC/Directv Financing Co.-Obligor, Inc.
5.88%, 8/15/2027 (a)
| | | 320,000 | | 289,750 |
| DISH DBS Corp.: | | | | | |
5.13%, 6/1/2029
| | | 195,000 | | 90,975 |
5.75%, 12/1/2028 (a)
| | | 405,000 | | 303,066 |
5.88%, 11/15/2024
| | | 110,000 | | 96,726 |
| Dollar General Corp.: | | | | | |
3.50%, 4/3/2030
| | | 2,490,000 | | 2,230,218 |
4.25%, 9/20/2024
| | | 1,190,000 | | 1,167,676 |
Dollar Tree, Inc.
4.00%, 5/15/2025
| | | 2,113,000 | | 2,047,222 |
Dornoch Debt Merger Sub, Inc.
6.63%, 10/15/2029 (a)
| | | 270,000 | | 219,891 |
| DTE Energy Co.: | | | | | |
4.22%, 11/1/2024 (e)
| | | 1,155,000 | | 1,130,098 |
4.88%, 6/1/2028
| | | 2,310,000 | | 2,260,474 |
Duke Energy Carolinas LLC
3.55%, 3/15/2052
| | | 950,000 | | 724,565 |
Duke Energy Corp.
2.65%, 9/1/2026
| | | 3,870,000 | | 3,579,286 |
Dun & Bradstreet Corp.
5.00%, 12/15/2029 (a)
| | | 730,000 | | 643,342 |
Elevance Health, Inc.
4.10%, 5/15/2032
| | | 2,460,000 | | 2,294,073 |
Embarq Corp.
8.00%, 6/1/2036
| | | 225,000 | | 137,570 |
| Security Description | | | Principal
Amount | | Value |
Emergent BioSolutions, Inc.
3.88%, 8/15/2028 (a)
| | | $ 100,000 | | $ 57,673 |
| Encompass Health Corp.: | | | | | |
4.50%, 2/1/2028
| | | 185,000 | | 172,476 |
4.63%, 4/1/2031
| | | 455,000 | | 403,098 |
4.75%, 2/1/2030
| | | 60,000 | | 54,633 |
Endo Luxembourg Finance Co. I SARL/Endo U.S., Inc.
6.13%, 4/1/2029 (a) (d)
| | | 170,000 | | 125,127 |
Energizer Holdings, Inc.
6.50%, 12/31/2027 (a)
| | | 235,000 | | 226,310 |
| Energy Transfer LP: | | | | | |
4.75%, 1/15/2026
| | | 1,185,000 | | 1,159,072 |
5.00%, 5/15/2044
| | | 1,200,000 | | 1,010,112 |
Entergy Louisiana LLC
4.75%, 9/15/2052
| | | 830,000 | | 760,529 |
EQM Midstream Partners LP
4.75%, 1/15/2031 (a)
| | | 395,000 | | 345,815 |
Essential Utilities, Inc.
3.35%, 4/15/2050
| | | 3,575,000 | | 2,493,348 |
Everi Holdings, Inc.
5.00%, 7/15/2029 (a)
| | | 580,000 | | 509,594 |
| Exelon Corp.: | | | | | |
4.10%, 3/15/2052
| | | 350,000 | | 282,779 |
5.15%, 3/15/2028
| | | 1,450,000 | | 1,445,026 |
| Expedia Group, Inc.: | | | | | |
3.80%, 2/15/2028
| | | 3,225,000 | | 3,019,309 |
5.00%, 2/15/2026
| | | 1,780,000 | | 1,756,682 |
Exxon Mobil Corp.
2.99%, 3/19/2025
| | | 1,490,000 | | 1,436,047 |
Ferrellgas LP/Ferrellgas Finance Corp.
5.38%, 4/1/2026 (a)
| | | 430,000 | | 399,483 |
Fertitta Entertainment LLC/Fertitta Entertainment Finance Co., Inc.
6.75%, 1/15/2030 (a)
| | | 445,000 | | 377,876 |
Ford Motor Co.
3.25%, 2/12/2032
| | | 1,275,000 | | 1,001,283 |
| Ford Motor Credit Co. LLC: | | | | | |
3.63%, 6/17/2031
| | | 545,000 | | 446,382 |
4.95%, 5/28/2027
| | | 400,000 | | 377,424 |
6.95%, 3/6/2026
| | | 1,000,000 | | 1,005,070 |
Fortrea Holdings, Inc.
7.50%, 7/1/2030 (a)
| | | 520,000 | | 532,272 |
Fortress Transportation & Infrastructure Investors LLC
5.50%, 5/1/2028 (a)
| | | 310,000 | | 284,372 |
| Freeport-McMoRan, Inc.: | | | | | |
4.38%, 8/1/2028
| | | 100,000 | | 94,363 |
4.63%, 8/1/2030
| | | 300,000 | | 283,344 |
5.25%, 9/1/2029
| | | 700,000 | | 687,659 |
| Frontier Communications Holdings LLC: | | | | | |
5.00%, 5/1/2028 (a)
| | | 250,000 | | 215,690 |
5.88%, 10/15/2027 (a)
| | | 125,000 | | 114,239 |
See accompanying notes to financial statements.
101
SPDR DOUBLELINE TOTAL RETURN TACTICAL ETF
SCHEDULE OF INVESTMENTS (continued)
June 30, 2023
| Security Description | | | Principal
Amount | | Value |
Full House Resorts, Inc.
8.25%, 2/15/2028 (a)
| | | $ 185,000 | | $ 173,227 |
Gap, Inc.
3.88%, 10/1/2031 (a)
| | | 395,000 | | 270,749 |
| General Motors Financial Co., Inc.: | | | | | |
2.40%, 10/15/2028
| | | 1,385,000 | | 1,174,882 |
3.10%, 1/12/2032
| | | 465,000 | | 376,120 |
Georgia-Pacific LLC
3.60%, 3/1/2025 (a)
| | | 2,318,000 | | 2,237,403 |
Goldman Sachs Group, Inc. 3 Month USD LIBOR + 1.17%,
6.49%, 5/15/2026 (b)
| | | 4,625,000 | | 4,647,061 |
Goodyear Tire & Rubber Co.
5.25%, 7/15/2031
| | | 470,000 | | 408,294 |
GrafTech Finance, Inc.
4.63%, 12/15/2028 (a)
| | | 185,000 | | 150,599 |
Griffon Corp.
5.75%, 3/1/2028
| | | 430,000 | | 402,136 |
Group 1 Automotive, Inc.
4.00%, 8/15/2028 (a)
| | | 285,000 | | 250,583 |
Guardian Life Global Funding
1.25%, 5/13/2026 (a)
| | | 2,150,000 | | 1,913,113 |
Gulfport Energy Corp.
8.00%, 5/17/2026 (a)
| | | 175,000 | | 175,868 |
Halliburton Co.
2.92%, 3/1/2030
| | | 922,000 | | 811,378 |
| HCA, Inc.: | | | | | |
4.13%, 6/15/2029
| | | 1,270,000 | | 1,176,249 |
5.13%, 6/15/2039
| | | 1,290,000 | | 1,196,965 |
Helios Software Holdings, Inc./ION Corporate Solutions Finance SARL
4.63%, 5/1/2028 (a)
| | | 575,000 | | 492,924 |
Hertz Corp.
5.00%, 12/1/2029 (a)
| | | 125,000 | | 103,261 |
| Hess Midstream Operations LP: | | | | | |
4.25%, 2/15/2030 (a)
| | | 750,000 | | 654,570 |
5.13%, 6/15/2028 (a)
| | | 365,000 | | 343,392 |
5.50%, 10/15/2030 (a)
| | | 310,000 | | 288,994 |
Hewlett Packard Enterprise Co.
5.90%, 10/1/2024
| | | 1,005,000 | | 1,003,804 |
H-Food Holdings LLC/Hearthside Finance Co., Inc.
8.50%, 6/1/2026 (a)
| | | 290,000 | | 114,538 |
Hightower Holding LLC
6.75%, 4/15/2029 (a)
| | | 315,000 | | 272,670 |
Hilcorp Energy I LP/Hilcorp Finance Co.
6.25%, 11/1/2028 (a)
| | | 540,000 | | 509,074 |
Host Hotels & Resorts LP Series I,
3.50%, 9/15/2030
| | | 2,622,000 | | 2,224,924 |
| Security Description | | | Principal
Amount | | Value |
HUB International Ltd.
7.25%, 6/15/2030 (a)
| | | $ 450,000 | | $ 464,665 |
Hyundai Capital America
5.68%, 6/26/2028 (a)
| | | 1,845,000 | | 1,830,129 |
Icahn Enterprises LP/Icahn Enterprises Finance Corp.
5.25%, 5/15/2027
| | | 385,000 | | 331,970 |
iHeartCommunications, Inc.
8.38%, 5/1/2027
| | | 75,000 | | 49,963 |
Illuminate Buyer LLC/Illuminate Holdings IV, Inc.
9.00%, 7/1/2028 (a)
| | | 320,000 | | 279,619 |
Installed Building Products, Inc.
5.75%, 2/1/2028 (a)
| | | 435,000 | | 410,483 |
Invitation Homes Operating Partnership LP
2.70%, 1/15/2034
| | | 2,975,000 | | 2,258,858 |
| Iron Mountain, Inc.: | | | | | |
7.00%, 2/15/2029 (a)
| | | 470,000 | | 470,973 |
REIT, 4.50%, 2/15/2031 (a)
| | | 580,000 | | 498,353 |
Jacobs Engineering Group, Inc.
5.90%, 3/1/2033
| | | 2,420,000 | | 2,374,867 |
JELD-WEN, Inc.
4.88%, 12/15/2027 (a)
| | | 285,000 | | 252,405 |
| JPMorgan Chase & Co.: | | | | | |
3 Month SOFR + 1.25%, 2.58%, 4/22/2032 (b)
| | | 2,965,000 | | 2,461,928 |
SOFR + 1.26%, 2.96%, 1/25/2033 (b)
| | | 2,845,000 | | 2,398,193 |
SOFR + 1.99%, 4.85%, 7/25/2028 (b)
| | | 1,275,000 | | 1,257,762 |
Kinder Morgan, Inc.
5.20%, 6/1/2033
| | | 2,345,000 | | 2,271,297 |
Leeward Renewable Energy Operations LLC
4.25%, 7/1/2029 (a)
| | | 425,000 | | 378,556 |
Legacy LifePoint Health LLC
4.38%, 2/15/2027 (a)
| | | 310,000 | | 242,296 |
Legends Hospitality Holding Co. LLC/Legends Hospitality Co.-Issuer, Inc.
5.00%, 2/1/2026 (a)
| | | 340,000 | | 310,362 |
Level 3 Financing, Inc.
10.50%, 5/15/2030 (a)
| | | 320,000 | | 324,826 |
LFS Topco LLC
5.88%, 10/15/2026 (a)
| | | 345,000 | | 303,428 |
LifePoint Health, Inc.
5.38%, 1/15/2029 (a)
| | | 145,000 | | 85,689 |
Lions Gate Capital Holdings LLC
5.50%, 4/15/2029 (a)
| | | 140,000 | | 101,384 |
Lowe's Cos., Inc.
4.40%, 9/8/2025
| | | 2,825,000 | | 2,769,489 |
See accompanying notes to financial statements.
102
SPDR DOUBLELINE TOTAL RETURN TACTICAL ETF
SCHEDULE OF INVESTMENTS (continued)
June 30, 2023
| Security Description | | | Principal
Amount | | Value |
LSF9 Atlantis Holdings LLC/Victra Finance Corp.
7.75%, 2/15/2026 (a)
| | | $ 350,000 | | $ 326,015 |
Lumen Technologies, Inc.
4.00%, 2/15/2027 (a)
| | | 155,000 | | 115,796 |
M/I Homes, Inc.
4.95%, 2/1/2028
| | | 365,000 | | 340,246 |
| Madison IAQ LLC: | | | | | |
4.13%, 6/30/2028 (a)
| | | 570,000 | | 502,027 |
5.88%, 6/30/2029 (a)
| | | 220,000 | | 178,730 |
Marriott International, Inc. Series HH,
2.85%, 4/15/2031
| | | 2,705,000 | | 2,274,607 |
Marvell Technology, Inc.
1.65%, 4/15/2026
| | | 2,000,000 | | 1,801,960 |
Massachusetts Mutual Life Insurance Co.
3.38%, 4/15/2050 (a)
| | | 2,780,000 | | 1,992,760 |
Match Group Holdings II LLC
5.00%, 12/15/2027 (a)
| | | 775,000 | | 726,655 |
Mativ Holdings, Inc.
6.88%, 10/1/2026 (a)
| | | 250,000 | | 218,298 |
McGraw-Hill Education, Inc.
5.75%, 8/1/2028 (a)
| | | 565,000 | | 488,539 |
Medline Borrower LP
5.25%, 10/1/2029 (a)
| | | 555,000 | | 481,751 |
Merck & Co., Inc.
4.50%, 5/17/2033
| | | 805,000 | | 798,930 |
Meta Platforms, Inc.
5.60%, 5/15/2053
| | | 2,315,000 | | 2,377,158 |
Metis Merger Sub LLC
6.50%, 5/15/2029 (a)
| | | 410,000 | | 353,395 |
MetLife, Inc.
5.25%, 1/15/2054
| | | 2,690,000 | | 2,618,823 |
| Michaels Cos., Inc.: | | | | | |
5.25%, 5/1/2028 (a)
| | | 360,000 | | 290,696 |
7.88%, 5/1/2029 (a)
| | | 200,000 | | 134,988 |
Microsoft Corp.
2.92%, 3/17/2052
| | | 1,590,000 | | 1,181,656 |
Midwest Gaming Borrower LLC/Midwest Gaming Finance Corp.
4.88%, 5/1/2029 (a)
| | | 555,000 | | 491,591 |
ModivCare Escrow Issuer, Inc.
5.00%, 10/1/2029 (a)
| | | 565,000 | | 418,286 |
Monongahela Power Co.
5.40%, 12/15/2043 (a)
| | | 1,230,000 | | 1,191,858 |
Morgan Stanley SOFR + 1.36%,
2.48%, 9/16/2036 (b)
| | | 5,620,000 | | 4,253,778 |
Moss Creek Resources Holdings, Inc.
7.50%, 1/15/2026 (a)
| | | 90,000 | | 82,859 |
MPLX LP
1.75%, 3/1/2026
| | | 905,000 | | 822,283 |
| Security Description | | | Principal
Amount | | Value |
Murphy Oil USA, Inc.
4.75%, 9/15/2029
| | | $ 285,000 | | $ 261,961 |
Nabors Industries Ltd.
7.25%, 1/15/2026 (a)
| | | 305,000 | | 284,922 |
National Rural Utilities Cooperative Finance Corp.
4.80%, 3/15/2028
| | | 450,000 | | 445,693 |
Nationstar Mortgage Holdings, Inc.
5.75%, 11/15/2031 (a)
| | | 480,000 | | 394,190 |
Navient Corp.
5.00%, 3/15/2027
| | | 285,000 | | 255,725 |
| NCL Corp. Ltd.: | | | | | |
5.88%, 3/15/2026 (a)
| | | 395,000 | | 370,771 |
8.38%, 2/1/2028 (a)
| | | 275,000 | | 288,844 |
NetApp, Inc.
1.88%, 6/22/2025
| | | 1,850,000 | | 1,719,482 |
News Corp.
5.13%, 2/15/2032 (a)
| | | 155,000 | | 141,920 |
NextEra Energy Capital Holdings, Inc.
4.26%, 9/1/2024
| | | 950,000 | | 934,163 |
NGL Energy Operating LLC/NGL Energy Finance Corp.
7.50%, 2/1/2026 (a)
| | | 465,000 | | 457,983 |
NGL Energy Partners LP/NGL Energy Finance Corp.
7.50%, 4/15/2026
| | | 110,000 | | 103,547 |
NRG Energy, Inc.
3.63%, 2/15/2031 (a)
| | | 545,000 | | 426,354 |
NuStar Logistics LP
6.00%, 6/1/2026
| | | 510,000 | | 497,485 |
| Olympus Water U.S. Holding Corp.: | | | | | |
4.25%, 10/1/2028 (a)
| | | 400,000 | | 316,136 |
6.25%, 10/1/2029 (a)
| | | 200,000 | | 144,354 |
Omnicom Group, Inc.
2.45%, 4/30/2030
| | | 2,700,000 | | 2,265,354 |
| OneMain Finance Corp.: | | | | | |
5.38%, 11/15/2029
| | | 250,000 | | 213,468 |
7.13%, 3/15/2026
| | | 324,000 | | 318,942 |
| Oracle Corp.: | | | | | |
3.60%, 4/1/2050
| | | 2,585,000 | | 1,845,819 |
3.80%, 11/15/2037
| | | 155,000 | | 126,744 |
6.25%, 11/9/2032
| | | 165,000 | | 175,057 |
Organon & Co./Organon Foreign Debt Co.-Issuer BV
5.13%, 4/30/2031 (a)
| | | 570,000 | | 470,170 |
Owens & Minor, Inc.
6.63%, 4/1/2030 (a)
| | | 530,000 | | 480,906 |
Pacific Gas & Electric Co.
2.50%, 2/1/2031
| | | 1,395,000 | | 1,094,336 |
See accompanying notes to financial statements.
103
SPDR DOUBLELINE TOTAL RETURN TACTICAL ETF
SCHEDULE OF INVESTMENTS (continued)
June 30, 2023
| Security Description | | | Principal
Amount | | Value |
Pactiv Evergreen Group Issuer, Inc./Pactiv Evergreen Group Issuer LLC
4.00%, 10/15/2027 (a)
| | | $ 550,000 | | $ 490,556 |
Park Intermediate Holdings LLC/PK Domestic Property LLC/PK Finance Co-Issuer
4.88%, 5/15/2029 (a)
| | | 850,000 | | 732,836 |
Parker-Hannifin Corp.
4.25%, 9/15/2027
| | | 655,000 | | 635,396 |
PBF Holding Co. LLC/PBF Finance Corp.
6.00%, 2/15/2028
| | | 100,000 | | 93,740 |
PECF USS Intermediate Holding III Corp.
8.00%, 11/15/2029 (a)
| | | 100,000 | | 57,217 |
| Penn Entertainment, Inc.: | | | | | |
4.13%, 7/1/2029 (a)
| | | 310,000 | | 254,126 |
5.63%, 1/15/2027 (a)
| | | 620,000 | | 582,651 |
PennyMac Financial Services, Inc.
4.25%, 2/15/2029 (a)
| | | 635,000 | | 510,838 |
Penske Truck Leasing Co. Lp/PTL Finance Corp.
4.20%, 4/1/2027 (a)
| | | 1,220,000 | | 1,144,275 |
Penske Truck Leasing Co. LP/PTL Finance Corp.
4.40%, 7/1/2027 (a)
| | | 175,000 | | 165,214 |
PepsiCo, Inc.
3.60%, 2/18/2028
| | | 750,000 | | 722,857 |
Performance Food Group, Inc.
4.25%, 8/1/2029 (a)
| | | 380,000 | | 338,325 |
PetSmart, Inc./PetSmart Finance Corp.
7.75%, 2/15/2029 (a)
| | | 1,000,000 | | 994,080 |
Phillips 66 Co.
4.95%, 12/1/2027
| | | 910,000 | | 902,110 |
Pike Corp.
5.50%, 9/1/2028 (a)
| | | 560,000 | | 503,754 |
| Post Holdings, Inc.: | | | | | |
4.63%, 4/15/2030 (a)
| | | 90,000 | | 78,924 |
5.50%, 12/15/2029 (a)
| | | 140,000 | | 129,501 |
Premier Entertainment Sub LLC/Premier Entertainment Finance Corp.
5.63%, 9/1/2029 (a)
| | | 260,000 | | 196,105 |
Prime Security Services Borrower LLC/Prime Finance, Inc.
6.25%, 1/15/2028 (a)
| | | 220,000 | | 206,010 |
Qorvo, Inc.
1.75%, 12/15/2024 (a)
| | | 950,000 | | 883,728 |
Quanta Services, Inc.
2.35%, 1/15/2032
| | | 2,930,000 | | 2,306,262 |
| Security Description | | | Principal
Amount | | Value |
Radiate Holdco LLC/Radiate Finance, Inc.
4.50%, 9/15/2026 (a)
| | | $ 120,000 | | $ 95,822 |
Radiology Partners, Inc.
9.25%, 2/1/2028 (a)
| | | 230,000 | | 85,707 |
Raytheon Technologies Corp.
3.03%, 3/15/2052
| | | 1,630,000 | | 1,146,053 |
Realogy Group LLC/Realogy Co.-Issuer Corp.
5.25%, 4/15/2030 (a)
| | | 290,000 | | 206,625 |
Realty Income Corp.
5.05%, 1/13/2026
| | | 1,110,000 | | 1,101,708 |
RegionalCare Hospital Partners Holdings, Inc./LifePoint Health, Inc.
9.75%, 12/1/2026 (a)
| | | 195,000 | | 163,591 |
Roller Bearing Co. of America, Inc.
4.38%, 10/15/2029 (a)
| | | 555,000 | | 497,080 |
| Royal Caribbean Cruises Ltd.: | | | | | |
5.50%, 8/31/2026 (a)
| | | 420,000 | | 398,521 |
7.25%, 1/15/2030 (a)
| | | 70,000 | | 71,037 |
Royalty Pharma PLC
3.30%, 9/2/2040
| | | 3,275,000 | | 2,331,603 |
RP Escrow Issuer LLC
5.25%, 12/15/2025 (a)
| | | 190,000 | | 140,220 |
Ryan Specialty LLC
4.38%, 2/1/2030 (a)
| | | 575,000 | | 508,748 |
Sabine Pass Liquefaction LLC
5.00%, 3/15/2027
| | | 1,530,000 | | 1,506,423 |
Santander Holdings USA, Inc. SOFR + 1.25%,
2.49%, 1/6/2028 (b)
| | | 2,825,000 | | 2,443,032 |
Scientific Games Holdings LP/Scientific Games U.S. FinCo, Inc.
6.63%, 3/1/2030 (a)
| | | 555,000 | | 488,472 |
Scientific Games International, Inc.
7.25%, 11/15/2029 (a)
| | | 505,000 | | 507,086 |
Scotts Miracle-Gro Co.
4.50%, 10/15/2029
| | | 440,000 | | 381,735 |
Scripps Escrow II, Inc.
3.88%, 1/15/2029 (a)
| | | 170,000 | | 137,352 |
Scripps Escrow, Inc.
5.88%, 7/15/2027 (a)
| | | 105,000 | | 85,670 |
SEG Holding LLC/SEG Finance Corp.
5.63%, 10/15/2028 (a)
| | | 605,000 | | 576,039 |
Select Medical Corp.
6.25%, 8/15/2026 (a)
| | | 490,000 | | 481,062 |
Sirius XM Radio, Inc.
5.50%, 7/1/2029 (a)
| | | 1,025,000 | | 934,872 |
SK Invictus Intermediate II SARL
5.00%, 10/30/2029 (a)
| | | 195,000 | | 155,201 |
Smithfield Foods, Inc.
4.25%, 2/1/2027 (a)
| | | 2,440,000 | | 2,261,880 |
See accompanying notes to financial statements.
104
SPDR DOUBLELINE TOTAL RETURN TACTICAL ETF
SCHEDULE OF INVESTMENTS (continued)
June 30, 2023
| Security Description | | | Principal
Amount | | Value |
Sonic Automotive, Inc.
4.63%, 11/15/2029 (a)
| | | $ 515,000 | | $ 433,851 |
| Southern Co.: | | | | | |
Series 21-A, VRN, 5 Year CMT + 2.92%, 3.75%, 9/15/2051 (b)
| | | 200,000 | | 170,348 |
Series A, 3.70%, 4/30/2030
| | | 2,510,000 | | 2,305,134 |
| Southwestern Energy Co.: | | | | | |
4.75%, 2/1/2032
| | | 430,000 | | 379,888 |
5.38%, 2/1/2029
| | | 410,000 | | 387,044 |
Spectrum Brands, Inc.
5.00%, 10/1/2029 (a)
| | | 670,000 | | 601,044 |
| SRS Distribution, Inc.: | | | | | |
4.63%, 7/1/2028 (a)
| | | 315,000 | | 282,309 |
6.13%, 7/1/2029 (a)
| | | 285,000 | | 247,500 |
Standard Industries, Inc.
4.38%, 7/15/2030 (a)
| | | 600,000 | | 519,966 |
| Staples, Inc.: | | | | | |
7.50%, 4/15/2026 (a)
| | | 340,000 | | 280,174 |
10.75%, 4/15/2027 (a)
| | | 150,000 | | 87,191 |
Station Casinos LLC
4.63%, 12/1/2031 (a)
| | | 295,000 | | 248,605 |
Suburban Propane Partners LP/Suburban Energy Finance Corp.
5.00%, 6/1/2031 (a)
| | | 520,000 | | 437,538 |
SunCoke Energy, Inc.
4.88%, 6/30/2029 (a)
| | | 510,000 | | 430,246 |
| Sunoco LP/Sunoco Finance Corp.: | | | | | |
4.50%, 5/15/2029
| | | 150,000 | | 133,140 |
6.00%, 4/15/2027
| | | 170,000 | | 167,848 |
SWF Escrow Issuer Corp.
6.50%, 10/1/2029 (a)
| | | 165,000 | | 101,561 |
Sysco Corp.
3.25%, 7/15/2027
| | | 1,330,000 | | 1,242,898 |
| Tenet Healthcare Corp.: | | | | | |
6.13%, 10/1/2028
| | | 230,000 | | 221,375 |
6.13%, 6/15/2030
| | | 450,000 | | 443,452 |
6.25%, 2/1/2027
| | | 245,000 | | 242,952 |
T-Mobile USA, Inc.
2.25%, 2/15/2026
| | | 3,945,000 | | 3,633,818 |
TMS International Corp.
6.25%, 4/15/2029 (a)
| | | 180,000 | | 151,207 |
Townsquare Media, Inc.
6.88%, 2/1/2026 (a)
| | | 380,000 | | 364,629 |
| TransDigm, Inc.: | | | | | |
5.50%, 11/15/2027
| | | 520,000 | | 491,754 |
6.25%, 3/15/2026 (a)
| | | 450,000 | | 447,804 |
6.75%, 8/15/2028 (a)
| | | 250,000 | | 251,330 |
Transocean Poseidon Ltd.
6.88%, 2/1/2027 (a)
| | | 511,875 | | 508,404 |
Trident TPI Holdings, Inc.
12.75%, 12/31/2028 (a)
| | | 265,000 | | 274,853 |
Triton Water Holdings, Inc.
6.25%, 4/1/2029 (a)
| | | 220,000 | | 188,410 |
| Security Description | | | Principal
Amount | | Value |
Truist Financial Corp. SOFR + 1.44%,
4.87%, 1/26/2029 (b)
| | | $ 1,100,000 | | $ 1,056,924 |
U.S. Foods, Inc.
4.75%, 2/15/2029 (a)
| | | 515,000 | | 472,693 |
United Airlines, Inc.
4.63%, 4/15/2029 (a)
| | | 400,000 | | 364,500 |
United Natural Foods, Inc.
6.75%, 10/15/2028 (a)
| | | 325,000 | | 269,318 |
UnitedHealth Group, Inc.
4.25%, 1/15/2029
| | | 4,875,000 | | 4,736,599 |
Uniti Group LP/Uniti Group Finance, Inc./CSL Capital LLC
10.50%, 2/15/2028 (a)
| | | 140,000 | | 138,936 |
| Univision Communications, Inc.: | | | | | |
4.50%, 5/1/2029 (a)
| | | 325,000 | | 279,367 |
7.38%, 6/30/2030 (a)
| | | 305,000 | | 290,723 |
Upbound Group, Inc.
6.38%, 2/15/2029 (a)
| | | 160,000 | | 142,544 |
| Venture Global LNG, Inc.: | | | | | |
8.13%, 6/1/2028 (a)
| | | 375,000 | | 381,398 |
8.38%, 6/1/2031 (a)
| | | 245,000 | | 247,379 |
Verizon Communications, Inc.
1.75%, 1/20/2031
| | | 4,819,000 | | 3,799,492 |
Viatris, Inc.
1.65%, 6/22/2025
| | | 800,000 | | 736,440 |
Victoria's Secret & Co.
4.63%, 7/15/2029 (a)
| | | 335,000 | | 244,661 |
| Viking Cruises Ltd.: | | | | | |
5.88%, 9/15/2027 (a)
| | | 875,000 | | 803,477 |
9.13%, 7/15/2031 (a)
| | | 510,000 | | 515,329 |
Virtusa Corp.
7.13%, 12/15/2028 (a)
| | | 130,000 | | 106,582 |
Warnermedia Holdings, Inc.
3.76%, 3/15/2027
| | | 2,510,000 | | 2,342,006 |
WASH Multifamily Acquisition, Inc.
5.75%, 4/15/2026 (a)
| | | 555,000 | | 519,730 |
| Weatherford International Ltd.: | | | | | |
6.50%, 9/15/2028 (a)
| | | 240,000 | | 241,008 |
8.63%, 4/30/2030 (a)
| | | 440,000 | | 447,040 |
| Wells Fargo & Co.: | | | | | |
SOFR + 1.98%, 4.81%, 7/25/2028 (b)
| | | 815,000 | | 796,891 |
Series MTN, 3 Month SOFR + 1.57%, 3.58%, 5/22/2028 (b)
| | | 2,435,000 | | 2,268,957 |
Welltower OP LLC
2.05%, 1/15/2029
| | | 2,640,000 | | 2,200,176 |
Western Midstream Operating LP
4.30%, 2/1/2030
| | | 395,000 | | 355,543 |
Wheel Pros, Inc.
6.50%, 5/15/2029 (a)
| | | 100,000 | | 30,000 |
See accompanying notes to financial statements.
105
SPDR DOUBLELINE TOTAL RETURN TACTICAL ETF
SCHEDULE OF INVESTMENTS (continued)
June 30, 2023
| Security Description | | | Principal
Amount | | Value |
Williams Cos., Inc.
3.75%, 6/15/2027
| | | $ 931,000 | | $ 879,246 |
Workday, Inc.
3.70%, 4/1/2029
| | | 2,600,000 | | 2,412,280 |
WR Grace Holdings LLC
5.63%, 8/15/2029 (a)
| | | 600,000 | | 490,332 |
WRKCo, Inc.
3.75%, 3/15/2025
| | | 2,310,000 | | 2,225,015 |
| XHR LP: | | | | | |
4.88%, 6/1/2029 (a)
| | | 1,125,000 | | 969,041 |
6.38%, 8/15/2025 (a)
| | | 265,000 | | 260,278 |
XPO, Inc.
7.13%, 6/1/2031 (a)
| | | 520,000 | | 524,280 |
Yum! Brands, Inc.
4.75%, 1/15/2030 (a)
| | | 375,000 | | 352,050 |
| | | | | | 286,950,466 |
| VIETNAM — 0.0% (c) | | | | |
Mong Duong Finance Holdings BV Series REGS,
5.13%, 5/7/2029
| | | 250,000 | | 219,490 |
TOTAL CORPORATE BONDS & NOTES
(Cost $420,583,213)
| | | | | 381,946,960 |
| ASSET-BACKED SECURITIES — 11.7% | | | | | |
| ACE Securities Corp. Home Equity Loan Trust: | | | | | |
Series 2006-FM1, Class A2C, ABS, 1 Month USD LIBOR + 0.30%, 5.45%, 7/25/2036 (b)
| | | 8,472,846 | | 2,273,039 |
Series 2007-WM2, Class A2C, ABS, 1 Month USD LIBOR + 0.28%, 5.43%, 2/25/2037 (b)
| | | 2,799,965 | | 1,185,438 |
ACRE Commercial Mortgage Ltd. Series 2021-FL4, Class B, 1 Month USD LIBOR + 1.51%,
6.61%, 12/18/2037 (a) (b)
| | | 3,000,000 | | 2,810,208 |
| Affirm Asset Securitization Trust: | | | | | |
Series 2022-A, Class A, 4.30%, 5/17/2027 (a)
| | | 3,000,000 | | 2,919,447 |
Series 2023-A, Class A, 6.61%, 1/18/2028 (a)
| | | 1,750,000 | | 1,749,636 |
AIMCO CLO 11 Ltd. Series 2020-11A, Class AR, 3 Month USD LIBOR + 1.13%,
6.39%, 10/17/2034 (a) (b)
| | | 2,000,000 | | 1,963,538 |
| Security Description | | | Principal
Amount | | Value |
Allegro CLO II-S Ltd. Series 2014-1RA, Class A1, 3 Month USD LIBOR + 1.08%,
6.34%, 10/21/2028 (a) (b)
| | | $ 304,514 | | $ 302,595 |
Ameriquest Mortgage Securities Asset-Backed Pass-Through Certificates Series 2004-FR1, Class M5,
3.89%, 5/25/2034 (e)
| | | 4,804,032 | | 3,511,937 |
| AMSR Trust: | | | | | |
Series 2021-SFR2, Class E1, ABS, 2.48%, 8/17/2038 (a)
| | | 3,000,000 | | 2,569,687 |
Series 2021-SFR2, Class F1, ABS, 3.28%, 8/17/2038 (a)
| | | 3,000,000 | | 2,552,809 |
Series 2021-SFR2, Class F2, ABS, 3.67%, 8/17/2038 (a)
| | | 2,000,000 | | 1,695,812 |
Series 2023-SFR1, Class B, 4.00%, 4/17/2040 (a)
| | | 12,000,000 | | 10,973,293 |
Anchorage Capital CLO 19 Ltd. Series 2021-19A, Class A, ABS, 3 Month USD LIBOR + 1.21%,
6.47%, 10/15/2034 (a) (b)
| | | 2,000,000 | | 1,947,800 |
AREIT Trust Series 2021-CRE5, Class B, 1 Month USD LIBOR + 1.82%,
6.98%, 11/17/2038 (a) (b)
| | | 300,000 | | 286,339 |
Argent Securities Trust Series 2006-M1, Class A2B, ABS, 1 Month USD LIBOR + 0.18%,
5.33%, 7/25/2036 (b)
| | | 17,696,941 | | 4,714,241 |
| Bain Capital Credit CLO Ltd.: | | | | | |
Series 2018-1A, Class A1, 3 Month USD LIBOR + 0.96%, 6.23%, 4/23/2031 (a) (b)
| | | 500,000 | | 495,250 |
Series 2019-3A, Class DR, ABS, 3 Month USD LIBOR + 3.10%, 8.36%, 10/21/2034 (a) (b)
| | | 1,000,000 | | 919,647 |
Series 2020-5A, Class D, ABS, 3 Month USD LIBOR + 3.55%, 8.80%, 1/20/2032 (a) (b)
| | | 2,500,000 | | 2,366,180 |
Series 2021-6A, Class A1, 3 Month USD LIBOR + 1.15%, 6.41%, 10/21/2034 (a) (b)
| | | 3,000,000 | | 2,942,700 |
Series 2022-3A, Class D, 3 Month SOFR + 3.70%, 8.69%, 7/17/2035 (a) (b)
| | | 1,000,000 | | 923,789 |
See accompanying notes to financial statements.
106
SPDR DOUBLELINE TOTAL RETURN TACTICAL ETF
SCHEDULE OF INVESTMENTS (continued)
June 30, 2023
| Security Description | | | Principal
Amount | | Value |
Series 2023-3A, Class C, Zero Coupon%, 7/24/2036 (a) (b)
| | | $ 2,000,000 | | $ 2,000,000 |
Blackbird Capital Aircraft Series 2021-1A, Class B, ABS,
3.45%, 7/15/2046 (a)
| | | 4,475,959 | | 3,692,666 |
BNC Mortgage Loan Trust Series 2006-1, Class A1, ABS, 1 Month USD LIBOR + 0.36%,
3.82%, 10/25/2036 (b)
| | | 16,664,647 | | 11,262,302 |
| Canyon Capital CLO Ltd.: | | | | | |
Series 2017-1A, Class DR, ABS, 3 Month USD LIBOR + 3.00%, 8.26%, 7/15/2030 (a) (b)
| | | 1,000,000 | | 925,492 |
Series 2021-1A, Class D, ABS, 3 Month USD LIBOR + 3.10%, 8.36%, 4/15/2034 (a) (b)
| | | 2,000,000 | | 1,867,334 |
| Carlyle U.S. CLO Ltd.: | | | | | |
Series 2021-1A, Class D, ABS, 3 Month USD LIBOR + 6.00%, 11.26%, 4/15/2034 (a) (b)
| | | 1,000,000 | | 875,628 |
Series 2022-2A, Class A2, 3 Month SOFR + 2.00%, 7.05%, 4/20/2035 (a) (b)
| | | 2,000,000 | | 1,989,328 |
Catamaran CLO Ltd. Series 2018-1A, Class C, 3 Month USD LIBOR + 2.50%,
7.76%, 10/25/2031 (a) (b)
| | | 1,000,000 | | 966,565 |
Cathedral Lake VIII Ltd. Series 2021-8A, Class C, 3 Month USD LIBOR + 2.62%,
7.87%, 1/20/2035 (a) (b)
| | | 2,550,000 | | 2,460,750 |
| CIFC Funding Ltd.: | | | | | |
Series 2013-1A, Class CR, ABS, 3 Month USD LIBOR + 3.55%, 8.81%, 7/16/2030 (a) (b)
| | | 1,000,000 | | 956,500 |
Series 2017-1A, Class D, ABS, 3 Month USD LIBOR + 3.50%, 8.76%, 4/23/2029 (a) (b)
| | | 1,000,000 | | 981,200 |
Series 2021-1A, Class E, ABS, 3 Month USD LIBOR + 6.00%, 11.26%, 4/25/2033 (a) (b)
| | | 500,000 | | 449,525 |
Series 2021-6A, Class B, 3 Month USD LIBOR + 1.65%, 6.91%, 10/15/2034 (a) (b)
| | | 1,000,000 | | 970,200 |
Series 2022-3A, Class B, 3 Month SOFR + 2.00%, 7.06%, 4/21/2035 (a) (b)
| | | 2,000,000 | | 1,953,800 |
| Security Description | | | Principal
Amount | | Value |
CyrusOne Data Centers Issuer I LLC Series 2023-1A, Class A2,
4.30%, 4/20/2048 (a)
| | | $ 5,000,000 | | $ 4,436,793 |
DataBank Issuer Series 2023-1A, Class A2,
5.12%, 2/25/2053 (a)
| | | 4,000,000 | | 3,686,775 |
Drive Auto Receivables Trust Series 2021-3, Class C,
1.47%, 1/15/2027
| | | 4,000,000 | | 3,838,818 |
Dryden 37 Senior Loan Fund Series 2015-37A, Class BR,
6.97%, 1/15/2031 (a) (b)
| | | 1,626,877 | | 1,576,444 |
Dryden 68 CLO Ltd. Series 2019-68A, Class DR, ABS, 3 Month USD LIBOR + 3.35%,
8.61%, 7/15/2035 (a) (b)
| | | 1,500,000 | | 1,413,798 |
Elmwood CLO VIII Ltd. Series 2021-1A, Class D1, ABS, 3 Month USD LIBOR + 3.00%,
8.25%, 1/20/2034 (a) (b)
| | | 1,500,000 | | 1,440,615 |
| Exeter Automobile Receivables Trust: | | | | | |
Series 2021-1A, Class D, ABS, 1.08%, 11/16/2026
| | | 1,000,000 | | 938,975 |
Series 2021-1A, Class E, ABS, 2.21%, 2/15/2028 (a)
| | | 1,500,000 | | 1,374,758 |
First Franklin Mortgage Loan Trust Series 2007-FF2, Class A1, ABS, 1 Month USD LIBOR + 0.14%,
5.29%, 3/25/2037 (b)
| | | 8,971,280 | | 4,710,833 |
| FirstKey Homes Trust: | | | | | |
Series 2020-SFR2, Class DR, ABS, 1.97%, 10/19/2037 (a)
| | | 2,000,000 | | 1,789,918 |
Series 2020-SFR2, Class E, 2.67%, 10/19/2037 (a)
| | | 2,000,000 | | 1,811,448 |
| FMC GMSR Issuer Trust: | | | | | |
Series 2020-GT1, Class A, CMO, VRN, 4.45%, 1/25/2026 (a) (b)
| | | 3,000,000 | | 2,572,971 |
Series 2021-GT2, Class A, 3.85%, 10/25/2026 (a) (b)
| | | 2,650,000 | | 2,160,548 |
FREED ABS Trust Series 2021-2, Class C, ABS,
1.94%, 6/19/2028 (a)
| | | 3,105,123 | | 3,071,155 |
FS Rialto Issuer LLC Series 2021-FL2, Class A, ABS, 1 Month USD LIBOR + 1.33%,
6.44%, 5/16/2038 (a) (b)
| | | 1,966,844 | | 1,919,797 |
See accompanying notes to financial statements.
107
SPDR DOUBLELINE TOTAL RETURN TACTICAL ETF
SCHEDULE OF INVESTMENTS (continued)
June 30, 2023
| Security Description | | | Principal
Amount | | Value |
GAIA Aviation Ltd. Series 2019-1, Class A,
3.97%, 12/15/2044 (a) (e)
| | | $ 1,105,243 | | $ 966,015 |
Galaxy XXII CLO Ltd. Series 2016-22A, Class CRR,
7.72%, 4/16/2034 (a) (b)
| | | 500,000 | | 481,300 |
Galaxy Xxviii CLO Ltd. Series 2018-28A, Class D, ABS, 3 Month USD LIBOR + 3.00%,
8.26%, 7/15/2031 (a) (b)
| | | 2,100,000 | | 1,954,604 |
GLS Auto Receivables Issuer Trust Series 2021-2A, Class C,
1.08%, 6/15/2026 (a)
| | | 4,000,000 | | 3,885,789 |
GoodLeap Sustainable Home Solutions Trust Series 2021-5CS, Class C,
3.50%, 10/20/2048 (a)
| | | 3,166,985 | | 2,329,847 |
Greystone CRE Notes Ltd. Series 2021-FL3, Class B, ABS, 1 Month USD LIBOR + 1.76%,
6.91%, 7/15/2039 (a) (b)
| | | 2,925,000 | | 2,786,884 |
| GSAA Home Equity Trust: | | | | | |
Series 2007-10, Class A2A, 6.50%, 11/25/2037
| | | 2,131,469 | | 977,596 |
Series 2007-4, Class A3A, ABS, 1 Month USD LIBOR + 0.60%, 5.75%, 3/25/2037 (b)
| | | 5,770,115 | | 2,479,556 |
Hardee's Funding LLC Series 2018-1A, Class A23, ABS,
5.71%, 6/20/2048 (a)
| | | 1,619,250 | | 1,450,633 |
Hayfin Kingsland X Ltd. Series 2019-1A, Class B1R, ABS, 3 Month USD LIBOR + 1.85%,
7.12%, 4/28/2031 (a) (b)
| | | 2,000,000 | | 1,977,574 |
Jamestown CLO XII Ltd. Series 2019-1A, Class A2, ABS, 3 Month USD LIBOR + 2.15%,
7.40%, 4/20/2032 (a) (b)
| | | 1,000,000 | | 995,600 |
JOL Air Ltd. Series 2019-1, Class A,
3.97%, 4/15/2044 (a)
| | | 2,079,515 | | 1,840,558 |
LCCM Trust Series 2021-FL3, Class A, 1 Month USD LIBOR + 1.56%,
6.71%, 11/15/2038 (a) (b)
| | | 2,864,000 | | 2,812,202 |
LCM XVIII LP Series 18A, Class CR, 3 Month USD LIBOR + 1.85%,
7.10%, 4/20/2031 (a) (b)
| | | 1,435,000 | | 1,351,627 |
Lendbuzz Securitization Trust Series 2022-1A, Class A,
4.22%, 5/17/2027 (a)
| | | 2,883,881 | | 2,786,027 |
| Security Description | | | Principal
Amount | | Value |
LendingPoint Asset Securitization Trust Series 2021-A, Class C, ABS,
2.75%, 12/15/2028 (a)
| | | $ 3,723,318 | | $ 3,637,186 |
Madison Park Funding XLVIII Ltd. Series 2021-48A, Class D, ABS, 3 Month USD LIBOR + 3.00%,
8.27%, 4/19/2033 (a) (b)
| | | 1,000,000 | | 952,595 |
Madison Park Funding XVII Ltd. Series 2015-17A, Class DR, 3 Month USD LIBOR + 3.60%,
8.86%, 7/21/2030 (a) (b)
| | | 1,000,000 | | 977,300 |
Magnetite XXIX Ltd. Series 2021-29A, Class E, ABS, 3 Month USD LIBOR + 5.75%,
11.01%, 1/15/2034 (a) (b)
| | | 500,000 | | 465,001 |
Magnetite XXXI Ltd. Series 2021-31A, Class E, 3 Month USD LIBOR + 6.00%,
11.26%, 7/15/2034 (a) (b)
| | | 500,000 | | 466,064 |
Marble Point CLO XI Ltd. Series 2017-2A, Class B, 3 Month USD LIBOR + 1.50%,
6.76%, 12/18/2030 (a) (b)
| | | 3,500,000 | | 3,381,000 |
| Merrill Lynch Mortgage Investors Trust: | | | | | |
Series 2006-HE4, Class A2B, 1 Month USD LIBOR + 0.20%, 5.35%, 7/25/2037 (b)
| | | 3,798,373 | | 894,071 |
Series 2006-HE4, Class A2C, 1 Month USD LIBOR + 0.30%, 5.45%, 7/25/2037 (b)
| | | 5,257,162 | | 1,241,560 |
MetroNet Infrastructure Issuer LLC Series 2023-1A, Class A2,
6.56%, 4/20/2053 (a)
| | | 4,000,000 | | 3,914,976 |
MKS CLO Ltd. Series 2017-1A, Class AR, 3 Month USD LIBOR + 1.00%,
6.25%, 7/20/2030 (a) (b)
| | | 442,800 | | 436,866 |
Mosaic Solar Loan Trust Series 2018-1A, Class C, ABS, PO,
0.00%, 6/22/2043 (a)
| | | 206,215 | | 190,336 |
MP CLO III Ltd. Series 2013-1A, Class CR, 3 Month USD LIBOR + 2.00%,
7.25%, 10/20/2030 (a) (b)
| | | 1,000,000 | | 949,600 |
See accompanying notes to financial statements.
108
SPDR DOUBLELINE TOTAL RETURN TACTICAL ETF
SCHEDULE OF INVESTMENTS (continued)
June 30, 2023
| Security Description | | | Principal
Amount | | Value |
| MVW LLC: | | | | | |
Series 2021-1WA, Class C, ABS, 1.94%, 1/22/2041 (a)
| | | $ 682,835 | | $ 590,785 |
Series 2021-1WA, Class D, ABS, 3.17%, 1/22/2041 (a)
| | | 1,138,059 | | 990,631 |
Neuberger Berman Loan Advisers CLO 40 Ltd. Series 2021-40A, Class D, ABS, 3 Month USD LIBOR + 2.75%,
8.01%, 4/16/2033 (a) (b)
| | | 1,500,000 | | 1,419,311 |
Neuberger Berman Loan Advisers CLO 47 Ltd. Series 2022-47A, Class D, ABS, 3 Month SOFR + 3.10%,
8.09%, 4/14/2035 (a) (b)
| | | 500,000 | | 453,650 |
Ocean Trails CLO V Series 2014-5A, Class DRR, ABS, 3 Month USD LIBOR + 3.45%,
8.69%, 10/13/2031 (a) (b)
| | | 1,000,000 | | 860,206 |
Octagon Investment Partners 27 Ltd. Series 2016-1A, Class DR, ABS, 3 Month USD LIBOR + 2.95%,
8.21%, 7/15/2030 (a) (b)
| | | 500,000 | | 447,200 |
Octagon Investment Partners 30 Ltd. Series 2017-1A, Class CR, ABS, 3 Month USD LIBOR + 3.30%,
8.55%, 3/17/2030 (a) (b)
| | | 1,000,000 | | 964,473 |
Octagon Investment Partners 31 Ltd. Series 2017-1A, Class DR, ABS, 3 Month USD LIBOR + 3.40%,
8.65%, 7/20/2030 (a) (b)
| | | 1,000,000 | | 967,739 |
Octagon Investment Partners 40 Ltd. Series 2019-1A, Class DR, ABS, 3 Month USD LIBOR + 3.35%,
8.60%, 1/20/2035 (a) (b)
| | | 500,000 | | 441,900 |
Octagon Investment Partners 49 Ltd. Series 2020-5A, Class D, ABS, 3 Month USD LIBOR + 3.40%,
8.66%, 1/15/2033 (a) (b)
| | | 2,500,000 | | 2,295,000 |
| Octagon Investment Partners 51 Ltd.: | | | | | |
Series 2021-1A, Class A, ABS, 3 Month USD LIBOR + 1.15%, 6.40%, 7/20/2034 (a) (b)
| | | 1,385,000 | | 1,357,300 |
Series 2021-1A, Class C, 7.20%, 7/20/2034 (a) (b)
| | | 500,000 | | 476,450 |
| Security Description | | | Principal
Amount | | Value |
| Pagaya AI Debt Trust: | | | | | |
Series 2022-1, Class A, 2.03%, 10/15/2029 (a)
| | | $ 5,410,920 | | $ 5,262,690 |
Series 2022-1, Class B, ABS, 3.34%, 10/15/2029 (a)
| | | 4,499,405 | | 4,161,202 |
Series 2022-2, Class A, 4.97%, 1/15/2030 (a)
| | | 1,855,806 | | 1,830,948 |
Series 2023-1, Class A, 7.56%, 7/15/2030 (a)
| | | 1,815,755 | | 1,820,768 |
Series 2023-3, Class A, 7.60%, 12/16/2030 (a)
| | | 5,935,640 | | 5,963,737 |
Park Avenue Institutional Advisers CLO Ltd. Series 2018-1A, Class BR, 3 Month USD LIBOR + 2.10%,
7.35%, 10/20/2031 (a) (b)
| | | 4,000,000 | | 3,798,000 |
PMT Issuer Trust - FMSR Series 2021-FT1, Class A, ABS, 1 Month USD LIBOR + 3.00%,
8.15%, 3/25/2026 (a) (b)
| | | 1,300,000 | | 1,254,777 |
PPM CLO Ltd. Series 2018-1A, Class D, 3 Month USD LIBOR + 3.25%,
8.51%, 7/15/2031 (a) (b)
| | | 500,000 | | 417,077 |
| PRET LLC: | | | | | |
Series 2021-NPL5, Class A1, 2.49%, 10/25/2051 (a) (e)
| | | 4,038,979 | | 3,757,927 |
Series 2022-RN1, Class A1, 3.72%, 7/25/2051 (a) (e)
| | | 12,652,723 | | 11,827,772 |
Race Point IX CLO Ltd. Series 2015-9A, Class BR, 3 Month USD LIBOR + 2.15%,
7.41%, 10/15/2030 (a) (b)
| | | 2,250,000 | | 2,160,225 |
Ready Capital Mortgage Financing LLC Series 2023-FL12, Class A,
7.34%, 5/25/2038 (a) (b)
| | | 1,743,000 | | 1,735,070 |
Regatta VI Funding Ltd. Series 2016-1A, Class AR2, 3 Month USD LIBOR + 1.16%,
6.41%, 4/20/2034 (a) (b)
| | | 850,000 | | 833,680 |
Regatta XXIII Funding Ltd. Series 2021-4A, Class A1, 3 Month USD LIBOR + 1.15%,
6.40%, 1/20/2035 (a) (b)
| | | 4,500,000 | | 4,412,250 |
Renaissance Home Equity Loan Trust Series 2006-2, Class AF4, ABS,
6.12%, 8/25/2036 (e)
| | | 8,664,451 | | 3,591,541 |
See accompanying notes to financial statements.
109
SPDR DOUBLELINE TOTAL RETURN TACTICAL ETF
SCHEDULE OF INVESTMENTS (continued)
June 30, 2023
| Security Description | | | Principal
Amount | | Value |
Sapphire Aviation Finance II Ltd. Series 2020-1A, Class A,
3.23%, 3/15/2040 (a)
| | | $ 1,058,830 | | $ 890,137 |
| Securitized Asset-Backed Receivables LLC Trust: | | | | | |
Series 2007-BR4, Class A2A, ABS, 1 Month USD LIBOR + 0.09%, 5.24%, 5/25/2037 (b)
| | | 3,521,541 | | 2,130,817 |
Series 2007-BR4, Class A2B, ABS, 1 Month USD LIBOR + 0.20%, 5.35%, 5/25/2037 (b)
| | | 24,470,633 | | 14,820,288 |
Series 2007-BR5, Class A2B, 1 Month USD LIBOR + 0.18%, 5.33%, 5/25/2037 (b)
| | | 34,363,639 | | 25,931,727 |
Shenton Aircraft Investment I Ltd. Series 2015-1A, Class A, ABS,
4.75%, 10/15/2042 (a)
| | | 1,826,964 | | 1,535,830 |
Sound Point CLO II Ltd. Series 2013-1A, Class A1R, 3 Month USD LIBOR + 1.07%,
6.34%, 1/26/2031 (a) (b)
| | | 500,000 | | 493,200 |
| Sound Point CLO Ltd.: | | | | | |
Series 2023-36A, Class B, Zero Coupon%, 7/26/2036 (a) (b)
| | | 1,000,000 | | 1,000,000 |
Series 2023-36A, Class C, Zero Coupon%, 7/26/2036 (a) (b)
| | | 500,000 | | 500,000 |
Sound Point CLO XII Ltd. Series 2016-2A, Class DR, ABS, 3 Month USD LIBOR + 3.85%,
9.10%, 10/20/2028 (a) (b)
| | | 1,000,000 | | 994,949 |
Sound Point CLO XIV Ltd. Series 2016-3A, Class DR, ABS, 3 Month USD LIBOR + 3.65%,
8.92%, 1/23/2029 (a) (b)
| | | 1,000,000 | | 994,943 |
Sound Point CLO XXIII Ltd. Series 2019-2A, Class ER, 3 Month USD LIBOR + 6.47%,
11.73%, 7/15/2034 (a) (b)
| | | 1,000,000 | | 798,295 |
Sound Point CLO XXVI Ltd. Series 2020-1A, Class DR, 3 Month USD LIBOR + 3.35%,
8.60%, 7/20/2034 (a) (b)
| | | 500,000 | | 447,464 |
| Security Description | | | Principal
Amount | | Value |
Sound Point CLO XXVIII Ltd. Series 2020-3A, Class D, ABS, 3 Month USD LIBOR + 3.65%,
8.91%, 1/25/2032 (a) (b)
| | | $ 4,000,000 | | $ 3,702,212 |
Sound Point CLO XXXIII Ltd. Series 2022-1A, Class D, ABS, 3 Month SOFR + 3.30%,
8.37%, 4/25/2035 (a) (b)
| | | 700,000 | | 606,340 |
Start II Ltd. Series 2019-1, Class A,
4.09%, 3/15/2044 (a)
| | | 462,976 | | 407,577 |
Steele Creek CLO Ltd. Series 2017-1A, Class A, 3 Month USD LIBOR + 1.25%,
6.51%, 10/15/2030 (a) (b)
| | | 950,348 | | 941,985 |
Stratus CLO Ltd. Series 2021-1A, Class C,
7.34%, 12/29/2029 (a) (b)
| | | 1,000,000 | | 960,500 |
Structured Asset Securities Corp. Mortgage Loan Trust Series 2006-BC4, Class A4, 1 Month USD LIBOR + 0.34%,
5.49%, 12/25/2036 (b)
| | | 659,049 | | 638,785 |
Sunnova Helios V Issuer LLC Series 2021-A, Class A, ABS,
1.80%, 2/20/2048 (a)
| | | 1,235,084 | | 960,119 |
Sunrun Demeter Issuer LLC Series 2021-2A, Class A,
2.27%, 1/30/2057 (a)
| | | 2,547,457 | | 2,060,416 |
Tesla Auto Lease Trust Series 2021-B, Class B,
0.91%, 9/22/2025 (a)
| | | 3,250,000 | | 3,076,118 |
Theorem Funding Trust Series 2023-1A, Class A,
7.58%, 4/15/2029 (a)
| | | 4,939,462 | | 4,945,531 |
THL Credit Wind River CLO Ltd. Series 2017-3A, Class AR, ABS, 3 Month USD LIBOR + 1.15%,
6.41%, 4/15/2035 (a) (b)
| | | 2,150,000 | | 2,098,185 |
| TIF Funding II LLC: | | | | | |
Series 2021-1A, Class A, ABS, 1.65%, 2/20/2046 (a)
| | | 4,053,125 | | 3,352,939 |
Series 2021-1A, Class B, ABS, 2.54%, 2/20/2046 (a)
| | | 1,621,250 | | 1,323,718 |
Tricon Residential Trust Series 2023-SFR1, Class A,
5.10%, 7/17/2040 (a)
| | | 10,000,000 | | 9,722,935 |
See accompanying notes to financial statements.
110
SPDR DOUBLELINE TOTAL RETURN TACTICAL ETF
SCHEDULE OF INVESTMENTS (continued)
June 30, 2023
| Security Description | | | Principal
Amount | | Value |
Trimaran Cavu Ltd. Series 2021-3A, Class D, ABS, 3 Month USD LIBOR + 3.78%,
9.04%, 1/18/2035 (a) (b)
| | | $ 1,500,000 | | $ 1,423,585 |
| TRTX Issuer Ltd.: | | | | | |
Series 2019-FL3, Class AS, 1 Month USD LIBOR + 1.56%, 6.67%, 10/15/2034 (a) (b)
| | | 1,043,032 | | 1,042,774 |
Series 2021-FL4, Class A, ABS, 1 Month USD LIBOR + 1.20%, 6.36%, 3/15/2038 (a) (b)
| | | 173,552 | | 167,762 |
Upstart Pass-Through Trust Series 2021-ST3, Class A, ABS,
2.00%, 5/20/2027 (a)
| | | 1,463,332 | | 1,401,983 |
| Upstart Securitization Trust: | | | | | |
Series 2020-1, Class C, ABS, 4.90%, 4/22/2030 (a)
| | | 1,136,340 | | 1,116,126 |
Series 2022-1, Class B, 4.48%, 3/20/2032 (a)
| | | 6,500,000 | | 6,126,072 |
Series 2023-2, Class A, 6.77%, 6/20/2033 (a)
| | | 3,500,000 | | 3,494,704 |
Venture 39 CLO Ltd. Series 2020-39A, Class D, ABS, 3 Month USD LIBOR + 4.25%,
9.51%, 4/15/2033 (a) (b)
| | | 1,750,000 | | 1,662,675 |
VOLT XCVI LLC Series 2021-NPL5, Class A1, CMO,
2.12%, 3/27/2051 (a) (e)
| | | 1,328,246 | | 1,243,307 |
| Voya CLO Ltd.: | | | | | |
Series 2013-1A, Class BR, 3 Month SOFR + 2.16%, 7.15%, 10/15/2030 (a) (b)
| | | 1,000,000 | | 942,600 |
Series 2014-2A, Class BRR, 7.67%, 4/17/2030 (a) (b)
| | | 1,000,000 | | 957,200 |
Series 2017-3A, Class A2AR, 3 Month USD LIBOR + 1.55%, 6.80%, 4/20/2034 (a) (b)
| | | 1,005,000 | | 978,167 |
Series 2017-3A, Class CR, ABS, 3 Month USD LIBOR + 3.15%, 8.40%, 4/20/2034 (a) (b)
| | | 1,000,000 | | 918,590 |
Washington Mutual Asset-Backed Certificates WMABS Trust Series 2007-HE2, Class 2A2, 1 Month USD LIBOR + 0.22%,
5.37%, 2/25/2037 (b)
| | | 13,068,808 | | 3,998,930 |
| Security Description | | | Principal
Amount | | Value |
| Wellfleet CLO Ltd.: | | | | | |
Series 2017-3A, Class A2, 7.07%, 1/17/2031 (a) (b)
| | | $ 1,700,000 | | $ 1,642,686 |
Series 2020-2A, Class CR, 3 Month USD LIBOR + 2.30%, 7.56%, 7/15/2034 (a) (b)
| | | 1,550,000 | | 1,468,165 |
Wellfleet CLO X Ltd. Series 2019-XA, Class A2R, 3 Month USD LIBOR + 1.75%,
7.00%, 7/20/2032 (a) (b)
| | | 3,500,000 | | 3,381,602 |
Wind River CLO Ltd. Series 2016-2A, Class BR, 3 Month USD LIBOR + 1.80%,
7.10%, 11/1/2031 (a) (b)
| | | 3,000,000 | | 2,933,700 |
TOTAL ASSET-BACKED SECURITIES
(Cost $376,243,073)
| | | | | 348,108,635 |
| FOREIGN GOVERNMENT OBLIGATIONS — 0.4% | | | | | |
| CHILE — 0.1% | | | | | |
| Chile Government International Bonds: | | | | | |
3.10%, 5/7/2041
| | | 200,000 | | 150,744 |
3.10%, 1/22/2061
| | | 500,000 | | 327,265 |
3.50%, 1/25/2050
| | | 1,300,000 | | 978,211 |
| | | | | | 1,456,220 |
| COLOMBIA — 0.1% | | | | | |
| Colombia Government International Bonds: | | | | | |
4.13%, 5/15/2051
| | | 1,700,000 | | 1,019,320 |
5.00%, 6/15/2045
| | | 900,000 | | 624,501 |
| | | | | | 1,643,821 |
| DOMINICAN REPUBLIC — 0.0% (c) | | | | | |
Dominican Republic International Bonds
8.63%, 4/20/2027
| | | 350,000 | | 364,658 |
| INDONESIA — 0.0% (c) | | | | | |
Indonesia Government International Bonds
3.70%, 10/30/2049
| | | 1,100,000 | | 877,349 |
| MEXICO — 0.1% | | | | | |
| Mexico Government International Bonds: | | | | | |
2.66%, 5/24/2031
| | | 1,200,000 | | 998,604 |
6.34%, 5/4/2053
| | | 2,484,000 | | 2,536,040 |
| | | | | | 3,534,644 |
| PANAMA — 0.1% | | | | | |
Banco Latinoamericano de Comercio Exterior SA
2.38%, 9/14/2025
| | | 500,000 | | 465,780 |
See accompanying notes to financial statements.
111
SPDR DOUBLELINE TOTAL RETURN TACTICAL ETF
SCHEDULE OF INVESTMENTS (continued)
June 30, 2023
| Security Description | | | Principal
Amount | | Value |
| Panama Government International Bonds: | | | | | |
2.25%, 9/29/2032
| | | $ 200,000 | | $ 152,796 |
3.87%, 7/23/2060
| | | 1,000,000 | | 661,610 |
4.30%, 4/29/2053
| | | 400,000 | | 297,816 |
4.50%, 4/1/2056
| | | 400,000 | | 299,624 |
| | | | | | 1,877,626 |
| PERU — 0.0% (c) | | | | | |
Corp. Financiera de Desarrollo SA Series REGS, 3 Month USD LIBOR + 5.61%,
5.25%, 7/15/2029 (b)
| | | 1,000,000 | | 970,790 |
| PHILIPPINES — 0.0% (c) | | | | | |
| Philippines Government International Bonds: | | | | | |
1.65%, 6/10/2031
| | | 200,000 | | 158,828 |
2.95%, 5/5/2045
| | | 600,000 | | 431,154 |
| | | | | | 589,982 |
| SAUDI ARABIA — 0.0% (c) | | | | | |
Saudi Government International Bonds Series REGS,
2.25%, 2/2/2033
| | | 1,000,000 | | 804,740 |
| SOUTH AFRICA — 0.0% (c) | | | | | |
Republic of South Africa Government International Bonds
4.30%, 10/12/2028
| | | 650,000 | | 574,054 |
| SOUTH KOREA — 0.0% (c) | | | | | |
Korea Development Bank
1.63%, 1/19/2031
| | | 200,000 | | 161,292 |
TOTAL FOREIGN GOVERNMENT OBLIGATIONS
(Cost $15,872,727)
| | | | | 12,855,176 |
| | | Shares | |
| COMMON STOCKS — 0.0% (c) | | |
| UNITED KINGDOM — 0.0% (c) | | |
Avation Capital SA
(f)
| | 4,550 | 1,880 |
| UNITED STATES — 0.0% (c) | | |
Bright Bidco BV
(f) (g)
| | 710 | 357 |
Phoenix Services International
(h)
| | 6,972 | — |
| Security Description | | | Shares | | Value |
Phoenix Services International
(h)
| | | 693 | | $ 15,733 |
| | | | | | 16,090 |
TOTAL COMMON STOCKS
(Cost $38,998)
| | | | | 17,970 |
| | | Principal
Amount | |
| SENIOR FLOATING RATE LOANS — 1.7% | | | |
| ADVERTISING SERVICES — 0.0% (c) | | | |
CMG Media Corp., Senior Secured 2021 Term Loan, 3 Month USD LIBOR + 3.50%, 8.84%, 12/17/2026 (b)
| | $ 150,758 | 135,400 |
| AEROSPACE & DEFENSE — 0.0% (c) | | | |
| Dynasty Acquisition Co., Inc.: | | | |
Senior Secured 2020 CAD Term Loan B2, 1 Month USD SOFR + 3.50%, 8.70%, 4/6/2026 (b)
| | 75,707 | 75,186 |
Senior Secured 2020 Term Loan B1, 1 Month USD SOFR + 3.50%, 8.70%, 4/6/2026 (b)
| | 140,815 | 139,847 |
Spirit Aerosystems, Inc., Senior Secured 2022 Term Loan, 3 Month USD SOFR + 4.50%, 9.55%, 1/15/2027 (b)
| | 79,400 | 79,658 |
TransDigm, Inc., Senior Secured 2023 Term Loan I, 3 Month USD SOFR + 3.25%, 8.49%, 8/24/2028 (b)
| | 394,012 | 394,241 |
| | | | 688,932 |
| AIR FREIGHT & LOGISTICS — 0.0% (c) | | | |
Kenan Advantage Group, Inc., Senior Secured 2021 Term Loan B1, 3 Month USD SOFR + 3.75%, 9.48%, 3/24/2026 (b)
| | 376,597 | 376,430 |
Worldwide Express Operations LLC, Senior Secured 2021 1st Lien Term Loan, 3 Month USD SOFR + 4.00%, 9.50%, 7/26/2028 (b)
| | 62,618 | 59,630 |
| | | | 436,060 |
See accompanying notes to financial statements.
112
SPDR DOUBLELINE TOTAL RETURN TACTICAL ETF
SCHEDULE OF INVESTMENTS (continued)
June 30, 2023
| Security Description | | | Principal
Amount | | Value |
| AUTOMOBILE COMPONENTS — 0.0% (c) | | | | | |
Clarios Global LP, 2023 Incremental Term Loan, 1 Month USD SOFR + 3.75%, 8.85%, 5/6/2030 (b)
| | | $ 280,000 | | $ 279,693 |
DexKo Global, Inc., Senior Secured 2021 USD Term Loan B, 3 Month USD SOFR + 3.75%, 9.25%, 10/4/2028 (b)
| | | 149,938 | | 143,566 |
| | | | | | 423,259 |
| BEVERAGES — 0.0% (c) | | | | | |
Triton Water Holdings, Inc., Senior Secured Term Loan, 3 Month USD LIBOR + 0.00%, 5.24%, 3/31/2028 (b)
| | | 294,901 | | 285,824 |
| BROADCAST SERV/PROGRAM — 0.0% (c) | | | | | |
EW Scripps Co., Senior Secured 2019 Term Loan B2, 1 Month USD SOFR + 2.56%, 7.78%, 5/1/2026 (b)
| | | 446,083 | | 438,834 |
| BUILDING PRODUCTS — 0.0% (c) | | | | | |
Cornerstone Building Brands, Inc., Senior Secured 2021 Term Loan B, 1 Month USD SOFR + 3.25%, 8.50%, 4/12/2028 (b)
| | | 129,668 | | 124,645 |
Ingersoll-Rand Services Co., Senior Secured 2020 USD Spinco Term Loan, 1 Month USD SOFR + 1.75%, 6.95%, 3/1/2027 (b)
| | | 344,111 | | 344,138 |
Quikrete Holdings, Inc., Senior Secured 2021 Term Loan B1, 1 Month USD LIBOR + 3.00%, 8.22%, 3/18/2029 (b)
| | | 123,438 | | 123,712 |
| | | | | | 592,495 |
| CASINO SERVICES — 0.0% (c) | | | | | |
Stars Group Holdings BV, Senior Secured 2018 USD Incremental Term Loan, 3 Month USD SOFR + 2.25%, 7.75%, 7/21/2026 (b)
| | | 312,291 | | 312,643 |
| Security Description | | | Principal
Amount | | Value |
| CHEMICALS — 0.1% | | | | | |
Axalta Coating Systems U.S. Holdings, Inc., 2022 USD Term Loan B4, 3 Month USD SOFR + 3.00%, 8.22%, 12/20/2029 (b)
| | | $ 133,762 | | $ 134,212 |
Diamond BV, Senior Secured 2021 Term Loan B, 3 Month USD SOFR + 2.75%, 8.06%, 9/29/2028 (b)
| | | 448,175 | | 448,235 |
Hexion Holdings Corp., Senior Secured 2022 USD Term Loan, 3 Month USD SOFR + 4.50%, 3/15/2029 (b)
| | | 64,836 | | 61,361 |
Illuminate Buyer LLC, Senior Secured 2021 Term Loan, 1 Month USD SOFR + 3.50%, 8.72%, 6/30/2027 (b)
| | | 369,895 | | 367,254 |
Ineos U.S. Finance LLC, Senior Secured 2023 USD Term Loan B, 3 Month USD SOFR + 3.50%, 8.75%, 2/18/2030 (b)
| | | 320,000 | | 318,600 |
Messer Industries GmbH, Senior Secured 2018 USD Term Loan, 3 Month USD SOFR + 2.50%, 8.00%, 3/2/2026 (b)
| | | 314,766 | | 314,973 |
Nouryon Finance BV, 2023 USD Term Loan B, 3 Month USD SOFR + 4.00%, 9.32%, 4/3/2028 (b)
| | | 135,000 | | 133,988 |
Olympus Water U.S. Holding Corp., Senior Secured 2021 USD Term Loan B, 3 Month USD SOFR + 3.75%, 9.25%, 11/9/2028 (b)
| | | 197,000 | | 189,736 |
PMHC II, Inc., Senior Secured 2022 Term Loan B, 3 Month USD SOFR + 4.25%, 9.30%, 4/23/2029 (b)
| | | 124,063 | | 109,710 |
Polar U.S. Borrower LLC, Senior Secured 2018 1st Lien Term Loan, 3 Month USD SOFR + 4.75%, 9.67%, 10/15/2025 (b)
| | | 154,390 | | 122,482 |
PQ Corp., Senior Secured 2021 Term Loan B, 3 Month USD SOFR + 2.50%, 7.65%, 6/9/2028 (b)
| | | 292,517 | | 291,671 |
See accompanying notes to financial statements.
113
SPDR DOUBLELINE TOTAL RETURN TACTICAL ETF
SCHEDULE OF INVESTMENTS (continued)
June 30, 2023
| Security Description | | | Principal
Amount | | Value |
Vantage Specialty Chemicals, Inc., Senior Secured 2023 Term Loan B, 1 Month USD SOFR + 4.75%, 9.90%, 10/26/2026 (b)
| | | $ 24,875 | | $ 24,216 |
| | | | | | 2,516,438 |
| COMMERCIAL SERVICES — 0.1% | | | | | |
AlixPartners LLP, Senior Secured 2021 USD Term Loan B, 1 Month USD SOFR + 2.50%, 7.72%, 2/4/2028 (b)
| | | 354,094 | | 353,785 |
Allied Universal Holdco LLC, Senior Secured 2021 USD Incremental Term Loan B, 1 Month USD SOFR + 3.75%, 8.95%, 5/12/2028 (b)
| | | 330,938 | | 322,297 |
APX Group, Inc., Senior Secured 2021 Term Loan B, 3 Month USD LIBOR + 3.25%, 8.76%, 7/10/2028 (b)
| | | 277,195 | | 277,346 |
CoreLogic, Inc., Senior Secured Term Loan, 1 Month USD LIBOR + 3.50%, 8.75%, 6/2/2028 (b)
| | | 199,492 | | 180,590 |
EAB Global, Inc., Senior Secured 2021 Term Loan, 3 Month USD LIBOR + 3.50%, 8.87%, 8/16/2028 (b)
| | | 155,702 | | 154,170 |
Mavis Tire Express Services Corp., Senior Secured 2021 Term Loan B, 1 Month USD SOFR + 4.00%, 9.22%, 5/4/2028 (b)
| | | 360,649 | | 358,057 |
PECF USS Intermediate Holding III Corp., Senior Secured Term Loan B, 3 Month USD LIBOR + 4.25%, 9.52%, 12/15/2028 (b)
| | | 149,939 | | 123,568 |
Spin Holdco, Inc., Senior Secured 2021 Term Loan, 3 Month USD LIBOR + 4.00%, 9.23%, 3/4/2028 (b)
| | | 245,954 | | 212,311 |
Verscend Holding Corp., Senior Secured 2021 Term Loan B, 1 Month USD LIBOR + 4.00%, 9.22%, 8/27/2025 (b)
| | | 413,394 | | 413,781 |
| Security Description | | | Principal
Amount | | Value |
Viad Corp., Senior Secured Initial Term Loan, 1 Month USD SOFR + 5.00%, 10.22%, 7/30/2028 (b)
| | | $ 211,911 | | $ 206,613 |
| VT Topco, Inc.: | | | | | |
2021 Delayed Draw Term Loan, 1 Month USD LIBOR + 3.75%, 3.75%, 8/1/2025 (b)
| | | 30 | | 30 |
Senior Secured 2021 Incremental Term Loan, 1 Month USD SOFR + 3.75%, 8.97%, 8/1/2025 (b)
| | | 68,687 | | 67,906 |
Wand NewCo 3, Inc., Senior Secured 2020 Term Loan, 1 Month USD LIBOR + 2.75%, 7.94%, 2/5/2026 (b)
| | | 170,376 | | 169,228 |
| | | | | | 2,839,682 |
| COMMERCIAL SERVICES & SUPPLIES — 0.1% | | | | | |
| Asurion LLC: | | | | | |
Senior Secured 2021 2nd Lien Term Loan B3, 1 Month USD LIBOR + 5.25%, 10.45%, 1/31/2028 (b)
| | | 70,000 | | 59,828 |
Senior Secured 2021 Second Lien Term Loan B4, 1 Month USD SOFR + 5.25%, 10.45%, 1/20/2029 (b)
| | | 105,000 | | 88,350 |
| Garda World Security Corp.: | | | | | |
Senior Secured 2021 Term Loan B, 1 Month USD SOFR + 6.25%, 9.43%, 10/30/2026 (b)
| | | 214,126 | | 213,323 |
Senior Secured 2022 Term Loan B, 1 Month USD SOFR + 4.25%, 9.33%, 2/1/2029 (b)
| | | 153,838 | | 152,491 |
National Intergovernmental Purchasing Alliance Co., Senior Secured 1st Lien Term Loan, 3 Month USD SOFR + 3.50%, 8.74%, 5/23/2025 (b)
| | | 323,302 | | 322,251 |
Packaging Coordinators Midco, Inc., Senior Secured 2020 1st Lien Term Loan, 3 Month USD SOFR + 3.50%, 8.74%, 11/30/2027 (b)
| | | 131,614 | | 129,980 |
See accompanying notes to financial statements.
114
SPDR DOUBLELINE TOTAL RETURN TACTICAL ETF
SCHEDULE OF INVESTMENTS (continued)
June 30, 2023
| Security Description | | | Principal
Amount | | Value |
Packers Holdings LLC, Senior Secured 2021 Term Loan, 1 Month USD SOFR + 3.25%, 8.44%, 3/9/2028 (b)
| | | $ 167,349 | | $ 116,935 |
Prime Security Services Borrower LLC, Senior Secured 2021 Term Loan, 3 Month USD LIBOR + 2.75%, 7.94%, 9/23/2026 (b)
| | | 292,909 | | 293,192 |
| | | | | | 1,376,350 |
| COMPUTER SERVICES — 0.0% (c) | | | | | |
Tempo Acquisition LLC, Senior Secured 2022 Term Loan B, 1 Month USD SOFR + 3.00%, 8.10%, 8/31/2028 (b)
| | | 142,825 | | 143,042 |
| COMPUTERS & PERIPHERALS — 0.0% (c) | | | | | |
NCR Corp., Senior Secured 2019 Term Loan, 3 Month USD LIBOR + 2.50%, 7.78%, 8/28/2026 (b)
| | | 363,697 | | 363,242 |
| CONSTRUCTION & ENGINEERING — 0.0% (c) | | | | | |
Brown Group Holding LLC, Senior Secured Term Loan B, 1 Month USD SOFR + 2.50%, 7.70%, 6/7/2028 (b)
| | | 45,456 | | 44,826 |
| DG Investment Intermediate Holdings 2, Inc.: | | | | | |
Senior Secured 2021 2nd Lien Term Loan, 1 Month USD SOFR + 6.75%, 11.97%, 3/30/2029 (b)
| | | 60,000 | | 53,438 |
Senior Secured 2021 Term Loan, 1 Month USD SOFR + 3.75%, 8.97%, 3/31/2028 (b)
| | | 229,848 | | 226,113 |
KKR Apple Bidco LLC, Senior Secured 2021 Term Loan, 1 Month USD SOFR + 2.75%, 7.97%, 9/23/2028 (b)
| | | 187,150 | | 185,847 |
Tecta America Corp., Senior Secured 2021 Term Loan, 1 Month USD SOFR + 4.25%, 9.22%, 4/10/2028 (b)
| | | 191,100 | | 190,384 |
| | | | | | 700,608 |
| Security Description | | | Principal
Amount | | Value |
| CONSTRUCTION MATERIALS — 0.0% (c) | | | | | |
Traverse Midstream Partners LLC, Senior Secured 2017 Term Loan, 1 Month USD SOFR + 3.75%, 8.94%, 2/16/2028 (b)
| | | $ 53,496 | | $ 53,128 |
| CONSUMER STAPLES DISTRIBUTION & RETAIL — 0.0% (c) | | | | | |
Monogram Food Solutions LLC, Senior Secured Term Loan B, 1 Month USD LIBOR + 4.00%, 9.19%, 8/28/2028 (b)
| | | 256,100 | | 250,018 |
| CONTAINERS & PACKAGING — 0.1% | | | | | |
Charter NEX U.S., Inc., Senior Secured 2021 Term Loan, 1 Month USD SOFR + 3.75%, 8.97%, 12/1/2027 (b)
| | | 297,375 | | 295,424 |
Graham Packaging Co., Inc., Senior Secured 2021 Term Loan, 1 Month USD SOFR + 3.00%, 8.22%, 8/4/2027 (b)
| | | 300,000 | | 298,524 |
Pregis TopCo Corp., Senior Secured 1st Lien Term Loan, 1 Month USD SOFR + 3.75%, 8.97%, 7/31/2026 (b)
| | | 296,345 | | 295,124 |
| Pretium PKG Holdings, Inc.: | | | | | |
Senior Secured 2021 1st Lien Term Loan, 3 Month USD LIBOR + 4.00%, 9.22%, 10/2/2028 (b)
| | | 216,700 | | 163,363 |
Senior Secured 2021 2nd Lien Term Loan, 3 Month USD LIBOR + 6.75%, 12.26%, 10/1/2029 (b)
| | | 45,000 | | 24,357 |
TricorBraun Holdings, Inc., Senior Secured 2021 Term Loan, 1 Month USD SOFR + 3.25%, 8.47%, 3/3/2028 (b)
| | | 193,227 | | 188,517 |
Trident TPI Holdings, Inc., Senior Secured 2021 Incremental Term Loan, 3 Month USD LIBOR + 4.00%, 9.54%, 9/15/2028 (b)
| | | 243,378 | | 240,075 |
| | | | | | 1,505,384 |
See accompanying notes to financial statements.
115
SPDR DOUBLELINE TOTAL RETURN TACTICAL ETF
SCHEDULE OF INVESTMENTS (continued)
June 30, 2023
| Security Description | | | Principal
Amount | | Value |
| COSMETICS & TOILETRIES — 0.0% (c) | | | | | |
Solis IV BV, Senior Secured USD Term Loan B1, 3 Month USD SOFR + 3.50%, 8.67%, 2/26/2029 (b)
| | | $ 272,026 | | $ 259,361 |
Sunshine Luxembourg VII SARL, Senior Secured 2021 Term Loan B3, 3 Month USD SOFR + 3.75%, 9.09%, 10/1/2026 (b)
| | | 303,537 | | 302,400 |
| | | | | | 561,761 |
| DISTRIBUTION/WHOLESALE — 0.0% (c) | | | | | |
BCPE Empire Holdings, Inc., 2023 Extended Term Loan, 3 Month USD SOFR + 4.75%, 9.83%, 12/11/2028 (b)
| | | 353,966 | | 353,580 |
| DISTRIBUTORS — 0.0% (c) | | | | | |
American Tire Distributors Holdings, Inc., Senior Secured 2021 Term Loan B, 3 Month USD SOFR + 6.25%, 11.49%, 10/20/2028 (b)
| | | 162,938 | | 142,144 |
| DIVERSIFIED CONSUMER SERVICES — 0.0% (c) | | | | | |
| Ascend Learning LLC: | | | | | |
Senior Secured 2021 2nd Lien Term Loan, 1 Month USD SOFR + 5.75%, 10.95%, 12/10/2029 (b)
| | | 64,708 | | 55,406 |
Senior Secured 2021 Term Loan, 1 Month USD SOFR + 3.50%, 8.58%, 12/11/2028 (b)
| | | 267,459 | | 252,081 |
| | | | | | 307,487 |
| DIVERSIFIED TELECOMMUNICATION SERVICES — 0.0% (c) | | | | | |
Intelsat Jackson Holdings SA, Senior Secured 2021 Exit Term Loan B, 3 Month USD SOFR + 4.25%, 9.44%, 2/1/2029 (b)
| | | 283,725 | | 282,939 |
Level 3 Financing, Inc., Senior Secured 2019 Term Loan B, 1 Month USD SOFR + 1.75%, 6.97%, 3/1/2027 (b)
| | | 135,000 | | 126,099 |
| Security Description | | | Principal
Amount | | Value |
Telesat Canada, Senior Secured Term Loan B5, 3 Month USD LIBOR + 2.75%, 8.03%, 12/7/2026 (b)
| | | $ 102,573 | | $ 63,582 |
Zayo Group Holdings, Inc., 2022 USD Incremental Term Loan B, 1 Month USD SOFR + 4.25%, 9.35%, 3/9/2027 (b)
| | | 179,545 | | 143,075 |
| | | | | | 615,695 |
| ELECTRICAL EQUIPMENT — 0.0% (c) | | | | | |
Energizer Holdings, Inc., Senior Secured 2020 Term Loan, 1 Month USD SOFR + 2.25%, 7.44%, 12/22/2027 (b)
| | | 149,851 | | 149,290 |
Gates Global LLC, Senior Secured 2022 Term Loan B4, 1 Month USD SOFR + 3.50%, 8.60%, 11/16/2029 (b)
| | | 59,550 | | 59,618 |
| | | | | | 208,908 |
| ELECTRONIC EQUIPMENT, INSTRUMENTS & COMPONENTS — 0.0% (c) | | | | | |
Compass Power Generation LLC, Senior Secured 2022 Term Loan B2, 1 Month USD SOFR + 4.25%, 9.47%, 4/14/2029 (b)
| | | 217,360 | | 217,174 |
Mirion Technologies, Inc., Senior Secured 2021 Term Loan, 6 Month USD LIBOR + 2.75%, 7.94%, 10/20/2028 (b)
| | | 205,040 | | 204,314 |
| | | | | | 421,488 |
| ENTERTAINMENT — 0.1% | | | | | |
AMC Entertainment Holdings, Inc., Senior Secured 2019 Term Loan B, 1 Month USD LIBOR + 3.00%, 8.22%, 4/22/2026 (b)
| | | 48,931 | | 38,350 |
Fertitta Entertainment LLC, Senior Secured 2022 Term Loan B, 1 Month USD SOFR + 4.00%, 9.10%, 1/27/2029 (b)
| | | 303,765 | | 300,379 |
Formula One Holdings Ltd., Term Loan B, 1 Month USD SOFR + 3.00%, 8.10%, 1/15/2030 (b)
| | | 260,000 | | 260,357 |
See accompanying notes to financial statements.
116
SPDR DOUBLELINE TOTAL RETURN TACTICAL ETF
SCHEDULE OF INVESTMENTS (continued)
June 30, 2023
| Security Description | | | Principal
Amount | | Value |
NASCAR Holdings LLC, Senior Secured Term Loan B, 1 Month USD SOFR + 2.50%, 7.72%, 10/19/2026 (b)
| | | $ 158,215 | | $ 158,623 |
SMG U.S. Midco 2, Inc., Senior Secured 2020 Term Loan, 3 Month USD LIBOR + 2.50%, 7.79%, 1/23/2025 (b)
| | | 343,427 | | 343,070 |
UFC Holdings LLC, Senior Secured 2021 Term Loan B, 3 Month USD LIBOR + 2.75%, 8.05%, 4/29/2026 (b)
| | | 224,366 | | 224,381 |
WMG Acquisition Corp., Senior Secured 2021 Term Loan G, 1 Month USD SOFR + 2.13%, 7.33%, 1/20/2028 (b)
| | | 345,000 | | 344,493 |
| | | | | | 1,669,653 |
| FINANCIAL SERVICES — 0.1% | | | | | |
AllSpring Buyer LLC, Senior Secured Term Loan B, 3 Month USD LIBOR + 3.00%, 8.53%, 11/1/2028 (b)
| | | 245,890 | | 242,406 |
| Astra Acquisition Corp.: | | | | | |
Senior Secured 2021 1st Lien Term Loan, 1 Month USD LIBOR + 5.25%, 10.44%, 10/25/2028 (b)
| | | 139,181 | | 98,080 |
Senior Secured 2021 2nd Lien Term Loan, 1 Month USD LIBOR + 8.88%, 14.09%, 10/25/2029 (b)
| | | 159,961 | | 89,179 |
Castlelake Aviation Ltd., Senior Secured Term Loan B, 3 Month USD LIBOR + 2.75%, 8.30%, 10/22/2026 (b)
| | | 340,666 | | 339,639 |
Deerfield Dakota Holding LLC, Senior Secured 2020 USD Term Loan B, 3 Month USD SOFR + 3.75%, 8.99%, 4/9/2027 (b)
| | | 253,679 | | 246,839 |
DirecTV Financing LLC, Senior Secured Term Loan, 1 Month USD LIBOR + 5.00%, 10.22%, 8/2/2027 (b)
| | | 297,389 | | 291,400 |
| Security Description | | | Principal
Amount | | Value |
| Edelman Financial Center LLC: | | | | | |
Senior Secured 2018 2nd Lien Term Loan, 1 Month USD LIBOR + 6.75%, 11.94%, 7/20/2026 (b)
| | | $ 91,670 | | $ 88,817 |
Senior Secured 2021 Term Loan B, 1 Month USD LIBOR + 3.75%, 8.94%, 4/7/2028 (b)
| | | 187,109 | | 182,770 |
Eisner Advisory Group LLC, Senior Secured Term Loan, 1 Month USD SOFR + 4.48%, 10.47%, 7/28/2028 (b)
| | | 157,201 | | 157,201 |
Focus Financial Partners LLC, 2023 Term Loan B6, 6/30/2028 (b)
| | | 50,000 | | 49,794 |
Greystone Select Financial LLC, Senior Secured Term Loan B, 3 Month USD LIBOR + 5.00%, 10.27%, 6/16/2028 (b)
| | | 87,508 | | 83,132 |
HighTower Holdings LLC, Senior Secured 2021 Term Loan B, 3 Month USD LIBOR + 4.00%, 9.15%, 4/21/2028 (b)
| | | 247,654 | | 241,772 |
Minotaur Acquisition, Inc., Senior Secured Term Loan B, 1 Month USD SOFR + 4.75%, 9.85%, 3/27/2026 (b)
| | | 193,987 | | 191,260 |
Walker & Dunlop, Inc., Senior Secured 2021 Term Loan, 1 Month USD SOFR + 2.25%, 7.45%, 12/16/2028 (b)
| | | 113,275 | | 112,425 |
| | | | | | 2,414,714 |
| FOOD-MISC/DIVERSIFIED — 0.0% (c) | | | | | |
H Food Holdings LLC, Senior Secured 2018 Term Loan B, 6 Month USD LIBOR + 3.69%, 9.27%, 5/23/2025 (b)
| | | 180,832 | | 159,698 |
| HEALTH CARE EQUIPMENT & SUPPLIES — 0.0% (c) | | | | | |
Bausch & Lomb, Inc., Senior Secured Term Loan, 3 Month USD SOFR + 3.25%, 8.59%, 5/10/2027 (b)
| | | 346,773 | | 337,237 |
See accompanying notes to financial statements.
117
SPDR DOUBLELINE TOTAL RETURN TACTICAL ETF
SCHEDULE OF INVESTMENTS (continued)
June 30, 2023
| Security Description | | | Principal
Amount | | Value |
Gainwell Acquisition Corp., Senior Secured Term Loan B, 3 Month USD SOFR + 4.00%, 9.24%, 10/1/2027 (b)
| | | $ 313,539 | | $ 309,228 |
| | | | | | 646,465 |
| HEALTH CARE PROVIDERS & SERVICES — 0.1% | | | | | |
Air Methods Corp., Senior Secured 2017 Term Loan B, 3 Month USD LIBOR + 3.50%, 9.04%, 4/22/2024 (b)
| | | 71,286 | | 26,732 |
| Aveanna Healthcare LLC: | | | | | |
Senior Secured 2021 2nd Lien Term Loan, 3 Month USD LIBOR + 7.00%, 12.48%, 12/10/2029 (b)
| | | 82,260 | | 51,310 |
Senior Secured 2021 Term Loan B, 1 Month USD LIBOR + 3.75%, 9.23%, 7/17/2028 (b)
| | | 100,798 | | 86,519 |
Catalent Pharma Solutions, Inc., Senior Secured 2021 Term Loan B3, 1 Month USD LIBOR + 2.00%, 2/22/2028 (b)
| | | 184,528 | | 181,125 |
CHG Healthcare Services, Inc., Senior Secured 2021 Term Loan, 1 Month USD LIBOR + 3.25%, 8.44%, 9/29/2028 (b)
| | | 351,536 | | 350,261 |
| Envision Healthcare Corp.: | | | | | |
2018 Third Out Term Loan, 3 Month USD SOFR + 3.75%, 8.99%, 3/31/2027 (b) (d)
| | | 263,563 | | 5,025 |
Senior Secured 2022 Second Out Term Loan, 3 Month USD SOFR + 4.25%, 9.49%, 3/31/2027 (b) (d)
| | | 107,841 | | 24,366 |
Fortrea Holdings, Inc., Term Loan B, 7/1/2030 (b)
| | | 45,000 | | 45,067 |
Global Medical Response, Inc., Senior Secured 2017 Incremental Term Loan, 1 Month USD SOFR + 4.25%, 9.47%, 3/14/2025 (b)
| | | 108,019 | | 61,301 |
Heartland Dental LLC, Senior Secured 2021 Incremental Term Loan, 1 Month USD SOFR + 4.00%, 9.20%, 4/30/2025 (b)
| | | 7,438 | | 7,373 |
| Security Description | | | Principal
Amount | | Value |
Horizon Therapeutics USA, Inc., Senior Secured 2021 Term Loan B2, 1 Month USD SOFR + 1.75%, 6.95%, 3/15/2028 (b)
| | | $ 254,150 | | $ 253,719 |
ICON Luxembourg SARL, Senior Secured LUX Term Loan, 3 Month USD SOFR + 2.25%, 7.75%, 7/3/2028 (b)
| | | 135,185 | | 135,354 |
Medline Borrower LP, Senior Secured USD Term Loan B, 1 Month USD SOFR + 3.25%, 8.35%, 10/23/2028 (b)
| | | 593,498 | | 587,375 |
| Pediatric Associates Holding Co. LLC: | | | | | |
Senior Secured 2021 Term Loan B, 1 Month USD SOFR + 3.25%, 8.47%, 12/29/2028 (b)
| | | 106,213 | | 104,169 |
Senior Secured 2022 Delayed Draw Term Loan, 3 Month USD LIBOR + 3.25%, 3.25%, 12/29/2028 (b)
| | | 11,331 | | 11,113 |
PRA Health Sciences, Inc., Senior Secured US Term Loan, 3 Month USD SOFR + 2.25%, 7.75%, 7/3/2028 (b)
| | | 33,681 | | 33,723 |
RegionalCare Hospital Partners Holdings, Inc., Senior Secured 2018 Term Loan B, 3 Month USD LIBOR + 3.75%, 9.02%, 11/16/2025 (b)
| | | 292,714 | | 271,819 |
| | | | | | 2,236,351 |
| HOME FURNISHINGS — 0.0% (c) | | | | | |
AI Aqua Merger Sub, Inc., Senior Secured 2021 1st Lien Term Loan B, 1 Month USD SOFR + 3.75%, 8.80%, 7/31/2028 (b)
| | | 298,197 | | 293,128 |
| HOTELS, RESTAURANTS & LEISURE — 0.1% | | | | | |
| Alterra Mountain Co.: | | | | | |
2023 Term Loan B, 1 Month USD SOFR + 3.75%, 8.95%, 5/31/2030 (b)
| | | 90,000 | | 90,000 |
Senior Secured 2021 Series B-2 Consenting Term Loan, 1 Month USD LIBOR + 3.50%, 8.69%, 8/17/2028 (b)
| | | 267,675 | | 267,592 |
See accompanying notes to financial statements.
118
SPDR DOUBLELINE TOTAL RETURN TACTICAL ETF
SCHEDULE OF INVESTMENTS (continued)
June 30, 2023
| Security Description | | | Principal
Amount | | Value |
Caesars Entertainment Corp., Senior Secured Term Loan B, 1 Month USD SOFR + 3.25%, 8.45%, 2/6/2030 (b)
| | | $ 64,838 | | $ 64,922 |
ClubCorp Holdings, Inc., Senior Secured 2017 Term Loan B, 3 Month USD LIBOR + 2.75%, 8.29%, 9/18/2024 (b)
| | | 123,259 | | 118,526 |
PENN Entertainment, Inc., Senior Secured 2022 Term Loan B, 1 Month USD SOFR + 2.75%, 7.95%, 5/3/2029 (b)
| | | 352,918 | | 352,219 |
Peraton Corp., Senior Secured Term Loan B, 1 Month USD SOFR + 3.75%, 8.95%, 2/1/2028 (b)
| | | 399,551 | | 393,344 |
Playa Resorts Holding BV, Senior Secured 2022 Term Loan B, 1 Month USD SOFR + 4.25%, 9.34%, 1/5/2029 (b)
| | | 234,012 | | 233,707 |
Scientific Games International, Inc., Senior Secured 2022 USD Term Loan, 1 Month USD SOFR + 3.00%, 8.25%, 4/14/2029 (b)
| | | 138,600 | | 138,633 |
Travelport Finance SARL, Senior Secured 2020 Super Priority Term Loan, 1 Month USD LIBOR + 1.50%, 7.25%, 2/28/2025 (b)
| | | 313,460 | | 309,152 |
| | | | | | 1,968,095 |
| HOUSEHOLD DURABLES — 0.0% (c) | | | | | |
Springs Windows Fashions LLC, Senior Secured 2021 Term Loan B, 1 Month USD SOFR + 4.00%, 9.22%, 10/6/2028 (b)
| | | 117,381 | | 95,372 |
| HOUSEHOLD PRODUCTS — 0.0% (c) | | | | | |
Conair Holdings LLC, Senior Secured Term Loan B, 3 Month USD LIBOR + 3.75%, 9.29%, 5/17/2028 (b)
| | | 64,244 | | 60,750 |
| Security Description | | | Principal
Amount | | Value |
| INDEPENDENT POWER PRODUCERS & ENERGY TRADERS — 0.0% (c) | | | | | |
Calpine Corp., Senior Secured 2019 Term Loan B10, 1 Month USD LIBOR + 2.00%, 7.19%, 8/12/2026 (b)
| | | $ 77,000 | | $ 77,022 |
Vistra Operations Co. LLC, Senior Secured 1st Lien Term Loan B3, 1 Month USD LIBOR + 1.75%, 6.90%, 12/31/2025 (b)
| | | 343,046 | | 342,617 |
| | | | | | 419,639 |
| INSURANCE — 0.1% | | | | | |
| Acrisure LLC: | | | | | |
Senior Secured 2020 Term Loan B, 1 Month USD LIBOR + 3.50%, 8.69%, 2/15/2027 (b)
| | | 162,372 | | 158,037 |
Senior Secured 2021 First Lien Term Loan B, 1 Month USD LIBOR + 4.25%, 9.43%, 2/15/2027 (b)
| | | 137,900 | | 135,430 |
| Alliant Holdings Intermediate LLC: | | | | | |
Senior Secured 2021 Term Loan B4, 1 Month USD LIBOR + 3.50%, 8.65%, 11/6/2027 (b)
| | | 152,287 | | 151,580 |
Senior Secured 2023 Term Loan B5, 1 Month USD SOFR + 3.50%, 8.65%, 11/5/2027 (b)
| | | 164,175 | | 163,377 |
AmWINS Group, Inc., Senior Secured 2021 Term Loan B, 1 Month USD LIBOR + 2.25%, 7.44%, 2/19/2028 (b)
| | | 348,423 | | 345,811 |
| AssuredPartners, Inc.: | | | | | |
Senior Secured 2020 Term Loan B, 1 Month USD SOFR + 3.50%, 8.72%, 2/12/2027 (b)
| | | 254,644 | | 253,026 |
Senior Secured 2022 Term Loan, 1 Month USD SOFR + 3.50%, 8.60%, 2/12/2027 (b)
| | | 103,687 | | 102,888 |
HUB International Ltd., 2023 Term Loan B, 6/20/2030 (b)
| | | 65,000 | | 65,221 |
OneDigital Borrower LLC, Senior Secured 2021 Term Loan, 3 Month USD SOFR + 4.25%, 9.45%, 11/16/2027 (b)
| | | 310,557 | | 306,675 |
| | | | | | 1,682,045 |
See accompanying notes to financial statements.
119
SPDR DOUBLELINE TOTAL RETURN TACTICAL ETF
SCHEDULE OF INVESTMENTS (continued)
June 30, 2023
| Security Description | | | Principal
Amount | | Value |
| INTERACTIVE MEDIA & SERVICES — 0.0% (c) | | | | | |
Rentpath, Inc., Senior Secured 2021 Stub Current Face Term Loan, 4/1/2028 (d) (i)
| | | $ 24,474 | | $ 367 |
| INTERNET & CATALOG RETAIL — 0.0% (c) | | | | | |
ION Trading Finance Ltd., Senior Secured 2021 USD Term Loan, 3 Month USD LIBOR + 4.75%, 10.29%, 4/3/2028 (b)
| | | 189,238 | | 185,995 |
PUG LLC, Senior Secured USD Term Loan, 1 Month USD LIBOR + 3.50%, 8.52%, 2/12/2027 (b)
| | | 310,368 | | 277,633 |
| | | | | | 463,628 |
| INTERNET & TELECOM — 0.0% (c) | | | | | |
Cablevision Lightpath LLC, Senior Secured Term Loan B, 1 Month USD LIBOR + 3.25%, 8.44%, 11/30/2027 (b)
| | | 385,125 | | 371,827 |
CNT Holdings I Corp., Senior Secured 2020 Term Loan, 3 Month USD SOFR + 3.50%, 8.46%, 11/8/2027 (b)
| | | 133,221 | | 132,871 |
Go Daddy Operating Co. LLC, Senior Secured 2022 Term Loan B5, 1 Month USD SOFR + 3.25%, 8.08%, 11/9/2029 (b)
| | | 49,750 | | 49,903 |
Uber Technologies, Inc., Senior Secured 2023 Term Loan B, 3 Month USD SOFR + 2.75%, 7.99%, 3/3/2030 (b)
| | | 144,275 | | 144,447 |
| | | | | | 699,048 |
| LEISURE INDUSTRY — 0.0% (c) | | | | | |
Carnival Corp., Senior Secured 2021 Incremental Term Loan B, 1 Month USD SOFR + 3.25%, 8.47%, 10/18/2028 (b)
| | | 292,411 | | 290,339 |
| LEISURE&REC/GAMES — 0.0% (c) | | | | | |
Scientific Games Holdings LP, Senior Secured 2022 USD Term Loan B, 3 Month USD SOFR + 3.50%, 8.42%, 4/4/2029 (b)
| | | 273,323 | | 270,419 |
| Security Description | | | Principal
Amount | | Value |
| LIFE SCIENCES TOOLS & SERVICES — 0.0% (c) | | | | | |
Parexel International Corp., Senior Secured 2021 1st Lien Term Loan, 1 Month USD LIBOR + 3.25%, 8.44%, 11/15/2028 (b)
| | | $ 380,187 | | $ 377,716 |
| MACHINERY — 0.0% (c) | | | | | |
Ali Group North America Corp., Senior Secured 2021 Term Loan B, 1 Month USD SOFR + 2.00%, 7.08%, 7/30/2029 (b)
| | | 284,005 | | 284,325 |
American Trailer World Corp., Senior Secured Term Loan B, 1 Month USD SOFR + 3.75%, 8.86%, 3/3/2028 (b)
| | | 74,018 | | 66,964 |
Columbus McKinnon Corp., Senior Secured 2021 Term Loan B, 3 Month USD SOFR + 2.75%, 8.23%, 5/14/2028 (b)
| | | 30,204 | | 30,166 |
Madison IAQ LLC, Senior Secured Term Loan, 6 Month USD LIBOR + 3.25%, 8.30%, 6/21/2028 (b)
| | | 357,700 | | 350,814 |
Titan Acquisition Ltd., Senior Secured 2018 Term Loan B, 6 Month USD LIBOR + 3.00%, 8.73%, 3/28/2025 (b)
| | | 266,826 | | 261,099 |
| | | | | | 993,368 |
| MACHINERY-CONSTRUCTION & MINING — 0.0% (c) | | | | | |
Brookfield WEC Holdings, Inc., Senior Secured 2021 Term Loan, 1 Month USD LIBOR + 2.75%, 7.94%, 8/1/2025 (b)
| | | 379,028 | | 378,712 |
Clear Channel Outdoor Holdings, Inc., Senior Secured Term Loan B, 1 Month USD SOFR + 3.50%, 8.58%, 8/21/2026 (b)
| | | 237,711 | | 227,480 |
| | | | | | 606,192 |
| MEDIA — 0.1% | | | | | |
Charter Communications Operating LLC, Senior Secured 2019 Term Loan B2, 1 Month USD SOFR + 1.75%, 6.83%, 2/1/2027 (b)
| | | 182,161 | | 181,288 |
See accompanying notes to financial statements.
120
SPDR DOUBLELINE TOTAL RETURN TACTICAL ETF
SCHEDULE OF INVESTMENTS (continued)
June 30, 2023
| Security Description | | | Principal
Amount | | Value |
Diamond Sports Group LLC, 2022 2nd Lien Term Loan, 3 Month USD SOFR + 3.25%, 8.31%, 8/24/2026 (b) (d)
| | | $ 171,496 | | $ 6,145 |
Go Daddy Operating Co. LLC, Senior Secured 2021 Term Loan B4, 1 Month USD LIBOR + 2.00%, 7.19%, 8/10/2027 (b)
| | | 284,267 | | 284,252 |
Gray Television, Inc., Senior Secured 2021 Term Loan D, 1 Month USD SOFR + 3.00%, 8.27%, 12/1/2028 (b)
| | | 348,232 | | 340,914 |
iHeartCommunications, Inc., Senior Secured 2020 Term Loan, 1 Month USD LIBOR + 3.00%, 5/1/2026 (b)
| | | 170,000 | | 147,677 |
NEP/NCP Holdco, Inc., Senior Secured 2018 1st Lien Term Loan, 1 Month USD SOFR + 3.25%, 8.33%, 10/20/2025 (b)
| | | 142,391 | | 128,695 |
Radiate Holdco LLC, Senior Secured 2021 Term Loan B, 3 Month USD SOFR + 3.25%, 8.48%, 9/25/2026 (b)
| | | 146,337 | | 122,502 |
Sinclair Television Group, Inc., Senior Secured Term Loan B2B, 1 Month USD SOFR + 2.50%, 7.72%, 9/30/2026 (b)
| | | 127,089 | | 113,427 |
Univision Communications, Inc., Senior Secured 2022 First Lien Term Loan B, 3 Month USD SOFR + 4.25%, 9.49%, 6/24/2029 (b)
| | | 179,210 | | 179,135 |
Vertical U.S. Newco, Inc., Senior Secured Term Loan B, 6 Month USD LIBOR + 3.50%, 8.60%, 7/30/2027 (b)
| | | 303,714 | | 301,741 |
Ziggo Financing Partnership, Senior Secured USD Term Loan I, 1 Month USD LIBOR + 2.50%, 7.69%, 4/30/2028 (b)
| | | 190,000 | | 187,422 |
| | | | | | 1,993,198 |
| METALS & MINING — 0.0% (c) | | | | | |
Tiger Acquisition LLC, Senior Secured 2021 Term Loan, 1 Month USD SOFR + 3.25%, 8.45%, 6/1/2028 (b)
| | | 115,912 | | 113,859 |
| Security Description | | | Principal
Amount | | Value |
| MRI/MEDICAL DIAG IMAGING — 0.0% (c) | | | | | |
Radiology Partners, Inc., Senior Secured 2018 1st Lien Term Loan B, 1 Month USD SOFR + 4.25%, 9.33%, 7/9/2025 (b)
| | | $ 159,661 | | $ 121,093 |
| OIL, GAS & CONSUMABLE FUELS — 0.0% (c) | | | | | |
Pacific Gas & Electric Co., 2020 Term Loan B1, 1 Month USD LIBOR + 3.00%, 8.22%, 6/23/2025 (b)
| | | 313,512 | | 313,848 |
Par Petroleum LLC, Senior Secured 2023 Term Loan B, 3 Month USD SOFR + 4.25%, 9.61%, 2/28/2030 (b)
| | | 49,875 | | 49,189 |
Waterbridge Midstream Operating LLC, Senior Secured Term Loan B, 3 Month USD LIBOR + 5.75%, 11.01%, 6/22/2026 (b)
| | | 165,696 | | 164,959 |
| | | | | | 527,996 |
| PASSENGER AIRLINES — 0.1% | | | | | |
Air Canada, Senior Secured 2021 Term Loan B, 3 Month USD LIBOR + 3.50%, 8.84%, 8/11/2028 (b)
| | | 193,050 | | 193,309 |
| American Airlines, Inc.: | | | | | |
Senior Secured 2017 1st Lien Term Loan, 6 Month USD LIBOR + 3.50%, 8.26%, 1/29/2027 (b)
| | | 213,400 | | 208,332 |
Senior Secured 2021 Term Loan, 3 Month USD LIBOR + 4.75%, 10.00%, 4/20/2028 (b)
| | | 310,000 | | 317,031 |
Kestrel Bidco, Inc., Senior Secured Term Loan B, 3 Month USD SOFR + 3.00%, 7.51%, 12/11/2026 (b)
| | | 184,325 | | 179,269 |
Mileage Plus Holdings LLC, Senior Secured 2020 Term Loan B, 3 Month USD LIBOR + 5.25%, 10.76%, 6/21/2027 (b)
| | | 404,000 | | 420,412 |
SkyMiles IP Ltd., Senior Secured 2020 Skymiles Term Loan B, 3 Month USD LIBOR + 3.75%, 8.80%, 10/20/2027 (b)
| | | 193,500 | | 201,240 |
See accompanying notes to financial statements.
121
SPDR DOUBLELINE TOTAL RETURN TACTICAL ETF
SCHEDULE OF INVESTMENTS (continued)
June 30, 2023
| Security Description | | | Principal
Amount | | Value |
United Airlines, Inc., Senior Secured 2021 Term Loan B, 3 Month USD LIBOR + 3.75%, 9.29%, 4/21/2028 (b)
| | | $ 279,078 | | $ 279,389 |
| | | | | | 1,798,982 |
| PERSONAL CARE PRODUCTS — 0.0% (c) | | | | | |
Kronos Acquisition Holdings, Inc., Senior Secured 2021 Term Loan B, 3 Month USD LIBOR + 3.75%, 9.25%, 12/22/2026 (b)
| | | 225,406 | | 220,140 |
| PHARMACEUTICALS — 0.1% | | | | | |
Grifols Worldwide Operations USA, Inc., Senior Secured USD 2019 Term Loan B, 3 Month USD SOFR + 2.00%, 7.41%, 11/15/2027 (b)
| | | 240,000 | | 236,550 |
Jazz Financing Lux SARL, Senior Secured USD Term Loan, 1 Month USD LIBOR + 3.50%, 8.86%, 5/5/2028 (b)
| | | 507,855 | | 507,718 |
Organon & Co., Senior Secured USD Term Loan, 3 Month USD LIBOR + 3.00%, 8.25%, 6/2/2028 (b)
| | | 486,545 | | 487,078 |
Perrigo Investments LLC, Senior Secured Term Loan B, 1 Month USD SOFR + 2.50%, 7.45%, 4/20/2029 (b)
| | | 193,723 | | 192,512 |
PetVet Care Centers LLC, Senior Secured 2021 Term Loan B3, 1 Month USD LIBOR + 3.50%, 8.69%, 2/14/2025 (b)
| | | 220,658 | | 216,576 |
Southern Veterinary Partners LLC, Senior Secured Term Loan, 1 Month USD SOFR + 4.00%, 9.22%, 10/5/2027 (b)
| | | 308,292 | | 303,795 |
| | | | | | 1,944,229 |
| PIPELINES — 0.1% | | | | | |
BCP Renaissance Parent LLC, Senior Secured 2022 Term Loan B3, 3 Month USD SOFR + 3.50%, 8.74%, 10/31/2026 (b)
| | | 137,829 | | 137,559 |
| Security Description | | | Principal
Amount | | Value |
Buckeye Partners LP, Senior Secured 2021 Term Loan B, 1 Month USD LIBOR + 2.25%, 7.45%, 11/1/2026 (b)
| | | $ 364,067 | | $ 362,057 |
CQP Holdco LP, Senior Secured 2021 Term Loan B, 3 Month USD LIBOR + 3.75%, 9.29%, 6/5/2028 (b)
| | | 272,245 | | 272,090 |
Freeport LNG Investments LLLP, Senior Secured Term Loan B, 3 Month USD LIBOR + 3.50%, 8.75%, 12/21/2028 (b)
| | | 210,529 | | 206,650 |
GIP II Blue Holding LP, Senior Secured Term Loan B, 1 Month USD SOFR + 4.50%, 9.72%, 9/29/2028 (b)
| | | 92,081 | | 92,509 |
Oryx Midstream Services Permian Basin LLC, Senior Secured 2023 Incremental Term Loan, 1 Month USD SOFR + 3.25%, 8.54%, 10/5/2028 (b)
| | | 240,059 | | 240,000 |
| | | | | | 1,310,865 |
| PROFESSIONAL SERVICES — 0.0% (c) | | | | | |
Dun & Bradstreet Corp., Senior Secured 2022 Incremental Term Loan B2, 1 Month USD SOFR + 3.25%, 8.33%, 1/18/2029 (b)
| | | 69,125 | | 69,060 |
Proofpoint, Inc., Senior Secured 1st Lien Term Loan, 3 Month USD LIBOR + 3.25%, 8.44%, 8/31/2028 (b)
| | | 334,900 | | 328,341 |
Trans Union LLC, Senior Secured 2021 Term Loan B6, 1 Month USD SOFR + 2.25%, 7.47%, 12/1/2028 (b)
| | | 492,198 | | 491,608 |
| | | | | | 889,009 |
| PUBLISHING-BOOKS — 0.0% (c) | | | | | |
Getty Images, Inc., Senior Secured 2019 USD Term Loan B, 1 Month USD SOFR + 4.50%, 9.70%, 2/19/2026 (b)
| | | 157,575 | | 157,772 |
See accompanying notes to financial statements.
122
SPDR DOUBLELINE TOTAL RETURN TACTICAL ETF
SCHEDULE OF INVESTMENTS (continued)
June 30, 2023
| Security Description | | | Principal
Amount | | Value |
| RETAIL-BUILDING PRODUCTS — 0.0% (c) | | | | | |
LBM Acquisition LLC, Senior Secured Term Loan B, 6 Month USD LIBOR + 3.75%, 8.95%, 12/17/2027 (b)
| | | $ 250,017 | | $ 240,771 |
Park River Holdings, Inc., Senior Secured Term Loan, 6 Month USD LIBOR + 3.25%, 8.52%, 12/28/2027 (b)
| | | 159,858 | | 153,709 |
| | | | | | 394,480 |
| RETAIL-RESTAURANTS — 0.0% (c) | | | | | |
IRB Holding Corp., Senior Secured 2022 Term Loan B, 1 Month USD SOFR + 3.00%, 8.20%, 12/15/2027 (b)
| | | 348,953 | | 346,990 |
| SEMICONDUCTORS & SEMICONDUCTOR EQUIPMENT — 0.0% (c) | | | | | |
Bright Bidco BV, Senior Secured 2022 Exit Term Loan, 3 Month USD SOFR + 1.00%, 8.00%, 10/31/2027 (b)
| | | 24,262 | | 12,576 |
Ultra Clean Holdings, Inc., Senior Secured 2021 Term Loan B, 1 Month USD LIBOR + 3.75%, 8.94%, 8/27/2025 (b)
| | | 128,036 | | 128,216 |
| | | | | | 140,792 |
| SOFTWARE — 0.2% | | | | | |
| Applied Systems, Inc.: | | | | | |
Senior Secured 2021 2nd Lien Term Loan, 3 Month USD SOFR + 6.75%, 11.99%, 9/17/2027 (b)
| | | 210,000 | | 210,591 |
Senior Secured 2022 Extended 1st Lien Term Loan, 3 Month USD SOFR + 4.50%, 9.74%, 9/18/2026 (b)
| | | 277,195 | | 277,910 |
Athenahealth Group, Inc., Senior Secured 2022 Term Loan B, 1 Month USD SOFR + 3.50%, 8.59%, 2/15/2029 (b)
| | | 266,505 | | 257,177 |
Camelot U.S. Acquisition LLC, Senior Secured Term Loan B, 1 Month USD SOFR + 3.00%, 8.22%, 10/30/2026 (b)
| | | 365,000 | | 364,909 |
| Security Description | | | Principal
Amount | | Value |
Castle U.S. Holding Corp., Senior Secured USD Term Loan B, 1 Month USD LIBOR + 3.75%, 8.94%, 1/29/2027 (b)
| | | $ 312,192 | | $ 230,778 |
CDK Global, Inc., Senior Secured 2022 USD Term Loan B, 3 Month USD SOFR + 4.50%, 9.49%, 7/6/2029 (b)
| | | 204,125 | | 203,792 |
Cengage Learning, Inc., Senior Secured 2021 Term Loan B, 3 Month USD LIBOR + 4.75%, 9.88%, 7/14/2026 (b)
| | | 303,401 | | 297,960 |
Constant Contact, Inc., Senior Secured Term Loan, 3 Month USD LIBOR + 4.00%, 9.20%, 2/10/2028 (b)
| | | 114,155 | | 109,321 |
Cornerstone OnDemand, Inc., Senior Secured 2021 Term Loan, 1 Month USD LIBOR + 3.75%, 8.93%, 10/16/2028 (b)
| | | 131,783 | | 123,135 |
| DCert Buyer, Inc.: | | | | | |
2021 2nd Lien Term Loan, 3 Month USD SOFR + 7.00%, 12.26%, 2/19/2029 (b)
| | | 55,000 | | 50,692 |
Senior Secured 2019 Term Loan B, 3 Month USD SOFR + 4.00%, 9.26%, 10/16/2026 (b)
| | | 75,200 | | 74,671 |
| Finastra USA, Inc.: | | | | | |
Senior Secured USD 1st Lien Term Loan, 6 Month USD LIBOR + 3.50%, 9.23%, 6/13/2024 (b)
| | | 119,939 | | 115,610 |
USD 2nd Lien Term Loan, 6 Month USD LIBOR + 7.25%, 12.79%, 6/13/2025 (b)
| | | 105,000 | | 95,701 |
First Advantage Holdings LLC, Senior Secured 2021 Term Loan B, 3 Month USD SOFR + 2.75%, 7.99%, 1/31/2027 (b)
| | | 275,666 | | 275,667 |
GoTo Group, Inc., Senior Secured Term Loan B, 1 Month USD LIBOR + 4.75%, 9.93%, 8/31/2027 (b)
| | | 127,493 | | 80,392 |
Grab Holdings, Inc., Senior Secured Term Loan B, 1 Month USD LIBOR + 4.50%, 9.70%, 1/29/2026 (b)
| | | 135,685 | | 135,827 |
See accompanying notes to financial statements.
123
SPDR DOUBLELINE TOTAL RETURN TACTICAL ETF
SCHEDULE OF INVESTMENTS (continued)
June 30, 2023
| Security Description | | | Principal
Amount | | Value |
Greeneden U.S. Holdings II LLC, Senior Secured 2020 USD Term Loan B4, 1 Month USD SOFR + 4.00%, 9.19%, 12/1/2027 (b)
| | | $ 318,512 | | $ 318,086 |
Hyland Software, Inc., Senior Secured 2021 2nd Lien Term Loan, 1 Month USD LIBOR + 6.25%, 11.47%, 7/7/2025 (b)
| | | 45,000 | | 43,481 |
I-Logic Technologies Bidco Ltd., Senior Secured 2021 USD Term Loan B, 3 Month USD SOFR + 4.00%, 9.24%, 2/16/2028 (b)
| | | 272,500 | | 269,750 |
Informatica LLC, Senior Secured 2021 USD Term Loan B, 1 Month USD LIBOR + 2.75%, 8.00%, 10/27/2028 (b)
| | | 325,875 | | 325,976 |
Ivanti Software, Inc., Senior Secured 2021 Term Loan B, 3 Month USD LIBOR + 4.25%, 9.42%, 12/1/2027 (b)
| | | 72,135 | | 61,128 |
McAfee LLC, Senior Secured 2022 USD Term Loan B, 1 Month USD SOFR + 3.75%, 9.01%, 3/1/2029 (b)
| | | 103,079 | | 98,885 |
MedAssets Software Intermediate Holdings, Inc., Senior Secured 2021 Term Loan, 1 Month USD LIBOR + 4.00%, 9.18%, 12/18/2028 (b)
| | | 212,313 | | 181,527 |
| Mitchell International, Inc.: | | | | | |
Senior Secured 2021 2nd Lien Term Loan, 11.69%, 10/15/2029 (b)
| | | 40,000 | | 35,500 |
Senior Secured 2021 Term Loan B, 3 Month USD LIBOR + 3.75%, 8.94%, 10/15/2028 (b)
| | | 242,041 | | 237,125 |
PointClickCare Technologies, Inc., Senior Secured Term Loan B, 3 Month USD LIBOR + 3.00%, 8.19%, 12/29/2027 (b)
| | | 141,738 | | 141,738 |
Polaris Newco LLC, Senior Secured USD Term Loan B, 3 Month USD LIBOR + 4.00%, 9.52%, 6/2/2028 (b)
| | | 122,382 | | 112,999 |
| Security Description | | | Principal
Amount | | Value |
RealPage, Inc., Senior Secured 1st Lien Term Loan, 1 Month USD LIBOR + 3.00%, 8.19%, 4/24/2028 (b)
| | | $ 249,365 | | $ 244,285 |
Sophia LP, Senior Secured 2021 Term Loan B, 3 Month USD LIBOR + 3.50%, 9.04%, 10/7/2027 (b)
| | | 419,554 | | 415,709 |
| Ultimate Software Group, Inc.: | | | | | |
2023 Incremental Term Loan, 3 Month USD SOFR + 7.00%, 9.78%, 5/4/2026 (b)
| | | 95,000 | | 94,981 |
Senior Secured 2021 2nd Lien Term Loan, 3 Month USD SOFR + 5.25%, 10.27%, 5/3/2027 (b)
| | | 70,000 | | 68,075 |
Senior Secured Term Loan B, 1 Month USD LIBOR + 3.75%, 5/4/2026 (b)
| | | 269,301 | | 266,070 |
| | | | | | 5,819,448 |
| SPECIALTY RETAIL — 0.1% | | | | | |
Great Outdoors Group LLC, Senior Secured 2021 Term Loan B1, 1 Month USD LIBOR + 3.75%, 8.94%, 3/6/2028 (b)
| | | 269,838 | | 268,151 |
Jo-Ann Stores, Inc., Senior Secured 2021 Term Loan B1, 3 Month USD LIBOR + 4.75%, 10.02%, 7/7/2028 (b)
| | | 235,800 | | 123,991 |
K-Mac Holdings Corp., Senior Secured 2021 Term Loan, 1 Month USD LIBOR + 3.50%, 8.47%, 7/21/2028 (b)
| | | 190,856 | | 187,784 |
Leslie's Poolmart, Inc., 2021 Term Loan B, 7.97%, 3/9/2028 (b)
| | | 344,120 | | 343,833 |
Michaels Cos., Inc., Senior Secured 2021 Term Loan B, 3 Month USD LIBOR + 4.25%, 9.75%, 4/15/2028 (b)
| | | 88,958 | | 79,039 |
Petco Health & Wellness Co., Inc., Senior Secured 2021 Term Loan B, 3 Month USD SOFR + 3.25%, 8.75%, 3/3/2028 (b)
| | | 355,000 | | 352,982 |
PetSmart, Inc., Senior Secured 2021 Term Loan B, 1 Month USD SOFR + 3.75%, 8.83%, 2/11/2028 (b)
| | | 344,623 | | 344,553 |
See accompanying notes to financial statements.
124
SPDR DOUBLELINE TOTAL RETURN TACTICAL ETF
SCHEDULE OF INVESTMENTS (continued)
June 30, 2023
| Security Description | | | Principal
Amount | | Value |
Pilot Travel Centers LLC, Senior Secured 2021 Term Loan B, 1 Month USD SOFR + 2.00%, 7.20%, 8/4/2028 (b)
| | | $ 343,244 | | $ 343,183 |
Rent-A-Center, Inc., Senior Secured 2021 First Lien Term Loan B, 3 Month USD LIBOR + 3.25%, 8.56%, 2/17/2028 (b)
| | | 158,072 | | 158,269 |
Restoration Hardware, Inc., Senior Secured Term Loan B, 1 Month USD LIBOR + 2.50%, 7.60%, 10/20/2028 (b)
| | | 235,800 | | 228,608 |
SRS Distribution, Inc., Senior Secured 2021 Term Loan B, 1 Month USD LIBOR + 3.50%, 8.69%, 6/2/2028 (b)
| | | 310,313 | | 302,191 |
Staples, Inc., Senior Secured 7 Year Term Loan, 3 Month USD LIBOR + 5.00%, 10.30%, 4/16/2026 (b)
| | | 205,714 | | 176,593 |
Victoria's Secret & Co., Senior Secured Term Loan B, 1 Month USD SOFR + 3.25%, 8.51%, 8/2/2028 (b)
| | | 206,325 | | 204,262 |
Whatabrands LLC, Senior Secured 2021 Term Loan B, 1 Month USD LIBOR + 3.25%, 8.47%, 8/3/2028 (b)
| | | 290,575 | | 289,235 |
| | | | | | 3,402,674 |
| STEEL-PRODUCERS — 0.0% (c) | | | | | |
Phoenix Services International LLC, Term Load, 11.00%, 3/1/2025
| | | 44,829 | | 44,829 |
| TELECOM SERVICES — 0.0% (c) | | | | | |
Connect Finco SARL, Senior Secured 2021 Term Loan B, 1 Month USD LIBOR + 3.50%, 8.70%, 12/11/2026 (b)
| | | 140,288 | | 140,375 |
| TELECOMMUNICATION EQUIP — 0.0% (c) | | | | | |
Cyxtera DC Holdings, Inc., Senior Secured Term Loan B, 3 Month USD SOFR + 3.00%, 8.07%, 5/1/2024 (b) (d)
| | | 294,531 | | 149,866 |
| Security Description | | | Principal
Amount | | Value |
GOGO Intermediate Holdings LLC, Senior Secured Term Loan B, 1 Month USD SOFR + 3.75%, 8.97%, 4/30/2028 (b)
| | | $ 144,045 | | $ 144,032 |
| | | | | | 293,898 |
| TRANSPORT-SERVICES — 0.1% | | | | | |
Echo Global Logistics, Inc., Senior Secured Term Loan, 1 Month USD SOFR + 3.500%, 8.70%, 11/23/2028 (b)
| | | 122,640 | | 119,267 |
EG America LLC, Senior Secured 2018 USD Term Loan, 1 Month USD SOFR + 4.00%, 9.08%, 2/7/2025 (b)
| | | 174,360 | | 172,036 |
EG Group Ltd., Senior Secured 2021 Term Loan, 3 Month USD LIBOR + 4.25%, 3/31/2026 (b)
| | | 152,692 | | 152,167 |
| Element Materials Technology Group U.S. Holdings, Inc.: | | | | | |
2022 USD Delayed Draw Term Loan, 3 Month USD SOFR + 4.25%, 9.59%, 7/6/2029 (b)
| | | 40,847 | | 40,133 |
Senior Secured 2022 USD Term Loan, 3 Month USD SOFR + 4.25%, 9.59%, 7/6/2029 (b)
| | | 88,503 | | 86,954 |
Endure Digital, Inc., Senior Secured Term Loan, 3 Month USD LIBOR + 3.50%, 8.79%, 2/10/2028 (b)
| | | 121,648 | | 113,589 |
Everi Holdings, Inc., Senior Secured 2021 Term Loan B, 1 Month USD LIBOR + 2.50%, 7.69%, 8/3/2028 (b)
| | | 112,412 | | 112,424 |
ExGen Renewables IV LLC, Senior Secured 2020 Term Loan, 3 Month USD LIBOR + 2.50%, 8.03%, 12/15/2027 (b)
| | | 187,039 | | 186,162 |
| LaserShip, Inc.: | | | | | |
Senior Secured 2021 2nd Lien Term Loan, 3 Month USD LIBOR + 7.50%, 12.69%, 5/7/2029 (b)
| | | 40,000 | | 30,000 |
See accompanying notes to financial statements.
125
SPDR DOUBLELINE TOTAL RETURN TACTICAL ETF
SCHEDULE OF INVESTMENTS (continued)
June 30, 2023
| Security Description | | | Principal
Amount | | Value |
Senior Secured 2021 Term Loan, 3 Month USD LIBOR + 4.50%, 9.69%, 5/7/2028 (b)
| | | $ 137,550 | | $ 114,167 |
| | | | | | 1,126,899 |
TOTAL SENIOR FLOATING RATE LOANS
(Cost $53,510,295)
| | | | | 51,806,917 |
| U.S. GOVERNMENT AGENCY OBLIGATIONS — 31.7% | | | | | |
| Federal Home Loan Mortgage Corp.: | | | | | |
2.13%, 12/1/2051 (b)
| | | 11,307,075 | | 9,923,954 |
2.22%, 7/1/2051 (b)
| | | 12,900,772 | | 11,382,679 |
2.50%, 9/1/2050
| | | 12,914,247 | | 10,992,314 |
3.00%, 6/1/2042
| | | 10,576,962 | | 9,518,801 |
3.00%, 11/1/2042
| | | 5,950,100 | | 5,385,366 |
3.00%, 12/1/2042
| | | 4,935,290 | | 4,417,209 |
3.00%, 1/1/2045
| | | 688,580 | | 621,243 |
3.00%, 2/1/2045
| | | 480,590 | | 430,531 |
3.00%, 3/1/2045
| | | 472,721 | | 423,482 |
3.00%, 4/1/2045
| | | 13,500,229 | | 12,157,049 |
3.00%, 5/1/2045
| | | 1,859,191 | | 1,665,533 |
3.00%, 8/1/2045
| | | 5,390,657 | | 4,829,155 |
3.00%, 7/1/2047
| | | 1,893,328 | | 1,694,576 |
3.00%, 6/1/2051
| | | 17,356,157 | | 15,340,737 |
3.00%, 10/1/2051
| | | 15,551,127 | | 13,836,513 |
3.00%, 3/1/2052
| | | 5,940,595 | | 5,233,770 |
3.50%, 2/1/2045
| | | 751,006 | | 697,622 |
3.50%, 4/1/2045
| | | 11,690,448 | | 10,856,150 |
3.50%, 6/1/2045
| | | 5,931,426 | | 5,508,113 |
3.50%, 10/1/2045
| | | 6,113,201 | | 5,676,916 |
3.50%, 2/1/2046
| | | 3,045,611 | | 2,815,228 |
4.00%, 4/1/2047
| | | 8,034,815 | | 7,657,841 |
4.00%, 7/1/2047
| | | 2,049,502 | | 1,953,331 |
4.00%, 10/1/2047
| | | 4,599,817 | | 4,383,976 |
4.00%, 7/1/2052
| | | 32,249,062 | | 30,270,638 |
4.30%, 1/1/2033
| | | 10,000,000 | | 9,830,223 |
4.50%, 6/1/2044
| | | 912,614 | | 898,873 |
4.50%, 7/1/2052
| | | 14,230,148 | | 13,679,190 |
4.50%, 10/1/2052
| | | 17,674,243 | | 16,986,885 |
4.80%, 1/1/2030
| | | 17,395,000 | | 17,582,120 |
| Federal Home Loan Mortgage Corp. REMICS: | | | | | |
Series 3852, Class NS, CMO, IO, REMIC, 1 Month USD LIBOR - 6.00%, 0.81%, 5/15/2041 (b)
| | | 3,191,261 | | 231,439 |
Series 3889, Class VZ, CMO, REMIC, 4.00%, 7/15/2041
| | | 1,999,063 | | 1,890,517 |
| Security Description | | | Principal
Amount | | Value |
Series 3935, Class SJ, CMO, IO, REMIC, 1 Month USD LIBOR - 6.65%, 1.46%, 5/15/2041 (b)
| | | $ 488,020 | | $ 11,459 |
Series 4120, Class KA, CMO, REMIC, 1.75%, 10/15/2032
| | | 4,973,500 | | 4,572,881 |
Series 4165, Class ZT, CMO, REMIC, 3.00%, 2/15/2043
| | | 4,414,330 | | 3,478,673 |
Series 4364, Class ZX, CMO, REMIC, 4.00%, 7/15/2044
| | | 28,358,863 | | 26,856,663 |
Series 4434, Class LZ, CMO, REMIC, 3.00%, 2/15/2045
| | | 3,850,875 | | 3,265,268 |
Series 4444, Class CZ, CMO, REMIC, 3.00%, 2/15/2045
| | | 14,119,874 | | 12,114,519 |
Series 4471, Class BA, CMO, REMIC, 3.00%, 12/15/2041
| | | 628,911 | | 604,664 |
Series 4471, Class GA, CMO, REMIC, 3.00%, 2/15/2044
| | | 3,416,485 | | 3,159,332 |
Series 4474, Class ZX, CMO, REMIC, 4.00%, 4/15/2045
| | | 14,292,326 | | 13,596,876 |
Series 4483, Class CA, CMO, REMIC, 3.00%, 6/15/2044
| | | 3,304,826 | | 3,072,461 |
Series 4484, ClassCD, CMO, REMIC, 1.75%, 7/15/2030
| | | 2,639,988 | | 2,444,688 |
Series 4492, Class GZ, CMO, REMIC, 3.50%, 7/15/2045
| | | 7,589,078 | | 6,955,796 |
Series 4504, Class CA, CMO, REMIC, 3.00%, 4/15/2044
| | | 2,977,006 | | 2,792,193 |
Series 4533, Class AB, CMO, REMIC, 3.00%, 6/15/2044
| | | 2,787,595 | | 2,594,166 |
Series 4543, Class HG, CMO, REMIC, 2.70%, 4/15/2044
| | | 4,999,287 | | 4,639,329 |
Series 4702, Class ZL, CMO, 3.00%, 7/15/2047
| | | 14,805,148 | | 12,872,482 |
Series 4792, Class A, CMO, REMIC, 3.00%, 5/15/2048
| | | 2,893,754 | | 2,578,872 |
Series 5130, Class SD, CMO, IO, SOFR30A - 2.60%, 0.00%, 8/25/2051 (b)
| | | 79,201,061 | | 1,084,833 |
Series 5243, Class IB, 3.00%, 1/25/2051
| | | 17,285,666 | | 2,877,279 |
See accompanying notes to financial statements.
126
SPDR DOUBLELINE TOTAL RETURN TACTICAL ETF
SCHEDULE OF INVESTMENTS (continued)
June 30, 2023
| Security Description | | | Principal
Amount | | Value |
| Federal Home Loan Mortgage Corp. STACR REMIC Trust: | | | | | |
Series 2021-HQA4, Class M2, CMO, SOFR30A + 2.35%, 7.42%, 12/25/2041 (a) (b)
| | | $ 5,000,000 | | $ 4,683,568 |
Series 2022-DNA2, Class M2, SOFR30A + 3.75%, 8.82%, 2/25/2042 (a) (b)
| | | 9,500,000 | | 9,553,502 |
Series 2022-DNA3, Class M1B, SOFR30A + 2.90%, 7.97%, 4/25/2042 (a) (b)
| | | 20,000,000 | | 19,955,714 |
Federal Home Loan Mortgage Corp. Strips Series 326, Class 300, CMO, 3.00%, 3/15/2044
| | | 9,628,702 | | 8,596,464 |
| Federal National Mortgage Association: | | | | | |
1.41%, 12/1/2030
| | | 10,000,000 | | 8,034,229 |
1.91%, 12/1/2031
| | | 10,000,000 | | 8,146,962 |
1.98%, 10/1/2033
| | | 19,500,000 | | 15,795,218 |
2.22%, 12/1/2029
| | | 5,400,000 | | 4,694,807 |
2.50%, 10/1/2040
| | | 18,362,395 | | 16,277,609 |
2.50%, 9/1/2046
| | | 1,832,053 | | 1,550,557 |
2.50%, 2/1/2047
| | | 4,582,468 | | 3,964,796 |
2.50%, 11/1/2050
| | | 7,544,718 | | 6,473,710 |
2.50%, 5/1/2051
| | | 8,146,021 | | 6,914,369 |
2.80%, 11/1/2039
| | | 10,034,000 | | 7,911,705 |
3.00%, 5/1/2035
| | | 2,844,859 | | 2,637,199 |
3.00%, 10/1/2041
| | | 9,060,559 | | 8,109,031 |
3.00%, 3/1/2043
| | | 2,157,054 | | 1,950,062 |
3.00%, 7/1/2043
| | | 2,126,443 | | 1,890,283 |
3.00%, 1/1/2045
| | | 68,601 | | 60,900 |
3.00%, 3/1/2045
| | | 625,479 | | 559,679 |
3.00%, 4/1/2045
| | | 1,247,773 | | 1,099,475 |
3.00%, 7/1/2045
| | | 11,670,783 | | 10,550,852 |
3.00%, 10/1/2046
| | | 2,266,451 | | 2,028,431 |
3.00%, 2/1/2047
| | | 8,220,858 | | 7,357,514 |
3.00%, 11/1/2048
| | | 5,040,522 | | 4,504,806 |
3.00%, 10/1/2049
| | | 3,468,713 | | 3,037,464 |
3.00%, 11/1/2051
| | | 25,157,734 | | 22,235,604 |
3.00%, 4/1/2052
| | | 9,185,962 | | 8,110,005 |
3.00%, 4/1/2053
| | | 10,731,476 | | 9,552,376 |
3.50%, 9/1/2034
| | | 808,555 | | 766,063 |
3.50%, 12/1/2034
| | | 690,304 | | 654,026 |
3.50%, 2/1/2035
| | | 470,197 | | 445,486 |
3.50%, 1/1/2045
| | | 5,085,316 | | 4,718,536 |
3.50%, 2/1/2045
| | | 1,531,925 | | 1,421,435 |
3.50%, 6/1/2045
| | | 5,977,435 | | 5,544,320 |
3.50%, 11/1/2051
| | | 12,366,190 | | 11,360,544 |
3.72%, 6/1/2032
| | | 11,718,445 | | 11,046,494 |
3.88%, 10/1/2030
| | | 11,448,205 | | 10,981,464 |
4.00%, 6/1/2052
| | | 11,902,046 | | 11,164,956 |
| Security Description | | | Principal
Amount | | Value |
4.00%, 12/1/2052
| | | $ 24,155,976 | | $ 22,746,136 |
4.50%, 3/1/2044
| | | 673,816 | | 662,901 |
4.50%, 6/1/2044
| | | 218,578 | | 215,037 |
4.50%, 7/1/2044
| | | 272,406 | | 267,993 |
4.50%, 2/1/2045
| | | 452,511 | | 445,181 |
4.55%, 3/1/2053 (b)
| | | 19,789,498 | | 19,026,253 |
5.00%, 9/1/2052
| | | 8,435,430 | | 8,264,203 |
5.13%, 11/1/2032
| | | 13,371,000 | | 13,964,676 |
3.00%, 6/1/2051
| | | 15,534,960 | | 13,745,699 |
| Federal National Mortgage Association Connecticut Avenue Securities: | | | | | |
Series 2022-R02, Class 2M2, CMO, SOFR30A + 3.00%, 8.07%, 1/25/2042 (a) (b)
| | | 12,000,000 | | 11,891,312 |
Series 2023-R02, Class 1M2, SOFR30A + 3.35%, 8.42%, 1/25/2043 (a) (b)
| | | 13,500,000 | | 13,610,811 |
| Federal National Mortgage Association REMICS: | | | | | |
Series 2010-109, Class NS, CMO, REMIC, 3.00%, 10/25/2040
| | | 1,032,085 | | 965,657 |
Series 2011-51, Class CI, CMO, IO, REMIC, 1 Month USD LIBOR - 6.00%, 0.85%, 6/25/2041 (b)
| | | 1,884,458 | | 153,621 |
Series 2012-127, Class PA, CMO, REMIC, 2.75%, 11/25/2042
| | | 1,417,232 | | 1,293,706 |
Series 2012-148, Class VZ, 3.00%, 1/25/2043
| | | 32,226,835 | | 28,618,696 |
Series 2012-151, Class SB, CMO, REMIC, 1 Month USD LIBOR - 6.00%, 0.00%, 1/25/2043 (b)
| | | 20,907 | | 12,100 |
Series 2013-114, Class HZ, CMO, REMIC, 3.00%, 11/25/2038
| | | 19,066,592 | | 17,057,649 |
Series 2013-18, Class CD, CMO, REMIC, 1.50%, 10/25/2027
| | | 719,319 | | 693,420 |
Series 2013-30, Class PS, CMO, REMIC, 1 Month USD LIBOR - 6.00%, 0.00%, 4/25/2043 (b)
| | | 611,451 | | 387,814 |
Series 2014-21, Class GZ, CMO, REMIC, 3.00%, 4/25/2044
| | | 3,650,768 | | 3,222,210 |
Series 2014-39, Class ZA, CMO, REMIC, 3.00%, 7/25/2044
| | | 4,317,490 | | 3,833,462 |
Series 2015-42, Class CA, CMO, REMIC, 3.00%, 3/25/2044
| | | 2,087,984 | | 1,939,707 |
See accompanying notes to financial statements.
127
SPDR DOUBLELINE TOTAL RETURN TACTICAL ETF
SCHEDULE OF INVESTMENTS (continued)
June 30, 2023
| Security Description | | | Principal
Amount | | Value |
Series 2016-32, Class LA, CMO, REMIC, 3.00%, 10/25/2044
| | | $ 3,398,268 | | $ 3,158,206 |
Series 2016-72, Class PA, CMO, REMIC, 3.00%, 7/25/2046
| | | 3,641,530 | | 3,237,554 |
Series 2016-81, Class PA, CMO, REMIC, 3.00%, 2/25/2044
| | | 1,645,196 | | 1,573,747 |
Series 2016-9, Class A, CMO, REMIC, 3.00%, 9/25/2043
| | | 25,383 | | 25,220 |
Series 2016-92, Class A, CMO, REMIC, 3.00%, 4/25/2042
| | | 3,834,543 | | 3,657,739 |
Series 2017-87, Class BA, CMO, REMIC, 3.00%, 12/25/2042
| | | 1,047,045 | | 1,026,904 |
Series 2020-1, Class LA, 4.00%, 2/25/2060
| | | 12,839,665 | | 11,124,091 |
Series 2020-47, Class GL, CMO, 2.00%, 5/25/2046
| | | 8,686,588 | | 7,416,331 |
Series 2021-29, Class BA, CMO, 1.25%, 5/25/2041
| | | 9,243,513 | | 7,930,245 |
Series 2021-35, Class EH, CMO, 2.00%, 2/25/2037
| | | 15,671,752 | | 13,799,780 |
| Federal National Mortgage Association-Aces: | | | | | |
Series 2018-M10, Class A1, 3.47%, 7/25/2028 (b)
| | | 1,044,860 | | 1,034,071 |
Series 2020-M12, Class IO, 1.40%, 7/25/2029 (b)
| | | 98,729,458 | | 5,721,423 |
| Government National Mortgage Association: | | | | | |
2.50%, 3/20/2051
| | | 8,967,716 | | 7,702,373 |
3.00%, 2/20/2052
| | | 23,037,009 | | 20,642,959 |
Series 2021-143, Class IO, IO, VRN, 0.97%, 10/16/2063 (b)
| | | 83,692,862 | | 5,473,423 |
Series 2021-40, Class IO, IO, VRN, 0.82%, 2/16/2063 (b)
| | | 72,579,357 | | 4,335,265 |
Series 2021-57, Class AI, 2.00%, 2/20/2051
| | | 8,989,108 | | 965,980 |
Series 2021-60, Class IO, IO, VRN, 0.83%, 5/16/2063 (b)
| | | 56,386,108 | | 3,396,814 |
Series 2021-79, Class IO, IO, 0.88%, 8/16/2063 (b)
| | | 81,112,690 | | 5,169,993 |
Series 2021-80, Class IO, IO, VRN, 0.90%, 12/16/2062 (b)
| | | 88,459,130 | | 5,715,048 |
Series 2021-85, Class IO, IO, VRN, 0.68%, 3/16/2063 (b)
| | | 100,566,566 | | 5,633,800 |
| Security Description | | | Principal
Amount | | Value |
Series 2021-99, Class IO, IO, VRN, 0.59%, 5/16/2061 (b)
| | | $ 41,696,972 | | $ 2,121,737 |
Series 2022-91, Class IO, 0.43%, 7/16/2064 (b)
| | | 81,868,888 | | 4,003,231 |
| Government National Mortgage Association REMICS: | | | | | |
Series 2013-34, Class PL, CMO, REMIC, 3.00%, 3/20/2042
| | | 1,160,626 | | 1,107,396 |
Series 2014-43, Class PS, CMO, IO, REMIC, 1 Month USD LIBOR - 6.18%, 1.03%, 7/20/2042 (b)
| | | 1,351,968 | | 27,499 |
Series 2020-116, Class HS, CMO, IO, 1 Month USD LIBOR - 6.20%, 1.04%, 8/20/2050 (b)
| | | 7,090,701 | | 806,072 |
Series 2020-173, Class SY, CMO, IO, 1 Month USD LIBOR - 6.30%, 1.14%, 11/20/2050 (b)
| | | 26,379,690 | | 3,686,827 |
Series 2020-173, Class TI, CMO, IO, 2.00%, 11/20/2050
| | | 32,221,116 | | 3,735,383 |
Series 2020-176, Class SL, CMO, IO, 1 Month USD LIBOR - 5.00%, 0.00%, 11/20/2050 (b)
| | | 8,797,700 | | 568,319 |
Series 2020-185, Class SE, CMO, IO, 1 Month USD LIBOR - 6.30%, 1.14%, 12/20/2050 (b)
| | | 31,665,732 | | 3,839,020 |
Series 2021-1, Class IH, 2.50%, 1/20/2051
| | | 39,553,769 | | 5,405,074 |
Series 2021-118, Class EI, 2.50%, 7/20/2051
| | | 15,998,726 | | 1,946,952 |
Series 2021-125, Class SN, CMO, IO, 1 Month USD LIBOR - 4.20%, 0.00%, 1/20/2051 (b)
| | | 8,133,656 | | 384,373 |
Series 2021-137, Class IQ, 3.00%, 8/20/2051
| | | 22,120,752 | | 3,393,247 |
Series 2021-196, Class IM, 3.00%, 11/20/2051
| | | 28,980,635 | | 4,509,289 |
Series 2021-196, Class UI, IO, 3.00%, 11/20/2051
| | | 45,284,428 | | 4,563,054 |
Series 2021-30, Class KI, 3.00%, 2/20/2051
| | | 8,771,002 | | 1,308,915 |
Series 2021-44, Class IQ, 3.00%, 3/20/2051
| | | 16,273,840 | | 2,472,158 |
Series 2021-8, Class KX, 3.00%, 1/20/2051
| | | 11,327,703 | | 1,746,601 |
Series 2022-180, Class IO, 2.50%, 6/20/2051
| | | 44,550,205 | | 6,645,569 |
See accompanying notes to financial statements.
128
SPDR DOUBLELINE TOTAL RETURN TACTICAL ETF
SCHEDULE OF INVESTMENTS (continued)
June 30, 2023
| Security Description | | | Principal
Amount | | Value |
Series 2022-61, Class EI, 3.00%, 7/20/2051
| | | $ 3,785,030 | | $ 583,952 |
TOTAL U.S. GOVERNMENT AGENCY OBLIGATIONS
(Cost $1,049,387,762)
| | | | | 947,298,501 |
| U.S. TREASURY OBLIGATIONS — 23.6% | | | | | |
U.S. Treasury Bill 4.79%, 12/28/2023
| | | 3,700,000 | | 3,604,206 |
| U.S. Treasury Bonds: | | | | | |
3.63%, 2/15/2053
| | | 347,000,000 | | 333,282,656 |
3.63%, 5/15/2053
| | | 165,000,000 | | 158,657,812 |
| U.S. Treasury Notes: | | | | | |
3.38%, 5/15/2033
| | | 74,500,000 | | 71,857,578 |
3.50%, 2/15/2033
| | | 10,800,000 | | 10,521,563 |
3.63%, 3/31/2028
| | | 11,500,000 | | 11,234,062 |
3.63%, 5/31/2028
| | | 8,700,000 | | 8,510,367 |
3.63%, 3/31/2030
| | | 10,800,000 | | 10,567,125 |
3.75%, 4/15/2026
| | | 23,100,000 | | 22,610,930 |
3.75%, 5/31/2030
| | | 12,800,000 | | 12,624,000 |
3.88%, 3/31/2025
| | | 11,600,000 | | 11,372,531 |
3.88%, 4/30/2025
| | | 18,700,000 | | 18,336,957 |
4.00%, 2/29/2028
| | | 8,700,000 | | 8,637,469 |
4.00%, 6/30/2028
| | | 8,600,000 | | 8,552,969 |
4.13%, 6/15/2026
| | | 14,300,000 | | 14,153,649 |
TOTAL U.S. TREASURY OBLIGATIONS
(Cost $709,204,692)
| | | | | 704,523,874 |
| MORTGAGE-BACKED SECURITIES — 13.7% | | | | | |
American Home Mortgage Investment Trust Series 2007-1, Class GA1C, 1 Month USD LIBOR + 0.19%, 5.34%, 5/25/2047 (b)
| | | 5,185,815 | | 2,922,238 |
| Banc of America Funding Trust: | | | | | |
Series 2006-8T2, Class A4, CMO, 5.83%, 10/25/2036 (e)
| | | 1,713,806 | | 1,441,444 |
Series 2007-5, Class CA1, CMO, 6.00%, 7/25/2037
| | | 3,146,257 | | 2,555,830 |
| BBCMS Mortgage Trust: | | | | | |
Series 2022-C18, Class XD, 2.35%, 12/15/2055 (a) (b)
| | | 12,094,000 | | 1,842,307 |
Series 2023-C19, Class A5, 5.45%, 4/15/2056
| | | 1,700,000 | | 1,725,198 |
BCAP LLC Trust Series 2010-RR4, Class 3212, CMO, 5.81%, 1/26/2037 (a) (b)
| | | 5,736,291 | | 4,486,664 |
| Security Description | | | Principal
Amount | | Value |
| BRAVO Residential Funding Trust: | | | | | |
Series 2022-NQM3, Class A1, 5.11%, 7/25/2062 (a) (b)
| | | $ 3,633,944 | | $ 3,506,816 |
Series 2023-NQM4, Class A1, 6.44%, 5/25/2063 (a) (e)
| | | 12,000,000 | | 11,939,916 |
ChaseFlex Trust Series 2007-3, Class 1A2, CMO , IO, 1 Month USD LIBOR + 0.46%, 5.61%, 7/25/2037 (b)
| | | 7,750,902 | | 2,159,244 |
| CHL Mortgage Pass-Through Trust: | | | | | |
Series 2007-3, Class A1, 6.00%, 4/25/2037
| | | 2,923,760 | | 1,541,888 |
Series 2005-J2, Class 3A14, CMO, 5.50%, 8/25/2035
| | | 690,478 | | 525,664 |
Series 2007-10, Class A4, 5.50%, 7/25/2037
| | | 3,461,521 | | 1,643,612 |
Series 2007-12, Class A9, CMO, 5.75%, 8/25/2037
| | | 2,094,926 | | 1,256,806 |
Series 2007-HYB1, Class 2A1, CMO, 3.78%, 3/25/2037 (b)
| | | 1,001,708 | | 857,460 |
| CIM Trust: | | | | | |
Series 2023-R2, Class A1, 5.50%, 8/25/2064 (a) (b)
| | | 15,971,678 | | 15,709,199 |
Series 2023-R4, Class A1, 5.00%, 5/25/2062 (a) (b)
| | | 9,902,289 | | 9,592,089 |
| Citigroup Mortgage Loan Trust, Inc.: | | | | | |
Series 2007-10, Class 2A2A, CMO, 3.97%, 9/25/2037 (b)
| | | 1,991,030 | | 1,587,097 |
Series 2007-AR4, Class 1A1A, CMO, 4.00%, 3/25/2037 (b)
| | | 1,187,540 | | 983,168 |
Series 2007-AR5, Class 1A2A, CMO, 4.19%, 4/25/2037 (b)
| | | 536,649 | | 450,126 |
Series 2021-JL1, Class A, 2.75%, 2/27/2062 (a) (b)
| | | 844,927 | | 764,676 |
| CitiMortgage Alternative Loan Trust: | | | | | |
Series 2007-A3, Class 1A4, 5.75%, 3/25/2037
| | | 2,800,604 | | 2,229,417 |
Series 2007-A1, Class 1A7, CMO, 6.00%, 1/25/2037
| | | 3,564,717 | | 2,942,529 |
| COLT Mortgage Loan Trust: | | | | | |
Series 2022-2, Class A1, 2.99%, 2/25/2067 (a) (e)
| | | 16,318,196 | | 14,430,078 |
Series 2022-3, Class M1, 4.23%, 2/25/2067 (a) (b)
| | | 10,023,000 | | 7,947,169 |
Series 2023-1, Class A1, 6.05%, 4/25/2068 (a) (e)
| | | 9,630,719 | | 9,487,491 |
See accompanying notes to financial statements.
129
SPDR DOUBLELINE TOTAL RETURN TACTICAL ETF
SCHEDULE OF INVESTMENTS (continued)
June 30, 2023
| Security Description | | | Principal
Amount | | Value |
| Countrywide Alternative Loan Trust: | | | | | |
Series 2005-54CB, Class 1A1, 1 Month USD LIBOR + 0.65%, 5.50%, 11/25/2035 (b)
| | | $ 5,167,252 | | $ 3,813,763 |
Series 2007-16CB, Class 2A1, 1 Month USD LIBOR + 0.45%, 5.60%, 8/25/2037 (b)
| | | 6,562,538 | | 2,492,470 |
Series 2005-21CB, Class A3, CMO, 5.25%, 6/25/2035
| | | 1,611,775 | | 1,261,086 |
Series 2005-79CB, Class A4, CMO, 5.50%, 1/25/2036
| | | 3,124,255 | | 1,919,509 |
Series 2006-24CB, Class A9, CMO, 6.00%, 8/25/2036
| | | 2,525,238 | | 1,492,948 |
Series 2006-43CB, Class 1A12, CMO, 5.75%, 2/25/2037
| | | 2,299,187 | | 1,270,032 |
Series 2006-OA2, Class A1, CMO, 1 Month USD LIBOR + 0.42%, 5.58%, 5/20/2046 (b)
| | | 1,697,060 | | 1,505,773 |
| Credit Suisse Mortgage Capital Certificates: | | | | | |
Series 2019-ICE4, Class A, 1 Month USD LIBOR + 0.98%, 6.17%, 5/15/2036 (a) (b)
| | | 1,685,806 | | 1,674,973 |
Series 2021-RPL9, Class A1, 2.44%, 2/25/2061 (a) (b)
| | | 5,057,421 | | 4,663,673 |
CSMC Mortgage-Backed Trust Series 2006-7, Class 7A7, CMO, 6.00%, 8/25/2036
| | | 1,197,441 | | 1,087,232 |
| CSMC Trust: | | | | | |
Series 2021-JR2, Class A1, 2.22%, 11/25/2061 (a) (b)
| | | 6,864,881 | | 6,514,621 |
Series 2022-JR1, Class A1, 4.27%, 10/25/2066 (a) (e)
| | | 9,516,363 | | 9,089,377 |
Deephaven Residential Mortgage Trust Series 2022-2, Class A1, 4.30%, 3/25/2067 (a) (b)
| | | 4,719,928 | | 4,370,618 |
Deutsche Alt-A Securities Mortgage Loan Trust Series 2007-AR3, Class 1A4, 1 Month USD LIBOR + 0.64%, 5.79%, 6/25/2037 (b)
| | | 3,415,200 | | 2,857,874 |
| Security Description | | | Principal
Amount | | Value |
Ellington Financial Mortgage Trust Series 2022-3, Class A1, 5.00%, 8/25/2067 (a) (e)
| | | $ 5,698,933 | | $ 5,518,035 |
| Federal Home Loan Mortgage Corp. REMICS: | | | | | |
Series 4341, Class AZ, 3.00%, 5/15/2044
| | | 10,502,376 | | 9,207,167 |
Series 4342, Class JZ, 3.00%, 1/15/2045
| | | 3,989,185 | | 3,417,078 |
Series 5319, Class PO, 0.01%, 8/25/2050
| | | 11,645,216 | | 8,002,288 |
| Federal National Mortgage Association REMICS: | | | | | |
Series 2021-57, Class EA, 1.00%, 5/25/2046
| | | 7,243,878 | | 5,734,024 |
Series 2021-9, Class CA, 2.00%, 3/25/2051
| | | 12,389,917 | | 10,241,381 |
| First Horizon Alternative Mortgage Securities Trust: | | | | | |
Series 2007-FA4, Class 1A4, 6.25%, 8/25/2037
| | | 2,727,394 | | 1,172,127 |
Series 2007-FA4, Class 1A7, 6.00%, 8/25/2037
| | | 1,909,491 | | 792,557 |
| Government National Mortgage Association REMICS: | | | | | |
Series 2016-99, Class LA, 2.00%, 11/20/2043
| | | 8,888,356 | | 7,374,873 |
Series 2020-181, Class QI, 3.00%, 12/20/2050
| | | 8,415,914 | | 1,136,517 |
Series 2020-84, Class NT, 1.25%, 6/20/2050
| | | 4,635,201 | | 3,485,540 |
GS Mortgage Securities Trust Series 2023-GS1, Class AS, 4.04%, 11/10/2048 (b)
| | | 1,958,000 | | 1,732,842 |
| GSR Mortgage Loan Trust: | | | | | |
Series 2006-OA1, Class 1A1, CMO, 1 Month USD LIBOR + 0.44%, 5.59%, 8/25/2046 (b)
| | | 13,876,872 | | 3,205,779 |
Series 2007-AR1, Class 2A1, 3.57%, 3/25/2047 (b)
| | | 4,212,393 | | 2,633,057 |
HOMES Trust Series 2023-NQM1, Class A1, 6.18%, 1/25/2068 (a) (e)
| | | 6,675,657 | | 6,612,574 |
IndyMac IMJA Mortgage Loan Trust Series 2007-A4, Class A1, CMO, 6.25%, 2/25/2038
| | | 21,516,182 | | 7,336,798 |
IndyMac INDX Mortgage Loan Trust Series 2006-AR3, Class 3A1B, CMO, 3.29%, 4/25/2036 (b)
| | | 1,150,887 | | 1,042,554 |
See accompanying notes to financial statements.
130
SPDR DOUBLELINE TOTAL RETURN TACTICAL ETF
SCHEDULE OF INVESTMENTS (continued)
June 30, 2023
| Security Description | | | Principal
Amount | | Value |
Legacy Mortgage Asset Trust Series 2020-SL1, Class M, 3.25%, 1/25/2060 (a) (b)
| | | $ 8,492,000 | | $ 7,951,674 |
Lehman XS Trust Series 2006-GP2, Class 1A4, 1 Month USD LIBOR + 0.66%, 4.07%, 6/25/2046 (b)
| | | 5,590,801 | | 4,047,804 |
Luminent Mortgage Trust Series 2007-1, Class 1A1, CMO, 1 Month USD LIBOR + 0.32%, 5.47%, 11/25/2036 (b)
| | | 6,887,166 | | 6,380,923 |
Morgan Stanley Resecuritization Trust Series 2014-R7, Class B2, CMO, 4.03%, 1/26/2051 (a) (b)
| | | 14,550,068 | | 13,484,101 |
Morgan Stanley Residential Mortgage Loan Trust Series 2020-RPL1, Class A1, CMO, VRN, 2.69%, 10/25/2060 (a) (b)
| | | 693,317 | | 644,696 |
NRPL Trust Series 2019-3A, Class A1, CMO, 6.00%, 7/25/2059 (a) (e)
| | | 3,084,555 | | 3,088,383 |
| OBX Trust: | | | | | |
Series 2023-NQM3, Class A1, 5.95%, 2/25/2063 (a) (e)
| | | 4,946,018 | | 4,848,873 |
Series 2023-NQM4, Class A1, 6.11%, 3/25/2063 (a) (e)
| | | 15,837,399 | | 15,657,290 |
| PMT Credit Risk Transfer Trust: | | | | | |
Series 2019-2R, Class A, 1 Month USD LIBOR + 2.75%, 8.93%, 5/30/2025 (a) (b)
| | | 1,233,049 | | 1,233,049 |
Series 2021-1R, Class A, 1 Month USD LIBOR + 2.90%, 8.08%, 2/27/2024 (a) (b)
| | | 864,700 | | 844,501 |
| Preston Ridge Partners Mortgage LLC: | | | | | |
Series 2020-6, Class A1, CMO, 2.36%, 11/25/2025 (a) (e)
| | | 3,041,290 | | 2,906,101 |
Series 2022-1, Class A1, 3.72%, 2/25/2027 (a) (e)
| | | 14,735,804 | | 13,959,092 |
PRPM LLC Series 2022-5, Class A1, 6.90%, 9/27/2027 (a) (e)
| | | 6,183,247 | | 5,973,164 |
RALI Trust Series 2005-QS13, Class 2A4, 5.75%, 9/25/2035
| | | 3,133,247 | | 2,640,524 |
| Security Description | | | Principal
Amount | | Value |
RBSGC Mortgage Loan Trust Series 2007-A, Class 2A2, 6.00%, 1/25/2037
| | | $ 2,602,973 | | $ 2,278,702 |
Residential Accredit Loans, Inc. Trust Series 2005-QA7, Class A22, CMO, 4.87%, 7/25/2035 (b)
| | | 1,807,276 | | 1,702,649 |
Residential Asset Securitization Trust Series 2005-A16, Class A3, 6.00%, 2/25/2036
| | | 3,015,040 | | 1,276,850 |
| Seasoned Credit Risk Transfer Trust: | | | | | |
Series 2019-4, Class MV, 3.00%, 2/25/2059
| | | 15,644,590 | | 13,552,139 |
Series 2020-2, Class MT, CMO, 2.00%, 11/25/2059
| | | 6,312,805 | | 5,152,110 |
Series 2020-3, Class MT, CMO, 2.00%, 5/25/2060
| | | 10,237,285 | | 8,359,649 |
Structured Adjustable Rate Mortgage Loan Trust Series 2006-8, Class 4A3, CMO, 3.25%, 9/25/2036 (b)
| | | 139,362 | | 139,362 |
| Structured Asset Mortgage Investments II Trust: | | | | | |
Series 2007-AR3, Class 1A3, 1 Month USD LIBOR + 0.42%, 5.57%, 9/25/2047 (b)
| | | 7,395,847 | | 5,013,717 |
Series 2004-AR3, Class M, CMO, 1 Month USD LIBOR + 0.68%, 5.82%, 7/19/2034 (b)
| | | 1,026,958 | | 1,002,521 |
TBW Mortgage-Backed Trust Series 2006-6, Class A2B, 6.16%, 1/25/2037 (e)
| | | 10,522,162 | | 3,077,295 |
UBS Commercial Mortgage Trust Series 2018-C8, Class C, 4.84%, 2/15/2051 (b)
| | | 1,969,000 | | 1,629,336 |
| Verus Securitization Trust: | | | | | |
Series 2022-3, Class A1, 4.13%, 2/25/2067 (a) (e)
| | | 17,444,814 | | 15,930,964 |
Series 2023-3, Class A1, 5.93%, 3/25/2068 (a) (e)
| | | 4,951,120 | | 4,884,547 |
Series 2023-4, Class A1, 5.81%, 5/25/2068 (a) (e)
| | | 10,963,211 | | 10,787,262 |
Series 2023-INV1, Class A1, 6.00%, 2/25/2068 (a) (e)
| | | 7,591,463 | | 7,509,337 |
WaMu Mortgage Pass-Through Certificates Trust Series 2006-AR14, Class 1A5, 3.34%, 11/25/2036 (b)
| | | 3,283,615 | | 2,806,436 |
See accompanying notes to financial statements.
131
SPDR DOUBLELINE TOTAL RETURN TACTICAL ETF
SCHEDULE OF INVESTMENTS (continued)
June 30, 2023
| Security Description | | | Principal
Amount | | Value |
| Washington Mutual Mortgage Pass-Through Certificates WMALT Trust: | | | | | |
Series 2006-AR9, Class 2A, 4.82%, 11/25/2046 (b)
| | | $ 2,871,188 | | $ 2,170,096 |
Series 2005-8, Class 2CB1, CMO, 5.50%, 10/25/2035
| | | 671,612 | | 642,345 |
Series 2006-1, Class 4CB, 6.50%, 2/25/2036
| | | 4,724,869 | | 3,665,004 |
Series 2006-5, Class 3A2, CMO, 6.50%, 7/25/2036 (e)
| | | 2,515,439 | | 574,207 |
Series 2007-2, Class 1A3, CMO, 6.00%, 4/25/2037
| | | 3,745,342 | | 2,995,189 |
Series 2007-HY1, Class A3A, CMO, 1 Month USD LIBOR + 0.46%, 5.61%, 2/25/2037 (b)
| | | 4,078,285 | | 2,997,236 |
Wells Fargo Mortgage-Backed Securities Trust Series 2007-AR4, Class A1, CMO, 4.49%, 8/25/2037 (b)
| | | 759,007 | | 747,124 |
TOTAL MORTGAGE-BACKED SECURITIES
(Cost $443,552,256)
| | | | | 409,741,518 |
| COMMERCIAL MORTGAGE BACKED SECURITIES — 3.2% | | | | | |
BAMLL Commercial Mortgage Securities Trust Series 2018-DSNY, Class A, 1 Month USD LIBOR + 0.85%, 6.04%, 9/15/2034 (a) (b)
| | | 720,000 | | 715,089 |
| Bank: | | | | | |
Series 2017-BNK4, Class XA, IO, 1.50%, 5/15/2050 (b)
| | | 24,590,788 | | 977,121 |
Series 2017-BNK6, Class XA, IO, 0.91%, 7/15/2060 (b)
| | | 48,534,085 | | 1,143,101 |
Series 2021-BN35, Class XA, IO, VRN, 1.15%, 6/15/2064 (b)
| | | 9,171,140 | | 522,580 |
| Benchmark Mortgage Trust: | | | | | |
Series 2018-B2, Class C, VRN, 4.43%, 2/15/2051 (b)
| | | 2,545,000 | | 2,029,181 |
Series 2020-B19, Class XA, IO, VRN, 1.88%, 9/15/2053 (b)
| | | 19,919,459 | | 1,433,250 |
| Security Description | | | Principal
Amount | | Value |
Series 2021-B24, Class XA, IO, VRN, 1.27%, 3/15/2054 (b)
| | | $ 3,381,535 | | $ 198,422 |
| BX Commercial Mortgage Trust: | | | | | |
Series 2020-VKNG, Class A, 1 Month USD LIBOR + 1.04%, 6.19%, 10/15/2037 (a) (b)
| | | 1,502,771 | | 1,483,830 |
Series 2021-VOLT, Class E, 1 Month USD LIBOR + 2.00%, 7.19%, 9/15/2036 (a) (b)
| | | 1,923,000 | | 1,814,981 |
Series 2021-XL2, Class E, 1 Month USD LIBOR + 1.85%, 7.04%, 10/15/2038 (a) (b)
| | | 2,670,793 | | 2,545,166 |
BX Trust Series 2019-OC11, Class E, 4.08%, 12/9/2041 (a) (b)
| | | 3,830,000 | | 3,095,250 |
CD Mortgage Trust Series 2017-CD4, Class XA, IO, 1.38%, 5/10/2050 (b)
| | | 13,315,712 | | 467,441 |
CFCRE Commercial Mortgage Trust Series 2016-C4, Class XA, IO, 1.77%, 5/10/2058 (b)
| | | 9,907,343 | | 331,032 |
| Citigroup Commercial Mortgage Trust: | | | | | |
Series 2015-GC27, Class C, VRN, 4.57%, 2/10/2048 (b)
| | | 2,541,000 | | 2,332,368 |
Series 2015-GC27, Class D, 4.57%, 2/10/2048 (a) (b)
| | | 423,700 | | 340,646 |
Series 2015-GC31, Class C, 4.17%, 6/10/2048 (b)
| | | 1,500,000 | | 1,202,062 |
Series 2015-GC33, Class C, 4.73%, 9/10/2058 (b)
| | | 1,500,000 | | 1,250,327 |
Series 2016-GC36, Class XA, IO, 1.37%, 2/10/2049 (b)
| | | 19,327,754 | | 457,316 |
Series 2020-555, Class E, 3.62%, 12/10/2041 (a) (b)
| | | 2,047,000 | | 1,522,296 |
| COMM Mortgage Trust: | | | | | |
Series 2013-CR12, Class XA, IO, 1.20%, 10/10/2046 (b)
| | | 15,237,851 | | 28,860 |
Series 2015-CR22, Class XA, IO, 0.95%, 3/10/2048 (b)
| | | 7,180,630 | | 75,758 |
Series 2015-CR26, Class XA, IO, 1.04%, 10/10/2048 (b)
| | | 18,498,723 | | 279,408 |
See accompanying notes to financial statements.
132
SPDR DOUBLELINE TOTAL RETURN TACTICAL ETF
SCHEDULE OF INVESTMENTS (continued)
June 30, 2023
| Security Description | | | Principal
Amount | | Value |
Series 2015-DC1, Class A5, 3.35%, 2/10/2048
| | | $ 1,767,000 | | $ 1,682,760 |
Series 2015-DC1, Class C, VRN, 4.44%, 2/10/2048 (b)
| | | 644,000 | | 547,628 |
Series 2015-DC1, Class XA, IO, 1.12%, 2/10/2048 (b)
| | | 5,942,336 | | 62,471 |
Series 2016-DC2, Class XA, IO, 1.08%, 2/10/2049 (b)
| | | 14,344,150 | | 261,903 |
Series 2017-PANW, Class E, 4.13%, 10/10/2029 (a) (b)
| | | 2,316,000 | | 2,073,748 |
| CSAIL Commercial Mortgage Trust: | | | | | |
Series 2015-C2, Class AS, 3.85%, 6/15/2057 (b)
| | | 900,000 | | 840,043 |
Series 2015-C4, Class XA, IO, 0.95%, 11/15/2048 (b)
| | | 31,230,808 | | 449,037 |
Series 2017-CX10, Class XA, IO, 0.89%, 11/15/2050 (b)
| | | 54,904,754 | | 1,298,819 |
Series 2019-C17, Class XA, IO, VRN, 1.49%, 9/15/2052 (b)
| | | 29,755,375 | | 1,633,550 |
| CSMC Trust: | | | | | |
Series 2017-TIME, Class A, 3.65%, 11/13/2039 (a)
| | | 2,977,000 | | 2,434,944 |
Series 2020-NET, Class A, 2.26%, 8/15/2037 (a)
| | | 2,384,659 | | 2,129,956 |
Series 2021-B33, Class A1, 3.05%, 10/10/2043 (a)
| | | 632,000 | | 539,581 |
Series 2021-B33, Class A2, 3.17%, 10/10/2043 (a)
| | | 2,250,000 | | 1,724,986 |
DOLP Trust Series 2021-NYC, Class E, VRN, 3.70%, 5/10/2041 (a) (b)
| | | 1,000,000 | | 610,059 |
Grace Trust Series 2020-GRCE, Class D, VRN, 2.77%, 12/10/2040 (a) (b)
| | | 1,147,000 | | 798,661 |
| Great Wolf Trust: | | | | | |
Series 2019-WOLF, Class E, 1 Month USD LIBOR + 2.85%, 7.99%, 12/15/2036 (a) (b)
| | | 100,000 | | 97,176 |
Series 2019-WOLF, Class F, 1 Month USD LIBOR + 3.25%, 8.39%, 12/15/2036 (a) (b)
| | | 100,000 | | 95,585 |
| Security Description | | | Principal
Amount | | Value |
| GS Mortgage Securities Corp Trust: | | | | | |
Series 2018-TWR, Class A, 1 Month USD LIBOR + 1.15%, 6.34%, 7/15/2031 (a) (b)
| | | $ 283,000 | | $ 271,456 |
Series 2018-TWR, Class D, 1 Month USD LIBOR + 1.85%, 7.04%, 7/15/2031 (a) (b)
| | | 650,000 | | 441,865 |
Series 2018-TWR, Class E, 1 Month USD LIBOR + 2.35%, 7.54%, 7/15/2031 (a) (b)
| | | 650,000 | | 415,875 |
Series 2018-TWR, Class F, 1 Month USD LIBOR + 3.05%, 8.24%, 7/15/2031 (a) (b)
| | | 650,000 | | 389,885 |
Series 2018-TWR, Class G, 1 Month USD LIBOR + 4.17%, 9.37%, 7/15/2031 (a) (b)
| | | 650,000 | | 354,147 |
| GS Mortgage Securities Trust: | | | | | |
Series 2014-GC20, Class A5, 4.00%, 4/10/2047
| | | 1,774,000 | | 1,744,867 |
Series 2014-GC24, Class XA, IO, 0.83%, 9/10/2047 (b)
| | | 24,571,680 | | 144,823 |
Series 2014-GC26, Class A5, 3.63%, 11/10/2047
| | | 1,749,000 | | 1,680,829 |
Series 2015-GC32, Class XA, IO, 0.85%, 7/10/2048 (b)
| | | 20,629,542 | | 237,557 |
Series 2015-GC34, Class XA, IO, 1.36%, 10/10/2048 (b)
| | | 14,589,247 | | 314,396 |
Series 2015-GS1, Class XA, IO, 0.90%, 11/10/2048 (b)
| | | 25,024,438 | | 368,463 |
Series 2016-GS3, Class XA, IO, 1.32%, 10/10/2049 (b)
| | | 23,525,652 | | 696,164 |
Series 2017-GS7, Class XA, IO, 1.23%, 8/10/2050 (b)
| | | 38,578,465 | | 1,259,316 |
| JP Morgan Chase Commercial Mortgage Securities Trust: | | | | | |
Series 2014-C20, Class B, 4.40%, 7/15/2047 (b)
| | | 3,000,000 | | 2,658,269 |
Series 2015-JP1, Class XA, IO, 1.05%, 1/15/2049 (b)
| | | 14,725,563 | | 261,616 |
Series 2016-JP3, Class B, VRN, 3.40%, 8/15/2049 (b)
| | | 2,899,000 | | 2,392,058 |
See accompanying notes to financial statements.
133
SPDR DOUBLELINE TOTAL RETURN TACTICAL ETF
SCHEDULE OF INVESTMENTS (continued)
June 30, 2023
| Security Description | | | Principal
Amount | | Value |
Series 2022-NLP, Class A, 1 Month USD LIBOR + 0.60%, 5.74%, 4/15/2037 (a) (b)
| | | $ 2,359,019 | | $ 2,161,487 |
| JPMBB Commercial Mortgage Securities Trust: | | | | | |
Series 2014-C23, Class A4, 3.67%, 9/15/2047
| | | 1,700,301 | | 1,649,962 |
Series 2014-C21, Class B, VRN, 4.34%, 8/15/2047 (b)
| | | 1,055,000 | | 959,746 |
Series 2014-C25, Class XA, IO, 0.95%, 11/15/2047 (b)
| | | 4,456,886 | | 33,025 |
Series 2015-C28, Class XA, IO, 1.06%, 10/15/2048 (b)
| | | 7,822,300 | | 85,158 |
Series 2015-C30, Class XA, IO, 0.57%, 7/15/2048 (b)
| | | 21,709,961 | | 144,775 |
Series 2015-C32, Class C, 4.81%, 11/15/2048 (b)
| | | 1,132,000 | | 858,902 |
JPMDB Commercial Mortgage Securities Trust Series 2016-C2, Class XA, IO, 1.63%, 6/15/2049 (b)
| | | 15,498,986 | | 474,785 |
LoanCore Issuer Ltd. Series 2019-CRE2, Class AS, 1 Month USD LIBOR + 1.50%, 6.69%, 5/15/2036 (a) (b)
| | | 1,936,278 | | 1,898,921 |
LSTAR Commercial Mortgage Trust Series 2017-5, Class X, IO, 0.95%, 3/10/2050 (a) (b)
| | | 34,547,384 | | 602,109 |
| Manhattan West Mortgage Trust: | | | | | |
Series 2020-1MW, Class C, VRN, 2.41%, 9/10/2039 (a) (b)
| | | 2,462,000 | | 2,032,353 |
Series 2020-1MW, Class D, VRN, 2.41%, 9/10/2039 (a) (b)
| | | 2,462,000 | | 1,993,987 |
Med Trust Series 2021-MDLN, Class G, 1 Month USD LIBOR + 5.25%, 10.44%, 11/15/2038 (a) (b)
| | | 2,850,321 | | 2,649,809 |
| Morgan Stanley Bank of America Merrill Lynch Trust: | | | | | |
Series 2013-C12, Class XA, IO, 0.79%, 10/15/2046 (b)
| | | 6,106,177 | | 238 |
Series 2015-C20, Class C, 4.60%, 2/15/2048 (b)
| | | 500,000 | | 453,920 |
Series 2016-C28, Class XA, IO, 1.31%, 1/15/2049 (b)
| | | 17,935,707 | | 393,643 |
| Security Description | | | Principal
Amount | | Value |
Series 2016-C30, Class XA, IO, 1.48%, 9/15/2049 (b)
| | | $ 16,786,464 | | $ 525,647 |
Series 2016-C31, Class C, 4.41%, 11/15/2049 (b)
| | | 3,358,000 | | 2,576,527 |
| Morgan Stanley Capital I Trust: | | | | | |
Series 2015-UBS8, Class XA, IO, 1.00%, 12/15/2048 (b)
| | | 22,205,837 | | 352,740 |
Series 2016-UB12, Class XA, IO, 0.79%, 12/15/2049 (b)
| | | 47,026,853 | | 845,744 |
Series 2019-L3, Class XA, IO, 0.76%, 11/15/2052 (b)
| | | 55,585,625 | | 1,801,721 |
One New York Plaza Trust Series 2020-1NYP, Class C, 1 Month USD LIBOR + 2.20%, 7.39%, 1/15/2036 (a) (b)
| | | 1,599,000 | | 1,439,386 |
SG Commercial Mortgage Securities Trust Series 2016-C5, Class B, 3.93%, 10/10/2048
| | | 450,000 | | 363,597 |
| SLG Office Trust: | | | | | |
Series 2021-OVA, Class E, 2.85%, 7/15/2041 (a)
| | | 1,989,000 | | 1,422,893 |
Series 2021-OVA, Class F, 2.85%, 7/15/2041 (a)
| | | 1,989,000 | | 1,355,048 |
SREIT Trust Series 2021-MFP, Class D, 1 Month USD LIBOR + 1.58%, 6.77%, 11/15/2038 (a) (b)
| | | 2,864,000 | | 2,747,599 |
| UBS Commercial Mortgage Trust: | | | | | |
Series 2017-C1, Class XA, IO, 1.69%, 6/15/2050 (b)
| | | 17,138,615 | | 742,961 |
Series 2017-C4, Class XA, IO, 1.24%, 10/15/2050 (b)
| | | 20,190,449 | | 698,156 |
Velocity Commercial Capital Loan Trust Series 2020-1, Class M3, VRN, 3.19%, 2/25/2050 (a) (b)
| | | 2,187,753 | | 1,747,497 |
Waterfall Commercial Mortgage Trust Series 2015-SBC5, Class A, 4.10%, 9/14/2022 (a) (b)
| | | 798,717 | | 756,235 |
| Wells Fargo Commercial Mortgage Trust: | | | | | |
Series 2015-C26, Class XA, IO, 1.32%, 2/15/2048 (b)
| | | 6,781,930 | | 87,795 |
Series 2015-LC20, Class XA, IO, 1.42%, 4/15/2050 (b)
| | | 6,100,278 | | 80,149 |
See accompanying notes to financial statements.
134
SPDR DOUBLELINE TOTAL RETURN TACTICAL ETF
SCHEDULE OF INVESTMENTS (continued)
June 30, 2023
| Security Description | | | Principal
Amount | | Value |
Series 2015-NXS1, Class XA, IO, 1.21%, 5/15/2048 (b)
| | | $ 6,642,481 | | $ 86,217 |
Series 2015-NXS2, Class XA, IO, 0.74%, 7/15/2058 (b)
| | | 20,891,766 | | 189,613 |
Series 2015-P2, Class XA, IO, 1.08%, 12/15/2048 (b)
| | | 14,043,616 | | 247,388 |
Series 2016-BNK1, Class XB, IO, VRN, 1.46%, 8/15/2049 (b)
| | | 19,849,000 | | 664,888 |
Series 2016-C33, Class XA, IO, 1.73%, 3/15/2059 (b)
| | | 10,469,066 | | 337,644 |
Series 2016-C35, Class B, 3.44%, 7/15/2048
| | | 3,000,000 | | 2,528,635 |
Series 2017-C38, Class XA, IO, 1.11%, 7/15/2050 (b)
| | | 33,726,426 | | 987,978 |
Series 2017-RC1, Class XA, IO, 1.55%, 1/15/2060 (b)
| | | 15,703,951 | | 633,745 |
| WFRBS Commercial Mortgage Trust: | | | | | |
Series 2014-C19, Class XA, IO, 1.11%, 3/15/2047 (b)
| | | 5,593,719 | | 14,441 |
Series 2014-C21, Class XA, IO, 1.15%, 8/15/2047 (b)
| | | 12,439,671 | | 84,600 |
TOTAL COMMERCIAL MORTGAGE BACKED SECURITIES
(Cost $154,359,936)
| | | | | 94,869,642 |
| | | Shares | |
| SHORT-TERM INVESTMENT — 1.0% | | | |
State Street Institutional U.S. Government Money Market Fund, Class G Shares 5.07% (j) (k)
(Cost $30,238,919)
| | 30,238,919 | 30,238,919 |
TOTAL INVESTMENTS — 99.8%
(Cost $3,252,991,871)
| | | 2,981,408,112 |
OTHER ASSETS IN EXCESS OF LIABILITIES — 0.2%
| | | 6,032,201 |
NET ASSETS — 100.0%
| | | $ 2,987,440,313 |
| (a) | Securities purchased pursuant to Rule 144A of the Securities Act of 1933, as amended. These securities, which represent 23.7% of net assets as of June 30, 2023, are considered liquid and may be resold in transactions exempt from registration, normally to qualified institutional buyers. |
| (b) | Variable Rate Security - Interest rate shown is rate in effect at June 30, 2023. For securities based on a published reference rate and spread, the reference rate and spread are indicated in the description above. |
| (c) | Amount is less than 0.05% of net assets. |
| (d) | Security is currently in default and/or issuer is in bankruptcy. |
| (e) | Step-up bond - Coupon rate increases in increments to maturity. Rate shown as of June 30, 2023. Maturity date shown is the final maturity. |
| (f) | Non-income producing security. |
| (g) | Fair valued as determined in good faith by the Trust's Oversight Committee in accordance with policy and procedures approved by the Board of Trustees. Security value is determined based on Level 3 inputs. As of June 30, 2023, total aggregate fair value of this security is $357, representing less than 0.05% of the Fund's net assets. |
| (h) | Reflects separate holdings of the issuer's common stock traded on different securities exchanges. |
| (i) | Position is unsettled. Contract rate was not determined at June 30, 2023 and does not take effect until settlement date. Maturity date is not finalized until settlement date. |
| (j) | The Fund invested in certain money market funds managed by SSGA Funds Management, Inc. Amounts related to these transactions during the period ended June 30, 2023 are shown in the Affiliate Table below. |
| (k) | The rate shown is the annualized seven-day yield at June 30, 2023. |
| ABS | Asset-Backed Security |
| CLO | Collateralized Loan Obligation |
| CMO | Collateralized Mortgage Obligation |
| CMT | Constant Maturity Treasury |
| EMTN | Euro Medium Term Note |
| GMTN | Global Medium Term Note |
| IO | Interest Only |
| LIBOR | London Interbank Offered Rate |
| MTN | Medium Term Note |
| PIK | Payment in Kind |
| PO | Principal Only |
| REIT | Real Estate Investment Trust |
| REMIC | Real Estate Mortgage Investment Conduit |
| SOFR | Secured Overnight Financing Rate |
| VRN | Variable Rate Note |
See accompanying notes to financial statements.
135
SPDR DOUBLELINE TOTAL RETURN TACTICAL ETF
SCHEDULE OF INVESTMENTS (continued)
June 30, 2023
At June 30, 2023, the Fund had unfunded loan commitments of $37,658, which could be extended at the option of the borrowers, pursuant to the following loan agreements:
| Borrower | | Unfunded Loan
Commitment ($) | | Value ($) | | Unrealized
Appreciation/(Depreciation) ($) |
| Pediatric Associates Holding Company, LLC | | 4,836 | | 4,742 | | (94) |
| Athenahealth Group, Inc. | | 32,822 | | 31,673 | | (1,149) |
| | | $37,658 | | $36,415 | | $(1,243) |
The following table summarizes the value of the Fund's investments according to the fair value hierarchy as of June 30, 2023.
| Description | | Level 1 –
Quoted Prices | | Level 2 –
Other Significant
Observable Inputs | | Level 3 –
Significant
Unobservable Inputs | | Total |
| ASSETS: | | | | | | | | |
| INVESTMENTS: | | | | | | | | |
Corporate Bonds & Notes
| | $ — | | $ 381,946,960 | | $ — | | $ 381,946,960 |
Asset-Backed Securities
| | — | | 348,108,635 | | — | | 348,108,635 |
Foreign Government Obligations
| | — | | 12,855,176 | | — | | 12,855,176 |
U.S. Government Agency Obligations
| | — | | 947,298,501 | | — | | 947,298,501 |
U.S. Treasury Obligations
| | — | | 704,523,874 | | — | | 704,523,874 |
Mortgage-Backed Securities
| | — | | 408,508,469 | | — | | 409,741,518 |
Commercial Mortgage Backed Securities
| | — | | 94,869,642 | | — | | 94,869,642 |
Common Stocks
| | 15,733 | | 1,880 | | 357 | | 17,970 |
Senior Floating Rate Loans
| | — | | 51,806,917 | | — | | 51,806,917 |
Short-Term Investment
| | 30,238,919 | | — | | — | | 30,238,919 |
TOTAL INVESTMENTS
| | $30,254,652 | | $2,949,920,054 | | $357 | | $2,981,408,112 |
| OTHER FINANCIAL INSTRUMENTS: | | | | | | | | |
Unfunded Loans - Unrealized Depreciation
| | $ — | | $ (1,243) | | $ — | | $ (1,243) |
TOTAL OTHER FINANCIAL INSTRUMENTS:
| | $ — | | $ (1,243) | | $ — | | $ (1,243) |
Affiliate Table
| | Number of
Shares Held
at
6/30/22 | | Value at
6/30/22 | | Cost of
Purchases | | Proceeds
from
Shares Sold | | Realized
Gain (Loss) | | Change in
Unrealized
Appreciation/
Depreciation | | Number of
Shares Held
at
6/30/23 | | Value at
6/30/23 | | Dividend
Income |
State Street Institutional U.S. Government Money Market Fund, Class G Shares
| 78,929,216 | | $78,929,216 | | $1,128,464,721 | | $1,177,155,018 | | $— | | $— | | 30,238,919 | | $30,238,919 | | $3,050,003 |
See accompanying notes to financial statements.
136
[This Page Intentionally Left Blank]
SSGA ACTIVE TRUST
STATEMENTS OF ASSETS AND LIABILITIES
June 30, 2023
| | SPDR SSGA Multi-Asset Real Return ETF | | SPDR SSGA Income Allocation ETF | | SPDR SSGA Global Allocation ETF |
| ASSETS | | | | | |
Investments in unaffiliated issuers, at value*
| $ 105,174,455 | | $ 9,468,061 | | $ — |
Investments in affiliated issuers, at value
| 461,156,630 | | 67,671,459 | | 271,138,183 |
Total Investments
| 566,331,085 | | 77,139,520 | | 271,138,183 |
Foreign currency, at value
| — | | — | | — |
Net cash at broker
| — | | — | | — |
Cash
| 352 | | — | | — |
Receivable from broker — accumulated variation margin on futures contracts
| — | | — | | — |
Receivable for investments sold
| — | | — | | — |
Receivable for fund shares sold
| — | | — | | — |
Dividends receivable — unaffiliated issuers
| — | | — | | — |
Dividends receivable — affiliated issuers
| 96,072 | | 6,025 | | 259,272 |
Interest receivable — unaffiliated issuers
| — | | — | | — |
Securities lending income receivable — unaffiliated issuers
| 632 | | 5,378 | | 250 |
Securities lending income receivable — affiliated issuers
| 12,772 | | 6,901 | | 31,806 |
Receivable for foreign taxes recoverable
| — | | — | | — |
Other receivable
| — | | — | | — |
TOTAL ASSETS
| 566,440,913 | | 77,157,824 | | 271,429,511 |
| LIABILITIES | | | | | |
Due to custodian
| — | | — | | — |
Payable upon return of securities loaned
| 32,724,798 | | 5,978,695 | | 41,508,999 |
Payable for investments purchased
| — | | — | | — |
Payable for fund shares repurchased
| 36,885 | | — | | — |
Payable to broker – accumulated variation margin on open futures contracts
| — | | — | | — |
Payable for accumulated variation margin on swap contracts
| — | | — | | — |
Advisory fee payable
| 45,564 | | 5,545 | | 29,869 |
Trustees’ fees and expenses payable
| 230 | | 37 | | 102 |
TOTAL LIABILITIES
| 32,807,477 | | 5,984,277 | | 41,538,970 |
NET ASSETS
| $ 533,633,436 | | $ 71,173,547 | | $229,890,541 |
| NET ASSETS CONSIST OF: | | | | | |
Paid-in Capital
| $ 636,513,554 | | $ 94,932,994 | | $227,127,850 |
Total distributable earnings (loss)
| (102,880,118) | | (23,759,447) | | 2,762,691 |
NET ASSETS
| $ 533,633,436 | | $ 71,173,547 | | $229,890,541 |
| NET ASSET VALUE PER SHARE | | | | | |
Net asset value per share
| $ 26.64 | | $ 30.29 | | $ 39.98 |
Shares outstanding (unlimited amount authorized, $0.01 par value)
| 20,030,000 | | 2,350,000 | | 5,750,000 |
| COST OF INVESTMENTS: | | | | | |
Investments in unaffiliated issuers
| $ 131,221,210 | | $ 10,652,255 | | $ — |
Investments in affiliated issuers
| 474,344,143 | | 72,234,288 | | 255,392,233 |
Total cost of investments
| $ 605,565,353 | | $ 82,886,543 | | $255,392,233 |
Foreign currency, at cost
| $ — | | $ — | | $ — |
* Includes investments in securities on loan, at value
| $ 33,996,738 | | $ 17,067,582 | | $ 43,391,568 |
See accompanying notes to financial statements.
138
| SPDR SSGA Ultra Short Term Bond ETF | | SPDR Loomis Sayles Opportunistic Bond ETF | | SPDR Nuveen Municipal Bond ETF | | SPDR Nuveen Municipal Bond ESG ETF |
| | | | | | | |
| $500,602,101 | | $27,185,478 | | $42,421,864 | | $ 36,354,511 |
| 49,808,408 | | 1,554,320 | | 167,594 | | 263,694 |
| 550,410,509 | | 28,739,798 | | 42,589,458 | | 36,618,205 |
| — | | 2,026 | | — | | — |
| 497,309 | | 904,039 | | — | | — |
| 1,129 | | — | | — | | — |
| — | | 9,070 | | — | | — |
| — | | 249,221 | | — | | — |
| 2,011,291 | | — | | — | | — |
| — | | — | | 492,931 | | — |
| 152,611 | | 1,756 | | 3,142 | | 2,846 |
| 3,180,521 | | 341,422 | | — | | 432,177 |
| — | | — | | — | | — |
| — | | — | | — | | — |
| — | | 2,396 | | — | | — |
| 603 | | — | | — | | — |
| 556,253,973 | | 30,249,728 | | 43,085,531 | | 37,053,228 |
| | | | | | | |
| — | | 3,546 | | — | | — |
| — | | — | | — | | — |
| 2,497,500 | | 719,922 | | — | | 250,000 |
| — | | — | | — | | — |
| 295,115 | | — | | — | | — |
| — | | 35,473 | | — | | — |
| 90,937 | | 13,354 | | 14,127 | | 12,964 |
| 150 | | 13 | | 16 | | 14 |
| 2,883,702 | | 772,308 | | 14,143 | | 262,978 |
| $553,370,271 | | $29,477,420 | | $43,071,388 | | $36,790,250 |
| | | | | | | |
| $555,270,880 | | $34,648,829 | | $46,527,295 | | $37,353,464 |
| (1,900,609) | | (5,171,409) | | (3,455,907) | | (563,214) |
| $553,370,271 | | $29,477,420 | | $43,071,388 | | $36,790,250 |
| | | | | | | |
| $ 40.25 | | $ 25.63 | | $ 26.92 | | $ 29.43 |
| 13,750,000 | | 1,150,000 | | 1,600,000 | | 1,250,000 |
| | | | | | | |
| $503,896,216 | | $28,136,278 | | $44,464,808 | | $36,724,757 |
| 49,808,408 | | 1,546,219 | | 167,594 | | 263,694 |
| $553,704,624 | | $29,682,497 | | $44,632,402 | | $36,988,451 |
| $ — | | $ 2,036 | | $ — | | $ — |
| $ — | | $ — | | $ — | | $ — |
SSGA ACTIVE TRUST
STATEMENTS OF ASSETS AND LIABILITIES (continued)
June 30, 2023
| | SPDR SSGA Fixed Income Sector Rotation ETF | | SPDR SSGA US Sector Rotation ETF | | SPDR DoubleLine Emerging Markets Fixed Income ETF |
| ASSETS | | | | | |
Investments in unaffiliated issuers, at value*
| $ — | | $ — | | $ 76,059,929 |
Investments in affiliated issuers, at value
| 227,868,269 | | 390,759,491 | | 2,452,803 |
Total Investments
| 227,868,269 | | 390,759,491 | | 78,512,732 |
Foreign currency, at value
| — | | — | | — |
Cash
| — | | — | | 576,238 |
Receivable for investments sold
| — | | — | | — |
Receivable for fund shares sold
| — | | — | | — |
Dividends receivable — affiliated issuers
| 1,285 | | 1,021 | | 10,670 |
Interest receivable — unaffiliated issuers
| — | | — | | 1,016,309 |
Securities lending income receivable — unaffiliated issuers
| 916 | | 452 | | — |
Securities lending income receivable — affiliated issuers
| 32,805 | | 27,461 | | — |
Receivable from Adviser
| 25,722 | | 43,115 | | — |
Other receivable
| — | | — | | — |
TOTAL ASSETS
| 227,928,997 | | 390,831,540 | | 80,115,949 |
| LIABILITIES | | | | | |
Due to custodian
| — | | — | | 84 |
Payable upon return of securities loaned
| 48,283,244 | | 91,543,951 | | — |
Payable for investments purchased
| — | | — | | 542,133 |
Unrealized depreciation on unfunded loan commitments
| — | | — | | — |
Advisory fee payable
| 73,835 | | 163,141 | | 42,137 |
Trustees’ fees and expenses payable
| 54 | | 95 | | 28 |
TOTAL LIABILITIES
| 48,357,133 | | 91,707,187 | | 584,382 |
NET ASSETS
| $179,571,864 | | $299,124,353 | | $ 79,531,567 |
| NET ASSETS CONSIST OF: | | | | | |
Paid-in Capital
| $202,174,361 | | $289,216,900 | | $ 95,231,527 |
Total distributable earnings (loss)
| (22,602,497) | | 9,907,453 | | (15,699,960) |
NET ASSETS
| $179,571,864 | | $299,124,353 | | $ 79,531,567 |
| NET ASSET VALUE PER SHARE | | | | | |
Net asset value per share
| $ 25.87 | | $ 43.35 | | $ 40.79 |
Shares outstanding (unlimited amount authorized, $0.01 par value)
| 6,940,000 | | 6,900,000 | | 1,950,000 |
| COST OF INVESTMENTS: | | | | | |
Investments in unaffiliated issuers
| $ — | | $ — | | $ 86,149,318 |
Investments in affiliated issuers
| 231,853,147 | | 363,068,942 | | 2,452,803 |
Total cost of investments
| $231,853,147 | | $363,068,942 | | $ 88,602,121 |
Foreign currency, at cost
| $ — | | $ — | | $ — |
* Includes investments in securities on loan, at value
| $ 49,580,901 | | $ 95,360,242 | | $ — |
See accompanying notes to financial statements.
140
| SPDR DoubleLine Short Duration Total Return Tactical ETF | | SPDR DoubleLine Total Return Tactical ETF |
| | | |
| $ 123,110,685 | | $2,951,169,193 |
| 3,869,754 | | 30,238,919 |
| 126,980,439 | | 2,981,408,112 |
| — | | 289 |
| 23,174 | | 249,792 |
| 17,997 | | 52,674,042 |
| — | | 10,083,414 |
| 12,670 | | 144,397 |
| 804,927 | | 21,166,556 |
| — | | — |
| — | | — |
| — | | — |
| — | | 9,880 |
| 127,839,207 | | 3,065,736,482 |
| | | |
| 33 | | — |
| — | | — |
| 161,301 | | 76,967,053 |
| — | | 1,243 |
| 46,985 | | 1,326,979 |
| 56 | | 894 |
| 208,375 | | 78,296,169 |
| $127,630,832 | | $2,987,440,313 |
| | | |
| $137,665,039 | | $3,535,673,060 |
| (10,034,207) | | (548,232,747) |
| $127,630,832 | | $2,987,440,313 |
| | | |
| $ 46.41 | | $ 40.45 |
| 2,750,000 | | 73,850,000 |
| | | |
| $128,796,555 | | $3,222,752,952 |
| 3,869,754 | | 30,238,919 |
| $132,666,309 | | $3,252,991,871 |
| $ — | | $ 278 |
| $ — | | $ — |
SSGA ACTIVE TRUST
STATEMENTS OF OPERATIONS
For the Year Ended June 30, 2023
| | SPDR SSGA Multi-Asset Real Return ETF | | SPDR SSGA Income Allocation ETF | | SPDR SSGA Global Allocation ETF |
| INVESTMENT INCOME | | | | | |
Interest income — unaffiliated issuers
| $ — | | $ — | | $ — |
Dividend income — unaffiliated issuers
| 16,150,805 | | 197,003 | | 873,969 |
Dividend income — affiliated issuers
| 16,414,506 | | 3,534,661 | | 6,169,407 |
Unaffiliated securities lending income
| 68,073 | | 70,346 | | 23,217 |
Affiliated securities lending income
| 199,469 | | 241,690 | | 444,225 |
Foreign taxes withheld
| — | | — | | — |
TOTAL INVESTMENT INCOME (LOSS)
| 32,832,853 | | 4,043,700 | | 7,510,818 |
| EXPENSES | | | | | |
Advisory fee
| 547,405 | | 69,462 | | 247,697 |
Trustees’ fees and expenses
| 6,271 | | 1,044 | | 2,799 |
Proxy voting expenses
| 34,087 | | 3,990 | | 10,173 |
Miscellaneous expenses
| 270 | | 42 | | 112 |
TOTAL EXPENSES
| 588,033 | | 74,538 | | 260,781 |
NET INVESTMENT INCOME (LOSS)
| $ 32,244,820 | | $ 3,969,162 | | $ 7,250,037 |
| REALIZED AND UNREALIZED GAIN (LOSS) | | | | | |
| Net realized gain (loss) on: | | | | | |
Investments — unaffiliated issuers
| (6,532,514) | | (1,349,009) | | (435,565) |
Investments — affiliated issuers
| (13,382,775) | | (6,991,262) | | (11,160,291) |
In-kind redemptions — unaffiliated issuers
| 693,072 | | 64,302 | | 348,112 |
In-kind redemptions — affiliated issuers
| 12,122,716 | | 563,177 | | 4,752,224 |
Forward foreign currency exchange contracts
| — | | — | | — |
Foreign currency transactions
| — | | — | | — |
Futures contracts
| — | | — | | — |
Swap contracts
| — | | — | | — |
Net realized gain (loss)
| (7,099,501) | | (7,712,792) | | (6,495,520) |
| Net change in unrealized appreciation/depreciation on: | | | | | |
Investments — unaffiliated issuers
| (29,027,578) | | 497,416 | | (1,569,618) |
Investments — affiliated issuers
| 7,353,816 | | 5,885,551 | | 21,079,762 |
Forward foreign currency exchange contracts
| — | | — | | — |
Foreign currency translations
| — | | — | | — |
Futures contracts
| — | | — | | — |
Swap contracts
| — | | — | | — |
Net change in unrealized appreciation/depreciation
| (21,673,762) | | 6,382,967 | | 19,510,144 |
NET REALIZED AND UNREALIZED GAIN (LOSS)
| (28,773,263) | | (1,329,825) | | 13,014,624 |
NET INCREASE (DECREASE) IN NET ASSETS FROM OPERATIONS
| $ 3,471,557 | | $ 2,639,337 | | $ 20,264,661 |
See accompanying notes to financial statements.
142
| SPDR SSGA Ultra Short Term Bond ETF | | SPDR Loomis Sayles Opportunistic Bond ETF | | SPDR Nuveen Municipal Bond ETF | | SPDR Nuveen Municipal Bond ESG ETF | | SPDR SSGA Fixed Income Sector Rotation ETF | | SPDR SSGA US Sector Rotation ETF | | SPDR DoubleLine Emerging Markets Fixed Income ETF |
| | | | | | | | | | | | | |
| $15,160,194 | | $ 1,853,245 | | $ 849,095 | | $1,022,666 | | $ — | | $ — | | $ 3,690,845 |
| — | | — | | — | | — | | — | | — | | — |
| 1,091,063 | | 104,055 | | 72,627 | | 51,961 | | 3,975,217 | | 4,273,640 | | 100,724 |
| — | | — | | — | | — | | 17,137 | | 39,169 | | — |
| — | | — | | — | | — | | 305,592 | | 229,631 | | — |
| — | | — | | — | | — | | — | | — | | (2,892) |
| 16,251,257 | | 1,957,300 | | 921,722 | | 1,074,627 | | 4,297,946 | | 4,542,440 | | 3,788,677 |
| | | | | | | | | | | | | |
| 856,882 | | 166,896 | | 159,950 | | 151,146 | | 509,254 | | 1,326,079 | | 471,259 |
| 4,516 | | 402 | | 468 | | 430 | | 1,532 | | 2,655 | | 874 |
| 13,837 | | 1,228 | | 1,529 | | 1,382 | | 5,276 | | 9,240 | | 2,996 |
| 194 | | — | | — | | — | | 66 | | 111 | | — |
| 875,429 | | 168,526 | | 161,947 | | 152,958 | | 516,128 | | 1,338,085 | | 475,129 |
| $15,375,828 | | $ 1,788,774 | | $ 759,775 | | $ 921,669 | | $ 3,781,818 | | $ 3,204,355 | | $ 3,313,548 |
| | | | | | | | | | | | | |
| | | | | | | | | | | | | |
| (916,335) | | (2,122,869) | | (1,181,504) | | (88,163) | | — | | (3,581,797) | | (5,095,150) |
| — | | (19,020) | | — | | 485 | | (12,445,559) | | (13,683,523) | | — |
| — | | (122,007) | | — | | — | | — | | 3,581,800 | | — |
| — | | — | | — | | — | | (85,067) | | 397,980 | | — |
| — | | (1,704) | | — | | — | | — | | — | | — |
| — | | 8,801 | | — | | — | | — | | — | | — |
| 2,086,475 | | (710,768) | | — | | — | | — | | — | | — |
| — | | (123,401) | | — | | — | | — | | — | | — |
| 1,170,140 | | (3,090,968) | | (1,181,504) | | (87,678) | | (12,530,626) | | (13,285,540) | | (5,095,150) |
| | | | | | | | | | | | | |
| 2,042,516 | | 2,510,334 | | 1,363,270 | | 106,492 | | — | | — | | 4,727,940 |
| — | | 8,101 | | — | | (31) | | 5,722,938 | | 47,025,282 | | — |
| — | | (2,566) | | — | | — | | — | | — | | — |
| — | | (31) | | — | | — | | — | | — | | — |
| (419,791) | | 24,090 | | — | | — | | — | | — | | — |
| — | | (16,281) | | — | | — | | — | | — | | — |
| 1,622,725 | | 2,523,647 | | 1,363,270 | | 106,461 | | 5,722,938 | | 47,025,282 | | 4,727,940 |
| 2,792,865 | | (567,321) | | 181,766 | | 18,783 | | (6,807,688) | | 33,739,742 | | (367,210) |
| $18,168,693 | | $ 1,221,453 | | $ 941,541 | | $ 940,452 | | $ (3,025,870) | | $ 36,944,097 | | $ 2,946,338 |
SSGA ACTIVE TRUST
STATEMENTS OF OPERATIONS (continued)
For the Year Ended June 30, 2023
| | SPDR DoubleLine Short Duration Total Return Tactical ETF | | SPDR DoubleLine Total Return Tactical ETF |
| INVESTMENT INCOME | | | |
Interest income — unaffiliated issuers
| $ 5,010,028 | | $ 111,662,448 |
Dividend income — unaffiliated issuers
| 19 | | — |
Dividend income — affiliated issuers
| 184,641 | | 3,050,003 |
Other income
| 9,236 | | — |
Foreign taxes withheld
| — | | (4,317) |
TOTAL INVESTMENT INCOME (LOSS)
| 5,203,924 | | 114,708,134 |
| EXPENSES | | | |
Advisory fee
| 573,619 | | 13,532,233 |
Trustees’ fees and expenses
| 1,584 | | 26,925 |
Proxy voting expenses
| 5,542 | | 94,235 |
Miscellaneous expenses
| — | | 1,141 |
TOTAL EXPENSES
| 580,745 | | 13,654,534 |
NET INVESTMENT INCOME (LOSS)
| $ 4,623,179 | | $101,053,600 |
| REALIZED AND UNREALIZED GAIN (LOSS) | | | |
| Net realized gain (loss) on: | | | |
Investments — unaffiliated issuers
| (1,185,399) | | (73,961,643) |
Foreign currency transactions
| — | | 6 |
Net realized gain (loss)
| (1,185,399) | | (73,961,637) |
| Net change in unrealized appreciation/depreciation on: | | | |
Investments — unaffiliated issuers
| 522,666 | | (12,307,412) |
Unfunded loan commitments
| — | | 7,366 |
Foreign currency translations
| (2) | | — |
Net change in unrealized appreciation/depreciation
| 522,664 | | (12,300,046) |
NET REALIZED AND UNREALIZED GAIN (LOSS)
| (662,735) | | (86,261,683) |
NET INCREASE (DECREASE) IN NET ASSETS FROM OPERATIONS
| $ 3,960,444 | | $ 14,791,917 |
See accompanying notes to financial statements.
144
[This Page Intentionally Left Blank]
SSGA ACTIVE TRUST
STATEMENTS OF CHANGES IN NET ASSETS
| | SPDR SSGA Multi-Asset Real Return ETF | | SPDR SSGA Income Allocation ETF |
| | Year Ended
6/30/23 | | Year Ended
6/30/22 | | Year Ended
6/30/23 | | Year Ended
6/30/22 |
| INCREASE (DECREASE) IN NET ASSETS FROM OPERATIONS: | | | | | | | |
Net investment income (loss)
| $ 32,244,820 | | $ 23,531,552 | | $ 3,969,162 | | $ 4,230,037 |
Net realized gain (loss)
| (7,099,501) | | 4,007,362 | | (7,712,792) | | (2,550) |
Net change in unrealized appreciation/depreciation
| (21,673,762) | | (26,093,305) | | 6,382,967 | | (15,709,270) |
Net increase (decrease) in net assets resulting from operations
| 3,471,557 | | 1,445,609 | | 2,639,337 | | (11,481,783) |
Net equalization credits and charges
| (320,063) | | 2,661,692 | | (50,204) | | (16,609) |
Distributions to shareholders
| (32,025,253) | | (26,209,495) | | (4,182,212) | | (4,045,876) |
| FROM BENEFICIAL INTEREST TRANSACTIONS: | | | | | | | |
Proceeds from shares sold
| 282,817,522 | | 419,842,759 | | 21,883,439 | | 38,728,531 |
Cost of shares redeemed
| (188,661,245) | | (57,424,560) | | (44,726,185) | | (52,680,244) |
Net income equalization
| 320,063 | | (2,661,692) | | 50,204 | | 16,609 |
Other Capital
| — | | 18,255 | | — | | — |
Net increase (decrease) in net assets from beneficial interest transactions
| 94,476,340 | | 359,774,762 | | (22,792,542) | | (13,935,104) |
Net increase (decrease) in net assets during the period
| 65,602,581 | | 337,672,568 | | (24,385,621) | | (29,479,372) |
Net assets at beginning of period
| 468,030,855 | | 130,358,287 | | 95,559,168 | | 125,038,540 |
NET ASSETS AT END OF PERIOD
| $ 533,633,436 | | $468,030,855 | | $ 71,173,547 | | $ 95,559,168 |
| SHARES OF BENEFICIAL INTEREST: | | | | | | | |
Shares sold
| 10,100,000 | | 14,140,000 | | 720,000 | | 1,120,000 |
Shares redeemed
| (6,830,000) | | (1,950,000) | | (1,480,000) | | (1,520,000) |
Net increase (decrease) from share transactions
| 3,270,000 | | 12,190,000 | | (760,000) | | (400,000) |
See accompanying notes to financial statements.
146
| SPDR SSGA Global Allocation ETF | | SPDR SSGA Ultra Short Term Bond ETF | | SPDR Loomis Sayles Opportunistic Bond ETF |
Year Ended
6/30/23 | | Year Ended
6/30/22 | | Year Ended
6/30/23 | | Year Ended
6/30/22 | | Year Ended
6/30/23 | | For the Period
9/28/21*-
6/30/22 |
| | | | | | | | | | | |
| $ 7,250,037 | | $ 9,954,711 | | $ 15,375,828 | | $ 2,171,248 | | $ 1,788,774 | | $ 966,581 |
| (6,495,520) | | 12,256,385 | | 1,170,140 | | (685,236) | | (3,090,968) | | (2,421,925) |
| 19,510,144 | | (53,905,411) | | 1,622,725 | | (6,068,494) | | 2,523,647 | | (3,484,542) |
| 20,264,661 | | (31,694,315) | | 18,168,693 | | (4,582,482) | | 1,221,453 | | (4,939,886) |
| 73,146 | | 192 | | 398,172 | | (79,660) | | (426) | | (29,064) |
| (14,220,211) | | (12,089,236) | | (13,852,204) | | (2,137,247) | | (1,679,743) | | (831,308) |
| | | | | | | | | | | |
| 27,236,038 | | 36,021,408 | | 366,334,053 | | 239,500,100 | | 7,602,349 | | 44,823,447 |
| (44,224,301) | | (34,093,710) | | (120,141,901) | | (332,794,845) | | (6,390,149) | | (10,438,804) |
| (73,146) | | (192) | | (398,172) | | 79,660 | | 426 | | 29,064 |
| 529 | | — | | 133,928 | | 138,713 | | 20,414 | | 89,647 |
| (17,060,880) | | 1,927,506 | | 245,927,908 | | (93,076,372) | | 1,233,040 | | 34,503,354 |
| (10,943,284) | | (41,855,853) | | 250,642,569 | | (99,875,761) | | 774,324 | | 28,703,096 |
| 240,833,825 | | 282,689,678 | | 302,727,702 | | 402,603,463 | | 28,703,096 | | — |
| $229,890,541 | | $240,833,825 | | $ 553,370,271 | | $ 302,727,702 | | $29,477,420 | | $ 28,703,096 |
| | | | | | | | | | | |
| 710,000 | | 810,000 | | 9,150,000 | | 5,950,000 | | 300,000 | | 1,500,000 |
| (1,140,000) | | (770,000) | | (3,000,000) | | (8,300,000) | | (250,000) | | (400,000) |
| (430,000) | | 40,000 | | 6,150,000 | | (2,350,000) | | 50,000 | | 1,100,000 |
| | |
| * | Commencement of operations. |
SSGA ACTIVE TRUST
STATEMENTS OF CHANGES IN NET ASSETS (continued)
| | SPDR Nuveen Municipal Bond ETF | | SPDR Nuveen Municipal Bond ESG ETF |
| | Year Ended
6/30/23 | | Year Ended
6/30/22 | | Year Ended
6/30/23 | | For the Period
4/5/22*-
6/30/22 |
| INCREASE (DECREASE) IN NET ASSETS FROM OPERATIONS: | | | | | | | |
Net investment income (loss)
| $ 759,775 | | $ 231,606 | | $ 921,669 | | $ 152,659 |
Net realized gain (loss)
| (1,181,504) | | (189,996) | | (87,678) | | (105,291) |
Net change in unrealized appreciation/depreciation
| 1,363,270 | | (3,416,424) | | 106,461 | | (476,707) |
Net increase (decrease) in net assets resulting from operations
| 941,541 | | (3,374,814) | | 940,452 | | (429,339) |
Net equalization credits and charges
| 10,872 | | (1,113) | | 3,028 | | 1,649 |
Distributions to shareholders
| (530,211) | | (700,875) | | (974,780) | | (102,786) |
Return of capital
| (389,728) | | — | | — | | — |
Total Distributions to shareholders
| (919,939) | | (700,875) | | (974,780) | | (102,786) |
| FROM BENEFICIAL INTEREST TRANSACTIONS: | | | | | | | |
Proceeds from shares sold
| 7,988,301 | | 10,685,680 | | 4,356,963 | | 32,963,912 |
Cost of shares redeemed
| — | | (16,723,473) | | — | | — |
Net income equalization
| (10,872) | | 1,113 | | (3,028) | | (1,649) |
Other Capital
| 118 | | 10,686 | | 2,864 | | 32,964 |
Net increase (decrease) in net assets from beneficial interest transactions
| 7,977,547 | | (6,025,994) | | 4,356,799 | | 32,995,227 |
Net increase (decrease) in net assets during the period
| 8,010,021 | | (10,102,796) | | 4,325,499 | | 32,464,751 |
Net assets at beginning of period
| 35,061,367 | | 45,164,163 | | 32,464,751 | | — |
NET ASSETS AT END OF PERIOD
| $43,071,388 | | $ 35,061,367 | | $36,790,250 | | $32,464,751 |
| SHARES OF BENEFICIAL INTEREST: | | | | | | | |
Shares sold
| 300,000 | | 400,000 | | 150,000 | | 1,100,000 |
Shares redeemed
| — | | (600,000) | | — | | — |
Net increase (decrease) from share transactions
| 300,000 | | (200,000) | | 150,000 | | 1,100,000 |
| | |
| * | Commencement of operations. |
See accompanying notes to financial statements.
148
| SPDR SSGA Fixed Income Sector Rotation ETF | | SPDR SSGA US Sector Rotation ETF | | SPDR DoubleLine Emerging Markets Fixed Income ETF |
Year Ended
6/30/23 | | Year Ended
6/30/22 | | Year Ended
6/30/23 | | Year Ended
6/30/22 | | Year Ended
6/30/23 | | Year Ended
6/30/22 |
| | | | | | | | | | | |
| $ 3,781,818 | | $ 1,864,166 | | $ 3,204,355 | | $ 2,044,310 | | $ 3,313,548 | | $ 2,925,925 |
| (12,530,626) | | (5,800,454) | | (13,285,540) | | 2,571,374 | | (5,095,150) | | 769,507 |
| 5,722,938 | | (9,885,098) | | 47,025,282 | | (30,518,656) | | 4,727,940 | | (17,006,267) |
| (3,025,870) | | (13,821,386) | | 36,944,097 | | (25,902,972) | | 2,946,338 | | (13,310,835) |
| (760,410) | | (509,259) | | (400,836) | | (142,580) | | 10,499 | | (15,165) |
| (3,737,844) | | (1,883,135) | | (4,093,813) | | (7,269,494) | | (3,330,606) | | (5,404,954) |
| — | | — | | — | | — | | — | | — |
| (3,737,844) | | (1,883,135) | | (4,093,813) | | (7,269,494) | | (3,330,606) | | (5,404,954) |
| | | | | | | | | | | |
| 110,570,222 | | 112,910,613 | | 107,269,046 | | 107,170,499 | | 22,282,311 | | 9,309,790 |
| (42,780,089) | | (61,634,491) | | (44,239,964) | | (45,148,661) | | (16,630,979) | | (40,124,127) |
| 760,410 | | 509,259 | | 400,836 | | 142,580 | | (10,499) | | 15,165 |
| — | | — | | — | | — | | 83,477 | | 68,054 |
| 68,550,543 | | 51,785,381 | | 63,429,918 | | 62,164,418 | | 5,724,310 | | (30,731,118) |
| 61,026,419 | | 35,571,601 | | 95,879,366 | | 28,849,372 | | 5,350,541 | | (49,462,072) |
| 118,545,445 | | 82,973,844 | | 203,244,987 | | 174,395,615 | | 74,181,026 | | 123,643,098 |
| $179,571,864 | | $118,545,445 | | $299,124,353 | | $203,244,987 | | $ 79,531,567 | | $ 74,181,026 |
| | | | | | | | | | | |
| 4,210,000 | | 3,780,000 | | 2,680,000 | | 2,450,000 | | 550,000 | | 200,000 |
| (1,640,000) | | (2,060,000) | | (1,120,000) | | (1,040,000) | | (400,000) | | (825,000) |
| 2,570,000 | | 1,720,000 | | 1,560,000 | | 1,410,000 | | 150,000 | | (625,000) |
SSGA ACTIVE TRUST
STATEMENTS OF CHANGES IN NET ASSETS (continued)
| | SPDR DoubleLine Short Duration Total Return Tactical ETF | | SPDR DoubleLine Total Return Tactical ETF |
| | Year Ended
6/30/23 | | Year Ended
6/30/22 | | Year Ended
6/30/23 | | Year Ended
6/30/22 |
| INCREASE (DECREASE) IN NET ASSETS FROM OPERATIONS: | | | | | | | |
Net investment income (loss)
| $ 4,623,179 | | $ 2,322,666 | | $ 101,053,600 | | $ 77,993,893 |
Net realized gain (loss)
| (1,185,399) | | (3,083,762) | | (73,961,637) | | (71,677,135) |
Net change in unrealized appreciation/depreciation
| 522,664 | | (6,559,270) | | (12,300,046) | | (268,963,903) |
Net increase (decrease) in net assets resulting from operations
| 3,960,444 | | (7,320,366) | | 14,791,917 | | (262,647,145) |
Net equalization credits and charges
| (29,009) | | (22,189) | | — | | (3,201) |
Distributions to shareholders
| (4,502,769) | | (2,972,526) | | (117,444,339) | | (96,266,392) |
| FROM BENEFICIAL INTEREST TRANSACTIONS: | | | | | | | |
Proceeds from shares sold
| 16,211,354 | | 89,243,755 | | 1,101,213,991 | | 12,031,920 |
Cost of shares redeemed
| (19,702,219) | | (107,825,844) | | (258,273,252) | | (597,715,967) |
Net income equalization
| 29,009 | | 22,189 | | — | | 3,201 |
Other Capital
| 51,328 | | 241,692 | | 2,456,789 | | 621,780 |
Net increase (decrease) in net assets from beneficial interest transactions
| (3,410,528) | | (18,318,208) | | 845,397,528 | | (585,059,066) |
Contribution from affiliate (Note 5)
| 7,309 | | — | | — | | — |
Net increase (decrease) in net assets during the period
| (3,974,553) | | (28,633,289) | | 742,745,106 | | (943,975,804) |
Net assets at beginning of period
| 131,605,385 | | 160,238,674 | | 2,244,695,207 | | 3,188,671,011 |
NET ASSETS AT END OF PERIOD
| $127,630,832 | | $ 131,605,385 | | $2,987,440,313 | | $2,244,695,207 |
| SHARES OF BENEFICIAL INTEREST: | | | | | | | |
Shares sold
| 350,000 | | 1,800,000 | | 27,100,000 | | 250,000 |
Shares redeemed
| (425,000) | | (2,200,000) | | (6,350,000) | | (12,950,000) |
Net increase (decrease) from share transactions
| (75,000) | | (400,000) | | 20,750,000 | | (12,700,000) |
See accompanying notes to financial statements.
150
SSGA ACTIVE TRUST
FINANCIAL HIGHLIGHTS
Selected data for a share outstanding throughout each period
| | SPDR SSGA Multi-Asset Real Return ETF |
| | Year
Ended
6/30/23 | | Year
Ended
6/30/22 | | Year
Ended
6/30/21 | | Year
Ended
6/30/20 | | Year
Ended
6/30/19 |
Net asset value, beginning of period
| $ 27.93 | | $ 28.52 | | $ 21.25 | | $ 25.18 | | $ 26.62 |
| Income (loss) from investment operations: | | | | | | | | | |
Net investment income (loss) (a)
| 1.61 | | 2.99 | | 0.65 | | 0.78 | | 0.69 |
Net realized and unrealized gain (loss) (b)
| (1.37) | | (0.44) | | 7.15 | | (3.89) | | (1.43) |
Total from investment operations
| 0.24 | | 2.55 | | 7.80 | | (3.11) | | (0.74) |
Net equalization credits and charges (a)
| (0.02) | | 0.34 | | 0.02 | | (0.02) | | 0.00(c) |
Other capital (a)
| — | | 0.00(c) | | — | | — | | — |
| Distributions to shareholders from: | | | | | | | | | |
Net investment income
| (1.51) | | (3.48) | | (0.55) | | (0.80) | | (0.70) |
Net asset value, end of period
| $ 26.64 | | $ 27.93 | | $ 28.52 | | $ 21.25 | | $ 25.18 |
Total return (d)
| 0.78% | | 10.57% | | 37.12% | | (12.71)% | | (2.71)% |
| Ratios and Supplemental Data: | | | | | | | | | |
Net assets, end of period (in 000s)
| $533,633 | | $468,031 | | $130,358 | | $53,750 | | $112,792 |
| Ratios to average net assets: | | | | | | | | | |
Total expenses (e)
| 0.11% | | 0.05% | | 0.08% | | 0.08% | | 0.12% |
Net investment income (loss)
| 5.79% | | 10.09% | | 2.56% | | 3.30% | | 2.76% |
Portfolio turnover rate (f)
| 30% | | 38% | | 49% | | 30% | | 28% |
| (a) | Per share numbers have been calculated using average shares outstanding, which more appropriately presents the per share data for the year. |
| (b) | Amounts shown in this caption for a share outstanding may not accord with the change in aggregate gains and losses in securities for the fiscal period because of the timing of sales and repurchases of Fund shares in relation to fluctuating market values for the Fund. |
| (c) | Amount is less than $0.005 per share. |
| (d) | Total return is calculated assuming a purchase of shares at net asset value on the first day and a sale at net asset value on the last day of each period reported. Distributions are assumed, for the purpose of this calculation, to be reinvested at net asset value per share on the respective payment dates of each distribution. Total returns for periods of less than one year are not annualized. Broker commission charges are not included in this calculation. |
| (e) | Does not include expenses of the Underlying Funds in which the Fund invests. |
| (f) | Portfolio turnover rate excludes securities received or delivered from in-kind processing of creations or redemptions. |
See accompanying notes to financial statements.
151
SSGA ACTIVE TRUST
FINANCIAL HIGHLIGHTS (continued)
Selected data for a share outstanding throughout each period
| | SPDR SSGA Income Allocation ETF |
| | Year
Ended
6/30/23 | | Year
Ended
6/30/22 | | Year
Ended
6/30/21 | | Year
Ended
6/30/20 | | Year
Ended
6/30/19 |
Net asset value, beginning of period
| $ 30.73 | | $ 35.62 | | $ 30.37 | | $ 33.32 | | $ 32.42 |
| Income (loss) from investment operations: | | | | | | | | | |
Net investment income (loss) (a)
| 1.45 | | 1.33 | | 1.35 | | 1.43 | | 1.53 |
Net realized and unrealized gain (loss) (b)
| (0.33) | | (4.92) | | 5.18 | | (2.95) | | 0.91 |
Total from investment operations
| 1.12 | | (3.59) | | 6.53 | | (1.52) | | 2.44 |
Net equalization credits and charges (a)
| (0.02) | | (0.01) | | 0.04 | | 0.03 | | 0.03 |
Other capital (a)
| — | | — | | — | | — | | 0.00(c) |
| Distributions to shareholders from: | | | | | | | | | |
Net investment income
| (1.54) | | (1.29) | | (1.32) | | (1.46) | | (1.57) |
Net asset value, end of period
| $ 30.29 | | $ 30.73 | | $ 35.62 | | $ 30.37 | | $ 33.32 |
Total return (d)
| 3.79% | | (10.41)% | | 21.90% | | (4.56)% | | 7.93% |
| Ratios and Supplemental Data: | | | | | | | | | |
Net assets, end of period (in 000s)
| $71,174 | | $95,559 | | $125,039 | | $126,039 | | $104,613 |
| Ratios to average net assets: | | | | | | | | | |
Total expenses (e)
| 0.09% | | 0.12% | | 0.16% | | 0.18% | | 0.18% |
Net investment income (loss)
| 4.78% | | 3.85% | | 4.02% | | 4.41% | | 4.71% |
Portfolio turnover rate (f)
| 89% | | 58% | | 60% | | 38% | | 71% |
| (a) | Per share numbers have been calculated using average shares outstanding, which more appropriately presents the per share data for the year. |
| (b) | Amounts shown in this caption for a share outstanding may not accord with the change in aggregate gains and losses in securities for the fiscal period because of the timing of sales and repurchases of Fund shares in relation to fluctuating market values for the Fund. |
| (c) | Amount is less than $0.005 per share. |
| (d) | Total return is calculated assuming a purchase of shares at net asset value on the first day and a sale at net asset value on the last day of each period reported. Distributions are assumed, for the purpose of this calculation, to be reinvested at net asset value per share on the respective payment dates of each distribution. Total returns for periods of less than one year are not annualized. Broker commission charges are not included in this calculation. |
| (e) | Does not include expenses of the Underlying Funds in which the Fund invests. |
| (f) | Portfolio turnover rate excludes securities received or delivered from in-kind processing of creations or redemptions. |
See accompanying notes to financial statements.
152
SSGA ACTIVE TRUST
FINANCIAL HIGHLIGHTS (continued)
Selected data for a share outstanding throughout each period
| | SPDR SSGA Global Allocation ETF |
| | Year
Ended
6/30/23 | | Year
Ended
6/30/22 | | Year
Ended
6/30/21 | | Year
Ended
6/30/20 | | Year
Ended
6/30/19 |
Net asset value, beginning of period
| $ 38.97 | | $ 46.04 | | $ 36.88 | | $ 38.33 | | $ 37.72 |
| Income (loss) from investment operations: | | | | | | | | | |
Net investment income (loss) (a)
| 1.21 | | 1.61 | | 0.91 | | 1.07 | | 1.03 |
Net realized and unrealized gain (loss) (b)
| 2.14 | | (6.71) | | 9.16 | | (1.44) | | 0.57 |
Total from investment operations
| 3.35 | | (5.10) | | 10.07 | | (0.37) | | 1.60 |
Net equalization credits and charges (a)
| 0.01 | | 0.00(c) | | (0.00)(c) | | 0.00(c) | | 0.01 |
Other capital (a)
| 0.00(c) | | — | | — | | 0.00(c) | | — |
| Distributions to shareholders from: | | | | | | | | | |
Net investment income
| (1.51) | | (1.62) | | (0.91) | | (1.08) | | (1.00) |
Net realized gains
| (0.84) | | (0.35) | | — | | — | | — |
Total distributions
| (2.35) | | (1.97) | | (0.91) | | (1.08) | | (1.00) |
Net asset value, end of period
| $ 39.98 | | $ 38.97 | | $ 46.04 | | $ 36.88 | | $ 38.33 |
Total return (d)
| 9.15% | | (11.58)% | | 27.51% | | (1.00)% | | 4.37% |
| Ratios and Supplemental Data: | | | | | | | | | |
Net assets, end of period (in 000s)
| $229,891 | | $240,834 | | $282,690 | | $237,850 | | $255,687 |
| Ratios to average net assets: | | | | | | | | | |
Total expenses (e)
| 0.11% | | 0.11% | | 0.17% | | 0.09% | | 0.15% |
Net investment income (loss)
| 3.12% | | 3.59% | | 2.16% | | 2.84% | | 2.76% |
Portfolio turnover rate (f)
| 144% | | 153% | | 110% | | 94% | | 71% |
| (a) | Per share numbers have been calculated using average shares outstanding, which more appropriately presents the per share data for the year. |
| (b) | Amounts shown in this caption for a share outstanding may not accord with the change in aggregate gains and losses in securities for the fiscal period because of the timing of sales and repurchases of Fund shares in relation to fluctuating market values for the Fund. |
| (c) | Amount is less than $0.005 per share. |
| (d) | Total return is calculated assuming a purchase of shares at net asset value on the first day and a sale at net asset value on the last day of each period reported. Distributions are assumed, for the purpose of this calculation, to be reinvested at net asset value per share on the respective payment dates of each distribution. Total returns for periods of less than one year are not annualized. Broker commission charges are not included in this calculation. |
| (e) | Does not include expenses of the Underlying Funds in which the Fund invests. |
| (f) | Portfolio turnover rate excludes securities received or delivered from in-kind processing of creations or redemptions. |
See accompanying notes to financial statements.
153
SSGA ACTIVE TRUST
FINANCIAL HIGHLIGHTS (continued)
Selected data for a share outstanding throughout each period
| | SPDR SSGA Ultra Short Term Bond ETF |
| | Year
Ended
6/30/23 | | Year
Ended
6/30/22 | | Year
Ended
6/30/21 | | Year
Ended
6/30/20 | | Year
Ended
6/30/19 |
Net asset value, beginning of period
| $ 39.83 | | $ 40.46 | | $ 40.26 | | $ 40.41 | | $ 40.27 |
| Income (loss) from investment operations: | | | | | | | | | |
Net investment income (loss) (a)
| 1.44 | | 0.21 | | 0.27 | | 0.81 | | 1.02 |
Net realized and unrealized gain (loss) (b)
| 0.18 | | (0.63) | | 0.25 | | (0.11) | | 0.04 |
Total from investment operations
| 1.62 | | (0.42) | | 0.52 | | 0.70 | | 1.06 |
Net equalization credits and charges (a)
| 0.04 | | (0.01) | | 0.00(c) | | 0.02 | | 0.03 |
Other capital (a)
| 0.01 | | 0.01 | | 0.01 | | 0.03 | | 0.02 |
| Distributions to shareholders from: | | | | | | | | | |
Net investment income
| (1.25) | | (0.21) | | (0.33) | | (0.90) | | (0.97) |
Net asset value, end of period
| $ 40.25 | | $ 39.83 | | $ 40.46 | | $ 40.26 | | $ 40.41 |
Total return (d)
| 4.24% | | (1.05)% | | 1.34% | | 1.86% | | 2.79% |
| Ratios and Supplemental Data: | | | | | | | | | |
Net assets, end of period (in 000s)
| $553,370 | | $302,728 | | $402,603 | | $298,907 | | $167,719 |
| Ratios to average net assets: | | | | | | | | | |
Total expenses
| 0.20% | | 0.20% | | 0.20% | | 0.20% | | 0.20% |
Net investment income (loss)
| 3.59% | | 0.51% | | 0.67% | | 2.02% | | 2.54% |
Portfolio turnover rate (e)
| 34% | | 68% | | 76% | | 71% | | 100% |
| (a) | Per share numbers have been calculated using average shares outstanding, which more appropriately presents the per share data for the year. |
| (b) | Amounts shown in this caption for a share outstanding may not accord with the change in aggregate gains and losses in securities for the fiscal period because of the timing of sales and repurchases of Fund shares in relation to fluctuating market values for the Fund. |
| (c) | Amount is less than $0.005 per share. |
| (d) | Total return is calculated assuming a purchase of shares at net asset value on the first day and a sale at net asset value on the last day of each period reported. Distributions are assumed, for the purpose of this calculation, to be reinvested at net asset value per share on the respective payment dates of each distribution. Total returns for periods of less than one year are not annualized. Broker commission charges are not included in this calculation. |
| (e) | Portfolio turnover rate excludes securities received or delivered from in-kind processing of creations or redemptions. |
See accompanying notes to financial statements.
154
SSGA ACTIVE TRUST
FINANCIAL HIGHLIGHTS (continued)
Selected data for a share outstanding throughout each period
| | SPDR Loomis Sayles Opportunistic Bond ETF |
| | Year
Ended
6/30/23 | | For the
Period
9/28/2021*-
6/30/22 |
Net asset value, beginning of period
| $ 26.09 | | $ 30.00 |
| Income (loss) from investment operations: | | | |
Net investment income (loss) (a)
| 1.45 | | 0.67 |
Net realized and unrealized gain (loss) (b)
| (0.57) | | (4.05) |
Total from investment operations
| 0.88 | | (3.38) |
Net equalization credits and charges (a)
| (0.00)(c) | | (0.02) |
Other capital (a)
| 0.02 | | 0.06 |
| Distributions to shareholders from: | | | |
Net investment income
| (1.36) | | (0.57) |
Net asset value, end of period
| $ 25.63 | | $ 26.09 |
Total return (d)
| 3.58% | | (11.25)% |
| Ratios and Supplemental Data: | | | |
Net assets, end of period (in 000s)
| $29,477 | | $28,703 |
| Ratios to average net assets: | | | |
Total expenses
| 0.53% | | 0.55%(e) |
Net expenses
| 0.53% | | 0.51%(e) |
Net investment income (loss)
| 5.62% | | 3.11%(e) |
Portfolio turnover rate (f)
| 137% | | 101%(g) |
| * | Commencement of operations. |
| (a) | Per share numbers have been calculated using average shares outstanding, which more appropriately presents the per share data for the year. |
| (b) | Amounts shown in this caption for a share outstanding may not accord with the change in aggregate gains and losses in securities for the fiscal period because of the timing of sales and repurchases of Fund shares in relation to fluctuating market values for the Fund. |
| (c) | Amount is less than $0.005 per share. |
| (d) | Total return is calculated assuming a purchase of shares at net asset value on the first day and a sale at net asset value on the last day of each period reported. Distributions are assumed, for the purpose of this calculation, to be reinvested at net asset value per share on the respective payment dates of each distribution. Total returns for periods of less than one year are not annualized. Broker commission charges are not included in this calculation. |
| (e) | Annualized. |
| (f) | Portfolio turnover rate excludes securities received or delivered from in-kind processing of creations or redemptions. |
| (g) | Not annualized. |
See accompanying notes to financial statements.
155
SSGA ACTIVE TRUST
FINANCIAL HIGHLIGHTS (continued)
Selected data for a share outstanding throughout each period
| | SPDR Nuveen Municipal Bond ETF |
| | Year
Ended
6/30/23 | | Year
Ended
6/30/22 | | For the
Period
2/3/21*-
6/30/21 |
Net asset value, beginning of period
| $ 26.97 | | $ 30.11 | | $ 30.00 |
| Income (loss) from investment operations: | | | | | |
Net investment income (loss) (a)
| 0.51 | | 0.17 | | 0.07 |
Net realized and unrealized gain (loss) (b)
| 0.04 | | (2.80) | | 0.11 |
Total from investment operations
| 0.55 | | (2.63) | | 0.18 |
Net equalization credits and charges (a)
| 0.01 | | (0.00)(c) | | 0.00(c) |
Other capital (a)
| 0.00(c) | | 0.01 | | 0.03 |
| Distributions to shareholders from: | | | | | |
Net investment income
| (0.36) | | (0.30) | | (0.10) |
Net realized gains
| — | | (0.22) | | — |
Return of Capital
| (0.25) | | — | | — |
Total distributions
| (0.61) | | (0.52) | | (0.10) |
Net asset value, end of period
| $ 26.92 | | $ 26.97 | | $ 30.11 |
Total return (d)
| 2.10% | | (8.83)% | | 0.69% |
| Ratios and Supplemental Data: | | | | | |
Net assets, end of period (in 000s)
| $43,071 | | $35,061 | | $45,164 |
| Ratios to average net assets: | | | | | |
Total expenses
| 0.40% | | 0.40% | | 0.40%(e) |
Net investment income (loss)
| 1.90% | | 0.57% | | 0.57%(e) |
Portfolio turnover rate (f)
| 52% | | 49% | | 51%(g) |
| * | Commencement of operations. |
| (a) | Per share numbers have been calculated using average shares outstanding, which more appropriately presents the per share data for the year. |
| (b) | Amounts shown in this caption for a share outstanding may not accord with the change in aggregate gains and losses in securities for the fiscal period because of the timing of sales and repurchases of Fund shares in relation to fluctuating market values for the Fund. |
| (c) | Amount is less than $0.005 per share. |
| (d) | Total return is calculated assuming a purchase of shares at net asset value on the first day and a sale at net asset value on the last day of each period reported. Distributions are assumed, for the purpose of this calculation, to be reinvested at net asset value per share on the respective payment dates of each distribution. Total returns for periods of less than one year are not annualized. Broker commission charges are not included in this calculation. |
| (e) | Annualized. |
| (f) | Portfolio turnover rate excludes securities received or delivered from in-kind processing of creations or redemptions. |
| (g) | Not annualized. |
See accompanying notes to financial statements.
156
SSGA ACTIVE TRUST
FINANCIAL HIGHLIGHTS (continued)
Selected data for a share outstanding throughout each period
| | SPDR Nuveen Municipal Bond ESG ETF |
| | Year
Ended
6/30/23 | | For the
Period
4/5/2022*-
6/30/22 |
Net asset value, beginning of period
| $ 29.51 | | $ 30.00 |
| Income (loss) from investment operations: | | | |
Net investment income (loss) (a)
| 0.77 | | 0.14 |
Net realized and unrealized gain (loss) (b)
| (0.03) | | (0.57) |
Total from investment operations
| 0.74 | | (0.43) |
Net equalization credits and charges (a)
| 0.00(c) | | 0.00(c) |
Other capital (a)
| 0.00(c) | | 0.03 |
| Distributions to shareholders from: | | | |
Net investment income
| (0.82) | | (0.09) |
Net asset value, end of period
| $ 29.43 | | $ 29.51 |
Total return (d)
| 2.53% | | (1.31)% |
| Ratios and Supplemental Data: | | | |
Net assets, end of period (in 000s)
| $36,790 | | $32,465 |
| Ratios to average net assets: | | | |
Total expenses
| 0.44% | | 0.43%(e) |
Net investment income (loss)
| 2.62% | | 2.00%(e) |
Portfolio turnover rate (f)
| 50% | | 5%(g) |
| * | Commencement of operations. |
| (a) | Per share numbers have been calculated using average shares outstanding, which more appropriately presents the per share data for the year. |
| (b) | Amounts shown in this caption for a share outstanding may not accord with the change in aggregate gains and losses in securities for the fiscal period because of the timing of sales and repurchases of Fund shares in relation to fluctuating market values for the Fund. |
| (c) | Amount is less than $0.005 per share. |
| (d) | Total return is calculated assuming a purchase of shares at net asset value on the first day and a sale at net asset value on the last day of each period reported. Distributions are assumed, for the purpose of this calculation, to be reinvested at net asset value per share on the respective payment dates of each distribution. Total returns for periods of less than one year are not annualized. Broker commission charges are not included in this calculation. |
| (e) | Annualized. |
| (f) | Portfolio turnover rate excludes securities received or delivered from in-kind processing of creations or redemptions. |
| (g) | Not annualized. |
See accompanying notes to financial statements.
157
SSGA ACTIVE TRUST
FINANCIAL HIGHLIGHTS (continued)
Selected data for a share outstanding throughout each period
| | SPDR SSGA Fixed Income Sector Rotation ETF |
| | Year
Ended
6/30/23 | | Year
Ended
6/30/22 | | Year
Ended
6/30/21 | | Year
Ended
6/30/20 | | For the
Period
4/3/2019*-
6/30/19 |
Net asset value, beginning of period
| $ 27.13 | | $ 31.31 | | $ 31.98 | | $ 31.08 | | $ 30.10 |
| Income (loss) from investment operations: | | | | | | | | | |
Net investment income (loss) (a)
| 0.69 | | 0.52 | | 0.63 | | 0.81 | | 0.15 |
Net realized and unrealized gain (loss) (b)
| (1.14) | | (4.02) | | (0.37) | | 1.31 | | 0.99 |
Total from investment operations
| (0.45) | | (3.50) | | 0.26 | | 2.12 | | 1.14 |
Net equalization credits and charges (a)
| (0.14) | | (0.14) | | (0.16) | | (0.17) | | 0.00(c) |
| Distributions to shareholders from: | | | | | | | | | |
Net investment income
| (0.67) | | (0.54) | | (0.77) | | (1.05) | | (0.16) |
Net asset value, end of period
| $ 25.87 | | $ 27.13 | | $ 31.31 | | $ 31.98 | | $ 31.08 |
Total return (d)
| (2.12)% | | (11.78)% | | 0.29% | | 6.42% | | 3.81% |
| Ratios and Supplemental Data: | | | | | | | | | |
Net assets, end of period (in 000s)
| $179,572 | | $118,545 | | $82,974 | | $47,014 | | $10,877 |
| Ratios to average net assets: | | | | | | | | | |
Total expenses (e)
| 0.36% | | 0.39% | | 0.39% | | 0.31% | | 0.31%(f) |
Net investment income (loss)
| 2.62% | | 1.76% | | 1.99% | | 2.57% | | 1.98%(f) |
Portfolio turnover rate (g)
| 110% | | 75% | | 79% | | 150% | | 32%(h) |
| * | Commencement of operations. |
| (a) | Per share numbers have been calculated using average shares outstanding, which more appropriately presents the per share data for the period. |
| (b) | Amounts shown in this caption for a share outstanding may not accord with the change in aggregate gains and losses in securities for the fiscal period because of the timing of sales and repurchases of Fund shares in relation to fluctuating market values for the Fund. |
| (c) | Amount is less than $0.005 per share. |
| (d) | Total return is calculated assuming a purchase of shares at net asset value on the first day and a sale at net asset value on the last day of each period reported. Distributions are assumed, for the purpose of this calculation, to be reinvested at net asset value per share on the respective payment dates of each distribution. Total returns for periods of less than one year are not annualized. Broker commission charges are not included in this calculation. |
| (e) | Does not include expenses of the Underlying Funds in which the Fund invests. |
| (f) | Annualized. |
| (g) | Portfolio turnover rate excludes securities received or delivered from in-kind processing of creations or redemptions. |
| (h) | Not annualized. |
See accompanying notes to financial statements.
158
SSGA ACTIVE TRUST
FINANCIAL HIGHLIGHTS (continued)
Selected data for a share outstanding throughout each period
| | SPDR SSGA US Sector Rotation ETF |
| | Year
Ended
6/30/23 | | Year
Ended
6/30/22 | | Year
Ended
6/30/21 | | Year
Ended
6/30/20 | | For the
Period
4/3/2019*-
6/30/19 |
Net asset value, beginning of period
| $ 38.06 | | $ 44.38 | | $ 32.83 | | $ 30.73 | | $ 30.09 |
| Income (loss) from investment operations: | | | | | | | | | |
Net investment income (loss) (a)
| 0.54 | | 0.47 | | 0.36 | | 0.57 | | 0.23 |
Net realized and unrealized gain (loss) (b)
| 5.51 | | (5.07) | | 11.62 | | 1.98 | | 0.55 |
Total from investment operations
| 6.05 | | (4.60) | | 11.98 | | 2.55 | | 0.78 |
Net equalization credits and charges (a)
| (0.07) | | (0.03) | | (0.04) | | 0.03 | | (0.03) |
| Distributions to shareholders from: | | | | | | | | | |
Net investment income
| (0.69) | | (0.46) | | (0.39) | | (0.48) | | (0.11) |
Net realized gains
| — | | (1.23) | | — | | — | | — |
Total distributions
| (0.69) | | (1.69) | | (0.39) | | (0.48) | | (0.11) |
Net asset value, end of period
| $ 43.35 | | $ 38.06 | | $ 44.38 | | $ 32.83 | | $ 30.73 |
Total return (c)
| 15.91% | | (11.02)% | | 36.48% | | 8.52% | | 2.50% |
| Ratios and Supplemental Data: | | | | | | | | | |
Net assets, end of period (in 000s)
| $299,124 | | $203,245 | | $174,396 | | $68,617 | | $14,136 |
| Ratios to average net assets: | | | | | | | | | |
Total expenses (d)
| 0.57% | | 0.54% | | 0.52% | | 0.49% | | 0.49%(e) |
Net investment income (loss)
| 1.37% | | 1.06% | | 0.89% | | 1.79% | | 3.12%(e) |
Portfolio turnover rate (f)
| 203% | | 202% | | 263% | | 154% | | 39%(g) |
| * | Commencement of operations. |
| (a) | Per share numbers have been calculated using average shares outstanding, which more appropriately presents the per share data for the period. |
| (b) | Amounts shown in this caption for a share outstanding may not accord with the change in aggregate gains and losses in securities for the fiscal period because of the timing of sales and repurchases of Fund shares in relation to fluctuating market values for the Fund. |
| (c) | Total return is calculated assuming a purchase of Units at net asset value per Unit on the first day and a sale at net asset value per Unit on the last day of each period reported. Distributions are assumed, for the purposes of this calculation, to be reinvested at the net asset value per Unit on the respective payment dates of the Trust. Broker commission charges are not included in this calculation. |
| (d) | Does not include expenses of the Underlying Funds in which the Fund invests. |
| (e) | Annualized. |
| (f) | Portfolio turnover rate excludes securities received or delivered from in-kind processing of creations or redemptions. |
| (g) | Not annualized. |
See accompanying notes to financial statements.
159
SSGA ACTIVE TRUST
FINANCIAL HIGHLIGHTS (continued)
Selected data for a share outstanding throughout each period
| | SPDR DoubleLine Emerging Markets Fixed Income ETF |
| | Year
Ended
6/30/23 | | Year
Ended
6/30/22 | | Year
Ended
6/30/21 | | Year
Ended
6/30/20 | | Year
Ended
6/30/19 |
Net asset value, beginning of period
| $ 41.21 | | $ 50.99 | | $ 49.09 | | $ 51.02 | | $ 48.25 |
| Income (loss) from investment operations: | | | | | | | | | |
Net investment income (loss) (a)
| 1.85 | | 1.49 | | 1.48 | | 1.87 | | 1.98 |
Net realized and unrealized gain (loss)
| (0.47) | | (8.60) | | 1.83 | | (2.06) | | 2.60 |
Total from investment operations
| 1.38 | | (7.11) | | 3.31 | | (0.19) | | 4.58 |
Net equalization credits and charges (a)
| 0.01 | | (0.01) | | 0.03 | | 0.04 | | 0.03 |
Other capital (a)
| 0.05 | | 0.03 | | 0.09 | | 0.13 | | 0.08 |
| Distributions to shareholders from: | | | | | | | | | |
Net investment income
| (1.86) | | (1.47) | | (1.53) | | (1.91) | | (1.92) |
Net realized gains
| — | | (1.22) | | — | | — | | — |
Total distributions
| (1.86) | | (2.69) | | (1.53) | | (1.91) | | (1.92) |
Net asset value, end of period
| $ 40.79 | | $ 41.21 | | $ 50.99 | | $ 49.09 | | $ 51.02 |
Total return (b)
| 3.63% | | (14.57)% | | 7.09% | | (0.04)% | | 9.99% |
| Ratios and Supplemental Data: | | | | | | | | | |
Net assets, end of period (in 000s)
| $79,532 | | $74,181 | | $123,643 | | $94,494 | | $65,050 |
| Ratios to average net assets: | | | | | | | | | |
Total expenses
| 0.66% | | 0.65% | | 0.72% | | 0.75% | | 0.75% |
Net expenses
| 0.66% | | 0.65% | | 0.65% | | 0.65% | | 0.65% |
Net investment income (loss)
| 4.57% | | 3.12% | | 2.95% | | 3.77% | | 4.06% |
Portfolio turnover rate (c)
| 48% | | 38% | | 77% | | 54% | | 37% |
| (a) | Per share numbers have been calculated using average shares outstanding, which more appropriately presents the per share data for the year. |
| (b) | Total return is calculated assuming a purchase of shares at net asset value on the first day and a sale at net asset value on the last day of each period reported. Distributions are assumed, for the purpose of this calculation, to be reinvested at net asset value per share on the respective payment dates of each distribution. Total returns for periods of less than one year are not annualized. Broker commission charges are not included in this calculation. |
| (c) | Portfolio turnover rate excludes securities received or delivered from in-kind processing of creations or redemptions. |
See accompanying notes to financial statements.
160
SSGA ACTIVE TRUST
FINANCIAL HIGHLIGHTS (continued)
Selected data for a share outstanding throughout each period
| | SPDR DoubleLine Short Duration Total Return Tactical ETF |
| | Year
Ended
6/30/23 | | Year
Ended
6/30/22 | | Year
Ended
6/30/21 | | Year
Ended
6/30/20 | | Year
Ended
6/30/19 |
Net asset value, beginning of period
| $ 46.59 | | $ 49.69 | | $ 49.57 | | $ 49.53 | | $ 48.81 |
| Income (loss) from investment operations: | | | | | | | | | |
Net investment income (loss) (a)
| 1.68 | | 0.69 | | 0.68 | | 1.08 | | 1.30 |
Net realized and unrealized gain (loss) (b)
| (0.22) | | (2.96) | | 0.14 | | 0.07 | | 0.62 |
Total from investment operations
| 1.46 | | (2.27) | | 0.82 | | 1.15 | | 1.92 |
Net equalization credits and charges (a)
| (0.01) | | (0.01) | | 0.01 | | 0.00(c) | | 0.03 |
Contribution from affiliate (Note 5)
| 0.00(c) | | — | | — | | — | | — |
Other capital (a)
| 0.02 | | 0.07 | | 0.01 | | 0.03 | | 0.06 |
| Distributions to shareholders from: | | | | | | | | | |
Net investment income
| (1.65) | | (0.73) | | (0.72) | | (1.14) | | (1.29) |
Net realized gains
| — | | (0.16) | | — | | — | | — |
Total distributions
| (1.65) | | (0.89) | | (0.72) | | (1.14) | | (1.29) |
Net asset value, end of period
| $ 46.41 | | $ 46.59 | | $ 49.69 | | $ 49.57 | | $ 49.53 |
Total return (d)
| 3.24% | | (4.52)% | | 1.70% | | 2.43% | | 4.18% |
| Ratios and Supplemental Data: | | | | | | | | | |
Net assets, end of period (in 000s)
| $127,631 | | $131,605 | | $160,239 | | $142,519 | | $121,344 |
| Ratios to average net assets: | | | | | | | | | |
Total expenses
| 0.46% | | 0.45% | | 0.49% | | 0.50% | | 0.50% |
Net expenses
| 0.46% | | 0.45% | | 0.45% | | 0.45% | | 0.45% |
Net investment income (loss)
| 3.63% | | 1.41% | | 1.36% | | 2.18% | | 2.65% |
Portfolio turnover rate (e)
| 34% | | 104% | | 58% | | 43% | | 62% |
| (a) | Per share numbers have been calculated using average shares outstanding, which more appropriately presents the per share data for the year. |
| (b) | Amounts shown in this caption for a share outstanding may not accord with the change in aggregate gains and losses in securities for the fiscal period because of the timing of sales and repurchases of Fund shares in relation to fluctuating market values for the Fund. |
| (c) | Amount is less than $0.005 per share. |
| (d) | Total return is calculated assuming a purchase of shares at net asset value on the first day and a sale at net asset value on the last day of each period reported. Distributions are assumed, for the purpose of this calculation, to be reinvested at net asset value per share on the respective payment dates of each distribution. Total returns for periods of less than one year are not annualized. Broker commission charges are not included in this calculation. |
| (e) | Portfolio turnover rate excludes securities received or delivered from in-kind processing of creations or redemptions. |
See accompanying notes to financial statements.
161
SSGA ACTIVE TRUST
FINANCIAL HIGHLIGHTS (continued)
Selected data for a share outstanding throughout each period
| | SPDR DoubleLine Total Return Tactical ETF |
| | Year
Ended
6/30/23 | | Year
Ended
6/30/22 | | Year
Ended
6/30/21 | | Year
Ended
6/30/20 | | Year
Ended
6/30/19 |
Net asset value, beginning of period
| $ 42.27 | | $ 48.46 | | $ 49.40 | | $ 48.96 | | $ 47.60 |
| Income (loss) from investment operations: | | | | | | | | | |
Net investment income (loss) (a)
| 1.68 | | 1.30 | | 1.09 | | 1.37 | | 1.56 |
Net realized and unrealized gain (loss) (b)
| (1.55) | | (5.91) | | (0.70) | | 0.59 | | 1.44 |
Total from investment operations
| 0.13 | | (4.61) | | 0.39 | | 1.96 | | 3.00 |
Net equalization credits and charges (a)
| — | | (0.00)(c) | | 0.00(c) | | (0.00)(c) | | 0.00(c) |
Contribution from affiliate
| — | | — | | 0.00(c) | | — | | — |
Other capital (a)
| 0.04 | | 0.01 | | 0.00(c) | | 0.03 | | 0.04 |
| Distributions to shareholders from: | | | | | | | | | |
Net investment income
| (1.99) | | (1.59) | | (1.33) | | (1.55) | | (1.68) |
Net asset value, end of period
| $ 40.45 | | $ 42.27 | | $ 48.46 | | $ 49.40 | | $ 48.96 |
Total return (d)
| 0.49% | | (9.75)% | | 0.81%(e) | | 4.13% | | 6.53% |
| Ratios and Supplemental Data: | | | | | | | | | |
Net assets, end of period (in 000s)
| $2,987,440 | | $2,244,695 | | $3,188,671 | | $3,191,242 | | $3,336,881 |
| Ratios to average net assets: | | | | | | | | | |
Total expenses
| 0.56% | | 0.55% | | 0.62% | | 0.65% | | 0.65% |
Net expenses
| 0.56% | | 0.55% | | 0.55% | | 0.55% | | 0.55% |
Net investment income (loss)
| 4.11% | | 2.79% | | 2.22% | | 2.80% | | 3.27% |
Portfolio turnover rate (f)
| 113% | | 119% | | 82%(f) | | 25% | | 47% |
| (a) | Per share numbers have been calculated using average shares outstanding, which more appropriately presents the per share data for the year. |
| (b) | Amounts shown in this caption for a share outstanding may not accord with the change in aggregate gains and losses in securities for the fiscal period because of the timing of sales and repurchases of Fund shares in relation to fluctuating market values for the Fund. |
| (c) | Amount is less than $0.005 per share. |
| (d) | Total return is calculated assuming a purchase of shares at net asset value on the first day and a sale at net asset value on the last day of each period reported. Distributions are assumed, for the purpose of this calculation, to be reinvested at net asset value per share on the respective payment dates of each distribution. Total returns for periods of less than one year are not annualized. Broker commission charges are not included in this calculation. |
| (e) | If an affiliate had not made a contribution during the year ended ended June 30, 2021, the total return would have remained 0.81%. |
| (f) | Portfolio turnover rate excludes securities received or delivered from in-kind processing of creations or redemptions. |
See accompanying notes to financial statements.
162
SSGA ACTIVE TRUST
NOTES TO FINANCIAL STATEMENTS
June 30, 2023
1. Organization
SSGA Active Trust (the “Trust”), a Massachusetts business trust registered under the Investment Company Act of 1940, as amended (“1940 Act”), is an open-end management investment company.
As of June 30, 2023, the Trust consists of fourteen (14) series, each of which represents a separate series of beneficial interest in the Trust. The Declaration of Trust permits the Board of Trustees of the Trust (the “Board”) to authorize the issuance of an unlimited number of shares of beneficial interest with no par value. The financial statements herein relate to the following series (each, a “Fund” and collectively, the “Funds”):
| SPDR SSGA Multi-Asset Real Return ETF |
| SPDR SSGA Income Allocation ETF |
| SPDR SSGA Global Allocation ETF |
| SPDR SSGA Ultra Short Term Bond ETF |
| SPDR Loomis Sayles Opportunistic Bond ETF |
| SPDR Nuveen Municipal Bond ETF |
| SPDR Nuveen Municipal Bond ESG ETF |
| SPDR SSGA Fixed Income Sector Rotation ETF |
| SPDR SSGA US Sector Rotation ETF |
| SPDR DoubleLine Emerging Markets Fixed Income ETF |
| SPDR DoubleLine Short Duration Total Return Tactical ETF |
| SPDR DoubleLine Total Return Tactical ETF |
The SPDR SSGA Ultra Short Term Bond ETF, SPDR Loomis Sayles Opportunistic Bond ETF, SPDR Nuveen Municipal Bond ETF and SPDR Nuveen Municipal Bond ESG ETF are each classified as a non-diversified investment company. The remaining Funds are each classified as a diversified investment company under the 1940 Act.
Under the Trust’s organizational documents, its officers and Trustees are indemnified against certain liabilities arising out of the performance of their duties to the Trust. Additionally, in the normal course of business, the Trust enters into contracts with service providers that contain general indemnification clauses. The Trust’s maximum exposure under these arrangements is unknown as this would involve future claims that may be made against the Trust that have not yet occurred.
2. Summary of Significant Accounting Policies
The following is a summary of significant accounting policies followed by the Trust in the preparation of its financial statements:
The preparation of financial statements in accordance with U.S. generally accepted accounting principles (“U.S. GAAP”) requires management to make estimates and assumptions that affect the reported amounts and disclosures in the financial statements. Actual results could differ from those estimates. Each Fund is an investment company under U.S. GAAP and follows the accounting and reporting guidance applicable to investment companies.
Security Valuation
Each Fund's investments are valued at fair value each day that the New York Stock Exchange (“NYSE”) is open and, for financial reporting purposes, as of the report date should the reporting period end on a day that the NYSE is not open. Fair value is generally defined as the price a fund would receive to sell an asset or pay to transfer a liability in an orderly transaction between market participants at the measurement date. By its nature, a fair value price is a good faith estimate of the valuation in a current sale and may not reflect an actual market price. The investments of each Fund are valued pursuant to the policy and procedures developed by the Oversight Committee (the “Committee”) and approved by the Board. The Committee provides oversight of the valuation of investments for the Funds. The Board has responsibility for overseeing the determination of the fair value of investments.
Valuation techniques used to value each Fund’s investments by major category are as follows:
• Equity investments (including preferred stocks and registered investment companies that are exchange-traded funds) traded on a recognized securities exchange for which market quotations are readily available are valued at the last sale price or official closing price, as applicable, on the primary market or exchange on which they trade. Equity investments traded on a recognized exchange for which there were no sales on that day are valued at the last published sale price or at fair value.
• Investments in registered investment companies (including money market funds) or other unitized pooled investment vehicles that are not traded on an exchange are valued at that day’s published net asset value
SSGA ACTIVE TRUST
NOTES TO FINANCIAL STATEMENTS (continued)
June 30, 2023
(“NAV”) per share or unit.
• Government and municipal fixed income securities are generally valued using quotations from independent pricing services or brokers. Certain government inflation-indexed securities may require a calculated fair valuation as the cumulative inflation is contained within the price provided by the pricing service or broker. For these securities, the inflation component of the price is “cleaned” from the pricing service or broker price utilizing the published inflation factors in order to ensure proper accrual of income.
• Debt obligations (including short-term investments and convertible debt securities) are valued using quotations from independent pricing services or brokers or are generally valued at the last reported evaluated prices.
• Exchange-traded futures contracts are valued at the closing settlement price on the primary market on which they are traded most extensively. Exchange-traded futures contracts traded on a recognized exchange for which there were no sales on that day are valued at the last reported sale price obtained from independent pricing services or brokers or at fair value.
• Forward foreign currency exchange contracts are valued based on that day’s prevailing forward exchange rate for the underlying currencies. The rates are obtained from independent pricing services in accordance with the valuation policy and procedures approved by the Board.
• Swap agreements are valued daily based upon prices supplied by Board approved pricing vendors or through brokers. Depending on the product and terms of the transaction, the value of agreements is determined using a series of techniques including valuation models that incorporate a number of market data factors, such as discounted cash flows, yields, curves, trades and values of the underlying reference instruments. In the event the advisor is unable to obtain an independent, third–party valuation the agreements will be fair valued.
• Senior loans or other loans are valued at evaluated bid prices supplied by an independent pricing service, if available. Senior loans and other loans for which the Committee determines that there are no reliable valuations available from pricing services or brokers will be initially valued at cost and adjusted for amortization of principal until remeasurement is warranted due to a credit or economic event or other factors affecting the loan.
In the event prices or quotations are not readily available or that the application of these valuation methods results in a price for an investment that is deemed to be not representative of the fair value of such investment, fair value will be determined in good faith by the Committee, in accordance with the valuation policy and procedures approved by the Board.
Various inputs are used in determining the value of the Funds' investments.
The Funds value their assets and liabilities at fair value using a fair value hierarchy consisting of three broad levels that prioritize the inputs to valuation techniques giving the highest priority to readily available unadjusted quoted prices in active markets for identical assets or liabilities (Level 1 measurements) and the lowest priority to unobservable inputs (Level 3 measurements) when market prices are not readily available or reliable. The categorization of a value determined for an investment within the hierarchy is based upon the pricing transparency of the investment and is not necessarily an indication of the risk associated with investing in it.
The three levels of the fair value hierarchy are as follows:
• Level 1 – Unadjusted quoted prices in active markets for an identical asset or liability;
• Level 2 – Inputs other than quoted prices included within Level 1 that are observable for the asset or liability either directly or indirectly, including quoted prices for similar assets or liabilities in active markets, quoted prices for identical or similar assets or liabilities in markets that are not considered to be active, inputs other than quoted prices that are observable for the asset or liability (such as exchange rates, financing terms, interest rates, yield curves, volatilities, prepayment speeds, loss severities, credit risks and default rates) or other market-corroborated inputs; and
• Level 3 – Unobservable inputs for the asset or liability, including the Committee’s assumptions used in determining the fair value of investments.
SSGA ACTIVE TRUST
NOTES TO FINANCIAL STATEMENTS (continued)
June 30, 2023
The value of each Fund’s investments, according to the fair value hierarchy as of June 30, 2023, is disclosed in each Fund’s respective Schedule of Investments.
Investment Transactions and Income Recognition
Investment transactions are accounted for on the trade date for financial reporting purposes. Realized gains and losses from the sale and disposition of investments are determined using the identified cost method.
Dividend income and capital gain distributions, if any, are recognized daily on the ex-dividend date, net of any foreign taxes withheld at source, if any. Interest income is recorded daily on an accrual basis. All premiums and discounts are amortized/accreted for financial reporting purposes.
Expenses
Certain expenses, which are directly identifiable to a specific Fund, are applied to that Fund within the Trust. Other expenses which cannot be attributed to a specific Fund are allocated in such a manner as deemed equitable, taking into consideration the nature and type of expense and the relative net assets of the Funds within the Trust.
Foreign Currency Translation
The accounting records of the Funds are maintained in U.S. dollars. Foreign currencies as well as investment securities and other assets and liabilities denominated in a foreign currency are translated to U.S. dollars using exchange rates at period end. Purchases and sales of securities, income receipts and expense payments denominated in foreign currencies are translated into U.S. dollars at the prevailing exchange rate on the respective dates of the transactions.
The effects of exchange rate fluctuations on investments are included with the net realized and unrealized gain (loss) on investment securities. Other foreign currency transactions resulting in realized and unrealized gain (loss) are disclosed separately.
Foreign Taxes
The Funds may be subject to foreign taxes (a portion of which may be reclaimable) on income, stock dividends, realized and unrealized capital gain on investments or certain foreign currency transactions. Foreign taxes are recorded in accordance with SSGA FM’s understanding of the applicable foreign tax regulations and rates that exist in the foreign jurisdictions in which the Funds invest. These foreign taxes, if any, are paid by the Funds and are reflected in the Statements of Operations, if applicable. Foreign taxes payable or deferred as of June 30, 2023, if any, are disclosed in the Funds’ Statements of Assets and Liabilities.
Equalization
The Funds follow the accounting practice known as “Equalization” by which a portion of the proceeds from sales and costs of reacquiring Fund shares, equivalent on a per share basis to the amount of distributable net investment income on the date of the transaction, is credited or charged to undistributed net investment income. As a result, undistributed net investment income per share is unaffected by sales or reacquisition of Fund shares. Amounts related to Equalization can be found on the Statements of Changes in Net Assets.
Distributions
Distributions from net investment income are declared and paid quarterly for SPDR SSGA Multi-Asset Real Return ETF, SPDR SSGA Income Allocation ETF, SPDR SSGA Global Allocation ETF and SPDR SSGA US Sector Rotation ETF and declared and paid monthly for SPDR SSGA Ultra Short Term Bond ETF, SPDR Loomis Sayles Opportunistic Bond ETF, SPDR Doubline Total Return Tactical ETF, SPDR Doubline Emerging Markets Fixed Income ETF, SPDR DoubleLine Short Duration Total Return Tactical ETF, SPDR SSGA Fixed Income Sector Rotation ETF, SPDR Nuveen Municipal Bond ESG ETF and SPDR Nuveen Municipal Bond ETF.
Net realized capital gains, if any, are distributed annually. Dividends may be declared and paid more frequently or at any other times to improve Index tracking or to comply with the distribution requirements of the Internal Revenue Code of 1986, as amended. The amount and character of income and capital gains to be distributed are determined in accordance with applicable tax regulations which may differ from net investment income and realized gains recognized for U.S. GAAP purposes.
SSGA ACTIVE TRUST
NOTES TO FINANCIAL STATEMENTS (continued)
June 30, 2023
3. Securities and Other Investments
Delayed Delivery Transactions
During the year, certain Funds transacted in securities on a delayed delivery or when-issued basis. Payment and delivery may take place after the customary settlement period for that security. The price of the underlying securities and the date when the securities will be delivered and paid for are fixed at the time the transaction is negotiated. The securities purchased on a delayed delivery or when-issued basis are identified as such in each applicable Fund’s Schedule of Investments. The Funds may receive compensation for interest forgone in the purchase of a delayed delivery or when-issued security. With respect to purchase commitments, the Funds identify securities as segregated in their records with a value at least equal to the amount of the commitment. Losses may arise due to changes in the value of the underlying securities or if the counterparty does not perform under the contract’s terms, or if the issuer does not issue the securities due to political, economic or other factors.
Loan Agreements
The SPDR Loomis Sayles Opportunistic Bond ETF, SPDR DoubleLine Short Duration Total Return Tactical ETF and SPDR DoubleLine Total Return Tactical ETF invest in Senior Loans. Senior Loans consist generally of obligations of companies and other entities (collectively, “borrowers”) incurred for the purpose of reorganizing the assets and liabilities of a borrower; acquiring another company; taking over control of a company (leveraged buyout); temporary refinancing; or financing internal growth or other general business purposes. Senior Loans are often obligations of borrowers who have incurred a significant percentage of debt compared to their total assets and thus are highly leveraged. Funds do not treat the banks originating or acting as agents for the lenders, or granting or acting as intermediary in participation interests, in loans held by the Funds as the issuers of such loans.
4. Derivative Financial Instruments
Forward Foreign Currency Exchange Contracts
The SPDR Loomis Sayles Opportunitistic Bond ETF may engage in forward foreign currency exchange contracts to acquire exposure to foreign currencies or to hedge the Fund's investments against currency fluctuations. A forward foreign currency exchange contract is a commitment to purchase or sell a foreign currency at the settlement date at a negotiated rate. Non-deliverable forward foreign currency exchange contracts are settled with the counterparty in cash without the delivery of foreign currency. The contract is marked-to-market daily and the change in market value is recorded by the Fund as an unrealized gain or loss. When the contract is closed, the Fund recognizes a realized gain or loss equal to the difference between the value of the contract at the time it was opened and the value at the time it was closed. Certain risks may arise upon entering into forward foreign currency exchange contracts from the potential inability of counterparties to meet the terms of their contracts and are generally limited to the amount of unrealized gains on appreciated contracts, if any. Additionally, when utilizing forward foreign currency exchange contracts to hedge, the Fund gives up the opportunity to profit from favorable exchange rate movements during the term of the contract. For the year ended June 30, 2023, the Fund entered into forward foreign currency exchange contracts to offset the Fund’s exposure to the component currencies.
Futures Contracts
Funds may enter into futures contracts to meet the Funds' objectives. A futures contract is a standardized, exchange-traded agreement to buy or sell a financial instrument at a set price on a future date. Upon entering into a futures contract, the Funds are required to deposit with the broker, cash or securities in an amount equal to the minimum initial margin requirements of the clearing house. Subsequent payments are made or received Funds equal to the daily change in the contract value, accumulated, exchange rates, and or other transactional fees. The accumulation of those payments are recorded as variation margin receivable or payable with a corresponding offset to unrealized gains or losses. The Funds recognizes a realized gain or loss when the contract is closed.
Losses may arise if the value of a futures contract decreases due to unfavorable changes in the market rates or values of the underlying instrument during the term of the contract or if the counterparty does not perform under the contract. The use of futures contracts also involves the risk that the movements in the price of the futures contracts do not correlate with the movement of the assets underlying such contracts.
For the year ended June 30, 2023, the SPDR SSGA Ultra Short Term Bond ETF and SPDR Loomis Sayles Opportunistic Bond ETF entered into futures contracts to hedge interest rate exposure and manage duration.
SSGA ACTIVE TRUST
NOTES TO FINANCIAL STATEMENTS (continued)
June 30, 2023
Swaps
Certain Funds may enter into swap agreements, in which a Fund and counterparty agree either to make periodic net payments on a specified notional amount or a net payment upon termination. Swap agreements are privately negotiated in the OTC market and may be entered into as a bilateral contract (“BL OTC”) or centrally cleared (“centrally cleared swaps”). Swaps are marked-to-market daily and changes in value are recorded as unrealized appreciation (depreciation).
A BL OTC swap is a transaction between a fund and dealer counterparty where cash flows are exchanged between the two parties for the life of the swap. For BL OTC swaps, any upfront premiums paid are recorded as assets and any upfront fees received are recorded as liabilities and are shown as credit default swap contracts premiums paid and credit default swap contracts premiums received, respectively, in the Statement of Assets and Liabilities and amortized to realized gain/loss ratably over the term of the BL OTC swap. Payments received or made by the Fund for BL OTC swaps are recorded in the Statement of Operations as realized gains or losses, respectively. When a BL OTC swap is terminated, the Fund will record a realized gain or loss equal to the difference between the proceeds from (or cost of) the closing transaction and a Fund’s basis in the contract, if any. Generally, the basis of the contracts is the premium received or paid.
A centrally cleared OTC swap is a transaction executed between a fund and a dealer counterparty, then cleared by a futures commission merchant (FCM) through a clearinghouse. Once cleared, the clearinghouse serves as a central counterparty (“CCP”), with whom a fund exchanges cash flows for the life of the transaction, similar to transactions in futures contracts.
A Fund is required to interface with the CCP through a broker. Upon entering into a centrally cleared swap, the Fund is required to deposit initial margin with the broker in the form of cash or securities in an amount that varies depending on the size and risk profile of the particular swap. Securities deposited as initial margin if any, are designated on the Schedule of Investments and cash deposited is segregated and recorded on the Statement of Assets and Liabilities as due from broker. The daily change in valuation of centrally cleared swaps is recorded as a receivable or payable for variation margin in the Statement of Assets and Liabilities. Payments received from (paid to) the counterparty, including at termination, are recorded as realized gain (loss) in the Statement of Operations. For both bi-lateral and centrally cleared OTC swaps, payments are exchanged at specified intervals, accrued daily commencing with the effective date of the contract and recorded as realized gain or (loss). Some swaps may be terminated prior to the effective date and realize a gain or loss upon termination.
Interest Rate Swaps
Interest rate swaps involve the exchange by the Fund with another party of their respective commitments to pay or receive interest, such as an exchange of fixed rate payments for floating rate payments. During the fiscal year ended June 30, 2023, the SPDR Loomis Sayles Opportunistic Bond ETF entered into interest rate swaps in order to manage interest rate risk.
Credit Default Swaps
During the year ended June 30, 2023, the SPDR Loomis Sayles Opportunistic Bond ETF engaged in credit default swaps to manage credit risk. When the Fund is the buyer in a credit default swap contract, the Fund is entitled to receive the par (or other agreed upon) value (full notional value) of a referenced debt obligation (or basket of debt obligations) from the counterparty (or central clearing party (“CCP”) in the case of a centrally cleared swap) to the contract if a credit event by a third party, such as a U.S. or foreign corporate issuer or sovereign issuer, on the debt obligation occurs. In return, the Fund pays the counterparty a periodic stream of payments over the term of the contract provided that no credit event has occurred. If no credit event occurs, the Fund loses its investment and recovers nothing. However, if a credit event occurs, the Fund receives full notional value for a referenced debt obligation that may have little or no value. When the Fund is the seller of a credit default swap, it receives a fixed rate of income throughout the term of the contract, provided there is no credit event. If a credit event occurs, the Fund is obligated to pay the notional amount of the swap and in certain instances take delivery of securities of the reference entity upon the occurrence of a credit event, as defined under the terms of that particular swap agreement. Credit events are contract specific but may include bankruptcy, failure to pay, restructuring, obligation acceleration and repudiation/moratorium. If the Fund is a seller of protection and a credit event occurs, the maximum potential amount of future payments that the Fund could be required to make would be an amount equal to the notional amount of the agreement. This potential amount would be partially offset by any recovery value of the respective referenced obligation, or net amount received from the settlement.
As the seller, the Fund may create economic leverage to its portfolio because, in addition to its total net assets, the Fund is subject to investment exposure on the notional amount of the swap. The interest fee paid or received on the swap, which is based on a specified interest rate on a fixed notional amount, is accrued daily as a component.
SSGA ACTIVE TRUST
NOTES TO FINANCIAL STATEMENTS (continued)
June 30, 2023
The following tables summarize the value of the Fund's derivative instruments as of June 30, 2023, and the related location in the accompanying Statements of Assets and Liabilities and Statements of Operations, presented by primary underlying risk exposure:
| | Asset Derivatives |
| | Interest
Rate
Risk | | Foreign
Exchange
Risk | | Credit
Risk | | Equity
Risk | | Commodity
Risk | | Total |
| SPDR Loomis Sayles Opportunistic Bond ETF | | | | | | | | | | | |
Futures Contracts
| $9,070 | | $— | | $— | | $— | | $— | | $9,070 |
| | Liability Derivatives |
| | Interest
Rate
Risk | | Foreign
Exchange
Risk | | Credit
Risk | | Equity
Risk | | Commodity
Risk | | Total |
| SPDR SSGA Ultra Short Term Bond ETF | | | | | | | | | | | |
Futures Contracts
| $295,115 | | $— | | $— | | $— | | $— | | $295,115 |
| SPDR Loomis Sayles Opportunistic Bond ETF | | | | | | | | | | | |
Swap Contracts
| 35,473 | | — | | — | | — | | — | | 35,473 |
| | Net Realized Gain (Loss) |
| | Interest
Rate
Risk | | Foreign
Exchange
Risk | | Credit
Risk | | Equity
Risk | | Commodity
Risk | | Total |
| SPDR SSGA Ultra Short Term Bond ETF | | | | | | | | | | | |
Futures Contracts
| $2,086,475 | | $ — | | $ — | | $— | | $— | | $2,086,475 |
| SPDR Loomis Sayles Opportunistic Bond ETF | | | | | | | | | | | |
Forward Foreign Currency Exchange Contracts
| — | | (1,704) | | — | | — | | — | | (1,704) |
Futures Contracts
| (710,768) | | — | | — | | — | | — | | (710,768) |
Swap Contracts
| (1,101) | | — | | (122,300) | | — | | — | | (123,401) |
| | Net Change in Unrealized Appreciation/Depreciation |
| | Interest
Rate
Risk | | Foreign
Exchange
Risk | | Credit
Risk | | Equity
Risk | | Commodity
Risk | | Total |
| SPDR SSGA Ultra Short Term Bond ETF | | | | | | | | | | | |
Futures Contracts
| $(419,791) | | $ — | | $ — | | $— | | $— | | $(419,791) |
| SPDR Loomis Sayles Opportunistic Bond ETF | | | | | | | | | | | |
Forward Foreign Currency Exchange Contracts
| — | | (2,566) | | — | | — | | — | | (2,566) |
Futures Contracts
| 24,090 | | — | | — | | — | | — | | 24,090 |
Swap Contracts
| (27,192) | | — | | 10,911 | | — | | — | | (16,281) |
5. Fees and Transactions with Affiliates
Advisory Fee
The Trust on behalf of each Fund, has entered into an Investment Advisory Agreement with SSGA FM. As compensation for services rendered, facilities furnished, and expenses borne by the Adviser, each Fund pays the Adviser a fee (“Management/Advisory fee”) accrued daily and paid monthly, based on a percentage of each Fund’s
SSGA ACTIVE TRUST
NOTES TO FINANCIAL STATEMENTS (continued)
June 30, 2023
average daily net assets as shown in the following table:
| | Annual Rate |
SPDR SSGA Multi-Asset Real Return ETF
| 0.50 *% |
SPDR SSGA Income Allocation ETF
| 0.50 * |
SPDR SSGA Global Allocation ETF
| 0.35 * |
SPDR SSGA Ultra Short Term Bond ETF
| 0.20 |
SPDR Loomis Sayles Opportunistic Bond ETF
| 0.55 * |
SPDR Nuveen Municipal Bond ETF
| 0.40 |
SPDR Nuveen Municipal Bond ESG ETF
| 0.43 |
SPDR SSGA Fixed Income Sector Rotation ETF
| 0.50 * |
SPDR SSGA US Sector Rotation ETF
| 0.70 * |
SPDR DoubleLine Emerging Markets Fixed Income ETF
| 0.65 |
SPDR DoubleLine Short Duration Total Return Tactical ETF
| 0.45 |
SPDR DoubleLine Total Return Tactical ETF
| 0.55 |
| * | The Advisory fees are reduced for SPDR SSGA Multi-Asset Real Return ETF, SPDR SSGA Income Allocation ETF, SPDR SSGA Global Allocation ETF, SPDR Loomis Sayles Opportunistic Bond ETF, SPDR SSGA Fixed Income Sector Rotation ETF and SPDR SSGA US Sector Rotation ETF by the acquired fund fees and expenses and for the year ended June 30, 2023, the net annualized advisory fees were 0.10%, 0.08%, 0.11%, 0.52%, 0,35% and 0.56%, respectively. |
With respect to each Fund, the Management fee is reduced by the acquired fund fees and expenses attributable to the Fund's investments in other investment companies (except acquired fund fees and expenses associated with holdings of acquired funds for cash management purposes).
From time to time, the Adviser may waive all or a portion of it's Management fee. The Adviser pays all expenses of each Fund other than the Management fee, brokerage expenses, taxes, interest, fees and expenses of the Trusts's trustees, who are not “interested persons” of the Trust, as defined in the 1940 Act (“Independent Trustees”) (including any Trustee’s counsel fees), acquired fund fees and expenses, litigation expenses and other extraordinary expenses.
Administrator, Custodian, Sub-Administrator and Transfer Agent Fees
SSGA FM serves as administrator and State Street Bank and Trust Company (“State Street”), an affiliate of the Adviser, serves as custodian, sub-administrator and transfer agent. State Street receives fees for its services as custodian, sub-administrator and transfer agent from the Adviser.
Distributor
State Street Global Advisors Funds Distributors, LLC (“SSGA FD” or the “Distributor”), an affiliate of the Adviser, serves as the Distributor of the Trust.
Other Transactions with Affiliates - Securities Lending
State Street, an affiliate of the Funds, acts as the securities lending agent for the Funds, pursuant to an amended and restated securities lending authorization agreement January 6, 2017, as amended.
Net proceeds collected by State Street on investment of cash collateral or any fee income less rebates payable to borrowers are paid as follows: If the calendar year to date net proceeds are below a specified threshold across SPDR ETFs, each Fund retains eighty five percent (85%) of the net proceeds and fifteen percent (15%) of such net proceeds is payable to State Street. Starting the business day following the date that calendar year to date net proceeds exceeds a specified threshold, each Fund retains ninety percent (90%) of the net proceeds and ten percent (10%) of such net proceeds is payable to State Street.
In addition, cash collateral from lending activities is invested in the State Street Navigator Securities Lending Portfolio II, an affiliated fund, for which SSGA FM serves as investment adviser. See Note 10 for additional information regarding securities lending.
SSGA ACTIVE TRUST
NOTES TO FINANCIAL STATEMENTS (continued)
June 30, 2023
Other Transactions with Affiliates
The Funds may invest in affiliated entities, including securities issued by State Street Corporation, affiliated funds, or entities deemed to be affiliates as a result of the Funds owning more than five percent of the entity’s voting securities or outstanding shares. Amounts relating to these transactions during the year ended June 30, 2023 are disclosed in the Schedules of Investments.
During the fiscal year ended June 30, 2023 State Street made a contribution of $7,309 to the SPDR DoubleLine Short Duration Total Return Tactical ETF related to an accounting matter.
Due to Custodian
In certain circumstances, the Funds may have cash overdrafts with the Custodian due to expense payments, capital transactions, trading of securities, investment operations or derivative transactions. The Due to Custodian amount, if any, reflects cash overdrawn with State Street, as custodian, who is an affiliate of the Funds.
6. Trustees’ Fees
The fees and expenses of the Independent Trustees and one interested, non-management Trustee are paid directly by the Funds. The Independent Trustees and one interested, non-management Trustee are reimbursed for travel and other out-of-pocket expenses in connection with meeting attendance and industry seminars.
7. Investment Transactions
Purchases and sales of investments (excluding in-kind transactions and short term investments) for the year ended June 30, 2023, were as follows:
| | U.S. Government Obligations | | Other Securities |
| | Purchases | | Sales | | Purchases | | Sales |
SPDR SSGA Multi-Asset Real Return ETF
| $ — | | $ — | | $156,581,376 | | $167,437,692 |
SPDR SSGA Income Allocation ETF
| — | | — | | 73,673,527 | | 71,041,968 |
SPDR SSGA Global Allocation ETF
| — | | — | | 314,746,777 | | 321,091,227 |
SPDR SSGA Ultra Short Term Bond ETF
| — | | — | | 233,479,072 | | 136,374,870 |
SPDR Loomis Sayles Opportunistic Bond ETF
| 830,909 | | 1,656,915 | | 41,649,007 | | 37,682,308 |
SPDR Nuveen Municipal Bond ETF
| — | | — | | 21,164,364 | | 19,641,711 |
SPDR Nuveen Municipal Bond ESG ETF
| — | | — | | 20,739,207 | | 16,691,281 |
SPDR SSGA Fixed Income Sector Rotation ETF
| — | | — | | 159,357,289 | | 159,429,538 |
SPDR SSGA US Sector Rotation ETF
| — | | — | | 479,451,438 | | 479,984,299 |
SPDR DoubleLine Emerging Markets Fixed Income ETF
| — | | — | | 36,604,432 | | 33,026,404 |
SPDR DoubleLine Short Duration Total Return Tactical ETF
| 23,740,117 | | 9,654,578 | | 19,023,248 | | 24,907,892 |
SPDR DoubleLine Total Return Tactical ETF
| 3,117,516,985 | | 2,389,921,243 | | 490,532,299 | | 306,503,489 |
For the year ended June 30, 2023, the following Funds had in-kind contributions, redemptions and net realized gains/losses in the amounts as follows:
| | In-kind
Contributions | | In-kind
Redemptions | | In-kind Net
Realized
Gains/(Losses) |
SPDR SSGA Multi-Asset Real Return ETF
| $265,604,141 | | $173,042,608 | | $12,815,788 |
SPDR SSGA Income Allocation ETF
| 20,092,826 | | 42,341,606 | | 627,479 |
SPDR SSGA Global Allocation ETF
| 25,596,557 | | 41,563,797 | | 5,100,336 |
SPDR Loomis Sayles Opportunistic Bond ETF
| — | | 4,186,225 | | (122,007) |
SPDR Nuveen Municipal Bond ETF
| 8,484,662 | | — | | — |
SPDR SSGA Fixed Income Sector Rotation ETF
| 110,568,611 | | 42,778,398 | | (85,067) |
SPDR SSGA US Sector Rotation ETF
| 106,426,542 | | 43,396,485 | | 3,979,780 |
SSGA ACTIVE TRUST
NOTES TO FINANCIAL STATEMENTS (continued)
June 30, 2023
8. Shareholder Transactions
Each Fund issues and redeems its shares, at NAV, by each Fund only in aggregations of a specified number of shares or multiples thereof (“Creation Units”). Except when aggregated in Creation Units, shares of each Fund are not redeemable. Transactions in capital shares for each Fund are disclosed in detail in the Statements of Changes in Net Assets.
The consideration for the purchase of Creation Units of a Fund may consist of the in-kind deposit of a designated portfolio of securities and a specified amount of cash. Investors purchasing and redeeming Creation Units may pay a purchase transaction fee and a redemption transaction fee directly to the Trust and/or custodian, to offset transfer and other transaction costs associated with the issuance and redemption of Creation Units, including Creation Units for cash. An additional variable fee may be charged for certain transactions. Such variable charges, if any, are included in “Other Capital” on the Statements of Changes in Net Assets.
9. Income Tax Information
The Funds have qualified and intend to continue to qualify as regulated investment companies under Subchapter M of the Internal Revenue Code of 1986, as amended. Each Fund will not be subject to federal income taxes to the extent it distributes its taxable income, including any net realized capital gains, for each fiscal year. Therefore, no provision for federal income tax is required.
The Funds file federal and various state and local tax returns as required. No income tax returns are currently under examination. Generally, the federal returns are subject to examination by the Internal Revenue Service for a period of three years from date of filing, while the state returns may remain open for an additional year depending upon jurisdiction. SSGA FM has analyzed each Fund's tax positions taken on tax returns for all open years and does not believe there are any uncertain tax positions that would require recognition of a tax liability.
Distributions to shareholders are recorded on ex-dividend date. Income dividends and gain distributions are determined in accordance with income tax rules and regulations, which may differ from generally accepted accounting principles.
Certain capital accounts in the financial statements have been adjusted for permanent book-tax differences. These adjustments have no impact on net asset values or results of operations. Temporary book-tax differences will reverse in the future. These book-tax differences are primarily due to differing treatments for in-kind transactions, paydown gain and losses, distributions in excess of current earnings and wash sale loss deferrals. In addition, certain funds claimed a portion of the payments made to redeeming shareholders as a distribution for income tax purposes.
The tax character of distributions paid during the year ended June 30, 2023, was as follows:
| | Ordinary
Income | | Tax Exempt
Income | | Long-Term
Capital Gains | | Tax Return
of Capital | | Total |
SPDR SSGA Multi-Asset Real Return ETF
| $ 32,025,253 | | $ — | | $ — | | $ — | | $ 32,025,253 |
SPDR SSGA Income Allocation ETF
| 4,182,212 | | — | | — | | — | | 4,182,212 |
SPDR SSGA Global Allocation ETF
| 9,050,475 | | — | | 5,169,736 | | — | | 14,220,211 |
SPDR SSGA Ultra Short Term Bond ETF
| 13,852,204 | | — | | — | | — | | 13,852,204 |
SPDR Loomis Sayles Opportunistic Bond ETF
| 1,679,743 | | — | | — | | — | | 1,679,743 |
SPDR Nuveen Municipal Bond ETF
| 76,677 | | 453,534 | | — | | 389,728 | | 919,939 |
SPDR Nuveen Municipal Bond ESG ETF
| 5,789 | | 968,991 | | — | | — | | 974,780 |
SPDR SSGA Fixed Income Sector Rotation ETF
| 3,737,844 | | — | | — | | — | | 3,737,844 |
SPDR SSGA US Sector Rotation ETF
| 4,093,813 | | — | | — | | — | | 4,093,813 |
SPDR DoubleLine Emerging Markets Fixed Income ETF
| 3,330,606 | | — | | — | | — | | 3,330,606 |
SPDR DoubleLine Short Duration Total Return Tactical ETF
| 4,502,769 | | — | | — | | — | | 4,502,769 |
SPDR DoubleLine Total Return Tactical ETF
| 117,444,339 | | — | | — | | — | | 117,444,339 |
SSGA ACTIVE TRUST
NOTES TO FINANCIAL STATEMENTS (continued)
June 30, 2023
The tax character of distributions paid during the year ended June 30, 2022, was as follows:
| | Ordinary
Income | | Tax Exempt
Income | | Long-Term
Capital Gains | | Total |
SPDR SSGA Multi-Asset Real Return ETF
| $ 26,209,495 | | $ — | | $ — | | $ 26,209,495 |
SPDR SSGA Income Allocation ETF
| 4,045,876 | | — | | — | | 4,045,876 |
SPDR SSGA Global Allocation ETF
| 9,962,243 | | — | | 2,126,993 | | 12,089,236 |
SPDR SSGA Ultra Short Term Bond ETF
| 2,137,247 | | — | | — | | 2,137,247 |
SPDR Loomis Sayles Opportunistic Bond ETF
| 831,308 | | — | | — | | 831,308 |
SPDR Nuveen Municipal Bond ETF
| 304,924 | | 395,951 | | — | | 700,875 |
SPDR Nuveen Municipal Bond ESG ETF
| 6,073 | | 96,713 | | — | | 102,786 |
SPDR SSGA Fixed Income Sector Rotation ETF
| 1,883,135 | | — | | — | | 1,883,135 |
SPDR SSGA US Sector Rotation ETF
| 7,269,494 | | — | | — | | 7,269,494 |
SPDR DoubleLine Emerging Markets Fixed Income ETF
| 4,608,767 | | — | | 796,187 | | 5,404,954 |
SPDR DoubleLine Short Duration Total Return Tactical ETF
| 2,715,591 | | — | | 256,935 | | 2,972,526 |
SPDR DoubleLine Total Return Tactical ETF
| 96,266,392 | | — | | — | | 96,266,392 |
At June 30, 2023, the components of distributable earnings on a tax basis were as follows:
| | Undistributed
Ordinary Income | | Capital Loss
Carryforwards | | Undistributed
Long-Term
Capital Gains | | Net Unrealized
Gains (Losses) | | Total |
SPDR SSGA Multi-Asset Real Return ETF
| $ 219,567 | | $ (60,765,529) | | $— | | $ (42,334,156) | | $ (102,880,118) |
SPDR SSGA Income Allocation ETF
| — | | (17,340,170) | | — | | (6,419,277) | | (23,759,447) |
SPDR SSGA Global Allocation ETF
| — | | (9,703,927) | | — | | 12,466,618 | | 2,762,691 |
SPDR SSGA Ultra Short Term Bond ETF
| 1,706,812 | | (302,524) | | — | | (3,304,897) | | (1,900,609) |
SPDR Loomis Sayles Opportunistic Bond ETF
| 147,767 | | (4,329,041) | | — | | (990,135) | | (5,171,409) |
SPDR Nuveen Municipal Bond ETF
| — | | (1,412,963) | | — | | (2,042,944) | | (3,455,907) |
SPDR Nuveen Municipal Bond ESG ETF
| — | | (192,969) | | — | | (370,245) | | (563,214) |
SPDR SSGA Fixed Income Sector Rotation ETF
| 43,974 | | (18,350,483) | | — | | (4,295,988) | | (22,602,497) |
SPDR SSGA US Sector Rotation ETF
| — | | (16,311,007) | | — | | 26,218,460 | | 9,907,453 |
SPDR DoubleLine Emerging Markets Fixed Income ETF
| 72,697 | | (5,651,939) | | — | | (10,120,718) | | (15,699,960) |
SPDR DoubleLine Short Duration Total Return Tactical ETF
| 560,513 | | (4,848,825) | | — | | (5,745,895) | | (10,034,207) |
SPDR DoubleLine Total Return Tactical ETF
| 12,882,827 | | (289,320,692) | | — | | (271,794,882) | | (548,232,747) |
As of June 30, 2023, the following Funds had capital loss carryforwards available to offset future realized capital gains as follows:
| | Non-Expiring
Short Term | | Non-Expiring
Long Term |
SPDR SSGA Multi-Asset Real Return ETF
| $ 25,250,988 | | $ 35,514,541 |
SPDR SSGA Income Allocation ETF
| 9,618,849 | | 7,721,321 |
SPDR SSGA Global Allocation ETF
| 7,243,186 | | 2,460,741 |
SPDR SSGA Ultra Short Term Bond ETF
| 302,524 | | — |
SPDR Loomis Sayles Opportunistic Bond ETF
| 2,902,740 | | 1,426,301 |
SPDR Nuveen Municipal Bond ETF
| — | | 1,412,963 |
SPDR Nuveen Municipal Bond ESG ETF
| 156,548 | | 36,421 |
SPDR SSGA Fixed Income Sector Rotation ETF
| 9,946,884 | | 8,403,599 |
SPDR SSGA US Sector Rotation ETF
| 12,136,781 | | 4,174,226 |
SPDR DoubleLine Emerging Markets Fixed Income ETF
| 358,351 | | 5,293,588 |
SPDR DoubleLine Short Duration Total Return Tactical ETF
| 2,623,845 | | 2,224,980 |
SPDR DoubleLine Total Return Tactical ETF
| 174,806,045 | | 114,514,647 |
SSGA ACTIVE TRUST
NOTES TO FINANCIAL STATEMENTS (continued)
June 30, 2023
As of June 30, 2023, gross unrealized appreciation and gross unrealized depreciation of investments and other financial instruments based on cost for federal income tax purposes were as follows:
| | Tax
Cost | | Gross
Unrealized
Appreciation | | Gross
Unrealized
Depreciation | | Net Unrealized
Appreciation
(Depreciation) |
SPDR SSGA Multi-Asset Real Return ETF
| $ 608,665,241 | | $ 1,643,484 | | $ 43,977,640 | | $ (42,334,156) |
SPDR SSGA Income Allocation ETF
| 83,558,797 | | 176,349 | | 6,595,626 | | (6,419,277) |
SPDR SSGA Global Allocation ETF
| 258,671,565 | | 16,414,791 | | 3,948,173 | | 12,466,618 |
SPDR SSGA Ultra Short Term Bond ETF
| 553,420,012 | | 309,109 | | 3,614,006 | | (3,304,897) |
SPDR Loomis Sayles Opportunistic Bond ETF
| 29,711,737 | | 225,048 | | 1,215,173 | | (990,125) |
SPDR Nuveen Municipal Bond ETF
| 44,632,402 | | 112,970 | | 2,155,914 | | (2,042,944) |
SPDR Nuveen Municipal Bond ESG ETF
| 36,988,451 | | 197,927 | | 568,173 | | (370,246) |
SPDR SSGA Fixed Income Sector Rotation ETF
| 232,164,257 | | 230,354 | | 4,526,342 | | (4,295,988) |
SPDR SSGA US Sector Rotation ETF
| 364,541,031 | | 26,633,313 | | 414,853 | | 26,218,460 |
SPDR DoubleLine Emerging Markets Fixed Income ETF
| 88,633,450 | | 300,768 | | 10,421,486 | | (10,120,718) |
SPDR DoubleLine Short Duration Total Return Tactical ETF
| 132,726,332 | | 52,988 | | 5,798,881 | | (5,745,893) |
SPDR DoubleLine Total Return Tactical ETF
| 3,253,201,751 | | 6,182,226 | | 277,975,865 | | (271,793,639) |
10. Securities Lending
Each Fund may lend securities to qualified broker-dealers or institutional investors. The loans are secured at all times by cash, cash equivalents or U.S. government securities in an amount at least equal to the market value of the securities loaned, plus accrued interest and dividends, determined on a daily basis and adjusted accordingly. The value of the collateral with respect to a loaned security may be temporarily more or less than the value of a security due to market fluctuations of securities values. With respect to each loan, if on any U.S. business day the aggregate market value of securities collateral plus cash collateral is less than the aggregate market value of the securities which are subject to the loan, the borrower will be notified to provide additional collateral on the next business day.
The Funds will regain record ownership of loaned securities to exercise certain beneficial rights; however, the Funds may bear the risk of delay in recovery of, or even loss of rights in the securities loaned should the borrower fail financially. In addition, the Funds will bear the risk of loss of any cash collateral that it may invest. The Funds receives compensation for lending its securities from interest or dividends earned on the cash, cash equivalents or U.S. government securities held as collateral, net of fee rebates paid to the borrower and net of fees paid to State Street as the lending agent. Additionally, the Funds will receive a fee from the borrower for non-cash collateral equal to a percentage of the market value of the loaned securities.
The market value of securities on loan as of June 30, 2023, and the value of the invested cash collateral are disclosed in the Funds' Statements of Assets and Liabilities. Non-cash collateral is not disclosed in the Funds' Statements of Assets and Liabilities as it is held by the lending agent on behalf of the Funds, and the Funds does not have the ability to re-hypothecate those securities. Securities lending income, as disclosed in the Funds' Statements of Operations, represents the income earned from the non-cash collateral and the investment of cash collateral, net of fee rebates paid to the borrower and net of fees paid to State Street as lending agent.
The following is a summary of each Fund's securities lending agreements and related cash and non-cash collateral received as of June 30, 2023:
| Fund | | Market Value of
Securities on Loan | | Cash
Collateral
Received | | Non-Cash
Collateral
Received* | | Total
Collateral
Received |
SPDR SSGA Multi-Asset Real Return ETF
| | $ 33,996,738 | | $ 32,724,798 | | $ 1,837,100 | | $ 34,561,898 |
SPDR SSGA Income Allocation ETF
| | 17,067,582 | | 5,978,695 | | 11,402,825 | | 17,381,520 |
SPDR SSGA Global Allocation ETF
| | 43,391,568 | | 41,508,999 | | 2,538,119 | | 44,047,118 |
SPDR SSGA Fixed Income Sector Rotation ETF
| | 49,580,901 | | 48,283,244 | | 2,280,151 | | 50,563,395 |
SPDR SSGA US Sector Rotation ETF
| | 95,360,242 | | 91,543,951 | | 5,019,782 | | 96,563,733 |
| * | The non-cash collateral includes U.S. Treasuries and U.S. Government Agency securities. |
SSGA ACTIVE TRUST
NOTES TO FINANCIAL STATEMENTS (continued)
June 30, 2023
The following table reflects a breakdown of transactions accounted for as secured borrowings, the gross obligation by the type of collateral pledged or securities loaned, and the remaining contractual maturity of those transactions as of June 30, 2023:
| | | | | Remaining Contractual Maturity of the Agreements
as of June 30, 2023 |
| Fund | | Securities
Lending
Transactions | | Overnight
and
Continuous | | <30 Days | | Between
30 & 90
Days | | >90 Days | | Total
Borrowings | | Gross Amount
of Recognized
Liabilities for
Securities Lending Transactions |
SPDR SSGA Multi-Asset Real Return ETF
| | Mutual Funds and Exchange Traded Products | | $32,724,798 | | $— | | $— | | $— | | $32,724,798 | | $32,724,798 |
SPDR SSGA Income Allocation ETF
| | Mutual Funds and Exchange Traded Products | | 5,978,695 | | — | | — | | — | | 5,978,695 | | 5,978,695 |
SPDR SSGA Global Allocation ETF
| | Mutual Funds and Exchange Traded Products | | 41,508,999 | | — | | — | | — | | 41,508,999 | | 41,508,999 |
SPDR SSGA Fixed Income Sector Rotation ETF
| | Mutual Funds and Exchange Traded Products | | 48,283,244 | | — | | — | | — | | 48,283,244 | | 48,283,244 |
SPDR SSGA US Sector Rotation ETF
| | Mutual Funds and Exchange Traded Products | | 91,543,951 | | — | | — | | — | | 91,543,951 | | 91,543,951 |
11. Line of Credit
Certain Funds and other affiliated funds (each a “Participant” and, collectively, the “Participants”) have access to $200 million of a $1.275 billion ($1.1 billion prior to October 6, 2022) revolving credit facility provided by a syndication of banks under which the Participants may borrow to fund shareholder redemptions. This agreement expires in October 2023 unless extended or renewed.
The following Funds participate in the credit facility as of June 30, 2023:
| SPDR SSGA Ultra Short Term Bond ETF |
| SPDR Loomis Sayles Opportunistic Bond ETF |
| SPDR DoubleLine Emerging Markets Fixed Income ETF |
| SPDR DoubleLine Short Duration Total Return Tactical ETF |
| SPDR DoubleLine Total Return Tactical ETF |
The Participants are charged an annual commitment fee which is calculated based on the unused portion of the shared credit line. Commitment fees are allocated among each of the Participants based on relative net assets. Commitment fees are ordinary fund operating expenses paid by the Adviser. A Participant incurs and pays the interest expense related to its borrowing. Interest is calculated at a rate per annum equal to the sum of 1.00% plus the greater of the New York Fed Bank Rate and the one-month SOFR Rate.
The Funds had no outstanding loans as of June 30, 2023.
12. Risks
Concentration Risk
As a result of the Funds' ability to invest a large percentage of their assets in obligations of issuers within the same country, state, region, currency or economic sector, an adverse economic, business or political development may affect the value of the Funds' investments more than if the were more broadly diversified.
SSGA ACTIVE TRUST
NOTES TO FINANCIAL STATEMENTS (continued)
June 30, 2023
Foreign and Emerging Markets Risk
Investing in foreign markets involves risks and considerations not typically associated with investing in the U.S. Foreign securities may be subject to risk of loss because of government regulation, economic, political and social instability in the countries in which the undefined invests. Foreign markets may be less liquid than investments in the U.S. and may be subject to the risks of currency fluctuations. To the extent that the undefined invests in securities of issuers located in emerging markets, these risks may be even more pronounced.
Market Risk
The Funds' investments are subject to changes in general economic conditions, and general market fluctuations and the risks inherent in investment in securities markets. Investment markets can be volatile and prices of investments can change substantially due to various factors including, but not limited to, economic growth or recession, changes in interest rates, changes in the actual or perceived creditworthiness of issuers, and general market liquidity. The Fund is subject to the risk that geopolitical events will disrupt securities markets and adversely affect global economies and markets. Local, regional or global events such as war, acts of terrorism, the spread of infectious illness, such as COVID-19, or other public health issues, or other events could have a significant impact on the Fund and its investments.
13. Recent Accounting Pronouncement
In December 2022, the Financial Accounting Standards Board (FASB) issued Accounting Standards Update (ASU) No. 2206 Reference Rate Reform (Topic 848). ASU No. 2022-06 updates and clarifies ASU No. 2020-04, which provides optional, temporary relief with respect to the financial reporting of contracts subject to certain types of modifications due to the planned discontinuation of LIBOR and other interbank-offered reference rates. The temporary relief provided by ASU No. 2022-06 is effective immediately for certain reference rate-related contract modifications that occur through December 31, 2024. Management does not expect ASU No. 2022-06 to have a material impact on the financial statements.
14. Subsequent Events
Management has evaluated the impact of all subsequent events on the Funds through the date the financial statements were issued and has determined that there were no subsequent events requiring adjustment or disclosure in the financial statements.
SSGA ACTIVE TRUST
REPORT OF INDEPENDENT REGISTERED PUBLIC
ACCOUNTING FIRM
To the Shareholders of SPDR SSGA Multi-Asset Real Return ETF, SPDR SSGA Income Allocation ETF, SPDR SSGA Global Allocation ETF, SPDR SSGA Ultra Short Term Bond ETF, SPDR Loomis Sayles Opportunistic Bond ETF, SPDR Nuveen Municipal Bond ETF, SPDR Nuveen Municipal Bond ESG ETF, SPDR SSGA Fixed Income Sector Rotation ETF, SPDR SSGA US Sector Rotation ETF, SPDR DoubleLine Emerging Markets Fixed Income ETF, SPDR DoubleLine Short Duration Total Return Tactical ETF and SPDR DoubleLine Total Return Tactical ETF and the Board of Trustees of SSGA Active Trust
Opinion on the Financial Statements
We have audited the accompanying statements of assets and liabilities of SPDR SSGA Multi-Asset Real Return ETF, SPDR SSGA Income Allocation ETF, SPDR SSGA Global Allocation ETF, SPDR SSGA Ultra Short Term Bond ETF, SPDR Loomis Sayles Opportunistic Bond ETF, SPDR Nuveen Municipal Bond ETF, SPDR Nuveen Municipal Bond ESG ETF, SPDR SSGA Fixed Income Sector Rotation ETF, SPDR SSGA US Sector Rotation ETF, SPDR DoubleLine Emerging Markets Fixed Income ETF, SPDR DoubleLine Short Duration Total Return Tactical ETF and SPDR DoubleLine Total Return Tactical ETF (collectively, the “Funds”) (twelve of the funds constituting SSGA Active Trust (the “Trust”)), including the schedules of investments, as of June 30, 2023, and the related statements of operations and changes in net assets, and the financial highlights for each of the periods indicated in the table below and the related notes (collectively referred to as the “financial statements”). In our opinion, the financial statements present fairly, in all material respects, the financial position of each of the Funds (twelve of the funds constituting SSGA Active Trust) at June 30, 2023, and the results of their operations, changes in net assets and financial highlights for each of the periods indicated in the table below, in conformity with U.S. generally accepted accounting principles.
| Individual Fund constituting theSSGA Active Trust | Statement of operations | Statement of changes in net assets | Financial highlights |
SPDR SSGA Multi-Asset Real Return ETF
SPDR SSGA Income Allocation ETF
SPDR SSGA Global Allocation ETF
SPDR SSGA Ultra Short Term Bond ETF
SPDR DoubleLine Emerging Markets Fixed Income ETF
SPDR DoubleLine Short Duration Total Return Tactical ETF
SPDR DoubleLine Total Return Tactical ETF | For the year ended June 30, 2023 | For each of the two years in the period ended June 30, 2023 | For each of the five years in the period ended June 30, 2023 |
| SPDR Loomis Sayles Opportunistic Bond ETF | For the year ended June 30, 2023 | For the year ended June 30, 2023 and the period from September 28, 2021 (commencement of operations) through June 30, 2022 | For the year ended June 30, 2023 and the period from September 28, 2021 (commencement of operations) through June 30, 2022 |
| SPDR Nuveen Municipal Bond ETF | For the year ended June 30, 2023 | For the year ended June 30, 2023 and the period from September 28, 2021 (commencement of operations) through June 30, 2022 | For each of the two years in the period ended June 30, 2023 and the period from February 3, 2021 (commencement of operations) through June 30, 2021 |
| SPDR Nuveen Municipal Bond ESG ETF | For the year ended June 30, 2023 | For the year ended June 30, 2023 and the period from April 5, 2022 (commencement of operations) through June 30, 2022 | For the year ended June 30, 2023 and the period from April 5, 2022 (commencement of operations) through June 30, 2022 |
SSGA ACTIVE TRUST
REPORT OF INDEPENDENT REGISTERED PUBLIC
ACCOUNTING FIRM
| Individual Fund constituting theSSGA Active Trust | Statement of operations | Statement of changes in net assets | Financial highlights |
| SPDR SSGA Fixed Income Sector Rotation ETFSPDR SSGA US Sector Rotation ETF | For the year ended June 30, 2023 | For each of the two years in the period ended June 30, 2023 | For each of the four years in the period ended June 30, 2023 and the period from April 3, 2019 (commencement of operations) through June 30, 2019 |
Basis for Opinion
These financial statements are the responsibility of the Trust’s management. Our responsibility is to express an opinion on the Funds’ financial statements based on our audits. We are a public accounting firm registered with the Public Company Accounting Oversight Board (United States) (“PCAOB”) and are required to be independent with respect to the Trust in accordance with the U.S. federal securities laws and the applicable rules and regulations of the Securities and Exchange Commission and the PCAOB.
We conducted our audits in accordance with the standards of the PCAOB. Those standards require that we plan and perform the audit to obtain reasonable assurance about whether the financial statements are free of material misstatement, whether due to error or fraud. The Trust is not required to have, nor were we engaged to perform, an audit of the Trust’s internal control over financial reporting. As part of our audits we are required to obtain an understanding of internal control over financial reporting, but not for the purpose of expressing an opinion on the effectiveness of the Trust’s internal control over financial reporting. Accordingly, we express no such opinion.
Our audits included performing procedures to assess the risks of material misstatement of the financial statements, whether due to error or fraud, and performing procedures that respond to those risks. Such procedures included examining, on a test basis, evidence regarding the amounts and disclosures in the financial statements. Our procedures included confirmation of securities owned as of June 30, 2023, by correspondence with the custodian, brokers and others; when replies from brokers and others were not received, we performed other auditing procedures. Our audits also included evaluating the accounting principles used and significant estimates made by management, as well as evaluating the overall presentation of the financial statements. We believe that our audits provide a reasonable basis for our opinion.
We have served as the auditor of one or more State Street Global Advisors investment companies since 2000.
Boston, Massachusetts
August 25, 2023
SSGA ACTIVE TRUST
OTHER INFORMATION
June 30, 2023 (Unaudited)
Expense Example
As a shareholder of a Fund, you incur two types of costs: (1) transaction costs, including sales charges (loads), if applicable, on purchase payments, reinvested dividends, or other distributions and (2) ongoing costs, including advisory fees and other Fund expenses. This example is intended to help you understand your ongoing costs (in dollars) of investing in the Fund and to compare these costs with the ongoing costs of investing in other mutual funds. It is based on an investment of $1,000 made at the beginning of the period shown and held for the entire period from January 1, 2023 to June 30, 2023.
The table below illustrates your Fund's cost in two ways:
Based on actual fund return ——This section helps you to estimate the actual expenses that you paid over the period. The “Ending Account Value” shown is derived from each Fund's actual return, and the third column shows the dollar amount that would have been paid by an investor who started with $1,000 in the Fund. You may use the information here, together with the amount you invested, to estimate the expenses that you paid over the period. To do so, simply divide your account value by $1,000 (for example, an $8,600 account value divided by $1,000 = 8.6), then multiply the result by the number given for the Fund under the heading “Expenses Paid During Period”.
Based on hypothetical 5% return ——This section is intended to help you compare your Fund's costs with those of other mutual funds. It assumes that the Fund had a yearly return of 5% before expenses, but that the expense ratio is unchanged. In this case, because the return used is not the Fund's actual return, the results do not apply to your investment. The example is useful in making comparisons because the U.S. Securities and Exchange Commission (the “SEC”) requires all mutual funds to calculate expenses based on a 5% return. You can assess your Fund's costs by comparing this hypothetical example with the hypothetical examples that appear in shareholder reports of other funds.
Please note that the expenses shown in the table are meant to highlight your ongoing costs only and do not reflect any transaction costs, such as sales load charges (loads). Therefore, the hypothetical 5% return section of the table is useful in comparing ongoing costs only, and will not help you determine the relative total costs of owning different funds. In addition, if these transaction costs were included, your costs would have been higher.
| | | | Actual | | Hypothetical (assuming a 5%
return before expenses) |
| | Annualized
Expense Ratio | | Ending Account
Value | | Expenses Paid
During Period(a) | | Ending Account
Value | | Expenses Paid
During Period(a) |
SPDR SSGA Multi-Asset Real Return ETF
| 0.11% | | $ 982.80 | | $0.54 | | $1,024.20 | | $0.55 |
SPDR SSGA Income Allocation ETF
| 0.13 | | 1,050.10 | | 0.66 | | 1,024.10 | | 0.65 |
SPDR SSGA Global Allocation ETF
| 0.11 | | 1,080.30 | | 0.57 | | 1,024.20 | | 0.55 |
SPDR SSGA Ultra Short Term Bond ETF
| 0.20 | | 1,023.80 | | 1.00 | | 1,023.80 | | 1.00 |
SPDR Loomis Sayles Opportunistic Bond ETF
| 0.53 | | 1,034.60 | | 2.67 | | 1,022.20 | | 2.66 |
SPDR Nuveen Municipal Bond ETF
| 0.40 | | 1,020.30 | | 2.00 | | 1,022.80 | | 2.01 |
SPDR Nuveen Municipal Bond ESG ETF
| 0.43 | | 1,018.90 | | 2.15 | | 1,022.70 | | 2.16 |
SPDR SSGA Fixed Income Sector Rotation ETF
| 0.35 | | 1,023.50 | | 1.76 | | 1,023.10 | | 1.76 |
SPDR SSGA US Sector Rotation ETF
| 0.57 | | 1,120.10 | | 3.00 | | 1,022.00 | | 2.86 |
SPDR DoubleLine Emerging Markets Fixed Income ETF
| 0.65 | | 1,035.20 | | 3.28 | | 1,021.60 | | 3.26 |
SPDR DoubleLine Short Duration Total Return Tactical ETF
| 0.45 | | 1,026.70 | | 2.26 | | 1,022.60 | | 2.26 |
SPDR DoubleLine Total Return Tactical ETF
| 0.55 | | 1,031.60 | | 2.77 | | 1,022.10 | | 2.76 |
| (a) | Expenses are equal to the Fund's annualized net expense ratio multiplied by the average account value of the period, multiplied by 181, then divided by 365. |
SSGA ACTIVE TRUST
OTHER INFORMATION (continued)
June 30, 2023 (Unaudited)
Liquidity Risk Management Program
Pursuant to Rule 22e-4 under the 1940 Act, the Funds have adopted a liquidity risk management program (the "Program"). The Program’s principal objectives include assessing, managing and periodically reviewing each Fund’s liquidity risk, based on factors specific to the circumstances of the Fund. Liquidity risk is defined as the risk that a Fund could not meet redemption requests without significant dilution of remaining investors’ interests in the Fund.
SSGA FM has been designated by the Board to administer the Funds’ Program. Over the course of the prior year, SSGA FM provided the Board with reports addressing the operations of the Program and assessing its adequacy and the effectiveness of the Program’s implementation for the period December 31, 2021 through December 31, 2022 including:
| • | the Program supported each Fund’s ability to honor redemption requests timely; |
| • | the Program supported SSGA FM’s management of each Fund’s liquidity profile, including during periods of market volatility and net redemptions; |
| • | no material liquidity issues were identified during the period; |
| • | there were no material changes to the Program during the period; |
| • | the implementation of the Program was effective to manage each Fund’s liquidity risk; and |
| • | the Program operated adequately during the period. |
There can be no assurance that the Program will achieve its objectives in the future. Please refer to your Fund’s prospectus for more information regarding the Fund’s exposure to liquidity risk and other principal risks to which an investment in the Fund may be subject.
SSGA ACTIVE TRUST
OTHER INFORMATION (continued)
June 30, 2023 (Unaudited)
Tax Information
For federal income tax purposes, the following information is furnished with respect to the distributions of the Trust for its fiscal year ended June 30, 2023.
Dividends Received Deduction
Each Fund reports the maximum amount allowable of its net taxable income as eligible for the corporate dividends received deduction.
Qualified Business Income Deduction
Each Fund reports the maximum amount allowable of qualified REIT dividends eligible for the qualified business income deduction under Section 199A.
Qualified Dividend Income
A portion of dividends distributed by the Funds during the fiscal year ended June 30, 2023 are considered qualified dividend income and are eligible for reduced tax rates. Each Fund reports the maximum amount allowable of its net taxable income as qualified dividend income as provided in the Jobs and Growth Tax Relief Reconciliation Act of 2003.
Qualified Interest Income
Each Fund reports the maximum amount allowable of its net taxable income and short-term capital gain as qualified interest income.
Interest Dividends
Each Fund reports the maximum amount allowable as Section 163(j) Interest Dividends.
Capital Gain Dividend
| | Amount |
SPDR SSGA Global Allocation ETF
| $5,169,736 |
Foreign Tax Credit
For the year ended June 30, 2023, the following Funds have made an election under Internal Revenue Code Section 853 to pass through foreign taxes paid by the Funds to its shareholders and accordingly have earned foreign source income:
SPDR SSGA Multi-Asset Real Return ETF
SPDR SSGA Income Allocation ETF
SPDR SSGA Global Allocation ETF
Foreign Source Income
For the year ended June 30, 2023, the following funds earned foreign source income:
SPDR SSGA Multi-Asset Real Return ETF
SPDR SSGA Income Allocation ETF
SPDR SSGA Global Allocation ETF
SSGA ACTIVE TRUST
OTHER INFORMATION (continued)
June 30, 2023 (Unaudited)
Tax-Exempt Income
The percentage of distributions paid by the Funds that are exempt-interest distributions are as follows:
| | Percentage |
SPDR Nuveen Municipal Bond ETF
| 49.30% |
SPDR Nuveen Municipal Bond ESG ETF
| 99.40% |
Proxy Voting Policies and Procedures and Records
A description of the Trust's proxy voting policies and procedures that are used by the Funds’ investment adviser to vote proxies relating to the Funds’ portfolio of securities are available (i) without charge, upon request by calling 1-866-787-2257 (toll free) or (ii) on the SEC's website at www.sec.gov.
Information regarding how the Funds voted for the 12-month period ended June 30 is available by August 31 of each year by calling the same number, on the SEC’s website, at www.sec.gov and on the Funds’ website at https://www.ssga.com/spdrs.
Quarterly Portfolio Schedule
Following the Funds’ first and third fiscal quarter-ends, complete Schedules of Investments are filed with the SEC as exhibits on Form N-PORT, which can be found on the Funds' website at https://www.ssga.com/spdrs and on the SEC's website at www.sec.gov. The Funds’ Schedules of Investments are available upon request, without charge, by calling 1-866-787-2257 (toll free).
SSGA ACTIVE TRUST
OTHER INFORMATION (continued)
June 30, 2023 (Unaudited)
Approval of Advisory Agreement
At meetings held prior to June 30, 2023, the Board of Trustees of the Trust (the “Board”) evaluated proposals to continue the Investment Advisory Agreement (the “Agreement”) between the Trust and SSGA Funds Management, Inc. (the “Adviser” or “SSGA FM”) with respect to the following series of SSGA Active Trust: SPDR SSGA Multi-Asset Real Return ETF, SPDR SSGA Income Allocation ETF, SPDR SSGA Global Allocation ETF, SPDR SSGA Ultra Short Term Bond ETF, SPDR Loomis Sayles Opportunistic Bond ETF, SPDR Nuveen Municipal Bond ETF, SPDR Nuveen Municipal Bond ESG ETF, SPDR SSGA Fixed Income Sector Rotation ETF, SPDR SSGA US Sector Rotation ETF, SPDR DoubleLine Emerging Markets Fixed Income ETF, SPDR DoubleLine Short Duration Total Return Tactical ETF, and SPDR DoubleLine Total Return Tactical ETF (the “Funds”). The Trustees who are not “interested persons” of the Trust within the meaning of the Investment Company Act of 1940, as amended (the “Independent Trustees”), also met separately to consider the Agreement. The Independent Trustees were advised by their independent legal counsel throughout the process.
To evaluate the Agreement, the Board requested, and SSGA FM, the Trust’s investment adviser and administrator, and State Street Bank and Trust Company, the Trust’s sub-administrator, transfer agent and custodian (“State Street”) provided, such materials as the Board, with the advice of counsel, deemed reasonably necessary. In deciding whether to approve the Agreement, the Board considered various factors, including the (i) nature, extent and quality of services provided by the Adviser with respect to the Funds under the Agreement, (ii) investment performance of the Funds, (iii) profits realized by the Adviser and its affiliates from its relationship with the Trust, (iv) fees charged to comparable funds, (v) other benefits to the Adviser, and (vi) extent to which economies of scale would be shared as the Funds grow.
Nature, Extent and Quality of Services
The Board considered the nature, extent and quality of services provided by the Adviser. In doing so, the Trustees relied on their prior experience in overseeing the management of the Trust and the materials provided prior to and at the meetings. The Board reviewed the Agreement and the Adviser’s responsibilities for managing investment operations of each of the Funds in accordance with each Fund’s investment objectives and policies, and applicable legal and regulatory requirements. The Board appreciated the nature of the Funds as exchange-traded funds and the experience and expertise of the Adviser in managing exchange-traded funds. The Board considered the background and experience of the Adviser’s senior management, including those individuals responsible for portfolio management, oversight of sub-advisers and regulatory compliance of the Funds. The Board also considered the portfolio management resources, structures and practices of the Adviser, including those associated with monitoring and ensuring each Fund’s compliance with its investment objectives and policies, and applicable laws and regulations. The Board further considered information about the Adviser’s best execution procedures and overall investment management business, noting that the Adviser serves a wide range of clients across a broad spectrum of asset classes. The Board looked at the Adviser’s general knowledge of the investment management business and that of its affiliates which make up State Street Global Advisors, through which the Adviser shares all of its senior personnel. The Board considered that the Adviser and its affiliates constitute one of the world’s largest investment management enterprises for indexed products generally and exchange-traded funds in particular. The Board specifically considered the Adviser’s experience in managing actively-managed exchange-traded funds. The Board also considered the Adviser’s role in overseeing third party sub-advisers, as applicable.
Investment Performance
The Board compared the investment performance of each actively-managed series of the Trust to the performance of a group of comparable funds (net of expenses) (“Performance Group”) obtained from Broadridge Financial Solutions, Inc. (“Broadridge”) and/or to the performance of an appropriate benchmark (gross of expenses) provided by the Adviser. Among other information, the Board considered the following performance information over various periods ended December 31, 2022 in its evaluation of the Funds:
SPDR SSGA Multi-Asset Real Return ETF. The Board considered that the Fund outperformed the median of its Performance Group for the 1-, 2-, 3-, 4- and 5-year periods, but underperformed for the 10-year period. In addition, the Board considered that the Fund underperformed its benchmark index for the 10-year and since inception periods, but outperformed its benchmark index for the 1-, 3- and 5-year periods.
SPDR SSGA Income Allocation ETF. The Board considered that the Fund underperformed the median of its Performance Group for the 2-, 3-, 4- and 5-year periods, outperformed the median of its Performance Group for the 1-year period and had an annualized total return equal to the median of its Performance Group for the 10-year period. In addition, the Board considered that the Fund underperformed its benchmark index for the 1-, 3-, 5- and 10-year and since inception periods.
SSGA ACTIVE TRUST
OTHER INFORMATION (continued)
June 30, 2023 (Unaudited)
SPDR SSGA Global Allocation ETF. The Board considered that the Fund underperformed the median of its Performance Group for the 2-, 3- and 4-year periods, had an annualized total return equal to the median of its Performance Group for the 1- and 5-year periods and outperformed the median of its Performance Group for the 10-year period. In addition, the Board considered that the Fund outperformed its benchmark index for the 1-, 3-, 5- and 10-year and since inception periods.
SPDR SSGA Ultra Short Term Bond ETF. The Board considered that the Fund underperformed the median of its Performance Group for the 4- and 5-year periods, outperformed the median of its Performance Group for the 1- and 2-year periods, and had an annualized total return equal to the median of its Performance Group for the 3-year period. In addition, the Board considered that the Fund underperformed its benchmark index for the 1-year period, but outperformed its benchmark index for the 3- and 5-year and since inception periods.
SPDR DoubleLine Short Duration Total Return Tactical ETF. The Board considered that the Fund underperformed the median of its Performance Group for the 1-, 2-, 3-, 4- and 5-year periods. In addition, the Board considered that the Fund underperformed its benchmark for the 1-, 3- and 5-year periods, but outperformed its benchmark index for the since inception period.
SPDR DoubleLine Total Return Tactical ETF. The Board considered that the Fund underperformed the median of its Performance Group for the 3-, 4- and 5-year periods, but outperformed the median of its Performance Group for the 1- and 2-year periods. In addition, the Board considered that the Fund underperformed its benchmark index for the 3- and 5-year and since inception periods, but outperformed its benchmark index for the 1-year period.
SPDR DoubleLine Emerging Markets Fixed Income ETF. The Board considered that the Fund underperformed the median of its Performance Group for the 3-, 4- and 5-year periods but had an annualized total return equal to the median of its Performance Group for the 1- and 2-year periods. In addition, the Board considered that the Fund underperformed its benchmark index for the 1-, 3- and 5-year and since inception periods.
SPDR SSGA US Sector Rotation ETF. The Board considered that the Fund underperformed the median of its Performance Group for the 2-year period, but had an annualized total return equal to the median of its Performance Group for the 1-year period and outperformed the median of its Performance Group for the 3-year period. In addition, the Board considered that the Fund underperformed its benchmark index for the 3-year and since inception periods, but outperformed its benchmark index for the 1-year period.
SPDR SSGA Fixed Income Sector Rotation ETF. The Board considered that the Fund underperformed the median of its Performance Group for the 1-, 2- and 3-year periods. In addition, the Board considered that the Fund underperformed its benchmark index for the 1- and 3-year and since inception periods.
SPDR Loomis Sayles Opportunistic Bond ETF. The Board considered that the Fund commenced operations on September 28, 2021 and that performance information was provided for a short operating history of the Fund. The Board considered that the Fund outperformed the median of its Performance Group for the 1-year period. In addition, the Board considered that the Fund outperformed its benchmark index for the 1-year and since inception periods.
SPDR Nuveen Municipal Bond ETF. The Board considered that the Fund commenced operations on February 3, 2021 and that performance information was provided for only a short operating history of the Fund. The Board considered the Fund’s performance for the 1-year and since inception periods, including that the Fund underperformed its benchmark index for the 1-year and since inception periods.
SPDR Nuveen Municipal Bond ESG ETF. The Board considered that the Fund commenced operations on April 4, 2022 and that performance information was not provided given the short operating history of the Fund.
In those instances where the Board observed underperformance for an extended period of time, the Trustees discussed with management those factors that contributed to such underperformance and steps being taken in response to such factors, where appropriate.
Profits Realized by Adviser
The Board considered the profitability of the advisory arrangement with the Funds to the Adviser and its affiliates, including data on the Funds’ historical profitability to these entities. The Board, including the Independent Trustees, with their independent legal counsel, had the opportunity to discuss, with representatives of the Adviser and State Street Global Advisors, methodologies used in computing costs that formed the bases of profitability calculations.
SSGA ACTIVE TRUST
OTHER INFORMATION (continued)
June 30, 2023 (Unaudited)
Fees Charged to Comparable Funds
The Board evaluated each Fund’s unitary fee through review of comparative information with respect to fees paid by similar funds – i.e., exchange-traded funds that are actively managed with respect to each series of the Trust. The Board reviewed the universe of similar exchange-traded funds for each Fund based upon data independently obtained from Broadridge and related comparative information for similar exchange-traded funds. In doing so, the Board used a fund by fund analysis of the data. In certain instances as considered appropriate by the Board, the Board explored with management the reasons for the differences between a Fund’s fee and fees paid by similar funds.
Other Benefits
The Board also considered whether the Adviser or its affiliates benefited in other ways from its relationship with the Trust, noting that the Adviser does not maintain soft-dollar arrangements in connection with the Trust’s brokerage transactions.
Economies of Scale
The Board reviewed information regarding economies of scale or other efficiencies that may result as each Fund’s assets grow in size. The Board noted that the advisory fee rate for each Fund does not provide for breakpoints as assets of the Fund increase. However, the Board further noted the Adviser’s assertion that future economies of scale (among several factors) had been taken into consideration for the Funds by fixing relatively low advisory fees, effectively sharing the benefits of lower fees with the Funds from inception. The Adviser also asserted that one of the benefits of the unitary fee was to provide an unvarying expense structure, which could be lost or diluted with the addition of breakpoints. The Board noted that it intends to continue to monitor fees as the Funds grow in size and assess whether fee breakpoints may be warranted.
Conclusion
After weighing the foregoing factors, none of which was dispositive in itself and may have been weighed differently by each Trustee, the Board, including the Independent Trustees voting separately, approved the continuation of the Agreement for each Fund. In approving the continuance of the Advisory Agreement, the Board, including the Independent Trustees voting separately, found that the terms of the Advisory Agreement are fair and reasonable and that the continuance of the Advisory Agreement is in the best interests of each Fund and each Fund’s respective shareholders. The Board’s conclusions with respect to the factors were as follows: (a) the nature, extent and quality of the services provided by the Adviser with respect to the Funds were appropriate; (b) the performance and, more importantly, the index tracking, of each Fund had been satisfactory or the Adviser had demonstrated due attention to the remediation of underperformance, where appropriate; (c) the Adviser’s unitary fee for each Fund considered in relation to the services provided, and in relation to the fees charged to comparable funds, was reasonable; (d) the profitability of the Trust’s relationships with the Adviser and its affiliates was not excessive in view of the nature, extent and quality of the services provided; (e) any additional potential benefits to the Adviser or its affiliates were not of a magnitude to materially affect the Board’s conclusions; and (f) the fees paid to the Adviser adequately shared the economies of scale with respect to the Funds by way of the relatively low fee structure of the Trust. The Independent Trustees were advised by their independent counsel throughout the process.
Approval of DoubleLine Capital LP Sub-Advisory Agreement
At meetings held prior to June 30, 2023, the Board also considered a proposal to continue the Sub-Advisory Agreement (the “DoubleLine Sub-Advisory Agreement”) between the Adviser and DoubleLine Capital LP (“DoubleLine”) with respect to SPDR DoubleLine Emerging Markets Fixed Income ETF, SPDR DoubleLine Short Duration Total Return Tactical ETF, and SPDR DoubleLine Total Return Tactical ETF (the “Doubleline Funds”). The Independent Trustees also met separately to consider the DoubleLine Sub-Advisory Agreement. The Independent Trustees were advised by their independent legal counsel throughout the process.
To evaluate the DoubleLine Sub-Advisory Agreement, the Board requested, and DoubleLine and the Adviser provided, such materials as the Board, with the advice of counsel, deemed reasonably necessary. In deciding whether to approve the DoubleLine Sub-Advisory Agreement, the Board considered various factors, including the (i) nature, extent and quality of services provided by DoubleLine with respect to each Doubleline Fund under the DoubleLine Sub-Advisory Agreement; and (ii) investment performance of each Doubleline Fund. The Board further considered the portion of the current advisory fee that the Adviser would continue to pay to DoubleLine under the DoubleLine Sub-Advisory Agreement and also considered that such fees would continue to be paid directly by the Adviser and would not result in increased fees payable by the Doubleline Funds.
SSGA ACTIVE TRUST
OTHER INFORMATION (continued)
June 30, 2023 (Unaudited)
The Board considered the background and experience of senior management at DoubleLine and, in particular, DoubleLine’s experience in investing in fixed income securities. The Board reviewed each Doubleline Fund’s performance, noting that each Doubleline Fund underperformed at least three of the last five calendar years, but considered management’s explanation of those factors that contributed to such underperformance and the steps being taken in response to such factors. The Board also considered the unitary fee paid to the Adviser by each Doubleline Fund and DoubleLine’s fees paid by the Adviser. The Board also considered whether DoubleLine benefited in other ways from its relationship with the Trust.
After weighing the foregoing factors, as well as the relevant factors discussed in relation to the Double-Line Sub-Advisory Agreement between DoubleLine and the Adviser, none of which was dispositive in itself and may have been weighed differently by each Trustee, the Board, including the Independent Trustees voting separately, approved the continuation of the DoubleLine Sub-Advisory Agreement for each Doubleline Fund. In approving the continuance of the DoubleLine Sub-Advisory Agreement, the Board, including the Independent Trustees voting separately, found that the terms of the DoubleLine Sub-Advisory Agreement, with respect to each Doubleline Fund, are fair and reasonable and that the continuance of the DoubleLine Sub-Advisory Agreement is in the best interests of each Doubleline Fund and its shareholders. The Board’s conclusions with respect to the factors were as follows: (a) the nature, extent and quality of the services provided by DoubleLine with respect to each Doubleline Fund were adequate and appropriate; (b) the performance of each Doubleline Fund had been satisfactory; (c) DoubleLine’s fees for each Doubleline Fund and the unitary fee, considered in relation to the services provided, were reasonable; (d) any additional potential benefits to DoubleLine were not of a magnitude to materially affect the Board’s conclusions; and (e) the fees paid to DoubleLine adequately shared the economies of scale with each Doubleline Fund by way of the relatively low fee structure of the Trust. The Independent Trustees were advised by their independent counsel throughout the process.
Approval of Loomis, Sayles & Company, L.P. (“Loomis”) Sub-Advisory Agreement
At meetings held prior to June 30, 2023, the Board also considered a proposal to continue the Sub-Advisory Agreement (the “Loomis Sub-Advisory Agreement”) between the Adviser and Loomis, Sayles & Company, L.P. (“Loomis”) with respect to the SPDR Loomis Sayles Opportunistic Bond ETF (the “Loomis Fund”). The Independent Trustees also met separately to consider the Loomis Sub-Advisory Agreement. The Independent Trustees were advised by their independent legal counsel throughout the process.
To evaluate the Loomis Sub-Advisory Agreement, the Board requested, and Loomis and the Adviser provided, such materials as the Board, with the advice of counsel, deemed reasonably necessary. In deciding whether to approve the Loomis Sub-Advisory Agreement, the Board considered various factors, including the (i) nature, extent and quality of services provided by Loomis with respect to the Loomis Fund under the Loomis Sub-Advisory Agreement; and (ii) investment performance of the Loomis Fund. The Board further considered the portion of the current advisory fee that the Adviser would continue to pay to Loomis under the Loomis Sub-Advisory Agreement and also considered that such fees would continue to be paid directly by the Adviser and would not result in increased fees payable by the Loomis Fund.
The Board considered the background and experience of senior management at Loomis and, in particular, Loomis’s experience in investing in fixed income securities. The Board reviewed the performance of the Loomis Fund. The Board also considered the unitary fee paid to the Adviser by the Loomis Fund and Loomis’s fees paid by the Adviser. The Board also considered whether Loomis benefited in other ways from its relationship with the Trust.
After weighing the foregoing factors, as well as the relevant factors discussed in relation to the Loomis Sub-Advisory Agreement between Loomis and the Adviser, none of which was dispositive in itself and may have been weighed differently by each Trustee, the Board, including the Independent Trustees voting separately, approved the continuation of the Loomis Sub-Advisory Agreement for the Loomis Fund. In approving the continuance of the Loomis Sub-Advisory Agreement, the Board, including the Independent Trustees voting separately, found that the terms of the Loomis Sub-Advisory Agreement, with respect to the Loomis Fund, are fair and reasonable and that the continuance of the Loomis Sub-Advisory Agreement is in the best interests of the Loomis Fund and its shareholders. The Board’s conclusions with respect to the factors were as follows: (a) the nature, extent and quality of the services provided by Loomis with respect to the Loomis Fund were adequate and appropriate; (b) the performance of the Loomis Fund had been satisfactory; (c) Loomis’s fees for the Loomis Fund and the unitary fee, considered in relation to the services provided, were reasonable; (d) any additional potential benefits to Loomis were not of a magnitude to materially affect the Board’s conclusions; and (e) the fees paid to Loomis adequately shared the economies of scale with the Loomis Fund by way of the relatively low fee structure of the Trust. The Independent Trustees were advised by their independent counsel throughout the process.
SSGA ACTIVE TRUST
OTHER INFORMATION (continued)
June 30, 2023 (Unaudited)
Approval of Nuveen Asset Management Sub-Advisory Agreement
At a meeting held prior to June 30, 2023, the Board also considered a proposal to continue the Sub-Advisory Agreement (the “Nuveen Sub-Advisory Agreement”) between the Adviser and Nuveen Asset Management (“Nuveen”), with respect to the SPDR Nuveen Municipal Bond ETF and SPDR Nuveen Municipal Bond ESG ETF (the “Nuveen Funds”). The Independent Trustees also met separately to consider the Nuveen Sub-Advisory Agreement. The Independent Trustees were advised by their independent legal counsel throughout the process.
To evaluate the Nuveen Sub-Advisory Agreement, the Board requested, and Nuveen and the Adviser provided, such materials as the Board, with the advice of counsel, deemed reasonably necessary. In deciding whether to approve the Nuveen Sub-Advisory Agreement, the Board considered various factors, including the nature, extent and quality of services provided by Nuveen with respect to each Nuveen Fund under the Nuveen Sub-Advisory Agreement and the investment performance of each Nuveen Fund. The Board further considered the portion of the current advisory fee that the Adviser would pay to Nuveen under the Nuveen Sub-Advisory Agreement and also considered that such fees would be paid directly by the Adviser and would not result in increased fees paid by each Nuveen Fund.
The Board considered the background and experience of Nuveen’s senior management and, in particular, Nuveen’s experience in investing in municipal securities. The Board reviewed the performance of the Nuveen Funds. The Board noted that each Nuveen Fund had a relatively short operating history and thus, Broadridge Financial Solutions, Inc. performance information was not provided. The Board also considered the unitary fee paid to the Adviser by each Nuveen Fund and Nuveen’s fees paid by the Adviser. The Board also considered whether Nuveen benefited in other ways from its relationship with the Trust.
After weighing the foregoing factors, as well as the relevant factors discussed in relation to the Nuveen Sub-Advisory Agreement between Nuveen and the Adviser, none of which was dispositive in itself and may have been weighed differently by each Trustee, the Board, including the independent Trustees voting separately, approved the continuation of the Nuveen Sub-Advisory Agreement for the Nuveen Funds. In approving the continuance of the Nuveen Sub-Advisory Agreement, the Board, including the Independent Trustees voting separately, found that, with respect to each Nuveen Fund, the terms of the Nuveen Sub-Advisory Agreement are fair and reasonable and that the continuance of the Nuveen Sub-Advisory Agreement is in the best interests of each Nuveen Fund and its shareholders. The Board’s conclusions with respect to the factors were as follows: (a) the nature, extent and quality of the services provided by Nuveen with respect to the Nuveen Funds were appropriate; (b) the performance and, more importantly for those Nuveen Funds measured against an index, the index tracking, of the Nuveen Fund (except for the SPDR Nuveen Municipal Bond ESG ETF, for which performance was not provided given the Fund’s short operating history) had been satisfactory; (c) Nuveen’s fees for each Nuveen Fund and the unitary fee, considered in relation to the services provided, were reasonable; (d) any additional potential benefits to Nuveen were not of a magnitude to materially affect the Board’s conclusions; and (e) the fees paid to Nuveen adequately shared the economies of scale with each applicable Nuveen Fund by way of the relatively low fee structure of the Trust. The Independent Trustees were advised by their independent counsel throughout the process.
SSGA ACTIVE TRUST
OTHER INFORMATION (continued)
June 30, 2023 (Unaudited)
TRUSTEES AND OFFICERS INFORMATION
Name, Address
and Year of Birth | | Position(s)
with Funds | | Term of
Office and
Length of
Time Served | | Principal
Occupation(s)
During Past
5 Years | | Number of
Portfolios
in Fund
Complex
Overseen
by Trustee† | | Other
Directorships
Held by Trustee
During the
Past 5 Years |
| Trustees | | | | | | | | | | |
| Independent Trustees | | | | | | | | | | |
CARL G. VERBONCOEUR
c/o SSGAActive Trust
One Iron Street
Boston, MA 02210
1952 | | Independent
Trustee,
Trustee
Committee
Chair | | Term:
Unlimited
Served: since
March 2011 | | Self-employed
consultant since 2009. | | 121 | | The Motley Fool Funds Trust (Trustee). |
DWIGHT D. CHURCHILL c/o SSGAActive Trust One Iron Street
Boston, MA 02210
1953 | | Independent
Trustee,
Audit Committee
Chair | | Term:
Unlimited
Served: since
March 2011 | | Self-employed
consultant since 2010;
CEO and President,
CFA Institute (June
2014 - January 2015). | | 121 | | Affiliated Managers Group, Inc. (Chairman, Director and Audit Committee Chair). |
CLARE S. RICHER
c/o SSGAActive Trust
One Iron Street
Boston, MA 02210
1958 | | Independent
Trustee | | Term:
Unlimited
Served: since
July 2018 | | Retired.
Chief Financial
Officer, Putnam
Investments LLC
(December 2008 -
May 2017). | | 121 | | Principal Financial Group (Director) and Financial Committee Chair; Bain Capital Specialty Finance (Director); University of Notre Dame (Trustee); Putnam Acquisition Financing Inc. (Director); Putnam Acquisition Financing LLC (Director); Putnam GP Inc. (Director); Putnam Investor Services, Inc. (Director); Putnam Investments Limited (Director). |
SANDRA G. SPONEM
c/o SSGA Active Trust
One Iron Street
Boston, MA 02210
1958 | | Independent
Trustee | | Term: Unlimited
Served: since
July 2018 | | Retired.
Chief Financial
Officer, M.A.
Mortenson
Companies, Inc.(construction and
real estate company)
(February 2007-
April 2017). | | 121 | | Rydex Series Funds;
Rydex Dynamic Funds;
Rydex Variable Trust;
Guggenheim Funds Trust;
Guggenheim Variable Funds Trust;
Guggenheim Strategy Funds Trust;
Transparent Value Trust;
Fiduciary/Claymore Energy Infrastructure
Fund;
Guggenheim Taxable Municipal
Bond & Investment Grade Debt
Trust;
Guggenheim Strategic
Opportunities Fund;
Guggenheim Enhanced,
Equity Income Fund;
Guggenheim Credit Allocation Fund,
Guggenheim Energy & Income Fund,
Guggenheim Active Allocation Fund
(Trustee and Audit Committee Chair). |
CAROLYN M. CLANCY
c/o SSGA Active Trust
One Iron Street
Boston, MA 02210
1960 | | Independent
Trustee | | Term:
Unlimited
Served: since
October 2022 | | Retired. Executive Vice President, Head of Strategy, Analytics and Market Readiness, Fidelity Investments (April 2020 – June 2021); Executive Vice President, Head of Broker Dealer Business, Fidelity Investments (July 2017 – March 2020). | | 121 | | Assumption University (Trustee); Big Sister Association of Greater Boston (Director). |
KRISTI L. ROWSELL
c/o SSGA Active Trust
One Iron Street
Boston, MA 02210
1966 | | Independent
Trustee | | Term:
Unlimited
Served: since
October 2022 | | Partner and
President,
Harris
Associates
(2010 – 2021). | | 121 | | Oakmark Funds (Trustee); Board of Governors, Investment Company Institute (Member); Habitat for Humanity Chicago (Director). |
SSGA ACTIVE TRUST
OTHER INFORMATION (continued)
June 30, 2023 (Unaudited)
Name, Address
and Year of Birth | | Position(s)
with Funds | | Term of
Office and
Length of
Time Served | | Principal
Occupation(s)
During Past
5 Years | | Number of
Portfolios
in Fund
Complex
Overseen
by Trustee† | | Other
Directorships
Held by Trustee
During the
Past 5 Years |
| Interested Trustee | | | | | | | | | | |
JAMES E. ROSS*
c/o SSGA Active Trust
One Iron Street
Boston, MA 02210
1965 | | Interested
Trustee | | Term: Unlimited
Served as
Trustee: since
March 2011 | | President, Winnisquam
Capital LLC (December
2022 – present);
Non-Executive,
Chairman, Fusion
Acquisition Corp II
(February 2020 -
Present); Non-Executive Chairman, Fusion
Acquisition Corp. (June
2020 - September 2021);
Retired Chairman
and Director, SSGA
Funds Management,
Inc. (2005 - March 2020); Retired
Executive Vice
President, State Street Global
Advisors (2012
- March 2020);
Retired Chief Executive
Officer and Manager,
State Street Global Advisors
Funds Distributors,
LLC (May 2017 -
March 2020); Director,
State Street Global Markets,
LLC (2013 - April 2017);
President, SSGA Funds
Management, Inc.
(2005 - 2012); Principal,
State Street Global Advisors
(2000 - 2005). | | 132 | | Investment Managers
Series Trust (December
2022 – present);
The Select Sector SPDR
Trust (November 2005 -
Present);
SSGA SPDR ETFs
Europe I PLC (Director)
(November 2016 -
March 2020);
SSGA SPDR ETFs Europe II
PLC (Director)
(November 2016 -
March 2020);
State Street Navigator
Securities Lending
Trust (July 2016 -
March 2020);
SSGA Funds (January 2014 -
March 2020);
State Street Institutional
Investment Trust
(February 2007 -
March 2020);
State Street Master Funds
(February 2007 -
March 2020);
Elfun Funds (July 2016 -
December 2018). |
GUNJAN CHAUHAN**
c/o SSGA Active Trust
One Iron Street
Boston, MA 02210
1982 | | Interested
Trustee | | Term: Unlimited
Served: since
October 2022 | | Senior Managing Director, State Street Global Advisors (April 2018 – Present); Managing Director, State Street Global Advisors (June 2015– March 2018). | | 121 | | State Street ICAV (Director). |
| † For the purpose of determining the number of portfolios overseen by the Trustees, “Fund Complex” comprises registered investment companies for which SSGA Funds Management, Inc. serves as investment adviser, which includes series of the the SPDR Series Trust, SSGA Active Trust and SPDR Index Shares Funds. |
| * Mr. Ross is an Interested Trustee because of his ownership interest in an affiliate of the Adviser. Mr. Ross previously served as an Interested Trustee from November 2005 to December 2009. |
| ** Ms. Chauhan is an Interested Trustee because of her position with an affiliate of the Adviser. |
SSGA ACTIVE TRUST
OTHER INFORMATION (continued)
June 30, 2023 (Unaudited)
Name, Address
and Year of Birth | | Position(s)
with Funds | | Term of
Office and
Length of
Time Served | | Principal Occupation(s) During the Past 5 Years |
| Officers | | | | | | |
ANN M. CARPENTER
SSGA Funds Management Inc.
One Iron Street Boston, MA 02210
1966 | | President
and Principal
Executive
Officer;
Deputy
Treasurer | | Term: Unlimited Served: since May 2023 (with respect to President and Principal Executive Officer); Term: Unlimited Served: since February 2016 (with respect to Deputy Treasurer) | | Chief Operating Officer, SSGA Funds Management, Inc. (April 2005 - present)*; Managing Direct Street Global Advisors (April 2005 - present).* |
BRUCE S. ROSENBERG
SSGA Funds Management, Inc.
One Iron Street
Boston, MA 02210
1961 | | Treasurer
and Principal
Financial
Officer | | Term: Unlimited
Served: since
February 2016 | | Managing Director, State Street Global Advisors and SSGA Funds Management, Inc. (July 2015 - present); Director, Credit Suisse (April 2008 - July 2015). |
CHAD C. HALLETT
SSGA Funds Management, Inc.
One Iron Street
Boston, MA 02210
1969 | | Deputy
Treasurer | | Term: Unlimited
Served: since
February 2016 | | Vice President, State Street Global Advisors and SSGA Funds Management, Inc. (November 2014 - present)* |
MICHAEL P. RILEY
SSGA Funds Management, Inc.
One Iron Street
Boston, MA 02210
1969 | | Vice
President | | Term: Unlimited
Served: since
March 2011 | | Managing Director, State Street Global Advisors (2005 - present).* |
SEAN O’MALLEY
SSGA Funds Management, Inc.
One Iron Street
Boston, MA 02210
1969 | | Chief Legal
Officer | | Term: Unlimited
Served: since
August 2019 | | Senior Vice President and Deputy General Counsel, State Street Global Advisors (November 2013 - present). |
DAVID URMAN
SSGA Funds Management, Inc.
One Iron Street
Boston, MA 02210
1985 | | Assistant
Secretary | | Term: Unlimited
Served: since
August 2019 | | Vice President and Senior Counsel, State Street Global Advisors (April 2019 - present); Vice President and Counsel, State Street Global Advisors (August 2015 - April 2019); Associate, Ropes & Gray LLP (November 2012 - August 2015). |
DAVID BARR
SSGA Funds Management, Inc.
One Iron Street
Boston, MA 02210
1974 | | Assistant
Secretary | | Term: Unlimited
Served: since
November 2020 | | Vice President and Senior Counsel, State Street Global Advisors (October 2019 - present); Vice President and Counsel, Eaton Vance Corp. (2010 - 2019). |
E. GERARD MAIORANA, JR.
SSGA Funds Management, Inc.
One Iron Street
Boston, MA 02210
1971 | | Assistant
Secretary | | Term: Unlimited
Served: since May
2023 | | Assistant Vice President, State Street Global Advisors (July 2014 - present). |
DARLENE ANDERSON-VASQUEZ
SSGA Funds Management, Inc.
One Iron Street
Boston, MA 02210
1968 | | Deputy
Treasurer | | Term: Unlimited
Served: since
November 2016 | | Managing Director, State Street Global Advisors and SSGA Funds Management, Inc. (May 2016 - present); Senior Vice President, John Hancock Investments (September 2007 - May 2016). |
SSGA ACTIVE TRUST
OTHER INFORMATION (continued)
June 30, 2023 (Unaudited)
Name, Address
and Year of Birth | | Position(s)
with Funds | | Term of
Office and
Length of
Time Served | | Principal Occupation(s) During the Past 5 Years |
ARTHUR A. JENSEN
SSGA Funds Management, Inc.
1600 Summer Street
Stamford, CT 06905
1966 | | Deputy
Treasurer | | Term: Unlimited
Served: Since
August 2017 | | Vice President, State Street Global Advisors and SSGA Funds Management, Inc. (July 2016 - present); Mutual Funds Controller of GE Asset Management Incorporated (April 2011 - July 2016). |
JOHN BETTENCOURT
SSGA Funds Management, Inc
One Iron Street
Boston, MA 02210
1976 | | Assistant
Treasurer | | Term: Unlimited
Served: since
May 2022 | | Vice President, State Street Global Advisors and SSGA Funds Management Inc. (March 2020 - present); Assistant Vice President, State Street Global Advisors (June 2007 - March 2020). |
DAVID LANCASTER
SSGA Funds Management, Inc.
One Iron Street
Boston, MA 02210
1971 | | Assistant
Treasurer | | Term: Unlimited
Served: since
November 2020 | | Vice President, State Street Global Advisors and SSGA Funds Management, Inc. (July 2017 - present); Assistant Vice President, State Street Bank and Trust Company (November 2011 - July 2017). |
BRIAN HARRIS
SSGA Funds Management, Inc.
One Iron Street
Boston, MA 02210
1973 | | Chief Compliance
Officer; Anti-Money
Laundering
Officer; Code of Ethics
Compliance
Officer | | Term: Unlimited
Served: since
November 2013 | | Managing Director, State Street Global Advisors and SSGA Funds Management, Inc. (June 2013 - present)*; Senior Vice President and Global Head of Investment Compliance, BofA Global Capital Management (2010 - 2013); Director of Compliance, AARP Financial Inc. (2008 - 2010). |
| * Served in various capacities and/or with various affiliated entities during noted time period. |
| The Statement of Additional Information (SAI) includes additional information about the Funds' trustees and is available, without charge, upon request and by calling 1-866-787-2257. |
Trustees
Gunjan Chauhan, Interested Trustee
Dwight D. Churchill
Carolyn M. Clancy
Clare S. Richer
James E. Ross, Interested Non-management Trustee
Kristi L. Rowsell
Sandra G. Sponem
Carl G. Verboncoeur, Chairman
Investment Manager and Administrator
SSGA Funds Management, Inc.
One Iron Street
Boston, MA 02210
Distributor
State Street Global Advisors Funds Distributors, LLC
One Iron Street
Boston, MA 02210
Custodian, Sub-Administrator and Transfer Agent
State Street Bank and Trust Company
One Congress Street
Boston, MA 02114
Legal Counsel
Morgan, Lewis & Bockius LLP
1111 Pennsylvania Avenue, NW
Washington, DC 20004
Independent Registered Public Accounting Firm
Ernst & Young LLP
200 Clarendon Street
Boston, MA 02116
The information contained in this report is intended for the general information of shareholders of the Trust. This report is not authorized for distribution to prospective investors unless preceded or accompanied by a current Trust prospectus which contains important information concerning the Trust. You may obtain a current prospectus and SAI from the Distributor by calling 1-866-787-2257 or visiting https://www.ssga.com/spdrs. Please read the prospectus carefully before you invest.
For more complete information, please call 1.866.787.2257 or visit https://www.ssga.com/spdrs today.
State Street Global Advisors
One Iron Street
Boston, MA 02210
ETFs trade like stocks, are subject to investment risk, fluctuate in market value and may trade at prices above or below the ETF's net asset value. Brokerage commissions and ETF expenses will reduce returns.
Because the Funds are actively managed, they are therefore subject to the risk that the investments selected by SSGA may cause the Funds to underperform relative to their benchmarks or other funds with similar investment objectives. Actively managed ETFs do not seek to replicate the performance of a specified index.
Foreign investments involve greater risks than U.S. investments, including political and economic risks and the risk of currency fluctuations, all of which may be magnified in emerging markets.
Bonds generally present less short-term risk and volatility than stocks, but contain interest rate risk (as interest rates rise bond prices usually fall); issuer default risk; issuer credit risk; liquidity risk; and inflation risk. These effects are usually pronounced for longer-term securities. Any fixed income security sold or redeemed prior to maturity may be subject to a substantial gain or loss.
Investing in commodities entail significant risk and is not appropriate for all investors. Commodities investing entail significant risk as commodity prices can be extremely volatile due to wide range of factors. A few such factors include overall market movements, real or perceived inflationary trends, commodity index volatility, international, economic and political changes, change in interest and currency exchange rates.
Past performance is no guarantee of future results. It is not possible to invest directly in an index. Index performance does not reflect charges and expenses associated with the fund or brokerage commissions associated with buying and selling a fund. Index performance is not meant to represent that of any particular fund.
Standard & Poor’s, S& P and SPDR are registered trademarks of Standard & Poor’s Financial Services LLC (S&P); Dow Jones is a registered trademark of Dow Jones Trademark Holdings LLC (Dow Jones); and these trademarks have been licensed for use by S&P Dow Jones Indices LLC (SPDJI) and sublicensed for certain purposes by State Street Corporation. State Street Corporation’s financial products are not sponsored, endorsed, sold or promoted by SPDJI, Dow Jones, S&P, their respective affiliates and third party licensors and none of such parties make any representation regarding the advisability of investing in such product(s) nor do they have any liability in relation thereto, including for any errors, omissions, or interruptions of any index.
DoubleLine® is a registered trademark of DoubleLine Capital LP.
State Street Global Advisors Funds Distributors, LLC is the distributor for all registered products on behalf of the adviser. SSGA Funds Management has retained GSO Capital Partners, Massachusetts Financial Services Company & DoubleLine Capital LP as the Sub-Adviser.
Before investing, consider a Fund’s investment objectives, risks, charges and expenses. To obtain a prospectus or summary prospectus which contains this and other information, call 1.866.787.2257 or visit https://www.ssga.com/spdrs. Read it carefully.
Not FDIC Insured. No Bank Guarantee. May Lose Value.
The information contained in this report is intended for the general information of shareholders of the Trust. This report is not authorized for distribution to prospective investors unless preceded or accompanied by a current Trust prospectus which contains important information concerning the Trust. You may obtain a current prospectus and SAI from the Distributor by calling 1-866-787-2257 or visiting https://www.ssga.com/spdrs. Please read the prospectus carefully before you invest.
© 2023 State Street Corporation - All Rights Reserved
SPDRACTIVEAR
Annual Report
June 30, 2023
SSGA Active Trust
| SPDR Blackstone High Income ETF |
| SPDR Blackstone Senior Loan ETF |
The information contained in this report is intended for the general information of shareholders of the Trust. This report is not authorized for distribution to prospective investors unless preceded or accompanied by a current Trust prospectus which contains important information concerning the Trust. You may obtain a current prospectus and SAI from the Distributor by calling 1-866-787-2257 or visiting https://www.ssga.com/spdrs. Please read the prospectus carefully before you invest.
TABLE OF CONTENTS
The information contained in this report is intended for the general information of shareholders of the Trust. This report is not authorized for distribution to prospective investors unless preceded or accompanied by a current Trust prospectus which contains important information concerning the Trust. You may obtain a current prospectus and SAI from the Distributor by calling 1-866-787-2257 or visiting https://www.ssga.com/spdrs. Please read the prospectus carefully before you invest.
[This Page Intentionally Left Blank]
Notes to Performance Summary (Unaudited)
The performance chart of a Fund’s total return at net asset value (“NAV”), the total return based on market price and its benchmark index is provided for comparative purposes only and represents the periods noted. A Fund’s per share NAV is the value of one share of a Fund and is calculated by dividing the value of total assets less total liabilities by the number of shares outstanding. The NAV return is based on the NAV of a Fund and the market return is based on the market price per share of a Fund. The market price used to calculate the market return is determined by using the midpoint between the highest bid and the lowest offer on the exchange on which the shares of a Fund are listed for trading, as of the time that a Fund’s NAV is calculated. NAV and market returns assume that dividends and capital gain distributions have been reinvested in a Fund at NAV. Market returns do not include brokerage commissions that may be payable on secondary market transactions. If brokerage commissions were included market returns would be lower.
An index is a statistical measure of a specified financial market or sector. An index does not actually hold a portfolio of securities and therefore does not reflect deductions for fees or expenses. In comparison, a Fund’s performance is negatively impacted by these deductions. Index returns reflect all items of income, gain and loss and the reinvestment of dividends and other income.
The Bloomberg U.S. Aggregate Bond Index is designed to measure the performance of the U.S. dollar denominated investment grade bond market, which includes investment grade (must be Baa3/BBB- or higher using the middle rating of Moody's Investors Service, Inc., Standard & Poor's Financial Services, LLC, and Fitch Inc.) government bonds, investment grade corporate bonds, mortgage pass through securities, commercial mortgage backed securities and other asset backed securities that are publicly for sale in the United States. The securities in the index must have at least 1 year remaining to maturity and must have $300 million or more of outstanding face value. Asset backed securities must have a minimum deal size of $500 million and a minimum tranche size of $25 million. For commercial mortgage backed securities, the original aggregate transaction must have a minimum deal size of $500 million, and a minimum tranche size of $25 million; the aggregate outstanding transaction sizes must be at least $300 million to remain in the index. In addition, the securities must be U.S. dollar denominated, fixed rate, non-convertible, and taxable.
The SPDR Blackstone High Income Composite Index is a 50%/50% blend of the ICE BofA US High Yield Constrained Index and the Morningstar LSTA Leveraged Loan Index.
The Markit iBoxx USD Liquid Leveraged Loan Index is comprised of about 100 of the most liquid, tradable leveraged loans, as identified by Markit’s Loans Liquidity service. Markit is dedicated to utilizing its unique datasets on loans to become the premier provider of independent and objective loan indices for trading, product structuring, and benchmarking.
The Morningstar LSTA U.S. Leveraged Loan 100 Index is designed to reflect the largest facilities in the U.S. leveraged loan market. It mirrors the market-weighted performance of the largest institutional leveraged loans based upon market weightings, spreads, and interest payments. The index consists of 100 loan facilities drawn from a larger benchmark, the Morningstar LSTA (Loan Syndications and Trading Association) Leveraged Loan Index (LLI).
See accompanying notes to financial statements.
1
SPDR Blackstone High Income ETF
Management's Discussion of Fund Performance (Unaudited)
The SPDR Blackstone High Income ETF (the “Fund”) seeks to provide risk-adjusted total return and high current income. The Fund’s primary benchmark is the Bloomberg U.S. Aggregate Bond Index (the "Primary Index") and the Fund's secondary benchmark is the SPDR Blackstone High Income Composite Index (the "Secondary Index") (together "the Indices").
For the 12-month period ended June 30, 2023 (the “Reporting Period”), the total return for the Fund was 8.48% compared to –0.94% and 9.85% for the Primary Index and Secondary Index respectively. The Fund and Indices returns reflect the reinvestment of dividends and other income. The Fund’s performance primarily reflects the expenses of managing the Fund, including brokerage and advisory expenses. The Indices are unmanaged and index returns do not reflect fees and expenses, which if reflected would have a negative impact on returns.
The Fund's allocation to shorter duration assets coupled with the contribution from its credit risk exposure were the largest contributors to the Fund's outperformance vs. Primary Index during the Reporting Period.
The Fund’s credit selection within its loan allocation was the primary driver of underperformance during the Reporting Period relative to the Secondary Index. This headwind was partially offset by the Fund’s positive credit selection within its high yield bond allocation as well as its favorable asset class allocation during the Reporting Period.
The Fund did not invest in derivatives during the Reporting Period.
On an issuer level, the top contributors to the Fund’s total return during the Reporting Period were Carnival Corp., Royal Caribbean Cruises Corporate Ltd., and Transocean Inc. The top detractors from the Fund’s total return during the Reporting Period were Phoenix Services, Crown Finance US Inc., and Mitchell International, Inc.
The views expressed above reflect those of the Fund’s portfolio manager only through the Reporting Period, and do not necessarily represent the views of the Adviser as a whole. Any such views are subject to change at any time based upon market or other conditions and the Adviser disclaims any responsibility to update such views. These views may not be relied on as investment advice and, because investment decisions for a fund are based on numerous factors, may not be relied on as an indication of trading intent on behalf of any fund.
See accompanying notes to financial statements.
2
SPDR Blackstone High Income ETF
Performance Summary (Unaudited)
Performance as of June 30, 2023
| | | Cumulative Total Return | | Average Annual Total Return | |
| | | Net
Asset
Value | Market
Value | Bloomberg U.S. Aggregate Bond Index | SPDR Blackstone High Income Composite Index | | Net
Asset
Value | Market
Value | Bloomberg U.S. Aggregate Bond Index | SPDR Blackstone High Income Composite Index |
| ONE YEAR | | 8.48% | 8.25% | (0.94)% | 9.85% | | 8.48% | 8.25% | (0.94)% | 9.85% |
| SINCE INCEPTION(1) | | (0.12)% | 0.22% | (7.43)% | 1.66% | | (0.09)% | 0.16% | (5.49)% | 1.21% |
| (1) | For the period February 16, 2022 to June 30, 2023. Since shares of the Fund did not trade in the secondary market until one day after the Fund’s inception, for the period from inception to the first day of secondary market trading in shares of the Fund (2/16/22, 2/17/22, respectively), the NAV of the Fund is used as a proxy for the secondary market trading price to calculate market returns. |
Comparison of Change in Value of a $10,000 Investment
(Based on Net Asset Value)
Line graph is based on cumulative total return.
The total expense ratio for SPDR Blackstone High Income ETF as stated in the Fees and Expenses table of the most recent prospectus is 0.70%. Please see the financial highlights for the total expense ratio for the fiscal period ended June 30, 2023.
Performance quoted represents past performance, which is no guarantee of future results. Investment return and principal value will fluctuate, so you may have a gain or loss when shares are sold. Current performance may be higher or lower than that quoted. Visit www.ssga.com for most recent month-end performance. The returns do not reflect the deduction of taxes that a shareholder would pay on Fund distributions or on the redemption or sale of Fund shares. See "Notes to Performance Summaries" on page 1 for more information.
See accompanying notes to financial statements.
3
SPDR Blackstone High Income ETF
Portfolio Statistics (Unaudited)
Top Five Holdings as of June 30, 2023
| | | |
| | Description | % of Net Assets | |
| | Point Au Roche Park CLO Ltd.
11.35% 7/20/2034 | 1.0% | |
| | Ares LXVIII CLO Ltd.
13.63% 4/25/2035 | 0.6 | |
| | Sunoco LP/Sunoco Finance Corp.
4.50% 5/15/2029 | 0.6 | |
| | Ballyrock CLO Ltd.
11.40% 10/20/2031 | 0.6 | |
| | Hughes Satellite Systems Corp.
6.63% 8/1/2026 | 0.5 | |
| | TOTAL | 3.3% | |
(The five largest holdings are subject to change, and there are no guarantees the Fund will continue to remain invested in any particular company.)
Industry Breakdown as of June 30, 2023
| | | |
| | | % of Net Assets | |
| | Software | 8.4% | |
| | Financial Services | 4.5 | |
| | Oil, Gas & Consumable Fuels | 4.3 | |
| | Asset Backed Securities | 3.8 | |
| | Commercial Services | 3.4 | |
| | Pipelines | 3.3 | |
| | Other ABS | 3.0 | |
| | Aerospace & Defense | 2.9 | |
| | Media | 2.8 | |
| | Hotels, Restaurants & Leisure | 2.8 | |
| | Entertainment | 2.7 | |
| | Health Care Providers & Services | 2.7 | |
| | Real Estate Investment Trusts (REITs) | 2.4 | |
| | Specialty Retail | 2.3 | |
| | Retail-Restaurants | 2.2 | |
| | Insurance | 2.1 | |
| | Home Furnishings | 2.1 | |
| | Commercial Services & Supplies | 1.9 | |
| | Leisure Industry | 1.9 | |
| | Chemicals | 1.6 | |
| | Construction & Engineering | 1.6 | |
| | Building Products | 1.6 | |
| | Passenger Airlines | 1.3 | |
| | Containers & Packaging | 1.2 | |
| | IT Services | 1.0 | |
| | Pharmaceuticals | 0.9 | |
| | Machinery | 0.9 | |
| | Metals & Mining | 0.9 | |
| | Construction Materials | 0.8 | |
| | Transport-Services | 0.8 | |
| | Consumer Staples Distribution & Retail | 0.8 | |
| | Diversified Telecommunication Services | 0.8 | |
| | Finance-Consumer Loans | 0.8 | |
| | Professional Services | 0.7 | |
| | Health Care Equipment & Supplies | 0.7 | |
| | Machinery-Construction & Mining | 0.7 | |
| | Internet & Telecom | 0.6 | |
| | Retail-Building Products | 0.6 | |
| | Auto-Cars/Light Trucks | 0.6 | |
| | Oil-Field Services | 0.6 | |
| | Bldg-Residential/Commer | 0.6 | |
| | Real Estate | 0.6 | |
| | Metal-Iron | 0.6 | |
| | Food Products | 0.5 | |
| | Broadline Retail | 0.5 | |
| | Beverages | 0.5 | |
| | Computer Services | 0.5 | |
| | Electrical Equipment | 0.5 | |
| | Telecom Services | 0.5 | |
| | Office Automation&Equip | 0.5 | |
| | Ground Transportation | 0.4 | |
| | Automobile Components | 0.4 | |
| | Miscellaneous Manufactur | 0.4 | |
| | Capital Markets | 0.4 | |
| | Commercial Banks | 0.4 | |
See accompanying notes to financial statements.
4
SPDR Blackstone High Income ETF
Portfolio Statistics (Unaudited) (continued)
| | | |
| | | % of Net Assets | |
| | Paper & Forest Products | 0.4% | |
| | Automobiles | 0.4 | |
| | Electronic Equipment, Instruments & Components | 0.3 | |
| | Household Products | 0.3 | |
| | Independent Power Producers & Energy Traders | 0.3 | |
| | Consumer Finance | 0.3 | |
| | Telecommunication Equip | 0.3 | |
| | Cosmetics & Toiletries | 0.3 | |
| | Cable/Satellite TV | 0.3 | |
| | Life Sciences Tools & Services | 0.3 | |
| | Distribution/Wholesale | 0.3 | |
| | Medical Labs&Testing Srv | 0.3 | |
| | Casino Services | 0.3 | |
| | Steel-Producers | 0.3 | |
| | Gas-Distribution | 0.3 | |
| | Bldg Prod-Doors&Windows | 0.3 | |
| | Commercial Serv-Finance | 0.3 | |
| | Advertising Services | 0.2 | |
| | Communications Equipment | 0.2 | |
| | Trading Companies & Distributors | 0.2 | |
| | Leisure&Rec/Games | 0.2 | |
| | Investment Companies | 0.2 | |
| | Semiconductors & Semiconductor Equipment | 0.2 | |
| | Internet Security | 0.2 | |
| | Advertising Agencies | 0.2 | |
| | Diversified Finan Serv | 0.2 | |
| | Medical-Hospitals | 0.2 | |
| | Food-Retail | 0.2 | |
| | Finance-Mtge Loan/Banker | 0.2 | |
| | Electric Utilities | 0.2 | |
| | E-Commerce/Services | 0.2 | |
| | Electronic Compo-Semicon | 0.2 | |
| | Electronic Compo-Misc | 0.2 | |
| | Publishing-Newspapers | 0.2 | |
| | Internet & Catalog Retail | 0.1 | |
| | Energy Equipment & Services | 0.1 | |
| | Food-Misc/Diversified | 0.1 | |
| | Computers | 0.1 | |
| | Distributors | 0.1 | |
| | Diversified Consumer Services | 0.1 | |
| | Gaming & Entertainment | 0.1 | |
| | Food & Beverage | 0.1 | |
| | Cellular Telecom | 0.1 | |
| | Television | 0.1 | |
| | Casino Hotels | 0.1 | |
| | Broadcast Serv/Program | 0.1 | |
| | Environ Monitoring&Det | 0.1 | |
| | Medical-Drugs | 0.1 | |
| | Real Estate Management & Development | 0.1 | |
| | Retail-Automobile | 0.1 | |
| | Printing-Commercial | 0.1 | |
| | Rental Auto/Equipment | 0.1 | |
| | Building&Construct-Misc | 0.1 | |
| | Cruise Lines | 0.1 | |
| | Enterprise Software/Serv | 0.1 | |
| | Air Freight & Logistics | 0.0 * | |
| | Retail-Major Dept Store | 0.0 * | |
| | Coal | 0.0 * | |
| | Short-Term Investment | 5.3 | |
| | Liabilities in Excess of Other Assets | (2.4) | |
| | TOTAL | 100.0% | |
| * | Amount shown represents less than 0.05% of net assets. | | |
(The Fund’s industry breakdown is expressed as a percentage of net assets and may change over time.)
See accompanying notes to financial statements.
5
SPDR Blackstone Senior Loan ETF
Management's Discussion of Fund Performance (Unaudited)
The investment objective of the SPDR Blackstone Senior Loan ETF (the “Fund”) is to provide current income consistent with the preservation of capital. The Fund’s primary benchmark is the Markit iBoxx USD Liquid Leveraged Loan Index (the "Primary Index") and the Fund's secondary benchmark is the Morningstar LSTA U.S. Leveraged Loan 100 Index (the "Secondary Index") (together, the "Indices").
For the 12-month period ended June 30, 2023 (the “Reporting Period”), the total return for the Fund was 6.95% compared to 11.02% for the Primary Index and 11.78% for the Secondary Index. The Fund and Indices returns reflect the reinvestment of dividends and other income. The Fund’s performance reflects the expenses of managing the Fund, including brokerage and advisory expenses. The Indices are unmanaged and index returns do not reflect fees and expenses of any kind, which if reflected would have a negative impact on returns.
The primary detractors from Fund performance relative to the Indices during the Reporting Period were an overallocation to higher quality loans, which underperformed relative to lower quality credits loans, credit selection within single-B senior secured term loans, and the allocation to high yield bonds, which underperformed loans.
The Fund did not invest in derivatives during the Reporting Period.
On an issuer level, the top contributors to the Fund’s total return during the Reporting Period were HUB International Ltd, Medline Borrower LP, and LBM Acquisition LLC. The top detractors from the Fund’s total return during the Reporting Period were Crown Finance US Inc, AMC Entertainment Holdings Inc, and Lumen Technologies Inc.
The views expressed above reflect those of the Fund’s portfolio manager only through the Reporting Period, and do not necessarily represent the views of the Adviser as a whole. Any such views are subject to change at any time based upon market or other conditions and the Adviser disclaims any responsibility to update such views. These views may not be relied on as investment advice and, because investment decisions for a fund are based on numerous factors, may not be relied on as an indication of trading intent on behalf of any fund.
See accompanying notes to financial statements.
6
SPDR Blackstone Senior Loan ETF
Performance Summary (Unaudited)
Performance as of June 30, 2023
| | | Cumulative Total Return | | Average Annual Total Return | |
| | | Net
Asset
Value | Market
Value | Markit iBoxx USD Liquid Leveraged Loan Index | Morningstar LSTA U.S. Leveraged Loan 100 Index | | Net
Asset
Value | Market
Value | Markit iBoxx USD Liquid Leveraged Loan Index | Morningstar LSTA U.S. Leveraged Loan 100 Index |
| ONE YEAR | | 6.95% | 7.63% | 11.02% | 11.78% | | 6.95% | 7.63% | 11.02% | 11.78% |
| FIVE YEARS | | 15.93% | 16.16% | 14.82% | 21.47% | | 3.00% | 3.04% | 2.80% | 3.97% |
| TEN YEARS | | 33.19% | 33.12% | 32.16% | 43.35% | | 2.91% | 2.90% | 2.83% | 3.67% |
Comparison of Change in Value of a $10,000 Investment
(Based on Net Asset Value)
Line graph is based on cumulative total return.
The total expense ratio for SPDR Blackstone Senior Loan ETF as stated in the Fees and Expenses table of the most recent prospectus is 0.70%. Please see the financial highlights for the total expense ratio for the fiscal period ended June 30, 2023.
Performance quoted represents past performance, which is no guarantee of future results. Investment return and principal value will fluctuate, so you may have a gain or loss when shares are sold. Current performance may be higher or lower than that quoted. Visit www.ssga.com for most recent month-end performance. The returns do not reflect the deduction of taxes that a shareholder would pay on Fund distributions or on the redemption or sale of Fund shares. See "Notes to Performance Summary" on page 1 for more information.
See accompanying notes to financial statements.
7
SPDR Blackstone Senior Loan ETF
Portfolio Statistics (Unaudited)
Top Five Holdings as of June 30, 2023
| | | |
| | Description | % of Net Assets | |
| | Barclays Capital, Inc.
5.11% 6/15/2024 | 2.1% | |
| | Peraton Corp. Senior Secured Term Loan B
8.95% 2/1/2028 | 1.7 | |
| | Athenahealth Group, Inc. Senior Secured 2022 Term Loan B
8.59% 2/15/2029 | 1.7 | |
| | Medline Borrower LP Senior Secured USD Term Loan B
8.35% 10/23/2028 | 1.7 | |
| | TransDigm, Inc. Senior Secured 2023 Term Loan I
8.49% 8/24/2028 | 1.5 | |
| | TOTAL | 8.7% | |
(The five largest holdings are subject to change, and there are no guarantees the Fund will continue to remain invested in any particular company.)
Industry Breakdown as of June 30, 2023
| | | |
| | | % of Net Assets | |
| | Software | 14.4% | |
| | Commercial Services | 5.5 | |
| | Health Care Providers & Services | 5.4 | |
| | Insurance | 5.2 | |
| | Passenger Airlines | 4.9 | |
| | Media | 4.7 | |
| | Hotels, Restaurants & Leisure | 4.5 | |
| | Financial Services | 3.8 | |
| | Commercial Services & Supplies | 2.9 | |
| | Entertainment | 2.7 | |
| | Pipelines | 2.4 | |
| | Pharmaceuticals | 2.3 | |
| | Retail-Restaurants | 2.0 | |
| | Health Care Equipment & Supplies | 2.0 | |
| | Diversified Telecommunication Services | 1.9 | |
| | Specialty Retail | 1.9 | |
| | Aerospace & Defense | 1.8 | |
| | Building Products | 1.4 | |
| | Machinery-Construction & Mining | 1.3 | |
| | Home Furnishings | 1.3 | |
| | Chemicals | 1.2 | |
| | Oil, Gas & Consumable Fuels | 1.2 | |
| | Retail-Building Products | 1.2 | |
| | Containers & Packaging | 1.2 | |
| | Machinery | 1.2 | |
| | Semiconductors & Semiconductor Equipment | 1.2 | |
| | Casino Services | 1.0 | |
| | Automobile Components | 1.0 | |
| | Independent Power Producers & Energy Traders | 0.9 | |
| | Beverages | 0.9 | |
| | Broadline Retail | 0.8 | |
| | Life Sciences Tools & Services | 0.8 | |
| | Internet & Telecom | 0.8 | |
| | Communications Equipment | 0.7 | |
| | Ground Transportation | 0.7 | |
| | Cosmetics & Toiletries | 0.7 | |
| | Electronic Equipment, Instruments & Components | 0.7 | |
| | Professional Services | 0.6 | |
| | Construction & Engineering | 0.5 | |
| | Distributors | 0.4 | |
| | Food Products | 0.4 | |
| | Investment Companies | 0.4 | |
| | Computers | 0.3 | |
| | Transport-Services | 0.3 | |
| | Distribution/Wholesale | 0.3 | |
| | Construction Materials | 0.2 | |
| | Electrical Equipment | 0.2 | |
| | Industrial Conglomerates | 0.2 | |
| | Real Estate Investment Trusts (REITs) | 0.2 | |
| | Leisure Industry | 0.2 | |
| | Automobiles | 0.2 | |
| | Telecom Services | 0.1 | |
| | Household Products | 0.1 | |
| | Telecommunication Equip | 0.1 | |
| | Air Freight & Logistics | 0.1 | |
See accompanying notes to financial statements.
8
SPDR Blackstone Senior Loan ETF
Portfolio Statistics (Unaudited) (continued)
| | | |
| | | % of Net Assets | |
| | Leisure&Rec/Games | 0.1% | |
| | Diversified Consumer Services | 0.1 | |
| | Capital Markets | 0.1 | |
| | Internet Security | 0.1 | |
| | Advertising Agencies | 0.1 | |
| | Steel-Producers | 0.1 | |
| | Cable/Satellite TV | 0.1 | |
| | Oil-Field Services | 0.1 | |
| | Bldg Prod-Doors&Windows | 0.1 | |
| | Metals & Mining | 0.1 | |
| | Real Estate | 0.1 | |
| | Office Automation&Equip | 0.1 | |
| | Metal-Iron | 0.1 | |
| | Enterprise Software/Serv | 0.1 | |
| | E-Commerce/Products | 0.1 | |
| | Oil&Gas Drilling | 0.1 | |
| | MRI/Medical Diag Imaging | 0.0 * | |
| | Miscellaneous Manufactur | 0.0 * | |
| | Food-Misc/Diversified | 0.0 * | |
| | IT Services | 0.0 * | |
| | Gaming & Entertainment | 0.0 * | |
| | Commercial Banks | 0.0 * | |
| | Gas-Distribution | 0.0 * | |
| | Retail-Major Dept Store | 0.0 * | |
| | Medical-Hospitals | 0.0 * | |
| | Auto-Cars/Light Trucks | 0.0 * | |
| | Bldg-Residential/Commer | 0.0 * | |
| | Finance-Mtge Loan/Banker | 0.0 * | |
| | Electric Utilities | 0.0 * | |
| | E-Commerce/Services | 0.0 * | |
| | Broadcast Serv/Program | 0.0 * | |
| | Finance-Consumer Loans | 0.0 * | |
| | Computer Services | 0.0 * | |
| | Paper & Forest Products | 0.0 * | |
| | Real Estate Management & Development | 0.0 * | |
| | Real Estate Oper/Develop | 0.0 * | |
| | Textiles, Apparel & Luxury Goods | 0.0 * | |
| | Internet Connectiv Svcs | 0.0 * | |
| | Commercial Serv-Finance | 0.0 * | |
| | Building&Construct-Misc | 0.0 * | |
| | Consumer Staples Distribution & Retail | 0.0 * | |
| | Bldg&Construct Prod-Misc | 0.0 * | |
| | Food-Retail | 0.0 * | |
| | Aerospace/Defense | 0.0 * | |
| | Diversified Finan Serv | 0.0 * | |
| | Short-Term Investment | 6.5 | |
| | Repurchase Agreements | 2.1 | |
| | Liabilities in Excess of Other Assets | (3.5) | |
| | TOTAL | 100.0% | |
| * | Amount shown represents less than 0.05% of net assets. | | |
(The Fund’s industry breakdown is expressed as a percentage of net assets and may change over time.)
See accompanying notes to financial statements.
9
SPDR BLACKSTONE HIGH INCOME ETF
SCHEDULE OF INVESTMENTS
June 30, 2023
| Security Description | | | Principal
Amount | | Value |
| SENIOR FLOATING RATE LOANS — 46.0% | | | | | |
| ADVERTISING AGENCIES — 0.2% | | | | | |
ABG Intermediate Holdings 2 LLC
2023 Term Loan B2, 1 Month USD SOFR + 4.00%, 9.35%, 12/21/2028 (a)
| | | $ 200,826 | | $ 200,650 |
| ADVERTISING SERVICES — 0.2% | | | | | |
AppLovin Corp.
Senior Secured 2018 Term Loan B, 1 Month USD SOFR + 3.35%, 8.43%, 8/15/2025 (a)
| | | 134,700 | | 134,815 |
CMG Media Corp.
Senior Secured 2021 Term Loan, 3 Month USD LIBOR + 3.50%, 8.84%, 12/17/2026 (a)
| | | 62,031 | | 55,712 |
| | | | | | 190,527 |
| AEROSPACE & DEFENSE — 0.5% | | | | | |
| Dynasty Acquisition Co., Inc.: | | | | | |
Senior Secured 2020 CAD Term Loan B2, 1 Month USD SOFR + 3.50%, 8.70%, 4/6/2026 (a)
| | | 28,400 | | 28,205 |
Senior Secured 2020 Term Loan B1, 1 Month USD SOFR + 3.50%, 8.70%, 4/6/2026 (a)
| | | 52,823 | | 52,460 |
TransDigm, Inc.
Senior Secured 2023 Term Loan I, 3 Month USD SOFR + 3.25%, 8.49%, 8/24/2028 (a)
| | | 518,162 | | 518,462 |
| | | | | | 599,127 |
| AIR FREIGHT & LOGISTICS — 0.0% (b) | | | | | |
Worldwide Express Operations LLC
Senior Secured 2021 1st Lien Term Loan, 3 Month USD SOFR + 4.00%, 9.50%, 7/26/2028 (a)
| | | 45,390 | | 43,225 |
| AUTOMOBILE COMPONENTS — 0.4% | | | | | |
Belron Finance U.S. LLC
2019 USD Term Loan B3, 3 Month USD LIBOR + 2.25%, 7.56%, 10/30/2026 (a)
| | | 122,558 | | 122,609 |
Clarios Global LP
2023 Incremental Term Loan, 1 Month USD SOFR + 3.75%, 8.85%, 5/6/2030 (a)
| | | 250,000 | | 249,726 |
| Security Description | | | Principal
Amount | | Value |
USI, Inc.
Senior Secured 2022 Incremental Term Loan, 3 Month USD SOFR + 3.75%, 8.99%, 11/22/2029 (a)
| | | $ 148,875 | | $ 148,862 |
| | | | | | 521,197 |
| BEVERAGES — 0.4% | | | | | |
Triton Water Holdings, Inc.
Senior Secured Term Loan, 3 Month USD LIBOR + 0.00%, 5.24%, 3/31/2028 (a)
| | | 572,284 | | 554,669 |
| BROADLINE RETAIL — 0.5% | | | | | |
EG America LLC
2023 USD First Lien Incremental Tranche B Term Loan B, 2/28/2028 (a)
| | | 94,311 | | 93,722 |
EG Group Ltd.
Senior Secured 2023 USD First Lien Incremental Tranche C Term Loan B, 2/28/2028 (a)
| | | 141,467 | | 135,631 |
Harbor Freight Tools USA, Inc.
Senior Secured 2021 Term Loan B, 1 Month USD SOFR + 2.75%, 7.97%, 10/19/2027 (a)
| | | 234,911 | | 232,122 |
KFC Holding Co.
Senior Secured 2021 Term Loan B, 1 Month USD LIBOR + 1.75%, 6.90%, 3/15/2028 (a)
| | | 199,490 | | 198,168 |
| | | | | | 659,643 |
| BUILDING PRODUCTS — 1.0% | | | | | |
ACProducts, Inc.
Senior Secured 2021 Term Loan B, 3 Month USD LIBOR + 4.25%, 9.78%, 5/17/2028 (a)
| | | 299,237 | | 252,481 |
Chamberlain Group, Inc.
Senior Secured Term Loan B, 1 Month USD SOFR + 3.25%, 8.45%, 11/3/2028 (a)
| | | 340,595 | | 333,449 |
Cornerstone Building Brands, Inc.
Senior Secured 2021 Term Loan B, 1 Month USD SOFR + 3.25%, 8.50%, 4/12/2028 (a)
| | | 112,068 | | 107,726 |
Oscar AcquisitionCo LLC
Senior Secured Term Loan B, 3 Month USD SOFR + 4.50%, 9.84%, 4/29/2029 (a)
| | | 371,278 | | 363,389 |
Summit Materials LLC
Senior Secured Term Loan B, 6 Month USD SOFR + 3.00%, 8.49%, 12/14/2027 (a)
| | | 199,000 | | 200,337 |
| | | | | | 1,257,382 |
See accompanying notes to financial statements.
10
SPDR BLACKSTONE HIGH INCOME ETF
SCHEDULE OF INVESTMENTS (continued)
June 30, 2023
| Security Description | | | Principal
Amount | | Value |
| CABLE/SATELLITE TV — 0.1% | | | | | |
Cable One, Inc.
Senior Secured 2021 Term Loan B4, 1 Month USD LIBOR + 2.00%, 7.19%, 5/3/2028 (a)
| | | $ 122,431 | | $ 120,533 |
| CAPITAL MARKETS — 0.4% | | | | | |
AqGen Island Holdings, Inc.
Senior Secured Term Loan, 3 Month USD LIBOR + 3.50%, 8.69%, 8/2/2028 (a)
| | | 215,121 | | 212,030 |
Focus Financial Partners LLC
Senior Secured 2021 Term Loan B4, 1 Month USD SOFR + 2.50%, 7.60%, 6/30/2028 (a)
| | | 312,978 | | 309,805 |
| | | | | | 521,835 |
| CASINO SERVICES — 0.3% | | | | | |
Stars Group Holdings BV
Senior Secured 2022 USD Term Loan B, 3 Month USD SOFR + 3.25%, 8.49%, 7/22/2028 (a)
| | | 397,000 | | 398,195 |
| CHEMICALS — 0.7% | | | | | |
Axalta Coating Systems U.S. Holdings, Inc.
2022 USD Term Loan B4, 3 Month USD SOFR + 3.00%, 8.22%, 12/20/2029 (a)
| | | 230,625 | | 231,400 |
Messer Industries GmbH
Senior Secured 2018 USD Term Loan, 3 Month USD SOFR + 2.50%, 8.00%, 3/2/2026 (a)
| | | 135,098 | | 135,186 |
PQ Corp.
Senior Secured 2021 Term Loan B, 3 Month USD SOFR + 2.50%, 7.65%, 6/9/2028 (a)
| | | 125,760 | | 125,397 |
SCIH Salt Holdings, Inc.
Senior Secured 2021 Incremental Term Loan B, 3 Month USD LIBOR + 4.00%, 9.19%, 3/16/2027 (a)
| | | 171,891 | | 169,621 |
Starfruit Finco BV
Senior Secured 2018 USD Term Loan B, 3 Month USD SOFR + 2.75%, 8.07%, 10/1/2025 (a)
| | | 263,966 | | 264,263 |
| | | | | | 925,867 |
| COMMERCIAL SERVICES — 2.0% | | | | | |
AEA International Holdings SARL
Senior Secured Term Loan B, 3 Month USD LIBOR + 3.75%, 9.29%, 9/7/2028 (a)
| | | 289,332 | | 288,970 |
| Security Description | | | Principal
Amount | | Value |
AlixPartners LLP
Senior Secured 2021 USD Term Loan B, 1 Month USD SOFR + 2.50%, 7.72%, 2/4/2028 (a)
| | | $ 177,310 | | $ 177,154 |
Allied Universal Holdco LLC
Senior Secured 2021 USD Incremental Term Loan B, 1 Month USD SOFR + 3.75%, 8.95%, 5/12/2028 (a)
| | | 355,167 | | 345,894 |
CoreLogic, Inc.
Senior Secured Term Loan, 1 Month USD LIBOR + 3.50%, 8.75%, 6/2/2028 (a)
| | | 138,013 | | 124,937 |
Corp. Service Co.
Senior Secured Term Loan B, 1 Month USD SOFR + 3.25%, 8.45%, 11/2/2029 (a)
| | | 330,775 | | 331,726 |
Mavis Tire Express Services Corp.
Senior Secured 2021 Term Loan B, 1 Month USD SOFR + 4.00%, 9.22%, 5/4/2028 (a)
| | | 293,822 | | 291,711 |
Neptune Bidco U.S., Inc.
Senior Secured 2022 USD Term Loan B, 3 Month USD SOFR + 5.00%, 10.00%, 4/11/2029 (a)
| | | 273,485 | | 241,693 |
PECF USS Intermediate Holding III Corp.
Senior Secured Term Loan B, 3 Month USD LIBOR + 4.25%, 9.52%, 12/15/2028 (a)
| | | 396,742 | | 326,965 |
Verscend Holding Corp.
Senior Secured 2021 Term Loan B, 1 Month USD LIBOR + 4.00%, 9.22%, 8/27/2025 (a)
| | | 396,118 | | 396,488 |
| | | | | | 2,525,538 |
| COMMERCIAL SERVICES & SUPPLIES — 1.8% | | | | | |
Aramark Services, Inc.
Senior Secured 2021 Term Loan B, 1 Month USD LIBOR + 2.50%, 7.69%, 4/6/2028 (a)
| | | 355,896 | | 356,074 |
| Asurion LLC: | | | | | |
Senior Secured 2021 Second Lien Term Loan B4, 1 Month USD SOFR + 5.25%, 10.45%, 1/20/2029 (a)
| | | 99,524 | | 83,742 |
Senior Secured 2021 Term Loan B9, 3 Month USD LIBOR + 3.25%, 8.79%, 7/31/2027 (a)
| | | 228,147 | | 216,277 |
Belron Finance U.S. LLC
2023 Term Loan, 3 Month USD SOFR + 2.75%, 7.83%, 4/18/2029 (a)
| | | 125,000 | | 125,235 |
See accompanying notes to financial statements.
11
SPDR BLACKSTONE HIGH INCOME ETF
SCHEDULE OF INVESTMENTS (continued)
June 30, 2023
| Security Description | | | Principal
Amount | | Value |
Cast & Crew Payroll LLC
Senior Secured 2019 1st Lien Term Loan, 1 Month USD LIBOR + 3.50%, 8.69%, 2/9/2026 (a)
| | | $ 198,413 | | $ 195,624 |
| Covanta Holding Corp.: | | | | | |
Senior Secured 2021 Term Loan B, 1 Month USD SOFR + 2.50%, 7.60%, 11/30/2028 (a)
| | | 131,798 | | 130,847 |
Senior Secured 2021 Term Loan C, 1 Month USD SOFR + 2.50%, 7.60%, 11/30/2028 (a)
| | | 9,997 | | 9,925 |
Garda World Security Corp.
Senior Secured 2021 Term Loan B, 1 Month USD SOFR + 6.25%, 9.43%, 10/30/2026 (a)
| | | 305,848 | | 304,701 |
GFL Environmental, Inc.
Senior Secured 2023 Term Loan, 1 Month USD SOFR + 3.00%, 8.15%, 5/28/2027 (a)
| | | 82,149 | | 82,313 |
McGraw-Hill Global Education Holdings LLC
Senior Secured 2021 Term Loan, 6 Month USD LIBOR + 4.75%, 9.95%, 7/28/2028 (a)
| | | 87,716 | | 82,453 |
Packaging Coordinators Midco, Inc.
Senior Secured 2020 1st Lien Term Loan, 3 Month USD SOFR + 3.50%, 8.74%, 11/30/2027 (a)
| | | 188,143 | | 185,806 |
Prime Security Services Borrower LLC
Senior Secured 2021 Term Loan, 3 Month USD LIBOR + 2.75%, 7.94%, 9/23/2026 (a)
| | | 329,440 | | 329,757 |
Thevelia U.S. LLC
USD Term Loan B, 6/18/2029 (c)
| | | 150,000 | | 149,812 |
| | | | | | 2,252,566 |
| COMMUNICATIONS EQUIPMENT — 0.2% | | | | | |
Cogeco Financing 2 LP
Senior Secured 2021 Incremental Term Loan B, 1 Month USD SOFR + 2.50%, 7.72%, 9/1/2028 (a)
| | | 126,956 | | 126,321 |
Zayo Group Holdings, Inc.
Senior Secured USD Term Loan, 1 Month USD LIBOR + 3.00%, 8.22%, 3/9/2027 (a)
| | | 137,687 | | 108,566 |
| | | | | | 234,887 |
| Security Description | | | Principal
Amount | | Value |
| COMPUTER SERVICES — 0.4% | | | | | |
Maximus, Inc.
Senior Secured Term Loan B, 2 Month USD SOFR + 2.00%, 7.23%, 5/28/2028 (a)
| | | $ 110,414 | | $ 110,506 |
Tempo Acquisition LLC
Senior Secured 2022 Term Loan B, 1 Month USD SOFR + 3.00%, 8.10%, 8/31/2028 (a)
| | | 357,355 | | 357,898 |
| | | | | | 468,404 |
| COMPUTERS — 0.1% | | | | | |
Magenta Buyer LLC
Senior Secured 2021 USD 1st Lien Term Loan, 3 Month USD LIBOR + 4.75%, 10.03%, 7/27/2028 (a)
| | | 165,912 | | 125,471 |
| CONSTRUCTION & ENGINEERING — 0.9% | | | | | |
| Brown Group Holding LLC: | | | | | |
Senior Secured 2022 Incremental Term Loan B2, 3 Month USD SOFR + 3.75%, 8.80%, 7/2/2029 (a)
| | | 153,906 | | 153,796 |
Senior Secured Term Loan B, 1 Month USD SOFR + 2.50%, 7.70%, 6/7/2028 (a)
| | | 167,460 | | 165,139 |
DG Investment Intermediate Holdings 2, Inc.
Senior Secured 2021 Term Loan, 1 Month USD SOFR + 3.75%, 8.97%, 3/31/2028 (a)
| | | 387,848 | | 381,546 |
KKR Apple Bidco LLC
Senior Secured 2021 Term Loan, 1 Month USD SOFR + 2.75%, 7.97%, 9/23/2028 (a)
| | | 272,991 | | 271,090 |
Pike Corp.
Senior Secured 2021 Incremental Term Loan B, 1 Month USD SOFR + 3.00%, 8.22%, 1/21/2028 (a)
| | | 184,204 | | 183,716 |
| | | | | | 1,155,287 |
| CONSTRUCTION MATERIALS — 0.3% | | | | | |
Quikrete Holdings, Inc.
Senior Secured 2016 1st Lien Term Loan, 1 Month USD LIBOR + 2.63%, 7.84%, 2/1/2027 (a)
| | | 422,760 | | 422,475 |
| CONSUMER FINANCE — 0.3% | | | | | |
Amentum Government Services Holdings LLC
Senior Secured Term Loan B, 1 Month USD SOFR + 4.00%, 9.22%, 1/29/2027 (a)
| | | 351,368 | | 346,976 |
See accompanying notes to financial statements.
12
SPDR BLACKSTONE HIGH INCOME ETF
SCHEDULE OF INVESTMENTS (continued)
June 30, 2023
| Security Description | | | Principal
Amount | | Value |
| CONSUMER STAPLES DISTRIBUTION & RETAIL — 0.1% | | | | | |
U.S. Foods, Inc.
Senior Secured 2019 Term Loan B, 1 Month USD LIBOR + 2.00%, 7.19%, 9/13/2026 (a)
| | | $ 137,423 | | $ 137,479 |
| CONTAINERS & PACKAGING — 0.9% | | | | | |
Berlin Packaging LLC
Senior Secured 2021 Term Loan B5, 3 Month USD LIBOR + 3.75%, 9.28%, 3/11/2028 (a)
| | | 222,075 | | 218,791 |
Berry Global, Inc.
Senior Secured 2021 Term Loan Z, 1 Month USD LIBOR + 1.75%, 6.97%, 7/1/2026 (a)
| | | 201,954 | | 201,956 |
Charter NEX U.S., Inc.
Senior Secured 2021 Term Loan, 1 Month USD SOFR + 3.75%, 8.97%, 12/1/2027 (a)
| | | 188,252 | | 187,017 |
Clydesdale Acquisition Holdings, Inc.
Senior Secured Term Loan B, 1 Month USD SOFR + 4.18%, 9.38%, 4/13/2029 (a)
| | | 435,233 | | 429,120 |
Graham Packaging Co., Inc.
Senior Secured 2021 Term Loan, 1 Month USD SOFR + 3.00%, 8.22%, 8/4/2027 (a)
| | | 50,161 | | 49,915 |
Trident TPI Holdings, Inc.
Senior Secured 2021 Incremental Term Loan, 3 Month USD LIBOR + 4.00%, 9.54%, 9/15/2028 (a)
| | | 79,097 | | 78,023 |
| | | | | | 1,164,822 |
| COSMETICS & TOILETRIES — 0.2% | | | | | |
Sunshine Luxembourg VII SARL
Senior Secured 2021 Term Loan B3, 3 Month USD SOFR + 3.75%, 9.09%, 10/1/2026 (a)
| | | 281,163 | | 280,110 |
| DISTRIBUTION/WHOLESALE — 0.3% | | | | | |
Resideo Funding, Inc.
Senior Secured 2021 Term Loan, 3 Month USD LIBOR + 2.25%, 7.60%, 2/11/2028 (a)
| | | 303,321 | | 302,752 |
Windsor Holdings III LLC
USD Term Loan B, 6/21/2030 (a)
| | | 115,000 | | 113,117 |
| | | | | | 415,869 |
| Security Description | | | Principal
Amount | | Value |
| DISTRIBUTORS — 0.1% | | | | | |
American Tire Distributors Holdings, Inc.
Senior Secured 2021 Term Loan B, 3 Month USD SOFR + 6.25%, 11.49%, 10/20/2028 (a)
| | | $ 173,853 | | $ 151,667 |
| DIVERSIFIED CONSUMER SERVICES — 0.1% | | | | | |
Ascend Learning LLC
Senior Secured 2021 2nd Lien Term Loan, 1 Month USD SOFR + 5.75%, 10.95%, 12/10/2029 (a)
| | | 157,414 | | 134,786 |
| DIVERSIFIED FINAN SERV — 0.1% | | | | | |
Avolon TLB Borrower 1 (US) LLC
Senior Secured 2023 Term Loan B6, 1 Month USD SOFR + 2.50%, 7.58%, 6/22/2028
| | | 103,465 | | 103,539 |
| DIVERSIFIED TELECOMMUNICATION SERVICES — 0.3% | | | | | |
Altice France SA
Senior Secured 2023 USD Term Loan B14, 3 Month USD SOFR + 5.50%, 10.49%, 8/15/2028 (a)
| | | 202,214 | | 180,644 |
CCI Buyer, Inc.
Senior Secured Term Loan, 3 Month USD SOFR + 4.00%, 9.24%, 12/17/2027 (a)
| | | 85,420 | | 83,979 |
CenturyLink, Inc.
Senior Secured 2020 Term Loan B, 1 Month USD SOFR + 2.25%, 7.47%, 3/15/2027 (a)
| | | 162,913 | | 126,156 |
| | | | | | 390,779 |
| ELECTRICAL EQUIPMENT — 0.1% | | | | | |
Energizer Holdings, Inc.
Senior Secured 2020 Term Loan, 1 Month USD SOFR + 2.25%, 7.44%, 12/22/2027 (a)
| | | 118,000 | | 117,558 |
| ELECTRONIC EQUIPMENT, INSTRUMENTS & COMPONENTS — 0.3% | | | | | |
II-VI, Inc.
Senior Secured 2022 Term Loan B, 3 Month USD SOFR + 2.75%, 7.97%, 7/2/2029 (a)
| | | 246,281 | | 246,205 |
Ingram Micro, Inc.
Senior Secured 2021 Term Loan B, 3 Month USD LIBOR + 3.50%, 9.04%, 6/30/2028 (a)
| | | 54,000 | | 53,899 |
See accompanying notes to financial statements.
13
SPDR BLACKSTONE HIGH INCOME ETF
SCHEDULE OF INVESTMENTS (continued)
June 30, 2023
| Security Description | | | Principal
Amount | | Value |
MX Holdings U.S., Inc.
Senior Secured 2018 USD Term Loan B1C, 1 Month USD SOFR + 2.50%, 7.72%, 7/31/2025 (a)
| | | $ 115,500 | | $ 115,572 |
| | | | | | 415,676 |
| ENERGY EQUIPMENT & SERVICES — 0.1% | | | | | |
WIN Waste Innovations Holdings, Inc.
Senior Secured 2021 Term Loan B, 1 Month USD SOFR + 2.75%, 7.97%, 3/24/2028 (a)
| | | 150,574 | | 130,265 |
| ENTERTAINMENT — 1.6% | | | | | |
Crown Finance U.S., Inc.
Senior Secured 2018 USD Term Loan, 2/28/2025 (c) (d)
| | | 95,314 | | 29,445 |
Fertitta Entertainment LLC
Senior Secured 2022 Term Loan B, 1 Month USD SOFR + 4.00%, 9.10%, 1/27/2029 (a)
| | | 447,945 | | 442,953 |
Formula One Holdings Ltd.
Term Loan B, 1 Month USD SOFR + 3.00%, 8.10%, 1/15/2030 (a)
| | | 250,000 | | 250,344 |
| GVC Holdings Ltd.: | | | | | |
2022 USD Term Loan B2, 6 Month USD SOFR + 3.50%, 8.44%, 10/31/2029 (a)
| | | 278,139 | | 278,069 |
Senior Secured 2021 USD Term Loan B4, 3 Month USD SOFR + 2.50%, 7.44%, 3/29/2027 (a)
| | | 80,928 | | 80,827 |
Motion Finco SARL
Senior Secured Delayed Draw Term Loan B2, 3 Month USD LIBOR + 3.25%, 8.79%, 11/12/2026 (a)
| | | 22,996 | | 22,831 |
NASCAR Holdings LLC
Senior Secured Term Loan B, 1 Month USD SOFR + 2.50%, 7.72%, 10/19/2026 (a)
| | | 220,757 | | 221,326 |
SMG U.S. Midco 2, Inc.
Senior Secured 2020 Term Loan, 3 Month USD LIBOR + 2.50%, 7.79%, 1/23/2025 (a)
| | | 139,538 | | 139,393 |
UFC Holdings LLC
Senior Secured 2021 Term Loan B, 3 Month USD LIBOR + 2.75%, 8.05%, 4/29/2026 (a)
| | | 423,037 | | 423,064 |
WMG Acquisition Corp.
Senior Secured 2021 Term Loan G, 1 Month USD SOFR + 2.13%, 7.33%, 1/20/2028 (a)
| | | 134,203 | | 134,006 |
| | | | | | 2,022,258 |
| Security Description | | | Principal
Amount | | Value |
| FINANCIAL SERVICES — 2.1% | | | | | |
Apex Group Treasury LLC
Senior Secured USD Term Loan, 3 Month USD LIBOR + 3.75%, 9.07%, 7/27/2028 (a)
| | | $ 90,968 | | $ 89,944 |
Belron Finance U.S. LLC
Senior Secured 2021 USD Term Loan B, 3 Month USD LIBOR + 2.43%, 7.80%, 4/13/2028 (a)
| | | 301,986 | | 302,137 |
CE Intermediate I LLC
Senior Secured Term Loan B, 3 Month USD LIBOR + 4.00%, 9.34%, 11/10/2028 (a)
| | | 189,332 | | 186,492 |
Citadel Securities LP
Senior Secured 2021 Term Loan B, 1 Month USD SOFR + 2.50%, 7.72%, 2/2/2028 (a)
| | | 400,278 | | 400,216 |
Deerfield Dakota Holding LLC
Senior Secured 2020 USD Term Loan B, 3 Month USD SOFR + 3.75%, 8.99%, 4/9/2027 (a)
| | | 102,859 | | 100,085 |
DirecTV Financing LLC
Senior Secured Term Loan, 1 Month USD LIBOR + 5.00%, 10.22%, 8/2/2027 (a)
| | | 295,611 | | 289,658 |
Edelman Financial Center LLC
Senior Secured 2021 Term Loan B, 1 Month USD LIBOR + 3.75%, 8.94%, 4/7/2028 (a)
| | | 219,230 | | 214,147 |
NFP Corp.
Senior Secured 2020 Term Loan, 1 Month USD SOFR + 3.25%, 8.47%, 2/15/2027 (a)
| | | 135,119 | | 132,658 |
Paysafe Holdings Corp.
Senior Secured USD Term Loan B1, 1 Month USD SOFR + 2.75%, 7.97%, 6/28/2028 (a)
| | | 76,410 | | 74,468 |
Setanta Aircraft Leasing Designated Activity Co.
Senior Secured Term Loan B, 3 Month USD LIBOR + 2.00%, 7.54%, 11/5/2028 (a)
| | | 159,762 | | 159,976 |
Victory Capital Holdings, Inc.
Senior Secured 2021 Term Loan B, 3 Month USD SOFR + 2.25%, 7.29%, 7/1/2026 (a)
| | | 299,958 | | 298,959 |
Walker & Dunlop, Inc.
Senior Secured 2021 Term Loan, 1 Month USD SOFR + 2.25%, 7.45%, 12/16/2028 (a)
| | | 117,359 | | 116,479 |
See accompanying notes to financial statements.
14
SPDR BLACKSTONE HIGH INCOME ETF
SCHEDULE OF INVESTMENTS (continued)
June 30, 2023
| Security Description | | | Principal
Amount | | Value |
William Morris Endeavor Entertainment LLC
Senior Secured 2018 1st Lien Term Loan, 3 Month USD LIBOR + 2.75%, 7.95%, 5/18/2025 (a)
| | | $ 275,092 | | $ 274,900 |
| | | | | | 2,640,119 |
| FOOD & BEVERAGE — 0.1% | | | | | |
7.74%, 6/28/2030
| | | 108,546 | | 108,479 |
| FOOD PRODUCTS — 0.3% | | | | | |
Froneri International Ltd.
Senior Secured 2020 USD Term Loan, 3 Month USD SOFR + 2.25%, 7.45%, 1/29/2027 (a)
| | | 358,090 | | 356,702 |
| FOOD-MISC/DIVERSIFIED — 0.1% | | | | | |
Skopima Merger Sub, Inc.
Senior Secured Term Loan B, 1 Month USD LIBOR + 4.00%, 9.19%, 5/12/2028 (a)
| | | 188,965 | | 184,140 |
| GAMING & ENTERTAINMENT — 0.1% | | | | | |
PCI Gaming Authority
Senior Secured Term Loan, 1 Month USD LIBOR + 2.50%, 7.72%, 5/29/2026 (a)
| | | 130,998 | | 131,256 |
| GROUND TRANSPORTATION — 0.4% | | | | | |
Genesee & Wyoming, Inc.
Senior Secured Term Loan, 3 Month USD SOFR + 2.00%, 7.34%, 12/30/2026 (a)
| | | 166,178 | | 166,222 |
Kenan Advantage Group, Inc.
Senior Secured 2021 Term Loan B1, 3 Month USD SOFR + 3.75%, 9.48%, 3/24/2026 (a)
| | | 312,778 | | 312,638 |
| | | | | | 478,860 |
| HEALTH CARE EQUIPMENT & SUPPLIES — 0.7% | | | | | |
Bausch & Lomb, Inc.
Senior Secured Term Loan, 3 Month USD SOFR + 3.25%, 8.59%, 5/10/2027 (a)
| | | 555,375 | | 540,102 |
Gainwell Acquisition Corp.
Senior Secured Term Loan B, 3 Month USD SOFR + 4.00%, 9.24%, 10/1/2027 (a)
| | | 335,175 | | 330,566 |
| | | | | | 870,668 |
| Security Description | | | Principal
Amount | | Value |
| HEALTH CARE PROVIDERS & SERVICES — 1.7% | | | | | |
Avantor Funding, Inc.
Senior Secured 2021 Term Loan B5, 1 Month USD SOFR + 2.25%, 7.45%, 11/8/2027 (a)
| | | $ 174,319 | | $ 174,465 |
DaVita, Inc.
Senior Secured 2020 Term Loan B, 1 Month USD SOFR + 1.75%, 6.99%, 8/12/2026 (a)
| | | 360,318 | | 355,670 |
GHX Ultimate Parent Corp.
2023 Term Loan, 3 Month USD SOFR + 4.75%, 9.79%, 6/30/2027 (a)
| | | 170,632 | | 171,112 |
Horizon Therapeutics USA, Inc.
Senior Secured 2021 Term Loan B2, 1 Month USD SOFR + 1.75%, 6.95%, 3/15/2028 (a)
| | | 74,042 | | 73,917 |
ICON Luxembourg SARL
Senior Secured LUX Term Loan, 3 Month USD SOFR + 2.25%, 7.75%, 7/3/2028 (a)
| | | 182,538 | | 182,766 |
Medline Borrower LP
Senior Secured USD Term Loan B, 1 Month USD SOFR + 3.25%, 8.35%, 10/23/2028 (a)
| | | 536,516 | | 530,982 |
| National Mentor Holdings, Inc.: | | | | | |
Senior Secured 2021 Term Loan, 3 Month USD SOFR + 3.75%, 8.95%, 3/2/2028 (a)
| | | 91,730 | | 69,801 |
Senior Secured 2021 Term Loan C, 3 Month USD SOFR + 3.75%, 9.09%, 3/2/2028 (a)
| | | 2,631 | | 2,002 |
| Pediatric Associates Holding Co. LLC: | | | | | |
Senior Secured 2021 Term Loan B, 1 Month USD SOFR + 3.25%, 8.47%, 12/29/2028 (a)
| | | 147,978 | | 145,130 |
Senior Secured 2022 Delayed Draw Term Loan, 3 Month USD LIBOR + 3.25%, 3.25%, 12/29/2028 (a)
| | | 22,524 | | 18,751 |
PRA Health Sciences, Inc.
Senior Secured US Term Loan, 3 Month USD SOFR + 2.25%, 7.75%, 7/3/2028 (a)
| | | 45,479 | | 45,536 |
Radnet Management, Inc.
Senior Secured 2021 Term Loan, 1 Month USD SOFR + 3.00%, 8.22%, 4/21/2028 (a)
| | | 142,778 | | 142,677 |
RegionalCare Hospital Partners Holdings, Inc.
Senior Secured 2018 Term Loan B, 3 Month USD LIBOR + 3.75%, 9.02%, 11/16/2025 (a)
| | | 145,797 | | 135,389 |
See accompanying notes to financial statements.
15
SPDR BLACKSTONE HIGH INCOME ETF
SCHEDULE OF INVESTMENTS (continued)
June 30, 2023
| Security Description | | | Principal
Amount | | Value |
Vizient, Inc.
2022 Term Loan B7, 1 Month SOFR CME + 2.25%, 7.44%, 5/16/2029 (a)
| | | $ 115,758 | | $ 115,825 |
| | | | | | 2,164,023 |
| HOME FURNISHINGS — 0.4% | | | | | |
AI Aqua Merger Sub, Inc.
Senior Secured 2021 1st Lien Term Loan B, 1 Month USD SOFR + 3.75%, 8.80%, 7/31/2028 (a)
| | | 474,413 | | 466,348 |
| HOTELS, RESTAURANTS & LEISURE — 1.9% | | | | | |
1011778 BC Unlimited Liability Co.
Senior Secured Term Loan B4, 1 Month USD LIBOR + 1.75%, 6.94%, 11/19/2026 (a)
| | | 456,611 | | 454,137 |
Alterra Mountain Co.
Senior Secured 2021 Series B-2 Consenting Term Loan, 1 Month USD LIBOR + 3.50%, 8.69%, 8/17/2028 (a)
| | | 312,988 | | 312,891 |
Caesars Entertainment Corp.
Senior Secured Term Loan B, 1 Month USD SOFR + 3.25%, 8.45%, 2/6/2030 (a)
| | | 427,419 | | 427,977 |
Motion Finco SARL
Senior Secured USD Term Loan B1, 3 Month USD LIBOR + 3.25%, 8.79%, 11/12/2026 (a)
| | | 161,305 | | 160,146 |
Peraton Corp.
Senior Secured Term Loan B, 1 Month USD SOFR + 3.75%, 8.95%, 2/1/2028 (a)
| | | 622,043 | | 612,380 |
Scientific Games International, Inc.
Senior Secured 2022 USD Term Loan, 1 Month USD SOFR + 3.00%, 8.25%, 4/14/2029 (a)
| | | 308,295 | | 308,367 |
Wyndham Hotels & Resorts, Inc.
2023 Term Loan B, 1 Month USD SOFR + 2.25%, 7.45%, 5/24/2030 (a)
| | | 150,000 | | 150,254 |
| | | | | | 2,426,152 |
| HOUSEHOLD PRODUCTS — 0.1% | | | | | |
Champ Acquisition Corp.
Senior Secured Term Loan, 3 Month USD LIBOR + 5.50%, 10.71%, 12/19/2025 (a)
| | | 136,708 | | 136,896 |
| Security Description | | | Principal
Amount | | Value |
| INDEPENDENT POWER PRODUCERS & ENERGY TRADERS — 0.3% | | | | | |
| Calpine Corp.: | | | | | |
Senior Secured 2020 Term Loan B5, 1 Month USD LIBOR + 2.50%, 7.70%, 12/16/2027 (a)
| | | $ 25,910 | | $ 25,924 |
Senior Secured Term Loan B9, 1 Month USD LIBOR + 2.00%, 7.20%, 4/5/2026 (a)
| | | 337,780 | | 337,885 |
| | | | | | 363,809 |
| INSURANCE — 1.9% | | | | | |
Acrisure LLC
Senior Secured 2021 First Lien Term Loan B, 1 Month USD LIBOR + 4.25%, 9.43%, 2/15/2027 (a)
| | | 170,828 | | 167,768 |
Alliant Holdings Intermediate LLC
Senior Secured 2021 Term Loan B4, 1 Month USD LIBOR + 3.50%, 8.65%, 11/6/2027 (a)
| | | 351,232 | | 349,600 |
AmWINS Group, Inc.
Senior Secured 2023 Incremental Term Loan B, 1 Month USD SOFR + 2.75%, 7.83%, 2/19/2028 (a)
| | | 129,350 | | 129,202 |
AssuredPartners, Inc.
Senior Secured 2020 Term Loan B, 1 Month USD SOFR + 3.50%, 8.72%, 2/12/2027 (a)
| | | 491,064 | | 487,944 |
Broadstreet Partners, Inc.
Senior Secured 2020 Term Loan B, 1 Month USD LIBOR + 2.75%, 7.94%, 1/27/2027 (a)
| | | 205,863 | | 203,622 |
HUB International Ltd.
2023 Term Loan B, 6/20/2030 (a)
| | | 115,000 | | 115,392 |
Hyperion Insurance Group Ltd.
Senior Secured 2021 Term Loan B, 1 Month USD LIBOR + 3.25%, 8.44%, 11/12/2027 (a)
| | | 333,605 | | 332,354 |
Ryan Specialty Group LLC
Senior Secured Term Loan, 1 Month USD SOFR + 3.00%, 8.20%, 9/1/2027 (a)
| | | 245,618 | | 245,887 |
Sedgwick Claims Management Services, Inc.
Senior Secured 2023 Term Loan B, 1 Month USD SOFR + 3.75%, 8.85%, 2/17/2028 (a)
| | | 357,773 | | 356,180 |
| | | | | | 2,387,949 |
See accompanying notes to financial statements.
16
SPDR BLACKSTONE HIGH INCOME ETF
SCHEDULE OF INVESTMENTS (continued)
June 30, 2023
| Security Description | | | Principal
Amount | | Value |
| INTERNET & CATALOG RETAIL — 0.1% | | | | | |
Imperva, Inc.
Senior Secured 1st Lien Term Loan, 3 Month USD LIBOR - 4.00%, 1.00%, 1/12/2026 (a)
| | | $ 49,640 | | $ 45,079 |
ION Trading Finance Ltd.
Senior Secured 2021 USD Term Loan, 3 Month USD LIBOR + 4.75%, 10.29%, 4/3/2028 (a)
| | | 74,690 | | 73,410 |
| | | | | | 118,489 |
| INTERNET & TELECOM — 0.4% | | | | | |
Adevinta ASA
Senior Secured USD Term Loan B, 8.29%, 6/26/2028 (a)
| | | 86,238 | | 86,436 |
Uber Technologies, Inc.
Senior Secured 2023 Term Loan B, 3 Month USD SOFR + 2.75%, 7.99%, 3/3/2030 (a)
| | | 351,875 | | 352,293 |
| | | | | | 438,729 |
| INTERNET SECURITY — 0.2% | | | | | |
Proofpoint, Inc.
Senior Secured 2nd Lien Term Loan, 3 Month USD LIBOR + 6.25%, 11.47%, 8/31/2029 (a)
| | | 240,040 | | 233,439 |
| INVESTMENT COMPANIES — 0.2% | | | | | |
AL GCX Holdings LLC
Senior Secured Term Loan B, 3 Month USD SOFR + 3.50%, 8.55%, 5/17/2029 (a)
| | | 134,324 | | 133,707 |
LSF11 Trinity Bidco, Inc.
Term Loan, 9.65%, 6/14/2030 (a)
| | | 125,000 | | 124,844 |
| | | | | | 258,551 |
| IT SERVICES — 0.4% | | | | | |
Access CIG LLC
Senior Secured 2018 2nd Lien Term Loan, 3 Month USD LIBOR + 7.75%, 12.94%, 2/27/2026 (a)
| | | 194,616 | | 183,751 |
Ahead DB Holdings LLC
Senior Secured 2021 Term Loan B, 3 Month USD LIBOR + 3.75%, 9.29%, 10/18/2027 (a)
| | | 52,661 | | 49,332 |
Presidio Holdings, Inc.
Senior Secured 2020 Term Loan B, 1 Month USD SOFR + 3.50%, 8.70%, 1/22/2027 (a)
| | | 22,702 | | 22,628 |
| Security Description | | | Principal
Amount | | Value |
WEX, Inc.
Senior Secured 2021 Term Loan, 1 Month USD SOFR + 2.25%, 7.47%, 3/31/2028 (a)
| | | $ 246,844 | | $ 246,998 |
| | | | | | 502,709 |
| LEISURE INDUSTRY — 0.3% | | | | | |
Carnival Corp.
Senior Secured 2021 Incremental Term Loan B, 1 Month USD SOFR + 3.25%, 8.47%, 10/18/2028 (a)
| | | 418,528 | | 415,563 |
| LEISURE&REC/GAMES — 0.2% | | | | | |
Scientific Games Holdings LP
Senior Secured 2022 USD Term Loan B, 3 Month USD SOFR + 3.50%, 8.42%, 4/4/2029 (a)
| | | 277,090 | | 274,145 |
| LIFE SCIENCES TOOLS & SERVICES — 0.3% | | | | | |
Parexel International Corp.
Senior Secured 2021 1st Lien Term Loan, 1 Month USD LIBOR + 3.25%, 8.44%, 11/15/2028 (a)
| | | 419,759 | | 417,031 |
| MACHINERY — 0.8% | | | | | |
Chart Industries, Inc.
2023 Term Loan B, 1 Month USD SOFR + 3.75%, 8.94%, 3/15/2030 (a)
| | | 171,507 | | 171,578 |
Clark Equipment Co.
Senior Secured 2022 Term Loan B, 3 Month USD SOFR + 2.50%, 7.84%, 4/20/2029 (a)
| | | 124,684 | | 124,899 |
Engineered Machinery Holdings, Inc.
Senior Secured 2021 USD Incremental Term Loan, 3 Month USD LIBOR + 3.50%, 9.04%, 5/19/2028 (a)
| | | 318,746 | | 313,168 |
Madison IAQ LLC
Senior Secured Term Loan, 6 Month USD LIBOR + 3.25%, 8.30%, 6/21/2028 (a)
| | | 406,902 | | 399,069 |
| | | | | | 1,008,714 |
| MACHINERY-CONSTRUCTION & MINING — 0.4% | | | | | |
Brookfield WEC Holdings, Inc.
Senior Secured 2021 Term Loan, 1 Month USD LIBOR + 2.75%, 7.94%, 8/1/2025 (a)
| | | 467,297 | | 466,907 |
| MEDIA — 1.9% | | | | | |
Cogeco Communications Finance LP
Senior Secured Term Loan B, 1 Month USD SOFR + 2.00%, 7.20%, 1/3/2025 (a)
| | | 64,556 | | 64,583 |
See accompanying notes to financial statements.
17
SPDR BLACKSTONE HIGH INCOME ETF
SCHEDULE OF INVESTMENTS (continued)
June 30, 2023
| Security Description | | | Principal
Amount | | Value |
CSC Holdings LLC
Senior Secured 2019 Term Loan B5, 1 Month USD LIBOR + 2.50%, 7.69%, 4/15/2027 (a)
| | | $ 129,413 | | $ 113,433 |
| Gray Television, Inc.: | | | | | |
Senior Secured 2021 Term Loan D, 1 Month USD SOFR + 3.00%, 8.27%, 12/1/2028 (a)
| | | 58,867 | | 57,630 |
Senior Secured 2023 Term Loan E, 1 Month USD SOFR + 2.50%, 7.77%, 1/2/2026 (a)
| | | 47,196 | | 46,458 |
| MH Sub I LLC: | | | | | |
Senior Secured 2020 Incremental Term Loan, 1 Month USD LIBOR + 3.75%, 8.85%, 9/13/2024 (a)
| | | 109,243 | | 109,379 |
Senior Secured 2021 2nd Lien Term Loan, 1 Month USD SOFR + 6.25%, 11.35%, 2/23/2029 (a)
| | | 116,242 | | 101,731 |
Nexstar Broadcasting, Inc.
Senior Secured 2019 Term Loan B4, 1 Month USD SOFR + 2.50%, 7.72%, 9/18/2026 (a)
| | | 136,843 | | 136,867 |
Radiate Holdco LLC
Senior Secured 2021 Term Loan B, 3 Month USD SOFR + 3.25%, 8.48%, 9/25/2026 (a)
| | | 151,362 | | 126,709 |
Telenet Financing USD LLC
Senior Secured 2020 USD Term Loan AR, 1 Month USD LIBOR + 2.00%, 7.19%, 4/30/2028 (a)
| | | 311,409 | | 306,405 |
Univision Communications, Inc.
Senior Secured 2022 Term Loan B, 1 Month USD LIBOR + 3.25%, 8.44%, 1/31/2029 (a)
| | | 153,801 | | 151,224 |
UPC Broadband Holding BV
Senior Secured 2020 USD Term Loan AT, 1 Month USD LIBOR + 2.25%, 7.44%, 4/30/2028 (a)
| | | 322,531 | | 318,096 |
Vertical U.S. Newco, Inc.
Senior Secured Term Loan B, 6 Month USD LIBOR + 3.50%, 8.60%, 7/30/2027 (a)
| | | 431,799 | | 428,995 |
Virgin Media Bristol LLC
Senior Secured USD Term Loan N, 1 Month USD LIBOR + 2.50%, 7.69%, 1/31/2028 (a)
| | | 164,749 | | 163,586 |
| Security Description | | | Principal
Amount | | Value |
Ziggo Financing Partnership
Senior Secured USD Term Loan I, 1 Month USD LIBOR + 2.50%, 7.69%, 4/30/2028 (a)
| | | $ 322,531 | | $ 318,154 |
| | | | | | 2,443,250 |
| MEDICAL LABS&TESTING SRV — 0.3% | | | | | |
Electron BidCo, Inc.
Senior Secured 2021 Term Loan, 1 Month USD SOFR + 3.00%, 8.22%, 11/1/2028 (a)
| | | 60,933 | | 60,762 |
U.S. Anesthesia Partners, Inc.
Senior Secured 2021 Term Loan, 9.42%, 10/1/2028 (a)
| | | 398,530 | | 375,294 |
| | | | | | 436,056 |
| MISCELLANEOUS MANUFACTUR — 0.2% | | | | | |
Gates Global LLC
Senior Secured 2021 Term Loan B3, 1 Month USD SOFR + 2.50%, 7.70%, 3/31/2027 (a)
| | | 186,351 | | 185,652 |
LTI Holdings, Inc.
Senior Secured 2018 2nd Lien Term Loan, 1 Month USD LIBOR + 6.75%, 11.97%, 9/6/2026 (a)
| | | 53,021 | | 45,444 |
| | | | | | 231,096 |
| OIL, GAS & CONSUMABLE FUELS — 0.4% | | | | | |
ITT Holdings LLC
Senior Secured 2021 Term Loan, 1 Month USD LIBOR + 2.75%, 7.97%, 7/10/2028 (a)
| | | 118,712 | | 117,970 |
Pacific Gas & Electric Co.
2020 Term Loan B1, 1 Month USD LIBOR + 3.00%, 8.22%, 6/23/2025 (a)
| | | 323,917 | | 324,264 |
| | | | | | 442,234 |
| PASSENGER AIRLINES — 1.3% | | | | | |
Air Canada
Senior Secured 2021 Term Loan B, 3 Month USD LIBOR + 3.50%, 8.84%, 8/11/2028 (a)
| | | 258,085 | | 258,430 |
American Airlines, Inc.
Senior Secured 2023 Term Loan B, 6 Month USD SOFR + 2.75%, 8.15%, 2/15/2028 (a)
| | | 482,442 | | 474,433 |
Kestrel Bidco, Inc.
Senior Secured Term Loan B, 3 Month USD SOFR + 3.00%, 7.51%, 12/11/2026 (a)
| | | 78,029 | | 75,889 |
See accompanying notes to financial statements.
18
SPDR BLACKSTONE HIGH INCOME ETF
SCHEDULE OF INVESTMENTS (continued)
June 30, 2023
| Security Description | | | Principal
Amount | | Value |
Mileage Plus Holdings LLC
Senior Secured 2020 Term Loan B, 3 Month USD LIBOR + 5.25%, 10.76%, 6/21/2027 (a)
| | | $ 257,367 | | $ 267,823 |
SkyMiles IP Ltd.
Senior Secured 2020 Skymiles Term Loan B, 3 Month USD LIBOR + 3.75%, 8.80%, 10/20/2027 (a)
| | | 111,301 | | 115,753 |
United Airlines, Inc.
Senior Secured 2021 Term Loan B, 3 Month USD LIBOR + 3.75%, 9.29%, 4/21/2028 (a)
| | | 405,800 | | 406,253 |
| | | | | | 1,598,581 |
| PHARMACEUTICALS — 0.9% | | | | | |
Elanco Animal Health, Inc.
Senior Secured Term Loan B, 1 Month USD SOFR + 1.75%, 7.01%, 8/1/2027 (a)
| | | 190,657 | | 187,440 |
Grifols Worldwide Operations USA, Inc.
Senior Secured USD 2019 Term Loan B, 3 Month USD SOFR + 2.00%, 7.41%, 11/15/2027 (a)
| | | 171,055 | | 168,596 |
Horizon Therapeutics USA, Inc.
Term Loan B1, 1 Month USD LIBOR - 2.25%, 5/22/2026 (a)
| | | 71,304 | | 71,291 |
Jazz Financing Lux SARL
Senior Secured USD Term Loan, 1 Month USD LIBOR + 3.50%, 8.86%, 5/5/2028 (a)
| | | 306,814 | | 306,732 |
Organon & Co.
Senior Secured USD Term Loan, 3 Month USD LIBOR + 3.00%, 8.25%, 6/2/2028 (a)
| | | 354,367 | | 354,754 |
| | | | | | 1,088,813 |
| PIPELINES — 1.4% | | | | | |
Buckeye Partners LP
Senior Secured 2021 Term Loan B, 1 Month USD LIBOR + 2.25%, 7.45%, 11/1/2026 (a)
| | | 307,467 | | 305,770 |
CQP Holdco LP
Senior Secured 2021 Term Loan B, 3 Month USD LIBOR + 3.75%, 9.29%, 6/5/2028 (a)
| | | 390,395 | | 390,172 |
Freeport LNG Investments LLLP
Senior Secured Term Loan B, 3 Month USD LIBOR + 3.50%, 8.75%, 12/21/2028 (a)
| | | 361,654 | | 354,993 |
| Security Description | | | Principal
Amount | | Value |
Oryx Midstream Services Permian Basin LLC
Senior Secured 2023 Incremental Term Loan, 1 Month USD SOFR + 3.25%, 8.54%, 10/5/2028 (a)
| | | $ 349,119 | | $ 349,034 |
TransMontaigne Operating Co. LP
Senior Secured Term Loan B, 1 Month USD LIBOR + 3.50%, 8.65%, 11/17/2028 (a)
| | | 151,696 | | 149,678 |
Whitewater Whistler Holdings LLC
Senior Secured 2023 Term Loan B, 3 Month USD SOFR + 3.25%, 8.49%, 2/15/2030 (a)
| | | 175,000 | | 175,109 |
| | | | | | 1,724,756 |
| PROFESSIONAL SERVICES — 0.7% | | | | | |
Anticimex International AB
Senior Secured 2021 USD Term Loan B1, 3 Month USD LIBOR + 3.50%, 8.55%, 11/16/2028 (a)
| | | 175,650 | | 173,729 |
Dun & Bradstreet Corp.
Senior Secured Term Loan, 1 Month USD SOFR + 3.25%, 8.43%, 2/6/2026 (a)
| | | 383,115 | | 383,929 |
Trans Union LLC
Senior Secured 2021 Term Loan B6, 1 Month USD SOFR + 2.25%, 7.47%, 12/1/2028 (a)
| | | 319,545 | | 319,161 |
| | | | | | 876,819 |
| RETAIL-BUILDING PRODUCTS — 0.4% | | | | | |
LBM Acquisition LLC
Senior Secured Term Loan B, 6 Month USD LIBOR + 3.75%, 8.95%, 12/17/2027 (a)
| | | 575,783 | | 554,490 |
| RETAIL-RESTAURANTS — 0.5% | | | | | |
Hilton Domestic Operating Co., Inc.
Senior Secured 2019 Term Loan B2, 1 Month USD SOFR + 1.75%, 6.94%, 6/22/2026 (a)
| | | 173,211 | | 173,272 |
IRB Holding Corp.
Senior Secured 2022 Term Loan B, 1 Month USD SOFR + 3.00%, 8.20%, 12/15/2027 (a)
| | | 445,472 | | 442,966 |
| | | | | | 616,238 |
See accompanying notes to financial statements.
19
SPDR BLACKSTONE HIGH INCOME ETF
SCHEDULE OF INVESTMENTS (continued)
June 30, 2023
| Security Description | | | Principal
Amount | | Value |
| SEMICONDUCTORS & SEMICONDUCTOR EQUIPMENT — 0.2% | | | | | |
Entegris, Inc.
Senior Secured 2023 Term Loan B, 3 Month USD SOFR + 2.75%, 7.99%, 7/6/2029 (a)
| | | $ 81,101 | | $ 81,286 |
MKS Instruments, Inc.
Senior Secured 2022 USD Term Loan B, 1 Month USD SOFR + 2.75%, 7.94%, 8/17/2029 (a)
| | | 140,722 | | 141,073 |
| | | | | | 222,359 |
| SOFTWARE — 7.1% | | | | | |
Applied Systems, Inc.
Senior Secured 2022 Extended 1st Lien Term Loan, 3 Month USD SOFR + 4.50%, 9.74%, 9/18/2026 (a)
| | | 164,587 | | 165,012 |
Apttus Corp.
Senior Secured 2021 Term Loan, 3 Month USD LIBOR + 4.25%, 9.52%, 5/8/2028 (a)
| | | 170,383 | | 167,366 |
Athenahealth Group, Inc.
Senior Secured 2022 Term Loan B, 1 Month USD SOFR + 3.50%, 8.59%, 2/15/2029 (a)
| | | 544,143 | | 525,098 |
| Banff Merger Sub, Inc.: | | | | | |
Senior Secured 2021 USD 2nd Lien Term Loan, 1 Month USD SOFR + 5.50%, 10.72%, 2/27/2026 (a)
| | | 73,647 | | 71,990 |
Senior Secured 2021 USD Term Loan, 1 Month USD SOFR + 3.75%, 8.97%, 10/2/2025 (a)
| | | 165,414 | | 164,293 |
Camelot U.S. Acquisition LLC
Senior Secured Term Loan B, 1 Month USD SOFR + 3.00%, 8.22%, 10/30/2026 (a)
| | | 378,945 | | 378,850 |
CDK Global, Inc.
Senior Secured 2022 USD Term Loan B, 3 Month USD SOFR + 4.50%, 9.49%, 7/6/2029 (a)
| | | 398,000 | | 397,351 |
Cloud Software Group, Inc.
Senior Secured 2022 USD Term Loan, 3 Month USD SOFR + 4.50%, 9.74%, 3/30/2029 (a)
| | | 429,275 | | 402,535 |
DCert Buyer, Inc.
Senior Secured 2019 Term Loan B, 3 Month USD SOFR + 4.00%, 9.26%, 10/16/2026 (a)
| | | 548,004 | | 544,151 |
EP Purchaser LLC
Senior Secured 2021 Term Loan B, 3 Month USD SOFR + 3.50%, 9.00%, 11/6/2028 (a)
| | | 145,386 | | 142,660 |
| Security Description | | | Principal
Amount | | Value |
Epicor Software Corp.
Senior Secured 2020 Term Loan, 1 Month USD SOFR + 3.25%, 8.33%, 7/30/2027 (a)
| | | $ 407,319 | | $ 402,814 |
EverCommerce, Inc.
Senior Secured Term Loan B, 1 Month USD SOFR + 3.25%, 8.47%, 7/6/2028 (a)
| | | 137,066 | | 136,792 |
First Advantage Holdings LLC
Senior Secured 2021 Term Loan B, 3 Month USD SOFR + 2.75%, 7.99%, 1/31/2027 (a)
| | | 116,548 | | 116,548 |
Flexera Software LLC
Senior Secured 2021 Term Loan B, 1 Month USD LIBOR + 3.75%, 8.97%, 3/3/2028 (a)
| | | 186,727 | | 184,334 |
Fortra LLC
Senior Secured 2021 Term Loan, 3 Month USD SOFR + 4.00%, 9.15%, 11/19/2026 (a)
| | | 97,212 | | 88,949 |
Greeneden U.S. Holdings II LLC
Senior Secured 2020 USD Term Loan B4, 1 Month USD SOFR + 4.00%, 9.19%, 12/1/2027 (a)
| | | 89 | | 89 |
Hyland Software, Inc.
Senior Secured 2018 1st Lien Term Loan, 1 Month USD LIBOR + 3.50%, 8.69%, 7/1/2024 (a)
| | | 122,230 | | 121,374 |
Idera, Inc.
Senior Secured 2021 Term Loan, 1 Month USD SOFR + 3.75%, 9.01%, 3/2/2028 (a)
| | | 188,674 | | 184,153 |
I-Logic Technologies Bidco Ltd.
Senior Secured 2021 USD Term Loan B, 3 Month USD SOFR + 4.00%, 9.24%, 2/16/2028 (a)
| | | 177,920 | | 176,125 |
Informatica LLC
Senior Secured 2021 USD Term Loan B, 1 Month USD LIBOR + 2.75%, 8.00%, 10/27/2028 (a)
| | | 153,566 | | 153,613 |
McAfee LLC
Senior Secured 2022 USD Term Loan B, 1 Month USD SOFR + 3.75%, 9.01%, 3/1/2029 (a)
| | | 505,242 | | 484,681 |
MeridianLink, Inc.
Senior Secured 2021 Term Loan B, 3 Month USD LIBOR + 3.00%, 8.73%, 11/10/2028 (a)
| | | 114,704 | | 113,414 |
| Mitchell International, Inc.: | | | | | |
Senior Secured 2021 2nd Lien Term Loan, 11.69%, 10/15/2029 (a)
| | | 77,379 | | 68,674 |
See accompanying notes to financial statements.
20
SPDR BLACKSTONE HIGH INCOME ETF
SCHEDULE OF INVESTMENTS (continued)
June 30, 2023
| Security Description | | | Principal
Amount | | Value |
Senior Secured 2021 Term Loan B, 3 Month USD LIBOR + 3.75%, 8.94%, 10/15/2028 (a)
| | | $ 297,665 | | $ 291,619 |
Navicure, Inc.
Senior Secured 2019 Term Loan B, 1 Month USD SOFR + 4.00%, 9.22%, 10/22/2026 (a)
| | | 178,639 | | 178,416 |
NortonLifeLock, Inc.
Senior Secured 2022 Term Loan B, 1 Month USD SOFR + 2.00%, 7.20%, 9/12/2029 (a)
| | | 397,313 | | 395,825 |
Open Text Corp.
Senior Secured 2022 Term Loan B, 1 Month USD SOFR + 3.50%, 8.58%, 1/31/2030 (a)
| | | 252,452 | | 253,872 |
Project Alpha Intermediate Holding, Inc.
Senior Secured 2021 Term Loan B, 1 Month USD LIBOR + 4.00%, 9.20%, 4/26/2024 (a)
| | | 50,771 | | 50,716 |
Project Ruby Ultimate Parent Corp.
Senior Secured 2021 Term Loan, 1 Month USD SOFR + 3.25%, 8.47%, 3/10/2028 (a)
| | | 191,597 | | 187,611 |
Quartz Acquireco LLC
Term Loan B, 6/28/2030 (a)
| | | 200,000 | | 200,250 |
RealPage, Inc.
Senior Secured 1st Lien Term Loan, 1 Month USD LIBOR + 3.00%, 8.19%, 4/24/2028 (a)
| | | 447,457 | | 438,340 |
Roper Industrial Products Investment Co. LLC
Senior Secured USD Term Loan, 3 Month USD SOFR + 4.50%, 9.74%, 11/22/2029 (a)
| | | 54,890 | | 54,740 |
SolarWinds Holdings, Inc.
Senior Secured 2022 Term Loan B, 1 Month USD SOFR + 4.00%, 8.85%, 2/5/2027 (a)
| | | 250,785 | | 251,146 |
Sovos Compliance LLC
Senior Secured 2021 Term Loan, 1 Month USD SOFR + 4.50%, 9.72%, 8/11/2028 (a)
| | | 218,455 | | 211,335 |
| SS&C Technologies, Inc.: | | | | | |
Senior Secured 2022 Term Loan B6, 1 Month USD SOFR + 2.25%, 7.45%, 3/22/2029 (a)
| | | 179,617 | | 179,318 |
Senior Secured 2022 Term Loan B7, 1 Month USD SOFR + 2.25%, 7.45%, 3/22/2029 (a)
| | | 270,717 | | 270,266 |
Surf Holdings LLC
Senior Secured USD Term Loan, 3 Month USD LIBOR + 3.50%, 8.70%, 3/5/2027 (a)
| | | 94,409 | | 93,804 |
| Security Description | | | Principal
Amount | | Value |
| Ultimate Software Group, Inc.: | | | | | |
Senior Secured 2021 2nd Lien Term Loan, 3 Month USD SOFR + 5.25%, 10.27%, 5/3/2027 (a)
| | | $ 100,669 | | $ 97,901 |
Senior Secured 2021 Term Loan, 3 Month USD SOFR + 3.25%, 8.27%, 5/4/2026 (a)
| | | 565,858 | | 556,191 |
| | | | | | 8,902,216 |
| SPECIALTY RETAIL — 1.4% | | | | | |
Petco Health & Wellness Co., Inc.
Senior Secured 2021 Term Loan B, 3 Month USD SOFR + 3.25%, 8.75%, 3/3/2028 (a)
| | | 431,011 | | 428,561 |
PetSmart, Inc.
Senior Secured 2021 Term Loan B, 1 Month USD SOFR + 3.75%, 8.83%, 2/11/2028 (a)
| | | 323,402 | | 323,336 |
Pilot Travel Centers LLC
Senior Secured 2021 Term Loan B, 1 Month USD SOFR + 2.00%, 7.20%, 8/4/2028 (a)
| | | 355,100 | | 355,036 |
SRS Distribution, Inc.
Senior Secured 2021 Term Loan B, 1 Month USD LIBOR + 3.50%, 8.69%, 6/2/2028 (a)
| | | 381,973 | | 371,975 |
Whatabrands LLC
Senior Secured 2021 Term Loan B, 1 Month USD LIBOR + 3.25%, 8.47%, 8/3/2028 (a)
| | | 307,507 | | 306,089 |
| | | | | | 1,784,997 |
| STEEL-PRODUCERS — 0.2% | | | | | |
Phoenix Services International LLC
Term Load, 11.00%, 3/1/2025
| | | 205,217 | | 205,217 |
| TELECOMMUNICATION EQUIP — 0.3% | | | | | |
Coral-U.S. Co-Borrower LLC
Senior Secured 2021 Term Loan B6, 1 Month USD LIBOR + 3.00%, 8.19%, 10/15/2029 (a)
| | | 305,848 | | 303,826 |
Delta TopCo, Inc.
Senior Secured 2020 Term Loan B, 6 Month USD SOFR + 3.75%, 9.07%, 12/1/2027 (a)
| | | 119,118 | | 115,545 |
| | | | | | 419,371 |
| TRADING COMPANIES & DISTRIBUTORS — 0.2% | | | | | |
Foundation Building Materials Holding Co. LLC
Senior Secured 2021 Term Loan, 3 Month USD LIBOR + 3.25%, 8.52%, 1/31/2028 (a)
| | | 200,913 | | 195,697 |
See accompanying notes to financial statements.
21
SPDR BLACKSTONE HIGH INCOME ETF
SCHEDULE OF INVESTMENTS (continued)
June 30, 2023
| Security Description | | | Principal
Amount | | Value |
| TRANSPORT-SERVICES — 0.3% | | | | | |
EG America LLC
Senior Secured 2018 USD Term Loan, 1 Month USD SOFR + 4.00%, 9.08%, 2/7/2025 (a)
| | | $ 17,772 | | $ 17,711 |
Endure Digital, Inc.
Senior Secured Term Loan, 3 Month USD LIBOR + 3.50%, 8.79%, 2/10/2028 (a)
| | | 411,351 | | 384,099 |
| | | | | | 401,810 |
TOTAL SENIOR FLOATING RATE LOANS
(Cost $57,805,963)
| | | | | 57,982,940 |
| ASSET-BACKED SECURITIES — 6.8% | | | | | |
| OTHER ABS — 6.8% | | | | | |
Apidos CLO XI
Series 2012-11A, Class ER3, 3 Month USD LIBOR + 6.57%, 11.83%, 4/17/2034 (a) (e)
| | | 500,000 | | 438,600 |
Ares LXVIII CLO Ltd.
Series 2023-68A, Class E, 3 Month SOFR + 8.55%, 13.63%, 4/25/2035 (a) (e)
| | | 750,000 | | 743,400 |
Balboa Bay Loan Funding Ltd.
Series 2022-1A, Class E, 3 Month SOFR + 7.93%, 12.98%, 4/20/2034 (a) (e)
| | | 500,000 | | 456,400 |
Ballyrock CLO Ltd.
Series 2020-2A, Class DR, 3 Month USD LIBOR + 6.15%, 11.40%, 10/20/2031 (a) (e)
| | | 750,000 | | 696,300 |
Benefit Street Partners CLO X Ltd.
Series 2016-10A, Class DRR, 3 Month USD LIBOR + 6.75%, 12.00%, 4/20/2034 (a) (e)
| | | 500,000 | | 455,300 |
Canyon CLO Ltd.
Series 2020-1A, Class ER, 3 Month USD LIBOR + 6.35%, 11.61%, 7/15/2034 (a) (e)
| | | 602,000 | | 526,810 |
| Carlyle U.S. CLO Ltd.: | | | | | |
Series 2020-1A, Class DR, 3 Month USD LIBOR + 6.25%, 11.50%, 7/20/2034 (a) (e)
| | | 500,000 | | 434,050 |
Series 2021-9A, Class E, 3 month USD LIBOR + 6.63%, 11.88%, 10/20/2034 (a) (e)
| | | 712,882 | | 620,065 |
GoldenTree Loan Management U.S. CLO Ltd.
Series 2022-12A, Class E, 3 Month SOFR + 7.25%, 12.30%, 4/20/2034 (a) (e)
| | | 500,000 | | 471,000 |
| Security Description | | | Principal
Amount | | Value |
Palmer Square CLO Ltd.
Series 2019-1A, Class DR, 3 Month USD LIBOR + 6.50%, 11.82%, 11/14/2034 (a) (e)
| | | $ 500,000 | | $ 432,850 |
Point Au Roche Park CLO Ltd.
Series 2021-1A, Class E, 3 Month USD LIBOR + 6.10%, 11.35%, 7/20/2034 (a) (e)
| | | 1,480,000 | | 1,259,776 |
Rad CLO 15 Ltd.
Series 2021-15A, Class E, 3 Month USD LIBOR + 6.20%, 11.45%, 1/20/2034 (a) (e)
| | | 652,349 | | 575,763 |
RR 20 Ltd.
Series 2022-20A, Class D, 3 Month SOFR + 7.25%, 12.24%, 7/15/2037 (a) (e)
| | | 500,000 | | 476,500 |
Vibrant CLO XVI Ltd.
Series 2023-16A, Class C, 3 month USD SOFR + 5.84%, 10.92%, 4/15/2036 (a) (e)
| | | 500,000 | | 489,472 |
Voya CLO Ltd.
Series 2019-2A, Class E, 3 Month USD LIBOR + 6.60%, 11.85%, 7/20/2032 (a) (e)
| | | 500,000 | | 440,150 |
| | | | | | 8,516,436 |
TOTAL ASSET-BACKED SECURITIES
(Cost $8,788,256)
| | | | | 8,516,436 |
| | | Shares | |
| COMMON STOCKS — 0.2% | | | |
| AEROSPACE & DEFENSE — 0.2% | | | |
Flame NewCo. LLC
| | 19,856 | 205,112 |
| | | Principal
Amount | |
| CORPORATE BONDS & NOTES — 44.1% | | | |
| ADVERTISING — 0.1% | | | |
| Clear Channel Outdoor Holdings, Inc.: | | | |
7.50%, 6/1/2029 (e)
| | $ 100,000 | 74,091 |
7.75%, 4/15/2028 (e)
| | 130,000 | 101,980 |
| | | | 176,071 |
| AEROSPACE & DEFENSE — 2.2% | | | |
| Bombardier, Inc.: | | | |
6.00%, 2/15/2028 (e)
| | 380,000 | 359,176 |
7.50%, 2/1/2029 (e)
| | 493,000 | 487,301 |
| Howmet Aerospace, Inc.: | | | |
3.00%, 1/15/2029
| | 682,000 | 597,425 |
5.95%, 2/1/2037
| | 50,000 | 50,940 |
Spirit AeroSystems, Inc.
4.60%, 6/15/2028
| | 80,000 | 67,060 |
See accompanying notes to financial statements.
22
SPDR BLACKSTONE HIGH INCOME ETF
SCHEDULE OF INVESTMENTS (continued)
June 30, 2023
| Security Description | | | Principal
Amount | | Value |
| TransDigm, Inc.: | | | | | |
4.63%, 1/15/2029
| | | $ 580,000 | | $ 515,800 |
4.88%, 5/1/2029
| | | 390,000 | | 349,378 |
Triumph Group, Inc.
7.75%, 8/15/2025
| | | 300,000 | | 291,627 |
| | | | | | 2,718,707 |
| AUTO MANUFACTURERS — 1.0% | | | | | |
Allison Transmission, Inc.
3.75%, 1/30/2031 (e)
| | | 490,000 | | 415,775 |
Ford Motor Co.
4.75%, 1/15/2043
| | | 100,000 | | 76,773 |
| Ford Motor Credit Co. LLC: | | | | | |
3.82%, 11/2/2027
| | | 200,000 | | 178,978 |
6.80%, 5/12/2028
| | | 465,000 | | 466,055 |
Wabash National Corp.
4.50%, 10/15/2028 (e)
| | | 130,000 | | 112,745 |
| | | | | | 1,250,326 |
| BANKS — 0.4% | | | | | |
Intesa Sanpaolo SpA
5.71%, 1/15/2026 (e)
| | | 559,000 | | 531,687 |
| BEVERAGES — 0.1% | | | | | |
Primo Water Holdings, Inc.
4.38%, 4/30/2029 (e)
| | | 90,000 | | 77,066 |
| CHEMICALS — 1.3% | | | | | |
Ashland, Inc.
3.38%, 9/1/2031 (e)
| | | 320,000 | | 255,683 |
| Chemours Co.: | | | | | |
4.63%, 11/15/2029 (e)
| | | 394,000 | | 332,903 |
5.75%, 11/15/2028 (e)
| | | 100,000 | | 91,889 |
Mativ Holdings, Inc.
6.88%, 10/1/2026 (e)
| | | 60,000 | | 52,391 |
Methanex Corp.
5.25%, 12/15/2029
| | | 330,000 | | 301,353 |
Nufarm Australia Ltd./Nufarm Americas, Inc.
5.00%, 1/27/2030 (e)
| | | 80,000 | | 70,973 |
Valvoline, Inc.
3.63%, 6/15/2031 (e)
| | | 595,000 | | 483,824 |
| | | | | | 1,589,016 |
| COAL — 0.1% | | | | | |
SunCoke Energy, Inc.
4.88%, 6/30/2029 (e)
| | | 170,000 | | 143,415 |
| COMMERCIAL SERVICES — 1.9% | | | | | |
Adtalem Global Education, Inc.
5.50%, 3/1/2028 (e)
| | | 180,000 | | 163,526 |
ASGN, Inc.
4.63%, 5/15/2028 (e)
| | | 80,000 | | 73,174 |
Deluxe Corp.
8.00%, 6/1/2029 (e)
| | | 110,000 | | 86,176 |
| Gartner, Inc.: | | | | | |
3.63%, 6/15/2029 (e)
| | | 510,000 | | 449,744 |
3.75%, 10/1/2030 (e)
| | | 200,000 | | 174,340 |
| Security Description | | | Principal
Amount | | Value |
MPH Acquisition Holdings LLC
5.75%, 11/1/2028 (e)
| | | $ 535,000 | | $ 402,673 |
| Service Corp. International: | | | | | |
3.38%, 8/15/2030
| | | 73,000 | | 61,061 |
4.00%, 5/15/2031
| | | 410,000 | | 350,788 |
TriNet Group, Inc.
3.50%, 3/1/2029 (e)
| | | 170,000 | | 148,130 |
United Rentals North America, Inc.
3.75%, 1/15/2032
| | | 180,000 | | 152,627 |
WW International, Inc.
4.50%, 4/15/2029 (e)
| | | 150,000 | | 89,993 |
ZipRecruiter, Inc.
5.00%, 1/15/2030 (e)
| | | 220,000 | | 188,122 |
| | | | | | 2,340,354 |
| COMPUTERS — 0.5% | | | | | |
KBR, Inc.
4.75%, 9/30/2028 (e)
| | | 90,000 | | 82,474 |
Science Applications International Corp.
4.88%, 4/1/2028 (e)
| | | 90,000 | | 84,414 |
| Seagate HDD Cayman: | | | | | |
4.13%, 1/15/2031
| | | 292,000 | | 239,612 |
9.63%, 12/1/2032 (e)
| | | 50,000 | | 55,270 |
Unisys Corp.
6.88%, 11/1/2027 (e)
| | | 180,000 | | 129,550 |
| | | | | | 591,320 |
| CONSTRUCTION MATERIALS — 1.4% | | | | | |
| Builders FirstSource, Inc.: | | | | | |
4.25%, 2/1/2032 (e)
| | | 448,000 | | 389,935 |
5.00%, 3/1/2030 (e)
| | | 120,000 | | 112,158 |
Griffon Corp.
5.75%, 3/1/2028
| | | 219,000 | | 204,809 |
JELD-WEN, Inc.
4.88%, 12/15/2027 (e)
| | | 401,000 | | 355,137 |
Louisiana-Pacific Corp.
3.63%, 3/15/2029 (e)
| | | 170,000 | | 148,789 |
Masonite International Corp.
5.38%, 2/1/2028 (e)
| | | 230,000 | | 218,912 |
Summit Materials LLC/Summit Materials Finance Corp.
5.25%, 1/15/2029 (e)
| | | 300,000 | | 283,695 |
| | | | | | 1,713,435 |
| DIVERSIFIED FINANCIAL SERVICES — 3.5% | | | | | |
Burford Capital Global Finance LLC
6.88%, 4/15/2030 (e)
| | | 220,000 | | 201,256 |
Enova International, Inc.
8.50%, 9/15/2025 (e)
| | | 140,000 | | 136,254 |
goeasy Ltd.
4.38%, 5/1/2026 (e)
| | | 325,000 | | 296,419 |
See accompanying notes to financial statements.
23
SPDR BLACKSTONE HIGH INCOME ETF
SCHEDULE OF INVESTMENTS (continued)
June 30, 2023
| Security Description | | | Principal
Amount | | Value |
| Nationstar Mortgage Holdings, Inc.: | | | | | |
5.50%, 8/15/2028 (e)
| | | $ 610,000 | | $ 534,726 |
5.75%, 11/15/2031 (e)
| | | 123,000 | | 101,011 |
6.00%, 1/15/2027 (e)
| | | 231,000 | | 214,927 |
| Navient Corp.: | | | | | |
4.88%, 3/15/2028
| | | 420,000 | | 359,848 |
5.00%, 3/15/2027
| | | 160,000 | | 143,565 |
9.38%, 7/25/2030
| | | 57,000 | | 56,690 |
Series A, 5.63%, 8/1/2033
| | | 190,000 | | 142,827 |
| OneMain Finance Corp.: | | | | | |
3.50%, 1/15/2027
| | | 700,000 | | 601,944 |
5.38%, 11/15/2029
| | | 110,000 | | 93,926 |
7.13%, 3/15/2026
| | | 160,000 | | 157,502 |
| PennyMac Financial Services, Inc.: | | | | | |
4.25%, 2/15/2029 (e)
| | | 170,000 | | 136,760 |
5.38%, 10/15/2025 (e)
| | | 200,000 | | 189,618 |
5.75%, 9/15/2031 (e)
| | | 270,000 | | 219,929 |
PHH Mortgage Corp.
7.88%, 3/15/2026 (e)
| | | 180,000 | | 160,835 |
SLM Corp.
4.20%, 10/29/2025
| | | 470,000 | | 437,805 |
Synchrony Financial
7.25%, 2/2/2033
| | | 120,000 | | 107,737 |
World Acceptance Corp.
7.00%, 11/1/2026 (e)
| | | 140,000 | | 122,199 |
| | | | | | 4,415,778 |
| ELECTRIC — 0.2% | | | | | |
| PG&E Corp.: | | | | | |
5.00%, 7/1/2028
| | | 100,000 | | 91,796 |
5.25%, 7/1/2030
| | | 200,000 | | 179,346 |
| | | | | | 271,142 |
| ELECTRICAL COMPONENTS & EQUIPMENT — 0.5% | | | | | |
| Energizer Holdings, Inc.: | | | | | |
4.38%, 3/31/2029 (e)
| | | 260,000 | | 224,070 |
4.75%, 6/15/2028 (e)
| | | 340,000 | | 303,406 |
6.50%, 12/31/2027 (e)
| | | 150,000 | | 144,453 |
| | | | | | 671,929 |
| ELECTRONICS — 0.2% | | | | | |
Sensata Technologies BV
4.00%, 4/15/2029 (e)
| | | 350,000 | | 311,539 |
| ENGINEERING & CONSTRUCTION — 0.5% | | | | | |
Brundage-Bone Concrete Pumping Holdings, Inc.
6.00%, 2/1/2026 (e)
| | | 184,000 | | 175,205 |
Great Lakes Dredge & Dock Corp.
5.25%, 6/1/2029 (e)
| | | 121,000 | | 101,629 |
| TopBuild Corp.: | | | | | |
3.63%, 3/15/2029 (e)
| | | 100,000 | | 87,365 |
4.13%, 2/15/2032 (e)
| | | 150,000 | | 128,587 |
| Security Description | | | Principal
Amount | | Value |
Tutor Perini Corp.
6.88%, 5/1/2025 (e)
| | | $ 100,000 | | $ 83,653 |
| | | | | | 576,439 |
| ENTERTAINMENT — 1.3% | | | | | |
CDI Escrow Issuer, Inc.
5.75%, 4/1/2030 (e)
| | | 640,000 | | 596,531 |
Cinemark USA, Inc.
5.25%, 7/15/2028 (e)
| | | 550,000 | | 488,746 |
Lions Gate Capital Holdings LLC
5.50%, 4/15/2029 (e)
| | | 180,000 | | 130,351 |
Wynn Resorts Finance LLC/Wynn Resorts Capital Corp.
REGS, 5.13%, 10/1/2029 (e)
| | | 480,000 | | 430,373 |
| | | | | | 1,646,001 |
| ENVIRONMENTAL CONTROL — 0.2% | | | | | |
GFL Environmental, Inc.
4.00%, 8/1/2028 (e)
| | | 100,000 | | 89,661 |
Stericycle, Inc.
3.88%, 1/15/2029 (e)
| | | 199,000 | | 176,977 |
| | | | | | 266,638 |
| FOOD — 1.1% | | | | | |
| Albertsons Cos., Inc./Safeway, Inc./New Albertsons LP/Albertsons LLC: | | | | | |
3.50%, 3/15/2029 (e)
| | | 200,000 | | 173,942 |
4.63%, 1/15/2027 (e)
| | | 130,000 | | 123,273 |
| Lamb Weston Holdings, Inc.: | | | | | |
4.13%, 1/31/2030 (e)
| | | 540,000 | | 482,679 |
4.88%, 5/15/2028 (e)
| | | 290,000 | | 277,808 |
| Post Holdings, Inc.: | | | | | |
4.50%, 9/15/2031 (e)
| | | 100,000 | | 85,340 |
5.50%, 12/15/2029 (e)
| | | 290,000 | | 268,253 |
| | | | | | 1,411,295 |
| GAS — 0.5% | | | | | |
| AmeriGas Partners LP/AmeriGas Finance Corp.: | | | | | |
5.75%, 5/20/2027
| | | 200,000 | | 183,956 |
5.88%, 8/20/2026
| | | 406,000 | | 383,146 |
| | | | | | 567,102 |
| HEALTH CARE PRODUCTS — 0.3% | | | | | |
Hologic, Inc.
3.25%, 2/15/2029 (e)
| | | 438,000 | | 383,110 |
| HEALTH CARE SERVICES — 1.3% | | | | | |
| CHS/Community Health Systems, Inc.: | | | | | |
5.25%, 5/15/2030 (e)
| | | 70,000 | | 55,364 |
6.13%, 4/1/2030 (e)
| | | 100,000 | | 60,554 |
6.88%, 4/15/2029 (e)
| | | 310,000 | | 193,573 |
See accompanying notes to financial statements.
24
SPDR BLACKSTONE HIGH INCOME ETF
SCHEDULE OF INVESTMENTS (continued)
June 30, 2023
| Security Description | | | Principal
Amount | | Value |
| DaVita, Inc.: | | | | | |
3.75%, 2/15/2031 (e)
| | | $ 240,000 | | $ 192,466 |
4.63%, 6/1/2030 (e)
| | | 510,000 | | 437,932 |
| Encompass Health Corp.: | | | | | |
4.63%, 4/1/2031
| | | 185,000 | | 163,897 |
4.75%, 2/1/2030
| | | 350,000 | | 318,692 |
| Tenet Healthcare Corp.: | | | | | |
6.13%, 10/1/2028
| | | 100,000 | | 96,250 |
6.88%, 11/15/2031
| | | 160,000 | | 159,698 |
| | | | | | 1,678,426 |
| HOME BUILDERS — 2.2% | | | | | |
| Beazer Homes USA, Inc.: | | | | | |
5.88%, 10/15/2027
| | | 35,000 | | 33,018 |
7.25%, 10/15/2029
| | | 270,000 | | 263,110 |
Century Communities, Inc.
3.88%, 8/15/2029 (e)
| | | 270,000 | | 234,193 |
Forestar Group, Inc.
3.85%, 5/15/2026 (e)
| | | 200,000 | | 183,862 |
Installed Building Products, Inc.
5.75%, 2/1/2028 (e)
| | | 110,000 | | 103,800 |
KB Home
4.00%, 6/15/2031
| | | 353,000 | | 305,038 |
LGI Homes, Inc.
4.00%, 7/15/2029 (e)
| | | 150,000 | | 125,372 |
| M/I Homes, Inc.: | | | | | |
3.95%, 2/15/2030
| | | 47,000 | | 40,461 |
4.95%, 2/1/2028
| | | 200,000 | | 186,436 |
Meritage Homes Corp.
3.88%, 4/15/2029 (e)
| | | 450,000 | | 399,996 |
| Taylor Morrison Communities, Inc.: | | | | | |
5.13%, 8/1/2030 (e)
| | | 280,000 | | 260,145 |
5.75%, 1/15/2028 (e)
| | | 225,000 | | 218,846 |
Tri Pointe Homes, Inc.
5.70%, 6/15/2028
| | | 470,000 | | 454,236 |
| | | | | | 2,808,513 |
| HOME FURNISHINGS — 0.4% | | | | | |
Tempur Sealy International, Inc.
4.00%, 4/15/2029 (e)
| | | 610,000 | | 528,242 |
| HOUSEHOLD PRODUCTS — 0.1% | | | | | |
Edgewell Personal Care Co.
4.13%, 4/1/2029 (e)
| | | 200,000 | | 174,536 |
| HOUSEHOLD PRODUCTS & WARES — 0.1% | | | | | |
Central Garden & Pet Co.
4.13%, 10/15/2030
| | | 200,000 | | 167,760 |
| INSURANCE — 0.2% | | | | | |
MGIC Investment Corp.
5.25%, 8/15/2028
| | | 310,000 | | 291,967 |
| INTERNET — 0.5% | | | | | |
ANGI Group LLC
3.88%, 8/15/2028 (e)
| | | 240,000 | | 196,277 |
| Security Description | | | Principal
Amount | | Value |
Cogent Communications Group, Inc.
7.00%, 6/15/2027 (e)
| | | $ 330,000 | | $ 319,311 |
Ziff Davis, Inc.
4.63%, 10/15/2030 (e)
| | | 150,000 | | 130,157 |
| | | | | | 645,745 |
| IRON/STEEL — 0.7% | | | | | |
ATI, Inc.
5.13%, 10/1/2031
| | | 190,000 | | 169,632 |
Commercial Metals Co.
4.38%, 3/15/2032
| | | 120,000 | | 104,150 |
| Mineral Resources Ltd.: | | | | | |
8.00%, 11/1/2027 (e)
| | | 440,000 | | 442,772 |
8.50%, 5/1/2030 (e)
| | | 100,000 | | 101,013 |
| | | | | | 817,567 |
| IT SERVICES — 0.2% | | | | | |
| Seagate HDD Cayman: | | | | | |
8.25%, 12/15/2029 (e)
| | | 129,000 | | 134,788 |
8.50%, 7/15/2031 (e)
| | | 100,000 | | 104,939 |
| | | | | | 239,727 |
| LEISURE TIME — 1.9% | | | | | |
| Carnival Corp.: | | | | | |
5.75%, 3/1/2027 (e)
| | | 500,000 | | 459,960 |
6.00%, 5/1/2029 (e)
| | | 100,000 | | 89,286 |
7.63%, 3/1/2026 (e)
| | | 200,000 | | 195,852 |
| NCL Corp. Ltd.: | | | | | |
5.88%, 3/15/2026 (e)
| | | 260,000 | | 244,052 |
7.75%, 2/15/2029 (e)
| | | 580,000 | | 552,548 |
| Royal Caribbean Cruises Ltd.: | | | | | |
3.70%, 3/15/2028
| | | 145,000 | | 125,945 |
5.38%, 7/15/2027 (e)
| | | 170,000 | | 159,389 |
5.50%, 8/31/2026 (e)
| | | 130,000 | | 123,352 |
5.50%, 4/1/2028 (e)
| | | 300,000 | | 279,975 |
Vista Outdoor, Inc.
4.50%, 3/15/2029 (e)
| | | 210,000 | | 172,286 |
| | | | | | 2,402,645 |
| LODGING — 0.8% | | | | | |
| Hilton Domestic Operating Co., Inc.: | | | | | |
3.63%, 2/15/2032 (e)
| | | 200,000 | | 166,774 |
3.75%, 5/1/2029 (e)
| | | 290,000 | | 257,192 |
4.00%, 5/1/2031 (e)
| | | 80,000 | | 69,470 |
Las Vegas Sands Corp.
3.90%, 8/8/2029
| | | 420,000 | | 375,153 |
Station Casinos LLC
4.50%, 2/15/2028 (e)
| | | 100,000 | | 89,874 |
| | | | | | 958,463 |
| MACHINERY, CONSTRUCTION & MINING — 0.2% | | | | | |
Manitowoc Co., Inc.
9.00%, 4/1/2026 (e)
| | | 230,000 | | 229,554 |
See accompanying notes to financial statements.
25
SPDR BLACKSTONE HIGH INCOME ETF
SCHEDULE OF INVESTMENTS (continued)
June 30, 2023
| Security Description | | | Principal
Amount | | Value |
| MACHINERY-DIVERSIFIED — 0.1% | | | | | |
ATS Corp.
4.13%, 12/15/2028 (e)
| | | $ 168,000 | | $ 150,990 |
| MEDIA — 1.7% | | | | | |
| CCO Holdings LLC/CCO Holdings Capital Corp.: | | | | | |
4.50%, 8/15/2030 (e)
| | | 100,000 | | 83,301 |
4.75%, 3/1/2030 (e)
| | | 350,000 | | 299,481 |
4.75%, 2/1/2032 (e)
| | | 200,000 | | 162,768 |
5.00%, 2/1/2028 (e)
| | | 60,000 | | 54,691 |
5.13%, 5/1/2027 (e)
| | | 230,000 | | 213,893 |
CSC Holdings LLC
7.50%, 4/1/2028 (e)
| | | 200,000 | | 114,000 |
DISH DBS Corp.
7.75%, 7/1/2026
| | | 230,000 | | 141,054 |
Gray Television, Inc.
7.00%, 5/15/2027 (e)
| | | 100,000 | | 85,307 |
| News Corp.: | | | | | |
3.88%, 5/15/2029 (e)
| | | 300,000 | | 264,321 |
5.13%, 2/15/2032 (e)
| | | 75,000 | | 68,671 |
| Nexstar Media, Inc.: | | | | | |
4.75%, 11/1/2028 (e)
| | | 200,000 | | 173,532 |
5.63%, 7/15/2027 (e)
| | | 50,000 | | 46,617 |
Townsquare Media, Inc.
6.88%, 2/1/2026 (e)
| | | 256,000 | | 245,645 |
Urban One, Inc.
7.38%, 2/1/2028 (e)
| | | 150,000 | | 131,307 |
| | | | | | 2,084,588 |
| MINING — 0.9% | | | | | |
Eldorado Gold Corp.
6.25%, 9/1/2029 (e)
| | | 210,000 | | 188,433 |
| FMG Resources August 2006 Pty. Ltd.: | | | | | |
4.38%, 4/1/2031 (e)
| | | 100,000 | | 85,348 |
5.88%, 4/15/2030 (e)
| | | 316,000 | | 301,154 |
6.13%, 4/15/2032 (e)
| | | 275,000 | | 261,393 |
IAMGOLD Corp.
5.75%, 10/15/2028 (e)
| | | 220,000 | | 165,103 |
New Gold, Inc.
7.50%, 7/15/2027 (e)
| | | 160,000 | | 149,658 |
Taseko Mines Ltd.
7.00%, 2/15/2026 (e)
| | | 40,000 | | 36,512 |
| | | | | | 1,187,601 |
| MISCELLANEOUS MANUFACTURER — 0.2% | | | | | |
Hillenbrand, Inc.
3.75%, 3/1/2031
| | | 350,000 | | 296,713 |
| OFFICE & BUSINESS EQUIPMENT — 0.5% | | | | | |
| Pitney Bowes, Inc.: | | | | | |
6.88%, 3/15/2027 (e)
| | | 140,000 | | 103,638 |
7.25%, 3/15/2029 (e)
| | | 50,000 | | 33,042 |
| Security Description | | | Principal
Amount | | Value |
Xerox Holdings Corp.
5.50%, 8/15/2028 (e)
| | | $ 550,000 | | $ 467,841 |
| | | | | | 604,521 |
| OIL & GAS — 3.0% | | | | | |
Calumet Specialty Products Partners LP/Calumet Finance Corp.
9.75%, 7/15/2028 (a) (e)
| | | 110,000 | | 108,229 |
CNX Resources Corp.
6.00%, 1/15/2029 (e)
| | | 528,000 | | 490,179 |
CVR Energy, Inc.
5.75%, 2/15/2028 (e)
| | | 100,000 | | 88,774 |
MEG Energy Corp.
5.88%, 2/1/2029 (e)
| | | 520,000 | | 488,743 |
| Northern Oil & Gas, Inc.: | | | | | |
8.13%, 3/1/2028 (e)
| | | 200,000 | | 196,018 |
8.75%, 6/15/2031 (a) (e)
| | | 94,000 | | 92,321 |
| Parkland Corp.: | | | | | |
4.50%, 10/1/2029 (e)
| | | 480,000 | | 417,029 |
4.63%, 5/1/2030 (e)
| | | 353,000 | | 306,217 |
| Sunoco LP/Sunoco Finance Corp.: | | | | | |
4.50%, 5/15/2029
| | | 830,000 | | 736,708 |
4.50%, 4/30/2030
| | | 60,000 | | 52,726 |
| Transocean, Inc.: | | | | | |
7.50%, 1/15/2026 (e)
| | | 80,000 | | 76,082 |
7.50%, 4/15/2031
| | | 460,000 | | 362,494 |
8.00%, 2/1/2027 (e)
| | | 400,000 | | 362,712 |
| | | | | | 3,778,232 |
| OIL & GAS SERVICES — 0.8% | | | | | |
Archrock Partners LP/Archrock Partners Finance Corp.
6.25%, 4/1/2028 (e)
| | | 500,000 | | 469,730 |
Enerflex Ltd.
9.00%, 10/15/2027 (e)
| | | 253,000 | | 246,541 |
Oceaneering International, Inc.
6.00%, 2/1/2028
| | | 260,000 | | 246,925 |
| | | | | | 963,196 |
| PACKAGING & CONTAINERS — 0.3% | | | | | |
Cascades, Inc./Cascades USA, Inc.
5.38%, 1/15/2028 (e)
| | | 150,000 | | 141,306 |
OI European Group BV
4.75%, 2/15/2030 (e)
| | | 310,000 | | 280,649 |
| | | | | | 421,955 |
| PHARMACEUTICALS — 0.1% | | | | | |
Prestige Brands, Inc.
3.75%, 4/1/2031 (e)
| | | 150,000 | | 123,591 |
| PIPELINES — 2.3% | | | | | |
| Antero Midstream Partners LP/Antero Midstream Finance Corp.: | | | | | |
5.38%, 6/15/2029 (e)
| | | 200,000 | | 185,724 |
See accompanying notes to financial statements.
26
SPDR BLACKSTONE HIGH INCOME ETF
SCHEDULE OF INVESTMENTS (continued)
June 30, 2023
| Security Description | | | Principal
Amount | | Value |
5.75%, 3/1/2027 (e)
| | | $ 200,000 | | $ 192,670 |
| Crestwood Midstream Partners LP/Crestwood Midstream Finance Corp.: | | | | | |
5.63%, 5/1/2027 (e)
| | | 380,000 | | 360,019 |
6.00%, 2/1/2029 (e)
| | | 115,000 | | 107,355 |
Delek Logistics Partners LP/Delek Logistics Finance Corp.
7.13%, 6/1/2028 (e)
| | | 170,000 | | 158,266 |
EnLink Midstream Partners LP
5.05%, 4/1/2045
| | | 120,000 | | 95,776 |
EQM Midstream Partners LP
6.50%, 7/15/2048
| | | 150,000 | | 135,771 |
Global Partners LP/GLP Finance Corp.
6.88%, 1/15/2029
| | | 273,000 | | 253,893 |
| Hess Midstream Operations LP: | | | | | |
4.25%, 2/15/2030 (e)
| | | 200,000 | | 174,552 |
5.13%, 6/15/2028 (e)
| | | 300,000 | | 282,240 |
5.50%, 10/15/2030 (e)
| | | 400,000 | | 372,896 |
Holly Energy Partners LP/Holly Energy Finance Corp.
5.00%, 2/1/2028 (e)
| | | 60,000 | | 55,959 |
| NuStar Logistics LP: | | | | | |
5.63%, 4/28/2027
| | | 120,000 | | 115,351 |
6.00%, 6/1/2026
| | | 80,000 | | 78,037 |
6.38%, 10/1/2030
| | | 290,000 | | 278,322 |
| | | | | | 2,846,831 |
| REAL ESTATE — 0.8% | | | | | |
| Howard Hughes Corp.: | | | | | |
4.13%, 2/1/2029 (e)
| | | 505,000 | | 418,796 |
4.38%, 2/1/2031 (e)
| | | 210,000 | | 167,933 |
| Kennedy-Wilson, Inc.: | | | | | |
4.75%, 3/1/2029
| | | 200,000 | | 158,060 |
4.75%, 2/1/2030
| | | 200,000 | | 151,486 |
Realogy Group LLC/Realogy Co.-Issuer Corp.
5.75%, 1/15/2029 (e)
| | | 150,000 | | 112,608 |
| | | | | | 1,008,883 |
| REAL ESTATE INVESTMENT TRUSTS — 2.3% | | | | | |
Apollo Commercial Real Estate Finance, Inc.
4.63%, 6/15/2029 (e)
| | | 100,000 | | 77,902 |
| Iron Mountain, Inc.: | | | | | |
4.88%, 9/15/2029 (e)
| | | 100,000 | | 89,527 |
5.25%, 7/15/2030 (e)
| | | 80,000 | | 72,086 |
5.63%, 7/15/2032 (e)
| | | 60,000 | | 53,771 |
7.00%, 2/15/2029 (a) (e)
| | | 144,000 | | 144,298 |
REIT, 4.50%, 2/15/2031 (e)
| | | 510,000 | | 438,207 |
MPT Operating Partnership LP/MPT Finance Corp.
4.63%, 8/1/2029
| | | 200,000 | | 151,458 |
| Security Description | | | Principal
Amount | | Value |
Rithm Capital Corp.
6.25%, 10/15/2025 (e)
| | | $ 240,000 | | $ 225,065 |
| Service Properties Trust: | | | | | |
3.95%, 1/15/2028
| | | 390,000 | | 305,140 |
4.75%, 10/1/2026
| | | 230,000 | | 199,656 |
4.95%, 2/15/2027
| | | 270,000 | | 230,904 |
5.25%, 2/15/2026
| | | 120,000 | | 108,814 |
| Starwood Property Trust, Inc.: | | | | | |
3.63%, 7/15/2026 (e)
| | | 390,000 | | 337,131 |
4.38%, 1/15/2027 (e)
| | | 560,000 | | 482,328 |
Uniti Group LP/Uniti Group Finance, Inc./CSL Capital LLC
6.50%, 2/15/2029 (e)
| | | 50,000 | | 35,350 |
| | | | | | 2,951,637 |
| RETAIL — 2.7% | | | | | |
1011778 BC ULC/New Red Finance, Inc.
4.00%, 10/15/2030 (e)
| | | 630,000 | | 542,165 |
| Asbury Automotive Group, Inc.: | | | | | |
4.63%, 11/15/2029 (e)
| | | 120,000 | | 106,810 |
4.75%, 3/1/2030
| | | 235,000 | | 208,710 |
5.00%, 2/15/2032 (e)
| | | 290,000 | | 253,376 |
Bath & Body Works, Inc.
6.75%, 7/1/2036
| | | 200,000 | | 180,234 |
Bloomin' Brands, Inc./OSI Restaurant Partners LLC
5.13%, 4/15/2029 (e)
| | | 141,000 | | 126,229 |
Carrols Restaurant Group, Inc.
5.88%, 7/1/2029 (e)
| | | 140,000 | | 115,150 |
Carvana Co.
5.50%, 4/15/2027 (e)
| | | 150,000 | | 101,968 |
FirstCash, Inc.
4.63%, 9/1/2028 (e)
| | | 410,000 | | 366,606 |
Group 1 Automotive, Inc.
4.00%, 8/15/2028 (e)
| | | 150,000 | | 131,886 |
Murphy Oil USA, Inc.
3.75%, 2/15/2031 (e)
| | | 160,000 | | 134,446 |
Nordstrom, Inc.
5.00%, 1/15/2044
| | | 99,000 | | 68,812 |
Patrick Industries, Inc.
4.75%, 5/1/2029 (e)
| | | 300,000 | | 257,592 |
Suburban Propane Partners LP/Suburban Energy Finance Corp.
5.00%, 6/1/2031 (e)
| | | 240,000 | | 201,941 |
Superior Plus LP/Superior General Partner, Inc.
4.50%, 3/15/2029 (e)
| | | 240,000 | | 210,689 |
| Yum! Brands, Inc.: | | | | | |
3.63%, 3/15/2031
| | | 130,000 | | 112,550 |
4.63%, 1/31/2032
| | | 102,000 | | 92,564 |
4.75%, 1/15/2030 (e)
| | | 180,000 | | 168,984 |
| | | | | | 3,380,712 |
| SEMICONDUCTORS — 0.2% | | | | | |
ams-OSRAM AG
7.00%, 7/31/2025 (e)
| | | 300,000 | | 264,399 |
See accompanying notes to financial statements.
27
SPDR BLACKSTONE HIGH INCOME ETF
SCHEDULE OF INVESTMENTS (continued)
June 30, 2023
| Security Description | | | Principal
Amount | | Value |
| SOFTWARE — 1.3% | | | | | |
Fair Isaac Corp.
4.00%, 6/15/2028 (e)
| | | $ 600,000 | | $ 550,770 |
MicroStrategy, Inc.
6.13%, 6/15/2028 (e)
| | | 220,000 | | 197,133 |
| Open Text Corp.: | | | | | |
3.88%, 2/15/2028 (e)
| | | 560,000 | | 493,019 |
3.88%, 12/1/2029 (e)
| | | 175,000 | | 146,314 |
Open Text Holdings, Inc.
4.13%, 2/15/2030 (e)
| | | 230,000 | | 195,760 |
| | | | | | 1,582,996 |
| TELECOMMUNICATIONS — 1.0% | | | | | |
Hughes Satellite Systems Corp.
6.63%, 8/1/2026
| | | 680,000 | | 637,976 |
U.S. Cellular Corp.
6.70%, 12/15/2033
| | | 90,000 | | 77,404 |
Viasat, Inc.
6.50%, 7/15/2028 (e)
| | | 675,000 | | 571,219 |
| | | | | | 1,286,599 |
| TRANSPORTATION — 0.0% (b) | | | | | |
Danaos Corp.
8.50%, 3/1/2028 (e)
| | | 40,000 | | 40,086 |
TOTAL CORPORATE BONDS & NOTES
(Cost $55,445,828)
| | | | | 55,569,045 |
| | | Shares | |
| SHORT-TERM INVESTMENT — 5.3% | | | |
State Street Institutional U.S. Government Money Market Fund, Class G Shares 5.07% (f) (g)
(Cost $6,605,513)
| | 6,605,513 | 6,605,513 |
TOTAL INVESTMENTS — 102.4%
(Cost $128,837,177)
| | | 128,879,046 |
LIABILITIES IN EXCESS OF OTHER ASSETS — (2.4)%
| | | (2,991,137) |
NET ASSETS — 100.0%
| | | $ 125,887,909 |
| (a) | Variable Rate Security - Interest rate shown is rate in effect at June 30, 2023. For securities based on a published reference rate and spread, the reference rate and spread are indicated in the description above. |
| (b) | Amount is less than 0.05% of net assets. |
| (c) | Position is unsettled. Contract rate was not determined at June 30, 2023 and does not take effect until settlement date. Maturity date is not finalized until settlement date. |
| (d) | Security is currently in default and/or issuer is in bankruptcy. |
| (e) | Securities purchased pursuant to Rule 144A of the Securities Act of 1933, as amended. These securities, which represent 38.5% of net assets as of June 30, 2023, are considered liquid and may be resold in transactions exempt from registration, normally to qualified institutional buyers. |
| (f) | The Fund invested in certain money market funds managed by SSGA Funds Management, Inc. Amounts related to these transactions during the period ended June 30, 2023 are shown in the Affiliate Table below. |
| (g) | The rate shown is the annualized seven-day yield at June 30, 2023. |
| ABS | Asset-Backed Security |
| CDI | CREST Depository Interest |
| CLO | Collateralized Loan Obligation |
| CME | Chicago Mercantile Exchange |
| CVR | Contingent Value Rights |
| LIBOR | London Interbank Offered Rate |
| REIT | Real Estate Investment Trust |
| SOFR | Secured Overnight Financing Rate |
See accompanying notes to financial statements.
28
SPDR BLACKSTONE HIGH INCOME ETF
SCHEDULE OF INVESTMENTS (continued)
June 30, 2023
At June 30, 2023, the Fund had unfunded loan commitments of $136,266, which could be extended at the option of the borrowers, pursuant to the following loan agreements:
| Borrower | | Unfunded Loan
Commitment ($) | | Value ($) | | Unrealized
Appreciation/(Depreciation) ($) |
| Pediatric Associates Holding Company, LLC | | 3,406 | | 3,340 | | (66) |
| Athenahealth Group, Inc. | | 67,015 | | 64,669 | | (2,346) |
| ABG Intermediate Holdings 2 LLC | | 65,845 | | 65,787 | | (58) |
| | | $136,266 | | $133,796 | | $(2,470) |
The following table summarizes the value of the Fund's investments according to the fair value hierarchy as of June 30, 2023.
| Description | | Level 1 –
Quoted Prices | | Level 2 –
Other Significant
Observable Inputs | | Level 3 –
Significant
Unobservable Inputs | | Total |
| ASSETS: | | | | | | | | |
| INVESTMENTS: | | | | | | | | |
Corporate Bonds & Notes
| | $ — | | $ 55,569,045 | | $— | | $ 55,569,045 |
Asset-Backed Securities
| | — | | 8,516,436 | | — | | 8,516,436 |
Common Stocks
| | 205,112 | | — | | — | | 205,112 |
Senior Floating Rate Loans
| | — | | 57,982,940 | | — | | 57,982,940 |
Short-Term Investment
| | 6,605,513 | | — | | — | | 6,605,513 |
TOTAL INVESTMENTS
| | $6,810,625 | | $122,068,421 | | $— | | $128,879,046 |
| OTHER FINANCIAL INSTRUMENTS: | | | | | | | | |
Unfunded Loans - Unrealized Depreciation
| | $ — | | $ (2,470) | | $— | | $ (2,470) |
TOTAL OTHER FINANCIAL INSTRUMENTS:
| | $ — | | $ (2,470) | | $— | | $ (2,470) |
Affiliate Table
| | Number of
Shares Held
at
6/30/22 | | Value at
6/30/22 | | Cost of
Purchases | | Proceeds
from
Shares Sold | | Realized
Gain (Loss) | | Change in
Unrealized
Appreciation/
Depreciation | | Number of
Shares Held
at
6/30/23 | | Value at
6/30/23 | | Dividend
Income |
SPDR Blackstone Senior Loan ETF
| — | | $ — | | $ 2,327,133 | | $ 2,323,843 | | $(3,290) | | $— | | — | | $ — | | $ 14,073 |
State Street Institutional U.S. Government Money Market Fund, Class G Shares
| 2,996,829 | | 2,996,829 | | 90,854,811 | | 87,246,127 | | — | | — | | 6,605,513 | | 6,605,513 | | 215,318 |
Total
| | | $2,996,829 | | $93,181,944 | | $89,569,970 | | $(3,290) | | $— | | | | $6,605,513 | | $229,391 |
See accompanying notes to financial statements.
29
SPDR BLACKSTONE SENIOR LOAN ETF
SCHEDULE OF INVESTMENTS
June 30, 2023
| Security Description | | | Principal
Amount | | Value |
| SENIOR FLOATING RATE LOANS — 91.0% | | | | | |
| ADVERTISING AGENCIES — 0.1% | | | | | |
ABG Intermediate Holdings 2 LLC
2023 Term Loan B2, 1 Month USD SOFR + 4.00%, 9.35%, 12/21/2028 (a)
| | | $ 5,355,578 | | $ 5,350,892 |
| AEROSPACE & DEFENSE — 1.6% | | | | | |
| Dynasty Acquisition Co., Inc.: | | | | | |
Senior Secured 2020 CAD Term Loan B2, 1 Month USD SOFR + 3.50%, 8.70%, 4/6/2026 (a)
| | | 182,043 | | 180,792 |
Senior Secured 2020 Term Loan B1, 1 Month USD SOFR + 3.50%, 8.70%, 4/6/2026 (a)
| | | 339,574 | | 337,239 |
| TransDigm, Inc.: | | | | | |
Senior Secured 2022 Term Loan H, 3 Month USD SOFR + 3.25%, 8.49%, 2/22/2027 (a)
| | | 5,392,267 | | 5,400,410 |
Senior Secured 2023 Term Loan I, 3 Month USD SOFR + 3.25%, 8.49%, 8/24/2028 (a)
| | | 68,352,032 | | 68,391,676 |
| | | | | | 74,310,117 |
| AIR FREIGHT & LOGISTICS — 0.1% | | | | | |
Kenan Advantage Group, Inc.
Senior Secured 2021 Term Loan B1, 3 Month USD SOFR + 3.75%, 9.48%, 3/24/2026 (a)
| | | 250,694 | | 250,583 |
Worldwide Express Operations LLC
Senior Secured 2021 1st Lien Term Loan, 3 Month USD SOFR + 4.00%, 9.50%, 7/26/2028 (a)
| | | 2,598,759 | | 2,474,785 |
| | | | | | 2,725,368 |
| AUTOMOBILE COMPONENTS — 1.0% | | | | | |
Clarios Global LP
2023 Incremental Term Loan, 1 Month USD SOFR + 3.75%, 8.85%, 5/6/2030 (a)
| | | 35,341,635 | | 35,302,935 |
| Security Description | | | Principal
Amount | | Value |
USI, Inc.
Senior Secured 2022 Incremental Term Loan, 3 Month USD SOFR + 3.75%, 8.99%, 11/22/2029 (a)
| | | $ 10,390,379 | | $ 10,389,444 |
| | | | | | 45,692,379 |
| BEVERAGES — 0.9% | | | | | |
Triton Water Holdings, Inc.
Senior Secured Term Loan, 3 Month USD LIBOR + 0.00%, 5.24%, 3/31/2028 (a)
| | | 42,973,944 | | 41,651,206 |
| BROADLINE RETAIL — 0.8% | | | | | |
EG America LLC
2023 USD First Lien Incremental Tranche B Term Loan B, 2/28/2028 (a)
| | | 196,882 | | 195,652 |
EG Group Ltd.
Senior Secured 2023 USD First Lien Incremental Tranche C Term Loan B, 2/28/2028 (b)
| | | 295,324 | | 283,141 |
GYP Holdings III Corp.
2023 Term Loan, 1 Month USD SOFR + 3.00%, 8.10%, 5/12/2030 (a)
| | | 734,041 | | 735,303 |
Harbor Freight Tools USA, Inc.
Senior Secured 2021 Term Loan B, 1 Month USD SOFR + 2.75%, 7.97%, 10/19/2027 (a)
| | | 37,400,983 | | 36,956,847 |
| | | | | | 38,170,943 |
| BUILDING PRODUCTS — 1.4% | | | | | |
ACProducts, Inc.
Senior Secured 2021 Term Loan B, 3 Month USD LIBOR + 4.25%, 9.78%, 5/17/2028 (a)
| | | 11,747,438 | | 9,911,901 |
Chamberlain Group, Inc.
Senior Secured Term Loan B, 1 Month USD SOFR + 3.25%, 8.45%, 11/3/2028 (a)
| | | 9,974,684 | | 9,765,415 |
Cornerstone Building Brands, Inc.
Senior Secured 2021 Term Loan B, 1 Month USD SOFR + 3.25%, 8.50%, 4/12/2028 (a)
| | | 34,756,651 | | 33,410,005 |
See accompanying notes to financial statements.
30
SPDR BLACKSTONE SENIOR LOAN ETF
SCHEDULE OF INVESTMENTS (continued)
June 30, 2023
| Security Description | | | Principal
Amount | | Value |
Oscar AcquisitionCo LLC
Senior Secured Term Loan B, 3 Month USD SOFR + 4.50%, 9.84%, 4/29/2029 (a)
| | | $ 10,957,784 | | $ 10,724,931 |
| | | | | | 63,812,252 |
| CAPITAL MARKETS — 0.1% | | | | | |
AqGen Ascensus, Inc.
Senior Secured 2021 2nd Lien Term Loan, 3 Month USD LIBOR + 6.50%, 11.69%, 8/2/2029 (a)
| | | 7,194,340 | | 6,474,906 |
AqGen Island Holdings, Inc.
Senior Secured Term Loan, 3 Month USD LIBOR + 3.50%, 8.69%, 8/2/2028 (a)
| | | 496,245 | | 489,114 |
| | | | | | 6,964,020 |
| CASINO SERVICES — 1.0% | | | | | |
| Stars Group Holdings BV: | | | | | |
Senior Secured 2018 USD Incremental Term Loan, 3 Month USD SOFR + 2.25%, 7.75%, 7/21/2026 (a)
| | | 36,819,290 | | 36,860,895 |
Senior Secured 2022 USD Term Loan B, 3 Month USD SOFR + 3.25%, 8.49%, 7/22/2028 (a)
| | | 7,535,958 | | 7,558,642 |
| | | | | | 44,419,537 |
| CHEMICALS — 1.1% | | | | | |
Axalta Coating Systems U.S. Holdings, Inc.
2022 USD Term Loan B4, 3 Month USD SOFR + 3.00%, 8.22%, 12/20/2029 (a)
| | | 10,664,428 | | 10,700,260 |
Diamond BV
Senior Secured 2021 Term Loan B, 3 Month USD SOFR + 2.75%, 8.06%, 9/29/2028 (a)
| | | 10,398,172 | | 10,399,576 |
Messer Industries GmbH
Senior Secured 2018 USD Term Loan, 3 Month USD SOFR + 2.50%, 8.00%, 3/2/2026 (a)
| | | 11,474,942 | | 11,482,458 |
SCIH Salt Holdings, Inc.
Senior Secured 2021 Incremental Term Loan B, 3 Month USD LIBOR + 4.00%, 9.19%, 3/16/2027 (a)
| | | 2,777,669 | | 2,740,990 |
| Security Description | | | Principal
Amount | | Value |
| Starfruit Finco BV: | | | | | |
2023 Term Loan B, 3 Month USD SOFR + 4.00%, 8.99%, 4/3/2028 (a)
| | | $ 3,362,922 | | $ 3,347,503 |
Senior Secured 2018 USD Term Loan B, 3 Month USD SOFR + 2.75%, 8.07%, 10/1/2025 (a)
| | | 12,062,962 | | 12,076,533 |
| | | | | | 50,747,320 |
| COMMERCIAL SERVICES — 5.4% | | | | | |
AlixPartners LLP
Senior Secured 2021 USD Term Loan B, 1 Month USD SOFR + 2.50%, 7.72%, 2/4/2028 (a)
| | | 6,809,998 | | 6,804,039 |
Allied Universal Holdco LLC
Senior Secured 2021 USD Incremental Term Loan B, 1 Month USD SOFR + 3.75%, 8.95%, 5/12/2028 (a)
| | | 47,044,698 | | 45,816,361 |
APX Group, Inc.
Senior Secured 2021 Term Loan B, 3 Month USD LIBOR + 3.25%, 8.76%, 7/10/2028 (a)
| | | 10,649,512 | | 10,655,315 |
Avis Budget Car Rental LLC
Senior Secured 2022 Term Loan C, 1 Month SOFR + 3.50%, 3/16/2029 (a)
| | | 3,950,000 | | 3,963,983 |
CoreLogic, Inc.
Senior Secured Term Loan, 1 Month USD LIBOR + 3.50%, 8.75%, 6/2/2028 (a)
| | | 48,153,670 | | 43,591,109 |
Corp. Service Co.
Senior Secured Term Loan B, 1 Month USD SOFR + 3.25%, 8.45%, 11/2/2029 (a)
| | | 955,000 | | 957,746 |
Mavis Tire Express Services Corp.
Senior Secured 2021 Term Loan B, 1 Month USD SOFR + 4.00%, 9.22%, 5/4/2028 (a)
| | | 4,987,277 | | 4,951,444 |
Neptune Bidco U.S., Inc.
Senior Secured 2022 USD Term Loan B, 3 Month USD SOFR + 5.00%, 10.00%, 4/11/2029 (a)
| | | 50,815,580 | | 44,908,269 |
PECF USS Intermediate Holding III Corp.
Senior Secured Term Loan B, 3 Month USD LIBOR + 4.25%, 9.52%, 12/15/2028 (a)
| | | 15,883,585 | | 13,090,059 |
See accompanying notes to financial statements.
31
SPDR BLACKSTONE SENIOR LOAN ETF
SCHEDULE OF INVESTMENTS (continued)
June 30, 2023
| Security Description | | | Principal
Amount | | Value |
Vaco Holdings LLC
Senior Secured 2022 Term Loan, 3 Month USD SOFR + 5.00%, 10.59%, 1/21/2029 (a)
| | | $ 3,347,294 | | $ 3,060,699 |
Verscend Holding Corp.
Senior Secured 2021 Term Loan B, 1 Month USD LIBOR + 4.00%, 9.22%, 8/27/2025 (a)
| | | 51,890,790 | | 51,939,308 |
| VT Topco, Inc.: | | | | | |
Senior Secured 2018 1st Lien Term Loan, 1 Month USD LIBOR + 3.50%, 8.72%, 8/1/2025 (a)
| | | 1,073,230 | | 1,061,489 |
Senior Secured 2021 Incremental Term Loan, 1 Month USD SOFR + 3.75%, 8.97%, 8/1/2025 (a)
| | | 8,642,489 | | 8,548,283 |
Wand NewCo 3, Inc.
Senior Secured 2020 Term Loan, 1 Month USD LIBOR + 2.75%, 7.94%, 2/5/2026 (a)
| | | 11,968,992 | | 11,888,381 |
| | | | | | 251,236,485 |
| COMMERCIAL SERVICES & SUPPLIES — 2.9% | | | | | |
Aramark Services, Inc.
Senior Secured 2023 Term Loan B6, 1 Week USD SOFR + 2.50%, 7.72%, 6/22/2030 (a)
| | | 509,395 | | 510,032 |
| Asurion LLC: | | | | | |
Senior Secured 2020 Term Loan B8, 1 Month USD LIBOR + 3.25%, 8.44%, 12/23/2026 (a)
| | | 43,146,821 | | 41,647,470 |
Senior Secured 2021 Second Lien Term Loan B4, 1 Month USD SOFR + 5.25%, 10.45%, 1/20/2029 (a)
| | | 12,724,070 | | 10,706,414 |
Belron Finance U.S. LLC
2023 Term Loan, 3 Month USD SOFR + 2.75%, 7.83%, 4/18/2029 (a)
| | | 7,614,629 | | 7,628,944 |
| Covanta Holding Corp.: | | | | | |
2023 Term Loan B, 3 Month USD SOFR + 3.00%, 8.15%, 11/30/2028 (a)
| | | 2,906,977 | | 2,899,259 |
2023 Term Loan C, 8.15%, 11/30/2028 (a)
| | | 218,023 | | 217,444 |
Senior Secured 2021 Term Loan B, 1 Month USD SOFR + 2.50%, 7.60%, 11/30/2028 (a)
| | | 920,054 | | 913,416 |
| Security Description | | | Principal
Amount | | Value |
Senior Secured 2021 Term Loan C, 1 Month USD SOFR + 2.50%, 7.60%, 11/30/2028 (a)
| | | $ 69,849 | | $ 69,345 |
Garda World Security Corp.
Senior Secured 2021 Term Loan B, 1 Month USD SOFR + 6.25%, 9.43%, 10/30/2026 (a)
| | | 1,000,000 | | 996,250 |
GFL Environmental, Inc.
Senior Secured 2023 Term Loan, 1 Month USD SOFR + 3.00%, 8.15%, 5/28/2027 (a)
| | | 2,499,173 | | 2,504,147 |
McGraw-Hill Global Education Holdings LLC
Senior Secured 2021 Term Loan, 6 Month USD LIBOR + 4.75%, 9.95%, 7/28/2028 (a)
| | | 9,143,675 | | 8,595,054 |
Prime Security Services Borrower LLC
Senior Secured 2021 Term Loan, 3 Month USD LIBOR + 2.75%, 7.94%, 9/23/2026 (a)
| | | 48,621,144 | | 48,668,064 |
Thevelia U.S. LLC
USD Term Loan B, 6/18/2029 (b)
| | | 10,217,949 | | 10,205,176 |
| | | | | | 135,561,015 |
| COMMUNICATIONS EQUIPMENT — 0.7% | | | | | |
CommScope, Inc.
Senior Secured 2019 Term Loan B, 1 Month USD LIBOR + 3.25%, 8.44%, 4/6/2026 (a)
| | | 15,064,120 | | 14,463,438 |
Zayo Group Holdings, Inc.
Senior Secured USD Term Loan, 1 Month USD LIBOR + 3.00%, 8.22%, 3/9/2027 (a)
| | | 25,693,232 | | 20,259,113 |
| | | | | | 34,722,551 |
| COMPUTERS — 0.3% | | | | | |
Magenta Buyer LLC
Senior Secured 2021 USD 1st Lien Term Loan, 3 Month USD LIBOR + 4.75%, 10.03%, 7/27/2028 (a)
| | | 16,351,681 | | 12,365,959 |
| CONSTRUCTION & ENGINEERING — 0.5% | | | | | |
Brown Group Holding LLC
Senior Secured Term Loan B, 1 Month USD SOFR + 2.50%, 7.70%, 6/7/2028 (a)
| | | 11,986,456 | | 11,820,384 |
See accompanying notes to financial statements.
32
SPDR BLACKSTONE SENIOR LOAN ETF
SCHEDULE OF INVESTMENTS (continued)
June 30, 2023
| Security Description | | | Principal
Amount | | Value |
DG Investment Intermediate Holdings 2, Inc.
Senior Secured 2021 Term Loan, 1 Month USD SOFR + 3.75%, 8.97%, 3/31/2028 (a)
| | | $ 493,697 | | $ 485,674 |
| KKR Apple Bidco LLC: | | | | | |
2022 Incremental Term Loan, 1 Month USD SOFR + 4.00%, 9.10%, 9/22/2028 (a)
| | | 8,119,135 | | 8,088,688 |
Senior Secured 2021 Term Loan, 1 Month USD SOFR + 2.75%, 7.97%, 9/23/2028 (a)
| | | 4,594,039 | | 4,562,041 |
| | | | | | 24,956,787 |
| CONSTRUCTION MATERIALS — 0.2% | | | | | |
Quikrete Holdings, Inc.
Senior Secured 2016 1st Lien Term Loan, 1 Month USD LIBOR + 2.63%, 7.84%, 2/1/2027 (a)
| | | 10,359,483 | | 10,352,490 |
| CONTAINERS & PACKAGING — 1.2% | | | | | |
Berry Global, Inc.
Senior Secured 2021 Term Loan Z, 1 Month USD LIBOR + 1.75%, 6.97%, 7/1/2026 (a)
| | | 20,852,318 | | 20,852,526 |
Clydesdale Acquisition Holdings, Inc.
Senior Secured Term Loan B, 1 Month USD SOFR + 4.18%, 9.38%, 4/13/2029 (a)
| | | 37,028,910 | | 36,508,839 |
| | | | | | 57,361,365 |
| COSMETICS & TOILETRIES — 0.7% | | | | | |
Sunshine Luxembourg VII SARL
Senior Secured 2021 Term Loan B3, 3 Month USD SOFR + 3.75%, 9.09%, 10/1/2026 (a)
| | | 35,081,148 | | 34,949,769 |
| DISTRIBUTION/WHOLESALE — 0.3% | | | | | |
Windsor Holdings III LLC
USD Term Loan B, 6/21/2030 (a)
| | | 12,454,104 | | 12,250,169 |
| Security Description | | | Principal
Amount | | Value |
| DISTRIBUTORS — 0.4% | | | | | |
American Builders & Contractors Supply Co., Inc.
Senior Secured 2019 Term Loan, 1 Month USD LIBOR + 2.00%, 7.08%, 1/15/2027 (a)
| | | $ 9,194,673 | | $ 9,178,169 |
American Tire Distributors Holdings, Inc.
Senior Secured 2021 Term Loan B, 3 Month USD SOFR + 6.25%, 11.49%, 10/20/2028 (a)
| | | 11,845,774 | | 10,334,075 |
| | | | | | 19,512,244 |
| DIVERSIFIED CONSUMER SERVICES — 0.1% | | | | | |
Bright Horizons Family Solutions LLC
Senior Secured 2021 Term Loan B, 1 Month USD LIBOR + 2.25%, 7.33%, 11/24/2028 (a)
| | | 4,173,237 | | 4,167,165 |
| DIVERSIFIED TELECOMMUNICATION SERVICES — 1.9% | | | | | |
Altice France SA
Senior Secured 2023 USD Term Loan B14, 3 Month USD SOFR + 5.50%, 10.49%, 8/15/2028 (a)
| | | 48,674,229 | | 43,482,392 |
CCI Buyer, Inc.
Senior Secured Term Loan, 3 Month USD SOFR + 4.00%, 9.24%, 12/17/2027 (a)
| | | 572,203 | | 562,547 |
CenturyLink, Inc.
Senior Secured 2020 Term Loan B, 1 Month USD SOFR + 2.25%, 7.47%, 3/15/2027 (a)
| | | 46,645,217 | | 36,120,890 |
| Ciena Corp.: | | | | | |
2023 Term Loan B, 1 Month USD SOFR + 2.50%, 7.59%, 1/18/2030 (a)
| | | 2,000,000 | | 2,004,380 |
Senior Secured 2020 Term Loan B, 1 Month USD LIBOR + 1.75%, 6.84%, 9/26/2025 (a)
| | | 4,333,745 | | 4,341,871 |
| | | | | | 86,512,080 |
| ELECTRICAL EQUIPMENT — 0.2% | | | | | |
Energizer Holdings, Inc.
Senior Secured 2020 Term Loan, 1 Month USD SOFR + 2.25%, 7.44%, 12/22/2027 (a)
| | | 4,621,552 | | 4,604,245 |
See accompanying notes to financial statements.
33
SPDR BLACKSTONE SENIOR LOAN ETF
SCHEDULE OF INVESTMENTS (continued)
June 30, 2023
| Security Description | | | Principal
Amount | | Value |
Gates Global LLC
Senior Secured 2021 Term Loan B3, 1 Month USD SOFR + 2.50%, 7.70%, 3/31/2027 (a)
| | | $ 5,566,910 | | $ 5,546,034 |
| | | | | | 10,150,279 |
| ELECTRONIC EQUIPMENT, INSTRUMENTS & COMPONENTS — 0.7% | | | | | |
II-VI, Inc.
Senior Secured 2022 Term Loan B, 3 Month USD SOFR + 2.75%, 7.97%, 7/2/2029 (a)
| | | 33,895,299 | | 33,884,791 |
| ENTERTAINMENT — 2.6% | | | | | |
AP Gaming I LLC
Senior Secured 2022 Term Loan B, 1 Month USD SOFR + 4.00%, 9.39%, 2/15/2029 (a)
| | | 2,350,701 | | 2,331,601 |
| Crown Finance U.S., Inc.: | | | | | |
Senior Secured 2018 USD Term Loan, 2/28/2025 (a)
| | | 49,204,796 | | 15,200,837 |
Senior Secured 2019 Incremental Term Loan, 3 Month USD LIBOR + 2.75%, 8.29%, 9/30/2026 (a)
| | | 6,043,316 | | 1,866,962 |
Fertitta Entertainment LLC
Senior Secured 2022 Term Loan B, 1 Month USD SOFR + 4.00%, 9.10%, 1/27/2029 (a)
| | | 41,849,001 | | 41,382,594 |
Formula One Holdings Ltd.
Term Loan B, 1 Month USD SOFR + 3.00%, 8.10%, 1/15/2030 (a)
| | | 8,213,403 | | 8,224,697 |
| GVC Holdings Ltd.: | | | | | |
2022 USD Term Loan B2, 6 Month USD SOFR + 3.50%, 8.44%, 10/31/2029 (a)
| | | 7,875,956 | | 7,873,987 |
Senior Secured 2021 USD Term Loan B4, 3 Month USD SOFR + 2.50%, 7.44%, 3/29/2027 (a)
| | | 2,578,579 | | 2,575,356 |
NASCAR Holdings LLC
Senior Secured Term Loan B, 1 Month USD SOFR + 2.50%, 7.72%, 10/19/2026 (a)
| | | 2,341,135 | | 2,347,175 |
| Security Description | | | Principal
Amount | | Value |
UFC Holdings LLC
Senior Secured 2021 Term Loan B, 3 Month USD LIBOR + 2.75%, 8.05%, 4/29/2026 (a)
| | | $ 37,599,177 | | $ 37,601,621 |
| | | | | | 119,404,830 |
| FINANCIAL SERVICES — 3.5% | | | | | |
Apex Group Treasury LLC
Senior Secured USD Term Loan, 3 Month USD LIBOR + 3.75%, 9.07%, 7/27/2028 (a)
| | | 496,212 | | 490,630 |
Camelot U.S. Acquisition LLC
Senior Secured 2020 Incremental Term Loan B, 1 Month USD LIBOR + 3.00%, 8.22%, 10/30/2026 (a)
| | | 2,085,022 | | 2,084,594 |
Citadel Securities LP
Senior Secured 2021 Term Loan B, 1 Month USD SOFR + 2.50%, 7.72%, 2/2/2028 (a)
| | | 46,396,716 | | 46,389,525 |
DirecTV Financing LLC
Senior Secured Term Loan, 1 Month USD LIBOR + 5.00%, 10.22%, 8/2/2027 (a)
| | | 36,847,702 | | 36,105,589 |
Edelman Financial Center LLC
Senior Secured 2021 Term Loan B, 1 Month USD LIBOR + 3.75%, 8.94%, 4/7/2028 (a)
| | | 6,828,043 | | 6,669,734 |
Focus Financial Partners LLC
Senior Secured 2022 Term Loan B5, 1 Month USD SOFR + 3.25%, 8.35%, 6/30/2028 (a)
| | | 22,264,888 | | 22,131,856 |
NFP Corp.
Senior Secured 2020 Term Loan, 1 Month USD SOFR + 3.25%, 8.47%, 2/15/2027 (a)
| | | 3,729,848 | | 3,661,909 |
Trans Union LLC
Senior Secured 2019 Term Loan B5, 1 Month USD LIBOR + 1.75%, 6.95%, 11/16/2026 (a)
| | | 14,282,215 | | 14,263,362 |
William Morris Endeavor Entertainment LLC
Senior Secured 2018 1st Lien Term Loan, 3 Month USD LIBOR + 2.75%, 7.95%, 5/18/2025 (a)
| | | 32,140,886 | | 32,118,388 |
| | | | | | 163,915,587 |
See accompanying notes to financial statements.
34
SPDR BLACKSTONE SENIOR LOAN ETF
SCHEDULE OF INVESTMENTS (continued)
June 30, 2023
| Security Description | | | Principal
Amount | | Value |
| FOOD PRODUCTS — 0.3% | | | | | |
Froneri International Ltd.
Senior Secured 2020 USD Term Loan, 3 Month USD SOFR + 2.25%, 7.45%, 1/29/2027 (a)
| | | $ 14,283,370 | | $ 14,228,022 |
| FOOD-MISC/DIVERSIFIED — 0.0% (c) | | | | | |
Skopima Merger Sub, Inc.
Senior Secured Term Loan B, 1 Month USD LIBOR + 4.00%, 9.19%, 5/12/2028 (a)
| | | 575,734 | | 561,033 |
| GAMING & ENTERTAINMENT — 0.0% (c) | | | | | |
PCI Gaming Authority
Senior Secured Term Loan, 1 Month USD LIBOR + 2.50%, 7.72%, 5/29/2026 (a)
| | | 1,000,000 | | 1,001,965 |
| GROUND TRANSPORTATION — 0.7% | | | | | |
Avis Budget Car Rental LLC
Senior Secured 2020 Term Loan B, 1 Month USD LIBOR + 2.25%, 8/6/2027 (a)
| | | 2,992,248 | | 2,962,565 |
Genesee & Wyoming, Inc.
Senior Secured Term Loan, 3 Month USD SOFR + 2.00%, 7.34%, 12/30/2026 (a)
| | | 24,932,367 | | 24,938,850 |
XPO Logistics, Inc.
2023 Term Loan B, 5/24/2028 (a)
| | | 3,334,446 | | 3,350,234 |
| | | | | | 31,251,649 |
| HEALTH CARE EQUIPMENT & SUPPLIES — 2.0% | | | | | |
Bausch & Lomb, Inc.
Senior Secured Term Loan, 3 Month USD SOFR + 3.25%, 8.59%, 5/10/2027 (a)
| | | 35,716,548 | | 34,734,342 |
Carestream Health, Inc.
Senior Secured 2022 Term Loan, 3 Month USD SOFR + 7.50%, 12.84%, 9/30/2027 (a)
| | | 4,713,866 | | 3,450,550 |
Gainwell Acquisition Corp.
Senior Secured Term Loan B, 3 Month USD SOFR + 4.00%, 9.24%, 10/1/2027 (a)
| | | 55,084,813 | | 54,327,397 |
| | | | | | 92,512,289 |
| Security Description | | | Principal
Amount | | Value |
| HEALTH CARE PROVIDERS & SERVICES — 5.2% | | | | | |
Avantor Funding, Inc.
Senior Secured 2021 Term Loan B5, 1 Month USD SOFR + 2.25%, 7.45%, 11/8/2027 (a)
| | | $ 4,820,921 | | $ 4,824,946 |
DaVita, Inc.
Senior Secured 2020 Term Loan B, 1 Month USD SOFR + 1.75%, 6.99%, 8/12/2026 (a)
| | | 33,601,846 | | 33,168,382 |
| Envision Healthcare Corp.: | | | | | |
Senior Secured 2022 First Out Term Loan, 3 Month USD SOFR + 7.875%, 13.11%, 3/31/2027 (a),(d)
| | | 16,938,100 | | 18,653,083 |
Senior Secured 2022 Second Out Term Loan, 3 Month USD SOFR + 4.25%, 9.49%, 3/31/2027 (a),(d)
| | | 7,618,580 | | 1,721,342 |
GHX Ultimate Parent Corp.
2023 Term Loan, 3 Month USD SOFR + 4.75%, 9.79%, 6/30/2027 (a)
| | | 5,422,907 | | 5,438,173 |
Horizon Therapeutics USA, Inc.
Senior Secured 2021 Term Loan B2, 1 Month USD SOFR + 1.75%, 6.95%, 3/15/2028 (a)
| | | 19,719,776 | | 19,686,351 |
ICON Luxembourg SARL
Senior Secured LUX Term Loan, 3 Month USD SOFR + 2.25%, 7.75%, 7/3/2028 (a)
| | | 31,304,872 | | 31,344,003 |
Medline Borrower LP
Senior Secured USD Term Loan B, 1 Month USD SOFR + 3.25%, 8.35%, 10/23/2028 (a)
| | | 79,469,527 | | 78,649,799 |
| National Mentor Holdings, Inc.: | | | | | |
Senior Secured 2021 Term Loan, 3 Month USD SOFR + 3.75%, 8.95%, 3/2/2028 (a)
| | | 11,097,268 | | 8,444,355 |
Senior Secured 2021 Term Loan C, 3 Month USD SOFR + 3.75%, 9.09%, 3/2/2028 (a)
| | | 418,466 | | 318,427 |
PRA Health Sciences, Inc.
Senior Secured US Term Loan, 3 Month USD SOFR + 2.25%, 7.75%, 7/3/2028 (a)
| | | 7,877,219 | | 7,887,065 |
See accompanying notes to financial statements.
35
SPDR BLACKSTONE SENIOR LOAN ETF
SCHEDULE OF INVESTMENTS (continued)
June 30, 2023
| Security Description | | | Principal
Amount | | Value |
RegionalCare Hospital Partners Holdings, Inc.
Senior Secured 2018 Term Loan B, 3 Month USD LIBOR + 3.75%, 9.02%, 11/16/2025 (a)
| | | $ 27,900,511 | | $ 25,908,833 |
Sotera Health Holdings LLC
Senior Secured 2021 Term Loan, 3 Month USD LIBOR + 2.75%, 8.02%, 12/11/2026 (a)
| | | 9,099,451 | | 8,984,298 |
| | | | | | 245,029,057 |
| HOME FURNISHINGS — 0.9% | | | | | |
AI Aqua Merger Sub, Inc.
Senior Secured 2021 1st Lien Term Loan B, 1 Month USD SOFR + 3.75%, 8.80%, 7/31/2028 (a)
| | | 41,995,902 | | 41,281,971 |
| HOTELS, RESTAURANTS & LEISURE — 4.5% | | | | | |
1011778 BC Unlimited Liability Co.
Senior Secured Term Loan B4, 1 Month USD LIBOR + 1.75%, 6.94%, 11/19/2026 (a)
| | | 61,580,756 | | 61,246,988 |
Alterra Mountain Co.
Senior Secured 2021 Series B-2 Consenting Term Loan, 1 Month USD LIBOR + 3.50%, 8.69%, 8/17/2028 (a)
| | | 4,739,002 | | 4,737,533 |
Caesars Entertainment Corp.
Senior Secured Term Loan B, 1 Month USD SOFR + 3.25%, 8.45%, 2/6/2030 (a)
| | | 26,296,191 | | 26,330,508 |
PENN Entertainment, Inc.
Senior Secured 2022 Term Loan B, 1 Month USD SOFR + 2.75%, 7.95%, 5/3/2029 (a)
| | | 6,295,542 | | 6,283,077 |
Peraton Corp.
Senior Secured Term Loan B, 1 Month USD SOFR + 3.75%, 8.95%, 2/1/2028 (a)
| | | 81,329,591 | | 80,066,135 |
Scientific Games International, Inc.
Senior Secured 2022 USD Term Loan, 1 Month USD SOFR + 3.00%, 8.25%, 4/14/2029 (a)
| | | 20,316,294 | | 20,321,069 |
| Security Description | | | Principal
Amount | | Value |
Wyndham Hotels & Resorts, Inc.
2023 Term Loan B, 1 Month USD SOFR + 2.25%, 7.45%, 5/24/2030 (a)
| | | $ 9,502,552 | | $ 9,518,659 |
| | | | | | 208,503,969 |
| HOUSEHOLD PRODUCTS — 0.1% | | | | | |
Reynolds Consumer Products LLC
Senior Secured Term Loan, 1 Month USD SOFR + 1.75%, 6.83%, 2/4/2027 (a)
| | | 6,134,190 | | 6,134,896 |
| INDEPENDENT POWER PRODUCERS & ENERGY TRADERS — 0.9% | | | | | |
| Calpine Corp.: | | | | | |
Senior Secured 2019 Term Loan B10, 1 Month USD LIBOR + 2.00%, 7.19%, 8/12/2026 (a)
| | | 3,661,885 | | 3,662,948 |
Senior Secured 2020 Term Loan B5, 1 Month USD LIBOR + 2.50%, 7.70%, 12/16/2027 (a)
| | | 19,948,849 | | 19,959,721 |
Vistra Operations Co. LLC
Senior Secured 1st Lien Term Loan B3, 1 Month USD LIBOR + 1.75%, 6.90%, 12/31/2025 (a)
| | | 17,118,578 | | 17,097,179 |
| | | | | | 40,719,848 |
| INDUSTRIAL CONGLOMERATES — 0.2% | | | | | |
Magenta Buyer LLC
Senior Secured 2021 USD 2nd Lien Term Loan, 3 Month USD LIBOR + 8.25%, 13.53%, 7/27/2029 (a)
| | | 13,082,319 | | 8,634,331 |
| INSURANCE — 5.2% | | | | | |
| Acrisure LLC: | | | | | |
Senior Secured 2020 Term Loan B, 1 Month USD LIBOR + 3.50%, 8.69%, 2/15/2027 (a)
| | | 36,713,127 | | 35,733,070 |
Senior Secured 2021 First Lien Term Loan B, 1 Month USD LIBOR + 4.25%, 9.43%, 2/15/2027 (a)
| | | 1,381,695 | | 1,356,942 |
See accompanying notes to financial statements.
36
SPDR BLACKSTONE SENIOR LOAN ETF
SCHEDULE OF INVESTMENTS (continued)
June 30, 2023
| Security Description | | | Principal
Amount | | Value |
Senior Secured 2021 Incremental Term Loan B, 1 Month USD LIBOR + 3.75%, 8.93%, 2/15/2027 (a)
| | | $ 989,924 | | $ 967,651 |
| Alliant Holdings Intermediate LLC: | | | | | |
Senior Secured 2021 Term Loan B4, 1 Month USD LIBOR + 3.50%, 8.65%, 11/6/2027 (a)
| | | 6,381,451 | | 6,351,809 |
Senior Secured 2023 Term Loan B5, 1 Month USD SOFR + 3.50%, 8.65%, 11/5/2027 (a)
| | | 1,956,636 | | 1,947,127 |
| AmWINS Group, Inc.: | | | | | |
Senior Secured 2021 Term Loan B, 1 Month USD LIBOR + 2.25%, 7.44%, 2/19/2028 (a)
| | | 31,314,148 | | 31,079,448 |
Senior Secured 2023 Incremental Term Loan B, 1 Month USD SOFR + 2.75%, 7.83%, 2/19/2028 (a)
| | | 155,162 | | 154,984 |
AssuredPartners, Inc.
Senior Secured 2020 Term Loan B, 1 Month USD SOFR + 3.50%, 8.72%, 2/12/2027 (a)
| | | 3,463,428 | | 3,441,418 |
| Broadstreet Partners, Inc.: | | | | | |
2023 Term Loan B3, 1 Month USD SOFR + 4.00%, 9.16%, 1/27/2029 (a)
| | | 14,435,484 | | 14,381,351 |
Senior Secured 2020 Term Loan B, 1 Month USD LIBOR + 2.75%, 7.94%, 1/27/2027 (a)
| | | 3,982,038 | | 3,938,693 |
| HUB International Ltd.: | | | | | |
2023 Term Loan B, 6/20/2030 (b)
| | | 51,890,476 | | 52,067,163 |
Senior Secured 2022 Term Loan B, 3 Month USD SOFR + 4.00%, 9.24%, 11/10/2029 (a)
| | | 4,270,208 | | 4,273,283 |
Hyperion Insurance Group Ltd.
Senior Secured 2021 Term Loan B, 1 Month USD LIBOR + 3.25%, 8.44%, 11/12/2027 (a)
| | | 36,702,363 | | 36,564,730 |
Ryan Specialty Group LLC
Senior Secured Term Loan, 1 Month USD SOFR + 3.00%, 8.20%, 9/1/2027 (a)
| | | 3,540,321 | | 3,544,198 |
| Security Description | | | Principal
Amount | | Value |
Sedgwick Claims Management Services, Inc.
Senior Secured 2023 Term Loan B, 1 Month USD SOFR + 3.75%, 8.85%, 2/17/2028 (a)
| | | $ 46,171,776 | | $ 45,966,311 |
| | | | | | 241,768,178 |
| INTERNET & TELECOM — 0.8% | | | | | |
Go Daddy Operating Co. LLC
Senior Secured 2022 Term Loan B5, 1 Month USD SOFR + 3.25%, 8.08%, 11/9/2029 (a)
| | | 8,686,960 | | 8,713,716 |
Uber Technologies, Inc.
Senior Secured 2023 Term Loan B, 3 Month USD SOFR + 2.75%, 7.99%, 3/3/2030 (a)
| | | 29,889,584 | | 29,925,152 |
| | | | | | 38,638,868 |
| INTERNET SECURITY — 0.1% | | | | | |
Proofpoint, Inc.
Senior Secured 2nd Lien Term Loan, 3 Month USD LIBOR + 6.25%, 11.47%, 8/31/2029 (a)
| | | 3,678,427 | | 3,577,270 |
| INVESTMENT COMPANIES — 0.4% | | | | | |
AL GCX Holdings LLC
Senior Secured Term Loan B, 3 Month USD SOFR + 3.50%, 8.55%, 5/17/2029 (a)
| | | 2,981,370 | | 2,967,701 |
Energize HoldCo LLC
Senior Secured 2021 1st Lien Term Loan, 1 Month USD LIBOR + 3.75%, 8.94%, 12/8/2028 (a)
| | | 6,510,416 | | 6,420,898 |
LSF11 Trinity Bidco, Inc.
Term Loan, 4/26/2030 (b)
| | | 9,869,506 | | 9,857,169 |
| | | | | | 19,245,768 |
| IT SERVICES — 0.0% (c) | | | | | |
Ahead DB Holdings LLC
Senior Secured 2021 Term Loan B, 3 Month USD LIBOR + 3.75%, 9.29%, 10/18/2027 (a)
| | | 175,742 | | 164,633 |
| LEISURE&REC/GAMES — 0.1% | | | | | |
Scientific Games Holdings LP
Senior Secured 2022 USD Term Loan B, 3 Month USD SOFR + 3.50%, 8.42%, 4/4/2029 (a)
| | | 6,045,707 | | 5,981,471 |
See accompanying notes to financial statements.
37
SPDR BLACKSTONE SENIOR LOAN ETF
SCHEDULE OF INVESTMENTS (continued)
June 30, 2023
| Security Description | | | Principal
Amount | | Value |
| LIFE SCIENCES TOOLS & SERVICES — 0.8% | | | | | |
Parexel International Corp.
Senior Secured 2021 1st Lien Term Loan, 1 Month USD LIBOR + 3.25%, 8.44%, 11/15/2028 (a)
| | | $ 37,446,499 | | $ 37,203,097 |
| MACHINERY — 1.2% | | | | | |
Chart Industries, Inc.
2023 Term Loan B, 1 Month USD SOFR + 3.75%, 8.94%, 3/15/2030 (a)
| | | 8,775,234 | | 8,778,876 |
Clark Equipment Co.
Senior Secured 2022 Term Loan B, 3 Month USD SOFR + 2.50%, 7.84%, 4/20/2029 (a)
| | | 2,375,387 | | 2,379,473 |
Engineered Machinery Holdings, Inc.
Senior Secured 2021 USD Incremental Term Loan, 3 Month USD LIBOR + 3.50%, 9.04%, 5/19/2028 (a)
| | | 8,996,190 | | 8,838,756 |
Madison IAQ LLC
Senior Secured Term Loan, 6 Month USD LIBOR + 3.25%, 8.30%, 6/21/2028 (a)
| | | 36,176,660 | | 35,480,259 |
| | | | | | 55,477,364 |
| MACHINERY-CONSTRUCTION & MINING — 1.3% | | | | | |
Brookfield WEC Holdings, Inc.
Senior Secured 2021 Term Loan, 1 Month USD LIBOR + 2.75%, 7.94%, 8/1/2025 (a)
| | | 61,399,509 | | 61,348,241 |
| MEDIA — 4.7% | | | | | |
| Charter Communications Operating LLC: | | | | | |
Senior Secured 2019 Term Loan B1, 3 Month USD SOFR + 1.75%, 6.80%, 4/30/2025 (a)
| | | 1,016,768 | | 1,017,404 |
Senior Secured 2019 Term Loan B2, 1 Month USD SOFR + 1.75%, 6.83%, 2/1/2027 (a)
| | | 17,199,106 | | 17,116,637 |
CSC Holdings LLC
Senior Secured 2019 Term Loan B5, 1 Month USD LIBOR + 2.50%, 7.69%, 4/15/2027 (a)
| | | 21,011,221 | | 18,416,650 |
| Security Description | | | Principal
Amount | | Value |
Go Daddy Operating Co. LLC
Senior Secured 2021 Term Loan B4, 1 Month USD LIBOR + 2.00%, 7.19%, 8/10/2027 (a)
| | | $ 5,178 | | $ 5,178 |
| MH Sub I LLC: | | | | | |
2023 Term Loan, 1 Month USD SOFR + 4.25%, 9.35%, 5/3/2028 (a)
| | | 42,575,138 | | 40,904,064 |
Senior Secured 2020 Incremental Term Loan, 1 Month USD LIBOR + 3.75%, 8.85%, 9/13/2024 (a)
| | | 859,842 | | 860,916 |
Senior Secured 2021 2nd Lien Term Loan, 1 Month USD SOFR + 6.25%, 11.35%, 2/23/2029 (a)
| | | 8,294,933 | | 7,259,393 |
Nexstar Broadcasting, Inc.
Senior Secured 2019 Term Loan B4, 1 Month USD SOFR + 2.50%, 7.72%, 9/18/2026 (a)
| | | 9,593,549 | | 9,595,228 |
Radiate Holdco LLC
Senior Secured 2021 Term Loan B, 3 Month USD SOFR + 3.25%, 8.48%, 9/25/2026 (a)
| | | 39,627,554 | | 33,173,217 |
UPC Financing Partnership
Senior Secured 2021 USD Term Loan AX, 1 Month USD LIBOR + 2.93%, 8.12%, 1/31/2029 (a)
| | | 1,000,000 | | 981,980 |
Vertical U.S. Newco, Inc.
Senior Secured Term Loan B, 6 Month USD LIBOR + 3.50%, 8.60%, 7/30/2027 (a)
| | | 47,778,558 | | 47,468,236 |
| Virgin Media Bristol LLC: | | | | | |
2020 USD Term Loan Q, 8.44%, 1/31/2029 (a)
| | | 14,000,000 | | 13,959,960 |
Senior Secured USD Term Loan N, 1 Month USD LIBOR + 2.50%, 7.69%, 1/31/2028 (a)
| | | 27,951,876 | | 27,754,535 |
| | | | | | 218,513,398 |
| MISCELLANEOUS MANUFACTUR — 0.0% (c) | | | | | |
LTI Holdings, Inc.
Senior Secured 2018 2nd Lien Term Loan, 1 Month USD LIBOR + 6.75%, 11.97%, 9/6/2026 (a)
| | | 1,026,869 | | 880,114 |
See accompanying notes to financial statements.
38
SPDR BLACKSTONE SENIOR LOAN ETF
SCHEDULE OF INVESTMENTS (continued)
June 30, 2023
| Security Description | | | Principal
Amount | | Value |
| MRI/MEDICAL DIAG IMAGING — 0.0% (c) | | | | | |
IQVIA, Inc.
Senior Secured 2018 USD Term Loan B3, 3 Month USD LIBOR + 1.75%, 7.29%, 6/11/2025 (a)
| | | $ 1,000,000 | | $ 1,000,940 |
| OIL, GAS & CONSUMABLE FUELS — 1.1% | | | | | |
ITT Holdings LLC
Senior Secured 2021 Term Loan, 1 Month USD LIBOR + 2.75%, 7.97%, 7/10/2028 (a)
| | | 5,746,743 | | 5,710,826 |
Pacific Gas & Electric Co.
2020 Term Loan B1, 1 Month USD LIBOR + 3.00%, 8.22%, 6/23/2025 (a)
| | | 46,726,252 | | 46,776,249 |
| | | | | | 52,487,075 |
| PASSENGER AIRLINES — 4.9% | | | | | |
Air Canada
Senior Secured 2021 Term Loan B, 3 Month USD LIBOR + 3.50%, 8.84%, 8/11/2028 (a)
| | | 16,086,688 | | 16,108,244 |
American Airlines, Inc.
Senior Secured 2021 Term Loan, 3 Month USD LIBOR + 4.75%, 10.00%, 4/20/2028 (a)
| | | 63,702,237 | | 65,157,161 |
Kestrel Bidco, Inc.
Senior Secured Term Loan B, 3 Month USD SOFR + 3.00%, 7.51%, 12/11/2026 (a)
| | | 15,290 | | 14,871 |
Mileage Plus Holdings LLC
Senior Secured 2020 Term Loan B, 3 Month USD LIBOR + 5.25%, 10.76%, 6/21/2027 (a)
| | | 45,250,070 | | 47,088,353 |
SkyMiles IP Ltd.
Senior Secured 2020 Skymiles Term Loan B, 3 Month USD LIBOR + 3.75%, 8.80%, 10/20/2027 (a)
| | | 38,268,575 | | 39,799,318 |
United Airlines, Inc.
Senior Secured 2021 Term Loan B, 3 Month USD LIBOR + 3.75%, 9.29%, 4/21/2028 (a)
| | | 58,388,508 | | 58,453,612 |
| | | | | | 226,621,559 |
| Security Description | | | Principal
Amount | | Value |
| PHARMACEUTICALS — 2.3% | | | | | |
Amneal Pharmaceuticals LLC
Senior Secured 2018 Term Loan B, 1 Month USD SOFR + 3.50%, 8.58%, 5/4/2025 (a)
| | | $ 7,590,714 | | $ 7,362,993 |
Elanco Animal Health, Inc.
Senior Secured Term Loan B, 1 Month USD SOFR + 1.75%, 7.01%, 8/1/2027 (a)
| | | 34,019,678 | | 33,445,596 |
Grifols Worldwide Operations USA, Inc.
Senior Secured USD 2019 Term Loan B, 3 Month USD SOFR + 2.00%, 7.41%, 11/15/2027 (a)
| | | 6,800,627 | | 6,702,868 |
Jazz Financing Lux SARL
Senior Secured USD Term Loan, 1 Month USD LIBOR + 3.50%, 8.86%, 5/5/2028 (a)
| | | 47,813,804 | | 47,800,894 |
Organon & Co.
Senior Secured USD Term Loan, 3 Month USD LIBOR + 3.00%, 8.25%, 6/2/2028 (a)
| | | 14,393,004 | | 14,408,764 |
| | | | | | 109,721,115 |
| PIPELINES — 2.2% | | | | | |
Buckeye Partners LP
Senior Secured 2021 Term Loan B, 1 Month USD LIBOR + 2.25%, 7.45%, 11/1/2026 (a)
| | | 5,940,622 | | 5,907,830 |
CQP Holdco LP
Senior Secured 2021 Term Loan B, 3 Month USD LIBOR + 3.75%, 9.29%, 6/5/2028 (a)
| | | 44,805,528 | | 44,779,989 |
Freeport LNG Investments LLLP
Senior Secured Term Loan B, 3 Month USD LIBOR + 3.50%, 8.75%, 12/21/2028 (a)
| | | 21,795,529 | | 21,394,055 |
Oryx Midstream Services Permian Basin LLC
Senior Secured 2023 Incremental Term Loan, 1 Month USD SOFR + 3.25%, 8.54%, 10/5/2028 (a)
| | | 10,435,788 | | 10,433,231 |
See accompanying notes to financial statements.
39
SPDR BLACKSTONE SENIOR LOAN ETF
SCHEDULE OF INVESTMENTS (continued)
June 30, 2023
| Security Description | | | Principal
Amount | | Value |
TransMontaigne Operating Co. LP
Senior Secured Term Loan B, 1 Month USD LIBOR + 3.50%, 8.65%, 11/17/2028 (a)
| | | $ 10,270,120 | | $ 10,133,527 |
Whitewater Whistler Holdings LLC
Senior Secured 2023 Term Loan B, 3 Month USD SOFR + 3.25%, 8.49%, 2/15/2030 (a)
| | | 11,074,651 | | 11,081,573 |
| | | | | | 103,730,205 |
| PROFESSIONAL SERVICES — 0.6% | | | | | |
Dun & Bradstreet Corp.
Senior Secured Term Loan, 1 Month USD SOFR + 3.25%, 8.43%, 2/6/2026 (a)
| | | 25,991,066 | | 26,046,655 |
Proofpoint, Inc.
Senior Secured 1st Lien Term Loan, 3 Month USD LIBOR + 3.25%, 8.44%, 8/31/2028 (a)
| | | 907,133 | | 889,367 |
Trans Union LLC
Senior Secured 2021 Term Loan B6, 1 Month USD SOFR + 2.25%, 7.47%, 12/1/2028 (a)
| | | 2,419,251 | | 2,416,348 |
| | | | | | 29,352,370 |
| RETAIL-BUILDING PRODUCTS — 1.2% | | | | | |
Kodiak Building Partners, Inc.
Senior Secured Term Loan B, 1 Month USD LIBOR + 3.25%, 8.49%, 3/12/2028 (a)
| | | 6,248,730 | | 6,108,134 |
LBM Acquisition LLC
Senior Secured Term Loan B, 6 Month USD LIBOR + 3.75%, 8.95%, 12/17/2027 (a)
| | | 52,808,082 | | 50,855,239 |
| | | | | | 56,963,373 |
| RETAIL-RESTAURANTS — 1.7% | | | | | |
Hilton Domestic Operating Co., Inc.
Senior Secured 2019 Term Loan B2, 1 Month USD SOFR + 1.75%, 6.94%, 6/22/2026 (a)
| | | 24,539,449 | | 24,548,161 |
| Security Description | | | Principal
Amount | | Value |
IRB Holding Corp.
Senior Secured 2022 Term Loan B, 1 Month USD SOFR + 3.00%, 8.20%, 12/15/2027 (a)
| | | $ 54,226,578 | | $ 53,921,553 |
| | | | | | 78,469,714 |
| SEMICONDUCTORS & SEMICONDUCTOR EQUIPMENT — 1.2% | | | | | |
Entegris, Inc.
Senior Secured 2023 Term Loan B, 3 Month USD SOFR + 2.75%, 7.99%, 7/6/2029 (a)
| | | 11,306,859 | | 11,315,435 |
MKS Instruments, Inc.
Senior Secured 2022 USD Term Loan B, 1 Month USD SOFR + 2.75%, 7.94%, 8/17/2029 (a)
| | | 43,068,553 | | 43,176,224 |
| | | | | | 54,491,659 |
| SOFTWARE — 14.4% | | | | | |
Applied Systems, Inc.
Senior Secured 2022 Extended 1st Lien Term Loan, 3 Month USD SOFR + 4.50%, 9.74%, 9/18/2026 (a)
| | | 2,073,872 | | 2,079,223 |
Apttus Corp.
Senior Secured 2021 Term Loan, 3 Month USD LIBOR + 4.25%, 9.52%, 5/8/2028 (a)
| | | 4,170,435 | | 4,096,576 |
| Athenahealth Group, Inc.: | | | | | |
Senior Secured 2022 Delayed Draw Term Loan, 2/15/2029 (b)
| | | 1,634,221 | | 1,577,024 |
Senior Secured 2022 Term Loan B, 1 Month USD SOFR + 3.50%, 8.59%, 2/15/2029 (a)
| | | 81,986,236 | | 79,116,718 |
| Banff Merger Sub, Inc.: | | | | | |
Senior Secured 2021 USD 2nd Lien Term Loan, 1 Month USD SOFR + 5.50%, 10.72%, 2/27/2026 (a)
| | | 15,197,744 | | 14,855,795 |
Senior Secured 2021 USD Term Loan, 1 Month USD SOFR + 3.75%, 8.97%, 10/2/2025 (a)
| | | 32,089,404 | | 31,871,837 |
Camelot U.S. Acquisition LLC
Senior Secured Term Loan B, 1 Month USD SOFR + 3.00%, 8.22%, 10/30/2026 (a)
| | | 8,345,322 | | 8,343,236 |
See accompanying notes to financial statements.
40
SPDR BLACKSTONE SENIOR LOAN ETF
SCHEDULE OF INVESTMENTS (continued)
June 30, 2023
| Security Description | | | Principal
Amount | | Value |
CDK Global, Inc.
Senior Secured 2022 USD Term Loan B, 3 Month USD SOFR + 4.50%, 9.49%, 7/6/2029 (a)
| | | $ 54,553,873 | | $ 54,464,950 |
Cloud Software Group, Inc.
Senior Secured 2022 USD Term Loan, 3 Month USD SOFR + 4.50%, 9.74%, 3/30/2029 (a)
| | | 68,199,046 | | 63,950,927 |
Cloudera, Inc.
Senior Secured 2021 Second Lien Term Loan, 1 Month USD LIBOR + 6.00%, 11.08%, 10/8/2029 (a)
| | | 5,883,443 | | 5,353,933 |
ConnectWise LLC
Senior Secured 2021 Term Loan B, 3 Month USD LIBOR + 3.50%, 8.69%, 9/29/2028 (a)
| | | 4,003,101 | | 3,908,047 |
| DCert Buyer, Inc.: | | | | | |
2021 2nd Lien Term Loan, 3 Month USD SOFR + 7.00%, 12.26%, 2/19/2029 (a)
| | | 7,467,875 | | 6,882,917 |
Senior Secured 2019 Term Loan B, 3 Month USD SOFR + 4.00%, 9.26%, 10/16/2026 (a)
| | | 10,900,719 | | 10,824,087 |
ECI Macola Max Holding LLC
Senior Secured 2020 Term Loan, 3 Month USD LIBOR + 3.75%, 9.27%, 11/9/2027 (a)
| | | 407,113 | | 403,426 |
Epicor Software Corp.
Senior Secured 2020 Term Loan, 1 Month USD SOFR + 3.25%, 8.33%, 7/30/2027 (a)
| | | 7,764,963 | | 7,679,082 |
Fortra LLC
Senior Secured 2021 Term Loan, 3 Month USD SOFR + 4.00%, 9.15%, 11/19/2026 (a)
| | | 7,280,993 | | 6,662,108 |
Idera, Inc.
Senior Secured 2021 Term Loan, 1 Month USD SOFR + 3.75%, 9.01%, 3/2/2028 (a)
| | | 514,269 | | 501,947 |
I-Logic Technologies Bidco Ltd.
Senior Secured 2021 USD Term Loan B, 3 Month USD SOFR + 4.00%, 9.24%, 2/16/2028 (a)
| | | 763,435 | | 755,732 |
| Security Description | | | Principal
Amount | | Value |
Informatica LLC
Senior Secured 2021 USD Term Loan B, 1 Month USD LIBOR + 2.75%, 8.00%, 10/27/2028 (a)
| | | $ 8,171,793 | | $ 8,174,326 |
McAfee LLC
Senior Secured 2022 USD Term Loan B, 1 Month USD SOFR + 3.75%, 9.01%, 3/1/2029 (a)
| | | 68,782,078 | | 65,982,991 |
MeridianLink, Inc.
Senior Secured 2021 Term Loan B, 3 Month USD LIBOR + 3.00%, 8.73%, 11/10/2028 (a)
| | | 7,047,015 | | 6,967,736 |
Mitchell International, Inc.
Senior Secured 2021 Term Loan B, 3 Month USD LIBOR + 3.75%, 8.94%, 10/15/2028 (a)
| | | 30,257,894 | | 29,643,356 |
Navicure, Inc.
Senior Secured 2019 Term Loan B, 1 Month USD SOFR + 4.00%, 9.22%, 10/22/2026 (a)
| | | 10,747,487 | | 10,734,053 |
NortonLifeLock, Inc.
Senior Secured 2022 Term Loan B, 1 Month USD SOFR + 2.00%, 7.20%, 9/12/2029 (a)
| | | 43,962,357 | | 43,797,718 |
Open Text Corp.
Senior Secured 2022 Term Loan B, 1 Month USD SOFR + 3.50%, 8.58%, 1/31/2030 (a)
| | | 19,669,142 | | 19,779,781 |
Project Ruby Ultimate Parent Corp.
Senior Secured 2021 Term Loan, 1 Month USD SOFR + 3.25%, 8.47%, 3/10/2028 (a)
| | | 3,719,194 | | 3,641,817 |
Quartz Acquireco LLC
Term Loan B, 6/28/2030 (a)
| | | 6,766,304 | | 6,774,762 |
Quest Software U.S. Holdings, Inc.
Senior Secured 2022 Term Loan, 3 Month USD SOFR + 4.25%, 9.45%, 2/1/2029 (a)
| | | 33,545,991 | | 26,207,806 |
RealPage, Inc.
Senior Secured 1st Lien Term Loan, 1 Month USD LIBOR + 3.00%, 8.19%, 4/24/2028 (a)
| | | 51,691,031 | | 50,637,826 |
| Rocket Software, Inc.: | | | | | |
2018 Term Loan, 1 Month USD LIBOR + 4.25%, 9.47%, 11/28/2025 (a)
| | | 662,551 | | 656,943 |
See accompanying notes to financial statements.
41
SPDR BLACKSTONE SENIOR LOAN ETF
SCHEDULE OF INVESTMENTS (continued)
June 30, 2023
| Security Description | | | Principal
Amount | | Value |
Senior Secured 2021 USD Incremental Term Loan B, 1 Month USD LIBOR + 4.25%, 9.44%, 11/28/2025 (a)
| | | $ 660,647 | | $ 655,692 |
SolarWinds Holdings, Inc.
Senior Secured 2022 Term Loan B, 1 Month USD SOFR + 4.00%, 8.85%, 2/5/2027 (a)
| | | 8,554,043 | | 8,566,361 |
Sophia LP
Senior Secured 2021 Term Loan B, 3 Month USD LIBOR + 3.50%, 9.04%, 10/7/2027 (a)
| | | 493,712 | | 489,187 |
| SS&C Technologies, Inc.: | | | | | |
Senior Secured 2022 Term Loan B6, 1 Month USD SOFR + 2.25%, 7.45%, 3/22/2029 (a)
| | | 1,018,590 | | 1,016,894 |
Senior Secured 2022 Term Loan B7, 1 Month USD SOFR + 2.25%, 7.45%, 3/22/2029 (a)
| | | 1,602,687 | | 1,600,018 |
Surf Holdings LLC
Senior Secured USD Term Loan, 3 Month USD LIBOR + 3.50%, 8.70%, 3/5/2027 (a)
| | | 6,467,305 | | 6,425,850 |
Ultimate Software Group, Inc.
Senior Secured 2021 Term Loan, 3 Month USD SOFR + 3.25%, 8.27%, 5/4/2026 (a)
| | | 61,864,984 | | 60,808,021 |
| Vision Solutions, Inc.: | | | | | |
Senior Secured 2021 2nd Lien Term Loan, 3 Month USD LIBOR + 7.25%, 12.51%, 4/23/2029 (a)
| | | 1,233,333 | | 1,070,071 |
Senior Secured 2021 Incremental Term Loan, 3 Month USD LIBOR + 4.25%, 9.51%, 4/24/2028 (a)
| | | 16,200,691 | | 15,432,859 |
| | | | | | 672,391,633 |
| SPECIALTY RETAIL — 1.8% | | | | | |
Petco Health & Wellness Co., Inc.
Senior Secured 2021 Term Loan B, 3 Month USD SOFR + 3.25%, 8.75%, 3/3/2028 (a)
| | | 3,985,646 | | 3,962,987 |
PetSmart, Inc.
Senior Secured 2021 Term Loan B, 1 Month USD SOFR + 3.75%, 8.83%, 2/11/2028 (a)
| | | 26,652,317 | | 26,646,853 |
| Security Description | | | Principal
Amount | | Value |
Pilot Travel Centers LLC
Senior Secured 2021 Term Loan B, 1 Month USD SOFR + 2.00%, 7.20%, 8/4/2028 (a)
| | | $ 39,258,092 | | $ 39,251,026 |
SRS Distribution, Inc.
Senior Secured 2021 Term Loan B, 1 Month USD LIBOR + 3.50%, 8.69%, 6/2/2028 (a)
| | | 6,363,325 | | 6,196,765 |
Whatabrands LLC
Senior Secured 2021 Term Loan B, 1 Month USD LIBOR + 3.25%, 8.47%, 8/3/2028 (a)
| | | 6,687,266 | | 6,656,438 |
| | | | | | 82,714,069 |
| STEEL-PRODUCERS — 0.1% | | | | | |
Phoenix Services International LLC
Term Load, 11.00%, 3/1/2025
| | | 2,377,813 | | 2,377,813 |
| TELECOM SERVICES — 0.0% (c) | | | | | |
SBA Senior Finance II LLC
Senior Secured 2018 Term Loan B, 1 Month USD LIBOR + 1.75%, 6.95%, 4/11/2025 (a)
| | | 997,376 | | 998,283 |
| TELECOMMUNICATION EQUIP — 0.1% | | | | | |
Delta TopCo, Inc.
Senior Secured 2020 Term Loan B, 6 Month USD SOFR + 3.75%, 9.07%, 12/1/2027 (a)
| | | 5,072,977 | | 4,920,788 |
| TRANSPORT-SERVICES — 0.3% | | | | | |
Endure Digital, Inc.
Senior Secured Term Loan, 3 Month USD LIBOR + 3.50%, 8.79%, 2/10/2028 (a)
| | | 15,181,858 | | 14,176,060 |
TOTAL SENIOR FLOATING RATE LOANS
(Cost $4,282,982,015)
| | | | | 4,248,221,688 |
| | | Shares | |
| COMMON STOCKS — 0.1% | | | |
| AEROSPACE & DEFENSE — 0.0% | | | |
Flame NewCo. LLC
| | 230,071 | 2,376,633 |
See accompanying notes to financial statements.
42
SPDR BLACKSTONE SENIOR LOAN ETF
SCHEDULE OF INVESTMENTS (continued)
June 30, 2023
| Security Description | | | Shares | | Value |
| HEALTH CARE EQUIPMENT & SUPPLIES — 0.1% | | | | | |
Carestream Health, Inc. (e),(f)
| | | 396,286 | | $ 2,476,788 |
TOTAL COMMON STOCKS
(Cost $9,882,290)
| | | | | 4,853,421 |
| | | Principal
Amount | |
| CORPORATE BONDS & NOTES — 3.8% | | | |
| AEROSPACE & DEFENSE — 0.2% | | | |
| Bombardier, Inc.: | | | |
6.00%, 2/15/2028 (g)
| | $ 3,280,000 | 3,100,256 |
7.50%, 2/1/2029 (g)
| | 343,000 | 339,035 |
Howmet Aerospace, Inc.
3.00%, 1/15/2029
| | 800,000 | 700,792 |
| TransDigm, Inc.: | | | |
4.63%, 1/15/2029
| | 1,545,000 | 1,373,984 |
4.88%, 5/1/2029
| | 2,400,000 | 2,150,016 |
| | | | 7,664,083 |
| AIRLINES — 0.0% (c) | | | |
Allegiant Travel Co.
7.25%, 8/15/2027 (g)
| | 800,000 | 797,128 |
| APPAREL — 0.0% (c) | | | |
Crocs, Inc.
4.25%, 3/15/2029 (g)
| | 610,000 | 520,306 |
| AUTO MANUFACTURERS — 0.2% | | | |
| Allison Transmission, Inc.: | | | |
3.75%, 1/30/2031 (g)
| | 800,000 | 678,816 |
5.88%, 6/1/2029 (g)
| | 3,000,000 | 2,927,730 |
Ford Motor Co.
4.75%, 1/15/2043
| | 100,000 | 76,773 |
| Ford Motor Credit Co. LLC: | | | |
2.30%, 2/10/2025
| | 3,260,000 | 3,044,775 |
2.70%, 8/10/2026
| | 526,000 | 469,623 |
Wabash National Corp.
4.50%, 10/15/2028 (g)
| | 900,000 | 780,543 |
| | | | 7,978,260 |
| BANKS — 0.0% (c) | | | |
Intesa Sanpaolo SpA
5.71%, 1/15/2026 (g)
| | 1,839,000 | 1,749,146 |
| BEVERAGES — 0.0% (c) | | | |
Primo Water Holdings, Inc.
4.38%, 4/30/2029 (g)
| | 300,000 | 256,887 |
| CHEMICALS — 0.1% | | | |
Ashland, Inc.
3.38%, 9/1/2031 (g)
| | 600,000 | 479,406 |
Chemours Co.
5.75%, 11/15/2028 (g)
| | 2,050,000 | 1,883,725 |
| Security Description | | | Principal
Amount | | Value |
Valvoline, Inc.
3.63%, 6/15/2031 (g)
| | | $ 1,500,000 | | $ 1,219,725 |
| | | | | | 3,582,856 |
| COAL — 0.0% (c) | | | | | |
SunCoke Energy, Inc.
4.88%, 6/30/2029 (g)
| | | 1,110,000 | | 936,418 |
| COMMERCIAL SERVICES — 0.1% | | | | | |
Adtalem Global Education, Inc.
5.50%, 3/1/2028 (g)
| | | 425,000 | | 386,104 |
Gartner, Inc.
3.63%, 6/15/2029 (g)
| | | 2,340,000 | | 2,063,529 |
MPH Acquisition Holdings LLC
5.50%, 9/1/2028 (g)
| | | 1,500,000 | | 1,278,435 |
Service Corp. International
4.00%, 5/15/2031
| | | 410,000 | | 350,788 |
TriNet Group, Inc.
3.50%, 3/1/2029 (g)
| | | 1,120,000 | | 975,912 |
WW International, Inc.
4.50%, 4/15/2029 (g)
| | | 150,000 | | 89,992 |
ZipRecruiter, Inc.
5.00%, 1/15/2030 (g)
| | | 772,000 | | 660,137 |
| | | | | | 5,804,897 |
| COMPUTERS — 0.0% (c) | | | | | |
KBR, Inc.
4.75%, 9/30/2028 (g)
| | | 560,000 | | 513,173 |
Science Applications International Corp.
4.88%, 4/1/2028 (g)
| | | 310,000 | | 290,758 |
Seagate HDD Cayman
4.13%, 1/15/2031
| | | 550,000 | | 451,325 |
Unisys Corp.
6.88%, 11/1/2027 (g)
| | | 500,000 | | 359,860 |
| | | | | | 1,615,116 |
| CONSTRUCTION MATERIALS — 0.1% | | | | | |
| Builders FirstSource, Inc.: | | | | | |
4.25%, 2/1/2032 (g)
| | | 1,100,000 | | 957,429 |
6.38%, 6/15/2032 (g)
| | | 435,000 | | 432,073 |
JELD-WEN, Inc.
4.88%, 12/15/2027 (g)
| | | 2,205,000 | | 1,952,814 |
Louisiana-Pacific Corp.
3.63%, 3/15/2029 (g)
| | | 700,000 | | 612,661 |
| | | | | | 3,954,977 |
| DIVERSIFIED FINANCIAL SERVICES — 0.3% | | | | | |
| Burford Capital Global Finance LLC: | | | | | |
6.25%, 4/15/2028 (g)
| | | 260,000 | | 240,708 |
6.88%, 4/15/2030 (g)
| | | 500,000 | | 457,400 |
Enova International, Inc.
8.50%, 9/15/2025 (g)
| | | 530,000 | | 515,817 |
See accompanying notes to financial statements.
43
SPDR BLACKSTONE SENIOR LOAN ETF
SCHEDULE OF INVESTMENTS (continued)
June 30, 2023
| Security Description | | | Principal
Amount | | Value |
goeasy Ltd.
4.38%, 5/1/2026 (g)
| | | $ 200,000 | | $ 182,412 |
| Nationstar Mortgage Holdings, Inc.: | | | | | |
5.50%, 8/15/2028 (g)
| | | 1,970,000 | | 1,726,902 |
5.75%, 11/15/2031 (g)
| | | 700,000 | | 574,861 |
6.00%, 1/15/2027 (g)
| | | 355,000 | | 330,299 |
| Navient Corp.: | | | | | |
4.88%, 3/15/2028
| | | 3,250,000 | | 2,784,535 |
9.38%, 7/25/2030
| | | 217,000 | | 215,822 |
Series A, 5.63%, 8/1/2033
| | | 760,000 | | 571,307 |
| OneMain Finance Corp.: | | | | | |
3.50%, 1/15/2027
| | | 1,564,000 | | 1,344,915 |
6.63%, 1/15/2028
| | | 300,000 | | 282,945 |
7.13%, 3/15/2026
| | | 1,697,000 | | 1,670,510 |
| PennyMac Financial Services, Inc.: | | | | | |
5.38%, 10/15/2025 (g)
| | | 1,380,000 | | 1,308,364 |
5.75%, 9/15/2031 (g)
| | | 1,800,000 | | 1,466,190 |
PHH Mortgage Corp.
7.88%, 3/15/2026 (g)
| | | 500,000 | | 446,765 |
| SLM Corp.: | | | | | |
3.13%, 11/2/2026
| | | 600,000 | | 519,024 |
4.20%, 10/29/2025
| | | 1,100,000 | | 1,024,650 |
Synchrony Financial
7.25%, 2/2/2033
| | | 370,000 | | 332,190 |
| | | | | | 15,995,616 |
| ELECTRIC — 0.0% (c) | | | | | |
| PG&E Corp.: | | | | | |
5.00%, 7/1/2028
| | | 991,000 | | 909,698 |
5.25%, 7/1/2030
| | | 300,000 | | 269,019 |
| | | | | | 1,178,717 |
| ELECTRICAL COMPONENTS & EQUIPMENT — 0.0% (c) | | | | | |
| Energizer Holdings, Inc.: | | | | | |
4.75%, 6/15/2028 (g)
| | | 300,000 | | 267,711 |
6.50%, 12/31/2027 (g)
| | | 1,530,000 | | 1,473,421 |
| | | | | | 1,741,132 |
| ENGINEERING & CONSTRUCTION — 0.0% (c) | | | | | |
Brundage-Bone Concrete Pumping Holdings, Inc.
6.00%, 2/1/2026 (g)
| | | 840,000 | | 799,848 |
TopBuild Corp.
4.13%, 2/15/2032 (g)
| | | 200,000 | | 171,450 |
| | | | | | 971,298 |
| ENTERTAINMENT — 0.1% | | | | | |
CDI Escrow Issuer, Inc.
5.75%, 4/1/2030 (g)
| | | 500,000 | | 466,040 |
Churchill Downs, Inc.
4.75%, 1/15/2028 (g)
| | | 2,010,000 | | 1,867,712 |
| Security Description | | | Principal
Amount | | Value |
Cinemark USA, Inc.
5.25%, 7/15/2028 (g)
| | | $ 2,250,000 | | $ 1,999,417 |
Lions Gate Capital Holdings LLC
5.50%, 4/15/2029 (g)
| | | 150,000 | | 108,626 |
Wynn Resorts Finance LLC/Wynn Resorts Capital Corp.
REGS, 5.13%, 10/1/2029 (g)
| | | 1,665,000 | | 1,492,856 |
| | | | | | 5,934,651 |
| ENVIRONMENTAL CONTROL — 0.0% (c) | | | | | |
GFL Environmental, Inc.
4.00%, 8/1/2028 (g)
| | | 265,000 | | 237,602 |
| FOOD — 0.1% | | | | | |
Albertsons Cos., Inc./Safeway, Inc./New Albertsons LP/Albertsons LLC
6.50%, 2/15/2028 (g)
| | | 132,000 | | 132,208 |
Lamb Weston Holdings, Inc.
4.13%, 1/31/2030 (g)
| | | 1,602,000 | | 1,431,948 |
Post Holdings, Inc.
4.63%, 4/15/2030 (g)
| | | 2,100,000 | | 1,841,553 |
| | | | | | 3,405,709 |
| GAS — 0.0% (c) | | | | | |
| AmeriGas Partners LP/AmeriGas Finance Corp.: | | | | | |
5.75%, 5/20/2027
| | | 640,000 | | 588,659 |
5.88%, 8/20/2026
| | | 1,354,000 | | 1,277,784 |
| | | | | | 1,866,443 |
| HEALTH CARE SERVICES — 0.1% | | | | | |
CHS/Community Health Systems, Inc.
5.63%, 3/15/2027 (g)
| | | 1,000,000 | | 884,480 |
| DaVita, Inc.: | | | | | |
3.75%, 2/15/2031 (g)
| | | 1,000,000 | | 801,940 |
4.63%, 6/1/2030 (g)
| | | 1,310,000 | | 1,124,884 |
Tenet Healthcare Corp.
6.88%, 11/15/2031
| | | 523,000 | | 522,011 |
| | | | | | 3,333,315 |
| HOME BUILDERS — 0.3% | | | | | |
| Beazer Homes USA, Inc.: | | | | | |
5.88%, 10/15/2027
| | | 710,000 | | 669,800 |
7.25%, 10/15/2029
| | | 1,450,000 | | 1,412,996 |
Century Communities, Inc.
3.88%, 8/15/2029 (g)
| | | 1,315,000 | | 1,140,605 |
Forestar Group, Inc.
3.85%, 5/15/2026 (g)
| | | 1,650,000 | | 1,516,861 |
Installed Building Products, Inc.
5.75%, 2/1/2028 (g)
| | | 550,000 | | 519,002 |
See accompanying notes to financial statements.
44
SPDR BLACKSTONE SENIOR LOAN ETF
SCHEDULE OF INVESTMENTS (continued)
June 30, 2023
| Security Description | | | Principal
Amount | | Value |
| KB Home: | | | | | |
4.00%, 6/15/2031
| | | $ 200,000 | | $ 172,826 |
7.25%, 7/15/2030
| | | 210,000 | | 213,872 |
LGI Homes, Inc.
4.00%, 7/15/2029 (g)
| | | 670,000 | | 559,993 |
| M/I Homes, Inc.: | | | | | |
3.95%, 2/15/2030
| | | 300,000 | | 258,261 |
4.95%, 2/1/2028
| | | 1,230,000 | | 1,146,581 |
Meritage Homes Corp.
3.88%, 4/15/2029 (g)
| | | 1,320,000 | | 1,173,322 |
| Taylor Morrison Communities, Inc.: | | | | | |
5.13%, 8/1/2030 (g)
| | | 1,700,000 | | 1,579,453 |
5.75%, 1/15/2028 (g)
| | | 600,000 | | 583,590 |
Tri Pointe Homes, Inc.
5.70%, 6/15/2028
| | | 1,940,000 | | 1,874,932 |
| | | | | | 12,822,094 |
| HOME FURNISHINGS — 0.1% | | | | | |
| Tempur Sealy International, Inc.: | | | | | |
3.88%, 10/15/2031 (g)
| | | 2,760,000 | | 2,254,147 |
4.00%, 4/15/2029 (g)
| | | 870,000 | | 753,394 |
| | | | | | 3,007,541 |
| INSURANCE — 0.0% (c) | | | | | |
MGIC Investment Corp.
5.25%, 8/15/2028
| | | 735,000 | | 692,245 |
NMI Holdings, Inc.
7.38%, 6/1/2025 (g)
| | | 890,000 | | 903,332 |
| | | | | | 1,595,577 |
| INTERNET — 0.1% | | | | | |
ANGI Group LLC
3.88%, 8/15/2028 (g)
| | | 1,001,000 | | 818,638 |
| Cogent Communications Group, Inc.: | | | | | |
3.50%, 5/1/2026 (g)
| | | 322,000 | | 299,045 |
7.00%, 6/15/2027 (g)
| | | 1,020,000 | | 986,962 |
Rakuten Group, Inc.
10.25%, 11/30/2024 (g)
| | | 1,295,000 | | 1,288,292 |
| | | | | | 3,392,937 |
| IRON/STEEL — 0.1% | | | | | |
ATI, Inc.
5.13%, 10/1/2031
| | | 2,670,000 | | 2,383,776 |
Mineral Resources Ltd.
8.00%, 11/1/2027 (g)
| | | 1,050,000 | | 1,056,615 |
| | | | | | 3,440,391 |
| IT SERVICES — 0.0% (c) | | | | | |
Seagate HDD Cayman
8.25%, 12/15/2029 (g)
| | | 775,000 | | 809,774 |
| LEISURE TIME — 0.2% | | | | | |
| Carnival Corp.: | | | | | |
5.75%, 3/1/2027 (g)
| | | 2,010,000 | | 1,849,039 |
7.63%, 3/1/2026 (g)
| | | 1,730,000 | | 1,694,120 |
| Security Description | | | Principal
Amount | | Value |
| Royal Caribbean Cruises Ltd.: | | | | | |
5.38%, 7/15/2027 (g)
| | | $ 405,000 | | $ 379,720 |
5.50%, 4/1/2028 (g)
| | | 1,810,000 | | 1,689,182 |
7.50%, 10/15/2027
| | | 1,510,000 | | 1,516,538 |
Vista Outdoor, Inc.
4.50%, 3/15/2029 (g)
| | | 980,000 | | 804,002 |
| | | | | | 7,932,601 |
| LODGING — 0.1% | | | | | |
| Hilton Domestic Operating Co., Inc.: | | | | | |
3.75%, 5/1/2029 (g)
| | | 590,000 | | 523,253 |
4.00%, 5/1/2031 (g)
| | | 500,000 | | 434,190 |
| Las Vegas Sands Corp.: | | | | | |
3.50%, 8/18/2026
| | | 1,000,000 | | 931,160 |
3.90%, 8/8/2029
| | | 1,069,000 | | 954,852 |
Marriott Ownership Resorts, Inc.
4.50%, 6/15/2029 (g)
| | | 510,000 | | 439,911 |
| | | | | | 3,283,366 |
| MACHINERY-DIVERSIFIED — 0.0% (c) | | | | | |
ATS Corp.
4.13%, 12/15/2028 (g)
| | | 508,000 | | 456,565 |
| MEDIA — 0.1% | | | | | |
CCO Holdings LLC/CCO Holdings Capital Corp.
5.13%, 5/1/2027 (g)
| | | 1,750,000 | | 1,627,447 |
News Corp.
5.13%, 2/15/2032 (g)
| | | 75,000 | | 68,671 |
Nexstar Media, Inc.
4.75%, 11/1/2028 (g)
| | | 410,000 | | 355,741 |
Townsquare Media, Inc.
6.88%, 2/1/2026 (g)
| | | 1,248,000 | | 1,197,518 |
Urban One, Inc.
7.38%, 2/1/2028 (g)
| | | 400,000 | | 350,152 |
| | | | | | 3,599,529 |
| MINING — 0.1% | | | | | |
| FMG Resources August 2006 Pty. Ltd.: | | | | | |
4.38%, 4/1/2031 (g)
| | | 2,195,000 | | 1,873,388 |
5.88%, 4/15/2030 (g)
| | | 500,000 | | 476,510 |
6.13%, 4/15/2032 (g)
| | | 140,000 | | 133,073 |
New Gold, Inc.
7.50%, 7/15/2027 (g)
| | | 550,000 | | 514,448 |
Taseko Mines Ltd.
7.00%, 2/15/2026 (g)
| | | 230,000 | | 209,942 |
| | | | | | 3,207,361 |
| OFFICE & BUSINESS EQUIPMENT — 0.1% | | | | | |
Pitney Bowes, Inc.
7.25%, 3/15/2029 (g)
| | | 550,000 | | 363,462 |
See accompanying notes to financial statements.
45
SPDR BLACKSTONE SENIOR LOAN ETF
SCHEDULE OF INVESTMENTS (continued)
June 30, 2023
| Security Description | | | Principal
Amount | | Value |
Xerox Holdings Corp.
5.50%, 8/15/2028 (g)
| | | $ 3,010,000 | | $ 2,560,366 |
| | | | | | 2,923,828 |
| OIL & GAS — 0.2% | | | | | |
CNX Resources Corp.
6.00%, 1/15/2029 (g)
| | | 1,547,000 | | 1,436,188 |
CVR Energy, Inc.
5.75%, 2/15/2028 (g)
| | | 311,000 | | 276,087 |
MEG Energy Corp.
5.88%, 2/1/2029 (g)
| | | 500,000 | | 469,945 |
| Northern Oil & Gas, Inc.: | | | | | |
8.13%, 3/1/2028 (g)
| | | 590,000 | | 578,253 |
8.75%, 6/15/2031 (g)
| | | 361,000 | | 354,553 |
| Parkland Corp.: | | | | | |
4.50%, 10/1/2029 (g)
| | | 2,029,000 | | 1,762,816 |
4.63%, 5/1/2030 (g)
| | | 895,000 | | 776,386 |
Sunoco LP/Sunoco Finance Corp.
4.50%, 5/15/2029
| | | 2,980,000 | | 2,645,048 |
Transocean, Inc.
8.75%, 2/15/2030 (g)
| | | 2,590,000 | | 2,629,782 |
| | | | | | 10,929,058 |
| OIL & GAS SERVICES — 0.1% | | | | | |
| Archrock Partners LP/Archrock Partners Finance Corp.: | | | | | |
6.25%, 4/1/2028 (g)
| | | 300,000 | | 281,838 |
6.88%, 4/1/2027 (g)
| | | 250,000 | | 240,852 |
Enerflex Ltd.
9.00%, 10/15/2027 (g)
| | | 813,000 | | 792,244 |
Oceaneering International, Inc.
6.00%, 2/1/2028
| | | 1,580,000 | | 1,500,542 |
| | | | | | 2,815,476 |
| PACKAGING & CONTAINERS — 0.0% (c) | | | | | |
Cascades, Inc./Cascades USA, Inc.
5.38%, 1/15/2028 (g)
| | | 700,000 | | 659,428 |
OI European Group BV
4.75%, 2/15/2030 (g)
| | | 1,900,000 | | 1,720,108 |
| | | | | | 2,379,536 |
| PIPELINES — 0.2% | | | | | |
Antero Midstream Partners LP/Antero Midstream Finance Corp.
5.38%, 6/15/2029 (g)
| | | 1,100,000 | | 1,021,482 |
Crestwood Midstream Partners LP/Crestwood Midstream Finance Corp.
6.00%, 2/1/2029 (g)
| | | 1,100,000 | | 1,026,872 |
| Security Description | | | Principal
Amount | | Value |
Delek Logistics Partners LP/Delek Logistics Finance Corp.
7.13%, 6/1/2028 (g)
| | | $ 1,510,000 | | $ 1,405,780 |
EQM Midstream Partners LP
6.50%, 7/15/2048
| | | 900,000 | | 814,626 |
Global Partners LP/GLP Finance Corp.
6.88%, 1/15/2029
| | | 950,000 | | 883,509 |
| Hess Midstream Operations LP: | | | | | |
4.25%, 2/15/2030 (g)
| | | 1,570,000 | | 1,370,233 |
5.13%, 6/15/2028 (g)
| | | 1,300,000 | | 1,223,040 |
5.50%, 10/15/2030 (g)
| | | 150,000 | | 139,836 |
NuStar Logistics LP
6.38%, 10/1/2030
| | | 1,360,000 | | 1,305,233 |
| | | | | | 9,190,611 |
| REAL ESTATE — 0.1% | | | | | |
| Howard Hughes Corp.: | | | | | |
4.13%, 2/1/2029 (g)
| | | 2,600,000 | | 2,156,180 |
4.38%, 2/1/2031 (g)
| | | 74,000 | | 59,176 |
5.38%, 8/1/2028 (g)
| | | 1,000,000 | | 894,450 |
| Kennedy-Wilson, Inc.: | | | | | |
4.75%, 3/1/2029
| | | 750,000 | | 592,725 |
4.75%, 2/1/2030
| | | 100,000 | | 75,743 |
5.00%, 3/1/2031
| | | 250,000 | | 186,925 |
Realogy Group LLC/Realogy Co.-Issuer Corp.
5.75%, 1/15/2029 (g)
| | | 470,000 | | 352,839 |
| | | | | | 4,318,038 |
| REAL ESTATE INVESTMENT TRUSTS — 0.2% | | | | | |
Apollo Commercial Real Estate Finance, Inc.
4.63%, 6/15/2029 (g)
| | | 300,000 | | 233,706 |
Iron Mountain Information Management Services, Inc.
5.00%, 7/15/2032 (g)
| | | 1,820,000 | | 1,575,028 |
| Iron Mountain, Inc.: | | | | | |
4.88%, 9/15/2029 (g)
| | | 500,000 | | 447,635 |
7.00%, 2/15/2029 (g)
| | | 555,000 | | 556,149 |
Rithm Capital Corp.
6.25%, 10/15/2025 (g)
| | | 1,275,000 | | 1,195,657 |
| Service Properties Trust: | | | | | |
4.75%, 10/1/2026
| | | 100,000 | | 86,807 |
4.95%, 2/15/2027
| | | 2,180,000 | | 1,864,336 |
4.95%, 10/1/2029
| | | 1,070,000 | | 830,234 |
| Starwood Property Trust, Inc.: | | | | | |
3.63%, 7/15/2026 (g)
| | | 90,000 | | 77,800 |
4.38%, 1/15/2027 (g)
| | | 3,890,000 | | 3,350,457 |
| | | | | | 10,217,809 |
See accompanying notes to financial statements.
46
SPDR BLACKSTONE SENIOR LOAN ETF
SCHEDULE OF INVESTMENTS (continued)
June 30, 2023
| Security Description | | | Principal
Amount | | Value |
| RETAIL — 0.3% | | | | | |
| 1011778 BC ULC/New Red Finance, Inc.: | | | | | |
4.00%, 10/15/2030 (g)
| | | $ 2,060,000 | | $ 1,772,795 |
4.38%, 1/15/2028 (g)
| | | 420,000 | | 388,084 |
Abercrombie & Fitch Management Co.
8.75%, 7/15/2025 (g)
| | | 670,000 | | 682,355 |
| Asbury Automotive Group, Inc.: | | | | | |
4.63%, 11/15/2029 (g)
| | | 500,000 | | 445,040 |
4.75%, 3/1/2030
| | | 1,700,000 | | 1,509,821 |
5.00%, 2/15/2032 (g)
| | | 650,000 | | 567,912 |
Bath & Body Works, Inc.
6.75%, 7/1/2036
| | | 600,000 | | 540,702 |
Bloomin' Brands, Inc./OSI Restaurant Partners LLC
5.13%, 4/15/2029 (g)
| | | 670,000 | | 599,811 |
FirstCash, Inc.
5.63%, 1/1/2030 (g)
| | | 2,310,000 | | 2,086,923 |
Group 1 Automotive, Inc.
4.00%, 8/15/2028 (g)
| | | 480,000 | | 422,035 |
| Murphy Oil USA, Inc.: | | | | | |
3.75%, 2/15/2031 (g)
| | | 308,000 | | 258,809 |
4.75%, 9/15/2029
| | | 540,000 | | 496,346 |
Nordstrom, Inc.
5.00%, 1/15/2044
| | | 299,000 | | 207,826 |
Patrick Industries, Inc.
4.75%, 5/1/2029 (g)
| | | 1,560,000 | | 1,339,479 |
Suburban Propane Partners LP/Suburban Energy Finance Corp.
5.00%, 6/1/2031 (g)
| | | 790,000 | | 664,722 |
Superior Plus LP/Superior General Partner, Inc.
4.50%, 3/15/2029 (g)
| | | 1,330,000 | | 1,167,567 |
Yum! Brands, Inc.
4.75%, 1/15/2030 (g)
| | | 80,000 | | 75,104 |
| | | | | | 13,225,331 |
| SOFTWARE — 0.1% | | | | | |
| Fair Isaac Corp.: | | | | | |
4.00%, 6/15/2028 (g)
| | | 850,000 | | 780,257 |
5.25%, 5/15/2026 (g)
| | | 1,030,000 | | 1,007,711 |
MicroStrategy, Inc.
6.13%, 6/15/2028 (g)
| | | 1,100,000 | | 985,666 |
Open Text Corp.
3.88%, 12/1/2029 (g)
| | | 2,400,000 | | 2,006,592 |
| | | | | | 4,780,226 |
| Security Description | | | Principal
Amount | | Value |
| TELECOMMUNICATIONS — 0.1% | | | | | |
Frontier Communications Holdings LLC
5.00%, 5/1/2028 (g)
| | | $ 580,000 | | $ 500,401 |
Hughes Satellite Systems Corp.
6.63%, 8/1/2026
| | | 2,150,000 | | 2,017,130 |
Viasat, Inc.
6.50%, 7/15/2028 (g)
| | | 1,495,000 | | 1,265,144 |
| | | | | | 3,782,675 |
| TRANSPORTATION — 0.0% (c) | | | | | |
Danaos Corp.
8.50%, 3/1/2028 (g)
| | | 610,000 | | 611,305 |
TOTAL CORPORATE BONDS & NOTES
(Cost $175,401,193)
| | | | | 178,246,186 |
| | | Shares | |
| REPURCHASE AGREEMENTS — 2.1% | | | |
Barclays Capital, Inc., dated 06/29/2023 (collateralized by U.S. Treasury Notes 2.875% due 11/15/2046, valued at $121,951,000); expected proceeds $104,996,444, 5.11%, 06/15/2024
(Cost $100,000,000)
| | 100,000,000 | 100,000,000 |
| SHORT-TERM INVESTMENT — 6.5% | | | |
State Street Institutional U.S. Government Money Market Fund, Class G Shares 5.07% (h),(i)
(Cost $302,552,338)
| | 302,552,338 | 302,552,338 |
TOTAL INVESTMENTS — 103.5%
(Cost $4,870,817,836)
| | | 4,833,873,633 |
LIABILITIES IN EXCESS OF OTHER ASSETS — (3.5)%
| | | (162,017,971) |
NET ASSETS — 100.0%
| | | $ 4,671,855,662 |
See accompanying notes to financial statements.
47
SPDR BLACKSTONE SENIOR LOAN ETF
SCHEDULE OF INVESTMENTS (continued)
June 30, 2023
At June 30, 2023, the Fund had unfunded loan commitments of $10,224,101, which could be extended at the option of the borrowers, pursuant to the following loan agreements:
| Borrower | | Unfunded Loan
Commitment ($) | | Value ($) | | Unrealized
Appreciation/(Depreciation) ($) |
| VT Topco, Inc. | | 3,762 | | 3,719 | | (43) |
| Athenahealth Group, Inc. | | 8,464,412 | | 8,168,157 | | (296,255) |
| ABG Intermediate Holdings 2 LLC | | 1,755,927 | | 1,754,391 | | (1,536) |
| | | $10,224,101 | | $9,926,267 | | $(297,834) |
| (a) | Variable Rate Security - Interest rate shown is rate in effect at June 30, 2023. For securities based on a published reference rate and spread, the reference rate and spread are indicated in the description above. |
| (b) | Position is unsettled. Contract rate was not determined at June 30, 2023 and does not take effect until settlement date. Maturity date is not finalized until settlement date. |
| (c) | Amount is less than 0.05% of net assets. |
| (d) | Security is currently in default and/or issuer is in bankruptcy. |
| (e) | Fair valued as determined in good faith by the Trust's Oversight Committee in accordance with policy and procedures approved by the Board of Trustees. Security value is determined based on Level 3 inputs. As of June 30, 2023, total aggregate fair value of this security is $2,476,788, representing less than 0.05% of the Fund's net assets. |
| (f) | Non-income producing security. |
| (g) | Securities purchased pursuant to Rule 144A of the Securities Act of 1933, as amended. These securities, which represent 2.8% of net assets as of June 30, 2023, are considered liquid and may be resold in transactions exempt from registration, normally to qualified institutional buyers. |
| (h) | The Fund invested in certain money market funds managed by SSGA Funds Management, Inc. Amounts related to these transactions during the period ended June 30, 2023 are shown in the Affiliate Table below. |
| (i) | The rate shown is the annualized seven-day yield at June 30, 2023. |
| SOFR | Secured Overnight Financing Rate |
| LIBOR | London Interbank Offered Rate |
| GO | Government Obligation |
| CDI | CREST Depository Interest |
| CVR | Contingent Value Rights |
The following table summarizes the value of the Fund's investments according to the fair value hierarchy as of June 30, 2023.
| Description | | Level 1 –
Quoted Prices | | Level 2 –
Other Significant
Observable Inputs | | Level 3 –
Significant
Unobservable Inputs | | Total |
| ASSETS: | | | | | | | | |
| INVESTMENTS: | | | | | | | | |
Corporate Bonds & Notes
| | $ — | | $ 178,246,186 | | $ — | | $ 178,246,186 |
Common Stocks
| | 2,376,633 | | — | | 2,476,788 | | 4,853,421 |
Repurchase Agreements
| | — | | 100,000,000 | | — | | 100,000,000 |
Senior Floating Rate Loans
| | — | | 4,248,221,688 | | — | | 4,248,221,688 |
Short-Term Investment
| | 302,552,338 | | — | | — | | 302,552,338 |
TOTAL INVESTMENTS
| | $304,928,971 | | $4,526,467,874 | | $2,476,788 | | $4,833,873,633 |
| OTHER FINANCIAL INSTRUMENTS: | | | | | | | | |
Unfunded Loans - Unrealized Depreciation
| | $ — | | $ (297,834) | | $ — | | $ (297,834) |
TOTAL OTHER FINANCIAL INSTRUMENTS:
| | $ — | | $ (297,834) | | $ — | | $ (297,834) |
See accompanying notes to financial statements.
48
SPDR BLACKSTONE SENIOR LOAN ETF
SCHEDULE OF INVESTMENTS (continued)
June 30, 2023
Affiliate Table
| | Number of
Shares Held
at
6/30/22 | | Value at
6/30/22 | | Cost of
Purchases | | Proceeds
from
Shares Sold | | Realized
Gain (Loss) | | Change in
Unrealized
Appreciation/
Depreciation | | Number of
Shares Held
at
6/30/23 | | Value at
6/30/23 | | Dividend
Income |
SPDR Bloomberg High Yield Bond ETF
| — | | $ — | | $ 25,027,937 | | $ 24,446,819 | | $(581,118) | | $— | | — | | $ — | | $ 129,475 |
State Street Institutional U.S. Government Money Market Fund, Class G Shares
| 910,350,809 | | 910,350,809 | | 4,700,474,930 | | 5,308,273,401 | | — | | — | | 302,552,338 | | 302,552,338 | | 12,307,149 |
Total
| | | $910,350,809 | | $4,725,502,867 | | $5,332,720,220 | | $(581,118) | | $— | | | | $302,552,338 | | $12,436,624 |
See accompanying notes to financial statements.
49
SSGA ACTIVE TRUST
STATEMENTS OF ASSETS AND LIABILITIES
June 30, 2023
| | SPDR Blackstone High Income ETF | | SPDR Blackstone Senior Loan ETF |
| ASSETS | | | |
Investments in unaffiliated issuers, at value
| $122,273,533 | | $ 4,431,321,295 |
Investments in affiliated issuers, at value
| 6,605,513 | | 302,552,338 |
Repurchase agreements, at value and amortized cost
| — | | 100,000,000 |
Total Investments
| 128,879,046 | | 4,833,873,633 |
Cash
| 344,284 | | 16,909,728 |
Receivable for investments sold
| 2,906,050 | | 209,212,906 |
Receivable for fund shares sold
| — | | 158,866,011 |
Dividends receivable — affiliated issuers
| 29,691 | | 1,203,821 |
Interest receivable — unaffiliated issuers
| 1,553,801 | | 38,913,482 |
Receivable for foreign taxes recoverable
| 3,827 | | 12,589 |
Other receivable
| 3,786 | | — |
TOTAL ASSETS
| 133,720,485 | | 5,258,992,170 |
| LIABILITIES | | | |
Payable for investments purchased
| 7,757,215 | | 584,110,714 |
Unrealized depreciation on unfunded loan commitments
| 2,470 | | 297,834 |
Advisory fee payable
| 72,842 | | 2,725,056 |
Trustees’ fees and expenses payable
| 49 | | 2,904 |
TOTAL LIABILITIES
| 7,832,576 | | 587,136,508 |
NET ASSETS
| $125,887,909 | | $ 4,671,855,662 |
| NET ASSETS CONSIST OF: | | | |
Paid-in Capital
| $135,859,210 | | $ 5,781,018,758 |
Total distributable earnings (loss)
| (9,971,301) | | (1,109,163,096) |
NET ASSETS
| $125,887,909 | | $ 4,671,855,662 |
| NET ASSET VALUE PER SHARE | | | |
Net asset value per share
| $ 27.67 | | $ 41.84 |
Shares outstanding (unlimited amount authorized, $0.01 par value)
| 4,550,000 | | 111,650,000 |
| COST OF INVESTMENTS: | | | |
Investments in unaffiliated issuers
| $122,231,664 | | $ 4,468,265,498 |
Investments in affiliated issuers
| 6,605,513 | | 302,552,338 |
Repurchase agreements
| — | | 100,000,000 |
Total cost of investments
| $128,837,177 | | $ 4,870,817,836 |
See accompanying notes to financial statements.
50
SSGA ACTIVE TRUST
STATEMENTS OF OPERATIONS
For the Year Ended June 30, 2023
| | SPDR Blackstone High Income ETF | | SPDR Blackstone Senior Loan ETF |
| INVESTMENT INCOME | | | |
Interest income — unaffiliated issuers
| $ 9,169,963 | | $ 480,799,161 |
Dividend income — affiliated issuers
| 229,391 | | 12,436,624 |
TOTAL INVESTMENT INCOME (LOSS)
| 9,399,354 | | 493,235,785 |
| EXPENSES | | | |
Advisory fee
| 823,714 | | 43,690,236 |
Trustees’ fees and expenses
| 1,409 | | 81,386 |
Miscellaneous expenses
| 6,024 | | 268,575 |
TOTAL EXPENSES
| 831,147 | | 44,040,197 |
NET INVESTMENT INCOME (LOSS)
| $ 8,568,207 | | $ 449,195,588 |
| REALIZED AND UNREALIZED GAIN (LOSS) | | | |
| Net realized gain (loss) on: | | | |
Investments — unaffiliated issuers
| (8,148,238) | | (617,557,774) |
Investments — affiliated issuers
| (3,290) | | (581,118) |
In-kind redemptions — unaffiliated issuers
| 41,335 | | — |
Net realized gain (loss)
| (8,110,193) | | (618,138,892) |
| Net change in unrealized appreciation/depreciation on: | | | |
Investments — unaffiliated issuers
| 9,380,791 | | 563,240,825 |
Unfunded loan commitments
| 50 | | 1,040,163 |
Net change in unrealized appreciation/depreciation
| 9,380,841 | | 564,280,988 |
NET REALIZED AND UNREALIZED GAIN (LOSS)
| 1,270,648 | | (53,857,904) |
NET INCREASE (DECREASE) IN NET ASSETS FROM OPERATIONS
| $ 9,838,855 | | $ 395,337,684 |
See accompanying notes to financial statements.
51
SSGA ACTIVE TRUST
STATEMENTS OF CHANGES IN NET ASSETS
| | SPDR Blackstone High Income ETF | | SPDR Blackstone Senior Loan ETF |
| | Year Ended
6/30/23 | | For the Period
2/17/22*-
6/30/22 | | Year Ended
6/30/23 | | Year Ended
6/30/22 |
| INCREASE (DECREASE) IN NET ASSETS FROM OPERATIONS: | | | | | | | |
Net investment income (loss)
| $ 8,568,207 | | $ 2,126,689 | | $ 449,195,588 | | $ 375,689,558 |
Net realized gain (loss)
| (8,110,193) | | (2,925,500) | | (618,138,892) | | (250,379,712) |
Net change in unrealized appreciation/depreciation
| 9,380,841 | | (9,341,442) | | 564,280,988 | | (698,437,560) |
Net increase (decrease) in net assets resulting from operations
| 9,838,855 | | (10,140,253) | | 395,337,684 | | (573,127,714) |
Net equalization credits and charges
| 40,471 | | 294 | | (1,905,227) | | 1,321,939 |
Distributions to shareholders
| (8,087,000) | | (1,548,000) | | (419,871,500) | | (384,792,728) |
Return of capital
| — | | — | | — | | (2,807,272) |
Total Distributions to shareholders
| (8,087,000) | | (1,548,000) | | (419,871,500) | | (387,600,000) |
| FROM BENEFICIAL INTEREST TRANSACTIONS: | | | | | | | |
Proceeds from shares sold
| 16,447,735 | | 128,999,422 | | 1,862,640,864 | | 6,597,224,116 |
Cost of shares redeemed
| (9,655,756) | | — | | (5,642,644,491) | | (3,482,041,836) |
Net income equalization
| (40,471) | | (294) | | 1,905,227 | | (1,321,939) |
Other Capital
| 32,498 | | 408 | | 16,111,574 | | 11,592,704 |
Net increase (decrease) in net assets from beneficial interest transactions
| 6,784,006 | | 128,999,536 | | (3,761,986,826) | | 3,125,453,045 |
Contribution from Affiliate (Note 4)
| — | | — | | 38,051 | | — |
Net increase (decrease) in net assets during the period
| 8,576,332 | | 117,311,577 | | (3,788,387,818) | | 2,166,047,270 |
Net assets at beginning of period
| 117,311,577 | | — | | 8,460,243,480 | | 6,294,196,210 |
NET ASSETS AT END OF PERIOD
| $125,887,909 | | $ 117,311,577 | | $ 4,671,855,662 | | $ 8,460,243,480 |
| SHARES OF BENEFICIAL INTEREST: | | | | | | | |
Shares sold
| 600,000 | | 4,300,000 | | 44,500,000 | | 145,850,000 |
Shares redeemed
| (350,000) | | — | | (135,100,000) | | (79,550,000) |
Net increase (decrease) from share transactions
| 250,000 | | 4,300,000 | | (90,600,000) | | 66,300,000 |
| | |
| * | Commencement of operations. |
See accompanying notes to financial statements.
52
SSGA ACTIVE TRUST
FINANCIAL HIGHLIGHTS
Selected data for a share outstanding throughout each period
| | SPDR Blackstone High Income ETF |
| | Year
Ended
6/30/23 | | For the
Period
02/17/22*-
6/30/22 |
Net asset value, beginning of period
| $ 27.28 | | $ 30.00 |
| Income (loss) from investment operations: | | | |
Net investment income (loss) (a)
| 2.00 | | 0.50 |
Net realized and unrealized gain (loss) (b)
| 0.26 | | (2.86) |
Total from investment operations
| 2.26 | | (2.36) |
Net equalization credits and charges (a)
| 0.01 | | 0.00(c) |
Other capital (a)
| 0.01 | | 0.00(c) |
| Distributions to shareholders from: | | | |
Net investment income
| (1.89) | | (0.36) |
Net asset value, end of period
| $ 27.67 | | $ 27.28 |
Total return (d)
| 8.48% | | (7.93)% |
| Ratios and Supplemental Data: | | | |
Net assets, end of period (in 000s)
| $125,888 | | $117,312 |
| Ratios to average net assets: | | | |
Total expenses
| 0.70% | | 0.70%(e) |
Net investment income (loss)
| 7.26% | | 4.63%(e) |
Portfolio turnover rate
| 133% | | 55%(f) |
| * | Commencement of operations. |
| (a) | Per share numbers have been calculated using average shares outstanding, which more appropriately presents the per share data for the year. |
| (b) | Amounts shown in this caption for a share outstanding may not accord with the change in aggregate gains and losses in securities for the fiscal period because of the timing of sales and repurchases of Fund shares in relation to fluctuating market values for the Fund. |
| (c) | Amount is less than $0.005 per share. |
| (d) | Total return is calculated assuming a purchase of shares at net asset value on the first day and a sale at net asset value on the last day of each period reported. Distributions are assumed, for the purpose of this calculation, to be reinvested at net asset value per share on the respective payment dates of each distribution. Total returns for periods of less than one year are not annualized. Broker commission charges are not included in this calculation. |
| (e) | Annualized. |
| (f) | Not annualized. |
See accompanying notes to financial statements.
53
SSGA ACTIVE TRUST
FINANCIAL HIGHLIGHTS (continued)
Selected data for a share outstanding throughout each period
| | SPDR Blackstone Senior Loan ETF |
| | Year
Ended
6/30/23 | | Year
Ended
6/30/22 | | Year
Ended
6/30/21 | | Year
Ended
6/30/20(a) | | Year
Ended
6/30/19(a) |
Net asset value, beginning of period
| $ 41.83 | | $ 46.30 | | $ 43.36 | | $ 46.25 | | $ 47.04 |
| Income (loss) from investment operations: | | | | | | | | | |
Net investment income (loss) (b)
| 3.01 | | 1.95 | | 1.98 | | 2.34 | | 2.48 |
Net realized and unrealized gain (loss) (c)
| (0.27) | | (4.44) | | 3.02 | | (3.06) | | (0.86) |
Total from investment operations
| 2.74 | | (2.49) | | 5.00 | | (0.72) | | 1.62 |
Net equalization credits and charges (b)
| (0.01) | | 0.01 | | 0.06 | | (0.04) | | (0.03) |
Contribution from Affiliate (Note 4)
| 0.00(d) | | — | | 0.00(d) | | 0.01 | | — |
Other capital (b)
| 0.11 | | 0.06 | | 0.02 | | 0.21 | | 0.09 |
| Distributions to shareholders from: | | | | | | | | | |
Net investment income
| (2.83) | | (2.04) | | (2.14) | | (2.35) | | (2.47) |
Return of Capital
| — | | (0.01) | | — | | — | | — |
Total distributions
| (2.83) | | (2.05) | | — | | — | | — |
Net asset value, end of period
| $ 41.84 | | $ 41.83 | | $ 46.30 | | $ 43.36 | | $ 46.25 |
Total return (e)
| 6.95%(f) | | (5.46)% | | 11.97%(f) | | (1.23)%(f) | | 3.68% |
| Ratios and Supplemental Data: | | | | | | | | | |
Net assets, end of period (in 000s)
| $4,671,856 | | $8,460,243 | | $6,294,196 | | $1,433,094 | | $2,222,400 |
| Ratios to average net assets: | | | | | | | | | |
Total expenses
| 0.71% | | 0.70% | | 0.70% | | 0.70% | | 0.70% |
Net investment income (loss)
| 7.19% | | 4.33% | | 4.31% | | 5.17% | | 5.33% |
Portfolio turnover rate
| 125% | | 140% | | 176% | | 195%(g) | | 124%(g) |
| (a) | The per share amounts and percentages include the Fund’s proportionate share of income and expenses of the Portfolio prior to discontinuance of the master feeder structure. |
| (b) | Per share numbers have been calculated using average shares outstanding, which more appropriately presents the per share data for the year. |
| (c) | Amounts shown in this caption for a share outstanding may not accord with the change in aggregate gains and losses in securities for the fiscal period because of the timing of sales and repurchases of Fund shares in relation to fluctuating market values for the Fund. |
| (d) | Amount is less than $0.005 per share. |
| (e) | Total return is calculated assuming a purchase of shares at net asset value on the first day and a sale at net asset value on the last day of each period reported. Distributions are assumed, for the purpose of this calculation, to be reinvested at net asset value per share on the respective payment dates of each distribution. Total returns for periods of less than one year are not annualized. Broker commission charges are not included in this calculation. |
| (f) | If an affiliate had not made a contribution during the years ended ended June 30, 2023, June 30, 2021 and June 30, 2020, the total return would have remained 6.95%, 11.97% and (1.23)%, respectively. |
| (g) | Portfolio turnover rate is from the the affiliated Portfolio prior to the discontinuance of the master feeder structure. |
See accompanying notes to financial statements.
54
SSGA ACTIVE TRUST
NOTES TO FINANCIAL STATEMENTS
June 30, 2023
1. Organization
SSGA Active Trust (the “Trust”), a Massachusetts business trust registered under the Investment Company Act of 1940, as amended (“1940 Act”), is an open-end management investment company.
As of June 30, 2023, the Trust consists of fourteen (14) series, each of which represents a separate series of beneficial interest in the Trust. The Declaration of Trust permits the Board of Trustees of the Trust (the “Board”) to authorize the issuance of an unlimited number of shares of beneficial interest with no par value. The financial statements herein relate to the following series (each, a “Fund” and collectively, the “Funds”):
| SPDR Blackstone High Income ETF |
| SPDR Blackstone Senior Loan ETF |
SPDR Blackstone High Income ETF was formed on February 16, 2022 and commenced operations on February 17, 2022.
Each Fund is classified as a diversified investment company under the 1940 Act.
Under the Trust’s organizational documents, its officers and Trustees are indemnified against certain liabilities arising out of the performance of their duties to the Trust. Additionally, in the normal course of business, the Trust enters into contracts with service providers that contain general indemnification clauses. The Trust’s maximum exposure under these arrangements is unknown as this would involve future claims that may be made against the Trust that have not yet occurred.
2. Summary of Significant Accounting Policies
The following is a summary of significant accounting policies followed by the Trust in the preparation of its financial statements:
The preparation of financial statements in accordance with U.S. generally accepted accounting principles (“U.S. GAAP”) requires management to make estimates and assumptions that affect the reported amounts and disclosures in the financial statements. Actual results could differ from those estimates. Each Fund is an investment company under U.S. GAAP and follows the accounting and reporting guidance applicable to investment companies.
Security Valuation
Each Fund's investments are valued at fair value each day that the New York Stock Exchange (“NYSE”) is open and, for financial reporting purposes, as of the report date should the reporting period end on a day that the NYSE is not open. Fair value is generally defined as the price a fund would receive to sell an asset or pay to transfer a liability in an orderly transaction between market participants at the measurement date. By its nature, a fair value price is a good faith estimate of the valuation in a current sale and may not reflect an actual market price. The investments of each Fund are valued pursuant to the policy and procedures developed by the Oversight Committee (the “Committee”) and approved by the Board. The Committee provides oversight of the valuation of investments for the Funds. The Board has responsibility for overseeing the determination of the fair value of investments.
Valuation techniques used to value each Fund’s investments by major category are as follows:
• Investments in registered investment companies (including money market funds) or other unitized pooled investment vehicles that are not traded on an exchange are valued at that day’s published net asset value (“NAV”) per share or unit.
• Repurchase agreements are valued at the repurchase price as of valuation date.
• Debt obligations (including short-term investments) are valued using quotations from independent pricing services or brokers or are generally valued at the last reported evaluated prices.
• Senior loans or other loans are valued at evaluated bid prices supplied by an independent pricing service, if available. Senior loans and other loans for which the Committee determines that there are no reliable valuations available from pricing services or brokers will be initially valued at cost and adjusted for amortization of principal until remeasurement is warranted due to a credit or economic event or other factors affecting the loan.
SSGA ACTIVE TRUST
NOTES TO FINANCIAL STATEMENTS (continued)
June 30, 2023
In the event prices or quotations are not readily available or that the application of these valuation methods results in a price for an investment that is deemed to be not representative of the fair value of such investment, fair value will be determined in good faith by the Committee, in accordance with the valuation policy and procedures approved by the Board.
Fair value pricing could result in a difference between the prices used to calculate the Fund's NAV and the prices used by the Fund's underlying benchmark.
Various inputs are used in determining the value of the Funds' investments.
The Funds value their assets and liabilities at fair value using a fair value hierarchy consisting of three broad levels that prioritize the inputs to valuation techniques giving the highest priority to readily available unadjusted quoted prices in active markets for identical assets or liabilities (Level 1 measurements) and the lowest priority to unobservable inputs (Level 3 measurements) when market prices are not readily available or reliable. The categorization of a value determined for an investment within the hierarchy is based upon the pricing transparency of the investment and is not necessarily an indication of the risk associated with investing in it.
The three levels of the fair value hierarchy are as follows:
• Level 1 – Unadjusted quoted prices in active markets for an identical asset or liability;
• Level 2 – Inputs other than quoted prices included within Level 1 that are observable for the asset or liability either directly or indirectly, including quoted prices for similar assets or liabilities in active markets, quoted prices for identical or similar assets or liabilities in markets that are not considered to be active, inputs other than quoted prices that are observable for the asset or liability (such as exchange rates, financing terms, interest rates, yield curves, volatilities, prepayment speeds, loss severities, credit risks and default rates) or other market-corroborated inputs; and
• Level 3 – Unobservable inputs for the asset or liability, including the Committee’s assumptions used in determining the fair value of investments.
The value of each Fund’s investments, according to the fair value hierarchy as of June 30, 2023, is disclosed in each Fund’s respective Schedule of Investments.
Investment Transactions and Income Recognition
Investment transactions are accounted for on the trade date for financial reporting purposes. Realized gains and losses from the sale and disposition of investments are determined using the identified cost method.
Dividend income and capital gain distributions, if any, are recognized on the ex-dividend date, net of any foreign taxes withheld at source, if any. Interest income is recorded on an accrual basis. All premiums and discounts are amortized/accreted for financial reporting purposes. Paydown gains and losses are recorded as an adjustment to interest income. Non-cash dividends, if any, received in the form of stock are recorded as dividend income at fair value.
Expenses
Certain expenses, which are directly identifiable to a specific Fund, are applied to that Fund within the Trust. Other expenses which cannot be attributed to a specific Fund are allocated in such a manner as deemed equitable, taking into consideration the nature and type of expense and the relative net assets of the Funds within the Trust. Class specific expenses are borne by each class.
Equalization
The Funds follow the accounting practice known as “Equalization” by which a portion of the proceeds from sales and costs of reacquiring Fund shares, equivalent on a per share basis to the amount of distributable net investment income on the date of the transaction, is credited or charged to undistributed net investment income. As a result, undistributed net investment income per share is unaffected by sales or reacquisition of Fund shares. Amounts related to Equalization can be found on the Statements of Changes in Net Assets.
SSGA ACTIVE TRUST
NOTES TO FINANCIAL STATEMENTS (continued)
June 30, 2023
Distributions
Distributions from net investment income, if any, are declared and paid monthly. Net realized capital gains, if any, are distributed annually. Dividends may be declared and paid more frequently or at any other times to improve Index tracking or to comply with the distribution requirements of the Internal Revenue Code of 1986, as amended (the “Internal Revenue Code”). The amount and character of income and capital gains to be distributed are determined in accordance with applicable tax regulations which may differ from net investment income and realized gains recognized for U.S. GAAP purposes.
3. Securities and Other Investments
Loan Agreements
The Funds invest in Senior Loans. Senior Loans consist generally of obligations of companies and other entities (collectively, “borrowers”) incurred for the purpose of reorganizing the assets and liabilities of a borrower; acquiring another company; taking over control of a company (leveraged buyout); temporary refinancing; or financing internal growth or other general business purposes. Senior Loans are often obligations of borrowers who have incurred a significant percentage of debt compared to their total assets and thus are highly leveraged. Funds do not treat the banks originating or acting as agents for the lenders, or granting or acting as intermediary in participation interests, in loans held by the Funds as the issuers of such loans.
Repurchase Agreements
The Funds may enter into repurchase agreements under the terms of a Master Repurchase Agreement. A repurchase agreement customarily obligates the seller at the time it sells securities to a Fund to repurchase the securities at a mutually agreed upon price and time. During the term of a repurchase agreement, the value of the underlying securities held as collateral on behalf of a Fund including accrued interest, is required to exceed the value of the repurchase agreement, including accrued interest.
The applicable Fund monitors, on a daily basis, the value of the collateral to ensure it is at least equal to the Fund’s principal amount of the repurchase agreement (including accrued interest). The underlying securities are ordinarily United States Government or Government Agency securities, but may consist of other securities. The use of repurchase agreements involves certain risks including counterparty risks. In the event of a default by the counterparty, realization of the collateral proceeds could be delayed, during which the value of the collateral may decline.
As of June 30, 2023, the SPDR Blackstone Senior Loan ETF had invested in repurchase agreements with the gross values (principal) of $100,000,000 and associated collateral equal to $121,951,000.
4. Fees and Transactions with Affiliates
Advisory Fee
The Trust, on behalf of each Fund, has entered into an Investment Advisory Agreement with SSGA Funds Management, Inc. (the “Adviser” or “SSGA FM”). For its advisory services to the Fund, facilities furnished and expenses borne by the Adviser, the Fund pays the Adviser a fee (“Management/Advisory fee”) accrued daily and paid monthly, based on a percentage of the Fund’s average daily net assets as shown in the following table:
| | Annual Rate |
SPDR Blackstone High Income ETF
| 0.70% |
SPDR Blackstone Senior Loan ETF
| 0.70 |
With respect to each Fund, the Management fee is reduced by the acquired fund fees and expenses attributable to the Fund's investments in other investment companies (except acquired fund fees and expenses associated with holdings of acquired funds for cash management purposes).
From time to time, the Adviser may waive all or a portion of it's Management fee. The Adviser pays all operating expenses of each Fund other than the Management fee, brokerage expenses, taxes, interest, fees and expenses of the Trust's Trustees, who are not "interested persons" of the Trust, as defined in the 1940 Act ("Independent Trustees") (including any Trustees’ counsel fees), litigation expenses and other extraordinary expenses.
SSGA ACTIVE TRUST
NOTES TO FINANCIAL STATEMENTS (continued)
June 30, 2023
Blackstone Liquid Credit Strategies LLC receives fees for its services as the Sub-Adviser to the Funds from the Adviser.
Administrator, Custodian, Sub-Administrator and Transfer Agent Fees
SSGA FM serves as administrator and State Street Bank and Trust Company (“State Street”), an affiliate of the Adviser, serves as custodian, sub-administrator and transfer agent. State Street receives fees for its services as custodian, sub-administrator and transfer agent from the Adviser.
Distributor
State Street Global Advisors Funds Distributors, LLC (“SSGA FD” or the “Distributor”), an affiliate of the Adviser, serves as the Distributor of the Trust.
Other Transactions with Affiliates
The Funds may invest in affiliated entities, including securities issued by State Street Corporation, affiliated funds, or entities deemed to be affiliates as a result of the Funds owning more than five percent of the entity’s voting securities or outstanding shares. Amounts relating to these transactions during the year ended June 30, 2023 are disclosed in the Schedules of Investments.
During the fiscal year ended June 30, 2023, State Street made contributions of $4,615 and $33,436 to the SPDR Blackstone Senior Loan ETF related to separate accounting matters.
5. Trustees’ Fees
The fees and expenses of the Independent Trustees and one interested, non-management Trustee are paid directly by the Funds. The Independent Trustees and one interested, non-management Trustee are reimbursed for travel and other out-of-pocket expenses in connection with meeting attendance and industry seminars.
6. Investment Transactions
Purchases and sales of investments (excluding in-kind transactions and short term investments) for the year ended June 30, 2023, were as follows:
| | Purchases | | Sales |
SPDR Blackstone High Income ETF
| $ 158,634,540 | | $ 152,580,070 |
SPDR Blackstone Senior Loan ETF
| 7,150,881,402 | | 10,594,165,980 |
For the year ended June 30, 2023, the following Funds had in-kind contributions, redemptions and net realized gains/losses in the amounts as follows:
| | In-kind
Contributions | | In-kind
Redemptions | | In-kind Net
Realized
Gains/(Losses) |
SPDR Blackstone High Income ETF
| $6,124,927 | | $3,201,341 | | $41,335 |
7. Shareholder Transactions
Each Fund issues and redeems its shares, at NAV, by each Fund only in aggregations of a specified number of shares or multiples thereof (“Creation Units”). Except when aggregated in Creation Units, shares of each Fund are not redeemable. Transactions in capital shares for each Fund are disclosed in detail in the Statements of Changes in Net Assets.
The consideration for the purchase of Creation Units of a Fund may consist of the in-kind deposit of a designated portfolio of securities and a specified amount of cash. Investors purchasing and redeeming Creation Units may pay a purchase transaction fee and a redemption transaction fee directly to the Trust and/or custodian, to offset transfer and other transaction costs associated with the issuance and redemption of Creation Units, including Creation Units for cash. An additional variable fee may be charged for certain transactions. Such variable charges, if any, are included in “Other Capital” on the Statements of Changes in Net Assets.
SSGA ACTIVE TRUST
NOTES TO FINANCIAL STATEMENTS (continued)
June 30, 2023
8. Income Tax Information
The Funds have qualified and intend to continue to qualify as regulated investment company under Subchapter M of the Internal Revenue Code. The qualify as a regulated investment company under Subchapter M of the Internal Revenue Code.
The Funds file federal and various state and local tax returns as required. No income tax returns are currently under examination. Generally, the federal returns are subject to examination by the Internal Revenue Service for a period of three years from date of filing, while the state returns may remain open for an additional year depending upon jurisdiction. SSGA FM has analyzed the Fund's tax positions taken on tax returns for all open years and does not believe there are any uncertain tax positions that would require recognition of a tax liability.
Distributions to shareholders are recorded on ex-dividend date. Income dividends and gain distributions are determined in accordance with income tax rules and regulations, which may differ from generally accepted accounting principles.
Certain capital accounts in the financial statements have been adjusted for permanent book-tax differences. These adjustments have no impact on net asset values or results of operations. Temporary book-tax differences will reverse in the future. These book-tax differences are primarily due to amortization and accretion of premium and discount for financial statement purposes and differing treatments for wash sales.
The tax character of distributions paid during the year ended June 30, 2023, was as follows:
| | Ordinary
Income | | Long-Term
Capital Gains | | Total |
SPDR Blackstone High Income ETF
| $ 8,087,000 | | $— | | $ 8,087,000 |
SPDR Blackstone Senior Loan ETF
| 419,871,500 | | — | | 419,871,500 |
The tax character of distributions paid during the year ended June 30, 2022, was as follows:
| | Ordinary
Income | | Long-Term
Capital Gains | | Tax Return
of Capital | | Total |
SPDR Blackstone High Income ETF
| $ 1,548,000 | | $ — | | $ — | | $ 1,548,000 |
SPDR Blackstone Senior Loan ETF
| 384,792,728 | | — | | 2,807,272 | | 387,600,000 |
At June 30, 2023, the components of distributable earnings on a tax basis were as follows:
| | Undistributed
Ordinary Income | | Capital Loss
Carryforwards | | Undistributed
Long-Term
Capital Gains | | Net Unrealized
Gains (Losses) | | Total |
SPDR Blackstone High Income ETF
| $ 1,075,898 | | $ (10,722,813) | | $— | | $ (324,386) | | $ (9,971,301) |
SPDR Blackstone Senior Loan ETF
| 29,351,474 | | (1,061,105,358) | | — | | (77,409,212) | | (1,109,163,096) |
As of June 30, 2023, the following Funds had capital loss carryforwards available to offset future realized capital gains as follows:
| | Non-Expiring
Short Term | | Non-Expiring
Long Term |
SPDR Blackstone High Income ETF
| $ 9,359,240 | | $ 1,363,573 |
SPDR Blackstone Senior Loan ETF
| 516,487,819 | | 544,617,539 |
As of June 30, 2023, gross unrealized appreciation and gross unrealized depreciation of investments based on cost for federal income tax purposes were as follows:
| | Tax
Cost | | Gross
Unrealized
Appreciation | | Gross
Unrealized
Depreciation | | Net Unrealized
Appreciation
(Depreciation) |
SPDR Blackstone High Income ETF
| $ 129,200,962 | | $ 1,291,106 | | $ 1,613,022 | | $ (321,916) |
SPDR Blackstone Senior Loan ETF
| 4,910,985,010 | | 35,612,340 | | 112,723,717 | | (77,111,377) |
SSGA ACTIVE TRUST
NOTES TO FINANCIAL STATEMENTS (continued)
June 30, 2023
9. Line of Credit
The Funds and other affiliated funds (each a “Participant” and, collectively, the “Participants”) participate in a $1.275 billion ($1.1 billion prior to October 6,2022) revolving credit facility provided by a syndication of banks under which the Participants may borrow to fund shareholder redemptions. The SPDR Blackstone Senior Loan ETF has exclusive access to $1.05 billion ($900 million prior to October 6, 2022) and as of October 6, 2022 SPDR Blackstone High Income ETF has exclusive access to $25 million of the total credit facility. This agreement expires in October 2023 unless extended or renewed.
The Participants are charged an annual commitment fee which is calculated based on the unused portion of the shared credit line. Commitment fees are allocated among each of the Participants based on relative net assets.SPDR Blackstone Senior Loan ETF is allocated the commitment fee for its exclusive portion of the credit line. Commitment fees are ordinary fund operating expenses paid by the Adviser.Interest is calculated at a rate per annum equal to the sum of 1.00% plus the greater of the New York Fed Bank Rate and the one-month SOFR Rate.
The Funds have no outstanding loans as of June 30, 2023.
The SPDR Blackstone Senior Loan ETF also has exclusive access to a $500 million uncommitted line of credit with State Street that may be used solely for temporary or emergency purposes, including to temporarily finance the redemption of shares or for other temporary and emergency purposes consistent with the current investment objectives and investment restrictions of the Fund. The Adviser, on behalf of the Fund, paid an upfront fee to participate in this uncommitted line of credit.
10. Risks
Concentration Risk
As a result of the Funds' ability to invest a large percentage of their assets in obligations of issuers within the same country, state, region, currency or economic sector, an adverse economic, business or political development may affect the value of the Funds' investments more than if they were more broadly diversified.
Foreign and Emerging Markets Risk
Investing in foreign markets involves risks and considerations not typically associated with investing in the U.S. Foreign securities may be subject to risk of loss because of government regulation, economic, political and social instability in the countries in which the Funds' invest. Foreign markets may be less liquid than investments in the U.S. and may be subject to the risks of currency fluctuations. To the extent that the Funds' invest in securities of issuers located in emerging markets, these risks may be even more pronounced.
Credit Risk
The Funds may be exposed to credit risk in the event that an issuer or guarantor fails to perform or that an institution or entity with which the Funds have unsettled or open transactions defaults.
Market Risk
Each Fund’s investments are subject to changes in general economic conditions, general market fluctuations and the risks inherent in investment in securities markets. Investment markets can be volatile and prices of investments can change substantially due to various factors including, but not limited to, economic growth or recession, changes in interest rates, changes in the actual or perceived creditworthiness of issuers, and general market liquidity. A Fund is subject to the risk that geopolitical events will disrupt securities markets and adversely affect global economies and markets. Local, regional or global events such as war, acts of terrorism, the spread of infectious illness, such as COVID-19, or other public health issues, or other events could have a significant impact on a Fund and its investments.
11. Recent Accounting Pronouncement
In December 2022, the Financial Accounting Standards Board (FASB) issued Accounting Standards Update (ASU) No. 2206 Reference Rate Reform (Topic 848). ASU No. 2022-06 updates and clarifies ASU No. 2020-04, which provides optional, temporary relief with respect to the financial reporting of contracts subject to certain types of modifications due to the planned discontinuation of LIBOR and other interbank-offered reference rates. The temporary relief provided by ASU No. 2022-06 is effective immediately for certain reference rate-related contract
SSGA ACTIVE TRUST
NOTES TO FINANCIAL STATEMENTS (continued)
June 30, 2023
modifications that occur through December 31, 2024. Management does not expect ASU No. 2022-06 to have a material impact on the financial statements.
12. Subsequent Events
Management has evaluated the impact of all subsequent events on the Funds through the date the financial statements were issued and has determined that there were no subsequent events requiring adjustment or disclosure in the financial statements.
SSGA ACTIVE TRUST
REPORT OF INDEPENDENT REGISTERED PUBLIC
ACCOUNTING FIRM
To the Shareholders of SPDR Blackstone High Income ETF and SPDR Blackstone Senior Loan ETF and the Board of Trustees of SSGA Active Trust
Opinion on the Financial Statements
We have audited the accompanying statements of assets and liabilities of SPDR Blackstone High Income ETF and SPDR Blackstone Senior Loan ETF (collectively, the “Funds”) (two of the funds constituting SSGA Active Trust (the “Trust”)), including the schedules of investments, as of June 30, 2023, and the related statements of operations and changes in net assets, and the financial highlights for each of the periods indicated in the table below and the related notes (collectively referred to as the “financial statements”). In our opinion, the financial statements present fairly, in all material respects, the financial position of each of the Funds (two of the funds constituting SSGA Active Trust) at June 30, 2023, and the results of their operations, changes in net assets and financial highlights for each of the periods indicated in the table below, in conformity with U.S. generally accepted accounting principles.
| Individual Fund constituting theSSGA Active Trust | Statement of operations | Statement of changes in net assets | Financial highlights |
| SPDR Blackstone High Income ETF | For the year ended June 30, 2023 | For the year ended June 30, 2023 and the period from February 17, 2022 (commencement of operations) through June 30, 2022 | For the year ended June 30, 2023 and the period from February 17, 2022 (commencement of operations) through June 30, 2022 |
| SPDR Blackstone Senior Loan ETF | For the year ended June 30, 2023 | For each of the two years in the period ended June 30, 2023 | For each of the five years in the period ended June 30, 2023 |
Basis for Opinion
These financial statements are the responsibility of the Trust’s management. Our responsibility is to express an opinion on the Funds’ financial statements based on our audits. We are a public accounting firm registered with the Public Company Accounting Oversight Board (United States) (“PCAOB”) and are required to be independent with respect to the Trust in accordance with the U.S. federal securities laws and the applicable rules and regulations of the Securities and Exchange Commission and the PCAOB.
We conducted our audits in accordance with the standards of the PCAOB. Those standards require that we plan and perform the audit to obtain reasonable assurance about whether the financial statements are free of material misstatement, whether due to error or fraud. The Trust is not required to have, nor were we engaged to perform, an audit of the Trust’s internal control over financial reporting. As part of our audits we are required to obtain an understanding of internal control over financial reporting, but not for the purpose of expressing an opinion on the effectiveness of the Trust’s internal control over financial reporting. Accordingly, we express no such opinion.
Our audits included performing procedures to assess the risks of material misstatement of the financial statements, whether due to error or fraud, and performing procedures that respond to those risks. Such procedures included examining, on a test basis, evidence regarding the amounts and disclosures in the financial statements. Our procedures included confirmation of securities owned as of June 30, 2023, by correspondence with the custodian, brokers and others; when replies from brokers and others were not received, we performed other auditing procedures. Our audits also included evaluating the accounting principles used and significant estimates made by management, as well as evaluating the overall presentation of the financial statements. We believe that our audits provide a reasonable basis for our opinion.
We have served as the auditor of one or more State Street Global Advisors investment companies since 2000.
Boston, Massachusetts
August 25, 2023
SSGA ACTIVE TRUST
OTHER INFORMATION
June 30, 2023 (Unaudited)
Expense Example
As a shareholder of a Fund, you incur two types of costs: (1) transaction costs, including sales charges (loads), if applicable, on purchase payments, reinvested dividends, or other distributions and (2) ongoing costs, including advisory fees and other Fund expenses. This example is intended to help you understand your ongoing costs (in dollars) of investing in the Fund and to compare these costs with the ongoing costs of investing in other mutual funds. It is based on an investment of $1,000 made at the beginning of the period shown and held for the entire period from January 1, 2023 to June 30, 2023.
The table below illustrates your Fund's cost in two ways:
Based on actual fund return ——This section helps you to estimate the actual expenses that you paid over the period. The “Ending Account Value” shown is derived from each Fund's actual return, and the third column shows the dollar amount that would have been paid by an investor who started with $1,000 in the Fund. You may use the information here, together with the amount you invested, to estimate the expenses that you paid over the period. To do so, simply divide your account value by $1,000 (for example, an $8,600 account value divided by $1,000 = 8.6), then multiply the result by the number given for the Fund under the heading “Expenses Paid During Period”.
Based on hypothetical 5% return ——This section is intended to help you compare your Fund's costs with those of other mutual funds. It assumes that the Fund had a yearly return of 5% before expenses, but that the expense ratio is unchanged. In this case, because the return used is not the Fund's actual return, the results do not apply to your investment. The example is useful in making comparisons because the U.S. Securities and Exchange Commission (the “SEC”) requires all mutual funds to calculate expenses based on a 5% return. You can assess your Fund's costs by comparing this hypothetical example with the hypothetical examples that appear in shareholder reports of other funds.
Please note that the expenses shown in the table are meant to highlight your ongoing costs only and do not reflect any transaction costs, such as sales load charges (loads). Therefore, the hypothetical 5% return section of the table is useful in comparing ongoing costs only, and will not help you determine the relative total costs of owning different funds. In addition, if these transaction costs were included, your costs would have been higher.
| | | | Actual | | Hypothetical (assuming a 5%
return before expenses) |
| | Annualized
Expense Ratio | | Ending Account
Value | | Expenses Paid
During Period(a) | | Ending Account
Value | | Expenses Paid
During Period(a) |
SPDR Blackstone High Income ETF
| 0.71% | | $1,050.70 | | $3.61 | | $1,021.30 | | $3.56 |
SPDR Blackstone Senior Loan ETF
| 0.71 | | 1,048.50 | | 3.61 | | 1,021.30 | | 3.56 |
| (a) | Expenses are equal to the Fund's annualized net expense ratio multiplied by the average account value of the period, multiplied by 181, then divided by 365. |
SSGA ACTIVE TRUST
OTHER INFORMATION (continued)
June 30, 2023 (Unaudited)
Liquidity Risk Management Program
Pursuant to Rule 22e-4 under the 1940 Act, the Funds have adopted a liquidity risk management program (the "Program"). The Program’s principal objectives include assessing, managing and periodically reviewing each Fund’s liquidity risk, based on factors specific to the circumstances of the Fund. Liquidity risk is defined as the risk that a Fund could not meet redemption requests without significant dilution of remaining investors’ interests in the Fund.
SSGA FM has been designated by the Board to administer the Funds’ Program. Over the course of the prior year, SSGA FM provided the Board with reports addressing the operations of the Program and assessing its adequacy and the effectiveness of the Program’s implementation for the period from December 31, 2021 through December 31, 2022 including:
* the Program supported each Fund’s ability to honor redemption requests timely;
* the Program supported SSGA FM’s management of each Fund’s liquidity profile, including during periods of market volatility and net redemptions;
* no material liquidity issues were identified during the period;
* there were no material changes to the Program during the period;
* the implementation of the Program was effective to manage each Fund’s liquidity risk; and
* the Program operated adequately during the period.
There can be no assurance that the Program will achieve its objectives in the future. Please refer to your Fund’s prospectus for more information regarding the Fund’s exposure to liquidity risk and other principal risks to which an investment in the Fund may be subject.
SSGA ACTIVE TRUST
OTHER INFORMATION (continued)
June 30, 2023 (Unaudited)
Tax Information
For federal income tax purposes, the following information is furnished with respect to the distributions of the Trust for its fiscal year ended June 30, 2023.
Qualified Interest Income
Each Fund reports the maximum amount allowable of its net taxable income and short-term capital gain as qualified interest income.
Interest Dividends
Each Fund reports the maximum amount allowable as Section 163(j) Interest Dividends.
Premium/Discount Information
Information regarding how often the Shares of each Fund traded on the exchange at a price above (i.e., at a premium) or below (i.e., at a discount) the NAV of the Fund during the past calendar year can be found at https://www.ssga.com/spdrs.
Proxy Voting Policies and Procedures and Records
A description of the Trust’s proxy voting policies and procedures that are used by the Funds’ investment Adviser to vote proxies relating to the Funds’ portfolio of securities are available (i) without charge, upon request by calling 1-866-787-2257 (toll free) or (ii) on the SEC's website at www.sec.gov.
Information regarding how the Funds voted for the prior 12-month period ended June 30, is available by August 31 of each year by calling the same number, on the SEC’s website at www.sec.gov and on the Funds’ website at https://www.ssga.com/spdrs.
Quarterly Portfolio Schedule
Following the Funds’ first and third fiscal quarter-ends, complete Schedules of Investments are filed with the SEC as exhibits on Form N-PORT, which can be found on the Funds' website at https://www.ssga.com/spdrs and on the SEC's website at www.sec.gov. The Funds’ Schedules of Investments are available upon request, without charge, by calling 1-866-787-2257 (toll free).
SSGA ACTIVE TRUST
OTHER INFORMATION (continued)
June 30, 2023 (Unaudited)
Approval of Advisory Agreement
At meetings held prior to June 30, 2023, the Board of Trustees of the Trust (the “Board”) evaluated proposals to continue the Investment Advisory Agreement (the “Agreement”) between the Trust and SSGA Funds Management, Inc. (the “Adviser” or “SSGA FM”) with respect to the following series of SSGA Active Trust (the “Trust”): SPDR Blackstone High Income ETF and SPDR Blackstone Senior Loan ETF (the “Funds”). The Trustees who are not “interested persons” of the Trust within the meaning of the Investment Company Act of 1940, as amended (the “Independent Trustees”), also met separately to consider the Agreement. The Independent Trustees were advised by their independent legal counsel throughout the process.
To evaluate the Agreement, the Board requested, and SSGA FM, the Trust’s investment adviser and administrator, and State Street Bank and Trust Company, the Trust’s sub-administrator, transfer agent and custodian (“State Street”) provided, such materials as the Board, with the advice of counsel, deemed reasonably necessary. In deciding whether to approve the Agreement, the Board considered various factors, including the (i) nature, extent and quality of services provided by the Adviser with respect to the Funds under the Agreement, (ii) investment performance of the Funds, (iii) profits realized by the Adviser and its affiliates from its relationship with the Trust, (iv) fees charged to comparable funds, (v) other benefits to the Adviser, and (vi) extent to which economies of scale would be shared as the Funds grow.
Nature, Extent and Quality of Services
The Board considered the nature, extent and quality of services provided by the Adviser. In doing so, the Trustees relied on their prior experience in overseeing the management of the Trust and the materials provided prior to and at the meetings. The Board reviewed the Agreement and the Adviser’s responsibilities for managing investment operations of each of the Funds in accordance with each Fund’s investment objectives and policies, and applicable legal and regulatory requirements. The Board appreciated the nature of the Funds as exchange-traded funds and the experience and expertise of the Adviser in managing exchange-traded funds. The Board considered the background and experience of the Adviser’s senior management, including those individuals responsible for portfolio management, oversight of sub-advisers and regulatory compliance of the Funds. The Board also considered the portfolio management resources, structures and practices of the Adviser, including those associated with monitoring and ensuring each Fund’s compliance with its investment objectives and policies, and applicable laws and regulations. The Board further considered information about the Adviser’s best execution procedures and overall investment management business, noting that the Adviser serves a wide range of clients across a broad spectrum of asset classes. The Board looked at the Adviser’s general knowledge of the investment management business and that of its affiliates which make up State Street Global Advisors, through which the Adviser shares all of its senior personnel. The Board considered that the Adviser and its affiliates constitute one of the world’s largest investment management enterprises for indexed products generally and exchange-traded funds in particular. The Board specifically considered the Adviser’s experience in managing actively-managed exchange-traded funds. The Board also considered the Adviser’s role in overseeing third party sub-advisers, as applicable.
Investment Performance
The Board compared the investment performance of each series of the Trust to the performance of a group of comparable funds (net of expenses) (“Performance Group”) obtained from Broadridge Financial Solutions, Inc. (“Broadridge”) and to the performance of an appropriate benchmark (gross of expenses) provided by the Adviser. Among other information, the Board considered the following performance information over various periods ended December 31, 2022 in its evaluation of the Funds:
SPDR Blackstone Senior Loan ETF. The Board considered that the Fund underperformed the median of its Performance Group for the 1-, 2-, 3- and 4-year periods, but had an annualized total return equal to the median of its Performance Group for the 5-year period. In addition, the Board considered that the Fund underperformed its benchmark index for the 1-year period, but outperformed its benchmark index for the 3- and 5-year and since inception periods.
SPDR Blackstone High Income ETF. The Board considered that the Fund commenced operations on February 16, 2022 and that performance information was not provided given the short operating history of the Fund.
In those instances where the Board observed underperformance for an extended period of time, the Trustees discussed with management those factors that contributed to such underperformance and steps being taken in response to such factors, where appropriate.
SSGA ACTIVE TRUST
OTHER INFORMATION (continued)
June 30, 2023 (Unaudited)
Profits Realized by Adviser
The Board considered the profitability of the advisory arrangement with the Funds to the Adviser and its affiliates, including data on the Funds’ historical profitability to these entities. The Board, including the Independent Trustees, with their independent legal counsel, had the opportunity to discuss, with representatives of the Adviser and State Street Global Advisors, methodologies used in computing costs that formed the bases of profitability calculations.
Fees Charged to Comparable Funds
The Board evaluated each Fund’s unitary fee through review of comparative information with respect to fees paid by similar funds – i.e., exchange-traded funds that are actively managed. The Board reviewed the universe of similar exchange-traded funds for each Fund based upon data independently obtained from Broadridge and related comparative information for similar exchange-traded funds. In doing so, the Board used a fund by fund analysis of the data. In certain instances as considered appropriate by the Board, the Board explored with management the reasons for the differences between a Fund’s fee and fees paid by similar funds.
Other Benefits
The Board also considered whether the Adviser or its affiliates benefited in other ways from its relationship with the Trust, noting that the Adviser does not maintain soft-dollar arrangements in connection with the Trust’s brokerage transactions.
Economies of Scale
The Board reviewed information regarding economies of scale or other efficiencies that may result as each Fund’s assets grow in size. The Board noted that the advisory fee rate for each Fund does not provide for breakpoints as assets of the Fund increase. However, the Board further noted the Adviser’s assertion that future economies of scale (among several factors) had been taken into consideration for the Funds by fixing relatively low advisory fees, effectively sharing the benefits of lower fees with the Funds from inception. The Adviser also asserted that one of the benefits of the unitary fee was to provide an unvarying expense structure, which could be lost or diluted with the addition of breakpoints. The Board noted that it intends to continue to monitor fees as the Funds grow in size and assess whether fee breakpoints may be warranted.
Conclusion
After weighing the foregoing factors, none of which was dispositive in itself and may have been weighed differently by each Trustee, the Board, including the Independent Trustees voting separately, approved the continuation of the Agreement for each Fund. In approving the continuance of the Advisory Agreement, the Board, including the Independent Trustees voting separately, found that the terms of the Advisory Agreement are fair and reasonable and that the continuance of the Advisory Agreement is in the best interests of each Fund and each Fund’s respective shareholders. The Board’s conclusions with respect to the factors were as follows: (a) the nature, extent and quality of the services provided by the Adviser with respect to the Funds were appropriate; (b) the performance and, more importantly for those Funds measured against an index, the index tracking, of each Fund had been satisfactory or the Adviser had demonstrated due attention to the remediation of underperformance, where appropriate; (c) the Adviser’s unitary fee for each Fund considered in relation to the services provided, and in relation to the fees charged to comparable funds, was reasonable; (d) the profitability of the Trust’s relationships with the Adviser and its affiliates was not excessive in view of the nature, extent and quality of the services provided; (e) any additional potential benefits to the Adviser or its affiliates were not of a magnitude to materially affect the Board’s conclusions; and (f) the fees paid to the Adviser adequately shared the economies of scale with respect to the Funds by way of the relatively low fee structure of the Trust.
SSGA ACTIVE TRUST
OTHER INFORMATION (continued)
June 30, 2023 (Unaudited)
Approval of Blackstone Liquid Credit Strategies LLC (“Blackstone Credit”) Sub-Advisory Agreement
At meetings held prior to June 30, 2023, the Board also considered a proposal to continue the Sub-Advisory Agreement (the “Blackstone Credit Sub-Advisory Agreement”) between the Adviser and Blackstone Liquid Credit Strategies LLC (“Blackstone Credit”) with respect to SPDR Blackstone High Income ETF and SPDR Blackstone Senior Loan ETF (the “Blackstone Funds”). The Independent Trustees also met separately to consider the Blackstone Credit Sub-Advisory Agreement. The Independent Trustees were advised by their independent legal counsel throughout the process.
To evaluate the Blackstone Credit Sub-Advisory Agreement, the Board requested, and Blackstone Credit and the Adviser provided, such materials as the Board, with the advice of counsel, deemed reasonably necessary. In deciding whether to approve the Blackstone Credit Sub-Advisory Agreement, the Board considered various factors, including the (i) nature, extent and quality of services provided by Blackstone Credit with respect to each Blackstone Fund under the Blackstone Credit Sub-Advisory Agreement; and (ii) investment performance of each Blackstone Fund. The Board further considered the portion of the current advisory fee that the Adviser would continue to pay to Blackstone Credit under the Blackstone Credit Sub-Advisory Agreement and also considered that such fees would continue to be paid directly by the Adviser and would not result in increased fees payable by the Blackstone Funds.
The Board considered the background and experience of Blackstone Credit’s senior management and, in particular, Blackstone Credit’s experience in investing in senior loan securities. The Board reviewed the performance of the Blackstone Funds, noting that the SPDR Blackstone Senior Loan ETF underperformed 4 of the last 5 calendar years, but considered management’s explanation of those factors that contributed to such underperformance and the steps being taken in response to such factors. The Board also noted that the SPDR Blackstone High Income ETF commenced operations on February 17, 2022 and thus, Broadridge Financial Solutions, Inc. performance information was not provided given the short operating history of the Fund. The Board also considered the unitary fee paid to the Adviser by each Blackstone Fund and Blackstone Credit’s fees paid by the Adviser. The Board also considered whether Blackstone Credit benefited in other ways from its relationship with the Trust.
After weighing the foregoing factors, as well as the relevant factors discussed in relation to the Blackstone Credit Sub-Advisory Agreement between Blackstone Credit and the Adviser, none of which was dispositive in itself and may have been weighed differently by each Trustee, the Board, including the Independent Trustees voting separately, approved the continuation of the Blackstone Credit Sub-Advisory Agreement for each Blackstone Fund. In approving the continuance of the Blackstone Credit Sub-Advisory Agreement, the Board, including the Independent Trustees voting separately, found that the terms of the Blackstone Credit Sub-Advisory Agreement are fair and reasonable and that the continuance of the Blackstone Credit Sub-Advisory Agreement is in the best interests of each Blackstone Fund and its shareholders. The Board’s conclusions with respect to the factors were as follows: (a) the nature, extent and quality of the services provided by Blackstone Credit with respect to each Blackstone Fund were appropriate; (b) the performance of the SPDR Blackstone Senior Loan ETF had been satisfactory; (c) Blackstone Credit’s fees for each Blackstone Fund and the unitary fee, considered in relation to the services provided, were reasonable; (d) any additional potential benefits to Blackstone Credit were not of a magnitude to materially affect the Board’s conclusions; and (e) the fees paid to Blackstone Credit adequately shared the economies of scale with each Blackstone Fund by way of the relatively low fee structure of SSAT. The Independent Trustees were advised by their independent counsel throughout the process.
SSGA ACTIVE TRUST
OTHER INFORMATION (continued)
June 30, 2023 (Unaudited)
TRUSTEES AND OFFICERS INFORMATION
Name, Address
and Year of Birth | | Position(s)
with Funds | | Term of
Office and
Length of
Time Served | | Principal
Occupation(s)
During Past
5 Years | | Number of
Portfolios
in Fund
Complex
Overseen
by Trustee† | | Other
Directorships
Held by Trustee
During the
Past 5 Years |
| Trustees | | | | | | | | | | |
| Independent Trustees | | | | | | | | | | |
CARL G. VERBONCOEUR
c/o SSGAActive Trust
One Iron Street
Boston, MA 02210
1952 | | Independent
Trustee,
Trustee
Committee
Chair | | Term:
Unlimited
Served: since
March 2011 | | Self-employed
consultant since 2009. | | 121 | | The Motley Fool Funds Trust (Trustee). |
DWIGHT D. CHURCHILL c/o SSGAActive Trust One Iron Street
Boston, MA 02210
1953 | | Independent
Trustee,
Audit Committee
Chair | | Term:
Unlimited
Served: since
March 2011 | | Self-employed
consultant since 2010;
CEO and President,
CFA Institute (June
2014 - January 2015). | | 121 | | Affiliated Managers Group, Inc. (Chairman, Director and Audit Committee Chair). |
CLARE S. RICHER
c/o SSGAActive Trust
One Iron Street
Boston, MA 02210
1958 | | Independent
Trustee | | Term:
Unlimited
Served: since
July 2018 | | Retired.
Chief Financial
Officer, Putnam
Investments LLC
(December 2008 -
May 2017). | | 121 | | Principal Financial Group (Director) and Financial Committee Chair; Bain Capital Specialty Finance (Director); University of Notre Dame (Trustee); Putnam Acquisition Financing Inc. (Director); Putnam Acquisition Financing LLC (Director); Putnam GP Inc. (Director); Putnam Investor Services, Inc. (Director); Putnam Investments Limited (Director). |
SANDRA G. SPONEM
c/o SSGA Active Trust
One Iron Street
Boston, MA 02210
1958 | | Independent
Trustee | | Term: Unlimited
Served: since
July 2018 | | Retired.
Chief Financial
Officer, M.A.
Mortenson
Companies, Inc.(construction and
real estate company)
(February 2007-
April 2017). | | 121 | | Rydex Series Funds;
Rydex Dynamic Funds;
Rydex Variable Trust;
Guggenheim Funds Trust;
Guggenheim Variable Funds Trust;
Guggenheim Strategy Funds Trust;
Transparent Value Trust;
Fiduciary/Claymore Energy Infrastructure
Fund;
Guggenheim Taxable Municipal
Bond & Investment Grade Debt
Trust;
Guggenheim Strategic
Opportunities Fund;
Guggenheim Enhanced,
Equity Income Fund;
Guggenheim Credit Allocation Fund,
Guggenheim Energy & Income Fund,
Guggenheim Active Allocation Fund
(Trustee and Audit Committee Chair). |
CAROLYN M. CLANCY
c/o SSGA Active Trust
One Iron Street
Boston, MA 02210
1960 | | Independent
Trustee | | Term:
Unlimited
Served: since
October 2022 | | Retired. Executive Vice President, Head of Strategy, Analytics and Market Readiness, Fidelity Investments (April 2020 – June 2021); Executive Vice President, Head of Broker Dealer Business, Fidelity Investments (July 2017 – March 2020). | | 121 | | Assumption University (Trustee); Big Sister Association of Greater Boston (Director). |
KRISTI L. ROWSELL
c/o SSGA Active Trust
One Iron Street
Boston, MA 02210
1966 | | Independent
Trustee | | Term:
Unlimited
Served: since
October 2022 | | Partner and
President,
Harris
Associates
(2010 – 2021). | | 121 | | Oakmark Funds (Trustee); Board of Governors, Investment Company Institute (Member); Habitat for Humanity Chicago (Director). |
SSGA ACTIVE TRUST
OTHER INFORMATION (continued)
June 30, 2023 (Unaudited)
Name, Address
and Year of Birth | | Position(s)
with Funds | | Term of
Office and
Length of
Time Served | | Principal
Occupation(s)
During Past
5 Years | | Number of
Portfolios
in Fund
Complex
Overseen
by Trustee† | | Other
Directorships
Held by Trustee
During the
Past 5 Years |
| Interested Trustee | | | | | | | | | | |
JAMES E. ROSS*
c/o SSGA Active Trust
One Iron Street
Boston, MA 02210
1965 | | Interested
Trustee | | Term: Unlimited
Served as
Trustee: since
March 2011 | | President, Winnisquam
Capital LLC (December
2022 – present);
Non-Executive,
Chairman, Fusion
Acquisition Corp II
(February 2020 -
Present); Non-Executive Chairman, Fusion
Acquisition Corp. (June
2020 - September 2021);
Retired Chairman
and Director, SSGA
Funds Management,
Inc. (2005 - March 2020); Retired
Executive Vice
President, State Street Global
Advisors (2012
- March 2020);
Retired Chief Executive
Officer and Manager,
State Street Global Advisors
Funds Distributors,
LLC (May 2017 -
March 2020); Director,
State Street Global Markets,
LLC (2013 - April 2017);
President, SSGA Funds
Management, Inc.
(2005 - 2012); Principal,
State Street Global Advisors
(2000 - 2005). | | 132 | | Investment Managers
Series Trust (December
2022 – present);
The Select Sector SPDR
Trust (November 2005 -
Present);
SSGA SPDR ETFs
Europe I PLC (Director)
(November 2016 -
March 2020);
SSGA SPDR ETFs Europe II
PLC (Director)
(November 2016 -
March 2020);
State Street Navigator
Securities Lending
Trust (July 2016 -
March 2020);
SSGA Funds (January 2014 -
March 2020);
State Street Institutional
Investment Trust
(February 2007 -
March 2020);
State Street Master Funds
(February 2007 -
March 2020);
Elfun Funds (July 2016 -
December 2018). |
GUNJAN CHAUHAN**
c/o SSGA Active Trust
One Iron Street
Boston, MA 02210
1982 | | Interested
Trustee | | Term: Unlimited
Served: since
October 2022 | | Senior Managing Director, State Street Global Advisors (April 2018 – Present); Managing Director, State Street Global Advisors (June 2015– March 2018). | | 121 | | State Street ICAV (Director). |
| † For the purpose of determining the number of portfolios overseen by the Trustees, “Fund Complex” comprises registered investment companies for which SSGA Funds Management, Inc. serves as investment adviser, which includes series of the the SPDR Series Trust, SSGA Active Trust and SPDR Index Shares Funds. |
| * Mr. Ross is an Interested Trustee because of his ownership interest in an affiliate of the Adviser. Mr. Ross previously served as an Interested Trustee from November 2005 to December 2009. |
| ** Ms. Chauhan is an Interested Trustee because of her position with an affiliate of the Adviser. |
SSGA ACTIVE TRUST
OTHER INFORMATION (continued)
June 30, 2023 (Unaudited)
Name, Address
and Year of Birth | | Position(s)
with Funds | | Term of
Office and
Length of
Time Served | | Principal Occupation(s) During the Past 5 Years |
| Officers | | | | | | |
ANN M. CARPENTER
SSGA Funds Management Inc.
One Iron Street Boston, MA 02210
1966 | | President
and Principal
Executive
Officer;
Deputy
Treasurer | | Term: Unlimited Served: since May 2023 (with respect to President and Principal Executive Officer); Term: Unlimited Served: since February 2016 (with respect to Deputy Treasurer) | | Chief Operating Officer, SSGA Funds Management, Inc. (April 2005 - present)*; Managing Direct Street Global Advisors (April 2005 - present).* |
BRUCE S. ROSENBERG
SSGA Funds Management, Inc.
One Iron Street
Boston, MA 02210
1961 | | Treasurer
and Principal
Financial
Officer | | Term: Unlimited
Served: since
February 2016 | | Managing Director, State Street Global Advisors and SSGA Funds Management, Inc. (July 2015 - present); Director, Credit Suisse (April 2008 - July 2015). |
CHAD C. HALLETT
SSGA Funds Management, Inc.
One Iron Street
Boston, MA 02210
1969 | | Deputy
Treasurer | | Term: Unlimited
Served: since
February 2016 | | Vice President, State Street Global Advisors and SSGA Funds Management, Inc. (November 2014 - present)* |
MICHAEL P. RILEY
SSGA Funds Management, Inc.
One Iron Street
Boston, MA 02210
1969 | | Vice
President | | Term: Unlimited
Served: since
March 2011 | | Managing Director, State Street Global Advisors (2005 - present).* |
SEAN O’MALLEY
SSGA Funds Management, Inc.
One Iron Street
Boston, MA 02210
1969 | | Chief Legal
Officer | | Term: Unlimited
Served: since
August 2019 | | Senior Vice President and Deputy General Counsel, State Street Global Advisors (November 2013 - present). |
DAVID URMAN
SSGA Funds Management, Inc.
One Iron Street
Boston, MA 02210
1985 | | Assistant
Secretary | | Term: Unlimited
Served: since
August 2019 | | Vice President and Senior Counsel, State Street Global Advisors (April 2019 - present); Vice President and Counsel, State Street Global Advisors (August 2015 - April 2019); Associate, Ropes & Gray LLP (November 2012 - August 2015). |
DAVID BARR
SSGA Funds Management, Inc.
One Iron Street
Boston, MA 02210
1974 | | Assistant
Secretary | | Term: Unlimited
Served: since
November 2020 | | Vice President and Senior Counsel, State Street Global Advisors (October 2019 - present); Vice President and Counsel, Eaton Vance Corp. (2010 - 2019). |
E. GERARD MAIORANA, JR.
SSGA Funds Management, Inc.
One Iron Street
Boston, MA 02210
1971 | | Assistant
Secretary | | Term: Unlimited
Served: since May
2023 | | Assistant Vice President, State Street Global Advisors (July 2014 - present). |
DARLENE ANDERSON-VASQUEZ
SSGA Funds Management, Inc.
One Iron Street
Boston, MA 02210
1968 | | Deputy
Treasurer | | Term: Unlimited
Served: since
November 2016 | | Managing Director, State Street Global Advisors and SSGA Funds Management, Inc. (May 2016 - present); Senior Vice President, John Hancock Investments (September 2007 - May 2016). |
SSGA ACTIVE TRUST
OTHER INFORMATION (continued)
June 30, 2023 (Unaudited)
Name, Address
and Year of Birth | | Position(s)
with Funds | | Term of
Office and
Length of
Time Served | | Principal Occupation(s) During the Past 5 Years |
ARTHUR A. JENSEN
SSGA Funds Management, Inc.
1600 Summer Street
Stamford, CT 06905
1966 | | Deputy
Treasurer | | Term: Unlimited
Served: Since
August 2017 | | Vice President, State Street Global Advisors and SSGA Funds Management, Inc. (July 2016 - present); Mutual Funds Controller of GE Asset Management Incorporated (April 2011 - July 2016). |
JOHN BETTENCOURT
SSGA Funds Management, Inc
One Iron Street
Boston, MA 02210
1976 | | Assistant
Treasurer | | Term: Unlimited
Served: since
May 2022 | | Vice President, State Street Global Advisors and SSGA Funds Management Inc. (March 2020 - present); Assistant Vice President, State Street Global Advisors (June 2007 - March 2020). |
DAVID LANCASTER
SSGA Funds Management, Inc.
One Iron Street
Boston, MA 02210
1971 | | Assistant
Treasurer | | Term: Unlimited
Served: since
November 2020 | | Vice President, State Street Global Advisors and SSGA Funds Management, Inc. (July 2017 - present); Assistant Vice President, State Street Bank and Trust Company (November 2011 - July 2017). |
BRIAN HARRIS
SSGA Funds Management, Inc.
One Iron Street
Boston, MA 02210
1973 | | Chief Compliance
Officer; Anti-Money
Laundering
Officer; Code of Ethics
Compliance
Officer | | Term: Unlimited
Served: since
November 2013 | | Managing Director, State Street Global Advisors and SSGA Funds Management, Inc. (June 2013 - present)*; Senior Vice President and Global Head of Investment Compliance, BofA Global Capital Management (2010 - 2013); Director of Compliance, AARP Financial Inc. (2008 - 2010). |
| * Served in various capacities and/or with various affiliated entities during noted time period. |
| The Statement of Additional Information (SAI) includes additional information about the Funds' trustees and is available, without charge, upon request and by calling 1-866-787-2257. |
[This Page Intentionally Left Blank]
[This Page Intentionally Left Blank]
Trustees
Gunjan Chauhan, Interested Trustee
Dwight D. Churchill
Carolyn M. Clancy
Clare S. Richer
James E. Ross, Interested Non-management Trustee
Kristi L. Rowsell
Sandra G. Sponem
Carl G. Verboncoeur, Chairman
Investment Manager and Administrator
SSGA Funds Management, Inc.
One Iron Street
Boston, MA 02210
Distributor
State Street Global Advisors Funds Distributors, LLC
One Iron Street
Boston, MA 02210
Custodian, Sub-Administrator and Transfer Agent
State Street Bank and Trust Company
One Congress Street
Boston, MA 02114
Legal Counsel
Morgan, Lewis & Bockius LLP
1111 Pennsylvania Avenue, NW
Washington, DC 20004
Independent Registered Public Accounting Firm
Ernst & Young LLP
200 Clarendon Street
Boston, MA 02116
The information contained in this report is intended for the general information of shareholders of the Trust. This report is not authorized for distribution to prospective investors unless preceded or accompanied by a current Trust prospectus which contains important information concerning the Trust. You may obtain a current prospectus and SAI from the Distributor by calling 1-866-787-2257 or visiting https://www.ssga.com/spdrs. Please read the prospectus carefully before you invest.
For more complete information, please call 1.866.787.2257 or visit https://www.ssga.com/spdrs today.
State Street Global Advisors
One Iron Street
Boston, MA 02210
ETFs trade like stocks, are subject to investment risk, fluctuate in market value and may trade at prices above or below the ETF's net asset value. Brokerage commissions and ETF expenses will reduce returns.
Foreign investments involve greater risks than U.S. investments, including political and economic risks and the risk of currency fluctuations, all of which may be magnified in emerging markets.
Bonds generally present less short-term risk and volatility than stocks, but contain interest rate risk (as interest rates rise bond prices usually fall); issuer default risk; issuer credit risk; liquidity risk; and inflation risk. These effects are usually pronounced for longer-term securities. Any fixed income security sold or redeemed prior to maturity may be subject to a substantial gain or loss.
Investing in commodities entail significant risk and is not appropriate for all investors. Commodities investing entail significant risk as commodity prices can be extremely volatile due to wide range of factors. A few such factors include overall market movements, real or perceived inflationary trends, commodity index volatility, international, economic and political changes, change in interest and currency exchange rates.
Past performance is no guarantee of future results. It is not possible to invest directly in an index. Index performance does not reflect charges and expenses associated with the fund or brokerage commissions associated with buying and selling a fund. Index
performance is not meant to represent that of any particular fund.
Standard & Poor’s, S& P and SPDR are registered trademarks of Standard & Poor’s Financial Services LLC (S&P); Dow Jones is a registered trademark of Dow Jones Trademark Holdings LLC (Dow Jones); and these trademarks have been licensed for use by S&P Dow Jones Indices LLC (SPDJI) and sublicensed for certain purposes by State Street Corporation. State Street Corporation’s financial products are not sponsored, endorsed, sold or promoted by SPDJI, Dow Jones, S&P, their respective affiliates and third party licensors and none of such parties make any representation regarding the advisability of investing in such product(s) nor do they have any liability in relation thereto, including for any errors, omissions, or interruptions of any index.
Distributor: State Street Global Advisors Funds Distributors, LLC, member FINRA, SIPC, an indirect wholly owned subsidiary of State Street Corporation. References to State Street may include State Street Corporation and its affiliates. Certain State Street affiliates provide services and receive fees from the SPDR ETFs.
SSGA Funds Management has retained Blackstone Liquid Credit Strategies LLC as the Sub-Advisor. State Street Global Advisors Funds Distributors, LLC is not affiliated with Blackstone Liquid Credit Strategies LLC.
Before investing, consider a Fund’s investment objectives, risks, charges and expenses. To obtain a prospectus or summary prospectus which contains this and other information, call 1.866.787.2257 or visit https://www.ssga.com/spdrs. Read it carefully.
Not FDIC Insured. No Bank Guarantee. May Lose Value.
The information contained in this report is intended for the general information of shareholders of the Trust. This report is not authorized for distribution to prospective investors unless preceded or accompanied by a current Trust prospectus which contains important information concerning the Trust. You may obtain a current prospectus and SAI from the Distributor by calling 1-866-787-2257 or visiting https://www.ssga.com/spdrs. Please read the prospectus carefully before you invest.
© 2023 State Street Corporation - All Rights Reserved
SPDRGSOAR
As of the end of the period covered by this report, the registrant has adopted a code of ethics that applies to the registrant’s principal executive officer, principal financial officer, principal accounting officer or controller, or persons performing similar functions, regardless of whether these individuals are employed by the registrant or a third party (the “Code of Ethics”). During the period covered by this report, no substantive amendments were made to the Code of Ethics. During the period covered by this report, the registrant did not grant any waivers, including any implicit waivers, from any provision of the Code of Ethics.
The Code of Ethics is attached hereto as Exhibit 13(a)(1).
| Item 3. | Audit Committee Financial Expert. |
(a)(1) The Board of Trustees of the registrant has determined that the registrant has four Board members serving on the Audit Committee that possess the attributes identified in Instructions 2(b) of Item 3 to Form N-CSR to qualify as an “audit committee financial expert.”
(2) Dwight Churchill, Clare Richer, Kristi Rowsell, Sandra Sponem and Carl Verboncoeur are the registrant’s audit committee financial experts. The Board also determined that each of the foregoing persons are not “interested person(s)” of the registrant as that term is defined in Section 2(a)(19) of the Investment Company Act of 1940, as amended (the “1940 Act”).
| Item 4. | Principal Accountant Fees and Services. |
(a) Audit Fees.
For the fiscal years ending June 30, 2023 and June 30, 2022, the aggregate audit fees billed for professional services rendered by the principal accountant were $397,862 and $397,862, respectively. Audit fees include the performance of the annual audits and routine regulatory filings (one for each SEC registrant).
(b) Audit-Related Fees.
For the fiscal years ending June 30, 2023 and June 30, 2022, the principal accountant did not bill the registrant any fees for assurances and related services that are reasonably related to the performance of the audit of the registrant’s financial statements and are not reported under paragraph (a) of this Item.
(c) Tax Fees.
For the fiscal years ending June 30, 2023 and June 30, 2022, the aggregate tax fees billed for professional services rendered by the principal accountant were $38,065 and $38,065, respectively. Tax fees represent services related to the review of year-end distribution requirements.
(d) All Other Fees.
For the fiscal years ended June 30, 2023 and June 30, 2022, there were no fees billed for professional services rendered by E&Y for products and services provided by E&Y to the Trust, other than the services reported in paragraphs (a)through (c).
For the fiscal years ended June 30, 2023 and June 30, 2022, the aggregate fees for professional services rendered by E&Y for products and services provided by E&Y to the Adviser and any entity controlling, controlled by, or under common control with the Adviser that provides ongoing services to the Trust that (i) relate directly to the operations and financial reporting of the Trust and (ii) were pre-approved by the Audit Committee were approximately $9,540,002 and $9,327,125, respectively.
(e)(1) Audit Committee Pre-Approval Policies and Procedures.
The registrant’s Audit Committee Charter states the following with respect to pre-approval procedures:
Before the independent auditors are engaged by the Trust to render audit, audit-related or permissible non-audit services, either:
| | (a) | The Audit Committee shall pre-approve all audit, audit-related and permissible non-audit services provided to the Trust. The Audit Committee may delegate to one or more of its members the authority to grant pre-approvals. Any decision of any member to whom authority is delegated under this section shall be presented to the full Audit Committee at its next regularly scheduled meeting; |
or
| | (b) | The engagement to render the audit, audit-related or permissible non-audit service is entered into pursuant to pre-approval policies and procedures established by the Audit Committee. Any such policies and procedures must (1) be detailed as to the particular service and (2) not involve any delegation of the Audit Committee’s responsibilities to the investment adviser. The Audit Committee must be informed of each service entered into pursuant to the policies and procedures. A copy of any such policies and procedures shall be attached as an exhibit to the Audit Committee Charter. |
| | (c) | Pre-Approval for a service provided to the Trust other than audit or audit-related services is not required if: (1) the aggregate amount of all such permissible non-audit services provided to the Trust constitutes not more than five percent (5%) of the total amount of revenues paid by the Trust to the independent auditors during the fiscal year in which the permissible non-audit services are provided; (2) such services were not recognized by the Trust at the time of the engagement to be permissible non-audit services; and (3) such services are promptly brought to the attention of the Audit Committee and are approved by the Audit Committee or by one or more members of the Audit Committee to whom authority to grant such approvals has been delegated by the Audit Committee prior to the completion of the audit. |
| | (d) | The Audit Committee shall pre-approve any permissible non-audit services proposed to be provided by the independent auditors to (a) the investment adviser and (b) any entity controlling, controlled by, or under common control with the investment adviser that provides ongoing services to the Trust, if the independent auditors’ engagement with the investment adviser or any such control persons relates directly to the operations and financial reporting of the Trust. It shall be the responsibility of the independent auditors to notify the Audit Committee of any permissible non-audit services that need to be pre-approved. |
Notwithstanding the above, Pre-Approval for any permissible non-audit services under this Sub-section is not required if: (1) the aggregate amount of all such permissible non-audit services constitutes not more than five percent (5%) of the total amount of revenues paid to the independent auditors by the Trust and any other entity that has its services approved under this Section (i.e., the investment adviser or any control person)
during the fiscal year in which the permissible non-audit services are provided; (2) such services were not recognized by the Trust at the time of the engagement to be permissible non-audit services; and (3) such services are promptly brought to the attention of the Audit Committee and are approved by the Audit Committee or by one or more members of the Audit Committee to whom authority to grant such approvals has been delegated by the Audit Committee prior to the completion of the audit.
(e)(2) Percentage of Services.
One hundred percent of the services described in each of paragraphs (b) through (d) of this Item were approved by the registrant’s Audit Committee pursuant to paragraph (c)(7)(i)(C) of Rule 2-01 of Regulation S-X.
(f) Not applicable.
(g) The aggregate non-audit fees billed for by the registrant’s accountant for services rendered to the registrant, and rendered to the registrant’s investment adviser (not including any sub-adviser whose role is primarily portfolio management and is subcontracted with or overseen by another investment adviser), and any entity controlling, controlled by, or under common control with the adviser were as follows:
| | | | | | | | |
| | | FY 2023
(in millions) | | | FY 2022
(in millions) | |
Non audit services billed to: | | | | | | | | |
Registrant: | | | See Item 4 | (c) | | | See Item 4 | (c) |
Investment Adviser: | | | — | | | | — | |
| | |
Other entities in the Investment Company
Complex (1)(2): | | | | | | | | |
Audit Related Fees | | $ | 17.9 | | | $ | 18.1 | |
Tax Fees | | $ | 5.6 | | | $ | 5.4 | |
All Other Fees | | $ | 15.5 | | | $ | 14.5 | |
| (1) | Information is for the calendar years 2023 and 2022, respectively. |
| (2) | Services under the caption Audit-Related Fees consisted principally of reports on the processing of transactions by servicing organizations, audits of employee benefit plan, non-statutory audits and due diligence procedures. Services under the caption Tax Fees consisted principally of expatriate, compliance and corporate tax advisory services. Services under the caption All Other Fees primarily related to statutory and financial statement audits and the requirement to opine on the design and operating effectiveness of internal control over financial reporting. |
(h) The registrant’s principal accountant notified the registrant’s Audit Committee of all non-audit services that were rendered by the principal accountant to the Adviser and any entity controlling, controlled by, or under common control with the Adviser that provides services to the registrant, which services were not required to be pre-approved pursuant to paragraph (c)(7)(ii) of Rule 2-01 of Regulation S-X, allowing the registrant’s Audit Committee to consider whether such services were compatible with maintaining the principal accountant’s independence.
(i) Not applicable.
(j) Not applicable.
| Item 5. | Audit Committees of Listed Registrants. |
The registrant has an audit committee which was established by the Board of Trustees of the Trust in accordance with Section 3(a)(58)(A) of the Securities Exchange Act of 1934, as amended (the “1934 Act”). The members of the registrant’s Audit Committee are Dwight Churchill, Carolyn Clancy, Clare Richer, Kristi Rowsell, Sandra Sponem and Carl Verboncoeur.
(a) Schedules of Investments are included as part of the reports to shareholders filed under Item 1 of this Form N-CSR.
(b) Not applicable to the registrant.
| Item 7. | Disclosure of Proxy Voting Policies and Procedures for Closed-End Management Investment Companies. |
Not applicable to the registrant.
| Item 8. | Portfolio Managers of Closed-End Management Investment Companies. |
Not applicable to the registrant.
| Item 9. | Purchases of Equity Securities by Closed-End Management Investment Company and Affiliated Purchasers. |
Not applicable to the registrant.
| Item 10. | Submission of Matters to a Vote of Security Holders. |
The registrant has not adopted any material changes to the procedures by which shareholders may recommend nominees to the registrant’s Board.
| Item 11. | Controls and Procedures. |
(a) Within 90 days of the filing date of this Form N-CSR, Ann M. Carpenter, the registrant’s President and Principal Executive Officer, and Bruce S. Rosenberg, the registrant’s Treasurer and Principal Financial Officer, reviewed the registrant’s disclosure controls and procedures (as defined in Rule 30a-3(c) under the 1940 Act) and evaluated their effectiveness. Based on their review, Ms. Carpenter and Mr. Rosenberg determined that the disclosure controls and procedures adequately ensure that information required to be disclosed by the registrant in its periodic reports is recorded, processed, summarized and reported within the time periods required by the U.S. Securities and Exchange Commission.
(b) There were no changes in the registrant’s internal control over financial reporting (as defined in Rule 30a-3(d) under the 1940 Act) that occurred during the period covered by this report that have materially affected, or are reasonably likely to materially affect, the registrant’s internal control over financial reporting.
| Item 12. | Disclosure of Securities Lending Activities for Closed-End Management Investment Companies. |
(a) Not applicable to the registrant.
(b) Not applicable to the registrant.
(a)(1) Code of Ethics referred to in Item 2.
(a)(2) Separate certifications required by Rule 30a-2(a) under the 1940 Act for each principal executive officer and principal financial officer of the registrant are attached.
(a)(3) Not applicable to the registrant.
(a)(4) Not applicable.
(b) A single certification required by Rule 30a-2(b) under the 1940 Act, Rule 13a-14(b) or Rule 15d-14(b) under the 1934 Act, as amended, and Section 1350 of Chapter 63 of Title 18 of the United States Code for the principal executive officer and principal financial officer of the registrant is attached.
SIGNATURES
Pursuant to the requirements of the Securities Exchange Act of 1934, as amended, and the Investment Company Act of 1940, as amended, the registrant has duly caused this report to be signed on its behalf by the undersigned, thereunto duly authorized.
SSGA Active Trust
| | |
| By: | | /s/ Ann M. Carpenter |
| | Ann M. Carpenter |
| | President and Principal Executive Officer |
Date: September 7, 2023
Pursuant to the requirements of the Securities Exchange Act of 1934, as amended, and the Investment Company Act of 1940, as amended, this report has been signed below by the following persons on behalf of the registrant and in the capacities and on the dates indicated.
| | |
| By: | | /s/ Ann M. Carpenter |
| | Ann M. Carpenter |
| | President and Principal Executive Officer |
Date: September 7, 2023
| | |
| By: | | /s/ Bruce S. Rosenberg |
| | Bruce S. Rosenberg |
| | Treasurer and Principal Financial Officer |
Date: September 7, 2023