Table of Contents
UNITED STATES
SECURITIES AND EXCHANGE COMMISSION
Washington, D.C. 20549
FORM N-CSR
CERTIFIED SHAREHOLDER REPORT OF REGISTERED
MANAGEMENT INVESTMENT COMPANIES
Investment Company Act file number: 811-22542
SSGA ACTIVE TRUST
(Exact name of registrant as specified in charter)
One Iron Street, Boston, Massachusetts 02210
(Address of principal executive offices) (zip code)
Sean O’Malley, Esq.
Senior Vice President and Deputy General Counsel
c/o SSGA Funds Management, Inc.
One Iron Street
Boston, Massachusetts 02210
(Name and address of agent for service)
Copy to:
W. John McGuire, Esq.
Morgan, Lewis & Bockius LLP
1111 Pennsylvania Avenue, NW
Washington, DC 20004
Registrant’s telephone number, including area code: (617) 664-1465
Date of fiscal year end: June 30
Date of reporting period: June 30, 2020
Table of Contents
Explanatory Note: The Registrant is filing this amendment to its Form N-CSR for the year ended June 30, 2020, originally filed with the Securities and Exchange Commission on September 3, 2020 (Accession Number 0001193125-20-239008) to amend Item 1, “Reports to Shareholders”. The sole purpose of this amendment is to include the Management’s Discussion of Fund Performance disclosure for Series S000033060, that was inadvertently omitted in the original filing.
Table of Contents
Item 1. Reports to Shareholders.
Table of Contents
| SPDR SSGA Multi-Asset Real Return ETF |
| SPDR SSGA Income Allocation ETF |
| SPDR SSGA Global Allocation ETF |
| SPDR SSGA Ultra Short Term Bond ETF |
| SPDR MFS Systematic Core Equity ETF |
| SPDR MFS Systematic Growth Equity ETF |
| SPDR MFS Systematic Value Equity ETF |

Table of Contents
Table of Contents
| 1 | |
| Management’s Discussion of Fund Performance, Performance Summaries & Portfolio Statistics (Unaudited) | |
| 2 | |
| 5 | |
| 8 | |
| 11 | |
| 14 | |
| 17 | |
| 21 | |
| Schedules of Investments | |
| 24 | |
| 26 | |
| 28 | |
| 31 | |
| 38 | |
| 40 | |
| 42 | |
| 44 | |
| 51 | |
| 58 | |
| 67 | |
| 68 |
Table of Contents
Table of Contents
Table of Contents
Table of Contents
| Cumulative Total Return | Average Annual Total Return | |||||||||||||
| Net Asset Value | Market Value | Bloomberg Barclays U.S. Government Inflation-linked Bond Index | DBIQ Optimum Yield Diversified Commodity Index Excess Return | Net Asset Value | Market Value | Bloomberg Barclays U.S. Government Inflation-linked Bond Index | DBIQ Optimum Yield Diversified Commodity Index Excess Return | |||||||
| ONE YEAR | – 12.71% | – 12.81% | 8.74% | – 21.33% | – 12.71% | – 12.81% | 8.74% | – 21.33% | ||||||
| FIVE YEARS | – 7.36% | – 7.32% | 21.16% | – 30.78% | – 1.52% | – 1.51% | 3.91% | – 7.09% | ||||||
| SINCE INCEPTION(1) | – 14.72% | – 14.70% | 20.25% | – 53.60% | – 1.93% | – 1.92% | 2.28% | – 8.96% | ||||||
| (1) | For the period April 25, 2012 to June 30, 2020. |
(Based on Net Asset Value)

Table of Contents
| Description | % of Net Assets | ||
| Invesco Optimum Yield Diversified Commodity Strategy No. K-1 ETF | 21.3% | ||
| SPDR S&P Global Natural Resources ETF | 21.3 | ||
| SPDR Portfolio TIPS ETF | 17.6 | ||
| SPDR S&P Global Infrastructure ETF | 10.5 | ||
| SPDR FTSE International Government Inflation-Protected Bond ETF | 7.8 | ||
| TOTAL | 78.5% |
| % of Net Assets | |||
| Commodities | 23.5% | ||
| Natural Resources | 23.3 | ||
| Inflation Linked | 17.6 | ||
| International Equity | 12.6 | ||
| Real Estate | 12.2 | ||
| International Fixed Income | 7.8 | ||
| Domestic Equity | 2.6 | ||
| Short Term Investments | 20.2 | ||
| Liabilities in Excess of Other Assets | (19.8) | ||
| TOTAL | 100.0% |
Table of Contents
Table of Contents
| Cumulative Total Return | Average Annual Total Return | |||||||||||||
| Net Asset Value | Market Value | MSCI World Index | Bloomberg Barclays US Long Government /Credit Bond Index | Net Asset Value | Market Value | MSCI World Index | Bloomberg Barclays US Long Government /Credit Bond Index | |||||||
| ONE YEAR | – 4.56% | – 4.55% | 2.84% | 18.91% | – 4.56% | – 4.55% | 2.84% | 18.91% | ||||||
| FIVE YEARS | 17.95% | 18.00% | 39.59% | 53.73% | 3.36% | 3.37% | 6.90% | 8.98% | ||||||
| SINCE INCEPTION(1) | 38.58% | 38.58% | 101.42% | 73.16% | 4.07% | 4.07% | 8.94% | 6.94% | ||||||
| (1) | For the period April 25, 2012 to June 30, 2020. |
(Based on Net Asset Value)
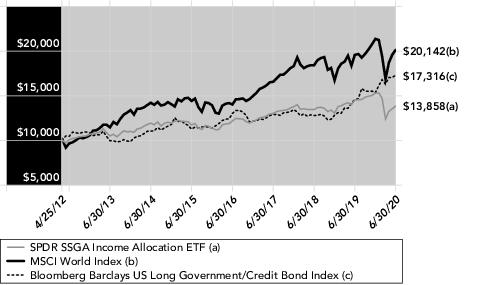
Table of Contents
| Description | % of Net Assets | ||
| SPDR Portfolio S&P 500 High Dividend ETF | 12.8% | ||
| SPDR Bloomberg Barclays High Yield Bond ETF | 12.1 | ||
| SPDR Blackstone / GSO Senior Loan ETF | 10.4 | ||
| SPDR Bloomberg Barclays Emerging Markets Local Bond ETF | 10.3 | ||
| SPDR Portfolio Long Term Treasury ETF | 8.6 | ||
| TOTAL | 54.2% |
| % of Net Assets | |||
| Domestic Fixed Income | 50.3% | ||
| Domestic Equity | 24.8 | ||
| International Equity | 11.7 | ||
| International Fixed Income | 10.3 | ||
| Inflation Linked | 2.7 | ||
| Short Term Investments | 17.1 | ||
| Liabilities in Excess of Other Assets | (16.9) | ||
| TOTAL | 100.0% |
Table of Contents
Table of Contents
| Cumulative Total Return | Average Annual Total Return | |||||||||||||
| Net Asset Value | Market Value | MSCI ACWI IMI Index | Bloomberg Barclays U.S. Aggregate Bond Index | Net Asset Value | Market Value | MSCI ACWI IMI Index | Bloomberg Barclays U.S. Aggregate Bond Index | |||||||
| ONE YEAR | – 1.00% | – 0.87% | 1.17% | 8.74% | – 1.00% | – 0.87% | 1.17% | 8.74% | ||||||
| FIVE YEARS | 21.53% | 21.55% | 34.52% | 23.45% | 3.98% | 3.98% | 6.11% | 4.30% | ||||||
| SINCE INCEPTION(1) | 54.19% | 54.37% | 88.35% | 31.89% | 5.43% | 5.45% | 8.05% | 3.44% | ||||||
| (1) | For the period April 25, 2012 to June 30, 2020. |
(Based on Net Asset Value)

Table of Contents
| Description | % of Net Assets | ||
| SPDR S&P 500 ETF Trust | 19.7% | ||
| SPDR Portfolio Developed World ex-US ETF | 16.5 | ||
| SPDR Portfolio Intermediate Term Corporate Bond ETF | 15.6 | ||
| SPDR Bloomberg Barclays High Yield Bond ETF | 11.0 | ||
| SPDR Portfolio Emerging Markets ETF | 7.1 | ||
| TOTAL | 69.9% |
| % of Net Assets | |||
| Domestic Fixed Income | 28.7% | ||
| Domestic Equity | 27.5 | ||
| International Equity | 27.5 | ||
| Inflation Linked | 5.3 | ||
| Commodities | 4.3 | ||
| International Fixed Income | 3.0 | ||
| Real Estate | 1.9 | ||
| Short Term Investments | 27.7 | ||
| Liabilities in Excess of Other Assets | (25.9) | ||
| TOTAL | 100.0% |
Table of Contents
Table of Contents
| Cumulative Total Return | Average Annual Total Return | ||||||||
| Net Asset Value | Market Value | Bloomberg Barclays US Treasury Bellwether 3 Month Index | Net Asset Value | Market Value | Bloomberg Barclays US Treasury Bellwether 3 Month Index | ||||
| ONE YEAR | 1.86% | 2.02% | 1.65% | 1.86% | 2.02% | 1.65% | |||
| FIVE YEARS | 8.72% | 8.89% | 6.20% | 1.69% | 1.72% | 1.21% | |||
| SINCE INCEPTION(1) | 9.44% | 9.62% | 6.30% | 1.35% | 1.38% | 0.91% | |||
| (1) | For the period October 9, 2013 to June 30, 2020. |
(Based on Net Asset Value)
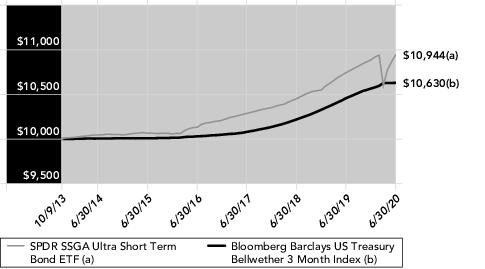
Table of Contents
| Description | % of Net Assets | ||
| Treasury Notes 1.63% 7/31/2020 | 3.5% | ||
| Ford Credit Auto Lease Trust 2.90% 5/15/2022 | 2.0 | ||
| Nissan Master Owner Trust Receivables ABS 0.50% 10/17/2022 | 1.9 | ||
| L3Harris Technologies, Inc. 1.06% 3/10/2023 | 1.6 | ||
| Albemarle Corp. 1.44% 11/15/2022 | 1.6 | ||
| TOTAL | 10.6% |
| % of Net Assets | |||
| Corporate Bonds & Notes | 62.6% | ||
| Asset-Backed Securities | 27.4 | ||
| U.S. Treasury Obligations | 3.5 | ||
| Mortgage-Backed Securities | 1.9 | ||
| Foreign Government Obligations | 0.1 | ||
| Short-Term Investment | 3.9 | ||
| U.S. Treasury | 0.4 | ||
| Other Assets in Excess of Liabilities | 0.2 | ||
| TOTAL | 100.0% |
Table of Contents
Table of Contents
| Cumulative Total Return | Average Annual Total Return | ||||||||
| Net Asset Value | Market Value | S&P 500 Index | Net Asset Value | Market Value | S&P 500 Index | ||||
| ONE YEAR | 2.78% | 2.77% | 7.51% | 2.78% | 2.77% | 7.51% | |||
| FIVE YEARS | 55.84% | 56.19% | 66.45% | 9.28% | 9.33% | 10.73% | |||
| SINCE INCEPTION(1) | 91.02% | 90.94% | 92.61% | 10.51% | 10.50% | 10.66% | |||
| (1) | For the period January 8, 2014 to June 30, 2020. |
(Based on Net Asset Value)
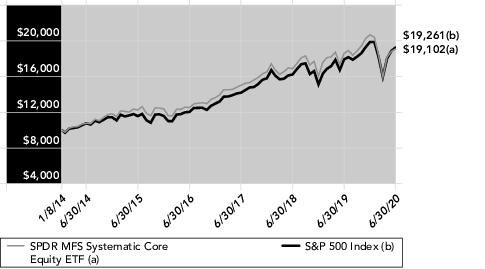
Table of Contents
| Description | % of Net Assets | ||
| Apple, Inc. | 9.5% | ||
| Microsoft Corp. | 9.5 | ||
| Johnson & Johnson | 4.2 | ||
| Intel Corp. | 4.0 | ||
| Alphabet, Inc. | 3.7 | ||
| TOTAL | 30.9% |
| % of Net Assets | |||
| Software | 12.6% | ||
| Technology Hardware, Storage & Peripherals | 9.5 | ||
| Pharmaceuticals | 7.9 | ||
| Interactive Media & Services | 7.1 | ||
| Machinery | 5.0 | ||
| Insurance | 4.6 | ||
| Semiconductors & Semiconductor Equipment | 4.0 | ||
| Health Care Providers & Services | 3.7 | ||
| Biotechnology | 3.4 | ||
| Internet & Direct Marketing Retail | 3.3 | ||
| Equity Real Estate Investment Trusts (REITs) | 3.1 | ||
| Hotels, Restaurants & Leisure | 3.1 | ||
| IT Services | 3.0 | ||
| Media | 3.0 | ||
| Tobacco | 2.9 | ||
| Banks | 2.8 | ||
| Independent Power and Renewable Electricity Producers | 2.6 | ||
| Multiline Retail | 2.6 | ||
| Food Products | 2.3 | ||
| Electric Utilities | 2.0 | ||
| Food & Staples Retailing | 1.8 | ||
| Oil, Gas & Consumable Fuels | 1.8 | ||
| Road & Rail | 1.5 | ||
| Consumer Finance | 1.4 | ||
| Entertainment | 1.1 | ||
| Health Care Equipment & Supplies | 0.9 | ||
| Capital Markets | 0.8 | ||
| Household Products | 0.7 | ||
| Construction & Engineering | 0.5 | ||
| Containers & Packaging | 0.5 | ||
| Short Term Investments | 0.5 | ||
| Other Assets in Excess of Liabilities | 0.0 | ||
| TOTAL | 100.0% |
Table of Contents
Table of Contents
Table of Contents
| Cumulative Total Return | Average Annual Total Return | ||||||||
| Net Asset Value | Market Value | Russell 1000 Growth Index | Net Asset Value | Market Value | Russell 1000 Growth Index | ||||
| ONE YEAR | 17.13% | 17.09% | 23.28% | 17.12% | 17.09% | 23.28% | |||
| FIVE YEARS | 75.73% | 75.30% | 109.04% | 11.94% | 11.88% | 15.89% | |||
| SINCE INCEPTION(1) | 122.41% | 122.33% | 147.36% | 13.14% | 13.13% | 15.02% | |||
| (1) | For the period January 8, 2014 to June 30, 2020. |
(Based on Net Asset Value)
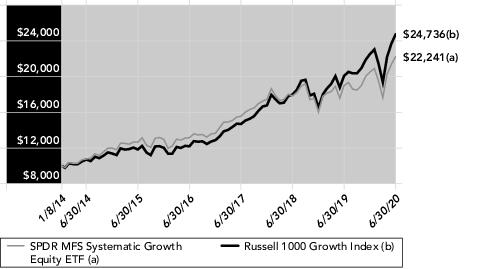
Table of Contents
| Description | % of Net Assets | ||
| Microsoft Corp. | 9.9% | ||
| Apple, Inc. | 8.8 | ||
| Amazon.com, Inc. | 6.2 | ||
| PayPal Holdings, Inc. | 3.7 | ||
| Alphabet, Inc. | 3.3 | ||
| TOTAL | 31.9% |
| % of Net Assets | |||
| Software | 19.3% | ||
| Technology Hardware, Storage & Peripherals | 8.8 | ||
| Internet & Direct Marketing Retail | 7.5 | ||
| IT Services | 7.0 | ||
| Interactive Media & Services | 6.4 | ||
| Semiconductors & Semiconductor Equipment | 6.3 | ||
| Pharmaceuticals | 6.0 | ||
| Entertainment | 4.8 | ||
| Biotechnology | 4.6 | ||
| Hotels, Restaurants & Leisure | 3.7 | ||
| Machinery | 3.5 | ||
| Health Care Providers & Services | 3.1 | ||
| Equity Real Estate Investment Trusts (REITs) | 2.4 | ||
| Tobacco | 2.4 | ||
| Media | 2.2 | ||
| Multiline Retail | 1.9 | ||
| Consumer Finance | 1.3 | ||
| Food & Staples Retailing | 1.1 | ||
| Construction & Engineering | 1.0 | ||
| Road & Rail | 1.0 | ||
| Independent Power & Renewable Electricity Producers | 1.0 | ||
| Specialty Retail | 0.9 | ||
| Insurance | 0.7 | ||
| Building Products | 0.7 | ||
| Industrial Conglomerates | 0.6 | ||
| Electric Utilities | 0.4 | ||
| Health Care Equipment & Supplies | 0.4 | ||
| Short-Term Investment | 1.0 | ||
| Other Assets in Excess of Liabilities | 0.0 | ||
| TOTAL | 100.0% |
Table of Contents
Table of Contents
| Cumulative Total Return | Average Annual Total Return | ||||||||
| Net Asset Value | Market Value | Russell 1000 Value Index | Net Asset Value | Market Value | Russell 1000 Value Index | ||||
| ONE YEAR | – 7.77% | – 7.80% | – 8.84% | – 7.77% | – 7.80% | – 8.84% | |||
| FIVE YEARS | 26.97% | 26.91% | 25.46% | 4.89% | 4.88% | 4.64% | |||
| SINCE INCEPTION(1) | 52.78% | 52.70% | 41.84% | 6.76% | 6.75% | 5.55% | |||
| (1) | For the period January 8, 2014 to June 30, 2020. |
(Based on Net Asset Value)
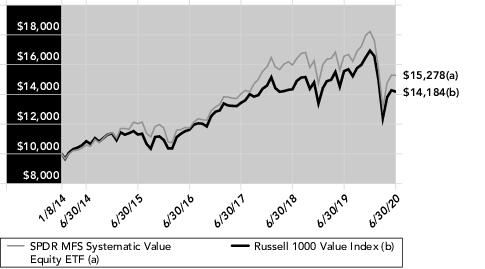
Table of Contents
| Description | % of Net Assets | ||
| Johnson & Johnson | 5.0% | ||
| Intel Corp. | 4.3 | ||
| Eaton Corp. PLC | 3.6 | ||
| Target Corp. | 3.5 | ||
| Citigroup, Inc. | 3.5 | ||
| TOTAL | 19.9% |
| % of Net Assets | |||
| Pharmaceuticals | 9.2% | ||
| Banks | 7.6 | ||
| Oil, Gas & Consumable Fuels | 6.5 | ||
| Equity Real Estate Investment Trusts (REITs) | 6.1 | ||
| Electrical Equipment | 6.0 | ||
| Electric Utilities | 5.3 | ||
| Insurance | 5.0 | ||
| Health Care Providers & Services | 4.6 | ||
| Capital Markets | 4.3 | ||
| Semiconductors & Semiconductor Equipment | 4.3 | ||
| Entertainment | 3.7 | ||
| Food Products | 3.7 | ||
| Independent Power and Renewable Electricity Producers | 3.5 | ||
| Software | 3.5 | ||
| Multiline Retail | 3.5 | ||
| Machinery | 2.5 | ||
| Household Durables | 2.5 | ||
| Media | 2.4 | ||
| Tobacco | 2.2 | ||
| IT Services | 1.9 | ||
| Containers & Packaging | 1.7 | ||
| Diversified Telecommunication Services | 1.6 | ||
| Food & Staples Retailing | 1.3 | ||
| Health Care Equipment & Supplies | 1.2 | ||
| Biotechnology | 1.2 | ||
| Road & Rail | 1.2 | ||
| Chemicals | 0.8 | ||
| Beverages | 0.7 | ||
| Household Products | 0.5 | ||
| Consumer Finance | 0.5 | ||
| Short Term Investments | 0.9 | ||
| Other Assets in Excess of Liabilities | 0.1 | ||
| TOTAL | 100.0% |
Table of Contents
| Security Description | Shares | Value | ||||
| MUTUAL FUNDS AND EXCHANGE TRADED PRODUCTS — 99.6% | ||||||
| COMMODITIES — 23.5% | ||||||
Invesco DB Gold Fund | 22,373 | $ 1,190,020 | ||||
Invesco Optimum Yield Diversified Commodity Strategy No. K-1 ETF (a) | 885,189 | 11,454,346 | ||||
| 12,644,366 | ||||||
| DOMESTIC EQUITY — 2.6% | ||||||
The Energy Select Sector SPDR Fund (a)(b) | 36,394 | 1,377,513 | ||||
| INFLATION LINKED — 17.6% | ||||||
SPDR Portfolio TIPS ETF (a)(b) | 313,232 | 9,440,812 | ||||
| INTERNATIONAL EQUITY — 12.6% | ||||||
SPDR S&P Global Infrastructure ETF (a)(b) | 129,115 | 5,650,072 | ||||
VanEck Vectors Agribusiness ETF (a) | 18,838 | 1,133,106 | ||||
| 6,783,178 | ||||||
| INTERNATIONAL FIXED INCOME — 7.8% | ||||||
SPDR FTSE International Government Inflation-Protected Bond ETF (a)(b) | 80,439 | 4,223,048 | ||||
| NATURAL RESOURCES — 23.3% | ||||||
SPDR S&P Global Natural Resources ETF (a)(b) | 309,534 | 11,431,090 | ||||
SPDR S&P Metals & Mining ETF (a)(b) | 50,635 | 1,072,956 | ||||
| 12,504,046 | ||||||
| REAL ESTATE — 12.2% | ||||||
SPDR Dow Jones International Real Estate ETF (a)(b) | 124,317 | 3,582,816 | ||||
SPDR Dow Jones REIT ETF (a)(b) | 38,078 | 2,971,226 | ||||
| 6,554,042 | ||||||
TOTAL MUTUAL FUNDS AND EXCHANGE TRADED PRODUCTS (Cost $64,927,413) | 53,527,005 | |||||
| Security Description | Shares | Value | ||||
| SHORT-TERM INVESTMENTS — 20.2% | ||||||
State Street Institutional U.S. Government Money Market Fund, Class G Shares 0.16% (c)(d) | 228,808 | $ 228,808 | ||||
State Street Navigator Securities Lending Portfolio II (e)(f) | 10,616,056 | 10,616,056 | ||||
TOTAL SHORT-TERM INVESTMENTS (Cost $10,844,864) | $ 10,844,864 | |||||
TOTAL INVESTMENTS—119.8% (Cost $75,772,277) | 64,371,869 | |||||
LIABILITIES IN EXCESS OF OTHER ASSETS—(19.8)% | (10,622,013) | |||||
NET ASSETS—100.0% | $ 53,749,856 | |||||
| The Fund invests in other funds and financial statements of underlying funds can be found at www.sec.gov. | |
| (a) | All or a portion of the shares of the security are on loan at June 30, 2020. |
| (b) | Affiliated fund managed by SSGA Funds Management, Inc. Amounts related to these transactions during the period ended June 30, 2020 are shown in the Affiliate Table below. |
| (c) | The Fund invested in certain money market funds managed by SSGA Funds Management, Inc. Amounts related to these transactions during the period ended June 30, 2020 are shown in the Affiliate Table below. |
| (d) | The rate shown is the annualized seven-day yield at June 30, 2020. |
| (e) | The Fund invested in an affiliated entity. Amounts related to these transactions during the period ended June 30, 2020 are shown in the Affiliate Table below. |
| (f) | Investment of cash collateral for securities loaned. |
| Description | Level 1 – Quoted Prices | Level 2 – Other Significant Observable Inputs | Level 3 – Significant Unobservable Inputs | Total | ||||
| ASSETS: | ||||||||
| INVESTMENTS: | ||||||||
Mutual Funds and Exchange Traded Products | $53,527,005 | $— | $— | $53,527,005 | ||||
Short-Term Investments | 10,844,864 | — | — | 10,844,864 | ||||
TOTAL INVESTMENTS | $64,371,869 | $— | $— | $64,371,869 |
Table of Contents
| Number of Shares Held at 6/30/19 | Value at 6/30/19 | Cost of Purchases | Proceeds from Shares Sold | Realized Gain (Loss) | Change in Unrealized Appreciation/ Depreciation | Number of Shares Held at 6/30/20 | Value at 6/30/20 | Dividend Income | |||||||||
SPDR Dow Jones International Real Estate ETF | 254,986 | $ 9,880,708 | $ 1,903,931 | $ 6,091,481 | $(1,016,828) | $(1,093,514) | 124,317 | $ 3,582,816 | $ 708,459 | ||||||||
SPDR Dow Jones REIT ETF | 99,368 | 9,817,558 | 3,510,348 | 8,769,104 | (344,936) | (1,242,640) | 38,078 | 2,971,226 | 253,707 | ||||||||
SPDR FTSE International Government Inflation-Protected Bond ETF | 120,728 | 6,710,062 | 1,996,501 | 4,109,612 | (278,507) | (95,396) | 80,439 | 4,223,048 | 131,689 | ||||||||
SPDR Portfolio TIPS ETF | 295,379 | 16,715,498 | 4,847,807 | 12,791,271 | 205,040 | 463,738 | 313,232 | 9,440,812 | 295,867 | ||||||||
SPDR S&P Global Infrastructure ETF | 212,055 | 11,266,482 | 2,335,988 | 6,181,154 | (107,804) | (1,663,440) | 129,115 | 5,650,072 | 234,177 | ||||||||
SPDR S&P Global Natural Resources ETF | 520,207 | 23,861,895 | 7,075,205 | 13,967,312 | (2,709,972) | (2,828,725) | 309,534 | 11,431,091 | 645,989 | ||||||||
SPDR S&P Metals & Mining ETF | 122,057 | 3,463,978 | 442,816 | 2,171,073 | (511,067) | (151,698) | 50,635 | 1,072,956 | 26,173 | ||||||||
State Street Institutional U.S. Government Money Market Fund, Class G Shares | 200,382 | 200,382 | 4,526,660 | 4,498,234 | — | — | 228,808 | 228,808 | 15,219 | ||||||||
State Street Navigator Securities Lending Portfolio II | — | — | 145,256,566 | 134,640,510 | — | — | 10,616,057 | 10,616,056 | 103,247 | ||||||||
State Street Navigator Securities Lending Portfolio III | 8,210,284 | 8,210,284 | 126,231,378 | 134,441,662 | — | — | — | — | 33,640 | ||||||||
The Energy Select Sector SPDR Fund | 89,126 | 5,678,217 | 1,292,014 | 4,139,545 | (1,278,828) | (174,345) | 36,394 | 1,377,513 | 189,638 | ||||||||
Total | $95,805,064 | $299,419,214 | $331,800,958 | $(6,042,902) | $(6,786,020) | $50,594,398 | $2,637,805 |
Table of Contents
| Security Description | Shares | Value | ||||
| MUTUAL FUNDS AND EXCHANGE TRADED PRODUCTS — 99.8% | ||||||
| DOMESTIC EQUITY — 24.8% | ||||||
Invesco KBW Premium Yield Equity REIT ETF | 157,076 | $ 3,017,430 | ||||
iShares Mortgage Real Estate ETF (a) | 228,622 | 5,683,543 | ||||
SPDR Portfolio S&P 500 High Dividend ETF (a)(b) | 579,022 | 16,125,763 | ||||
SPDR Wells Fargo Preferred Stock ETF (a)(b) | 155,828 | 6,521,402 | ||||
| 31,348,138 | ||||||
| DOMESTIC FIXED INCOME — 50.3% | ||||||
SPDR Blackstone / GSO Senior Loan ETF (a)(b) | 301,443 | 13,076,597 | ||||
SPDR Bloomberg Barclays Convertible Securities ETF (a)(b) | 110,491 | 6,684,706 | ||||
SPDR Bloomberg Barclays High Yield Bond ETF (b) | 151,472 | 15,322,908 | ||||
SPDR Portfolio Intermediate Term Corporate Bond ETF (a)(b) | 254,744 | 9,305,798 | ||||
SPDR Portfolio Long Term Corporate Bond ETF (b) | 258,039 | 8,179,836 | ||||
SPDR Portfolio Long Term Treasury ETF (b) | 230,530 | 10,814,162 | ||||
| 63,384,007 | ||||||
| INFLATION LINKED — 2.7% | ||||||
SPDR Portfolio TIPS ETF (a)(b) | 112,242 | 3,382,974 | ||||
| INTERNATIONAL EQUITY — 11.7% | ||||||
SPDR Portfolio Europe ETF (b) | 120,535 | 3,787,511 | ||||
SPDR S&P Global Infrastructure ETF (a)(b) | 137,414 | 6,013,237 | ||||
SPDR S&P International Dividend ETF (a)(b) | 148,835 | 4,930,903 | ||||
| 14,731,651 | ||||||
| INTERNATIONAL FIXED INCOME — 10.3% | ||||||
SPDR Bloomberg Barclays Emerging Markets Local Bond ETF (a)(b) | 496,684 | 13,018,088 | ||||
TOTAL MUTUAL FUNDS AND EXCHANGE TRADED PRODUCTS (Cost $134,961,804) | 125,864,858 | |||||
| Security Description | Shares | Value | ||||
| SHORT-TERM INVESTMENTS — 17.1% | ||||||
State Street Institutional U.S. Government Money Market Fund, Class G Shares 0.16% (c)(d) | 161,736 | $ 161,736 | ||||
State Street Navigator Securities Lending Portfolio II (e)(f) | 21,343,138 | 21,343,138 | ||||
TOTAL SHORT-TERM INVESTMENTS (Cost $21,504,874) | $ 21,504,874 | |||||
TOTAL INVESTMENTS—116.9% (Cost $156,466,678) | 147,369,732 | |||||
LIABILITIES IN EXCESS OF OTHER ASSETS—(16.9)% | (21,330,660) | |||||
NET ASSETS—100.0% | $ 126,039,072 | |||||
| The Fund invests in other funds and financial statements of underlying funds can be found at www.sec.gov. | |
| (a) | All or a portion of the shares of the security are on loan at June 30, 2020. |
| (b) | Affiliated fund managed by SSGA Funds Management, Inc. Amounts related to these transactions during the period ended June 30, 2020 are shown in the Affiliate Table below. |
| (c) | The Fund invested in certain money market funds managed by SSGA Funds Management, Inc. Amounts related to these transactions during the period ended June 30, 2020 are shown in the Affiliate Table below. |
| (d) | The rate shown is the annualized seven-day yield at June 30, 2020. |
| (e) | The Fund invested in an affiliated entity. Amounts related to these transactions during the period ended June 30, 2020 are shown in the Affiliate Table below. |
| (f) | Investment of cash collateral for securities loaned. |
Table of Contents
| Description | Level 1 – Quoted Prices | Level 2 – Other Significant Observable Inputs | Level 3 – Significant Unobservable Inputs | Total | ||||
| ASSETS: | ||||||||
| INVESTMENTS: | ||||||||
Mutual Funds and Exchange Traded Products | $125,864,858 | $— | $— | $125,864,858 | ||||
Short-Term Investments | 21,504,874 | — | — | 21,504,874 | ||||
TOTAL INVESTMENTS | $147,369,732 | $— | $— | $147,369,732 |
| Number of Shares Held at 6/30/19 | Value at 6/30/19 | Cost of Purchases | Proceeds from Shares Sold | Realized Gain (Loss) | Change in Unrealized Appreciation/ Depreciation | Number of Shares Held at 6/30/20 | Value at 6/30/20 | Dividend Income | |||||||||
SPDR Blackstone / GSO Senior Loan ETF | 221,297 | $10,228,347 | $ 12,895,437 | $ 8,781,351 | $ (532,941) | $ (732,895) | 301,443 | $ 13,076,597 | $ 645,501 | ||||||||
SPDR Bloomberg Barclays Convertible Securities ETF | 98,095 | 5,186,283 | 6,044,627 | 5,070,034 | 100,899 | 422,931 | 110,491 | 6,684,706 | 201,292 | ||||||||
SPDR Bloomberg Barclays Emerging Markets Local Bond ETF | 379,704 | 10,563,365 | 12,483,164 | 9,068,101 | (183,062) | (777,278) | 496,684 | 13,018,088 | 541,492 | ||||||||
SPDR Bloomberg Barclays High Yield Bond ETF | 134,592 | 14,662,453 | 18,296,799 | 15,897,094 | (1,303,315) | (435,935) | 151,472 | 15,322,908 | 818,815 | ||||||||
SPDR Portfolio Europe ETF | 91,861 | 3,138,890 | 7,141,824 | 5,567,728 | (509,603) | (415,872) | 120,535 | 3,787,511 | 109,879 | ||||||||
SPDR Portfolio Intermediate Term Corporate Bond ETF | 30,296 | 1,058,239 | 12,662,895 | 4,608,744 | 35,692 | 157,716 | 254,744 | 9,305,798 | 52,954 | ||||||||
SPDR Portfolio Long Term Corporate Bond ETF | 188,290 | 5,413,338 | 7,872,531 | 5,620,370 | 313,676 | 200,661 | 258,039 | 8,179,836 | 231,465 | ||||||||
SPDR Portfolio Long Term Treasury ETF | 278,234 | 10,617,409 | 12,622,521 | 15,211,285 | 2,005,695 | 779,822 | 230,530 | 10,814,162 | 261,357 | ||||||||
SPDR Portfolio S&P 500 High Dividend ETF | 361,461 | 13,749,976 | 24,310,923 | 14,675,055 | (2,105,111) | (5,154,970) | 579,022 | 16,125,763 | 955,385 | ||||||||
SPDR Portfolio TIPS ETF | 46,570 | 2,635,396 | 4,830,511 | 4,316,702 | 130,233 | 103,536 | 112,242 | 3,382,974 | 73,975 | ||||||||
SPDR S&P Global Infrastructure ETF | 99,667 | 5,295,308 | 6,710,718 | 4,416,385 | (201,596) | (1,374,808) | 137,414 | 6,013,237 | 190,770 | ||||||||
SPDR S&P International Dividend ETF | 106,418 | 4,188,613 | 7,824,120 | 5,839,192 | (83,177) | (1,159,460) | 148,835 | 4,930,904 | 160,484 | ||||||||
SPDR Wells Fargo Preferred Stock ETF | 120,314 | 5,198,768 | 6,133,481 | 4,320,076 | (282,300) | (208,471) | 155,828 | 6,521,402 | 333,500 | ||||||||
State Street Institutional U.S. Government Money Market Fund, Class G Shares | 241,663 | 241,663 | 12,660,547 | 12,740,474 | — | — | 161,736 | 161,736 | 24,336 | ||||||||
State Street Navigator Securities Lending Portfolio II | — | — | 376,326,779 | 354,983,641 | — | — | 21,343,138 | 21,343,138 | 204,749 | ||||||||
State Street Navigator Securities Lending Portfolio III | 4,478,400 | 4,478,400 | 104,750,346 | 109,228,746 | — | — | — | — | 80,211 | ||||||||
Total | $96,656,448 | $633,567,223 | $580,344,978 | $(2,614,910) | $(8,595,023) | $138,668,760 | $4,886,165 |
Table of Contents
| Security Description | Shares | Value | ||||
| MUTUAL FUNDS AND EXCHANGE TRADED PRODUCTS — 98.2% | ||||||
| COMMODITIES — 4.3% | ||||||
Invesco DB Gold Fund | 193,448 | $ 10,289,499 | ||||
| DOMESTIC EQUITY — 27.5% | ||||||
SPDR S&P 500 ETF Trust (a)(b) | 151,960 | 46,858,385 | ||||
SPDR S&P MidCap 400 ETF Trust (a)(b) | 13,834 | 4,488,995 | ||||
The Financial Select Sector SPDR Fund (a)(b) | 183,714 | 4,251,142 | ||||
The Health Care Select Sector SPDR Fund (a)(b) | 47,216 | 4,724,905 | ||||
The Technology Select Sector SPDR Fund (a)(b) | 48,236 | 5,040,180 | ||||
| 65,363,607 | ||||||
| DOMESTIC FIXED INCOME — 28.7% | ||||||
SPDR Bloomberg Barclays High Yield Bond ETF (a) | 257,809 | 26,079,959 | ||||
SPDR Portfolio Intermediate Term Corporate Bond ETF (a) | 1,018,040 | 37,189,001 | ||||
SPDR Portfolio Long Term Corporate Bond ETF (a) | 158,470 | 5,023,499 | ||||
| 68,292,459 | ||||||
| INFLATION LINKED — 5.3% | ||||||
SPDR Portfolio TIPS ETF (a)(b) | 414,567 | 12,495,049 | ||||
| INTERNATIONAL EQUITY — 27.5% | ||||||
SPDR Portfolio Developed World ex-US ETF (a)(b) | 1,424,858 | 39,354,578 | ||||
SPDR Portfolio Emerging Markets ETF (a)(b) | 501,104 | 16,766,940 | ||||
SPDR S&P Emerging Markets SmallCap ETF (a)(b) | 59,550 | 2,431,426 | ||||
SPDR S&P International Small Cap ETF (a) | 252,679 | 6,910,771 | ||||
| 65,463,715 | ||||||
| INTERNATIONAL FIXED INCOME — 3.0% | ||||||
SPDR Bloomberg Barclays Emerging Markets Local Bond ETF (a)(b) | 91,620 | 2,401,360 | ||||
SPDR Bloomberg Barclays International Corporate Bond ETF (a)(b) | 143,333 | 4,818,870 | ||||
| 7,220,230 | ||||||
| Security Description | Shares | Value | ||||
| REAL ESTATE — 1.9% | ||||||
SPDR Dow Jones International Real Estate ETF (a)(b) | 153,639 | $ 4,427,876 | ||||
TOTAL MUTUAL FUNDS AND EXCHANGE TRADED PRODUCTS (Cost $223,886,335) | 233,552,435 | |||||
| SHORT-TERM INVESTMENTS — 27.7% | ||||||
State Street Institutional U.S. Government Money Market Fund, Class G Shares 0.16% (c)(d) | 4,054,699 | 4,054,699 | ||||
State Street Navigator Securities Lending Portfolio II (e)(f) | 61,808,691 | 61,808,691 | ||||
TOTAL SHORT-TERM INVESTMENTS (Cost $65,863,390) | $ 65,863,390 | |||||
TOTAL INVESTMENTS—125.9% (Cost $289,749,725) | 299,415,825 | |||||
LIABILITIES IN EXCESS OF OTHER ASSETS—(25.9)% | (61,566,123) | |||||
NET ASSETS—100.0% | $ 237,849,702 | |||||
| The Fund invests in other funds and financial statements of underlying funds can be found at www.sec.gov. | |
| (a) | Affiliated fund managed by SSGA Funds Management, Inc. Amounts related to these transactions during the period ended June 30, 2020 are shown in the Affiliate Table below. |
| (b) | All or a portion of the shares of the security are on loan at June 30, 2020. |
| (c) | The Fund invested in certain money market funds managed by SSGA Funds Management, Inc. Amounts related to these transactions during the period ended June 30, 2020 are shown in the Affiliate Table below. |
| (d) | The rate shown is the annualized seven-day yield at June 30, 2020. |
| (e) | The Fund invested in an affiliated entity. Amounts related to these transactions during the period ended June 30, 2020 are shown in the Affiliate Table below. |
| (f) | Investment of cash collateral for securities loaned. |
Table of Contents
| Description | Level 1 – Quoted Prices | Level 2 – Other Significant Observable Inputs | Level 3 – Significant Unobservable Inputs | Total | ||||
| ASSETS: | ||||||||
| INVESTMENTS: | ||||||||
Mutual Funds and Exchange Traded Products | $233,552,435 | $— | $— | $233,552,435 | ||||
Short-Term Investments | 65,863,390 | — | — | 65,863,390 | ||||
TOTAL INVESTMENTS | $299,415,825 | $— | $— | $299,415,825 |
| Number of Shares Held at 6/30/19 | Value at 6/30/19 | Cost of Purchases | Proceeds from Shares Sold | Realized Gain (Loss) | Change in Unrealized Appreciation/ Depreciation(a) | Number of Shares Held at 6/30/20 | Value at 6/30/20 | Dividend Income | |||||||||
SPDR Bloomberg Barclays Emerging Markets Local Bond ETF | 94,356 | $ 2,624,984 | $ 478,369 | $ 587,656 | $ (21,953) | $ (92,384) | 91,620 | $ 2,401,360 | $ 111,713 | ||||||||
SPDR Bloomberg Barclays High Yield Bond ETF | 330,621 | 36,017,852 | 21,668,300 | 29,483,492 | (770,373) | (1,352,328) | 257,809 | 26,079,959 | 1,406,016 | ||||||||
SPDR Bloomberg Barclays International Corporate Bond ETF | 153,181 | 5,237,549 | 1,218,767 | 1,546,580 | (36,109) | (54,757) | 143,333 | 4,818,870 | 30,827 | ||||||||
SPDR Bloomberg Barclays International Treasury Bond ETF | 268,338 | 7,760,335 | 5,733,086 | 13,170,324 | (11,069) | (312,028) | — | — | 56,998 | ||||||||
SPDR Dow Jones International Real Estate ETF | 196,691 | 7,621,776 | 5,279,486 | 6,474,815 | (829,160) | (1,169,411) | 153,639 | 4,427,876 | 689,812 | ||||||||
SPDR Dow Jones REIT ETF | 177,621 | 17,548,955 | 10,371,758 | 24,896,026 | (2,827,930) | (196,757) | — | — | 468,825 | ||||||||
SPDR Portfolio Aggregate Bond ETF | 176,602 | 5,151,480 | 14,941,623 | 19,921,264 | 90,415 | (262,254) | — | — | 117,887 | ||||||||
SPDR Portfolio Developed World ex-US ETF | 1,382,195 | 40,899,150 | 18,798,641 | 16,485,790 | 174,335 | (4,031,758) | 1,424,858 | 39,354,578 | 900,028 | ||||||||
SPDR Portfolio Emerging Markets ETF | 364,020 | 13,028,276 | 21,385,432 | 15,417,279 | 991,136 | (3,220,625) | 501,104 | 16,766,940 | 424,002 | ||||||||
SPDR Portfolio Europe ETF | — | — | 12,006,787 | 10,338,983 | (1,667,804) | —* | — | —* | 75,918 | ||||||||
SPDR Portfolio Intermediate Term Corporate Bond ETF | 149,799 | 5,232,479 | 38,663,577 | 8,098,180 | 113,048 | 1,278,077 | 1,018,040 | 37,189,001 | 263,772 | ||||||||
SPDR Portfolio Intermediate Term Treasury ETF | 84,943 | 5,249,478 | 488,018 | 5,762,676 | 248,298 | (223,118) | — | — | 57,524 | ||||||||
SPDR Portfolio Long Term Corporate Bond ETF | — | — | 4,690,666 | 35,670 | 1,375 | 367,128 | 158,470 | 5,023,499 | 13,335 | ||||||||
SPDR Portfolio Small Cap ETF | 170,359 | 5,219,800 | 672,121 | 5,285,082 | (500,034) | (106,805) | — | — | 34,136 | ||||||||
SPDR Portfolio TIPS ETF | 228,037 | 12,904,614 | 3,663,349 | 4,871,900 | 139,948 | 659,038 | 414,567 | 12,495,049 | 263,752 | ||||||||
SPDR S&P 500 ETF Trust | 176,029 | 51,576,497 | 16,251,810 | 22,571,496 | 978,786 | 622,788 | 151,960 | 46,858,385 | 1,024,540 | ||||||||
SPDR S&P Emerging Markets SmallCap ETF | 56,408 | 2,521,438 | 3,192,938 | 2,950,935 | (10,372) | (321,643) | 59,550 | 2,431,426 | 72,312 | ||||||||
SPDR S&P International Small Cap ETF | 250,396 | 7,499,360 | 2,157,614 | 1,997,916 | (248,074) | (500,213) | 252,679 | 6,910,771 | 259,930 | ||||||||
SPDR S&P MidCap 400 ETF Trust | 14,440 | 5,120,280 | 1,300,766 | 1,500,615 | (10,243) | (421,193) | 13,834 | 4,488,995 | 74,910 | ||||||||
State Street Institutional U.S. Government Money Market Fund, Class G Shares | 2,263,193 | 2,263,193 | 27,058,087 | 25,266,581 | — | — | 4,054,699 | 4,054,699 | 142,385 | ||||||||
State Street Navigator Securities Lending Portfolio II | — | — | 1,037,475,283 | 975,666,592 | — | — | 61,808,691 | 61,808,691 | 314,878 | ||||||||
State Street Navigator Securities Lending Portfolio III | 10,451,625 | 10,451,625 | 408,353,101 | 418,804,726 | — | —* | — | —* | 94,290 | ||||||||
The Communication Services Select Sector SPDR Fund | — | — | 5,305,313 | 5,331,372 | 26,059 | —* | — | —* | 12,221 | ||||||||
The Consumer Staples Select Sector SPDR Fund | 86,816 | 5,041,405 | 4,598,072 | 9,733,220 | 25,306 | 68,437 | — | — | — | ||||||||
The Financial Select Sector SPDR Fund | — | — | 6,693,344 | 1,268,549 | (156,035) | (1,017,618) | 183,714 | 4,251,142 | 89,850 | ||||||||
The Health Care Select Sector SPDR Fund | 56,856 | 5,267,140 | 11,538,816 | 12,112,130 | 331,793 | (300,714) | 47,216 | 4,724,905 | 99,743 | ||||||||
The Industrial Select Sector SPDR Fund | 66,672 | 5,161,746 | 44,758 | 5,274,230 | 264,778 | (197,052) | — | — | — |
Table of Contents
| Number of Shares Held at 6/30/19 | Value at 6/30/19 | Cost of Purchases | Proceeds from Shares Sold | Realized Gain (Loss) | Change in Unrealized Appreciation/ Depreciation(a) | Number of Shares Held at 6/30/20 | Value at 6/30/20 | Dividend Income | |||||||||
The Real Estate Select Sector SPDR Fund | — | $ — | $ 10,910,382 | $ 11,226,015 | $ 315,633 | $ —* | — | $ —* | $ 35,758 | ||||||||
The Technology Select Sector SPDR Fund | — | — | 10,565,221 | 6,456,413 | 498,534 | 432,838 | 48,236 | 5,040,180 | 70,422 | ||||||||
Total | $259,399,412 | $1,705,505,485 | $1,662,536,507 | $(2,889,712) | $(10,352,352) | $289,126,326 | $7,205,784 |
| (a) | Does not include change in unrealized appreciation and depreciation from investments that are no longer affiliates at period ended June 30, 2020. |
| * | As of June 30, 2020, no longer an affiliate. |
Table of Contents
| Security Description | Principal Amount | Value | |||
| CORPORATE BONDS & NOTES — 62.6% | |||||
| AEROSPACE & DEFENSE — 1.6% | |||||
L3Harris Technologies, Inc. 3 Month USD LIBOR + 0.75%, 1.06%, 3/10/2023 (a) | $ 5,000,000 | $ 4,953,850 | |||
| AGRICULTURE — 1.9% | |||||
BAT Capital Corp. 3 Month USD LIBOR + 0.88%, 1.27%, 8/15/2022 (a) | 2,500,000 | 2,488,550 | |||
BAT International Finance PLC 3.50%, 6/15/2022 (b) | 2,000,000 | 2,091,980 | |||
Imperial Brands Finance PLC 3.50%, 2/11/2023 (b) | 1,000,000 | 1,039,830 | |||
| 5,620,360 | |||||
| AUTO MANUFACTURERS — 8.0% | |||||
| American Honda Finance Corp.: | |||||
Series GMTN, 3 Month USD LIBOR + 0.21%, 0.64%, 2/12/2021 (a) | 300,000 | 299,646 | |||
Series MTN, 3 Month USD LIBOR + 0.47%, 0.86%, 11/16/2022 (a) | 1,200,000 | 1,193,868 | |||
| Daimler Finance North America LLC: | |||||
3 Month USD LIBOR + 0.45%, 0.81%, 2/22/2021 (a) (b) | 1,515,000 | 1,508,395 | |||
3 Month USD LIBOR + 0.88%, 1.24%, 2/22/2022 (a) (b) | 2,000,000 | 1,974,720 | |||
3 Month USD LIBOR + 0.90%, 1.29%, 2/15/2022 (a) (b) | 1,250,000 | 1,233,212 | |||
| Ford Motor Credit Co. LLC: | |||||
2.34%, 11/2/2020 | 2,923,000 | 2,923,321 | |||
3.34%, 3/18/2021 | 2,659,000 | 2,632,304 | |||
| General Motors Financial Co., Inc.: | |||||
3 Month USD LIBOR + 0.54%, 1.04%, 11/6/2020 (a) | 1,000,000 | 993,840 | |||
3 Month USD LIBOR + 1.31%, 1.62%, 6/30/2022 (a) | 3,500,000 | 3,413,795 | |||
Hyundai Capital America 3 Month USD LIBOR + 0.94%, 2.29%, 7/8/2021 (a) (b) | 1,480,000 | 1,462,788 | |||
| Nissan Motor Acceptance Corp.: | |||||
3 Month USD LIBOR + 0.63%, 0.94%, 9/21/2021 (a) (b) | 1,500,000 | 1,436,685 | |||
3 Month USD LIBOR + 0.65%, 1.96%, 7/13/2022 (a) (b) | 3,000,000 | 2,788,260 | |||
Toyota Motor Credit Corp. Series MTN, 3 Month USD LIBOR + 0.48%, 0.80%, 9/8/2022 (a) | 2,000,000 | 1,990,200 | |||
| 23,851,034 |
| Security Description | Principal Amount | Value | |||
| BANKS — 22.3% | |||||
| Bank of America Corp.: | |||||
3 Month USD LIBOR + 0.38%, 1.42%, 1/23/2022 (a) | $ 625,000 | $ 624,394 | |||
Series MTN, 3 Month USD LIBOR + 0.65%, 0.95%, 10/1/2021 (a) | 1,400,000 | 1,400,350 | |||
Series MTN, 3 Month USD LIBOR + 1.18%, 2.29%, 10/21/2022 (a) | 1,814,000 | 1,827,986 | |||
Barclays Bank PLC 1.70%, 5/12/2022 | 985,000 | 1,002,829 | |||
CIT Group, Inc. 5.00%, 8/15/2022 | 1,000,000 | 1,021,560 | |||
| Citigroup, Inc.: | |||||
2.75%, 4/25/2022 | 1,000,000 | 1,035,940 | |||
3 Month USD LIBOR + 0.96%, 1.95%, 4/25/2022 (a) | 1,250,000 | 1,254,187 | |||
3 Month USD LIBOR + 1.43%, 1.78%, 9/1/2023 (a) | 1,250,000 | 1,261,900 | |||
Cooperatieve Rabobank UA 3 Month USD LIBOR + 0.48%, 1.79%, 1/10/2023 (a) | 250,000 | 249,845 | |||
Deutsche Bank AG 3 Month USD LIBOR + 1.31%, 1.69%, 8/20/2020 (a) | 4,180,000 | 4,171,556 | |||
| Goldman Sachs Group, Inc.: | |||||
2.35%, 11/15/2021 | 1,250,000 | 1,257,675 | |||
3 Month USD LIBOR + 1.36%, 2.35%, 4/23/2021 (a) | 2,250,000 | 2,265,435 | |||
Series FRN, 3 Month USD LIBOR + 1.77%, 2.13%, 2/25/2021 (a) | 250,000 | 252,240 | |||
| HSBC Holdings PLC: | |||||
3 Month USD LIBOR + 0.65%, 0.97%, 9/11/2021 (a) | 1,250,000 | 1,250,213 | |||
3 Month USD LIBOR + 1.50%, 2.87%, 1/5/2022 (a) | 1,500,000 | 1,519,080 | |||
3 Month USD LIBOR + 1.66%, 2.02%, 5/25/2021 (a) | 730,000 | 737,913 | |||
| JPMorgan Chase & Co.: | |||||
3 Month USD LIBOR + 0.61%, 3.51%, 6/18/2022 (a) | 2,000,000 | 2,053,820 | |||
3 Month USD LIBOR + 1.10%, 1.42%, 6/7/2021 (a) | 1,750,000 | 1,763,405 | |||
3 Month USD LIBOR + 1.23%, 2.25%, 10/24/2023 (a) | 1,500,000 | 1,516,215 | |||
KeyBank NA Series BKNT, 3 Month USD LIBOR + 0.66%, 1.35%, 2/1/2022 (a) | 1,000,000 | 1,002,990 | |||
Lloyds Banking Group PLC 1 year CMT + 1.10%, 1.33%, 6/15/2023 (a) | 1,295,000 | 1,303,793 | |||
| Mitsubishi UFJ Financial Group, Inc.: | |||||
3.54%, 7/26/2021 | 2,000,000 | 2,064,840 |
Table of Contents
| Security Description | Principal Amount | Value | |||
3 Month USD LIBOR + 0.65%, 1.64%, 7/26/2021 (a) | $ 436,000 | $ 437,038 | |||
3 Month USD LIBOR + 0.79%, 1.78%, 7/25/2022 (a) | 1,500,000 | 1,503,300 | |||
3 Month USD LIBOR + 1.06%, 1.37%, 9/13/2021 (a) | 300,000 | 302,304 | |||
Mizuho Financial Group, Inc. 3 Month USD LIBOR + 0.88%, 1.19%, 9/11/2022 (a) | 3,500,000 | 3,482,150 | |||
| Morgan Stanley: | |||||
Series GMTN, SOFR + 0.70%, 0.76%, 1/20/2023 (a) | 2,400,000 | 2,389,368 | |||
Series MTN, 3 Month USD LIBOR + 1.40%, 2.42%, 10/24/2023 (a) | 2,000,000 | 2,020,280 | |||
| National Australia Bank, Ltd.: | |||||
3 Month USD LIBOR + 0.58%, 0.89%, 9/20/2021 (a) (b) | 750,000 | 752,655 | |||
3 Month USD LIBOR + 0.71%, 1.27%, 11/4/2021 (a) (b) | 500,000 | 503,120 | |||
| Royal Bank of Canada: | |||||
Series GMTN, 3 Month USD LIBOR + 0.36%, 1.49%, 1/17/2023 (a) | 3,000,000 | 2,982,060 | |||
Series GMTN, SOFR + 0.40%, 0.47%, 8/5/2022 (a) | 4,000,000 | 3,969,960 | |||
| Santander UK PLC: | |||||
3 Month USD LIBOR + 0.30%, 0.86%, 11/3/2020 (a) | 600,000 | 600,420 | |||
3 Month USD LIBOR + 0.62%, 0.97%, 6/1/2021 (a) | 300,000 | 300,792 | |||
Skandinaviska Enskilda Banken AB 3 Month USD LIBOR + 0.43%, 0.82%, 5/17/2021 (a) (b) | 1,500,000 | 1,503,210 | |||
Sumitomo Mitsui Financial Group, Inc. 3 Month USD LIBOR + 1.14%, 2.28%, 10/19/2021 (a) | 2,252,000 | 2,269,633 | |||
Toronto-Dominion Bank 3 Month USD LIBOR + 0.90%, 2.21%, 7/13/2021 (a) | 400,000 | 403,260 | |||
Truist Bank Series BKNT, 3 Month USD LIBOR + 0.50%, 1.49%, 10/26/2021 (a) | 1,000,000 | 1,000,750 | |||
UBS AG 3 Month USD LIBOR + 0.48%, 0.83%, 12/1/2020 (a) (b) | 550,000 | 550,704 | |||
| UBS Group AG: | |||||
3 Month USD LIBOR + 0.95%, 1.34%, 8/15/2023 (a) (b) | 3,850,000 | 3,852,117 | |||
3 Month USD LIBOR + 1.53%, 2.22%, 2/1/2022 (a) (b) | 3,000,000 | 3,051,720 | |||
| Westpac Banking Corp.: | |||||
3 Month USD LIBOR + 0.34%, 1.33%, 1/25/2021 (a) | 1,000,000 | 1,001,120 |
| Security Description | Principal Amount | Value | |||
3 Month USD LIBOR + 0.39%, 1.70%, 1/13/2023 (a) | $ 3,000,000 | $ 2,998,140 | |||
| 66,712,267 | |||||
| BEVERAGES — 0.4% | |||||
Constellation Brands, Inc. 3 Month USD LIBOR + 0.70%, 1.09%, 11/15/2021 (a) | 1,200,000 | 1,197,612 | |||
| CHEMICALS — 2.1% | |||||
Albemarle Corp. 3 Month USD LIBOR + 1.05%, 1.44%, 11/15/2022 (a) (b) | 5,000,000 | 4,780,150 | |||
DuPont de Nemours, Inc. 3 Month USD LIBOR + 1.11%, 1.50%, 11/15/2023 (a) | 1,460,000 | 1,462,000 | |||
| 6,242,150 | |||||
| COMPUTERS — 1.0% | |||||
Apple, Inc. 3 Month USD LIBOR + 0.50%, 0.95%, 2/9/2022 (a) | 750,000 | 754,680 | |||
IBM Credit LLC 3 Month USD LIBOR + 0.16%, 0.70%, 2/5/2021 (a) | 725,000 | 725,478 | |||
Leidos, Inc. 2.95%, 5/15/2023 (b) | 1,435,000 | 1,506,377 | |||
| 2,986,535 | |||||
| DIVERSIFIED FINANCIAL SERVICES — 0.6% | |||||
AerCap Ireland Capital DAC/AerCap Global Aviation Trust 5.00%, 10/1/2021 | 1,300,000 | 1,314,690 | |||
American Express Credit Corp. Series MTN, 3 Month USD LIBOR + 0.70%, 1.04%, 3/3/2022 (a) | 619,000 | 621,755 | |||
| 1,936,445 | |||||
| ELECTRIC — 3.3% | |||||
Dominion Energy, Inc. 3 Month USD LIBOR + 0.40%, 0.75%, 12/1/2020 (a) (b) | 1,500,000 | 1,495,500 | |||
Duke Energy Corp. 3 Month USD LIBOR + 0.65%, 0.96%, 3/11/2022 (a) | 2,200,000 | 2,200,572 | |||
Duke Energy Florida LLC Series A, 3 Month USD LIBOR + 0.25%, 0.61%, 11/26/2021 (a) | 1,330,000 | 1,328,111 | |||
| Pacific Gas & Electric Co.: | |||||
1.75%, 6/16/2022 | 770,000 | 771,532 | |||
3 Month USD LIBOR + 1.48%, 1.80%, 6/16/2022 (a) | 1,500,000 | 1,502,865 | |||
| Sempra Energy: | |||||
3 Month USD LIBOR + 0.45%, 0.76%, 3/15/2021 (a) | 1,395,000 | 1,397,790 |
Table of Contents
| Security Description | Principal Amount | Value | |||
3 Month USD LIBOR + 0.50%, 1.72%, 1/15/2021 (a) | $ 1,050,000 | $ 1,049,948 | |||
| 9,746,318 | |||||
| FOOD — 1.2% | |||||
General Mills, Inc. 3 Month USD LIBOR + 1.01%, 2.14%, 10/17/2023 (a) | 1,000,000 | 1,004,960 | |||
Tyson Foods, Inc. 3 Month USD LIBOR + 0.45%, 0.82%, 8/21/2020 (a) | 2,611,000 | 2,611,235 | |||
| 3,616,195 | |||||
| HEALTH CARE SERVICES — 0.9% | |||||
| UnitedHealth Group, Inc.: | |||||
3 Month USD LIBOR + 0.07%, 1.29%, 10/15/2020 (a) | 2,046,000 | 2,046,123 | |||
3 Month USD LIBOR + 0.26%, 0.57%, 6/15/2021 (a) | 600,000 | 599,646 | |||
| 2,645,769 | |||||
| INSURANCE — 3.8% | |||||
Allstate Corp 3 Month USD LIBOR + 0.63%, 0.94%, 3/29/2023 (a) | 1,500,000 | 1,495,395 | |||
Jackson National Life Global Funding 3 Month USD LIBOR + 0.73%, 1.04%, 6/27/2022 (a) (b) | 650,000 | 651,989 | |||
MET Tower Global Funding SOFR + 0.55%, 0.61%, 1/17/2023 (a) (b) | 1,500,000 | 1,488,540 | |||
| Metropolitan Life Global Funding I: | |||||
1.95%, 9/15/2021 (b) | 3,000,000 | 3,052,140 | |||
SOFR + 0.57%, 0.62%, 1/13/2023 (a) (b) | 3,000,000 | 2,979,300 | |||
Pricoa Global Funding I 2.40%, 9/23/2024 (b) | 1,500,000 | 1,588,395 | |||
| 11,255,759 | |||||
| MACHINERY, CONSTRUCTION & MINING — 1.6% | |||||
| Caterpillar Financial Services Corp.: | |||||
Series MTN, 3 Month USD LIBOR + 0.23%, 0.54%, 3/15/2021 (a) | 1,426,000 | 1,426,913 | |||
Series MTN, 3 Month USD LIBOR + 0.28%, 0.60%, 9/7/2021 (a) | 500,000 | 500,625 | |||
Series MTN, 3 Month USD LIBOR + 0.59%, 0.91%, 6/6/2022 (a) | 2,872,000 | 2,886,992 | |||
| 4,814,530 |
| Security Description | Principal Amount | Value | |||
| MACHINERY-DIVERSIFIED — 0.9% | |||||
John Deere Capital Corp. Series MTN, 3 Month USD LIBOR + 0.48%, 0.80%, 9/8/2022 (a) | $ 1,395,000 | $ 1,399,603 | |||
Otis Worldwide Corp. 3 Month USD LIBOR + 0.45%, 2.09%, 4/5/2023 (a) (b) | 1,250,000 | 1,235,163 | |||
| 2,634,766 | |||||
| MEDIA — 1.9% | |||||
NBCUniversal Enterprise, Inc. 3 Month USD LIBOR + 0.40%, 0.70%, 4/1/2021 (a) (b) | 3,400,000 | 3,406,052 | |||
Walt Disney Co. 3 Month USD LIBOR + 0.25%, 0.60%, 9/1/2021 (a) | 2,300,000 | 2,296,228 | |||
| 5,702,280 | |||||
| MISCELLANEOUS MANUFACTURER — 0.5% | |||||
General Electric Co. Series MTN, 4.65%, 10/17/2021 | 1,500,000 | 1,570,365 | |||
| OIL & GAS — 2.2% | |||||
BP Capital Markets America, Inc. 3 Month USD LIBOR + 0.65%, 0.97%, 9/19/2022 (a) | 250,000 | 249,095 | |||
| Chevron Corp.: | |||||
1.14%, 5/11/2023 | 285,000 | 289,885 | |||
3 Month USD LIBOR + 0.48%, 0.82%, 3/3/2022 (a) | 500,000 | 501,645 | |||
ConocoPhillips Co. 3 Month USD LIBOR + 0.90%, 1.29%, 5/15/2022 (a) | 2,100,000 | 2,108,274 | |||
Occidental Petroleum Corp. 3 Month USD LIBOR + 1.25%, 1.68%, 8/13/2021 (a) | 750,000 | 718,343 | |||
Shell International Finance B.V. 3 Month USD LIBOR + 0.40%, 0.83%, 11/13/2023 (a) | 2,000,000 | 1,988,020 | |||
Suncor Energy, Inc. 2.80%, 5/15/2023 | 650,000 | 678,561 | |||
| 6,533,823 | |||||
| PHARMACEUTICALS — 3.1% | |||||
AstraZeneca PLC 3 Month USD LIBOR + 0.62%, 0.93%, 6/10/2022 (a) | 690,000 | 692,360 | |||
Bayer US Finance II LLC 3 Month USD LIBOR + 0.63%, 0.93%, 6/25/2021 (a) (b) | 2,000,000 | 2,000,520 | |||
| Bristol-Myers Squibb Co.: | |||||
2.25%, 8/15/2021 (b) | 1,000,000 | 1,019,160 | |||
3 Month USD LIBOR + 0.38%, 0.77%, 5/16/2022 (a) (b) | 2,000,000 | 2,005,880 |
Table of Contents
| Security Description | Principal Amount | Value | |||
CVS Health Corp. 3 Month USD LIBOR + 0.72%, 1.03%, 3/9/2021 (a) | $ 750,000 | $ 752,677 | |||
Mylan NV 3.15%, 6/15/2021 | 2,724,000 | 2,780,605 | |||
| 9,251,202 | |||||
| PIPELINES — 3.1% | |||||
Kinder Morgan Energy Partners L.P. 3.50%, 3/1/2021 | 2,000,000 | 2,024,340 | |||
| MPLX L.P.: | |||||
3 Month USD LIBOR + 0.90%, 1.21%, 9/9/2021 (a) | 3,000,000 | 2,971,590 | |||
3 Month USD LIBOR + 1.10%, 1.41%, 9/9/2022 (a) | 1,925,000 | 1,896,356 | |||
| Plains All American Pipeline L.P./PAA Finance Corp.: | |||||
3.65%, 6/1/2022 | 1,000,000 | 1,021,110 | |||
5.00%, 2/1/2021 | 1,500,000 | 1,515,465 | |||
| 9,428,861 | |||||
| RETAIL — 0.2% | |||||
Home Depot, Inc. 3 Month USD LIBOR + 0.31%, 0.66%, 3/1/2022 (a) | 500,000 | 500,155 | |||
| SEMICONDUCTORS — 0.6% | |||||
Broadcom, Inc. 2.25%, 11/15/2023 (b) | 1,785,000 | 1,843,994 | |||
| TELECOMMUNICATIONS — 1.3% | |||||
Vodafone Group PLC 3 Month USD LIBOR + 0.99%, 2.17%, 1/16/2024 (a) | 4,000,000 | 3,988,520 | |||
| TRANSPORTATION — 0.1% | |||||
United Parcel Service, Inc. 3 Month USD LIBOR + 0.45%, 0.75%, 4/1/2023 (a) | 200,000 | 199,932 | |||
TOTAL CORPORATE BONDS & NOTES (Cost $187,873,651) | 187,232,722 | ||||
| ASSET-BACKED SECURITIES — 27.4% | |||||
| ASSET-BACKED - OTHER — 4.6% | |||||
| BMW Floorplan Master Owner Trust: | |||||
Series 2018-1, Class A1, 3.15%, 5/15/2023 (b) | 375,000 | 381,785 | |||
Series 2018-1, Class A2, 1 Month USD LIBOR + 0.32%, 0.50%, 5/15/2023 (a) (b) | 500,000 | 498,547 |
| Security Description | Principal Amount | Value | |||
Ford Credit Floorplan Master Owner Trust A Series 2017-2, Class A2, 1 Month USD LIBOR + 0.35%, 0.53%, 9/15/2022 (a) | $ 270,000 | $ 269,962 | |||
| GMF Floorplan Owner Revolving Trust: | |||||
Series 2018-3, Class A, 1 Month USD LIBOR + 0.32%, 0.50%, 9/15/2022 (a) (b) | 3,600,000 | 3,598,384 | |||
Series 2018-2, Class A2, 1 Month USD LIBOR + 0.38%, 0.56%, 3/15/2023 (a) (b) | 1,100,000 | 1,097,929 | |||
Series 2017-2, Class A2, 1 Month USD LIBOR + 0.43%, 0.61%, 7/15/2022 (a) (b) | 2,100,000 | 2,099,965 | |||
Nissan Master Owner Trust Receivables Series 2017-C, Class A, 1 Month USD LIBOR + 0.32%, 0.50%, 10/17/2022 (a) | 5,815,000 | 5,811,293 | |||
| 13,757,865 | |||||
| AUTOMOBILE — 12.0% | |||||
| Ally Auto Receivables Trust: | |||||
Series 2017-3, Class A4, 2.01%, 3/15/2022 | 750,000 | 753,893 | |||
Series 2018-3, Class A3, 3.00%, 1/17/2023 | 1,439,289 | 1,459,549 | |||
| Carmax Auto Owner Trust: | |||||
Series 2017-1, Class B, 2.54%, 9/15/2022 | 723,000 | 733,550 | |||
Series 2019-4, Class A2B, 1 Month USD LIBOR + 0.30%, 0.48%, 3/15/2023 (a) | 1,417,767 | 1,418,317 | |||
Series 2019-4, Class A2A, 2.01%, 3/15/2023 | 344,990 | 348,097 | |||
CarMax Auto Owner Trust Series 2018-3, Class A3, 3.13%, 6/15/2023 | 989,156 | 1,010,417 | |||
Chrysler Capital Auto Receivables Trust Series 2016-AA, Class D, 4.22%, 2/15/2023 (b) | 269,971 | 270,276 | |||
| Enterprise Fleet Financing LLC: | |||||
Series 2017-1, Class A3, 2.60%, 7/20/2022 (b) | 1,799,419 | 1,800,880 | |||
Series 2019-1, Class A2, 2.98%, 10/20/2024 (b) | 1,843,154 | 1,878,080 | |||
Series 2018-3, Class A2, 3.38%, 5/20/2024 (b) | 1,467,068 | 1,492,376 | |||
Ford Credit Auto Lease Trust Series 2019-A, Class A3, Class A3, 2.90%, 5/15/2022 | 6,050,000 | 6,133,810 |
Table of Contents
| Security Description | Principal Amount | Value | |||
Ford Credit Auto Owner Trust Series 2016-C, Class A4, Class A4, 1.40%, 2/15/2022 | $ 94,688 | $ 94,835 | |||
| GM Financial Automobile Leasing Trust: | |||||
Series 2018-2, Class A3, 3.06%, 6/21/2021 | 478,935 | 480,138 | |||
Series 2020-1, Class A2B, 1 Month USD LIBOR + 0.14%, 0.33%, 4/20/2022 (a) | 2,000,000 | 1,994,639 | |||
GM Financial Consumer Automobile Receivables Trust Series 2017-3A, Class A4, 2.13%, 3/16/2023 (b) | 2,000,000 | 2,030,767 | |||
| Hyundai Auto Lease Securitization Trust: | |||||
Series 2018-B, Class A4, 3.20%, 6/15/2022 (b) | 2,534,000 | 2,567,224 | |||
Series 2020-A, Class A2, 1.90%, 5/16/2022 (b) | 1,000,000 | 1,009,474 | |||
Series 2018-A, Class A4, 2.89%, 3/15/2022 (b) | 800,000 | 804,852 | |||
Series 2019-A, Class A3, 2.98%, 7/15/2022 (b) | 1,200,000 | 1,219,502 | |||
Nissan Auto Lease Trust Series 2018-A, Class A3, 3.25%, 9/15/2021 | 578,384 | 582,737 | |||
| Santander Retail Auto Lease Trust: | |||||
Series 2019-C, Class A2A, 1.89%, 9/20/2022 (b) | 1,316,306 | 1,328,715 | |||
Series 2019-B, Class A3, 2.30%, 1/20/2023 (b) | 2,200,000 | 2,249,168 | |||
| Securitized Term Auto Receivables Trust: | |||||
Series 2017-2A, Class A4, 2.29%, 3/25/2022 (b) | 825,000 | 829,076 | |||
Series 2019-1A, Class A2, 2.86%, 5/25/2021 (b) | 116,308 | 116,468 | |||
Series 2018-2A, Class A3, 3.33%, 8/25/2022 (b) | 1,080,165 | 1,096,749 | |||
World Omni Auto Receivables Trust Series 2018-C, Class A2, 2.80%, 1/18/2022 | 82,284 | 82,353 | |||
World Omni Auto Receivables Trust Series 2018-B, Class A3, 2.87%, 7/17/2023 | 1,414,103 | 1,437,681 | |||
| World Omni Automobile Lease Securitization Trust: | |||||
Series 2018-A, Class A3, 2.83%, 7/15/2021 | 381,123 | 381,814 | |||
Series 2018-B, Class A2A, 2.96%, 6/15/2021 | 261,160 | 261,797 | |||
| 35,867,234 |
| Security Description | Principal Amount | Value | |||
| CREDIT CARD — 10.0% | |||||
Capital One Multi-Asset Execution Trust Series 2016-A2, Class A2, Class A2, 1 Month USD LIBOR + 0.63%, 0.81%, 2/15/2024 (a) | $ 500,000 | $ 501,861 | |||
| Chase Issuance Trust: | |||||
Series 2018-A1, Class A1, Class A1, 1 Month USD LIBOR + 0.20%, 0.38%, 4/17/2023 (a) | 400,000 | 400,228 | |||
Series 2017-A2, Class A, 1 Month USD LIBOR + 0.40%, 0.58%, 3/15/2024 (a) | 3,681,000 | 3,691,222 | |||
| Evergreen Credit Card Trust: | |||||
Series 2018-2, Class A, 1 Month USD LIBOR + 0.35%, 0.53%, 7/15/2022 (a) (b) | 665,000 | 665,042 | |||
Series 2019-1, Class A, 1 Month USD LIBOR + 0.48%, 0.66%, 1/15/2023 (a) (b) | 4,500,000 | 4,508,185 | |||
| Golden Credit Card Trust: | |||||
Series 2019-1A, Class A, 1 Month USD LIBOR + 0.45%, 0.63%, 12/15/2022 (a) (b) | 3,030,000 | 3,033,864 | |||
Series 2018-1A, Class A, 2.62%, 1/15/2023 (b) | 2,750,000 | 2,782,188 | |||
Series 2018-3A, Class A, 1 Month USD LIBOR + 0.32%, 0.50%, 5/15/2023 (a) (b) | 1,100,000 | 1,099,688 | |||
Master Credit Card Trust Series 2019-1A, Class A, 1 Month USD LIBOR + 0.48%, 0.67%, 7/21/2022 (a) (b) | 3,400,000 | 3,392,293 | |||
| Master Credit Card Trust II: | |||||
Series 2018-3A, Class A, 1 Month USD LIBOR + 0.34%, 0.53%, 1/21/2022 (a) (b) | 1,000,000 | 999,660 | |||
Series 2019-2A, Class A, 1 Month USD LIBOR + 0.39%, 0.58%, 1/21/2023 (a) (b) | 3,150,000 | 3,142,814 | |||
| Trillium Credit Card Trust II: | |||||
Series 2018-2A, Class A, 1 Month USD LIBOR + 0.35%, 0.53%, 9/26/2023 (a) (b) | 3,775,000 | 3,774,529 | |||
Series 2019-1A, Class A, 1 Month USD LIBOR + 0.48%, 0.66%, 1/26/2024 (a) (b) | 1,725,000 | 1,727,427 | |||
| 29,719,001 |
Table of Contents
| Security Description | Principal Amount | Value | |||
| OTHER ABS — 0.8% | |||||
Verizon Owner Trust Series 2018-1A, Class A1A, 2.82%, 9/20/2022 (b) | $ 2,454,740 | $ 2,476,709 | |||
TOTAL ASSET-BACKED SECURITIES (Cost $81,721,731) | 81,820,809 | ||||
| FOREIGN GOVERNMENT OBLIGATIONS — 0.1% | |||||
| CANADA — 0.1% | |||||
Province of Quebec Canada Series MTN, 3 Month USD LIBOR + 0.13%, 0.44%, 9/21/2020 (a) (Cost $250,000) | 250,000 | 249,983 | |||
| U.S. TREASURY OBLIGATIONS — 3.5% | |||||
Treasury Notes 1.63%, 7/31/2020 | 10,614,000 | 10,626,438 | |||
| MORTGAGE-BACKED SECURITIES — 1.9% | |||||
| BX Commercial Mortgage Trust: | |||||
Series 2018-BIOA, Class A, Class A, 1 Month USD LIBOR + 0.67%, 0.86%, 3/15/2037 (a) (b) | 1,437,000 | 1,398,421 | |||
Series 2019-XL, Class A, Class A, 1 Month USD LIBOR + 0.92%, 1.10%, 10/15/2036 (a) (b) | 1,815,261 | 1,799,615 | |||
Credit Suisse Mortgage Capital Certificates Series 2019-ICE4, Class A, 1 Month USD LIBOR + 0.98%, 1.16%, 5/15/2036 (a) (b) | 2,460,000 | 2,437,111 | |||
TOTAL MORTGAGE-BACKED SECURITIES (Cost $5,700,632) | 5,635,147 |
| Shares | |||
| U.S. TREASURY — 0.4% | |||
U.S. Treasury Note 0.09%, 9/30/2020 (Cost $990,219) | 987,000 | 989,969 |
| Security Description | Shares | Value | ||||
| SHORT-TERM INVESTMENT — 3.9% | ||||||
State Street Institutional U.S. Government Money Market Fund, Class G Shares 0.16% (c) (d) (Cost $11,722,245) | 11,722,245 | $ 11,722,245 | ||||
TOTAL INVESTMENTS — 99.8% (Cost $298,872,994) | 298,277,313 | |||||
OTHER ASSETS IN EXCESS OF LIABILITIES — 0.2% | 630,089 | |||||
NET ASSETS — 100.0% | $ 298,907,402 | |||||
| (a) | Variable Rate Security - Interest rate shown is rate in effect at June 30, 2020. For securities based on a published reference rate and spread, the reference rate and spread are indicated in the description above. |
| (b) | Securities purchased pursuant to Rule 144A of the Securities Act of 1933, as amended. These securities, which represent 37.6% of net assets as of June 30, 2020, are considered liquid and may be resold in transactions exempt from registration, normally to qualified institutional buyers. |
| (c) | The Fund invested in certain money market funds managed by SSGA Funds Management, Inc. Amounts related to these transactions during the period ended June 30, 2020 are shown in the Affiliate Table below. |
| (d) | The rate shown is the annualized seven-day yield at June 30, 2020. |
| ABS | Asset-Backed Security |
| BKNT | Bank Notes |
| CMT | Constant Maturity Treasury |
| FRN | Floating Rate Note |
| GMTN | Global Medium Term Note |
| LIBOR | London Interbank Offered Rate |
| MTN | Medium Term Note |
| SOFR | Secured Overnight Financing Rate |
Table of Contents
| Description | Level 1 – Quoted Prices | Level 2 – Other Significant Observable Inputs | Level 3 – Significant Unobservable Inputs | Total | ||||
| ASSETS: | ||||||||
| INVESTMENTS: | ||||||||
Corporate Bonds & Notes | $ — | $187,232,722 | $— | $187,232,722 | ||||
Asset-Backed Securities | — | 81,820,809 | — | 81,820,809 | ||||
Foreign Government Obligations | — | 249,983 | — | 249,983 | ||||
U.S. Treasury Obligations | — | 10,626,438 | — | 10,626,438 | ||||
U.S. Treasury | — | 989,969 | — | 989,969 | ||||
Mortgage-Backed Securities | — | 5,635,147 | — | 5,635,147 | ||||
Short-Term Investment | 11,722,245 | — | — | 11,722,245 | ||||
TOTAL INVESTMENTS | $11,722,245 | $286,555,068 | $— | $298,277,313 |
| Number of Shares Held at 6/30/19 | Value at 6/30/19 | Cost of Purchases | Proceeds from Shares Sold | Realized Gain (Loss) | Change in Unrealized Appreciation/ Depreciation | Number of Shares Held at 6/30/20 | Value at 6/30/20 | Dividend Income | |||||||||
State Street Institutional U.S. Government Money Market Fund, Class G Shares | 2,317,630 | $2,317,630 | $101,436,595 | $92,031,980 | $— | $— | 11,722,245 | $11,722,245 | $42,357 |
Table of Contents
| Security Description | Shares | Value | ||||
| COMMON STOCKS — 99.5% | ||||||
| BANKS — 2.8% | ||||||
Citigroup, Inc. | 13,287 | $ 678,966 | ||||
| BIOTECHNOLOGY — 3.4% | ||||||
Biogen, Inc. (a) | 1,286 | 344,069 | ||||
Incyte Corp. (a) | 2,651 | 275,625 | ||||
Vertex Pharmaceuticals, Inc. (a) | 649 | 188,411 | ||||
| 808,105 | ||||||
| CAPITAL MARKETS — 0.8% | ||||||
Morgan Stanley | 3,858 | 186,341 | ||||
| CONSTRUCTION & ENGINEERING — 0.5% | ||||||
Quanta Services, Inc. | 2,863 | 112,316 | ||||
| CONSUMER FINANCE — 1.4% | ||||||
Synchrony Financial | 14,614 | 323,846 | ||||
| CONTAINERS & PACKAGING — 0.5% | ||||||
Graphic Packaging Holding Co. | 8,642 | 120,902 | ||||
| ELECTRIC UTILITIES — 2.0% | ||||||
NRG Energy, Inc. | 14,527 | 472,999 | ||||
| ENTERTAINMENT — 1.1% | ||||||
Electronic Arts, Inc. (a) | 2,031 | 268,194 | ||||
| EQUITY REAL ESTATE INVESTMENT TRUSTS (REITS) — 3.1% | ||||||
QTS Realty Trust, Inc. Class A REIT | 4,705 | 301,543 | ||||
SBA Communications Corp. REIT | 1,466 | 436,751 | ||||
| 738,294 | ||||||
| FOOD & STAPLES RETAILING — 1.8% | ||||||
Costco Wholesale Corp. | 1,408 | 426,920 | ||||
| FOOD PRODUCTS — 2.3% | ||||||
Tyson Foods, Inc. Class A | 9,071 | 541,629 | ||||
| HEALTH CARE EQUIPMENT & SUPPLIES — 0.9% | ||||||
DexCom, Inc. (a) | 511 | 207,159 | ||||
| HEALTH CARE PROVIDERS & SERVICES — 3.7% | ||||||
CVS Health Corp. | 9,907 | 643,658 | ||||
HCA Healthcare, Inc. | 2,410 | 233,914 | ||||
| 877,572 | ||||||
| HOTELS, RESTAURANTS & LEISURE — 3.1% | ||||||
Domino's Pizza, Inc. | 918 | 339,146 | ||||
Starbucks Corp. | 5,284 | 388,850 | ||||
| 727,996 | ||||||
| HOUSEHOLD PRODUCTS — 0.7% | ||||||
Procter & Gamble Co. | 1,406 | 168,116 | ||||
| INDEPENDENT POWER AND RENEWABLE ELECTRICITY PRODUCERS — 2.6% | ||||||
AES Corp. | 19,836 | 287,423 | ||||
Vistra Energy Corp. | 18,235 | 339,536 | ||||
| 626,959 | ||||||
| Security Description | Shares | Value | ||||
| INSURANCE — 4.6% | ||||||
Allstate Corp. | 3,913 | $ 379,522 | ||||
MetLife, Inc. | 12,573 | 459,166 | ||||
Prudential Financial, Inc. | 4,342 | 264,428 | ||||
| 1,103,116 | ||||||
| INTERACTIVE MEDIA & SERVICES — 7.1% | ||||||
Alphabet, Inc. Class A (a) | 163 | 231,142 | ||||
Alphabet, Inc. Class C (a) | 622 | 879,265 | ||||
Facebook, Inc. Class A (a) | 2,623 | 595,605 | ||||
| 1,706,012 | ||||||
| INTERNET & DIRECT MARKETING RETAIL — 3.3% | ||||||
Amazon.com, Inc. (a) | 206 | 568,317 | ||||
eBay, Inc. | 4,056 | 212,737 | ||||
| 781,054 | ||||||
| IT SERVICES — 3.0% | ||||||
Akamai Technologies, Inc. (a) | 1,226 | 131,292 | ||||
Fidelity National Information Services, Inc. | 1,290 | 172,976 | ||||
PayPal Holdings, Inc. (a) | 1,327 | 231,203 | ||||
VeriSign, Inc. (a) | 849 | 175,599 | ||||
| 711,070 | ||||||
| MACHINERY — 5.0% | ||||||
AGCO Corp. | 6,680 | 370,473 | ||||
Allison Transmission Holdings, Inc. | 11,839 | 435,439 | ||||
Cummins, Inc. | 2,251 | 390,008 | ||||
| 1,195,920 | ||||||
| MEDIA — 3.0% | ||||||
Charter Communications, Inc. Class A (a) | 1,409 | 718,646 | ||||
| MULTILINE RETAIL — 2.6% | ||||||
Target Corp. | 5,187 | 622,077 | ||||
| OIL, GAS & CONSUMABLE FUELS — 1.8% | ||||||
Devon Energy Corp. | 8,312 | 94,258 | ||||
Valero Energy Corp. | 5,783 | 340,156 | ||||
| 434,414 | ||||||
| PHARMACEUTICALS — 7.9% | ||||||
Eli Lilly & Co. | 2,388 | 392,062 | ||||
Johnson & Johnson | 7,035 | 989,332 | ||||
Merck & Co., Inc. | 6,473 | 500,557 | ||||
| 1,881,951 | ||||||
| ROAD & RAIL — 1.5% | ||||||
CSX Corp. | 4,992 | 348,142 | ||||
| SEMICONDUCTORS & SEMICONDUCTOR EQUIPMENT — 4.0% | ||||||
Intel Corp. | 15,952 | 954,408 | ||||
| SOFTWARE — 12.6% | ||||||
Microsoft Corp. | 11,159 | 2,270,968 | ||||
Oracle Corp. | 13,440 | 742,829 | ||||
| 3,013,797 | ||||||
Table of Contents
| Security Description | Shares | Value | ||||
| TECHNOLOGY HARDWARE, STORAGE & PERIPHERALS — 9.5% | ||||||
Apple, Inc. | 6,240 | $ 2,276,352 | ||||
| TOBACCO — 2.9% | ||||||
Philip Morris International, Inc. | 9,904 | 693,874 | ||||
TOTAL COMMON STOCKS (Cost $22,813,758) | 23,727,147 | |||||
| SHORT-TERM INVESTMENT — 0.5% | ||||||
State Street Institutional U.S. Government Money Market Fund, Class G Shares 0.16% (b) (c) (Cost $124,759) | 124,759 | 124,759 | ||||
TOTAL INVESTMENTS — 100.0% (Cost $22,938,517) | 23,851,906 | |||||
OTHER ASSETS IN EXCESS OF LIABILITIES — 0.0% (d) | 8,919 | |||||
NET ASSETS — 100.0% | $ 23,860,825 | |||||
| (a) | Non-income producing security. |
| (b) | The Fund invested in certain money market funds managed by SSGA Funds Management, Inc. Amounts related to these transactions during the period ended June 30, 2020 are shown in the Affiliate Table below. |
| (c) | The rate shown is the annualized seven-day yield at June 30, 2020. |
| (d) | Amount is less than 0.05% of net assets. |
| REIT | Real Estate Investment Trust |
| Description | Level 1 – Quoted Prices | Level 2 – Other Significant Observable Inputs | Level 3 – Significant Unobservable Inputs | Total | ||||
| ASSETS: | ||||||||
| INVESTMENTS: | ||||||||
Common Stocks | $23,727,147 | $— | $— | $23,727,147 | ||||
Short-Term Investment | 124,759 | — | — | 124,759 | ||||
TOTAL INVESTMENTS | $23,851,906 | $— | $— | $23,851,906 |
| Number of Shares Held at 6/30/19 | Value at 6/30/19 | Cost of Purchases | Proceeds from Shares Sold | Realized Gain (Loss) | Change in Unrealized Appreciation/ Depreciation | Number of Shares Held at 6/30/20 | Value at 6/30/20 | Dividend Income | |||||||||
State Street Institutional U.S. Government Money Market Fund, Class G Shares | 255,902 | $255,902 | $932,420 | $1,063,563 | $— | $— | 124,759 | $124,759 | $4,369 |
Table of Contents
| Security Description | Shares | Value | ||||
| COMMON STOCKS — 99.0% | ||||||
| BIOTECHNOLOGY — 4.6% | ||||||
Biogen, Inc. (a) | 1,840 | $ 492,292 | ||||
Incyte Corp. (a) | 4,053 | 421,391 | ||||
Vertex Pharmaceuticals, Inc. (a) | 2,798 | 812,287 | ||||
| 1,725,970 | ||||||
| BUILDING PRODUCTS — 0.7% | ||||||
Owens Corning | 4,663 | 260,009 | ||||
| CONSTRUCTION & ENGINEERING — 1.0% | ||||||
Quanta Services, Inc. | 9,697 | 380,413 | ||||
| CONSUMER FINANCE — 1.3% | ||||||
Synchrony Financial | 22,212 | 492,218 | ||||
| ELECTRIC UTILITIES — 0.4% | ||||||
NRG Energy, Inc. | 5,160 | 168,010 | ||||
| ENTERTAINMENT — 4.8% | ||||||
Activision Blizzard, Inc. | 7,378 | 559,990 | ||||
Electronic Arts, Inc. (a) | 7,014 | 926,199 | ||||
Netflix, Inc. (a) | 701 | 318,983 | ||||
| 1,805,172 | ||||||
| EQUITY REAL ESTATE INVESTMENT TRUSTS (REITS) — 2.4% | ||||||
American Tower Corp. REIT | 3,534 | 913,680 | ||||
| FOOD & STAPLES RETAILING — 1.1% | ||||||
Costco Wholesale Corp. | 1,355 | 410,850 | ||||
| HEALTH CARE EQUIPMENT & SUPPLIES — 0.4% | ||||||
Hill-Rom Holdings, Inc. | 1,505 | 165,219 | ||||
| HEALTH CARE PROVIDERS & SERVICES — 3.1% | ||||||
Cigna Corp. | 1,058 | 198,534 | ||||
CVS Health Corp. | 4,802 | 311,986 | ||||
HCA Healthcare, Inc. | 4,608 | 447,252 | ||||
Humana, Inc. | 520 | 201,630 | ||||
| 1,159,402 | ||||||
| HOTELS, RESTAURANTS & LEISURE — 3.7% | ||||||
Domino's Pizza, Inc. | 2,588 | 956,111 | ||||
Starbucks Corp. | 6,148 | 452,431 | ||||
| 1,408,542 | ||||||
| INDEPENDENT POWER & RENEWABLE ELECTRICITY PRODUCERS — 1.0% | ||||||
Vistra Energy Corp. | 20,527 | 382,213 | ||||
| INDUSTRIAL CONGLOMERATES — 0.6% | ||||||
Honeywell International, Inc. | 1,654 | 239,152 | ||||
| INSURANCE — 0.7% | ||||||
MetLife, Inc. | 5,867 | 214,263 | ||||
Prudential Financial, Inc. | 957 | 58,281 | ||||
| 272,544 | ||||||
| INTERACTIVE MEDIA & SERVICES — 6.4% | ||||||
Alphabet, Inc. Class C (a) | 895 | 1,265,181 | ||||
| Security Description | Shares | Value | ||||
Facebook, Inc. Class A (a) | 5,183 | $ 1,176,904 | ||||
| 2,442,085 | ||||||
| INTERNET & DIRECT MARKETING RETAIL — 7.5% | ||||||
Amazon.com, Inc. (a) | 861 | 2,375,344 | ||||
eBay, Inc. | 9,255 | 485,425 | ||||
| 2,860,769 | ||||||
| IT SERVICES — 7.0% | ||||||
Leidos Holdings, Inc. | 2,173 | 203,545 | ||||
Okta, Inc. (a) | 651 | 130,350 | ||||
PayPal Holdings, Inc. (a) | 8,028 | 1,398,718 | ||||
VeriSign, Inc. (a) | 4,482 | 927,012 | ||||
| 2,659,625 | ||||||
| MACHINERY — 3.5% | ||||||
AGCO Corp. | 5,512 | 305,696 | ||||
Allison Transmission Holdings, Inc. | 13,274 | 488,218 | ||||
Cummins, Inc. | 3,101 | 537,279 | ||||
| 1,331,193 | ||||||
| MEDIA — 2.2% | ||||||
Charter Communications, Inc. Class A (a) | 1,649 | 841,056 | ||||
| MULTILINE RETAIL — 1.9% | ||||||
Target Corp. | 5,934 | 711,665 | ||||
| PHARMACEUTICALS — 6.0% | ||||||
Eli Lilly & Co. | 6,943 | 1,139,902 | ||||
Johnson & Johnson | 7,958 | 1,119,133 | ||||
| 2,259,035 | ||||||
| ROAD & RAIL — 1.0% | ||||||
CSX Corp. | 5,556 | 387,475 | ||||
| SEMICONDUCTORS & SEMICONDUCTOR EQUIPMENT — 6.3% | ||||||
Broadcom, Inc. | 2,505 | 790,603 | ||||
Intel Corp. | 16,434 | 983,246 | ||||
NVIDIA Corp. | 1,621 | 615,834 | ||||
| 2,389,683 | ||||||
| SOFTWARE — 19.3% | ||||||
Adobe, Inc. (a) | 1,835 | 798,794 | ||||
Citrix Systems, Inc. | 2,984 | 441,363 | ||||
Microsoft Corp. | 18,419 | 3,748,451 | ||||
Oracle Corp. | 21,932 | 1,212,181 | ||||
ServiceNow, Inc. (a) | 2,795 | 1,132,143 | ||||
| 7,332,932 | ||||||
| SPECIALTY RETAIL — 0.9% | ||||||
Best Buy Co., Inc. | 3,827 | 333,982 | ||||
| TECHNOLOGY HARDWARE, STORAGE & PERIPHERALS — 8.8% | ||||||
Apple, Inc. | 9,094 | 3,317,491 | ||||
Table of Contents
| Security Description | Shares | Value | ||||
| TOBACCO — 2.4% | ||||||
Altria Group, Inc. | 22,900 | $ 898,825 | ||||
TOTAL COMMON STOCKS (Cost $31,926,507) | 37,549,210 | |||||
| SHORT-TERM INVESTMENT — 1.0% | ||||||
State Street Institutional U.S. Government Money Market Fund, Class G Shares 0.16% (b) (c) (Cost $365,868) | 365,868 | 365,868 | ||||
TOTAL INVESTMENTS — 100.0% (Cost $32,292,375) | 37,915,078 | |||||
OTHER ASSETS IN EXCESS OF LIABILITIES — 0.0% | 7,765 | |||||
NET ASSETS — 100.0% | $ 37,922,843 | |||||
| (a) | Non-income producing security. |
| (b) | The Fund invested in certain money market funds managed by SSGA Funds Management, Inc. Amounts related to these transactions during the period ended June 30, 2020 are shown in the Affiliate Table below. |
| (c) | The rate shown is the annualized seven-day yield at June 30, 2020. |
| REIT | Real Estate Investment Trust |
| Description | Level 1 – Quoted Prices | Level 2 – Other Significant Observable Inputs | Level 3 – Significant Unobservable Inputs | Total | ||||
| ASSETS: | ||||||||
| INVESTMENTS: | ||||||||
Common Stocks | $37,549,210 | $— | $— | $37,549,210 | ||||
Short-Term Investment | 365,868 | — | — | 365,868 | ||||
TOTAL INVESTMENTS | $37,915,078 | $— | $— | $37,915,078 |
| Number of Shares Held at 6/30/19 | Value at 6/30/19 | Cost of Purchases | Proceeds from Shares Sold | Realized Gain (Loss) | Change in Unrealized Appreciation/ Depreciation | Number of Shares Held at 6/30/20 | Value at 6/30/20 | Dividend Income | |||||||||
State Street Institutional U.S. Government Money Market Fund, Class G Shares | 460,630 | $460,630 | $853,374 | $948,136 | $— | $— | 365,868 | $365,868 | $7,606 |
Table of Contents
| Security Description | Shares | Value | ||||
| COMMON STOCKS — 99.0% | ||||||
| BANKS — 7.6% | ||||||
Bank of America Corp. | 27,950 | $ 663,813 | ||||
Citigroup, Inc. | 14,239 | 727,613 | ||||
Wells Fargo & Co. | 7,339 | 187,878 | ||||
| 1,579,304 | ||||||
| BEVERAGES — 0.7% | ||||||
Molson Coors Beverage Co. Class B | 4,431 | 152,249 | ||||
| BIOTECHNOLOGY — 1.2% | ||||||
Biogen, Inc. (a) | 924 | 247,216 | ||||
| CAPITAL MARKETS — 4.3% | ||||||
Bank of New York Mellon Corp. | 6,190 | 239,244 | ||||
Charles Schwab Corp. | 10,002 | 337,467 | ||||
Morgan Stanley | 6,792 | 328,054 | ||||
| 904,765 | ||||||
| CHEMICALS — 0.8% | ||||||
Eastman Chemical Co. | 2,393 | 166,649 | ||||
| CONSUMER FINANCE — 0.5% | ||||||
SLM Corp. | 13,488 | 94,821 | ||||
| CONTAINERS & PACKAGING — 1.7% | ||||||
Graphic Packaging Holding Co. | 25,172 | 352,156 | ||||
| DIVERSIFIED TELECOMMUNICATION SERVICES — 1.6% | ||||||
Verizon Communications, Inc. | 6,203 | 341,971 | ||||
| ELECTRIC UTILITIES — 5.3% | ||||||
Exelon Corp. | 15,943 | 578,571 | ||||
FirstEnergy Corp. | 7,442 | 288,601 | ||||
NRG Energy, Inc. | 7,343 | 239,088 | ||||
| 1,106,260 | ||||||
| ELECTRICAL EQUIPMENT — 6.0% | ||||||
Eaton Corp. PLC | 8,715 | 762,388 | ||||
Regal Beloit Corp. | 5,711 | 498,685 | ||||
| 1,261,073 | ||||||
| ENTERTAINMENT — 3.7% | ||||||
Activision Blizzard, Inc. | 3,830 | 290,697 | ||||
Electronic Arts, Inc. (a) | 1,940 | 256,177 | ||||
Take-Two Interactive Software, Inc. (a) | 1,538 | 214,659 | ||||
| 761,533 | ||||||
| EQUITY REAL ESTATE INVESTMENT TRUSTS (REITS) — 6.1% | ||||||
Brixmor Property Group, Inc. REIT | 13,707 | 175,724 | ||||
Medical Properties Trust, Inc. REIT | 26,658 | 501,170 | ||||
Spirit Realty Capital, Inc. REIT | 6,659 | 232,133 | ||||
STORE Capital Corp. REIT | 8,044 | 191,527 | ||||
WP Carey, Inc. REIT | 2,600 | 175,890 | ||||
| 1,276,444 | ||||||
| FOOD & STAPLES RETAILING — 1.3% | ||||||
Walmart, Inc. | 2,198 | 263,276 | ||||
| FOOD PRODUCTS — 3.7% | ||||||
Mondelez International, Inc. Class A | 5,230 | 267,410 | ||||
| Security Description | Shares | Value | ||||
Tyson Foods, Inc. Class A | 8,325 | $ 497,086 | ||||
| 764,496 | ||||||
| HEALTH CARE EQUIPMENT & SUPPLIES — 1.2% | ||||||
Medtronic PLC | 2,840 | 260,428 | ||||
| HEALTH CARE PROVIDERS & SERVICES — 4.6% | ||||||
Cigna Corp. | 1,143 | 214,484 | ||||
Humana, Inc. | 466 | 180,692 | ||||
McKesson Corp. | 3,636 | 557,835 | ||||
| 953,011 | ||||||
| HOUSEHOLD DURABLES — 2.5% | ||||||
Toll Brothers, Inc. | 16,273 | 530,337 | ||||
| HOUSEHOLD PRODUCTS — 0.5% | ||||||
Procter & Gamble Co. | 852 | 101,874 | ||||
| INDEPENDENT POWER AND RENEWABLE ELECTRICITY PRODUCERS — 3.5% | ||||||
AES Corp. | 20,641 | 299,088 | ||||
Vistra Energy Corp. | 22,656 | 421,855 | ||||
| 720,943 | ||||||
| INSURANCE — 5.0% | ||||||
Everest Re Group, Ltd. | 860 | 177,332 | ||||
MetLife, Inc. | 8,900 | 325,028 | ||||
Prudential Financial, Inc. | 4,926 | 299,993 | ||||
Travelers Cos., Inc. | 2,050 | 233,803 | ||||
| 1,036,156 | ||||||
| IT SERVICES — 1.9% | ||||||
Fiserv, Inc. (a) | 4,011 | 391,554 | ||||
| MACHINERY — 2.5% | ||||||
AGCO Corp. | 9,215 | 511,064 | ||||
| MEDIA — 2.4% | ||||||
Charter Communications, Inc. Class A (a) | 994 | 506,980 | ||||
| MULTILINE RETAIL — 3.5% | ||||||
Target Corp. | 6,111 | 732,892 | ||||
| OIL, GAS & CONSUMABLE FUELS — 6.5% | ||||||
Exxon Mobil Corp. | 6,583 | 294,392 | ||||
Phillips 66 | 7,542 | 542,270 | ||||
Valero Energy Corp. | 8,880 | 522,321 | ||||
| 1,358,983 | ||||||
| PHARMACEUTICALS — 9.2% | ||||||
Eli Lilly & Co. | 2,808 | 461,017 | ||||
Johnson & Johnson | 7,502 | 1,055,006 | ||||
Merck & Co., Inc. | 5,299 | 409,772 | ||||
| 1,925,795 | ||||||
| ROAD & RAIL — 1.2% | ||||||
Union Pacific Corp. | 1,431 | 241,939 | ||||
| SEMICONDUCTORS & SEMICONDUCTOR EQUIPMENT — 4.3% | ||||||
Intel Corp. | 14,930 | 893,262 | ||||
Table of Contents
| Security Description | Shares | Value | ||||
| SOFTWARE — 3.5% | ||||||
Microsoft Corp. | 2,076 | $ 422,487 | ||||
Oracle Corp. | 5,743 | 317,415 | ||||
| 739,902 | ||||||
| TOBACCO — 2.2% | ||||||
Philip Morris International, Inc. | 6,574 | 460,574 | ||||
TOTAL COMMON STOCKS (Cost $21,995,302) | 20,637,907 | |||||
| SHORT-TERM INVESTMENT — 0.9% | ||||||
State Street Institutional U.S. Government Money Market Fund, Class G Shares 0.16% (b) (c) (Cost $187,314) | 187,314 | 187,314 | ||||
TOTAL INVESTMENTS — 99.9% (Cost $22,182,616) | 20,825,221 | |||||
OTHER ASSETS IN EXCESS OF LIABILITIES — 0.1% | 27,472 | |||||
NET ASSETS — 100.0% | $ 20,852,693 | |||||
| (a) | Non-income producing security. |
| (b) | The Fund invested in certain money market funds managed by SSGA Funds Management, Inc. Amounts related to these transactions during the period ended June 30, 2020 are shown in the Affiliate Table below. |
| (c) | The rate shown is the annualized seven-day yield at June 30, 2020. |
| REIT | Real Estate Investment Trust |
| Description | Level 1 – Quoted Prices | Level 2 – Other Significant Observable Inputs | Level 3 – Significant Unobservable Inputs | Total | ||||
| ASSETS: | ||||||||
| INVESTMENTS: | ||||||||
Common Stocks | $20,637,907 | $— | $— | $20,637,907 | ||||
Short-Term Investment | 187,314 | — | — | 187,314 | ||||
TOTAL INVESTMENTS | $20,825,221 | $— | $— | $20,825,221 |
| Number of Shares Held at 6/30/19 | Value at 6/30/19 | Cost of Purchases | Proceeds from Shares Sold | Realized Gain (Loss) | Change in Unrealized Appreciation/ Depreciation | Number of Shares Held at 6/30/20 | Value at 6/30/20 | Dividend Income | |||||||||
State Street Institutional U.S. Government Money Market Fund, Class G Shares | 286,017 | $286,017 | $936,696 | $1,035,399 | $— | $— | 187,314 | $187,314 | $4,369 |
Table of Contents
| SPDR SSGA Multi-Asset Real Return ETF | SPDR SSGA Income Allocation ETF | SPDR SSGA Global Allocation ETF | |||
| ASSETS | |||||
Investments in unaffiliated issuers, at value* | $ 13,777,471 | $ 8,700,972 | $ 10,289,499 | ||
Investments in affiliated issuers, at value | 50,594,398 | 138,668,760 | 289,126,326 | ||
Total Investments | 64,371,869 | 147,369,732 | 299,415,825 | ||
Cash | — | — | — | ||
Receivable for fund shares sold | — | 7,635 | — | ||
Dividends receivable — unaffiliated issuers | — | — | — | ||
Dividends receivable — affiliated issuers | 20 | 66 | 223,747 | ||
Securities lending income receivable — unaffiliated issuers | 1,029 | 9,495 | 4,069 | ||
Securities lending income receivable — affiliated issuers | 6,442 | 13,790 | 44,530 | ||
TOTAL ASSETS | 64,379,360 | 147,400,718 | 299,688,171 | ||
| LIABILITIES | |||||
Payable upon return of securities loaned | 10,616,056 | 21,343,138 | 61,808,691 | ||
Payable for fund shares repurchased | 8,482 | — | — | ||
Advisory fee payable | 4,909 | 18,449 | 29,647 | ||
Trustees’ fees and expenses payable | 57 | 59 | 131 | ||
TOTAL LIABILITIES | 10,629,504 | 21,361,646 | 61,838,469 | ||
NET ASSETS | $ 53,749,856 | $126,039,072 | $237,849,702 | ||
| NET ASSETS CONSIST OF: | |||||
Paid-in Capital | $106,102,362 | $144,616,396 | $236,752,991 | ||
Total distributable earnings (loss) | (52,352,506) | (18,577,324) | 1,096,711 | ||
NET ASSETS | $ 53,749,856 | $126,039,072 | $237,849,702 | ||
| NET ASSET VALUE PER SHARE | |||||
Net asset value per share | $ 21.25 | $ 30.37 | $ 36.88 | ||
Shares outstanding (unlimited amount authorized, no par value) | 2,530,000 | 4,150,000 | 6,450,000 | ||
| COST OF INVESTMENTS: | |||||
Investments in unaffiliated issuers | $ 18,376,399 | $ 11,446,779 | $ 8,107,070 | ||
Investments in affiliated issuers | 57,395,878 | 145,019,899 | 281,642,655 | ||
Total cost of investments | $ 75,772,277 | $156,466,678 | $289,749,725 | ||
* Includes investments in securities on loan, at value | $ 14,056,558 | $ 26,684,773 | $ 71,525,522 |
Table of Contents
| SPDR SSGA Ultra Short Term Bond ETF | SPDR MFS Systematic Core Equity ETF | SPDR MFS Systematic Growth Equity ETF | SPDR MFS Systematic Value Equity ETF | |||
| $286,555,068 | $23,727,147 | $37,549,210 | $20,637,907 | |||
| 11,722,245 | 124,759 | 365,868 | 187,314 | |||
| 298,277,313 | 23,851,906 | 37,915,078 | 20,825,221 | |||
| 274 | — | — | — | |||
| — | — | — | — | |||
| — | 20,652 | 26,038 | 37,994 | |||
| 678,812 | 24 | 59 | 37 | |||
| — | — | — | — | |||
| — | — | — | — | |||
| 298,956,399 | 23,872,582 | 37,941,175 | 20,863,252 | |||
| — | — | — | — | |||
| — | — | — | — | |||
| 48,875 | 11,730 | 18,304 | 10,536 | |||
| 122 | 27 | 28 | 23 | |||
| 48,997 | 11,757 | 18,332 | 10,559 | |||
| $298,907,402 | $23,860,825 | $37,922,843 | $20,852,693 | |||
| $299,947,769 | $23,905,691 | $33,355,641 | $23,865,065 | |||
| (1,040,367) | (44,866) | 4,567,202 | (3,012,372) | |||
| $298,907,402 | $23,860,825 | $37,922,843 | $20,852,693 | |||
| $ 40.26 | $ 82.28 | $ 97.24 | $ 59.58 | |||
| 7,425,000 | 290,000 | 390,000 | 350,000 | |||
| $287,150,749 | $22,813,758 | $31,926,507 | $21,995,302 | |||
| 11,722,245 | 124,759 | 365,868 | 187,314 | |||
| $298,872,994 | $22,938,517 | $32,292,375 | $22,182,616 | |||
| $ — | $ — | $ — | $ — |
Table of Contents
| SPDR SSGA Multi-Asset Real Return ETF | SPDR SSGA Income Allocation ETF | SPDR SSGA Global Allocation ETF | |||
| INVESTMENT INCOME | |||||
Interest income — unaffiliated issuers | $ — | $ — | $ — | ||
Dividend income — unaffiliated issuers | 303,556 | 745,036 | 132,751 | ||
Dividend income — affiliated issuers | 2,500,918 | 4,601,205 | 6,796,616 | ||
Unaffiliated securities lending income | 23,975 | 70,960 | 95,136 | ||
Affiliated securities lending income | 136,887 | 284,960 | 409,168 | ||
Foreign taxes withheld | — | — | — | ||
TOTAL INVESTMENT INCOME (LOSS) | 2,965,336 | 5,702,161 | 7,433,671 | ||
| EXPENSES | |||||
Advisory fee | 70,916 | 223,466 | 215,937 | ||
Trustees’ fees and expenses | 1,405 | 1,768 | 3,722 | ||
Miscellaneous expenses | 403 | 377 | 500 | ||
TOTAL EXPENSES | 72,724 | 225,611 | 220,159 | ||
NET INVESTMENT INCOME (LOSS) | $ 2,892,612 | $ 5,476,550 | $ 7,213,512 | ||
| REALIZED AND UNREALIZED GAIN (LOSS) | |||||
| Net realized gain (loss) on: | |||||
Investments — unaffiliated issuers | (623,166) | (3,925,855) | (1,068,270) | ||
Investments — affiliated issuers | (3,218,009) | (2,644,258) | (3,923,084) | ||
In-kind redemptions — unaffiliated issuers | (1,588,194) | (565,805) | 228,145 | ||
In-kind redemptions — affiliated issuers | (2,824,893) | 29,348 | 1,033,372 | ||
Net realized gain (loss) | (8,254,262) | (7,106,570) | (3,729,837) | ||
| Net change in unrealized appreciation/depreciation on: | |||||
Investments — unaffiliated issuers | (2,212,495) | (1,956,249) | 1,871,412 | ||
Investments — affiliated issuers | (6,786,020) | (8,595,023) | (10,352,345) | ||
Net change in unrealized appreciation/depreciation | (8,998,515) | (10,551,272) | (8,480,933) | ||
NET REALIZED AND UNREALIZED GAIN (LOSS) | (17,252,777) | (17,657,842) | (12,210,770) | ||
NET INCREASE (DECREASE) IN NET ASSETS FROM OPERATIONS | $(14,360,165) | $(12,181,292) | $ (4,997,258) |
Table of Contents
| SPDR SSGA Ultra Short Term Bond ETF | SPDR MFS Systematic Core Equity ETF | SPDR MFS Systematic Growth Equity ETF | SPDR MFS Systematic Value Equity ETF | |||
| $ 5,130,242 | $ — | $ — | $ — | |||
| — | 774,628 | 561,605 | 843,216 | |||
| 42,357 | 4,369 | 7,606 | 4,369 | |||
| — | — | — | — | |||
| — | — | — | — | |||
| — | — | (1,752) | — | |||
| 5,172,599 | 778,997 | 567,459 | 847,585 | |||
| 465,044 | 209,371 | 220,583 | 180,791 | |||
| 3,118 | 575 | 473 | 484 | |||
| 402 | 326 | 330 | 327 | |||
| 468,564 | 210,272 | 221,386 | 181,602 | |||
| $ 4,704,035 | $ 568,725 | $ 346,073 | $ 665,983 | |||
| (390,164) | (960,836) | (847,184) | (1,109,136) | |||
| — | — | — | — | |||
| — | 716,228 | 2,549,618 | 28,711 | |||
| — | — | — | — | |||
| (390,164) | (244,608) | 1,702,434 | (1,080,425) | |||
| (896,263) | (1,072,493) | 3,796,090 | (2,199,897) | |||
| — | — | — | — | |||
| (896,263) | (1,072,493) | 3,796,090 | (2,199,897) | |||
| (1,286,427) | (1,317,101) | 5,498,524 | (3,280,322) | |||
| $ 3,417,608 | $ (748,376) | $5,844,597 | $(2,614,339) |
Table of Contents
| SPDR SSGA Multi-Asset Real Return ETF | SPDR SSGA Income Allocation ETF | ||||||
| Year Ended 6/30/20 | Year Ended 6/30/19 | Year Ended 6/30/20 | Year Ended 6/30/19 | ||||
| INCREASE (DECREASE) IN NET ASSETS FROM OPERATIONS: | |||||||
Net investment income (loss) | $ 2,892,612 | $ 3,631,029 | $ 5,476,550 | $ 4,637,548 | |||
Net realized gain (loss) | (8,254,262) | (2,143,100) | (7,106,570) | 4,363,213 | |||
Net change in unrealized appreciation/depreciation | (8,998,515) | (6,389,726) | (10,551,272) | (971,140) | |||
Net increase (decrease) in net assets resulting from operations | (14,360,165) | (4,901,797) | (12,181,292) | 8,029,621 | |||
Net equalization credits and charges | (81,758) | 24,895 | 115,750 | 105,971 | |||
Distributions to shareholders | (2,878,161) | (3,617,253) | (5,787,114) | (4,936,932) | |||
| FROM BENEFICIAL INTEREST TRANSACTIONS: | |||||||
Proceeds from shares sold | 7,725,150 | 33,283,792 | 115,985,875 | 23,973,127 | |||
Cost of shares redeemed | (49,528,810) | (55,714,874) | (76,591,192) | (14,842,690) | |||
Net income equalization | 81,758 | (24,895) | (115,750) | (105,971) | |||
Other Capital | — | — | — | 686 | |||
Net increase (decrease) in net assets from beneficial interest transactions | (41,721,902) | (22,455,977) | 39,278,933 | 9,025,152 | |||
Net increase (decrease) in net assets during the period | (59,041,986) | (30,950,132) | 21,426,277 | 12,223,812 | |||
Net assets at beginning of period | 112,791,842 | 143,741,974 | 104,612,795 | 92,388,983 | |||
NET ASSETS AT END OF PERIOD | $ 53,749,856 | $112,791,842 | $126,039,072 | $104,612,795 | |||
| SHARES OF BENEFICIAL INTEREST: | |||||||
Shares sold | 340,000 | 1,350,000 | 3,590,000 | 750,000 | |||
Shares redeemed | (2,290,000) | (2,270,000) | (2,580,000) | (460,000) | |||
Net increase (decrease) from share transactions | (1,950,000) | (920,000) | 1,010,000 | 290,000 | |||
Table of Contents
| SPDR SSGA Global Allocation ETF | SPDR SSGA Ultra Short Term Bond ETF | SPDR MFS Systematic Core Equity ETF | ||||||||
| Year Ended 6/30/20 | Year Ended 6/30/19 | Year Ended 6/30/20 | Year Ended 6/30/19 | Year Ended 6/30/20 | Year Ended 6/30/19 | |||||
| $ 7,213,512 | $ 7,053,566 | $ 4,704,035 | $ 3,320,929 | $ 568,725 | $ 557,940 | |||||
| (3,729,837) | 7,468,496 | (390,164) | 190,469 | (244,608) | 1,681,070 | |||||
| (8,480,933) | (3,125,237) | (896,263) | 292,631 | (1,072,493) | 1,551,309 | |||||
| (4,997,258) | 11,396,825 | 3,417,608 | 3,804,029 | (748,376) | 3,790,319 | |||||
| 19,354 | 42,319 | 135,058 | 87,297 | (22,967) | 1,861 | |||||
| (7,327,692) | (7,044,570) | (4,951,989) | (3,073,623) | (573,138) | (561,229) | |||||
| 22,973,653 | 66,920,704 | 167,508,423 | 152,893,417 | 8,428,314 | 18,295,264 | |||||
| (28,488,708) | (64,514,651) | (34,951,266) | (36,316,451) | (22,349,855) | (12,523,740) | |||||
| (19,354) | (42,319) | (135,058) | (87,297) | 22,967 | (1,861) | |||||
| 2,474 | — | 165,286 | 68,420 | 580 | 314 | |||||
| (5,531,935) | 2,363,734 | 132,587,385 | 116,558,089 | (13,897,994) | 5,769,977 | |||||
| (17,837,531) | 6,758,308 | 131,188,062 | 117,375,792 | (15,242,475) | 9,000,928 | |||||
| 255,687,233 | 248,928,925 | 167,719,340 | 50,343,548 | 39,103,300 | 30,102,372 | |||||
| $237,849,702 | $255,687,233 | $298,907,402 | $167,719,340 | $ 23,860,825 | $ 39,103,300 | |||||
| 600,000 | 1,850,000 | 4,150,000 | 3,800,000 | 100,000 | 240,000 | |||||
| (820,000) | (1,780,000) | (875,000) | (900,000) | (290,000) | (160,000) | |||||
| (220,000) | 70,000 | 3,275,000 | 2,900,000 | (190,000) | 80,000 | |||||
Table of Contents
| SPDR MFS Systematic Growth Equity ETF | SPDR MFS Systematic Value Equity ETF | ||||||
| Year Ended 6/30/20 | Year Ended 6/30/19 | Year Ended 6/30/20 | Year Ended 6/30/19 | ||||
| INCREASE (DECREASE) IN NET ASSETS FROM OPERATIONS: | |||||||
Net investment income (loss) | $ 346,073 | $ 410,349 | $ 665,983 | $ 756,480 | |||
Net realized gain (loss) | 1,702,434 | 1,275,022 | (1,080,425) | 128,129 | |||
Net change in unrealized appreciation/depreciation | 3,796,090 | 167,078 | (2,199,897) | (36,634) | |||
Net increase (decrease) in net assets resulting from operations | 5,844,597 | 1,852,449 | (2,614,339) | 847,975 | |||
Net equalization credits and charges | (16,068) | (10,318) | (34,490) | 1,385 | |||
Distributions to shareholders | (335,571) | (879,302) | (665,847) | (1,072,684) | |||
| FROM BENEFICIAL INTEREST TRANSACTIONS: | |||||||
Proceeds from shares sold | 13,637,046 | 4,121,088 | — | 6,702,411 | |||
Cost of shares redeemed | (15,584,895) | (15,157,132) | (9,627,538) | (5,670,724) | |||
Net income equalization | 16,068 | 10,318 | 34,490 | (1,385) | |||
Other Capital | 363 | 332 | 488 | 272 | |||
Net increase (decrease) in net assets from beneficial interest transactions | (1,931,418) | (11,025,394) | (9,592,560) | 1,030,574 | |||
Net increase (decrease) in net assets during the period | 3,561,540 | (10,062,565) | (12,907,236) | 807,250 | |||
Net assets at beginning of period | 34,361,303 | 44,423,868 | 33,759,929 | 32,952,679 | |||
NET ASSETS AT END OF PERIOD | $ 37,922,843 | $ 34,361,303 | $ 20,852,693 | $33,759,929 | |||
| SHARES OF BENEFICIAL INTEREST: | |||||||
Shares sold | 160,000 | 50,000 | — | 100,000 | |||
Shares redeemed | (180,000) | (190,000) | (160,000) | (90,000) | |||
Net increase (decrease) from share transactions | (20,000) | (140,000) | (160,000) | 10,000 | |||
Table of Contents
| SPDR SSGA Multi-Asset Real Return ETF | |||||||||
| Year Ended 6/30/20 | Year Ended 6/30/19 | Year Ended 6/30/18(a) | Year Ended 6/30/17(a) | Year Ended 6/30/16(a) | |||||
Net asset value, beginning of period | $ 25.18 | $ 26.62 | $ 23.97 | $ 24.38 | $ 25.85 | ||||
| Income (loss) from investment operations: | |||||||||
Net investment income (loss) (b) | 0.78 | 0.69 | 0.53 | 0.56 | 0.30 | ||||
Net realized and unrealized gain (loss) (c) | (3.89) | (1.43) | 2.64 | (0.44) | (1.43) | ||||
Total from investment operations | (3.11) | (0.74) | 3.17 | 0.12 | (1.13) | ||||
Net equalization credits and charges (b) | (0.02) | 0.00(d) | (0.00)(d) | 0.01 | 0.01 | ||||
| Distributions to shareholders from: | |||||||||
Net investment income | (0.80) | (0.70) | (0.52) | (0.54) | (0.35) | ||||
Net asset value, end of period | $ 21.25 | $ 25.18 | $ 26.62 | $ 23.97 | $ 24.38 | ||||
Total return (e) | (12.71)% | (2.71)% | 13.26% | 0.56% | (4.22)% | ||||
| Ratios and Supplemental Data: | |||||||||
Net assets, end of period (in 000s) | $53,750 | $112,792 | $143,742 | $115,075 | $80,441 | ||||
| Ratios to average net assets: | |||||||||
Total expenses (f) | 0.08% | 0.12% | 0.22% | 0.22% | 0.28% | ||||
Net investment income (loss) | 3.30% | 2.76% | 2.04% | 2.28% | 1.29% | ||||
Portfolio turnover rate | 30% | 28% | 44% | 46%(g) | 25%(g) | ||||
| (a) | The per share amounts and percentages include the Fund’s proportionate share of income and expenses of the Portfolio prior to discontinuance of the master feeder structure. |
| (b) | Per share numbers have been calculated using average shares outstanding, which more appropriately presents the per share data for the year. |
| (c) | Amounts shown in this caption for a share outstanding may not accord with the change in aggregate gains and losses in securities for the fiscal period because of the timing of sales and repurchases of Fund shares in relation to fluctuating market values for the Fund. |
| (d) | Amount is less than $0.005 per share. |
| (e) | Total return is calculated assuming a purchase of shares at net asset value on the first day and a sale at net asset value on the last day of each period reported. Distributions are assumed, for the purpose of this calculation, to be reinvested at net asset value per share on the respective payment dates of each distribution. Total returns for periods of less than one year are not annualized. Broker commission charges are not included in this calculation. |
| (f) | Does not include expenses of the Underlying Funds in which the Fund invests. |
| (g) | Portfolio turnover is from the Fund's Portfolio prior to discontinuance of master-feeder structure. |
Table of Contents
| SPDR SSGA Income Allocation ETF | |||||||||
| Year Ended 6/30/20 | Year Ended 6/30/19 | Year Ended 6/30/18(a) | Year Ended 6/30/17(a) | Year Ended 6/30/16(a) | |||||
Net asset value, beginning of period | $ 33.32 | $ 32.42 | $ 32.33 | $ 31.23 | $ 31.16 | ||||
| Income (loss) from investment operations: | |||||||||
Net investment income (loss) (b) | 1.43 | 1.53 | 1.02 | 1.10 | 0.93 | ||||
Net realized and unrealized gain (loss) (c) | (2.95) | 0.91 | 0.09 | 0.98 | 0.22 | ||||
Total from investment operations | (1.52) | 2.44 | 1.11 | 2.08 | 1.15 | ||||
Net equalization credits and charges (b) | 0.03 | 0.03 | (0.01) | (0.01) | (0.02) | ||||
Other capital (b) | — | 0.00(d) | — | — | — | ||||
| Distributions to shareholders from: | |||||||||
Net investment income | (1.46) | (1.57) | (1.01) | (0.97) | (1.06) | ||||
Net asset value, end of period | $ 30.37 | $ 33.32 | $ 32.42 | $ 32.33 | $ 31.23 | ||||
Total return (e) | (4.56)% | 7.93% | 3.34% | 6.78% | 3.77% | ||||
| Ratios and Supplemental Data: | |||||||||
Net assets, end of period (in 000s) | $126,039 | $104,613 | $92,389 | $95,376 | $104,605 | ||||
| Ratios to average net assets: | |||||||||
Total expenses (f) | 0.18% | 0.18% | 0.39% | 0.37% | 0.37% | ||||
Net investment income (loss) | 4.41% | 4.71% | 3.07% | 3.49% | 3.07% | ||||
Portfolio turnover rate | 38% | 71% | 29% | 47%(g) | 54%(g) | ||||
| (a) | The per share amounts and percentages include the Fund’s proportionate share of income and expenses of the Portfolio prior to discontinuance of the master feeder structure. |
| (b) | Per share numbers have been calculated using average shares outstanding, which more appropriately presents the per share data for the year. |
| (c) | Amounts shown in this caption for a share outstanding may not accord with the change in aggregate gains and losses in securities for the fiscal period because of the timing of sales and repurchases of Fund shares in relation to fluctuating market values for the Fund. |
| (d) | Amount is less than $0.005 per share. |
| (e) | Total return is calculated assuming a purchase of shares at net asset value on the first day and a sale at net asset value on the last day of each period reported. Distributions are assumed, for the purpose of this calculation, to be reinvested at net asset value per share on the respective payment dates of each distribution. Total returns for periods of less than one year are not annualized. Broker commission charges are not included in this calculation. |
| (f) | Does not include expenses of the Underlying Funds in which the Fund invests. |
| (g) | Portfolio turnover is from the Fund's Portfolio prior to discontinuance of master-feeder structure. |
Table of Contents
| SPDR SSGA Global Allocation ETF | |||||||||
| Year Ended 6/30/20 | Year Ended 6/30/19 | Year Ended 6/30/18(a) | Year Ended 6/30/17(a) | Year Ended 6/30/16(a) | |||||
Net asset value, beginning of period | $ 38.33 | $ 37.72 | $ 35.52 | $ 33.35 | $ 34.61 | ||||
| Income (loss) from investment operations: | |||||||||
Net investment income (loss) (b) | 1.07 | 1.03 | 0.81 | 0.99 | 0.81 | ||||
Net realized and unrealized gain (loss) (c) | (1.44) | 0.57 | 2.18 | 2.03 | (1.09) | ||||
Total from investment operations | (0.37) | 1.60 | 2.99 | 3.02 | (0.28) | ||||
Net equalization credits and charges (b) | 0.00(d) | 0.01 | 0.01 | 0.00(d) | 0.02 | ||||
Other capital | 0.00(d) | — | — | — | — | ||||
| Distributions to shareholders from: | |||||||||
Net investment income | (1.08) | (1.00) | (0.80) | (0.85) | (0.94) | ||||
Net realized gains | — | — | — | — | (0.06) | ||||
Total distributions | (1.08) | (1.00) | (0.80) | (0.85) | (1.00) | ||||
Net asset value, end of period | $ 36.88 | $ 38.33 | $ 37.72 | $ 35.52 | $ 33.35 | ||||
Total return (e) | (1.00)% | 4.37% | 8.46% | 9.14% | (0.63)% | ||||
| Ratios and Supplemental Data: | |||||||||
Net assets, end of period (in 000s) | $237,850 | $255,687 | $248,929 | $207,780 | $185,112 | ||||
| Ratios to average net assets: | |||||||||
Total expenses (f) | 0.09% | 0.15% | 0.20% | 0.20% | 0.20% | ||||
Net expenses | 0.09% | 0.15% | 0.09% | 0.01% | 0.06% | ||||
Net investment income (loss) | 2.84% | 2.76% | 2.14% | 2.91% | 2.45% | ||||
Portfolio turnover rate | 94% | 71% | 43% | 90%(g) | 86%(g) | ||||
| (a) | The per share amounts and percentages include the Fund’s proportionate share of income and expenses of the Portfolio prior to discontinuance of the master feeder structure. |
| (b) | Per share numbers have been calculated using average shares outstanding, which more appropriately presents the per share data for the year. |
| (c) | Amounts shown in this caption for a share outstanding may not accord with the change in aggregate gains and losses in securities for the fiscal period because of the timing of sales and repurchases of Fund shares in relation to fluctuating market values for the Fund. |
| (d) | Amount is less than $0.005 per share. |
| (e) | Total return is calculated assuming a purchase of shares at net asset value on the first day and a sale at net asset value on the last day of each period reported. Distributions are assumed, for the purpose of this calculation, to be reinvested at net asset value per share on the respective payment dates of each distribution. Total returns for periods of less than one year are not annualized. Broker commission charges are not included in this calculation. |
| (f) | Does not include expenses of the Underlying Funds in which the Fund invests. |
| (g) | Portfolio turnover is from the Fund's Portfolio prior to discontinuance of master-feeder structure. |
Table of Contents
| SPDR SSGA Ultra Short Term Bond ETF | |||||||||
| Year Ended 6/30/20 | Year Ended 6/30/19 | Year Ended 6/30/18(a) | Year Ended 6/30/17(a) | Year Ended 6/30/16(a) | |||||
Net asset value, beginning of period | $ 40.41 | $ 40.27 | $ 40.26 | $ 40.06 | $ 40.05 | ||||
| Income (loss) from investment operations: | |||||||||
Net investment income (loss) (b) | 0.81 | 1.02 | 0.68 | 0.44 | 0.27 | ||||
Net realized and unrealized gain (loss) (c) | (0.11) | 0.04 | (0.14) | 0.13 | (0.21) | ||||
Total from investment operations | 0.70 | 1.06 | 0.54 | 0.57 | 0.06 | ||||
Net equalization credits and charges (b) | 0.02 | 0.03 | 0.04 | (0.00)(d) | 0.07 | ||||
Other capital (b) | 0.03 | 0.02 | 0.06 | 0.05 | 0.12 | ||||
| Distributions to shareholders from: | |||||||||
Net investment income | (0.90) | (0.97) | (0.63) | (0.42) | (0.18) | ||||
Net realized gains | — | — | — | — | (0.06) | ||||
Total distributions | (0.90) | (0.97) | (0.63) | (0.42) | (0.24) | ||||
Net asset value, end of period | $ 40.26 | $ 40.41 | $ 40.27 | $ 40.26 | $ 40.06 | ||||
Total return (e) | 1.86% | 2.79% | 1.60% | 1.53% | 0.65% | ||||
| Ratios and Supplemental Data: | |||||||||
Net assets, end of period (in 000s) | $298,907 | $167,719 | $50,344 | $18,117 | $24,039 | ||||
| Ratios to average net assets: | |||||||||
Total expenses | 0.20% | 0.20% | 0.20% | 0.20% | 0.20% | ||||
Net investment income (loss) | 2.02% | 2.54% | 1.70% | 1.09% | 0.69% | ||||
Portfolio turnover rate | 71% | 100% | 76% | 83%(f) | 407%(f) | ||||
| (a) | The per share amounts and percentages include the Fund’s proportionate share of income and expenses of the Portfolio prior to discontinuance of the master feeder structure. |
| (b) | Per share numbers have been calculated using average shares outstanding, which more appropriately presents the per share data for the year. |
| (c) | Amounts shown in this caption for a share outstanding may not accord with the change in aggregate gains and losses in securities for the fiscal period because of the timing of sales and repurchases of Fund shares in relation to fluctuating market values for the Fund. |
| (d) | Amount is less than $0.005 per share. |
| (e) | Total return is calculated assuming a purchase of shares at net asset value on the first day and a sale at net asset value on the last day of each period reported. Distributions are assumed, for the purpose of this calculation, to be reinvested at net asset value per share on the respective payment dates of each distribution. Total returns for periods of less than one year are not annualized. Broker commission charges are not included in this calculation. |
| (f) | Portfolio turnover is from the Fund's Portfolio prior to discontinuance of master-feeder structure. |
Table of Contents
| SPDR MFS Systematic Core Equity ETF | |||||||||
| Year Ended 6/30/20 | Year Ended 6/30/19 | Year Ended 6/30/18(a) | Year Ended 6/30/17(a) | Year Ended 6/30/16(a) | |||||
Net asset value, beginning of period | $ 81.47 | $ 75.26 | $ 68.62 | $58.09 | $58.53 | ||||
| Income (loss) from investment operations: | |||||||||
Net investment income (loss) (b) | 1.36 | 1.34 | 1.13 | 0.97 | 1.020 | ||||
Net realized and unrealized gain (loss) (c) | 0.90 | 6.20 | 7.30 | 10.53 | 0.00(d) | ||||
Total from investment operations | 2.26 | 7.54 | 8.43 | 11.50 | 1.02 | ||||
Net equalization credits and charges (b) | (0.05) | 0.00(d) | 0.05 | — | 0.20 | ||||
Other capital (b) | 0.00(d) | 0.00(d) | (0.00)(d) | — | — | ||||
| Distributions to shareholders from: | |||||||||
Net investment income | (1.40) | (1.33) | (0.96) | (0.97) | (1.03) | ||||
Net realized gains | — | — | (0.88) | — | (0.63) | ||||
Total distributions | (1.40) | (1.33) | (1.84) | (0.97) | (1.66) | ||||
Net asset value, end of period | $ 82.28 | $ 81.47 | $ 75.26 | $68.62 | $58.09 | ||||
Total return (e) | 2.78% | 10.11% | 12.36% | 19.92% | 2.21% | ||||
| Ratios and Supplemental Data: | |||||||||
Net assets, end of period (in 000s) | $23,861 | $39,103 | $30,102 | $6,862 | $5,809 | ||||
| Ratios to average net assets: | |||||||||
Total expenses | 0.60% | 0.60% | 0.60% | 0.60% | 0.61% | ||||
Net investment income (loss) | 1.63% | 1.70% | 1.51% | 1.52% | 1.78% | ||||
Portfolio turnover rate | 53% | 65% | 67% | 67%(f) | 39%(f) | ||||
| (a) | The per share amounts and percentages include the Fund’s proportionate share of income and expenses of the Portfolio prior to discontinuance of the master feeder structure. |
| (b) | Per share numbers have been calculated using average shares outstanding, which more appropriately presents the per share data for the year. |
| (c) | Amounts shown in this caption for a share outstanding may not accord with the change in aggregate gains and losses in securities for the fiscal period because of the timing of sales and repurchases of Fund shares in relation to fluctuating market values for the Fund. |
| (d) | Amount is less than $0.005 per share. |
| (e) | Total return is calculated assuming a purchase of shares at net asset value on the first day and a sale at net asset value on the last day of each period reported. Distributions are assumed, for the purpose of this calculation, to be reinvested at net asset value per share on the respective payment dates of each distribution. Total returns for periods of less than one year are not annualized. Broker commission charges are not included in this calculation. |
| (f) | Portfolio turnover is from the Fund's Portfolio prior to discontinuance of master-feeder structure. |
Table of Contents
| SPDR MFS Systematic Growth Equity ETF | |||||||||
| Year Ended 6/30/20 | Year Ended 6/30/19 | Year Ended 6/30/18(a) | Year Ended 6/30/17(a) | Year Ended 6/30/16(a) | |||||
Net asset value, beginning of period | $ 83.81 | $ 80.77 | $ 71.05 | $ 60.67 | $ 60.24 | ||||
| Income (loss) from investment operations: | |||||||||
Net investment income (loss) (b) | 0.82 | 0.87 | 0.61 | 0.70 | 0.63 | ||||
Net realized and unrealized gain (loss) (c) | 13.47 | 4.13 | 9.80 | 10.27 | 1.62 | ||||
Total from investment operations | 14.29 | 5.00 | 10.41 | 10.97 | 2.25 | ||||
Net equalization credits and charges (b) | (0.04) | (0.02) | 0.04 | 0.01 | 0.01 | ||||
Other capital (b) | 0.00(d) | 0.00(d) | — | — | — | ||||
| Distributions to shareholders from: | |||||||||
Net investment income | (0.82) | (0.95) | (0.60) | (0.60) | (0.61) | ||||
Net realized gains | — | (0.99) | (0.13) | — | (1.22) | ||||
Total distributions | (0.82) | (1.94) | (0.73) | (0.60) | (1.83) | ||||
Net asset value, end of period | $ 97.24 | $ 83.81 | $ 80.77 | $ 71.05 | $ 60.67 | ||||
Total return (e) | 17.12% | 6.47% | 14.71% | 18.18% | 3.96% | ||||
| Ratios and Supplemental Data: | |||||||||
Net assets, end of period (in 000s) | $37,923 | $34,361 | $44,424 | $39,079 | $12,134 | ||||
| Ratios to average net assets: | |||||||||
Total expenses | 0.60% | 0.60% | 0.61% | 0.60% | 0.61% | ||||
Net investment income (loss) | 0.94% | 1.08% | 0.77% | 1.05% | 1.06% | ||||
Portfolio turnover rate | 73% | 77% | 76% | 55%(f) | 56%(f) | ||||
| (a) | The per share amounts and percentages include the Fund’s proportionate share of income and expenses of the Portfolio prior to discontinuance of the master feeder structure. |
| (b) | Per share numbers have been calculated using average shares outstanding, which more appropriately presents the per share data for the year. |
| (c) | Amounts shown in this caption for a share outstanding may not accord with the change in aggregate gains and losses in securities for the fiscal period because of the timing of sales and repurchases of Fund shares in relation to fluctuating market values for the Fund. |
| (d) | Amount is less than $0.005 per share. |
| (e) | Total return is calculated assuming a purchase of shares at net asset value on the first day and a sale at net asset value on the last day of each period reported. Distributions are assumed, for the purpose of this calculation, to be reinvested at net asset value per share on the respective payment dates of each distribution. Total returns for periods of less than one year are not annualized. Broker commission charges are not included in this calculation. |
| (f) | Portfolio turnover is from the Fund's Portfolio prior to discontinuance of master-feeder structure. |
Table of Contents
| SPDR MFS Systematic Value Equity ETF | |||||||||
| Year Ended 6/30/20 | Year Ended 6/30/19 | Year Ended 6/30/18(a) | Year Ended 6/30/17(a) | Year Ended 6/30/16(a) | |||||
Net asset value, beginning of period | $ 66.20 | $ 65.91 | $ 59.81 | $51.99 | $57.90 | ||||
| Income (loss) from investment operations: | |||||||||
Net investment income (loss) (b) | 1.44 | 1.44 | 1.21 | 1.03 | 0.99 | ||||
Net realized and unrealized gain (loss) (c) | (6.49) | 0.86 | 6.94 | 8.99 | (2.66) | ||||
Total from investment operations | (5.05) | 2.30 | 8.15 | 10.02 | (1.67) | ||||
Net equalization credits and charges (b) | (0.07) | 0.00(d) | 0.12 | 0.04 | — | ||||
Other capital (b) | 0.00(d) | 0.00(d) | — | — | — | ||||
| Distributions to shareholders from: | |||||||||
Net investment income | (1.50) | (1.47) | (1.06) | (1.01) | (1.01) | ||||
Net realized gains | — | (0.54) | (1.11) | (1.23) | (3.23) | ||||
Total distributions | (1.50) | (2.01) | (2.17) | (2.24) | (4.24) | ||||
Net asset value, end of period | $ 59.58 | $ 66.20 | $ 65.91 | $59.81 | $51.99 | ||||
Total return (e) | (7.77)% | 3.69% | 13.82% | 19.61% | (2.47)% | ||||
| Ratios and Supplemental Data: | |||||||||
Net assets, end of period (in 000s) | $20,853 | $33,760 | $32,953 | $5,981 | $2,599 | ||||
| Ratios to average net assets: | |||||||||
Total expenses | 0.60% | 0.60% | 0.60% | 0.60% | 0.62% | ||||
Net investment income (loss) | 2.21% | 2.18% | 1.83% | 1.80% | 1.85% | ||||
Portfolio turnover rate | 53% | 53% | 54% | 64%(f) | 64%(f) | ||||
| (a) | The per share amounts and percentages include the Fund’s proportionate share of income and expenses of the Portfolio prior to discontinuance of the master feeder structure. |
| (b) | Per share numbers have been calculated using average shares outstanding, which more appropriately presents the per share data for the year. |
| (c) | Amounts shown in this caption for a share outstanding may not accord with the change in aggregate gains and losses in securities for the fiscal period because of the timing of sales and repurchases of Fund shares in relation to fluctuating market values for the Fund. |
| (d) | Amount is less than $0.005 per share. |
| (e) | Total return is calculated assuming a purchase of shares at net asset value on the first day and a sale at net asset value on the last day of each period reported. Distributions are assumed, for the purpose of this calculation, to be reinvested at net asset value per share on the respective payment dates of each distribution. Total returns for periods of less than one year are not annualized. Broker commission charges are not included in this calculation. |
| (f) | Portfolio turnover is from the Fund's Portfolio prior to discontinuance of master-feeder structure. |
Table of Contents
| SPDR SSGA Multi-Asset Real Return ETF |
| SPDR SSGA Income Allocation ETF |
| SPDR SSGA Global Allocation ETF |
| SPDR SSGA Ultra Short Term Bond ETF |
| SPDR MFS Systematic Core Equity ETF |
| SPDR MFS Systematic Growth Equity ETF |
| SPDR MFS Systematic Value Equity ETF |
Table of Contents
Table of Contents
| Annual Rate* | |
SPDR SSGA Multi-Asset Real Return ETF | 0.50% |
SPDR SSGA Income Allocation ETF | 0.50 |
SPDR SSGA Global Allocation ETF | 0.35 |
SPDR SSGA Ultra Short Term Bond ETF | 0.20 |
SPDR MFS Systematic Core Equity ETF | 0.60 |
SPDR MFS Systematic Growth Equity ETF | 0.60 |
Table of Contents
| Annual Rate* | |
SPDR MFS Systematic Value Equity ETF | 0.60% |
| * | The Advisory fee is reduced for SPDR SSGA Multi-Asset Real Return ETF, SPDR SSGA Income Allocation ETF and SPDR SSGA Global Allocation ETF by the acquired fund fees and expenses. For the year ended June 30, 2020, the net annualized advisory fee was 0.08%, 0.18%, and 0.09% for the SPDR SSGA Multi-Asset Real Return ETF, SPDR SSGA Income Allocation ETF, SPDR SSGA Global Allocation ETF, respectively. |
Table of Contents
| U.S. Government Obligations | |||||||
| Purchases | Sales | Purchases | Sales | ||||
SPDR SSGA Multi-Asset Real Return ETF | $ — | $ — | $ 25,401,624 | $ 26,182,593 | |||
SPDR SSGA Income Allocation ETF | — | — | 48,322,712 | 47,191,506 | |||
SPDR SSGA Global Allocation ETF | — | — | 230,755,357 | 231,819,424 | |||
SPDR SSGA Ultra Short Term Bond ETF | 10,608,936 | 11,975,376 | 248,728,075 | 132,364,716 | |||
SPDR MFS Systematic Core Equity ETF | — | — | 18,011,080 | 17,963,210 | |||
SPDR MFS Systematic Growth Equity ETF | — | — | 26,378,273 | 26,273,901 | |||
SPDR MFS Systematic Value Equity ETF | — | — | 15,678,797 | 15,604,247 | |||
| In-kind Contributions | In-kind Redemptions | In-kind Net Realized Gains/(Losses) | |||
SPDR SSGA Multi-Asset Real Return ETF | $ 7,571,587 | $48,535,196 | $(4,413,087) | ||
SPDR SSGA Income Allocation ETF | 109,711,265 | 71,301,409 | (536,457) | ||
SPDR SSGA Global Allocation ETF | 21,588,470 | 26,767,131 | 1,261,517 | ||
SPDR MFS Systematic Core Equity ETF | 8,354,167 | 22,162,888 | 716,228 | ||
SPDR MFS Systematic Growth Equity ETF | 13,535,197 | 15,463,108 | 2,549,618 | ||
SPDR MFS Systematic Value Equity ETF | — | 9,555,505 | 28,711 |
Table of Contents
| Ordinary Income | Long-Term Capital Gains | Total | |||
SPDR SSGA Multi-Asset Real Return ETF | $2,878,161 | $— | $2,878,161 | ||
SPDR SSGA Income Allocation ETF | 5,787,114 | — | 5,787,114 | ||
SPDR SSGA Global Allocation ETF | 7,327,692 | — | 7,327,692 | ||
SPDR SSGA Ultra Short Term Bond ETF | 4,951,989 | — | 4,951,989 | ||
SPDR MFS Systematic Core Equity ETF | 573,138 | — | 573,138 | ||
SPDR MFS Systematic Growth Equity ETF | 335,571 | — | 335,571 | ||
SPDR MFS Systematic Value Equity ETF | 665,847 | — | 665,847 |
| Ordinary Income | Long-Term Capital Gains | Total | |||
SPDR SSGA Multi-Asset Real Return ETF | $ 3,617,253 | $ — | $ 3,617,253 | ||
SPDR SSGA Income Allocation ETF | 4,936,932 | — | 4,936,932 | ||
SPDR SSGA Global Allocation ETF | 7,044,570 | — | 7,044,570 | ||
SPDR SSGA Ultra Short Term Bond ETF | 3,073,623 | — | 3,073,623 | ||
SPDR MFS Systematic Core Equity ETF | 555,651 | 5,578 | 561,229 | ||
SPDR MFS Systematic Growth Equity ETF | 879,302 | — | 879,302 | ||
SPDR MFS Systematic Value Equity ETF | 897,607 | 175,077 | 1,072,684 |
| Undistributed Ordinary Income | Capital Loss Carryforwards | Undistributed Long-Term Capital Gains | Net Unrealized Gains (Losses) | Qualified Late-Year Losses | Total | ||||||
SPDR SSGA Multi-Asset Real Return ETF | $ — | $(40,663,016) | $— | $(11,689,490) | $— | $(52,352,506) | |||||
SPDR SSGA Income Allocation ETF | — | (9,425,137) | — | (9,152,187) | — | (18,577,324) | |||||
SPDR SSGA Global Allocation ETF | 200 | (7,784,550) | — | 8,881,061 | — | 1,096,711 | |||||
SPDR SSGA Ultra Short Term Bond ETF | 128,087 | (537,191) | — | (631,263) | — | (1,040,367) | |||||
SPDR MFS Systematic Core Equity ETF | — | (958,255) | — | 913,389 | — | (44,866) | |||||
SPDR MFS Systematic Growth Equity ETF | 10,502 | (1,066,003) | — | 5,622,703 | — | 4,567,202 | |||||
SPDR MFS Systematic Value Equity ETF | 136 | (1,655,110) | — | (1,357,398) | — | (3,012,372) |
| Non-Expiring Short Term | Non-Expiring Long Term | ||
SPDR SSGA Multi-Asset Real Return ETF | $11,141,325 | $29,521,691 | |
SPDR SSGA Income Allocation ETF | 6,603,434 | 2,821,703 | |
SPDR SSGA Global Allocation ETF | 7,784,550 | — |
Table of Contents
| Non-Expiring Short Term | Non-Expiring Long Term | ||
SPDR SSGA Ultra Short Term Bond ETF | $ 245,190 | $ 292,001 | |
SPDR MFS Systematic Core Equity ETF | 597,086 | 361,169 | |
SPDR MFS Systematic Growth Equity ETF | 1,066,003 | — | |
SPDR MFS Systematic Value Equity ETF | 1,422,682 | 232,428 |
| Tax Cost | Gross Unrealized Appreciation | Gross Unrealized Depreciation | Net Unrealized Appreciation (Depreciation) | ||||
SPDR SSGA Multi-Asset Real Return ETF | $ 76,061,359 | $ 649,862 | $12,339,352 | $(11,689,490) | |||
SPDR SSGA Income Allocation ETF | 156,521,919 | 3,512,277 | 12,664,464 | (9,152,187) | |||
SPDR SSGA Global Allocation ETF | 290,534,764 | 15,650,494 | 6,769,433 | 8,881,061 | |||
SPDR SSGA Ultra Short Term Bond ETF | 298,908,576 | 780,977 | 1,412,240 | (631,263) | |||
SPDR MFS Systematic Core Equity ETF | 22,938,517 | 3,048,708 | 2,135,319 | 913,389 | |||
SPDR MFS Systematic Growth Equity ETF | 32,292,375 | 7,131,425 | 1,508,722 | 5,622,703 | |||
SPDR MFS Systematic Value Equity ETF | 22,182,619 | 1,367,376 | 2,724,774 | (1,357,398) |
| Fund | Market Value of Securities on Loan | Cash Collateral Received | Non-Cash Collateral Received | Total Collateral Received | ||||
SPDR SSGA Multi-Asset Real Return ETF | $ 14,056,558 | $ 10,616,056 | $ 3,715,541 | $ 14,331,597 | ||||
SPDR SSGA Income Allocation ETF | 26,684,773 | 21,343,138 | 5,853,851 | 27,196,989 | ||||
SPDR SSGA Global Allocation ETF | 71,525,522 | 61,808,691 | 11,142,919 | 72,951,610 |
Table of Contents
| Remaining Contractual Maturity of the Agreements As of June 30, 2020 | ||||||||||||||
| Fund | Securities Lending Transactions | Overnight and Continuous | <30 Days | Between 30 & 90 Days | >90 Days | Total Borrowings | Gross Amount of Recognized Liabilities for Securities Lending Transactions | |||||||
SPDR SSGA Multi-Asset Real Return ETF | Mutual Funds and Exchange Traded Products | $10,616,056 | $— | $— | $— | $10,616,056 | $10,616,056 | |||||||
SPDR SSGA Income Allocation ETF | Mutual Funds and Exchange Traded Products | 21,343,138 | — | — | — | 21,343,138 | 21,343,138 | |||||||
SPDR SSGA Global Allocation ETF | Mutual Funds and Exchange Traded Products | 61,808,691 | — | — | — | 61,808,691 | 61,808,691 | |||||||
Table of Contents
Table of Contents

August 28, 2020
Table of Contents
| Actual | Hypothetical (assuming a 5% return before expenses) | ||||||||
| Annualized Expense Ratio | Ending Account Value | Expenses Paid During Period(a) | Ending Account Value | Expenses Paid During Period(a) | |||||
SPDR SSGA Multi-Asset Real Return ETF | 0.08% | $ 844.40 | $0.37 | $1,024.50 | $0.40 | ||||
SPDR SSGA Income Allocation ETF | 0.18 | 905.70 | 0.85 | 1,024.00 | 0.91 | ||||
SPDR SSGA Global Allocation ETF | 0.08 | 930.50 | 0.38 | 1,024.50 | 0.40 | ||||
SPDR SSGA Ultra Short Term Bond ETF | 0.20 | 1,005.30 | 1.00 | 1,023.90 | 1.01 | ||||
SPDR MFS Systematic Core Equity ETF | 0.60 | 923.80 | 2.87 | 1,021.90 | 3.02 | ||||
SPDR MFS Systematic Growth Equity ETF | 0.60 | 1,084.30 | 3.11 | 1,021.90 | 3.02 | ||||
SPDR MFS Systematic Value Equity ETF | 0.60 | 838.20 | 2.74 | 1,021.90 | 3.02 | ||||
| (a) | Expenses are equal to the Fund's annualized net expense ratio multiplied by the average account value of the period, multiplied by 182, then divided by 366. |
Table of Contents
Table of Contents
Table of Contents
Table of Contents
Table of Contents
| Name, Address and Year of Birth | Position(s) with Funds | Term of Office and Length of Time Served | Principal Occupation(s) During Past 5 Years | Number of Portfolios in Fund Complex Overseen by Trustee† | Other Directorships Held by Trustee During the Past 5 Years | |||||
| Trustees | ||||||||||
| Independent Trustees | ||||||||||
| FRANK NESVET c/o SSGA Active Trust One Iron Street Boston, MA 02210 1943 | Independent Trustee, Chairman, Trustee Committee Chair | Term: Unlimited Served: since March 2011 | Retired. | 123 | None. | |||||
| BONNY EUGENIA BOATMAN c/o SSGA Active Trust One Iron Street Boston, MA 02210 1950 | Independent Trustee | Term: Unlimited Served: since March 2011 | Retired. | 123 | None. | |||||
| DWIGHT D. CHURCHILL c/o SSGA Active Trust One Iron Street Boston, MA 02210 1953 | Independent Trustee | Term: Unlimited Served: since March 2011 | Self-employed consultant since 2010; CEO and President, CFA Institute (June 2014-January 2015). | 123 | Affiliated Managers Group, Inc. (Chairman, Director and Audit Committee Chair). | |||||
| CLARE S. RICHER c/o SSGA Active Trust One Iron Street Boston, MA 02210 1958 | Independent Trustee | Term: Unlimited Served: since July 2018 | Retired. Chief Financial Officer, Putnam Investments LLC (December 2008- May 2017). | 123 | Principal Financial Group (Director); Bain Capital Specialty Finance (Director); Putnam Acquisition Financing Inc. (Director); Putnam Acquisition Financing LLC (Director); Putnam GP Inc. (Director); Putnam Investor Services, Inc. (Director); University of Notre Dame (Trustee). | |||||
| SANDRA G. SPONEM c/o SSGA Active Trust One Iron Street Boston, MA 02210 1958 | Independent Trustee | Term: Unlimited Served: since July 2018 | Retired. Chief Financial Officer, M.A. Mortenson Companies, Inc. (February 2007- April 2017). | 123 | Rydex Series Funds, Rydex Dynamic Funds, Rydex Variable Trust, Guggenheim Funds Trust, Guggenheim Variable Funds Trust, Guggenheim Strategy Funds Trust, Transparent Value Trust, Fiduciary/ Claymore Energy Infrastructure Fund, Guggenheim Taxable Municipal Managed Duration Trust, Guggenheim Strategic Opportunities Fund, Guggenheim Enhanced, Equity Income Fund, Guggenheim Credit Allocation Fund, Guggenheim Energy & Income Fund (Trustee and Audit Committee Chair). |
Table of Contents
| Name, Address and Year of Birth | Position(s) with Funds | Term of Office and Length of Time Served | Principal Occupation(s) During Past 5 Years | Number of Portfolios in Fund Complex Overseen by Trustee† | Other Directorships Held by Trustee During the Past 5 Years | |||||
| CARL G. VERBONCOEUR c/o SSGA Active Trust One Iron Street Boston, MA 02210 1952 | Independent Trustee, Audit Committee Chair | Term: Unlimited Served: since March 2011 | Self-employed consultant since 2009. | 123 | The Motley Fool Funds Trust (Trustee). | |||||
| Interested Trustee | ||||||||||
| JAMES E. ROSS* c/o SSGA Active Trust One Iron Street Boston, MA 02210 1965 | Interested Trustee | Term: Unlimited Served as Trustee: since March 2011 | Non-Executive Chairman, Fusion Acquisition Corp. (June 2020 - Present); Retired Chairman and Director, SSGA Funds Management, Inc. (2005 - March 2020); Retired Executive Vice President, State Street Global Advisors (2012 - March 2020); Retired Chief Executive Officer and Director, State Street Global Advisors Funds Distributors, LLC (May 2017 - March 2020); Director, State Street Global Markets, LLC (2013 - April 2017); President, SSGA Funds Management, Inc. (2005 - 2012); Principal, State Street Global Advisors (2000 - 2005). | 134 | SSGA SPDR ETFs Europe I plc (Director) (November 2016 - March 2020); SSGA SPDR ETFs Europe II plc (Director) (November 2016 - March 2020); State Street Navigator Securities Lending Trust (July 2016 - March 2020); SSGA Funds (January 2014 - March 2020); State Street Institutional Investment Trust (February 2007 - March 2020); State Street Master Funds (February 2007 - March 2020); Elfun Funds (July 2016 - December 2018). | |||||
| † For the purpose of determining the number of portfolios overseen by the Trustees, “Fund Complex” comprises registered investment companies for which SSGA Funds Management, Inc. serves as investment adviser. | ||||||||||
| * Mr. Ross is an Interested Trustee because of his former position with the Adviser and ownership interest in an affiliate of the Adviser. | ||||||||||
| Name, Address and Year of Birth | Position(s) with Funds | Term of Office and Length of Time Served | Principal Occupation(s) During the Past 5 Years | |||
| Officers | ||||||
| ELLEN M. NEEDHAM SSGA Funds Management, Inc. One Iron Street Boston, MA 02210 1967 | President | Term: Unlimited Served: since October 2012 | Chairman, SSGA Funds Management, Inc. (March 2020 - present); President and Director, SSGA Funds Management, Inc. (2001 - present)*; Senior Managing Director, State Street Global Advisors (1992 - present)*; Manager, State Street Global Advisors Funds Distributors, LLC (May 2017 - present). | |||
| BRUCE S. ROSENBERG SSGA Funds Management, Inc. One Iron Street Boston, MA 02210 1961 | Treasurer | Term: Unlimited Served: since February 2016 | Managing Director, State Street Global Advisors and SSGA Funds Management, Inc. (July 2015 - present); Director, Credit Suisse (April 2008 - July 2015). |
Table of Contents
| Name, Address and Year of Birth | Position(s) with Funds | Term of Office and Length of Time Served | Principal Occupation(s) During the Past 5 Years | |||
| ANN M. CARPENTER SSGA Funds Management, Inc. One Iron Street Boston, MA 02210 1966 | Vice President; Deputy Treasurer | Term: Unlimited Served: since August 2012 (with respect to Vice President); since February 2016 (with respect to Deputy Treasurer) | Chief Operating Officer, SSGA Funds Management, Inc. (2005 - Present)*; Managing Director, State Street Global Advisors (2005 - present).* | |||
| MICHAEL P. RILEY SSGA Funds Management, Inc. One Iron Street Boston, MA 02210 1969 | Vice President | Term: Unlimited Served: since March 2011 | Managing Director, State Street Global Advisors (2005 - present).* | |||
| SEAN O’MALLEY SSGA Funds Management, Inc. One Iron Street Boston, MA 02210 1969 | Chief Legal Officer | Term: Unlimited Served: since August 2019 | Senior Vice President and Deputy General Counsel, State Street Global Advisors (November 2013 -present). | |||
| ANDREW DELORME SSGA Funds Management, Inc. One Iron Street Boston, MA 02210 1975 | Secretary | Term: Unlimited Served: since August 2019 | Vice President and Senior Counsel, State Street Global Advisors (April 2016 - present); Vice President and Counsel, State Street Global Advisors (August 2014 - March 2016). | |||
| KEVIN MORRIS SSGA Funds Management, Inc. One Iron Street Boston, MA 02210 1982 | Assistant Secretary | Term: Unlimited Served: since August 2019 | Vice President and Senior Counsel, State Street Global Advisors (April 2019 - present); Vice President and Counsel, State Street Global Advisors (January 2016 -April 2019); Director, Asset Management Compliance, Fidelity Investments (June 2015 - January 2016); Senior Compliance Advisor, Asset Management Compliance, Fidelity Investments (June 2012 - June 2015). | |||
| DAVID URMAN SSGA Funds Management, Inc. One Iron Street Boston, MA 02210 1985 | Assistant Secretary | Term: Unlimited Served: since August 2019 | Vice President and Senior Counsel, State Street Global Advisors (April 2019 - present); Vice President and Counsel, State Street Global Advisors (August 2015 - April 2019); Associate, Ropes & Gray LLP (November 2012 - August 2015). | |||
| CHAD C. HALLETT SSGA Funds Management, Inc. One Iron Street Boston, MA 02210 1969 | Deputy Treasurer | Term: Unlimited Served: since February 2016 | Vice President, State Street Global Advisors and SSGA Funds Management, Inc. (November 2014 - present); Vice President, State Street Bank and Trust Company (2001 - November 2014).* | |||
| DARLENE ANDERSON-VASQUEZ SSGA Funds Management, Inc. One Iron Street Boston, MA 02210 1968 | Deputy Treasurer | Term: Unlimited Served: since November 2016 | Managing Director, State Street Global Advisors and SSGA Funds Management, Inc. (May 2016 - present); Senior Vice President, John Hancock Investments (September 2007 - May 2016). | |||
| ARTHUR A. JENSEN SSGA Funds Management, Inc. 1600 Summer Street Stamford, CT 06905 1966 | Deputy Treasurer | Term: Unlimited Served: Since August 2017 | Vice President at State Street Global Advisors (July 2016 – present); Mutual Funds Controller of GE Asset Management Incorporated (April 2011 - July 2016). |
Table of Contents
| Name, Address and Year of Birth | Position(s) with Funds | Term of Office and Length of Time Served | Principal Occupation(s) During the Past 5 Years | |||
| SUJATA UPRETI SSGA Funds Management, Inc. One Iron Street Boston, MA 02210 1974 | Assistant Treasurer | Term: Unlimited Served: since February 2016 | Vice President, State Street Global Advisors and SSGA Funds Management, Inc. (May 2015 - present). | |||
| DANIEL FOLEY SSGA Funds Management, Inc. One Iron Street Boston, MA 02210 1972 | Assistant Treasurer | Term: Unlimited Served: since February 2016 | Vice President, State Street Global Advisors and SSGA Funds Management, Inc. (April 2007 - present).* | |||
| DANIEL G. PLOURDE SSGA Funds Management, Inc. One Iron Street Boston, MA 02210 1980 | Assistant Treasurer | Term: Unlimited Served: since May 2017 | Vice President, State Street Global Advisors and SSGA Funds Management, Inc. (May 2015 - present); Officer, State Street Bank and Trust Company (March 2009 - May 2015). | |||
| BRIAN HARRIS SSGA Funds Management, Inc. One Iron Street Boston, MA 02210 1973 | Chief Compliance Officer; Anti-Money Laundering Officer; Code of Ethics Compliance Officer | Term: Unlimited Served: since November 2013 | Managing Director, State Street Global Advisors and SSGA Funds Management, Inc. (June 2013 - present)*; Senior Vice President and Global Head of Investment Compliance, BofA Global Capital Management (2010 - 2013); Director of Compliance, AARP Financial Inc. (2008 - 2010). | |||
| * Served in various capacities and/or with various affiliated entities during noted time period. | ||||||
| The Statement of Additional Information (SAI) includes additional information about the Funds' trustees and is available, without charge, upon request and by calling 1-866-787-2257. | ||||||
Table of Contents
Table of Contents
Table of Contents
One Iron Street
Boston, MA 02210
One Iron Street
Boston, MA 02210
One Lincoln Street
Boston, MA 02111
1111 Pennsylvania Avenue, NW
Washington, DC 20004
200 Clarendon Street
Boston, MA 02116
Table of Contents
One Iron Street
Boston, MA 02210
Table of Contents
| SPDR SSGA Fixed Income Sector Rotation ETF |
| SPDR SSGA US Sector Rotation ETF |

Table of Contents
Table of Contents
| 1 | |
| Management’s Discussion of Fund Performance, Performance Summaries & Portfolio Statistics (Unaudited) | |
| 2 | |
| 5 | |
| Schedules of Investments | |
| 8 | |
| 10 | |
| 12 | |
| 15 | |
| 17 | |
| 27 | |
| 29 |
Table of Contents
Table of Contents
Table of Contents
Table of Contents
| Cumulative Total Return | Average Annual Total Return | ||||||||
| Net Asset Value | Market Value | Bloomberg Barclays U.S. Aggregate Bond Index | Net Asset Value | Market Value | Bloomberg Barclays U.S. Aggregate Bond Index | ||||
| ONE YEAR | 6.42% | 6.24% | 8.74% | 6.42% | 6.24% | 8.74% | |||
| SINCE INCEPTION(1) | 10.47% | 10.42% | 12.41% | 8.34% | 8.29% | 9.89% | |||
| (1) | For the period April 2, 2019 to June 30, 2020. |
(Based on Net Asset Value)
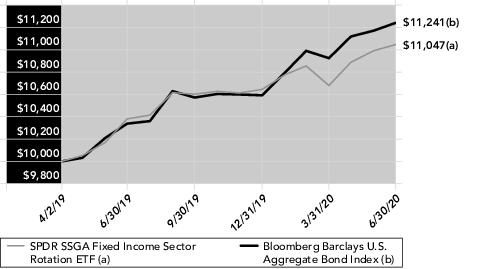
Table of Contents
| Description | % of Net Assets | ||
| SPDR Portfolio Mortgage Backed Bond ETF | 33.0% | ||
| SPDR Portfolio Intermediate Term Corporate Bond ETF | 28.1 | ||
| SPDR Portfolio Intermediate Term Treasury ETF | 17.0 | ||
| SPDR Portfolio Long Term Corporate Bond ETF | 10.2 | ||
| SPDR Bloomberg Barclays High Yield Bond ETF | 9.4 | ||
| TOTAL | 97.7% |
| % of Net Assets | |||
| Domestic Fixed Income | 97.7% | ||
| Short Term Investments | 23.3 | ||
| Liabilities in Excess of Other Assets | (21.0) | ||
| TOTAL | 100.0% |
Table of Contents
Table of Contents
| Cumulative Total Return | Average Annual Total Return | ||||||||
| Net Asset Value | Market Value | S&P 500 Index | Net Asset Value | Market Value | S&P 500 Index | ||||
| ONE YEAR | 8.52% | 8.81% | 7.51% | 8.52% | 8.81% | 7.51% | |||
| SINCE INCEPTION(1) | 11.24% | 11.39% | 10.84% | 8.94% | 9.06% | 8.65% | |||
| (1) | For the period April 2, 2019 to June 30, 2020. |
(Based on Net Asset Value)
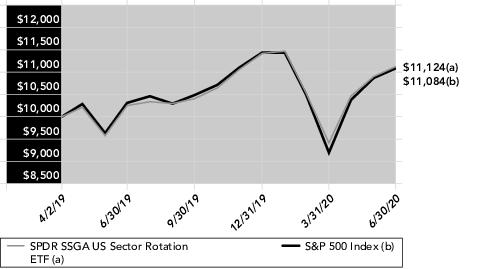
Table of Contents
| Description | % of Net Assets | ||
| The Technology Select Sector SPDR Fund | 38.0% | ||
| The Health Care Select Sector SPDR Fund | 25.5 | ||
| The Financial Select Sector SPDR Fund | 16.1 | ||
| The Communication Services Select Sector SPDR Fund | 12.9 | ||
| The Energy Select Sector SPDR Fund | 2.7 | ||
| TOTAL | 95.2% |
| % of Net Assets | |||
| Domestic Equity | 100.0% | ||
| Short Term Investments | 6.5 | ||
| Liabilities in Excess of Other Assets | (6.5) | ||
| TOTAL | 100.0% |
Table of Contents
| Security Description | Shares | Value | ||||
| MUTUAL FUNDS AND EXCHANGE TRADED PRODUCTS — 97.7% | ||||||
| DOMESTIC FIXED INCOME — 97.7% | ||||||
SPDR Bloomberg Barclays High Yield Bond ETF (a)(b) | 43,696 | $ 4,420,287 | ||||
SPDR Portfolio Intermediate Term Corporate Bond ETF (a)(b) | 362,090 | 13,227,148 | ||||
SPDR Portfolio Intermediate Term Treasury ETF (a)(b) | 239,904 | 7,969,611 | ||||
SPDR Portfolio Long Term Corporate Bond ETF (a)(b) | 151,623 | 4,806,450 | ||||
SPDR Portfolio Mortgage Backed Bond ETF (a)(b) | 578,818 | 15,506,534 | ||||
TOTAL MUTUAL FUNDS AND EXCHANGE TRADED PRODUCTS (Cost $44,634,429) | 45,930,030 | |||||
| SHORT-TERM INVESTMENTS — 23.3% | ||||||
State Street Institutional U.S. Government Money Market Fund, Class G Shares 0.16% (c)(d) | 1,091,555 | 1,091,555 | ||||
State Street Navigator Securities Lending Portfolio II (e)(f) | 9,882,034 | 9,882,034 | ||||
TOTAL SHORT-TERM INVESTMENTS (Cost $10,973,589) | $ 10,973,589 | |||||
TOTAL INVESTMENTS—121.0% (Cost $55,608,018) | 56,903,619 | |||||
LIABILITIES IN EXCESS OF OTHER ASSETS—(21.0)% | (9,889,223) | |||||
NET ASSETS—100.0% | $ 47,014,396 | |||||
| The Fund invests in other funds and financial statements of underlying funds can be found at www.sec.gov. | |
| (a) | Affiliated fund managed by SSGA Funds Management, Inc. Amounts related to these transactions during the period ended June 30, 2020 are shown in the Affiliate Table below. |
| (b) | All or a portion of the shares of the security are on loan at June 30, 2020. |
| (c) | The Fund invested in certain money market funds managed by SSGA Funds Management, Inc. Amounts related to these transactions during the period ended June 30, 2020 are shown in the Affiliate Table below. |
| (d) | The rate shown is the annualized seven-day yield at June 30, 2020. |
| (e) | The Fund invested in an affiliated entity. Amounts related to these transactions during the period ended June 30, 2020 are shown in the Affiliate Table below. |
| (f) | Investment of cash collateral for securities loaned. |
| Description | Level 1 – Quoted Prices | Level 2 – Other Significant Observable Inputs | Level 3 – Significant Unobservable Inputs | Total | ||||
| ASSETS: | ||||||||
| INVESTMENTS: | ||||||||
Mutual Funds and Exchange Traded Products | $45,930,030 | $— | $— | $45,930,030 | ||||
Short-Term Investments | 10,973,589 | — | — | 10,973,589 | ||||
TOTAL INVESTMENTS | $56,903,619 | $— | $— | $56,903,619 |
Table of Contents
| Number of Shares Held at 6/30/19 | Value at 6/30/19 | Cost of Purchases | Proceeds from Shares Sold | Realized Gain (Loss) | Change in Unrealized Appreciation/ Depreciation | Number of Shares Held at 6/30/20 | Value at 6/30/20 | Dividend Income | |||||||||
SPDR Bloomberg Barclays 1-3 Month T-Bill ETF | 3,742 | $ 342,805 | $ 6,774,386 | $ 7,113,976 | $ (2,678) | $ (537) | — | $ — | $ 30,855 | ||||||||
SPDR Bloomberg Barclays High Yield Bond ETF | 5,218 | 568,449 | 7,741,517 | 3,749,374 | (231,013) | 90,708 | 43,696 | 4,420,287 | 98,119 | ||||||||
SPDR Portfolio Intermediate Term Corporate Bond ETF | 31,956 | 1,116,223 | 20,381,969 | 8,598,301 | (48,412) | 375,669 | 362,090 | 13,227,148 | 166,807 | ||||||||
SPDR Portfolio Intermediate Term Treasury ETF | 23,909 | 1,477,576 | 14,530,839 | 8,485,176 | 33,846 | 412,526 | 239,904 | 7,969,611 | 78,922 | ||||||||
SPDR Portfolio Long Term Corporate Bond ETF | 114,074 | 3,279,628 | 9,227,355 | 7,824,445 | 212,588 | (88,676) | 151,623 | 4,806,450 | 53,073 | ||||||||
SPDR Portfolio Long Term Treasury ETF | 13,503 | 515,274 | 2,199,711 | 2,649,106 | (55,642) | (10,237) | — | — | 7,119 | ||||||||
SPDR Portfolio Mortgage Backed Bond ETF | 136,205 | 3,560,399 | 16,044,975 | 4,323,220 | 17,974 | 206,406 | 578,818 | 15,506,534 | 231,353 | ||||||||
State Street Institutional U.S. Government Money Market Fund, Class G Shares | 19,198 | 19,198 | 1,406,329 | 333,972 | — | — | 1,091,555 | 1,091,555 | 603 | ||||||||
State Street Navigator Securities Lending Portfolio II | — | — | 200,534,986 | 190,652,952 | — | — | 9,882,034 | 9,882,034 | 67,826 | ||||||||
State Street Navigator Securities Lending Portfolio III | — | — | 18,934,708 | 18,934,708 | — | — | — | — | 9,412 | ||||||||
Total | $10,879,552 | $297,776,775 | $252,665,230 | $ (73,337) | $985,859 | $56,903,619 | $744,089 |
Table of Contents
| Security Description | Shares | Value | ||||
| MUTUAL FUNDS AND EXCHANGE TRADED PRODUCTS — 100.0% | ||||||
| DOMESTIC EQUITY — 100.0% | ||||||
The Communication Services Select Sector SPDR Fund (a)(b) | 164,031 | $ 8,864,235 | ||||
The Consumer Staples Select Sector SPDR Fund (a)(b) | 29,312 | 1,718,856 | ||||
The Energy Select Sector SPDR Fund (a)(b) | 48,903 | 1,850,978 | ||||
The Financial Select Sector SPDR Fund (a)(b) | 476,814 | 11,033,476 | ||||
The Health Care Select Sector SPDR Fund (a)(b) | 174,726 | 17,484,831 | ||||
The Technology Select Sector SPDR Fund (a) | 249,472 | 26,067,329 | ||||
The Utilities Select Sector SPDR Fund (a)(b) | 28,492 | 1,607,804 | ||||
TOTAL MUTUAL FUNDS AND EXCHANGE TRADED PRODUCTS (Cost $65,231,650) | 68,627,509 | |||||
| SHORT-TERM INVESTMENTS — 6.5% | ||||||
State Street Institutional U.S. Government Money Market Fund, Class G Shares 0.16% (c)(d) | 11,345 | 11,345 | ||||
State Street Navigator Securities Lending Portfolio II (e)(f) | 4,445,869 | 4,445,869 | ||||
TOTAL SHORT-TERM INVESTMENTS (Cost $4,457,214) | $ 4,457,214 | |||||
TOTAL INVESTMENTS—106.5% (Cost $69,688,864) | 73,084,723 | |||||
LIABILITIES IN EXCESS OF OTHER ASSETS—(6.5)% | (4,467,435) | |||||
NET ASSETS—100.0% | $ 68,617,288 | |||||
| The Fund invests in other funds and financial statements of underlying funds can be found at www.sec.gov. | |
| (a) | Affiliated fund managed by SSGA Funds Management, Inc. Amounts related to these transactions during the period ended June 30, 2020 are shown in the Affiliate Table below. |
| (b) | All or a portion of the shares of the security are on loan at June 30, 2020. |
| (c) | The Fund invested in certain money market funds managed by SSGA Funds Management, Inc. Amounts related to these transactions during the period ended June 30, 2020 are shown in the Affiliate Table below. |
| (d) | The rate shown is the annualized seven-day yield at June 30, 2020. |
| (e) | The Fund invested in an affiliated entity. Amounts related to these transactions during the period ended June 30, 2020 are shown in the Affiliate Table below. |
| (f) | Investment of cash collateral for securities loaned. |
Table of Contents
| Description | Level 1 – Quoted Prices | Level 2 – Other Significant Observable Inputs | Level 3 – Significant Unobservable Inputs | Total | ||||
| ASSETS: | ||||||||
| INVESTMENTS: | ||||||||
Mutual Funds and Exchange Traded Products | $68,627,509 | $— | $— | $68,627,509 | ||||
Short-Term Investments | 4,457,214 | — | — | 4,457,214 | ||||
TOTAL INVESTMENTS | $73,084,723 | $— | $— | $73,084,723 |
| Number of Shares Held at 6/30/19 | Value at 6/30/19 | Cost of Purchases | Proceeds from Shares Sold | Realized Gain (Loss) | Change in Unrealized Appreciation/ Depreciation | Number of Shares Held at 6/30/20 | Value at 6/30/20 | Dividend Income | |||||||||
State Street Institutional U.S. Government Money Market Fund, Class G Shares | 43,535 | $ 43,535 | $ 1,093,608 | $ 1,125,798 | $ — | $ — | 11,345 | $ 11,345 | $ 756 | ||||||||
State Street Navigator Securities Lending Portfolio II | — | — | 188,393,975 | 183,948,106 | — | — | 4,445,869 | 4,445,869 | 18,947 | ||||||||
State Street Navigator Securities Lending Portfolio III | — | — | 13,512,034 | 13,512,034 | — | — | — | — | 223 | ||||||||
The Communication Services Select Sector SPDR Fund | — | — | 17,149,970 | 8,752,043 | 350,160 | 116,148 | 164,031 | 8,864,235 | 29,716 | ||||||||
The Consumer Staples Select Sector SPDR Fund | 26,360 | 1,530,725 | 10,817,089 | 10,520,211 | (148,510) | 39,763 | 29,312 | 1,718,856 | 40,866 | ||||||||
The Energy Select Sector SPDR Fund | — | — | 2,087,186 | 240,139 | 25,966 | (22,035) | 48,903 | 1,850,978 | 22,744 | ||||||||
The Financial Select Sector SPDR Fund | — | — | 22,540,495 | 8,243,324 | (1,527,223) | (1,736,472) | 476,814 | 11,033,476 | 200,227 | ||||||||
The Health Care Select Sector SPDR Fund | 43,744 | 4,052,444 | 23,258,862 | 10,439,473 | (32,274) | 645,272 | 174,726 | 17,484,831 | 250,092 | ||||||||
The Industrial Select Sector SPDR Fund | 43,980 | 3,404,932 | 3,811,359 | 7,266,437 | 145,490 | (95,344) | — | — | 21,459 | ||||||||
The Real Estate Select Sector SPDR Fund | 37,107 | 1,364,424 | 10,640,510 | 12,337,528 | 319,909 | 12,685 | — | — | 23,052 | ||||||||
The Technology Select Sector SPDR Fund | 47,988 | 3,744,984 | 28,145,827 | 9,609,861 | (300,307) | 4,086,686 | 249,472 | 26,067,329 | 219,145 | ||||||||
The Utilities Select Sector SPDR Fund | — | — | 1,614,137 | — | — | (6,333) | 28,492 | 1,607,804 | 12,585 | ||||||||
Total | $14,141,044 | $323,065,052 | $265,994,954 | $(1,166,789) | $ 3,040,370 | $73,084,723 | $839,812 |
Table of Contents
| SPDR SSGA Fixed Income Sector Rotation ETF | SPDR SSGA US Sector Rotation ETF | ||
| ASSETS | |||
Investments in affiliated issuers, at value* | $56,903,619 | $73,084,723 | |
Dividends receivable — affiliated issuers | 104 | 8 | |
Securities lending income receivable — unaffiliated issuers | 1,067 | 1,884 | |
Securities lending income receivable — affiliated issuers | 2,935 | 1,981 | |
Receivable from Adviser | 6,916 | 10,895 | |
TOTAL ASSETS | 56,914,641 | 73,099,491 | |
| LIABILITIES | |||
Payable upon return of securities loaned | 9,882,034 | 4,445,869 | |
Advisory fee payable | 18,200 | 36,317 | |
Trustees’ fees and expenses payable | 11 | 17 | |
TOTAL LIABILITIES | 9,900,245 | 4,482,203 | |
NET ASSETS | $47,014,396 | $68,617,288 | |
| NET ASSETS CONSIST OF: | |||
Paid-in Capital | $45,918,236 | $66,988,425 | |
Total distributable earnings (loss) | 1,096,160 | 1,628,863 | |
NET ASSETS | $47,014,396 | $68,617,288 | |
| NET ASSET VALUE PER SHARE | |||
Net asset value per share | $ 31.98 | $ 32.83 | |
Shares outstanding (unlimited amount authorized, no par value) | 1,470,000 | 2,090,000 | |
| COST OF INVESTMENTS: | |||
Investments in affiliated issuers | $55,608,018 | $69,688,864 | |
* Includes investments in securities on loan, at value | $17,641,488 | $15,761,999 |
Table of Contents
| SPDR SSGA Fixed Income Sector Rotation ETF | SPDR SSGA US Sector Rotation ETF | ||
| INVESTMENT INCOME | |||
Dividend income — affiliated issuers | $ 666,851 | $ 820,642 | |
Unaffiliated securities lending income | 5,102 | 8,340 | |
Affiliated securities lending income | 77,238 | 19,170 | |
TOTAL INVESTMENT INCOME (LOSS) | 749,191 | 848,152 | |
| EXPENSES | |||
Advisory fee | 80,659 | 181,978 | |
Trustees’ fees and expenses | 276 | 404 | |
Miscellaneous expenses | 5 | 1,330 | |
TOTAL EXPENSES | 80,940 | 183,712 | |
NET INVESTMENT INCOME (LOSS) | $ 668,251 | $ 664,440 | |
| REALIZED AND UNREALIZED GAIN (LOSS) | |||
| Net realized gain (loss) on: | |||
Investments — affiliated issuers | (82,173) | (1,766,996) | |
In-kind redemptions — affiliated issuers | 8,836 | 600,207 | |
Net realized gain (loss) | (73,337) | (1,166,789) | |
| Net change in unrealized appreciation/depreciation on: | |||
Investment — affiliated issuers | 985,859 | 3,040,370 | |
NET REALIZED AND UNREALIZED GAIN (LOSS) | 912,522 | 1,873,581 | |
NET INCREASE (DECREASE) IN NET ASSETS FROM OPERATIONS | $1,580,773 | $ 2,538,021 |
Table of Contents
| SPDR SSGA Fixed Income Sector Rotation ETF | SPDR SSGA US Sector Rotation ETF | ||||||
| Year Ended 6/30/20 | For the Period 04/02/19* - 6/30/19 | Year Ended 6/30/20 | For the Period 04/02/19* - 6/30/19 | ||||
| INCREASE (DECREASE) IN NET ASSETS FROM OPERATIONS: | |||||||
Net investment income (loss) | $ 668,251 | $ 33,091 | $ 664,440 | $ 59,414 | |||
Net realized gain (loss) | (73,337) | 2,149 | (1,166,789) | 45,425 | |||
Net change in unrealized appreciation/depreciation | 985,859 | 309,742 | 3,040,370 | 355,489 | |||
Net increase (decrease) in net assets resulting from operations | 1,580,773 | 344,982 | 2,538,021 | 460,328 | |||
Net equalization credits and charges | (143,677) | 173 | 34,502 | (7,742) | |||
Distributions to shareholders | (785,178) | (36,040) | (704,061) | (52,452) | |||
| FROM BENEFICIAL INTEREST TRANSACTIONS: | |||||||
Proceeds from shares sold | 37,162,072 | 10,567,861 | 62,332,050 | 13,728,143 | |||
Cost of shares redeemed | (1,820,074) | — | (9,684,741) | — | |||
Net income equalization | 143,677 | (173) | (34,502) | 7,742 | |||
Net increase (decrease) in net assets from beneficial interest transactions | 35,485,675 | 10,567,688 | 52,612,807 | 13,735,885 | |||
Net increase (decrease) in net assets during the period | 36,137,593 | 10,876,803 | 54,481,269 | 14,136,019 | |||
Net assets at beginning of period | 10,876,803 | — | 14,136,019 | — | |||
NET ASSETS AT END OF PERIOD | $47,014,396 | $10,876,803 | $68,617,288 | $14,136,019 | |||
| SHARES OF BENEFICIAL INTEREST: | |||||||
Shares sold | 1,180,000 | 350,000 | 1,940,000 | 460,000 | |||
Shares redeemed | (60,000) | — | (310,000) | — | |||
Net increase (decrease) from share transactions | 1,120,000 | 350,000 | 1,630,000 | 460,000 | |||
| *Inception date. |
Table of Contents
| SPDR SSGA Fixed Income Sector Rotation ETF | |||
| Year Ended 6/30/20 | For the Period 4/3/2019*- 6/30/19 | ||
Net asset value, beginning of period | $ 31.08 | $ 30.10 | |
| Income (loss) from investment operations: | |||
Net investment income (loss) (a) | 0.81 | 0.15 | |
Net realized and unrealized gain (loss) (b) | 1.31 | 0.99 | |
Total from investment operations | 2.12 | 1.14 | |
Net equalization credits and charges (a) | (0.17) | 0.00(c) | |
| Distributions to shareholders from: | |||
Net investment income | (1.05) | (0.16) | |
Net asset value, end of period | $ 31.98 | $ 31.08 | |
Total return (d) | 6.42% | 3.81% | |
| Ratios and Supplemental Data: | |||
Net assets, end of period (in 000s) | $47,014 | $10,877 | |
| Ratios to average net assets: | |||
Total expenses (e) | 0.31% | 0.31%(f) | |
Net investment income (loss) | 2.57% | 1.98%(f) | |
Portfolio turnover rate (g) | 150% | 32%(h) | |
| * | Commencement of operations. |
| (a) | Per share numbers have been calculated using average shares outstanding, which more appropriately presents the per share data for the period. |
| (b) | Amounts shown in this caption for a share outstanding may not accord with the change in aggregate gains and losses in securities for the fiscal period because of the timing of sales and repurchases of Fund shares in relation to fluctuating market values for the Fund. |
| (c) | Amount is less than $0.005 per share. |
| (d) | Total return is calculated assuming a purchase of shares at net asset value on the first day and a sale at net asset value on the last day of each period reported. Distributions are assumed, for the purpose of this calculation, to be reinvested at net asset value per share on the respective payment dates of each distribution. Total returns for periods of less than one year are not annualized. Broker commission charges are not included in this calculation. |
| (e) | Does not include expenses of the Underlying Funds in which the Fund invests. |
| (f) | Annualized. |
| (g) | Portfolio turnover rate excludes securities received or delivered from in-kind processing of creations or redemptions. |
| (h) | Not annualized. |
Table of Contents
| SPDR SSGA US Sector Rotation ETF | |||
| Year Ended 6/30/20 | For the Period 4/3/2019*- 6/30/19 | ||
Net asset value, beginning of period | $ 30.73 | $ 30.09 | |
| Income (loss) from investment operations: | |||
Net investment income (loss) (a) | 0.57 | 0.23 | |
Net realized and unrealized gain (loss) (b) | 1.98 | 0.55 | |
Total from investment operations | 2.55 | 0.78 | |
Net equalization credits and charges (a) | 0.03 | (0.03) | |
| Distributions to shareholders from: | |||
Net investment income | (0.48) | (0.11) | |
Net asset value, end of period | $ 32.83 | $ 30.73 | |
Total return (c) | 8.52% | 2.50% | |
| Ratios and Supplemental Data: | |||
Net assets, end of period (in 000s) | $68,617 | $14,136 | |
| Ratios to average net assets: | |||
Total expenses (d) | 0.49% | 0.49%(e) | |
Net investment income (loss) | 1.79% | 3.12%(e) | |
Portfolio turnover rate (f) | 154% | 39%(g) | |
| * | Commencement of operations. |
| (a) | Per share numbers have been calculated using average shares outstanding, which more appropriately presents the per share data for the period. |
| (b) | Amounts shown in this caption for a share outstanding may not accord with the change in aggregate gains and losses in securities for the fiscal period because of the timing of sales and repurchases of Fund shares in relation to fluctuating market values for the Fund. |
| (c) | Total return is calculated assuming a purchase of Units at net asset value per Unit on the first day and a sale at net asset value per Unit on the last day of each period reported. Distributions are assumed, for the purposes of this calculation, to be reinvested at the net asset value per Unit on the respective payment dates of the Trust. Broker commission charges are not included in this calculation. |
| (d) | Does not include expenses of the Underlying Funds in which the Fund invests. |
| (e) | Annualized. |
| (f) | Portfolio turnover rate excludes securities received or delivered from in-kind processing of creations or redemptions. |
| (g) | Not annualized. |
Table of Contents
| SPDR SSGA Fixed Income Sector Rotation ETF |
| SPDR SSGA US Sector Rotation ETF |
Table of Contents
Table of Contents
Table of Contents
| Annual Rate | |
SPDR SSGA Fixed Income Sector Rotation ETF | 0.50% |
SPDR SSGA US Sector Rotation ETF | 0.70 |
Table of Contents
| Purchases | Sales | ||
SPDR SSGA Fixed Income Sector Rotation ETF | $39,740,898 | $40,923,243 | |
SPDR SSGA US Sector Rotation ETF | 57,741,955 | 57,723,530 |
| In-kind Contributions | In-kind Redemptions | In-kind Net Realized Gains/(Losses) | |||
SPDR SSGA Fixed Income Sector Rotation ETF | $37,159,854 | $1,820,354 | $ 8,836 | ||
SPDR SSGA US Sector Rotation ETF | 62,323,479 | 9,685,485 | 600,207 |
Table of Contents
Table of Contents
| Ordinary Income | Long-Term Capital Gains | Total | |||
SPDR SSGA Fixed Income Sector Rotation ETF | $785,178 | $— | $785,178 | ||
SPDR SSGA US Sector Rotation ETF | 704,061 | — | 704,061 |
| Ordinary Income | Long-Term Capital Gains | Total | |||
SPDR SSGA Fixed Income Sector Rotation ETF | $ 36,040 | $ — | $ 36,040 | ||
SPDR SSGA US Sector Rotation ETF | 52,452 | — | 52,452 |
| Undistributed Ordinary Income | Capital Loss Carryforwards | Undistributed Long-Term Capital Gains | Net Unrealized Gains (Losses) | Qualified Late-Year Losses | Total | ||||||
SPDR SSGA Fixed Income Sector Rotation ETF | $— | $ — | $— | $1,213,129 | $(116,969) | $1,096,160 | |||||
SPDR SSGA US Sector Rotation ETF | — | (1,688,039) | — | 3,316,902 | — | 1,628,863 |
| Non-Expiring Short Term | Non-Expiring Long Term | ||
SPDR SSGA US Sector Rotation ETF | $1,688,039 | $— |
| Tax Cost | Gross Unrealized Appreciation | Gross Unrealized Depreciation | Net Unrealized Appreciation (Depreciation) | ||||
SPDR SSGA Fixed Income Sector Rotation ETF | $55,690,490 | $1,213,129 | $ — | $1,213,129 | |||
SPDR SSGA US Sector Rotation ETF | 69,767,821 | 5,081,742 | 1,764,840 | 3,316,902 |
Table of Contents
| Fund | Market Value of Securities on Loan | Cash Collateral Received | Non-Cash Collateral Received* | Total Collateral Received | ||||
SPDR SSGA Fixed Income Sector Rotation ETF | $ 17,641,488 | $ 9,882,034 | $ 8,089,600 | $ 17,971,634 | ||||
SPDR SSGA US Sector Rotation ETF | 15,761,999 | 4,445,869 | 11,518,811 | 15,964,680 |
Table of Contents
| * | The non-cash collateral includes U.S. Treasuries and U.S. Government Agency securities. |
| Remaining Contractual Maturity of the Agreements As of June 30, 2020 | ||||||||||||||
| Fund | Securities Lending Transactions | Overnight and Continuous | <30 Days | Between 30 & 90 Days | >90 Days | Total Borrowings | Gross Amount of Recognized Liabilities for Securities Lending Transactions | |||||||
SPDR SSGA Fixed Income Sector Rotation ETF | Mutual Funds and Exchange Traded Products | $9,882,034 | $— | $— | $— | $9,882,034 | $9,882,034 | |||||||
SPDR SSGA US Sector Rotation ETF | Mutual Funds and Exchange Traded Products | 4,445,869 | — | — | — | 4,445,869 | 4,445,869 | |||||||
Table of Contents
Table of Contents
Table of Contents

August 28, 2020
Table of Contents
Table of Contents
| SPDR SSGA Fixed Income Sector Rotation ETF | SPDR SSGA US Sector Rotation ETF | ||
Annualized Expense Ratio | 0.33% | 0.49% | |
| Actual: | |||
Ending Account Value | $1,037.70 | $ 974.30 | |
Expenses Paid During Period | 1.67 | 2.41 | |
| Hypothetical (assuming a 5% return before expenses): | |||
Ending Account Value | 1,023.20 | 1,022.40 | |
Expenses Paid During Period(a) | 1.66 | 2.46 |
| (a) | Expenses are equal to the Fund's annualized net expense ratio multiplied by the average account value of the period, multiplied by 182, then divided by 366. |
Table of Contents
Table of Contents
Table of Contents
Table of Contents
Table of Contents
Table of Contents
| Name, Address and Year of Birth | Position(s) with Funds | Term of Office and Length of Time Served | Principal Occupation(s) During Past 5 Years | Number of Portfolios in Fund Complex Overseen by Trustee† | Other Directorships Held by Trustee During the Past 5 Years | |||||
| Trustees | ||||||||||
| Independent Trustees | ||||||||||
| FRANK NESVET c/o SSGA Active Trust One Iron Street Boston, MA 02210 1943 | Independent Trustee, Chairman, Trustee Committee Chair | Term: Unlimited Served: since March 2011 | Retired. | 123 | None. | |||||
| BONNY EUGENIA BOATMAN c/o SSGA Active Trust One Iron Street Boston, MA 02210 1950 | Independent Trustee | Term: Unlimited Served: since March 2011 | Retired. | 123 | None. | |||||
| DWIGHT D. CHURCHILL c/o SSGA Active Trust One Iron Street Boston, MA 02210 1953 | Independent Trustee | Term: Unlimited Served: since March 2011 | Self-employed consultant since 2010; CEO and President, CFA Institute (June 2014-January 2015). | 123 | Affiliated Managers Group, Inc. (Chairman, Director and Audit Committee Chair). | |||||
| CLARE S. RICHER c/o SSGA Active Trust One Iron Street Boston, MA 02210 1958 | Independent Trustee | Term: Unlimited Served: since July 2018 | Retired. Chief Financial Officer, Putnam Investments LLC (December 2008- May 2017). | 123 | Principal Financial Group (Director); Bain Capital Specialty Finance (Director); Putnam Acquisition Financing Inc. (Director); Putnam Acquisition Financing LLC (Director); Putnam GP Inc. (Director); Putnam Investor Services, Inc. (Director); University of Notre Dame (Trustee). |
Table of Contents
| Name, Address and Year of Birth | Position(s) with Funds | Term of Office and Length of Time Served | Principal Occupation(s) During Past 5 Years | Number of Portfolios in Fund Complex Overseen by Trustee† | Other Directorships Held by Trustee During the Past 5 Years | |||||
| SANDRA G. SPONEM c/o SSGA Active Trust One Iron Street Boston, MA 02210 1958 | Independent Trustee | Term: Unlimited Served: since July 2018 | Retired. Chief Financial Officer, M.A. Mortenson Companies, Inc. (February 2007- April 2017). | 123 | Rydex Series Funds, Rydex Dynamic Funds, Rydex Variable Trust, Guggenheim Funds Trust, Guggenheim Variable Funds Trust, Guggenheim Strategy Funds Trust, Transparent Value Trust, Fiduciary/ Claymore Energy Infrastructure Fund, Guggenheim Taxable Municipal Managed Duration Trust, Guggenheim Strategic Opportunities Fund, Guggenheim Enhanced, Equity Income Fund, Guggenheim Credit Allocation Fund, Guggenheim Energy & Income Fund (Trustee and Audit Committee Chair). | |||||
| CARL G. VERBONCOEUR c/o SSGA Active Trust One Iron Street Boston, MA 02210 1952 | Independent Trustee, Audit Committee Chair | Term: Unlimited Served: since March 2011 | Self-employed consultant since 2009. | 123 | The Motley Fool Funds Trust (Trustee). |
Table of Contents
| Name, Address and Year of Birth | Position(s) with Funds | Term of Office and Length of Time Served | Principal Occupation(s) During Past 5 Years | Number of Portfolios in Fund Complex Overseen by Trustee† | Other Directorships Held by Trustee During the Past 5 Years | |||||
| Interested Trustee | ||||||||||
| JAMES E. ROSS* c/o SSGA Active Trust One Iron Street Boston, MA 02210 1965 | Interested Trustee | Term: Unlimited Served as Trustee: since March 2011 | Non-Executive Chairman, Fusion Acquisition Corp. (June 2020 - Present); Retired Chairman and Director, SSGA Funds Management, Inc. (2005 - March 2020); Retired Executive Vice President, State Street Global Advisors (2012 - March 2020); Retired Chief Executive Officer and Director, State Street Global Advisors Funds Distributors, LLC (May 2017 - March 2020); Director, State Street Global Markets, LLC (2013 - April 2017); President, SSGA Funds Management, Inc. (2005 - 2012); Principal, State Street Global Advisors (2000 - 2005). | 134 | SSGA SPDR ETFs Europe I plc (Director) (November 2016 - March 2020); SSGA SPDR ETFs Europe II plc (Director) (November 2016 - March 2020); State Street Navigator Securities Lending Trust (July 2016 - March 2020); SSGA Funds (January 2014 - March 2020); State Street Institutional Investment Trust (February 2007 - March 2020); State Street Master Funds (February 2007 - March 2020); Elfun Funds (July 2016 - December 2018). | |||||
| † For the purpose of determining the number of portfolios overseen by the Trustees, “Fund Complex” comprises registered investment companies for which SSGA Funds Management, Inc. serves as investment adviser. | ||||||||||
| * Mr. Ross is an Interested Trustee because of his former position with the Adviser and ownership interest in an affiliate of the Adviser. | ||||||||||
Table of Contents
| Name, Address and Year of Birth | Position(s) with Funds | Term of Office and Length of Time Served | Principal Occupation(s) During the Past 5 Years | |||
| Officers | ||||||
| ELLEN M. NEEDHAM SSGA Funds Management, Inc. One Iron Street Boston, MA 02210 1967 | President | Term: Unlimited Served: since October 2012 | Chairman, SSGA Funds Management, Inc. (March 2020 - present); President and Director, SSGA Funds Management, Inc. (2001 - present)*; Senior Managing Director, State Street Global Advisors (1992 - present)*; Manager, State Street Global Advisors Funds Distributors, LLC (May 2017 - present). | |||
| BRUCE S. ROSENBERG SSGA Funds Management, Inc. One Iron Street Boston, MA 02210 1961 | Treasurer | Term: Unlimited Served: since February 2016 | Managing Director, State Street Global Advisors and SSGA Funds Management, Inc. (July 2015 - present); Director, Credit Suisse (April 2008 - July 2015). | |||
| ANN M. CARPENTER SSGA Funds Management, Inc. One Iron Street Boston, MA 02210 1966 | Vice President; Deputy Treasurer | Term: Unlimited Served: since August 2012 (with respect to Vice President); since February 2016 (with respect to Deputy Treasurer) | Chief Operating Officer, SSGA Funds Management, Inc. (2005 - Present)*; Managing Director, State Street Global Advisors (2005 - present).* | |||
| MICHAEL P. RILEY SSGA Funds Management, Inc. One Iron Street Boston, MA 02210 1969 | Vice President | Term: Unlimited Served: since March 2011 | Managing Director, State Street Global Advisors (2005 - present).* | |||
| SEAN O’MALLEY SSGA Funds Management, Inc. One Iron Street Boston, MA 02210 1969 | Chief Legal Officer | Term: Unlimited Served: since August 2019 | Senior Vice President and Deputy General Counsel, State Street Global Advisors (November 2013 -present). | |||
| ANDREW DELORME SSGA Funds Management, Inc. One Iron Street Boston, MA 02210 1975 | Secretary | Term: Unlimited Served: since August 2019 | Vice President and Senior Counsel, State Street Global Advisors (April 2016 - present); Vice President and Counsel, State Street Global Advisors (August 2014 - March 2016). |
Table of Contents
| Name, Address and Year of Birth | Position(s) with Funds | Term of Office and Length of Time Served | Principal Occupation(s) During the Past 5 Years | |||
| KEVIN MORRIS SSGA Funds Management, Inc. One Iron Street Boston, MA 02210 1982 | Assistant Secretary | Term: Unlimited Served: since August 2019 | Vice President and Senior Counsel, State Street Global Advisors (April 2019 - present); Vice President and Counsel, State Street Global Advisors (January 2016 -April 2019); Director, Asset Management Compliance, Fidelity Investments (June 2015 - January 2016); Senior Compliance Advisor, Asset Management Compliance, Fidelity Investments (June 2012 - June 2015). | |||
| DAVID URMAN SSGA Funds Management, Inc. One Iron Street Boston, MA 02210 1985 | Assistant Secretary | Term: Unlimited Served: since August 2019 | Vice President and Senior Counsel, State Street Global Advisors (April 2019 - present); Vice President and Counsel, State Street Global Advisors (August 2015 - April 2019); Associate, Ropes & Gray LLP (November 2012 - August 2015). | |||
| CHAD C. HALLETT SSGA Funds Management, Inc. One Iron Street Boston, MA 02210 1969 | Deputy Treasurer | Term: Unlimited Served: since February 2016 | Vice President, State Street Global Advisors and SSGA Funds Management, Inc. (November 2014 - present); Vice President, State Street Bank and Trust Company (2001 - November 2014).* | |||
| DARLENE ANDERSON-VASQUEZ SSGA Funds Management, Inc. One Iron Street Boston, MA 02210 1968 | Deputy Treasurer | Term: Unlimited Served: since November 2016 | Managing Director, State Street Global Advisors and SSGA Funds Management, Inc. (May 2016 - present); Senior Vice President, John Hancock Investments (September 2007 - May 2016). | |||
| ARTHUR A. JENSEN SSGA Funds Management, Inc. 1600 Summer Street Stamford, CT 06905 1966 | Deputy Treasurer | Term: Unlimited Served: Since August 2017 | Vice President at State Street Global Advisors (July 2016 – present); Mutual Funds Controller of GE Asset Management Incorporated (April 2011 - July 2016). | |||
| SUJATA UPRETI SSGA Funds Management, Inc. One Iron Street Boston, MA 02210 1974 | Assistant Treasurer | Term: Unlimited Served: since February 2016 | Vice President, State Street Global Advisors and SSGA Funds Management, Inc. (May 2015 - present). | |||
| DANIEL FOLEY SSGA Funds Management, Inc. One Iron Street Boston, MA 02210 1972 | Assistant Treasurer | Term: Unlimited Served: since February 2016 | Vice President, State Street Global Advisors and SSGA Funds Management, Inc. (April 2007 - present).* |
Table of Contents
| Name, Address and Year of Birth | Position(s) with Funds | Term of Office and Length of Time Served | Principal Occupation(s) During the Past 5 Years | |||
| DANIEL G. PLOURDE SSGA Funds Management, Inc. One Iron Street Boston, MA 02210 1980 | Assistant Treasurer | Term: Unlimited Served: since May 2017 | Vice President, State Street Global Advisors and SSGA Funds Management, Inc. (May 2015 - present); Officer, State Street Bank and Trust Company (March 2009 - May 2015). | |||
| BRIAN HARRIS SSGA Funds Management, Inc. One Iron Street Boston, MA 02210 1973 | Chief Compliance Officer; Anti-Money Laundering Officer; Code of Ethics Compliance Officer | Term: Unlimited Served: since November 2013 | Managing Director, State Street Global Advisors and SSGA Funds Management, Inc. (June 2013 - present)*; Senior Vice President and Global Head of Investment Compliance, BofA Global Capital Management (2010 - 2013); Director of Compliance, AARP Financial Inc. (2008 - 2010). | |||
| * Served in various capacities and/or with various affiliated entities during noted time period. | ||||||
| The Statement of Additional Information (SAI) includes additional information about the Funds' trustees and is available, without charge, upon request and by calling 1-866-787-2257. | ||||||
Table of Contents
Table of Contents
One Iron Street
Boston, MA 02210
One Iron Street
Boston, MA 02210
One Lincoln Street
Boston, MA 02111
1111 Pennsylvania Avenue, NW
Washington, DC 20004
200 Clarendon Street
Boston, MA 02116
Table of Contents
One Iron Street
Boston, MA 02210
Table of Contents
| SPDR DoubleLine Emerging Markets Fixed Income ETF |
| SPDR DoubleLine Short Duration Total Return Tactical ETF |
| SPDR DoubleLine Total Return Tactical ETF |

Table of Contents
Table of Contents
| 1 | |
| Management's Discussion of Fund Performance, Performance Summaries and Performance Statistics (Unaudited) | |
| 2 | |
| 5 | |
| 8 | |
| Schedules of Investments | |
| 12 | |
| 21 | |
| 47 | |
| 62 | |
| 69 | |
| 72 | |
| 84 | |
| 86 |
Table of Contents
Table of Contents
Table of Contents
| • | EM sovereign and corporate external bonds posted positive performance in the 12-month period ended June 30, 2020 against a backdrop of a severe shock to global growth and commodity prices induced by the COVID-19 pandemic outbreak, significant fiscal and monetary policy responses by governments and central banks in developed and emerging markets, and elevated US-China trade tensions. |
| • | The Index’s positive return in the 12-month period was driven by lower Treasury yields, which offset spread performance, with the spread over U.S. Treasuries widening 106 bps to 439 bps. |
| • | The Middle East was the best performing region across the corporate index, while Latin America was the worst performing region. |
| • | The U.S. Treasury curve steepened over the 12-month period. 2 year UST yields fell 161 bps over the 12-month period to end at 0.15%, while 10 year UST yields fell 135 bps over the 12-month period to end at 0.66%. |
Table of Contents
| Cumulative Total Return | Average Annual Total Return | ||||||||
| Net Asset Value | Market Value | JP Morgan Corporate Emerging Markets Bond Index Broad Diversified | Net Asset Value | Market Value | JP Morgan Corporate Emerging Markets Bond Index Broad Diversified | ||||
| ONE YEAR | – 0.04% | – 0.21% | 3.74% | – 0.04% | – 0.21% | 3.74% | |||
| SINCE INCEPTION(1) | 21.78% | 21.86% | 25.59% | 4.78% | 4.80% | 5.56% | |||
| (1) | For the period April 13, 2016 to June 30, 2020. |
(Based on Net Asset Value)
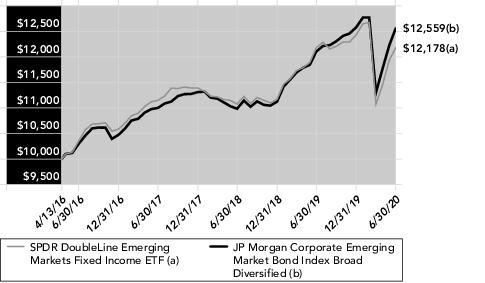
Table of Contents
| Description | % of Net Assets | ||
| Panama Government International Bond 4.00% 9/22/2024 | 3.2% | ||
| Indonesia Government International Bond 4.88% 5/5/2021 | 2.7 | ||
| Colombia Government International Bond 4.38% 7/12/2021 | 2.2 | ||
| Republic Of Indonesia 3.85% 10/15/2030 | 2.1 | ||
| Philippine Government International Bond 4.00% 1/15/2021 | 2.1 | ||
| TOTAL | 12.3% |
| % of Net Assets | |||
| Corporate Bonds & Notes | 73.2% | ||
| Foreign Government Obligations | 24.7 | ||
| Convertible Bonds | 0.0 * | ||
| Short-Term Investment | 0.8 | ||
| Other Assets in Excess of Liabilities | 1.3 | ||
| TOTAL | 100.0% |
| * | Amount shown represents less than 0.05% of net assets. |
Table of Contents
Table of Contents
| Cumulative Total Return | Average Annual Total Return | ||||||||
| Net Asset Value | Market Value | Bloomberg Barclays U.S. Aggregate 1-3 Year Index | Net Asset Value | Market Value | Bloomberg Barclays U.S. Aggregate 1-3 Year Index | ||||
| ONE YEAR | 2.43% | 2.22% | 4.00% | 2.43% | 2.22% | 4.00% | |||
| SINCE INCEPTION(1) | 9.52% | 9.56% | 9.79% | 2.18% | 2.19% | 2.24% | |||
| (1) | For the period April 13, 2016 to June 30, 2020. |
(Based on Net Asset Value)
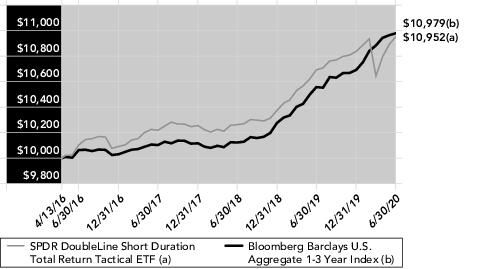
Table of Contents
| Description | % of Net Assets | ||
| Treasury Note 2.75% 9/15/2021 | 6.6% | ||
| Treasury Bill 0.18% 12/24/2020 | 5.3 | ||
| Treasury Bill 0.17% 10/1/2020 | 4.2 | ||
| Treasury Note 1.63% 4/30/2023 | 3.9 | ||
| Treasury Bill 0.12% 8/6/2020 | 3.8 | ||
| TOTAL | 23.8% |
| % of Net Assets | |||
| U.S. Treasury Obligations | 32.0% | ||
| Corporate Bonds & Notes | 27.5 | ||
| U.S. Government Agency Obligations | 23.1 | ||
| Mortgage-Backed Securities | 9.2 | ||
| Asset-Backed Securities | 2.9 | ||
| Foreign Government Obligations | 2.2 | ||
| Short-Term Investment | 2.3 | ||
| Other Assets in Excess of Liabilities | 0.8 | ||
| TOTAL | 100.0% |
Table of Contents
Table of Contents
| Cumulative Total Return | Average Annual Total Return | ||||||||
| Net Asset Value | Market Value | Bloomberg Barclays U.S. Aggregate Bond Index | Net Asset Value | Market Value | Bloomberg Barclays U.S. Aggregate Bond Index | ||||
| ONE YEAR | 4.13% | 4.03% | 8.74% | 4.13% | 4.03% | 8.74% | |||
| FIVE YEARS | 17.26% | 17.45% | 23.45% | 3.24% | 3.27% | 4.30% | |||
| SINCE INCEPTION(1) | 16.86% | 17.15% | 22.34% | 2.96% | 3.00% | 3.84% | |||
| (1) | For the period February 23, 2015 to June 30, 2020. |
(Based on Net Asset Value)
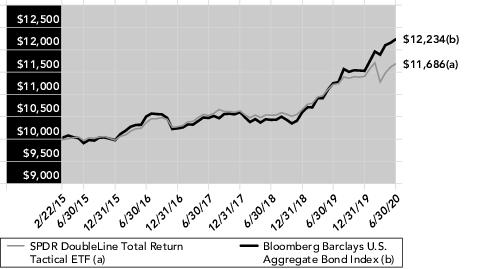
Table of Contents
| Description | % of Net Assets | ||
| Treasury Notes 2.25% 11/15/2025 | 4.3% | ||
| Treasury Notes 1.63% 5/15/2026 | 3.8 | ||
| Treasury Notes 2.13% 7/31/2024 | 3.5 | ||
| Treasury Notes 2.13% 2/29/2024 | 2.7 | ||
| Treasury Bill 0.17% 12/3/2020 | 2.2 | ||
| TOTAL | 16.5% |
| % of Net Assets | |||
| U.S. Government Agency Obligations | 41.7% | ||
| U.S. Treasury Obligations | 26.2 | ||
| Mortgage-Backed Securities | 5.2 | ||
| Commercial Mortgage Backed Securities | 3.2 | ||
| Asset-Backed Securities | 2.5 | ||
| Foreign Government Obligations | 1.0 | ||
| Banks | 2.6 | ||
| Electric | 1.4 | ||
| Oil & Gas | 1.0 | ||
| Software | 0.9 | ||
| Pharmaceuticals | 0.9 | ||
| Diversified Financial Services | 0.8 | ||
| Telecommunications | 0.7 | ||
| Health Care Services | 0.7 | ||
| Media | 0.6 | ||
| Food | 0.6 | ||
| Insurance | 0.6 | ||
| Pipelines | 0.6 | ||
| Retail | 0.5 | ||
| Real Estate Investment Trusts | 0.5 | ||
| Transportation | 0.5 | ||
| Chemicals | 0.4 | ||
| Internet | 0.4 | ||
| Entertainment | 0.3 | ||
| Auto Manufacturers | 0.3 | ||
| IT Services | 0.3 | ||
| Commercial Services | 0.2 | ||
| Mining | 0.2 | ||
| Packaging & Containers | 0.2 | ||
| Forest Products & Paper | 0.2 | ||
| Electronics | 0.2 | ||
| Computers | 0.2 | ||
| Iron/Steel | 0.2 |
Table of Contents
| % of Net Assets | |||
| Lodging | 0.1% | ||
| Real Estate | 0.1 | ||
| Machinery, Construction & Mining | 0.1 | ||
| Environmental Control | 0.1 | ||
| Leisure Time | 0.1 | ||
| Agriculture | 0.1 | ||
| Oil & Gas Services | 0.1 | ||
| Building Materials | 0.1 | ||
| Beverages | 0.1 | ||
| Construction Materials | 0.1 | ||
| Semiconductors | 0.1 | ||
| Advertising | 0.1 | ||
| Toys/Games/Hobbies | 0.1 | ||
| Water | 0.1 | ||
| Machinery-Diversified | 0.1 | ||
| Biotechnology | 0.1 | ||
| Energy-Alternate Sources | 0.1 | ||
| Gas | 0.1 | ||
| Home Furnishings | 0.1 | ||
| Aerospace & Defense | 0.0* | ||
| Auto Parts & Equipment | 0.0* | ||
| Distribution & Wholesale | 0.0* | ||
| Airlines | 0.0* | ||
| Home Builders | 0.0* | ||
| Food Service | 0.0* | ||
| Health Care Products | 0.0* | ||
| Miscellaneous Manufacturer | 0.0* | ||
| Engineering & Construction | 0.0* | ||
| Household Products & Wares | 0.0* | ||
| Coal | 0.0* | ||
| Electrical Components & Equipment | 0.0* | ||
| Housewares | 0.0* | ||
| Metal Fabricate & Hardware | 0.0* | ||
| Apparel | 0.0* | ||
| Household Products | 0.0* | ||
| Short-Term Investment | 2.1 | ||
| Other Assets in Excess of Liabilities | 0.2 | ||
| TOTAL | 100.0% |
| * | Amount shown represents less than 0.05% of net assets. |
Table of Contents
| Security Description | Principal Amount | Value | ||||
| CORPORATE BONDS & NOTES — 73.2% | ||||||
| ARGENTINA — 1.1% | ||||||
Banco Macro SA Series REGS, USD 5 Year Swap Rate + 5.46%, 6.75%, 11/4/2026 (a) | $ 800,000 | $ 654,816 | ||||
Pampa Energia SA Series REGS, 7.50%, 1/24/2027 | 450,000 | 363,582 | ||||
| 1,018,398 | ||||||
| BRAZIL — 2.7% | ||||||
Banco BTG Pactual SA Series REGS, 5 Year CMT + 5.26%, 7.75%, 2/15/2029 (a) | 500,000 | 504,510 | ||||
Banco do Brasil SA Series REGS, 10 Year CMT + 4.40%, 6.25%, 4/15/2024 (a) | 500,000 | 438,995 | ||||
CSN Islands XII Corp. Series REGS, 7.00%, 9/23/2020 | 900,000 | 673,173 | ||||
CSN Resources SA 7.63%, 4/17/2026 (b) | 200,000 | 175,092 | ||||
Globo Comunicacao e Participacoes SA 4.88%, 1/22/2030 (b) | 300,000 | 271,386 | ||||
Itau Unibanco Holding SA Series REGS, 6.20%, 12/21/2021 | 500,000 | 522,630 | ||||
| 2,585,786 | ||||||
| CANADA — 0.2% | ||||||
Canacol Energy, Ltd. Series REGS, 7.25%, 5/3/2025 | 200,000 | 202,234 | ||||
| CAYMAN ISLANDS — 1.6% | ||||||
CK Hutchison Capital Securities 17, Ltd. Series REGS, 5 Year CMT + 2.07%, 4.00%, 5/12/2022 (a) | 837,000 | 838,766 | ||||
Grupo Aval, Ltd. Series REGS, 4.38%, 2/4/2030 | 700,000 | 668,955 | ||||
| 1,507,721 | ||||||
| CHILE — 12.0% | ||||||
| AES Gener SA: | ||||||
Series REGS, 5.00%, 7/14/2025 | 860,000 | 831,508 | ||||
5 Year CMT + 4.92%, 6.35%, 10/7/2079 (a)(b) | 900,000 | 901,107 | ||||
Series REGS, 5 Year CMT + 4.92%, 6.35%, 10/7/2079 (a) | 500,000 | 500,615 | ||||
Banco del Estado de Chile Series REGS, 4.13%, 10/7/2020 | 1,300,000 | 1,306,903 | ||||
Banco Santander Chile Series REGS, 2.50%, 12/15/2020 | 1,300,000 | 1,304,433 | ||||
Colbun SA Series REGS, 4.50%, 7/10/2024 | 1,500,000 | 1,591,470 | ||||
Corp. Nacional del Cobre de Chile 3.75%, 1/15/2031 (b) | 500,000 | 544,815 | ||||
Empresa Electrica Angamos SA Series REGS, 4.88%, 5/25/2029 | 156,500 | 162,925 | ||||
Empresa Electrica Guacolda SA Series REGS, 4.56%, 4/30/2025 | 400,000 | 330,276 | ||||
Empresa Nacional de Telecomunicaciones SA Series REGS, 4.75%, 8/1/2026 | 500,000 | 531,900 | ||||
GNL Quintero SA Series REGS, 4.63%, 7/31/2029 | 1,600,000 | 1,709,776 | ||||
SACI Falabella Series REGS, 3.75%, 4/30/2023 | 600,000 | 614,670 | ||||
Table of Contents
| Security Description | Principal Amount | Value | |||
Sociedad Quimica y Minera de Chile SA Series REGS, 4.38%, 1/28/2025 | $ 400,000 | $ 427,920 | |||
Transelec SA Series REGS, 4.63%, 7/26/2023 | 500,000 | 531,285 | |||
| 11,289,603 | |||||
| CHINA — 5.0% | |||||
Baidu, Inc. 3.43%, 4/7/2030 | 200,000 | 215,266 | |||
CNOOC Finance 2011, Ltd. Series REGS, 4.25%, 1/26/2021 | 200,000 | 203,240 | |||
Gran Tierra Energy International Holdings, Ltd. Series REGS, 6.25%, 2/15/2025 | 600,000 | 274,086 | |||
JD.com, Inc. 3.38%, 1/14/2030 | 1,400,000 | 1,494,612 | |||
Sinopec Group Overseas Development 2016, Ltd. Series REGS, 2.75%, 5/3/2021 | 400,000 | 404,620 | |||
Sinopec Group Overseas Development 2018, Ltd. 2.70%, 5/13/2030 (b) | 1,100,000 | 1,133,198 | |||
Tencent Holdings, Ltd. 2.39%, 6/3/2030 (b) | 1,000,000 | 1,005,520 | |||
| 4,730,542 | |||||
| COLOMBIA — 5.5% | |||||
Banco Bilbao Vizcaya Argentaria Colombia SA Series REGS, 4.88%, 4/21/2025 | 200,000 | 210,642 | |||
| Banco de Bogota SA: | |||||
Series REGS, 5.38%, 2/19/2023 | 700,000 | 725,403 | |||
Series REGS, 6.25%, 5/12/2026 | 200,000 | 211,220 | |||
| Ecopetrol SA: | |||||
4.13%, 1/16/2025 | 1,000,000 | 1,002,160 | |||
6.88%, 4/29/2030 | 200,000 | 229,078 | |||
Empresas Publicas de Medellin ESP 4.25%, 7/18/2029 (b) | 300,000 | 300,636 | |||
| Geopark, Ltd.: | |||||
5.50%, 1/17/2027 (b) | 200,000 | 172,678 | |||
Class REGS, 5.50%, 1/17/2027 | 200,000 | 172,678 | |||
Series REGS, 6.50%, 9/21/2024 | 500,000 | 456,595 | |||
Grupo Aval, Ltd. Series REGS, 4.75%, 9/26/2022 | 1,500,000 | 1,518,660 | |||
Grupo Energia Bogota SA ESP 4.88%, 5/15/2030 (b) | 200,000 | 211,164 | |||
| 5,210,914 | |||||
| INDIA — 4.3% | |||||
| Adani Ports & Special Economic Zone, Ltd.: | |||||
Series REGS, 3.38%, 7/24/2024 | 600,000 | 594,576 | |||
Series REGS, 3.95%, 1/19/2022 | 400,000 | 404,128 | |||
Indian Oil Corp., Ltd. 5.75%, 8/1/2023 | 800,000 | 864,065 | |||
Network i2i, Ltd. 5 Year CMT + 4.28%, 5.65%, 1/15/2025 (a)(b) | 200,000 | 193,588 | |||
ONGC Videsh Vankorneft Pte, Ltd. 3.75%, 7/27/2026 | 600,000 | 616,826 | |||
Reliance Holding USA, Inc. Series REGS, 5.40%, 2/14/2022 | 1,050,000 | 1,106,837 |
Table of Contents
| Security Description | Principal Amount | Value | |||
Vedanta Resources PLC Series REGS, 6.13%, 8/9/2024 | $ 400,000 | $ 275,724 | |||
| 4,055,744 | |||||
| INDONESIA — 1.9% | |||||
Perusahaan Listrik Negara PT Series REGS, 5.50%, 11/22/2021 | 1,500,000 | 1,567,155 | |||
Star Energy Geothermal Wayang Windu, Ltd. Series REGS, 6.75%, 4/24/2033 | 181,400 | 188,681 | |||
| 1,755,836 | |||||
| ISRAEL — 0.2% | |||||
Israel Electric Corp., Ltd. Series 6, 5.00%, 11/12/2024 (b) | 200,000 | 225,124 | |||
| JAMAICA — 0.0% (c) | |||||
Digicel Group 0.5, Ltd. 8.00%, 4/1/2025 (b) | 40,978 | 11,315 | |||
| KUWAIT — 1.3% | |||||
| MEGlobal Canada ULC: | |||||
5.00%, 5/18/2025 (b) | 700,000 | 756,469 | |||
5.88%, 5/18/2030 (b) | 400,000 | 452,860 | |||
| 1,209,329 | |||||
| MALAYSIA — 6.5% | |||||
Axiata SPV2 Bhd Series 2, 3.47%, 11/19/2020 | 1,000,000 | 1,004,510 | |||
Gohl Capital, Ltd. 4.25%, 1/24/2027 | 800,000 | 806,828 | |||
Malayan Banking Bhd USD 5 Year Swap Rate + 2.54%, 3.91%, 10/29/2026 (a) | 1,000,000 | 1,013,610 | |||
Malaysia Sovereign Sukuk Bhd Series REGS, 3.04%, 4/22/2025 | 800,000 | 858,320 | |||
Malaysia Sukuk Global Bhd Series REGS, 3.18%, 4/27/2026 | 250,000 | 272,490 | |||
| Petronas Capital, Ltd.: | |||||
Series REGS, 3.50%, 3/18/2025 | 600,000 | 653,388 | |||
3.50%, 4/21/2030 (b) | 200,000 | 221,558 | |||
TNB Global Ventures Capital Bhd Series EMTN, 3.24%, 10/19/2026 | 1,200,000 | 1,276,572 | |||
| 6,107,276 | |||||
| MEXICO — 10.5% | |||||
| Banco Mercantil del Norte SA: | |||||
Series REGS, 10 Year CMT + 5.35%, 7.63%, 1/10/2028 (a) | 700,000 | 666,652 | |||
Series REGS, 10 Year CMT + 5.47%, 7.50%, 6/27/2029 (a) | 800,000 | 756,736 | |||
Banco Santander Mexico SA Institucion de Banca Multiple Grupo Financiero Santand 5.38%, 4/17/2025 (b) | 1,000,000 | 1,094,540 | |||
| BBVA Bancomer SA: | |||||
Series REGS, 5 Year CMT + 3.00%, 5.35%, 11/12/2029 (a) | 200,000 | 195,580 | |||
5 year CMT + 4.31%, 5.88%, 9/13/2034 (a)(b) | 1,100,000 | 1,077,967 |
Table of Contents
| Security Description | Principal Amount | Value | |||
Braskem Idesa SAPI 7.45%, 11/15/2029 (b) | $ 400,000 | $ 374,268 | |||
Cemex SAB de CV Series REGS, 7.75%, 4/16/2026 | 400,000 | 409,052 | |||
Cometa Energia SA de CV Series REGS, 6.38%, 4/24/2035 | 1,330,000 | 1,386,711 | |||
| Credito Real SAB de CV: | |||||
9.50%, 2/7/2026 (b) | 400,000 | 410,424 | |||
Series REGS, 5 Year CMT + 7.03%, 9.13%, 11/29/2022 (a) | 200,000 | 170,882 | |||
Docuformas SAPI de CV 10.25%, 7/24/2024 (b) | 300,000 | 251,157 | |||
Fomento Economico Mexicano SAB de CV 2.88%, 5/10/2023 | 600,000 | 621,672 | |||
Grupo Bimbo SAB de CV Series REGS, 4.50%, 1/25/2022 | 900,000 | 942,669 | |||
Operadora de Servicios Mega SA de CV Sofom ER 8.25%, 2/11/2025 (b) | 350,000 | 324,888 | |||
| Unifin Financiera SAB de CV: | |||||
Series REGS, 7.38%, 2/12/2026 | 900,000 | 671,886 | |||
Series REGS, 5 Year CMT + 6.31%, 8.88%, 1/29/2025 (a) | 800,000 | 533,248 | |||
| 9,888,332 | |||||
| NETHERLANDS — 3.2% | |||||
| Minejesa Capital B.V.: | |||||
Series REGS, 4.63%, 8/10/2030 | 800,000 | 814,248 | |||
Series REGS, 5.63%, 8/10/2037 | 800,000 | 821,376 | |||
Syngenta Finance NV Series REGS, 5.68%, 4/24/2048 | 1,400,000 | 1,405,782 | |||
| 3,041,406 | |||||
| PANAMA — 4.9% | |||||
Aeropuerto Internacional de Tocumen SA Series REGS, 5.63%, 5/18/2036 | 530,000 | 570,587 | |||
Banistmo SA Series REGS, 3.65%, 9/19/2022 | 1,900,000 | 1,899,848 | |||
Empresa de Transmision Electrica SA 5.13%, 5/2/2049 (b) | 500,000 | 583,965 | |||
| Global Bank Corp.: | |||||
Series REGS, 4.50%, 10/20/2021 | 1,075,000 | 1,097,704 | |||
3 Month USD LIBOR + 3.30%, 5.25%, 4/16/2029 (a)(b) | 300,000 | 307,533 | |||
Multibank, Inc. Series REGS, 4.38%, 11/9/2022 | 150,000 | 150,648 | |||
| 4,610,285 | |||||
| PERU — 5.1% | |||||
| Banco de Credito del Peru: | |||||
Series REGS, 3 Month USD LIBOR + 7.04%, 6.13%, 4/24/2027 (a) | 200,000 | 212,084 | |||
5 year CMT + 3.00%, 3.13%, 7/1/2030 (a)(b) | 250,000 | 247,957 | |||
Banco Internacional del Peru SAA Interbank Series REGS, 3 Month USD LIBOR + 5.76%, 6.63%, 3/19/2029 (a) | 898,000 | 973,953 | |||
Hunt Oil Co. of Peru LLC Sucursal Del Peru Class REGS, 6.38%, 6/1/2028 | 600,000 | 582,306 | |||
Kallpa Generacion SA Series REGS, 4.13%, 8/16/2027 | 1,500,000 | 1,530,975 |
Table of Contents
| Security Description | Principal Amount | Value | ||||
Peru LNG S.r.l. Class REGS, 5.38%, 3/22/2030 | $ 1,000,000 | $ 789,350 | ||||
Southern Copper Corp. 3.50%, 11/8/2022 | 482,000 | 505,088 | ||||
| 4,841,713 | ||||||
| PHILIPPINES — 0.6% | ||||||
BDO Unibank, Inc. Series EMTN, 2.95%, 3/6/2023 | 500,000 | 511,196 | ||||
| QATAR — 1.1% | ||||||
Ooredoo International Finance, Ltd. Class REGS, 3.25%, 2/21/2023 | 1,000,000 | 1,042,710 | ||||
| SINGAPORE — 4.3% | ||||||
DBS Group Holdings, Ltd. Series GMTN, USD 5 Year Swap Rate + 2.39%, 3.60%, 9/7/2021 (a) | 1,300,000 | 1,303,250 | ||||
LLPL Capital Pte, Ltd. 6.88%, 2/4/2039 (b) | 384,520 | 420,407 | ||||
ONGC Videsh Vankorneft Pte, Ltd. 2.88%, 1/27/2022 | 400,000 | 401,932 | ||||
PSA Treasury Pte, Ltd. Class GMTN, 2.13%, 9/5/2029 | 600,000 | 618,150 | ||||
| United Overseas Bank, Ltd.: | ||||||
Series EMTN, USD 5 Year Swap Rate + 1.79%, 3.88%, 10/19/2023 (a) | 1,100,000 | 1,110,648 | ||||
Series EMTN, USD 5 Year Swap Rate + 2.24%, 3.50%, 9/16/2026 (a) | 200,000 | 203,816 | ||||
| 4,058,203 | ||||||
| SOUTH KOREA — 0.2% | ||||||
Korea East-West Power Co., Ltd. 1.75%, 5/6/2025 (b) | 200,000 | 205,986 | ||||
| THAILAND — 0.2% | ||||||
PTTEP Treasury Center Co., Ltd. 2.59%, 6/10/2027 (b) | 200,000 | 204,772 | ||||
| UNITED KINGDOM — 0.8% | ||||||
Radiant Access, Ltd. 4.60%, 11/18/2020 | 800,000 | 793,624 | ||||
TOTAL CORPORATE BONDS & NOTES (Cost $67,984,075) | 69,108,049 | |||||
| FOREIGN GOVERNMENT OBLIGATIONS — 24.7% | ||||||
| CHILE — 0.8% | ||||||
| Chile Government International Bond: | ||||||
2.45%, 1/31/2031 | 500,000 | 519,360 | ||||
3.13%, 3/27/2025 | 200,000 | 217,152 | ||||
| 736,512 | ||||||
| COLOMBIA — 3.5% | ||||||
| Colombia Government International Bond: | ||||||
2.63%, 3/15/2023 | 1,000,000 | 1,013,490 | ||||
Table of Contents
| Security Description | Principal Amount | Value | |||
4.38%, 7/12/2021 | $ 2,000,000 | $ 2,055,680 | |||
5.20%, 5/15/2049 | 200,000 | 234,444 | |||
| 3,303,614 | |||||
| GUATEMALA — 0.5% | |||||
| Republic Of Guatemala: | |||||
5.38%, 4/24/2032 (b) | 200,000 | 221,172 | |||
6.13%, 6/1/2050 (b) | 200,000 | 231,598 | |||
| 452,770 | |||||
| INDONESIA — 5.9% | |||||
Indonesia Government International Bond Series REGS, 4.88%, 5/5/2021 | 2,500,000 | 2,575,350 | |||
PERUSAHAAN PENERBIT SBSN Series REGS, 3.40%, 3/29/2021 | 1,000,000 | 1,014,110 | |||
Republic Of Indonesia 3.85%, 10/15/2030 | 1,800,000 | 2,001,780 | |||
| 5,591,240 | |||||
| MEXICO — 1.1% | |||||
| Mexico Government International Bond: | |||||
4.00%, 10/2/2023 | 300,000 | 319,395 | |||
4.75%, 4/27/2032 | 500,000 | 551,320 | |||
5.00%, 4/27/2051 | 200,000 | 215,926 | |||
| 1,086,641 | |||||
| PANAMA — 3.2% | |||||
Panama Government International Bond 4.00%, 9/22/2024 | 2,800,000 | 3,047,296 | |||
| PERU — 1.6% | |||||
| Peruvian Government International Bond: | |||||
2.39%, 1/23/2026 | 300,000 | 312,021 | |||
2.78%, 1/23/2031 | 1,150,000 | 1,226,372 | |||
| 1,538,393 | |||||
| PHILIPPINES — 3.0% | |||||
| Philippine Government International Bond: | |||||
2.46%, 5/5/2030 | 400,000 | 419,852 | |||
2.95%, 5/5/2045 | 400,000 | 415,776 | |||
4.00%, 1/15/2021 | 1,930,000 | 1,962,057 | |||
| 2,797,685 | |||||
| QATAR — 1.5% | |||||
| Qatar Government International Bond: | |||||
Series REGS, 3.38%, 3/14/2024 | 900,000 | 964,314 |
Table of Contents
| Security Description | Principal Amount | Value | |||
Series REGS, 3.88%, 4/23/2023 | $ 400,000 | $ 428,980 | |||
| 1,393,294 | |||||
| SAUDI ARABIA — 2.5% | |||||
| Saudi Government International Bond: | |||||
Series REGS, 2.38%, 10/26/2021 | 900,000 | 913,410 | |||
Series REGS, 2.88%, 3/4/2023 | 500,000 | 521,405 | |||
2.90%, 10/22/2025 (b) | 850,000 | 901,943 | |||
| 2,336,758 | |||||
| SOUTH KOREA — 0.4% | |||||
Korea Electric Power Corp. 1.13%, 6/15/2025 (b) | 400,000 | 401,772 | |||
| UNITED ARAB EMIRATES — 0.7% | |||||
| Abu Dhabi Government International Bond: | |||||
2.50%, 4/16/2025 (b) | 200,000 | 210,230 | |||
3.13%, 4/16/2030 (b) | 400,000 | 439,764 | |||
| 649,994 | |||||
TOTAL FOREIGN GOVERNMENT OBLIGATIONS (Cost $22,428,572) | 23,335,969 |
| Shares | |||
| CONVERTIBLE BONDS — 0.0% (c) | |||
| JAMAICA — 0.0% (c) | |||
Digicel Group 0.5, Ltd. PIK (b) | 61,264 | 5,207 | |
TOTAL CONVERTIBLE BONDS (Cost $5,162) | 5,207 | ||
| SHORT-TERM INVESTMENT — 0.8% | |||
State Street Institutional U.S. Government Money Market Fund, Class G Shares 0.16% (d) (e) (Cost $780,408) | 780,408 | 780,408 | |
TOTAL INVESTMENTS — 98.7% (Cost $91,198,812) | 93,229,633 | ||
OTHER ASSETS IN EXCESS OF LIABILITIES — 1.3% | 1,264,465 | ||
NET ASSETS — 100.0% | $ 94,494,098 | ||
| (a) | Variable Rate Security - Interest rate shown is rate in effect at June 30, 2020. For securities based on a published reference rate and spread, the reference rate and spread are indicated in the description above. |
Table of Contents
| (b) | Securities purchased pursuant to Rule 144A of the Securities Act of 1933, as amended. These securities, which represent 15.3% of net assets as of June 30, 2020, are considered liquid and may be resold in transactions exempt from registration, normally to qualified institutional buyers. |
| (c) | Amount is less than 0.05% of net assets. |
| (d) | The Fund invested in certain money market funds managed by SSGA Funds Management, Inc. Amounts related to these transactions during the period ended June 30, 2020 are shown in the Affiliate Table below. |
| (e) | The rate shown is the annualized seven-day yield at June 30, 2020. |
| CMT | Constant Maturity Treasury |
| EMTN | Euro Medium Term Note |
| LIBOR | London Interbank Offered Rate |
| PIK | Payment in Kind |
| Description | Level 1 – Quoted Prices | Level 2 – Other Significant Observable Inputs | Level 3 – Significant Unobservable Inputs | Total | ||||
| ASSETS: | ||||||||
| INVESTMENTS: | ||||||||
Corporate Bonds & Notes | $ — | $69,108,049 | $— | $69,108,049 | ||||
Foreign Government Obligations | — | 23,335,969 | — | 23,335,969 | ||||
Convertible Bonds | — | 5,207 | — | 5,207 | ||||
Short-Term Investment | 780,408 | — | — | 780,408 | ||||
TOTAL INVESTMENTS | $780,408 | $92,449,225 | $— | $93,229,633 |
| % of Net Assets | ||
| Foreign Government Obligations | 24.7% | |
| Banks | 21.7 | |
| Electric | 14.9 | |
| Oil & Gas | 7.8 | |
| Chemicals | 3.6 | |
| Diversified Financial Services | 3.0 | |
| Telecommunications | 3.0 | |
| Internet | 2.9 | |
| Pipelines | 2.7 | |
| Mining | 1.4 | |
| Gas | 1.4 | |
| Sovereign | 1.2 | |
| Commercial Services | 1.0 | |
| Food | 1.0 | |
| Iron/Steel | 0.9 | |
| Holding Companies-Diversified | 0.9 | |
| Lodging | 0.9 | |
| Real Estate | 0.8 |
Table of Contents
| % of Net Assets | ||
| Energy-Alternate Sources | 0.8% | |
| Beverages | 0.7 | |
| Transportation | 0.7 | |
| Retail | 0.6 | |
| Engineering & Construction | 0.6 | |
| Construction Materials | 0.4 | |
| Media | 0.3 | |
| Short-Term Investment | 0.8 | |
| Other Assets in Excess of Liabilities | 1.3 | |
| TOTAL | 100.0% |
| Number of Shares Held at 6/30/19 | Value at 6/30/19 | Cost of Purchases | Proceeds from Shares Sold | Realized Gain (Loss) | Change in Unrealized Appreciation/ Depreciation | Number of Shares Held at 6/30/20 | Value at 6/30/20 | Dividend Income | |||||||||
State Street Institutional U.S. Government Money Market Fund, Class G Shares | 85,220 | $85,220 | $62,920,997 | $62,225,809 | $— | $— | 780,408 | $780,408 | $47,366 |
Table of Contents
| Security Description | Principal Amount | Value | |||
| CORPORATE BONDS & NOTES — 27.5% | |||||
| ADVERTISING — 0.4% | |||||
Omnicom Group, Inc./Omnicom Capital, Inc. 3.63%, 5/1/2022 | $ 485,000 | $ 511,331 | |||
| AEROSPACE & DEFENSE — 0.5% | |||||
Bombardier, Inc. 6.00%, 10/15/2022 (a) | 45,000 | 31,784 | |||
Northrop Grumman Corp. 2.08%, 10/15/2020 | 452,000 | 453,898 | |||
| TransDigm, Inc.: | |||||
5.50%, 11/15/2027 | 40,000 | 34,904 | |||
6.25%, 3/15/2026 (a) | 65,000 | 64,809 | |||
6.38%, 6/15/2026 | 25,000 | 22,809 | |||
8.00%, 12/15/2025 (a) | 10,000 | 10,504 | |||
Triumph Group, Inc. 7.75%, 8/15/2025 | 25,000 | 19,041 | |||
| 637,749 | |||||
| AGRICULTURE — 0.3% | |||||
BAT Capital Corp. 2.76%, 8/15/2022 | 265,000 | 274,455 | |||
Reynolds American, Inc. 4.00%, 6/12/2022 | 195,000 | 205,856 | |||
| 480,311 | |||||
| AIRLINES — 0.2% | |||||
Delta Air Lines, Inc. 3.40%, 4/19/2021 | 210,000 | 204,792 | |||
Mileage Plus Holdings LLC/Mileage Plus Intellectual Property Assets, Ltd. 6.50%, 6/20/2027 (a) (b) | 70,000 | 70,369 | |||
| 275,161 | |||||
| APPAREL — 0.1% | |||||
William Carter Co. 5.50%, 5/15/2025 (a) | 105,000 | 108,179 | |||
| AUTO MANUFACTURERS — 0.8% | |||||
Daimler Finance North America LLC 2.30%, 2/12/2021 (a) | 560,000 | 563,853 | |||
Ford Motor Co. 9.00%, 4/22/2025 | 40,000 | 43,242 |
Table of Contents
| Security Description | Principal Amount | Value | |||
Hyundai Capital America 2.85%, 11/1/2022 (a) | $ 485,000 | $ 494,201 | |||
| 1,101,296 | |||||
| AUTO PARTS & EQUIPMENT — 0.0% (c) | |||||
Clarios Global L.P./Clarios US Finance Co. 6.25%, 5/15/2026 (a) | 50,000 | 51,551 | |||
| BANKS — 4.6% | |||||
Banco de Credito del Peru Series REGS, 3 Month USD LIBOR + 7.04%, 6.13%, 4/24/2027 (d) | 200,000 | 212,084 | |||
Banco de Reservas de la Republica Dominicana Series REGS, 7.00%, 2/1/2023 | 150,000 | 145,140 | |||
Banco Mercantil del Norte SA Series REGS, 5 Year CMT + 5.04%, 6.88%, 7/6/2022 (d) | 200,000 | 191,000 | |||
Banco Santander Chile Series REGS, 2.50%, 12/15/2020 | 150,000 | 150,511 | |||
Bangkok Bank PCL Class REGS, 4.80%, 10/18/2020 | 200,000 | 201,896 | |||
Bank of America Corp. Series MTN, 3 Month USD LIBOR + 0.79%, 1.12%, 3/5/2024 (d) | 510,000 | 508,327 | |||
BBVA Bancomer SA Series REGS, 5 Year CMT + 3.00%, 5.35%, 11/12/2029 (d) | 200,000 | 195,580 | |||
BDO Unibank, Inc. Series EMTN, 2.63%, 10/24/2021 | 200,000 | 201,475 | |||
Citigroup, Inc. 3 Month USD LIBOR + 1.02%, 1.37%, 6/1/2024 (d) | 745,000 | 742,944 | |||
JPMorgan Chase & Co. 3 Month USD LIBOR + 0.70%, 3.21%, 4/1/2023 (d) | 485,000 | 504,706 | |||
Macquarie Bank, Ltd. 2.10%, 10/17/2022 (a) | 385,000 | 394,794 | |||
Malayan Banking Bhd USD 5 Year Swap Rate + 2.54%, 3.91%, 10/29/2026 (d) | 200,000 | 204,036 | |||
Morgan Stanley 3 Month USD LIBOR + 0.93%, 2.03%, 7/22/2022 (d) | 730,000 | 732,759 | |||
Oversea-Chinese Banking Corp., Ltd. Series REGS, 4.25%, 6/19/2024 | 200,000 | 217,428 | |||
Sumitomo Mitsui Financial Group, Inc. 2.06%, 7/14/2021 | 480,000 | 488,078 | |||
Toronto-Dominion Bank Series MTN, SOFR + 0.48%, 0.54%, 1/27/2023 (d) | 445,000 | 441,409 | |||
Truist Financial Corp. Series MTN, 2.20%, 3/16/2023 | 245,000 | 254,330 |
Table of Contents
| Security Description | Principal Amount | Value | |||
United Overseas Bank, Ltd. Series EMTN, USD 5 Year Swap Rate + 1.65%, 2.88%, 3/8/2027 (d) | $ 200,000 | $ 202,734 | |||
Wells Fargo & Co. Series MTN, SOFR + 1.60%, 1.65%, 6/2/2024 (d) | 490,000 | 497,556 | |||
| 6,486,787 | |||||
| BEVERAGES — 0.3% | |||||
Cott Holdings, Inc. 5.50%, 4/1/2025 (a) | 75,000 | 75,521 | |||
PepsiCo, Inc. 0.75%, 5/1/2023 | 360,000 | 362,671 | |||
| 438,192 | |||||
| BUILDING MATERIALS — 0.5% | |||||
| Builders FirstSource, Inc.: | |||||
5.00%, 3/1/2030 (a) | 40,000 | 37,688 | |||
6.75%, 6/1/2027 (a) | 65,000 | 66,539 | |||
Carrier Global Corp. 1.92%, 2/15/2023 (a) | 505,000 | 514,913 | |||
Griffon Corp. 5.75%, 3/1/2028 | 35,000 | 34,592 | |||
| 653,732 | |||||
| CHEMICALS — 0.7% | |||||
CNAC HK Finbridge Co., Ltd. 3.50%, 7/19/2022 | 200,000 | 205,078 | |||
DowDuPont, Inc. 3.77%, 11/15/2020 | 140,000 | 141,596 | |||
LG Chem, Ltd. Class REGS, 3.25%, 10/15/2024 | 200,000 | 212,870 | |||
MEGlobal Canada ULC 5.00%, 5/18/2025 (a) | 200,000 | 216,134 | |||
Nutrien, Ltd. 1.90%, 5/13/2023 | 85,000 | 87,478 | |||
UPL Corp., Ltd. Series REGS, 3.25%, 10/13/2021 | 200,000 | 200,234 | |||
| 1,063,390 | |||||
| COAL — 0.0% (c) | |||||
Peabody Energy Corp. 6.00%, 3/31/2022 (a) | 30,000 | 19,507 | |||
SunCoke Energy Partners L.P./SunCoke Energy Partners Finance Corp. 7.50%, 6/15/2025 (a) | 50,000 | 42,623 | |||
| 62,130 |
Table of Contents
| Security Description | Principal Amount | Value | |||
| COMMERCIAL SERVICES — 1.1% | |||||
| Allied Universal Holdco LLC/Allied Universal Finance Corp.: | |||||
6.63%, 7/15/2026 (a) | $ 40,000 | $ 41,977 | |||
9.75%, 7/15/2027 (a) | 45,000 | 47,409 | |||
Cintas Corp. No. 2 2.90%, 4/1/2022 | 470,000 | 488,222 | |||
Financial & Risk US Holdings, Inc. 6.25%, 5/15/2026 (a) | 65,000 | 68,888 | |||
Garda World Security Corp. 8.75%, 5/15/2025 (a) | 50,000 | 50,463 | |||
HPHT Finance 19, Ltd. 2.88%, 11/5/2024 | 200,000 | 206,588 | |||
Jaguar Holding Co. II/PPD Development L.P. 5.00%, 6/15/2028 (a) | 25,000 | 25,589 | |||
MPH Acquisition Holdings LLC 7.13%, 6/1/2024 (a) | 50,000 | 46,495 | |||
| PayPal Holdings, Inc.: | |||||
1.35%, 6/1/2023 | 100,000 | 101,906 | |||
2.20%, 9/26/2022 | 375,000 | 388,072 | |||
United Rentals North America, Inc. 6.50%, 12/15/2026 | 35,000 | 36,757 | |||
Verscend Escrow Corp. 9.75%, 8/15/2026 (a) | 50,000 | 53,870 | |||
| 1,556,236 | |||||
| COMPUTERS — 0.1% | |||||
Tempo Acquisition LLC/Tempo Acquisition Finance Corp. 6.75%, 6/1/2025 (a) | 75,000 | 76,069 | |||
| DISTRIBUTION & WHOLESALE — 0.0% (c) | |||||
Performance Food Group, Inc. 5.50%, 10/15/2027 (a) | 45,000 | 43,426 | |||
| DIVERSIFIED FINANCIAL SERVICES — 1.1% | |||||
American Express Co. 3.70%, 11/5/2021 | 475,000 | 493,853 | |||
B3 SA - Brasil Bolsa Balcao Class REGS, 5.50%, 7/16/2020 | 100,000 | 99,923 | |||
| Capital One Financial Corp.: | |||||
2.40%, 10/30/2020 | 167,000 | 167,683 | |||
3.20%, 1/30/2023 | 335,000 | 353,589 | |||
Global Aircraft Leasing Co., Ltd. PIK 6.50%, 9/15/2024 (a) | 50,000 | 35,303 |
Table of Contents
| Security Description | Principal Amount | Value | |||
| Icahn Enterprises L.P./Icahn Enterprises Finance Corp.: | |||||
5.25%, 5/15/2027 | $ 35,000 | $ 33,773 | |||
6.25%, 5/15/2026 | 55,000 | 55,002 | |||
Nationstar Mortgage Holdings, Inc. 8.13%, 7/15/2023 (a) | 50,000 | 51,272 | |||
Navient Corp. 5.00%, 3/15/2027 | 25,000 | 21,290 | |||
NFP Corp. 6.88%, 7/15/2025 (a) | 75,000 | 73,965 | |||
Springleaf Finance Corp. 6.63%, 1/15/2028 | 40,000 | 39,814 | |||
Unifin Financiera SAB de CV Class REGS, 7.00%, 1/15/2025 | 200,000 | 150,040 | |||
| 1,575,507 | |||||
| ELECTRIC — 2.1% | |||||
AES Andres B.V./Dominican Power Partners/Empresa Generadora de Electricidad It Series REGS, 7.95%, 5/11/2026 | 200,000 | 201,430 | |||
AES Gener SA USD 5 Year Swap Rate + 4.64%, 7.13%, 3/26/2079 (a) (d) | 200,000 | 207,092 | |||
Calpine Corp. 5.13%, 3/15/2028 (a) | 40,000 | 39,155 | |||
Consolidated Edison, Inc. 2.00%, 5/15/2021 | 435,000 | 441,125 | |||
| DTE Energy Co.: | |||||
2.25%, 11/1/2022 | 260,000 | 268,559 | |||
Series C, 2.53%, 10/1/2024 | 255,000 | 268,434 | |||
Empresa Electrica Angamos SA Series REGS, 4.88%, 5/25/2029 | 156,500 | 162,924 | |||
Empresa Electrica Guacolda SA Series REGS, 4.56%, 4/30/2025 | 200,000 | 165,138 | |||
Israel Electric Corp., Ltd. Series REGS, 6.88%, 6/21/2023 | 200,000 | 228,858 | |||
Korea East-West Power Co., Ltd. 1.75%, 5/6/2025 (a) | 200,000 | 205,986 | |||
Perusahaan Listrik Negara PT Series REGS, 5.50%, 11/22/2021 | 200,000 | 208,954 | |||
PG&E Corp. 5.00%, 7/1/2028 | 25,000 | 25,035 | |||
PSEG Power LLC 3.85%, 6/1/2023 | 470,000 | 506,937 | |||
| 2,929,627 |
Table of Contents
| Security Description | Principal Amount | Value | |||
| ELECTRICAL COMPONENTS & EQUIPMENT — 0.0% (c) | |||||
Energizer Holdings, Inc. 4.75%, 6/15/2028 (a) (b) | $ 60,000 | $ 58,990 | |||
| ENTERTAINMENT — 0.3% | |||||
Colt Merger Sub, Inc. 6.25%, 7/1/2025 (a) (b) | 55,000 | 54,953 | |||
Lions Gate Capital Holdings LLC 6.38%, 2/1/2024 (a) | 65,000 | 63,337 | |||
| Live Nation Entertainment, Inc.: | |||||
4.75%, 10/15/2027 (a) | 65,000 | 56,093 | |||
6.50%, 5/15/2027 (a) | 50,000 | 51,508 | |||
Scientific Games International, Inc. 7.25%, 11/15/2029 (a) | 40,000 | 32,095 | |||
Six Flags Theme Parks, Inc. 7.00%, 7/1/2025 (a) | 105,000 | 108,996 | |||
Twin River Worldwide Holdings, Inc. 6.75%, 6/1/2027 (a) | 45,000 | 42,755 | |||
| 409,737 | |||||
| ENVIRONMENTAL CONTROL — 0.8% | |||||
| GFL Environmental, Inc.: | |||||
4.25%, 6/1/2025 (a) | 45,000 | 45,348 | |||
5.13%, 12/15/2026 (a) | 55,000 | 56,778 | |||
8.50%, 5/1/2027 (a) | 15,000 | 16,314 | |||
Republic Services, Inc. 2.50%, 8/15/2024 | 485,000 | 515,841 | |||
Tervita Corp. 7.63%, 12/1/2021 (a) | 50,000 | 40,122 | |||
Waste Management, Inc. 2.95%, 6/15/2024 | 450,000 | 459,882 | |||
| 1,134,285 | |||||
| FOOD — 0.6% | |||||
| B&G Foods, Inc.: | |||||
5.25%, 4/1/2025 | 30,000 | 30,175 | |||
5.25%, 9/15/2027 | 20,000 | 20,018 | |||
Grupo Bimbo SAB de CV Series REGS, 4.50%, 1/25/2022 | 200,000 | 209,482 | |||
| JBS USA LUX SA/JBS USA Finance, Inc.: | |||||
5.75%, 6/15/2025 (a) | 5,000 | 5,055 | |||
5.88%, 7/15/2024 (a) | 10,000 | 10,135 | |||
6.75%, 2/15/2028 (a) | 50,000 | 52,807 |
Table of Contents
| Security Description | Principal Amount | Value | |||
| Kraft Heinz Foods Co.: | |||||
3.95%, 7/15/2025 | $ 19,000 | $ 20,297 | |||
5.00%, 7/15/2035 | 20,000 | 21,999 | |||
5.20%, 7/15/2045 | 60,000 | 65,013 | |||
| Mondelez International, Inc.: | |||||
0.63%, 7/1/2022 | 195,000 | 194,973 | |||
3.63%, 5/7/2023 | 75,000 | 80,822 | |||
Pilgrim's Pride Corp. 5.88%, 9/30/2027 (a) | 45,000 | 45,027 | |||
Post Holdings, Inc. 4.63%, 4/15/2030 (a) | 50,000 | 49,024 | |||
US Foods, Inc. 6.25%, 4/15/2025 (a) | 10,000 | 10,174 | |||
| 815,001 | |||||
| FOOD SERVICE — 0.1% | |||||
Aramark Services, Inc. 6.38%, 5/1/2025 (a) | 90,000 | 92,929 | |||
| FOREST PRODUCTS & PAPER — 0.1% | |||||
Inversiones CMPC SA Series REGS, 4.50%, 4/25/2022 | 200,000 | 207,708 | |||
| HAND & MACHINE TOOLS — 0.1% | |||||
Colfax Corp. 6.38%, 2/15/2026 (a) | 70,000 | 73,150 | |||
| HEALTH CARE PRODUCTS — 0.1% | |||||
Avantor, Inc. 9.00%, 10/1/2025 (a) | 65,000 | 69,834 | |||
Ortho-Clinical Diagnostics, Inc./Ortho-Clinical Diagnostics SA 7.25%, 2/1/2028 (a) | 35,000 | 35,538 | |||
| 105,372 | |||||
| HEALTH CARE SERVICES — 0.7% | |||||
| Anthem, Inc.: | |||||
2.50%, 11/21/2020 | 325,000 | 327,515 | |||
3.30%, 1/15/2023 | 170,000 | 181,004 | |||
HCA, Inc. 5.38%, 9/1/2026 | 70,000 | 76,049 | |||
| LifePoint Health, Inc.: | |||||
4.38%, 2/15/2027 (a) | 40,000 | 37,692 | |||
6.75%, 4/15/2025 (a) | 30,000 | 30,806 |
Table of Contents
| Security Description | Principal Amount | Value | |||
Molina Healthcare, Inc. 4.38%, 6/15/2028 (a) | $ 15,000 | $ 15,007 | |||
Radiology Partners, Inc. 9.25%, 2/1/2028 (a) | 45,000 | 42,397 | |||
Select Medical Corp. 6.25%, 8/15/2026 (a) | 120,000 | 121,307 | |||
Tenet Healthcare Corp. 5.13%, 11/1/2027 (a) | 60,000 | 59,356 | |||
West Street Merger Sub, Inc. 6.38%, 9/1/2025 (a) | 40,000 | 38,795 | |||
| 929,928 | |||||
| HOME BUILDERS — 0.0% (c) | |||||
Mattamy Group Corp. 4.63%, 3/1/2030 (a) | 55,000 | 53,028 | |||
| HOME FURNISHINGS — 0.1% | |||||
Tempur Sealy International, Inc. 5.50%, 6/15/2026 | 75,000 | 76,545 | |||
| HOUSEHOLD PRODUCTS & WARES — 0.0% (c) | |||||
Kronos Acquisition Holdings, Inc. 9.00%, 8/15/2023 (a) | 45,000 | 42,937 | |||
| INSURANCE — 0.6% | |||||
Alliant Holdings Intermediate LLC/Alliant Holdings Co-Issuer 6.75%, 10/15/2027 (a) | 30,000 | 29,786 | |||
GTCR AP Finance, Inc. 8.00%, 5/15/2027 (a) | 40,000 | 41,143 | |||
Marsh & McLennan Cos., Inc. 3 Month USD LIBOR + 1.20%, 1.51%, 12/29/2021 (d) | 330,000 | 330,162 | |||
| Prudential Financial, Inc.: | |||||
Series MTN, 3.50%, 5/15/2024 | 340,000 | 375,724 | |||
Series MTN, 4.50%, 11/16/2021 | 30,000 | 31,640 | |||
| 808,455 | |||||
| INTERNET — 1.0% | |||||
Alibaba Group Holding, Ltd. 2.80%, 6/6/2023 | 200,000 | 208,930 | |||
Baidu, Inc. 3.08%, 4/7/2025 | 200,000 | 210,020 | |||
eBay, Inc. 2.75%, 1/30/2023 | 475,000 | 497,206 |
Table of Contents
| Security Description | Principal Amount | Value | |||
JD.com, Inc. 3.13%, 4/29/2021 | $ 200,000 | $ 202,266 | |||
Tencent Holdings, Ltd. 1.81%, 1/26/2026 (a) | 200,000 | 201,800 | |||
Uber Technologies, Inc. 7.50%, 9/15/2027 (a) | 35,000 | 35,068 | |||
| 1,355,290 | |||||
| INVESTMENT COMPANY SECURITY — 0.1% | |||||
Grupo de Inversiones Suramericana SA Series REGS, 5.70%, 5/18/2021 | 200,000 | 206,026 | |||
| IRON/STEEL — 0.1% | |||||
POSCO Class REGS, 2.38%, 11/12/2022 | 200,000 | 204,010 | |||
| LEISURE TIME — 0.1% | |||||
Carnival Corp. 11.50%, 4/1/2023 (a) | 20,000 | 21,699 | |||
| Viking Cruises, Ltd.: | |||||
5.88%, 9/15/2027 (a) | 95,000 | 56,675 | |||
13.00%, 5/15/2025 (a) | 20,000 | 21,003 | |||
| 99,377 | |||||
| LODGING — 0.1% | |||||
Boyd Gaming Corp. 4.75%, 12/1/2027 (a) | 55,000 | 47,303 | |||
| Hilton Domestic Operating Co., Inc.: | |||||
5.38%, 5/1/2025 (a) | 10,000 | 9,958 | |||
5.75%, 5/1/2028 (a) | 10,000 | 10,134 | |||
MGM Resorts International 6.75%, 5/1/2025 | 90,000 | 89,214 | |||
| 156,609 | |||||
| MACHINERY, CONSTRUCTION & MINING — 0.0% (c) | |||||
BWX Technologies, Inc. 4.13%, 6/30/2028 (a) | 25,000 | 25,023 | |||
| MEDIA — 0.4% | |||||
| CCO Holdings LLC/CCO Holdings Capital Corp.: | |||||
4.75%, 3/1/2030 (a) | 45,000 | 46,071 | |||
5.75%, 2/15/2026 (a) | 95,000 | 98,485 | |||
Cengage Learning, Inc. 9.50%, 6/15/2024 (a) | 30,000 | 20,615 |
Table of Contents
| Security Description | Principal Amount | Value | |||
Diamond Sports Group LLC/Diamond Sports Finance Co. 5.38%, 8/15/2026 (a) | $ 40,000 | $ 28,912 | |||
DISH DBS Corp. 5.88%, 11/15/2024 | 40,000 | 39,802 | |||
Gray Television, Inc. 7.00%, 5/15/2027 (a) | 50,000 | 51,582 | |||
iHeartCommunications, Inc. 8.38%, 5/1/2027 | 10,000 | 9,156 | |||
Nexstar Broadcasting, Inc. 5.63%, 7/15/2027 (a) | 25,000 | 24,821 | |||
Scripps Escrow, Inc. 5.88%, 7/15/2027 (a) | 35,000 | 33,164 | |||
VTR Finance N.V. Series REGS, 6.88%, 1/15/2024 | 200,000 | 204,584 | |||
| 557,192 | |||||
| MINING — 0.2% | |||||
Arconic Corp. 6.13%, 2/15/2028 (a) | 80,000 | 80,309 | |||
Corp. Nacional del Cobre de Chile Class REGS, 3.88%, 11/3/2021 | 200,000 | 204,838 | |||
Novelis Corp. 4.75%, 1/30/2030 (a) | 20,000 | 19,106 | |||
| 304,253 | |||||
| MISCELLANEOUS MANUFACTURER — 0.0% (c) | |||||
Gates Global LLC/Gates Global Co. 6.25%, 1/15/2026 (a) | 35,000 | 34,556 | |||
| OIL & GAS — 1.9% | |||||
Apache Corp. 4.38%, 10/15/2028 | 30,000 | 26,558 | |||
CNOOC Finance, Ltd. 3.00%, 5/9/2023 | 200,000 | 208,894 | |||
CNPC General Capital, Ltd. Series REGS, 3.40%, 4/16/2023 | 200,000 | 211,318 | |||
EQT Corp. 6.13%, 2/1/2025 | 35,000 | 34,873 | |||
Exxon Mobil Corp. 1.57%, 4/15/2023 | 345,000 | 354,022 | |||
Geopark, Ltd. Series REGS, 6.50%, 9/21/2024 | 200,000 | 182,638 | |||
Gulfport Energy Corp. 6.38%, 5/15/2025 | 45,000 | 22,458 |
Table of Contents
| Security Description | Principal Amount | Value | |||
Hilcorp Energy I L.P./Hilcorp Finance Co. 6.25%, 11/1/2028 (a) | $ 40,000 | $ 31,781 | |||
Indigo Natural Resources LLC 6.88%, 2/15/2026 (a) | 20,000 | 18,575 | |||
| MEG Energy Corp.: | |||||
7.00%, 3/31/2024 (a) | 12,000 | 10,282 | |||
7.13%, 2/1/2027 (a) | 70,000 | 58,155 | |||
Oasis Petroleum, Inc. 6.88%, 3/15/2022 | 20,000 | 3,635 | |||
| Occidental Petroleum Corp.: | |||||
3.50%, 8/15/2029 | 40,000 | 29,275 | |||
8.00%, 7/15/2025 (b) | 25,000 | 25,125 | |||
Series 1, 4.10%, 2/1/2021 | 50,000 | 50,113 | |||
ONGC Videsh, Ltd. 3.75%, 5/7/2023 | 250,000 | 257,143 | |||
Parkland Fuel Corp. 5.88%, 7/15/2027 (a) | 40,000 | 41,390 | |||
Parsley Energy LLC/Parsley Finance Corp. 5.63%, 10/15/2027 (a) | 55,000 | 54,187 | |||
QEP Resources, Inc. 5.63%, 3/1/2026 | 40,000 | 25,293 | |||
Reliance Industries, Ltd. Class REGS, 4.13%, 1/28/2025 | 250,000 | 271,605 | |||
Saudi Arabian Oil Co. Class REGS, 2.75%, 4/16/2022 | 200,000 | 204,358 | |||
Sinopec Group Overseas Development 2016, Ltd. Series REGS, 2.00%, 9/29/2021 | 200,000 | 201,504 | |||
Sinopec Group Overseas Development 2018, Ltd. 2.15%, 5/13/2025 (a) | 200,000 | 205,408 | |||
Sunoco L.P./Sunoco Finance Corp. 6.00%, 4/15/2027 | 70,000 | 70,062 | |||
Transocean Poseidon, Ltd. 6.88%, 2/1/2027 (a) | 75,000 | 66,214 | |||
Transocean, Inc. 8.00%, 2/1/2027 (a) | 35,000 | 19,332 | |||
| WPX Energy, Inc.: | |||||
4.50%, 1/15/2030 | 30,000 | 26,397 | |||
5.88%, 6/15/2028 | 35,000 | 33,742 | |||
| 2,744,337 | |||||
| OIL & GAS SERVICES — 0.3% | |||||
Schlumberger Holdings Corp. 3.75%, 5/1/2024 (a) | 370,000 | 398,952 |
Table of Contents
| Security Description | Principal Amount | Value | |||
USA Compression Partners L.P./USA Compression Finance Corp. 6.88%, 9/1/2027 | $ 80,000 | $ 76,282 | |||
| 475,234 | |||||
| PACKAGING & CONTAINERS — 0.1% | |||||
Berry Global, Inc. 5.63%, 7/15/2027 (a) | 65,000 | 66,894 | |||
Flex Acquisition Co., Inc. 6.88%, 1/15/2025 (a) | 50,000 | 48,077 | |||
Silgan Holdings, Inc. 4.13%, 2/1/2028 (a) | 65,000 | 64,564 | |||
| 179,535 | |||||
| PHARMACEUTICALS — 2.0% | |||||
AbbVie, Inc. 2.30%, 11/21/2022 (a) | 215,000 | 222,418 | |||
| AstraZeneca PLC: | |||||
2.38%, 11/16/2020 | 400,000 | 402,840 | |||
2.38%, 6/12/2022 | 55,000 | 56,896 | |||
3.50%, 8/17/2023 | 30,000 | 32,464 | |||
Bausch Health Cos., Inc. 6.25%, 2/15/2029 (a) | 95,000 | 95,529 | |||
Bristol-Myers Squibb Co. 2.60%, 5/16/2022 (a) | 480,000 | 498,504 | |||
Cardinal Health, Inc. 2.62%, 6/15/2022 | 475,000 | 490,798 | |||
Cigna Corp. 3.40%, 9/17/2021 | 450,000 | 464,881 | |||
CVS Health Corp. 3.70%, 3/9/2023 | 470,000 | 504,484 | |||
Upjohn, Inc. 1.13%, 6/22/2022 (a) | 145,000 | 145,956 | |||
| 2,914,770 | |||||
| PIPELINES — 0.2% | |||||
Antero Midstream Partners L.P./Antero Midstream Finance Corp. 5.75%, 3/1/2027 (a) | 22,000 | 17,871 | |||
Cheniere Energy Partners L.P. 5.63%, 10/1/2026 | 90,000 | 89,324 | |||
EQM Midstream Partners L.P. 6.50%, 7/1/2027 (a) | 60,000 | 61,659 | |||
Hess Midstream Operations L.P. 5.13%, 6/15/2028 (a) | 55,000 | 52,901 |
Table of Contents
| Security Description | Principal Amount | Value | |||
Targa Resources Partners L.P./Targa Resources Partners Finance Corp. 5.50%, 3/1/2030 (a) | $ 55,000 | $ 52,945 | |||
Western Midstream Operating L.P. 3.10%, 2/1/2025 | 40,000 | 38,046 | |||
| 312,746 | |||||
| REAL ESTATE — 0.0% (c) | |||||
Realogy Group LLC/Realogy Co-Issuer Corp. 7.63%, 6/15/2025 (a) | 20,000 | 20,080 | |||
| REAL ESTATE INVESTMENT TRUSTS — 0.9% | |||||
Crown Castle International Corp. 1.35%, 7/15/2025 | 150,000 | 151,209 | |||
ESH Hospitality, Inc. 5.25%, 5/1/2025 (a) | 55,000 | 52,949 | |||
MGM Growth Properties Operating Partnership L.P./MGP Finance Co-Issuer, Inc. 5.75%, 2/1/2027 | 50,000 | 51,725 | |||
MPT Operating Partnership L.P./MPT Finance Corp. 5.25%, 8/1/2026 | 35,000 | 36,408 | |||
Simon Property Group L.P. 2.00%, 9/13/2024 | 370,000 | 378,169 | |||
| VICI Properties L.P./VICI Note Co., Inc.: | |||||
3.75%, 2/15/2027 (a) | 5,000 | 4,693 | |||
4.13%, 8/15/2030 (a) | 35,000 | 33,369 | |||
Welltower, Inc. 3.63%, 3/15/2024 | 485,000 | 517,883 | |||
| 1,226,405 | |||||
| RETAIL — 0.7% | |||||
1011778 BC ULC/New Red Finance, Inc. 5.00%, 10/15/2025 (a) | 30,000 | 29,828 | |||
| Asbury Automotive Group, Inc.: | |||||
4.50%, 3/1/2028 (a) | 5,000 | 4,851 | |||
4.75%, 3/1/2030 (a) | 5,000 | 4,876 | |||
Beacon Roofing Supply, Inc. 4.88%, 11/1/2025 (a) | 70,000 | 62,611 | |||
Carvana Co. 8.88%, 10/1/2023 (a) | 20,000 | 20,097 | |||
Golden Nugget, Inc. 6.75%, 10/15/2024 (a) | 60,000 | 42,960 | |||
IRB Holding Corp. 6.75%, 2/15/2026 (a) | 50,000 | 47,782 |
Table of Contents
| Security Description | Principal Amount | Value | |||
McDonald's Corp. Series MTN, 2.63%, 1/15/2022 | $ 370,000 | $ 382,317 | |||
Nordstrom, Inc. 8.75%, 5/15/2025 (a) | 10,000 | 10,753 | |||
| PetSmart, Inc.: | |||||
5.88%, 6/1/2025 (a) | 17,000 | 17,060 | |||
7.13%, 3/15/2023 (a) | 50,000 | 49,291 | |||
Staples, Inc. 7.50%, 4/15/2026 (a) | 50,000 | 39,381 | |||
Target Corp. 2.90%, 1/15/2022 | 230,000 | 239,207 | |||
Yum! Brands, Inc. 7.75%, 4/1/2025 (a) | 20,000 | 21,569 | |||
| 972,583 | |||||
| SEMICONDUCTORS — 0.8% | |||||
Analog Devices, Inc. 2.95%, 1/12/2021 | 510,000 | 515,855 | |||
Microchip Technology, Inc. 3.92%, 6/1/2021 | 480,000 | 489,278 | |||
Micron Technology, Inc. 2.50%, 4/24/2023 | 150,000 | 155,894 | |||
| 1,161,027 | |||||
| SOFTWARE — 0.2% | |||||
Genesys Telecommunications Laboratories, Inc./Greeneden Lux 3 Sarl/Greeneden US Holdings II LLC 10.00%, 11/30/2024 (a) | 45,000 | 46,688 | |||
Open Text Corp. 3.88%, 2/15/2028 (a) | 70,000 | 67,363 | |||
Oracle Corp. 2.50%, 4/1/2025 | 160,000 | 171,528 | |||
Star Merger Sub, Inc. 6.88%, 8/15/2026 (a) | 45,000 | 47,520 | |||
| 333,099 | |||||
| TELECOMMUNICATIONS — 1.1% | |||||
Axiata SPV2 Bhd Series 2, 3.47%, 11/19/2020 | 200,000 | 200,902 | |||
| CenturyLink, Inc.: | |||||
4.00%, 2/15/2027 (a) | 40,000 | 38,838 | |||
5.13%, 12/15/2026 (a) | 45,000 | 44,937 | |||
Cincinnati Bell, Inc. 7.00%, 7/15/2024 (a) | 35,000 | 35,751 |
Table of Contents
| Security Description | Principal Amount | Value | |||
Frontier Communications Corp. 8.00%, 4/1/2027 (a) (e) | $ 70,000 | $ 71,117 | |||
Gogo Intermediate Holdings LLC/Gogo Finance Co., Inc. 9.88%, 5/1/2024 (a) | 45,000 | 38,225 | |||
GTT Communications, Inc. 7.88%, 12/31/2024 (a) | 30,000 | 15,760 | |||
Intelsat Jackson Holdings SA 8.50%, 10/15/2024 (a) (e) | 40,000 | 24,076 | |||
| Level 3 Financing, Inc.: | |||||
4.25%, 7/1/2028 (a) | 85,000 | 85,202 | |||
4.63%, 9/15/2027 (a) | 55,000 | 55,322 | |||
| SingTel Group Treasury Pte, Ltd.: | |||||
Class EMTN, 2.38%, 10/3/2026 | 200,000 | 211,888 | |||
Class EMTN, 3.25%, 6/30/2025 | 200,000 | 219,220 | |||
Telesat Canada/Telesat LLC 6.50%, 10/15/2027 (a) | 15,000 | 14,719 | |||
Verizon Communications, Inc. 3 Month USD LIBOR + 1.10%, 1.49%, 5/15/2025 (d) | 475,000 | 480,700 | |||
| Zayo Group Holdings,Inc.: | |||||
4.00%, 3/1/2027 (a) | 45,000 | 42,794 | |||
6.13%, 3/1/2028 (a) | 15,000 | 14,581 | |||
| 1,594,032 | |||||
| TRANSPORTATION — 0.5% | |||||
Kenan Advantage Group, Inc. 7.88%, 7/31/2023 (a) | 10,000 | 8,898 | |||
PSA Treasury Pte, Ltd. Class GMTN, 2.50%, 4/12/2026 | 200,000 | 212,858 | |||
Union Pacific Corp. 3.20%, 6/8/2021 | 515,000 | 528,549 | |||
| 750,305 | |||||
| TRUCKING & LEASING — 0.5% | |||||
Avolon Holdings Funding, Ltd. 3.63%, 5/1/2022 (a) | 260,000 | 244,972 | |||
Penske Truck Leasing Co. L.P./PTL Finance Corp. 2.70%, 11/1/2024 (a) | 485,000 | 498,279 | |||
| 743,251 | |||||
TOTAL CORPORATE BONDS & NOTES (Cost $38,871,840) | 39,228,479 |
Table of Contents
| Security Description | Principal Amount | Value | |||
| ASSET-BACKED SECURITIES — 2.9% | |||||
| AUTOMOBILE — 0.0% (c) | |||||
Westlake Automobile Receivables Trust Series 2017-2A, Class C, 2.59%, 12/15/2022 (a) | $ 54,781 | $ 54,832 | |||
| OTHER ABS — 2.8% | |||||
Ajax Mortgage Loan Trust Series 2018-E, Class A, 4.38%, 6/25/2058 (a) (d) | 454,391 | 459,252 | |||
Arbor Realty Commercial Real Estate Notes 2018-FL1, Ltd. Series 2018-FL1, Class A, 1 Month USD LIBOR + 1.15%, 1.33%, 6/15/2028 (a) (d) | 71,000 | 69,815 | |||
BDS, Ltd. Series 2019-FL4, Class A, 1 Month USD LIBOR + 1.10%, 1.29%, 8/15/2036 (a) (d) | 100,000 | 97,133 | |||
BSPRT Issuer, Ltd. Series 2019-FL5, Class A, 1 Month USD LIBOR + 1.15%, 1.33%, 5/15/2029 (a) (d) | 401,000 | 392,782 | |||
Consumer Loan Underlying Bond Credit Trust 2018-P1 Series 2018-P1, Class A, 3.39%, 7/15/2025 (a) | 30,667 | 30,689 | |||
FS Rialto 2019-FL1 Series 2019-FL1, Class A, 1 Month USD LIBOR + 1.20%, 1.40%, 12/16/2036 (a) (d) | 161,000 | 153,111 | |||
LoanCore 2018-CRE1 Issuer, Ltd. Series 2018-CRE1, Class A, 1 Month USD LIBOR + 1.13%, 1.31%, 5/15/2028 (a) (d) | 100,000 | 98,850 | |||
LoanCore Issuer, Ltd. Series 2019-CRE2, Class AS, 1 Month USD LIBOR + 1.50%, 1.68%, 5/15/2036 (a) (d) | 100,000 | 91,484 | |||
Marathon CRE 2018 FL1, Ltd. Series 2018-FL1, Class A, 1 Month USD LIBOR + 1.15%, 1.33%, 6/15/2028 (a) (d) | 100,000 | 98,125 | |||
| Marlette Funding Trust: | |||||
Series 2019-2A, Class A, 3.13%, 7/16/2029 (a) | 228,916 | 230,584 | |||
Series 2018-3A, Class A, 3.20%, 9/15/2028 (a) | 9,820 | 9,825 | |||
Marlette Funding Trust 2019-4 Series 2019-4A, Class A, 2.39%, 12/17/2029 (a) | 336,724 | 338,381 | |||
NLY Commercial Mortgage Trust Series 2019-FL2, Class AS, 1 Month USD LIBOR + 1.60%, 1.78%, 2/15/2036 (a) (d) | 120,000 | 114,087 | |||
OneMain Financial Issuance Trust Series 2017-1A, Class A1, 2.37%, 9/14/2032 (a) | 115,241 | 115,582 | |||
Sapphire Aviation Finance II, Ltd. Series 2020-1A, Class A, 3.23%, 3/15/2040 (a) | 494,167 | 419,786 |
Table of Contents
| Security Description | Principal Amount | Value | |||
Sofi Consumer Loan Program LLC Series 2017-1, Class A, 3.28%, 1/26/2026 (a) | $ 37,880 | $ 37,979 | |||
STWD, Ltd. Series 2019-FL1, Class AS, 1 Month USD LIBOR + 1.40%, 1.58%, 7/15/2038 (a) (d) | 100,000 | 97,125 | |||
Textainer Marine Containers VII, Ltd. Series 2019-1A, Class A, 3.96%, 4/20/2044 (a) | 453,333 | 461,527 | |||
TRTX 2019-FL3 Issuer, Ltd. Series 2019-FL3, Class A, 1 Month USD LIBOR + 1.15%, 1.34%, 10/15/2034 (a) (d) | 200,000 | 195,250 | |||
Upstart Securitization Trust Series 2020-1, Class A, 2.32%, 4/22/2030 (a) | 436,971 | 436,591 | |||
| 3,947,958 | |||||
| STUDENT LOAN ABS — 0.1% | |||||
Laurel Road Prime Student Loan Trust Series 2019-A, Class A1FX, 2.34%, 10/25/2048 (a) | 157,002 | 157,355 | |||
TOTAL ASSET-BACKED SECURITIES (Cost $4,251,937) | 4,160,145 | ||||
| FOREIGN GOVERNMENT OBLIGATIONS — 2.2% | |||||
| BRAZIL — 0.3% | |||||
Banco Bradesco (Cayman) Class REGS, 5.90%, 1/16/2021 | 200,000 | 203,404 | |||
Banco do Brasil SA Series REGS, 10 Year CMT + 7.78%, 8.50%, 10/20/2020 (d) | 200,000 | 201,820 | |||
| 405,224 | |||||
| CHILE — 0.1% | |||||
Chile Government International Bond 3.88%, 8/5/2020 | 200,000 | 200,382 | |||
| COLOMBIA — 0.2% | |||||
Colombia Government International Bond 2.63%, 3/15/2023 | 300,000 | 304,047 | |||
| DOMINICAN REPUBLIC — 0.1% | |||||
Dominican Republic International Bond Series REGS, 7.50%, 5/6/2021 | 133,333 | 137,696 | |||
| INDONESIA — 0.1% | |||||
Indonesia Government International Bond Series REGS, 4.88%, 5/5/2021 | 200,000 | 206,028 |
Table of Contents
| Security Description | Principal Amount | Value | |||
| MALAYSIA — 0.2% | |||||
Wakala Global Sukuk Bhd Class REGS, 4.65%, 7/6/2021 | $ 250,000 | $ 259,000 | |||
| MEXICO — 0.3% | |||||
Mexico Government International Bond 3.90%, 4/27/2025 | 200,000 | 214,048 | |||
Nacional Financiera SNC Series REGS, 3.38%, 11/5/2020 | 200,000 | 200,006 | |||
| 414,054 | |||||
| PERU — 0.1% | |||||
Peruvian Government International Bond 2.39%, 1/23/2026 | 100,000 | 104,007 | |||
| QATAR — 0.1% | |||||
Qatar Government International Bond Series REGS, 2.38%, 6/2/2021 | 200,000 | 202,498 | |||
| SAUDI ARABIA — 0.3% | |||||
Saudi Government International Bond Series REGS, 2.88%, 3/4/2023 | 350,000 | 364,983 | |||
| THAILAND — 0.2% | |||||
Export Import Bank of Thailand Series EMTN, 3 Month USD LIBOR + 0.85%, 1.21%, 5/23/2024 (d) | 250,000 | 245,043 | |||
| UNITED ARAB EMIRATES — 0.2% | |||||
Abu Dhabi Government International Bond 2.50%, 4/16/2025 (a) | 200,000 | 210,230 | |||
TOTAL FOREIGN GOVERNMENT OBLIGATIONS (Cost $3,016,317) | 3,053,192 | ||||
| U.S. GOVERNMENT AGENCY OBLIGATIONS — 23.1% | |||||
| Federal Home Loan Mortgage Corp.: | |||||
3.00%, 10/1/2034 | 803,128 | 843,814 | |||
3.50%, 9/1/2032 | 567,097 | 595,997 | |||
Series 264, Class F1, 1 Month USD LIBOR + 0.55%, 0.73%, 7/15/2042 (d) | 1,585,763 | 1,601,113 | |||
Series 4125, Class FH, 1 Month USD LIBOR + 0.35%, 0.53%, 11/15/2042 (d) | 592,053 | 589,876 | |||
Series 4211, Class AP, 1.60%, 3/15/2043 | 1,559,022 | 1,589,499 |
Table of Contents
| Security Description | Principal Amount | Value | |||
Series 3798, Class FG, CMO, 1 Month USD LIBOR + 0.51%, 0.69%, 1/15/2041 (d) | $ 2,096,985 | $ 2,107,233 | |||
Series 4461, Class BA, CMO, 2.00%, 12/15/2043 | 1,195,251 | 1,220,804 | |||
Series 4030, Class AN, CMO, REMIC, 1.75%, 4/15/2027 | 1,205,081 | 1,218,432 | |||
Series 4060, Class QA, CMO, REMIC, 1.50%, 9/15/2026 | 396,374 | 399,954 | |||
Series 4125, Class FA, CMO, REMIC, 1 Month USD LIBOR + 0.35%, 0.53%, 11/15/2042 (d) | 379,029 | 377,822 | |||
Series 4484, Class CD, CMO, REMIC, 1.75%, 7/15/2030 | 190,206 | 190,946 | |||
Series 4582, Class HA, CMO, REMIC, 3.00%, 9/15/2045 | 514,818 | 544,620 | |||
Series 4738, Class LA, CMO, REMIC, 3.00%, 11/15/2043 | 524,621 | 555,467 | |||
Series 4764, Class WF, CMO, REMIC, 1 Month USD LIBOR + 0.30%, 0.48%, 2/15/2048 (d) | 690,751 | 689,507 | |||
Series K722, Class X1, IO, 1.44%, 3/25/2023 (d) | 469,728 | 11,729 | |||
| Federal National Mortgage Association: | |||||
2.00%, 3/1/2035 | 1,461,887 | 1,514,129 | |||
2.00%, 7/1/2035 | 1,500,000 | 1,553,605 | |||
2.50%, 1/1/2032 | 1,814,758 | 1,913,560 | |||
3.00%, 11/1/2033 | 1,391,468 | 1,481,445 | |||
3.00%, 11/1/2036 | 413,252 | 438,392 | |||
1 Year CMT + 1.67 %, 2.70%, 5/1/2044 (d) | 210,362 | 217,696 | |||
Series 2010-141, Class FB, 1 Month USD LIBOR + 0.47%, 0.65%, 12/25/2040 (d) | 266,840 | 267,520 | |||
Series 2014-73, Class AF, 1 Month USD LIBOR + 0.45%, 0.63%, 11/25/2044 (d) | 1,611,251 | 1,610,790 | |||
Series 2016-23, Class FT, 1 Month USD LIBOR + 0.50%, 0.68%, 11/25/2045 (d) | 792,722 | 795,201 | |||
Series 2012-56, Class FA, CMO, 1 Month USD LIBOR + 0.55%, 0.73%, 6/25/2042 (d) | 1,412,214 | 1,424,766 | |||
Series 2018-77, Class FA, CMO, 1 Month USD LIBOR + 0.30%, 0.48%, 10/25/2048 (d) | 615,077 | 612,270 | |||
Series 2007-54, Class FW, CMO, REMIC, 1 Month USD LIBOR + 0.25%, 0.43%, 6/25/2037 (d) | 474,489 | 471,492 | |||
Series 2012-32, Class DA, CMO, REMIC, 2.00%, 11/25/2026 | 1,345,201 | 1,371,104 | |||
Series 2015-59, Class A, CMO, REMIC, 3.00%, 6/25/2041 | 306,619 | 311,074 | |||
Series 2016-8, Class FA, CMO, REMIC, 1 Month USD LIBOR + 0.45%, 0.63%, 3/25/2046 (d) | 517,152 | 517,038 | |||
Series 2017-13, Class ML, CMO, REMIC, 3.00%, 8/25/2041 | 601,562 | 628,059 | |||
Series 2017-2, Class HA, CMO, REMIC, 3.00%, 9/25/2041 | 495,377 | 514,977 | |||
Series 2018-27, Class FJ, CMO, REMIC, 1 Month USD LIBOR + 0.30%, 0.48%, 12/25/2047 (d) | 585,983 | 583,508 | |||
Series 2018-30, Class FA, CMO, REMIC, 1 Month USD LIBOR + 0.30%, 0.48%, 5/25/2048 (d) | 706,515 | 705,387 |
Table of Contents
| Security Description | Principal Amount | Value | |||
Series 2018-39, Class EF, CMO, REMIC, 1 Month USD LIBOR + 0.30%, 0.48%, 6/25/2048 (d) | $ 582,544 | $ 580,805 | |||
Series 2018-39, Class FG, CMO, REMIC, 1 Month USD LIBOR + 0.25%, 0.43%, 11/25/2033 (d) | 636,865 | 634,578 | |||
Series 2018-45, Class FA, CMO, REMIC, 1 Month USD LIBOR + 0.30%, 0.48%, 6/25/2048 (d) | 577,248 | 574,614 | |||
| Government National Mortgage Association: | |||||
Series 2014-94, Class FB, CMO, REMIC, 1 Month USD LIBOR + 0.25%, 0.44%, 9/20/2035 (d) | 605,984 | 604,126 | |||
Series 2017-116, Class FA, CMO, REMIC, 1 Month USD LIBOR + 0.30%, 0.47%, 11/20/2043 (d) | 494,746 | 493,349 | |||
Series 2017-116, Class FB, CMO, REMIC, 1 Month USD LIBOR + 0.25%, 0.44%, 5/20/2044 (d) | 570,411 | 567,817 | |||
TOTAL U.S. GOVERNMENT AGENCY OBLIGATIONS (Cost $32,484,981) | 32,924,115 | ||||
| U.S. TREASURY OBLIGATIONS — 32.0% | |||||
| Treasury Bill: | |||||
0.15%, 9/10/2020 | 3,000,000 | 2,999,201 | |||
0.12%, 8/6/2020 | 5,400,000 | 5,399,352 | |||
0.16%, 11/27/2020 | 4,000,000 | 3,997,268 | |||
0.17%, 10/1/2020 (b) | 6,000,000 | 5,997,624 | |||
0.18%, 12/24/2020 | 7,600,000 | 7,593,869 | |||
| Treasury Note: | |||||
1.63%, 4/30/2023 | 5,340,000 | 5,558,189 | |||
2.25%, 12/31/2023 | 4,420,000 | 4,735,271 | |||
2.75%, 9/15/2021 | 9,100,000 | 9,382,242 | |||
TOTAL U.S. TREASURY OBLIGATIONS (Cost $44,929,245) | 45,663,016 | ||||
| MORTGAGE-BACKED SECURITIES — 9.2% | |||||
Alternative Loan Trust Series 2006-41CB, Class 1A3, CMO, 6.00%, 1/25/2037 | 326,951 | 261,204 | |||
Atrium Hotel Portfolio Trust Series 2017-ATRM, Class E, 1 Month USD LIBOR + 3.05%, 3.23%, 12/15/2036 (a) (d) | 36,000 | 28,828 | |||
Atrium Hotel Portfolio Trust 2018-ATRM Series 2018-ATRM, Class A, 1 Month USD LIBOR + 0.95%, 1.13%, 6/15/2035 (a) (d) | 100,000 | 93,713 | |||
Bancorp Commercial Mortgage Trust Series 2019-CRE5, Class A, 1 Month USD LIBOR + 1.00%, 1.18%, 3/15/2036 (a) (d) | 71,207 | 68,623 | |||
| BANK: | |||||
Series 2017-BNK6, Class XA, IO, 0.97%, 7/15/2060 (d) | 1,106,423 | 43,812 | |||
Series 2020-BN26, Class XA, IO, VRN, 1.36%, 3/15/2063 (d) | 1,324,441 | 122,773 |
Table of Contents
| Security Description | Principal Amount | Value | |||
| BBCMS Mortgage Trust: | |||||
Series 2017-DELC, Class B, 1 Month USD LIBOR + 1.03%, 1.21%, 8/15/2036 (a) (d) | $ 124,000 | $ 115,710 | |||
Series 2017-DELC, Class C, 1 Month USD LIBOR + 1.20%, 1.38%, 8/15/2036 (a) (d) | 17,000 | 15,582 | |||
Series 2017-DELC, Class D, 1 Month USD LIBOR + 1.70%, 1.88%, 8/15/2036 (a) (d) | 19,000 | 16,948 | |||
Series 2017-DELC, Class E, 1 Month USD LIBOR + 2.50%, 2.68%, 8/15/2036 (a) (d) | 38,000 | 33,511 | |||
Series 2017-DELC, Class F, 1 Month USD LIBOR + 3.50%, 3.68%, 8/15/2036 (a) (d) | 38,000 | 28,263 | |||
Series 2018-TALL, Class A, 1 Month USD LIBOR + 0.72%, 0.91%, 3/15/2037 (a) (d) | 101,000 | 96,126 | |||
BBCMS Trust Series 2018-BXH, Class A, 1 Month USD LIBOR + 1.00%, 1.18%, 10/15/2037 (a) (d) | 12,519 | 11,688 | |||
BENCHMARK Mortgage Trust Series 2018-B1, Class XA, IO, 0.66%, 1/15/2051 (d) | 2,254,870 | 68,960 | |||
BFLD 2019-DPLO Series 2019-DPLO, Class E, 1 Month USD LIBOR + 2.24%, 2.42%, 10/15/2034 (a) (d) | 117,000 | 102,372 | |||
BHMS Series 2018-ATLS, Class A, 1 Month USD LIBOR + 1.25%, 1.43%, 7/15/2035 (a) (d) | 75,000 | 70,956 | |||
| BHP Trust: | |||||
Series 2019-BXHP, Class A, 1 Month USD LIBOR + 0.98%, 1.16%, 8/15/2036 (a) (d) | 100,000 | 95,084 | |||
Series 2019-BXHP, Class C, 1 Month USD LIBOR + 1.52%, 1.71%, 8/15/2036 (a) (d) | 100,000 | 91,189 | |||
Braemar Hotels & Resorts Trust 2018-Prime Series 2018-PRME, Class A, 1 Month USD LIBOR + 0.82%, 1.00%, 6/15/2035 (a) (d) | 115,000 | 108,392 | |||
BX Commercial Mortgage Trust Series 2018-BIOA, Class E, 1 Month USD LIBOR + 1.95%, 2.14%, 3/15/2037 (a) (d) | 257,000 | 242,086 | |||
BX Trust Series 2018-EXCL, Class A, 1 Month USD LIBOR + 1.09%, 1.27%, 9/15/2037 (a) (d) | 13,611 | 12,117 | |||
BX Trust 2018-BILT Series 2018-BILT, Class A, 1 Month USD LIBOR + 0.80%, 0.98%, 5/15/2030 (a) (d) | 115,000 | 108,611 | |||
BX Trust 2019-MMP Series 2019-MMP, Class B, 1 Month USD LIBOR + 1.30%, 1.48%, 8/15/2036 (a) (d) | 116,000 | 111,208 | |||
| BXMT, Ltd.: | |||||
Series 2017-FL1, Class C, 1 Month USD LIBOR + 1.95%, 2.14%, 6/15/2035 (a) (d) | 150,000 | 146,475 | |||
Series 2020-FL2, Class C, 1 Month USD LIBOR + 1.65%, 1.84%, 2/16/2037 (a) (d) | 119,000 | 110,670 | |||
CAMB Commercial Mortgage Trust Series 2019-LIFE, Class A, 1 Month USD LIBOR + 1.07%, 1.25%, 12/15/2037 (a) (d) | 79,000 | 78,074 |
Table of Contents
| Security Description | Principal Amount | Value | |||
| Cantor Commercial Real Estate: | |||||
Series 2019-CF1, Class 65A, 4.41%, 5/15/2052 (a) (d) | $ 163,000 | $ 163,850 | |||
Series 2019-CF1, Class 65B, 4.14%, 5/15/2052 (a) (d) | 163,000 | 155,233 | |||
CF Trust Series 2019-MF1, Class A, 1 Month USD LIBOR + 1.05%, 2.05%, 8/21/2032 (a) (d) | 100,000 | 100,399 | |||
CGDBB Commercial Mortgage Trust Series 2017-BIOC, Class A, 1 Month USD LIBOR + 0.79%, 0.97%, 7/15/2032 (a) (d) | 91,354 | 90,367 | |||
| CHT COSMO Mortgage Trust: | |||||
Series 2017-CSMO, Class E, 1 Month USD LIBOR + 3.00%, 3.18%, 11/15/2036 (a) (d) | 59,000 | 53,679 | |||
Series 2017-CSMO, Class F, 1 Month USD LIBOR + 3.74%, 3.93%, 11/15/2036 (a) (d) | 116,000 | 103,265 | |||
| Citigroup Commercial Mortgage Trust: | |||||
Series 2018-TBR, Class D, 1 Month USD LIBOR + 1.80%, 1.98%, 12/15/2036 (a) (d) | 95,000 | 81,462 | |||
Series 2019-PRM, Class D, 4.35%, 5/10/2036 (a) | 261,000 | 262,772 | |||
Series 2016-GC37, Class XA, IO, 1.91%, 4/10/2049 (d) | 490,992 | 38,764 | |||
| COMM Mortgage Trust: | |||||
Series 2014-FL5, Class D, 1 Month USD LIBOR + 4.00%, 1.57%, 10/15/2031 (a) (d) | 100,000 | 81,250 | |||
Series 2018-HCLV, Class A, 1 Month USD LIBOR + 1.00%, 1.18%, 9/15/2033 (a) (d) | 70,000 | 66,759 | |||
Series 2015-CR25, Class XA, IO, 0.99%, 8/10/2048 (d) | 1,210,023 | 44,193 | |||
| Credit Suisse Mortgage Capital Certificates: | |||||
Series 2017-CHOP, Class D, 1 Month USD LIBOR + 1.90%, 2.08%, 7/15/2032 (a) (d) | 29,000 | 24,409 | |||
Series 2019-ICE4, Class A, 1 Month USD LIBOR + 0.98%, 1.16%, 5/15/2036 (a) (d) | 102,000 | 101,051 | |||
| CSAIL Commercial Mortgage Trust: | |||||
Series 2017-C8, Class XA, IO, 1.38%, 6/15/2050 (d) | 339,189 | 16,818 | |||
Series 2017-CX10, Class XA, IO, 0.86%, 11/15/2050 (d) | 990,722 | 39,077 | |||
Series 2017-CX9, Class XA, IO, 1.02%, 9/15/2050 (d) | 1,831,305 | 55,168 | |||
DBGS BIOD Mortgage Trust Series 2018-BIOD, Class A, 1 Month USD LIBOR + 0.80%, 0.99%, 5/15/2035 (a) (d) | 139,221 | 136,179 | |||
Exantas Capital Corp., Ltd. Series 2019-RSO7, Class A, 1 Month USD LIBOR + 1.00%, 1.19%, 4/15/2036 (a) (d) | 93,326 | 90,293 | |||
| Federal Home Loan Mortgage Corp.: | |||||
Series 4703, Class FA, 1 Month USD LIBOR + 0.35%, 0.53%, 7/15/2047 (d) | 936,962 | 936,442 | |||
Series 4818, Class FC, 1 Month USD LIBOR + 0.30%, 0.48%, 4/15/2048 (d) | 439,788 | 437,848 |
Table of Contents
| Security Description | Principal Amount | Value | |||
| Federal National Mortgage Association: | |||||
Series 2012-56, Class FK, 1 Month USD LIBOR + 0.45%, 0.63%, 6/25/2042 (d) | $ 864,621 | $ 864,471 | |||
Series 2017-96, Class FA, 1 Month USD LIBOR + 0.40%, 0.58%, 12/25/2057 (d) | 821,432 | 820,344 | |||
Series 2018-55, Class FA, 1 Month USD LIBOR + 0.30%, 0.48%, 8/25/2048 (d) | 595,418 | 592,701 | |||
GPMT 2018-FL1, Ltd. Series 2018-FL1, Class A, 1 Month USD LIBOR + 0.90%, 1.09%, 11/21/2035 (a) (d) | 26,240 | 26,012 | |||
Great Wolf Trust Series 2019-WOLF, Class E, 1 Month USD LIBOR + 2.73%, 2.92%, 12/15/2036 (a) (d) | 125,000 | 111,376 | |||
| GS Mortgage Securities Trust: | |||||
Series 2012-ALOH, Class A, 3.55%, 4/10/2034 (a) | 129,000 | 130,902 | |||
Series 2017-500K, Class E, 1 Month USD LIBOR + 1.50%, 1.75%, 7/15/2032 (a) (d) | 50,000 | 48,587 | |||
Series 2017-500K, Class F, 1 Month USD LIBOR + 1.80%, 2.15%, 7/15/2032 (a) (d) | 107,000 | 103,530 | |||
Series 2018-TWR, Class A, 1 Month USD LIBOR + 0.90%, 1.08%, 7/15/2031 (a) (d) | 100,000 | 97,048 | |||
Series 2018-TWR, Class D, 1 Month USD LIBOR + 1.60%, 1.78%, 7/15/2031 (a) (d) | 100,000 | 92,439 | |||
Series 2017-GS7, Class XA, IO, 1.27%, 8/10/2050 (d) | 390,387 | 23,553 | |||
JP Morgan Chase Commercial Mortgage Securities Corp. Series 2018-LAQ, Class A, 1 Month USD LIBOR + 1.00%, 1.18%, 6/15/2032 (a) (d) | 82,830 | 77,853 | |||
| JP Morgan Chase Commercial Mortgage Securities Trust: | |||||
Series 2018-WPT, Class EFL, 1 Month USD LIBOR + 2.60%, 2.77%, 7/5/2033 (a) (d) | 100,000 | 89,058 | |||
Series 2019-MFP, Class A, 1 Month USD LIBOR + 0.96% , 1.14%, 7/15/2036 (a) (d) | 107,000 | 103,670 | |||
Series 2016-JP4, Class XA, IO, 0.82%, 12/15/2049 (d) | 1,560,502 | 46,388 | |||
Series 2019-COR5, Class XA, IO, VRN, 1.66%, 6/13/2052 (d) | 1,127,544 | 113,429 | |||
LoanCore 2019-CRE3 Issuer, Ltd. Series 2019-CRE3, Class A, 1 Month USD LIBOR + 1.05%, 1.23%, 4/15/2034 (a) (d) | 100,000 | 95,112 | |||
MF1 2019-FL2, Ltd. Series 2019-FL2, Class A, 1 Month USD LIBOR + 1.13%, 1.31%, 12/25/2034 (a) (d) | 121,000 | 118,883 | |||
MF1 2020-FL3, Ltd. Series 2020-FL3, Class A, 1 Month USD LIBOR + 2.05%, 2.24%, 7/15/2035 (a) (d) | 175,000 | 175,328 | |||
| Morgan Stanley Bank of America Merrill Lynch Trust: | |||||
Series 2014-C15, Class XA, IO, 1.13%, 4/15/2047 (d) | 807,207 | 23,541 | |||
Series 2014-C19, Class LNCX, IO, 0.60%, 12/15/2046 (a) | 1,198,219 | 27,748 | |||
| Morgan Stanley Capital I Trust: | |||||
Series 2006-IQ11, Class B, 6.05%, 10/15/2042 (d) | 61,945 | 60,565 |
Table of Contents
| Security Description | Principal Amount | Value | |||
Series 2018-SUN, Class A, 1 Month USD LIBOR + 0.90%, 1.08%, 7/15/2035 (a) (d) | $ 74,000 | $ 70,672 | |||
Series 2019-PLND, Class B, 1 Month USD LIBOR + 1.30%, 1.48%, 5/15/2036 (a) (d) | 163,000 | 151,510 | |||
Series 2019-PLND, Class D, 1 Month USD LIBOR + 1.75%, 1.93%, 5/15/2036 (a) (d) | 127,000 | 114,346 | |||
Series 2016-UB12, Class XA, IO, 0.90%, 12/15/2049 (d) | 1,569,735 | 53,349 | |||
Motel 6 Trust Series 2017-MTL6, Class D, 1 Month USD LIBOR + 2.15%, 2.33%, 8/15/2034 (a) (d) | 59,381 | 55,550 | |||
MSCG Trust Series 2018-SELF, Class A, 1 Month USD LIBOR + 0.90%, 1.08%, 10/15/2037 (a) (d) | 79,000 | 77,705 | |||
| Natixis Commercial Mortgage Securities Trust 2018-850T: | |||||
Series 2018-850T, Class C, 1 Month USD LIBOR + 1.15%, 1.34%, 7/15/2033 (a) (d) | 100,000 | 98,411 | |||
Series 2018-850T, Class D, 1 Month USD LIBOR + 1.45%, 1.64%, 7/15/2033 (a) (d) | 100,000 | 97,413 | |||
Natixis Commercial Mortgage Securities Trust 2018-FL1 Series 2018-FL1, Class A, 1 Month USD LIBOR + 0.95%, 1.13%, 6/15/2035 (a) (d) | 93,384 | 88,618 | |||
PFP 2019-6, Ltd. Series 2019-6, Class A, 1 Month USD LIBOR + 1.05%, 1.25%, 4/14/2037 (a) (d) | 121,000 | 116,992 | |||
PFP, Ltd. Series 2019-5, Class A, 1 Month USD LIBOR + 0.97%, 1.17%, 4/14/2036 (a) (d) | 99,991 | 96,491 | |||
ReadyCap Commercial Mortgage Trust Series 2019-FL3, Class A, 1 Month USD LIBOR + 1.00%, 1.18%, 3/25/2034 (a) (d) | 100,000 | 95,297 | |||
| Rosslyn Portfolio Trust: | |||||
Series 2017-ROSS, Class A, 1 Month USD LIBOR + 0.95%, 1.94%, 6/15/2033 (a) (d) | 15,000 | 14,784 | |||
Series 2017-ROSS, Class B, 1 Month USD LIBOR + 1.25%, 2.24%, 6/15/2033 (a) (d) | 15,000 | 14,788 | |||
Shelter Growth CRE 2019-FL2 Issuer, Ltd. Series 2019-FL2, Class B, 1 Month USD LIBOR + 2.30%, 2.48%, 5/15/2036 (a) (d) | 99,109 | 89,403 | |||
Toorak Mortgage Corp., Ltd. Series 2020-1, Class A1, 2.73%, 3/25/2023 (a) (f) | 1,000,000 | 978,020 | |||
| UBS Commercial Mortgage Trust: | |||||
Series 2018-NYCH, Class D, 1 Month USD LIBOR + 2.10%, 2.28%, 2/15/2032 (a) (d) | 261,000 | 237,523 | |||
Series 2017-C1, Class XA, IO, 1.72%, 6/15/2050 (d) | 792,571 | 64,737 | |||
Velocity Commercial Capital Loan Trust Series 2018-2, Class A, 4.05%, 10/26/2048 (a) (d) | 667,028 | 681,511 | |||
Washington Mutual Mortgage Pass-Through Certificates WMALT Series 2005-8, Class 2CB3, CMO, 1 Month USD LIBOR + 0.41%, 0.59%, 10/25/2035 (d) | 617,414 | 541,063 |
Table of Contents
| Security Description | Principal Amount | Value | |||
Wells Fargo Commercial Mortgage Trust Series 2019-C51, Class XA, 1.53%, 6/15/2052 (d) | $ 1,029,886 | $ 94,147 | |||
WFRBS Commercial Mortgage Trust Series 2013-C18, Class XA, IO, 0.88%, 12/15/2046 (d) | 1,116,760 | 21,344 | |||
TOTAL MORTGAGE-BACKED SECURITIES (Cost $13,865,780) | 13,058,465 |
| Shares | |||
| SHORT-TERM INVESTMENT — 2.3% | |||
State Street Institutional U.S. Government Money Market Fund, Class G Shares 0.16% (g) (h) (Cost $3,357,926) | 3,357,926 | 3,357,926 | |
TOTAL INVESTMENTS — 99.2% (Cost $140,778,026) | 141,445,338 | ||
OTHER ASSETS IN EXCESS OF LIABILITIES — 0.8% | 1,073,401 | ||
NET ASSETS — 100.0% | $ 142,518,739 | ||
| (a) | Securities purchased pursuant to Rule 144A of the Securities Act of 1933, as amended. These securities, which represent 15.7% of net assets as of June 30, 2020, are considered liquid and may be resold in transactions exempt from registration, normally to qualified institutional buyers. |
| (b) | When-issued security. |
| (c) | Amount is less than 0.05% of net assets. |
| (d) | Variable Rate Security - Interest rate shown is rate in effect at June 30, 2020. For securities based on a published reference rate and spread, the reference rate and spread are indicated in the description above. |
| (e) | Security is currently in default and/or issuer is in bankruptcy. |
| (f) | Step-up bond - Coupon rate increases in increments to maturity. Rate shown as of June 30, 2020. Maturity date shown is the final maturity. |
| (g) | The Fund invested in certain money market funds managed by SSGA Funds Management, Inc. Amounts related to these transactions during the period ended June 30, 2020 are shown in the Affiliate Table below. |
| (h) | The rate shown is the annualized seven-day yield at June 30, 2020. |
| ABS | Asset-Backed Security |
| CMO | Collateralized Mortgage Obligation |
| CMT | Constant Maturity Treasury |
| EMTN | Euro Medium Term Note |
| GMTN | Global Medium Term Note |
| IO | Interest Only |
| LIBOR | London Interbank Offered Rate |
| MTN | Medium Term Note |
| PIK | Payment in Kind |
| REMIC | Real Estate Mortgage Investment Conduit |
Table of Contents
| SOFR | Secured Overnight Financing Rate |
| VRN | Variable Rate Note |
| Description | Level 1 – Quoted Prices | Level 2 – Other Significant Observable Inputs | Level 3 – Significant Unobservable Inputs | Total | ||||
| ASSETS: | ||||||||
| INVESTMENTS: | ||||||||
Corporate Bonds & Notes | $ — | $ 39,228,479 | $— | $ 39,228,479 | ||||
Asset-Backed Securities | — | 4,160,145 | — | 4,160,145 | ||||
Foreign Government Obligations | — | 3,053,192 | — | 3,053,192 | ||||
U.S. Government Agency Obligations | — | 32,924,115 | — | 32,924,115 | ||||
U.S. Treasury Obligations | — | 45,663,016 | — | 45,663,016 | ||||
Mortgage-Backed Securities | — | 13,058,465 | — | 13,058,465 | ||||
Short-Term Investment | 3,357,926 | — | — | 3,357,926 | ||||
TOTAL INVESTMENTS | $3,357,926 | $138,087,412 | $— | $141,445,338 |
| Number of Shares Held at 6/30/19 | Value at 6/30/19 | Cost of Purchases | Proceeds from Shares Sold | Realized Gain (Loss) | Change in Unrealized Appreciation/ Depreciation | Number of Shares Held at 6/30/20 | Value at 6/30/20 | Dividend Income | |||||||||
State Street Institutional U.S. Government Money Market Fund, Class G Shares | 6,248,841 | $6,248,841 | $76,983,553 | $79,874,468 | $— | $— | 3,357,926 | $3,357,926 | $59,685 |
Table of Contents
| Security Description | Principal Amount | Value | |||
| CORPORATE BONDS & NOTES — 14.9% | |||||
| ARGENTINA — 0.1% | |||||
Other Securities | $ 3,407,857 | ||||
| AUSTRALIA — 0.1% | |||||
Other Securities | 4,772,020 | ||||
| BELGIUM — 0.1% | |||||
Other Security | 2,131,328 | ||||
| BRAZIL — 0.3% | |||||
Other Securities | 10,225,549 | ||||
| CANADA — 0.5% | |||||
Other Securities | 15,608,090 | ||||
| CAYMAN ISLANDS — 0.2% | |||||
Other Securities | 5,072,377 | ||||
| CHILE — 0.5% | |||||
Other Securities | 16,714,032 | ||||
| CHINA — 0.3% | |||||
Other Securities | 8,573,333 | ||||
| COLOMBIA — 0.3% | |||||
Other Securities | 8,307,642 | ||||
| DOMINICAN REPUBLIC — 0.2% | |||||
Other Securities | 7,246,330 | ||||
| FRANCE — 0.1% | |||||
Other Securities | 2,487,746 | ||||
| INDIA — 0.3% | |||||
Other Securities | 10,647,465 | ||||
| INDONESIA — 0.0% (a) | |||||
Other Securities | 1,542,474 | ||||
| IRELAND — 0.1% | |||||
Other Securities | 1,782,788 | ||||
| ISRAEL — 0.1% | |||||
Other Securities | 2,608,005 | ||||
| JAMAICA — 0.0% (a) | |||||
Other Security | 226,027 | ||||
| JAPAN — 0.1% | |||||
Other Securities | 4,448,944 | ||||
Table of Contents
| Security Description | Principal Amount | Value | |||
| KUWAIT — 0.1% | |||||
Other Securities | $ 2,305,443 | ||||
| LUXEMBOURG — 0.1% | |||||
Other Securities | 2,430,308 | ||||
| MALAYSIA — 0.1% | |||||
Other Securities | 4,592,827 | ||||
| MAURITIUS — 0.0% (a) | |||||
Other Security | 1,298,687 | ||||
| MEXICO — 0.8% | |||||
Other Securities | 26,347,652 | ||||
| NETHERLANDS — 0.3% | |||||
Other Securities | 9,091,157 | ||||
| NORWAY — 0.0% (a) | |||||
Other Security | 362,502 | ||||
| PANAMA — 0.1% | |||||
Other Securities | 3,997,131 | ||||
| PERU — 0.2% | |||||
Other Securities | 5,129,488 | ||||
| PHILIPPINES — 0.2% | |||||
Other Security | 6,338,826 | ||||
| QATAR — 0.1% | |||||
Other Securities | 1,989,565 | ||||
| SINGAPORE — 0.4% | |||||
Other Securities | 12,178,560 | ||||
| SOUTH KOREA — 0.0% (a) | |||||
Other Security | 308,979 | ||||
| SWITZERLAND — 0.0% (a) | |||||
Other Security | 189,728 | ||||
| THAILAND — 0.0% (a) | |||||
Other Security | 204,772 | ||||
| UNITED KINGDOM — 0.3% | |||||
Other Securities | 10,096,006 | ||||
| UNITED STATES — 8.9% | |||||
Other Securities | 283,615,897 | ||||
Total Corporate Bonds & Notes (Cost $475,403,973) | 476,279,535 | ||||
Table of Contents
| Security Description | Principal Amount | Value | |||
| ASSET-BACKED SECURITIES — 2.5% | |||||
Aegis Asset Backed Securities Trust Series 2006-1, Class A2, Class A2, 1 Month USD LIBOR + 0.17%, 0.35%, 1/25/2037 (b) | $ 25,913,056 | $ 21,070,086 | |||
Other Securities | 57,749,283 | ||||
Total Asset-Backed Securities (Cost $79,916,741) | 78,819,369 | ||||
| FOREIGN GOVERNMENT OBLIGATIONS — 1.0% | |||||
| CHILE — 0.0% (a) | |||||
Other Security | 1,454,208 | ||||
| COLOMBIA — 0.1% | |||||
Other Security | 2,432,376 | ||||
| DOMINICAN REPUBLIC — 0.1% | |||||
Other Securities | 2,459,264 | ||||
| GUATEMALA — 0.0% (a) | |||||
Other Securities | 673,942 | ||||
| INDONESIA — 0.1% | |||||
Other Security | 3,336,300 | ||||
| MEXICO — 0.1% | |||||
Other Securities | 1,590,205 | ||||
| PANAMA — 0.1% | |||||
Other Security | 4,353,280 | ||||
| PERU — 0.1% | |||||
Other Securities | 3,130,106 | ||||
| PHILIPPINES — 0.1% | |||||
Other Securities | 1,463,368 | ||||
| QATAR — 0.1% | |||||
Other Securities | 2,786,588 | ||||
| SAUDI ARABIA — 0.2% | |||||
Other Securities | 4,881,118 | ||||
| SOUTH KOREA — 0.0% (a) | |||||
Other Security | 703,101 | ||||
| THAILAND — 0.0% (a) | |||||
Other Security | 412,041 | ||||
Table of Contents
| Security Description | Principal Amount | Value | |||
| UNITED ARAB EMIRATES — 0.0% (a) | |||||
Other Securities | $ 1,295,162 | ||||
Total Foreign Government Obligations (Cost $29,937,752) | 30,971,059 | ||||
| SENIOR FLOATING RATE LOANS — 3.0% | |||||
| ADVERTISING SERVICES — 0.0% (a) | |||||
Other Security | 443,012 | ||||
| AEROSPACE & DEFENSE — 0.0% (a) | |||||
Other Security | 1,022,523 | ||||
| AIRLINES — 0.0% (a) | |||||
Other Securities | 613,257 | ||||
| AUTO COMPONENTS — 0.0% (a) | |||||
Other Securities | 741,521 | ||||
| BROADCAST SERV/PROGRAM — 0.1% | |||||
Other Security | 1,160,923 | ||||
| BUILDING PRODUCTS — 0.0% (a) | |||||
Other Security | 172,016 | ||||
| CASINO SERVICES — 0.0% (a) | |||||
Other Security | 387,925 | ||||
| CHEMICALS — 0.1% | |||||
Other Securities | 2,677,398 | ||||
| COMMERCIAL SERVICES — 0.0% (a) | |||||
Other Securities | 1,080,661 | ||||
| COMMERCIAL SERVICES & SUPPLIES — 0.2% | |||||
Other Securities | 6,394,834 | ||||
| COMMUNICATIONS EQUIPMENT — 0.0% (a) | |||||
Other Security | 488,706 | ||||
| COMPUTER SERVICES — 0.1% | |||||
Other Security | 1,175,814 | ||||
| CONSTRUCTION & ENGINEERING — 0.0% (a) | |||||
Other Securities | 1,003,598 | ||||
| CONSTRUCTION MATERIALS — 0.0% (a) | |||||
Other Security | 221,043 | ||||
| CONSUMER FINANCE — 0.0% (a) | |||||
Other Security | 137,841 | ||||
Table of Contents
| Security Description | Principal Amount | Value | |||
| CONTAINERS & PACKAGING — 0.1% | |||||
Other Securities | $ 1,126,554 | ||||
| CONTAINERS-PAPER/PLASTIC — 0.0% (a) | |||||
Other Security | 522,323 | ||||
| DIVERSIFIED CONSUMER SERVICES — 0.1% | |||||
Other Securities | 1,598,005 | ||||
| DIVERSIFIED FINANCIAL SERVICES — 0.1% | |||||
Other Securities | 2,732,775 | ||||
| DIVERSIFIED TELECOMMUNICATION SERVICES — 0.1% | |||||
Other Securities | 3,300,210 | ||||
| ELECTRONIC EQUIPMENT, INSTRUMENTS & COMPONENTS — 0.0% (a) | |||||
Other Security | 307,255 | ||||
| ENERGY EQUIPMENT & SERVICES — 0.0% (a) | |||||
Other Security | 4,555 | ||||
| ENTERTAINMENT — 0.0% (a) | |||||
Other Security | 325,492 | ||||
| FINANCE-OTHER SERVICES — 0.0% (a) | |||||
Other Securities | 683,276 | ||||
| FOOD & BEVERAGE — 0.0% (a) | |||||
Other Securities | 777,817 | ||||
| FOOD & STAPLES RETAILING — 0.0% (a) | |||||
Other Security | 195,568 | ||||
| FOOD PRODUCTS — 0.1% | |||||
Other Security | 1,345,655 | ||||
| FOOD-MISC/DIVERSIFIED — 0.0% (a) | |||||
Other Securities | 971,330 | ||||
| HEALTH CARE PROVIDERS & SERVICES — 0.2% | |||||
Other Securities | 5,414,684 | ||||
| HOTELS, RESTAURANTS & LEISURE — 0.2% | |||||
Other Securities | 6,071,541 | ||||
| INDEPENDENT POWER PRODUCERS & ENERGY TRADERS — 0.0% (a) | |||||
Other Securities | 1,027,010 | ||||
| INSURANCE — 0.1% | |||||
Other Securities | 2,769,284 | ||||
Table of Contents
| Security Description | Principal Amount | Value | |||
| INTERACTIVE MEDIA & SERVICES — 0.0% (a) | |||||
Other Securities | $ 645,984 | ||||
| INTERNET & CATALOG RETAIL — 0.0% (a) | |||||
Other Securities | 961,963 | ||||
| IT SERVICES — 0.1% | |||||
Other Securities | 3,450,059 | ||||
| LIFE SCIENCES TOOLS & SERVICES — 0.0% (a) | |||||
Other Security | 677,352 | ||||
| MACHINERY — 0.1% | |||||
Other Securities | 1,823,986 | ||||
| MACHINERY-CONSTRUCTION & MINING — 0.0% (a) | |||||
Other Security | 63,361 | ||||
| MEDIA — 0.2% | |||||
Other Securities | 5,029,570 | ||||
| METAL-DIVERSIFIED — 0.0% (a) | |||||
Other Security | 97,041 | ||||
| MRI/MEDICAL DIAG IMAGING — 0.0% (a) | |||||
Other Securities | 978,296 | ||||
| OIL REFINING & MARKETING — 0.0% (a) | |||||
Other Security | 227,516 | ||||
| OIL, GAS & CONSUMABLE FUELS — 0.0% (a) | |||||
Other Securities | 764,705 | ||||
| PERSONAL PRODUCTS — 0.0% (a) | |||||
Other Security | 463,449 | ||||
| PHARMACEUTICALS — 0.1% | |||||
Other Securities | 1,293,362 | ||||
| PIPELINES — 0.1% | |||||
Other Securities | 1,641,212 | ||||
| PROFESSIONAL SERVICES — 0.1% | |||||
Other Security | 1,208,297 | ||||
| PUBLISHING-BOOKS — 0.0% (a) | |||||
Other Security | 215,825 | ||||
| REAL ESTATE INVESTMENT TRUSTS (REITS) — 0.1% | |||||
Other Securities | 1,680,377 | ||||
Table of Contents
| Security Description | Principal Amount | Value | |||
| REAL ESTATE MANAGEMENT & DEVELOPMENT — 0.0% (a) | |||||
Other Security | $ 113,054 | ||||
| RETAIL-RESTAURANTS — 0.0% (a) | |||||
Other Securities | 975,133 | ||||
| ROAD & RAIL — 0.0% (a) | |||||
Other Security | 496,010 | ||||
| SEMICONDUCTORS & SEMICONDUCTOR EQUIPMENT — 0.0% (a) | |||||
Other Security | 224,710 | ||||
| SOFTWARE — 0.6% | |||||
Other Securities | 19,877,038 | ||||
| SPECIALTY RETAIL — 0.0% (a) | |||||
Other Securities | 1,100,071 | ||||
| TELECOM SERVICES — 0.0% (a) | |||||
Other Securities | 831,277 | ||||
| TELECOMMUNICATION EQUIP — 0.0% (a) | |||||
Other Securities | 886,182 | ||||
| TELEVISION — 0.1% | |||||
Other Security | 1,174,884 | ||||
| THRIFTS & MORTGAGE FINANCE — 0.0% (a) | |||||
Other Security | 801,637 | ||||
| TRADING COMPANIES & DISTRIBUTORS — 0.0% (a) | |||||
Other Security | 331,298 | ||||
| TRANSPORT-AIR FREIGHT — 0.0% (a) | |||||
Other Security | 456,615 | ||||
Total Senior Floating Rate Loans (Cost $99,567,400) | 95,384,670 | ||||
| U.S. GOVERNMENT AGENCY OBLIGATIONS — 41.7% | |||||
| Federal Home Loan Mortgage Corp.: | |||||
2.50%, 4/1/2033 | $ 2,551,556 | 2,685,813 | |||
2.50%, 2/1/2035 | 6,919,572 | 7,242,938 | |||
2.50%, 11/1/2039 | 16,297,863 | 17,016,431 | |||
3.00%, 11/1/2042 | 13,492,266 | 14,432,538 | |||
3.00%, 12/1/2042 | 12,272,020 | 12,951,872 | |||
3.00%, 1/1/2045 | 2,033,872 | 2,158,141 | |||
3.00%, 2/1/2045 | 1,416,688 | 1,499,142 | |||
Table of Contents
| Security Description | Principal Amount | Value | |||
3.00%, 3/1/2045 | $ 1,490,947 | $ 1,577,723 | |||
3.00%, 4/1/2045 | 10,556,959 | 11,171,394 | |||
3.00%, 4/1/2045 | 21,916,799 | 23,254,605 | |||
3.00%, 5/1/2045 | 5,389,182 | 5,702,843 | |||
3.00%, 8/1/2045 | 14,693,795 | 15,549,001 | |||
3.00%, 7/1/2047 | 5,095,356 | 5,377,632 | |||
3.50%, 2/1/2045 | 2,363,298 | 2,534,329 | |||
3.50%, 4/1/2045 | 16,806,641 | 18,336,280 | |||
3.50%, 4/1/2045 | 7,918,302 | 8,482,793 | |||
3.50%, 6/1/2045 | 11,510,457 | 12,558,476 | |||
3.50%, 10/1/2045 | 13,488,940 | 14,716,095 | |||
3.50%, 2/1/2046 | 11,250,905 | 11,939,271 | |||
4.00%, 4/1/2047 | 25,805,294 | 27,679,797 | |||
4.00%, 7/1/2047 | 7,906,203 | 8,428,653 | |||
4.00%, 10/1/2047 | 16,550,904 | 17,644,603 | |||
4.50%, 6/1/2044 | 1,738,761 | 1,925,366 | |||
Series 326, Class 300, Class 300, CMO 3.00%, 3/15/2044 | 25,587,484 | 27,573,227 | |||
Series 358, Class 300, Class 300, CMO 3.00%, 10/15/2047 | 27,385,451 | 30,227,062 | |||
Series 3822, Class ZG, Class ZG, CMO, REMIC 4.00%, 2/15/2041 | 3,952,428 | 4,499,924 | |||
Series 3852, Class NS, Class NS, CMO, IO, REMIC 6.00% - 1 Month USD LIBOR, 5.82%, 5/15/2041 (b) | 8,493,625 | 1,331,221 | |||
Series 3889, Class VZ, Class VZ, CMO, REMIC 4.00%, 7/15/2041 | 7,376,005 | 7,922,474 | |||
Series 3935, Class SJ, Class SJ, CMO, IO, REMIC 6.65% - 1 Month USD LIBOR, 6.47%, 5/15/2041 (b) | 1,464,154 | 152,438 | |||
Series 4120, Class KA, Class KA, CMO, REMIC 1.75%, 10/15/2032 | 11,547,176 | 11,863,840 | |||
Series 4165, Class ZT, Class ZT, CMO, REMIC 3.00%, 2/15/2043 | 16,601,900 | 17,365,502 | |||
Series 4215, Class KC, Class KC, CMO, REMIC 2.25%, 3/15/2038 | 3,357,698 | 3,370,907 | |||
Series 4364, Class ZX, Class ZX, CMO, REMIC 4.00%, 7/15/2044 | 30,247,271 | 34,363,916 | |||
Series 4434, Class LZ, Class LZ, CMO, REMIC 3.00%, 2/15/2045 | 3,502,296 | 3,895,569 | |||
Series 4444, Class CZ, Class CZ, CMO, REMIC 3.00%, 2/15/2045 | 12,841,753 | 14,304,621 |
Table of Contents
| Security Description | Principal Amount | Value | |||
Series 4447, Class A, Class A, CMO, REMIC 3.00%, 6/15/2041 | $ 1,320,546 | $ 1,355,478 | |||
Series 4447, Class Z, Class Z, CMO, REMIC 3.00%, 3/15/2045 | 4,238,593 | 4,711,230 | |||
Series 4471, Class BA, Class BA, CMO, REMIC 3.00%, 12/15/2041 | 4,603,116 | 4,776,340 | |||
Series 4471, Class GA, Class GA, CMO, REMIC 3.00%, 2/15/2044 | 7,791,527 | 8,145,818 | |||
Series 4474, Class ZX, Class ZX, CMO, REMIC 4.00%, 4/15/2045 | 12,678,686 | 14,457,796 | |||
Series 4481, Class B, Class B, CMO, REMIC 3.00%, 12/15/2042 | 4,834,606 | 5,045,954 | |||
Series 4483, Class CA, Class CA, CMO, REMIC 3.00%, 6/15/2044 | 9,506,026 | 9,946,735 | |||
Series 4484, Class CD, CMO, REMIC 1.75%, 7/15/2030 | 8,306,495 | 8,338,818 | |||
Series 4491, Class B, Class B, CMO, REMIC 3.00%, 8/15/2040 | 6,923,552 | 7,022,138 | |||
Series 4492, Class GZ, Class GZ, CMO, REMIC 3.50%, 7/15/2045 | 8,970,752 | 9,773,462 | |||
Series 4499, Class AB, Class AB, CMO, REMIC 3.00%, 6/15/2042 | 9,478,992 | 9,819,812 | |||
Series 4504, Class CA, Class CA, CMO, REMIC 3.00%, 4/15/2044 | 9,895,653 | 10,320,462 | |||
Series 4511, Class QA, Class QA, CMO, REMIC 3.00%, 1/15/2041 | 5,070,958 | 5,132,574 | |||
Series 4511, Class QC, Class QC, CMO, REMIC 3.00%, 12/15/2040 | 5,248,679 | 5,326,362 | |||
Series 4533, Class AB, Class AB, CMO, REMIC 3.00%, 6/15/2044 | 7,149,061 | 7,530,572 | |||
Series 4543, Class HG, Class HG, CMO, REMIC 2.70%, 4/15/2044 | 13,514,441 | 14,023,198 | |||
Series 4582, Class HA, CMO, REMIC 3.00%, 9/15/2045 | 10,296,369 | 10,892,408 | |||
Series 4629, Class KA, Class KA, CMO, REMIC 3.00%, 3/15/2045 | 29,200,258 | 30,264,502 | |||
Series 4750, Class PA, Class PA, 3.00%, 7/15/2046 | 15,559,455 | 16,160,884 | |||
Series 4792, Class A, Class A, CMO, REMIC 3.00%, 5/15/2048 | 14,259,507 | 14,902,499 | |||
Series 4951, Class EA, Class EA, CMO 2.50%, 9/15/2044 | 10,799,055 | 11,178,289 |
Table of Contents
| Security Description | Principal Amount | Value | |||
| Federal National Mortgage Association: | |||||
2.00%, 7/1/2035 | $ 2,000,000 | $ 2,071,473 | |||
2.22%, 12/1/2029 | 5,400,000 | 5,820,132 | |||
2.29%, 10/1/2031 | 3,508,000 | 3,786,430 | |||
2.32%, 12/1/2029 | 7,600,000 | 8,232,280 | |||
2.41%, 10/1/2029 | 25,000,000 | 27,198,898 | |||
2.44%, 1/1/2032 | 16,600,000 | 18,126,496 | |||
2.50%, 2/1/2035 | 3,013,149 | 3,153,959 | |||
2.50%, 12/1/2039 | 10,112,083 | 10,557,921 | |||
2.50%, 4/1/2040 | 24,592,166 | 25,700,847 | |||
2.50%, 9/1/2046 | 4,175,901 | 4,340,977 | |||
2.50%, 2/1/2047 | 11,119,728 | 11,682,292 | |||
2.69%, 8/1/2030 | 24,295,242 | 26,806,839 | |||
1 Year CMT + 1.67 %, 2.70%, 5/1/2044 (b) | 11,219,295 | 11,610,465 | |||
2.80%, 11/1/2039 | 10,034,000 | 11,023,822 | |||
3.00%, 5/1/2035 | 7,223,905 | 7,663,822 | |||
3.00%, 10/1/2041 | 23,823,679 | 25,145,206 | |||
3.00%, 3/1/2043 | 4,356,635 | 4,653,864 | |||
3.00%, 7/1/2043 | 7,026,576 | 7,396,613 | |||
3.00%, 1/1/2045 | 1,369,829 | 1,430,102 | |||
3.00%, 3/1/2045 | 2,114,764 | 2,237,217 | |||
3.00%, 4/1/2045 | 8,140,783 | 8,478,009 | |||
3.00%, 7/1/2045 | 26,330,845 | 28,127,252 | |||
3.00%, 10/1/2046 | 6,677,251 | 7,047,646 | |||
3.00%, 2/1/2047 | 21,755,198 | 22,961,984 | |||
3.00%, 11/1/2048 | 13,277,897 | 14,014,437 | |||
3.00%, 10/1/2049 | 7,423,618 | 7,838,771 | |||
3.00%, 4/1/2053 | 15,114,199 | 16,416,111 | |||
3.50%, 9/1/2034 | 1,891,026 | 2,027,936 | |||
3.50%, 12/1/2034 | 1,703,539 | 1,826,875 | |||
3.50%, 2/1/2035 | 1,085,586 | 1,164,182 | |||
3.50%, 1/1/2045 | 11,744,279 | 12,783,733 | |||
3.50%, 2/1/2045 | 3,476,062 | 3,726,775 | |||
3.50%, 6/1/2045 | 10,935,636 | 11,928,441 | |||
4.50%, 3/1/2044 | 1,856,932 | 2,055,361 | |||
4.50%, 6/1/2044 | 915,638 | 1,013,481 | |||
4.50%, 7/1/2044 | 770,842 | 853,212 | |||
4.50%, 2/1/2045 | 1,148,627 | 1,271,367 | |||
Series 2010-109, Class N, Class N, CMO, REMIC 3.00%, 10/25/2040 | 2,188,501 | 2,334,080 |
Table of Contents
| Security Description | Principal Amount | Value | |||
Series 2011-51, Class CI, Class CI, CMO, IO, REMIC 6.00% - 1 Month USD LIBOR, 5.82%, 6/25/2041 (b) | $ 5,233,243 | $ 946,283 | |||
Series 2012-101, Class AP, Class AP, CMO, REMIC 2.00%, 8/25/2040 | 4,412,288 | 4,452,652 | |||
Series 2012-127, Class PA, Class PA, CMO, REMIC 2.75%, 11/25/2042 | 2,957,867 | 3,139,794 | |||
Series 2012-151, Class SB, Class SB, CMO, REMIC 6.00% - 1 Month USD LIBOR, 5.74%, 1/25/2043 (b) | 1,167,097 | 1,218,082 | |||
Series 2013-114, Class HZ, Class HZ, CMO, REMIC 3.00%, 11/25/2038 | 17,340,698 | 18,889,127 | |||
Series 2013-18, Class CD, Class CD, CMO, REMIC 1.50%, 10/25/2027 | 3,566,191 | 3,615,554 | |||
Series 2013-30, Class PS, Class PS, CMO, REMIC 6.00% - 1 Month USD LIBOR, 5.74%, 4/25/2043 (b) | 1,718,187 | 1,786,342 | |||
Series 2014-21, Class GZ, Class GZ, CMO, REMIC 3.00%, 4/25/2044 | 6,660,718 | 7,065,039 | |||
Series 2014-39, Class ZA, Class ZA, CMO, REMIC 3.00%, 7/25/2044 | 9,527,889 | 10,084,961 | |||
Series 2015-42, Class CA, Class CA, CMO, REMIC 3.00%, 3/25/2044 | 5,965,776 | 6,233,101 | |||
Series 2015-9, Class HA, Class HA, CMO, REMIC 3.00%, 1/25/2045 | 8,395,045 | 9,063,949 | |||
Series 2015-95, Class AP, Class AP, CMO, REMIC 3.00%, 8/25/2042 | 8,684,499 | 9,083,665 | |||
Series 2016-21, Class BZ, Class BZ, CMO, REMIC 3.00%, 4/25/2046 | 4,894,931 | 5,437,861 | |||
Series 2016-32, Class LA, Class LA, CMO, REMIC 3.00%, 10/25/2044 | 9,776,297 | 10,232,465 | |||
Series 2016-72, Class PA, Class PA, CMO, REMIC 3.00%, 7/25/2046 | 15,074,517 | 16,114,122 | |||
Series 2016-81, Class PA, Class PA, CMO, REMIC 3.00%, 2/25/2044 | 20,111,522 | 21,076,480 | |||
Series 2016-9, Class A, Class A, CMO, REMIC 3.00%, 9/25/2043 | 8,447,557 | 8,957,551 | |||
Series 2016-92, Class A, Class A, CMO, REMIC 3.00%, 4/25/2042 | 25,610,392 | 27,381,646 | |||
Series 2017-13, Class CA, Class CA, CMO, REMIC 2.50%, 10/25/2043 | 12,620,517 | 12,708,682 | |||
Series 2017-15, Class MA, Class MA, CMO, REMIC 3.00%, 2/25/2042 | 10,866,964 | 11,346,032 |
Table of Contents
| Security Description | Principal Amount | Value | |||
Series 2017-18, Class A, Class A, CMO, REMIC 3.00%, 8/25/2042 | $ 28,657,321 | $ 29,233,722 | |||
Series 2017-32, Class CA, Class CA, CMO, REMIC 3.00%, 10/25/2042 | 26,861,698 | 28,137,043 | |||
Series 2017-87, Class BA, Class BA, CMO, REMIC 3.00%, 12/25/2042 | 23,019,890 | 23,739,898 | |||
Series 2017-9, Class EA, Class EA, CMO, REMIC 3.00%, 10/25/2042 | 42,408,690 | 43,214,625 | |||
Series 2018-27, Class JA, Class JA, CMO, REMIC 3.00%, 12/25/2047 | 10,401,193 | 10,893,296 | |||
Series 2018-38, Class JB, Class JB, CMO, REMIC 3.00%, 6/25/2048 | 8,658,726 | 9,011,637 | |||
Series 2018-M10, Class A1, Class A1, 3.50%, 7/25/2028 (b) | 12,976,984 | 14,408,594 | |||
Other Securities | 9,056,284 | ||||
Total U.S. Government Agency Obligations (Cost $1,273,430,363) | 1,331,899,563 | ||||
| U.S. TREASURY OBLIGATIONS — 26.2% | |||||
| Treasury Bill: | |||||
0.11%, 7/2/2020 | 66,000,000 | 65,999,830 | |||
0.12%, 8/6/2020 | 20,600,000 | 20,597,528 | |||
0.16%, 11/27/2020 | 20,000,000 | 19,986,342 | |||
0.17%, 12/3/2020 | 70,000,000 | 69,953,285 | |||
| Treasury Notes: | |||||
0.13%, 4/30/2022 | 31,000,000 | 30,979,414 | |||
1.50%, 2/15/2030 | 32,000,000 | 34,595,000 | |||
1.63%, 5/15/2026 | 113,200,000 | 121,292,032 | |||
2.13%, 2/29/2024 | 81,100,000 | 86,770,664 | |||
2.13%, 7/31/2024 | 103,800,000 | 111,763,406 | |||
2.25%, 11/15/2025 | 123,900,000 | 136,502,953 | |||
2.38%, 1/31/2023 | 29,800,000 | 31,490,219 | |||
2.38%, 5/15/2029 | 43,100,000 | 49,740,094 | |||
2.63%, 2/15/2029 | 18,500,000 | 21,679,688 | |||
2.88%, 8/15/2028 | 18,900,000 | 22,384,687 | |||
3.13%, 11/15/2028 | 8,800,000 | 10,639,750 | |||
Total U.S. Treasury Obligations (Cost $782,550,551) | 834,374,892 | ||||
Table of Contents
| Security Description | Principal Amount | Value | |||
| MORTGAGE-BACKED SECURITIES — 5.2% | |||||
Seasoned Credit Risk Transfer Trust Series 2019-4, Class MV, Class MV, 3.00%, 2/25/2059 | $ 17,342,887 | $ 19,402,074 | |||
Other Securities | 146,859,906 | ||||
Total Mortgage-Backed Securities (Cost $173,048,709) | 166,261,980 | ||||
| COMMERCIAL MORTGAGE BACKED SECURITIES — 3.2% | |||||
Other Securities (Cost $134,933,550) | 101,691,129 | ||||
| Shares | |||
| COMMON STOCKS - 0.0% (a) | |||
| UNITED STATES – 0.0% (a) | |||
Tapstone Energy Holdings (c) (d) | 5,920 | — | |
Other Security (cost: $47,619) | 4,080 | ||
| 4,080 | |||
| CONVERTIBLE BONDS - 0.0% (a) | |||
| JAMAICA – 0.0% (a) | |||
Other Security (cost: $49,269) | 49,269 | ||
| SHORT-TERM INVESTMENT - 2.1% | |||
State Street Institutional U.S. Government Money Market Fund, Class G Shares 0.16% (e) (f) (Cost $67,857,504) | 67,857,504 | 67,857,504 | |
TOTAL INVESTMENTS - 99.8% (Cost $3,116,743,431) | 3,183,593,050 | ||
OTHER ASSETS IN EXCESS OF LIABILITIES - 0.2% | 7,649,093 | ||
NET ASSETS - 100.0% | $ 3,191,242,143 | ||
| The Summary Schedule of Investments does not reflect the complete portfolio holdings. It includes the Fund’s 50 largest holdings and each investment of any issuer that exceeds 1% of the Fund’s net assets. “Other Securities” represent all issues not required to be disclosed under the rules adopted by the U.S. Securities and Exchange Commission (“SEC”). In certain instances, securities for which footnotes listed below may otherwise apply are included in the Other Securities caption. The complete schedule of portfolio holdings is available on the Fund's website at www.ssga.com, without charge, upon request by calling 1-866-787-2257 (toll-free) and on the SEC's website at www.sec.gov. | |
| (a) | Amount is less than 0.05% of net assets. |
Table of Contents
| (b) | Variable Rate Security - Interest rate shown is rate in effect at June 30, 2020. For securities based on a published reference rate and spread, the reference rate and spread are indicated in the description above. |
| (c) | Fair valued as determined in good faith by the Trust's Oversight Committee in accordance with policy and procedures approved by the Board of Trustees. Security value is determined based on Level 3 inputs. As of June 30, 2020, total aggregate fair value of the security is $0, representing less than 0.05% of the Fund's net assets. |
| (d) | Non-income producing security. |
| (e) | The Fund invested in certain money market funds managed by SSGA Funds Management, Inc. Amounts related to these transactions during the period ended June 30, 2020 are shown in the Affiliate Table below. |
| (f) | The rate shown is the annualized seven-day yield at June 30, 2020. |
| CMO | Collateralized Mortgage Obligation |
| CMT | Constant Maturity Treasury |
| IO | Interest Only |
| LIBOR | London Interbank Offered Rate |
| REMIC | Real Estate Mortgage Investment Conduit |
| Borrower | Unfunded Loan Commitment ($) | Value ($) | Unrealized Appreciation/(Depreciation) ($) | |||
| Intelsat Jackson Holdings S.A. | 93,014 | 94,671 | 1,657 |
Table of Contents
| Description | Level 1 – Quoted Prices | Level 2 – Other Significant Observable Inputs | Level 3 – Significant Unobservable Inputs | Total | ||||
| ASSETS: | ||||||||
| INVESTMENTS: | ||||||||
Corporate Bonds & Notes | $ — | $ 476,279,535 | $— | $ 476,279,535 | ||||
Asset-Backed Securities | — | 78,819,369 | — | 78,819,369 | ||||
Foreign Government Obligations | — | 30,971,059 | — | 30,971,059 | ||||
U.S. Government Agency Obligations | — | 1,331,899,563 | — | 1,331,899,563 | ||||
U.S. Treasury Obligations | — | 834,374,892 | — | 834,374,892 | ||||
Mortgage-Backed Securities | — | 166,261,980 | — | 166,261,980 | ||||
Commercial Mortgage Backed Securities | — | 101,691,129 | — | 101,691,129 | ||||
Common Stocks | 4,080 | — | 0(a) | 4,080 | ||||
Convertible Bonds | — | 49,269 | — | 49,269 | ||||
Senior Floating Rate Loans | — | 95,384,670 | — | 95,384,670 | ||||
Short-Term Investment | 67,857,504 | — | — | 67,857,504 | ||||
TOTAL INVESTMENTS | $67,861,584 | $3,115,731,466 | $ 0 | $3,183,593,050 | ||||
| LIABILITIES: | ||||||||
| OTHER FINANCIAL INSTRUMENTS: | ||||||||
Unfunded Loans(b) | — | 1,657 | — | 1,657 | ||||
TOTAL OTHER FINANCIAL INSTRUMENTS: | $ — | $ 1,657 | $— | $ 1,657 |
| (a) | The Fund held a Level 3 security that was valued at $0 at June 30, 2020. |
| (b) | Includes appreciation (depreciation) on unfunded loan commitments. |
| Number of Shares Held at 6/30/19 | Value at 6/30/19 | Cost of Purchases | Proceeds from Shares Sold | Realized Gain (Loss) | Change in Unrealized Appreciation/ Depreciation | Number of Shares Held at 6/30/20 | Value at 6/30/20 | Dividend Income | |||||||||
State Street Institutional U.S. Government Money Market Fund, Class G Shares | 84,316,399 | $84,316,399 | $1,125,021,728 | $1,141,480,623 | $— | $— | 67,857,504 | $67,857,504 | $748,875 |
Table of Contents
| SPDR DoubleLine Emerging Markets Fixed Income ETF | SPDR DoubleLine Short Duration Total Return Tactical ETF | ||
| ASSETS | |||
Investments in unaffiliated issuers, at value | $92,449,225 | $138,087,412 | |
Investments in affiliated issuers, at value | 780,408 | 3,357,926 | |
Total Investments | 93,229,633 | 141,445,338 | |
Cash | — | 69,736 | |
Receivable for investments sold | 423,077 | 1,096,294 | |
Dividends receivable — affiliated issuers | 85 | 507 | |
Interest receivable — unaffiliated issuers | 1,156,027 | 494,518 | |
Receivable from Adviser | 7,787 | 5,991 | |
Receivable for foreign taxes recoverable | — | 447 | |
TOTAL ASSETS | 94,816,609 | 143,112,831 | |
| LIABILITIES | |||
Payable for investments purchased | 264,611 | 535,710 | |
Advisory fee payable | 57,853 | 58,301 | |
Trustees’ fees and expenses payable | 47 | 81 | |
TOTAL LIABILITIES | 322,511 | 594,092 | |
NET ASSETS | $94,494,098 | $142,518,739 | |
| NET ASSETS CONSIST OF: | |||
Paid-in Capital | $94,686,001 | $142,031,336 | |
Total distributable earnings (loss) | (191,903) | 487,403 | |
NET ASSETS | $94,494,098 | $142,518,739 | |
| NET ASSET VALUE PER SHARE | |||
Net asset value per share | $ 49.09 | $ 49.57 | |
Shares outstanding (unlimited amount authorized, no par value) | 1,925,000 | 2,875,000 | |
| COST OF INVESTMENTS: | |||
Investments in unaffiliated issuers | $90,418,404 | $137,420,100 | |
Investments in affiliated issuers | 780,408 | 3,357,926 | |
Total cost of investments | $91,198,812 | $140,778,026 |
Table of Contents
| SPDR DoubleLine Total Return Tactical ETF | |
| ASSETS | |
Investments in unaffiliated issuers, at value | $3,115,735,546 |
Investments in affiliated issuers, at value | 67,857,504 |
Total Investments | 3,183,593,050 |
Receivable for investments sold | 5,464,458 |
Dividends receivable — affiliated issuers | 10,111 |
Interest receivable — unaffiliated issuers | 16,002,528 |
Unrealized appreciation on unfunded loan commitments | 1,657 |
Receivable from Adviser | 258,483 |
TOTAL ASSETS | 3,205,330,287 |
| LIABILITIES | |
Due to custodian | 11,948 |
Payable for investments purchased | 12,380,431 |
Advisory fee payable | 1,686,972 |
Trustees’ fees and expenses payable | 2,294 |
Accrued expenses and other liabilities | 6,499 |
TOTAL LIABILITIES | 14,088,144 |
NET ASSETS | $3,191,242,143 |
| NET ASSETS CONSIST OF: | |
Paid-in Capital | $3,215,303,977 |
Total distributable earnings (loss) | (24,061,834) |
NET ASSETS | $3,191,242,143 |
| NET ASSET VALUE PER SHARE | |
Net asset value per share | $ 49.40 |
Shares outstanding (unlimited amount authorized, no par value) | 64,600,000 |
| COST OF INVESTMENTS: | |
Investments in unaffiliated issuers | $3,048,885,927 |
Investments in affiliated issuers | 67,857,504 |
Total cost of investments | $3,116,743,431 |
Table of Contents
| SPDR DoubleLine Emerging Markets Fixed Income ETF | SPDR DoubleLine Short Duration Total Return Tactical ETF | ||
| INVESTMENT INCOME | |||
Interest income — unaffiliated issuers | $ 3,390,310 | $3,469,605 | |
Dividend income — affiliated issuers | 47,366 | 59,685 | |
Foreign taxes withheld | — | (7) | |
TOTAL INVESTMENT INCOME (LOSS) | 3,437,676 | 3,529,283 | |
| EXPENSES | |||
Advisory fee | 582,952 | 671,492 | |
Trustees’ fees and expenses | 1,363 | 2,268 | |
TOTAL EXPENSES | 584,315 | 673,760 | |
Expenses waived/reimbursed by the Adviser | (79,090) | (69,417) | |
NET EXPENSES | 505,225 | 604,343 | |
NET INVESTMENT INCOME (LOSS) | $ 2,932,451 | $2,924,940 | |
| REALIZED AND UNREALIZED GAIN (LOSS) | |||
| Net realized gain (loss) on: | |||
Investments — unaffiliated issuers | (2,205,780) | (18,615) | |
| Net change in unrealized appreciation/depreciation on: | |||
Investments — unaffiliated issuers | 401,488 | 125,822 | |
NET REALIZED AND UNREALIZED GAIN (LOSS) | (1,804,292) | 107,207 | |
NET INCREASE (DECREASE) IN NET ASSETS FROM OPERATIONS | $ 1,128,159 | $3,032,147 |
Table of Contents
| SPDR DoubleLine Total Return Tactical ETF | |
| INVESTMENT INCOME | |
Interest income — unaffiliated issuers | $109,341,308 |
Dividend income — affiliated issuers | 748,875 |
TOTAL INVESTMENT INCOME (LOSS) | 110,090,183 |
| EXPENSES | |
Advisory fee | 21,349,833 |
Trustees’ fees and expenses | 45,839 |
Miscellaneous expenses | 1,922 |
TOTAL EXPENSES | 21,397,594 |
Expenses waived/reimbursed by the Adviser | (3,332,350) |
NET EXPENSES | 18,065,244 |
NET INVESTMENT INCOME (LOSS) | $ 92,024,939 |
| REALIZED AND UNREALIZED GAIN (LOSS) | |
| Net realized gain (loss) on: | |
Investments — unaffiliated issuers | (16,611,611) |
| Net change in unrealized appreciation/depreciation on: | |
Investments — unaffiliated issuers | 52,685,559 |
Unfunded loan commitments | 8,536 |
Net change in unrealized appreciation/depreciation | 52,694,095 |
NET REALIZED AND UNREALIZED GAIN (LOSS) | 36,082,484 |
NET INCREASE (DECREASE) IN NET ASSETS FROM OPERATIONS | $128,107,423 |
Table of Contents
| SPDR DoubleLine Emerging Markets Fixed Income ETF | |||
| Year Ended 6/30/20 | Year Ended 6/30/19 | ||
| INCREASE (DECREASE) IN NET ASSETS FROM OPERATIONS: | |||
Net investment income (loss) | $ 2,932,451 | $ 2,300,308 | |
Net realized gain (loss) | (2,205,780) | (43,081) | |
Net change in unrealized appreciation/depreciation | 401,488 | 3,351,797 | |
Net increase (decrease) in net assets resulting from operations | 1,128,159 | 5,609,024 | |
Net equalization credits and charges | 68,814 | 35,847 | |
Distributions to shareholders | (2,929,647) | (2,240,675) | |
| FROM BENEFICIAL INTEREST TRANSACTIONS: | |||
Proceeds from shares sold | 49,043,585 | 23,145,799 | |
Cost of shares redeemed | (17,996,911) | (9,812,692) | |
Net income equalization | (68,814) | (35,847) | |
Other Capital | 198,648 | 95,729 | |
Net increase (decrease) in net assets from beneficial interest transactions | 31,176,508 | 13,392,989 | |
Net increase (decrease) in net assets during the period | 29,443,834 | 16,797,185 | |
Net assets at beginning of period | 65,050,264 | 48,253,079 | |
NET ASSETS AT END OF PERIOD | $ 94,494,098 | $65,050,264 | |
| SHARES OF BENEFICIAL INTEREST: | |||
Shares sold | 1,025,000 | 475,000 | |
Shares redeemed | (375,000) | (200,000) | |
Net increase (decrease) from share transactions | 650,000 | 275,000 | |
Table of Contents
| SPDR DoubleLine Short Duration Total Return Tactical ETF | |||
| Year Ended 6/30/20 | Year Ended 6/30/19 | ||
| INCREASE (DECREASE) IN NET ASSETS FROM OPERATIONS: | |||
Net investment income (loss) | $ 2,924,940 | $ 2,463,390 | |
Net realized gain (loss) | (18,615) | 117,898 | |
Net change in unrealized appreciation/depreciation | 125,822 | 1,310,293 | |
Net increase (decrease) in net assets resulting from operations | 3,032,147 | 3,891,581 | |
Net equalization credits and charges | 11,473 | 50,594 | |
Distributions to shareholders | (3,062,675) | (2,440,795) | |
| FROM BENEFICIAL INTEREST TRANSACTIONS: | |||
Proceeds from shares sold | 33,417,005 | 41,653,504 | |
Cost of shares redeemed | (12,303,910) | (4,850,418) | |
Net income equalization | (11,473) | (50,594) | |
Other Capital | 92,112 | 106,559 | |
Net increase (decrease) in net assets from beneficial interest transactions | 21,193,734 | 36,859,051 | |
Net increase (decrease) in net assets during the period | 21,174,679 | 38,360,431 | |
Net assets at beginning of period | 121,344,060 | 82,983,629 | |
NET ASSETS AT END OF PERIOD | $142,518,739 | $121,344,060 | |
| SHARES OF BENEFICIAL INTEREST: | |||
Shares sold | 675,000 | 850,000 | |
Shares redeemed | (250,000) | (100,000) | |
Net increase (decrease) from share transactions | 425,000 | 750,000 | |
Table of Contents
| SPDR DoubleLine Total Return Tactical ETF | |||
| Year Ended 6/30/20 | Year Ended 6/30/19 | ||
| INCREASE (DECREASE) IN NET ASSETS FROM OPERATIONS: | |||
Net investment income (loss) | $ 92,024,939 | $ 100,519,822 | |
Net realized gain (loss) | (16,611,611) | (29,183,284) | |
Net change in unrealized appreciation/depreciation | 52,694,095 | 122,210,213 | |
Net increase (decrease) in net assets resulting from operations | 128,107,423 | 193,546,751 | |
Net equalization credits and charges | (152,877) | 159,504 | |
Distributions to shareholders | (104,243,448) | (108,291,677) | |
| FROM BENEFICIAL INTEREST TRANSACTIONS: | |||
Proceeds from shares sold | 242,342,927 | 536,959,704 | |
Cost of shares redeemed | (413,569,469) | (470,157,761) | |
Net income equalization | 152,877 | (159,504) | |
Other Capital | 1,723,362 | 2,585,534 | |
Net increase (decrease) in net assets from beneficial interest transactions | (169,350,303) | 69,227,973 | |
Net increase (decrease) in net assets during the period | (145,639,205) | 154,642,551 | |
Net assets at beginning of period | 3,336,881,348 | 3,182,238,797 | |
NET ASSETS AT END OF PERIOD | $3,191,242,143 | $3,336,881,348 | |
| SHARES OF BENEFICIAL INTEREST: | |||
Shares sold | 4,950,000 | 11,250,000 | |
Shares redeemed | (8,500,000) | (9,950,000) | |
Net increase (decrease) from share transactions | (3,550,000) | 1,300,000 | |
Table of Contents
| SPDR DoubleLine Emerging Markets Fixed Income ETF | |||||||||
| Year Ended 6/30/20 | Year Ended 6/30/19 | Year Ended 6/30/18 | Year Ended 6/30/17 | For the Period 4/14/16*- 6/30/16 | |||||
Net asset value, beginning of period | $ 51.02 | $ 48.25 | $ 50.45 | $ 51.52 | $ 50.00 | ||||
| Income (loss) from investment operations: | |||||||||
Net investment income (loss) (a) | 1.87 | 1.98 | 1.31 | 1.77 | 0.45 | ||||
Net realized and unrealized gain (loss) | (2.06) | 2.60 | (1.74) | 1.91 | 1.17 | ||||
Total from investment operations | (0.19) | 4.58 | (0.43) | 3.68 | 1.62 | ||||
Net equalization credits and charges (a) | 0.04 | 0.03 | 0.04 | 0.01 | — | ||||
Other capital (a) | 0.13 | 0.08 | 0.10 | 0.05 | 0.15 | ||||
| Distributions to shareholders from: | |||||||||
Net investment income | (1.91) | (1.92) | (1.36) | (1.81) | (0.25) | ||||
Net realized gains | — | — | (0.55) | (3.00) | — | ||||
Total distributions | (1.91) | (1.92) | (1.91) | (4.81) | (0.25) | ||||
Net asset value, end of period | $ 49.09 | $ 51.02 | $ 48.25 | $ 50.45 | $ 51.52 | ||||
Total return (b) | (0.04)% | 9.99% | (0.65)% | 7.67% | 3.55% | ||||
| Ratios and Supplemental Data: | |||||||||
Net assets, end of period (in 000s) | $94,494 | $65,050 | $48,253 | $27,748 | $38,639 | ||||
| Ratios to average net assets: | |||||||||
Total expenses | 0.75% | 0.75% | 0.76% | 0.75% | 0.75%(c) | ||||
Net expenses | 0.65% | 0.65% | 0.65% | 0.65% | 0.65%(c) | ||||
Net investment income (loss) | 3.77% | 4.06% | 2.64% | 3.46% | 4.15%(c) | ||||
Portfolio turnover rate (d) | 54% | 37% | 55% | 141% | 12%(e) | ||||
| * | Commencement of operations. |
| (a) | Per share numbers have been calculated using average shares outstanding, which more appropriately presents the per share data for the year. |
| (b) | Total return is calculated assuming a purchase of shares at net asset value on the first day and a sale at net asset value on the last day of each period reported. Distributions are assumed, for the purpose of this calculation, to be reinvested at net asset value per share on the respective payment dates of each distribution. Total returns for periods of less than one year are not annualized. Broker commission charges are not included in this calculation. |
| (c) | Annualized. |
| (d) | Portfolio turnover rate excludes securities received or delivered from in-kind processing of creations or redemptions. |
| (e) | Not annualized. |
Table of Contents
| SPDR DoubleLine Short Duration Total Return Tactical ETF | |||||||||
| Year Ended 6/30/20 | Year Ended 6/30/19 | Year Ended 6/30/18 | Year Ended 6/30/17 | For the Period 4/14/16*- 6/30/16 | |||||
Net asset value, beginning of period | $ 49.53 | $ 48.81 | $ 49.61 | $ 50.40 | $ 50.00 | ||||
| Income (loss) from investment operations: | |||||||||
Net investment income (loss) (a) | 1.08 | 1.30 | 1.02 | 1.04 | 0.22 | ||||
Net realized and unrealized gain (loss) | 0.07 | 0.62 | (0.99) | (0.53) | 0.20 | ||||
Total from investment operations | 1.15 | 1.92 | 0.03 | 0.51 | 0.42 | ||||
Net equalization credits and charges (a) | 0.00(b) | 0.03 | 0.05 | 0.00(b) | — | ||||
Other capital (a) | 0.03 | 0.06 | 0.12 | 0.06 | 0.10 | ||||
| Distributions to shareholders from: | |||||||||
Net investment income | (1.14) | (1.29) | (1.00) | (1.13) | (0.12) | ||||
Net realized gains | — | — | — | (0.23) | — | ||||
Total distributions | (1.14) | (1.29) | (1.00) | (1.36) | (0.12) | ||||
Net asset value, end of period | $ 49.57 | $ 49.53 | $ 48.81 | $ 49.61 | $ 50.40 | ||||
Total return (c) | 2.43% | 4.18% | 0.43% | 1.14% | 1.04% | ||||
| Ratios and Supplemental Data: | |||||||||
Net assets, end of period (in 000s) | $142,519 | $121,344 | $82,984 | $34,725 | $50,404 | ||||
| Ratios to average net assets: | |||||||||
Total expenses | 0.50% | 0.50% | 0.50% | 0.50% | 0.50%(d) | ||||
Net expenses | 0.45% | 0.45% | 0.45% | 0.45% | 0.45%(d) | ||||
Net investment income (loss) | 2.18% | 2.65% | 2.07% | 2.10% | 2.06%(d) | ||||
Portfolio turnover rate (e) | 43% | 62% | 50% | 123% | 25%(f) | ||||
| * | Commencement of operations. |
| (a) | Per share numbers have been calculated using average shares outstanding, which more appropriately presents the per share data for the year. |
| (b) | Amount is less than $0.005 per share. |
| (c) | Total return is calculated assuming a purchase of shares at net asset value on the first day and a sale at net asset value on the last day of each period reported. Distributions are assumed, for the purpose of this calculation, to be reinvested at net asset value per share on the respective payment dates of each distribution. Total returns for periods of less than one year are not annualized. Broker commission charges are not included in this calculation. |
| (d) | Annualized. |
| (e) | Portfolio turnover rate excludes securities received or delivered from in-kind processing of creations or redemptions. |
| (f) | Not annualized. |
Table of Contents
| SPDR DoubleLine Total Return Tactical ETF | |||||||||
| Year Ended 6/30/20 | Year Ended 6/30/19 | Year Ended 6/30/18(a) | Year Ended 6/30/17(a) | Year Ended 6/30/16(a) | |||||
Net asset value, beginning of period | $ 48.96 | $ 47.60 | $ 49.03 | $ 49.87 | $ 49.43 | ||||
| Income (loss) from investment operations: | |||||||||
Net investment income (loss) (b) | 1.37 | 1.56 | 1.34 | 1.33 | 1.54 | ||||
Net realized and unrealized gain (loss) (c) | 0.59 | 1.44 | (1.34) | (0.66) | 0.34 | ||||
Total from investment operations | 1.96 | 3.00 | — | 0.67 | 1.88 | ||||
Net equalization credits and charges (b) | (0.00)(d) | 0.00(d) | 0.00(d) | 0.01 | 0.07 | ||||
Other capital (b) | 0.03 | 0.04 | 0.02 | 0.04 | 0.03 | ||||
| Distributions to shareholders from: | |||||||||
Net investment income | (1.55) | (1.68) | (1.45) | (1.48) | (1.54) | ||||
Net realized gains | — | — | — | (0.08) | — | ||||
Total distributions | (1.55) | (1.68) | (1.45) | (1.56) | (1.54) | ||||
Net asset value, end of period | $ 49.40 | $ 48.96 | $ 47.60 | $ 49.03 | $ 49.87 | ||||
Total return (e) | 4.13% | 6.53% | 0.04% | 1.55% | 4.03% | ||||
| Ratios and Supplemental Data: | |||||||||
Net assets, end of period (in 000s) | $3,191,242 | $3,336,881 | $3,182,239 | $3,353,801 | $2,657,951 | ||||
| Ratios to average net assets: | |||||||||
Total expenses | 0.65% | 0.65% | 0.65% | 0.66% | 0.65% | ||||
Net expenses | 0.55% | 0.55% | 0.55% | 0.55% | 0.55% | ||||
Net investment income (loss) | 2.80% | 3.27% | 2.78% | 2.70% | 3.14% | ||||
Portfolio turnover rate | 25%(f) | 47%(f) | 34%(g) | 72%(g) | 38%(g) | ||||
| (a) | The per share amounts and percentages include the Fund’s proportionate share of income and expenses of the Portfolio prior to discontinuance of the master feeder structure. |
| (b) | Per share numbers have been calculated using average shares outstanding, which more appropriately presents the per share data for the year. |
| (c) | Amounts shown in this caption for a share outstanding may not accord with the change in aggregate gains and losses in securities for the fiscal period because of the timing of sales and repurchases of Fund shares in relation to fluctuating market values for the Fund. |
| (d) | Amount is less than $0.005 per share. |
| (e) | Total return is calculated assuming a purchase of shares at net asset value on the first day and a sale at net asset value on the last day of each period reported. Distributions are assumed, for the purpose of this calculation, to be reinvested at net asset value per share on the respective payment dates of each distribution. Total returns for periods of less than one year are not annualized. Broker commission charges are not included in this calculation. |
| (f) | Portfolio turnover rate excludes securities received or delivered from in-kind processing of creations or redemptions. |
| (g) | Portfolio turnover is from the Fund's Portfolio prior to discontinuance of master-feeder structure. |
Table of Contents
| SPDR DoubleLine Emerging Markets Fixed Income ETF |
| SPDR DoubleLine Short Duration Total Return Tactical ETF |
| SPDR DoubleLine Total Return Tactical ETF |
Table of Contents
Table of Contents
Table of Contents
Table of Contents
| SPDR DoubleLine Emerging Markets Fixed Income ETF |
| SPDR DoubleLine Short Duration Total Return Tactical ETF |
| SPDR DoubleLine Total Return Tactical ETF |
Table of Contents
| Annual Rate | |
SPDR DoubleLine Emerging Markets Fixed Income ETF | 0.75% |
SPDR DoubleLine Short Duration Total Return Tactical ETF | 0.50 |
SPDR DoubleLine Total Return Tactical ETF | 0.65 |
Table of Contents
Table of Contents
| U.S. Government Obligations | Other Securities | ||||||
| Purchases | Sales | Purchases | Sales | ||||
SPDR DoubleLine Emerging Markets Fixed Income ETF | $ — | $ — | $ 63,893,208 | $ 39,050,539 | |||
SPDR DoubleLine Short Duration Total Return Tactical ETF | 24,361,919 | 11,281,469 | 41,958,342 | 33,143,328 | |||
SPDR DoubleLine Total Return Tactical ETF | 642,730,439 | 183,654,087 | 430,656,870 | 561,632,423 | |||
Table of Contents
| Ordinary Income | Long-Term Capital Gains | Total | |||
SPDR DoubleLine Emerging Markets Fixed Income ETF | $ 2,929,647 | $— | $ 2,929,647 | ||
SPDR DoubleLine Short Duration Total Return Tactical ETF | 3,062,675 | — | 3,062,675 | ||
SPDR DoubleLine Total Return Tactical ETF | 104,243,448 | — | 104,243,448 |
| Ordinary Income | Long-Term Capital Gains | Total | |||
SPDR DoubleLine Emerging Markets Fixed Income ETF | $ 2,240,675 | $ — | $ 2,240,675 | ||
SPDR DoubleLine Short Duration Total Return Tactical ETF | 2,440,795 | — | 2,440,795 | ||
SPDR DoubleLine Total Return Tactical ETF | 108,291,677 | — | 108,291,677 |
Table of Contents
| Undistributed Ordinary Income | Capital Loss Carryforwards | Undistributed Long-Term Capital Gains | Net Unrealized Gains (Losses) | Qualified Late-Year Losses | Total | ||||||
SPDR DoubleLine Emerging Markets Fixed Income ETF | $ 148,324 | $ (2,331,735) | $— | $ 1,991,508 | $— | $ (191,903) | |||||
SPDR DoubleLine Short Duration Total Return Tactical ETF | 89,803 | (257,417) | — | 655,017 | — | 487,403 | |||||
SPDR DoubleLine Total Return Tactical ETF | 9,255,922 | (99,950,099) | — | 66,632,343 | — | (24,061,834) |
| Non-Expiring Short Term | Non-Expiring Long Term | ||
SPDR DoubleLine Emerging Markets Fixed Income ETF | $ 500,315 | $ 1,831,420 | |
SPDR DoubleLine Short Duration Total Return Tactical ETF | 59,288 | 198,129 | |
SPDR DoubleLine Total Return Tactical ETF | 16,850,299 | 83,099,800 |
| Tax Cost | Gross Unrealized Appreciation | Gross Unrealized Depreciation | Net Unrealized Appreciation (Depreciation) | ||||
SPDR DoubleLine Emerging Markets Fixed Income ETF | $ 91,238,080 | $ 3,353,472 | $ 1,361,919 | $ 1,991,553 | |||
SPDR DoubleLine Short Duration Total Return Tactical ETF | 140,790,321 | 2,116,208 | 1,461,191 | 655,017 | |||
SPDR DoubleLine Total Return Tactical ETF | 3,116,962,364 | 137,190,878 | 70,560,192 | 66,630,686 |
Table of Contents
Table of Contents
Table of Contents
| Individual fund constituting the SSGA Active Trust | Statement of operations | Statement of changes in net assets | Financial highlights |
| SPDR DoubleLine Emerging Markets Fixed Income ETF SPDR DoubleLine Short Duration Total Return Tactical ETF | For the year ended June 30, 2020 | For each of the two years in the period ended June 30, 2020 | For each of the two years in the period ended June 30, 2020 and the period from April 14, 2016 (commencement of operations) through June 30, 2016 |
| SPDR DoubleLine Total Return Tactical ETF | For the year ended June 30, 2020 | For each of the two years in the period ended June 30, 2020 | For each of the five years in the period ended June 30, 2020 |
Table of Contents

August 28, 2020
Table of Contents
Table of Contents
| SPDR DoubleLine Emerging Markets Fixed Income ETF | SPDR DoubleLine Short Duration Total Return Tactical ETF | SPDR DoubleLine Total Return Tactical ETF | |||
Annualized Expense Ratio | 0.65% | 0.45% | 0.55% | ||
| Actual: | |||||
Ending Account Value | $ 979.50 | $1,010.70 | $1,024.70 | ||
Expenses Paid During Period(a) | 3.20 | 2.25 | 2.77 | ||
| Hypothetical (assuming a 5% return before expenses): | |||||
Ending Account Value | 1,021.60 | 1,022.60 | 1,022.10 | ||
Expenses Paid During Period(a) | 3.27 | 2.26 | 2.77 |
| (a) | Expenses are equal to the Fund's annualized net expense ratio multiplied by the average account value of the period, multiplied by 182, then divided by 366. |
Table of Contents
Table of Contents
Table of Contents
Table of Contents
Table of Contents
Table of Contents
Table of Contents
| Name, Address and Year of Birth | Position(s) with Funds | Term of Office and Length of Time Served | Principal Occupation(s) During Past 5 Years | Number of Portfolios in Fund Complex Overseen by Trustee† | Other Directorships Held by Trustee During the Past 5 Years | |||||
| Trustees | ||||||||||
| Independent Trustees | ||||||||||
| FRANK NESVET c/o SSGA Active Trust One Iron Street Boston, MA 02210 1943 | Independent Trustee, Chairman, Trustee Committee Chair | Term: Unlimited Served: since March 2011 | Retired. | 123 | None. | |||||
| BONNY EUGENIA BOATMAN c/o SSGA Active Trust One Iron Street Boston, MA 02210 1950 | Independent Trustee | Term: Unlimited Served: since March 2011 | Retired. | 123 | None. | |||||
| DWIGHT D. CHURCHILL c/o SSGA Active Trust One Iron Street Boston, MA 02210 1953 | Independent Trustee | Term: Unlimited Served: since March 2011 | Self-employed consultant since 2010; CEO and President, CFA Institute (June 2014-January 2015). | 123 | Affiliated Managers Group, Inc. (Chairman, Director and Audit Committee Chair). |
Table of Contents
| Name, Address and Year of Birth | Position(s) with Funds | Term of Office and Length of Time Served | Principal Occupation(s) During Past 5 Years | Number of Portfolios in Fund Complex Overseen by Trustee† | Other Directorships Held by Trustee During the Past 5 Years | |||||
| CLARE S. RICHER c/o SSGA Active Trust One Iron Street Boston, MA 02210 1958 | Independent Trustee | Term: Unlimited Served: since July 2018 | Retired. Chief Financial Officer, Putnam Investments LLC (December 2008- May 2017). | 123 | Principal Financial Group (Director); Bain Capital Specialty Finance (Director); Putnam Acquisition Financing Inc. (Director); Putnam Acquisition Financing LLC (Director); Putnam GP Inc. (Director); Putnam Investor Services, Inc. (Director); University of Notre Dame (Trustee). |
Table of Contents
| Name, Address and Year of Birth | Position(s) with Funds | Term of Office and Length of Time Served | Principal Occupation(s) During Past 5 Years | Number of Portfolios in Fund Complex Overseen by Trustee† | Other Directorships Held by Trustee During the Past 5 Years | |||||
| SANDRA G. SPONEM c/o SSGA Active Trust One Iron Street Boston, MA 02210 1958 | Independent Trustee | Term: Unlimited Served: since July 2018 | Retired. Chief Financial Officer, M.A. Mortenson Companies, Inc. (February 2007- April 2017). | 123 | Rydex Series Funds, Rydex Dynamic Funds, Rydex Variable Trust, Guggenheim Funds Trust, Guggenheim Variable Funds Trust, Guggenheim Strategy Funds Trust, Transparent Value Trust, Fiduciary/ Claymore Energy Infrastructure Fund, Guggenheim Taxable Municipal Managed Duration Trust, Guggenheim Strategic Opportunities Fund, Guggenheim Enhanced, Equity Income Fund, Guggenheim Credit Allocation Fund, Guggenheim Energy & Income Fund (Trustee and Audit Committee Chair). | |||||
| CARL G. VERBONCOEUR c/o SSGA Active Trust One Iron Street Boston, MA 02210 1952 | Independent Trustee, Audit Committee Chair | Term: Unlimited Served: since March 2011 | Self-employed consultant since 2009. | 123 | The Motley Fool Funds Trust (Trustee). |
Table of Contents
| Name, Address and Year of Birth | Position(s) with Funds | Term of Office and Length of Time Served | Principal Occupation(s) During Past 5 Years | Number of Portfolios in Fund Complex Overseen by Trustee† | Other Directorships Held by Trustee During the Past 5 Years | |||||
| Interested Trustee | ||||||||||
| JAMES E. ROSS* c/o SSGA Active Trust One Iron Street Boston, MA 02210 1965 | Interested Trustee | Term: Unlimited Served as Trustee: since March 2011 | Non-Executive Chairman, Fusion Acquisition Corp. (June 2020 - Present); Retired Chairman and Director, SSGA Funds Management, Inc. (2005 - March 2020); Retired Executive Vice President, State Street Global Advisors (2012 - March 2020); Retired Chief Executive Officer and Director, State Street Global Advisors Funds Distributors, LLC (May 2017 - March 2020); Director, State Street Global Markets, LLC (2013 - April 2017); President, SSGA Funds Management, Inc. (2005 - 2012); Principal, State Street Global Advisors (2000 - 2005). | 134 | SSGA SPDR ETFs Europe I plc (Director) (November 2016 - March 2020); SSGA SPDR ETFs Europe II plc (Director) (November 2016 - March 2020); State Street Navigator Securities Lending Trust (July 2016 - March 2020); SSGA Funds (January 2014 - March 2020); State Street Institutional Investment Trust (February 2007 - March 2020); State Street Master Funds (February 2007 - March 2020); Elfun Funds (July 2016 - December 2018). | |||||
| † For the purpose of determining the number of portfolios overseen by the Trustees, “Fund Complex” comprises registered investment companies for which SSGA Funds Management, Inc. serves as investment adviser. | ||||||||||
| * Mr. Ross is an Interested Trustee because of his former position with the Adviser and ownership interest in an affiliate of the Adviser. | ||||||||||
Table of Contents
| Name, Address and Year of Birth | Position(s) with Funds | Term of Office and Length of Time Served | Principal Occupation(s) During the Past 5 Years | |||
| Officers | ||||||
| ELLEN M. NEEDHAM SSGA Funds Management, Inc. One Iron Street Boston, MA 02210 1967 | President | Term: Unlimited Served: since October 2012 | Chairman, SSGA Funds Management, Inc. (March 2020 - present); President and Director, SSGA Funds Management, Inc. (2001 - present)*; Senior Managing Director, State Street Global Advisors (1992 - present)*; Manager, State Street Global Advisors Funds Distributors, LLC (May 2017 - present). | |||
| BRUCE S. ROSENBERG SSGA Funds Management, Inc. One Iron Street Boston, MA 02210 1961 | Treasurer | Term: Unlimited Served: since February 2016 | Managing Director, State Street Global Advisors and SSGA Funds Management, Inc. (July 2015 - present); Director, Credit Suisse (April 2008 - July 2015). | |||
| ANN M. CARPENTER SSGA Funds Management, Inc. One Iron Street Boston, MA 02210 1966 | Vice President; Deputy Treasurer | Term: Unlimited Served: since August 2012 (with respect to Vice President); since February 2016 (with respect to Deputy Treasurer) | Chief Operating Officer, SSGA Funds Management, Inc. (2005 - Present)*; Managing Director, State Street Global Advisors (2005 - present).* | |||
| MICHAEL P. RILEY SSGA Funds Management, Inc. One Iron Street Boston, MA 02210 1969 | Vice President | Term: Unlimited Served: since March 2011 | Managing Director, State Street Global Advisors (2005 - present).* | |||
| SEAN O’MALLEY SSGA Funds Management, Inc. One Iron Street Boston, MA 02210 1969 | Chief Legal Officer | Term: Unlimited Served: since August 2019 | Senior Vice President and Deputy General Counsel, State Street Global Advisors (November 2013 -present). | |||
| ANDREW DELORME SSGA Funds Management, Inc. One Iron Street Boston, MA 02210 1975 | Secretary | Term: Unlimited Served: since August 2019 | Vice President and Senior Counsel, State Street Global Advisors (April 2016 - present); Vice President and Counsel, State Street Global Advisors (August 2014 - March 2016). |
Table of Contents
| Name, Address and Year of Birth | Position(s) with Funds | Term of Office and Length of Time Served | Principal Occupation(s) During the Past 5 Years | |||
| KEVIN MORRIS SSGA Funds Management, Inc. One Iron Street Boston, MA 02210 1982 | Assistant Secretary | Term: Unlimited Served: since August 2019 | Vice President and Senior Counsel, State Street Global Advisors (April 2019 - present); Vice President and Counsel, State Street Global Advisors (January 2016 -April 2019); Director, Asset Management Compliance, Fidelity Investments (June 2015 - January 2016); Senior Compliance Advisor, Asset Management Compliance, Fidelity Investments (June 2012 - June 2015). | |||
| DAVID URMAN SSGA Funds Management, Inc. One Iron Street Boston, MA 02210 1985 | Assistant Secretary | Term: Unlimited Served: since August 2019 | Vice President and Senior Counsel, State Street Global Advisors (April 2019 - present); Vice President and Counsel, State Street Global Advisors (August 2015 - April 2019); Associate, Ropes & Gray LLP (November 2012 - August 2015). | |||
| CHAD C. HALLETT SSGA Funds Management, Inc. One Iron Street Boston, MA 02210 1969 | Deputy Treasurer | Term: Unlimited Served: since February 2016 | Vice President, State Street Global Advisors and SSGA Funds Management, Inc. (November 2014 - present); Vice President, State Street Bank and Trust Company (2001 - November 2014).* | |||
| DARLENE ANDERSON-VASQUEZ SSGA Funds Management, Inc. One Iron Street Boston, MA 02210 1968 | Deputy Treasurer | Term: Unlimited Served: since November 2016 | Managing Director, State Street Global Advisors and SSGA Funds Management, Inc. (May 2016 - present); Senior Vice President, John Hancock Investments (September 2007 - May 2016). | |||
| ARTHUR A. JENSEN SSGA Funds Management, Inc. 1600 Summer Street Stamford, CT 06905 1966 | Deputy Treasurer | Term: Unlimited Served: Since August 2017 | Vice President at State Street Global Advisors (July 2016 – present); Mutual Funds Controller of GE Asset Management Incorporated (April 2011 - July 2016). | |||
| SUJATA UPRETI SSGA Funds Management, Inc. One Iron Street Boston, MA 02210 1974 | Assistant Treasurer | Term: Unlimited Served: since February 2016 | Vice President, State Street Global Advisors and SSGA Funds Management, Inc. (May 2015 - present). | |||
| DANIEL FOLEY SSGA Funds Management, Inc. One Iron Street Boston, MA 02210 1972 | Assistant Treasurer | Term: Unlimited Served: since February 2016 | Vice President, State Street Global Advisors and SSGA Funds Management, Inc. (April 2007 - present).* |
Table of Contents
| Name, Address and Year of Birth | Position(s) with Funds | Term of Office and Length of Time Served | Principal Occupation(s) During the Past 5 Years | |||
| DANIEL G. PLOURDE SSGA Funds Management, Inc. One Iron Street Boston, MA 02210 1980 | Assistant Treasurer | Term: Unlimited Served: since May 2017 | Vice President, State Street Global Advisors and SSGA Funds Management, Inc. (May 2015 - present); Officer, State Street Bank and Trust Company (March 2009 - May 2015). | |||
| BRIAN HARRIS SSGA Funds Management, Inc. One Iron Street Boston, MA 02210 1973 | Chief Compliance Officer; Anti-Money Laundering Officer; Code of Ethics Compliance Officer | Term: Unlimited Served: since November 2013 | Managing Director, State Street Global Advisors and SSGA Funds Management, Inc. (June 2013 - present)*; Senior Vice President and Global Head of Investment Compliance, BofA Global Capital Management (2010 - 2013); Director of Compliance, AARP Financial Inc. (2008 - 2010). | |||
| * Served in various capacities and/or with various affiliated entities during noted time period. | ||||||
| The Statement of Additional Information (SAI) includes additional information about the Funds' trustees and is available, without charge, upon request and by calling 1-866-787-2257. | ||||||
Table of Contents
Table of Contents
Table of Contents
Table of Contents
Table of Contents
Table of Contents
Table of Contents
One Iron Street
Boston, MA 02210
One Iron Street
Boston, MA 02210
One Lincoln Street
Boston, MA 02111
1111 Pennsylvania Avenue, NW
Washington, DC 20004
200 Clarendon Street
Boston, MA 02116
Table of Contents
One Iron Street
Boston, MA 02210
Table of Contents
| SPDR Blackstone / GSO Senior Loan ETF |

Table of Contents
Table of Contents
TABLE OF CONTENTS
| 1 | |
| 2 | |
| 7 | |
| 32 | |
| 35 | |
| 36 | |
| 47 | |
| 49 |
Table of Contents
Table of Contents
Table of Contents
| Cumulative Total Return | Average Annual Total Return | ||||||||
| Net Asset Value | Market Value | Markit iBoxx USD Liquid Leveraged Loan Index | Net Asset Value | Market Value | Markit iBoxx USD Liquid Leveraged Loan Index | ||||
| ONE YEAR(1) | – 1.23% | – 1.23% | – 3.08% | – 1.23% | – 1.23% | – 3.08% | |||
| FIVE YEARS(1) | 10.74% | 10.65% | 8.88% | 2.06% | 2.04% | 1.72% | |||
| SINCE INCEPTION(1) (2) | 17.08% | 17.00% | 15.00% | 2.20% | 2.19% | 1.95% | |||
| (1) | The One Year, Five Year and Since Inception Cumulative Total Returns for the Fund’s secondary benchmark, S&P/LSTA U.S. Leveraged Loan 100 Index, were (0.47)%, 15.65% and 22.15%, respectively. The One Year, Five Year and Since Inception Average Annual Total Returns for the Fund’s secondary benchmark, S&P/LSTA U.S. Leveraged Loan 100 Index, were (0.47)%, 2.95% and 2.80%, respectively. |
| (2) | For the period April 3, 2013 to June 30, 2020. |
(Based on Net Asset Value)
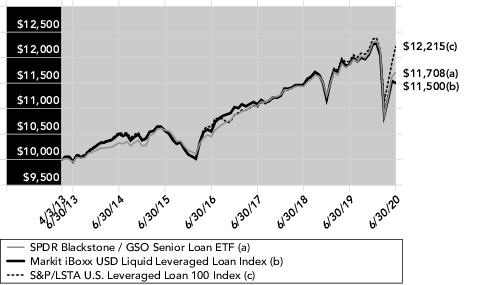
Table of Contents
Table of Contents
| Description | % of Net Assets | ||
| Asurion LLC Senior Secured 2017 2nd Lien Term Loan 6.68% 8/4/2025 | 2.2% | ||
| Bass Pro Group LLC Senior Secured Term Loan B 6.07% 9/25/2024 | 2.2 | ||
| Univision Communications, Inc. 6.63% 6/1/2027 | 1.4 | ||
| Envision Healthcare Corporation Senior Secured 2018 1st Lien Term Loan 3.93% 10/10/2025 | 1.3 | ||
| Banff Merger Sub, Inc. Senior Secured 2018 USD Term Loan B 4.43% 10/2/2025 | 1.2 | ||
| TOTAL | 8.3% |
| % of Net Assets | |||
| Health Care Providers & Services | 9.8% | ||
| Software | 9.1 | ||
| Commercial Services & Supplies | 9.1 | ||
| Media | 9.0 | ||
| Specialty Retail | 4.5 | ||
| Diversified Financial Services | 3.8 | ||
| Insurance | 3.7 | ||
| Pharmaceuticals | 3.3 | ||
| Hotels, Restaurants & Leisure | 2.6 | ||
| Chemicals | 2.6 | ||
| Professional Services | 2.5 | ||
| IT Services | 2.4 | ||
| Communications Equipment | 2.1 | ||
| Retail-Restaurants | 1.9 | ||
| Interactive Media & Services | 1.8 | ||
| Auto Components | 1.7 | ||
| Commercial Services | 1.6 | ||
| Health Care Equipment & Supplies | 1.5 | ||
| Aerospace & Defense | 1.4 | ||
| Machinery | 1.3 | ||
| Construction & Engineering | 1.2 | ||
| Computer Services | 1.1 | ||
| Entertainment | 1.1 | ||
| Electronic Equipment, Instruments & Components | 1.0 | ||
| Diversified Consumer Services | 1.0 | ||
| Cosmetics&Toiletries | 1.0 | ||
| Advertising Services | 0.9 | ||
| Machinery-Construction & Mining | 0.9 | ||
| Diversified Telecommunication Services | 0.8 | ||
| Real Estate Investment Trusts (REITs) | 0.8 |
Table of Contents
| % of Net Assets | |||
| Building Products | 0.7% | ||
| Construction Materials | 0.7 | ||
| Hand/Machine Tools and Related Products | 0.7 | ||
| Containers & Packaging | 0.6 | ||
| Finance-Other Services | 0.6 | ||
| Electrical Equipment | 0.6 | ||
| Industrial Conglomerates | 0.6 | ||
| Oil, Gas & Consumable Fuels | 0.5 | ||
| Telecommunication Equip | 0.5 | ||
| Casino Services | 0.5 | ||
| Retail-Petroleum Product | 0.5 | ||
| Food & Beverage | 0.5 | ||
| Internet & Catalog Retail | 0.3 | ||
| Financial Services | 0.3 | ||
| Capital Markets | 0.3 | ||
| Recycling | 0.3 | ||
| Pipelines | 0.3 | ||
| Food Products | 0.2 | ||
| Semiconductor Equipment | 0.2 | ||
| Containers-Paper/Plastic | 0.2 | ||
| Multiline Retail | 0.2 | ||
| Computers | 0.2 | ||
| Transport-Equip&Leasng | 0.2 | ||
| Apparel Manufacturers | 0.2 | ||
| Life Sciences Tools & Services | 0.1 | ||
| Trading Companies & Distributors | 0.1 | ||
| Thrifts & Mortgage Finance | 0.1 | ||
| Auto/Trk Prts&Equip-Repl | 0.1 | ||
| Communications Software | 0.1 | ||
| Retail-Apparel/Shoe | 0.1 | ||
| Automobiles | 0.1 | ||
| Home Furnishings | 0.1 | ||
| Health Care Technology | 0.0 * | ||
| Pollution Control | 0.0 * | ||
| Airlines | 0.0 * | ||
| Food & Staples Retailing | 0.0 * | ||
| Road & Rail | 0.0 * | ||
| Food-Misc/Diversified | 0.0 * | ||
| Consumer Finance | 0.0 * | ||
| Energy-Alternate Sources | 0.0 * | ||
| Short-Term Investment | 8.4 | ||
| Liabilities in Excess of Other Assets | (4.6) | ||
| TOTAL | 100.0% | ||
| * | Amount shown represents less than 0.05% of net assets. |
Table of Contents
| Security Description | Principal Amount | Value | |||
| SENIOR FLOATING RATE LOANS — 82.0% (a) | |||||
| ADVERTISING SERVICES — 0.9% | |||||
AppLovin Corp. Senior Secured 2018 Term Loan B, 1 Month USD LIBOR + 3.50%, 3.68%, 8/15/2025 | $ 3,053,713 | $ 2,972,270 | |||
Red Ventures LLC Senior Secured 2020 Term Loan B, 1 Month USD LIBOR + 2.50%, 2.68%, 11/8/2024 | 1,147,222 | 1,089,506 | |||
Terrier Media Buyer, Inc. Senior Secured Term Loan B, 1 Month USD LIBOR + 4.25%, 4.43%, 12/17/2026 | 9,604,487 | 9,196,296 | |||
| 13,258,072 | |||||
| AEROSPACE & DEFENSE — 1.2% | |||||
| TransDigm, Inc.: | |||||
Senior Secured 2020 Term Loan E, 1 Month USD LIBOR + 2.25%, 2.43%, 5/30/2025 | 1,718,996 | 1,552,871 | |||
Senior Secured 2020 Term Loan F, 1 Month USD LIBOR + 2.25%, 2.43%, 12/9/2025 | 13,064,372 | 11,826,719 | |||
Senior Secured 2020 Term Loan G, 1 Month USD LIBOR + 2.25%, 2.43%, 8/22/2024 | 4,456,612 | 4,052,130 | |||
| 17,431,720 | |||||
| AIRLINES — 0.0% (b) | |||||
American Airlines, Inc. Senior Secured 2017 1st Lien Term Loan, 1 Month USD LIBOR + 1.75%, 1.93%, 1/29/2027 | 4,709 | 3,616 | |||
| AUTO COMPONENTS — 1.7% | |||||
Belron Finance US LLC Senior Secured 2019 USD Term Loan B, 3 Month USD LIBOR + 2.50%, 3.26%, 10/30/2026 | 778,696 | 755,985 | |||
Panther BF Aggregator 2 L.P. Senior Secured USD Term Loan B, 1 Month USD LIBOR + 3.50%, 3.68%, 4/30/2026 | 17,301,021 | 16,544,102 | |||
| USI, Inc.: | |||||
Senior Secured 2017 Repriced Term Loan, 3 Month USD LIBOR + 3.00%, 3.31%, 5/16/2024 | 1,321,479 | 1,258,048 | |||
Senior Secured 2019 Incremental Term Loan B, 3 Month USD LIBOR + 4.00%, 4.31%, 12/2/2026 | 6,195,283 | 6,034,608 | |||
| 24,592,743 |
Table of Contents
| Security Description | Principal Amount | Value | |||
| BUILDING PRODUCTS — 0.7% | |||||
Builders FirstSource, Inc. Senior Secured 2017 Term Loan B, 3 Month USD LIBOR + 3.00%, 4.00%, 2/29/2024 | $ 216,417 | $ 209,429 | |||
CPG International, Inc. Senior Secured 2017 Term Loan, 12 Month USD LIBOR + 3.75%, 4.75%, 5/5/2024 | 2,588,894 | 2,571,911 | |||
Jeld-Wen, Inc. Senior Secured 2017 1st Lien Term Loan, 1 Month USD LIBOR + 2.00%, 2.18%, 12/14/2024 | 362,790 | 342,951 | |||
NCI Building Systems, Inc. Senior Secured 2018 Term Loan, 1 Month USD LIBOR + 3.75%, 3.94%, 4/12/2025 | 6,977,125 | 6,669,713 | |||
| 9,794,004 | |||||
| CAPITAL MARKETS — 0.3% | |||||
AqGen Ascensus, Inc. Senior Secured 2017 Repriced Term Loan, 3 Month USD LIBOR + 4.00%, 5.07%, 12/3/2022 | 3,751,046 | 3,668,223 | |||
| CASINO SERVICES — 0.5% | |||||
Stars Group Holdings B.V. Senior Secured 2018 USD Incremental Term Loan, 7/10/2025 (c) | 6,676,821 | 6,652,985 | |||
| CHEMICALS — 2.3% | |||||
Ascend Performance Materials Operations LLC Senior Secured 2019 Term Loan B, 3 Month USD LIBOR + 5.25%, 6.25%, 8/27/2026 | 3,957,563 | 3,894,915 | |||
Axalta Coating Systems US Holdings, Inc. Senior Secured USD Term Loan B3, 3 Month USD LIBOR + 1.75%, 2.06%, 6/1/2024 | 231,263 | 222,339 | |||
Composite Resins Holding B.V. Senior Secured 2018 Term Loan B, 6 Month USD LIBOR + 4.25%, 5.47%, 8/1/2025 | 7,006,642 | 6,726,376 | |||
Messer Industries GmbH Senior Secured 2018 USD Term Loan, 3 Month USD LIBOR + 2.50%, 2.81%, 3/1/2026 | 1,468,694 | 1,405,474 | |||
PQ Corporation Senior Secured 2020 USD Incremental Term Loan B, 2/7/2027 (c) | 2,313,167 | 2,239,435 | |||
Starfruit Finco B.V. Senior Secured 2018 USD Term Loan B, 1 Month USD LIBOR + 3.00%, 3.19%, 10/1/2025 | 18,858,020 | 17,773,684 | |||
| 32,262,223 |
Table of Contents
| Security Description | Principal Amount | Value | |||
| COMMERCIAL SERVICES — 0.5% | |||||
ERM Emerald US Inc. Senior Secured USD Term Loan B1, 3 Month USD LIBOR + 3.75%, 4.06%, 7/10/2026 | $ 5,103,093 | $ 4,918,106 | |||
LegalZoom.com, Inc. Senior Secured 2018 1st Lien Term Loan, 1 Month USD LIBOR + 4.50%, 4.68%, 11/21/2024 | 1,726,483 | 1,691,953 | |||
Wand NewCo 3, Inc. Senior Secured 2020 Term Loan, 3 Month USD LIBOR + 3.00%, 4.07%, 2/5/2026 | 368,518 | 351,014 | |||
| 6,961,073 | |||||
| COMMERCIAL SERVICES & SUPPLIES — 8.9% | |||||
Allied Universal Holdco LLC Senior Secured 2019 Term Loan B, 1 Month USD LIBOR + 4.25%, 4.43%, 7/10/2026 | 3,979,999 | 3,874,410 | |||
Ancestry.com Operations, Inc. Senior Secured 2019 Extended Term Loan B, 1 Month USD LIBOR + 4.25%, 5.25%, 8/27/2026 | 2,826,993 | 2,694,039 | |||
ASGN Incorporated Senior Secured 2019 Term Loan B3, 1 Month USD LIBOR + 1.75%, 1.93%, 4/2/2025 | 361,999 | 352,541 | |||
| Asurion LLC: | |||||
Senior Secured 2017 2nd Lien Term Loan, 1 Month USD LIBOR + 6.50%, 6.68%, 8/4/2025 | 31,913,822 | 31,834,037 | |||
Senior Secured 2017 Term Loan B4, 1 Month USD LIBOR + 3.00%, 3.18%, 8/4/2022 | 2,916,324 | 2,847,061 | |||
Senior Secured 2018 Term Loan B6, 3 Month USD LIBOR + 3.00%, 3.18%, 11/3/2023 | 11,567,650 | 11,224,206 | |||
Senior Secured 2018 Term Loan B7, 1 Month USD LIBOR + 3.00%, 3.18%, 11/3/2024 | 290,332 | 281,139 | |||
Cast and Crew Payroll LLC Senior Secured 2019 1st Lien Term Loan, 1 Month USD LIBOR + 3.75%, 3.93%, 2/9/2026 | 4,533,882 | 4,176,862 | |||
Coinamatic Canada, Inc. Senior Secured Canadian 1st Lien Term Loan, 1 Month USD LIBOR + 3.25%, 4.25%, 5/14/2022 | 249,220 | 240,082 | |||
Comet Acquisition, Inc. Senior Secured Term Loan, 3 Month USD LIBOR + 3.50%, 3.81%, 10/24/2025 | 4,029,545 | 3,767,625 | |||
Emerald TopCo, Inc. Senior Secured Term Loan, 3 Month USD LIBOR + 3.50%, 4.26%, 7/24/2026 | 539,743 | 523,551 |
Table of Contents
| Security Description | Principal Amount | Value | |||
EnergySolutions LLC Senior Secured 2018 Term Loan B, 3 Month USD LIBOR + 3.75%, 4.75%, 5/9/2025 | $ 5,243,350 | $ 4,867,559 | |||
Garda World Security Corporation Senior Secured 2018 1st Lien Term Loan B, 3 Month USD LIBOR + 4.75%, 4.93%, 10/30/2026 | 10,316,877 | 10,156,966 | |||
Guidehouse LLP Senior Secured 2018 Term Loan, 1 Month USD LIBOR + 4.50%, 4.68%, 5/1/2025 | 4,541,052 | 4,416,173 | |||
KAR Auction Services, Inc. Senior Secured 2019 Term Loan B6, 1 Month USD LIBOR + 2.25%, 2.50%, 9/19/2026 | 288,493 | 274,429 | |||
Learning Care Group, Inc. Senior Secured 2018 1st Lien Term Loan, 3 Month USD LIBOR + 3.25%, 4.25%, 3/13/2025 | 4,947,963 | 4,380,481 | |||
Lineage Logistics Holdings LLC Senior Secured 2018 Term Loan, 1 Month USD LIBOR + 3.00%, 4.00%, 2/27/2025 | 941,880 | 914,801 | |||
National Intergovernmental Purchasing Alliance Co. Senior Secured 1st Lien Term Loan, 3 Month USD LIBOR + 3.75%, 4.06%, 5/23/2025 | 5,626,273 | 5,457,485 | |||
Packers Holdings LLC Senior Secured 2017 Term Loan B, 1 Month USD LIBOR + 3.00%, 4.00%, 12/4/2024 | 804,632 | 775,666 | |||
Prime Security Services Borrower LLC Senior Secured 2019 Term Loan B1, 6 Month USD LIBOR + 3.25%, 4.25%, 9/23/2026 | 3,680,418 | 3,548,162 | |||
SSH Group Holdings, Inc. Senior Secured 2018 1st Lien Term Loan, 3 Month USD LIBOR + 4.25%, 4.56%, 7/30/2025 | 5,087,361 | 4,743,964 | |||
TruGreen Ltd. Partnership Senior Secured 2019 Term Loan, 1 Month USD LIBOR + 3.75%, 3.93%, 3/19/2026 | 6,605,999 | 6,440,849 | |||
USS Ultimate Holdings, Inc. Senior Secured 1st Lien Term Loan, 3 Month USD LIBOR + 3.75%, 4.75%, 8/25/2024 | 805,279 | 760,582 | |||
Verscend Holding Corp. Senior Secured 2018 Term Loan B, 1 Month USD LIBOR + 4.50%, 4.68%, 8/27/2025 | 15,573,943 | 15,104,778 | |||
VT Topco, Inc. Senior Secured 2018 1st Lien Term Loan, 1 Month USD LIBOR + 3.50%, 3.68%, 8/1/2025 | 4,535,559 | 4,195,392 | |||
| 127,852,840 |
Table of Contents
| Security Description | Principal Amount | Value | |||
| COMMUNICATIONS EQUIPMENT — 2.1% | |||||
Avaya, Inc. Senior Secured 2018 Term Loan B, 1 Month USD LIBOR + 4.25%, 4.43%, 12/15/2024 | $ 14,651,905 | $ 13,574,990 | |||
CommScope, Inc. Senior Secured 2019 Term Loan B, 1 Month USD LIBOR + 3.25%, 3.43%, 4/6/2026 | 10,481,944 | 9,966,600 | |||
Securus Technologies Holdings, Inc. Senior Secured 2017 1st Lien Term Loan, 6 Month USD LIBOR + 4.50%, 5.50%, 11/1/2024 | 1,567,883 | 1,310,812 | |||
Zayo Group Holdings, Inc. Senior Secured USD Term Loan, 1 Month USD LIBOR + 3.00%, 3.18%, 3/9/2027 | 5,204,428 | 4,956,957 | |||
| 29,809,359 | |||||
| COMPUTER SERVICES — 1.1% | |||||
ConvergeOne Holdings, Inc. Senior Secured 2019 Term Loan, 1 Month USD LIBOR + 5.00%, 5.18%, 1/4/2026 | 7,144,312 | 6,077,774 | |||
Genuine Financial Holdings LLC Senior Secured 2018 1st Lien Term Loan, 1 Month USD LIBOR + 3.75%, 3.93%, 7/12/2025 | 8,809,083 | 7,945,792 | |||
Perforce Software, Inc. Senior Secured 2020 Term Loan B, 1 Month USD LIBOR + 3.75%, 3.93%, 7/1/2026 | 1,991,699 | 1,926,969 | |||
Tempo Acquisition LLC Senior Secured Term Loan, 1 Month USD LIBOR + 2.75%, 2.93%, 5/1/2024 | 459,838 | 438,283 | |||
| 16,388,818 | |||||
| COMPUTERS — 0.2% | |||||
Brave Parent Holdings, Inc. Senior Secured 1st Lien Term Loan, 1 Month USD LIBOR + 4.00%, 4.18%, 4/18/2025 | 2,924,012 | 2,833,850 | |||
| CONSTRUCTION & ENGINEERING — 1.2% | |||||
CNT Holdings III Corp. Senior Secured 2017 Term Loan, 3 Month USD LIBOR + 3.00%, 4.08%, 1/22/2023 | 1,300,778 | 1,271,719 | |||
| Dynasty Acquisition Co., Inc.: | |||||
Senior Secured 2020 CAD Term Loan B2, 3 Month USD LIBOR + 3.50%, 3.81%, 4/6/2026 | 5,660,562 | 4,875,158 | |||
Senior Secured 2020 Term Loan B1, 3 Month USD LIBOR + 3.50%, 3.81%, 4/6/2026 | 10,528,644 | 9,067,795 |
Table of Contents
| Security Description | Principal Amount | Value | |||
MX Holdings US, Inc. Senior Secured 2018 USD Term Loan B1C, 1 Month USD LIBOR + 2.75%, 3.50%, 7/31/2025 | $ 974,754 | $ 952,822 | |||
Pike Corp. Senior Secured 2019 Term Loan B, 1 Month USD LIBOR + 3.25%, 4.25%, 7/24/2026 | 1,067,472 | 1,039,931 | |||
| 17,207,425 | |||||
| CONSTRUCTION MATERIALS — 0.2% | |||||
Forterra Finance LLC Senior Secured 2017 Term Loan B, 10/25/2023 (c) | 646,010 | 629,860 | |||
Quikrete Holdings, Inc. Senior Secured 2016 1st Lien Term Loan, 1 Month USD LIBOR + 2.50%, 2.68%, 2/1/2027 | 877,171 | 846,746 | |||
Tamko Building Products LLC Senior Secured Term Loan B, 1 Month USD LIBOR + 3.25%, 3.43%, 6/1/2026 | 1,451,568 | 1,400,763 | |||
| 2,877,369 | |||||
| CONSUMER FINANCE — 0.0% (b) | |||||
Amentum Government Services Holdings LLC Senior Secured Term Loan B, 1 Month USD LIBOR + 4.00%, 4.18%, 2/1/2027 | 733,945 | 722,628 | |||
| CONTAINERS & PACKAGING — 0.6% | |||||
Berlin Packaging LLC Senior Secured 2018 1st Lien Term Loan, 3 Month USD LIBOR + 3.00%, 3.31%, 11/7/2025 | 1,265,323 | 1,203,639 | |||
Berry Global, Inc. Senior Secured Term Loan Y, 1 Month USD LIBOR + 2.00%, 2.18%, 7/1/2026 | 1,994,962 | 1,912,799 | |||
Charter NEX US Holdings, Inc. Senior Secured Incremental Term Loan, 1 Month USD LIBOR + 3.25%, 3.43%, 5/16/2024 | 2,264,170 | 2,177,000 | |||
Reynolds Group Holdings, Inc. Senior Secured USD 2017 Term Loan, 1 Month USD LIBOR + 2.75%, 2.93%, 2/5/2023 | 534,595 | 512,104 | |||
Trident TPI Holdings, Inc. Senior Secured 2017 USD Term Loan B1, 3 Month USD LIBOR + 3.00%, 4.07%, 10/17/2024 | 3,130,971 | 2,996,605 | |||
| 8,802,147 |
Table of Contents
| Security Description | Principal Amount | Value | |||
| CONTAINERS-PAPER/PLASTIC — 0.2% | |||||
Flex Acquisition Company, Inc. Senior Secured 1st Lien Term Loan, 3 Month USD LIBOR + 3.00%, 4.43%, 12/29/2023 | $ 2,810,242 | $ 2,693,308 | |||
| COSMETICS&TOILETRIES — 1.0% | |||||
Sunshine Luxembourg VII SARL Senior Secured USD Term Loan B1, 6 Month USD LIBOR + 4.25%, 5.32%, 10/1/2026 | 14,704,128 | 14,131,329 | |||
| DIVERSIFIED CONSUMER SERVICES — 1.0% | |||||
Cambium Learning Group, Inc. Senior Secured Term Loan B, 3 Month USD LIBOR + 4.50%, 4.81%, 12/18/2025 | 9,945,524 | 9,531,144 | |||
GI Revelation Acquisition LLC Senior Secured 2018 1st Lien Term Loan, 1 Month USD LIBOR + 5.00%, 5.18%, 4/16/2025 | 3,769,040 | 3,451,799 | |||
WASH Multifamily Laundry Systems LLC Senior Secured 2015 1st Lien Term Loan, 1 Month USD LIBOR + 3.25%, 4.25%, 5/14/2022 | 1,705,625 | 1,643,089 | |||
| 14,626,032 | |||||
| DIVERSIFIED FINANCIAL SERVICES — 3.6% | |||||
Advisor Group, Inc. Senior Secured 2019 Term Loan B, 1 Month USD LIBOR + 5.00%, 5.18%, 7/31/2026 | 5,502,340 | 5,129,557 | |||
Deerfield Dakota Holding LLC Senior Secured 2020 USD Term Loan B, 1 Month USD LIBOR + 3.75%, 4.75%, 4/9/2027 | 7,718,735 | 7,522,563 | |||
| Edelman Financial Center LLC: | |||||
Senior Secured 2018 1st Lien Term Loan, 1 Month USD LIBOR + 3.00%, 3.18%, 7/21/2025 | 3,940,098 | 3,775,717 | |||
Senior Secured 2018 2nd Lien Term Loan, 1 Month USD LIBOR + 6.75%, 6.93%, 7/20/2026 | 769,231 | 705,050 | |||
Ellie Mae, Inc. Senior Secured Term Loan, 3 Month USD LIBOR + 3.75%, 4.06%, 4/17/2026 | 3,559,387 | 3,464,174 | |||
IG Investment Holdings LLC Senior Secured 2018 1st Lien Term Loan, 3 Month USD LIBOR + 4.00%, 5.00%, 5/23/2025 | 4,479,151 | 4,194,725 | |||
LDiscovery LLC Senior Secured Term Loan, 3 Month USD LIBOR + 5.88%, 7.25%, 12/9/2022 | 8,511,602 | 8,171,138 |
Table of Contents
| Security Description | Principal Amount | Value | |||
Minotaur Acquisition, Inc. Senior Secured Term Loan B, 1 Month USD LIBOR + 5.00%, 5.18%, 3/27/2026 | $ 5,405,892 | $ 5,022,966 | |||
UFC Holdings LLC Senior Secured 2019 Term Loan, 6 Month USD LIBOR + 3.25%, 4.25%, 4/29/2026 | 4,401,756 | 4,222,010 | |||
William Morris Endeavor Entertainment LLC Senior Secured 2018 1st Lien Term Loan, 1 Month USD LIBOR + 2.75%, 2.93%, 5/18/2025 | 11,638,822 | 9,585,384 | |||
| 51,793,284 | |||||
| DIVERSIFIED TELECOMMUNICATION SERVICES — 0.8% | |||||
Altice France S.A. Senior Secured USD Term Loan B12, 1 Month USD LIBOR + 3.69%, 3.87%, 1/31/2026 | 6,344,346 | 6,103,832 | |||
Consolidated Communications, Inc. Senior Secured 2016 Term Loan B, 1 Month USD LIBOR + 3.00%, 4.00%, 10/4/2023 | 4,801,037 | 4,572,676 | |||
Telesat Canada Senior Secured Term Loan B5, 1 Month USD LIBOR + 2.75%, 2.93%, 12/7/2026 | 344,570 | 332,366 | |||
| 11,008,874 | |||||
| ELECTRICAL EQUIPMENT — 0.3% | |||||
EXC Holdings III Corp. Senior Secured USD 2017 1st Lien Term Loan, 3 Month USD LIBOR + 3.50%, 4.50%, 12/2/2024 | 4,552,265 | 4,464,998 | |||
| ELECTRONIC EQUIPMENT, INSTRUMENTS & COMPONENTS — 1.0% | |||||
CPI International, Inc. Senior Secured 2017 1st Lien Term Loan, 1 Month USD LIBOR + 3.50%, 4.50%, 7/26/2024 | 2,714,771 | 2,574,498 | |||
GrafTech Finance, Inc. Senior Secured 2018 Term Loan B, 1 Month USD LIBOR + 3.50%, 4.50%, 2/12/2025 | 10,027,672 | 9,797,888 | |||
Vertiv Group Corporation Senior Secured Term Loan B, 1 Month USD LIBOR + 3.00%, 3.18%, 3/2/2027 | 1,995,000 | 1,905,225 | |||
| 14,277,611 |
Table of Contents
| Security Description | Principal Amount | Value | |||
| ENERGY-ALTERNATE SOURCES — 0.0% (b) | |||||
Granite Acquisition Inc. Senior Secured Term Loan B, 3 Month USD LIBOR + 3.50%, 4.50%, 12/19/2021 | $ 262,736 | $ 258,532 | |||
| ENTERTAINMENT — 0.9% | |||||
Crown Finance US, Inc. Senior Secured 2019 Incremental Term Loan, 9/30/2026 (c) | 1,492,481 | 1,116,562 | |||
Diamond Sports Group LLC Senior Secured Term Loan, 3 Month USD LIBOR + 3.25%, 3.43%, 8/24/2026 | 12,015,804 | 9,837,940 | |||
| Motion Finco Sarl: | |||||
Senior Secured Delayed Draw Term Loan B2, 6 Month USD LIBOR + 3.25%, 4.32%, 11/4/2026 | 163,313 | 148,615 | |||
Senior Secured USD Term Loan B1, 6 Month USD LIBOR + 3.25%, 4.32%, 11/13/2026 | 1,232,216 | 1,121,317 | |||
SMG US Midco 2, Inc. Senior Secured 2020 Term Loan, 3 Month USD LIBOR + 2.50%, 3.52%, 1/23/2025 | 1,483,287 | 1,316,417 | |||
| 13,540,851 | |||||
| FINANCE-OTHER SERVICES — 0.6% | |||||
Veritas Bermuda, Ltd. Senior Secured USD Repriced Term Loan B, 3 Month USD LIBOR + 4.50%, 5.50%, 1/27/2023 | 8,721,913 | 8,105,928 | |||
| FINANCIAL SERVICES — 0.3% | |||||
AI Alpine AT Bidco GmbH Senior Secured 2018 USD Term Loan B, 6 Month USD LIBOR + 3.00%, 4.21%, 10/31/2025 | 3,990,329 | 3,641,175 | |||
| FOOD & STAPLES RETAILING — 0.0% (b) | |||||
Hostess Brands LLC Senior Secured 2019 Term Loan, 1 Month USD LIBOR + 2.25%, 3.01%, 8/3/2025 | 211,088 | 204,333 | |||
| FOOD PRODUCTS — 0.2% | |||||
Chobani LLC Senior Secured 2017 Term Loan B, 1 Month USD LIBOR + 3.50%, 4.50%, 10/10/2023 | 1,827,508 | 1,766,123 |
Table of Contents
| Security Description | Principal Amount | Value | |||
Dole Food Co., Inc. Senior Secured 2017 Term Loan B, 1 Month USD LIBOR + 2.75%, 3.75%, 4/6/2024 | $ 528,286 | $ 515,628 | |||
| 2,281,751 | |||||
| FOOD-MISC/DIVERSIFIED — 0.0% (b) | |||||
Froneri International Ltd. Senior Secured 2020 USD Term Loan, 1 Month USD LIBOR + 2.25%, 2.43%, 1/29/2027 | 278,195 | 262,374 | |||
| HAND/MACHINE TOOLS AND RELATED PRODUCTS — 0.7% | |||||
Apex Tool Group LLC Senior Secured 2019 Term Loan B, 1 Month USD LIBOR + 5.25%, 6.50%, 8/1/2024 | 10,697,779 | 9,645,064 | |||
| HEALTH CARE EQUIPMENT & SUPPLIES — 1.0% | |||||
Carestream Health, Inc. Senior Secured 2020 Extended 2nd Lien PIK Term Loan, 3 Month USD LIBOR + 4.50%, 5.57%, 8/8/2023 | 17,678,213 | 14,230,961 | |||
| HEALTH CARE PROVIDERS & SERVICES — 9.6% | |||||
Agiliti Health, Inc. Senior Secured Term Loan, 1 Month USD LIBOR + 3.00%, 3.19%, 1/4/2026 | 1,135,019 | 1,100,968 | |||
Alphabet Holding Company, Inc. Senior Secured 2017 1st Lien Term Loan, 1 Month USD LIBOR + 3.50%, 3.68%, 9/26/2024 | 11,182,745 | 10,557,182 | |||
American Renal Holdings Inc. Senior Secured 2017 Term Loan B, 1 Month USD LIBOR + 5.00%, 5.18%, 6/21/2024 | 520,624 | 491,990 | |||
Athenahealth, Inc. Senior Secured 2019 Term Loan B, 3 Month USD LIBOR + 4.50%, 4.82%, 2/11/2026 | 13,947,016 | 13,563,473 | |||
Auris Luxembourg III S.a.r.l. Senior Secured 2019 USD Term Loan B2, 1 Month USD LIBOR + 3.75%, 3.93%, 2/27/2026 | 1,519,233 | 1,336,925 | |||
Certara L.P. Senior Secured 2018 Term Loan B, 3 Month USD LIBOR + 3.50%, 3.81%, 8/15/2024 | 1,631,214 | 1,525,185 | |||
CHG Healthcare Services, Inc. Senior Secured 2017 1st Lien Term Loan B, 3 Month USD LIBOR + 3.00%, 4.07%, 6/7/2023 | 8,134,254 | 7,864,116 |
Table of Contents
| Security Description | Principal Amount | Value | |||
CPI Holdco LLC Senior Secured 2019 Term Loan, 3 Month USD LIBOR + 4.25%, 4.43%, 11/4/2026 | $ 514,175 | $ 497,465 | |||
Envision Healthcare Corporation Senior Secured 2018 1st Lien Term Loan, 1 Month USD LIBOR + 3.75%, 3.93%, 10/10/2025 | 29,055,519 | 19,321,920 | |||
ExamWorks Group, Inc. Senior Secured 2017 Term Loan, 3 Month USD LIBOR + 3.25%, 4.32%, 7/27/2023 | 2,961,638 | 2,904,256 | |||
| Global Medical Response, Inc.: | |||||
Senior Secured 2017 Term Loan B2, 3 Month USD LIBOR + 4.25%, 5.25%, 3/14/2025 | 9,976,811 | 9,571,503 | |||
Senior Secured 2018 Term Loan B1, 3 Month USD LIBOR + 3.25%, 4.25%, 4/28/2022 | 2,169,536 | 2,094,155 | |||
Loire Finco Luxembourg S.a.r.l. Senior Secured Term Loan, 1 Month USD LIBOR + 3.5%, 3.68%, 4/21/2027 | 2,800,000 | 2,705,500 | |||
MPH Acquisition Holdings LLC Senior Secured 2016 Term Loan B, 3 Month USD LIBOR + 2.75%, 3.75%, 6/7/2023 | 12,864,150 | 12,267,382 | |||
Ortho-Clinical Diagnostics SA Senior Secured 2018 Term Loan B, 1 Month USD LIBOR + 3.25%, 3.43%, 6/30/2025 | 15,063,327 | 14,131,359 | |||
| Pathway Vet Alliance LLC: | |||||
Senior Secured 2020 Delayed Draw Term Loan, 3/31/2027 (c) | 303,692 | 295,720 | |||
Senior Secured 2020 Term Loan, 3/31/2027 (c) | 3,727,370 | 3,629,527 | |||
Phoenix Guarantor Inc Senior Secured 2020 Term Loan B, 1 Month USD LIBOR + 3.25%, 3.43%, 3/5/2026 | 4,049,164 | 3,911,492 | |||
RegionalCare Hospital Partners Holdings, Inc. Senior Secured 2018 Term Loan B, 1 Month USD LIBOR + 3.75%, 3.93%, 11/17/2025 | 8,811,947 | 8,287,328 | |||
Surgery Center Holdings, Inc. Senior Secured 2017 Term Loan B, 1 Month USD LIBOR + 3.25%, 4.25%, 9/3/2024 | 5,821,066 | 5,151,643 | |||
Team Health Holdings, Inc. Senior Secured 1st Lien Term Loan, 1 Month USD LIBOR + 2.75%, 3.75%, 2/6/2024 | 20,816,245 | 16,080,654 | |||
| 137,289,743 | |||||
| HEALTH CARE TECHNOLOGY — 0.0% (b) | |||||
Change Healthcare Holdings LLC. Senior Secured 2017 Term Loan B, 3 Month USD LIBOR + 2.50%, 3.50%, 3/1/2024 | 276,315 | 266,355 |
Table of Contents
| Security Description | Principal Amount | Value | |||
| HOTELS, RESTAURANTS & LEISURE — 2.5% | |||||
1011778 B.C. Unlimited Liability Co. Senior Secured Term Loan B4, 1 Month USD LIBOR + 1.75%, 1.93%, 11/19/2026 | $ 442,937 | $ 420,846 | |||
Alterra Mountain Company Senior Secured Term Loan B1, 1 Month USD LIBOR + 2.75%, 2.93%, 7/31/2024 | 380,031 | 359,724 | |||
Caesars Resort Collection LLC Senior Secured 2017 1st Lien Term Loan B, 1 Month USD LIBOR + 2.75%, 2.93%, 12/23/2024 | 12,351,832 | 11,029,815 | |||
Delta 2 (LUX) S.A.R.L. Senior Secured 2018 USD Term Loan, 1 Month USD LIBOR + 2.50%, 3.50%, 2/1/2024 | 3,232,248 | 3,088,833 | |||
Fogo De Chao, Inc. Senior Secured 2018 Add On Term Loan, 3 Month USD LIBOR + 4.25%, 5.25%, 4/7/2025 | 3,498,752 | 2,536,595 | |||
Scientific Games International, Inc. Senior Secured 2018 Term Loan B5, 6 Month USD LIBOR + 2.75%, 3.61%, 8/14/2024 | 12,616,503 | 11,216,071 | |||
| Travelport Finance (Luxembourg) S.a.r.l.: | |||||
Senior Secured 2019 2nd Lien Term Loan, 3 Month USD LIBOR + 9.00%, 10.07%, 5/28/2027 | 19,300,000 | 6,214,600 | |||
Senior Secured 2019 Term Loan, 3 Month USD LIBOR + 5.00%, 6.07%, 5/29/2026 | 1,468,512 | 979,564 | |||
| 35,846,048 | |||||
| INSURANCE — 3.4% | |||||
| Alliant Holdings Intermediate LLC: | |||||
Senior Secured 2018 Term Loan B, 1 Month USD LIBOR + 2.75%, 2.93%, 5/9/2025 | 691,347 | 658,315 | |||
Senior Secured Term Loan B, 1 Month USD LIBOR + 3.25%, 3.44%, 5/9/2025 | 1,572,353 | 1,502,580 | |||
AmWINS Group, Inc. Senior Secured 2017 Term Loan B, 1 Month USD LIBOR + 2.75%, 3.75%, 1/25/2024 | 606,526 | 590,702 | |||
AssuredPartners, Inc. Senior Secured 2020 Term Loan B, 1 Month USD LIBOR + 3.50%, 3.68%, 2/12/2027 | 5,858,408 | 5,620,410 | |||
Broadstreet Partners, Inc. Senior Secured 2020 Term Loan B, 1 Month USD LIBOR + 3.25%, 3.43%, 1/27/2027 | 310,535 | 296,853 | |||
| Hub International, Ltd.: | |||||
Senior Secured 2018 Term Loan B, 3 Month USD LIBOR + 3.00%, 4.02%, 4/25/2025 | 12,017,533 | 11,464,246 |
Table of Contents
| Security Description | Principal Amount | Value | |||
Senior Secured 2019 Incremental Term Loan B, 3 Month USD LIBOR + 4.00%, 5.00%, 4/25/2025 | $ 5,410,659 | $ 5,345,731 | |||
NFP Corp. Senior Secured 2020 Term Loan, 1 Month USD LIBOR + 3.25%, 3.43%, 2/15/2027 | 10,508,620 | 9,825,559 | |||
| Sedgwick Claims Management Services, Inc.: | |||||
Senior Secured 2018 Term Loan B, 1 Month USD LIBOR + 3.25%, 3.43%, 12/31/2025 | 7,674,539 | 7,268,901 | |||
Senior Secured 2019 Term Loan B, 1 Month USD LIBOR + 4.00%, 4.18%, 9/3/2026 | 6,018,145 | 5,800,619 | |||
| 48,373,916 | |||||
| INTERACTIVE MEDIA & SERVICES — 1.8% | |||||
Ivanti Software, Inc. Senior Secured 2017 Term Loan B, 1 Month USD LIBOR + 4.25%, 5.25%, 1/20/2024 | 9,472,420 | 9,081,683 | |||
Rackspace Hosting, Inc. Senior Secured 2017 Incremental 1st Lien Term Loan, 3 Month USD LIBOR + 3.00%, 4.00%, 11/3/2023 | 17,613,103 | 16,861,200 | |||
| 25,942,883 | |||||
| INTERNET & CATALOG RETAIL — 0.3% | |||||
Harbor Freight Tools USA, Inc. Senior Secured 2018 Term Loan B, 1 Month USD LIBOR + 2.50%, 3.25%, 8/18/2023 | 4,534,066 | 4,377,278 | |||
| IT SERVICES — 2.4% | |||||
Access CIG LLC Senior Secured 2018 1st Lien Term Loan, 1 Month USD LIBOR + 3.75%, 3.92%, 2/27/2025 | 13,547,110 | 12,940,335 | |||
Presidio, Inc. Senior Secured 2020 Term Loan B, 3 Month USD LIBOR + 3.50%, 4.27%, 1/22/2027 | 1,477,612 | 1,430,513 | |||
TierPoint LLC Senior Secured 2017 1st Lien Term Loan, 1 Month USD LIBOR + 3.75%, 4.75%, 5/6/2024 | 3,080,659 | 2,948,361 | |||
TKC Holdings, Inc. Senior Secured 2017 1st Lien Term Loan, 3 Month USD LIBOR + 3.75%, 4.75%, 2/1/2023 | 6,671,461 | 6,273,809 | |||
Verra Mobility Corporation Senior Secured 2020 Term Loan B, 3 Month USD LIBOR + 3.25%, 3.56%, 2/28/2025 | 2,911,332 | 2,787,600 |
Table of Contents
| Security Description | Principal Amount | Value | |||
Web.com Group, Inc. Senior Secured 2018 Term Loan B, 1 Month USD LIBOR + 3.75%, 3.94%, 10/10/2025 | $ 9,092,055 | $ 8,648,817 | |||
| 35,029,435 | |||||
| LIFE SCIENCES TOOLS & SERVICES — 0.1% | |||||
Albany Molecular Research, Inc. Senior Secured 2017 1st Lien Term Loan, 3 Month USD LIBOR + 3.25%, 4.25%, 8/30/2024 | 1,183,369 | 1,148,756 | |||
eResearchTechnology, Inc. Senior Secured 2020 1st Lien Term Loan, 1 Month USD LIBOR + 4.50%, 5.50%, 2/4/2027 | 1,000,000 | 982,750 | |||
| 2,131,506 | |||||
| MACHINERY — 1.3% | |||||
Engineered Machinery Holdings, Inc. Senior Secured USD 1st Lien Term Loan, 3 Month USD LIBOR + 3.00%, 4.00%, 7/19/2024 | 4,875,000 | 4,659,671 | |||
Gardner Denver, Inc. Senior Secured 2020 USD Term Loan B, 3/1/2027 (c) | 2,272,727 | 2,214,489 | |||
Hillman Group, Inc. Senior Secured 2018 Term Loan B, 6 Month USD LIBOR + 4.00%, 5.07%, 5/31/2025 | 7,079,301 | 6,683,320 | |||
Titan Acquisition, Ltd. Senior Secured 2018 Term Loan B, 3 Month USD LIBOR + 3.00%, 3.36%, 3/28/2025 | 6,170,458 | 5,669,139 | |||
| 19,226,619 | |||||
| MACHINERY-CONSTRUCTION & MINING — 0.9% | |||||
Brookfield WEC Holdings Inc. Senior Secured 2020 Term Loan, 1 Month USD LIBOR + 3.00%, 3.75%, 8/1/2025 | 10,606,370 | 10,274,920 | |||
Clear Channel Outdoor Holdings, Inc. Senior Secured Term Loan B, 3 Month USD LIBOR + 3.50%, 4.26%, 8/21/2026 | 2,862,247 | 2,610,370 | |||
| 12,885,290 | |||||
| MEDIA — 3.9% | |||||
Entercom Media Corp. Senior Secured 2019 Term Loan, 1 Month USD LIBOR + 2.50%, 2.68%, 11/18/2024 | 3,996,415 | 3,750,815 | |||
Entravision Communications Corp. Senior Secured 2017 Term Loan B, 1 Month USD LIBOR + 2.75%, 2.93%, 11/29/2024 | 4,526,006 | 4,202,102 |
Table of Contents
| Security Description | Principal Amount | Value | |||
iHeartCommunications, Inc. Senior Secured 2020 Term Loan, 1 Month USD LIBOR + 3.00%, 3.18%, 5/1/2026 | $ 947,215 | $ 876,965 | |||
MH Sub I LLC Senior Secured 2017 1st Lien Term Loan, 3 Month USD LIBOR + 3.50%, 4.57%, 9/13/2024 | 15,572,581 | 15,064,681 | |||
Nexstar Broadcasting, Inc. Senior Secured 2019 Term Loan B4, 1 Month USD LIBOR + 2.75%, 2.92%, 9/18/2026 | 387,524 | 370,017 | |||
| Nielsen Finance LLC: | |||||
Senior Secured 2020 USD Term Loan B5, 1 Month USD LIBOR + 3.75%, 4.75%, 6/4/2025 | 2,064,220 | 2,050,029 | |||
Senior Secured USD Term Loan B4, 1 Month USD LIBOR + 2.00%, 2.18%, 10/4/2023 | 493 | 493 | |||
Radiate Holdco LLC Senior Secured 1st Lien Term Loan, 1 Month USD LIBOR + 3.00%, 3.75%, 2/1/2024 | 12,914,208 | 12,367,807 | |||
Recorded Books Inc. Senior Secured 2018 Term Loan B, 1 Month USD LIBOR + 4.25%, 4.44%, 8/29/2025 | 2,865,797 | 2,790,570 | |||
Univision Communications Inc. Senior Secured 2020 Term Loan B, 3 Month USD LIBOR + 3.75%, 4.75%, 3/13/2026 | 2,341,797 | 2,194,264 | |||
WideOpenWest Finance LLC Senior Secured 2017 Term Loan B, 1 Month USD LIBOR + 3.25%, 4.25%, 8/18/2023 | 11,319,774 | 10,835,175 | |||
Ziggo Financing Partnership Senior Secured USD Term Loan I, 1 Month USD LIBOR + 2.50%, 2.68%, 4/30/2028 | 732,057 | 693,321 | |||
| 55,196,239 | |||||
| MULTILINE RETAIL — 0.2% | |||||
AI Aqua Merger Sub, Inc. Senior Secured 2017 1st Lien Term Loan B, 3 Month USD LIBOR + 3.25%, 4.32%, 12/13/2023 | 3,207,620 | 3,091,344 | |||
| OIL, GAS & CONSUMABLE FUELS — 0.5% | |||||
EG America LLC Senior Secured 2018 USD Term Loan, 6 Month USD LIBOR + 4.00%, 5.07%, 2/7/2025 | 8,014,406 | 7,546,926 |
Table of Contents
| Security Description | Principal Amount | Value | |||
| PHARMACEUTICALS — 2.5% | |||||
Amneal Pharmaceuticals LLC Senior Secured 2018 Term Loan B, 1 Month USD LIBOR + 3.50%, 3.69%, 5/4/2025 | $ 13,973,667 | $ 12,836,560 | |||
Arbor Pharmaceuticals, Inc. Senior Secured Term Loan B, 6 Month USD LIBOR + 5.00%, 6.00%, 7/5/2023 | 4,463,380 | 4,088,189 | |||
Endo Luxembourg Finance Co. I S.a.r.l. Senior Secured 2017 Term Loan B, 1 Month USD LIBOR + 4.25%, 5.00%, 4/29/2024 | 17,426,198 | 16,535,806 | |||
Packaging Coordinators Midco, Inc. Senior Secured 1st Lien Term Loan, 6 Month USD LIBOR + 4.00%, 5.08%, 6/30/2023 | 974,938 | 957,467 | |||
Pearl Intermediate Parent LLC Senior Secured 2018 1st Lien Term Loan, 1 Month USD LIBOR + 2.75%, 2.93%, 2/14/2025 | 1,950,247 | 1,862,486 | |||
| 36,280,508 | |||||
| PIPELINES — 0.3% | |||||
Buckeye Partners, L.P. Senior Secured 2019 Term Loan B, 1 Month USD LIBOR + 2.75%, 2.92%, 11/1/2026 | 997,500 | 958,847 | |||
Lower Cadence Holdings LLC Senior Secured Term Loan B, 1 Month USD LIBOR + 4.00%, 4.18%, 5/22/2026 | 3,353,113 | 3,001,036 | |||
| 3,959,883 | |||||
| POLLUTION CONTROL — 0.0% (b) | |||||
Core & Main L.P. Senior Secured 2017 Term Loan B, 3 Month USD LIBOR + 2.75%, 3.75%, 8/1/2024 | 148,012 | 141,767 | |||
| PROFESSIONAL SERVICES — 2.5% | |||||
Advantage Sales & Marketing, Inc. Senior Secured 2014 2nd Lien Term Loan, 3 Month USD LIBOR + 6.50%, 7.50%, 7/25/2022 | 14,369,542 | 11,994,688 | |||
Dun & Bradstreet Corp. Senior Secured Term Loan, 1 Month USD LIBOR + 4.00%, 4.18%, 2/6/2026 | 14,126,316 | 13,799,645 | |||
KUEHG Corp. Senior Secured 2018 Incremental Term Loan, 3 Month USD LIBOR + 3.75%, 4.75%, 2/21/2025 | 11,196,816 | 9,593,264 | |||
| 35,387,597 |
Table of Contents
| Security Description | Principal Amount | Value | |||
| RECYCLING — 0.3% | |||||
Tunnel Hill Partners LP Senior Secured Term Loan B, 3 Month USD LIBOR + 3.50%, 3.81%, 2/6/2026 | $ 4,684,071 | $ 4,274,215 | |||
| RETAIL-RESTAURANTS — 1.8% | |||||
IRB Holding Corp Senior Secured 2020 Term Loan B, 1 Month USD LIBOR + 2.75%, 3.75%, 2/5/2025 | 14,971,545 | 13,878,098 | |||
K-Mac Holdings Corp. Senior Secured 2018 1st Lien Term Loan, 1 Month USD LIBOR + 3.00%, 3.18%, 3/14/2025 | 4,739,885 | 4,463,953 | |||
SRS Distribution, Inc. Senior Secured 2018 1st Lien Term Loan, 3 Month USD LIBOR + 3.25%, 4.32%, 5/23/2025 | 4,695,042 | 4,455,594 | |||
Tacala LLC Senior Secured 1st Lien Term Loan, 1 Month USD LIBOR + 3.50%, 3.68%, 2/5/2027 | 3,365,079 | 3,189,809 | |||
| 25,987,454 | |||||
| ROAD & RAIL — 0.0% (b) | |||||
Avis Budget Car Rental LLC Senior Secured 2020 Term Loan B, 1 Month USD LIBOR + 2.25%, 2.43%, 8/6/2027 | 288,582 | 258,642 | |||
| SEMICONDUCTOR EQUIPMENT — 0.2% | |||||
MA FinanceCo. LLC Senior Secured USD Term Loan B3, 1 Month USD LIBOR + 2.50%, 2.68%, 6/21/2024 | 296,343 | 278,192 | |||
Seattle Spinco, Inc. Senior Secured USD Term Loan B3, 1 Month USD LIBOR + 2.50%, 2.68%, 6/21/2024 | 2,001,279 | 1,878,700 | |||
| 2,156,892 | |||||
| SOFTWARE — 8.6% | |||||
Applied Systems, Inc. Senior Secured 2017 1st Lien Term Loan, 3 Month USD LIBOR + 3.25%, 4.25%, 9/19/2024 | 1,240,784 | 1,210,043 | |||
Banff Merger Sub, Inc. Senior Secured 2018 USD Term Loan B, 1 Month USD LIBOR + 4.25%, 4.43%, 10/2/2025 | 18,789,091 | 17,848,603 | |||
CCC Information Services, Inc. Senior Secured 2017 1st Lien Term Loan, 1 Month USD LIBOR + 3.00%, 4.00%, 4/29/2024 | 562,876 | 546,223 |
Table of Contents
| Security Description | Principal Amount | Value | |||
DCert Buyer, Inc. Senior Secured 2019 Term Loan B, 1 Month USD LIBOR + 4.00%, 4.18%, 10/16/2026 | $ 1,030,345 | $ 999,862 | |||
ECI Macola Max Holdings LLC Senior Secured 1st Lien Term Loan, 3 Month USD LIBOR + 4.25%, 5.25%, 9/27/2024 | 2,177,429 | 2,142,961 | |||
Finastra USA, Inc. Senior Secured USD 1st Lien Term Loan, 6 Month USD LIBOR + 3.50%, 4.50%, 6/13/2024 | 11,502,740 | 10,109,356 | |||
Flexera Software LLC Senior Secured 2018 1st Lien Term Loan, 3 Month USD LIBOR + 3.50%, 4.50%, 2/26/2025 | 5,160,970 | 5,046,061 | |||
Help/Systems Holdings, Inc. Senior Secured 2019 Term Loan B, 3 Month USD LIBOR + 4.75%, 5.75%, 11/19/2026 | 6,676,424 | 6,492,823 | |||
Hyland Software, Inc. Senior Secured 2018 1st Lien Term Loan, 1 Month USD LIBOR + 3.25%, 4.00%, 7/1/2024 | 6,127,126 | 5,973,457 | |||
Imperva, Inc. Senior Secured 2nd Lien Term Loan, 3 Month USD LIBOR + 7.75%, 8.75%, 1/10/2027 | 2,312,693 | 2,091,068 | |||
| Informatica LLC: | |||||
Senior Secured 2020 USD 2nd Lien Term Loan, 3 Month USD LIBOR + 7.13%, 7.13%, 2/25/2025 | 550,388 | 552,796 | |||
Senior Secured 2020 USD Term Loan B, 1 Month USD LIBOR + 3.25%, 3.43%, 2/25/2027 | 5,413,568 | 5,199,732 | |||
Kronos, Inc. Senior Secured 2017 Term Loan B, 1 Month USD LIBOR + 3.00%, 3.18%, 11/1/2023 | 3,154,528 | 3,152,304 | |||
MA FinanceCo. LLC Senior Secured USD Term Loan B, 3 Month USD LIBOR + 4.25%, 5.25%, 6/5/2025 | 5,281,690 | 5,176,056 | |||
McAfee LLC Senior Secured 2018 USD Term Loan B, 1 Month USD LIBOR + 3.75%, 3.93%, 9/30/2024 | 5,709,947 | 5,577,505 | |||
| Mitchell International, Inc.: | |||||
Senior Secured 2017 1st Lien Term Loan, 1 Month USD LIBOR + 3.25%, 3.43%, 11/29/2024 | 1,556,569 | 1,459,447 | |||
Senior Secured 2017 2nd Lien Term Loan, 1 Month USD LIBOR + 7.75%, 7.43%, 12/1/2025 | 1,709,210 | 1,529,743 | |||
NAVEX TopCo, Inc. Senior Secured 2018 1st Lien Term Loan, 1 Month USD LIBOR + 3.25%, 3.43%, 9/5/2025 | 440,845 | 427,412 |
Table of Contents
| Security Description | Principal Amount | Value | |||
Project Alpha Intermediate Holding, Inc. Senior Secured 2017 Term Loan B, 3 Month USD LIBOR + 3.50%, 5.38%, 4/26/2024 | $ 13,955,604 | $ 13,490,394 | |||
Project Angel Holdings LLC Senior Secured 2018 1st Lien Term Loan, 5/30/2025 (c) | 2,707,944 | 2,640,245 | |||
Project Boost Purchaser LLC Senior Secured 2019 Term Loan B, 1 Month USD LIBOR + 3.50%, 3.68%, 6/1/2026 | 7,392,774 | 7,071,669 | |||
| Project Leopard Holdings, Inc.: | |||||
Senior Secured 2018 Term Loan, 3 Month USD LIBOR + 4.50%, 5.50%, 7/7/2023 | 1,984,733 | 1,940,076 | |||
Senior Secured 2019 Term Loan, 7/7/2023 (c) | 302,213 | 295,288 | |||
Project Ruby Ultimate Parent Corp. Senior Secured 2017 Term Loan B, 1 Month USD LIBOR + 3.50%, 4.75%, 2/9/2024 | 2,313,202 | 2,185,975 | |||
| Quest Software US Holdings, Inc.: | |||||
Senior Secured 2018 1st Lien Term Loan, 3 Month USD LIBOR + 4.25%, 5.01%, 5/16/2025 | 2,538,744 | 2,447,349 | |||
Senior Secured 2018 2nd Lien Term Loan, 3 Month USD LIBOR + 8.25%, 9.01%, 5/18/2026 | 3,886,053 | 3,492,590 | |||
Rocket Software, Inc. Senior Secured 2018 2nd Lien Term Loan, 3 Month USD LIBOR + 8.25%, 9.01%, 11/27/2026 | 4,000,000 | 3,248,000 | |||
Sophia L.P. Senior Secured 2017 Term Loan B, 3 Month USD LIBOR + 3.25%, 4.25%, 9/30/2022 | 360,506 | 352,846 | |||
STG-Fairway Holdings LLC Senior Secured Term Loan B, 3 Month USD LIBOR + 3.50%, 4.57%, 1/31/2027 | 6,521,739 | 6,123,620 | |||
Surf Holdings LLC Senior Secured USD Term Loan, 3 Month USD LIBOR + 3.50%, 3.83%, 3/5/2027 | 2,026,972 | 1,952,045 | |||
Syncsort Incorporated Senior Secured 2018 Term Loan B, 3 Month USD LIBOR + 6.25%, 6.61%, 8/16/2024 | 3,224,261 | 2,982,441 | |||
| 123,757,990 | |||||
| SPECIALTY RETAIL — 4.5% | |||||
Bass Pro Group LLC Senior Secured Term Loan B, 3 Month USD LIBOR + 5.00%, 6.07%, 9/25/2024 | 32,382,135 | 31,283,409 | |||
Petco Animal Supplies, Inc. Senior Secured 2017 Term Loan B, 3 Month USD LIBOR + 3.25%, 4.25%, 1/26/2023 | 15,442,591 | 12,673,658 |
Table of Contents
| Security Description | Principal Amount | Value | |||
PetSmart, Inc. Senior Secured Consenting Term Loan, 3 Month USD LIBOR + 4.00%, 5.00%, 3/11/2022 | $ 17,551,150 | $ 17,367,652 | |||
Priso Acquisition Corp. Senior Secured 2017 Term Loan B, 6 Month USD LIBOR + 3.00%, 4.18%, 5/8/2022 | 3,460,671 | 3,322,244 | |||
| 64,646,963 | |||||
| TELECOMMUNICATION EQUIP — 0.2% | |||||
MLN US HoldCo LLC Senior Secured 2018 1st Lien Term Loan, 1 Month USD LIBOR + 4.50%, 4.68%, 11/30/2025 | 3,900,958 | 3,220,748 | |||
| THRIFTS & MORTGAGE FINANCE — 0.1% | |||||
Capri Finance LLC Senior Secured USD 2017 1st Lien Term Loan, 3 Month USD LIBOR + 3.00%, 3.76%, 11/1/2024 | 1,073,085 | 1,032,844 | |||
| TRADING COMPANIES & DISTRIBUTORS — 0.1% | |||||
SiteOne Landscape Supply, Inc. Senior Secured 2018 Term Loan E, 1 Month USD LIBOR + 2.75%, 3.75%, 10/29/2024 | 491,746 | 482,526 | |||
Univar, Inc. Senior Secured 2019 USD Term Loan B5, 3 Month USD LIBOR + 2.00%, 2.18%, 7/1/2026 | 384,801 | 370,252 | |||
| 852,778 | |||||
TOTAL SENIOR FLOATING RATE LOANS (Cost $1,212,141,603) | 1,175,447,363 | ||||
| CORPORATE BONDS & NOTES — 14.2% | |||||
| AEROSPACE & DEFENSE — 0.2% | |||||
TransDigm, Inc. 6.25%, 3/15/2026 (d) | 2,424,000 | 2,416,873 | |||
| APPAREL — 0.2% | |||||
Hanesbrands, Inc. 5.38%, 5/15/2025 (d) | 3,361,000 | 3,401,130 | |||
| AUTO PARTS & EQUIPMENT — 0.2% | |||||
| Dana, Inc.: | |||||
5.38%, 11/15/2027 | 1,250,000 | 1,248,538 | |||
5.63%, 6/15/2028 | 1,546,000 | 1,539,244 | |||
| 2,787,782 |
Table of Contents
| Security Description | Principal Amount | Value | |||
| BUILDING MATERIALS — 0.5% | |||||
Builders FirstSource, Inc. 6.75%, 6/1/2027 (d) | $ 4,000,000 | $ 4,094,720 | |||
Standard Industries, Inc. 4.38%, 7/15/2030 (d) | 2,757,000 | 2,757,028 | |||
| 6,851,748 | |||||
| CHEMICALS — 0.3% | |||||
Tronox, Inc. 6.50%, 5/1/2025 (d) | 4,651,000 | 4,702,115 | |||
| COMMERCIAL SERVICES — 1.3% | |||||
Avis Budget Car Rental LLC/Avis Budget Finance, Inc. 5.75%, 7/15/2027 (d) | 3,000,000 | 2,292,030 | |||
Jaguar Holding Co. II/PPD Development L.P. 5.00%, 6/15/2028 (d) | 1,351,000 | 1,382,803 | |||
MPH Acquisition Holdings LLC 7.13%, 6/1/2024 (d) | 3,500,000 | 3,254,650 | |||
Prime Security Services Borrower LLC/Prime Finance, Inc. 6.25%, 1/15/2028 (d) | 11,667,000 | 10,999,064 | |||
| 17,928,547 | |||||
| DIVERSIFIED FINANCIAL SERVICES — 0.4% | |||||
AG Issuer LLC 6.25%, 3/1/2028 (d) | 3,827,000 | 3,625,853 | |||
Vertical US Newco, Inc. 5.25%, 7/15/2027 | 2,578,000 | 2,578,000 | |||
| 6,203,853 | |||||
| ELECTRICAL COMPONENTS & EQUIPMENT — 0.3% | |||||
Energizer Holdings, Inc. 6.38%, 7/15/2026 (d) | 1,648,000 | 1,705,680 | |||
Wesco Distribution, Inc. Co. 7.25%, 6/15/2028 (d) | 2,290,000 | 2,433,812 | |||
| 4,139,492 | |||||
| ENTERTAINMENT — 0.2% | |||||
International Game Technology PLC 5.25%, 1/15/2029 (d) | 2,193,000 | 2,147,956 | |||
| FOOD — 0.5% | |||||
Albertsons Cos., Inc./Safeway, Inc./New Albertsons L.P./Albertsons LLC 5.88%, 2/15/2028 (d) | 6,609,000 | 6,817,580 |
Table of Contents
| Security Description | Principal Amount | Value | |||
| HEALTH CARE SERVICES — 0.5% | |||||
Acadia Healthcare Co., Inc. 5.50%, 7/1/2028 (d) | $ 820,000 | $ 828,512 | |||
LifePoint Health, Inc. 6.75%, 4/15/2025 (d) | 6,666,000 | 6,845,115 | |||
| 7,673,627 | |||||
| HOME BUILDERS — 0.1% | |||||
Picasso Finance Sub, Inc. 6.13%, 6/15/2025 (d) | 1,416,000 | 1,451,329 | |||
| INSURANCE — 0.3% | |||||
HUB International, Ltd. 7.00%, 5/1/2026 (d) | 5,000,000 | 4,985,850 | |||
| INTERNET — 0.1% | |||||
Photo Holdings Merger Sub, Inc. 8.50%, 10/1/2026 (d) | 1,746,000 | 1,649,760 | |||
| LODGING — 0.1% | |||||
Hilton Domestic Operating Co., Inc. 5.38%, 5/1/2025 (d) | 826,000 | 822,547 | |||
| MEDIA — 4.3% | |||||
Altice Financing SA 5.00%, 1/15/2028 (d) | 4,952,000 | 4,925,655 | |||
| CSC Holdings LLC: | |||||
4.63%, 12/1/2030 (d) | 1,505,000 | 1,466,969 | |||
5.75%, 1/15/2030 (d) | 2,000,000 | 2,081,220 | |||
| iHeartCommunications, Inc.: | |||||
4.75%, 1/15/2028 (d) | 5,000,000 | 4,619,600 | |||
5.25%, 8/15/2027 (d) | 7,417,000 | 7,105,486 | |||
LCPR Senior Secured Financing DAC 6.75%, 10/15/2027 (d) | 5,357,000 | 5,470,729 | |||
Sinclair Television Group, Inc. 5.63%, 8/1/2024 (d) | 6,000,000 | 5,770,380 | |||
| Univision Communications, Inc.: | |||||
5.13%, 5/15/2023 (d) | 6,000,000 | 6,055,080 | |||
6.63%, 6/1/2027 (d) | 20,548,000 | 19,676,149 | |||
Virgin Media Finance PLC 5.00%, 7/15/2030 (d) | 4,660,000 | 4,561,441 | |||
| 61,732,709 |
Table of Contents
| Security Description | Principal Amount | Value | |||
| PACKAGING & CONTAINERS — 0.6% | |||||
| Ardagh Packaging Finance PLC/Ardagh Holdings USA, Inc.: | |||||
5.25%, 4/30/2025 (d) | $ 5,059,000 | $ 5,197,920 | |||
5.25%, 8/15/2027 (d) | 2,963,000 | 2,907,533 | |||
| 8,105,453 | |||||
| PHARMACEUTICALS — 0.8% | |||||
| Bausch Health Cos., Inc.: | |||||
5.25%, 1/30/2030 (d) | 3,232,000 | 3,062,708 | |||
6.25%, 2/15/2029 (d) | 6,957,000 | 6,995,750 | |||
Par Pharmaceutical, Inc. 7.50%, 4/1/2027 (d) | 2,000,000 | 2,051,500 | |||
| 12,109,958 | |||||
| REAL ESTATE INVESTMENT TRUSTS — 0.8% | |||||
Iron Mountain, Inc. 5.25%, 7/15/2030 (d) | 12,270,000 | 12,128,036 | |||
| RETAIL — 0.7% | |||||
eG Global Finance PLC 6.75%, 2/7/2025 (d) | 7,042,000 | 6,862,992 | |||
IRB Holding Corp. 7.00%, 6/15/2025 (d) | 1,429,000 | 1,471,641 | |||
L Brands, Inc. 6.88%, 7/1/2025 (d) | 1,409,000 | 1,460,894 | |||
| 9,795,527 | |||||
| SOFTWARE — 0.5% | |||||
Boxer Parent Co., Inc. 7.13%, 10/2/2025 (d) | 2,059,000 | 2,158,738 | |||
Change Healthcare Holdings LLC/Change Healthcare Finance, Inc. 5.75%, 3/1/2025 (d) | 5,000,000 | 4,936,500 | |||
| 7,095,238 | |||||
| TELECOMMUNICATIONS — 1.1% | |||||
Altice France Holding SA 6.00%, 2/15/2028 (d) | 1,598,000 | 1,510,637 | |||
Altice France SA 5.50%, 1/15/2028 (d) | 12,000,000 | 12,126,960 | |||
CommScope, Inc. 7.13%, 7/1/2028 (d) (e) | 2,325,000 | 2,328,232 | |||
| 15,965,829 |
Table of Contents
| Security Description | Principal Amount | Value | |||
| TRANSPORTATION — 0.2% | |||||
XPO Logistics, Inc. 6.25%, 5/1/2025 (d) | $ 2,160,000 | $ 2,261,866 | |||
TOTAL CORPORATE BONDS & NOTES (Cost $205,814,777) | 203,174,805 |
| Shares | |||
| SHORT-TERM INVESTMENT — 8.4% | |||
State Street Institutional U.S. Government Money Market Fund, Class G Shares 0.16% (f) (g) (Cost $120,384,183) | 120,384,183 | 120,384,183 | |
TOTAL INVESTMENTS — 104.6% (Cost $1,538,340,563) | 1,499,006,351 | ||
LIABILITIES IN EXCESS OF OTHER ASSETS — (4.6)% | (65,911,853) | ||
NET ASSETS — 100.0% | $ 1,433,094,498 |
| (a) | The rate shown represents the rate at June 30, 2020. |
| (b) | Amount is less than 0.05% of net assets. |
| (c) | Position is unsettled. Contract rate was not determined at June 30, 2020 and does not take effect until settlement date. Maturity date is not finalized until settlement date. |
| (d) | Securities purchased pursuant to Rule 144A of the Securities Act of 1933, as amended. These securities, which represent 13.8% of net assets as of June 30, 2020, are considered liquid and may be resold in transactions exempt from registration, normally to qualified institutional buyers. |
| (e) | When-issued security. |
| (f) | The Fund invested in certain money market funds managed by SSGA Funds Management, Inc. Amounts related to these transactions during the period ended June 30, 2020 are shown in the Affiliate Table below. |
| (g) | The rate shown is the annualized seven-day yield at June 30, 2020. |
| LIBOR | London Interbank Offered Rate |
| LP | Limited Partnership |
| PIK | Payment in Kind |
Table of Contents
| Description | Level 1 – Quoted Prices | Level 2 – Other Significant Observable Inputs | Level 3 – Significant Unobservable Inputs | Total | ||||
| ASSETS: | ||||||||
| INVESTMENTS: | ||||||||
Corporate Bonds & Notes | $ — | $ 203,174,805 | $— | $ 203,174,805 | ||||
Senior Floating Rate Loans | — | 1,175,447,363 | — | 1,175,447,363 | ||||
Short-Term Investment | 120,384,183 | — | — | 120,384,183 | ||||
TOTAL INVESTMENTS | $120,384,183 | $1,378,622,168 | $— | $1,499,006,351 |
| Number of Shares Held at 6/30/19* | Value at 6/30/19* | Cost of Purchases** | Proceeds from Shares Sold | Realized Gain (Loss) | Change in Unrealized Appreciation/ Depreciation | Number of Shares Held at 6/30/20 | Value at 6/30/20 | Dividend Income | |||||||||
State Street Institutional U.S. Government Money Market Fund, Class G Shares | — | $— | $2,421,546,618 | $2,301,162,435 | $— | $— | 120,384,183 | $120,384,183 | $2,246,425 |
| * | Refer to Note 1 on the Notes to Financial Statements regarding the discontinuance of the master-feeder structure. |
| ** | Includes transfers from Portfolio - See Note 1 in the Notes to Financial Statements. |
Table of Contents
| SPDR Blackstone / GSO Senior Loan ETF | |
| ASSETS | |
Investments in unaffiliated issuers, at value | $1,378,622,168 |
Investments in affiliated issuers, at value | 120,384,183 |
Total Investments | 1,499,006,351 |
Cash | 512,063 |
Receivable for investments sold | 133,563,948 |
Dividends receivable — affiliated issuers | 18,344 |
Interest receivable — unaffiliated issuers | 6,826,608 |
Other Receivable | 32,844 |
Due from broker | 114,000 |
TOTAL ASSETS | 1,640,074,158 |
| LIABILITIES | |
Payable for investments purchased | 186,587,575 |
Payable for fund shares repurchased | 19,531,355 |
Advisory fee payable | 853,332 |
Trustees’ fees and expenses payable | 7,398 |
TOTAL LIABILITIES | 206,979,660 |
NET ASSETS | $1,433,094,498 |
| NET ASSETS CONSIST OF: | |
Paid-in Capital | $1,707,591,039 |
Total distributable earnings (loss) | (274,496,541) |
NET ASSETS | $1,433,094,498 |
| NET ASSET VALUE PER SHARE | |
Net asset value per share | $ 43.36 |
Shares outstanding (unlimited amount authorized, no par value) | 33,050,000 |
| COST OF INVESTMENTS: | |
Investments in unaffiliated issuers | $1,417,956,380 |
Investments in affiliated issuers | 120,384,183 |
Total cost of investments | $1,538,340,563 |
Table of Contents
| SPDR Blackstone / GSO Senior Loan ETF | |
| INVESTMENT INCOME | |
Interest income allocated from the Portfolio | $ 25,780,068 |
Dividend income allocated from the Portfolio | 506,438 |
Interest income — unaffiliated issuers | 90,180,215 |
Dividend income — affiliated issuers | 2,246,425 |
Expenses allocated from affiliated Portfolio | (1,222,731) |
TOTAL INVESTMENT INCOME | 117,490,415 |
| EXPENSES | |
Advisory fee | 12,940,867 |
Trustees’ fees and expenses | 29,732 |
Miscellaneous expenses | 1,371 |
TOTAL EXPENSES | 12,971,970 |
NET INVESTMENT INCOME (LOSS) | $ 104,518,445 |
| REALIZED AND UNREALIZED GAIN (LOSS) | |
| Net realized gain (loss) on: | |
Investments allocated from the Portfolio | (1,496,289) |
Investments — unaffiliated issuers | (110,455,754) |
Net realized gain (loss) | (111,952,043) |
| Net change in unrealized appreciation/depreciation on: | |
Investments — unaffiliated issuers | (39,334,212) |
Investments allocated from the Portfolio | 15,428,267 |
Net change in unrealized appreciation/depreciation | (23,905,945) |
NET REALIZED AND UNREALIZED GAIN (LOSS) | (135,857,988) |
NET INCREASE (DECREASE) IN NET ASSETS FROM OPERATIONS | $ (31,339,543) |
Table of Contents
| SPDR Blackstone / GSO Senior Loan ETF | |||
| Year Ended 6/30/20 | Year Ended 6/30/19 | ||
| INCREASE (DECREASE) IN NET ASSETS FROM OPERATIONS: | |||
Net investment income (loss) | $ 104,518,445 | $ 146,684,741 | |
Net realized gain (loss) | (111,952,043) | (68,985,052) | |
Net change in unrealized appreciation/depreciation | (23,905,945) | (7,710,527) | |
Net increase (decrease) in net assets resulting from operations | (31,339,543) | 69,989,162 | |
Net equalization credits and charges | (1,610,641) | (1,756,152) | |
Distributions to shareholders | (106,659,500) | (147,138,500) | |
| FROM BENEFICIAL INTEREST TRANSACTIONS: | |||
Proceeds from shares sold | 1,236,697,606 | 780,016,464 | |
Cost of shares redeemed | (1,898,029,896) | (1,675,706,058) | |
Net income equalization | 1,610,641 | 1,756,152 | |
Other Capital | 9,447,256 | 5,615,427 | |
Net increase (decrease) in net assets from beneficial interest transactions | (650,274,393) | (888,318,015) | |
Contribution from Affiliate (Note 4) | 578,465 | — | |
Net increase (decrease) in net assets during the period | (789,305,612) | (967,223,505) | |
Net assets at beginning of period | 2,222,400,110 | 3,189,623,615 | |
NET ASSETS AT END OF PERIOD | $ 1,433,094,498 | $ 2,222,400,110 | |
| SHARES OF BENEFICIAL INTEREST: | |||
Shares sold | 27,700,000 | 16,750,000 | |
Shares redeemed | (42,700,000) | (36,500,000) | |
Net increase (decrease) from share transactions | (15,000,000) | (19,750,000) | |
Table of Contents
| SPDR Blackstone / GSO Senior Loan ETF | |||||||||
| Year Ended 6/30/20(a) | Year Ended 6/30/19(a) | Year Ended 6/30/18(a) | Year Ended 6/30/17(a) | Year Ended 6/30/16(a) | |||||
Net asset value, beginning of period | $ 46.25 | $ 47.04 | $ 47.41 | $ 46.64 | $ 49.22 | ||||
| Income (loss) from investment operations: | |||||||||
Net investment income (loss) (b) | 2.34 | 2.48 | 2.04 | 1.85 | 1.95 | ||||
Net realized and unrealized gain (loss) (c) | (3.06) | (0.86) | (0.50) | 0.73 | (2.58) | ||||
Total from investment operations | (0.72) | 1.62 | 1.54 | 2.58 | (0.63) | ||||
Net equalization credits and charges (b) | (0.04) | (0.03) | 0.04 | 0.05 | 0.02 | ||||
Contribution from Affiliate (Note 4) | 0.01 | — | — | — | — | ||||
Other capital (b) | 0.21 | 0.09 | 0.02 | 0.02 | 0.02 | ||||
| Distributions to shareholders from: | |||||||||
Net investment income | (2.35) | (2.47) | (1.97) | (1.88) | (1.99) | ||||
Net asset value, end of period | $ 43.36 | $ 46.25 | $ 47.04 | $ 47.41 | $ 46.64 | ||||
Total return (d) | (1.23)%(e) | 3.68% | 3.43% | 5.77% | (1.15)% | ||||
| Ratios and Supplemental Data: | |||||||||
Net assets, end of period (in 000s) | $1,433,094 | $2,222,400 | $3,189,624 | $1,820,505 | $802,228 | ||||
| Ratios to average net assets: | |||||||||
Total expenses | 0.70% | 0.70% | 0.70% | 0.70% | 0.71% | ||||
Net investment income (loss) | 5.17% | 5.33% | 4.30% | 3.91% | 4.15% | ||||
Portfolio turnover rate (f) | 195% | 124% | 90% | 68% | 88% | ||||
| (a) | The per share amounts and percentages include the Fund’s proportionate share of income and expenses of the Portfolio prior to discontinuance of the master feeder structure. |
| (b) | Per share numbers have been calculated using average shares outstanding, which more appropriately presents the per share data for the year. |
| (c) | Amounts shown in this caption for a share outstanding may not accord with the change in aggregate gains and losses in securities for the fiscal period because of the timing of sales and repurchases of Fund shares in relation to fluctuating market values for the Fund. |
| (d) | Total return is calculated assuming a purchase of shares at net asset value on the first day and a sale at net asset value on the last day of each period reported. Distributions are assumed, for the purpose of this calculation, to be reinvested at net asset value per share on the respective payment dates of each distribution. Total returns for periods of less than one year are not annualized. Broker commission charges are not included in this calculation. |
| (e) | If an affiliate had not made a contribution during the ended June 30, 2020, the total return would have remained (1.23)%. |
| (f) | Portfolio turnover rate is from the the affiliated Portfolio prior to the discontinuance of the master feeder structure. See Note 1. |
Table of Contents
Table of Contents
Table of Contents
Table of Contents
Table of Contents
| Annual Rate | |
SPDR Blackstone / GSO Senior Loan ETF | 0.70% |
Table of Contents
| Purchases | Sales | ||
SPDR Blackstone / GSO Senior Loan ETF | $3,792,000,466 | $4,434,484,202 |
Table of Contents
Table of Contents
| Ordinary Income | Long-Term Capital Gains | Total | |||
SPDR Blackstone / GSO Senior Loan ETF | $106,659,500 | $— | $106,659,500 |
| Ordinary Income | Long-Term Capital Gains | Total | |||
SPDR Blackstone / GSO Senior Loan ETF | $ 147,138,500 | $ — | $ 147,138,500 |
| Undistributed Ordinary Income | Capital Loss Carryforwards | Undistributed Long-Term Capital Gains | Net Unrealized Gains (Losses) | Qualified Late-Year Losses | Total | ||||||
SPDR Blackstone / GSO Senior Loan ETF | $5,826,090 | $(216,243,650) | $— | $(64,078,981) | $— | $(274,496,541) |
| Non-Expiring Short Term | Non-Expiring Long Term | ||
SPDR Blackstone / GSO Senior Loan ETF | $115,491,607 | $100,752,043 |
| Tax Cost | Gross Unrealized Appreciation | Gross Unrealized Depreciation | Net Unrealized Appreciation (Depreciation) | ||||
SPDR Blackstone / GSO Senior Loan ETF | $1,563,085,332 | $15,331,499 | $79,410,480 | $(64,078,981) |
Table of Contents
Table of Contents
Table of Contents
Table of Contents
Table of Contents

August 28, 2020
Table of Contents
Table of Contents
| SPDR Blackstone / GSO Senior Loan ETF | |
Annualized Expense Ratio | 0.70% |
| Actual: | |
Ending Account Value | $ 952.50 |
Expenses Paid During Period(a) | 3.40 |
| Hypothetical (assuming a 5% return before expenses): | |
Ending Account Value | 1,021.40 |
Expenses Paid During Period(a) | 3.52 |
| (a) | Expenses are equal to the Fund's annualized net expense ratio multiplied by the average account value of the period, multiplied by 182, then divided by 366. |
Table of Contents
Table of Contents
Table of Contents
Table of Contents
Table of Contents
Table of Contents
| Name, Address and Year of Birth | Position(s) with Funds | Term of Office and Length of Time Served | Principal Occupation(s) During Past 5 Years | Number of Portfolios in Fund Complex Overseen by Trustee† | Other Directorships Held by Trustee During the Past 5 Years | |||||
| Trustees | ||||||||||
| Independent Trustees | ||||||||||
| FRANK NESVET c/o SSGA Active Trust One Iron Street Boston, MA 02210 1943 | Independent Trustee, Chairman, Trustee Committee Chair | Term: Unlimited Served: since March 2011 | Retired. | 123 | None. | |||||
| BONNY EUGENIA BOATMAN c/o SSGA Active Trust One Iron Street Boston, MA 02210 1950 | Independent Trustee | Term: Unlimited Served: since March 2011 | Retired. | 123 | None. | |||||
| DWIGHT D. CHURCHILL c/o SSGA Active Trust One Iron Street Boston, MA 02210 1953 | Independent Trustee | Term: Unlimited Served: since March 2011 | Self-employed consultant since 2010; CEO and President, CFA Institute (June 2014-January 2015). | 123 | Affiliated Managers Group, Inc. (Chairman, Director and Audit Committee Chair). | |||||
| CLARE S. RICHER c/o SSGA Active Trust One Iron Street Boston, MA 02210 1958 | Independent Trustee | Term: Unlimited Served: since July 2018 | Retired. Chief Financial Officer, Putnam Investments LLC (December 2008- May 2017). | 123 | Principal Financial Group (Director); Bain Capital Specialty Finance (Director); Putnam Acquisition Financing Inc. (Director); Putnam Acquisition Financing LLC (Director); Putnam GP Inc. (Director); Putnam Investor Services, Inc. (Director); University of Notre Dame (Trustee). |
Table of Contents
| Name, Address and Year of Birth | Position(s) with Funds | Term of Office and Length of Time Served | Principal Occupation(s) During Past 5 Years | Number of Portfolios in Fund Complex Overseen by Trustee† | Other Directorships Held by Trustee During the Past 5 Years | |||||
| SANDRA G. SPONEM c/o SSGA Active Trust One Iron Street Boston, MA 02210 1958 | Independent Trustee | Term: Unlimited Served: since July 2018 | Retired. Chief Financial Officer, M.A. Mortenson Companies, Inc. (February 2007- April 2017). | 123 | Rydex Series Funds, Rydex Dynamic Funds, Rydex Variable Trust, Guggenheim Funds Trust, Guggenheim Variable Funds Trust, Guggenheim Strategy Funds Trust, Transparent Value Trust, Fiduciary/ Claymore Energy Infrastructure Fund, Guggenheim Taxable Municipal Managed Duration Trust, Guggenheim Strategic Opportunities Fund, Guggenheim Enhanced, Equity Income Fund, Guggenheim Credit Allocation Fund, Guggenheim Energy & Income Fund (Trustee and Audit Committee Chair). | |||||
| CARL G. VERBONCOEUR c/o SSGA Active Trust One Iron Street Boston, MA 02210 1952 | Independent Trustee, Audit Committee Chair | Term: Unlimited Served: since March 2011 | Self-employed consultant since 2009. | 123 | The Motley Fool Funds Trust (Trustee). |
Table of Contents
| Name, Address and Year of Birth | Position(s) with Funds | Term of Office and Length of Time Served | Principal Occupation(s) During Past 5 Years | Number of Portfolios in Fund Complex Overseen by Trustee† | Other Directorships Held by Trustee During the Past 5 Years | |||||
| Interested Trustee | ||||||||||
| JAMES E. ROSS* c/o SSGA Active Trust One Iron Street Boston, MA 02210 1965 | Interested Trustee | Term: Unlimited Served as Trustee: since March 2011 | Non-Executive Chairman, Fusion Acquisition Corp. (June 2020 - Present); Retired Chairman and Director, SSGA Funds Management, Inc. (2005 - March 2020); Retired Executive Vice President, State Street Global Advisors (2012 - March 2020); Retired Chief Executive Officer and Director, State Street Global Advisors Funds Distributors, LLC (May 2017 - March 2020); Director, State Street Global Markets, LLC (2013 - April 2017); President, SSGA Funds Management, Inc. (2005 - 2012); Principal, State Street Global Advisors (2000 - 2005). | 134 | SSGA SPDR ETFs Europe I plc (Director) (November 2016 - March 2020); SSGA SPDR ETFs Europe II plc (Director) (November 2016 - March 2020); State Street Navigator Securities Lending Trust (July 2016 - March 2020); SSGA Funds (January 2014 - March 2020); State Street Institutional Investment Trust (February 2007 - March 2020); State Street Master Funds (February 2007 - March 2020); Elfun Funds (July 2016 - December 2018). | |||||
| † For the purpose of determining the number of portfolios overseen by the Trustees, “Fund Complex” comprises registered investment companies for which SSGA Funds Management, Inc. serves as investment adviser. | ||||||||||
| * Mr. Ross is an Interested Trustee because of his former position with the Adviser and ownership interest in an affiliate of the Adviser. | ||||||||||
Table of Contents
| Name, Address and Year of Birth | Position(s) with Funds | Term of Office and Length of Time Served | Principal Occupation(s) During the Past 5 Years | |||
| Officers | ||||||
| ELLEN M. NEEDHAM SSGA Funds Management, Inc. One Iron Street Boston, MA 02210 1967 | President | Term: Unlimited Served: since October 2012 | Chairman, SSGA Funds Management, Inc. (March 2020 - present); President and Director, SSGA Funds Management, Inc. (2001 - present)*; Senior Managing Director, State Street Global Advisors (1992 - present)*; Manager, State Street Global Advisors Funds Distributors, LLC (May 2017 - present). | |||
| BRUCE S. ROSENBERG SSGA Funds Management, Inc. One Iron Street Boston, MA 02210 1961 | Treasurer | Term: Unlimited Served: since February 2016 | Managing Director, State Street Global Advisors and SSGA Funds Management, Inc. (July 2015 - present); Director, Credit Suisse (April 2008 - July 2015). | |||
| ANN M. CARPENTER SSGA Funds Management, Inc. One Iron Street Boston, MA 02210 1966 | Vice President; Deputy Treasurer | Term: Unlimited Served: since August 2012 (with respect to Vice President); since February2016 (with respect to Deputy Treasurer) | Chief Operating Officer, SSGA Funds Management, Inc. (2005 - Present)*; Managing Director, State Street Global Advisors (2005 - present).* | |||
| MICHAEL P. RILEY SSGA Funds Management, Inc. One Iron Street Boston, MA 02210 1969 | Vice President | Term: Unlimited Served: since March 2011 | Managing Director, State Street Global Advisors (2005 - present).* | |||
| SEAN O’MALLEY SSGA Funds Management, Inc. One Iron Street Boston, MA 02210 1969 | Chief Legal Officer | Term: Unlimited Served: since August 2019 | Senior Vice President and Deputy General Counsel, State Street Global Advisors (November 2013 -present). | |||
| ANDREW DELORME SSGA Funds Management, Inc. One Iron Street Boston, MA 02210 1975 | Secretary | Term: Unlimited Served: since August 2019 | Vice President and Senior Counsel, State Street Global Advisors (April 2016 - present); Vice President and Counsel, State Street Global Advisors (August 2014 - March 2016). |
Table of Contents
| Name, Address and Year of Birth | Position(s) with Funds | Term of Office and Length of Time Served | Principal Occupation(s) During the Past 5 Years | |||
| KEVIN MORRIS SSGA Funds Management, Inc. One Iron Street Boston, MA 02210 1982 | Assistant Secretary | Term: Unlimited Served: since August 2019 | Vice President and Senior Counsel, State Street Global Advisors (April 2019 - present); Vice President and Counsel, State Street Global Advisors (January 2016 -April 2019); Director, Asset Management Compliance, Fidelity Investments (June 2015 - January 2016); Senior Compliance Advisor, Asset Management Compliance, Fidelity Investments (June 2012 - June 2015). | |||
| DAVID URMAN SSGA Funds Management, Inc. One Iron Street Boston, MA 02210 1985 | Assistant Secretary | Term: Unlimited Served: since August 2019 | Vice President and Senior Counsel, State Street Global Advisors (April 2019 - present); Vice President and Counsel, State Street Global Advisors (August 2015 - April 2019); Associate, Ropes & Gray LLP (November 2012 - August 2015). | |||
| CHAD C. HALLETT SSGA Funds Management, Inc. One Iron Street Boston, MA 02210 1969 | Deputy Treasurer | Term: Unlimited Served: since February 2016 | Vice President, State Street Global Advisors and SSGA Funds Management, Inc. (November 2014 - present); Vice President, State Street Bank and Trust Company (2001 - November 2014).* | |||
| DARLENE ANDERSON-VASQUEZ SSGA Funds Management, Inc. One Iron Street Boston, MA 02210 1968 | Deputy Treasurer | Term: Unlimited Served: since November 2016 | Managing Director, State Street Global Advisors and SSGA Funds Management, Inc. (May 2016 - present); Senior Vice President, John Hancock Investments (September 2007 - May 2016). | |||
| ARTHUR A. JENSEN SSGA Funds Management, Inc. 1600 Summer Street Stamford, CT 06905 1966 | Deputy Treasurer | Term: Unlimited Served: Since August 2017 | Vice President at State Street Global Advisors (July 2016 – present); Mutual Funds Controller of GE Asset Management Incorporated (April 2011 - July 2016). | |||
| SUJATA UPRETI SSGA Funds Management, Inc. One Iron Street Boston, MA 02210 1974 | Assistant Treasurer | Term: Unlimited Served: since February 2016 | Vice President, State Street Global Advisors and SSGA Funds Management, Inc. (May 2015 - present). | |||
| DANIEL FOLEY SSGA Funds Management, Inc. One Iron Street Boston, MA 02210 1972 | Assistant Treasurer | Term: Unlimited Served: since February 2016 | Vice President, State Street Global Advisors and SSGA Funds Management, Inc. (April 2007 - present).* |
Table of Contents
| Name, Address and Year of Birth | Position(s) with Funds | Term of Office and Length of Time Served | Principal Occupation(s) During the Past 5 Years | |||
| DANIEL G. PLOURDE SSGA Funds Management, Inc. One Iron Street Boston, MA 02210 1980 | Assistant Treasurer | Term: Unlimited Served: since May 2017 | Vice President, State Street Global Advisors and SSGA Funds Management, Inc. (May 2015 - present); Officer, State Street Bank and Trust Company (March 2009 - May 2015). | |||
| BRIAN HARRIS SSGA Funds Management, Inc. One Iron Street Boston, MA 02210 1973 | Chief Compliance Officer; Anti-Money Laundering Officer; Code of Ethics Compliance Officer | Term: Unlimited Served: since November 2013 | Managing Director, State Street Global Advisors and SSGA Funds Management, Inc. (June 2013 - present)*; Senior Vice President and Global Head of Investment Compliance, BofA Global Capital Management (2010 - 2013); Director of Compliance, AARP Financial Inc. (2008 - 2010). | |||
| * Served in various capacities and/or with various affiliated entities during noted time period. | ||||||
| The Statement of Additional Information (SAI) includes additional information about the Fund's trustees and is available, without charge, upon request and by calling 1-866-787-2257. | ||||||
Table of Contents
Table of Contents
Table of Contents
Table of Contents
Table of Contents
Table of Contents
Table of Contents
One Iron Street
Boston, MA 02210
One Iron Street
Boston, MA 02210
One Lincoln Street
Boston, MA 02111
1111 Pennsylvania Avenue, NW
Washington, DC 20004
200 Clarendon Street
Boston, MA 02116
Table of Contents
One Iron Street
Boston, MA 02210
Table of Contents
| State Street Defensive Global Equity Portfolio |

Table of Contents
Table of Contents
| 1 | |
| 2 | |
| 5 | |
| 8 | |
| 9 | |
| 10 | |
| 11 | |
| 12 | |
| 18 | |
| 19 |
Table of Contents
Table of Contents
Table of Contents
Table of Contents
| Cumulative Total Return | Average Annual Total Return | ||||||||
| Net Asset Value | Market Value | MSCI World Index | Net Asset Value | Market Value | MSCI World Index | ||||
| ONE YEAR | – 3.50% | N/A | 2.84% | – 3.50% | N/A | 2.84% | |||
| SINCE INCEPTION(1) | 38.78% | N/A | 55.35% | 7.79% | N/A | 10.63% | |||
| (1) | For the period February 18, 2016 to June 30, 2020. |
(Based on Net Asset Value)
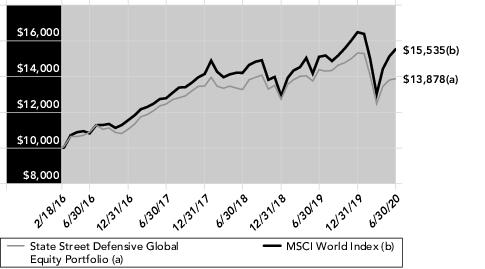
Table of Contents
| Description | Market Value | % of Net Assets | ||
| Eli Lilly & Co. | 32,179 | 1.5% | ||
| AutoZone, Inc. | 31,587 | 1.5 | ||
| Home Depot, Inc. | 31,564 | 1.5 | ||
| Target Corp. | 31,062 | 1.5 | ||
| Koninklijke Ahold Delhaize NV | 30,733 | 1.5 | ||
| TOTAL | 157,125 | 7.5% |
Table of Contents
| Security Description | Shares | Value | |||
| COMMON STOCKS — 97.9% | |||||
| AUSTRALIA — 4.7% | |||||
BHP Group, Ltd. | 634 | $ 15,749 | |||
Coles Group, Ltd. | 371 | 4,400 | |||
Mirvac Group REIT | 3,259 | 4,911 | |||
Scentre Group REIT | 6,862 | 10,393 | |||
Sonic Healthcare, Ltd. | 971 | 20,457 | |||
Telstra Corp., Ltd. | 5,705 | 12,355 | |||
Wesfarmers, Ltd. | 846 | 26,243 | |||
Woolworths Group, Ltd. | 184 | 4,732 | |||
| 99,240 | |||||
| BELGIUM — 0.3% | |||||
Ageas SA/NV | 152 | 5,385 | |||
| CANADA — 2.3% | |||||
BCE, Inc. | 281 | 11,682 | |||
Kirkland Lake Gold, Ltd. | 169 | 6,936 | |||
Loblaw Cos., Ltd. | 85 | 4,126 | |||
Metro, Inc. | 178 | 7,319 | |||
TELUS Corp. | 1,123 | 18,774 | |||
| 48,837 | |||||
| DENMARK — 2.6% | |||||
Carlsberg A/S Class B | 57 | 7,555 | |||
Coloplast A/S Class B | 107 | 16,669 | |||
Novo Nordisk A/S Class B | 452 | 29,431 | |||
| 53,655 | |||||
| FRANCE — 1.6% | |||||
Peugeot SA (a) | 686 | 11,247 | |||
Sanofi | 209 | 21,308 | |||
| 32,555 | |||||
| GERMANY — 3.3% | |||||
Allianz SE | 65 | 13,278 | |||
Deutsche Telekom AG | 1,612 | 27,040 | |||
Merck KGaA | 112 | 13,038 | |||
Muenchener Rueckversicherungs-Gesellschaft AG in Muenchen | 57 | 14,838 | |||
| 68,194 | |||||
| HONG KONG — 1.2% | |||||
CLP Holdings, Ltd. | 1,500 | 14,732 | |||
HKT Trust & HKT, Ltd. Stapled Security | 7,000 | 10,272 | |||
| 25,004 | |||||
| IRELAND — 0.8% | |||||
Accenture PLC Class A | 82 | 17,607 | |||
| ITALY — 0.4% | |||||
Snam SpA | 1,667 | 8,124 | |||
| JAPAN — 13.9% | |||||
Astellas Pharma, Inc. | 1,700 | 28,413 | |||
FUJIFILM Holdings Corp. | 500 | 21,419 | |||
Fujitsu, Ltd. | 200 | 23,436 | |||
Hitachi, Ltd. | 200 | 6,362 | |||
ITOCHU Corp. | 900 | 19,490 | |||
| Security Description | Shares | Value | |||
Japan Post Holdings Co., Ltd. | 2,400 | $ 17,142 | |||
KDDI Corp. | 500 | 14,931 | |||
Mitsubishi UFJ Financial Group, Inc. | 3,300 | 12,998 | |||
Mitsui & Co., Ltd. | 400 | 5,932 | |||
Mizuho Financial Group, Inc. | 4,700 | 5,786 | |||
Nippon Telegraph & Telephone Corp. | 1,000 | 23,319 | |||
NTT DOCOMO, Inc. | 1,000 | 26,570 | |||
Sekisui House, Ltd. | 200 | 3,822 | |||
Seven & i Holdings Co., Ltd. | 400 | 13,096 | |||
Sony Corp. | 400 | 27,635 | |||
Sumitomo Mitsui Trust Holdings, Inc. | 300 | 8,461 | |||
Tokyo Gas Co., Ltd. | 300 | 7,190 | |||
Toyota Motor Corp. | 400 | 25,175 | |||
| 291,177 | |||||
| NETHERLANDS — 2.4% | |||||
Koninklijke Ahold Delhaize NV | 1,128 | 30,733 | |||
Koninklijke KPN NV | 4,054 | 10,780 | |||
Koninklijke Vopak NV | 150 | 7,932 | |||
| 49,445 | |||||
| NEW ZEALAND — 0.9% | |||||
Spark New Zealand, Ltd. | 6,222 | 18,365 | |||
| NORWAY — 0.3% | |||||
DNB ASA | 401 | 5,340 | |||
| SWEDEN — 1.4% | |||||
Swedish Match AB | 406 | 28,650 | |||
| SWITZERLAND — 5.5% | |||||
Nestle SA | 212 | 23,502 | |||
Novartis AG | 335 | 29,182 | |||
Roche Holding AG | 84 | 29,099 | |||
Swiss Life Holding AG | 28 | 10,415 | |||
Swisscom AG | 45 | 23,596 | |||
| 115,794 | |||||
| UNITED KINGDOM — 0.5% | |||||
Direct Line Insurance Group PLC | 3,228 | 10,793 | |||
| UNITED STATES — 55.8% | |||||
AbbVie, Inc. | 278 | 27,294 | |||
Adobe, Inc. (a) | 25 | 10,883 | |||
Alliant Energy Corp. | 199 | 9,520 | |||
Allstate Corp. | 284 | 27,545 | |||
Ameren Corp. | 116 | 8,162 | |||
American Electric Power Co., Inc. | 103 | 8,203 | |||
Amgen, Inc. | 120 | 28,303 | |||
AT&T, Inc. | 319 | 9,643 | |||
AutoZone, Inc. (a) | 28 | 31,587 | |||
Baxter International, Inc. | 153 | 13,173 | |||
Bristol-Myers Squibb Co. | 462 | 27,166 | |||
Cadence Design Systems, Inc. (a) | 135 | 12,955 | |||
Campbell Soup Co. | 288 | 14,293 | |||
Cerner Corp. | 228 | 15,629 | |||
Cisco Systems, Inc. | 445 | 20,755 | |||
Citrix Systems, Inc. | 128 | 18,933 | |||
Clorox Co. | 65 | 14,259 | |||
CMS Energy Corp. | 87 | 5,083 |
Table of Contents
| Security Description | Shares | Value | |||
Coca-Cola Co. | 386 | $ 17,246 | |||
Consolidated Edison, Inc. | 97 | 6,977 | |||
Costco Wholesale Corp. | 40 | 12,128 | |||
Dollar General Corp. | 88 | 16,765 | |||
Duke Energy Corp. | 59 | 4,714 | |||
Electronic Arts, Inc. (a) | 149 | 19,675 | |||
Eli Lilly & Co. | 196 | 32,179 | |||
Entergy Corp. | 143 | 13,415 | |||
Equinix, Inc. REIT | 19 | 13,344 | |||
Equity LifeStyle Properties, Inc. REIT | 158 | 9,872 | |||
Eversource Energy | 182 | 15,155 | |||
F5 Networks, Inc. (a) | 60 | 8,369 | |||
General Mills, Inc. | 209 | 12,885 | |||
Gilead Sciences, Inc. | 212 | 16,311 | |||
Hershey Co. | 133 | 17,239 | |||
Home Depot, Inc. | 126 | 31,564 | |||
International Business Machines Corp. | 86 | 10,386 | |||
Johnson & Johnson | 197 | 27,704 | |||
JPMorgan Chase & Co. | 161 | 15,144 | |||
Kellogg Co. | 336 | 22,196 | |||
Kimberly-Clark Corp. | 196 | 27,705 | |||
Kroger Co. | 710 | 24,034 | |||
Lockheed Martin Corp. | 57 | 20,800 | |||
McDonald's Corp. | 148 | 27,302 | |||
Medtronic PLC | 283 | 25,951 | |||
Merck & Co., Inc. | 360 | 27,839 | |||
Mondelez International, Inc. Class A | 261 | 13,345 | |||
Motorola Solutions, Inc. | 85 | 11,911 | |||
Newmont Corp. | 352 | 21,733 | |||
NortonLifeLock, Inc. | 633 | 12,552 | |||
Oracle Corp. | 303 | 16,747 | |||
PepsiCo, Inc. | 224 | 29,626 | |||
Pfizer, Inc. | 785 | 25,670 | |||
Philip Morris International, Inc. | 277 | 19,407 | |||
Procter & Gamble Co. | 242 | 28,936 | |||
Public Service Enterprise Group, Inc. | 281 | 13,814 |
| Security Description | Shares | Value | |||
Public Storage REIT | 31 | $ 5,949 | |||
QUALCOMM, Inc. | 116 | 10,580 | |||
Republic Services, Inc. | 128 | 10,502 | |||
Target Corp. | 259 | 31,062 | |||
Texas Instruments, Inc. | 44 | 5,587 | |||
UGI Corp. | 21 | 668 | |||
Verizon Communications, Inc. | 485 | 26,738 | |||
Walmart, Inc. | 231 | 27,669 | |||
Waste Management, Inc. | 287 | 30,396 | |||
Western Union Co. | 1,145 | 24,755 | |||
Yum! Brands, Inc. | 217 | 18,859 | |||
| 1,166,791 | |||||
TOTAL COMMON STOCKS (Cost $1,945,759) | 2,044,956 |
| SHORT-TERM INVESTMENT — 1.3% | |||
State Street Institutional Liquid Reserves Fund, Premier Class 0.35% (b) (c) (Cost $27,634) | 27,623 | 27,634 | |
TOTAL INVESTMENTS — 99.2% (Cost $1,973,393) | 2,072,590 | ||
OTHER ASSETS IN EXCESS OF LIABILITIES — 0.8% | 16,417 | ||
NET ASSETS — 100.0% | $ 2,089,007 | ||
| (a) | Non-income producing security. |
| (b) | The Portfolio invested in certain money market funds managed by SSGA Funds Management, Inc. Amounts related to these transactions during the period ended June 30, 2020 are shown in the Affiliate Table below. |
| (c) | The rate shown is the annualized seven-day yield at June 30, 2020. |
| REIT | Real Estate Investment Trust |
| Description | Level 1 – Quoted Prices | Level 2 – Other Significant Observable Inputs | Level 3 – Significant Unobservable Inputs | Total | ||||
| ASSETS: | ||||||||
| INVESTMENTS: | ||||||||
Common Stocks | $1,241,167 | $803,789 | $— | $2,044,956 | ||||
Short-Term Investment | 27,634 | — | — | 27,634 | ||||
TOTAL INVESTMENTS | $1,268,801 | $803,789 | $— | $2,072,590 |
Table of Contents
| % of Net Assets | ||
| Pharmaceuticals | 13.8% | |
| Diversified Telecommunication Services | 9.3 | |
| Food & Staples Retailing | 6.1 | |
| Food Products | 4.9 | |
| Insurance | 4.8 | |
| IT Services | 3.6 | |
| Multiline Retail | 3.6 | |
| Biotechnology | 3.5 | |
| Software | 3.4 | |
| Household Products | 3.4 | |
| Electric Utilities | 3.1 | |
| Specialty Retail | 3.0 | |
| Health Care Equipment & Supplies | 2.7 | |
| Beverages | 2.6 | |
| Banks | 2.3 | |
| Tobacco | 2.3 | |
| Hotels, Restaurants & Leisure | 2.2 | |
| Equity Real Estate Investment Trusts (REITs) | 2.1 | |
| Communications Equipment | 2.0 | |
| Commercial Services & Supplies | 2.0 | |
| Metals & Mining | 2.0 | |
| Wireless Telecommunication Services | 2.0 | |
| Automobiles | 1.8 | |
| Multi-Utilities | 1.7 | |
| Household Durables | 1.5 | |
| Trading Companies & Distributors | 1.2 | |
| Aerospace & Defense | 1.0 | |
| Technology Hardware, Storage & Peripherals | 1.0 | |
| Health Care Providers & Services | 1.0 | |
| Entertainment | 0.9 | |
| Health Care Technology | 0.8 | |
| Semiconductors & Semiconductor Equipment | 0.8 | |
| Gas Utilities | 0.8 | |
| Oil, Gas & Consumable Fuels | 0.4 | |
| Electronic Equipment, Instruments & Components | 0.3 | |
| Short-Term Investment | 1.3 | |
| Other Assets in Excess of Liabilities | 0.8 | |
| TOTAL | 100.0% |
| Number of Shares Held at 6/30/19 | Value at 6/30/19 | Cost of Purchases | Proceeds from Shares Sold | Realized Gain (Loss) | Change in Unrealized Appreciation/ Depreciation | Number of Shares Held at 6/30/20 | Value at 6/30/20 | Dividend Income | |||||||||
State Street Institutional Liquid Reserves Fund, Premier Class | — | $ — | $505,244 | $477,640 | $30 | $— | 27,623 | $27,634 | $306 | ||||||||
State Street Institutional U.S. Government Money Market Fund, Class G Shares | 10,308 | 10,308 | 25,494 | 35,802 | — | — | — | — | 20 | ||||||||
Total | $10,308 | $530,738 | $513,442 | $30 | $— | $27,634 | $326 |
Table of Contents
| ASSETS | |
Investments in unaffiliated issuers, at value | $2,044,956 |
Investments in affiliated issuers, at value | 27,634 |
Total Investments | 2,072,590 |
Foreign currency, at value | 14,610 |
Cash | 604 |
Dividends receivable — unaffiliated issuers | 2,256 |
Dividends receivable — affiliated issuers | 29 |
Receivable from Adviser | 432 |
Receivable for foreign taxes recoverable | 4,417 |
TOTAL ASSETS | 2,094,938 |
| LIABILITIES | |
Payable for fund shares repurchased | 5,501 |
Advisory fee payable | 428 |
Trustees’ fees and expenses payable | 2 |
TOTAL LIABILITIES | 5,931 |
NET ASSETS | $2,089,007 |
| NET ASSETS CONSIST OF: | |
Paid-in Capital | $1,974,336 |
Total distributable earnings (loss) | 114,671 |
NET ASSETS | $2,089,007 |
| NET ASSET VALUE PER SHARE | |
Net asset value per share | $ 9.82 |
Shares outstanding (unlimited amount authorized, no par value) | 212,675 |
| COST OF INVESTMENTS: | |
Investments in unaffiliated issuers | $1,945,759 |
Investments in affiliated issuers | 27,634 |
Total cost of investments | $1,973,393 |
Foreign currency, at cost | $ 14,543 |
Table of Contents
| INVESTMENT INCOME | |
Dividend income — unaffiliated issuers | $ 64,610 |
Dividend income — affiliated issuers | 326 |
Foreign taxes withheld | (4,297) |
TOTAL INVESTMENT INCOME (LOSS) | 60,639 |
| EXPENSES | |
Advisory fee | 5,692 |
Trustees’ fees and expenses | 30 |
Miscellaneous expenses | 3 |
TOTAL EXPENSES | 5,725 |
Expenses waived/reimbursed by the Adviser | (5,725) |
NET EXPENSES | — |
NET INVESTMENT INCOME (LOSS) | $ 60,639 |
| REALIZED AND UNREALIZED GAIN (LOSS) | |
| Net realized gain (loss) on: | |
Investments — unaffiliated issuers | 11,851 |
Investments — affiliated issuers | 30 |
Foreign currency transactions | (614) |
Net realized gain (loss) | 11,267 |
| Net change in unrealized appreciation/depreciation on: | |
Investments — unaffiliated issuers | (153,624) |
Foreign currency translations | 122 |
Net change in unrealized appreciation/depreciation | (153,502) |
NET REALIZED AND UNREALIZED GAIN (LOSS) | (142,235) |
NET INCREASE (DECREASE) IN NET ASSETS FROM OPERATIONS | $ (81,596) |
Table of Contents
| Year Ended 6/30/20 | Year Ended 6/30/19 | ||
| INCREASE (DECREASE) IN NET ASSETS FROM OPERATIONS: | |||
Net investment income (loss) | $ 60,639 | $ 101,470 | |
Net realized gain (loss) | 11,267 | 83,542 | |
Net change in unrealized appreciation/depreciation | (153,502) | (204,703) | |
Net increase (decrease) in net assets resulting from operations | (81,596) | (19,691) | |
Distributions to shareholders | (188,440) | (351,241) | |
| FROM BENEFICIAL INTEREST TRANSACTIONS: | |||
Proceeds from sale of shares sold | 296,196 | 631,379 | |
Reinvestment of distributions | 188,440 | 351,241 | |
Cost of shares redeemed | (415,467) | (3,326,507) | |
Net increase (decrease) in net assets from beneficial interest transactions | 69,169 | (2,343,887) | |
Net increase (decrease) in net assets during the period | (200,867) | (2,714,819) | |
Net assets at beginning of period | 2,289,874 | 5,004,693 | |
NET ASSETS AT END OF PERIOD | $2,089,007 | $ 2,289,874 | |
| SHARES OF BENEFICIAL INTEREST: | |||
Shares sold | 28,561 | 51,951 | |
Reinvestment of distributions | 17,400 | 36,856 | |
Shares redeemed | (41,531) | (288,025) | |
Net increase (decrease) from share transactions | 4,430 | (199,218) |
Table of Contents
| State Street Defensive Global Equity Portfolio | |||||||||
| Year Ended 6/30/20 | Year Ended 6/30/19 | Year Ended 6/30/18 | Year Ended 6/30/17 | For the Period 2/19/16*- 6/30/16 | |||||
Net asset value, beginning of period | $11.00 | $12.28 | $12.03 | $10.89 | $10.00 | ||||
Net investment income (loss) (a) | 0.28 | 0.33 | 0.42 | 0.31 | 0.15 | ||||
Net realized and unrealized gain (loss) | (0.58) | 0.39 | 0.36 | 1.21 | 0.74 | ||||
Total from investment operations | (0.30) | 0.72 | 0.78 | 1.52 | 0.89 | ||||
| Distributions to shareholders from: | |||||||||
Net investment income | (0.39) | (0.74) | (0.38) | (0.28) | — | ||||
Net realized gains | (0.49) | (1.26) | (0.15) | (0.10) | — | ||||
Total distributions | (0.88) | (2.00) | (0.53) | (0.38) | — | ||||
Net asset value, end of period | $ 9.82 | $11.00 | $12.28 | $12.03 | $10.89 | ||||
Total return (b) | (3.50)% | 8.38% | 6.48% | 14.43% | 8.90%(c) | ||||
| Ratios and Supplemental Data: | |||||||||
Net assets, end of period (in 000s) | $2,089 | $2,290 | $5,005 | $4,631 | $3,270 | ||||
| Ratios to average net assets: | |||||||||
Total expenses | 0.25% | 0.27% | 0.30% | 0.33% | 0.27%(d) | ||||
Net expenses | —% | —% | —% | —%(e) | —%(d) | ||||
Net investment income (loss) | 2.66% | 2.73% | 3.37% | 2.75% | 4.00%(d) | ||||
Portfolio turnover rate | 57% | 72% | 47% | 30% | 21%(c) | ||||
| * | Commencement of operations. |
| (a) | Per share numbers have been calculated using average shares outstanding, which more appropriately presents the per share data for the year. |
| (b) | Total return is calculated assuming a purchase of shares at net asset value on the first day and a sale at net asset value on the last day of each period reported. Distributions are assumed, for the purpose of this calculation, to be reinvested at net asset value per share on the respective payment dates. Total return for periods of less than one year is not annualized. Results represent past performance and are not indicative of future results. |
| (c) | Not annualized. |
| (d) | Annualized. |
| (e) | Amount is less than 0.005%. |
Table of Contents
| Portfolio | Commencement of Operations | Diversification Classification |
| State Street Defensive Global Equity Portfolio | February 19, 2016 | Diversified |
Table of Contents
Table of Contents
Table of Contents
| Purchases | Sales | ||
State Street Defensive Global Equity Portfolio | $1,260,086 | $1,329,371 |
| Ordinary Income | Long-Term Capital Gains | Total | |||
State Street Defensive Global Equity Portfolio | $90,226 | $98,214 | $188,440 |
| Ordinary Income | Long-Term Capital Gains | Total | |||
State Street Defensive Global Equity Portfolio | $ 165,202 | $ 186,039 | $ 351,241 |
| Undistributed Ordinary Income | Capital Loss Carryforwards | Undistributed Long-Term Capital Gains | Net Unrealized Gains (Losses) | Qualified Late-Year Losses | Total | ||||||
State Street Defensive Global Equity Portfolio | $26,317 | $— | $— | $88,354 | $— | $114,671 |
Table of Contents
| Tax Cost | Gross Unrealized Appreciation | Gross Unrealized Depreciation | Net Unrealized Appreciation (Depreciation) | ||||
State Street Defensive Global Equity Portfolio | $1,984,436 | $182,824 | $94,670 | $88,154 |
Table of Contents
Table of Contents

August 28, 2020
Table of Contents
| Actual | Hypothetical (assuming a 5% return before expenses) | ||||||||
| Annualized Expense Ratio | Ending Account Value | Expenses Paid During Period(a) | Ending Account Value | Expenses Paid During Period(a) | |||||
State Street Defensive Global Equity Portfolio | 0.00% | $905.90 | $0.00 | $1,024.90 | $0.00 | ||||
| (a) | Expenses are equal to the Portfolio's annualized net expense ratio multiplied by the average account value of the period, multiplied by 182, then divided by 366. |
Table of Contents
Table of Contents
Table of Contents
Table of Contents
| Name, Address and Year of Birth | Position(s) with Funds | Term of Office and Length of Time Served | Principal Occupation(s) During Past 5 Years | Number of Portfolios in Fund Complex Overseen by Trustee† | Other Directorships Held by Trustee During the Past 5 Years | |||||
| Trustees | ||||||||||
| Independent Trustees | ||||||||||
| FRANK NESVET c/o SSGA Active Trust One Iron Street Boston, MA 02210 1943 | Independent Trustee, Chairman, Trustee Committee Chair | Term: Unlimited Served: since March 2011 | Retired. | 123 | None. | |||||
| BONNY EUGENIA BOATMAN c/o SSGA Active Trust One Iron Street Boston, MA 02210 1950 | Independent Trustee | Term: Unlimited Served: since March 2011 | Retired. | 123 | None. | |||||
| DWIGHT D. CHURCHILL c/o SSGA Active Trust One Iron Street Boston, MA 02210 1953 | Independent Trustee | Term: Unlimited Served: since March 2011 | Self-employed consultant since 2010; CEO and President, CFA Institute (June 2014-January 2015). | 123 | Affiliated Managers Group, Inc. (Chairman, Director and Audit Committee Chair). | |||||
| CLARE S. RICHER c/o SSGA Active Trust One Iron Street Boston, MA 02210 1958 | Independent Trustee | Term: Unlimited Served: since July 2018 | Retired. Chief Financial Officer, Putnam Investments LLC (December 2008- May 2017). | 123 | Principal Financial Group (Director); Bain Capital Specialty Finance (Director); Putnam Acquisition Financing Inc. (Director); Putnam Acquisition Financing LLC (Director); Putnam GP Inc. (Director); Putnam Investor Services, Inc. (Director); University of Notre Dame (Trustee). | |||||
| SANDRA G. SPONEM c/o SSGA Active Trust One Iron Street Boston, MA 02210 1958 | Independent Trustee | Term: Unlimited Served: since July 2018 | Retired. Chief Financial Officer, M.A. Mortenson Companies, Inc. (February 2007- April 2017). | 123 | Rydex Series Funds, Rydex Dynamic Funds, Rydex Variable Trust, Guggenheim Funds Trust, Guggenheim Variable Funds Trust, Guggenheim Strategy Funds Trust, Transparent Value Trust, Fiduciary/ Claymore Energy Infrastructure Fund, Guggenheim Taxable Municipal Managed Duration Trust, Guggenheim Strategic Opportunities Fund, Guggenheim Enhanced, Equity Income Fund, Guggenheim Credit Allocation Fund, Guggenheim Energy & Income Fund (Trustee and Audit Committee Chair). |
Table of Contents
| Name, Address and Year of Birth | Position(s) with Funds | Term of Office and Length of Time Served | Principal Occupation(s) During Past 5 Years | Number of Portfolios in Fund Complex Overseen by Trustee† | Other Directorships Held by Trustee During the Past 5 Years | |||||
| CARL G. VERBONCOEUR c/o SSGA Active Trust One Iron Street Boston, MA 02210 1952 | Independent Trustee, Audit Committee Chair | Term: Unlimited Served: since March 2011 | Self-employed consultant since 2009. | 123 | The Motley Fool Funds Trust (Trustee). | |||||
| Interested Trustee | ||||||||||
| JAMES E. ROSS* c/o SSGA Active Trust One Iron Street Boston, MA 02210 1965 | Interested Trustee | Term: Unlimited Served as Trustee: since March 2011 | Non-Executive Chairman, Fusion Acquisition Corp. (June 2020 - Present); Retired Chairman and Director, SSGA Funds Management, Inc. (2005 - March 2020); Retired Executive Vice President, State Street Global Advisors (2012 - March 2020); Retired Chief Executive Officer and Director, State Street Global Advisors Funds Distributors, LLC (May 2017 - March 2020); Director, State Street Global Markets, LLC (2013 - April 2017); President, SSGA Funds Management, Inc. (2005 - 2012); Principal, State Street Global Advisors (2000 - 2005). | 134 | SSGA SPDR ETFs Europe I plc (Director) (November 2016 - March 2020); SSGA SPDR ETFs Europe II plc (Director) (November 2016 - March 2020); State Street Navigator Securities Lending Trust (July 2016 - March 2020); SSGA Funds (January 2014 - March 2020); State Street Institutional Investment Trust (February 2007 - March 2020); State Street Master Funds (February 2007 - March 2020); Elfun Funds (July 2016 - December 2018). | |||||
| † For the purpose of determining the number of portfolios overseen by the Trustees, “Fund Complex” comprises registered investment companies for which SSGA Funds Management, Inc. serves as investment adviser. | ||||||||||
| * Mr. Ross is an Interested Trustee because of his former position with the Adviser and ownership interest in an affiliate of the Adviser. | ||||||||||
Table of Contents
| Name, Address and Year of Birth | Position(s) with Funds | Term of Office and Length of Time Served | Principal Occupation(s) During the Past 5 Years | |||
| Officers | ||||||
| ELLEN M. NEEDHAM SSGA Funds Management, Inc. One Iron Street Boston, MA 02210 1967 | President | Term: Unlimited Served: since October 2012 | Chairman, SSGA Funds Management, Inc. (March 2020 - present); President and Director, SSGA Funds Management, Inc. (2001 - present)*; Senior Managing Director, State Street Global Advisors (1992 - present)*; Manager, State Street Global Advisors Funds Distributors, LLC (May 2017 - present). | |||
| BRUCE S. ROSENBERG SSGA Funds Management, Inc. One Iron Street Boston, MA 02210 1961 | Treasurer | Term: Unlimited Served: since February 2016 | Managing Director, State Street Global Advisors and SSGA Funds Management, Inc. (July 2015 - present); Director, Credit Suisse (April 2008 - July 2015). | |||
| ANN M. CARPENTER SSGA Funds Management, Inc. One Iron Street Boston, MA 02210 1966 | Vice President; Deputy Treasurer | Term: Unlimited Served: since August 2012 (with respect to Vice President);Since February 2016 (with respect to Deputy Treasurer) | Chief Operating Officer, SSGA Funds Management, Inc. (2005 - Present)*; Managing Director, State Street Global Advisors (2005 - present).* | |||
| MICHAEL P. RILEY SSGA Funds Management, Inc. One Iron Street Boston, MA 02210 1969 | Vice President | Term: Unlimited Served: since March 2011 | Managing Director, State Street Global Advisors (2005 - present).* | |||
| SEAN O’MALLEY SSGA Funds Management, Inc. One Iron Street Boston, MA 02210 1969 | Chief Legal Officer | Term: Unlimited Served: since August 2019 | Senior Vice President and Deputy General Counsel, State Street Global Advisors (November 2013 -present). | |||
| ANDREW DELORME SSGA Funds Management, Inc. One Iron Street Boston, MA 02210 1975 | Secretary | Term: Unlimited Served: since August 2019 | Vice President and Senior Counsel, State Street Global Advisors (April 2016 - present); Vice President and Counsel, State Street Global Advisors (August 2014 - March 2016). | |||
| KEVIN MORRIS SSGA Funds Management, Inc. One Iron Street Boston, MA 02210 1982 | Assistant Secretary | Term: Unlimited Served: since August 2019 | Vice President and Senior Counsel, State Street Global Advisors (April 2019 - present); Vice President and Counsel, State Street Global Advisors (January 2016 -April 2019); Director, Asset Management Compliance, Fidelity Investments (June 2015 - January 2016); Senior Compliance Advisor, Asset Management Compliance, Fidelity Investments (June 2012 - June 2015). | |||
| DAVID URMAN SSGA Funds Management, Inc. One Iron Street Boston, MA 02210 1985 | Assistant Secretary | Term: Unlimited Served: since August 2019 | Vice President and Senior Counsel, State Street Global Advisors (April 2019 - present); Vice President and Counsel, State Street Global Advisors (August 2015 - April 2019); Associate, Ropes & Gray LLP (November 2012 - August 2015). | |||
| CHAD C. HALLETT SSGA Funds Management, Inc. One Iron Street Boston, MA 02210 1969 | Deputy Treasurer | Term: Unlimited Served: since February 2016 | Vice President, State Street Global Advisors and SSGA Funds Management, Inc. (November 2014 - present); Vice President, State Street Bank and Trust Company (2001 - November 2014).* |
Table of Contents
| Name, Address and Year of Birth | Position(s) with Funds | Term of Office and Length of Time Served | Principal Occupation(s) During the Past 5 Years | |||
| DARLENE ANDERSON-VASQUEZ SSGA Funds Management, Inc. One Iron Street Boston, MA 02210 1968 | Deputy Treasurer | Term: Unlimited Served: since November 2016 | Managing Director, State Street Global Advisors and SSGA Funds Management, Inc. (May 2016 - present); Senior Vice President, John Hancock Investments (September 2007 - May 2016). | |||
| ARTHUR A. JENSEN SSGA Funds Management, Inc. 1600 Summer Street Stamford, CT 06905 1966 | Deputy Treasurer | Term: Unlimited Served: Since August 2017 | Vice President at State Street Global Advisors (July 2016 – present); Mutual Funds Controller of GE Asset Management Incorporated (April 2011 - July 2016). | |||
| SUJATA UPRETI SSGA Funds Management, Inc. One Iron Street Boston, MA 02210 1974 | Assistant Treasurer | Term: Unlimited Served: since February 2016 | Vice President, State Street Global Advisors and SSGA Funds Management, Inc. (May 2015 - present). | |||
| DANIEL FOLEY SSGA Funds Management, Inc. One Iron Street Boston, MA 02210 1972 | Assistant Treasurer | Term: Unlimited Served: since February 2016 | Vice President, State Street Global Advisors and SSGA Funds Management, Inc. (April 2007 - present).* | |||
| DANIEL G. PLOURDE SSGA Funds Management, Inc. One Iron Street Boston, MA 02210 1980 | Assistant Treasurer | Term: Unlimited Served: since May 2017 | Vice President, State Street Global Advisors and SSGA Funds Management, Inc. (May 2015 - present); Officer, State Street Bank and Trust Company (March 2009 - May 2015). | |||
| BRIAN HARRIS SSGA Funds Management, Inc. One Iron Street Boston, MA 02210 1973 | Chief Compliance Officer; Anti-Money Laundering Officer; Code of Ethics Compliance Officer | Term: Unlimited Served: since November 2013 | Managing Director, State Street Global Advisors and SSGA Funds Management, Inc. (June 2013 - present)*; Senior Vice President and Global Head of Investment Compliance, BofA Global Capital Management (2010 - 2013); Director of Compliance, AARP Financial Inc. (2008 - 2010). | |||
| * Served in various capacities and/or with various affiliated entities during noted time period. | ||||||
| The Statement of Additional Information (SAI) includes additional information about the Portfolio's trustees and is available, without charge, upon request and by calling 1-866-787-2257. | ||||||
Table of Contents
Table of Contents
One Iron Street
Boston, MA 02210
One Iron Street
Boston, MA 02210
One Lincoln Street
Boston, MA 02111
1111 Pennsylvania Avenue, NW
Washington, DC 20004
200 Clarendon Street
Boston, MA 02116
Table of Contents
Item 2. Code of Ethics.
As of the end of the period covered by this report, the registrant has adopted a code of ethics that applies to the registrant’s principal executive officer, principal financial officer, principal accounting officer or controller, or persons performing similar functions, regardless of whether these individuals are employed by the registrant or a third party (the “Code of Ethics”). During the period covered by this report, no substantive amendments were made to the Code of Ethics. During the period covered by this report, the registrant did not grant any waivers, including any implicit waivers, from any provision of the Code of Ethics.
The Code of Ethics is attached hereto as Exhibit 13(a)(1).
Item 3. Audit Committee Financial Expert.
(a)(1) The Board of Trustees of the registrant has determined that the registrant has six Board members serving on the Audit Committee that possess the attributes identified in Instructions 2(b) of Item 3 to Form N-CSR to qualify as an “audit committee financial expert.”
(2) Bonny Boatman, Dwight Churchill, Frank Nesvet, Clare Richer, Sandra Sponem and Carl Verboncoeur are the registrant’s audit committee financial experts. The Board also determined that each of the foregoing persons are not “interested person(s)” of the registrant as that term is defined in Section 2(a)(19) of the Investment Company Act of 1940, as amended (the “1940 Act”).
Item 4. Principal Accountant Fees and Services.
(a) Audit Fees.
For the fiscal years ending June 30, 2020 and June 30, 2019, the aggregate audit fees billed for professional services rendered by the principal accountant were $273,506 and $257,071, respectively. Audit fees include the performance of the annual audits and routine regulatory filings (one for each SEC registrant).
(b) Audit-Related Fees.
For the fiscal years ending June 30, 2020 and June 30, 2019, the principal accountant did not bill the registrant any fees for assurances and related services that are reasonably related to the performance of the audit of the registrant’s financial statements and are not reported under paragraph (a) of this Item.
(c) Tax Fees.
For the fiscal years ending June 30, 2020 and June 30, 2019, the aggregate tax fees billed for professional services rendered by the principal accountant were $138,894 and $138,894, respectively. Tax fees represent services related to the review of year-end distribution requirements, as well as the review and signing as preparer of all federal, state and excise income tax returns for the series of the registrant.
(d) All Other Fees.
There were no other fees billed by the principal accountant for the fiscal years ending June 30, 2020 and June 30, 2019.
(e)(1) Audit Committee Pre-Approval Policies and Procedures.
The registrant’s Audit Committee Charter states the following with respect to pre-approval procedures:
Before the independent auditors are engaged by the Trust to render audit, audit-related or permissible non-audit services, either:
Table of Contents
| (a) | The Audit Committee shall pre-approve all audit, audit-related and permissible non-audit services provided to the Trust. The Audit Committee may delegate to one or more of its members the authority to grant pre-approvals. Any decision of any member to whom authority is delegated under this section shall be presented to the full Audit Committee at its next regularly scheduled meeting; |
or
| (b) | The engagement to render the audit, audit-related or permissible non-audit service is entered into pursuant to pre-approval policies and procedures established by the Audit Committee. Any such policies and procedures must (1) be detailed as to the particular service and (2) not involve any delegation of the Audit Committee’s responsibilities to the investment adviser. The Audit Committee must be informed of each service entered into pursuant to the policies and procedures. A copy of any such policies and procedures shall be attached as an exhibit to the Audit Committee Charter. |
| (c) | Pre-Approval for a service provided to the Trust other than audit or audit-related services is not required if: (1) the aggregate amount of all such permissible non-audit services provided to the Trust constitutes not more than 5 percent of the total amount of revenues paid by the Trust to the independent auditors during the fiscal year in which the permissible non-audit services are provided; (2) such services were not recognized by the Trust at the time of the engagement to be permissible non-audit services; and (3) such services are promptly brought to the attention of the Audit Committee and are approved by the Audit Committee or by one or more members of the Audit Committee to whom authority to grant such approvals has been delegated by the Audit Committee prior to the completion of the audit (the “De Minimis Exception”). |
| (d) | The Audit Committee shall pre-approve any permissible non-audit services proposed to be provided by the independent auditors to (a) the investment adviser and (b) any entity controlling, controlled by, or under common control with the investment adviser that provides ongoing services to the Trust, if the independent auditors’ engagement with the investment adviser or any such control persons relates directly to the operations and financial reporting of the Trust. It shall be the responsibility of the independent auditors to notify the Audit Committee of any permissible non-audit services that need to be pre-approved. |
| (e) | The De Minimis exception set forth above applies to pre-approvals under this Section as well, except that the “total amount of revenues” calculation is based on the total amount of revenues paid to the independent auditors by the Trust and any other entity that has its services approved under this Section (i.e., the investment adviser or any control person). |
(e)(2) Percentage of Services.
One hundred percent of the services described in each of paragraphs (b) through (d) of this Item were approved by the registrant’s Audit Committee pursuant to paragraph (c)(7)(i)(C) of Rule 2-01 of Regulation S-X.
Table of Contents
(f) Not applicable.
(g) The aggregate non-audit fees billed for by the registrant’s accountant for services rendered to the registrant, and rendered to the registrant’s investment adviser (not including any sub-adviser whose role is primarily portfolio management and is subcontracted with or overseen by another investment adviser), and any entity controlling, controlled by, or under common control with the adviser were as follows:
| FY 2020 (in millions) | FY 2019 (in millions) | |||||||
Non audit services billed to: | ||||||||
Registrant: | See Item 4 | (c) | See Item 4 | (c) | ||||
Investment Adviser: | — | — | ||||||
Other entities in the Investment Company Complex (1)(2): | ||||||||
Audit Related Fees | $ | 15.2 | $ | 14.8 | ||||
Tax Fees | $ | 5.8 | $ | 5.3 | ||||
All Other Fees | $ | 14.2 | $ | 16.2 | ||||
| (1) | Information is for the calendar years 2019 and 2018, respectively. |
| (2) | Services under the caption Audit-Related Fees consisted principally of reports on the processing of transactions by servicing organizations, audits of employee benefit plan, non-statutory audits and due diligence procedures. Services under the caption Tax Fees consisted principally of expatriate, compliance and corporate tax advisory services. Services under the caption All Other Fees primarily related to statutory and financial statement audits and the requirement to opine on the design and operating effectiveness of internal control over financial reporting. |
(h) The registrant’s principal accountant notified the registrant’s Audit Committee of all non-audit services that were rendered by the principal accountant to the Adviser and any entity controlling, controlled by, or under common control with the Adviser that provides services to the registrant, which services were not required to be pre-approved pursuant to paragraph (c)(7)(ii) of Rule 2-01 of Regulation S-X, allowing the registrant’s Audit Committee to consider whether such services were compatible with maintaining the principal accountant’s independence.
Item 5. Audit Committees of Listed Registrants.
The registrant has an audit committee which was established by the Board of Trustees of the Trust in accordance with Section 3(a)(58)(A) of the Securities Exchange Act of 1934, as amended. The members of the registrant’s Audit Committee are Bonny Boatman, Dwight Churchill, Frank Nesvet, Clare Richer, Sandra Sponem and Carl Verboncoeur.
Item 6. Investments.
| (a) | The Schedule of Investments for the SPDR DoubleLine Total Return Tactical ETF is listed below. The Summary Schedule of Investments for this Fund as well as the Schedules of Investments for the remaining series of the registrant are included as part of the reports to shareholders filed under Item 1 of this Form N-CSR. |
Table of Contents
| Security Description | Principal Amount | Value | |||
| CORPORATE BONDS & NOTES — 14.9% | |||||
| ARGENTINA — 0.1% | |||||
AES Argentina Generacion SA Series REGS, 7.75%, 2/2/2024 | $ 500,000 | $ 359,865 | |||
| Banco Macro SA: | |||||
USD 5 Year Swap Rate + 5.46%, 6.75%, 11/4/2026 (a) (b) | 450,000 | 368,334 | |||
Series REGS, USD 5 Year Swap Rate + 5.46%, 6.75%, 11/4/2026 (b) | 1,150,000 | 941,298 | |||
| Pampa Energia SA: | |||||
Series REGS, 7.50%, 1/24/2027 | �� | 2,000,000 | 1,615,920 | ||
Series REGS, 9.13%, 4/15/2029 | 150,000 | 122,440 | |||
| 3,407,857 | |||||
| AUSTRALIA — 0.1% | |||||
Commonwealth Bank of Australia 3.90%, 7/12/2047 (a) | 658,000 | 799,635 | |||
| Macquarie Group, Ltd.: | |||||
3 Month USD LIBOR + 1.02%, 3.19%, 11/28/2023 (a) (b) | 1,155,000 | 1,201,292 | |||
3 Month USD LIBOR + 1.33%, 4.15%, 3/27/2024 (a) (b) | 2,590,000 | 2,771,093 | |||
| 4,772,020 | |||||
| BELGIUM — 0.1% | |||||
Anheuser-Busch InBev Worldwide, Inc. 5.55%, 1/23/2049 | 1,605,000 | 2,131,328 | |||
| BRAZIL — 0.3% | |||||
Banco BTG Pactual SA 5 Year CMT + 5.26%, 7.75%, 2/15/2029 (a) (b) | 2,700,000 | 2,724,354 | |||
Banco do Brasil SA Series REGS, 10 Year CMT + 4.40%, 6.25%, 4/15/2024 (b) | 800,000 | 702,392 | |||
CSN Islands XI Corp. 6.75%, 1/28/2028 (a) | 500,000 | 425,505 | |||
CSN Islands XII Corp. Series REGS, 7.00%, 9/23/2020 | 2,100,000 | 1,570,737 | |||
CSN Resources SA 7.63%, 4/17/2026 (a) | 1,800,000 | 1,575,828 | |||
| Globo Comunicacao e Participacoes SA: | |||||
4.88%, 1/22/2030 (a) | 1,000,000 | 904,620 | |||
Series REGS, 4.84%, 6/8/2025 | 300,000 | 300,006 |
| Security Description | Principal Amount | Value | |||
Itau Unibanco Holding SA VRN, 5 Year CMT + 3.22%, 4.63%, 2/27/2025 (a) (b) | $ 200,000 | $ 165,190 | |||
| JBS USA LUX SA/JBS USA Finance, Inc.: | |||||
5.75%, 6/15/2025 (a) | 85,000 | 85,937 | |||
5.88%, 7/15/2024 (a) | 130,000 | 131,754 | |||
NBM US Holdings, Inc. 7.00%, 5/14/2026 (a) | 400,000 | 401,676 | |||
| Petrobras Global Finance B.V.: | |||||
5.75%, 2/1/2029 | 1,000,000 | 1,026,800 | |||
6.90%, 3/19/2049 | 200,000 | 210,750 | |||
| 10,225,549 | |||||
| CANADA — 0.5% | |||||
Bank of Nova Scotia 1.63%, 5/1/2023 | 1,720,000 | 1,760,042 | |||
| Bombardier, Inc.: | |||||
6.00%, 10/15/2022 (a) | 300,000 | 211,893 | |||
7.88%, 4/15/2027 (a) | 350,000 | 228,137 | |||
Canadian Natural Resources, Ltd. 2.95%, 1/15/2023 | 1,945,000 | 2,008,874 | |||
| Garda World Security Corp.: | |||||
4.63%, 2/15/2027 (a) | 615,000 | 605,763 | |||
8.75%, 5/15/2025 (a) | 505,000 | 509,676 | |||
| GFL Environmental, Inc.: | |||||
4.25%, 6/1/2025 (a) | 165,000 | 166,275 | |||
5.13%, 12/15/2026 (a) | 460,000 | 474,872 | |||
8.50%, 5/1/2027 (a) | 171,000 | 185,974 | |||
Kronos Acquisition Holdings, Inc. 9.00%, 8/15/2023 (a) | 490,000 | 467,534 | |||
Masonite International Corp. 5.75%, 9/15/2026 (a) | 490,000 | 500,589 | |||
Mattamy Group Corp. 4.63%, 3/1/2030 (a) | 395,000 | 380,835 | |||
| MEG Energy Corp.: | |||||
7.00%, 3/31/2024 (a) | 165,000 | 141,377 | |||
7.13%, 2/1/2027 (a) | 620,000 | 515,084 | |||
Parkland Fuel Corp. 5.88%, 7/15/2027 (a) | 520,000 | 538,070 | |||
Royal Bank of Canada Series GMTN, 2.55%, 7/16/2024 | 4,630,000 | 4,918,958 | |||
Superior Plus L.P./Superior General Partner, Inc. 7.00%, 7/15/2026 (a) | 655,000 | 677,991 | |||
| Telesat Canada/Telesat LLC: | |||||
4.88%, 6/1/2027 (a) | 370,000 | 364,050 | |||
6.50%, 10/15/2027 (a) | 375,000 | 367,984 | |||
Tervita Corp. 7.63%, 12/1/2021 (a) | 545,000 | 437,335 | |||
Titan Acquisition, Ltd./Titan Co-Borrower LLC 7.75%, 4/15/2026 (a) | 155,000 | 146,777 | |||
| 15,608,090 |
Table of Contents
| Security Description | Principal Amount | Value | |||
| CAYMAN ISLANDS — 0.2% | �� | ||||
Cosan Overseas, Ltd. 8.25%, 8/5/2020 | $ 4,314,000 | $ 4,319,436 | |||
Global Aircraft Leasing Co., Ltd. PIK PIK, 6.50%, 9/15/2024 (a) | 525,000 | 370,681 | |||
Grupo Aval, Ltd. Series REGS, 4.38%, 2/4/2030 | 400,000 | 382,260 | |||
| 5,072,377 | |||||
| CHILE — 0.5% | |||||
| AES Gener SA: | |||||
5 Year CMT + 4.92%, 6.35%, 10/7/2079 (a) (b) | 200,000 | 200,246 | |||
USD 5 Year Swap Rate + 4.64%, 7.13%, 3/26/2079 (a) (b) | 1,000,000 | 1,035,460 | |||
Series REGS, 5.00%, 7/14/2025 | 200,000 | 193,374 | |||
Series REGS, USD 5 Year Swap Rate + 4.64%, 7.13%, 3/26/2079 (b) | 3,000,000 | 3,106,380 | |||
Series REGS, VRN, 5 Year CMT + 4.92%, 6.35%, 10/7/2079 (b) | 400,000 | 400,492 | |||
Corp. Nacional del Cobre de Chile 3.75%, 1/15/2031 (a) | 1,000,000 | 1,089,630 | |||
Empresa Electrica Angamos SA Series REGS, 4.88%, 5/25/2029 | 1,565,000 | 1,629,243 | |||
Empresa Electrica Guacolda SA Series REGS, 4.56%, 4/30/2025 | 1,900,000 | 1,568,811 | |||
Empresa Nacional de Telecomunicaciones SA Series REGS, 4.75%, 8/1/2026 | 1,300,000 | 1,382,940 | |||
GNL Quintero SA Series REGS, 4.63%, 7/31/2029 | 200,000 | 213,722 | |||
Inversiones CMPC SA Series REGS, 4.50%, 4/25/2022 | 2,000,000 | 2,077,080 | |||
Latam Finance, Ltd. 7.00%, 3/1/2026 (a) (c) | 2,700,000 | 764,532 | |||
SACI Falabella Series REGS, 3.75%, 4/30/2023 | 1,700,000 | 1,741,565 | |||
Sociedad Quimica y Minera de Chile SA Series REGS, 4.38%, 1/28/2025 | 300,000 | 320,940 | |||
Transelec SA Series REGS, 4.63%, 7/26/2023 | 450,000 | 478,157 | |||
VTR Finance N.V. Series REGS, 6.88%, 1/15/2024 | 500,000 | 511,460 | |||
| 16,714,032 |
| Security Description | Principal Amount | Value | |||
| CHINA — 0.3% | |||||
Baidu, Inc. 3.43%, 4/7/2030 | $ 200,000 | $ 215,266 | |||
Gran Tierra Energy International Holdings, Ltd. Series REGS, 6.25%, 2/15/2025 | 2,600,000 | 1,187,706 | |||
JD.com, Inc. 3.38%, 1/14/2030 | 1,800,000 | 1,921,644 | |||
Sinopec Group Overseas Development 2017, Ltd. 3.63%, 4/12/2027 (a) | 700,000 | 767,711 | |||
Sinopec Group Overseas Development 2018, Ltd. 2.70%, 5/13/2030 (a) | 2,300,000 | 2,369,414 | |||
Tencent Holdings, Ltd. 2.39%, 6/3/2030 (a) | 2,100,000 | 2,111,592 | |||
| 8,573,333 | |||||
| COLOMBIA — 0.3% | |||||
Banco Bilbao Vizcaya Argentaria Colombia SA Series REGS, 4.88%, 4/21/2025 | 200,000 | 210,642 | |||
Banco de Bogota SA Series REGS, 5.38%, 2/19/2023 | 700,000 | 725,403 | |||
| Bancolombia SA: | |||||
5 Year CMT + 2.93%, 4.88%, 10/18/2027 (b) | 1,700,000 | 1,660,662 | |||
VRN, 5 Year CMT + 2.94%, 4.63%, 12/18/2029 (b) | 1,200,000 | 1,132,956 | |||
Ecopetrol SA 6.88%, 4/29/2030 | 1,300,000 | 1,489,007 | |||
Empresas Publicas de Medellin ESP 4.25%, 7/18/2029 (a) | 500,000 | 501,060 | |||
| Geopark, Ltd.: | |||||
5.50%, 1/17/2027 (a) | 500,000 | 431,695 | |||
Class REGS, 5.50%, 1/17/2027 | 500,000 | 431,695 | |||
Series REGS, 6.50%, 9/21/2024 | 700,000 | 639,233 | |||
| Grupo Aval, Ltd.: | |||||
4.38%, 2/4/2030 (a) | 500,000 | 477,825 | |||
Series REGS, 4.75%, 9/26/2022 | 600,000 | 607,464 | |||
| 8,307,642 | |||||
| DOMINICAN REPUBLIC — 0.2% | |||||
| AES Andres B.V./Dominican Power Partners/Empresa Generadora de Electricidad It: | |||||
7.95%, 5/11/2026 (a) | 2,200,000 | 2,215,730 | |||
Series REGS, 7.95%, 5/11/2026 | 1,200,000 | 1,208,580 | |||
| Banco de Reservas de la Republica Dominicana: | |||||
7.00%, 2/1/2023 (a) | 1,200,000 | 1,161,120 |
Table of Contents
| Security Description | Principal Amount | Value | |||
Series REGS, 7.00%, 2/1/2023 | $ 2,750,000 | $ 2,660,900 | |||
| 7,246,330 | |||||
| FRANCE — 0.1% | |||||
Altice France SA 7.38%, 5/1/2026 (a) | 725,000 | 754,841 | |||
Total Capital International SA 3.39%, 6/29/2060 | 1,685,000 | 1,732,905 | |||
| 2,487,746 | |||||
| INDIA — 0.3% | |||||
Adani Ports & Special Economic Zone, Ltd. Series REGS, 3.95%, 1/19/2022 | 2,200,000 | 2,222,704 | |||
Indian Oil Corp., Ltd. 5.75%, 8/1/2023 | 200,000 | 216,016 | |||
Network i2i, Ltd. 5 Year CMT + 4.28%, 5.65%, 1/15/2025 (a) (b) | 900,000 | 871,146 | |||
ONGC Videsh Vankorneft Pte, Ltd. 3.75%, 7/27/2026 | 3,100,000 | 3,186,936 | |||
Reliance Holding USA, Inc. Series REGS, 5.40%, 2/14/2022 | 500,000 | 527,065 | |||
Vedanta Resources Finance II PLC 9.25%, 4/23/2026 (a) | 1,400,000 | 1,004,220 | |||
Vedanta Resources PLC Series REGS, 6.13%, 8/9/2024 | 3,800,000 | 2,619,378 | |||
| 10,647,465 | |||||
| INDONESIA — 0.0% (d) | |||||
Medco Bell Pte, Ltd. 6.38%, 1/30/2027 (a) | 600,000 | 504,726 | |||
Star Energy Geothermal Wayang Windu, Ltd. Series REGS, 6.75%, 4/24/2033 | 997,700 | 1,037,748 | |||
| 1,542,474 | |||||
| IRELAND — 0.1% | |||||
Ardagh Packaging Finance PLC/Ardagh Holdings USA, Inc. 5.25%, 8/15/2027 (a) | 300,000 | 294,555 | |||
Avolon Holdings Funding, Ltd. 3.25%, 2/15/2027 (a) | 850,000 | 696,337 | |||
C&W Senior Financing DAC Series REGS, 6.88%, 9/15/2027 | 800,000 | 791,896 | |||
| 1,782,788 | |||||
| ISRAEL — 0.1% | |||||
| Delek & Avner Tamar Bond, Ltd.: | |||||
4.44%, 12/30/2020 (a) | 1,600,000 | 1,600,688 | |||
5.41%, 12/30/2025 (a) | 340,000 | 331,945 |
| Security Description | Principal Amount | Value | |||
Israel Electric Corp., Ltd. Series 6, 5.00%, 11/12/2024 (a) | $ 600,000 | $ 675,372 | |||
| 2,608,005 | |||||
| JAMAICA — 0.0% (d) | |||||
Digicel Group 0.5, Ltd. PIK, 8.00%, 4/1/2025 (a) | 786,072 | 226,027 | |||
| JAPAN — 0.1% | |||||
Mitsubishi UFJ Financial Group, Inc. 3 Month USD LIBOR + 0.74%, 1.08%, 3/2/2023 (b) | 2,100,000 | 2,089,017 | |||
Sumitomo Mitsui Financial Group, Inc. 3 Month USD LIBOR + 0.74%, 1.87%, 1/17/2023 (b) | 2,369,000 | 2,359,927 | |||
| 4,448,944 | |||||
| KUWAIT — 0.1% | |||||
| MEGlobal Canada ULC: | |||||
5.00%, 5/18/2025 (a) | 1,400,000 | 1,512,938 | |||
5.88%, 5/18/2030 (a) | 700,000 | 792,505 | |||
| 2,305,443 | |||||
| LUXEMBOURG — 0.1% | |||||
Altice Financing SA 5.00%, 1/15/2028 (a) | 240,000 | 238,723 | |||
Altice France Holding SA 6.00%, 2/15/2028 (a) | 430,000 | 406,492 | |||
ARD Finance SA PIK, 6.50%, 6/30/2027 (a) | 200,000 | 198,022 | |||
| Intelsat Jackson Holdings SA: | |||||
5.50%, 8/1/2023 (c) | 310,000 | 178,033 | |||
8.50%, 10/15/2024 (a) (c) | 540,000 | 325,021 | |||
JSL Europe SA Series REGS, 7.75%, 7/26/2024 | 1,100,000 | 1,084,017 | |||
| 2,430,308 | |||||
| MALAYSIA — 0.1% | |||||
Gohl Capital, Ltd. 4.25%, 1/24/2027 | 1,200,000 | 1,210,242 | |||
Malayan Banking Bhd USD 5 Year Swap Rate + 2.54%, 3.91%, 10/29/2026 (b) | 2,900,000 | 2,939,469 | |||
Petronas Capital, Ltd. 3.50%, 4/21/2030 (a) | 400,000 | 443,116 | |||
| 4,592,827 | |||||
| MAURITIUS — 0.0% (d) | |||||
UPL Corp., Ltd. 4.50%, 3/8/2028 | 1,300,000 | 1,298,687 | |||
| MEXICO — 0.8% | |||||
| Banco Mercantil del Norte SA: | |||||
10 year CMT + 5.47%, 7.50%, 6/27/2029 (a) (b) | 1,600,000 | 1,513,472 |
Table of Contents
| Security Description | Principal Amount | Value | |||
Series REGS, 10 Year CMT + 5.35%, 7.63%, 1/10/2028 (b) | $ 3,210,000 | $ 3,057,076 | |||
Series REGS, 5 Year CMT + 5.04%, 6.88%, 7/6/2022 (b) | 1,264,000 | 1,207,120 | |||
Banco Santander Mexico SA 5 Year CMT + 3.00%, 5.95%, 10/1/2028 (a) (b) | 1,200,000 | 1,229,196 | |||
Banco Santander Mexico SA Institucion de Banca Multiple Grupo Financiero Santand 5.38%, 4/17/2025 (a) | 1,000,000 | 1,094,540 | |||
| BBVA Bancomer SA: | |||||
5 year CMT + 4.31%, 5.88%, 9/13/2034 (a) (b) | 200,000 | 195,994 | |||
Series REGS, 5 Year CMT + 2.65%, 5.13%, 1/18/2033 (b) | 2,900,000 | 2,714,226 | |||
Series REGS, 5 Year CMT + 3.00%, 5.35%, 11/12/2029 (b) | 200,000 | 195,580 | |||
Braskem Idesa SAPI 7.45%, 11/15/2029 (a) | 200,000 | 187,134 | |||
Cemex SAB de CV Series REGS, 7.75%, 4/16/2026 | 1,400,000 | 1,431,682 | |||
Cometa Energia SA de CV Series REGS, 6.38%, 4/24/2035 | 4,370,000 | 4,556,337 | |||
| Credito Real SAB de CV: | |||||
9.50%, 2/7/2026 (a) | 1,800,000 | 1,846,908 | |||
Series REGS, 5 Year CMT + 7.03%, 9.13%, 11/29/2022 (b) | 1,500,000 | 1,281,615 | |||
Docuformas SAPI de CV 10.25%, 7/24/2024 (a) | 1,400,000 | 1,172,066 | |||
Grupo Idesa SA de CV PIK, 10.13%, 5/22/2026 (a) | 1,414,000 | 763,602 | |||
Operadora de Servicios Mega SA de CV Sofom ER 8.25%, 2/11/2025 (a) | 1,000,000 | 928,250 | |||
| Unifin Financiera SAB de CV: | |||||
Series REGS, 7.38%, 2/12/2026 | 500,000 | 373,270 | |||
Series REGS, 5 Year CMT + 6.31%, 8.88%, 1/29/2025 (b) | 3,900,000 | 2,599,584 | |||
| 26,347,652 | |||||
| NETHERLANDS — 0.3% | |||||
| Minejesa Capital B.V.: | |||||
Series REGS, 4.63%, 8/10/2030 | 2,000,000 | 2,035,620 | |||
Series REGS, 5.63%, 8/10/2037 | 1,700,000 | 1,745,424 |
| Security Description | Principal Amount | Value | |||
Starfruit Finco B.V./Starfruit US Holdco LLC 8.00%, 10/1/2026 (a) | $ 150,000 | $ 154,138 | |||
Stars Group Holdings B.V./Stars Group US Co-Borrower LLC 7.00%, 7/15/2026 (a) | 695,000 | 733,079 | |||
Syngenta Finance NV Series REGS, 5.68%, 4/24/2048 | 4,000,000 | 4,016,520 | |||
Trivium Packaging Finance B.V. 5.50%, 8/15/2026 (a) | 400,000 | 406,376 | |||
| 9,091,157 | |||||
| NORWAY — 0.0% (d) | |||||
Aker BP ASA 4.75%, 6/15/2024 (a) | 360,000 | 362,502 | |||
| PANAMA — 0.1% | |||||
| Global Bank Corp.: | |||||
3 Month USD LIBOR + 3.30%, 5.25%, 4/16/2029 (a) (b) | 3,700,000 | 3,792,907 | |||
Series REGS, 4.50%, 10/20/2021 | 200,000 | 204,224 | |||
| 3,997,131 | |||||
| PERU — 0.2% | |||||
| Banco de Credito del Peru: | |||||
VRN, 5 year CMT + 3.00%, 3.13%, 7/1/2030 (a) (b) (e) | 700,000 | 694,281 | |||
Series REGS, 3 Month USD LIBOR + 7.04%, 6.13%, 4/24/2027 (b) | 450,000 | 477,189 | |||
Banco Internacional del Peru SAA Interbank Series REGS, 3.38%, 1/18/2023 | 450,000 | 458,473 | |||
Hunt Oil Co. of Peru LLC Sucursal Del Peru Class REGS, 6.38%, 6/1/2028 | 1,500,000 | 1,455,765 | |||
Peru LNG S.r.l. Class REGS, 5.38%, 3/22/2030 | 1,900,000 | 1,499,765 | |||
Scotiabank Peru SAA Series REGS, 3 Month USD LIBOR + 3.86%, 4.50%, 12/13/2027 (b) | 531,000 | 544,015 | |||
| 5,129,488 | |||||
| PHILIPPINES — 0.2% | |||||
BDO Unibank, Inc. Series EMTN, 2.95%, 3/6/2023 | 6,200,000 | 6,338,826 | |||
| QATAR — 0.1% | |||||
| Ooredoo International Finance, Ltd.: | |||||
Class REGS, 3.25%, 2/21/2023 | 1,700,000 | 1,772,607 |
Table of Contents
| Security Description | Principal Amount | Value | |||
Class REGS, 3.75%, 6/22/2026 | $ 200,000 | $ 216,958 | |||
| 1,989,565 | |||||
| SINGAPORE — 0.4% | |||||
| DBS Group Holdings, Ltd.: | |||||
Series GMTN, USD 5 Year Swap Rate + 2.39%, 3.60%, 9/7/2021 (b) | 4,100,000 | 4,110,250 | |||
Series REGS, VRN, USD 5 year ICE Swap Rate + 1.59%, 4.52%, 12/11/2028 (b) | 500,000 | 541,295 | |||
Oversea-Chinese Banking Corp., Ltd. Series REGS, 3 Month USD LIBOR + 0.45%, 0.84%, 5/17/2021 (b) | 500,000 | 499,996 | |||
PSA Treasury Pte, Ltd. Class GMTN, 2.13%, 9/5/2029 | 1,100,000 | 1,133,275 | |||
| United Overseas Bank, Ltd.: | |||||
Series EMTN, USD 5 Year Swap Rate + 1.79%, 3.88%, 10/19/2023 (b) | 1,800,000 | 1,817,424 | |||
Series EMTN, USD 5 Year Swap Rate + 2.24%, 3.50%, 9/16/2026 (b) | 4,000,000 | 4,076,320 | |||
| 12,178,560 | |||||
| SOUTH KOREA — 0.0% (d) | |||||
Korea East-West Power Co., Ltd. 1.75%, 5/6/2025 (a) | 300,000 | 308,979 | |||
| SWITZERLAND — 0.0% (d) | |||||
Syngenta Finance NV 4.38%, 3/28/2042 | 200,000 | 189,728 | |||
| THAILAND — 0.0% (d) | |||||
PTTEP Treasury Center Co., Ltd. 2.59%, 6/10/2027 (a) | 200,000 | 204,772 | |||
| UNITED KINGDOM — 0.3% | |||||
Avation Capital SA 6.50%, 5/15/2021 (a) | 600,000 | 451,224 | |||
CK Hutchison International 20, Ltd. 2.50%, 5/8/2030 (a) | 1,000,000 | 1,023,480 | |||
eG Global Finance PLC 8.50%, 10/30/2025 (a) | 615,000 | 632,146 | |||
Radiant Access, Ltd. 4.60%, 11/18/2020 | 3,950,000 | 3,918,519 | |||
Reynolds American, Inc. 4.00%, 6/12/2022 | 3,295,000 | 3,478,433 | |||
Virgin Media Finance PLC 5.00%, 7/15/2030 (a) | 605,000 | 592,204 | |||
| 10,096,006 | |||||
| UNITED STATES — 8.9% | |||||
| AbbVie, Inc.: | |||||
3.20%, 11/6/2022 | 1,450,000 | 1,524,762 |
| Security Description | Principal Amount | Value | |||
3.85%, 6/15/2024 (a) | $ 1,590,000 | $ 1,746,074 | |||
Acrisure LLC/Acrisure Finance, Inc. 8.13%, 2/15/2024 (a) | 730,000 | 758,733 | |||
Advanced Drainage Systems, Inc. 5.00%, 9/30/2027 (a) | 370,000 | 372,919 | |||
AECOM 5.13%, 3/15/2027 | 375,000 | 402,889 | |||
AEP Texas, Inc. Series H, 3.45%, 1/15/2050 | 1,280,000 | 1,380,019 | |||
Air Lease Corp. 3.25%, 3/1/2025 | 1,965,000 | 1,969,814 | |||
Air Medical Group Holdings, Inc. 6.38%, 5/15/2023 (a) | 465,000 | 438,900 | |||
Air Methods Corp. 8.00%, 5/15/2025 (a) | 358,000 | 252,909 | |||
Albertsons Cos., Inc./Safeway, Inc./New Albertsons L.P./Albertsons LLC 4.63%, 1/15/2027 (a) | 385,000 | 384,977 | |||
Alcoa Nederland Holding B.V. 6.13%, 5/15/2028 (a) | 620,000 | 639,394 | |||
Alliant Holdings Intermediate LLC/Alliant Holdings Co-Issuer 6.75%, 10/15/2027 (a) | 370,000 | 367,362 | |||
| Allied Universal Holdco LLC/Allied Universal Finance Corp.: | |||||
6.63%, 7/15/2026 (a) | 530,000 | 556,198 | |||
9.75%, 7/15/2027 (a) | 435,000 | 458,286 | |||
Allison Transmission, Inc. 5.00%, 10/1/2024 (a) | 1,070,000 | 1,074,505 | |||
Amazon.com, Inc. 2.80%, 8/22/2024 | 2,090,000 | 2,272,018 | |||
American Axle & Manufacturing, Inc. 6.25%, 3/15/2026 | 325,000 | 315,269 | |||
American Express Co. 2.50%, 8/1/2022 | 1,980,000 | 2,052,607 | |||
Amgen, Inc. 2.45%, 2/21/2030 | 1,795,000 | 1,897,782 | |||
Antero Midstream Partners L.P./Antero Midstream Finance Corp. 5.75%, 3/1/2027 (a) | 300,000 | 243,693 | |||
Anthem, Inc. 3.30%, 1/15/2023 | 3,947,000 | 4,202,489 | |||
Apache Corp. 4.38%, 10/15/2028 | 355,000 | 314,271 | |||
Aramark Services, Inc. 6.38%, 5/1/2025 (a) | 430,000 | 443,992 | |||
| Arconic Corp.: | |||||
6.00%, 5/15/2025 (a) | 170,000 | 175,770 | |||
6.13%, 2/15/2028 (a) | 600,000 | 602,316 |
Table of Contents
| Security Description | Principal Amount | Value | |||
Arrow Electronics, Inc. 3.88%, 1/12/2028 | $ 1,667,000 | $ 1,747,900 | |||
| Asbury Automotive Group, Inc.: | |||||
4.50%, 3/1/2028 (a) | 107,000 | 103,811 | |||
4.75%, 3/1/2030 (a) | 107,000 | 104,340 | |||
Ascend Learning LLC 6.88%, 8/1/2025 (a) | 1,030,000 | 1,039,679 | |||
AssuredPartners, Inc. 7.00%, 8/15/2025 (a) | 952,000 | 950,743 | |||
AT&T, Inc. 3.40%, 5/15/2025 | 2,780,000 | 3,050,939 | |||
Axalta Coating Systems LLC/Axalta Coating Systems Dutch Holding B B.V. 4.75%, 6/15/2027 (a) | 655,000 | 659,775 | |||
| B&G Foods, Inc.: | |||||
5.25%, 4/1/2025 | 305,000 | 306,775 | |||
5.25%, 9/15/2027 | 240,000 | 240,214 | |||
Banff Merger Sub, Inc. 9.75%, 9/1/2026 (a) | 150,000 | 151,106 | |||
Bank of America Corp. Series GMTN, 3 Month USD LIBOR + 0.66%, 2.37%, 7/21/2021 (b) | 2,845,000 | 2,847,617 | |||
| Bausch Health Cos., Inc.: | |||||
5.25%, 1/30/2030 (a) | 390,000 | 369,572 | |||
6.25%, 2/15/2029 (a) | 300,000 | 301,671 | |||
7.00%, 3/15/2024 (a) | 240,000 | 248,882 | |||
7.00%, 1/15/2028 (a) | 730,000 | 752,820 | |||
| Beacon Roofing Supply, Inc.: | |||||
4.50%, 11/15/2026 (a) | 250,000 | 244,228 | |||
4.88%, 11/1/2025 (a) | 610,000 | 545,608 | |||
Becton Dickinson and Co. 2.89%, 6/6/2022 | 3,370,000 | 3,488,455 | |||
Boston Properties L.P. 3.65%, 2/1/2026 | 3,715,000 | 4,122,313 | |||
Boxer Parent Co., Inc. 7.13%, 10/2/2025 (a) | 35,000 | 36,695 | |||
Boyd Gaming Corp. 4.75%, 12/1/2027 (a) | 615,000 | 528,937 | |||
Boyne USA, Inc. 7.25%, 5/1/2025 (a) | 1,115,000 | 1,167,974 | |||
Brink's Co. 5.50%, 7/15/2025 (a) | 50,000 | 51,060 | |||
Bristol-Myers Squibb Co. 4.35%, 11/15/2047 (a) | 3,360,000 | 4,421,827 | |||
Broadcom, Inc. 3.15%, 11/15/2025 (a) | 570,000 | 606,759 | |||
| Builders FirstSource, Inc.: | |||||
5.00%, 3/1/2030 (a) | 400,000 | 376,880 | |||
6.75%, 6/1/2027 (a) | 184,000 | 188,357 | |||
BWX Technologies, Inc. 4.13%, 6/30/2028 (a) | 745,000 | 745,700 | |||
| Calpine Corp.: | |||||
4.50%, 2/15/2028 (a) | 265,000 | 260,233 | |||
5.13%, 3/15/2028 (a) | 165,000 | 161,514 |
| Security Description | Principal Amount | Value | |||
5.25%, 6/1/2026 (a) | $ 370,000 | $ 373,659 | |||
Camelot Finance SA 4.50%, 11/1/2026 (a) | 125,000 | 125,000 | |||
Carnival Corp. 11.50%, 4/1/2023 (a) | 165,000 | 179,013 | |||
Carrier Global Corp. 3.58%, 4/5/2050 (a) | 1,080,000 | 1,054,447 | |||
Carvana Co. 8.88%, 10/1/2023 (a) | 200,000 | 200,968 | |||
Castle US Holding Corp. 9.50%, 2/15/2028 (a) | 175,000 | 162,159 | |||
Catalent Pharma Solutions, Inc. 5.00%, 7/15/2027 (a) | 655,000 | 680,348 | |||
Caterpillar, Inc. 3.40%, 5/15/2024 | 3,346,000 | 3,669,993 | |||
| CCO Holdings LLC/CCO Holdings Capital Corp.: | |||||
4.50%, 8/15/2030 (a) | 370,000 | 377,359 | |||
4.75%, 3/1/2030 (a) | 755,000 | 772,969 | |||
5.00%, 2/1/2028 (a) | 195,000 | 201,382 | |||
5.75%, 2/15/2026 (a) | 1,600,000 | 1,658,688 | |||
CDK Global, Inc. 5.88%, 6/15/2026 | 200,000 | 208,150 | |||
Cedar Fair L.P. 5.25%, 7/15/2029 (a) | 430,000 | 388,922 | |||
Cengage Learning, Inc. 9.50%, 6/15/2024 (a) | 355,000 | 243,949 | |||
Centene Corp. 4.25%, 12/15/2027 | 460,000 | 474,490 | |||
Century Communities, Inc. 6.75%, 6/1/2027 | 360,000 | 371,261 | |||
| CenturyLink, Inc.: | |||||
4.00%, 2/15/2027 (a) | 355,000 | 344,691 | |||
5.13%, 12/15/2026 (a) | 390,000 | 389,458 | |||
Charles River Laboratories International, Inc. 4.25%, 5/1/2028 (a) | 370,000 | 369,782 | |||
Charter Communications Operating LLC/Charter Communications Operating Capital 4.46%, 7/23/2022 | 1,475,000 | 1,573,427 | |||
| Cheniere Energy Partners L.P.: | |||||
5.25%, 10/1/2025 | 750,000 | 747,345 | |||
5.63%, 10/1/2026 | 455,000 | 451,583 | |||
| Cigna Corp.: | |||||
4.90%, 12/15/2048 | 1,610,000 | 2,122,382 | |||
3 Month USD LIBOR + 0.89%, 2.11%, 7/15/2023 (b) | 1,665,000 | 1,663,651 | |||
Citigroup, Inc. 3 Month USD LIBOR + 1.39%, 3.67%, 7/24/2028 (b) | 3,385,000 | 3,779,183 | |||
| Clarios Global L.P./Clarios US Finance Co.: | |||||
6.25%, 5/15/2026 (a) | 440,000 | 453,649 | |||
8.50%, 5/15/2027 (a) | 225,000 | 226,422 |
Table of Contents
| Security Description | Principal Amount | Value | |||
| Clean Harbors, Inc.: | |||||
4.88%, 7/15/2027 (a) | $ 460,000 | $ 472,581 | |||
5.13%, 7/15/2029 (a) | 145,000 | 150,278 | |||
Clear Channel Worldwide Holdings, Inc. 9.25%, 2/15/2024 | 395,000 | 366,430 | |||
Clearway Energy Operating LLC 4.75%, 3/15/2028 (a) | 375,000 | 382,001 | |||
CNX Midstream Partners L.P./CNX Midstream Finance Corp. 6.50%, 3/15/2026 (a) | 510,000 | 469,113 | |||
Colt Merger Sub, Inc. 6.25%, 7/1/2025 (a) (e) | 440,000 | 439,622 | |||
| CommScope, Inc.: | |||||
5.50%, 3/1/2024 (a) | 445,000 | 450,562 | |||
6.00%, 3/1/2026 (a) | 145,000 | 148,574 | |||
Constellation Brands, Inc. 2.88%, 5/1/2030 | 375,000 | 397,792 | |||
Constellation Merger Sub, Inc. 8.50%, 9/15/2025 (a) | 440,000 | 351,754 | |||
CRC Escrow Issuer LLC/CRC Finco, Inc. 5.25%, 10/15/2025 (a) | 505,000 | 439,456 | |||
Credit Acceptance Corp. 6.63%, 3/15/2026 | 590,000 | 596,337 | |||
Crown Americas LLC/Crown Americas Capital Corp. 4.50%, 1/15/2023 | 400,000 | 410,800 | |||
Crown Castle International Corp. 4.30%, 2/15/2029 | 1,605,000 | 1,860,676 | |||
CSC Holdings LLC 5.75%, 1/15/2030 (a) | 810,000 | 842,894 | |||
CSI Compressco L.P./CSI Compressco Finance, Inc. 7.50%, 4/1/2025 (a) | 660,000 | 559,251 | |||
CSX Corp. 3.35%, 9/15/2049 | 1,935,000 | 2,147,308 | |||
CVS Health Corp. 3.70%, 3/9/2023 | 3,520,000 | 3,778,262 | |||
Dana Financing Luxembourg Sarl 5.75%, 4/15/2025 (a) | 325,000 | 329,943 | |||
| Dana, Inc.: | |||||
5.38%, 11/15/2027 | 125,000 | 124,854 | |||
5.63%, 6/15/2028 | 300,000 | 298,689 | |||
DaVita, Inc. 4.63%, 6/1/2030 (a) | 225,000 | 223,895 | |||
Dealer Tire LLC/DT Issuer LLC 8.00%, 2/1/2028 (a) | 165,000 | 153,386 | |||
Delta Air Lines, Inc. 7.00%, 5/1/2025 (a) | 130,000 | 134,189 | |||
Diamond Sports Group LLC/Diamond Sports Finance Co. 5.38%, 8/15/2026 (a) | 470,000 | 339,716 |
| Security Description | Principal Amount | Value | |||
Discover Financial Services 4.10%, 2/9/2027 | $ 1,885,000 | $ 2,065,715 | |||
DISH DBS Corp. 5.88%, 11/15/2024 | 380,000 | 378,119 | |||
Dollar General Corp. 3.50%, 4/3/2030 | 1,550,000 | 1,742,975 | |||
Dollar Tree, Inc. 4.00%, 5/15/2025 | 1,068,000 | 1,200,913 | |||
DowDuPont, Inc. 5.42%, 11/15/2048 | 700,000 | 920,948 | |||
Duke Energy Corp. 2.65%, 9/1/2026 | 3,535,000 | 3,836,571 | |||
Dun & Bradstreet Corp. 10.25%, 2/15/2027 (a) | 205,000 | 227,530 | |||
DXC Technology Co. 4.00%, 4/15/2023 | 1,835,000 | 1,924,915 | |||
Eldorado Resorts, Inc. 6.00%, 4/1/2025 | 550,000 | 574,970 | |||
Embarq Corp. 8.00%, 6/1/2036 | 370,000 | 415,732 | |||
| Encompass Health Corp.: | |||||
4.50%, 2/1/2028 | 185,000 | 177,495 | |||
4.75%, 2/1/2030 | 60,000 | 57,544 | |||
Endeavor Energy Resources L.P./EER Finance, Inc. 6.63%, 7/15/2025 (a) | 240,000 | 242,722 | |||
Energizer Holdings, Inc. 7.75%, 1/15/2027 (a) | 525,000 | 560,863 | |||
Energy Transfer Operating L.P. 4.75%, 1/15/2026 | 955,000 | 1,042,115 | |||
Enterprise Products Operating LLC 3.75%, 2/15/2025 | 1,805,000 | 1,999,525 | |||
Envision Helthcare Corp. 8.75%, 10/15/2026 (a) | 265,000 | 130,499 | |||
EQM Midstream Partners L.P. 6.50%, 7/1/2027 (a) | 135,000 | 138,734 | |||
EQT Corp. 6.13%, 2/1/2025 | 320,000 | 318,842 | |||
ESH Hospitality, Inc. 5.25%, 5/1/2025 (a) | 610,000 | 587,253 | |||
Essential Utilities, Inc. 3.35%, 4/15/2050 | 1,885,000 | 1,978,289 | |||
Expedia Group, Inc. 3.80%, 2/15/2028 | 2,515,000 | 2,409,596 | |||
Exterran Energy Solutions L.P./EES Finance Corp. 8.13%, 5/1/2025 | 190,000 | 157,518 | |||
Extraction Oil & Gas, Inc. 5.63%, 2/1/2026 (a) (c) | 155,000 | 30,014 | |||
Exxon Mobil Corp. 2.99%, 3/19/2025 | 1,260,000 | 1,368,738 | |||
FedEx Corp. 4.75%, 11/15/2045 | 815,000 | 907,152 | |||
| Financial & Risk US Holdings, Inc.: | |||||
6.25%, 5/15/2026 (a) | 485,000 | 514,013 |
Table of Contents
| Security Description | Principal Amount | Value | |||
8.25%, 11/15/2026 (a) | $ 500,000 | $ 541,215 | |||
FirstEnergy Corp. Series C, 4.85%, 7/15/2047 | 1,415,000 | 1,798,989 | |||
Flex Acquisition Co., Inc. 6.88%, 1/15/2025 (a) | 635,000 | 610,578 | |||
| Ford Motor Co.: | |||||
7.45%, 7/16/2031 | 430,000 | 451,504 | |||
9.00%, 4/22/2025 | 175,000 | 189,186 | |||
| Ford Motor Credit Co. LLC: | |||||
4.25%, 9/20/2022 | 800,000 | 784,256 | |||
5.75%, 2/1/2021 | 800,000 | 803,400 | |||
Series GMTN, 4.39%, 1/8/2026 | 600,000 | 571,044 | |||
Foresight Energy LLC/Foresight Energy Finance Corp. 11.50%, 4/1/2023 (a) (c) | 510,000 | 5 | |||
| Freeport-McMoRan, Inc.: | |||||
5.40%, 11/14/2034 | 1,000,000 | 1,008,780 | |||
5.45%, 3/15/2043 | 300,000 | 294,894 | |||
frontdoor, Inc. 6.75%, 8/15/2026 (a) | 690,000 | 734,036 | |||
| Frontier Communications Corp.: | |||||
7.13%, 1/15/2023 (c) | 285,000 | 85,509 | |||
8.00%, 4/1/2027 (a) (c) | 410,000 | 416,539 | |||
8.50%, 4/15/2020 (c) | 135,000 | 42,166 | |||
8.50%, 4/1/2026 (a) (c) | 230,000 | 217,743 | |||
FTS International, Inc. 6.25%, 5/1/2022 | 320,000 | 107,856 | |||
Gates Global LLC/Gates Global Co. 6.25%, 1/15/2026 (a) | 405,000 | 399,869 | |||
General Electric Co. Series MTN, 5.88%, 1/14/2038 | 700,000 | 784,630 | |||
General Motors Co. 3 Month USD LIBOR + 0.80%, 1.27%, 8/7/2020 (b) | 645,000 | 644,478 | |||
| General Motors Financial Co., Inc.: | |||||
3.95%, 4/13/2024 | 125,000 | 129,083 | |||
3 Month USD LIBOR + 0.99%, 2.36%, 1/5/2023 (b) | 2,691,000 | 2,596,331 | |||
Genesys Telecommunications Laboratories, Inc./Greeneden Lux 3 Sarl/Greeneden US Holdings II LLC 10.00%, 11/30/2024 (a) | 1,095,000 | 1,136,073 | |||
Georgia-Pacific LLC 3.60%, 3/1/2025 (a) | 1,543,000 | 1,708,008 | |||
Gogo Intermediate Holdings LLC/Gogo Finance Co., Inc. 9.88%, 5/1/2024 (a) | 475,000 | 403,484 | |||
Golden Entertainment, Inc. 7.63%, 4/15/2026 (a) | 315,000 | 293,555 |
| Security Description | Principal Amount | Value | |||
| Golden Nugget, Inc.: | |||||
6.75%, 10/15/2024 (a) | $ 740,000 | $ 529,840 | |||
8.75%, 10/1/2025 (a) | 150,000 | 88,227 | |||
Goldman Sachs Group, Inc. Series ., 3 Month USD LIBOR + 1.17%, 1.56%, 5/15/2026 (b) | 3,790,000 | 3,749,674 | |||
| Gray Television, Inc.: | |||||
5.13%, 10/15/2024 (a) | 195,000 | 194,667 | |||
7.00%, 5/15/2027 (a) | 575,000 | 593,193 | |||
Griffon Corp. 5.75%, 3/1/2028 (a) | 835,000 | 831,087 | |||
GrubHub Holdings, Inc. 5.50%, 7/1/2027 (a) | 225,000 | 230,405 | |||
GTT Communications, Inc. 7.88%, 12/31/2024 (a) | 310,000 | 162,849 | |||
Gulfport Energy Corp. 6.38%, 5/15/2025 | 500,000 | 249,535 | |||
Halliburton Co. 2.92%, 3/1/2030 | 1,177,000 | 1,115,678 | |||
Hasbro, Inc. 3.50%, 9/15/2027 | 1,932,000 | 2,001,475 | |||
| HCA, Inc.: | |||||
4.13%, 6/15/2029 | 870,000 | 959,923 | |||
5.38%, 9/1/2026 | 965,000 | 1,048,395 | |||
| Hess Midstream Operations L.P.: | |||||
5.13%, 6/15/2028 (a) | 590,000 | 567,486 | |||
5.63%, 2/15/2026 (a) | 455,000 | 450,737 | |||
Hexion, Inc. 7.88%, 7/15/2027 (a) | 300,000 | 278,913 | |||
H-Food Holdings LLC/Hearthside Finance Co., Inc. 8.50%, 6/1/2026 (a) | 450,000 | 421,618 | |||
Hilcorp Energy I L.P./Hilcorp Finance Co. 6.25%, 11/1/2028 (a) | 540,000 | 429,046 | |||
Hillman Group, Inc. 6.38%, 7/15/2022 (a) | 135,000 | 125,322 | |||
Hill-Rom Holdings, Inc. 4.38%, 9/15/2027 (a) | 295,000 | 301,741 | |||
| Hilton Domestic Operating Co., Inc.: | |||||
5.38%, 5/1/2025 (a) | 25,000 | 24,896 | |||
5.75%, 5/1/2028 (a) | 25,000 | 25,335 | |||
Home Depot, Inc. 3.90%, 6/15/2047 | 1,590,000 | 1,931,182 | |||
Horizon Pharma USA, Inc. 5.50%, 8/1/2027 (a) | 730,000 | 759,477 | |||
Hyundai Capital America 3.00%, 2/10/2027 (a) | 2,120,000 | 2,093,733 | |||
IAA, Inc. 5.50%, 6/15/2027 (a) | 570,000 | 589,266 | |||
| Icahn Enterprises L.P./Icahn Enterprises Finance Corp.: | |||||
5.25%, 5/15/2027 | 385,000 | 371,498 | |||
6.25%, 5/15/2026 | 715,000 | 715,029 |
Table of Contents
| Security Description | Principal Amount | Value | |||
| iHeartCommunications, Inc.: | |||||
5.25%, 8/15/2027 (a) | $ 310,000 | $ 296,980 | |||
8.38%, 5/1/2027 | 75,000 | 68,666 | |||
Illuminate Buyer LLC/Illuminate Holdings IV, Inc. 9.00%, 7/1/2028 (a) | 345,000 | 360,804 | |||
Indigo Natural Resources LLC 6.88%, 2/15/2026 (a) | 265,000 | 246,119 | |||
Installed Building Products, Inc. 5.75%, 2/1/2028 (a) | 435,000 | 438,941 | |||
Intel Corp. 3.10%, 2/15/2060 | 895,000 | 990,505 | |||
| IRB Holding Corp.: | |||||
6.75%, 2/15/2026 (a) | 575,000 | 549,487 | |||
7.00%, 6/15/2025 (a) | 250,000 | 257,460 | |||
Iron Mountain, Inc. 4.88%, 9/15/2029 (a) | 230,000 | 223,521 | |||
iStar, Inc. 4.75%, 10/1/2024 | 305,000 | 286,142 | |||
Jaguar Holding Co. II/PPD Development L.P. 5.00%, 6/15/2028 (a) | 175,000 | 179,120 | |||
| JBS USA LUX SA/JBS USA Food Co./JBS USA Finance, Inc.: | |||||
5.50%, 1/15/2030 (a) | 190,000 | 194,585 | |||
6.50%, 4/15/2029 (a) | 320,000 | 339,392 | |||
Jeld-Wen, Inc. 4.63%, 12/15/2025 (a) | 610,000 | 585,533 | |||
JPMorgan Chase & Co. 3 Month USD LIBOR + 1.10%, 1.42%, 6/7/2021 (b) | 2,040,000 | 2,055,626 | |||
KAR Auction Services, Inc. 5.13%, 6/1/2025 (a) | 790,000 | 777,376 | |||
Kenan Advantage Group, Inc. 7.88%, 7/31/2023 (a) | 85,000 | 75,630 | |||
Kinder Morgan, Inc. 4.30%, 3/1/2028 | 935,000 | 1,059,149 | |||
| Kraft Heinz Foods Co.: | |||||
3.95%, 7/15/2025 | 367,000 | 392,055 | |||
5.00%, 7/15/2035 | 430,000 | 472,983 | |||
5.20%, 7/15/2045 | 1,195,000 | 1,294,842 | |||
Kraton Polymers LLC/Kraton Polymers Capital Corp. 7.00%, 4/15/2025 (a) | 450,000 | 452,272 | |||
Kratos Defense & Security Solutions, Inc. 6.50%, 11/30/2025 (a) | 475,000 | 495,876 | |||
Laboratory Corp. of America Holdings 3.60%, 2/1/2025 | 3,096,000 | 3,414,424 | |||
| Level 3 Financing, Inc.: | |||||
4.25%, 7/1/2028 (a) | 300,000 | 300,714 | |||
4.63%, 9/15/2027 (a) | 460,000 | 462,696 | |||
| LifePoint Health, Inc.: | |||||
4.38%, 2/15/2027 (a) | 410,000 | 386,339 | |||
6.75%, 4/15/2025 (a) | 220,000 | 225,911 |
| Security Description | Principal Amount | Value | |||
Lions Gate Capital Holdings LLC 6.38%, 2/1/2024 (a) | $ 415,000 | $ 404,380 | |||
| Live Nation Entertainment, Inc.: | |||||
5.63%, 3/15/2026 (a) | 960,000 | 909,840 | |||
6.50%, 5/15/2027 (a) | 185,000 | 190,581 | |||
LTF Merger Sub, Inc. 8.50%, 6/15/2023 (a) | 640,000 | 529,574 | |||
M/I Homes, Inc. 4.95%, 2/1/2028 | 365,000 | 364,646 | |||
Marriott Ownership Resorts, Inc./ILG LLC 6.50%, 9/15/2026 | 620,000 | 626,584 | |||
Massachusetts Mutual Life Insurance Co. 3.38%, 4/15/2050 (a) | 1,885,000 | 1,937,497 | |||
| Match Group, Inc.: | |||||
4.63%, 6/1/2028 (a) | 165,000 | 167,133 | |||
5.00%, 12/15/2027 (a) | 775,000 | 806,604 | |||
MGM Growth Properties Operating Partnership L.P./MGP Finance Co-Issuer, Inc. 5.75%, 2/1/2027 | 735,000 | 760,357 | |||
| MGM Resorts International: | |||||
5.75%, 6/15/2025 | 453,000 | 449,430 | |||
6.75%, 5/1/2025 | 420,000 | 416,329 | |||
Micron Technology, Inc. 2.50%, 4/24/2023 | 765,000 | 795,057 | |||
Mileage Plus Holdings LLC/Mileage Plus Intellectual Property Assets, Ltd. 6.50%, 6/20/2027 (a) (e) | 510,000 | 512,688 | |||
Molina Healthcare, Inc. 4.38%, 6/15/2028 (a) | 135,000 | 135,062 | |||
Monongahela Power Co. 5.40%, 12/15/2043 (a) | 675,000 | 946,282 | |||
Morgan Stanley 3 Month USD LIBOR + 0.85%, 3.74%, 4/24/2024 (b) | 3,710,000 | 3,997,302 | |||
Moss Creek Resources Holdings, Inc. 7.50%, 1/15/2026 (a) | 345,000 | 172,379 | |||
MPH Acquisition Holdings LLC 7.13%, 6/1/2024 (a) | 860,000 | 799,714 | |||
MSCI, Inc. 3.63%, 9/1/2030 (a) | 115,000 | 114,608 | |||
Murphy Oil USA, Inc. 4.75%, 9/15/2029 | 285,000 | 291,284 | |||
Nabors Industries, Ltd. 7.25%, 1/15/2026 (a) | 305,000 | 190,427 | |||
| Nationstar Mortgage Holdings, Inc.: | |||||
6.00%, 1/15/2027 (a) | 65,000 | 62,446 | |||
8.13%, 7/15/2023 (a) | 570,000 | 584,506 |
Table of Contents
| Security Description | Principal Amount | Value | |||
| Navient Corp.: | |||||
5.00%, 3/15/2027 | $ 285,000 | $ 242,706 | |||
6.50%, 6/15/2022 | 895,000 | 879,123 | |||
NCL Corp., Ltd. 3.63%, 12/15/2024 (a) | 585,000 | 357,669 | |||
NetApp, Inc. 1.88%, 6/22/2025 | 965,000 | 979,726 | |||
| Netflix, Inc.: | |||||
5.38%, 11/15/2029 (a) | 240,000 | 262,898 | |||
5.88%, 2/15/2025 | 410,000 | 455,100 | |||
New York Life Global Funding 2.30%, 6/10/2022 (a) | 2,035,000 | 2,109,115 | |||
Newell Brands, Inc. 4.88%, 6/1/2025 | 165,000 | 172,633 | |||
Nexstar Broadcasting, Inc. 5.63%, 7/15/2027 (a) | 310,000 | 307,784 | |||
NextEra Energy Capital Holdings, Inc. 2.75%, 5/1/2025 | 1,975,000 | 2,140,623 | |||
| NFP Corp.: | |||||
6.88%, 7/15/2025 (a) | 990,000 | 976,338 | |||
7.00%, 5/15/2025 (a) | 50,000 | 52,500 | |||
NGL Energy Partners L.P./NGL Energy Finance Corp. 7.50%, 4/15/2026 | 250,000 | 190,480 | |||
Nordstrom, Inc. 8.75%, 5/15/2025 (a) | 100,000 | 107,533 | |||
Novelis Corp. 4.75%, 1/30/2030 (a) | 235,000 | 224,503 | |||
NuStar Logistics L.P. 6.00%, 6/1/2026 | 510,000 | 490,345 | |||
NUVEEN FINANCE LLC 4.13%, 11/1/2024 (a) | 3,045,000 | 3,427,482 | |||
| Oasis Petroleum, Inc.: | |||||
6.25%, 5/1/2026 (a) | 330,000 | 57,014 | |||
6.88%, 3/15/2022 | 500,000 | 90,880 | |||
| Occidental Petroleum Corp.: | |||||
2.70%, 8/15/2022 | 400,000 | 372,412 | |||
3.50%, 8/15/2029 | 695,000 | 508,650 | |||
8.00%, 7/15/2025 (e) | 255,000 | 256,278 | |||
Series 1, 4.10%, 2/1/2021 | 365,000 | 365,829 | |||
Omnicom Group, Inc. 2.45%, 4/30/2030 | 1,770,000 | 1,794,798 | |||
Oracle Corp. 3.60%, 4/1/2050 | 1,450,000 | 1,625,899 | |||
| Ortho-Clinical Diagnostics, Inc./Ortho-Clinical Diagnostics SA: | |||||
7.25%, 2/1/2028 (a) | 380,000 | 385,844 | |||
7.38%, 6/1/2025 (a) | 65,000 | 66,151 | |||
Par Petroleum LLC/Petroleum Finance Corp. 7.75%, 12/15/2025 (a) | 750,000 | 651,135 | |||
Parsley Energy LLC/Parsley Finance Corp. 5.63%, 10/15/2027 (a) | 595,000 | 586,206 |
| Security Description | Principal Amount | Value | |||
PBF Holding Co. LLC/PBF Finance Corp. 6.00%, 2/15/2028 (a) | $ 235,000 | $ 196,192 | |||
Peabody Energy Corp. 6.00%, 3/31/2022 (a) | 388,000 | 252,285 | |||
Penn National Gaming, Inc. 5.63%, 1/15/2027 (a) | 620,000 | 580,686 | |||
Penske Truck Leasing Co. L.P./PTL Finance Corp. 4.20%, 4/1/2027 (a) | 675,000 | 726,853 | |||
Performance Food Group, Inc. 5.50%, 10/15/2027 (a) | 575,000 | 554,886 | |||
| PetSmart, Inc.: | |||||
5.88%, 6/1/2025 (a) | 307,000 | 308,081 | |||
7.13%, 3/15/2023 (a) | 555,000 | 547,136 | |||
PG&E Corp. 5.00%, 7/1/2028 | 560,000 | 560,784 | |||
Pilgrim's Pride Corp. 5.88%, 9/30/2027 (a) | 440,000 | 440,264 | |||
Polaris Intermediate Corp. PIK PIK, 8.50%, 12/1/2022 (a) | 200,000 | 175,968 | |||
| Post Holdings, Inc.: | |||||
4.63%, 4/15/2030 (a) | 530,000 | 519,654 | |||
5.50%, 12/15/2029 (a) | 140,000 | 145,250 | |||
Prime Security Services Borrower LLC/Prime Finance, Inc. 6.25%, 1/15/2028 (a) | 330,000 | 311,108 | |||
QEP Resources, Inc. 5.25%, 5/1/2023 | 755,000 | 513,196 | |||
Radiate Holdco LLC/Radiate Finance, Inc. 6.88%, 2/15/2023 (a) | 465,000 | 472,045 | |||
Radiology Partners, Inc. 9.25%, 2/1/2028 (a) | 440,000 | 414,546 | |||
Realogy Group LLC/Realogy Co-Issuer Corp. 7.63%, 6/15/2025 (a) | 195,000 | 195,778 | |||
Resideo Funding, Inc. 6.13%, 11/1/2026 (a) | 680,000 | 664,190 | |||
Riverbed Technology, Inc. 8.88%, 3/1/2023 (a) | 255,000 | 154,250 | |||
Roper Technologies, Inc. 4.20%, 9/15/2028 | 1,505,000 | 1,761,256 | |||
Sabine Pass Liquefaction LLC 5.00%, 3/15/2027 | 1,485,000 | 1,658,374 | |||
Sabre GLBL, Inc. 9.25%, 4/15/2025 (a) | 125,000 | 131,609 | |||
Santander Holdings USA, Inc. 3.40%, 1/18/2023 | 1,970,000 | 2,053,469 | |||
Schweitzer-Mauduit International, Inc. 6.88%, 10/1/2026 (a) | 475,000 | 486,034 | |||
| Scientific Games International, Inc.: | |||||
5.00%, 10/15/2025 (a) | 580,000 | 537,822 |
Table of Contents
| Security Description | Principal Amount | Value | |||
8.25%, 3/15/2026 (a) | $ 225,000 | $ 201,737 | |||
Scotts Miracle-Gro Co 4.50%, 10/15/2029 | 440,000 | 452,778 | |||
Scripps Escrow, Inc. 5.88%, 7/15/2027 (a) | 280,000 | 265,311 | |||
Select Medical Corp. 6.25%, 8/15/2026 (a) | 860,000 | 869,365 | |||
Silgan Holdings, Inc. 4.13%, 2/1/2028 (a) | 570,000 | 566,175 | |||
| Sirius XM Radio, Inc.: | |||||
4.13%, 7/1/2030 (a) | 510,000 | 505,935 | |||
5.50%, 7/1/2029 (a) | 340,000 | 357,945 | |||
Six Flags Entertainment Corp. 4.88%, 7/31/2024 (a) | 710,000 | 635,272 | |||
Six Flags Theme Parks, Inc. 7.00%, 7/1/2025 (a) | 235,000 | 243,944 | |||
Smithfield Foods, Inc. 4.25%, 2/1/2027 (a) | 1,620,000 | 1,661,326 | |||
Southern Co. Series A, 3.70%, 4/30/2030 | 1,855,000 | 2,113,309 | |||
Spectrum Brands, Inc. 5.00%, 10/1/2029 (a) | 370,000 | 365,442 | |||
| Springleaf Finance Corp.: | |||||
5.38%, 11/15/2029 | 250,000 | 234,048 | |||
6.63%, 1/15/2028 | 125,000 | 124,418 | |||
7.13%, 3/15/2026 | 324,000 | 335,210 | |||
Sprint Capital Corp. 6.88%, 11/15/2028 | 1,270,000 | 1,548,930 | |||
Sprint Corp. 7.13%, 6/15/2024 | 1,355,000 | 1,528,142 | |||
| Staples, Inc.: | |||||
7.50%, 4/15/2026 (a) | 330,000 | 259,911 | |||
10.75%, 4/15/2027 (a) | 150,000 | 89,003 | |||
Star Merger Sub, Inc. 6.88%, 8/15/2026 (a) | 285,000 | 300,963 | |||
SunCoke Energy Partners L.P./SunCoke Energy Partners Finance Corp. 7.50%, 6/15/2025 (a) | 880,000 | 750,165 | |||
| Sunoco L.P./Sunoco Finance Corp.: | |||||
6.00%, 4/15/2027 | 300,000 | 300,264 | |||
5.50%, 2/15/2026 | 570,000 | 553,630 | |||
| Sysco Corp.: | |||||
3.25%, 7/15/2027 | 925,000 | 978,613 | |||
3.30%, 2/15/2050 | 960,000 | 906,346 | |||
Talen Energy Supply LLC 6.63%, 1/15/2028 (a) | 335,000 | 327,690 | |||
| Targa Resources Partners L.P./Targa Resources Partners Finance Corp.: | |||||
5.88%, 4/15/2026 | 615,000 | 611,205 | |||
6.50%, 7/15/2027 | 200,000 | 202,266 | |||
Tempo Acquisition LLC/Tempo Acquisition Finance Corp. 6.75%, 6/1/2025 (a) | 610,000 | 618,699 |
| Security Description | Principal Amount | Value | |||
Tempur Sealy International, Inc. 5.50%, 6/15/2026 | $ 937,000 | $ 956,302 | |||
| Tenet Healthcare Corp.: | |||||
4.88%, 1/1/2026 (a) | 545,000 | 534,040 | |||
5.13%, 11/1/2027 (a) | 230,000 | 227,530 | |||
6.25%, 2/1/2027 (a) | 610,000 | 605,010 | |||
7.00%, 8/1/2025 | 560,000 | 545,709 | |||
Terrier Media Buyer, Inc. 8.88%, 12/15/2027 (a) | 155,000 | 149,042 | |||
T-Mobile USA, Inc. 3.88%, 4/15/2030 (a) | 2,735,000 | 3,044,192 | |||
| TransDigm, Inc.: | |||||
5.50%, 11/15/2027 | 360,000 | 314,140 | |||
6.25%, 3/15/2026 (a) | 675,000 | 673,015 | |||
6.38%, 6/15/2026 | 430,000 | 392,315 | |||
8.00%, 12/15/2025 (a) | 90,000 | 94,535 | |||
Transocean Poseidon, Ltd. 6.88%, 2/1/2027 (a) | 585,000 | 516,467 | |||
Transocean Proteus, Ltd. 6.25%, 12/1/2024 (a) | 325,000 | 298,685 | |||
Transocean, Inc. 8.00%, 2/1/2027 (a) | 310,000 | 171,222 | |||
TRI Pointe Group, Inc. 5.70%, 6/15/2028 | 410,000 | 420,242 | |||
Trident Merger Sub, Inc. 6.63%, 11/1/2025 (a) | 410,000 | 396,527 | |||
| Triumph Group, Inc.: | |||||
6.25%, 9/15/2024 (a) | 160,000 | 136,000 | |||
7.75%, 8/15/2025 | 282,000 | 214,777 | |||
Twin River Worldwide Holdings, Inc. 6.75%, 6/1/2027 (a) | 670,000 | 636,574 | |||
| Uber Technologies, Inc.: | |||||
7.50%, 9/15/2027 (a) | 210,000 | 210,405 | |||
8.00%, 11/1/2026 (a) | 385,000 | 391,711 | |||
Union Pacific Corp. 4.30%, 3/1/2049 | 1,590,000 | 2,029,762 | |||
| United Rentals North America, Inc.: | |||||
4.00%, 7/15/2030 | 360,000 | 348,563 | |||
5.25%, 1/15/2030 | 70,000 | 72,355 | |||
6.50%, 12/15/2026 | 360,000 | 378,072 | |||
| Univision Communications, Inc.: | |||||
5.13%, 5/15/2023 (a) | 185,000 | 186,698 | |||
6.63%, 6/1/2027 (a) | 355,000 | 339,937 | |||
Upjohn, Inc. 1.65%, 6/22/2025 (a) | 540,000 | 550,751 | |||
US Foods, Inc. 6.25%, 4/15/2025 (a) | 35,000 | 35,610 | |||
USA Compression Partners L.P./USA Compression Finance Corp. 6.88%, 9/1/2027 | 895,000 | 853,400 | |||
Valero Energy Corp. 2.85%, 4/15/2025 | 1,260,000 | 1,331,240 | |||
Verscend Escrow Corp. 9.75%, 8/15/2026 (a) | 760,000 | 818,824 |
Table of Contents
| Security Description | Principal Amount | Value | |||
Vertical US Newco, Inc. 5.25%, 7/15/2027 | $ 400,000 | $ 400,000 | |||
ViaSat, Inc. 6.50%, 7/15/2028 (a) | 365,000 | 366,183 | |||
| VICI Properties L.P./VICI Note Co., Inc.: | |||||
3.75%, 2/15/2027 (a) | 70,000 | 65,708 | |||
4.13%, 8/15/2030 (a) | 315,000 | 300,318 | |||
| Viking Cruises, Ltd.: | |||||
5.88%, 9/15/2027 (a) | 955,000 | 569,734 | |||
13.00%, 5/15/2025 (a) | 125,000 | 131,269 | |||
Vine Oil & Gas L.P./Vine Oil & Gas Finance Corp. 8.75%, 4/15/2023 (a) | 175,000 | 105,424 | |||
Viper Energy Partners L.P. 5.38%, 11/1/2027 (a) | 365,000 | 357,240 | |||
Vizient, Inc. 6.25%, 5/15/2027 (a) | 380,000 | 398,084 | |||
Waste Management, Inc. 3.45%, 6/15/2029 | 1,620,000 | 1,663,659 | |||
Waste Pro USA, Inc. 5.50%, 2/15/2026 (a) | 375,000 | 357,780 | |||
Weatherford International, Ltd. 11.00%, 12/1/2024 (a) | 14,000 | 9,697 | |||
| Wells Fargo & Co.: | |||||
3.07%, 1/24/2023 | 2,000,000 | 2,072,960 | |||
Series MTN, 3 Month USD LIBOR + 1.31%, 3.58%, 5/22/2028 (b) | 1,920,000 | 2,130,586 | |||
Welltower, Inc. 4.13%, 3/15/2029 | 3,550,000 | 3,910,396 | |||
West Street Merger Sub, Inc. 6.38%, 9/1/2025 (a) | 495,000 | 480,091 | |||
| Western Midstream Operating L.P.: | |||||
3.10%, 2/1/2025 | 380,000 | 361,433 | |||
4.05%, 2/1/2030 | 395,000 | 379,950 | |||
WeWork Cos., Inc. 7.88%, 5/1/2025 (a) | 215,000 | 104,176 | |||
Whiting Petroleum Corp. 6.63%, 1/15/2026 (c) | 750,000 | 133,635 | |||
William Carter Co. 5.63%, 3/15/2027 (a) | 485,000 | 499,448 | |||
Williams Cos., Inc. 3.75%, 6/15/2027 | 990,000 | 1,058,845 | |||
Willis North America, Inc. 3.88%, 9/15/2049 | 1,940,000 | 2,143,215 | |||
Wolverine Escrow LLC 9.00%, 11/15/2026 (a) | 290,000 | 212,338 | |||
| WPX Energy, Inc.: | |||||
4.50%, 1/15/2030 | 245,000 | 215,576 | |||
5.25%, 10/15/2027 | 435,000 | 406,877 | |||
5.88%, 6/15/2028 | 315,000 | 303,676 | |||
WR Grace & Co-Conn 4.88%, 6/15/2027 (a) | 675,000 | 685,213 | |||
WRKCo, Inc. 3.75%, 3/15/2025 | 1,785,000 | 1,949,470 |
| Security Description | Principal Amount | Value | |||
| Yum! Brands, Inc.: | |||||
4.75%, 1/15/2030 (a) | $ 375,000 | $ 383,209 | |||
7.75%, 4/1/2025 (a) | 170,000 | 183,340 | |||
| Zayo Group Holdings,Inc.: | |||||
4.00%, 3/1/2027 (a) | 455,000 | 432,691 | |||
6.13%, 3/1/2028 (a) | 215,000 | 208,991 | |||
| 283,615,897 | |||||
TOTAL CORPORATE BONDS & NOTES (Cost $475,403,973) | 476,279,535 | ||||
| ASSET-BACKED SECURITIES — 2.5% | |||||
Aaset Trust Series 2019-2, Class A, Class A, 3.38%, 10/16/2039 (a) | 1,897,191 | 1,711,954 | |||
AccessLex Institute Series 2004-2, Class A3, Class A3, 3 Month USD LIBOR + 0.19%, 1.18%, 10/25/2024 (b) | 1,098,593 | 1,042,688 | |||
Aegis Asset Backed Securities Trust Series 2006-1, Class A2, Class A2, 1 Month USD LIBOR + 0.17%, 0.35%, 1/25/2037 (b) | 25,913,056 | 21,070,086 | |||
Ajax Mortgage Loan Trust Series 2017-C, Class A, Class A, 3.75%, 7/25/2060 (a) (f) | 5,375,493 | 5,400,000 | |||
CLI Funding VI LLC Series 2019-1A, Class A, Class A, 3.71%, 5/18/2044 (a) | 1,339,466 | 1,322,071 | |||
CLNC, Ltd. Series 2019-FL1, Class A, Class A, 1 Month USD LIBOR + 1.25%, 1.44%, 8/20/2035 (a) (b) | 3,527,000 | 3,431,111 | |||
DT Auto Owner Trust Series 2019-2A, Class A, Class A, 2.85%, 9/15/2022 (a) | 454,615 | 456,794 | |||
First Franklin Mortgage Loan Trust Series 2007-FF2, Class A1, Class A1, ABS, 1 Month USD LIBOR + .14%, 0.32%, 3/25/2037 (b) | 12,213,171 | 8,165,726 | |||
GAIA Aviation, Ltd. Series 2019-1, Class A, Class A, 3.97%, 12/15/2044 (a) (f) | 1,700,340 | 1,448,423 | |||
GSAA Home Equity Trust Series 2007-10, Class A2A, Class A2A, 6.50%, 11/25/2037 | 2,467,425 | 1,555,744 | |||
JOL Air, Ltd. Series 2019-1, Class A, Class A, 3.97%, 4/15/2044 (a) | 2,707,368 | 2,339,582 | |||
LoanCore Issuer, Ltd. Series 2019-CRE2, Class AS, 1 Month USD LIBOR + 1.50%, 1.68%, 5/15/2036 (a) (b) | 3,382,000 | 3,093,982 |
Table of Contents
| Security Description | Principal Amount | Value | |||
Marlette Funding Trust Series 2019-2A, Class A, 3.13%, 7/16/2029 (a) | $ 915,665 | $ 922,336 | |||
Navient Private Education Refi Loan Trust Series 2019-CA, Class A1, Class A1, 2.82%, 2/15/2068 (a) | 522,980 | 526,180 | |||
Pretium Mortgage Credit Partners I LLC Series 2019-NPL2, Class A1, Class A1, 3.84%, 12/27/2058 (a) (f) | 4,480,545 | 4,448,914 | |||
Sapphire Aviation Finance II, Ltd. Series 2020-1A, Class A, 3.23%, 3/15/2040 (a) | 1,482,500 | 1,259,358 | |||
START Ireland Series 2019-1, Class A, Class A, 4.09%, 3/15/2044 (a) | 659,653 | 583,606 | |||
Structured Asset Investment Loan Trust Series 2006-BNC2, Class A5, Class A5, 1 Month USD LIBOR + 0.16%, 0.34%, 5/25/2036 (b) | 2,607,914 | 2,527,259 | |||
Structured Asset Securities Corp. Mortgage Loan Trust Series 2006-BC4, Class A4, Class A4, 1 Month USD LIBOR + 0.17%, 0.35%, 12/25/2036 (b) | 1,716,473 | 1,632,145 | |||
Textainer Marine Containers VII, Ltd. Series 2019-1A, Class A, 3.96%, 4/20/2044 (a) | 1,360,000 | 1,384,581 | |||
TRTX Issuer, Ltd. Series 2019-FL3, Class AS, Class AS, 1 Month USD LIBOR + 1.45%, 1.64%, 9/15/2034 (a) (b) | 3,527,000 | 3,394,738 | |||
Upstart Securitization Trust Series 2020-1, Class A, ABS, 2.32%, 4/22/2030 (a) | 1,747,884 | 1,746,364 | |||
Vericrest Opportunity Loan Trust Series 2020-NPL5, Class A1A, Class A1A, ABS, 2.98%, 3/25/2050 (a) (f) | 806,183 | 799,843 | |||
VOLT LXXX LLC Series 2019-NPL6, Class A1A, Class A1A, ABS, 3.23%, 10/25/2049 (a) (f) | 2,367,178 | 2,356,142 | |||
VOLT LXXXV LLC Series 2020-NPL1, Class A1A, Class A1A, ABS, 3.23%, 1/25/2050 (a) (f) | 6,238,506 | 6,199,742 | |||
TOTAL ASSET-BACKED SECURITIES (Cost $79,916,741) | 78,819,369 |
| Security Description | Principal Amount | Value | |||
| FOREIGN GOVERNMENT OBLIGATIONS — 1.0% | |||||
| CHILE — 0.0% (d) | |||||
Chile Government International Bond 2.45%, 1/31/2031 | $ 1,400,000 | $ 1,454,208 | |||
| COLOMBIA — 0.1% | |||||
Colombia Government International Bond 2.63%, 3/15/2023 | 2,400,000 | 2,432,376 | |||
| DOMINICAN REPUBLIC — 0.1% | |||||
| Dominican Republic International Bond: | |||||
4.50%, 1/30/2030 (a) | 1,700,000 | 1,544,144 | |||
6.40%, 6/5/2049 (a) | 1,000,000 | 915,120 | |||
| 2,459,264 | |||||
| GUATEMALA — 0.0% (d) | |||||
| Republic Of Guatemala: | |||||
5.38%, 4/24/2032 (a) | 400,000 | 442,344 | |||
6.13%, 6/1/2050 (a) | 200,000 | 231,598 | |||
| 673,942 | |||||
| INDONESIA — 0.1% | |||||
Republic Of Indonesia 3.85%, 10/15/2030 | 3,000,000 | 3,336,300 | |||
| MEXICO — 0.1% | |||||
Banco Nacional de Costa Rica Series REGS, 5 year CMT + 3.00%, 3.80%, 8/11/2026 (b) | 500,000 | 487,565 | |||
Mexico Government International Bond 4.75%, 4/27/2032 | 1,000,000 | 1,102,640 | |||
| 1,590,205 | |||||
| PANAMA — 0.1% | |||||
Panama Government International Bond 4.00%, 9/22/2024 | 4,000,000 | 4,353,280 | |||
| PERU — 0.1% | |||||
| Peruvian Government International Bond: | |||||
2.39%, 1/23/2026 | 600,000 | 624,042 | |||
2.78%, 1/23/2031 | 2,350,000 | 2,506,064 | |||
| 3,130,106 | |||||
| PHILIPPINES — 0.1% | |||||
| Philippine Government International Bond: | |||||
2.46%, 5/5/2030 | 800,000 | 839,704 | |||
2.95%, 5/5/2045 | 600,000 | 623,664 | |||
| 1,463,368 |
Table of Contents
| Security Description | Principal Amount | Value | |||
| QATAR — 0.1% | |||||
| Qatar Government International Bond: | |||||
Series REGS, 3.38%, 3/14/2024 | $ 1,800,000 | $ 1,928,628 | |||
Series REGS, 3.88%, 4/23/2023 | 800,000 | 857,960 | |||
| 2,786,588 | |||||
| SAUDI ARABIA — 0.2% | |||||
| Saudi Government International Bond: | |||||
2.90%, 10/22/2025 (a) | 1,800,000 | 1,909,998 | |||
Series REGS, 2.38%, 10/26/2021 | 1,900,000 | 1,928,310 | |||
Series REGS, 2.88%, 3/4/2023 | 1,000,000 | 1,042,810 | |||
| 4,881,118 | |||||
| SOUTH KOREA — 0.0% (d) | |||||
Korea Electric Power Corp. 1.13%, 6/15/2025 (a) | 700,000 | 703,101 | |||
| THAILAND — 0.0% (d) | |||||
Export Import Bank of Thailand Series EMTN, 3 Month USD LIBOR + 0.90%, 1.28%, 11/20/2023 (b) | 420,000 | 412,041 | |||
| UNITED ARAB EMIRATES — 0.0% (d) | |||||
| Abu Dhabi Government International Bond: | |||||
2.50%, 4/16/2025 (a) | 500,000 | 525,575 | |||
3.13%, 4/16/2030 (a) | 700,000 | 769,587 | |||
| 1,295,162 | |||||
TOTAL FOREIGN GOVERNMENT OBLIGATIONS (Cost $29,937,752) | 30,971,059 |
| Shares | |||
| COMMON STOCKS — 0.0% (d) | |||
| UNITED STATES — 0.0% (d) | |||
Tapstone Energy Holdings (g) (h) | 5,920 | — | |
Weatherford International PLC (h) | 2,071 | 4,080 | |
| 4,080 | |||
TOTAL COMMON STOCKS (Cost $47,619) | 4,080 |
| Security Description | Shares | Value | |||
| CONVERTIBLE BONDS — 0.0% (d) | |||||
| JAMAICA — 0.0% (d) | |||||
Digicel Group 0.5, Ltd. PIK (a) | 579,635 | $ 49,269 | |||
TOTAL CONVERTIBLE BONDS (Cost $49,269) | 49,269 |
| Principal Amount | |||
| SENIOR FLOATING RATE LOANS — 3.0% | |||
| ADVERTISING SERVICES — 0.0% (d) | |||
Terrier Media Buyer, Inc. Senior Secured Term Loan B, 1 Month USD LIBOR + 4.25%, 4.43%, 12/17/2026 | $ 462,676 | 443,012 | |
| AEROSPACE & DEFENSE — 0.0% (d) | |||
TransDigm, Inc. Senior Secured 2020 Term Loan E, 1 Month USD LIBOR + 2.25%, 2.43%, 5/30/2025 | 1,131,910 | 1,022,523 | |
| AIRLINES — 0.0% (d) | |||
American Airlines, Inc. Senior Secured 2017 1st Lien Term Loan, 1 Month USD LIBOR + 1.75%, 1.93%, 1/29/2027 | 145,000 | 111,360 | |
Mileage Plus Holdings LLC Senior Secured 2020 Term Loan B, 6/25/2027 (i) | 505,000 | 501,897 | |
| 613,257 | |||
| AUTO COMPONENTS — 0.0% (d) | |||
Mavis Tire Express Services Corp. Senior Secured 2018 1st Lien Term Loan, 4 Month USD LIBOR + 3.25%, 3.56%, 3/20/2025 | 519,360 | 470,185 | |
Panther BF Aggregator 2 L.P. Senior Secured USD Term Loan B, 1 Month USD LIBOR + 3.50%, 3.68%, 4/30/2026 | 283,750 | 271,336 | |
| 741,521 |
Table of Contents
| Principal Amount | Value | |||
| BROADCAST SERV/PROGRAM — 0.1% (d) | ||||
E.W. Scripps Company (The) Senior Secured 2019 Term Loan B2, 1 Month USD LIBOR + 2.50%, 2.68%, 5/1/2026 | $ 1,223,835 | $ 1,160,923 | ||
| BUILDING PRODUCTS — 0.0% (d) | ||||
NCI Building Systems, Inc. Senior Secured 2018 Term Loan, 1 Month USD LIBOR + 3.75%, 3.94%, 4/12/2025 | 179,945 | 172,016 | ||
| CASINO SERVICES — 0.0% (d) | ||||
Stars Group Holdings B.V. Senior Secured 2018 USD Incremental Term Loan, 7/10/2025 | 389,315 | 387,925 | ||
| CHEMICALS — 0.1% | ||||
Avantor Funding, Inc. Senior Secured USD Term Loan B3, 1 Month USD LIBOR + 2.25%, 3.25%, 11/21/2024 | 158,636 | 154,967 | ||
Diamond (BC) B.V. Senior Secured USD Term Loan, 3 Month USD LIBOR + 3.00%, 3.76%, 9/6/2024 | 582,015 | 537,395 | ||
Illuminate Buyer, LLC , 6/16/2027 (i) | 695,000 | 685,791 | ||
Messer Industries GmbH Senior Secured 2018 USD Term Loan, 3 Month USD LIBOR + 2.50%, 2.81%, 3/1/2026 | 142,168 | 136,048 | ||
Solenis Holdings LLC Senior Secured 2018 1st Lien Term Loan, 3 Month USD LIBOR + 4.00%, 4.36%, 6/26/2025 | 636,751 | 614,201 | ||
Starfruit Finco B.V. Senior Secured 2018 USD Term Loan B, 1 Month USD LIBOR + 3.00%, 3.19%, 10/1/2025 | 582,489 | 548,996 | ||
| 2,677,398 | ||||
| COMMERCIAL SERVICES — 0.0% (d) | ||||
IRI Holdings, Inc. , 4.61%, 12/1/2025 | 389,013 | 370,535 |
| Principal Amount | Value | |||
Wand NewCo 3, Inc. Senior Secured 2020 Term Loan, 3 Month USD LIBOR + 3.00%, 4.07%, 2/5/2026 | $ 745,539 | $ 710,126 | ||
| 1,080,661 | ||||
| COMMERCIAL SERVICES & SUPPLIES — 0.2% | ||||
Allied Universal Holdco LLC Senior Secured 2019 Term Loan B, 1 Month USD LIBOR + 4.25%, 4.43%, 7/10/2026 | 1,019,875 | 992,818 | ||
Aramark Services, Inc. Senior Secured 2019 Term Loan B4, 1 Month USD LIBOR + 1.75%, 1.93%, 1/15/2027 | 314,213 | 297,275 | ||
Asurion LLC Senior Secured 2017 2nd Lien Term Loan, 1 Month USD LIBOR + 6.50%, 6.68%, 8/4/2025 | 410,000 | 408,975 | ||
Dealer Tire, LLC Senior Secured 2020 Term Loan B, 1 Month USD LIBOR + 4.25%, 4.43%, 12/12/2025 | 44,775 | 42,909 | ||
Emerald TopCo, Inc. Senior Secured Term Loan, 3 Month USD LIBOR + 3.50%, 4.26%, 7/24/2026 | 273,355 | 265,155 | ||
Lineage Logistics Holdings LLC Senior Secured 2018 Term Loan, 1 Month USD LIBOR + 3.00%, 4.00%, 2/27/2025 | 698,214 | 678,141 | ||
Prime Security Services Borrower LLC Senior Secured 2019 Term Loan B1, 6 Month USD LIBOR + 3.25%, 4.25%, 9/23/2026 | 511,759 | 493,369 | ||
Refinitiv US Holdings, Inc. Senior Secured 2018 USD Term Loan, 1 Month USD LIBOR + 3.25%, 3.43%, 10/1/2025 | 2,074,470 | 2,029,350 | ||
Verscend Holding Corp. Senior Secured 2018 Term Loan B, 1 Month USD LIBOR + 4.50%, 4.68%, 8/27/2025 | 1,223,707 | 1,186,842 | ||
| 6,394,834 | ||||
| COMMUNICATIONS EQUIPMENT — 0.0% (d) | ||||
Avaya, Inc. Senior Secured 2018 Term Loan B, 1 Month USD LIBOR + 4.25%, 4.43%, 12/15/2024 | 527,476 | 488,706 |
Table of Contents
| Principal Amount | Value | |||
| COMPUTER SERVICES — 0.1% | ||||
Tempo Acquisition LLC Senior Secured Term Loan, 1 Month USD LIBOR + 2.75%, 2.93%, 5/1/2024 | $ 1,233,641 | $ 1,175,814 | ||
| CONSTRUCTION & ENGINEERING — 0.0% (d) | ||||
Brand Energy & Infrastructure Services, Inc. Senior Secured 2017 Term Loan, 3 Month USD LIBOR + 4.25%, 5.45%, 6/21/2024 | 398,498 | 366,286 | ||
| Dynasty Acquisition Co., Inc.: | ||||
Senior Secured 2020 CAD Term Loan B2, 3 Month USD LIBOR + 3.50%, 3.81%, 4/6/2026 | 258,736 | 222,836 | ||
Senior Secured 2020 Term Loan B1, 3 Month USD LIBOR + 3.50%, 3.81%, 4/6/2026 | 481,249 | 414,476 | ||
| 1,003,598 | ||||
| CONSTRUCTION MATERIALS — 0.0% (d) | ||||
Forterra Finance LLC Senior Secured 2017 Term Loan B, 10/25/2023 | 226,711 | 221,043 | ||
| CONSUMER FINANCE — 0.0% (d) | ||||
Amentum Government Services Holdings LLC Senior Secured Term Loan B, 1 Month USD LIBOR + 4.00%, 4.18%, 2/1/2027 | 140,000 | 137,841 | ||
| CONTAINERS & PACKAGING — 0.1% (d) | ||||
Reynolds Consumer Products LLC Senior Secured Term Loan, 1 Month USD LIBOR + 1.75%, 1.93%, 2/4/2027 | 274,312 | 265,103 | ||
Reynolds Group Holdings, Inc. Senior Secured USD 2017 Term Loan, 1 Month USD LIBOR + 2.75%, 2.93%, 2/5/2023 | 899,284 | 861,451 | ||
| 1,126,554 | ||||
| CONTAINERS-PAPER/PLASTIC — 0.0% (d) | ||||
Flex Acquisition Company, Inc. Senior Secured 1st Lien Term Loan, 3 Month USD LIBOR + 3.00%, 4.43%, 12/29/2023 | 545,000 | 522,323 |
| Principal Amount | Value | |||
| DIVERSIFIED CONSUMER SERVICES — 0.1% | ||||
Ascend Learning LLC Senior Secured 2017 Term Loan B, 4.00%, 7/12/2024 | $ 1,228,682 | $ 1,178,644 | ||
Mister Car Wash Holdings, Inc. Senior Secured 2019 Term Loan B, 2 Month USD LIBOR + 3.25%, 4.38%, 5/14/2026 | 462,664 | 419,361 | ||
| 1,598,005 | ||||
| DIVERSIFIED FINANCIAL SERVICES — 0.1% | ||||
Deerfield Dakota Holding LLC Senior Secured 2020 USD Term Loan B, 1 Month USD LIBOR + 3.75%, 4.75%, 4/9/2027 | 835,000 | 813,779 | ||
Edelman Financial Center LLC Senior Secured 2018 1st Lien Term Loan, 1 Month USD LIBOR + 3.00%, 3.18%, 7/21/2025 | 394,000 | 377,562 | ||
Trans Union LLC Senior Secured 2019 Term Loan B5, 1.93%, 11/16/2026 | 202,892 | 194,650 | ||
UFC Holdings LLC Senior Secured 2019 Term Loan, 6 Month USD LIBOR + 3.25%, 4.25%, 4/29/2026 | 1,404,122 | 1,346,784 | ||
| 2,732,775 | ||||
| DIVERSIFIED TELECOMMUNICATION SERVICES — 0.1% | ||||
CenturyLink, Inc. Senior Secured 2020 Term Loan B, 3/15/2027 (i) | 897,744 | 849,553 | ||
| Intelsat Jackson Holdings S.A.: | ||||
Senior Secured 2017 Term Loan B3, 3 Month USD LIBOR + 3.75%, 8.00%, 11/27/2023 | 1,237,174 | 1,236,209 | ||
Senior Secured 2020 DIP Term Loan, 5.05%, 7/14/2021 | 93,014 | 94,671 | ||
Level 3 Financing, Inc. Senior Secured 2019 Term Loan B, 1 Month USD LIBOR + 1.75%, 1.93%, 3/1/2027 | 957,531 | 908,629 | ||
Telesat Canada Senior Secured Term Loan B5, 1 Month USD LIBOR + 2.75%, 2.93%, 12/7/2026 | 218,900 | 211,148 | ||
| 3,300,210 |
Table of Contents
| Principal Amount | Value | |||
| ELECTRONIC EQUIPMENT, INSTRUMENTS & COMPONENTS — 0.0% (d) | ||||
GrafTech Finance, Inc. Senior Secured 2018 Term Loan B, 1 Month USD LIBOR + 3.50%, 4.50%, 2/12/2025 | $ 314,461 | $ 307,255 | ||
| ENERGY EQUIPMENT & SERVICES — 0.0% (d) | ||||
Tapstone Energy Holdings III, LLC Senior Secured Term Loan, 5.00%, 4/17/2024 | 4,555 | 4,555 | ||
| ENTERTAINMENT — 0.0% (d) | ||||
NASCAR Holdings, Inc. Senior Secured Term Loan B, 1 Month USD LIBOR + 2.75%, 2.93%, 10/19/2026 | 338,802 | 325,492 | ||
| FINANCE-OTHER SERVICES — 0.0% (d) | ||||
| RPI Intermediate Finance Trust: | ||||
Senior Secured 2020 Term Loan B1, 1 Month USD LIBOR + 1.75%, 1.93%, 2/11/2027 | 318,125 | 308,979 | ||
Senior Secured 2020 Term Loan B1, 1 Month USD LIBOR + 1.75%, 1.93%, 2/11/2027 | 383,075 | 374,297 | ||
| 683,276 | ||||
| FOOD & BEVERAGE — 0.0% (d) | ||||
Caesars Resort Collection, LLC Senior Secured 2020 Term Loan, 6/19/2025 (i) | 475,000 | 447,911 | ||
Elanco Animal Health Incorporated Senior Secured Term Loan B, 2/4/2027 (i) | 345,000 | 329,906 | ||
| 777,817 | ||||
| FOOD & STAPLES RETAILING — 0.0% (d) | ||||
United Natural Foods, Inc. Senior Secured Term Loan B, 1 Month USD LIBOR + 4.25%, 4.43%, 10/22/2025 | 203,967 | 195,568 | ||
| FOOD PRODUCTS — 0.1% | ||||
JBS USA Lux S.A. Senior Secured 2019 Term Loan B, 2 Month USD LIBOR + 2.00%, 3.07%, 5/1/2026 | 1,401,315 | 1,345,655 |
| Principal Amount | Value | |||
| FOOD-MISC/DIVERSIFIED — 0.0% (d) | ||||
Froneri International Ltd. Senior Secured 2020 USD Term Loan, 1 Month USD LIBOR + 2.25%, 2.43%, 1/29/2027 | $ 430,000 | $ 405,546 | ||
Hearthside Food Solutions, LLC Senior Secured 2018 Term Loan B, 1 Month USD LIBOR + 3.69%, 3.87%, 5/23/2025 | 592,121 | 565,784 | ||
| 971,330 | ||||
| HEALTH CARE PROVIDERS & SERVICES — 0.2% | ||||
Air Methods Corporation Senior Secured 2017 Term Loan B, 3 Month USD LIBOR + 3.50%, 4.50%, 4/22/2024 | 397,949 | 330,214 | ||
Athenahealth, Inc. Senior Secured 2019 Term Loan B, 3 Month USD LIBOR + 4.50%, 4.82%, 2/11/2026 | 274,178 | 266,638 | ||
Auris Luxembourg III S.a.r.l. Senior Secured 2019 USD Term Loan B2, 1 Month USD LIBOR + 3.75%, 3.93%, 2/27/2026 | 546,121 | 480,586 | ||
CHG Healthcare Services, Inc. Senior Secured 2017 1st Lien Term Loan B, 3 Month USD LIBOR + 3.00%, 4.07%, 6/7/2023 | 698,681 | 675,477 | ||
Envision Healthcare Corporation Senior Secured 2018 1st Lien Term Loan, 1 Month USD LIBOR + 3.75%, 3.93%, 10/10/2025 | 332,152 | 220,881 | ||
Global Medical Response, Inc. Senior Secured 2018 Term Loan B1, 3 Month USD LIBOR + 3.25%, 4.25%, 4/28/2022 | 432,780 | 417,744 | ||
MPH Acquisition Holdings LLC Senior Secured 2016 Term Loan B, 3 Month USD LIBOR + 2.75%, 3.75%, 6/7/2023 | 710,000 | 677,063 | ||
| Pathway Vet Alliance LLC: | ||||
Senior Secured 2020 Delayed Draw Term Loan, 3/31/2027 (i) | 73,660 | 71,966 | ||
Senior Secured 2020 Term Loan, 3/31/2027 (i) | 905,889 | 885,056 |
Table of Contents
| Principal Amount | Value | |||
RegionalCare Hospital Partners Holdings, Inc. Senior Secured 2018 Term Loan B, 1 Month USD LIBOR + 3.75%, 3.93%, 11/17/2025 | $ 367,574 | $ 345,691 | ||
Sotera Health Holdings, LLC Senior Secured 2019 Term Loan, 1 Month USD LIBOR + 4.50%, 5.50%, 12/11/2026 | 822,937 | 806,051 | ||
Team Health Holdings, Inc. Senior Secured 1st Lien Term Loan, 1 Month USD LIBOR + 2.75%, 3.75%, 2/6/2024 | 174,100 | 134,493 | ||
Zelis Healthcare Corporation Senior Secured Term Loan B, 1 Month USD LIBOR + 4.75%, 4.93%, 9/30/2026 | 104,475 | 102,824 | ||
| 5,414,684 | ||||
| HOTELS, RESTAURANTS & LEISURE — 0.2% | ||||
Alterra Mountain Company Senior Secured Term Loan B1, 1 Month USD LIBOR + 2.75%, 2.93%, 7/31/2024 | 994,729 | 941,575 | ||
Caesars Entertainment Operating Company Senior Secured Exit Term Loan, 1 Month USD LIBOR + 2.00%, 2.18%, 10/7/2024 | 592,736 | 590,792 | ||
Caesars Resort Collection LLC Senior Secured 2017 1st Lien Term Loan B, 1 Month USD LIBOR + 2.75%, 2.93%, 12/23/2024 | 1,131,298 | 1,010,215 | ||
Carnival Corporation Senior Secured USD Term Loan B, 6/30/2025 (i) | 640,000 | 619,200 | ||
ClubCorp Holdings, Inc. Senior Secured 2017 Term Loan B, 3 Month USD LIBOR + 2.75%, 3.06%, 9/18/2024 | 225,065 | 192,045 | ||
Golden Nugget, Inc. Senior Secured 2017 Incremental Term Loan B, 2 Month USD LIBOR + 2.50%, 3.25%, 10/4/2023 | 334,879 | 268,740 | ||
Life Time Fitness, Inc. Senior Secured 2017 Term Loan B, 3 Month USD LIBOR + 2.75%, 3.75%, 6/10/2022 | 596,798 | 533,764 | ||
Penn National Gaming, Inc. Senior Secured 2018 1st Lien Term Loan B, 3 Month USD LIBOR + 2.25%, 3.00%, 10/15/2025 | 232,055 | 217,648 |
| Principal Amount | Value | |||
Travelport Finance (Luxembourg) S.a.r.l. Senior Secured 2019 Term Loan, 3 Month USD LIBOR + 5.00%, 6.07%, 5/29/2026 | $ 157,503 | $ 105,062 | ||
Vertical US Newco Inc Senior Secured USD Term Loan B, 7/1/2027 (i) | 1,625,000 | 1,592,500 | ||
| 6,071,541 | ||||
| INDEPENDENT POWER PRODUCERS & ENERGY TRADERS — 0.0% (d) | ||||
| Calpine Corporation: | ||||
Senior Secured 2019 Term Loan B10, 1 Month USD LIBOR + 2.00%, 2.18%, 8/12/2026 | 79,400 | 76,557 | ||
Senior Secured Term Loan B9, 1 Month USD LIBOR + 2.25%, 2.43%, 4/5/2026 | 982,801 | 950,453 | ||
| 1,027,010 | ||||
| INSURANCE — 0.1% | ||||
Acrisure, LLC Senior Secured 2020 Term Loan B, 1 Month USD LIBOR + 3.50%, 3.68%, 2/15/2027 | 841,748 | 798,397 | ||
AssuredPartners, Inc. Senior Secured 2020 Term Loan B, 1 Month USD LIBOR + 3.50%, 3.68%, 2/12/2027 | 1,223,982 | 1,174,258 | ||
Sedgwick Claims Management Services, Inc. Senior Secured 2018 Term Loan B, 1 Month USD LIBOR + 3.25%, 3.43%, 12/31/2025 | 841,084 | 796,629 | ||
| 2,769,284 | ||||
| INTERACTIVE MEDIA & SERVICES — 0.0% (d) | ||||
GTT Communications, Inc. Senior Secured 2018 USD Term Loan B, 1 Month USD LIBOR + 2.75%, 2.93%, 5/31/2025 | 216,239 | 160,941 | ||
ION Trading Technologies S.a.r.l. Senior Secured USD Incremental Term Loan B, 3 Month USD LIBOR + 4.00%, 5.07%, 11/21/2024 | 501,707 | 485,043 | ||
| 645,984 | ||||
| INTERNET & CATALOG RETAIL — 0.0% (d) | ||||
PUG LLC Senior Secured USD Term Loan, 1 Month USD LIBOR + 3.50%, 3.68%, 2/12/2027 | 104,475 | 91,677 |
Table of Contents
| Principal Amount | Value | |||
Uber Technologies, Inc. Senior Secured 2018 Term Loan, 5.00%, 4/4/2025 | $ 902,697 | $ 870,286 | ||
| 961,963 | ||||
| IT SERVICES — 0.1% | ||||
Blackhawk Network Holdings, Inc Senior Secured 2018 1st Lien Term Loan, 1 Month USD LIBOR + 3.00%, 3.18%, 6/15/2025 | 704,870 | 652,590 | ||
Flexential Intermediate Corporation Senior Secured 2017 1st Lien Term Loan, 3 Month USD LIBOR + 3.50%, 3.81%, 8/1/2024 | 453,298 | 366,604 | ||
Science Applications International Corporation Senior Secured 2020 Incremental Term Loan B, 1 Month USD LIBOR + 2.25%, 2.43%, 3/12/2027 | 356,250 | 348,234 | ||
TKC Holdings, Inc. Senior Secured 2017 1st Lien Term Loan, 3 Month USD LIBOR + 3.75%, 4.75%, 2/1/2023 | 859,064 | 807,859 | ||
VS Buyer LLC Senior Secured Term Loan B, 3.43%, 2/28/2027 | 1,032,412 | 1,000,150 | ||
Web.com Group, Inc. Senior Secured 2018 Term Loan B, 1 Month USD LIBOR + 3.75%, 3.94%, 10/10/2025 | 288,696 | 274,622 | ||
| 3,450,059 | ||||
| LIFE SCIENCES TOOLS & SERVICES — 0.0% (d) | ||||
Parexel International Corporation Senior Secured Term Loan B, 1 Month USD LIBOR + 2.75%, 2.93%, 9/27/2024 | 712,297 | 677,352 | ||
| MACHINERY — 0.1% | ||||
Filtration Group Corporation Senior Secured 2018 1st Lien Term Loan, 1 Month USD LIBOR + 3.00%, 3.18%, 3/29/2025 | 1,391,774 | 1,329,144 | ||
Ingersoll-Rand Services Company Senior Secured 2020 USD Spinco Term Loan, 1 Month USD LIBOR + 1.75%, 1.93%, 3/1/2027 | 239,400 | 228,778 | ||
Titan Acquisition, Ltd. Senior Secured 2018 Term Loan B, 3 Month USD LIBOR + 3.00%, 3.36%, 3/28/2025 | 289,592 | 266,064 | ||
| 1,823,986 |
| Principal Amount | Value | |||
| MACHINERY-CONSTRUCTION & MINING — 0.0% (d) | ||||
Clear Channel Outdoor Holdings, Inc. Senior Secured Term Loan B, 3 Month USD LIBOR + 3.50%, 4.26%, 8/21/2026 | $ 69,475 | $ 63,361 | ||
| MEDIA — 0.2% | ||||
CSC Holdings LLC Senior Secured 2019 Term Loan B5, 1 Month USD LIBOR + 2.50%, 2.68%, 4/15/2027 | 1,407,853 | 1,340,853 | ||
Nexstar Broadcasting, Inc. Senior Secured 2019 Term Loan B4, 1 Month USD LIBOR + 2.75%, 2.92%, 9/18/2026 | 1,186,372 | 1,132,778 | ||
Radiate Holdco LLC Senior Secured 1st Lien Term Loan, 1 Month USD LIBOR + 3.00%, 3.75%, 2/1/2024 | 771,024 | 738,402 | ||
Rentpath, Inc. Senior Secured 2017 Term Loan, 3 Month USD LIBOR + 4.75%, 7.00%, 12/17/2021 | 361,692 | 260,166 | ||
Sinclair Television Group Inc. Senior Secured Term Loan B2B, 1 Month USD LIBOR + 2.50%, 2.69%, 9/30/2026 | 277,900 | 266,089 | ||
Virgin Media Bristol LLC Senior Secured USD Term Loan N, 1 Month USD LIBOR + 2.50%, 2.68%, 1/31/2028 | 1,348,421 | 1,291,282 | ||
| 5,029,570 | ||||
| METAL-DIVERSIFIED — 0.0% (d) | ||||
Covia Holdings Corporation Senior Secured Term Loan, 3 Month USD LIBOR + 4.00%, 5.39%, 6/1/2025 | 169,041 | 97,041 | ||
| MRI/MEDICAL DIAG IMAGING — 0.0% (d) | ||||
IQVIA Inc. Senior Secured 2018 USD Term Loan B3, 3 Month USD LIBOR + 1.75%, 2.06%, 6/11/2025 | 454,207 | 442,191 | ||
Radiology Partners, Inc. Senior Secured 2018 1st Lien Term Loan B, 3 Month USD LIBOR + 4.75%, 5.67%, 7/9/2025 | 573,810 | 536,105 | ||
| 978,296 |
Table of Contents
| Principal Amount | Value | |||
| OIL REFINING & MARKETING — 0.0% (d) | ||||
Gulf Finance, LLC Senior Secured Term Loan B, 3 Month USD LIBOR + 5.25%, 6.25%, 8/25/2023 | $ 347,796 | $ 227,516 | ||
| OIL, GAS & CONSUMABLE FUELS — 0.0% (d) | ||||
EG America LLC Senior Secured 2018 USD Term Loan, 6 Month USD LIBOR + 4.00%, 5.07%, 2/7/2025 | 179,878 | 169,385 | ||
Pacific Gas & Electric Company Senior Secured 2020 Exit Term Loan B, 5.50%, 6/23/2025 | 605,000 | 595,320 | ||
| 764,705 | ||||
| PERSONAL PRODUCTS — 0.0% (d) | ||||
KIK Custom Products, Inc. Senior Secured 2015 Term Loan B, 2 Month USD LIBOR + 4.00%, 5.00%, 5/15/2023 | 485,000 | 463,449 | ||
| PHARMACEUTICALS — 0.1% | ||||
| Bausch Health Companies Inc.: | ||||
Senior Secured 2018 Term Loan B, 1 Month USD LIBOR + 3.00%, 3.19%, 6/2/2025 | 383,119 | 373,447 | ||
Senior Secured Term Loan B, 1 Month USD LIBOR + 2.75%, 2.94%, 11/27/2025 | 924,000 | 895,897 | ||
Grifols Worldwide Operations USA, Inc. Senior Secured USD 2019 Term Loan B, 1 Week USD LIBOR + 2.00%, 2.11%, 11/15/2027 | 24,875 | 24,018 | ||
| 1,293,362 | ||||
| PIPELINES — 0.1% | ||||
Blackstone CQP Holdco L.P. Senior Secured Term Loan B, 3 Month USD LIBOR + 3.50%, 3.81%, 9/30/2024 | 572,111 | 549,704 | ||
Buckeye Partners, L.P. Senior Secured 2019 Term Loan B, 1 Month USD LIBOR + 2.75%, 2.92%, 11/1/2026 | 483,787 | 465,041 | ||
Lower Cadence Holdings LLC Senior Secured Term Loan B, 1 Month USD LIBOR + 4.00%, 4.18%, 5/22/2026 | 699,964 | 626,467 | ||
| 1,641,212 |
| Principal Amount | Value | |||
| PROFESSIONAL SERVICES — 0.1% | ||||
Dun & Bradstreet Corp. Senior Secured Term Loan, 1 Month USD LIBOR + 4.00%, 4.18%, 2/6/2026 | $ 1,236,900 | $ 1,208,297 | ||
| PUBLISHING-BOOKS — 0.0% (d) | ||||
Getty Images, Inc. Senior Secured 2019 USD Term Loan B, 1 Month USD LIBOR + 4.50%, 4.69%, 2/19/2026 | 241,145 | 215,825 | ||
| REAL ESTATE INVESTMENT TRUSTS (REITS) — 0.1% | ||||
Forest City Enterprises, L.P. Senior Secured 2019 Term Loan B, 1 Month USD LIBOR + 3.50%, 3.68%, 12/8/2025 | 372,606 | 350,249 | ||
VICI Properties 1 LLC Senior Secured Replacement Term Loan B, 1 Month USD LIBOR + 1.75%, 1.94%, 12/20/2024 | 1,423,068 | 1,330,128 | ||
| 1,680,377 | ||||
| REAL ESTATE MANAGEMENT & DEVELOPMENT — 0.0% (d) | ||||
Bright Bidco B.V. Senior Secured 2018 Term Loan B, 3 Month USD LIBOR + 3.50%, 4.57%, 6/30/2024 | 254,052 | 113,054 | ||
| RETAIL-RESTAURANTS — 0.0% (d) | ||||
IRB Holding Corp Senior Secured 2020 Term Loan B, 1 Month USD LIBOR + 2.75%, 3.75%, 2/5/2025 | 732,125 | 678,655 | ||
Whatabrands LLC Senior Secured 2020 Term Loan B, 1 Month USD LIBOR + 2.75%, 2.93%, 7/31/2026 | 307,679 | 296,478 | ||
| 975,133 | ||||
| ROAD & RAIL — 0.0% (d) | ||||
Genesee & Wyoming Inc. Senior Secured Term Loan, 3 Month USD LIBOR + 1.10%, 2.31%, 12/30/2026 | 513,713 | 496,010 |
Table of Contents
| Principal Amount | Value | |||
| SEMICONDUCTORS & SEMICONDUCTOR EQUIPMENT — 0.0% (d) | ||||
ON Semiconductor Corporation Senior Secured 2019 Term Loan B, 1 Month USD LIBOR + 2.00%, 2.18%, 9/19/2026 | $ 233,238 | $ 224,710 | ||
| SOFTWARE — 0.6% | ||||
Almonde, Inc. Senior Secured USD 2nd Lien Term Loan, 6 Month USD LIBOR + 7.25%, 8.25%, 6/13/2025 | 145,000 | 126,391 | ||
Camelot U.S. Acquisition 1 Co. Senior Secured Term Loan B, 1 Month USD LIBOR + 3.25%, 3.18%, 10/30/2026 | 1,238,775 | 1,202,968 | ||
Castle US Holding Corp. Senior Secured USD Term Loan B, 3 Month USD LIBOR + 3.75%, 4.06%, 1/29/2027 | 1,277,333 | 1,171,953 | ||
Cengage Learning, Inc. Senior Secured 2016 Term Loan B, 6 Month USD LIBOR + 4.25%, 5.25%, 6/7/2023 | 542,021 | 441,747 | ||
Cornerstone OnDemand, Inc. Senior Secured Term Loan B, 5.35%, 4/22/2027 | 365,000 | 359,755 | ||
Finastra USA, Inc. Senior Secured USD 1st Lien Term Loan, 6 Month USD LIBOR + 3.50%, 4.50%, 6/13/2024 | 1,055,485 | 927,628 | ||
Greeneden U.S. Holdings II, LLC Senior Secured 2018 USD Term Loan B, 1 Month USD LIBOR + 3.25%, 3.43%, 12/1/2023 | 1,227,018 | 1,185,391 | ||
Hyland Software, Inc. Senior Secured 2018 1st Lien Term Loan, 1 Month USD LIBOR + 3.25%, 4.00%, 7/1/2024 | 1,228,942 | 1,198,120 | ||
Informatica LLC Senior Secured 2020 USD Term Loan B, 1 Month USD LIBOR + 3.25%, 3.43%, 2/25/2027 | 204,487 | 196,410 | ||
Kronos, Inc. Senior Secured 2017 Term Loan B, 1 Month USD LIBOR + 3.00%, 3.18%, 11/1/2023 | 1,019,551 | 1,018,833 | ||
Mitchell International, Inc. Senior Secured 2017 1st Lien Term Loan, 1 Month USD LIBOR + 3.25%, 3.43%, 11/29/2024 | 1,078,569 | 1,011,272 |
| Principal Amount | Value | |||
Project Alpha Intermediate Holding, Inc. Senior Secured 2017 Term Loan B, 3 Month USD LIBOR + 3.50%, 5.38%, 4/26/2024 | $ 716,308 | $ 692,430 | ||
Severin Acquisition, LLC Senior Secured 2018 Term Loan B, 3.43%, 8/1/2025 | 1,044,697 | 1,005,521 | ||
Solera, LLC Senior Secured USD Term Loan B, 1 Month USD LIBOR + 2.75%, 2.93%, 3/3/2023 | 1,420,957 | 1,377,042 | ||
Sophia L.P. Senior Secured 2017 Term Loan B, 3 Month USD LIBOR + 3.25%, 4.25%, 9/30/2022 | 1,233,354 | 1,207,145 | ||
Surf Holdings LLC Senior Secured USD Term Loan, 3 Month USD LIBOR + 3.50%, 3.83%, 3/5/2027 | 1,040,000 | 1,001,556 | ||
Tech Data Corporation Senior Secured ABL Term Loan, 6/30/2025 (j) | 1,125,000 | 1,116,563 | ||
Tibco Software Inc. Senior Secured 2020 Term Loan B, 1 Month USD LIBOR + 3.75%, 3.93%, 6/30/2026 | 1,039,712 | 985,127 | ||
| Ultimate Software Group Inc(The): | ||||
Senior Secured 2020 2nd Lien Incremental Term Loan, 5/3/2027 (i) | 95,000 | 96,841 | ||
Senior Secured 2020 Incremental Term Loan B, 5/4/2026 (i) | 870,000 | 861,235 | ||
Ultimate Software Group, Inc. Senior Secured Term Loan B, 1 Month USD LIBOR + 3.75%, 3.93%, 5/4/2026 | 1,414,312 | 1,373,892 | ||
Vertafore, Inc. Senior Secured 2018 1st Lien Term Loan, 1 Month USD LIBOR + 3.25%, 3.43%, 7/2/2025 | 1,392,388 | 1,319,218 | ||
| 19,877,038 | ||||
| SPECIALTY RETAIL — 0.0% (d) | ||||
Bass Pro Group LLC Senior Secured Term Loan B, 3 Month USD LIBOR + 5.00%, 6.07%, 9/25/2024 | 398,974 | 385,437 | ||
PetSmart, Inc. Senior Secured Consenting Term Loan, 3 Month USD LIBOR + 4.00%, 5.00%, 3/11/2022 | 722,185 | 714,634 | ||
| 1,100,071 |
Table of Contents
| Principal Amount | Value | |||
| TELECOM SERVICES — 0.0% (d) | ||||
Connect Finco Sarl Senior Secured Term Loan B, 1 Month USD LIBOR + 4.50%, 5.50%, 12/11/2026 | $ 144,638 | $ 136,593 | ||
T-Mobile USA, Inc. Senior Secured 2020 Term Loan, 3.18%, 4/1/2027 | 695,000 | 694,684 | ||
| 831,277 | ||||
| TELECOMMUNICATION EQUIP — 0.0% (d) | ||||
Altice France S.A. Senior Secured 2018 Term Loan B13, 1 Month USD LIBOR + 4.00%, 4.18%, 8/14/2026 | 763,063 | 736,764 | ||
MLN US HoldCo LLC Senior Secured 2018 1st Lien Term Loan, 1 Month USD LIBOR + 4.50%, 4.68%, 11/30/2025 | 180,974 | 149,418 | ||
| 886,182 | ||||
| TELEVISION — 0.1% | ||||
Gray Television, Inc. Senior Secured 2018 Term Loan C, 1 Month USD LIBOR + 2.50%, 2.67%, 1/2/2026 | 1,209,581 | 1,174,884 | ||
| THRIFTS & MORTGAGE FINANCE — 0.0% (d) | ||||
Capri Finance LLC Senior Secured USD 2017 1st Lien Term Loan, 3 Month USD LIBOR + 3.00%, 3.76%, 11/1/2024 | 832,870 | 801,637 | ||
| TRADING COMPANIES & DISTRIBUTORS — 0.0% (d) | ||||
HD Supply, Inc. Senior Secured Term Loan B5, 1 Month USD LIBOR + 1.75%, 1.93%, 10/17/2023 | 340,666 | 331,298 | ||
| TRANSPORT-AIR FREIGHT — 0.0% (d) | ||||
Kestrel Bidco, Inc. Senior Secured Term Loan B, 6 Month USD LIBOR + 3.00%, 4.00%, 12/11/2026 | 561,988 | 456,615 | ||
TOTAL SENIOR FLOATING RATE LOANS (Cost $99,567,400) | 95,384,670 |
| Principal Amount | Value | |||
| U.S. GOVERNMENT AGENCY OBLIGATIONS — 41.7% | ||||
| Federal Home Loan Mortgage Corp.: | ||||
2.50%, 4/1/2033 | $ 2,551,556 | $ 2,685,813 | ||
2.50%, 2/1/2035 | 6,919,572 | 7,242,938 | ||
2.50%, 11/1/2039 | 16,297,863 | 17,016,431 | ||
3.00%, 11/1/2042 | 13,492,266 | 14,432,538 | ||
3.00%, 12/1/2042 | 12,272,020 | 12,951,872 | ||
3.00%, 1/1/2045 | 2,033,872 | 2,158,141 | ||
3.00%, 2/1/2045 | 1,416,688 | 1,499,142 | ||
3.00%, 3/1/2045 | 1,490,947 | 1,577,723 | ||
3.00%, 4/1/2045 | 32,473,758 | 34,425,999 | ||
3.00%, 5/1/2045 | 5,389,182 | 5,702,843 | ||
3.00%, 8/1/2045 | 14,693,795 | 15,549,001 | ||
3.00%, 7/1/2047 | 5,095,356 | 5,377,632 | ||
3.50%, 2/1/2045 | 2,363,298 | 2,534,329 | ||
3.50%, 4/1/2045 | 24,724,943 | 26,819,073 | ||
3.50%, 6/1/2045 | 11,510,457 | 12,558,476 | ||
3.50%, 10/1/2045 | 13,488,940 | 14,716,095 | ||
3.50%, 2/1/2046 | 11,250,905 | 11,939,271 | ||
4.00%, 4/1/2047 | 25,805,294 | 27,679,797 | ||
4.00%, 7/1/2047 | 7,906,203 | 8,428,653 | ||
4.00%, 10/1/2047 | 16,550,904 | 17,644,603 | ||
4.50%, 6/1/2044 | 1,738,761 | 1,925,366 | ||
Series 326, Class 300, Class 300, CMO, 3.00%, 3/15/2044 | 25,587,484 | 27,573,227 | ||
Series 358, Class 300, Class 300, CMO, 3.00%, 10/15/2047 | 27,385,451 | 30,227,062 | ||
Series 3822, Class ZG, Class ZG, CMO, REMIC, 4.00%, 2/15/2041 | 3,952,428 | 4,499,924 | ||
Series 3852, Class NS, Class NS, CMO, IO, REMIC, 6.00% - 1 Month USD LIBOR 5.82%, 5/15/2041 (b) | 8,493,625 | 1,331,221 | ||
Series 3889, Class VZ, Class VZ, CMO, REMIC, 4.00%, 7/15/2041 | 7,376,005 | 7,922,474 | ||
Series 3935, Class SJ, Class SJ, CMO, IO, REMIC, 6.65% - 1 Month USD LIBOR 6.47%, 5/15/2041 (b) | 1,464,154 | 152,438 | ||
Series 4120, Class KA, Class KA, CMO, REMIC, 1.75%, 10/15/2032 | 11,547,176 | 11,863,840 | ||
Series 4165, Class ZT, Class ZT, CMO, REMIC, 3.00%, 2/15/2043 | 16,601,900 | 17,365,502 | ||
Series 4215, Class KC, Class KC, CMO, REMIC, 2.25%, 3/15/2038 | 3,357,698 | 3,370,907 |
Table of Contents
| Principal Amount | Value | |||
Series 4364, Class ZX, Class ZX, CMO, REMIC, 4.00%, 7/15/2044 | $ 30,247,271 | $ 34,363,916 | ||
Series 4434, Class LZ, Class LZ, CMO, REMIC, 3.00%, 2/15/2045 | 3,502,296 | 3,895,569 | ||
Series 4444, Class CZ, Class CZ, CMO, REMIC, 3.00%, 2/15/2045 | 12,841,753 | 14,304,621 | ||
Series 4447, Class A, Class A, CMO, REMIC, 3.00%, 6/15/2041 | 1,320,546 | 1,355,478 | ||
Series 4447, Class Z, Class Z, CMO, REMIC, 3.00%, 3/15/2045 | 4,238,593 | 4,711,230 | ||
Series 4471, Class BA, Class BA, CMO, REMIC, 3.00%, 12/15/2041 | 4,603,116 | 4,776,340 | ||
Series 4471, Class GA, Class GA, CMO, REMIC, 3.00%, 2/15/2044 | 7,791,527 | 8,145,818 | ||
Series 4474, Class ZX, Class ZX, CMO, REMIC, 4.00%, 4/15/2045 | 12,678,686 | 14,457,796 | ||
Series 4481, Class B, Class B, CMO, REMIC, 3.00%, 12/15/2042 | 4,834,606 | 5,045,954 | ||
Series 4483, Class CA, Class CA, CMO, REMIC, 3.00%, 6/15/2044 | 9,506,026 | 9,946,735 | ||
Series 4484, Class CD, CMO, REMIC, 1.75%, 7/15/2030 | 8,306,495 | 8,338,818 | ||
Series 4491, Class B, Class B, CMO, REMIC, 3.00%, 8/15/2040 | 6,923,552 | 7,022,138 | ||
Series 4492, Class GZ, Class GZ, CMO, REMIC, 3.50%, 7/15/2045 | 8,970,752 | 9,773,462 | ||
Series 4499, Class AB, Class AB, CMO, REMIC, 3.00%, 6/15/2042 | 9,478,992 | 9,819,812 | ||
Series 4504, Class CA, Class CA, CMO, REMIC, 3.00%, 4/15/2044 | 9,895,653 | 10,320,462 | ||
Series 4511, Class QA, Class QA, CMO, REMIC, 3.00%, 1/15/2041 | 5,070,958 | 5,132,574 | ||
Series 4511, Class QC, Class QC, CMO, REMIC, 3.00%, 12/15/2040 | 5,248,679 | 5,326,362 | ||
Series 4533, Class AB, Class AB, CMO, REMIC, 3.00%, 6/15/2044 | 7,149,061 | 7,530,572 | ||
Series 4543, Class HG, Class HG, CMO, REMIC, 2.70%, 4/15/2044 | 13,514,441 | 14,023,198 |
| Principal Amount | Value | |||
Series 4582, Class HA, CMO, REMIC, 3.00%, 9/15/2045 | $ 10,296,369 | $ 10,892,408 | ||
Series 4629, Class KA, Class KA, CMO, REMIC, 3.00%, 3/15/2045 | 29,200,258 | 30,264,502 | ||
Series 4750, Class PA, Class PA, 3.00%, 7/15/2046 | 15,559,455 | 16,160,884 | ||
Series 4792, Class A, Class A, CMO, REMIC, 3.00%, 5/15/2048 | 14,259,507 | 14,902,499 | ||
Series 4951, Class EA, Class EA, CMO, 2.50%, 9/15/2044 | 10,799,055 | 11,178,289 | ||
| Federal National Mortgage Association: | ||||
2.00%, 7/1/2035 | 2,000,000 | 2,071,473 | ||
2.22%, 12/1/2029 | 5,400,000 | 5,820,132 | ||
2.29%, 10/1/2031 | 3,508,000 | 3,786,430 | ||
2.32%, 12/1/2029 | 7,600,000 | 8,232,280 | ||
2.41%, 10/1/2029 | 25,000,000 | 27,198,898 | ||
2.44%, 1/1/2032 | 16,600,000 | 18,126,496 | ||
2.50%, 2/1/2035 | 3,013,149 | 3,153,959 | ||
2.50%, 12/1/2039 | 10,112,083 | 10,557,921 | ||
2.50%, 4/1/2040 | 24,592,166 | 25,700,847 | ||
2.50%, 9/1/2046 | 4,175,901 | 4,340,977 | ||
2.50%, 2/1/2047 | 11,119,728 | 11,682,292 | ||
2.69%, 8/1/2030 | 24,295,242 | 26,806,839 | ||
1 Year CMT + 1.67 % 2.70%, 5/1/2044 (b) | 11,219,295 | 11,610,465 | ||
2.80%, 11/1/2039 | 10,034,000 | 11,023,822 | ||
3.00%, 5/1/2035 | 7,223,905 | 7,663,822 | ||
3.00%, 10/1/2041 | 23,823,679 | 25,145,206 | ||
3.00%, 3/1/2043 | 4,356,635 | 4,653,864 | ||
3.00%, 7/1/2043 | 7,026,576 | 7,396,613 | ||
3.00%, 1/1/2045 | 1,369,829 | 1,430,102 | ||
3.00%, 3/1/2045 | 2,114,764 | 2,237,217 | ||
3.00%, 4/1/2045 | 8,140,783 | 8,478,009 | ||
3.00%, 7/1/2045 | 26,330,845 | 28,127,252 | ||
3.00%, 10/1/2046 | 6,677,251 | 7,047,646 | ||
3.00%, 2/1/2047 | 21,755,198 | 22,961,984 | ||
3.00%, 11/1/2048 | 13,277,897 | 14,014,437 | ||
3.00%, 10/1/2049 | 7,423,618 | 7,838,771 | ||
3.00%, 4/1/2053 | 15,114,199 | 16,416,111 | ||
3.50%, 9/1/2034 | 1,891,026 | 2,027,936 | ||
3.50%, 12/1/2034 | 1,703,539 | 1,826,875 | ||
3.50%, 2/1/2035 | 1,085,586 | 1,164,182 | ||
3.50%, 1/1/2045 | 11,744,279 | 12,783,733 | ||
3.50%, 2/1/2045 | 3,476,062 | 3,726,775 | ||
3.50%, 6/1/2045 | 10,935,636 | 11,928,441 | ||
4.50%, 3/1/2044 | 1,856,932 | 2,055,361 | ||
4.50%, 6/1/2044 | 915,638 | 1,013,481 | ||
4.50%, 7/1/2044 | 770,842 | 853,212 | ||
4.50%, 2/1/2045 | 1,148,627 | 1,271,367 |
Table of Contents
| Principal Amount | Value | |||
Series 2010-109, Class N, Class N, CMO, REMIC, 3.00%, 10/25/2040 | $ 2,188,501 | $ 2,334,080 | ||
Series 2011-51, Class CI, Class CI, CMO, IO, REMIC, 6.00% - 1 Month USD LIBOR 5.82%, 6/25/2041 (b) | 5,233,243 | 946,283 | ||
Series 2012-101, Class AP, Class AP, CMO, REMIC, 2.00%, 8/25/2040 | 4,412,288 | 4,452,652 | ||
Series 2012-127, Class PA, Class PA, CMO, REMIC, 2.75%, 11/25/2042 | 2,957,867 | 3,139,794 | ||
Series 2012-151, Class SB, Class SB, CMO, REMIC, 6.00% - 1 Month USD LIBOR 5.74%, 1/25/2043 (b) | 1,167,097 | 1,218,082 | ||
Series 2013-114, Class HZ, Class HZ, CMO, REMIC, 3.00%, 11/25/2038 | 17,340,698 | 18,889,127 | ||
Series 2013-18, Class CD, Class CD, CMO, REMIC, 1.50%, 10/25/2027 | 3,566,191 | 3,615,554 | ||
Series 2013-30, Class PS, Class PS, CMO, REMIC, 6.00% - 1 Month USD LIBOR 5.74%, 4/25/2043 (b) | 1,718,187 | 1,786,342 | ||
Series 2014-21, Class GZ, Class GZ, CMO, REMIC, 3.00%, 4/25/2044 | 6,660,718 | 7,065,039 | ||
Series 2014-39, Class ZA, Class ZA, CMO, REMIC, 3.00%, 7/25/2044 | 9,527,889 | 10,084,961 | ||
Series 2015-42, Class CA, Class CA, CMO, REMIC, 3.00%, 3/25/2044 | 5,965,776 | 6,233,101 | ||
Series 2015-9, Class HA, Class HA, CMO, REMIC, 3.00%, 1/25/2045 | 8,395,045 | 9,063,949 | ||
Series 2015-95, Class AP, Class AP, CMO, REMIC, 3.00%, 8/25/2042 | 8,684,499 | 9,083,665 | ||
Series 2016-21, Class BZ, Class BZ, CMO, REMIC, 3.00%, 4/25/2046 | 4,894,931 | 5,437,861 | ||
Series 2016-32, Class LA, Class LA, CMO, REMIC, 3.00%, 10/25/2044 | 9,776,297 | 10,232,465 | ||
Series 2016-72, Class PA, Class PA, CMO, REMIC, 3.00%, 7/25/2046 | 15,074,517 | 16,114,122 | ||
Series 2016-81, Class PA, Class PA, CMO, REMIC, 3.00%, 2/25/2044 | 20,111,522 | 21,076,480 |
| Principal Amount | Value | |||
Series 2016-9, Class A, Class A, CMO, REMIC, 3.00%, 9/25/2043 | $ 8,447,557 | $ 8,957,551 | ||
Series 2016-92, Class A, Class A, CMO, REMIC, 3.00%, 4/25/2042 | 25,610,392 | 27,381,646 | ||
Series 2017-13, Class CA, Class CA, CMO, REMIC, 2.50%, 10/25/2043 | 12,620,517 | 12,708,682 | ||
Series 2017-15, Class MA, Class MA, CMO, REMIC, 3.00%, 2/25/2042 | 10,866,964 | 11,346,032 | ||
Series 2017-18, Class A, Class A, CMO, REMIC, 3.00%, 8/25/2042 | 28,657,321 | 29,233,722 | ||
Series 2017-32, Class CA, Class CA, CMO, REMIC, 3.00%, 10/25/2042 | 26,861,698 | 28,137,043 | ||
Series 2017-87, Class BA, Class BA, CMO, REMIC, 3.00%, 12/25/2042 | 23,019,890 | 23,739,898 | ||
Series 2017-9, Class EA, Class EA, CMO, REMIC, 3.00%, 10/25/2042 | 42,408,690 | 43,214,625 | ||
Series 2018-27, Class JA, Class JA, CMO, REMIC, 3.00%, 12/25/2047 | 10,401,193 | 10,893,296 | ||
Series 2018-38, Class JB, Class JB, CMO, REMIC, 3.00%, 6/25/2048 | 8,658,726 | 9,011,637 | ||
Series 2018-M10, Class A1, Class A1, 3.50%, 7/25/2028 (b) | 12,976,984 | 14,408,594 | ||
| Government National Mortgage Association: | ||||
Series 2013-169, Class SE, Class SE, CMO, IO, REMIC, 6.05% - 1 Month USD LIBOR 5.85%, 11/16/2043 (b) | 1,961,215 | 240,073 | ||
Series 2013-34, Class PL, Class PL, CMO, REMIC, 3.00%, 3/20/2042 | 8,049,688 | 8,271,592 | ||
Series 2014-43, Class PS, Class PS, CMO, IO, REMIC, 6.18% - 1 Month USD LIBOR 5.99%, 7/20/2042 (b) | 5,270,990 | 544,619 | ||
TOTAL U.S. GOVERNMENT AGENCY OBLIGATIONS (Cost $1,273,430,363) | 1,331,899,563 | |||
| U.S. TREASURY OBLIGATIONS — 26.2% | ||||
| Treasury Bill: | ||||
0.11%, 7/2/2020 | 66,000,000 | 65,999,830 | ||
0.12%, 8/6/2020 | 20,600,000 | 20,597,528 | ||
0.16%, 11/27/2020 | 20,000,000 | 19,986,342 |
Table of Contents
| Principal Amount | Value | |||
0.17%, 12/3/2020 | $ 70,000,000 | $ 69,953,285 | ||
| Treasury Notes: | ||||
0.13%, 4/30/2022 | 31,000,000 | 30,979,414 | ||
1.50%, 2/15/2030 | 32,000,000 | 34,595,000 | ||
1.63%, 5/15/2026 | 113,200,000 | 121,292,032 | ||
2.13%, 2/29/2024 | 81,100,000 | 86,770,664 | ||
2.13%, 7/31/2024 | 103,800,000 | 111,763,406 | ||
2.25%, 11/15/2025 | 123,900,000 | 136,502,953 | ||
2.38%, 1/31/2023 | 29,800,000 | 31,490,219 | ||
2.38%, 5/15/2029 | 43,100,000 | 49,740,094 | ||
2.63%, 2/15/2029 | 18,500,000 | 21,679,688 | ||
2.88%, 8/15/2028 | 18,900,000 | 22,384,687 | ||
3.13%, 11/15/2028 | 8,800,000 | 10,639,750 | ||
TOTAL U.S. TREASURY OBLIGATIONS (Cost $782,550,551) | 834,374,892 | |||
| MORTGAGE-BACKED SECURITIES — 5.2% | ||||
| Alternative Loan Trust: | ||||
Series 2005-79CB, Class A4, Class A4, CMO, 5.50%, 1/25/2036 | 5,262,493 | 4,429,097 | ||
Series 2006-24CB, Class A9, Class A9, CMO, 6.00%, 8/25/2036 | 3,537,705 | 2,771,290 | ||
Series 2006-43CB, Class 1A12, Class 1A12, CMO, 5.75%, 2/25/2037 | 3,166,669 | 2,421,451 | ||
Angel Oak Mortgage Trust I Series 2018-1, Class A1, Class A1, 3.26%, 4/27/2048 (a) (b) | 3,292,614 | 3,335,725 | ||
Banc of America Alternative Loan Trust Series 2005-9, Class 1CB2, Class 1CB2, CMO, 5.50%, 10/25/2035 | 3,555,944 | 3,542,577 | ||
| Banc of America Funding Trust: | ||||
Series 2006-8T2, Class A4, Class A4, CMO, 5.83%, 10/25/2036 (f) | 3,104,203 | 2,936,634 | ||
Series 2007-5, Class CA1, Class CA1, CMO, 6.00%, 7/25/2037 | 4,810,503 | 4,097,289 | ||
BANK Series 2017-BNK6, Class XA, IO, 0.97%, 7/15/2060 (b) | 53,888,531 | 2,133,878 | ||
| BBCMS Mortgage Trust: | ||||
Series 2017-DELC, Class B, 1 Month USD LIBOR + 1.03% 1.21%, 8/15/2036 (a) (b) | 2,449,000 | 2,285,277 | ||
Series 2017-DELC, Class C, 1 Month USD LIBOR + 1.20% 1.38%, 8/15/2036 (a) (b) | 863,000 | 790,992 |
| Principal Amount | Value | |||
Series 2017-DELC, Class D, 1 Month USD LIBOR + 1.70% 1.88%, 8/15/2036 (a) (b) | $ 983,000 | $ 876,829 | ||
Series 2017-DELC, Class E, 1 Month USD LIBOR + 2.50% 2.68%, 8/15/2036 (a) (b) | 1,982,000 | 1,747,879 | ||
Series 2017-DELC, Class F, 1 Month USD LIBOR + 3.50% 3.68%, 8/15/2036 (a) (b) | 1,974,000 | 1,468,198 | ||
BBCMS Trust Series 2018-BXH, Class A, 1 Month USD LIBOR + 1.00%, 1.18%, 10/15/2037 (a) (b) | 205,725 | 192,067 | ||
BCAP LLC Trust Series 2010-RR4, Class 3212, Class 3212, CMO, 6.45%, 1/26/2037 (a) (b) | 9,703,751 | 8,759,005 | ||
BX Trust Series 2018-EXCL, Class A, 1 Month USD LIBOR + 1.09%, 1.27%, 9/15/2037 (a) (b) | 223,671 | 199,127 | ||
CAMB Commercial Mortgage Trust Series 2019-LIFE, Class A, 1 Month USD LIBOR + 1.07%, 1.25%, 12/15/2037 (a) (b) | 1,068,000 | 1,055,481 | ||
| CHL Mortgage PassThrough Trust: | ||||
Series 2005-J2, Class 3A14, Class 3A14, CMO, 5.50%, 8/25/2035 | 1,039,708 | 853,546 | ||
Series 2007-12, Class A9, Class A9, CMO, 5.75%, 8/25/2037 | 3,233,851 | 2,602,294 | ||
| CHT COSMO Mortgage Trust: | ||||
Series 2017-CSMO, Class E, 1 Month USD LIBOR + 3.00% 3.18%, 11/15/2036 (a) (b) | 2,407,000 | 2,189,940 | ||
Series 2017-CSMO, Class F, 1 Month USD LIBOR + 3.74% 3.93%, 11/15/2036 (a) (b) | 1,138,000 | 1,013,062 | ||
| Citigroup Mortgage Loan Trust: | ||||
Series 2007-AR4, Class 1A1A, Class 1A1A, CMO, 4.00%, 3/25/2037 (b) | 2,728,386 | 2,473,389 | ||
Series 2007-AR5, Class 1A2A, Class 1A2A, CMO, 4.00%, 4/25/2037 (b) | 1,425,172 | 1,315,572 | ||
CitiMortgage Alternative Loan Trust Series 2007-A1, Class 1A7, Class 1A7, CMO, 6.00%, 1/25/2037 | 6,088,083 | 5,909,093 |
Table of Contents
| Principal Amount | Value | |||
COMM Mortgage Trust Series 2018-HCLV, Class A, 1 Month USD LIBOR + 1.00%, 1.18%, 9/15/2033 (a) (b) | $ 347,000 | $ 330,934 | ||
Credit Suisse Commercial Mortgage Trust Series 2018-TOP, Class A, Class A, 1 Month USD LIBOR + 1.00%, 1.18%, 8/15/2035 (a) (b) | 480,711 | 462,220 | ||
Credit Suisse Mortgage Trust Series 2017-MOON, Class E, Class E, 3.30%, 7/10/2034 (a) (b) | 3,181,000 | 3,094,401 | ||
CSAIL Commercial Mortgage Trust Series 2017-CX10, Class XA, IO, 0.86%, 11/15/2050 (b) | 64,595,097 | 2,547,850 | ||
CSMC MortgageBacked Trust Series 2006-7, Class 7A7, Class 7A7, CMO, 6.00%, 8/25/2036 | 1,851,763 | 1,900,888 | ||
CSMC Trust Series 2020-RPL2, Class A12, Class A12, CMO, 3.55%, 2/25/2060 (a) | 12,472,941 | 12,557,285 | ||
DBGS BIOD Mortgage Trust Series 2018-BIOD, Class A, 1 Month USD LIBOR + 0.80%, 0.99%, 5/15/2035 (a) (b) | 3,086,062 | 3,018,643 | ||
Exantas Capital Corp., Ltd. Series 2019-RSO7, Class A, 1 Month USD LIBOR + 1.00%, 1.19%, 4/15/2036 (a) (b) | 2,381,692 | 2,304,287 | ||
FMC GMSR Issuer Trust Series 2019-GT2, Class A, Class A, CMO, VRN, 4.23%, 9/25/2024 (a) (b) | 3,100,000 | 2,936,288 | ||
FWD Securitization Trust Series 2019-INV1, Class A3, Class A3, 3.11%, 6/25/2049 (a) (b) | 2,068,755 | 2,067,711 | ||
Great Wolf Trust Series 2019-WOLF, Class E, 1 Month USD LIBOR + 2.73%, 2.92%, 12/15/2036 (a) (b) | 100,000 | 89,101 | ||
| GS Mortgage Securities Trust: | ||||
Series 2017-GS7, Class XA, IO, 1.27%, 8/10/2050 (b) | 40,531,865 | 2,445,368 | ||
Series 2018-TWR, Class A, 1 Month USD LIBOR + 0.90% 1.08%, 7/15/2031 (a) (b) | 650,000 | 630,812 | ||
Series 2018-TWR, Class D, 1 Month USD LIBOR + 1.60% 1.78%, 7/15/2031 (a) (b) | 650,000 | 600,854 | ||
Series 2018-TWR, Class E, Class E, 1 Month USD LIBOR + 2.10% 2.28%, 7/15/2031 (a) (b) | 650,000 | 594,148 |
| Principal Amount | Value | |||
Series 2018-TWR, Class F, Class F, 1 Month USD LIBOR + 2.80% 2.98%, 7/15/2031 (a) (b) | $ 650,000 | $ 580,989 | ||
Series 2018-TWR, Class G, Class G, 1 Month USD LIBOR + 3.92% 4.11%, 7/15/2031 (a) (b) | 650,000 | 559,025 | ||
Series 2019-SOHO, Class E, Class E, 1 Month USD LIBOR + 1.87% 2.06%, 6/15/2036 (a) (b) | 3,411,000 | 3,173,215 | ||
GSR Mortgage Loan Trust Series 2006-OA1, Class 1A1, Class 1A1, CMO, 1 Month USD LIBOR + .22%, 0.40%, 8/25/2046 (b) | 16,024,100 | 5,342,850 | ||
Headlands Residential Series 2019-RPL1, Class NOTE, Class NOTE, 3.97%, 6/25/2024 (a) (f) | 4,100,000 | 4,086,397 | ||
JP Morgan Chase Commercial Mortgage Securities Corp. Series 2018-LAQ, Class A, 1 Month USD LIBOR + 1.00%, 1.18%, 6/15/2032 (a) (b) | 2,722,630 | 2,559,034 | ||
Morgan Stanley Capital I Trust Series 2016-UB12, Class XA, IO, 0.90%, 12/15/2049 (b) | 55,545,930 | 1,887,797 | ||
| NRPL Trust: | ||||
Series 2018-2A, Class A1, Class A1, CMO, 4.25%, 7/25/2067 (a) (f) | 4,310,145 | 4,374,485 | ||
Series 2019-3A, Class A1, Class A1, CMO, 3.00%, 7/25/2059 (a) (f) | 5,139,928 | 5,126,697 | ||
OBX Trust Series 2018-1, Class A2, Class A2, CMO, 1 Month USD LIBOR + 0.65%, 0.83%, 6/25/2057 (a) (b) | 734,552 | 724,911 | ||
PMT Credit Risk Transfer Trust Series 2019-2R, Class A, Class A, 1 Month USD LIBOR + 2.75%, 2.93%, 5/27/2023 (a) (b) | 4,173,696 | 3,633,098 | ||
| Rosslyn Portfolio Trust: | ||||
Series 2017-ROSS, Class A, 1 Month USD LIBOR + 0.95% 1.94%, 6/15/2033 (a) (b) | 3,945,000 | 3,888,090 | ||
Series 2017-ROSS, Class B, 1 Month USD LIBOR + 1.25% 2.24%, 6/15/2033 (a) (b) | 1,686,000 | 1,662,210 | ||
Seasoned Credit Risk Transfer Trust Series 2019-4, Class MV, Class MV, 3.00%, 2/25/2059 | 17,342,887 | 19,402,074 |
Table of Contents
| Principal Amount | Value | |||
Structured Adjustable Rate Mortgage Loan Trust Series 2006-8, Class 4A3, Class 4A3, CMO, 4.33%, 9/25/2036 (b) | $ 642,522 | $ 600,603 | ||
Structured Asset Mortgage Investments II Trust Series 2004-AR3, Class M, Class M, CMO, 1 Month USD LIBOR + 0.68%, 0.87%, 7/19/2034 (b) | 2,001,163 | 1,860,399 | ||
UBS Commercial Mortgage Trust Series 2017-C1, Class XA, IO, 1.72%, 6/15/2050 (b) | 22,640,083 | 1,849,245 | ||
| Washington Mutual Mortgage PassThrough Certificates WMALT Trust: | ||||
Series 2005-8, Class 2CB1, Class 2CB1, CMO, 5.50%, 10/25/2035 | 1,462,063 | 1,462,063 | ||
Series 2006-5, Class 3A2, Class 3A2, CMO, 6.00%, 7/25/2036 (f) | 2,976,871 | 1,039,182 | ||
Series 2007-2, Class 1A3, Class 1A3, CMO, 6.00%, 4/25/2037 | 5,521,017 | 4,955,369 | ||
Wells Fargo Mortgage Backed Securities Trust Series 2007-AR4, Class A1, Class A1, CMO, 4.56%, 8/25/2037 (b) | 2,667,773 | 2,513,765 | ||
TOTAL MORTGAGE-BACKED SECURITIES (Cost $173,048,709) | 166,261,980 | |||
| COMMERCIAL MORTGAGE BACKED SECURITIES — 3.2% | ||||
BANK Series 2017-BNK4, Class XA, Class XA, IO, 1.57%, 5/15/2050 (b) | 29,840,329 | 2,032,569 | ||
BBCMS 2017-DELC Mortgage Trust Series 2017-DELC, Class A, Class A, 1.03%, 8/15/2036 (a) (b) | 2,552,000 | 2,435,466 | ||
| BX Trust: | ||||
Series 2017-APPL, Class E, Class E, 1 Month USD LIBOR + 3.15% 3.33%, 7/15/2034 (a) (b) | 1,280,181 | 1,191,176 | ||
Series 2017-SLCT, Class D, Class D, 1 Month USD LIBOR + 2.05% 2.23%, 7/15/2034 (a) (b) | 736,547 | 682,442 | ||
Series 2017-SLCT, Class E, Class E, 1 Month USD LIBOR + 3.15% 3.33%, 7/15/2034 (a) (b) | 1,805,400 | 1,661,092 |
| Principal Amount | Value | |||
Series 2018-GW, Class D, Class D, 1 Month USD LIBOR + 1.77% 1.95%, 5/15/2035 (a) (b) | $ 275,000 | $ 247,545 | ||
Series 2019-OC11, Class E, Class E, 4.08%, 12/9/2041 (a) (b) | 4,009,000 | 3,537,933 | ||
CD Mortgage Trust Series 2017-CD4, Class XA, Class XA, IO, 1.46%, 5/10/2050 (b) | 16,688,213 | 1,061,362 | ||
| CFCRE Commercial Mortgage Trust: | ||||
Series 2016-C3, Class XA, Class XA, IO, 1.17%, 1/10/2048 (b) | 23,996,099 | 1,149,048 | ||
Series 2016-C4, Class XA, Class XA, IO, 1.86%, 5/10/2058 (b) | 11,589,419 | 884,129 | ||
Series 2017-C8, Class XA, Class XA, IO, 1.78%, 6/15/2050 (b) | 27,158,346 | 1,835,030 | ||
| Citigroup Commercial Mortgage Trust: | ||||
Series 2015-GC27, Class D, Class D, 4.57%, 2/10/2048 (a) (b) | 423,700 | 253,099 | ||
Series 2015-GC31, Class C, Class C, 4.19%, 6/10/2048 (b) | 1,500,000 | 1,305,832 | ||
Series 2015-GC33, Class C, Class C, 4.72%, 9/10/2058 (b) | 1,500,000 | 1,326,764 | ||
Series 2016-GC36, Class XA, Class XA, IO, 1.42%, 2/10/2049 (b) | 21,091,685 | 1,169,708 | ||
Series 2020-555, Class E, Class E, 3.62%, 12/10/2041 (a) | 2,047,000 | 1,969,662 | ||
| COMM Mortgage Trust: | ||||
Series 2013-CR12, Class XA, Class XA, IO, 1.29%, 10/10/2046 (b) | 27,277,632 | 846,526 | ||
Series 2015-CR22, Class XA, Class XA, IO, 1.03%, 3/10/2048 (b) | 9,019,518 | 288,437 | ||
Series 2015-CR26, Class B, Class B, 4.63%, 10/10/2048 (b) | 1,600,000 | 1,653,497 | ||
Series 2015-CR26, Class XA, Class XA, IO, 1.08%, 10/10/2048 (b) | 20,680,814 | 838,988 | ||
Series 2015-DC1, Class C, Class C, VRN, 4.45%, 2/10/2048 (b) | 644,000 | 483,856 | ||
Series 2015-DC1, Class XA, Class XA, IO, 1.17%, 2/10/2048 (b) | 7,585,697 | 274,509 |
Table of Contents
| Principal Amount | Value | |||
Series 2015-LC21, Class C, Class C, 4.48%, 7/10/2048 (b) | $ 968,000 | $ 856,446 | ||
Series 2016-CR28, Class C, Class C, 4.80%, 2/10/2049 (b) | 2,011,000 | 1,794,253 | ||
Series 2016-DC2, Class XA, Class XA, IO, 1.15%, 2/10/2049 (b) | 19,046,029 | 840,455 | ||
Series 2017-PANW, Class D, Class D, 4.34%, 10/10/2029 (a) (b) | 1,388,000 | 1,420,201 | ||
Series 2017-PANW, Class E, Class E, 4.13%, 10/10/2029 (a) (b) | 2,316,000 | 2,265,312 | ||
| CSAIL Commercial Mortgage Trust: | ||||
Series 2015-C2, Class AS, Class AS, 3.85%, 6/15/2057 (b) | 900,000 | 955,854 | ||
Series 2015-C4, Class XA, Class XA, IO, 1.01%, 11/15/2048 (b) | 34,447,658 | 1,259,077 | ||
CSMC Trust Series 2017-MOON, Class D, Class D, 3.30%, 7/10/2034 (a) (b) | 2,263,000 | 2,258,253 | ||
DBUBS Mortgage Trust Series 2017-BRBK, Class E, Class E, VRN, 3.65%, 10/10/2034 (a) (b) | 872,000 | 848,531 | ||
DBWF Mortgage Trust Series 2018-GLKS, Class A, Class A, 1 Month USD LIBOR + 1.03%, 1.22%, 12/19/2030 (a) (b) | 2,552,000 | 2,416,679 | ||
Great Wolf Trust Series 2019-WOLF, Class F, Class F, 1 Month USD LIBOR + 3.13%, 3.32%, 12/15/2036 (a) (b) | 100,000 | 84,338 | ||
GS Mortgage Securities Corp. II Series 2013-GC10, Class XA, Class XA, IO, 1.64%, 2/10/2046 (b) | 12,145,896 | 389,742 | ||
| GS Mortgage Securities Trust: | ||||
Series 2014-GC24, Class XA, Class XA, IO, 0.87%, 9/10/2047 (b) | 28,392,487 | 737,199 | ||
Series 2015-GC32, Class XA, Class XA, IO, 0.91%, 7/10/2048 (b) | 23,975,630 | 719,561 | ||
Series 2015-GC34, Class XA, Class XA, IO, 1.42%, 10/10/2048 (b) | 16,146,600 | 845,364 | ||
Series 2015-GS1, Class XA, Class XA, IO, 0.92%, 11/10/2048 (b) | 26,120,802 | 929,827 |
| Principal Amount | Value | |||
Series 2016-GS3, Class XA, Class XA, IO, 1.37%, 10/10/2049 (b) | $ 27,852,224 | $ 1,595,286 | ||
Series 2019-GC38, Class XA, Class XA, IO, 1.12%, 2/10/2052 (b) | 40,624,691 | 2,749,359 | ||
HPLY Trust Series 2019-HIT, Class F, Class F, 1 Month USD LIBOR + 3.15%, 3.33%, 11/15/2036 (a) (b) | 2,786,616 | 2,285,700 | ||
| IMT Trust: | ||||
Series 2017-APTS, Class BFL, Class BFL, 1 Month USD LIBOR + 0.95% 1.13%, 6/15/2034 (a) (b) | 1,937,636 | 1,865,001 | ||
Series 2017-APTS, Class CFL, Class CFL, 1 Month USD LIBOR + 1.10% 1.28%, 6/15/2034 (a) (b) | 1,937,636 | 1,856,324 | ||
JP Morgan Chase Commercial Mortgage Securities Corp. Series 2017-FL10, Class D, Class D, 1 Month USD LIBOR + 1.90%, 2.08%, 6/15/2032 (a) (b) | 126,758 | 120,664 | ||
| JP Morgan Chase Commercial Mortgage Securities Trust: | ||||
Series 2012-C8, Class B, Class B, 3.98%, 10/15/2045 (a) (b) | 1,775,000 | 1,769,393 | ||
Series 2015-JP1, Class XA, Class XA, IO, 1.23%, 1/15/2049 (b) | 22,199,284 | 720,888 | ||
| JPMBB Commercial Mortgage Securities Trust: | ||||
Series 2014-C25, Class XA, Class XA, IO, 1.00%, 11/15/2047 (b) | 5,332,128 | 168,104 | ||
Series 2014-C26, Class C, Class C, 4.52%, 1/15/2048 (b) | 1,500,000 | 1,407,251 | ||
Series 2015-C28, Class XA, Class XA, IO, 1.11%, 10/15/2048 (b) | 9,038,024 | 296,881 | ||
Series 2015-C30, Class XA, Class XA, IO, 0.65%, 7/15/2048 (b) | 26,331,957 | 578,324 | ||
Series 2015-C32, Class C, Class C, 4.80%, 11/15/2048 (b) | 1,132,000 | 967,836 | ||
Series 2015-C33, Class C, Class C, 4.77%, 12/15/2048 (b) | 1,739,000 | 1,582,740 |
Table of Contents
| Principal Amount | Value | |||
JPMDB Commercial Mortgage Securities Trust Series 2016-C2, Class XA, Class XA, IO, 1.82%, 6/15/2049 (b) | $ 21,463,055 | $ 1,249,514 | ||
LSTAR Commercial Mortgage Trust Series 2017-5, Class X, Class X, IO, 1.15%, 3/10/2050 (a) (b) | 43,861,076 | 1,537,936 | ||
| Morgan Stanley Bank of America Merrill Lynch Trust: | ||||
Series 2013-C12, Class XA, Class XA, IO, 0.76%, 10/15/2046 (b) | 12,807,554 | 211,873 | ||
Series 2013-C7, Class XA, Class XA, IO, 1.47%, 2/15/2046 (b) | 13,336,238 | 368,554 | ||
Series 2015-C20, Class C, Class C, 4.61%, 2/15/2048 (b) | 500,000 | 456,439 | ||
Series 2015-C27, Class C, Class C, 4.68%, 12/15/2047 (b) | 1,219,000 | 1,083,479 | ||
Series 2015-C27, Class D, Class D, 3.24%, 12/15/2047 (a) (b) | 1,750,000 | 1,079,372 | ||
Series 2016-C28, Class XA, Class XA, IO, 1.35%, 1/15/2049 (b) | 20,977,921 | 1,036,131 | ||
Series 2016-C30, Class XA, Class XA, IO, 1.55%, 9/15/2049 (b) | 18,381,322 | 1,232,710 | ||
Series 2016-C31, Class C, Class C, 4.46%, 11/15/2049 (b) | 3,358,000 | 2,850,668 | ||
| Morgan Stanley Capital I Trust: | ||||
Series 2015-UBS8, Class XA, Class XA, IO, 1.03%, 12/15/2048 (b) | 24,740,620 | 1,005,064 | ||
Series 2019-L3, Class XA, Class XA, IO, 0.77%, 11/15/2052 (b) | 56,044,703 | 2,651,144 | ||
Series 2020-L4, Class XA, Class XA, IO, VRN, 1.20%, 2/15/2053 (b) | 33,149,607 | 2,691,649 | ||
UBS Commercial Mortgage Trust Series 2017-C4, Class XA, Class XA, IO, 1.21%, 10/15/2050 (b) | 24,278,486 | 1,484,297 | ||
Velocity Commercial Capital Loan Trust Series 2020-1, Class M3, Class M3, VRN, 3.19%, 2/25/2050 (a) (b) | 3,132,176 | 2,839,652 | ||
Waterfall Commercial Mortgage Trust Series 2015-SBC5, Class A, Class A, 4.10%, 9/14/2022 (a) (b) | 4,205,336 | 4,132,207 |
| Principal Amount | Value | |||
| Wells Fargo Commercial Mortgage Trust: | ||||
Series 2014-LC16, Class D, Class D, 3.94%, 8/15/2050 (a) | $ 277,000 | $ 152,448 | ||
Series 2015-C26, Class XA, Class XA, IO, 1.35%, 2/15/2048 (b) | 7,813,550 | 346,763 | ||
Series 2015-C28, Class C, Class C, 4.24%, 5/15/2048 (b) | 1,500,000 | 1,337,799 | ||
Series 2015-LC20, Class XA, Class XA, IO, 1.46%, 4/15/2050 (b) | 6,957,431 | 290,323 | ||
Series 2015-NXS1, Class XA, Class XA, IO, 1.25%, 5/15/2048 (b) | 7,628,046 | 322,676 | ||
Series 2015-NXS2, Class XA, Class XA, IO, 0.81%, 7/15/2058 (b) | 23,686,931 | 683,562 | ||
Series 2015-P2, Class XA, Class XA, IO, 1.12%, 12/15/2048 (b) | 21,419,101 | 745,629 | ||
Series 2016-C33, Class XA, Class XA, IO, 1.87%, 3/15/2059 (b) | 14,049,383 | 919,567 | ||
Series 2017-C38, Class XA, Class XA, IO, 1.20%, 7/15/2050 (b) | 38,307,366 | 2,117,999 | ||
Series 2017-RC1, Class XA, Class XA, IO, 1.66%, 1/15/2060 (b) | 24,540,935 | 1,655,038 | ||
Series 2019-C50, Class XA, Class XA, IO, 1.59%, 5/15/2052 (b) | 30,088,511 | 2,735,840 | ||
| WFRBS Commercial Mortgage Trust: | ||||
Series 2014-C19, Class XA, Class XA, IO, 1.19%, 3/15/2047 (b) | 8,983,630 | 247,444 | ||
Series 2014-C21, Class XA, Class XA, IO, 1.19%, 8/15/2047 (b) | 15,634,109 | 511,839 | ||
TOTAL COMMERCIAL MORTGAGE BACKED SECURITIES (Cost $134,933,550) | 101,691,129 |
Table of Contents
| Security Description | Shares | Value | |||
| SHORT-TERM INVESTMENT — 2.1% | |||||
State Street Institutional U.S. Government Money Market Fund, Class G Shares 0.16% (k) (l) (Cost $67,857,504) | 67,857,504 | $ 67,857,504 | |||
TOTAL INVESTMENTS — 99.8% (Cost $3,116,743,431) | 3,183,593,050 | ||||
OTHER ASSETS IN EXCESS OF LIABILITIES — 0.2% | 7,649,093 | ||||
NET ASSETS — 100.0% | $ 3,191,242,143 |
| (a) | Securities purchased pursuant to Rule 144A of the Securities Act of 1933, as amended. These securities, which represent 10.8% of net assets as of June 30, 2020, are considered liquid and may be resold in transactions exempt from registration, normally to qualified institutional buyers. |
| (b) | Variable Rate Security - Interest rate shown is rate in effect at June 30, 2020. For securities based on a published reference rate and spread, the reference rate and spread are indicated in the description above. |
| (c) | Security is currently in default and/or issuer is in bankruptcy. |
| (d) | Amount is less than 0.05% of net assets. |
| (e) | When-issued security. |
| (f) | Step-up bond - Coupon rate increases in increments to maturity. Rate shown as of June 30, 2020. Maturity date shown is the final maturity. |
| (g) | Fair valued as determined in good faith by the Trust's Oversight Committee in accordance with policy and procedures approved by the Board of Trustees. Security value is determined based on Level 3 inputs. As of June 30, 2020, total aggregate fair value of the security is $0, representing less than 0.05% of the Fund's net assets. |
| (h) | Non-income producing security. |
| (i) | Position is unsettled. Contract rate was not determined at June 30, 2020 and does not take effect until settlement date. Maturity date is not finalized until settlement date. |
| (j) | This Senior Loan will settle after June 30, 2020, at which time the interest rate will be determined. |
| (k) | The Fund invested in certain money market funds managed by SSGA Funds Management, Inc. Amounts related to these transactions during the period ended June 30, 2020 are shown in the Affiliate Table below. |
| (l) | The rate shown is the annualized seven-day yield at June 30, 2020. |
| ABS | Asset-Backed Security |
| CMO | Collateralized Mortgage Obligation |
| CMT | Constant Maturity Treasury |
| EMTN | Euro Medium Term Note |
| GMTN | Global Medium Term Note |
| IO | Interest Only |
| LIBOR | London Interbank Offered Rate |
| PIK | Payment in Kind |
| REMIC | Real Estate Mortgage Investment Conduit |
| VRN | Variable Rate Note |
| Borrower | Unfunded Loan Commitment ($) | Value ($) | Unrealized Appreciation/(Depreciation) ($) | |||
Intelsat Jackson Holdings S.A. | 93,014 | 94,671 | 1,657 |
| Description | Level 1 – Quoted Prices | Level 2 – Other Significant Observable Inputs | Level 3 – Significant Unobservable Inputs | Total | ||||
| ASSETS: | ||||||||
| INVESTMENTS: | ||||||||
Corporate Bonds & Notes | $ — | $ 476,279,535 | $— | $ 476,279,535 | ||||
Asset-Backed Securities | — | 78,819,369 | — | 78,819,369 | ||||
Foreign Government Obligations | — | 30,971,059 | — | 30,971,059 | ||||
U.S. Government Agency Obligations | — | 1,331,899,563 | — | 1,331,899,563 | ||||
U.S. Treasury Obligations | — | 834,374,892 | — | 834,374,892 | ||||
Mortgage-Backed Securities | — | 166,261,980 | — | 166,261,980 | ||||
Commercial Mortgage Backed Securities | — | 101,691,129 | — | 101,691,129 | ||||
Common Stocks | 4,080 | — | 0(a) | 4,080 | ||||
Convertible Bonds | — | 49,269 | — | 49,269 | ||||
Senior Floating Rate Loans | — | 95,384,670 | — | 95,384,670 | ||||
Short-Term Investment | 67,857,504 | — | — | 67,857,504 | ||||
TOTAL INVESTMENTS | $67,861,584 | $3,115,731,466 | $ 0 | $3,183,593,050 |
Table of Contents
| Description | Level 1 – Quoted Prices | Level 2 – Other Significant Observable Inputs | Level 3 – Significant Unobservable Inputs | Total | ||||
| LIABILITIES: | ||||||||
| OTHER FINANCIAL INSTRUMENTS: | ||||||||
Unfunded Loans(b) | $ — | $ 1,657 | $— | $ 1,657 | ||||
TOTAL OTHER FINANCIAL INSTRUMENTS: | $ — | $ 1,657 | $— | $ 1,657 |
| (a) | The Fund held a Level 3 security that was valued at $0 at June 30, 2020. |
| (b) | Includes appreciation (depreciation) on unfunded loan commitments. |
| Number of Shares Held at 6/30/19 | Value at 6/30/19 | Cost of Purchases | Proceeds from Shares Sold | Realized Gain (Loss) | Change in Unrealized Appreciation/ Depreciation | Number of Shares Held at 6/30/20 | Value at 6/30/20 | Dividend Income | |||||||||
State Street Institutional U.S. Government Money Market Fund, Class G Shares | 84,316,399 | $84,316,399 | $1,125,021,728 | $1,141,480,623 | $— | $— | 67,857,504 | $67,857,504 | $748,875 |
| 31 | ARTOTL |
Table of Contents
(b) Not applicable to the registrant.
Item 7. Disclosure of Proxy Voting Policies and Procedures for Closed-End Management Investment Companies.
Not applicable to the registrant.
Item 8. Portfolio Managers of Closed-End Management Investment Companies.
Not applicable to the registrant.
Item 9. Purchases of Equity Securities by Closed-End Management Investment Company and Affiliated Purchasers.
Not applicable to the registrant.
Item 10. Submission of Matters to a Vote of Security Holders.
The registrant has not adopted any material changes to the procedures by which shareholders may recommend nominees to the registrant’s Board.
Item 11. Controls and Procedures.
(a) Within 90 days of the filing date of this Form N-CSR, Ellen M. Needham, the registrant’s President and Principal Executive Officer, and Bruce S. Rosenberg, the registrant’s Treasurer and Principal Financial Officer, reviewed the registrant’s disclosure controls and procedures (as defined in Rule 30a-3(c) under the 1940 Act) and evaluated their effectiveness. Based on their review, Ms. Needham and Mr. Rosenberg determined that the disclosure controls and procedures adequately ensure that information required to be disclosed by the registrant in its periodic reports is recorded, processed, summarized and reported within the time periods required by the U.S. Securities and Exchange Commission.
(b) There were no changes in the registrant’s internal control over financial reporting (as defined in Rule 30a-3(d) under the 1940 Act) that occurred during the period covered by this report that have materially affected, or are reasonably likely to materially affect, the registrant’s internal control over financial reporting.
Item 12. Disclosure of Securities Lending Activities for Closed-End Management Investment Companies.
(a) Not applicable to the registrant.
(b) Not applicable to the registrant.
Item 13. Exhibits.
(a)(1) Code of Ethics referred to in Item 2.
Table of Contents
(a)(3) Not applicable to the registrant.
(a)(4) Not applicable.
| (b) |
Table of Contents
SIGNATURES
Pursuant to the requirements of the Securities Exchange Act of 1934, as amended, and the Investment Company Act of 1940, as amended, the registrant has duly caused this report to be signed on its behalf by the undersigned, thereunto duly authorized.
SSGA Active Trust
| By: | /s/ Ellen M. Needham | |
| Ellen M. Needham | ||
| President and Principal Executive Officer | ||
| Date: | September 25, 2020 | |
Pursuant to the requirements of the Securities Exchange Act of 1934, as amended, and the Investment Company Act of 1940, as amended, this report has been signed below by the following persons on behalf of the registrant and in the capacities and on the dates indicated.
| By: | /s/ Ellen M. Needham | |
| Ellen M. Needham | ||
| President and Principal Executive Officer | ||
| Date: | September 25, 2020 | |
| By: | /s/ Bruce S. Rosenberg | |
| Bruce S. Rosenberg | ||
| Treasurer and Principal Financial Officer | ||
| Date: | September 25, 2020 | |