Table of Contents
UNITED STATES
SECURITIES AND EXCHANGE COMMISSION
Washington, D.C. 20549
FORM N-CSR
CERTIFIED SHAREHOLDER REPORT OF REGISTERED
MANAGEMENT INVESTMENT COMPANIES
Investment Company Act file number: 811-22542
SSGA ACTIVE TRUST
(Exact name of registrant as specified in charter)
One Iron Street, Boston, Massachusetts 02210
(Address of principal executive offices) (zip code)
Joshua A. Weinberg, Esq.
Managing Director and Managing Counsel
c/o SSGA Funds Management, Inc.
One Iron Street
Boston, Massachusetts 02210
(Name and address of agent for service)
Copy to:
W. John McGuire, Esq.
Morgan, Lewis & Bockius LLP
1111 Pennsylvania Avenue, NW
Washington, DC 20004
Registrant’s telephone number, including area code: (617) 664-7037
Date of fiscal year end: June 30
Date of reporting period: June 30, 2018
Table of Contents
Item 1. Reports to Shareholders.
Table of Contents
Annual Report
June 30, 2018
SSGA Active Trust
SPDR SSGA Multi-Asset Real Return ETF
SPDR SSGA Income Allocation ETF
SPDR SSGA Global Allocation ETF
SPDR SSGA Ultra Short Term Bond ETF
SPDR MFS Systematic Core Equity ETF
SPDR MFS Systematic Growth Equity ETF
SPDR MFS Systematic Value Equity ETF
The information contained in this report is intended for the general information of shareholders of the Trust. This report is not authorized for distribution to prospective investors unless preceded or accompanied by a current Trust prospectus which contains important information concerning the Trust. You may obtain a current prospectus and SAI from the Distributor by calling 1-866-787-2257 or visiting www.spdrs.com. Please read the prospectus carefully before you invest.

Table of Contents
| 1 | ||||
Management’s Discussion of Fund Performance, Performance Summaries & Portfolio Statistics (Unaudited) | ||||
| 2 | ||||
| 4 | ||||
| 6 | ||||
| 8 | ||||
| 10 | ||||
| 13 | ||||
| 16 | ||||
Schedules of Investments | ||||
| 19 | ||||
| 21 | ||||
| 23 | ||||
| 26 | ||||
| 31 | ||||
| 33 | ||||
| 35 | ||||
| 38 | ||||
| 45 | ||||
| 52 | ||||
| 59 | ||||
| 61 |
Table of Contents
NOTESTO PERFORMANCE SUMMARY (UNAUDITED)
The performance chart of a Fund’s total return at net asset value (“NAV”), the total return based on market price and its benchmark index is provided for comparative purposes only and represents the periods noted. A Fund’s per share NAV is the value of one share of a Fund and is calculated by dividing the value of total assets less total liabilities by the number of shares outstanding. The NAV return is based on the NAV of a Fund and the market return is based on the market price per share of a Fund. The market price used to calculate the market return is determined by using the midpoint between the highest bid and the lowest offer on the exchange on which the shares of a Fund are listed for trading, as of the time that a Fund’s NAV is calculated. NAV and market returns assume that dividends and capital gain distributions have been reinvested in a Fund at NAV. Market returns do not include brokerage commissions that may be payable on secondary market transactions. If brokerage commissions were included market returns would be lower.
An index is a statistical measure of a specified financial market or sector. An index does not actually hold a portfolio of securities and therefore does not reflect deductions for fees or expenses. In comparison, a Fund’s performance is negatively impacted by these deductions. Index returns reflect all items of income, gain and loss and the reinvestment of dividends and other income.
The Bloomberg Barclays U.S. Government Inflation-linked Bond Index includes publicly issued, U.S. Treasury inflation protected securities that have at least 1 year remaining to maturity on index rebalancing date, with an issue size equal to or in excess of $500 million. Bonds must be capital-indexed and linked to an eligible inflation index. The securities must be denominated in U.S. Dollars and pay coupon and principal in U.S. Dollars. The notional coupon of a bond must be fixed or zero. Bonds must settle on or before the index rebalancing date.
The DBIQ Optimum Yield Diversified Commodity Index Excess Return employs a rule based approach when it rolls from one futures contract to another for each commodity in the index. DBLCI Diversified Index represents 14 commodities drawn from the Energy, Precious Metals, Industrial Metals and Agriculture sectors.
The MSCI World Index is a free float-adjusted market capitalization weighted index that is designed to measure the large and mid-cap equity market performance of developed markets.
The Bloomberg Barclays Long Government/Credit Index measures the investment return of all medium and larger public issues of U.S. Treasury, agency, investment-grade corporate, and investment-grade international dollar-denominated bonds with maturities longer than 10 years. The average maturity is approximately 20 years
The MSCI ACWI IMI Index is a free float-adjusted market capitalization-weighted index that is designed to measure the combined equity market performance of developed and emerging markets. The Index covers approximately 99% of the global equity markets.
The Bloomberg Barclays U.S. Aggregate Bond Index provides a measure of the performance of the U.S. dollar denominated investment grade bond market, which includes investment grade (must be Baa3/BBB- or higher using the middle rating of Moody’s Investor Service, Inc., Standard & Poor’s, and Fitch Inc.) government bonds, investment grade corporate bonds, mortgage pass through securities, commercial mortgage backed securities and asset backed securities that are publicly for sale in the United States.
The Bloomberg Barclays US Treasury Bellwether 3 Month Index is a benchmark tracking the performance and attributes of the on-the-run U.S. Treasury that reflects the most recently issued three month security.
The S&P 500 Index is composed of five hundred (500) selected stocks, all of which are listed on national stock exchanges and spans over 25 separate industry groups.
The Russell 1000 Growth Index measures the performance of the large-cap growth segment of the U.S. equity universe. It includes those Russell 1000 Index companies with higher price-to-book ratios and higher forecasted growth values.
The Russell 1000 Value Index measures the performance of the large-cap value segment of the U.S. equity universe. It includes those Russell 1000 Index companies with lower price-to-book ratios and lower expected growth values.
1
Table of Contents
SPDR SSGA MULTI-ASSET REAL RETURN ETF —
MANAGEMENT’S DISCUSSIONOF FUND PERFORMANCE (UNAUDITED)
The SPDR SSGA Multi-Asset Real Return ETF (the “Fund”)* seeks to achieve real return consisting of capital appreciation and current income. The Fund’s primary benchmark is the Bloomberg Barclays U.S. Government Inflation-linked Bond Index (the “Index”).
For the 12-month period ended June 30, 2018 (the “Reporting Period”), the total return for the Fund was 13.26%, and the Index was 2.26%. The Fund and Index returns reflect the reinvestment of dividends and other income. The Fund’s performance reflects the expenses of managing the Fund, including brokerage and advisory expenses. The Index is unmanaged and Index returns do not reflect fees and expenses of any kind, which would have a negative impact on returns.
The allocations to commodities, broad global natural resource equities, along with targeted holdings within the U.S. energy sector and reduced exposure to global inflation linked bonds were the primary drivers of Fund performance during the Reporting Period relative to the Index. At the beginning of the Reporting Period through the end of 2017, commodities faced bouts of increased volatility, but ultimately generated positive returns. Base metals companies surged on better fundamentals coming from resilient Chinese demand. Energy rallied from bear market territory, buoyed by continued cooperation to comply with production limits among OPEC and other large crude oil exporting countries, coupled with incidental supply disruptions, which contributed to a nascent rebalancing of global oil inventories supporting prices. This, combined with supportive global macroeconomic factors, provided a stimulus for global natural resource equities, especially for the companies in the energy sector and metals and mining industry. As the calendar turned to 2018, the synchronized global growth narrative, combined with an uptick in inflation expectations, was in place. Energy commodities gained further momentum and returns marched higher, but the supportive risk backdrop changed and increased volatility across assets took hold. During January of 2018, crude oils hit their highest levels since 2014. While the global supply glut of oil continued to rebalance and declined to just over its 5 year historical averages, concerns shifted to meeting projected global demand. Energy companies took a divergent path from the underlying commodities during the brief market correction, but retraced the path to achieve new highs for the period in May. At the same time, heightened geopolitical tensions were stoked by U.S. threats of tariffs and other protectionist trade policies with China and other countries. By the end of the second quarter of 2018, this began to have an adverse impact on the industrial metals and agricultural commodities which spilled over to pressure associated companies. Despite fits of geopolitical tensions, the Reporting Period in its entirety was characterized by improving global economic activity and rising realized and expected inflation, which offered tailwinds to real asset classes and the Fund more broadly.
On an individual security level, the top positive contributors to the Fund’s performance on an absolute basis were SPDR S&P Global Natural Resources ETF (GNR), PowerShares DB Commodity Index Tracking Fund (DBC), SPDR S&P Energy Select Sector ETF (XLE), and SPDR S&P Metals & Mining ETF (XME). The holdings with the lowest contribution to the Fund’s performance on an absolute basis were SPDR S&P Global Infrastructure ETF (GII), SPDR FTSE International Government Inflation-Protected Bond ETF (WIP), and SPDR Bloomberg Barclays TIPS ETF (IPE).
* Prior to May 7, 2018, the Fund operated in a “master-feeder” arrangement, under which the Fund invested substantially all of its assets in the SPDR SSGA Multi-Asset Real Return Portfolio (the “Master Fund”), which had an identical investment objective and substantially identical investment strategies, policies and risks as the Fund. Effective May 7, 2018, the master-feeder arrangement was discontinued and the Fund pursues its investment objective through direct investment in securities that previously would have been owned by the Master Fund. Other than discontinuing the master-feeder arrangement, there were no changes to the investment objective, strategies or policies of the Fund on such date.
The views expressed above reflect those of the Fund’s portfolio manager only through the Reporting Period, and do not necessarily represent the views of the Adviser as a whole. Any such views are subject to change at any time based upon market or other conditions and the Adviser disclaims any responsibility to update such views. These views may not be relied on as investment advice and, because investment decisions for a fund are based on numerous factors, may not be relied on as an indication of trading intent on behalf of any fund.
2
Table of Contents
SPDR SSGA MULTI-ASSET REAL RETURN ETF —
PERFORMANCE SUMMARYAND PORTFOLIO STATISTICS (UNAUDITED)
Performance as of June 30, 2018
| Cumulative Total Return | Average Annual Total Return | |||||||||||||||||||||||||||||
| Net Asset Value | Market Value | Bloomberg U.S. Inflation- Bond Index | Net Asset Value | Market Value | Bloomberg U.S. Inflation- Bond Index | |||||||||||||||||||||||||
| ONE YEAR (1) | 13.25% | 13.22% | 2.26% | 13.25% | 13.22% | 2.26% | ||||||||||||||||||||||||
| FIVE YEARS (1) | 5.76% | 5.63% | 9.38% | 1.13% | 1.10% | 1.81% | ||||||||||||||||||||||||
| SINCE INCEPTION (1) (2) | 0.42% | 0.33% | 5.44% | 0.07% | 0.05% | 0.86% | ||||||||||||||||||||||||
| (1) | The One Year, Five Year and Since Inception Cumulative Total Returns for the Fund’s secondary benchmark, DBIQ Optimum Yield Diversified Commodity Index Excess Return, were 21.92%, –26.69% and –33.73%, respectively. The One Year, Five Year and Since Inception Average Annual Total Returns for the Fund’s secondary benchmark, DBIQ Optimum Yield Diversified Commodity Index Excess Return, were 21.92%, –6.02% and –6.44%, respectively. |
| (2) | For the period April 25, 2012 to June 30, 2017. |
Comparison of Change in Value of a $10,000 Investment (Based on Net Asset Value)

Line graph is based on cumulative total return.
Top Five Holdings as of June 30, 2018
| Description | % of Net Assets | |||||||
SPDR S&P Global Natural Resources ETF | 26.1 | % | ||||||
Invesco Optimum Yield Diversified Commodity Strategy No. K-1 ETF | 23.3 | |||||||
SPDR Bloomberg Barclays TIPS ETF | 14.7 | |||||||
SPDR S&P Global Infrastructure ETF | 7.4 | |||||||
SPDR FTSE International Government Inflation-Protected Bond ETF | 6.0 | |||||||
TOTAL | 77.5 | % | ||||||
(The five largest holdings are subject to change, and there are no guarantees the Fund will continue to remain invested in any particular company.)
Asset Allocation as of June 30, 2018
| % of Net Assets | ||||||||
Natural Resources | 39.0 | % | ||||||
Commodities | 23.3 | |||||||
Inflation Linked | 14.7 | |||||||
Real Estate | 9.6 | |||||||
International Equity | 7.4 | |||||||
International Fixed Income | 6.0 | |||||||
Short Term Investments | 5.5 | |||||||
Liabilities in Excess of Other Assets | (5.5 | ) | ||||||
TOTAL | 100.0 | % | ||||||
(The Fund’s asset allocation is expressed as a percentage of net assets and may change over time.)
The total expense ratio for SPDR SSGA Multi-Asset Real Return ETF as stated in the Fees and Expenses table of the most recent prospectus is 0.70%.
Performance quoted represents past performance, which is no guarantee of future results. Investment return and principal value will fluctuate, so you may have a gain or loss when shares are sold. Current performance may be higher or lower than that quoted. Visit www.spdrs.com for most recent month-end performance. The returns do not reflect the deduction of taxes that a shareholder would pay on Fund distributions or on the redemption or sale of Fund shares. See “Notes to Performance Summary” on page 1 for more information.
3
Table of Contents
SPDR SSGA INCOME ALLOCATION ETF — MANAGEMENT’S DISCUSSIONOF FUND PERFORMANCE (UNAUDITED)
The SPDR SSGA Income Allocation ETF (the “Fund”) seeks to provide total return by focusing on investments in income and yield-generating assets. The Fund’s primary benchmark is the MSCI World Index (the “Index”).*
For the 12-month period ended June 30, 2018 (the “Reporting Period”), the total return for the Fund was 3.34%, and the Index was 11.09%. The Fund and Index returns reflect the reinvestment of dividends and other income. The Fund’s performance reflects the expenses of managing the Fund, including brokerage and advisory expenses. The Index is unmanaged and Index returns do not reflect fees and expenses of any kind, which would have a negative impact on returns.
Investments in global fixed income asset classes, dividend-focused equity instruments and other interest rate sensitive markets such as infrastructure and REITs were primary drivers of Fund performance during the Reporting Period relative to the Index. Allocations to global fixed income asset classes detracted from the Fund’s performance relative to the Index as interest rates generally rose during the Reporting Period while global equity markets advanced. Rising interest rates, which negatively impact bond prices, were driven in part by gradually tightening Federal Reserve monetary policy, a pick-up in inflation and oil prices as well as stimulative fiscal policy in the form of increased government spending and the passage of the Tax Cuts and Jobs Act in the United States in late 2017. Dividend-focused equities, infrastructure and REITs all share similarities in that they historically typically exhibit greater sensitivity to interest rates than other equity markets. During the Reporting Period, these assets detracted from the Fund’s performance as they underperformed when compared against a broader equity benchmark such as the Index. The allocations to interest rate sensitive asset classes did help to mitigate the Fund’s volatility during the Reporting Period, although there were some market periods (as occurred in February 2018) where rising inflation concerns and a dramatic increase in the VIX Index hurt equities, fixed income and hybrid asset classes.
On an individual security level, the top positive contributors to the Fund’s performance on an absolute basis during the Reporting Period were the SPDR S&P Dividend ETF (SDY), the SPDR Bloomberg Barclays Convertible Securities ETF (CWB) and the Technology Select Sector SPDR Fund (XLK). The top negative contributors to the Fund’s performance on an absolute basis during the Reporting Period were the SPDR Bloomberg Barclays Emerging Market Local Bond ETF (EBND), the SPDR Portfolio Long Term Corporate Bond ETF (SPLB) and the Industrial Select Sector SPDR Fund (XLI).
* Prior to May 7, 2018, the Fund operated in a “master-feeder” arrangement, under which the Fund invested substantially all of its assets in the SSGA Income Allocation Portfolio (the “Master Fund”), which had an identical investment objective and substantially identical investment strategies, policies and risks as the Fund. Effective May 7, 2018, the master-feeder arrangement was discontinued and the Fund pursues its investment objective through direct investment in securities that previously would have been owned by the Master Fund. Other than discontinuing the master-feeder arrangement, there were no changes to the investment objective, strategies or policies of the Fund on such date.
The views expressed above reflect those of the Fund’s portfolio manager only through the Reporting Period, and do not necessarily represent the views of the Adviser as a whole. Any such views are subject to change at any time based upon market or other conditions and the Adviser disclaims any responsibility to update such views. These views may not be relied on as investment advice and, because investment decisions for a fund are based on numerous factors, may not be relied on as an indication of trading intent on behalf of any fund.
4
Table of Contents
SPDR SSGA INCOME ALLOCATION ETF — PERFORMANCE SUMMARYAND PORTFOLIO STATISTICS (UNAUDITED)
Performance as of June 30, 2018
| Cumulative Total Return | Average Annual Total Return | |||||||||||||||||||||||||||||
| Net Asset Value | Market Value | MSCI World Index | Net Asset Value | Market Value | MSCI World Index | |||||||||||||||||||||||||
| ONE YEAR (1) | 3.34% | 3.29% | 11.09% | 3.34% | 3.29% | 11.09% | ||||||||||||||||||||||||
| FIVE YEARS (1) | 27.99% | 27.95% | 60.61% | 5.06% | 5.05% | 9.94% | ||||||||||||||||||||||||
| SINCE INCEPTION (2) | 34.54% | 34.49% | 84.19% | 4.92% | 4.91% | 10.39% | ||||||||||||||||||||||||
| (1) | The One Year, Five Year and Since Inception Cumulative Total Returns for the Fund’s secondary benchmark, Bloomberg Barclays US Long Government/Credit Bond Index, were –0.78%, 28.26% and 27.94%, respectively. The One Year, Five Year and Since Inception Average Annual Total Returns for the Fund’s secondary benchmark, Bloomberg Barclays US Long Government/Credit Bond Index, were –0.78%, 5.1% and 4.07%, respectively. |
| (2) | For the period April 25, 2012 to June 30, 2018. |
Comparison of Change in Value of a $10,000 Investment (Based on Net Asset Value)
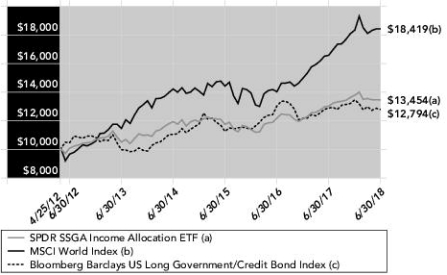
Line graph is based on cumulative total return.
Top Five Holdings as of June 30, 2018
| Description | % of Net Assets | |||||||
SPDR S&P Dividend ETF | 15.0 | % | ||||||
SPDR Portfolio Long Term Corporate Bond ETF | 10.2 | |||||||
SPDR Bloomberg Barclays High Yield Bond ETF | 9.0 | |||||||
SPDR S&P International Dividend ETF | 8.9 | |||||||
SPDR Portfolio Long Term Treasury ETF | 7.2 | |||||||
TOTAL | 50.3 | % | ||||||
(The five largest holdings are subject to change, and there are no guarantees the Fund will continue to remain invested in any particular company.)
Asset Allocation as of June 30, 2018
| % of Net Assets | ||||||||
Domestic Fixed Income | 34.5 | % | ||||||
Domestic Equity | 24.0 | |||||||
International Equity | 22.8 | |||||||
Real Estate | 6.6 | |||||||
Inflation Linked | 5.1 | |||||||
International Fixed Income | 5.0 | |||||||
Natural Resources | 2.0 | |||||||
Short Term Investments | 13.2 | |||||||
Liabilities in Excess of Other Assets | (13.2 | ) | ||||||
TOTAL | 100.0 | % | ||||||
(The Fund’s asset allocation is expressed as a percentage of net assets and may change over time.)
The total expense ratio for SPDR SSGA Income Allocation ETF as stated in the Fees and Expenses table of the most recent prospectus is 0.70%.
Performance quoted represents past performance, which is no guarantee of future results. Investment return and principal value will fluctuate, so you may have a gain or loss when shares are sold. Current performance may be higher or lower than that quoted. Visit www.spdrs.com for most recent month-end performance. The returns do not reflect the deduction of taxes that a shareholder would pay on Fund distributions or on the redemption or sale of Fund shares. See “Notes to Performance Summary” on page 1 for more information.
5
Table of Contents
SPDR SSGA GLOBAL ALLOCATION ETF — MANAGEMENT’S DISCUSSIONOF FUND PERFORMANCE (UNAUDITED)
The SPDR SSGA Global Allocation ETF (the “Fund”) seeks to provide capital appreciation. The Fund’s primary benchmark is the MSCI ACWI IMI Index (the “Index”).*
The 12-month period ended June 30, 2018 (the “Reporting Period”), the total return for the Fund was 8.46%, and the Index was 11.14%. The Fund and Index returns reflect the reinvestment of dividends and other income. The Fund’s performance reflects the expenses of managing the Fund, including brokerage and advisory expenses. The Index is unmanaged and Index returns do not reflect fees and expenses of any kind, which would have a negative impact on returns.
Investments in global fixed income asset classes, other interest rate sensitive markets, such as emerging market debt and REITs, as well as allocations within U.S. equities were primary drivers of Fund performance during the Reporting Period relative to the Index. Allocations to global fixed income asset classes detracted from the Fund’s performance relative to the index as interest rates generally rose during the Reporting Period, while global equity markets advanced. Rising interest rates, which negatively impact bond prices, were driven in part by gradually tightening Federal Reserve monetary policy, a pick-up in inflation and oil prices, as well as stimulative fiscal policy in the form of increased government spending and the passage of the Tax Cuts and Jobs Act in late 2017. Emerging market debt and REITs share some similarities in that they typically exhibit greater sensitivity to interest rates as the relative attractiveness of their respective income streams deteriorates and funding concerns may arise. During the Reporting Period, these assets detracted from the Fund’s performance as they underperformed when compared against the broader equity market. The allocations to interest rate sensitive asset classes did help to mitigate the Fund’s volatility during the Reporting Period, although there were some market periods (such as February 2018) where rising inflation concerns and a dramatic increase in the VIX Index hurt equities, fixed income and hybrid asset classes. Allocations within U.S. equities contributed to favorable performance as compared to the Index as domestic equities were supported by stronger earnings and economic growth than many international markets. Within the portfolio, allocations to small cap U.S. stocks and technology stocks, in particular, benefited the performance of the Fund.
On an individual security level, the top positive contributors to the Fund’s performance on an absolute basis during the Reporting Period were the SPDR S&P 500 ETF Trust (SPY), the SPDR Portfolio Developed World ex-US ETF (SPDW) and the Technology Select SPDR Fund (XLK). The top negative contributors to the Fund’s performance on an absolute basis during the Reporting Period were the SPDR Bloomberg Barclays International Corporate Bond ETF (IBND), the Industrial Select Sector SPDR Fund (XLI) and the SPDR Portfolio Long Term Treasury ETF (SPTL).
* Prior to May 7, 2018, the Fund operated in a “master-feeder” arrangement, under which the Fund invested substantially all of its assets in the SSGA Global Allocation Portfolio (the “Master Fund”), which had an identical investment objective and substantially identical investment strategies, policies and risks as the Fund. Effective May 7, 2018, the master-feeder arrangement was discontinued and the Fund pursues its investment objective through direct investment in securities that previously would have been owned by the Master Fund. Other than discontinuing the master-feeder arrangement, there were no changes to the investment objective, strategies or policies of the Fund on such date.
The views expressed above reflect those of the Fund’s portfolio manager only through the Reporting Period, and do not necessarily represent the views of the Adviser as a whole. Any such views are subject to change at any time based upon market or other conditions and the Adviser disclaims any responsibility to update such views. These views may not be relied on as investment advice and, because investment decisions for a fund are based on numerous factors, may not be relied on as an indication of trading intent on behalf of any fund.
6
Table of Contents
SPDR SSGA GLOBAL ALLOCATION ETF — PERFORMANCE SUMMARYAND PORTFOLIO STATISTICS (UNAUDITED)
Performance as of June 30, 2018
| Cumulative Total Return | Average Annual Total Return | |||||||||||||||||||||||||||||
| Net Asset Value | Market Value | MSCI Index | Net Asset Value | Market Value | MSCI Index | |||||||||||||||||||||||||
| ONE YEAR (1) | 8.46% | 8.54% | 11.14% | 8.46% | 8.54% | 11.14% | ||||||||||||||||||||||||
| FIVE YEARS (1) | 38.30% | 38.45% | 58.12% | 6.70% | 6.72% | 9.60% | ||||||||||||||||||||||||
| SINCE INCEPTION (2) | 49.23% | 49.39% | 78.05% | 6.69% | 6.71% | 9.78% | ||||||||||||||||||||||||
| (1) | The One Year, Five Year and Since Inception Cumulative Total Returns for the Fund’s secondary benchmark, Bloomberg Barclays US Aggregate Bond Index, were –0.40%, 11.89% and 12.44%, respectively. The One Year, Five Year and Since Inception Average Annual Total Returns for the Fund’s secondary benchmark, Bloomberg Barclays US Aggregate Bond Index, were –0.40%, 2.27% and 1.92%, respectively. |
| (2) | For the period April 25, 2012 to June 30, 2018. |
Comparison of Change in Value of a $10,000 Investment (Based on Net Asset Value)
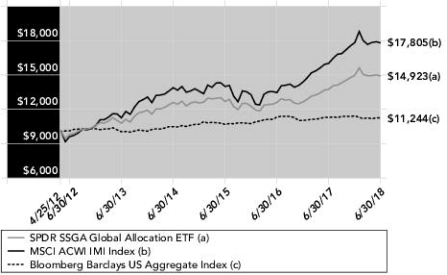
Line graph is based on cumulative total return.
Top Five Holdings as of June 30, 2018
| Description | % of Net Assets | |||||||
SPDR S&P 500 ETF Trust | 25.1 | % | ||||||
SPDR Portfolio Developed World ex-US ETF | 18.6 | |||||||
SPDR Portfolio Emerging Markets ETF | 7.8 | |||||||
SPDR Bloomberg Barclays TIPS ETF | 5.2 | |||||||
Invesco Optimum Yield Diversified Commodity Strategy No. K-1 ETF | 5.1 | |||||||
TOTAL | 61.8 | % | ||||||
(The five largest holdings are subject to change, and there are no guarantees the Fund will continue to remain invested in any particular company.)
Asset Allocation as of June 30, 2018
| % of Net Assets | ||||||||
Domestic Equity | 34.0 | % | ||||||
International Equity | 31.2 | |||||||
Domestic Fixed Income | 10.3 | |||||||
Inflation Linked | 5.2 | |||||||
Commodities | 5.1 | |||||||
International Fixed Income | 3.1 | |||||||
Natural Resources | 2.0 | |||||||
Real Estate | 1.0 | |||||||
Short Term Investments | 11.4 | |||||||
Liabilities in Excess of Other Assets | (3.3 | ) | ||||||
TOTAL | 100.0 | % | ||||||
(The Fund’s asset allocation is expressed as a percentage of net assets and may change over time.)
The total expense ratio for SPDR SSGA Global Allocation ETF as stated in the Fees and Expenses table of the most recent prospectus is 0.35%.
Performance quoted represents past performance, which is no guarantee of future results. Investment return and principal value will fluctuate, so you may have a gain or loss when shares are sold. Current performance may be higher or lower than that quoted. Visit www.spdrs.com for most recent month-end performance. The returns do not reflect the deduction of taxes that a shareholder would pay on Fund distributions or on the redemption or sale of Fund shares. See “Notes to Performance Summary” on page 1 for more information.
7
Table of Contents
SPDR SSGA ULTRA SHORT TERM BOND ETF — MANAGEMENT’S DISCUSSIONOF FUND PERFORMANCE (UNAUDITED)
The SPDR SSGA Ultra Short Term Bond ETF (the “Fund”) seeks to provide current income consistent with preservation of capital and daily liquidity through short duration high quality investments. The Fund’s benchmark is the Bloomberg Barclays US Treasury Bellwether 3 Month Index (the “Index”).*
For the 12-month period ended June 30, 2018 (the “Reporting Period”), the total return for the Fund was 1.60%, and the Index was 1.37%. The Fund and Index returns reflect the reinvestment of dividends and other income. The Fund’s performance reflects the expenses of managing the Fund, including brokerage and advisory expenses. The Index is unmanaged and Index returns do not reflect fees and expenses of any kind, which would have a negative impact on returns.
The Fund outperformed the Index during the Reporting Period primarily due to the yield advantage that the Fund enjoyed. The Fund maintained its exposure to short corporate bonds and Asset Backed Securities (ABS) that traded at a significant spread to the 3 month T-Bill benchmark. Additionally, the Fund continued to invest the majority of its assets in floating rate securities which allowed the Fund to avoid the negative price impacts from higher short term rates while benefitting from a steady rise in coupon levels on its holdings. The Fund maintained a duration measure of approximately .25 years and a Weighted Average Life measure in the 1.35-1.5 year range for the majority of the Reporting Period.
The Federal Open Market Committee (FOMC) continued to raise rates during the Reporting Period as the economy continued to show strength with low unemployment and a steady but manageable uptick in inflation. The FOMC raised rates by 0.25% at the December 2017, March 2018 and June 2018 meetings as was widely expected. This brought the Fed Funds target range from 1 – 1.25% to 1.75 – 2.0% during the course of the year. The Fund’s exposure to both 1 and 3 month Libor indexes on its floating rate holdings captured these moves through steadily increasing coupon resets. In fact, 3 month Libor increased by more than 1.0% during the Reporting Period. 3 month Libor traded at a historically wide spread to both Fed Funds and Treasury Bills during the early part of 2018. After reaching a level of 0.18% in November 2017, 3 month Libor’s spread to 3 month T-Bill yields moved to approximately 0.30% by calendar year end and to 0.62% by early April 2018. The Libor spike versus all other short term benchmark rates was attributable to a large increase in US T-Bill issuance which crowded out credit investors and a lack of buying from investors who would normally be investing their offshore cash balances but were now busy repatriating their cash after the favorable tax law changes. Regardless of the reasons, the spike higher in Libor levels benefitted the Fund due to its holdings of floating rate securities benchmarked to Libor (approximately 68.5% as of June 30, 2018).
Credit spreads on most portfolio holdings were little changed during the Reporting Period overall. Generally speaking, spreads narrowed throughout the second half of 2017 and into early February. Spreads then moved wider during February and March of 2018, ultimately bringing them back to roughly where they began the Reporting Period.
* Prior to May 7, 2018, the Fund operated in a “master-feeder” arrangement, under which the Fund invested substantially all of its assets in the SSGA Ultra Short Term Bond Portfolio (the “Master Fund”), which had an identical investment objective and substantially identical investment strategies, policies and risks as the Fund. Effective May 7, 2018, the master-feeder arrangement was discontinued and the Fund pursues its investment objective through direct investment in securities that previously would have been owned by the Master Fund. Other than discontinuing the master-feeder arrangement, there were no changes to the investment objective, strategies or policies of the Fund on such date.
The views expressed above reflect those of the Fund’s portfolio manager only through the Reporting Period, and do not necessarily represent the views of the Adviser as a whole. Any such views are subject to change at any time based upon market or other conditions and the Adviser disclaims any responsibility to update such views. These views may not be relied on as investment advice and, because investment decisions for a fund are based on numerous factors, may not be relied on as an indication of trading intent on behalf of any fund.
8
Table of Contents
SPDR SSGA ULTRA SHORT TERM BOND ETF — PERFORMANCE SUMMARYAND PORTFOLIO STATISTICS (UNAUDITED)
Performance as of June 30, 2018
| Cumulative Total Return | Average Annual Total Return | |||||||||||||||||||||||||||||
| Net Asset Value | Market Value | Bloomberg US Bellwether Index | Net Asset Value | Market Value | Bloomberg US Bellwether Index | |||||||||||||||||||||||||
| ONE YEAR | 1.60% | 1.55% | 1.37% | 1.60% | 1.55% | 1.37% | ||||||||||||||||||||||||
| SINCE INCEPTION (1) | 4.51% | 4.57% | 2.19% | 0.94% | 0.95% | 0.46% | ||||||||||||||||||||||||
| (1) | For the period October 9, 2013 to June 30, 2018. |
Comparison of Change in Value of a $10,000 Investment (Based on Net Asset Value)
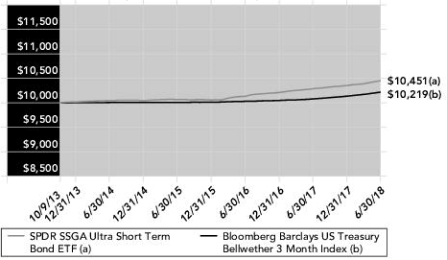
Line graph is based on cumulative total return.
Top Five Holdings as of June 30, 2018
| Description | % of Net Assets | |||||||
Citibank Credit Card Issuance Trust ABS 1.74% 1/19/2021 | 2.8 | % | ||||||
JPMorgan Chase & Co. 3.42% 6/7/2021 | 2.0 | |||||||
Drive Auto Receivables Trust ABS 2.64% 9/15/2020 | 2.0 | |||||||
BMW Vehicle Lease Trust ABS 1.51% 6/20/2019 | 2.0 | |||||||
Treasury Notes 1.25% 6/30/2019 | 1.9 | |||||||
TOTAL | 10.7 | % | ||||||
(The five largest holdings are subject to change, and there are no guarantees the Fund will continue to remain invested in any particular company.)
Asset Allocation as of June 30, 2018
| % of Net Assets | ||||||||
Corporate Bonds & Notes | 62.9 | % | ||||||
Asset-Backed Securities | 24.3 | |||||||
U.S. Treasury Obligations | 5.5 | |||||||
Foreign Government Obligations | 0.5 | |||||||
Short-Term Investment | 8.0 | |||||||
Liabilities in Excess of Other Assets | (1.2 | ) | ||||||
TOTAL | 100.0 | % | ||||||
(The Fund’s asset allocation is expressed as a percentage of net assets and may change over time.)
The total expense ratio for SPDR SSGA Ultra Short Term Bond ETF as stated in the Fees and Expenses table of the most recent prospectus is 0.20%.
Performance quoted represents past performance, which is no guarantee of future results. Investment return and principal value will fluctuate, so you may have a gain or loss when shares are sold. Current performance may be higher or lower than that quoted. Visit www.spdrs.com for most recent month-end performance. The returns do not reflect the deduction of taxes that a shareholder would pay on Fund distributions or on the redemption or sale of Fund shares. See “Notes to Performance Summary” on page 1 for more information.
9
Table of Contents
SPDR MFS SYSTEMATIC CORE EQUITY ETF — MANAGEMENT’S DISCUSSIONOF FUND PERFORMANCE (UNAUDITED)
The SPDR MFS Systematic Core Equity ETF’s (the “Fund”) investment objective is to seek capital appreciation. The Fund’s benchmark is the S&P 500 Index (the “Index”).*
For the 12-month period ended June 30, 2018 (the “Reporting Period”), the total return for the Fund was 12.36% and the Index was 14.37%. The Fund and Index returns reflect the reinvestment of dividends and other income. The Fund’s performance reflects the expenses of managing the Fund, including brokerage and advisory expenses. The Index is unmanaged and Index returns do not reflect fees and expenses of any kind, which would have a negative impact on returns.
Despite continued solid global economic growth, financial markets were buffeted by increased volatility late in the Reporting Period. The increase in volatility dented what appeared to have been high levels of investor confidence, leading to a correction in elevated valuations more in line with long-term averages. The rise in volatility did not disrupt the synchronized upturn in growth, although developed markets and China showed signs of a modest slowdown in the expansion’s pace during the first half of 2018.
During the Reporting Period, the U.S. Federal Reserve raised interest rates by 75 basis points, bringing the total number of hikes to seven since the central bank began to normalize monetary policy in late 2015. The growth rate in the U.S., eurozone and Japan remained above potential, although inflation remained contained, particularly outside the U.S. Late in the Reporting Period, the European Central Bank announced that it would end its asset purchase program at the end of 2018, but issued forward guidance that it does not expect to raise interest rates until after the summer of 2019. Both the Bank of England (“BOE”) and the Bank of Canada raised rates during the Reporting Period, the BOE for the first time in a decade. The European political backdrop became a bit more volatile late in the Reporting Period, spurred by a chaotic process which resulted in the formation of an anti-establishment coalition government in Italy.
Bond yields rose in the U.S. during the Reporting Period, but they remained low by historical standards, while yields in many developed markets fell during the Reporting Period. Credit spreads remained relatively tight but widened modestly late in the Reporting Period as market volatility increased. Increasing concern over growing global trade friction risks appeared to have weighed on business sentiment during the Reporting Period’s second half. International trade negotiations took a number of unpredictable swings late in the Reporting Period, with investors largely taking a wait-and-see approach while ignoring mostly individual actions and counteractions.
Security selection among financial services, health care and leisure companies detracted from performance relative to the Index. Within the financial services sector, the Fund’s holdings of real estate services provider Realogy held back relative returns. The Fund’s overweight position in insurance company Prudential Financial also hurt relative performance. Within the health care sector, overweighting biopharmaceutical company Celgene hampered relative results. Among leisure companies, the Fund’s overweight holdings of cable services provider Comcast and not owning strong-performing internet TV show and movie subscription services provider Netflix further detracted from relative performance.
Elsewhere, the Fund’s overweight positions in tobacco company Philip Morris International, travel related services provider Booking Holdings and diversified technology products and services company International Business Machines all held back relative performance. The Fund’s underweight holdings of strong-performing software giant Microsoft and Netflix further hampered relative results.
Security selection among industrial goods & services, utilities & communications, and energy companies contributed positively to relative performance. Among industrial goods & services companies, the Fund’s overweight position in aerospace company Boeing and avoiding poor-performing diversified industrial conglomerate General Electric aided relative results. Among utilities & communications companies, avoiding telecommunication services provider AT&T bolstered relative performance. Among energy companies, an overweight position in independent oil refiner Valero Energy further added to relative returns.
In other sectors, overweight positions in software company Adobe Systems, multinational retailer Best Buy, real estate investment trust Host Hotels & Resorts, railroad and freight transportation services provider Union Pacific, internet security services provider VeriSign and open source software services provider Red Hat all contributed to relative performance.
10
Table of Contents
SPDR MFS SYSTEMATIC CORE EQUITY ETF — MANAGEMENT’S DISCUSSIONOF FUND PERFORMANCE (UNAUDITED) (CONTINUED)
On an individual security level, the top positive contributors to the Fund’s performance on an absolute basis during the Reporting Period were Valero Energy Corporation, Boeing Company and Adobe Systems, Inc. The top negative contributors to the Fund’s performance on an absolute basis during the Reporting Period were Realogy Holdings Corporation, Prudential Financial, Inc., and Philip Morris International, Inc.
* Prior to May 7, 2018, the Fund operated in a “master-feeder” arrangement, under which the Fund invested substantially all of its assets in the SSGA MFS Systematic Core Equity Portfolio (the “Master Fund”), which had an identical investment objective and substantially identical investment strategies, policies and risks as the Fund. Effective May 7, 2018, the master-feeder arrangement was discontinued and the Fund pursues its investment objective through direct investment in securities that previously would have been owned by the Master Fund. Other than discontinuing the master-feeder arrangement, there were no changes to the investment objective, strategies or policies of the Fund on such date.
The views expressed above reflect those of the Fund’s portfolio manager only through the Reporting Period, and do not necessarily represent the views of the Adviser as a whole. Any such views are subject to change at any time based upon market or other conditions and the Adviser disclaims any responsibility to update such views. These views may not be relied on as investment advice and, because investment decisions for a fund are based on numerous factors, may not be relied on as an indication of trading intent on behalf of any fund.
11
Table of Contents
SPDR MFS SYSTEMATIC CORE EQUITY ETF — PERFORMANCE SUMMARYAND PORTFOLIO STATISTICS (UNAUDITED)
Performance as of June 30, 2018
| Cumulative Total Return | Average Annual Total Return | |||||||||||||||||||||||||||||
| Net Asset Value | Market Value | S&P 500 Index | Net Asset Value | Market Value | S&P 500 Index | |||||||||||||||||||||||||
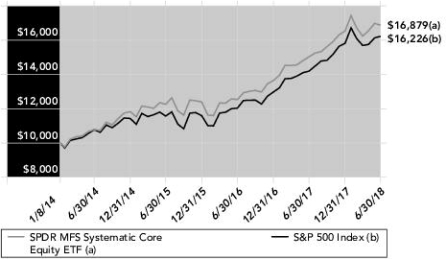
| ONE YEAR | 12.36% | 12.49% | 14.37% | 12.36% | 12.49% | 14.37% | ||||||||||||||||||||||||
| SINCE INCEPTION (1) | 68.79% | 68.83% | 62.26% | 12.40% | 12.41% | 11.43% | ||||||||||||||||||||||||
| (1) | For the period January 8, 2014 to June 30, 2018. |
Top Five Holdings as of June 30, 2018
| Description | % of Net Assets | |||||||
Facebook, Inc. | 5.4 | % | ||||||
Microsoft Corp. | 4.9 | |||||||
Boeing Co. | 3.9 | |||||||
JPMorgan Chase & Co. | 3.7 | |||||||
Express Scripts Holding Co. | 3.6 | |||||||
TOTAL | 21.5 | % | ||||||
(The five largest holdings are subject to change, and there are no guarantees the Fund will continue to remain invested in any particular company.)
Industry Breakdown as of June 30, 2018
| % of Net Assets | ||||||||
Internet Software & Services | 10.0 | % | ||||||
Software | 8.8 | |||||||
Pharmaceuticals | 7.9 | |||||||
Insurance | 6.2 | |||||||
Equity Real Estate Investment Trusts (REITs) | 5.9 | |||||||
Oil, Gas & Consumable Fuels | 5.1 | |||||||
Computers & Peripherals | 4.8 | |||||||
Health Care Providers & Services | 4.8 | |||||||
IT Services | 4.5 | |||||||
Commercial Banks | 4.5 | |||||||
Aerospace & Defense | 3.9 | |||||||
Machinery | 3.2 | |||||||
Independent Power Producers & Energy Traders | 3.2 | |||||||
Electric Utilities | 3.0 | |||||||
Hotels, Restaurants & Leisure | 3.0 | |||||||
Food Products | 2.6 | |||||||
Road & Rail | 2.5 | |||||||
Tobacco | 2.4 | |||||||
Media | 2.4 | |||||||
Food & Staples Retailing | 2.3 | |||||||
Beverages | 1.7 | |||||||
Internet & Catalog Retail | 1.3 | |||||||
Consumer Finance | 1.1 | |||||||
Semiconductors & Semiconductor Equipment | 1.1 | |||||||
Biotechnology | 0.9 | |||||||
Specialty Retail | 0.7 | |||||||
Household Products | 0.6 | |||||||
Chemicals | 0.6 | |||||||
Short-Term Investment | 0.9 | |||||||
Other Assets in Excess of Liabilities | 0.1 | |||||||
TOTAL | 100.0 | % | ||||||
(The Fund’s industry breakdown is expressed as a percentage of net assets and may change over time.)
The total expense ratio for SPDR MFS Systematic Core Equity ETF as stated in the Fees and Expenses table of the most recent prospectus is 0.60%.
Performance quoted represents past performance, which is no guarantee of future results. Investment return and principal value will fluctuate, so you may have a gain or loss when shares are sold. Current performance may be higher or lower than that quoted. Visit www.spdrs.com for most recent month-end performance. The returns do not reflect the deduction of taxes that a shareholder would pay on Fund distributions or on the redemption or sale of Fund shares. See “Notes to Performance Summary” on page 1 for more information.
12
Table of Contents
SPDR MFS SYSTEMATIC GROWTH EQUITY ETF — MANAGEMENT’S DISCUSSIONOF FUND PERFORMANCE (UNAUDITED)
The SPDR MFS Systematic Growth Equity ETF’s (the “Fund”) investment objective is to seek capital appreciation. The Fund’s benchmark is the Russell 1000 Growth Index (the “Index”).*
For the 12-month period ended June 30, 2018 (the “Reporting Period”), the total return for the Fund was 14.71%, and the Index was 22.51%. The Fund and Index returns reflect the reinvestment of dividends and other income. The Fund’s performance reflects the expenses of managing the Fund, including brokerage and advisory expenses. The Index is unmanaged and Index returns do not reflect fees and expenses of any kind, which would have a negative impact on returns.
Despite continued solid global economic growth, financial markets were buffeted by increased volatility late in the Reporting Period. The increase in volatility dented what appeared to have been high levels of investor confidence, leading to a correction in elevated valuations more in line with long-term averages., The rise in volatility did not disrupt the synchronized upturn in growth, although developed markets and China showed signs of a modest slowdown in the expansion’s pace during the first half of 2018.
During the Reporting Period, the U.S. Federal Reserve raised interest rates by 75 basis points, bringing the total number of hikes to seven since the central bank began to normalize monetary policy in late 2015. The growth rate in the US, eurozone and Japan remained above potential, although inflation remained contained, particularly outside the U.S. Late in the Reporting Period, the European Central Bank announced that it would end its asset purchase program at the end of 2018, but issued forward guidance that it does not expect to raise interest rates until after the summer of 2019. Both the Bank of England (“BOE”) and the Bank of Canada raised rates during the Reporting Period, the BOE for the first time in a decade. The European political backdrop became a bit more volatile late in the Reporting Period, spurred by a chaotic process which resulted in the formation of an anti-establishment coalition government in Italy.
Bond yields rose in the U.S. during the Reporting Period, but they remained low by historical standards, while yields in many developed markets fell during the Reporting Period. Credit spreads remained relatively tight but widened modestly late in the Reporting Period as market volatility increased. Increasing concern over growing global trade friction risks appeared to have weighed on business sentiment during the Reporting Period’s second half. International trade negotiations took a number of unpredictable swings late in the Reporting Period, with investors largely taking a wait-and-see approach while ignoring mostly individual actions and counteractions.
Security selection among both the technology and financial services companies negatively impacted performance relative to the Index during the Reporting Period. Among technology companies, the Fund’s underweight position in shares of software giant Microsoft, as well as overweight positions in shares of enterprise software products maker Oracle, diversified technology products and services company IBM and computer hard drive maker Western Digital, hurt relative returns. Among financial services companies, holding shares of insurance company Prudential Financial further weighed on relative performance as the stock lagged the benchmark over the course of the Reporting Period.
Stock selection and, to a lesser extent, an overweight position among leisure companies also weighed on relative results. Among these companies, not holding shares of strong-performing internet TV show and movie subscription services provider Netflix and an overweight position in poor-performing cable services provider Charter Communications dampened relative returns.
An underweight position among strong-performing retailing companies further diminished relative returns. The Fund’s underweight position in shares of internet retailer Amazon.com hindered relative returns as the stock outpaced the benchmark during the Reporting Period.
Other stocks that detracted from relative performance included the Fund’s overweight positions in health services and information technology company McKesson and tobacco company Philip Morris International.
Strong security selection among industrial goods & services, auto and housing companies lifted relative performance to the Index over the Reporting Period. Among industrial goods & services companies, the Fund’s overweight positions in aerospace company Boeing, construction and mining equipment manufacturer Caterpillar and equipment rental company United Rentals buoyed relative returns. Within the auto and housing companies, overweighting shares of automotive seating and electrical distribution systems manufacturer Lear helped relative results as the stock outpaced the benchmark during the Reporting Period.
13
Table of Contents
SPDR MFS SYSTEMATIC GROWTH EQUITY ETF —
MANAGEMENT’S DISCUSSIONOF FUND PERFORMANCE (UNAUDITED) (CONTINUED)
The Fund’s underweight position among basic materials companies further benefited relative returns. Not holding shares of poor-performing diversified technology company 3M aided relative results.
Elsewhere, the Fund’s overweight positions in game developer Take-Two Interactive and software company Adobe Systems, as well as the timing of the Fund’s ownership in shares of multinational retailer Best Buy, Medicaid-related solutions provider Molina Healthcare and real estate investment trust Extra Space Storage, contributed positively to relative results.
On an individual security level, the top positive contributors to the Fund’s performance on an absolute basis during the Reporting Period were Facebook, Inc., Take-Two Interactive Software, Inc. and Adobe Systems, Inc. The top negative contributors to the Fund’s performance on an absolute basis during the Reporting Period were McKesson Corporation, Philip Morris International, Inc. and Comcast Corp.
* Prior to May 7, 2018, the Fund operated in a “master-feeder” arrangement, under which the Fund invested substantially all of its assets in the SSGA MFS Systematic Growth Equity Portfolio (the “Master Fund”), which had an identical investment objective and substantially identical investment strategies, policies and risks as the Fund. Effective May 7, 2018, the master-feeder arrangement was discontinued and the Fund pursues its investment objective through direct investment in securities that previously would have been owned by the Master Fund. Other than discontinuing the master-feeder arrangement, there were no changes to the investment objective, strategies or policies of the Fund on such date.
The views expressed above reflect those of the Fund’s portfolio manager only through the Reporting Period, and do not necessarily represent the views of the Adviser as a whole. Any such views are subject to change at any time based upon market or other conditions and the Adviser disclaims any responsibility to update such views. These views may not be relied on as investment advice and, because investment decisions for a fund are based on numerous factors, may not be relied on as an indication of trading intent on behalf of any fund.
14
Table of Contents
SPDR MFS SYSTEMATIC GROWTH EQUITY ETF — PERFORMANCE SUMMARYAND PORTFOLIO STATISTICS (UNAUDITED)
Performance as of June 30, 2018
| Cumulative Total Return | Average Annual Total Return | |||||||||||||||||||||||||||||
| Net Asset Value | Market Value | Russell Growth | Net Asset Value | Market Value | Russell Growth | |||||||||||||||||||||||||
| ONE YEAR | 14.71% | 14.11% | 22.51% | 14.71% | 14.11% | 22.51% | ||||||||||||||||||||||||
| SINCE INCEPTION (1) | 78.35% | 77.71% | 79.85% | 13.80% | 13.71% | 14.02% | ||||||||||||||||||||||||
| (1) | For the period January 8, 2014 to June 30, 2018. |
Top Five Holdings as of June 30, 2018
| Description | % of Net Assets | |||||||
Facebook, Inc. | 6.8 | % | ||||||
Boeing Co. | 4.4 | |||||||
Amazon.com, Inc. | 4.2 | |||||||
Apple, Inc. | 3.9 | |||||||
Adobe Systems, Inc. | 3.8 | |||||||
TOTAL | 23.1 | % | ||||||
(The five largest holdings are subject to change, and there are no guarantees the Fund will continue to remain invested in any particular company.)
Industry Breakdown as of June 30, 2018
| % of Net Assets | ||||||||
Software | 11.5 | % | ||||||
Internet Software & Services | 10.3 | |||||||
Health Care Providers & Services | 10.2 | |||||||
Internet & Catalog Retail | 7.7 | |||||||
Technology Hardware, Storage & Peripherals | 6.9 | |||||||
IT Services | 6.4 | |||||||
Machinery | 4.5 | |||||||
Aerospace & Defense | 4.4 | |||||||
Equity Real Estate Investment Trusts (REITS) | 4.3 | |||||||
Pharmaceuticals | 3.7 | |||||||
Hotels, Restaurants & Leisure | 3.7 | |||||||
Biotechnology | 3.6 | |||||||
Specialty Retail | 3.2 | |||||||
Tobacco | 3.1 | |||||||
Insurance | 2.9 | |||||||
Independent Power Producers & Energy Traders | 2.3 | |||||||
Chemicals | 2.2 | |||||||
Trading Companies & Distributors | 1.9 | |||||||
Semiconductors & Semiconductor Equipment | 1.9 | |||||||
Consumer Finance | 1.4 | |||||||
Food Products | 1.2 | |||||||
Road & Rail | 0.8 | |||||||
Household Durables | 0.7 | |||||||
Health Care Equipment & Supplies | 0.2 | |||||||
Short-Term Investment | 0.9 | |||||||
Other Assets in Excess of Liabilities | 0.1 | |||||||
TOTAL | 100.0 | % | ||||||
(The Fund’s industry breakdown is expressed as a percentage of net assets and may change over time.)
The total expense ratio for SPDR MFS Systematic Growth Equity ETF as stated in the Fees and Expenses table of the most recent prospectus is 0.60%.
Performance quoted represents past performance, which is no guarantee of future results. Investment return and principal value will fluctuate, so you may have a gain or loss when shares are sold. Current performance may be higher or lower than that quoted. Visit www.spdrs.com for most recent month-end performance. The returns do not reflect the deduction of taxes that a shareholder would pay on Fund distributions or on the redemption or sale of Fund shares. See “Notes to Performance Summary” on page 1 for more information.
15
Table of Contents
SPDR MFS SYSTEMATIC VALUE EQUITY ETF —
MANAGEMENT’S DISCUSSIONOF FUND PERFORMANCE (UNAUDITED)
The SPDR MFS Systematic Value Equity ETF’s (the “Fund”) investment objective is to seek capital appreciation. The Fund’s benchmark is the Russell 1000 Value Index (the “Index”).*
For the 12-month period ended June 30, 2018 (the “Reporting Period”), the total return for the Fund was 13.82%, and the Index was 6.77%. The Fund and Index returns reflect the reinvestment of dividends and other income. The Fund’s performance reflects the expenses of managing the Fund, including brokerage and advisory expenses. The Index is unmanaged and Index returns do not reflect fees and expenses of any kind, which would have a negative impact on returns.
Despite continued solid global economic growth, financial markets were buffeted by increased volatility late in the Reporting Period. The increase in volatility dented what appeared to have been high levels of investor confidence, leading to a correction in elevated valuations more in line with long-term. The rise in volatility did not disrupt the synchronized upturn in growth, although developed markets and China showed signs of a modest slowdown in the expansion’s pace during the first half of 2018.
During the Reporting Period, the U.S. Federal Reserve raised interest rates by 75 basis points, bringing the total number of hikes to seven since the central bank began to normalize monetary policy in late 2015. The growth rate in the US, eurozone and Japan remained above potential, although inflation remained contained, particularly outside the U.S. Late in the Reporting Period, the European Central Bank announced that it would end its asset purchase program at the end of 2018, but issued forward guidance that it does not expect to raise interest rates until after the summer of 2019. Both the Bank of England (“BOE”) and the Bank of Canada raised rates during the Reporting Period, the BOE for the first time in a decade. The European political backdrop became a bit more volatile late in the Reporting Period, spurred by a chaotic process which resulted in the formation of an anti-establishment coalition government in Italy.
Bond yields rose in the U.S. during the Reporting Period, but they remained low by historical standards, while yields in many developed markets fell during the Reporting Period. Credit spreads remained relatively tight but widened modestly late in the Reporting Period as market volatility increased. Increasing concern over growing global trade friction risks appeared to have weighed on business sentiment during the Reporting Period’s second half. International trade negotiations took a number of unpredictable swings late in the Reporting Period, with investors largely taking a wait-and-see approach while ignoring mostly individual actions and counteractions.
Security selection among technology and energy companies contributed to performance relative to the Index. Among technology companies, an overweight position in enterprise storage and data management software company Netapp bolstered relative results. Among energy companies, overweight positions in independent oil refiner Valero Energy, oil and gas exploration & production company Anadarko Petroleum and fuel refiner Phillips 66 further supported relative returns.
Elsewhere, not holding a position in diversified industrial conglomerate General Electric, and overweight positions in multinational retailer Best Buy, freight hauling railroad company Union Pacific Corp, utility services holding company Exelon Corp, information technology company DXC Technology and health and well-being company Humana, aided relative performance. In addition, security selection in the consumer staples sector also added to relative performance.
Security selection among leisure companies hindered relative performance led by the Fund’s overweight position in cruise line operator Royal Caribbean Cruises.
Individual stocks that held back relative returns included overweight positions in health services and information technology company McKesson, utility company PG&E, insurance company Prudential Financial, manufacturer, and distributor of engines, filtration, and power generation products Cummins, estate services provider Realogy, utility company PPL and insurance company MetLife. Additionally, the timing of the fund’s ownership in shares of hospital operator HCA Healthcare and not holding shares of strong-performing integrated energy company Chevron further weakened relative results.
On an individual security level, the top positive contributors to the Fund’s performance on an absolute basis during the Reporting Period were Valero Energy Corporation, Netapp, Inc. and Intel Corp. The top negative contributors to the Fund’s performance on an absolute basis during the Reporting Period were McKesson Corporation, PG&E Corporation, and Prudential Financial Inc.
16
Table of Contents
SPDR MFS SYSTEMATIC VALUE EQUITY ETF —
MANAGEMENT’S DISCUSSIONOF FUND PERFORMANCE (UNAUDITED) (CONTINUED)
* Prior to May 7, 2018, the Fund operated in a “master-feeder” arrangement, under which the Fund invested substantially all of its assets in the SSGA MFS Systematic Core Portfolio (the “Master Fund”), which had an identical investment objective and substantially identical investment strategies, policies and risks as the Fund. Effective May 7, 2018, the master-feeder arrangement was discontinued and the Fund pursues its investment objective through direct investment in securities that previously would have been owned by the Master Fund. Other than discontinuing the master-feeder arrangement, there were no changes to the investment objective, strategies or policies of the Fund on such date.
The views expressed above reflect those of the Fund’s portfolio manager only through the Reporting Period, and do not necessarily represent the views of the Adviser as a whole. Any such views are subject to change at any time based upon market or other conditions and the Adviser disclaims any responsibility to update such views. These views may not be relied on as investment advice and, because investment decisions for a fund are based on numerous factors, may not be relied on as an indication of trading intent on behalf of any fund.
17
Table of Contents
SPDR MFS SYSTEMATIC VALUE EQUITY ETF — PERFORMANCE SUMMARYAND PORTFOLIO STATISTICS (UNAUDITED)
Performance as of June 30, 2018
| Cumulative Total Return | Average Annual Total Return | |||||||||||||||||||||||||||||
| Net Asset Value | Market Value | Russell Index | Net Asset Value | Market Value | Russell Index | |||||||||||||||||||||||||
| ONE YEAR | 13.82% | 14.21% | 6.77% | 13.82% | 14.21% | 6.77% | ||||||||||||||||||||||||
| SINCE INCEPTION (1) | 59.77% | 60.15% | 43.45% | 11.03% | 11.09% | 8.40% | ||||||||||||||||||||||||
| (1) | For the period January 8, 2014 to June 30, 2018. |
Top Five Holdings as of June 30, 2018
| Description | % of Net Assets | |||||||
JPMorgan Chase & Co. | 4.5 | % | ||||||
Bank of America Corp. | 4.2 | |||||||
Exelon Corp. | 3.7 | |||||||
Valero Energy Corp. | 3.6 | |||||||
NRG Energy, Inc. | 3.2 | |||||||
TOTAL | 19.2 | % | ||||||
(The five largest holdings are subject to change, and there are no guarantees the Fund will continue to remain invested in any particular company.)
Industry Breakdown as of June 30, 2018
| % of Net Assets | ||||||||
Oil, Gas & Consumable Fuels | 10.6 | % | ||||||
Commercial Banks | 9.7 | |||||||
Equity Real Estate Investment Trusts (REITs) | 7.5 | |||||||
Health Care Providers & Services | 7.3 | |||||||
Pharmaceuticals | 6.6 | |||||||
Insurance | 6.1 | |||||||
Electric Utilities | 4.6 | |||||||
Consumer Finance | 4.5 | |||||||
Independent Power Producers & Energy Traders | 4.5 | |||||||
Electrical Equipment | 4.3 | |||||||
Hotels, Restaurants & Leisure | 3.9 | |||||||
Food Products | 3.6 | |||||||
Machinery | 2.9 | |||||||
IT Services | 2.7 | |||||||
Road & Rail | 2.5 | |||||||
Tobacco | 2.5 | |||||||
Semiconductors & Semiconductor Equipment | 2.5 | |||||||
Chemicals | 2.3 | |||||||
Communications Equipment | 2.1 | |||||||
Computers & Peripherals | 1.9 | |||||||
Automobiles | 1.7 | |||||||
Specialty Retail | 0.9 | |||||||
Beverages | 0.9 | |||||||
Multiline Retail | 0.8 | |||||||
Diversified Telecommunication Services | 0.8 | |||||||
Health Care Equipment & Supplies | 0.7 | |||||||
Household Durables | 0.7 | |||||||
Short-Term Investment | 0.8 | |||||||
Other Assets in Excess of Liabilities | 0.1 | |||||||
TOTAL | 100.0 | % | ||||||
(The Fund’s industry breakdown is expressed as a percentage of net assets and may change over time.)
The total expense ratio for SPDR MFS Systematic Value Equity ETF as stated in the Fees and Expenses table of the most recent prospectus is 0.60%.
Performance quoted represents past performance, which is no guarantee of future results. Investment return and principal value will fluctuate, so you may have a gain or loss when shares are sold. Current performance may be higher or lower than that quoted. Visit www.spdrs.com for most recent month-end performance. The returns do not reflect the deduction of taxes that a shareholder would pay on Fund distributions or on the redemption or sale of Fund shares. See “Notes to Performance Summary” on page 1 for more information.
18
Table of Contents
SPDR SSGA Multi-Asset Real Return ETF
SCHEDULE OF INVESTMENTS
June 30, 2018
Security Description | Shares | Value | ||||||
MUTUAL FUNDS AND EXCHANGE TRADED PRODUCTS — 100.0% |
| |||||||
COMMODITIES — 23.3% |
| |||||||
Invesco Optimum Yield Diversified Commodity Strategy No. K-1 ETF (a) | 1,817,463 | $ | 33,550,367 | |||||
|
| |||||||
INFLATION LINKED — 14.7% |
| |||||||
SPDR Bloomberg Barclays TIPS ETF (b) | 381,395 | 21,178,864 | ||||||
|
| |||||||
INTERNATIONAL EQUITY — 7.4% |
| |||||||
SPDR S&P Global Infrastructure ETF (a) (b) | 214,010 | 10,552,534 | ||||||
|
| |||||||
INTERNATIONAL FIXED INCOME — 6.0% |
| |||||||
SPDR FTSE International Government Inflation-Protected Bond ETF (b) | 160,079 | 8,682,685 | ||||||
|
| |||||||
NATURAL RESOURCES — 39.0% |
| |||||||
Invesco Global Agriculture ETF | 107,408 | 2,896,794 | ||||||
SPDR S&P Global Natural Resources ETF (b) | 748,533 | 37,486,532 | ||||||
SPDR S&P Metals & Mining ETF (a) (b) | 153,827 | 5,456,244 | ||||||
SPDR S&P Oil & Gas Equipment & Services ETF (a) (b) | 172,636 | 2,927,906 | ||||||
The Energy Select Sector SPDR Fund (b) | 95,071 | 7,219,692 | ||||||
|
| |||||||
| 55,987,168 | ||||||||
|
| |||||||
REAL ESTATE — 9.6% |
| |||||||
SPDR Dow Jones International Real Estate ETF (a) (b) | 219,619 | 8,595,887 | ||||||
SPDR Dow Jones REIT ETF (a) (b) | 55,830 | 5,245,787 | ||||||
|
| |||||||
| 13,841,674 | ||||||||
|
| |||||||
TOTAL MUTUAL FUNDS AND EXCHANGE TRADED PRODUCTS | 143,793,292 | |||||||
|
| |||||||
SHORT-TERM INVESTMENTS — 5.5% |
| |||||||
State Street Institutional U.S. Government Money Market Fund, Class G Shares 1.86% (c) (d) | 12,678 | $ | 12,678 | |||||
State Street Navigator Securities Lending Government Money Market Portfolio (c) (e) | 7,809,131 | 7,809,131 | ||||||
|
| |||||||
TOTAL SHORT-TERM INVESTMENTS | 7,821,809 | |||||||
|
| |||||||
TOTAL INVESTMENTS — 105.5% | 151,615,101 | |||||||
LIABILITIES IN EXCESS OF | (7,873,127 | ) | ||||||
|
| |||||||
NET ASSETS — 100.0% | $ | 143,741,974 | ||||||
|
| |||||||
| (a) | All or a portion of the shares of the security are on loan at June 30, 2018. |
| (b) | Affiliated fund managed by SSGA Funds Management, Inc. Amounts related to these transactions during the period ended June 30, 2018 are shown in the Affiliate Table below. |
| (c) | The Fund invested in certain money market funds managed by SSGA Funds Management, Inc. Amounts related to these transactions during the period ended June 30, 2018 are shown in the Affiliate Table below. |
| (d) | The rate shown is the annualized seven-day yield at June 30, 2018. |
| (e) | Investment of cash collateral for securities loaned. |
The following table summarizes the value of the Fund’s investments according to the fair value hierarchy as of June 30, 2018.
Description | Level 1 — Quoted Prices | Level 2 — Other Significant Observable Inputs | Level 3 — Significant Unobservable Inputs | Total | ||||||||||||
ASSETS: | ||||||||||||||||
INVESTMENTS: | ||||||||||||||||
Mutual Funds and Exchange Traded Products | ||||||||||||||||
Commodities | $ | 33,550,367 | $ | — | $ | — | $ | 33,550,367 | ||||||||
Inflation Linked | 21,178,864 | — | — | 21,178,864 | ||||||||||||
International Equity | 10,552,534 | — | — | 10,552,534 | ||||||||||||
International Fixed Income | 8,682,685 | — | — | 8,682,685 | ||||||||||||
Natural Resources | 55,987,168 | — | — | 55,987,168 | ||||||||||||
Real Estate | 13,841,674 | — | — | 13,841,674 | ||||||||||||
Short-Term Investments | 7,821,809 | — | — | 7,821,809 | ||||||||||||
|
|
|
|
|
|
|
| |||||||||
TOTAL INVESTMENTS | $ | 151,615,101 | $ | — | $ | — | $ | 151,615,101 | ||||||||
|
|
|
|
|
|
|
| |||||||||
See accompanying notes to financial statements.
19
Table of Contents
SPDR SSGA Multi-Asset Real Return ETF
SCHEDULE OF INVESTMENTS (continued)
June 30, 2018
Affiliate Table
| Number of Shares Held at 6/30/17* | Value at 6/30/17* | Cost of Purchases** | Proceeds from Shares Sold | Realized Gain (Loss) | Change in Unrealized Appreciation/ Depreciation | Number of Shares Held at 6/30/18 | Value at 6/30/18 | Dividend Income | Capital Gains Distributions | |||||||||||||||||||||||||||||||
SPDR Bloomberg Barclays TIPS ETF | — | $ | — | $ | 22,900,018 | $ | 1,368,779 | $ | 9,392 | $ | (361,767 | ) | 381,395 | $ | 21,178,864 | $ | 135,366 | $ | — | |||||||||||||||||||||
SPDR FTSE International Government Inflation-Protected Bond ETF | — | — | 9,683,741 | 565,642 | 5,075 | (440,489 | ) | 160,079 | 8,682,685 | 58,885 | — | |||||||||||||||||||||||||||||
SPDR Dow Jones International Real Estate ETF | — | — | 9,338,720 | 557,812 | 31,443 | (216,464 | ) | 219,619 | 8,595,887 | 81,089 | — | |||||||||||||||||||||||||||||
SPDR Dow Jones REIT ETF | — | — | 5,078,091 | 455,987 | 43,739 | 579,944 | 55,830 | 5,245,787 | 48,460 | — | ||||||||||||||||||||||||||||||
SPDR S&P Global Infrastructure ETF | — | — | 13,525,706 | 3,087,205 | (92,333 | ) | 206,366 | 214,010 | 10,552,534 | 184,091 | — | |||||||||||||||||||||||||||||
SPDR S&P Global Natural Resources ETF | — | — | 37,555,770 | 3,502,625 | 358,510 | 3,074,877 | 748,533 | 37,486,532 | 465,499 | — | ||||||||||||||||||||||||||||||
SPDR S&P Metals & Mining ETF | — | — | 6,808,933 | 2,220,501 | 97,160 | 770,652 | 153,827 | 5,456,244 | 59,117 | — | ||||||||||||||||||||||||||||||
SPDR S&P Oil & Gas Equipment & Services ETF | — | — | 3,708,004 | 627,053 | (53,388 | ) | (99,657 | ) | 172,636 | 2,927,906 | 5,067 | — | ||||||||||||||||||||||||||||
State Street Institutional U.S. Government Money Market Fund, Class G Shares | — | — | 1,522,553 | 1,509,875 | — | — | 12,678 | 12,678 | 1,321 | — | ||||||||||||||||||||||||||||||
State Street Navigator Securities Lending Government Money Market Portfolio | — | — | 26,250,915 | 18,441,784 | — | — | 7,809,131 | 7,809,131 | 6,443 | — | ||||||||||||||||||||||||||||||
The Energy Select Sector SPDR Fund | — | — | 7,603,321 | 875,527 | 52,021 | 439,877 | 95,071 | 7,219,692 | 50,070 | — | ||||||||||||||||||||||||||||||
|
|
|
|
|
|
|
|
|
|
|
|
|
|
|
| |||||||||||||||||||||||||
TOTAL | $ | — | $ | 143,975,772 | $ | 33,212,790 | $ | 451,619 | $ | 3,953,339 | $ | 115,167,940 | $ | 1,095,408 | $ | — | ||||||||||||||||||||||||
|
|
|
|
|
|
|
|
|
|
|
|
|
|
|
| |||||||||||||||||||||||||
| * | Refer to Note 1 on the Notes to Financial Statements regarding the discontinuance of the master-feeder structure. |
| ** | Includes transfers from Portfolio – See Note 1 in the Notes to Financial Statements. |
See accompanying notes to financial statements.
20
Table of Contents
SPDR SSGA Income Allocation ETF
SCHEDULE OF INVESTMENTS
June 30, 2018
Security Description | Shares | Value | ||||||
MUTUAL FUNDS AND EXCHANGE TRADED |
| |||||||
DOMESTIC EQUITY — 24.0% |
| |||||||
SPDR S&P Dividend ETF (a) (b) | 150,116 | $ | 13,915,753 | |||||
SPDR Wells Fargo Preferred Stock ETF (a) | 108,376 | 4,711,105 | ||||||
The Industrial Select Sector SPDR Fund (a) (b) | 24,633 | 1,764,462 | ||||||
The Technology Select Sector SPDR Fund (a) | 26,269 | 1,824,907 | ||||||
|
| |||||||
| 22,216,227 | ||||||||
|
| |||||||
DOMESTIC FIXED INCOME — 34.5% |
| |||||||
SPDR Bloomberg Barclays Convertible Securities ETF (a) | 87,008 | 4,613,164 | ||||||
SPDR Bloomberg Barclays High Yield Bond ETF (a) (b) | 233,882 | 8,298,133 | ||||||
SPDR Portfolio Intermediate Term Corporate Bond ETF (a) | 85,069 | 2,831,947 | ||||||
SPDR Portfolio Long Term Corporate Bond ETF (a) | 359,992 | 9,402,991 | ||||||
SPDR Portfolio Long Term Treasury ETF (a) | 191,485 | 6,707,624 | ||||||
|
| |||||||
| 31,853,859 | ||||||||
|
| |||||||
INFLATION LINKED — 5.1% |
| |||||||
SPDR Bloomberg Barclays TIPS ETF (a) | 85,518 | 4,748,815 | ||||||
|
| |||||||
INTERNATIONAL EQUITY — 22.8% |
| |||||||
SPDR MSCI Emerging Markets StrategicFactors ETF (a) | 89,470 | 5,308,255 | ||||||
SPDR S&P Global Infrastructure ETF (a) | 98,391 | 4,851,522 | ||||||
SPDR S&P International Dividend ETF (a) | 214,263 | 8,208,416 | ||||||
SPDR STOXX Europe 50 ETF (a) | 81,394 | 2,720,993 | ||||||
|
| |||||||
| 21,089,186 | ||||||||
|
| |||||||
INTERNATIONAL FIXED INCOME — 5.0% |
| |||||||
SPDR Bloomberg Barclays Emerging Markets Local Bond ETF (a) (b) | 169,930 | 4,581,313 | ||||||
|
| |||||||
NATURAL RESOURCES — 2.0% |
| |||||||
The Energy Select Sector SPDR Fund (a) | 24,486 | 1,859,467 | ||||||
|
| |||||||
REAL ESTATE — 6.6% |
| |||||||
SPDR Dow Jones International Real Estate ETF (a) | 87,581 | 3,427,920 | ||||||
SPDR Dow Jones REIT ETF (a) | 27,950 | 2,626,182 | ||||||
|
| |||||||
| 6,054,102 | ||||||||
|
| |||||||
TOTAL MUTUAL FUNDS AND EXCHANGE TRADED PRODUCTS |
| 92,402,969 | ||||||
|
| |||||||
SHORT-TERM INVESTMENT — 13.2% |
| |||||||
State Street Navigator Securities Lending Government Money Market Portfolio (c) (d) | 12,183,127 | 12,183,127 | ||||||
|
| |||||||
TOTAL INVESTMENTS — 113.2% (Cost $102,160,630) | 104,586,096 | |||||||
LIABILITIES IN EXCESS OF | (12,197,113 | ) | ||||||
|
| |||||||
NET ASSETS — 100.0% | $ | 92,388,983 | ||||||
|
| |||||||
| (a) | Affiliated fund managed by SSGA Funds Management, Inc. Amounts related to these transactions during the period ended June 30, 2018 are shown in the Affiliate Table below. |
| (b) | All or a portion of the shares of the security are on loan at June 30, 2018. |
| (c) | The Fund invested in certain money market funds managed by SSGA Funds Management, Inc. Amounts related to these transactions during the period ended June 30, 2018 are shown in the Affiliate Table below. |
| (d) | Investment of cash collateral for securities loaned. |
The following table summarizes the value of the Fund’s investments according to the fair value hierarchy as of June 30, 2018.
Description | Level 1 — Quoted Prices | Level 2 — Other Significant Observable Inputs | Level 3 — Significant Unobservable Inputs | Total | ||||||||||||
ASSETS: | ||||||||||||||||
INVESTMENTS: | ||||||||||||||||
Mutual Funds and Exchange Traded Products | ||||||||||||||||
Domestic Equity | $ | 22,216,227 | $ | — | $ | — | $ | 22,216,227 | ||||||||
Domestic Fixed Income | 31,853,859 | — | — | 31,853,859 | ||||||||||||
Inflation Linked | 4,748,815 | — | — | 4,748,815 | ||||||||||||
International Equity | 21,089,186 | — | — | 21,089,186 | ||||||||||||
International Fixed Income | 4,581,313 | — | — | 4,581,313 | ||||||||||||
Natural Resources | 1,859,467 | — | — | 1,859,467 | ||||||||||||
Real Estate | 6,054,102 | — | — | 6,054,102 | ||||||||||||
Short-Term Investment | 12,183,127 | — | — | 12,183,127 | ||||||||||||
|
|
|
|
|
|
|
| |||||||||
TOTAL INVESTMENTS | $ | 104,586,096 | $ | — | $ | — | $ | 104,586,096 | ||||||||
|
|
|
|
|
|
|
| |||||||||
See accompanying notes to financial statements.
21
Table of Contents
SPDR SSGA Income Allocation ETF
SCHEDULE OF INVESTMENTS (continued)
June 30, 2018
Affiliate Table
| Number of Shares Held at 6/30/17* | Value at 6/30/17* | Cost of Purchases** | Proceeds from Shares Sold | Realized Gain (Loss) | Change in Unrealized Appreciation/ Depreciation | Number of Shares Held at 6/30/18 | Value at 6/30/18 | Dividend Income | Capital Gains Distributions | |||||||||||||||||||||||||||||||
SPDR Bloomberg Barclays Convertible Securities ETF | — | $ | — | $ | 4,551,940 | $ | 346,833 | $ | 27,462 | $ | 380,595 | 87,008 | $ | 4,613,164 | $ | 17,492 | $ | — | ||||||||||||||||||||||
SPDR Bloomberg Barclays Emerging Markets Local Bond ETF | — | — | 4,910,037 | 77,983 | 1,557 | (252,298 | ) | 169,930 | 4,581,313 | 33,354 | — | |||||||||||||||||||||||||||||
SPDR Bloomberg Barclays High Yield Bond ETF | — | — | 9,307,056 | 254,051 | (11,425 | ) | (743,447 | ) | 233,882 | 8,298,133 | 70,812 | — | ||||||||||||||||||||||||||||
SPDR Bloomberg Barclays Long Term Corporate Bond ETF | — | — | 9,920,166 | 158,371 | (1,185 | ) | (357,619 | ) | 359,992 | 9,402,991 | 66,358 | — | ||||||||||||||||||||||||||||
SPDR Bloomberg Barclays Long Term Treasury ETF | — | — | 6,776,436 | 112,678 | 2,454 | 41,412 | 191,485 | 6,707,624 | 29,539 | — | ||||||||||||||||||||||||||||||
SPDR Bloomberg Barclays TIPS ETF | — | — | 4,884,218 | 80,165 | 309 | (55,547 | ) | 85,518 | 4,748,815 | 33,039 | — | |||||||||||||||||||||||||||||
SPDR Dow Jones International Real Estate ETF | — | — | 3,550,162 | 57,904 | 2,021 | (66,359 | ) | 87,581 | 3,427,920 | 31,993 | — | |||||||||||||||||||||||||||||
SPDR Dow Jones REIT ETF | — | — | 2,389,940 | 249,749 | 13,505 | 472,486 | 27,950 | 2,626,182 | 24,002 | — | ||||||||||||||||||||||||||||||
SPDR MSCI Emerging Markets StrategicFactors ETF | — | — | 6,538,676 | 1,781,639 | (29,428 | ) | 580,646 | 89,470 | 5,308,255 | 38,004 | — | |||||||||||||||||||||||||||||
SPDR Portfolio Intermediate Term Corporate Bond ETF | — | — | 2,897,161 | 47,912 | (3 | ) | (17,299 | ) | 85,069 | 2,831,947 | 9,018 | — | ||||||||||||||||||||||||||||
SPDR S&P Dividend ETF | — | — | 12,464,268 | 693,178 | 79,405 | 2,065,258 | 150,116 | 13,915,753 | 96,263 | — | ||||||||||||||||||||||||||||||
SPDR S&P Global Infrastructure ETF | — | — | 4,856,633 | 80,776 | 12,303 | 63,362 | 98,391 | 4,851,522 | 66,617 | — | ||||||||||||||||||||||||||||||
SPDR S&P International Dividend ETF | — | — | 9,311,444 | 1,140,358 | (44,793 | ) | 82,123 | 214,263 | 8,208,416 | 157,473 | — | |||||||||||||||||||||||||||||
SPDR STOXX Europe 50 ETF | — | — | 2,817,225 | 45,926 | (1,089 | ) | (49,217 | ) | 81,394 | 2,720,993 | 52,056 | — | ||||||||||||||||||||||||||||
SPDR Wells Fargo Preferred Stock ETF | — | — | 5,059,438 | 121,369 | (3,779 | ) | (223,185 | ) | 108,376 | 4,711,105 | 44,842 | — | ||||||||||||||||||||||||||||
State Street Institutional U.S. Government Money Market Fund, Class G Shares | — | — | 1,300,574 | 1,300,574 | — | — | — | — | 1,316 | — | ||||||||||||||||||||||||||||||
State Street Navigator Securities Lending Government Money Market Portfolio | — | — | 37,961,288 | 25,778,161 | — | — | 12,183,127 | 12,183,127 | 19,838 | — | ||||||||||||||||||||||||||||||
The Energy Select Sector SPDR Fund | — | — | 1,915,879 | 30,651 | (1,354 | ) | (24,407 | ) | 24,486 | 1,859,467 | 12,759 | — | ||||||||||||||||||||||||||||
The Financial Select Sector SPDR Fund | — | — | 1,815,944 | 1,943,766 | 127,822 | — | — | — | — | |||||||||||||||||||||||||||||||
The Industrial Select Sector SPDR Fund | — | — | 1,965,548 | 147,174 | 2,714 | (56,626 | ) | 24,633 | 1,764,462 | 7,556 | — | |||||||||||||||||||||||||||||
The Material Select Sector SPDR Fund | — | — | 1,953,024 | 1,960,439 | 7,415 | — | — | — | — | |||||||||||||||||||||||||||||||
The Technology Select Sector SPDR Fund | — | — | 1,406,449 | 214,086 | 46,956 | 585,588 | 26,269 | 1,824,907 | 6,820 | — | ||||||||||||||||||||||||||||||
|
|
|
|
|
|
|
|
|
|
|
|
|
|
|
| |||||||||||||||||||||||||
TOTAL | $ | — | $ | 138,553,506 | $ | 36,623,743 | $ | 230,867 | $ | 2,425,466 | $ | 104,586,096 | $ | 819,151 | $ | — | ||||||||||||||||||||||||
|
|
|
|
|
|
|
|
|
|
|
|
|
|
|
| |||||||||||||||||||||||||
| * | Refer to Note 1 on the Notes to Financial Statements regarding the discontinuance of the master-feeder structure. |
| ** | Includes transfers from Portfolio – See Note 1 in the Notes to Financial Statements. |
See accompanying notes to financial statements.
22
Table of Contents
SPDR SSGA Global Allocation ETF
SCHEDULE OF INVESTMENTS
June 30, 2018
Security Description | Shares | Value | ||||||
MUTUAL FUNDS AND EXCHANGE TRADED PRODUCTS — 91.9% |
| |||||||
COMMODITIES — 5.1% |
| |||||||
Invesco Optimum Yield Diversified Commodity Strategy No. K-1 ETF (a) | 689,516 | $ | 12,728,466 | |||||
|
| |||||||
DOMESTIC EQUITY — 34.0% |
| |||||||
SPDR Portfolio Small Cap ETF (a) (b) | 233,351 | 7,532,570 | ||||||
SPDR S&P 500 ETF Trust (b) | 230,121 | 62,427,225 | ||||||
SPDR S&P MidCap 400 ETF Trust (b) | 14,060 | 4,991,581 | ||||||
The Industrial Select Sector SPDR Fund (a) (b) | 66,988 | 4,798,351 | ||||||
The Technology Select Sector SPDR Fund (b) | 71,494 | 4,966,688 | ||||||
|
| |||||||
| 84,716,415 | ||||||||
|
| |||||||
DOMESTIC FIXED INCOME — 10.3% |
| |||||||
SPDR Bloomberg Barclays High Yield Bond ETF (a) (b) | 143,202 | 5,080,807 | ||||||
SPDR Bloomberg Barclays Intermediate Term Treasury ETF (b) | 87,887 | 5,158,088 | ||||||
SPDR Bloomberg Barclays Short Term High Yield Bond ETF (a) (b) | 186,886 | 5,100,119 | ||||||
SPDR Portfolio Intermediate Term Corporate Bond ETF (a) (b) | 154,667 | 5,148,865 | ||||||
SPDR Portfolio Long Term Treasury ETF (b) | 149,332 | 5,231,025 | ||||||
|
| |||||||
| 25,718,904 | ||||||||
|
| |||||||
INFLATION LINKED — 5.2% |
| |||||||
SPDR Bloomberg Barclays TIPS ETF (b) | 232,855 | 12,930,438 | ||||||
|
| |||||||
INTERNATIONAL EQUITY — 31.2% |
| |||||||
SPDR Portfolio Developed World ex-US ETF (a) (b) | 1,519,455 | 46,191,432 | ||||||
SPDR Portfolio Emerging Markets ETF (b) | 545,940 | 19,293,520 | ||||||
SPDR S&P International Small Cap ETF (a) (b) | 212,042 | 7,277,281 | ||||||
Vanguard FTSE Pacific ETF | 69,378 | 4,855,072 | ||||||
|
| |||||||
| 77,617,305 | ||||||||
|
| |||||||
INTERNATIONAL FIXED INCOME — 3.1% |
| |||||||
SPDR Bloomberg Barclays Emerging Markets Local Bond ETF (b) | 92,904 | 2,504,692 | ||||||
SPDR Bloomberg Barclays International Corporate Bond ETF (a) (b) | 151,066 | 5,109,052 | ||||||
|
| |||||||
| 7,613,744 | ||||||||
|
| |||||||
NATURAL RESOURCES — 2.0% |
| |||||||
The Energy Select Sector SPDR Fund (b) | 66,339 | 5,037,784 | ||||||
|
| |||||||
REAL ESTATE — 1.0% |
| |||||||
SPDR Dow Jones International Real Estate ETF (b) | 63,705 | 2,493,414 | ||||||
|
| |||||||
TOTAL MUTUAL FUNDS AND EXCHANGE TRADED PRODUCTS |
| 228,856,470 | ||||||
|
| |||||||
SHORT-TERM INVESTMENTS — 11.4% |
| |||||||
State Street Institutional U.S. Government Money Market Fund, Class G Shares 1.86% (c) (d) | 19,809,280 | 19,809,280 | ||||||
State Street Navigator Securities Lending Government Money Market Portfolio (c) (e) | 8,492,442 | 8,492,442 | ||||||
|
| |||||||
TOTAL SHORT-TERM INVESTMENTS | 28,301,722 | |||||||
|
| |||||||
TOTAL INVESTMENTS — 103.3% | 257,158,192 | |||||||
LIABILITIES IN EXCESS OF | (8,229,267 | ) | ||||||
|
| |||||||
NET ASSETS — 100.0% | $ | 248,928,925 | ||||||
|
| |||||||
| (a) | All or a portion of the shares of the security are on loan at June 30, 2018. |
| (b) | Affiliated fund managed by SSGA Funds Management, Inc. Amounts related to these transactions during the period ended June 30, 2018 are shown in the Affiliate Table below. |
| (c) | The Fund invested in certain money market funds managed by SSGA Funds Management, Inc. Amounts related to these transactions during the period ended June 30, 2018 are shown in the Affiliate Table below. |
| (d) | The rate shown is the annualized seven-day yield at June 30, 2018. |
| (e) | Investment of cash collateral for securities loaned. |
The following table summarizes the value of the Fund’s investments according to the fair value hierarchy as of June 30, 2018.
Description | Level 1 — Quoted Prices | Level 2 — Other Significant Observable Inputs | Level 3 — Significant Unobservable Inputs | Total | ||||||||||||
ASSETS: | ||||||||||||||||
INVESTMENTS: | ||||||||||||||||
Mutual Funds and Exchange Traded Products | ||||||||||||||||
Commodities | $ | 12,728,466 | $ | — | $ | — | $ | 12,728,466 | ||||||||
Domestic Equity | 84,716,415 | — | — | 84,716,415 | ||||||||||||
Domestic Fixed Income | 25,718,904 | — | — | 25,718,904 | ||||||||||||
See accompanying notes to financial statements.
23
Table of Contents
SPDR SSGA Global Allocation ETF
SCHEDULE OF INVESTMENTS (continued)
June 30, 2018
Description | Level 1 — Quoted Prices | Level 2 — Other Significant Observable Inputs | Level 3 — Significant Unobservable Inputs | Total | ||||||||||||
Inflation Linked | $ | 12,930,438 | $ | — | $ | — | $ | 12,930,438 | ||||||||
International Equity | 77,617,305 | — | — | 77,617,305 | ||||||||||||
International Fixed Income | 7,613,744 | — | — | 7,613,744 | ||||||||||||
Natural Resources | 5,037,784 | — | — | 5,037,784 | ||||||||||||
Real Estate | 2,493,414 | — | — | 2,493,414 | ||||||||||||
Short-Term Investments | 28,301,722 | — | — | 28,301,722 | ||||||||||||
|
|
|
|
|
|
|
| |||||||||
TOTAL INVESTMENTS | $ | 257,158,192 | $ | — | $ | — | $ | 257,158,192 | ||||||||
|
|
|
|
|
|
|
| |||||||||
Affiliate Table
| Number of Shares Held at 6/30/17* | Value at 6/30/17* | Cost of Purchases** | Proceeds from Shares Sold | Realized Gain (Loss) | Change in Unrealized Appreciation/ Depreciation | Number of Shares Held at 6/30/18 | Value at 6/30/18 | Dividend Income | Capital Gains Distributions | |||||||||||||||||||||||||||||||
SPDR Bloomberg Barclays Emerging Markets Local Bond ETF | — | $ | — | $ | 2,654,684 | $ | — | $ | — | $ | (149,992 | ) | 92,904 | $ | 2,504,692 | $ | 17,707 | $ | — | |||||||||||||||||||||
SPDR Bloomberg Barclays High Yield Bond ETF | — | — | 5,133,981 | — | — | (53,174 | ) | 143,202 | 5,080,807 | — | — | |||||||||||||||||||||||||||||
SPDR Bloomberg Barclays Intermediate Term Treasury ETF | — | — | 5,192,277 | — | — | (34,189 | ) | 87,887 | 5,158,088 | 15,156 | — | |||||||||||||||||||||||||||||
SPDR Bloomberg Barclays International Corporate Bond ETF | — | — | 5,313,337 | — | — | (204,285 | ) | 151,066 | 5,109,052 | 4,989 | — | |||||||||||||||||||||||||||||
SPDR Bloomberg Barclays Short Term High Yield Bond ETF | — | — | 5,142,835 | — | — | (42,716 | ) | 186,886 | 5,100,119 | 44,256 | — | |||||||||||||||||||||||||||||
SPDR Bloomberg Barclays TIPS ETF | — | — | 13,080,693 | — | — | (150,255 | ) | 232,855 | 12,930,438 | 85,018 | — | |||||||||||||||||||||||||||||
SPDR Dow Jones International Real Estate ETF | — | — | 2,411,755 | — | — | 81,659 | 63,705 | 2,493,414 | 22,713 | — | ||||||||||||||||||||||||||||||
SPDR Portfolio DevelopedWorld ex-US ETF | — | — | 45,077,935 | 4,833,284 | 451,345 | 5,495,436 | 1,519,455 | 46,191,432 | 803,123 | — | ||||||||||||||||||||||||||||||
SPDR Portfolio Emerging Markets ETF | — | — | 24,098,432 | 6,225,559 | (414,118 | ) | 1,834,765 | 545,940 | 19,293,520 | 174,750 | — | |||||||||||||||||||||||||||||
SPDR Portfolio Emerging Markets Small Cap ETF | — | — | 2,117,227 | 2,518,246 | 401,019 | — | — | — | — | — | ||||||||||||||||||||||||||||||
SPDR Portfolio Intermediate Term Corporate Bond ETF | — | — | 5,228,162 | — | — | (79,297 | ) | 154,667 | 5,148,865 | 23,344 | — | |||||||||||||||||||||||||||||
SPDR Portfolio Long Term Treasury ETF | — | — | 5,091,546 | — | — | 139,479 | 149,332 | 5,231,025 | 21,993 | — | ||||||||||||||||||||||||||||||
SPDR Portfolio Small Cap ETF | — | — | 6,864,075 | 591,783 | 34,309 | 1,225,969 | 233,351 | 7,532,570 | 28,982 | — | ||||||||||||||||||||||||||||||
SPDR S&P 500 ETF Trust | — | — | 55,044,166 | 2,273,076 | 72,252 | 9,583,883 | 230,121 | 62,427,225 | 284,503 | — | ||||||||||||||||||||||||||||||
SPDR S&P International Small Cap ETF | — | — | 6,519,309 | — | — | 757,972 | 212,042 | 7,277,281 | 16,561 | — | ||||||||||||||||||||||||||||||
SPDR S&P MidCap 400 ETF Trust | — | — | 4,246,736 | 249,871 | 9,838 | 984,878 | 14,060 | 4,991,581 | 14,093 | — | ||||||||||||||||||||||||||||||
See accompanying notes to financial statements.
24
Table of Contents
SPDR SSGA Global Allocation ETF
SCHEDULE OF INVESTMENTS (continued)
June 30, 2018
| Number of Shares Held at 6/30/17* | Value at 6/30/17* | Cost of Purchases** | Proceeds from Shares Sold | Realized Gain (Loss) | Change in Unrealized Appreciation/ Depreciation | Number of Shares Held at 6/30/18 | Value at 6/30/18 | Dividend Income | Capital Gains Distributions | |||||||||||||||||||||||||||||||
State Street Institutional U.S. Government Money Market Fund, Class G Shares | — | $ | — | $ | 31,833,290 | $ | 12,024,010 | $ | — | $ | — | 19,809,280 | $ | 19,809,280 | $ | 43,614 | $ | — | ||||||||||||||||||||||
State Street Navigator Securities Lending Government Money Market Portfolio | — | — | 33,306,752 | 24,814,310 | — | — | 8,492,442 | 8,492,442 | 21,770 | — | ||||||||||||||||||||||||||||||
The Energy Select Sector SPDR Fund | — | — | 5,102,840 | — | — | (65,056 | ) | 66,339 | 5,037,784 | 33,738 | — | |||||||||||||||||||||||||||||
The Financial Select Sector SPDR Fund | — | — | 4,747,037 | 5,071,537 | 324,500 | — | — | — | — | |||||||||||||||||||||||||||||||
The Industrial Select Sector SPDR Fund | — | — | 5,097,738 | 149,539 | 4,256 | (154,104 | ) | 66,988 | 4,798,351 | 20,056 | — | |||||||||||||||||||||||||||||
The Material Select Sector SPDR Fund | — | — | 5,050,656 | 5,069,479 | 18,823 | — | — | — | — | |||||||||||||||||||||||||||||||
The Technology Select Sector SPDR Fund | — | — | 3,772,782 | 390,303 | 20,072 | 1,564,135 | 71,494 | 4,966,688 | 18,115 | — | ||||||||||||||||||||||||||||||
|
|
|
|
|
|
|
|
|
|
|
|
|
|
|
| |||||||||||||||||||||||||
TOTAL | $ | — | $ | 282,128,245 | $ | 64,210,997 | $ | 922,296 | $ | 20,735,108 | $ | 239,574,654 | $ | 1,694,481 | $ | — | ||||||||||||||||||||||||
|
|
|
|
|
|
|
|
|
|
|
|
|
|
|
| |||||||||||||||||||||||||
| * | Refer to Note 1 on the Notes to Financial Statements regarding the discontinuance of the master-feeder structure. |
| ** | Includes transfers from Portfolio — See Note 1 in the Notes to Financial Statements. |
See accompanying notes to financial statements.
25
Table of Contents
SPDR SSGA Ultra Short Term Bond ETF
SCHEDULE OF INVESTMENTS
June 30, 2018
Security Description | Principal | Value | ||||||
CORPORATE BONDS & NOTES — 62.9% |
| |||||||
AEROSPACE & DEFENSE — 1.3% |
| |||||||
General Dynamics Corp. | $ | 400,000 | $ | 401,200 | ||||
United Technologies Corp. | 250,000 | 250,688 | ||||||
|
| |||||||
| 651,888 | ||||||||
|
| |||||||
AUTO MANUFACTURERS — 8.4% |
| |||||||
American Honda Finance Corp.: | ||||||||
Series MTN, 3 Month USD LIBOR + 0.15%, 2.51%, 1/22/2019 (a) | 300,000 | 300,129 | ||||||
Series MTN, 3 Month USD LIBOR + 0.27%, 2.63%, 7/20/2020 (a) | 400,000 | 400,288 | ||||||
BMW US Capital LLC | 600,000 | 601,848 | ||||||
Daimler Finance North America LLC: | ||||||||
3 Month USD LIBOR + 0.25%, | 300,000 | 300,207 | ||||||
3 Month USD LIBOR + 0.39%, | 500,000 | 500,580 | ||||||
Nissan Motor Acceptance Corp.: | ||||||||
3 Month USD LIBOR + 0.52%, | 435,000 | 436,553 | ||||||
3 Month USD LIBOR + 1.01%, | 300,000 | 301,773 | ||||||
PACCAR Financial Corp. Series MTN, 3 Month USD LIBOR + 0.26%, | 750,000 | 750,585 | ||||||
Toyota Motor Credit Corp.: | ||||||||
3 Month USD LIBOR + 0.10%, | 250,000 | 249,805 | ||||||
Series MTN, 3 Month USD LIBOR + 0.39%, 2.74%, 1/17/2019 (a) | 368,000 | 368,655 | ||||||
|
| |||||||
| 4,210,423 | ||||||||
|
| |||||||
BANKS — 21.4% | ||||||||
Australia & New Zealand Banking Group, Ltd. 3 Month USD LIBOR + 0.32%, | 300,000 | 299,910 | ||||||
Bank of Montreal: | ||||||||
Series MTN, 3 Month USD LIBOR + 0.44%, 2.78%, 6/15/2020 (a) | 250,000 | 250,627 | ||||||
Series MTN, 3 Month USD LIBOR + 0.60%, 2.93%, 12/12/2019 (a) | 200,000 | 201,088 | ||||||
Bank of Nova Scotia: | ||||||||
3 Month USD LIBOR + 0.66%, 3.00%, 6/14/2019 (a) | 400,000 | 401,884 | ||||||
Series BKNT, 3 Month USD LIBOR + 0.44%, 2.80%, 4/20/2021 (a) | 500,000 | 500,565 | ||||||
Branch Banking & Trust Co. | 250,000 | 251,115 | ||||||
Citibank NA: | ||||||||
Series BKNT, 3 Month USD LIBOR + 0.30%, 2.66%, 10/20/2020 (a) | 500,000 | 499,645 | ||||||
Series BKNT, 3 Month USD LIBOR + 0.32%, 2.68%, 5/1/2020 (a) | 250,000 | 250,058 | ||||||
Commonwealth Bank of Australia | 450,000 | 451,066 | ||||||
Cooperatieve Rabobank UA | 250,000 | 249,563 | ||||||
Goldman Sachs Group, Inc.: | ||||||||
3 Month USD LIBOR + 1.02%, | 659,000 | 665,069 | ||||||
Series FRN, 3 Month USD LIBOR + 1.77%, 4.10%, 2/25/2021 (a) | 250,000 | 257,695 | ||||||
JPMorgan Chase & Co. | 1,000,000 | 1,018,320 | ||||||
Morgan Stanley: | ||||||||
3 Month USD LIBOR + 0.85%, 3.21%, 1/24/2019 (a) | 430,000 | 431,604 | ||||||
Series GMTN, 3 Month USD LIBOR + 0.55%, 2.90%, 2/10/2021 (a) | 500,000 | 500,915 | ||||||
National Australia Bank, Ltd. | 750,000 | 749,925 | ||||||
Royal Bank of Canada: | ||||||||
Series GMTN, 3 Month USD LIBOR + 0.48%, 2.84%, 7/29/2019 (a) | 250,000 | 250,825 | ||||||
Series GMTN, 3 Month USD LIBOR + 0.53%, 2.87%, 3/15/2019 (a) | 250,000 | 250,675 | ||||||
Santander UK PLC: | ||||||||
3 Month USD LIBOR + 0.30%, | 600,000 | 598,008 | ||||||
3 Month USD LIBOR + 0.62%, | 300,000 | 300,051 | ||||||
Sumitomo Mitsui Banking Corp. | 250,000 | 249,995 | ||||||
Sumitomo Mitsui Trust Bank, Ltd. | 150,000 | 151,170 | ||||||
Toronto-Dominion Bank: | ||||||||
Series BKNT, 3 Month USD LIBOR + 0.44%, 2.78%, 7/2/2019 (a) | 250,000 | 250,650 | ||||||
Series MTN, 3 Month USD LIBOR + 0.56%, 2.92%, 11/5/2019 (a) | 253,000 | 254,151 | ||||||
Series MTN, 3 Month USD LIBOR + 0.84%, 3.20%, 1/22/2019 (a) | 100,000 | 100,409 | ||||||
UBS AG: | ||||||||
3 Month USD LIBOR + 0.32%, | 250,000 | 250,323 | ||||||
3 Month USD LIBOR + 0.48%, | 250,000 | 250,045 | ||||||
US Bank NA Series BKNT, | 100,000 | 100,437 | ||||||
Wells Fargo & Co. | 500,000 | 505,005 | ||||||
See accompanying notes to financial statements.
26
Table of Contents
SPDR SSGA Ultra Short Term Bond ETF
SCHEDULE OF INVESTMENTS (continued)
June 30, 2018
Security Description | Principal | Value | ||||||
Westpac Banking Corp. | $ | 275,000 | $ | 275,951 | ||||
|
| |||||||
| 10,766,744 | ||||||||
|
| |||||||
BEVERAGES — 3.0% |
| |||||||
Anheuser-Busch InBev Finance, Inc. 3 Month USD LIBOR + 0.40%, | 200,000 | 200,324 | ||||||
Diageo Capital PLC | 825,000 | 825,503 | ||||||
PepsiCo, Inc.: | ||||||||
3 Month USD LIBOR + 0.27%, | 250,000 | 250,268 | ||||||
3 Month USD LIBOR + 0.37%, | 250,000 | 251,647 | ||||||
|
| |||||||
| 1,527,742 | ||||||||
|
| |||||||
BIOTECHNOLOGY — 1.2% |
| |||||||
Gilead Sciences, Inc.: | ||||||||
3 Month USD LIBOR + 0.17%, | 250,000 | 250,073 | ||||||
3 Month USD LIBOR + 0.22%, | 350,000 | 350,234 | ||||||
|
| |||||||
| 600,307 | ||||||||
|
| |||||||
CHEMICALS — 1.4% |
| |||||||
EI du Pont de Nemours & Co. | 700,000 | 704,032 | ||||||
|
| |||||||
COMPUTERS — 1.9% |
| |||||||
Apple, Inc. | 680,000 | 680,299 | ||||||
IBM Credit LLC | 300,000 | 300,555 | ||||||
|
| |||||||
| 980,854 | ||||||||
|
| |||||||
DIVERSIFIED FINANCIAL SERVICES — 1.4% |
| |||||||
American Express Credit Corp.: | ||||||||
3 Month USD LIBOR + 0.55%, | 350,000 | 351,095 | ||||||
Series MTN, 3 Month USD LIBOR + 0.43%, 2.75%, 3/3/2020 (a) | 350,000 | 350,886 | ||||||
|
| |||||||
| 701,981 | ||||||||
|
| |||||||
ELECTRONICS — 0.5% |
| |||||||
Honeywell International, Inc. | 235,000 | 235,750 | ||||||
|
| |||||||
HEALTH CARE SERVICES — 3.3% |
| |||||||
Roche Holdings, Inc. | 750,000 | 752,910 | ||||||
UnitedHealth Group, Inc.: | ||||||||
3 Month USD LIBOR + 0.07%, | 300,000 | 299,535 | ||||||
3 Month USD LIBOR + 0.26%, | 600,000 | 600,330 | ||||||
|
| |||||||
| 1,652,775 | ||||||||
|
| |||||||
MACHINERY, CONSTRUCTION & MINING — 2.1% |
| |||||||
Caterpillar Financial Services Corp.: | ||||||||
Series MTN, 3 Month USD LIBOR + 0.13%, 2.45%, 11/29/2019 (a) | 500,000 | 500,255 | ||||||
Series MTN, 3 Month USD LIBOR + 0.18%, 2.49%, 12/6/2018 (a) | 250,000 | 250,167 | ||||||
Series MTN, 3 Month USD LIBOR + 0.28%, 2.61%, 3/22/2019 (a) | 300,000 | 300,474 | ||||||
|
| |||||||
| 1,050,896 | ||||||||
|
| |||||||
MACHINERY-DIVERSIFIED — 2.6% |
| |||||||
John Deere Capital Corp.: | ||||||||
3 Month USD LIBOR + 0.57%, | 200,000 | 200,524 | ||||||
Series GMTN, 3 Month USD LIBOR + 0.18%, 2.56%, 1/7/2020 (a) | 500,000 | 500,065 | ||||||
Series MTN, 3 Month USD LIBOR + 0.29%, 2.62%, 10/9/2019 (a) | 325,000 | 325,702 | ||||||
Series MTN, 3 Month USD LIBOR + 0.29%, 2.62%, 6/22/2020 (a) | 275,000 | 275,495 | ||||||
|
| |||||||
| 1,301,786 | ||||||||
|
| |||||||
MEDIA — 0.8% |
| |||||||
NBCUniversal Enterprise, Inc. | 400,000 | 400,804 | ||||||
|
| |||||||
MISCELLANEOUS MANUFACTURER — 1.4% |
| |||||||
General Electric Co. Series GMTN, | 63,000 | 63,097 | ||||||
Siemens Financieringsmaatschappij NV: | ||||||||
3 Month USD LIBOR + 0.32%, 2.65%, 9/13/2019 (a) (b) | 200,000 | 200,594 | ||||||
3 Month USD LIBOR + 0.34%, 2.67%, 3/16/2020 (a) (b) | 450,000 | 451,337 | ||||||
|
| |||||||
| 715,028 | ||||||||
|
| |||||||
OIL & GAS — 6.5% |
| |||||||
BP Capital Markets PLC: | ||||||||
3 Month USD LIBOR + 0.65%, 2.98%, 9/19/2022 (a) | 250,000 | 252,757 | ||||||
3 Month USD LIBOR + 0.87%, 3.20%, 9/16/2021 (a) | 500,000 | 509,095 | ||||||
ConocoPhillips Co. | 550,000 | 560,466 | ||||||
Equinor ASA | 250,000 | 250,403 | ||||||
Exxon Mobil Corp. | 500,000 | 497,405 | ||||||
Shell International Finance B.V.: | ||||||||
3 Month USD LIBOR + 0.35%, 2.68%, 9/12/2019 (a) | 300,000 | 301,035 | ||||||
3 Month USD LIBOR + 0.45%, 2.81%, 5/11/2020 (a) | 200,000 | 201,438 | ||||||
See accompanying notes to financial statements.
27
Table of Contents
SPDR SSGA Ultra Short Term Bond ETF
SCHEDULE OF INVESTMENTS (continued)
June 30, 2018
Security Description | Principal | Value | ||||||
3 Month USD LIBOR + 0.58%, 2.93%, 11/10/2018 (a) | $ | 250,000 | $ | 250,563 | ||||
Total Capital International SA | 450,000 | 451,309 | ||||||
|
| |||||||
| 3,274,471 | ||||||||
|
| |||||||
RETAIL — 3.4% |
| |||||||
Home Depot, Inc. | 350,000 | 350,840 | ||||||
Lowe’s Cos., Inc. | 750,000 | 752,947 | ||||||
Walmart, Inc. | 600,000 | 600,768 | ||||||
|
| |||||||
| 1,704,555 | ||||||||
|
| |||||||
SEMICONDUCTORS — 0.3% |
| |||||||
QUALCOMM, Inc. | 150,000 | 151,488 | ||||||
|
| |||||||
SOFTWARE — 0.5% |
| |||||||
Oracle Corp. | 250,000 | 251,468 | ||||||
|
| |||||||
TELECOMMUNICATIONS — 1.1% |
| |||||||
Cisco Systems, Inc. | 560,000 | 561,876 | ||||||
|
| |||||||
TRANSPORTATION — 0.4% |
| |||||||
United Parcel Service, Inc. | 200,000 | 200,292 | ||||||
|
| |||||||
TOTAL CORPORATE BONDS & NOTES | 31,645,160 | |||||||
|
| |||||||
ASSET-BACKED SECURITIES — 24.3% |
| |||||||
AUTOMOBILE — 10.6% | ||||||||
BMW Floorplan Master Owner Trust Series 2018-1, Class A2, 1 Month USD LIBOR + 0.32%, 2.35%, 5/15/2023 (a) (b) | 500,000 | 499,722 | ||||||
BMW Vehicle Lease Trust | 1,000,000 | 999,130 | ||||||
BMW Vehicle Owner Trust | 163,400 | 163,302 | ||||||
CarMax Auto Owner Trust | 591,992 | 589,622 | ||||||
Drive Auto Receivables Trust | 1,000,000 | 999,441 | ||||||
Ford Credit Auto Owner Trust | 33,366 | 33,363 | ||||||
Honda Auto Receivables 2017-4 Owner Trust | 222,702 | 222,009 | ||||||
Nissan Auto Receivables Owner Trust: | ||||||||
Series 2017-A, Class A2A, 1.47%, 1/15/2020 | 55,614 | 55,468 | ||||||
Series 2015-C, Class A3, 1.37%, 5/15/2020 | 263,414 | 261,809 | ||||||
Series 2018-A, Class A2A, 2.39%, 12/15/2020 | 500,000 | 498,897 | ||||||
Toyota Auto Receivables Owner Trust: | ||||||||
Series 2016-D, Class A2A, 1.06%, 5/15/2019 | 5,831 | 5,828 | ||||||
Series 2015-A, Class A4, 1.52%, 6/15/2020 | 184,650 | 184,211 | ||||||
Series 2017-B, Class A2A, 1.46%, 1/15/2020 | 132,229 | 131,852 | ||||||
Series 2015-B, Class A4, 1.74%, 9/15/2020 | 300,000 | 299,032 | ||||||
World Omni Auto Receivables Trust | 393,601 | 392,242 | ||||||
|
| |||||||
| 5,335,928 | ||||||||
|
| |||||||
CREDIT CARD — 13.7% |
| |||||||
American Express Credit Account Master Trust | 500,000 | 495,740 | ||||||
BA Credit Card Trust: | ||||||||
Series 2016-A1, Class A, 1 Month USD LIBOR + 0.39%, 2.46%, 10/15/2021 (a) | 400,000 | 400,852 | ||||||
Series 2014-A1, Class A, 1 Month USD LIBOR + 0.38%, 2.45%, 6/15/2021 (a) | 250,000 | 250,376 | ||||||
Capital One Multi-Asset Execution Trust Series 2015-A5, Class A5, 1.60%, 5/17/2021 | 855,000 | 854,719 | ||||||
CARDS II Trust | 400,000 | 400,389 | ||||||
Chase Issuance Trust | 1,000,000 | 985,365 | ||||||
Citibank Credit Card Issuance Trust | 1,400,000 | 1,394,055 | ||||||
Discover Card Execution Note Trust: | ||||||||
Series 2015-A3, Class A, 1.45%, 3/15/2021 | 530,000 | 528,883 | ||||||
See accompanying notes to financial statements.
28
Table of Contents
SPDR SSGA Ultra Short Term Bond ETF
SCHEDULE OF INVESTMENTS (continued)
June 30, 2018
Security Description | Principal | Value | ||||||
Series 2013-A6, Class A6, 1 Month USD LIBOR + 0.45%, 2.52%, 4/15/2021 (a) | $ | 300,000 | $ | 300,331 | ||||
Evergreen Credit Card Trust | 700,000 | 700,627 | ||||||
Golden Credit Card Trust | 600,000 | 600,006 | ||||||
|
| |||||||
| 6,911,343 | ||||||||
|
| |||||||
TOTAL ASSET-BACKED SECURITIES | 12,247,271 | |||||||
|
| |||||||
FOREIGN GOVERNMENT OBLIGATIONS — 0.5% |
| |||||||
CANADA — 0.5% |
| |||||||
Province of Quebec Canada | 250,000 | 250,565 | ||||||
|
| |||||||
U.S. TREASURY OBLIGATIONS — 5.5% |
| |||||||
Treasury Notes: | ||||||||
1.00%, 11/30/2018 | 765,000 | 761,623 | ||||||
1.25%, 6/30/2019 | 1,000,000 | 989,136 | ||||||
1.38%, 9/30/2019 | 340,000 | 335,602 | ||||||
2.00%, 1/31/2020 | 700,000 | 694,725 | ||||||
|
| |||||||
TOTAL U.S. TREASURY OBLIGATIONS | 2,781,086 | |||||||
|
| |||||||
SHORT-TERM INVESTMENT — 8.0% |
| |||||||
State Street Institutional U.S. Government Money Market Fund, Class G Shares 1.86% (c) (d) (Cost $4,033,700) | 4,033,700 | 4,033,700 | ||||||
|
| |||||||
TOTAL INVESTMENTS — 101.2% | 50,957,782 | |||||||
LIABILITIES IN EXCESS OF OTHER ASSETS — (1.2)% | (614,234 | ) | ||||||
|
| |||||||
NET ASSETS — 100.0% | $ | 50,343,548 | ||||||
|
| |||||||
| (a) | Variable Rate Security — Interest rate shown is the rate in effect at June 30, 2018. For securities based on a published reference rate and spread, the reference rate and spread are indicated in the description above. |
| (b) | Securities purchased pursuant to Rule 144A of the Securities Act of 1933, as amended. These securities, which represent 16.5% of net assets as of June 30, 2018, are considered liquid and may be resold in transactions exempt from registration, normally to qualified institutional buyers. |
| (c) | The Fund invested in certain money market funds managed by SSGA Funds Management, Inc. Amounts related to these transactions during the period ended June 30, 2018 are shown in the Affiliate Table below. |
| (d) | The rate shown is the annualized seven-day yield at June 30, 2018. |
FRN = Floating Rate Note
GMTN = Global Medium Term Note
LIBOR = London Interbank Offered Rate
The following table summarizes the value of the Fund’s investments according to the fair value hierarchy as of June 30, 2018.
Description | Level 1 — Quoted Prices | Level 2 — Other Significant Observable Inputs | Level 3 — Significant Unobservable Inputs | Total | ||||||||||||
ASSETS: | ||||||||||||||||
INVESTMENTS: | ||||||||||||||||
Corporate Bonds & Notes | ||||||||||||||||
Aerospace & Defense | $ | — | $ | 651,888 | $ | — | $ | 651,888 | ||||||||
Auto Manufacturers | — | 4,210,423 | — | 4,210,423 | ||||||||||||
Banks | — | 10,766,744 | — | 10,766,744 | ||||||||||||
Beverages | — | 1,527,742 | — | 1,527,742 | ||||||||||||
Biotechnology | — | 600,307 | — | 600,307 | ||||||||||||
Chemicals | — | 704,032 | — | 704,032 | ||||||||||||
Computers | — | 980,854 | — | 980,854 | ||||||||||||
Diversified Financial Services | — | 701,981 | — | 701,981 | ||||||||||||
Electronics | — | 235,750 | — | 235,750 | ||||||||||||
Health Care Services | — | 1,652,775 | — | 1,652,775 | ||||||||||||
Machinery, Construction & Mining | — | 1,050,896 | — | 1,050,896 | ||||||||||||
Machinery-Diversified | — | 1,301,786 | — | 1,301,786 | ||||||||||||
Media | — | 400,804 | — | 400,804 | ||||||||||||
Miscellaneous Manufacturer | — | 715,028 | — | 715,028 | ||||||||||||
Oil & Gas | — | 3,274,471 | — | 3,274,471 | ||||||||||||
See accompanying notes to financial statements.
29
Table of Contents
SPDR SSGA Ultra Short Term Bond ETF
SCHEDULE OF INVESTMENTS (continued)
June 30, 2018
Description | Level 1 — Quoted Prices | Level 2 — Other Significant Observable Inputs | Level 3 — Significant Unobservable Inputs | Total | ||||||||||||
Retail | $ | — | $ | 1,704,555 | $ | — | $ | 1,704,555 | ||||||||
Semiconductors | — | 151,488 | — | 151,488 | ||||||||||||
Software | — | 251,468 | — | 251,468 | ||||||||||||
Telecommunications | — | 561,876 | — | 561,876 | ||||||||||||
Transportation | — | 200,292 | — | 200,292 | ||||||||||||
Asset-Backed Securities | ||||||||||||||||
Automobile | — | 5,335,928 | — | 5,335,928 | ||||||||||||
Credit Card | — | 6,911,343 | — | 6,911,343 | ||||||||||||
U.S. Treasury Obligations | — | 2,781,086 | — | 2,781,086 | ||||||||||||
Foreign Government Obligations | ||||||||||||||||
Provincial | — | 250,565 | — | 250,565 | ||||||||||||
Short-Term Investment | 4,033,700 | — | — | 4,033,700 | ||||||||||||
|
|
|
|
|
|
|
| |||||||||
TOTAL INVESTMENTS | $ | 4,033,700 | $ | 46,924,082 | $ | — | $ | 50,957,782 | ||||||||
|
|
|
|
|
|
|
| |||||||||
Affiliate Table
| Number of Shares Held at 6/30/17* | Value at 6/30/17* | Cost of Purchases | Proceeds from Shares Sold | Realized Gain (Loss) | Change in Unrealized Appreciation/ Depreciation | Number of Shares Held at 6/30/18 | Value at 6/30/18 | Dividend Income | Capital Gains Distributions | |||||||||||||||||||||||||||||||
State Street Institutional U.S. Government Money Market Fund, Class G Shares | — | $ | — | $ | 14,300,442 | $ | 10,266,742 | $ | — | $ | — | 4,033,700 | $ | 4,033,700 | $ | 2,743 | $ | — | ||||||||||||||||||||||
| * | Refer to Note 1 on the Notes to Financial Statements regarding the discontinuance of the master-feeder structure. |
See accompanying notes to financial statements.
30
Table of Contents
SPDR MFS Systematic Core Equity ETF
SCHEDULE OF INVESTMENTS
June 30, 2018
Security Description | Shares | Value | ||||||
COMMON STOCKS — 99.0% | ||||||||
AEROSPACE & DEFENSE — 3.9% | ||||||||
Boeing Co. | 3,479 | $ | 1,167,239 | |||||
|
| |||||||
BANKS — 4.5% | ||||||||
JPMorgan Chase & Co. | 10,687 | 1,113,586 | ||||||
Wells Fargo & Co. | 4,321 | 239,556 | ||||||
|
| |||||||
| 1,353,142 | ||||||||
|
| |||||||
BEVERAGES — 1.7% | ||||||||
Molson Coors Brewing Co. Class B | 7,633 | 519,349 | ||||||
|
| |||||||
BIOTECHNOLOGY — 0.9% | ||||||||
Celgene Corp. (a) | 3,315 | 263,277 | ||||||
|
| |||||||
CHEMICALS — 0.6% | ||||||||
LyondellBasell Industries NV Class A | 1,734 | 190,480 | ||||||
|
| |||||||
CONSUMER FINANCE — 1.1% | ||||||||
Discover Financial Services | 4,784 | 336,841 | ||||||
|
| |||||||
ELECTRIC UTILITIES — 3.0% | ||||||||
Exelon Corp. | 21,255 | 905,463 | ||||||
|
| |||||||
EQUITY REAL ESTATE INVESTMENT TRUSTS (REITS) — 5.9% |
| |||||||
Extra Space Storage, Inc. REIT | 7,515 | 750,072 | ||||||
Host Hotels & Resorts, Inc. REIT | 48,714 | 1,026,404 | ||||||
|
| |||||||
| 1,776,476 | ||||||||
|
| |||||||
FOOD & STAPLES RETAILING — 2.3% | ||||||||
Walgreens Boots Alliance, Inc. | 11,507 | 690,593 | ||||||
|
| |||||||
FOOD PRODUCTS — 2.6% | ||||||||
Tyson Foods, Inc. Class A | 11,262 | 775,389 | ||||||
|
| |||||||
HEALTH CARE PROVIDERS & SERVICES — 4.8% |
| |||||||
Express Scripts Holding Co. (a) | 14,115 | 1,089,819 | ||||||
Humana, Inc. | 712 | 211,913 | ||||||
McKesson Corp. | 981 | 130,865 | ||||||
|
| |||||||
| 1,432,597 | ||||||||
|
| |||||||
HOTELS, RESTAURANTS & LEISURE — 3.0% |
| |||||||
Marriott International, Inc. Class A | 3,251 | 411,577 | ||||||
Royal Caribbean Cruises, Ltd. | 4,671 | 483,915 | ||||||
|
| |||||||
| 895,492 | ||||||||
|
| |||||||
HOUSEHOLD PRODUCTS — 0.6% | ||||||||
Procter & Gamble Co. | 2,462 | 192,184 | ||||||
|
| |||||||
INDEPENDENT POWER PRODUCERS & ENERGY TRADERS — 3.2% |
| |||||||
AES Corp. | 39,094 | 524,251 | ||||||
NRG Energy, Inc. | 14,489 | 444,812 | ||||||
|
| |||||||
| 969,063 | ||||||||
|
| |||||||
INSURANCE — 6.2% | ||||||||
MetLife, Inc. | 21,238 | 925,977 | ||||||
Prudential Financial, Inc. | 9,977 | 932,949 | ||||||
|
| |||||||
| 1,858,926 | ||||||||
|
| |||||||
INTERNET & CATALOG RETAIL — 1.3% |
| |||||||
Amazon.com, Inc. (a) | 222 | 377,356 | ||||||
|
| |||||||
INTERNET SOFTWARE & SERVICES — 10.0% |
| |||||||
Alphabet, Inc. Class C (a) | 325 | 362,586 | ||||||
Facebook, Inc. Class A (a) | 8,293 | 1,611,496 | ||||||
VeriSign, Inc. (a) | 7,454 | 1,024,329 | ||||||
|
| |||||||
| 2,998,411 | ||||||||
|
| |||||||
IT SERVICES — 4.5% | ||||||||
DXC Technology Co. | 9,700 | 781,917 | ||||||
International Business Machines Corp. | 4,177 | 583,527 | ||||||
|
| |||||||
| 1,365,444 | ||||||||
|
| |||||||
MACHINERY — 3.2% | ||||||||
Allison Transmission Holdings, Inc. | 6,922 | 280,272 | ||||||
Caterpillar, Inc. | 2,749 | 372,957 | ||||||
Cummins, Inc. | 2,438 | 324,254 | ||||||
|
| |||||||
| 977,483 | ||||||||
|
| |||||||
MEDIA — 2.4% | ||||||||
Comcast Corp. Class A | 22,097 | 725,003 | ||||||
|
| |||||||
OIL, GAS & CONSUMABLE FUELS — 5.1% |
| |||||||
Exxon Mobil Corp. | 6,914 | 571,995 | ||||||
Valero Energy Corp. | 8,711 | 965,440 | ||||||
|
| |||||||
| 1,537,435 | ||||||||
|
| |||||||
PHARMACEUTICALS — 7.9% | ||||||||
Eli Lilly & Co. | 9,764 | 833,162 | ||||||
Johnson & Johnson | 7,663 | 929,828 | ||||||
Merck & Co., Inc. | 10,275 | 623,693 | ||||||
|
| |||||||
| 2,386,683 | ||||||||
|
| |||||||
ROAD & RAIL — 2.5% | ||||||||
Union Pacific Corp. | 5,268 | 746,370 | ||||||
|
| |||||||
SEMICONDUCTORS & SEMICONDUCTOR EQUIPMENT — 1.1% |
| |||||||
Intel Corp. (a) | 6,650 | 330,571 | ||||||
|
| |||||||
SOFTWARE — 8.8% | ||||||||
Adobe Systems, Inc. (a) | 3,100 | 755,811 | ||||||
Microsoft Corp. | 14,765 | 1,455,976 | ||||||
Oracle Corp. | 9,732 | 428,792 | ||||||
|
| |||||||
| 2,640,579 | ||||||||
|
| |||||||
SPECIALTY RETAIL — 0.7% | ||||||||
Best Buy Co., Inc. | 2,832 | 211,210 | ||||||
|
| |||||||
TECHNOLOGY HARDWARE, STORAGE & PERIPHERALS — 4.8% |
| |||||||
Apple, Inc. | 5,314 | 983,675 | ||||||
Western Digital Corp. | 5,996 | 464,150 | ||||||
|
| |||||||
| 1,447,825 | ||||||||
|
| |||||||
TOBACCO — 2.4% | ||||||||
Philip Morris International, Inc. | 8,990 | 725,853 | ||||||
|
| |||||||
TOTAL COMMON STOCKS | 29,796,734 | |||||||
|
| |||||||
SHORT-TERM INVESTMENT — 0.9% |
| |||||||
State Street Institutional U.S. Government Money Market Fund, Class G Shares 1.86% (b) (c) (Cost $285,615) | 285,615 | 285,615 | ||||||
|
| |||||||
TOTAL INVESTMENTS — 99.9% | 30,082,349 | |||||||
OTHER ASSETS IN EXCESS OF LIABILITIES — 0.1% | 20,023 | |||||||
|
| |||||||
NET ASSETS — 100.0% | $ | 30,102,372 | ||||||
|
| |||||||
See accompanying notes to financial statements.
31
Table of Contents
SPDR MFS Systematic Core Equity ETF
SCHEDULE OF INVESTMENTS (continued)
June 30, 2018
| (a) | Non-income producing security. |
| (b) | The Fund invested in certain money market funds managed by SSGA Funds Management, Inc. Amounts related to these transactions during the period ended June 30, 2018 are shown in the Affiliate Table below. |
| (c) | The rate shown is the annualized seven-day yield at June 30, 2018. |
REIT = Real Estate Investment Trust
Description | Level 1 — Quoted Prices | Level 2 — Other Significant Observable Inputs | Level 3 — Significant Unobservable Inputs | Total | ||||||||||||
ASSETS: | ||||||||||||||||
INVESTMENTS: | ||||||||||||||||
Common Stocks | ||||||||||||||||
Aerospace & Defense | $ | 1,167,239 | $ | — | $ | — | $ | 1,167,239 | ||||||||
Banks | 1,353,142 | — | — | 1,353,142 | ||||||||||||
Beverages | 519,349 | — | — | 519,349 | ||||||||||||
Biotechnology | 263,277 | — | — | 263,277 | ||||||||||||
Chemicals | 190,480 | — | — | 190,480 | ||||||||||||
Consumer Finance | 336,841 | — | — | 336,841 | ||||||||||||
Electric Utilities | 905,463 | — | — | 905,463 | ||||||||||||
Equity Real Estate Investment Trusts (REITS) | 1,776,476 | — | — | 1,776,476 | ||||||||||||
Food & Staples Retailing | 690,593 | — | — | 690,593 | ||||||||||||
Food Products | 775,389 | — | — | 775,389 | ||||||||||||
Health Care Providers & Services | 1,432,597 | — | — | 1,432,597 | ||||||||||||
Hotels, Restaurants & Leisure | 895,492 | — | — | 895,492 | ||||||||||||
Household Products | 192,184 | — | — | 192,184 | ||||||||||||
Independent Power Producers & Energy Traders | 969,063 | — | — | 969,063 | ||||||||||||
Insurance | 1,858,926 | — | — | 1,858,926 | ||||||||||||
Internet & Catalog Retail | 377,356 | — | — | 377,356 | ||||||||||||
Internet Software & Services | 2,998,411 | — | — | 2,998,411 | ||||||||||||
IT Services | 1,365,444 | — | — | 1,365,444 | ||||||||||||
Machinery | 977,483 | — | — | 977,483 | ||||||||||||
Media | 725,003 | — | — | 725,003 | ||||||||||||
Oil, Gas & Consumable Fuels | 1,537,435 | — | — | 1,537,435 | ||||||||||||
Pharmaceuticals | 2,386,683 | — | — | 2,386,683 | ||||||||||||
Road & Rail | 746,370 | — | — | 746,370 | ||||||||||||
Semiconductors & Semiconductor Equipment | 330,571 | — | — | 330,571 | ||||||||||||
Software | 2,640,579 | — | — | 2,640,579 | ||||||||||||
Specialty Retail | 211,210 | — | — | 211,210 | ||||||||||||
Technology Hardware, Storage & Peripherals | 1,447,825 | — | — | 1,447,825 | ||||||||||||
Tobacco | 725,853 | — | — | 725,853 | ||||||||||||
Short-Term Investment | 285,615 | — | — | 285,615 | ||||||||||||
|
|
|
|
|
|
|
| |||||||||
TOTAL INVESTMENTS | $ | 30,082,349 | $ | — | $ | — | $ | 30,082,349 | ||||||||
|
|
|
|
|
|
|
| |||||||||
Affiliate Table
| Number of Shares Held at 6/30/17* | Value at 6/30/17* | Cost of Purchases | Proceeds from Shares Sold | Realized Gain (Loss) | Change in Unrealized Appreciation/ Depreciation | Number of Shares Held at 6/30/18 | Value at 6/30/18 | Dividend Income | Capital Gains Distributions | |||||||||||||||||||||||||||||||
State Street Institutional U.S. Government Money Market Fund, Class G Shares | — | $ | — | $ | 719,134 | $ | 433,519 | $ | — | $ | — | 285,615 | $ | 285,615 | $ | 836 | $ | — | ||||||||||||||||||||||
| * | Refer to Note 1 on the Notes to Financial Statements regarding the discontinuance of the master-feeder structure. |
See accompanying notes to financial statements.
32
Table of Contents
SPDR MFS Systematic Growth Equity ETF
SCHEDULE OF INVESTMENTS
June 30, 2018
Security Description | Shares | Value | ||||||
COMMON STOCKS — 99.0% | ||||||||
AEROSPACE & DEFENSE — 4.4% | ||||||||
Boeing Co. | 5,821 | $ | 1,953,004 | |||||
|
| |||||||
BIOTECHNOLOGY — 3.6% | ||||||||
Amgen, Inc. | 4,143 | 764,756 | ||||||
Biogen, Inc. (a) | 1,228 | 356,415 | ||||||
Celgene Corp. (a) | 2,695 | 214,037 | ||||||
Gilead Sciences, Inc. | 3,850 | 272,734 | ||||||
|
| |||||||
| 1,607,942 | ||||||||
|
| |||||||
CHEMICALS — 2.2% | ||||||||
LyondellBasell Industries NV Class A | 8,886 | 976,127 | ||||||
|
| |||||||
CONSUMER FINANCE — 1.4% | ||||||||
Synchrony Financial | 18,383 | 613,624 | ||||||
|
| |||||||
EQUITY REAL ESTATE INVESTMENT TRUSTS (REITS) — 4.3% |
| |||||||
Extra Space Storage, Inc. REIT | 14,872 | 1,484,374 | ||||||
Host Hotels & Resorts, Inc. REIT | 20,866 | 439,647 | ||||||
|
| |||||||
| 1,924,021 | ||||||||
|
| |||||||
FOOD PRODUCTS — 1.2% | ||||||||
Tyson Foods, Inc. Class A | 7,567 | 520,988 | ||||||
|
| |||||||
HEALTH CARE EQUIPMENT & SUPPLIES — 0.2% |
| |||||||
Stryker Corp. | 668 | 112,798 | ||||||
|
| |||||||
HEALTH CARE PROVIDERS & SERVICES — 10.2% |
| |||||||
Express Scripts Holding Co. (a) | 1,555 | 120,061 | ||||||
HCA Healthcare, Inc. | 5,820 | 597,132 | ||||||
Humana, Inc. | 3,046 | 906,581 | ||||||
McKesson Corp. | 6,952 | 927,397 | ||||||
UnitedHealth Group, Inc. | 6,790 | 1,665,859 | ||||||
WellCare Health Plans, Inc. (a) | 1,283 | 315,926 | ||||||
|
| |||||||
| 4,532,956 | ||||||||
|
| |||||||
HOTELS, RESTAURANTS & LEISURE — 3.7% |
| |||||||
Marriott International, Inc. Class A | 10,989 | 1,391,208 | ||||||
Wynn Resorts, Ltd. | 1,442 | 241,304 | ||||||
|
| |||||||
| 1,632,512 | ||||||||
|
| |||||||
HOUSEHOLD DURABLES — 0.7% | ||||||||
PulteGroup, Inc. | 11,266 | 323,897 | ||||||
|
| |||||||
INDEPENDENT POWER PRODUCERS & ENERGY TRADERS — 2.3% |
| |||||||
NRG Energy, Inc. | 32,721 | 1,004,535 | ||||||
|
| |||||||
INSURANCE — 2.9% | ||||||||
Allstate Corp. | 4,024 | 367,270 | ||||||
MetLife, Inc. | 3,128 | 136,381 | ||||||
Prudential Financial, Inc. | 8,357 | 781,463 | ||||||
|
| |||||||
| 1,285,114 | ||||||||
|
| |||||||
INTERNET & CATALOG RETAIL — 7.7% |
| |||||||
Amazon.com, Inc. (a) | 1,111 | 1,888,478 | ||||||
Booking Holdings, Inc. (a) | 764 | 1,548,696 | ||||||
|
| |||||||
| 3,437,174 | ||||||||
|
| |||||||
INTERNET SOFTWARE & SERVICES — 10.3% |
| |||||||
Alphabet, Inc. Class C (a) | 821 | 915,949 | ||||||
Facebook, Inc. Class A (a) | 15,571 | 3,025,757 | ||||||
VeriSign, Inc. (a) | 4,522 | 621,413 | ||||||
|
| |||||||
| 4,563,119 | ||||||||
|
| |||||||
IT SERVICES — 6.4% | ||||||||
DXC Technology Co. | 17,438 | 1,405,677 | ||||||
International Business Machines Corp. | 10,477 | 1,463,637 | ||||||
|
| |||||||
| 2,869,314 | ||||||||
|
| |||||||
MACHINERY — 4.5% | ||||||||
Allison Transmission Holdings, Inc. | 16,725 | 677,195 | ||||||
Caterpillar, Inc. | 9,796 | 1,329,024 | ||||||
|
| |||||||
| 2,006,219 | ||||||||
|
| |||||||
PHARMACEUTICALS — 3.7% | ||||||||
Eli Lilly & Co. | 11,966 | 1,021,059 | ||||||
Johnson & Johnson | 5,192 | 629,997 | ||||||
|
| |||||||
| 1,651,056 | ||||||||
|
| |||||||
ROAD & RAIL — 0.8% | ||||||||
Union Pacific Corp. | 2,440 | 345,699 | ||||||
|
| |||||||
SEMICONDUCTORS & SEMICONDUCTOR EQUIPMENT — 1.9% |
| |||||||
Broadcom, Inc. | 3,449 | 836,865 | ||||||
|
| |||||||
SOFTWARE — 11.5% | ||||||||
Adobe Systems, Inc. (a) | 6,932 | 1,690,091 | ||||||
Citrix Systems, Inc. (a) | 1,937 | 203,075 | ||||||
Microsoft Corp. | 11,098 | 1,094,374 | ||||||
Oracle Corp. | 27,791 | 1,224,471 | ||||||
ServiceNow, Inc. (a) | 5,101 | 879,770 | ||||||
|
| |||||||
| 5,091,781 | ||||||||
|
| |||||||
SPECIALTY RETAIL — 3.2% | ||||||||
Best Buy Co., Inc. | 16,382 | 1,221,770 | ||||||
Ross Stores, Inc. | 2,536 | 214,926 | ||||||
|
| |||||||
| 1,436,696 | ||||||||
|
| |||||||
TECHNOLOGY HARDWARE, STORAGE & PERIPHERALS — 6.9% |
| |||||||
Apple, Inc. | 9,374 | 1,735,221 | ||||||
Western Digital Corp. | 17,087 | 1,322,705 | ||||||
|
| |||||||
| 3,057,926 | ||||||||
|
| |||||||
TOBACCO — 3.1% | ||||||||
Philip Morris International, Inc. | 17,023 | 1,374,437 | ||||||
|
| |||||||
TRADING COMPANIES & DISTRIBUTORS — 1.9% |
| |||||||
United Rentals, Inc. (a) | 5,595 | 825,934 | ||||||
|
| |||||||
TOTAL COMMON STOCKS | 43,983,738 | |||||||
|
| |||||||
SHORT-TERM INVESTMENT — 0.9% | ||||||||
State Street Institutional U.S. Government Money Market Fund, Class G Shares 1.86% (b) (c) | 414,275 | 414,275 | ||||||
|
| |||||||
TOTAL INVESTMENTS — 99.9% | 44,398,013 | |||||||
OTHER ASSETS IN EXCESS OF LIABILITIES — 0.1% | 25,855 | |||||||
|
| |||||||
NET ASSETS — 100.0% | $ | 44,423,868 | ||||||
|
| |||||||
| (a) | Non-income producing security. |
| (b) | The Fund invested in certain money market funds managed by SSGA Funds Management, Inc. Amounts related to these transactions during the period ended June 30, 2018 are shown in the Affiliate Table below. |
| (c) | The rate shown is the annualized seven-day yield at June 30, 2018. |
REIT = Real Estate Investment Trust
See accompanying notes to financial statements.
33
Table of Contents
SPDR MFS Systematic Growth Equity ETF
SCHEDULE OF INVESTMENTS (continued)
June 30, 2018
Description | Level 1 — Quoted Prices | Level 2 — Other Significant Observable Inputs | Level 3 — Significant Unobservable Inputs | Total | ||||||||||||
ASSETS: | ||||||||||||||||
INVESTMENTS: | ||||||||||||||||
Common Stocks | ||||||||||||||||
Aerospace & Defense | $ | 1,953,004 | $ | — | $ | — | $ | 1,953,004 | ||||||||
Biotechnology | 1,607,942 | — | — | 1,607,942 | ||||||||||||
Chemicals | 976,127 | — | — | 976,127 | ||||||||||||
Consumer Finance | 613,624 | — | — | 613,624 | ||||||||||||
Equity Real Estate Investment Trusts (REITS) | 1,924,021 | — | — | 1,924,021 | ||||||||||||
Food Products | 520,988 | — | — | 520,988 | ||||||||||||
Health Care Equipment & Supplies | 112,798 | — | — | 112,798 | ||||||||||||
Health Care Providers & Services | 4,532,956 | — | — | 4,532,956 | ||||||||||||
Hotels, Restaurants & Leisure | 1,632,512 | — | — | 1,632,512 | ||||||||||||
Household Durables | 323,897 | — | — | 323,897 | ||||||||||||
Independent Power Producers & Energy Traders | 1,004,535 | — | — | 1,004,535 | ||||||||||||
Insurance | 1,285,114 | — | — | 1,285,114 | ||||||||||||
Internet & Catalog Retail | 3,437,174 | — | — | 3,437,174 | ||||||||||||
Internet Software & Services | 4,563,119 | — | — | 4,563,119 | ||||||||||||
IT Services | 2,869,314 | — | — | 2,869,314 | ||||||||||||
Machinery | 2,006,219 | — | — | 2,006,219 | ||||||||||||
Pharmaceuticals | 1,651,056 | — | — | 1,651,056 | ||||||||||||
Road & Rail | 345,699 | — | — | 345,699 | ||||||||||||
Semiconductors & Semiconductor Equipment | 836,865 | — | — | 836,865 | ||||||||||||
Software | 5,091,781 | — | — | 5,091,781 | ||||||||||||
Specialty Retail | 1,436,696 | — | — | 1,436,696 | ||||||||||||
Technology Hardware, Storage & Peripherals | 3,057,926 | — | — | 3,057,926 | ||||||||||||
Tobacco | 1,374,437 | — | — | 1,374,437 | ||||||||||||
Trading Companies & Distributors | 825,934 | — | — | 825,934 | ||||||||||||
Short-Term Investment | 414,275 | — | — | 414,275 | ||||||||||||
|
|
|
|
|
|
|
| |||||||||
TOTAL INVESTMENTS | $ | 44,398,013 | $ | — | $ | — | $ | 44,398,013 | ||||||||
|
|
|
|
|
|
|
| |||||||||
Affiliate Table
| Number of Shares Held at 6/30/17* | Value at 6/30/17* | Cost of Purchases | Proceeds from Shares Sold | Realized Gain (Loss) | Change in Unrealized Appreciation/ Depreciation | Number of Shares Held at 6/30/18 | Value at 6/30/18 | Dividend Income | Capital Gains Distributions | |||||||||||||||||||||||||||||||
State Street Institutional U.S. Government Money Market Fund, Class G Shares | — | $ | — | $ | 896,691 | $ | 482,416 | $ | — | $ | — | 414,275 | $ | 414,275 | $ | 1,076 | $ | — | ||||||||||||||||||||||
| * | Refer to Note 1 on the Notes to Financial Statements regarding the discontinuance of the master-feeder structure. |
See accompanying notes to financial statements.
34
Table of Contents
SPDR MFS Systematic Value Equity ETF
SCHEDULE OF INVESTMENTS
June 30, 2018
Security Description | Shares | Value | ||||||
COMMON STOCKS — 99.1% | ||||||||
AUTOMOBILES — 1.7% | ||||||||
General Motors Co. | 14,450 | $ | 569,330 | |||||
|
| |||||||
BANKS — 9.7% | ||||||||
Bank of America Corp. | 49,198 | 1,386,892 | ||||||
Citigroup, Inc. | 5,043 | 337,477 | ||||||
JPMorgan Chase & Co. | 14,118 | 1,471,096 | ||||||
|
| |||||||
| 3,195,465 | ||||||||
|
| |||||||
BEVERAGES — 0.9% | ||||||||
Molson Coors Brewing Co. Class B | 4,291 | 291,960 | ||||||
|
| |||||||
CHEMICALS — 2.3% | ||||||||
LyondellBasell Industries NV Class A | 6,882 | 755,988 | ||||||
|
| |||||||
COMMUNICATIONS EQUIPMENT — 2.1% | ||||||||
Cisco Systems, Inc. | 16,244 | 698,979 | ||||||
|
| |||||||
CONSUMER FINANCE — 4.5% | ||||||||
Discover Financial Services | 13,471 | 948,493 | ||||||
Synchrony Financial | 16,346 | 545,630 | ||||||
|
| |||||||
| 1,494,123 | ||||||||
|
| |||||||
DIVERSIFIED TELECOMMUNICATION SERVICES — 0.8% |
| |||||||
Verizon Communications, Inc. | 5,090 | 256,078 | ||||||
|
| |||||||
ELECTRIC UTILITIES — 4.6% | ||||||||
Exelon Corp. | 28,606 | 1,218,616 | ||||||
PPL Corp. | 10,499 | 299,746 | ||||||
|
| |||||||
| 1,518,362 | ||||||||
|
| |||||||
ELECTRICAL EQUIPMENT — 4.3% | ||||||||
Eaton Corp. PLC | 11,015 | 823,261 | ||||||
Regal Beloit Corp. | 7,324 | 599,103 | ||||||
|
| |||||||
| 1,422,364 | ||||||||
|
| |||||||
EQUITY REAL ESTATE INVESTMENT TRUSTS (REITS) — 7.5% |
| |||||||
Extra Space Storage, Inc. REIT | 7,582 | 756,759 | ||||||
Host Hotels & Resorts, Inc. REIT | 47,727 | 1,005,608 | ||||||
STORE Capital Corp. REIT | 26,560 | 727,744 | ||||||
|
| |||||||
| 2,490,111 | ||||||||
|
| |||||||
FOOD PRODUCTS — 3.6% | ||||||||
J.M. Smucker Co. | 1,795 | 192,927 | ||||||
Tyson Foods, Inc. Class A | 14,410 | 992,128 | ||||||
|
| |||||||
| 1,185,055 | ||||||||
|
| |||||||
HEALTH CARE EQUIPMENT & SUPPLIES — 0.7% |
| |||||||
Baxter International, Inc. | 3,190 | 235,550 | ||||||
|
| |||||||
HEALTH CARE PROVIDERS & SERVICES — 7.3% |
| |||||||
Express Scripts Holding Co. (a) | 10,589 | 817,577 | ||||||
Humana, Inc. | 2,155 | 641,393 | ||||||
McKesson Corp. | 7,156 | 954,610 | ||||||
|
| |||||||
| 2,413,580 | ||||||||
|
| |||||||
HOTELS, RESTAURANTS & LEISURE — 3.9% |
| |||||||
Royal Caribbean Cruises, Ltd. | 8,542 | 884,951 | ||||||
Wynn Resorts, Ltd. | 2,410 | 403,290 | ||||||
|
| |||||||
| 1,288,241 | ||||||||
|
| |||||||
HOUSEHOLD DURABLES — 0.7% | ||||||||
PulteGroup, Inc. | 7,649 | 219,909 | ||||||
|
| |||||||
INDEPENDENT POWER PRODUCERS & ENERGY TRADERS — 4.5% |
| |||||||
AES Corp. | 32,709 | 438,628 | ||||||
NRG Energy, Inc. | 33,632 | 1,032,502 | ||||||
|
| |||||||
| 1,471,130 | ||||||||
|
| |||||||
INSURANCE — 6.1% | ||||||||
MetLife, Inc. | 19,935 | 869,166 | ||||||
Progressive Corp. | 3,441 | 203,535 | ||||||
Prudential Financial, Inc. | 9,939 | 929,396 | ||||||
|
| |||||||
| 2,002,097 | ||||||||
|
| |||||||
IT SERVICES — 2.7% | ||||||||
DXC Technology Co. | 10,958 | 883,324 | ||||||
|
| |||||||
MACHINERY — 2.9% | ||||||||
Caterpillar, Inc. | 1,976 | 268,084 | ||||||
Cummins, Inc. | 5,089 | 676,837 | ||||||
|
| |||||||
| 944,921 | ||||||||
|
| |||||||
MULTILINE RETAIL — 0.8% | ||||||||
Target Corp. | 3,385 | 257,666 | ||||||
|
| |||||||
OIL, GAS & CONSUMABLE FUELS — 10.6% |
| |||||||
Anadarko Petroleum Corp. | 10,175 | 745,319 | ||||||
Exxon Mobil Corp. | 8,809 | 728,768 | ||||||
Phillips 66 | 7,455 | 837,271 | ||||||
Valero Energy Corp. | 10,729 | 1,189,095 | ||||||
|
| |||||||
| 3,500,453 | ||||||||
|
| |||||||
PHARMACEUTICALS — 6.6% | ||||||||
Eli Lilly & Co. | 7,156 | 610,621 | ||||||
Johnson & Johnson | 8,437 | 1,023,746 | ||||||
Merck & Co., Inc. | 8,840 | 536,588 | ||||||
|
| |||||||
| 2,170,955 | ||||||||
|
| |||||||
ROAD & RAIL — 2.5% | ||||||||
Union Pacific Corp. | 5,878 | 832,795 | ||||||
|
| |||||||
SEMICONDUCTORS & SEMICONDUCTOR EQUIPMENT — 2.5% |
| |||||||
Intel Corp. (a) | 16,326 | 811,565 | ||||||
|
| |||||||
SPECIALTY RETAIL — 0.9% | ||||||||
Best Buy Co., Inc. | 4,019 | 299,737 | ||||||
|
| |||||||
TECHNOLOGY HARDWARE, STORAGE & PERIPHERALS — 1.9% |
| |||||||
Western Digital Corp. | 7,990 | 618,506 | ||||||
|
| |||||||
TOBACCO — 2.5% | ||||||||
Philip Morris International, Inc. | 10,150 | 819,511 | ||||||
|
| |||||||
TOTAL COMMON STOCKS | 32,647,755 | |||||||
|
| |||||||
SHORT-TERM INVESTMENT — 0.8% | ||||||||
State Street Institutional U.S. Government Money Market Fund, Class G Shares 1.86% (b) (c) | 272,118 | 272,118 | ||||||
|
| |||||||
TOTAL INVESTMENTS — 99.9% | 32,919,873 | |||||||
OTHER ASSETS IN EXCESS OF LIABILITIES — 0.1% | 32,806 | |||||||
|
| |||||||
NET ASSETS — 100.0% | $32,952,679 | |||||||
|
| |||||||
See accompanying notes to financial statements.
35
Table of Contents
SPDR MFS Systematic Value Equity ETF
SCHEDULE OF INVESTMENTS (continued)
June 30, 2018
| (a) | Non-income producing security. |
| (b) | The Fund invested in certain money market funds managed by SSGA Funds Management, Inc. Amounts related to these transactions during the period ended June 30, 2018 are shown in the Affiliate Table below. |
| (c) | The rate shown is the annualized seven-day yield at June 30, 2018. |
REIT = Real Estate Investment Trust
Description | Level 1 — Quoted Prices | Level 2 — Other Significant Observable Inputs | Level 3 — Significant Unobservable Inputs | Total | ||||||||||||
ASSETS: | ||||||||||||||||
INVESTMENTS: | ||||||||||||||||
Common Stocks | ||||||||||||||||
Automobiles | $ | 569,330 | $ | — | $ | — | $ | 569,330 | ||||||||
Banks | 3,195,465 | — | — | 3,195,465 | ||||||||||||
Beverages | 291,960 | — | — | 291,960 | ||||||||||||
Chemicals | 755,988 | — | — | 755,988 | ||||||||||||
Communications Equipment | 698,979 | — | — | 698,979 | ||||||||||||
Consumer Finance | 1,494,123 | — | — | 1,494,123 | ||||||||||||
Diversified Telecommunication Services | 256,078 | — | — | 256,078 | ||||||||||||
Electric Utilities | 1,518,362 | — | — | 1,518,362 | ||||||||||||
Electrical Equipment | 1,422,364 | — | — | 1,422,364 | ||||||||||||
Equity Real Estate Investment Trusts (REITS) | 2,490,111 | — | — | 2,490,111 | ||||||||||||
Food Products | 1,185,055 | — | — | 1,185,055 | ||||||||||||
Health Care Equipment & Supplies | 235,550 | — | — | 235,550 | ||||||||||||
Health Care Providers & Services | 2,413,580 | — | — | 2,413,580 | ||||||||||||
Hotels, Restaurants & Leisure | 1,288,241 | — | — | 1,288,241 | ||||||||||||
Household Durables | 219,909 | — | — | 219,909 | ||||||||||||
Independent Power Producers & Energy Traders | 1,471,130 | — | — | 1,471,130 | ||||||||||||
Insurance | 2,002,097 | — | — | 2,002,097 | ||||||||||||
IT Services | 883,324 | — | — | 883,324 | ||||||||||||
Machinery | 944,921 | — | — | 944,921 | ||||||||||||
Multiline Retail | 257,666 | — | — | 257,666 | ||||||||||||
Oil, Gas & Consumable Fuels | 3,500,453 | — | — | 3,500,453 | ||||||||||||
Pharmaceuticals | 2,170,955 | — | — | 2,170,955 | ||||||||||||
Road & Rail | 832,795 | — | — | 832,795 | ||||||||||||
Semiconductors & Semiconductor Equipment | 811,565 | — | — | 811,565 | ||||||||||||
Specialty Retail | 299,737 | — | — | 299,737 | ||||||||||||
Technology Hardware, Storage & Peripherals | 618,506 | — | — | 618,506 | ||||||||||||
Tobacco | 819,511 | — | — | 819,511 | ||||||||||||
Short-Term Investment | 272,118 | — | — | 272,118 | ||||||||||||
|
|
|
|
|
|
|
| |||||||||
TOTAL INVESTMENTS | $ | 32,919,873 | $ | — | $ | — | $ | 32,919,873 | ||||||||
|
|
|
|
|
|
|
| |||||||||
| Number of Shares Held at 6/30/17* | Value at 6/30/17* | Cost of Purchases | Proceeds from Shares Sold | Realized Gain (Loss) | Change in Unrealized Appreciation/ Depreciation | Number of Shares Held at 6/30/18 | Value at 6/30/18 | Dividend Income | Capital Gains Distributions | |||||||||||||||||||||||||||||||
State Street Institutional U.S. Government Money Market Fund, Class G Shares | — | $ | — | $ | 756,759 | $ | 484,641 | $ | — | $ | — | 272,118 | $ | 272,118 | $ | 528 | $ | — | ||||||||||||||||||||||
| * | Refer to Note 1 on the Notes to Financial Statements regarding the discontinuance of the master-feeder structure. |
See accompanying notes to financial statements.
36
Table of Contents
[This Page Intentionally Left Blank]
37
Table of Contents
STATEMENTS OF ASSETS AND LIABILITIES
June 30, 2018
| SPDR SSGA Multi-Asset Real Return ETF | SPDR SSGA Income Allocation ETF | SPDR SSGA Global Allocation ETF | ||||||||||
ASSETS | ||||||||||||
Investments in unaffiliated issuers, at value* | $ | 36,447,161 | $ | — | $ | 17,583,538 | ||||||
Investments in affiliated issuers, at value | 115,167,940 | 104,586,096 | 239,574,654 | |||||||||
|
|
|
|
|
| |||||||
Total Investments | 151,615,101 | 104,586,096 | 257,158,192 | |||||||||
Cash | 132 | 9,569 | 101 | |||||||||
Dividends receivable — unaffiliated issuers | — | — | — | |||||||||
Dividends receivable — affiliated issuers | 1,140 | 830 | 325,726 | |||||||||
Interest receivable — unaffiliated issuers | — | — | — | |||||||||
|
|
|
|
|
| |||||||
TOTAL ASSETS | 151,616,373 | 104,596,495 | 257,484,019 | |||||||||
|
|
|
|
|
| |||||||
LIABILITIES | ||||||||||||
Payable upon return of securities loaned | 7,809,131 | 12,183,127 | 8,492,442 | |||||||||
Payable for investments purchased | 84 | — | — | |||||||||
Advisory fee payable | 55,948 | 18,809 | 61,564 | |||||||||
Accrued expenses and other liabilities | 9,236 | 5,576 | 1,088 | |||||||||
|
|
|
|
|
| |||||||
TOTAL LIABILITIES | 7,874,399 | 12,207,512 | 8,555,094 | |||||||||
|
|
|
|
|
| |||||||
NET ASSETS | $ | 143,741,974 | $ | 92,388,983 | $ | 248,928,925 | ||||||
|
|
|
|
|
| |||||||
NET ASSETS CONSIST OF: | ||||||||||||
Paid-in Capital | $ | 175,112,440 | $ | 96,677,975 | $ | 233,768,680 | ||||||
Undistributed (distribution in excess of) net investment income (loss) | — | 302,435 | 335,901 | |||||||||
Accumulated net realized gain (loss) on investments | (35,358,299 | ) | (7,016,893 | ) | (6,447,926 | ) | ||||||
Net unrealized appreciation (depreciation) on: | ||||||||||||
Investments — unaffiliated issuers | 34,494 | — | 537,162 | |||||||||
Investments — affiliated issuers | 3,953,339 | 2,425,466 | 20,735,108 | |||||||||
|
|
|
|
|
| |||||||
NET ASSETS | $ | 143,741,974 | $ | 92,388,983 | $ | 248,928,925 | ||||||
|
|
|
|
|
| |||||||
NET ASSET VALUE PER SHARE | ||||||||||||
Net asset value per share | $ | 26.62 | $ | 32.42 | $ | 37.72 | ||||||
|
|
|
|
|
| |||||||
Shares outstanding (unlimited amount authorized, no par value) | 5,400,000 | 2,850,000 | 6,600,000 | |||||||||
|
|
|
|
|
| |||||||
COST OF INVESTMENTS: | ||||||||||||
Investments in unaffiliated issuers | $ | 36,412,667 | $ | — | $ | 17,046,376 | ||||||
Investments in affiliated issuers | 111,214,601 | 102,160,630 | 218,839,546 | |||||||||
|
|
|
|
|
| |||||||
Total cost of investments | $ | 147,627,268 | $ | 102,160,630 | $ | 235,885,922 | ||||||
|
|
|
|
|
| |||||||
* Includes investments in securities on loan, at value | $ | 9,147,492 | $ | 13,463,319 | $ | 12,594,432 | ||||||
|
|
|
|
|
| |||||||
See accompanying notes to financial statements.
38
Table of Contents
| SPDR SSGA Ultra Short Term Bond ETF | SPDR MFS Systematic Core Equity ETF | SPDR MFS Systematic Growth Equity ETF | SPDR MFS Systematic Value Equity ETF | |||||||||||
| $ | 46,924,082 | $ | 29,796,734 | $ | 43,983,738 | $ | 32,647,755 | |||||||
| 4,033,700 | 285,615 | 414,275 | 272,118 | |||||||||||
|
|
|
|
|
|
|
| |||||||
| 50,957,782 | 30,082,349 | 44,398,013 | 32,919,873 | |||||||||||
| 118 | 150 | — | — | |||||||||||
| — | 35,959 | 49,854 | 50,395 | |||||||||||
| 2,167 | 494 | 636 | 528 | |||||||||||
| 142,478 | — | — | — | |||||||||||
|
|
|
|
|
|
|
| |||||||
| 51,102,545 | 30,118,952 | 44,448,503 | 32,970,796 | |||||||||||
|
|
|
|
|
|
|
| |||||||
| — | — | — | — | |||||||||||
| 751,009 | — | — | — | |||||||||||
| 7,983 | 16,430 | 24,617 | 18,117 | |||||||||||
| 5 | 150 | 18 | — | |||||||||||
|
|
|
|
|
|
|
| |||||||
| 758,997 | 16,580 | 24,635 | 18,117 | |||||||||||
|
|
|
|
|
|
|
| |||||||
| $ | 50,343,548 | $ | 30,102,372 | $ | 44,423,868 | $ | 32,952,679 | |||||||
|
|
|
|
|
|
|
| |||||||
| $ | 50,579,940 | $ | 29,673,862 | $ | 42,335,618 | $ | 31,776,397 | |||||||
| 47,385 | — | — | — | |||||||||||
| (288,693 | ) | (6,063 | ) | 428,715 | 297,146 | |||||||||
| 4,916 | 434,573 | 1,659,535 | 879,136 | |||||||||||
| — | — | — | — | |||||||||||
|
|
|
|
|
|
|
| |||||||
| $ | 50,343,548 | $ | 30,102,372 | $ | 44,423,868 | $ | 32,952,679 | |||||||
|
|
|
|
|
|
|
| |||||||
| $ | 40.27 | $ | 75.26 | $ | 80.77 | $ | 65.91 | |||||||
|
|
|
|
|
|
|
| |||||||
| 1,250,000 | 400,000 | 550,000 | 500,000 | |||||||||||
|
|
|
|
|
|
|
| |||||||
| $ | 46,919,166 | $ | 29,362,161 | $ | 42,324,203 | $ | 31,768,619 | |||||||
| 4,033,700 | 285,615 | 414,275 | 272,118 | |||||||||||
|
|
|
|
|
|
|
| |||||||
| $ | 50,952,866 | $ | 29,647,776 | $ | 42,738,478 | $ | 32,040,737 | |||||||
|
|
|
|
|
|
|
| |||||||
| $ | — | $ | — | $ | — | $ | — | |||||||
|
|
|
|
|
|
|
| |||||||
39
Table of Contents
SSGA ACTIVE TRUST
STATEMENTS OF OPERATIONS
For the Year Ended June 30, 2018
| SPDR SSGA Multi-Asset Real Return ETF | SPDR SSGA Income Allocation ETF | SPDR SSGA Global Allocation ETF | ||||||||||
INVESTMENT INCOME | ||||||||||||
Interest income allocated from the Portfolio | $ | — | $ | — | $ | — | ||||||
Dividend income allocated from the Portfolio | 1,720,645 | 2,681,305 | 3,375,274 | |||||||||
Interest income — unaffiliated issuers | — | — | — | |||||||||
Dividend income — unaffiliated issuers | 20,896 | — | 36,626 | |||||||||
Dividend income — affiliated issuers | 979,637 | 644,934 | 1,672,711 | |||||||||
Unaffiliated securities lending income | 38,596 | 43,544 | 61,042 | |||||||||
Affiliated securities lending income | 6,443 | 19,838 | 21,770 | |||||||||
Expenses allocated from affiliated Portfolio | (199,965 | ) | (171,775 | ) | (397,512 | ) | ||||||
|
|
|
|
|
| |||||||
TOTAL INVESTMENT INCOME (LOSS) | 2,566,252 | 3,217,846 | 4,769,911 | |||||||||
|
|
|
|
|
| |||||||
EXPENSES | ||||||||||||
Advisory fee | 59,525 | 202,417 | 58,547 | |||||||||
Trustees’ fees and expenses | 358 | 313 | 758 | |||||||||
Miscellaneous expenses | 5,404 | 3,602 | 3,848 | |||||||||
|
|
|
|
|
| |||||||
TOTAL EXPENSES | 65,287 | 206,332 | 63,153 | |||||||||
|
|
|
|
|
| |||||||
Expenses waived/reimbursed by the Adviser | — | — | (260,382 | ) | ||||||||
|
|
|
|
|
| |||||||
NET EXPENSES | 65,287 | 206,332 | (197,229 | ) | ||||||||
|
|
|
|
|
| |||||||
NET INVESTMENT INCOME (LOSS) | 2,500,965 | 3,011,514 | 4,967,140 | |||||||||
|
|
|
|
|
| |||||||
REALIZED AND UNREALIZED GAIN (LOSS) | ||||||||||||
Net realized gain (loss) on: | ||||||||||||
Investment transactions allocated from affiliated Portfolio | (2,307,096 | ) | 687,930 | 3,521,199 | ||||||||
In-kind redemptions allocated from affiliated Portfolio | 1,543,539 | 694,945 | 787,354 | |||||||||
Investments — unaffiliated issuers | (639,746 | ) | — | 47,592 | ||||||||
Investments — affiliated issuers | (210,492 | ) | 94,942 | 922,296 | ||||||||
In-kind redemptions — unaffiliated issuers | 239,648 | — | — | |||||||||
In-kind redemptions — affiliated issuers | 662,111 | 135,925 | — | |||||||||
Capital gain distributions — allocated from Portfolio | 46,309 | 378,388 | 194,675 | |||||||||
|
|
|
|
|
| |||||||
Net realized gain (loss) | (665,727 | ) | 1,992,130 | 5,473,116 | ||||||||
|
|
|
|
|
| |||||||
Net change in unrealized appreciation/depreciation on: | ||||||||||||
Investments — unaffiliated issuers | 34,494 | — | 537,162 | |||||||||
Investments — affiliated issuers | 3,953,339 | 2,425,466 | 20,735,108 | |||||||||
Investments allocated from affiliated Portfolio | 8,572,113 | (4,180,698 | ) | (14,099,951 | ) | |||||||
|
|
|
|
|
| |||||||
Net change in unrealized appreciation/depreciation | 12,559,946 | (1,755,232 | ) | 7,172,319 | ||||||||
|
|
|
|
|
| |||||||
NET REALIZED AND UNREALIZED GAIN (LOSS) | 11,894,219 | 236,898 | 12,645,435 | |||||||||
|
|
|
|
|
| |||||||
NET INCREASE (DECREASE) IN NET ASSETS FROM OPERATIONS | $ | 14,395,184 | $ | 3,248,412 | $ | 17,612,575 | ||||||
|
|
|
|
|
| |||||||
See accompanying notes to financial statements.
40
Table of Contents
| SPDR SSGA Ultra Short Term Bond ETF | SPDR MFS Systematic Core Equity ETF | SPDR MFS Systematic Growth Equity ETF | SPDR MFS Systematic Value Equity ETF | |||||||||||
| $ | 395,777 | $ | — | $ | — | $ | — | |||||||
| — | 175,475 | 513,915 | 156,621 | |||||||||||
| 137,206 | — | — | — | |||||||||||
| — | 152,753 | 166,480 | 173,887 | |||||||||||
| 2,743 | 836 | 1,076 | 528 | |||||||||||
| — | — | — | — | |||||||||||
| — | — | — | — | |||||||||||
| (44,600 | ) | (32,264 | ) | (128,050 | ) | (25,814 | ) | |||||||
|
|
|
|
|
|
|
| |||||||
| 491,126 | 296,800 | 553,421 | 305,222 | |||||||||||
|
|
|
|
|
|
|
| |||||||
| 11,941 | 61,018 | 168,872 | 55,447 | |||||||||||
| 89 | 47 | 119 | 31 | |||||||||||
| 570 | 359 | 2,459 | 313 | |||||||||||
|
|
|
|
|
|
|
| |||||||
| 12,600 | 61,424 | 171,450 | 55,791 | |||||||||||
|
|
|
|
|
|
|
| |||||||
| — | — | — | — | |||||||||||
|
|
|
|
|
|
|
| |||||||
| 12,600 | 61,424 | 171,450 | 55,791 | |||||||||||
|
|
|
|
|
|
|
| |||||||
| 478,526 | 235,376 | 381,971 | 249,431 | |||||||||||
|
|
|
|
|
|
|
| |||||||
| (10,589 | ) | (19,335 | ) | 617,137 | 254,071 | |||||||||
| — | 1,006,581 | 3,859,303 | — | |||||||||||
| 1,757 | 71,569 | 75,403 | 142,955 | |||||||||||
| — | — | — | — | |||||||||||
| — | 465,466 | — | — | |||||||||||
| — | — | — | — | |||||||||||
| — | — | — | — | |||||||||||
|
|
|
|
|
|
|
| |||||||
| (8,832 | ) | 1,524,281 | 4,551,843 | 397,026 | ||||||||||
|
|
|
|
|
|
|
| |||||||
| 4,916 | 434,573 | 1,659,535 | 879,136 | |||||||||||
| — | — | — | — | |||||||||||
| (39,765 | ) | (903,515 | ) | (185,665 | ) | (541,655 | ) | |||||||
|
|
|
|
|
|
|
| |||||||
| (34,849 | ) | (468,942 | ) | 1,473,870 | 337,481 | |||||||||
|
|
|
|
|
|
|
| |||||||
| (43,681 | ) | 1,055,339 | 6,025,713 | 734,507 | ||||||||||
|
|
|
|
|
|
|
| |||||||
| $ | 434,845 | $ | 1,290,715 | $ | 6,407,684 | $ | 983,938 | |||||||
|
|
|
|
|
|
|
| |||||||
41
Table of Contents
SSGA ACTIVE TRUST
STATEMENTS OF CHANGES IN NET ASSETS
| SPDR SSGA Multi-Asset Real Return ETF | SPDR SSGA Income Allocation ETF | |||||||||||||||
| Year Ended 6/30/18 | Year Ended 6/30/17 | Year Ended 6/30/18 | Year Ended 6/30/17 | |||||||||||||
INCREASE (DECREASE) IN NET ASSETS FROM OPERATIONS: | ||||||||||||||||
Net investment income (loss) | $ | 2,500,965 | $ | 2,204,386 | $ | 3,011,514 | $ | 3,530,853 | ||||||||
Net realized gain (loss) | (665,727 | ) | (5,020,099 | ) | 1,992,130 | 1,636,027 | ||||||||||
Net change in unrealized appreciation/depreciation | 12,559,946 | 2,590,190 | (1,755,232 | ) | 1,395,074 | |||||||||||
|
|
|
|
|
|
|
| |||||||||
Net increase (decrease) in net assets resulting from operations | 14,395,184 | (225,523 | ) | 3,248,412 | 6,561,954 | |||||||||||
|
|
|
|
|
|
|
| |||||||||
Net equalization credits and charges | (6,781 | ) | 26,885 | (16,838 | ) | (24,329 | ) | |||||||||
|
|
|
|
|
|
|
| |||||||||
DISTRIBUTIONS TO SHAREHOLDERS FROM: | ||||||||||||||||
Net investment income | (2,524,937 | ) | (2,180,468 | ) | (2,983,228 | ) | (3,075,849 | ) | ||||||||
|
|
|
|
|
|
|
| |||||||||
Net realized gains | — | — | — | — | ||||||||||||
|
|
|
|
|
|
|
| |||||||||
Total distributions to shareholders | (2,524,937 | ) | (2,180,468 | ) | (2,983,228 | ) | (3,075,849 | ) | ||||||||
|
|
|
|
|
|
|
| |||||||||
FROM BENEFICIAL INTEREST TRANSACTIONS: | ||||||||||||||||
Proceeds from sale of shares sold | 44,751,476 | 47,857,927 | 4,988,040 | 1,595,744 | ||||||||||||
Cost of shares redeemed | (27,954,964 | ) | (10,818,117 | ) | (8,240,529 | ) | (14,310,948 | ) | ||||||||
Net income equalization | 6,781 | (26,885 | ) | 16,838 | 24,329 | |||||||||||
Other capital | — | — | — | — | ||||||||||||
|
|
|
|
|
|
|
| |||||||||
Net increase (decrease) in net assets from beneficial interest transactions | 16,803,293 | 37,012,925 | (3,235,651 | ) | (12,690,875 | ) | ||||||||||
|
|
|
|
|
|
|
| |||||||||
Net increase (decrease) in net assets during the period | 28,666,759 | 34,633,819 | (2,987,305 | ) | (9,229,099 | ) | ||||||||||
|
|
|
|
|
|
|
| |||||||||
Net assets at beginning of period | 115,075,215 | 80,441,396 | 95,376,288 | 104,605,387 | ||||||||||||
|
|
|
|
|
|
|
| |||||||||
NET ASSETS AT END OF PERIOD | $ | 143,741,974 | $ | 115,075,215 | $ | 92,388,983 | $ | 95,376,288 | ||||||||
|
|
|
|
|
|
|
| |||||||||
Undistributed (distribution in excess of) net investment income (loss) | $ | — | $ | (433,560 | ) | $ | 302,435 | $ | 149,271 | |||||||
|
|
|
|
|
|
|
| |||||||||
SHARES OF BENEFICIAL INTEREST: | ||||||||||||||||
Shares sold | 1,700,000 | 1,950,000 | 150,000 | 50,000 | ||||||||||||
Shares redeemed | (1,100,000 | ) | (450,000 | ) | (250,000 | ) | (450,000 | ) | ||||||||
|
|
|
|
|
|
|
| |||||||||
Net increase (decrease) | 600,000 | 1,500,000 | (100,000 | ) | (400,000 | ) | ||||||||||
|
|
|
|
|
|
|
| |||||||||
See accompanying notes to financial statements.
42
Table of Contents
| SPDR SSGA Global Allocation ETF | SPDR SSGA Ultra Short Term Bond ETF | SPDR MFS Systematic Core Equity ETF | ||||||||||||||||||||
| Year Ended 6/30/18 | Year Ended 6/30/17 | Year Ended 6/30/18 | Year Ended 6/30/17 | Year Ended 6/30/18 | Year Ended 6/30/17 | |||||||||||||||||
| $ | 4,967,140 | $ | 5,663,196 | $ | 478,526 | $ | 167,483 | $ | 235,376 | $ | 96,734 | |||||||||||
| 5,473,116 | 280,703 | (8,832 | ) | (4,025 | ) | 1,524,281 | 141,523 | |||||||||||||||
| 7,172,319 | 11,097,304 | (34,849 | ) | 44,001 | (468,942 | ) | 911,630 | |||||||||||||||
|
|
|
|
|
|
|
|
|
|
|
| |||||||||||
| 17,612,575 | 17,041,203 | 434,845 | 207,459 | 1,290,715 | 1,149,887 | |||||||||||||||||
|
|
|
|
|
|
|
|
|
|
|
| |||||||||||
| 32,328 | (5,755 | ) | 31,387 | (82 | ) | 9,845 | — | |||||||||||||||
|
|
|
|
|
|
|
|
|
|
|
| |||||||||||
| (5,038,036 | ) | (4,865,796 | ) | (440,203 | ) | (162,266 | ) | (230,288 | ) | (96,747 | ) | |||||||||||
|
|
|
|
|
|
|
|
|
|
|
| |||||||||||
| — | — | — | — | (132,165 | ) | — | ||||||||||||||||
|
|
|
|
|
|
|
|
|
|
|
| |||||||||||
| (5,038,036 | ) | (4,865,796 | ) | (440,203 | ) | (162,266 | ) | (362,453 | ) | (96,747 | ) | |||||||||||
|
|
|
|
|
|
|
|
|
|
|
| |||||||||||
| 34,147,005 | 27,444,065 | 48,298,111 | 6,030,951 | 33,108,321 | — | |||||||||||||||||
| (5,573,015 | ) | (16,951,553 | ) | (16,107,275 | ) | (12,015,514 | ) | (10,795,866 | ) | — | ||||||||||||
| (32,328 | ) | 5,755 | (31,387 | ) | 82 | (9,845 | ) | — | ||||||||||||||
| — | — | 40,638 | 18,045 | (35 | ) | — | ||||||||||||||||
|
|
|
|
|
|
|
|
|
|
|
| |||||||||||
| 28,541,662 | 10,498,267 | 32,200,087 | (5,966,436 | ) | 22,302,575 | — | ||||||||||||||||
|
|
|
|
|
|
|
|
|
|
|
| |||||||||||
| 41,148,529 | 22,667,919 | 32,226,116 | (5,921,325 | ) | 23,240,682 | 1,053,140 | ||||||||||||||||
|
|
|
|
|
|
|
|
|
|
|
| |||||||||||
| 207,780,396 | 185,112,477 | 18,117,432 | 24,038,757 | 6,861,690 | 5,808,550 | |||||||||||||||||
|
|
|
|
|
|
|
|
|
|
|
| |||||||||||
| $ | 248,928,925 | $ | 207,780,396 | $ | 50,343,548 | $ | 18,117,432 | $ | 30,102,372 | $ | 6,861,690 | |||||||||||
|
|
|
|
|
|
|
|
|
|
|
| |||||||||||
| $ | 335,901 | $ | 310,145 | $ | 47,385 | $ | 5,324 | $ | — | $ | (21,904 | ) | ||||||||||
|
|
|
|
|
|
|
|
|
|
|
| |||||||||||
| 900,000 | 800,000 | 1,200,000 | 150,000 | 450,000 | — | |||||||||||||||||
| (150,000 | ) | (500,000 | ) | (400,000 | ) | (300,000 | ) | (150,000 | ) | — | ||||||||||||
|
|
|
|
|
|
|
|
|
|
|
| |||||||||||
| 750,000 | 300,000 | 800,000 | (150,000 | ) | 300,000 | — | ||||||||||||||||
|
|
|
|
|
|
|
|
|
|
|
| |||||||||||
43
Table of Contents
SSGA ACTIVE TRUST
STATEMENTS OF CHANGES IN NET ASSETS (continued)
| SPDR MFS Systematic Growth Equity ETF | SPDR MFS Systematic Value Equity ETF | |||||||||||||||
| Year Ended 6/30/18 | Year Ended 6/30/17 | Year Ended 6/30/18 | Year Ended 6/30/17 | |||||||||||||
INCREASE (DECREASE) IN NET ASSETS FROM OPERATIONS: | ||||||||||||||||
Net investment income (loss) | $ | 381,971 | $ | 203,810 | $ | 249,431 | $ | 71,072 | ||||||||
Net realized gain (loss) | 4,551,843 | 3,301,828 | 397,026 | 55,555 | ||||||||||||
Net change in unrealized appreciation/depreciation | 1,473,870 | (247,234 | ) | 337,481 | 483,114 | |||||||||||
|
|
|
|
|
|
|
| |||||||||
Net increase (decrease) in net assets resulting from operations | 6,407,684 | 3,258,404 | 983,938 | 609,741 | ||||||||||||
|
|
|
|
|
|
|
| |||||||||
Net equalization credits and charges | 24,904 | 3,639 | 25,776 | 2,637 | ||||||||||||
|
|
|
|
|
|
|
| |||||||||
DISTRIBUTIONS TO SHAREHOLDERS FROM: | ||||||||||||||||
Net investment income | (390,903 | ) | (196,549 | ) | (261,180 | ) | (74,269 | ) | ||||||||
|
|
|
|
|
|
|
| |||||||||
Net realized gains | (110,197 | ) | — | (111,415 | ) | (61,570 | ) | |||||||||
|
|
|
|
|
|
|
| |||||||||
Total distributions to shareholders | (501,100 | ) | (196,549 | ) | (372,595 | ) | (135,839 | ) | ||||||||
|
|
|
|
|
|
|
| |||||||||
FROM BENEFICIAL INTEREST TRANSACTIONS: | ||||||||||||||||
Proceeds from sale of shares sold | 27,658,642 | 45,181,472 | 26,360,403 | 2,907,751 | ||||||||||||
Cost of shares redeemed | (28,220,128 | ) | (21,298,530 | ) | — | — | ||||||||||
Net income equalization | (24,904 | ) | (3,639 | ) | (25,776 | ) | (2,637 | ) | ||||||||
|
|
|
|
|
|
|
| |||||||||
Net increase (decrease) in net assets from beneficial interest transactions | (586,390 | ) | 23,879,303 | 26,334,627 | 2,905,114 | |||||||||||
|
|
|
|
|
|
|
| |||||||||
Net increase (decrease) in net assets during the period | 5,345,098 | 26,944,797 | 26,971,746 | 3,381,653 | ||||||||||||
|
|
|
|
|
|
|
| |||||||||
Net assets at beginning of period | 39,078,770 | 12,133,973 | 5,980,933 | 2,599,280 | ||||||||||||
|
|
|
|
|
|
|
| |||||||||
NET ASSETS AT END OF PERIOD | $ | 44,423,868 | $ | 39,078,770 | $ | 32,952,679 | $ | 5,980,933 | ||||||||
|
|
|
|
|
|
|
| |||||||||
Undistributed (distribution in excess of) net investment income (loss) | $ | — | $ | (22,472 | ) | $ | — | $ | (17,301 | ) | ||||||
|
|
|
|
|
|
|
| |||||||||
SHARES OF BENEFICIAL INTEREST: | ||||||||||||||||
Shares sold | 350,000 | 650,000 | 400,000 | 50,000 | ||||||||||||
Shares redeemed | (350,000 | ) | (300,000 | ) | — | — | ||||||||||
|
|
|
|
|
|
|
| |||||||||
Net increase (decrease) | — | 350,000 | 400,000 | 50,000 | ||||||||||||
|
|
|
|
|
|
|
| |||||||||
See accompanying notes to financial statements.
44
Table of Contents
SSGA ACTIVE TRUST
Selected data for a share outstanding throughout each period
| SPDR SSGA Multi-Asset Real Return ETF | ||||||||||||||||||||
| Year Ended 6/30/18(a) | Year Ended 6/30/17(a) | Year Ended 6/30/16(a) | Year Ended 6/30/15(a) | Year Ended 6/30/14(a) | ||||||||||||||||
Net asset value, beginning of period | $ | 23.97 | $ | 24.38 | $ | 25.85 | $ | 30.86 | $ | 27.68 | ||||||||||
|
|
|
|
|
|
|
|
|
| |||||||||||
Income (loss) from investment operations: | ||||||||||||||||||||
Net investment income (loss) (b) | 0.53 | 0.56 | 0.30 | 0.43 | 0.57 | |||||||||||||||
Net realized and unrealized gain (loss) (c) | 2.64 | (0.44 | ) | (1.43 | ) | (5.02 | ) | 3.22 | ||||||||||||
|
|
|
|
|
|
|
|
|
| |||||||||||
Total from investment operations | 3.17 | 0.12 | (1.13 | ) | (4.59 | ) | 3.79 | |||||||||||||
|
|
|
|
|
|
|
|
|
| |||||||||||
Net equalization credits and charges (b) | (0.00 | )(d) | 0.01 | 0.01 | 0.01 | 0.01 | ||||||||||||||
|
|
|
|
|
|
|
|
|
| |||||||||||
Distributions to shareholders from: | ||||||||||||||||||||
Net investment income | (0.52 | ) | (0.54 | ) | (0.35 | ) | (0.43 | ) | (0.62 | ) | ||||||||||
|
|
|
|
|
|
|
|
|
| |||||||||||
Net asset value, end of period | $ | 26.62 | $ | 23.97 | $ | 24.38 | $ | 25.85 | $ | 30.86 | ||||||||||
|
|
|
|
|
|
|
|
|
| |||||||||||
Total return (e) | 13.26 | % | 0.56 | % | (4.22 | )% | (14.84 | )% | 13.85 | % | ||||||||||
Ratios and Supplemental Data: | ||||||||||||||||||||
Net assets, end of period (in 000s) | $ | 143,742 | $ | 115,075 | $ | 80,441 | $ | 140,895 | $ | 163,580 | ||||||||||
Ratios to average net assets: | ||||||||||||||||||||
Total expenses | 0.22 | % | 0.22 | % | 0.28 | % | 0.23 | % | 0.24 | % | ||||||||||
Net investment income (loss) | 2.04 | % | 2.28 | % | 1.29 | % | 1.53 | % | 1.97 | % | ||||||||||
Portfolio turnover rate | 44 | % | 46 | %(f) | 25 | %(f) | 33 | %(f) | 40 | %(f) | ||||||||||
| (a) | The per share amounts and percentages include the Fund’s proportionate share of income and expenses of the Portfolio prior to discontinuance of the master feeder structure. See Note 1. |
| (b) | Per share numbers have been calculated using average shares outstanding, which more appropriately presents the per share data for the year. |
| (c) | Amounts shown in this caption for a share outstanding may not accord with the change in aggregate gains and losses in securities for the fiscal period because of the timing of sales and repurchases of Fund shares in relation to fluctuating market values for the Fund. |
| (d) | Amount is less than $0.005 per share. |
| (e) | Total return is calculated assuming a purchase of shares at net asset value on the first day and a sale at net asset value on the last day of each period reported. Distributions are assumed, for the purpose of this calculation, to be reinvested at net asset value per share on the respective payment dates of each distribution. Total returns for periods of less than one year are not annualized. Broker commission charges are not included in this calculation. |
| (f) | Portfolio turnover is from the Fund’s Portfolio prior to discontinuance of master-feeder structure. See Note 1. |
See accompanying notes to financial statements.
45
Table of Contents
SSGA ACTIVE TRUST
FINANCIAL HIGHLIGHTS (continued)
Selected data for a share outstanding throughout each period
| SPDR SSGA Income Allocation ETF | ||||||||||||||||||||
| Year Ended 6/30/18 (a) | Year Ended 6/30/17 (a) | Year Ended 6/30/16 (a) | Year Ended 6/30/15 (a) | Year Ended 6/30/14 (a) | ||||||||||||||||
Net asset value, beginning of period | $ | 32.33 | $ | 31.23 | $ | 31.16 | $ | 32.70 | $ | 29.90 | ||||||||||
|
|
|
|
|
|
|
|
|
| |||||||||||
Income (loss) from investment operations: | ||||||||||||||||||||
Net investment income (loss) (b) | 1.02 | 1.10 | 0.93 | 0.97 | 1.16 | |||||||||||||||
Net realized and unrealized gain (loss) (c) | 0.09 | 0.98 | 0.22 | (1.51 | ) | 2.86 | ||||||||||||||
|
|
|
|
|
|
|
|
|
| |||||||||||
Total from investment operations | 1.11 | 2.08 | 1.15 | (0.54 | ) | 4.02 | ||||||||||||||
|
|
|
|
|
|
|
|
|
| |||||||||||
Net equalization credits and charges (b) | (0.01 | ) | (0.01 | ) | (0.02 | ) | 0.02 | (0.03 | ) | |||||||||||
|
|
|
|
|
|
|
|
|
| |||||||||||
Distributions to shareholders from: | ||||||||||||||||||||
Net investment income | (1.01 | ) | (0.97 | ) | (1.06 | ) | (1.02 | ) | (1.19 | ) | ||||||||||
|
|
|
|
|
|
|
|
|
| |||||||||||
Net asset value, end of period | $ | 32.42 | $ | 32.33 | $ | 31.23 | $ | 31.16 | $ | 32.70 | ||||||||||
|
|
|
|
|
|
|
|
|
| |||||||||||
Total return (d) | 3.34 | % | 6.78 | % | 3.77 | % | (1.59 | )% | 13.57 | % | ||||||||||
Ratios and Supplemental Data: | ||||||||||||||||||||
Net assets, end of period (in 000s) | $ | 92,389 | $ | 95,376 | $ | 104,605 | $ | 120,020 | $ | 103,035 | ||||||||||
Ratios to average net assets: | ||||||||||||||||||||
Total expenses | 0.39 | % | 0.37 | % | 0.37 | % | 0.35 | % | 0.36 | % | ||||||||||
Net investment income (loss) | 3.07 | % | 3.49 | % | 3.07 | % | 3.00 | % | 3.73 | % | ||||||||||
Portfolio turnover rate | 29 | % | 47 | %(e) | 54 | %(e) | 64 | %(e) | 63 | %(e) | ||||||||||
| (a) | The per share amounts and percentages include the Fund’s proportionate share of income and expenses of the Portfolio prior to discontinuance of the master feeder structure. See Note 1. |
| (b) | Per share numbers have been calculated using average shares outstanding, which more appropriately presents the per share data for the year. |
| (c) | Amounts shown in this caption for a share outstanding may not accord with the change in aggregate gains and losses in securities for the fiscal period because of the timing of sales and repurchases of Fund shares in relation to fluctuating market values for the Fund. |
| (d) | Total return is calculated assuming a purchase of shares at net asset value on the first day and a sale at net asset value on the last day of each period reported. Distributions are assumed, for the purpose of this calculation, to be reinvested at net asset value per share on the respective payment dates of each distribution. Total returns for periods of less than one year are not annualized. Broker commission charges are not included in this calculation. |
| (e) | Portfolio turnover is from the Fund’s Portfolio prior to discontinuance of master-feeder structure. See Note 1. |
See accompanying notes to financial statements.
46
Table of Contents
SSGA ACTIVE TRUST
FINANCIAL HIGHLIGHTS (continued)
Selected data for a share outstanding throughout each period
| SPDR SSGA Global Allocation ETF | ||||||||||||||||||||
| Year Ended 6/30/18 (a) | Year Ended 6/30/17 (a) | Year Ended 6/30/16 (a) | Year Ended 6/30/15 (a) | Year Ended 6/30/14 (a) | ||||||||||||||||
Net asset value, beginning of period | $ | 35.52 | $ | 33.35 | $ | 34.61 | $ | 35.47 | $ | 31.18 | ||||||||||
|
|
|
|
|
|
|
|
|
| |||||||||||
Income (loss) from investment operations: | ||||||||||||||||||||
Net investment income (loss) (b) | 0.81 | 0.99 | 0.81 | 0.92 | 0.98 | |||||||||||||||
Net realized and unrealized gain (loss) (c) | 2.18 | 2.03 | (1.09 | ) | (0.73 | ) | 4.20 | |||||||||||||
|
|
|
|
|
|
|
|
|
| |||||||||||
Total from investment operations | 2.99 | 3.02 | (0.28 | ) | 0.19 | 5.18 | ||||||||||||||
|
|
|
|
|
|
|
|
|
| |||||||||||
Net equalization credits and charges (b) | 0.01 | 0.00 | (d) | 0.02 | 0.05 | 0.02 | ||||||||||||||
|
|
|
|
|
|
|
|
|
| |||||||||||
Distributions to shareholders from: | ||||||||||||||||||||
Net investment income | (0.80 | ) | (0.85 | ) | (0.94 | ) | (0.91 | ) | (0.91 | ) | ||||||||||
Net realized gains | — | — | (0.06 | ) | (0.19 | ) | — | |||||||||||||
|
|
|
|
|
|
|
|
|
| |||||||||||
Total distributions | (0.80 | ) | (0.85 | ) | (1.00 | ) | (1.10 | ) | (0.91 | ) | ||||||||||
|
|
|
|
|
|
|
|
|
| |||||||||||
Net asset value, end of period | $ | 37.72 | $ | 35.52 | $ | 33.35 | $ | 34.61 | $ | 35.47 | ||||||||||
|
|
|
|
|
|
|
|
|
| |||||||||||
Total return (e) | 8.46 | % | 9.14 | % | (0.63 | )% | 0.66 | % | 16.81 | % | ||||||||||
Ratios and Supplemental Data: | ||||||||||||||||||||
Net assets, end of period (in 000s) | $ | 248,929 | $ | 207,780 | $ | 185,112 | $ | 143,655 | $ | 97,589 | ||||||||||
Ratios to average net assets: | ||||||||||||||||||||
Total expenses | 0.20 | % | 0.20 | % | 0.20 | % | 0.20 | % | 0.20 | % | ||||||||||
Net expenses | 0.09 | %(d) | 0.01 | % | 0.06 | % | 0.05 | % | 0.05 | % | ||||||||||
Net investment income (loss) | 2.14 | % | 2.91 | % | 2.45 | % | 2.60 | % | 2.91 | % | ||||||||||
Portfolio turnover rate | 43 | % | 90 | %(f) | 86 | %(f) | 98 | %(f) | 89 | %(f) | ||||||||||
| (a) | The per share amounts and percentages include the Fund’s proportionate share of income and expenses of the Portfolio prior to discontinuance of the master feeder structure. See Note 1. |
| (b) | Per share numbers have been calculated using average shares outstanding, which more appropriately presents the per share data for the year. |
| (c) | Amounts shown in this caption for a share outstanding may not accord with the change in aggregate gains and losses in securities for the fiscal period because of the timing of sales and repurchases of Fund shares in relation to fluctuating market values for the Fund. |
| (d) | Amount is less than 0.005%. |
| (e) | Total return is calculated assuming a purchase of shares at net asset value on the first day and a sale at net asset value on the last day of each period reported. Distributions are assumed, for the purpose of this calculation, to be reinvested at net asset value per share on the respective payment dates of each distribution. Total returns for periods of less than one year are not annualized. Broker commission charges are not included in this calculation. |
| (f) | Portfolio turnover is from the Fund’s Portfolio prior to discontinuance of master-feeder structure. See Note 1. |
See accompanying notes to financial statements.
47
Table of Contents
SSGA ACTIVE TRUST
FINANCIAL HIGHLIGHTS (continued)
Selected data for a share outstanding throughout each period
| SPDR SSGA Ultra Short Term Bond ETF | ||||||||||||||||||||
| Year Ended 6/30/18 (a) | Year Ended 6/30/17 (a) | Year Ended 6/30/16 (a) | Year Ended 6/30/15 (a) | For the Period 10/9/13* - 6/30/14 (a) | ||||||||||||||||
Net asset value, beginning of period | $ | 40.26 | $ | 40.06 | $ | 40.05 | $ | 40.10 | $ | 40.00 | ||||||||||
|
|
|
|
|
|
|
|
|
| |||||||||||
Income (loss) from investment operations: | ||||||||||||||||||||
Net investment income (loss) (b) | 0.68 | 0.44 | 0.27 | 0.13 | 0.10 | |||||||||||||||
Net realized and unrealized gain (loss) (c) | (0.14 | ) | 0.13 | (0.21 | ) | (0.05 | ) | 0.03 | ||||||||||||
|
|
|
|
|
|
|
|
|
| |||||||||||
Total from investment operations | 0.54 | 0.57 | 0.06 | 0.08 | 0.13 | |||||||||||||||
|
|
|
|
|
|
|
|
|
| |||||||||||
Net equalization credits and charges (b) | 0.04 | (0.00 | )(d) | 0.07 | 0.00 | (d) | 0.00 | (d) | ||||||||||||
|
|
|
|
|
|
|
|
|
| |||||||||||
Other capital (b) | 0.06 | 0.05 | 0.12 | 0.01 | 0.05 | |||||||||||||||
|
|
|
|
|
|
|
|
|
| |||||||||||
Distributions to shareholders from: | ||||||||||||||||||||
Net investment income | (0.63 | ) | (0.42 | ) | (0.18 | ) | (0.14 | ) | (0.08 | ) | ||||||||||
Net realized gains | — | — | (0.06 | ) | — | — | ||||||||||||||
|
|
|
|
|
|
|
|
|
| |||||||||||
Total distributions | (0.63 | ) | (0.42 | ) | (0.24 | ) | (0.14 | ) | (0.08 | ) | ||||||||||
|
|
|
|
|
|
|
|
|
| |||||||||||
Net asset value, end of period | $ | 40.27 | $ | 40.26 | $ | 40.06 | $ | 40.05 | $ | 40.10 | ||||||||||
|
|
|
|
|
|
|
|
|
| |||||||||||
Total return (e) | 1.60 | % | 1.53 | % | 0.65 | % | 0.20 | % | 0.46 | % | ||||||||||
Ratios and Supplemental Data: | ||||||||||||||||||||
Net assets, end of period (in 000s) | $ | 50,344 | $ | 18,117 | $ | 24,039 | $ | 16,018 | $ | 14,035 | ||||||||||
Ratios to average net assets: | ||||||||||||||||||||
Total expenses | 0.20 | % | 0.20 | % | 0.20 | % | 0.20 | % | 0.20 | %(f) | ||||||||||
Net investment income (loss) | 1.70 | % | 1.09 | % | 0.69 | % | 0.33 | % | 0.34 | %(f) | ||||||||||
Portfolio turnover rate | 76 | % | 83 | %(g) | 407 | %(g) | 79 | %(g) | 39 | %(g)(h) | ||||||||||
| * | Commencement of operations. |
| (a) | The per share amounts and percentages include the Fund’s proportionate share of income and expenses of the Portfolio prior to discontinuance of the master feeder structure. See Note 1. |
| (b) | Per share numbers have been calculated using average shares outstanding, which more appropriately presents the per share data for the year. |
| (c) | Amounts shown in this caption for a share outstanding may not accord with the change in aggregate gains and losses in securities for the fiscal period because of the timing of sales and repurchases of Fund shares in relation to fluctuating market values for the Fund. |
| (d) | Amount is less than $0.005 per share. |
| (e) | Total return is calculated assuming a purchase of shares at net asset value on the first day and a sale at net asset value on the last day of each period reported. Distributions are assumed, for the purpose of this calculation, to be reinvested at net asset value per share on the respective payment dates of each distribution. Total returns for periods of less than one year are not annualized. Broker commission charges are not included in this calculation. |
| (f) | Annualized. |
| (g) | Portfolio turnover is from the Fund’s Portfolio prior to discontinuance of master-feeder structure. See Note 1. |
| (h) | Not annualized. |
See accompanying notes to financial statements.
48
Table of Contents
SSGA ACTIVE TRUST
FINANCIAL HIGHLIGHTS (continued)
Selected data for a share outstanding throughout each period
| SPDR MFS Systematic Core Equity ETF | ||||||||||||||||||||
| Year Ended 6/30/18 (a) | Year Ended 6/30/17 (a) | Year Ended 6/30/16 (a) | Year Ended 6/30/15 (a) | For the Period 1/8/14* - 6/30/14 (a) | ||||||||||||||||
Net asset value, beginning of period | $ | 68.62 | $ | 58.09 | $ | 58.53 | $ | 53.60 | $ | 50.00 | ||||||||||
|
|
|
|
|
|
|
|
|
| |||||||||||
Income (loss) from investment operations: | ||||||||||||||||||||
Net investment income (loss) (b) | 1.13 | 0.97 | 1.02 | 0.81 | 0.31 | |||||||||||||||
Net realized and unrealized gain (loss) (c) | 7.30 | 10.53 | 0.00 | (d) | 6.48 | 3.59 | ||||||||||||||
|
|
|
|
|
|
|
|
|
| |||||||||||
Total from investment operations | 8.43 | 11.50 | 1.02 | 7.29 | 3.90 | |||||||||||||||
|
|
|
|
|
|
|
|
|
| |||||||||||
Net equalization credits and charges (b) | 0.05 | — | 0.20 | (0.04 | ) | — | ||||||||||||||
|
|
|
|
|
|
|
|
|
| |||||||||||
Other capital (b) | (0.00 | )(d) | — | — | — | — | ||||||||||||||
|
|
|
|
|
|
|
|
|
| |||||||||||
Distributions to shareholders from: | ||||||||||||||||||||
Net investment income | (0.96 | ) | (0.97 | ) | (1.03 | ) | (0.88 | ) | (0.30 | ) | ||||||||||
Net realized gains | (0.88 | ) | — | (0.63 | ) | (1.44 | ) | — | ||||||||||||
|
|
|
|
|
|
|
|
|
| |||||||||||
Total distributions | (1.84 | ) | (0.97 | ) | (1.66 | ) | (2.32 | ) | (0.30 | ) | ||||||||||
|
|
|
|
|
|
|
|
|
| |||||||||||
Net asset value, end of period | $ | 75.26 | $ | 68.62 | $ | 58.09 | $ | 58.53 | $ | 53.60 | ||||||||||
|
|
|
|
|
|
|
|
|
| |||||||||||
Total return (e) | 12.36 | % | 19.92 | % | 2.21 | % | 13.70 | % | 7.81 | % | ||||||||||
Ratios and Supplemental Data: | ||||||||||||||||||||
Net assets, end of period (in 000s) | $ | 30,102 | $ | 6,862 | $ | 5,809 | $ | 2,926 | $ | 5,360 | ||||||||||
Ratios to average net assets: | ||||||||||||||||||||
Total expenses | 0.60 | % | 0.60 | % | 0.61 | % | 0.60 | % | 0.60 | %(f) | ||||||||||
Net investment income (loss) | 1.51 | % | 1.52 | % | 1.78 | % | 1.42 | % | 1.25 | %(f) | ||||||||||
Portfolio turnover rate | 67 | % | 67 | %(g) | 39 | %(g) | 54 | %(g) | 27 | %(g)(h) | ||||||||||
| * | Commencement of operations. |
| (a) | The per share amounts and percentages include the Fund’s proportionate share of income and expenses of the Portfolio prior to discontinuance of the master feeder structure. See Note 1. |
| (b) | Per share numbers have been calculated using average shares outstanding, which more appropriately presents the per share data for the year. |
| (c) | Amounts shown in this caption for a share outstanding may not accord with the change in aggregate gains and losses in securities for the fiscal period because of the timing of sales and repurchases of Fund shares in relation to fluctuating market values for the Fund. |
| (d) | Amount is less than $0.005 per share. |
| (e) | Total return is calculated assuming a purchase of shares at net asset value on the first day and a sale at net asset value on the last day of each period reported. Distributions are assumed, for the purpose of this calculation, to be reinvested at net asset value per share on the respective payment dates of each distribution. Total returns for periods of less than one year are not annualized. Broker commission charges are not included in this calculation. |
| (f) | Annualized. |
| (g) | Portfolio turnover is from the Fund’s Portfolio prior to discontinuance of master-feeder structure. See Note 1. |
| (h) | Not annualized. |
See accompanying notes to financial statements.
49
Table of Contents
SSGA ACTIVE TRUST
FINANCIAL HIGHLIGHTS (continued)
Selected data for a share outstanding throughout each period
| SPDR MFS Systematic Growth Equity ETF | ||||||||||||||||||||
| Year Ended 6/30/18 (a) | Year Ended 6/30/17 (a) | Year Ended 6/30/16 (a) | Year Ended 6/30/15 (a) | For the Period 1/8/14* - 6/30/14 (a) | ||||||||||||||||
Net asset value, beginning of period | $ | 71.05 | $ | 60.67 | $ | 60.24 | $ | 53.56 | $ | 50.00 | ||||||||||
|
|
|
|
|
|
|
|
|
| |||||||||||
Income (loss) from investment operations: | ||||||||||||||||||||
Net investment income (loss) (b) | 0.61 | 0.70 | 0.63 | 0.66 | 0.28 | |||||||||||||||
Net realized and unrealized gain (loss) (c) | 9.80 | 10.27 | 1.62 | 8.60 | 3.55 | |||||||||||||||
|
|
|
|
|
|
|
|
|
| |||||||||||
Total from investment operations | 10.41 | 10.97 | 2.25 | 9.26 | 3.83 | |||||||||||||||
|
|
|
|
|
|
|
|
|
| |||||||||||
Net equalization credits and charges (b) | 0.04 | 0.01 | 0.01 | 0.00 | (d) | — | ||||||||||||||
|
|
|
|
|
|
|
|
|
| |||||||||||
Distributions to shareholders from: | ||||||||||||||||||||
Net investment income | (0.60 | ) | (0.60 | ) | (0.61 | ) | (0.68 | ) | 0.27 | |||||||||||
Net realized gains | (0.13 | ) | — | (1.22 | ) | (1.90 | ) | — | ||||||||||||
|
|
|
|
|
|
|
|
|
| |||||||||||
Total distributions | (0.73 | ) | (0.60 | ) | (1.83 | ) | (2.58 | ) | (0.27 | ) | ||||||||||
|
|
|
|
|
|
|
|
|
| |||||||||||
Net asset value, end of period | $ | 80.77 | $ | 71.05 | $ | 60.67 | $ | 60.24 | $ | 53.56 | ||||||||||
|
|
|
|
|
|
|
|
|
| |||||||||||
Total return (e) | 14.71 | % | 18.18 | % | 3.96 | % | 17.53 | % | 7.68 | % | ||||||||||
Ratios and Supplemental Data: | ||||||||||||||||||||
Net assets, end of period (in 000s) | $ | 44,424 | $ | 39,079 | $ | 12,134 | $ | 6,024 | $ | 5,356.00 | ||||||||||
Ratios to average net assets: | ||||||||||||||||||||
Total expenses | 0.61 | % | 0.60 | % | 0.61 | % | 0.60 | % | 0.60 | %(f) | ||||||||||
Net investment income (loss) | 0.77 | % | 1.05 | % | 1.06 | % | 1.14 | % | 1.16 | %(f) | ||||||||||
Portfolio turnover rate | 76 | % | 55 | %(g) | 56 | %(g) | 67 | %(g) | 20 | %(g)(h) | ||||||||||
| * | Commencement of operations. |
| (a) | The per share amounts and percentages include the Fund’s proportionate share of income and expenses of the Portfolio prior to discontinuance of the master feeder structure. See Note 1. |
| (b) | Per share numbers have been calculated using average shares outstanding, which more appropriately presents the per share data for the year. |
| (c) | Amounts shown in this caption for a share outstanding may not accord with the change in aggregate gains and losses in securities for the fiscal period because of the timing of sales and repurchases of Fund shares in relation to fluctuating market values for the Fund. |
| (d) | Amount is less than $0.005 per share. |
| (e) | Total return is calculated assuming a purchase of shares at net asset value on the first day and a sale at net asset value on the last day of each period reported. Distributions are assumed, for the purpose of this calculation, to be reinvested at net asset value per share on the respective payment dates of each distribution. Total returns for periods of less than one year are not annualized. Broker commission charges are not included in this calculation. |
| (f) | Annualized. |
| (g) | Portfolio turnover is from the Fund’s Portfolio prior to discontinuance of master-feeder structure. See Note 1. |
| (h) | Not annualized. |
See accompanying notes to financial statements.
50
Table of Contents
SSGA ACTIVE TRUST
FINANCIAL HIGHLIGHTS (continued)
Selected data for a share outstanding throughout each period
| SPDR MFS Systematic Value Equity ETF | ||||||||||||||||||||
| Year Ended 6/30/18 (a) | Year Ended 6/30/17 (a) | Year Ended 6/30/16 (a) | Year Ended 6/30/15 (a) | For the Period 1/8/14* - 6/30/14 (a) | ||||||||||||||||
Net asset value, beginning of period | $ | 59.81 | $ | 51.99 | $ | 57.90 | $ | 52.67 | $ | 50.00 | ||||||||||
|
|
|
|
|
|
|
|
|
| |||||||||||
Income (loss) from investment operations: | ||||||||||||||||||||
Net investment income (loss) (b) | 1.21 | 1.03 | 0.99 | 0.75 | 0.34 | |||||||||||||||
Net realized and unrealized gain (loss) (c) | 6.94 | 8.99 | (2.66 | ) | 6.28 | 2.67 | ||||||||||||||
|
|
|
|
|
|
|
|
|
| |||||||||||
Total from investment operations | 8.15 | 10.02 | (1.67 | ) | 7.03 | 3.01 | ||||||||||||||
|
|
|
|
|
|
|
|
|
| |||||||||||
Net equalization credits and charges (b) | 0.12 | 0.04 | — | (0.03 | ) | — | ||||||||||||||
|
|
|
|
|
|
|
|
|
| |||||||||||
Distributions to shareholders from: | ||||||||||||||||||||
Net investment income | (1.06 | ) | (1.01 | ) | (1.01 | ) | (0.85 | ) | (0.34 | ) | ||||||||||
Net realized gains | (1.11 | ) | (1.23 | ) | (3.23 | ) | (0.92 | ) | — | |||||||||||
|
|
|
|
|
|
|
|
|
| |||||||||||
Total distributions | (2.17 | ) | (2.24 | ) | (4.24 | ) | (1.77 | ) | (0.34 | ) | ||||||||||
|
|
|
|
|
|
|
|
|
| |||||||||||
Net asset value, end of period | $ | 65.91 | $ | 59.81 | $ | 51.99 | $ | 57.90 | $ | 52.67 | ||||||||||
|
|
|
|
|
|
|
|
|
| |||||||||||
Total return (d) | 13.82 | % | 19.61 | % | (2.47 | )% | 13.47 | % | 6.04 | % | ||||||||||
Ratios and Supplemental Data: | ||||||||||||||||||||
Net assets, end of period (in 000s) | $ | 32,953 | $ | 5,981 | $ | 2,599 | $ | 2,895 | $ | 5,267 | ||||||||||
Ratios to average net assets: | ||||||||||||||||||||
Total expenses | 0.60 | % | 0.60 | % | 0.62 | % | 0.60 | % | 0.60 | %(e) | ||||||||||
Net investment income (loss) | 1.83 | % | 1.80 | % | 1.85 | % | 1.36 | % | 1.43 | %(e) | ||||||||||
Portfolio turnover rate | 54 | % | 64 | %(f) | 64 | %(f) | 61 | %(f) | 23 | %(f)(g) | ||||||||||
| * | Commencement of operations. |
| (a) | The per share amounts and percentages include the Fund’s proportionate share of income and expenses of the Portfolio prior to discontinuance of the master feeder structure. See Note 1. |
| (b) | Per share numbers have been calculated using average shares outstanding, which more appropriately presents the per share data for the year. |
| (c) | Amounts shown in this caption for a share outstanding may not accord with the change in aggregate gains and losses in securities for the fiscal period because of the timing of sales and repurchases of Fund shares in relation to fluctuating market values for the Fund. |
| (d) | Total return is calculated assuming a purchase of shares at net asset value on the first day and a sale at net asset value on the last day of each period reported. Distributions are assumed, for the purpose of this calculation, to be reinvested at net asset value per share on the respective payment dates of each distribution. Total returns for periods of less than one year are not annualized. Broker commission charges are not included in this calculation. |
| (e) | Annualized. |
| (f) | Portfolio turnover is from the Fund’s Portfolio prior to discontinuance of master-feeder structure. See Note 1. |
| (g) | Not annualized. |
See accompanying notes to financial statements.
51
Table of Contents
SSGA ACTIVE TRUST
June 30, 2018
| 1. | Organization |
SSGA Active Trust (the “Trust”), a Massachusetts business trust registered under the Investment Company Act of 1940, as amended (“1940 Act”), is an open-end management investment company.
As of June 30, 2018, the Trust consists of twelve (12) series, each of which represents a separate series of beneficial interest in the Trust. The Declaration of Trust permits the Board of Trustees of the Trust (the “Board”) to authorize the issuance of an unlimited number of shares of beneficial interest with no par value. The financial statements herein relate to the following series (each, a “Fund” and collectively, the “Funds”):
SPDR SSGA Multi-Asset Real Return ETF
SPDR SSGA Income Allocation ETF
SPDR SSGA Global Allocation ETF
SPDR SSGA Ultra Short Term Bond ETF
SPDR MFS Systematic Core Equity ETF
SPDR MFS Systematic Growth Equity ETF
SPDR MFS Systematic Value Equity ETF
Each Fund is classified as a diversified investment company under the 1940 Act, with the exception of SPDR SSGA Ultra Short Term Bond ETF, which is a non-diversified investment company.
Prior to the close of business on May 7, 2018, each fund had been operating in a “ master-feeder” arrangement, under which each Fund invested substantially all of its assets in a corresponding series of SSGA Master Trust (i.e., a “Portfolio/ Master fund”). Each Portfolio was a separate mutual fund that had identical investment objective, and substantially identical investment strategies, policies and risks as the respective Fund ( i.e., a “feeder”). As a result of this arrangement, each Fund had an indirect interest in all of the securities owned by the corresponding Portfolio.
As of the close of business on May 8, 2018, the securities held by each Portfolio were transferred “in-kind” to their respective Feeder in a tax-free exchange of each Feeder’s interests as part of a complete liquidation of the corresponding Portfolio.
Effective May 7, 2018, each Fund pursues its investment objective through direct investment in securities of the same type that previously would have been owned by the corresponding Portfolio. The discontinuance of the master-feeder arrangement on each Fund had no impact on shareholder’s net asset value or the results of operations for each Fund.
Under the Trust’s organizational documents, its officers and trustees are indemnified against certain liabilities arising out of the performance of their duties to the Trust. Additionally, in the normal course of business, the Trust enters into contracts with service providers that contain general indemnification clauses. The Trust’s maximum exposure under these arrangements is unknown as this would involve future claims that may be made against the Trust that have not yet occurred.
| 2. | Summary of Significant Accounting Policies |
The following is a summary of significant accounting policies followed by the Trust in the preparation of its financial statements:
The preparation of financial statements in accordance with U.S. generally accepted accounting principles (“U.S. GAAP”) requires management to make estimates and assumptions that affect the reported amounts and disclosures in the financial statements. Actual results could differ from those estimates. Each Fund is an investment company under U.S. GAAP and follows the accounting and reporting guidance applicable to investment companies.
Security Valuation
Each Fund’s investments are valued at fair value each day that the New York Stock Exchange (“NYSE”) is open and, for financial reporting purposes, as of the report date should the reporting period end on a day that the NYSE is not open. Fair value is generally defined as the price a fund would receive to sell an asset or pay to transfer a liability in an orderly transaction between market participants at the measurement date. By its nature, a fair value price is a good faith estimate of the valuation in a current sale and may not reflect an actual market price. The investments of each Fund are valued pursuant to the policy and procedures developed by the Oversight Committee (the “Committee”) and approved by the Board. The Committee provides oversight of the valuation of investments for the Funds. The Board has responsibility for determining the fair value of investments.
52
Table of Contents
SSGA ACTIVE TRUST
NOTES TO FINANCIAL STATEMENTS (continued)
June 30, 2018
Valuation techniques used to value each Fund’s investments by major category are as follows:
| • | Equity investments (including preferred stocks and registered investment companies that are exchange-traded funds) traded on a recognized securities exchange for which market quotations are readily available are valued at the last sale price or official closing price, as applicable, on the primary market or exchange on which they trade. Equity investments traded on a recognized exchange for which there were no sales on that day are valued at the last published sale price or at fair value. |
| • | Investments in registered investment companies (including money market funds) or other unitized pooled investment vehicles that are not traded on an exchange are valued at that day’s published net asset value (“NAV”) per share or unit. |
| • | Government and municipal fixed income securities are generally valued using quotations from independent pricing services or brokers. Certain government inflation-indexed securities may require a calculated fair valuation as the cumulative inflation is contained within the price provided by the pricing service or broker. For these securities, the inflation component of the price is “cleaned” from the pricing service or broker price utilizing the published inflation factors in order to ensure proper accrual of income. |
| • | Debt obligations (including short-term investments and convertible debt securities) are valued using quotations from independent pricing services or brokers or are generally valued at the last reported evaluated prices. |
In the event prices or quotations are not readily available or that the application of these valuation methods results in a price for an investment that is deemed to be not representative of the fair value of such investment, fair value will be determined in good faith by the Committee, in accordance with the valuation policy and procedures approved by the Board.
Various inputs are used in determining the value of the Funds’ investments.
The Funds value their assets and liabilities at fair value using a fair value hierarchy consisting of three broad levels that prioritize the inputs to valuation techniques giving the highest priority to readily available unadjusted quoted prices in active markets for identical assets or liabilities (Level 1 measurements) and the lowest priority to unobservable inputs (Level 3 measurements) when market prices are not readily available or reliable. The categorization of a value determined for an investment within the hierarchy is based upon the pricing transparency of the investment and is not necessarily an indication of the risk associated with investing in it.
The three levels of the fair value hierarchy are as follows:
| • | Level 1 — Unadjusted quoted prices in active markets for an identical asset or liability; |
| • | Level 2 — Inputs other than quoted prices included within Level 1 that are observable for the asset or liability either directly or indirectly, including quoted prices for similar assets or liabilities in active markets, quoted prices for identical or similar assets or liabilities in markets that are not considered to be active, inputs other than quoted prices that are observable for the asset or liability (such as exchange rates, financing terms, interest rates, yield curves, volatilities, prepayment speeds, loss severities, credit risks and default rates) or other market-corroborated inputs; and |
| • | Level 3 — Unobservable inputs for the asset or liability, including the Committee’s assumptions used in determining the fair value of investments. |
The value of each Fund’s investments according to the fair value hierarchy as of June 30, 2018, is disclosed in each Fund’s respective Schedule of Investments.
Changes in valuation techniques may result in transfers in or out of an assigned level within the fair value hierarchy. Transfers between different levels of the fair value hierarchy are recognized at the end of the reporting period. The Funds had no transfers between levels for the period ended June 30, 2018.
Investment Transactions and Income Recognition
Investment transactions are accounted for on the trade date for financial reporting purposes. Realized gains and losses from security transactions, prior to May 7, 2018, consist of each Fund’s pro-rata share of its corresponding Portfolio’s realized gains and losses. Realized gains and losses from the sale and disposition of investments are determined using
53
Table of Contents
SSGA ACTIVE TRUST
NOTES TO FINANCIAL STATEMENTS (continued)
June 30, 2018
the identified cost method. For activity prior to May 7, 2018, net investment income consists of each Fund’s pro-rata share of the net investment income of its corresponding Portfolio less expenses of the Fund.
Subsequent to May 7, 2018 Dividend income and capital gain distributions, if any, are recognized on the ex-dividend date, net of any foreign taxes withheld at source, if any. Interest income is recorded on an accrual basis. All premiums and discounts are amortized/accreted for financial reporting purposes. Paydown gains and losses are recorded as an adjustment to interest income. Non-cash dividends received in the form of stock are recorded as dividend income at fair value.
Expenses
Certain expenses, which are directly identifiable to a specific Fund, are applied to that Fund within the Trust. Other expenses which cannot be attributed to a specific Fund are allocated in such a manner as deemed equitable, taking into consideration the nature and type of expense and the relative net assets of the Funds within the Trust.
Each Fund was allocated a pro rata share of the expenses of its corresponding portfolio prior to May 7, 2018.
Equalization
Certain Funds in the Trust follow the accounting practice known as “Equalization” by which a portion of the proceeds from sales and costs of reacquiring Fund shares, equivalent on a per share basis to the amount of distributable net investment income on the date of the transaction, is credited or charged to undistributed net investment income. As a result, undistributed net investment income per share is unaffected by sales or reacquisition of Fund shares. Amounts related to Equalization can be found on the Statements of Changes in Net Assets.
The following Funds utilized equalization during the period ended June 30, 2018:
SPDR SSGA Multi-Asset Real Return ETF
SPDR SSGA Income Allocation ETF
SPDR SSGA Global Allocation ETF
SPDR SSGA Ultra Short Term Bond ETF
SPDR MFS Systematic Core Equity ETF
SPDR MFS Systematic Growth Equity ETF
SPDR MFS Systematic Value Equity ETF
Distributions
Distributions from net investment income, if any, are declared and paid annually for all Funds, except for the SPDR SSGA Ultra Short Term Bond Fund ETF. The SPDR SSGA Ultra Short Term Bond Fund ETF declares and distributes distributions to shareholders monthly.
Net realized capital gains, if any, are distributed annually. Dividends may be declared and paid more frequently or at any other times to improve index tracking or to comply with the distribution requirements of the Internal Revenue Code of 1986, as amended (“Internal Revenue Code’). The amount and character of income and capital gains to be distributed are determined in accordance with applicable tax regulations which may differ from net investment income and realized gains recognized for U.S. GAAP purposes.
| 3. | Fees and Transactions with Affiliates |
Advisory Fee
Each Fund has entered into an Investment Advisory Agreement with SSGA FM. As compensation for services rendered, facilities furnished, and expenses borne by the Adviser, each Fund pays the Adviser a fee accrued daily and paid monthly, based on a percentage of each Fund’s average daily net assets as shown in the following table:
| Annual Rate* | ||||
SPDR SSGA Multi-Asset Real Return ETF | 0.70 | % | ||
SPDR SSGA Income Allocation ETF | 0.70 | |||
SPDR SSGA Global Allocation ETF | 0.35 | |||
SPDR SSGA Ultra Short Term Bond ETF | 0.20 | |||
54
Table of Contents
SSGA ACTIVE TRUST
NOTES TO FINANCIAL STATEMENTS (continued)
June 30, 2018
| Annual Rate | ||||
SPDR MFS Systematic Core Equity ETF | 0.60 | % | ||
SPDR MFS Systematic Growth Equity ETF | 0.60 | |||
SPDR MFS Systematic Value Equity ETF | 0.60 | |||
| * | The Advisory fee is reduced by the proportional amount of the advisory fee, of each Fund’s respective Portfolio prior discontinuance of master feeder structure on May 7, 2018, as well as for SPDR SSGA Multi-Asset Real Return ETF, SPDR SSGA Income Allocation ETF and SPDR SSGA Global Allocation ETF acquired fund fees and expenses. For the year ended June 30, 2018, the net annualized advisory fee was 0.05%, 0.21%, (0.09)%, 0.04%, 0.39%, 0.34% and 0.41% for the SPDR SSGA Multi-Asset Real Return ETF, SPDR SSGA Income Allocation ETF, SPDR SSGA Global Allocation ETF, SPDR SSGA Ultra Short Term Bond ETF, SPDR MFS Systematic Core Equity ETF, SPDR MFS Systematic Growth Equity ETF and SPDR MFS Systematic Value Equity ETF, respectively. For the SPDR SSGA Global Allocation ETF the reduction resulted in a fee reimbursement which is identified on the Statements of Operations. |
The Adviser pays all operating expenses of each Fund other than management fee, brokerage expenses, taxes, interest, fees and expenses of the Trust’s Independent Trustees (including any Trustees’ counsel fees), acquired fund fees and expenses, litigation expenses, and other extraordinary expenses.
Administrator, Custodian, Sub-Administrator and Transfer Agent Fees
SSGA FM serves as administrator and State Street Bank and Trust Company (“State Street”), an affiliate of the Adviser, serves as custodian, sub-administrator and transfer agent. State Street receives fees for its services as custodian, sub-administrator and transfer agent from the Adviser.
Distributor
State Street Global Advisors Funds Distributors, LLC (“SSGA FD” or the “Distributor”), an affiliate of the Adviser, serves as the distributor of the Trust.
Other Transactions with Affiliates
The Funds may invest in affiliated entities, including securities issued by State Street Corporation, affiliated funds, or entities deemed to be affiliates as a result of the Funds owning more than five percent of the entity’s voting securities or outstanding shares. Amounts relating to these transactions during the period ended June 30, 2018, are disclosed in the Schedules of Investments.
| 4. | Trustees’ Fees |
The fees and expenses of the Trust’s trustees , who are not “interested persons” of the Trust, as defined in the 1940 Act (“Independent Trustees”), are paid directly by the Funds. The Independent Trustees are reimbursed for travel and other out-of-pocket expenses in connection with meeting attendance and industry seminars.
| 5. | Investment Transactions |
Purchases and sales of investments (excluding in-kind transactions, derivative contracts and short term investments) for the period ended June 30, 2018, were as follows:
| Purchases | Sales | |||||||
SPDR SSGA Multi-Asset Real Return ETF | $ | 54,398,443 | $ | 54,340,299 | ||||
SPDR SSGA Income Allocation ETF | 28,915,101 | 28,731,400 | ||||||
SPDR SSGA Global Allocation ETF | 95,567,041 | 108,319,160 | ||||||
SPDR SSGA Ultra Short Term Bond ETF | 50,586,914 | 20,147,053 | ||||||
SPDR MFS Systematic Core Equity ETF | 10,432,933 | 10,675,039 | ||||||
SPDR MFS Systematic Growth Equity ETF | 37,322,582 | 37,586,674 | ||||||
SPDR MFS Systematic Value Equity ETF | 7,702,935 | 7,858,359 | ||||||
55
Table of Contents
SSGA ACTIVE TRUST
NOTES TO FINANCIAL STATEMENTS (continued)
June 30, 2018
For the period ended June 30, 2018, the following Funds had in-kind contributions, redemptions and net realized gains/losses in the amounts as follows:
| In-kind Contributions | In-kind Redemptions | In-kind Net Realized Gains/(Losses) | ||||||||||
SPDR SSGA Multi-Asset Real Return ETF | $ | 12,084,174 | $ | 9,224,196 | $ | 901,759 | ||||||
SPDR SSGA Income Allocation ETF | — | 1,567,090 | 135,925 | |||||||||
SPDR SSGA Global Allocation ETF | 1,711,605 | — | — | |||||||||
SPDR SSGA Ultra Short Term Bond ETF | — | — | — | |||||||||
SPDR MFS Systematic Core Equity ETF | 3,777,571 | 3,769,369 | 465,466 | |||||||||
SPDR MFS Systematic Growth Equity ETF | — | — | — | |||||||||
SPDR MFS Systematic Value Equity ETF | 3,304,364 | — | — | |||||||||
| 6. | Shareholder Transactions |
Each Fund issues and redeems its shares, at NAV, by each Fund only in aggregations of a specified number of shares or multiples thereof (“Creation Units”). Except when aggregated in Creation Units, shares of each Fund are not redeemable. Transactions in capital shares for each Fund are disclosed in detail in the Statements of Changes in Net Assets.
The consideration for the purchase of Creation Units of a Fund may consist of the in-kind deposit of a designated portfolio of securities and a specified amount of cash. Investors purchasing and redeeming Creation Units may pay a purchase transaction fee and a redemption transaction fee directly to the Trust and/or custodian, to offset transfer and other transaction costs associated with the issuance and redemption of Creation Units, including Creation Units for cash. An additional variable fee may be charged for certain transactions. Such variable charges, if any, are included in “Other Capital” on the Statements of Changes in Net Assets.
| 7. | Income Tax Information |
The Funds have qualified and intend to continue to qualify as regulated investment companies under Subchapter M of the Internal Revenue Code of 1986, as amended. Each Fund will not be subject to federal income taxes to the extent it distributes its taxable income, including any net realized capital gains, for each fiscal year. Therefore, no provision for federal income tax is required.
The Funds file federal and various state and local tax returns as required. No income tax returns are currently under examination. Generally, the federal returns are subject to examination by the Internal Revenue Service for a period of three years from date of filing, while the state returns may remain open for an additional year depending upon jurisdiction. SSGA FM has analyzed each Fund’s tax positions taken on tax returns for all open years and does not believe there are any uncertain tax positions that would require recognition of a tax liability.
Distributions to shareholders are recorded on ex-dividend date. Income dividends and gain distributions are determined in accordance with income tax rules and regulations, which may differ from generally accepted accounting principles.
Certain capital accounts in the financial statements have been adjusted for permanent book-tax differences. These adjustments have no impact on net asset values or results of operations. Temporary book-tax differences will reverse in the future. These book-tax differences are primarily due to differing treatments for character of distributions, nontaxable dividend adjustments to income, in-kind transactions, partnership basis adjustments and wash sale loss deferrals. In addition, certain Funds claimed a portion of the payments made to redeeming shareholders as a distribution for income tax purposes.
The tax character of distributions paid during the year ended June 30, 2018, was as follows:
| Ordinary Income | Long-Term Capital Gains | Total | ||||||||||
SPDR SSGA Multi-Asset Real Return ETF | $ | 2,542,937 | $ | — | $ | 2,524,937 | ||||||
SPDR SSGA Income Allocation ETF | 2,983,228 | — | 2,983,228 | |||||||||
56
Table of Contents
SSGA ACTIVE TRUST
NOTES TO FINANCIAL STATEMENTS (continued)
June 30, 2018
| Ordinary Income | Long-Term Capital Gains | Total | ||||||||||
SPDR SSGA Global Allocation ETF | $ | 5,038,036 | $ | — | $ | 5,038,036 | ||||||
SPDR SSGA Ultra Short Term Bond ETF | 440,203 | — | 440,203 | |||||||||
SPDR MFS Systematic Core Equity ETF | 288,664 | 73,789 | 362,453 | |||||||||
SPDR MFS Systematic Growth Equity ETF | 501,100 | — | 501,100 | |||||||||
SPDR MFS Systematic Value Equity ETF | 311,625 | 60,970 | 372,595 | |||||||||
The tax character of distributions paid during the year ended June 30, 2017, was as follows:
| Ordinary Income | Long-Term Capital Gains | Total | ||||||||||
SPDR SSGA Multi-Asset Real Return ETF | $ | 2,180,468 | $ | — | $ | 2,180,468 | ||||||
SPDR SSGA Income Allocation ETF | 3,075,849 | — | 3,075,849 | |||||||||
SPDR SSGA Global Allocation ETF | 4,865,796 | — | 4,865,796 | |||||||||
SPDR SSGA Ultra Short Term Bond ETF | 162,266 | — | 162,266 | |||||||||
SPDR MFS Systematic Core Equity ETF | 96,747 | — | 96,747 | |||||||||
SPDR MFS Systematic Growth Equity ETF | 196,549 | — | 196,549 | |||||||||
SPDR MFS Systematic Value Equity ETF | 83,567 | 52,272 | 135,839 | |||||||||
At June 30, 2018, the components of distributable earnings on a tax basis were as follows:
| Undistributed Ordinary Income | Capital Loss Carryforwards | Undistributed Long-Term Capital Gains | Net Unrealized Gains (Losses) | Qualified Late-Year Losses* | Total | |||||||||||||||||||
SPDR SSGA Multi-Asset Real Return ETF | — | (33,524,267 | ) | — | 2,153,801 | — | (31,370,466 | ) | ||||||||||||||||
SPDR SSGA Income Allocation ETF | 302,435 | (6,875,279 | ) | — | 2,283,852 | — | (4,288,992 | ) | ||||||||||||||||
SPDR SSGA Global Allocation ETF | 335,901 | (6,376,823 | ) | — | 21,201,167 | — | 15,160,245 | |||||||||||||||||
SPDR SSGA Ultra Short Term Bond ETF | 47,385 | (287,597 | ) | — | 3,820 | — | (236,392 | ) | ||||||||||||||||
SPDR MFS Systematic Core Equity ETF | — | — | — | 431,910 | (3,400 | ) | 428,510 | |||||||||||||||||
SPDR MFS Systematic Growth Equity ETF | 412,702 | — | — | 1,675,548 | — | 2,088,250 | ||||||||||||||||||
SPDR MFS Systematic Value Equity ETF | 123,367 | — | 175,077 | 877,838 | — | 1,176,282 | ||||||||||||||||||
| * | The Funds have elected to defer certain qualified late-year losses and recognize such losses in the next taxable year. |
As of June 30, 2018, the following Funds had capital loss carryforwards available to offset future realized capital gains through the indicated expiration dates as follows:
| Non-Expiring Short Term | Non-Expiring Long Term | |||||||
SPDR SSGA Multi-Asset Real Return ETF | $ | 9,431,204 | $ | 24,093,063 | ||||
SPDR SSGA Income Allocation ETF | 5,331,081 | 1,544,198 | ||||||
SPDR SSGA Global Allocation ETF | 6,376,823 | — | ||||||
SPDR SSGA Ultra Short Term Bond ETF | 272,054 | 15,543 | ||||||
As of June 30, 2018, gross unrealized appreciation and gross unrealized depreciation of investments and other financial instruments based on cost for federal income tax purposes were as follows:
| Tax Cost | Gross Unrealized Appreciation | Gross Unrealized Depreciation | Net Unrealized Appreciation (Depreciation) | |||||||||||||
SPDR SSGA Multi-Asset Real Return ETF | $ | 149,461,300 | $ | 3,422,646 | $ | 1,268,844 | $ | 2,153,802 | ||||||||
SPDR SSGA Income Allocation ETF | 102,302,244 | 4,129,857 | 1,846,004 | 2,283,853 | ||||||||||||
57
Table of Contents
SSGA ACTIVE TRUST
NOTES TO FINANCIAL STATEMENTS (continued)
June 30, 2018
| Tax Cost | Gross Unrealized Appreciation | Gross Unrealized Depreciation | Net Unrealized Appreciation (Depreciation) | |||||||||||||
SPDR SSGA Global Allocation ETF | $ | 235,957,025 | $ | 22,134,237 | $ | 933,070 | $ | 21,201,167 | ||||||||
SPDR SSGA Ultra Short Term Bond ETF | 50,953,962 | 35,853 | 32,033 | 3,820 | ||||||||||||
SPDR MFS Systematic Core Equity ETF | 29,650,439 | 1,542,457 | 1,110,546 | 431,911 | ||||||||||||
SPDR MFS Systematic Growth Equity ETF | 42,722,465 | 3,360,541 | 1,684,993 | 1,675,548 | ||||||||||||
SPDR MFS Systematic Value Equity ETF | 32,042,035 | 1,687,603 | 809,766 | 877,837 | ||||||||||||
| 8. | Line of Credit |
Certain Funds and other affiliated funds (each a “Participant” and, collectively, the “Participants”) participate in a $500 million revolving credit facility provided by a syndication of banks under which the Participants may borrow to fund shareholder redemptions. This agreement expires in October 2018 unless extended or renewed.
The SPDR Ultra Short Term Bond ETF participates in the credit facility as of period ended June 30, 2018:
The Participants are charged an annual commitment fee which is calculated based on the unused portion of the shared credit line. Commitment fees are allocated among each of the Participants based on relative net assets. Commitment fees are ordinary fund operating expenses. A Participant incurs and pays the interest expense related to its borrowing. Interest is calculated at a rate per annum equal to the sum of 1% plus the greater of the New York Fed Bank Rate and 1-month LIBOR rate.
The Fund had no outstanding loans as of June 30, 2018.
| 9. | Risks |
Concentration Risk
As a result of the Funds’ ability to invest a large percentage of its assets in obligations of issuers within the same country, state, region, currency or economic sector, an adverse economic, business or political development may affect the value of the Funds’ investments more than if the Fund were more broadly diversified.
Foreign and Emerging Markets Risk
Investing in foreign markets involves risks and considerations not typically associated with investing in the U.S. Foreign securities may be subject to risk of loss because of government regulation, economic, political and social instability in the countries in which the Funds invest. Foreign markets may be less liquid than investments in the U.S. and may be subject to the risks of currency fluctuations. To the extent that the Funds invest in securities of issuers located in emerging markets, these risks may be even more pronounced.
Market and Credit Risk
In the normal course of business, the Funds trade financial instruments and enter into financial transactions where risk of potential loss exists due to changes in the general economic conditions and fluctuations of the market (market risk). Additionally, a Fund may also be exposed to credit risk in the event that an issuer or guarantor fails to perform or that an institution or entity with which the Fund has unsettled or open transactions defaults.
| 10. | Recent Accounting Pronouncements |
In March 2017, the Financial Accounting Standards Board (FASB) issued Accounting Standards Update (ASU) No. 2017-08, Receivables — Nonrefundable Fees and Other Costs (Subtopic 310-20): Premium Amortization on Purchased Callable Debt Securities. The amendments in the ASU shorten the amortization period for certain callable debt securities, held at a premium, to be amortized to the earliest call date. The ASU does not require an accounting change for securities held at a discount; which continues to be amortized to maturity. The ASU is effective for fiscal years and interim periods within those fiscal years beginning after December 15, 2018. Management is currently evaluating the impact, if any, of applying this provision.
| 11. | Subsequent Events |
Management has evaluated the impact of all subsequent events on the Funds through the date on which the financial statements were available to be issued and has determined that there were no subsequent events requiring adjustment or disclosure in the financial statements.
58
Table of Contents
SSGA ACTIVE TRUST
REPORT OF INDEPENDENT REGISTERED PUBLIC ACCOUNTING FIRM
To the Shareholders of SPDR SSGA Multi-Asset Real Return ETF, SPDR SSGA Income Allocation ETF, SPDR SSGA Global Allocation ETF, SPDR SSGA Ultra Short Term Bond ETF, SPDR MFS Systematic Core Equity ETF, SPDR MFS Systematic Growth Equity ETF and SPDR MFS Systematic Value Equity ETF and Board of Trustees of SSGA Active Trust
Opinion on the Financial Statements
We have audited the accompanying statements of assets and liabilities of SPDR SSGA Multi-Asset Real Return ETF, SPDR SSGA Income Allocation ETF, SPDR SSGA Global Allocation ETF, SPDR SSGA Ultra Short Term Bond ETF, SPDR MFS Systematic Core Equity ETF, SPDR MFS Systematic Growth Equity ETF and SPDR MFS Systematic Value Equity ETF (collectively referred to as the “Funds”) (seven of the funds constituting SSGA Active Trust (the “Trust”)), including the schedules of investments, as of June 30, 2018, and the related statements of operations and changes in net assets, and the financial highlights for each of the periods indicated in the table below and the related notes (collectively referred to as the “financial statements”). In our opinion, the financial statements present fairly, in all material respects, the financial position of each of the Funds (seven of the funds constituting SSGA Active Trust) at June 30, 2018, and the results of their operations, changes in net assets and financial highlights for each of the periods indicated in the table below, in conformity with U.S. generally accepted accounting principles.
| Individual fund constituting the SSGA Active Trust | Statement of operations | Statements of changes in net assets | Financial highlights | |||
| SPDR SSGA Multi-Asset Real Return ETF | For the year ended June 30, 2018 | For each of the two years in the period ended June 30, 2018 | For each of the five years in the period ended June 30, 2018 | |||
| SPDR SSGA Income Allocation ETF | For the year ended June 30, 2018 | For each of the two years in the period ended June 30, 2018 | For each of the five years in the period ended June 30, 2018 | |||
| SPDR SSGA Global Allocation ETF | For the year ended June 30, 2018 | For each of the two years in the period ended June 30, 2018 | For each of the five years in the period ended June 30, 2018 | |||
| SPDR SSGA Ultra Short Term Bond ETF | For the year ended June 30, 2018 | For each of the two years in the period ended June 30, 2018 | For each of the four years in the period ended June 30, 2018 and the period from October 9, 2013 (commencement of operations) through June 30, 2014 | |||
| SPDR MFS Systematic Core Equity ETF | For the year ended June 30, 2018 | For each of the two years in the period ended June 30, 2018 | For each of the four years in the period ended June 30, 2018 and the period from January 8, 2014 (commencement of operations) through June 30, 2014 | |||
| SPDR MFS Systematic Growth Equity ETF | For the year ended June 30, 2018 | For each of the two years in the period ended June 30, 2018 | For each of the four years in the period ended June 30, 2018 and the period from January 8, 2014 (commencement of operations) through June 30, 2014 | |||
| SPDR MFS Systematic Value Equity ETF | For the year ended June 30, 2018 | For each of the two years in the period ended June 30, 2018 | For each of the four years in the period ended June 30, 2018 and the period from January 8, 2014 (commencement of operations) through June 30, 2014 |
Basis for Opinion
These financial statements are the responsibility of the Trust’s management. Our responsibility is to express an opinion on the Funds’ financial statements based on our audits. We are a public accounting firm registered with the Public Company Accounting Oversight Board (United States) (“PCAOB”) and are required to be independent with respect to the Trust in accordance with the U.S. federal securities laws and the applicable rules and regulations of the Securities and Exchange Commission and the PCAOB.
59
Table of Contents
SSGA ACTIVE TRUST
REPORT OF INDEPENDENT REGISTERED PUBLIC ACCOUNTING FIRM (continued)
We conducted our audits in accordance with the standards of the PCAOB. Those standards require that we plan and perform the audit to obtain reasonable assurance about whether the financial statements are free of material misstatement, whether due to error or fraud. The Trust is not required to have, nor were we engaged to perform, an audit of the Trust’s internal control over financial reporting. As part of our audits, we are required to obtain an understanding of internal control over financial reporting, but not for the purpose of expressing an opinion on the effectiveness of the Trust’s internal control over financial reporting. Accordingly, we express no such opinion.
Our audits included performing procedures to assess the risks of material misstatement of the financial statements, whether due to error or fraud, and performing procedures that respond to those risks. Such procedures included examining, on a test basis, evidence regarding the amounts and disclosures in the financial statements. Our procedures included confirmation of securities owned as of June 30, 2018, by correspondence with the custodian, brokers and others or by other appropriate auditing procedures where replies from brokers and others were not received. Our audits also included evaluating the accounting principles used and significant estimates made by management, as well as evaluating the overall presentation of the financial statements. We believe that our audits provide a reasonable basis for our opinion.

We have served as the auditor of one or more State Street Global Advisors investment companies since 2000.
Boston, Massachusetts
August 31, 2018
60
Table of Contents
SSGA ACTIVE TRUST
June 30, 2018 (Unaudited)
Expense Example
As a shareholder of a Fund, you incur two types of costs: (1) transaction costs, including sales charges (loads), if applicable, on purchase payments, reinvested dividends, or other distributions and (2) ongoing costs, including advisory fees and other Fund expenses. This example is intended to help you understand your ongoing costs (in dollars) of investing in the Fund and to compare these costs with the ongoing costs of investing in other mutual funds. It is based on an investment of $1,000 made at the beginning of the period shown and held for the entire period from January 1, 2018 to June 30, 2018.
The table below illustrates your Fund’s cost in two ways:
Based on actual fund return —This section helps you to estimate the actual expenses that you paid over the period. The “Ending Account Value” shown is derived from each Fund’s actual return, and the third column shows the dollar amount that would have been paid by an investor who started with $1,000 in the Fund. You may use the information here, together with the amount you invested, to estimate the expenses that you paid over the period. To do so, simply divide your account value by $1,000 (for example, an $8,600 account value divided by $1,000 = 8.6), then multiply the result by the number given for the Fund under the heading “Expenses Paid During Period”.
Based on hypothetical 5% return —This section is intended to help you compare your Fund’s costs with those of other mutual funds. It assumes that the Fund had a yearly return of 5% before expenses, but that the expense ratio is unchanged. In this case, because the return used is not the Fund’s actual return, the results do not apply to your investment. The example is useful in making comparisons because the U.S. Securities and Exchange Commission (the “SEC”) requires all mutual funds to calculate expenses based on a 5% return. You can assess your Fund’s costs by comparing this hypothetical example with the hypothetical examples that appear in shareholder reports of other funds.
Please note that the expenses shown in the table are meant to highlight your ongoing costs only and do not reflect any transaction costs, such as sales load charges (loads). Therefore, the hypothetical 5% return section of the table is useful in comparing ongoing costs only, and will not help you determine the relative total costs of owning different funds. In addition, if these transaction costs were included, your costs would have been higher.
| Actual | Hypothetical (assuming a 5% return before expenses) | |||||||||||||||||||
| Annualized Expense Ratio(a) | Ending Account Value | Expenses Paid During Period(a) | Ending Account Value | Expenses Paid During Period(a) | ||||||||||||||||
SPDR SSGA Multi-Asset Real Return ETF | 0.22 | % | $ | 1,018.70 | $ | 1.10 | $ | 1,023.70 | $ | 1.10 | ||||||||||
SPDR SSGA Income Allocation ETF | 0.39 | 975.50 | 1.91 | 1,022.90 | 1.96 | |||||||||||||||
SPDR SSGA Global Allocation ETF | 0.10 | 996.10 | 0.49 | 1,024.30 | 0.50 | |||||||||||||||
SPDR SSGA Ultra Short Term Bond ETF | 0.20 | 1,009.50 | 1.00 | 1,023.80 | 1.00 | |||||||||||||||
SPDR MFS Systematic Core Equity ETF | 0.60 | 1,021.20 | 3.01 | 1,021.80 | 3.01 | |||||||||||||||
SPDR MFS Systematic Growth Equity ETF | 0.61 | 1,022.10 | 3.06 | 1,021.80 | 3.06 | |||||||||||||||
SPDR MFS Systematic Value Equity ETF | 0.60 | 1,009.10 | 2.99 | 1,021.80 | 3.01 | |||||||||||||||
| (a) | Expenses are equal to the Fund’s annualized net expense ratio multiplied by the average account value of the period, multiplied by 181, then divided by 365. |
Tax Information
For federal income tax purposes, the following information is furnished with respect to the distributions of the Trust for its fiscal year ended June 30, 2018.
61
Table of Contents
SSGA ACTIVE TRUST
OTHER INFORMATION (continued)
June 30, 2018 (Unaudited)
Dividends Received Deduction
Each Fund reports the maximum amount allowable of its net taxable income as eligible for the corporate dividends received deduction.
Qualified Dividend Income
A portion of dividends distributed by the Funds during the fiscal year ended June 30, 2018 are considered qualified dividend income and are eligible for reduced tax rates. These lower rates range from 5% to 20% depending on the individual’s tax bracket. Each Fund reports the maximum amount allowable of its net taxable income as qualified dividend income as provided in the Jobs and Growth Tax Relief Reconciliation Act of 2003.
Qualified Interest Income
Each Fund reports the maximum amount allowable of its net taxable income and short-term capital gain as qualified interest income.
Long term capital gains dividends were paid from the following Funds during the year ended June 30, 2018:
| Amount | ||||
SPDR MFS Systematic Core Equity ETF | $ | 136,260 | ||
SPDR MFS Systematic Value Equity ETF | 60,970 | |||
Foreign Tax Credit
The Funds have made an election under Internal Revenue Code Section 853 to pass through foreign taxes paid by the Funds to its shareholders. For the year ended June 30, 2018, the total amount of foreign taxes that will be passed through are:
| Amount | ||||
SPDR SSGA Multi-Asset Real Return ETF | $ | 124,514 | ||
SPDR SSGA Income Allocation ETF | 90,328 | |||
SPDR SSGA Global Allocation ETF | 121,724 | |||
The amount of foreign source income earned on the following Funds during the year ended June 30, 2018 were as follows:
| Amount | ||||
SPDR SSGA Multi-Asset Real Return ETF | $ | 1,233,247 | ||
SPDR SSGA Income Allocation ETF | 1,015,389 | |||
SPDR SSGA Global Allocation ETF | 2,097,001 | |||
Premium/Discount Information
Information regarding how often the Shares of each Fund traded on the exchange at a price above (i.e. at a premium) or below (i.e. at a discount) the NAV of the Fund during the past calendar year can be found at www.spdrs.com.
Proxy Voting Policies and Procedures and Records
A description of the Trust’s proxy voting policies and procedures that are used by the Funds’ investment adviser to vote proxies relating to the Funds’ portfolio of securities are available (i) without charge, upon request by calling 1-866-787-2257 (toll free) or (ii) on the SEC’s website, at www.sec.gov.
Information regarding how the investment adviser voted for the prior 12-months period ended June 30, is available by August 31 of each year by calling the same number and on the SEC’s website, at www.sec.gov, and on the Funds’ website at www.spdrs.com.
62
Table of Contents
SSGA ACTIVE TRUST
OTHER INFORMATION (continued)
June 30, 2018 (Unaudited)
Quarterly Portfolio Schedule
The Funds file a complete schedule of investments with the SEC for the first and third quarters of each fiscal year on Form N-Q. The Funds’ Forms N-Q are available on the SEC’s website at www.sec.gov and may be reviewed and copied at the SEC’s Public Reference Room in Washington DC. Information on the operation of the Public Reference Room may be obtained by calling 1-800-SEC-0330. The information on the Form N-Q is available upon request, without charge, by calling 1-866-787-2257 (toll free) and on the Funds’ website at www.spdrs.com.
Approval of Advisory Agreement
At in-person meetings held prior to June 30, 2018, the Board of Trustees of the Trust (the “Board”) evaluated proposals to continue the Investment Advisory Agreement (the “Agreement”) between the Trust and SSGA Funds Management, Inc. (the “Adviser” or “SSGA FM”) with respect to the following operational series of SSGA Active Trust: SPDR SSGA Multi-Asset Real Return ETF, SPDR SSGA Income Allocation ETF, SPDR SSGA Global Allocation ETF, SPDR SSGA Ultra Short Term Bond ETF, SPDR MFS Systematic Core Equity ETF, SPDR MFS Systematic Growth Equity ETF and SPDR MFS Systematic Value Equity ETF (the “Funds”). The Trustees who are not “interested persons” of the Trust within the meaning of the Investment Company Act of 1940, as amended (the “Independent Trustees”), also met separately to consider the Agreement. The Independent Trustees were advised by their independent legal counsel throughout the process.
To evaluate the Agreement, the Board requested, and SSGA FM, the Trust’s investment adviser and administrator, and State Street Bank and Trust Company, the Trust’s sub-administrator, transfer agent and custodian (“State Street”) provided, such materials as the Board, with the advice of counsel, deemed reasonably necessary. In deciding whether to approve the Agreement, the Board considered various factors, including the (i) nature, extent and quality of services provided by the Adviser with respect to the Funds under the Agreement, (ii) investment performance of the Funds, (iii) profits realized by the Adviser and its affiliates from its relationship with the Trust, (iv) fees charged to comparable funds, (v) other benefits to the Adviser, and (vi) extent to which economies of scale would be shared as the Funds grow.
Nature, Extent and Quality of Services
The Board considered the nature, extent and quality of services provided by the Adviser. In doing so, the Trustees relied on their prior experience in overseeing the management of the Trust and materials provided prior to and at the meeting. The Board reviewed the Agreement and the Adviser’s responsibilities for managing investment operations of each of the Funds in accordance with each Fund’s investment objectives and policies, and applicable legal and regulatory requirements. The Board appreciated the nature of the Funds as exchange-traded funds and the experience and expertise of the Adviser with exchange-traded funds. The Board considered the background and experience of the Adviser’s senior management, including those individuals responsible for portfolio management, oversight of sub-advisers and regulatory compliance of the Funds. The Board also considered the portfolio management resources, structures and practices of the Adviser, including those associated with monitoring and securing each Fund’s compliance with its investment objectives and policies and with applicable laws and regulations. The Board also considered information about the Adviser’s best execution procedures and overall investment management business, noting that the Adviser serves a wide range of clients across a broad spectrum of asset classes. The Board looked at the Adviser’s general knowledge of the investment management business and that of its affiliates which make up State Street Global Advisors, through which the Adviser shares all of its senior personnel. The Board considered that the Adviser and its affiliates constitute one of the world’s largest investment management enterprises for exchange-traded funds. The Board specifically considered the Adviser’s experience in active management, managing exchange-traded funds, and in overseeing third-party sub-advisers, as applicable.
Investment Performance
The Board then reviewed the Funds’ performance. The Board compared each Fund’s investment performance to the performance of an appropriate benchmark (gross of expenses) and a group of comparable funds (net of expenses). Among other information, the Board considered the following performance information in its evaluation of the Funds:
SPDR SSGA Multi-Asset Real Return ETF. The Board considered that, although the Fund underperformed the median of its Performance Group for the 1-, 3-, 4- and 5-year periods, the Fund outperformed the median of its Performance Group for the 2-year period. In addition, the Board considered that the Fund underperformed its benchmark index for the 1-, 3- and 5-year and since inception periods.
63
Table of Contents
SSGA ACTIVE TRUST
OTHER INFORMATION (continued)
June 30, 2018 (Unaudited)
SPDR SSGA Income Allocation ETF. The Board considered that, although the Fund underperformed the median of its Performance Group for the 1- and 5-year periods, it either equaled or outperformed the median of its Performance Group for the 2-, 3- and 4-year periods. In addition, the Board considered that although the Fund underperformed its benchmark index for the 3- and 5-year and since inception periods, it outperformed its benchmark index for the 1-year period.
SPDR SSGA Global Allocation ETF. The Board considered that the Fund outperformed the median of its Performance Group for the 1-, 2-, 3-, 4- and 5-year periods. In addition, the Board considered that although the Fund underperformed its benchmark index for the 3-year period, it outperformed its benchmark index for the 1- and 5-year and since inception periods.
SPDR SSGA Ultra Short Term Bond ETF. The Board considered that although the Fund underperformed the median of its Performance Group for the 1- and 4-year periods, it equaled the median of its Performance Group for the 2- and 3-year periods. In addition, the Board considered that the Fund outperformed its benchmark index for the 1- and 3-year and since inception periods.
SPDR MFS Systematic Core Equity ETF. The Board considered that the Fund outperformed the median of its Performance Group for the 1-, 2- and 3-year periods. In addition, the Board considered that although the Fund underperformed its benchmark index for the most recent 1-year period, it outperformed its benchmark index for the 3-year and since inception periods.
SPDR MFS Systematic Growth Equity ETF. The Board considered that the Fund outperformed the median of its Performance Group for the 1-, 2- and 3- year periods. In addition, the Board considered that although the Fund underperformed its benchmark index for the most recent 1-year period, it outperformed its benchmark index for the 3-year and since inception periods.
SPDR MFS Systematic Value Equity ETF. The Board considered that the Fund outperformed the median of its Performance Group for the 1-, 2- and 3- year periods. In addition, the Board considered that the Fund outperformed its benchmark index for the 1- and 3-year and since inception periods.
In those instances where the Board observed underperformance, the Trustees considered management’s explanation of those factors that contributed to such underperformance and steps being taken in response to such factors.
Profits Realized by Adviser
The Board considered the profitability of the advisory arrangement with the Funds to the Adviser, including data on the Funds’ historical profitability to the Adviser. The Board, including the Independent Trustees, with their independent legal counsel, had the opportunity to discuss, with representatives of the Adviser and State Street, methodologies used in computing costs that formed the bases of profitability calculations.
Fees Charged to Comparable Funds
The Board evaluated each Fund’s unitary fee through review of comparative information with respect to fees paid by similar funds — i.e., exchange-traded funds that are actively managed. The Board reviewed the universe of similar exchange-traded funds for each Fund based upon data independently obtained from Broadridge Financial Solutions, Inc. (formerly Lipper Analytical Services) and related comparative information for similar exchange-traded funds. In doing so, the Board used a fund by fund analysis of the data.
Other Benefits
The Board also considered whether the Adviser or its affiliates benefited in other ways from its relationship with the Trust, noting that the Adviser does not maintain soft-dollar arrangements in connection with the Trust’s brokerage transactions.
Economies of Scale
The Board reviewed information regarding economies of scale or other efficiencies that may result as each Fund’s assets grow in size. The Board noted that the Agreement did not provide for breakpoints in each Fund’s advisory fee rates as assets of a Fund increase. However, the Board further noted the Adviser’s assertion that future economies of scale
64
Table of Contents
SSGA ACTIVE TRUST
OTHER INFORMATION (continued)
June 30, 2018 (Unaudited)
(among several factors) had been taken into consideration for the Funds by fixing relatively low advisory fees, effectively sharing the benefits of lower fees with the Funds from inception. The Adviser also asserted that one of the benefits of the unitary fee was to provide an unvarying expense structure, which could be lost or diluted with the addition of breakpoints. The Board noted that it intends to continue to monitor fees as the Funds grow in size and assess whether fee breakpoints may be warranted.
Conclusion
After weighing the foregoing factors, none of which was dispositive in itself and may have been weighed differently by each Trustee, the Board, including the Independent Trustees voting separately, approved the Agreement for each Fund. The Board’s conclusions with respect to the factors were as follows: (a) the nature and extent of the services provided by the Adviser with respect to the Funds were appropriate; (b) the performance of each Fund had been satisfactory; (c) the Adviser’s unitary fee for each Fund, considered in relation to services provided and in relation to fees charged to comparable funds, was fair and reasonable; (d) profitability of the Trust’s relationship with the Adviser was not excessive; (e) any additional potential benefits to the Adviser or its affiliates were not of a magnitude to materially affect the Board’s conclusions; and (f) the fees paid to the Adviser shared the economies of scale with respect to the Funds by way of the relatively low fee structure of the Trust.
Approval of Massachusetts Financial Services Company Sub-Advisory Agreement
At in-person meetings held prior to June 30, 2018, the Board also evaluated a proposal to continue the Sub-Advisory Agreement (the “MFS Sub-Advisory Agreement”) between the Adviser and Massachusetts Financial Services Company (“MFS”) with respect to the SPDR MFS Systematic Core Equity ETF, SPDR MFS Systematic Growth Equity ETF and SPDR MFS Systematic Value Equity ETF, each a series of the SSGA Active Trust (the “MFS Funds”). The Independent Trustees also met separately to consider the MFS Sub-Advisory Agreement. The Independent Trustees were advised by their independent legal counsel throughout the process.
To evaluate the MFS Sub-Advisory Agreement, the Board requested, and MFS and the Adviser provided, such materials as the Board, with the advice of counsel, deemed reasonably necessary. In deciding whether to approve the MFS Sub-Advisory Agreement, the Board considered various factors, including the (i) nature, extent and quality of services provided by MFS with respect to the MFS Funds under the MFS Sub-Advisory Agreement and (ii) investment performance of the MFS Funds. The Board was informed of the portion of the current advisory fee that the Adviser would pay to MFS under the MFS Sub-Advisory Agreement and also considered that such fees would be paid directly by the Adviser and would not result in increased fees payable by the MFS Funds.
The Board considered the background and experience of MFS’s senior management and, in particular, MFS’s experience in investing in equity securities. The Board reviewed the MFS Funds’ performance, noting that the performance of the MFS Funds was satisfactory. The Board also considered the unitary fee paid to the Adviser by each MFS Fund and MFS’s fees paid by the Adviser. The Board also considered whether MFS benefited in other ways from its relationship with the SSGA Active Trust.
After weighing the foregoing factors as well as the relevant factors discussed in relation to the MFS Sub-Advisory Agreement between the SSGA Active Trust and the Adviser, none of which was dispositive in itself and may have been weighed differently by each Trustee, the Board, including the Independent Trustees voting separately, approved the MFS Sub-Advisory Agreement for each MFS Fund. The Board’s conclusions with respect to the factors were as follows: (a) the nature and extent of the services provided by MFS with respect to the MFS Funds were appropriate; (b) the performance of the MFS Funds had been satisfactory; (c) MFS’s fees for the MFS Funds and the unitary fee, considered in relation to the services provided, were fair and reasonable; (d) any additional potential benefits to MFS were not of a magnitude to materially affect the Board’s conclusions; and (e) the fees paid to MFS adequately shared the economies of scale with each applicable MFS Fund by way of the relatively low fee structure of the Trust.
65
Table of Contents
SSGA ACTIVE TRUST
OTHER INFORMATION (continued)
June 30, 2018 (Unaudited)
TRUSTEES AND OFFICERS
Name, Address and Year of Birth | Position(s) | Term of | Principal Occupation(s) During Past 5 Years | Number of | Other | |||||
Trustees | ||||||||||
Independent Trustees | ||||||||||
FRANK NESVET c/o SSGA Active Trust One Iron Street Boston, MA 02210 1943 | Independent Trustee, Chairman, Trustee Committee Chair | Term: Unlimited Served: since March 2011 | Retired. | 127 | None. | |||||
DAVID M. KELLY c/o SSGA Active Trust One Iron Street Boston, MA 02210 1938 | Independent Trustee | Term: Unlimited Served: since March 2011 | Retired. | 127 | Chicago Stock Exchange (Former Director, retired); Penson Worldwide Inc. (Former Director, retired). | |||||
BONNY EUGENIA BOATMAN c/o SSGA Active Trust One Iron Street Boston, MA 02210 1950 | Independent Trustee | Term: Unlimited Served: since March 2011 | Retired. | 127 | None. | |||||
DWIGHT D. CHURCHILL c/o SSGA Active Trust One Iron Street Boston, MA 02210 1953 | Independent Trustee | Term: Unlimited Served: since March 2011 | Self-employed consultant since 2010; CEO and President, CFA Institute (June 2014-January 2015). | 127 | Affiliated Managers Group, Inc. (Director). | |||||
CARL G. VERBONCOEUR c/o SSGA Active Trust One Iron Street Boston, MA 02210 1952 | Independent Trustee, Audit Committee Chair | Term: Unlimited Served: since March 2011 | Self-employed consultant since 2009. | 127 | The Motley Fool Funds Trust (Trustee). | |||||
Interested Trustee | ||||||||||
JAMES E. ROSS* SSGA Funds Management, Inc. One Iron Street Boston, MA 02210 1965 | Interested Trustee | Term: Unlimited Served as Trustee: since March 2011 | Chairman and Director, SSGA Funds Management, Inc. (2005-present); Executive Vice President and Principal, State Street Global Advisors (2006-present); Chief Executive Officer and Director, State Street Global Advisors Funds Distributors, LLC (May 2017-present); Director, State Street Global Markets, LLC (2013-April 2017); President, SSGA Funds Management, Inc. (2005-2012). | 196 | None. |
| † | For the purpose of determining the number of portfolios overseen by the Trustees, “Fund Complex” comprises registered investment companies for which SSGA Funds Management, Inc. serves as investment adviser. |
| * | Mr. Ross is an Interested Trustee because of his employment with the Adviser and ownership interest in an affiliate of the Adviser. Mr. Ross previously served as an Interested Trustee from November 2005 to December 2009. |
66
Table of Contents
SSGA ACTIVE TRUST
OTHER INFORMATION (continued)
June 30, 2018 (Unaudited)
Name, Address and Year of Birth | Position(s) | Term of | Principal Occupation(s) During the Past 5 Years | |||
Officers | ||||||
ELLEN M. NEEDHAM SSGA Funds Management, Inc. One Iron Street Boston, MA 02210 1967 | President | Term: Unlimited Served: since October 2012 | President and Director, SSGA Funds Management, Inc. (2001-present)*; Senior Managing Director, State Street Global Advisors (1992-present)*; Director, State Street Global Advisors Funds Distributors, LLC (May 2017-present). | |||
BRUCE S. ROSENBERG SSGA Funds Management, Inc. One Iron Street Boston, MA 02210 1961 | Treasurer | Term: Unlimited Served: since February 2016 | Managing Director, State Street Global Advisors and SSGA Funds Management, Inc. (July 2015-present); Director, Credit Suisse (April 2008-July 2015). | |||
ANN M. CARPENTER SSGA Funds Management, Inc. One Iron Street Boston, MA 02210 1966 | Vice President; Deputy Treasurer | Term: Unlimited Served: since August 2012 | Chief Operating Officer, SSGA Funds Management, Inc. (2005-Present)*; Managing Director, State Street Global Advisors (2005-present).* | |||
MICHAEL P. RILEY SSGA Funds Management, Inc. One Iron Street Boston, MA 02210 1969 | Vice President | Term: Unlimited Served: since March 2011 | Managing Director, State Street Global Advisors (2005-present).* | |||
JOSHUA A. WEINBERG SSGA Funds Management, Inc. One Iron Street Boston, MA 02210 1978 | Chief Legal Officer | Term: Unlimited Served: since February 2015 | Managing Director and Managing Counsel, State Street Global Advisors (2011-present); Clerk, SSGA Funds Management, Inc. (2013-present); Associate, Financial Services Group, Dechert LLP (2006-2011). | |||
JESSE D. HALLEE State Street Bank and Trust Company 100 Summer Street, SUM0703 Boston, MA 02111 1976 | Secretary | Term: Unlimited Served: since August 2017 | Vice President and Managing Counsel, State Street Bank and Trust Company (2013-present); Vice President and Counsel, Brown Brothers Harriman & Co. (2007- 2013).** | |||
ESTEFANIA SALOMON State Street Bank and Trust Company 100 Summer Street SUM0703 Boston, MA 02111 1983 | Assistant Secretary | Term: Unlimited Served: since May 2018 | Assistant Vice President and Associate Counsel, State Street Bank and Trust Company (2018-present); Senior Compliance Consultant, AdvisorAssist, LLC (2017); Attorney, Commonwealth of Massachusetts, Securities Division (2014-2017). | |||
CHAD C. HALLETT SSGA Funds Management, Inc. One Iron Street Boston, MA 02210 1969 | Deputy Treasurer | Term: Unlimited Served: since February 2016 | Vice President, State Street Global Advisors and SSGA Funds Management, Inc. (November 2014-present); Vice President, State Street Bank and Trust Company (2001-November 2014).* | |||
DARLENE ANDERSON-VASQUEZ SSGA Funds Management, Inc. One Iron Street Boston, MA 02210 1968 | Deputy Treasurer | Term: Unlimited Served: since November 2016 | Managing Director, State Street Global Advisors and SSGA Funds Management, Inc. (May 2016-present); Senior Vice President, John Hancock Investments (September 2007-May 2016). |
67
Table of Contents
SSGA ACTIVE TRUST
OTHER INFORMATION (continued)
June 30, 2018 (Unaudited)
Name, Address and Year of Birth | Position(s) | Term of | Principal Occupation(s) During the Past 5 Years | |||
ARTHUR A. JENSEN SSGA Funds Management, Inc. 1600 Summer Street Stamford, CT 06905 1966 | Deputy Treasurer | Term: Unlimited Served: Since August 2017 | Vice President at State Street Global Advisors (July 2016 – present); Mutual Funds Controller of GE Asset Management Incorporated (April 2011-July 2016). | |||
SUJATA UPRETI SSGA Funds Management, Inc. One Iron Street Boston, MA 02210 1974 | Assistant Treasurer | Term: Unlimited Served: since February 2016 | Vice President, State Street Global Advisors and SSGA Funds Management, Inc. (May 2015-present); Assistant Director, Cambridge Associates, LLC (July 2014-January 2015); Vice President, Bank of New York Mellon (July 2012-August 2013); Manager, PricewaterhouseCoopers, LLP (September 2003-July 2012). | |||
DANIEL FOLEY SSGA Funds Management, Inc. One Iron Street Boston, MA 02210 1972 | Assistant Treasurer | Term: Unlimited Served: since February 2016 | Vice President, State Street Global Advisors and SSGA Funds Management, Inc. (April 2007-present).* | |||
DANIEL G. PLOURDE SSGA Funds Management, Inc. One Iron Street Boston, MA 02210 1980 | Assistant Treasurer | Term: Unlimited Served: since May 2017 | Vice President, State Street Global Advisors and SSGA Funds Management, Inc. (May 2015-present); Officer, State Street Bank and Trust Company (March 2009-May 2015). | |||
BRIAN HARRIS SSGA Funds Management, Inc. One Iron Street Boston, MA 02210 1973 | Chief Compliance Officer; Anti-Money Laundering Officer; Code of Ethics Compliance Officer | Term: Unlimited Served: since November 2013 | Managing Director, State Street Global Advisors and SSGA Funds Management, Inc. (June 2013-present)*; Senior Vice President and Global Head of Investment Compliance, BofA Global Capital Management (2010-2013); Director of Compliance, AARP Financial Inc. (2008-2010). |
| * | Served in various capacities and/or with various affiliated entities during noted time period. |
| ** | Served in various capacities and/or with unaffiliated mutual funds or closed-end funds for which State Street Bank and Trust Company or its affiliates act as a provider of services during the noted time period. |
Statement of Additional Information (SAI) includes additional information about Funds’ directors and is available, without charge, upon request and by calling 1-866-787-2257.
68
Table of Contents
SPDR Series Trust
Trustees
Bonny E. Boatman
Dwight D. Churchill
David M. Kelly
Frank Nesvet, Chairman
James E. Ross
Carl G. Verboncoeur
Officers
Ellen M. Needham, President
Bruce S. Rosenberg, Treasurer
Ann M. Carpenter, Vice President and Deputy Treasurer
Michael P. Riley, Vice President
Chad C. Hallett, Deputy Treasurer
Darlene Anderson-Vasquez, Deputy Treasurer
Arthur A. Jensen, Deputy Treasurer
Sujata Upreti, Assistant Treasurer
Daniel Foley, Assistant Treasurer
Daniel G. Plourde, Assistant Treasurer
Jesse D. Hallee, Secretary
Estefania Salomon, Assistant Secretary
Brian Harris, Chief Compliance Officer; Anti-Money
Laundering Officer; Code of Ethics Compliance Officer
Joshua A. Weinberg, Chief Legal Officer
Investment Manager and Administrator
SSGA Funds Management, Inc.
One Iron Street
Boston, MA 02210
Distributor
State Street Global Advisors Funds Distributors, LLC
One Iron Street
Boston, MA 02210
Custodian, Sub-Administrator and Transfer Agent
State Street Bank and Trust Company
One Lincoln Street
Boston, MA 02111
Legal Counsel
Morgan, Lewis & Bockius LLP
1111 Pennsylvania Avenue, NW
Washington, DC 20004
Independent Registered Public Accounting Firm
Ernst & Young LLP
200 Clarendon Street
Boston, MA 02116
The information contained in this report is intended for the general information of shareholders of the Trust. This report is not authorized for distribution to prospective investors unless preceded or accompanied by a current Trust prospectus which contains important information concerning the Trust. You may obtain a current prospectus and SAI from the Distributor by calling 1-866-787-2257 or visiting www.spdrs.com. Please read the prospectus carefully before you invest.
Table of Contents
SSGA Active Trust
For more complete information, please call 1.866.787.2257 or
visit www.spdrs.com today.
State Street Global Advisors,
One Iron Street
Boston, MA 02210
ETFs trade like stocks, are subject to investment risk, fluctuate in market value and may trade at prices above or below the ETFs net asset value. Brokerage commissions and ETF expenses will reduce returns.
Because the SPDR SSGA Active Asset Allocation ETFs are actively managed, they are therefore subject to the risk that the investments selected by SSGA may cause the ETFs to underperform relative to their benchmarks or other funds with similar investment objectives. Actively managed ETFs do not seek to replicate the performance of a specified index.
Foreign investments involve greater risks than U.S. investments, including political and economic risks and the risk of currency fluctuations, all of which may be magnified in emerging markets.
Bonds generally present less short-term risk and volatility than stocks, but contain interest rate risk (as interest rates rise bond prices usually fall); issuer default risk; issuer credit risk; liquidity risk; and inflation risk. These effects are usually pronounced for longer-term securities. Any fixed income security sold or redeemed prior to maturity may be subject to a substantial gain or loss.
Investing in commodities entail significant risk and is not appropriate for all investors. Commodities investing entail significant risk as commodity prices can be extremely volatile due to wide range of factors. A few such factors include overall market movements, real or perceived inflationary trends, commodity index volatility, international, economic and political changes, change in interest and currency exchange rates.
Past performance is no guarantee of future results. It is not possible to invest directly in an index. Index performance does not reflect charges and expenses associated with the fund or brokerage commissions associated with buying and selling a fund. Index performance is not meant to represent that of any particular fund.
Standard & Poor’s, S&P and SPDR are registered trademarks of Standard & Poor’s Financial Services LLC (S&P); Dow Jones is a registered trademark of Dow Jones Trademark Holdings LLC (Dow Jones); and these trademarks have been licensed for use by S&P Dow Jones Indices LLC (SPDJI) and sublicensed for certain purposes by State Street Corporation. State Street Corporation’s financial products are not sponsored, endorsed, sold or promoted by SPDJI, Dow Jones, S&P, their respective affiliates and third party licensors and none of such parties make any representation regarding the advisability of investing in such product(s) nor do they have any liability in relation thereto, including for any errors, omissions, or interruptions of any index.
State Street Global Advisors Funds Distributors, LLC is the distributor for all registered products on behalf of the adviser. SSGA Funds Management has retained Massachusetts Financial Services Company as the sub-adviser.
Massachusetts Financial Services Company is not affiliated with State Street Global Advisors Funds Distributors, LLC.
Before investing, consider a Fund’s investment objectives, risks, charges and expenses. To obtain a prospectus or summary prospectus which contains this and other information, call 1.866.787.2257 or visit www.spdrs.com. Read it carefully.
Not FDIC Insured. No Bank Guarantee. May Lose Value.
The information contained in this report is intended for the general information of shareholders of the Trust. This report is not authorized for distribution to prospective investors unless preceded or accompanied by a current Trust prospectus which contains important information concerning the Trust. You may obtain a current prospectus and SAI from the Distributor by calling 1-866-787-2257 or visiting www.spdrs.com. Please read the prospectus carefully before you invest.
© 2018 State Street Corporation - All Rights Reserved
SPDRACTIVEAR
Table of Contents
| SPDR DoubleLine Emerging Markets Fixed Income ETF |
| SPDR DoubleLine Short Duration Total Return Tactical ETF |
| SPDR DoubleLine Total Return Tactical ETF |

Table of Contents
Table of Contents
| 1 | |
| Management’s Discussion of Fund Performance, Performance Summaries & Portfolio Statistics (Unaudited) | |
| 2 | |
| 5 | |
| 8 | |
| Schedules of Investments | |
| 12 | |
| 19 | |
| 33 | |
| 47 | |
| 54 | |
| 57 | |
| 69 | |
| 72 |
Table of Contents
Table of Contents
Table of Contents
Table of Contents
| Cumulative Total Return | Average Annual Total Return | ||||||||
| Net Asset Value | Market Value | JP Morgan Corporate Emerging Markets Bond Index Broad Diversified | Net Asset Value | Market Value | JP Morgan Corporate Emerging Markets Bond Index Broad Diversified | ||||
| ONE YEAR | – 0.65% | – 0.20% | – 0.14% | – 0.65% | – 0.20% | – 0.14% | |||
| SINCE INCEPTION(1) | 10.77% | 11.08% | 9.85% | 4.72% | 4.86% | 4.34% | |||
| (1) | For the period April 13, 2016 to June 30, 2018. |
(Based on Net Asset Value)
Table of Contents
| Description | % of Net Assets | ||
| Temasek Financial I, Ltd. 2.38% 1/23/2023 | 2.8% | ||
| Philippine Government International Bond 4.20% 1/21/2024 | 2.3 | ||
| Axiata SPV2 Bhd 3.47% 11/19/2020 | 2.1 | ||
| Malayan Banking Bhd 3.91% 10/29/2026 | 2.0 | ||
| SACI Falabella 3.75% 4/30/2023 | 2.0 | ||
| TOTAL | 11.2% |
| % of Net Assets | |||
| Corporate Bonds & Notes | 70.1% | ||
| Foreign Government Obligations | 21.7 | ||
| Short-Term Investment | 7.3 | ||
| Other Assets in Excess of Liabilities | 0.9 | ||
| TOTAL | 100.0% |
Table of Contents
Table of Contents
| Cumulative Total Return | Average Annual Total Return | ||||||||
| Net Asset Value | Market Value | Bloomberg Barclays U.S. Aggregate 1-3 Year Index | Net Asset Value | Market Value | Bloomberg Barclays U.S. Aggregate 1-3 Year Index | ||||
| ONE YEAR | 0.43% | 0.83% | 0.22% | 0.43% | 0.83% | 0.22% | |||
| SINCE INCEPTION(1) | 2.63% | 2.76% | 1.23% | 1.18% | 1.23% | 0.56% | |||
| (1) | For the period April 13, 2016 to June 30, 2018. |
(Based on Net Asset Value)
Table of Contents
| Description | % of Net Assets | ||
| U.S. Treasury Notes 1.25% 7/31/2023 | 4.9% | ||
| U.S. Treasury Notes 2.13% 9/30/2021 | 4.2 | ||
| U.S. Treasury Notes 2.00% 8/31/2021 | 4.2 | ||
| U.S. Treasury Notes 2.75% 2/15/2028 | 4.1 | ||
| U.S. Treasury Bill 1.79% 8/16/2018 | 4.0 | ||
| TOTAL | 21.4% |
| % of Net Assets | |||
| U.S. Treasury Obligations | 38.6% | ||
| Corporate Bonds & Notes | 25.6 | ||
| U.S. Government Agency Obligations | 25.0 | ||
| Mortgage-Backed Securities | 5.8 | ||
| Asset-Backed Securities | 2.9 | ||
| Foreign Government Obligations | 1.8 | ||
| Senior Floating Rate Loans | 0.0 * | ||
| Short-Term Investment | 0.5 | ||
| Liabilities in Excess of Other Assets | (0.2) | ||
| TOTAL | 100.0% |
| * | Amount shown represents less than 0.05% of net assets. |
Table of Contents
Table of Contents
| Cumulative Total Return | Average Annual Total Return | ||||||||
| Net Asset Value | Market Value | Bloomberg Barclays U.S. Aggregate Bond Index | Net Asset Value | Market Value | Bloomberg Barclays U.S. Aggregate Bond Index | ||||
| ONE YEAR | 0.04% | – 0.32% | – 0.40% | 0.04% | – 0.32% | – 0.40% | |||
| SINCE INCEPTION(1) | 5.35% | 5.32% | 4.30% | 1.57% | 1.56% | 1.26% | |||
| (1) | For the period February 23, 2015 to June 30, 2018. |
(Based on Net Asset Value)
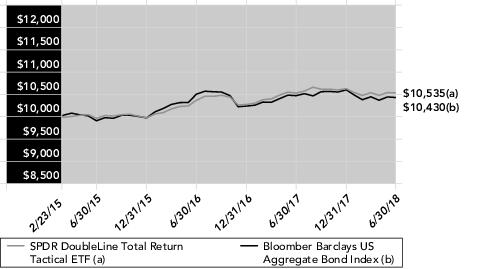
Table of Contents
| Description | % of Net Assets | ||
| Treasury Notes 1.50% 5/31/2020 | 2.8% | ||
| Federal National Mortgage Association CMO, REMIC 3.00% 8/25/2042 | 2.7 | ||
| Treasury Notes 2.13% 1/31/2021 | 2.7 | ||
| Federal National Mortgage Association CMO, REMIC 3.00% 10/25/2042 | 2.3 | ||
| Federal National Mortgage Association CMO, REMIC 3.00% 2/25/2042 | 2.2 | ||
| TOTAL | 12.7% |
| % of Net Assets | |||
| U.S. Government Agency Obligations | 48.5% | ||
| U.S. Treasury Obligations | 16.0 | ||
| Commercial Mortgage Backed Securities | 5.2 | ||
| Mortgage-Backed Securities | 4.4 | ||
| Asset-Backed Securities | 2.5 | ||
| Foreign Government Obligations | 2.0 | ||
| Banks | 3.2 | ||
| Oil & Gas | 1.7 | ||
| Software | 1.3 | ||
| Telecommunications | 1.3 | ||
| Commercial Services | 1.0 | ||
| Health Care Services | 0.9 | ||
| Food | 0.7 | ||
| Pharmaceuticals | 0.7 | ||
| Insurance | 0.6 | ||
| Lodging | 0.6 | ||
| Diversified Financial Services | 0.6 | ||
| Electric | 0.6 | ||
| Internet | 0.6 | ||
| Pipelines | 0.6 | ||
| Media | 0.5 | ||
| Energy-Alternate Sources | 0.5 | ||
| Retail | 0.4 | ||
| Beverages | 0.4 | ||
| Chemicals | 0.4 | ||
| Investment Company Security | 0.3 | ||
| Construction Materials | 0.3 | ||
| Auto Parts & Equipment | 0.3 | ||
| IT Services | 0.3 | ||
| Leisure Time | 0.3 |
Table of Contents
| % of Net Assets | |||
| Machinery, Construction & Mining | 0.2% | ||
| Packaging & Containers | 0.2 | ||
| Health Care Products | 0.2 | ||
| Gas | 0.2 | ||
| Entertainment | 0.2 | ||
| Machinery-Diversified | 0.2 | ||
| Forest Products & Paper | 0.2 | ||
| Agriculture | 0.2 | ||
| Real Estate Investment Trusts | 0.1 | ||
| Transportation | 0.1 | ||
| Semiconductors | 0.1 | ||
| Food Service | 0.1 | ||
| Auto Manufacturers | 0.1 | ||
| Biotechnology | 0.1 | ||
| Airlines | 0.1 | ||
| Holding Companies-Divers | 0.1 | ||
| Aerospace & Defense | 0.1 | ||
| Real Estate | 0.1 | ||
| Metal Fabricate & Hardware | 0.1 | ||
| Toys/Games/Hobbies | 0.1 | ||
| Oil & Gas Services | 0.0* | ||
| Mining | 0.0* | ||
| Coal | 0.0* | ||
| Environmental Control | 0.0* | ||
| Housewares | 0.0* | ||
| Home Furnishings | 0.0* | ||
| Household Products | 0.0* | ||
| Building Materials | 0.0* | ||
| Iron/Steel | 0.0* | ||
| Distribution & Wholesale | 0.0* | ||
| Cosmetics/Personal Care | 0.0* | ||
| Household Products & Wares | 0.0* | ||
| Other Assets in Excess of Liabilities | 0.5 | ||
| TOTAL | 100.0% |
| * | Amount shown represents less than 0.05% of net assets. |
Table of Contents
| Security Description | Principal Amount | Value | ||||
| CORPORATE BONDS & NOTES — 70.1% | ||||||
| ARGENTINA — 3.7% | ||||||
Banco Macro SA Series REGS, USD 5 Year Swap Rate + 5.46%, 6.75%, 11/4/2026 (a) | $ 450,000 | $ 420,750 | ||||
Pampa Energia SA Series REGS, 7.50%, 1/24/2027 | 750,000 | 675,000 | ||||
| YPF SA: | ||||||
Series REGS, 6.95%, 7/21/2027 | 200,000 | 171,750 | ||||
Series REGS, 8.50%, 7/28/2025 | 550,000 | 523,710 | ||||
| 1,791,210 | ||||||
| BRAZIL — 4.6% | ||||||
Itau Unibanco Holding SA Series REGS, 5 Year CMT + 3.86%, 6.50%, 12/31/2099 (a) | 600,000 | 569,100 | ||||
JBS Investments GmbH Series REGS, 7.25%, 4/3/2024 | 500,000 | 484,270 | ||||
| MARB BondCo PLC: | ||||||
Series REGS, 6.88%, 1/19/2025 | 300,000 | 285,000 | ||||
7.00%, 3/15/2024 (b) | 200,000 | 192,250 | ||||
Petrobras Global Finance B.V. 5.75%, 2/1/2029 | 800,000 | 703,304 | ||||
| 2,233,924 | ||||||
| CANADA — 0.4% | ||||||
Canacol Energy, Ltd. Series REGS, 7.25%, 5/3/2025 | 200,000 | 193,000 | ||||
| CHILE — 8.5% | ||||||
Banco de Credito e Inversiones SA Series REGS, 4.00%, 2/11/2023 | 200,000 | 198,501 | ||||
| Banco del Estado de Chile: | ||||||
2.67%, 1/8/2021 (b)(c) | 300,000 | 291,750 | ||||
Series REGS, 3.88%, 2/8/2022 | 150,000 | 149,416 | ||||
Series REGS, 4.13%, 10/7/2020 | 300,000 | 302,874 | ||||
Banco Santander Chile Series REGS, 3.88%, 9/20/2022 | 263,000 | 261,239 | ||||
Celulosa Arauco y Constitucion SA 4.75%, 1/11/2022 | 100,000 | 102,101 | ||||
Embotelladora Andina SA Series REGS, 5.00%, 10/1/2023 | 800,000 | 827,777 | ||||
Inversiones CMPC SA Series REGS, 4.50%, 4/25/2022 | 700,000 | 705,247 | ||||
Itau CorpBanca Series REGS, 3.88%, 9/22/2019 | 300,000 | 301,088 | ||||
SACI Falabella Series REGS, 3.75%, 4/30/2023 | 1,000,000 | 977,318 | ||||
| 4,117,311 | ||||||
| CHINA — 5.4% | ||||||
Alibaba Group Holding, Ltd. 2.80%, 6/6/2023 | 200,000 | 192,556 | ||||
CNOOC Finance 2011, Ltd. Series REGS, 4.25%, 1/26/2021 | 200,000 | 203,807 | ||||
CNPC General Capital, Ltd. Series REGS, 3.95%, 4/19/2022 | 300,000 | 302,660 | ||||
Gran Tierra Energy International Holdings, Ltd. Series REGS, 6.25%, 2/15/2025 | 400,000 | 375,500 | ||||
| Sinopec Group Overseas Development 2016, Ltd.: | ||||||
Series REGS, 2.75%, 5/3/2021 | 400,000 | 392,049 | ||||
Table of Contents
| Security Description | Principal Amount | Value | |||
Series REGS, 2.75%, 9/29/2026 | $ 700,000 | $ 628,542 | |||
Tencent Holdings, Ltd. Series REGS, 2.88%, 2/11/2020 | 500,000 | 497,684 | |||
| 2,592,798 | |||||
| COLOMBIA — 4.1% | |||||
Banco de Bogota SA Series REGS, 6.25%, 5/12/2026 | 200,000 | 204,126 | |||
Bancolombia SA 6.13%, 7/26/2020 | 800,000 | 832,000 | |||
| Ecopetrol SA: | |||||
5.88%, 9/18/2023 | 100,000 | 106,129 | |||
7.63%, 7/23/2019 | 800,000 | 835,912 | |||
| 1,978,167 | |||||
| COSTA RICA — 0.4% | |||||
Banco Nacional de Costa Rica Series REGS, 4.88%, 11/1/2018 | 200,000 | 200,000 | |||
| HONG KONG — 1.6% | |||||
CK Hutchison International 17 II, Ltd. Series REGS, 2.25%, 9/29/2020 | 400,000 | 391,144 | |||
CK Hutchison International 17, Ltd. Series REGS, 2.88%, 4/5/2022 | 400,000 | 389,860 | |||
| 781,004 | |||||
| INDIA — 9.8% | |||||
| Adani Ports & Special Economic Zone, Ltd.: | |||||
Series REGS, 3.50%, 7/29/2020 | 500,000 | 493,932 | |||
Series REGS, 3.95%, 1/19/2022 | 400,000 | 392,300 | |||
| Bharat Petroleum Corp., Ltd.: | |||||
Series EMTN, 4.00%, 5/8/2025 | 500,000 | 475,827 | |||
4.63%, 10/25/2022 | 600,000 | 608,178 | |||
Bharti Airtel International Netherlands B.V. Series REGS, 5.13%, 3/11/2023 | 700,000 | 691,570 | |||
Bharti Airtel, Ltd. Series REGS, 4.38%, 6/10/2025 | 200,000 | 184,153 | |||
Indian Oil Corp., Ltd. 5.75%, 8/1/2023 | 800,000 | 844,204 | |||
ONGC Videsh Vankorneft Pte, Ltd. 3.75%, 7/27/2026 | 600,000 | 560,042 | |||
Reliance Holding USA, Inc. Series REGS, 5.40%, 2/14/2022 | 300,000 | 311,465 | |||
Vedanta Resources PLC Series REGS, 6.13%, 8/9/2024 | 200,000 | 175,784 | |||
| 4,737,455 | |||||
| ISRAEL — 1.6% | |||||
Delek & Avner Tamar Bond, Ltd. 4.44%, 12/30/2020 (b) | 560,000 | 558,538 | |||
Israel Electric Corp., Ltd. Series 6, 5.00%, 11/12/2024 (b) | 200,000 | 205,300 | |||
| 763,838 | |||||
| JAMAICA — 0.5% | |||||
Digicel Group, Ltd. Series REGS, 7.13%, 4/1/2022 | 400,000 | 262,000 |
Table of Contents
| Security Description | Principal Amount | Value | |||
| LUXEMBOURG — 1.1% | |||||
| Minerva Luxembourg SA: | |||||
Series REGS, 5.88%, 1/19/2028 | $ 400,000 | $ 349,200 | |||
Series REGS, 6.50%, 9/20/2026 | 200,000 | 183,250 | |||
| 532,450 | |||||
| MALAYSIA — 6.5% | |||||
Axiata SPV2 Bhd Series 2, 3.47%, 11/19/2020 | 1,000,000 | 994,565 | |||
Gohl Capital, Ltd. 4.25%, 1/24/2027 | 600,000 | 567,929 | |||
Malayan Banking Bhd USD 5 Year Swap Rate + 2.54%, 3.91%, 10/29/2026 (a) | 1,000,000 | 984,155 | |||
Petronas Capital, Ltd. Series REGS, 3.50%, 3/18/2025 | 600,000 | 579,997 | |||
| 3,126,646 | |||||
| MEXICO — 6.5% | |||||
America Movil SAB de CV 3.13%, 7/16/2022 | 600,000 | 589,740 | |||
Banco Santander Mexico SA Series REGS, 5 Year CMT + 4.58%, 5.95%, 1/30/2024 (a)(c) | 600,000 | 603,000 | |||
| BBVA Bancomer SA: | |||||
Series REGS, 5 Year CMT + 2.65%, 5.13%, 1/18/2033 (a) | 400,000 | 354,500 | |||
Series REGS, 5 Year CMT + 3.00%, 5.35%, 11/12/2029 (a) | 200,000 | 185,500 | |||
Coca-Cola Femsa SAB de CV 3.88%, 11/26/2023 | 300,000 | 299,922 | |||
Credito Real SAB de CV Series REGS, 10 Year CMT + 7.03%, 9.13%, 12/31/2099 (a) | 200,000 | 188,150 | |||
Fomento Economico Mexicano SAB de CV 2.88%, 5/10/2023 | 600,000 | 570,372 | |||
Grupo Idesa SA de CV Series REGS, 7.88%, 12/18/2020 | 200,000 | 154,000 | |||
Unifin Financiera SAB de CV Series REGS, 5 Year CMT + 6.31%, 8.88%, 12/31/2099 (a) | 200,000 | 178,602 | |||
| 3,123,786 | |||||
| PANAMA — 1.7% | |||||
| Global Bank Corp.: | |||||
Series REGS, 4.50%, 10/20/2021 | 300,000 | 292,050 | |||
Series REGS, 5.13%, 10/30/2019 | 500,000 | 503,650 | |||
| 795,700 | |||||
| PERU — 2.1% | |||||
| Banco de Credito del Peru: | |||||
Series REGS, 2.25%, 10/25/2019 | 200,000 | 197,000 | |||
Series REGS, 5.38%, 9/16/2020 | 300,000 | 311,550 | |||
BBVA Banco Continental SA Series REGS, 5.00%, 8/26/2022 | 100,000 | 102,625 | |||
Fondo MIVIVIENDA SA Series REGS, 3.50%, 1/31/2023 | 200,000 | 192,802 | |||
Transportadora de Gas del Peru SA Series REGS, 4.25%, 4/30/2028 | 200,000 | 192,620 | |||
| 996,597 |
Table of Contents
| Security Description | Principal Amount | Value | ||||
| PHILIPPINES — 1.9% | ||||||
| BDO Unibank, Inc.: | ||||||
Series EMTN, 2.63%, 10/24/2021 | $ 450,000 | $ 432,557 | ||||
Series EMTN, 2.95%, 3/6/2023 | 500,000 | 472,456 | ||||
| 905,013 | ||||||
| SINGAPORE — 9.7% | ||||||
| DBS Group Holdings, Ltd.: | ||||||
Series REGS, 3 Month USD LIBOR + 0.62%, 2.98%, 7/25/2022 (a) | 200,000 | 200,470 | ||||
Series GMTN, USD 5 Year Swap Rate + 2.39%, 3.60%, 9/7/2021 (a) | 300,000 | 286,364 | ||||
ONGC Videsh Vankorneft Pte, Ltd. 2.88%, 1/27/2022 | 400,000 | 383,125 | ||||
PSA International Pte, Ltd. Series GMTN, 3.88%, 2/11/2021 | 650,000 | 660,074 | ||||
SingTel Group Treasury Pte, Ltd. Series EMTN, 4.50%, 9/8/2021 | 880,000 | 907,640 | ||||
Temasek Financial I, Ltd. Series REGS, 2.38%, 1/23/2023 | 1,400,000 | 1,345,314 | ||||
| United Overseas Bank, Ltd.: | ||||||
Series EMTN, USD 5 Year Swap Rate + 2.00%, 3.75%, 9/19/2024 (a) | 700,000 | 699,732 | ||||
Series EMTN, USD 5 Year Swap Rate + 2.24%, 3.50%, 9/16/2026 (a) | 200,000 | 196,159 | ||||
| 4,678,878 | ||||||
TOTAL CORPORATE BONDS & NOTES (Cost $34,980,735) | 33,809,777 | |||||
| FOREIGN GOVERNMENT OBLIGATIONS — 21.7% | ||||||
| ARGENTINA — 2.9% | ||||||
| Argentine Republic Government International Bond: | ||||||
5.88%, 1/11/2028 | 200,000 | 162,500 | ||||
6.63%, 7/6/2028 | 350,000 | 294,875 | ||||
6.88%, 1/26/2027 | 650,000 | 572,000 | ||||
Provincia de Buenos Aires Series REGS, 7.88%, 6/15/2027 | 450,000 | 393,750 | ||||
| 1,423,125 | ||||||
| BRAZIL — 1.0% | ||||||
Banco do Brasil SA Series REGS, 10 Year CMT + 4.40%, 6.25%, 10/29/2049 (a) | 600,000 | 469,500 | ||||
| CHILE — 1.6% | ||||||
| Chile Government International Bond: | ||||||
3.13%, 3/27/2025 | 200,000 | 193,770 | ||||
3.13%, 1/21/2026 | 600,000 | 575,412 | ||||
| 769,182 | ||||||
| COSTA RICA — 0.7% | ||||||
Costa Rica Government International Bond 10.00%, 8/1/2020 | 300,000 | 326,250 | ||||
| INDIA — 1.0% | ||||||
Export-Import Bank of India Series EMTN, 4.00%, 1/14/2023 | 500,000 | 495,442 | ||||
Table of Contents
| Security Description | Principal Amount | Value | |||
| INDONESIA — 2.9% | |||||
Indonesia Government International Bond Series REGS, 4.88%, 5/5/2021 | $ 500,000 | $ 514,186 | |||
Perusahaan Penerbit SBSN Indonesia III 4.15%, 3/29/2027 (b) | 900,000 | 867,375 | |||
| 1,381,561 | |||||
| ISRAEL — 2.9% | |||||
| Israel Government International Bond: | |||||
2.88%, 3/16/2026 | 400,000 | 380,264 | |||
3.15%, 6/30/2023 | 400,000 | 395,416 | |||
4.00%, 6/30/2022 | 600,000 | 616,278 | |||
| 1,391,958 | |||||
| MALAYSIA — 2.1% | |||||
Malaysia Sovereign Sukuk Bhd Series REGS, 3.04%, 4/22/2025 | 800,000 | 762,032 | |||
Malaysia Sukuk Global Bhd Series REGS, 3.18%, 4/27/2026 | 250,000 | 237,105 | |||
| 999,137 | |||||
| MEXICO — 2.0% | |||||
| Mexico Government International Bond: | |||||
3.75%, 1/11/2028 | 200,000 | 188,950 | |||
4.00%, 10/2/2023 | 300,000 | 301,215 | |||
4.15%, 3/28/2027 | 500,000 | 491,765 | |||
| 981,930 | |||||
| PANAMA — 1.7% | |||||
Panama Government International Bond 4.00%, 9/22/2024 | 800,000 | 808,296 | |||
| PHILIPPINES — 2.9% | |||||
| Philippine Government International Bond: | |||||
4.00%, 1/15/2021 | 300,000 | 303,366 | |||
4.20%, 1/21/2024 | 1,100,000 | 1,121,934 | |||
| 1,425,300 | |||||
TOTAL FOREIGN GOVERNMENT OBLIGATIONS (Cost $11,023,232) | 10,471,681 |
Table of Contents
| Security Description | Shares | Value | ||||
| SHORT-TERM INVESTMENT — 7.3% | ||||||
State Street Institutional U.S. Government Money Market Fund, Class G Shares 1.86% (d) (e) (Cost $3,529,453) | 3,529,453 | $ 3,529,453 | ||||
TOTAL INVESTMENTS — 99.1% (Cost $49,533,420) | 47,810,911 | |||||
OTHER ASSETS IN EXCESS OF LIABILITIES — 0.9% | 442,168 | |||||
NET ASSETS — 100.0% | $ 48,253,079 | |||||
| (a) | Variable Rate Security - Interest rate shown is the rate in effect at June 30, 2018. For securities based on a published reference rate and spread, the reference rate and spread are indicated in the description above. |
| (b) | Securities purchased pursuant to Rule 144A of the Securities Act of 1933, as amended. These securities, which represent 4.4% of net assets as of June 30, 2018, are considered liquid and may be resold in transactions exempt from registration, normally to qualified institutional buyers. |
| (c) | Fair valued as determined in good faith by the Trust’s Oversight Committee in accordance with policy and procedures approved by the Board of Trustees. As of June 30, 2018, total aggregate fair value of securities is $894,750 representing 1.9% of net assets. |
| (d) | The Fund invested in certain money market funds managed by SSGA Funds Management, Inc. Amounts related to these transactions during the period ended June 30, 2018 are shown in the Affiliate Table below. |
| (e) | The rate shown is the annualized seven-day yield at June 30, 2018. |
| CMT | = Constant Maturity Treasury |
| LIBOR | = London Interbank Offered Rate |
| Description | Level 1 – Quoted Prices | Level 2 – Other Significant Observable Inputs | Level 3 – Significant Unobservable Inputs | Total | ||||
| ASSETS: | ||||||||
| INVESTMENTS: | ||||||||
| Corporate Bonds & Notes | ||||||||
Argentina | $ — | $ 1,791,210 | $— | $ 1,791,210 | ||||
Brazil | — | 2,233,924 | — | 2,233,924 | ||||
Canada | — | 193,000 | — | 193,000 | ||||
Chile | — | 4,117,311 | — | 4,117,311 | ||||
China | — | 2,592,798 | — | 2,592,798 | ||||
Colombia | — | 1,978,167 | — | 1,978,167 | ||||
Costa Rica | — | 200,000 | — | 200,000 | ||||
Hong Kong | — | 781,004 | — | 781,004 | ||||
India | — | 4,737,455 | — | 4,737,455 | ||||
Israel | — | 763,838 | — | 763,838 | ||||
Jamaica | — | 262,000 | — | 262,000 |
Table of Contents
| Description | Level 1 – Quoted Prices | Level 2 – Other Significant Observable Inputs | Level 3 – Significant Unobservable Inputs | Total | ||||
Luxembourg | $ — | $ 532,450 | $— | $ 532,450 | ||||
Malaysia | — | 3,126,646 | — | 3,126,646 | ||||
Mexico | — | 3,123,786 | — | 3,123,786 | ||||
Panama | — | 795,700 | — | 795,700 | ||||
Peru | — | 996,597 | — | 996,597 | ||||
Philippines | — | 905,013 | — | 905,013 | ||||
Singapore | — | 4,678,878 | — | 4,678,878 | ||||
| Foreign Government Obligations | ||||||||
Argentina | — | 1,423,125 | — | 1,423,125 | ||||
Brazil | — | 469,500 | — | 469,500 | ||||
Chile | — | 769,182 | — | 769,182 | ||||
Costa Rica | — | 326,250 | — | 326,250 | ||||
India | — | 495,442 | — | 495,442 | ||||
Indonesia | — | 1,381,561 | — | 1,381,561 | ||||
Israel | — | 1,391,958 | — | 1,391,958 | ||||
Malaysia | — | 999,137 | — | 999,137 | ||||
Mexico | — | 981,930 | — | 981,930 | ||||
Panama | — | 808,296 | — | 808,296 | ||||
Philippines | — | 1,425,300 | — | 1,425,300 | ||||
Short-Term Investment | 3,529,453 | — | — | 3,529,453 | ||||
TOTAL INVESTMENTS | $3,529,453 | $44,281,458 | $— | $47,810,911 |
| Number of Shares Held at 6/30/17 | Value at 6/30/17 | Cost of Purchases | Proceeds from Shares Sold | Realized Gain (Loss) | Change in Unrealized Appreciation/ Depreciation | Number of Shares Held at 6/30/18 | Value at 6/30/18 | Dividend Income | |||||||||
State Street Institutional U.S. Government Money Market Fund, Class G Shares | 1,072,343 | $1,072,343 | $34,624,365 | $32,167,255 | $— | $— | 3,529,453 | $3,529,453 | $15,091 |
Table of Contents
| Security Description | Principal Amount | Value | |||
| CORPORATE BONDS & NOTES — 25.6% | |||||
| AEROSPACE & DEFENSE — 0.8% | |||||
General Dynamics Corp. 3.00%, 5/11/2021 | $ 350,000 | $ 348,831 | |||
Northrop Grumman Corp. 2.08%, 10/15/2020 | 360,000 | 351,810 | |||
| 700,641 | |||||
| AGRICULTURE — 0.7% | |||||
BAT Capital Corp. 2.30%, 8/14/2020 (a) | 490,000 | 479,367 | |||
Reynolds American, Inc. 3.25%, 6/12/2020 | 65,000 | 64,854 | |||
| 544,221 | |||||
| AIRLINES — 0.2% | |||||
Delta Air Lines, Inc. 3.40%, 4/19/2021 | 170,000 | 169,284 | |||
| AUTO MANUFACTURERS — 1.3% | |||||
Daimler Finance North America LLC 2.30%, 2/12/2021 (a) | 560,000 | 543,961 | |||
| General Motors Financial Co., Inc.: | |||||
2.65%, 4/13/2020 | 130,000 | 128,440 | |||
3.20%, 7/6/2021 | 390,000 | 384,376 | |||
| 1,056,777 | |||||
| BANKS — 8.4% | |||||
| Banco de Credito del Peru: | |||||
Series REGS, 4.25%, 4/1/2023 | 100,000 | 99,700 | |||
Series REGS, 5.38%, 9/16/2020 | 90,000 | 93,465 | |||
Banco del Estado de Chile Series REGS, 3.88%, 2/8/2022 | 200,000 | 199,222 | |||
Banco Santander Chile 2.50%, 12/15/2020 (a) | 200,000 | 194,256 | |||
Banco Santander Mexico SA Series REGS, 5 Year CMT + 4.58%, 5.95%, 1/30/2024 (b) (c) | 200,000 | 201,000 | |||
Bank of America Corp. Series MTN, 3 Month USD LIBOR + 0.79%, 3.11%, 3/5/2024 (c) | 270,000 | 269,062 | |||
BBVA Bancomer S.A. Texas 7.25%, 4/22/2020 | 100,000 | 104,500 | |||
BDO Unibank, Inc. Series EMTN, 2.63%, 10/24/2021 | 200,000 | 192,247 | |||
BNP Paribas SA Series BKNT, 5.00%, 1/15/2021 | 200,000 | 207,836 |
Table of Contents
| Security Description | Principal Amount | Value | |||
Capital One Financial Corp. 2.40%, 10/30/2020 | $ 325,000 | $ 317,639 | |||
Citigroup, Inc. 3 Month USD LIBOR + 1.02%, 3.35%, 6/1/2024 (c) | 510,000 | 510,466 | |||
Commonwealth Bank of Australia 2.25%, 3/10/2020 (a) | 105,000 | 103,499 | |||
DBS Group Holdings, Ltd. Series GMTN, USD 5 Year Swap Rate + 2.39%, 3.60%, 9/7/2021 (c) | 200,000 | 190,909 | |||
Global Bank Corp. Series REGS, 5.13%, 10/30/2019 | 200,000 | 201,460 | |||
Goldman Sachs Group, Inc. 2.30%, 12/13/2019 | 520,000 | 514,238 | |||
Itau CorpBanca Series REGS, 3.88%, 9/22/2019 | 200,000 | 200,725 | |||
Itau Unibanco Holding SA Series REGS, 6.20%, 12/21/2021 | 200,000 | 206,100 | |||
Morgan Stanley 3 Month USD LIBOR + 0.93%, 3.29%, 7/22/2022 (c) | 510,000 | 514,108 | |||
| PNC Financial Services Group, Inc.: | |||||
4.38%, 8/11/2020 | 95,000 | 97,191 | |||
5.13%, 2/8/2020 | 420,000 | 433,348 | |||
| Royal Bank of Canada: | |||||
1.50%, 7/29/2019 | 135,000 | 133,052 | |||
Series GMTN, 3.20%, 4/30/2021 | 370,000 | 369,863 | |||
Sumitomo Mitsui Financial Group, Inc. 2.06%, 7/14/2021 | 540,000 | 518,519 | |||
Toronto-Dominion Bank Series MTN, 3.25%, 6/11/2021 | 545,000 | 545,534 | |||
United Overseas Bank, Ltd. Series EMTN, 2.88%, 3/8/2027 (c) | 200,000 | 191,342 | |||
Westpac Banking Corp. 1.60%, 8/19/2019 | 355,000 | 349,973 | |||
| 6,959,254 | |||||
| BEVERAGES — 0.1% | |||||
Molson Coors Brewing Co. 1.45%, 7/15/2019 | 90,000 | 88,577 | |||
| BIOTECHNOLOGY — 0.8% | |||||
Amgen, Inc. 2.20%, 5/11/2020 | 175,000 | 172,209 | |||
Celgene Corp. 2.88%, 8/15/2020 | 525,000 | 520,747 | |||
| 692,956 |
Table of Contents
| Security Description | Principal Amount | Value | |||
| CHEMICALS — 0.4% | |||||
Sherwin-Williams Co. 2.25%, 5/15/2020 | $ 377,000 | $ 371,183 | |||
| DIVERSIFIED FINANCIAL SERVICES — 0.6% | |||||
Air Lease Corp. 2.50%, 3/1/2021 | 525,000 | 510,762 | |||
| ELECTRIC — 0.9% | |||||
Comision Federal de Electricidad Series REGS, 4.88%, 5/26/2021 | 200,000 | 202,500 | |||
| Consolidated Edison, Inc.: | |||||
2.00%, 5/15/2021 | 410,000 | 395,634 | |||
Series A, 2.00%, 3/15/2020 | 150,000 | 147,192 | |||
| 745,326 | |||||
| FOOD — 1.4% | |||||
| General Mills, Inc.: | |||||
2.20%, 10/21/2019 | 165,000 | 163,200 | |||
3.20%, 4/16/2021 | 380,000 | 378,134 | |||
JBS Investments GmbH Series REGS, 7.75%, 10/28/2020 | 200,000 | 203,750 | |||
Kroger Co. 6.15%, 1/15/2020 | 280,000 | 292,390 | |||
Mondelez International, Inc. 3.00%, 5/7/2020 | 120,000 | 119,696 | |||
| 1,157,170 | |||||
| HEALTH CARE PRODUCTS — 0.6% | |||||
Thermo Fisher Scientific, Inc. 3.60%, 8/15/2021 | 540,000 | 543,137 | |||
| HEALTH CARE SERVICES — 0.4% | |||||
| Anthem, Inc.: | |||||
2.30%, 7/15/2018 | 45,000 | 44,994 | |||
2.50%, 11/21/2020 | 305,000 | 299,779 | |||
| 344,773 | |||||
| HOUSEWARES — 0.6% | |||||
| Newell Brands, Inc.: | |||||
2.60%, 3/29/2019 | 14,000 | 13,951 | |||
3.15%, 4/1/2021 | 515,000 | 510,360 | |||
| 524,311 | |||||
| INSURANCE — 0.6% | |||||
Berkshire Hathaway Finance Corp. 1.30%, 8/15/2019 | 155,000 | 152,673 |
Table of Contents
| Security Description | Principal Amount | Value | |||
Nuveen Finance LLC 2.95%, 11/1/2019 (a) | $ 110,000 | $ 109,571 | |||
Prudential Financial, Inc. Series D, 7.38%, 6/15/2019 | 200,000 | 208,298 | |||
| 470,542 | |||||
| INTERNET — 0.5% | |||||
Alibaba Group Holding, Ltd. 3.13%, 11/28/2021 | 200,000 | 198,088 | |||
Tencent Holdings, Ltd. 3 Month USD LIBOR + 0.61%, 2.96%, 1/19/2023 (a) (c) | 200,000 | 199,689 | |||
| 397,777 | |||||
| INVESTMENT COMPANY SECURITY — 0.3% | |||||
Temasek Financial I, Ltd. Series REGS, 2.38%, 1/23/2023 | 250,000 | 240,235 | |||
| OIL & GAS — 0.7% | |||||
CNPC General Capital, Ltd. Series REGS, 3.95%, 4/19/2022 | 200,000 | 201,773 | |||
Indian Oil Corp., Ltd. 5.63%, 8/2/2021 | 200,000 | 208,616 | |||
ONGC Videsh, Ltd. 3.25%, 7/15/2019 | 200,000 | 199,380 | |||
| 609,769 | |||||
| PACKAGING & CONTAINERS — 0.3% | |||||
Packaging Corp. of America 2.45%, 12/15/2020 | 275,000 | 269,852 | |||
| PHARMACEUTICALS — 1.4% | |||||
AstraZeneca PLC 2.38%, 11/16/2020 | 555,000 | 544,472 | |||
Cardinal Health, Inc. 1.95%, 6/14/2019 | 275,000 | 272,431 | |||
CVS Health Corp. 2.80%, 7/20/2020 | 320,000 | 317,197 | |||
| 1,134,100 | |||||
| REAL ESTATE INVESTMENT TRUSTS — 0.3% | |||||
Simon Property Group L.P. 2.20%, 2/1/2019 | 235,000 | 234,158 | |||
| RETAIL — 0.5% | |||||
CK Hutchison International 17, Ltd. 2.25%, 9/29/2020 (a) | 200,000 | 195,572 |
Table of Contents
| Security Description | Principal Amount | Value | |||
SACI Falabella Series REGS, 3.75%, 4/30/2023 | $ 200,000 | $ 195,464 | |||
| 391,036 | |||||
| SEMICONDUCTORS — 0.9% | |||||
Analog Devices, Inc. 2.95%, 1/12/2021 | 370,000 | 367,203 | |||
Microchip Technology, Inc. 3.92%, 6/1/2021 (a) | 345,000 | 345,573 | |||
| 712,776 | |||||
| TELECOMMUNICATIONS — 1.6% | |||||
AT&T, Inc. 2.80%, 2/17/2021 | 515,000 | 506,580 | |||
Axiata SPV2 Bhd Series 2, 3.47%, 11/19/2020 | 200,000 | 198,913 | |||
Bharti Airtel International Netherlands B.V. Series REGS, 5.13%, 3/11/2023 | 200,000 | 197,591 | |||
Orange SA 2.75%, 2/6/2019 | 105,000 | 104,929 | |||
Verizon Communications, Inc. 3 Month USD LIBOR + 1.10%, 3.44%, 5/15/2025 (c) | 350,000 | 349,603 | |||
| 1,357,616 | |||||
| TEXTILES — 0.6% | |||||
Cintas Corp. No. 2 2.90%, 4/1/2022 | 520,000 | 508,310 | |||
| TRANSPORTATION — 0.7% | |||||
PSA International Pte, Ltd. Series GMTN, 4.63%, 9/11/2019 | 200,000 | 203,746 | |||
Union Pacific Corp. 3.20%, 6/8/2021 | 350,000 | 350,777 | |||
| 554,523 | |||||
TOTAL CORPORATE BONDS & NOTES (Cost $21,511,088) | 21,289,066 | ||||
| ASSET-BACKED SECURITIES — 2.9% | |||||
| AUTOMOBILE — 0.5% | |||||
Westlake Automobile Receivables Trust Series 2017-2A, Class C, 2.59%, 12/15/2022 (a) | 400,000 | 395,754 | |||
| COMMERCIAL MORTGAGE-BACKED SECURITIES — 0.3% | |||||
Velocity Commercial Capital Loan Trust Series 2016-1, Class AFX, 3.53%, 4/25/2046 (a) (c) | 229,901 | 230,203 |
Table of Contents
| Security Description | Principal Amount | Value | |||
| OTHER ABS — 2.1% | |||||
Arbor Realty Commercial Real Estate Notes 2018-FL1, Ltd. Series 2018-FL1, Class A, 1 Month USD LIBOR + 1.15%, 3.06%, 6/15/2028 (a) (c) | $ 71,000 | $ 71,068 | |||
Bear Stearns Asset Backed Securities Trust Series 2006-2, Class M1, 1 Month USD LIBOR + 0.42%, 2.51%, 7/25/2036 (c) | 143,291 | 143,311 | |||
Consumer Loan Underlying Bond Credit Trust 2018-P1 Series 2018-P1, Class A, 3.39%, 7/15/2025 (a) | 500,000 | 499,619 | |||
Invitation Homes Trust Series 2015-SFR3, Class A, 1 Month USD LIBOR + 1.30%, 3.37%, 8/17/2032 (a) (c) | 93,514 | 93,631 | |||
LoanCore 2018-CRE1 Issuer, Ltd. Series 2018-CRE1, Class A, 1 Month USD LIBOR + 1.13%, 3.20%, 5/15/2028 (a) (c) | 100,000 | 100,031 | |||
Marathon CRE 2018 FL1, Ltd. Series 2018-FL1, Class A, 1 Month USD LIBOR + 1.15%, 1.00%, 6/15/2028 (a) (c) (d) | 100,000 | 99,998 | |||
Mill City Mortgage Trust Series 2015-2, Class A1, 3.00%, 9/25/2057 (a) (c) | 45,754 | 46,012 | |||
OneMain Financial Issuance Trust Series 2017-1A, Class A1, 2.37%, 9/14/2032 (a) | 250,000 | 245,113 | |||
Sofi Consumer Loan Program 2018-2 Trust Series 2018-2, Class A1, 2.93%, 4/26/2027 (a) | 219,218 | 219,118 | |||
Sofi Consumer Loan Program LLC Series 2017-1, Class A, 3.28%, 1/26/2026 (a) | 246,288 | 246,080 | |||
| 1,763,981 | |||||
TOTAL ASSET-BACKED SECURITIES (Cost $2,397,456) | 2,389,938 | ||||
| FOREIGN GOVERNMENT OBLIGATIONS — 1.8% | |||||
| CHILE — 0.2% | |||||
Chile Government International Bond 2.25%, 10/30/2022 | 200,000 | 190,784 | |||
| INDONESIA — 0.3% | |||||
Indonesia Government International Bond Series REGS, 4.88%, 5/5/2021 | 200,000 | 205,675 | |||
| ISRAEL — 0.2% | |||||
Israel Government International Bond 4.00%, 6/30/2022 | 200,000 | 205,426 | |||
| MALAYSIA — 0.3% | |||||
Wakala Global Sukuk Bhd 4.65%, 7/6/2021 | 250,000 | 258,430 |
Table of Contents
| Security Description | Principal Amount | Value | |||
| PANAMA — 0.3% | |||||
Panama Government International Bond 5.20%, 1/30/2020 | $ 200,000 | $ 206,778 | |||
| PHILIPPINES — 0.2% | |||||
Philippine Government International Bond 4.00%, 1/15/2021 | 200,000 | 202,244 | |||
| POLAND — 0.3% | |||||
Poland Government International Bond 5.13%, 4/21/2021 | 200,000 | 210,118 | |||
TOTAL FOREIGN GOVERNMENT OBLIGATIONS (Cost $1,518,024) | 1,479,455 | ||||
| U.S. GOVERNMENT AGENCY OBLIGATIONS — 25.0% | |||||
| Federal Home Loan Mortgage Corp.: | |||||
3.50%, 9/1/2032 | 894,800 | 906,123 | |||
Series 4030, Class AN, CMO, REMIC, 1.75%, 4/15/2027 | 2,228,481 | 2,145,528 | |||
Series 4060, Class QA, CMO, REMIC, 1.50%, 9/15/2026 | 803,237 | 774,675 | |||
Series 4125, Class FA, CMO, REMIC, 1 Month USD LIBOR + 0.35%, 2.42%, 11/15/2042 (c) | 508,517 | 509,789 | |||
Series 4484, Class CD, CMO, REMIC, 1.75%, 7/15/2030 | 390,677 | 377,206 | |||
Series 4582, Class HA, CMO, REMIC, 3.00%, 9/15/2045 | 714,359 | 699,039 | |||
Series 4738, Class LA, CMO, REMIC, 3.00%, 11/15/2043 | 957,286 | 940,123 | |||
Series 4764, Class WF, CMO, REMIC, 1 Month USD LIBOR + 0.30%, 2.37%, 2/15/2048 (c) | 976,215 | 974,847 | |||
Series K722, Class X1, IO, 1.44%, 3/25/2023 (c) | 500,117 | 24,862 | |||
| Federal National Mortgage Association: | |||||
3.00%, 11/1/2036 | 578,714 | 570,381 | |||
Series 2007-54, Class FW, CMO, REMIC, 1 Month USD LIBOR + 0.25%, 2.34%, 6/25/2037 (c) | 867,655 | 867,546 | |||
Series 2012-32, Class DA, CMO, REMIC, 2.00%, 11/25/2026 | 2,433,822 | 2,363,444 | |||
Series 2015-59, Class A, CMO, REMIC, 3.00%, 6/25/2041 | 576,455 | 567,646 | |||
Series 2017-13, Class ML, CMO, REMIC, 3.00%, 8/25/2041 | 898,943 | 887,284 | |||
Series 2017-2, Class HA, CMO, REMIC, 3.00%, 9/25/2041 | 853,443 | 840,594 | |||
Series 2018-27, Class FJ, CMO, REMIC, 1 Month USD LIBOR + 0.30%, 2.39%, 12/25/2047 (c) | 981,242 | 979,985 | |||
Series 2018-30, Class FA, CMO, REMIC, 1 Month USD LIBOR + 0.30%, 2.39%, 5/25/2048 (c) | 991,569 | 992,466 | |||
Series 2018-39, Class EF, CMO, REMIC, 1 Month USD LIBOR + 0.30%, 2.39%, 6/25/2048 (c) | 981,631 | 980,759 | |||
Series 2018-39, Class FG, CMO, REMIC, 1 Month USD LIBOR + 0.25%, 2.34%, 11/25/2033 (c) | 981,785 | 981,125 | |||
Series 2018-45, Class FA, CMO, REMIC, 1 Month USD LIBOR + 0.30%, 2.39%, 6/25/2048 (c) | 983,444 | 982,838 |
Table of Contents
| Security Description | Principal Amount | Value | |||
| Government National Mortgage Association: | |||||
Series 2014-94, Class FB, CMO, REMIC, 1 Month USD LIBOR + 0.25%, 2.33%, 9/20/2035 (c) | $ 837,226 | $ 836,899 | |||
Series 2017-116, Class FA, CMO, REMIC, 1 Month USD LIBOR + 0.30%, 2.28%, 11/20/2043 (c) | 729,185 | 728,993 | |||
Series 2017-116, Class FB, CMO, REMIC, 1 Month USD LIBOR + 0.25%, 2.33%, 5/20/2044 (c) | 824,290 | 824,593 | |||
TOTAL U.S. GOVERNMENT AGENCY OBLIGATIONS (Cost $21,083,817) | 20,756,745 | ||||
| U.S. TREASURY OBLIGATIONS — 38.6% | |||||
| U.S. Treasury Bill: | |||||
1.76%, 7/19/2018 | 2,770,000 | 2,767,615 | |||
1.79%, 8/16/2018 | 3,280,000 | 3,272,397 | |||
1.91%, 9/20/2018 | 2,530,000 | 2,519,338 | |||
2.00%, 10/18/2018 | 2,530,000 | 2,515,185 | |||
U.S. Treasury Inflation Protected Indexed Notes 0.13%, 4/15/2019 | 2,448,262 | 2,434,013 | |||
| U.S. Treasury Notes: | |||||
1.25%, 7/31/2023 | 4,400,000 | 4,089,668 | |||
1.50%, 8/15/2020 | 3,070,000 | 3,003,565 | |||
1.88%, 1/31/2022 | 1,030,000 | 1,002,108 | |||
2.00%, 8/31/2021 | 3,580,000 | 3,510,369 | |||
2.13%, 9/30/2021 | 3,570,000 | 3,512,345 | |||
2.75%, 2/15/2028 | 3,400,000 | 3,370,794 | |||
TOTAL U.S. TREASURY OBLIGATIONS (Cost $31,986,313) | 31,997,397 | ||||
| MORTGAGE-BACKED SECURITIES — 5.8% | |||||
Alternative Loan Trust Series 2006-41CB, Class 1A3, CMO, 6.00%, 1/25/2037 | 426,009 | 365,120 | |||
Atrium Hotel Portfolio Trust Series 2017-ATRM, Class E, 1 Month USD LIBOR + 3.05%, 5.12%, 12/15/2036 (a) (c) | 36,000 | 35,955 | |||
Atrium Hotel Portfolio Trust 2018-ATRM Series 2018-ATRM, Class A, 1 Month USD LIBOR + 0.95%, 2.93%, 6/15/2035 (a) (c) | 100,000 | 99,937 | |||
BANK Series 2017-BNK6, Class XA, IO, 1.01%, 7/15/2060 (c) | 1,136,292 | 64,935 | |||
| BBCMS Mortgage Trust: | |||||
Series 2017-DELC, Class C, 1 Month USD LIBOR + 1.20%, 3.27%, 8/15/2036 (a) (c) | 17,000 | 16,989 | |||
Series 2017-DELC, Class D, 1 Month USD LIBOR + 1.70%, 3.77%, 8/15/2036 (a) (c) | 19,000 | 18,988 | |||
Series 2017-DELC, Class E, 1 Month USD LIBOR + 2.50%, 4.57%, 8/15/2036 (a) (c) | 40,000 | 40,083 | |||
Series 2017-DELC, Class F, 1 Month USD LIBOR + 3.50%, 5.57%, 8/15/2036 (a) (c) | 38,000 | 38,092 |
Table of Contents
| Security Description | Principal Amount | Value | |||
Series 2018-TALL, Class A, 1 Month USD LIBOR + 0.72%, 2.80%, 3/15/2037 (a) (c) | $ 47,000 | $ 46,926 | |||
Bear Stearns Commercial Mortgage Securities Trust Series 2014-BXO, Class E, 1 Month USD LIBOR + 3.75%, 5.82%, 8/15/2027 (a) (c) | 26,000 | 26,104 | |||
BENCHMARK Mortgage Trust Series 2018-B1, Class XA, IO, 0.67%, 1/15/2051 (c) | 2,270,437 | 90,177 | |||
Braemar Hotels & Resorts Trust 2018-Prime Series 2018-PRME, Class A, 1 Month USD LIBOR + 0.82%, 2.89%, 6/15/2035 (a) (c) | 115,000 | 114,875 | |||
BX Commercial Mortgage Trust Series 2018-BIOA, Class E, 1 Month USD LIBOR + 1.95%, 4.02%, 3/15/2037 (a) (c) | 257,000 | 255,711 | |||
BX Trust 2017-IMC Series 2017-IMC, Class A, 1 Month USD LIBOR + 1.05%, 3.12%, 10/15/2032 (a) (c) | 100,000 | 100,082 | |||
BX Trust 2018-BILT Series 2018-BILT, Class A, 1 Month USD LIBOR + 0.80%, 2.70%, 5/15/2030 (a) (c) | 115,000 | 114,748 | |||
BX Trust 2018-MCSF Series 2018-MCSF, Class F, 1 Month USD LIBOR + 2.65%, 4.72%, 4/15/2035 (a) (c) | 47,000 | 46,518 | |||
BXMT, Ltd. Series 2017-FL1, Class C, 1 Month USD LIBOR + 1.95%, 4.02%, 6/15/2035 (a) (c) | 150,000 | 150,375 | |||
| CFCRE Commercial Mortgage Trust: | |||||
Series 2018-TAN, Class B, 4.69%, 2/15/2033 (a) | 55,000 | 55,938 | |||
Series 2018-TAN, Class C, 5.29%, 2/15/2033 (a) | 55,000 | 56,060 | |||
Series 2018-TAN, Class D, 6.10%, 2/15/2033 (a) | 33,000 | 33,909 | |||
CGGS Commercial Mortgage Trust Series 2018-WSS, Class D, 1 Month USD LIBOR + 2.30%, 4.37%, 2/15/2037 (a) (c) | 100,000 | 100,182 | |||
CGGS Commercial Mortgage Trust 2018-WSS Series 2018-WSS, Class A, 1 Month USD LIBOR + 0.90%, 2.97%, 2/15/2037 (a) (c) | 100,000 | 99,947 | |||
| CHT COSMO Mortgage Trust: | |||||
Series 2017-CSMO, Class E, 1 Month USD LIBOR + 3.00%, 5.07%, 11/15/2036 (a) (c) | 59,000 | 59,423 | |||
Series 2017-CSMO, Class F, 1 Month USD LIBOR + 3.74%, 5.81%, 11/15/2036 (a) (c) | 131,000 | 132,183 | |||
| Citigroup Commercial Mortgage Trust: | |||||
Series 2008-C7, Class AM, 6.34%, 12/10/2049 (b) (c) | 20,506 | 20,466 | |||
Series 2018-TBR, Class D, 1 Month USD LIBOR + 1.80%, 3.87%, 12/15/2036 (a) (c) | 95,000 | 95,385 | |||
Series 2016-GC37, Class XA, IO, 1.96%, 4/10/2049 (c) | 986,249 | 104,105 | |||
| CLNS Trust: | |||||
Series 2017-IKPR, Class D, 1 Month USD LIBOR + 2.05%, 4.10%, 6/11/2032 (a) (c) | 18,000 | 18,022 | |||
Series 2017-IKPR, Class E, 1 Month USD LIBOR + 3.50%, 5.55%, 6/11/2032 (a) (c) | 18,000 | 18,051 | |||
COLT Mortgage Loan Trust Series 2018-1, Class A1, CMO, 2.93%, 2/25/2048 (a) (c) | 281,714 | 280,415 |
Table of Contents
| Security Description | Principal Amount | Value | |||
COMM Mortgage Trust Series 2015-CR25, Class XA, IO, 1.08%, 8/10/2048 (c) | $ 1,347,751 | $ 66,034 | |||
Credit Suisse Commercial Mortgage Trust Series 2008-C1, Class AM, 6.17%, 2/15/2041 (a) (b) (c) | 13,069 | 13,005 | |||
Credit Suisse Mortgage Capital Certificates Series 2017-CHOP, Class D, 1 Month USD LIBOR + 1.90%, 3.97%, 7/15/2032 (a) (c) | 29,000 | 29,055 | |||
| CSAIL Commercial Mortgage Trust: | |||||
Series 2017-C8, Class XA, IO, 1.40%, 6/15/2050 (c) | 343,049 | 25,364 | |||
Series 2017-CX10, Class XA, IO, 0.87%, 11/15/2050 (c) | 998,039 | 52,322 | |||
Series 2017-CX9, Class XA, IO, 1.04%, 9/15/2050 (c) | 1,853,468 | 88,134 | |||
DBGS BIOD Mortgage Trust Series 2018-BIOD, Class A, 1 Month USD LIBOR + 0.80%, 2.70%, 5/15/2035 (a) (c) | 150,000 | 149,812 | |||
GPMT 2018-FL1, Ltd. Series 2018-FL1, Class A, 1 Month USD LIBOR + 0.90%, 2.98%, 11/21/2035 (a) (c) | 100,000 | 99,813 | |||
| GS Mortgage Securities Trust: | |||||
Series 2013-GC14, Class A2, 3.00%, 8/10/2046 | 3,524 | 3,522 | |||
Series 2017-500K, Class E, 1 Month USD LIBOR + 1.50%, 3.57%, 7/15/2032 (a) (c) | 50,000 | 49,984 | |||
Series 2017-500K, Class F, 1 Month USD LIBOR + 1.80%, 3.87%, 7/15/2032 (a) (c) | 107,000 | 107,000 | |||
Series 2017-500K, Class G, 1 Month USD LIBOR + 2.50%, 4.57%, 7/15/2032 (a) (c) | 22,000 | 22,007 | |||
Series 2017-GS7, Class XA, IO, 1.29%, 8/10/2050 (c) | 393,107 | 30,842 | |||
JP Morgan Chase Commercial Mortgage Securities Corp. Series 2018-LAQ, Class A, 1 Month USD LIBOR + 1.00%, 3.00%, 6/15/2032 (a) (c) (d) | 100,000 | 100,017 | |||
| JP Morgan Chase Commercial Mortgage Securities Trust: | |||||
Series 2006-LDP9, Class AMS, 5.34%, 5/15/2047 (b) | 67,000 | 67,397 | |||
Series 2007-LDPX, Class AM, 5.46%, 1/15/2049 (b) (c) | 8,856 | 8,878 | |||
Series 2017-MAUI, Class C, 1 Month USD LIBOR + 1.25%, 3.30%, 7/15/2034 (a) (c) | 27,000 | 27,008 | |||
Series 2017-MAUI, Class D, 1 Month USD LIBOR + 1.95%, 4.00%, 7/15/2034 (a) (c) | 25,000 | 25,055 | |||
Series 2017-MAUI, Class E, 1 Month USD LIBOR + 2.95%, 5.00%, 7/15/2034 (a) (c) | 22,000 | 22,055 | |||
Series 2017-MAUI, Class F, 1 Month USD LIBOR + 3.75%, 5.80%, 7/15/2034 (a) (c) | 31,000 | 31,078 | |||
Series 2016-JP4, Class XA, IO, 0.94%, 12/15/2049 (c) | 1,716,488 | 71,820 | |||
JPMBB Commercial Mortgage Securities Trust Series 2014-C22, Class XA, IO, 1.05%, 9/15/2047 (c) | 1,035,357 | 43,629 | |||
JPMDB Commercial Mortgage Securities Trust Series 2016-C4, Class XA, IO, 0.96%, 12/15/2049 (c) | 788,894 | 43,155 | |||
LMREC 2015-CRE1, Inc. Series 2015-CRE1, Class AR, 1 Month USD LIBOR + 0.98% , 3.08%, 2/22/2032 (a) (c) | 110,000 | 110,000 |
Table of Contents
| Security Description | Principal Amount | Value | |||
| Morgan Stanley Bank of America Merrill Lynch Trust: | |||||
Series 2014-C15, Class XA, IO, 1.23%, 4/15/2047 (c) | $ 979,919 | $ 40,387 | |||
Series 2014-C19, Class LNCX, IO, 0.60%, 12/15/2046 (a) | 1,238,288 | 41,722 | |||
Morgan Stanley Capital I Trust Series 2016-UB12, Class XA, IO, 0.95%, 12/15/2049 (c) | 1,617,748 | 76,281 | |||
Natixis Commercial Mortgage Securities Trust 2018-FL1 Series 2018-FL1, Class A, 1 Month USD LIBOR + 0.95%, 2.87%, 6/15/2035 (a) (c) (d) | 100,000 | 100,000 | |||
| RAIT Trust: | |||||
Series 2017-FL7, Class A, 1 Month USD LIBOR + 0.950%, 3.02%, 6/15/2037 (a) (c) | 22,804 | 22,814 | |||
Series 2017-FL7, Class AS, 1 Month USD LIBOR + 1.30%, 3.37%, 6/15/2037 (a) (c) | 6,000 | 6,000 | |||
| Rosslyn Portfolio Trust: | |||||
Series 2017-ROSS, Class A, 1 Month USD LIBOR + 0.95%, 3.02%, 6/15/2033 (a) (c) | 15,000 | 15,005 | |||
Series 2017-ROSS, Class B, 1 Month USD LIBOR + 1.25%, 3.32%, 6/15/2033 (a) (c) | 15,000 | 15,005 | |||
| TPG Real Estate Finance, Ltd.: | |||||
Series 2018-FL1, Class A, 1 Month USD LIBOR + 0.75%, 2.82%, 2/15/2035 (a) (c) | 61,000 | 60,848 | |||
Series 2018-FL1, Class AS, 1 Month USD LIBOR + 0.95%, 3.02%, 2/15/2035 (a) (c) | 117,000 | 116,708 | |||
Series 2018-FL1, Class B, 1 Month USD LIBOR + 1.30%, 3.37%, 2/15/2035 (a) (c) | 49,000 | 48,908 | |||
UBS Commercial Mortgage Trust Series 2017-C1, Class XA, IO, 1.77%, 6/15/2050 (c) | 990,312 | 103,174 | |||
VSD LLC 3.60%, 12/25/2043 | 18,267 | 18,254 | |||
| Wachovia Bank Commercial Mortgage Trust: | |||||
Series 2006-C25, Class F, 5.36%, 5/15/2043 (c) | 13,240 | 13,224 | |||
Series 2007-C30, Class AJ, 5.41%, 12/15/2043 (b) (c) | 43,451 | 43,757 | |||
| Waldorf Astoria Boca Raton Trust: | |||||
Series 2016-BOCA, Class B, 1 Month USD LIBOR + 2.05%, 4.12%, 6/15/2029 (a) (c) | 37,000 | 37,023 | |||
Series 2016-BOCA, Class C, 1 Month USD LIBOR + 2.50%, 4.57%, 6/15/2029 (a) (c) | 31,000 | 31,038 | |||
WFRBS Commercial Mortgage Trust Series 2013-C18, Class XA, IO, 0.98%, 12/15/2046 (c) | 1,321,706 | 36,387 | |||
TOTAL MORTGAGE-BACKED SECURITIES (Cost $4,998,188) | 4,813,222 |
Table of Contents
| Security Description | Principal Amount | Value | ||||
| SENIOR FLOATING RATE LOANS — 0.0% (e) | ||||||
| HEALTH CARE PROVIDERS & SERVICES — 0.0% (e) | ||||||
Select Medical Corp. Senior Secured 2017 Term Loan B 4.80% 7/11/2018 | $ 34,563 | $ 34,552 | ||||
| MEDIA — 0.0% (e) | ||||||
Tribune Media Co. Senior Secured Term Loan 5.09% 7/31/2018(b) | 4,246 | 4,257 | ||||
TOTAL SENIOR FLOATING RATE LOANS (Cost $38,863) | 38,809 | |||||
| Shares | |||
| SHORT-TERM INVESTMENT — 0.5% | |||
State Street Institutional U.S. Government Money Market Fund, Class G Shares 1.86% (f) (g) (Cost $376,094) | 376,094 | 376,094 | |
TOTAL INVESTMENTS — 100.2% (Cost $83,909,843) | 83,140,726 | ||
LIABILITIES IN EXCESS OF OTHER ASSETS — (0.2)% | (157,097) | ||
NET ASSETS — 100.0% | $ 82,983,629 | ||
| (a) | Securities purchased pursuant to Rule 144A of the Securities Act of 1933, as amended. These securities, which represent 9.3% of net assets as of June 30, 2018, are considered liquid and may be resold in transactions exempt from registration, normally to qualified institutional buyers. |
| (b) | Fair valued as determined in good faith by the Trust’s Oversight Committee in accordance with policy and procedures approved by the Board of Trustees. As of June 30, 2018, total aggregate fair value of securities is $358,760 representing 0.4% of net assets. |
| (c) | Variable Rate Security - Interest rate shown is the rate in effect at June 30, 2018. For securities based on a published reference rate and spread, the reference rate and spread are indicated in the description above. |
| (d) | When-issued security. |
| (e) | Amount shown represents less than 0.05% of net assets. |
| (f) | The Fund invested in certain money market funds managed by SSGA Funds Management, Inc. Amounts related to these transactions during the period ended June 30, 2018 are shown in the Affiliate Table below. |
| (g) | The rate shown is the annualized seven-day yield at June 30, 2018. |
| ABS | = Asset-Backed Security |
| BKNT | = Bank Notes |
| CMO | = Collateralized Mortgage Obligation |
| CMT | = Constant Maturity Treasury |
| GMTN | = Global Medium Term Note |
| IO | = Interest Only |
| LIBOR | = London Interbank Offered Rate |
| MTN | = Medium Term Note |
| REMIC | = Real Estate Mortgage Investment Conduit |
Table of Contents
| Description | Level 1 – Quoted Prices | Level 2 – Other Significant Observable Inputs | Level 3 – Significant Unobservable Inputs | Total | ||||
| ASSETS: | ||||||||
| INVESTMENTS: | ||||||||
Corporate Bonds & Notes | ||||||||
Aerospace & Defense | $ — | $ 700,641 | $— | $ 700,641 | ||||
Agriculture | — | 544,221 | — | 544,221 | ||||
Airlines | — | 169,284 | — | 169,284 | ||||
Auto Manufacturers | — | 1,056,777 | — | 1,056,777 | ||||
Banks | — | 6,959,254 | — | 6,959,254 | ||||
Beverages | — | 88,577 | — | 88,577 | ||||
Biotechnology | — | 692,956 | — | 692,956 | ||||
Chemicals | — | 371,183 | — | 371,183 | ||||
Diversified Financial Services | — | 510,762 | — | 510,762 | ||||
Electric | — | 745,326 | — | 745,326 | ||||
Food | — | 1,157,170 | — | 1,157,170 | ||||
Health Care Products | — | 543,137 | — | 543,137 | ||||
Health Care Services | — | 344,773 | — | 344,773 | ||||
Housewares | — | 524,311 | — | 524,311 | ||||
Insurance | — | 470,542 | — | 470,542 | ||||
Internet | — | 397,777 | — | 397,777 | ||||
Investment Company Security | — | 240,235 | — | 240,235 | ||||
Oil & Gas | — | 609,769 | — | 609,769 | ||||
Packaging & Containers | — | 269,852 | — | 269,852 | ||||
Pharmaceuticals | — | 1,134,100 | — | 1,134,100 | ||||
Real Estate Investment Trusts | — | 234,158 | — | 234,158 | ||||
Retail | — | 391,036 | — | 391,036 | ||||
Semiconductors | — | 712,776 | — | 712,776 | ||||
Telecommunications | — | 1,357,616 | — | 1,357,616 | ||||
Textiles | — | 508,310 | — | 508,310 | ||||
Transportation | — | 554,523 | — | 554,523 | ||||
U.S. Treasury Obligations | — | 31,997,397 | — | 31,997,397 | ||||
U.S. Government Agency Obligations | — | 20,756,745 | — | 20,756,745 | ||||
Mortgage-Backed Securities | — | 4,813,222 | — | 4,813,222 | ||||
Asset-Backed Securities | — | 2,389,938 | — | 2,389,938 | ||||
Foreign Government Obligations | — | 1,479,455 | — | 1,479,455 | ||||
Senior Floating Rate Loans | — | 38,809 | — | 38,809 | ||||
Short-Term Investment | 376,094 | — | — | 376,094 | ||||
TOTAL INVESTMENTS | $376,094 | $82,764,632 | $— | $83,140,726 |
Table of Contents
| Number of Shares Held at 6/30/17 | Value at 6/30/17 | Cost of Purchases | Proceeds from Shares Sold | Realized Gain (Loss) | Change in Unrealized Appreciation/ Depreciation | Number of Shares Held at 6/30/18 | Value at 6/30/18 | Dividend Income | |||||||||
State Street Institutional U.S. Government Money Market Fund, Class G Shares | 270,252 | $270,252 | $46,288,699 | $46,182,857 | $— | $— | 376,094 | $376,094 | $32,258 |
Table of Contents
| Security Description | Principal Amount | Value | |||
| CORPORATE BONDS & NOTES — 13.8% | |||||
| ARGENTINA — 0.3% | |||||
Other Securities | $ 8,300,000 | $ 7,543,845 | |||
| AUSTRALIA — 0.2% | |||||
Other Securities | 7,430,000 | 7,222,966 | |||
| BELGIUM — 0.1% | |||||
Other Security | 3,305,000 | 3,257,970 | |||
| BRAZIL — 0.4% | |||||
Other Securities | 13,769,000 | 12,980,063 | |||
| CANADA — 0.3% | |||||
Other Securities | 10,285,000 | 10,015,902 | |||
| CAYMAN ISLANDS — 0.1% | |||||
Other Security | 4,314,000 | 4,303,215 | |||
| CHILE — 0.8% | |||||
Other Securities | 24,924,084 | 24,981,478 | |||
| CHINA — 0.3% | |||||
Other Securities | 10,500,000 | 10,292,027 | |||
| COLOMBIA — 0.1% | |||||
Other Securities | 1,900,000 | 1,968,301 | |||
| COSTA RICA — 0.1% | |||||
Other Securities | 2,990,000 | 3,032,383 | |||
| DOMINICAN REPUBLIC — 0.2% | |||||
Other Securities | 6,150,000 | 6,235,750 | |||
| HONG KONG — 0.1% | |||||
Other Securities | 3,000,000 | 2,916,351 | |||
| INDIA — 1.1% | |||||
Other Securities | 35,500,000 | 34,847,079 | |||
| IRELAND — 0.0% (a) | |||||
Other Security | 815,000 | 847,600 | |||
| ISRAEL — 0.2% | |||||
Other Securities | 7,125,000 | 6,615,989 | |||
| JAMAICA — 0.1% | |||||
Other Securities | 4,300,000 | 2,916,500 | |||
| JAPAN — 0.1% | |||||
Other Securities | 3,715,000 | 3,720,528 | |||
| LUXEMBOURG — 0.1% | |||||
Other Securities | 3,480,000 | 3,118,856 | |||
Table of Contents
| Security Description | Principal Amount | Value | |||
| MALAYSIA — 0.7% | |||||
Other Securities | $ 23,900,000 | $ 23,310,346 | |||
| MEXICO — 0.4% | |||||
Other Securities | 12,599,000 | 11,704,957 | |||
| NETHERLANDS — 0.0% (a) | |||||
Other Securities | 455,000 | 426,550 | |||
| PANAMA — 0.2% | |||||
Other Security | 7,000,000 | 7,051,100 | |||
| PERU — 0.3% | |||||
Other Securities | 8,000,000 | 8,018,688 | |||
| PHILIPPINES — 0.2% | |||||
Other Securities | 7,400,000 | 7,011,945 | |||
| SINGAPORE — 0.6% | |||||
Other Securities | 18,950,000 | 18,543,073 | |||
| UNITED KINGDOM — 0.3% | |||||
Other Securities | 9,410,000 | 9,274,719 | |||
| UNITED STATES — 6.5% | |||||
Other Securities | 212,382,250 | 206,734,819 | |||
Total Corporate Bonds & Notes (Cost $452,971,273) | 438,893,000 | ||||
| ASSET-BACKED SECURITIES — 2.5% | |||||
Aegis Asset Backed Securities Trust Series 2006-1, Class A2, 1 Month USD LIBOR + 0.17%, 2.26%, 1/25/2037 (b) | 31,211,812 | 24,826,999 | |||
Other Securities | 56,071,870 | 54,746,275 | |||
Total Asset-Backed Securities (Cost $79,750,522) | 79,573,274 | ||||
| FOREIGN GOVERNMENT OBLIGATIONS — 2.0% | |||||
| ARGENTINA — 0.2% | |||||
Other Securities | 9,000,000 | 7,770,750 | |||
| BRAZIL — 0.2% | |||||
Other Securities | 7,200,000 | 6,015,250 | |||
| CHILE — 0.3% | |||||
Other Securities | 10,200,000 | 9,803,630 | |||
| COSTA RICA — 0.1% | |||||
Other Security | 2,905,000 | 3,159,188 | |||
Table of Contents
| Security Description | Principal Amount | Value | |||
| INDIA — 0.0% (a) | |||||
Other Securities | $ 1,650,000 | $ 1,633,107 | |||
| INDONESIA — 0.2% | |||||
Other Securities | 7,000,000 | 6,778,561 | |||
| ISRAEL — 0.3% | |||||
Other Securities | 8,800,000 | 8,682,626 | |||
| MALAYSIA — 0.1% | |||||
Other Securities | 3,650,000 | 3,467,501 | |||
| MEXICO — 0.1% | |||||
Other Securities | 2,700,000 | 2,639,775 | |||
| PANAMA — 0.2% | |||||
Other Security | 5,600,000 | 5,658,072 | |||
| PERU — 0.0% (a) | |||||
Other Security | 800,000 | 771,208 | |||
| PHILIPPINES — 0.3% | |||||
Other Security | 7,900,000 | 8,057,526 | |||
| UNITED STATES — 0.0% (a) | |||||
Other Security | 28,114 | 27,940 | |||
Total Foreign Government Obligations (Cost $67,926,787) | 64,465,134 | ||||
| SENIOR FLOATING RATE LOANS — 7.1% (c) | |||||
| AEROSPACE & DEFENSE — 0.0% (a) | |||||
Other Securities | 802,345 | 798,240 | |||
| AUTO COMPONENTS — 0.3% | |||||
Other Securities | 9,228,387 | 9,196,998 | |||
| BUILDING PRODUCTS — 0.1% | |||||
Other Security | 2,515,000 | 2,512,648 | |||
| CAPITAL MARKETS — 0.1% | |||||
Other Security | 3,017,438 | 3,009,260 | |||
| CASINO SERVICES — 0.0% (a) | |||||
Other Security | 790,000 | 790,000 | |||
| CHEMICALS — 0.2% | |||||
Other Securities | 5,450,720 | 5,441,959 | |||
| COMMERCIAL SERVICES & SUPPLIES — 0.4% | |||||
Other Securities | 13,462,228 | 13,453,004 | |||
| COMMUNICATIONS EQUIPMENT — 0.2% | |||||
Other Securities | 6,591,578 | 6,504,272 | |||
Table of Contents
| Security Description | Principal Amount | Value | |||
| CONSTRUCTION & ENGINEERING — 0.1% | |||||
Other Security | $ 4,242,150 | $ 4,255,152 | |||
| CONSTRUCTION MATERIALS — 0.1% | |||||
Other Securities | 2,894,998 | 2,860,565 | |||
| CONTAINERS & PACKAGING — 0.1% | |||||
Other Securities | 4,258,767 | 4,249,871 | |||
| DISTRIBUTORS — 0.0% (a) | |||||
Other Security | 207,931 | 136,325 | |||
| DIVERSIFIED FINANCIAL SERVICES — 0.0% (a) | |||||
Other Security | 1,355,000 | 1,355,007 | |||
| DIVERSIFIED TELECOMMUNICATION SERVICES — 0.2% | |||||
Other Securities | 5,087,800 | 5,021,472 | |||
| ELECTRICAL EQUIPMENT — 0.1% | |||||
Other Security | 2,123,206 | 2,124,819 | |||
| ENERGY EQUIPMENT & SERVICES — 0.1% | |||||
Other Security | 2,330,000 | 2,328,905 | |||
| FINANCIAL SERVICES — 0.1% | |||||
Other Security | 2,845,804 | 2,845,804 | |||
| FOOD & STAPLES RETAILING — 0.1% | |||||
Other Securities | 3,636,103 | 3,639,277 | |||
| FOOD PRODUCTS — 0.0% (a) | |||||
Other Security | 808,032 | 786,320 | |||
| FOOD-MISC/DIVERSIFIED — 0.0% (a) | |||||
Other Security | 700,000 | 694,488 | |||
| HEALTH CARE PROVIDERS & SERVICES — 0.5% | |||||
Other Securities | 16,963,446 | 16,767,514 | |||
| HEALTH CARE TECHNOLOGY — 0.1% | |||||
Other Security | 4,043,812 | 4,034,957 | |||
| HOTELS, RESTAURANTS & LEISURE — 0.6% | |||||
Other Securities | 17,377,721 | 17,305,029 | |||
| HOUSEHOLD PRODUCTS — 0.0% (a) | |||||
Other Security | 870,682 | 866,981 | |||
| INSURANCE — 0.3% | |||||
Other Securities | 10,581,217 | 10,532,373 | |||
| INTERNET SOFTWARE & SERVICES — 0.3% | |||||
Other Securities | 7,871,701 | 7,787,200 | |||
Table of Contents
| Security Description | Principal Amount | Value | |||
| IT SERVICES — 0.3% | |||||
Other Securities | $ 9,385,750 | $ 9,344,669 | |||
| LIFE SCIENCES TOOLS & SERVICES — 0.2% | |||||
Other Securities | 5,854,449 | 5,831,932 | |||
| MACHINERY — 0.2% | |||||
Other Securities | 5,238,583 | 5,184,067 | |||
| MEDIA — 0.4% | |||||
Other Securities | 11,278,960 | 11,153,672 | |||
| METAL-DIVERSIFIED — 0.1% | |||||
Other Security | 1,635,000 | 1,637,305 | |||
| METALS & MINING — 0.1% | |||||
Other Securities | 4,308,312 | 4,299,856 | |||
| OIL REFINING&MARKETING — 0.0% (a) | |||||
Other Security | 925,000 | 802,438 | |||
| OIL, GAS & CONSUMABLE FUELS — 0.1% | |||||
Other Security | 3,022,425 | 3,000,890 | |||
| PHARMACEUTICALS — 0.1% | |||||
Other Securities | 4,009,189 | 4,007,061 | |||
| REAL ESTATE INVESTMENT TRUSTS (REITS) — 0.0% (a) | |||||
Other Security | 393,809 | 397,255 | |||
| REAL ESTATE MANAGEMENT & DEVELOPMENT — 0.1% | |||||
Other Security | 2,392,552 | 2,377,598 | |||
| RETAIL-RESTAURANTS — 0.1% | |||||
Other Security | 3,347,076 | 3,356,833 | |||
| SOFTWARE — 1.3% | |||||
Other Securities | 42,177,562 | 41,663,353 | |||
| SPECIALTY RETAIL — 0.1% | |||||
Other Securities | 2,494,750 | 2,471,337 | |||
Total Senior Floating Rate Loans (Cost $226,081,789) | 224,826,706 | ||||
| U.S. GOVERNMENT AGENCY OBLIGATIONS — 48.5% | |||||
| Federal Home Loan Mortgage Corp.: | |||||
3.00%, 11/1/2042 | 17,401,592 | 16,998,727 | |||
3.00%, 1/1/2045 | 2,783,041 | 2,710,442 | |||
3.00%, 2/1/2045 | 1,968,059 | 1,913,604 | |||
3.00%, 3/1/2045 | 2,090,819 | 2,032,967 | |||
3.00%, 4/1/2045 | 14,445,836 | 14,046,131 | |||
Table of Contents
| Security Description | Principal Amount | Value | |||
3.00%, 4/1/2045 | $ 28,034,523 | $ 27,303,202 | |||
3.00%, 5/1/2045 | 7,345,313 | 7,142,074 | |||
3.00%, 8/1/2045 | 19,997,656 | 19,444,337 | |||
3.00%, 10/1/2045 | 13,091,329 | 12,729,102 | |||
3.50%, 2/1/2045 | 3,781,706 | 3,775,467 | |||
3.50%, 4/1/2045 | 18,793,156 | 18,757,180 | |||
3.50%, 4/1/2045 | 12,141,855 | 12,118,611 | |||
3.50%, 6/1/2045 | 13,885,330 | 13,858,748 | |||
3.50%, 10/1/2045 | 16,489,502 | 16,457,935 | |||
3.50%, 2/1/2046 | 16,697,191 | 16,650,522 | |||
3.50%, 5/1/2046 | 52,943,662 | 52,795,684 | |||
4.00%, 4/1/2047 | 43,827,803 | 44,703,520 | |||
4.00%, 7/1/2047 | 13,378,031 | 13,645,336 | |||
4.00%, 10/1/2047 | 27,150,968 | 27,693,468 | |||
4.50%, 6/1/2044 | 2,623,222 | 2,753,544 | |||
Series 326, Class 300, CMO 3.00%, 3/15/2044 | 36,584,459 | 35,887,408 | |||
Series 358, Class 300, CMO 3.00%, 10/15/2047 | 36,652,136 | 35,578,857 | |||
Series 3822, Class ZG, CMO, REMIC 4.00%, 2/15/2041 | 3,673,404 | 3,826,271 | |||
Series 3852, Class NS, CMO, IO, REMIC 6.00% - 1 Month USD LIBOR, 3.93%, 5/15/2041 (b) | 12,798,078 | 1,589,890 | |||
Series 3889, Class VZ, CMO, REMIC 4.00%, 7/15/2041 | 13,068,866 | 13,469,762 | |||
Series 3935, Class SJ, CMO, IO, REMIC 6.65% - 1 Month USD LIBOR, 4.58%, 5/15/2041 (b) | 3,006,527 | 276,710 | |||
Series 4120, Class KA, CMO, REMIC 1.75%, 10/15/2032 | 19,794,819 | 18,976,082 | |||
Series 4165, Class ZT, CMO, REMIC 3.00%, 2/15/2043 | 15,714,530 | 14,342,664 | |||
Series 4215, Class KC, CMO, REMIC 2.25%, 3/15/2038 | 14,117,355 | 13,855,129 | |||
Series 4364, Class ZX, CMO, REMIC 4.00%, 7/15/2044 | 39,804,956 | 41,327,686 | |||
Series 4434, Class LZ, CMO, REMIC 3.00%, 2/15/2045 | 3,315,099 | 2,979,464 | |||
Series 4444, Class CZ, CMO, REMIC 3.00%, 2/15/2045 | 12,155,363 | 10,822,360 | |||
Series 4447, Class A, CMO, REMIC 3.00%, 6/15/2041 | 2,028,656 | 2,001,053 |
Table of Contents
| Security Description | Principal Amount | Value | |||
Series 4447, Class Z, CMO, REMIC 3.00%, 3/15/2045 | $ 4,012,040 | $ 3,632,316 | |||
Series 4471, Class BA, CMO, REMIC 3.00%, 12/15/2041 | 6,836,205 | 6,641,278 | |||
Series 4471, Class GA, CMO, REMIC 3.00%, 2/15/2044 | 10,350,321 | 10,070,711 | |||
Series 4474, Class ZX, CMO, REMIC 4.00%, 4/15/2045 | 11,705,459 | 12,078,778 | |||
Series 4481, Class B, CMO, REMIC 3.00%, 12/15/2042 | 6,988,802 | 6,819,443 | |||
Series 4483, Class CA, CMO, REMIC 3.00%, 6/15/2044 | 12,961,138 | 12,604,271 | |||
Series 4484, Class CD, CMO, REMIC 1.75%, 7/15/2030 | 17,061,305 | 16,473,026 | |||
Series 4491, Class B, CMO, REMIC 3.00%, 8/15/2040 | 12,991,689 | 12,859,384 | |||
Series 4492, Class GZ, CMO, REMIC 3.50%, 7/15/2045 | 8,413,994 | 8,077,345 | |||
Series 4499, Class AB, CMO, REMIC 3.00%, 6/15/2042 | 13,942,342 | 13,671,568 | |||
Series 4504, Class CA, CMO, REMIC 3.00%, 4/15/2044 | 14,630,504 | 14,293,157 | |||
Series 4511, Class QA, CMO, REMIC 3.00%, 1/15/2041 | 12,358,326 | 12,229,189 | |||
Series 4511, Class QC, CMO, REMIC 3.00%, 12/15/2040 | 9,351,332 | 9,211,505 | |||
Series 4533, Class AB, CMO, REMIC 3.00%, 6/15/2044 | 9,904,703 | 9,573,447 | |||
Series 4543, Class HG, CMO, REMIC 2.70%, 4/15/2044 | 18,236,294 | 17,497,558 | |||
Series 4582, Class HA, CMO, REMIC 3.00%, 9/15/2045 | 14,287,191 | 13,980,773 | |||
Series 4629, Class KA, CMO, REMIC 3.00%, 3/15/2045 | 43,966,955 | 42,890,209 | |||
Series 4750, Class PA, 3.00%, 7/15/2046 | 24,460,059 | 23,803,976 | |||
Series 4792, Class A, CMO, REMIC 3.00%, 5/15/2048 | 26,782,661 | 25,942,057 | |||
Series K053, Class A2, 3.00%, 12/25/2025 | 2,232,000 | 2,189,860 | |||
| Federal National Mortgage Association: | |||||
2.50%, 9/1/2046 | 5,177,563 | 4,822,719 | |||
2.50%, 2/1/2047 | 14,493,058 | 13,586,533 | |||
3.00%, 10/1/2041 | 33,824,343 | 32,797,443 |
Table of Contents
| Security Description | Principal Amount | Value | |||
3.00%, 3/1/2043 | $ 5,899,186 | $ 5,760,114 | |||
3.00%, 7/1/2043 | 9,170,238 | 8,849,239 | |||
3.00%, 1/1/2045 | 2,031,275 | 1,959,954 | |||
3.00%, 3/1/2045 | 2,889,693 | 2,811,536 | |||
3.00%, 4/1/2045 | 11,955,414 | 11,536,056 | |||
3.00%, 7/1/2045 | 35,693,584 | 34,852,809 | |||
3.50%, 9/1/2034 | 2,781,198 | 2,806,893 | |||
3.50%, 12/1/2034 | 2,496,755 | 2,519,823 | |||
3.50%, 2/1/2035 | 1,591,587 | 1,606,292 | |||
3.50%, 1/1/2045 | 13,915,817 | 13,900,771 | |||
3.50%, 2/1/2045 | 5,290,962 | 5,285,241 | |||
3.50%, 6/1/2045 | 14,216,355 | 14,197,276 | |||
4.50%, 3/1/2044 | 2,968,059 | 3,117,315 | |||
4.50%, 6/1/2044 | 1,522,695 | 1,599,268 | |||
4.50%, 7/1/2044 | 1,580,220 | 1,659,686 | |||
4.50%, 2/1/2045 | 1,999,181 | 2,099,715 | |||
Series 2010-109, Class N, CMO, REMIC 3.00%, 10/25/2040 | 3,191,816 | 3,142,993 | |||
Series 2011-51, Class CI, CMO, IO, REMIC 6.00% - 1 Month USD LIBOR, 3.91%, 6/25/2041 (b) | 8,698,273 | 986,569 | |||
Series 2012-101, Class AP, CMO, REMIC 2.00%, 8/25/2040 | 8,234,620 | 7,885,276 | |||
Series 2012-127, Class PA, CMO, REMIC 2.75%, 11/25/2042 | 4,177,422 | 4,054,476 | |||
Series 2012-151, Class SB, CMO, REMIC 6.00% - 1 Month USD LIBOR, 3.03%, 1/25/2043 (b) | 1,248,324 | 966,425 | |||
Series 2013-114, Class HZ, CMO, REMIC 3.00%, 11/25/2038 | 16,413,840 | 14,940,583 | |||
Series 2013-18, Class CD, CMO, REMIC 1.50%, 10/25/2027 | 6,290,771 | 6,027,937 | |||
Series 2013-30, Class PS, CMO, REMIC 6.00% - 1 Month USD LIBOR, 3.03%, 4/25/2043 (b) | 1,718,187 | 1,339,435 | |||
Series 2014-21, Class GZ, CMO, REMIC 3.00%, 4/25/2044 | 6,273,297 | 5,695,048 | |||
Series 2014-39, Class ZA, CMO, REMIC 3.00%, 7/25/2044 | 9,018,624 | 8,367,207 | |||
Series 2015-42, Class CA, CMO, REMIC 3.00%, 3/25/2044 | 8,039,884 | 7,868,015 | |||
Series 2015-9, Class HA, CMO, REMIC 3.00%, 1/25/2045 | 12,464,356 | 12,364,965 |
Table of Contents
| Security Description | Principal Amount | Value | |||
Series 2015-95, Class AP, CMO, REMIC 3.00%, 8/25/2042 | $ 16,037,980 | $ 15,701,981 | |||
Series 2016-21, Class BZ, CMO, REMIC 3.00%, 4/25/2046 | 4,633,297 | 4,176,304 | |||
Series 2016-32, Class LA, CMO, REMIC 3.00%, 10/25/2044 | 13,890,968 | 13,601,083 | |||
Series 2016-72, Class PA, CMO, REMIC 3.00%, 7/25/2046 | 21,867,885 | 21,302,745 | |||
Series 2016-81, Class PA, CMO, REMIC 3.00%, 2/25/2044 | 30,560,229 | 29,997,569 | |||
Series 2016-9, Class A, CMO, REMIC 3.00%, 9/25/2043 | 10,962,866 | 10,752,256 | |||
Series 2016-92, Class A, CMO, REMIC 3.00%, 4/25/2042 | 35,566,494 | 34,718,916 | |||
Series 2016-M3, Class A2, 2.70%, 2/25/2026 | 2,150,000 | 2,054,460 | |||
Series 2017-13, Class CA, CMO, REMIC 2.50%, 10/25/2043 | 30,180,990 | 29,145,991 | |||
Series 2017-15, Class MA, CMO, REMIC 3.00%, 2/25/2042 | 71,116,085 | 70,036,166 | |||
Series 2017-18, Class A, CMO, REMIC 3.00%, 8/25/2042 | 88,679,363 | 86,703,321 | |||
Series 2017-32, Class CA, CMO, REMIC 3.00%, 10/25/2042 | 42,973,152 | 42,258,698 | |||
Series 2017-87, Class BA, CMO, REMIC 3.00%, 12/25/2042 | 30,575,760 | 30,240,436 | |||
Series 2017-9, Class EA, CMO, REMIC 3.00%, 10/25/2042 | 73,180,052 | 71,660,760 | |||
Series 2018-27, Class JA, CMO, REMIC 3.00%, 12/25/2047 | 17,417,041 | 16,771,130 | |||
Series 2018-38, Class JB, CMO, REMIC 3.00%, 6/25/2048 | 14,751,658 | 14,285,540 | |||
Other Securities | 24,007,259 | 13,686,799 | |||
Total U.S. Government Agency Obligations (Cost $1,603,925,312) | 1,543,505,555 | ||||
| U.S. TREASURY OBLIGATIONS — 16.0% | |||||
Treasury Bonds 3.13%, 2/15/2043 | 49,890,000 | 51,174,171 | |||
| Treasury Notes: | |||||
0.75%, 9/30/2018 | 35,000,000 | 34,898,500 | |||
1.13%, 2/28/2019 | 15,000,000 | 14,890,350 | |||
1.50%, 5/31/2020 | 92,300,000 | 90,523,222 | |||
1.63%, 5/15/2026 | 66,620,000 | 60,952,634 | |||
Table of Contents
| Security Description | Principal Amount | Value | |||
1.75%, 3/31/2022 | $ 62,160,000 | $ 60,105,612 | |||
2.13%, 1/31/2021 | 87,000,000 | 85,967,313 | |||
2.13%, 2/29/2024 | 57,600,000 | 55,648,512 | |||
2.25%, 11/15/2025 | 36,900,000 | 35,497,430 | |||
Other Securities | 21,156,959 | 20,659,191 | |||
Total U.S. Treasury Obligations (Cost $520,859,130) | 510,316,935 | ||||
| MORTGAGE-BACKED SECURITIES — 4.4% | |||||
Other Securities (cost: $140,033,336) | 379,495,209 | 140,250,327 | |||
| COMMERCIAL MORTGAGE BACKED SECURITIES — 5.2% | |||||
Other Securities (cost: $182,270,150) | 1,112,509,218 | 163,921,712 | |||
TOTAL INVESTMENTS - 99.5% (Cost $3,273,818,299) | 3,165,752,643 | ||||
OTHER ASSETS IN EXCESS OF LIABILITIES - 0.5% | 16,486,154 | ||||
NET ASSETS - 100.0% | $ 3,182,238,797 | ||||
| The Summary Schedule of Investments does not reflect the complete portfolio holdings. It includes the Fund’s 50 largest holdings and each investment of any issuer that exceeds 1% of the Fund’s net assets. “Other Securities” represent all issues not required to be disclosed under the rules adopted by the U.S. Securities and Exchange Commission (“SEC”). In certain instances, securities for which footnotes listed above may otherwise apply are included in the Other Securities caption. The complete schedule of portfolio holdings is available on the Fund's website at www.spdrs.com, without charge, upon request by calling 1-866-787-2257 (toll-free) and on the SEC's website at www.sec.gov. | |
| (a) | Amount is less than 0.05% of net assets. |
| (b) | Variable Rate Security - Interest rate shown is the rate in effect at June 30, 2018. For securities based on a published reference rate and spread, the reference rate and spread are indicated in the description above. |
| (c) | Rate shown is the discount rate at time of purchase. |
| LIBOR | London Interbank Offered Rate |
| CMO | Collateralized Mortgage Obligation |
| REMIC | Real Estate Mortgage Investment Conduit |
| IO | Interest Only |
Table of Contents
| Borrower | Unfunded Loan Commitment ($) | Value ($) | Unrealized Appreciation/(Depreciation) ($) | |||
| Sinclair Television Group, Inc. | 3,012,945 | 3,014,353 | 1,408 | |||
| Mavis Tire Express Services Corp. | 483,096 | 480,076 | (3,020) | |||
| $(1,612) |
| Description | Level 1 – Quoted Prices | Level 2 – Other Significant Observable Inputs | Level 3 – Significant Unobservable Inputs | Total | ||||
| ASSETS: | ||||||||
| INVESTMENTS: | ||||||||
| Corporate Bonds & Notes | ||||||||
Argentina | $— | $ 7,543,845 | $— | $ 7,543,845 | ||||
Australia | — | 7,222,966 | — | 7,222,966 | ||||
Belgium | — | 3,257,970 | — | 3,257,970 | ||||
Brazil | — | 12,980,063 | — | 12,980,063 | ||||
Canada | — | 10,015,902 | — | 10,015,902 | ||||
Cayman Islands | — | 4,303,215 | — | 4,303,215 | ||||
Chile | — | 24,981,478 | — | 24,981,478 | ||||
China | — | 10,292,027 | — | 10,292,027 | ||||
Colombia | — | 1,968,301 | — | 1,968,301 | ||||
Costa Rica | — | 3,032,383 | — | 3,032,383 | ||||
Dominican Republic | — | 6,235,750 | — | 6,235,750 | ||||
Hong Kong | — | 2,916,351 | — | 2,916,351 | ||||
India | — | 34,847,079 | — | 34,847,079 | ||||
Ireland | — | 847,600 | — | 847,600 | ||||
Israel | — | 6,615,989 | — | 6,615,989 | ||||
Jamaica | — | 2,916,500 | — | 2,916,500 | ||||
Japan | — | 3,720,528 | — | 3,720,528 | ||||
Luxembourg | — | 3,118,856 | — | 3,118,856 | ||||
Malaysia | — | 23,310,346 | — | 23,310,346 | ||||
Mexico | — | 11,704,957 | — | 11,704,957 | ||||
Netherlands | — | 426,550 | — | 426,550 | ||||
Panama | — | 7,051,100 | — | 7,051,100 |
Table of Contents
| Description | Level 1 – Quoted Prices | Level 2 – Other Significant Observable Inputs | Level 3 – Significant Unobservable Inputs | Total | ||||
Peru | $— | $ 8,018,688 | $— | $ 8,018,688 | ||||
Philippines | — | 7,011,945 | — | 7,011,945 | ||||
Singapore | — | 18,543,073 | — | 18,543,073 | ||||
United Kingdom | — | 9,274,719 | — | 9,274,719 | ||||
United States | — | 206,734,819 | — | 206,734,819 | ||||
Asset-Backed Securities | — | 79,573,274 | — | 79,573,274 | ||||
| Foreign Government Obligations | ||||||||
Argentina | — | 7,770,750 | — | 7,770,750 | ||||
Brazil | — | 6,015,250 | — | 6,015,250 | ||||
Chile | — | 9,803,630 | — | 9,803,630 | ||||
Costa Rica | — | 3,159,188 | — | 3,159,188 | ||||
India | — | 1,633,107 | — | 1,633,107 | ||||
Indonesia | — | 6,778,561 | — | 6,778,561 | ||||
Israel | — | 8,682,626 | — | 8,682,626 | ||||
Malaysia | — | 3,467,501 | — | 3,467,501 | ||||
Mexico | — | 2,639,775 | — | 2,639,775 | ||||
Panama | — | 5,658,072 | — | 5,658,072 | ||||
Peru | — | 771,208 | — | 771,208 | ||||
Philippines | — | 8,057,526 | — | 8,057,526 | ||||
United States | — | 27,940 | — | 27,940 | ||||
| Senior Floating Rate Loans | ||||||||
Aerospace & Defense | — | 798,240 | — | 798,240 | ||||
Auto Components | — | 9,196,998 | — | 9,196,998 | ||||
Building Products | — | 2,512,648 | — | 2,512,648 | ||||
Capital Markets | — | 3,009,260 | — | 3,009,260 | ||||
Casino Services | — | 790,000 | — | 790,000 | ||||
Chemicals | — | 5,441,959 | — | 5,441,959 | ||||
Commercial Services & Supplies | — | 13,453,004 | — | 13,453,004 | ||||
Communications Equipment | — | 6,504,272 | — | 6,504,272 | ||||
Construction & Engineering | — | 4,255,152 | — | 4,255,152 | ||||
Construction Materials | — | 2,860,565 | — | 2,860,565 | ||||
Containers & Packaging | — | 4,249,871 | — | 4,249,871 | ||||
Distributors | — | 136,325 | — | 136,325 | ||||
Diversified Financial Services | — | 1,355,007 | — | 1,355,007 | ||||
Diversified Telecommunication Services | — | 5,021,472 | — | 5,021,472 | ||||
Electrical Equipment | — | 2,124,819 | — | 2,124,819 | ||||
Energy Equipment & Services | — | 2,328,905 | — | 2,328,905 | ||||
Financial Services | — | 2,845,804 | — | 2,845,804 | ||||
Food & Staples Retailing | — | 3,639,277 | — | 3,639,277 | ||||
Food Products | — | 786,320 | — | 786,320 |
Table of Contents
| Description | Level 1 – Quoted Prices | Level 2 – Other Significant Observable Inputs | Level 3 – Significant Unobservable Inputs | Total | ||||
Food-Misc/Diversified | $— | $ 694,488 | $— | $ 694,488 | ||||
Health Care Providers & Services | — | 16,767,514 | — | 16,767,514 | ||||
Health Care Technology | — | 4,034,957 | — | 4,034,957 | ||||
Hotels, Restaurants & Leisure | — | 17,305,029 | — | 17,305,029 | ||||
Household Products | — | 866,981 | — | 866,981 | ||||
Insurance | — | 10,532,373 | — | 10,532,373 | ||||
Internet Software & Services | — | 7,787,200 | — | 7,787,200 | ||||
IT Services | — | 9,344,669 | — | 9,344,669 | ||||
Life Sciences Tools & Services | — | 5,831,932 | — | 5,831,932 | ||||
Machinery | — | 5,184,067 | — | 5,184,067 | ||||
Media | — | 11,153,672 | — | 11,153,672 | ||||
Metal-Diversified | — | 1,637,305 | — | 1,637,305 | ||||
Metals & Mining | — | 4,299,856 | — | 4,299,856 | ||||
Oil Refining&Marketing | — | 802,438 | — | 802,438 | ||||
Oil, Gas & Consumable Fuels | — | 3,000,890 | — | 3,000,890 | ||||
Pharmaceuticals | — | 4,007,061 | — | 4,007,061 | ||||
Real Estate Investment Trusts (REITs) | — | 397,255 | — | 397,255 | ||||
Real Estate Management & Development | — | 2,377,598 | — | 2,377,598 | ||||
Retail-Restaurants | — | 3,356,833 | — | 3,356,833 | ||||
Software | — | 41,663,353 | — | 41,663,353 | ||||
Specialty Retail | — | 2,471,337 | — | 2,471,337 | ||||
U.S. Government Agency Obligations | — | 1,543,505,555 | — | 1,543,505,555 | ||||
U.S. Treasury Obligations | — | 510,316,935 | — | 510,316,935 | ||||
Mortgage-Backed Securities | — | 140,250,327 | — | 140,250,327 | ||||
Commercial Mortgage Backed Securities | — | 163,921,712 | — | 163,921,712 | ||||
TOTAL INVESTMENTS | $— | $3,165,752,643 | $— | $3,165,752,643 | ||||
| OTHER FINANCIAL INSTRUMENTS: | ||||||||
Unfunded Loan(a) | — | (1,612) | — | (1,612) | ||||
TOTAL INVESTMENTS AND OTHER FINANCIAL INSTRUMENTS | $— | $3,165,751,031 | $— | $3,165,751,031 |
| (a) | Includes appreciation (depreciation) on unfunded loan commitments. |
| Number of Shares Held at 6/30/17* | Value at 6/30/17* | Cost of Purchases** | Proceeds from Shares Sold | Realized Gain (Loss) | Change in Unrealized Appreciation/ Depreciation | Number of Shares Held at 6/30/18 | Value at 6/30/18 | Dividend Income | |||||||||
State Street Institutional U.S. Government Money Market Fund, Class G Shares | — | $— | $172,560,754 | $172,560,754 | $— | $— | — | $— | $30,142 |
Table of Contents
| * | Refer to Note 1 on the Notes to Financial Statements regarding the discontinuance of the master-feeder structure. |
| ** | Includes transfers from Portfolio - See Note 1 in the Notes to Financial Statements. |
Table of Contents
| SPDR DoubleLine Emerging Markets Fixed Income ETF | SPDR DoubleLine Short Duration Total Return Tactical ETF | ||
| ASSETS | |||
Investments in unaffiliated issuers, at value | $44,281,458 | $82,764,632 | |
Investments in affiliated issuers, at value | 3,529,453 | 376,094 | |
Total Investments | 47,810,911 | 83,140,726 | |
Cash | 181,855 | 196,905 | |
Receivable for investments sold | — | 102,932 | |
Dividends receivable — affiliated issuers | 2,383 | 2,271 | |
Interest receivable — unaffiliated issuers | 670,177 | 373,466 | |
Receivable from Adviser | 5,470 | 5,132 | |
TOTAL ASSETS | 48,670,796 | 83,821,432 | |
| LIABILITIES | |||
Payable for investments purchased | 389,249 | 803,940 | |
Advisory fee payable | 28,458 | 33,856 | |
Trustees’ fees and expenses payable | 10 | 7 | |
TOTAL LIABILITIES | 417,717 | 837,803 | |
NET ASSETS | $48,253,079 | $82,983,629 | |
| NET ASSETS CONSIST OF: | |||
Paid-in Capital | $50,011,843 | $83,916,484 | |
Undistributed (distribution in excess of) net investment income (loss) | 85,677 | 79,557 | |
Accumulated net realized gain (loss) on investments | (121,932) | (243,295) | |
| Net unrealized appreciation (depreciation) on: | |||
Investments — unaffiliated issuers | (1,722,509) | (769,117) | |
NET ASSETS | $48,253,079 | $82,983,629 | |
| NET ASSET VALUE PER SHARE | |||
Net asset value per share | $ 48.25 | $ 48.81 | |
Shares outstanding (unlimited amount authorized, no par value) | 1,000,000 | 1,700,000 | |
| COST OF INVESTMENTS: | |||
Investments in unaffiliated issuers | $46,003,967 | $83,533,749 | |
Investments in affiliated issuers | 3,529,453 | 376,094 | |
Total cost of investments | $49,533,420 | $83,909,843 |
Table of Contents
| SPDR DoubleLine Total Return Tactical ETF | |
| ASSETS | |
Investments in unaffiliated issuers, at value | $3,165,752,643 |
Cash | 3,598,372 |
Receivable for investments sold | 33,874,211 |
Interest receivable — unaffiliated issuers | 16,942,910 |
Receivable from Adviser | 279,347 |
Other Receivable | 2,971,079 |
TOTAL ASSETS | 3,223,418,562 |
| LIABILITIES | |
Payable for investments purchased | 39,307,548 |
Unrealized depreciation on unfunded loan commitments | 1,612 |
Advisory fee payable | 1,868,927 |
Accrued expenses and other liabilities | 1,678 |
TOTAL LIABILITIES | 41,179,765 |
NET ASSETS | $3,182,238,797 |
| NET ASSETS CONSIST OF: | |
Paid-in Capital | $3,315,419,680 |
Undistributed (distribution in excess of) net investment income (loss) | 9,694,482 |
Accumulated net realized gain (loss) on investments | (34,808,097) |
| Net unrealized appreciation (depreciation) on: | |
Investments — unaffiliated issuers | (108,065,656) |
Unfunded loan commitments | (1,612) |
NET ASSETS | $3,182,238,797 |
| NET ASSET VALUE PER SHARE | |
Net asset value per share | $ 47.60 |
Shares outstanding (unlimited amount authorized, no par value) | 66,850,000 |
| COST OF INVESTMENTS: | |
Investments in unaffiliated issuers | $3,273,818,299 |
Table of Contents
| SPDR DoubleLine Emerging Markets Fixed Income ETF | SPDR DoubleLine Short Duration Total Return Tactical ETF | ||
| INVESTMENT INCOME | |||
Interest income — unaffiliated issuers | $ 1,282,733 | $1,203,376 | |
Dividend income — affiliated issuers | 15,091 | 32,258 | |
Foreign taxes withheld | (1,446) | — | |
TOTAL INVESTMENT INCOME (LOSS) | 1,296,378 | 1,235,634 | |
| EXPENSES | |||
Advisory fee | 295,514 | 245,100 | |
Trustees’ fees and expenses | 614 | 708 | |
Miscellaneous expenses | 1,396 | 1,442 | |
TOTAL EXPENSES | 297,524 | 247,250 | |
Expenses waived/reimbursed by the Adviser | (41,412) | (26,660) | |
NET EXPENSES | 256,112 | 220,590 | |
NET INVESTMENT INCOME (LOSS) | 1,040,266 | 1,015,044 | |
| REALIZED AND UNREALIZED GAIN (LOSS) | |||
| Net realized gain (loss) on: | |||
Investments — unaffiliated issuers | 203,609 | (66,759) | |
| Net change in unrealized appreciation/depreciation on: | |||
Investments — unaffiliated issuers | (1,996,624) | (702,128) | |
NET REALIZED AND UNREALIZED GAIN (LOSS) | (1,793,015) | (768,887) | |
NET INCREASE (DECREASE) IN NET ASSETS FROM OPERATIONS | $ (752,749) | $ 246,157 |
Table of Contents
| SPDR DoubleLine Total Return Tactical ETF | |
| INVESTMENT INCOME | |
Interest income — unaffiliated issuers | $ 9,906,413 |
Interest income allocated from the Portfolio | 103,545,099 |
Dividend income allocated from the Portfolio | 1,276,376 |
Dividend income — affiliated issuers | 30,142 |
Expenses allocated from the Portfolio | (8,937,875) |
Foreign taxes withheld | (3,975) |
TOTAL INVESTMENT INCOME (LOSS) | 105,816,180 |
| EXPENSES | |
Advisory fee | 13,523,982 |
Trustees’ fees and expenses | 11,269 |
Miscellaneous expenses | 38,462 |
TOTAL EXPENSES | 13,573,713 |
Expenses waived/reimbursed by the Adviser | (3,543,588) |
NET EXPENSES | 10,030,125 |
NET INVESTMENT INCOME (LOSS) | 95,786,055 |
| REALIZED AND UNREALIZED GAIN (LOSS) | |
| Net realized gain (loss) on: | |
Investments allocated from the Portfolio | (8,048,777) |
Investments — unaffiliated issuers | 2,640,805 |
Net realized gain (loss) | (5,407,972) |
| Net change in unrealized appreciation/depreciation on: | |
Investments — unaffiliated issuers | (108,065,036) |
Unfunded loan commitments | (1,612) |
Unfunded loan commitments allocated from the Portfolio | (620) |
Investments allocated from the Portfolio | 14,970,327 |
Net change in unrealized appreciation/depreciation | (93,096,941) |
NET REALIZED AND UNREALIZED GAIN (LOSS) | (98,504,913) |
NET INCREASE (DECREASE) IN NET ASSETS FROM OPERATIONS | $ (2,718,858) |
Table of Contents
| SPDR DoubleLine Emerging Markets Fixed Income ETF | |||
| Year Ended 6/30/18 | Year Ended 6/30/17 | ||
| INCREASE (DECREASE) IN NET ASSETS FROM OPERATIONS: | |||
Net investment income (loss) | $ 1,040,266 | $ 1,068,230 | |
Net realized gain (loss) | 203,609 | 1,818,115 | |
Net change in unrealized appreciation/depreciation | (1,996,624) | (543,528) | |
Net increase (decrease) in net assets resulting from operations | (752,749) | 2,342,817 | |
Net equalization credits and charges | 34,869 | 4,915 | |
| DISTRIBUTIONS TO SHAREHOLDERS FROM: | |||
Net investment income | (1,032,793) | (1,136,725) | |
Net realized gains | (465,069) | (1,500,330) | |
Total distributions to shareholders | (1,497,862) | (2,637,055) | |
| FROM BENEFICIAL INTEREST TRANSACTIONS: | |||
Proceeds from sale of shares sold | 22,676,121 | 2,484,201 | |
Cost of shares redeemed | — | (13,109,131) | |
Net income equalization | (34,869) | (4,915) | |
Other capital | 79,367 | 28,358 | |
Net increase (decrease) in net assets from beneficial interest transactions | 22,720,619 | (10,601,487) | |
Net increase (decrease) in net assets during the period | 20,504,877 | (10,890,810) | |
Net assets at beginning of period | 27,748,202 | 38,639,012 | |
NET ASSETS AT END OF PERIOD | $48,253,079 | $ 27,748,202 | |
Undistributed (distribution in excess of) net investment income (loss) | $ 85,677 | $ 78,204 | |
| SHARES OF BENEFICIAL INTEREST: | |||
Shares sold | 450,000 | 50,000 | |
Shares redeemed | — | (250,000) | |
Net increase (decrease) | 450,000 | (200,000) | |
Table of Contents
| SPDR DoubleLine Short Duration Total Return Tactical ETF | |||
| Year Ended 6/30/18 | Year Ended 6/30/17 | ||
| INCREASE (DECREASE) IN NET ASSETS FROM OPERATIONS: | |||
Net investment income (loss) | $ 1,015,044 | $ 735,309 | |
Net realized gain (loss) | (66,759) | 590 | |
Net change in unrealized appreciation/depreciation | (702,128) | (281,924) | |
Net increase (decrease) in net assets resulting from operations | 246,157 | 453,975 | |
Net equalization credits and charges | 46,752 | 1,711 | |
| DISTRIBUTIONS TO SHAREHOLDERS FROM: | |||
Net investment income | (974,641) | (835,059) | |
Net realized gains | — | (127,004) | |
Total distributions to shareholders | (974,641) | (962,063) | |
| FROM BENEFICIAL INTEREST TRANSACTIONS: | |||
Proceeds from sale of shares sold | 48,865,257 | 12,388,012 | |
Cost of shares redeemed | — | (27,603,720) | |
Net income equalization | (46,752) | (1,711) | |
Other capital | 122,163 | 44,772 | |
Net increase (decrease) in net assets from beneficial interest transactions | 48,940,668 | (15,172,647) | |
Net increase (decrease) in net assets during the period | 48,258,936 | (15,679,024) | |
Net assets at beginning of period | 34,724,693 | 50,403,717 | |
NET ASSETS AT END OF PERIOD | $82,983,629 | $ 34,724,693 | |
Undistributed (distribution in excess of) net investment income (loss) | $ 79,557 | $ — | |
| SHARES OF BENEFICIAL INTEREST: | |||
Shares sold | 1,000,000 | 250,000 | |
Shares redeemed | — | (550,000) | |
Net increase (decrease) | 1,000,000 | (300,000) | |
Table of Contents
| SPDR DoubleLine Total Return Tactical ETF | |||
| Year Ended 6/30/18 | Year Ended 6/30/17 | ||
| INCREASE (DECREASE) IN NET ASSETS FROM OPERATIONS: | |||
Net investment income (loss) | $ 95,786,055 | $ 82,714,166 | |
Net realized gain (loss) | (5,407,972) | 2,330,164 | |
Net change in unrealized appreciation/depreciation | (93,096,941) | (41,419,853) | |
Net increase (decrease) in net assets resulting from operations | (2,718,858) | 43,624,477 | |
Net equalization credits and charges | 37,755 | 890,764 | |
| DISTRIBUTIONS TO SHAREHOLDERS FROM: | |||
Net investment income | (103,695,830) | (91,135,299) | |
Net realized gains | — | (5,206,246) | |
Total distributions to shareholders | (103,695,830) | (96,341,545) | |
| FROM BENEFICIAL INTEREST TRANSACTIONS: | |||
Proceeds from sale of shares sold | 299,844,384 | 765,835,234 | |
Cost of shares redeemed | (366,600,086) | (19,509,802) | |
Net income equalization | (37,755) | (890,764) | |
Other capital | 1,607,981 | 2,241,745 | |
Net increase (decrease) in net assets from beneficial interest transactions | (65,185,476) | 747,676,413 | |
Net increase (decrease) in net assets during the period | (171,562,409) | 695,850,109 | |
Net assets at beginning of period | 3,353,801,206 | 2,657,951,097 | |
NET ASSETS AT END OF PERIOD | $3,182,238,797 | $3,353,801,206 | |
Undistributed (distribution in excess of) net investment income (loss) | $ 9,694,482 | $ 7,446,958 | |
| SHARES OF BENEFICIAL INTEREST: | |||
Shares sold | 6,100,000 | 15,500,000 | |
Shares redeemed | (7,650,000) | (400,000) | |
Net increase (decrease) | (1,550,000) | 15,100,000 | |
Table of Contents
| SPDR DoubleLine Emerging Markets Fixed Income ETF | |||||
| Year Ended 6/30/18 | Year Ended 6/30/17 | For the Period 4/14/16* - 6/30/16 | |||
Net asset value, beginning of period | $ 50.45 | $ 51.52 | $ 50.00 | ||
| Income (loss) from investment operations: | |||||
Net investment income (loss) (a) | 1.31 | 1.77 | 0.45 | ||
Net realized and unrealized gain (loss) | (1.74) | 1.91 | 1.17 | ||
Total from investment operations | (0.43) | 3.68 | 1.62 | ||
Net equalization credits and charges (a) | 0.04 | 0.01 | — | ||
Other capital (a) | 0.10 | 0.05 | 0.15 | ||
| Distributions to shareholders from: | |||||
Net investment income | (1.36) | (1.81) | (0.25) | ||
Net realized gains | (0.55) | (3.00) | — | ||
Total distributions | (1.91) | (4.81) | (0.25) | ||
Net asset value, end of period | $ 48.25 | $ 50.45 | $ 51.52 | ||
Total return (b) | (0.65)% | 7.67% | 3.55% | ||
| Ratios and Supplemental Data: | |||||
Net assets, end of period (in 000s) | $48,253 | $27,748 | $38,639 | ||
| Ratios to average net assets: | |||||
Total expenses | 0.76% | 0.75% | 0.75%(c) | ||
Net expenses | 0.65% | 0.65% | 0.65%(c) | ||
Net investment income (loss) | 2.64% | 3.46% | 4.15%(c) | ||
Portfolio turnover rate (d) | 55% | 141% | 12%(e) | ||
| * | Commencement of operations. |
| (a) | Per share numbers have been calculated using average shares outstanding, which more appropriately presents the per share data for the year. |
| (b) | Total return is calculated assuming a purchase of shares at net asset value on the first day and a sale at net asset value on the last day of each period reported. Distributions are assumed, for the purpose of this calculation, to be reinvested at net asset value per share on the respective payment dates of each distribution. Total returns for periods of less than one year are not annualized. Broker commission charges are not included in this calculation. |
| (c) | Annualized. |
| (d) | Portfolio turnover rate excludes securities received or delivered from in-kind processing of creations or redemptions. |
| (e) | Not annualized. |
Table of Contents
| SPDR DoubleLine Short Duration Total Return Tactical ETF | |||||
| Year Ended 6/30/18 | Year Ended 6/30/17 | For the Period 4/14/16* - 6/30/16 | |||
Net asset value, beginning of period | $ 49.61 | $ 50.40 | $ 50.00 | ||
| Income (loss) from investment operations: | |||||
Net investment income (loss) (a) | 1.02 | 1.04 | 0.22 | ||
Net realized and unrealized gain (loss) | (0.99) | (0.53) | 0.20 | ||
Total from investment operations | 0.03 | 0.51 | 0.42 | ||
Net equalization credits and charges (a) | 0.05 | 0.00(b) | — | ||
Other capital (a) | 0.12 | 0.06 | 0.10 | ||
| Distributions to shareholders from: | |||||
Net investment income | (1.00) | (1.13) | (0.12) | ||
Net realized gains | — | (0.23) | — | ||
Total distributions | (1.00) | (1.36) | (0.12) | ||
Net asset value, end of period | $ 48.81 | $ 49.61 | $ 50.40 | ||
Total return (c) | 0.43% | 1.14% | 1.04% | ||
| Ratios and Supplemental Data: | |||||
Net assets, end of period (in 000s) | $82,984 | $34,725 | $50,404 | ||
| Ratios to average net assets: | |||||
Total expenses | 0.50% | 0.50% | 0.50%(d) | ||
Net expenses | 0.45% | 0.45% | 0.45%(d) | ||
Net investment income (loss) | 2.07% | 2.10% | 2.06%(d) | ||
Portfolio turnover rate (e) | 50% | 123% | 25%(f) | ||
| * | Commencement of operations. |
| (a) | Per share numbers have been calculated using average shares outstanding, which more appropriately presents the per share data for the year. |
| (b) | Amount is less than $0.005 per share. |
| (c) | Total return is calculated assuming a purchase of shares at net asset value on the first day and a sale at net asset value on the last day of each period reported. Distributions are assumed, for the purpose of this calculation, to be reinvested at net asset value per share on the respective payment dates of each distribution. Total returns for periods of less than one year are not annualized. Broker commission charges are not included in this calculation. |
| (d) | Annualized. |
| (e) | Portfolio turnover rate excludes securities received or delivered from in-kind processing of creations or redemptions. |
| (f) | Not annualized. |
Table of Contents
| SPDR DoubleLine Total Return Tactical ETF | |||||||
| Year Ended 6/30/18(a) | Year Ended 6/30/17(a) | Year Ended 6/30/16(a) | For the Period 2/23/15* - 6/30/15(a) | ||||
Net asset value, beginning of period | $ 49.03 | $ 49.87 | $ 49.43 | $ 50.00 | |||
| Income (loss) from investment operations: | |||||||
Net investment income (loss) (b) | 1.34 | 1.33 | 1.54 | 0.55 | |||
Net realized and unrealized gain (loss) (c) | (1.34) | (0.66) | 0.34 | (0.88) | |||
Total from investment operations | — | 0.67 | 1.88 | (0.33) | |||
Net equalization credits and charges (b) | 0.00(d) | 0.01 | 0.07 | 0.10 | |||
Other capital (b) | 0.02 | 0.04 | 0.03 | 0.05 | |||
| Distributions to shareholders from: | |||||||
Net investment income | (1.45) | (1.48) | (1.54) | (0.39) | |||
Net realized gains | — | (0.08) | — | — | |||
Total distributions | (1.45) | (1.56) | (1.54) | (0.39) | |||
Net asset value, end of period | $ 47.60 | $ 49.03 | $ 49.87 | $ 49.43 | |||
Total return (e) | 0.04% | 1.55% | 4.03% | (0.34)% | |||
| Ratios and Supplemental Data: | |||||||
Net assets, end of period (in 000s) | $3,182,239 | $3,353,801 | $2,657,951 | $746,443 | |||
| Ratios to average net assets: | |||||||
Total expenses | 0.65% | 0.66% | 0.65% | 0.65%(f) | |||
Net expenses | 0.55% | 0.55% | 0.55% | 0.56%(f) | |||
Net investment income (loss) | 2.78% | 2.70% | 3.14% | 3.18%(f) | |||
Portfolio turnover rate | 34%(g) | 72%(g) | 38%(g) | 14%(g) | |||
| * | Commencement of operations. |
| (a) | The per share amounts and percentages include the Fund’s proportionate share of income and expenses of the Portfolio of the master feeder structure. See Note 1. |
| (b) | Per share numbers have been calculated using average shares outstanding, which more appropriately presents the per share data for the year. |
| (c) | Amounts shown in this caption for a share outstanding may not accord with the change in aggregate gains and losses in securities for the fiscal period because of the timing of sales and repurchases of Fund shares in relation to fluctuating market values for the Fund. |
| (d) | Amount is less than $0.005 per share. |
| (e) | Total return is calculated assuming a purchase of shares at net asset value on the first day and a sale at net asset value on the last day of each period reported. Distributions are assumed, for the purpose of this calculation, to be reinvested at net asset value per share on the respective payment dates of each distribution. Total returns for periods of less than one year are not annualized. Broker commission charges are not included in this calculation. |
| (f) | Annualized. |
| (g) | Portfolio turnover is from the Fund's Portfolio prior to discontinuance of master feeder structure. See Note 1. |
Table of Contents
| SPDR DoubleLine Emerging Markets Fixed Income ETF |
| SPDR DoubleLine Short Duration Total Return Tactical ETF |
| SPDR DoubleLine Total Return Tactical ETF |
Table of Contents
Table of Contents
Table of Contents
Table of Contents
| SPDR DoubleLine Emerging Markets Fixed Income ETF |
| SPDR DoubleLine Short Duration Total Return Tactical ETF |
| SPDR DoubleLine Total Return Tactical ETF |
Table of Contents
| Annual Rate | |
SPDR DoubleLine Emerging Markets Fixed Income ETF | 0.75% |
SPDR DoubleLine Short Duration Total Return Tactical ETF | 0.50 |
SPDR DoubleLine Total Return Tactical ETF | 0.65 * |
| * | The Advisory fee was reduced by the proportional amount of the advisory fee of the Fund’s Portfolio prior to the close of business on May 7, 2018. For the period ended June 30, 2018, the net annualized advisory fee was 0.29%. The reduction resulted in a fee reimbursement which is identified on the Statements of Operations. |
Table of Contents
| U.S. Government Obligations | Other Securities | ||||||
| Purchases | Sales | Purchases | Sales | ||||
SPDR DoubleLine Emerging Markets Fixed Income ETF | $ — | $ — | $ 40,973,387 | $ 20,875,532 | |||
SPDR DoubleLine Short Duration Total Return Tactical ETF | 55,775,234 | 19,905,792 | 9,989,842 | — | |||
Table of Contents
| U.S. Government Obligations | Other Securities | ||||||
| Purchases | Sales | Purchases | Sales | ||||
SPDR DoubleLine Total Return Tactical ETF | $14,418,750 | $46,683,475 | $1,692,007,770 | $1,085,723,436 | |||
Table of Contents
| Ordinary Income | Long-Term Capital Gains | Total | |||
SPDR DoubleLine Emerging Markets Fixed Income ETF | $ 1,449,429 | $48,433 | $ 1,497,862 | ||
SPDR DoubleLine Short Duration Total Return Tactical ETF | 974,641 | — | 974,641 | ||
SPDR DoubleLine Total Return Tactical ETF | 103,695,830 | — | 103,695,830 |
| Ordinary Income | Long-Term Capital Gains | Total | |||
SPDR DoubleLine Emerging Markets Fixed Income ETF | $ 2,637,055 | $ — | $ 2,637,055 | ||
SPDR DoubleLine Short Duration Total Return Tactical ETF | 962,063 | — | 962,063 | ||
SPDR DoubleLine Total Return Tactical ETF | 94,588,915 | 1,752,630 | 96,341,545 |
| Undistributed Ordinary Income | Capital Loss Carryforwards | Undistributed Long-Term Capital Gains | Net Unrealized Gains (Losses) | Qualified Late-Year Losses* | Total | ||||||
SPDR DoubleLine Emerging Markets Fixed Income ETF | $ 85,677 | $ — | $— | $ (1,722,509) | $(121,932) | $ (1,758,764) | |||||
SPDR DoubleLine Short Duration Total Return Tactical ETF | 79,557 | (197,251) | — | (815,161) | — | (932,855) | |||||
SPDR DoubleLine Total Return Tactical ETF | 9,694,482 | (34,332,694) | — | (108,542,671) | — | (133,180,883) |
| * The Funds have elected to defer certain qualified late-year losses and recognize such losses in the next taxable year. |
Table of Contents
| Non-Expiring Short Term | Non-Expiring Long Term | ||
SPDR DoubleLine Short Duration Total Return Tactical ETF | $ 97,886 | $ 99,365 | |
SPDR DoubleLine Total Return Tactical ETF | 17,091,058 | 17,241,636 |
| Tax Cost | Gross Unrealized Appreciation | Gross Unrealized Depreciation | Net Unrealized Appreciation (Depreciation) | ||||
SPDR DoubleLine Emerging Markets Fixed Income ETF | $ 49,533,420 | $ 23,662 | $ 1,746,171 | $ (1,722,509) | |||
SPDR DoubleLine Short Duration Total Return Tactical ETF | 83,955,887 | 96,230 | 911,391 | (815,161) | |||
SPDR DoubleLine Total Return Tactical ETF | 3,277,306,647 | 6,751,260 | 115,293,931 | (108,542,671) |
Table of Contents
Table of Contents
Table of Contents
| Individual fund constituting the SSGA Active Trust | Statement of operations | Statement of changes in net assets | Financial highlights |
| SPDR ® DoubleLine® Emerging Markets Fixed Income ETF | For the year ended June 30, 2018 | For each of the two years in the period ended June 30, 2018 | For each of the two years in the period ended June 30, 2018 and the period from April 14, 2016 (commencement of operations) through June 30, 2016 |
| SPDR ® DoubleLine® Short Duration Total Return Tactical ETF | For the year ended June 30, 2018 | For each of the two years in the period ended June 30, 2018 | For each of the two years in the period ended June 30, 2018 and the period from April 14, 2016 (commencement of operations) through June 30, 2016 |
Table of Contents
| Individual fund constituting the SSGA Active Trust | Statement of operations | Statement of changes in net assets | Financial highlights |
| SPDR ® DoubleLine® Total Return Tactical ETF | For the year ended June 30, 2018 | For each of the two years in the period ended June 30, 2018 | For each of the three years in the period ended June 30, 2018 and the period from February 23, 2015 (commencement of operations) through June 30, 2015 |
Table of Contents

August 30, 2018
Table of Contents
Table of Contents
| SPDR DoubleLine Emerging Markets Fixed Income ETF | SPDR DoubleLine Short Duration Total Return Tactical ETF | SPDR DoubleLine Total Return Tactical ETF | ||||
Annualized Expense Ratio | 0.65% | 0.45% | 0.55% | |||
| Actual: | ||||||
Ending Account Value | $ 972.40 | $1,000.70 | $ 991.10 | |||
Expenses Paid During Period(a) | 3.18 | 2.23 | 2.72(b) | |||
| Hypothetical (assuming a 5% return before expenses): | ||||||
Ending Account Value | 1,021.60 | 1,022.60 | 1,022.10 | |||
Expenses Paid During Period(a) | 3.26 | 2.26 | 2.76(b) |
| (b) | Reflects the expenses of both the Fund and the Portfolio for the period while the Fund was making investments directly in the Portfolio. |
| (a) | Expenses are equal to the Fund's annualized net expense ratio multiplied by the average account value of the period, multiplied by 181, then divided by 365. |
Table of Contents
| Amount | |
SPDR DoubleLine Emerging Markets Fixed Income ETF | $48,433 |
Table of Contents
Table of Contents
Table of Contents
Table of Contents
Table of Contents
| Name, Address and Year of Birth | Position(s) with Funds | Term of Office and Length of Time Served | Principal Occupation(s) During Past 5 Years | Number of Portfolios in Fund Complex Overseen by Trustee† | Other Directorships Held by Trustee During the Past 5 Years | |||||
| Trustees | ||||||||||
| Independent Trustees | ||||||||||
| FRANK NESVET c/o SSGA Active Trust One Iron Street Boston, MA 02210 1943 | Independent Trustee, Chairman, Trustee Committee Chair | Term: Unlimited Served: since March 2011 | Retired. | 127 | None. | |||||
| DAVID M. KELLY c/o SSGA Active Trust One Iron Street Boston, MA 02210 1938 | Independent Trustee | Term: Unlimited Served: since March 2011 | Retired. | 127 | Chicago Stock Exchange (Former Director, retired); Penson Worldwide Inc. (Former Director, retired). |
Table of Contents
| Name, Address and Year of Birth | Position(s) with Funds | Term of Office and Length of Time Served | Principal Occupation(s) During Past 5 Years | Number of Portfolios in Fund Complex Overseen by Trustee† | Other Directorships Held by Trustee During the Past 5 Years | |||||
| BONNY EUGENIA BOATMAN c/o SSGA Active Trust One Iron Street Boston, MA 02210 1950 | Independent Trustee | Term: Unlimited Served: since March 2011 | Retired. | 127 | None. | |||||
| DWIGHT D. CHURCHILL c/o SSGA Active Trust One Iron Street Boston, MA 02210 1953 | Independent Trustee | Term: Unlimited Served: since March 2011 | Self-employed consultant since 2010; CEO and President, CFA Institute (June 2014-January 2015). | 127 | Affiliated Managers Group, Inc. (Director). | |||||
| CARL G. VERBONCOEUR c/o SSGA Active Trust One Iron Street Boston, MA 02210 1952 | Independent Trustee, Audit Committee Chair | Term: Unlimited Served: since March 2011 | Self-employed consultant since 2009. | 127 | The Motley Fool Funds Trust (Trustee). | |||||
| Interested Trustee | ||||||||||
| JAMES E. ROSS* SSGA Funds Management, Inc. One Iron Street Boston, MA 02210 1965 | Interested Trustee | Term: Unlimited Served as Trustee: since March 2011 | Chairman and Director, SSGA Funds Management, Inc. (2005-present); Executive Vice President and Principal, State Street Global Advisors (2006-present); Chief Executive Officer and Director, State Street Global Advisors Funds Distributors, LLC (May 2017- present); Director, State Street Global Markets, LLC (2013-April 2017); President, SSGA Funds Management, Inc. (2005-2012). | 196 | None. |
Table of Contents
| Name, Address and Year of Birth | Position(s) with Funds | Term of Office and Length of Time Served | Principal Occupation(s) During Past 5 Years | Number of Portfolios in Fund Complex Overseen by Trustee† | Other Directorships Held by Trustee During the Past 5 Years | |||||
| † For the purpose of determining the number of portfolios overseen by the Trustees, “Fund Complex” comprises registered investment companies for which SSGA Funds Management, Inc. serves as investment adviser. | ||||||||||
| * Mr. Ross is an Interested Trustee because of his employment with the Adviser and ownership interest in an affiliate of the Adviser. Mr. Ross previously served as an Interested Trustee from November 2005 to December 2009. | ||||||||||
| Name, Address and Year of Birth | Position(s) with Funds | Term of Office and Length of Time Served | Principal Occupation(s) During the Past 5 Years | |||
| Officers | ||||||
| ELLEN M. NEEDHAM SSGA Funds Management, Inc. One Iron Street Boston, MA 02210 1967 | President | Term: Unlimited Served: since October 2012 | President and Director, SSGA Funds Management, Inc. (2001 - present)*; Senior Managing Director, State Street Global Advisors (1992 - present)*; Director, State Street Global Advisors Funds Distributors, LLC (May 2017 - present). | |||
| BRUCE S. ROSENBERG SSGA Funds Management, Inc. One Iron Street Boston, MA 02210 1961 | Treasurer | Term: Unlimited Served: since February 2016 | Managing Director, State Street Global Advisors and SSGA Funds Management, Inc. (July 2015 - present); Director, Credit Suisse (April 2008 - July 2015). | |||
| ANN M. CARPENTER SSGA Funds Management, Inc. One Iron Street Boston, MA 02210 1966 | Vice President; Deputy Treasurer | Term: Unlimited Served: since August 2012 | Chief Operating Officer, SSGA Funds Management, Inc. (2005 - Present)*; Managing Director, State Street Global Advisors (2005 - present).* | |||
| MICHAEL P. RILEY SSGA Funds Management, Inc. One Iron Street Boston, MA 02210 1969 | Vice President | Term: Unlimited Served: since March 2011 | Managing Director, State Street Global Advisors (2005 - present).* | |||
| JOSHUA A. WEINBERG SSGA Funds Management, Inc. One Iron Street Boston, MA 02210 1978 | Chief Legal Officer | Term: Unlimited Served: since February 2015 | Managing Director and Managing Counsel, State Street Global Advisors (2011 - present); Clerk, SSGA Funds Management, Inc. (2013 - present); Associate, Financial Services Group, Dechert LLP (2006 - 2011). |
Table of Contents
| Name, Address and Year of Birth | Position(s) with Funds | Term of Office and Length of Time Served | Principal Occupation(s) During the Past 5 Years | |||
| JESSE D. HALLEE State Street Bank and Trust Company 100 Summer Street, SUM0703 Boston, MA 02111 1976 | Secretary | Term: Unlimited Served: since August 2017 | Vice President and Managing Counsel, State Street Bank and Trust Company (2013 – present); Vice President and Counsel, Brown Brothers Harriman & Co. (2007- 2013).** | |||
| ESTEFANIA SALOMON State Street Bank and Trust Company 100 Summer Street SUM0703 Boston, MA 02111 1983 | Assistant Secretary | Term:Unlimited Served: since May 2018 | Assistant Vice President and Associate Counsel, State Street Bank and Trust Company (2018 – present); Senior Compliance Consultant, AdvisorAssist, LLC (2017); Attorney, Commonwealth of Massachusetts, Securities Division (2014-2017). | |||
| CHAD C. HALLETT SSGA Funds Management, Inc. One Iron Street Boston, MA 02210 1969 | Deputy Treasurer | Term: Unlimited Served: since February 2016 | Vice President, State Street Global Advisors and SSGA Funds Management, Inc. (November 2014 - present); Vice President, State Street Bank and Trust Company (2001 - November 2014).* | |||
| DARLENE ANDERSON-VASQUEZ SSGA Funds Management, Inc. One Iron Street Boston, MA 02210 1968 | Deputy Treasurer | Term: Unlimited Served: since November 2016 | Managing Director, State Street Global Advisors and SSGA Funds Management, Inc. (May 2016 - present); Senior Vice President, John Hancock Investments (September 2007 - May 2016). | |||
| ARTHUR A. JENSEN SSGA Funds Management, Inc. 1600 Summer Street Stamford, CT 06905 1966 | Deputy Treasurer | Term: Unlimited Served: Since August 2017 | Vice President at State Street Global Advisors (July 2016 – present); Mutual Funds Controller of GE Asset Management Incorporated (April 2011 - July 2016). | |||
| SUJATA UPRETI SSGA Funds Management, Inc. One Iron Street Boston, MA 02210 1974 | Assistant Treasurer | Term: Unlimited Served: since February 2016 | Vice President, State Street Global Advisors and SSGA Funds Management, Inc. (May 2015 - present); Assistant Director, Cambridge Associates, LLC (July 2014 - January 2015); Vice President, Bank of New York Mellon (July 2012 - August 2013); Manager, PricewaterhouseCoopers, LLP (September 2003 - July 2012). |
Table of Contents
| Name, Address and Year of Birth | Position(s) with Funds | Term of Office and Length of Time Served | Principal Occupation(s) During the Past 5 Years | |||
| DANIEL FOLEY SSGA Funds Management, Inc. One Iron Street Boston, MA 02210 1972 | Assistant Treasurer | Term: Unlimited Served: since February 2016 | Vice President, State Street Global Advisors and SSGA Funds Management, Inc. (April 2007 - present).* | |||
| DANIEL G. PLOURDE SSGA Funds Management, Inc. One Iron Street Boston, MA 02210 1980 | Assistant Treasurer | Term: Unlimited Served: since May 2017 | Vice President, State Street Global Advisors and SSGA Funds Management, Inc. (May 2015 - present); Officer, State Street Bank and Trust Company (March 2009 - May 2015). | |||
| BRIAN HARRIS SSGA Funds Management, Inc. One Iron Street Boston, MA 02210 1973 | Chief Compliance Officer; Anti-Money Laundering Officer; Code of Ethics Compliance Officer | Term: Unlimited Served: since November 2013 | Managing Director, State Street Global Advisors and SSGA Funds Management, Inc. (June 2013 - present)*; Senior Vice President and Global Head of Investment Compliance, BofA Global Capital Management (2010 - 2013); Director of Compliance, AARP Financial Inc. (2008 - 2010). | |||
| * Served in various capacities and/or with various affiliated entities during noted time period. | ||||||
| ** Served in various capacities and/or with unaffiliated mutual funds or closed-end funds for which State Street Bank and Trust Company or its affiliates act as a provider of services during the noted time period. | ||||||
| Statement of Additional Information (SAI) includes additional information about Funds' directors and is available, without charge, upon request and by calling 1-866-787-2257. | ||||||
Table of Contents
Table of Contents
Table of Contents
Table of Contents
Laundering Officer; Code of Ethics Compliance Officer
One Iron Street
Boston, MA 02210
One Iron Street
Boston, MA 02210
One Lincoln Street
Boston, MA 02111
1111 Pennsylvania Avenue, NW
Washington, DC 20004
200 Clarendon Street
Boston, MA 02116
Table of Contents
One Iron Street
Boston, MA 02210
Table of Contents

Table of Contents
Table of Contents
| 1 | |
| 2 | |
| 4 | |
| 7 | |
| 8 | |
| 14 | |
| 16 |
Table of Contents
Table of Contents
Table of Contents
| Cumulative Total Return | Average Annual Total Return | ||||||||
| Net Asset Value | Market Value | Markit iBoxx USD Liquid Leveraged Loan Index | Net Asset Value | Market Value | Markit iBoxx USD Liquid Leveraged Loan Index | ||||
| ONE YEAR(1) | 3.43% | 3.29% | 3.43% | 3.43% | 3.29% | 3.43% | |||
| FIVE YEARS(1) | 14.89% | 14.60% | 15.10% | 2.82% | 2.76% | 2.85% | |||
| SINCE INCEPTION(1) (2) | 14.34% | 14.22% | 14.65% | 2.59% | 2.57% | 2.64% | |||
| (1) | The One Year, Five Year and Since Inception Cumulative Total Returns for the Fund’s secondary benchmark, S&P/LSTA U.S. Leveraged Loan 100 Index, were 3.72%, 18.00% and 17.73%, respectively. The One Year, Five Year and Since Inception Average Annual Total Returns for the Fund’s secondary benchmark, S&P/LSTA U.S. Leveraged Loan 100 Index, were 3.72%, 3.37% and 3.16%, respectively. |
| (2) | For the period April 3, 2013 to June 30, 2018. |
(Based on Net Asset Value)
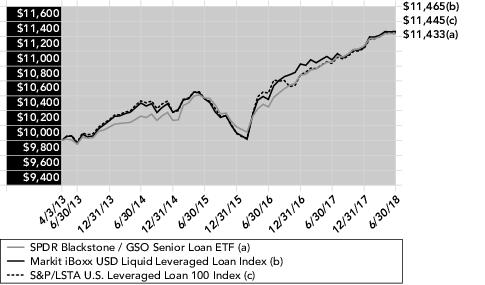
Table of Contents
| SPDR Blackstone / GSO Senior Loan ETF | |
| ASSETS | |
Investment in corresponding affiliated Portfolio, at value | $3,190,663,095 |
Cash | 102,744 |
TOTAL ASSETS | 3,190,765,839 |
| LIABILITIES | |
Payable for fund shares repurchased | 102,743 |
Advisory fee payable | 1,039,020 |
Accrued expenses and other liabilities | 461 |
TOTAL LIABILITIES | 1,142,224 |
NET ASSETS | $3,189,623,615 |
| NET ASSETS CONSIST OF: | |
Paid-in Capital | $3,248,971,775 |
Undistributed (distribution in excess of) net investment income (loss) | 8,406,201 |
Accumulated net realized gain (loss) on investments | (60,036,621) |
| Net unrealized appreciation (depreciation) on: | |
Investments — affiliated issuers | (7,717,740) |
NET ASSETS | $3,189,623,615 |
| NET ASSET VALUE PER SHARE | |
Net asset value per share | $ 47.04 |
Shares outstanding (unlimited amount authorized, no par value) | 67,800,000 |
| COST OF INVESTMENTS: | |
Investments in corresponding affiliated Portfolio | $3,198,380,835 |
Table of Contents
| SPDR Blackstone / GSO Senior Loan ETF | |
| INCOME AND EXPENSES ALLOCATED FROM AFFILIATED PORTFOLIO | |
Interest income allocated from affiliated Portfolio | $117,281,240 |
Dividend income allocated from affiliated Portfolio | 2,615,497 |
Expenses allocated from affiliated Portfolio | (7,231,542) |
TOTAL INVESTMENT INCOME (LOSS) ALLOCATED FROM AFFILIATED PORTFOLIO | 112,665,195 |
| EXPENSES | |
Advisory fee | 9,582,402 |
Trustees’ fees and expenses | 36,635 |
TOTAL EXPENSES | 9,619,037 |
NET INVESTMENT INCOME (LOSS) | 103,046,158 |
| REALIZED AND UNREALIZED GAIN (LOSS) | |
| Net realized gain (loss) on: | |
Investment transactions allocated from affiliated Portfolio | (11,863,241) |
| Net change in unrealized appreciation/depreciation on: | |
Investment transactions allocated from affiliated Portfolio | (16,510,899) |
NET REALIZED AND UNREALIZED GAIN (LOSS) | (28,374,140) |
NET INCREASE (DECREASE) IN NET ASSETS FROM OPERATIONS | $ 74,672,018 |
Table of Contents
| SPDR Blackstone / GSO Senior Loan ETF | |||
| Year Ended 6/30/18 | Year Ended 6/30/17 | ||
| INCREASE (DECREASE) IN NET ASSETS FROM OPERATIONS: | |||
Net investment income (loss) | $ 103,046,158 | $ 46,491,283 | |
Net realized gain (loss) | (11,863,241) | 2,066,423 | |
Net change in unrealized appreciation/depreciation | (16,510,899) | 10,003,246 | |
Net increase (decrease) in net assets resulting from operations | 74,672,018 | 58,560,952 | |
Net equalization credits and charges | 1,868,667 | 1,344,767 | |
| DISTRIBUTIONS TO SHAREHOLDERS FROM: | |||
Net investment income | (97,740,250) | (45,308,923) | |
| FROM BENEFICIAL INTEREST TRANSACTIONS: | |||
Proceeds from sale of shares sold | 1,509,849,497 | 1,009,200,238 | |
Cost of shares redeemed | (118,513,417) | (4,708,856) | |
Net income equalization | (1,868,667) | (1,344,767) | |
Other capital | 850,598 | 533,984 | |
Net increase (decrease) in net assets from beneficial interest transactions | 1,390,318,011 | 1,003,680,599 | |
Net increase (decrease) in net assets during the period | 1,369,118,446 | 1,018,277,395 | |
Net assets at beginning of period | 1,820,505,169 | 802,227,774 | |
NET ASSETS AT END OF PERIOD | $3,189,623,615 | $1,820,505,169 | |
Undistributed (distribution in excess of) net investment income (loss) | $ 8,406,201 | $ 3,100,293 | |
| SHARES OF BENEFICIAL INTEREST: | |||
Shares sold | 31,900,000 | 21,300,000 | |
Shares redeemed | (2,500,000) | (100,000) | |
Net increase (decrease) | 29,400,000 | 21,200,000 | |
Table of Contents
| SPDR Blackstone / GSO Senior Loan ETF | |||||||||
| Year Ended 6/30/18(a) | Year Ended 6/30/17(a) | Year Ended 6/30/16(a) | Year Ended 6/30/15(a) | Year Ended 6/30/14(a) | |||||
Net asset value, beginning of period | $ 47.41 | $ 46.64 | $ 49.22 | $ 50.02 | $ 49.65 | ||||
| Income (loss) from investment operations: | |||||||||
Net investment income (loss) (b) | 2.04 | 1.85 | 1.95 | 2.01 | 1.54 | ||||
Net realized and unrealized gain (loss) (c) | (0.50) | 0.73 | (2.58) | (0.88) | 0.24 | ||||
Total from investment operations | 1.54 | 2.58 | (0.63) | 1.13 | 1.78 | ||||
Net equalization credits and charges (b) | 0.04 | 0.05 | 0.02 | 0.01 | 0.03 | ||||
Other capital (b) | 0.02 | 0.02 | 0.02 | 0.02 | 0.04 | ||||
| Distributions to shareholders from: | |||||||||
Net investment income | (1.97) | (1.88) | (1.99) | (1.96) | (1.48) | ||||
Net asset value, end of period | $ 47.04 | $ 47.41 | $ 46.64 | $ 49.22 | $ 50.02 | ||||
Total return (d) | 3.43% | 5.77% | (1.15)% | 2.38% | 3.77% | ||||
| Ratios and Supplemental Data: | |||||||||
Net assets, end of period (in 000s) | $3,189,624 | $1,820,505 | $802,228 | $671,810 | $610,275 | ||||
| Ratios to average net assets: | |||||||||
Total expenses | 0.70% | 0.70% | 0.71% | 0.71% | 0.85% | ||||
Net investment income (loss) | 4.30% | 3.91% | 4.15% | 4.09% | 3.09% | ||||
Portfolio turnover rate (e) | 90% | 68% | 88% | 65% | 77% | ||||
| (a) | The per share amounts and percentages include the Fund’s proportionate share of income and expenses of the Portfolio. |
| (b) | Per share numbers have been calculated using average shares outstanding, which more appropriately presents the per share data for the year. |
| (c) | Amounts shown in this caption for a share outstanding may not accord with the change in aggregate gains and losses in securities for the fiscal period because of the timing of sales and repurchases of Fund shares in relation to fluctuating market values for the Fund. |
| (d) | Total return is calculated assuming a purchase of shares at net asset value on the first day and a sale at net asset value on the last day of each period reported. Distributions are assumed, for the purpose of this calculation, to be reinvested at net asset value per share on the respective payment dates of each distribution. Broker commission charges are not included in this calculation. |
| (e) | Portfolio turnover rate is from the Portfolio. |
Table of Contents
Table of Contents
Table of Contents
| Annual Rate | |
SPDR Blackstone / GSO Senior Loan ETF | 0.70 *% |
| * | The Advisory fee is reduced by the proportional amount of the advisory fee of the Fund’s Portfolio prior to the close of business on May 7, 2018. For the period ended June 30, 2018, the net annualized advisory fee was 0.40%. |
Table of Contents
Table of Contents
| Ordinary Income | Long-Term Capital Gains | Total | |||
SPDR Blackstone / GSO Senior Loan ETF | $97,740,250 | $— | $97,740,250 |
| Ordinary Income | Long-Term Capital Gains | Total | |||
SPDR Blackstone / GSO Senior Loan ETF | $ 45,308,923 | $ — | $ 45,308,923 |
Table of Contents
| Undistributed Ordinary Income | Capital Loss Carryforwards | Undistributed Long-Term Capital Gains | Net Unrealized Gains (Losses) | Qualified Late-Year Losses* | Total | ||||||
SPDR Blackstone / GSO Senior Loan ETF | $8,406,201 | $(58,719,996) | $— | $(9,034,365) | $— | $(59,348,160) |
| * The Fund has elected to defer certain qualified late-year losses and recognize such losses in the next taxable year. |
| Non-Expiring Short Term | Non-Expiring Long Term | ||
SPDR Blackstone / GSO Senior Loan ETF | $23,769,922 | $34,950,074 |
| Tax Cost | Gross Unrealized Appreciation | Gross Unrealized Depreciation | Net Unrealized Appreciation (Depreciation) | ||||
SPDR Blackstone / GSO Senior Loan ETF | $3,199,697,460 | $— | $9,034,365 | $(9,034,365) |
Table of Contents
Table of Contents

August 31, 2018
Table of Contents
Table of Contents
| SPDR Blackstone / GSO Senior Loan ETF (a) | ||
Annualized Expense Ratio | 0.70% | |
| Actual: | ||
Ending Account Value | $1,014.40 | |
Expenses Paid During Period(b) | 3.50 | |
| Hypothetical (assuming a 5% return before expenses): | ||
Ending Account Value | 1,021.30 | |
Expenses Paid During Period(b) | 3.51 |
| (a) | Because the Fund invests all of its assets in its respective Master Portfolio, the expense example reflects the net expenses of both the Fund and the Master Portfolio in which it invests. |
| (b) | Expenses are equal to the Fund's annualized net expense ratio multiplied by the average account value of the period, multiplied by 181, then divided by 365. |
Table of Contents
Table of Contents
Table of Contents
Table of Contents
Table of Contents
Table of Contents
| Name, Address and Year of Birth | Position(s) with Funds | Term of Office and Length of Time Served | Principal Occupation(s) During Past 5 Years | Number of Portfolios in Fund Complex Overseen by Trustee† | Other Directorships Held by Trustee During the Past 5 Years | |||||
| Trustees | ||||||||||
| Independent Trustees | ||||||||||
| FRANK NESVET c/o SSGA Active Trust One Iron Street Boston, MA 02210 1943 | Independent Trustee, Chairman, Trustee Committee Chair | Term: Unlimited Served: since March 2011 | Retired. | 127 | None. | |||||
| DAVID M. KELLY c/o SSGA Active Trust One Iron Street Boston, MA 02210 1938 | Independent Trustee | Term: Unlimited Served: since March 2011 | Retired. | 127 | Chicago Stock Exchange (Former Director, retired); Penson Worldwide Inc. (Former Director, retired). | |||||
| BONNY EUGENIA BOATMAN c/o SSGA Active Trust One Iron Street Boston, MA 02210 1950 | Independent Trustee | Term: Unlimited Served: since March 2011 | Retired. | 127 | None. | |||||
| DWIGHT D. CHURCHILL c/o SSGA Active Trust One Iron Street Boston, MA 02210 1953 | Independent Trustee | Term: Unlimited Served: since March 2011 | Self-employed consultant since 2010; CEO and President, CFA Institute (June 2014-January 2015). | 127 | Affiliated Managers Group, Inc. (Director). | |||||
| CARL G. VERBONCOEUR c/o SSGA Active Trust One Iron Street Boston, MA 02210 1952 | Independent Trustee, Audit Committee Chair | Term: Unlimited Served: since March 2011 | Self-employed consultant since 2009. | 127 | The Motley Fool Funds Trust (Trustee). |
Table of Contents
| Name, Address and Year of Birth | Position(s) with Funds | Term of Office and Length of Time Served | Principal Occupation(s) During Past 5 Years | Number of Portfolios in Fund Complex Overseen by Trustee† | Other Directorships Held by Trustee During the Past 5 Years | |||||
| Interested Trustee | ||||||||||
| JAMES E. ROSS* SSGA Funds Management, Inc. One Iron Street Boston, MA 02210 1965 | Interested Trustee | Term: Unlimited Served as Trustee: since March 2011 | Chairman and Director, SSGA Funds Management, Inc. (2005-present); Executive Vice President and Principal, State Street Global Advisors (2006-present); Chief Executive Officer and Director, State Street Global Advisors Funds Distributors, LLC (May 2017- present); Director, State Street Global Markets, LLC (2013-April 2017); President, SSGA Funds Management, Inc. (2005-2012). | 196 | None. | |||||
| † For the purpose of determining the number of portfolios overseen by the Trustees, “Fund Complex” comprises registered investment companies for which SSGA Funds Management, Inc. serves as investment adviser. | ||||||||||
| * Mr. Ross is an Interested Trustee because of his employment with the Adviser and ownership interest in an affiliate of the Adviser. Mr. Ross previously served as an Interested Trustee from November 2005 to December 2009. | ||||||||||
Table of Contents
| Name, Address and Year of Birth | Position(s) with Funds | Term of Office and Length of Time Served | Principal Occupation(s) During the Past 5 Years | |||
| Officers | ||||||
| ELLEN M. NEEDHAM SSGA Funds Management, Inc. One Iron Street Boston, MA 02210 1967 | President | Term: Unlimited Served: since October 2012 | President and Director, SSGA Funds Management, Inc. (2001 - present)*; Senior Managing Director, State Street Global Advisors (1992 - present)*; Director, State Street Global Advisors Funds Distributors, LLC (May 2017 - present). | |||
| BRUCE S. ROSENBERG SSGA Funds Management, Inc. One Iron Street Boston, MA 02210 1961 | Treasurer | Term: Unlimited Served: since February 2016 | Managing Director, State Street Global Advisors and SSGA Funds Management, Inc. (July 2015 - present); Director, Credit Suisse (April 2008 - July 2015). | |||
| ANN M. CARPENTER SSGA Funds Management, Inc. One Iron Street Boston, MA 02210 1966 | Vice President; Deputy Treasurer | Term: Unlimited Served: since August 2012 | Chief Operating Officer, SSGA Funds Management, Inc. (2005 - Present)*; Managing Director, State Street Global Advisors (2005 - present).* | |||
| MICHAEL P. RILEY SSGA Funds Management, Inc. One Iron Street Boston, MA 02210 1969 | Vice President | Term: Unlimited Served: since March 2011 | Managing Director, State Street Global Advisors (2005 - present).* | |||
| JOSHUA A. WEINBERG SSGA Funds Management, Inc. One Iron Street Boston, MA 02210 1978 | Chief Legal Officer | Term: Unlimited Served: since February 2015 | Managing Director and Managing Counsel, State Street Global Advisors (2011 - present); Clerk, SSGA Funds Management, Inc. (2013 - present); Associate, Financial Services Group, Dechert LLP (2006 - 2011). | |||
| JESSE D. HALLEE State Street Bank and Trust Company 100 Summer Street, SUM0703 Boston, MA 02111 1976 | Secretary | Term: Unlimited Served: since August 2017 | Vice President and Managing Counsel, State Street Bank and Trust Company (2013 – present); Vice President and Counsel, Brown Brothers Harriman & Co. (2007- 2013).** | |||
| ESTEFANIA SALOMON State Street Bank and Trust Company 100 Summer Street SUM0703 Boston, MA 02111 1983 | Assistant Secretary | Term:Unlimited Served: since May 2018 | Assistant Vice President and Associate Counsel, State Street Bank and Trust Company (2018 – present); Senior Compliance Consultant, AdvisorAssist, LLC (2017); Attorney, Commonwealth of Massachusetts, Securities Division (2014-2017). |
Table of Contents
| Name, Address and Year of Birth | Position(s) with Funds | Term of Office and Length of Time Served | Principal Occupation(s) During the Past 5 Years | |||
| CHAD C. HALLETT SSGA Funds Management, Inc. One Iron Street Boston, MA 02210 1969 | Deputy Treasurer | Term: Unlimited Served: since February 2016 | Vice President, State Street Global Advisors and SSGA Funds Management, Inc. (November 2014 - present); Vice President, State Street Bank and Trust Company (2001 - November 2014).* | |||
| DARLENE ANDERSON-VASQUEZ SSGA Funds Management, Inc. One Iron Street Boston, MA 02210 1968 | Deputy Treasurer | Term: Unlimited Served: since November 2016 | Managing Director, State Street Global Advisors and SSGA Funds Management, Inc. (May 2016 - present); Senior Vice President, John Hancock Investments (September 2007 - May 2016). | |||
| ARTHUR A. JENSEN SSGA Funds Management, Inc. 1600 Summer Street Stamford, CT 06905 1966 | Deputy Treasurer | Term: Unlimited Served: Since August 2017 | Vice President at State Street Global Advisors (July 2016 – present); Mutual Funds Controller of GE Asset Management Incorporated (April 2011 - July 2016). | |||
| SUJATA UPRETI SSGA Funds Management, Inc. One Iron Street Boston, MA 02210 1974 | Assistant Treasurer | Term: Unlimited Served: since February 2016 | Vice President, State Street Global Advisors and SSGA Funds Management, Inc. (May 2015 - present); Assistant Director, Cambridge Associates, LLC (July 2014 - January 2015); Vice President, Bank of New York Mellon (July 2012 - August 2013); Manager, PricewaterhouseCoopers, LLP (September 2003 - July 2012). | |||
| DANIEL FOLEY SSGA Funds Management, Inc. One Iron Street Boston, MA 02210 1972 | Assistant Treasurer | Term: Unlimited Served: since February 2016 | Vice President, State Street Global Advisors and SSGA Funds Management, Inc. (April 2007 - present).* | |||
| DANIEL G. PLOURDE SSGA Funds Management, Inc. One Iron Street Boston, MA 02210 1980 | Assistant Treasurer | Term: Unlimited Served: since May 2017 | Vice President, State Street Global Advisors and SSGA Funds Management, Inc. (May 2015 - present); Officer, State Street Bank and Trust Company (March 2009 - May 2015). |
Table of Contents
| Name, Address and Year of Birth | Position(s) with Funds | Term of Office and Length of Time Served | Principal Occupation(s) During the Past 5 Years | |||
| BRIAN HARRIS SSGA Funds Management, Inc. One Iron Street Boston, MA 02210 1973 | Chief Compliance Officer; Anti-Money Laundering Officer; Code of Ethics Compliance Officer | Term: Unlimited Served: since November 2013 | Managing Director, State Street Global Advisors and SSGA Funds Management, Inc. (June 2013 - present)*; Senior Vice President and Global Head of Investment Compliance, BofA Global Capital Management (2010 - 2013); Director of Compliance, AARP Financial Inc. (2008 - 2010). | |||
| * Served in various capacities and/or with various affiliated entities during noted time period. | ||||||
| ** Served in various capacities and/or with unaffiliated mutual funds or closed-end funds for which State Street Bank and Trust Company or its affiliates act as a provider of services during the noted time period. | ||||||
| Statement of Additional Information (SAI) includes additional information about Funds' directors and is available, without charge, upon request and by calling 1-866-787-2257. | ||||||
Table of Contents
Table of Contents
Laundering Officer; Code of Ethics Compliance Officer
One Iron Street
Boston, MA 02210
One Iron Street
Boston, MA 02210
One Lincoln Street
Boston, MA 02111
1111 Pennsylvania Avenue, NW
Washington, DC 20004
200 Clarendon Street
Boston, MA 02116
Table of Contents
Table of Contents
Table of Contents
| 1 | |
| 3 | |
| 32 | |
| 35 | |
| 36 | |
| 43 | |
| 45 |
Table of Contents
| Description | % of Net Assets | ||
| CenturyLink Escrow LLC Senior Secured 2017 Term Loan B 4.84% 1/31/2025 | 1.9% | ||
| Asurion LLC Senior Secured 2017 2nd Lien Term Loan 8.09% 8/4/2025 | 1.8 | ||
| Univision Communications, Inc. Senior Secured Term Loan C5 4.84% 3/15/2024 | 1.5 | ||
| Valeant Pharmaceuticals International, Inc. Senior Secured 2018 Term Loan B 4.98% 6/1/2025 | 1.2 | ||
| Delta 2 (LUX) S.A.R.L. Senior Secured 2018 USD Term Loan 4.59% 2/1/2024 | 1.2 | ||
| TOTAL | 7.6% |
| % of Net Assets | |||
| Software | 12.5% | ||
| Commercial Services & Supplies | 8.8 | ||
| Media | 8.1 | ||
| Health Care Providers & Services | 7.1 | ||
| Hotels, Restaurants & Leisure | 5.5 | ||
| Pharmaceuticals | 4.7 | ||
| Insurance | 4.0 | ||
| Diversified Telecommunication Services | 3.5 | ||
| Specialty Retail | 3.1 | ||
| Diversified Financial Services | 2.9 | ||
| Food & Staples Retailing | 2.7 | ||
| Internet Software & Services | 2.4 | ||
| Aerospace & Defense | 2.3 | ||
| Chemicals | 2.0 | ||
| Professional Services | 1.7 | ||
| Trading Companies & Distributors | 1.6 | ||
| IT Services | 1.6 | ||
| Containers & Packaging | 1.3 | ||
| Communications Equipment | 1.3 | ||
| Health Care Equipment & Supplies | 1.3 | ||
| Machinery | 1.1 | ||
| Distributors | 1.1 | ||
| Life Sciences Tools & Services | 1.0 | ||
| Oil, Gas & Consumable Fuels | 1.0 | ||
| Construction & Engineering | 1.0 | ||
| Diversified Consumer Services | 0.9 |
Table of Contents
| % of Net Assets | |||
| Food Products | 0.8% | ||
| Auto Components | 0.8 | ||
| Semiconductors & Semiconductor Equipment | 0.8 | ||
| Electronic Equipment, Instruments & Components | 0.7 | ||
| Semiconductor Equipment | 0.7 | ||
| Capital Markets | 0.6 | ||
| Building Products | 0.6 | ||
| Internet & Catalog Retail | 0.6 | ||
| Electric Utilities | 0.6 | ||
| Multiline Retail | 0.5 | ||
| Telecom Services | 0.5 | ||
| Independent Power Producers & Energy Traders | 0.5 | ||
| Health Care Technology | 0.5 | ||
| Real Estate Investment Trusts (REITs) | 0.5 | ||
| Casino Hotels | 0.5 | ||
| Retail-Restaurants | 0.5 | ||
| Metals & Mining | 0.4 | ||
| Paper&Related Products | 0.4 | ||
| Pollution Control | 0.3 | ||
| Real Estate Management & Development | 0.3 | ||
| Airlines | 0.3 | ||
| Leisure Equipment & Products | 0.2 | ||
| Recycling | 0.2 | ||
| Automobiles | 0.2 | ||
| Computers & Peripherals | 0.2 | ||
| Road & Rail | 0.2 | ||
| Electrical Equipment | 0.1 | ||
| Personal Products | 0.1 | ||
| Construction Materials | 0.1 | ||
| Thrifts & Mortgage Finance | 0.1 | ||
| Transportation Infrastructure | 0.1 | ||
| Energy Equipment & Services | 0.1 | ||
| Apparel Manufacturers | 0.1 | ||
| Oil-Field Services | 0.0 * | ||
| Short-Term Investment | 6.1 | ||
| Liabilities in Excess of Other Assets | (3.7) | ||
| TOTAL | 100.0% | ||
| * | Amount shown represents less than 0.05% of net assets. | ||
Table of Contents
| Security Description | Principal Amount | Value | |||
| SENIOR FLOATING RATE LOANS — 94.0% (a) | |||||
| AEROSPACE & DEFENSE — 2.1% | |||||
DAE Aviation Holdings, Inc. Senior Secured 1st Lien Term Loan 5.84%, 7/7/2022 | $ 8,560,739 | $ 8,584,838 | |||
Engility Corp. Senior Secured Term Loan B2 4.84%, 8/12/2023 | 5,614,608 | 5,614,159 | |||
MacDonald Dettwiler & Associates, Ltd. Senior Secured Term Loan B 4.85%, 10/4/2024 | 16,182,621 | 16,142,164 | |||
| TransDigm, Inc.: | |||||
Senior Secured 2018 Term Loan E 4.59%, 5/30/2025 | 23,337,238 | 23,189,630 | |||
Senior Secured 2018 Term Loan F 4.59%, 6/9/2023 | 11,775,666 | 11,721,204 | |||
Senior Secured 2018 Term Loan G 4.59%, 8/22/2024 | 2,919,135 | 2,902,116 | |||
| 68,154,111 | |||||
| AIRLINES — 0.3% | |||||
American Airlines, Inc. Senior Secured 2018 Term Loan B 3.85%, 6/27/2025 | 9,000,000 | 8,850,915 | |||
United Airlines, Inc. Senior Secured 2018 Term Loan B 3.84%, 4/1/2024 | 791,858 | 784,929 | |||
| 9,635,844 | |||||
| APPAREL MANUFACTURERS — 0.1% | |||||
Samsonite IP Holdings S.A.R.L. Senior Secured 2018 Term Loan B 3.84%, 4/18/2025 | 1,803,279 | 1,787,500 | |||
| AUTO COMPONENTS — 0.8% | |||||
USI, Inc. Senior Secured 2017 Repriced Term Loan 5.33%, 5/16/2024 | 25,063,212 | 24,947,295 | |||
| AUTOMOBILES — 0.2% | |||||
American Axle & Manufacturing, Inc. Senior Secured Term Loan B 4.35%, 4/6/2024 | 4,355,442 | 4,344,554 |
Table of Contents
| Security Description | Principal Amount | Value | |||
TI Group Automotive Systems LLC Senior Secured 2015 USD Term Loan 4.59%, 6/30/2022 | $ 1,671,755 | $ 1,674,889 | |||
| 6,019,443 | |||||
| BUILDING PRODUCTS — 0.6% | |||||
AZEK Co. LLC Senior Secured 2017 Term Loan Zero Coupon, 5/3/2024 | 1,994,949 | 1,997,443 | |||
Builders FirstSource, Inc. Senior Secured 2017 Term Loan B 5.33%, 2/29/2024 | 4,924,623 | 4,930,779 | |||
SRS Distribution, Inc. Senior Secured 2018 1st Lien Term Loan 5.58%, 5/23/2025 | 12,727,273 | 12,557,618 | |||
| 19,485,840 | |||||
| CAPITAL MARKETS — 0.6% | |||||
Duff & Phelps Corp. Senior Secured 2017 Term Loan B 5.58%, 2/13/2025 | 15,340,341 | 15,298,769 | |||
LPL Holdings, Inc. Senior Secured 2017 1st Lien Term Loan B 4.64%, 9/23/2024 | 4,631,667 | 4,612,862 | |||
| 19,911,631 | |||||
| CASINO HOTELS — 0.5% | |||||
Crown Finance US, Inc. Senior Secured 2018 USD Term Loan 4.59%, 2/28/2025 | 15,002,453 | 14,915,439 | |||
| CHEMICALS — 1.8% | |||||
Alpha 3 B.V. Senior Secured 2017 Term Loan B1 5.33%, 1/31/2024 | 4,368,182 | 4,355,448 | |||
Avantor, Inc. Senior Secured 2017 1st Lien Term Loan 6.09%, 11/21/2024 | 22,038,307 | 22,176,047 | |||
Composite Resins Holding B.V. Senior Secured 2018 Term Loan B Zero Coupon, 6/26/2025 | 15,000,000 | 14,962,500 | |||
GrafTech Finance, Inc. Senior Secured 2018 Term Loan B 5.50%, 2/12/2025 | 12,987,013 | 12,938,377 |
Table of Contents
| Security Description | Principal Amount | Value | |||
PQ Corp. Senior Secured 2018 Term Loan B 4.59%, 2/8/2025 | $ 2,729,143 | $ 2,721,979 | |||
| 57,154,351 | |||||
| COMMERCIAL SERVICES & SUPPLIES — 8.8% | |||||
Advanced Disposal Services, Inc. Senior Secured Term Loan B3 4.23%, 11/10/2023 | 4,415,231 | 4,411,917 | |||
Allied Universal Holdco LLC Senior Secured 2015 Term Loan 5.84%, 7/28/2022 | 28,101,258 | 27,735,380 | |||
Ancestry.com Operations Inc. Senior Secured 2017 1st Lien Term Loan 5.35%, 10/19/2023 | 8,622,091 | 8,626,402 | |||
| Asurion LLC: | |||||
Senior Secured 2017 2nd Lien Term Loan 8.09%, 8/4/2025 | 55,082,344 | 55,977,433 | |||
Senior Secured 2017 Term Loan B4 4.84%, 8/4/2022 | 5,007,441 | 5,006,089 | |||
Senior Secured 2018 Term Loan B6 4.84%, 11/3/2023 | 13,687,846 | 13,685,382 | |||
Senior Secured 2018 Term Loan B7 Zero Coupon, 11/3/2023 | 22,835,395 | 22,778,306 | |||
Belron S.A. Senior Secured USD Term Loan B 4.86%, 11/7/2024 | 4,425,032 | 4,425,032 | |||
Equian LLC Senior Secured Add on Term Loan B 5.33%, 5/20/2024 | 4,403,988 | 4,396,633 | |||
GFL Environmental, Inc. Senior Secured 2018 USD Term Loan B 5.08%, 5/30/2025 | 8,613,539 | 8,570,472 | |||
| IBC Capital, Ltd.: | |||||
Senior Secured 2018 1st Lien Term Loan 6.08%, 9/11/2023 | 7,980,000 | 7,996,638 | |||
Senior Secured 2018 2nd Lien Term Loan 9.33%, 9/11/2024 | 7,252,747 | 7,289,011 | |||
| KAR Auction Services, Inc.: | |||||
Senior Secured Term Loan B4 4.38%, 3/11/2021 | 1,818,727 | 1,825,929 | |||
Senior Secured Term Loan B5 4.63%, 3/9/2023 | 1,490,494 | 1,486,306 |
Table of Contents
| Security Description | Principal Amount | Value | |||
Learning Care Group, Inc. Senior Secured 2018 1st Lien Term Loan 5.61%, 3/13/2025 | $ 10,087,079 | $ 10,046,125 | |||
Lineage Logistics Holdings LLC Senior Secured 2018 Term Loan 5.09%, 2/16/2025 | 16,797,280 | 16,720,264 | |||
Packers Holdings LLC Senior Secured 2017 Term Loan B 5.27%, 12/4/2024 | 7,871,835 | 7,842,316 | |||
Prime Security Services Borrower LLC Senior Secured 2016 1st Lien Term Loan 4.84%, 5/2/2022 | 27,720,969 | 27,621,728 | |||
Prometric Holdings, Inc. Senior Secured 1st Lien Term Loan 5.10%, 1/29/2025 | 2,914,773 | 2,912,951 | |||
Southern Graphics, Inc. Senior Secured 2018 Term Loan B 5.34%, 12/31/2022 | 18,812,754 | 18,798,080 | |||
TruGreen, Ltd. Partnership Senior Secured 2017 Term Loan 6.05%, 4/13/2023 (b) | 730,675 | 739,808 | |||
Vantiv LLC Senior Secured 2018 1st Lien Term Loan B4 3.79%, 8/9/2024 | 21,388,103 | 21,334,633 | |||
| 280,226,835 | |||||
| COMMUNICATIONS EQUIPMENT — 1.3% | |||||
Arris Group, Inc. Senior Secured 2017 Repriced Term Loan 4.34%, 4/26/2024 | 1,955,446 | 1,961,557 | |||
Avaya, Inc. Senior Secured 2018 Term Loan B 6.32%, 12/15/2024 | 9,597,731 | 9,623,981 | |||
Digicel International Finance, Ltd. Senior Secured 2017 Term Loan B 5.61%, 5/28/2024 | 12,440,380 | 11,942,765 | |||
Plantronics, Inc. Senior Secured 2018 Term Loan B Zero Coupon, 5/30/2025 | 8,411,765 | 8,407,853 | |||
Riverbed Technology, Inc. Senior Secured 2016 Term Loan 5.35%, 4/24/2022 | 8,929,257 | 8,836,795 | |||
| 40,772,951 |
Table of Contents
| Security Description | Principal Amount | Value | |||
| COMPUTERS & PERIPHERALS — 0.2% | |||||
TierPoint LLC Senior Secured 2017 1st Lien Term Loan 5.84%, 5/6/2024 | $ 5,218,303 | $ 5,091,133 | |||
| CONSTRUCTION & ENGINEERING — 1.0% | |||||
CNT Holdings III Corp. Senior Secured 2017 Term Loan 5.35%, 1/22/2023 (b) | 4,962,217 | 4,869,175 | |||
Hamilton Holdco LLC Senior Secured 2018 Term Loan B Zero Coupon, 5/30/2025 | 6,106,870 | 6,091,603 | |||
MX Holdings US, Inc. Senior Secured 2018 USD Term Loan B Zero Coupon, 6/14/2025 | 2,009,918 | 2,013,696 | |||
Pike Corp. Senior Secured 2018 Term Loan B 5.60%, 3/23/2025 | 11,165,644 | 11,215,666 | |||
Summit Materials Cos. I LLC Senior Secured 2017 Term Loan B 4.09%, 11/21/2024 | 7,580,952 | 7,564,388 | |||
| 31,754,528 | |||||
| CONSTRUCTION MATERIALS — 0.1% | |||||
Traverse Midstream Partners LLC Senior Secured 2017 Term Loan 6.34%, 9/27/2024 | 3,431,373 | 3,435,353 | |||
| CONTAINERS & PACKAGING — 1.3% | |||||
Berlin Packaging LLC Senior Secured 2018 Term Loan B 5.10%, 11/7/2025 | 9,642,857 | 9,602,502 | |||
Plastipak Holdings, Inc. Senior Secured 2018 Term Loan B 4.60%, 10/14/2024 | 2,787,921 | 2,777,467 | |||
Reynolds Group Holdings, Inc. Senior Secured USD 2017 Term Loan 4.84%, 2/5/2023 | 21,304,058 | 21,286,269 | |||
Trident TPI Holdings, Inc. Senior Secured 2017 USD Term Loan B1 5.34%, 10/17/2024 | 7,690,867 | 7,662,064 | |||
| 41,328,302 |
Table of Contents
| Security Description | Principal Amount | Value | |||
| DISTRIBUTORS — 0.9% | |||||
American Tire Distributors Holdings, Inc. Senior Secured 2015 Term Loan 6.34%, 9/1/2021 | $ 4,971,176 | $ 3,259,227 | |||
Explorer Holdings, Inc. Senior Secured 2016 Term Loan B 6.08%, 5/2/2023 | 24,810,127 | 24,810,127 | |||
| 28,069,354 | |||||
| DIVERSIFIED CONSUMER SERVICES — 0.9% | |||||
Weight Watchers International, Inc. Senior Secured 2017 Term Loan B 7.06%, 11/29/2024 | 27,300,000 | 27,666,912 | |||
| DIVERSIFIED FINANCIAL SERVICES — 2.9% | |||||
AlixPartners LLP Senior Secured 2017 Term Loan B 4.84%, 4/4/2024 | 10,797,100 | 10,802,499 | |||
AqGen Ascensus, Inc. Senior Secured 2018 Incremental Term Loan 5.59%, 12/5/2022 | 2,770,833 | 2,774,297 | |||
Edelman Financial Center LLC Senior Secured 2018 2nd Lien Term Loan Zero Coupon, 6/8/2026 | 5,769,231 | 5,826,029 | |||
Edelman Financial Group Senior Secured 2018 Term Loan B Zero Coupon, 6/8/2027 | 22,012,578 | 22,012,689 | |||
Focus Financial Partners LLC Senior Secured 2018 1st Lien Term Loan 4.84%, 7/3/2024 | 11,084,931 | 11,108,043 | |||
IG Investment Holdings LLC Senior Secured 2018 1st Lien Term Loan 5.59%, 5/18/2025 | 2,229,730 | 2,228,804 | |||
Infinity Acquisition LLC Senior Secured New Term Loan B 5.09%, 8/6/2021 | 5,723,003 | 5,730,157 | |||
UFC Holdings LLC Senior Secured 1st Lien Term Loan 5.35%, 8/18/2023 | 5,478,490 | 5,489,447 | |||
Victory Capital Management, Inc. Senior Secured 2018 Term Loan B 5.08%, 2/12/2025 | 3,144,654 | 3,144,654 |
Table of Contents
| Security Description | Principal Amount | Value | |||
William Morris Endeavor Entertainment LLC Senior Secured 2018 1st Lien Term Loan 4.93%, 5/18/2025 | $ 24,411,021 | $ 24,250,884 | |||
| 93,367,503 | |||||
| DIVERSIFIED TELECOMMUNICATION SERVICES — 3.5% | |||||
CenturyLink Escrow LLC Senior Secured 2017 Term Loan B 4.84%, 1/31/2025 | 61,234,529 | 60,073,522 | |||
Consolidated Communications, Inc. Senior Secured 2016 Term Loan B 5.10%, 10/4/2023 | 14,101,462 | 13,920,822 | |||
Hargray Communications Group, Inc. Senior Secured 2017 Term Loan B 5.09%, 5/16/2024 | 6,930,000 | 6,921,337 | |||
TDC A/S Senior Secured USD Term Loan Zero Coupon, 5/31/2025 | 18,604,651 | 18,598,884 | |||
Telesat Canada Senior Secured Term Loan B4 4.84%, 11/17/2023 | 10,996,781 | 10,934,924 | |||
Zayo Group LLC Senior Secured 2017 Incremental Term Loan 4.34%, 1/19/2024 | 740,131 | 740,746 | |||
| 111,190,235 | |||||
| ELECTRIC UTILITIES — 0.6% | |||||
TEX Operations Co. LLC Senior Secured Exit Term Loan B 4.09%, 8/4/2023 | 18,385,580 | 18,280,782 | |||
| ELECTRICAL EQUIPMENT — 0.1% | |||||
EXC Holdings III Corp. Senior Secured USD 2017 1st Lien Term Loan 5.83%, 12/2/2024 | 2,315,360 | 2,322,607 | |||
Generac Power Systems, Inc. Senior Secured 2018 1st Lien Term Loan 4.06%, 5/31/2023 | 2,222,222 | 2,203,700 | |||
| 4,526,307 | |||||
| ELECTRONIC EQUIPMENT, INSTRUMENTS & COMPONENTS — 0.6% | |||||
CPI International, Inc. Senior Secured 2017 1st Lien Term Loan 5.59%, 7/26/2024 | 9,656,541 | 9,702,796 |
Table of Contents
| Security Description | Principal Amount | Value | |||
Energizer Holdings, Inc. Senior Secured 2018 Term Loan B Zero Coupon, 6/30/2025 | $ 4,310,345 | $ 4,315,733 | |||
TTM Technologies, Inc. Senior Secured 2017 Term Loan 4.48%, 9/28/2024 | 6,105,988 | 6,094,570 | |||
| 20,113,099 | |||||
| ENERGY EQUIPMENT & SERVICES — 0.1% | |||||
BCP Renaissance Parent LLC Senior Secured 2017 Term Loan B 5.86%, 10/31/2024 | 2,285,714 | 2,284,640 | |||
| FOOD & STAPLES RETAILING — 2.3% | |||||
| Albertsons LLC: | |||||
Senior Secured 2018 ABL Last Out Term Loan Zero Coupon, 5/2/2023 | 10,434,783 | 10,434,835 | |||
Senior Secured USD 2017 Term Loan B5 5.34%, 12/21/2022 | 3,184,714 | 3,160,367 | |||
Senior Secured USD 2017 Term Loan B6 5.32%, 6/22/2023 | 24,570,067 | 24,341,442 | |||
Chobani LLC Senior Secured 2017 Term Loan B 5.59%, 10/10/2023 | 13,044,513 | 13,074,386 | |||
Genoa, a QoL Healthcare Co. LLC Senior Secured 2017 1st Lien Term Loan 5.34%, 10/28/2023 | 2,945,807 | 2,952,553 | |||
Mastronardi Produce, Ltd. Senior Secured Term Loan B 5.23%, 4/18/2025 | 2,373,418 | 2,385,285 | |||
Smart & Final Stores LLC Senior Secured 1st Lien Term Loan 5.59%, 11/15/2022 | 5,750,000 | 5,625,426 | |||
US Foods, Inc. Senior Secured 2016 Term Loan B 4.09%, 6/27/2023 | 10,125,052 | 10,125,609 | |||
| 72,099,903 | |||||
| FOOD PRODUCTS — 0.8% | |||||
CSM Bakery Solutions LLC Senior Secured 1st Lien Term Loan 6.31%, 7/3/2020 | 4,973,227 | 4,839,597 | |||
Dole Food Co., Inc. Senior Secured 2017 Term Loan B 4.84%, 4/6/2024 | 4,743,956 | 4,728,301 |
Table of Contents
| Security Description | Principal Amount | Value | |||
Hostess Brands LLC Senior Secured 2017 Repriced Term Loan 4.34%, 8/3/2022 | $ 2,752,500 | $ 2,739,604 | |||
JBS USA LLC Senior Secured 2017 Term Loan B 4.83%, 10/30/2022 | 13,536,122 | 13,451,521 | |||
| 25,759,023 | |||||
| HEALTH CARE EQUIPMENT & SUPPLIES — 1.2% | |||||
DJO Finance LLC Senior Secured 2015 Term Loan 5.56%, 6/8/2020 | 8,664,194 | 8,642,577 | |||
LifeScan Global Corp. Senior Secured 2018 1st Lien Term Loan Zero Coupon, 5/23/2025 | 10,000,000 | 9,725,000 | |||
| Onex Carestream Finance L.P.: | |||||
Senior Secured 1st Lien Term Loan 6.09%, 6/7/2019 | 4,323,128 | 4,330,196 | |||
Senior Secured 2nd Lien Term Loan 10.59%, 12/7/2019 | 16,900,077 | 16,921,202 | |||
| 39,618,975 | |||||
| HEALTH CARE PROVIDERS & SERVICES — 6.4% | |||||
ADMI Corp. Senior Secured 2018 Term Loan B 5.34%, 4/30/2025 | 15,517,241 | 15,497,922 | |||
| Air Medical Group Holdings, Inc.: | |||||
Senior Secured 2017 Term Loan B2 6.34%, 3/14/2025 | 33,895,828 | 33,493,315 | |||
Senior Secured 2018 Term Loan B1 5.28%, 4/28/2022 | 2,585,163 | 2,517,302 | |||
ATI Holdings Acquisition, Inc. Senior Secured 2016 Term Loan 5.55%, 5/10/2023 | 2,959,831 | 2,965,381 | |||
BioClinica, Inc. Senior Secured 1st Lien Term Loan 6.63%, 10/20/2023 (b) | 2,349,678 | 2,241,005 | |||
Certara L.P. Senior Secured 2018 Term Loan B 5.83%, 8/15/2024 (b) | 1,669,765 | 1,678,114 | |||
CHG Healthcare Services, Inc. Senior Secured 2017 1st Lien Term Loan B 5.36%, 6/7/2023 | 10,168,465 | 10,195,462 |
Table of Contents
| Security Description | Principal Amount | Value | |||
Envision Healthcare Corp. Senior Secured 2016 Term Loan B 5.10%, 12/1/2023 | $ 13,691,617 | $ 13,697,367 | |||
Gem Acquisitions, Inc. Senior Secured 2018 1st Lien Term Loan 5.28%, 2/14/2025 | 4,879,076 | 4,846,557 | |||
GHX Ultimate Parent Corp. Senior Secured 2017 1st Lien Term Loan 5.33%, 6/28/2024 | 4,342,105 | 4,343,929 | |||
Heartland Dental LLC Senior Secured 2018 1st Lien Term Loan 5.84%, 4/30/2025 | 11,469,265 | 11,419,087 | |||
MPH Acquisition Holdings LLC Senior Secured 2016 Term Loan B 5.08%, 6/7/2023 | 14,994,160 | 14,932,084 | |||
National Mentor Holdings, Inc. Senior Secured Term Loan B 5.33%, 1/31/2021 | 2,643,669 | 2,646,564 | |||
NVA Holdings, Inc. Senior Secured Term Loan B3 4.84%, 2/2/2025 | 14,038,662 | 14,018,165 | |||
Ortho-Clinical Diagnostics, Inc. Senior Secured 2018 Term Loan B 5.34%, 6/30/2025 | 24,766,425 | 24,696,832 | |||
| PharMerica Corp.: | |||||
Senior Secured 1st Lien Term Loan 5.55%, 12/6/2024 | 11,970,000 | 11,975,626 | |||
Senior Secured 2nd Lien Term Loan 9.80%, 12/7/2025 | 4,765,000 | 4,777,913 | |||
Sterigenics-Nordion Holdings LLC Senior Secured 2017 Term Loan 5.33%, 5/15/2022 | 11,340,266 | 11,326,091 | |||
Surgery Center Holdings, Inc. Senior Secured 2017 Term Loan B 5.35%, 9/2/2024 | 6,823,437 | 6,815,591 | |||
Team Health Holdings, Inc. Senior Secured 1st Lien Term Loan 4.84%, 2/6/2024 | 10,990,711 | 10,592,297 | |||
| 204,676,604 | |||||
| HEALTH CARE TECHNOLOGY — 0.5% | |||||
Change Healthcare Holdings, Inc. Senior Secured 2017 Term Loan B 4.84%, 3/1/2024 | 12,837,500 | 12,809,386 |
Table of Contents
| Security Description | Principal Amount | Value | |||
Press Ganey Holdings, Inc. Senior Secured 2018 1st Lien Term Loan 4.84%, 10/23/2023 | $ 2,529,565 | $ 2,529,173 | |||
| 15,338,559 | |||||
| HOTELS, RESTAURANTS & LEISURE — 5.5% | |||||
1011778 BC ULC Senior Secured Term Loan B3 4.34%, 2/16/2024 | 5,399,443 | 5,383,407 | |||
Alterra Mountain Co. Senior Secured 2018 Add On Term Loan Zero Coupon, 7/31/2024 | 714,286 | 715,625 | |||
Big Jack Holdings LP Senior Secured 2018 Term Loan B 5.60%, 4/5/2024 | 6,812,524 | 6,812,524 | |||
Boyd Gaming Corp. Senior Secured Term Loan B3 4.49%, 9/15/2023 | 894,746 | 898,106 | |||
Caesars Resort Collection LLC Senior Secured Term Loan 4.09%, 10/6/2024 | 1,810,267 | 1,799,332 | |||
CEC Entertainment, Inc. Senior Secured Term Loan B 5.34%, 2/14/2021 | 7,517,372 | 7,020,925 | |||
Cyan Blue Holding co. 3, Ltd. Senior Secured 2017 USD Term Loan B 4.84%, 8/23/2024 | 15,494,140 | 15,497,316 | |||
Delta 2 (LUX) S.A.R.L. Senior Secured 2018 USD Term Loan 4.59%, 2/1/2024 | 38,346,487 | 37,909,146 | |||
Fogo de Chao Churrascaria Holdings LLC Senior Secured 2018 Term Loan 6.59%, 4/7/2025 | 10,807,692 | 10,834,711 | |||
Golden Nugget, Inc. Senior Secured 2017 Incremental Term Loan B 4.84%, 10/4/2023 | 16,380,930 | 16,390,103 | |||
Intrawest Resorts Holdings, Inc. Senior Secured Term Loan B1 5.09%, 7/31/2024 | 6,120,152 | 6,124,008 | |||
NPC International, Inc. Senior Secured 1st Lien Term Loan 5.59%, 4/19/2024 | 6,491,803 | 6,537,765 | |||
Penn National Gaming, Inc. Senior Secured 2017 Term Loan B 4.59%, 1/19/2024 | 1,235,000 | 1,240,403 |
Table of Contents
| Security Description | Principal Amount | Value | |||
Red Lobster Management LLC Senior Secured Term Loan B 7.34%, 7/28/2021 | $ 1,751,750 | $ 1,750,655 | |||
Scientific Games International, Inc. Senior Secured 2018 Term Loan B5 4.92%, 8/14/2024 | 32,714,306 | 32,540,593 | |||
Travel Leaders Group LLC Senior Secured 2017 1st Lien Term Loan 7.00%, 1/25/2024 (b) | 4,385,579 | 4,418,471 | |||
Travelport Finance (Luxembourg) S.A.R.L. Senior Secured 2018 Term Loan B 4.83%, 3/17/2025 | 20,480,663 | 20,433,353 | |||
| 176,306,443 | |||||
| INDEPENDENT POWER PRODUCERS & ENERGY TRADERS — 0.5% | |||||
Calpine Corp. Senior Secured Term Loan B5 4.84%, 1/15/2024 | 7,429,733 | 7,425,832 | |||
Vistra Energy Corp. Senior Secured 1st Lien Term Loan B3 4.06%, 12/31/2025 | 8,224,299 | 8,182,602 | |||
| 15,608,434 | |||||
| INSURANCE — 3.9% | |||||
| Acrisure LLC: | |||||
Senior Secured 2017 Term Loan B 6.61%, 11/22/2023 | 15,367,506 | 15,357,978 | |||
Senior Secured 2018 Term Loan B Zero Coupon, 11/22/2023 | 4,213,483 | 4,187,149 | |||
Alliant Holdings I, Inc. Senior Secured 2018 Term Loan B 5.05%, 5/9/2025 | 11,551,258 | 11,489,170 | |||
AmWINS Group, Inc. Senior Secured 2017 Term Loan B 4.84%, 1/25/2024 | 15,051,282 | 15,012,600 | |||
AssuredPartners, Inc. Senior Secured 2017 1st Lien Add-On Term Loan 5.34%, 10/22/2024 | 16,488,638 | 16,437,194 | |||
Hub International, Ltd. Senior Secured 2018 Term Loan B 5.36%, 4/25/2025 | 33,321,429 | 33,158,487 | |||
NFP Corp. Senior Secured Term Loan B 5.09%, 1/8/2024 | 10,939,990 | 10,880,751 |
Table of Contents
| Security Description | Principal Amount | Value | |||
| Sedgwick Claims Management Services, Inc.: | |||||
Senior Secured 2017 1st Lien Term Loan 4.84%, 3/1/2021 | $ 11,801,636 | $ 11,753,662 | |||
Senior Secured 2nd Lien Term Loan 7.84%, 2/28/2022 | 7,666,667 | 7,719,413 | |||
| 125,996,404 | |||||
| INTERNET & CATALOG RETAIL — 0.6% | |||||
Harbor Freight Tools USA, Inc. Senior Secured 2018 Term Loan B 4.59%, 8/18/2023 | 18,770,794 | 18,708,288 | |||
Spencer Gifts LLC Senior Secured Term Loan B1 6.31%, 7/16/2021 | 730,159 | 683,063 | |||
| 19,391,351 | |||||
| INTERNET SOFTWARE & SERVICES — 2.3% | |||||
Genuine Financial Holdings LLC Senior Secured 2018 1st Lien Term Loan Zero Coupon, 6/27/2025 | 19,672,131 | 19,647,541 | |||
Go Daddy Operating Co. LLC Senior Secured 2017 Repriced Term Loan 4.34%, 2/15/2024 | 13,316,313 | 13,264,046 | |||
LANDesk Group, Inc. Senior Secured 2017 Term Loan B 6.35%, 1/20/2024 | 19,878,296 | 19,741,732 | |||
Rackspace Hosting, Inc. Senior Secured 2017 Incremental 1st Lien Term Loan 5.36%, 11/3/2023 | 10,320,568 | 10,206,578 | |||
SMS Systems Maintenance Services, Inc. Senior Secured 2016 1st Lien Term Loan 7.09%, 10/30/2023 | 1,955,038 | 1,577,070 | |||
TCH-2 Holding LLC Senior Secured 2018 Term Loan B 5.59%, 5/6/2021 | 10,561,406 | 10,676,948 | |||
| 75,113,915 | |||||
| IT SERVICES — 1.6% | |||||
Access CIG LLC Senior Secured 2018 1st Lien Term Loan 5.84%, 2/27/2025 | 5,127,085 | 5,142,466 | |||
DigiCert, Inc. Senior Secured 2017 Term Loan B1 6.84%, 10/31/2024 | 3,771,797 | 3,774,154 | |||
| First Data Corp.: |
Table of Contents
| Security Description | Principal Amount | Value | |||
Senior Secured 2017 USD Term Loan 4.09%, 7/8/2022 | $ 2,535,273 | $ 2,527,351 | |||
Senior Secured 2024 USD Term Loan 4.09%, 4/26/2024 | 20,018,044 | 19,926,862 | |||
Presidio, Inc. Senior Secured 2017 Refinanced Term Loan B 5.05%, 2/2/2024 | 7,174,334 | 7,177,347 | |||
TKC Holdings, Inc. Senior Secured 2017 1st Lien Term Loan 5.85%, 2/1/2023 | 11,946,386 | 11,938,919 | |||
| 50,487,099 | |||||
| LIFE SCIENCES TOOLS & SERVICES — 1.0% | |||||
Albany Molecular Research, Inc. Senior Secured 2017 1st Lien Term Loan 5.34%, 8/30/2024 | 6,258,792 | 6,252,533 | |||
Jaguar Holding Co. II Senior Secured 2018 Term Loan 4.59%, 8/18/2022 | 8,874,711 | 8,842,008 | |||
Parexel International Corp. Senior Secured Term Loan B 4.84%, 9/27/2024 | 16,857,901 | 16,787,688 | |||
Syneos Health, Inc. Senior Secured 2018 Term Loan B 4.09%, 8/1/2024 | 1,758,489 | 1,752,167 | |||
| 33,634,396 | |||||
| MACHINERY — 1.1% | |||||
Apex Tool Group LLC Senior Secured 2018 Term Loan B 5.84%, 2/1/2022 | 3,616,628 | 3,624,530 | |||
Engineered Machinery Holdings, Inc. Senior Secured USD 1st Lien Term Loan 5.58%, 7/19/2024 | 4,975,000 | 4,959,478 | |||
Hayward Industries, Inc. Senior Secured 1st Lien Term Loan 5.59%, 8/5/2024 | 2,438,470 | 2,446,480 | |||
Pro Mach Group, Inc. Senior Secured 2018 Term Loan B 5.02%, 3/7/2025 | 10,109,797 | 9,997,326 | |||
Titan Acquisition, Ltd. Senior Secured 2018 Term Loan B 5.09%, 3/28/2025 | 14,785,638 | 14,586,106 | |||
| 35,613,920 |
Table of Contents
| Security Description | Principal Amount | Value | |||
| MEDIA — 7.8% | |||||
Altice Financing SA Senior Secured USD 2017 1st Lien Term Loan 5.10%, 1/31/2026 | $ 12,469,588 | $ 12,257,605 | |||
CBS Radio, Inc. Senior Secured 2017 Term Loan B 4.84%, 11/17/2024 | 6,693,183 | 6,616,211 | |||
Cogeco Communications (USA) II L.P. Senior Secured 2017 1st Lien Term Loan 4.47%, 1/3/2025 | 2,972,973 | 2,959,119 | |||
| CSC Holdings LLC: | |||||
Senior Secured 2017 1st Lien Term Loan 4.32%, 7/17/2025 | 8,828,717 | 8,783,647 | |||
Senior Secured 2018 Term Loan B 4.57%, 1/25/2026 | 11,666,667 | 11,647,183 | |||
Entravision Communications Corp. Senior Secured 2017 Term Loan B 4.84%, 11/29/2024 | 8,270,833 | 8,188,125 | |||
Gray Television, Inc. Senior Secured 2017 Term Loan B 4.25%, 2/7/2024 | 3,356,394 | 3,349,681 | |||
Lions Gate Entertainment Corp. Senior Secured 2018 Term Loan B 4.34%, 3/24/2025 | 2,100,000 | 2,096,503 | |||
MH Sub I LLC Senior Secured 2017 1st Lien Term Loan 5.84%, 9/13/2024 | 21,862,717 | 21,885,564 | |||
Mission Broadcasting, Inc. Senior Secured 2017 Term Loan B2 4.48%, 1/17/2024 | 510,324 | 510,830 | |||
Nexstar Broadcasting, Inc. Senior Secured 2017 Term Loan B2 4.48%, 1/17/2024 | 3,929,521 | 3,933,411 | |||
Numericable Group SA Senior Secured USD Term Loan B12 5.35%, 1/31/2026 | 16,320,028 | 16,084,041 | |||
Red Ventures LLC Senior Secured 1st Lien Term Loan 6.09%, 11/8/2024 | 31,462,250 | 31,665,496 | |||
Sinclair Television Group, Inc. Senior Secured 2017 Term Loan B Zero Coupon, 12/12/2024 | 7,390,244 | 7,376,424 |
Table of Contents
| Security Description | Principal Amount | Value | |||
Unitymedia Finance LLC Senior Secured USD Term Loan D 4.32%, 1/15/2026 | $ 5,111,111 | $ 5,079,627 | |||
Univision Communications, Inc. Senior Secured Term Loan C5 4.84%, 3/15/2024 | 50,551,777 | 48,930,076 | |||
Virgin Media Bristol LLC Senior Secured Term Loan K 4.57%, 1/15/2026 | 21,590,909 | 21,462,767 | |||
WideOpenWest Finance LLC Senior Secured 2017 Term Loan B 5.34%, 8/18/2023 | 7,979,900 | 7,640,754 | |||
WMG Acquisition Corp. Senior Secured 2018 Term Loan F 4.22%, 11/1/2023 | 12,317,916 | 12,245,549 | |||
Ziggo Secured Finance Partnership Senior Secured USD Term Loan E 4.57%, 4/15/2025 | 15,089,037 | 14,946,822 | |||
| 247,659,435 | |||||
| METALS & MINING — 0.4% | |||||
Aleris International, Inc. Senior Secured 2018 Term Loan 6.86%, 2/8/2023 | 12,068,966 | 11,982,190 | |||
PLZ Aeroscience Corp. Senior Secured USD Term Loan 5.83%, 7/31/2022 | 1,271,559 | 1,277,917 | |||
| 13,260,107 | |||||
| MULTILINE RETAIL — 0.5% | |||||
AI Aqua Merger Sub, Inc. Senior Secured 2017 1st Lien Term Loan B Zero Coupon, 12/13/2023 | 15,000,000 | 14,948,475 | |||
Neiman Marcus Group, Ltd. LLC Senior Secured 2020 Term Loan 5.26%, 10/25/2020 | 1,873,958 | 1,665,480 | |||
| 16,613,955 | |||||
| OIL, GAS & CONSUMABLE FUELS — 1.0% | |||||
BCP Raptor LLC Senior Secured Term Loan B 6.42%, 6/24/2024 | 1,813,600 | 1,777,328 | |||
EG Finco, Ltd. Senior Secured 2018 USD Term Loan 6.33%, 2/7/2025 | 24,615,294 | 24,439,910 |
Table of Contents
| Security Description | Principal Amount | Value | |||
Lucid Energy Group II LLC Senior Secured 2018 1st Lien Term Loan 5.09%, 2/17/2025 (b) | $ 6,960,788 | $ 6,934,685 | |||
| 33,151,923 | |||||
| OIL-FIELD SERVICES — 0.0% (c) | |||||
MRC Global (US) Inc. Senior Secured 2018 1st Lien Term Loan B 5.09%, 9/20/2024 | 842,478 | 846,956 | |||
| PAPER&RELATED PRODUCTS — 0.4% | |||||
Flex Acquisition Co., Inc. Senior Secured 2018 1st Lien Term Loan Zero Coupon, 6/29/2025 | 11,904,762 | 11,899,762 | |||
| PERSONAL PRODUCTS — 0.1% | |||||
Zodiac Pool Solutions LLC Senior Secured 2018 Term Loan B Zero Coupon, 3/31/2025 | 4,098,361 | 4,093,238 | |||
| PHARMACEUTICALS — 4.5% | |||||
Akorn, Inc. Senior Secured Term Loan B 6.38%, 4/16/2021 | 12,666,667 | 12,439,744 | |||
Alvogen Pharma US, Inc. Senior Secured 2018 Term Loan B Zero Coupon, 4/2/2022 | 7,142,857 | 7,169,679 | |||
Amneal Pharmaceuticals LLC Senior Secured 2018 Term Loan B 5.63%, 5/4/2025 | 14,775,066 | 14,770,485 | |||
Arbor Pharmaceuticals, Inc. Senior Secured Term Loan B 7.49%, 7/5/2023 | 1,623,209 | 1,634,028 | |||
Endo Luxembourg Finance Co. I S.A.R.L. Senior Secured 2017 Term Loan B 6.38%, 4/29/2024 | 36,078,978 | 36,078,978 | |||
Horizon Pharma, Inc. Senior Secured 2017 1st Lien Term Loan 5.38%, 3/29/2024 | 14,270,507 | 14,264,585 | |||
| Pearl Intermediate Parent LLC: | |||||
Senior Secured 2018 1st Lien Term Loan 4.84%, 2/14/2025 | 15,803,416 | 15,526,856 | |||
Senior Secured 2018 Delayed Draw Term Loan 2.13%, 2/14/2025 | 2,204,795 | 2,166,212 |
Table of Contents
| Security Description | Principal Amount | Value | |||
Valeant Pharmaceuticals International, Inc. Senior Secured 2018 Term Loan B 4.98%, 6/1/2025 | $ 39,253,636 | $ 39,171,988 | |||
| 143,222,555 | |||||
| POLLUTION CONTROL — 0.3% | |||||
Core & Main L.P. Senior Secured 2017 Term Loan B 5.21%, 8/1/2024 | 2,344,241 | 2,347,171 | |||
EnergySolutions LLC Senior Secured 2018 Term Loan B 6.08%, 5/9/2025 | 7,457,377 | 7,480,682 | |||
| 9,827,853 | |||||
| PROFESSIONAL SERVICES — 1.7% | |||||
| Advantage Sales & Marketing, Inc.: | |||||
Senior Secured 2014 1st Lien Term Loan 5.34%, 7/23/2021 | 19,889,062 | 18,857,416 | |||
Senior Secured 2014 2nd Lien Term Loan 8.59%, 7/25/2022 | 15,753,373 | 14,427,490 | |||
Senior Secured Incremental Term Loan B 5.34%, 7/25/2021 | 1,994,962 | 1,891,055 | |||
Information Resources, Inc. Senior Secured 1st Lien Term Loan 6.57%, 1/18/2024 | 18,377,792 | 18,406,553 | |||
| 53,582,514 | |||||
| REAL ESTATE INVESTMENT TRUSTS (REITS) — 0.5% | |||||
Capital Automotive L.P. Senior Secured 2017 1st Lien Term Loan 4.60%, 3/24/2024 | 1,275,434 | 1,270,651 | |||
Communications Sales & Leasing, Inc. Senior Secured 2017 Term Loan B 5.09%, 10/24/2022 | 14,321,494 | 13,709,823 | |||
| 14,980,474 | |||||
| REAL ESTATE MANAGEMENT & DEVELOPMENT — 0.3% | |||||
Bright Bidco B.V. Senior Secured 2018 Term Loan B 5.83%, 6/30/2024 | 1,501,450 | 1,492,066 | |||
DTZ U.S. Borrower LLC Senior Secured 2017 1st Lien Term Loan 5.56%, 11/4/2021 | 6,024,473 | 6,025,136 |
Table of Contents
| Security Description | Principal Amount | Value | |||
Realogy Corp. Senior Secured 2018 Term Loan B 4.30%, 2/8/2025 | $ 2,274,761 | $ 2,272,634 | |||
| 9,789,836 | |||||
| RECYCLING — 0.2% | |||||
Gopher Resource LLC Senior Secured 1st Lien Term Loan 5.34%, 3/6/2025 | 7,741,903 | 7,761,258 | |||
| RETAIL-RESTAURANTS — 0.5% | |||||
IRB Holding Corp. Senior Secured 1st Lien Term Loan 5.28%, 2/5/2025 | 7,001,041 | 7,021,449 | |||
K-Mac Holdings Corp. Senior Secured 2018 1st Lien Term Loan 5.34%, 3/7/2025 | 2,493,750 | 2,483,226 | |||
Tacala LLC Senior Secured 1st Lien Term Loan 5.23%, 1/31/2025 | 5,209,167 | 5,197,446 | |||
| 14,702,121 | |||||
| ROAD & RAIL — 0.2% | |||||
Direct ChassisLink, Inc. Senior Secured 2017 2nd Lien Term Loan 8.09%, 6/15/2023 | 5,000,000 | 5,056,250 | |||
| SEMICONDUCTOR EQUIPMENT — 0.7% | |||||
MA FinanceCo. LLC Senior Secured USD Term Loan B3 4.84%, 6/21/2024 | 2,810,442 | 2,804,301 | |||
Seattle Spinco, Inc. Senior Secured USD Term Loan B3 4.84%, 6/21/2024 | 18,979,607 | 18,938,136 | |||
| 21,742,437 | |||||
| SEMICONDUCTORS & SEMICONDUCTOR EQUIPMENT — 0.8% | |||||
Cypress Semiconductor Corp. Senior Secured 2016 Term Loan B 4.35%, 7/5/2021 | 8,970,681 | 9,007,685 | |||
MACOM Technology Solutions Holdings, Inc. Senior Secured 2017 Add on Term Loan 4.34%, 5/17/2024 | 6,140,264 | 6,050,739 |
Table of Contents
| Security Description | Principal Amount | Value | |||
Microchip Technology, Inc. Senior Secured 2018 Term Loan B 4.10%, 5/29/2025 | $ 9,858,841 | $ 9,860,911 | |||
| 24,919,335 | |||||
| SOFTWARE — 11.9% | |||||
| Applied Systems, Inc.: | |||||
Senior Secured 2017 1st Lien Term Loan 5.33%, 9/19/2024 | 1,825,287 | 1,829,987 | |||
Senior Secured 2017 2nd Lien Term Loan 9.33%, 9/19/2025 | 454,545 | 469,659 | |||
Avast Software B.V. Senior Secured 2018 USD Term Loan B 4.83%, 9/30/2023 | 3,426,114 | 3,429,335 | |||
CCC Information Services, Inc. Senior Secured 2017 1st Lien Term Loan 5.10%, 4/27/2024 | 4,522,425 | 4,521,227 | |||
Compuware Corp. Senior Secured Term Loan B3 5.59%, 12/15/2021 | 23,135,772 | 23,216,747 | |||
Epicor Software Corp. Senior Secured 1st Lien Term Loan 5.35%, 6/1/2022 | 23,893,032 | 23,854,206 | |||
Flexera Software LLC Senior Secured 2018 1st Lien Term Loan 5.35%, 2/26/2025 | 10,144,068 | 10,139,351 | |||
Help/Systems LLC Senior Secured 2018 1st Lien Term Loan 5.84%, 3/28/2025 | 9,811,024 | 9,823,287 | |||
| Hyland Software, Inc.: | |||||
Senior Secured 2017 1st Lien Term Loan 5.34%, 7/1/2022 | 11,559,007 | 11,604,780 | |||
Senior Secured 2017 2nd Lien Term Loan 9.09%, 7/7/2025 | 608,696 | 619,348 | |||
Informatica Corp. Senior Secured 2018 USD Term Loan 5.34%, 8/5/2022 | 4,949,548 | 4,963,704 | |||
Kronos, Inc. Senior Secured 2017 Term Loan B 5.36%, 11/1/2023 | 18,775,705 | 18,763,971 | |||
McAfee LLC Senior Secured 2017 USD Term Loan B 6.59%, 9/30/2024 | 36,660,469 | 36,902,794 | |||
| Mitchell International, Inc.: |
Table of Contents
| Security Description | Principal Amount | Value | |||
Senior Secured 2017 1st Lien Term Loan 5.34%, 11/29/2024 | $ 15,093,750 | $ 15,030,809 | |||
Senior Secured 2017 2nd Lien Term Loan 9.34%, 11/20/2025 | 19,272,727 | 19,326,980 | |||
Project Alpha Intermediate Holding, Inc. Senior Secured 2017 Term Loan B 5.99%, 4/26/2024 | 30,413,199 | 30,299,149 | |||
Project Ruby Ultimate Parent Corp. Senior Secured 2017 Term Loan B 5.59%, 2/9/2024 | 5,954,829 | 5,969,716 | |||
| Quest Software US Holdings, Inc.: | |||||
Senior Secured 2018 1st Lien Term Loan 6.58%, 5/16/2025 | 15,000,000 | 14,965,650 | |||
Senior Secured 2018 2nd Lien Term Loan 10.58%, 5/16/2026 | 10,000,000 | 10,018,800 | |||
SolarWinds Holdings, Inc. Senior Secured 2018 Term Loan B 5.09%, 2/5/2024 | 23,009,375 | 23,028,473 | |||
Solera Holdings, Inc. Senior Secured USD Term Loan B 4.84%, 3/3/2023 | 2,783,726 | 2,775,027 | |||
SonicWALL, Inc. Senior Secured 1st Lien Term Loan 5.83%, 5/16/2025 | 16,935,484 | 16,984,935 | |||
Sophia L.P. Senior Secured 2017 Term Loan B 5.58%, 9/30/2022 | 3,336,141 | 3,327,801 | |||
SS&C Technologies Holdings Europe S.A.R.L. Senior Secured 2018 Term Loan B4 4.59%, 4/16/2025 | 10,574,996 | 10,590,382 | |||
SS&C Technologies, Inc. Senior Secured 2018 Term Loan B3 4.59%, 4/16/2025 | 27,953,019 | 27,993,691 | |||
TIBCO Software, Inc. Senior Secured Repriced Term Loan B 5.60%, 12/4/2020 | 18,424,829 | 18,456,520 | |||
Veritas Bermuda, Ltd. Senior Secured USD Repriced Term Loan B 6.65%, 1/27/2023 | 19,895,860 | 18,279,321 | |||
VF Holding Corp. Senior Secured Reprice Term Loan 5.34%, 6/30/2023 | 11,201,334 | 11,145,328 | |||
| 378,330,978 |
Table of Contents
| Security Description | Principal Amount | Value | |||
| SPECIALTY RETAIL — 3.0% | |||||
Ascena Retail Group, Inc. Senior Secured 2015 Term Loan B 6.63%, 8/21/2022 | $ 847,374 | $ 758,824 | |||
Bass Pro Group LLC Senior Secured Term Loan B 7.09%, 9/25/2024 | 31,839,252 | 31,928,879 | |||
Burlington Coat Factory Warehouse Corp. Senior Secured 2017 Term Loan B5 4.60%, 11/17/2024 | 8,489,484 | 8,521,320 | |||
National Vision, Inc. Senior Secured 2017 Repriced Term Loan 4.84%, 11/20/2024 | 7,318,821 | 7,317,284 | |||
Party City Holdings, Inc. Senior Secured 2018 Term Loan B 4.85%, 8/19/2022 | 7,055,006 | 7,059,874 | |||
Petco Animal Supplies, Inc. Senior Secured 2017 Term Loan B 5.61%, 1/26/2023 | 2,300,000 | 1,666,545 | |||
Staples, Inc. Senior Secured 2017 Term Loan B 6.36%, 9/12/2024 | 38,027,840 | 37,582,344 | |||
| 94,835,070 | |||||
| TELECOM SERVICES — 0.5% | |||||
SBA Senior Finance II LLC Senior Secured 2018 Term Loan B 4.10%, 4/11/2025 | 10,734,865 | 10,678,292 | |||
Securus Technologies Holdings, Inc. Senior Secured 2017 1st Lien Term Loan 6.59%, 11/1/2024 | 5,138,604 | 5,170,721 | |||
| 15,849,013 | |||||
| THRIFTS & MORTGAGE FINANCE — 0.1% | |||||
Capri Finance LLC Senior Secured USD 2017 1st Lien Term Loan 5.61%, 11/1/2024 | 3,295,650 | 3,273,009 | |||
| TRADING COMPANIES & DISTRIBUTORS — 1.6% | |||||
Avolon TLB Borrower 1 (Luxembourg) S.A.R.L. Senior Secured Term Loan B3 4.09%, 1/15/2025 | 36,773,145 | 36,369,560 | |||
SiteOne Landscape Supply, Inc. Senior Secured 2017 1st Lien Term Loan 4.85%, 4/29/2022 (b) | 1,028,498 | 1,033,964 |
Table of Contents
| Security Description | Principal Amount | Value | |||
Univar, Inc. Senior Secured 2017 USD Term Loan B 4.59%, 7/1/2024 | $ 15,277,369 | $ 15,259,571 | |||
| 52,663,095 | |||||
TOTAL SENIOR FLOATING RATE LOANS (Cost $3,003,786,312) | 2,997,825,588 | ||||
| CORPORATE BONDS & NOTES — 3.6% | |||||
| AEROSPACE & DEFENSE — 0.1% | |||||
TransDigm, Inc. 6.50%, 7/15/2024 | 5,000,000 | 5,082,500 | |||
| COMMERCIAL SERVICES — 0.1% | |||||
Prime Security Services Borrower LLC/Prime Finance, Inc. 9.25%, 5/15/2023 (d) | 2,122,000 | 2,259,293 | |||
| DIVERSIFIED FINANCIAL SERVICES — 0.1% | |||||
Fly Leasing, Ltd. 5.25%, 10/15/2024 | 3,145,000 | 2,958,266 | |||
| ELECTRIC — 0.0% (c) | |||||
Calpine Corp. 5.88%, 1/15/2024 (d) | 1,000,000 | 990,000 | |||
| ELECTRONICS — 0.1% | |||||
TTM Technologies, Inc. 5.63%, 10/1/2025 (d) | 3,500,000 | 3,421,250 | |||
| ENTERTAINMENT — 0.2% | |||||
Scientific Games International, Inc. 5.00%, 10/15/2025 (d) | 7,750,000 | 7,364,825 | |||
| FOOD — 0.4% | |||||
Albertsons Cos., Inc. 3 Month USD LIBOR + 3.75% 6.09%, 1/15/2024 (d) (e) | 9,000,000 | 9,000,000 | |||
Post Holdings, Inc. 5.00%, 8/15/2026 (d) | 4,000,000 | 3,730,000 | |||
| 12,730,000 | |||||
| HEALTH CARE PRODUCTS — 0.3% | |||||
Avantor, Inc. 6.00%, 10/1/2024 (d) | 7,750,000 | 7,657,000 | |||
Kinetic Concepts, Inc./KCI USA, Inc. 7.88%, 2/15/2021 (d) | 830,000 | 838,300 | |||
| 8,495,300 |
Table of Contents
| Security Description | Principal Amount | Value | |||
| HEALTH CARE SERVICES — 0.7% | |||||
HCA, Inc. 5.00%, 3/15/2024 | $ 1,000,000 | $ 998,800 | |||
MPH Acquisition Holdings LLC 7.13%, 6/1/2024 (d) | 10,000,000 | 10,213,000 | |||
| Tenet Healthcare Corp.: | |||||
6.75%, 2/1/2020 | 2,000,000 | 2,050,000 | |||
8.13%, 4/1/2022 | 8,000,000 | 8,350,400 | |||
| 21,612,200 | |||||
| INSURANCE — 0.1% | |||||
AssuredPartners, Inc. 7.00%, 8/15/2025 (d) | 3,410,000 | 3,278,033 | |||
| LEISURE TIME — 0.0% (c) | |||||
Sabre GLBL, Inc. 5.25%, 11/15/2023 (d) | 500,000 | 503,125 | |||
| MEDIA — 0.4% | |||||
| Gray Television, Inc.: | |||||
5.13%, 10/15/2024 (d) | 3,000,000 | 2,856,600 | |||
5.88%, 7/15/2026 (d) | 3,000,000 | 2,850,000 | |||
Nexstar Broadcasting, Inc. 5.63%, 8/1/2024 (d) | 1,000,000 | 967,500 | |||
Sinclair Television Group, Inc. 5.63%, 8/1/2024 (d) | 5,000,000 | 4,956,250 | |||
| 11,630,350 | |||||
| PACKAGING & CONTAINERS — 0.2% | |||||
Ardagh Packaging Finance PLC/Ardagh Holdings USA, Inc. 7.25%, 5/15/2024 (d) | 2,320,000 | 2,412,800 | |||
Flex Acquisition Co., Inc. 6.88%, 1/15/2025 (d) | 1,478,000 | 1,426,270 | |||
Reynolds Group Issuer, Inc./Reynolds Group Issuer LLC/Reynolds Group Issuer Lu 3 Month USD LIBOR + 3.50% 5.85%, 7/15/2021 (d) (e) | 2,000,000 | 2,016,200 | |||
| 5,855,270 | |||||
| PHARMACEUTICALS — 0.2% | |||||
Endo Dac/Endo Finance LLC/Endo Finco, Inc. 5.88%, 10/15/2024 (d) | 1,517,000 | 1,479,075 | |||
Endo Finance LLC/Endo Finco, Inc. 5.38%, 1/15/2023 (d) | 1,000,000 | 810,000 | |||
| Valeant Pharmaceuticals International, Inc.: | |||||
5.50%, 11/1/2025 (d) | 3,000,000 | 2,952,900 |
Table of Contents
| Security Description | Principal Amount | Value | |||
6.50%, 3/15/2022 (d) | $ 1,734,000 | $ 1,794,690 | |||
| 7,036,665 | |||||
| RETAIL — 0.1% | |||||
1011778 BC ULC/New Red Finance, Inc. 4.25%, 5/15/2024 (d) | 2,034,000 | 1,932,300 | |||
CEC Entertainment, Inc. 8.00%, 2/15/2022 | 1,148,000 | 1,010,240 | |||
| 2,942,540 | |||||
| SOFTWARE — 0.6% | |||||
First Data Corp. 5.00%, 1/15/2024 (d) | 7,396,000 | 7,349,775 | |||
Infor US, Inc. 6.50%, 5/15/2022 | 7,000,000 | 7,026,600 | |||
Riverbed Technology, Inc. 8.88%, 3/1/2023 (d) | 5,500,000 | 5,214,000 | |||
| 19,590,375 | |||||
TOTAL CORPORATE BONDS & NOTES (Cost $117,611,059) | 115,749,992 |
| Shares | |||
| SHORT-TERM INVESTMENT — 6.1% | |||
State Street Institutional U.S. Government Money Market Fund, Class G Shares 1.86% (f) (g) (Cost $196,673,118) | 196,673,118 | 196,673,118 | |
TOTAL INVESTMENTS — 103.7% (Cost $3,318,070,489) | 3,310,248,698 | ||
LIABILITIES IN EXCESS OF OTHER ASSETS — (3.7)% | (119,585,739) | ||
NET ASSETS — 100.0% | $ 3,190,662,959 |
Table of Contents
| (a) | The rate shown represents the rate at June 30, 2018. |
| (b) | Fair valued as determined in good faith by the Trust’s Oversight Committee in accordance with policy and procedures approved by the Board of Trustees. As of June 30, 2018, total aggregate fair value of securities is $21,915,222 representing 0.7% of net assets. |
| (c) | Amount is less than 0.05% of net assets. |
| (d) | Securities purchased pursuant to Rule 144A of the Securities Act of 1933, as amended. These securities, which represent 2.8% of net assets as of June 30, 2018, are considered liquid and may be resold in transactions exempt from registration, normally to qualified institutional buyers. |
| (e) | Variable Rate Security - Interest rate shown is the rate in effect at June 30, 2018. For securities based on a published reference rate and spread, the reference rate and spread are indicated in the description above. |
| (f) | The Fund invested in certain money market funds managed by SSGA Funds Management, Inc. Amounts related to these transactions during the period ended June 30, 2018 are shown in the Affiliate Table below. |
| (g) | The rate shown is the annualized seven-day yield at June 30, 2018. |
| LIBOR | = London Interbank Offered Rate |
| LP | = Limited Partnership |
| Borrower | Unfunded Loan Commitment ($) | Value ($) | Unrealized Appreciation/(Depreciation) ($) | |||
| Access CIG LLC | 640,413 | 642,335 | 1,922 | |||
| Heartland Dental LLC | 1,720,390 | 1,712,863 | (7,527) | |||
| Pearl Intermediate Parent LLC | 2,454,917 | 2,411,956 | (42,961) | |||
| ION Trading Technologies S.A.R.L. | 8,977,500 | 8,943,750 | (33,750) | |||
| GFL Environmental, Inc. | 1,070,005 | 1,064,655 | (5,350) | |||
| AqGen Ascensus, Inc. | 1,662,527 | 1,668,750 | 6,223 | |||
| BMC Software Finance, Inc. | 39,600,000 | 39,800,000 | 200,000 | |||
| $118,557 |
| Description | Level 1 – Quoted Prices | Level 2 – Other Significant Observable Inputs | Level 3 – Significant Unobservable Inputs | Total | ||||
| ASSETS: | ||||||||
| INVESTMENTS: | ||||||||
Senior Floating Rate Loans | ||||||||
Aerospace & Defense | $ — | $ 68,154,111 | $— | $ 68,154,111 |
Table of Contents
| Description | Level 1 – Quoted Prices | Level 2 – Other Significant Observable Inputs | Level 3 – Significant Unobservable Inputs | Total | ||||
Airlines | $ — | $ 9,635,844 | $— | $ 9,635,844 | ||||
Apparel Manufacturers | — | 1,787,500 | — | 1,787,500 | ||||
Auto Components | — | 24,947,295 | — | 24,947,295 | ||||
Automobiles | — | 6,019,443 | — | 6,019,443 | ||||
Building Products | — | 19,485,840 | — | 19,485,840 | ||||
Capital Markets | — | 19,911,631 | — | 19,911,631 | ||||
Casino Hotels | — | 14,915,439 | — | 14,915,439 | ||||
Chemicals | — | 57,154,351 | — | 57,154,351 | ||||
Commercial Services & Supplies | — | 280,226,835 | — | 280,226,835 | ||||
Communications Equipment | — | 40,772,951 | — | 40,772,951 | ||||
Computers & Peripherals | — | 5,091,133 | — | 5,091,133 | ||||
Construction & Engineering | — | 31,754,528 | — | 31,754,528 | ||||
Construction Materials | — | 3,435,353 | — | 3,435,353 | ||||
Containers & Packaging | — | 41,328,302 | — | 41,328,302 | ||||
Distributors | — | 28,069,354 | — | 28,069,354 | ||||
Diversified Consumer Services | — | 27,666,912 | — | 27,666,912 | ||||
Diversified Financial Services | — | 93,367,503 | — | 93,367,503 | ||||
Diversified Telecommunication Services | — | 111,190,235 | — | 111,190,235 | ||||
Electric Utilities | — | 18,280,782 | — | 18,280,782 | ||||
Electrical Equipment | — | 4,526,307 | — | 4,526,307 | ||||
Electronic Equipment, Instruments & Components | — | 20,113,099 | — | 20,113,099 | ||||
Energy Equipment & Services | — | 2,284,640 | — | 2,284,640 | ||||
Food & Staples Retailing | — | 72,099,903 | — | 72,099,903 | ||||
Food Products | — | 25,759,023 | — | 25,759,023 | ||||
Health Care Equipment & Supplies | — | 39,618,975 | — | 39,618,975 | ||||
Health Care Providers & Services | — | 204,676,604 | — | 204,676,604 | ||||
Health Care Technology | — | 15,338,559 | — | 15,338,559 | ||||
Hotels, Restaurants & Leisure | — | 176,306,443 | — | 176,306,443 | ||||
Independent Power Producers & Energy Traders | — | 15,608,434 | — | 15,608,434 | ||||
Insurance | — | 125,996,404 | — | 125,996,404 | ||||
Internet & Catalog Retail | — | 19,391,351 | — | 19,391,351 | ||||
Internet Software & Services | — | 75,113,915 | — | 75,113,915 | ||||
IT Services | — | 50,487,099 | — | 50,487,099 | ||||
Life Sciences Tools & Services | — | 33,634,396 | — | 33,634,396 | ||||
Machinery | — | 35,613,920 | — | 35,613,920 | ||||
Media | — | 247,659,435 | — | 247,659,435 | ||||
Metals & Mining | — | 13,260,107 | — | 13,260,107 | ||||
Multiline Retail | — | 16,613,955 | — | 16,613,955 | ||||
Oil, Gas & Consumable Fuels | — | 33,151,923 | — | 33,151,923 |
Table of Contents
| Description | Level 1 – Quoted Prices | Level 2 – Other Significant Observable Inputs | Level 3 – Significant Unobservable Inputs | Total | ||||
Oil-Field Services | $ — | $ 846,956 | $— | $ 846,956 | ||||
Paper&Related Products | — | 11,899,762 | — | 11,899,762 | ||||
Personal Products | — | 4,093,238 | — | 4,093,238 | ||||
Pharmaceuticals | — | 143,222,555 | — | 143,222,555 | ||||
Pollution Control | — | 9,827,853 | — | 9,827,853 | ||||
Professional Services | — | 53,582,514 | — | 53,582,514 | ||||
Real Estate Investment Trusts (REITs) | — | 14,980,474 | — | 14,980,474 | ||||
Real Estate Management & Development | — | 9,789,836 | — | 9,789,836 | ||||
Recycling | — | 7,761,258 | — | 7,761,258 | ||||
Retail-Restaurants | — | 14,702,121 | — | 14,702,121 | ||||
Road & Rail | — | 5,056,250 | — | 5,056,250 | ||||
Semiconductor Equipment | — | 21,742,437 | — | 21,742,437 | ||||
Semiconductors & Semiconductor Equipment | — | 24,919,335 | — | 24,919,335 | ||||
Software | — | 378,330,978 | — | 378,330,978 | ||||
Specialty Retail | — | 94,835,070 | — | 94,835,070 | ||||
Telecom Services | — | 15,849,013 | — | 15,849,013 | ||||
Thrifts & Mortgage Finance | — | 3,273,009 | — | 3,273,009 | ||||
Trading Companies & Distributors | — | 52,663,095 | — | 52,663,095 | ||||
Corporate Bonds & Notes | ||||||||
Aerospace & Defense | — | 5,082,500 | — | 5,082,500 | ||||
Commercial Services | — | 2,259,293 | — | 2,259,293 | ||||
Diversified Financial Services | — | 2,958,266 | — | 2,958,266 | ||||
Electric | — | 990,000 | — | 990,000 | ||||
Electronics | — | 3,421,250 | — | 3,421,250 | ||||
Entertainment | — | 7,364,825 | — | 7,364,825 | ||||
Food | — | 12,730,000 | — | 12,730,000 | ||||
Health Care Products | — | 8,495,300 | — | 8,495,300 | ||||
Health Care Services | — | 21,612,200 | — | 21,612,200 | ||||
Insurance | — | 3,278,033 | — | 3,278,033 | ||||
Leisure Time | — | 503,125 | — | 503,125 | ||||
Media | — | 11,630,350 | — | 11,630,350 | ||||
Packaging & Containers | — | 5,855,270 | — | 5,855,270 | ||||
Pharmaceuticals | — | 7,036,665 | — | 7,036,665 | ||||
Retail | — | 2,942,540 | — | 2,942,540 | ||||
Software | — | 19,590,375 | — | 19,590,375 | ||||
Short-Term Investment | 196,673,118 | — | — | 196,673,118 | ||||
TOTAL INVESTMENTS | $196,673,118 | $3,113,575,580 | $— | $3,310,248,698 |
Table of Contents
| Description | Level 1 – Quoted Prices | Level 2 – Other Significant Observable Inputs | Level 3 – Significant Unobservable Inputs | Total | ||||
| OTHER FINANCIAL INSTRUMENTS: | ||||||||
Unfunded Loan Commitments(a) | $ — | $ 118,557 | $— | $ 118,557 | ||||
TOTAL INVESTMENTS AND OTHER FINANCIAL INSTRUMENTS | $196,673,118 | $3,113,694,137 | $— | $3,310,367,255 |
| (a) | appreciation (depreciation) on unfunded loan commitments. |
| Number of Shares Held at 6/30/17 | Value at 6/30/17 | Cost of Purchases | Proceeds from Shares Sold | Realized Gain (Loss) | Change in Unrealized Appreciation/ Depreciation | Number of Shares Held at 6/30/18 | Value at 6/30/18 | Dividend Income | |||||||||
State Street Institutional U.S. Government Money Market Fund, Class G Shares | 119,281,817 | $119,281,817 | $1,857,721,773 | $1,780,330,472 | $— | $— | 196,673,118 | $196,673,118 | $2,615,497 |
Table of Contents
| Blackstone / GSO Senior Loan Portfolio | |
| ASSETS | |
Investments in unaffiliated issuers, at value | $3,113,575,580 |
Investments in affiliated issuers, at value | 196,673,118 |
Total Investments | 3,310,248,698 |
Cash | 5,047,803 |
Receivable for investments sold | 219,637,294 |
Dividends receivable — affiliated issuers | 283,625 |
Interest receivable — unaffiliated issuers | 8,002,305 |
Unrealized appreciation on unfunded loan commitments | 118,557 |
Other Receivable | 102,744 |
TOTAL ASSETS | 3,543,441,026 |
| LIABILITIES | |
Payable for investments purchased | 351,996,464 |
Advisory fee payable | 779,983 |
Trustees’ fees and expenses payable | 461 |
Accrued expenses and other liabilities | 1,159 |
TOTAL LIABILITIES | 352,778,067 |
NET ASSETS | $3,190,662,959 |
| COST OF INVESTMENTS: | |
Investments in unaffiliated issuers | $3,121,411,873 |
Investments in affiliated issuers | 196,673,118 |
Total cost of investments | $3,318,084,991 |
Table of Contents
| Blackstone / GSO Senior Loan Portfolio | |
| INVESTMENT INCOME | |
Interest income — unaffiliated issuers | $117,281,297 |
Dividend income — affiliated issuers | 2,615,497 |
TOTAL INVESTMENT INCOME (LOSS) | 119,896,794 |
| EXPENSES | |
Advisory fee | 7,194,761 |
Trustees’ fees and expenses | 36,785 |
TOTAL EXPENSES | 7,231,546 |
NET INVESTMENT INCOME (LOSS) | 112,665,248 |
| REALIZED AND UNREALIZED GAIN (LOSS) | |
| Net realized gain (loss) on: | |
Investments — unaffiliated issuers | (11,863,247) |
| Net change in unrealized appreciation/depreciation on: | |
Investments — unaffiliated issuers | (16,629,536) |
Unfunded loan commitments | 118,557 |
Net change in unrealized appreciation/depreciation | (16,510,979) |
NET REALIZED AND UNREALIZED GAIN (LOSS) | (28,374,226) |
NET INCREASE (DECREASE) IN NET ASSETS FROM OPERATIONS | $ 84,291,022 |
Table of Contents
| Blackstone / GSO Senior Loan Portfolio | |||
| Year Ended 6/30/18 | Year Ended 6/30/17 | ||
| INCREASE (DECREASE) IN NET ASSETS FROM OPERATIONS: | |||
Net investment income (loss) | $ 112,665,248 | $ 51,271,905 | |
Net realized gain (loss) | (11,863,247) | 2,066,427 | |
Net change in unrealized appreciation/depreciation | (16,510,979) | 10,003,339 | |
Net increase (decrease) in net assets resulting from operations | 84,291,022 | 63,341,671 | |
| CAPITAL TRANSACTIONS | |||
Contributions | 1,509,849,498 | 1,009,734,223 | |
Withdrawals | (225,415,777) | (54,477,525) | |
Other capital | 850,599 | — | |
Net increase (decrease) in net assets from capital transactions | 1,285,284,320 | 955,256,698 | |
Net increase (decrease) in net assets during the period | 1,369,575,342 | 1,018,598,369 | |
Net assets at beginning of period | 1,821,087,617 | 802,489,248 | |
NET ASSETS AT END OF PERIOD | $3,190,662,959 | $1,821,087,617 | |
Table of Contents
| Blackstone / GSO Senior Loan Portfolio | |||||||||
| Year Ended 6/30/18 | Year Ended 6/30/17 | Year Ended 6/30/16 | Year Ended 6/30/15 | Year Ended 6/30/14 | |||||
Total return | 4.43% | 6.19% | (0.20)% | 2.98% | 4.00% | ||||
| Ratios and Supplemental Data: | |||||||||
Net assets, end of period (in 000s) | $3,190,663 | $1,821,088 | $802,489 | $672,264 | $610,477 | ||||
| Ratios to average net assets: | |||||||||
Total expenses | 0.30% | 0.30% | 0.30% | 0.31% | 0.30% | ||||
Net investment income (loss) | 4.70% | 4.31% | 4.54% | 4.49% | 3.63% | ||||
Portfolio turnover rate | 90% | 68% | 88% | 65% | 77% | ||||
Table of Contents
Table of Contents
Table of Contents
Table of Contents
| Annual Rate | |
Blackstone / GSO Senior Loan Portfolio | 0.30% |
Table of Contents
| Purchases | Sales | ||
Blackstone / GSO Senior Loan Portfolio | $3,518,282,459 | $2,125,948,104 |
Table of Contents
| Tax Cost | Gross Unrealized Appreciation | Gross Unrealized Depreciation | Net Unrealized Appreciation (Depreciation) | ||||
Blackstone / GSO Senior Loan Portfolio | $3,366,658,352 | $10,089,147 | $17,755,050 | $(7,665,903) |
Table of Contents
Table of Contents
Table of Contents
August 31, 2018
Table of Contents
Table of Contents
| Blackstone / GSO Senior Loan Portfolio | ||
Annualized Expense Ratio | 0.30% | |
| Actual: | ||
Ending Account Value | $1,016.40 | |
Expenses Paid During Period(a) | 1.50 | |
| Hypothetical (assuming a 5% return before expenses): | ||
Ending Account Value | 1,023.30 | |
Expenses Paid During Period(a) | 1.51 |
| (a) | Expenses are equal to the Portfolio’s annualized net expense ratio multiplied by the average account value of the period, multiplied by 181, then divided by 365. |
Table of Contents
Table of Contents
Table of Contents
Table of Contents
Table of Contents
| Name, Address and Year of Birth | Position(s) with Funds | Term of Office and Length of Time Served | Principal Occupation(s) During Past 5 Years | Number of Portfolios in Fund Complex Overseen by Trustee† | Other Directorships Held by Trustee During the Past 5 Years | |||||
| Trustees | ||||||||||
| Independent Trustees | ||||||||||
| FRANK NESVET c/o SSGA Master Trust One Iron Street Boston, MA 02210 1943 | Independent Trustee, Chairman, Trustee Committee Chair | Term: Unlimited Served: since March 2011 | Retired. | 127 | None. | |||||
| DAVID M. KELLY c/o SSGA Master Trust One Iron Street Boston, MA 02210 1938 | Independent Trustee | Term: Unlimited Served: since March 2011 | Retired. | 127 | Chicago Stock Exchange (Former Director, retired); Penson Worldwide Inc. (Former Director, retired). | |||||
| BONNY EUGENIA BOATMAN c/o SSGA Master Trust One Iron Street Boston, MA 02210 1950 | Independent Trustee | Term: Unlimited Served: since March 2011 | Retired. | 127 | None. | |||||
| DWIGHT D. CHURCHILL c/o SSGA Master Trust One Iron Street Boston, MA 02210 1953 | Independent Trustee | Term: Unlimited Served: since March 2011 | Self-employed consultant since 2010; CEO and President, CFA Institute (June 2014-January 2015). | 127 | Affiliated Managers Group, Inc. (Director). | |||||
| CARL G. VERBONCOEUR c/o SSGA Master Trust One Iron Street Boston, MA 02210 1952 | Independent Trustee, Audit Committee Chair | Term: Unlimited Served: since March 2011 | Self-employed consultant since 2009. | 127 | The Motley Fool Funds Trust (Trustee). |
Table of Contents
| Name, Address and Year of Birth | Position(s) with Funds | Term of Office and Length of Time Served | Principal Occupation(s) During Past 5 Years | Number of Portfolios in Fund Complex Overseen by Trustee† | Other Directorships Held by Trustee During the Past 5 Years | |||||
| Interested Trustee | ||||||||||
| JAMES E. ROSS* SSGA Funds Management, Inc. One Iron Street Boston, MA 02210 1965 | Interested Trustee | Term: Unlimited Served as Trustee: since March 2011 | Chairman and Director, SSGA Funds Management, Inc. (2005-present); Executive Vice President and Principal, State Street Global Advisors (2006-present); Chief Executive Officer and Director, State Street Global Advisors Funds Distributors, LLC (May 2017- present); Director, State Street Global Markets, LLC (2013-April 2017); President, SSGA Funds Management, Inc. (2005-2012). | 196 | None. | |||||
| † For the purpose of determining the number of portfolios overseen by the Trustees, “Fund Complex” comprises registered investment companies for which SSGA Funds Management, Inc. serves as investment adviser. | ||||||||||
| * Mr. Ross is an Interested Trustee because of his employment with the Adviser and ownership interest in an affiliate of the Adviser. Mr. Ross previously served as an Interested Trustee from November 2005 to December 2009. | ||||||||||
Table of Contents
| Name, Address and Year of Birth | Position(s) with Funds | Term of Office and Length of Time Served | Principal Occupation(s) During the Past 5 Years | |||
| Officers | ||||||
| ELLEN M. NEEDHAM SSGA Funds Management, Inc. One Iron Street Boston, MA 02210 1967 | President | Term: Unlimited Served: since October 2012 | President and Director, SSGA Funds Management, Inc. (2001 - present)*; Senior Managing Director, State Street Global Advisors (1992 - present)*; Director, State Street Global Advisors Funds Distributors, LLC (May 2017 - present). | |||
| BRUCE S. ROSENBERG SSGA Funds Management, Inc. One Iron Street Boston, MA 02210 1961 | Treasurer | Term: Unlimited Served: since February 2016 | Managing Director, State Street Global Advisors and SSGA Funds Management, Inc. (July 2015 - present); Director, Credit Suisse (April 2008 - July 2015). | |||
| ANN M. CARPENTER SSGA Funds Management, Inc. One Iron Street Boston, MA 02210 1966 | Vice President; Deputy Treasurer | Term: Unlimited Served: since August 2012 | Chief Operating Officer, SSGA Funds Management, Inc. (2005 - Present)*; Managing Director, State Street Global Advisors (2005 - present).* | |||
| MICHAEL P. RILEY SSGA Funds Management, Inc. One Iron Street Boston, MA 02210 1969 | Vice President | Term: Unlimited Served: since March 2011 | Managing Director, State Street Global Advisors (2005 - present).* | |||
| JOSHUA A. WEINBERG SSGA Funds Management, Inc. One Iron Street Boston, MA 02210 1978 | Chief Legal Officer | Term: Unlimited Served: since February 2015 | Managing Director and Managing Counsel, State Street Global Advisors (2011 - present); Clerk, SSGA Funds Management, Inc. (2013 - present); Associate, Financial Services Group, Dechert LLP (2006 - 2011). | |||
| JESSE D. HALLEE State Street Bank and Trust Company 100 Summer Street, SUM0703 Boston, MA 02111 1976 | Secretary | Term: Unlimited Served: since August 2017 | Vice President and Managing Counsel, State Street Bank and Trust Company (2013 – present); Vice President and Counsel, Brown Brothers Harriman & Co. (2007- 2013).** | |||
| ESTEFANIA SALOMON State Street Bank and Trust Company 100 Summer Street SUM0703 Boston, MA 02111 1983 | Assistant Secretary | Term: Unlimited Served: since May 2018 | Assistant Vice President and Associate Counsel, State Street Bank and Trust Company (2018 – present); Senior Compliance Consultant, AdvisorAssist, LLC (2017); Attorney, Commonwealth of Massachusetts, Securities Division (2014-2017). |
Table of Contents
| Name, Address and Year of Birth | Position(s) with Funds | Term of Office and Length of Time Served | Principal Occupation(s) During the Past 5 Years | |||
| CHAD C. HALLETT SSGA Funds Management, Inc. One Iron Street Boston, MA 02210 1969 | Deputy Treasurer | Term: Unlimited Served: since February 2016 | Vice President, State Street Global Advisors and SSGA Funds Management, Inc. (November 2014 - present); Vice President, State Street Bank and Trust Company (2001 - November 2014).* | |||
| DARLENE ANDERSON-VASQUEZ SSGA Funds Management, Inc. One Iron Street Boston, MA 02210 1968 | Deputy Treasurer | Term: Unlimited Served: since November 2016 | Managing Director, State Street Global Advisors and SSGA Funds Management, Inc. (May 2016 - present); Senior Vice President, John Hancock Investments (September 2007 - May 2016). | |||
| ARTHUR A. JENSEN SSGA Funds Management, Inc. 1600 Summer Street Stamford, CT 06905 1966 | Deputy Treasurer | Term: Unlimited Served: Since August 2017 | Vice President at State Street Global Advisors (July 2016 – present); Mutual Funds Controller of GE Asset Management Incorporated (April 2011 - July 2016). | |||
| SUJATA UPRETI SSGA Funds Management, Inc. One Iron Street Boston, MA 02210 1974 | Assistant Treasurer | Term: Unlimited Served: since February 2016 | Vice President, State Street Global Advisors and SSGA Funds Management, Inc. (May 2015 - present); Assistant Director, Cambridge Associates, LLC (July 2014 - January 2015); Vice President, Bank of New York Mellon (July 2012 - August 2013); Manager, PricewaterhouseCoopers, LLP (September 2003 - July 2012). | |||
| DANIEL FOLEY SSGA Funds Management, Inc. One Iron Street Boston, MA 02210 1972 | Assistant Treasurer | Term: Unlimited Served: since February 2016 | Vice President, State Street Global Advisors and SSGA Funds Management, Inc. (April 2007 - present).* | |||
| DANIEL G. PLOURDE SSGA Funds Management, Inc. One Iron Street Boston, MA 02210 1980 | Assistant Treasurer | Term: Unlimited Served: since May 2017 | Vice President, State Street Global Advisors and SSGA Funds Management, Inc. (May 2015 - present); Officer, State Street Bank and Trust Company (March 2009 - May 2015). |
Table of Contents
| Name, Address and Year of Birth | Position(s) with Funds | Term of Office and Length of Time Served | Principal Occupation(s) During the Past 5 Years | |||
| BRIAN HARRIS SSGA Funds Management, Inc. One Iron Street Boston, MA 02210 1973 | Chief Compliance Officer; Anti-Money Laundering Officer; Code of Ethics Compliance Officer | Term: Unlimited Served: since November 2013 | Managing Director, State Street Global Advisors and SSGA Funds Management, Inc. (June 2013 - present)*; Senior Vice President and Global Head of Investment Compliance, BofA Global Capital Management (2010 - 2013); Director of Compliance, AARP Financial Inc. (2008 - 2010). | |||
| * Served in various capacities and/or with various affiliated entities during noted time period. | ||||||
| ** Served in various capacities and/or with unaffiliated mutual funds or closed-end funds for which State Street Bank and Trust Company or its affiliates act as a provider of services during the noted time period. | ||||||
| Statement of Additional Information (SAI) includes additional information about Funds' directors and is available, without charge, upon request and by calling 1-866-787-2257. | ||||||
Table of Contents
One Iron Street
Boston, MA 02210
One Lincoln Street
Boston, MA 02111
1111 Pennsylvania Avenue, NW
Washington, DC 20004
200 Clarendon Street
Boston, MA 02116
Table of Contents
Table of Contents
| State Street Disciplined Global Equity Portfolio |

Table of Contents
Table of Contents
Table of Contents
| 1 | |
| 2 | |
| 5 | |
| 8 | |
| 9 | |
| 10 | |
| 11 | |
| 12 | |
| 17 | |
| 18 |
Table of Contents
Table of Contents
Table of Contents
| Cumulative Total Return | Average Annual Total Return | ||||||||
| Net Asset Value | Market Value | MSCI World Index | Net Asset Value | Market Value | MSCI World Index | ||||
| ONE YEAR | 6.48% | N/A | 11.09% | 6.48% | N/A | 11.09% | |||
| SINCE INCEPTION(1) | 32.69% | N/A | 42.06% | 12.69% | N/A | 6.26% | |||
| (1) | For the period February 18, 2016 to June 30, 2018. |
(Based on Net Asset Value)
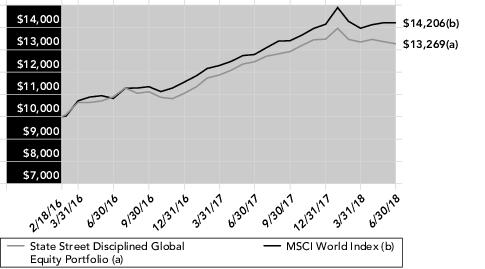
Table of Contents
| Description | Market Value | % of Net Assets | ||
| Motorola Solutions, Inc. | 79,597 | 1.6% | ||
| Baxter International, Inc. | 79,230 | 1.6 | ||
| Mitsui & Co., Ltd. | 76,726 | 1.5 | ||
| Swedish Match AB | 71,619 | 1.4 | ||
| CLP Holdings, Ltd. | 70,009 | 1.4 | ||
| TOTAL | 377,181 | 7.5% |
| % of Net Assets | |||
| Banks | 8.6% | ||
| Health Care Providers & Services | 6.1 | ||
| Pharmaceuticals | 6.1 | ||
| Insurance | 6.0 | ||
| Multi-Utilities | 3.7 | ||
| Diversified Telecommunication Services | 3.6 | ||
| Aerospace & Defense | 3.4 | ||
| Trading Companies & Distributors | 3.2 | ||
| Electric Utilities | 3.0 | ||
| Beverages | 2.9 | ||
| Food & Staples Retailing | 2.8 | ||
| Construction & Engineering | 2.8 | ||
| Oil, Gas & Consumable Fuels | 2.7 | ||
| Technology Hardware, Storage & Peripherals | 2.5 | ||
| Electronic Equipment, Instruments & Components | 2.5 | ||
| Health Care Equipment & Supplies | 2.4 | ||
| Communications Equipment | 2.3 | ||
| Automobiles | 2.3 | ||
| Mortgage Real Estate Investment Trust (REITs) | 2.2 | ||
| Hotels, Restaurants & Leisure | 2.2 | ||
| IT Services | 2.0 | ||
| Semiconductors & Semiconductor Equipment | 1.9 | ||
| Real Estate Management & Development | 1.8 | ||
| Textiles, Apparel & Luxury Goods | 1.7 | ||
| Food Products | 1.5 | ||
| Commercial Services & Supplies | 1.5 | ||
| Specialty Retail | 1.5 | ||
| Airlines | 1.5 | ||
| Tobacco | 1.4 | ||
| Life Sciences Tools & Services | 1.3 | ||
| Software | 1.3 | ||
| Real Estate Investment Trusts (REITs) | 1.2 | ||
| Metals & Mining | 1.2 | ||
| Containers & Packaging | 1.1 | ||
| Capital Markets | 1.1 | ||
| Industrial Conglomerates | 1.0 | ||
| Wireless Telecommunication Services | 1.0 | ||
| Household Products | 0.7 | ||
| Air Freight & Logistics | 0.7 | ||
| Gas Utilities | 0.6 | ||
| Consumer Finance | 0.6 | ||
| Chemicals | 0.6 | ||
| Diversified Consumer Services | 0.1 | ||
| Short-Term Investment | 0.7 | ||
| Other Assets in Excess of Liabilities | 0.7 | ||
| TOTAL | 100.0% |
Table of Contents
| Security Description | Shares | Value | |||
| COMMON STOCKS — 98.6% | |||||
| AUSTRALIA — 2.3% | |||||
Insurance Australia Group, Ltd. | 1,644 | $ 10,361 | |||
Macquarie Group, Ltd. | 61 | 5,573 | |||
Qantas Airways, Ltd. | 6,574 | 29,921 | |||
South32, Ltd. | 16,183 | 43,164 | |||
Woodside Petroleum, Ltd. | 1,043 | 27,326 | |||
| 116,345 | |||||
| BELGIUM — 0.5% | |||||
Ageas | 462 | 23,308 | |||
| CANADA — 3.0% | |||||
BCE, Inc. | 859 | 34,766 | |||
Sun Life Financial, Inc. | 592 | 23,775 | |||
TELUS Corp. | 1,279 | 45,406 | |||
Toronto-Dominion Bank | 817 | 47,258 | |||
| 151,205 | |||||
| CHINA — 1.1% | |||||
BOC Hong Kong Holdings, Ltd. | 12,000 | 56,517 | |||
| DENMARK — 2.1% | |||||
Danske Bank A/S | 1,803 | 56,437 | |||
Novo Nordisk A/S Class B | 766 | 35,530 | |||
Pandora A/S | 183 | 12,784 | |||
| 104,751 | |||||
| FRANCE — 1.8% | |||||
Peugeot SA | 1,992 | 45,492 | |||
Sanofi | 544 | 43,603 | |||
| 89,095 | |||||
| GERMANY — 0.4% | |||||
Allianz SE | 44 | 9,094 | |||
CECONOMY AG | 1,496 | 12,467 | |||
| 21,561 | |||||
| HONG KONG — 5.4% | |||||
CLP Holdings, Ltd. | 6,500 | 70,009 | |||
Hang Seng Bank, Ltd. | 2,100 | 52,517 | |||
Jardine Matheson Holdings, Ltd. | 400 | 25,240 | |||
Link REIT | 6,500 | 59,362 | |||
Sun Hung Kai Properties, Ltd. | 3,000 | 45,275 | |||
WH Group, Ltd. | 23,000 | 18,733 | |||
| 271,136 | |||||
| ITALY — 1.7% | |||||
Enel SpA | 5,469 | 30,375 | |||
Eni SpA | 2,838 | 52,705 | |||
| 83,080 | |||||
| JAPAN — 15.4% | |||||
Astellas Pharma, Inc. | 4,100 | 62,519 | |||
Canon, Inc. | 300 | 9,834 | |||
Daiwa House Industry Co., Ltd. | 800 | 27,272 | |||
FUJIFILM Holdings Corp. | 900 | 35,150 | |||
Hitachi, Ltd. | 9,000 | 63,507 | |||
Honda Motor Co., Ltd. | 300 | 8,811 | |||
ITOCHU Corp. | 2,300 | 41,685 | |||
Japan Airlines Co., Ltd. | 1,300 | 46,101 | |||
Kajima Corp. | 5,000 | 38,731 |
| Security Description | Shares | Value | |||
Kirin Holdings Co., Ltd. | 1,300 | $ 34,775 | |||
Marubeni Corp. | 5,900 | 45,015 | |||
Mitsubishi Materials Corp. | 600 | 16,494 | |||
Mitsui & Co., Ltd. | 4,600 | 76,726 | |||
Mitsui Chemicals, Inc. | 1,200 | 31,960 | |||
Nippon Telegraph & Telephone Corp. | 1,200 | 54,559 | |||
NTT DOCOMO, Inc. | 2,000 | 50,964 | |||
Taisei Corp. | 1,200 | 66,194 | |||
Toyota Motor Corp. | 900 | 58,258 | |||
| 768,555 | |||||
| NETHERLANDS — 0.6% | |||||
Koninklijke Ahold Delhaize NV | 1,333 | 31,913 | |||
| NORWAY — 1.1% | |||||
Equinor ASA | 2,169 | 57,589 | |||
| SINGAPORE — 0.6% | |||||
Oversea-Chinese Banking Corp., Ltd. | 2,000 | 17,074 | |||
UOL Group, Ltd. | 2,485 | 13,887 | |||
| 30,961 | |||||
| SPAIN — 0.7% | |||||
ACS Actividades de Construccion y Servicios SA | 817 | 33,100 | |||
| SWEDEN — 1.4% | |||||
Swedish Match AB | 1,444 | 71,619 | |||
| SWITZERLAND — 3.5% | |||||
Swiss Re AG | 495 | 42,722 | |||
Swisscom AG | 98 | 43,742 | |||
TE Connectivity, Ltd. | 663 | 59,710 | |||
Zurich Insurance Group AG | 100 | 29,619 | |||
| 175,793 | |||||
| UNITED KINGDOM — 0.8% | |||||
Direct Line Insurance Group PLC | 8,421 | 38,123 | |||
| UNITED STATES — 56.2% | |||||
Aflac, Inc. | 720 | 30,974 | |||
Agilent Technologies, Inc. | 1,021 | 63,139 | |||
AGNC Investment Corp. REIT | 2,977 | 55,343 | |||
Allstate Corp. | 686 | 62,611 | |||
Ameren Corp. | 768 | 46,733 | |||
American Express Co. | 319 | 31,262 | |||
Annaly Capital Management, Inc. REIT | 5,205 | 53,560 | |||
Anthem, Inc. | 235 | 55,937 | |||
Apple, Inc. | 173 | 32,024 | |||
Avery Dennison Corp. | 522 | 53,296 | |||
Bank of New York Mellon Corp. | 951 | 51,287 | |||
Baxter International, Inc. | 1,073 | 79,230 | |||
BB&T Corp. | 1,145 | 57,754 | |||
CA, Inc. | 837 | 29,839 | |||
Carnival Corp. | 849 | 48,656 | |||
CenterPoint Energy, Inc. | 1,662 | 46,054 | |||
Cisco Systems, Inc. | 834 | 35,887 | |||
Coca-Cola Co. | 1,381 | 60,571 | |||
Cognizant Technology Solutions Corp. Class A | 598 | 47,236 | |||
DTE Energy Co. | 492 | 50,986 | |||
Eli Lilly & Co. | 481 | 41,044 | |||
Exelon Corp. | 1,239 | 52,781 |
Table of Contents
| Security Description | Shares | Value | |||
H&R Block, Inc. | 193 | $ 4,397 | |||
Harris Corp. | 439 | 63,453 | |||
HCA Healthcare, Inc. | 637 | 65,356 | |||
Home Depot, Inc. | 221 | 43,117 | |||
Honeywell International, Inc. | 172 | 24,777 | |||
HP, Inc. | 2,260 | 51,279 | |||
Humana, Inc. | 181 | 53,871 | |||
IDEXX Laboratories, Inc. (a) | 175 | 38,140 | |||
International Business Machines Corp. | 379 | 52,946 | |||
Johnson & Johnson | 458 | 55,574 | |||
JPMorgan Chase & Co. | 642 | 66,896 | |||
Lockheed Martin Corp. | 184 | 54,359 | |||
Maxim Integrated Products, Inc. | 751 | 44,054 | |||
McDonald's Corp. | 373 | 58,445 | |||
Merck & Co., Inc. | 809 | 49,106 | |||
Motorola Solutions, Inc. | 684 | 79,597 | |||
PepsiCo, Inc. | 473 | 51,496 | |||
Pfizer, Inc. | 404 | 14,657 | |||
PNC Financial Services Group, Inc. | 476 | 64,308 | |||
Procter & Gamble Co. | 421 | 32,863 | |||
Public Service Enterprise Group, Inc. | 846 | 45,803 | |||
PVH Corp. | 466 | 69,770 | |||
Quest Diagnostics, Inc. | 580 | 63,765 | |||
Raytheon Co. | 260 | 50,227 | |||
Republic Services, Inc. | 211 | 14,424 | |||
Synopsys, Inc. (a) | 404 | 34,570 | |||
Sysco Corp. | 659 | 45,003 | |||
Texas Instruments, Inc. | 443 | 48,841 | |||
TJX Cos., Inc. | 305 | 29,030 | |||
Torchmark Corp. | 401 | 32,645 | |||
Tyson Foods, Inc. Class A | 785 | 54,047 | |||
UGI Corp. | 616 | 32,075 | |||
United Parcel Service, Inc. Class B | 318 | 33,781 | |||
UnitedHealth Group, Inc. | 266 | 65,261 | |||
US Bancorp | 469 | 23,459 |
| Security Description | Shares | Value | |||
Walmart, Inc. | 654 | $ 56,015 | |||
Waste Management, Inc. | 713 | 57,995 | |||
| 2,811,606 | |||||
TOTAL COMMON STOCKS (Cost $4,478,347) | 4,936,257 |
| RIGHTS — 0.0% (b) | |||
| SPAIN — 0.0% (b) | |||
ACS Actividades de Construccion y Servicios SA (expiring 7/11/18) (a) (Cost $890) | 817 | 841 | |
| SHORT-TERM INVESTMENT — 0.7% | |||
State Street Institutional U.S. Government Money Market Fund, Class G Shares 1.86% (c) (d) (Cost $33,569) | 33,569 | 33,569 | |
TOTAL INVESTMENTS — 99.3% (Cost $4,512,806) | 4,970,667 | ||
OTHER ASSETS IN EXCESS OF LIABILITIES — 0.7% | 34,026 | ||
NET ASSETS — 100.0% | $ 5,004,693 | ||
| (a) | Non-income producing security. |
| (b) | Amount shown represents less than 0.05% of net assets. |
| (c) | The Portfolio invested in certain money market funds managed by SSGA Funds Management, Inc. Amounts related to these transactions during the period ended June 30, 2018 are shown in the Affiliate Table below. |
| (d) | The rate shown is the annualized seven-day yield at June 30, 2018. |
| REIT | = Real Estate Investment Trust |
| Description | Level 1 — Quoted Prices | Level 2 — Other Significant Observable Inputs | Level 3 — Significant Unobservable Inputs | Total | ||||
| ASSETS: | ||||||||
| INVESTMENTS: | ||||||||
| Common Stocks | ||||||||
Australia | $ 116,345 | $— | $— | $ 116,345 | ||||
Belgium | 23,308 | — | — | 23,308 | ||||
Canada | 151,205 | — | — | 151,205 | ||||
China | 56,517 | — | — | 56,517 | ||||
Denmark | 104,751 | — | — | 104,751 | ||||
France | 89,095 | — | — | 89,095 | ||||
Germany | 21,561 | — | — | 21,561 | ||||
Hong Kong | 271,136 | — | — | 271,136 | ||||
Italy | 83,080 | — | — | 83,080 | ||||
Japan | 768,555 | — | — | 768,555 | ||||
Netherlands | 31,913 | — | — | 31,913 | ||||
Norway | 57,589 | — | — | 57,589 |
Table of Contents
| Description | Level 1 — Quoted Prices | Level 2 — Other Significant Observable Inputs | Level 3 — Significant Unobservable Inputs | Total | ||||
Singapore | $ 30,961 | $— | $— | $ 30,961 | ||||
Spain | 33,100 | — | — | 33,100 | ||||
Sweden | 71,619 | — | — | 71,619 | ||||
Switzerland | 175,793 | — | — | 175,793 | ||||
United Kingdom | 38,123 | — | — | 38,123 | ||||
United States | 2,811,606 | — | — | 2,811,606 | ||||
| Rights | ||||||||
Spain | 841 | — | — | 841 | ||||
Short-Term Investment | 33,569 | — | — | 33,569 | ||||
TOTAL INVESTMENTS | $4,970,667 | $— | $— | $4,970,667 |
| Number of Shares Held at 6/30/17 | Value at 6/30/17 | Cost of Purchases | Proceeds from Shares Sold | Realized Gain (Loss) | Change in Unrealized Appreciation/ Depreciation | Number of Shares Held at 6/30/18 | Value at 6/30/18 | Dividend Income | Capital Gains Distributions | ||||||||||
State Street Institutional U.S. Government Money Market Fund, Class G Shares | 23,785 | $23,785 | $604,136 | $594,352 | $— | $— | 33,569 | $33,569 | $639 | $— |
Table of Contents
| ASSETS | |
Investments in unaffiliated issuers, at value | $4,937,098 |
Investments in affiliated issuers, at value | 33,569 |
Total Investments | 4,970,667 |
Foreign currency, at value | 23,317 |
Dividends receivable — unaffiliated issuers | 8,882 |
Dividends receivable — affiliated issuers | 42 |
Receivable from Adviser | 3,327 |
Receivable for foreign taxes recoverable | 4,009 |
TOTAL ASSETS | 5,010,244 |
| LIABILITIES | |
Payable for fund shares repurchased | 4,506 |
Advisory fee payable | 1,045 |
TOTAL LIABILITIES | 5,551 |
NET ASSETS | $5,004,693 |
| NET ASSETS CONSIST OF: | |
Paid-in Capital | $4,249,054 |
Undistributed (distribution in excess of) net investment income (loss) | 77,508 |
Accumulated net realized gain (loss) on investments and foreign currency transactions | 220,529 |
| Net unrealized appreciation (depreciation) on: | |
Investments — unaffiliated issuers | 457,861 |
Foreign currency translations | (259) |
NET ASSETS | $5,004,693 |
| NET ASSET VALUE PER SHARE | |
Net asset value per share | $ 12.28 |
Shares outstanding (unlimited amount authorized, no par value) | 407,463 |
| COST OF INVESTMENTS: | |
Investments in unaffiliated issuers | $4,479,237 |
Investments in affiliated issuers | 33,569 |
Total cost of investments | $4,512,806 |
Foreign currency, at cost | $ 23,568 |
Table of Contents
| INVESTMENT INCOME | |
Dividend income — unaffiliated issuers | $175,567 |
Dividend income — affiliated issuers | 639 |
Foreign taxes withheld | (7,922) |
TOTAL INVESTMENT INCOME (LOSS) | 168,284 |
| EXPENSES | |
Advisory fee | 12,467 |
Trustees’ fees and expenses | 95 |
Miscellaneous expenses | 2,237 |
TOTAL EXPENSES | 14,799 |
Expenses waived/reimbursed by the Adviser | (14,799) |
NET EXPENSES | — |
NET INVESTMENT INCOME (LOSS) | 168,284 |
| REALIZED AND UNREALIZED GAIN (LOSS) | |
| Net realized gain (loss) on: | |
Investments — unaffiliated issuers | 222,624 |
Foreign currency transactions | (562) |
Net realized gain (loss) | 222,062 |
| Net change in unrealized appreciation/depreciation on: | |
Investments — unaffiliated issuers | (82,180) |
Foreign currency translations | (482) |
Net change in unrealized appreciation/depreciation | (82,662) |
NET REALIZED AND UNREALIZED GAIN (LOSS) | 139,400 |
NET INCREASE (DECREASE) IN NET ASSETS FROM OPERATIONS | $307,684 |
Table of Contents
| Year Ended 6/30/18 | Year Ended 6/30/17 | ||
| INCREASE (DECREASE) IN NET ASSETS FROM OPERATIONS: | |||
Net investment income (loss) | $ 168,284 | $ 99,295 | |
Net realized gain (loss) | 222,062 | 73,293 | |
Net change in unrealized appreciation/depreciation | (82,662) | 333,980 | |
Net increase (decrease) in net assets resulting from operations | 307,684 | 506,568 | |
| DISTRIBUTIONS TO SHAREHOLDERS FROM: | |||
Net investment income | (151,316) | (84,310) | |
Net realized gains | (60,447) | (30,762) | |
Total distributions to shareholders | (211,763) | (115,072) | |
| FROM BENEFICIAL INTEREST TRANSACTIONS: | |||
Proceeds from sale of shares sold | 348,917 | 1,071,399 | |
Reinvestment of distributions | 211,763 | 115,072 | |
Cost of shares redeemed | (282,814) | (217,386) | |
Net increase (decrease) in net assets from beneficial interest transactions | 277,866 | 969,085 | |
Net increase (decrease) in net assets during the period | 373,787 | 1,360,581 | |
Net assets at beginning of period | 4,630,906 | 3,270,325 | |
NET ASSETS AT END OF PERIOD | $5,004,693 | $4,630,906 | |
Undistributed (distribution in excess of) net investment income (loss) | $ 77,508 | $ 60,327 | |
| SHARES OF BENEFICIAL INTEREST: | |||
Shares sold | 27,995 | 93,862 | |
Reinvestment of distributions | 17,050 | 10,805 | |
Shares redeemed | (22,549) | (19,900) | |
Net increase (decrease) | 22,496 | 84,767 |
Table of Contents
| State Street Disciplined Global Equity Portfolio | |||||
| Year Ended 6/30/18 | Year Ended 6/30/17 | For the Period 2/19/16* - 6/30/16 | |||
Net asset value, beginning of period | $12.03 | $10.89 | $10.00 | ||
Net investment income (loss) (a) | 0.42 | 0.31 | 0.15 | ||
Net realized and unrealized gain (loss) | 0.36 | 1.21 | 0.74 | ||
Total from investment operations | 0.78 | 1.52 | 0.89 | ||
Distributions to shareholders from: | |||||
Net investment income | (0.38) | (0.28) | — | ||
Net realized gains | (0.15) | (0.10) | — | ||
Total distributions | (0.53) | (0.38) | — | ||
Net asset value, end of period | $12.28 | $12.03 | $10.89 | ||
Total return (b) | 6.48% | 14.43% | 8.90%(c) | ||
Ratios and Supplemental Data: | |||||
Net assets, end of period (in 000s) | $5,005 | $4,631 | $3,270 | ||
Ratios to average net assets: | |||||
Total expenses | 0.30% | 0.33% | 0.27%(d) | ||
Net expenses | —%(e) | —%(e) | —%(d) | ||
Net investment income (loss) | 3.37% | 2.75% | 4.00%(d) | ||
Portfolio turnover rate | 47% | 30% | 21%(c) | ||
| * | Commencement of operations. |
| (a) | Per share numbers have been calculated using average shares outstanding, which more appropriately presents the per share data for the year. |
| (b) | Total return is calculated assuming a purchase of shares at net asset value on the first day and a sale at net asset value on the last day of each period reported. Distributions are assumed, for the purpose of this calculation, to be reinvested at net asset value per share on the respective payment dates. Total return for periods of less than one year is not annualized. Results represent past performance and are not indicative of future results. |
| (c) | Not annualized. |
| (d) | Annualized. |
| (e) | Amount is less than 0.005%. |
Table of Contents
| Portfolio | Commencement of Operations | Diversification Classification |
| State Street Disciplined Global Equity Portfolio | February 19, 2016 | Diversified |
Table of Contents
Table of Contents
| Purchases | Sales | ||
State Street Disciplined Global Equity Portfolio | $2,473,055 | $2,286,081 |
Table of Contents
| Ordinary Income | Long-Term Capital Gains | Total | |||
State Street Disciplined Global Equity Portfolio | $186,089 | $25,674 | $211,763 |
| Ordinary Income | Long-Term Capital Gains | Total | |||
State Street Disciplined Global Equity Portfolio | $ 115,072 | $ — | $ 115,072 |
| Undistributed Ordinary Income | Capital Loss Carryforwards | Undistributed Long-Term Capital Gains | Net Unrealized Gains (Losses) | Qualified Late-Year Losses* | Total | ||||||
State Street Disciplined Global Equity Portfolio | 121,582 | — | 186,027 | 448,030 | — | 755,639 |
| * The Portfolio has elected to defer certain qualified late-year losses and recognize such losses in the next taxable year. |
| Tax Cost | Gross Unrealized Appreciation | Gross Unrealized Depreciation | Net Unrealized Appreciation (Depreciation) | ||||
State Street Disciplined Global Equity Portfolio | $4,522,378 | $618,743 | $170,454 | $448,289 |
Table of Contents
Table of Contents

August 29, 2018
Table of Contents
| Actual | Hypothetical (assuming a 5% return before expenses) | ||||||||
| Annualized Expense Ratio | Ending Account Value | Expenses Paid During Period(a) | Ending Account Value | Expenses Paid During Period(a) | |||||
State Street Disciplined Global Equity Portfolio | 0.00% | $984.80 | $0.00 | $1,024.80 | $0.00 | ||||
| (a) | Expenses are equal to the Portfolio's annualized net expense ratio multiplied by the average account value of the period, multiplied by 181, then divided by 365. |
Table of Contents
Table of Contents
Table of Contents
Table of Contents
| Name, Address and Year of Birth | Position(s) with Funds | Term of Office and Length of Time Served | Principal Occupation(s) During Past 5 Years | Number of Portfolios in Fund Complex Overseen by Trustee† | Other Directorships Held by Trustee During the Past 5 Years | |||||
| Trustees | ||||||||||
| Independent Trustees | ||||||||||
| FRANK NESVET c/o SSGA Active Trust One Iron Street Boston, MA 02210 1943 | Independent Trustee, Chairman, Trustee Committee Chair | Term: Unlimited Served: since March 2011 | Retired. | 127 | None. | |||||
| DAVID M. KELLY c/o SSGA Active Trust One Iron Street Boston, MA 02210 1938 | Independent Trustee | Term: Unlimited Served: since March 2011 | Retired. | 127 | Chicago Stock Exchange (Former Director, retired); Penson Worldwide Inc. (Former Director, retired). | |||||
| BONNY EUGENIA BOATMAN c/o SSGA Active Trust One Iron Street Boston, MA 02210 1950 | Independent Trustee | Term: Unlimited Served: since March 2011 | Retired. | 127 | None. | |||||
| DWIGHT D. CHURCHILL c/o SSGA Active Trust One Iron Street Boston, MA 02210 1953 | Independent Trustee | Term: Unlimited Served: since March 2011 | Self-employed consultant since 2010; CEO and President, CFA Institute (June 2014-January 2015). | 127 | Affiliated Managers Group, Inc. (Director). | |||||
| CARL G. VERBONCOEUR c/o SSGA Active Trust One Iron Street Boston, MA 02210 1952 | Independent Trustee, Audit Committee Chair | Term: Unlimited Served: since March 2011 | Self-employed consultant since 2009. | 127 | The Motley Fool Funds Trust (Trustee). | |||||
| Interested Trustee | ||||||||||
| JAMES E. ROSS* SSGA Funds Management, Inc. One Iron Street Boston, MA 02210 1965 | Interested Trustee | Term: Unlimited Served as Trustee: since March 2011 | Chairman and Director, SSGA Funds Management, Inc. (2005-present); Executive Vice President and Principal, State Street Global Advisors (2006-present); Chief Executive Officer and Director, State Street Global Advisors Funds Distributors, LLC (May 2017- present); Director, State Street Global Markets, LLC (2013-April 2017); President, SSGA Funds Management, Inc. (2005-2012). | 196 | None. | |||||
| † For the purpose of determining the number of portfolios overseen by the Trustees, “Fund Complex” comprises registered investment companies for which SSGA Funds Management, Inc. serves as investment adviser. | ||||||||||
Table of Contents
| Name, Address and Year of Birth | Position(s) with Funds | Term of Office and Length of Time Served | Principal Occupation(s) During Past 5 Years | Number of Portfolios in Fund Complex Overseen by Trustee† | Other Directorships Held by Trustee During the Past 5 Years | |||||
| * Mr. Ross is an Interested Trustee because of his employment with the Adviser and ownership interest in an affiliate of the Adviser. Mr. Ross previously served as an Interested Trustee from November 2005 to December 2009. | ||||||||||
| Name, Address and Year of Birth | Position(s) with Funds | Term of Office and Length of Time Served | Principal Occupation(s) During the Past 5 Years | |||
| Officers | ||||||
| ELLEN M. NEEDHAM SSGA Funds Management, Inc. One Iron Street Boston, MA 02210 1967 | President | Term: Unlimited Served: since October 2012 | President and Director, SSGA Funds Management, Inc. (2001 - present)*; Senior Managing Director, State Street Global Advisors (1992 - present)*; Director, State Street Global Advisors Funds Distributors, LLC (May 2017 - present). | |||
| BRUCE S. ROSENBERG SSGA Funds Management, Inc. One Iron Street Boston, MA 02210 1961 | Treasurer | Term: Unlimited Served: since February 2016 | Managing Director, State Street Global Advisors and SSGA Funds Management, Inc. (July 2015 - present); Director, Credit Suisse (April 2008 - July 2015). | |||
| ANN M. CARPENTER SSGA Funds Management, Inc. One Iron Street Boston, MA 02210 1966 | Vice President; Deputy Treasurer | Term: Unlimited Served: since August 2012 | Chief Operating Officer, SSGA Funds Management, Inc. (2005 - Present)*; Managing Director, State Street Global Advisors (2005 - present).* | |||
| MICHAEL P. RILEY SSGA Funds Management, Inc. One Iron Street Boston, MA 02210 1969 | Vice President | Term: Unlimited Served: since March 2011 | Managing Director, State Street Global Advisors (2005 - present).* | |||
| JOSHUA A. WEINBERG SSGA Funds Management, Inc. One Iron Street Boston, MA 02210 1978 | Chief Legal Officer | Term: Unlimited Served: since February 2015 | Managing Director and Managing Counsel, State Street Global Advisors (2011 - present); Clerk, SSGA Funds Management, Inc. (2013 - present); Associate, Financial Services Group, Dechert LLP (2006 - 2011). | |||
| JESSE D. HALLEE State Street Bank and Trust Company 100 Summer Street, SUM0703 Boston, MA 02111 1976 | Secretary | Term: Unlimited Served: since August 2017 | Vice President and Managing Counsel, State Street Bank and Trust Company (2013 – present); Vice President and Counsel, Brown Brothers Harriman & Co. (2007- 2013).** | |||
| ESTEFANIA SALOMON State Street Bank and Trust Company 100 Summer Street SUM0703 Boston, MA 02111 1983 | Assistant Secretary | Term:Unlimited Served: since May 2018 | Assistant Vice President and Associate Counsel, State Street Bank and Trust Company (2018 – present); Senior Compliance Consultant, AdvisorAssist, LLC (2017); Attorney, Commonwealth of Massachusetts, Securities Division (2014-2017). |
Table of Contents
| Name, Address and Year of Birth | Position(s) with Funds | Term of Office and Length of Time Served | Principal Occupation(s) During the Past 5 Years | |||
| CHAD C. HALLETT SSGA Funds Management, Inc. One Iron Street Boston, MA 02210 1969 | Deputy Treasurer | Term: Unlimited Served: since February 2016 | Vice President, State Street Global Advisors and SSGA Funds Management, Inc. (November 2014 - present); Vice President, State Street Bank and Trust Company (2001 - November 2014).* | |||
| DARLENE ANDERSON-VASQUEZ SSGA Funds Management, Inc. One Iron Street Boston, MA 02210 1968 | Deputy Treasurer | Term: Unlimited Served: since November 2016 | Managing Director, State Street Global Advisors and SSGA Funds Management, Inc. (May 2016 - present); Senior Vice President, John Hancock Investments (September 2007 - May 2016). | |||
| ARTHUR A. JENSEN SSGA Funds Management, Inc. 1600 Summer Street Stamford, CT 06905 1966 | Deputy Treasurer | Term: Unlimited Served: Since August 2017 | Vice President at State Street Global Advisors (July 2016 – present); Mutual Funds Controller of GE Asset Management Incorporated (April 2011 - July 2016). | |||
| SUJATA UPRETI SSGA Funds Management, Inc. One Iron Street Boston, MA 02210 1974 | Assistant Treasurer | Term: Unlimited Served: since February 2016 | Vice President, State Street Global Advisors and SSGA Funds Management, Inc. (May 2015 - present); Assistant Director, Cambridge Associates, LLC (July 2014 - January 2015); Vice President, Bank of New York Mellon (July 2012 - August 2013); Manager, PricewaterhouseCoopers, LLP (September 2003 - July 2012). | |||
| DANIEL FOLEY SSGA Funds Management, Inc. One Iron Street Boston, MA 02210 1972 | Assistant Treasurer | Term: Unlimited Served: since February 2016 | Vice President, State Street Global Advisors and SSGA Funds Management, Inc. (April 2007 - present).* | |||
| DANIEL G. PLOURDE SSGA Funds Management, Inc. One Iron Street Boston, MA 02210 1980 | Assistant Treasurer | Term: Unlimited Served: since May 2017 | Vice President, State Street Global Advisors and SSGA Funds Management, Inc. (May 2015 - present); Officer, State Street Bank and Trust Company (March 2009 - May 2015). | |||
| BRIAN HARRIS SSGA Funds Management, Inc. One Iron Street Boston, MA 02210 1973 | Chief Compliance Officer; Anti-Money Laundering Officer; Code of Ethics Compliance Officer | Term: Unlimited Served: since November 2013 | Managing Director, State Street Global Advisors and SSGA Funds Management, Inc. (June 2013 - present)*; Senior Vice President and Global Head of Investment Compliance, BofA Global Capital Management (2010 - 2013); Director of Compliance, AARP Financial Inc. (2008 - 2010). | |||
| * Served in various capacities and/or with various affiliated entities during noted time period. | ||||||
| ** Served in various capacities and/or with unaffiliated mutual funds or closed-end funds for which State Street Bank and Trust Company or its affiliates act as a provider of services during the noted time period. | ||||||
| Statement of Additional Information (SAI) includes additional information about Funds' directors and is available, without charge, upon request and by calling 1-866-787-2257. | ||||||
Table of Contents
Table of Contents
Table of Contents
Table of Contents
Laundering Officer; Code of Ethics Compliance Officer
One Iron Street
Boston, MA 02210
One Iron Street
Boston, MA 02210
One Lincoln Street
Boston, MA 02111
1111 Pennsylvania Avenue, NW
Washington, DC 20004
200 Clarendon Street
Boston, MA 02116
Table of Contents
Item 2. Code of Ethics.
As of the end of the period covered by this report, the registrant has adopted a code of ethics that applies to the registrant’s principal executive officer, principal financial officer, principal accounting officer or controller, or persons performing similar functions, regardless of whether these individuals are employed by the registrant or a third party (the “Code of Ethics”). During the period covered by this report, no substantive amendments were made to the Code of Ethics. During the period covered by this report, the registrant did not grant any waivers, including any implicit waivers, from any provision of the Code of Ethics.
The Code of Ethics is attached hereto as Exhibit 13(a)(1).
Item 3. Audit Committee Financial Expert.
(a)(1) The Board of Trustees of the registrant has determined that the registrant has six Board members serving on the Audit Committee that possess the attributes identified in Instructions 2(b) of Item 3 to Form N-CSR to qualify as an “audit committee financial expert.”
(2) Bonny Boatman, Dwight Churchill, Frank Nesvet, Clare Richer, Sandra Sponem and Carl Verboncoeur are the registrant’s audit committee financial experts. The Board also determined that each of the foregoing persons are not “interested person(s)” of the registrant as that term is defined in Section 2(a)(19) of the Investment Company Act of 1940, as amended.
Item 4. Principal Accountant Fees and Services.
(a) Audit Fees.
For the fiscal years ending June 30, 2018 and June 30, 2017, the aggregate audit fees billed for professional services rendered by the principal accountant were $209,557 and $145,557, respectively. Audit fees include the performance of the annual audits and routine regulatory filings (one for each SEC registrant).
(b) Audit-Related Fees.
For the fiscal years ending June 30, 2018 and June 30, 2017, the principal accountant did not bill the registrant any fees for assurances and related services that are reasonably related to the performance of the audit of the registrant’s financial statements and are not reported under paragraph (a) of this Item.
(c) Tax Fees.
For the fiscal years ending June 30, 2018 and June 30, 2017, the aggregate tax fees billed for professional services rendered by the principal accountant were $117,852 and $121,185, respectively. Tax fees represent services related to the review of year-end distribution requirements, as well as the review and signing as preparer of all federal, state and excise income tax returns for the series of the registrant.
(d) All Other Fees.
There were no other fees billed by the principal accountant for the fiscal years ending June 30, 2018 and June 30, 2017.
(e)(1) Audit Committee Pre-Approval Policies and Procedures.
The registrant’s Audit Committee Charter states the following with respect to pre-approval procedures:
Before the independent auditors are engaged by the Trust to render audit or non-audit services, either:
| a. | The Audit Committee shall pre-approve all auditing services and permissible non-audit services (e.g., tax services) provided to the Trust. The Audit Committee may delegate to one or more of its members the authority to grant pre-approvals. Any decision of any member to whom authority is delegated under this section shall be presented to the full Audit Committee at its next regularly scheduled meeting; |
or
Table of Contents
| b. | The engagement to render the auditing service or permissible non-audit service is entered into pursuant to pre-approval policies and procedures established by the Audit Committee. Any such policies and procedures must (1) be detailed as to the particular service and (2) not involve any delegation of the Audit Committee’s responsibilities to the investment adviser. The Audit Committee must be informed of each service entered into pursuant to the policies and procedures. A copy of any such policies and procedures shall be attached as an exhibit to the Audit Committee Charter. |
| c. | De Minimis Exceptions to Pre-Approval Requirements. Pre-Approval for a service provided to the Trust other than audit, review or attest services is not required if: (1) the aggregate amount of all such non-audit services provided to the Trust constitutes not more than 5 percent of the total amount of revenues paid by the Trust to the independent auditors during the fiscal year in which the non-audit services are provided; (2) such services were not recognized by the Trust at the time of the engagement to be non-audit services; and (3) such services are promptly brought to the attention of the Audit Committee and are approved by the Audit Committee or by one or more members of the Audit Committee to whom authority to grant such approvals has been delegated by the Audit Committee prior to the completion of the audit. |
| d. | Pre-Approval of Non-Audit Services Provided to the investment adviser and Certain Control Persons. The Audit Committee shall pre-approve any non-audit services proposed to be provided by the independent auditors to (a) the investment adviser and (b) any entity controlling, controlled by, or under common control with the investment adviser that provides ongoing services to the Trust, if the independent auditors’ engagement with the investment adviser or any such control persons relates directly to the operations and financial reporting of the Trust. It shall be the responsibility of the independent auditors to notify the Audit Committee of any non-audit services that need to be pre-approved. |
| e. | Application of De Minimis Exception: The De Minimis exception set forth above applies to pre-approvals under this Section as well, except that the “total amount of revenues” calculation is based on the total amount of revenues paid to the independent auditors by the Trust and any other entity that has its services approved under this Section (i.e., the investment adviser or any control person). |
(e)(2) Percentage of Services.
One hundred percent of the services described in each of paragraphs (b) through (d) of this Item were approved by the registrant’s Audit Committee pursuant to paragraph (c)(7)(i)(C) of Rule 2-01 of Regulation S-X.
(f) Not applicable
Table of Contents
(g) The aggregate non-audit fees billed for by the registrant’s accountant for services rendered to the registrant, and rendered to the registrant’s investment adviser (not including any sub-adviser whose role is primarily portfolio management and is subcontracted with or overseen by another investment adviser), and any entity controlling, controlled by, or under common control with the adviser were as follows:
| FY 2018 (in millions) | FY 2017 (in millions) | |||||||
Non audit services billed to: | ||||||||
Registrant: | See Item 4(c) | See Item 4(c) | ||||||
Investment Adviser: | — | — | ||||||
Other entities in the Investment Company Complex (1)(2): | ||||||||
Audit Related Fees | $ | 15.4 | $ | 15.7 | ||||
Tax Fees | 7.8 | 8.7 | ||||||
All Other Fees | 16.2 | 23.0 | (3) | |||||
| (1) | Information is for the calendar years 2017 and 2016, respectively. |
| (2) | Services under the caption Audit-Related Fees consisted principally of reports on the processing of transactions by servicing organizations, audits of employee benefit plan, non-statutory audits and due diligence procedures. Services under the caption Tax Fees consisted principally of expatriate, compliance and corporate tax advisory services. Services under the caption All Other Fees consisted of advisory services related to certain regulatory initiatives. |
| (3) | This figure had previously been reported as $4.4 million and is being restated to include certain other audit fees totaling $18.6 million, in the aggregate, primarily relating to statutory and financial statement audits, the requirement to opine on the design and operating effectiveness of internal control over financial reporting and accounting consultations. |
(h) The registrant’s principal accountant notified the registrant’s Audit Committee of all non-audit services that were rendered by the principal accountant to the Adviser and any entity controlling, controlled by, or under common control with the Adviser that provides services to the registrant, which services were not required to be pre-approved pursuant to paragraph (c)(7)(ii) of Rule 2-01 of Regulation S-X, allowing the registrant’s Audit Committee to consider whether such services were compatible with maintaining the principal accountant’s independence.
Item 5. Audit Committees of Listed Registrants.
The registrant has an audit committee which was established by the Board of Trustees of the Trust in accordance with Section 3(a)(58)(A) of the Securities Exchange Act of 1934, as amended. The members of the registrant’s audit committee are Bonny Boatman, Dwight Churchill, Frank Nesvet, Clare Richer, Sandra Sponem and Carl Verboncoeur.
Item 6. Investments.
| (a) | The Schedule of Investments for the SPDR DoubleLine Total Return Tactical ETF is listed below. The Summary Schedule of Investments for this Fund as well as the Schedules of Investments for the remaining series of the registrant are included as part of the reports to shareholders filed under Item 1 of this Form N-CSR. |
| (b) | Not applicable to the registrant. |
Table of Contents
| Security Description | Principal Amount | Value | |||
| CORPORATE BONDS & NOTES — 13.8% | |||||
| ARGENTINA — 0.3% | |||||
Pampa Energia SA Series REGS, 7.50%, 1/24/2027 | $ 4,200,000 | $ 3,780,000 | |||
| YPF SA: | |||||
Series REGS, 6.95%, 7/21/2027 | 1,500,000 | 1,288,125 | |||
Series REGS, 8.50%, 7/28/2025 | 2,600,000 | 2,475,720 | |||
| 7,543,845 | |||||
| AUSTRALIA — 0.2% | |||||
Commonwealth Bank of Australia 2.75%, 3/10/2022 (a) | 2,555,000 | 2,492,291 | |||
FMG Resources August 2006 Pty, Ltd. 4.75%, 5/15/2022 (a) | 1,275,000 | 1,230,375 | |||
| Macquarie Group, Ltd.: | |||||
3 Month USD LIBOR + 1.02%, 3.19%, 11/28/2023 (a) (b) | 2,010,000 | 1,917,821 | |||
3 Month USD LIBOR + 1.33%, 4.15%, 3/27/2024 (a) (b) | 1,590,000 | 1,582,479 | |||
| 7,222,966 | |||||
| BELGIUM — 0.1% | |||||
Anheuser-Busch InBev Finance, Inc. 2.65%, 2/1/2021 | 3,305,000 | 3,257,970 | |||
| BRAZIL — 0.4% | |||||
Banco BTG Pactual SA 5.50%, 1/31/2023 | 500,000 | 465,005 | |||
Itau Unibanco Holding SA Series REGS, 5 Year CMT + 3.86%, 6.50%, 12/31/2099 (b) | 1,000,000 | 948,500 | |||
JBS Investments GmbH Series REGS, 7.25%, 4/3/2024 | 3,000,000 | 2,905,620 | |||
JBS USA LUX SA/JBS USA Finance, Inc. 7.25%, 6/1/2021 (a) | 1,869,000 | 1,887,690 | |||
| MARB BondCo PLC: | |||||
7.00%, 3/15/2024 (a) | 600,000 | 576,750 | |||
Series REGS, 6.88%, 1/19/2025 | 1,200,000 | 1,140,000 | |||
Marfrig Holdings Europe B.V. 8.00%, 6/8/2023 (a) | 1,000,000 | 1,012,500 | |||
Petrobras Global Finance B.V. 5.75%, 2/1/2029 | 4,600,000 | 4,043,998 | |||
| 12,980,063 | |||||
| CANADA — 0.3% | |||||
1011778 BC ULC/New Red Finance, Inc. 5.00%, 10/15/2025 (a) | 890,000 | 842,162 |
| Security Description | Principal Amount | Value | |||
Calfrac Holdings L.P. 8.50%, 6/15/2026 (a) | $ 415,000 | $ 412,925 | |||
Canadian Natural Resources, Ltd. 2.95%, 1/15/2023 | 3,300,000 | 3,184,302 | |||
Fortis, Inc. 2.10%, 10/4/2021 | 1,605,000 | 1,531,113 | |||
Garda World Security Corp. 8.75%, 5/15/2025 (a) | 840,000 | 861,000 | |||
Hulk Finance Corp. 7.00%, 6/1/2026 (a) | 495,000 | 473,962 | |||
Kronos Acquisition Holdings, Inc. 9.00%, 8/15/2023 (a) | 415,000 | 374,538 | |||
MEG Energy Corp. 7.00%, 3/31/2024 (a) | 475,000 | 444,125 | |||
Superior Plus L.P./Superior General Partner, Inc. 7.00%, 7/15/2026 (a) | 635,000 | 639,762 | |||
Telesat Canada/Telesat LLC 8.88%, 11/15/2024 (a) | 390,000 | 418,763 | |||
Tervita Escrow Corp. 7.63%, 12/1/2021 (a) | 825,000 | 833,250 | |||
| 10,015,902 | |||||
| CAYMAN ISLANDS — 0.1% | |||||
Cosan Overseas, Ltd. 8.25%, 11/29/2049 | 4,314,000 | 4,303,215 | |||
| CHILE — 0.8% | |||||
Banco de Credito e Inversiones SA Series REGS, 4.00%, 2/11/2023 | 2,000,000 | 1,985,007 | |||
| Banco del Estado de Chile: | |||||
Series REGS, 3.88%, 2/8/2022 | 1,500,000 | 1,494,165 | |||
Series REGS, 4.13%, 10/7/2020 | 1,000,000 | 1,009,578 | |||
Banco Santander Chile Series REGS, 3.88%, 9/20/2022 | 434,000 | 431,094 | |||
Celulosa Arauco y Constitucion SA 4.75%, 1/11/2022 | 1,400,000 | 1,429,414 | |||
Embotelladora Andina SA Series REGS, 5.00%, 10/1/2023 | 4,900,000 | 5,070,136 | |||
Guanay Finance, Ltd. Series REGS, 6.00%, 12/15/2020 | 1,076,084 | 1,078,774 | |||
Inversiones CMPC SA Series REGS, 4.50%, 4/25/2022 | 2,300,000 | 2,317,242 | |||
Itau CorpBanca Series REGS, 3.88%, 9/22/2019 | 5,714,000 | 5,734,713 | |||
SACI Falabella Series REGS, 3.75%, 4/30/2023 | 3,600,000 | 3,518,345 |
Table of Contents
| Security Description | Principal Amount | Value | |||
Transelec SA Series REGS, 3.88%, 1/12/2029 | $ 1,000,000 | $ 913,010 | |||
| 24,981,478 | |||||
| CHINA — 0.3% | |||||
Alibaba Group Holding, Ltd. 2.80%, 6/6/2023 | 200,000 | 192,556 | |||
CNOOC Finance 2011, Ltd. Series REGS, 4.25%, 1/26/2021 | 700,000 | 713,326 | |||
| CNPC General Capital, Ltd.: | |||||
Series REGS, 3.40%, 4/16/2023 | 3,000,000 | 2,956,320 | |||
Series REGS, 3.95%, 4/19/2022 | 500,000 | 504,432 | |||
CNPC HK Overseas Capital, Ltd. Series REGS, 4.50%, 4/28/2021 | 1,900,000 | 1,950,987 | |||
| Sinopec Group Overseas Development 2016, Ltd.: | |||||
Series REGS, 2.75%, 5/3/2021 | 2,000,000 | 1,960,246 | |||
Series REGS, 2.75%, 9/29/2026 | 1,500,000 | 1,346,876 | |||
Sinopec Group Overseas Development 2017, Ltd. 3.63%, 4/12/2027 (a) | 700,000 | 667,284 | |||
| 10,292,027 | |||||
| COLOMBIA — 0.1% | |||||
| Bancolombia SA: | |||||
4.88%, 10/18/2027 (b) | 200,000 | 190,002 | |||
6.13%, 7/26/2020 | 600,000 | 624,000 | |||
| Ecopetrol SA: | |||||
5.88%, 9/18/2023 | 300,000 | 318,387 | |||
7.63%, 7/23/2019 | 800,000 | 835,912 | |||
| 1,968,301 | |||||
| COSTA RICA — 0.1% | |||||
Banco Nacional de Costa Rica Series REGS, 5.88%, 4/25/2021 (a) | 2,990,000 | 3,032,383 | |||
| DOMINICAN REPUBLIC — 0.2% | |||||
AES Andres B.V./Dominican Power Partners/Empresa Generadora de Electricidad It 7.95%, 5/11/2026 (a) | 2,200,000 | 2,266,000 | |||
Banco de Reservas de la Republica Dominicana Series REGS, 7.00%, 2/1/2023 (a) | 3,950,000 | 3,969,750 | |||
| 6,235,750 | |||||
| HONG KONG — 0.1% | |||||
| CK Hutchison International 17, Ltd.: | |||||
3.50%, 4/5/2027 (a) | 1,100,000 | 1,054,826 |
| Security Description | Principal Amount | Value | |||
Series REGS, 2.88%, 4/5/2022 | $ 900,000 | $ 877,185 | |||
Hutchison Whampoa International 12 II, Ltd. 3.25%, 11/8/2022 | 1,000,000 | 984,340 | |||
| 2,916,351 | |||||
| INDIA — 1.1% | |||||
| Adani Ports & Special Economic Zone, Ltd.: | |||||
Series REGS, 3.50%, 7/29/2020 | 700,000 | 691,506 | |||
Series REGS, 3.95%, 1/19/2022 | 2,500,000 | 2,451,873 | |||
Bharat Petroleum Corp., Ltd. 4.63%, 10/25/2022 | 1,100,000 | 1,114,993 | |||
Bharti Airtel International Netherlands B.V. Series REGS, 5.13%, 3/11/2023 | 3,400,000 | 3,359,054 | |||
Bharti Airtel, Ltd. Series REGS, 4.38%, 6/10/2025 | 4,000,000 | 3,683,054 | |||
BPRL International Singapore Pte, Ltd. Series EMTN, 4.38%, 1/18/2027 | 3,900,000 | 3,703,865 | |||
Export-Import Bank of India Series EMTN, 3.13%, 7/20/2021 | 1,500,000 | 1,461,750 | |||
| Indian Oil Corp., Ltd.: | |||||
5.63%, 8/2/2021 | 2,000,000 | 2,086,160 | |||
5.75%, 8/1/2023 | 4,900,000 | 5,170,749 | |||
ONGC Videsh Vankorneft Pte, Ltd. 3.75%, 7/27/2026 | 5,500,000 | 5,133,716 | |||
Reliance Holding USA, Inc. Series REGS, 5.40%, 2/14/2022 | 4,500,000 | 4,671,976 | |||
Vedanta Resources PLC Series REGS, 6.13%, 8/9/2024 | 1,500,000 | 1,318,383 | |||
| 34,847,079 | |||||
| IRELAND — 0.0% (c) | |||||
Ardagh Packaging Finance PLC/Ardagh Holdings USA, Inc. 7.25%, 5/15/2024 (a) | 815,000 | 847,600 | |||
| ISRAEL — 0.2% | |||||
| Delek & Avner Tamar Bond, Ltd.: | |||||
4.44%, 12/30/2020 (a) | 1,600,000 | 1,595,824 | |||
5.41%, 12/30/2025 (a) | 340,000 | 341,020 | |||
Israel Electric Corp., Ltd. Series 6, 5.00%, 11/12/2024 (a) | 600,000 | 615,900 | |||
| Teva Pharmaceutical Finance Netherlands III B.V.: | |||||
2.80%, 7/21/2023 | 3,725,000 | 3,211,565 |
Table of Contents
| Security Description | Principal Amount | Value | |||
6.00%, 4/15/2024 | $ 860,000 | $ 851,680 | |||
| 6,615,989 | |||||
| JAMAICA — 0.1% | |||||
| Digicel Group, Ltd.: | |||||
Series REGS, 7.13%, 4/1/2022 | 3,300,000 | 2,161,500 | |||
Series REGS, 8.25%, 9/30/2020 | 1,000,000 | 755,000 | |||
| 2,916,500 | |||||
| JAPAN — 0.1% | |||||
Mitsubishi UFJ Financial Group, Inc. 3 Month USD LIBOR + 0.74%, 3.06%, 3/2/2023 (b) | 1,600,000 | 1,603,317 | |||
Sumitomo Mitsui Financial Group, Inc. 3 Month USD LIBOR + 0.74%, 3.09%, 1/17/2023 (b) | 2,115,000 | 2,117,211 | |||
| 3,720,528 | |||||
| LUXEMBOURG — 0.1% | |||||
Intelsat Jackson Holdings SA 5.50%, 8/1/2023 | 480,000 | 430,656 | |||
| Minerva Luxembourg SA: | |||||
Series REGS, 5.88%, 1/19/2028 | 1,400,000 | 1,222,200 | |||
Series REGS, 6.50%, 9/20/2026 | 1,600,000 | 1,466,000 | |||
| 3,118,856 | |||||
| MALAYSIA — 0.7% | |||||
Axiata SPV2 Bhd Series 2, 3.47%, 11/19/2020 | 6,200,000 | 6,166,303 | |||
Gohl Capital, Ltd. 4.25%, 1/24/2027 | 5,000,000 | 4,732,745 | |||
Malayan Banking Bhd USD 5 Year Swap Rate + 2.54%, 3.91%, 10/29/2026 (b) | 7,700,000 | 7,577,993 | |||
Petronas Capital, Ltd. Series REGS, 3.50%, 3/18/2025 | 5,000,000 | 4,833,305 | |||
| 23,310,346 | |||||
| MEXICO — 0.4% | |||||
America Movil SAB de CV 3.13%, 7/16/2022 | 1,000,000 | 982,900 | |||
Banco Santander Mexico SA Series REGS, 5 Year CMT + 4.58%, 5.95%, 1/30/2024 (b) (d) | 3,500,000 | 3,517,500 | |||
| BBVA Bancomer SA: | |||||
Series REGS, 5 Year CMT + 2.65%, 5.13%, 1/18/2033 (b) | 800,000 | 709,000 | |||
Series REGS, 5 Year CMT + 3.00%, 5.35%, 11/12/2029 (b) | 200,000 | 185,500 |
| Security Description | Principal Amount | Value | |||
Coca-Cola Femsa SAB de CV 3.88%, 11/26/2023 | $ 650,000 | $ 649,831 | |||
Fomento Economico Mexicano SAB de CV 2.88%, 5/10/2023 | 2,314,000 | 2,199,735 | |||
Grupo Idesa SA de CV Series REGS, 7.88%, 12/18/2020 | 2,000,000 | 1,540,000 | |||
Petroleos Mexicanos 6.35%, 2/12/2048 (a) | 1,735,000 | 1,563,287 | |||
Unifin Financiera SAB de CV Series REGS, 5 Year CMT + 6.31%, 8.88%, 12/31/2099 (b) | 400,000 | 357,204 | |||
| 11,704,957 | |||||
| NETHERLANDS — 0.0% (c) | |||||
Ajecorp B.V. Series REGS, 6.50%, 5/14/2022 | 150,000 | 118,500 | |||
Stars Group Holdings B.V. 7.00%, 7/15/2026 (a) (e) | 305,000 | 308,050 | |||
| 426,550 | |||||
| PANAMA — 0.2% | |||||
Global Bank Corp. Series REGS, 5.13%, 10/30/2019 | 7,000,000 | 7,051,100 | |||
| PERU — 0.3% | |||||
| Banco de Credito del Peru: | |||||
Series REGS, 2.25%, 10/25/2019 | 1,700,000 | 1,674,500 | |||
Series REGS, 5.38%, 9/16/2020 | 2,300,000 | 2,388,550 | |||
Banco Internacional del Peru SAA Series REGS, 3 Month USD LIBOR + 6.74%, 8.50%, 4/23/2070 (b) (d) | 500,000 | 520,000 | |||
BBVA Banco Continental SA Series REGS, 5.00%, 8/26/2022 | 1,000,000 | 1,026,250 | |||
Fondo MIVIVIENDA SA Series REGS, 3.50%, 1/31/2023 | 1,800,000 | 1,735,218 | |||
Transportadora de Gas del Peru SA Series REGS, 4.25%, 4/30/2028 | 700,000 | 674,170 | |||
| 8,018,688 | |||||
| PHILIPPINES — 0.2% | |||||
| BDO Unibank, Inc.: | |||||
Series EMTN, 2.63%, 10/24/2021 | 1,200,000 | 1,153,484 | |||
Series EMTN, 2.95%, 3/6/2023 | 6,200,000 | 5,858,461 | |||
| 7,011,945 | |||||
| SINGAPORE — 0.6% | |||||
DBS Group Holdings, Ltd. Series GMTN, USD 5 Year Swap Rate + 2.39%, 3.60%, 9/7/2021 (b) | 1,300,000 | 1,240,911 |
Table of Contents
| Security Description | Principal Amount | Value | |||
Oversea-Chinese Banking Corp., Ltd. Series REGS, USD 5 Year Swap Rate + 2.20%, 4.00%, 10/15/2024 (b) | $ 2,000,000 | $ 2,006,946 | |||
SingTel Group Treasury Pte, Ltd. Series EMTN, 4.50%, 9/8/2021 | 1,000,000 | 1,031,409 | |||
Temasek Financial I, Ltd. Series REGS, 2.38%, 1/23/2023 | 7,650,000 | 7,351,178 | |||
| United Overseas Bank, Ltd.: | |||||
Series EMTN, USD 5 Year Swap Rate + 2.00%, 3.75%, 9/19/2024 (b) | 2,500,000 | 2,499,043 | |||
Series EMTN, USD 5 Year Swap Rate + 2.24%, 3.50%, 9/16/2026 (b) | 4,500,000 | 4,413,586 | |||
| 18,543,073 | |||||
| UNITED KINGDOM — 0.3% | |||||
AstraZeneca PLC 2.38%, 6/12/2022 | 1,745,000 | 1,678,324 | |||
Avation Capital SA 6.50%, 5/15/2021 (a) | 900,000 | 904,500 | |||
Noble Holding International, Ltd. 7.88%, 2/1/2026 (a) | 200,000 | 206,000 | |||
Reynolds American, Inc. 4.00%, 6/12/2022 | 3,295,000 | 3,316,121 | |||
Royal Bank of Scotland Group PLC 3 Month USD LIBOR + 1.48%, 3.50%, 5/15/2023 (b) | 3,270,000 | 3,169,774 | |||
| 9,274,719 | |||||
| UNITED STATES — 6.5% | |||||
AbbVie, Inc. 3.20%, 11/6/2022 | 1,650,000 | 1,621,191 | |||
Air Lease Corp. 3.25%, 3/1/2025 | 3,395,000 | 3,155,177 | |||
AK Steel Corp. 6.38%, 10/15/2025 | 895,000 | 832,349 | |||
Albertsons Cos. LLC/Safeway, Inc./New Albertson's, Inc./Albertson's LLC 5.75%, 3/15/2025 | 480,000 | 422,100 | |||
Albertsons Cos., Inc. 3 Month USD LIBOR + 3.75%, 6.09%, 1/15/2024 (a) (b) | 250,000 | 250,000 | |||
Alcoa Nederland Holding B.V. 6.13%, 5/15/2028 (a) | 220,000 | 221,386 | |||
| Allergan Funding SCS: | |||||
3.80%, 3/15/2025 | 1,115,000 | 1,084,605 | |||
3.85%, 6/15/2024 | 2,375,000 | 2,330,825 | |||
Alliant Holdings Intermediate LLC/Alliant Holdings Co-Issuer 8.25%, 8/1/2023 (a) | 815,000 | 835,783 | |||
Altice US Finance I Corp. 5.38%, 7/15/2023 (a) | 875,000 | 870,625 |
| Security Description | Principal Amount | Value | |||
| Amazon.com, Inc.: | |||||
2.60%, 12/5/2019 | $ 400,000 | $ 400,084 | |||
2.80%, 8/22/2024 | 1,985,000 | 1,913,004 | |||
3.80%, 12/5/2024 | 1,255,000 | 1,280,577 | |||
American Axle & Manufacturing, Inc. 6.25%, 3/15/2026 | 435,000 | 424,125 | |||
American Express Co. 2.50%, 8/1/2022 | 1,630,000 | 1,564,034 | |||
Anthem, Inc. 3.30%, 1/15/2023 | 2,982,000 | 2,905,691 | |||
ASP AMC Merger Sub, Inc. 8.00%, 5/15/2025 (a) | 730,000 | 605,900 | |||
AssuredPartners, Inc. 7.00%, 8/15/2025 (a) | 822,000 | 790,189 | |||
AT&T, Inc. 3.40%, 5/15/2025 | 1,530,000 | 1,436,593 | |||
| Avantor, Inc.: | |||||
6.00%, 10/1/2024 (a) | 310,000 | 306,280 | |||
9.00%, 10/1/2025 (a) | 415,000 | 418,196 | |||
B&G Foods, Inc. 5.25%, 4/1/2025 | 915,000 | 862,387 | |||
Bank of America Corp. Series GMTN, 3 Month USD LIBOR + 0.66%, 2.37%, 7/21/2021 (b) | 3,440,000 | 3,371,062 | |||
Beacon Roofing Supply, Inc. 4.88%, 11/1/2025 (a) | 920,000 | 848,700 | |||
Becton Dickinson and Co. 2.89%, 6/6/2022 | 3,245,000 | 3,129,153 | |||
BlueLine Rental Finance Corp./BlueLine Rental LLC 9.25%, 3/15/2024 (a) | 805,000 | 856,439 | |||
Boston Properties L.P. 3.65%, 2/1/2026 | 3,415,000 | 3,298,480 | |||
Boyd Gaming Corp. 6.00%, 8/15/2026 (a) | 185,000 | 183,150 | |||
Boyne USA, Inc. 7.25%, 5/1/2025 (a) (d) | 835,000 | 870,487 | |||
Builders FirstSource, Inc. 5.63%, 9/1/2024 (a) | 860,000 | 834,200 | |||
Calpine Corp. 5.75%, 1/15/2025 | 950,000 | 869,250 | |||
Cardinal Health, Inc. 3.41%, 6/15/2027 | 3,605,000 | 3,307,660 | |||
Caterpillar, Inc. 3.40%, 5/15/2024 | 2,791,000 | 2,783,046 | |||
CB Escrow Corp. 8.00%, 10/15/2025 (a) | 121,000 | 112,833 | |||
| CCO Holdings LLC/CCO Holdings Capital Corp.: | |||||
5.00%, 2/1/2028 (a) | 475,000 | 435,243 | |||
5.75%, 2/15/2026 (a) | 405,000 | 397,913 | |||
CDK Global, Inc. 5.88%, 6/15/2026 | 205,000 | 208,588 | |||
Celgene Corp. 4.35%, 11/15/2047 | 3,490,000 | 3,079,541 |
Table of Contents
| Security Description | Principal Amount | Value | |||
Cengage Learning, Inc. 9.50%, 6/15/2024 (a) | $ 635,000 | $ 538,559 | |||
Centene Corp. 4.75%, 1/15/2025 | 880,000 | 875,600 | |||
Centene Escrow I Corp. 5.38%, 6/1/2026 (a) | 90,000 | 91,179 | |||
Charter Communications Operating LLC/Charter Communications Operating Capital 4.46%, 7/23/2022 | 1,575,000 | 1,593,585 | |||
Cheniere Energy Partners L.P. 5.25%, 10/1/2025 (a) | 935,000 | 914,430 | |||
Cincinnati Bell, Inc. 7.00%, 7/15/2024 (a) | 1,179,000 | 1,075,837 | |||
Citigroup, Inc. 3 Month USD LIBOR + 1.39%, 3.67%, 7/24/2028 (b) | 3,445,000 | 3,280,639 | |||
CNX Midstream Partners L.P./CNX Midstream Finance Corp. 6.50%, 3/15/2026 (a) | 870,000 | 846,075 | |||
CommScope Technologies LLC 6.00%, 6/15/2025 (a) | 850,000 | 868,105 | |||
Constellation Merger Sub, Inc. 8.50%, 9/15/2025 (a) | 445,000 | 423,306 | |||
Coty, Inc. 6.50%, 4/15/2026 (a) | 440,000 | 420,464 | |||
CRC Escrow Issuer LLC/CRC Finco, Inc. 5.25%, 10/15/2025 (a) | 895,000 | 846,938 | |||
CSC Holdings LLC 5.25%, 6/1/2024 | 440,000 | 416,900 | |||
CSI Compressco L.P./CSI Compressco Finance, Inc. 7.50%, 4/1/2025 (a) | 425,000 | 426,594 | |||
CVS Health Corp. 3.70%, 3/9/2023 | 3,190,000 | 3,166,713 | |||
Dana Financing Luxembourg Sarl 5.75%, 4/15/2025 (a) | 425,000 | 418,625 | |||
Delta Air Lines, Inc. 3.63%, 3/15/2022 | 2,010,000 | 1,986,805 | |||
Discover Financial Services 4.10%, 2/9/2027 | 1,650,000 | 1,584,726 | |||
DJO Finance LLC/DJO Finance Corp. 8.13%, 6/15/2021 (a) | 420,000 | 424,988 | |||
Dollar Tree, Inc. 4.00%, 5/15/2025 | 1,650,000 | 1,613,502 | |||
Duke Energy Corp. 2.65%, 9/1/2026 | 3,510,000 | 3,166,897 | |||
Edison International 4.13%, 3/15/2028 | 1,650,000 | 1,624,656 | |||
Eldorado Resorts, Inc. 6.00%, 4/1/2025 | 420,000 | 421,050 | |||
Embarq Corp. 8.00%, 6/1/2036 | 460,000 | 434,148 | |||
| Energy Transfer Partners L.P.: |
| Security Description | Principal Amount | Value | |||
4.20%, 4/15/2027 | $ 100,000 | $ 94,822 | |||
4.75%, 1/15/2026 | 2,330,000 | 2,318,723 | |||
Enterprise Products Operating LLC 3.75%, 2/15/2025 | 2,355,000 | 2,332,628 | |||
| EP Energy LLC/Everest Acquisition Finance, Inc.: | |||||
7.75%, 5/15/2026 (a) | 170,000 | 173,825 | |||
9.38%, 5/1/2024 (a) | 530,000 | 435,289 | |||
EQT Corp. 3.90%, 10/1/2027 | 3,535,000 | 3,298,155 | |||
EQT Midstream Partners L.P. Series 5Y, 4.75%, 7/15/2023 | 2,010,000 | 2,008,452 | |||
ESH Hospitality, Inc. 5.25%, 5/1/2025 (a) | 900,000 | 868,500 | |||
Expedia Group, Inc. 3.80%, 2/15/2028 | 3,640,000 | 3,342,248 | |||
Extraction Oil & Gas, Inc. 5.63%, 2/1/2026 (a) | 450,000 | 430,335 | |||
FedEx Corp. 4.75%, 11/15/2045 | 3,210,000 | 3,203,227 | |||
First Data Corp. 5.75%, 1/15/2024 (a) | 835,000 | 835,000 | |||
| Flex Acquisition Co., Inc.: | |||||
6.88%, 1/15/2025 (a) | 885,000 | 854,025 | |||
7.88%, 7/15/2026 (a) | 140,000 | 139,454 | |||
Foresight Energy LLC/Foresight Energy Finance Corp. 11.50%, 4/1/2023 (a) | 510,000 | 450,394 | |||
Frontier Communications Corp. 8.50%, 4/1/2026 (a) | 240,000 | 231,600 | |||
FTS International, Inc. 6.25%, 5/1/2022 | 845,000 | 852,351 | |||
General Motors Co. 3 Month USD LIBOR + 0.80%, 3.16%, 8/7/2020 (b) | 820,000 | 822,733 | |||
| General Motors Financial Co., Inc.: | |||||
3.95%, 4/13/2024 | 275,000 | 269,280 | |||
3 Month USD LIBOR + 0.99%, 3.31%, 1/5/2023 (b) | 2,070,000 | 2,076,765 | |||
Genesys Telecommunications Laboratories, Inc./Greeneden Lux 3 Sarl/Greeneden US Holdings II LLC 10.00%, 11/30/2024 (a) | 765,000 | 852,133 | |||
Georgia-Pacific LLC 3.60%, 3/1/2025 (a) | 1,713,000 | 1,705,265 | |||
GLP Capital L.P./GLP Financing II, Inc. 5.75%, 6/1/2028 | 1,345,000 | 1,351,725 | |||
Golden Nugget, Inc. 6.75%, 10/15/2024 (a) | 640,000 | 639,296 | |||
| Goldman Sachs Group, Inc.: | |||||
3 Month USD LIBOR + 0.78%, 3.14%, 10/31/2022 (b) | 1,710,000 | 1,710,349 |
Table of Contents
| Security Description | Principal Amount | Value | |||
3 Month USD LIBOR + 1.17%, 3.49%, 5/15/2026 (b) | $ 1,650,000 | $ 1,629,891 | |||
GTT Communications, Inc. 7.88%, 12/31/2024 (a) | 840,000 | 832,692 | |||
Gulfport Energy Corp. 6.38%, 5/15/2025 | 875,000 | 850,937 | |||
Hasbro, Inc. 3.50%, 9/15/2027 | 1,365,000 | 1,265,273 | |||
Hess Infrastructure Partners L.P./Hess Infrastructure Partners Finance Corp. 5.63%, 2/15/2026 (a) | 845,000 | 842,888 | |||
| Hexion, Inc.: | |||||
6.63%, 4/15/2020 | 225,000 | 210,825 | |||
10.38%, 2/1/2022 (a) | 650,000 | 634,563 | |||
Hilton Domestic Operating Co., Inc. 4.25%, 9/1/2024 | 440,000 | 418,000 | |||
Icahn Enterprises L.P./Icahn Enterprises Finance Corp. 6.25%, 2/1/2022 | 870,000 | 887,400 | |||
Indigo Natural Resources LLC 6.88%, 2/15/2026 (a) | 445,000 | 428,313 | |||
Informatica LLC 7.13%, 7/15/2023 (a) | 800,000 | 808,160 | |||
IRB Holding Corp. 6.75%, 2/15/2026 (a) | 865,000 | 826,075 | |||
Iridium Communications, Inc. 10.25%, 4/15/2023 (a) | 405,000 | 435,628 | |||
Jeld-Wen, Inc. 4.63%, 12/15/2025 (a) | 450,000 | 428,625 | |||
KAR Auction Services, Inc. 5.13%, 6/1/2025 (a) | 440,000 | 420,200 | |||
Kinder Morgan, Inc. 4.30%, 3/1/2028 | 1,635,000 | 1,590,332 | |||
Kraft Heinz Foods Co. 2.80%, 7/2/2020 | 3,210,000 | 3,185,379 | |||
Laboratory Corp. of America Holdings 3.60%, 2/1/2025 | 3,271,000 | 3,193,837 | |||
Level 3 Financing, Inc. 5.38%, 8/15/2022 | 1,915,000 | 1,915,000 | |||
LTF Merger Sub, Inc. 8.50%, 6/15/2023 (a) | 1,700,000 | 1,761,625 | |||
Match Group, Inc. 5.00%, 12/15/2027 (a) | 905,000 | 840,564 | |||
Matterhorn Merger Sub LLC/Matterhorn Finance Sub, Inc. 8.50%, 6/1/2026 (a) | 210,000 | 202,650 | |||
MGM Growth Properties Operating Partnership L.P./MGP Finance Co-Issuer, Inc. 4.50%, 1/15/2028 | 930,000 | 843,975 | |||
Microchip Technology, Inc. 4.33%, 6/1/2023 (a) | 3,230,000 | 3,235,492 |
| Security Description | Principal Amount | Value | |||
Morgan Stanley 3 Month USD LIBOR + 0.85%, 3.74%, 4/24/2024 (b) | $ 3,220,000 | $ 3,206,186 | |||
Mosaic Co. 4.05%, 11/15/2027 | 1,680,000 | 1,603,745 | |||
Moss Creek Resources Holdings, Inc. 7.50%, 1/15/2026 (a) | 430,000 | 423,550 | |||
MPT Operating Partnership L.P./MPT Finance Corp. 5.25%, 8/1/2026 | 855,000 | 833,625 | |||
Nabors Industries, Inc. 5.75%, 2/1/2025 (a) | 440,000 | 416,900 | |||
Navient Corp. 6.50%, 6/15/2022 | 1,310,000 | 1,337,903 | |||
NCL Corp., Ltd. 4.75%, 12/15/2021 (a) | 1,461,000 | 1,461,000 | |||
New York Life Global Funding 2.30%, 6/10/2022 (a) | 1,705,000 | 1,639,332 | |||
Newell Brands, Inc. 5.50%, 4/1/2046 | 1,060,000 | 1,037,846 | |||
NextEra Energy Operating Partners L.P. 4.25%, 9/15/2024 (a) | 925,000 | 892,625 | |||
NFP Corp. 6.88%, 7/15/2025 (a) | 870,000 | 843,900 | |||
NGL Energy Partners L.P./NGL Energy Finance Corp. 7.50%, 11/1/2023 | 355,000 | 360,325 | |||
NRG Energy, Inc. 6.25%, 7/15/2022 | 825,000 | 849,007 | |||
NUVEEN FINANCE LLC 4.13%, 11/1/2024 (a) | 3,220,000 | 3,202,307 | |||
NVA Holdings, Inc. 6.88%, 4/1/2026 (a) | 855,000 | 849,656 | |||
Par Petroleum LLC/Petroleum Finance Corp. 7.75%, 12/15/2025 (a) | 425,000 | 432,438 | |||
Peabody Energy Corp. 6.00%, 3/31/2022 (a) | 843,000 | 856,699 | |||
Penske Truck Leasing Co. L.P./PTL Finance Corp. 4.20%, 4/1/2027 (a) | 675,000 | 665,223 | |||
PetSmart, Inc. 7.13%, 3/15/2023 (a) | 655,000 | 439,702 | |||
Pilgrim's Pride Corp. 5.75%, 3/15/2025 (a) | 885,000 | 849,600 | |||
Post Holdings, Inc. 5.50%, 3/1/2025 (a) | 1,800,000 | 1,759,860 | |||
Prime Security Services Borrower LLC/Prime Finance, Inc. 9.25%, 5/15/2023 (a) | 1,009,000 | 1,074,282 | |||
Prudential Financial, Inc. Series MTN, 3.50%, 5/15/2024 | 3,350,000 | 3,333,250 | |||
QEP Resources, Inc. 5.25%, 5/1/2023 | 1,000,000 | 982,500 |
Table of Contents
| Security Description | Principal Amount | Value | |||
Radiate Holdco LLC/Radiate Finance, Inc. 6.88%, 2/15/2023 (a) | $ 465,000 | $ 446,400 | |||
Republic Services, Inc. 3.38%, 11/15/2027 | 450,000 | 426,483 | |||
Riverbed Technology, Inc. 8.88%, 3/1/2023 (a) | 680,000 | 644,640 | |||
Sabine Pass Liquefaction LLC 5.00%, 3/15/2027 | 2,500,000 | 2,551,325 | |||
Santander Holdings USA, Inc. 3.40%, 1/18/2023 | 1,625,000 | 1,571,342 | |||
Select Medical Corp. 6.38%, 6/1/2021 | 1,350,000 | 1,365,390 | |||
ServiceMaster Co. LLC 5.13%, 11/15/2024 (a) | 440,000 | 426,800 | |||
Sirius XM Radio, Inc. 5.38%, 7/15/2026 (a) | 625,000 | 601,563 | |||
Six Flags Entertainment Corp. 4.88%, 7/31/2024 (a) | 1,295,000 | 1,261,071 | |||
Smithfield Foods, Inc. 4.25%, 2/1/2027 (a) | 1,620,000 | 1,558,838 | |||
Sophia L.P./Sophia Finance, Inc. 9.00%, 9/30/2023 (a) | 810,000 | 850,399 | |||
Southern Co. 1.85%, 7/1/2019 | 1,320,000 | 1,307,486 | |||
Springleaf Finance Corp. 7.13%, 3/15/2026 | 280,000 | 278,600 | |||
Sprint Corp. 7.13%, 6/15/2024 | 1,355,000 | 1,368,008 | |||
SunCoke Energy Partners L.P./SunCoke Energy Partners Finance Corp. 7.50%, 6/15/2025 (a) | 845,000 | 859,787 | |||
Sunoco L.P./Sunoco Finance Corp. 5.50%, 2/15/2026 (a) | 450,000 | 426,375 | |||
Sysco Corp. 3.25%, 7/15/2027 | 1,820,000 | 1,706,341 | |||
Tapstone Energy LLC/Tapstone Energy Finance Corp. 9.75%, 6/1/2022 (a) | 505,000 | 440,613 | |||
Targa Resources Partners L.P./Targa Resources Partners Finance Corp. 5.88%, 4/15/2026 (a) | 615,000 | 618,075 | |||
Team Health Holdings, Inc. 6.38%, 2/1/2025 (a) | 975,000 | 837,330 | |||
Tempo Acquisition LLC/Tempo Acquisition Finance Corp. 6.75%, 6/1/2025 (a) | 885,000 | 849,600 | |||
Tempur Sealy International, Inc. 5.50%, 6/15/2026 | 900,000 | 870,750 | |||
Tenet Healthcare Corp. 7.00%, 8/1/2025 (a) | 860,000 | 853,550 | |||
TerraForm Power Operating LLC 4.25%, 1/31/2023 (a) | 535,000 | 516,275 | |||
T-Mobile USA, Inc. 4.50%, 2/1/2026 | 450,000 | 420,210 |
| Security Description | Principal Amount | Value | |||
TransDigm UK Holdings PLC 6.88%, 5/15/2026 (a) | $ 1,070,000 | $ 1,083,375 | |||
Transocean Guardian, Ltd. 5.88%, 1/15/2024 (a) (e) | 220,000 | 219,186 | |||
Transocean Proteus, Ltd. 6.25%, 12/1/2024 (a) | 565,250 | 575,142 | |||
Triumph Group, Inc. 7.75%, 8/15/2025 | 855,000 | 846,450 | |||
USA Compression Partners L.P./USA Compression Finance Corp. 6.88%, 4/1/2026 (a) | 665,000 | 687,477 | |||
| Valeant Pharmaceuticals International, Inc.: | |||||
7.00%, 3/15/2024 (a) | 240,000 | 251,640 | |||
8.50%, 1/31/2027 (a) | 565,000 | 572,063 | |||
Verizon Communications, Inc. 3.50%, 11/1/2024 | 1,510,000 | 1,448,437 | |||
Viking Cruises, Ltd. 5.88%, 9/15/2027 (a) | 910,000 | 861,087 | |||
Vizient, Inc. 10.38%, 3/1/2024 (a) | 780,000 | 859,950 | |||
Wand Merger Corp. 8.13%, 7/15/2023 (a) (e) | 380,000 | 385,700 | |||
Waste Pro USA, Inc. 5.50%, 2/15/2026 (a) | 435,000 | 418,166 | |||
Weatherford International, Ltd. 9.88%, 2/15/2024 | 420,000 | 423,822 | |||
WellCare Health Plans, Inc. 5.25%, 4/1/2025 | 575,000 | 572,125 | |||
| Wells Fargo & Co.: | |||||
3.07%, 1/24/2023 | 1,810,000 | 1,758,940 | |||
Series MTN, 3 Month USD LIBOR + 1.31%, 3.58%, 5/22/2028 (b) | 1,785,000 | 1,707,460 | |||
WestRock Co. 3.75%, 3/15/2025 (a) | 1,660,000 | 1,631,398 | |||
Whiting Petroleum Corp. 6.63%, 1/15/2026 (a) | 825,000 | 848,760 | |||
Williams Partners L.P. 3.75%, 6/15/2027 | 1,710,000 | 1,615,796 | |||
Xerium Technologies, Inc. 9.50%, 8/15/2021 | 405,000 | 426,769 | |||
Zimmer Biomet Holdings, Inc. 3.70%, 3/19/2023 | 1,580,000 | 1,570,299 | |||
| 206,734,819 | |||||
TOTAL CORPORATE BONDS & NOTES (Cost $452,971,273) | 438,893,000 | ||||
| ASSET-BACKED SECURITIES — 2.5% | |||||
Aegis Asset Backed Securities Trust Series 2006-1, Class A2, 1 Month USD LIBOR + 0.17%, 2.26%, 1/25/2037 (b) | 31,211,812 | 24,826,999 | |||
| Ajax Mortgage Loan Trust: |
Table of Contents
| Security Description | Principal Amount | Value | |||
Series 2016-B, Class A, 4.00, 9/25/2065 (a) (f) | $ 7,760,846 | $ 7,776,327 | |||
Series 2017-C, Class A, 3.75, 7/25/2060 (a) (f) | 7,316,050 | 7,182,191 | |||
Colony Starwood Homes Trust Series 2016-2A, Class D, 1 Month USD LIBOR + 2.35%, 4.42%, 12/17/2033 (a) (b) | 4,000,000 | 4,033,806 | |||
Flagship Credit Auto Trust Series 2016-3, Class B, 2.43%, 6/15/2021 (a) | 3,500,000 | 3,478,593 | |||
GSAA Home Equity Trust Series 2007-10, Class A2A, 6.50%, 11/25/2037 | 2,887,967 | 2,066,926 | |||
OneMain Financial Issuance Trust Series 2015-1A, Class A, 3.19%, 3/18/2026 (a) | 13,458,584 | 13,487,475 | |||
Progress Residential Trust Series 2016-SFR2, Class D, 1 Month USD LIBOR + 2.50%, 4.59%, 1/17/2034 (a) (b) | 1,000,000 | 1,004,935 | |||
Structured Asset Investment Loan Trust Series 2006-BNC2, Class A5, 1 Month USD LIBOR + 0.16%, 2.25%, 5/25/2036 (b) | 4,926,556 | 4,624,210 | |||
Structured Asset Securities Corp. Mortgage Loan Trust Series 2006-BC4, Class A4, 1 Month USD LIBOR + 0.17%, 2.26%, 12/25/2036 (b) | 2,600,938 | 2,511,097 | |||
Towd Point Mortgage Trust Series 2015-1, Class AE, 3.00%, 10/25/2053 (a) | 1,824,889 | 1,809,811 | |||
US Residential Opportunity Fund IV Trust Series 2017-1III, Class A, 3.35%, 11/27/2037 (a) (f) | 5,435,801 | 5,411,023 | |||
Westlake Automobile Receivables Trust Series 2016-2A, Class B, 2.30%, 11/15/2019 (a) | 1,360,239 | 1,359,881 | |||
TOTAL ASSET-BACKED SECURITIES (Cost $79,750,522) | 79,573,274 | ||||
| FOREIGN GOVERNMENT OBLIGATIONS — 2.0% | |||||
| ARGENTINA — 0.2% | |||||
| Argentine Republic Government International Bond: | |||||
5.88%, 1/11/2028 | 1,350,000 | 1,096,875 | |||
6.63%, 7/6/2028 | 1,150,000 | 968,875 | |||
6.88%, 1/26/2027 | 3,500,000 | 3,080,000 | |||
Provincia de Buenos Aires Series REGS, 7.88%, 6/15/2027 | 3,000,000 | 2,625,000 | |||
| 7,770,750 |
| Security Description | Principal Amount | Value | |||
| BRAZIL — 0.2% | |||||
Banco do Brasil SA Series REGS, 10 Year CMT + 4.40%, 6.25%, 10/29/2049 (b) | $ 4,700,000 | $ 3,677,750 | |||
Itau Unibanco Holding SA 6.13%, 12/31/2099 (b) | 2,500,000 | 2,337,500 | |||
| 6,015,250 | |||||
| CHILE — 0.3% | |||||
| Chile Government International Bond: | |||||
3.13%, 3/27/2025 | 2,200,000 | 2,131,470 | |||
3.13%, 1/21/2026 | 8,000,000 | 7,672,160 | |||
| 9,803,630 | |||||
| COSTA RICA — 0.1% | |||||
Costa Rica Government International Bond 10.00%, 8/1/2020 | 2,905,000 | 3,159,188 | |||
| INDIA — 0.0% (c) | |||||
| Export-Import Bank of India: | |||||
Series EMTN, 2.75%, 4/1/2020 | 200,000 | 196,327 | |||
Series EMTN, 4.00%, 1/14/2023 | 1,450,000 | 1,436,780 | |||
| 1,633,107 | |||||
| INDONESIA — 0.2% | |||||
Indonesia Government International Bond Series REGS, 4.88%, 5/5/2021 | 500,000 | 514,186 | |||
| Perusahaan Penerbit SBSN Indonesia III: | |||||
4.15%, 3/29/2027 (a) | 4,500,000 | 4,336,875 | |||
Series REGS, 4.15%, 3/29/2027 | 2,000,000 | 1,927,500 | |||
| 6,778,561 | |||||
| ISRAEL — 0.3% | |||||
| Israel Government International Bond: | |||||
2.88%, 3/16/2026 | 3,900,000 | 3,707,574 | |||
3.15%, 6/30/2023 | 1,500,000 | 1,482,810 | |||
4.00%, 6/30/2022 | 3,400,000 | 3,492,242 | |||
| 8,682,626 | |||||
| MALAYSIA — 0.1% | |||||
Malaysia Sovereign Sukuk Bhd Series REGS, 3.04%, 4/22/2025 | 1,400,000 | 1,333,556 | |||
Malaysia Sukuk Global Bhd Series REGS, 3.18%, 4/27/2026 | 2,250,000 | 2,133,945 | |||
| 3,467,501 | |||||
| MEXICO — 0.1% | |||||
| Mexico Government International Bond: |
Table of Contents
| Security Description | Principal Amount | Value | |||
3.75%, 1/11/2028 | $ 1,200,000 | $ 1,133,700 | |||
4.00%, 10/2/2023 | 1,500,000 | 1,506,075 | |||
| 2,639,775 | |||||
| PANAMA — 0.2% | |||||
Panama Government International Bond 4.00%, 9/22/2024 | 5,600,000 | 5,658,072 | |||
| PERU — 0.0% (c) | |||||
Fondo MIVIVIENDA SA 3.50%, 1/31/2023 (a) | 800,000 | 771,208 | |||
| PHILIPPINES — 0.3% | |||||
Philippine Government International Bond 4.20%, 1/21/2024 | 7,900,000 | 8,057,526 | |||
| UNITED STATES — 0.0% (c) | |||||
Mavis Tire Express Services Corp. 5.33%, 3/20/2025 | 28,114 | 27,940 | |||
TOTAL FOREIGN GOVERNMENT OBLIGATIONS (Cost $67,926,787) | 64,465,134 | ||||
| SENIOR FLOATING RATE LOANS — 7.1% (g) | |||||
| AEROSPACE & DEFENSE — 0.0% (c) | |||||
| TransDigm, Inc.: | |||||
Senior Secured 2018 Term Loan E 4.59%, 5/30/2025 | 231,650 | 230,184 | |||
Senior Secured 2018 Term Loan F 4.59%, 6/9/2023 | 570,695 | 568,056 | |||
| 798,240 | |||||
| AUTO COMPONENTS — 0.3% | |||||
CH Hold Corp. Senior Secured 1st Lien Term Loan 5.09%, 2/1/2024 | 107,569 | 107,670 | |||
Federal-Mogul Holdings Corp. Senior Secured Term Loan C 5.83%, 4/15/2021 | 3,230,084 | 3,240,469 | |||
Mavis Tire Express Services Corp. Senior Secured 2018 1st Lien Term Loan 5.33%, 3/20/2025 | 3,185,734 | 3,165,824 | |||
Tenneco, Inc. Senior Secured 1st Lien Term Loan B Zero Coupon, 6/14/2025 | 2,705,000 | 2,683,035 | |||
| 9,196,998 | |||||
| BUILDING PRODUCTS — 0.1% | |||||
Ply Gem Industries, Inc. Senior Secured 2018 Term Loan 6.09%, 4/12/2025 | 2,515,000 | 2,512,648 |
| Security Description | Principal Amount | Value | |||
| CAPITAL MARKETS — 0.1% | |||||
Duff & Phelps Corp. Senior Secured 2017 Term Loan B 5.58%, 2/13/2025 | $ 3,017,438 | $ 3,009,260 | |||
| CASINO SERVICES — 0.0% (c) | |||||
Stars Group Holdings B.V. Senior Secured 2018 USD Incremental Term Loan Zero Coupon, 7/10/2025 | 790,000 | 790,000 | |||
| CHEMICALS — 0.2% | |||||
Avantor, Inc. Senior Secured 2017 1st Lien Term Loan 6.09%, 11/21/2024 | 1,165,720 | 1,173,006 | |||
GrafTech Finance, Inc. Senior Secured 2018 Term Loan B 5.50%, 2/12/2025 | 4,285,000 | 4,268,953 | |||
| 5,441,959 | |||||
| COMMERCIAL SERVICES & SUPPLIES — 0.4% | |||||
| Asurion LLC: | |||||
Senior Secured 2018 Incremental 2nd Lien Term Loan B2 Zero Coupon, 8/4/2025 | 940,000 | 955,275 | |||
Senior Secured 2018 Term Loan B6 4.84%, 11/3/2023 | 4,287,061 | 4,286,289 | |||
Prime Security Services Borrower LLC Senior Secured 2016 1st Lien Term Loan 4.84%, 5/2/2022 | 4,280,042 | 4,264,719 | |||
West Corp. Senior Secured 2017 Term Loan 6.09%, 10/10/2024 | 3,955,125 | 3,946,721 | |||
| 13,453,004 | |||||
| COMMUNICATIONS EQUIPMENT — 0.2% | |||||
Avaya, Inc. Senior Secured 2018 Term Loan B 6.32%, 12/15/2024 | 2,184,013 | 2,189,986 | |||
Digicel International Finance, Ltd. Senior Secured 2017 Term Loan B 5.61%, 5/28/2024 | 2,307,565 | 2,215,263 | |||
Plantronics, Inc. Senior Secured 2018 Term Loan B Zero Coupon, 5/30/2025 | 2,100,000 | 2,099,023 | |||
| 6,504,272 | |||||
| CONSTRUCTION & ENGINEERING — 0.1% | |||||
Brand Energy & Infrastructure Services, Inc. Senior Secured 2017 Term Loan 6.61%, 6/21/2024 | 4,242,150 | 4,255,152 |
Table of Contents
| Security Description | Principal Amount | Value | |||
| CONSTRUCTION MATERIALS — 0.1% | |||||
Forterra Finance, Inc. Senior Secured 2017 Term Loan B 5.09%, 10/25/2023 | $ 584,998 | $ 547,886 | |||
Traverse Midstream Partners LLC Senior Secured 2017 Term Loan 6.34%, 9/27/2024 | 2,310,000 | 2,312,679 | |||
| 2,860,565 | |||||
| CONTAINERS & PACKAGING — 0.1% | |||||
BWAY Holding Company Senior Secured 2017 Term Loan B 5.59%, 4/3/2024 | 1,655,592 | 1,648,870 | |||
Reynolds Group Holdings, Inc. Senior Secured USD 2017 Term Loan 4.84%, 2/5/2023 | 2,603,175 | 2,601,001 | |||
| 4,249,871 | |||||
| DISTRIBUTORS — 0.0% (c) | |||||
American Tire Distributors Holdings, Inc. Senior Secured 2015 Term Loan 6.34%, 9/1/2021 | 207,931 | 136,325 | |||
| DIVERSIFIED FINANCIAL SERVICES — 0.0% (c) | |||||
Edelman Financial Group Senior Secured 2018 Term Loan B Zero Coupon, 6/8/2027 | 1,355,000 | 1,355,007 | |||
| DIVERSIFIED TELECOMMUNICATION SERVICES — 0.2% | |||||
CenturyLink Escrow LLC Senior Secured 2017 Term Loan B 4.84%, 1/31/2025 | 3,422,800 | 3,357,904 | |||
Intelsat Jackson Holdings S.A. Senior Secured 2017 Term Loan B3 5.85%, 11/27/2023 | 1,665,000 | 1,663,568 | |||
| 5,021,472 | |||||
| ELECTRICAL EQUIPMENT — 0.1% | |||||
Gates Global LLC Senior Secured 2017 USD Repriced Term Loan B 5.08%, 4/1/2024 | 2,123,206 | 2,124,819 | |||
| ENERGY EQUIPMENT & SERVICES — 0.1% | |||||
BCP Renaissance Parent LLC Senior Secured 2017 Term Loan B 5.86%, 10/31/2024 | 2,330,000 | 2,328,905 |
| Security Description | Principal Amount | Value | |||
| FINANCIAL SERVICES — 0.1% | |||||
GTCR Valor Companies, Inc. Senior Secured 2017 Term Loan B1 5.58%, 6/16/2023 | $ 2,845,804 | $ 2,845,804 | |||
| FOOD & STAPLES RETAILING — 0.1% | |||||
Albertsons LLC Senior Secured 2018 ABL Last Out Term Loan Zero Coupon, 5/2/2023 | 465,000 | 465,003 | |||
BJ's Wholesale Club, Inc. Senior Secured 2017 1st Lien Term Loan 5.53%, 2/3/2024 | 3,171,103 | 3,174,274 | |||
| 3,639,277 | |||||
| FOOD PRODUCTS — 0.0% (c) | |||||
CSM Bakery Solutions LLC Senior Secured 1st Lien Term Loan 6.31%, 7/3/2020 | 808,032 | 786,320 | |||
| FOOD-MISC/DIVERSIFIED — 0.0% (c) | |||||
Hearthside Food Solutions LLC Senior Secured 2018 Term Loan B 5.09%, 5/23/2025 | 700,000 | 694,488 | |||
| HEALTH CARE PROVIDERS & SERVICES — 0.5% | |||||
Air Methods Corp. Senior Secured 2017 Term Loan B 5.83%, 4/21/2024 | 1,125,701 | 1,082,435 | |||
CHG Healthcare Services, Inc. Senior Secured 2017 1st Lien Term Loan B 5.36%, 6/7/2023 | 3,182,526 | 3,190,976 | |||
Envision Healthcare Corp. Senior Secured 2016 Term Loan B 5.10%, 12/1/2023 | 1,753,571 | 1,754,307 | |||
| Gentiva Health Services, Inc.: | |||||
Senior Secured 2018 1st Lien Delayed Draw Term Loan Zero Coupon, 6/2/2025 | 1,388,462 | 1,381,519 | |||
Senior Secured 2018 1st Lien Term Loan Zero Coupon, 6/2/2025 | 2,221,538 | 2,210,431 | |||
Select Medical Corp. Senior Secured 2017 Term Loan B 4.80%, 7/11/2018 | 3,347,625 | 3,346,587 | |||
Team Health Holdings, Inc. Senior Secured 1st Lien Term Loan 4.84%, 2/6/2024 | 3,935,187 | 3,792,537 |
Table of Contents
| Security Description | Principal Amount | Value | |||
U.S. Renal Care, Inc. Senior Secured 2015 Term Loan B 6.55%, 12/31/2022 | $ 8,836 | $ 8,722 | |||
| 16,767,514 | |||||
| HEALTH CARE TECHNOLOGY — 0.1% | |||||
Change Healthcare Holdings, Inc. Senior Secured 2017 Term Loan B 4.84%, 3/1/2024 | 4,043,812 | 4,034,957 | |||
| HOTELS, RESTAURANTS & LEISURE — 0.6% | |||||
ClubCorp Club Operations, Inc. Senior Secured 2017 Term Loan B 5.08%, 9/18/2024 | 3,339,304 | 3,305,911 | |||
Delta 2 (LUX) S.A.R.L. Senior Secured 2018 USD Term Loan 4.59%, 2/1/2024 | 1,405,525 | 1,389,495 | |||
Intrawest Resorts Holdings, Inc. Senior Secured Term Loan B1 5.09%, 7/31/2024 | 2,832,525 | 2,834,310 | |||
LTF Merger Sub, Inc. Senior Secured 2017 Term Loan B 5.06%, 6/10/2022 | 4,498,507 | 4,493,783 | |||
Mohegan Tribal Gaming Authority Senior Secured 2016 Term Loan B 6.09%, 10/13/2023 | 89,530 | 84,785 | |||
Scientific Games International, Inc. Senior Secured 2018 Term Loan B5 4.92%, 8/14/2024 | 4,268,340 | 4,245,675 | |||
Travel Leaders Group LLC Senior Secured 2017 1st Lien Term Loan 7.00%, 1/25/2024 (d) | 943,990 | 951,070 | |||
| 17,305,029 | |||||
| HOUSEHOLD PRODUCTS — 0.0% (c) | |||||
KIK Custom Products, Inc. Senior Secured 2015 Term Loan B 5.99%, 5/15/2023 | 870,682 | 866,981 | |||
| INSURANCE — 0.3% | |||||
| Acrisure LLC: | |||||
Senior Secured 2017 Term Loan B 6.61%, 11/22/2023 | 4,363,491 | 4,360,786 | |||
Senior Secured 2018 Term Loan B Zero Coupon, 11/22/2023 | 910,000 | 904,312 | |||
AssuredPartners, Inc. Senior Secured 2017 1st Lien Add-On Term Loan 5.34%, 10/22/2024 | 4,305,783 | 4,292,350 |
| Security Description | Principal Amount | Value | |||
York Risk Services Holding Corp. Senior Secured Term Loan B 5.84%, 10/1/2021 | $ 1,001,943 | $ 974,925 | |||
| 10,532,373 | |||||
| INTERNET SOFTWARE & SERVICES — 0.3% | |||||
GTT Communications, Inc. Senior Secured 2018 USD Term Loan B 4.88%, 5/31/2025 | 4,230,000 | 4,175,814 | |||
ION Trading Technologies S.A.R.L. Senior Secured USD Incremental Term Loan B Zero Coupon, 11/21/2024 | 3,475,000 | 3,453,281 | |||
SkillSoft Corp. Senior Secured 1st Lien Term Loan 6.84%, 4/28/2021 | 166,701 | 158,105 | |||
| 7,787,200 | |||||
| IT SERVICES — 0.3% | |||||
Blackhawk Network Holdings, Inc Senior Secured 2018 1st Lien Term Loan 5.07%, 6/15/2025 | 990,000 | 988,554 | |||
Peak 10, Inc. Senior Secured 2017 1st Lien Term Loan 5.83%, 8/1/2024 | 4,317,375 | 4,280,289 | |||
TKC Holdings, Inc. Senior Secured 2017 1st Lien Term Loan 5.85%, 2/1/2023 | 4,078,375 | 4,075,826 | |||
| 9,344,669 | |||||
| LIFE SCIENCES TOOLS & SERVICES — 0.2% | |||||
Jaguar Holding Co. II Senior Secured 2018 Term Loan 4.59%, 8/18/2022 | 3,889,299 | 3,874,967 | |||
Parexel International Corp. Senior Secured Term Loan B 4.84%, 9/27/2024 | 1,965,150 | 1,956,965 | |||
| 5,831,932 | |||||
| MACHINERY — 0.2% | |||||
Filtration Group Corporation Senior Secured 2018 1st Lien Term Loan 5.34%, 3/29/2025 | 900,612 | 901,851 | |||
Milacron LLC Senior Secured Amended Term Loan B 4.59%, 9/28/2023 | 328,021 | 326,380 | |||
Titan Acquisition, Ltd. Senior Secured 2018 Term Loan B 5.09%, 3/28/2025 | 4,009,950 | 3,955,836 | |||
| 5,184,067 |
Table of Contents
| Security Description | Principal Amount | Value | |||
| MEDIA — 0.4% | |||||
CBS Radio, Inc. Senior Secured 2017 Term Loan B 4.84%, 11/17/2024 | $ 2,273,575 | $ 2,247,429 | |||
Meredith Corp. Senior Secured Term Loan B 5.09%, 1/31/2025 | 568,575 | 569,152 | |||
Mission Broadcasting, Inc. Senior Secured 2017 Term Loan B2 4.48%, 1/17/2024 | 134,433 | 134,566 | |||
Nexstar Broadcasting, Inc. Senior Secured 2017 Term Loan B2 4.48%, 1/17/2024 | 1,035,140 | 1,036,165 | |||
Radiate Holdco LLC Senior Secured 1st Lien Term Loan 5.09%, 2/1/2024 | 2,491,142 | 2,458,246 | |||
Rentpath, Inc. Senior Secured 2017 Term Loan 6.85%, 12/17/2021 | 855,619 | 785,030 | |||
| Tribune Media Co.: | |||||
Senior Secured Term Loan 5.09%, 7/31/2018 (d) | 83,967 | 84,177 | |||
Senior Secured Term Loan C 5.09%, 1/27/2024 | 3,836,509 | 3,838,907 | |||
| 11,153,672 | |||||
| METAL-DIVERSIFIED — 0.1% | |||||
Covia Holdings Corp. Senior Secured Term Loan 6.05%, 6/1/2025 | 1,635,000 | 1,637,305 | |||
| METALS & MINING — 0.1% | |||||
Aleris International, Inc. Senior Secured 2018 Term Loan 6.86%, 2/8/2023 | 1,640,000 | 1,628,208 | |||
U.S. Silica Company Senior Secured 2018 Term Loan B 6.13%, 5/1/2025 | 2,668,312 | 2,671,648 | |||
| 4,299,856 | |||||
| OIL REFINING&MARKETING — 0.0% (c) | |||||
Gulf Finance LLC Senior Secured Term Loan B Zero Coupon, 8/25/2023 | 925,000 | 802,438 | |||
| OIL, GAS & CONSUMABLE FUELS — 0.1% | |||||
EG Finco, Ltd. Senior Secured 2018 USD Term Loan 6.33%, 2/7/2025 | 3,022,425 | 3,000,890 |
| Security Description | Principal Amount | Value | |||
| PHARMACEUTICALS — 0.1% | |||||
Amneal Pharmaceuticals LLC Senior Secured 2018 Term Loan B 5.63%, 5/4/2025 | $ 3,509,189 | $ 3,508,101 | |||
Valeant Pharmaceuticals International, Inc. Senior Secured 2018 Term Loan B 4.98%, 6/1/2025 | 500,000 | 498,960 | |||
| 4,007,061 | |||||
| REAL ESTATE INVESTMENT TRUSTS (REITS) — 0.0% (c) | |||||
Capital Automotive L.P. Senior Secured 2017 2nd Lien Term Loan 8.10%, 3/24/2025 | 393,809 | 397,255 | |||
| REAL ESTATE MANAGEMENT & DEVELOPMENT — 0.1% | |||||
Bright Bidco B.V. Senior Secured 2018 Term Loan B 5.83%, 6/30/2024 | 2,392,552 | 2,377,598 | |||
| RETAIL-RESTAURANTS — 0.1% | |||||
IRB Holding Corp. Senior Secured 1st Lien Term Loan 5.28%, 2/5/2025 | 3,347,076 | 3,356,833 | |||
| SOFTWARE — 1.3% | |||||
| Almonde, Inc.: | |||||
Senior Secured 1st Lien Term Loan 5.81%, 6/13/2024 | 2,214,722 | 2,178,887 | |||
Senior Secured USD 2nd Lien Term Loan 9.56%, 6/13/2025 | 2,250,000 | 2,173,354 | |||
Applied Systems, Inc. Senior Secured 2017 1st Lien Term Loan 5.33%, 9/19/2024 | 4,255,331 | 4,266,289 | |||
BMC Software Finance, Inc. Senior Secured 2018 USD Term Loan B Zero Coupon, 6/26/2025 | 4,195,000 | 4,174,025 | |||
Cengage Learning Acquisitions, Inc. Senior Secured 2016 Term Loan B 6.34%, 6/7/2023 | 4,675,000 | 4,304,506 | |||
Compuware Corp. Senior Secured Term Loan B3 5.59%, 12/15/2021 | 3,805,749 | 3,819,069 | |||
Greeneden U.S. Holdings II LLC Senior Secured 2018 USD Term Loan B 5.83%, 12/1/2023 | 2,178,551 | 2,181,274 |
Table of Contents
| Security Description | Principal Amount | Value | |||
Kronos, Inc. Senior Secured 2017 Term Loan B 5.36%, 11/1/2023 | $ 3,960,050 | $ 3,957,575 | |||
Quest Software US Holdings, Inc. Senior Secured 2018 1st Lien Term Loan 6.58%, 5/16/2025 | 2,190,000 | 2,184,985 | |||
SolarWinds Holdings, Inc. Senior Secured 2018 Term Loan B 5.09%, 2/5/2024 | 2,600,675 | 2,602,834 | |||
Solera Holdings, Inc. Senior Secured USD Term Loan B 4.84%, 3/3/2023 | 4,001,510 | 3,989,006 | |||
Sophia L.P. Senior Secured 2017 Term Loan B 5.58%, 9/30/2022 | 4,005,974 | 3,995,959 | |||
Vertafore, Inc. Senior Secured 2018 1st Lien Term Loan Zero Coupon, 5/30/2025 | 1,845,000 | 1,835,590 | |||
| 41,663,353 | |||||
| SPECIALTY RETAIL — 0.1% | |||||
Jo-Ann Stores, Inc. Senior Secured 2016 Term Loan 7.51%, 10/20/2023 | 922,650 | 917,654 | |||
Staples, Inc. Senior Secured 2017 Term Loan B 6.36%, 9/12/2024 | 1,572,100 | 1,553,683 | |||
| 2,471,337 | |||||
TOTAL SENIOR FLOATING RATE LOANS (Cost $226,081,789) | 224,826,706 | ||||
| U.S. GOVERNMENT AGENCY OBLIGATIONS — 48.5% | |||||
| Federal Home Loan Mortgage Corp.: | |||||
3.00%, 11/1/2042 | 17,401,592 | 16,998,727 | |||
3.00%, 1/1/2045 | 2,783,041 | 2,710,442 | |||
3.00%, 2/1/2045 | 1,968,059 | 1,913,604 | |||
3.00%, 3/1/2045 | 2,090,819 | 2,032,967 | |||
3.00%, 4/1/2045 | 42,480,359 | 41,349,333 | |||
3.00%, 5/1/2045 | 7,345,313 | 7,142,074 | |||
3.00%, 8/1/2045 | 19,997,656 | 19,444,337 | |||
3.00%, 10/1/2045 | 13,091,329 | 12,729,102 | |||
3.50%, 2/1/2045 | 3,781,706 | 3,775,467 | |||
3.50%, 4/1/2045 | 30,935,011 | 30,875,791 | |||
3.50%, 6/1/2045 | 13,885,330 | 13,858,748 | |||
3.50%, 10/1/2045 | 16,489,502 | 16,457,935 | |||
3.50%, 2/1/2046 | 16,697,191 | 16,650,522 | |||
3.50%, 5/1/2046 | 52,943,662 | 52,795,684 | |||
4.00%, 4/1/2047 | 43,827,803 | 44,703,520 | |||
4.00%, 7/1/2047 | 13,378,031 | 13,645,336 | |||
4.00%, 10/1/2047 | 27,150,968 | 27,693,468 | |||
4.50%, 6/1/2044 | 2,623,222 | 2,753,544 | |||
Series 326, Class 300, CMO, 3.00%, 3/15/2044 | 36,584,459 | 35,887,408 |
| Security Description | Principal Amount | Value | |||
Series 358, Class 300, CMO, 3.00%, 10/15/2047 | $ 36,652,136 | $ 35,578,857 | |||
Series 3822, Class ZG, CMO, REMIC, 4.00%, 2/15/2041 | 3,673,404 | 3,826,271 | |||
Series 3852, Class NS, CMO, IO, REMIC, 6.00% - 1 Month USD LIBOR 3.93%, 5/15/2041 (b) | 12,798,078 | 1,589,890 | |||
Series 3889, Class VZ, CMO, REMIC, 4.00%, 7/15/2041 | 13,068,866 | 13,469,762 | |||
Series 3935, Class SJ, CMO, IO, REMIC, 6.65% - 1 Month USD LIBOR 4.58%, 5/15/2041 (b) | 3,006,527 | 276,710 | |||
Series 4120, Class KA, CMO, REMIC, 1.75%, 10/15/2032 | 19,794,819 | 18,976,082 | |||
Series 4165, Class ZT, CMO, REMIC, 3.00%, 2/15/2043 | 15,714,530 | 14,342,664 | |||
Series 4215, Class KC, CMO, REMIC, 2.25%, 3/15/2038 | 14,117,355 | 13,855,129 | |||
Series 4364, Class ZX, CMO, REMIC, 4.00%, 7/15/2044 | 39,804,956 | 41,327,686 | |||
Series 4434, Class LZ, CMO, REMIC, 3.00%, 2/15/2045 | 3,315,099 | 2,979,464 | |||
Series 4444, Class CZ, CMO, REMIC, 3.00%, 2/15/2045 | 12,155,363 | 10,822,360 | |||
Series 4447, Class A, CMO, REMIC, 3.00%, 6/15/2041 | 2,028,656 | 2,001,053 | |||
Series 4447, Class Z, CMO, REMIC, 3.00%, 3/15/2045 | 4,012,040 | 3,632,316 | |||
Series 4471, Class BA, CMO, REMIC, 3.00%, 12/15/2041 | 6,836,205 | 6,641,278 | |||
Series 4471, Class GA, CMO, REMIC, 3.00%, 2/15/2044 | 10,350,321 | 10,070,711 | |||
Series 4474, Class ZX, CMO, REMIC, 4.00%, 4/15/2045 | 11,705,459 | 12,078,778 | |||
Series 4481, Class B, CMO, REMIC, 3.00%, 12/15/2042 | 6,988,802 | 6,819,443 | |||
Series 4483, Class CA, CMO, REMIC, 3.00%, 6/15/2044 | 12,961,138 | 12,604,271 | |||
Series 4484, Class CD, CMO, REMIC, 1.75%, 7/15/2030 | 17,061,305 | 16,473,026 |
Table of Contents
| Security Description | Principal Amount | Value | |||
Series 4491, Class B, CMO, REMIC, 3.00%, 8/15/2040 | $ 12,991,689 | $ 12,859,384 | |||
Series 4492, Class GZ, CMO, REMIC, 3.50%, 7/15/2045 | 8,413,994 | 8,077,345 | |||
Series 4499, Class AB, CMO, REMIC, 3.00%, 6/15/2042 | 13,942,342 | 13,671,568 | |||
Series 4504, Class CA, CMO, REMIC, 3.00%, 4/15/2044 | 14,630,504 | 14,293,157 | |||
Series 4511, Class QA, CMO, REMIC, 3.00%, 1/15/2041 | 12,358,326 | 12,229,189 | |||
Series 4511, Class QC, CMO, REMIC, 3.00%, 12/15/2040 | 9,351,332 | 9,211,505 | |||
Series 4533, Class AB, CMO, REMIC, 3.00%, 6/15/2044 | 9,904,703 | 9,573,447 | |||
Series 4543, Class HG, CMO, REMIC, 2.70%, 4/15/2044 | 18,236,294 | 17,497,558 | |||
Series 4582, Class HA, CMO, REMIC, 3.00%, 9/15/2045 | 14,287,191 | 13,980,773 | |||
Series 4629, Class KA, CMO, REMIC, 3.00%, 3/15/2045 | 43,966,955 | 42,890,209 | |||
Series 4750, Class PA, 3.00%, 7/15/2046 | 24,460,059 | 23,803,976 | |||
Series 4792, Class A, CMO, REMIC, 3.00%, 5/15/2048 | 26,782,661 | 25,942,057 | |||
Series K053, Class A2, 3.00%, 12/25/2025 | 2,232,000 | 2,189,860 | |||
| Federal National Mortgage Association: | |||||
2.50%, 9/1/2046 | 5,177,563 | 4,822,719 | |||
2.50%, 2/1/2047 | 14,493,058 | 13,586,533 | |||
3.00%, 10/1/2041 | 33,824,343 | 32,797,443 | |||
3.00%, 3/1/2043 | 5,899,186 | 5,760,114 | |||
3.00%, 7/1/2043 | 9,170,238 | 8,849,239 | |||
3.00%, 1/1/2045 | 2,031,275 | 1,959,954 | |||
3.00%, 3/1/2045 | 2,889,693 | 2,811,536 | |||
3.00%, 4/1/2045 | 11,955,414 | 11,536,056 | |||
3.00%, 7/1/2045 | 35,693,584 | 34,852,809 | |||
3.50%, 9/1/2034 | 2,781,198 | 2,806,893 | |||
3.50%, 12/1/2034 | 2,496,755 | 2,519,823 | |||
3.50%, 2/1/2035 | 1,591,587 | 1,606,292 | |||
3.50%, 1/1/2045 | 13,915,817 | 13,900,771 | |||
3.50%, 2/1/2045 | 5,290,962 | 5,285,241 | |||
3.50%, 6/1/2045 | 14,216,355 | 14,197,276 | |||
4.50%, 3/1/2044 | 2,968,059 | 3,117,315 | |||
4.50%, 6/1/2044 | 1,522,695 | 1,599,268 | |||
4.50%, 7/1/2044 | 1,580,220 | 1,659,686 | |||
4.50%, 2/1/2045 | 1,999,181 | 2,099,715 |
| Security Description | Principal Amount | Value | |||
Series 2010-109, Class N, CMO, REMIC, 3.00%, 10/25/2040 | $ 3,191,816 | $ 3,142,993 | |||
Series 2011-51, Class CI, CMO, IO, REMIC, 6.00% - 1 Month USD LIBOR 3.91%, 6/25/2041 (b) | 8,698,273 | 986,569 | |||
Series 2012-101, Class AP, CMO, REMIC, 2.00%, 8/25/2040 | 8,234,620 | 7,885,276 | |||
Series 2012-127, Class PA, CMO, REMIC, 2.75%, 11/25/2042 | 4,177,422 | 4,054,476 | |||
Series 2012-151, Class SB, CMO, REMIC, 6.00% - 1 Month USD LIBOR 3.03%, 1/25/2043 (b) | 1,248,324 | 966,425 | |||
Series 2013-114, Class HZ, CMO, REMIC, 3.00%, 11/25/2038 | 16,413,840 | 14,940,583 | |||
Series 2013-18, Class CD, CMO, REMIC, 1.50%, 10/25/2027 | 6,290,771 | 6,027,937 | |||
Series 2013-30, Class PS, CMO, REMIC, 6.00% - 1 Month USD LIBOR 3.03%, 4/25/2043 (b) | 1,718,187 | 1,339,435 | |||
Series 2014-21, Class GZ, CMO, REMIC, 3.00%, 4/25/2044 | 6,273,297 | 5,695,048 | |||
Series 2014-39, Class ZA, CMO, REMIC, 3.00%, 7/25/2044 | 9,018,624 | 8,367,207 | |||
Series 2015-42, Class CA, CMO, REMIC, 3.00%, 3/25/2044 | 8,039,884 | 7,868,015 | |||
Series 2015-9, Class HA, CMO, REMIC, 3.00%, 1/25/2045 | 12,464,356 | 12,364,965 | |||
Series 2015-95, Class AP, CMO, REMIC, 3.00%, 8/25/2042 | 16,037,980 | 15,701,981 | |||
Series 2016-21, Class BZ, CMO, REMIC, 3.00%, 4/25/2046 | 4,633,297 | 4,176,304 | |||
Series 2016-32, Class LA, CMO, REMIC, 3.00%, 10/25/2044 | 13,890,968 | 13,601,083 | |||
Series 2016-72, Class PA, CMO, REMIC, 3.00%, 7/25/2046 | 21,867,885 | 21,302,745 | |||
Series 2016-81, Class PA, CMO, REMIC, 3.00%, 2/25/2044 | 30,560,229 | 29,997,569 | |||
Series 2016-9, Class A, CMO, REMIC, 3.00%, 9/25/2043 | 10,962,866 | 10,752,256 |
Table of Contents
| Security Description | Principal Amount | Value | |||
Series 2016-92, Class A, CMO, REMIC, 3.00%, 4/25/2042 | $ 35,566,494 | $ 34,718,916 | |||
Series 2016-M3, Class A2, 2.70%, 2/25/2026 | 2,150,000 | 2,054,460 | |||
Series 2017-13, Class CA, CMO, REMIC, 2.50%, 10/25/2043 | 30,180,990 | 29,145,991 | |||
Series 2017-15, Class MA, CMO, REMIC, 3.00%, 2/25/2042 | 71,116,085 | 70,036,166 | |||
Series 2017-18, Class A, CMO, REMIC, 3.00%, 8/25/2042 | 88,679,363 | 86,703,321 | |||
Series 2017-32, Class CA, CMO, REMIC, 3.00%, 10/25/2042 | 42,973,152 | 42,258,698 | |||
Series 2017-87, Class BA, CMO, REMIC, 3.00%, 12/25/2042 | 30,575,760 | 30,240,436 | |||
Series 2017-9, Class EA, CMO, REMIC, 3.00%, 10/25/2042 | 73,180,052 | 71,660,760 | |||
Series 2018-27, Class JA, CMO, REMIC, 3.00%, 12/25/2047 | 17,417,041 | 16,771,130 | |||
Series 2018-38, Class JB, CMO, REMIC, 3.00%, 6/25/2048 | 14,751,658 | 14,285,540 | |||
| Government National Mortgage Association: | |||||
Series 2013-169, Class SE, CMO, IO, REMIC, 6.05% - 1 Month USD LIBOR 3.96%, 11/16/2043 (b) | 2,902,022 | 343,275 | |||
Series 2013-34, Class PL, CMO, REMIC, 3.00%, 3/20/2042 | 12,665,261 | 12,405,588 | |||
Series 2014-43, Class PS, CMO, IO, REMIC, 6.18% - 1 Month USD LIBOR 4.10%, 7/20/2042 (b) | 8,439,976 | 937,936 | |||
TOTAL U.S. GOVERNMENT AGENCY OBLIGATIONS (Cost $1,603,925,312) | 1,543,505,555 | ||||
| U.S. TREASURY OBLIGATIONS — 16.0% | |||||
Treasury Bonds 3.13%, 2/15/2043 | 49,890,000 | 51,174,171 | |||
| Treasury Inflation Protected Indexed Notes: | |||||
0.13%, 4/15/2022 | 10,403,909 | 10,192,710 | |||
0.38%, 7/15/2027 | 10,753,050 | 10,466,481 | |||
| Treasury Notes: | |||||
0.75%, 9/30/2018 | 35,000,000 | 34,898,500 | |||
1.13%, 2/28/2019 | 15,000,000 | 14,890,350 | |||
1.50%, 5/31/2020 | 92,300,000 | 90,523,222 | |||
1.63%, 5/15/2026 | 66,620,000 | 60,952,634 |
| Security Description | Principal Amount | Value | |||
1.75%, 3/31/2022 | $ 62,160,000 | $ 60,105,612 | |||
2.13%, 1/31/2021 | 87,000,000 | 85,967,313 | |||
2.13%, 2/29/2024 | 57,600,000 | 55,648,512 | |||
2.25%, 11/15/2025 | 36,900,000 | 35,497,430 | |||
TOTAL U.S. TREASURY OBLIGATIONS (Cost $520,859,130) | 510,316,935 | ||||
| MORTGAGE-BACKED SECURITIES — 4.4% | |||||
| Alternative Loan Trust: | |||||
Series 2005-79CB, Class A4, CMO, 5.50%, 1/25/2036 | 7,760,993 | 6,856,750 | |||
Series 2006-24CB, Class A9, CMO, 6.00%, 6/25/2036 | 4,449,322 | 3,853,530 | |||
Series 2006-43CB, Class 1A12, CMO, 5.75%, 2/25/2037 | 4,009,231 | 3,359,244 | |||
Angel Oak Mortgage Trust I Series 2018-1, Class A1, 3.26%, 4/27/2048 (a) (b) | 9,019,180 | 9,017,128 | |||
Atrium Hotel Portfolio Trust Series 2017-ATRM, Class E, 1 Month USD LIBOR + 3.05%, 5.12%, 12/15/2036 (a) (b) | 3,697,000 | 3,692,344 | |||
Banc of America Alternative Loan Trust Series 2005-9, Class 1CB2, CMO, 5.50%, 10/25/2035 | 5,041,362 | 5,017,817 | |||
| Banc of America Funding Trust: | |||||
Series 2006-8T2, Class A4, CMO, 5.83%, 10/25/2036 (f) | 4,450,484 | 4,062,398 | |||
Series 2007-5, Class CA1, CMO, 6.00%, 7/25/2037 | 6,307,051 | 5,626,732 | |||
BANK Series 2017-BNK6, Class XA, IO, 1.01%, 7/15/2060 (b) | 55,343,271 | 3,162,691 | |||
| BBCMS Mortgage Trust: | |||||
Series 2017-DELC, Class C, 1 Month USD LIBOR + 1.20% 3.27%, 8/15/2036 (a) (b) | 863,000 | 862,452 | |||
Series 2017-DELC, Class D, 1 Month USD LIBOR + 1.70% 3.77%, 8/15/2036 (a) (b) | 983,000 | 982,376 | |||
Series 2017-DELC, Class E, 1 Month USD LIBOR + 2.50% 4.57%, 8/15/2036 (a) (b) | 2,060,000 | 2,064,281 | |||
Series 2017-DELC, Class F, 1 Month USD LIBOR + 3.50% 5.57%, 8/15/2036 (a) (b) | 1,974,000 | 1,978,774 |
Table of Contents
| Security Description | Principal Amount | Value | |||
BCAP LLC Trust Series 2010-RR4, Class 3212, CMO, 6.23%, 1/26/2037 (a) (b) | $ 13,046,597 | $ 11,795,950 | |||
| CHL Mortgage PassThrough Trust: | |||||
Series 2005-J2, Class 3A14, CMO, 5.50%, 8/25/2035 | 1,336,426 | 1,223,966 | |||
Series 2007-12, Class A9, CMO, 5.75%, 8/25/2037 | 4,577,355 | 4,138,977 | |||
| CHT COSMO Mortgage Trust: | |||||
Series 2017-CSMO, Class E, 1 Month USD LIBOR + 3.00% 5.07%, 11/15/2036 (a) (b) | 2,407,000 | 2,424,265 | |||
Series 2017-CSMO, Class F, 1 Month USD LIBOR + 3.74% 5.81%, 11/15/2036 (a) (b) | 1,284,000 | 1,295,600 | |||
Citigroup Commercial Mortgage Trust Series 2008-C7, Class AM, 6.34%, 12/10/2049 (b) (d) | 842,834 | 841,200 | |||
Citigroup Mortgage Loan Trust Series 2007-AR5, Class 1A2A, CMO, 3.74%, 4/25/2037 (b) | 2,534,980 | 2,360,577 | |||
CitiMortgage Alternative Loan Trust Series 2007-A1, Class 1A7, CMO, 6.00%, 1/25/2037 | 8,354,160 | 7,801,554 | |||
CLNS Trust Series 2017-IKPR, Class D, 1 Month USD LIBOR + 2.05%, 4.10%, 6/11/2032 (a) (b) | 3,338,000 | 3,342,171 | |||
Credit Suisse Commercial Mortgage Trust Series 2008-C1, Class AM, 6.17%, 2/15/2041 (a) (b) (d) | 296,236 | 294,783 | |||
CSAIL Commercial Mortgage Trust Series 2017-CX10, Class XA, IO, 0.87%, 11/15/2050 (b) | 65,072,134 | 3,411,381 | |||
CSMC MortgageBacked Trust Series 2006-7, Class 7A7, CMO, 6.00%, 8/25/2036 | 2,589,813 | 2,622,730 | |||
CSMC Trust Series 2018-RPL2, Class A1, CMO, 4.03%, 8/25/2062 (a) (f) | 1,963,644 | 1,963,493 | |||
DBGS BIOD Mortgage Trust Series 2018-BIOD, Class A, 1 Month USD LIBOR + 0.80%, 2.70%, 5/15/2035 (a) (b) | 3,325,000 | 3,320,827 | |||
| GS Mortgage Securities Trust: | |||||
Series 2013-GC14, Class A2, 3.00%, 8/10/2046 | 186,962 | 186,840 | |||
Series 2017-GS7, Class XA, IO, 1.29%, 8/10/2050 (b) | 40,814,314 | 3,202,205 |
| Security Description | Principal Amount | Value | |||
JP Morgan Chase Commercial Mortgage Securities Corp. Series 2018-LAQ, Class A, 1 Month USD LIBOR + 1.00%, 3.00%, 6/15/2032 (a) (b) (e) | $ 3,287,000 | $ 3,287,562 | |||
| JP Morgan Chase Commercial Mortgage Securities Trust: | |||||
Series 2007-LDPX, Class AM, 5.46%, 1/15/2049 (b) (d) | 262,783 | 263,439 | |||
Series 2017-MAUI, Class C, 1 Month USD LIBOR + 1.25% 3.30%, 7/15/2034 (a) (b) | 865,000 | 865,265 | |||
Series 2017-MAUI, Class D, 1 Month USD LIBOR + 1.95% 4.00%, 7/15/2034 (a) (b) | 812,000 | 813,776 | |||
Series 2017-MAUI, Class E, 1 Month USD LIBOR + 2.95% 5.00%, 7/15/2034 (a) (b) | 719,000 | 720,800 | |||
Series 2017-MAUI, Class F, 1 Month USD LIBOR + 3.75% 5.80%, 7/15/2034 (a) (b) | 1,012,000 | 1,014,532 | |||
Morgan Stanley Capital I Trust Series 2016-UB12, Class XA, IO, 0.95%, 12/15/2049 (b) | 57,244,904 | 2,699,252 | |||
OBX Trust Series 2018-1, Class A2, CMO, 1 Month USD LIBOR + 0.65%, 2.74%, 6/25/2057 (a) (b) | 1,844,333 | 1,846,531 | |||
| Rosslyn Portfolio Trust: | |||||
Series 2017-ROSS, Class A, 1 Month USD LIBOR + 0.95% 3.02%, 6/15/2033 (a) (b) | 1,686,000 | 1,686,554 | |||
Series 2017-ROSS, Class B, 1 Month USD LIBOR + 1.25% 3.32%, 6/15/2033 (a) (b) | 1,686,000 | 1,686,565 | |||
Structured Adjustable Rate Mortgage Loan Trust Series 2006-8, Class 4A3, CMO, 3.69%, 9/25/2036 (b) | 1,281,287 | 1,168,939 | |||
Structured Asset Mortgage Investments II Trust Series 2004-AR3, Class M, CMO, 1 Month USD LIBOR + 0.68%, 2.76%, 7/19/2034 (b) | 3,143,284 | 3,035,479 | |||
UBS Commercial Mortgage Trust Series 2017-C1, Class XA, IO, 1.77%, 6/15/2050 (b) | 28,290,231 | 2,947,375 | |||
VSD LLC 3.60%, 12/25/2043 | 2,032,421 | 2,030,944 | |||
Wachovia Bank Commercial Mortgage Trust Series 2007-C30, Class AJ, 5.41%, 12/15/2043 (b) (d) | 1,579,061 | 1,590,153 |
Table of Contents
| Security Description | Principal Amount | Value | |||
| Waldorf Astoria Boca Raton Trust: | |||||
Series 2016-BOCA, Class B, 1 Month USD LIBOR + 2.05% 4.12%, 6/15/2029 (a) (b) | $ 1,536,000 | $ 1,536,942 | |||
Series 2016-BOCA, Class C, 1 Month USD LIBOR + 2.50% 4.57%, 6/15/2029 (a) (b) | 1,300,000 | 1,301,612 | |||
| Washington Mutual Mortgage PassThrough Certificates WMALT Trust: | |||||
Series 2005-8, Class 2CB1, CMO, 5.50%, 10/25/2035 | 2,212,335 | 2,164,588 | |||
Series 2006-5, Class 3A2, CMO, 6.00%, 7/25/2036 (f) | 3,248,643 | 1,404,224 | |||
Wells Fargo Commercial Mortgage Trust Series 2015-P2, Class A4, 3.81%, 12/15/2048 | 1,568,000 | 1,581,829 | |||
Wells Fargo Mortgage Backed Securities Trust Series 2007-AR4, Class A1, CMO, 3.77%, 8/25/2037 (b) | 5,957,578 | 5,840,930 | |||
TOTAL MORTGAGE-BACKED SECURITIES (Cost $140,033,336) | 140,250,327 | ||||
| COMMERCIAL MORTGAGE BACKED SECURITIES — 5.2% | |||||
A10 Securitization LLC Series 2016-1, Class A1, 2.42%, 3/15/2035 (a) | 287,119 | 286,711 | |||
BAMLL Commercial Mortgage Securities Trust Series 2015-200P, Class XA, IO, 0.50%, 4/14/2033 (a) (b) | 30,000,000 | 716,196 | |||
Banc of America Commercial Mortgage Trust Series 2015-UBS7, Class C, 4.51%, 9/15/2048 (b) | 945,000 | 950,812 | |||
BANK Series 2017-BNK4, Class XA, IO, 1.61%, 5/15/2050 (b) | 30,534,898 | 2,756,736 | |||
BBCMS Trust Series 2015-STP, Class D, 4.43%, 9/10/2028 (a) (b) | 1,750,000 | 1,738,079 | |||
| BX Trust: | |||||
Series 2017-APPL, Class D, 1 Month USD LIBOR + 3.15% 4.12%, 7/15/2034 (a) (b) | 1,215,478 | 1,219,519 |
| Security Description | Principal Amount | Value | |||
Series 2017-APPL, Class E, 1 Month USD LIBOR + 3.15% 5.22%, 7/15/2034 (a) (b) | $ 1,881,097 | $ 1,889,338 | |||
Series 2017-IMC, Class D, 1 Month USD LIBOR + 2.25% 4.32%, 10/15/2032 (a) (b) | 1,412,000 | 1,414,196 | |||
Series 2017-IMC, Class E, 1 Month USD LIBOR + 3.25% 5.32%, 10/15/2032 (a) (b) | 2,277,000 | 2,282,686 | |||
Series 2017-SLCT, Class D, 1 Month USD LIBOR + 2.05% 4.12%, 7/15/2034 (a) (b) | 1,291,000 | 1,293,021 | |||
Series 2017-SLCT, Class E, 1 Month USD LIBOR + 3.15% 5.22%, 7/15/2034 (a) (b) | 2,124,000 | 2,133,975 | |||
Series 2018-GW, Class A, 2.70%, 5/15/2035 (a) (b) | 3,140,000 | 3,141,175 | |||
Series 2018-GW, Class D, 3.67%, 5/15/2035 (a) (b) | 275,000 | 274,828 | |||
CD Mortgage Trust Series 2017-CD4, Class XA, IO, 1.48%, 5/10/2050 (b) | 16,938,895 | 1,419,884 | |||
| CFCRE Commercial Mortgage Trust: | |||||
Series 2016-C3, Class XA, IO, 1.22%, 1/10/2048 (b) | 24,640,907 | 1,563,811 | |||
Series 2016-C4, Class XA, IO, 1.90%, 5/10/2058 (b) | 19,534,084 | 1,971,782 | |||
Series 2017-C8, Class XA, IO, 1.83%, 6/15/2050 (b) | 28,174,414 | 2,914,502 | |||
| Citigroup Commercial Mortgage Trust: | |||||
Series 2015-GC27, Class D, 4.58%, 2/10/2048 (a) (b) | 943,700 | 813,112 | |||
Series 2015-GC31, Class C, 4.20%, 6/10/2048 (b) | 1,500,000 | 1,417,290 | |||
Series 2015-GC33, Class C, 4.72%, 9/10/2058 (b) | 1,500,000 | 1,480,680 | |||
Series 2015-GC35, Class C, 4.65%, 11/10/2048 (b) | 1,435,000 | 1,391,342 | |||
Series 2016-GC36, Class XA, IO, 1.48%, 2/10/2049 (b) | 21,815,717 | 1,652,318 | |||
Series 2016-P4, Class A4, 2.90%, 7/10/2049 | 2,023,000 | 1,911,368 | |||
Series 2016-P6, Class A5, 3.72%, 12/10/2049 (b) | 2,558,000 | 2,558,821 | |||
| Cold Storage Trust: | |||||
Series 2017-ICE3, Class A, 1 Month USD LIBOR + 1.00% 3.07%, 4/15/2036 (a) (b) | 1,965,000 | 1,972,349 |
Table of Contents
| Security Description | Principal Amount | Value | |||
Series 2017-ICE3, Class C, 1 Month USD LIBOR + 1.35% 3.42%, 4/15/2036 (a) (b) | $ 2,397,000 | $ 2,404,486 | |||
| COMM Mortgage Trust: | |||||
Series 2013-CR12, Class XA, IO, 1.43%, 10/10/2046 (b) | 32,566,421 | 1,443,819 | |||
Series 2015-CR22, Class D, 4.26%, 3/10/2048 (a) (b) | 1,500,000 | 1,246,985 | |||
Series 2015-CR22, Class XA, IO, 1.12%, 3/10/2048 (b) | 10,653,359 | 459,207 | |||
Series 2015-CR23, Class D, 4.39%, 5/10/2048 (b) | 900,000 | 735,882 | |||
Series 2015-CR26, Class B, 4.64%, 10/10/2048 (b) | 1,600,000 | 1,640,673 | |||
Series 2015-CR26, Class XA, IO, 1.18%, 10/10/2048 (b) | 22,434,380 | 1,236,316 | |||
Series 2015-DC1, Class D, 4.50%, 2/10/2048 (a) (b) | 750,000 | 635,711 | |||
Series 2015-DC1, Class XA, IO, 1.28%, 2/10/2048 (b) | 8,952,983 | 443,109 | |||
Series 2015-LC19, Class D, 2.87%, 2/10/2048 (a) | 1,200,000 | 997,310 | |||
Series 2015-LC21, Class C, 4.45%, 7/10/2048 (b) | 968,000 | 948,407 | |||
Series 2016-CR28, Class C, 4.80%, 2/10/2049 (b) | 2,235,000 | 2,231,234 | |||
Series 2016-DC2, Class C, 4.80%, 2/10/2049 (b) | 1,329,000 | 1,298,688 | |||
Series 2016-DC2, Class XA, IO, 1.21%, 2/10/2049 (b) | 19,617,835 | 1,173,694 | |||
Series 2017-PANW, Class D, 4.34%, 10/10/2029 (a) (b) | 1,388,000 | 1,345,637 | |||
Series 2017-PANW, Class E, 4.13%, 10/10/2029 (a) (b) | 2,316,000 | 2,159,118 | |||
| CSAIL Commercial Mortgage Trust: | |||||
Series 2015-C2, Class AS, 3.85%, 6/15/2057 (b) | 900,000 | 899,215 | |||
Series 2015-C4, Class XA, IO, 1.07%, 11/15/2048 (b) | 35,865,337 | 1,770,320 | |||
GE Commercial Mortgage Corp. Trust Series 2007-C1, Class AM, 5.61%, 12/10/2049 (b) | 854,155 | 848,490 | |||
| Great Wolf Trust: | |||||
Series 2017-WOLF, Class D, 1 Month USD LIBOR + 2.10% 4.32%, 9/15/2034 (a) (b) | 1,798,000 | 1,802,490 | |||
Series 2017-WOLF, Class E, 1 Month USD LIBOR + 3.10% 5.32%, 9/15/2034 (a) (b) | 2,787,000 | 2,797,459 |
| Security Description | Principal Amount | Value | |||
Series 2017-WOLF, Class F, 1 Month USD LIBOR + 4.07% 6.29%, 9/15/2034 (a) (b) | $ 1,484,000 | $ 1,489,570 | |||
GS Mortgage Securities Corp. Series 2017-GS8, Class C, 4.48%, 11/10/2050 (b) | 469,000 | 465,865 | |||
GS Mortgage Securities Corp. II Series 2013-GC10, Class XA, IO, 1.69%, 2/10/2046 (b) | 14,265,830 | 788,154 | |||
| GS Mortgage Securities Trust: | |||||
Series 2014-GC20, Class XA, IO, 1.17%, 4/10/2047 (b) | 40,709,796 | 1,762,734 | |||
Series 2014-GC24, Class XA, IO, 0.95%, 9/10/2047 (b) | 31,684,697 | 1,126,955 | |||
Series 2015-GC32, Class XA, IO, 0.99%, 7/10/2048 (b) | 25,971,863 | 1,103,822 | |||
Series 2015-GC34, Class XA, IO, 1.50%, 10/10/2048 (b) | 17,169,073 | 1,214,085 | |||
Series 2015-GS1, Class XA, IO, 0.96%, 11/10/2048 (b) | 26,748,057 | 1,282,222 | |||
Series 2016-GS3, Class XA, IO, 1.40%, 10/10/2049 (b) | 32,649,862 | 2,524,073 | |||
| JP Morgan Chase Commercial Mortgage Securities Corp.: | |||||
Series 2017-FL10, Class B, 1 Month USD LIBOR + 1.00% 3.07%, 6/15/2032 (a) (b) | 815,000 | 814,959 | |||
Series 2017-FL10, Class C, 1 Month USD LIBOR + 1.25% 3.32%, 6/15/2032 (a) (b) | 616,000 | 617,783 | |||
Series 2017-FL10, Class D, 1 Month USD LIBOR + 1.90% 3.97%, 6/15/2032 (a) (b) | 1,994,000 | 1,987,052 | |||
| JP Morgan Chase Commercial Mortgage Securities Trust: | |||||
Series 2006-LDP9, Class AM, 5.37%, 5/15/2047 (d) | 481,737 | 484,679 | |||
Series 2007-C1, Class AM, 6.11%, 2/15/2051 (b) | 839,832 | 838,185 | |||
Series 2007-LD11, Class AM, 6.16%, 6/15/2049 (b) (d) | 365,422 | 371,059 | |||
Series 2012-C8, Class B, 3.98%, 10/15/2045 (a) (b) | 1,775,000 | 1,777,290 | |||
Series 2015-JP1, Class XA, IO, 1.29%, 1/15/2049 (b) | 22,890,728 | 1,137,292 |
Table of Contents
| Security Description | Principal Amount | Value | |||
Series 2016-ASH, Class B, 1 Month USD LIBOR + 2.15% 4.22%, 10/15/2034 (a) (b) | $ 2,009,294 | $ 2,009,274 | |||
Series 2016-ASH, Class C, 1 Month USD LIBOR + 2.75% 4.82%, 10/15/2034 (a) (b) | 1,134,405 | 1,134,749 | |||
Series 2016-JP2, Class XA, IO, 2.00%, 8/15/2049 (b) | 19,893,906 | 2,278,254 | |||
Series 2016-WIKI, Class E, 4.14%, 10/5/2031 (a) (b) | 3,160,000 | 3,076,779 | |||
| JPMBB Commercial Mortgage Securities Trust: | |||||
Series 2014-C25, Class XA, IO, 1.10%, 11/15/2047 (b) | 6,294,000 | 263,416 | |||
Series 2014-C26, Class C, 4.57%, 1/15/2048 (b) | 1,500,000 | 1,473,476 | |||
Series 2015-C28, Class XA, IO, 1.29%, 10/15/2048 (b) | 11,592,638 | 542,904 | |||
Series 2015-C30, Class XA, IO, 0.77%, 7/15/2048 (b) | 29,688,492 | 869,460 | |||
Series 2015-C32, Class C, 4.82%, 11/15/2048 (b) | 1,300,000 | 1,287,073 | |||
Series 2015-C33, Class C, 4.77%, 12/15/2048 (b) | 1,739,000 | 1,746,412 | |||
Series 2016-C1, Class C, 4.90%, 3/15/2049 (b) | 2,180,000 | 2,202,365 | |||
JPMDB Commercial Mortgage Securities Trust Series 2016-C2, Class XA, IO, 1.85%, 6/15/2049 (b) | 21,859,762 | 1,834,782 | |||
LSTAR Commercial Mortgage Trust Series 2017-5, Class X, IO, 1.39%, 3/10/2050 (a) (b) | 48,198,843 | 2,310,248 | |||
| Merrill Lynch Mortgage Trust: | |||||
Series 2006-C1, Class AJ, 5.78%, 5/12/2039 (b) (d) | 142,326 | 143,662 | |||
Series 2007-C1, Class AM, 5.99%, 6/12/2050 (b) | 232,747 | 232,280 | |||
| Morgan Stanley Bank of America Merrill Lynch Trust: | |||||
Series 2013-C12, Class XA, IO, 0.99%, 10/15/2046 (b) | 17,243,362 | 413,949 | |||
Series 2013-C7, Class XA, IO, 1.52%, 2/15/2046 (b) | 14,927,629 | 766,940 | |||
Series 2015-C20, Class C, 4.61%, 2/15/2048 (b) | 500,000 | 490,980 | |||
Series 2015-C25, Class C, 4.68%, 10/15/2048 (b) | 1,700,000 | 1,711,040 | |||
Series 2015-C27, Class C, 4.68%, 12/15/2047 (b) | 1,219,000 | 1,172,620 | |||
Series 2015-C27, Class D, 3.24%, 12/15/2047 (a) (b) | 1,750,000 | 1,386,909 |
| Security Description | Principal Amount | Value | |||
Series 2016-C28, Class XA, IO, 1.43%, 1/15/2049 (b) | $ 23,999,183 | $ 1,674,745 | |||
Series 2016-C30, Class XA, IO, 1.59%, 9/15/2049 (b) | 28,462,767 | 2,517,631 | |||
Series 2016-C31, Class C, 4.46%, 11/15/2049 (b) | 3,358,000 | 3,250,400 | |||
Series 2016-C32, Class A4, 3.72%, 12/15/2049 | 2,665,000 | 2,666,913 | |||
Morgan Stanley Capital I Trust Series 2015-UBS8, Class XA, IO, 1.08%, 12/15/2048 (b) | 25,466,497 | 1,391,248 | |||
| PFP, Ltd.: | |||||
Series 2017-3, Class A, 1 Month USD LIBOR + 1.05% 3.12%, 1/14/2035 (a) (b) | 985,260 | 985,574 | |||
Series 2017-3, Class AS, 1 Month USD LIBOR + 1.30% 3.37%, 1/14/2035 (a) (b) | 1,253,000 | 1,254,683 | |||
Series 2017-3, Class B, 1 Month USD LIBOR + 1.75% 3.82%, 1/14/2035 (a) (b) | 720,000 | 720,915 | |||
Series 2017-3, Class C, 1 Month USD LIBOR + 2.50% 4.57%, 1/14/2035 (a) (b) | 752,000 | 754,110 | |||
UBS Commercial Mortgage Trust Series 2017-C4, Class XA, IO, 1.26%, 10/15/2050 (b) | 44,396,407 | 3,440,136 | |||
| Wachovia Bank Commercial Mortgage Trust: | |||||
Series 2006-C26, Class AM, 6.20%, 6/15/2045 (b) | 240,006 | 242,380 | |||
Series 2007-C33, Class AM, 6.21%, 2/15/2051 (b) (d) | 773,290 | 793,009 | |||
Waterfall Commercial Mortgage Trust Series 2015-SBC5, Class A, 4.10%, 9/14/2022 (a) (b) | 7,537,979 | 7,350,034 | |||
| Wells Fargo Commercial Mortgage Trust: | |||||
Series 2014-LC16, Class D, 3.94%, 8/15/2050 (a) | 920,000 | 754,689 | |||
Series 2015-C26, Class D, 3.59%, 2/15/2048 (a) | 900,000 | 731,730 | |||
Series 2015-C26, Class XA, IO, 1.42%, 2/15/2048 (b) | 8,847,611 | 549,580 | |||
Series 2015-C27, Class C, 3.89%, 2/15/2048 | 750,000 | 698,069 | |||
Series 2015-C28, Class C, 4.27%, 5/15/2048 (b) | 1,500,000 | 1,430,686 |
Table of Contents
| Security Description | Principal Amount | Value | |||
Series 2015-LC20, Class XA, IO, 1.52%, 4/15/2050 (b) | $ 7,772,725 | $ 481,565 | |||
Series 2015-NXS1, Class XA, IO, 1.30%, 5/15/2048 (b) | 9,711,216 | 505,566 | |||
Series 2015-NXS2, Class XA, IO, 0.90%, 7/15/2058 (b) | 29,288,481 | 1,030,427 | |||
Series 2015-NXS3, Class C, 4.64%, 9/15/2057 (b) | 1,600,000 | 1,545,077 | |||
Series 2015-P2, Class XA, IO, 1.15%, 12/15/2048 (b) | 21,900,815 | 1,148,809 | |||
Series 2016-C32, Class C, 4.88%, 1/15/2059 (b) | 1,581,000 | 1,550,791 | |||
Series 2016-C33, Class XA, IO, 1.96%, 3/15/2059 (b) | 15,247,702 | 1,447,220 | |||
Series 2016-LC24, Class XA, IO, 1.87%, 10/15/2049 (b) | 16,405,064 | 1,671,740 | |||
Series 2017-C38, Class XA, IO, 1.23%, 7/15/2050 (b) | 38,979,296 | 2,792,071 | |||
Series 2017-RC1, Class XA, IO, 1.72%, 1/15/2060 (b) | 25,452,390 | 2,411,286 | |||
| WFRBS Commercial Mortgage Trust: | |||||
Series 2014-C19, Class XA, IO, 1.27%, 3/15/2047 (b) | 9,972,272 | 436,098 | |||
Series 2014-C21, Class XA, IO, 1.23%, 8/15/2047 (b) | 18,702,177 | 878,398 | |||
TOTAL COMMERCIAL MORTGAGE BACKED SECURITIES (Cost $182,270,150) | 163,921,712 | ||||
TOTAL INVESTMENTS — 99.5% (Cost $3,273,818,299) | 3,165,752,643 | ||||
OTHER ASSETS IN EXCESS OF LIABILITIES — 0.5% | 16,486,154 | ||||
NET ASSETS — 100.0% | $ 3,182,238,797 |
| (a) | Securities purchased pursuant to Rule 144A of the Securities Act of 1933, as amended. These securities, which represent 8.5% of net assets as of June 30, 2018, are considered liquid and may be resold in transactions exempt from registration, normally to qualified institutional buyers. |
| (b) | Variable Rate Security - Interest rate shown is the rate in effect at June 30, 2018. For securities based on a published reference rate and spread, the reference rate and spread are indicated in the description above. |
| (c) | Amount is less than 0.05% of net assets. |
| (d) | Fair valued as determined in good faith by the Trust’s Oversight Committee in accordance with policy and procedures approved by the Board of Trustees. As of June 30, 2018, total aggregate fair value of securities is $10,725,218 representing 0.3% of net assets. |
| (e) | When-issued security. |
| (f) | Step-up bond - Coupon rate increases in increments to maturity. Rate shown as of June 30, 2018. Maturity date shown is the final maturity. |
| (g) | The rate shown represents the rate at June 30, 2018. |
| CMO | =Collateralized Mortgage Obligation |
| CMT | =Constant Maturity Treasury |
| EMTN | =Euro Medium Term Note |
| GMTN | =Global Medium Term Note |
| IO | =Interest Only |
| LIBOR | =London Interbank Offered Rate |
| MTN | =Medium Term Note |
| REMIC | =Real Estate Mortgage Investment Conduit |
| Borrower | Unfunded Loan Commitment ($) | Value ($) | Unrealized Appreciation/(Depreciation) ($) | |||
Sinclair Television Group, Inc. | 3,012,945 | 3,014,353 | 1,408 | |||
Mavis Tire Express Services Corp. | 483,096 | 480,076 | (3,020) | |||
| $(1,612) |
Table of Contents
| Description | Level 1 – Quoted Prices | Level 2 – Other Significant Observable Inputs | Level 3 – Significant Unobservable Inputs | Total | ||||
| ASSETS: | ||||||||
| INVESTMENTS: | ||||||||
| Corporate Bonds & Notes | ||||||||
Argentina | $— | $ 7,543,845 | $— | $ 7,543,845 | ||||
Australia | — | 7,222,966 | — | 7,222,966 | ||||
Belgium | — | 3,257,970 | — | 3,257,970 | ||||
Brazil | — | 12,980,063 | — | 12,980,063 | ||||
Canada | — | 10,015,902 | — | 10,015,902 | ||||
Cayman Islands | — | 4,303,215 | — | 4,303,215 | ||||
Chile | — | 24,981,478 | — | 24,981,478 | ||||
China | — | 10,292,027 | — | 10,292,027 | ||||
Colombia | — | 1,968,301 | — | 1,968,301 | ||||
Costa Rica | — | 3,032,383 | — | 3,032,383 | ||||
Dominican Republic | — | 6,235,750 | — | 6,235,750 | ||||
Hong Kong | — | 2,916,351 | — | 2,916,351 | ||||
India | — | 34,847,079 | — | 34,847,079 | ||||
Ireland | — | 847,600 | — | 847,600 | ||||
Israel | — | 6,615,989 | — | 6,615,989 | ||||
Jamaica | — | 2,916,500 | — | 2,916,500 | ||||
Japan | — | 3,720,528 | — | 3,720,528 | ||||
Luxembourg | — | 3,118,856 | — | 3,118,856 | ||||
Malaysia | — | 23,310,346 | — | 23,310,346 | ||||
Mexico | — | 11,704,957 | — | 11,704,957 | ||||
Netherlands | — | 426,550 | — | 426,550 | ||||
Panama | — | 7,051,100 | — | 7,051,100 | ||||
Peru | — | 8,018,688 | — | 8,018,688 | ||||
Philippines | — | 7,011,945 | — | 7,011,945 | ||||
Singapore | — | 18,543,073 | — | 18,543,073 | ||||
United Kingdom | — | 9,274,719 | — | 9,274,719 | ||||
United States | — | 206,734,819 | — | 206,734,819 | ||||
Asset-Backed Securities | — | 79,573,274 | — | 79,573,274 | ||||
| Foreign Government Obligations | ||||||||
Argentina | — | 7,770,750 | — | 7,770,750 | ||||
Brazil | — | 6,015,250 | — | 6,015,250 | ||||
Chile | — | 9,803,630 | — | 9,803,630 | ||||
Costa Rica | — | 3,159,188 | — | 3,159,188 | ||||
India | — | 1,633,107 | — | 1,633,107 | ||||
Indonesia | — | 6,778,561 | — | 6,778,561 | ||||
Israel | — | 8,682,626 | — | 8,682,626 | ||||
Malaysia | — | 3,467,501 | — | 3,467,501 | ||||
Mexico | — | 2,639,775 | — | 2,639,775 | ||||
Panama | — | 5,658,072 | — | 5,658,072 | ||||
Peru | — | 771,208 | — | 771,208 | ||||
Philippines | — | 8,057,526 | — | 8,057,526 | ||||
United States | — | 27,940 | — | 27,940 | ||||
| Senior Floating Rate Loans | ||||||||
Aerospace & Defense | — | 798,240 | — | 798,240 | ||||
Auto Components | — | 9,196,998 | — | 9,196,998 | ||||
Building Products | — | 2,512,648 | — | 2,512,648 | ||||
Capital Markets | — | 3,009,260 | — | 3,009,260 | ||||
Casino Services | — | 790,000 | — | 790,000 | ||||
Chemicals | — | 5,441,959 | — | 5,441,959 | ||||
Commercial Services & Supplies | — | 13,453,004 | — | 13,453,004 | ||||
Communications Equipment | — | 6,504,272 | — | 6,504,272 |
Table of Contents
| Description | Level 1 – Quoted Prices | Level 2 – Other Significant Observable Inputs | Level 3 – Significant Unobservable Inputs | Total | ||||
Construction & Engineering | $— | $ 4,255,152 | $— | $ 4,255,152 | ||||
Construction Materials | — | 2,860,565 | — | 2,860,565 | ||||
Containers & Packaging | — | 4,249,871 | — | 4,249,871 | ||||
Distributors | — | 136,325 | — | 136,325 | ||||
Diversified Financial Services | — | 1,355,007 | — | 1,355,007 | ||||
Diversified Telecommunication Services | — | 5,021,472 | — | 5,021,472 | ||||
Electrical Equipment | — | 2,124,819 | — | 2,124,819 | ||||
Energy Equipment & Services | — | 2,328,905 | — | 2,328,905 | ||||
Financial Services | — | 2,845,804 | — | 2,845,804 | ||||
Food & Staples Retailing | — | 3,639,277 | — | 3,639,277 | ||||
Food Products | — | 786,320 | — | 786,320 | ||||
Food-Misc/Diversified | — | 694,488 | — | 694,488 | ||||
Health Care Providers & Services | — | 16,767,514 | — | 16,767,514 | ||||
Health Care Technology | — | 4,034,957 | — | 4,034,957 | ||||
Hotels, Restaurants & Leisure | — | 17,305,029 | — | 17,305,029 | ||||
Household Products | — | 866,981 | — | 866,981 | ||||
Insurance | — | 10,532,373 | — | 10,532,373 | ||||
Internet Software & Services | — | 7,787,200 | — | 7,787,200 | ||||
IT Services | — | 9,344,669 | — | 9,344,669 | ||||
Life Sciences Tools & Services | — | 5,831,932 | — | 5,831,932 | ||||
Machinery | — | 5,184,067 | — | 5,184,067 | ||||
Media | — | 11,153,672 | — | 11,153,672 | ||||
Metal-Diversified | — | 1,637,305 | — | 1,637,305 | ||||
Metals & Mining | — | 4,299,856 | — | 4,299,856 | ||||
Oil Refining&Marketing | — | 802,438 | — | 802,438 | ||||
Oil, Gas & Consumable Fuels | — | 3,000,890 | — | 3,000,890 | ||||
Pharmaceuticals | — | 4,007,061 | — | 4,007,061 | ||||
Real Estate Investment Trusts (REITs) | — | 397,255 | — | 397,255 | ||||
Real Estate Management & Development | — | 2,377,598 | — | 2,377,598 | ||||
Retail-Restaurants | — | 3,356,833 | — | 3,356,833 | ||||
Software | — | 41,663,353 | — | 41,663,353 | ||||
Specialty Retail | — | 2,471,337 | — | 2,471,337 | ||||
U.S. Government Agency Obligations | — | 1,543,505,555 | — | 1,543,505,555 | ||||
U.S. Treasury Obligations | — | 510,316,935 | — | 510,316,935 | ||||
Mortgage-Backed Securities | — | 140,250,327 | — | 140,250,327 | ||||
Commercial Mortgage Backed Securities | — | 163,921,712 | — | 163,921,712 | ||||
TOTAL INVESTMENTS | $— | $3,165,752,643 | $— | $3,165,752,643 | ||||
| OTHER FINANCIAL INSTRUMENTS: | ||||||||
Unfunded Loan Commitments(a) | — | (1,612) | — | (1,612) | ||||
TOTAL INVESTMENTS AND OTHER FINANCIAL INSTRUMENTS | $— | $3,165,751,031 | $— | $3,165,751,031 |
| (a) | appreciation (depreciation) on unfunded loan commitments. |
| Number of Shares Held at 6/30/17* | Value at 6/30/17* | Cost of Purchases** | Proceeds from Shares Sold | Realized Gain (Loss) | Change in Unrealized Appreciation/ Depreciation | Number of Shares Held at 6/30/18 | Value at 6/30/18 | Dividend Income | Capital Gains Distributions | ||||||||||
State Street Institutional U.S. Government Money Market Fund, Class G Shares | — | $— | $172,560,754 | $172,560,754 | $— | $— | — | $— | $30,142 | $— |
| * | Refer to Note 1 on the Notes to Financial Statements regarding the discontinuance of the master-feeder structure. |
| ** | Includes transfers from Portfolio - See Note 1 in the Notes to Financial Statements. |
| 22 | ARTOTL |
Table of Contents
Item 7. Disclosure of Proxy Voting Policies and Procedures for Closed-End Management Investment Companies.
Not applicable to the registrant.
Item 8. Portfolio Managers of Closed-End Management Investment Companies.
Not applicable to the registrant.
Item 9. Purchases of Equity Securities by Closed-End Management Investment Company and Affiliated Purchasers.
Not applicable to the registrant.
Item 10. Submission of Matters to a Vote of Security Holders.
The registrant has not adopted any material changes to the procedures by which shareholders may recommend nominees to the registrant’s Board.
Item 11. Controls and Procedures.
(a) Within 90 days of the filing date of this Form N-CSR, Ellen M. Needham, the registrant’s President and Principal Executive Officer, and Bruce S. Rosenberg, the registrant’s Treasurer and Principal Financial Officer, reviewed the registrant’s disclosure controls and procedures (as defined in Rule 30a-3(c) under the Investment Company Act of 1940, as amended (the “1940 Act”)) and evaluated their effectiveness. Based on their review, Ms. Needham and Mr. Rosenberg determined that the disclosure controls and procedures adequately ensure that information required to be disclosed by the registrant in its periodic reports is recorded, processed, summarized and reported within the time periods required by the U.S. Securities and Exchange Commission.
(b) There were no changes in the registrant’s internal control over financial reporting (as defined in Rule 30a-3(d) under the 1940 Act) that occurred during the second fiscal quarter of the period covered by this report that have materially affected, or are reasonably likely to materially affect, the registrant’s internal control over financial reporting.
Item 12. Disclosure of Securities Lending Activities for Closed-End Management Investment Companies.
(a) Not applicable.
Table of Contents
(b) Not applicable.
Item 13. Exhibits.
(a)(1) Code of Ethics referred to in Item 2.
(a)(2) Separate certifications required by Rule 30a-2(a) under the Investment Company Act of 1940, as amended, for each principal executive officer and principal financial officer of the registrant are attached.
(a)(3) Not applicable to the registrant.
(a)(4) Not applicable.
| (b) | A single certification required by Rule 30a-2(b) under the Investment Company Act of 1940, as amended, Rule 13a-14(b) or Rule 15d-14(b) under the Securities Exchange Act of 1934, as amended, and Section 1350 of Chapter 63 of Title 18 of the United States Code for the principal executive officer and principal financial officer of the registrant is attached. |
Table of Contents
SIGNATURES
Pursuant to the requirements of the Securities Exchange Act of 1934, as amended, and the Investment Company Act of 1940, as amended, the registrant has duly caused this report to be signed on its behalf by the undersigned, thereunto duly authorized.
| SSGA Active Trust | ||
| By: | /s/ Ellen M. Needham | |
| Ellen M. Needham | ||
| President and Principal Executive Officer | ||
| Date: | September 6, 2018 | |
Pursuant to the requirements of the Securities Exchange Act of 1934, as amended, and the Investment Company Act of 1940, as amended, this report has been signed below by the following persons on behalf of the registrant and in the capacities and on the dates indicated.
| By: | /s/ Ellen M. Needham | |
| Ellen M. Needham | ||
| President and Principal Executive Officer | ||
| Date: | September 6, 2018 | |
| By: | /s/ Bruce S. Rosenberg | |
| Bruce S. Rosenberg | ||
| Treasurer and Principal Financial Officer | ||
| Date: | September 6, 2018 | |