Table of Contents
UNITED STATES
SECURITIES AND EXCHANGE COMMISSION
Washington, D.C. 20549
FORM N-CSR
CERTIFIED SHAREHOLDER REPORT OF REGISTERED
MANAGEMENT INVESTMENT COMPANIES
Investment Company Act file number: 811-22542
SSGA ACTIVE TRUST
(Exact name of registrant as specified in charter)
One Lincoln Street, Boston, Massachusetts 02111
(Address of principal executive offices) (zip code)
Christopher A. Madden, Esq.
State Street Bank and Trust Company
One Lincoln Street/SUM0703
Boston, Massachusetts 02111
(Name and address of agent for service)
Copy to:
W. John McGuire, Esq.
Morgan, Lewis & Bockius LLP
1111 Pennsylvania Avenue, NW
Washington, DC 20004
Registrant’s telephone number, including area code: (617) 664-7037
Date of fiscal year end: June 30
Date of reporting period: June 30, 2016
Table of Contents
Item 1. Reports to Shareholders.
Table of Contents
Annual Report
30 June 2016
SSGA Active Trust

The information contained in this report is intended for the general information of shareholders of the Trust. This report is not authorized for distribution to prospective investors unless preceded or accompanied by a current Trust prospectus which contains important information concerning the Trust. You may obtain a current prospectus and SAI from the Distributor by calling 1-866-787-2257 or visiting www.spdrs.com Please read the prospectus carefully before you invest.
Table of Contents
Management’s Discussion of Fund Performance & Performance Summary | ||||
| 1 | ||||
| 4 | ||||
| 7 | ||||
| 10 | ||||
| 13 | ||||
| 16 | ||||
| 19 | ||||
| 22 | ||||
| 25 | ||||
| 28 | ||||
| 32 | ||||
| 40 | ||||
| 50 | ||||
| 57 | ||||
| 58 |
The information contained in this report is intended for the general information of shareholders of the Trust. This report is not authorized for distribution to prospective investors unless preceded or accompanied by a current Trust prospectus which contains important information concerning the Trust. You may obtain a current prospectus and SAI from the Distributor by calling 1-866-787-2257 or visiting www.spdrs.com Please read the prospectus carefully before you invest.
Table of Contents

SPDR SSGA Multi-Asset Real Return ETF —
MANAGEMENT’S DISCUSSIONOF FUND PERFORMANCE (UNAUDITED)
The SPDR SSGA Multi-Asset Real Return ETF (the “Fund”) invests substantially all of its assets in the SSGA Multi-Asset Real Return Portfolio (the “Portfolio”), which seeks to achieve real return consisting of capital appreciation and current income. As a result, the Fund invests indirectly through the Portfolio.
For the 12-month period ended June 30, 2016 (the “Reporting Period”), the total return for the Fund was –4.22%, and the total return for the Barclays U.S. Government Inflation-Linked Bond Index (the “Index”) was 4.59%. The Fund and Index returns reflect the reinvestment of dividends and other income. The Fund’s performance reflects the expenses of managing the Fund, including brokerage and advisory expenses. The Index is unmanaged and Index returns do not reflect fees and expenses of any kind, which would have a negative impact on returns.
The Fund underperformed the Index during the Reporting Period. Much of the Reporting Period was characterized by deteriorating expectations for global growth and benign inflation expectations. Further impeding inflation sensitive assets was the persistent weakness in oil prices due to elevated supply and lackluster demand in the crude oil market. These dynamics imposed downward pressure on inflation expectations as measured by five year breakeven interest rates over much of the reporting period. Realized inflation prints supported these expectations as inflation trended lower and in fact decreased on a year over year basis in September 2015, as measured by the U.S. Consumer Price Index for All Items Not Seasonally Adjusted. Weak input prices manifested in broad weakness across earnings expectations for resource equities. In fact, the reported earnings for the U.S. energy sector within the S&P 500 Index contracted over 70% for both Q3 and Q4 of 2015. The second half of the Reporting Period picked up where the first half left off as growth expectations languished and Brent crude oil prices dropped below $30 a barrel in January. However, momentum began to shift in mid-February as global central banks implemented further monetary accommodation in efforts to support growth and stabilize prices. Speculation for a coordinated production freeze further aided in stabilizing oil prices. The International Energy Agency offered a tailwind for oil prices after publishing a report suggesting that crude oil prices may have bottomed, helping support the “reflation” trade that characterized much of the remainder of the first half of calendar year 2016. Real assets broadly were supported by improved inflation expectations, realized inflation, and rising commodity prices associated with the reflation trade. Despite a rocky start, real assets enjoyed a favorable first half of 2016 as commodities, Real Estate Investment Trusts (“REITs”), and resource equities offered double digit returns.
Top contributors to overall portfolio performance during the Reporting Period were U.S. REITs, U.S. Treasury Inflation Protected Securities (TIPS), and international REITs. Global securitized real estate companies offered favorable returns benefitting from attractive yields, a low interest rate environment, rising property values, and improved demand for apartments, commercial and industrial space. U.S. TIPS performed well over the Reporting Period as real yields progressed lower during the first half of 2016, finishing the period slightly above 0.0%. Wavering global growth and expectations for the U.S. Federal Reserve to pause in raising administered interest rates favored defensive fixed income assets. Despite a strong second half of the fiscal period, the primary negative contributors to portfolio performance were broad commodities and resource equities. Deteriorations in the global growth outlook and unfavorable supply and demand balances for many commodities, including oil, placed significant downward pressure on broad commodities during Q3 and Q4 of 2015. One of many knock-on effects of falling commodity prices was weaker earnings expectations for commodity sensitive companies within resource equities. Resource equities fell over 20% in the first quarter of the Reporting Period driven by negative impacts of low commodity prices to corporate bottom lines.
The views expressed above reflect those of the Fund’s portfolio manager only through the Reporting Period, and do not necessarily represent the views of the Adviser as a whole. Any such views are subject to change at any time based upon market or other conditions and the Adviser disclaims any responsibility to update such views. These views may not be relied on as investment advice and, because investment decisions for a fund are based on numerous factors, may not be relied on as an indication of trading intent on behalf of any fund.
1
Table of Contents
SPDR SSGA MULTI-ASSET REAL RETURN ETF — PERFORMANCE SUMMARY
The following performance chart of the Fund’s total return at net asset value, the total return based on market price and its benchmark index is provided for comparative purposes only and represents the periods noted. The Fund’s per share net asset value (“NAV”) is the value of one share of the Fund and is calculated by dividing the value of total assets less total liabilities by the number of shares outstanding. The NAV return is based on the NAV of the Fund and the market return is based on the market price per share of the Fund. The market price used to calculate the market return is determined by using the midpoint between the highest bid and the lowest offer on the exchange on which the shares of the Fund are listed for trading, as of the time that the Fund’s NAV is calculated. Since shares of the Fund did not trade in the secondary market until one day after the Fund’s inception, for the period from inception to the first day of secondary market trading in shares of the Fund (4/25/12, 4/26/12, respectively), the NAV of the Fund is used as a proxy for the secondary market trading price to calculate market returns. NAV and market returns assume that dividends and capital gain distributions have been reinvested in the Fund at NAV. Market returns do not include brokerage commissions that may be payable on secondary market transactions. If brokerage commissions were included market returns would be lower.
An index is a statistical measure of a specified financial market or sector. An index does not actually hold a portfolio of securities and therefore does not reflect deductions for fees or expenses. In comparison, the Fund’s performance is negatively impacted by these deductions.
Performance quoted represents past performance, which is no guarantee of future results. Investment return and principal value will fluctuate, so you may have a gain or loss when shares are sold. Current performance may be higher or lower than that quoted. Visit www.spdrs.com for most recent month-end performance. The returns do not reflect the deduction of taxes that a shareholder would pay on Fund distributions or on the redemption or sale of Fund shares. The total expense ratio for SPDR SSGA Multi-Asset Real Return ETF as stated in the Fees and Expenses table of the prospectus dated October 31, 2015 (as supplemented June 10, 2016) is 0.70%.
PERFORMANCE AS OF JUNE 30, 2016
| CUMULATIVE TOTAL RETURN | AVERAGE ANNUAL TOTAL RETURN | |||||||||||||||||||||||||||||||||||||
| NET ASSET VALUE | MARKET VALUE | PRIMARY
BARCLAYS US | SECONDARY
DBIQ OPTIMUM | NET ASSET VALUE | MARKET VALUE | PRIMARY
BARCLAYS US | SECONDARY
DBIQ OPTIMUM | |||||||||||||||||||||||||||||||
| ONE YEAR | –4.22% | –4.22% | 4.59% | –14.41% | –4.22% | –4.22% | 4.59% | –14.41% | ||||||||||||||||||||||||||||||
| THREE YEAR | –7.13% | –7.19% | 7.69% | –36.54% | –2.44% | –2.46% | 2.50% | –14.06% | ||||||||||||||||||||||||||||||
| SINCE INCEPTION (1) | –11.83% | –11.85% | 3.81% | –42.63% | –2.96% | –2.97% | 0.90% | –12.44% | ||||||||||||||||||||||||||||||
| (1) | For the period April 25, 2012 to June 30, 2016. |
| Barclays | U.S. Government Inflation-linked Bond Index |
The Barclays U.S. Government Inflation-linked Bond Index includes publicly issued, U.S. Treasury inflation protected securities that have at least 1 year remaining to maturity on index rebalancing date, with an issue size equal to or in excess of $500 million. Bonds must be capital-indexed and linked to an eligible inflation index.
| DBIQ | Optimum Yield Diversified Commodity Index Excess Return |
The DBIQ Optimum Yield Diversified Commodity Index Excess Return employs a rule based approach when it rolls from one futures contract to another for each commodity in the index. DBLCI Diversified Index represents 14 commodities drawn from the Energy, Precious Metals, Industrial Metals and Agriculture sectors.
2
Table of Contents
SPDR SSGA MULTI-ASSET REAL RETURN ETF — PERFORMANCE SUMMARY (CONTINUED)
COMPARISON OF CHANGE IN VALUE OF A $10,000 INVESTMENT (BASED ON NET ASSET VALUE)
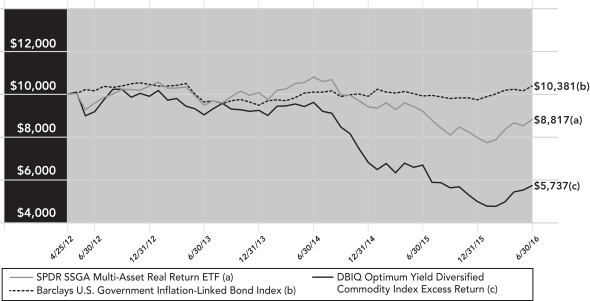
Past performance is not a guarantee of future results.
Index returns are unmanaged and do not reflect the deduction of any fees or expenses. Index returns reflect all items of income, gain and loss and the reinvestment of dividends and other income.
Line graph is based on cumulative total return.
3
Table of Contents
SPDR SSGA INCOME ALLOCATION ETF — MANAGEMENT’S DISCUSSIONOF FUND PERFORMANCE (UNAUDITED)
The SPDR SSGA Income Allocation ETF (the “Fund”) invests substantially all of its assets in the SSGA Income Allocation Portfolio (the “Portfolio”), which seeks to provide total return by focusing on investments in income and yield-generating assets. As a result, the Fund invests indirectly through the Portfolio.
For the 12-month period ended June 30, 2016 (the “Reporting Period”), the total return for the Fund was 3.77%, and the total return for the MSCI World Index (the “Index”) was –2.78%. The Fund and Index returns reflect the reinvestment of dividends and other income. The Fund’s performance reflects the expenses of managing the Fund, including brokerage and advisory expenses. The Index is unmanaged and Index returns do not reflect fees and expenses of any kind, which would have a negative impact on returns.
The Fund outperformed the Index during the Reporting Period. A diversified blend of interest rate sensitive assets aided the Fund’s performance as interest rates marched steadily lower while performance across equity markets was mixed. The period was characterized by several significant equity market corrections, which appeared to emanate out of concerns related to growth and policy measures in China and also anticipation around the U.K. vote to leave the European Union. A surprise devaluation of the renminbi in August 2015 led to a cascade of selling across global equity markets and caused the CBOE volatility index (VIX) to spike to over 50 late in that month. This hurt the equity holdings of the Fund, particularly in international markets. However, the deterioration was short-lived and markets rebounded through the end of 2015. At the turn of the calendar year, Chinese policymakers again created angst in global markets with further currency devaluation and erratic steps to manage market volatility. Again, equity markets experienced sharp losses, including the income oriented equities held in the Fund. However, interest rates moved sharply lower which benefited the longer duration bond and securitized real estate exposures held within the Fund. By mid-February of 2016 oil prices began to rebound and that served as a catalyst for growth-oriented assets to perform well, including the oil-sensitive high yield bond market which represents a core holding in the Fund. The last notable instance of volatility impacting the Fund was found in the wake of the United Kingdom vote to leave the European Union. While this policy event caused a rapid and violent sell-off in equity markets in the immediate aftermath of the vote, the weakness was short-lived and most markets and assets recovered by the end of June, with income-oriented equities generally faring better than broad markets to finish the Reporting Period.
On an individual security level, the top positive contributors to the Fund’s performance were the SPDR Dow Jones REIT ETF (RWR), the SPDR S&P Dividend ETF (SDY) and the SPDR Barclays Long Term Treasury ETF (TLO). The SPDR Dow Jones REIT ETF benefited from its hybrid characteristics as it was supported during some of the turbulent market episodes by its interest rate sensitivity, and the asset class was also able to catch some of the equity market tailwind during recoveries. Similarly, the SPDR S&P Dividend ETF performed well over the period as investors sought the relative safety of higher quality dividend payers. The SPDR Barclays Long Term Treasury ETF was the most direct beneficiary of lower interest rates as longer term government bond yields declined by more than 80 basis points during the Reporting Period (30 Year U.S. Treasury yield). The top negative contributors to the Fund’s performance were the WisdomTree Japan Hedged Equity Fund (DXJ), the WisdomTree Europe Hedged Equity Fund (HEDJ) and the SPDR STOXX Europe 50 ETF (FEU). The WisdomTree Japan Hedged Equity Fund delivered negative results as the policy efforts from the Bank of Japan seemed to become less effective and the Japanese yen strengthened, which hurt Japanese equities. It was a similar phenomenon for European equities, where intervention from the European Central Bank was met with mixed market responses and European equities were also dented by the turmoil caused by the “Brexit” vote. These headwinds impacted both the WisdomTree Europe Hedged Equity Fund and the SPDR STOXX Europe 50 ETF.
The views expressed above reflect those of the Fund’s portfolio manager only through the Reporting Period, and do not necessarily represent the views of the Adviser as a whole. Any such views are subject to change at any time based upon market or other conditions and the Adviser disclaims any responsibility to update such views. These views may not be relied on as investment advice and, because investment decisions for a fund are based on numerous factors, may not be relied on as an indication of trading intent on behalf of any fund.
4
Table of Contents
SPDR SSGA INCOME ALLOCATION ETF — PERFORMANCE SUMMARY
The following performance chart of the Fund’s total return at net asset value, the total return based on market price and its benchmark index is provided for comparative purposes only and represents the periods noted. The Fund’s per share net asset value (“NAV”) is the value of one share of the Fund and is calculated by dividing the value of total assets less total liabilities by the number of shares outstanding. The NAV return is based on the NAV of the Fund and the market return is based on the market price per share of the Fund. The market price used to calculate the market return is determined by using the midpoint between the highest bid and the lowest offer on the exchange on which the shares of the Fund are listed for trading, as of the time that the Fund’s NAV is calculated. Since shares of the Fund did not trade in the secondary market until one day after the Fund’s inception, for the period from inception to the first day of secondary market trading in shares of the Fund (4/25/12, 4/26/12, respectively), the NAV of the Fund is used as a proxy for the secondary market trading price to calculate market returns. NAV and market returns assume that dividends and capital gain distributions have been reinvested in the Fund at NAV. Market returns do not include brokerage commissions that may be payable on secondary market transactions. If brokerage commissions were included market returns would be lower.
An index is a statistical measure of a specified financial market or sector. An index does not actually hold a portfolio of securities and therefore does not reflect deductions for fees or expenses. In comparison, the Fund’s performance is negatively impacted by these deductions.
Performance quoted represents past performance, which is no guarantee of future results. Investment return and principal value will fluctuate, so you may have a gain or loss when shares are sold. Current performance may be higher or lower than that quoted. Visit www.spdrs.com for most recent month-end performance. The returns do not reflect the deduction of taxes that a shareholder would pay on Fund distributions or on the redemption or sale of Fund shares. The total expense ratio for SPDR SSGA Income Allocation ETF as stated in the Fees and Expenses table of the prospectus dated October 31, 2015 (as supplemented June 10, 2016) is 0.70%.
PERFORMANCE AS OF JUNE 30, 2016
| CUMULATIVE TOTAL RETURN | AVERAGE ANNUAL TOTAL RETURN | |||||||||||||||||||||||||||||||||||||
NET ASSET VALUE | MARKET VALUE | PRIMARY
MSCI WORLD | SECONDARY
BARCLAYS US | NET ASSET VALUE | MARKET VALUE | PRIMARY
MSCI WORLD | SECONDARY
BARCLAYS US | |||||||||||||||||||||||||||||||
| ONE YEAR | 3.77% | 3.83% | –2.78% | 15.72% | 3.77% | 3.83% | –2.78% | 15.72% | ||||||||||||||||||||||||||||||
| THREE YEAR | 15.98% | 16.01% | 22.33% | 30.67% | 5.07% | 5.07% | 6.95% | 9.32% | ||||||||||||||||||||||||||||||
| SINCE INCEPTION (1) | 21.92% | 21.94% | 40.28% | 30.35% | 4.85% | 4.86% | 8.43% | 6.54% | ||||||||||||||||||||||||||||||
| (1) | For the period April 25, 2012 to June 30, 2016. |
| MSCI | World Index |
The MSCI World Index is a free float-adjusted market capitalization weighted index that is designed to measure the equity market performance of developed markets.
| Barclays | US Long Government/Credit Bond Index |
The Barclays Long Government/Credit Index measures the investment return of all medium and larger public issues of U.S. Treasury, agency, investment-grade corporate, and investment-grade international dollar-denominated bonds with maturities longer than 10 years.
5
Table of Contents
SPDR SSGA INCOME ALLOCATION ETF — PERFORMANCE SUMMARY (CONTINUED)
COMPARISON OF CHANGE IN VALUE OF A $10,000 INVESTMENT (BASED ON NET ASSET VALUE)
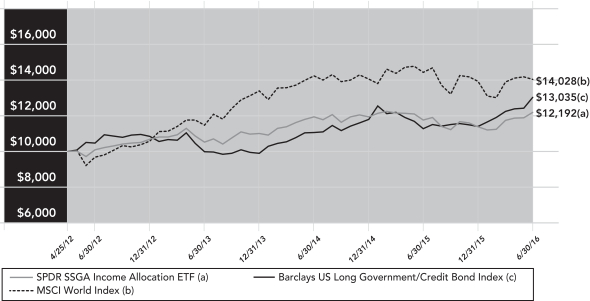
Past performance is not a guarantee of future results.
Index returns are unmanaged and do not reflect the deduction of any fees or expenses. Index returns reflect all items of income, gain and loss and the reinvestment of dividends and other income.
Line graph is based on cumulative total return.
6
Table of Contents
SPDR SSGA GLOBAL ALLOCATION ETF — MANAGEMENT’S DISCUSSIONOF FUND PERFORMANCE (UNAUDITED)
The SPDR SSGA Global Allocation ETF (the “Fund”) invests substantially all of its assets in the SSGA Global Allocation Portfolio (the “Portfolio”), which seeks to provide capital appreciation. As a result, the Fund invests indirectly through the Portfolio.
For the 12-month period ended June 30, 2016 (the “Reporting Period”), the total return for the Fund was –0.63%, and the total return for the MSCI ACWI IMI Index (the “Index”) was –3.87%. The Fund and Index returns reflect the reinvestment of dividends and other income. The Fund’s performance reflects the expenses of managing the Fund, including brokerage and advisory expenses. The Index is unmanaged and Index returns do not reflect fees and expenses of any kind, which would have a negative impact on returns.
The Fund outperformed the Index during the Reporting Period. A diversified blend of interest rate sensitive assets aided the Fund’s performance as interest rates marched steadily lower while performance across equity markets was mixed. The Reporting Period was characterized by several significant equity market corrections, which appeared to emanate out of concerns related to growth and policy measures in China and also anticipation around the U.K. vote to leave the European Union. A surprise devaluation of the renminbi in August 2015 led to a cascade of selling across global equity markets and caused the CBOE volatility index (VIX) to spike to over 50 late in that month. This hurt the equity holdings of the Fund, particularly in international markets. However, the deterioration was short-lived and markets rebounded through the end of 2015. At the turn of the calendar year, Chinese policymakers again created angst in global markets with further currency devaluation and erratic steps to manage market volatility. Again, equity markets experienced sharp losses. However, interest rates moved sharply lower which benefited the longer duration bond and securitized real estate exposures held within the Fund. By mid-February of 2016 oil prices began to rebound, serving as a catalyst for growth-oriented assets to perform well, including the oil-sensitive high yield bond market which represents a core holding in the Fund. The last notable instance of volatility impacting the Fund was found in the wake of the United Kingdom vote to leave the European Union. While this policy event caused a rapid and violent sell-off in equity markets in the immediate aftermath of the vote, the weakness was short-lived and most markets and assets recovered by the end of June.
On an individual security level, the top positive contributors to the Fund’s performance were the SPDR Dow Jones REIT ETF (RWR), the SPDR Barclays Long Term Treasury ETF (TLO) and the SPDR S&P 500 Growth ETF (SPYG). The SPDR Dow Jones REIT ETF benefited from its hybrid characteristics as it was supported during some of the turbulent market episodes by its interest rate sensitivity, and the asset class was also able to catch some of the equity market tailwind during recoveries. The SPDR Barclays Long Term Treasury ETF was the most direct beneficiary of lower interest rates as longer term government bond yields declined by more than 80 basis points during the Reporting Period (30 Year U.S. Treasury yield). The SPDR S&P 500 Growth ETF benefited from rebound in the growth assets that commenced mid-February 2016. The top negative contributors to the Fund’s performance were the WisdomTree Japan Hedged Equity Fund (DXJ), the WisdomTree Europe Hedged Equity Fund (HEDJ) and the SPDR S&P World ex-US ETF (GWL). The WisdomTree Japan Hedged Equity Fund delivered negative results as the policy efforts from the Bank of Japan seemed to become less effective and the Japanese yen strengthened, which hurt Japanese equities. It was a similar phenomenon for European equities, where intervention from the European Central Bank was met with mixed market responses and European equities were also dented by the turmoil caused by the “Brexit” vote. These headwinds impacted broader SPDR S&P World ex-US ETF.
The views expressed above reflect those of the Fund’s portfolio manager only through the Reporting Period, and do not necessarily represent the views of the Adviser as a whole. Any such views are subject to change at any time based upon market or other conditions and the Adviser disclaims any responsibility to update such views. These views may not be relied on as investment advice and, because investment decisions for a fund are based on numerous factors, may not be relied on as an indication of trading intent on behalf of any fund.
7
Table of Contents
SPDR SSGA GLOBAL ALLOCATION ETF — PERFORMANCE SUMMARY
The following performance chart of the Fund’s total return at net asset value, the total return based on market price and its benchmark index is provided for comparative purposes only and represents the periods noted. The Fund’s per share net asset value (“NAV”) is the value of one share of the Fund and is calculated by dividing the value of total assets less total liabilities by the number of shares outstanding. The NAV return is based on the NAV of the Fund and the market return is based on the market price per share of the Fund. The market price used to calculate the market return is determined by using the midpoint between the highest bid and the lowest offer on the exchange on which the shares of the Fund are listed for trading, as of the time that the Fund’s NAV is calculated. Since shares of the Fund did not trade in the secondary market until one day after the Fund’s inception, for the period from inception to the first day of secondary market trading in shares of the Fund (4/25/12, 4/26/12, respectively), the NAV of the Fund is used as a proxy for the secondary market trading price to calculate market returns. NAV and market returns assume that dividends and capital gain distributions have been reinvested in the Fund at NAV. Market returns do not include brokerage commissions that may be payable on secondary market transactions. If brokerage commissions were included market returns would be lower.
An index is a statistical measure of a specified financial market or sector. An index does not actually hold a portfolio of securities and therefore does not reflect deductions for fees or expenses. In comparison, the Fund’s performance is negatively impacted by these deductions.
Performance quoted represents past performance, which is no guarantee of future results. Investment return and principal value will fluctuate, so you may have a gain or loss when shares are sold. Current performance may be higher or lower than that quoted. Visit www.spdrs.com for most recent month-end performance. The returns do not reflect the deduction of taxes that a shareholder would pay on Fund distributions or on the redemption or sale of Fund shares. The total expense ratio for SPDR SSGA Global Allocation ETF as stated in the Fees and Expenses table of the prospectus dated October 31, 2015 (as supplemented June 10, 2016) is 0.35%.
PERFORMANCE AS OF JUNE 30, 2016
| CUMULATIVE TOTAL RETURN | AVERAGE ANNUAL TOTAL RETURN | |||||||||||||||||||||||||||||||||||||
| NET ASSET VALUE | MARKET VALUE | PRIMARY
MSCI ACWI | SECONDARY
BARCLAYS US | NET ASSET VALUE | MARKET VALUE | PRIMARY
MSCI ACWI | SECONDARY
BARCLAYS US | |||||||||||||||||||||||||||||||
| ONE YEAR | –0.63% | –0.68% | –3.87% | 6.00% | –0.63% | –0.68% | –3.87% | 6.00% | ||||||||||||||||||||||||||||||
| THREE YEAR | 16.84% | 16.90% | 19.54% | 12.69% | 5.32% | 5.34% | 6.13% | 4.06% | ||||||||||||||||||||||||||||||
| SINCE INCEPTION (1) | 26.07% | 26.13% | 34.60% | 13.24% | 5.69% | 5.71% | 7.37% | 3.02% | ||||||||||||||||||||||||||||||
| (1) | For the period April 25, 2012 to June 30, 2016. |
| MSCI | ACWI IMI Index |
The MSCI ACWI IMI Index is a free float-adjusted market capitalization-weighted index that is designed to measure the combined equity market performance of developed and emerging markets.
| Barclays | U.S. Aggregate Index |
The Barclays U.S. Aggregate Index provides a measure of the performance of the U.S. dollar denominated investment grade bond market.
8
Table of Contents
SPDR SSGA GLOBAL ALLOCATION ETF — PERFORMANCE SUMMARY (CONTINUED)
COMPARISON OF CHANGE IN VALUE OF A $10,000 INVESTMENT (BASED ON NET ASSET VALUE)
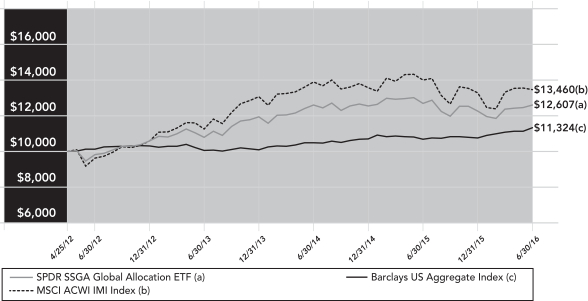
Past performance is not a guarantee of future results.
Index returns are unmanaged and do not reflect the deduction of any fees or expenses. Index returns reflect all items of income, gain and loss and the reinvestment of dividends and other income.
Line graph is based on cumulative total return.
9
Table of Contents
SPDR BLACKSTONE / GSO SENIOR LOAN ETF — MANAGEMENT’S DISCUSSIONOF FUND PERFORMANCE (UNAUDITED)
The SPDR Blackstone / GSO Senior Loan ETF (the “Fund”) invests substantially all of its assets in the Blackstone / GSO Senior Loan Portfolio (the “Portfolio”). The investment objective of the Portfolio is to provide current income consistent with the preservation of capital. As a result, the Fund invests indirectly through the Portfolio.
For the 12-month period ended June 30, 2016 (the “Reporting Period”), the total return for the Fund was –1.15%, and the total return for the Markit iBoxx USD Liquid Leveraged Loan Index (the “Index”) was –0.10%. The Fund and Index returns reflect the reinvestment of dividends and other income. The Fund’s performance reflects the expenses of managing the Fund, including brokerage and advisory expenses. The Index is unmanaged and Index returns do not reflect fees and expenses of any kind, which would have a negative impact on returns.
The Fund underperformed the Index during the Reporting Period primarily due to credit selection, including certain high beta, distressed and stressed loans within the Index that significantly outperformed over the period related to a series of highly idiosyncratic events.
On an issuer level, the top positive contributors to the Fund’s performance were an underweight to Energy Future Holdings (“TXU”), Seadrill Operating and iHeart Communications. TXU experienced a 42% decline over the Reporting Period as the energy commodity complex, particularly natural gas and crude, experienced unprecedented declines, exacerbating a lengthy and complex reorganization plan post-bankruptcy filing. Seadrill also suffered significantly over the Reporting Period as lower crude prices weighed heavily on viability concerns surrounding higher cost deep-sea drilling. Finally, iHeart Communications was plagued by weak segment performance, high cash burn due to interest cost, and elevated leverage during a particularly weak market with little tolerance for earnings softness. The top negative contributors to the Fund’s performance were an overweight to Avaya, and an underweight to both Fortescue Metals Group (“FMG”) and Weight Watchers International (“WTW”). Avaya suffered from a combination of unexpected softness in business performance and sizable near-term maturities that needed to be addressed in an unforgiving and risk-averse environment, as the macro landscape soured dramatically in the latter half of 2015. While the Fund initially benefitted from its underweight of FMG as iron ore prices fell nearly 63% in the second half of 2015, a combination of Chinese policy-driven demand, rebound in high beta names, and the unexpected announcement of opportunistic loan repayments by the issuer caused FMG to outperform significantly over the second half of the Reporting Period. WTW rose +30% over the course of a few days in October 2015 on the news that Oprah Winfrey would be contributing an equity stake as well as endorsing the brand across her properties, hurting the Fund given its underweight, which had been based on fundamental business model concerns.
The views expressed above reflect those of the Fund’s portfolio managers only through the Reporting Period, and do not necessarily represent the views of the Sub-Adviser as a whole. Any such views are subject to change at any time based upon market or other conditions and the Sub-Adviser disclaims any responsibility to update such views. These views may not be relied on as investment advice and, because investment decisions for a fund are based on numerous factors, may not be relied on as an indication of trading intent on behalf of any fund.
10
Table of Contents
SPDR BLACKSTONE / GSO SENIOR LOAN ETF — PERFORMANCE SUMMARY
The following performance chart of the Fund’s total return at net asset value, the total return based on market price and its benchmark index is provided for comparative purposes only and represents the periods noted. The Fund’s per share net asset value (“NAV”) is the value of one share of the Fund and is calculated by dividing the value of total assets less total liabilities by the number of shares outstanding. The NAV return is based on the NAV of the Fund and the market return is based on the market price per share of the Fund. The market price used to calculate the market return is determined by using the midpoint between the highest bid and the lowest offer on the exchange on which the shares of the Fund are listed for trading, as of the time that the Fund’s NAV is calculated. Since shares of the Fund did not trade in the secondary market until one day after the Fund’s inception, for the period from inception to the first day of secondary market trading in shares of the Fund (4/3/13, 4/4/13, respectively), the NAV of the Fund is used as a proxy for the secondary market trading price to calculate market returns. NAV and market returns assume that dividends and capital gain distributions have been reinvested in the Fund at NAV. Market returns do not include brokerage commissions that may be payable on secondary market transactions. If brokerage commissions were included market returns would be lower.
An index is a statistical measure of a specified financial market or sector. An index does not actually hold a portfolio of securities and therefore does not reflect deductions for fees or expenses. In comparison, the Fund’s performance is negatively impacted by these deductions.
Performance quoted represents past performance, which is no guarantee of future results. Investment return and principal value will fluctuate, so you may have a gain or loss when shares are sold. Current performance may be higher or lower than that quoted. Visit www.spdrs.com for most recent month-end performance. The returns do not reflect the deduction of taxes that a shareholder would pay on Fund distributions or on the redemption or sale of Fund shares. The total expense ratio for SPDR Blackstone/GSO Senior Loan ETF as stated in the Fees and Expenses table of the prospectus dated October 31, 2015 (as supplemented June 10, 2016) is 0.70%.
PERFORMANCE AS OF JUNE 30, 2016
| CUMULATIVE TOTAL RETURN | AVERAGE ANNUAL TOTAL RETURN | |||||||||||||||||||||||||||||||||||||
| NET ASSET VALUE | MARKET VALUE | PRIMARY
MARKIT IBOXX | SECONDARY
S&P/LSTA U.S. | NET ASSET VALUE | MARKET VALUE | PRIMARY
MARKIT IBOXX | SECONDARY
S&P/LSTA U.S. | |||||||||||||||||||||||||||||||
| ONE YEAR | –1.15% | –1.03% | –0.10% | 0.69% | –1.15% | –1.03% | –0.10% | 0.69% | ||||||||||||||||||||||||||||||
| THREE YEAR | 5.02% | 4.99% | 5.94% | 6.59% | 1.65% | 1.64% | 1.94% | 2.15% | ||||||||||||||||||||||||||||||
| SINCE INCEPTION (1) | 4.51% | 4.64% | 5.52% | 6.35% | 1.37% | 1.41% | 1.67% | 1.92% | ||||||||||||||||||||||||||||||
| (1) | For the period April 3, 2013 to June 30, 2016. |
| Markit | iBoxx USD Liquid Leveraged Loan Index |
The Markit iBoxx USD Liquid Leveraged Loan Index is comprised of about 100 of the most liquid, tradable leveraged loans, as identified by Markit’s Loans Liquidity service.
| S&P/LSTA | U.S. Leveraged Loan 100 Index |
The S&P/LSTA U.S. Leveraged Loan 100 Index is designed to reflect the largest facilities in the leveraged loan market. It mirrors the market-weighted performance of the largest institutional leveraged loans based upon market weightings, spreads, and interest payments.
11
Table of Contents
SPDR BLACKSTONE / GSO SENIOR LOAN ETF — PERFORMANCE SUMMARY (CONTINUED)
COMPARISON OF CHANGE IN VALUE OF A $10,000 INVESTMENT (BASED ON NET ASSET VALUE)
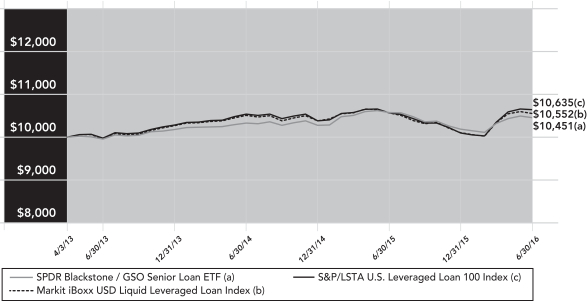
Past performance is not a guarantee of future results.
Index returns are unmanaged and do not reflect the deduction of any fees or expenses. Index returns reflect all items of income, gain and loss and the reinvestment of dividends and other income.
Line graph is based on cumulative total return.
12
Table of Contents
SPDR SSGA ULTRA SHORT TERM BOND ETF —
MANAGEMENT’S DISCUSSIONOF FUND PERFORMANCE (UNAUDITED)
The SPDR SSGA Ultra Short Term Bond ETF (the “Fund”) invests substantially all of its assets in the SSGA Ultra Short Term Bond Portfolio (the “Portfolio”), which seeks to provide current income consistent with preservation of capital and daily liquidity through short duration high quality investments. As a result, the Fund invests indirectly through the Portfolio.
For the 12-month period ended June 30, 2016 (the “Reporting Period”), the total return for the Fund was 0.65%, and the total return for the Barclays US Treasury Bellwether 3 Month Index (the “Index”) was 0.21%. The Fund and Index returns reflect the reinvestment of dividends and other income. The Fund’s performance reflects the expenses of managing the Fund, including brokerage and advisory expenses. The Index is unmanaged and Index returns do not reflect fees and expenses of any kind, which would have a negative impact on returns.
The Fund outperformed the Index during the Reporting Period. The Portfolio maintained duration within a range of 0.25-0.35 years for the Reporting Period. As of the end of the Reporting Period, the Portfolio’s asset allocation consisted of corporate bonds (58.4%), Asset Backed Securities (30.0%), U.S. Government obligations (11.2%) and Cash (.4%). Approximately 67% of Portfolio assets had floating rate coupons while the remaining 33% were fixed rate. The Portfolio’s use of floating rate bonds allowed for substantial exposure to corporate bonds and ABS without adding significant interest rate risk. The Portfolio’s yield advantage due to its exposure to corporate bonds and asset backed securities was the primary reason for the Portfolio’s outperformance versus its benchmark during the period. Credit spreads on the Portfolio’s corporate and asset backed holdings generally widened during the first half of the period as investors became somewhat uneasy as the Federal Open Market Committee’s first rate hike in many years approached. While the Federal Reserve did eventually achieve “lift off” with their 0.25% rate hike in December of 2015, this would prove to be the only move during the period. Questions around weaker global growth, primarily in China, and falling commodity prices early in 2016 prevented the Federal Reserve from hiking rates further. Commodity and equity prices recovered beginning around mid-February as new stimulus measures were introduced by the Bank of Japan and the European Central Bank. This also served to narrow credit spreads although spreads did finish slightly wider year on year. Markets remained somewhat calm into the spring as investors contemplated the prospects for further Federal Reserve hikes in 2016. Weaker employment data in the spring with continued subdued inflation readings allowed the FOMC to put a more dovish spin on their rhetoric during this period. The Reporting Period ended with quite a bit of volatility in asset prices as the UK voted to break free from the European Union. Prospects for further rate hikes from the FOMC were reduced even further after this event.
The Portfolio continued to focus on assets within the 1- 5 year maturity range while keeping the overall Portfolio weighted average life inside of 1.5 years. The Portfolio benefitted from a move higher in Libor levels after the Federal Reserve rate hike occurred in December. Libor moved from approximately 0.32% before the hike to a range of 0.62%-0.68% beginning in 2016. This move higher positively impacted the portfolio’s yield given its high allocation to floating rate coupons benchmarked to Libor rates.
The views expressed above reflect those of the Fund’s portfolio manager only through the Reporting Period, and do not necessarily represent the views of the Adviser as a whole. Any such views are subject to change at any time based upon market or other conditions and the Adviser disclaims any responsibility to update such views. These views may not be relied on as investment advice and, because investment decisions for a fund are based on numerous factors, may not be relied on as an indication of trading intent on behalf of any fund.
13
Table of Contents
SPDR SSGA ULTRA SHORT TERM BOND ETF —
PERFORMANCE SUMMARY
The following performance chart of the Fund’s total return at net asset value, the total return based on market price and its benchmark index is provided for comparative purposes only and represents the periods noted. The Fund’s per share net asset value (“NAV”) is the value of one share of the Fund and is calculated by dividing the value of total assets less total liabilities by the number of shares outstanding. The NAV return is based on the NAV of the Fund and the market return is based on the market price per share of the Fund. The market price used to calculate the market return is determined by using the midpoint between the highest bid and the lowest offer on the exchange on which the shares of the Fund are listed for trading, as of the time that the Fund’s NAV is calculated. Since shares of the Fund did not trade in the secondary market until one day after the Fund’s inception, for the period from inception to the first day of secondary market trading in shares of the Fund (10/9/13, 10/10/13, respectively), the NAV of the Fund is used as a proxy for the secondary market trading price to calculate market returns. NAV and market returns assume that dividends and capital gain distributions have been reinvested in the Fund at NAV. Market returns do not include brokerage commissions that may be payable on secondary market transactions. If brokerage commissions were included market returns would be lower.
An index is a statistical measure of a specified financial market or sector. An index does not actually hold a portfolio of securities and therefore does not reflect deductions for fees or expenses. In comparison, the Fund’s performance is negatively impacted by these deductions.
Performance quoted represents past performance, which is no guarantee of future results. Investment return and principal value will fluctuate, so you may have a gain or loss when shares are sold. Current performance may be higher or lower than that quoted. Visit www.spdrs.com for most recent month-end performance. The returns do not reflect the deduction of taxes that a shareholder would pay on Fund distributions or on the redemption or sale of Fund shares. The total expense ratio for SPDR SSGA Ultra Short Term Bond ETF as stated in the Fees and Expenses table of the prospectus dated October 31, 2015 (as supplemented June 10, 2016) is 0.20%.
PERFORMANCE AS OF JUNE 30, 2016
| CUMULATIVE TOTAL RETURN | AVERAGE ANNUAL TOTAL RETURN | |||||||||||||||||||||||||||||
| NET ASSET VALUE | MARKET VALUE | BARCLAYS US TREASURY BELLWETHER 3 MONTH INDEX | NET ASSET VALUE | MARKET VALUE | BARCLAYS US TREASURY BELLWETHER 3 MONTH INDEX | |||||||||||||||||||||||||
| ONE YEAR | 0.65% | 0.62% | 0.21% | 0.65% | 0.62% | 0.21% | ||||||||||||||||||||||||
| SINCE INCEPTION (1) | 1.32% | 1.30% | 0.30% | 0.48% | 0.48% | 0.11% | ||||||||||||||||||||||||
| (1) | For the period October 9, 2013 to June 30, 2016. |
| Barclays | US Treasury Bellwether 3 Month |
The Barclays US Treasury Bellwether 3 month is a benchmark tracking the performance and attributes of the on-the-run U.S. Treasury that reflects the most recently issued three month security.
14
Table of Contents
SPDR SSGA ULTRA SHORT TERM BOND ETF —
PERFORMANCE SUMMARY (CONTINUED)
COMPARISON OF CHANGE IN VALUE OF A $10,000 INVESTMENT (BASED ON NET ASSET VALUE)
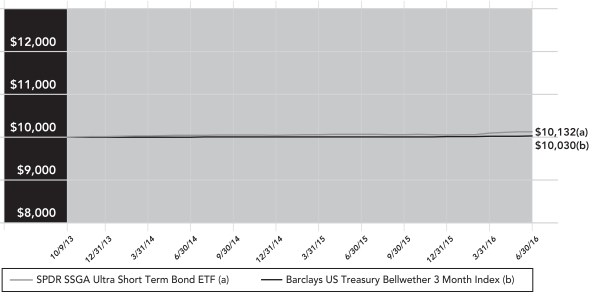
Past performance is not a guarantee of future results.
Index returns are unmanaged and do not reflect the deduction of any fees or expenses. Index returns reflect all items of income, gain and loss and the reinvestment of dividends and other income.
Line graph is based on cumulative total return.
15
Table of Contents
SPDR DOUBLELINE TOTAL RETURN TACTICAL ETF — MANAGEMENT’S DISCUSSIONOF FUND PERFORMANCE (UNAUDITED)
The SPDR DoubleLine Total Return Tactical ETF (the “Fund”) invests substantially all of its assets in the State Street DoubleLine Total Return Tactical Portfolio (the “Portfolio”) which seeks to maximize total return. As a result, the Fund invests indirectly through the Portfolio.
For the 12-month period ended June 30, 2016 (the “Reporting Period”), the total return for the Fund was 4.03%, and the total return for the Barclays U.S. Aggregate Bond Index (the “Index”) was 6.00%. The Fund and Index returns reflect the reinvestment of dividends and other income. The Fund’s performance reflects the expenses of managing the Fund, including brokerage and advisory expenses. The Index is unmanaged and Index returns do not reflect fees and expenses of any kind, which would have a negative impact on returns.
The Fund underperformed the Index during the Reporting Period. With a meaningful decline in U.S. interest rates over the trailing 12-month period, the Portfolio’s shorter duration relative to the Index was the main reason for its underperformance. The increase in volatility for sectors affected by declines in commodity prices, record low yields on sovereign bonds around the world and uncertain global growth prospects additionally detracted from returns relative to the Index.
On a sector level, the top positive contributors to the Fund’s performance were agency mortgage-backed securities, which contributed stable cash flows and were less influenced by volatility in credit, and non-agency mortgage-backed securities contributed relatively strong risk-adjusted yields and continue to benefit from supply/demand imbalance due to lower issuance. The top negative contributors to the Fund’s performance were high yield securities and bank loans, which due to declines in commodity prices, particularly in oil-related industries, experienced decreased valuations. Exposure to each was reduced over the Reporting Period. Commercial mortgage-backed securities also negatively contributed to the Fund’s performance due to wider spreads over the Reporting Period, reflecting low investor demand earlier in the Period.
The views expressed above reflect those of the Fund’s portfolio manager only through the Reporting Period, and do not necessarily represent the views of the Adviser as a whole. Any such views are subject to change at any time based upon market or other conditions and the Adviser disclaims any responsibility to update such views. These views may not be relied on as investment advice and, because investment decisions for a fund are based on numerous factors, may not be relied on as an indication of trading intent on behalf of any fund.
16
Table of Contents
SPDR DOUBLELINE TOTAL RETURN TACTICAL ETF — PERFORMANCE SUMMARY
The following performance chart of the Fund’s total return at net asset value, the total return based on market price and its benchmark index is provided for comparative purposes only and represents the periods noted. The Fund’s per share net asset value (“NAV”) is the value of one share of the Fund and is calculated by dividing the value of total assets less total liabilities by the number of shares outstanding. The NAV return is based on the NAV of the Fund and the market return is based on the market price per share of the Fund. The market price used to calculate the market return is determined by using the midpoint between the highest bid and the lowest offer on the exchange on which the shares of the Fund are listed for trading, as of the time that the Fund’s NAV is calculated. Since shares of the Fund did not trade in the secondary market until one day after the Fund’s inception, for the period from inception to the first day of secondary market trading in shares of the Fund (2/23/15, 2/24/15, respectively), the NAV of the Fund is used as a proxy for the secondary market trading price to calculate market returns. NAV and market returns assume that dividends and capital gain distributions have been reinvested in the Fund at NAV. Market returns do not include brokerage commissions that may be payable on secondary market transactions. If brokerage commissions were included market returns would be lower.
An index is a statistical measure of a specified financial market or sector. An index does not actually hold a portfolio of securities and therefore does not reflect deductions for fees or expenses. In comparison, the Fund’s performance is negatively impacted by these deductions.
Performance quoted represents past performance, which is no guarantee of future results. Investment return and principal value will fluctuate, so you may have a gain or loss when shares are sold. Current performance may be higher or lower than that quoted. Visit www.spdrs.com for most recent month-end performance. The returns do not reflect the deduction of taxes that a shareholder would pay on Fund distributions or on the redemption or sale of Fund shares. The total expense ratio for SPDR DoubleLine Total Return Tactical ETF as stated in the Fees and Expenses table of the prospectus dated October 31, 2015 (as supplemented June 10, 2016) is 0.65%.
PERFORMANCE AS OF JUNE 30, 2016
| CUMULATIVE TOTAL RETURN | AVERAGE ANNUAL TOTAL RETURN | |||||||||||||||||||||||||||||
| NET ASSET VALUE | MARKET VALUE | PRIMARY
BARCLAYS US | NET ASSET VALUE | MARKET VALUE | PRIMARY
BARCLAYS US | |||||||||||||||||||||||||
| ONE YEAR | 4.03% | 4.06% | 6.00% | 4.03% | 4.06% | 6.00% | ||||||||||||||||||||||||
| SINCE INCEPTION (1) | 3.68% | 3.79% | 5.04% | 2.71% | 2.79% | 3.71% | ||||||||||||||||||||||||
| (1) | For the period February 23, 2015 to June 30, 2016. |
| Barclays | U.S. Aggregate Bond Index |
The Barclays U.S. Aggregate Bond Index provides a measure of the performance of the U.S. dollar denominated investment grade bond market, which includes investment grade (must be Baa3/BBB- or higher using the middle rating of Moody’s Investor Service, Inc., Standard & Poor’s, and Fitch Inc.) government bonds, investment grade corporate bonds, mortgage pass through securities, commercial mortgage backed securities and asset backed securities that are publicly for sale in the United States.
17
Table of Contents
SPDR DOUBLELINE TOTAL RETURN TACTICAL ETF —
PERFORMANCE SUMMARY (CONTINUED)
COMPARISON OF CHANGE IN VALUE OF A $10,000 INVESTMENT (BASED ON NET ASSET VALUE)
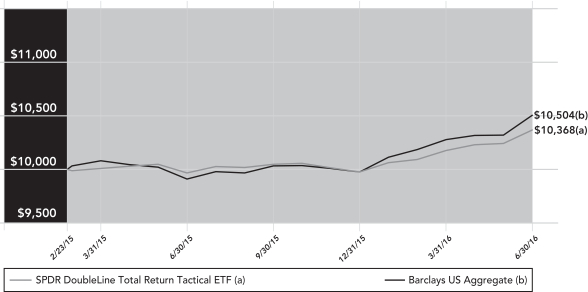
Past performance is not a guarantee of future results.
Index returns are unmanaged and do not reflect the deduction of any fees or expenses. Index returns reflect all items of income, gain and loss and the reinvestment of dividends and other income.
Line graph is based on cumulative total return.
18
Table of Contents
SPDR MFS SYSTEMATIC CORE EQUITY ETF — MANAGEMENT’S DISCUSSIONOF FUND PERFORMANCE (UNAUDITED)
The SPDR MFS Systematic Core Equity ETF (the “Fund”) invests substantially all of its assets in the MFS Systematic Core Equity Portfolio (the “Portfolio”), which seeks to achieve capital appreciation. As a result, the Fund invests indirectly through the Portfolio.
For the 12-month period ended June 30, 2016 (the “Reporting Period”), the total return for the Fund was 2.21%, and the total return for the S&P 500 Index (the “Index”) was 3.99%. The Fund and Index returns reflect the reinvestment of dividends and other income. The Fund’s performance reflects the expenses of managing the Fund, including brokerage and advisory expenses. The Index is unmanaged and Index returns do not reflect fees and expenses of any kind, which would have a negative impact on returns.
The Fund underperformed the Index during the Reporting Period. Sluggish global growth weighed on both developed and emerging market (“EM”) economies during the Reporting Period as EM economies proved to be particularly lackluster. The U.S. Federal Reserve began its long-anticipated monetary tightening cycle in the middle of the period, but the tightening cycle has proved to be more gradual than initially anticipated. Globally, central bank policy remained highly accommodative, which forced many government, and even some corporate, bond yields into negative territory. At the very end of the period, the United Kingdom voted to leave the European Union, beginning a multi-year process of negotiation in order to achieve “Brexit.”
During the second half of the Reporting Period, U.S. earnings headwinds expanded beyond the energy, materials and industrial sectors, to include most sectors of the market. The sharp rise in the U.S. dollar also weighed on earnings early in the period, though dollar strength ebbed somewhat late in the period. U.S. consumer spending held up well during the second half of the period amid a modest increase in real wages and falling gasoline prices. Demand for autos reached near-record territory before receding modestly late in the period. Global trade was dampened particularly by falling demand in emerging markets. Weaker Chinese growth, which drove the decline in commodity prices, weighed on EM economies and asset prices. China responded with a variety of monetary and fiscal measures to stimulate its economy, which showed signs of stabilization at the end of the period, though concerns over high debt levels persist. Structural factors like floating exchange rates and fiscal buffers partially offset the cyclical headwinds to emerging markets.
On an individual security level, the top positive contributors to the Fund’s performance were Amazon.Com Inc., Northrop Grumman Corp and Owens Corning. Strong stock selection in the retailing sector benefited relative performance. Within this sector, the Fund’s overweight position in internet retailer Amazon.Com Inc. supported strong relative returns.
Within the industrial goods & services sector, an overweight position in global security company Northrop Grumman further aided relative returns. Within the autos & housing sector, owning residential and commercial building materials manufacturer Owens Corning benefited relative results. The top negative contributors to the Fund’s performance were MetLife Inc., Lyondellbasell Industries NV, and Anthem, Inc. Within the financial services sector, overweight positions in insurance companies MetLife further hurt relative performance.
Within the basic materials sector, overweighting polypropylene manufacturer Lyondellbasell Industries (Netherlands) weighed on relative results. The Fund’s overweight positions in medical insurance plan provider Anthem also hurt relative returns.
The views expressed above reflect those of the Fund’s portfolio manager only through the Reporting Period, and do not necessarily represent the views of the Adviser as a whole. Any such views are subject to change at any time based upon market or other conditions and the Adviser disclaims any responsibility to update such views. These views may not be relied on as investment advice and, because investment decisions for a fund are based on numerous factors, may not be relied on as an indication of trading intent on behalf of any fund.
19
Table of Contents
SPDR MFS SYSTEMATIC CORE EQUITY ETF —
PERFORMANCE SUMMARY
The following performance chart of the Fund’s total return at net asset value, the total return based on market price and its benchmark index is provided for comparative purposes only and represents the periods noted. The Fund’s per share net asset value (“NAV”) is the value of one share of the Fund and is calculated by dividing the value of total assets less total liabilities by the number of shares outstanding. The NAV return is based on the NAV of the Fund and the market return is based on the market price per share of the Fund. The market price used to calculate the market return is determined by using the midpoint between the highest bid and the lowest offer on the exchange on which the shares of the Fund are listed for trading, as of the time that the Fund’s NAV is calculated. Since shares of the Fund did not trade in the secondary market until one day after the Fund’s inception, for the period from inception to the first day of secondary market trading in shares of the Fund (1/8/14, 1/9/14, respectively), the NAV of the Fund is used as a proxy for the secondary market trading price to calculate market returns. NAV and market returns assume that dividends and capital gain distributions have been reinvested in the Fund at NAV. Market returns do not include brokerage commissions that may be payable on secondary market transactions. If brokerage commissions were included market returns would be lower.
An index is a statistical measure of a specified financial market or sector. An index does not actually hold a portfolio of securities and therefore does not reflect deductions for fees or expenses. In comparison, the Fund’s performance is negatively impacted by these deductions.
Performance quoted represents past performance, which is no guarantee of future results. Investment return and principal value will fluctuate, so you may have a gain or loss when shares are sold. Current performance may be higher or lower than that quoted. Visit www.spdrs.com for most recent month-end performance. The returns do not reflect the deduction of taxes that a shareholder would pay on Fund distributions or on the redemption or sale of Fund shares. The total expense ratio for SPDR MFS Systematic Core Equity ETF as stated in the Fees and Expenses table of the prospectus dated October 31, 2015 (as supplemented June 10, 2016) is 0.60%.
PERFORMANCE AS OF JUNE 30, 2016
| CUMULATIVE TOTAL RETURN | AVERAGE ANNUAL TOTAL RETURN | |||||||||||||||||||||||||||||
| NET ASSET VALUE | MARKET VALUE | S&P 500 INDEX | NET ASSET VALUE | MARKET VALUE | S&P 500 INDEX | |||||||||||||||||||||||||
| ONE YEAR | 2.21% | 2.44% | 3.99% | 2.21% | 2.44% | 3.99% | ||||||||||||||||||||||||
| SINCE INCEPTION (1) | 25.28% | 25.23% | 20.33% | 9.52% | 9.50% | 7.76% | ||||||||||||||||||||||||
| (1) | For the period January 8, 2014 to June 30, 2016. |
| S&P | 500 Index |
The S&P 500 Index is composed of five hundred (500) selected stocks, all of which are listed on national stock exchanges and spans over 25 separate industry groups.
20
Table of Contents
SPDR MFS SYSTEMATIC CORE EQUITY ETF —
PERFORMANCE SUMMARY (CONTINUED)
COMPARISON OF CHANGE IN VALUE OF A $10,000 INVESTMENT (BASED ON NET ASSET VALUE)
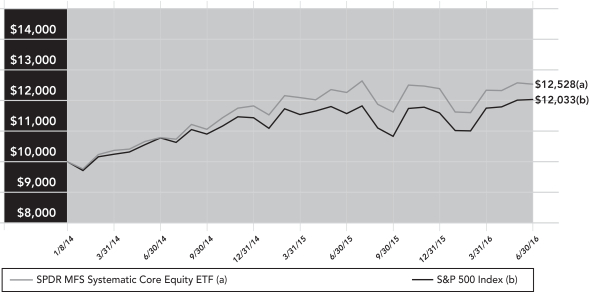
Past performance is not a guarantee of future results.
Index returns are unmanaged and do not reflect the deduction of any fees or expenses. Index returns reflect all items of income, gain and loss and the reinvestment of dividends and other income.
Line graph is based on cumulative total return.
21
Table of Contents
SPDR MFS SYSTEMATIC GROWTH EQUITY ETF — MANAGEMENT’S DISCUSSIONOF FUND PERFORMANCE (UNAUDITED)
The SPDR MFS Systematic Growth Equity ETF (the “Fund”) invests substantially all of its assets in the MFS Systematic Growth Equity Portfolio (the “Portfolio”), which seeks to achieve capital appreciation. As a result, the Fund invests indirectly through the Portfolio.
For the 12-month period ended June 30, 2016 (the “Reporting Period”), the total return for the Fund was 3.96%, and the total return for the Russell 1000 Growth Index (the “Index”) was 3.02%. The Fund and Index returns reflect the reinvestment of dividends and other income. The Fund’s performance reflects the expenses of managing the Fund, including brokerage and advisory expenses. The Index is unmanaged and Index returns do not reflect fees and expenses of any kind, which would have a negative impact on returns.
The Fund outperformed the Index during the Reporting Period. Sluggish global growth weighed on both developed and emerging market (“EM”) economies during the Reporting Period as EM economies proved to be particularly lackluster. Globally, central bank policy remained highly accommodative, which forced many government, and even some corporate, bond yields into negative territory. The U.S. Federal Reserve indicated that its monetary policy tightening cycle would be more gradual than earlier anticipated. At the very end of the period, the United Kingdom voted to leave the European Union, beginning a multi-year process of negotiation in order to achieve “Brexit.”
US earnings headwinds expanded beyond the energy, materials and industrial sectors, to include most sectors of the market. The sharp rise in the U.S. dollar also weighed on earnings early in the Reporting Period, though dollar strength ebbed somewhat late in the period. U.S. consumer spending held up well during the period amid a modest increase in real wages and falling gasoline prices. Global trade was dampened particularly by falling demand in emerging markets. Weaker Chinese growth, which contributed to the decline in commodity prices, weighed on EM economies and asset prices. China responded with a variety of monetary and fiscal measures to stimulate its economy, which showed signs of stabilization at the end of the Period, though concerns over high debt levels persist. Structural factors such as floating exchange rates and fiscal buffers partially offset the cyclical headwinds to emerging markets.
On an individual security level, the top positive contributors to the Fund’s performance were Tyson Foods Inc., Amazon.com Inc. and Verisign Inc. Stock selection and overweighting the consumer staples sector positively impacted performance relative to the Russell 1000® Growth Index. The Fund’s overweight position in food producer Tyson Foods benefited relative returns. Stock selection in the consumer discretionary sector also contributed to relative performance. Most notably, an overweight position in strong-performing internet retailer Amazon.com boosted relative results. The Fund’s overweight position in shares of domain registry services firm VeriSign bolstered relative returns over the reporting period. The top negative contributors to the Fund’s performance were Lyondellbasell Industries NV, Gilead Sciences Inc., and Marathon Petroleum Corp. Stock selection in the materials sector was a primary detractor from relative performance. The Fund’s overweight position in polypropylene manufacturer Lyondellbasell Industries (Netherlands) detracted from relative performance. The Fund’s overweight position in biotech firm Gilead Sciences was a notable detractors for relative performance as their shares underperformed the Index over the Reporting Period. An overweight position in the energy sector was also an area of relative weakness as an overweight position in independent petroleum products company Marathon Petroleum(h) hurt relative performance.
The views expressed above reflect those of the Fund’s portfolio manager only through the Reporting Period, and do not necessarily represent the views of the Adviser as a whole. Any such views are subject to change at any time based upon market or other conditions and the Adviser disclaims any responsibility to update such views. These views may not be relied on as investment advice and, because investment decisions for a fund are based on numerous factors, may not be relied on as an indication of trading intent on behalf of any fund.
22
Table of Contents
SPDR MFS SYSTEMATIC GROWTH EQUITY ETF —
PERFORMANCE SUMMARY
The following performance chart of the Fund’s total return at net asset value, the total return based on market price and its benchmark index is provided for comparative purposes only and represents the periods noted. The Fund’s per share net asset value (“NAV”) is the value of one share of the Fund and is calculated by dividing the value of total assets less total liabilities by the number of shares outstanding. The NAV return is based on the NAV of the Fund and the market return is based on the market price per share of the Fund. The market price used to calculate the market return is determined by using the midpoint between the highest bid and the lowest offer on the exchange on which the shares of the Fund are listed for trading, as of the time that the Fund’s NAV is calculated. Since shares of the Fund did not trade in the secondary market until one day after the Fund’s inception, for the period from inception to the first day of secondary market trading in shares of the Fund (1/8/14, 1/9/14, respectively), the NAV of the Fund is used as a proxy for the secondary market trading price to calculate market returns. NAV and market returns assume that dividends and capital gain distributions have been reinvested in the Fund at NAV. Market returns do not include brokerage commissions that may be payable on secondary market transactions. If brokerage commissions were included market returns would be lower.
An index is a statistical measure of a specified financial market or sector. An index does not actually hold a portfolio of securities and therefore does not reflect deductions for fees or expenses. In comparison, the Fund’s performance is negatively impacted by these deductions.
Performance quoted represents past performance, which is no guarantee of future results. Investment return and principal value will fluctuate, so you may have a gain or loss when shares are sold. Current performance may be higher or lower than that quoted. Visit www.spdrs.com for most recent month-end performance. The returns do not reflect the deduction of taxes that a shareholder would pay on Fund distributions or on the redemption or sale of Fund shares. The total expense ratio for SPDR MFS Systematic Growth Equity ETF as stated in the Fees and Expenses table of the prospectus dated October 31, 2015 (as supplemented June 10, 2016) is 0.60%.
PERFORMANCE AS OF JUNE 30, 2016
| CUMULATIVE TOTAL RETURN | AVERAGE ANNUAL TOTAL RETURN | |||||||||||||||||||||||||||||
| NET ASSET VALUE | MARKET VALUE | PRIMARY
RUSSELL 1000 | NET ASSET VALUE | MARKET VALUE | PRIMARY
RUSSELL 1000 | |||||||||||||||||||||||||
| ONE YEAR | 3.96% | 3.70% | 3.02% | 3.96% | 3.70% | 3.02% | ||||||||||||||||||||||||
| SINCE INCEPTION (1) | 31.57% | 31.53% | 21.91% | 11.71% | 11.69% | 8.33% | ||||||||||||||||||||||||
| (1) | For the period January 8, 2014 to June 30, 2016. |
| Russell | 1000 Growth Index |
The Russell 1000 Growth Index measures the performance of the large-cap growth segment of the U.S. equity universe. It includes those Russell 1000 Index companies with higher price-to-book ratios and higher forecasted growth values.
23
Table of Contents
SPDR MFS SYSTEMATIC GROWTH EQUITY ETF —
PERFORMANCE SUMMARY (CONTINUED)
COMPARISON OF CHANGE IN VALUE OF A $10,000 INVESTMENT (BASED ON NET ASSET VALUE)
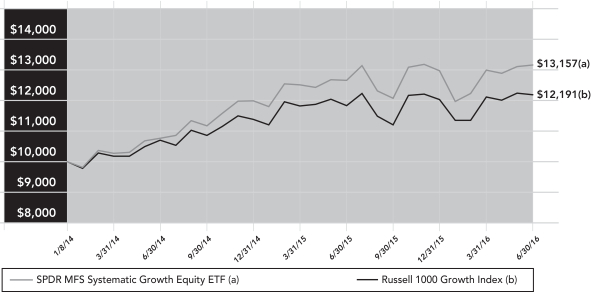
Past performance is not a guarantee of future results.
Index returns are unmanaged and do not reflect the deduction of any fees or expenses. Index returns reflect all items of income, gain and loss and the reinvestment of dividends and other income.
Line graph is based on cumulative total return.
24
Table of Contents
SPDR MFS SYSTEMATIC VALUE EQUITY ETF — MANAGEMENT’S DISCUSSIONOF FUND PERFORMANCE (UNAUDITED)
The SPDR MFS Systematic Value Equity ETF (the “Fund”) invests substantially all of its assets in the MFS Systematic Value Equity Portfolio (the “Portfolio”), which seeks to achieve capital appreciation. As a result, the Fund invests indirectly through the Portfolio.
For the 12-month period ended June 30, 2016 (the “Reporting Period”), the total return for the Fund was –2.47%, and the total return for the Russell 1000 Value Index (the “Index”) was 2.86%. The Fund and Index returns reflect the reinvestment of dividends and other income. The Fund’s performance reflects the expenses of managing the Fund, including brokerage and advisory expenses. The Index is unmanaged and Index returns do not reflect fees and expenses of any kind, which would have a negative impact on returns.
The Fund underperformed the Index during the Reporting Period. Sluggish global growth weighed on both developed and emerging market (“EM”) economies during the Reporting Period as EM economies proved to be particularly lackluster. The U.S. Federal Reserve began its long-anticipated monetary tightening cycle in the middle of the Reporting Period, but the tightening cycle has proved to be more gradual than initially anticipated. Globally, central bank policy remained highly accommodative, which forced many government, and even some corporate, bond yields into negative territory. At the very end of the Reporting Period, the United Kingdom voted to leave the European Union, beginning a multi-year process of negotiation in order to achieve “Brexit.”
During the second half of the Reporting Period, U.S. earnings headwinds expanded beyond the energy, materials and industrial sectors, to include most sectors of the market. The sharp rise in the U.S. dollar also weighed on earnings early in the Reporting Period, though dollar strength ebbed somewhat late in the period. U.S. consumer spending held up well during the second half of the Reporting Period amid a modest increase in real wages and falling gasoline prices. Demand for autos reached near-record territory before receding modestly late in the Reporting Period. Global trade was dampened particularly by falling demand in emerging markets. Weaker Chinese growth, which drove the decline in commodity prices, weighed on EM economies and asset prices. China responded with a variety of monetary and fiscal measures to stimulate its economy, which showed signs of stabilization at the end of the Reporting Period, though concerns over high debt levels persist. Structural factors like floating exchange rates and fiscal buffers partially offset the cyclical headwinds to emerging markets.
On an individual security level, the top positive contributors to the Fund’s performance were Northrop Grumman Corp, Tyson Food Inc. and Exelon Corp. The Fund’s overweight position in global security company Northrop Grumman aided relative returns. Stock selection in the consumer staples sector also helped relative results led by an overweight position in food company Tyson Foods. An individual stock that contributed to relative performance included an overweight position in utility services providers Exelon. The top negative contributors to the Fund’s performance were Lyondellbasell Industries NV, MetLife Inc., and Wpx Energy Inc. Stock selection in the basic materials sector further dampened relative returns led by an overweight position in polypropylene manufacturer Lyondellbasell Industries (Netherlands). Stock selection in the financial services sector detracted from performance relative to the Index. Within the financial services sector, overweight positions in insurance company MetLife dampened relative results. Stock selection in the energy sector also held back relative performance. Here, an overweight position in independent oil producer WPX Energy hindered relative performance as the stock lagged the benchmark during the Reporting Period.
The views expressed above reflect those of the Fund’s portfolio manager only through the Reporting Period, and do not necessarily represent the views of the Adviser as a whole. Any such views are subject to change at any time based upon market or other conditions and the Adviser disclaims any responsibility to update such views. These views may not be relied on as investment advice and, because investment decisions for a fund are based on numerous factors, may not be relied on as an indication of trading intent on behalf of any fund.
25
Table of Contents
SPDR MFS SYSTEMATIC VALUE EQUITY ETF —
PERFORMANCE SUMMARY
The following performance chart of the Fund’s total return at net asset value, the total return based on market price and its benchmark index is provided for comparative purposes only and represents the periods noted. The Fund’s per share net asset value (“NAV”) is the value of one share of the Fund and is calculated by dividing the value of total assets less total liabilities by the number of shares outstanding. The NAV return is based on the NAV of the Fund and the market return is based on the market price per share of the Fund. The market price used to calculate the market return is determined by using the midpoint between the highest bid and the lowest offer on the exchange on which the shares of the Fund are listed for trading, as of the time that the Fund’s NAV is calculated. Since shares of the Fund did not trade in the secondary market until one day after the Fund’s inception, for the period from inception to the first day of secondary market trading in shares of the Fund (1/8/14, 1/9/14, respectively), the NAV of the Fund is used as a proxy for the secondary market trading price to calculate market returns. NAV and market returns assume that dividends and capital gain distributions have been reinvested in the Fund at NAV. Market returns do not include brokerage commissions that may be payable on secondary market transactions. If brokerage commissions were included market returns would be lower.
An index is a statistical measure of a specified financial market or sector. An index does not actually hold a portfolio of securities and therefore does not reflect deductions for fees or expenses. In comparison, the Fund’s performance is negatively impacted by these deductions.
Performance quoted represents past performance, which is no guarantee of future results. Investment return and principal value will fluctuate, so you may have a gain or loss when shares are sold. Current performance may be higher or lower than that quoted. Visit www.spdrs.com for most recent month-end performance. The returns do not reflect the deduction of taxes that a shareholder would pay on Fund distributions or on the redemption or sale of Fund shares. The total expense ratio for SPDR MFS Systematic Value Equity ETF as stated in the Fees and Expenses table of the prospectus dated October 31, 2015 (as supplemented June 10, 2016) is 0.60%.
PERFORMANCE AS OF JUNE 30, 2016
| CUMULATIVE TOTAL RETURN | AVERAGE ANNUAL TOTAL RETURN | |||||||||||||||||||||||||||||
| NET ASSET VALUE | MARKET VALUE | PRIMARY
RUSSELL 1000 | NET ASSET VALUE | MARKET VALUE | PRIMARY
RUSSELL 1000 | |||||||||||||||||||||||||
| ONE YEAR | –2.47% | –2.58% | 2.86% | –2.47% | –2.58% | 2.86% | ||||||||||||||||||||||||
| SINCE INCEPTION (1) | 17.36% | 17.21% | 16.29% | 6.67% | 6.62% | 6.29% | ||||||||||||||||||||||||
| (1) | For the period January 8, 2014 to June 30, 2016. |
| Russell | 1000 Value Index |
The Russell 1000 Value Index measures the performance of the large-cap value segment of the U.S. equity universe. It includes those Russell 1000 Index companies with lower price-to-book ratios and lower expected growth values.
26
Table of Contents
SPDR MFS SYSTEMATIC VALUE EQUITY ETF —
PERFORMANCE SUMMARY (CONTINUED)
COMPARISON OF CHANGE IN VALUE OF A $10,000 INVESTMENT (BASED ON NET ASSET VALUE)

Past performance is not a guarantee of future results.
Index returns are unmanaged and do not reflect the deduction of any fees or expenses. Index returns reflect all items of income, gain and loss and the reinvestment of dividends and other income.
Line graph is based on cumulative total return.
27
Table of Contents
MANAGEMENT’S DISCUSSIONOF FUND PERFORMANCE (UNAUDITED)
The SPDR SSGA Risk Aware ETF (the “Fund”) normally invests substantially all of its assets in the SSGA Risk Aware Portfolio (the “Portfolio”), which seeks to provide competitive returns compared to the broad U.S. equity market and capital appreciation. As a result, this Fund invests indirectly through the Portfolio.
For the 12-month period ended June 30, 2016 (the “Reporting Period”), the total return for the Fund was 1.29%, and the total return for the Russell 3000 Index (the “Index”) was 2.14%. The Fund and Index returns reflect the reinvestment of dividends and other income. The Fund’s performance reflects the expenses of managing the Fund, including brokerage and advisory expenses. The Index is unmanaged and Index returns do not reflect fees and expenses of any kind, which would have a negative impact on returns.
In the early part of the Reporting Period (Q3 2015), the market environment was largely one of fear as China devalued its currency, oil continued its one year slide, and the Federal Reserve displayed concern around the current state of the economy. As a result, the Portfolio established a “risk off” profile with over-weights in defensive sectors such as consumer staples and utilities, and underweights in the cyclical sectors such as energy and technology. From a sector allocation standpoint, this was the correct decision given the volatility in the market, particularly in August. However, the model underperformed as it was challenged in several of its stock selection decisions, specifically within the pro-cyclical sectors of the market.
The Portfolio’s risk signal continued to take a risk-off stance throughout the remainder of the year and into early 2016. This was a good decision on the whole, and the Portfolio outperformed the Index from July through January by 2.54%. However, the “safe” posture was a liability in October and the Portfolio underperformed the Index by 3.78% as the markets rallied on the back of new accommodative policy commitments from global central banks. But, the Portfolio had an exceptional December and January which offset this. During these two months, fear once again returned and the markets began to struggle as the Federal Reserve raised interest rates, oil continued to sell off, and U.S. economic data releases indicated weaker economic growth than expected. In January alone, the Index declined 5.64% while the Portfolio declined only 0.03%, due to its defensive posture.
The middle part of February was a turning point for the markets as sentiment sharply improved. In March, the ISM Manufacturing Index, a measure of U.S. manufacturing activity, returned to expansionary readings after hitting a post-crisis low in December, while in China the Purchasing Managers Index also returned to expansionary readings after seven months of decline. Improvements in global manufacturing data, active and verbal support from central banks, and a significant rebound in the energy sector all provided the foundation for a “relief rally.” Unfortunately, during this time period (February through April), factor signals continued to suggest that a defensive posture was still warranted, and the Portfolio remained defensive with substantial underweights in the energy and technology sectors. This lead to underperformance during these months as the Portfolio missed the start of the “risk-on” rally and the commodity led global reflation trade drove markets higher.
Although the market had rebounded during this period and began to perform well, there was still a general theme of uncertainty and an unbalanced picture of global economic growth. The investment model struggled to get a footing and it wasn’t until May that the Portfolio started to take a more “risk-on” stance and added positions in the technology, financials, and materials sectors. By June, the model was firmly “risk-on” and further weight was added to these sectors along with materials, putting the portfolio in a more pro-cyclical stance. This resulted in slight outperformance for June and the final month of the Reporting Period.
In summary, the significant swings among market leadership, uncertainty over global economic growth, and the market’s sharp reaction to central bank rhetoric created a very challenging environment for the model. It correctly identified the appropriate market regime only half of the time and this ultimately lead to the majority of the underperformance during the Reporting Period.
28
Table of Contents

SPDR SSGA RISK AWARE ETF — MANAGEMENT’S DISCUSSIONOF FUND PERFORMANCE
(UNAUDITED) (CONTINUED)
The views expressed above reflect those of the Fund’s portfolio manager only through the Reporting Period, and do not necessarily represent the views of the Adviser as a whole. Any such views are subject to change at any time based upon market or other conditions and the Adviser disclaims any responsibility to update such views. These views may not be relied on as investment advice and, because investment decisions for a fund are based on numerous factors, may not be relied on as an indication of trading intent on behalf of any fund.
29
Table of Contents
SPDR SSGA RISK AWARE ETF —
PERFORMANCE SUMMARY
The following performance chart of the Fund’s total return at net asset value, the total return based on market price and its benchmark index is provided for comparative purposes only and represents the periods noted. The Fund’s per share net asset value (“NAV”) is the value of one share of the Fund and is calculated by dividing the value of total assets less total liabilities by the number of shares outstanding. The NAV return is based on the NAV of the Fund and the market return is based on the market price per share of the Fund. The market price used to calculate the market return is determined by using the midpoint between the highest bid and the lowest offer on the exchange on which the shares of the Fund are listed for trading, as of the time that the Fund’s NAV is calculated. Since shares of the Fund did not trade in the secondary market until one day after the Fund’s inception, for the period from inception to the first day of secondary market trading in shares of the Fund (9/9/14, 9/10/14, respectively), the NAV of the Fund is used as a proxy for the secondary market trading price to calculate market returns. NAV and market returns assume that dividends and capital gain distributions have been reinvested in the Fund at NAV. Market returns do not include brokerage commissions that may be payable on secondary market transactions. If brokerage commissions were included market returns would be lower.
An index is a statistical measure of a specified financial market or sector. An index does not actually hold a portfolio of securities and therefore does not reflect deductions for fees or expenses. In comparison, the Fund’s performance is negatively impacted by these deductions.
Performance quoted represents past performance, which is no guarantee of future results. Investment return and principal value will fluctuate, so you may have a gain or loss when shares are sold. Current performance may be higher or lower than that quoted. Visit www.spdrs.com for most recent month-end performance. The returns do not reflect the deduction of taxes that a shareholder would pay on Fund distributions or on the redemption or sale of Fund shares. The total expense ratio for SPDR SSGA Risk Aware ETF as stated in the Fees and Expenses table of the prospectus dated October 31, 2015 (as supplemented June 10, 2016) is 0.50%.
PERFORMANCE AS OF JUNE 30, 2016
| CUMULATIVE TOTAL RETURN | AVERAGE ANNUAL TOTAL RETURN | |||||||||||||||||||||||
| NET ASSET VALUE | MARKET VALUE | PRIMARY
RUSSELL | NET ASSET VALUE | MARKET VALUE | PRIMARY
RUSSELL | |||||||||||||||||||
| ONE YEAR | 1.29% | 1.40% | 2.14% | 1.29% | 1.40% | 2.14% | ||||||||||||||||||
| SINCE INCEPTION (1) | 0.29% | 0.31% | 8.08% | 0.16% | 0.17% | 4.39% | ||||||||||||||||||
| (1) | For the period September 9, 2014 to June 30, 2016. |
| Russell | 3000 Index |
The Russell 3000 Index measures the performance of the largest 3,000 U.S. companies representing approximately 98% of the investable U.S. equity market. The Russell 3000 Index is constructed to provide a comprehensive, unbiased, and stable barometer of the broad market and is completely reconstituted annually to ensure new and growing equities are reflected.
30
Table of Contents
SPDR SSGA RISK AWARE ETF — PERFORMANCE SUMMARY (CONTINUED)
COMPARISON OF CHANGE IN VALUE OF A $10,000 INVESTMENT (BASED ON NET ASSET VALUE)
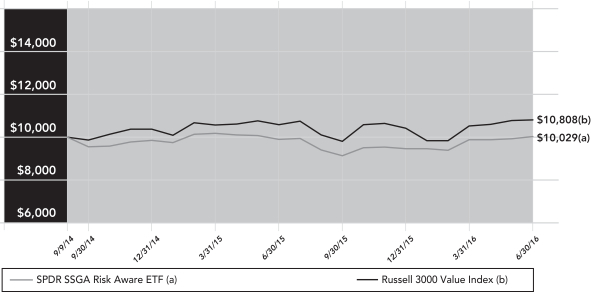
Past performance is not a guarantee of future results.
Index returns are unmanaged and do not reflect the deduction of any fees or expenses. Index returns reflect all items of income, gain and loss and the reinvestment of dividends and other income.
Line graph is based on cumulative total return.
31
Table of Contents
SSGA ACTIVE TRUST
STATEMENTS OF ASSETS AND LIABILITIES
June 30, 2016
| SPDR SSGA Multi-Asset Real Return ETF | SPDR SSGA Income Allocation ETF | SPDR SSGA Global Allocation ETF | ||||||||||
ASSETS | ||||||||||||
Investment in corresponding Portfolio, at value (Note 1) | $ | 80,824,140 | $ | 105,495,646 | $ | 179,711,957 | ||||||
Receivable for fund shares sold | — | — | 6,670,720 | |||||||||
Receivable from Adviser (Note 3) | — | — | 25,399 | |||||||||
|
|
|
|
|
| |||||||
TOTAL ASSETS | 80,824,140 | 105,495,646 | 186,408,076 | |||||||||
|
|
|
|
|
| |||||||
LIABILITIES | ||||||||||||
Advisory fee payable (Note 3) | 1,869 | 13,507 | — | |||||||||
Distribution payable | 380,757 | 876,752 | 1,295,599 | |||||||||
Accrued expenses and other liabilities | 118 | — | — | |||||||||
|
|
|
|
|
| |||||||
TOTAL LIABILITIES | 382,744 | 890,259 | 1,295,599 | |||||||||
|
|
|
|
|
| |||||||
NET ASSETS | $ | 80,441,396 | $ | 104,605,387 | $ | 185,112,477 | ||||||
|
|
|
|
|
| |||||||
NET ASSETS CONSIST OF: | ||||||||||||
Paid-in Capital | $ | 117,467,947 | $ | 110,648,692 | $ | 192,717,569 | ||||||
Undistributed (distribution in excess of) net investment income (loss) | (380,758 | ) | (359,964 | ) | (542,324 | ) | ||||||
Accumulated net realized gain (loss) on investments | (25,483,490 | ) | (8,468,965 | ) | (10,065,415 | ) | ||||||
Net unrealized appreciation (depreciation) on: | ||||||||||||
Investments | (11,162,303 | ) | 2,785,624 | 3,002,647 | ||||||||
|
|
|
|
|
| |||||||
NET ASSETS | $ | 80,441,396 | $ | 104,605,387 | $ | 185,112,477 | ||||||
|
|
|
|
|
| |||||||
NET ASSET VALUE PER SHARE | ||||||||||||
Net asset value per share | $ | 24.38 | $ | 31.23 | $ | 33.35 | ||||||
|
|
|
|
|
| |||||||
Shares outstanding (unlimited amount authorized, no par value) | 3,300,000 | 3,350,000 | 5,550,000 | |||||||||
|
|
|
|
|
| |||||||
See accompanying notes to financial statements and financial statements of the Master Portfolios.
32
Table of Contents
| SPDR Blackstone/ GSO Senior Loan ETF | SPDR SSGA Ultra Short Term Bond ETF | SPDR DoubleLine Total Return Tactical ETF | SPDR MFS Systematic Core Equity ETF | SPDR MFS Systematic Growth Equity ETF | SPDR MFS Systematic Value Equity ETF | SPDR SSGA Risk Aware ETF | ||||||||||||||||||||
| $ | 802,488,187 | $ | 24,038,757 | $ | 2,636,071,936 | $ | 5,835,902 | $ | 12,166,684 | $ | 2,612,598 | $ | 1,960,576 | |||||||||||||
| — | — | 22,430,353 | — | — | — | — | ||||||||||||||||||||
| — | — | — | — | — | — | — | ||||||||||||||||||||
|
|
|
|
|
|
|
|
|
|
|
|
|
| |||||||||||||
| 802,488,187 | 24,038,757 | 2,658,502,289 | 5,835,902 | 12,166,684 | 2,612,598 | 1,960,576 | ||||||||||||||||||||
|
|
|
|
|
|
|
|
|
|
|
|
|
| |||||||||||||
| 260,413 | — | 551,192 | 1,430 | 2,978 | 640 | 399 | ||||||||||||||||||||
| — | — | — | 25,922 | 29,733 | 12,678 | 6,049 | ||||||||||||||||||||
| — | — | — | — | — | — | — | ||||||||||||||||||||
|
|
|
|
|
|
|
|
|
|
|
|
|
| |||||||||||||
| 260,413 | — | 551,192 | 27,352 | 32,711 | 13,318 | 6,448 | ||||||||||||||||||||
|
|
|
|
|
|
|
|
|
|
|
|
|
| |||||||||||||
| $ | 802,227,774 | $ | 24,038,757 | $ | 2,657,951,097 | $ | 5,808,550 | $ | 12,133,973 | $ | 2,599,280 | $ | 1,954,128 | |||||||||||||
|
|
|
|
|
|
|
|
|
|
|
|
|
| |||||||||||||
| $ | 851,759,731 | $ | 24,314,985 | $ | 2,632,000,224 | $ | 5,843,651 | $ | 11,872,715 | $ | 2,508,243 | $ | 2,080,969 | |||||||||||||
| 1,917,933 | — | 3,974,284 | (25,922 | ) | (29,733 | ) | (12,678 | ) | (2,251 | ) | ||||||||||||||||
| (50,239,803 | ) | (271,992 | ) | (4,472,937 | ) | (1,064 | ) | (141,908 | ) | 45,174 | (200,303 | ) | ||||||||||||||
| (1,210,087 | ) | (4,236 | ) | 26,449,526 | (8,115 | ) | 432,899 | 58,541 | 75,713 | |||||||||||||||||
|
|
|
|
|
|
|
|
|
|
|
|
|
| |||||||||||||
| $ | 802,227,774 | $ | 24,038,757 | $ | 2,657,951,097 | $ | 5,808,550 | $ | 12,133,973 | $ | 2,599,280 | $ | 1,954,128 | |||||||||||||
|
|
|
|
|
|
|
|
|
|
|
|
|
| |||||||||||||
| $ | 46.64 | $ | 40.06 | $ | 49.87 | $ | 58.09 | $ | 60.67 | $ | 51.99 | $ | 39.08 | |||||||||||||
|
|
|
|
|
|
|
|
|
|
|
|
|
| |||||||||||||
| 17,200,000 | 600,000 | 53,300,000 | 100,000 | 200,000 | 50,000 | 50,000 | ||||||||||||||||||||
|
|
|
|
|
|
|
|
|
|
|
|
|
| |||||||||||||
33
Table of Contents
SSGA ACTIVE TRUST
STATEMENTS OF OPERATIONS
For the Year Ended June 30, 2016
| SPDR SSGA Multi-Asset Real Return ETF | SPDR SSGA Income Allocation ETF | SPDR SSGA Global Allocation ETF | SPDR Blackstone/ GSO Senior Loan ETF | |||||||||||||
INCOME AND EXPENSES ALLOCATED FROM PORTFOLIO | ||||||||||||||||
Interest income allocated from the Portfolio (Note 2) | $ | — | $ | — | $ | — | $ | 36,218,906 | ||||||||
Dividend income allocated from the Portfolio (Note 2) | 1,469,959 | 3,680,605 | 4,336,247 | 139,199 | ||||||||||||
Expenses allocated from Portfolio (Note 2) | (190,330 | ) | (216,263 | ) | (349,264 | ) | (2,262,684 | ) | ||||||||
|
|
|
|
|
|
|
| |||||||||
TOTAL INVESTMENT INCOME (LOSS) ALLOCATED FROM PORTFOLIO | 1,279,629 | 3,464,342 | 3,986,983 | 34,095,421 | ||||||||||||
|
|
|
|
|
|
|
| |||||||||
EXPENSES | ||||||||||||||||
Advisory fee (Note 3) | 66,537 | 176,146 | — | 2,995,864 | ||||||||||||
Trustees’ fees (Note 4) | 2,016 | 1,964 | 2,931 | 12,446 | ||||||||||||
Miscellaneous expenses | 7 | 8 | 12 | 18,229 | ||||||||||||
|
|
|
|
|
|
|
| |||||||||
TOTAL EXPENSES | 68,560 | 178,118 | 2,943 | 3,026,539 | ||||||||||||
|
|
|
|
|
|
|
| |||||||||
Expenses waived/reimbursed by the Adviser (Note 3) | — | — | (253,395 | ) | — | |||||||||||
|
|
|
|
|
|
|
| |||||||||
NET EXPENSES | 68,560 | 178,118 | (250,452 | ) | 3,026,539 | |||||||||||
|
|
|
|
|
|
|
| |||||||||
NET INVESTMENT INCOME (LOSS) | 1,211,069 | 3,286,224 | 4,237,435 | 31,068,882 | ||||||||||||
|
|
|
|
|
|
|
| |||||||||
REALIZED AND UNREALIZED GAIN (LOSS) | ||||||||||||||||
Net realized gain (loss) on: | ||||||||||||||||
Investment transactions allocated from Portfolio | (16,476,507 | ) | (4,798,745 | ) | (10,860,741 | ) | (46,702,938 | ) | ||||||||
Capital gain distributions allocated from Portfolio | 51,217 | 1,017,290 | 2,071,017 | — | ||||||||||||
Net change in unrealized appreciation/depreciation on: | ||||||||||||||||
Net change in unrealized appreciation (depreciation) allocated from Portfolio | 6,755,515 | 3,854,231 | 1,852,621 | 7,786,190 | ||||||||||||
|
|
|
|
|
|
|
| |||||||||
NET REALIZED AND UNREALIZED GAIN (LOSS) | (9,669,775 | ) | 72,776 | (6,937,103 | ) | (38,916,748 | ) | |||||||||
|
|
|
|
|
|
|
| |||||||||
NET INCREASE (DECREASE) IN NET ASSETS FROM OPERATIONS | $ | (8,458,706 | ) | $ | 3,359,000 | $ | (2,699,668 | ) | $ | (7,847,866 | ) | |||||
|
|
|
|
|
|
|
| |||||||||
See accompanying notes to financial statements and financial statements of the Master Portfolios.
34
Table of Contents
| SPDR SSGA Ultra Short Term Bond ETF | SPDR DoubleLine | SPDR MFS | SPDR MFS | SPDR MFS | SPDR SSGA Risk Aware ETF | |||||||||||||||||
$ | 283,171 |
| $ | 62,549,981 | $ | — | $ | — | $ | — | $ | — | ||||||||||
| 3,498 |
| 648,464 | 114,840 | 177,422 | 65,996 | 38,325 | |||||||||||||||
| (64,956 | ) | (5,144,755 | ) | (14,599 | ) | (32,223 | ) | (8,241 | ) | (4,913 | ) | |||||||||||
|
|
|
|
|
|
|
|
|
|
|
| |||||||||||
| 221,713 |
| 58,053,690 | 100,241 | 145,199 | 57,755 | 33,412 | |||||||||||||||
|
|
|
|
|
|
|
|
|
|
|
| |||||||||||
| — | 5,996,790 | 14,427 | 31,865 | 8,018 | 4,722 | |||||||||||||||||
| 716 | 23,546 | 222 | 313 | 197 | 182 | |||||||||||||||||
| 182 | 14,264 | 1 | 1 | — | — | |||||||||||||||||
|
|
|
|
|
|
|
|
|
|
|
| |||||||||||
| 898 | 6,034,600 | 14,650 | 32,179 | 8,215 | 4,904 | |||||||||||||||||
|
|
|
|
|
|
|
|
|
|
|
| |||||||||||
| — |
| (1,727,412 | ) | — | — | — | — | ||||||||||||||
|
|
|
|
|
|
|
|
|
|
|
| |||||||||||
| 898 | 4,307,188 | 14,650 | 32,179 | 8,215 | 4,904 | |||||||||||||||||
|
|
|
|
|
|
|
|
|
|
|
| |||||||||||
| 220,815 | 53,746,502 | 85,591 | 113,020 | 49,540 | 28,508 | |||||||||||||||||
|
|
|
|
|
|
|
|
|
|
|
| |||||||||||
| (268,823 | ) | (3,169,758 | ) | 351,022 | 378,142 | 109,849 | (69,214 | ) | |||||||||||||
| — |
| — | — | — | — | — | |||||||||||||||
| 5,478 |
| 33,117,148 | (346,244 | ) | 53,265 | (243,554 | ) | 64,841 | |||||||||||||
|
|
|
|
|
|
|
|
|
|
|
| |||||||||||
| (263,345 | ) | 29,947,390 | 4,778 | 431,407 | (133,705 | ) | (4,373 | ) | |||||||||||||
|
|
|
|
|
|
|
|
|
|
|
| |||||||||||
$ | (42,530 | ) | $ | 83,693,892 | $ | 90,369 | $ | 544,427 | $ | (84,165 | ) | $ | 24,135 | |||||||||
|
|
|
|
|
|
|
|
|
|
|
| |||||||||||
35
Table of Contents
SSGA ACTIVE TRUST
STATEMENTS OF CHANGES IN NET ASSETS
| SPDR SSGA Multi-Asset Real Return ETF | SPDR SSGA Income Allocation ETF | |||||||||||||||
| Year Ended 6/30/16 | Year Ended 6/30/15 | Year Ended 6/30/16 | Year Ended 6/30/15 | |||||||||||||
INCREASE (DECREASE) IN NET ASSETS FROM OPERATIONS: | ||||||||||||||||
Net investment income (loss) | $ | 1,211,069 | $ | 2,482,687 | $ | 3,286,224 | $ | 3,489,553 | ||||||||
Net realized gain (loss) | (16,425,290 | ) | (4,432,134 | ) | (3,781,455 | ) | 544,893 | |||||||||
Net change in unrealized appreciation/depreciation | 6,755,515 | (23,442,391 | ) | 3,854,231 | (6,319,996 | ) | ||||||||||
|
|
|
|
|
|
|
| |||||||||
Net increase (decrease) in net assets resulting from operations | (8,458,706 | ) | (25,391,838 | ) | 3,359,000 | (2,285,550 | ) | |||||||||
|
|
|
|
|
|
|
| |||||||||
Net equalization credits and charges (Note 2) | 23,691 | 42,131 | (86,567 | ) | 56,314 | |||||||||||
|
|
|
|
|
|
|
| |||||||||
DISTRIBUTIONS TO SHAREHOLDERS FROM: | ||||||||||||||||
Net investment income | (1,284,505 | ) | (2,527,694 | ) | (3,629,570 | ) | (3,780,064 | ) | ||||||||
Net realized gains | — | — | — | — | ||||||||||||
Return of Capital | — | — | — | — | ||||||||||||
|
|
|
|
|
|
|
| |||||||||
Total distributions to shareholders | (1,284,505 | ) | (2,527,694 | ) | (3,629,570 | ) | (3,780,064 | ) | ||||||||
|
|
|
|
|
|
|
| |||||||||
FROM BENEFICIAL INTEREST TRANSACTIONS: | ||||||||||||||||
Proceeds from sale of shares sold | 26,711,193 | 66,337,576 | 3,064,239 | 34,191,856 | ||||||||||||
Cost of shares redeemed | (77,421,277 | ) | (61,103,706 | ) | (18,208,088 | ) | (11,141,269 | ) | ||||||||
Net income equalization (Note 2) | (23,691 | ) | (42,131 | ) | 86,567 | (56,314 | ) | |||||||||
Other capital (Note 5) | — | — | — | — | ||||||||||||
|
|
|
|
|
|
|
| |||||||||
Net increase (decrease) in net assets from beneficial interest transactions | (50,733,775 | ) | 5,191,739 | (15,057,282 | ) | 22,994,273 | ||||||||||
|
|
|
|
|
|
|
| |||||||||
Net increase (decrease) in net assets during the period | (60,453,295 | ) | (22,685,662 | ) | (15,414,419 | ) | 16,984,973 | |||||||||
|
|
|
|
|
|
|
| |||||||||
Net assets at beginning of period | 140,894,691 | 163,580,353 | 120,019,806 | 103,034,833 | ||||||||||||
|
|
|
|
|
|
|
| |||||||||
NET ASSETS AT END OF PERIOD | $ | 80,441,396 | $ | 140,894,691 | $ | 104,605,387 | $ | 120,019,806 | ||||||||
|
|
|
|
|
|
|
| |||||||||
Undistributed (distribution in excess of) net investment income (loss) | $ | (380,758 | ) | $ | (455,607 | ) | $ | (359,964 | ) | $ | (554,739 | ) | ||||
|
|
|
|
|
|
|
| |||||||||
SHARES OF BENEFICIAL INTEREST: | ||||||||||||||||
Shares sold | 1,200,000 | 2,400,000 | 100,000 | 1,050,000 | ||||||||||||
Shares redeemed | (3,351,111 | ) | (2,250,000 | ) | (601,111 | ) | (350,000 | ) | ||||||||
|
|
|
|
|
|
|
| |||||||||
Net increase (decrease) | (2,151,111 | ) | 150,000 | (501,111 | ) | 700,000 | ||||||||||
|
|
|
|
|
|
|
| |||||||||
See accompanying notes to financial statements and financial statements of the Master Portfolios.
36
Table of Contents
| SPDR SSGA Global Allocation ETF | SPDR Blackstone/GSO Senior Loan ETF | SPDR SSGA Ultra Short Term Bond ETF | ||||||||||||||||||||
| Year Ended 6/30/16 | Year Ended 6/30/15 | Year Ended 6/30/16 | Year Ended 6/30/15 | Year Ended 6/30/16 | Year Ended 6/30/15 | |||||||||||||||||
| $ | 4,237,435 | $ | 3,228,950 | $ | 31,068,882 | $ | 24,960,615 | $ | 220,815 | $ | 53,459 | |||||||||||
| (8,789,724 | ) | 2,763,760 | (46,702,938 | ) | (750,611 | ) | (268,823 | ) | (4,836 | ) | ||||||||||||
| 1,852,621 |
| (5,265,486 | ) | 7,786,190 | (10,613,251 | ) | 5,478 | (20,193 | ) | ||||||||||||
|
|
|
|
|
|
|
|
|
|
|
| |||||||||||
| (2,699,668 | ) | 727,224 | (7,847,866 | ) | 13,596,753 | (42,530 | ) | 28,430 | |||||||||||||
|
|
|
|
|
|
|
|
|
|
|
| |||||||||||
| 90,933 |
| 172,315 | 291,518 | 126,497 | 60,118 | 166 | |||||||||||||||
|
|
|
|
|
|
|
|
|
|
|
| |||||||||||
| (5,119,774 | ) | (3,503,154 | ) | (31,186,434 | ) | (24,171,917 | ) | (223,429 | ) | (53,333 | ) | |||||||||||
| (382,777 | ) | (713,037 | ) | — | — | — | (715 | ) | ||||||||||||||
| — | — | — | — | (46,943 | ) | — | ||||||||||||||||
|
|
|
|
|
|
|
|
|
|
|
| |||||||||||
| (5,502,551 | ) | (4,216,191 | ) | (31,186,434 | ) | (24,171,917 | ) | (270,372 | ) | (54,048 | ) | |||||||||||
|
|
|
|
|
|
|
|
|
|
|
| |||||||||||
| 106,134,741 | 72,106,656 | 239,115,391 | 123,474,946 | 195,789,866 | 6,012,275 | |||||||||||||||||
| (56,475,220 | ) | (22,551,382 | ) | (70,050,396 | ) | (51,558,641 | ) | (187,553,580 | ) | (4,007,078 | ) | |||||||||||
| (90,933 | ) | (172,315 | ) | (291,518 | ) | (126,497 | ) | (60,118 | ) | (166 | ) | |||||||||||
| — | — | 386,597 | 194,062 | 97,270 | 3,607 | |||||||||||||||||
|
|
|
|
|
|
|
|
|
|
|
| |||||||||||
| 49,568,588 |
| 49,382,959 | 169,160,074 | 71,983,870 | 8,273,438 | 2,008,638 | |||||||||||||||
|
|
|
|
|
|
|
|
|
|
|
| |||||||||||
| 41,457,302 |
| 46,066,307 | 130,417,292 | 61,535,203 | 8,020,654 | 1,983,186 | |||||||||||||||
|
|
|
|
|
|
|
|
|
|
|
| |||||||||||
| 143,655,175 | 97,588,868 | 671,810,482 | 610,275,279 | 16,018,103 | 14,034,917 | |||||||||||||||||
|
|
|
|
|
|
|
|
|
|
|
| |||||||||||
| $ | 185,112,477 | $ | 143,655,175 | $ | 802,227,774 | $ | 671,810,482 | $ | 24,038,757 | $ | 16,018,103 | |||||||||||
|
|
|
|
|
|
|
|
|
|
|
| |||||||||||
$ | (542,324 | ) | $ | (554,214 | ) | $ | 1,917,933 | $ | 2,035,485 | $ | — | $ | 2,775 | |||||||||
|
|
|
|
|
|
|
|
|
|
|
| |||||||||||
| 3,150,000 | 2,050,000 | 5,050,000 | �� | 2,500,000 | 4,900,000 | 150,000 | ||||||||||||||||
| (1,751,111 | ) | (650,000 | ) | (1,500,000 | ) | (1,050,000 | ) | (4,700,000 | ) | (100,000 | ) | |||||||||||
|
|
|
|
|
|
|
|
|
|
|
| |||||||||||
| 1,398,889 | 1,400,000 | 3,550,000 | 1,450,000 | 200,000 | 50,000 | |||||||||||||||||
|
|
|
|
|
|
|
|
|
|
|
| |||||||||||
37
Table of Contents
SSGA ACTIVE TRUST
STATEMENTS OF CHANGES IN NET ASSETS (continued)
| SPDR DoubleLine Total Return Tactical ETF | SPDR MFS Systematic Core Equity ETF | |||||||||||||||
| Year Ended 6/30/16 | For the Period 2/23/15* - 6/30/15* | Year Ended 6/30/16 | Year Ended 6/30/15 | |||||||||||||
INCREASE (DECREASE) IN NET ASSETS FROM OPERATIONS: | ||||||||||||||||
Net investment income (loss) | $ | 53,746,502 | $ | 4,503,266 | $ | 85,591 | $ | 43,561 | ||||||||
Net realized gain (loss) | (3,169,758 | ) | (1,029,738 | ) | 351,022 | 313,374 | ||||||||||
Net change in unrealized appreciation/depreciation | 33,117,148 | (6,667,622 | ) | (346,244 | ) | 48,736 | ||||||||||
|
|
|
|
|
|
|
| |||||||||
Net increase (decrease) in net assets resulting from operations | 83,693,892 | (3,194,094 | ) | 90,369 | 405,671 | |||||||||||
|
|
|
|
|
|
|
| |||||||||
Net equalization credits and charges (Note 2) | 2,569,641 | 840,772 | 16,445 | (2,028 | ) | |||||||||||
|
|
|
|
|
|
|
| |||||||||
DISTRIBUTIONS TO SHAREHOLDERS FROM: | ||||||||||||||||
Net investment income | (51,231,117 | ) | (3,317,808 | ) | (102,966 | ) | (43,961 | ) | ||||||||
Net realized gains | — | — | (63,234 | ) | (72,014 | ) | ||||||||||
|
|
|
|
|
|
|
| |||||||||
Total distributions to shareholders | (51,231,117 | ) | (3,317,808 | ) | (166,200 | ) | (115,975 | ) | ||||||||
|
|
|
|
|
|
|
| |||||||||
FROM BENEFICIAL INTEREST TRANSACTIONS: | ||||||||||||||||
Proceeds from sale of shares sold | 1,878,119,722 | 752,576,239 | 5,860,887 | — | ||||||||||||
Cost of shares redeemed | — | — | (2,902,795 | ) | (2,723,021 | ) | ||||||||||
Net income equalization (Note 2) | (2,569,641 | ) | (840,772 | ) | (16,445 | ) | 2,028 | |||||||||
Other capital (Note 5) | 925,486 | 378,777 | — | — | ||||||||||||
|
|
|
|
|
|
|
| |||||||||
Net increase (decrease) in net assets from beneficial interest transactions | 1,876,475,567 | 752,114,244 | 2,941,647 | (2,720,993 | ) | |||||||||||
|
|
|
|
|
|
|
| |||||||||
Net increase (decrease) in net assets during the period | 1,911,507,983 | 746,443,114 | 2,882,261 | (2,433,325 | ) | |||||||||||
|
|
|
|
|
|
|
| |||||||||
Net assets at beginning of period | 746,443,114 | — | 2,926,289 | 5,359,614 | ||||||||||||
|
|
|
|
|
|
|
| |||||||||
NET ASSETS AT END OF PERIOD | $ | 2,657,951,097 | $ | 746,443,114 | $ | 5,808,550 | $ | 2,926,289 | ||||||||
|
|
|
|
|
|
|
| |||||||||
Undistributed (distribution in excess of) net investment income (loss) | $ | 3,974,284 | $ | 645,258 | $ | (25,922 | ) | $ | 310 | |||||||
|
|
|
|
|
|
|
| |||||||||
SHARES OF BENEFICIAL INTEREST: | ||||||||||||||||
Shares sold | 38,200,000 | 15,100,000 | 100,000 | — | ||||||||||||
Shares redeemed | — | — | (50,000 | ) | (50,000 | ) | ||||||||||
|
|
|
|
|
|
|
| |||||||||
Net increase (decrease) | 38,200,000 | 15,100,000 | 50,000 | (50,000 | ) | |||||||||||
|
|
|
|
|
|
|
| |||||||||
| * | Inception date. |
See accompanying notes to financial statements and financial statements of the Master Portfolios.
38
Table of Contents
SPDR MFS Systematic Growth Equity ETF | SPDR MFS Systematic Value Equity ETF | SPDR SSGA Risk Aware ETF | ||||||||||||||||||||
| Year Ended 6/30/16 | Year Ended 6/30/15 | Year Ended 6/30/16 | Year Ended 6/30/15 | Year Ended 6/30/16 | For the Period 9/9/14* - 6/30/15 | |||||||||||||||||
| $ | 113,020 | $ | 41,334 | $ | 49,540 | $ | 40,833 | $ | 28,508 | $ | 21,825 | |||||||||||
| 378,142 | 451,772 | 109,849 | 294,126 | (69,214 | ) | (232,419 | ) | |||||||||||||||
| 53,265 |
| 35,700 | (243,554 | ) | 41,437 | 64,841 | 10,872 | ||||||||||||||
|
|
|
|
|
|
|
|
|
|
|
| |||||||||||
| 544,427 |
| 528,806 | (84,165 | ) | 376,396 | 24,135 | (199,722 | ) | |||||||||||||
|
|
|
|
|
|
|
|
|
|
|
| |||||||||||
| 1,422 |
| 30 | — | (1,662 | ) | — | (437 | ) | |||||||||||||
|
|
|
|
|
|
|
|
|
|
|
| |||||||||||
| (115,383 | ) | (42,194 | ) | (50,382 | ) | (42,508 | ) | (29,724 | ) | (22,860 | ) | |||||||||||
| (183,280 | ) | (94,899 | ) | (161,371 | ) | (45,876 | ) | — | — | |||||||||||||
|
|
|
|
|
|
|
|
|
|
|
| |||||||||||
| (298,663 | ) | (137,093 | ) | (211,753 | ) | (88,384 | ) | (29,724 | ) | (22,860 | ) | |||||||||||
|
|
|
|
|
|
|
|
|
|
|
| |||||||||||
| 8,964,863 | 3,023,489 | — | — | — | 4,000,000 | |||||||||||||||||
| (3,100,803 | ) | (2,746,928 | ) | — | (2,659,898 | ) | — | (1,817,701 | ) | |||||||||||||
| (1,422 | ) | (30 | ) | — | 1,662 | — | 437 | |||||||||||||||
| — | — | — | — | — | — | |||||||||||||||||
|
|
|
|
|
|
|
|
|
|
|
| |||||||||||
| 5,862,638 |
| 276,531 | — | (2,658,236 | ) | — | 2,182,736 | ||||||||||||||
|
|
|
|
|
|
|
|
|
|
|
| |||||||||||
| 6,109,824 |
| 668,274 | (295,918 | ) | (2,371,886 | ) | (5,589 | ) | 1,959,717 | ||||||||||||
|
|
|
|
|
|
|
|
|
|
|
| |||||||||||
| 6,024,149 | 5,355,875 | 2,895,198 | 5,267,084 | 1,959,717 | — | |||||||||||||||||
|
|
|
|
|
|
|
|
|
|
|
| |||||||||||
| $ | 12,133,973 | $ | 6,024,149 | $ | 2,599,280 | $ | 2,895,198 | $ | 1,954,128 | $ | 1,959,717 | |||||||||||
|
|
|
|
|
|
|
|
|
|
|
| |||||||||||
$ | (29,733 | ) | $ | 107 | $ | (12,678 | ) | $ | (996 | ) | $ | (2,251 | ) | $ | (1,035 | ) | ||||||
|
|
|
|
|
|
|
|
|
|
|
| |||||||||||
| 150,000 | 50,000 | — | — | — | 100,000 | |||||||||||||||||
| (50,000 | ) | (50,000 | ) | — | (50,000 | ) | — | (50,000 | ) | |||||||||||||
|
|
|
|
|
|
|
|
|
|
|
| |||||||||||
| 100,000 | — | — | (50,000 | ) | — | 50,000 | ||||||||||||||||
|
|
|
|
|
|
|
|
|
|
|
| |||||||||||
39
Table of Contents
SSGA ACTIVE TRUST
Selected data for a share outstanding throughout each period (a)
| SPDR SSGA Multi-Asset Real Return ETF | ||||||||||||||||||||
| Year Ended 6/30/16 | Year Ended 6/30/15 | Year Ended 6/30/14 | Year Ended 6/30/13 | For the Period 4/25/12* - 6/30/12 | ||||||||||||||||
Net asset value, beginning of period | $ | 25.85 | $ | 30.86 | $ | 27.68 | $ | 28.77 | $ | 30.00 | ||||||||||
|
|
|
|
|
|
|
|
|
| |||||||||||
Income (loss) from investment operations: | ||||||||||||||||||||
Net investment income (loss) (b) | 0.30 | 0.43 | 0.57 | 0.86 | 0.20 | |||||||||||||||
Net realized and unrealized gain (loss) (c) | (1.43 | ) | (5.02 | ) | 3.22 | (1.33 | ) | (1.22 | ) | |||||||||||
|
|
|
|
|
|
|
|
|
| |||||||||||
Total from investment operations | (1.13 | ) | (4.59 | ) | 3.79 | (0.47 | ) | (1.02 | ) | |||||||||||
|
|
|
|
|
|
|
|
|
| |||||||||||
Net equalization credits and charges (b) | 0.01 | 0.01 | 0.01 | 0.03 | (0.01 | ) | ||||||||||||||
|
|
|
|
|
|
|
|
|
| |||||||||||
Distributions to shareholders from: | ||||||||||||||||||||
Net investment income | (0.35 | ) | (0.43 | ) | (0.62 | ) | (0.65 | ) | (0.20 | ) | ||||||||||
|
|
|
|
|
|
|
|
|
| |||||||||||
Net asset value, end of period | $ | 24.38 | $ | 25.85 | $ | 30.86 | $ | 27.68 | $ | 28.77 | ||||||||||
|
|
|
|
|
|
|
|
|
| |||||||||||
Total return (d) | (4.22 | )% | (14.84 | )% | 13.85 | % | (1.67 | )% | (3.44 | )% | ||||||||||
Ratios and Supplemental Data: | ||||||||||||||||||||
Net assets, end of period (in 000s) | $ | 80,441 | $ | 140,895 | $ | 163,580 | $ | 120,434 | $ | 5,786 | ||||||||||
Ratios to average net assets: | ||||||||||||||||||||
Total expenses | 0.28 | % | 0.23 | % | 0.24 | % | 0.25 | % | 0.27 | %(e) | ||||||||||
Net investment income (loss) | 1.29 | % | 1.53 | % | 1.97 | % | 2.86 | % | 3.77 | %(e) | ||||||||||
Portfolio turnover rate (f) | 25 | % | 33 | % | 40 | % | 31 | % | 10 | % | ||||||||||
| * | Commencement of operations. |
| (a) | The per share amounts and percentages include the Fund’s proportionate share of income and expenses of their respective Portfolio. |
| (b) | Per share numbers have been calculated using average shares outstanding, which more appropriately presents the per share data for the year. |
| (c) | Amounts shown in this caption for a share outstanding may not accord with the change in aggregate gains and losses in securities for the fiscal period because of the timing of sales and repurchases of Fund shares in relation to fluctuating market values for the Fund. |
| (d) | Total return is calculated assuming a purchase of shares at net asset value on the first day and a sale at net asset value on the last day of each period reported. Distributions are assumed, for the purpose of this calculation, to be reinvested at net asset value per share on the respective payment dates of each distribution. Total return for periods of less than one year is not annualized. Broker commission charges are not included in this calculation. |
| (e) | Annualized. |
| (f) | Portfolio turnover rate is from the Fund’s respective Portfolio. |
See accompanying notes to financial statements and financial statements of the Master Portfolios.
40
Table of Contents
SSGA ACTIVE TRUST
FINANCIAL HIGHLIGHTS
Selected data for a share outstanding throughout each period (a)
| SPDR SSGA Income Allocation ETF | ||||||||||||||||||||
| Year Ended 6/30/16 | Year Ended 6/30/15 | Year Ended 6/30/14 | Year Ended 6/30/13 | For the Period 4/25/12* - 6/30/12 | ||||||||||||||||
Net asset value, beginning of period | $ | 31.16 | $ | 32.70 | $ | 29.90 | $ | 29.85 | $ | 30.00 | ||||||||||
|
|
|
|
|
|
|
|
|
| |||||||||||
Income (loss) from investment operations: | ||||||||||||||||||||
Net investment income (loss) (b) | 0.93 | 0.97 | 1.16 | 1.41 | 0.44 | |||||||||||||||
Net realized and unrealized gain (loss) (c) | 0.22 | (1.51 | ) | 2.86 | (0.25 | ) | (0.29 | ) | ||||||||||||
|
|
|
|
|
|
|
|
|
| |||||||||||
Total from investment operations | 1.15 | (0.54 | ) | 4.02 | 1.16 | 0.15 | ||||||||||||||
|
|
|
|
|
|
|
|
|
| |||||||||||
Net equalization credits and charges (b) | (0.02 | ) | 0.02 | (0.03 | ) | 0.12 | 0.11 | |||||||||||||
|
|
|
|
|
|
|
|
|
| |||||||||||
Distributions to shareholders from: | ||||||||||||||||||||
Net investment income | (1.06 | ) | (1.02 | ) | (1.19 | ) | (1.23 | ) | (0.41 | ) | ||||||||||
|
|
|
|
|
|
|
|
|
| |||||||||||
Net asset value, end of period | $ | 31.23 | $ | 31.16 | $ | 32.70 | $ | 29.90 | $ | 29.85 | ||||||||||
|
|
|
|
|
|
|
|
|
| |||||||||||
Total return (d) | 3.77 | % | (1.59 | )% | 13.57 | % | 4.22 | % | 0.87 | % | ||||||||||
Ratios and Supplemental Data: | ||||||||||||||||||||
Net assets, end of period (in 000s) | $ | 104,605 | $ | 120,020 | $ | 103,035 | $ | 171,977 | $ | 8,989 | ||||||||||
Ratios to average net assets: | ||||||||||||||||||||
Total expenses | 0.37 | % | 0.35 | % | 0.36 | % | 0.35 | % | 0.36 | %(e) | ||||||||||
Net investment income (loss) | 3.07 | % | 3.00 | % | 3.73 | % | 4.50 | % | 8.24 | %(e) | ||||||||||
Portfolio turnover rate (f) | 54 | % | 64 | % | 63 | % | 80 | % | 15 | % | ||||||||||
| * | Commencement of operations. |
| (a) | The per share amounts and percentages include the Fund’s proportionate share of income and expenses of their respective Portfolio. |
| (b) | Per share numbers have been calculated using average shares outstanding, which more appropriately presents the per share data for the year. |
| (c) | Amounts shown in this caption for a share outstanding may not accord with the change in aggregate gains and losses in securities for the fiscal period because of the timing of sales and repurchases of Fund shares in relation to fluctuating market values for the Fund. |
| (d) | Total return is calculated assuming a purchase of shares at net asset value on the first day and a sale at net asset value on the last day of each period reported. Distributions are assumed, for the purpose of this calculation, to be reinvested at net asset value per share on the respective payment dates of each distribution. Total return for periods of less than one year is not annualized. Broker commission charges are not included in this calculation. |
| (e) | Annualized. |
| (f) | Portfolio turnover rate is from the Fund’s respective Portfolio. |
See accompanying notes to financial statements and financial statements of the Master Portfolios.
41
Table of Contents
SSGA ACTIVE TRUST
FINANCIAL HIGHLIGHTS
Selected data for a share outstanding throughout each period (a)
| SPDR SSGA Global Allocation ETF | ||||||||||||||||||||
| Year Ended 6/30/16 | Year Ended 6/30/15 | Year Ended 6/30/14 | Year Ended 6/30/13 | For the Period 4/25/12* - 6/30/12 | ||||||||||||||||
Net asset value, beginning of period | $ | 34.61 | $ | 35.47 | $ | 31.18 | $ | 29.19 | $ | 30.00 | ||||||||||
|
|
|
|
|
|
|
|
|
| |||||||||||
Income (loss) from investment operations: | ||||||||||||||||||||
Net investment income (loss) (b) | 0.81 | 0.92 | 0.98 | 1.03 | 0.24 | |||||||||||||||
Net realized and unrealized gain (loss) (c) | (1.09 | ) | (0.73 | ) | 4.20 | 1.77 | (0.77 | ) | ||||||||||||
|
|
|
|
|
|
|
|
|
| |||||||||||
Total from investment operations | (0.28 | ) | 0.19 | 5.18 | 2.80 | (0.53 | ) | |||||||||||||
|
|
|
|
|
|
|
|
|
| |||||||||||
Net equalization credits and charges (b) | 0.02 | 0.05 | 0.02 | 0.09 | (0.02 | ) | ||||||||||||||
|
|
|
|
|
|
|
|
|
| |||||||||||
Distributions to shareholders from: | ||||||||||||||||||||
Net investment income | (0.94 | ) | (0.91 | ) | (0.91 | ) | (0.90 | ) | (0.26 | ) | ||||||||||
Net realized gains | (0.06 | ) | (0.19 | ) | — | — | — | |||||||||||||
|
|
|
|
|
|
|
|
|
| |||||||||||
Total distributions | (1.00 | ) | (1.10 | ) | (0.91 | ) | (0.90 | ) | (0.26 | ) | ||||||||||
|
|
|
|
|
|
|
|
|
| |||||||||||
Net asset value, end of period | $ | 33.35 | $ | 34.61 | $ | 35.47 | $ | 31.18 | $ | 29.19 | ||||||||||
|
|
|
|
|
|
|
|
|
| |||||||||||
Total return (d) | (0.63 | )% | 0.66 | % | 16.81 | % | 9.91 | % | (1.82 | )% | ||||||||||
Ratios and Supplemental Data: | ||||||||||||||||||||
Net assets, end of period (in 000s) | $ | 185,112 | $ | 143,655 | $ | 97,589 | $ | 51,484 | $ | 4,411 | ||||||||||
Ratios to average net assets: | ||||||||||||||||||||
Total expenses | 0.20 | % | 0.20 | % | 0.20 | % | 0.20 | % | 0.20 | %(f) | ||||||||||
Net expenses | 0.06 | % | 0.05 | % | 0.05 | % | 0.04 | % | 0.05 | %(f) | ||||||||||
Net investment income (loss) | 2.45 | % | 2.60 | % | 2.91 | % | 3.23 | % | 4.48 | %(f) | ||||||||||
Portfolio turnover rate (g) | 86 | % | 98 | % | 89 | % | 123 | % | 25 | % | ||||||||||
| * | Commencement of operations. |
| (a) | The per share amounts and percentages include the Fund’s proportionate share of income and expenses of their respective Portfolio. |
| (b) | Per share numbers have been calculated using average shares outstanding, which more appropriately presents the per share data for the year. |
| (c) | Amounts shown in this caption for a share outstanding may not accord with the change in aggregate gains and losses in securities for the fiscal period because of the timing of sales and repurchases of Fund shares in relation to fluctuating market values for the Fund. |
| (d) | Total return is calculated assuming a purchase of shares at net asset value on the first day and a sale at net asset value on the last day of each period reported. Distributions are assumed, for the purpose of this calculation, to be reinvested at net asset value per share on the respective payment dates of each distribution. Total return for periods of less than one year is not annualized. Broker commission charges are not included in this calculation. |
| (e) | Annualized. |
| (f) | Annualized. |
| (g) | Portfolio turnover rate is from the Fund’s respective Portfolio. |
See accompanying notes to financial statements and financial statements of the Master Portfolios.
42
Table of Contents
SSGA ACTIVE TRUST
FINANCIAL HIGHLIGHTS
Selected data for a share outstanding throughout each period (a)
| SPDR Blackstone / GSO Senior Loan ETF | ||||||||||||||||
| Year Ended 6/30/16 | Year Ended 6/30/15 | Year Ended 6/30/14 | For the Period 4/3/13* - 6/30/13 | |||||||||||||
Net asset value, beginning of period | $ | 49.22 | $ | 50.02 | $ | 49.65 | $ | 50.00 | ||||||||
|
|
|
|
|
|
|
| |||||||||
Income (loss) from investment operations: | ||||||||||||||||
Net investment income (loss) (b) | 1.95 | 2.01 | 1.54 | 0.24 | ||||||||||||
Net realized and unrealized gain (loss) (c) | (2.58 | ) | (0.88 | ) | 0.24 | (0.65 | ) | |||||||||
|
|
|
|
|
|
|
| |||||||||
Total from investment operations | (0.63 | ) | 1.13 | 1.78 | (0.41 | ) | ||||||||||
|
|
|
|
|
|
|
| |||||||||
Net equalization credits and charges (b) | 0.02 | 0.01 | 0.03 | 0.06 | ||||||||||||
|
|
|
|
|
|
|
| |||||||||
Other capital | 0.02 | 0.02 | 0.04 | 0.10 | ||||||||||||
|
|
|
|
|
|
|
| |||||||||
Distributions to shareholders from: | ||||||||||||||||
Net investment income | (1.99 | ) | (1.96 | ) | (1.48 | ) | (0.10 | ) | ||||||||
|
|
|
|
|
|
|
| |||||||||
Net asset value, end of period | $ | 46.64 | $ | 49.22 | $ | 50.02 | $ | 49.65 | ||||||||
|
|
|
|
|
|
|
| |||||||||
Total return (d) | (1.15 | )% | 2.38 | % | 3.77 | % | (0.48 | )% | ||||||||
Ratios and Supplemental Data: | ||||||||||||||||
Net assets, end of period (in 000s) | $ | 802,228 | $ | 671,810 | $ | 610,275 | $ | 332,654 | ||||||||
Ratios to average net assets: | ||||||||||||||||
Total expenses | 0.71 | % | 0.71 | % | 0.85 | % | 0.90 | %(e) | ||||||||
Net investment income (loss) | 4.15 | % | 4.09 | % | 3.09 | % | 1.97 | %(e) | ||||||||
Portfolio turnover rate (g) | 88 | % | 65 | % | 77 | % | 4 | % | ||||||||
| * | Commencement of operations. |
| (a) | The per share amounts and percentages include the Fund’s proportionate share of income and expenses of their respective Portfolio. |
| (b) | Per share numbers have been calculated using average shares outstanding, which more appropriately presents the per share data for the year. |
| (c) | Amounts shown in this caption for a share outstanding may not accord with the change in aggregate gains and losses in securities for the fiscal period because of the timing of sales and repurchases of Fund shares in relation to fluctuating market values for the Fund. |
| (d) | Total return is calculated assuming a purchase of shares at net asset value on the first day and a sale at net asset value on the last day of each period reported. Distributions are assumed, for the purpose of this calculation, to be reinvested at net asset value per share on the respective payment dates of each distribution. Total return for periods of less than one year is not annualized. Broker commission charges are not included in this calculation. |
| (e) | Annualized. |
| (f) | Annualized. |
| (g) | Portfolio turnover rate is from the Fund’s respective Portfolio. |
See accompanying notes to financial statements and financial statements of the Master Portfolios.
43
Table of Contents
SSGA ACTIVE TRUST
FINANCIAL HIGHLIGHTS
Selected data for a share outstanding throughout each period (a)
| SPDR SSGA Ultra Short Term Bond ETF | ||||||||||||
| Year Ended 6/30/16 | Year Ended 6/30/15 | For the Period 10/9/13* - 6/30/14 | ||||||||||
Net asset value, beginning of period | $ | 40.05 | $ | 40.10 | $ | 40.00 | ||||||
|
|
|
|
|
| |||||||
Income (loss) from investment operations: | ||||||||||||
Net investment income (loss) (b) | 0.27 | 0.13 | 0.10 | |||||||||
Net realized and unrealized gain (loss) (c) | (0.21 | ) | (0.05 | ) | 0.03 | |||||||
|
|
|
|
|
| |||||||
Total from investment operations | 0.06 | 0.08 | 0.13 | |||||||||
|
|
|
|
|
| |||||||
Net equalization credits and charges (b) | 0.07 | 0.00 | (d) | 0.00 | (d) | |||||||
|
|
|
|
|
| |||||||
Other capital | 0.12 | 0.01 | 0.05 | |||||||||
|
|
|
|
|
| |||||||
Distributions to shareholders from: | ||||||||||||
Net investment income | (0.18 | ) | (0.14 | ) | (0.08 | ) | ||||||
Return of capital | (0.06 | ) | — | — | ||||||||
|
|
|
|
|
| |||||||
Total distributions | (0.24 | ) | (0.14 | ) | (0.08 | ) | ||||||
|
|
|
|
|
| |||||||
Net asset value, end of period | $ | 40.06 | $ | 40.05 | $ | 40.10 | ||||||
|
|
|
|
|
| |||||||
Total return (e) | 0.65 | % | 0.20 | % | 0.46 | % | ||||||
Ratios and Supplemental Data: | ||||||||||||
Net assets, end of period (in 000s) | $ | 24,039 | $ | 16,018 | $ | 14,035 | ||||||
Ratios to average net assets: | ||||||||||||
Total expenses | 0.20 | % | 0.20 | % | 0.20 | %(f) | ||||||
Net investment income (loss) | 0.69 | % | 0.33 | % | 0.34 | %(f) | ||||||
Portfolio turnover rate (g) | 407 | % | 79 | % | 39 | % | ||||||
| * | Commencement of operations. |
| (a) | The per share amounts and percentages include the Fund’s proportionate share of income and expenses of their respective Portfolio. |
| (b) | Per share numbers have been calculated using average shares outstanding, which more appropriately presents the per share data for the year. |
| (c) | Amounts shown in this caption for a share outstanding may not accord with the change in aggregate gains and losses in securities for the fiscal period because of the timing of sales and repurchases of Fund shares in relation to fluctuating market values for the Fund. |
| (d) | Amount is less than $0.005 per share. |
| (e) | Total return is calculated assuming a purchase of shares at net asset value on the first day and a sale at net asset value on the last day of each period reported. Distributions are assumed, for the purpose of this calculation, to be reinvested at net asset value per share on the respective payment dates of each distribution. Total return for periods of less than one year is not annualized. Broker commission charges are not included in this calculation. |
| (f) | Annualized. |
| (g) | Portfolio turnover rate is from the Fund’s respective Portfolio. |
See accompanying notes to financial statements and financial statements of the Master Portfolios.
44
Table of Contents
SSGA ACTIVE TRUST
FINANCIAL HIGHLIGHTS
Selected data for a share outstanding throughout each period (a)
| SPDR DoubleLine Total Return Tactical ETF | ||||||||
| Year Ended 6/30/16 | For the Period 2/23/15* - 6/30/15 | |||||||
Net asset value, beginning of period | $ | 49.43 | $ | 50.00 | ||||
|
|
|
| |||||
Income (loss) from investment operations: | ||||||||
Net investment income (loss) (b) | 1.54 | 0.55 | ||||||
Net realized and unrealized gain (loss) (c) | 0.34 | (0.88 | ) | |||||
|
|
|
| |||||
Total from investment operations | 1.88 | (0.33 | ) | |||||
|
|
|
| |||||
Net equalization credits and charges (b) | 0.07 | 0.10 | ||||||
|
|
|
| |||||
Other capital | 0.03 | 0.05 | ||||||
|
|
|
| |||||
Distributions to shareholders from: | ||||||||
Net investment income | (1.54 | ) | (0.39 | ) | ||||
|
|
|
| |||||
Net asset value, end of period | $ | 49.87 | $ | 49.43 | ||||
|
|
|
| |||||
Total return (d) | 4.03 | % | (0.34 | )% | ||||
Ratios and Supplemental Data: | ||||||||
Net assets, end of period (in 000s) | $ | 2,657,951 | $ | 746,443 | ||||
Ratios to average net assets: | ||||||||
Total expenses | 0.65 | % | 0.65 | %(e) | ||||
Net expenses | 0.55 | % | 0.56 | %(e) | ||||
Net investment income (loss) | 3.14 | % | 3.18 | %(e) | ||||
Portfolio turnover rate (f) | 38 | % | 14 | % | ||||
| * | Commencement of operations. |
| (a) | The per share amounts and percentages include the Fund’s proportionate share of income and expenses of their respective Portfolio. |
| (b) | Per share numbers have been calculated using average shares outstanding, which more appropriately presents the per share data for the year. |
| (c) | Amounts shown in this caption for a share outstanding may not accord with the change in aggregate gains and losses in securities for the fiscal period because of the timing of sales and repurchases of Fund shares in relation to fluctuating market values for the Fund. |
| (d) | Total return is calculated assuming a purchase of shares at net asset value on the first day and a sale at net asset value on the last day of each period reported. Distributions are assumed, for the purpose of this calculation, to be reinvested at net asset value per share on the respective payment dates of each distribution. Total return for periods of less than one year is not annualized. Broker commission charges are not included in this calculation. |
| (e) | Annualized. |
| (f) | Portfolio turnover rate is from the Fund’s respective Portfolio. |
See accompanying notes to financial statements and financial statements of the Master Portfolios.
45
Table of Contents
SSGA ACTIVE TRUST
FINANCIAL HIGHLIGHTS
Selected data for a share outstanding throughout each period (a)
| SPDR MFS Systematic Core Equity ETF | ||||||||||||
| Year Ended 6/30/16 | Year Ended 6/30/15 | For the Period 1/8/14* - 6/30/14 | ||||||||||
Net asset value, beginning of period | $ | 58.53 | $ | 53.60 | $ | 50.00 | ||||||
|
|
|
|
|
| |||||||
Income (loss) from investment operations: | ||||||||||||
Net investment income (loss) (b) | 1.02 | 0.81 | 0.31 | |||||||||
Net realized and unrealized gain (loss) (c) | (0.00 | )(d) | 6.48 | 3.59 | ||||||||
|
|
|
|
|
| |||||||
Total from investment operations | 1.02 | 7.29 | 3.90 | |||||||||
|
|
|
|
|
| |||||||
Net equalization credits and charges (b) | 0.20 | (0.04 | ) | — | ||||||||
|
|
|
|
|
| |||||||
Distributions to shareholders from: | ||||||||||||
Net investment income | (1.03 | ) | (0.88 | ) | (0.30 | ) | ||||||
Net realized gains | (0.63 | ) | (1.44 | ) | — | |||||||
|
|
|
|
|
| |||||||
Total distributions | (1.66 | ) | (2.32 | ) | (0.30 | ) | ||||||
|
|
|
|
|
| |||||||
Net asset value, end of period | $ | 58.09 | $ | 58.53 | $ | 53.60 | ||||||
|
|
|
|
|
| |||||||
Total return (e) | 2.21 | % | 13.70 | % | 7.81 | % | ||||||
Ratios and Supplemental Data: | ||||||||||||
Net assets, end of period (in 000s) | $ | 5,809 | $ | 2,926 | $ | 5,360 | ||||||
Ratios to average net assets: | ||||||||||||
Total expenses | 0.61 | % | 0.60 | % | 0.60 | %(f) | ||||||
Net investment income (loss) | 1.78 | % | 1.42 | % | 1.25 | %(f) | ||||||
Portfolio turnover rate (g) | 39 | % | 54 | % | 27 | % | ||||||
| * | Commencement of operations. |
| (a) | The per share amounts and percentages include the Fund’s proportionate share of income and expenses of their respective Portfolio. |
| (b) | Per share numbers have been calculated using average shares outstanding, which more appropriately presents the per share data for the year. |
| (c) | Amounts shown in this caption for a share outstanding may not accord with the change in aggregate gains and losses in securities for the fiscal period because of the timing of sales and repurchases of Fund shares in relation to fluctuating market values for the Fund. |
| (d) | Amount is less than $0.005 per share. |
| (e) | Total return is calculated assuming a purchase of shares at net asset value on the first day and a sale at net asset value on the last day of each period reported. Distributions are assumed, for the purpose of this calculation, to be reinvested at net asset value per share on the respective payment dates of each distribution. Total return for periods of less than one year is not annualized. Broker commission charges are not included in this calculation. |
| (f) | Annualized. |
| (g) | Portfolio turnover rate is from the Fund’s respective Portfolio. |
See accompanying notes to financial statements and financial statements of the Master Portfolios.
46
Table of Contents
SSGA ACTIVE TRUST
FINANCIAL HIGHLIGHTS
Selected data for a share outstanding throughout each period (a)
| SPDR MFS Systematic Growth Equity ETF | ||||||||||||
| Year Ended 6/30/16 | Year Ended 6/30/15 | For the Period 1/8/14* - 6/30/14 | ||||||||||
Net asset value, beginning of period | $ | 60.24 | $ | 53.56 | $ | 50.00 | ||||||
|
|
|
|
|
| |||||||
Income (loss) from investment operations: | ||||||||||||
Net investment income (loss) (b) | 0.63 | 0.66 | 0.28 | |||||||||
Net realized and unrealized gain (loss) (c) | 1.62 | 8.60 | 3.55 | |||||||||
|
|
|
|
|
| |||||||
Total from investment operations | 2.25 | 9.26 | 3.83 | |||||||||
|
|
|
|
|
| |||||||
Net equalization credits and charges (b) | 0.01 | 0.00 | (d) | — | ||||||||
|
|
|
|
|
| |||||||
Distributions to shareholders from: | ||||||||||||
Net investment income | (0.61 | ) | (0.68 | ) | (0.27 | ) | ||||||
Net realized gains | (1.22 | ) | (1.90 | ) | — | |||||||
|
|
|
|
|
| |||||||
Total distributions | (1.83 | ) | (2.58 | ) | (0.27 | ) | ||||||
|
|
|
|
|
| |||||||
Net asset value, end of period | $ | 60.67 | $ | 60.24 | $ | 53.56 | ||||||
|
|
|
|
|
| |||||||
Total return (e) | 3.96 | % | 17.53 | % | 7.68 | % | ||||||
Ratios and Supplemental Data: | ||||||||||||
Net assets, end of period (in 000s) | $ | 12,134 | $ | 6,024 | $ | 5,356 | ||||||
Ratios to average net assets: | ||||||||||||
Total expenses | 0.61 | % | 0.60 | % | 0.60 | %(f) | ||||||
Net investment income (loss) | 1.06 | % | 1.14 | % | 1.16 | %(f) | ||||||
Portfolio turnover rate (g) | 56 | % | 67 | % | 20 | % | ||||||
| * | Commencement of operations. |
| (a) | The per share amounts and percentages include the Fund’s proportionate share of income and expenses of their respective Portfolio. |
| (b) | Per share numbers have been calculated using average shares outstanding, which more appropriately presents the per share data for the year. |
| (c) | Amounts shown in this caption for a share outstanding may not accord with the change in aggregate gains and losses in securities for the fiscal period because of the timing of sales and repurchases of Fund shares in relation to fluctuating market values for the Fund. |
| (d) | Amount is less than $0.005 per share. |
| (e) | Total return is calculated assuming a purchase of shares at net asset value on the first day and a sale at net asset value on the last day of each period reported. Distributions are assumed, for the purpose of this calculation, to be reinvested at net asset value per share on the respective payment dates of each distribution. Total return for periods of less than one year is not annualized. Broker commission charges are not included in this calculation. |
| (f) | Annualized. |
| (g) | Portfolio turnover rate is from the Fund’s respective Portfolio. |
See accompanying notes to financial statements and financial statements of the Master Portfolios.
47
Table of Contents
SSGA ACTIVE TRUST
FINANCIAL HIGHLIGHTS
Selected data for a share outstanding throughout each period (a)
| SPDR MFS Systematic Value Equity ETF | ||||||||||||
| Year Ended 6/30/16 | Year Ended 6/30/15 | For the Period 1/8/14* - 6/30/14 | ||||||||||
Net asset value, beginning of period | $ | 57.90 | $ | 52.67 | $ | 50.00 | ||||||
|
|
|
|
|
| |||||||
Income (loss) from investment operations: | ||||||||||||
Net investment income (loss) (b) | 0.99 | 0.75 | 0.34 | |||||||||
Net realized and unrealized gain (loss) (c) | (2.66 | ) | 6.28 | 2.67 | ||||||||
|
|
|
|
|
| |||||||
Total from investment operations | (1.67 | ) | 7.03 | 3.01 | ||||||||
|
|
|
|
|
| |||||||
Net equalization credits and charges (b) | — | (0.03 | ) | — | ||||||||
|
|
|
|
|
| |||||||
Distributions to shareholders from: | ||||||||||||
Net investment income | (1.01 | ) | (0.85 | ) | (0.34 | ) | ||||||
Net realized gains | (3.23 | ) | (0.92 | ) | — | |||||||
|
|
|
|
|
| |||||||
Total distributions | (4.24 | ) | (1.77 | ) | (0.34 | ) | ||||||
|
|
|
|
|
| |||||||
Net asset value, end of period | $ | 51.99 | $ | 57.90 | $ | 52.67 | ||||||
|
|
|
|
|
| |||||||
Total return (d) | (2.47 | )% | 13.47 | % | 6.04 | % | ||||||
Ratios and Supplemental Data: | ||||||||||||
Net assets, end of period (in 000s) | $ | 2,599 | $ | 2,895 | $ | 5,267 | ||||||
Ratios to average net assets: | ||||||||||||
Total expenses | 0.62 | % | 0.60 | % | 0.60 | %(e) | ||||||
Net investment income (loss) | 1.85 | % | 1.36 | % | 1.43 | %(e) | ||||||
Portfolio turnover rate (f) | 64 | % | 61 | % | 23 | % | ||||||
| * | Commencement of operations. |
| (a) | The per share amounts and percentages include the Fund’s proportionate share of income and expenses of their respective Portfolio. |
| (b) | Per share numbers have been calculated using average shares outstanding, which more appropriately presents the per share data for the year. |
| (c) | Amounts shown in this caption for a share outstanding may not accord with the change in aggregate gains and losses in securities for the fiscal period because of the timing of sales and repurchases of Fund shares in relation to fluctuating market values for the Fund. |
| (d) | Total return is calculated assuming a purchase of shares at net asset value on the first day and a sale at net asset value on the last day of each period reported. Distributions are assumed, for the purpose of this calculation, to be reinvested at net asset value per share on the respective payment dates of each distribution. Total return for periods of less than one year is not annualized. Broker commission charges are not included in this calculation. |
| (e) | Annualized. |
| (f) | Portfolio turnover rate is from the Fund’s respective Portfolio. |
See accompanying notes to financial statements and financial statements of the Master Portfolios.
48
Table of Contents
SSGA ACTIVE TRUST
FINANCIAL HIGHLIGHTS
Selected data for a share outstanding throughout each period (a)
| SPDR SSGA Risk Aware ETF | ||||||||
| Year Ended 6/30/16 | For the Period 9/9/14* - 6/30/15 | |||||||
Net asset value, beginning of period | $ | 39.19 | $ | 40.00 | ||||
|
|
|
| |||||
Income (loss) from investment operations: | ||||||||
Net investment income (loss) (b) | 0.57 | 0.38 | ||||||
Net realized and unrealized gain (loss) (c) | (0.09 | ) | (0.77 | ) | ||||
|
|
|
| |||||
Total from investment operations | 0.48 | (0.39 | ) | |||||
|
|
|
| |||||
Net equalization credits and charges (b) | — | (0.01 | ) | |||||
|
|
|
| |||||
Distributions to shareholders from: | ||||||||
Net investment income | (0.59 | ) | (0.41 | ) | ||||
|
|
|
| |||||
Net asset value, end of period | $ | 39.08 | $ | 39.19 | ||||
|
|
|
| |||||
Total return (d) | 1.29 | % | (0.99 | )% | ||||
Ratios and Supplemental Data: | ||||||||
Net assets, end of period (in 000s) | $ | 1,954 | $ | 1,960 | ||||
Ratios to average net assets: | ||||||||
Total expenses | 0.52 | % | 0.50 | %(e) | ||||
Net investment income (loss) | 1.51 | % | 1.21 | %(e) | ||||
Portfolio turnover rate (f) | 76 | % | 122 | % | ||||
| * | Commencement of operations. |
| (a) | The per share amounts and percentages include the Fund’s proportionate share of income and expenses of their respective Portfolio. |
| (b) | Per share numbers have been calculated using average shares outstanding, which more appropriately presents the per share data for the year. |
| (c) | Amounts shown in this caption for a share outstanding may not accord with the change in aggregate gains and losses in securities for the fiscal period because of the timing of sales and repurchases of Fund shares in relation to fluctuating market values for the Fund. |
| (d) | Total return is calculated assuming a purchase of shares at net asset value on the first day and a sale at net asset value on the last day of each period reported. Distributions are assumed, for the purpose of this calculation, to be reinvested at net asset value per share on the respective payment dates of each distribution. Total return for periods of less than one year is not annualized. Broker commission charges are not included in this calculation. |
| (e) | Annualized. |
| (f) | Portfolio turnover rate is from the Fund’s respective Portfolio. |
See accompanying notes to financial statements and financial statements of the Master Portfolios.
49
Table of Contents
SSGA ACTIVE TRUST
June 30, 2016
| 1. | Organization |
SSGA Active Trust (the “Trust”), which is registered under the Investment Company Act of 1940, as amended (“1940 Act”), is an open-end management investment company that was organized as a Massachusetts business trust on March 30, 2011.
As of June 30, 2016, the Trust consists of fourteen (14) series, each of which represents a separate series of beneficial interest in the Trust (each, a “Fund” and collectively, the “Funds”). The financial statements herein relate to the following Funds:
SPDR SSGA Multi-Asset Real Return ETF
SPDR SSGA Income Allocation ETF
SPDR SSGA Global Allocation ETF
SPDR Blackstone / GSO Senior Loan ETF
SPDR SSGA Ultra Short Term Bond ETF
SPDR DoubleLine Total Return Tactical ETF
SPDR MFS Systematic Core Equity ETF
SPDR MFS Systematic Growth Equity ETF
SPDR MFS Systematic Value Equity ETF
SPDR SSGA Risk Aware ETF
Each fund is classified as a diversified investment company under the 1940 Act, with the exception of SPDR SSGA Ultra Short Term Bond ETF, SPDR Doubleline Total Return Tactical ETF and SPDR SSGA Risk Aware ETF, which are each a non-diversified investment company.
Each Fund is part of a master-feeder structure and each Fund invests substantially all of its assets in its respective master portfolio as shown below (each a “Portfolio” and collectively, the “Portfolios”). Each Portfolio is a separate series of SSGA Master Trust (“Master Trust”). The performance of each Fund is directly affected by the performance of its respective Portfolio. The financial statements of the Portfolios, including their Schedules of Investments, are attached to this report and should be read in conjunction with the Funds’ financial statements.
Fund Name | Portfolio Name | Fund Ownership Interest in Portfolio at 6/30/16 | ||
SPDR SSGA Multi-Asset Real Return ETF | SSGA Multi-Asset Real Return Portfolio | 99.98% | ||
SPDR SSGA Income Allocation ETF | SSGA Income Allocation Portfolio | 99.99% | ||
SPDR SSGA Global Allocation ETF | SSGA Global Allocation Portfolio | 99.99% | ||
SPDR Blackstone / GSO Senior Loan ETF | Blackstone / GSO Senior Loan Portfolio | 99.99% | ||
SPDR SSGA Ultra Short Term Bond ETF | SSGA Ultra Short Term Bond Portfolio | 99.99% | ||
SPDR DoubleLine Total Return Tactical ETF | State Street DoubleLine Total Return Tactical Portfolio | 99.99% | ||
SPDR MFS Systematic Core Equity ETF | SSGA MFS Systematic Core Equity Portfolio | 99.98% | ||
SPDR MFS Systematic Growth Equity ETF | SSGA MFS Systematic Growth Equity Portfolio | 99.99% | ||
SPDR MFS Systematic Value Equity ETF | SSGA MFS Systematic Value Equity Portfolio | 99.95% | ||
SPDR SSGA Risk Aware ETF | State Street Risk Aware Portfolio | 99.95% |
Under the Trust’s organizational documents, its officers and trustees are indemnified against certain liabilities arising out of the performance of their duties to the Trust. Additionally, in the normal course of business, the Trust enters into contracts with service providers that contain general indemnification clauses. The Trust’s maximum exposure under these arrangements is unknown as this could involve future claims that may be made against the Trust that have not yet occurred.
| 2. | Summary of Significant Accounting Policies |
The following is a summary of significant accounting policies followed by the Trust in the preparation of its financial statements:
The preparation of financial statements in accordance with U.S. generally accepted accounting principles (“U.S. GAAP”) requires management to make estimates and assumptions that affect the reported amounts and disclosures in the financial statements. Actual results could differ from those estimates. Each Fund is an investment company under U.S. GAAP and follows the accounting and reporting guidance applicable to investment companies.
50
Table of Contents
SSGA ACTIVE TRUST
NOTES TO FINANCIAL STATEMENTS (continued)
June 30, 2016
Security Valuation
Each Fund records its investments in its respective Portfolio at fair value (net asset value) each business day. The valuation policy of the Portfolios is discussed in Note 2 of the Portfolios’ Notes to Financial Statements, which are attached to this report.
The Portfolios’ investments are valued at fair value each day that the Portfolio’s listing exchange is open and, for financial reporting purposes, as of the report date should the reporting period end on a day that each Portfolio’s listing exchange is not open. Fair value is generally defined as the price a fund would receive to sell an asset or pay to transfer a liability in an orderly transaction between market participants at the measurement date. By its nature, a fair value price is a good faith estimate of the valuation in a current sale and may not reflect an actual market price. The investments of the Portfolios are valued pursuant to policy and procedures developed by the Oversight Committee (the “Committee”) and approved by the Board of Trustees of the Trust (the “Board”). The Committee provides oversight of the valuation of investments for the Portfolios. The Board has responsibility for determining the fair value of investments. The summary of the inputs used for each Portfolio, as of June 30, 2016, in valuing each Portfolio’s securities carried at fair value are discussed in Note 2 of the Portfolios’ Notes to Financial Statements, which are attached to this report.
Investment Transactions and Income Recognition
Investment transactions are accounted for on the trade date for financial reporting purposes. Realized gains and losses from security transactions consist of the Fund’s pro-rata share of its Portfolio’s realized gains and losses. Net investment income consists of the Fund’s pro-rata share of the net investment income of its Portfolio less expenses of the Fund.
Expenses
Certain expenses, which are directly identifiable to a specific fund, are applied to that fund within the Trust. Other expenses which cannot be attributed to a specific fund are allocated in such a manner as deemed equitable, taking into consideration the nature and type of expense and relative net assets of the Funds within the Trust.
The Fund is allocated a pro-rata share of the expense of the Portfolio. Class specific expenses are borne by each class.
Equalization
The Funds in the Trust follow the accounting practice known as “Equalization” by which a portion of the proceeds from sales and costs of reacquiring Fund shares, equivalent on a per share basis to the amount of distributable net investment income on the date of the transaction, is credited or charged to undistributed net investment income. As a result, undistributed net investment income per share is unaffected by sales or reacquisition of Fund shares. Amounts related to Equalization can be found on the Statements of Changes in Net Assets.
The following Funds utilized equalization during the period ended June 30, 2016:
SPDR SSGA Multi-Asset Real Return ETF
SPDR SSGA Income Allocation ETF
SPDR SSGA Global Allocation ETF
SPDR Blackstone/GSO Senior Loan ETF
SPDR Ultra Short Term Bond ETF
SPDR DoubleLine Total Return Tactical ETF
SPDR MFS Systematic Core Equity ETF
SPDR MFS Systematic Growth Equity ETF
51
Table of Contents
SSGA ACTIVE TRUST
NOTES TO FINANCIAL STATEMENTS (continued)
June 30, 2016
Distributions
The following Funds declare and distribute from net investment income, if any, to its shareholders:
| Name | Frequency | |
| SPDR SSGA Multi-Asset Real Return ETF | Quarterly | |
| SPDR SSGA Income Allocation ETF | Quarterly | |
| SPDR SSGA Global Allocation ETF | Quarterly | |
| SPDR Blackstone/GSO Senior Loan ETF | Monthly | |
| SPDR SSGA Ultra Short Term Bond ETF | Monthly | |
| SPDR DoubleLine Total Return Tactical ETF | Quarterly | |
| SPDR MFS Systematic Core Equity ETF | Quarterly | |
| SPDR MFS Systematic Growth Equity ETF | Quarterly | |
| SPDR MFS Systematic Value Equity ETF | Quarterly | |
| SPDR SSGA Risk Aware ETF | Quarterly |
Net realized capital gains, if any, are distributed annually, unless additional distributions are required for compliance with applicable tax regulations. The amount and character of income and capital gains to be distributed are determined in accordance with applicable tax regulations which may differ from net investment income and realized gains recognized for U.S. GAAP purposes.
| 3. | Fees and Transactions with Affiliates |
Advisory Fee
Each Fund has entered into an Investment Advisory Agreement with SSGA Funds Management, Inc. (the “Adviser” or “SSGA FM”). As compensation for services rendered, facilities furnished, and expenses borne by the Adviser, each Fund pays the Adviser a fee accrued daily and paid monthly, based on a percentage of each Fund’s average daily net assets as shown in the following table:
| Annual Rate* | ||||
SPDR SSGA Multi-Asset Real Return ETF | 0.70 | % | ||
SPDR SSGA Income Allocation ETF | 0.70 | |||
SPDR SSGA Global Allocation ETF | 0.35 | |||
SPDR Blackstone/GSO Senior Loan ETF | 0.70 | |||
SPDR SSGA Ultra Short Term Bond ETF | 0.20 | |||
SPDR DoubleLine Total Return Tactical ETF | 0.65 | ** | ||
SPDR MFS Systematic Core Equity ETF | 0.60 | |||
SPDR MFS Systematic Growth Equity ETF | 0.60 | |||
SPDR MFS Systematic Value Equity ETF | 0.60 | |||
SPDR SSGA Risk Aware ETF | 0.50 | |||
| * | The Advisory fee is reduced by the proportional amount of the advisory fee, as well as for SPDR SSGA Multi-Asset Real Return ETF, SPDR SSGA Income Allocation ETF and SPDR SSGA Global Allocation ETF acquired fund fees and expenses of each Fund’s respective Portfolio. For the year ended June 30, 2016, the net annualized advisory fee was 0.07%, 0.16%, (0.15)%, 0.40%, 0.00%, 0.25%, 0.30%, 0.30%, 0.30% and 0.25% for the SPDR SSGA Multi- Asset Real Return ETF, SPDR SSGA Income Allocation, ETF, SPDR SSGA Global Allocation ETF, SPDR Blackstone / GSO Senior Loan ETF, SPDR SSGA Ultra Short Term Bond ETF, SPDR DoubleLine Total Return Tactical ETF, SPDR MFS Systematic Core Equity ETF, SPDR MFS Systematic Growth Equity ETF, SPDR MFS Systemic Value Equity ETF and SPDR SSGA Risk Aware ETF, respectively. For the SPDR SSGA Global Allocation ETF and the SPDR DoubleLine Total Return Tactical ETF, the reduction resulted in a fee reimbursement which is identified on the Statement of Operations. |
| ** | The Adviser has contractually agreed to limit its management fee to the extent necessary to limit annual operating expenses to 0.55% until October 31, 2016 for the SPDR DoubleLine Total Return Tactical ETF. |
52
Table of Contents
SSGA ACTIVE TRUST
NOTES TO FINANCIAL STATEMENTS (continued)
June 30, 2016
The Adviser pays all operating expenses of each Fund other than management fee, distribution fee pursuant to each Fund’s Distribution and Service Plan, if any, brokerage expenses, taxes, interest, the fees and expenses of the Independent Trustees (including any Trustees’ counsel fees), litigation expenses, acquired fund fees and expenses and other expenses that are non-recurring in the ordinary course of business.
Administrator and Sub-Administrator Fees
SSGA FM serves as administrator and State Street Bank and Trust Company (“State Street”), an affiliate of the Adviser, serves as custodian, sub-administrator and transfer agent. State Street receives fees for its services as custodian, sub-administrator and transfer agent from the Adviser.
Distribution Fees
State Street Global Markets, LLC (“SSGM” or the “Distributor”), an affiliate of the Adviser, serves as the distributor of the Trust. Pursuant to a Distribution and Service Plan adopted in accordance with Rule 12b-1 under the 1940 Act, each Fund is authorized to pay an amount of up to 0.25% of its average daily net assets for certain distribution-related activities. However, the Board has determined that no such payments will be made through at least October 31, 2016, and therefore no such payments have been made.
Other Transactions with Affiliates
The Fund may invest in affiliated entities, included securities issued by State Street, affiliated funds, or entities deemed to be affiliates as a result of the Fund owning more than five percent of the entity’s voting securities or outstanding shares. Amounts relating to these transactions during the period ended June 30, 2016 are disclosed in the Schedule of Investments.
From time to time, the Funds may have a concentration of one or more accounts constituting a significant percentage of shares outstanding. Investment activities by holders of such accounts could have material impacts on the Funds. As of June 30, 2016, based on management’s evaluation of the shareholder account base, the Funds had accounts representing controlling ownership of more than 10% of the Fund’s total outstanding shares. The number of such accounts, based on accounts that represent more than 10% of the aggregate shares, and the aggregate percentage of net assets represented by such holdings were as follows:
Fund | Number of 10% Affiliated Account Holdings | Percentage of Affiliated Ownership | ||||||
SPDR SSGA Risk Aware ETF | 1 | 83.08 | % | |||||
| 4. | Trustees’ Fees |
The fees and expenses of the Trust’s trustees, who are not “interested persons” of the Trust, as defined in the 1940 Act (“Independent Trustees”), are paid directly by the Funds. The Independent Trustees are reimbursed for travel and other out-of-pocket expenses in connection with meeting attendance and industry seminars.
| 5. | Shareholder Transactions |
Each Fund issues and redeems its shares, at net asset value by each fund, only in aggregations of a specified number of shares or multiples thereof (“Creation Units”). Except when aggregated in Creation Units, shares of each Fund are not redeemable. Transactions in capital shares for each Fund are disclosed in detail in the Statements of Changes in Net Assets. The consideration for the purchase of Creation Units of a fund may consists of the in-kind deposit of a designated portfolio of securities and a specified amount of cash, except for certain funds that invest in TBAs or mortgage backed securities. Investors purchasing and redeeming Creation Units may pay a purchase transaction fee and a redemption transaction fee directly to the Trust and/or Custodian, to offset transfer and other transaction costs associated with the issuance and redemption of Creation Units, including Creation Units for cash. An additional variable fee may be charged for certain transactions. Such variable charges, if any, are included in “Other Capital” on the Statements of Changes on Net Assets.
53
Table of Contents
SSGA ACTIVE TRUST
NOTES TO FINANCIAL STATEMENTS (continued)
June 30, 2016
| 6. | Income Tax Information |
The Funds have qualified and intend to continue to qualify as regulated investment companies under Subchapter M of the Internal Revenue Code of 1986, as amended. Each Fund will not be subject to federal income taxes to the extent they distribute their taxable income, including any net realized capital gains, for each fiscal year. Therefore, no provision for federal income tax is required.
The Funds file federal and various state and local tax returns as required. No income tax returns are currently under examination. The federal returns are subject to examination by the Internal Revenue Service for a period of three years from date of filing, while the state returns may remain open for an additional year depending upon jurisdiction. SSGA FM has analyzed the fund’s tax positions taken on tax returns for all open years and does not believe there are any uncertain tax positions that would require recognition of a tax liability.
Distributions to shareholders are recorded on ex-dividend date. Income dividends and gain distributions are determined in accordance with income tax rules and regulations, which may differ from generally accepted accounting principles. Certain capital accounts in the financial statements have been adjusted for permanent book- tax differences. These adjustments have no impact on net asset values or results of operations. Temporary book-tax differences will reverse in the future. These book-tax differences are primarily due to differing treatments for character of distributions, nontaxable dividend adjustments to income, in-kind transactions, REITs, amortization and accretion of premium and discount for financial statement purposes, return of capital and wash sale loss deferrals. In addition, certain Funds claimed a portion of the payments made to redeeming shareholders as a distribution for income tax purposes.
The tax character of distributions paid during the year ended June 30, 2016, was as follows:
| Ordinary Income | Long-Term Capital Gains | Tax Return of Capital | Total | |||||||||||||
SPDR SSGA Multi-Asset Real Return ETF | $ | 1,284,505 | $ | — | $ | — | $ | 1,284,505 | ||||||||
SPDR SSGA Income Allocation ETF | 3,629,570 | — | — | 3,629,570 | ||||||||||||
SPDR SSGA Global Allocation ETF | 5,192,207 | 310,344 | — | 5,502,551 | ||||||||||||
SPDR Blackstone / GSO Senior Loan ETF | 31,186,434 | — | — | 31,186,434 | ||||||||||||
SPDR SSGA Ultra Short Term Bond ETF | 223,429 | — | 46,943 | 270,372 | ||||||||||||
SPDR DoubleLine Total Return Tactical ETF | 51,231,117 | — | — | 51,231,117 | ||||||||||||
SPDR MFS Systematic Core Equity ETF | 140,151 | 26,049 | — | 166,200 | ||||||||||||
SPDR MFS Systematic Growth Equity ETF | 181,192 | 117,471 | — | 298,663 | ||||||||||||
SPDR MFS Systematic Value Equity ETF | 140,433 | 71,320 | — | 211,753 | ||||||||||||
SPDR SSGA Risk Aware ETF | 29,724 | — | — | 29,724 | ||||||||||||
The tax character of distributions paid during the year ended June 30, 2015 was as follows:
| Ordinary Income | Long-Term Capital Gains | Tax Return of Capital | Total | |||||||||||||
SPDR SSGA Multi-Asset Real Return ETF | $ | 2,527,694 | $ | — | $ | — | $ | 2,527,694 | ||||||||
SPDR SSGA Income Allocation ETF | 3,780,064 | — | — | 3,780,064 | ||||||||||||
SPDR SSGA Global Allocation ETF | 3,658,288 | 557,903 | — | 4,216,191 | ||||||||||||
SPDR Blackstone / GSO Senior Loan ETF | 24,171,917 | — | — | 24,171,917 | ||||||||||||
SPDR SSGA Ultra Short Term Bond ETF | 54,048 | — | — | 54,048 | ||||||||||||
SPDR DoubleLine Total Return Tactical ETF | 3,317,808 | — | — | 3,317,808 | ||||||||||||
SPDR MFS Systematic Core Equity ETF | 115,975 | — | — | 115,975 | ||||||||||||
SPDR MFS Systematic Growth Equity ETF | 137,093 | — | — | 137,093 | ||||||||||||
SPDR MFS Systematic Value Equity ETF | 88,384 | — | — | 88,384 | ||||||||||||
SPDR SSGA Risk Aware ETF | 22,860 | — | — | 22,860 | ||||||||||||
54
Table of Contents
SSGA ACTIVE TRUST
NOTES TO FINANCIAL STATEMENTS (continued)
June 30, 2016
As of June 30, 2016, the components of distributable earnings on a tax basis were as follows:
| Undistributed Ordinary Income | Capital Loss Carryforwards | Undistributed Long-Term Capital Gains | Net Unrealized Gains (Losses) | Qualified Late-Year Losses* | Total | |||||||||||||||||||
SPDR SSGA Multi-Asset Real Return ETF | $ | — | $ | (28,506,952 | ) | $ | — | $ | (8,138,841 | ) | $ | — | $ | (36,645,793 | ) | |||||||||
SPDR SSGA Income Allocation ETF | 516,788 | (8,239,578 | ) | — | 2,556,237 | — | (5,166,553 | ) | ||||||||||||||||
SPDR SSGA Global Allocation ETF | 753,275 | (10,047,324 | ) | — | 2,984,556 | — | (6,309,493 | ) | ||||||||||||||||
SPDR Blackstone / GSO Senior Loan ETF | 1,917,933 | (49,549,779 | ) | — | (1,900,111 | ) | — | (49,531,957 | ) | |||||||||||||||
SPDR SSGA Ultra Short Term Bond ETF | — | (271,022 | ) | — | (5,206 | ) | — | (276,228 | ) | |||||||||||||||
SPDR DoubleLine Total Return Tactical ETF | 3,979,474 | (4,283,721 | ) | — | 26,255,120 | — | 25,950,872 | |||||||||||||||||
SPDR MFS Systematic Core Equity ETF | — | — | — | (9,179 | ) | — | (9,179 | ) | ||||||||||||||||
SPDR MFS Systematic Growth Equity ETF | — | — | — | 430,339 | (139,348 | ) | 290,991 | |||||||||||||||||
SPDR MFS Systematic Value Equity ETF | — | — | 46,420 | 57,295 | — | 103,715 | ||||||||||||||||||
SPDR SSGA Risk Aware ETF | 3,797 | (200,254 | ) | — | 75,664 | — | (120,793 | ) | ||||||||||||||||
| * | The Funds have elected to defer certain qualified late-year losses and recognize such losses in the next taxable year. |
As of June 30, 2016, the following Funds had capital loss carryforwards available to offset future realized capital gains as follows:
| Non-Expiring Short Term | Non-Expiring Long Term | Total | ||||||||||
SPDR SSGA Multi-Asset Real Return ETF | $ | 11,117,589 | $ | 17,389,363 | $ | 28,506,952 | ||||||
SPDR SSGA Income Allocation ETF | 6,747,761 | 1,491,817 | 8,239,578 | |||||||||
SPDR SSGA Global Allocation ETF | 9,678,617 | 368,707 | 10,047,324 | |||||||||
SPDR Blackstone / GSO Senior Loan ETF | 18,369,640 | 31,180,139 | 49,549,779 | |||||||||
SPDR SSGA Ultra Short Term Bond ETF | 257,060 | 13,962 | 271,022 | |||||||||
SPDR DoubleLine Total Return Tactical ETF | 4,255,893 | 27,828 | 4,283,721 | |||||||||
SPDR SSGA Risk Aware ETF | 200,254 | — | 200,254 | |||||||||
55
Table of Contents
SSGA ACTIVE TRUST
NOTES TO FINANCIAL STATEMENTS (continued)
June 30, 2016
As of June 30, 2016, gross unrealized appreciation and gross unrealized depreciation of investments based on cost for federal income tax purposes were as follows:
| Tax Cost | Gross Unrealized Appreciation | Gross Unrealized Depreciation | Net Unrealized Appreciation (Depreciation) | |||||||||||||
SPDR SSGA Multi-Asset Real Return ETF | $ | 88,962,981 | $ | — | $ | (8,138,841 | ) | $ | (8,138,841 | ) | ||||||
SPDR SSGA Income Allocation ETF | 102,939,409 | 2,556,237 | — | 2,556,237 | ||||||||||||
SPDR SSGA Global Allocation ETF | 176,727,401 | 2,984,556 | — | 2,984,556 | ||||||||||||
SPDR Blackstone / GSO Senior Loan ETF | 804,388,297 | — | 1,900,111 | (1,900,111 | ) | |||||||||||
SPDR SSGA Ultra Short Term Bond ETF | 24,035,491 | — | 5,206 | (5,206 | ) | |||||||||||
SPDR DoubleLine Total Return Tactical ETF | 2,609,816,816 | 26,255,120 | — | 26,255,120 | ||||||||||||
SPDR MFS Systematic Core Equity ETF | 5,828,851 | — | 9,179 | (9,179 | ) | |||||||||||
SPDR MFS Systematic Growth Equity ETF | 11,736,345 | 430,339 | — | 430,339 | ||||||||||||
SPDR MFS Systematic Value Equity ETF | 2,555,303 | 57,295 | — | 57,295 | ||||||||||||
SPDR SSGA Risk Aware ETF | 1,884,912 | 75,664 | — | 75,664 | ||||||||||||
| 7. | Subsequent Events |
Management has evaluated the impact of all subsequent events on the Funds through the date on which the financial statements were available to be issued and has determined that there were no subsequent events requiring adjustment or disclosure in the financial statements other than below.
On May 26, 2016, the Board unanimously voted to close and liquidate the SPDR SSGA Risk Aware ETF Fund. After the close of business on August 24, 2016, the Fund stopped accepting creation orders. Trading in the Fund halted prior to market open on August 25, 2016. Proceeds of the liquidation will be sent to shareholders on August 31, 2016.
56
Table of Contents
SSGA ACTIVE TRUST
REPORT OF INDEPENDENT REGISTERED PUBLIC ACCOUNTING FIRM
June 30, 2016
To the Shareholders and Board of Trustees of
SSGA Active Trust
We have audited the accompanying statements of assets and liabilities of SPDR SSGA Multi-Asset Real Return ETF, SPDR SSGA Income Allocation ETF, SPDR SSGA Global Allocation ETF, SPDR Blackstone/GSO Senior Loan ETF, SPDR SSGA Ultra Short Term Bond ETF, SPDR DoubleLine Total Return Tactical ETF, SPDR MFS Systematic Core Equity ETF, SPDR MFS Systematic Growth Equity ETF, SPDR MFS Systematic Value Equity ETF and SPDR SSGA Risk Aware ETF (collectively, the “Funds”) (ten of the funds constituting SSGA Active Trust) as of June 30, 2016, and the related statements of operations for the year then ended, and the statements of changes in net assets and the financial highlights for each of the periods indicated therein. These financial statements and financial highlights are the responsibility of the Funds’ management. Our responsibility is to express an opinion on these financial statements and financial highlights based on our audits.
We conducted our audits in accordance with the standards of the Public Company Accounting Oversight Board (United States). Those standards require that we plan and perform the audit to obtain reasonable assurance about whether the financial statements and financial highlights are free of material misstatement. We were not engaged to perform an audit of the Funds’ internal control over financial reporting. Our audits included consideration of internal control over financial reporting as a basis for designing audit procedures that are appropriate in the circumstances, but not for the purpose of expressing an opinion on the effectiveness of the Funds’ internal control over financial reporting. Accordingly, we express no such opinion. An audit also includes examining, on a test basis, evidence supporting the amounts and disclosures in the financial statements and financial highlights, assessing the accounting principles used and significant estimates made by management, and evaluating the overall financial statement presentation. We believe that our audits provide a reasonable basis for our opinion.
In our opinion, the financial statements and financial highlights referred to above present fairly, in all material respects, the financial position of each of the above mentioned Funds of SSGA Active Trust at June 30, 2016, the results of their operations for the year then ended, and the changes in their net assets and the financial highlights for each of the periods indicated therein, in conformity with U.S. generally accepted accounting principles.

Boston, Massachusetts
August 26, 2016
57
Table of Contents
SSGA ACTIVE TRUST
June 30, 2016
Expense Example
As a shareholder of a Fund, you incur two types of costs (1) transaction costs, including sales charges (loads), if applicable, on purchase payments, reinvested dividends, or other distributions and (2) ongoing costs, including advisory fees and to the extent applicable, distribution (12b-1) and/or service fees; and other Fund expenses. This example is intended to help you understand your ongoing costs (in dollars) of investing in the Fund and to compare these costs with the ongoing costs of investing in other mutual funds. It is based on an investment of $1,000 made at the beginning of the period shown and held for the entire period from January 1, 2016 to June 30, 2016.
The table below illustrates your Fund’s cost in two ways:
| • | Based on actual fund return — This section helps you to estimate the actual expenses that you paid over the period. The “Ending Account Value” shown is derived from each Fund’s actual return, and the third column shows the dollar amount that would have been paid by an investor who started with $1,000 in the Fund. You may use the information here, together with the amount you invested, to estimate the expenses that you paid over the period. To do so, simply divide your account value by $1,000 (for example, an $8,600 account value divided by $1,000 = 8.6), then multiply the result by the number given for the Fund under the heading “Expenses Paid During Period”. |
| • | Based on hypothetical 5% return — This section is intended to help you compare your Fund’s costs with those of other mutual funds. It assumes that the Fund had a yearly return of 5% before expenses, but that the expense ratio is unchanged. In this case, because the return used is not the Fund’s actual return, the results do not apply to your investment. The example is useful in making comparisons because the Securities and Exchange Commission requires all mutual funds to calculate expenses based on a 5% return. You can assess your Fund’s costs by comparing this hypothetical example with the hypothetical examples that appear in shareholder reports of other funds. |
Please note that the expenses shown in the table are meant to highlight your ongoing costs only and do not reflect any transaction costs, such as sales load charges (loads). Therefore, the hypothetical 5% return section of the table is useful in comparing ongoing costs only, and will not help you determine the relative total costs of owning different funds. In addition, if these transaction costs were included, your costs would have been higher.
| Actual | Hypothetical (assuming a 5% return before expenses) | |||||||||||||||||||
| Annualized Expense Ratio | Ending Account Value | Expenses Paid During Period (a) | Ending Account Value | Expenses Paid During Period (a) | ||||||||||||||||
SPDR SSGA Multi-Asset Real Return ETF | 0.28 | % | $ | 1,104.60 | $ | 1.47 | $ | 1,023.50 | $ | 1.41 | ||||||||||
SPDR SSGA Income Allocation ETF | 0.39 | 1,000.00 | 1.94 | 1,022.90 | 1.96 | |||||||||||||||
SPDR SSGA Global Allocation ETF | 0.07 | 1,028.00 | 0.35 | 1,024.50 | 0.35 | |||||||||||||||
SPDR Blackstone / GSO Senior Loan ETF | 0.70 | 1,026.40 | 3.53 | 1,021.40 | 3.52 | |||||||||||||||
SPDR SSGA Ultra Short Term Bond ETF | 0.20 | 1,007.30 | 1.00 | 1,023.90 | 1.01 | |||||||||||||||
SPDR DoubleLine Total Return Tactical ETF | 0.55 | 1,039.30 | 2.79 | 1,022.10 | 2.77 | |||||||||||||||
SPDR MFS Systematic Core Equity ETF | 0.61 | 1,011.40 | 3.05 | 1,021.80 | 3.07 | |||||||||||||||
SPDR MFS Systematic Growth Equity ETF | 0.61 | 1,014.40 | 3.06 | 1,021.80 | 3.07 | |||||||||||||||
SPDR MFS Systematic Value Equity ETF | 0.63 | 999.30 | 3.13 | 1,021.70 | 3.17 | |||||||||||||||
SPDR SSGA Risk Aware ETF | 0.54 | 1,059.80 | 2.77 | 1,022.20 | 2.72 | |||||||||||||||
| (a) | Expenses are equal to the Fund’s annualized net expense ratio multiplied by the average account value of the period, multiplied by 182, then divided by 366. |
58
Table of Contents
SSGA ACTIVE TRUST
OTHER INFORMATION (continued)
June 30, 2016
Tax Information
For federal income tax purposes, the following information is furnished with respect to the distributions of the Trust for its fiscal year ended June 30, 2016.
Percentage of distributions which qualify for the corporate dividends received deduction:
| Percentage | ||||
SPDR SSGA Multi-Asset Real Return ETF | 15.89 | % | ||
SPDR SSGA Income Allocation ETF | 6.98 | |||
SPDR SSGA Global Allocation ETF | 5.85 | |||
SPDR MFS Systematic Core Equity ETF | 88.43 | |||
SPDR MFS Systematic Growth Equity ETF | 75.59 | |||
SPDR MFS Systematic Value Equity ETF | 60.88 | |||
SPDR SSGA Risk Aware ETF | 100.00 | |||
Qualified Dividend Income
A portion of dividends distributed by the Funds during the fiscal year ended June 30, 2016, are considered qualified dividend income, and are eligible for reduced tax rates. These lower rates range from 5% to 20% depending on the individual’s tax bracket. These amounts are noted below:
| Amount | ||||
SPDR SSGA Multi-Asset Real Return ETF | $ | 950,371 | ||
SPDR SSGA Income Allocation ETF | 972,516 | |||
SPDR SSGA Global Allocation ETF | 1,066,329 | |||
SPDR MFS Systematic Core Equity ETF | 101,523 | |||
SPDR MFS Systematic Growth Equity ETF | 163,429 | |||
SPDR MFS Systematic Value Equity ETF | 58,074 | |||
SPDR SSGA Risk Aware ETF | 29,724 | |||
Qualified Interest Income
The Fund designated a portion of dividends distributed during the fiscal year ended June 30, 2016, as qualified interest income. These amounts are noted below:
| Amount | ||||
SPDR SSGA Multi-Asset Real Return ETF | $ | 74,604 | ||
SPDR SSGA Income Allocation ETF | 1,586,769 | |||
SPDR Blackstone / GSO Senior Loan ETF | 17,625,223 | |||
SPDR SSGA Ultra Short Term Bond ETF | 219,091 | |||
SPDR DoubleLine Total Return Tactical ETF | 51,231,117 | |||
Long term capital gain dividends were paid from the following Funds during the year ended June 30, 2016:
| Amount | ||||
SPDR SSGA Global Allocation ETF | $ | 310,344 | ||
SPDR MFS Systematic Core Equity ETF | 38,356 | |||
SPDR MFS Systematic Growth Equity ETF | 117,471 | |||
SPDR MFS Systematic Value Equity ETF | 71,320 | |||
59
Table of Contents
SSGA ACTIVE TRUST
OTHER INFORMATION (continued)
June 30, 2016
The Funds designate the following amount of ordinary income distributions paid during the fiscal year ended June 30, 2016 for qualified short term capital gains:
| Amount | ||||
SPDR SSGA Global Allocation ETF | $ | 72,431 | ||
SPDR MFS Systematic Core Equity ETF | 30,218 | |||
SPDR MFS Systematic Growth Equity ETF | 38,332 | |||
The amount of foreign source income earned on the following Funds during the year ended June 30, 2016 were as follows:
| Amount | ||||
SPDR SSGA Multi-Asset Real Return ETF | $ | 542,466 | ||
SPDR SSGA Income Allocation ETF | 345,106 | |||
SPDR SSGA Global Allocation ETF | 737,135 | |||
Foreign Tax Credit
The Trust has made an election under Internal Revenue Code Section 853 to pass through foreign taxes paid by a Fund to its shareholders. For the year ended June 30, 2016, the total amount of foreign taxes that will be passed through are:
| Amount | ||||
SPDR SSGA Multi-Asset Real Return ETF | $ | 62,342 | ||
SPDR SSGA Global Allocation ETF | 113,246 | |||
SPDR SSGA Income Allocation ETF | 47,555 | |||
Proxy Voting Policies and Procedures and Records
A description of the Trust’s proxy voting policies and procedures that are used by the Funds’ investment adviser to vote proxies relating to the Funds’ portfolio of securities are available (i) without charge, upon request by calling 1-866-787-2257 (toll free) or (ii) on the website of the U.S. Securities and Exchange Commission, at www.sec.gov.
Information regarding how the investment adviser voted for the prior 12-months period ended June 30 is available by August 31 of each year by calling the same number and on the SEC’s website, at www.sec.gov, and on the Funds’ website at www.spdrs.com.
Quarterly Portfolio Schedule
The Funds file a complete schedule of investments with the SEC for the first and third quarters of each fiscal year on Form N-Q. The Funds’ Forms N-Q are available on the SEC’s website at www.sec.gov and may be reviewed and copied at the SEC’s Public Reference Room in Washington DC. Information on the operation of the Public Reference Room may be obtained by calling 1-800-SEC-0330. The information on the Form N-Q is available upon request, without charge, by calling 1-866-787-2257 (toll free) and on the Funds’ website at www.spdrs.com.
Approval of Advisory Agreements
At in-person meetings held prior to June 30, 2016, the Board of Trustees of the Trusts (the “Board”) evaluated proposals (1) to continue the separate Investment Advisory Agreements (the “Agreements”) between each Trust and SSGA Funds Management, Inc. (the “Adviser” or “SSGA FM”) with respect to the operational series of SSGA Active Trust (the “Current ETFs”) and SSGA Master Trust (together with the Current ETFs, the “Current Funds”), and (2) to approve the separate Agreements between the Adviser and (a) the SSGA Active Trust with respect to the SPDR DoubleLine Short Duration Total Return Tactical ETF and SPDR DoubleLine Emerging Markets Fixed Income ETF (the “New ETFs” and, together with the Current ETFs, the “ETFs”), and the State Street Disciplined Global Equity Portfolio (together with the New ETFs, the “New Funds”) each a new series of the SSGA Active Trust, (with the Current Funds and New Funds collectively being referred to hereafter as the “Funds”), each of which commenced operations during the period covered
60
Table of Contents
SSGA ACTIVE TRUST
OTHER INFORMATION (continued)
June 30, 2016
by this Annual Report. The Trustees who are not “interested persons” of the Trust within the meaning of the Investment Company Act of 1940, as amended (the “Independent Trustees”), also met separately with their independent legal counsel to consider the Agreements.
In evaluating the Agreements, the Board drew on materials provided to them by SSGA FM, the Trust’s investment adviser and administrator, and other materials provided by State Street Bank and Trust Company, the Trusts’ sub-administrator, transfer agent and custodian (“State Street”). In deciding whether to approve the Agreements, the Board considered various factors, including the (i) nature, extent and quality of services provided by, or expected to be provided by, the Adviser with respect to the Funds under the Agreements, (ii) investment performance of the Current Funds, (iii) profits realized by the Adviser and its affiliates from its relationship with the Trusts, (iv) fees charged to comparable funds, (v) other benefits to the Adviser, and (vi) extent to which economies of scale would be shared as the Funds grow.
Nature, Extent and Quality of Services
The Board considered the nature, extent and quality of services provided by, or expected to be provided by, the Adviser. In doing so, the Trustees relied on their prior experience in overseeing the management of the Trusts and materials provided prior to and at the meeting. The Board reviewed the Agreements and the Adviser’s responsibilities for managing investment operations of each of the Funds in accordance with each Fund’s investment objectives and policies, and applicable legal and regulatory requirements. The Board appreciated the relatively unique nature of the ETFs as exchange-traded funds in a master-feeder structure, as appropriate, and the experience and expertise of the Adviser with exchange-traded funds. The Board considered the background and experience of the Adviser’s senior management, including those individuals responsible for portfolio management, oversight of sub-advisers and regulatory compliance of the Funds. The Board also considered the portfolio management resources, structures and practices of the Adviser, including those associated with monitoring and securing each Fund’s compliance with its investment objectives and policies and with applicable laws and regulations. The Board also considered information about the Adviser’s best execution procedures and overall investment management business, noting that the Adviser serves a wide range of clients across a broad spectrum of asset classes. The Board looked at the Adviser’s general knowledge of the investment business and that of its affiliates which make up State Street Global Advisors, through which the Adviser shares all of its senior personnel. The Board considered that the Adviser and its affiliates constitute one of the world’s largest investment management enterprises for exchange-traded funds. The Board also considered the Adviser’s experience in active management, managing exchange-traded funds in master-feeder structures and overseeing third-party sub-advisers, as applicable.
Investment Performance
The Board then reviewed the Current Funds’ performance. The Board compared each Current Fund’s investment performance to the performance of an appropriate benchmark and group of comparable funds. Among other information, the Board considered the following performance information in its evaluation of the Funds:
SPDR SSGA Multi-Asset Real Return ETF. The Board considered that: (a) the Fund underperformed the median of its Performance Group for the 1-, 2- and 3-year periods; and (b) outperformed its benchmark index for the 1-year period and underperformed its benchmark index for the 3-year period.
SPDR SSGA Income Allocation ETF. The Board considered that: (a) the Fund outperformed the median of its Performance Group for the 1-, 2- and 3-year periods; and (b) underperformed its benchmark index for the 1- and 3-year period.
SPDR SSGA Global Allocation ETF. The Board considered that: (a) the Fund outperformed the median of its Performance Group for the 1-, 2- and 3-year periods; and (b) underperformed its benchmark index for the 1-year period and outperformed its benchmark index for the 3-year period.
SPDR Blackstone / GSO Senior Loan ETF. The Board considered that: (a) the Fund underperformed the median of its Performance Group for the 1- and 2-year periods; and (b) outperformed its benchmark index for the 1-year period.
SPDR SSGA Ultra Short Term Bond ETF. The Board considered that: (a) the Fund underperformed the median of its Performance Group for the 1- and 2-year periods; and (b) outperformed its benchmark index for the 1-year period.
61
Table of Contents
SSGA ACTIVE TRUST
OTHER INFORMATION (continued)
June 30, 2016
SPDR DoubleLine Total Return Tactical ETF. The Board considered that: (a) the Fund outperformed the median of its Performance Group since inception; and (b) outperformed its benchmark index since inception.
SPDR MFS Systematic Core Equity ETF. The Board considered that: (a) the Fund outperformed the median of its Performance Group for the 1-year period; and (b) outperformed its benchmark index for the 1-year period.
SPDR MFS Systematic Growth Equity ETF. The Board considered that: (a) the Fund outperformed the median of its Performance Group for the 1-year period; and (b) outperformed its benchmark index for the 1-year period.
SPDR MFS Systematic Value Equity ETF. The Board considered that: (a) the Fund outperformed the median of its Performance Group for the 1-year period; and (b) outperformed its benchmark index for the 1-year period.
SPDR SSGA Risk Aware ETF. The Board considered that: (a) the Fund underperformed the median of its Performance Group for the 1-year period; and (b) underperformed its benchmark index for the 1-year period.
On the basis of the foregoing and other relevant information, the Board concluded that the performance of each Current Fund is satisfactory.
Profits Realized by Adviser
The Board considered the profitability of the advisory arrangement with the Current Funds to the Adviser, including data on the Current Funds’ historical profitability to the Adviser. The Independent Trustees, through their counsel, had the opportunity to discuss, with representatives of the Adviser and State Street, methodologies used in computing costs that formed the bases of profitability calculations and determined that these methodologies were reasonable.
Fees Charged to Comparable Funds
The Board evaluated each Fund’s unitary fee through review of comparative information with respect to fees paid by similar funds — i.e., exchange-traded funds that are actively managed, as applicable. The Board reviewed the universe of similar exchange-traded funds for each ETF based upon data independently obtained from Broadridge Financial Solutions, Inc. (formerly Lipper Analytical Services) and related comparative information for similar exchange-traded funds. The Board also reviewed the fee structure, as applicable, of each Fund in connection with the master-feeder structure, the historical expense ratios of each Current Fund and the estimated expense ratios for each New Fund. In doing so, the Board used a fund by fund analysis of the data.
Other Benefits
The Board also considered whether the Adviser or its affiliates benefited in other ways from its relationship with the Trusts, noting that the Adviser does not maintain soft-dollar arrangements in connection with the Trusts’ brokerage transactions.
Economies of Scale
The Board reviewed information regarding economies of scale or other efficiencies that may result as each Fund’s assets grow in size. The Board noted that the Agreements did not provide for breakpoints in each Fund’s advisory fee rates as assets of a Fund increase. However, the Board further noted the Adviser’s assertion that future economies of scale (among several factors) had been taken into consideration for the Funds by fixing relatively low advisory fees, effectively sharing the benefits of lower fees with the Funds from inception. The Adviser also asserted that one of the benefits of the unitary fee was to provide an unvarying expense structure, which could be lost or diluted with the addition of breakpoints. The Board noted that it intends to continue to monitor fees as the Funds grow in size and assess whether fee breakpoints may be warranted.
The Board, including the Independent Trustees voting separately, approved the Agreements for each Fund after weighing the foregoing factors, none of which was dispositive in itself and may have been weighed differently by each Trustee. The Board’s conclusions with respect to each Agreement were as follows: (a) the nature and extent of the services provided, or expected to be provided, by the Adviser with respect to the Funds were appropriate; (b) the performance of each Current Fund had been satisfactory; (c) the Adviser’s unitary fee for each Fund, considered in relation to services provided or expected to be provided, and in relation to fees charged to comparable funds, was fair and reasonable; (d) profitability of the Trusts’ relationship with the Adviser was not excessive; (e) any additional potential benefits to the Adviser or its affiliates were not of a magnitude to materially affect the Board’s conclusions;
62
Table of Contents
SSGA ACTIVE TRUST
OTHER INFORMATION (continued)
June 30, 2016
and (f) fees paid to the Adviser shared the economies of scale with respect to the Current Funds by way of the relatively low fee structure of the Trusts.
Approval of GSO / Blackstone Debt Funds Management LLC Sub-Advisory Agreements
At an in-person meeting held prior to June 30, 2016, the Board also evaluated proposals to continue the separate Sub-Advisory Agreements (the “GSO / Blackstone Sub-Advisory Agreements”) between the Adviser and GSO / Blackstone Debt Funds Management LLC (“GSO / Blackstone”) with respect to the SPDR Blackstone / GSO Senior Loan ETF, a series of the SSGA Active Trust, and Blackstone / GSO Senior Loan Portfolio, a series of the SSGA Master Trust, each sub-advised by GSO / Blackstone (the “GSO / Blackstone Funds”). The Independent Trustees also met separately with their independent legal counsel to consider the GSO / Blackstone Sub-Advisory Agreements.
In evaluating the GSO / Blackstone Sub-Advisory Agreements, the Board drew on materials provided to them by GSO / Blackstone and the Adviser. In deciding whether to approve the GSO / Blackstone Sub-Advisory Agreements, the Board considered various factors, including the (i) nature, extent and quality of services provided by GSO / Blackstone with respect to the GSO / Blackstone Funds under the GSO / Blackstone Sub-Advisory Agreements and (ii) investment performance of the GSO / Blackstone Funds. The Board was apprised of the portion of the current advisory fee that the Adviser would pay to GSO / Blackstone under the GSO / Blackstone Sub-Advisory Agreements and also considered that such fees would be paid directly by the Adviser and would not result in increased fees payable by the GSO / Blackstone Funds.
The Board considered the background and experience of GSO / Blackstone’s senior management and, in particular, GSO / Blackstone’s experience in investing in senior loan securities. The Board reviewed the GSO / Blackstone Funds’ performance, noting that that the performance of the GSO / Blackstone Funds was satisfactory. The Board also considered the unitary fee paid to the Adviser by each GSO / Blackstone Fund and GSO / Blackstone’s fees paid by the Adviser.
The Board, including the Independent Trustees voting separately, approved the GSO / Blackstone Sub-Advisory Agreements for each GSO / Blackstone Fund after weighing the foregoing factors, none of which was dispositive in itself and may have been weighed differently by each Trustee. The Board’s conclusions with respect to each GSO / Blackstone Sub-Advisory Agreement were as follows: (a) the nature and extent of the services provided by GSO / Blackstone with respect to the GSO / Blackstone Funds were appropriate; (b) the performance of the GSO / Blackstone Funds had been satisfactory; (c) GSO / Blackstone’s fees for the GSO / Blackstone Funds and the unitary fee, considered in relation to the services provided, were fair and reasonable; (d) any additional potential benefits to GSO / Blackstone were not of a magnitude to materially affect the Board’s conclusions; and (e) fees paid to GSO / Blackstone adequately shared the economies of scale with each applicable GSO / Blackstone Fund by way of the relatively low fee structure of the Trusts.
Approval of Massachusetts Financial Services Company Sub-Advisory Agreements
At an in-person meeting held prior to June 30, 2016, the Board also evaluated proposals to continue the separate Sub-Advisory Agreements (the “MFS Sub-Advisory Agreements”) between the Adviser and Massachusetts Financial Services Company (“MFS”) with respect to the SPDR MFS Systematic Core Equity ETF, SPDR MFS Systematic Growth Equity ETF and SPDR MFS Systematic Value Equity ETF, each a series of the SSGA Active Trust, and SSGA MFS Systematic Core Equity Portfolio, SSGA Systematic Growth Equity Portfolio and SSGA MFS Systematic Value Equity Portfolio, each a series of the SSGA Master Trust, each sub-advised by MFS (the “MFS Funds”). The Independent Trustees also met separately with their independent legal counsel to consider the MFS Sub-Advisory Agreements.
In evaluating the MFS Sub-Advisory Agreements, the Board drew on materials provided to them by MFS and the Adviser. In deciding whether to approve the MFS Sub-Advisory Agreements, the Board considered various factors, including the (i) nature, extent and quality of services provided by MFS with respect to the MFS Funds under the MFS Sub-Advisory Agreements and (ii) investment performance of the MFS Funds. The Board was apprised of the portion of the current advisory fee that the Adviser would pay to MFS under the MFS Sub-Advisory Agreements and also considered that such fees would be paid directly by the Adviser and would not result in increased fees payable by the MFS Funds.
63
Table of Contents
SSGA ACTIVE TRUST
OTHER INFORMATION (continued)
June 30, 2016
The Board considered the background and experience of MFS’s senior management and, in particular, MFS’s experience in investing in equity securities. The Board reviewed the MFS Funds’ performance, noting that that the performance of the MFS Funds was satisfactory. The Board also considered the unitary fee paid to the Adviser by each MFS Fund and MFS’s fees paid by the Adviser.
The Board, including the Independent Trustees voting separately, approved the MFS Sub-Advisory Agreements for each MFS Fund after weighing the foregoing factors, none of which was dispositive in itself and may have been weighed differently by each Trustee. The Board’s conclusions with respect to each MFS Sub-Advisory Agreement were as follows: (a) the nature and extent of the services provided by MFS with respect to the MFS Funds were appropriate; (b) the performance of the MFS Funds had been satisfactory; (c) MFS’s fees for the MFS Funds and the unitary fee, considered in relation to the services provided, were fair and reasonable; (d) any additional potential benefits to MFS were not of a magnitude to materially affect the Board’s conclusions; and (e) fees paid to MFS adequately shared the economies of scale with each applicable MFS Fund by way of the relatively low fee structure of the Trusts.
Approval of DoubleLine Capital LP Sub-Advisory Agreements
At in-person meetings held prior to June 30, 2016, the Board also considered proposals to continue the separate Sub-Advisory Agreements (the “DoubleLine Sub-Advisory Agreements”) between the Adviser and DoubleLine Capital LP (“DoubleLine”) with respect to the SPDR DoubleLine Total Return Tactical ETF, a series of the SSGA Active Trust, and State Street DoubleLine Total Return Tactical Portfolio, a series of the SSGA Master Trust (together, the “Current DoubleLine Funds”), and to approve the DoubleLine Sub-Advisory Agreements between the Adviser and DoubleLine with respect to the SPDR DoubleLine Short Duration Total Return Tactical ETF and SPDR DoubleLine Emerging Markets Fixed Income ETF, each a series of SSGA Active Trust (together with the Current DoubleLine Funds, the “DoubleLine Funds”), under which each of the DoubleLine Funds would be sub-advised by DoubleLine. The Independent Trustees also met separately with their independent legal counsel to consider the DoubleLine Sub-Advisory Agreements.
In evaluating the DoubleLine Sub-Advisory Agreements, the Board drew on materials provided to them by DoubleLine and the Adviser. In deciding whether to approve the DoubleLine Sub-Advisory Agreements, the Board considered various factors, including the (i) nature, extent and quality of services provided, or expected to be provided, by DoubleLine with respect to the DoubleLine Funds under the DoubleLine Sub-Advisory Agreements; and (ii) investment performance of the Current DoubleLine Funds. The Board was apprised of the portion of the advisory fee that the Adviser would pay to DoubleLine under the DoubleLine Sub-Advisory Agreements and also considered that such fees would be paid directly by the Adviser and would not result in increased fees payable by the DoubleLine Funds.
The Board considered the background and experience of DoubleLine’s senior management and, in particular, DoubleLine’s experience in investing in fixed income securities. The Board reviewed the Current DoubleLine Funds’ performance, noting that that the performance of the Current DoubleLine Funds was satisfactory. The Board also considered the unitary fee paid, or to be paid, to the Adviser by each DoubleLine Fund and DoubleLine’s fees paid by the Adviser.
The Board, including the Independent Trustees voting separately, approved the DoubleLine Sub-Advisory Agreements for the DoubleLine Funds after weighing the foregoing factors, none of which was dispositive in itself and may have been weighed differently by each Trustee. The Board’s conclusions with respect to each of the DoubleLine Sub-Advisory Agreements were as follows: (a) the nature and extent of the services provided, or expected to be provided, by DoubleLine with respect to the DoubleLine Funds were adequate and appropriate; (b) the performance of the Current DoubleLine Funds had been satisfactory; (c) DoubleLine’s fees for the DoubleLine Funds and the unitary fee, considered in relation to the services provided, or expected to be provided, were fair and reasonable; (d) any additional potential benefits to DoubleLine were not of a magnitude to materially affect the Board’s conclusions; and (e) fees paid, or expected to be paid, to DoubleLine were expected to share economies of scale with each applicable DoubleLine Fund by way of the relatively low fee structure of the Trusts.
64
Table of Contents
SSGA ACTIVE TRUST
OTHER INFORMATION (continued)
June 30, 2016
TRUSTEES
Name, Address and Year of Birth | Position(s) with Funds | Term of Office and Length of Time Served | Principal Occupation(s) During Past 5 Years | Number of Portfolios In Fund Complex Overseen By Trustee | Other Directorships Held By Trustee During The | |||||||
Independent Trustees | ||||||||||||
FRANK NESVET | Independent Trustee, Chairman, Trustee Committee Chair | Term: Unlimited Served: since September 2000 | Chief Executive Officer, Libra Group, Inc. (a financial services consulting company) (1998-present). | 218 | SPDR Index Shares Funds (Trustee); SPDR Series Trust (Trustee); SSGA Master Trust (Trustee). | |||||||
DAVID M. KELLY | Independent Trustee, Audit Committee Chair | Term: Unlimited Served: since September 2000 | Retired. | 218 | Chicago Stock Exchange (Former Director, retired); Penson Worldwide Inc. (Former Director, retired); SPDR Index Shares Funds (Trustee); SPDR Series Trust (Trustee); SSGA Master Trust (Trustee). | |||||||
BONNY EUGENIA BOATMAN | Independent Trustee | Term: Unlimited Served: since April 2010 | Retired. | 218 | SPDR Index Shares Funds (Trustee); SPDR Series Trust (Trustee); SSGA Master Trust (Trustee). | |||||||
DWIGHT D. CHURCHILL | Independent Trustee | Term: Unlimited Served: since April 2010 | Self-employed consultant since 2010; CEO and President, CFA Institute (June 2014-January 2015). | 218 | SPDR Index Shares Funds (Trustee); SPDR Series Trust (Trustee); SSGA Master Trust (Trustee); Affiliated Managers Group, Inc. (Director). | |||||||
CARL G. VERBONCOEUR | Independent Trustee | Term: Unlimited Served: since April 2010 | Self-employed consultant since 2009. | 218 | The Motley Fool Funds Trust (Trustee); SPDR Index Shares Funds (Trustee); SPDR Series Trust (Trustee); SSGA Master Trust (Trustee). | |||||||
65
Table of Contents
SSGA ACTIVE TRUST
OTHER INFORMATION (continued)
June 30, 2016
Name, Address and Year of Birth | Position(s) with Funds | Term of Office and Length of Time Served | Principal Occupation(s) During Past 5 Years | Number of Portfolios In Fund Complex Overseen By Trustee | Other Directorships Held By Trustee During The | |||||||
Interested Trustee | ||||||||||||
JAMES E. ROSS* | Interested Trustee | Term: Unlimited Served as Trustee: since April 2010 | Chairman and Director, SSGA Funds Management, Inc. (2005-present); Senior Managing Director and Principal, State Street Global Advisors (2006-present); President, SSGA Funds Management, Inc. (2005-2012). | 299 | SPDR Index Shares Funds (Trustee); SPDR Series Trust (Trustee); SSGA Master Trust (Trustee); Select Sector SPDR Trust (Trustee); State Street Master Funds (Trustee); and State Street Institutional Investment Trust (Trustee). | |||||||
| * | Mr. Ross is an Interested Trustee because of his employment with the Adviser and ownership interest in an affiliate of the Adviser. Mr. Ross previously served as an Interested Trustee from November 2005 to December 2009. |
OFFICERS
Name, Address and Year of Birth | Position(s) with Funds | Term of Office and Length of Time Served | Principal Occupation(s) During The Past 5 Years | |||
ELLEN M. NEEDHAM | President | Term: Unlimited Served: since October 2012 | President and Director, SSGA Funds Management, Inc. (2001-present)*; Senior Managing Director, State Street Global Advisors (1992-present).* | |||
ANN M. CARPENTER | Vice President; Deputy Treasurer | Term: Unlimited Served: since August 2012; Term: Unlimited Served: since February 2016 | Chief Operating Officer, SSGA Funds Management, Inc. (2005-Present)*; Managing Director, State Street Global Advisors (2005-present).* | |||
MICHAEL P. RILEY | Vice President | Term: Unlimited Served: since February 2005 | Managing Director, State Street Global Advisors and SSGA Funds Management, Inc. (February 2015-present); Vice President, State Street Global Advisors and SSGA Funds Management, Inc. (2008-February 2015); Principal, State Street Global Advisors and SSGA Funds Management, Inc. (2005-2008). |
66
Table of Contents
SSGA ACTIVE TRUST
OTHER INFORMATION (continued)
June 30, 2016
Name, Address and Year of Birth | Position(s) with Funds | Term of Office and Length of Time Served | Principal Occupation(s) During The Past 5 Years | |||
JOSHUA A. WEINBERG | Chief Legal Officer | Term: Unlimited Served: since February 2015 | Vice President and Managing Counsel, State Street Global Advisors (2011-present); Clerk, SSGA Funds Management, Inc. (2013-present); Associate, Financial Services Group, Dechert LLP (2006-2011). | |||
CHRISTOPHER A. MADDEN | Secretary | Term: Unlimited Served: since August 2013 | Vice President and Senior Counsel, State Street Bank and Trust Company (2013-present); Counsel, Atlantic Fund Services (2009-2013); Vice President.* | |||
PATRICIA A. MORISETTE | Assistant Secretary | Term: Unlimited Served: since February 2015 | Vice President and Counsel, State Street Bank and Trust Company (2014-present); Assistant Vice President and Counsel, John Hancock Financial Services (2011-2013); Independent legal consultant (2009-2011); Associate, Bingham McCutchen LLP (2003-2009).*,** | |||
BRUCE S. ROSENBERG | Treasurer | Term: Unlimited Served: since February 2016 | Managing Director, State Street Global Advisors and SSGA Funds Management, Inc. (July 2015-present; Director, Credit Suisse (April 2008-July 2015)). | |||
CHAD C. HALLETT | Deputy Treasurer | Term: Unlimited Served: since February 2016 | Vice President, State Street Global Advisors and SSGA Funds Management, Inc. (November 2014-present); Vice President, State Street Bank and Trust Company (2001-November 2014).* | |||
SUJATA UPRETI | Assistant Treasurer | Term: Unlimited Served: since February 2016 | Vice President, State Street Global Advisors and SSGA Funds Management, Inc. (May 2015-present; Assistant Director, Cambridge Associates, LLC (July 2014-January 2015); Vice President, Bank of New York Mellon (July 2012-August 2013); Manager, PricewaterhouseCoopers, LLP (September 2003-July 2012)). | |||
DANIEL FOLEY | Assistant Treasurer | Term: Unlimited Served: since February 2016 | Vice President, State Street Global Advisors and SSGA Funds Management, Inc. (April 2007-present).* | |||
BRIAN HARRIS | Chief Compliance Officer and Anti-Money Laundering Officer | Term: Unlimited Served: since November 2013 | Managing Director, State Street Global Advisors and SSGA Funds Management, Inc. (June 2013-present)*; Senior Vice President and Global Head of Investment Compliance, BofA Global Capital Management (2010-2013); Director of Compliance, AARP Financial Inc. (2008-2010). |
| * | Served in various capacities and/or with various affiliated entities during noted time period. |
| ** | Served in various capacities and/or with unaffiliated mutual funds or closed-end funds for which State Street Bank and Trust Company or its affiliates act as a provider of services during the noted time period. |
Statement of Additional information (SAI) includes additional information about Fund directors and is available, without charge, upon request and by calling 1-866-787-2257.
67
Table of Contents
SSGA Active Trust
Trustees
Bonny E. Boatman
Dwight D. Churchill
David M. Kelly
Frank Nesvet, Chairman
James E. Ross
Carl G. Verboncoeur
Officers
Ellen M. Needham, President
Bruce Rosenberg, Treasurer
Ann Carpenter, Vice President and Deputy Treasurer
Michael P. Riley, Vice President
Chad C. Hallett, Deputy Treasurer
Sujata Upreti, Assistant Treasurer
Daniel Foley, Assistant Treasurer
Christopher A. Madden, Secretary
Patricia A. Morisette, Assistant Secretary
Brian Harris, Chief Compliance Officer and Anti-Money Laundering Officer
Joshua A. Weinberg, Chief Legal Officer
Investment Manager and Administrator
SSGA Funds Management, Inc.
State Street Financial Center
One Lincoln Street
Boston, MA 02111
Distributor
State Street Global Markets, LLC
One Lincoln Street
Boston, MA 02111
Custodian, Sub-Administrator and Transfer Agent
State Street Bank and Trust Company
One Lincoln Street
Boston, MA 02111
Legal Counsel
Morgan, Lewis & Bockius LLP
1111 Pennsylvania Avenue, NW
Washington, DC 20004
Independent Registered Public Accounting Firm
Ernst & Young LLP
200 Clarendon Street
Boston, MA 02116
Fund Shares are distributed by State Street Global Markets, LLC, a wholly-owned subsidiary of State Street Corporation. State Street Global Markets, LLC; member FINRA, SIPC.
The information contained in this report is intended for the general information of shareholders of the Trust. This report is not authorized for distribution to prospective investors unless preceded or accompanied by a current Trust prospectus which contains important information concerning the Trust. You may obtain a current prospectus and SAI from the Distributor by calling 1-866-787-2257 or visiting www.spdrs.com Please read the prospectus carefully before you invest.
Table of Contents
SSGA Master Trust
Annual Report June 30, 2016
The information contained in this report is intended for the general information of shareholders of the Trust. This report is not authorized for distribution to prospective investors unless preceded or accompanied by a current Trust prospectus which contains important information concerning the Trust. You may obtain a current prospectus and SAI from the Distributor by calling 1-866-787-2257 or visiting www.spdrs.com Please read the prospectus carefully before you invest.
Table of Contents
Portfolio Summary | ||||
| 1 | ||||
| 2 | ||||
| 3 | ||||
| 4 | ||||
| 5 | ||||
| 6 | ||||
| 7 | ||||
| 8 | ||||
| 9 | ||||
| 10 | ||||
Schedules of Investments | ||||
| 11 | ||||
| 14 | ||||
| 17 | ||||
| 20 | ||||
| 30 | ||||
| 34 | ||||
| 52 | ||||
| 56 | ||||
| 59 | ||||
| 63 | ||||
| 68 | ||||
| 76 | ||||
| 86 | ||||
| 92 | ||||
| 93 |
The information contained in this report is intended for the general information of shareholders of the Trust. This report is not authorized for distribution to prospective investors unless preceded or accompanied by a current Trust prospectus which contains important information concerning the Trust. You may obtain a current prospectus and SAI from the Distributor by calling 1-866-787-2257 or visiting www.spdrs.com Please read the prospectus carefully before you invest.
Table of Contents
SSGA MULTI-ASSET REAL RETURN PORTFOLIO
PORTFOLIO SUMMARY (UNAUDITED)
TOP FIVE HOLDINGS AS OF JUNE 30, 2016
| DESCRIPTION | SPDR BARCLAYS TIPS ETF | POWERSHARES DB COMMODITY INDEX TRACKING FUND | SPDR S&P GLOBAL NATURAL RESOURCES ETF | SPDR DOW JONES REIT ETF | SPDR DOW JONES INTERNATIONAL REAL ESTATE ETF | |||||||||
| MARKET VALUE | $17,857,167 | 12,724,935 | 12,590,755 | 12,074,780 | 7,764,670 | |||||||||
| % OF NET ASSETS | 22.1 | 15.7 | 15.6 | 14.9 | 9.6 | |||||||||
(The five largest holdings are subject to change, and there are no guarantees the Fund will continue to remain invested in any particular fund.)
ASSET ALLOCATION AS OF JUNE 30, 2016*
| PERCENT OF NET ASSETS | ||||||||
Commodities | 17.7 | % | ||||||
Inflation Linked | 29.1 | |||||||
Natural Resources | 26.1 | |||||||
Real Estate | 24.5 | |||||||
Short-Term Investment | 2.6 | |||||||
Liabilities in Excess of Other Assets | (0.0 | )** | ||||||
TOTAL | 100.0 | % | ||||||
| * | The Portfolio’s asset allocation is expressed as a percentage of net assets and may change over time. |
| ** | Amount shown represents less than 0.05% of net assets. |
1
Table of Contents
SSGA INCOME ALLOCATION PORTFOLIO
PORTFOLIO SUMMARY (UNAUDITED)
TOP FIVE HOLDINGS AS OF JUNE 30, 2016
| DESCRIPTION | SPDR BARCLAYS HIGH YIELD BOND ETF | SPDR S&P DIVIDEND ETF | SPDR BARCLAYS LONG TERM CORPORATE BOND ETF | SPDR DOW JONES REIT ETF | SPDR BARCLAYS LONG TERM TREASURY ETF | |||||||||
| MARKET VALUE | $12,554,762 | 11,560,064 | 10,699,180 | 9,840,687 | 9,787,608 | |||||||||
| % OF NET ASSETS | 11.9 | 11.0 | 10.1 | 9.3 | 9.3 | |||||||||
(The five largest holdings are subject to change, and there are no guarantees the Fund will continue to remain invested in any particular fund.)
ASSET ALLOCATION AS OF JUNE 30, 2016*
| PERCENT OF NET ASSETS | ||||||||
Domestic Equity | 20.7 | % | ||||||
Domestic Fixed Income | 43.1 | |||||||
Inflation Linked | 4.9 | |||||||
International Equity | 11.1 | |||||||
Real Estate | 15.1 | |||||||
Short-Term Investment | 4.5 | |||||||
Other Assets in Excess of Liabilities | 0.6 | |||||||
TOTAL | 100.0 | % | ||||||
| * | The Portfolio’s asset allocation is expressed as a percentage of net assets and may change over time. |
2
Table of Contents
SSGA GLOBAL ALLOCATION PORTFOLIO
PORTFOLIO SUMMARY (UNAUDITED)
TOP FIVE HOLDINGS AS OF JUNE 30, 2016
| DESCRIPTION | SPDR S&P WORLD EX-US ETF | SPDR S&P 500 GROWTH ETF | SPDR DOW JONES REIT ETF | SPDR BARCLAYS HIGH YIELD BOND ETF | POWERSHARES DB GOLD FUND | |||||||||
| MARKET VALUE | $23,693,696 | 16,563,367 | 15,625,524 | 14,954,409 | 14,488,240 | |||||||||
| % OF NET ASSETS | 13.2 | 9.2 | 8.7 | 8.3 | 8.1 | |||||||||
(The five largest holdings are subject to change, and there are no guarantees the Fund will continue to remain invested in any particular fund.)
ASSET ALLOCATION AS OF JUNE 30, 2016*
| PERCENT OF NET ASSETS | ||||||||
Commodities | 8.1 | % | ||||||
Domestic Equity | 19.5 | |||||||
Domestic Fixed Income | 26.3 | |||||||
Inflation Linked | 5.2 | |||||||
International Equity | 18.4 | |||||||
Real Estate | 14.7 | |||||||
Short-Term Investment | 11.2 | |||||||
Liabilities in Excess of Other Assets | (3.4 | ) | ||||||
TOTAL | 100.0 | % | ||||||
| * | The Portfolio’s asset allocation is expressed as a percentage of net assets and may change over time. |
3
Table of Contents
BLACKSTONE / GSO SENIOR LOAN PORTFOLIO
PORTFOLIO SUMMARY (UNAUDITED)
TOP FIVE HOLDINGS AS OF JUNE 30, 2016
| DESCRIPTION | AVAGO TECHNOLOGIES CAYMAN, LTD. SENIOR SECURED TERM LOAN B1 4.25% 02/01/2023 | SCIENTIFIC GAMES INTERNATIONAL, INC. SENIOR SECURED TERM LOAN B2 6.00% 10/01/2021 | ON SEMICONDUCTOR CORP. SENIOR SECURED TERM LOAN B 5.25% 03/31/2023 | PETSMART, INC. SENIOR SECURED TERM LOAN B1 4.25% 03/11/2022 | SERVICEMASTER CO. SENIOR SECURED TERM LOAN B 4.25% 07/01/2021 | |||||||||
| MARKET VALUE | $16,190,858 | 13,638,239 | 11,993,373 | 11,558,779 | 11,558,581 | |||||||||
| % OF NET ASSETS | 2.0 | 1.7 | 1.5 | 1.5 | 1.4 | |||||||||
(The five largest holdings are subject to change, and there are no guarantees the Fund will continue to remain invested in any particular fund.)
INDUSTRY BREAKDOWN AS OF JUNE 30, 2016*
PERCENT OF NET ASSETS | ||||||||
Software | 10.2 | % | ||||||
Hotels, Restaurants & Leisure | 7.7 | |||||||
Media | 5.8 | |||||||
Semiconductors & Semiconductor Equipment | 4.4 | |||||||
Commercial Services & Supplies | 4.1 | |||||||
Pharmaceuticals | 3.9 | |||||||
Health Care Providers & Services | 3.6 | |||||||
Diversified Telecommunication Services | 3.5 | |||||||
Insurance | 3.2 | |||||||
Specialty Retail | 3.1 | |||||||
Food & Staples Retailing | 2.6 | |||||||
IT Services | 2.5 | |||||||
Electronic Equipment, Instruments & Components | 2.1 | |||||||
Aerospace & Defense | 2.0 | |||||||
Internet Software & Services | 2.0 | |||||||
Diversified Consumer Services | 1.8 | |||||||
Professional Services | 1.8 | |||||||
Containers & Packaging | 1.7 | |||||||
Chemicals | 1.6 | |||||||
Technology Hardware, Storage & Peripherals | 1.6 | |||||||
Wireless Telecommunication Services | 1.6 | |||||||
Diversified Financial Services | 1.5 | |||||||
Health Care Services | 1.5 | |||||||
Automobiles | 1.4 | |||||||
Health Care Technology | 1.4 | |||||||
Food Products | 1.3 | |||||||
Airlines | 1.1 | |||||||
Household Durables | 1.1 | |||||||
Road & Rail | 1.1 | |||||||
Telecommunications | 1.1 | |||||||
Distributors | 1.0 | |||||||
Life Sciences Tools & Services | 0.9 | |||||||
Capital Markets | 0.8 | |||||||
Entertainment | 0.8 | |||||||
Packaging & Containers | 0.7 | |||||||
Personal Products | 0.7 | |||||||
Multiline Retail | 0.6 | |||||||
Real Estate Management & Development | 0.6 | |||||||
Trading Companies & Distributors | 0.6 | |||||||
Biotechnology | 0.5 | |||||||
Machinery | 0.5 | |||||||
Building Products | 0.4 | |||||||
Electric Utilities | 0.4 | |||||||
Health Care Equipment & Supplies | 0.4 | |||||||
Leisure Time | 0.4 | |||||||
Household Products | 0.3 | |||||||
Retail | 0.3 | |||||||
Communications Equipment | 0.2 | |||||||
Independent Power Producers & Energy Traders | 0.2 | |||||||
Real Estate Investment Trusts (REITs) | 0.2 | |||||||
Computers & Peripherals | 0.1 | |||||||
Health Care Products | 0.1 | |||||||
Internet | 0.1 | |||||||
Food Service | 0.0 | ** | ||||||
Mining | 0.0 | ** | ||||||
Short-Term Investment | 8.6 | |||||||
Liabilities in Excess of Other Assets | (1.7 | ) | ||||||
TOTAL | 100.0 | % | ||||||
| * | The Portfolio’s industry breakdown is expressed as a percentage of net assets and may change over time. |
| ** | Amount shown represents less than 0.05% of net assets. |
4
Table of Contents
SSGA ULTRA SHORT TERM BOND PORTFOLIO
PORTFOLIO SUMMARY (UNAUDITED)
TOP FIVE HOLDINGS AS OF JUNE 30, 2016
| DESCRIPTION | TREASURY NOTES 0.63% 05/31/2017 | BA CREDIT CARD TRUST SERIES 2016-A1, CLASS A 0.84% 10/15/2021 | TREASURY BILL 10/06/2016 | HYUNDAI AUTO RECEIVABLES TRUST SERIES 2013-B, CLASS A4 1.01% 02/15/2019 | TOYOTA MOTOR CREDIT CORP. SERIES 2547 0.95% 01/12/2018 | |||||||||
| MARKET VALUE | $1,100,988 | 1,000,000 | 999,310 | 905,456 | 749,062 | |||||||||
| % OF NET ASSETS | 4.6 | 4.2 | 4.2 | 3.8 | 3.1 | |||||||||
(The five largest holdings are subject to change, and there are no guarantees the Fund will continue to remain invested in any particular fund.)
INDUSTRY BREAKDOWN AS OF JUNE 30, 2016*
| INDUSTRY | PERCENT OF NET ASSETS | |||||||
Banks | 25.5 | % | ||||||
Credit Card | 14.7 | |||||||
Automobile | 11.6 | |||||||
U.S. Treasury Obligations | 11.3 | |||||||
Oil & Gas | 6.6 | |||||||
Auto Manufacturers | 6.4 | |||||||
Asset-Backed — Other | 3.7 | |||||||
Beverages | 3.1 | |||||||
Machinery, Construction & Mining | 2.5 | |||||||
Machinery-Diversified | 2.5 | |||||||
Software | 2.1 | |||||||
Retail | 1.7 | |||||||
Telecommunications | 1.7 | |||||||
IT Services | 1.5 | |||||||
Aerospace & Defense | 1.0 | |||||||
Health Care Products | 1.0 | |||||||
Pharmaceuticals | 1.0 | |||||||
Internet | 0.7 | |||||||
Semiconductors | 0.6 | |||||||
Transportation | 0.4 | |||||||
Short-Term Investment | 2.0 | |||||||
Liabilities in Excess of Other Assets | (1.6 | ) | ||||||
TOTAL | 100.0 | % | ||||||
| * | The Portfolio’s industry breakdown is expressed as a percentage of net assets and may change over time. |
5
Table of Contents
STATE STREET DOUBLELINE TOTAL RETURN TACTICAL PORTFOLIO
PORTFOLIO SUMMARY (UNAUDITED)
TOP FIVE HOLDINGS AS OF JUNE 30, 2016
| DESCRIPTION | TREASURY NOTES 1.38% 04/30/2020 | TREASURY NOTES 2.00% 02/15/2025 | FEDERAL NATIONAL MORTGAGE ASSOCIATION 3.00% 07/01/2046 | FEDERAL HOME LOAN MORTGAGE CORP. SERIES 4364, CLASS ZX, CMO, REMIC 4.00% 07/15/2044 | TREASURY NOTES 1.75% 03/31/2022 | |||||||||
| MARKET VALUE | $69,694,811 | 62,959,568 | 50,305,679 | 42,120,741 | 41,847,436 | |||||||||
| % OF NET ASSETS | 2.7 | 2.4 | 1.9 | 1.6 | 1.6 | |||||||||
(The five largest holdings are subject to change, and there are no guarantees the Fund will continue to remain invested in any particular fund.)
INDUSTRY BREAKDOWN AS OF JUNE 30, 2016*
| PERCENT OF NET ASSETS | ||||||||
U.S. Government Agency Obligations | 41.3 | % | ||||||
Commercial Mortgage Backed Securities | 17.3 | |||||||
U.S. Treasury Obligations | 8.8 | |||||||
Banks | 3.9 | |||||||
Asset-Backed Securities | 1.5 | |||||||
Electric | 1.4 | |||||||
Oil & Gas | 1.2 | |||||||
Media | 1.0 | |||||||
Telecommunications | 1.0 | |||||||
Diversified Financial Services | 0.8 | |||||||
Food | 0.7 | |||||||
Health Care Services | 0.5 | |||||||
Mining | 0.5 | |||||||
Pharmaceuticals | 0.5 | |||||||
Chemicals | 0.4 | |||||||
Gas | 0.4 | |||||||
Health Care Providers & Services | 0.4 | |||||||
Investment Company Security | 0.4 | |||||||
Pipelines | 0.4 | |||||||
Real Estate Investment Trusts | 0.4 | |||||||
Software | 0.4 | |||||||
Aerospace & Defense | 0.3 | |||||||
Commercial Services | 0.3 | |||||||
Commercial Services & Supplies | 0.3 | |||||||
Engineering & Construction | 0.3 | |||||||
Food Products | 0.3 | |||||||
Foreign Government Obligations | 0.3 | |||||||
Forest Products & Paper | 0.3 | |||||||
Hotels, Restaurants & Leisure | 0.3 | |||||||
IT Services | 0.3 | |||||||
Retail | 0.3 | |||||||
Containers & Packaging | 0.2 | |||||||
Insurance | 0.2 | |||||||
Internet | 0.2 | |||||||
Packaging & Containers | 0.2 | |||||||
Semiconductors & Semiconductor Equipment | 0.2 | |||||||
Advertising | 0.1 | |||||||
Agriculture | 0.1 | |||||||
Airlines | 0.1 | |||||||
Auto Manufacturers | 0.1 | |||||||
Auto Parts & Equipment | 0.1 | |||||||
Beverages | 0.1 | |||||||
Construction Materials | 0.1 | |||||||
Diversified Telecommunication Services | 0.1 | |||||||
Electric Utilities | 0.1 | |||||||
Electronics | 0.1 | |||||||
Entertainment | 0.1 | |||||||
Environmental Control | 0.1 | |||||||
Food & Staples Retailing | 0.1 | |||||||
Holding Companies-Divers | 0.1 | |||||||
Household Durables | 0.1 | |||||||
Household Products | 0.1 | |||||||
Internet Software & Services | 0.1 | |||||||
Leisure Time | 0.1 | |||||||
Machinery, Construction & Mining | 0.1 | |||||||
Multiline Retail | 0.1 | |||||||
Personal Products | 0.1 | |||||||
Road & Rail | 0.1 | |||||||
Specialty Retail | 0.1 | |||||||
Technology Hardware, Storage & Peripherals | 0.1 | |||||||
Trading Companies & Distributors | 0.1 | |||||||
Transportation | 0.1 | |||||||
Short-Term Investment | 13.4 | |||||||
Liabilities in Excess of Other Assets | (3.2 | ) | ||||||
TOTAL | 100.0 | % | ||||||
| * | The Portfolio’s industry breakdown is expressed as a percentage of net assets and may change over time. |
6
Table of Contents
[LOGO]
SSGA MFS SYSTEMATIC CORE EQUITY PORTFOLIO
PORTFOLIO SUMMARY (UNAUDITED)
TOP FIVE HOLDINGS AS OF JUNE 30, 2016
| DESCRIPTION | AMAZON.COM, INC. | JPMORGAN CHASE & CO. | VERIZON COMMUNICATIONS, INC. | JOHNSON & JOHNSON | EXELON CORP. | |||||||||
| MARKET VALUE | $287,679 | 238,680 | 215,933 | 213,003 | 193,071 | |||||||||
| % OF NET ASSETS | 4.9 | 4.1 | 3.7 | 3.6 | 3.3 | |||||||||
(The five largest holdings are subject to change, and there are no guarantees the Fund will continue to remain invested in any particular fund.)
INDUSTRY BREAKDOWN AS OF JUNE 30, 2016*
| INDUSTRY | PERCENT OF NET ASSETS | |||||||
Pharmaceuticals | 8.4 | % | ||||||
Internet & Catalog Retail | 7.4 | |||||||
Technology Hardware, Storage & Peripherals | 6.4 | |||||||
Banks | 6.2 | |||||||
Insurance | 5.9 | |||||||
Software | 5.6 | |||||||
Food Products | 5.4 | |||||||
Oil, Gas & Consumable Fuels | 5.3 | |||||||
Biotechnology | 4.7 | |||||||
Specialty Retail | 4.5 | |||||||
Hotels, Restaurants & Leisure | 4.2 | |||||||
Tobacco | 4.2 | |||||||
Health Care Providers & Services | 4.1 | |||||||
Aerospace & Defense | 4.0 | |||||||
Diversified Telecommunication Services | 3.7 | |||||||
Electric Utilities | 3.3 | |||||||
Real Estate Investment Trusts (REITs) | 2.8 | |||||||
Chemicals | 2.7 | |||||||
Media | 2.2 | |||||||
Independent Power Producers & Energy Traders | 2.0 | |||||||
Textiles, Apparel & Luxury Goods | 1.8 | |||||||
Consumer Finance | 1.1 | |||||||
Food & Staples Retailing | 1.1 | |||||||
Household Products | 1.0 | |||||||
Multiline Retail | 0.7 | |||||||
Short-Term Investment | 1.2 | |||||||
Other Assets in Excess of Liabilities | 0.1 | |||||||
TOTAL | 100.0 | % | ||||||
| * | The Portfolio’s industry breakdown is expressed as a percentage of net assets and may change over time. |
7
Table of Contents
SSGA MFS SYSTEMATIC GROWTH EQUITY PORTFOLIO
PORTFOLIO SUMMARY (UNAUDITED)
TOP FIVE HOLDINGS AS OF JUNE 30, 2016
| DESCRIPTION | AMAZON.COM, INC. | COMCAST CORP. CLASS A | GILEAD SCIENCES, INC. | ELECTRONIC ARTS, INC. | PRICELINE GROUP, INC. | |||||||||
| MARKET VALUE | $775,732 | 492,315 | 459,978 | 457,818 | 448,179 | |||||||||
| % OF NET ASSETS | 6.4 | 4.1 | 3.8 | 3.8 | 3.7 | |||||||||
(The five largest holdings are subject to change, and there are no guarantees the Portfolio will continue to remain invested in any particular fund.)
INDUSTRY BREAKDOWN AS OF JUNE 30, 2016*
| INDUSTRY | PERCENT OF NET ASSETS | |||||||
Internet & Catalog Retail | 10.1 | % | ||||||
Software | 9.3 | |||||||
IT Services | 6.9 | |||||||
Health Care Providers & Services | 6.8 | |||||||
Biotechnology | 5.9 | |||||||
Pharmaceuticals | 5.5 | |||||||
Media | 5.3 | |||||||
Tobacco | 4.5 | |||||||
Food & Staples Retailing | 4.3 | |||||||
Internet Software & Services | 4.1 | |||||||
Specialty Retail | 3.8 | |||||||
Textiles, Apparel & Luxury Goods | 3.6 | |||||||
Food Products | 3.3 | |||||||
Aerospace & Defense | 3.2 | |||||||
Chemicals | 2.8 | |||||||
Hotels, Restaurants & Leisure | 2.7 | |||||||
Real Estate Investment Trusts (REITs) | 2.7 | |||||||
Diversified Telecommunication Services | 2.6 | |||||||
Beverages | 2.2 | |||||||
Technology Hardware, Storage & Peripherals | 2.2 | |||||||
Auto Components | 1.9 | |||||||
Insurance | 1.9 | |||||||
Trading Companies & Distributors | 1.5 | |||||||
Banks | 0.9 | |||||||
Road & Rail | 0.6 | |||||||
Short-Term Investment | 1.4 | |||||||
Other Assets in Excess of Liabilities | 0.0 | ** | ||||||
TOTAL | 100.0 | % | ||||||
| * | The Portfolio’s industry breakdown is expressed as a percentage of net assets and may change over time. |
| ** | Amount shown represents less than 0.05% of net assets. |
8
Table of Contents
SSGA MFS SYSTEMATIC VALUE EQUITY PORTFOLIO
PORTFOLIO SUMMARY (UNAUDITED)
TOP FIVE HOLDINGS AS OF JUNE 30, 2016
| DESCRIPTION | JPMORGAN CHASE & CO. | WELLS FARGO & CO. | EXELON CORP. | NORTHROP GRUMMAN CORP. | MICHAEL KORS HOLDINGS, LTD. | |||||||||
| MARKET VALUE | $132,296 | 105,972 | 101,590 | 100,248 | 90,054 | |||||||||
| % OF NET ASSETS | 5.1 | 4.1 | 3.9 | 3.8 | 3.4 | |||||||||
(The five largest holdings are subject to change, and there are no guarantees the Portfolio will continue to remain invested in any particular fund.)
INDUSTRY BREAKDOWN AS OF JUNE 30, 2016*
| INDUSTRY | PERCENT OF NET ASSETS | |||||||
Banks | 11.8 | % | ||||||
Oil, Gas & Consumable Fuels | 11.0 | |||||||
Insurance | 7.3 | |||||||
Electric Utilities | 7.2 | |||||||
Pharmaceuticals | 6.2 | |||||||
Food Products | 4.9 | |||||||
Software | 4.4 | |||||||
Health Care Providers & Services | 3.9 | |||||||
Real Estate Investment Trusts (REITs) | 3.9 | |||||||
Aerospace & Defense | 3.8 | |||||||
Hotels, Restaurants & Leisure | 3.4 | |||||||
Textiles, Apparel & Luxury Goods | 3.4 | |||||||
Tobacco | 2.7 | |||||||
Chemicals | 2.6 | |||||||
Independent Power Producers & Energy Traders | 2.4 | |||||||
Semiconductors & Semiconductor Equipment | 2.4 | |||||||
Specialty Retail | 2.0 | |||||||
Technology Hardware, Storage & Peripherals | 2.0 | |||||||
Automobiles | 1.8 | |||||||
Communications Equipment | 1.8 | |||||||
Consumer Finance | 1.7 | |||||||
Industrial Conglomerates | 1.6 | |||||||
Biotechnology | 1.4 | |||||||
Internet & Catalog Retail | 1.4 | |||||||
Diversified Telecommunication Services | 1.2 | |||||||
Auto Components | 1.0 | |||||||
Energy Equipment & Services | 0.9 | |||||||
Health Care Equipment & Supplies | 0.6 | |||||||
Short-Term Investment | 1.2 | |||||||
Other Assets in Excess of Liabilities | 0.1 | |||||||
TOTAL | 100.0 | % | ||||||
| * | The Portfolio’s industry breakdown is expressed as a percentage of net assets and may change over time. |
9
Table of Contents
PORTFOLIO SUMMARY (UNAUDITED)
TOP FIVE HOLDINGS AS OF JUNE 30, 2016
| DESCRIPTION | FLAGSTAR BANCORP, INC. | MCDONALD’S CORP. | PROCTER & GAMBLE CO. | VERIZON COMMUNICATIONS, INC. | AT&T, INC. | |||||||||
| MARKET VALUE | $98,690 | 97,114 | 95,846 | 86,496 | 83,179 | |||||||||
| % OF NET ASSETS | 5.0 | 5.0 | 4.9 | 4.4 | 4.2 | |||||||||
(The five largest holdings are subject to change, and there are no guarantees the Portfolio will continue to remain invested in any particular fund.)
INDUSTRY BREAKDOWN AS OF JUNE 30, 2016*
| INDUSTRY | PERCENT OF NET ASSETS | |||||||
Pharmaceuticals | 9.1 | % | ||||||
Diversified Telecommunication Services | 8.7 | |||||||
Hotels, Restaurants & Leisure | 7.9 | |||||||
Thrifts & Mortgage Finance | 6.1 | |||||||
Household Products | 4.9 | |||||||
Beverages | 4.6 | |||||||
Diversified Financial Services | 4.3 | |||||||
Software | 3.9 | |||||||
Food Products | 3.7 | |||||||
Oil, Gas & Consumable Fuels | 3.7 | |||||||
Biotechnology | 3.6 | |||||||
Communications Equipment | 3.1 | |||||||
Machinery | 3.0 | |||||||
Chemicals | 2.5 | |||||||
Household Durables | 2.5 | |||||||
Internet & Catalog Retail | 2.2 | |||||||
Energy Equipment & Services | 2.1 | |||||||
Health Care Equipment & Supplies | 2.1 | |||||||
Electronic Equipment, Instruments & Components | 2.0 | |||||||
IT Services | 1.8 | |||||||
Metals & Mining | 1.8 | |||||||
Building Products | 1.5 | |||||||
Insurance | 1.4 | |||||||
Capital Markets | 1.3 | |||||||
Multiline Retail | 1.2 | |||||||
Multi-Utilities | 1.0 | |||||||
Professional Services | 1.0 | |||||||
Air Freight & Logistics | 0.9 | |||||||
Commercial Services & Supplies | 0.9 | |||||||
Electric Utilities | 0.9 | |||||||
Trading Companies & Distributors | 0.9 | |||||||
Banks | 0.7 | |||||||
Real Estate Investment Trusts (REITs) | 0.7 | |||||||
Real Estate Management & Development | 0.7 | |||||||
Media | 0.5 | |||||||
Textiles, Apparel & Luxury Goods | 0.5 | |||||||
Semiconductors & Semiconductor Equipment | 0.4 | |||||||
Auto Components | 0.3 | |||||||
Construction & Engineering | 0.2 | |||||||
Electrical Equipment | 0.2 | |||||||
Road & Rail | 0.2 | |||||||
Paper & Forest Products | 0.1 | |||||||
Technology Hardware, Storage & Peripherals | 0.1 | |||||||
Marine | 0.0 | ** | ||||||
Short-Term Investment | 0.7 | |||||||
Other Assets in Excess of Liabilities | 0.1 | |||||||
TOTAL | 100.0 | % | ||||||
| * | The Portfolio’s industry breakdown is expressed as a percentage of net assets and may change over time. |
| ** | Amount shown represents less than 0.05% of net assets. |
10
Table of Contents
SSGA MULTI-ASSET REAL RETURN PORTFOLIO
SPDR SSGA Multi-Asset Real Return ETF is a feeder fund that invests substantially all of its investable assets in a master fund, the SSGA Multi-Asset Real Return Portfolio. The schedule of investments for the SSGA Multi-Asset Real Return Portfolio follows.
11
Table of Contents
SSGA Multi-Asset Real Return Portfolio
SCHEDULE OF INVESTMENTS
June 30, 2016
Security Description | Shares | Value | ||||||
MUTUAL FUNDS AND EXCHANGE TRADED PRODUCTS — 97.4% |
| |||||||
COMMODITIES — 17.7% | ||||||||
PowerShares DB Commodity Index Tracking Fund (a) (b) | 828,986 | $ | 12,724,935 | |||||
PowerShares DB Gold Fund (a) (b) | 36,964 | 1,595,736 | ||||||
PowerShares DB Oil Fund (a) (b) | 485 | 4,442 | ||||||
|
| |||||||
| 14,325,113 | ||||||||
|
| |||||||
INFLATION LINKED — 29.1% |
| |||||||
SPDR Barclays TIPS ETF (c) | 307,088 | 17,857,167 | ||||||
SPDR Citi International Government Inflation-Protected Bond ETF (c) | 103,106 | 5,661,550 | ||||||
|
| |||||||
| 23,518,717 | ||||||||
|
| |||||||
NATURAL RESOURCES — 26.1% |
| |||||||
PowerShares Global Agriculture Portfolio (b) | 98,726 | 2,268,724 | ||||||
SPDR S&P Global Natural Resources ETF (c) | 339,282 | 12,590,755 | ||||||
SPDR S&P International Energy Sector ETF (c) | 96,628 | 1,697,744 | ||||||
SPDR S&P Metals & Mining ETF (c) | 19,438 | 473,704 | ||||||
The Energy Select Sector SPDR Fund (c) | 59,348 | 4,049,909 | ||||||
|
| |||||||
| 21,080,836 | ||||||||
|
| |||||||
REAL ESTATE — 24.5% |
| |||||||
SPDR Dow Jones International Real Estate ETF (c) | 187,281 | 7,764,670 | ||||||
SPDR Dow Jones REIT ETF (c) | 121,440 | 12,074,780 | ||||||
|
| |||||||
| 19,839,450 | ||||||||
|
| |||||||
TOTAL MUTUAL FUNDS AND EXCHANGE TRADED PRODUCTS | 78,764,116 | |||||||
|
| |||||||
SHORT-TERM INVESTMENT — 2.6% |
| |||||||
State Street Institutional Liquid Reserves Fund, Premier Class 0.47% (d) (e) | 2,073,242 | 2,073,242 | ||||||
|
| |||||||
TOTAL INVESTMENTS — 100.0% | 80,837,358 | |||||||
LIABILITIES IN EXCESS OF OTHER ASSETS — (0.0)% (f) | (12,334 | ) | ||||||
|
| |||||||
NET ASSETS — 100.0% | $ | 80,825,024 | ||||||
|
| |||||||
| (a) | Non-income producing security. |
| (b) | Qualified Publicly Traded Partnerships |
| (c) | Affiliated fund managed by SSGA Funds Management, Inc. Amounts related to these transactions during the year ended June 30, 2016 are shown in the Affiliate Table below. |
| (d) | The Fund invested in certain money market funds managed by SSGA Funds Management, Inc. Amounts related to these transactions during the year ended June 30, 2016 are shown in the Affiliate Table below. |
| (e) | The rate shown is the annualized seven-day yield at June 30, 2016. |
| (f) | Amount shown represents less than 0.05% of net assets. |
REIT Real Estate Investment Trust
The following table summarizes the value of the Fund’s investments accordingly to the fair value hierarchy as of June 30, 2016.
Description | Level 1 — Quoted Prices | Level 2 — Other Significant Observable Inputs | Level 3 — Significant Unobservable Inputs | Total | ||||||||||||
ASSETS: | ||||||||||||||||
INVESTMENTS: | ||||||||||||||||
Mutual Funds and Exchange Traded Products | ||||||||||||||||
Commodities | $ | 14,325,113 | $ | — | $ | — | $ | 14,325,113 | ||||||||
Inflation Linked | 23,518,717 | — | — | 23,518,717 | ||||||||||||
Natural Resources | 21,080,836 | — | — | 21,080,836 | ||||||||||||
Real Estate | 19,839,450 | — | — | 19,839,450 | ||||||||||||
Short-Term Investment | 2,073,242 | — | — | 2,073,242 | ||||||||||||
|
|
|
|
|
|
|
| |||||||||
TOTAL INVESTMENTS | $ | 80,837,358 | $ | — | $ | — | $ | 80,837,358 | ||||||||
|
|
|
|
|
|
|
| |||||||||
See accompanying notes to financial statements.
12
Table of Contents
SSGA Multi-Asset Real Return Portfolio
SCHEDULE OF INVESTMENTS (continued)
June 30, 2016
Affiliate Table
| Number of Shares Held at 6/30/15 | Value At 6/30/15 | Shares | Number of Shares Held at 6/30/16 | Value at 6/30/16 | Dividend Income | Realized Gain (Loss) | ||||||||||||||||||||||||||
| Purchased | Sold | |||||||||||||||||||||||||||||||
SPDR Barclays TIPS ETF | 400,523 | $ | 22,321,147 | 220,506 | 313,941 | 307,088 | $ | 17,857,167 | $ | 75,180 | $ | (247,531 | ) | |||||||||||||||||||
SPDR Citi International Government Inflation-Protected Bond ETF | 119,100 | 6,539,781 | 79,263 | 95,257 | 103,106 | 5,661,551 | 4,397 | (217,916 | ) | |||||||||||||||||||||||
SPDR Dow Jones International Real Estate ETF | 286,691 | 12,000,886 | 97,652 | 197,062 | 187,281 | 7,764,670 | 208,087 | (136,365 | ) | |||||||||||||||||||||||
SPDR Dow Jones REIT ETF | 158,157 | 13,345,286 | 81,777 | 118,494 | 121,440 | 12,074,780 | 373,168 | 1,003,846 | ||||||||||||||||||||||||
SPDR S&P Global Natural Resources ETF | 938,966 | 39,483,520 | 234,553 | 834,237 | 339,282 | 12,590,755 | 511,827 | (10,975,293 | ) | |||||||||||||||||||||||
SPDR S&P International Energy Sector ETF | 144,816 | 2,802,190 | 40,615 | 88,803 | 96,628 | 1,697,744 | 77,216 | (327,928 | ) | |||||||||||||||||||||||
SPDR S&P Metals & Mining ETF | 25,451 | 619,223 | 17,790 | 23,803 | 19,438 | 473,704 | 9,578 | (123,044 | ) | |||||||||||||||||||||||
State Street Institutional Liquid Reserves Fund, Premier Class | 6,724,192 | 6,724,192 | 19,736,386 | 24,387,336 | 2,073,243 | 2,073,243 | 14,192 | — | ||||||||||||||||||||||||
The Energy Select Sector SPDR Fund | 88,920 | 6,683,227 | 36,377 | 65,949 | 59,348 | 4,049,909 | 120,286 | (770,914 | ) | |||||||||||||||||||||||
See accompanying notes to financial statements.
13
Table of Contents
SSGA INCOME ALLOCATION PORTFOLIO
SPDR SSGA Income Allocation ETF is a feeder fund that invests substantially all of its investable assets in a master fund, the SSGA Income Allocation Portfolio. The schedule of investments for the SSGA Income Allocation Portfolio follows.
14
Table of Contents
SSGA Income Allocation Portfolio
SCHEDULE OF INVESTMENTS
June 30, 2016
Security Description | Shares | Value | ||||||
MUTUAL FUNDS AND EXCHANGE TRADED PRODUCTS — 94.9% |
| |||||||
DOMESTIC EQUITY — 20.7% | ||||||||
SPDR S&P Dividend ETF (a) | 137,751 | $ | 11,560,064 | |||||
SPDR Wells Fargo Preferred Stock ETF (a) | 108,700 | 5,002,374 | ||||||
The Consumer Discretionary Select Sector SPDR Fund (a) | 13,128 | 1,024,640 | ||||||
The Consumer Staples Select Sector SPDR Fund (a) | 38,571 | 2,127,191 | ||||||
The Industrial Select Sector SPDR Fund (a) | 37,083 | 2,075,165 | ||||||
|
| |||||||
| 21,789,434 | ||||||||
|
| |||||||
DOMESTIC FIXED INCOME — 43.1% |
| |||||||
SPDR Barclays Convertible Securities ETF (a) | 118,404 | 5,190,831 | ||||||
SPDR Barclays High Yield Bond ETF (a) | 351,674 | 12,554,762 | ||||||
SPDR Barclays Intermediate Term Corporate Bond ETF (a) | 208,399 | 7,271,041 | ||||||
SPDR Barclays Long Term Corporate Bond ETF (a) | 253,475 | 10,699,180 | ||||||
SPDR Barclays Long Term Treasury ETF (a) | 122,621 | 9,787,608 | ||||||
|
| |||||||
| 45,503,422 | ||||||||
|
| |||||||
INFLATION LINKED — 4.9% |
| |||||||
SPDR Barclays TIPS ETF (a) | 88,421 | 5,141,681 | ||||||
|
| |||||||
INTERNATIONAL EQUITY — 11.1% |
| |||||||
SPDR MSCI Emerging Markets Quality Mix ETF (a) | 21,370 | 1,065,722 | ||||||
SPDR S&P Global Infrastructure ETF (a) | 66,584 | 3,108,141 | ||||||
SPDR S&P International Dividend ETF (a) | 61,571 | 2,167,299 | ||||||
SPDR STOXX Europe 50 ETF (a) | 112,268 | 3,352,323 | ||||||
WisdomTree Europe Hedged Equity Fund | 39,699 | 2,005,990 | ||||||
|
| |||||||
| 11,699,475 | ||||||||
|
| |||||||
REAL ESTATE — 15.1% | ||||||||
SPDR Dow Jones International Real Estate ETF (a) | 147,841 | 6,129,488 | ||||||
SPDR Dow Jones REIT ETF (a) | 98,971 | 9,840,687 | ||||||
|
| |||||||
| 15,970,175 | ||||||||
|
| |||||||
TOTAL MUTUAL FUNDS AND EXCHANGE TRADED PRODUCTS | 100,104,187 | |||||||
|
| |||||||
SHORT-TERM INVESTMENT — 4.5% |
| |||||||
State Street Institutional Liquid Reserves Fund, Premier Class 0.47% (b) (c) | 4,781,480 | 4,781,480 | ||||||
|
| |||||||
TOTAL INVESTMENTS — 99.4% | 104,885,667 | |||||||
OTHER ASSETS IN EXCESS OF LIABILITIES — 0.6% | 611,203 | |||||||
|
| |||||||
NET ASSETS — 100.0% | $ | 105,496,870 | ||||||
|
| |||||||
| (a) | Affiliated fund managed by SSGA Funds Management, Inc. Amounts related to these transactions during the year ended June 30, 2016 are shown in the Affiliate Table below. |
| (b) | The Fund invested in certain money market funds managed by SSGA Funds Management, Inc. Amounts related to these transactions during the year ended June 30, 2016 are shown in the Affiliate Table below. |
| (c) | The rate shown is the annualized seven-day yield at June 30, 2016. |
REIT Real Estate Investment Trust
The following table summarizes the value of the Fund’s investments accordingly to the fair value hierarchy as of June 30, 2016.
Description | Level 1 — Quoted Prices | Level 2 — Other Significant Observable Inputs | Level 3 — Significant Unobservable Inputs | Total | ||||||||||||
ASSETS: | ||||||||||||||||
INVESTMENTS: | ||||||||||||||||
Mutual Funds and Exchange Traded Products | ||||||||||||||||
Domestic Equity | $ | 21,789,434 | $ | — | $ | — | $ | 21,789,434 | ||||||||
Domestic Fixed Income | 45,503,422 | — | — | 45,503,422 | ||||||||||||
Inflation Linked | 5,141,681 | — | — | 5,141,681 | ||||||||||||
International Equity | 11,699,475 | — | — | 11,699,475 | ||||||||||||
Real Estate | 15,970,175 | — | — | 15,970,175 | ||||||||||||
Short-Term Investment | 4,781,480 | — | — | 4,781,480 | ||||||||||||
|
|
|
|
|
|
|
| |||||||||
TOTAL INVESTMENTS | $ | 104,885,667 | $ | — | $ | — | $ | 104,885,667 | ||||||||
|
|
|
|
|
|
|
| |||||||||
See accompanying notes to financial statements.
15
Table of Contents
SSGA Income Allocation Portfolio
SCHEDULE OF INVESTMENTS (continued)
June 30, 2016
Affiliate Table
| Number of Shares Held at 6/30/15 | Value At 6/30/15 | Shares | Number of Shares Held at 6/30/16 | Value at 6/30/16 | Dividend Income | Realized Gain (Loss) | ||||||||||||||||||||||||||
| Purchased | Sold | |||||||||||||||||||||||||||||||
SPDR Barclays Convertible Securities ETF | 126,174 | $ | 6,002,097 | 19,497 | 27,267 | 118,404 | $ | 5,190,831 | $ | 270,497 | $ | 98,229 | ||||||||||||||||||||
SPDR Barclays High Yield Bond ETF | 521,165 | 20,028,371 | 58,329 | 227,820 | 351,674 | 12,554,762 | 976,437 | (907,692 | ) | |||||||||||||||||||||||
SPDR Barclays Intermediate Term Corporate Bond ETF | 72,189 | 2,449,373 | 160,299 | 24,089 | 208,399 | 7,271,041 | 125,976 | (3,080 | ) | |||||||||||||||||||||||
SPDR Barclays Long Term Corporate Bond ETF | 444,142 | 17,006,197 | 26,681 | 217,348 | 253,475 | 10,699,180 | 562,153 | (629,981 | ) | |||||||||||||||||||||||
SPDR Barclays Long Term Treasury ETF | 125,248 | 8,556,943 | 74,510 | 77,137 | 122,621 | 9,787,608 | 237,532 | (92,000 | ) | |||||||||||||||||||||||
SPDR Barclays TIPS ETF | 33,157 | 1,847,840 | 72,742 | 17,478 | 88,421 | 5,141,681 | 20,005 | (10,963 | ) | |||||||||||||||||||||||
SPDR Dow Jones International Real Estate ETF | 116,337 | 4,869,867 | 96,658 | 65,154 | 147,841 | 6,129,488 | 132,820 | (26,474 | ) | |||||||||||||||||||||||
SPDR Dow Jones REIT ETF | 98,588 | 8,318,855 | 68,054 | 67,671 | 98,971 | 9,840,687 | 297,878 | 377,937 | ||||||||||||||||||||||||
SPDR MSCI Emerging Markets Quality Mix ETF | — | — | 21,370 | — | 21,370 | 1,065,722 | 9,588 | — | ||||||||||||||||||||||||
SPDR S&P Dividend ETF | 63,111 | 4,809,689 | 117,120 | 42,480 | 137,751 | 11,560,064 | 193,406 | 304,919 | ||||||||||||||||||||||||
SPDR S&P Global Infrastructure ETF | 76,611 | 3,573,137 | 53,319 | 63,346 | 66,584 | 3,108,141 | 61,837 | (132,961 | ) | |||||||||||||||||||||||
SPDR S&P International Dividend ETF | 85,886 | 3,561,693 | 17,389 | 41,704 | 61,571 | 2,167,299 | 103,771 | (404,201 | ) | |||||||||||||||||||||||
SPDR STOXX Europe 50 ETF | 136,012 | 4,729,137 | 25,488 | 49,232 | 112,268 | 3,352,323 | 149,671 | (169,142 | ) | |||||||||||||||||||||||
SPDR Wells Fargo Preferred Stock ETF | 138,428 | 6,006,391 | 6,671 | 36,399 | 108,700 | 5,002,374 | 285,069 | (10,379 | ) | |||||||||||||||||||||||
State Street Institutional Liquid Reserves Fund, Premier Class | 2,787,882 | 2,787,882 | 9,790,344 | 7,796,746 | 4,781,480 | 4,781,480 | 14,282 | — | ||||||||||||||||||||||||
The Consumer Discretionary Select Sector SPDR Fund | 32,130 | 2,457,303 | 3,658 | 22,660 | 13,128 | 1,024,640 | 29,192 | 66,472 | ||||||||||||||||||||||||
The Consumer Staples Select Sector SPDR Fund | — | — | 39,146 | 575 | 38,571 | 2,127,191 | 22,770 | 1,002 | ||||||||||||||||||||||||
The Industrial Select Sector SPDR Fund | — | — | 79,633 | 42,550 | 37,083 | 2,075,165 | 11,391 | 35,119 | ||||||||||||||||||||||||
See accompanying notes to financial statements.
16
Table of Contents
SSGA GLOBAL ALLOCATION PORTFOLIO
SPDR SSGA Global Allocation ETF is a feeder fund that invests substantially all of its investable assets in a master fund, the SSGA Global Allocation Portfolio. The schedule of investments for the SSGA Global Allocation Portfolio follows.
17
Table of Contents
SSGA Global Allocation Portfolio
SCHEDULE OF INVESTMENTS
June 30, 2016
Security Description | Shares | Value | ||||||
MUTUAL FUNDS AND EXCHANGE TRADED PRODUCTS — 92.2% |
| |||||||
COMMODITIES — 8.1% | ||||||||
PowerShares DB Gold Fund (a) | 335,609 | $ | 14,488,240 | |||||
|
| |||||||
DOMESTIC EQUITY — 19.5% | ||||||||
SPDR S&P 500 ETF Trust (b) | 35,139 | 7,362,675 | ||||||
SPDR S&P 500 Growth ETF (b) | 164,140 | 16,563,367 | ||||||
The Consumer Discretionary Select Sector SPDR Fund (b) | 46,932 | 3,663,043 | ||||||
The Consumer Staples Select Sector SPDR Fund (b) | 69,248 | 3,819,027 | ||||||
The Industrial Select Sector SPDR Fund (b) | 65,280 | 3,653,069 | ||||||
|
| |||||||
| 35,061,181 | ||||||||
|
| |||||||
DOMESTIC FIXED INCOME — 26.3% |
| |||||||
SPDR Barclays Aggregate Bond ETF (b) | 222,017 | 13,190,030 | ||||||
SPDR Barclays High Yield Bond ETF (b) | 418,891 | 14,954,409 | ||||||
SPDR Barclays Intermediate Term Corporate Bond ETF (b) | 216,183 | 7,542,625 | ||||||
SPDR Barclays Intermediate Term Treasury ETF (b) | 30,530 | 1,882,174 | ||||||
SPDR Barclays Long Term Treasury ETF (b) | 121,549 | 9,702,041 | ||||||
|
| |||||||
| 47,271,279 | ||||||||
|
| |||||||
INFLATION LINKED — 5.2% | ||||||||
SPDR Barclays TIPS ETF (b) | 161,908 | 9,414,950 | ||||||
|
| |||||||
INTERNATIONAL EQUITY — 18.4% |
| |||||||
SPDR S&P International Small Cap ETF (b) | 181,960 | 5,288,486 | ||||||
SPDR S&P World ex-US ETF (b) | 950,409 | 23,693,696 | ||||||
WisdomTree Europe Hedged Equity Fund | 81,758 | 4,131,232 | ||||||
|
| |||||||
| 33,113,414 | ||||||||
|
| |||||||
REAL ESTATE — 14.7% | ||||||||
SPDR Dow Jones International Real Estate ETF (b) | 259,646 | 10,764,923 | ||||||
SPDR Dow Jones REIT ETF (b) | 157,151 | 15,625,524 | ||||||
|
| |||||||
| 26,390,447 | ||||||||
|
| |||||||
TOTAL MUTUAL FUNDS AND EXCHANGE TRADED PRODUCTS | 165,739,511 | |||||||
|
| |||||||
SHORT-TERM INVESTMENT — 11.2% |
| |||||||
State Street Institutional Liquid Reserves Fund, Premier Class 0.47% (c) (d) | 20,031,452 | 20,031,452 | ||||||
|
| |||||||
TOTAL INVESTMENTS — 103.4% | 185,770,963 | |||||||
LIABILITIES IN EXCESS OF OTHER ASSETS — (3.4)% | (6,057,750 | ) | ||||||
|
| |||||||
NET ASSETS — 100.0% | $ | 179,713,213 | ||||||
|
| |||||||
| (a) | Qualified Publicly Traded Partnerships |
| (b) | Affiliated fund managed by SSGA Funds Management, Inc. Amounts related to these transactions during the year ended June 30, 2016 are shown in the Affiliate Table below. |
| (c) | The Fund invested in certain money market funds managed by SSGA Funds Management, Inc. Amounts related to these transactions during the year ended June 30, 2016 are shown in the Affiliate Table below. |
| (d) | The rate shown is the annualized seven-day yield at June 30, 2016. |
REIT Real Estate Investment Trust
The following table summarizes the value of the Fund’s investments accordingly to the fair value hierarchy as of June 30, 2016.
Description | Level 1 — Quoted Prices | Level 2 — Other Significant Observable Inputs | Level 3 — Significant Unobservable Inputs | Total | ||||||||||||
ASSETS: | ||||||||||||||||
INVESTMENTS: | ||||||||||||||||
Mutual Funds and Exchange Traded Products | ||||||||||||||||
Commodities | $ | 14,488,240 | $ | — | $ | — | $ | 14,488,240 | ||||||||
Domestic Equity | 35,061,181 | — | — | 35,061,181 | ||||||||||||
Domestic Fixed Income | 47,271,279 | — | — | 47,271,279 | ||||||||||||
Inflation Linked | 9,414,950 | — | — | 9,414,950 | ||||||||||||
International Equity | 33,113,414 | — | — | 33,113,414 | ||||||||||||
Real Estate | 26,390,447 | — | — | 26,390,447 | ||||||||||||
Short-Term Investment | 20,031,452 | — | — | 20,031,452 | ||||||||||||
|
|
|
|
|
|
|
| |||||||||
TOTAL INVESTMENTS | $ | 185,770,963 | $ | — | $ | — | $ | 185,770,963 | ||||||||
|
|
|
|
|
|
|
| |||||||||
See accompanying notes to financial statements.
18
Table of Contents
SSGA Global Allocation Portfolio
SCHEDULE OF INVESTMENTS (continued)
June 30, 2016
Affiliate Table
| Number of Shares Held at 6/30/15 | Value At 6/30/15 | Shares | Number of Shares Held at 6/30/16 | Value at 6/30/16 | Dividend Income | Realized Gain (Loss) | ||||||||||||||||||||||||||
| Purchased | Sold | |||||||||||||||||||||||||||||||
SPDR Barclays Aggregate Bond ETF | 50,686 | $ | 2,909,377 | 233,576 | 62,245 | 222,017 | $ | 13,190,030 | $ | 193,454 | $ | 18,118 | ||||||||||||||||||||
SPDR Barclays High Yield Bond ETF | 599,493 | 23,038,516 | 399,442 | 580,044 | 418,891 | 14,954,409 | 1,116,742 | (1,777,427 | ) | |||||||||||||||||||||||
SPDR Barclays Intermediate Term Corporate Bond ETF | 41,866 | 1,420,513 | 203,393 | 29,076 | 216,183 | 7,542,625 | 81,973 | 3,216 | ||||||||||||||||||||||||
SPDR Barclays Intermediate Term Treasury ETF | — | — | 42,068 | 11,538 | 30,530 | 1,882,174 | 16,406 | 6,455 | ||||||||||||||||||||||||
SPDR Barclays Long Term Corporate Bond ETF | 302,860 | 11,596,509 | 108,114 | 410,974 | — | — | 264,036 | (852,322 | ) | |||||||||||||||||||||||
SPDR Barclays Long Term Treasury ETF | 65,248 | 4,457,743 | 260,261 | 203,960 | 121,549 | 9,702,041 | 250,791 | 87,766 | ||||||||||||||||||||||||
SPDR Barclays TIPS ETF | 52,369 | 2,918,525 | 168,253 | 58,714 | 161,908 | 9,414,950 | 35,773 | 9,682 | ||||||||||||||||||||||||
SPDR Dow Jones International Real Estate ETF | 68,930 | 2,885,410 | 345,656 | 154,940 | 259,646 | 10,764,923 | 169,909 | (3,632 | ) | |||||||||||||||||||||||
SPDR Dow Jones REIT ETF | 117,788 | 9,938,950 | 190,823 | 151,460 | 157,151 | 15,625,524 | 415,852 | 434,763 | ||||||||||||||||||||||||
SPDR S&P 500 ETF Trust | 63,090 | 12,987,076 | 60,540 | 88,491 | 35,139 | 7,362,675 | 196,547 | (19,630 | ) | |||||||||||||||||||||||
SPDR S&P 500 Growth ETF | — | — | 179,160 | 15,020 | 164,140 | 16,563,367 | 87,735 | 96,183 | ||||||||||||||||||||||||
SPDR S&P Emerging Markets ETF | 22,137 | 1,426,508 | 6,143 | 28,280 | — | — | — | (350,845 | ) | |||||||||||||||||||||||
SPDR S&P International Small Cap ETF | 143,131 | 4,368,358 | 121,507 | 82,678 | 181,960 | 5,288,486 | 161,729 | (150,530 | ) | |||||||||||||||||||||||
SPDR S&P World ex-US ETF | 785,051 | 22,075,634 | 683,195 | 517,837 | 950,409 | 23,693,696 | 758,154 | (959,181 | ) | |||||||||||||||||||||||
State Street Institutional Liquid Reserves Fund, Premier Class | 15,054,957 | 15,054,957 | 32,741,824 | 27,765,329 | 20,031,452 | 20,031,452 | 75,844 | — | ||||||||||||||||||||||||
The Consumer Discretionary Select Sector SPDR Fund | 38,328 | 2,931,325 | 31,704 | 23,100 | 46,932 | 3,663,043 | 56,381 | (8,198 | ) | |||||||||||||||||||||||
The Consumer Staples Select Sector SPDR Fund | — | — | 77,280 | 8,032 | 69,248 | 3,819,027 | 39,059 | 16,404 | ||||||||||||||||||||||||
The Financial Select Sector SPDR Fund | — | — | 146,236 | 146,236 | — | — | 15,785 | (243,353 | ) | |||||||||||||||||||||||
The Health Care Select Sector SPDR Fund | 39,379 | 2,929,404 | 27,402 | 66,781 | — | — | 29,857 | 91,874 | ||||||||||||||||||||||||
The Industrial Select Sector SPDR Fund | — | — | 139,714 | 74,434 | 65,280 | 3,653,069 | 21,232 | 32,395 | ||||||||||||||||||||||||
The Technology Select Sector SPDR Fund | 68,939 | 2,854,075 | 193,470 | 262,409 | — | — | 36,666 | (72,420 | ) | |||||||||||||||||||||||
See accompanying notes to financial statements.
19
Table of Contents
BLACKSTONE / GSO SENIOR LOAN PORTFOLIO
SPDR Blackstone / GSO Senior Loan ETF is a feeder fund that invests substantially all of its investable assets in a master fund, the Blackstone / GSO Senior Loan Portfolio. The schedule of investments for the Blackstone / GSO Senior Loan Portfolio follows.
20
Table of Contents
Blackstone / GSO Senior Loan Portfolio
SCHEDULE OF INVESTMENTS
June 30, 2016
Security Description | Principal | Value | ||||||
SENIOR FLOATING RATE LOANS (a) — 86.6% |
| |||||||
AEROSPACE & DEFENSE — 2.0% |
| |||||||
Atlantic Aviation FBO, Inc. | $ | 3,333,002 | $ | 3,333,002 | ||||
TransDigm, Inc.: | ||||||||
Senior Secured Term Loan C, | 2,979,421 | 2,958,938 | ||||||
Senior Secured Term Loan D, | 4,937,028 | 4,888,990 | ||||||
Senior Secured Term Loan E, | 1,884,401 | 1,859,226 | ||||||
WP CPP Holdings LLC | 2,799,407 | 2,713,087 | ||||||
|
| |||||||
| 15,753,243 | ||||||||
|
| |||||||
AIRLINES — 1.1% | ||||||||
American Airlines, Inc.: | ||||||||
Senior Secured Term Loan, | 1,975,000 | 1,953,403 | ||||||
Senior Secured Term Loan B, | 3,712,500 | 3,688,369 | ||||||
US Airways Group, Inc. | 3,188,780 | 3,182,402 | ||||||
|
| |||||||
| 8,824,174 | ||||||||
|
| |||||||
AUTOMOBILES — 1.4% | ||||||||
Chrysler Group LLC: | ||||||||
Senior Secured Term Loan B, | 5,904,966 | 5,899,415 | ||||||
Senior Secured Term Loan B, | 2,037,421 | 2,038,908 | ||||||
Doosan Infracore International, Inc. | 1,541,143 | 1,544,996 | ||||||
TI Group Automotive Systems LLC | 1,678,334 | 1,648,963 | ||||||
|
| |||||||
| 11,132,282 | ||||||||
|
| |||||||
BIOTECHNOLOGY — 0.5% |
| |||||||
Grifols Worldwide Operations USA, Inc. | 3,969,543 | 3,970,555 | ||||||
|
| |||||||
BUILDING PRODUCTS — 0.4% |
| |||||||
Stardust Finance Holdings, Inc. | 3,246,753 | 3,176,396 | ||||||
|
| |||||||
CAPITAL MARKETS — 0.8% |
| |||||||
Blue Coat Systems, Inc. | 4,817,040 | 4,817,040 | ||||||
Hamilton Lane Advisors LLC | 1,346,878 | 1,346,878 | ||||||
|
| |||||||
| 6,163,918 | ||||||||
|
| |||||||
CHEMICALS — 1.6% |
| |||||||
Avantor Performance Materials Holdings, Inc. | 4,009,434 | 3,986,881 | ||||||
Axalta Coating Systems US Holdings, Inc. | 4,831,719 | 4,833,603 | ||||||
Ineos US Finance LLC | 3,998,764 | 3,988,767 | ||||||
|
| |||||||
| 12,809,251 | ||||||||
|
| |||||||
COMMERCIAL SERVICES & SUPPLIES — 4.1% |
| |||||||
ADS Waste Holdings, Inc. | 5,259,660 | 5,185,709 | ||||||
Allied Security Holdings LLC | 312,926 | 312,144 | ||||||
Asurion LLC: | ||||||||
Senior Secured 2nd Lien Term Loan, 8.50%, 3/3/2021 | 2,000,000 | 1,934,000 | ||||||
Senior Secured Term Loan B1, 5.00%, 5/24/2019 | 1,886,130 | 1,879,849 | ||||||
Senior Secured Term Loan B4, 5.00%, 8/4/2022 | 8,447,966 | 8,348,702 | ||||||
KAR Auction Services, Inc. | 1,930,868 | 1,939,711 | ||||||
Lineage Logistics Holdings LLC | 4,431,687 | 4,221,182 | ||||||
Multi Packaging Solutions, Inc. Senior Secured Term Loan B, | 1,550,964 | 1,539,331 | ||||||
Prime Security Services Borrower LLC | 7,475,410 | 7,501,873 | ||||||
|
| |||||||
| 32,862,501 | ||||||||
|
| |||||||
COMMUNICATIONS EQUIPMENT — 0.2% |
| |||||||
CommScope, Inc. | 1,395,006 | 1,397,844 | ||||||
|
| |||||||
COMPUTERS & PERIPHERALS — 0.1% |
| |||||||
Western Digital Corp. | 1,000,000 | 1,005,470 | ||||||
|
| |||||||
CONTAINERS & PACKAGING — 1.7% |
| |||||||
Ardagh Holdings USA, Inc. | 1,989,687 | 1,989,687 | ||||||
Berry Plastics Holding Corp.: | ||||||||
Senior Secured Term Loan D, | 2,904,925 | 2,889,412 | ||||||
Senior Secured Term Loan G, | 1,105,503 | 1,097,643 | ||||||
See accompanying notes to financial statements.
21
Table of Contents
Blackstone / GSO Senior Loan Portfolio
SCHEDULE OF INVESTMENTS (continued)
June 30, 2016
Security Description | Principal | Value | ||||||
Hilex Poly Co. LLC | $ | 2,789,224 | $ | 2,800,381 | ||||
Reynolds Group Holdings, Inc. Senior Secured Dollar Term Loan, | 2,400,190 | 2,403,670 | ||||||
Tekni-Plex, Inc. | 2,213,665 | 2,180,460 | ||||||
|
| |||||||
| 13,361,253 | ||||||||
|
| |||||||
DISTRIBUTORS — 1.0% |
| |||||||
ABC Supply Co., Inc. | 2,000,000 | 1,998,750 | ||||||
American Tire Distributors Holdings, Inc. Senior Secured Term Loan, | 6,329,131 | 6,131,378 | ||||||
|
| |||||||
| 8,130,128 | ||||||||
|
| |||||||
DIVERSIFIED CONSUMER SERVICES — 1.8% |
| |||||||
Nord Anglia Education Finance LLC | 2,795,009 | 2,786,289 | ||||||
ServiceMaster Co. | 11,532,172 | 11,558,581 | ||||||
|
| |||||||
| 14,344,870 | ||||||||
|
| |||||||
DIVERSIFIED FINANCIAL SERVICES — 1.4% |
| |||||||
AlixPartners LLP | 1,768,812 | 1,769,254 | ||||||
CeraTec Services GmbH: | ||||||||
Senior Secured Term Loan B1, | 1,356,254 | 1,358,513 | ||||||
Senior Secured Term Loan B3, | 413,900 | 414,589 | ||||||
Tech Finance & Co. S.C.A | 7,991,531 | 7,929,117 | ||||||
|
| |||||||
| 11,471,473 | ||||||||
|
| |||||||
DIVERSIFIED TELECOMMUNICATION SERVICES — 3.5% |
| |||||||
Fairpoint Communications, Inc. Senior Secured Refi Term Loan, | 290,250 | 290,280 | ||||||
Level 3 Financing, Inc. | 11,500,000 | 11,475,563 | ||||||
Telesat LLC | 3,969,231 | 3,956,827 | ||||||
Virgin Media Investment Holdings, Ltd. Senior Secured Term Loan F, | 1,550,101 | 1,514,611 | ||||||
Windstream Corp. | 11,221,875 | 11,197,355 | ||||||
|
| |||||||
| 28,434,636 | ||||||||
|
| |||||||
ELECTRIC UTILITIES — 0.4% |
| |||||||
Astoria Energy LLC | 684,646 | 651,557 | ||||||
PowerTeam Services LLC | 2,867,009 | 2,856,258 | ||||||
|
| |||||||
| 3,507,815 | ||||||||
|
| |||||||
ELECTRONIC EQUIPMENT, INSTRUMENTS & COMPONENTS — 2.1% |
| |||||||
CDW LLC | 6,014,050 | 6,017,388 | ||||||
TTM Technologies, Inc. | 7,724,500 | 7,666,566 | ||||||
Zebra Technologies Corp. | 3,054,117 | 3,057,935 | ||||||
|
| |||||||
| 16,741,889 | ||||||||
|
| |||||||
FOOD & STAPLES RETAILING — 2.6% |
| |||||||
Albertsons LLC: | ||||||||
Senior Secured 2016 Term Loan B6, 4.75%, 6/22/2023 | 3,642,616 | 3,642,160 | ||||||
Senior Secured Term Loan B4, | 6,940,156 | 6,943,280 | ||||||
Supervalu, Inc. | 2,195,807 | 2,196,147 | ||||||
US Foods, Inc. | 7,867,403 | 7,848,561 | ||||||
|
| |||||||
| 20,630,148 | ||||||||
|
| |||||||
FOOD PRODUCTS — 1.3% |
| |||||||
AdvancePierre Foods, Inc. | 3,708,609 | 3,703,973 | ||||||
Candy Intermediate Holdings, Inc. Senior Secured Term Loan, | 1,578,947 | 1,579,934 | ||||||
Dole Food Co., Inc. | 4,657,172 | 4,647,718 | ||||||
Hostess Brands LLC | 723,627 | 724,170 | ||||||
|
| |||||||
| 10,655,795 | ||||||||
|
| |||||||
HEALTH CARE EQUIPMENT & SUPPLIES — 0.4% |
| |||||||
Convatec, Inc. | 2,960,307 | 2,956,606 | ||||||
|
| |||||||
HEALTH CARE PROVIDERS & SERVICES — 3.6% |
| |||||||
Acadia Healthcare Co., Inc. | 1,155,437 | 1,146,529 | ||||||
Air Medical Group Holdings, Inc. | 3,478,672 | 3,403,654 | ||||||
See accompanying notes to financial statements.
22
Table of Contents
Blackstone / GSO Senior Loan Portfolio
SCHEDULE OF INVESTMENTS (continued)
June 30, 2016
Security Description | Principal | Value | ||||||
CeramTec Acquisition Corp. | $ | 147,177 | $ | 147,422 | ||||
CHG Healthcare Services, Inc. | 3,167,864 | 3,172,822 | ||||||
Community Health Systems, Inc. | 5,181,865 | 5,048,121 | ||||||
Envision Healthcare Corp. | 3,586,914 | 3,590,052 | ||||||
FHC Health Systems, Inc. | 534,257 | 514,666 | ||||||
MedImpact OpCo Holdings, Inc. | 974,684 | 977,120 | ||||||
MPH Acquisition Holdings LLC | 4,662,005 | 4,680,653 | ||||||
National Mentor Holdings, Inc. Senior Secured Term Loan B, | 2,698,889 | 2,678,647 | ||||||
NVA Holdings, Inc. | 1,509,680 | 1,505,906 | ||||||
U.S. Renal Care, Inc. | 1,904,306 | 1,904,316 | ||||||
|
| |||||||
| 28,769,908 | ||||||||
|
| |||||||
HEALTH CARE TECHNOLOGY — 1.4% |
| |||||||
CT Technologies Intermediate Holdings, Inc. | 4,693,954 | 4,623,545 | ||||||
IMS Health, Inc. | 6,385,019 | 6,349,103 | ||||||
|
| |||||||
| 10,972,648 | ||||||||
|
| |||||||
HOTELS, RESTAURANTS & LEISURE — 7.7% |
| |||||||
Aristocrat Leisure, Ltd. | 2,000,000 | 2,007,330 | ||||||
Burger King 1011778 B.C. Unlimited Liability Co. | 5,959,588 | 5,959,588 | ||||||
CEC Entertainment, Inc. | 8,792,467 | 8,557,972 | ||||||
Delta 2 (LUX) S.A.R.L.: | ||||||||
Senior Secured 2nd Lien Term Loan, | 1,320,000 | 1,258,950 | ||||||
Senior Secured Term Loan B3, | 7,018,093 | 6,769,161 | ||||||
La Quinta Intermediate Holdings LLC | 7,466,143 | 7,316,820 | ||||||
Las Vegas Sands LLC | 4,107,856 | 4,110,711 | ||||||
Scientific Games International, Inc. | 13,809,127 | 13,638,239 | ||||||
Travelport Finance (Luxembourg) S.A.R.L. | 9,937,114 | 9,896,769 | ||||||
Yum! Brands Inc. | 2,465,331 | 2,471,495 | ||||||
|
| |||||||
| 61,987,035 | ||||||||
|
| |||||||
HOUSEHOLD DURABLES — 1.1% |
| |||||||
Serta Simmons Holdings LLC Senior Secured Term Loan, | 5,109,704 | 5,111,824 | ||||||
Spin Holdco, Inc. | 3,832,340 | 3,766,864 | ||||||
|
| |||||||
| 8,878,688 | ||||||||
|
| |||||||
HOUSEHOLD PRODUCTS — 0.3% |
| |||||||
Energizer Holdings, Inc. | 1,582,680 | 1,579,713 | ||||||
Samsonite International SA | 883,978 | 889,392 | ||||||
|
| |||||||
| 2,469,105 | ||||||||
|
| |||||||
INDEPENDENT POWER PRODUCERS & ENERGY TRADERS — 0.2% |
| |||||||
Calpine Construction Finance Company L.P. Senior Secured Original Term Loan B2, | 1,959,715 | 1,919,296 | ||||||
INSURANCE — 3.2% |
| |||||||
Alliant Holdings I, Inc. | 2,344,737 | 2,315,428 | ||||||
Hub International, Ltd. | 8,963,265 | 8,826,933 | ||||||
National Financial Partners Corp. | 7,545,151 | 7,488,562 | ||||||
Sedgwick Claims Management Services, Inc.: | ||||||||
Senior Secured 1st Lien Term Loan, 3.75%, 3/1/2021 | 3,972,056 | 3,892,614 | ||||||
Senior Secured 1st Lien Term Loan, 5.25%, 3/1/2021 | 1,000,000 | 1,002,500 | ||||||
See accompanying notes to financial statements.
23
Table of Contents
Blackstone / GSO Senior Loan Portfolio
SCHEDULE OF INVESTMENTS (continued)
June 30, 2016
Security Description | Principal | Value | ||||||
Senior Secured 2nd Lien Term Loan, 6.75%, 2/28/2022 | $ | 2,000,000 | $ | 1,925,000 | ||||
|
| |||||||
| 25,451,037 | ||||||||
|
| |||||||
INTERNET SOFTWARE & SERVICES — 2.0% |
| |||||||
Abacus Innovations Corp. | 2,487,047 | 2,488,079 | ||||||
Go Daddy Operating Company LLC | 1,345,817 | 1,347,742 | ||||||
Inmar, Inc. | 3,118,182 | 3,085,051 | ||||||
Sabre, Inc. | 5,332,974 | 5,339,640 | ||||||
TCH-2 Holding LLC | 3,980,217 | 3,955,341 | ||||||
|
| |||||||
| 16,215,853 | ||||||||
|
| |||||||
IT SERVICES — 2.5% |
| |||||||
First Data Corp.: | ||||||||
Senior Secured Extended Term Loan, 4.45%, 3/24/2021 | 8,870,404 | 8,855,635 | ||||||
Senior Secured Term Loan, | 8,666,284 | 8,606,703 | ||||||
Global Payments, Inc. | 1,540,656 | 1,552,981 | ||||||
TNS, Inc. | 1,311,090 | 1,312,729 | ||||||
|
| |||||||
| 20,328,048 | ||||||||
|
| |||||||
LIFE SCIENCES TOOLS & SERVICES — 0.9% |
| |||||||
Jaguar Holding Company II | 7,052,632 | 6,995,329 | ||||||
|
| |||||||
MACHINERY — 0.5% |
| |||||||
Allison Transmission, Inc. | 3,876,844 | 3,880,314 | ||||||
|
| |||||||
MEDIA — 5.0% |
| |||||||
Acosta Holdco, Inc. | 5,312,008 | 5,119,447 | ||||||
Charter Communications Operating LLC | 1,672,183 | 1,676,104 | ||||||
Gray Television, Inc. | 1,000,000 | 1,001,665 | ||||||
McGraw-Hill Global Education Holdings LLC | 1,142,857 | 1,143,143 | ||||||
Neptune Finco Corp. | 9,849,315 | 9,883,788 | ||||||
Numericable Group SA | 1,772,909 | 1,752,077 | ||||||
Numericable U.S. LLC | 3,149,171 | 3,132,119 | ||||||
Penton Media, Inc. | 1,326,908 | 1,325,256 | ||||||
Sinclair Television Group, Inc. | 746,231 | 746,231 | ||||||
Telenet International Finance S.A.R.L. Senior Secured Term Loan AD, | 1,351,351 | 1,343,750 | ||||||
Univision Communications, Inc.: | ||||||||
Senior Secured Term Loan C3, | 1,959,820 | 1,950,433 | ||||||
Senior Secured Term Loan C4, | 2,910,830 | 2,898,867 | ||||||
UPC Financing Partnership | 4,000,000 | 3,911,660 | ||||||
WMG Acquisition Corp. | 1,989,770 | 1,971,653 | ||||||
Ziggo B.V.: | ||||||||
Senior Secured Term Loan B1, | 739,574 | 723,396 | ||||||
Senior Secured Term Loan B2A, 3.60%, 1/15/2022 | 38,298 | 37,460 | ||||||
Senior Secured Term Loan B2A, 3.65%, 1/15/2022 | 438,298 | 428,710 | ||||||
Senior Secured Term Loan B3, | 783,830 | 766,683 | ||||||
|
| |||||||
| 39,812,442 | ||||||||
|
| |||||||
MULTILINE RETAIL — 0.6% |
| |||||||
Burlington Coat Factory Warehouse Corp. | 1,000,000 | 1,000,205 | ||||||
Dollar Tree, Inc. | 1,562,008 | 1,564,609 | ||||||
Neiman Marcus Group, Inc. | 2,414,014 | 2,174,532 | ||||||
|
| |||||||
| 4,739,346 | ||||||||
|
| |||||||
PERSONAL PRODUCTS — 0.7% |
| |||||||
Revlon Consumer Products Corp. | 5,653,335 | 5,667,496 | ||||||
|
| |||||||
See accompanying notes to financial statements.
24
Table of Contents
Blackstone / GSO Senior Loan Portfolio
SCHEDULE OF INVESTMENTS (continued)
June 30, 2016
Security Description | Principal | Value | ||||||
PHARMACEUTICALS — 3.9% |
| |||||||
Amneal Pharmaceuticals LLC | $ | 2,234,343 | $ | 2,224,099 | ||||
Capsugel Holdings US, Inc. | 2,992,500 | 2,986,276 | ||||||
Concordia Healthcare Corp. | 6,302,199 | 6,064,291 | ||||||
Horizon Pharma, Inc. | 664,987 | 651,688 | ||||||
Valeant Pharmaceuticals International | 11,361,638 | 11,082,312 | ||||||
Valeant Pharmaceuticals International, Inc. | 8,253,262 | 8,028,237 | ||||||
|
| |||||||
| 31,036,903 | ||||||||
|
| |||||||
PROFESSIONAL SERVICES — 1.8% |
| |||||||
Advantage Sales & Marketing, Inc. | 6,351,421 | 6,209,848 | ||||||
Information Resources, Inc. | 1,994,885 | 1,996,760 | ||||||
TransUnion LLC | 6,460,097 | 6,392,492 | ||||||
|
| |||||||
| 14,599,100 | ||||||||
|
| |||||||
REAL ESTATE INVESTMENT TRUSTS (REITS) — 0.2% |
| |||||||
Communications Sales & Leasing, Inc. | 1,994,962 | 1,976,259 | ||||||
|
| |||||||
REAL ESTATE MANAGEMENT & DEVELOPMENT — 0.6% |
| |||||||
Americold Realty Operating Partnership, L.P. | 1,188,119 | 1,195,544 | ||||||
Realogy Corp. | 3,920,108 | 3,920,598 | ||||||
|
| |||||||
| 5,116,142 | ||||||||
|
| |||||||
ROAD & RAIL — 1.1% | ||||||||
Hertz Corp. | 8,602,151 | 8,607,527 | ||||||
|
| |||||||
SEMICONDUCTORS & SEMICONDUCTOR EQUIPMENT — 4.4% |
| |||||||
Avago Technologies Cayman, Ltd. Senior Secured Term Loan B1, | 16,151,690 | 16,190,858 | ||||||
Microsemi Corp. | 3,634,634 | 3,633,126 | ||||||
NXP B.V. | 3,567,454 | 3,579,440 | ||||||
ON Semiconductor Corp. | 11,925,043 | 11,993,373 | ||||||
|
| |||||||
| 35,396,797 | ||||||||
|
| |||||||
SOFTWARE — 9.6% |
| |||||||
Applied Systems, Inc. | 1,562,424 | 1,552,010 | ||||||
Aspect Software, Inc. | 7,312,770 | 7,038,541 | ||||||
BMC Software Finance, Inc. | 12,439,747 | 11,071,375 | ||||||
CCC Information Services, Inc. | 4,894,377 | 4,872,964 | ||||||
Cengage Learning Acquisitions, Inc. | 4,610,778 | 4,564,671 | ||||||
Compuware Corp. | 6,433,508 | 5,979,141 | ||||||
Epicor Software Corp. | 5,668,235 | 5,579,669 | ||||||
Hyland Software, Inc. | 1,990,354 | 1,982,890 | ||||||
Infor (US), Inc. | 2,992,186 | 2,925,804 | ||||||
Informatica Corp. | 5,969,320 | 5,824,355 | ||||||
Kronos, Inc.: | ||||||||
Senior Secured 2nd Lien Term Loan, | 6,094,695 | 6,150,583 | ||||||
Senior Secured Initial Incremental Term Loan, 4.50%, 10/30/2019 | 4,948,085 | 4,943,137 | ||||||
MA FinanceCo. LLC | 4,344,525 | 4,347,240 | ||||||
Mitchell International, Inc. | 2,757,660 | 2,722,500 | ||||||
Solera Holdings, Inc. | 481,919 | 482,370 | ||||||
Sophia L.P. | 3,493,156 | 3,458,225 | ||||||
Vertafore, Inc. | 3,738,318 | 3,730,150 | ||||||
|
| |||||||
| 77,225,625 | ||||||||
|
| |||||||
See accompanying notes to financial statements.
25
Table of Contents
Blackstone / GSO Senior Loan Portfolio
SCHEDULE OF INVESTMENTS (continued)
June 30, 2016
Security Description | Principal | Value | ||||||
SPECIALTY RETAIL — 3.1% |
| |||||||
Men’s Wearhouse, Inc. | $ | 1,891,779 | $ | 1,825,567 | ||||
Michaels Stores, Inc. | 4,927,173 | 4,919,462 | ||||||
Petco Animal Supplies, Inc. | 6,484,736 | 6,461,002 | ||||||
PetSmart, Inc. | 11,592,049 | 11,558,779 | ||||||
|
| |||||||
| 24,764,810 | ||||||||
|
| |||||||
TECHNOLOGY HARDWARE, STORAGE & PERIPHERALS — 1.6% |
| |||||||
Dell, Inc. | 10,948,546 | 10,924,569 | ||||||
Diebold, Inc. | 1,676,296 | 1,673,496 | ||||||
|
| |||||||
| 12,598,065 | ||||||||
|
| |||||||
TRADING COMPANIES & DISTRIBUTORS — 0.6% |
| |||||||
Beacon Roofing Supply, Inc. | 1,760,099 | 1,762,668 | ||||||
McJunkin Red Man Corp. | 1,984,904 | 1,920,395 | ||||||
Univar, Inc. | 1,437,746 | 1,419,774 | ||||||
|
| |||||||
| 5,102,837 | ||||||||
|
| |||||||
WIRELESS TELECOMMUNICATION SERVICES — 1.6% |
| |||||||
LTS Buyer LLC | 4,966,726 | 4,931,040 | ||||||
SBA Senior Finance II LLC | 5,964,506 | 5,915,209 | ||||||
T-Mobile USA, Inc. | 2,216,517 | 2,226,568 | ||||||
|
| |||||||
| 13,072,817 | ||||||||
|
| |||||||
TOTAL SENIOR FLOATING RATE LOANS | 694,913,674 | |||||||
|
| |||||||
CORPORATE BONDS & NOTES — 6.5% |
| |||||||
DIVERSIFIED FINANCIAL SERVICES — 0.1% |
| |||||||
Fly Leasing, Ltd. | 500,000 | 485,000 | ||||||
|
| |||||||
ENTERTAINMENT — 0.8% |
| |||||||
Cedar Fair L.P./Canada’s Wonderland Co./Magnum Management Corp. | 2,000,000 | 2,075,000 | ||||||
Scientific Games Corp. | 1,037,000 | 1,015,938 | ||||||
Scientific Games International, Inc. 7.00%, 1/1/2022 (b) | 3,400,000 | 3,425,500 | ||||||
|
| |||||||
| 6,516,438 | ||||||||
|
| |||||||
FOOD SERVICE — 0.0% (c) |
| |||||||
Aramark Services, Inc. | 229,000 | 235,023 | ||||||
|
| |||||||
HEALTH CARE PRODUCTS — 0.1% |
| |||||||
Kinetic Concepts, Inc./KCI USA, Inc. | 830,000 | 880,298 | ||||||
|
| |||||||
HEALTH CARE SERVICES — 1.5% |
| |||||||
CHS/Community Health Systems, Inc. | 2,000,000 | 1,985,000 | ||||||
HCA, Inc. | 1,000,000 | 1,045,000 | ||||||
Tenet Healthcare Corp.: | ||||||||
4.15%, 6/15/2020 | 3,000,000 | 2,962,500 | ||||||
6.75%, 2/1/2020 | 2,000,000 | 1,970,000 | ||||||
6.75%, 6/15/2023 | 2,000,000 | 1,912,600 | ||||||
8.13%, 4/1/2022 | 2,000,000 | 2,044,600 | ||||||
|
| |||||||
| 11,919,700 | ||||||||
|
| |||||||
INTERNET — 0.1% |
| |||||||
Blue Coat Holdings, Inc. | 1,000,000 | 1,130,000 | ||||||
|
| |||||||
LEISURE TIME — 0.4% |
| |||||||
Sabre GLBL, Inc. | 2,950,000 | 3,016,375 | ||||||
|
| |||||||
MEDIA — 0.8% |
| |||||||
Altice Financing SA | 490,000 | 478,975 | ||||||
Altice US Finance I Corp. | 610,000 | 607,438 | ||||||
CCO Holdings LLC/CCO Holdings Capital Corp. | 2,000,000 | 2,055,000 | ||||||
Cequel Communications Holdings I LLC/Cequel Capital Corp. | 1,000,000 | 1,014,900 | ||||||
McGraw-Hill Global Education Holdings LLC/McGraw-Hill Global Education Finance | 360,000 | 372,600 | ||||||
Numericable-SFR SA | 2,000,000 | 1,941,200 | ||||||
|
| |||||||
| 6,470,113 | ||||||||
|
| |||||||
MINING — 0.0% (c) |
| |||||||
Kaiser Aluminum Corp. | 220,000 | 226,050 | ||||||
|
| |||||||
PACKAGING & CONTAINERS — 0.7% |
| |||||||
Ardagh Packaging Finance PLC/Ardagh Holdings USA, Inc. | 1,320,000 | 1,344,816 | ||||||
Reynolds Group Issuer, Inc./Reynolds Group Issuer LLC/Reynolds Group Issuer Lu: | ||||||||
4.13%, 7/15/2021 (b) | 2,000,000 | 2,005,000 | ||||||
5.13%, 7/15/2023 (b) | 450,000 | 455,625 | ||||||
See accompanying notes to financial statements.
26
Table of Contents
Blackstone / GSO Senior Loan Portfolio
SCHEDULE OF INVESTMENTS (continued)
June 30, 2016
Security Description | Principal | Value | ||||||
5.75%, 10/15/2020 | $ | 1,000,000 | $ | 1,032,500 | ||||
7.00%, 7/15/2024 (b) | 550,000 | 565,125 | ||||||
|
| |||||||
| 5,403,066 | ||||||||
|
| |||||||
RETAIL — 0.3% |
| |||||||
CEC Entertainment, Inc. | 440,000 | 425,700 | ||||||
Serta Simmons Bedding LLC | 2,000,000 | 2,060,000 | ||||||
|
| |||||||
| 2,485,700 | ||||||||
|
| |||||||
SOFTWARE — 0.6% |
| |||||||
First Data Corp. | 2,000,000 | 2,000,000 | ||||||
Infor US, Inc. | 3,000,000 | 2,851,800 | ||||||
|
| |||||||
| 4,851,800 | ||||||||
|
| |||||||
TELECOMMUNICATIONS — 1.1% |
| |||||||
Altice Luxembourg SA | 2,000,000 | 2,021,250 | ||||||
T-Mobile USA, Inc.: | ||||||||
6.50%, 1/15/2026 | 2,000,000 | 2,110,000 | ||||||
6.63%, 4/1/2023 | 2,000,000 | 2,118,800 | ||||||
6.73%, 4/28/2022 | 2,000,000 | 2,103,200 | ||||||
|
| |||||||
| 8,353,250 | ||||||||
|
| |||||||
TOTAL CORPORATE BONDS & NOTES | 51,972,813 | |||||||
|
| |||||||
SHORT-TERM INVESTMENT — 8.6% |
| |||||||
State Street Institutional Liquid Reserves Fund, Premier Class 0.47% (d) (e) | 68,870,496 | 68,870,496 | ||||||
|
| |||||||
TOTAL INVESTMENTS — 101.7% |
| |||||||
(Cost $816,967,079) | 815,756,983 | |||||||
|
| |||||||
LIABILITIES IN EXCESS OF OTHER ASSETS — (1.7)% | (13,267,735 | ) | ||||||
|
| |||||||
NET ASSETS — 100.0% | $ | 802,489,248 | ||||||
|
| |||||||
| (a) | The rate shown represents the rate at June 30, 2016. |
| (b) | Securities purchased pursuant to Rule 144A of the Securities Act of 1933. These securities, which represent 3.2% of net assets as of June 30, 2016, are considered liquid and may be resold in transactions exempt from registration, normally to qualified institutional buyers. |
| (c) | Amount is less than 0.05% of net assets. |
| (d) | The rate shown is the annualized seven-day yield at June 30, 2016. |
| (e) | The Fund invested in certain money market funds managed by SSGA Funds Management, Inc. Amounts related to these transactions during the year ended June 30, 2016 are shown in the Affiliate Table below. |
The following table summarizes the value of the Fund’s investments accordingly to the fair value hierarchy as of June 30, 2016.
Description | Level 1 — Quoted Prices | Level 2 — Other Significant Observable Inputs | Level 3 — Significant Unobservable Inputs | Total | ||||||||||||
ASSETS: | ||||||||||||||||
INVESTMENTS: | ||||||||||||||||
Senior Floating Rate Loans | ||||||||||||||||
Aerospace & Defense | $ | — | $ | 15,753,243 | $ | — | $ | 15,753,243 | ||||||||
Airlines | — | 8,824,174 | — | 8,824,174 | ||||||||||||
Automobiles | — | 11,132,282 | — | 11,132,282 | ||||||||||||
Biotechnology | — | 3,970,555 | — | 3,970,555 | ||||||||||||
Building Products | — | 3,176,396 | — | 3,176,396 | ||||||||||||
Capital Markets | — | 6,163,918 | — | 6,163,918 | ||||||||||||
Chemicals | — | 12,809,251 | — | 12,809,251 | ||||||||||||
Commercial Services & Supplies | — | 32,862,501 | — | 32,862,501 | ||||||||||||
Communications Equipment | — | 1,397,844 | — | 1,397,844 | ||||||||||||
Computers & Peripherals | — | 1,005,470 | — | 1,005,470 | ||||||||||||
Containers & Packaging | — | 13,361,253 | — | 13,361,253 | ||||||||||||
Distributors | — | 8,130,128 | — | 8,130,128 | ||||||||||||
See accompanying notes to financial statements.
27
Table of Contents
Blackstone / GSO Senior Loan Portfolio
SCHEDULE OF INVESTMENTS (continued)
June 30, 2016
Description | Level 1 — Quoted Prices | Level 2 — Other Significant Observable Inputs | Level 3 — Significant Unobservable Inputs | Total | ||||||||||||
Diversified Consumer Services | $ | — | $ | 14,344,870 | $ | — | $ | 14,344,870 | ||||||||
Diversified Financial Services | — | 11,471,473 | — | 11,471,473 | ||||||||||||
Diversified Telecommunication Services | — | 28,434,636 | — | 28,434,636 | ||||||||||||
Electric Utilities | — | 3,507,815 | — | 3,507,815 | ||||||||||||
Electronic Equipment, Instruments & Components | — | 16,741,889 | — | 16,741,889 | ||||||||||||
Food & Staples Retailing | — | 20,630,148 | — | 20,630,148 | ||||||||||||
Food Products | — | 10,655,795 | — | 10,655,795 | ||||||||||||
Health Care Equipment & Supplies | — | 2,956,606 | — | 2,956,606 | ||||||||||||
Health Care Providers & Services | — | 28,769,908 | — | 28,769,908 | ||||||||||||
Health Care Technology | — | 10,972,648 | — | 10,972,648 | ||||||||||||
Hotels, Restaurants & Leisure | — | 61,987,035 | — | 61,987,035 | ||||||||||||
Household Durables | — | 8,878,688 | — | 8,878,688 | ||||||||||||
Household Products | — | 2,469,105 | — | 2,469,105 | ||||||||||||
Independent Power Producers & Energy Traders | — | 1,919,296 | — | 1,919,296 | ||||||||||||
Insurance | — | 25,451,037 | — | 25,451,037 | ||||||||||||
Internet Software & Services | — | 16,215,853 | — | 16,215,853 | ||||||||||||
IT Services | — | 20,328,048 | — | 20,328,048 | ||||||||||||
Life Sciences Tools & Services | — | 6,995,329 | — | 6,995,329 | ||||||||||||
Machinery | — | 3,880,314 | — | 3,880,314 | ||||||||||||
Media | — | 39,812,442 | — | 39,812,442 | ||||||||||||
Multiline Retail | — | 4,739,346 | — | 4,739,346 | ||||||||||||
Personal Products | — | 5,667,496 | — | 5,667,496 | ||||||||||||
Pharmaceuticals | — | 31,036,903 | — | 31,036,903 | ||||||||||||
Professional Services | — | 14,599,100 | — | 14,599,100 | ||||||||||||
Real Estate Investment Trusts (REITs) | — | 1,976,259 | — | 1,976,259 | ||||||||||||
Real Estate Management & Development | — | 5,116,142 | — | 5,116,142 | ||||||||||||
Road & Rail | — | 8,607,527 | — | 8,607,527 | ||||||||||||
Semiconductors & Semiconductor Equipment | — | 35,396,797 | — | 35,396,797 | ||||||||||||
Software | — | 77,225,625 | — | 77,225,625 | ||||||||||||
Specialty Retail | — | 24,764,810 | — | 24,764,810 | ||||||||||||
Technology Hardware, Storage & Peripherals | — | 12,598,065 | — | 12,598,065 | ||||||||||||
Trading Companies & Distributors | — | 5,102,837 | — | 5,102,837 | ||||||||||||
Wireless Telecommunication Services | — | 13,072,817 | — | 13,072,817 | ||||||||||||
Corporate Bonds & Notes | ||||||||||||||||
Diversified Financial Services | — | 485,000 | — | 485,000 | ||||||||||||
Entertainment | — | 6,516,438 | — | 6,516,438 | ||||||||||||
Food Service | — | 235,023 | — | 235,023 | ||||||||||||
Health Care Products | — | 880,298 | — | 880,298 | ||||||||||||
Health Care Services | — | 11,919,700 | — | 11,919,700 | ||||||||||||
Internet | — | 1,130,000 | — | 1,130,000 | ||||||||||||
See accompanying notes to financial statements.
28
Table of Contents
Blackstone / GSO Senior Loan Portfolio
SCHEDULE OF INVESTMENTS (continued)
June 30, 2016
Description | Level 1 — Quoted Prices | Level 2 — Other Significant Observable Inputs | Level 3 — Significant Unobservable Inputs | Total | ||||||||||||
Leisure Time | $ | — | $ | 3,016,375 | $ | — | $ | 3,016,375 | ||||||||
Media | — | 6,470,113 | — | 6,470,113 | ||||||||||||
Mining | — | 226,050 | — | 226,050 | ||||||||||||
Packaging & Containers | — | 5,403,066 | — | 5,403,066 | ||||||||||||
Retail | — | 2,485,700 | — | 2,485,700 | ||||||||||||
Software | — | 4,851,800 | — | 4,851,800 | ||||||||||||
Telecommunications | — | 8,353,250 | — | 8,353,250 | ||||||||||||
Short-Term Investment | 68,870,496 | — | — | 68,870,496 | ||||||||||||
|
|
|
|
|
|
|
| |||||||||
TOTAL INVESTMENTS | $ | 68,870,496 | $ | 746,886,487 | $ | — | $ | 815,756,983 | ||||||||
|
|
|
|
|
|
|
| |||||||||
Affiliate Table
| Number of Shares Held at 6/30/15 | Value At 6/30/15 | Shares | Number of Shares Held at 6/30/16 | Value at 6/30/16 | Dividend Income | Realized Gain (Loss) | ||||||||||||||||||||||||||
| Purchased | Sold | |||||||||||||||||||||||||||||||
State Street Institutional Liquid Reserves Fund, Premier Class | 11,996,420 | $ | 11,996,420 | 542,017,209 | 485,143,133 | 68,870,496 | $ | 68,870,496 | $ | 139,199 | $ | — | ||||||||||||||||||||
See accompanying notes to financial statements.
29
Table of Contents
SSGA ULTRA SHORT TERM BOND PORTFOLIO
SPDR SSGA Ultra Short Term Bond ETF is a feeder fund that invests substantially all of its investable assets in a master fund, the SSGA Ultra Short Term Bond Portfolio. The schedule of investments for the SSGA Ultra Short Term Bond Portfolio follows.
30
Table of Contents
SSGA Ultra Short Term Bond Portfolio
SCHEDULE OF INVESTMENTS
June 30, 2016
Security Description | Principal | Value | ||||||
ASSET-BACKED SECURITIES — 30.0% |
| |||||||
ASSET-BACKED — OTHER — 3.7% | ||||||||
Ford Credit Floorplan Master Owner Trust A: | ||||||||
Series 2013-5, Class A1, | $ | 210,000 | $ | 210,206 | ||||
Series 2013-5, Class A2, | 230,000 | 230,066 | ||||||
Series 2014-1, Class A2, | 200,000 | 199,917 | ||||||
Mercedes-Benz Master Owner Trust | 250,000 | 250,000 | ||||||
|
| |||||||
| 890,189 | ||||||||
|
| |||||||
AUTOMOBILE — 11.6% | ||||||||
BMW Vehicle Lease Trust | 103,211 | 103,208 | ||||||
Drive Auto Receivables Trust | 64,174 | 64,177 | ||||||
Ford Credit Auto Lease Trust | 250,000 | 249,991 | ||||||
Harley-Davidson Motorcycle Trust | 238,359 | 238,458 | ||||||
Hyundai Auto Receivables Trust | 905,143 | 905,456 | ||||||
Mercedes-Benz Auto Receivables Trust | 354,189 | 354,048 | ||||||
Nissan Auto Receivables Owner Trust | 250,000 | 250,306 | ||||||
Santander Drive Auto Receivables Trust | 195,761 | 195,820 | ||||||
Toyota Auto Receivables Owner Trust | 425,000 | 425,942 | ||||||
World Omni Auto Receivables Trust | 478 | 478 | ||||||
|
| |||||||
| 2,787,884 | ||||||||
|
| |||||||
CREDIT CARD — 14.7% | ||||||||
American Express Credit Account Master Trust | 230,000 | 231,770 | ||||||
American Express Credit Account Secured Note Trust | 250,000 | 250,125 | ||||||
BA Credit Card Trust | 1,000,000 | 1,000,000 | ||||||
Barclays Dryrock Issuance Trust | 100,000 | 99,983 | ||||||
Cabela’s Credit Card Master Note Trust | 250,000 | 249,710 | ||||||
Capital One Multi-Asset Execution Trust | 250,000 | 250,318 | ||||||
Chase Issuance Trust: | ||||||||
Series 2007-A3, Class A3, | 500,000 | 513,350 | ||||||
Series 2013-A3, Class A3, | 150,000 | 149,783 | ||||||
Citibank Credit Card Issuance Trust: | ||||||||
Series 2013-A12, Class A12, | 200,000 | 200,047 | ||||||
Series 2013-A2, Class A2, | 420,000 | 420,087 | ||||||
Golden Credit Card Trust Series 2014-1A, Class A, 0.89%, 3/15/2019 (a) (b) | 175,000 | 174,761 | ||||||
|
| |||||||
| 3,539,934 | ||||||||
|
| |||||||
TOTAL ASSET-BACKED SECURITIES |
| |||||||
(Cost $7,216,142) | 7,218,007 | |||||||
|
| |||||||
CORPORATE BONDS & NOTES — 58.3% |
| |||||||
AEROSPACE & DEFENSE — 1.0% | ||||||||
Boeing Co. | 250,000 | 249,947 | ||||||
|
| |||||||
AUTO MANUFACTURERS — 6.4% | ||||||||
American Honda Finance Corp.: | ||||||||
Series MTN, 0.81%, 9/2/2016 (a) | 100,000 | 100,035 | ||||||
Series MTN, 0.97%, 12/11/2017 (a) | 187,000 | 186,854 | ||||||
Daimler Finance North America LLC: | ||||||||
0.99%, 3/2/2017 (a) (b) | 350,000 | 349,661 | ||||||
1.35%, 8/3/2017 (a) (b) | 150,000 | 150,099 | ||||||
Toyota Motor Credit Corp. | 750,000 | 749,062 | ||||||
|
| |||||||
| 1,535,711 | ||||||||
|
| |||||||
BANKS — 25.5% | ||||||||
Bank of America NA: | ||||||||
1.05%, 5/8/2017 (a) | 150,000 | 150,113 | ||||||
1.13%, 6/5/2017 (a) | 300,000 | 300,288 | ||||||
Bank of Nova Scotia | 400,000 | 403,180 | ||||||
Branch Banking & Trust Co. | 500,000 | 500,435 | ||||||
Canadian Imperial Bank of Commerce | 100,000 | 100,034 | ||||||
Commonwealth Bank of Australia | 200,000 | 199,200 | ||||||
Fifth Third Bank | 200,000 | 200,129 | ||||||
Goldman Sachs Group, Inc.: | ||||||||
1.66%, 10/23/2019 (a) | 500,000 | 496,950 | ||||||
Series 1, 1.84%, 4/30/2018 (a) | 100,000 | 100,450 | ||||||
JPMorgan Chase & Co.: | ||||||||
1.78%, 6/7/2021 (a) | 250,000 | 249,385 | ||||||
Series 1, 1.26%, 1/28/2019 (a) | 350,000 | 349,303 | ||||||
See accompanying notes to financial statements.
31
Table of Contents
SSGA Ultra Short Term Bond Portfolio
SCHEDULE OF INVESTMENTS (continued)
June 30, 2016
Security Description | Principal | Value | ||||||
Morgan Stanley: | ||||||||
1.49%, 1/24/2019 (a) | $ | 305,000 | $ | 304,680 | ||||
Series GMTN, 1.92%, 4/25/2018 (a) | 100,000 | 100,839 | ||||||
National Australia Bank, Ltd. | 250,000 | 249,537 | ||||||
Nederlandse Waterschapsbank NV | 200,000 | 200,054 | ||||||
Royal Bank of Canada: | ||||||||
Series GMTN, 0.90%, 6/16/2017 (a) | 120,000 | 119,771 | ||||||
Series GMTN, 1.18%, 3/15/2019 (a) | 250,000 | 248,630 | ||||||
Toronto-Dominion Bank: | ||||||||
1.09%, 7/2/2019 (a) | 500,000 | 495,790 | ||||||
Series MTN, 1.48%, 1/22/2019 (a) | 100,000 | 100,468 | ||||||
US Bank NA: | ||||||||
0.94%, 1/26/2018 (a) | 100,000 | 99,749 | ||||||
1.11%, 10/28/2019 (a) | 400,000 | 398,728 | ||||||
Series MTN, 1.22%, 1/29/2018 (a) | 100,000 | 100,233 | ||||||
Wells Fargo & Co.: | ||||||||
1.06%, 9/14/2018 (a) | 300,000 | 298,401 | ||||||
1.27%, 4/23/2018 (a) | 100,000 | 100,068 | ||||||
Wells Fargo Bank NA | 250,000 | 251,002 | ||||||
|
| |||||||
| 6,117,417 | ||||||||
|
| |||||||
BEVERAGES — 3.1% | ||||||||
Anheuser-Busch InBev Finance, Inc. | 500,000 | 498,409 | ||||||
PepsiCo, Inc. | 250,000 | 250,495 | ||||||
|
| |||||||
| 748,904 | ||||||||
|
| |||||||
HEALTH CARE PRODUCTS — 1.0% | ||||||||
Medtronic, Inc. | 250,000 | 249,896 | ||||||
|
| |||||||
INTERNET — 0.7% | ||||||||
eBay, Inc. | 160,000 | 157,227 | ||||||
|
| |||||||
IT SERVICES — 1.5% | ||||||||
Apple, Inc. | 150,000 | 150,060 | ||||||
International Business Machines Corp. | 205,000 | 204,844 | ||||||
|
| |||||||
| 354,904 | ||||||||
|
| |||||||
MACHINERY, CONSTRUCTION & MINING — 2.5% |
| |||||||
Caterpillar Financial Services Corp.: | ||||||||
Series GMTN, 0.83%, 6/9/2017 (a) | 200,000 | 199,994 | ||||||
Series MTN, 1.00%, 3/3/2017 | 400,000 | 400,288 | ||||||
|
| |||||||
| 600,282 | ||||||||
|
| |||||||
MACHINERY-DIVERSIFIED — 2.5% | ||||||||
John Deere Capital Corp.: | ||||||||
1.20%, 1/8/2019 (a) | 200,000 | 200,931 | ||||||
Series MTN, 0.87%, 12/15/2017 (a) | 200,000 | 199,790 | ||||||
Series MTN, 1.85%, 9/15/2016 | 200,000 | 200,460 | ||||||
|
| |||||||
| 601,181 | ||||||||
|
| |||||||
OIL & GAS — 6.6% | ||||||||
BP Capital Markets PLC | 500,000 | 497,816 | ||||||
Chevron Corp.: | ||||||||
0.99%, 11/9/2017 (a) | 250,000 | 249,970 | ||||||
1.14%, 11/16/2018 (a) | 250,000 | 248,954 | ||||||
ConocoPhillips Co. | 100,000 | 98,863 | ||||||
Shell International Finance B.V. | 250,000 | 250,255 | ||||||
Statoil ASA | 250,000 | 248,913 | ||||||
|
| |||||||
| 1,594,771 | ||||||||
|
| |||||||
PHARMACEUTICALS — 1.0% | ||||||||
Pfizer, Inc. | 250,000 | 250,045 | ||||||
|
| |||||||
RETAIL — 1.7% | ||||||||
Home Depot, Inc. | 150,000 | 150,404 | ||||||
Lowe’s Cos., Inc. | 250,000 | 250,407 | ||||||
|
| |||||||
| 400,811 | ||||||||
|
| |||||||
SEMICONDUCTORS — 0.6% | ||||||||
QUALCOMM, Inc. | 150,000 | 149,540 | ||||||
|
| |||||||
SOFTWARE — 2.1% | ||||||||
Oracle Corp. | 500,000 | 501,180 | ||||||
|
| |||||||
TELECOMMUNICATIONS — 1.7% | ||||||||
Cisco Systems, Inc.: | ||||||||
0.96%, 6/15/2018 (a) | 150,000 | 149,931 | ||||||
1.25%, 2/21/2018 (a) | 250,000 | 251,495 | ||||||
|
| |||||||
| 401,426 | ||||||||
|
| |||||||
TRANSPORTATION — 0.4% | ||||||||
Canadian National Railway Co. | 100,000 | 100,038 | ||||||
|
| |||||||
TOTAL CORPORATE BONDS & NOTES |
| |||||||
(Cost $14,023,761) | 14,013,280 | |||||||
|
| |||||||
U.S. TREASURY OBLIGATIONS — 11.3% |
| |||||||
Treasury Bill | 1,000,000 | 999,310 | ||||||
Treasury Notes: | ||||||||
0.63%, 5/31/2017 | 1,100,000 | 1,100,988 | ||||||
0.63%, 9/30/2017 | 300,000 | 300,281 | ||||||
0.88%, 3/31/2018 | 300,000 | 301,500 | ||||||
|
| |||||||
TOTAL U.S. TREASURY OBLIGATIONS | 2,702,079 | |||||||
|
| |||||||
Shares | ||||||||
SHORT-TERM INVESTMENT — 2.0% |
| |||||||
State Street Institutional Liquid Reserves Fund, Premier Class 0.47% (c) (d) | 483,761 | 483,761 | ||||||
|
| |||||||
TOTAL INVESTMENTS — 101.6% | 24,417,127 | |||||||
LIABILITIES IN EXCESS OF | (377,360 | ) | ||||||
|
| |||||||
NET ASSETS — 100.0% | $ | 24,039,767 | ||||||
|
| |||||||
See accompanying notes to financial statements.
32
Table of Contents
SSGA Ultra Short Term Bond Portfolio
SCHEDULE OF INVESTMENTS (continued)
June 30, 2016
| (a) | Variable Rate Security — Interest rate shown is rate in effect at June 30, 2016. |
| (b) | Securities purchased pursuant to Rule 144A of the Securities Act of 1933. These securities, which represent 7.9% of net assets as of June 30, 2016, are considered liquid and may be resold in transactions exempt from registration, normally to qualified institutional buyers. |
| (c) | The Fund invested in certain money market funds managed by SSGA Funds Management, Inc. Amounts related to these transactions during the year ended June 30, 2016 are shown in the Affiliate Table below. |
| (d) | The rate shown is the annualized seven-day yield at June 30, 2016. |
The following table summarizes the value of the Fund’s investments accordingly to the fair value hierarchy as of June 30, 2016.
Description | Level 1 — Quoted Prices | Level 2 — Other Significant Observable Inputs | Level 3 — Significant Unobservable Inputs | Total | ||||||||||||
ASSETS: | ||||||||||||||||
INVESTMENTS: | ||||||||||||||||
Asset-Backed Securities | ||||||||||||||||
Asset-Backed — Other | $ | — | $ | 890,189 | $ | — | $ | 890,189 | ||||||||
Automobile | — | 2,787,884 | — | 2,787,884 | ||||||||||||
Credit Card | — | 3,539,934 | — | 3,539,934 | ||||||||||||
Corporate Bonds & Notes | ||||||||||||||||
Aerospace & Defense | — | 249,947 | — | 249,947 | ||||||||||||
Auto Manufacturers | — | 1,535,711 | — | 1,535,711 | ||||||||||||
Banks | — | 6,117,417 | — | 6,117,417 | ||||||||||||
Beverages | — | 748,904 | — | 748,904 | ||||||||||||
Health Care Products | — | 249,896 | — | 249,896 | ||||||||||||
Internet | — | 157,227 | — | 157,227 | ||||||||||||
IT Services | — | 354,904 | — | 354,904 | ||||||||||||
Machinery, Construction & Mining | — | 600,282 | — | 600,282 | ||||||||||||
Machinery-Diversified | — | 601,181 | — | 601,181 | ||||||||||||
Oil & Gas | — | 1,594,771 | — | 1,594,771 | ||||||||||||
Pharmaceuticals | — | 250,045 | — | 250,045 | ||||||||||||
Retail | — | 400,811 | — | 400,811 | ||||||||||||
Semiconductors | — | 149,540 | — | 149,540 | ||||||||||||
Software | — | 501,180 | — | 501,180 | ||||||||||||
Telecommunications | — | 401,426 | — | 401,426 | ||||||||||||
Transportation | — | 100,038 | — | 100,038 | ||||||||||||
U.S. Treasury Obligations | — | 2,702,079 | — | 2,702,079 | ||||||||||||
Short-Term Investment | 483,761 | — | — | 483,761 | ||||||||||||
|
|
|
|
|
|
|
| |||||||||
TOTAL INVESTMENTS | $ | 483,761 | $ | 23,933,366 | $ | — | $ | 24,417,127 | ||||||||
|
|
|
|
|
|
|
| |||||||||
Affiliate Table
| Number of Shares Held at 6/30/15 | Value At 6/30/15 | Shares | Number of Shares Held at 6/30/16 | Value at 6/30/16 | Dividend Income | Realized Gain (Loss) | ||||||||||||||||||||||||||
| Purchased | Sold | |||||||||||||||||||||||||||||||
State Street Institutional Liquid Reserves Fund, Premier Class | 487,918 | $ | 487,918 | 171,008,642 | 171,012,799 | 483,761 | $ | 483,761 | $ | 3,498 | $ | — | ||||||||||||||||||||
See accompanying notes to financial statements.
33
Table of Contents
STATE STREET DOUBLELINE TOTAL RETURN TACTICAL PORTFOLIO
SPDR DoubleLine Total Return Tactical ETF is a feeder fund that invests substantially all of its investable assets in a master fund, the State Street DoubleLine Total Return Tactical Portfolio. The schedule of investments for the State Street DoubleLine Total Return Tactical Portfolio follows.
34
Table of Contents
State Street DoubleLine Total Return Tactical Portfolio
SCHEDULE OF INVESTMENTS
June 30, 2016
Security Description | Principal | Value | ||||||
ASSET-BACKED SECURITIES — 1.5% |
| |||||||
AVANT Loans Funding Trust | $ | 674,290 | $ | 677,096 | ||||
Octagon Investment Partners, Ltd.: | ||||||||
Series 2012-1AR, Class AR, | 2,006,488 | 2,000,462 | ||||||
Series 2016-1A, Class B, | 2,500,000 | 2,487,500 | ||||||
OneMain Financial Issuance Trust Series 2015-1A, Class A, | 24,000,000 | 24,247,166 | ||||||
TCI-Flatiron CLO, Ltd. | 2,500,000 | 2,487,500 | ||||||
Venture CLO, Ltd. Series 2015-20A, Class A, 2.12%, 4/15/2027 (a) (b) | 2,500,000 | 2,477,153 | ||||||
Westlake Automobile Receivables Trust | 2,500,000 | 2,509,571 | ||||||
Wind River CLO, Ltd. | 2,500,000 | 2,492,475 | ||||||
|
| |||||||
TOTAL ASSET-BACKED SECURITIES |
| |||||||
(Cost $39,069,353) | 39,378,923 | |||||||
|
| |||||||
CORPORATE BONDS & NOTES — 16.6% |
| |||||||
AUSTRALIA — 0.1% |
| |||||||
Westpac Banking Corp. | 2,570,000 | 2,647,129 | ||||||
|
| |||||||
BARBADOS — 0.0% (c) |
| |||||||
Columbus International, Inc. | 1,000,000 | 1,056,000 | ||||||
|
| |||||||
BELGIUM — 0.1% |
| |||||||
Anheuser-Busch InBev Finance, Inc. 2.65%, 2/1/2021 | 2,530,000 | 2,622,006 | ||||||
|
| |||||||
BERMUDA — 0.0% (c) |
| |||||||
Aircastle, Ltd. | 465,000 | 471,394 | ||||||
|
| |||||||
BRAZIL — 0.5% |
| |||||||
Banco do Brasil SA | 200,000 | 155,000 | ||||||
CIMPOR Financial Operations B.V. 5.75%, 7/17/2024 | 700,000 | 516,250 | ||||||
Cosan Overseas, Ltd. | 4,564,000 | 4,312,980 | ||||||
Eldorado Intl. Finance GmbH | 500,000 | 483,925 | ||||||
ESAL GmbH | 200,000 | 197,500 | ||||||
Globo Comunicacao e Participacoes SA | 700,000 | 707,000 | ||||||
GTL Trade Finance, Inc. | 250,000 | 220,425 | ||||||
JBS Investments GmbH | 400,000 | 419,500 | ||||||
JBS USA LLC/JBS USA Finance, Inc. | 974,000 | 1,008,090 | ||||||
Marfrig Holdings Europe B.V.: | ||||||||
6.88%, 6/24/2019 | 1,300,000 | 1,303,900 | ||||||
8.00%, 6/8/2023 (a) | 1,500,000 | 1,530,750 | ||||||
Marfrig Overseas, Ltd. | 250,000 | 257,120 | ||||||
Minerva Luxembourg SA | 1,650,000 | 1,658,250 | ||||||
|
| |||||||
| 12,770,690 | ||||||||
|
| |||||||
CANADA — 0.3% |
| |||||||
Lundin Mining Corp. | 875,000 | 887,578 | ||||||
Open Text Corp. | 590,000 | 594,425 | ||||||
Royal Bank of Canada | 2,750,000 | 2,815,608 | ||||||
Toronto-Dominion Bank | 2,725,000 | 2,767,133 | ||||||
|
| |||||||
| 7,064,744 | ||||||||
|
| |||||||
CAYMAN ISLANDS — 0.0% (c) |
| |||||||
Interoceanica IV Finance, Ltd. Zero Coupon, 11/30/2018 | 566,478 | 543,819 | ||||||
|
| |||||||
CHILE — 1.1% |
| |||||||
Banco de Credito e Inversiones | 1,500,000 | 1,578,323 | ||||||
Celulosa Arauco y Constitucion SA: | ||||||||
4.75%, 1/11/2022 | 1,500,000 | 1,599,375 | ||||||
5.00%, 1/21/2021 | 260,000 | 280,800 | ||||||
Colbun SA | 1,500,000 | 1,659,891 | ||||||
CorpGroup Banking SA | 2,750,000 | 2,564,375 | ||||||
Empresa Electrica Angamos SA 4.88%, 5/25/2029 | 4,000,000 | 3,929,512 | ||||||
Empresa Electrica Guacolda SA 4.56%, 4/30/2025 (a) | 900,000 | 836,414 | ||||||
GNL Quintero SA | 3,200,000 | 3,264,000 | ||||||
Guanay Finance, Ltd. | 4,340,306 | 4,307,754 | ||||||
Inversiones CMPC SA | 1,580,000 | 1,655,320 | ||||||
Itau CorpBanca | 1,300,000 | 1,362,153 | ||||||
Latam Airlines Group SA: | ||||||||
7.25%, 6/9/2020 (a) | 800,000 | 775,000 | ||||||
7.25%, 6/9/2020 | 700,000 | 678,125 | ||||||
Sociedad Quimica y Minera de Chile SA: | ||||||||
4.38%, 1/28/2025 | 2,000,000 | 1,940,000 | ||||||
5.50%, 4/21/2020 | 850,000 | 894,625 | ||||||
Tanner Servicios Financieros SA 4.38%, 3/13/2018 | 1,100,000 | 1,102,750 | ||||||
VTR Finance B.V. | 1,200,000 | 1,196,376 | ||||||
|
| |||||||
| 29,624,793 | ||||||||
|
| |||||||
See accompanying notes to financial statements.
35
Table of Contents
State Street DoubleLine Total Return Tactical Portfolio
SCHEDULE OF INVESTMENTS (continued)
June 30, 2016
Security Description | Principal | Value | ||||||
CHINA — 0.2% |
| |||||||
CNOOC Finance 2015 Australia Pty, Ltd. 2.63%, 5/5/2020 | $ | 1,500,000 | $ | 1,513,679 | ||||
CNPC General Capital, Ltd. | 500,000 | 509,477 | ||||||
Sinopec Group Overseas Development 2015, Ltd.: | ||||||||
2.50%, 4/28/2020 (a) | 500,000 | 505,393 | ||||||
2.50%, 4/28/2020 | 500,000 | 505,394 | ||||||
Tencent Holdings, Ltd. | 2,000,000 | 2,051,806 | ||||||
|
| |||||||
| 5,085,749 | ||||||||
|
| |||||||
COLOMBIA — 1.6% |
| |||||||
Avianca Holdings SA/Avianca Leasing LLC/Grupo Taca Holdings, Ltd. | 1,500,000 | 1,215,150 | ||||||
Banco Bilbao Vizcaya Argentaria Colombia SA | 2,900,000 | 2,871,000 | ||||||
Banco Davivienda SA | 1,600,000 | 1,636,000 | ||||||
Banco de Bogota SA: | ||||||||
5.38%, 2/19/2023 | 600,000 | 606,000 | ||||||
6.25%, 5/12/2026 | 600,000 | 610,500 | ||||||
6.25%, 5/12/2026 (a) | 3,200,000 | 3,256,000 | ||||||
Banco GNB Sudameris SA: | ||||||||
3.88%, 5/2/2018 | 2,600,000 | 2,554,500 | ||||||
7.50%, 7/30/2022 | 400,000 | 417,000 | ||||||
Bancolombia SA: | ||||||||
5.95%, 6/3/2021 | 1,000,000 | 1,092,500 | ||||||
6.13%, 7/26/2020 | 3,000,000 | 3,210,000 | ||||||
Ecopetrol SA: | ||||||||
5.88%, 5/28/2045 | 500,000 | 432,500 | ||||||
7.38%, 9/18/2043 | 2,000,000 | 1,997,500 | ||||||
Empresa de Energia de Bogota SA ESP | 3,000,000 | 3,123,750 | ||||||
Empresas Publicas de Medellin ESP 7.63%, 7/29/2019 | 600,000 | 690,000 | ||||||
Grupo Aval, Ltd. | 4,500,000 | 4,398,750 | ||||||
GrupoSura Finance SA: | ||||||||
5.50%, 4/29/2026 (a) | 1,400,000 | 1,459,500 | ||||||
5.70%, 5/18/2021 | 2,000,000 | 2,142,000 | ||||||
Oleoducto Central SA | 1,200,000 | 1,172,400 | ||||||
Pacific Exploration and Production Corp. | 400,000 | 74,000 | ||||||
SUAM Finance B.V. | 5,330,000 | 5,529,875 | ||||||
Transportadora de Gas Internacional SA ESP: | ||||||||
5.70%, 3/20/2022 | 3,000,000 | 3,127,500 | ||||||
5.70%, 3/20/2022 (a) | 200,000 | 208,500 | ||||||
|
| |||||||
| 41,824,925 | ||||||||
|
| |||||||
COSTA RICA — 0.1% |
| |||||||
Banco Nacional de Costa Rica: | ||||||||
4.88%, 11/1/2018 | 700,000 | 714,000 | ||||||
5.88%, 4/25/2021 (a) | 3,000,000 | 3,095,100 | ||||||
|
| |||||||
| 3,809,100 | ||||||||
|
| |||||||
DOMINICAN REPUBLIC — 0.2% |
| |||||||
Aeropuertos Dominicanos Siglo XXI SA 9.75%, 11/13/2019 | 400,000 | 426,000 | ||||||
AES Andres B.V./Dominican Power Partners/Empresa Generadora de Electricidad It | 2,200,000 | 2,288,000 | ||||||
Banco de Reservas de la Republica Dominicana: | ||||||||
7.00%, 2/1/2023 (a) | 1,200,000 | 1,188,000 | ||||||
7.00%, 2/1/2023 | 1,300,000 | 1,287,000 | ||||||
|
| |||||||
| 5,189,000 | ||||||||
|
| |||||||
GUATEMALA — 0.3% |
| |||||||
Agromercantil Senior Trust | 1,714,000 | 1,773,133 | ||||||
Cementos Progreso Trust | 1,100,000 | 1,166,000 | ||||||
Central American Bottling Corp. 6.75%, 2/9/2022 | 500,000 | 518,750 | ||||||
Comcel Trust via Comunicaciones Celulares SA 6.88%, 2/6/2024 | 4,000,000 | 3,900,000 | ||||||
Industrial Senior Trust | 1,900,000 | 1,862,000 | ||||||
|
| |||||||
| 9,219,883 | ||||||||
|
| |||||||
HONG KONG — 0.1% |
| |||||||
Hutchison Whampoa International 12 II, Ltd. 3.25%, 11/8/2022 | 1,500,000 | 1,581,566 | ||||||
Hutchison Whampoa International 12, Ltd. 6.00%, 5/29/2049 (b) | 2,000,000 | 2,060,000 | ||||||
|
| |||||||
| 3,641,566 | ||||||||
|
| |||||||
INDIA — 0.8% |
| |||||||
Adani Ports & Special Economic Zone, Ltd. 3.50%, 7/29/2020 | 4,000,000 | 3,978,516 | ||||||
Bharat Petroleum Corp., Ltd.: | ||||||||
4.00%, 5/8/2025 | 500,000 | 507,263 | ||||||
4.63%, 10/25/2022 | 600,000 | 647,280 | ||||||
Bharti Airtel, Ltd. | 3,700,000 | 3,877,704 | ||||||
Export-Import Bank of India | 700,000 | 710,166 | ||||||
ONGC Videsh, Ltd.: | ||||||||
3.25%, 7/15/2019 | 500,000 | 513,850 | ||||||
3.75%, 5/7/2023 | 3,800,000 | 3,880,225 | ||||||
4.63%, 7/15/2024 | 1,000,000 | 1,067,316 | ||||||
Reliance Holding USA, Inc. | 250,000 | 270,614 | ||||||
Reliance Industries, Ltd. | 3,500,000 | 3,556,700 | ||||||
Vedanta Resources PLC: | ||||||||
6.00%, 1/31/2019 | 500,000 | 426,875 | ||||||
8.25%, 6/7/2021 | 500,000 | 411,250 | ||||||
|
| |||||||
| 19,847,759 | ||||||||
|
| |||||||
See accompanying notes to financial statements.
36
Table of Contents
State Street DoubleLine Total Return Tactical Portfolio
SCHEDULE OF INVESTMENTS (continued)
June 30, 2016
Security Description | Principal | Value | ||||||
ISRAEL — 0.4% |
| |||||||
Delek & Avner Tamar Bond, Ltd.: | ||||||||
4.44%, 12/30/2020 (a) | $ | 3,000,000 | $ | 3,112,500 | ||||
5.41%, 12/30/2025 (a) | 2,000,000 | 2,070,000 | ||||||
Israel Electric Corp., Ltd.: | ||||||||
5.63%, 6/21/2018 | 3,800,000 | 4,024,200 | ||||||
Series 6, 5.00%, 11/12/2024 (a) | 700,000 | 747,250 | ||||||
|
| |||||||
| 9,953,950 | ||||||||
|
| |||||||
JAMAICA — 0.1% |
| |||||||
Digicel Group, Ltd.: | ||||||||
7.13%, 4/1/2022 | 3,300,000 | 2,437,875 | ||||||
8.25%, 9/30/2020 | 1,700,000 | 1,419,500 | ||||||
|
| |||||||
| 3,857,375 | ||||||||
|
| |||||||
MALAYSIA — 0.2% |
| |||||||
Axiata SPV2 Bhd Series 2, | 1,900,000 | 1,980,005 | ||||||
Petronas Global Sukuk, Ltd. | 4,200,000 | 4,247,473 | ||||||
|
| |||||||
| 6,227,478 | ||||||||
|
| |||||||
MEXICO — 1.5% |
| |||||||
Banco Mercantil del Norte SA | 650,000 | 648,375 | ||||||
Banco Nacional de Comercio Exterior SNC: | ||||||||
4.38%, 10/14/2025 (a) | 1,200,000 | 1,252,320 | ||||||
4.38%, 10/14/2025 | 2,700,000 | 2,817,720 | ||||||
Banco Santander Mexico SA | 4,250,000 | 4,462,500 | ||||||
Banco Santander Mexico SA Institucion de Banca Multiple Grupo Financiero Santand | 1,400,000 | 1,438,500 | ||||||
BBVA Bancomer SA: | ||||||||
5.35%, 11/12/2029 (b) | 980,000 | 967,750 | ||||||
6.01%, 5/17/2022 | 2,350,000 | 2,338,250 | ||||||
6.50%, 3/10/2021 | 2,496,000 | 2,739,360 | ||||||
Comision Federal de Electricidad: | ||||||||
4.88%, 5/26/2021 | 1,750,000 | 1,865,937 | ||||||
4.88%, 1/15/2024 | 2,000,000 | 2,092,500 | ||||||
6.13%, 6/16/2045 | 1,200,000 | 1,270,500 | ||||||
Credito Real SAB de CV SOFOM ER | 200,000 | 206,000 | ||||||
Fermaca Enterprises S de RL de CV 6.38%, 3/30/2038 | 2,610,657 | 2,597,604 | ||||||
Grupo Elektra SAB de CV | 900,000 | 888,750 | ||||||
Grupo Idesa SA de CV | 2,000,000 | 2,035,000 | ||||||
Grupo Posadas SAB de CV | 400,000 | 406,000 | ||||||
Mexico Generadora de Energia S de RL 5.50%, 12/6/2032 | 4,852,038 | 4,657,956 | ||||||
Petroleos Mexicanos: | ||||||||
5.50%, 1/21/2021 | 1,500,000 | 1,589,940 | ||||||
6.38%, 1/23/2045 | 2,000,000 | 2,007,762 | ||||||
6.63%, 9/29/2049 | 600,000 | 592,500 | ||||||
Sixsigma Networks Mexico SA de CV 8.25%, 11/7/2021 | 600,000 | 597,000 | ||||||
TV Azteca SAB de CV: | ||||||||
7.50%, 5/25/2018 | 600,000 | 400,500 | ||||||
7.63%, 9/18/2020 | 600,000 | 375,000 | ||||||
Unifin Financiera SAB de CV | 400,000 | 392,400 | ||||||
|
| |||||||
| 38,640,124 | ||||||||
|
| |||||||
NETHERLANDS — 0.2% |
| |||||||
Ajecorp B.V. | 150,000 | 60,375 | ||||||
Mylan NV | 1,360,000 | 1,380,609 | ||||||
NXP B.V./NXP Funding LLC | 900,000 | 918,000 | ||||||
Shell International Finance B.V. 1.38%, 5/10/2019 | 2,510,000 | 2,515,595 | ||||||
|
| |||||||
| 4,874,579 | ||||||||
|
| |||||||
NEW ZEALAND — 0.1% |
| |||||||
Reynolds Group Issuer, Inc./Reynolds Group Issuer LLC/Reynolds Group Issuer Lu 5.13%, 7/15/2023 (a) | 1,335,000 | 1,351,688 | ||||||
|
| |||||||
PANAMA — 0.5% |
| |||||||
Aeropuerto Internacional de Tocumen SA: | ||||||||
5.63%, 5/18/2036 (a) | 1,700,000 | 1,700,000 | ||||||
5.75%, 10/9/2023 | 2,600,000 | 2,717,000 | ||||||
ENA Norte Trust | 2,770,209 | 2,818,687 | ||||||
Global Bank Corp.: | ||||||||
4.75%, 10/5/2017 | 1,000,000 | 1,014,000 | ||||||
5.13%, 10/30/2019 | 4,300,000 | 4,439,750 | ||||||
5.13%, 10/30/2019 (a) | 200,000 | 206,500 | ||||||
|
| |||||||
| 12,895,937 | ||||||||
|
| |||||||
PARAGUAY — 0.2% |
| |||||||
Banco Continental SAECA | 2,000,000 | 2,030,000 | ||||||
Banco Regional SAECA | 550,000 | 576,813 | ||||||
Telefonica Celular del Paraguay SA 6.75%, 12/13/2022 | 1,500,000 | 1,507,500 | ||||||
|
| |||||||
| 4,114,313 | ||||||||
|
| |||||||
PERU — 0.8% |
| |||||||
Abengoa Transmision Sur SA: | ||||||||
6.88%, 4/30/2043 (a) | 1,000,000 | 1,040,000 | ||||||
6.88%, 4/30/2043 | 2,200,000 | 2,288,000 | ||||||
Banco Internacional del Peru SAA 6.63%, 3/19/2029 (b) | 2,000,000 | 2,122,500 | ||||||
BBVA Banco Continental SA | 225,000 | 232,987 | ||||||
Cia Minera Ares SAC | 1,000,000 | 1,038,750 | ||||||
Corp. Azucarera del Peru SA | 300,000 | 276,900 | ||||||
Corp. Financiera de Desarrollo SA: | ||||||||
4.75%, 2/8/2022 | 800,000 | 848,000 | ||||||
5.25%, 7/15/2029 (b) | 500,000 | 512,500 | ||||||
See accompanying notes to financial statements.
37
Table of Contents
State Street DoubleLine Total Return Tactical Portfolio
SCHEDULE OF INVESTMENTS (continued)
June 30, 2016
Security Description | Principal | Value | ||||||
Inkia Energy, Ltd.: | ||||||||
8.38%, 4/4/2021 (a) | $ | 200,000 | $ | 210,000 | ||||
8.38%, 4/4/2021 | 500,000 | 525,000 | ||||||
Intercorp Peru, Ltd. | 600,000 | 598,500 | ||||||
Lima Metro Line 2 Finance, Ltd. 5.88%, 7/5/2034 | 1,000,000 | 1,048,500 | ||||||
Minsur SA | 2,000,000 | 2,030,000 | ||||||
Peru Enhanced Pass-Through Finance, Ltd. | 1,600,000 | 1,251,824 | ||||||
Southern Copper Corp. | 4,000,000 | 3,765,000 | ||||||
Union Andina de Cementos SAA 5.88%, 10/30/2021 | 3,000,000 | 3,040,500 | ||||||
Volcan Cia Minera SAA | 1,800,000 | 1,611,000 | ||||||
|
| |||||||
| 22,439,961 | ||||||||
|
| |||||||
QATAR — 0.0% (c) |
| |||||||
Ras Laffan Liquefied Natural Gas Co., Ltd. II | 428,940 | 458,254 | ||||||
|
| |||||||
SINGAPORE — 0.6% | ||||||||
DBS Bank, Ltd. VRN, | 4,000,000 | 4,088,964 | ||||||
Oversea-Chinese Banking Corp., Ltd. 4.00%, 10/15/2024 (b) | 4,500,000 | 4,708,413 | ||||||
United Overseas Bank, Ltd.: | ||||||||
3.50%, 9/16/2026 (b) | 1,200,000 | 1,223,046 | ||||||
3.75%, 9/19/2024 (b) | 4,500,000 | 4,657,500 | ||||||
|
| |||||||
| 14,677,923 | ||||||||
|
| |||||||
TRINIDAD AND TOBAGO — 0.2% |
| |||||||
National Gas Co. of Trinidad & Tobango, Ltd. | 3,900,000 | 4,036,500 | ||||||
|
| |||||||
UNITED STATES — 6.4% |
| |||||||
21st Century Fox America, Inc. 3.00%, 9/15/2022 | 2,713,000 | 2,811,843 | ||||||
AbbVie, Inc. | 2,300,000 | 2,373,675 | ||||||
Actavis Funding SCS | 2,375,000 | 2,480,671 | ||||||
Activision Blizzard, Inc. | 1,318,000 | 1,374,015 | ||||||
Air Medical Merger Sub Corp. | 725,000 | 691,016 | ||||||
Amazon.com, Inc.: | ||||||||
2.60%, 12/5/2019 | 1,825,000 | 1,905,140 | ||||||
3.80%, 12/5/2024 | 485,000 | 543,013 | ||||||
American Axle & Manufacturing, Inc. | 1,415,000 | 1,508,673 | ||||||
American Express Credit Corp. | 2,350,000 | 2,372,083 | ||||||
Anthem, Inc. 3.30%, 1/15/2023 | 2,530,000 | 2,613,613 | ||||||
Apache Corp. | 670,000 | 678,532 | ||||||
Apple, Inc. | 2,280,000 | 2,456,192 | ||||||
AT&T, Inc.: | ||||||||
3.40%, 5/15/2025 | 1,990,000 | 2,029,680 | ||||||
4.13%, 2/17/2026 | 600,000 | 643,936 | ||||||
Bank of America Corp. | 2,933,000 | 2,952,770 | ||||||
BB&T Corp.: | ||||||||
2.05%, 5/10/2021 | 1,595,000 | 1,612,060 | ||||||
Series MTN, | 930,000 | 956,635 | ||||||
Berry Plastics Corp. | 1,325,000 | 1,358,125 | ||||||
Boston Properties L.P. | 2,225,000 | 2,361,746 | ||||||
Burlington Northern Santa Fe LLC 3.40%, 9/1/2024 | 2,476,000 | 2,686,238 | ||||||
Caterpillar, Inc. | 2,408,000 | 2,591,478 | ||||||
CCO Holdings LLC/CCO Holdings Capital Corp.: | ||||||||
5.13%, 5/1/2023 (a) | 250,000 | 251,250 | ||||||
5.25%, 9/30/2022 | 1,350,000 | 1,382,130 | ||||||
Centene Corp.: | ||||||||
4.75%, 5/15/2022 | 325,000 | 331,500 | ||||||
5.63%, 2/15/2021 (a) | 900,000 | 936,540 | ||||||
Cequel Communications Holdings I LLC/Cequel Capital Corp. | 1,355,000 | 1,375,189 | ||||||
Chevron Corp.: | ||||||||
1.56%, 5/16/2019 | 905,000 | 910,231 | ||||||
1.79%, 11/16/2018 | 496,000 | 501,993 | ||||||
Cisco Systems, Inc. | 2,320,000 | 2,471,808 | ||||||
Citigroup, Inc. | 2,735,000 | 2,796,012 | ||||||
Comcast Corp. | 2,078,000 | 2,333,761 | ||||||
CommScope, Inc. | 1,010,000 | 1,029,796 | ||||||
CSC Holdings LLC | 607,000 | 619,140 | ||||||
Dollar Tree, Inc. | 1,295,000 | 1,375,937 | ||||||
Duke Energy Corp. | 2,610,000 | 2,807,919 | ||||||
Eli Lilly & Co. | 2,585,000 | 2,732,011 | ||||||
Energy Transfer Partners L.P.: | ||||||||
4.75%, 1/15/2026 | 1,975,000 | 2,032,714 | ||||||
5.20%, 2/1/2022 | 1,075,000 | 1,112,625 | ||||||
Enterprise Products Operating LLC 3.75%, 2/15/2025 | 1,895,000 | 1,964,770 | ||||||
Equinix, Inc. | 1,565,000 | 1,611,950 | ||||||
ESH Hospitality, Inc. | 1,405,000 | 1,368,189 | ||||||
First Data Corp. | 1,350,000 | 1,328,906 | ||||||
See accompanying notes to financial statements.
38
Table of Contents
State Street DoubleLine Total Return Tactical Portfolio
SCHEDULE OF INVESTMENTS (continued)
June 30, 2016
Security Description | Principal | Value | ||||||
Freeport-McMoRan, Inc.: | ||||||||
3.88%, 3/15/2023 | $ | 800,000 | $ | 698,000 | ||||
4.00%, 11/14/2021 | 700,000 | 630,630 | ||||||
5.45%, 3/15/2043 | 300,000 | 240,750 | ||||||
Frontier Communications Corp. 10.50%, 9/15/2022 | 845,000 | 895,700 | ||||||
Gates Global LLC/Gates Global Co. | 866,000 | 764,245 | ||||||
General Motors Financial Co., Inc.: | ||||||||
3.20%, 7/13/2020 | 970,000 | 980,254 | ||||||
4.20%, 3/1/2021 | 1,295,000 | 1,351,462 | ||||||
Georgia-Pacific LLC | 2,388,000 | 2,554,133 | ||||||
Goldman Sachs Group, Inc. | 2,575,000 | 2,640,517 | ||||||
Goodyear Tire & Rubber Co. | 1,270,000 | 1,311,275 | ||||||
HCA, Inc. | 1,585,000 | 1,653,353 | ||||||
HD Supply, Inc. | 845,000 | 882,941 | ||||||
Hewlett Packard Enterprise Co. 3.60%, 10/15/2020 (a) | 2,665,000 | 2,775,353 | ||||||
Home Depot, Inc.: | ||||||||
3.00%, 4/1/2026 | 1,677,000 | 1,781,884 | ||||||
3.35%, 9/15/2025 | 836,000 | 913,453 | ||||||
Iron Mountain, Inc. | 940,000 | 946,486 | ||||||
JPMorgan Chase & Co. | 2,355,000 | 2,387,790 | ||||||
Kindred Healthcare, Inc. | 1,440,000 | 1,438,200 | ||||||
Kraft Heinz Foods Co. | 2,490,000 | 2,583,371 | ||||||
Laboratory Corp. of America Holdings 3.60%, 2/1/2025 | 2,500,000 | 2,592,263 | ||||||
Lam Research Corp.: | ||||||||
2.80%, 6/15/2021 | 112,000 | 114,906 | ||||||
3.45%, 6/15/2023 | 337,000 | 347,361 | ||||||
Level 3 Communications, Inc. | 1,346,000 | 1,362,825 | ||||||
Levi Strauss & Co. | 895,000 | 897,238 | ||||||
LifePoint Health, Inc. | 1,015,000 | 1,020,075 | ||||||
Memorial Production Partners L.P./Memorial Production Finance Corp. | 1,495,000 | 747,500 | ||||||
MetLife, Inc. | 2,675,000 | 2,811,219 | ||||||
MGM Growth Properties Operating Partnership L.P./MGP Escrow Co-Issuer, Inc. 5.63%, 5/1/2024 (a) | 170,000 | 179,350 | ||||||
Morgan Stanley: | ||||||||
2.50%, 4/21/2021 | 1,015,000 | 1,024,402 | ||||||
2.65%, 1/27/2020 | 1,750,000 | 1,785,070 | ||||||
MPLX L.P. | 1,195,000 | 1,200,975 | ||||||
National Rural Utilities Cooperative Finance Corp. 2.30%, 11/1/2020 | 2,310,000 | 2,374,738 | ||||||
NCL Corp., Ltd. | 1,330,000 | 1,343,300 | ||||||
NRG Energy, Inc. | 625,000 | 607,813 | ||||||
Oracle Corp.: | ||||||||
2.25%, 10/8/2019 | 2,250,000 | 2,317,807 | ||||||
2.38%, 1/15/2019 | 380,000 | 391,564 | ||||||
Outfront Media Capital LLC/Outfront Media Capital Corp. | 1,570,000 | 1,593,550 | ||||||
Prime Security Services Borrower LLC/Prime Finance, Inc. | 865,000 | 916,900 | ||||||
Quintiles Transnational Corp. | 1,565,000 | 1,593,366 | ||||||
Regal Entertainment Group | 1,430,000 | 1,465,750 | ||||||
Revlon Consumer Products Corp. 5.75%, 2/15/2021 | 715,000 | 693,550 | ||||||
Reynolds American, Inc. | 2,490,000 | 2,703,088 | ||||||
Sabre GLBL, Inc. | 1,155,000 | 1,179,544 | ||||||
Sally Holdings LLC/Sally Capital, Inc. | 1,299,000 | 1,350,960 | ||||||
SBA Communications Corp. | 1,305,000 | 1,349,044 | ||||||
Scientific Games International, Inc. 7.00%, 1/1/2022 (a) | 1,335,000 | 1,345,012 | ||||||
Select Medical Corp. | 1,515,000 | 1,440,197 | ||||||
Signode Industrial Group Lux SA/Signode Industrial Group US, Inc. | 630,000 | 601,650 | ||||||
Simon Property Group L.P. | 1,590,000 | 1,797,408 | ||||||
Sinclair Television Group, Inc. | 1,340,000 | 1,372,662 | ||||||
Sirius XM Radio, Inc. | 500,000 | 495,000 | ||||||
Southern Co. 2.45%, 9/1/2018 | 2,505,000 | 2,562,987 | ||||||
Spectrum Brands, Inc. | 862,000 | 913,720 | ||||||
Station Casinos LLC | 1,265,000 | 1,339,382 | ||||||
Thermo Fisher Scientific, Inc. | 2,310,000 | 2,392,197 | ||||||
TIAA Asset Management Finance Co. LLC | 2,275,000 | 2,389,876 | ||||||
Time Warner, Inc. | 1,680,000 | 1,860,202 | ||||||
TransDigm, Inc. | 1,450,000 | 1,457,540 | ||||||
TreeHouse Foods, Inc. | 275,000 | 291,500 | ||||||
See accompanying notes to financial statements.
39
Table of Contents
State Street DoubleLine Total Return Tactical Portfolio
SCHEDULE OF INVESTMENTS (continued)
June 30, 2016
Security Description | Principal | Value | ||||||
Tribune Media Co. | $ | 1,190,000 | $ | 1,184,050 | ||||
Tyson Foods, Inc. | 2,430,000 | 2,621,881 | ||||||
United Technologies Corp. | 2,730,000 | 2,899,118 | ||||||
Universal Health Services, Inc. | 1,175,000 | 1,195,116 | ||||||
Verizon Communications, Inc. | 2,425,000 | 2,575,128 | ||||||
Viking Cruises, Ltd. | 1,095,000 | 933,487 | ||||||
Waste Management, Inc. | 1,955,000 | 2,048,087 | ||||||
Wells Fargo & Co.: | ||||||||
3.00%, 4/22/2026 | 1,410,000 | 1,433,485 | ||||||
Series MTN, 3.55%, 9/29/2025 | 1,450,000 | 1,541,118 | ||||||
|
| |||||||
| 168,360,263 | ||||||||
|
| |||||||
TOTAL CORPORATE BONDS & NOTES |
| |||||||
(Cost $428,494,467) | 437,306,902 | |||||||
|
| |||||||
FOREIGN GOVERNMENT OBLIGATIONS — 0.3% |
| |||||||
COSTA RICA — 0.1% |
| |||||||
Banco de Costa Rica | 850,000 | 868,062 | ||||||
Instituto Costarricense de Electricidad | 1,200,000 | 1,242,000 | ||||||
|
| |||||||
| 2,110,062 | ||||||||
|
| |||||||
MEXICO — 0.1% |
| |||||||
Mexico Government International Bond | 2,236,000 | 2,290,782 | ||||||
|
| |||||||
PANAMA — 0.1% |
| |||||||
Banco Latinoamericano de Comercio Exterior SA: | ||||||||
3.25%, 5/7/2020 (a) | 1,500,000 | 1,507,500 | ||||||
3.25%, 5/7/2020 | 2,800,000 | 2,814,000 | ||||||
|
| |||||||
| 4,321,500 | ||||||||
|
| |||||||
TOTAL FOREIGN GOVERNMENT OBLIGATIONS | 8,722,344 | |||||||
|
| |||||||
SENIOR FLOATING RATE LOANS — 4.0% |
| |||||||
AEROSPACE & DEFENSE — 0.1% |
| |||||||
BE Aerospace, Inc. Senior Secured Term Loan B, | 1,204,357 | 1,209,928 | ||||||
TransDigm, Inc.: | ||||||||
Senior Secured Delayed Draw Term Loan F, | 304,105 | 300,240 | ||||||
Senior Secured Term Loan F, 3.75%, 6/9/2023 | 337,895 | 333,600 | ||||||
|
| |||||||
| 1,843,768 | ||||||||
|
| |||||||
AUTO COMPONENTS — 0.0% (c) |
| |||||||
Federal-Mogul Holdings Corp. | 330,761 | 308,124 | ||||||
|
| |||||||
BEVERAGES — 0.0% (c) |
| |||||||
Maple Holdings Acquisition Corp. Senior Secured Term Loan B, 5.25%, 3/3/2023 | 575,000 | 576,437 | ||||||
|
| |||||||
BUILDING PRODUCTS — 0.0% (c) |
| |||||||
Jeld-Wen, Inc. | 1,177,521 | 1,176,785 | ||||||
|
| |||||||
CAPITAL MARKETS — 0.0% (c) |
| |||||||
Guggenheim Partners LLC | 1,005,872 | 1,005,716 | ||||||
|
| |||||||
CHEMICALS — 0.2% |
| |||||||
Avantor Performance Materials Holdings, Inc. | 1,200,000 | 1,193,250 | ||||||
Huntsman International, LLC | 1,172,200 | 1,174,761 | ||||||
Klockner-Pentaplast of America, Inc. Senior Secured Term Loan, | 829,289 | 832,055 | ||||||
PolyOne Corporation | 1,099,482 | 1,099,482 | ||||||
PQ Corporation | 1,180,000 | 1,182,289 | ||||||
|
| |||||||
| 5,481,837 | ||||||||
|
| |||||||
COMMERCIAL SERVICES & SUPPLIES — 0.3% |
| |||||||
Allied Security Holdings LLC | 1,151,262 | 1,148,384 | ||||||
Asurion LLC: | ||||||||
Senior Secured Term Loan B1, 5.00%, 5/24/2019 | 716,654 | 714,267 | ||||||
Senior Secured Term Loan B4, 5.00%, 8/4/2022 | 641,901 | 634,359 | ||||||
Dealer Tire, LLC Senior Secured Term Loan B, | 1,196,193 | 1,202,174 | ||||||
KAR Auction Services, Inc. | 1,180,130 | 1,185,535 | ||||||
Prime Security Services Borrower LLC | 1,115,397 | 1,118,325 | ||||||
USAGM HoldCo LLC | 1,218,875 | 1,179,262 | ||||||
|
| |||||||
| 7,182,306 | ||||||||
|
| |||||||
See accompanying notes to financial statements.
40
Table of Contents
State Street DoubleLine Total Return Tactical Portfolio
SCHEDULE OF INVESTMENTS (continued)
June 30, 2016
Security Description | Principal | Value | ||||||
CONSTRUCTION & ENGINEERING — 0.0%(c) |
| |||||||
Summit Materials Cos., I LLC | $ | 1,180,836 | $ | 1,176,408 | ||||
|
| |||||||
CONTAINERS & PACKAGING — 0.2% |
| |||||||
Ardagh Holdings USA, Inc. Senior Secured Incremental Term Loan, | 1,177,139 | 1,177,139 | ||||||
Berry Plastics Holding Corporation Senior Secured Term Loan H, | 1,159,838 | 1,152,508 | ||||||
KP Germany Erste GmbH Senior Secured 1st Lien Term Loan, 5.00%, 4/28/2020 | 354,397 | 355,579 | ||||||
Reynolds Group Holdings, Inc. | 1,209,671 | 1,211,425 | ||||||
|
| |||||||
| 3,896,651 | ||||||||
|
| |||||||
DIVERSIFIED CONSUMER SERVICES — 0.0% (c) |
| |||||||
Nord Anglia Education Finance LLC Senior Secured Term Loan, | 1,188,032 | 1,184,325 | ||||||
|
| |||||||
DIVERSIFIED FINANCIAL SERVICES — 0.1% |
| |||||||
AlixPartners LLP | 1,207,396 | 1,207,697 | ||||||
|
| |||||||
DIVERSIFIED TELECOMMUNICATION SERVICES — 0.1% |
| |||||||
Level 3 Financing, Inc. | 1,160,000 | 1,157,535 | ||||||
Virgin Media Investment Holdings, Ltd. | 1,155,000 | 1,128,556 | ||||||
|
| |||||||
| 2,286,091 | ||||||||
|
| |||||||
ELECTRIC UTILITIES — 0.1% |
| |||||||
EFS Cogen Holdings I LLC | 946,000 | 949,548 | ||||||
Southeast PowerGen LLC | 850,030 | 822,404 | ||||||
|
| |||||||
| 1,771,952 | ||||||||
|
| |||||||
FOOD & STAPLES RETAILING — 0.1% |
| |||||||
Albertsons LLC | 1,212,831 | 1,213,377 | ||||||
|
| |||||||
FOOD PRODUCTS — 0.3% |
| |||||||
AdvancePierre Foods, Inc. | 1,214,000 | 1,212,482 | ||||||
B&G Foods, Inc. | 1,202,015 | 1,206,522 | ||||||
Candy Intermediate Holdings, Inc. Senior Secured Term Loan, | 1,221,000 | 1,221,763 | ||||||
CSM Bakery Solutions LLC | 1,209,833 | 1,196,525 | ||||||
Hostess Brands LLC | 1,177,171 | 1,178,054 | ||||||
Pinnacle Foods Finance LLC | 1,164,586 | 1,171,784 | ||||||
|
| |||||||
| 7,187,130 | ||||||||
|
| |||||||
HEALTH CARE EQUIPMENT & SUPPLIES — 0.0% (c) |
| |||||||
National Vision, Inc. | 1,184,362 | 1,153,273 | ||||||
|
| |||||||
HEALTH CARE PROVIDERS & SERVICES — 0.4% |
| |||||||
Acadia Healthcare Co., Inc. | 1,199,549 | 1,190,301 | ||||||
American Renal Holdings, Inc. | 1,207,290 | 1,206,161 | ||||||
CHG Healthcare Services, Inc. | 1,218,015 | 1,219,921 | ||||||
Envision Healthcare Corp. | 1,164,487 | 1,165,506 | ||||||
MPH Acquisition Holdings LLC Senior Secured Term Loan B, 5.00%, 6/7/2023 | 1,210,000 | 1,214,840 | ||||||
Surgery Center Holdings, Inc. | 1,186,820 | 1,183,853 | ||||||
U.S. Renal Care, Inc. | 1,195,075 | 1,195,081 | ||||||
Vizient, Inc. | 1,177,500 | 1,187,803 | ||||||
|
| |||||||
| 9,563,466 | ||||||||
|
| |||||||
HOTELS, RESTAURANTS & LEISURE — 0.3% |
| |||||||
Burger King 1011778 B.C. Unlimited Liability Co. | 1,201,157 | 1,201,157 | ||||||
Eldorado Resorts LLC | 1,200,999 | 1,205,503 | ||||||
Four Seasons Holdings, Inc. | 1,151,303 | 1,144,591 | ||||||
LTF Merger Sub, Inc. | 1,199,523 | 1,172,533 | ||||||
MGM Growth Prop. Operating Partnership L.P. | 1,146,128 | 1,150,070 | ||||||
See accompanying notes to financial statements.
41
Table of Contents
State Street DoubleLine Total Return Tactical Portfolio
SCHEDULE OF INVESTMENTS (continued)
June 30, 2016
Security Description | Principal | Value | ||||||
Scientific Games International, Inc. Senior Secured Term Loan B2, | $ | 1,169,412 | $ | 1,154,940 | ||||
Travelport Finance (Luxembourg) S.A.R.L. | 20,000 | 19,919 | ||||||
Yum! Brands Inc. | 1,210,000 | 1,213,025 | ||||||
|
| |||||||
| 8,261,738 | ||||||||
|
| |||||||
HOUSEHOLD DURABLES — 0.1% |
| |||||||
Serta Simmons Holdings LLC | 1,185,000 | 1,185,492 | ||||||
Spin Holdco, Inc. | 1,205,747 | 1,185,147 | ||||||
|
| |||||||
| 2,370,639 | ||||||||
|
| |||||||
HOUSEHOLD PRODUCTS — 0.1% |
| |||||||
KIK Custom Products, Inc. | 1,132,283 | 1,118,736 | ||||||
Samsonite International SA | 1,306,000 | 1,313,999 | ||||||
|
| |||||||
| 2,432,735 | ||||||||
|
| |||||||
INSURANCE — 0.0% (c) |
| |||||||
York Risk Services Holding Corp. Senior Secured Term Loan B, 4.75%, 10/1/2021 | 1,022,762 | 905,145 | ||||||
|
| |||||||
INTERNET SOFTWARE & SERVICES — 0.1% |
| |||||||
Match Group Inc. | 1,206,250 | 1,214,796 | ||||||
|
| |||||||
IT SERVICES — 0.1% |
| |||||||
First Data Corp. | 1,157,611 | 1,155,684 | ||||||
Global Payments, Inc. | 1,208,000 | 1,217,664 | ||||||
|
| |||||||
| 2,373,348 | ||||||||
|
| |||||||
LIFE SCIENCES TOOLS & SERVICES — 0.0% (c) |
| |||||||
Jaguar Holding Company II | 1,156,636 | 1,147,238 | ||||||
|
| |||||||
MACHINERY — 0.0% (c) |
| |||||||
Filtration Group Corp. | 1,162,858 | 1,158,131 | ||||||
|
| |||||||
MEDIA — 0.4% |
| |||||||
Charter Communications Operating LLC Senior Secured Term Loan I, | 1,207,063 | 1,209,893 | ||||||
Emerald Expositions Holding, Inc. Senior Secured Term Loan B, 4.75%, 6/17/2020 | 1,061,291 | 1,059,635 | ||||||
Live Nation Entertainment, Inc. | 1,172,274 | 1,174,472 | ||||||
McGraw-Hill Global Education Holdings LLC | 857,000 | 857,214 | ||||||
MGOC, Inc. | 1,181,508 | 1,182,247 | ||||||
Neptune Finco Corp. | 1,165,000 | 1,169,078 | ||||||
Tribune Media Co. | 1,209,359 | 1,208,603 | ||||||
Univision Communications, Inc. Senior Secured Term Loan C3, 4.00%, 3/1/2020 | 1,185,814 | 1,180,134 | ||||||
Yankee Cable Acquisition LLC | 494,044 | 494,352 | ||||||
|
| |||||||
| 9,535,628 | ||||||||
|
| |||||||
MULTILINE RETAIL — 0.1% |
| |||||||
Dollar Tree, Inc. | 1,205,936 | 1,207,943 | ||||||
|
| |||||||
OIL, GAS & CONSUMABLE FUELS — 0.0% (c) |
| |||||||
Energy Transfer Equity, L.P. | 356,000 | 344,939 | ||||||
|
| |||||||
PERSONAL PRODUCTS — 0.1% |
| |||||||
Galleria Co. | 1,180,000 | 1,180,732 | ||||||
NBTY, Inc. | 1,151,000 | 1,144,013 | ||||||
|
| |||||||
| 2,324,745 | ||||||||
|
| |||||||
PHARMACEUTICALS — 0.0% (c) |
| |||||||
Endo Luxembourg Finance Company I S.A.R.L. Senior Secured Term Loan B, 3.75%, 9/26/2022 | 1,214,325 | 1,197,324 | ||||||
|
| |||||||
PROFESSIONAL SERVICES — 0.0% (c) |
| |||||||
TransUnion LLC Senior Secured Term Loan B2, 3.50%, 4/9/2021 | 1,160,998 | 1,148,848 | ||||||
|
| |||||||
REAL ESTATE INVESTMENT TRUSTS (REITS) — 0.0% (c) |
| |||||||
Capital Automotive L.P. Senior Secured Term Loan B, | 1,198,627 | 1,202,199 | ||||||
|
| |||||||
REAL ESTATE MANAGEMENT & DEVELOPMENT — 0.0% (c) |
| |||||||
Americold Realty Operating Partnership, L.P. Senior Secured Term Loan B, 1.00%, 12/1/2022 | 249,000 | 250,556 | ||||||
|
| |||||||
See accompanying notes to financial statements.
42
Table of Contents
State Street DoubleLine Total Return Tactical Portfolio
SCHEDULE OF INVESTMENTS (continued)
June 30, 2016
Security Description | Principal | Value | ||||||
ROAD & RAIL — 0.1% |
| |||||||
Hertz Corp. Senior Secured Term Loan B, 1.00%, 6/30/2023 | $ | 1,210,000 | $ | 1,210,756 | ||||
PODS LLC Senior Secured 1st Lien Term Loan, 4.50%, 2/2/2022 | 1,200,680 | 1,194,677 | ||||||
|
| |||||||
| 2,405,433 | ||||||||
|
| |||||||
SEMICONDUCTORS & SEMICONDUCTOR |
| |||||||
Avago Technologies Cayman, Ltd. Senior Secured Term Loan B1, 4.25%, 2/1/2023 | 1,207,113 | 1,210,040 | ||||||
Microsemi Corp. Senior Secured Term Loan B, 3.75%, 1/15/2023 | 967,894 | 967,492 | ||||||
NXP B.V. | 1,203,254 | 1,207,297 | ||||||
ON Semiconductor Corp. | 1,180,000 | 1,186,761 | ||||||
|
| |||||||
| 4,571,590 | ||||||||
|
| |||||||
SOFTWARE — 0.2% |
| |||||||
Cengage Learning Acquisitions, Inc. Senior Secured Term Loan B, 1.00%, 6/7/2023 | 844,000 | 835,560 | ||||||
Cision US Inc. | 1,000,000 | 955,940 | ||||||
Mitchell International, Inc. | 280,000 | 260,634 | ||||||
SolarWinds Holdings, Inc. | 1,180,000 | 1,177,787 | ||||||
Sophia L.P. | 1,182,358 | 1,170,535 | ||||||
Vertafore, Inc. | 1,204,000 | 1,201,369 | ||||||
|
| |||||||
| 5,601,825 | ||||||||
|
| |||||||
SPECIALTY RETAIL — 0.1% |
| |||||||
Michaels Stores, Inc. | 1,185,728 | 1,187,768 | ||||||
Party City Holdings, Inc. | 1,177,547 | 1,171,659 | ||||||
|
| |||||||
| 2,359,427 | ||||||||
|
| |||||||
TECHNOLOGY HARDWARE, STORAGE & |
| |||||||
Dell, Inc.: | ||||||||
Senior Secured Term Loan B, 1.00%, 5/24/2023 | 1,212,000 | 1,209,346 | ||||||
Senior Secured Term Loan B2, 4.00%, 4/29/2020 | 1,132,688 | 1,130,740 | ||||||
|
| |||||||
| 2,340,086 | ||||||||
|
| |||||||
TRADING COMPANIES & DISTRIBUTORS — 0.1% |
| |||||||
Beacon Roofing Supply, Inc. | 1,140,194 | 1,141,859 | ||||||
Solenis International LP | 494,716 | 490,389 | ||||||
Univar, Inc. | 1,192,558 | 1,177,651 | ||||||
|
| |||||||
| 2,809,899 | ||||||||
|
| |||||||
WIRELESS TELECOMMUNICATION SERVICES — 0.0% (c) |
| |||||||
T-Mobile USA, Inc. | 1,149,412 | 1,154,625 | ||||||
|
| |||||||
TOTAL SENIOR FLOATING RATE LOANS |
| |||||||
(Cost $106,588,901) | 106,534,180 | |||||||
|
| |||||||
COMMERCIAL MORTGAGE BACKED SECURITIES — 17.0% |
| |||||||
A10 Securitization LLC: | ||||||||
Series 2016-1, Class 2A3, CMO, 3.00%, 12/20/2030 (a) (b) | 4,486,800 | 4,591,608 | ||||||
Series 2016-1, Class A1, | 2,487,000 | 2,508,486 | ||||||
Ajax Mortgage Loan Trust | 7,461,391 | 7,385,831 | ||||||
ALM, Ltd. | 2,500,000 | 2,471,973 | ||||||
Alternative Loan Trust: | ||||||||
Series 2005-79CB, Class A4, 5.50%, 1/25/2036 | 12,601,472 | 10,369,783 | ||||||
Series 2006-24CB, Class A9, 6.00%, 6/25/2036 | 6,138,369 | 4,838,718 | ||||||
Series 2007-11T1, Class A21, 6.00%, 5/25/2037 | 2,460,598 | 1,890,013 | ||||||
Series 2007-14T2, Class A1, CMO, 6.00%, 7/25/2037 | 27,813,671 | 17,993,159 | ||||||
Apidos CLO | 1,250,000 | 1,231,258 | ||||||
Atrium | 1,000,000 | 960,979 | ||||||
AVANT Loans Funding Trust | 1,521,074 | 1,526,783 | ||||||
BAMLL Commercial Mortgage Securities Trust | 30,000,000 | 925,500 | ||||||
BAMLL Re-REMIC Trust | 550,000 | 551,305 | ||||||
See accompanying notes to financial statements.
43
Table of Contents
State Street DoubleLine Total Return Tactical Portfolio
SCHEDULE OF INVESTMENTS (continued)
June 30, 2016
Security Description | Principal | Value | ||||||
Banc of America Alternative Loan Trust: | ||||||||
Series 2005-7, Class 2CB1, | $ | 13,844,752 | $ | 13,183,040 | ||||
Series 2005-9, Class 1CB2, CMO, | 8,176,827 | 7,351,336 | ||||||
Banc of America Commercial Mortgage Trust: | ||||||||
Series 2006-6, Class AM, | 500,000 | 504,086 | ||||||
Series 2015-UBS7, Class C, | 945,000 | 930,487 | ||||||
Banc of America Funding Trust: | ||||||||
Series 2005-5, Class 2A1, | 1,930,513 | 2,005,653 | ||||||
Series 2006-8T2, Class A4, | 6,568,140 | 5,334,085 | ||||||
Series 2007-5, Class CA1, | 9,030,454 | 6,822,297 | ||||||
Series 2010-R5, Class 1A3, | 5,838,321 | 5,050,286 | ||||||
BBCMS Trust | 1,750,000 | 1,759,343 | ||||||
BCAP LLC Trust | 6,908,673 | 6,139,984 | ||||||
Bear Stearns ALTA Trust | 5,075,299 | 3,521,730 | ||||||
BlueMountain CLO, Ltd.: | ||||||||
Series 2012-1A, Class A, | 2,500,000 | 2,478,520 | ||||||
Series 2012-2A, Class A1, | 2,500,000 | 2,501,917 | ||||||
Series 2013-4A, Class A, | 2,500,000 | 2,494,082 | ||||||
Series 2015-1A, Class A2, | 1,800,000 | 1,765,768 | ||||||
Series 2015-2A, Class D, | 750,000 | 696,656 | ||||||
Series 2015-3A, Class A1, | 2,500,000 | 2,476,240 | ||||||
Series 2015-3A, Class B, | 2,500,000 | 2,479,887 | ||||||
Series 2015-3A, Class C, | 2,500,000 | 2,335,425 | ||||||
BXHTL Mortgage Trust | 1,500,000 | 1,494,934 | ||||||
Carlyle Global Market Strategies CLO, Ltd. | 2,500,000 | 2,496,240 | ||||||
CD Mortgage Trust: | ||||||||
Series 2007-CD4, Class AMFX, 5.37%, 12/11/2049 (b) | 2,542,000 | 2,585,668 | ||||||
Series 2007-CD5, Class AJA, | 800,000 | 821,766 | ||||||
CFCRE Commercial Mortgage Trust: | ||||||||
Series 2016-C3, Class XA, IO, | 25,084,671 | 1,940,370 | ||||||
Series 2016-C4, Class XA, IO, | 19,947,176 | 2,490,704 | ||||||
CGGS Commercial Mortgage Trust | 2,289,000 | 2,312,069 | ||||||
CHL Mortgage PassThrough Trust: | ||||||||
Series 2005-HYB8, Class 4A1, | 15,498,998 | 12,075,341 | ||||||
Series 2005-J2, Class 3A14, | 1,982,903 | 1,752,075 | ||||||
Series 2007-12, Class A9, CMO, | 6,819,098 | 5,908,145 | ||||||
Series 2007-HY1, Class 1A1, | 2,443,715 | 2,141,820 | ||||||
Citigroup Commercial Mortgage Trust: | ||||||||
Series 2007-C6, Class AMFX, | 750,000 | 755,624 | ||||||
Series 2015-GC27, Class D, | 943,700 | 719,504 | ||||||
Series 2015-GC31, Class C, | 1,500,000 | 1,469,797 | ||||||
Series 2015-GC33, Class C, | 1,500,000 | 1,501,565 | ||||||
Series 2015-GC35, Class C, | 1,435,000 | 1,419,447 | ||||||
Series 2016-GC36, Class XA, IO, | 22,173,108 | 2,060,826 | ||||||
Citigroup Mortgage Loan Trust: | ||||||||
Series 2007-AR5, Class 1A2A, | 4,597,646 | 4,162,563 | ||||||
Series 2009-7, Class 3A2, | 6,129,910 | 3,956,020 | ||||||
CitiMortgage Alternative Loan Trust: | ||||||||
Series 2006-A7, Class 1A8, CMO, | 7,184,013 | 6,169,833 | ||||||
Series 2007-A1, Class 1A7, | 12,103,429 | 10,257,062 | ||||||
COBALT CMBS Commercial Mortgage Trust Series 2006-C1, Class AM, 5.25%, 8/15/2048 | 2,180,000 | 2,181,271 | ||||||
Colony Mortgage Capital, Ltd. | 1,320,876 | 1,316,248 | ||||||
COMM Mortgage Trust: | ||||||||
Series 2015-CR22, Class D, | 1,500,000 | 1,197,709 | ||||||
Series 2015-CR22, Class XA, IO, | 10,904,651 | 650,057 | ||||||
Series 2015-CR23, Class D, | 900,000 | 662,970 | ||||||
Series 2015-CR26, Class B, | 1,600,000 | 1,720,070 | ||||||
Series 2015-CR26, Class XA, IO, | 22,805,488 | 1,591,390 | ||||||
See accompanying notes to financial statements.
44
Table of Contents
State Street DoubleLine Total Return Tactical Portfolio
SCHEDULE OF INVESTMENTS (continued)
June 30, 2016
Security Description | Principal | Value | ||||||
Series 2015-DC1, Class D, | $ | 750,000 | $ | 556,667 | ||||
Series 2015-DC1, Class XA, IO, | 9,181,372 | 621,720 | ||||||
Series 2015-LC19, Class D, | 1,200,000 | 873,618 | ||||||
Series 2015-LC21, Class C, | 968,000 | 881,360 | ||||||
Series 2016-CR28, Class C, | 2,235,000 | 2,204,786 | ||||||
Series 2016-DC2, Class C, | 1,329,000 | 1,294,947 | ||||||
Series 2016-DC2, Class XA, IO, | 19,984,525 | 1,469,174 | ||||||
Commercial Mortgage Trust | 3,000,000 | 3,013,728 | ||||||
Countrywide Commercial Mortgage Trust | 857,908 | 878,199 | ||||||
Credit Suisse Commercial Mortgage Trust: | ||||||||
Series 2007-C4, Class A1AM, | 1,500,000 | 1,517,314 | ||||||
Series 2007-C5, Class A4, | 1,648,080 | 1,684,454 | ||||||
CSAIL Commercial Mortgage Trust: | ||||||||
Series 2015-C2, Class AS, | 900,000 | 967,923 | ||||||
Series 2015-C4, Class XA, IO, | 36,516,893 | 2,246,994 | ||||||
CSMC MortgageBacked Trust: | ||||||||
Series 2006-7, Class 7A7, | 4,219,467 | 3,828,602 | ||||||
Series 2006-8, Class 4A1, | 7,977,153 | 6,658,725 | ||||||
CSMC Trust: | ||||||||
Series 2015-RPL1, Class A1, 3.63%, 2/25/2057 (a) (d) | 4,415,991 | 4,359,073 | ||||||
Series 2015-SAND, Class D, 3.29%, 8/15/2030 (a) (b) | 1,550,000 | 1,491,973 | ||||||
Galaxy CLO, Ltd. | 2,500,000 | 2,473,055 | ||||||
GE Commercial Mortgage Corp. Trust Series 2007-C1, Class AM, | 2,109,000 | 2,040,187 | ||||||
GS Mortgage Securities Corp. II Series 2013-GC10, Class XA, IO, 1.75%, 2/10/2046 (b) | 15,492,826 | 1,217,620 | ||||||
GS Mortgage Securities Trust: | ||||||||
Series 2014-GC20, Class XA, IO, | 54,568,850 | 3,338,921 | ||||||
Series 2014-GC24, Class XA, IO, | 32,489,343 | 1,623,603 | ||||||
Series 2015-GC32, Class B, | 1,500,000 | 1,579,445 | ||||||
Series 2015-GC32, Class XA, IO, | 26,734,505 | 1,434,884 | ||||||
Series 2015-GC34, Class XA, IO, | 17,431,110 | 1,563,721 | ||||||
Series 2015-GS1, Class XA, IO, | 27,157,590 | 1,627,687 | ||||||
Series 2016-ICE2, Class A, | 2,225,000 | 2,240,222 | ||||||
GSAA Home Equity Trust | 3,434,895 | 2,454,077 | ||||||
GSR Mortgage Loan Trust | 7,727,486 | 7,416,949 | ||||||
IndyMac INDX Mortgage Loan Trust | 7,652,029 | 6,246,132 | ||||||
JP Morgan Chase Commercial Mortgage Securities Trust: | ||||||||
Series 2006-LDP9, Class AM, 5.37%, 5/15/2047 | 1,465,000 | 1,460,529 | ||||||
Series 2007-C1, Class AM, | 2,108,000 | 2,141,336 | ||||||
Series 2007-CB20, Class AJ, | 1,500,000 | 1,492,755 | ||||||
Series 2007-LD11, Class AM, | 2,180,000 | 2,180,307 | ||||||
Series 2007-LD12, Class AM, | 800,000 | 821,318 | ||||||
Series 2008-C2, Class A4, | 1,907,890 | 1,979,024 | ||||||
Series 2012-C8, Class B, | 1,775,000 | 1,887,220 | ||||||
Series 2015-CSMO, Class C, | 1,500,000 | 1,488,707 | ||||||
Series 2015-JP1, Class XA, | 23,251,191 | 1,568,437 | ||||||
JP Morgan Mortgage Trust: | ||||||||
Series 2006-A3, Class 1A1, | 12,724,912 | 11,587,233 | ||||||
Series 2007-S3, Class 1A35, | 16,925,070 | 14,644,263 | ||||||
JPMBB Commercial Mortgage Securities Trust: | ||||||||
Series 2014-C25, Class XA, IO, | 6,443,862 | 370,725 | ||||||
Series 2014-C26, Class C, | 1,500,000 | 1,479,255 | ||||||
Series 2015-C27, Class XA, IO, | 7,901,087 | 593,033 | ||||||
Series 2015-C28, Class XA, IO, | 11,925,133 | 791,983 | ||||||
Series 2015-C30, Class XA, IO, | 31,004,113 | 1,222,895 | ||||||
Series 2015-C32, Class C, | 1,300,000 | 1,212,803 | ||||||
Series 2015-C33, Class C, | 1,739,000 | 1,699,514 | ||||||
See accompanying notes to financial statements.
45
Table of Contents
State Street DoubleLine Total Return Tactical Portfolio
SCHEDULE OF INVESTMENTS (continued)
June 30, 2016
Security Description | Principal | Value | ||||||
Series 2016-C1, Class C, | $ | 2,180,000 | $ | 2,178,683 | ||||
JPMDB Commercial Mortgage Securities Trust | 22,119,643 | 2,471,689 | ||||||
LB Commercial Mortgage Trust: | ||||||||
Series 2007-C3, Class AMB, | 1,084,000 | 1,114,119 | ||||||
Series 2007-C3, Class AMFL, | 990,000 | 1,023,088 | ||||||
LBUBS Commercial Mortgage Trust: | ||||||||
Series 2007-C1, Class AJ, | 3,000,000 | 3,016,465 | ||||||
Series 2007-C2, Class AM, | 1,110,000 | 1,125,897 | ||||||
Series 2007-C7, Class AJ, | 1,615,000 | 1,615,523 | ||||||
LCM L.P. Series 16A, Class A, 2.13%, 7/15/2026 (a) (b) | 2,500,000 | 2,494,590 | ||||||
Limerock CLO | 500,000 | 473,346 | ||||||
Madison Park Funding, Ltd.: | ||||||||
Series 2014-14A, Class D, | 1,250,000 | 1,152,716 | ||||||
Series 2015-16A, Class B, | 2,500,000 | 2,486,025 | ||||||
Merrill Lynch Mortgage Investors Trust | 3,665,080 | 3,013,753 | ||||||
Merrill Lynch Mortgage Trust: | ||||||||
Series 2006-C1, Class AJ, | 1,294,044 | 1,286,425 | ||||||
Series 2007-C1, Class AM, | 2,180,000 | 2,142,491 | ||||||
ML-CFC Commercial Mortgage Trust | 2,174,637 | 2,238,273 | ||||||
Morgan Stanley Bank of America Merrill Lynch Trust: | ||||||||
Series 2013-C12, Class XA, IO, | 19,230,162 | 732,135 | ||||||
Series 2013-C7, Class XA, IO, | 18,403,525 | 1,231,941 | ||||||
Series 2015-C20, Class A4, | 355,000 | 374,584 | ||||||
Series 2015-C20, Class C, | 500,000 | 479,366 | ||||||
Series 2015-C25, Class C, | 1,700,000 | 1,676,441 | ||||||
Series 2015-C27, Class C, | 1,219,000 | 1,188,883 | ||||||
Series 2015-C27, Class D, | 1,750,000 | 1,113,711 | ||||||
Series 2016-C28, Class XA, IO, | 24,276,871 | 2,112,520 | ||||||
Morgan Stanley Capital I Trust: | ||||||||
Series 2007-IQ14, Class A4, | 1,616,210 | 1,646,560 | ||||||
Series 2015-UBS8, Class XA, IO, | 26,297,314 | 1,804,493 | ||||||
Series 2015-XLF1, Class D, | 750,000 | 742,282 | ||||||
Morgan Stanley Mortgage Loan Trust | 9,690,037 | 8,093,151 | ||||||
OZLM, Ltd. | 2,500,000 | 2,444,625 | ||||||
Race Point CLO, Ltd. | 2,500,000 | 2,490,245 | ||||||
RALI Trust | 2,066,954 | 2,098,098 | ||||||
Residential Asset Securitization Trust | 3,538,199 | 3,231,362 | ||||||
Structured Adjustable Rate Mortgage Loan Trust: | ||||||||
Series 2005-21, Class 1A, | 3,125,623 | 2,467,639 | ||||||
Series 2006-8, Class 4A3, | 2,368,261 | 2,059,652 | ||||||
Structured Asset Securities Corp. | 3,665,301 | 3,134,471 | ||||||
Towd Point Mortgage Trust | 3,128,589 | 3,148,721 | ||||||
Venture CLO, Ltd. | 2,500,000 | 2,423,823 | ||||||
Wachovia Bank Commercial Mortgage Trust: | ||||||||
Series 2006-C24, Class AJ, | 183,577 | 183,364 | ||||||
Series 2006-C28, Class AJ, | 1,500,000 | 1,496,917 | ||||||
Series 2007-C33, Class AJ, | 1,600,000 | 1,586,773 | ||||||
Series 2007-C33, Class AM, | 1,550,000 | 1,596,086 | ||||||
Series 2007-C34, Class A3, | 707,202 | 728,245 | ||||||
Washington Mutual Mortgage PassThrough Certificates WMALT Trust: | ||||||||
Series 2005-8, Class 2CB1, | 3,464,707 | 3,393,413 | ||||||
See accompanying notes to financial statements.
46
Table of Contents
State Street DoubleLine Total Return Tactical Portfolio
SCHEDULE OF INVESTMENTS (continued)
June 30, 2016
Security Description | Principal | Value | ||||||
Series 2006-5, Class 3A2, | $ | 3,643,929 | $ | 1,650,774 | ||||
Waterfall Commercial Mortgage Trust | 14,940,052 | 14,361,245 | ||||||
Wells Fargo Commercial Mortgage Trust: | ||||||||
Series 2014-LC16, Class D, | 920,000 | 721,803 | ||||||
Series 2015-C26, Class D, | 900,000 | 623,846 | ||||||
Series 2015-C26, | 9,317,601 | 748,054 | ||||||
Series 2015-C27, Class C, | 750,000 | 692,547 | ||||||
Series 2015-C28, Class C, | 1,500,000 | 1,408,853 | ||||||
Series 2015-LC20, Class XA, IO, | 7,932,647 | 640,903 | ||||||
Series 2015-NXS1, Class XA, IO, | 9,910,559 | 710,704 | ||||||
Series 2015-NXS2, Class XA, IO, | 29,816,585 | 1,443,379 | ||||||
Series 2015-NXS3, Class C, | 1,600,000 | 1,533,992 | ||||||
Series 2015-P2, Class A4, | 1,568,000 | 1,724,635 | ||||||
Series 2015-P2, Class XA, IO, | 22,148,517 | 1,524,257 | ||||||
Series 2016-C32, Class C, | 1,581,000 | 1,600,970 | ||||||
Series 2016-C33, Class XA, IO, | 15,623,084 | 1,862,873 | ||||||
Wells Fargo Mortgage Backed Securities Trust | 11,788,117 | 10,667,377 | ||||||
WFRBS Commercial Mortgage Trust: | ||||||||
Series 2014-C19, Class XA, IO, | 10,571,945 | 663,979 | ||||||
Series 2014-C21, Class XA, IO, | 19,620,166 | 1,272,395 | ||||||
|
| |||||||
TOTAL COMMERCIAL MORTGAGE BACKED SECURITIES | 448,679,573 | |||||||
|
| |||||||
MORTGAGE-BACKED SECURITIES — 0.3% |
| |||||||
Citigroup Commercial Mortgage Trust | 800,000 | 802,850 | ||||||
COMM Mortgage Trust | 33,994,841 | 2,258,345 | ||||||
Commercial Mortgage Trust | 225,000 | 232,752 | ||||||
Credit Suisse Commercial Mortgage Trust | 1,700,000 | 1,774,356 | ||||||
GS Mortgage Securities Trust | 1,524,694 | 1,562,181 | ||||||
Wachovia Bank Commercial Mortgage Trust | 1,750,000 | 1,780,244 | ||||||
|
| |||||||
TOTAL MORTGAGE-BACKED SECURITIES (Cost $8,654,310) | 8,410,728 | |||||||
|
| |||||||
U.S. GOVERNMENT AGENCY OBLIGATIONS — 41.3% |
| |||||||
Federal Home Loan Mortgage Corp.: | ||||||||
3.00%, 6/15/2044 | 13,969,663 | 14,428,305 | ||||||
3.00%, 1/1/2045 | 3,849,294 | 3,991,354 | ||||||
3.00%, 2/1/2045 | 2,674,770 | 2,773,484 | ||||||
3.00%, 3/1/2045 | 2,750,684 | 2,852,199 | ||||||
3.00%, 4/1/2045 | 18,568,636 | 19,253,919 | ||||||
3.00%, 5/1/2045 | 9,350,640 | 9,695,729 | ||||||
3.00%, 7/1/2045 | 4,744,546 | 4,919,646 | ||||||
3.00%, 8/1/2045 | 24,773,344 | 25,687,614 | ||||||
3.00%, 10/1/2045 | 15,997,292 | 16,587,679 | ||||||
3.00%, 12/1/2045 | 30,995,409 | 32,139,307 | ||||||
3.00%, 12/1/2045 | 38,811,792 | 40,244,157 | ||||||
3.00%, 1/1/2046 | 21,484,456 | 22,277,348 | ||||||
3.50%, 2/1/2045 | 5,287,805 | 5,576,803 | ||||||
3.50%, 4/1/2045 | 9,176,785 | 9,678,330 | ||||||
3.50%, 4/1/2045 | 7,345,857 | 7,747,336 | ||||||
3.50%, 4/1/2045 | 24,969,567 | 26,334,246 | ||||||
3.50%, 6/1/2045 | 16,664,933 | 17,575,733 | ||||||
3.50%, 10/1/2045 | 19,533,406 | 20,600,979 | ||||||
3.50%, 2/1/2046 | 24,499,196 | 25,848,908 | ||||||
4.50%, 6/1/2044 | 3,530,299 | 3,849,288 | ||||||
IO, 5.56%, 5/15/2041 (b) | 21,231,885 | 3,876,335 | ||||||
Series 3822, Class ZG, | 3,391,430 | 3,901,976 | ||||||
Series 3889, Class VZ, | 18,392,161 | 19,908,130 | ||||||
Series 3935, Class SJ, IO, | 5,078,147 | 717,874 | ||||||
Series 4165, Class ZT, | 14,800,496 | 14,756,653 | ||||||
Series 4215, Class KC, | 26,196,777 | 26,765,171 | ||||||
Series 4364, Class ZX, CMO, REMIC, 4.00%, 7/15/2044 | 36,749,493 | 42,120,741 | ||||||
Series 4434, Class LZ, | 3,122,276 | 3,125,029 | ||||||
Series 4444, Class CZ, | 11,448,347 | 11,348,808 | ||||||
Series 4447, Class A, | 2,908,701 | 3,046,827 | ||||||
Series 4447, Class Z, | 3,778,680 | 3,908,320 | ||||||
Series 4471, Class BA, | 9,194,949 | 9,660,208 | ||||||
See accompanying notes to financial statements.
47
Table of Contents
State Street DoubleLine Total Return Tactical Portfolio
SCHEDULE OF INVESTMENTS (continued)
June 30, 2016
Security Description | Principal | Value | ||||||
Series 4471, Class GA, | $ | 13,315,498 | $ | 13,863,027 | ||||
Series 4474, Class ZX, CMO, REMIC, 4.00%, 4/15/2045 | 10,806,938 | 12,339,264 | ||||||
Series 4481, Class B, | 9,266,554 | 9,601,412 | ||||||
Series 4483, Class CA, | 17,740,676 | 18,677,379 | ||||||
Series 4491, Class B, | 18,686,648 | 19,345,237 | ||||||
Series 4492, Class GZ, | 7,845,955 | 8,375,280 | ||||||
Series 4499, Class AB, | 18,661,115 | 19,326,655 | ||||||
Series 4503, Class AB, CMO, REMIC, 3.00%, 11/15/2040 | 12,820,637 | 13,254,278 | ||||||
Series 4504, Class CA, | 20,250,999 | 21,332,471 | ||||||
Series 4511, Class QA, | 18,810,939 | 19,527,577 | ||||||
Series 4511, Class QC, | 14,037,505 | 14,600,946 | ||||||
Series 4543, Class HG, | 23,854,059 | 24,488,611 | ||||||
Series 4582, Class HA, | 19,826,371 | 20,736,732 | ||||||
Series K053, Class A2, | 2,232,000 | 2,395,405 | ||||||
Federal National Mortgage Association: | ||||||||
3.00%, 11/1/2030 | 26,582,689 | 27,884,166 | ||||||
3.00%, 10/1/2034 | 5,900,991 | 6,187,026 | ||||||
3.00%, 4/1/2035 | 4,555,628 | 4,777,604 | ||||||
3.00%, 4/1/2035 | 5,258,115 | 5,514,320 | ||||||
3.00%, 5/1/2035 | 2,628,572 | 2,756,650 | ||||||
3.00%, 5/1/2035 | 2,704,897 | 2,836,694 | ||||||
3.00%, 6/1/2036 | 19,922,397 | 20,899,993 | ||||||
3.00%, 4/1/2040 | 21,634,876 | 22,457,116 | ||||||
3.00%, 1/1/2045 | 3,415,964 | 3,503,448 | ||||||
3.00%, 2/1/2045 | 3,674,575 | 3,770,112 | ||||||
3.00%, 3/1/2045 | 3,707,270 | 3,848,166 | ||||||
3.00%, 4/1/2045 | 16,206,739 | 16,628,336 | ||||||
3.00%, 7/1/2045 | 14,503,197 | 14,886,001 | ||||||
3.00%, 7/1/2046 | 49,000,000 | 50,305,679 | ||||||
3.50%, 9/1/2034 | 4,379,772 | 4,659,777 | ||||||
3.50%, 12/1/2034 | 3,888,926 | 4,137,551 | ||||||
3.50%, 2/1/2035 | 2,495,667 | 2,656,222 | ||||||
3.50%, 1/1/2045 | 17,071,203 | 18,009,142 | ||||||
3.50%, 2/1/2045 | 8,224,635 | 8,679,803 | ||||||
3.50%, 6/1/2045 | 17,261,609 | 18,216,904 | ||||||
4.50%, 3/1/2044 | 1,909,002 | 2,083,058 | ||||||
4.50%, 3/1/2044 | 3,111,469 | 3,395,162 | ||||||
4.50%, 6/1/2044 | 2,819,892 | 3,077,000 | ||||||
4.50%, 7/1/2044 | 2,974,540 | 3,245,748 | ||||||
4.50%, 2/1/2045 | 3,302,748 | 3,603,881 | ||||||
Series 2010-109, Class N, | 5,316,566 | 5,559,982 | ||||||
Series 2011-51, Class CI, | 15,663,879 | 2,488,271 | ||||||
Series 2012-127, Class PA, | 5,831,783 | 5,985,059 | ||||||
Series 2012-151, Class SB, | 1,546,036 | 1,503,984 | ||||||
Series 2013-114, Class HZ, CMO, REMIC, 3.00%, 11/25/2038 | 15,459,130 | 15,645,989 | ||||||
Series 2013-30, Class PS, | 1,718,187 | 1,699,775 | ||||||
Series 2014-21, Class GZ, | 5,908,411 | 5,847,186 | ||||||
Series 2014-39, Class ZA, CMO, REMIC, 3.00%, 7/25/2044 | 8,494,056 | 8,583,083 | ||||||
Series 2015-42, Class CA, | 10,631,836 | 11,132,501 | ||||||
Series 2015-9, Class HA, | 19,666,256 | 20,645,040 | ||||||
Series 2015-95, Class AP, CMO, REMIC, 3.00%, 8/25/2042 | 28,103,105 | 29,247,589 | ||||||
Series 2016-21, Class BZ, CMO, REMIC, 3.00%, 4/25/2046 | 4,363,802 | 4,384,127 | ||||||
Series 2016-32, Class LA, CMO, REMIC, 3.00%, 10/25/2044 | 19,782,679 | 20,781,275 | ||||||
Series 2016-M3, Class A2, | 2,150,000 | 2,248,234 | ||||||
Government National Mortgage Association: | ||||||||
Series 2013-169, Class SE, IO, 5.61%, 11/16/2043 (b) | 5,132,328 | 769,005 | ||||||
Series 2013-34, Class PL, | 17,510,032 | 18,136,758 | ||||||
Series 2014-43, Class PS, IO, 5.73%, 7/20/2042 (b) | 15,050,376 | 1,970,365 | ||||||
|
| |||||||
TOTAL U.S. GOVERNMENT AGENCY OBLIGATIONS | 1,087,710,492 | |||||||
|
| |||||||
U.S. TREASURY OBLIGATIONS — 8.8% |
| |||||||
Treasury Bond | 27,200,000 | 32,003,247 | ||||||
Treasury Notes: | ||||||||
0.88%, 6/15/2017 | 24,200,000 | 24,285,911 | ||||||
1.38%, 4/30/2020 | 68,400,000 | 69,694,811 | ||||||
1.75%, 3/31/2022 | 40,500,000 | 41,847,436 | ||||||
2.00%, 2/15/2025 | 60,200,000 | 62,959,568 | ||||||
TOTAL U.S. TREASURY OBLIGATIONS |
| |||||||
(Cost $223,655,281) | 230,790,973 | |||||||
SHORT-TERM INVESTMENT — 13.4% |
| |||||||
State Street Institutional Liquid Reserves Fund, Premier Class 0.47% (e) (f) | 351,792,987 | 351,792,987 | ||||||
|
| |||||||
TOTAL INVESTMENTS — 103.2% | 2,719,327,102 | |||||||
LIABILITIES IN EXCESS OF | (83,254,125 | ) | ||||||
|
| |||||||
NET ASSETS — 100.0% | $ | 2,636,072,977 | ||||||
|
| |||||||
See accompanying notes to financial statements.
48
Table of Contents
State Street DoubleLine Total Return Tactical Portfolio
SCHEDULE OF INVESTMENTS (continued)
June 30, 2016
| (a) | Securities purchased pursuant to Rule 144A of the Securities Act of 1933. These securities, which represent 8.7% of net assets as of June 30, 2016, are considered liquid and may be resold in transactions exempt from registration, normally to qualified institutional buyers. |
| (b) | Variable Rate Security — Interest rate shown is rate in effect at June 30, 2016. |
| (c) | Amount is less than 0.05% of net assets. |
| (d) | Step-up bond — Coupon rate increases in increments to maturity. Rate shown as of June 30, 2016. Maturity date shown is the final maturity. |
| (e) | The Fund invested in certain money market funds managed by SSGA Funds Management, Inc. Amounts related to these transactions during the year ended June 30, 2016 are shown in the Affiliate Table below. |
| (f) | The rate shown is the annualized seven-day yield at June 30, 2016. |
CMO Collateralized Mortgage Obligation
IO Interest Only
MTN Medium Term Note
REMIC Real Estate Mortgage Investment Conduit
The following table summarizes the value of the Fund’s investments accordingly to the fair value hierarchy as of June 30, 2016.
Description | Level 1 — Quoted Prices | Level 2 — Other Significant Observable Inputs | Level 3 — Significant Unobservable Inputs | Total | ||||||||||||
ASSETS: | ||||||||||||||||
INVESTMENTS: | ||||||||||||||||
Asset-Backed Securities | $ | — | $ | 39,378,923 | $ | — | $ | 39,378,923 | ||||||||
Corporate Bonds & Notes | ||||||||||||||||
Australia | — | 2,647,129 | — | 2,647,129 | ||||||||||||
Barbados | — | 1,056,000 | — | 1,056,000 | ||||||||||||
Belgium | — | 2,622,006 | — | 2,622,006 | ||||||||||||
Bermuda | — | 471,394 | — | 471,394 | ||||||||||||
Brazil | — | 12,770,690 | — | 12,770,690 | ||||||||||||
Canada | — | 7,064,744 | — | 7,064,744 | ||||||||||||
Cayman Islands | — | 543,819 | — | 543,819 | ||||||||||||
Chile | — | 29,624,793 | — | 29,624,793 | ||||||||||||
China | — | 5,085,749 | — | 5,085,749 | ||||||||||||
Colombia | — | 41,824,925 | — | 41,824,925 | ||||||||||||
Costa Rica | — | 3,809,100 | — | 3,809,100 | ||||||||||||
Dominican Republic | — | 5,189,000 | — | 5,189,000 | ||||||||||||
Guatemala | — | 9,219,883 | — | 9,219,883 | ||||||||||||
Hong Kong | — | 3,641,566 | — | 3,641,566 | ||||||||||||
India | — | 19,847,759 | — | 19,847,759 | ||||||||||||
Israel | — | 9,953,950 | — | 9,953,950 | ||||||||||||
Jamaica | — | 3,857,375 | — | 3,857,375 | ||||||||||||
Malaysia | — | 6,227,478 | — | 6,227,478 | ||||||||||||
Mexico | — | 38,640,124 | — | 38,640,124 | ||||||||||||
Netherlands | — | 4,874,579 | — | 4,874,579 | ||||||||||||
New Zealand | — | 1,351,688 | — | 1,351,688 | ||||||||||||
Panama | — | 12,895,937 | — | 12,895,937 | ||||||||||||
Paraguay | — | 4,114,313 | — | 4,114,313 | ||||||||||||
Peru | — | 22,439,961 | — | 22,439,961 | ||||||||||||
Qatar | — | 458,254 | — | 458,254 | ||||||||||||
See accompanying notes to financial statements.
49
Table of Contents
State Street DoubleLine Total Return Tactical Portfolio
SCHEDULE OF INVESTMENTS (continued)
June 30, 2016
Description | Level 1 — Quoted Prices | Level 2 — Other Significant Observable Inputs | Level 3 — Significant Unobservable Inputs | Total | ||||||||||||
Singapore | $ | — | $ | 14,677,923 | $ | — | $ | 14,677,923 | ||||||||
Trinidad And Tobago | — | 4,036,500 | — | 4,036,500 | ||||||||||||
United States | — | 168,360,263 | — | 168,360,263 | ||||||||||||
Foreign Government Obligations | ||||||||||||||||
Costa Rica | — | 2,110,062 | — | 2,110,062 | ||||||||||||
Mexico | — | 2,290,782 | — | 2,290,782 | ||||||||||||
Panama | — | 4,321,500 | — | 4,321,500 | ||||||||||||
Senior Floating Rate Loans | ||||||||||||||||
Aerospace & Defense | — | 1,843,768 | — | 1,843,768 | ||||||||||||
Auto Components | — | 308,124 | — | 308,124 | ||||||||||||
Beverages | — | 576,437 | — | 576,437 | ||||||||||||
Building Products | — | 1,176,785 | — | 1,176,785 | ||||||||||||
Capital Markets | — | 1,005,716 | — | 1,005,716 | ||||||||||||
Chemicals | — | 5,481,837 | — | 5,481,837 | ||||||||||||
Commercial Services & Supplies | — | 7,182,306 | — | 7,182,306 | ||||||||||||
Construction & Engineering | — | 1,176,408 | — | 1,176,408 | ||||||||||||
Containers & Packaging | — | 3,896,651 | — | 3,896,651 | ||||||||||||
Diversified Consumer Services | — | 1,184,325 | — | 1,184,325 | ||||||||||||
Diversified Financial Services | — | 1,207,697 | — | 1,207,697 | ||||||||||||
Diversified Telecommunication Services | — | 2,286,091 | — | 2,286,091 | ||||||||||||
Electric Utilities | — | 1,771,952 | — | 1,771,952 | ||||||||||||
Food & Staples Retailing | — | 1,213,377 | — | 1,213,377 | ||||||||||||
Food Products | — | 7,187,130 | — | 7,187,130 | ||||||||||||
Health Care Equipment & Supplies | — | 1,153,273 | — | 1,153,273 | ||||||||||||
Health Care Providers & Services | — | 9,563,466 | — | 9,563,466 | ||||||||||||
Hotels, Restaurants & Leisure | — | 8,261,738 | — | 8,261,738 | ||||||||||||
Household Durables | — | 2,370,639 | — | 2,370,639 | ||||||||||||
Household Products | — | 2,432,735 | — | 2,432,735 | ||||||||||||
Insurance | — | 905,145 | — | 905,145 | ||||||||||||
Internet Software & Services | — | 1,214,796 | — | 1,214,796 | ||||||||||||
IT Services | — | 2,373,348 | — | 2,373,348 | ||||||||||||
Life Sciences Tools & Services | — | 1,147,238 | — | 1,147,238 | ||||||||||||
Machinery | — | 1,158,131 | — | 1,158,131 | ||||||||||||
Media | — | 9,535,628 | — | 9,535,628 | ||||||||||||
Multiline Retail | — | 1,207,943 | — | 1,207,943 | ||||||||||||
Oil, Gas & Consumable Fuels | — | 344,939 | — | 344,939 | ||||||||||||
Personal Products | — | 2,324,745 | — | 2,324,745 | ||||||||||||
Pharmaceuticals | — | 1,197,324 | — | 1,197,324 | ||||||||||||
Professional Services | — | 1,148,848 | — | 1,148,848 | ||||||||||||
Real Estate Investment Trusts (REITs) | — | 1,202,199 | — | 1,202,199 | ||||||||||||
See accompanying notes to financial statements.
50
Table of Contents
State Street DoubleLine Total Return Tactical Portfolio
SCHEDULE OF INVESTMENTS (continued)
June 30, 2016
Description | Level 1 — Quoted Prices | Level 2 — Other Significant Observable Inputs | Level 3 — Significant Unobservable Inputs | Total | ||||||||||||
Real Estate Management & Development | $ | — | $ | 250,556 | $ | — | $ | 250,556 | ||||||||
Road & Rail | — | 2,405,433 | — | 2,405,433 | ||||||||||||
Semiconductors & Semiconductor Equipment | — | 4,571,590 | — | 4,571,590 | ||||||||||||
Software | — | 5,601,825 | — | 5,601,825 | ||||||||||||
Specialty Retail | — | 2,359,427 | — | 2,359,427 | ||||||||||||
Technology Hardware, Storage & Peripherals | — | 2,340,086 | — | 2,340,086 | ||||||||||||
Trading Companies & Distributors | — | 2,809,899 | — | 2,809,899 | ||||||||||||
Wireless Telecommunication Services | — | 1,154,625 | — | 1,154,625 | ||||||||||||
Commercial Mortgage Backed Securities | — | 448,679,573 | — | 448,679,573 | ||||||||||||
Mortgage-Backed Securities | — | 8,410,728 | — | 8,410,728 | ||||||||||||
U.S. Government Agency Obligations | — | 1,087,710,492 | — | 1,087,710,492 | ||||||||||||
U.S. Treasury Obligations | — | 230,790,973 | — | 230,790,973 | ||||||||||||
Short-Term Investment | 351,792,987 | — | — | 351,792,987 | ||||||||||||
|
|
|
|
|
|
|
| |||||||||
TOTAL INVESTMENTS | $ | 351,792,987 | $ | 2,367,534,115 | $ | — | $ | 2,719,327,102 | ||||||||
|
|
|
|
|
|
|
| |||||||||
Affiliate Table
| Number of Shares Held at 6/30/15 | Value At 6/30/15 | Shares | Number of Shares Held at 6/30/16 | Value at 6/30/16 | Dividend Income | Realized Gain (Loss) | ||||||||||||||||||||||||||
| Purchased | Sold | |||||||||||||||||||||||||||||||
State Street Institutional Liquid Reserves Fund, Premier Class | 152,859,462 | $ | 152,859,462 | 1,649,219,723 | 1,450,286,198 | 351,792,987 | $ | 351,792,987 | $ | 648,464 | $ | — | ||||||||||||||||||||
See accompanying notes to financial statements.
51
Table of Contents
SSGA MFS SYSTEMATIC CORE EQUITY PORTFOLIO
SPDR MFS Systematic Core Equity ETF is a feeder fund that invests substantially all of its investable assets in a master fund, the SSGA MFS Systematic Core Equity Portfolio. The schedule of investments for the SSGA MFS Systematic Core Equity Portfolio follows.
52
Table of Contents
SSGA MFS Systematic Core Equity Portfolio
SCHEDULE OF INVESTMENTS
June 30, 2016
Security Description | Shares | Value | ||||||
COMMON STOCKS — 98.7% | ||||||||
AEROSPACE & DEFENSE — 4.0% | ||||||||
General Dynamics Corp. | 340 | $ | 47,342 | |||||
Northrop Grumman Corp. | 845 | 187,826 | ||||||
|
| |||||||
| 235,168 | ||||||||
|
| |||||||
BANKS — 6.2% | ||||||||
JPMorgan Chase & Co. | 3,841 | 238,680 | ||||||
Wells Fargo & Co. | 2,555 | 120,928 | ||||||
|
| |||||||
| 359,608 | ||||||||
|
| |||||||
BIOTECHNOLOGY — 4.7% | ||||||||
Amgen, Inc. | 615 | 93,572 | ||||||
Gilead Sciences, Inc. | 2,199 | 183,441 | ||||||
|
| |||||||
| 277,013 | ||||||||
|
| |||||||
CHEMICALS — 2.7% | ||||||||
LyondellBasell Industries NV Class A | 2,082 | 154,942 | ||||||
|
| |||||||
CONSUMER FINANCE — 1.1% | ||||||||
Discover Financial Services | 1,212 | 64,951 | ||||||
|
| |||||||
DIVERSIFIED TELECOMMUNICATION SERVICES — 3.7% |
| |||||||
Verizon Communications, Inc. | 3,867 | 215,933 | ||||||
|
| |||||||
ELECTRIC UTILITIES — 3.3% | ||||||||
Exelon Corp. | 5,310 | 193,071 | ||||||
|
| |||||||
FOOD & STAPLES RETAILING — 1.1% |
| |||||||
Kroger Co. | 1,699 | 62,506 | ||||||
|
| |||||||
FOOD PRODUCTS — 5.4% | ||||||||
Archer-Daniels-Midland Co. | 2,725 | 116,875 | ||||||
Mondelez International, Inc. Class A | 930 | 42,324 | ||||||
Tyson Foods, Inc. Class A | 2,354 | 157,224 | ||||||
|
| |||||||
| 316,423 | ||||||||
|
| |||||||
HEALTH CARE PROVIDERS & SERVICES — 4.1% |
| |||||||
Aetna, Inc. | 616 | 75,232 | ||||||
Anthem, Inc. | 751 | 98,637 | ||||||
UnitedHealth Group, Inc. | 471 | 66,505 | ||||||
|
| |||||||
| 240,374 | ||||||||
|
| |||||||
HOTELS, RESTAURANTS & LEISURE — 4.2% |
| |||||||
Carnival Corp. | 1,149 | 50,786 | ||||||
McDonald’s Corp. | 491 | 59,087 | ||||||
Royal Caribbean Cruises, Ltd. | 2,028 | 136,180 | ||||||
|
| |||||||
| 246,053 | ||||||||
|
| |||||||
HOUSEHOLD PRODUCTS — 1.0% | ||||||||
Procter & Gamble Co. | 697 | 59,015 | ||||||
|
| |||||||
INDEPENDENT POWER PRODUCERS & |
| |||||||
AES Corp. | 9,280 | 115,814 | ||||||
|
| |||||||
INSURANCE — 5.9% | ||||||||
MetLife, Inc. | 4,108 | 163,622 | ||||||
Security Description | Shares | Value | ||||||
Prudential Financial, Inc. | 2,539 | 181,132 | ||||||
|
| |||||||
| 344,754 | ||||||||
|
| |||||||
INTERNET & CATALOG RETAIL — 7.4% |
| |||||||
Amazon.com, Inc. (a) | 402 | 287,679 | ||||||
Priceline Group, Inc. (a) | 118 | 147,313 | ||||||
|
| |||||||
| 434,992 | ||||||||
|
| |||||||
MEDIA — 2.2% | ||||||||
Charter Communications, Inc. Class A (a) | 289 | 66,077 | ||||||
Comcast Corp. Class A | 946 | 61,670 | ||||||
|
| |||||||
| 127,747 | ||||||||
|
| |||||||
MULTILINE RETAIL — 0.7% | ||||||||
Target Corp. | 605 | 42,241 | ||||||
|
| |||||||
OIL, GAS & CONSUMABLE FUELS — 5.3% |
| |||||||
Exxon Mobil Corp. | 1,674 | 156,921 | ||||||
Valero Energy Corp. | 3,011 | 153,561 | ||||||
|
| |||||||
| 310,482 | ||||||||
|
| |||||||
PHARMACEUTICALS — 8.4% | ||||||||
Eli Lilly & Co. | 1,605 | 126,394 | ||||||
Johnson & Johnson | 1,756 | 213,003 | ||||||
Merck & Co., Inc. | 2,597 | 149,613 | ||||||
|
| |||||||
| 489,010 | ||||||||
|
| |||||||
REAL ESTATE INVESTMENT TRUSTS (REITS) — 2.8% |
| |||||||
Extra Space Storage, Inc. REIT | 1,743 | 161,297 | ||||||
|
| |||||||
SOFTWARE — 5.6% | ||||||||
Activision Blizzard, Inc. | 2,698 | 106,922 | ||||||
Oracle Corp. | 2,387 | 97,700 | ||||||
Take-Two Interactive Software, Inc. (a) | 3,208 | 121,647 | ||||||
|
| |||||||
| 326,269 | ||||||||
|
| |||||||
SPECIALTY RETAIL — 4.5% | ||||||||
Best Buy Co., Inc. | 5,169 | 158,171 | ||||||
O’Reilly Automotive, Inc. (a) | 386 | 104,645 | ||||||
|
| |||||||
| 262,816 | ||||||||
|
| |||||||
TECHNOLOGY HARDWARE, STORAGE & |
| |||||||
Apple, Inc. | 1,925 | 184,030 | ||||||
Hewlett Packard Enterprise Co. | 7,724 | 141,118 | ||||||
HP, Inc. | 3,817 | 47,903 | ||||||
|
| |||||||
| 373,051 | ||||||||
|
| |||||||
TEXTILES, APPAREL & LUXURY GOODS — 1.8% |
| |||||||
Michael Kors Holdings, Ltd. (a) | 2,145 | 106,135 | ||||||
|
| |||||||
TOBACCO — 4.2% | ||||||||
Altria Group, Inc. | 1,205 | 83,097 | ||||||
Philip Morris International, Inc. | 1,567 | 159,395 | ||||||
|
| |||||||
| 242,492 | ||||||||
|
| |||||||
TOTAL COMMON STOCKS (Cost $5,769,415) | 5,762,157 | |||||||
|
| |||||||
SHORT-TERM INVESTMENT — 1.2% | ||||||||
State Street Institutional Liquid Reserves Fund, Premier Class 0.47% (b) (c) | 70,177 | 70,177 | ||||||
|
| |||||||
TOTAL INVESTMENTS — 99.9% (Cost $5,839,592) | 5,832,334 | |||||||
OTHER ASSETS IN EXCESS OF LIABILITIES — 0.1% | 4,829 | |||||||
|
| |||||||
NET ASSETS — 100.0% | $ | 5,837,163 | ||||||
|
| |||||||
| (a) | Non-income producing security. |
| (b) | The Fund invested in certain money market funds managed by SSGA Funds Management, Inc. Amounts related to these transactions during the year ended June 30, 2016 are shown in the Affiliate Table below. |
| (c) | The rate shown is the annualized seven-day yield at June 30, 2016. |
| REIT | Real Estate Investment Trust |
See accompanying notes to financial statements.
53
Table of Contents
SSGA MFS Systematic Core Equity Portfolio
SCHEDULE OF INVESTMENTS (continued)
June 30, 2016
The following table summarizes the value of the Fund’s investments accordingly to the fair value hierarchy as of June 30, 2016.
Description | Level 1 — Quoted Prices | Level 2 — Other Significant Observable Inputs | Level 3 — Significant Unobservable Inputs | Total | ||||||||||||
ASSETS: | ||||||||||||||||
INVESTMENTS: | ||||||||||||||||
Common Stocks | ||||||||||||||||
Aerospace & Defense | $ | 235,168 | $ | — | $ | — | $ | 235,168 | ||||||||
Banks | 359,608 | — | — | 359,608 | ||||||||||||
Biotechnology | 277,013 | — | — | 277,013 | ||||||||||||
Chemicals | 154,942 | — | — | 154,942 | ||||||||||||
Consumer Finance | 64,951 | — | — | 64,951 | ||||||||||||
Diversified Telecommunication Services | 215,933 | — | — | 215,933 | ||||||||||||
Electric Utilities | 193,071 | — | — | 193,071 | ||||||||||||
Food & Staples Retailing | 62,506 | — | — | 62,506 | ||||||||||||
Food Products | 316,423 | — | — | 316,423 | ||||||||||||
Health Care Providers & Services | 240,374 | — | — | 240,374 | ||||||||||||
Hotels, Restaurants & Leisure | 246,053 | — | — | 246,053 | ||||||||||||
Household Products | 59,015 | — | — | 59,015 | ||||||||||||
Independent Power Producers & Energy Traders | 115,814 | — | — | 115,814 | ||||||||||||
Insurance | 344,754 | — | — | 344,754 | ||||||||||||
Internet & Catalog Retail | 434,992 | — | — | 434,992 | ||||||||||||
Media | 127,747 | — | — | 127,747 | ||||||||||||
Multiline Retail | 42,241 | — | — | 42,241 | ||||||||||||
Oil, Gas & Consumable Fuels | 310,482 | — | — | 310,482 | ||||||||||||
Pharmaceuticals | 489,010 | — | — | 489,010 | ||||||||||||
Real Estate Investment Trusts (REITs) | 161,297 | — | — | 161,297 | ||||||||||||
Software | 326,269 | — | — | 326,269 | ||||||||||||
Specialty Retail | 262,816 | — | — | 262,816 | ||||||||||||
Technology Hardware, Storage & Peripherals | 373,051 | — | — | 373,051 | ||||||||||||
Textiles, Apparel & Luxury Goods | 106,135 | — | — | 106,135 | ||||||||||||
Tobacco | 242,492 | — | — | 242,492 | ||||||||||||
Short-Term Investment | 70,177 | — | — | 70,177 | ||||||||||||
|
|
|
|
|
|
|
| |||||||||
TOTAL INVESTMENTS | $ | 5,832,334 | $ | — | $ | — | $ | 5,832,334 | ||||||||
|
|
|
|
|
|
|
| |||||||||
Affiliate Table
| Number of Shares Held at 6/30/15 | Value At 6/30/15 | Shares | Number of Shares Held at 6/30/16 | Value at 6/30/16 | Dividend Income | Realized Gain (Loss) | ||||||||||||||||||||||||||
| Purchased | Sold | |||||||||||||||||||||||||||||||
State Street Institutional Liquid Reserves Fund, Premier Class | 26,105 | $ | 26,105 | 203,801 | 159,729 | 70,177 | $ | 70,177 | $ | 144 | $ | — | ||||||||||||||||||||
54
See accompanying notes to financial statements.
Table of Contents
SSGA MFS SYSTEMATIC GROWTH EQUITY PORTFOLIO
SPDR MFS Systematic Growth Equity ETF is a feeder fund that invests substantially all of its investable assets in a master fund, the SSGA MFS Systematic Growth Equity Portfolio. The schedule of investments for the SSGA MFS Systematic Growth Equity Portfolio follows.
55
Table of Contents
SSGA MFS Systematic Growth Equity Portfolio
SCHEDULE OF INVESTMENTS
June 30, 2016
Security Description | Shares | Value | ||||||
COMMON STOCKS — 98.6% | ||||||||
AEROSPACE & DEFENSE — 3.2% | ||||||||
Huntington Ingalls Industries, Inc. | 586 | $ | 98,466 | |||||
Northrop Grumman Corp. | 1,293 | 287,408 | ||||||
|
| |||||||
| 385,874 | ||||||||
|
| |||||||
AUTO COMPONENTS — 1.9% | ||||||||
Lear Corp. | 2,295 | 233,539 | ||||||
|
| |||||||
BANKS — 0.9% | ||||||||
JPMorgan Chase & Co. | 1,712 | 106,384 | ||||||
|
| |||||||
BEVERAGES — 2.2% | ||||||||
Coca-Cola Co. | 5,863 | 265,770 | ||||||
|
| |||||||
BIOTECHNOLOGY — 5.9% | ||||||||
Amgen, Inc. | 1,691 | 257,286 | ||||||
Gilead Sciences, Inc. | 5,514 | 459,978 | ||||||
|
| |||||||
| 717,264 | ||||||||
|
| |||||||
CHEMICALS — 2.8% | ||||||||
LyondellBasell Industries NV Class A | 4,657 | 346,574 | ||||||
|
| |||||||
DIVERSIFIED TELECOMMUNICATION SERVICES — 2.6% |
| |||||||
Verizon Communications, Inc. | 5,772 | 322,308 | ||||||
|
| |||||||
FOOD & STAPLES RETAILING — 4.3% |
| |||||||
CVS Health Corp. | 1,755 | 168,024 | ||||||
Kroger Co. | 9,704 | 357,010 | ||||||
|
| |||||||
| 525,034 | ||||||||
|
| |||||||
FOOD PRODUCTS — 3.3% | ||||||||
Tyson Foods, Inc. Class A | 6,077 | 405,883 | ||||||
|
| |||||||
HEALTH CARE PROVIDERS & SERVICES — 6.8% |
| |||||||
Anthem, Inc. | 2,450 | 321,783 | ||||||
HCA Holdings, Inc. (a) | 1,159 | 89,255 | ||||||
McKesson Corp. | 1,810 | 337,837 | ||||||
UnitedHealth Group, Inc. | 517 | 73,000 | ||||||
|
| |||||||
| 821,875 | ||||||||
|
| |||||||
HOTELS, RESTAURANTS & LEISURE — 2.7% |
| |||||||
Carnival Corp. | 3,139 | 138,744 | ||||||
McDonald’s Corp. | 621 | 74,731 | ||||||
Norwegian Cruise Line Holdings, Ltd. (a) | 2,985 | 118,922 | ||||||
|
| |||||||
| 332,397 | ||||||||
|
| |||||||
INSURANCE — 1.9% | ||||||||
Prudential Financial, Inc. | 3,230 | 230,428 | ||||||
|
| |||||||
INTERNET & CATALOG RETAIL — 10.1% |
| |||||||
Amazon.com, Inc. (a) | 1,084 | 775,732 | ||||||
Priceline Group, Inc. (a) | 359 | 448,179 | ||||||
|
| |||||||
| 1,223,911 | ||||||||
|
| |||||||
INTERNET SOFTWARE & SERVICES — 4.1% |
| |||||||
Alphabet, Inc. Class A (a) | 109 | 76,685 | ||||||
Facebook, Inc. Class A (a) | 667 | 76,225 | ||||||
VeriSign, Inc. (a) | 3,958 | 342,208 | ||||||
|
| |||||||
| 495,118 | ||||||||
|
| |||||||
IT SERVICES — 6.9% | ||||||||
Cognizant Technology Solutions Corp. Class A (a) | 1,580 | 90,439 | ||||||
Fiserv, Inc. (a) | 1,490 | 162,008 | ||||||
Global Payments, Inc. | 5,189 | 370,391 | ||||||
International Business Machines Corp. | 1,411 | 214,161 | ||||||
|
| |||||||
| 836,999 | ||||||||
|
| |||||||
MEDIA — 5.3% | ||||||||
Charter Communications, Inc. Class A (a) | 654 | 149,530 | ||||||
Comcast Corp. Class A | 7,552 | 492,315 | ||||||
|
| |||||||
| 641,845 | ||||||||
|
| |||||||
PHARMACEUTICALS — 5.5% | ||||||||
Bristol-Myers Squibb Co. | 2,789 | 205,131 | ||||||
Eli Lilly & Co. | 1,794 | 141,277 | ||||||
Johnson & Johnson | 1,779 | 215,793 | ||||||
Merck & Co., Inc. | 1,873 | 107,904 | ||||||
|
| |||||||
| 670,105 | ||||||||
|
| |||||||
REAL ESTATE INVESTMENT TRUSTS (REITS) — 2.7% |
| |||||||
Extra Space Storage, Inc. REIT | 1,325 | 122,616 | ||||||
Simon Property Group, Inc. REIT | 938 | 203,452 | ||||||
|
| |||||||
| 326,068 | ||||||||
|
| |||||||
ROAD & RAIL — 0.6% | ||||||||
Union Pacific Corp. | 886 | 77,304 | ||||||
|
| |||||||
SOFTWARE — 9.3% | ||||||||
Electronic Arts, Inc. (a) | 6,043 | 457,818 | ||||||
Oracle Corp. | 7,209 | 295,064 | ||||||
Take-Two Interactive Software, Inc. (a) | 9,936 | 376,773 | ||||||
|
| |||||||
| 1,129,655 | ||||||||
|
| |||||||
SPECIALTY RETAIL — 3.8% | ||||||||
AutoZone, Inc. (a) | 189 | 150,036 | ||||||
Best Buy Co., Inc. | 8,237 | 252,052 | ||||||
O’Reilly Automotive, Inc. (a) | 140 | 37,954 | ||||||
Urban Outfitters, Inc. (a) | 952 | 26,180 | ||||||
|
| |||||||
| 466,222 | ||||||||
|
| |||||||
TECHNOLOGY HARDWARE, STORAGE & |
| |||||||
Apple, Inc. | 2,810 | 268,636 | ||||||
|
| |||||||
TEXTILES, APPAREL & LUXURY GOODS — 3.6% |
| |||||||
Michael Kors Holdings, Ltd. (a) | 8,750 | 432,950 | ||||||
|
| |||||||
TOBACCO — 4.5% |
| |||||||
Altria Group, Inc. | 4,948 | 341,214 | ||||||
Security Description | Shares | Value | ||||||
Philip Morris International, Inc. | 2,063 | 209,848 | ||||||
|
| |||||||
| 551,062 | ||||||||
|
| |||||||
TRADING COMPANIES & DISTRIBUTORS — 1.5% |
| |||||||
United Rentals, Inc. (a) | 2,654 | 178,083 | ||||||
|
| |||||||
TOTAL COMMON STOCKS | 11,991,288 | |||||||
|
| |||||||
SHORT-TERM INVESTMENT — 1.4% |
| |||||||
State Street Institutional Liquid Reserves Fund, Premier Class 0.47% (b) (c) | 175,794 | 175,794 | ||||||
|
| |||||||
TOTAL INVESTMENTS — 100.0% | 12,167,082 | |||||||
OTHER ASSETS IN EXCESS OF LIABILITIES — 0.0% | 927 | |||||||
|
| |||||||
NET ASSETS — 100.0% | $ | 12,168,009 | ||||||
|
| |||||||
See accompanying notes to financial statements.
56
Table of Contents
SSGA MFS Systematic Growth Equity Portfolio
SCHEDULE OF INVESTMENTS (continued)
June 30, 2016
| (a) | Non-income producing security. |
| (b) | The Fund invested in certain money market funds managed by SSGA Funds Management, Inc. Amounts related to these transactions during the year ended June 30, 2016 are shown in the Affiliate Table below. |
| (c) | The rate shown is the annualized seven-day yield at June 30, 2016. |
| REIT | Real Estate Investment Trust |
The following table summarizes the value of the Fund’s investments accordingly to the fair value hierarchy as of June 30, 2016.
Description | Level 1 — Quoted Prices | Level 2 — Other Significant Observable Inputs | Level 3 — Significant Unobservable Inputs | Total | ||||||||||||
ASSETS: | ||||||||||||||||
INVESTMENTS: | ||||||||||||||||
Common Stocks | ||||||||||||||||
Aerospace & Defense | $ | 385,874 | $ | — | $ | — | $ | 385,874 | ||||||||
Auto Components | 233,539 | — | — | 233,539 | ||||||||||||
Banks | 106,384 | — | — | 106,384 | ||||||||||||
Beverages | 265,770 | — | — | 265,770 | ||||||||||||
Biotechnology | 717,264 | — | — | 717,264 | ||||||||||||
Chemicals | 346,574 | — | — | 346,574 | ||||||||||||
Diversified Telecommunication Services | 322,308 | — | — | 322,308 | ||||||||||||
Food & Staples Retailing | 525,034 | — | — | 525,034 | ||||||||||||
Food Products | 405,883 | — | — | 405,883 | ||||||||||||
Health Care Providers & Services | 821,875 | — | — | 821,875 | ||||||||||||
Hotels, Restaurants & Leisure | 332,397 | — | — | 332,397 | ||||||||||||
Insurance | 230,428 | — | — | 230,428 | ||||||||||||
Internet & Catalog Retail | 1,223,911 | — | — | 1,223,911 | ||||||||||||
Internet Software & Services | 495,118 | — | — | 495,118 | ||||||||||||
IT Services | 836,999 | — | — | 836,999 | ||||||||||||
Media | 641,845 | — | — | 641,845 | ||||||||||||
Pharmaceuticals | 670,105 | — | — | 670,105 | ||||||||||||
Real Estate Investment Trusts (REITs) | 326,068 | — | — | 326,068 | ||||||||||||
Road & Rail | 77,304 | — | — | 77,304 | ||||||||||||
Software | 1,129,655 | — | — | 1,129,655 | ||||||||||||
Specialty Retail | 466,222 | — | — | 466,222 | ||||||||||||
Technology Hardware, Storage & Peripherals | 268,636 | — | — | 268,636 | ||||||||||||
Textiles, Apparel & Luxury Goods | 432,950 | — | — | 432,950 | ||||||||||||
Tobacco | 551,062 | — | — | 551,062 | ||||||||||||
Trading Companies & Distributors | 178,083 | — | — | 178,083 | ||||||||||||
Short-Term Investment | 175,794 | — | — | 175,794 | ||||||||||||
|
|
|
|
|
|
|
| |||||||||
TOTAL INVESTMENTS | $ | 12,167,082 | $ | — | $ | — | $ | 12,167,082 | ||||||||
|
|
|
|
|
|
|
| |||||||||
See accompanying notes to financial statements.
57
Table of Contents
SSGA MFS Systematic Growth Equity Portfolio
SCHEDULE OF INVESTMENTS (continued)
June 30, 2016
Affiliate Table
| Number of Shares Held at 6/30/15 | Value At 6/30/15 | Shares | Number of Shares Held at 6/30/16 | Value at 6/30/16 | Dividend Income | Realized Gain (Loss) | ||||||||||||||||||||||||||
| Purchased | Sold | |||||||||||||||||||||||||||||||
State Street Institutional Liquid Reserves Fund, Premier Class | 63,671 | $ | 63,671 | 498,592 | 386,469 | 175,794 | $ | 175,794 | $ | 351 | $ | — | ||||||||||||||||||||
See accompanying notes to financial statements.
58
Table of Contents
SSGA MFS SYSTEMATIC VALUE EQUITY PORTFOLIO
SPDR MFS Systematic Value Equity ETF is a feeder fund that invests substantially all of its investable assets in a master fund, the SSGA MFS Systematic Value Equity Portfolio. The schedule of investments for the SSGA MFS Systematic Value Equity Portfolio follows.
59
Table of Contents
SSGA MFS Systematic Value Equity Portfolio
SCHEDULE OF INVESTMENTS
June 30, 2016
Security Description | Shares | Value | ||||||
COMMON STOCKS — 98.7% |
| |||||||
AEROSPACE & DEFENSE — 3.8% |
| |||||||
Northrop Grumman Corp. | 451 | $ | 100,248 | |||||
|
| |||||||
AUTO COMPONENTS — 1.0% | ||||||||
Goodyear Tire & Rubber Co. | 1,004 | 25,763 | ||||||
|
| |||||||
AUTOMOBILES — 1.8% | ||||||||
General Motors Co. | 1,640 | 46,412 | ||||||
|
| |||||||
BANKS — 11.8% | ||||||||
Citigroup, Inc. | 1,631 | 69,138 | ||||||
JPMorgan Chase & Co. | 2,129 | 132,296 | ||||||
Wells Fargo & Co. | 2,239 | 105,972 | ||||||
|
| |||||||
| 307,406 | ||||||||
|
| |||||||
BIOTECHNOLOGY — 1.4% |
| |||||||
Gilead Sciences, Inc. | 452 | 37,706 | ||||||
|
| |||||||
CHEMICALS — 2.6% | ||||||||
LyondellBasell Industries NV Class A | 896 | 66,680 | ||||||
|
| |||||||
COMMUNICATIONS EQUIPMENT — 1.8% |
| |||||||
Cisco Systems, Inc. | 1,678 | 48,142 | ||||||
|
| |||||||
CONSUMER FINANCE — 1.7% |
| |||||||
Discover Financial Services | 831 | 44,533 | ||||||
|
| |||||||
DIVERSIFIED TELECOMMUNICATION SERVICES — 1.2% |
| |||||||
Verizon Communications, Inc. | 556 | 31,047 | ||||||
|
| |||||||
ELECTRIC UTILITIES — 7.2% |
| |||||||
Exelon Corp. | 2,794 | 101,590 | ||||||
PG&E Corp. | 854 | 54,587 | ||||||
PPL Corp. | 837 | 31,597 | ||||||
|
| |||||||
| 187,774 | ||||||||
|
| |||||||
ENERGY EQUIPMENT & SERVICES — 0.9% |
| |||||||
Schlumberger, Ltd. | 290 | 22,933 | ||||||
|
| |||||||
FOOD PRODUCTS — 4.9% |
| |||||||
Bunge, Ltd. | 670 | 39,631 | ||||||
Tyson Foods, Inc. Class A | 1,331 | 88,897 | ||||||
|
| |||||||
| 128,528 | ||||||||
|
| |||||||
HEALTH CARE EQUIPMENT & SUPPLIES — 0.6% |
| |||||||
Abbott Laboratories | 407 | 15,999 | ||||||
|
| |||||||
HEALTH CARE PROVIDERS & SERVICES — 3.9% |
| |||||||
Anthem, Inc. | 167 | 21,934 | ||||||
Cardinal Health, Inc. | 309 | 24,105 | ||||||
HCA Holdings, Inc. (a) | 460 | 35,425 | ||||||
UnitedHealth Group, Inc. | 151 | 21,321 | ||||||
|
| |||||||
| 102,785 | ||||||||
|
| |||||||
HOTELS, RESTAURANTS & LEISURE — 3.4% |
| |||||||
Carnival Corp. | 1,593 | 70,411 | ||||||
Royal Caribbean Cruises, Ltd. | 266 | 17,862 | ||||||
|
| |||||||
| 88,273 | ||||||||
|
| |||||||
INDEPENDENT POWER PRODUCERS & ENERGY TRADERS — 2.4% |
| |||||||
AES Corp. | 5,123 | 63,935 | ||||||
|
| |||||||
INDUSTRIAL CONGLOMERATES — 1.6% |
| |||||||
Danaher Corp. | 424 | 42,824 | ||||||
|
| |||||||
INSURANCE — 7.3% |
| |||||||
MetLife, Inc. | 1,638 | 65,242 | ||||||
Prudential Financial, Inc. | 1,027 | 73,266 | ||||||
Travelers Cos., Inc. | 192 | 22,856 | ||||||
Validus Holdings, Ltd. | 629 | 30,563 | ||||||
|
| |||||||
| 191,927 | ||||||||
|
| |||||||
INTERNET & CATALOG RETAIL — 1.4% |
| |||||||
Priceline Group, Inc. (a) | 30 | 37,452 | ||||||
|
| |||||||
OIL, GAS & CONSUMABLE FUELS — 11.0% |
| |||||||
Chevron Corp. | 160 | 16,773 | ||||||
Exxon Mobil Corp. | 543 | 50,901 | ||||||
Marathon Petroleum Corp. | 861 | 32,683 | ||||||
Occidental Petroleum Corp. | 544 | 41,105 | ||||||
Rice Energy, Inc. (a) | 2,280 | 50,251 | ||||||
Valero Energy Corp. | 1,363 | 69,513 | ||||||
WPX Energy, Inc. (a) | 2,736 | 25,472 | ||||||
|
| |||||||
| 286,698 | ||||||||
|
| |||||||
PHARMACEUTICALS — 6.2% |
| |||||||
Johnson & Johnson | 629 | 76,298 | ||||||
Merck & Co., Inc. | 1,469 | 84,629 | ||||||
|
| |||||||
| 160,927 | ||||||||
|
| |||||||
REAL ESTATE INVESTMENT TRUSTS (REITS) — 3.9% |
| |||||||
AvalonBay Communities, Inc. REIT | 411 | 74,140 | ||||||
STORE Capital Corp. | 950 | 27,978 | ||||||
|
| |||||||
| 102,118 | ||||||||
|
| |||||||
SEMICONDUCTORS & SEMICONDUCTOR EQUIPMENT — 2.4% |
| |||||||
Intel Corp. | 1,876 | 61,533 | ||||||
|
| |||||||
SOFTWARE — 4.4% |
| |||||||
Activision Blizzard, Inc. | 1,709 | 67,727 | ||||||
Take-Two Interactive Software, Inc. (a) | 1,240 | 47,021 | ||||||
|
| |||||||
| 114,748 | ||||||||
|
| |||||||
SPECIALTY RETAIL — 2.0% |
| |||||||
Best Buy Co., Inc. | 1,669 | 51,071 | ||||||
|
| |||||||
TECHNOLOGY HARDWARE, STORAGE & PERIPHERALS — 2.0% |
| |||||||
HP, Inc. | 1,809 | 22,703 | ||||||
NetApp, Inc. | 1,151 | 28,303 | ||||||
|
| |||||||
| 51,006 | ||||||||
|
| |||||||
TEXTILES, APPAREL & LUXURY GOODS — 3.4% |
| |||||||
Michael Kors Holdings, Ltd. (a) | 1,820 | 90,054 | ||||||
|
| |||||||
TOBACCO — 2.7% |
| |||||||
Altria Group, Inc. | 1,020 | 70,339 | ||||||
|
| |||||||
TOTAL COMMON STOCKS | 2,578,861 | |||||||
|
| |||||||
SHORT-TERM INVESTMENT — 1.2% |
| |||||||
State Street Institutional Liquid Reserves Fund, Premier Class 0.47% (b) (c) | 31,318 | 31,318 | ||||||
|
| |||||||
TOTAL INVESTMENTS — 99.9% |
| |||||||
(Cost $2,550,160) | 2,610,179 | |||||||
OTHER ASSETS IN EXCESS OF LIABILITIES — 0.1% | 3,620 | |||||||
|
| |||||||
NET ASSETS — 100.0% | $ | 2,613,799 | ||||||
|
| |||||||
| (a) | Non-income producing security. |
See accompanying notes to financial statements.
60
Table of Contents
SSGA MFS Systematic Value Equity Portfolio
SCHEDULE OF INVESTMENTS (continued)
June 30, 2016
| (b) | The Fund invested in certain money market funds managed by SSGA Funds Management, Inc. Amounts related to these transactions during the year ended June 30, 2016 are shown in the Affiliate Table below. |
| (c) | The rate shown is the annualized seven-day yield at June 30, 2016. |
REIT Real Estate Investment Trust
The following table summarizes the value of the Fund’s investments accordingly to the fair value hierarchy as of June 30, 2016.
Description | Level 1 — Quoted Prices | Level 2 — Other Significant Observable Inputs | Level 3 — Significant Unobservable Inputs | Total | ||||||||||||
ASSETS: | ||||||||||||||||
INVESTMENTS: | ||||||||||||||||
Common Stocks | ||||||||||||||||
Aerospace & Defense | $ | 100,248 | $ | — | $ | — | $ | 100,248 | ||||||||
Auto Components | 25,763 | — | — | 25,763 | ||||||||||||
Automobiles | 46,412 | — | — | 46,412 | ||||||||||||
Banks | 307,406 | — | — | 307,406 | ||||||||||||
Biotechnology | 37,706 | — | — | 37,706 | ||||||||||||
Chemicals | 66,680 | — | — | 66,680 | ||||||||||||
Communications Equipment | 48,142 | — | — | 48,142 | ||||||||||||
Consumer Finance | 44,533 | — | — | 44,533 | ||||||||||||
Diversified Telecommunication Services | 31,047 | — | — | 31,047 | ||||||||||||
Electric Utilities | 187,774 | — | — | 187,774 | ||||||||||||
Energy Equipment & Services | 22,933 | — | — | 22,933 | ||||||||||||
Food Products | 128,528 | — | — | 128,528 | ||||||||||||
Health Care Equipment & Supplies | 15,999 | — | — | 15,999 | ||||||||||||
Health Care Providers & Services | 102,785 | — | — | 102,785 | ||||||||||||
Hotels, Restaurants & Leisure | 88,273 | — | — | 88,273 | ||||||||||||
Independent Power Producers & Energy Traders | 63,935 | — | — | 63,935 | ||||||||||||
Industrial Conglomerates | 42,824 | — | — | 42,824 | ||||||||||||
Insurance | 191,927 | — | — | 191,927 | ||||||||||||
Internet & Catalog Retail | 37,452 | — | — | 37,452 | ||||||||||||
Oil, Gas & Consumable Fuels | 286,698 | — | — | 286,698 | ||||||||||||
Pharmaceuticals | 160,927 | — | — | 160,927 | ||||||||||||
Real Estate Investment Trusts (REITs) | 102,118 | — | — | 102,118 | ||||||||||||
Semiconductors & Semiconductor Equipment | 61,533 | — | — | 61,533 | ||||||||||||
Software | 114,748 | — | — | 114,748 | ||||||||||||
Specialty Retail | 51,071 | — | — | 51,071 | ||||||||||||
Technology Hardware, Storage & Peripherals | 51,006 | — | — | 51,006 | ||||||||||||
Textiles, Apparel & Luxury Goods | 90,054 | — | — | 90,054 | ||||||||||||
Tobacco | 70,339 | — | — | 70,339 | ||||||||||||
Short-Term Investment | 31,318 | — | — | 31,318 | ||||||||||||
|
|
|
|
|
|
|
| |||||||||
TOTAL INVESTMENTS | $ | 2,610,179 | $ | — | $ | — | $ | 2,610,179 | ||||||||
|
|
|
|
|
|
|
| |||||||||
See accompanying notes to financial statements.
61
Table of Contents
SSGA MFS Systematic Value Equity Portfolio
SCHEDULE OF INVESTMENTS (continued)
June 30, 2016
Affiliate Table
| Number of Shares Held at 6/30/15 | Value At 6/30/15 | Shares | Number of Shares Held at 6/30/16 | Value at 6/30/16 | Dividend Income | Realized Gain (Loss) | ||||||||||||||||||||||||||
| Purchased | Sold | |||||||||||||||||||||||||||||||
State Street Institutional Liquid Reserves Fund, Premier Class | 27,610 | $ | 27,610 | 140,522 | 136,814 | 31,318 | $ | 31,318 | $ | 66 | $ | — | ||||||||||||||||||||
See accompanying notes to financial statements.
62
Table of Contents
STATE STREET RISK AWARE PORTFOLIO
SPDR SSGA Risk Aware ETF is a feeder fund that invests substantially all of its investable assets in a master fund, the State Street Risk Aware Portfolio. The schedule of investments for the State Street Risk Aware Portfolio follows.
63
Table of Contents
State Street Risk Aware Portfolio
SCHEDULE OF INVESTMENTS
June 30, 2016
Security Description | Shares | Value | ||||||
COMMON STOCKS — 99.2% |
| |||||||
AIR FREIGHT & LOGISTICS — 0.9% |
| |||||||
Park-Ohio Holdings Corp. | 594 | $ | 16,798 | |||||
|
| |||||||
AUTO COMPONENTS — 0.3% | ||||||||
Stoneridge, Inc. (a) | 296 | 4,422 | ||||||
Tenneco, Inc. (a) | 44 | 2,051 | ||||||
|
| |||||||
| 6,473 | ||||||||
|
| |||||||
BANKS — 0.7% |
| |||||||
First Connecticut Bancorp, Inc. | 144 | 2,385 | ||||||
People’s United Financial, Inc. | 759 | 11,127 | ||||||
|
| |||||||
| 13,512 | ||||||||
|
| |||||||
BEVERAGES — 4.6% |
| |||||||
Coca-Cola Co. | 1,011 | 45,829 | ||||||
PepsiCo, Inc. | 413 | 43,753 | ||||||
|
| |||||||
| 89,582 | ||||||||
|
| |||||||
BIOTECHNOLOGY — 3.6% |
| |||||||
Amgen, Inc. | 409 | 62,229 | ||||||
Arrowhead Pharmaceuticals, Inc. (a) | 734 | 3,905 | ||||||
Inovio Pharmaceuticals, Inc. (a) | 189 | 1,746 | ||||||
Karyopharm Therapeutics, Inc. (a) | 415 | 2,785 | ||||||
|
| |||||||
| 70,665 | ||||||||
|
| |||||||
BUILDING PRODUCTS — 1.5% |
| |||||||
Builders FirstSource, Inc. (a) | 963 | 10,834 | ||||||
USG Corp. (a) | 663 | 17,874 | ||||||
|
| |||||||
| 28,708 | ||||||||
|
| |||||||
CAPITAL MARKETS — 1.3% |
| |||||||
Goldman Sachs Group, Inc. | 31 | 4,606 | ||||||
Pzena Investment Management, Inc. Class A | 2,750 | 20,928 | ||||||
|
| |||||||
| 25,534 | ||||||||
|
| |||||||
CHEMICALS — 2.5% |
| |||||||
Ferro Corp. (a) | 2,445 | 32,714 | ||||||
Huntsman Corp. | 260 | 3,497 | ||||||
Kraton Performance Polymers, Inc. (a) | 347 | 9,692 | ||||||
Kronos Worldwide, Inc. | 354 | 1,858 | ||||||
LSB Industries, Inc. (a) | 134 | 1,619 | ||||||
|
| |||||||
| 49,380 | ||||||||
|
| |||||||
COMMERCIAL SERVICES & SUPPLIES — 0.9% |
| |||||||
ACCO Brands Corp. (a) | 1,721 | 17,778 | ||||||
|
| |||||||
COMMUNICATIONS EQUIPMENT — 3.1% |
| |||||||
Aerohive Networks, Inc. (a) | 2,845 | 18,834 | ||||||
Sonus Networks, Inc. (a) | 174 | 1,512 | ||||||
Ubiquiti Networks, Inc. (a) | 1,069 | 41,328 | ||||||
|
| |||||||
| 61,674 | ||||||||
|
| |||||||
CONSTRUCTION & ENGINEERING — 0.2% |
| |||||||
Tutor Perini Corp. (a) | 179 | 4,215 | ||||||
|
| |||||||
DIVERSIFIED FINANCIAL SERVICES — 4.3% |
| |||||||
Berkshire Hathaway, Inc. Class B (a) | 573 | 82,965 | ||||||
Moody’s Corp. | 10 | 937 | ||||||
S&P Global, Inc. | 13 | 1,394 | ||||||
|
| |||||||
| 85,296 | ||||||||
|
| |||||||
DIVERSIFIED TELECOMMUNICATION SERVICES — 8.7% |
| |||||||
AT&T, Inc. | 1,925 | 83,179 | ||||||
Globalstar, Inc. (a) | 1,390 | 1,682 | ||||||
Security Description | Shares | Value | ||||||
Verizon Communications, Inc. | 1,549 | 86,496 | ||||||
|
| |||||||
| 171,357 | ||||||||
|
| |||||||
ELECTRIC UTILITIES — 0.9% |
| |||||||
PG&E Corp. | 271 | 17,322 | ||||||
|
| |||||||
ELECTRICAL EQUIPMENT — 0.2% | ||||||||
FuelCell Energy, Inc. (a) | 510 | 3,172 | ||||||
|
| |||||||
ELECTRONIC EQUIPMENT, INSTRUMENTS & COMPONENTS — 2.0% |
| |||||||
Control4 Corp. (a) | 204 | 1,665 | ||||||
InvenSense, Inc. (a) | 4,313 | 26,439 | ||||||
VeriFone Systems, Inc. (a) | 614 | 11,383 | ||||||
|
| |||||||
| 39,487 | ||||||||
|
| |||||||
ENERGY EQUIPMENT & SERVICES — 2.1% |
| |||||||
Atwood Oceanics, Inc. | 399 | 4,995 | ||||||
Bristow Group, Inc. | 172 | 1,963 | ||||||
Fairmount Santrol Holdings, Inc. (a) | 385 | 2,968 | ||||||
Geospace Technologies Corp. (a) | 64 | 1,048 | ||||||
Helix Energy Solutions Group, Inc. (a) | 336 | 2,271 | ||||||
Hornbeck Offshore Services, Inc. (a) | 415 | 3,461 | ||||||
Seadrill, Ltd. (a) | 1,791 | 5,803 | ||||||
Tidewater, Inc. | 164 | 723 | ||||||
Unit Corp. (a) | 137 | 2,132 | ||||||
US Silica Holdings, Inc. | 466 | 16,063 | ||||||
|
| |||||||
| 41,427 | ||||||||
|
| |||||||
FOOD PRODUCTS — 3.7% |
| |||||||
General Mills, Inc. | 1,010 | 72,033 | ||||||
|
| |||||||
HEALTH CARE EQUIPMENT & SUPPLIES — 2.1% |
| |||||||
Cooper Cos., Inc. | 236 | 40,491 | ||||||
|
| |||||||
HOTELS, RESTAURANTS & LEISURE — 7.9% |
| |||||||
Eldorado Resorts, Inc. (a) | 2,929 | 44,506 | ||||||
Isle of Capri Casinos, Inc. (a) | 362 | 6,632 | ||||||
McDonald’s Corp. | 807 | 97,114 | ||||||
Norwegian Cruise Line Holdings, Ltd. (a) | 153 | 6,096 | ||||||
|
| |||||||
| 154,348 | ||||||||
|
| |||||||
HOUSEHOLD DURABLES — 2.5% |
| |||||||
Green Brick Partners, Inc. (a) | 4,296 | 31,232 | ||||||
Hovnanian Enterprises, Inc. Class A (a) | 5,059 | 8,499 | ||||||
KB Home | 622 | 9,461 | ||||||
|
| |||||||
| 49,192 | ||||||||
|
| |||||||
HOUSEHOLD PRODUCTS — 4.9% |
| |||||||
Procter & Gamble Co. | 1,132 | 95,846 | ||||||
|
| |||||||
INSURANCE — 1.4% | ||||||||
Allied World Assurance Co. Holdings AG | 640 | 22,489 | ||||||
American International Group, Inc. | 94 | 4,972 | ||||||
|
| |||||||
| 27,461 | ||||||||
|
| |||||||
INTERNET & CATALOG RETAIL — 2.2% |
| |||||||
Expedia, Inc. | 71 | 7,548 | ||||||
FTD Cos., Inc. (a) | 895 | 22,339 | ||||||
Netflix, Inc. (a) | 144 | 13,173 | ||||||
|
| |||||||
| 43,060 | ||||||||
|
| |||||||
IT SERVICES — 1.8% |
| |||||||
Visa, Inc. Class A | 476 | 35,305 | ||||||
|
| |||||||
See accompanying notes to financial statements.
64
Table of Contents
State Street Risk Aware Portfolio
SCHEDULE OF INVESTMENTS (continued)
June 30, 2016
Security Description | Shares | Value | ||||||
MACHINERY — 3.0% | ||||||||
Chart Industries, Inc. (a) | 606 | $ | 14,623 | |||||
ExOne Co. (a) | 606 | 6,406 | ||||||
Manitowoc Co., Inc. | 5,134 | 27,980 | ||||||
Oshkosh Corp. | 106 | 5,057 | ||||||
Titan International, Inc. | 656 | 4,067 | ||||||
|
| |||||||
| 58,133 | ||||||||
|
| |||||||
MARINE — 0.0% (b) |
| |||||||
Scorpio Bulkers, Inc. (a) | 263 | 734 | ||||||
|
| |||||||
MEDIA — 0.5% | ||||||||
Charter Communications, Inc. Class A (a) | 8 | 1,829 | ||||||
Eros International PLC (a) | 459 | 7,468 | ||||||
|
| |||||||
| 9,297 | ||||||||
|
| |||||||
METALS & MINING — 1.8% |
| |||||||
AK Steel Holding Corp. (a) | 1,602 | 7,465 | ||||||
Freeport-McMoRan, Inc. | 415 | 4,623 | ||||||
Newmont Mining Corp. | 430 | 16,822 | ||||||
Olympic Steel, Inc. | 137 | 3,742 | ||||||
Stillwater Mining Co. (a) | 92 | 1,091 | ||||||
United States Steel Corp. | 50 | 843 | ||||||
|
| |||||||
| 34,586 | ||||||||
|
| |||||||
MULTI-UTILITIES — 1.0% |
| |||||||
CenterPoint Energy, Inc. | 246 | 5,904 | ||||||
Dominion Resources, Inc. | 171 | 13,326 | ||||||
|
| |||||||
| 19,230 | ||||||||
|
| |||||||
MULTILINE RETAIL — 1.2% |
| |||||||
Dollar General Corp. | 239 | 22,466 | ||||||
Sears Holdings Corp. (a) | 106 | 1,443 | ||||||
|
| |||||||
| 23,909 | ||||||||
|
| |||||||
OIL, GAS & CONSUMABLE FUELS — 3.7% |
| |||||||
Cheniere Energy, Inc. (a) | 267 | 10,026 | ||||||
Chesapeake Energy Corp. (a) | 1,014 | 4,340 | ||||||
Clayton Williams Energy, Inc. (a) | 73 | 2,005 | ||||||
Denbury Resources, Inc. | 1,433 | 5,144 | ||||||
EP Energy Corp. Class A (a) | 827 | 4,284 | ||||||
Jones Energy, Inc. Class A (a) | 312 | 1,285 | ||||||
Kinder Morgan, Inc. | 1,452 | 27,181 | ||||||
Oasis Petroleum, Inc. (a) | 301 | 2,811 | ||||||
Pacific Ethanol, Inc. (a) | 713 | 3,886 | ||||||
SemGroup Corp. Class A | 50 | 1,628 | ||||||
SM Energy Co. | 33 | 891 | ||||||
Teekay Corp. | 137 | 977 | ||||||
W&T Offshore, Inc. (a) | 2,065 | 4,791 | ||||||
Whiting Petroleum Corp. (a) | 431 | 3,991 | ||||||
|
| |||||||
| 73,240 | ||||||||
|
| |||||||
PAPER & FOREST PRODUCTS — 0.1% |
| |||||||
Clearwater Paper Corp. (a) | 43 | 2,811 | ||||||
|
| |||||||
PHARMACEUTICALS — 9.1% | ||||||||
ANI Pharmaceuticals, Inc. (a) | 118 | 6,587 | ||||||
Bristol-Myers Squibb Co. | 528 | 38,834 | ||||||
Johnson & Johnson | 442 | 53,615 | ||||||
Merck & Co., Inc. | 982 | 56,573 | ||||||
Theravance Biopharma, Inc. (a) | 1,033 | 23,439 | ||||||
|
| |||||||
| 179,048 | ||||||||
|
| |||||||
Security Description | Shares | Value | ||||||
PROFESSIONAL SERVICES — 1.0% |
| |||||||
Advisory Board Co. (a) | 156 | 5,521 | ||||||
Verisk Analytics, Inc. (a) | 176 | 14,270 | ||||||
|
| |||||||
| 19,791 | ||||||||
|
| |||||||
REAL ESTATE INVESTMENT TRUSTS (REITS) — 0.7% |
| |||||||
American Tower Corp. REIT | 80 | 9,089 | ||||||
Annaly Capital Management, Inc. | 478 | 5,291 | ||||||
|
| |||||||
| 14,380 | ||||||||
|
| |||||||
REAL ESTATE MANAGEMENT & DEVELOPMENT — 0.7% |
| |||||||
Forestar Group, Inc. (a) | 1,233 | 14,660 | ||||||
|
| |||||||
ROAD & RAIL — 0.2% | ||||||||
YRC Worldwide, Inc. (a) | 389 | 3,423 | ||||||
|
| |||||||
SEMICONDUCTORS & SEMICONDUCTOR |
| |||||||
SunPower Corp. (a) | 558 | 8,643 | ||||||
|
| |||||||
SOFTWARE — 3.9% | ||||||||
Barracuda Networks, Inc. (a) | 871 | 13,187 | ||||||
Glu Mobile, Inc. (a) | 2,543 | 5,594 | ||||||
Interactive Intelligence Group, Inc. (a) | 36 | 1,476 | ||||||
VASCO Data Security International, Inc. (a) | 3,461 | 56,726 | ||||||
|
| |||||||
| 76,983 | ||||||||
|
| |||||||
TECHNOLOGY HARDWARE, STORAGE & PERIPHERALS — 0.1% |
| |||||||
3D Systems Corp. (a) | 160 | 2,190 | ||||||
|
| |||||||
TEXTILES, APPAREL & LUXURY GOODS — 0.5% |
| |||||||
Sequential Brands Group, Inc. (a) | 1,205 | 9,616 | ||||||
|
| |||||||
THRIFTS & MORTGAGE FINANCE — 6.1% |
| |||||||
Flagstar Bancorp, Inc. (a) | 4,043 | 98,690 | ||||||
Impac Mortgage Holdings, Inc. (a) | 455 | 7,134 | ||||||
MGIC Investment Corp. (a) | 1,604 | 9,544 | ||||||
Radian Group, Inc. | 389 | 4,053 | ||||||
|
| |||||||
| 119,421 | ||||||||
|
| |||||||
TRADING COMPANIES & DISTRIBUTORS — 0.9% |
| |||||||
CAI International, Inc. (a) | 102 | 765 | ||||||
H&E Equipment Services, Inc. | 436 | 8,297 | ||||||
United Rentals, Inc. (a) | 117 | 7,851 | ||||||
|
| |||||||
| 16,913 | ||||||||
|
| |||||||
TOTAL COMMON STOCKS | 1,947,124 | |||||||
SHORT-TERM INVESTMENT — 0.7% | ||||||||
State Street Institutional Liquid Reserves Fund, Premier Class 0.47% (c) (d) | 13,432 | 13,432 | ||||||
|
| |||||||
TOTAL INVESTMENTS — 99.9% | 1,960,556 | |||||||
OTHER ASSETS IN EXCESS OF LIABILITIES — 0.1% | 1,021 | |||||||
|
| |||||||
NET ASSETS — 100.0% | $ | 1,961,577 | ||||||
|
| |||||||
| (a) | Non-income producing security. |
| (b) | Amount is less than 0.05% of net assets. |
| (c) | The Fund invested in certain money market funds managed by SSGA Funds Management, Inc. Amounts related to these |
See accompanying notes to financial statements.
65
Table of Contents
State Street Risk Aware Portfolio
SCHEDULE OF INVESTMENTS (continued)
June 30, 2016
| transactions during the year ended June 30, 2016 are shown in the Affiliate Table below. |
| (d) | The rate shown is the annualized seven-day yield at June 30, 2016. |
REIT Real Estate Investment Trust
The following table summarizes the value of the Fund’s investments accordingly to the fair value hierarchy as of June 30, 2016.
Description | Level 1 — Quoted Prices | Level 2 — Other Significant Observable Inputs | Level 3 — Significant Unobservable Inputs | Total | ||||||||||||
ASSETS: | ||||||||||||||||
INVESTMENTS: | ||||||||||||||||
Common Stocks | ||||||||||||||||
Air Freight & Logistics | $ | 16,798 | $ | — | $ | — | $ | 16,798 | ||||||||
Auto Components | 6,473 | — | — | 6,473 | ||||||||||||
Banks | 13,512 | — | — | 13,512 | ||||||||||||
Beverages | 89,582 | — | — | 89,582 | ||||||||||||
Biotechnology | 70,665 | — | — | 70,665 | ||||||||||||
Building Products | 28,708 | — | — | 28,708 | ||||||||||||
Capital Markets | 25,534 | — | — | 25,534 | ||||||||||||
Chemicals | 49,380 | — | — | 49,380 | ||||||||||||
Commercial Services & Supplies | 17,778 | — | — | 17,778 | ||||||||||||
Communications Equipment | 61,674 | — | — | 61,674 | ||||||||||||
Construction & Engineering | 4,215 | — | — | 4,215 | ||||||||||||
Diversified Financial Services | 85,296 | — | — | 85,296 | ||||||||||||
Diversified Telecommunication Services | 171,357 | — | — | 171,357 | ||||||||||||
Electric Utilities | 17,322 | — | — | 17,322 | ||||||||||||
Electrical Equipment | 3,172 | — | — | 3,172 | ||||||||||||
Electronic Equipment, Instruments & Components | 39,487 | — | — | 39,487 | ||||||||||||
Energy Equipment & Services | 41,427 | — | — | 41,427 | ||||||||||||
Food Products | 72,033 | — | — | 72,033 | ||||||||||||
Health Care Equipment & Supplies | 40,491 | — | — | 40,491 | ||||||||||||
Hotels, Restaurants & Leisure | 154,348 | — | — | 154,348 | ||||||||||||
Household Durables | 49,192 | — | — | 49,192 | ||||||||||||
Household Products | 95,846 | — | — | 95,846 | ||||||||||||
Insurance | 27,461 | — | — | 27,461 | ||||||||||||
Internet & Catalog Retail | 43,060 | — | — | 43,060 | ||||||||||||
IT Services | 35,305 | — | — | 35,305 | ||||||||||||
Machinery | 58,133 | — | — | 58,133 | ||||||||||||
Marine | 734 | — | — | 734 | ||||||||||||
Media | 9,297 | — | — | 9,297 | ||||||||||||
Metals & Mining | 34,586 | — | — | 34,586 | ||||||||||||
Multi-Utilities | 19,230 | — | — | 19,230 | ||||||||||||
Multiline Retail | 23,909 | — | — | 23,909 | ||||||||||||
Oil, Gas & Consumable Fuels | 73,240 | — | — | 73,240 | ||||||||||||
Paper & Forest Products | 2,811 | — | — | 2,811 | ||||||||||||
Pharmaceuticals | 179,048 | — | — | 179,048 | ||||||||||||
Professional Services | 19,791 | — | — | 19,791 | ||||||||||||
See accompanying notes to financial statements.
66
Table of Contents
State Street Risk Aware Portfolio
SCHEDULE OF INVESTMENTS (continued)
June 30, 2016
Description | Level 1 — Quoted Prices | Level 2 — Other Significant Observable Inputs | Level 3 — Significant Unobservable Inputs | Total | ||||||||||||
Real Estate Investment Trusts (REITs) | $ | 14,380 | $ | — | $ | — | $ | 14,380 | ||||||||
Real Estate Management & Development | 14,660 | — | — | 14,660 | ||||||||||||
Road & Rail | 3,423 | — | — | 3,423 | ||||||||||||
Semiconductors & Semiconductor Equipment | 8,643 | — | — | 8,643 | ||||||||||||
Software | 76,983 | — | — | 76,983 | ||||||||||||
Technology Hardware, Storage & Peripherals | 2,190 | — | — | 2,190 | ||||||||||||
Textiles, Apparel & Luxury Goods | 9,616 | — | — | 9,616 | ||||||||||||
Thrifts & Mortgage Finance | 119,421 | — | — | 119,421 | ||||||||||||
Trading Companies & Distributors | 16,913 | — | — | 16,913 | ||||||||||||
Short-Term Investment | 13,432 | — | — | 13,432 | ||||||||||||
|
|
|
|
|
|
|
| |||||||||
TOTAL INVESTMENTS | $ | 1,960,556 | $ | — | $ | — | $ | 1,960,556 | ||||||||
|
|
|
|
|
|
|
| |||||||||
Affiliate Table
| Number of Shares Held at 6/30/15 | Value At 6/30/15 | Shares | Number of Shares Held at 6/30/16 | Value at 6/30/16 | Dividend Income | Realized Gain (Loss) | ||||||||||||||||||||||||||
| Purchased | Sold | |||||||||||||||||||||||||||||||
State Street Institutional Liquid Reserves Fund, Premier Class | 9,120 | $ | 9,120 | 91,072 | 86,760 | 13,432 | $ | 13,432 | $ | 18 | $ | — | ||||||||||||||||||||
See accompanying notes to financial statements.
67
Table of Contents
SSGA MASTER TRUST
STATEMENTS OF ASSETS AND LIABILITIES
June 30, 2016
| SSGA Multi-Asset Real Return Portfolio | SSGA Income Allocation Portfolio | SSGA Global Allocation Portfolio | Blackstone/ GSO Senior Loan Portfolio | |||||||||||||
ASSETS | ||||||||||||||||
Investments in unaffiliated issuers, at value (Note 2) | $ | 16,593,837 | $ | 2,005,990 | $ | 18,619,472 | $ | 746,886,487 | ||||||||
Investments in affiliated issuers, at value (Note 2) | 64,243,521 | 102,879,677 | 167,151,491 | 68,870,496 | ||||||||||||
|
|
|
|
|
|
|
| |||||||||
Total Investments | 80,837,358 | 104,885,667 | 185,770,963 | 815,756,983 | ||||||||||||
Receivable for capital contributions | — | — | — | — | ||||||||||||
Cash | — | 999,978 | — | 6,136,808 | ||||||||||||
Receivable for investments sold | — | 612,628 | 4,233,951 | 36,473,797 | ||||||||||||
Dividends receivable — unaffiliated issuers (Note 2) | — | — | — | — | ||||||||||||
Interest receivable — unaffiliated issuers (Note 2) | — | — | — | 2,938,682 | ||||||||||||
Dividends receivable — affiliated issuers (Note 2) | 795 | 15,605 | 48,119 | 18,164 | ||||||||||||
|
|
|
|
|
|
|
| |||||||||
TOTAL ASSETS | 80,838,153 | 106,513,878 | 190,053,033 | 861,324,434 | ||||||||||||
|
|
|
|
|
|
|
| |||||||||
LIABILITIES | ||||||||||||||||
Payable for capital withdrawals | — | — | 1,667,491 | — | ||||||||||||
Payable for investments purchased | — | 999,978 | 8,642,277 | 58,639,566 | ||||||||||||
Advisory fee payable (Note 4) | 12,999 | 17,019 | 30,037 | 195,557 | ||||||||||||
Trustees’ fees and expenses payable (Note 5) | 119 | — | — | — | ||||||||||||
Accrued expenses and other liabilities | 11 | 11 | 15 | 63 | ||||||||||||
|
|
|
|
|
|
|
| |||||||||
TOTAL LIABILITIES | 13,129 | 1,017,008 | 10,339,820 | 58,835,186 | ||||||||||||
|
|
|
|
|
|
|
| |||||||||
NET ASSETS | $ | 80,825,024 | $ | 105,496,870 | $ | 179,713,213 | $ | 802,489,248 | ||||||||
|
|
|
|
|
|
|
| |||||||||
COST OF INVESTMENTS: | ||||||||||||||||
Investments in unaffiliated issuers | $ | 23,913,491 | $ | 2,424,948 | $ | 18,822,438 | $ | 748,096,583 | ||||||||
Investments in affiliated issuers | 68,086,167 | 99,674,982 | 163,945,722 | 68,870,496 | ||||||||||||
|
|
|
|
|
|
|
| |||||||||
Total cost of investments | $ | 91,999,658 | $ | 102,099,930 | $ | 182,768,160 | $ | 816,967,079 | ||||||||
|
|
|
|
|
|
|
| |||||||||
See accompanying notes to financial statements.
68
Table of Contents
| SSGA Ultra Short Term Bond Portfolio | State Street DoubleLine Total Return Tactical Portfolio | SSGA MFS Systematic Core Equity Portfolio | SSGA MFS Systematic Growth Equity Portfolio | SSGA MFS Systematic Value Equity Portfolio | State Street Risk Aware Portfolio | |||||||||||||||||
| $ | 23,933,366 | $ | 2,367,534,115 | $ | 5,762,157 | $ | 11,991,288 | $ | 2,578,861 | $ | 1,947,124 | |||||||||||
| 483,761 | 351,792,987 | 70,177 | 175,794 | 31,318 | 13,432 | |||||||||||||||||
|
|
|
|
|
|
|
|
|
|
|
| |||||||||||
| 24,417,127 | 2,719,327,102 | 5,832,334 | 12,167,082 | 2,610,179 | 1,960,556 | |||||||||||||||||
| — | 9,963,422 | — | — | — | — | |||||||||||||||||
| 580 | 3,227,686 | — | — | — | 58 | |||||||||||||||||
| — | 16,501,207 | — | 983,475 | — | — | |||||||||||||||||
| — | — | 6,236 | 12,184 | 4,250 | 1,357 | |||||||||||||||||
| 33,520 | 11,828,914 | — | — | — | — | |||||||||||||||||
| 592 | 87,573 | 24 | 64 | 11 | 5 | |||||||||||||||||
|
|
|
|
|
|
|
|
|
|
|
| |||||||||||
| 24,451,819 | 2,760,935,904 | 5,838,594 | 13,162,805 | 2,614,440 | 1,961,976 | |||||||||||||||||
|
|
|
|
|
|
|
|
|
|
|
| |||||||||||
| — | — | — | — | — | — | |||||||||||||||||
| 408,242 | 124,243,447 | — | 991,816 | — | — | |||||||||||||||||
| 3,809 | 619,381 | 1,431 | 2,979 | 641 | 399 | |||||||||||||||||
| — | — | — | — | — | — | |||||||||||||||||
| 1 | 99 | — | 1 | — | — | |||||||||||||||||
|
|
|
|
|
|
|
|
|
|
|
| |||||||||||
| 412,052 | 124,862,927 | 1,431 | 994,796 | 641 | 399 | |||||||||||||||||
|
|
|
|
|
|
|
|
|
|
|
| |||||||||||
| $ | 24,039,767 | $ | 2,636,072,977 | $ | 5,837,163 | $ | 12,168,009 | $ | 2,613,799 | $ | 1,961,577 | |||||||||||
|
|
|
|
|
|
|
|
|
|
|
| |||||||||||
| $ | 23,937,593 | $ | 2,341,084,590 | $ | 5,769,415 | $ | 11,558,334 | $ | 2,518,842 | $ | 1,871,351 | |||||||||||
| 483,761 | 351,792,987 | 70,177 | 175,794 | 31,318 | 13,432 | |||||||||||||||||
|
|
|
|
|
|
|
|
|
|
|
| |||||||||||
| $ | 24,421,354 | $ | 2,692,877,577 | $ | 5,839,592 | $ | 11,734,128 | $ | 2,550,160 | $ | 1,884,783 | |||||||||||
|
|
|
|
|
|
|
|
|
|
|
| |||||||||||
69
Table of Contents
SSGA MASTER TRUST
STATEMENTS OF OPERATIONS
For the Year Ended June 30, 2016
| SSGA Multi-Asset Real Return Portfolio | SSGA Income Allocation Portfolio | SSGA Global Allocation Portfolio | Blackstone/ GSO Senior Loan Portfolio | |||||||||||||
INVESTMENT INCOME |
| |||||||||||||||
Interest income | $ | — | $ | — | $ | — | $ | 36,218,956 | ||||||||
Dividend income — unaffiliated issuers (Note 2) | 76,043 | 127,058 | 387,931 | — | ||||||||||||
Dividend income — affiliated issuers (Note 2) | 1,393,931 | 3,553,587 | 3,948,347 | 139,199 | ||||||||||||
|
|
|
|
|
|
|
| |||||||||
TOTAL INVESTMENT INCOME (LOSS) | 1,469,974 | 3,680,645 | 4,336,278 | 36,358,155 | ||||||||||||
|
|
|
|
|
|
|
| |||||||||
EXPENSES | ||||||||||||||||
Advisory fee (Note 3) | 188,316 | 214,271 | 346,326 | 2,250,290 | ||||||||||||
Trustees’ fees and expenses (Note 4) | 2,027 | 1,995 | 2,941 | 12,398 | ||||||||||||
Miscellaneous expenses | 8 | 8 | 12 | 18,229 | ||||||||||||
|
|
|
|
|
|
|
| |||||||||
TOTAL EXPENSES | 190,351 | 216,274 | 349,279 | 2,280,917 | ||||||||||||
|
|
|
|
|
|
|
| |||||||||
NET EXPENSES | 190,351 | 216,274 | 349,279 | 2,280,917 | ||||||||||||
|
|
|
|
|
|
|
| |||||||||
NET INVESTMENT INCOME (LOSS) | 1,279,623 | 3,464,371 | 3,986,999 | 34,077,238 | ||||||||||||
|
|
|
|
|
|
|
| |||||||||
REALIZED AND UNREALIZED GAIN (LOSS) | ||||||||||||||||
Net realized gain (loss) on: | ||||||||||||||||
Investment transactions — unaffiliated issuers | (4,630,292 | ) | (2,049,022 | ) | (7,220,134 | ) | (46,703,017 | ) | ||||||||
Investment transactions — affiliated issuers | (11,846,362 | ) | (2,749,776 | ) | (3,640,682 | ) | — | |||||||||
Capital gain distributions — unaffiliated issuers | 51,217 | 1,017,301 | 2,071,030 | — | ||||||||||||
|
|
|
|
|
|
|
| |||||||||
Net realized gain (loss) | (16,425,437 | ) | (3,781,497 | ) | (8,789,786 | ) | (46,703,017 | ) | ||||||||
|
|
|
|
|
|
|
| |||||||||
Net change in unrealized appreciation/depreciation on: | ||||||||||||||||
Investment transactions — unaffiliated issuers | (217,859 | ) | (542,000 | ) | (278,285 | ) | 7,786,198 | |||||||||
Investment transactions — affiliated issuers | 6,973,471 | 4,396,282 | 2,130,931 | — | ||||||||||||
|
|
|
|
|
|
|
| |||||||||
Net change in unrealized appreciation/depreciation | 6,755,612 | 3,854,282 | 1,852,646 | 7,786,198 | ||||||||||||
|
|
|
|
|
|
|
| |||||||||
NET REALIZED AND UNREALIZED GAIN (LOSS) | (9,669,825 | ) | 72,785 | (6,937,140 | ) | (38,916,819 | ) | |||||||||
|
|
|
|
|
|
|
| |||||||||
NET INCREASE (DECREASE) IN NET ASSETS FROM OPERATIONS | $ | (8,390,202 | ) | $ | 3,537,156 | $ | (2,950,141 | ) | $ | (4,839,581 | ) | |||||
|
|
|
|
|
|
|
| |||||||||
See accompanying notes to financial statements.
70
Table of Contents
| SSGA Ultra Short Term Bond Portfolio | State Street DoubleLine Total Return Tactical Portfolio | SSGA MFS Systematic Core Equity Portfolio | SSGA MFS Systematic Growth Equity Portfolio | SSGA MFS Systematic Value Equity Portfolio | State Street Risk Aware Portfolio | |||||||||||||||||
| $ | 283,180 | $ | 62,550,019 | $ | — | $ | — | $ | — | $ | — | |||||||||||
| — | — | 114,724 | 177,093 | 65,960 | 38,325 | |||||||||||||||||
| 3,498 | 648,464 | 144 | 351 | 66 | 18 | |||||||||||||||||
|
|
|
|
|
|
|
|
|
|
|
| |||||||||||
| 286,678 | 63,198,483 | 114,868 | 177,444 | 66,026 | 38,343 | |||||||||||||||||
|
|
|
|
|
|
|
|
|
|
|
| |||||||||||
| 64,247 | 5,121,226 | 14,379 | 31,913 | 8,048 | 4,729 | |||||||||||||||||
| 712 | 23,533 | 223 | 314 | 196 | 184 | |||||||||||||||||
| 182 | 13,423 | — | 1 | — | — | |||||||||||||||||
|
|
|
|
|
|
|
|
|
|
|
| |||||||||||
| 65,141 | 5,158,182 | 14,602 | 32,228 | 8,244 | 4,913 | |||||||||||||||||
|
|
|
|
|
|
|
|
|
|
|
| |||||||||||
| 65,141 | 5,158,182 | 14,602 | 32,228 | 8,244 | 4,913 | |||||||||||||||||
|
|
|
|
|
|
|
|
|
|
|
| |||||||||||
| 221,537 | 58,040,301 | 100,266 | 145,216 | 57,782 | 33,430 | |||||||||||||||||
|
|
|
|
|
|
|
|
|
|
|
| |||||||||||
| (268,835 | ) | (3,169,628 | ) | 351,176 | 378,209 | 109,895 | (69,249 | ) | ||||||||||||||
| — | — | — | — | — | — | |||||||||||||||||
| — |
| — | — | — | — | — | |||||||||||||||
|
|
|
|
|
|
|
|
|
|
|
| |||||||||||
| (268,835 | ) | (3,169,628 | ) | 351,176 | 378,209 | 109,895 | (69,249 | ) | ||||||||||||||
|
|
|
|
|
|
|
|
|
|
|
| |||||||||||
| 5,488 | 33,117,161 | (346,393 | ) | 53,236 | (243,654 | ) | 64,874 | |||||||||||||||
| — | — | — | — | — | — | |||||||||||||||||
|
|
|
| �� |
|
|
|
|
|
|
| |||||||||||
| 5,488 |
| 33,117,161 | (346,393 | ) | 53,236 | (243,654 | ) | 64,874 | |||||||||||||
|
|
|
|
|
|
|
|
|
|
|
| |||||||||||
| (263,347 | ) |
| 29,947,533 |
| 4,783 | 431,445 | (133,759 | ) | (4,375 | ) | ||||||||||||
|
|
|
|
|
|
|
|
|
|
|
| |||||||||||
$ | (41,810 | ) | $ | 87,987,834 | $ | 105,049 | $ | 576,661 | $ | (75,977 | ) | $ | 29,055 | |||||||||
|
|
|
|
|
|
|
|
|
|
|
| |||||||||||
71
Table of Contents
SSGA MASTER TRUST
STATEMENTS OF CHANGES IN NET ASSETS
| SSGA Multi-Asset Real Return Portfolio | SSGA Income Allocation Portfolio | |||||||||||||||
| Year Ended 6/30/16 | Year Ended 6/30/15 | Year Ended 6/30/16 | Year Ended 6/30/15 | |||||||||||||
INCREASE (DECREASE) IN NET ASSETS FROM OPERATIONS: | ||||||||||||||||
Net investment income (loss) | $ | 1,279,623 | $ | 2,533,608 | $ | 3,464,371 | $ | 3,664,590 | ||||||||
Net realized gain (loss) | (16,425,437 | ) | (4,432,160 | ) | (3,781,497 | ) | 544,895 | |||||||||
Net change in unrealized appreciation/depreciation | 6,755,612 | (23,442,541 | ) | 3,854,282 | (6,320,056 | ) | ||||||||||
|
|
|
|
|
|
|
| |||||||||
Net increase (decrease) in net assets resulting from operations | (8,390,202 | ) | (25,341,093 | ) | 3,537,156 | (2,110,571 | ) | |||||||||
|
|
|
|
|
|
|
| |||||||||
CAPITAL TRANSACTIONS: | ||||||||||||||||
Contributions | 26,711,193 | 66,337,576 | 3,064,239 | 34,191,856 | ||||||||||||
Withdrawals | (79,491,499 | ) | (63,635,938 | ) | (22,253,312 | ) | (14,962,876 | ) | ||||||||
|
|
|
|
|
|
|
| |||||||||
Net increase (decrease) in net assets from capital transactions | (52,780,306 | ) | 2,701,638 | (19,189,073 | ) | 19,228,980 | ||||||||||
|
|
|
|
|
|
|
| |||||||||
Net increase (decrease) in net assets during the period | (61,170,508 | ) | (22,639,455 | ) | (15,651,917 | ) | 17,118,409 | |||||||||
|
|
|
|
|
|
|
| |||||||||
Net assets at beginning of period | 141,995,532 | 164,634,987 | 121,148,787 | 104,030,378 | ||||||||||||
|
|
|
|
|
|
|
| |||||||||
NET ASSETS AT END OF PERIOD | $ | 80,825,024 | $ | 141,995,532 | $ | 105,496,870 | $ | 121,148,787 | ||||||||
|
|
|
|
|
|
|
| |||||||||
| * | Amounts have been adjusted from prior year annual report to reflect appropriate presentation. |
See accompanying notes to financial statements.
72
Table of Contents
| SSGA Global Allocation Portfolio | Blackstone/GSO Senior Loan Portfolio | SSGA Ultra Short Term Bond Portfolio | ||||||||||||||||||||
| Year Ended 6/30/16 | Year Ended 6/30/15 | Year Ended 6/30/16 | Year Ended 6/30/15* | Year Ended 6/30/16 | Year Ended 6/30/15* | |||||||||||||||||
| $ | 3,986,999 | $ | 3,038,349 | $ | 34,077,238 | $ | 27,436,035 | $ | 221,537 | $ | 53,847 | |||||||||||
| (8,789,786 | ) | 2,763,789 | (46,703,017 | ) | (750,613 | ) | (268,835 | ) | (4,837 | ) | ||||||||||||
| 1,852,646 |
| (5,265,539 | ) | 7,786,198 | (10,613,268 | ) | 5,488 | (20,194 | ) | ||||||||||||
|
|
|
|
|
|
|
|
|
|
|
| |||||||||||
| (2,950,141 | ) |
| 536,599 |
| (4,839,581 | ) | 16,072,154 | (41,810 | ) | 28,816 | ||||||||||||
|
|
|
|
|
|
|
|
|
|
|
| |||||||||||
| 99,464,019 | 72,106,656 | 239,502,612 | 123,669,008 | 195,887,137 | 6,015,883 | |||||||||||||||||
| (61,576,069 | ) | (26,359,458 | ) | (104,437,485 | ) | (77,954,422 | ) | (187,824,678 | ) | (4,061,512 | ) | |||||||||||
|
|
|
|
|
|
|
|
|
|
|
| |||||||||||
| 37,887,950 |
| 45,747,198 | 135,065,127 | 45,714,586 | 8,062,459 | 1,954,371 | |||||||||||||||
|
|
|
|
|
|
|
|
|
|
|
| |||||||||||
| 34,937,809 |
| 46,283,797 | 130,225,546 | 61,786,740 | 8,020,649 | 1,983,187 | |||||||||||||||
|
|
|
|
|
|
|
|
|
|
|
| |||||||||||
| 144,775,404 | 98,491,607 | 672,263,702 | 610,476,962 | 16,019,118 | 14,035,931 | |||||||||||||||||
|
|
|
|
|
|
|
|
|
|
|
| |||||||||||
| $ | 179,713,213 | $ | 144,775,404 | $ | 802,489,248 | $ | 672,263,702 | $ | 24,039,767 | $ | 16,019,118 | |||||||||||
|
|
|
|
|
|
|
|
|
|
|
| |||||||||||
73
Table of Contents
SSGA MASTER TRUST
STATEMENTS OF CHANGES IN NET ASSETS (continued)
| State Street DoubleLine Total Return Tactical Portfolio | SSGA MFS Systematic Core Equity Portfolio | |||||||||||||||
| Year Ended 6/30/16 | For the Period 2/23/15* - 6/30/15** | Year Ended 6/30/16 | Year Ended 6/30/15 | |||||||||||||
INCREASE (DECREASE) IN NET ASSETS FROM OPERATIONS: | ||||||||||||||||
Net investment income (loss) | $ | 58,040,301 | $ | 4,868,673 | $ | 100,266 | $ | 52,825 | ||||||||
Net realized gain (loss) | (3,169,628 | ) | (1,029,740 | ) | 351,176 | 313,500 | ||||||||||
Net change in unrealized appreciation/depreciation | 33,117,161 | (6,667,636 | ) | (346,393 | ) | 48,740 | ||||||||||
|
|
|
|
|
|
|
| |||||||||
Net increase (decrease) in net assets resulting from operations | 87,987,834 | (2,828,703 | ) | 105,049 | 415,065 | |||||||||||
|
|
|
|
|
|
|
| |||||||||
CAPITAL TRANSACTIONS: | ||||||||||||||||
Contributions | 1,856,614,856 | 749,522,765 | 5,860,886 | — | ||||||||||||
Withdrawals | (55,223,775 | ) | — | (3,069,067 | ) | (2,852,753 | ) | |||||||||
|
|
|
|
|
|
|
| |||||||||
Net increase (decrease) in net assets from capital transactions | 1,801,391,081 | 749,522,765 | 2,791,819 | (2,852,753 | ) | |||||||||||
|
|
|
|
|
|
|
| |||||||||
Net increase (decrease) in net assets during the period | 1,889,378,915 | 746,694,062 | 2,896,868 | (2,437,688 | ) | |||||||||||
|
|
|
|
|
|
|
| |||||||||
Net assets at beginning of period | 746,694,062 | — | 2,940,295 | 5,377,983 | ||||||||||||
|
|
|
|
|
|
|
| |||||||||
NET ASSETS AT END OF PERIOD | $ | 2,636,072,977 | $ | 746,694,062 | $ | 5,837,163 | $ | 2,940,295 | ||||||||
|
|
|
|
|
|
|
| |||||||||
| * | Inception date. |
| ** | Amounts have been adjusted from prior year annual report to reflect appropriate presentation. |
See accompanying notes to financial statements.
74
Table of Contents
| SSGA MFS Systematic Growth Equity Portfolio | SSGA MFS Systematic Value Equity Portfolio | State Street Risk Aware Portfolio | ||||||||||||||||||||
| Year Ended 6/30/16 | Year Ended 6/30/15 | Year Ended 6/30/16 | Year Ended 6/30/15 | Year Ended 6/30/16 | For the Period 9/9/14* - 6/30/15 | |||||||||||||||||
| $ | 145,216 | $ | 52,332 | $ | 57,782 | $ | 49,890 | $ | 33,430 | $ | 26,381 | |||||||||||
| 378,209 | 451,931 | 109,895 | 294,237 | (69,249 | ) | (232,469 | ) | |||||||||||||||
| 53,236 |
| 35,715 | (243,654 | ) | 41,453 | 64,874 | 10,899 | ||||||||||||||
|
|
|
|
|
|
|
|
|
|
|
| |||||||||||
| 576,661 |
| 539,978 | (75,977 | ) | 385,580 | 29,055 | (195,189 | ) | |||||||||||||
|
|
|
|
|
|
|
|
|
|
|
| |||||||||||
| 8,964,864 | 3,023,489 | — | — | — | 4,000,000 | |||||||||||||||||
| (3,418,489 | ) | (2,891,074 | ) | (219,833 | ) | (2,762,295 | ) | (34,512 | ) | (1,837,777 | ) | |||||||||||
|
|
|
|
|
|
|
|
|
|
|
| |||||||||||
| 5,546,375 |
| 132,415 | (219,833 | ) | (2,762,295 | ) | (34,512 | ) | 2,162,223 | ||||||||||||
|
|
|
|
|
|
|
|
|
|
|
| |||||||||||
| 6,123,036 |
| 672,393 | (295,810 | ) | (2,376,715 | ) | (5,457 | ) | 1,967,034 | ||||||||||||
|
|
|
|
|
|
|
|
|
|
|
| |||||||||||
| 6,044,973 | 5,372,580 | 2,909,609 | 5,286,324 | 1,967,034 | — | |||||||||||||||||
|
|
|
|
|
|
|
|
|
|
|
| |||||||||||
| $ | 12,168,009 | $ | 6,044,973 | $ | 2,613,799 | $ | 2,909,609 | $ | 1,961,577 | $ | 1,967,034 | |||||||||||
|
|
|
|
|
|
|
|
|
|
|
| |||||||||||
75
Table of Contents
SSGA MASTER TRUST
The following table includes selected supplemental data and ratios to average net assets:
| SSGA Multi-Asset Real Return Portfolio† | ||||||||||||||||||||
| Year Ended 6/30/16 | Year Ended 6/30/15 | Year Ended 6/30/14 | Year Ended 6/30/13 | For the Period 4/25/12* - 6/30/12 | ||||||||||||||||
Ratios and Supplemental Data: | ||||||||||||||||||||
Net assets, end of period (in 000s) | $ | 80,825 | $ | 141,996 | $ | 164,635 | $ | 121,584 | $ | 5,827 | ||||||||||
Ratios to average net assets: | ||||||||||||||||||||
Total expenses | 0.20 | % | 0.20 | % | 0.20 | % | 0.20 | % | 0.20 | %(b) | ||||||||||
Net investment income (loss) | 1.36 | % | 1.56 | % | 2.01 | % | 2.91 | % | 3.84 | %(b) | ||||||||||
Portfolio turnover rate | 25 | % | 33 | % | 40 | % | 31 | % | 10 | %(a) | ||||||||||
Total return | (3.94 | )% | (14.80 | )% | 13.93 | % | (1.63 | )% | (3.42 | )%(a) | ||||||||||
| † | The Portfolio invests in other underlying funds and indirectly bears its proportionate share of fees and expenses incurred by such funds. The ratios presented do not reflect the indirect expenses of the underlying funds in which the Portfolio invests. |
| * | Commencement of operations. |
| (a) | Not annualized. |
| (b) | Annualized. |
See accompanying notes to financial statements.
76
Table of Contents
SSGA MASTER TRUST
FINANCIAL HIGHLIGHTS
The following table includes selected supplemental data and ratios to average net assets:
| SSGA Income Allocation Portfolio† | ||||||||||||||||||||
| Year Ended 6/30/16 | Year Ended 6/30/15 | Year Ended 6/30/14 | Year Ended 6/30/13 | For the Period 4/25/12* - 6/30/12 | ||||||||||||||||
Ratios and Supplemental Data: | ||||||||||||||||||||
Net assets, end of period (in 000s) | $ | 105,497 | $ | 121,149 | $ | 104,030 | $ | 174,255 | $ | 9,114 | ||||||||||
Ratios to average net assets: | ||||||||||||||||||||
Total expenses | 0.20 | % | 0.20 | % | 0.20 | % | 0.20 | % | 0.20 | %(b) | ||||||||||
Net investment income (loss) | 3.23 | % | 3.15 | % | 3.89 | % | 4.65 | % | 8.39 | %(b) | ||||||||||
Portfolio turnover rate | 54 | % | 64 | % | 63 | % | 80 | % | 15 | %(a) | ||||||||||
Total return | 3.95 | % | (1.42 | )% | 13.84 | % | 4.39 | % | 0.92 | %(a) | ||||||||||
| † | The Portfolio invests in other underlying funds and indirectly bears its proportionate share of fees and expenses incurred by such funds. The ratios presented do not reflect the indirect expenses of the underlying funds in which the Portfolio invests. |
| * | Commencement of operations. |
| (a) | Not annualized. |
| (b) | Annualized. |
See accompanying notes to financial statements.
77
Table of Contents
SSGA MASTER TRUST
FINANCIAL HIGHLIGHTS
The following table includes selected supplemental data and ratios to average net assets:
| SSGA Global Allocation Portfolio† | ||||||||||||||||||||
| Year Ended 6/30/16 | Year Ended 6/30/15 | Year Ended 6/30/14 | Year Ended 6/30/13 | For the Period 4/25/12* - 6/30/12 | ||||||||||||||||
Ratios and Supplemental Data: | ||||||||||||||||||||
Net assets, end of period (in 000s) | $ | 179,713 | $ | 144,775 | $ | 98,492 | $ | 51,936 | $ | 4,451 | ||||||||||
Ratios to average net assets: | ||||||||||||||||||||
Total expenses | 0.20 | % | 0.20 | % | 0.20 | % | 0.20 | % | 0.20 | %(b) | ||||||||||
Net investment income (loss) | 2.30 | % | 2.45 | % | 2.76 | % | 3.07 | % | 4.34 | %(b) | ||||||||||
Portfolio turnover rate | 86 | % | 98 | % | 89 | % | 123 | % | 25 | %(a) | ||||||||||
Total return | (0.80 | )% | 0.49 | % | 16.80 | % | 9.92 | % | (1.82 | )%(a) | ||||||||||
| † | The Portfolio invests in other underlying funds and indirectly bears its proportionate share of fees and expenses incurred by such funds. The ratios presented do not reflect the indirect expenses of the underlying funds in which the Portfolio invests. |
| * | Commencement of operations. |
| (a) | Not annualized. |
| (b) | Annualized. |
See accompanying notes to financial statements.
78
Table of Contents
SSGA MASTER TRUST
FINANCIAL HIGHLIGHTS
The following table includes selected supplemental data and ratios to average net assets:
| Blackstone/GSO Senior Loan Portfolio | ||||||||||||||||
| Year Ended 6/30/16 | Year Ended 6/30/15 | Year Ended 6/30/14 | For the Period 4/3/13* - 6/30/13 | |||||||||||||
Ratios and Supplemental Data: | ||||||||||||||||
Net assets, end of period (in 000s) | $ | 802,489 | $ | 672,264 | $ | 610,477 | $ | 332,792 | ||||||||
Ratios to average net assets: | ||||||||||||||||
Total expenses | 0.30 | % | 0.31 | % | 0.30 | % | 0.30 | %(b) | ||||||||
Net investment income (loss) | 4.54 | % | 4.49 | % | 3.63 | % | 2.57 | %(b) | ||||||||
Portfolio turnover rate | 88 | % | 65 | % | 77 | % | 4 | %(a) | ||||||||
Total return | (0.20 | )% | 2.98 | % | 4.00 | % | (0.31 | )%(a) | ||||||||
| * | Commencement of operations. |
| (a) | Not annualized. |
| (b) | Annualized. |
See accompanying notes to financial statements.
79
Table of Contents
SSGA MASTER TRUST
FINANCIAL HIGHLIGHTS
The following table includes selected supplemental data and ratios to average net assets:
| SSGA Ultra Short Term Bond Portfolio | ||||||||||||
| Year Ended 6/30/16 | Year Ended 6/30/15 | For the Period 10/9/13* - 6/30/14 | ||||||||||
Ratios and Supplemental Data: | ||||||||||||
Net assets, end of period (in 000s) | $ | 24,040 | $ | 16,019 | $ | 14,036 | ||||||
Ratios to average net assets: | ||||||||||||
Total expenses | 0.20 | % | 0.20 | % | 0.20 | %(b) | ||||||
Net investment income (loss) | 0.69 | % | 0.33 | % | 0.34 | %(b) | ||||||
Portfolio turnover rate | 407 | % | 79 | % | 39 | %(a) | ||||||
Total return | 0.65 | % | 0.21 | % | 0.47 | %(a) | ||||||
| * | Commencement of operations. |
| (a) | Not annualized. |
| (b) | Annualized. |
See accompanying notes to financial statements.
80
Table of Contents
SSGA MASTER TRUST
FINANCIAL HIGHLIGHTS
The following table includes selected supplemental data and ratios to average net assets:
| State Street DoubleLine Total Return Tactical Portfolio | ||||||||
| Year Ended 6/30/16 | For the Period 2/23/15* - 6/30/15 | |||||||
Ratios and Supplemental Data: | ||||||||
Net assets, end of period (in 000s) | $ | 2,636,073 | $ | 746,694 | ||||
Ratios to average net assets: | ||||||||
Total expenses | 0.30 | % | 0.30 | %(b) | ||||
Net investment income (loss) | 3.38 | % | 3.46 | %(b) | ||||
Portfolio turnover rate | 38 | % | 14 | %(a) | ||||
Total return | 4.32 | % | (0.36 | )%(a) | ||||
| * | Commencement of operations. |
| (a) | Not annualized. |
| (b) | Annualized. |
See accompanying notes to financial statements.
81
Table of Contents
SSGA MASTER TRUST
FINANCIAL HIGHLIGHTS
The following table includes selected supplemental data and ratios to average net assets:
| SSGA MFS Systematic Core Equity Portfolio | ||||||||||||
| Year Ended 6/30/16 | Year Ended 6/30/15 | For thePeriod 1/8/14* - 6/30/14 | ||||||||||
Ratios and Supplemental Data: | ||||||||||||
Net assets, end of period (in 000s) | $ | 5,837 | $ | 2,940 | $ | 5,378 | ||||||
Ratios to average net assets: | ||||||||||||
Total expenses | 0.30 | % | 0.30 | % | 0.30 | %(b) | ||||||
Net investment income (loss) | 2.08 | % | 1.72 | % | 1.55 | %(b) | ||||||
Portfolio turnover rate | 39 | % | 54 | % | 27 | %(a) | ||||||
Total return | 2.53 | % | 14.00 | % | 7.92 | %(a) | ||||||
| * | Commencement of operations. |
| (a) | Not annualized. |
| (b) | Annualized. |
See accompanying notes to financial statements.
82
Table of Contents
SSGA MASTER TRUST
FINANCIAL HIGHLIGHTS
The following table includes selected supplemental data and ratios to average net assets:
| SSGA MFS Systematic Growth Equity Portfolio | ||||||||||||
| Year Ended 6/30/16 | Year Ended 6/30/15 | For thePeriod 1/8/14* - 6/30/14 | ||||||||||
Ratios and Supplemental Data: | ||||||||||||
Net assets, end of period (in 000s) | $ | 12,168 | $ | 6,045 | $ | 5,373 | ||||||
Ratios to average net assets: | ||||||||||||
Total expenses | 0.30 | % | 0.30 | % | 0.30 | %(b) | ||||||
Net investment income (loss) | 1.37 | % | 1.44 | % | 1.46 | %(b) | ||||||
Portfolio turnover rate | 56 | % | 67 | % | 20 | %(a) | ||||||
Total return | 4.24 | % | 17.85 | % | 7.85 | %(a) | ||||||
| * | Commencement of operations. |
| (a) | Not annualized. |
| (b) | Annualized. |
See accompanying notes to financial statements.
83
Table of Contents
SSGA MASTER TRUST
FINANCIAL HIGHLIGHTS
The following table includes selected supplemental data and ratios to average net assets:
| SSGA MFS Systematic Value Equity Portfolio | ||||||||||||
| Year Ended 6/30/16 | Year Ended 6/30/15 | For thePeriod 1/8/14* - 6/30/14 | ||||||||||
Ratios and Supplemental Data: | ||||||||||||
Net assets, end of period (in 000s) | $ | 2,614 | $ | 2,910 | $ | 5,286 | ||||||
Ratios to average net assets: | ||||||||||||
Total expenses | 0.31 | % | 0.30 | % | 0.30 | %(b) | ||||||
Net investment income (loss) | 2.15 | % | 1.67 | % | 1.73 | %(b) | ||||||
Portfolio turnover rate | 64 | % | 61 | % | 23 | %(a) | ||||||
Total return | (2.13 | )% | 13.79 | % | 6.20 | %(a) | ||||||
| * | Commencement of operations. |
| (a) | Not annualized. |
| (b) | Annualized. |
See accompanying notes to financial statements.
84
Table of Contents
SSGA MASTER TRUST
FINANCIAL HIGHLIGHTS
The following table includes selected supplemental data and ratios to average net assets:
| State Street Risk Aware Portfolio | ||||||||
| Year Ended 6/30/16 | For thePeriod 9/9/14* - 6/30/15 | |||||||
Ratios and Supplemental Data: | ||||||||
Net assets, end of period (in 000s) | $ | 1,962 | $ | 1,967 | ||||
Ratios to average net assets: | ||||||||
Total expenses | 0.26 | % | 0.25 | %(b) | ||||
Net investment income (loss) | 1.77 | % | 1.46 | %(b) | ||||
Portfolio turnover rate | 76 | % | 122 | %(a) | ||||
Total return | 1.57 | % | (0.46 | )%(a) | ||||
| * | Commencement of operations. |
| (a) | Not annualized. |
| (b) | Annualized. |
See accompanying notes to financial statements.
85
Table of Contents
SSGA MASTER TRUST
June 30, 2016
| 1. | Organization |
SSGA Master Trust (the “Trust”), which is registered under the Investment Company Act of 1940, as amended (“190 Act”), is an open-end management investment company that was organized as a Massachusetts business trust on March 30, 2011.
As of June 30, 2016, the Trust consists of ten (10) series, each of which represents a separate series of beneficial interest in the Trust (each, a “Portfolio” and collectively, the “Portfolios”). The financial statements herein relate to the following Funds:
SSGA Multi-Asset Real Return Portfolio
SSGA Income Allocation Portfolio
SSGA Global Allocation Portfolio
Blackstone / GSO Senior Loan Portfolio
SSGA Ultra Short Term Bond Portfolio
State Street DoubleLine Total Return Tactical Portfolio
SSGA MFS Systematic Core Equity Portfolio
SSGA MFS Systematic Growth Equity Portfolio
SSGA MFS Systematic Value Equity Portfolio
State Street Risk Aware Portfolio
Each portfolio is classified as a diversified investment company under the 1940 Act, with the exception of SPDR SSGA Ultra Short Term Bond Portfolio, State Street Doubleline Total Return Tactical Portfolio and State Street Risk Aware Portfolio, which are each a non-diversified investment company.
Each portfolio serves as a master fund in a master feeder structure.
Under the Trust’s organizational documents, its officers and trustees are indemnified against certain liabilities arising out of the performance of their duties to the Trust. Additionally, in the normal course of business, the Trust enters into contracts with service providers that contain general indemnification clauses. The Trust’s maximum exposure under these arrangements is unknown as this could involve future claims that may be made against the Trust that have not yet occurred.
| 2. | Summary of Significant Accounting Policies |
The following is a summary of significant accounting policies followed by the Trust in the preparation of its financial statements:
The preparation of financial statements in accordance with U.S. generally accepted accounting principles (“U.S. GAAP”) requires management to make estimates and assumptions that affect the reported amounts and disclosures in the financial statements. Actual results could differ from those estimates. Each Portfolio is an investment company under U.S. GAAP and follows the accounting and reporting guidance applicable to investment companies.
Security Valuation
Each Portfolio’s investments are valued at fair value each day that the Portfolio’s listing exchange is open and, for financial reporting purposes, as of the report date should the reporting period end on a day that the Fund’s listing exchange is not open. Fair value is generally defined as the price a fund would receive to sell an asset or pay to transfer a liability in an orderly transaction between market participants at the measurement date. By its nature, a fair value price is a good faith estimate of the valuation in a current sale and may not reflect an actual market price. The investments of each Portfolio are valued pursuant to the policy and procedures developed by the Oversight Committee (the “Committee”) and approved by the Board of Trustees of the Trust (the “Board”). The Committee provides oversight of the valuation of investments for the Portfolios. The Board has responsibility for determining the fair value of investments.
Valuation techniques used to value each Portfolio’s investments by major category are as follows:
| • | Equity investments (including preferred stocks and registered investment companies that are exchange-traded funds) traded on a recognized securities exchange for which market quotations are readily available are valued at the last sale price or official closing price, as applicable, on the primary market or exchange on which they trade. Equity investments traded on a recognized exchange for which there were no sales on that day are valued at the last published sale price or at fair value. |
| • | Investments in registered investment companies (including money market funds) or other unitized pooled investment vehicles that are not traded on an exchange are valued at that day’s published net asset value per share or unit. |
86
Table of Contents
SSGA MASTER TRUST
NOTES TO FINANCIAL STATEMENTS (continued)
June 30, 2016
| • | Debt obligations (both governmental and non-governmental) that are short term in nature (with a maturity of sixty days or less at purchase) valued using the amortized cost method as long as the amortized cost value of a particular portfolio instrument is reasonably determined to approximate the fair value of that investment established using market-based and issuer-specific factors or at a price obtained from an independent pricing service. |
| • | Debt obligations (both governmental and non-governmental) purchased with greater than sixty days to maturity valued at last reported evaluated bid prices obtained from independent pricing services or brokers. In determining the value of a fixed income investment, pricing services may use certain information with respect to transactions in such investments, quotations from dealers, pricing matrixes, market transactions in comparable investments, various relationships observed in the market between investments, and calculated yield measures. |
| • | Senior loans or other loans are valued at evaluated bid prices supplied by an independent pricing service, if available. Senior loans and other loans in which the Committee determines that there are no reliable valuations available from pricing services or brokers will be initially valued at cost and adjusted for amortization of principal until remeasurement is warranted due to a credit or economic event or other factors affecting the loan. |
In the event prices or quotations are not readily available or that the application of these valuation methods results in a price for an investment that is deemed to be not representative of the fair value of such investment, fair value will be determined in good faith by the Committee, in accordance with the valuation policy and procedures approved by the Board.
Fair value pricing could result in a difference between the prices used to calculate a Portfolio’s net asset value and the prices used by the Portfolios’ underlying benchmarks. Various inputs are used in determining the value of the Portfolios’ investments.
The Portfolios value their assets and liabilities at fair value using a fair value hierarchy consisting of three broad levels that prioritize the inputs to valuation techniques giving the highest priority to readily available unadjusted quoted prices in active markets for identical assets or liabilities (Level 1 measurements) and the lowest priority to unobservable inputs (Level 3 measurements) when market prices are not readily available or reliable. The categorization of a value determined for an investment within the hierarchy is based upon the pricing transparency of the investment and is not necessarily an indication of the risk associated with investing in it.
The three levels of the fair value hierarchy are as follows:
| • | Level 1 — Unadjusted quoted prices in active markets for identical assets or liabilities; |
| • | Level 2 — Inputs other than quoted prices included within Level 1 that are observable for the assets or liabilities either directly or indirectly, including quoted prices for similar assets or liabilities in active markets, quoted prices for identical or similar assets or liabilities in markets that are not considered to be active, inputs other than quoted prices that are observable for the asset or liability (such as exchange rates, financing terms, interest rates, yield curves, volatilities, prepayment speeds, loss severities, credit risks and default rates) or other market-corroborated inputs; and |
| • | Level 3 — Unobservable inputs for the asset or liability, including the Committee’s assumptions used in determining the fair value of investments. |
The value of each Portfolio’s investments according to the fair value hierarchy as of June 30, 2016, is disclosed in each Portfolio’s respective Schedule of Investments.
Changes in valuation techniques may result in transfers in or out of an assigned level within the fair value hierarchy. Transfers between different levels of the fair value hierarchy are recognized at the end of the reporting period.
The Funds had no material transfers between levels for the period ended June 30, 2016.
Investment Transactions and Income Recognition
Investment transactions are accounted for on trade date for financial reporting purposes. Realized gains and losses from the sale or disposition of investments and foreign exchange transactions, if any, are determined using the identified cost method. Dividend income and capital gain distributions, if any, are recognized daily on the ex-dividend date, net of any foreign taxes withheld at source, if any. Interest income is recorded daily on an accrual basis. All premium and
87
Table of Contents
SSGA MASTER TRUST
NOTES TO FINANCIAL STATEMENTS (continued)
June 30, 2016
discounts are amortized/accreted for financial reporting purposes. Paydown gains and losses are recorded as an adjustment to interest income. Non-cash dividends received in the form of stock are recorded as dividend income at fair value. Distributions received by the Portfolios may include a return of capital that is estimated by management. Such amounts are recorded as a reduction of the cost of investments or reclassified to capital gains.
Certain Portfolios invest in Real Estate Investment Trusts (REITs). REITs determine the tax character of their distributions annually and may characterize a portion of their distributions as a return of capital or capital gain. The Portfolios’ policy is to record all REIT distributions initially as dividend income and re-designate the prior calendar year’s to return of capital or capital gains distributions at year end based on information provided by the REIT and/or SSGA Funds Management, Inc. (the “Adviser” or “SSGA FM”) estimates of such re-designations for which actual information has not yet been reported.
All of the net investment income and realized and unrealized gains and losses from the security transactions of the Portfolio are allocated pro rata among the partners in the Portfolio on a daily basis based on each partner’s daily ownership percentage.
Expenses
Certain expenses, which are directly identifiable to a specific Portfolio, are applied to that Portfolio within the Trust. Other expenses which cannot be attributed to a specific Portfolio are allocated in such a manner as deemed equitable, taking into consideration the nature and type of expense and the relative net assets of the Portfolios within the Trust.
Foreign Currency Translation
The accounting records of the Portfolios are maintained in U.S. dollars. Foreign currencies as well as investment securities and other assets and liabilities denominated in a foreign currency are translated to U.S. dollars using exchange rates at period end. Purchases and sales of securities, income receipts and expense payments denominated in foreign currencies are translated into U.S. dollars at the prevailing exchange rate on the respective dates of the transactions.
The effects of exchange rate fluctuations on investments are included with the net realized and unrealized gain (loss) on investment securities. Other foreign currency transactions resulting in realized and unrealized gain (loss) are disclosed separately.
| 3. | Securities and Other Investments |
Loan Agreements
The Blackstone / GSO Senior Loan Portfolio and State Street DoubleLine Total Return Tactical Portfolio invest in Senior Loans. Senior Loans consist generally of obligations of companies and other entities (collectively, “borrowers”) incurred for the purpose of reorganizing the assets and liabilities of a borrower; acquiring another company; taking over control of a company (leveraged buyout); temporary refinancing; or financing internal growth or other general business purposes. Senior Loans are often obligations of borrowers who have incurred a significant percentage of debt compared to their total assets and thus are highly leveraged. The Portfolios do not treat the banks originating or acting as agents for the lenders, or granting or acting as intermediary in participation interests, in loans held by the Portfolios as the issuers of such loans.
| 4. | Fees and Transactions with Affiliates |
Advisory Fee
Each Portfolio has entered into an Investment Advisory Agreement with SSGA FM. For its advisory services to the Portfolios, facilities furnished, and expenses borne by the Adviser, each Portfolio pays the Adviser a fee accrued daily and paid monthly, based on a percentage of each Portfolio’s average daily net assets as shown in the following table:
| Annual Rate | ||||
SSGA Multi-Asset Real Return Portfolio | 0.20 | % | ||
SSGA Income Allocation Portfolio | 0.20 | |||
88
Table of Contents
SSGA MASTER TRUST
NOTES TO FINANCIAL STATEMENTS (continued)
June 30, 2016
| Annual Rate | ||||
SSGA Global Allocation Portfolio | 0.20 | % | ||
Blackstone / GSO Senior Loan Portfolio | 0.30 | |||
SSGA Ultra Short Term Bond Portfolio | 0.20 | |||
State Street DoubleLine Total Return Tactical Portfolio | 0.30 | |||
SSGA MFS Systematic Core Equity Portfolio | 0.30 | |||
SSGA MFS Systematic Growth Equity Portfolio | 0.30 | |||
SSGA MFS Systematic Value Equity Portfolio | 0.30 | |||
State Street Risk Aware Portfolio | 0.25 | |||
The Adviser pays all expenses of each Portfolio other than management fee, brokerage expenses, taxes, interest, fees and expenses of the Independent Trustees (including and Trustees’ counsel fees), litigation expenses, acquired fund fees and expenses and other extraordinary expenses.
GSO / Blackstone Debt Funds Management LLC receives fees for its services as the sub-adviser to the Blackstone / GSO Senior Loan Portfolio from the Adviser.
Massachusetts Financial Services Company (“MFS”) receives fees for its services as the sub-adviser to the SSGA MFS Systematic Core Equity Portfolio, SSGA MFS Systematic Growth Equity Portfolio and SSGA MFS Systematic Value Equity Portfolio from the Adviser.
DoubleLine Capital LP receives fees for its services as the sub-adviser to the State Street DoubleLine Total Return Portfolio from the Adviser.
Administrator and Sub-Administrator Fees
SSGA FM serves as administrator and State Street Bank and Trust Company (“State Street”), an affiliate of the Adviser, serves as custodian, sub-administrator and transfer agent. State Street receives fees for its services as custodian, sub-administrator and transfer agent from the Adviser.
Other Transactions with Affiliates
The Fund may invest in affiliated entities, included securities issued by State Street, affiliated funds, or entities deemed to be affiliates as a result of the Fund owning more than five percent of the entity’s voting securities or outstanding shares. Amounts relating to these transactions during the period ended June 30, 2016 are disclosed in the Schedules of Investments.
Due to custodian
In certain circumstances, funds may have cash overdraft with the custodian. The Due to custodian if any, reflects cash overdrawn with SSB as custodian who is an affiliate of the funds.
| 5. | Trustees’ Fees |
The fees and expenses of the Trust’s trustees, who are not “interested persons” of the Trust, as defined in the 1940 Act (“Independent Trustees”), are paid directly by the Portfolios. The Independent Trustees are reimbursed for travel and other out-of-pocket expenses in connection with meeting attendance and industry seminars.
| 6. | Investment Transactions |
Purchases and sales of investments (excluding in-kind transactions, short term investments and derivative contracts) for the year ended June 30, 2016, were as follows:
| U.S. Government Obligations | Other Securities | |||||||||||||||
| Purchases | Sales | Purchases | Sales | |||||||||||||
SSGA Multi-Asset Real Return Portfolio | $ | — | $ | — | $ | 22,768,409 | $ | 22,486,396 | ||||||||
SSGA Income Allocation Portfolio | — | — | 56,093,323 | 58,750,553 | ||||||||||||
89
Table of Contents
SSGA MASTER TRUST
NOTES TO FINANCIAL STATEMENTS (continued)
June 30, 2016
| U.S. Government Obligations | Other Securities | |||||||||||||||
| Purchases | Sales | Purchases | Sales | |||||||||||||
SSGA Global Allocation Portfolio | $ | — | $ | — | $ | 128,689,321 | $ | 126,408,223 | ||||||||
Blackstone / GSO Senior Loan Portfolio | — | — | 764,413,237 | 629,806,468 | ||||||||||||
SSGA Ultra Short Term Bond Portfolio | 7,608,073 | 8,181,986 | 161,117,320 | 154,907,878 | ||||||||||||
State Street DoubleLine Total Return Tactical Portfolio | 755,147,305 | 196,241,641 | 3,174,123,407 | 1,851,693,512 | ||||||||||||
SSGA MFS Systematic Core Equity Portfolio | — | — | 1,887,886 | 1,977,770 | ||||||||||||
SSGA MFS Systematic Growth Equity Portfolio | — | — | 5,884,211 | 6,118,543 | ||||||||||||
SSGA MFS Systematic Value Equity Portfolio | — | — | 1,710,807 | 1,854,012 | ||||||||||||
State Street Risk Aware Portfolio | — | — | 1,445,989 | 1,447,749 | ||||||||||||
For the year ended June 30, 2016, the following Portfolios had in-kind contributions, redemptions and net realized gains/losses in the amounts as follows:
| Contributions | Redemptions | Realized Gain/(Loss) | ||||||||||
SSGA Multi-Asset Real Return Portfolio | $ | 23,407,106 | $ | 69,524,043 | $ | (6,995,502 | ) | |||||
SSGA Income Allocation Portfolio | 2,957,156 | 17,386,235 | 422,737 | |||||||||
SSGA Global Allocation Portfolio | 90,870,924 | 47,767,242 | 593,025 | |||||||||
SSGA MFS Systematic Core Equity Portfolio | 5,816,924 | 2,881,127 | 349,502 | |||||||||
SSGA MFS Systematic Growth Equity Portfolio | 8,897,210 | 3,077,146 | 501,402 | |||||||||
| 7. | Income Tax Information |
The Portfolios are not required to pay federal income taxes on their net investment income and net capital gains because they are treated as partnerships for federal income tax purposes. All interest, gains and losses of the Portfolios are deemed to have been “passed through” to the Portfolios’ partners in proportion to their holdings in the respective Portfolio, regardless of whether such items have been distributed by the Portfolios. Each partner is responsible for its tax liability based on its distributive share; therefore, no provision has been made for federal income taxes.
The Portfolios file federal and various state and local tax returns as required. No income tax returns are currently under examination. The federal returns are subject to examination by the Internal Revenue Service for a period of three years from date of filing, while the state returns may remain open for an additional year depending upon jurisdiction. SSGA FM has analyzed the fund’s tax positions taken on tax returns for all open years and does not believe there are any uncertain tax positions that would require recognition of a tax liability.
At June 30, 2016, gross unrealized appreciation and gross unrealized depreciation of investments based on cost for federal income tax purposes were as follows:
| Tax Cost | Gross Unrealized Appreciation | Gross Unrealized Depreciation | Net Unrealized Appreciation (Depreciation) | |||||||||||||
SSGA Multi-Asset Real Return Portfolio | $ | 91,999,658 | $ | 1,858,766 | $ | 13,021,066 | $ | (11,162,300 | ) | |||||||
SSGA Income Allocation Portfolio | 102,099,930 | 5,918,172 | 3,132,435 | 2,785,737 | ||||||||||||
SSGA Global Allocation Portfolio | 182,768,160 | 6,729,453 | 3,726,650 | 3,002,803 | ||||||||||||
Blackstone / GSO Senior Loan Portfolio | 816,967,079 | 3,459,696 | 4,669,792 | (1,210,096 | ) | |||||||||||
SSGA Ultra Short Term Bond Portfolio | 24,421,354 | 17,733 | 21,960 | (4,227 | ) | |||||||||||
State Street DoubleLine Total Return Tactical Portfolio | 2,692,877,577 | 46,613,521 | 20,163,996 | 26,449,525 | ||||||||||||
SSGA MFS Systematic Core Equity Portfolio | 5,839,592 | 357,310 | 364,568 | (7,258 | ) | |||||||||||
SSGA MFS Systematic Growth Equity Portfolio | 11,734,128 | 929,484 | 496,530 | 432,954 | ||||||||||||
SSGA MFS Systematic Value Equity Portfolio | 2,550,160 | 227,465 | 167,446 | 60,019 | ||||||||||||
State Street Risk Aware Portfolio | 1,884,783 | 159,033 | 83,260 | 75,773 | ||||||||||||
90
Table of Contents
SSGA MASTER TRUST
NOTES TO FINANCIAL STATEMENTS (continued)
June 30, 2016
| 8. | Line of Credit |
Certain Portfolios and other affiliated funds (each a “Participant” and, collectively, the “Participants”) participate in a $360 million revolving credit facility provided by a syndication of banks under which the Participants may borrow to fund shareholder redemptions. Blackstone / GSO Senior Loan Portfolio has exclusive access to $100 million of the total credit facility. The agreement expires in October 2016 unless extended or renewed. Prior to October 14, 2015, the participants could borrow up to $300 million at any time outstanding, subject to asset coverage and other limitations as specified in the agreements. The following Funds participate in the credit facility:
Blackstone / GSO Senior Loan Portfolio
SSGA Ultra Short Term Bond Portfolio
SPDR DoubleLine Total Return Tactical Portfolio
The Participants are charged an annual commitment fee which is calculated based on the unused portion of the shared credit line. Commitment fees are allocated among each of the Participants based on relative net assets. Blackstone / GSO Senior Loan Portfolio pays the commitment fee for its exclusive portion of the credit line. Commitment fees are ordinary fund operating expenses. A Participant incurs and pays the interest expense related to its borrowing. Interest is calculated at a rate per annum equal to the sum of the New York Fed Bank Rate plus 1%. Blackstone / GSO Senior Loan Portfolio may borrow up to a maximum of 25 percent of its assets or a lower amount as set forth in the Portfolio’s prospectus. No Portfolios had outstanding loans during the six months ended June 30, 2016.
| 9. | Risks |
Concentration Risk
As a result of the Portfolios’ ability to invest a large percentage of their assets in obligations of issuers within the same country, state, region, currency or economic sector, an adverse economic, business or political development may affect the value of the Portfolios’ investments more than if the Portfolios were more broadly diversified.
Foreign and Emerging Markets Risks
Investing in foreign markets involve risks and considerations not typically associated with investing in the U.S. Foreign securities may be subject to risk of loss because of government regulation, economic, political and social instability in the countries in which the Portfolios’ invests. Foreign markets may be less liquid than investments in the U.S. and may be subject to the risks of currency fluctuations. To the extent that a Portfolio invests in securities of issuers located in emerging markets, these risks may be even more pronounced.
Market and Credit Risk
In the normal course of business, the Portfolios trade financial instruments and enter into financial transactions where risk of potential loss exists due to changes in the general economic conditions and fluctuations of the market (market risk). Additionally, a Portfolio may also be exposed to credit risk in the event that an issuer or guarantor fails to perform or that an institution or entity with which the Portfolio has unsettled or open transactions defaults.
| 10. | Subsequent Events |
Management has evaluated the impact of all subsequent events on the Portfolios through the date on which the financial statements were available to be issued and has determined that there were no subsequent events requiring adjustment or disclosure in the financial statements other than below.
On May 26, 2016, the Board unanimously voted to close and liquidate the State Street Risk Aware Portfolio effective August 24, 2016.
91
Table of Contents
SSGA MASTER TRUST
REPORT OF INDEPENDENT REGISTERED PUBLIC ACCOUNTING FIRM
To the Owners of Beneficial Interest and Board of Trustees of
SSGA Master Trust
We have audited the accompanying statements of assets and liabilities, including the schedules of investments, of SSGA Master Trust (comprising, respectively, the SSGA Multi-Asset Real Return Portfolio, SSGA Income Allocation Portfolio, SSGA Global Allocation Portfolio, Blackstone/GSO Senior Loan Portfolio, SSGA Ultra Short Term Bond Portfolio, State Street DoubleLine Total Return Tactical Portfolio, SSGA MFS Systematic Core Equity Portfolio, SSGA MFS Systematic Growth Equity Portfolio, SSGA MFS Systematic Value Equity Portfolio and State Street Risk Aware Portfolio) (collectively, the “Portfolios”), as of June 30, 2016, and the related statements of operations for the year then ended, and the statements of changes in net assets and the financial highlights for each of the periods indicated therein. These financial statements and financial highlights are the responsibility of the Portfolios’ management. Our responsibility is to express an opinion on these financial statements and financial highlights based on our audits.
We conducted our audits in accordance with the standards of the Public Company Accounting Oversight Board (United States). Those standards require that we plan and perform the audit to obtain reasonable assurance about whether the financial statements and financial highlights are free of material misstatement. We were not engaged to perform an audit of the Portfolios’ internal control over financial reporting. Our audits included consideration of internal control over financial reporting as a basis for designing audit procedures that are appropriate in the circumstances, but not for the purpose of expressing an opinion on the effectiveness of the Portfolios’ internal control over financial reporting. Accordingly, we express no such opinion. An audit also includes examining, on a test basis, evidence supporting the amounts and disclosures in the financial statements and financial highlights, assessing the accounting principles used and significant estimates made by management, and evaluating the overall financial statement presentation. Our procedures included confirmation of securities owned as of June 30, 2016 by correspondence with the custodian, brokers and others or by other appropriate auditing procedures where replies from brokers or others were not received. We believe that our audits provide a reasonable basis for our opinion.
In our opinion, the financial statements and financial highlights referred to above present fairly, in all material respects, the financial position of each of the respective Portfolios constituting SSGA Master Trust at June 30, 2016, the results of their operations for the year then ended, and the changes in their net assets and the financial highlights for each of the periods indicated therein, in conformity with U.S. generally accepted accounting principles.
Boston, Massachusetts
August 26, 2016
92
Table of Contents
SSGA MASTER TRUST
June 30, 2016
Proxy Voting Policies and Procedures and Records
A description of the Trust’s proxy voting policies and procedures that are used by the Portfolios’ investment adviser to vote proxies relating to the Portfolios’ portfolio of securities are available (i) without charge, upon request by calling 1-866-787-2257 (toll free) or (ii) on the website of the U.S. Securities and Exchange Commission, at www.sec.gov.
Information regarding how the investment adviser voted for the prior 12-months period ended June 30 is available by August 31 of each year by calling the same number and on the SEC’s website, at www.sec.gov, and on the Portfolios’ website at www.spdrs.com.
Quarterly Portfolio Schedule
The Portfolios file a complete schedule of investments with the SEC for the first and third quarters of each fiscal year on Form N-Q. The Portfolios’ Forms N-Q are available on the SEC’s website at www.sec.gov and may be reviewed and copied at the SEC’s Public Reference Room in Washington DC. Information on the operation of the Public Reference Room may be obtained by calling 1-800-SEC-0330. The information on the Form N-Q is available upon request, without charge, by calling 1-866-787-2257 (toll free) and on the Funds’ website at www.spdrs.com.
Approval of Advisory Agreements
At in-person meetings held prior to June 30, 2016, the Board of Trustees of the Trusts (the “Board”) evaluated proposals (1) to continue the separate Investment Advisory Agreements (the “Agreements”) between each Trust and SSGA Funds Management, Inc. (the “Adviser” or “SSGA FM”) with respect to the operational series of SSGA Active Trust (the “Current ETFs”) and SSGA Master Trust (together with the Current ETFs, the “Current Funds”), and (2) to approve the separate Agreements between the Adviser and (a) the SSGA Active Trust with respect to the SPDR DoubleLine Short Duration Total Return Tactical ETF and SPDR DoubleLine Emerging Markets Fixed Income ETF (the “New ETFs” and, together with the Current ETFs, the “ETFs”), and the State Street Disciplined Global Equity Portfolio (together with the New ETFs, the “New Funds”) each a new series of the SSGA Active Trust, (with the Current Funds and New Funds collectively being referred to hereafter as the “Funds”), each of which commenced operations during the period covered by this Annual Report. The Trustees who are not “interested persons” of the Trust within the meaning of the Investment Company Act of 1940, as amended (the “Independent Trustees”), also met separately with their independent legal counsel to consider the Agreements.
In evaluating the Agreements, the Board drew on materials provided to them by SSGA FM, the Trust’s investment adviser and administrator, and other materials provided by State Street Bank and Trust Company, the Trusts’ sub-administrator, transfer agent and custodian (“State Street”). In deciding whether to approve the Agreements, the Board considered various factors, including the (i) nature, extent and quality of services provided by, or expected to be provided by, the Adviser with respect to the Funds under the Agreements, (ii) investment performance of the Current Funds, (iii) profits realized by the Adviser and its affiliates from its relationship with the Trusts, (iv) fees charged to comparable funds, (v) other benefits to the Adviser, and (vi) extent to which economies of scale would be shared as the Funds grow.
Nature, Extent and Quality of Services
The Board considered the nature, extent and quality of services provided by, or expected to be provided by, the Adviser. In doing so, the Trustees relied on their prior experience in overseeing the management of the Trusts and materials provided prior to and at the meeting. The Board reviewed the Agreements and the Adviser’s responsibilities for managing investment operations of each of the Funds in accordance with each Fund’s investment objectives and policies, and applicable legal and regulatory requirements. The Board appreciated the relatively unique nature of the ETFs as exchange-traded funds in a master-feeder structure, as appropriate, and the experience and expertise of the Adviser with exchange-traded funds. The Board considered the background and experience of the Adviser’s senior management, including those individuals responsible for portfolio management, oversight of sub-advisers and regulatory compliance of the Funds. The Board also considered the portfolio management resources, structures and practices of the Adviser, including those associated with monitoring and securing each Fund’s compliance with its investment objectives and policies and with applicable laws and regulations. The Board also considered information about the Adviser’s best execution procedures and overall investment management business, noting that the Adviser
93
Table of Contents
SSGA MASTER TRUST
OTHER INFORMATION (continued)
June 30, 2016
serves a wide range of clients across a broad spectrum of asset classes. The Board looked at the Adviser’s general knowledge of the investment business and that of its affiliates which make up State Street Global Advisors, through which the Adviser shares all of its senior personnel. The Board considered that the Adviser and its affiliates constitute one of the world’s largest investment management enterprises for exchange-traded funds. The Board also considered the Adviser’s experience in active management, managing exchange-traded funds in master-feeder structures and overseeing third-party sub-advisers, as applicable.
Investment Performance
The Board then reviewed the Current Funds’ performance. The Board compared each Current Fund’s investment performance to the performance of an appropriate benchmark and group of comparable funds. Among other information, the Board considered the following performance information in its evaluation of the Funds:
SPDR SSGA Multi-Asset Real Return ETF. The Board considered that: (a) the Fund underperformed the median of its Performance Group for the 1-, 2- and 3-year periods; and (b) outperformed its benchmark index for the 1-year period and underperformed its benchmark index for the 3-year period.
SPDR SSGA Income Allocation ETF. The Board considered that: (a) the Fund outperformed the median of its Performance Group for the 1-, 2- and 3-year periods; and (b) underperformed its benchmark index for the 1- and 3-year period.
SPDR SSGA Global Allocation ETF. The Board considered that: (a) the Fund outperformed the median of its Performance Group for the 1-, 2- and 3-year periods; and (b) underperformed its benchmark index for the 1-year period and outperformed its benchmark index for the 3-year period.
SPDR Blackstone / GSO Senior Loan ETF. The Board considered that: (a) the Fund underperformed the median of its Performance Group for the 1- and 2-year periods; and (b) outperformed its benchmark index for the 1-year period.
SPDR SSGA Ultra Short Term Bond ETF. The Board considered that: (a) the Fund underperformed the median of its Performance Group for the 1- and 2-year periods; and (b) outperformed its benchmark index for the 1-year period.
SPDR DoubleLine Total Return Tactical ETF. The Board considered that: (a) the Fund outperformed the median of its Performance Group since inception; and (b) outperformed its benchmark index since inception.
SPDR MFS Systematic Core Equity ETF. The Board considered that: (a) the Fund outperformed the median of its Performance Group for the 1-year period; and (b) outperformed its benchmark index for the 1-year period.
SPDR MFS Systematic Growth Equity ETF. The Board considered that: (a) the Fund outperformed the median of its Performance Group for the 1-year period; and (b) outperformed its benchmark index for the 1-year period.
SPDR MFS Systematic Value Equity ETF. The Board considered that: (a) the Fund outperformed the median of its Performance Group for the 1-year period; and (b) outperformed its benchmark index for the 1-year period.
SPDR SSGA Risk Aware ETF. The Board considered that: (a) the Fund underperformed the median of its Performance Group for the 1-year period; and (b) underperformed its benchmark index for the 1-year period.
On the basis of the foregoing and other relevant information, the Board concluded that the performance of each Current Fund is satisfactory.
Profits Realized by Adviser
The Board considered the profitability of the advisory arrangement with the Current Funds to the Adviser, including data on the Current Funds’ historical profitability to the Adviser. The Independent Trustees, through their counsel, had the opportunity to discuss, with representatives of the Adviser and State Street, methodologies used in computing costs that formed the bases of profitability calculations and determined that these methodologies were reasonable.
Fees Charged to Comparable Funds
The Board evaluated each Fund’s unitary fee through review of comparative information with respect to fees paid by similar funds — i.e., exchange-traded funds that are actively managed, as applicable. The Board reviewed the universe of similar exchange-traded funds for each ETF based upon data independently obtained from Broadridge Financial
94
Table of Contents
SSGA MASTER TRUST
OTHER INFORMATION (continued)
June 30, 2016
Solutions, Inc. (formerly Lipper Analytical Services) and related comparative information for similar exchange-traded funds. The Board also reviewed the fee structure, as applicable, of each Fund in connection with the master-feeder structure, the historical expense ratios of each Current Fund and the estimated expense ratios for each New Fund. In doing so, the Board used a fund by fund analysis of the data.
Other Benefits
The Board also considered whether the Adviser or its affiliates benefited in other ways from its relationship with the Trusts, noting that the Adviser does not maintain soft-dollar arrangements in connection with the Trusts’ brokerage transactions.
Economies of Scale
The Board reviewed information regarding economies of scale or other efficiencies that may result as each Fund’s assets grow in size. The Board noted that the Agreements did not provide for breakpoints in each Fund’s advisory fee rates as assets of a Fund increase. However, the Board further noted the Adviser’s assertion that future economies of scale (among several factors) had been taken into consideration for the Funds by fixing relatively low advisory fees, effectively sharing the benefits of lower fees with the Funds from inception. The Adviser also asserted that one of the benefits of the unitary fee was to provide an unvarying expense structure, which could be lost or diluted with the addition of breakpoints. The Board noted that it intends to continue to monitor fees as the Funds grow in size and assess whether fee breakpoints may be warranted.
The Board, including the Independent Trustees voting separately, approved the Agreements for each Fund after weighing the foregoing factors, none of which was dispositive in itself and may have been weighed differently by each Trustee. The Board’s conclusions with respect to each Agreement were as follows: (a) the nature and extent of the services provided, or expected to be provided, by the Adviser with respect to the Funds were appropriate; (b) the performance of each Current Fund had been satisfactory; (c) the Adviser’s unitary fee for each Fund, considered in relation to services provided or expected to be provided, and in relation to fees charged to comparable funds, was fair and reasonable; (d) profitability of the Trusts’ relationship with the Adviser was not excessive; (e) any additional potential benefits to the Adviser or its affiliates were not of a magnitude to materially affect the Board’s conclusions; and (f) fees paid to the Adviser shared the economies of scale with respect to the Current Funds by way of the relatively low fee structure of the Trusts.
Approval of GSO / Blackstone Debt Funds Management LLC Sub-Advisory Agreements
At an in-person meeting held prior to June 30, 2016, the Board also evaluated proposals to continue the separate Sub-Advisory Agreements (the “GSO / Blackstone Sub-Advisory Agreements”) between the Adviser and GSO / Blackstone Debt Funds Management LLC (“GSO / Blackstone”) with respect to the SPDR Blackstone / GSO Senior Loan ETF, a series of the SSGA Active Trust, and Blackstone / GSO Senior Loan Portfolio, a series of the SSGA Master Trust, each sub-advised by GSO / Blackstone (the “GSO / Blackstone Funds”). The Independent Trustees also met separately with their independent legal counsel to consider the GSO / Blackstone Sub-Advisory Agreements.
In evaluating the GSO / Blackstone Sub-Advisory Agreements, the Board drew on materials provided to them by GSO / Blackstone and the Adviser. In deciding whether to approve the GSO / Blackstone Sub-Advisory Agreements, the Board considered various factors, including the (i) nature, extent and quality of services provided by GSO / Blackstone with respect to the GSO / Blackstone Funds under the GSO / Blackstone Sub-Advisory Agreements and (ii) investment performance of the GSO / Blackstone Funds. The Board was apprised of the portion of the current advisory fee that the Adviser would pay to GSO / Blackstone under the GSO / Blackstone Sub-Advisory Agreements and also considered that such fees would be paid directly by the Adviser and would not result in increased fees payable by the GSO / Blackstone Funds.
The Board considered the background and experience of GSO / Blackstone’s senior management and, in particular, GSO / Blackstone’s experience in investing in senior loan securities. The Board reviewed the GSO / Blackstone Funds’ performance, noting that that the performance of the GSO / Blackstone Funds was satisfactory. The Board also considered the unitary fee paid to the Adviser by each GSO / Blackstone Fund and GSO / Blackstone’s fees paid by the Adviser.
95
Table of Contents
SSGA MASTER TRUST
OTHER INFORMATION (continued)
June 30, 2016
The Board, including the Independent Trustees voting separately, approved the GSO / Blackstone Sub-Advisory Agreements for each GSO / Blackstone Fund after weighing the foregoing factors, none of which was dispositive in itself and may have been weighed differently by each Trustee. The Board’s conclusions with respect to each GSO / Blackstone Sub-Advisory Agreement were as follows: (a) the nature and extent of the services provided by GSO / Blackstone with respect to the GSO / Blackstone Funds were appropriate; (b) the performance of the GSO / Blackstone Funds had been satisfactory; (c) GSO / Blackstone’s fees for the GSO / Blackstone Funds and the unitary fee, considered in relation to the services provided, were fair and reasonable; (d) any additional potential benefits to GSO / Blackstone were not of a magnitude to materially affect the Board’s conclusions; and (e) fees paid to GSO / Blackstone adequately shared the economies of scale with each applicable GSO / Blackstone Fund by way of the relatively low fee structure of the Trusts.
Approval of Massachusetts Financial Services Company Sub-Advisory Agreements
At an in-person meeting held prior to June 30, 2016, the Board also evaluated proposals to continue the separate Sub-Advisory Agreements (the “MFS Sub-Advisory Agreements”) between the Adviser and Massachusetts Financial Services Company (“MFS”) with respect to the SPDR MFS Systematic Core Equity ETF, SPDR MFS Systematic Growth Equity ETF and SPDR MFS Systematic Value Equity ETF, each a series of the SSGA Active Trust, and SSGA MFS Systematic Core Equity Portfolio, SSGA Systematic Growth Equity Portfolio and SSGA MFS Systematic Value Equity Portfolio, each a series of the SSGA Master Trust, each sub-advised by MFS (the “MFS Funds”). The Independent Trustees also met separately with their independent legal counsel to consider the MFS Sub-Advisory Agreements.
In evaluating the MFS Sub-Advisory Agreements, the Board drew on materials provided to them by MFS and the Adviser. In deciding whether to approve the MFS Sub-Advisory Agreements, the Board considered various factors, including the (i) nature, extent and quality of services provided by MFS with respect to the MFS Funds under the MFS Sub-Advisory Agreements and (ii) investment performance of the MFS Funds. The Board was apprised of the portion of the current advisory fee that the Adviser would pay to MFS under the MFS Sub-Advisory Agreements and also considered that such fees would be paid directly by the Adviser and would not result in increased fees payable by the MFS Funds.
The Board considered the background and experience of MFS’s senior management and, in particular, MFS’s experience in investing in equity securities. The Board reviewed the MFS Funds’ performance, noting that that the performance of the MFS Funds was satisfactory. The Board also considered the unitary fee paid to the Adviser by each MFS Fund and MFS’s fees paid by the Adviser.
The Board, including the Independent Trustees voting separately, approved the MFS Sub-Advisory Agreements for each MFS Fund after weighing the foregoing factors, none of which was dispositive in itself and may have been weighed differently by each Trustee. The Board’s conclusions with respect to each MFS Sub-Advisory Agreement were as follows: (a) the nature and extent of the services provided by MFS with respect to the MFS Funds were appropriate; (b) the performance of the MFS Funds had been satisfactory; (c) MFS’s fees for the MFS Funds and the unitary fee, considered in relation to the services provided, were fair and reasonable; (d) any additional potential benefits to MFS were not of a magnitude to materially affect the Board’s conclusions; and (e) fees paid to MFS adequately shared the economies of scale with each applicable MFS Fund by way of the relatively low fee structure of the Trusts.
Approval of DoubleLine Capital LP Sub-Advisory Agreements
At in-person meetings held prior to June 30, 2016, the Board also considered proposals to continue the separate Sub-Advisory Agreements (the “DoubleLine Sub-Advisory Agreements”) between the Adviser and DoubleLine Capital LP (“DoubleLine”) with respect to the SPDR DoubleLine Total Return Tactical ETF, a series of the SSGA Active Trust, and State Street DoubleLine Total Return Tactical Portfolio, a series of the SSGA Master Trust (together, the “Current DoubleLine Funds”), and to approve the DoubleLine Sub-Advisory Agreements between the Adviser and DoubleLine with respect to the SPDR DoubleLine Short Duration Total Return Tactical ETF and SPDR DoubleLine Emerging Markets Fixed Income ETF, each a series of SSGA Active Trust (together with the Current DoubleLine Funds, the “DoubleLine Funds”), under which each of the DoubleLine Funds would be sub-advised by DoubleLine. The Independent Trustees also met separately with their independent legal counsel to consider the DoubleLine Sub-Advisory Agreements.
96
Table of Contents
SSGA MASTER TRUST
OTHER INFORMATION (continued)
June 30, 2016
In evaluating the DoubleLine Sub-Advisory Agreements, the Board drew on materials provided to them by DoubleLine and the Adviser. In deciding whether to approve the DoubleLine Sub-Advisory Agreements, the Board considered various factors, including the (i) nature, extent and quality of services provided, or expected to be provided, by DoubleLine with respect to the DoubleLine Funds under the DoubleLine Sub-Advisory Agreements; and (ii) investment performance of the Current DoubleLine Funds. The Board was apprised of the portion of the advisory fee that the Adviser would pay to DoubleLine under the DoubleLine Sub-Advisory Agreements and also considered that such fees would be paid directly by the Adviser and would not result in increased fees payable by the DoubleLine Funds.
The Board considered the background and experience of DoubleLine’s senior management and, in particular, DoubleLine’s experience in investing in fixed income securities. The Board reviewed the Current DoubleLine Funds’ performance, noting that that the performance of the Current DoubleLine Funds was satisfactory. The Board also considered the unitary fee paid, or to be paid, to the Adviser by each DoubleLine Fund and DoubleLine’s fees paid by the Adviser.
The Board, including the Independent Trustees voting separately, approved the DoubleLine Sub-Advisory Agreements for the DoubleLine Funds after weighing the foregoing factors, none of which was dispositive in itself and may have been weighed differently by each Trustee. The Board’s conclusions with respect to each of the DoubleLine Sub-Advisory Agreements were as follows: (a) the nature and extent of the services provided, or expected to be provided, by DoubleLine with respect to the DoubleLine Funds were adequate and appropriate; (b) the performance of the Current DoubleLine Funds had been satisfactory; (c) DoubleLine’s fees for the DoubleLine Funds and the unitary fee, considered in relation to the services provided, or expected to be provided, were fair and reasonable; (d) any additional potential benefits to DoubleLine were not of a magnitude to materially affect the Board’s conclusions; and (e) fees paid, or expected to be paid, to DoubleLine were expected to share economies of scale with each applicable DoubleLine Fund by way of the relatively low fee structure of the Trusts.
97
Table of Contents
SSGA MASTER TRUST
OTHER INFORMATION (continued)
June 30, 2016
TRUSTEES
Name, Address and Year of Birth | Position(s) with Funds | Term of Office and Length of Time Served | Principal Occupation(s) During Past 5 Years | Number of Portfolios in Fund Complex Overseen by Trustee | Other Directorships Held by Trustee During the Past 5 Years | |||||||
Independent Trustees | ||||||||||||
FRANK NESVET c/o SSGA Master Trust State Street Financial Center One Lincoln Street Boston, MA 02111-2900 1943 | Independent Trustee, Chairman, Trustee Committee Chair | Term: Unlimited Served: since September 2000 | Chief Executive Officer, Libra Group, Inc. (a financial services consulting company) (1998-present). | 218 | SPDR Index Shares Funds (Trustee); SPDR Series Trust (Trustee); SSGA Active Trust (Trustee). | |||||||
DAVID M. KELLY c/o SSGA Master Trust State Street Financial Center One Lincoln Street Boston, MA 02111-2900 1938 | Independent Trustee, Audit Committee Chair | Term: Unlimited Served: since September 2000 | Retired. | 218 | Chicago Stock Exchange (Former Director, retired); Penson Worldwide Inc. (Former Director, retired); SPDR Index Shares Funds (Trustee); SPDR Series Trust (Trustee); SSGA Active Trust (Trustee). | |||||||
BONNY EUGENIA BOATMAN c/o SSGA Master Trust State Street Financial Center One Lincoln Street Boston, MA 02111-2900 1950 | Independent Trustee | Term: Unlimited Served: since April 2010 | Retired. | 218 | SPDR Index Shares Funds (Trustee); SPDR Series Trust (Trustee); SSGA Active Trust (Trustee). | |||||||
DWIGHT D. CHURCHILL c/o SSGA Master Trust State Street Financial Center One Lincoln Street Boston, MA 02111-2900 1953 | Independent Trustee | Term: Unlimited Served: since April 2010 | Self-employed consultant since 2010; CEO and President, CFA Institute (June 2014-January 2015). | 218 | SPDR Index Shares Funds (Trustee); SPDR Series Trust (Trustee); SSGA Active Trust (Trustee); Affiliated Managers Group, Inc. (Director). | |||||||
CARL G. VERBONCOEUR c/o SSGA Master Trust State Street Financial Center One Lincoln Street Boston, MA 02111-2900 1952 | Independent Trustee | Term: Unlimited Served: since April 2010 | Self-employed consultant since 2009. | 218 | The Motley Fool Funds Trust (Trustee); SPDR Index Shares Funds (Trustee); SPDR Series Trust (Trustee); SSGA Active Trust (Trustee). | |||||||
98
Table of Contents
SSGA MASTER TRUST
OTHER INFORMATION (continued)
June 30, 2016
Name, Address and Year of Birth | Position(s) with Funds | Term of Office and Length of Time Served | Principal Occupation(s) During Past 5 Years | Number of Portfolios in Fund Complex Overseen by Trustee | Other Directorships Held by Trustee During the Past 5 Years | |||||||
Interested Trustee | ||||||||||||
JAMES E. ROSS* SSGA Funds Management, Inc. State Street Financial Center One Lincoln Street Boston, MA 02111 1965 | Interested Trustee | Term: Unlimited Served as Trustee: since April 2010 | Chairman and Director, SSGA Funds Management, Inc. (2005-present); Senior Managing Director and Principal, State Street Global Advisors (2006-present); President, SSGA Funds Management, Inc. (2005-2012). | 299 | SPDR Index Shares Funds (Trustee); SPDR Series Trust (Trustee); SSGA Active Trust (Trustee); Select Sector SPDR Trust (Trustee); State Street Master Funds (Trustee); and State Street Institutional Investment Trust (Trustee). | |||||||
| * | Mr. Ross is an Interested Trustee because of his employment with the Adviser and ownership interest in an affiliate of the Adviser. Mr. Ross previously served as an Interested Trustee from November 2005 to December 2009. |
OFFICERS
Name, Address and Year of Birth | Position(s) with Funds | Term of Office and Length of Time Served | Principal Occupation(s) During the Past 5 Years | |||
ELLEN M. NEEDHAM SSGA Funds Management, Inc. State Street Financial Center One Lincoln Street Boston, MA 02111 1967 | President | Term: Unlimited Served: since October 2012 | President and Director, SSGA Funds Management, Inc. (2001-present)*; Senior Managing Director, State Street Global Advisors (1992-present).* | |||
ANN M. CARPENTER SSGA Funds Management, Inc. State Street Financial Center One Lincoln Street Boston, MA 02111 1966 | Vice President; Deputy Treasurer | Term: Unlimited Served: since August 2012; Term: Unlimited Served: since February 2016 | Chief Operating Officer, SSGA Funds Management, Inc. (2005-Present)*; Managing Director, State Street Global Advisors (2005-present).* | |||
MICHAEL P. RILEY SSGA Funds Management, Inc. State Street Financial Center One Lincoln Street Boston, MA 02111 1969 | Vice President | Term: Unlimited Served: since February 2005 | Managing Director, State Street Global Advisors and SSGA Funds Management, Inc. (February 2015-present); Vice President, State Street Global Advisors and SSGA Funds Management, Inc. (2008-February 2015); Principal, State Street Global Advisors and SSGA Funds Management, Inc. (2005-2008). | |||
JOSHUA A. WEINBERG SSGA Funds Management, Inc. State Street Financial Center One Lincoln Street Boston, MA 02111 1978 | Chief Legal Officer | Term: Unlimited Served: since February 2015 | Vice President and Managing Counsel, State Street Global Advisors (2011-present); Clerk, SSGA Funds Management, Inc. (2013-present); Associate, Financial Services Group, Dechert LLP (2006-2011). |
99
Table of Contents
SSGA MASTER TRUST
OTHER INFORMATION (continued)
June 30, 2016
Name, Address and Year of Birth | Position(s) with Funds | Term of Office and Length of Time Served | Principal Occupation(s) During the Past 5 Years | |||
CHRISTOPHER A. MADDEN State Street Bank and Trust Company One Hundred Huntington Avenue, CPH0326 Boston, MA 02116 1967 | Secretary | Term: Unlimited Served: since August 2013 | Vice President and Senior Counsel, State Street Bank and Trust Company (2013-present); Counsel, Atlantic Fund Services (2009-2013); Vice President.* | |||
PATRICIA A. MORISETTE State Street Bank and Trust Company One Hundred Huntington Avenue, CPH0326 Boston, MA 02116 1973 | Assistant Secretary | Term: Unlimited Served: since February 2015 | Vice President and Counsel, State Street Bank and Trust Company (2014-present); Assistant Vice President and Counsel, John Hancock Financial Services (2011-2013); Independent legal consultant (2009-2011); Associate, Bingham McCutchen LLP (2003-2009).*,** | |||
BRUCE S. ROSENBERG SSGA Funds Management, Inc. State Street Financial Center One Lincoln Street Boston, MA 02111 1961 | Treasurer | Term: Unlimited Served: since February 2016 | Managing Director, State Street Global Advisors and SSGA Funds Management, Inc. (July 2015-present; Director, Credit Suisse (April 2008-July 2015)). | |||
CHAD C. HALLETT SSGA Funds Management, Inc. State Street Financial Center One Lincoln Street Boston, MA 02111 1969 | Deputy Treasurer | Term: Unlimited Served: since February 2016 | Vice President, State Street Global Advisors and SSGA Funds Management, Inc. (November 2014-present); Vice President, State Street Bank and Trust Company (2001-November 2014).* | |||
SUJATA UPRETI SSGA Funds Management, Inc. State Street Financial Center One Lincoln Street Boston, MA 02111 1974 | Assistant Treasurer | Term: Unlimited Served: since February 2016 | Vice President, State Street Global Advisors and SSGA Funds Management, Inc. (May 2015-present; Assistant Director, Cambridge Associates, LLC (July 2014-January 2015); Vice President, Bank of New York Mellon (July 2012-August 2013); Manager, PricewaterhouseCoopers, LLP (September 2003-July 2012)). | |||
DANIEL FOLEY SSGA Funds Management, Inc. State Street Financial Center One Lincoln Street Boston, MA 02111 1972 | Assistant Treasurer | Term: Unlimited Served: since February 2016 | Vice President, State Street Global Advisors and SSGA Funds Management, Inc. (April 2007-present).* | |||
BRIAN HARRIS SSGA Funds Management, Inc. State Street Financial Center One Lincoln Street Boston, MA 02111 1973 | Chief Compliance Officer and Anti-Money Laundering Officer | Term: Unlimited Served: since November 2013 | Managing Director, State Street Global Advisors and SSGA Funds Management, Inc. (June 2013-present)*; Senior Vice President and Global Head of Investment Compliance, BofA Global Capital Management (2010-2013); Director of Compliance, AARP Financial Inc. (2008-2010). |
| * | Served in various capacities and/or with various affiliated entities during noted time period. |
| ** | Served in various capacities and/or with unaffiliated mutual funds or closed-end funds for which State Street Bank and Trust Company or its affiliates act as a provider of services during the noted time period. |
Statement of Additional information (SAI) includes additional information about Fund directors and is available, without charge, upon request and by calling 1-866-787-2257.
100
Table of Contents
SSGA Master Trust
Trustees
Bonny E. Boatman
Dwight D. Churchill
David M. Kelly
Frank Nesvet, Chairman
James E. Ross
Carl G. Verboncoeur
Officers
Ellen M. Needham, President
Bruce Rosenberg, Treasurer
Ann Carpenter, Vice President and Deputy Treasurer
Michael P. Riley, Vice President
Chad C. Hallett, Deputy Treasurer
Sujata Upreti, Assistant Treasurer
Daniel Foley, Assistant Treasurer
Christopher A. Madden, Secretary
Patricia A. Morisette, Assistant Secretary
Brian Harris, Chief Compliance Officer and Anti-Money Laundering Officer
Joshua A. Weinberg, Chief Legal Officer
Investment Manager and Administrator
SSGA Funds Management, Inc.
State Street Financial Center
One Lincoln Street
Boston, MA 02111
Custodian, Sub-Administrator and Transfer Agent
State Street Bank and Trust Company
One Lincoln Street
Boston, MA 02111
Legal Counsel
Morgan, Lewis & Bockius LLP
1111 Pennsylvania Avenue, NW
Washington, DC 20004
Independent Registered Public Accounting Firm
Ernst & Young LLP
200 Clarendon Street
Boston, MA 02116
Table of Contents
For more complete information, please call 866.787.2257 or
visit www.spdrs.com today.
State Street Global Advisors, State Street Financial Center One Lincoln Street Boston, MA 02111
ETFs trade like stocks, are subject to investment risk, fluctuate in market value and may trade at prices above or below the ETFs net asset value. Brokerage commissions and ETF expenses will reduce returns.
Because the SPDR SSGA Active Asset Allocation ETFs are actively managed, they are therefore subject to the risk that the investments selected by SSGA may cause the ETFs to underperform relative to their benchmarks or other funds with similar investment objectives. Actively managed ETFs do not seek to replicate the performance of a specified index.
Foreign investments involve greater risks than U.S. investments, including political and economic risks and the risk of currency fluctuations, all of which may be magnified in emerging markets.
Bonds generally present less short-term risk and volatility than stocks, but contain interest rate risk (as interest rates rise bond prices usually fall); issuer default risk; issuer credit risk; liquidity risk; and inflation risk. These effects are usually pronounced for longer-term securities. Any fixed income security sold or redeemed prior to maturity may be subject to a substantial gain or loss.
Investing in commodities entail significant risk and is not appropriate for all investors. Commodities investing entail significant risk as commodity prices can be extremely volatile due to wide range of factors. A few such factors include overall market movements, real or perceived inflationary trends, commodity index volatility, international, economic and political changes, change in interest and currency exchange rates.
Past performance is no guarantee of future results. It is not possible to invest directly in an index. Index performance does not reflect charges and expenses associated with the fund or brokerage commissions associated with buying and selling a fund. Index performance is not meant to represent that of any particular fund.
Standard & Poor’s, S&P and SPDR are registered trademarks of Standard & Poor’s Financial Services LLC (S&P); Dow Jones is a registered trademark of Dow Jones Trademark Holdings LLC (Dow Jones); and these trademarks have been licensed for use by S&P Dow Jones Indices LLC (SPDJI) and sublicensed for certain purposes by State Street Corporation. State Street Corporation’s financial products are not sponsored, endorsed, sold or promoted by SPDJI, Dow Jones, S&P, their respective affiliates and third party licensors and none of such parties make any representation regarding the advisability of investing in such product(s) nor do they have any liability in relation thereto, including for any errors, omissions, or interruptions of any index.
Distributor: State Street Global Markets, LLC, member FINRA, SIPC, a wholly owned subsidiary of State Street Corporation. References to State Street may include State Street Corporation and its affiliates. Certain State Street affiliates provide services and receive fees from the SPDR ETFs.
State Street Global Markets, LLC is the distributor for all registered products on behalf of the adviser. SSGA Funds Management has retained GSO Capital Partners, Massachusetts Financial Services Company & DoubleLine Capital LP as the sub-adviser.
DoubleLine® is a registered trademark of DoubleLine Capital LP.
GSO Capital Partners, Massachusetts Financial Services Company and DoubleLine Capital LP is not affiliated with State Street Global Markets, LLC.
Before investing, consider the fund’s investment objectives, risks, charges and expenses. To obtain a prospectus or summary prospectus which contains this and other information, call 866.787.2257 or visit www.spdrs.com. Read it carefully.
Not FDIC Insured. No Bank Guarantee. May Lose Value
The information contained in this report is intended for the general information of shareholders of the Trust. This report is not authorized for distribution to prospective investors unless preceded or accompanied by a current Trust prospectus which contains important information concerning the Trust. You may obtain a current prospectus and SAI from the Distributor by calling 1-866-787-2257 or visiting www.spdrs.com Please read the prospectus carefully before you invest.
| State Street Global Advisors | © 2016 State Street Corporation - All Rights Reserved SPDRACTAR IBG-20863 |
Table of Contents
Annual Report
30 June 2016
SSGA Active Trust
SPDR DoubleLine® Short Duration Total Return Tactical ETF (STOT)

The information contained in this report is intended for the general information of shareholders of the Trust. This report is not authorized for distribution to prospective investors unless preceded or accompanied by a current Trust prospectus which contains important information concerning the Trust. You may obtain a current prospectus and SAI from the Distributor by calling 1-866-787-2257 or visiting www.spdrs.com. Please read the prospectus carefully before you invest.
Table of Contents
SSGA Active Trust
SPDR DoubleLine Short Duration Total Return Tactical ETF
Annual Report
June 30, 2016
| 1 | ||||
| 2 | ||||
| 8 | ||||
| 9 | ||||
| 10 | ||||
| 11 | ||||
| 12 | ||||
| 17 | ||||
| 18 |
The information contained in this report is intended for the general information of shareholders of the Trust. This report is not authorized for distribution to prospective investors unless preceded or accompanied by a current Trust prospectus which contains important information concerning the Trust. You may obtain a current prospectus and SAI from the Distributor by calling 1-866-787-2257 or visiting www.spdrs.com. Please read the prospectus carefully before you invest.
Table of Contents

SPDR DOUBLELINE SHORT DURATION TOTAL RETURN TACTICAL ETF — PORTFOLIO SUMMARY (UNAUDITED)
The fund had less than six months of operations at reporting period end and therefore does not have performance history to provide in this report.
TOP FIVE HOLDINGS AS OF JUNE 30, 2016
| DESCRIPTION | FEDERAL NATIONAL MORTGAGE ASSOCIATION 3.00% 06/01/2036 | TREASURY NOTES 1.00% 09/15/2017 | TREASURY NOTES 0.88% 07/15/2017 | TREASURY NOTES 1.00% 12/31/2017 | TREASURY NOTES 0.88% 11/30/2017 | |||||||||
| MARKET VALUE | $3,131,238 | 1,960,589 | 1,776,673 | 1,710,914 | 1,657,161 | |||||||||
| % OF NET ASSETS | 6.2 | 3.9 | 3.5 | 3.4 | 3.3 | |||||||||
(The five largest holdings are subject to change, and there are no guarantees the Fund will continue to remain invested in any particular security.)
| PORTFOLIO COMPOSITION* | JUNE 30, 2016 | |||||||
Corporate Bonds & Notes | 27.2 | % | ||||||
U.S. Treasury Obligations | 21.5 | |||||||
Mortgage-Backed Securities | 36.2 | |||||||
Asset-Backed Securities | 8.1 | |||||||
Senior Floating Rate Loans | 3.8 | |||||||
Short-Term Investment | 1.3 | |||||||
Foreign Government Obligations | 1.2 | |||||||
Other Assets in Excess of Liabilities | 0.7 | |||||||
TOTAL | 100.0 | % | ||||||
| * | The Fund’s portfolio composition is expressed as a percentage of net assets and may change over time. |
1
Table of Contents
SPDR DoubleLine Short Duration Total Return Tactical ETF
June 30, 2016
Security Description | Principal | Value | ||||||
CORPORATE BONDS & NOTES — 27.2% |
| |||||||
ADVERTISING — 0.2% |
| |||||||
Outfront Media Capital LLC/Outfront Media Capital Corp. | $ | 100,000 | $ | 101,500 | ||||
|
| |||||||
AEROSPACE & DEFENSE — 0.2% |
| |||||||
United Technologies Corp. | 100,000 | 112,285 | ||||||
|
| |||||||
AGRICULTURE — 0.7% |
| |||||||
Philip Morris International, Inc. | 200,000 | 217,262 | ||||||
Reynolds American, Inc. | 140,000 | 147,783 | ||||||
|
| |||||||
| 365,045 | ||||||||
|
| |||||||
AUTO MANUFACTURERS — 0.6% |
| |||||||
Kia Motors Corp. 2.63%, 4/21/2021 (a) | 200,000 | 206,551 | ||||||
Toyota Motor Credit Corp. Series MTN, | 75,000 | 75,861 | ||||||
|
| |||||||
| 282,412 | ||||||||
|
| |||||||
AUTO PARTS & EQUIPMENT — 0.1% |
| |||||||
American Axle & Manufacturing, Inc. | 65,000 | 69,303 | ||||||
|
| |||||||
BANKS — 6.6% |
| |||||||
Agromercantil Senior Trust | 200,000 | 206,900 | ||||||
Banco Mercantil del Norte SA | 200,000 | 199,500 | ||||||
Banco Nacional de Costa Rica | 200,000 | 204,000 | ||||||
Banco Santander Mexico SA | �� | 200,000 | 210,000 | |||||
Bancolombia SA 6.13%, 7/26/2020 | 200,000 | 214,000 | ||||||
Bank of America Corp. | 150,000 | 151,011 | ||||||
BB&T Corp. 2.25%, 2/1/2019 | 115,000 | 117,438 | ||||||
BBVA Bancomer SA 6.01%, 5/17/2022 | 200,000 | 199,000 | ||||||
Citigroup, Inc. 2.05%, 12/7/2018 | 150,000 | 151,240 | ||||||
Global Bank Corp. 5.13%, 10/30/2019 | 200,000 | 206,500 | ||||||
Goldman Sachs Group, Inc. | 115,000 | 117,834 | ||||||
Itau CorpBanca 3.88%, 9/22/2019 | 200,000 | 209,562 | ||||||
JPMorgan Chase & Co. | 115,000 | 116,601 | ||||||
Morgan Stanley Series GMTN, | 145,000 | 147,717 | ||||||
Oversea-Chinese Banking Corp., Ltd. | 200,000 | 209,263 | ||||||
PNC Funding Corp. 4.38%, 8/11/2020 | 65,000 | 71,481 | ||||||
Royal Bank of Canada | 130,000 | 132,080 | ||||||
Toronto-Dominion Bank Series GMTN, | 125,000 | 126,365 | ||||||
United Overseas Bank, Ltd. | 200,000 | 207,000 | ||||||
Wells Fargo & Co. 1.50%, 1/16/2018 | 115,000 | 115,540 | ||||||
|
| |||||||
| 3,313,032 | ||||||||
|
| |||||||
BEVERAGES — 0.7% |
| |||||||
Anheuser-Busch InBev Finance, Inc. | 130,000 | 132,157 | ||||||
Molson Coors Brewing Co. | 50,000 | 50,154 | ||||||
PepsiCo, Inc. 2.15%, 10/14/2020 | 180,000 | 184,637 | ||||||
|
| |||||||
| 366,948 | ||||||||
|
| |||||||
BIOTECHNOLOGY — 0.5% |
| |||||||
Celgene Corp. 2.13%, 8/15/2018 | 230,000 | 232,885 | ||||||
|
| |||||||
COMMERCIAL SERVICES — 0.4% |
| |||||||
Adani Ports & Special Economic Zone, Ltd. 3.50%, 7/29/2020 | 200,000 | 198,926 | ||||||
Prime Security Services Borrower LLC/Prime Finance, Inc. | 25,000 | 26,500 | ||||||
|
| |||||||
| 225,426 | ||||||||
|
| |||||||
DIVERSIFIED FINANCIAL SERVICES — 0.8% |
| |||||||
American Express Credit Corp. Series GMTN, 2.25%, 8/15/2019 | 230,000 | 234,638 | ||||||
National Rural Utilities Cooperative Finance Corp. 2.30%, 11/15/2019 | 115,000 | 118,484 | ||||||
Tanner Servicios Financieros SA | 50,000 | 50,125 | ||||||
|
| |||||||
| 403,247 | ||||||||
|
| |||||||
ELECTRIC — 1.2% |
| |||||||
Duke Energy Corp. 1.63%, 8/15/2017 | 115,000 | 115,617 | ||||||
Israel Electric Corp., Ltd. | 200,000 | 211,800 | ||||||
NRG Energy, Inc. 6.25%, 7/15/2022 | 45,000 | 43,763 | ||||||
Southern Co. 2.45%, 9/1/2018 | 230,000 | 235,324 | ||||||
|
| |||||||
| 606,504 | ||||||||
|
| |||||||
ENGINEERING & CONSTRUCTION — 0.3% |
| |||||||
Aeropuerto Internacional de Tocumen SA | 130,000 | 135,850 | ||||||
|
| |||||||
ENTERTAINMENT — 0.1% |
| |||||||
Scientific Games International, Inc. | 65,000 | 65,488 | ||||||
|
| |||||||
FOOD — 0.9% |
| |||||||
General Mills, Inc. 2.20%, 10/21/2019 | 230,000 | 235,132 | ||||||
Kraft Heinz Foods Co. | 115,000 | 116,514 | ||||||
Kroger Co. 6.15%, 1/15/2020 | 100,000 | 114,979 | ||||||
|
| |||||||
| 466,625 | ||||||||
|
| |||||||
FOREST PRODUCTS & PAPER — 0.4% |
| |||||||
Inversiones CMPC SA/Cayman Islands Branch 4.75%, 1/19/2018 | 200,000 | 207,109 | ||||||
|
| |||||||
HEALTH CARE PRODUCTS — 0.1% |
| |||||||
Thermo Fisher Scientific, Inc. | 75,000 | 75,642 | ||||||
|
| |||||||
HEALTH CARE SERVICES — 1.0% |
| |||||||
Aetna, Inc. 1.90%, 6/7/2019 | 70,000 | 70,992 | ||||||
Anthem, Inc. 2.30%, 7/15/2018 | 230,000 | 232,930 | ||||||
Centene Corp.: | ||||||||
4.75%, 5/15/2022 | 10,000 | 10,200 | ||||||
5.63%, 2/15/2021 (a) | 20,000 | 20,812 | ||||||
See accompanying notes to financial statements.
2
Table of Contents
SPDR DoubleLine Short Duration Total Return Tactical ETF
SCHEDULE OF INVESTMENTS (continued)
June 30, 2016
Security Description | Principal | Value | ||||||
HCA, Inc. 4.25%, 10/15/2019 | $ | 100,000 | $ | 104,313 | ||||
Select Medical Corp. 6.38%, 6/1/2021 | 45,000 | 42,778 | ||||||
|
| |||||||
| 482,025 | ||||||||
|
| |||||||
HOUSEHOLD PRODUCTS(c) — 0.0% |
| |||||||
Revlon Consumer Products Corp. | 15,000 | 14,550 | ||||||
|
| |||||||
HOUSEWARES — 0.2% |
| |||||||
Newell Brands, Inc. 2.60%, 3/29/2019 | 100,000 | 102,469 | ||||||
|
| |||||||
INSURANCE — 0.2% |
| |||||||
Berkshire Hathaway Finance Corp. | 120,000 | 121,961 | ||||||
|
| |||||||
INTERNET — 0.2% |
| |||||||
Amazon.com, Inc. 2.60%, 12/5/2019 | 110,000 | 114,830 | ||||||
|
| |||||||
INVESTMENT COMPANY SECURITY — 0.4% |
| |||||||
GrupoSura Finance SA | 200,000 | 214,200 | ||||||
|
| |||||||
IT SERVICES — 0.8% |
| |||||||
Apple, Inc. 1.70%, 2/22/2019 | 125,000 | 126,996 | ||||||
Hewlett Packard Enterprise Co. | 275,000 | 281,293 | ||||||
|
| |||||||
| 408,289 | ||||||||
|
| |||||||
LEISURE TIME — 0.3% |
| |||||||
NCL Corp., Ltd. 5.25%, 11/15/2019 (a) | 65,000 | 65,650 | ||||||
Sabre GLBL, Inc. | 60,000 | 61,275 | ||||||
|
| |||||||
| 126,925 | ||||||||
|
| |||||||
LODGING — 0.1% |
| |||||||
Station Casinos LLC 7.50%, 3/1/2021 | 45,000 | 47,646 | ||||||
|
| |||||||
MACHINERY, CONSTRUCTION & MINING — 0.2% |
| |||||||
Caterpillar Financial Services Corp. Series GMTN, 1.70%, 6/16/2018 | 115,000 | 116,352 | ||||||
|
| |||||||
MEDIA — 0.8% |
| |||||||
CCO Holdings LLC/CCO Holdings Capital Corp. 5.25%, 9/30/2022 | 65,000 | 66,547 | ||||||
Cequel Communications Holdings I LLC/Cequel Capital Corp. | 30,000 | 30,447 | ||||||
Comcast Corp. 5.88%, 2/15/2018 | 200,000 | 215,338 | ||||||
Sinclair Television Group, Inc. | 65,000 | 66,585 | ||||||
|
| |||||||
| 378,917 | ||||||||
|
| |||||||
OIL & GAS — 1.9% |
| |||||||
BP Capital Markets PLC | 30,000 | 30,200 | ||||||
Chevron Corp. 1.56%, 5/16/2019 | 75,000 | 75,433 | ||||||
Delek & Avner Tamar Bond, Ltd. | 200,000 | 207,500 | ||||||
ONGC Videsh, Ltd. 3.25%, 7/15/2019 | 200,000 | 205,540 | ||||||
Petroleos Mexicanos 5.50%, 1/21/2021 | 150,000 | 158,994 | ||||||
Petronas Global Sukuk, Ltd. | 200,000 | 202,261 | ||||||
Shell International Finance B.V. | 75,000 | 75,167 | ||||||
|
| |||||||
| 955,095 | ||||||||
|
| |||||||
PACKAGING & CONTAINERS — 0.2% |
| |||||||
Berry Plastics Corp. 5.50%, 5/15/2022 | 65,000 | 66,625 | ||||||
Reynolds Group Issuer, Inc./Reynolds Group Issuer LLC/Reynolds Group Issuer Lu 5.13%, 7/15/2023 (a) | 30,000 | 30,375 | ||||||
|
| |||||||
| 97,000 | ||||||||
|
| |||||||
PHARMACEUTICALS — 1.3% |
| |||||||
AbbVie, Inc. 1.80%, 5/14/2018 | 230,000 | 231,386 | ||||||
Cardinal Health, Inc. 1.95%, 6/15/2018 | 100,000 | 100,976 | ||||||
McKesson Corp. 1.29%, 3/10/2017 | 125,000 | 125,237 | ||||||
Mylan NV 2.50%, 6/7/2019 (a) | 75,000 | 76,052 | ||||||
Quintiles Transnational Corp. | 100,000 | 101,812 | ||||||
|
| |||||||
| 635,463 | ||||||||
|
| |||||||
PIPELINES — 1.1% |
| |||||||
Kinder Morgan Energy Partners L.P. | 110,000 | 112,556 | ||||||
Oleoducto Central SA 4.00%, 5/7/2021 | 200,000 | 195,400 | ||||||
Transportadora de Gas Internacional SA ESP 5.70%, 3/20/2022 | 200,000 | 208,500 | ||||||
Williams Partners L.P. / ACMP Finance Corp. 4.88%, 3/15/2024 | 20,000 | 19,100 | ||||||
|
| |||||||
| 535,556 | ||||||||
|
| |||||||
REAL ESTATE INVESTMENT TRUSTS — 0.7% |
| |||||||
Boston Properties L.P. | 100,000 | 112,003 | ||||||
Equinix, Inc. 5.38%, 4/1/2023 | 100,000 | 103,000 | ||||||
Simon Property Group L.P. | 115,000 | 117,358 | ||||||
|
| |||||||
| 332,361 | ||||||||
|
| |||||||
RETAIL — 1.0% |
| |||||||
CVS Health Corp. 1.90%, 7/20/2018 | 220,000 | �� | 223,015 | |||||
Dollar Tree, Inc. 5.75%, 3/1/2023 (a) | 65,000 | 69,063 | ||||||
Home Depot, Inc. 2.00%, 6/15/2019 | 150,000 | 154,086 | ||||||
Sally Holdings LLC/Sally Capital, Inc. | 65,000 | 67,600 | ||||||
|
| |||||||
| 513,764 | ||||||||
|
| |||||||
SOFTWARE — 0.7% |
| |||||||
Activision Blizzard, Inc. | 65,000 | 67,763 | ||||||
First Data Corp. 5.75%, 1/15/2024 (a) | 25,000 | 24,609 | ||||||
Oracle Corp. 2.25%, 10/8/2019 | 230,000 | 236,931 | ||||||
|
| |||||||
| 329,303 | ||||||||
|
| |||||||
TELECOMMUNICATIONS — 2.3% |
| |||||||
AT&T, Inc. 2.30%, 3/11/2019 | 115,000 | 117,496 | ||||||
Axiata SPV2 Bhd Series 2, | 200,000 | 208,422 | ||||||
British Telecommunications PLC | 200,000 | 213,990 | ||||||
Cisco Systems, Inc. 1.65%, 6/15/2018 | 115,000 | 116,597 | ||||||
Digicel, Ltd. 7.00%, 2/15/2020 | 200,000 | 185,000 | ||||||
Level 3 Communications, Inc. | 65,000 | 65,812 | ||||||
Orange SA 2.75%, 2/6/2019 | 115,000 | 118,335 | ||||||
See accompanying notes to financial statements.
3
Table of Contents
SPDR DoubleLine Short Duration Total Return Tactical ETF
SCHEDULE OF INVESTMENTS (continued)
June 30, 2016
Security Description | Principal | Value | ||||||
Verizon Communications, Inc. | $ | 145,000 | $ | 149,894 | ||||
|
| |||||||
| 1,175,546 | ||||||||
|
| |||||||
TOTAL CORPORATE BONDS & NOTES | 13,731,553 | |||||||
|
| |||||||
FOREIGN GOVERNMENT OBLIGATIONS — 1.2% |
| |||||||
Banco de Costa Rica 5.25%, 8/12/2018 | 200,000 | 204,250 | ||||||
Banco Latinoamericano de Comercio Exterior SA 3.25%, 5/7/2020 | 200,000 | 201,000 | ||||||
Fondo MIVIVIENDA SA | 200,000 | 205,980 | ||||||
|
| |||||||
TOTAL FOREIGN GOVERNMENT OBLIGATIONS | 611,230 | |||||||
|
| |||||||
U.S. TREASURY OBLIGATIONS — 21.5% |
| |||||||
Treasury Notes: | ||||||||
0.63%, 5/31/2017 | 1,300,000 | 1,301,365 | ||||||
0.75%, 1/31/2018 | 1,000,000 | 1,002,830 | ||||||
0.88%, 7/15/2017 | 1,770,000 | 1,776,673 | ||||||
0.88%, 11/30/2017 | 1,650,000 | 1,657,161 | ||||||
1.00%, 9/15/2017 | 1,950,000 | 1,960,589 | ||||||
1.00%, 12/31/2017 | 1,700,000 | 1,710,914 | ||||||
1.63%, 6/30/2020 | 1,380,000 | 1,419,233 | ||||||
|
| |||||||
TOTAL U.S. TREASURY OBLIGATIONS | 10,828,765 | |||||||
|
| |||||||
SENIOR FLOATING RATE LOANS — 3.8% |
| |||||||
AEROSPACE & DEFENSE — 0.1% |
| |||||||
TransDigm, Inc.: | ||||||||
Senior Secured Delayed Draw Term Loan F, 3.75%, 6/9/2023 | 20,368 | 20,109 | ||||||
Senior Secured Term Loan F, | 22,632 | 22,344 | ||||||
|
| |||||||
| 42,453 | ||||||||
|
| |||||||
CONTAINERS & PACKAGING — 0.2% |
| |||||||
Reynolds Group Holdings, Inc. | 100,000 | 100,145 | ||||||
|
| |||||||
DIVERSIFIED TELECOMMUNICATION SERVICES — 0.4% |
| |||||||
Level 3 Financing, Inc. | 100,000 | 99,787 | ||||||
Virgin Media Investment Holdings, Ltd. | 100,000 | 97,711 | ||||||
|
| |||||||
| 197,498 | ||||||||
|
| |||||||
HEALTH CARE PROVIDERS & SERVICES — 0.1% |
| |||||||
MPH Acquisition Holdings LLC Senior Secured Term Loan B, 5.00%, 6/7/2023 | 49,000 | 49,196 | ||||||
|
| |||||||
HOTELS, RESTAURANTS & LEISURE — 0.6% |
| |||||||
Burger King 1011778 B.C. Unlimited Liability Co. | 99,746 | 99,746 | ||||||
MGM Growth Prop. Operating Partnership L.P. | 99,750 | 100,093 | ||||||
Scientific Games International, Inc. | 69,747 | 68,884 | ||||||
Yum! Brands Inc. | 37,000 | 37,093 | ||||||
|
| |||||||
| 305,816 | ||||||||
|
| |||||||
LIFE SCIENCES TOOLS & SERVICES — 0.2% |
| |||||||
Jaguar Holding Company II Senior Secured Term Loan B, 4.25%, 8/18/2022 | 99,748 | 98,938 | ||||||
|
| |||||||
MEDIA — 0.5% |
| |||||||
Charter Communications Operating LLC | 99,750 | 99,984 | ||||||
McGraw-Hill Global Education Holdings LLC | 64,000 | 64,016 | ||||||
Tribune Media Co. | 99,748 | 99,686 | ||||||
|
| |||||||
| 263,686 | ||||||||
|
| |||||||
MULTILINE RETAIL — 0.2% |
| |||||||
Dollar Tree, Inc. | 100,000 | 100,166 | ||||||
|
| |||||||
PERSONAL PRODUCTS — 0.2% |
| |||||||
NBTY, Inc. | 100,000 | 99,393 | ||||||
|
| |||||||
PHARMACEUTICALS — 0.2% |
| |||||||
Endo Luxembourg Finance Company I S.A.R.L. | 99,749 | 98,353 | ||||||
|
| |||||||
PROFESSIONAL SERVICES — 0.2% |
| |||||||
TransUnion LLC | 99,745 | 98,701 | ||||||
|
| |||||||
ROAD & RAIL — 0.1% |
| |||||||
Hertz Corp. | 50,000 | 50,031 | ||||||
|
| |||||||
TECHNOLOGY HARDWARE, STORAGE & PERIPHERALS — 0.4% |
| |||||||
Dell, Inc.: | ||||||||
Senior Secured Term Loan B, 1.00%, 5/24/2023 | 96,000 | 95,790 | ||||||
Senior Secured Term Loan B2, 4.00%, 4/29/2020 | 100,000 | 99,828 | ||||||
|
| |||||||
| 195,618 | ||||||||
|
| |||||||
See accompanying notes to financial statements.
4
Table of Contents
SPDR DoubleLine Short Duration Total Return Tactical ETF
SCHEDULE OF INVESTMENTS (continued)
June 30, 2016
Security Description | Principal | Value | ||||||
TRADING COMPANIES & DISTRIBUTORS — 0.2% |
| |||||||
Univar, Inc. | $ | 99,749 | $ | 98,502 | ||||
|
| |||||||
WIRELESS TELECOMMUNICATION SERVICES — 0.2% |
| |||||||
T-Mobile USA, Inc. | 99,749 | 100,202 | ||||||
|
| |||||||
TOTAL SENIOR FLOATING RATE LOANS | 1,898,698 | |||||||
|
| |||||||
ASSET-BACKED SECURITIES — 8.1% |
| |||||||
ASSET-BACKED - OTHER — 6.1% |
| |||||||
AVANT Loans Funding Trust | 224,763 | 225,699 | ||||||
Bear Stearns Asset Backed Securities Trust | 897,784 | 886,792 | ||||||
CAM Mortgage Trust | 947,653 | 945,446 | ||||||
Springleaf Funding Trust | 1,000,000 | 1,005,915 | ||||||
|
| |||||||
| 3,063,852 | ||||||||
|
| |||||||
ASSET-BACKED - STUDENT LOAN — 2.0% |
| |||||||
Commonbond Student Loan Trust 2016-A | 985,458 | 997,319 | ||||||
|
| |||||||
TOTAL ASSET-BACKED SECURITIES | 4,061,171 | |||||||
|
| |||||||
MORTGAGE-BACKED SECURITIES — 36.2% |
| |||||||
Citigroup Commercial Mortgage Trust: | ||||||||
Series 2007-C6, Class AM, 5.90%, 12/10/2049 (b) | 36,000 | 36,128 | ||||||
Series 2014-GC19, Class XA, IO, 1.46%, 3/10/2047 (b) | 1,809,668 | 118,072 | ||||||
Series 2015-GC27, Class C, 4.58%, 2/10/2048 (b) | 125,000 | 118,915 | ||||||
Series 2016-GC37, Class XA, IO, 1.98%, 4/10/2049 (b) | 999,075 | 132,409 | ||||||
COMM Mortgage Trust: | ||||||||
Series 2013-CR12, Class XA, IO, 1.54%, 10/10/2046 (b) | 1,782,293 | 118,401 | ||||||
Series 2014-UBS3, Class XA, IO, 1.50%, 6/10/2047 (b) | 1,747,007 | 118,814 | ||||||
Commercial Mortgage Loan Trust | 82,942 | 85,548 | ||||||
Commercial Mortgage Trust | 125,000 | 129,307 | ||||||
Credit Suisse Commercial Mortgage Trust | 150,000 | 156,561 | ||||||
CSMC | 125,000 | 126,387 | ||||||
Fannie Mae Pool 3.50%, 8/1/2045 | 966,886 | 1,020,395 | ||||||
Federal Home Loan Mortgage Corp.: | ||||||||
3.00%, 3/1/2046 | 1,481,119 | 1,536,129 | ||||||
3.00%, 4/1/2046 | 1,491,343 | 1,546,733 | ||||||
Series 4582, Class HA, 3.00%, 9/15/2045 | 991,319 | 1,036,836 | ||||||
Series K722, Class X1, IO, 1.31%, 3/25/2023 (b) | 506,000 | 35,493 | ||||||
Federal National Mortgage Association: | ||||||||
3.00%, 6/1/2036 | 2,984,774 | 3,131,238 | ||||||
3.00%, 5/1/2046 | 1,490,111 | 1,547,118 | ||||||
3.50%, 7/1/2042 | 756,369 | 800,453 | ||||||
3.50%, 6/1/2045 | 968,667 | 1,022,275 | ||||||
3.50%, 3/1/2046 | 993,202 | 1,048,617 | ||||||
GS Mortgage Securities Trust | 130,838 | 134,054 | ||||||
JPMBB Commercial Mortgage Securities Trust | 2,138,147 | 120,503 | ||||||
LB Commercial Mortgage Trust | 125,000 | 128,971 | ||||||
LB-UBS Commercial Mortgage Trust | 34,975 | 36,515 | ||||||
Mill City Mortgage Trust | 279,659 | 282,552 | ||||||
ML-CFC Commercial Mortgage Trust: | ||||||||
Series 2007-5, Class A4, 5.38%, 8/12/2048 | 139,784 | 141,268 | ||||||
Series 2007-5, Class AM, 5.42%, 8/12/2048 | 125,000 | 127,171 | ||||||
Series 2007-9, Class A4, 5.70%, 9/12/2049 | 34,162 | 35,109 | ||||||
Morgan Stanley Bank of America Merrill Lynch Trust | 2,060,902 | 121,492 | ||||||
Morgan Stanley Capital I Trust: | ||||||||
5.41%, 3/15/2044 | 125,000 | 127,398 | ||||||
Series 2007-IQ16, Class AM, 6.26%, 12/12/2049 (b) | 61,000 | 63,225 | ||||||
Velocity Commercial Capital Loan Trust | 481,314 | 488,534 | ||||||
Wachovia Bank Commercial Mortgage Trust | 125,000 | 127,160 | ||||||
Wells Fargo Mortgage Backed Securities: | ||||||||
Series 2006-6, Class 1A17, 5.75%, 5/25/2036 | 825,952 | 824,099 | ||||||
Series 2007-10, Class 1A5, | 1,523,809 | 1,520,777 | ||||||
See accompanying notes to financial statements.
5
Table of Contents
SPDR DoubleLine Short Duration Total Return Tactical ETF
SCHEDULE OF INVESTMENTS (continued)
June 30, 2016
Security Description | Principal | Value | ||||||
WFRBS Commercial Mortgage Trust | $ | 2,760,823 | $ | 119,872 | ||||
|
| |||||||
TOTAL MORTGAGE-BACKED SECURITIES | 18,264,529 | |||||||
|
| |||||||
Shares | ||||||||
SHORT-TERM INVESTMENT — 1.3% |
| |||||||
State Street Institutional Liquid Reserves Fund, Premier Class 0.47% (d) (e) (Cost $673,680) | 673,680 | 673,680 | ||||||
|
| |||||||
TOTAL INVESTMENTS — 99.3% | 50,069,626 | |||||||
OTHER ASSETS IN EXCESS OF LIABILITIES — 0.7% | 334,091 | |||||||
|
| |||||||
NET ASSETS — 100.0% | $ | 50,403,717 | ||||||
|
| |||||||
| (a) | Securities purchased pursuant to Rule 144A of the Securities Act of 1933. These securities, which represent 11.4% of net assets as of June 30, 2016, are considered liquid and may be resold in transactions exempt from registration, normally to qualified institutional buyers. |
| (b) | Variable Rate Security — Interest rate shown is rate in effect at June 30, 2016. |
| (c) | Amount is less than 0.05% of net assets. |
| (d) | The rate shown is the annualized seven-day yield at June 30, 2016. |
| (e) | The Fund invested in certain money market funds managed by SSGA Funds Management, Inc. Amounts related to these transactions during the year ended June 30, 2016 are shown in the Affiliate Table below. |
| IO | Interest Only |
The following table summarizes the value of the Fund’s investments accordingly to the fair value hierarchy as of June 30, 2016.
Description | Level 1 — Quoted Prices | Level 2 — Other Significant Observable Inputs | Level 3 — Significant Unobservable Inputs | Total | ||||||||||||
ASSETS: | ||||||||||||||||
INVESTMENTS: | ||||||||||||||||
Corporate Bonds & Notes | ||||||||||||||||
Advertising | $ | — | $ | 101,500 | $ | — | $ | 101,500 | ||||||||
Aerospace & Defense | — | 112,285 | — | 112,285 | ||||||||||||
Agriculture | — | 365,045 | — | 365,045 | ||||||||||||
Auto Manufacturers | — | 282,412 | — | 282,412 | ||||||||||||
Auto Parts & Equipment | — | 69,303 | — | 69,303 | ||||||||||||
Banks | — | 3,313,032 | — | 3,313,032 | ||||||||||||
Beverages | — | 366,948 | — | 366,948 | ||||||||||||
Biotechnology | — | 232,885 | — | 232,885 | ||||||||||||
Commercial Services | — | 225,426 | — | 225,426 | ||||||||||||
Diversified Financial Services | — | 403,247 | — | 403,247 | ||||||||||||
Electric | — | 606,504 | — | 606,504 | ||||||||||||
Engineering & Construction | — | 135,850 | — | 135,850 | ||||||||||||
Entertainment | — | 65,488 | — | 65,488 | ||||||||||||
Food | — | 466,625 | — | 466,625 | ||||||||||||
Forest Products & Paper | — | 207,109 | — | 207,109 | ||||||||||||
Health Care Products | — | 75,642 | — | 75,642 | ||||||||||||
Health Care Services | — | 482,025 | — | 482,025 | ||||||||||||
Household Products | — | 14,550 | — | 14,550 | ||||||||||||
Housewares | — | 102,469 | — | 102,469 | ||||||||||||
Insurance | — | 121,961 | — | 121,961 | ||||||||||||
Internet | — | 114,830 | — | 114,830 | ||||||||||||
Investment Company Security | — | 214,200 | — | 214,200 | ||||||||||||
IT Services | — | 408,289 | — | 408,289 | ||||||||||||
Leisure Time | — | 126,925 | — | 126,925 | ||||||||||||
Lodging | — | 47,646 | — | 47,646 | ||||||||||||
Machinery, Construction & Mining | — | 116,352 | — | 116,352 | ||||||||||||
Media | — | 378,917 | — | 378,917 | ||||||||||||
Oil & Gas | — | 955,095 | — | 955,095 | ||||||||||||
Packaging & Containers | — | 97,000 | — | 97,000 | ||||||||||||
Pharmaceuticals | — | 635,463 | — | 635,463 | ||||||||||||
See accompanying notes to financial statements.
6
Table of Contents
SPDR DoubleLine Short Duration Total Return Tactical ETF
SCHEDULE OF INVESTMENTS (continued)
June 30, 2016
Description | Level 1 — Quoted Prices | Level 2 — Other Significant Observable Inputs | Level 3 — Significant Unobservable Inputs | Total | ||||||||||||
Pipelines | $ | — | $ | 535,556 | $ | — | $ | 535,556 | ||||||||
Real Estate Investment Trusts | — | 332,361 | — | 332,361 | ||||||||||||
Retail | — | 513,764 | — | 513,764 | ||||||||||||
Software | — | 329,303 | — | 329,303 | ||||||||||||
Telecommunications | — | 1,175,546 | — | 1,175,546 | ||||||||||||
Foreign Government Obligations | — | 611,230 | — | 611,230 | ||||||||||||
U.S. Treasury Obligations | — | 10,828,765 | — | 10,828,765 | ||||||||||||
Senior Floating Rate Loans | — | 1,898,698 | — | 1,898,698 | ||||||||||||
Asset-Backed Securities | — | 4,061,171 | — | 4,061,171 | ||||||||||||
Mortgage-Backed Securities | — | 18,264,529 | — | 18,264,529 | ||||||||||||
Short-Term Investment | 673,680 | — | — | 673,680 | ||||||||||||
|
|
|
|
|
|
|
| |||||||||
TOTAL INVESTMENTS | $ | 673,680 | $ | 49,395,946 | $ | — | $ | 50,069,626 | ||||||||
|
|
|
|
|
|
|
| |||||||||
Affiliate Table
| Number of Shares Held at 4/14/2016* | Value At 4/14/2016* | Shares Purchased | Shares Sold | Number of Shares Held at 6/30/16 | Value at 6/30/16 | Dividend Income | Realized Gain (Loss) | |||||||||||||||||||||||||
State Street Institutional Liquid Reserves Fund, Premier Class | — | $ | — | 42,737,300 | 42,063,620 | 673,680 | $ | 673,680 | $ | 5,971 | $ | — | ||||||||||||||||||||
| * | commencement of operations |
See accompanying notes to financial statements.
7
Table of Contents
SPDR DoubleLine Short Duration Total Return Tactical ETF
STATEMENT OF ASSETS AND LIABILITIES
June 30, 2016
ASSETS | ||||
Investments in unaffiliated issuers, at value (Note 2) | $ | 49,395,946 | ||
Investments in affiliated issuers, at value (Note 2) | 673,680 | |||
|
| |||
Total Investments | 50,069,626 | |||
Cash | 7,127 | |||
Receivable for investments sold | 427,929 | |||
Interest receivable — unaffiliated issuers (Note 2) | 233,230 | |||
Dividends receivable — affiliated issuers (Note 2) | 201 | |||
Receivable from Adviser (Note 4) | 2,134 | |||
|
| |||
TOTAL ASSETS | 50,740,247 | |||
|
| |||
LIABILITIES | ||||
Payable for investments purchased | 315,758 | |||
Advisory fee payable (Note 4) | 20,578 | |||
Trustees’ fees and expenses payable (Note 5) | 194 | |||
|
| |||
TOTAL LIABILITIES | 336,530 | |||
|
| |||
NET ASSETS | $ | 50,403,717 | ||
|
| |||
NET ASSETS CONSIST OF: | ||||
Paid-in Capital (Note 7) | $ | 50,100,000 | ||
Undistributed (distribution in excess of) net investment income (loss) | 93,148 | |||
Accumulated net realized gain (loss) on investments | (4,366 | ) | ||
Net unrealized appreciation (depreciation) on: | ||||
Investments | 214,935 | |||
|
| |||
NET ASSETS | $ | 50,403,717 | ||
|
| |||
NET ASSET VALUE PER SHARE | ||||
Net asset value per share | $ | 50.40 | ||
|
| |||
Shares outstanding (unlimited amount authorized, $0.01 par value) | 1,000,000 | |||
|
| |||
COST OF INVESTMENTS: | ||||
Investments in unaffiliated issuers | $ | 49,181,011 | ||
Investments in affiliated issuers | 673,680 | |||
|
| |||
Total cost of investments | $ | 49,854,691 | ||
|
|
See accompanying notes to financial statements.
8
Table of Contents
SPDR DoubleLine Short Duration Total Return Tactical ETF
For the Period Ended June 30, 2016(a)
INVESTMENT INCOME | ||||
Interest income — unaffiliated issuers (Note 2) | $ | 262,194 | ||
Dividend income — affiliated issuers (Note 2) | 5,971 | |||
|
| |||
TOTAL INVESTMENT INCOME (LOSS) | 268,165 | |||
|
| |||
EXPENSES | ||||
Advisory fee (Note 4) | 53,418 | |||
Trustees’ fees and expenses (Note 5) | 198 | |||
Miscellaneous expenses | 1 | |||
|
| |||
TOTAL EXPENSES | 53,617 | |||
|
| |||
Expenses waived/reimbursed by the Adviser (Note 4) | (5,539 | ) | ||
|
| |||
NET EXPENSES | 48,078 | |||
|
| |||
NET INVESTMENT INCOME (LOSS) | 220,087 | |||
|
| |||
REALIZED AND UNREALIZED GAIN (LOSS) | ||||
Net realized gain (loss) on: | ||||
Investment transactions — unaffiliated issuers | (15,198 | ) | ||
|
| |||
Net realized gain (loss) | (15,198 | ) | ||
|
| |||
Net change in unrealized appreciation/depreciation on: | ||||
Investment transactions — unaffiliated issuers | 214,935 | |||
|
| |||
Net change in unrealized appreciation/depreciation | 214,935 | |||
|
| |||
NET REALIZED AND UNREALIZED GAIN (LOSS) | 199,737 | |||
|
| |||
NET INCREASE (DECREASE) IN NET ASSETS FROM OPERATIONS | $ | 419,824 | ||
|
|
| (a) | For the period April 13, 2016 (inception date) through June 30, 2016. |
See accompanying notes to financial statements.
9
Table of Contents
SPDR DoubleLine Short Duration Total Return Tactical ETF
STATEMENT OF CHANGES IN NET ASSETS
| For the Period 4/13/16* - 6/30/16 | ||||
INCREASE (DECREASE) IN NET ASSETS FROM OPERATIONS: | ||||
Net investment income (loss) | $ | 220,087 | ||
Net realized gain (loss) | (15,198 | ) | ||
Net change in unrealized appreciation/depreciation | 214,935 | |||
|
| |||
Net increase (decrease) in net assets resulting from operations | 419,824 | |||
|
| |||
DISTRIBUTIONS TO SHAREHOLDERS FROM: | ||||
Net investment income | (116,107 | ) | ||
|
| |||
FROM BENEFICIAL INTEREST TRANSACTIONS: | ||||
Proceeds from sale of shares sold | 50,000,000 | |||
Other capital (Note 7) | 100,000 | |||
|
| |||
Net increase (decrease) in net assets from beneficial interest transactions | 50,100,000 | |||
|
| |||
Net increase (decrease) in net assets during the period | 50,403,717 | |||
|
| |||
Net assets at beginning of period | — | |||
|
| |||
NET ASSETS AT END OF PERIOD | $ | 50,403,717 | ||
|
| |||
Undistributed (distribution in excess of) net investment income (loss) | $ | 93,148 | ||
|
| |||
SHARES OF BENEFICIAL INTEREST: | ||||
Shares sold | 1,000,000 | |||
|
| |||
Net increase (decrease) | 1,000,000 | |||
|
| |||
| * | Inception date. |
See accompanying notes to financial statements.
10
Table of Contents
SPDR DoubleLine Short Duration Total Return Tactical ETF
Selected data for a share outstanding throughout each period
| For the Period 4/14/16* - 6/30/16 | ||||
Net asset value, beginning of period | $ | 50.00 | ||
|
| |||
Income (loss) from investment operations: | ||||
Net investment income (loss) (a) | 0.22 | |||
Net realized and unrealized gain (loss) | 0.20 | |||
|
| |||
Total from investment operations | 0.42 | |||
|
| |||
Other capital (a) | 0.10 | |||
|
| |||
Distributions to shareholders from: | ||||
Net investment income | (0.12 | ) | ||
|
| |||
Net asset value, end of period | $ | 50.40 | ||
|
| |||
Total return (b) | 1.04 | % | ||
Ratios and Supplemental Data: | ||||
Net assets, end of period (in 000s) | $ | 50,404 | ||
Ratios to average net assets: | ||||
Total expenses | 0.50 | %(c) | ||
Net expenses | 0.45 | %(c) | ||
Net investment income (loss) | 2.06 | %(c) | ||
Portfolio turnover rate (d) | 25 | %(e) | ||
| * | Commencement of operations. |
| (a) | Per share numbers have been calculated using average shares outstanding, which more appropriately presents the per share data for the period. |
| (b) | Total return is calculated assuming a purchase of shares at net asset value on the first day and a sale at net asset value on the last day of each period reported. Distributions are assumed, for the purpose of this calculation, to be reinvested at net asset value per share on the respective payment dates of each distribution. Total return for periods of less than one year is not annualized. Broker commission charges are not included in this calculation. |
| (c) | Annualized. |
| (d) | Portfolio turnover rate excludes transactions involving securities received or delivered from in-kind processing of creations or redemptions. |
| (e) | Not annualized. |
See accompanying notes to financial statements.
11
Table of Contents
SPDR DoubleLine Short Duration Total Return Tactical ETF
June 30, 2016
| 1. | Organization |
SSGA Active Trust (the “Trust”), which is registered under the Investment Company Act of 1940, as amended (“1940 Act”), is an open-end management investment company that was organized as a Massachusetts business trust on March 30, 2011.
As of June 30, 2016, the Trust consists of fourteen (14) series, each of which represents a separate series of beneficial interest in the Trust (each a “Fund” and collectively, the “Funds”). The Declaration of Trust permits the Board of Trustees of the Trust (the “Board”) to authorize the issuance of an unlimited number of shares of beneficial interest at no par value. The financial statements herein relate to the SPDR DoubleLine Short Duration Total Return Tactical ETF (the “Fund”).
The Fund is classified as a diversified investment company under the 1940 Act.
The Fund was formed on April 13, 2016 and commenced operations on April 14, 2016.
Under the Trust’s organizational documents, its officers and trustees are indemnified against certain liabilities arising out of the performance of their duties to the Trust. Additionally, in the normal course of business, the Trust enters into contracts with service providers that contain general indemnification clauses. The Trust’s maximum exposure under these arrangements is unknown as this could involve future claims that may be made against the Trust that have not yet occurred.
| 2. | Summary of Significant Accounting Policies |
The following is a summary of significant accounting policies followed by the Trust in the preparation of its financial statements:
The preparation of financial statements in accordance with U.S. generally accepted accounting principles (“U.S. GAAP”) requires management to make estimates and assumptions that affect the reported amounts and disclosures in the financial statements. Actual results could differ from those estimates. The Fund is an investment company under U.S. GAAP and follows the accounting and reporting guidance applicable to investment companies.
Security Valuation
The Fund’s investments are valued at fair value each day that the Fund’s listing exchange is open and, for financial reporting purposes, as of the report date should the reporting period end on a day that the Fund’s listing exchange is not open. Fair value is generally defined as the price a fund would receive to sell an asset or pay to transfer a liability in an orderly transaction between market participants at the measurement date. By its nature, a fair value price is a good faith estimate of the valuation in a current sale and may not reflect an actual market price. The investments of the Fund are valued pursuant to the policy and procedures developed by the Oversight Committee (the “Committee”) and approved by the Board. The Committee provides oversight of the valuation of investments for the Fund. The Board has responsibility for determining the fair value of investments.
Valuation techniques used to value the Fund’s investments by major category are as follows:
| • | Investments in registered investment companies (including money market funds) or other unitized pooled investment vehicles that are not traded on an exchange are valued at that day’s published net asset value per share or unit. |
| • | Debt obligations (both governmental and non-governmental) that are short term in nature (with a maturity of sixty days or less at purchase) are valued using the amortized cost method as long as the amortized cost value of a particular portfolio instrument is reasonably determined to approximate the fair value of that investment established using market-based and issuer-specific factors or at a price obtained from an independent pricing service. |
| • | Debt obligations (both governmental and non-governmental) purchased with greater than sixty days to maturity and are valued at last reported evaluated bid prices obtained from independent pricing services or brokers. In determining the value of a fixed income investment, pricing services may use certain information with respect to transactions in such investments, quotations from dealers, pricing matrixes, market transactions in comparable investments, various relationships observed in the market between investments, and calculated yield measures. |
12
Table of Contents
SPDR DoubleLine Short Duration Total Return Tactical ETF
NOTES TO FINANCIAL STATEMENTS (continued)
June 30, 2016
| • | Senior loans or other loans are valued at evaluated bid prices supplied by an independent pricing service, if available. Senior loans and other loans in which the Committee determines that there are no reliable valuations available from pricing services or brokers will be initially valued at cost and adjusted for amortization of principal until remeasurement is warranted due to a credit or economic event or other factors affecting the loan. |
In the event prices or quotations are not readily available or that the application of these valuation methods results in a price for an investment that is deemed to be not representative of the fair value of such investment, fair value will be determined in good faith by the Committee, in accordance with the valuation policy and procedures approved by the Board.
Fair value pricing could result in a difference between the prices used to calculate a Fund’s net asset value and the prices used by the Fund’s underlying benchmarks. Various inputs are used in determining the value of the Fund’s investments.
The Fund values its assets and liabilities at fair value using a fair value hierarchy consisting of three broad levels that prioritize the inputs to valuation techniques giving the highest priority to readily available unadjusted quoted prices in active markets for identical assets or liabilities (Level 1 measurements) and the lowest priority to unobservable inputs (Level 3 measurements) when market prices are not readily available or reliable. The categorization of a value determined for an investment within the hierarchy is based upon the pricing transparency of the investment and is not necessarily an indication of the risk associated with investing in it.
The three levels of the fair value hierarchy are as follows:
| • | Level 1 — Unadjusted quoted prices in active markets for identical assets or liabilities; |
| • | Level 2 — Inputs other than quoted prices included within Level 1 that are observable for the assets or liabilities either directly or indirectly, including quoted prices for similar assets or liabilities in active markets, quoted prices for identical or similar assets or liabilities in markets that are not considered to be active, inputs other than quoted prices that are observable for the asset or liability (such as exchange rates, financing terms, interest rates, yield curves, volatilities, prepayment speeds, loss severities, credit risks and default rates) or other market-corroborated inputs; and |
| • | Level 3 — Unobservable inputs for the asset or liability, including the Committee’s assumptions used in determining the fair value of investments. |
The value of the Fund’s investments according to the fair value hierarchy as of June 30, 2016, is disclosed in the Fund’s Schedule of Investments.
Changes in valuation techniques may result in transfers in or out of an assigned level within the fair value hierarchy. Transfers between different levels of the fair value hierarchy are recognized at the end of the reporting period.
The Fund had no material transfers between levels for the period ended June 30, 2016.
Investment Transactions and Income Recognition
Investment transactions are accounted for on trade date for financial reporting purposes. Realized gains and losses from the sale or disposition of investments and foreign exchange transactions, if any, are determined using the identified cost method. Dividend income and capital gain distributions, if any, are recognized daily on the ex-dividend date, net of any foreign taxes withheld at source, if any. Interest income is recorded daily on an accrual basis. All premiums and discounts are amortized/accreted for financial reporting purposes. Paydown gains and losses are recorded as an adjustment to interest income.
Expenses
Certain expenses, which are directly identifiable to a specific Fund, are applied to that Fund within the Trust. Other expenses which cannot be attributed to a specific Fund are allocated in such a manner as deemed equitable, taking into consideration the nature and type of expense and the relative net assets of the Funds within the Trust.
13
Table of Contents
SPDR DoubleLine Short Duration Total Return Tactical ETF
NOTES TO FINANCIAL STATEMENTS (continued)
June 30, 2016
Distributions
Distributions from net investment income, if any, are declared and paid monthly. Net realized capital gains, if any, are distributed annually, unless additional distributions are required for compliance with applicable tax regulations. The amount and character of income and capital gains to be distributed are determined in accordance with applicable tax regulations which may differ from net investment income and realized gains recognized for U.S. GAAP purposes.
| 3. | Securities and Other Investments |
Loan Agreements
The Fund invests in Senior Loans. Senior Loans consist generally of obligations of companies and other entities (collectively, “borrowers”) incurred for the purpose of reorganizing the assets and liabilities of a borrower; acquiring another company; taking over control of a company (leveraged buyout); temporary refinancing; or financing internal growth or other general business purposes. Senior Loans are often obligations of borrowers who have incurred a significant percentage of debt compared to their total assets and thus are highly leveraged. The Fund does not treat the banks originating or acting as agents for the lenders, or granting or acting as intermediary in participation interests, in loans held by the Fund as the issuers of such loans.
| 4. | Fees and Transactions with Affiliates |
Advisory Fee
The Fund has entered into an Investment Advisory Agreement with SSGA Funds Management, Inc. (the “Adviser” or “SSGA FM”). For its advisory services to the Fund, facilities furnished, and expenses borne by the Adviser, the Fund pays the Adviser a fee accrued daily and paid monthly, at the rate of 0.50% of the Fund’s average daily net assets.
SSGA FM has contractually agreed to waive its advisory fee and/or reimburse certain expenses, until October 31, 2017, so that the net annual fund operating expenses of the Fund will be limited to 0.45% of the Fund’s average daily net assets before application of any extraordinary expenses or acquired fund fees and expenses. The contractual fee waiver and/or reimbursement does not provide for the recoupment by the Adviser of any fees the Adviser previously waived. The Adviser may continue the waiver and/or reimbursement from year to year, but there is no guarantee that the Adviser will do so and after October 31, 2017, the waiver and/or reimbursement may be cancelled or modified at any time. This waiver and/or reimbursement may not be terminated during the relevant period except with the approval of the Board.
The Adviser pays all expenses of the Fund other than the management fee, distribution fee pursuant to the Fund’s Distribution and Service Plan, if any, brokerage, taxes, interest, fees and expenses of the Independent Trustees (including any Trustee’s counsel fees), litigation expenses, acquired fund fees and expenses and other extraordinary expenses.
DoubleLine Capital LP receives fees for its services as the sub-advisor to the Fund from the Adviser.
SSGA FM serves as administrator and State Street Bank and Trust Company (“State Street”), an affiliate of the Adviser, serves as custodian, sub-administrator and transfer agent. State Street receives fees for its services as custodian, sub-administrator and transfer agent from the Adviser.
Distribution Fees
State Street Global Markets, LLC (“SSGM” or the “Distributor”), an affiliate of the Adviser, serves as the Distributor of the Trust. Pursuant to a Distribution and Service Plan adopted in accordance with Rule 12b-1 under the 1940 Act, the Fund is authorized to pay an amount of up to 0.25% of its average daily net assets for certain distribution-related activities. However, the Board has determined that no such payments will be made through at least April 12, 2017, and therefore no such payments have been made.
Other Transactions with Affiliates
The Fund may invest in affiliated entities, included securities issued by State Street, affiliated funds, or entities deemed to be affiliates as a result of the Fund owning more than five percent of the entity’s voting securities or outstanding shares. Amounts relating to these transactions during the period ended June 30, 2016 are disclosed in the Schedule of Investments.
14
Table of Contents
SPDR DoubleLine Short Duration Total Return Tactical ETF
NOTES TO FINANCIAL STATEMENTS (continued)
June 30, 2016
| 5. | Trustees’ Fees |
The fees and expenses of the Trust’s trustees who are not “interested persons” of the Trust, as defined in the 1940 Act (“Independent Trustees”), are paid directly by the Fund. The Independent Trustees are reimbursed for travel and other out-of-pocket expenses in connection with meeting attendance and industry seminars.
| 6. | Investment Transactions |
Purchases and sales of investments (excluding short term investments) for the period ended June 30, 2016, were as follows:
| U.S. Government Obligations | Other Securities | |||||||||||||||
| Purchases | Sales | Purchases | Sales | |||||||||||||
SPDR DoubleLine Short Duration Total Return Tactical ETF | $ | — | $ | — | $ | 61,140,049 | $ | 12,153,964 | ||||||||
| 7. | Shareholder Transactions |
The Fund issues and redeems its shares, at net asset value, only in aggregations of a specified number of shares or multiples thereof (“Creation Units”). Except when aggregated in Creation Units, shares of the Fund are not redeemable. Transactions in capital shares for the Fund are disclosed in detail in the Statement of Changes in Net Assets.
The consideration for the purchase of Creation Units of a fund may consist of the in-kind deposit of a designated portfolio of securities and a specified amount of cash, except for certain funds that invest in TBAs or mortgage backed securities. Investors purchasing and redeeming Creation Units may pay a purchase transaction fee and a redemption transaction fee directly to the Trust and/or Custodian, to offset transfer and other transaction costs associated with the issuance and redemption of Creation Units, including Creation Units for cash. An additional variable fee may be charged for certain transactions. Such variable charges, if any, are included in “Other Capital” on the Statement of Changes on Net Assets.
| 8. | Income Tax Information |
The Fund intends to qualify as a regulated investment company under Subchapter M of the Internal Revenue Code of 1986, as amended. The Fund will not be subject to federal income taxes to the extent it distributes its taxable income, including any net realized capital gains, for each fiscal year. Therefore, no provision for federal income tax is required.
The Fund files federal and various state and local tax returns as required. No income tax returns are currently under examination. The federal returns are subject to examination by the Internal Revenue Service for a period of three years from date of filing, while the state returns may remain open for an additional year depending upon jurisdiction. SSGA FM has analyzed the Fund’s tax positions taken on tax returns and does not believe there are any uncertain tax positions that would require recognition of a tax liability.
Distributions to shareholders are recorded on ex-dividend date. Income dividends and gain distributions are determined in accordance with income tax rules and regulations, which may differ from generally accepted accounting principles. Certain capital accounts in the financial statements have been adjusted for permanent book- tax differences. These adjustments have no impact on net asset values or results of operations. Temporary book-tax differences will reverse in the future. These book-tax differences are primarily due to differing treatments for pay-down gains and losses and wash sale loss deferrals.
The tax character of distributions paid during the period ended June 30, 2016, was as follows:
| Ordinary Income | Long-Term Capital Gains | Tax Return of Capital | Total | |||||||||||||
SPDR DoubleLine Short Duration Total Return Tactical ETF | $ | 116,107 | $ | — | $ | — | $ | 116,107 | ||||||||
15
Table of Contents
SPDR DoubleLine Short Duration Total Return Tactical ETF
NOTES TO FINANCIAL STATEMENTS (continued)
June 30, 2016
As of June 30, 2016, the components of distributable earnings on a tax basis were as follows:
| Undistributed Ordinary Income | Capital Loss Carryforwards | Undistributed Long-Term Capital Gains | Net Unrealized Gains (Losses) | Qualified Late-Year Losses | Total | |||||||||||||||||||
SPDR DoubleLine Short Duration Total Return Tactical ETF | $ | 93,148 | $ | (3,417 | ) | $ | — | $ | 213,986 | $ | — | $ | 303,717 | |||||||||||
As of June 30, 2016, the Fund had capital loss carryforwards available to offset future realized capital gains through the indicated expiration dates as follows:
| Expiring 2017 | Expiring 2018 | Expiring 2019 | Expiring 2020 | Non-Expiring Short Term* | Non-Expiring Long Term | Total | ||||||||||||||||||||||
SPDR DoubleLine Short Duration Total Return Tactical ETF | $ | — | $ | — | $ | — | $ | — | $ | 3,417 | $ | — | $ | 3,417 | ||||||||||||||
| * | Must be utilized prior to losses subject to expiration |
As of June 30, 2016, gross unrealized appreciation and gross unrealized depreciation based on cost for federal income tax purposes were as follows:
| Tax Cost | Gross Unrealized Appreciation | Gross Unrealized Depreciation | Net Unrealized Appreciation (Depreciation) | |||||||||||||
SPDR DoubleLine Short Duration Total Return Tactical ETF | $ | 49,855,640 | $ | 278,590 | $ | 64,604 | $ | 213,986 | ||||||||
| 9. | Risks |
Concentration of Risk
As a result of the Fund’s ability to invest a large percentage of its assets in obligations of issuers within the same country, state, region, currency or economic sector, an adverse economic, business or political development may affect the value of the Fund’s investments more than if the Fund were more broadly diversified.
Foreign and Emerging Markets Risks
Investing in foreign markets involve risks and considerations not typically associated with investing in the U.S. Foreign securities may be subject to risk of loss because of government regulation, economic, political and social instability in the countries in which the Fund invests. Foreign markets may be less liquid than investments in the U.S. and may be subject to the risks of currency fluctuations. To the extent that the Fund invests in securities of issuers located in emerging markets, these risks may be even more pronounced.
Market and Credit Risk
In the normal course of business, the Fund trades financial instruments and enters into financial transactions where risk of potential loss exists due to changes in the general economic conditions and fluctuations of the market (market risk). Additionally, the Fund may also be exposed to credit risk in the event that an issuer or guarantor fails to perform or that an institution or entity with which the Fund has unsettled or open transactions defaults.
| 10. | Subsequent Events |
Management has evaluated the impact of all subsequent events on the Fund through the date on which the financial statements were available to be issued and has determined that there were no subsequent events requiring adjustment or disclosure in the financial statements.
16
Table of Contents
SPDR DoubleLine Short Duration Total Return Tactical ETF
REPORT OF INDEPENDENT REGISTERED PUBLIC ACCOUNTING FIRM
To the Shareholders and Board of Trustees of
SSGA Active Trust
We have audited the accompanying statement of assets and liabilities, including the schedule of investments, of SPDR DoubleLine Short Duration Total Return Tactical ETF (the “Fund”) (one of the portfolios constituting SSGA Active Trust) as of June 30, 2016, and the related statement of operations, statement of changes in net assets, and the financial highlights for the periods indicated therein. These financial statements and financial highlights are the responsibility of the Fund’s management. Our responsibility is to express an opinion on these financial statements and financial highlights based on our audit.
We conducted our audit in accordance with the standards of the Public Company Accounting Oversight Board (United States). Those standards require that we plan and perform the audit to obtain reasonable assurance about whether the financial statements and financial highlights are free of material misstatement. We were not engaged to perform an audit of the Fund’s internal control over financial reporting. Our audit included consideration of internal control over financial reporting as a basis for designing audit procedures that are appropriate in the circumstances, but not for the purpose of expressing an opinion on the effectiveness of the Fund’s internal control over financial reporting. Accordingly, we express no such opinion. An audit also includes examining, on a test basis, evidence supporting the amounts and disclosures in the financial statements and financial highlights, assessing the accounting principles used and significant estimates made by management, and evaluating the overall financial statement presentation. Our procedures included confirmation of securities owned as of June 30, 2016, by correspondence with the custodian and others or by other appropriate auditing procedures where replies from others were not received. We believe that our audit provides a reasonable basis for our opinion.
In our opinion, the financial statements and financial highlights referred to above present fairly, in all material respects, the financial position of SPDR DoubleLine Short Duration Total Return Tactical ETF (one of the portfolios constituting SSGA Active Trust) at June 30, 2016, and the results of its operations, the changes in its net assets and the financial highlights for the periods indicated therein, in conformity with U.S. generally accepted accounting principles.

Boston, Massachusetts
August 26, 2016
17
Table of Contents
SPDR DoubleLine Short Duration Total Return Tactical ETF
June 30, 2016 (Unaudited)
Expense Example
As a shareholder of a Fund, you incur two types of costs (1) transaction costs, including sales charges (loads), if applicable, on purchase payments, reinvested dividends, or other distributions and (2) ongoing costs, including advisory fees and to the extent applicable, distribution (12b-1) and/or service fees; and other Fund expenses. This example is intended to help you understand your ongoing costs (in dollars) of investing in the Fund and to compare these costs with the ongoing costs of investing in other mutual funds. It is based on an investment of $1,000 made at the beginning of the period shown and held for the entire period from January 1, 2016 to June 30, 2016.
The table below illustrates your Fund’s cost in two ways:
| • | Based on actual fund return — This section helps you to estimate the actual expenses that you paid over the period. The “Ending Account Value” shown is derived from each Fund’s actual return, and the third column shows the dollar amount that would have been paid by an investor who started with $1,000 in the Fund. You may use the information here, together with the amount you invested, to estimate the expenses that you paid over the period. To do so, simply divide your account value by $1,000 (for example, an $8,600 account value divided by $1,000 = 8.6), then multiply the result by the number given for the Fund under the heading “Expenses Paid During Period”. |
| • | Based on hypothetical 5% return — This section is intended to help you compare your Fund’s costs with those of other mutual funds. It assumes that the Fund had a yearly return of 5% before expenses, but that the expense ratio is unchanged. In this case, because the return used is not the Fund’s actual return, the results do not apply to your investment. The example is useful in making comparisons because the Securities and Exchange Commission requires all mutual funds to calculate expenses based on a 5% return. You can assess your Fund’s costs by comparing this hypothetical example with the hypothetical examples that appear in shareholder reports of other funds. |
Please note that the expenses shown in the table are meant to highlight your ongoing costs only and do not reflect any transaction costs, such as sales load charges (loads). Therefore, the hypothetical 5% return section of the table is useful in comparing ongoing costs only, and will not help you determine the relative total costs of owning different funds. In addition, if these transaction costs were included, your costs would have been higher.
| Actual | Hypothetical (assuming a 5% return before expenses) | |||||||||||||||||||
| Annualized Expense Ratio | Ending Account Value | Expenses Paid During Period(a) | Ending Account Value | Expenses Paid During Period(b) | ||||||||||||||||
SPDR DoubleLine Short Duration Total Return Tactical ETF | 0.45 | % | $ | 1,010.40 | $ | 0.96 | $ | 1,022.60 | $ | 2.26 | ||||||||||
| (a) | Actual period is from commencement of operations 4/14/2016. |
| (b) | Hypothetical expenses are equal to the Fund’s annualized net expense ratio multiplied by the average account value of the period, multiplied by 182, then divided by 366. |
Tax Information
Qualified Interest Income
The Fund designated a portion of dividends distributed during the fiscal year ended June 30, 2016, as qualified interest income. These amounts are noted below:
| Amount | ||||
SPDR DoubleLine Short Duration Total Return Tactical ETF | $ | 116,107 | ||
Premium/Discount Information
Information regarding how often the Shares of each Fund traded on the Exchange at a price above (i.e. at a premium) or below (i.e. at a discount) the net asset value of the Fund during the past calendar year can be found at http://www.spdrs.com.
18
Table of Contents
SPDR DoubleLine Short Duration Total Return Tactical ETF
OTHER INFORMATION (continued)
June 30, 2016 (Unaudited)
Proxy Voting Policies and Procedures and Records
A description of the Trust’s proxy voting policies and procedures that are used by the Fund’s investment adviser to vote proxies relating to the Fund’s portfolio of securities are available (i) without charge, upon request by calling 1-866-787-2257 (toll free) or (ii) on the website of the U.S. Securities and Exchange Commission, at www.sec.gov.
Information regarding how the investment adviser voted for the prior 12-months period ended June 30 is available by August 31 of each year by calling the same number and on the SEC’s website, at www.sec.gov, and on the Fund’s website at www.spdrs.com.
Quarterly Portfolio Schedule
The Fund files a complete schedule of investments with the SEC for the first and third quarters of each fiscal year on Form N-Q. The Fund’s Form N-Q are available on the SEC’s website at www.sec.gov and may be reviewed and copied at the SEC’s Public Reference Room in Washington DC. Information on the operation of the Public Reference Room may be obtained by calling 1-800-SEC-0330. The information on the Form N-Q is available upon request, without charge, by calling 1-866-787-2257 (toll free) and on the Funds’ website at www.spdrs.com.
Approval of Advisory Agreements
At in-person meetings held prior to June 30, 2016, the Board of Trustees of the Trusts (the “Board”) evaluated proposals (1) to continue the separate Investment Advisory Agreements (the “Agreements”) between each Trust and SSGA Funds Management, Inc. (the “Adviser” or “SSGA FM”) with respect to the operational series of SSGA Active Trust (the “Current ETFs”) and SSGA Master Trust (together with the Current ETFs, the “Current Funds”), and (2) to approve the separate Agreements between the Adviser and (a) the SSGA Active Trust with respect to the SPDR DoubleLine Short Duration Total Return Tactical ETF and SPDR DoubleLine Emerging Markets Fixed Income ETF (the “New ETFs” and, together with the Current ETFs, the “ETFs”), and the State Street Disciplined Global Equity Portfolio (together with the New ETFs, the “New Funds”) each a new series of the SSGA Active Trust, (with the Current Funds and New Funds collectively being referred to hereafter as the “Funds”), each of which commenced operations during the period covered by this Annual Report. The Trustees who are not “interested persons” of the Trust within the meaning of the Investment Company Act of 1940, as amended (the “Independent Trustees”), also met separately with their independent legal counsel to consider the Agreements.
In evaluating the Agreements, the Board drew on materials provided to them by SSGA FM, the Trust’s investment adviser and administrator, and other materials provided by State Street Bank and Trust Company, the Trusts’ sub-administrator, transfer agent and custodian (“State Street”). In deciding whether to approve the Agreements, the Board considered various factors, including the (i) nature, extent and quality of services provided by, or expected to be provided by, the Adviser with respect to the Funds under the Agreements, (ii) investment performance of the Current Funds, (iii) profits realized by the Adviser and its affiliates from its relationship with the Trusts, (iv) fees charged to comparable funds, (v) other benefits to the Adviser, and (vi) extent to which economies of scale would be shared as the Funds grow.
Nature, Extent and Quality of Services
The Board considered the nature, extent and quality of services provided by, or expected to be provided by, the Adviser. In doing so, the Trustees relied on their prior experience in overseeing the management of the Trusts and materials provided prior to and at the meeting. The Board reviewed the Agreements and the Adviser’s responsibilities for managing investment operations of each of the Funds in accordance with each Fund’s investment objectives and policies, and applicable legal and regulatory requirements. The Board appreciated the relatively unique nature of the ETFs as exchange-traded funds in a master-feeder structure, as appropriate, and the experience and expertise of the Adviser with exchange-traded funds. The Board considered the background and experience of the Adviser’s senior management, including those individuals responsible for portfolio management, oversight of sub-advisers and regulatory compliance of the Funds. The Board also considered the portfolio management resources, structures and practices of the Adviser, including those associated with monitoring and securing each Fund’s compliance with its investment objectives and policies and with applicable laws and regulations. The Board also considered information about the Adviser’s best execution procedures and overall investment management business, noting that the Adviser
19
Table of Contents
SPDR DoubleLine Short Duration Total Return Tactical ETF
OTHER INFORMATION (continued)
June 30, 2016 (Unaudited)
serves a wide range of clients across a broad spectrum of asset classes. The Board looked at the Adviser’s general knowledge of the investment business and that of its affiliates which make up State Street Global Advisors, through which the Adviser shares all of its senior personnel. The Board considered that the Adviser and its affiliates constitute one of the world’s largest investment management enterprises for exchange-traded funds. The Board also considered the Adviser’s experience in active management, managing exchange-traded funds in master-feeder structures and overseeing third-party sub-advisers, as applicable.
Investment Performance
The Board then reviewed the Current Funds’ performance. The Board compared each Current Fund’s investment performance to the performance of an appropriate benchmark and group of comparable funds. Among other information, the Board considered the following performance information in its evaluation of the Funds:
SPDR SSGA Multi-Asset Real Return ETF. The Board considered that: (a) the Fund underperformed the median of its Performance Group for the 1-, 2- and 3-year periods; and (b) outperformed its benchmark index for the 1-year period and underperformed its benchmark index for the 3-year period.
SPDR SSGA Income Allocation ETF. The Board considered that: (a) the Fund outperformed the median of its Performance Group for the 1-, 2- and 3-year periods; and (b) underperformed its benchmark index for the 1- and 3-year period.
SPDR SSGA Global Allocation ETF. The Board considered that: (a) the Fund outperformed the median of its Performance Group for the 1-, 2- and 3-year periods; and (b) underperformed its benchmark index for the 1-year period and outperformed its benchmark index for the 3-year period.
SPDR Blackstone / GSO Senior Loan ETF. The Board considered that: (a) the Fund underperformed the median of its Performance Group for the 1- and 2-year periods; and (b) outperformed its benchmark index for the 1-year period.
SPDR SSGA Ultra Short Term Bond ETF. The Board considered that: (a) the Fund underperformed the median of its Performance Group for the 1- and 2-year periods; and (b) outperformed its benchmark index for the 1-year period.
SPDR DoubleLine Total Return Tactical ETF. The Board considered that: (a) the Fund outperformed the median of its Performance Group since inception; and (b) outperformed its benchmark index since inception.
SPDR MFS Systematic Core Equity ETF. The Board considered that: (a) the Fund outperformed the median of its Performance Group for the 1-year period; and (b) outperformed its benchmark index for the 1-year period.
SPDR MFS Systematic Growth Equity ETF. The Board considered that: (a) the Fund outperformed the median of its Performance Group for the 1-year period; and (b) outperformed its benchmark index for the 1-year period.
SPDR MFS Systematic Value Equity ETF. The Board considered that: (a) the Fund outperformed the median of its Performance Group for the 1-year period; and (b) outperformed its benchmark index for the 1-year period.
SPDR SSGA Risk Aware ETF. The Board considered that: (a) the Fund underperformed the median of its Performance Group for the 1-year period; and (b) underperformed its benchmark index for the 1-year period.
On the basis of the foregoing and other relevant information, the Board concluded that the performance of each Current Fund is satisfactory.
Profits Realized by Adviser
The Board considered the profitability of the advisory arrangement with the Current Funds to the Adviser, including data on the Current Funds’ historical profitability to the Adviser. The Independent Trustees, through their counsel, had the opportunity to discuss, with representatives of the Adviser and State Street, methodologies used in computing costs that formed the bases of profitability calculations and determined that these methodologies were reasonable.
Fees Charged to Comparable Funds
The Board evaluated each Fund’s unitary fee through review of comparative information with respect to fees paid by similar funds — i.e., exchange-traded funds that are actively managed, as applicable. The Board reviewed the universe of similar exchange-traded funds for each ETF based upon data independently obtained from Broadridge Financial
20
Table of Contents
SPDR DoubleLine Short Duration Total Return Tactical ETF
OTHER INFORMATION (continued)
June 30, 2016 (Unaudited)
Solutions, Inc. (formerly Lipper Analytical Services) and related comparative information for similar exchange-traded funds. The Board also reviewed the fee structure, as applicable, of each Fund in connection with the master-feeder structure, the historical expense ratios of each Current Fund and the estimated expense ratios for each New Fund. In doing so, the Board used a fund by fund analysis of the data.
Other Benefits
The Board also considered whether the Adviser or its affiliates benefited in other ways from its relationship with the Trusts, noting that the Adviser does not maintain soft-dollar arrangements in connection with the Trusts’ brokerage transactions.
Economies of Scale
The Board reviewed information regarding economies of scale or other efficiencies that may result as each Fund’s assets grow in size. The Board noted that the Agreements did not provide for breakpoints in each Fund’s advisory fee rates as assets of a Fund increase. However, the Board further noted the Adviser’s assertion that future economies of scale (among several factors) had been taken into consideration for the Funds by fixing relatively low advisory fees, effectively sharing the benefits of lower fees with the Funds from inception. The Adviser also asserted that one of the benefits of the unitary fee was to provide an unvarying expense structure, which could be lost or diluted with the addition of breakpoints. The Board noted that it intends to continue to monitor fees as the Funds grow in size and assess whether fee breakpoints may be warranted.
The Board, including the Independent Trustees voting separately, approved the Agreements for each Fund after weighing the foregoing factors, none of which was dispositive in itself and may have been weighed differently by each Trustee. The Board’s conclusions with respect to each Agreement were as follows: (a) the nature and extent of the services provided, or expected to be provided, by the Adviser with respect to the Funds were appropriate; (b) the performance of each Current Fund had been satisfactory; (c) the Adviser’s unitary fee for each Fund, considered in relation to services provided or expected to be provided, and in relation to fees charged to comparable funds, was fair and reasonable; (d) profitability of the Trusts’ relationship with the Adviser was not excessive; (e) any additional potential benefits to the Adviser or its affiliates were not of a magnitude to materially affect the Board’s conclusions; and (f) fees paid to the Adviser shared the economies of scale with respect to the Current Funds by way of the relatively low fee structure of the Trusts.
Approval of Massachusetts Financial Services Company Sub-Advisory Agreements
At an in-person meeting held prior to June 30, 2016, the Board also evaluated proposals to continue the separate Sub-Advisory Agreements (the “MFS Sub-Advisory Agreements”) between the Adviser and Massachusetts Financial Services Company (“MFS”) with respect to the SPDR MFS Systematic Core Equity ETF, SPDR MFS Systematic Growth Equity ETF and SPDR MFS Systematic Value Equity ETF, each a series of the SSGA Active Trust, and SSGA MFS Systematic Core Equity Portfolio, SSGA Systematic Growth Equity Portfolio and SSGA MFS Systematic Value Equity Portfolio, each a series of the SSGA Master Trust, each sub-advised by MFS (the “MFS Funds”). The Independent Trustees also met separately with their independent legal counsel to consider the MFS Sub-Advisory Agreements.
In evaluating the MFS Sub-Advisory Agreements, the Board drew on materials provided to them by MFS and the Adviser. In deciding whether to approve the MFS Sub-Advisory Agreements, the Board considered various factors, including the (i) nature, extent and quality of services provided by MFS with respect to the MFS Funds under the MFS Sub-Advisory Agreements and (ii) investment performance of the MFS Funds. The Board was apprised of the portion of the current advisory fee that the Adviser would pay to MFS under the MFS Sub-Advisory Agreements and also considered that such fees would be paid directly by the Adviser and would not result in increased fees payable by the MFS Funds.
The Board considered the background and experience of MFS’s senior management and, in particular, MFS’s experience in investing in equity securities. The Board reviewed the MFS Funds’ performance, noting that that the performance of the MFS Funds was satisfactory. The Board also considered the unitary fee paid to the Adviser by each MFS Fund and MFS’s fees paid by the Adviser.
21
Table of Contents
SPDR DoubleLine Short Duration Total Return Tactical ETF
OTHER INFORMATION (continued)
June 30, 2016 (Unaudited)
The Board, including the Independent Trustees voting separately, approved the MFS Sub-Advisory Agreements for each MFS Fund after weighing the foregoing factors, none of which was dispositive in itself and may have been weighed differently by each Trustee. The Board’s conclusions with respect to each MFS Sub-Advisory Agreement were as follows: (a) the nature and extent of the services provided by MFS with respect to the MFS Funds were appropriate; (b) the performance of the MFS Funds had been satisfactory; (c) MFS’s fees for the MFS Funds and the unitary fee, considered in relation to the services provided, were fair and reasonable; (d) any additional potential benefits to MFS were not of a magnitude to materially affect the Board’s conclusions; and (e) fees paid to MFS adequately shared the economies of scale with each applicable MFS Fund by way of the relatively low fee structure of the Trusts.
Approval of DoubleLine Capital LP Sub-Advisory Agreements
At in-person meetings held prior to June 30, 2016, the Board also considered proposals to continue the separate Sub-Advisory Agreements (the “DoubleLine Sub-Advisory Agreements”) between the Adviser and DoubleLine Capital LP (“DoubleLine”) with respect to the SPDR DoubleLine Total Return Tactical ETF, a series of the SSGA Active Trust, and State Street DoubleLine Total Return Tactical Portfolio, a series of the SSGA Master Trust (together, the “Current DoubleLine Funds”), and to approve the DoubleLine Sub-Advisory Agreements between the Adviser and DoubleLine with respect to the SPDR DoubleLine Short Duration Total Return Tactical ETF and SPDR DoubleLine Emerging Markets Fixed Income ETF, each a series of SSGA Active Trust (together with the Current DoubleLine Funds, the “DoubleLine Funds”), under which each of the DoubleLine Funds would be sub-advised by DoubleLine. The Independent Trustees also met separately with their independent legal counsel to consider the DoubleLine Sub-Advisory Agreements.
In evaluating the DoubleLine Sub-Advisory Agreements, the Board drew on materials provided to them by DoubleLine and the Adviser. In deciding whether to approve the DoubleLine Sub-Advisory Agreements, the Board considered various factors, including the (i) nature, extent and quality of services provided, or expected to be provided, by DoubleLine with respect to the DoubleLine Funds under the DoubleLine Sub-Advisory Agreements; and (ii) investment performance of the Current DoubleLine Funds. The Board was apprised of the portion of the advisory fee that the Adviser would pay to DoubleLine under the DoubleLine Sub-Advisory Agreements and also considered that such fees would be paid directly by the Adviser and would not result in increased fees payable by the DoubleLine Funds.
The Board considered the background and experience of DoubleLine’s senior management and, in particular, DoubleLine’s experience in investing in fixed income securities. The Board reviewed the Current DoubleLine Funds’ performance, noting that that the performance of the Current DoubleLine Funds was satisfactory. The Board also considered the unitary fee paid, or to be paid, to the Adviser by each DoubleLine Fund and DoubleLine’s fees paid by the Adviser.
The Board, including the Independent Trustees voting separately, approved the DoubleLine Sub-Advisory Agreements for the DoubleLine Funds after weighing the foregoing factors, none of which was dispositive in itself and may have been weighed differently by each Trustee. The Board’s conclusions with respect to each of the DoubleLine Sub-Advisory Agreements were as follows: (a) the nature and extent of the services provided, or expected to be provided, by DoubleLine with respect to the DoubleLine Funds were adequate and appropriate; (b) the performance of the Current DoubleLine Funds had been satisfactory; (c) DoubleLine’s fees for the DoubleLine Funds and the unitary fee, considered in relation to the services provided, or expected to be provided, were fair and reasonable; (d) any additional potential benefits to DoubleLine were not of a magnitude to materially affect the Board’s conclusions; and (e) fees paid, or expected to be paid, to DoubleLine were expected to share economies of scale with each applicable DoubleLine Fund by way of the relatively low fee structure of the Trusts.
22
Table of Contents
SSGA Active Trust
SPDR DoubleLine Short Duration Total Return Tactical ETF
DISCLOSURE OF INFORMATION ABOUT FUND TRUSTEES AND OFFICERS
June 30, 2016 (Unaudited)
Name, Address | Position(s) | Term of | Principal | Number of Portfolios in Fund Complex Overseen by Trustee | Other | |||||||
Independent Trustees | ||||||||||||
FRANK NESVET c/o SSGA Active Trust State Street Financial Center One Lincoln Street Boston, MA 02111-2900 1943 | Independent Trustee, Chairman, Trustee Committee Chair | Term: Unlimited Served: since September 2000 | Chief Executive Officer, Libra Group, Inc. (a financial services consulting company) (1998- present). | 218 | SPDR Index Shares Funds (Trustee); SPDR Series Trust (Trustee); SSGA Master Trust (Trustee). | |||||||
DAVID M. KELLY c/o SSGA Active Trust State Street Financial Center One Lincoln Street Boston, MA 02111-2900 1938 | Independent Trustee, Audit Committee Chair | Term: Unlimited Served: since September 2000 | Retired. | 218 | Chicago Stock Exchange (Former Director, retired); Penson Worldwide Inc. (Former Director, retired); SPDR Index Shares Funds (Trustee); SPDR Series Trust (Trustee); SSGA Master Trust (Trustee). | |||||||
BONNY EUGENIA BOATMAN c/o SSGA Active Trust State Street Financial Center One Lincoln Street Boston, MA 02111-2900 1950 | Independent Trustee | Term: Unlimited Served: since April 2010 | Retired. | 218 | SPDR Index Shares Funds (Trustee); SPDR Series Trust (Trustee); SSGA Master Trust (Trustee). | |||||||
DWIGHT D. CHURCHILL c/o SSGA Active Trust State Street Financial Center One Lincoln Street Boston, MA 02111-2900 1953 | Independent Trustee | Term: Unlimited Served: since April 2010 | Self-employed consultant since CEO and President, CFA Institute (June 2014-January 2015). | 218 | SPDR Index Shares Funds (Trustee); SPDR Series Trust (Trustee); SSGA Master Trust (Trustee); Affiliated Managers Group, Inc. (Director). | |||||||
CARL G. VERBONCOEUR c/o SSGA Active Trust State Street Financial Center One Lincoln Street Boston, MA 02111-2900 1952 | Independent Trustee | Term: Unlimited Served: since April 2010 | Self-employed consultant since 2009. | 218 | The Motley Fool Funds Trust (Trustee); SPDR Index Shares Funds (Trustee); SPDR Series Trust (Trustee); SSGA Master Trust (Trustee). | |||||||
23
Table of Contents
SSGA Active Trust
SPDR DoubleLine Short Duration Total Return Tactical ETF
DISCLOSURE OF INFORMATION ABOUT FUND TRUSTEES AND OFFICERS (continued)
June 30, 2016 (Unaudited)
Name, Address | Position(s) | Term of | Principal | Number of Portfolios in Fund Complex Overseen by Trustee | Other | |||||||
Interested Trustee | ||||||||||||
JAMES E. ROSS* SSGA Funds Management, Inc. State Street Financial Center One Lincoln Street Boston, MA 02111 1965 | Interested Trustee | Term: Unlimited Served as Trustee: since April 2010 | Chairman and Director, SSGA Funds Management, Inc. (2005-present); Senior Managing Director and Principal, State Street Global Advisors (2006-present); President, SSGA Funds Management, Inc. (2005-2012). | 299 | SPDR Index Shares Funds (Trustee); SPDR Series Trust (Trustee); SSGA Master Trust (Trustee); Select Sector SPDR Trust (Trustee); State Street Master Funds (Trustee); and State Street Institutional Investment Trust (Trustee). | |||||||
| * | Mr. Ross is an Interested Trustee because of his employment with the Adviser and ownership interest in an affiliate of the Adviser. Mr. Ross previously served as an Interested Trustee from November 2005 to December 2009. |
Name, Address and Year of Birth | Position(s) with Funds | Term of Office and Length of Time Served | Principal Occupation(s) During the Past 5 Years | |||
Officers | ||||||
ELLEN M. NEEDHAM SSGA Funds Management, Inc. State Street Financial Center One Lincoln Street Boston, MA 02111 1967 | President | Term: Unlimited Served: since October 2012 | President and Director, SSGA Funds Management, Inc. (2001-present)*; Senior Managing Director, State Street Global Advisors (1992-present).* | |||
ANN M. CARPENTER SSGA Funds Management, Inc. State Street Financial Center One Lincoln Street Boston, MA 02111 1966 | Vice President;
Deputy Treasurer | Term: Unlimited Served: since August 2012; Term: Unlimited Served: since February 2016 | Chief Operating Officer, SSGA Funds Management, Inc. (2005-Present)*; Managing Director, State Street Global Advisors (2005-present).* | |||
MICHAEL P. RILEY SSGA Funds Management, Inc. State Street Financial Center One Lincoln Street Boston, MA 02111 1969 | Vice President | Term: Unlimited Served: since February 2005 | Managing Director, State Street Global Advisors and SSGA Funds Management, Inc. (February 2015-present); Vice President, State Street Global Advisors and SSGA Funds Management, Inc. (2008-February 2015); Principal, State Street Global Advisors and SSGA Funds Management, Inc. (2005-2008). | |||
JOSHUA A. WEINBERG SSGA Funds Management, Inc. State Street Financial Center One Lincoln Street Boston, MA 02111 1978 | Chief Legal Officer | Term: Unlimited Served: since February 2015 | Vice President and Managing Counsel, State Street Global Advisors (2011-present); Clerk, SSGA Funds Management, Inc. (2013-present); Associate, Financial Services Group, Dechert LLP (2006-2011). |
24
Table of Contents
SSGA Active Trust
SPDR DoubleLine Short Duration Total Return Tactical ETF
DISCLOSURE OF INFORMATION ABOUT FUND TRUSTEES AND OFFICERS (continued)
June 30, 2016 (Unaudited)
Name, Address and Year of Birth | Position(s) with Funds | Term of Office and Length of Time Served | Principal Occupation(s) During the Past 5 Years | |||
CHRISTOPHER A. MADDEN State Street Bank and Trust Company One Hundred Huntington Avenue, CPH0326 Boston, MA 02116 1967 | Secretary | Term: Unlimited Served: since August 2013 | Vice President and Senior Counsel, State Street Bank and Trust Company (2013-present); Counsel, Atlantic Fund Services (2009-2013); Vice President.* | |||
PATRICIA A. MORISETTE State Street Bank and Trust Company One Hundred Huntington Avenue, CPH0326 Boston, MA 02116 1973 | Assistant Secretary | Term: Unlimited Served: since February 2015 | Vice President and Counsel, State Street Bank and Trust Company (2014-present); Assistant Vice President and Counsel, John Hancock Financial Services (2011-2013); Independent legal consultant (2009-2011); Associate, Bingham McCutchen LLP (2003-2009).*,** | |||
BRUCE S. ROSENBERG SSGA Funds Management, Inc. State Street Financial Center One Lincoln Street Boston, MA 02111 1961 | Treasurer | Term: Unlimited Served: since February 2016 | Managing Director, State Street Global Advisors and SSGA Funds Management, Inc. (July 2015-present; Director, Credit Suisse (April 2008-July 2015)). | |||
CHAD C. HALLETT SSGA Funds Management, Inc. State Street Financial Center One Lincoln Street Boston, MA 02111 1969 | Deputy Treasurer | Term: Unlimited Served: since February 2016 | Vice President, State Street Global Advisors and SSGA Funds Management, Inc. (November 2014-present); Vice President, State Street Bank and Trust Company (2001-November 2014).* | |||
SUJATA UPRETI SSGA Funds Management, Inc. State Street Financial Center One Lincoln Street Boston, MA 02111 1974 | Assistant Treasurer | Term: Unlimited Served: since February 2016 | Vice President, State Street Global Advisors and SSGA Funds Management, Inc. (May 2015-present; Assistant Director, Cambridge Associates, LLC (July 2014-January 2015); Vice President, Bank of New York Mellon (July 2012-August 2013); Manager, PricewaterhouseCoopers, LLP (September 2003- July 2012)). | |||
DANIEL FOLEY SSGA Funds Management, Inc. State Street Financial Center One Lincoln Street Boston, MA 02111 1972 | Assistant Treasurer | Term: Unlimited Served: since February 2016 | Vice President, State Street Global Advisors and SSGA Funds Management, Inc. (April 2007-present).* | |||
BRIAN HARRIS SSGA Funds Management, Inc. State Street Financial Center One Lincoln Street Boston, MA 02111 1973 | Chief Compliance Officer and | Term: Unlimited Served: since November 2013 | Managing Director, State Street Global Advisors and SSGA Funds Management, Inc. (June 2013-present)*; Senior Vice President and Global Head of Investment Compliance, BofA Global Capital Management (2010-2013); Director of Compliance, AARP Financial Inc. (2008-2010). |
| * | Served in various capacities and/or with various affiliated entities during noted time period. |
| ** | Served in various capacities and/or with unaffiliated mutual funds or closed-end funds for which State Street Bank and Trust Company or its affiliates act as a provider of services during the noted time period. |
Statement of Additional information (SAI) includes additional information about Fund directors and is available, without charge, upon request and by calling 1-866-787-2257.
25
Table of Contents
SSGA Active Trust
Trustees
Bonny E. Boatman
Dwight D. Churchill
David M. Kelly
Frank Nesvet, Chairman
James E. Ross
Carl G. Verboncoeur
Officers
Ellen M. Needham, President
Bruce Rosenberg, Treasurer
Ann Carpenter, Vice President and Deputy Treasurer
Michael P. Riley, Vice President
Chad C. Hallett, Deputy Treasurer
Sujata Upreti, Assistant Treasurer
Daniel Foley, Assistant Treasurer
Christopher A. Madden, Secretary
Patricia A. Morisette, Assistant Secretary
Brian Harris, Chief Compliance Officer and Anti-Money Laundering Officer
Joshua A. Weinberg, Chief Legal Officer
Investment Manager and Administrator
SSGA Funds Management, Inc.
State Street Financial Center
One Lincoln Street
Boston, MA 02111
Distributor
State Street Global Markets, LLC
One Lincoln Street
Boston, MA 02111
Custodian, Sub-Administrator and Transfer Agent
State Street Bank and Trust Company
One Lincoln Street
Boston, MA 02111
Legal Counsel
Morgan, Lewis & Bockius LLP
1111 Pennsylvania Avenue, NW
Washington, DC 20004
Independent Registered Public Accounting Firm
Ernst & Young LLP
200 Clarendon Street
Boston, MA 02116
Fund Shares are distributed by State Street Global Markets, LLC, a wholly-owned subsidiary of State Street Corporation. State Street Global Markets, LLC; member FINRA, SIPC.
The information contained in this report is intended for the general information of shareholders of the Trust. This report is not authorized for distribution to prospective investors unless preceded or accompanied by a current Trust prospectus which contains important information concerning the Trust. You may obtain a current prospectus and SAI from the Distributor by calling 1-866-787-2257 or visiting www.spdrs.com Please read the prospectus carefully before you invest.
SPDRSTOTAR IBG-20860
Table of Contents
Annual Report
30 June 2016
SSGA Active Trust
SPDR DoubleLine® Emerging Markets Fixed Income ETF (EMTL)

The information contained in this report is intended for the general information of shareholders of the Trust. This report is not authorized for distribution to prospective investors unless preceded or accompanied by a current Trust prospectus which contains important information concerning the Trust. You may obtain a current prospectus and SAI from the Distributor by calling 1-866-787-2257 or visiting www.spdrs.com. Please read the prospectus carefully before you invest.
Table of Contents
SSGA Active Trust
SPDR DoubleLine Emerging Markets Fixed Income ETF
Annual Report
June 30, 2016
| 1 | ||||
| 2 | ||||
| 5 | ||||
| 6 | ||||
| 7 | ||||
| 8 | ||||
| 9 | ||||
| 14 | ||||
| 15 |
The information contained in this report is intended for the general information of shareholders of the Trust. This report is not authorized for distribution to prospective investors unless preceded or accompanied by a current Trust prospectus which contains important information concerning the Trust. You may obtain a current prospectus and SAI from the Distributor by calling 1-866-787-2257 or visiting www.spdrs.com. Please read the prospectus carefully before you invest.
Table of Contents

SPDR DOUBLELINE EMERGING MARKETS FIXED INCOME ETF — PORTFOLIO SUMMARY (UNAUDITED)
The fund had less than six months of operations at reporting period end and therefore does not have performance history to provide in this report.
TOP FIVE HOLDINGS AS OF JUNE 30, 2016
| DESCRIPTION | DELEK & AVNER TAMAR BOND, LTD. 4.44% 12/30/2020 | ONGC VIDESH, LTD. 3.75% 05/07/2023 | RELIANCE INDUSTRIES, LTD. 5.88% 02/05/2018 | PETRONAS GLOBAL SUKUK, LTD. 2.71% 03/18/2020 | GRUPO AVAL, LTD. 4.75% 09/26/2022 | |||||||||
| MARKET VALUE | $933,750 | 919,001 | 914,580 | 910,172 | 879,750 | |||||||||
| % OF NET ASSETS | 2.4 | 2.4 | 2.4 | 2.4 | 2.3 | |||||||||
(The five largest holdings are subject to change, and there are no guarantees the Fund will continue to remain invested in any particular security.)
| PORTFOLIO COMPOSITION* | JUNE 30, 2016 | |||||||
Corporate Bonds & Notes | 95.3 | % | ||||||
Foreign Government Obligations | 3.3 | |||||||
Short-Term Investment | 0.4 | |||||||
Other Assets in Excess of Liabilities | 1.0 | |||||||
TOTAL | 100.0 | % | ||||||
| * | The Fund’s portfolio composition is expressed as a percentage of net assets and may change over time. |
1
Table of Contents
SPDR DoubleLine Emerging Markets Fixed Income ETF
SCHEDULE OF INVESTMENTS
June 30, 2016
Security Description | Principal | Value | ||||||
CORPORATE BONDS & NOTES — 95.3% |
| |||||||
BRAZIL — 4.7% |
| |||||||
Cosan Overseas, Ltd. | $ | 850,000 | $ | 803,250 | ||||
Marfrig Holdings Europe B.V. | 200,000 | 204,100 | ||||||
Minerva Luxembourg SA | 800,000 | 804,000 | ||||||
|
| |||||||
| 1,811,350 | ||||||||
|
| |||||||
CHILE — 7.3% | ||||||||
Banco de Credito e Inversiones | 600,000 | 631,329 | ||||||
Empresa Electrica Angamos SA | 800,000 | 785,903 | ||||||
Guanay Finance, Ltd. | 456,874 | 453,448 | ||||||
SACI Falabella | 600,000 | 616,016 | ||||||
Sociedad Quimica y Minera de Chile SA 5.50%, 4/21/2020 | 164,000 | 172,610 | ||||||
Tanner Servicios Financieros SA | 168,000 | 168,420 | ||||||
|
| |||||||
| 2,827,726 | ||||||||
|
| |||||||
CHINA — 4.2% | ||||||||
CNOOC Finance 2015 Australia Pty, Ltd. 2.63%, 5/5/2020 | 800,000 | 807,296 | ||||||
Tencent Holdings, Ltd. | 800,000 | 820,722 | ||||||
|
| |||||||
| 1,628,018 | ||||||||
|
| |||||||
COLOMBIA — 17.1% | ||||||||
Avianca Holdings SA/Avianca Leasing LLC/Grupo Taca Holdings, Ltd. | 300,000 | 243,030 | ||||||
Banco Davivienda SA | 300,000 | 306,750 | ||||||
Banco de Bogota SA | 300,000 | 303,000 | ||||||
Banco GNB Sudameris SA | 300,000 | 294,750 | ||||||
Bancolombia SA | 300,000 | 321,000 | ||||||
Ecopetrol SA | 800,000 | 692,000 | ||||||
Empresa de Energia de Bogota SA ESP | 400,000 | 416,500 | ||||||
Grupo Aval, Ltd. | 900,000 | 879,750 | ||||||
GrupoSura Finance SA | 600,000 | 625,500 | ||||||
Oleoducto Central SA | 900,000 | 879,300 | ||||||
SUAM Finance B.V. | 800,000 | 830,000 | ||||||
Transportadora de Gas Internacional SA ESP 5.70%, 3/20/2022 | 800,000 | 834,000 | ||||||
|
| |||||||
| 6,625,580 | ||||||||
|
| |||||||
COSTA RICA — 1.3% | ||||||||
Banco Nacional de Costa Rica | 500,000 | 515,850 | ||||||
|
| |||||||
DOMINICAN REPUBLIC — 1.1% | ||||||||
AES Andres B.V./Dominican Power Partners/Empresa Generadora de Electricidad It 7.95%, 5/11/2026 (a) | 400,000 | 416,000 | ||||||
|
| |||||||
GUATEMALA — 0.8% | ||||||||
Comcel Trust via Comunicaciones Celulares SA 6.88%, 2/6/2024 | 300,000 | 292,500 | ||||||
|
| |||||||
HONG KONG — 2.2% | ||||||||
Hutchison Whampoa International 12 II, Ltd. 3.25%, 11/8/2022 | 800,000 | 843,502 | ||||||
|
| |||||||
INDIA — 10.7% | ||||||||
Adani Ports & Special Economic Zone, Ltd. 3.50%, 7/29/2020 | 500,000 | 497,314 | ||||||
Bharat Petroleum Corp., Ltd. | 500,000 | 539,400 | ||||||
Bharti Airtel, Ltd. | 800,000 | 838,422 | ||||||
ONGC Videsh, Ltd. | 900,000 | 919,001 | ||||||
Reliance Industries, Ltd. | 900,000 | 914,580 | ||||||
Vedanta Resources PLC | 500,000 | 411,250 | ||||||
|
| |||||||
| 4,119,967 | ||||||||
|
| |||||||
ISRAEL — 4.6% | ||||||||
Delek & Avner Tamar Bond, Ltd. | 900,000 | 933,750 | ||||||
Israel Electric Corp., Ltd. | 800,000 | 847,200 | ||||||
|
| |||||||
| 1,780,950 | ||||||||
|
| |||||||
JAMAICA — 1.5% | ||||||||
Digicel Group, Ltd. | 800,000 | 591,000 | ||||||
|
| |||||||
MALAYSIA — 4.0% | ||||||||
Axiata SPV2 Bhd | 600,000 | 625,265 | ||||||
Petronas Global Sukuk, Ltd. | 900,000 | 910,172 | ||||||
|
| |||||||
| 1,535,437 | ||||||||
|
| |||||||
MEXICO — 16.2% | ||||||||
Banco Mercantil del Norte SA | 700,000 | 698,250 | ||||||
Banco Santander Mexico SA | 800,000 | 840,000 | ||||||
BBVA Bancomer SA | 400,000 | 398,000 | ||||||
Comision Federal de Electricidad | 300,000 | 317,625 | ||||||
Fermaca Enterprises S de RL de CV | 241,727 | 240,519 | ||||||
Grupo Idesa SA de CV | 200,000 | 203,500 | ||||||
See accompanying notes to financial statements.
2
Table of Contents
SPDR DoubleLine Emerging Markets Fixed Income ETF
SCHEDULE OF INVESTMENTS (continued)
June 30, 2016
Security Description | Principal | Value | ||||||
Grupo Posadas SAB de CV | $ | 500,000 | $ | 507,500 | ||||
Mexico Generadora de Energia S de RL | 880,027 | 844,825 | ||||||
Petroleos Mexicanos | 800,000 | 803,105 | ||||||
Southern Copper Corp. | 900,000 | 798,750 | ||||||
Unifin Financiera SAB de CV | 600,000 | 588,600 | ||||||
|
| |||||||
| 6,240,674 | ||||||||
|
| |||||||
PANAMA — 4.5% | ||||||||
Aeropuerto Internacional de Tocumen SA 5.75%, 10/9/2023 | 800,000 | 836,000 | ||||||
ENA Norte Trust | 83,946 | 85,415 | ||||||
Global Bank Corp. | 800,000 | 826,000 | ||||||
|
| |||||||
| 1,747,415 | ||||||||
|
| |||||||
PERU — 9.2% | ||||||||
Abengoa Transmision Sur SA | 800,000 | 832,000 | ||||||
Banco Internacional del Peru SAA | 300,000 | 318,375 | ||||||
Corp. Financiera de Desarrollo SA | 300,000 | 318,000 | ||||||
Lima Metro Line 2 Finance, Ltd. | 500,000 | 524,250 | ||||||
Minsur SA | 500,000 | 507,500 | ||||||
Peru Enhanced Pass-Through Finance, Ltd. Zero Coupon, 6/2/2025 | 850,000 | 665,031 | ||||||
Volcan Cia Minera SAA | 450,000 | 402,750 | ||||||
|
| |||||||
| 3,567,906 | ||||||||
|
| |||||||
SINGAPORE — 4.0% | ||||||||
Oversea-Chinese Banking Corp., Ltd. | 600,000 | 627,788 | ||||||
United Overseas Bank, Ltd.: | ||||||||
3.50%, 9/16/2026 (b) | 300,000 | 305,762 | ||||||
3.75%, 9/19/2024 (b) | 600,000 | 621,000 | ||||||
|
| |||||||
| 1,554,550 | ||||||||
|
| |||||||
UNITED STATES — 1.9% | ||||||||
Freeport-McMoRan, Inc. | 800,000 | 720,720 | ||||||
|
| |||||||
TOTAL CORPORATE BONDS & NOTES | 36,819,145 | |||||||
|
| |||||||
FOREIGN GOVERNMENT OBLIGATIONS — 3.3% |
| |||||||
COSTA RICA — 2.1% | ||||||||
Instituto Costarricense de Electricidad | 800,000 | 828,000 | ||||||
|
| |||||||
PANAMA — 0.8% | ||||||||
Banco Latinoamericano de Comercio Exterior SA 3.25%, 5/7/2020 | 300,000 | 301,500 | ||||||
|
| |||||||
PERU — 0.4% | ||||||||
Fondo MIVIVIENDA SA Series REGS, 3.50%, 1/31/2023 | 150,000 | 149,625 | ||||||
|
| |||||||
TOTAL FOREIGN GOVERNMENT OBLIGATIONS | 1,279,125 | |||||||
|
| |||||||
Shares | ||||||||
SHORT-TERM INVESTMENT — 0.4% |
| |||||||
State Street Institutional Liquid Reserves Fund, Premier Class 0.47% (c) (d) (Cost $141,281) | 141,281 | 141,281 | ||||||
|
| |||||||
TOTAL INVESTMENTS — 99.0% | 38,239,551 | |||||||
OTHER ASSETS IN EXCESS OF LIABILITIES — 1.0% | 399,461 | |||||||
|
| |||||||
NET ASSETS — 100.0% | $ | 38,639,012 | ||||||
|
| |||||||
| (a) | Securities purchased pursuant to Rule 144A of the Securities Act of 1933. These securities, which represent 7.0% of net assets as of June 30, 2016, are considered liquid and may be resold in transactions exempt from registration, normally to qualified institutional buyers. |
| (b) | Variable Rate Security — Interest rate shown is rate in effect at June 30, 2016. |
| (c) | The rate shown is the annualized seven-day yield at June 30, 2016. |
| (d) | The Fund invested in certain money market funds managed by SSGA Funds Management, Inc. Amounts related to these transactions during the year ended June 30, 2016 are shown in the Affiliate Table below. |
See accompanying notes to financial statements.
3
Table of Contents
SPDR DoubleLine Emerging Markets Fixed Income ETF
SCHEDULE OF INVESTMENTS (continued)
June 30, 2016
The following table summarizes the value of the Fund’s investments accordingly to the fair value hierarchy as of June 30, 2016.
Description | Level 1 — Quoted Prices | Level 2 — Other Significant Observable Inputs | Level 3 — Significant Unobservable Inputs | Total | ||||||||||||
ASSETS: | ||||||||||||||||
INVESTMENTS: | ||||||||||||||||
Corporate Bonds & Notes | ||||||||||||||||
Brazil | $ | — | $ | 1,811,350 | $ | — | $ | 1,811,350 | ||||||||
Chile | — | 2,827,726 | — | 2,827,726 | ||||||||||||
China | — | 1,628,018 | — | 1,628,018 | ||||||||||||
Colombia | — | 6,625,580 | — | 6,625,580 | ||||||||||||
Costa Rica | — | 515,850 | — | 515,850 | ||||||||||||
Dominican Republic | — | 416,000 | — | 416,000 | ||||||||||||
Guatemala | — | 292,500 | — | 292,500 | ||||||||||||
Hong Kong | — | 843,502 | — | 843,502 | ||||||||||||
India | — | 4,119,967 | — | 4,119,967 | ||||||||||||
Israel | — | 1,780,950 | — | 1,780,950 | ||||||||||||
Jamaica | — | 591,000 | — | 591,000 | ||||||||||||
Malaysia | — | 1,535,437 | — | 1,535,437 | ||||||||||||
Mexico | — | 6,240,674 | — | 6,240,674 | ||||||||||||
Panama | — | 1,747,415 | — | 1,747,415 | ||||||||||||
Peru | — | 3,567,906 | — | 3,567,906 | ||||||||||||
Singapore | — | 1,554,550 | — | 1,554,550 | ||||||||||||
United States | — | 720,720 | — | 720,720 | ||||||||||||
Foreign Government Obligations | ||||||||||||||||
Costa Rica | — | 828,000 | — | 828,000 | ||||||||||||
Panama | — | 301,500 | — | 301,500 | ||||||||||||
Peru | — | 149,625 | — | 149,625 | ||||||||||||
Short-Term Investment | 141,281 | — | — | 141,281 | ||||||||||||
|
|
|
|
|
|
|
| |||||||||
TOTAL INVESTMENTS | $ | 141,281 | $ | 38,098,270 | $ | — | $ | 38,239,551 | ||||||||
|
|
|
|
|
|
|
| |||||||||
Affiliate Table
| Number of Shares Held at 4/14/2016* | Value At 4/14/2016* | Shares Purchased | Shares Sold | Number of Shares Held at 6/30/16 | Value at 6/30/16 | Dividend Income | Realized Gain (Loss) | |||||||||||||||||||||||||
State Street Institutional Liquid Reserves Fund, Premier Class | — | $ | — | 38,923,328 | 38,782,047 | 141,281 | $ | 141,281 | $ | 1,441 | $
| —
|
| |||||||||||||||||||
| * | Commencement of operations. |
See accompanying notes to financial statements.
4
Table of Contents
SPDR Doubleline Emerging Markets Fixed Income ETF
STATEMENT OF ASSETS AND LIABILITIES
June 30, 2016
ASSETS | ||||
Investments in unaffiliated issuers, at value (Note 2) | $ | 38,098,270 | ||
Investments in affiliated issuers, at value (Note 2) | 141,281 | |||
|
| |||
Total Investments | 38,239,551 | |||
Cash | 11,756 | |||
Interest receivable — unaffiliated issuers (Note 2) | 408,106 | |||
Dividends receivable — affiliated issuers (Note 2) | 52 | |||
Receivable from Adviser (Note 3) | 3,205 | |||
|
| |||
TOTAL ASSETS | 38,662,670 | |||
|
| |||
LIABILITIES | ||||
Advisory fee payable (Note 3) | 23,463 | |||
Trustees’ fees and expenses payable (Note 4) | 195 | |||
|
| |||
TOTAL LIABILITIES | 23,658 | |||
|
| |||
NET ASSETS | $ | 38,639,012 | ||
|
| |||
NET ASSETS CONSIST OF: | ||||
Paid-in Capital (Note 6) | $ | 37,612,500 | ||
Undistributed (distribution in excess of) net investment income (loss) | 146,699 | |||
Accumulated net realized gain (loss) on investments | 62,170 | |||
Net unrealized appreciation (depreciation) on: | ||||
Investments | 817,643 | |||
|
| |||
NET ASSETS | $ | 38,639,012 | ||
|
| |||
NET ASSET VALUE PER SHARE | ||||
Net asset value per share | $ | 51.52 | ||
|
| |||
Shares outstanding (unlimited amount authorized, no par value) | 750,000 | |||
|
| |||
COST OF INVESTMENTS: | ||||
Investments in unaffiliated issuers | $ | 37,280,627 | ||
Investments in affiliated issuers | 141,281 | |||
|
| |||
Total cost of investments | $ | 37,421,908 | ||
|
|
See accompanying notes to financial statements.
5
Table of Contents
SPDR Doubleline Emerging Markets Fixed Income ETF
For the Period Ended June 30, 2016 (a)
INVESTMENT INCOME |
| |||
Interest income — unaffiliated issuers (Note 2) | $ | 386,599 | ||
Dividend income — affiliated issuers (Note 2) | 1,441 | |||
|
| |||
TOTAL INVESTMENT INCOME (LOSS) | 388,040 | |||
|
| |||
EXPENSES | ||||
Advisory fee (Note 3) | 60,612 | |||
Trustees’ fees and expenses (Note 4) | 198 | |||
|
| |||
TOTAL EXPENSES | 60,810 | |||
|
| |||
Expenses waived/reimbursed by the Adviser (Note 3) | (8,280 | ) | ||
|
| |||
NET EXPENSES | 52,530 | |||
|
| |||
NET INVESTMENT INCOME (LOSS) | 335,510 | |||
|
| |||
REALIZED AND UNREALIZED GAIN (LOSS) | ||||
Net realized gain (loss) on: | ||||
Investment transactions — unaffiliated issuers | 62,170 | |||
|
| |||
Net realized gain (loss) | 62,170 | |||
|
| |||
Net change in unrealized appreciation/depreciation on: | ||||
Investment transactions — unaffiliated issuers | 817,643 | |||
|
| |||
Net change in unrealized appreciation/depreciation | 817,643 | |||
|
| |||
NET REALIZED AND UNREALIZED GAIN (LOSS) | 879,813 | |||
|
| |||
NET INCREASE (DECREASE) IN NET ASSETS FROM OPERATIONS | $ | 1,215,323 | ||
|
| |||
| (a) | For the period April 13, 2016 (inception date) through June 30, 2016. |
See accompanying notes to financial statements.
6
Table of Contents
SPDR Doubleline Emerging Markets Fixed Income ETF
STATEMENT OF CHANGES IN NET ASSETS
| For the Period 4/13/16* - 6/30/16 | ||||
INCREASE (DECREASE) IN NET ASSETS FROM OPERATIONS: | ||||
Net investment income (loss) | $ | 335,510 | ||
Net realized gain (loss) | 62,170 | |||
Net change in unrealized appreciation/depreciation | 817,643 | |||
|
| |||
Net increase (decrease) in net assets resulting from operations | 1,215,323 | |||
|
| |||
DISTRIBUTIONS TO SHAREHOLDERS FROM: | ||||
Net investment income | (188,811 | ) | ||
|
| |||
FROM BENEFICIAL INTEREST TRANSACTIONS: | ||||
Proceeds from sale of shares sold | 37,500,000 | |||
Other capital (Note 6) | 112,500 | |||
|
| |||
Net increase (decrease) in net assets from beneficial interest transactions | 37,612,500 | |||
|
| |||
Net increase (decrease) in net assets during the period | 38,639,012 | |||
|
| |||
Net assets at beginning of period | — | |||
|
| |||
NET ASSETS AT END OF PERIOD | $ | 38,639,012 | ||
|
| |||
Undistributed (distribution in excess of) net investment income (loss) | $ | 146,699 | ||
|
| |||
SHARES OF BENEFICIAL INTEREST: | ||||
Shares sold | 750,000 | |||
|
| |||
Net increase (decrease) | 750,000 | |||
|
| |||
| * | Inception date. |
See accompanying notes to financial statements.
7
Table of Contents
SPDR Doubleline Emerging Markets Fixed Income ETF
Selected data for a share outstanding throughout each period
| For the Period 4/14/16* - 6/30/16 | ||||
Net asset value, beginning of period | $ | 50.00 | ||
|
| |||
Income (loss) from investment operations: | ||||
Net investment income (loss) (a) | 0.45 | |||
Net realized and unrealized gain (loss) | 1.17 | |||
|
| |||
Total from investment operations | 1.62 | |||
|
| |||
Other capital (a) | 0.15 | |||
|
| |||
Distributions to shareholders from: | ||||
Net investment income | (0.25 | ) | ||
|
| |||
Net asset value, end of period | $ | 51.52 | ||
|
| |||
Total return (b) | 3.55 | % | ||
Ratios and Supplemental Data: | ||||
Net assets, end of period (in 000s) | $ | 38,639 | ||
Ratios to average net assets: | ||||
Total expenses | 0.75 | %(c) | ||
Net expenses | 0.65 | %(c) | ||
Net investment income (loss) | 4.15 | %(c) | ||
Portfolio turnover rate (d) | 12 | %(e) | ||
| * | Commencement of operations. |
| (a) | Per share numbers have been calculated using average shares outstanding, which more appropriately presents the per share data for the period. |
| (b) | Total return is calculated assuming a purchase of shares at net asset value on the first day and a sale at net asset value on the last day of each period reported. Distributions are assumed, for the purpose of this calculation, to be reinvested at net asset value per share on the respective payment dates of each distribution. Total return for periods of less than one year is not annualized. Broker commission charges are not included in this calculation. |
| (c) | Annualized. |
| (d) | Portfolio turnover rate excludes transactions involving securities received or delivered from in-kind processing of creations or redemptions. |
| (e) | Not annualized. |
See accompanying notes to financial statements.
8
Table of Contents
SPDR DoubleLine Emerging Markets Fixed Income ETF
NOTES TO FINANCIAL STATEMENTS
June 30, 2016
| 1. | Organization |
SSGA Active Trust (the “Trust”), which is registered under the Investment Company Act of 1940, as amended (“1940 Act”), is an open-end management investment company that was organized as a Massachusetts business trust on March 30, 2011.
As of June 30, 2016, the Trust consists of fourteen (14) series, each of which represents a separate series of beneficial interest in the Trust (each a “Fund” and collectively, the “Funds”). The Declaration of Trust permits the Board of Trustees of the Trust (the “Board”) to authorize the issuance of an unlimited number of shares of beneficial interest at no par value. The financial statements herein relate to the SPDR DoubleLine Emerging Markets Fixed Income ETF (the “Fund”).
The Fund is classified as a diversified investment company under the 1940 Act.
The Fund was formed on April 13, 2016 and commenced operations on April 14, 2016.
Under the Trust’s organizational documents, its officers and trustees are indemnified against certain liabilities arising out of the performance of their duties to the Trust. Additionally, in the normal course of business, the Trust enters into contracts with service providers that contain general indemnification clauses. The Trust’s maximum exposure under these arrangements is unknown as this could involve future claims that may be made against the Trust that have not yet occurred.
| 2. | Summary of Significant Accounting Policies |
The following is a summary of significant accounting policies followed by the Trust in the preparation of its financial statements:
The preparation of financial statements in accordance with U.S. generally accepted accounting principles (“U.S. GAAP”) requires management to make estimates and assumptions that affect the reported amounts and disclosures in the financial statements. Actual results could differ from those estimates. The Fund is an investment company under U.S. GAAP and follows the accounting and reporting guidance applicable to investment companies.
Security Valuation
The Fund’s investments are valued at fair value each day that the Fund’s listing exchange is open and, for financial reporting purposes, as of the report date should the reporting period end on a day that the Fund’s listing exchange is not open. Fair value is generally defined as the price a fund would receive to sell an asset or pay to transfer a liability in an orderly transaction between market participants at the measurement date. By its nature, a fair value price is a good faith estimate of the valuation in a current sale and may not reflect an actual market price. The investments of the Fund are valued pursuant to the policy and procedures developed by the Oversight Committee (the “Committee”) and approved by the Board. The Committee provides oversight of the valuation of investments for the Fund. The Board has responsibility for determining the fair value of investments.
Valuation techniques used to value the Fund’s investments by major category are as follows:
| • | Investments in registered investment companies (including money market funds) or other unitized pooled investment vehicles that are not traded on an exchange are valued at that day’s published net asset value per share or unit. |
| • | Debt obligations (both governmental and non-governmental) that are short term in nature (with a maturity of sixty days or less at purchase) are valued using the amortized cost method as long as the amortized cost value of a particular portfolio instrument is reasonably determined to approximate the fair value of that investment established using market-based and issuer-specific factors or at a price obtained from an independent pricing service. |
| • | Debt obligations (both governmental and non-governmental) purchased with greater than sixty days to maturity are valued at last reported evaluated bid prices obtained from independent pricing services or brokers. In determining the value of a fixed income investment, pricing services may use certain information with respect to transactions in such investments, quotations from dealers, pricing matrixes, market transactions in comparable investments, various relationships observed in the market between investments, and calculated yield measures. |
9
Table of Contents
SPDR DoubleLine Emerging Markets Fixed Income ETF
NOTES TO FINANCIAL STATEMENTS (continued)
June 30, 2016
In the event prices or quotations are not readily available or that the application of these valuation methods results in a price for an investment that is deemed to be not representative of the fair value of such investment, fair value will be determined in good faith by the Committee, in accordance with the valuation policy and procedures approved by the Board.
Fair value pricing could result in a difference between the prices used to calculate a Fund’s net asset value and the prices used by the Fund’s underlying benchmarks. Various inputs are used in determining the value of the Fund’s investments.
The Fund values its assets and liabilities at fair value using a fair value hierarchy consisting of three broad levels that prioritize the inputs to valuation techniques giving the highest priority to readily available unadjusted quoted prices in active markets for identical assets or liabilities (Level 1 measurements) and the lowest priority to unobservable inputs (Level 3 measurements) when market prices are not readily available or reliable. The categorization of a value determined for an investment within the hierarchy is based upon the pricing transparency of the investment and is not necessarily an indication of the risk associated with investing in it.
The three levels of the fair value hierarchy are as follows:
| • | Level 1 — Unadjusted quoted prices in active markets for identical assets or liabilities; |
| • | Level 2 — Inputs other than quoted prices included within Level 1 that are observable for the assets or liabilities either directly or indirectly, including quoted prices for similar assets or liabilities in active markets, quoted prices for identical or similar assets or liabilities in markets that are not considered to be active, inputs other than quoted prices that are observable for the asset or liability (such as exchange rates, financing terms, interest rates, yield curves, volatilities, prepayment speeds, loss severities, credit risks and default rates) or other market-corroborated inputs; and |
| • | Level 3 — Unobservable inputs for the asset or liability, including the Committee’s assumptions used in determining the fair value of investments. |
The value of the Fund’s investments according to the fair value hierarchy as of June 30, 2016, is disclosed in the Fund’s Schedule of Investments.
Changes in valuation techniques may result in transfers in or out of an assigned level within the fair value hierarchy. Transfers between different levels of the fair value hierarchy are recognized at the end of the reporting period.
The Fund had no material transfers between levels for the period ended June 30, 2016.
Investment Transactions and Income Recognition
Investment transactions are accounted for on trade date for financial reporting purposes. Realized gains and losses from the sale or disposition of investments and foreign exchange transactions, if any, are determined using the identified cost method. Dividend income and capital gain distributions, if any, are recognized daily on the ex-dividend date, net of any foreign taxes withheld at source, if any. Interest income is recorded daily on an accrual basis. All premiums and discounts are amortized/accreted for financial reporting purposes.
Expenses
Certain expenses, which are directly identifiable to a specific Fund, are applied to that Fund within the Trust. Other expenses which cannot be attributed to a specific Fund are allocated in such a manner as deemed equitable, taking into consideration the nature and type of expense and the relative net assets of the Funds within the Trust.
Distributions
Distributions from net investment income, if any, are declared and paid monthly. Net realized capital gains, if any, are distributed annually, unless additional distributions are required for compliance with applicable tax regulations. The amount and character of income and capital gains to be distributed are determined in accordance with applicable tax regulations which may differ from net investment income and realized gains recognized for U.S. GAAP purposes.
10
Table of Contents
SPDR DoubleLine Emerging Markets Fixed Income ETF
NOTES TO FINANCIAL STATEMENTS (continued)
June 30, 2016
| 3. | Fees and Transactions with Affiliates |
Advisory Fee
The Fund has entered into an Investment Advisory Agreement with SSGA Funds Management, Inc. (the “Adviser” or “SSGA FM”). For its advisory services to the Fund, facilities furnished, and expenses borne by the Adviser, the Fund pays the Adviser a fee accrued daily and paid monthly, at the rate of 0.75% of the Fund’s average daily net assets.
SSGA FM has contractually agreed to waive its advisory fee and/or reimburse certain expenses, until October 31, 2017, so that the net annual fund operating expenses of the Fund will be limited to 0.65% of the Fund’s average daily net assets before application of any extraordinary expenses or acquired fund fees and expenses. The contractual fee waiver and/or reimbursement does not provide for the recoupment by the Adviser of any fees the Adviser previously waived. The Adviser may continue the waiver and/or reimbursement from year to year, but there is no guarantee that the Adviser will do so and after October 31, 2017, the waiver and/or reimbursement may be cancelled or modified at any time. This waiver and/or reimbursement may not be terminated during the relevant period except with the approval of the Board.
The Adviser pays all expenses of the Fund other than the management fee, distribution fee pursuant to the Fund’s Distribution and Service Plan, if any, brokerage, taxes, interest, fees and expenses of the Independent Trustees (including any Trustee’s counsel fees), litigation expenses, acquired fund fees and expenses and other extraordinary expenses.
DoubleLine Capital LP receives fees for its services as the sub-advisor to the Fund from the Adviser.
SSGA FM serves as administrator and State Street Bank and Trust Company (“State Street”), an affiliate of the Adviser, serves as custodian, sub-administrator and transfer agent. State Street receives fees for its services as custodian, sub-administrator and transfer agent from the Adviser.
Distribution Fees
State Street Global Markets, LLC (“SSGM” or the “Distributor”), an affiliate of the Adviser, serves as the Distributor of the Trust. Pursuant to a Distribution and Service Plan adopted in accordance with Rule 12b-1 under the 1940 Act, the Fund is authorized to pay an amount of up to 0.25% of its average daily net assets for certain distribution-related activities. However, the Board has determined that no such payments will be made through at least April 12, 2017, and therefore no such payments have been made.
Other Transactions with Affiliates
The Fund may invest in affiliated entities, included securities issued by State Street, affiliated funds, or entities deemed to be affiliates as a result of the Fund owning more than five percent of the entity’s voting securities or outstanding shares. Amounts relating to these transactions during the period ended June 30, 2016 are disclosed in the Schedule of Investments.
In certain circumstances, the Fund may have cash overdraft with the custodian. The Due to custodian if any, reflects cash overdrawn with SSB as custodian who is an affiliate of the Fund.
| 4. | Trustees’ Fees |
The fees and expenses of the Trust’s trustees who are not “interested persons” of the Trust, as defined in the 1940 Act (“Independent Trustees”), are paid directly by the Fund. The Independent Trustees are reimbursed for travel and other out-of-pocket expenses in connection with meeting attendance and industry seminars.
| 5. | Investment Transactions |
Purchases and sales of investments (excluding short term investments) for the period ended June 30, 2016, were as follows:
| U.S. Government Obligations | Other Securities | |||||||||||||||
| Purchases | Sales | Purchases | Sales | |||||||||||||
SPDR DoubleLine Emerging Markets Fixed Income ETF | $ | — | $ | — | $ | 41,664,970 | $ | 4,414,688 | ||||||||
11
Table of Contents
SPDR DoubleLine Emerging Markets Fixed Income ETF
NOTES TO FINANCIAL STATEMENTS (continued)
June 30, 2016
| 6. | Shareholder Transactions |
The Fund issues and redeems its shares, at net asset value, only in aggregations of a specified number of shares or multiples thereof (“Creation Units”). Except when aggregated in Creation Units, shares of the Fund are not redeemable. Transactions in capital shares for the Fund are disclosed in detail in the Statement of Changes in Net Assets.
The consideration for the purchase of Creation Units of a fund may consist of the in-kind deposit of a designated portfolio of securities and a specified amount of cash, except for certain funds that invest in TBAs or mortgage backed securities. Investors purchasing and redeeming Creation Units may pay a purchase transaction fee and a redemption transaction fee directly to the Trust and/or Custodian, to offset transfer and other transaction costs associated with the issuance and redemption of Creation Units, including Creation Units for cash. An additional variable fee may be charged for certain transactions. Such variable charges, if any, are included in “Other Capital” on the Statement of Changes on Net Assets.
| 7. | Income Tax Information |
The Fund intends to qualify as a regulated investment company under Subchapter M of the Internal Revenue Code of 1986, as amended. The Fund will not be subject to federal income taxes to the extent it distributes its taxable income, including any net realized capital gains, for each fiscal year. Therefore, no provision for federal income tax is required.
The Fund files federal and various state and local tax returns as required. No income tax returns are currently under examination. The federal returns are subject to examination by the Internal Revenue Service for a period of three years from date of filing, while the state returns may remain open for an additional year depending upon jurisdiction. SSGA FM has analyzed the Fund’s tax positions taken on tax returns and does not believe there are any uncertain tax positions that would require recognition of a tax liability.
Distributions to shareholders are recorded on ex-dividend date. Income dividends and gain distributions are determined in accordance with income tax rules and regulations, which may differ from generally accepted accounting principles.
The tax character of distributions paid during the period ended June 30, 2016, was as follows:
| Ordinary Income | Long-Term Capital Gains | Tax Return of Capital | Total | |||||||||||||
SPDR DoubleLine Emerging Markets Fixed Income ETF | $ | 188,811 | $ | — | $ | — | $ | 188,811 | ||||||||
As of June 30, 2016, the components of distributable earnings on a tax basis were as follows:
| Undistributed Ordinary Income | Capital Loss Carryforwards | Undistributed Long-Term Capital Gains | Net Unrealized Gains (Losses) | Qualified Late-Year Losses | Total | |||||||||||||||||||
SPDR DoubleLine Emerging Markets Fixed Income ETF | $ | 208,869 | $ | — | $ | — | $ | 817,643 | $ | — | $ | 1,026,512 | ||||||||||||
As of June 30, 2016, gross unrealized appreciation and gross unrealized depreciation based on cost for federal income tax purposes were as follows:
| Tax Cost | Gross Unrealized Appreciation | Gross Unrealized Depreciation | Net Unrealized Appreciation (Depreciation) | |||||||||||||
SPDR DoubleLine Emerging Markets Fixed Income ETF | $ | 37,421,908 | $ | 895,033 | $ | 77,390 | $ | 817,643 | ||||||||
| 8. | Risks |
Concentration of Risk
As a result of the Fund’s ability to invest a large percentage of its assets in obligations of issuers within the same country, state, region, currency or economic sector, an adverse economic, business or political development may affect the value of the Fund’s investments more than if the Fund were more broadly diversified.
12
Table of Contents
SPDR DoubleLine Emerging Markets Fixed Income ETF
NOTES TO FINANCIAL STATEMENTS (continued)
June 30, 2016
Foreign and Emerging Markets Risks
Investing in foreign markets involve risks and considerations not typically associated with investing in the U.S. Foreign securities may be subject to risk of loss because of government regulation, economic, political and social instability in the countries in which the Fund invests. Foreign markets may be less liquid than investments in the U.S. and may be subject to the risks of currency fluctuations. To the extent that the Fund invests in securities of issuers located in emerging markets, these risks may be even more pronounced.
Market and Credit Risk
In the normal course of business, the Fund trades financial instruments and enters into financial transactions where risk of potential loss exists due to changes in the general economic conditions and fluctuations of the market (market risk). Additionally, the Fund may also be exposed to credit risk in the event that an issuer or guarantor fails to perform or that an institution or entity with which the Fund has unsettled or open transactions defaults.
| 9. | Subsequent Events |
Management has evaluated the impact of all subsequent events on the Fund through the date on which the financial statements were available to be issued and has determined that there were no subsequent events requiring adjustment or disclosure in the financial statements.
13
Table of Contents
SPDR DoubleLine Emerging Markets Fixed Income ETF
REPORT OF INDEPENDENT REGISTERED PUBLIC ACCOUNTING FIRM
To the Shareholders and Board of Trustees of
SSGA Active Trust
We have audited the accompanying statement of assets and liabilities, including the schedule of investments, of SPDR DoubleLine Emerging Markets Fixed Income ETF (the “Fund”) (one of the portfolios constituting SSGA Active Trust) as of June 30, 2016, and the related statement of operations, statement of changes in net assets, and the financial highlights for the periods indicated therein. These financial statements and financial highlights are the responsibility of the Fund’s management. Our responsibility is to express an opinion on these financial statements and financial highlights based on our audit.
We conducted our audit in accordance with the standards of the Public Company Accounting Oversight Board (United States). Those standards require that we plan and perform the audit to obtain reasonable assurance about whether the financial statements and financial highlights are free of material misstatement. We were not engaged to perform an audit of the Fund’s internal control over financial reporting. Our audit included consideration of internal control over financial reporting as a basis for designing audit procedures that are appropriate in the circumstances, but not for the purpose of expressing an opinion on the effectiveness of the Fund’s internal control over financial reporting. Accordingly, we express no such opinion. An audit also includes examining, on a test basis, evidence supporting the amounts and disclosures in the financial statements and financial highlights, assessing the accounting principles used and significant estimates made by management, and evaluating the overall financial statement presentation. Our procedures included confirmation of securities owned as of June 30, 2016, by correspondence with the custodian and others or by other appropriate auditing procedures where replies from others were not received. We believe that our audit provides a reasonable basis for our opinion.
In our opinion, the financial statements and financial highlights referred to above present fairly, in all material respects, the financial position of SPDR DoubleLine Emerging Markets Fixed Income ETF (one of the portfolios constituting SSGA Active Trust) at June 30, 2016, and the results of its operations, the changes in its net assets and the financial highlights for the periods indicated therein, in conformity with U.S. generally accepted accounting principles.

Boston, Massachusetts
August 26, 2016
14
Table of Contents
SPDR DoubleLine Emerging Markets Fixed Income ETF
June 30, 2016 (Unaudited)
Expense Example
As a shareholder of a Fund, you incur two types of costs (1) transaction costs, including sales charges (loads), if applicable, on purchase payments, reinvested dividends, or other distributions and (2) ongoing costs, including advisory fees and to the extent applicable, distribution (12b-1) and/or service fees; and other Fund expenses. This example is intended to help you understand your ongoing costs (in dollars) of investing in the Fund and to compare these costs with the ongoing costs of investing in other mutual funds. It is based on an investment of $1,000 made at the beginning of the period shown and held for the entire period from January 1, 2016 to June 30, 2016.
The table below illustrates your Fund’s cost in two ways:
| • | Based on actual fund return — This section helps you to estimate the actual expenses that you paid over the period. The “Ending Account Value” shown is derived from each Fund’s actual return, and the third column shows the dollar amount that would have been paid by an investor who started with $1,000 in the Fund. You may use the information here, together with the amount you invested, to estimate the expenses that you paid over the period. To do so, simply divide your account value by $1,000 (for example, an $8,600 account value divided by $1,000 = 8.6), then multiply the result by the number given for the Fund under the heading “Expenses Paid During Period”. |
| • | Based on hypothetical 5% return — This section is intended to help you compare your Fund’s costs with those of other mutual funds. It assumes that the Fund had a yearly return of 5% before expenses, but that the expense ratio is unchanged. In this case, because the return used is not the Fund’s actual return, the results do not apply to your investment. The example is useful in making comparisons because the Securities and Exchange Commission requires all mutual funds to calculate expenses based on a 5% return. You can assess your Fund’s costs by comparing this hypothetical example with the hypothetical examples that appear in shareholder reports of other funds. |
Please note that the expenses shown in the table are meant to highlight your ongoing costs only and do not reflect any transaction costs, such as sales load charges (loads). Therefore, the hypothetical 5% return section of the table is useful in comparing ongoing costs only, and will not help you determine the relative total costs of owning different funds. In addition, if these transaction costs were included, your costs would have been higher.
| Actual | Hypothetical (assuming a 5% return before expenses) | |||||||||||||||||||
| Annualized Expense Ratio | Ending Account Value | Expenses Paid During Period (a) | Ending Account Value | Expenses Paid During Period (b) | ||||||||||||||||
SPDR DoubleLine Emerging Markets Fixed Income ETF | 0.65 | % | $ | 1,035.50 | $ | 1.41 | $ | 1,021.60 | $ | 3.27 | ||||||||||
| (a) | Actual period is from commencement of operations 4/14/2016. |
| (b) | Hypothetical expenses are equal to the Fund’s annualized net expense ratio multiplied by the average account value of the period, multiplied by 182, then divided by 366. |
15
Table of Contents
SPDR DoubleLine Emerging Markets Fixed Income ETF
OTHER INFORMATION (continued)
June 30, 2016 (Unaudited)
Tax Information
Qualified Interest Income
The Fund designated a portion of dividends distributed during the fiscal year ended June 30, 2016, as qualified interest income. These amounts are noted below:
| Amount | ||||
SPDR DoubleLine Emerging Markets Fixed Income ETF | $ | 22,433 | ||
Premium/Discount Information
Information regarding how often the Shares of each Fund traded on the Exchange at a price above (i.e. at a premium) or below (i.e. at a discount) the net asset value of the Fund during the past calendar year can be found at http://www.spdrs.com.
Proxy Voting Policies and Procedures and Records
A description of the Trust’s proxy voting policies and procedures that are used by the Fund’s investment adviser to vote proxies relating to the Fund’s portfolio of securities are available (i) without charge, upon request by calling 1-866-787-2257 (toll free) or (ii) on the website of the U.S. Securities and Exchange Commission, at www.sec.gov.
Information regarding how the investment adviser voted for the prior 12-months period ended June 30 is available by August 31 of each year by calling the same number and on the SEC’s website, at www.sec.gov, and on the Fund’s’ website at www.spdrs.com.
Quarterly Portfolio Schedule
The Fund files a complete schedule of investments with the SEC for the first and third quarters of each fiscal year on Form N-Q. The Fund’s Form N-Q are available on the SEC’s website at www.sec.gov and may be reviewed and copied at the SEC’s Public Reference Room in Washington DC. Information on the operation of the Public Reference Room may be obtained by calling 1-800-SEC-0330. The information on the Form N-Q is available upon request, without charge, by calling 1-866-787-2257 (toll free) and on the Funds’ website at www.spdrs.com.
Approval of Advisory Agreements
At in-person meetings held prior to June 30, 2016, the Board of Trustees of the Trusts (the “Board”) evaluated proposals (1) to continue the separate Investment Advisory Agreements (the “Agreements”) between each Trust and SSGA Funds Management, Inc. (the “Adviser” or “SSGA FM”) with respect to the operational series of SSGA Active Trust (the “Current ETFs”) and SSGA Master Trust (together with the Current ETFs, the “Current Funds”), and (2) to approve the separate Agreements between the Adviser and (a) the SSGA Active Trust with respect to the SPDR DoubleLine Short Duration Total Return Tactical ETF and SPDR DoubleLine Emerging Markets Fixed Income ETF (the “New ETFs” and, together with the Current ETFs, the “ETFs”), and the State Street Disciplined Global Equity Portfolio (together with the New ETFs, the “New Funds”) each a new series of the SSGA Active Trust, (with the Current Funds and New Funds collectively being referred to hereafter as the “Funds”), each of which commenced operations during the period covered by this Annual Report. The Trustees who are not “interested persons” of the Trust within the meaning of the Investment Company Act of 1940, as amended (the “Independent Trustees”), also met separately with their independent legal counsel to consider the Agreements.
In evaluating the Agreements, the Board drew on materials provided to them by SSGA FM, the Trust’s investment adviser and administrator, and other materials provided by State Street Bank and Trust Company, the Trusts’ sub-administrator, transfer agent and custodian (“State Street”). In deciding whether to approve the Agreements, the Board considered various factors, including the (i) nature, extent and quality of services provided by, or expected to be provided by, the Adviser with respect to the Funds under the Agreements, (ii) investment performance of the Current Funds, (iii) profits realized by the Adviser and its affiliates from its relationship with the Trusts, (iv) fees charged to comparable funds, (v) other benefits to the Adviser, and (vi) extent to which economies of scale would be shared as the Funds grow.
16
Table of Contents
SPDR DoubleLine Emerging Markets Fixed Income ETF
OTHER INFORMATION (continued)
June 30, 2016 (Unaudited)
Nature, Extent and Quality of Services
The Board considered the nature, extent and quality of services provided by, or expected to be provided by, the Adviser. In doing so, the Trustees relied on their prior experience in overseeing the management of the Trusts and materials provided prior to and at the meeting. The Board reviewed the Agreements and the Adviser’s responsibilities for managing investment operations of each of the Funds in accordance with each Fund’s investment objectives and policies, and applicable legal and regulatory requirements. The Board appreciated the relatively unique nature of the ETFs as exchange-traded funds in a master-feeder structure, as appropriate, and the experience and expertise of the Adviser with exchange-traded funds. The Board considered the background and experience of the Adviser’s senior management, including those individuals responsible for portfolio management, oversight of sub-advisers and regulatory compliance of the Funds. The Board also considered the portfolio management resources, structures and practices of the Adviser, including those associated with monitoring and securing each Fund’s compliance with its investment objectives and policies and with applicable laws and regulations. The Board also considered information about the Adviser’s best execution procedures and overall investment management business, noting that the Adviser serves a wide range of clients across a broad spectrum of asset classes. The Board looked at the Adviser’s general knowledge of the investment business and that of its affiliates which make up State Street Global Advisors, through which the Adviser shares all of its senior personnel. The Board considered that the Adviser and its affiliates constitute one of the world’s largest investment management enterprises for exchange-traded funds. The Board also considered the Adviser’s experience in active management, managing exchange-traded funds in master-feeder structures and overseeing third-party sub-advisers, as applicable.
Investment Performance
The Board then reviewed the Current Funds’ performance. The Board compared each Current Fund’s investment performance to the performance of an appropriate benchmark and group of comparable funds. Among other information, the Board considered the following performance information in its evaluation of the Funds:
SPDR SSGA Multi-Asset Real Return ETF. The Board considered that: (a) the Fund underperformed the median of its Performance Group for the 1-, 2- and 3-year periods; and (b) outperformed its benchmark index for the 1-year period and underperformed its benchmark index for the 3-year period.
SPDR SSGA Income Allocation ETF. The Board considered that: (a) the Fund outperformed the median of its Performance Group for the 1-, 2- and 3-year periods; and (b) underperformed its benchmark index for the 1- and 3-year period.
SPDR SSGA Global Allocation ETF. The Board considered that: (a) the Fund outperformed the median of its Performance Group for the 1-, 2- and 3-year periods; and (b) underperformed its benchmark index for the 1-year period and outperformed its benchmark index for the 3-year period.
SPDR Blackstone / GSO Senior Loan ETF. The Board considered that: (a) the Fund underperformed the median of its Performance Group for the 1- and 2-year periods; and (b) outperformed its benchmark index for the 1-year period.
SPDR SSGA Ultra Short Term Bond ETF. The Board considered that: (a) the Fund underperformed the median of its Performance Group for the 1- and 2-year periods; and (b) outperformed its benchmark index for the 1-year period.
SPDR DoubleLine Total Return Tactical ETF. The Board considered that: (a) the Fund outperformed the median of its Performance Group since inception; and (b) outperformed its benchmark index since inception.
SPDR MFS Systematic Core Equity ETF. The Board considered that: (a) the Fund outperformed the median of its Performance Group for the 1-year period; and (b) outperformed its benchmark index for the 1-year period.
SPDR MFS Systematic Growth Equity ETF. The Board considered that: (a) the Fund outperformed the median of its Performance Group for the 1-year period; and (b) outperformed its benchmark index for the 1-year period.
SPDR MFS Systematic Value Equity ETF. The Board considered that: (a) the Fund outperformed the median of its Performance Group for the 1-year period; and (b) outperformed its benchmark index for the 1-year period.
SPDR SSGA Risk Aware ETF. The Board considered that: (a) the Fund underperformed the median of its Performance Group for the 1-year period; and (b) underperformed its benchmark index for the 1-year period.
17
Table of Contents
SPDR DoubleLine Emerging Markets Fixed Income ETF
OTHER INFORMATION (continued)
June 30, 2016 (Unaudited)
On the basis of the foregoing and other relevant information, the Board concluded that the performance of each Current Fund is satisfactory.
Profits Realized by Adviser
The Board considered the profitability of the advisory arrangement with the Current Funds to the Adviser, including data on the Current Funds’ historical profitability to the Adviser. The Independent Trustees, through their counsel, had the opportunity to discuss, with representatives of the Adviser and State Street, methodologies used in computing costs that formed the bases of profitability calculations and determined that these methodologies were reasonable.
Fees Charged to Comparable Funds
The Board evaluated each Fund’s unitary fee through review of comparative information with respect to fees paid by similar funds — i.e., exchange-traded funds that are actively managed, as applicable. The Board reviewed the universe of similar exchange-traded funds for each ETF based upon data independently obtained from Broadridge Financial Solutions, Inc. (formerly Lipper Analytical Services) and related comparative information for similar exchange-traded funds. The Board also reviewed the fee structure, as applicable, of each Fund in connection with the master-feeder structure, the historical expense ratios of each Current Fund and the estimated expense ratios for each New Fund. In doing so, the Board used a fund by fund analysis of the data.
Other Benefits
The Board also considered whether the Adviser or its affiliates benefited in other ways from its relationship with the Trusts, noting that the Adviser does not maintain soft-dollar arrangements in connection with the Trusts’ brokerage transactions.
Economies of Scale
The Board reviewed information regarding economies of scale or other efficiencies that may result as each Fund’s assets grow in size. The Board noted that the Agreements did not provide for breakpoints in each Fund’s advisory fee rates as assets of a Fund increase. However, the Board further noted the Adviser’s assertion that future economies of scale (among several factors) had been taken into consideration for the Funds by fixing relatively low advisory fees, effectively sharing the benefits of lower fees with the Funds from inception. The Adviser also asserted that one of the benefits of the unitary fee was to provide an unvarying expense structure, which could be lost or diluted with the addition of breakpoints. The Board noted that it intends to continue to monitor fees as the Funds grow in size and assess whether fee breakpoints may be warranted.
The Board, including the Independent Trustees voting separately, approved the Agreements for each Fund after weighing the foregoing factors, none of which was dispositive in itself and may have been weighed differently by each Trustee. The Board’s conclusions with respect to each Agreement were as follows: (a) the nature and extent of the services provided, or expected to be provided, by the Adviser with respect to the Funds were appropriate; (b) the performance of each Current Fund had been satisfactory; (c) the Adviser’s unitary fee for each Fund, considered in relation to services provided or expected to be provided, and in relation to fees charged to comparable funds, was fair and reasonable; (d) profitability of the Trusts’ relationship with the Adviser was not excessive; (e) any additional potential benefits to the Adviser or its affiliates were not of a magnitude to materially affect the Board’s conclusions; and (f) fees paid to the Adviser shared the economies of scale with respect to the Current Funds by way of the relatively low fee structure of the Trusts.
Approval of Massachusetts Financial Services Company Sub-Advisory Agreements
At an in-person meeting held prior to June 30, 2016, the Board also evaluated proposals to continue the separate Sub-Advisory Agreements (the “MFS Sub-Advisory Agreements”) between the Adviser and Massachusetts Financial Services Company (“MFS”) with respect to the SPDR MFS Systematic Core Equity ETF, SPDR MFS Systematic Growth Equity ETF and SPDR MFS Systematic Value Equity ETF, each a series of the SSGA Active Trust, and SSGA MFS Systematic Core Equity Portfolio, SSGA Systematic Growth Equity Portfolio and SSGA MFS Systematic Value Equity Portfolio, each a series of the SSGA Master Trust, each sub-advised by MFS (the “MFS Funds”). The
18
Table of Contents
SPDR DoubleLine Emerging Markets Fixed Income ETF
OTHER INFORMATION (continued)
June 30, 2016 (Unaudited)
Independent Trustees also met separately with their independent legal counsel to consider the MFS Sub-Advisory Agreements.
In evaluating the MFS Sub-Advisory Agreements, the Board drew on materials provided to them by MFS and the Adviser. In deciding whether to approve the MFS Sub-Advisory Agreements, the Board considered various factors, including the (i) nature, extent and quality of services provided by MFS with respect to the MFS Funds under the MFS Sub-Advisory Agreements and (ii) investment performance of the MFS Funds. The Board was apprised of the portion of the current advisory fee that the Adviser would pay to MFS under the MFS Sub-Advisory Agreements and also considered that such fees would be paid directly by the Adviser and would not result in increased fees payable by the MFS Funds.
The Board considered the background and experience of MFS’s senior management and, in particular, MFS’s experience in investing in equity securities. The Board reviewed the MFS Funds’ performance, noting that that the performance of the MFS Funds was satisfactory. The Board also considered the unitary fee paid to the Adviser by each MFS Fund and MFS’s fees paid by the Adviser.
The Board, including the Independent Trustees voting separately, approved the MFS Sub-Advisory Agreements for each MFS Fund after weighing the foregoing factors, none of which was dispositive in itself and may have been weighed differently by each Trustee. The Board’s conclusions with respect to each MFS Sub-Advisory Agreement were as follows: (a) the nature and extent of the services provided by MFS with respect to the MFS Funds were appropriate; (b) the performance of the MFS Funds had been satisfactory; (c) MFS’s fees for the MFS Funds and the unitary fee, considered in relation to the services provided, were fair and reasonable; (d) any additional potential benefits to MFS were not of a magnitude to materially affect the Board’s conclusions; and (e) fees paid to MFS adequately shared the economies of scale with each applicable MFS Fund by way of the relatively low fee structure of the Trusts.
Approval of DoubleLine Capital LP Sub-Advisory Agreements
At in-person meetings held prior to June 30, 2016, the Board also considered proposals to continue the separate Sub-Advisory Agreements (the “DoubleLine Sub-Advisory Agreements”) between the Adviser and DoubleLine Capital LP (“DoubleLine”) with respect to the SPDR DoubleLine Total Return Tactical ETF, a series of the SSGA Active Trust, and State Street DoubleLine Total Return Tactical Portfolio, a series of the SSGA Master Trust (together, the “Current DoubleLine Funds”), and to approve the DoubleLine Sub-Advisory Agreements between the Adviser and DoubleLine with respect to the SPDR DoubleLine Short Duration Total Return Tactical ETF and SPDR DoubleLine Emerging Markets Fixed Income ETF, each a series of SSGA Active Trust (together with the Current DoubleLine Funds, the “DoubleLine Funds”), under which each of the DoubleLine Funds would be sub-advised by DoubleLine. The Independent Trustees also met separately with their independent legal counsel to consider the DoubleLine Sub-Advisory Agreements.
In evaluating the DoubleLine Sub-Advisory Agreements, the Board drew on materials provided to them by DoubleLine and the Adviser. In deciding whether to approve the DoubleLine Sub-Advisory Agreements, the Board considered various factors, including the (i) nature, extent and quality of services provided, or expected to be provided, by DoubleLine with respect to the DoubleLine Funds under the DoubleLine Sub-Advisory Agreements; and (ii) investment performance of the Current DoubleLine Funds. The Board was apprised of the portion of the advisory fee that the Adviser would pay to DoubleLine under the DoubleLine Sub-Advisory Agreements and also considered that such fees would be paid directly by the Adviser and would not result in increased fees payable by the DoubleLine Funds.
The Board considered the background and experience of DoubleLine’s senior management and, in particular, DoubleLine’s experience in investing in fixed income securities. The Board reviewed the Current DoubleLine Funds’ performance, noting that that the performance of the Current DoubleLine Funds was satisfactory. The Board also considered the unitary fee paid, or to be paid, to the Adviser by each DoubleLine Fund and DoubleLine’s fees paid by the Adviser.
The Board, including the Independent Trustees voting separately, approved the DoubleLine Sub-Advisory Agreements for the DoubleLine Funds after weighing the foregoing factors, none of which was dispositive in itself and may have been weighed differently by each Trustee. The Board’s conclusions with respect to each of the DoubleLine Sub-Advisory Agreements were as follows: (a) the nature and extent of the services provided, or expected to be provided, by
19
Table of Contents
SPDR DoubleLine Emerging Markets Fixed Income ETF
OTHER INFORMATION (continued)
June 30, 2016 (Unaudited)
DoubleLine with respect to the DoubleLine Funds were adequate and appropriate; (b) the performance of the Current DoubleLine Funds had been satisfactory; (c) DoubleLine’s fees for the DoubleLine Funds and the unitary fee, considered in relation to the services provided, or expected to be provided, were fair and reasonable; (d) any additional potential benefits to DoubleLine were not of a magnitude to materially affect the Board’s conclusions; and (e) fees paid, or expected to be paid, to DoubleLine were expected to share economies of scale with each applicable DoubleLine Fund by way of the relatively low fee structure of the Trusts.
20
Table of Contents
SSGA Active Trust
SPDR DoubleLine Emerging Markets Fixed Income ETF
DISCLOSURE OF INFORMATION ABOUT FUND TRUSTEES AND OFFICERS
June 30, 2016 (Unaudited)
Name, Address and Year of Birth | Position(s) with Funds | Term of Time Served | Principal Occupation(s) During Past 5 Years | Number of Portfolios in Fund Complex Overseen by Trustee | Other Directorships Held by Trustee | |||||||
Independent Trustees | ||||||||||||
FRANK NESVET | Independent Trustee, Chairman, Trustee Committee Chair | Term: Unlimited Served: since September 2000 | Chief Executive Officer, Libra Group, Inc. (a financial services consulting company) (1998-present). | 218 | SPDR Index Shares Funds (Trustee); SPDR Series Trust (Trustee); SSGA Master Trust (Trustee). | |||||||
DAVID M. KELLY | Independent Trustee, Audit Committee Chair | Term: Unlimited Served: since September 2000 | Retired. | 218 | Chicago Stock Exchange (Former Director, retired); Penson Worldwide Inc. (Former Director, retired); SPDR Index Shares Funds (Trustee); SPDR Series Trust (Trustee); SSGA Master Trust (Trustee). | |||||||
BONNY EUGENIA BOATMAN c/o SSGA Active Trust | Independent Trustee | Term: Unlimited Served: since April 2010 | Retired. | 218 | SPDR Index Shares Funds (Trustee); SPDR Series Trust (Trustee); SSGA Master Trust (Trustee). | |||||||
DWIGHT D. CHURCHILL | Independent Trustee | Term: Unlimited Served: since April 2010 | Self-employed consultant since 2010; CEO and President, CFA Institute (June 2014-January 2015). | 218 | SPDR Index Shares Funds (Trustee); SPDR Series Trust (Trustee); SSGA Master Trust (Trustee); Affiliated Managers Group, Inc. (Director). | |||||||
CARL G. VERBONCOEUR | Independent Trustee | Term: Unlimited Served: since April 2010 | Self-employed consultant since 2009. | 218 | The Motley Fool Funds Trust (Trustee); SPDR Index Shares Funds (Trustee); SPDR Series Trust (Trustee); SSGA Master Trust (Trustee). | |||||||
21
Table of Contents
SSGA Active Trust
SPDR DoubleLine Emerging Markets Fixed Income ETF
DISCLOSURE OF INFORMATION ABOUT FUND TRUSTEES AND OFFICERS (continued)
June 30, 2016 (Unaudited)
Name, Address and Year of Birth | Position(s) with Funds | Term of Time Served | Principal Occupation(s) During Past 5 Years | Number of Portfolios in Fund Complex Overseen by Trustee | Other Directorships Held by Trustee | |||||||
Interested Trustee | ||||||||||||
JAMES E. ROSS* SSGA Funds Management, Inc. State Street Financial Center One Lincoln Street | Interested Trustee | Term: Unlimited Served as Trustee: since April 2010 | Chairman and Director, SSGA Funds Management, Inc. (2005-present); Senior Managing Director and Principal, State Street Global Advisors (2006-present); President, SSGA Funds Management, Inc. (2005-2012). | 299 | SPDR Index Shares Funds (Trustee); SPDR Series Trust (Trustee); SSGA Master Trust (Trustee); Select Sector SPDR Trust (Trustee); State Street Master Funds (Trustee); and State Street Institutional Investment Trust (Trustee). | |||||||
| * | Mr. Ross is an Interested Trustee because of his employment with the Adviser and ownership interest in an affiliate of the Adviser. Mr. Ross previously served as an Interested Trustee from November 2005 to December 2009. |
Name, Address and Year of Birth | Position(s) with Funds | Term of Office and Length of Time Served | Principal Occupation(s) During The Past 5 Years | |||
Officers | ||||||
ELLEN M. NEEDHAM | President | Term: Unlimited Served: since October 2012 | President and Director, SSGA Funds Management, Inc. (2001-present)*; Senior Managing Director, State Street Global Advisors (1992-present).* | |||
ANN M. CARPENTER | Vice President; Deputy Treasurer | Term: Unlimited Served: since August 2012; Term: Unlimited Served: since February 2016 | Chief Operating Officer, SSGA Funds Management, Inc. (2005-Present)*; Managing Director, State Street Global Advisors (2005-present).* | |||
MICHAEL P. RILEY | Vice President | Term: Unlimited Served: since February 2005 | Managing Director, State Street Global Advisors and SSGA Funds Management, Inc. (February 2015-present); Vice President, State Street Global Advisors and SSGA Funds Management, Inc. (2008-February 2015); Principal, State Street Global Advisors and SSGA Funds Management, Inc. (2005-2008). |
22
Table of Contents
SSGA Active Trust
SPDR DoubleLine Emerging Markets Fixed Income ETF
DISCLOSURE OF INFORMATION ABOUT FUND TRUSTEES AND OFFICERS (continued)
June 30, 2016 (Unaudited)
Name, Address and Year of Birth | Position(s) with Funds | Term of Office and Length of Time Served | Principal Occupation(s) During The Past 5 Years | |||
JOSHUA A. WEINBERG | Chief Legal Officer | Term: Unlimited Served: since February 2015 | Vice President and Managing Counsel, State Street Global Advisors (2011-present); Clerk, SSGA Funds Management, Inc. (2013-present); Associate, Financial Services Group, Dechert LLP (2006-2011). | |||
CHRISTOPHER A. MADDEN | Secretary | Term: Unlimited Served: since August 2013 | Vice President and Senior Counsel, State Street Bank and Trust Company (2013-present); Counsel, Atlantic Fund Services (2009-2013); Vice President.* | |||
PATRICIA A. MORISETTE | Assistant Secretary | Term: Unlimited Served: since February 2015 | Vice President and Counsel, State Street Bank and Trust Company (2014-present); Assistant Vice President and Counsel, John Hancock Financial Services (2011-2013); Independent legal consultant (2009-2011); Associate, Bingham McCutchen LLP (2003-2009).*,** | |||
BRUCE S. ROSENBERG | Treasurer | Term: Unlimited Served: since February 2016 | Managing Director, State Street Global Advisors and SSGA Funds Management, Inc. (July 2015-present; Director, Credit Suisse (April 2008-July 2015)). | |||
CHAD C. HALLETT | Deputy Treasurer | Term: Unlimited Served: since February 2016 | Vice President, State Street Global Advisors and SSGA Funds Management, Inc. (November 2014-present); Vice President, State Street Bank and Trust Company (2001-November 2014).* | |||
SUJATA UPRETI | Assistant Treasurer | Term: Unlimited Served: since February 2016 | Vice President, State Street Global Advisors and SSGA Funds Management, Inc. (May 2015-present; Assistant Director, Cambridge Associates, LLC (July 2014-January 2015); Vice President, Bank of New York Mellon (July 2012-August 2013); Manager, PricewaterhouseCoopers, LLP (September 2003-July 2012)). | |||
DANIEL FOLEY | Assistant Treasurer | Term: Unlimited Served: since February 2016 | Vice President, State Street Global Advisors and SSGA Funds Management, Inc. (April 2007-present).* | |||
BRIAN HARRIS | Chief Compliance Officer and Anti-Money Laundering Officer | Term: Unlimited Served: since November 2013 | Managing Director, State Street Global Advisors and SSGA Funds Management, Inc. (June 2013-present)*; Senior Vice President and Global Head of Investment Compliance, BofA Global Capital Management (2010-2013); Director of Compliance, AARP Financial Inc. (2008-2010). |
| * | Served in various capacities and/or with various affiliated entities during noted time period. |
| ** | Served in various capacities and/or with unaffiliated mutual funds or closed-end funds for which State Street Bank and Trust Company or its affiliates act as a provider of services during the noted time period. |
Statement of Additional information (SAI) includes additional information about Fund directors and is available, without charge, upon request and by calling 1-866-787-2257.
23
Table of Contents
SSGA Active Trust
Trustees
Bonny E. Boatman
Dwight D. Churchill
David M. Kelly
Frank Nesvet, Chairman
James E. Ross
Carl G. Verboncoeur
Officers
Ellen M. Needham, President
Bruce Rosenberg, Treasurer
Ann Carpenter, Vice President and Deputy Treasurer
Michael P. Riley, Vice President
Chad C. Hallett, Deputy Treasurer
Sujata Upreti, Assistant Treasurer
Daniel Foley, Assistant Treasurer
Christopher A. Madden, Secretary
Patricia A. Morisette, Assistant Secretary
Brian Harris, Chief Compliance Officer and Anti-Money Laundering Officer
Joshua A. Weinberg, Chief Legal Officer
Investment Manager and Administrator
SSGA Funds Management, Inc.
State Street Financial Center
One Lincoln Street
Boston, MA 02111
Distributor
State Street Global Markets, LLC
One Lincoln Street
Boston, MA 02111
Custodian, Sub-Administrator and Transfer Agent
State Street Bank and Trust Company
One Lincoln Street
Boston, MA 02111
Legal Counsel
Morgan, Lewis & Bockius LLP
1111 Pennsylvania Avenue, NW
Washington, DC 20004
Independent Registered Public Accounting Firm
Ernst & Young LLP
200 Clarendon Street
Boston, MA 02116
Fund Shares are distributed by State Street Global Markets, LLC, a wholly-owned subsidiary of State Street Corporation. State Street Global Markets, LLC; member FINRA, SIPC.
The information contained in this report is intended for the general information of shareholders of the Trust. This report is not authorized for distribution to prospective investors unless preceded or accompanied by a current Trust prospectus which contains important information concerning the Trust. You may obtain a current prospectus and SAI from the Distributor by calling 1-866-787-2257 or visiting www.spdrs.com Please read the prospectus carefully before you invest.
SPDREMTLAR IBG-20859
Table of Contents
Annual Report
30 June 2016
SSGA Active Trust
State Street Clarion Global Infrastructure & MLP Portfolio

The information contained in this report is intended for the general information of shareholders of the Portfolio and shareholders of any fund or any private client invested in the Portfolio. Generally, shares of the Portfolio may be purchased only by or on behalf of other registered investment companies or private clients for which the Adviser or an affiliate serves as investment adviser (or in a similar capacity). This report is not authorized for distribution (i) to prospective investors in any fund invested in the Portfolio unless preceded or accompanied by a current offering document for such fund or (ii) to prospective eligible investors in the Portfolio unless preceded or accompanied by a current offering document of the Portfolio. Eligible investors in the Portfolio may obtain a current prospectus and SAI from the Distributor by calling 1-866-787-2257. Please read the offering document carefully before investing in the Portfolio.
Table of Contents
Management Discussion of Portfolio Performance & Performance Summary | 1 | |||
| 4 | ||||
| 5 | ||||
| 7 | ||||
| 10 | ||||
| 11 | ||||
| 17 | ||||
| 18 |
The information contained in this report is intended for the general information of shareholders of the Portfolio and shareholders of any fund or any private client invested in the Portfolio. Generally, shares of the Portfolio may be purchased only by or on behalf of other registered investment companies or private clients for which the Adviser or an affiliate serves as investment adviser (or in a similar capacity). This report is not authorized for distribution (i) to prospective investors in any fund invested in the Portfolio unless preceded or accompanied by a current offering document for such fund or (ii) to prospective eligible investors in the Portfolio unless preceded or accompanied by a current offering document of the Portfolio. Eligible investors in the Portfolio may obtain a current prospectus and SAI from the Distributor by calling 1-866-787-2257. Please read the offering document carefully before investing in the Portfolio.
Table of Contents

STATE STREET CLARION GLOBAL INFRASTRUCTURE & MLP PORTFOLIO —
MANAGEMENT DISCUSSIONOF PORTFOLIO PERFORMANCE (UNAUDITED)
The State Street Clarion Global Infrastructure & MLP Portfolio (the “Portfolio”) seeks to provide long-term total return. The Portfolio’s benchmark is the MSCI ACWI IMI Index (the “Index”).
For the 12-month period ended June 30, 2016 (the “Reporting Period”), the total return for the Portfolio was 9.75%, and the total return for the Index was -3.87%. The Portfolio’s secondary benchmark, the State Street Clarion Global Infrastructure & MLP Composite Index (the “Secondary Index”), yielded a return of 5.59% for the Reporting Period. The returns of the Portfolio and both the Index and the Secondary Index reflect the reinvestment of dividends and other income. The Portfolio’s performance reflects the expenses of managing the Portfolio, including brokerage and advisory expenses. Both the Index and the Secondary Index are unmanaged and their returns do not reflect fees and expenses of any kind, which would have a negative impact on returns.
The Portfolio outperformed both the Index and Secondary Index during the Reporting Period. Global listed infrastructure saw positive returns helped by an environment of declining interest rates leading investors to seek safety and yield in more stable equities. Master Limited Partnership (“MLP”) securities were not as fortunate as they declined alongside falling commodity prices during the Reporting Period. By geography, the Portfolio’s absolute performance benefited from every region except Emerging Markets. Americas were the main driver of the positive performance. Investments in American utilities were the best contributor, followed by the tower sector. Their performance more than offset the negative returns of MLPs and renewable energy equities. MLPs showed a strong correlation with oil prices and regained some of their losses after oil bottomed in February. Asia was the next best region with all sectors seeing positive gains. Transportation and utilities led the way as the yield-seeking trade was a global theme, especially in 2016. The Portfolio’s attribution benefitted from Continental Europe where the two best performing sectors, transportation and utilities, were also the Portfolio’s biggest allocations in the region. The U.K. showed great resilience despite the uncertainty due to the “Brexit” vote. While renewable energy investments saw slight losses, U.K. utilities reinforced the safety trade and saw positive returns in U.S. dollar terms, even after the British pound depreciated following the Brexit Referendum.
On an individual security level, the top positive contributors to the Portfolio’s performance were Crown Castle International Corp., NextEra Energy Inc., and Transurban Group Ltd. Crown Castle International, a U.S. listed tower company, beat and raised guidance in the first quarter due to M&A and lower than expected carrier non-renewals. Transurban Group is an Australian toll road company. Positive traffic growth, completed and potential acquisitions, and U.S. organic growth helped drive its strong performance. NextEra Energy is a U.S. integrated utility. The Florida based utility benefited as being one of the premier U.S. utilities with a strong presence in renewable energy and one of the best growth stories in a sector that continued to be bid up during the period. The top detractors from the Portfolio’s performance were Williams Companies, TerraForm Power Inc., and Summit Midstream Partners LP. Williams Companies is an energy infrastructure company operating in the U.S. The Energy Transfer Equity acquisition drama that led to a termination of the deal damaged Williams Companies in an already sold off market with decreasing commodity prices. TerraForm Power is a renewable energy infrastructure company that suffered from the lack of corporate governance of its parent, SunEdison, who was greatly over leveraged before declaring bankruptcy. Summit Midstream is a gathering and processing MLP that suffered from worse than expected volumes due to timing of well completions.
The Portfolio did not invest in derivatives during the Reporting Period.
The views expressed above reflect those of the Portfolio’s portfolio manager only through the Reporting Period, and do not necessarily represent the views of the Adviser as a whole. Any such views are subject to change at any time based upon market or other conditions and the Adviser disclaims any responsibility to update such views. These views may not be relied on as investment advice and, because investment decisions for a fund are based on numerous factors, may not be relied on as an indication of trading intent on behalf of any fund.
1
Table of Contents
STATE STREET CLARION GLOBAL INFRASTRUCTURE & MLP PORTFOLIO —
PERFORMANCE SUMMARY (UNAUDITED)
The following performance chart of the Portfolio’s total return at net asset value, the total return based on market price and its benchmark index is provided for comparative purposes only and represents the periods noted. The Portfolio’s per share net asset value (“NAV”) is the value of one share of the Portfolio and is calculated by dividing the value of total assets less total liabilities by the number of shares outstanding. The NAV return is based on the NAV of the Portfolio and the market return is based on the market price per share of the Portfolio. The market price used to calculate the market return is determined by using the midpoint between the highest bid and the lowest offer on the exchange on which the shares of the Portfolio are listed for trading, as of the time that the Portfolio’s NAV is calculated. Since shares of the Portfolio did not trade in the secondary market until the day after the Portfolio’s inception, for the period from inception to the first day of secondary market trading in shares of the Portfolio (1/20/15, 1/21/15, respectively), the NAV of the Portfolio is used as a proxy for the secondary market trading price to calculate market returns. NAV and market returns assume that dividends and capital gain distributions have been reinvested in the Portfolio at NAV. Market returns do not include brokerage commissions that may be payable on secondary market transactions. If brokerage commissions were included market returns would be lower.
An index is a statistical measure of a specified financial market or sector. An index does not actually hold a portfolio of securities and therefore does not reflect deductions for fees or expenses. In comparison, the Portfolio’s performance is negatively impacted by these deductions.
Performance quoted represents past performance, which is no guarantee of future results. Investment return and principal value will fluctuate, so you may have a gain or loss when shares are sold. Current performance may be higher or lower than that quoted. The returns do not reflect the deduction of taxes that a shareholder would pay on Fund distributions or on the redemption or sale of Fund shares. The total expense ratio for State Street Clarion Global Infrastructure & MLP Portfolio as stated in the Fees and Expenses table of the prospectus dated October 31, 2015 is 0.30%.
PERFORMANCE AS OF JUNE 30, 2016
| CUMULATIVE TOTAL RETURN | AVERAGE ANNUAL TOTAL RETURN | |||||||||||||||||||||||||||||
| NET ASSET VALUE | PRIMARY BENCHMARK: MSCI ACWI IMI Index | SECONDARY State Street Clarion Global | NET ASSET VALUE | PRIMARY BENCHMARK: MSCI ACWI IMI Index | SECONDARY State Street Clarion Global | |||||||||||||||||||||||||
| ONE YEAR | 9.75% | –3.87% | 5.59% | 9.75% | –3.87% | 5.59% | ||||||||||||||||||||||||
| SINCE INCEPTION (1) | 64.46% | 32.39% | 42.66% | 12.16% | 6.69% | 8.55% | ||||||||||||||||||||||||
| (1) | For the period March 1, 2012 to June 30, 2016 |
MSCI ACWI IMI INDEX
The MSCI ACWI IMI Index is a free float-adjusted market capitalization-weighted index that is designed to measure the combined equity market performance of developed and emerging markets. The Index covers approximately 99% of the global equity investment opportunity set.
STATE STREET CLARION GLOBAL INFRASTRUCTURE & MLP COMPOSITE INDEX
The State Street Clarion Global Infrastructure & MLP Composite Index is a blended benchmark consisting of 85% FTSE Global Core Infrastructure 50/50 Index and 15% Alerian MLP Index. Prior to 3/2/2015, the blended benchmark consisted of 85% UBS Global 50/50 Infrastructure & Utilities Index and 15% Alerian MLP Index.
2
Table of Contents
STATE STREET CLARION GLOBAL INFRASTRUCTURE & MLP PORTFOLIO —
PERFORMANCE SUMMARY (CONTINUED) (UNAUDITED)
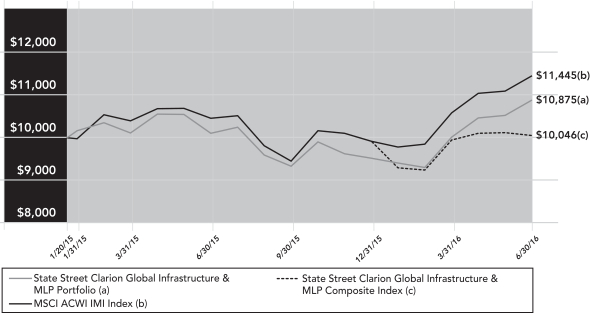
Past Performance is not indicative of future results.
Index Returns are unmanaged and do not reflect the deduction of any fees or expenses. Index returns reflect all items of income, gain and loss and the reinvestment of dividends and other income.
Line graph is based on cumulative total return.
3
Table of Contents
STATE STREET CLARION GLOBAL INFRASTRUCTURE & MLP PORTFOLIO —
PORTFOLIO SUMMARY (UNAUDITED)
TOP FIVE HOLDINGS AS OF JUNE 30, 2016
| DESCRIPTION | CROWN CASTLE INTERNATIONAL CORP. REIT | AMERICAN TOWER CORP. REIT | VINCI SA | ENBRIDGE, INC. | NEXTERA ENERGY, INC. | |||||||||
| MARKET VALUE | $804,847 | 681,660 | 662,491 | 640,561 | 562,024 | |||||||||
| % OF NET ASSETS | 4.7 | 4.0 | 3.8 | 3.7 | 3.3 | |||||||||
(The five largest holdings are subject to change, and there are no guarantees the Portfolio will continue to remain invested in any particular
security.)
INDUSTRY BREAKDOWN AS OF JUNE 30, 2016*
| % OF NET ASSETS | ||||||||
Oil, Gas & Consumable Fuels | 27.4 | % | ||||||
Electric Utilities | 20.8 | |||||||
Multi-Utilities | 11.6 | |||||||
Real Estate Investment Trusts (REITs) | 8.7 | |||||||
Transportation Infrastructure | 7.9 | |||||||
Road & Rail | 6.6 | |||||||
Construction & Engineering | 6.2 | |||||||
Independent Power Producers & Energy Traders | 3.3 | |||||||
Gas Utilities | 1.4 | |||||||
Communications Equipment | 1.0 | |||||||
Water Utilities | 0.9 | |||||||
Short-Term Investment | 4.6 | |||||||
Liabilities in Excess of Other Assets | (0.4 | ) | ||||||
TOTAL | 100.0 | % | ||||||
| * | The Portfolio’s industry breakdown is expressed as a percentage of net assets and may change over time. |
4
Table of Contents
SSGA Active Trust
State Street Clarion Global Infrastructure & MLP Portfolio
June 30, 2016
Security Description | Shares | Value | ||||||
COMMON STOCKS — 95.8% | ||||||||
AUSTRALIA — 3.7% | ||||||||
DUET Group (a) | 93,124 | $ | 174,383 | |||||
Transurban Group Stapled Security (a) | 51,741 | 465,269 | ||||||
|
| |||||||
| 639,652 | ||||||||
|
| |||||||
CANADA — 8.2% | ||||||||
Canadian Pacific Railway, Ltd. | 2,600 | 332,993 | ||||||
Enbridge, Inc. | 15,200 | 640,561 | ||||||
Pembina Pipeline Corp. | 9,600 | 290,210 | ||||||
Veresen, Inc. | 18,600 | 156,826 | ||||||
|
| |||||||
| 1,420,590 | ||||||||
|
| |||||||
FRANCE — 5.5% | ||||||||
Aeroports de Paris (a) | 1,312 | 143,912 | ||||||
Groupe Eurotunnel SE (a) | 13,776 | 145,669 | ||||||
Vinci SA (a) | 9,378 | 662,491 | ||||||
|
| |||||||
| 952,072 | ||||||||
|
| |||||||
HONG KONG — 1.3% | ||||||||
CLP Holdings, Ltd. (a) | 21,000 | 214,523 | ||||||
|
| |||||||
ITALY — 1.4% | ||||||||
Ei Towers SpA (a) (b) | 3,418 | 173,629 | ||||||
Snam SpA (a) | 10,515 | 62,931 | ||||||
|
| |||||||
| 236,560 | ||||||||
|
| |||||||
JAPAN — 4.6% | ||||||||
Central Japan Railway Co. (a) | 1,500 | 268,551 | ||||||
East Japan Railway Co. (a) | 3,600 | 335,819 | ||||||
Hokkaido Electric Power Co., Inc. (a) | 23,200 | 189,697 | ||||||
|
| |||||||
| 794,067 | ||||||||
|
| |||||||
SOUTH KOREA — 1.0% | ||||||||
Korea Electric Power Corp. (a) | 3,230 | 169,549 | ||||||
|
| |||||||
SPAIN — 7.2% | ||||||||
Abertis Infraestructuras SA (a) | 24,584 | 363,685 | ||||||
Enagas SA (a) | 5,769 | 176,435 | ||||||
Ferrovial SA (a) | 20,844 | 408,524 | ||||||
Red Electrica Corp. SA (a) | 3,248 | 290,534 | ||||||
|
| |||||||
| 1,239,178 | ||||||||
|
| |||||||
SWITZERLAND — 1.4% | ||||||||
Flughafen Zuerich AG (a) | 1,370 | 243,023 | ||||||
|
| |||||||
UNITED KINGDOM — 3.4% | ||||||||
National Grid PLC (a) | 24,662 | 364,175 | ||||||
Renewables Infrastructure Group, Ltd. | 56,821 | 73,870 | ||||||
United Utilities Group PLC (a) | 10,464 | 145,639 | ||||||
|
| |||||||
| 583,684 | ||||||||
|
| |||||||
UNITED STATES — 58.1% | ||||||||
American Electric Power Co., Inc. | 4,100 | 287,369 | ||||||
American Tower Corp. REIT | 6,000 | 681,660 | ||||||
Avangrid, Inc. | 1,500 | 69,090 | ||||||
Boardwalk Pipeline Partners L.P. (c) | 8,600 | 150,070 | ||||||
Crown Castle International Corp. REIT | 7,935 | 804,847 | ||||||
Delek Logistics Partners L.P. | 2,900 | 77,459 | ||||||
Dominion Resources, Inc. | 3,368 | 262,468 | ||||||
DTE Energy Co. | 5,484 | 543,574 | ||||||
Edison International | 4,009 | 311,379 | ||||||
Enbridge Energy Partners L.P. | 6,100 | 141,520 | ||||||
Energy Transfer Partners L.P. (c) | 6,729 | 256,173 | ||||||
Enterprise Products Partners L.P. (c) | 17,400 | 509,124 | ||||||
Eversource Energy | 4,862 | 291,234 | ||||||
Exelon Corp. | 2,398 | 87,191 | ||||||
ITC Holdings Corp. | 3,700 | 173,234 | ||||||
Kinder Morgan, Inc. | 20,900 | 391,248 | ||||||
Magellan Midstream Partners L.P. (c) | 4,100 | 311,600 | ||||||
MPLX L.P. | 8,700 | 292,581 | ||||||
NextEra Energy Partners L.P. | 4,031 | 122,462 | ||||||
NextEra Energy, Inc. | 4,310 | 562,024 | ||||||
NiSource, Inc. | 4,519 | 119,844 | ||||||
Norfolk Southern Corp. | 2,500 | 212,825 | ||||||
NRG Yield, Inc. Class A | 16,600 | 252,652 | ||||||
Pattern Energy Group, Inc. | 5,500 | 126,335 | ||||||
PG&E Corp. | 7,900 | 504,968 | ||||||
Sempra Energy | 4,805 | 547,866 | ||||||
Shell Midstream Partners L.P. (c) | 3,886 | 131,308 | ||||||
Tallgrass Energy Partners L.P. | 6,000 | 276,120 | ||||||
Targa Resources Corp. | 8,900 | 375,046 | ||||||
Tesoro Logistics L.P. (c) | 1,800 | 89,154 | ||||||
Valero Energy Partners L.P. (c) | 3,700 | 173,937 | ||||||
Westar Energy, Inc. | 2,200 | 123,398 | ||||||
Williams Cos., Inc. | 13,500 | 292,005 | ||||||
Williams Partners L.P. (c) | 5,200 | 180,128 | ||||||
Xcel Energy, Inc. | 6,400 | 286,592 | ||||||
|
| |||||||
| 10,018,485 | ||||||||
|
| |||||||
TOTAL COMMON STOCKS | 16,511,383 | |||||||
|
| |||||||
SHORT-TERM INVESTMENT — 4.6% |
| |||||||
State Street Institutional Liquid Reserves Fund, Premier Class 0.47% (d) (e) | 789,440 | 789,440 | ||||||
|
| |||||||
TOTAL INVESTMENTS — 100.4% | 17,300,823 | |||||||
LIABILITIES IN EXCESS OF OTHER | (62,764 | ) | ||||||
|
| |||||||
NET ASSETS — 100.0% | $ | 17,238,059 | ||||||
|
| |||||||
| (a) | Security is fair valued at year end by applying factors provided by independent third party in accordance with Portfolio’s valuation policy and procedures. The independent fair value service takes into account multiple factors including, but not limited to, movements in the U.S. securities markets, certain depositary receipts, futures contracts and foreign currency exchange rates that have occurred subsequent to the close of foreign securities exchanges. The use of the independent fair value service or alternative fair valuation methods would result in the investments being classified within Level 2 of the fair value hierarchy.Total market value of such securities represents 4,998,438 and 29.0% of net assets of the Portfolio at June 30, 2016. |
| (b) | Non-income producing security. |
| (c) | Master Limited Partnership. Total market value of such securities represents $1,801,494 or 10.5% of net assets |
| (d) | The Portfolio may invest in certain money market funds managed by SSGA Funds Management, Inc. Amounts related to these transactions during the year ended June 30, 2016 are shown in the Affiliate Table below. |
| (e) | The rate shown is the annualized seven-day yield at June 30, 2016. |
REIT Real Estate Investment Trust
See accompanying notes to financial statements.
5
Table of Contents
SSGA Active Trust
State Street Clarion Global Infrastructure & MLP Portfolio
SCHEDULE OF INVESTMENTS (continued)
June 30, 2016
The following table summarizes the value of the Portfolio’s investments accordingly to the fair value hierarchy as of June 30, 2016.
Description | Level 1 — Quoted Prices | Level 2 — Other Significant Observable Inputs | Level 3 — Significant Unobservable Inputs | Total | ||||||||||||
ASSETS: | ||||||||||||||||
INVESTMENTS: | ||||||||||||||||
Common Stocks | ||||||||||||||||
Australia | $ | — | $ | 639,652 | $ | — | $ | 639,652 | ||||||||
Canada | 1,420,590 | — | — | 1,420,590 | ||||||||||||
France | — | 952,072 | — | 952,072 | ||||||||||||
Hong Kong | — | 214,523 | — | 214,523 | ||||||||||||
Italy | — | 236,560 | — | 236,560 | ||||||||||||
Japan | — | 794,067 | — | 794,067 | ||||||||||||
South Korea | — | 169,549 | — | 169,549 | ||||||||||||
Spain | — | 1,239,178 | — | 1,239,178 | ||||||||||||
Switzerland | — | 243,023 | — | 243,023 | ||||||||||||
United Kingdom | 73,870 | 509,814 | — | 583,684 | ||||||||||||
United States | 10,018,485 | — | — | 10,018,485 | ||||||||||||
Short-Term Investment | 789,440 | — | — | 789,440 | ||||||||||||
|
|
|
|
|
|
|
| |||||||||
TOTAL INVESTMENTS | $ | 12,302,385 | $ | 4,998,438 | $ | — | $ | 17,300,823 | ||||||||
|
|
|
|
|
|
|
| |||||||||
Affiliate Table
| Number of Shares Held at 6/30/15 | Value at 6/30/15 | Shares Purchased | Shares Sold | Number of Shares Held at 6/30/16 | Value at 6/30/16 | Dividend Income | Realized Gain (Loss) | |||||||||||||||||||||||||
State Street Institutional Liquid Reserves Fund, Premier Class | 284,165 | $ | 284,165 | 7,459,882 | 6,954,607 | 789,440 | $ | 789,440 | $ | 523 | $ | — | ||||||||||||||||||||
See accompanying notes to financial statements.
6
Table of Contents
SSGA Active Trust
State Street Clarion Global Infrastructure & MLP Portfolio
STATEMENT OF ASSETS AND LIABILITIES
June 30, 2016
ASSETS | ||||
Investments in unaffiliated issuers, at value (Note 2) | $ | 16,511,383 | ||
Investments in affiliated issuers, at value (Note 2) | 789,440 | |||
|
| |||
Total Investments | 17,300,823 | |||
Foreign currency, at value | 16,669 | |||
Receivable for investments sold | 127,410 | |||
Dividends receivable — unaffiliated issuers (Note 2) | 62,098 | |||
Dividend receivable — affiliated issuers (Note 2) | 56 | |||
Receivable from Adviser (Note 3) | 4,134 | |||
Receivable for foreign taxes recoverable | 13,771 | |||
|
| |||
TOTAL ASSETS | 17,524,961 | |||
|
| |||
LIABILITIES | ||||
Payable for investments purchased | 279,018 | |||
Payable for fund shares repurchased | 3,750 | |||
Advisory fee payable (Note 3) | 4,134 | |||
|
| |||
TOTAL LIABILITIES | 286,902 | |||
|
| |||
NET ASSETS | $ | 17,238,059 | ||
|
| |||
NET ASSETS CONSIST OF: | ||||
Paid-in Capital | $ | 16,648,027 | ||
Undistributed (distribution in excess of) net investment income (loss) | — | |||
Accumulated net realized gain (loss) on investments, foreign currency transactions, and futures contracts | (1,665,724 | ) | ||
Net unrealized appreciation (depreciation) on: | ||||
Investments | 2,257,322 | |||
Foreign currency transactions | (1,566 | ) | ||
|
| |||
NET ASSETS | $ | 17,238,059 | ||
|
| |||
NET ASSET VALUE PER SHARE | ||||
Net asset value per share | $ | 10.29 | ||
|
| |||
Shares outstanding | 1,675,757 | |||
|
| |||
COST OF INVESTMENTS: | ||||
Investments in unaffiliated issuers | $ | 14,254,061 | ||
Investments in affiliated issuers | 789,440 | |||
|
| |||
Total cost of investments | $ | 15,043,501 | ||
|
| |||
Foreign currency, at cost | $ | 16,538 | ||
|
|
See accompanying notes to financial statements.
7
Table of Contents
SSGA Active Trust
State Street Clarion Global Infrastructure & MLP Portfolio
STATEMENT OF OPERATIONS
For the Year Ended June 30, 2016
INVESTMENT INCOME | ||||
Dividend income — unaffiliated issuers (Note 2) | $ | 448,506 | ||
Dividend income — affiliated issuers (Note 2) | 523 | |||
Dividend income from master limited partnership and related companies | 134,028 | |||
Return of capital from master limited partnerships and related companies | (138,518 | ) | ||
Foreign taxes withheld | (22,812 | ) | ||
|
| |||
TOTAL INVESTMENT INCOME (LOSS) | 421,727 | |||
|
| |||
EXPENSES | ||||
Advisory fee (Note 3) | 46,227 | |||
Trustees’ fees and expenses (Note 4) | 422 | |||
Miscellaneous expenses | 1,667 | |||
|
| |||
TOTAL EXPENSES | 48,316 | |||
|
| |||
Expenses waived/reimbursed by the Adviser (Note 3) | (46,227 | ) | ||
|
| |||
NET EXPENSES | 2,089 | |||
|
| |||
NET INVESTMENT INCOME (LOSS) | 419,638 | |||
|
| |||
REALIZED AND UNREALIZED GAIN (LOSS) | ||||
Net realized gain (loss) on: | ||||
Investment transactions — unaffiliated issuers | (1,638,134 | ) | ||
Foreign currency transactions | (2,226 | ) | ||
|
| |||
Net realized gain (loss) | (1,640,360 | ) | ||
|
| |||
Net change in unrealized appreciation/depreciation on: | ||||
Investment transactions — unaffiliated issuers | 2,734,296 | |||
Foreign currency transactions | (1,611 | ) | ||
|
| |||
Net change in unrealized appreciation/depreciation | 2,732,685 | |||
|
| |||
NET REALIZED AND UNREALIZED GAIN (LOSS) | 1,092,325 | |||
|
| |||
NET INCREASE (DECREASE) IN NET ASSETS FROM OPERATIONS | $ | 1,511,963 | ||
|
|
See accompanying notes to financial statements.
8
Table of Contents
SSGA Active Trust
State Street Clarion Global Infrastructure & MLP Portfolio
STATEMENTS OF CHANGES IN NET ASSETS
| Year Ended 6/30/16 | For the Period 1/20/15* - 6/30/15 | |||||||
INCREASE (DECREASE) IN NET ASSETS FROM OPERATIONS: | ||||||||
Net investment income (loss) | $ | 419,638 | $ | 213,493 | ||||
Net realized gain (loss) | (1,640,360 | ) | 415,237 | |||||
Net change in unrealized appreciation/depreciation | 2,732,685 | (476,929 | ) | |||||
|
|
|
| |||||
Net increase (decrease) in net assets resulting from operations | 1,511,963 | 151,801 | ||||||
|
|
|
| |||||
DISTRIBUTIONS TO SHAREHOLDERS FROM: | ||||||||
Net investment income | (480,070 | ) | (180,817 | ) | ||||
Net realized gains | (413,049 | ) | — | |||||
Return of capital | (39,003 | ) | — | |||||
|
|
|
| |||||
Total distributions to shareholders | (932,122 | ) | (180,817 | ) | ||||
|
|
|
| |||||
FROM BENEFICIAL INTEREST TRANSACTIONS: | ||||||||
In-kind transfer from CBRE Clarion Global Listed Infrastructure Fund, LP (Note 1) | — | 11,569,962 | ||||||
Contribution from SSGA Funds Management, Inc. (Note 1) | — | 4,000,100 | ||||||
Proceeds from sale of shares sold | 321,021 | 348,304 | ||||||
Reinvestment of distributions | 932,122 | 180,817 | ||||||
Cost of shares redeemed | (505,870 | ) | (159,222 | ) | ||||
|
|
|
| |||||
Net increase (decrease) in net assets from beneficial interest transactions | 747,273 | 15,939,961 | ||||||
|
|
|
| |||||
Net increase (decrease) in net assets during the period | 1,327,114 | 15,910,945 | ||||||
|
|
|
| |||||
Net assets at beginning of period | 15,910,945 | — | ||||||
|
|
|
| |||||
NET ASSETS AT END OF PERIOD | $ | 17,238,059 | $ | 15,910,945 | ||||
|
|
|
| |||||
Undistributed (distribution in excess of) net investment income (loss) | $ | — | $ | 26,377 | ||||
|
|
|
| |||||
SHARES OF BENEFICIAL INTEREST: | ||||||||
In-kind transfer from CBRE Clarion Global Listed Infrastructure Fund, LP (Note 1) | — | 1,176,596 | ||||||
Shares sold | 33,009 | 414,875 | ||||||
Reinvestment of distributions | 103,757 | 17,385 | ||||||
Shares redeemed | (54,490 | ) | (15,375 | ) | ||||
|
|
|
| |||||
Net increase (decrease) | 82,276 | 1,593,481 | ||||||
|
|
|
| |||||
| * | Inception date. |
See accompanying notes to financial statements.
9
Table of Contents
SSGA Active Trust
State Street Clarion Global Infrastructure & MLP Portfolio
Selected data for a share outstanding throughout each period
| Year Ended 6/30/16 | For the Period 1/21/15* - 6/30/15 | |||||||
Net asset value, beginning of period | $ | 9.99 | $ | 10.00 | ||||
|
|
|
| |||||
Income (loss) from investment operations: | ||||||||
Net investment income (loss) (a) | 0.26 | 0.14 | ||||||
Net realized and unrealized gain (loss) | 0.62 | (0.04 | ) | |||||
|
|
|
| |||||
Total from investment operations | 0.88 | 0.10 | ||||||
|
|
|
| |||||
Distributions to shareholders from: | ||||||||
Net investment income | (0.30 | ) | (0.11 | ) | ||||
Net realized gains | (0.26 | ) | — | |||||
Return of capital | (0.02 | ) | — | |||||
|
|
|
| |||||
Total distributions | (0.58 | ) | (0.11 | ) | ||||
|
|
|
| |||||
Net asset value, end of period | $ | 10.29 | $ | 9.99 | ||||
|
|
|
| |||||
Total return (b) | 9.75 | % | 1.00 | % | ||||
Ratios and Supplemental Data: | ||||||||
Net assets, end of period (in 000s) | $ | 17,238 | $ | 15,911 | ||||
Ratios to average net assets: | ||||||||
Total expenses | 0.31 | % | 0.30 | %(c) | ||||
Net expenses | 0.01 | % | 0.00 | %(c)(d) | ||||
Net investment income (loss) | 2.72 | % | 2.97 | %(c) | ||||
Portfolio turnover rate | 103 | % | 37 | %(e) | ||||
| * | Commencement of operations. |
| (a) | Net investment income per share is calculated using the average shares method. |
| (b) | Total return is calculated assuming a purchase of shares at net asset value on the first day and a sale at net asset value on the last day of each period reported. Distributions are assumed, for the purpose of this calculation, to be reinvested at net asset value per share on the respective payment dates of each distribution. Total return for periods of less than one year is not annualized. Broker commission charges are not included in this calculation. |
| (c) | Annualized. |
| (d) | Amount shown represents less than 0.005%. |
| (e) | Not annualized. |
See accompanying notes to financial statements.
10
Table of Contents
SSGA Active Trust
State Street Clarion Global Infrastructure & MLP Portfolio
June 30, 2016
| 1. | Organization |
SSGA Active Trust (the “Trust”), which is registered under the Investment Company Act of 1940, as amended (“1940 Act”), is an open-end management investment company that was organized as a Massachusetts business trust on March 30, 2011.
As of June 30, 2016, the Trust offered fourteen (14) funds, each of which represents a separate series of beneficial interest in the Trust (each a “Fund” and collectively, the “Funds”). The financial statements herein relate to the State Street Clarion Global Infrastructure & MLP Portfolio (the “Portfolio”), a separate nondiversified series of the Trust. The Portfolio operates as the master portfolio in a master feeder structure.
The Portfolio commenced operations on January 21, 2015, after it acquired the net assets of the CBRE Clarion Global Listed Infrastructure Fund, LP (the “Partnership”), via the Feeder Fund. The acquisition of net assets of the Partnership was accomplished by an in-kind transfer of all of the Partnership’s net assets amounting to $11,569,962 and a cash transfer of $196,000 by the Partnership in exchange for 1,176,596 shares of the Feeder Fund (the “transaction”). The Partnership elected to make a deemed sale election related to the transaction, pursuant to the subscription agreement. SSGA FM contributed initial capital of $4,000,100 to the Feeder Fund in exchange for the Feeder Fund’s shares. Immediately prior to the acquisition, the Portfolio did not have any assets or liabilities nor operations or investment activities.
Under the Trust’s organizational documents, its officers and trustees are indemnified against certain liabilities arising out of the performance of their duties to the Trust. Additionally, in the normal course of business, the Trust enters into contracts with service providers that contain general indemnification clauses. The Trust’s maximum exposure under these arrangements is unknown as this could involve future claims that may be made against the Trust that have not yet occurred.
| 2. | Summary of Significant Accounting Policies |
The following is a summary of significant accounting policies followed by the Trust in the preparation of its financial statements:
The preparation of financial statements in accordance with U.S. generally accepted accounting principles (“U.S. GAAP”) requires management to make estimates and assumptions that affect the reported amounts and disclosures in the financial statements. Actual results could differ from those estimates. The Portfolio is an investment company under U.S. GAAP and follows the accounting and reporting guidance applicable to investment companies.
Security Valuation
The Portfolio’s investments are valued at fair value each day that the Portfolio’s listing exchange is open and, for financial reporting purposes, as of the report date should the reporting period end on a day that the Portfolio’s listing exchange is not open. Fair value is generally defined as the price a fund would receive to sell an asset or pay to transfer a liability in an orderly transaction between market participants at the measurement date. By its nature, a fair value price is a good faith estimate of the valuation in a current sale and may not reflect an actual market price. The investments of the Portfolio are valued pursuant to the policy and procedures developed by the Oversight Committee (the “Committee”) and approved by the Board. The Committee provides oversight of the valuation of investments for the Portfolio. The Board has responsibility for determining the fair value of investments. Valuation techniques used to value the Portfolio’s investments by major category are as follows:
| • | Equity investments (including preferred stocks and registered investment companies that are exchange-traded funds) traded on a recognized securities exchange for which market quotations are readily available are valued at the last sale price or official closing price, as applicable, on the primary market or exchange on which they trade. Equity investments traded on a recognized exchange for which there were no sales on that day are valued at the last published sale price or at fair value. |
| • | Investments in registered investment companies (including money market funds) or other unitized pooled investment vehicles that are not traded on an exchange are valued at that day’s published net asset value per share or unit. |
11
Table of Contents
SSGA Active Trust
State Street Clarion Global Infrastructure & MLP Portfolio
NOTES TO FINANCIAL STATEMENTS (continued)
June 30, 2016
In the event prices or quotations are not readily available or that the application of these valuation methods results in a price for an investment that is deemed to be not representative of the fair value of such investment, fair value will be determined in good faith by the Committee, in accordance with the valuation policy and procedures approved by the Board.
A “significant event” is an event that the Trustee believes, with a reasonably high degree of certainty, has caused the closing market prices of a Portfolio’s securities to no longer reflect their value at the time of the Portfolio net asset value calculation. Fair value may be determined using an independent fair value service under valuation procedures approved by the Trustee. The independent fair value service takes into account multiple factors including, but not limited to, movements in the U.S. securities markets, certain depositary receipts, futures contracts and foreign currency exchange rates that have occurred subsequent to the close of foreign securities exchanges. The use of the independent fair value service or alternative fair valuation methods would result in the investments being classified within Level 2 of the fair value hierarchy. At June 30, 2016, the independent fair value service was used for certain foreign securities in the Portfolio’s, and these securities were classified within Level 2 of the fair value hierarchy.
Various inputs are used in determining the value of the Portfolio’s investments. These inputs are categorized into a hierarchy consisting of three broad levels for financial reporting purposes.
The Portfolio values its assets and liabilities at fair value using a hierarchy that prioritizes the inputs to valuation techniques giving the highest priority to readily available unadjusted quoted prices in active markets for identical assets or liabilities (Level 1 measurements) and the lowest priority to unobservable inputs (Level 3 measurements) when market prices are not readily available or reliable. The categorization of a value determined for an investment within the hierarchy is based upon the pricing transparency of the investment and is not necessarily an indication of the risk associated with investing in it.
The three levels of the fair value hierarchy are as follows:
| • | Level 1 — Unadjusted quoted prices in active markets for identical assets or liabilities; |
| • | Level 2 — Inputs other than quoted prices included within Level 1 that are observable for the assets or liabilities either directly or indirectly, including quoted prices for similar assets or liabilities in active markets, quoted prices for identical or similar assets or liabilities in markets that are not considered to be active, inputs other than quoted prices that are observable for the asset or liability (such as exchange rates, financing terms, interest rates, yield curves, volatilities, prepayment speeds, loss severities, credit risks and default rates) or other market-corroborated inputs; and |
| • | Level 3 — Unobservable inputs for the asset or liability, including the Committee’s assumptions used in determining the fair value of investments. |
The value of the Portfolio’s investments according to the fair value hierarchy as of June 30, 2016, is disclosed in the Schedule of Investments.
Changes in valuation techniques may result in transfers in or out of an assigned level within the fair value hierarchy. Transfers between different levels of the fair value hierarchy are recognized at the end of the reporting period.
The Portfolio had transfers from Level 1 to Level 2 during the year ended June 30, 2016 in the amount of $3,117,437. At June 30, 2016 these investments applied factor prices provided by an independent third party in accordance with the Portfolio’s valuation policy and procedures. At June 30, 2015 these investments were valued at exchange closing prices in accordance with the Portfolio’s valuation policy.
Investment Transactions and Income Recognition
Investment transactions are accounted for on trade date for financial reporting purposes. Realized gains and losses from the sale or disposition of investments and foreign exchange transactions, if any, are determined using the identified cost method. Dividend income and capital gain distributions, if any, are recognized daily on the ex-dividend date, net of any foreign taxes withheld at source, if any. Non-cash dividends received in the form of stock are recorded as dividend income at fair value. Such amounts are recorded as a reduction of the cost of investments or reclassified to capital gains.
12
Table of Contents
SSGA Active Trust
State Street Clarion Global Infrastructure & MLP Portfolio
NOTES TO FINANCIAL STATEMENTS (continued)
June 30, 2016
Distributions received from the Portfolio’s investments in master limited partnerships or limited liability companies that have economic characteristics substantially similar to master limited partnerships (collectively, “MLPs”) generally are comprised of ordinary income and return of capital from the MLPs. The Portfolio records distributions from MLPs as dividend income and redesignates between income and return of capital at year end. Such estimates are based on information provided by each MLP and other industry sources. These estimates may subsequently be revised based on actual allocations received from MLPs after their tax reporting periods are concluded, as the actual character of these distributions is not known until after the fiscal year end of the Portfolio. For the period ended June 30, 2016, the Portfolio estimated the allocation of investment income and return of capital for the distributions received from MLPs within the Statement of Operations. For this period, the Portfolio has estimated approximately 0.04% as income and approximately 99.6% as return of capital.
Expenses
Certain expenses, which are directly identifiable to a specific Portfolio, are applied to that Portfolio within the Trust. Other expenses which cannot be attributed directly to a specific Portfolio are allocated in such a manner as deemed equitable, taking into consideration the nature and type of expense and the relative net assets of the Portfolio within the Trust.
Foreign Currency Translation
The accounting records of the Portfolio are maintained in U.S. dollars. Foreign currencies as well as investment securities and other assets and liabilities denominated in a foreign currency are translated to U.S. dollars using exchange rates at period end. Purchases and sales of securities, income receipts and expense payments denominated in foreign currencies are translated into U.S. dollars at the prevailing exchange rate on the respective dates of the transactions.
The effects of exchange rate fluctuations on investments are included with the net realized and unrealized gain (loss) on investment securities. Other foreign currency transactions resulting in realized and unrealized gain (loss) are disclosed separately.
Foreign Taxes
The Portfolio may be subject to foreign taxes (a portion of which may be reclaimable) on income, stock dividends, realized and unrealized capital gains on investments or certain foreign currency transactions. Foreign taxes are recorded in accordance with SSGA Funds Management, Inc. (the “Adviser” or “SSGA FM”) understanding of the applicable foreign tax regulations and rates that exist in the foreign jurisdictions in which the Portfolio invests. These foreign taxes, if any, are paid by the Portfolio and are reflected in the Statement of Operations, if applicable. Foreign taxes payable or deferred as of June 30, 2016, if any, are disclosed in the Portfolio’s Statement of Assets and Liabilities.
Distributions
Distributions from net investment income, if any, are declared and paid quarterly. Net realized capital gains, if any, are distributed annually, unless additional distributions are required for compliance with applicable tax regulations. The Portfolio currently intends to pay distributions out of its distributable cash flow, which generally consists of cash and paid-in-kind distributions from MLPs or their affiliates, dividends from common stocks and income from other investments held by the Portfolio less current or accrued operating expenses of the Portfolio, including taxes on Portfolio taxable income. The amount and character of income and capital gains to be distributed are determined in accordance with applicable tax regulations which may differ from net investment income and realized gains recognized for U.S. GAAP purposes.
| 3. | Fees and Transactions with Affiliates |
Advisory Fee
The Trust on behalf of the Portfolio has entered into an Investment Advisory Agreement with SSGA FM. For its advisory services to the Portfolio, the Adviser is paid a management fee by the Portfolio at an annual rate of 0.30% of
13
Table of Contents
SSGA Active Trust
State Street Clarion Global Infrastructure & MLP Portfolio
NOTES TO FINANCIAL STATEMENTS (continued)
June 30, 2016
its average daily net assets. The Adviser has contractually agreed to waive the entire amount of this fee until the later of April 30, 2017 or such time as the shares of the Portfolio cease to be the only investment security held by the State Street Clarion Global Infrastructure & MLP Fund series of State Street Institutional Investment Trust. The waiver may be terminated only by the Portfolio’s Board of Trustees.
The Adviser pays all operating expenses of the Portfolio other than management fee, distribution fee pursuant to the Portfolio’s Distribution and Service Plan, if any, brokerage, taxes, interest, fees and expenses of the Independent Trustees (including any Trustees’ counsel fees), litigation expenses, and other extraordinary expenses.
Administrator and Sub-Administrator Fees
SSGA FM serves as administrator and State Street, an affiliate of the Adviser, serves as custodian, sub-administrator and transfer agent. State Street receives fees for its services as custodian, sub-administrator and transfer agent from the Adviser.
Other Transactions with Affiliates
The Funds may invest in affiliated entities, included securities issued by State Street, affiliated funds, or entities deemed to be affiliates as a result of the Funds owning more than five percent of the entity’s voting securities or outstanding shares. Amounts relating to these transactions during the period ended June 30, 2016 are disclosed in the Schedule of Investments.
| 4. | Trustees’ Fees |
The fees and expenses of the Trust’s trustees, who are not “interested persons” of the Trust, as defined in the 1940 Act (“Independent Trustees”), are paid directly by the Funds. The Independent Trustees are reimbursed for travel and other out-of-pocket expenses in connection with meeting attendance and industry seminars.
| 5. | Investment Transactions |
Purchases and sales of investments (excluding short term investments) for the year ended June 30, 2016 aggregated to $15,881,867 and $16,019,327, respectively.
| 6. | Income Tax Information |
The Portfolio has qualified and intends to continue to qualify as a regulated investment company under Subchapter M of the Internal Revenue Code of 1986, as amended. The Portfolio will not be subject to federal income taxes to the extent it distributes its taxable income, including any net realized capital gains, for each fiscal year. Therefore, no provision for federal income tax is required.
Distributions to shareholders are recorded on ex-dividend date. Income dividends and gain distributions are determined in accordance with income tax rules and regulations, which may differ from generally accepted accounting principles. Certain capital accounts in the financial statements have been adjusted for permanent book-tax differences. These adjustments have no impact on net asset values or results of operations. Temporary book-tax differences will reverse in the future. These book-tax differences are primarily due to differing treatments for character of distributions, nontaxable dividend adjustments to income, foreign currencies, distributions from MLPs and wash sale loss deferrals.
The Portfolio files federal and various state and local tax returns as required. No income tax returns are currently under examination. The federal returns are subject to examination by the Internal Revenue Service for a period of three years from date of filing, while the state returns may remain open for an additional year depending upon jurisdiction. SSGA FM has analyzed the Portfolio’s tax positions taken on tax returns for all open years and does not believe there are any uncertain tax positions that would require recognition of a tax liability.
As a limited partner in the MLPs, the Portfolio reports its allocable share of the MLP’s taxable income in computing its own taxable income. The distributions paid by the MLPs generally do not constitute income for tax purposes. Each MLP may allocate losses to the Portfolio which are generally not deductible in computing the Portfolio’s taxable income until such time as that particular MLP either generates income to offset those losses or the Portfolio disposes of units in that
14
Table of Contents
SSGA Active Trust
State Street Clarion Global Infrastructure & MLP Portfolio
NOTES TO FINANCIAL STATEMENTS (continued)
June 30, 2016
MLP. This may result in the Portfolio’s taxable income being substantially different than its book income in any given year. As a result, the Portfolio may have insufficient taxable income to support its distributions paid resulting in a return of capital to shareholders. A return of capital distribution is generally not treated as taxable income to shareholders and instead reduces a shareholder’s basis in their shares of the Portfolio.
Under the applicable foreign tax laws, a withholding tax may be imposed on interest, dividends and realized and unrealized capital gains at various rates.
The tax character of distributions paid during the period ended June 30, 2016 was as follows:
Ordinary Income | Long-Term Capital Gain | Tax Return of Capital | Total | |||
| $893,119 | $— | $39,003 | $932,122 |
The tax character of distributions paid during the period ended June 30, 2015 was as follows:
Ordinary Income | Long-Term Capital Gain | Tax Return of Capital | Total | |||
| $180,817 | $— | $— | $180,817 |
As of June 30, 2016, the components of distributable earnings on a tax basis were as follows:
Undistributed | Capital Loss | Undistributed | Net Unrealized | Qualified | Total | |||||
| $— | $(1,284,055) | $— | $1,874,085 | $— | $590,030 |
| * | The Portfolio has elected to defer certain qualified late year losses and recognize such losses in the next taxable year. |
As of June 30, 2016, the Portfolio had capital loss carryforwards available to offset future realized capital gains through the indicated expiration dates as follows:
Non-Expiring Short Term | Non-Expiring Long Term | |
$1,222,696 | $61,359 |
As of June 30, 2016, gross unrealized appreciation and gross unrealized depreciation based on cost for federal income tax purposes were as follows:
Tax Cost | Gross Unrealized Appreciation | Gross Unrealized Depreciation | Net Unrealized (Depreciation) | |||
| $15,425,172 | $2,005,676 | $130,025 | $1,875,651 |
| 7. | Risks |
Concentration Risk
As a result of the Portfolio’s ability to invest a large percentage of its assets in obligations of issuers within the same country, state, region, currency or economic sector, an adverse economic, business or political development may affect the value of the Portfolio’s investments more than if the Portfolio were more broadly diversified.
Foreign and Emerging Markets Risks
Investing in foreign markets involve risks and considerations not typically associated with investing in the U.S. Foreign securities may be subject to risk of loss because of government regulation, economic, political and social instability in the countries in which the Portfolio invests. Foreign markets may be less liquid than investments in the U.S. and may be subject to the risks of currency fluctuations. To the extent that a Portfolio invests in securities of issuers located in emerging markets, these risks may be even more pronounced.
15
Table of Contents
SSGA Active Trust
State Street Clarion Global Infrastructure & MLP Portfolio
NOTES TO FINANCIAL STATEMENTS (continued)
June 30, 2016
Market and Credit Risk
In the normal course of business, the Portfolio trades financial instruments and enters into financial transactions where risk of potential loss exists due to changes in the general economic conditions and fluctuations of the market (market risk). Additionally, the Portfolio may also be exposed to credit risk in the event that an issuer or guarantor fails to perform or that an institution or entity with which the Portfolio has unsettled or open transactions defaults.
| 8. | Subsequent Events |
Management has evaluated the impact of all subsequent events on the Portfolio through the date on which the financial statements were available to be issued and has determined that there were no subsequent events requiring adjustment or disclosure in the financial statements.
16
Table of Contents
SSGA Active Trust
REPORT OF INDEPENDENT REGISTERED PUBLIC ACCOUNTING FIRM
To the Shareholders and Board of Trustees of
SSGA Active Trust
We have audited the accompanying statement of assets and liabilities, including the schedule of investments, of State Street Clarion Global Infrastructure & MLP Portfolio (the “Portfolio”) (one of the portfolios constituting SSGA Active Trust) as of June 30, 2016, and the related statement of operations for the year then ended and the statement of changes in net assets and the financial highlights for each of the periods indicated therein. These financial statements and financial highlights are the responsibility of the Portfolio’s management. Our responsibility is to express an opinion on these financial statements and financial highlights based on our audit.
We conducted our audits in accordance with the standards of the Public Company Accounting Oversight Board (United States). Those standards require that we plan and perform the audit to obtain reasonable assurance about whether the financial statements and financial highlights are free of material misstatement. We were not engaged to perform an audit of the Portfolio’s internal control over financial reporting. Our audits included consideration of internal control over financial reporting as a basis for designing audit procedures that are appropriate in the circumstances, but not for the purpose of expressing an opinion on the effectiveness of the Portfolio’s internal control over financial reporting. Accordingly, we express no such opinion. An audit also includes examining, on a test basis, evidence supporting the amounts and disclosures in the financial statements and financial highlights, assessing the accounting principles used and significant estimates made by management, and evaluating the overall financial statement presentation. Our procedures included confirmation of securities owned as of June 30, 2016, by correspondence with the custodian, brokers and others or by other appropriate auditing procedures where replies from brokers or others were not received. We believe that our audits provide a reasonable basis for our opinion.
In our opinion, the financial statements and financial highlights referred to above present fairly, in all material respects, the financial position of State Street Clarion Global Infrastructure & MLP Portfolio (one of the portfolios constituting SSGA Active Trust) at June 30, 2016, the results of its operations for the year then ended and the changes in its net assets and the financial highlights for each of the periods indicated therein, in conformity with U.S. generally accepted accounting principles.

Boston, Massachusetts
August 26, 2016
17
Table of Contents
SSGA Active Trust
State Street Clarion Global Infrastructure & MLP Portfolio
June 30, 2016 (Unaudited)
Tax Information
Dividend Received Deduction
For federal income tax purposes, the following information is furnished with respect to the distributions of the Portfolio for its fiscal period ended June 30, 2016. For U.S. federal income tax purposes, the percentage of distributions that qualify for the corporate dividends received deduction for the fiscal period ended June 30, 2016 is 25.41%.
Qualified Dividend Income
A portion of dividends distributed by the Portfolio during the fiscal period ended June 30, 2016, are considered qualified dividend income, and are eligible for reduced tax rates. These lower rates range from 5% to 20% depending on the individual’s tax bracket. These amounts were $404,463 for the fiscal period ended June 30, 2016.
Expense Example
As a shareholder of a Fund, you incur two types of costs (1) transaction costs, including sales charges (loads), if applicable, on purchase payments, reinvested dividends, or other distributions and (2) ongoing costs, including advisory fees and to the extent applicable, distribution (12b-1) and or service fees; and other Fund expenses. This example is intended to help you understand your ongoing costs (in dollars) of investing in the Fund and to compare these costs with the ongoing costs of investing in other mutual funds. It is based on an investment of $1,000 made at the beginning of the period shown and held for the entire period from January 1, 2016 to June 30, 2016.
The table below illustrates your Fund’s cost in two ways:
Based on actual fund return — This section helps you to estimate the actual expenses that you paid over the period. The “Ending Account Value” shown is derived from each Fund’s actual return, and the third column shows the dollar amount that would have been paid by an investor who started with $1,000 in the Fund. You may use the information here, together with the amount you invested, to estimate the expenses that you paid over the period. To do so, simply divide your account value by $1,000 (for example, an $8,600 account value divided by $1,000 = 8.6), then multiply the result by the number given for the Fund under the heading “Expenses Paid During Period”.
Based on hypothetical 5% return — This section is intended to help you compare your Fund’s costs with those of other mutual funds. It assumes that the Fund had a yearly return of 5% before expenses, but that the expense ratio is unchanged. In this case, because the return used is not the Fund’s actual return, the results do not apply to your investment. The example is useful in making comparisons because the Securities and Exchange Commission requires all mutual funds to calculate expenses based on a 5% return. You can assess your Fund’s costs by comparing this hypothetical example with the hypothetical examples that appear in shareholder reports of other funds.
Please note that the expenses shown in the table are meant to highlight your ongoing costs only and do not reflect any transaction costs, such as sales load charges (loads). Therefore, the hypothetical 5% return section of the table is useful in comparing ongoing costs only, and will not help you determine the relative total costs of owning different funds. In addition, if these transaction costs were included, your costs would have been higher.
| Actual | Hypothetical (assuming a 5% return before expenses) | |||||||||||||||||||
| Annualized Expense Ratio | Ending Account Value | Expenses Paid During Period | Ending Account Value | Expenses Paid During Period(a) | ||||||||||||||||
State Street Clarion Global Infrastructure & MLP Portfolio | 0.03 | % | $ | 1,165.00 | $ | 0.16 | (a) | $ | 1,024.70 | $ | 0.15 | |||||||||
| (a) | Hypothetical expenses are equal to the Fund’s annualized net expense ratio multiplied by the average account value of the period, multiplied by 182, then divided by 366. |
18
Table of Contents
SSGA Active Trust
State Street Clarion Global Infrastructure & MLP Portfolio
OTHER INFORMATION (continued)
June 30, 2016 (Unaudited)
Proxy Voting Policies and Procedures and Records
A description of the Trust’s proxy voting policies and procedures that are used by the Funds’ investment adviser to vote proxies relating to the Funds’ portfolio of securities are available (i) without charge, upon request by calling 1-866-787-2257 (toll free) or (ii) on the website of the U.S. Securities and Exchange Commission, at www.sec.gov.
Information regarding how the investment adviser voted for the prior 12-months period ended June 30 is available by August 31 of each year by calling the same number and on the SEC’s website, at www.sec.gov, and on the Funds’ website at www.spdrs.com.
Quarterly Portfolio Schedule
The Portfolios file a complete schedule of investments with the SEC for the first and third quarters of each fiscal year on Form N-Q. The Funds’ Forms N-Q are available on the SEC’s website at www.sec.gov and may be reviewed and copied at the SEC’s Public Reference Room in Washington DC. Information on the operation of the Public Reference Room may be obtained by calling 1-800-SEC-0330. The information on the Form N-Q is available upon request, without charge, by calling 1-866-787-2257 (toll free) and on the Funds’ website at www.spdrs.com.
19
Table of Contents
SSGA ACTIVE TRUST
State Street Clarion Global Infrastructure & MLP Portfolio
OTHER INFORMATION (continued)
June 30, 2016
TRUSTEES
Name, Address and Year of Birth | Position(s) with Funds | Term of Office and Length of Time Served | Principal Occupation(s) During Past 5 Years | Number of Portfolios In Fund Complex Overseen By Trustee | Other Directorships Held By Trustee During The | |||||||
Independent Trustees | ||||||||||||
FRANK NESVET | Independent Trustee, Chairman, Trustee Committee Chair | Term: Unlimited Served: since September 2000 | Chief Executive Officer, Libra Group, Inc. (a financial services consulting company) (1998-present). | 218 | SPDR Index Shares Funds (Trustee); SPDR Series Trust (Trustee); SSGA Master Trust (Trustee). | |||||||
DAVID M. KELLY | Independent Trustee, Audit Committee Chair | Term: Unlimited Served: since September 2000 | Retired. | 218 | Chicago Stock Exchange (Former Director, retired); Penson Worldwide Inc. (Former Director, retired); SPDR Index Shares Funds (Trustee); SPDR Series Trust (Trustee); SSGA Master Trust (Trustee). | |||||||
BONNY EUGENIA BOATMAN | Independent Trustee | Term: Unlimited Served: since April 2010 | Retired. | 218 | SPDR Index Shares Funds (Trustee); SPDR Series Trust (Trustee); SSGA Master Trust (Trustee). | |||||||
DWIGHT D. CHURCHILL | Independent Trustee | Term: Unlimited Served: since April 2010 | Self-employed consultant since 2010; CEO and President, CFA Institute (June 2014-January 2015). | 218 | SPDR Index Shares Funds (Trustee); SPDR Series Trust (Trustee); SSGA Master Trust (Trustee); Affiliated Managers Group, Inc. (Director). | |||||||
CARL G. VERBONCOEUR | Independent Trustee | Term: Unlimited Served: since April 2010 | Self-employed consultant since 2009. | 218 | The Motley Fool Funds Trust (Trustee); SPDR Index Shares Funds (Trustee); SPDR Series Trust (Trustee); SSGA Master Trust (Trustee). | |||||||
20
Table of Contents
SSGA ACTIVE TRUST
State Street Clarion Global Infrastructure & MLP Portfolio
OTHER INFORMATION (continued)
June 30, 2016
Name, Address and Year of Birth | Position(s) with Funds | Term of Office and Length of Time Served | Principal Occupation(s) During Past 5 Years | Number of Portfolios In Fund Complex Overseen By Trustee | Other Directorships Held By Trustee During The | |||||||
Interested Trustee | ||||||||||||
JAMES E. ROSS* | Interested Trustee | Term: Unlimited Served as Trustee: since April 2010 | Chairman and Director, SSGA Funds Management, Inc. (2005-present); Senior Managing Director and Principal, State Street Global Advisors (2006-present); President, SSGA Funds Management, Inc. (2005-2012). | 299 | SPDR Index Shares Funds (Trustee); SPDR Series Trust (Trustee); SSGA Master Trust (Trustee); Select Sector SPDR Trust (Trustee); State Street Master Funds (Trustee); and State Street Institutional Investment Trust (Trustee). | |||||||
| * | Mr. Ross is an Interested Trustee because of his employment with the Adviser and ownership interest in an affiliate of the Adviser. Mr. Ross previously served as an Interested Trustee from November 2005 to December 2009. |
OFFICERS
Name, Address and Year of Birth | Position(s) with Funds | Term of Office and Length of Time Served | Principal Occupation(s) During The Past 5 Years | |||
ELLEN M. NEEDHAM | President | Term: Unlimited Served: since October 2012 | President and Director, SSGA Funds Management, Inc. (2001-present)*; Senior Managing Director, State Street Global Advisors (1992-present).* | |||
ANN M. CARPENTER | Vice President; Deputy Treasurer | Term: Unlimited Served: since August 2012; Term: Unlimited Served: since February 2016 | Chief Operating Officer, SSGA Funds Management, Inc. (2005-Present)*; Managing Director, State Street Global Advisors (2005-present).* | |||
MICHAEL P. RILEY | Vice President | Term: Unlimited Served: since February 2005 | Managing Director, State Street Global Advisors and SSGA Funds Management, Inc. (February 2015-present); Vice President, State Street Global Advisors and SSGA Funds Management, Inc. (2008-February 2015); Principal, State Street Global Advisors and SSGA Funds Management, Inc. (2005-2008). |
21
Table of Contents
SSGA ACTIVE TRUST
State Street Clarion Global Infrastructure & MLP Portfolio
OTHER INFORMATION (continued)
June 30, 2016
Name, Address and Year of Birth | Position(s) with Funds | Term of Office and Length of Time Served | Principal Occupation(s) During The Past 5 Years | |||
JOSHUA A. WEINBERG | Chief Legal Officer | Term: Unlimited Served: since February 2015 | Vice President and Managing Counsel, State Street Global Advisors (2011-present); Clerk, SSGA Funds Management, Inc. (2013-present); Associate, Financial Services Group, Dechert LLP (2006-2011). | |||
CHRISTOPHER A. MADDEN | Secretary | Term: Unlimited Served: since August 2013 | Vice President and Senior Counsel, State Street Bank and Trust Company (2013-present); Counsel, Atlantic Fund Services (2009-2013); Vice President.* | |||
PATRICIA A. MORISETTE | Assistant Secretary | Term: Unlimited Served: since February 2015 | Vice President and Counsel, State Street Bank and Trust Company (2014-present); Assistant Vice President and Counsel, John Hancock Financial Services (2011-2013); Independent legal consultant (2009-2011); Associate, Bingham McCutchen LLP (2003-2009).*,** | |||
BRUCE S. ROSENBERG | Treasurer | Term: Unlimited Served: since February 2016 | Managing Director, State Street Global Advisors and SSGA Funds Management, Inc. (July 2015-present; Director, Credit Suisse (April 2008-July 2015)). | |||
CHAD C. HALLETT | Deputy Treasurer | Term: Unlimited Served: since February 2016 | Vice President, State Street Global Advisors and SSGA Funds Management, Inc. (November 2014-present); Vice President, State Street Bank and Trust Company (2001-November 2014).* | |||
SUJATA UPRETI | Assistant Treasurer | Term: Unlimited Served: since February 2016 | Vice President, State Street Global Advisors and SSGA Funds Management, Inc. (May 2015-present; Assistant Director, Cambridge Associates, LLC (July 2014-January 2015); Vice President, Bank of New York Mellon (July 2012-August 2013); Manager, PricewaterhouseCoopers, LLP (September 2003-July 2012)). | |||
DANIEL FOLEY | Assistant Treasurer | Term: Unlimited Served: since February 2016 | Vice President, State Street Global Advisors and SSGA Funds Management, Inc. (April 2007-present).* | |||
BRIAN HARRIS | Chief Compliance Officer and Anti-Money Laundering Officer | Term: Unlimited Served: since November 2013 | Managing Director, State Street Global Advisors and SSGA Funds Management, Inc. (June 2013-present)*; Senior Vice President and Global Head of Investment Compliance, BofA Global Capital Management (2010-2013); Director of Compliance, AARP Financial Inc. (2008-2010). |
| * | Served in various capacities and/or with various affiliated entities during noted time period. |
| ** | Served in various capacities and/or with unaffiliated mutual funds or closed-end funds for which State Street Bank and Trust Company or its affiliates act as a provider of services during the noted time period. |
Statement of Additional information (SAI) includes additional information about Fund directors and is available, without charge, upon request and by calling 1-866-787-2257.
22
Table of Contents
SSGA Active Trust
Trustees
Bonny E. Boatman
Dwight D. Churchill
David M. Kelly
Frank Nesvet, Chairman
James E. Ross
Carl G. Verboncoeur
Officers
Ellen M. Needham, President
Bruce Rosenburg, Treasurer
Ann Carpenter, Vice President and Deputy Treasurer
Michael P. Riley, Vice President
Chad C. Hallett, Deputy Treasurer
Sujata Upreti, Assistant Treasurer
Daniel Foley, Assistant Treasurer
Christopher A. Madden, Secretary
Patricia A. Morisette, Assistant Secretary
Brian Harris, Chief Compliance Officer and Anti-Money Laundering Officer
Joshua A. Weinberg, Chief Legal Officer
Investment Manager and Administrator
SSGA Funds Management, Inc.
State Street Financial Center
One Lincoln Street
Boston, MA 02111
Distributor
State Street Global Markets, LLC
One Lincoln Street
Boston, MA 02111
Custodian, Sub-Administrator and Transfer Agent
State Street Bank and Trust Company
One Lincoln Street
Boston, MA 02111
Legal Counsel
Morgan, Lewis & Bockius LLP
1111 Pennsylvania Avenue, NW
Washington, DC 20006
Independent Registered Public Accounting Firm
Ernst & Young LLP
200 Clarendon Street
Boston, MA 02116
Distributor: State Street Global Markets, LLC, member FINRA, SIPC, a wholly owned subsidiary of State Street Corporation. References to State Street may include State Street Corporation and its affiliates. The SSGA Funds pay State Street Bank and Trust Company for its services as custodian, transfer agent and shareholder servicing agent and pays SSGA Funds Management, Inc. for investment advisory services.
Before investing, consider the funds’ investment objectives, risks, charges and expenses. To obtain a prospectus or summary prospectus which contains this and other information, call 1-800-997-7327 or visit www.SSGAfunds.com. Read it carefully.
Fund Shares are distributed by State Street Global Markets, LLC, a wholly-owned subsidiary of State Street Corporation. State Street Global Markets, LLC; member FINRA, SIPC.
The information contained in this report is intended for the general information of shareholders of the Portfolio and shareholders of any fund or any private client invested in the Portfolio. Generally, shares of the Portfolio may be purchased only by or on behalf of other registered investment companies or private clients for which the Adviser or an affiliate serves as investment adviser (or in a similar capacity). This report is not authorized for distribution (i) to prospective investors in any fund invested in the Portfolio unless preceded or accompanied by a current offering document for such fund or (ii) to prospective eligible investors in the Portfolio unless preceded or accompanied by a current offering document of the Portfolio. Eligible investors in the Portfolio may obtain a current prospectus and SAI from the Distributor by calling 1-866-787-2257. Please read the offering document carefully before investing in the Portfolio.
| Not FDIC Insured — No Bank Guarantee — May Lose Value | © 2016 State Street Corporation — All Rights Reserved SSITCGSAR IBG-20864 |
Table of Contents
Annual Report
30 June 2016
SSGA Active Trust
State Street Disciplined Global Equity Portfolio

The information contained in this report is intended for the general information of shareholders of the Portfolio and shareholders of any fund or private client invested in the Portfolio. Generally, shares of the Portfolio may be purchased only by or on behalf of other registered investment companies or private clients for which the Adviser or an affiliate serves as investment adviser (or in a similar capacity). This report is not authorized for distribution (i) to prospective investors in any fund invested in the Portfolio unless preceded or accompanied by a current offering document for such fund or (ii) to prospective eligible investors in the Portfolio unless preceded or accompanied by a current offering document of the Portfolio. Eligible investors in the Portfolio may obtain a current prospectus and SAI from the Distributor by calling 1-800-997-7327. Please read the offering document carefully before investing in the Portfolio.
Table of Contents
SSGA ACTIVE TRUST
STATE STREET DISCIPLINED GLOBAL EQUITY PORTFOLIO
ANNUAL REPORT
JUNE 30, 2016
| 1 | ||||
| 2 | ||||
| 5 | ||||
| 6 | ||||
| 7 | ||||
| 8 | ||||
| 9 | ||||
| 14 | ||||
| 15 |
The information contained in this report is intended for the general information of shareholders of the Portfolio and shareholders of any fund or private client invested in the Portfolio. Generally, shares of the Portfolio may be purchased only by or on behalf of other registered investment companies or private clients for which the Adviser or an affiliate serves as investment adviser (or in a similar capacity). This report is not authorized for distribution (i) to prospective investors in any fund invested in the Portfolio unless preceded or accompanied by a current offering document for such fund or (ii) to prospective eligible investors in the Portfolio unless preceded or accompanied by a current offering document of the Portfolio. Eligible investors in the Portfolio may obtain a current prospectus and SAI from the Distributor by calling 1-800-997-7327. Please read the offering document carefully before investing in the Portfolio.
Table of Contents
SSGA ACTIVE TRUST
STATE STREET DISCIPLINED GLOBAL EQUITY PORTFOLIO
TOP FIVE HOLDINGS AS OF JUNE 30, 2016
| DESCRIPTION | DTE Energy Co. | Waste Management, Inc. | Quest Diagnostics, Inc. | Henry Schein, Inc. | Johnson & Johnson | |||||||||
| MARKET VALUE | $48,767 | 47,250 | 47,218 | 47,029 | 46,822 | |||||||||
| % OF NET ASSETS | 1.5 | 1.5 | 1.5 | 1.4 | 1.4 | |||||||||
(The five largest holdings are subject to change, and there are no guarantees the Portfolio will continue to remain invested in any particular security.)
INDUSTRY BREAKDOWN AS OF JUNE 30, 2016*
| INDUSTRY | PERCENT OF NET ASSETS | |||||||||
Health Care Providers & Services | 10.2 | % | ||||||||
Electric Utilities | 9.4 | |||||||||
Diversified Telecommunication Services | 6.9 | |||||||||
Health Care Equipment & Supplies | 6.1 | |||||||||
Multi-Utilities | 5.8 | |||||||||
Food & Staples Retailing | 5.3 | |||||||||
Household Products | 5.0 | |||||||||
Insurance | 5.0 | |||||||||
Pharmaceuticals | 4.4 | |||||||||
Real Estate Investment Trusts (REITs) | 3.6 | |||||||||
Commercial Services & Supplies | 2.6 | |||||||||
Food Products | 2.3 | |||||||||
Media | 2.2 | |||||||||
Specialty Retail | 2.2 | |||||||||
Airlines | 2.1 | |||||||||
Software | 2.1 | |||||||||
Tobacco | 2.1 | |||||||||
Beverages | 1.7 | |||||||||
Technology Hardware, Storage & Peripherals | 1.7 | |||||||||
Metals & Mining | 1.6 | |||||||||
Aerospace & Defense | 1.3 | |||||||||
| INDUSTRY | PERCENT OF NET ASSETS | |||||||||
Auto Components | 1.2 | |||||||||
Containers & Packaging | 1.2 | |||||||||
Life Sciences Tools & Services | 1.2 | |||||||||
Internet Software & Services | 1.1 | |||||||||
Road & Rail | 1.1 | |||||||||
Communications Equipment | 1.0 | |||||||||
Consumer Finance | 1.0 | |||||||||
Industrial Conglomerates | 1.0 | |||||||||
Multiline Retail | 1.0 | |||||||||
Electrical Equipment | 0.8 | |||||||||
Household Durables | 0.8 | |||||||||
Banks | 0.6 | |||||||||
Oil, Gas & Consumable Fuels | 0.6 | |||||||||
Automobiles | 0.5 | |||||||||
Construction & Engineering | 0.4 | |||||||||
IT Services | 0.4 | |||||||||
Real Estate Management & Development | 0.4 | |||||||||
Short-Term Investment | 1.1 | |||||||||
Other Assets in Excess of Liabilities | 1.0 | |||||||||
TOTAL | 100.0 | % | ||||||||
| * | The Portfolio’s industry breakdown is expressed as a percentage of net assets and may change over time. |
1
Table of Contents
SSGA ACTIVE TRUST
STATE STREET DISCIPLINED GLOBAL EQUITY PORTFOLIO
June 30, 2016
Security Description | Shares | Value | ||||||
COMMON STOCKS — 97.9% | ||||||||
AUSTRALIA — 1.3% | ||||||||
Qantas Airways, Ltd. (a) | 3,476 | $ | 7,352 | |||||
Telstra Corp., Ltd. (a) | 8,632 | 36,021 | ||||||
|
| |||||||
| 43,373 | ||||||||
|
| |||||||
BELGIUM — 0.8% | ||||||||
Delhaize Group (a) | 234 | 24,745 | ||||||
|
| |||||||
CANADA — 3.9% | ||||||||
BCE, Inc. | 761 | 35,826 | ||||||
Metro, Inc. | 603 | 20,899 | ||||||
Shaw Communications, Inc. Class B | 1,757 | 33,552 | ||||||
TELUS Corp. | 1,156 | 37,029 | ||||||
|
| |||||||
| 127,306 | ||||||||
|
| |||||||
DENMARK — 1.2% | ||||||||
Novo Nordisk A/S Class B (a) | 247 | 13,312 | ||||||
Vestas Wind Systems A/S (a) | 370 | 25,168 | ||||||
|
| |||||||
| 38,480 | ||||||||
|
| |||||||
FRANCE — 1.5% | ||||||||
Peugeot SA (a)(b) | 1,271 | 15,251 | ||||||
Sanofi (a) | 393 | 32,687 | ||||||
|
| |||||||
| 47,938 | ||||||||
|
| |||||||
GERMANY — 2.8% | ||||||||
Fresenius SE & Co. KGaA (a) | 236 | 17,359 | ||||||
METRO AG (a) | 1,269 | 39,072 | ||||||
Muenchener Rueckversicherungs-Gesellschaft AG in Muenchen (a) | 79 | 13,262 | ||||||
RWE AG (a)(b) | 1,473 | 23,483 | ||||||
|
| |||||||
| 93,176 | ||||||||
|
| |||||||
HONG KONG — 4.5% | ||||||||
CK Hutchison Holdings, Ltd. (a) | 1,500 | 16,501 | ||||||
CLP Holdings, Ltd. (a) | 4,000 | 40,913 | ||||||
Hang Seng Bank, Ltd. (a) | 1,100 | 18,883 | ||||||
Jardine Matheson Holdings, Ltd. (a) | 300 | 17,539 | ||||||
Link REIT (a) | 4,000 | 27,354 | ||||||
Power Assets Holdings, Ltd. (a) | 3,000 | 27,584 | ||||||
|
| |||||||
| 148,774 | ||||||||
|
| |||||||
ISRAEL — 0.2% | ||||||||
Check Point Software Technologies, Ltd. (b) | 100 | 7,968 | ||||||
|
| |||||||
ITALY — 1.2% | ||||||||
Enel SpA (a) | 8,786 | 39,047 | ||||||
|
| |||||||
JAPAN — 8.4% | ||||||||
Astellas Pharma, Inc. (a) | 2,200 | 34,728 | ||||||
Bridgestone Corp. (a) | 500 | 16,174 | ||||||
Canon, Inc. (a) | 1,200 | 34,486 | ||||||
Central Japan Railway Co. (a) | 200 | 35,807 | ||||||
Hoya Corp. (a) | 400 | 14,380 | ||||||
Kirin Holdings Co., Ltd. (a) | 2,100 | 35,652 | ||||||
Mitsubishi Materials Corp. (a) | 5,000 | 12,050 | ||||||
Nippon Telegraph & Telephone Corp. (a) | 900 | 42,483 | ||||||
Sekisui Chemical Co., Ltd. (a) | 2,100 | 26,044 | ||||||
Sumitomo Rubber Industries, Ltd. (a) | 1,600 | $ | 21,562 | |||||
|
| |||||||
| 273,366 | ||||||||
|
| |||||||
NETHERLANDS — 1.3% | ||||||||
Koninklijke Ahold NV (a) | 1,851 | 40,919 | ||||||
Royal Dutch Shell PLC Class A (a) | 7 | 193 | ||||||
|
| |||||||
| 41,112 | ||||||||
NEW ZEALAND — 1.1% | ||||||||
Spark New Zealand, Ltd. (a) | 14,782 | 37,476 | ||||||
|
| |||||||
NORWAY — 0.5% | ||||||||
Norsk Hydro ASA (a) | 4,543 | 16,633 | ||||||
|
| |||||||
SINGAPORE — 1.2% | ||||||||
Ascendas REIT (a) | 6,500 | 12,040 | ||||||
Singapore Airlines, Ltd. (a) | 1,900 | 15,101 | ||||||
UOL Group, Ltd. (a) | 2,900 | 11,832 | ||||||
|
| |||||||
| 38,973 | ||||||||
|
| |||||||
SPAIN — 0.4% | ||||||||
ACS Actividades de Construccion y Servicios SA (a) | 535 | 14,690 | ||||||
|
| |||||||
SWEDEN — 1.1% | ||||||||
Swedish Match AB (a) | 994 | 34,640 | ||||||
|
| |||||||
SWITZERLAND — 3.3% | ||||||||
Sonova Holding AG (a) | 246 | 32,727 | ||||||
Swiss Re AG (a) | 422 | 36,945 | ||||||
Swisscom AG (a) | 78 | 38,842 | ||||||
|
| |||||||
| 108,514 | ||||||||
|
| |||||||
UNITED KINGDOM — 1.0% | ||||||||
Direct Line Insurance Group PLC (a) | 6,744 | 31,309 | ||||||
|
| |||||||
UNITED STATES — 62.2% | ||||||||
Agilent Technologies, Inc. | 875 | 38,815 | ||||||
Ally Financial, Inc. (b) | 1,825 | 31,153 | ||||||
Altria Group, Inc. | 458 | 31,584 | ||||||
Ameren Corp. | 768 | 41,149 | ||||||
American Capital Agency Corp. | 1,953 | 38,708 | ||||||
American Electric Power Co., Inc. | 520 | 36,447 | ||||||
Annaly Capital Management, Inc. | 3,380 | 37,417 | ||||||
Anthem, Inc. | 235 | 30,865 | ||||||
Archer-Daniels-Midland Co. | 859 | 36,842 | ||||||
Avery Dennison Corp. | 452 | 33,787 | ||||||
Axis Capital Holdings, Ltd. | 669 | 36,795 | ||||||
Ball Corp. | 100 | 7,219 | ||||||
Baxter International, Inc. | 832 | 37,623 | ||||||
C.R. Bard, Inc. | 196 | 46,091 | ||||||
Cardinal Health, Inc. | 391 | 30,502 | ||||||
Chubb, Ltd. | 341 | 44,572 | ||||||
Church & Dwight Co., Inc. | 258 | 26,546 | ||||||
Cintas Corp. | 366 | 35,916 | ||||||
Citrix Systems, Inc. (b) | 446 | 35,720 | ||||||
Clorox Co. | 315 | 43,593 | ||||||
Computer Sciences Corp. | 229 | 11,370 | ||||||
Consolidated Edison, Inc. | 458 | 36,841 | ||||||
DaVita HealthCare Partners, Inc. (b) | 565 | 43,686 | ||||||
Delta Air Lines, Inc. | 481 | 17,523 | ||||||
DENTSPLY SIRONA, Inc. | 648 | 40,202 | ||||||
Dr. Pepper Snapple Group, Inc. | 186 | 17,973 | ||||||
DTE Energy Co. | 492 | 48,767 | ||||||
eBay, Inc. (b) | 1,592 | 37,269 | ||||||
Edison International | 520 | 40,388 | ||||||
See accompanying notes to financial statements.
2
Table of Contents
SSGA ACTIVE TRUST
STATE STREET DISCIPLINED GLOBAL EQUITY PORTFOLIO
SCHEDULE OF INVESTMENTS (continued)
June 30, 2016
Security Description | Shares | Value | ||||||
Energizer Holdings, Inc. | 323 | $ | 16,631 | |||||
Entergy Corp. | 494 | 40,187 | ||||||
Exelon Corp. | 554 | 20,143 | ||||||
Express Scripts Holding Co. (b) | 534 | 40,477 | ||||||
F5 Networks, Inc. (b) | 296 | 33,697 | ||||||
Foot Locker, Inc. | 581 | 31,874 | ||||||
HCA Holdings, Inc. (b) | 522 | 40,199 | ||||||
Henry Schein, Inc. (b) | 266 | 47,029 | ||||||
Hologic, Inc. (b) | 824 | 28,510 | ||||||
Johnson & Johnson | 386 | 46,822 | ||||||
Kimberly-Clark Corp. | 249 | 34,232 | ||||||
L-3 Communications Holdings, Inc. | 282 | 41,367 | ||||||
McKesson Corp. | 123 | 22,958 | ||||||
NetApp, Inc. | 984 | 24,197 | ||||||
Newmont Mining Corp. | 568 | 22,220 | ||||||
O’Reilly Automotive, Inc. (b) | 144 | 39,038 | ||||||
Pfizer, Inc. | 501 | 17,640 | ||||||
Pinnacle West Capital Corp. | 493 | 39,963 | ||||||
PPL Corp. | 719 | 27,142 | ||||||
Procter & Gamble Co. | 498 | 42,166 | ||||||
Public Service Enterprise Group, Inc. | 846 | 39,432 | ||||||
Quest Diagnostics, Inc. | 580 | 47,218 | ||||||
Southwest Airlines Co. | 809 | 31,721 | ||||||
Synopsys, Inc. (b) | 458 | 24,769 | ||||||
Target Corp. | 485 | 33,863 | ||||||
Thomson Reuters Corp. | 980 | 39,443 | ||||||
Tyson Foods, Inc. Class A | 599 | 40,007 | ||||||
Universal Health Services, Inc. Class B | 141 | 18,908 | ||||||
Valero Energy Corp. | 364 | 18,564 | ||||||
Wal-Mart Stores, Inc. | 574 | 41,913 | ||||||
Waste Management, Inc. | 713 | 47,250 | ||||||
|
| |||||||
| 2,034,943 | ||||||||
|
| |||||||
TOTAL COMMON STOCKS | 3,202,463 | |||||||
|
| |||||||
RIGHTS — 0.0% (c) | ||||||||
SPAIN — 0.0% (c) | ||||||||
ACS Actividades de Construccion y Servicios SA (expiring 7/18/16) (b) (Cost $420) | 535 | 376 | ||||||
|
| |||||||
SHORT-TERM INVESTMENT — 1.1% | ||||||||
State Street Institutional Liquid Reserves Fund, Premier Class 0.47% (d)(e) (Cost $34,046) | 34,046 | 34,046 | ||||||
|
| |||||||
TOTAL INVESTMENTS — 99.0% | 3,236,885 | |||||||
OTHER ASSETS IN EXCESS OF LIABILITIES — 1.0% | 33,440 | |||||||
|
| |||||||
NET ASSETS — 100.0% | $ | 3,270,325 | ||||||
|
| |||||||
| (a) | Security is fair valued at year end by applying factors provided by independent third party in accordance with Portfolio’s valuation policy and procedures. The independent fair value service takes into account multiple factors including, but not limited to, movements in the U.S. securities markets, certain depositary receipts, futures contracts and foreign currency exchange rates that have occurred subsequent to the close of foreign securities exchanges. The use of the independent fair value service or alternative fair valuation methods would result in the investments being classified within Level 2 of the fair value hierarchy. Total market value of such securities represent $1,032,246 and 31.6% of net assets of the Fund at June 30, 2016. |
| (b) | Non-income producing security. |
| (c) | Amount is less than 0.05% of net assets. |
| (d) | The Portfolio invested in certain money market funds managed by SSGA Funds Management, Inc. Amounts related to these transactions during the year ended June 30, 2016 are shown in the Affiliate Table below. |
| (e) | The rate shown is the annualized seven-day yield at June 30, 2016. |
REIT Real Estate Investment Trust
See accompanying notes to financial statements.
3
Table of Contents
SSGA ACTIVE TRUST
STATE STREET DISCIPLINED GLOBAL EQUITY PORTFOLIO
SCHEDULE OF INVESTMENTS (continued)
June 30, 2016
The following table summarizes the value of the Portfolio’s investments accordingly to the fair value hierarchy as of June 30, 2016.
Description | Level 1 — Quoted Prices | Level 2 — Other Significant Observable Inputs | Level 3 — Significant Unobservable Inputs | Total | ||||||||||||
ASSETS: | ||||||||||||||||
INVESTMENTS: | ||||||||||||||||
Common Stocks | ||||||||||||||||
Australia | $ | — | $ | 43,373 | $ | — | $ | 43,373 | ||||||||
Belgium | — | 24,745 | — | 24,745 | ||||||||||||
Canada | 127,306 | — | — | 127,306 | ||||||||||||
Denmark | — | 38,480 | — | 38,480 | ||||||||||||
France | — | 47,938 | — | 47,938 | ||||||||||||
Germany | — | 93,176 | — | 93,176 | ||||||||||||
Hong Kong | — | 148,774 | — | 148,774 | ||||||||||||
Israel | 7,968 | — | — | 7,968 | ||||||||||||
Italy | — | 39,047 | — | 39,047 | ||||||||||||
Japan | — | 273,366 | — | 273,366 | ||||||||||||
Netherlands | — | 41,112 | — | 41,112 | ||||||||||||
New Zealand | — | 37,476 | — | 37,476 | ||||||||||||
Norway | — | 16,633 | — | 16,633 | ||||||||||||
Singapore | — | 38,973 | — | 38,973 | ||||||||||||
Spain | — | 14,690 | — | 14,690 | ||||||||||||
Sweden | — | 34,640 | — | 34,640 | ||||||||||||
Switzerland | — | 108,514 | — | 108,514 | ||||||||||||
United Kingdom | — | 31,309 | — | 31,309 | ||||||||||||
United States | 2,034,943 | — | — | 2,034,943 | ||||||||||||
Rights | ||||||||||||||||
Spain | 376 | — | — | 376 | ||||||||||||
Short-Term Investment | 34,046 | — | — | 34,046 | ||||||||||||
|
|
|
|
|
|
|
| |||||||||
TOTAL INVESTMENTS | $2,204,639 | $ | 1,032,246 | $— | $ | 3,236,885 | ||||||||||
|
|
|
|
|
|
|
| |||||||||
Affiliate Table
| Number of Shares Held at 2/19/16* | Value At 2/19/16* | Shares Purchased | Shares Sold | Number of Shares Held at 6/30/16 | Value at 6/30/16 | Dividend Income | Realized Gain (Loss) | |||||||||||||||||||||||||
State Street Institutional Liquid Reserves Fund, Premier Class | — | $ | — | 3,131,221 | 3,097,175 | 34,046 | $ | 34,046 | $ | 147 | $ | — | ||||||||||||||||||||
| * | Commencement of operations. |
See accompanying notes to financial statements.
4
Table of Contents
SSGA ACTIVE TRUST
STATE STREET DISCIPLINED GLOBAL EQUITY PORTFOLIO
STATEMENT OF ASSETS AND LIABILITIES
June 30, 2016
ASSETS | ||||
Investments in unaffiliated issuers, at value (Note 2) | $ | 3,202,839 | ||
Investments in affiliated issuers, at value (Note 2) | 34,046 | |||
|
| |||
Total Investments | 3,236,885 | |||
Foreign currency, at value | 15,950 | |||
Receivable for investments sold | 19,067 | |||
Dividends receivable — unaffiliated issuers (Note 2) | 7,180 | |||
Dividends receivable — affiliated issuers (Note 2) | 9 | |||
Receivable from Adviser (Note 3) | 692 | |||
Receivable for foreign taxes recoverable | 1,886 | |||
|
| |||
TOTAL ASSETS | 3,281,669 | |||
|
| |||
LIABILITIES | ||||
Payable for investments purchased | 7,594 | |||
Payable for fund shares repurchased | 3,750 | |||
|
| |||
TOTAL LIABILITIES | 11,344 | |||
|
| |||
NET ASSETS | $ | 3,270,325 | ||
|
| |||
NET ASSETS CONSIST OF: | ||||
Paid-in Capital | $ | 3,002,103 | ||
Undistributed (distribution in excess of) net investment income (loss) | 46,475 | |||
Accumulated net realized gain (loss) on investments | 15,463 | |||
Net unrealized appreciation (depreciation) on: | ||||
Investments | 206,727 | |||
Foreign currency transactions | (443 | ) | ||
|
| |||
NET ASSETS | $ | 3,270,325 | ||
|
| |||
NET ASSET VALUE PER SHARE | ||||
Net asset value per shares | $ | 10.89 | ||
|
| |||
Shares outstanding (unlimited amount authorized, no par value) | 300,200 | |||
|
| |||
COST OF INVESTMENTS: | ||||
Investments in unaffiliated issuers | $ | 2,996,112 | ||
Investments in affiliated issuers | 34,046 | |||
|
| |||
Total cost of investments | $ | 3,030,158 | ||
|
| |||
Foreign currency, at cost | $ | 16,084 | ||
|
|
See accompanying notes to financial statements.
5
Table of Contents
SSGA ACTIVE TRUST
STATE STREET DISCIPLINED GLOBAL EQUITY PORTFOLIO
For the Period Ended June 30, 2016 (a)
INVESTMENT INCOME | ||||
Dividend income — unaffiliated issuers (Note 2) | $ | 48,918 | ||
Dividend income — affiliated issuers (Note 2) | 147 | |||
Foreign taxes withheld | (3,389 | ) | ||
|
| |||
TOTAL INVESTMENT INCOME (LOSS) | 45,676 | |||
|
| |||
EXPENSES | ||||
Advisory fee (Note 3) | 2,300 | |||
Trustees’ fees and expenses (Note 4) | 163 | |||
Miscellaneous expenses | 600 | |||
|
| |||
TOTAL EXPENSES | 3,063 | |||
|
| |||
Expenses waived/reimbursed by the Adviser (Note 3) | (3,063 | ) | ||
|
| |||
NET INVESTMENT INCOME (LOSS) | 45,676 | |||
|
| |||
REALIZED AND UNREALIZED GAIN (LOSS) | ||||
Net realized gain (loss) on: | ||||
Investment transactions — unaffiliated issuers | 15,463 | |||
Foreign currency transactions | 799 | |||
|
| |||
Net realized gain (loss) | 16,262 | |||
|
| |||
Net change in unrealized appreciation/depreciation on: | ||||
Investment transactions — unaffiliated issuers | 206,727 | |||
Foreign currency transactions | �� | (443 | ) | |
|
| |||
Net change in unrealized appreciation/depreciation | 206,284 | |||
|
| |||
NET REALIZED AND UNREALIZED GAIN (LOSS) | 222,546 | |||
|
| |||
NET INCREASE (DECREASE) IN NET ASSETS FROM OPERATIONS | $ | 268,222 | ||
|
|
| (a) | For the period February 18, 2016 (inception date) through June 30, 2016. |
See accompanying notes to financial statements.
6
Table of Contents
SSGA ACTIVE TRUST
STATE STREET DISCIPLINED GLOBAL EQUITY PORTFOLIO
STATEMENT OF CHANGES IN NET ASSETS
| For the Period 2/18/16* - 6/30/16 | ||||
INCREASE (DECREASE) IN NET ASSETS FROM OPERATIONS: | ||||
Net investment income (loss) | $ | 45,676 | ||
Net realized gain (loss) | 16,262 | |||
Net change in unrealized appreciation/depreciation | 206,284 | |||
|
| |||
Net increase (decrease) in net assets resulting from operations | 268,222 | |||
|
| |||
FROM BENEFICIAL INTEREST TRANSACTIONS: | ||||
Proceeds from shares sold | 3,036,146 | |||
Cost of shares redeemed | (34,043 | ) | ||
|
| |||
Net increase (decrease) in net assets from beneficial interest transactions | 3,002,103 | |||
|
| |||
Net increase (decrease) in net assets during the period | 3,270,325 | |||
|
| |||
Net assets at beginning of period | — | |||
|
| |||
NET ASSETS AT END OF PERIOD | $ | 3,270,325 | ||
|
| |||
Undistributed(distribution in excess of) net investment income (loss) | $ | 46,475 | ||
|
| |||
SHARES OF BENEFICIAL INTEREST: | ||||
Shares sold | 303,384 | |||
Shares redeemed | (3,184 | ) | ||
|
| |||
Net increase (decrease) | 300,200 | |||
|
| |||
| * | Inception date. |
See accompanying notes to financial statements.
7
Table of Contents
SSGA ACTIVE TRUST
STATE STREET DISCIPLINED GLOBAL EQUITY PORTFOLIO
Selected data for a share outstanding throughout each period
| For the Period 2/19/16* - 6/30/16 | ||||
Net asset value, beginning of period | $ | 10.00 | ||
|
| |||
Income (loss) from investment operations: | ||||
Net investment income (loss) (a) | 0.15 | |||
Net realized and unrealized gain (loss) | 0.74 | |||
|
| |||
Total from investment operations | 0.89 | |||
|
| |||
Net asset value, end of period | $ | 10.89 | ||
|
| |||
Total return (b) | 8.90 | %(c) | ||
Ratios and Supplemental Data: | ||||
Net assets, end of period (in 000s) | $ | 3,270 | ||
Ratios to average net assets: | ||||
Total expenses | 0.27 | %(d) | ||
Net expenses | 0.00 | %(d) | ||
Net investment income (loss) | 4.00 | %(d) | ||
Portfolio turnover rate | 21 | %(c) | ||
| * | Commencement of operations. |
| (a) | Net investment income per share is calculated using the average shares method. |
| (b) | Total return is calculated assuming a purchase of shares at net asset value on the first day and a sale at net asset value on the last day of each period reported. Distributions are assumed, for the purpose of this calculation, to be reinvested at net asset value per share on the respective payment dates of each distribution. Total return for periods of less than one year is not annualized. Broker commission charges are not included in this calculation. |
| (c) | Not annualized. |
| (d) | Annualized. |
See accompanying notes to financial statements.
8
Table of Contents
SSGA ACTIVE TRUST
STATE STREET DISCIPLINED GLOBAL EQUITY PORTFOLIO
June 30, 2016
| 1. | Organization |
SSGA Active Trust (the “Trust”), which is registered under the Investment Company Act of 1940, as amended (“1940 Act”), is an open-end management investment company that was organized as a Massachusetts business trust on March 30, 2011.
As of June 30, 2016, the Trust consists of fourteen (14) series and corresponding classes, each of which have the same rights and privileges, including voting rights, each of which represets a separate series of beneficial interest in the Trust. The Declaration of Trust permits the Board of Trustees of the Trust (the “Board”) to authorize the issuance of an unlimited number of shares of beneficial interest with no par value. The financial statements herein relate only to:
| Fund | Inception Date | Commencement of Operations | Diversification Classification | |||
| State Street Disciplined Global Equity Portfolio | February 18, 2016 | February 19, 2016 | Diversified |
The Portfolio serves as a master fund in a master feeder structure.
Under the Trust’s organizational documents, its officers and trustees are indemnified against certain liabilities arising out of the performance of their duties to the Trust. Additionally, in the normal course of business, the Trust enters into contracts with service providers that contain general indemnification clauses. The Trust’s maximum exposure under these arrangements is unknown as this could involve future claims that may be made against the Trust that have not yet occurred.
| 2. | Summary of Significant Accounting Policies |
The following is a summary of significant accounting policies followed by the Trust in the preparation of its financial statements:
The preparation of financial statements in accordance with U.S. generally accepted accounting principles (“U.S. GAAP”) requires management to make estimates and assumptions that affect the reported amounts and disclosures in the financial statements. Actual results could differ from those estimates. The Portfolio is an investment company under U.S. GAAP and follows the accounting and reporting guidance applicable to investment companies.
Security Valuation
The Portfolio’s investments are valued at fair value each day that the Portfolio’s listing exchange is open and, for financial reporting purposes, as of the report date should the reporting period end on a day that the Portfolio’s listing exchange is not open. Fair value is generally defined as the price a fund would receive to sell an asset or pay to transfer a liability in an orderly transaction between market participants at the measurement date. By its nature, a fair value price is a good faith estimate of the valuation in a current sale and may not reflect an actual market price. The investments of the Portfolio are valued pursuant to the policy and procedures developed by the Oversight Committee (the “Committee”) and approved by the Board. The Committee provides oversight of the valuation of investments for the Portfolio. The Board has responsibility for determining the fair value of investments.
Valuation techniques used to value the Portfolio’s investments by major category are as follows:
| • | Equity investments traded on a recognized securities exchange for which market quotations are readily available are valued at the last sale price or official closing price, as applicable, on the primary market or exchange on which they trade. Equity investments traded on a recognized exchange for which there were no sales on that day are valued at the last published sale price or at fair value. |
| • | Rights and warrants are valued at the last reported sale price obtained from independent pricing services or brokers on the valuation date. If no prices are obtained from pricing services or brokers, valuation will be based upon the intrinsic value, pursuant to the valuation policy and procedures approved by the Board. |
| • | Investments in registered investment companies (including money market funds) or other unitized pooled investment vehicles that are not traded on an exchange are valued at that day’s published net asset value per share or unit. |
9
Table of Contents
SSGA ACTIVE TRUST
STATE STREET DISCIPLINED GLOBAL EQUITY PORTFOLIO
NOTES TO FINANCIAL STATEMENTS (continued)
June 30, 2016
In the event prices or quotations are not readily available or that the application of these valuation methods results in a price for an investment that is deemed to be not representative of the fair value of such investment, fair value will be determined in good faith by the Committee, in accordance with the valuation policy and procedures approved by the Board.
A “significant event” is an event that the Trustee believes, with a reasonably high degree of certainty, has caused the closing market prices of a Fund’s portfolio securities to no longer reflect their value at the time of the Fund’s net asset value calculation. Fair value may be determined using an independent fair value service under valuation procedures approved by the Trustee. The independent fair value service takes into account multiple factors including, but not limited to, movements in the U.S. securities markets, certain depositary receipts, futures contracts and foreign currency exchange rates that have occurred subsequent to the close of foreign securities exchanges. The use of the independent fair value service or alternative fair valuation methods would result in the investments being classified within Level 2 of the fair value hierarchy. At June 30,2016, the independent fair value service was used for certain foreign securities in the Fund’s portfolio, and these securities were classified within Level 2 of the fair value hierarchy.
Fair value pricing could result in a difference between the prices used to calculate a Portfolio’s net asset value and the prices used by the Portfolio’s underlying benchmark. Various inputs are used in determining the value of the Portfolio’s investments.
The Portfolio values its assets and liabilities at fair value using a fair value hierarchy consisting of three broad levels that prioritize the inputs to valuation techniques giving the highest priority to readily available unadjusted quoted prices in active markets for identical assets or liabilities (Level 1 measurements) and the lowest priority to unobservable inputs (Level 3 measurements) when market prices are not readily available or reliable. The categorization of a value determined for an investment within the hierarchy is based upon the pricing transparency of the investment and is not necessarily an indication of the risk associated with investing in it.
The three levels of the fair value hierarchy are as follows:
| • | Level 1 — Unadjusted quoted prices in active markets for identical assets or liabilities; |
| • | Level 2 — Inputs other than quoted prices included within Level 1 that are observable for the assets or liabilities either directly or indirectly, including quoted prices for similar assets or liabilities in active markets, quoted prices for identical or similar assets or liabilities in markets that are not considered to be active, inputs other than quoted prices that are observable for the asset or liability (such as exchange rates, financing terms, interest rates, yield curves, volatilities, prepayment speeds, loss severities, credit risks and default rates) or other market-corroborated inputs; and |
| • | Level 3 — Unobservable inputs for the asset or liability, including the Committee’s assumptions used in determining the fair value of investments. |
Changes in valuation techniques may result in transfers in or out of an assigned level within the disclosure hierarchy. Transfers between different levels of the fair value hierarchy are recognized at the end of the reporting period. The Portfolio had no transfers between levels for the period ended June 30, 2016.
The value of the Portfolio’s investments according to the fair value hierarchy as of June 30, 2016, is disclosed in the Portfolio’s Schedule of Investments.
Investment Transactions and Income Recognition
Investment transactions are accounted for on trade date for financial reporting purposes. Realized gains and losses from the sale or disposition of investments and foreign exchange transactions, if any, are determined using the identified cost method.
Dividend income and capital gain distributions, if any, are recognized daily on the ex-dividend date, net of any foreign taxes withheld at source, if any.
The Portfolio invests in Real Estate Investment Trusts (REITs). REITs determine the tax character of their distributions annually and may characterize a portion of their distributions as a return of capital or capital gain. The Portfolio’s policy is to record all REIT distributions initially as dividend income and re-designate to return of capital or capital gains
10
Table of Contents
SSGA ACTIVE TRUST
STATE STREET DISCIPLINED GLOBAL EQUITY PORTFOLIO
NOTES TO FINANCIAL STATEMENTS (continued)
June 30, 2016
distributions at year end based on information provided by the REIT and/or SSGA Funds Management, Inc. (the “Adviser” or “SSGA FM”) estimates of such re-designations for which actual information has not yet been reported.
Expenses
Certain expenses, which are directly identifiable to a specific Portfolio, are applied to that Portfolio within the Trust. Other expenses which cannot be attributed to a specific Portfolio are allocated in such a manner as deemed equitable, taking into consideration the nature and type of expense and the relative net assets of the Portfolio within the Trust.
Foreign Currency Translation
The accounting records of the Portfolio are maintained in U.S. dollars. Foreign currencies as well as investment securities and other assets and liabilities denominated in a foreign currency are translated to U.S. dollars using exchange rates at period end. Purchases and sales of securities, income receipts and expense payments denominated in foreign currencies are translated into U.S. dollars at the prevailing exchange rate on the respective dates of the transactions.
The effects of exchange rate fluctuations on investments are included with the net realized and unrealized gain (loss) on investment securities. Other foreign currency transactions resulting in realized and unrealized gain (loss) are disclosed separately.
Distributions
Distributions from net investment income, if any, are declared and paid annually. Net realized capital gains, if any, are distributed annually, unless additional distributions are required for compliance with applicable tax regulations. The amount and character of income and capital gains to be distributed are determined in accordance with applicable tax regulations which may differ from net investment income and realized gains recognized for U.S. GAAP purposes.
| 3. | Fees and Transactions with Affiliates |
Advisory Fee
The Portfolio has entered into an Investment Advisory Agreement with SSGA FM. For its advisory services, the Portfolio pays the Adviser a fee accrued daily and paid monthly, at a rate of 0.25% of the Portfolio’s average daily net assets.
The Adviser has contractually agreed to waive the entire amount of this fee until the later of April 30, 2017 or such time as the shares of the Portfolio cease to be the only investment security held by the Fund. The waiver may be terminated only by the Portfolio’s Board. The Adviser pays all expenses of the Portfolio other than the management fee, distribution fees pursuant to the Distribution and Service Plan, if any, brokerage, taxes, interest, fees and expenses of the Independent Trustees (including any Trustee’s counsel fees), litigation expenses and other extraordinary expenses.
Administrator and Sub-Administrator Fees
SSGA FM serves as administrator and State Street Bank and Trust Company (“State Street”), an affiliate of the Adviser, serves as custodian, sub-administrator and transfer agent. State Street receives fees for its services as custodian, sub-administrator and transfer agent from the Adviser.
Other Transactions with Affiliates
The Portfolio may invest in affiliated entities, included securities issued by State Street, affiliated funds, or entities deemed to be affiliates as a result of the Portfolio owning more than five percent of the entity’s voting securities or outstanding shares. Amounts relating to these transactions during the period ended June 30, 2016 are disclosed in the applicable Schedules of Investments.
| 4. | Trustees’ Fees |
The fees and expenses of the Trust’s trustees who are not “interested persons” of the Trust, as defined in the 1940 Act (“Independent Trustees”) are paid directly by the Portfolio. The Independent Trustees are reimbursed for travel and other out-of-pocket expenses in connection with meeting attendance and industry seminars.
11
Table of Contents
SSGA ACTIVE TRUST
STATE STREET DISCIPLINED GLOBAL EQUITY PORTFOLIO
NOTES TO FINANCIAL STATEMENTS (continued)
June 30, 2016
| 5. | Investment Transactions |
Purchases and sales of investments (excluding short term investments) for the period ended June 30, 2016, were as follows:
| Purchases | Sales | |||||||
State Street Disciplined Global Equity Portfolio | $ | 3,670,313 | $ | 666,949 | ||||
| 6. | Income Tax Information |
The Portfolio intends to qualify as a regulated investment company under Subchapter M of the Internal Revenue Code of 1986, as amended. The Portfolio will not be subject to federal income taxes to the extent it distributes its taxable income, including any net realized capital gains, for each fiscal year. Therefore, no provision for federal income tax is required.
The Portfolio files federal and various state and local tax returns as required. No income tax returns are currently under examination. The federal returns are subject to examination by the Internal Revenue Service for a period of three years from date of filing, while the state returns may remain open for an additional year depending upon jurisdiction. SSGA FM has analyzed the Portfolio’s tax positions taken on tax returns and does not believe there are any uncertain tax positions that would require recognition of a tax liability.
Distributions to shareholders are recorded on ex-dividend date. Income dividends and gain distributions are determined in accordance with income tax rules and regulations, which may differ from generally accepted accounting principles. Certain capital accounts in the financial statements have been adjusted for permanent book- tax differences. These adjustments have no impact on net asset values or results of operations. Temporary book-tax differences will reverse in the future. These book-tax differences are primarily due to differing treatments for foreign currencies gains and losses and passive foreign investment companies.
As of June 30, 2016, the components of distributable earnings on a tax basis were as follows:
| Undistributed Ordinary Income | Capital Loss Carryforwards | Undistributed Long-Term Capital Gains | Net Unrealized Gains (Losses) | Qualified Late-Year Losses | Total | |||||||||||||||||||
State Street Disciplined Global Equity Portfolio | $ | 62,761 | $ | — | $ | — | $ | 205,461 | $ | — | $ | 268,222 | ||||||||||||
As of June 30, 2016, gross unrealized appreciation and gross unrealized depreciation of investments based on cost for federal income tax purposes were as follows:
| Tax Cost | Gross Unrealized Appreciation | Gross Unrealized Depreciation | Net Unrealized Appreciation (Depreciation) | |||||||||||||
State Street Disciplined Global Equity Portfolio | $ | 3,030,981 | $ | 264,892 | $ | 58,988 | $ | 205,904 | ||||||||
| 7. | Risks |
Concentration Risk
As a result of the Portfolio’s ability to invest a large percentage of its assets in obligations of issuers within the same country, state, region, currency or economic sector, an adverse economic, business or political development may affect the value of the Portfolio’s investments more than if the Portfolio were more broadly diversified.
Foreign and Emerging Markets Risks
Investing in foreign markets involve risks and considerations not typically associated with investing in the U.S. Foreign securities may be subject to risk of loss because of government regulation, economic, political and social instability in the countries in which the Portfolio invests. Foreign markets may be less liquid than investments in the U.S. and may be
12
Table of Contents
SSGA ACTIVE TRUST
STATE STREET DISCIPLINED GLOBAL EQUITY PORTFOLIO
NOTES TO FINANCIAL STATEMENTS (continued)
June 30, 2016
subject to the risks of currency fluctuations. To the extent that the Portfolio invests in securities of issuers located in emerging markets, these risks may be even more pronounced.
Market and Credit Risk
In the normal course of business, the Portfolio trades financial instruments and enters into financial transactions where risk of potential loss exists due to changes in the general economic conditions and fluctuations of the market (market risk). Additionally, the Portfolio may also be exposed to credit risk in the event that an issuer or guarantor fails to perform or that an institution or entity with which the Portfolio has unsettled or open transactions defaults.
| 8. | Subsequent Events |
Management has evaluated the impact of all subsequent events on the Portfolio through the date on which the financial statements were available to be issued and has determined that there were no subsequent events requiring adjustment or disclosure in the financial statements.
13
Table of Contents
SPDR ACTIVE TRUST
STATE STREET DISCIPLINED GLOBAL EQUITY PORTFOLIO
REPORT OF INDEPENDENT REGISTERED PUBLIC ACCOUNTING FIRM
To the Shareholders and Board of Trustees of
SSGA Active Trust
We have audited the accompanying statement of assets and liabilities, including the schedule of investments, of State Street Disciplined Global Equity Portfolio (the “Portfolio”) (one of the portfolios constituting SSGA Active Trust) as of June 30, 2016, and the related statement of operations, statement of changes in net assets, and the financial highlights for the periods indicated therein. These financial statements and financial highlights are the responsibility of the Portfolio’s management. Our responsibility is to express an opinion on these financial statements and financial highlights based on our audit.
We conducted our audit in accordance with the standards of the Public Company Accounting Oversight Board (United States). Those standards require that we plan and perform the audit to obtain reasonable assurance about whether the financial statements and financial highlights are free of material misstatement. We were not engaged to perform an audit of the Portfolio’s internal control over financial reporting. Our audit included consideration of internal control over financial reporting as a basis for designing audit procedures that are appropriate in the circumstances, but not for the purpose of expressing an opinion on the effectiveness of the Portfolio’s internal control over financial reporting. Accordingly, we express no such opinion. An audit also includes examining, on a test basis, evidence supporting the amounts and disclosures in the financial statements and financial highlights, assessing the accounting principles used and significant estimates made by management, and evaluating the overall financial statement presentation. Our procedures included confirmation of securities owned as of June 30, 2016, by correspondence with the custodian, brokers and others or by other appropriate auditing procedures where replies from brokers or others were not received. We believe that our audit provides a reasonable basis for our opinion.
In our opinion, the financial statements and financial highlights referred to above present fairly, in all material respects, the financial position of State Street Disciplined Global Equity Portfolio (one of the portfolios constituting SSGA Active Trust) at June 30, 2016, and the results of its operations, the changes in its net assets and the financial highlights for the periods indicated therein in conformity with U.S. generally accepted accounting principles.
Boston, Massachusetts
August 26, 2016
14
Table of Contents
SSGA ACTIVE TRUST
STATE STREET DISCIPLINED GLOBAL EQUITY PORTFOLIO
June 30, 2016 (Unaudited)
Tax Information
Qualified Dividend Income
A portion of the dividends distributed by the Fund during the fiscal year ended June 30, 2016, are considered qualified dividend income, and are eligible for reduced tax rates. These lower rates range from 5% to 20% depending on the individual’s tax bracket. This amount is noted below:
| Amount | ||||
State Street Disciplined Global Equity Portfolio | $ | 39,926 | ||
Proxy Voting Policies and Procedures and Records
A description of the Trust’s proxy voting policies and procedures that are used by the Portfolio’s investment adviser to vote proxies relating to the Portfolio’s portfolio of securities are available (i) without charge, upon request by calling 1-866-787-2257 (toll free) or (ii) on the website of the U.S. Securities and Exchange Commission, at www.sec.gov.
Information regarding how the investment adviser voted for the prior 12-months period ended June 30 is available by August 31 of each year by calling the same number and on the SEC’s website, at www.sec.gov, and on the Portfolio’s website at www.spdrs.com.
Quarterly Portfolio Schedule
The Portfolio files a complete schedule of investments with the SEC for the first and third quarters of each fiscal year on Form N-Q. The Portfolio’s Forms N-Q are available on the SEC’s website at www.sec.gov and may be reviewed and copied at the SEC’s Public Reference Room in Washington DC. Information on the operation of the Public Reference Room may be obtained by calling 1-800-SEC-0330. The information on the Form N-Q is available upon request, without charge, by calling 1-866-787-2257 (toll free) and on the Fund’s website at www.spdrs.com.
Approval of Advisory Agreements
At in-person meetings held prior to June 30, 2016, the Board of Trustees of the Trusts (the “Board”) evaluated proposals (1) to continue the separate Investment Advisory Agreements (the “Agreements”) between each Trust and SSGA Funds Management, Inc. (the “Adviser” or “SSGA FM”) with respect to the operational series of SSGA Active Trust (the “Current ETFs”) and SSGA Master Trust (together with the Current ETFs, the “Current Funds”), and (2) to approve the separate Agreements between the Adviser and (a) the SSGA Active Trust with respect to the SPDR DoubleLine Short Duration Total Return Tactical ETF and SPDR DoubleLine Emerging Markets Fixed Income ETF (the “New ETFs” and, together with the Current ETFs, the “ETFs”), and the State Street Disciplined Global Equity Portfolio (together with the New ETFs, the “New Funds”) each a new series of the SSGA Active Trust, (with the Current Funds and New Funds collectively being referred to hereafter as the “Funds”), each of which commenced operations during the period covered by this Annual Report. The Trustees who are not “interested persons” of the Trust within the meaning of the Investment Company Act of 1940, as amended (the “Independent Trustees”), also met separately with their independent legal counsel to consider the Agreements.
In evaluating the Agreements, the Board drew on materials provided to them by SSGA FM, the Trust’s investment adviser and administrator, and other materials provided by State Street Bank and Trust Company, the Trusts’ sub-administrator, transfer agent and custodian (“State Street”). In deciding whether to approve the Agreements, the Board considered various factors, including the (i) nature, extent and quality of services provided by, or expected to be provided by, the Adviser with respect to the Funds under the Agreements, (ii) investment performance of the Current Funds, (iii) profits realized by the Adviser and its affiliates from its relationship with the Trusts, (iv) fees charged to comparable funds, (v) other benefits to the Adviser, and (vi) extent to which economies of scale would be shared as the Funds grow.
Nature, Extent and Quality of Services
The Board considered the nature, extent and quality of services provided by, or expected to be provided by, the Adviser. In doing so, the Trustees relied on their prior experience in overseeing the management of the Trusts and materials
15
Table of Contents
SSGA ACTIVE TRUST
STATE STREET DISCIPLINED GLOBAL EQUITY PORTFOLIO
OTHER INFORMATION (continued)
June 30, 2016 (Unaudited)
provided prior to and at the meeting. The Board reviewed the Agreements and the Adviser’s responsibilities for managing investment operations of each of the Funds in accordance with each Fund’s investment objectives and policies, and applicable legal and regulatory requirements. The Board appreciated the relatively unique nature of the ETFs as exchange-traded funds in a master-feeder structure, as appropriate, and the experience and expertise of the Adviser with exchange-traded funds. The Board considered the background and experience of the Adviser’s senior management, including those individuals responsible for portfolio management, oversight of sub-advisers and regulatory compliance of the Funds. The Board also considered the portfolio management resources, structures and practices of the Adviser, including those associated with monitoring and securing each Fund’s compliance with its investment objectives and policies and with applicable laws and regulations. The Board also considered information about the Adviser’s best execution procedures and overall investment management business, noting that the Adviser serves a wide range of clients across a broad spectrum of asset classes. The Board looked at the Adviser’s general knowledge of the investment business and that of its affiliates which make up State Street Global Advisors, through which the Adviser shares all of its senior personnel. The Board considered that the Adviser and its affiliates constitute one of the world’s largest investment management enterprises for exchange-traded funds. The Board also considered the Adviser’s experience in active management, managing exchange-traded funds in master-feeder structures and overseeing third-party sub-advisers, as applicable.
Investment Performance
The Board then reviewed the Current Funds’ performance. The Board compared each Current Fund’s investment performance to the performance of an appropriate benchmark and group of comparable funds. Among other information, the Board considered the following performance information in its evaluation of the Funds:
SPDR SSGA Multi-Asset Real Return ETF. The Board considered that: (a) the Fund underperformed the median of its Performance Group for the 1-, 2- and 3-year periods; and (b) outperformed its benchmark index for the 1-year period and underperformed its benchmark index for the 3-year period.
SPDR SSGA Income Allocation ETF. The Board considered that: (a) the Fund outperformed the median of its Performance Group for the 1-, 2- and 3-year periods; and (b) underperformed its benchmark index for the 1- and 3-year period.
SPDR SSGA Global Allocation ETF. The Board considered that: (a) the Fund outperformed the median of its Performance Group for the 1-, 2- and 3-year periods; and (b) underperformed its benchmark index for the 1-year period and outperformed its benchmark index for the 3-year period.
SPDR Blackstone / GSO Senior Loan ETF. The Board considered that: (a) the Fund underperformed the median of its Performance Group for the 1- and 2-year periods; and (b) outperformed its benchmark index for the 1-year period.
SPDR SSGA Ultra Short Term Bond ETF. The Board considered that: (a) the Fund underperformed the median of its Performance Group for the 1- and 2-year periods; and (b) outperformed its benchmark index for the 1-year period.
SPDR DoubleLine Total Return Tactical ETF. The Board considered that: (a) the Fund outperformed the median of its Performance Group since inception; and (b) outperformed its benchmark index since inception.
SPDR MFS Systematic Core Equity ETF. The Board considered that: (a) the Fund outperformed the median of its Performance Group for the 1-year period; and (b) outperformed its benchmark index for the 1-year period.
SPDR MFS Systematic Growth Equity ETF. The Board considered that: (a) the Fund outperformed the median of its Performance Group for the 1-year period; and (b) outperformed its benchmark index for the 1-year period.
SPDR MFS Systematic Value Equity ETF. The Board considered that: (a) the Fund outperformed the median of its Performance Group for the 1-year period; and (b) outperformed its benchmark index for the 1-year period.
SPDR SSGA Risk Aware ETF. The Board considered that: (a) the Fund underperformed the median of its Performance Group for the 1-year period; and (b) underperformed its benchmark index for the 1-year period.
On the basis of the foregoing and other relevant information, the Board concluded that the performance of each Current Fund is satisfactory.
16
Table of Contents
SSGA ACTIVE TRUST
STATE STREET DISCIPLINED GLOBAL EQUITY PORTFOLIO
OTHER INFORMATION (continued)
June 30, 2016 (Unaudited)
Profits Realized by Adviser
The Board considered the profitability of the advisory arrangement with the Current Funds to the Adviser, including data on the Current Funds’ historical profitability to the Adviser. The Independent Trustees, through their counsel, had the opportunity to discuss, with representatives of the Adviser and State Street, methodologies used in computing costs that formed the bases of profitability calculations and determined that these methodologies were reasonable.
Fees Charged to Comparable Funds
The Board evaluated each Fund’s unitary fee through review of comparative information with respect to fees paid by similar funds — i.e., exchange-traded funds that are actively managed, as applicable. The Board reviewed the universe of similar exchange-traded funds for each ETF based upon data independently obtained from Broadridge Financial Solutions, Inc. (formerly Lipper Analytical Services) and related comparative information for similar exchange-traded funds. The Board also reviewed the fee structure, as applicable, of each Fund in connection with the master-feeder structure, the historical expense ratios of each Current Fund and the estimated expense ratios for each New Fund. In doing so, the Board used a fund by fund analysis of the data.
Other Benefits
The Board also considered whether the Adviser or its affiliates benefited in other ways from its relationship with the Trusts, noting that the Adviser does not maintain soft-dollar arrangements in connection with the Trusts’ brokerage transactions.
Economies of Scale
The Board reviewed information regarding economies of scale or other efficiencies that may result as each Fund’s assets grow in size. The Board noted that the Agreements did not provide for breakpoints in each Fund’s advisory fee rates as assets of a Fund increase. However, the Board further noted the Adviser’s assertion that future economies of scale (among several factors) had been taken into consideration for the Funds by fixing relatively low advisory fees, effectively sharing the benefits of lower fees with the Funds from inception. The Adviser also asserted that one of the benefits of the unitary fee was to provide an unvarying expense structure, which could be lost or diluted with the addition of breakpoints. The Board noted that it intends to continue to monitor fees as the Funds grow in size and assess whether fee breakpoints may be warranted.
The Board, including the Independent Trustees voting separately, approved the Agreements for each Fund after weighing the foregoing factors, none of which was dispositive in itself and may have been weighed differently by each Trustee. The Board’s conclusions with respect to each Agreement were as follows: (a) the nature and extent of the services provided, or expected to be provided, by the Adviser with respect to the Funds were appropriate; (b) the performance of each Current Fund had been satisfactory; (c) the Adviser’s unitary fee for each Fund, considered in relation to services provided or expected to be provided, and in relation to fees charged to comparable funds, was fair and reasonable; (d) profitability of the Trusts’ relationship with the Adviser was not excessive; (e) any additional potential benefits to the Adviser or its affiliates were not of a magnitude to materially affect the Board’s conclusions; and (f) fees paid to the Adviser shared the economies of scale with respect to the Current Funds by way of the relatively low fee structure of the Trusts.
Approval of Massachusetts Financial Services Company Sub-Advisory Agreements
At an in-person meeting held prior to June 30, 2016, the Board also evaluated proposals to continue the separate Sub-Advisory Agreements (the “MFS Sub-Advisory Agreements”) between the Adviser and Massachusetts Financial Services Company (“MFS”) with respect to the SPDR MFS Systematic Core Equity ETF, SPDR MFS Systematic Growth Equity ETF and SPDR MFS Systematic Value Equity ETF, each a series of the SSGA Active Trust, and SSGA MFS Systematic Core Equity Portfolio, SSGA Systematic Growth Equity Portfolio and SSGA MFS Systematic Value Equity Portfolio, each a series of the SSGA Master Trust, each sub-advised by MFS (the “MFS Funds”). The Independent Trustees also met separately with their independent legal counsel to consider the MFS Sub-Advisory Agreements.
In evaluating the MFS Sub-Advisory Agreements, the Board drew on materials provided to them by MFS and the Adviser. In deciding whether to approve the MFS Sub-Advisory Agreements, the Board considered various factors,
17
Table of Contents
SSGA ACTIVE TRUST
STATE STREET DISCIPLINED GLOBAL EQUITY PORTFOLIO
OTHER INFORMATION (continued)
June 30, 2016 (Unaudited)
including the (i) nature, extent and quality of services provided by MFS with respect to the MFS Funds under the MFS Sub-Advisory Agreements and (ii) investment performance of the MFS Funds. The Board was apprised of the portion of the current advisory fee that the Adviser would pay to MFS under the MFS Sub-Advisory Agreements and also considered that such fees would be paid directly by the Adviser and would not result in increased fees payable by the MFS Funds.
The Board considered the background and experience of MFS’s senior management and, in particular, MFS’s experience in investing in equity securities. The Board reviewed the MFS Funds’ performance, noting that that the performance of the MFS Funds was satisfactory. The Board also considered the unitary fee paid to the Adviser by each MFS Fund and MFS’s fees paid by the Adviser.
The Board, including the Independent Trustees voting separately, approved the MFS Sub-Advisory Agreements for each MFS Fund after weighing the foregoing factors, none of which was dispositive in itself and may have been weighed differently by each Trustee. The Board’s conclusions with respect to each MFS Sub-Advisory Agreement were as follows: (a) the nature and extent of the services provided by MFS with respect to the MFS Funds were appropriate; (b) the performance of the MFS Funds had been satisfactory; (c) MFS’s fees for the MFS Funds and the unitary fee, considered in relation to the services provided, were fair and reasonable; (d) any additional potential benefits to MFS were not of a magnitude to materially affect the Board’s conclusions; and (e) fees paid to MFS adequately shared the economies of scale with each applicable MFS Fund by way of the relatively low fee structure of the Trusts.
Approval of DoubleLine Capital LP Sub-Advisory Agreements
At in-person meetings held prior to June 30, 2016, the Board also considered proposals to continue the separate Sub-Advisory Agreements (the “DoubleLine Sub-Advisory Agreements”) between the Adviser and DoubleLine Capital LP (“DoubleLine”) with respect to the SPDR DoubleLine Total Return Tactical ETF, a series of the SSGA Active Trust, and State Street DoubleLine Total Return Tactical Portfolio, a series of the SSGA Master Trust (together, the “Current DoubleLine Funds”), and to approve the DoubleLine Sub-Advisory Agreements between the Adviser and DoubleLine with respect to the SPDR DoubleLine Short Duration Total Return Tactical ETF and SPDR DoubleLine Emerging Markets Fixed Income ETF, each a series of SSGA Active Trust (together with the Current DoubleLine Funds, the “DoubleLine Funds”), under which each of the DoubleLine Funds would be sub-advised by DoubleLine. The Independent Trustees also met separately with their independent legal counsel to consider the DoubleLine Sub-Advisory Agreements.
In evaluating the DoubleLine Sub-Advisory Agreements, the Board drew on materials provided to them by DoubleLine and the Adviser. In deciding whether to approve the DoubleLine Sub-Advisory Agreements, the Board considered various factors, including the (i) nature, extent and quality of services provided, or expected to be provided, by DoubleLine with respect to the DoubleLine Funds under the DoubleLine Sub-Advisory Agreements; and (ii) investment performance of the Current DoubleLine Funds. The Board was apprised of the portion of the advisory fee that the Adviser would pay to DoubleLine under the DoubleLine Sub-Advisory Agreements and also considered that such fees would be paid directly by the Adviser and would not result in increased fees payable by the DoubleLine Funds.
The Board considered the background and experience of DoubleLine’s senior management and, in particular, DoubleLine’s experience in investing in fixed income securities. The Board reviewed the Current DoubleLine Funds’ performance, noting that that the performance of the Current DoubleLine Funds was satisfactory. The Board also considered the unitary fee paid, or to be paid, to the Adviser by each DoubleLine Fund and DoubleLine’s fees paid by the Adviser.
The Board, including the Independent Trustees voting separately, approved the DoubleLine Sub-Advisory Agreements for the DoubleLine Funds after weighing the foregoing factors, none of which was dispositive in itself and may have been weighed differently by each Trustee. The Board’s conclusions with respect to each of the DoubleLine Sub-Advisory Agreements were as follows: (a) the nature and extent of the services provided, or expected to be provided, by DoubleLine with respect to the DoubleLine Funds were adequate and appropriate; (b) the performance of the Current DoubleLine Funds had been satisfactory; (c) DoubleLine’s fees for the DoubleLine Funds and the unitary fee, considered in relation to the services provided, or expected to be provided, were fair and reasonable; (d) any additional potential benefits to DoubleLine were not of a magnitude to materially affect the Board’s conclusions; and (e) fees paid, or expected to be paid, to DoubleLine were expected to share economies of scale with each applicable DoubleLine Fund by way of the relatively low fee structure of the Trusts.
18
Table of Contents
SSGA ACTIVE TRUST
STATE STREET DISCIPLINED GLOBAL EQUITY PORTFOLIO
OTHER INFORMATION (continued)
June 30, 2016 (Unaudited)
TRUSTEES AND OFFICERS
Name, Address | Position(s) | Term of Time Served | Principal During Past | Number of Portfolios in Fund Complex Overseen by Trustee | Other Held by Trustee During the | |||||||
Trustees | ||||||||||||
Independent Trustees | ||||||||||||
FRANK NESVET c/o SSGA Active Trust State Street Financial Center One Lincoln Street Boston, MA 02111-2900 1943 | Independent Trustee, Chairman, Trustee Committee Chair | Term: Unlimited Served: since September 2000 | Chief Executive Officer, Libra Group, Inc. (a financial services consulting company) (1998-present). | 218 | SPDR Index Shares Funds (Trustee); SPDR Series Trust (Trustee); SSGA Master Trust (Trustee). | |||||||
DAVID M. KELLY c/o SSGA Active Trust State Street Financial Center One Lincoln Street Boston, MA 02111-2900 1938 | Independent Trustee, Audit Committee Chair | Term: Unlimited Served: since September 2000 | Retired. | 218 | Chicago Stock Exchange (Former Director, retired); Penson Worldwide Inc. (Former Director, retired); SPDR Index Shares Funds (Trustee); SPDR Series Trust (Trustee); SSGA Master Trust (Trustee). | |||||||
BONNY EUGENIA BOATMAN c/o SSGA Active Trust State Street Financial Center One Lincoln Street Boston, MA 02111-2900 1950 | Independent Trustee | Term: Unlimited Served: since April 2010 | Retired. | 218 | SPDR Index Shares Funds (Trustee); SPDR Series Trust (Trustee); SSGA Master Trust (Trustee). | |||||||
DWIGHT D. CHURCHILL c/o SSGA Active Trust State Street Financial Center One Lincoln Street Boston, MA 02111-2900 1953 | Independent Trustee | Term: Unlimited Served: since April 2010 | Self-employed consultant since 2010; CEO and President, CFA Institute (June 2014-January 2015). | 218 | SPDR Index Shares Funds (Trustee); SPDR Series Trust (Trustee); SSGA Master Trust (Trustee); Affiliated Managers Group, Inc. (Director). | |||||||
CARL G. VERBONCOEUR c/o SSGA Active Trust State Street Financial Center One Lincoln Street Boston, MA 02111-2900 1952 | Independent Trustee | Term: Unlimited Served: since April 2010 | Self-employed consultant since 2009. | 218 | The Motley Fool Funds Trust (Trustee); SPDR Index Shares Funds (Trustee); SPDR Series Trust (Trustee); SSGA Master Trust (Trustee). | |||||||
19
Table of Contents
SSGA ACTIVE TRUST
STATE STREET DISCIPLINED GLOBAL EQUITY PORTFOLIO
OTHER INFORMATION (continued)
June 30, 2016 (Unaudited)
Name, Address | Position(s) | Term of Time Served | Principal During Past | Number of Portfolios in Fund Complex Overseen by Trustee | Other Held by Trustee During the | |||||||
Interested Trustee | ||||||||||||
JAMES E. ROSS* SSGA Funds Management, Inc. State Street Financial Center One Lincoln Street Boston, MA 02111 1965 | Interested Trustee | Term: Unlimited Served as Trustee: since April 2010 | Chairman and Director, SSGA Funds Management, Inc. (2005-present); Senior Managing Director and Principal, State Street Global Advisors (2006-present); President, SSGA Funds Management, Inc. (2005-2012). | 299 | SPDR Index Shares Funds (Trustee); SPDR Series Trust (Trustee); SSGA Master Trust (Trustee); Select Sector SPDR Trust (Trustee); State Street Master Funds (Trustee); and State Street Institutional Investment Trust (Trustee). | |||||||
| * | Mr. Ross is an Interested Trustee because of his employment with the Adviser and ownership interest in an affiliate of the Adviser. Mr. Ross previously served as an Interested Trustee from November 2005 to December 2009. |
Name, Address | Position(s) | Term of | Principal | |||
Officers | ||||||
ELLEN M. NEEDHAM SSGA Funds Management, Inc. State Street Financial Center One Lincoln Street Boston, MA 02111 1967 | President | Term: Unlimited Served: since October 2012 | President and Director, SSGA Funds Management, Inc. (2001-present)*; Senior Managing Director, State Street Global Advisors (1992-present).* | |||
ANN M. CARPENTER SSGA Funds Management, Inc. State Street Financial Center One Lincoln Street Boston, MA 02111 1966 | Vice President; Deputy Treasurer | Term: Unlimited Served: since August 2012; Term: Unlimited Served: since February 2016 | Chief Operating Officer, SSGA Funds Management, Inc. (2005-Present)*; Managing Director, State Street Global Advisors (2005-present).* | |||
MICHAEL P. RILEY SSGA Funds Management, Inc. State Street Financial Center One Lincoln Street Boston, MA 02111 1969 | Vice President | Term: Unlimited Served: since February 2005 | Managing Director, State Street Global Advisors and SSGA Funds Management, Inc. (February 2015-present); Vice President, State Street Global Advisors and SSGA Funds Management, Inc. (2008-February 2015); Principal, State Street Global Advisors and SSGA Funds Management, Inc. (2005-2008). | |||
JOSHUA A. WEINBERG SSGA Funds Management, Inc. State Street Financial Center One Lincoln Street Boston, MA 02111 1978 | Chief Legal Officer | Term: Unlimited Served: since February 2015 | Vice President and Managing Counsel, State Street Global Advisors (2011-present); Clerk, SSGA Funds Management, Inc. (2013-present); Associate, Financial Services Group, Dechert LLP (2006-2011). | |||
20
Table of Contents
SSGA ACTIVE TRUST
STATE STREET DISCIPLINED GLOBAL EQUITY PORTFOLIO
OTHER INFORMATION (continued)
June 30, 2016 (Unaudited)
Name, Address | Position(s) | Term of | Principal | |||
CHRISTOPHER A. MADDEN State Street Bank and Trust Company One Hundred Huntington Avenue, CPH0326 Boston, MA 02116 1967 | Secretary | Term: Unlimited Served: since August 2013 | Vice President and Senior Counsel, State Street Bank and Trust Company (2013-present); Counsel, Atlantic Fund Services (2009-2013); Vice President.* | |||
PATRICIA A. MORISETTE State Street Bank and Trust Company One Hundred Huntington Avenue, CPH0326 Boston, MA 02116 1973 | Assistant Secretary | Term: Unlimited Served: since February 2015 | Vice President and Counsel, State Street Bank and Trust Company (2014-present); Assistant Vice President and Counsel, John Hancock Financial Services (2011-2013); Independent legal consultant (2009-2011); Associate, Bingham McCutchen LLP (2003-2009).*,** | |||
BRUCE S. ROSENBERG SSGA Funds Management, Inc. State Street Financial Center One Lincoln Street Boston, MA 02111 1961 | Treasurer | Term: Unlimited Served: since February 2016 | Managing Director, State Street Global Advisors and SSGA Funds Management, Inc. (July 2015-present; Director, Credit Suisse (April 2008-July 2015)). | |||
CHAD C. HALLETT SSGA Funds Management, Inc. State Street Financial Center One Lincoln Street Boston, MA 02111 1969 | Deputy Treasurer | Term: Unlimited Served: since February 2016 | Vice President, State Street Global Advisors and SSGA Funds Management, Inc. (November 2014-present); Vice President, State Street Bank and Trust Company (2001-November 2014).* | |||
SUJATA UPRETI SSGA Funds Management, Inc. State Street Financial Center One Lincoln Street Boston, MA 02111 1974 | Assistant Treasurer | Term: Unlimited Served: since February 2016 | Vice President, State Street Global Advisors and SSGA Funds Management, Inc. (May 2015-present; Assistant Director, Cambridge Associates, LLC (July 2014-January 2015); Vice President, Bank of New York Mellon (July 2012-August 2013); Manager, PricewaterhouseCoopers, LLP (September 2003-July 2012)). | |||
DANIEL FOLEY SSGA Funds Management, Inc. State Street Financial Center One Lincoln Street Boston, MA 02111 1972 | Assistant Treasurer | Term: Unlimited Served: since February 2016 | Vice President, State Street Global Advisors and SSGA Funds Management, Inc. (April 2007-present).* | |||
BRIAN HARRIS SSGA Funds Management, Inc. State Street Financial Center One Lincoln Street Boston, MA 02111 1973 | Chief Compliance Officer and Anti-Money Laundering Officer | Term: Unlimited Served: since November 2013 | Managing Director, State Street Global Advisors and SSGA Funds Management, Inc. (June 2013-present)*; Senior Vice President and Global Head of Investment Compliance, BofA Global Capital Management (2010-2013); Director of Compliance, AARP Financial Inc. (2008-2010). |
| * | Served in various capacities and/or with various affiliated entities during noted time period. |
| ** | Served in various capacities and/or with unaffiliated mutual funds or closed-end funds for which State Street Bank and Trust Company or its affiliates act as a provider of services during the noted time period. |
Statement of Additional information (SAI) includes additional information about Fund directors and is available, without charge, upon request and by calling 1-866-787-2257.
21
Table of Contents
SSGA Active Trust
Trustees
Bonny E. Boatman
Dwight D. Churchill
David M. Kelly
Frank Nesvet, Chairman
James E. Ross
Carl G. Verboncoeur
Officers
Ellen M. Needham, President
Bruce Rosenberg, Treasurer
Ann Carpenter, Vice President and Deputy Treasurer
Michael P. Riley, Vice President
Chad C. Hallett, Deputy Treasurer
Sujata Upreti, Assistant Treasurer
Daniel Foley, Assistant Treasurer
Christopher A. Madden, Secretary
Patricia A. Morisette, Assistant Secretary
Brian Harris, Chief Compliance Officer and Anti-Money Laundering Officer
Joshua A. Weinberg, Chief Legal Officer
Investment Manager and Administrator
SSGA Funds Management, Inc.
State Street Financial Center
One Lincoln Street
Boston, MA 02111
Distributor
State Street Global Markets, LLC
One Lincoln Street
Boston, MA 02111
Custodian, Sub-Administrator and Transfer Agent
State Street Bank and Trust Company
One Lincoln Street
Boston, MA 02111
Legal Counsel
Morgan, Lewis & Bockius LLP
1111 Pennsylvania Avenue, NW
Washington, DC 20004
Independent Registered Public Accounting Firm
Ernst & Young LLP
200 Clarendon Street
Boston, MA 02116
Fund Shares are distributed by State Street Global Markets, LLC, a wholly-owned subsidiary of State Street Corporation. State Street Global Markets, LLC; member FINRA, SIPC.
The information contained in this report is intended for the general information of shareholders of the Portfolio and shareholders of any fund or private client invested in the Portfolio. Generally, shares of the Portfolio may be purchased only by or on behalf of other registered investment companies or private clients for which the Adviser or an affiliate serves as investment adviser (or in a similar capacity). This report is not authorized for distribution (i) to prospective investors in any fund invested in the Portfolio unless preceded or accompanied by a current offering document for such fund or (ii) to prospective eligible investors in the Portfolio unless preceded or accompanied by a current offering document of the Portfolio. Eligible investors in the Portfolio may obtain a current prospectus and SAI from the Distributor by calling 1-800-997-7327. Please read the offering document carefully before investing in the Portfolio.
SSIITDGBLEQSAR
IBG-20865
Table of Contents
Item 2. Code of Ethics.
As of the end of the period covered by this report, the registrant has adopted a code of ethics that applies to the registrant’s principal executive officer, principal financial officer, principal accounting officer or controller, or persons performing similar functions, regardless of whether these individuals are employed by the registrant or a third party (the “Code of Ethics”). During the period covered by this report, no substantive amendments were made to the Code of Ethics. During the period covered by this report, the registrant did not grant any waivers, including any implicit waivers, from any provision of the Code of Ethics.
The Code of Ethics is attached hereto as Exhibit 12(a)(1).
Item 3. Audit Committee Financial Expert.
(a)(1) The Board of Trustees of the registrant has determined that the registrant has five Board members serving on the Audit Committee that possess the attributes identified in Instructions 2(b) of Item 3 to Form N-CSR to qualify as an “audit committee financial expert.”
(2) Bonny Boatman, Dwight Churchill, David M. Kelly, Frank Nesvet and Carl Verboncoeur are the registrant’s audit committee financial experts. The Board also determined that each of the foregoing persons are not “interested person(s)” of the registrant as that term is defined in Section 2(a)(19) of the Investment Company Act of 1940, as amended.
Item 4. Principal Accountant Fees and Services.
(a) Audit Fees.
For the fiscal years ending June 30, 2016 and June 30, 2015, the aggregate audit fees billed for professional services rendered by the principal accountant were $160,882 and $113,203, respectively. Audit fees include the performance of the annual audits and routine regulatory filings (one for each SEC registrant).
(b) Audit-Related Fees.
For the fiscal years ending June 30, 2016 and June 30, 2015, the principal accountant did not bill the registrant any fees for assurances and related services that are reasonably related to the performance of the audit of the registrant’s financial statements and are not reported under paragraph (a) of this Item.
(c) Tax Fees.
For the fiscal years ending June 30, 2016 and June 30, 2015, the aggregate tax fees billed for professional services rendered by the principal accountant were $124,389 and $96,657, respectively. Tax fees represent services related to the review of year-end distribution requirements, as well as the review and signing as preparer of all federal, state and excise income tax returns for the series of the registrant.
(d) All Other Fees.
There were no other fees billed by the principal accountant for the fiscal years ending June 30, 2016 and June 30, 2015.
Table of Contents
(e)(1) Audit Committee Pre-Approval Policies and Procedures.
The registrant’s Audit Committee Charter states the following with respect to pre-approval procedures:
Before the independent auditors are engaged by the Trust to render audit or non-audit services, either:
| a. | The Audit Committee shall pre-approve all auditing services and permissible non-audit services (e.g., tax services) provided to the Trust. The Audit Committee may delegate to one or more of its members the authority to grant pre-approvals. Any decision of any member to whom authority is delegated under this section shall be presented to the full Audit Committee at its next regularly scheduled meeting; |
or
| b. | The engagement to render the auditing service or permissible non-audit service is entered into pursuant to pre-approval policies and procedures established by the Audit Committee. Any such policies and procedures must (1) be detailed as to the particular service and (2) not involve any delegation of the Audit Committee’s responsibilities to the investment adviser. The Audit Committee must be informed of each service entered into pursuant to the policies and procedures. A copy of any such policies and procedures shall be attached as an exhibit to the Audit Committee Charter. |
| c. | De Minimis Exceptions to Pre-Approval Requirements. Pre-Approval for a service provided to the Trust other than audit, review or attest services is not required if: (1) the aggregate amount of all such non-audit services provided to the Trust constitutes not more than 5 percent of the total amount of revenues paid by the Trust to the independent auditors during the fiscal year in which the non-audit services are provided; (2) such services were not recognized by the Trust at the time of the engagement to be non-audit services; and (3) such services are promptly brought to the attention of the Audit Committee and are approved by the Audit Committee or by one or more members of the Audit Committee to whom authority to grant such approvals has been delegated by the Audit Committee prior to the completion of the audit. |
| d. | Pre-Approval of Non-Audit Services Provided to the investment adviser and Certain Control Persons. The Audit Committee shall pre-approve any non-audit services proposed to be provided by the independent auditors to (a) the investment adviser and (b) any entity controlling, controlled by, or under common control with the investment adviser that provides ongoing services to the Trust, if the independent auditors’ engagement with the investment adviser or any such control persons relates directly to the operations and financial reporting of the Trust. It shall be the responsibility of the independent auditors to notify the Audit Committee of any non-audit services that need to be pre-approved. |
| e. | Application of De Minimis Exception: The De Minimis exception set forth above applies to pre-approvals under this Section as well, except that the “total amount of revenues” calculation is based on the total amount of revenues paid to the independent auditors by the Trust and any other entity that has its services approved under this Section (i.e., the investment adviser or any control person). |
Table of Contents
(e)(2) Percentage of Services.
One hundred percent of the services described in each of paragraphs (b) through (d) of this Item were approved by the registrant’s Audit Committee pursuant to paragraph (c)(7)(i)(C) of Rule 2-01 of Regulation S-X.
(f) Not applicable.
(g) The aggregate non-audit fees billed for by the registrant’s accountant for services rendered to the registrant, and rendered to the registrant’s investment adviser (not including any sub-adviser whose role is primarily portfolio management and is subcontracted with or overseen by another investment adviser), and any entity controlling, controlled by, or under common control with the adviser were as follows:
| FY 2016 (in millions) | FY 2015 (in millions) | |||||||
Non audit services billed to: | ||||||||
Registrant: | See Item 4(c) | See Item 4(c) | ||||||
Investment Adviser: | — | — | ||||||
Other entities in the Investment Company Complex (1)(2): | ||||||||
Audit Related Fees | $ | 15.5 | $ | 16.0 | ||||
Tax Fees | 7.5 | 6.0 | ||||||
All Other Fees | 2.7 | 0.8 | ||||||
| (1) | Information is for the calendar years 2015 and 2014, respectively. |
| (2) | Services under the caption Audit-Related Fees consisted principally of reports on the processing of transactions by servicing organizations, audits of employee benefit plan, non-statutory audits and due diligence procedures. Services under the caption Tax Fees consisted principally of expatriate, compliance and corporate tax advisory services. Services under the caption All Other Fees consisted of advisory services related to certain regulatory initiatives. |
(h) The registrant’s principal accountant notified the registrant’s Audit Committee of all non-audit services that were rendered by the principal accountant to the Adviser and any entity controlling, controlled by, or under common control with the Adviser that provides services to the registrant, which services were not required to be pre-approved pursuant to paragraph (c)(7)(ii) of Rule 2-01 of Regulation S-X, allowing the registrant’s Audit Committee to consider whether such services were compatible with maintaining the principal accountant’s independence.
Item 5. Audit Committees of Listed Registrants.
The registrant has an audit committee which was established by the Board of Trustees of the Trust in accordance with Section 3(a)(58)(A) of the Securities Exchange Act of 1934, as amended. The members of the registrant’s audit committee are Bonny Boatman, Dwight Churchill, David M. Kelly, Frank Nesvet and Carl Verboncoeur.
Table of Contents
Item 6. Investments.
(a) A Schedule of Investments for each series of the registrant is included as a part of the reports to shareholders filed under Item 1 of this Form N-CSR.
(b) Not applicable to the registrant.
Item 7. Disclosure of Proxy Voting Policies and Procedures for Closed-End Management Investment Companies.
Not applicable to the registrant.
Item 8. Portfolio Managers of Closed-End Management Investment Companies.
Not applicable to the registrant.
Item 9. Purchases of Equity Securities by Closed-End Management Investment Company and Affiliated Purchasers.
Not applicable to the registrant.
Item 10. Submission of Matters to a Vote of Security Holders.
The registrant has not adopted any material changes to the procedures by which shareholders may recommend nominees to the registrant’s Board.
Item 11. Controls and Procedures.
(a) Within 90 days of the filing date of this Form N-CSR, Ellen M. Needham, the registrant’s President and Principal Executive Officer, and Bruce S. Rosenberg, the registrant’s Treasurer and Principal Financial Officer, reviewed the registrant’s disclosure controls and procedures and evaluated their effectiveness. Based on their review, Ms. Needham and Mr. Rosenberg determined that the disclosure controls and procedures adequately ensure that information required to be disclosed by the registrant in its periodic reports is recorded, processed, summarized and reported within the time periods required by the U.S. Securities and Exchange Commission.
(b) In the registrant’s second fiscal quarter covered by this form N-CSR filing, there were no significant changes in the registrant’s internal controls or in other factors that have materially affected, or are reasonably likely to materially affect, its controls over financial reporting subsequent to the date of their evaluation, including any corrective actions with regard to significant deficiencies and material weaknesses.
Item 12. Exhibits.
(a)(1) Code of Ethics referred to in Item 2.
(a)(2) Separate certifications required by Rule 30a-2(a) under the Investment Company Act of 1940, as amended, for each principal executive officer and principal financial officer of the registrant are attached.
Table of Contents
(a)(3) Not applicable to the registrant.
(b) A single certification required by Rule 30a-2(b) under the Investment Company Act of 1940, as amended, Rule 13a-14(b) or Rule 15d-14(b) under the Securities Exchange Act of 1934, as amended, and Section 1350 of Chapter 63 of Title 18 of the United States Code for the principal executive officer and principal financial officer of the registrant is attached.
Table of Contents
SIGNATURES
Pursuant to the requirements of the Securities Exchange Act of 1934, as amended, and the Investment Company Act of 1940, as amended, the registrant has duly caused this report to be signed on its behalf by the undersigned, thereunto duly authorized.
| SSGA Active Trust | ||
| By: | /s/ Ellen M. Needham | |
| Ellen M. Needham | ||
| President and Principal Executive Officer | ||
| Date: | September 8, 2016 | |
Pursuant to the requirements of the Securities Exchange Act of 1934, as amended, and the Investment Company Act of 1940, as amended, this report has been signed below by the following persons on behalf of the registrant and in the capacities and on the dates indicated.
| By: | /s/ Ellen M. Needham | |
| Ellen M. Needham | ||
| President and Principal Executive Officer | ||
| Date: | September 8, 2016 | |
| By: | /s/ Bruce S. Rosenberg | |
| Bruce S. Rosenberg | ||
| Treasurer and Principal Financial Officer | ||
| Date: | September 8, 2016 | |