UNITED STATES
SECURITIES AND EXCHANGE COMMISSION
Washington, D.C. 20549
FORM N-CSR
CERTIFIED SHAREHOLDER REPORT OF REGISTERED
MANAGEMENT INVESTMENT COMPANIES
Investment Company Act file number: 811-22542
SSGA ACTIVE ETF TRUST
(Exact name of registrant as specified in charter)
One Lincoln Street, Boston, Massachusetts 02111
(Address of principal executive offices) (zip code)
Christopher A. Madden, Esq.
State Street Bank and Trust Company
One Lincoln Street/CPH0326
Boston, Massachusetts 02111
(Name and address of agent for service)
Copy to:
W. John McGuire, Esq.
Bingham McCutchen LLP
2020 K Street, N.W.
Washington, DC 20006
Registrant’s telephone number, including area code: (866) 787-2257
Date of fiscal year end: June 30
Date of reporting period: June 30, 2013
Item 1. Reports to Shareholders.

SSgA Active ETF Trust
Annual Report June 30, 2013
Precise in a world that isn’t.SM
TABLE OF CONTENTS

PRESIDENT’S LETTERTO SHAREHOLDERS
Dear Shareholders:
The economy continues to recover. Fueled by unprecedented injections of central bank liquidity and an improving economy, the S&P 500 Index posted a 13.82% gain through the second quarter of 2013 as markets around the globe hit record highs. However, after a May peak of the S&P 500 Index, volatility returned to the market when the Federal Reserve (the “Fed”) announced plans to ease off its quantitative easing policy. The Fed’s mere utterance of plans to taper its bond-buying program sparked a steep, across-the-board global sell-off. Also, in another troublesome development, interest rates spiked higher, pushing bond returns into uncharted negative territory.
The market’s immediate reaction to the Fed’s statement served both as a reality check for investors who had prematurely heralded a return to normalcy and as a harbinger of future challenges. The Fed’s decision to end cash infusions could negatively impact European economies that have just begun to move past the recession as well as more fragile emerging markets.
With market uncertainty underscoring the need to implement investment decisions with greater precision, investors continued to embrace a broad array of ETFs for their ability to provide transparent, low cost and liquid access to all corners of the global market.
As part of our continued commitment to provide the products you need to help achieve your investment goals, State Street Global Advisors, with GSO Capital Partners LP, launched SPDR® Blackstone / GSO Senior Loan ETF (Ticker Symbol: SRLN), an actively managed ETF that provides exposure to senior loans.
We take great pride in this new addition to our SPDR family. You will find additional information on the SSgA Active ETF Trust Exchange Traded Funds, including Management’s Discussion of Fund Performance, in the enclosed June 30, 2013 Annual Report.
On behalf of the SSgA Active ETF Trust, I thank you for your continued support.
Sincerely,

Ellen M. Needham
President
1
SPDR SSgA MULTI-ASSET REAL RETURN ETF — MANAGEMENT’S DISCUSSIONOF FUND PERFORMANCE
The SPDR SSgA Multi-Asset Real Return ETF (the “Fund”), normally invests substantially all of its assets in the SSgA Multi-Asset Real Return Portfolio (the “Portfolio”), which seeks to achieve real return consisting of capital appreciation and current income. As a result, this Fund invests indirectly through the Portfolio.
For the 12-month period ended June 30, 2013 (the “Reporting Period”), the total return for the Fund was -1.67%, and the total return for the Barclays U.S. Government Inflation-linked Bond Index (the “Index”) was -5.16%. The Fund and Index returns reflect the reinvestment of dividends and other income. The Fund’s performance reflects the expenses of managing the Fund, including brokerage and advisory expenses. The Index is unmanaged and Index returns do not reflect fees and expenses of any kind, which would have a negative impact on returns.
The Fund outperformed the Index during the Reporting Period. As optimistic expectations related to global growth seemed unlikely to materialize and unease developed in connection with potential tapering of the U.S. Federal Reserve’s (the “Fed”) bond-buying program, the prospects for real assets moderated over the period. However, diversified exposure within the Fund’s portfolio offered a buffer from sharp increases in real yields that more negatively afflicted the Index following the Fed’s comments regarding tapering of the bond-buying program.
Benign inflation prints across many developed economies tempered the outlook for real assets over the period. Weaker than expected industrial production data out of China compounded growth concerns. Additionally, market reaction was rather severe given the change in tone of the Fed’s monetary policy during May and June of 2013, which caused nominal and real return bonds alike to sell off sharply. The unwelcome news prompted volatility beyond bond assets as the market reassessed outlooks amid the backdrop of tempered central bank policy.
Allocations to international and U.S. securitized real estate proved beneficial to the Fund’s performance as the low-rate environment served to benefit the asset class in multiple ways. First, low-cost financing enabled securitized real estate to bolster balance sheets and develop projects with more favorable terms. Second, investors desperate for yield acquiesced to taking on risk in favor of higher yielding asset classes. Another constructive portfolio holding was the targeted exposure to the U.S. energy sector, which was buoyed by attractive valuations and favorable increases in energy prices during the Reporting Period.
Exposure to resource equities detracted from performance as the composite group was overwhelmed by the negative performance of the metals and mining sector. Performance of this sector was hampered by bearish supply and demand fundamentals, falling metals prices, and concerns regarding rising production costs. A steady downward trend in gold prices over the period magnified the underperformance of the gold mining sub-industry relative to the broader metals and mining sector. U.S. inflation-linked bonds were also negative contributors to Fund performance. Performance of these bonds deteriorated as tapering concerns coupled with a reduction in forward looking inflation expectations prompted a dramatic back up in real yields.
The views expressed above reflect those of the Fund’s portfolio manager only through the Reporting Period, and do not necessarily represent the views of the Adviser as a whole. Any such views are subject to change at any time based upon market or other conditions and the Adviser disclaims any responsibility to update such views. These views may not be relied on as investment advice and, because investment decisions for a fund are based on numerous factors, may not be relied on as an indication of trading intent on behalf of any fund.
2
SPDR SSgA MULTI-ASSET REAL RETURN ETF — PERFORMANCE SUMMARY
The following performance chart of the Fund’s total return at net asset value, the total return based on market price and its benchmark index is provided for comparative purposes only and represents the periods noted. The Fund’s per share net asset value (“NAV”) is the value of one share of the Fund and is calculated by dividing the value of total assets less total liabilities by the number of shares outstanding. The NAV return is based on the NAV of the Fund and the market return is based on the market price per share of the Fund. The market price used to calculate the market return is determined by using the midpoint between the highest bid and the lowest offer on the exchange on which the shares of the Fund are listed for trading, as of the time that the Fund’s NAV is calculated. NAV and market returns assume that dividends and capital gain distributions have been reinvested in the Fund at NAV. Market returns do not include brokerage commissions that may be payable on secondary market transactions. If brokerage commissions were included market returns would be lower.
An index is a statistical measure of a specified financial market or sector. An index does not actually hold a portfolio of securities and therefore does not reflect deductions for fees or expenses. In comparison, the Fund’s performance is negatively impacted by these deductions.
Performance quoted represents past performance, which is no guarantee of future results. Investment return and principal value will fluctuate, so you may have a gain or loss when shares are sold. Current performance may be higher or lower than that quoted. Visit www.spdrs.com for most recent month-end performance. The returns do not reflect the deduction of taxes that a shareholder would pay on Fund distributions or on the redemption or sale of Fund shares. The total expense ratio for SPDR SSgA Multi-Asset Real Return ETF as stated in the Fees and Expenses table of the prospectus dated October 31, 2012 is 0.70%.
PERFORMANCE AS OF JUNE 30, 2013
| | | | | | | | | | | | | | | | | | | | | | | | | | | | | | | | | | | | | | |
| | | | | | | | | | | | | | | | | | | | |
| | | | | CUMULATIVE TOTAL RETURN | | | | | AVERAGE ANNUAL TOTAL RETURN | | | |
| | | | | NET ASSET
VALUE | | | MARKET
VALUE | | | PRIMARY
BENCHMARK:
BARCLAYS
U.S. GOVERNMENT
INFLATION-
LINKED BOND
INDEX | | | SECONDARY
BENCHMARK:
SSgA
MULTI-ASSET
REAL RETURN
COMPOSITE
INDEX | | | | | NET ASSET
VALUE | | | MARKET
VALUE | | | PRIMARY
BENCHMARK:
BARCLAYS
U.S. GOVERNMENT
INFLATION-
LINKED BOND
INDEX | | | SECONDARY
BENCHMARK:
SSgA
MULTI-ASSET
REAL RETURN
COMPOSITE
INDEX | | | |
| | | ONE YEAR | | | –1.67% | | | | –1.56% | | | | –5.16% | | | | 0.93% | | | | | | –1.67% | | | | –1.56% | | | | –5.16% | | | | 0.93% | | | |
| | | SINCE
INCEPTION (1) | | | –5.05% | | | | –5.02% | | | | –3.60% | | | | –2.76% | | | | | | –4.29% | | | | –4.25% | | | | –3.06% | | | | –2.34% | | | |
| | | | | | | | | | | | | | | | | | | | | | | | | | | | | | | |
| | (1) | For the period April 25, 2012 to June 30, 2013 |
3
SPDR SSgA MULTI-ASSET REAL RETURN ETF — PERFORMANCE SUMMARY (CONTINUED)
COMPARISON OF CHANGE IN VALUE OF A $10,000 INVESTMENT (BASED ON NET ASSET VALUE)
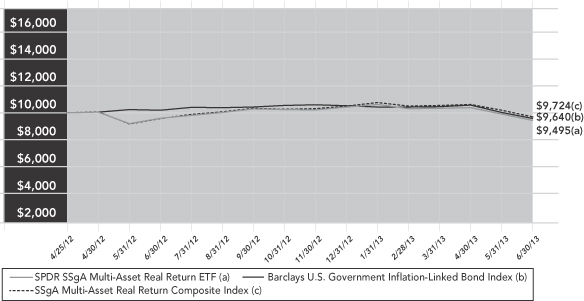
Past Performance is not a guarantee of future results.
Index returns are unmanaged and do not reflect the deduction of any fees or expenses. Index returns reflect all items of income, gain and loss and the reinvestment of dividends and other income.
4
SPDR SSgA INCOME ALLOCATION ETF — MANAGEMENT’S DISCUSSIONOF FUND PERFORMANCE
The SPDR SSgA Income Allocation ETF (the “Fund”), normally invests substantially all of its assets in the SSgA Income Allocation Portfolio (the “Portfolio”), which seeks to provide total return by focusing on investments in income and yield-generating assets. As a result, this Fund invests indirectly through the Portfolio.
For the 12-month period ended June 30, 2013 (the “Reporting Period”), the total return for the Fund was 4.22%, and the total return for the MSCI World Index (the “Index”) was 18.58%. The Fund and Index returns reflect the reinvestment of dividends and other income. The Fund’s performance reflects the expenses of managing the Fund, including brokerage and advisory expenses. The Index is unmanaged and Index returns do not reflect fees and expenses of any kind, which would have a negative impact on returns.
The Fund’s focus on income and yield-generating investments, contributed to its underperformance relative to the Index during the Reporting Period. Unfortunately, a May 2013 shift in language from the U.S. Federal Reserve (the “Fed”) raised the possibility that the pace of asset purchases in its quantitative easing program might ebb later in 2013. Even though any tapering of asset purchases would be conditional on U.S. economic performance, investors had to adjust to the more nuanced priorities at the Fed. As a result, debt securities lost value across the board, and many higher dividend stocks faltered as well. While the Fund lagged the Index significantly during May and June of 2013, it performed more closely in line with a globally diversified portfolio of income-focused securities that includes broad exposure to both stocks and bonds.
The relative strength of the U.S. dollar and U.S. equities had a negative effect on performance because the Fund maintains ample holdings in non-U.S. securities. Concerns in late 2012 about U.S. fiscal constraints gradually dissipated in the first half of 2013, even as European growth stagnated and worries increased about decelerating activity in China. Moreover, the apparently hawkish turn in U.S. monetary emphasis encouraged significant capital withdrawal from international markets. Talk of tapered accommodation shocked the bond markets as well, taking a notable toll on the Fund’s holdings of both government and corporate debt. The simultaneous deterioration in stock and bond prices that arose from fears of altered policy represented a shift in market behavior. The more usual pattern had been bond appreciation when equities were declining, but the change in Fed language unleashed a sharp rise in real yields that hurt both fixed income and equities, resulting in greater realized volatility for the Fund.
The top positive contributor to the Fund’s performance was the SPDR S&P Dividend ETF, which appreciated during each quarter of the Reporting Period. This holding, which retained a healthy double-digit weighting in the Fund throughout the period, benefited from the growing global preference for U.S. equities during the first half of 2013. While other securities in the Fund had a much smaller influence on performance, both the SPDR S&P Global Infrastructure ETF and the SPDR Dow Jones REIT ETF were noted contributors. Even though their appeal waned when tapering of asset purchases became a possibility, they retained positive performance for the Reporting Period.
The most negative contributors to the Fund’s performance were its long duration, fixed-income holdings in the SPDR Barclays Long Term Treasury ETF and the SPDR Barclays Long Term Corporate Bond ETF. While these positions continued to provide consistent income to the Fund, the change in Fed posture during the second quarter of 2013 provoked a major adjustment in bond yields that diminished their value and compromised their role as a diversifier of equity risk. Also detracting from Fund performance was the SPDR S&P Emerging Markets Dividend ETF, which offered scant protection from rising concerns that growth prospects in emerging countries might be dimming.
The views expressed above reflect those of the Fund’s portfolio manager only through the Reporting Period, and do not necessarily represent the views of the Adviser as a whole. Any such views are subject to change at any time based upon market or other conditions and the Adviser disclaims any responsibility to update such views. These views may not be relied on as investment advice and, because investment decisions for a fund are based on numerous factors, may not be relied on as an indication of trading intent on behalf of any fund.
5
SPDR SSgA INCOME ALLOCATION ETF — PERFORMANCE SUMMARY
The following performance chart of the Fund’s total return at net asset value, the total return based on market price and its benchmark index is provided for comparative purposes only and represents the periods noted. The Fund’s per share net asset value (“NAV”) is the value of one share of the Fund and is calculated by dividing the value of total assets less total liabilities by the number of shares outstanding. The NAV return is based on the NAV of the Fund and the market return is based on the market price per share of the Fund. The market price used to calculate the market return is determined by using the midpoint between the highest bid and the lowest offer on the exchange on which the shares of the Fund are listed for trading, as of the time that the Fund’s NAV is calculated. NAV and market returns assume that dividends and capital gain distributions have been reinvested in the Fund at NAV. Market returns do not include brokerage commissions that may be payable on secondary market transactions. If brokerage commissions were included market returns would be lower.
An index is a statistical measure of a specified financial market or sector. An index does not actually hold a portfolio of securities and therefore does not reflect deductions for fees or expenses. In comparison, the Fund’s performance is negatively impacted by these deductions.
Performance quoted represents past performance, which is no guarantee of future results. Investment return and principal value will fluctuate, so you may have a gain or loss when shares are sold. Current performance may be higher or lower than that quoted. Visit www.spdrs.com for most recent month-end performance. The returns do not reflect the deduction of taxes that a shareholder would pay on Fund distributions or on the redemption or sale of Fund shares. The total expense ratio for SPDR SSgA Income Allocation ETF as stated in the Fees and Expenses table of the prospectus dated October 31, 2012 is 0.70%.
PERFORMANCE AS OF JUNE 30, 2013
| | | | | | | | | | | | | | | | | | | | | | | | | | | | | | | | | | | | | | |
| | | | | | | | | | |
| | | | | CUMULATIVE TOTAL RETURN | | | | | AVERAGE ANNUAL TOTAL RETURN | | | |
| | | | | NET ASSET
VALUE | | | MARKET
VALUE | | | PRIMARY
BENCHMARK:
MSCI WORLD
INDEX | | | SECONDARY
BENCHMARK:
SSgA INCOME
ALLOCATION
COMPOSITE
INDEX | | | | | NET ASSET
VALUE | | | MARKET
VALUE | | | PRIMARY
BENCHMARK:
MSCI WORLD
INDEX | | | SECONDARY
BENCHMARK:
SSgA INCOME
ALLOCATION
COMPOSITE
INDEX | | | |
| | | ONE YEAR | | | 4.22% | | | | 4.19% | | | | 18.58% | | | | 6.77% | | | | | | 4.22% | | | | 4.19% | | | | 18.58% | | | | 6.77% | | | |
| | | SINCE INCEPTION (1) | | | 5.12% | | | | 5.11% | | | | 14.68% | | | | 7.20% | | | | | | 4.31% | | | | 4.30% | | | | 12.31% | | | | 6.09% | | | |
| | | | | | | | | | | | | | | | | | | | | | | | | | | | | | | |
| | (1) | For the period April 25, 2012 to June 30, 2013 |
6
SPDR SSgA INCOME ALLOCATION ETF — PERFORMANCE SUMMARY (CONTINUED)
COMPARISON OF CHANGE IN VALUE OF A $10,000 INVESTMENT (BASED ON NET ASSET VALUE)
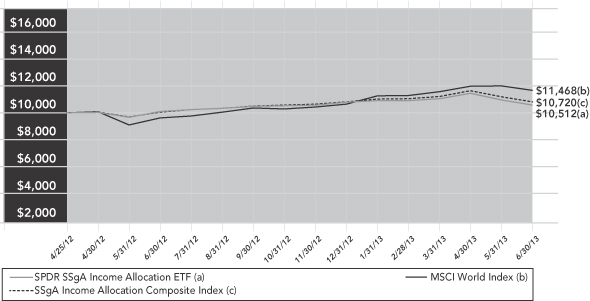
Past Performance is not a guarantee of future results.
Index returns are unmanaged and do not reflect the deduction of any fees or expenses. Index returns reflect all items of income, gain and loss and the reinvestment of dividends and other income.
7
SPDR SSgA GLOBAL ALLOCATION ETF — MANAGEMENT’S DISCUSSIONOF FUND PERFORMANCE
The SPDR SSgA Global Allocation ETF (the “Fund”), normally invests substantially all of its assets in the SSgA Global Allocation Portfolio (the “Portfolio”), which seeks to provide capital appreciation. As a result, this Fund invests indirectly through the Portfolio.
For the 12-month period ended June 30, 2013 (the “Reporting Period”), the total return for the Fund was 9.91%, and the total return for the MSCI All Country World IMI Index (the “Index”) was 17.08%. The Fund and Index returns reflect the reinvestment of dividends and other income. The Fund’s performance reflects the expenses of managing the Fund, including brokerage and advisory expenses. The Index is unmanaged and Index returns do not reflect fees and expenses of any kind, which would have a negative impact on returns.
The Fund invests broadly across regions and asset classes. The Fund’s diversified investment exposures, contributed to its underperformance relative to the equity only Index during the Reporting Period. The Fund generally enjoyed strong positive performance during the period until May 2013 when the shift in the language from the U.S. Federal Reserve (the “Fed”) raised the possibility that the pace of asset purchases in its quantitative easing program might ebb later in 2013. Even though any tapering of asset purchases would be conditional on U.S. economic performance, investors had to adjust to the more nuanced priorities at the Fed. As a result, debt securities, along with risky assets like equities, commodities, and real estate, lost value across the board.
The relative strength of the U.S. dollar and U.S. equities had a negative effect on performance because the Fund maintains ample holdings in non-U.S. securities. Concerns in late 2012 about U.S. fiscal constraints gradually dissipated in the first half of 2013, even as European growth stagnated and worries increased about decelerating activity in China. Moreover, the apparently hawkish turn in U.S. monetary emphasis encouraged significant capital withdrawal from international markets. Talk of tapered accommodation shocked the bond markets as well, taking a notable toll on the Fund’s holdings of both government and corporate debt. The simultaneous deterioration in stock and bond prices that arose from fears of altered policy represented a shift in market behavior. The more usual pattern had been bond appreciation when equities were declining, but the change in Fed language unleashed a sharp rise in real yields that hurt both fixed income and equities, resulting in greater realized volatility for the Fund.
Reflecting both the global exposures of the Fund and our tactical preference for risky assets in the past year, the Fund had overweight exposures to equities compared to bonds. The top positive contributors to the Fund’s performance were the SPDR S&P 500 ETF and the SPDR S&P World ex-US ETF. Other strong contributors within equities include SPDR S&P International Small Cap ETF, SPDR STOXX Europe 50 ETF, SPDR S&P Dividend ETF, and SPDR S&P 600 Small Cap ETF. In addition, investments in equity sectors added significant value to the Fund’s portfolio, with The Consumer Discretionary Select Sector SPDR Fund and The Financial Select Sector SPDR Fund performing strongly for the Fund. The Fund also enjoyed positive contributions from its real estate and high yield exposures through investments in the SPDR Dow Jones International Real Estate ETF and the SPDR Barclays High Yield Bond ETF.
The most negative contributors to the Fund’s performance were its holdings in the PowerShares DB Gold Fund and the SPDR Barclays TIPS ETF. Other detractors from performance were the SPDR Barclays Emerging Markets Local Bond ETF and the SPDR Barclays Aggregate Bond ETF.
The views expressed above reflect those of the Fund’s portfolio manager only through the Reporting Period, and do not necessarily represent the views of the Adviser as a whole. Any such views are subject to change at any time based upon market or other conditions and the Adviser disclaims any responsibility to update such views. These views may not be relied on as investment advice and, because investment decisions for a fund are based on numerous factors, may not be relied on as an indication of trading intent on behalf of any fund.
8
SPDR SSgA GLOBAL ALLOCATION ETF — PERFORMANCE SUMMARY
The following performance chart of the Fund’s total return at net asset value, the total return based on market price and its benchmark index is provided for comparative purposes only and represents the periods noted. The Fund’s per share net asset value (“NAV”) is the value of one share of the Fund and is calculated by dividing the value of total assets less total liabilities by the number of shares outstanding. The NAV return is based on the NAV of the Fund and the market return is based on the market price per share of the Fund. The market price used to calculate the market return is determined by using the midpoint between the highest bid and the lowest offer on the exchange on which the shares of the Fund are listed for trading, as of the time that the Fund’s NAV is calculated. NAV and market returns assume that dividends and capital gain distributions have been reinvested in the Fund at NAV. Market returns do not include brokerage commissions that may be payable on secondary market transactions. If brokerage commissions were included market returns would be lower.
An index is a statistical measure of a specified financial market or sector. An index does not actually hold a portfolio of securities and therefore does not reflect deductions for fees or expenses. In comparison, the Fund’s performance is negatively impacted by these deductions.
Performance quoted represents past performance, which is no guarantee of future results. Investment return and principal value will fluctuate, so you may have a gain or loss when shares are sold. Current performance may be higher or lower than that quoted. Visit www.spdrs.com for most recent month-end performance. The returns do not reflect the deduction of taxes that a shareholder would pay on Fund distributions or on the redemption or sale of Fund shares. The total expense ratio for SPDR SSgA Global Allocation ETF as stated in the Fees and Expenses table of the prospectus dated October 31, 2012 is 0.35%.
PERFORMANCE AS OF JUNE 30, 2013
| | | | | | | | | | | | | | | | | | | | | | | | | | | | | | | | | | | | | | |
| | | | | | | | | | |
| | | | | CUMULATIVE TOTAL RETURN | | | | | AVERAGE ANNUAL TOTAL RETURN | | | |
| | | | | NET ASSET
VALUE | | | MARKET
VALUE | | | PRIMARY
BENCHMARK:
MSCI ACWI
IMI INDEX | | | SECONDARY
BENCHMARK:
SSgA GLOBAL
ALLOCIATION
COMPOSITE
INDEX | | | | | NET ASSET
VALUE | | | MARKET
VALUE | | | PRIMARY
BENCHMARK:
MSCI ACWI
IMI INDEX | | | SECONDARY
BENCHMARK:
SSgA GLOBAL
ALLOCIATION
COMPOSITE
INDEX | | | |
| | | ONE YEAR | | | 9.91% | | | | 10.01% | | | | 17.08% | | | | 10.28% | | | | | | 9.91% | | | | 10.01% | | | | 17.08% | | | | 10.28% | | | |
| | | SINCE INCEPTION (1) | | | 7.90% | | | | 7.90% | | | | 12.60% | | | | 8.26% | | | | | | 6.64% | | | | 6.63% | | | | 10.58% | | | | 6.96% | | | |
| | | | | | | | | | | | | | | | | | | | | | | | | | | | | | | |
| | (1) | For the period April 25, 2012 to June 30, 2013 |
9
SPDR SSgA GLOBAL ALLOCATION ETF — PERFORMANCE SUMMARY (CONTINUED)
COMPARISON OF CHANGE IN VALUE OF A $10,000 INVESTMENT (BASED ON NET ASSET VALUE)
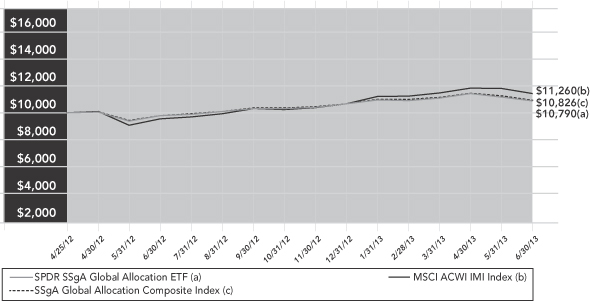
Past Performance is not a guarantee of future results.
Index returns are unmanaged and do not reflect the deduction of any fees or expenses. Index returns reflect all items of income, gain and loss and the reinvestment of dividends and other income.
10
SPDR BLACKSTONE / GSO SENIOR LOAN ETF — PERFORMANCE SUMMARY
The Fund had less than six months of operations at reporting period end and therefore does not have performance history to provide in this report.
11
SSgA ACTIVE ETF TRUST
STATEMENTS OF ASSETS AND LIABILITIES
June 30, 2013
| | | | | | | | | | | | | | | | |
| | | SPDR SSgA
Multi-Asset
Real Return
ETF | | | SPDR SSgA
Income
Allocation
ETF | | | SPDR SSgA
Global
Allocation
ETF | | | SPDR
Blackstone / GSO
Senior Loan
ETF | |
ASSETS | | | | | | | | | | | | | | | | |
Investments in corresponding Portfolio, at market value (Note 1) | | $ | 121,583,035 | | | $ | 174,253,776 | | | $ | 51,934,532 | | | $ | 332,791,500 | |
Due from Advisor | | | — | | | | — | | | | 6,126 | | | | — | |
| | | | | | | | | | | | | | | | |
TOTAL ASSETS | | | 121,583,035 | | | | 174,253,776 | | | | 51,940,658 | | | | 332,791,500 | |
| | | | | | | | | | | | | | | | |
LIABILITIES | | | | | | | | | | | | | | | | |
Income distributions payable | | | 1,144,521 | | | | 2,261,400 | | | | 456,897 | | | | — | |
Accrued Advisory fees | | | 4,167 | | | | 15,703 | | | | — | | | | 137,595 | |
Accrued trustees’ fees and expenses | | | 48 | | | | 62 | | | | 17 | | | | 155 | |
| | | | | | | | | | | | | | | | |
TOTAL LIABILITIES | | | 1,148,736 | | | | 2,277,165 | | | | 456,914 | | | | 137,750 | |
| | | | | | | | | | | | | | | | |
NET ASSETS | | $ | 120,434,299 | | | $ | 171,976,611 | | | $ | 51,483,744 | | | $ | 332,653,750 | |
| | | | | | | | | | | | | | | | |
NET ASSETS CONSIST OF: | | | | | | | | | | | | | | | | |
Paid-in capital (Note 4) | | $ | 132,135,990 | | | $ | 179,580,951 | | | $ | 52,361,000 | | | $ | 335,319,068 | |
Undistributed (distributions in excess of) net investment income | | | (66,390 | ) | | | (349,701 | ) | | | (65,033 | ) | | | 425,759 | |
Accumulated net realized gain (loss) on investments | | | (1,026,495 | ) | | | (1,096,929 | ) | | | (289,986 | ) | | | (18,346 | ) |
Net unrealized appreciation (depreciation) on investments | | | (10,608,806 | ) | | | (6,157,710 | ) | | | (522,237 | ) | | | (3,072,731 | ) |
| | | | | | | | | | | | | | | | |
NET ASSETS | | $ | 120,434,299 | | | $ | 171,976,611 | | | $ | 51,483,744 | | | $ | 332,653,750 | |
| | | | | | | | | | | | | | | | |
NET ASSET VALUE PER SHARE | | | | | | | | | | | | | | | | |
Net asset value per share | | $ | 27.68 | | | $ | 29.90 | | | $ | 31.18 | | | $ | 49.65 | |
| | | | | | | | | | | | | | | | |
Shares outstanding (unlimited amount authorized, $0.00 par value) | | | 4,351,111 | | | | 5,751,111 | | | | 1,651,111 | | | | 6,700,000 | |
| | | | | | | | | | | | | | | | |
See Notes to Financial Statements and Financial Statements of the Master Portfolios.
12
SSgA ACTIVE ETF TRUST
STATEMENTS OF OPERATIONS
Periods Ended June 30, 2013
| | | | | | | | | | | | | | | | |
| | | SPDR SSgA
Multi-Asset
Real Return
ETF | | | SPDR SSgA
Income
Allocation
ETF | | | SPDR SSgA
Global
Allocation
ETF | | | SPDR
Blackstone / GSO
Senior Loan
ETF* | |
INCOME AND EXPENSES ALLOCATED FROM PORTFOLIO | | | | | | | | | | | | | | | | |
Dividend income allocated from Portfolio (Note 2) | | $ | 1,860,768 | | | $ | 3,763,417 | | | $ | 716,581 | | | $ | 1,378,207 | |
Expenses allocated from Portfolio (Note 2) | | | (120,352 | ) | | | (156,089 | ) | | | (44,008 | ) | | | (144,375 | ) |
| | | | | | | | | | | | | | | | |
TOTAL INCOME | | | 1,740,416 | | | | 3,607,328 | | | | 672,573 | | | | 1,233,832 | |
| | | | | | | | | | | | | | | | |
EXPENSES | | | | | | | | | | | | | | | | |
Advisory fees (Note 3) | | | 25,833 | | | | 113,843 | | | | — | | | | 288,262 | |
Trustee Fees (Note 3) | | | 577 | | | | 727 | | | | 199 | | | | 277 | |
Miscellaneous expenses | | | 29 | | | | 37 | | | | 9 | | | | — | |
| | | | | | | | | | | | | | | | |
TOTAL EXPENSES | | | 26,439 | | | | 114,607 | | | | 208 | | | | 288,539 | |
| | | | | | | | | | | | | | | | |
Fees reimbursed by Adviser | | | — | | | | — | | | | (35,535 | ) | | | — | |
| | | | | | | | | | | | | | | | |
NET INVESTMENT INCOME | | | 1,713,977 | | | | 3,492,721 | | | | 707,900 | | | | 945,293 | |
| | | | | | | | | | | | | | | | |
REALIZED AND UNREALIZED GAIN (LOSS) ON INVESTMENTS | | | | | | | | | | | | | | | | |
Net realized gain (loss) allocated from Portfolio | | | (924,336 | ) | | | (1,103,415 | ) | | | 31,543 | | | | (18,346 | ) |
Net change in unrealized appreciation (depreciation) from corresponding Portfolio | | | (10,378,139 | ) | | | (6,205,343 | ) | | | (434,651 | ) | | | (3,072,731 | ) |
| | | | | | | | | | | | | | | | |
NET REALIZED AND UNREALIZED GAIN (LOSS) ON INVESTMENTS | | | (11,302,475 | ) | | | (7,308,758 | ) | | | (403,108 | ) | | | (3,091,077 | ) |
| | | | | | | | | | | | | | | | |
NET INCREASE (DECREASE) IN NET ASSETS RESULTING FROM OPERATIONS | | $ | (9,588,498 | ) | | $ | (3,816,037 | ) | | $ | 304,792 | | | $ | (2,145,784 | ) |
| | | | | | | | | | | | | | | | |
| * | For the period April 3, 2013 (commencement of operations) to June 30, 2013. |
See Notes to Financial Statements and Financial Statements of the Master Portfolios.
13
SSgA ACTIVE ETF TRUST
STATEMENTS OF CHANGES IN NET ASSETS
| | | | | | | | | | | | | | | | |
| | |
SPDR SSgA Multi-Asset Real Return ETF | | | SPDR SSgA Income Allocation ETF | |
| | | Year Ended
6/30/13 | | | For the Period
4/25/12* -
6/30/12 | | | Year Ended
6/30/13 | | | For the Period
4/25/12* -
6/30/12 | |
INCREASE (DECREASE) IN NET ASSETS FROM OPERATIONS: | | | | | | | | | | | | | | | | |
Net investment income (loss) | | $ | 1,713,977 | | | $ | 40,831 | | | $ | 3,492,721 | | | $ | 97,347 | |
Net realized gain (loss) on investments | | | (924,336 | ) | | | (6,834 | ) | | | (1,103,415 | ) | | | (17,901 | ) |
Net change in unrealized appreciation (depreciation) on investments | | | (10,378,139 | ) | | | (230,667 | ) | | | (6,205,343 | ) | | | 47,633 | |
| | | | | | | | | | | | | | | | |
Net increase (decrease) in net assets resulting from operations | | | (9,588,498 | ) | | | (196,670 | ) | | | (3,816,037 | ) | | | 127,079 | |
| | | | | | | | | | | | | | | | |
Net equalization credits and charges | | | 57,257 | | | | (1,313 | ) | | | 300,070 | | | | 25,031 | |
| | | | | | | | | | | | | | | | |
DISTRIBUTIONS TO SHAREHOLDERS FROM: | | | | | | | | | | | | | | | | |
Net investment income | | | (1,773,687 | ) | | | (39,652 | ) | | | (3,792,817 | ) | | | (122,565 | ) |
| | | | | | | | | | | | | | | | |
FROM BENEFICIAL INTEREST TRANSACTIONS: | | | | | | | | | | | | | | | | |
Proceeds from sale of shares | | | 130,398,415 | | | | 7,426,281 | | | | 170,596,375 | | | | 8,984,576 | |
Cost of shares redeemed | | | (4,387,694 | ) | | | (1,404,196 | ) | | | — | | | | — | |
Net income equalization (Note 2) | | | (57,257 | ) | | | 1,313 | | | | (300,070 | ) | | | (25,031 | ) |
Other capital (Note 4) | | | — | | | | — | | | | — | | | | — | |
| | | | | | | | | | | | | | | | |
Net increase (decrease) in net assets from beneficial interest transactions | | | 125,953,464 | | | | 6,023,398 | | | | 170,296,305 | | | | 8,959,545 | |
| | | | | | | | | | | | | | | | |
Net increase (decrease) in net assets during the period | | | 114,648,536 | | | | 5,785,763 | | | | 162,987,521 | | | | 8,989,090 | |
Net assets at beginning of period | | | 5,785,763 | | | | — | | | | 8,989,090 | | | | — | |
| | | | | | | | | | | | | | | | |
NET ASSETS END OF PERIOD (1) | | $ | 120,434,299 | | | $ | 5,785,763 | | | $ | 171,976,611 | | | $ | 8,989,090 | |
| | | | | | | | | | | | | | | | |
SHARES OF BENEFICIAL INTEREST | | | | | | | | | | | | | | | | |
Shares sold | | | 4,300,000 | | | | 251,111 | | | | 5,450,000 | | | | 301,111 | |
Shares redeemed | | | (150,000 | ) | | | (50,000 | ) | | | — | | | | — | |
| | | | | | | | | | | | | | | | |
Net increase in shares | | | 4,150,000 | | | | 201,111 | | | | 5,450,000 | | | | 301,111 | |
| | | | | | | | | | | | | | | | |
(1) Undistributed (distributions in excess of) net investment income | | $ | (66,390 | ) | | $ | 1,179 | | | $ | (349,701 | ) | | $ | (25,218 | ) |
| | | | | | | | | | | | | | | | |
| * | Commencement of operations |
See Notes to Financial Statements and Financial Statements of the Master Portfolios.
14
| | | | | | | | | | |
| SPDR SSgA Global Allocation ETF | | | SPDR Blackstone / GSO Senior
Loan ETF | |
Year Ended
6/30/13 | | | For the Period
4/25/12* -
6/30/12 | | | For the Period
4/3/13* -
6/30/13 | |
| | | | | | | | | | |
| $ | 707,900 | | | $ | 42,385 | | | $ | 945,293 | |
| | 31,543 | | | | (140,394 | ) | | | (18,346 | ) |
| (434,651 | ) | | | (87,586 | ) | | | (3,072,731 | ) |
| | | | | | | | | | |
| 304,792 | | | | (185,595 | ) | | | (2,145,784 | ) |
| | | | | | | | | | |
| | 59,672 | | | | (3,002 | ) | | | 232,911 | |
| | | | | | | | | | |
| | |
| | | | | | | | | | |
| | (768,378 | ) | | | (39,306 | ) | | | (519,534 | ) |
| | | | | | | | | | |
| | |
| | | | | | | | | | |
| | 50,769,956 | | | | 6,033,333 | | | | 334,914,199 | |
| | (3,233,657 | ) | | | (1,397,401 | ) | | | — | |
| | (59,672 | ) | | | 3,002 | | | | (232,911 | ) |
| | — | | | | — | | | | 404,869 | |
| | | | | | | | | | |
| 47,476,627 | | | | 4,638,934 | | | | 335,086,157 | |
| | | | | | | | | | |
| | |
| | 47,072,713 | | | | 4,411,031 | | | | 332,653,750 | |
| | 4,411,031 | | | | — | | | | — | |
| | | | | | | | | | |
| $ | 51,483,744 | | | $ | 4,411,031 | | | $ | 332,653,750 | |
| | | | | | | | | | |
| | | | | | | | | | |
| | 1,600,000 | | | | 201,111 | | | | 6,700,000 | |
| | (100,000 | ) | | | (50,000 | ) | | | — | |
| | | | | | | | | | |
| | 1,500,000 | | | | 151,111 | | | | 6,700,000 | |
| | | | | | | | | | |
$ |
(65,033 |
) | | $ | 3,079 | | | $ | 425,759 | |
| | | | | | | | | | |
15
SSgA ACTIVE ETF TRUST
FINANCIAL HIGHLIGHTS
Selected data for a share of beneficial interest outstanding throughout each period is presented below (1):
| | | | | | | | | | | | | | | | |
| | | SPDR SSgA Multi-Asset Real
Return ETF | | | SPDR SSgA Income Allocation
ETF | |
| | | Year Ended
6/30/13 | | | For the Period
4/25/12* -
6/30/12 | | | Year Ended
6/30/13 | | | For the Period
4/25/12* -
6/30/12 | |
Net asset value, beginning of period | | $ | 28.77 | | | $ | 30.00 | | | $ | 29.85 | | | $ | 30.00 | |
| | | | | | | | | | | | | | | | |
Income (loss) from investment operations: | | | | | | | | | | | | | | | | |
Net investment income (loss) (2) | | | 0.86 | | | | 0.20 | | | | 1.41 | | | | 0.44 | |
Net realized and unrealized gain (loss) on investments (3) | | | (1.33 | ) | | | (1.22 | ) | | | (0.25 | ) | | | (0.29 | ) |
| | | | | | | | | | | | | | | | |
Total from investment operations | | | (0.47 | ) | | | (1.02 | ) | | | 1.16 | | | | 0.15 | |
| | | | | | | | | | | | | | | | |
Net equalization credits and charges (2) | | | 0.03 | | | | (0.01 | ) | | | 0.12 | | | | 0.11 | |
| | | | | | | | | | | | | | | | |
Other capital | | | — | | | | — | | | | — | | | | — | |
| | | | | | | | | | | | | | | | |
Distributions to shareholders from: | | | | | | | | | | | | | | | | |
Net investment income | | | (0.65 | ) | | | (0.20 | ) | | | (1.23 | ) | | | (0.41 | ) |
| | | | | | | | | | | | | | | | |
Total distributions | | | (0.65 | ) | | | (0.20 | ) | | | (1.23 | ) | | | (0.41 | ) |
| | | | | | | | | | | | | | | | |
Net asset value, end of period | | $ | 27.68 | | | $ | 28.77 | | | $ | 29.90 | | | $ | 29.85 | |
| | | | | | | | | | | | | | | | |
Total Return (4) | | | (1.67 | )% | | | (3.44 | )% | | | 4.22 | % | | | 0.87 | % |
Ratios and Supplemental Data: | | | | | | | | | | | | | | | | |
Net Assets, End of Period (000s) | | $ | 120,434 | | | $ | 5,786 | | | $ | 171,977 | | | $ | 8,989 | |
Ratios to average net assets: | | | | | | | | | | | | | | | | |
Total expenses | | | 0.25 | % | | | 0.27 | %(5) | | | 0.35 | % | | | 0.36 | %(5) |
Net operating expenses | | | 0.25 | % | | | 0.27 | %(5) | | | 0.35 | % | | | 0.36 | %(5) |
Net investment income | | | 2.86 | % | | | 3.77 | %(5) | | | 4.50 | % | | | 8.24 | %(5) |
Portfolio turnover rate (6) | | | 31 | % | | | 10 | % | | | 80 | % | | | 15 | % |
| * | Commencement of operations |
| (1) | The per share amounts and percentages include each Fund’s proportionate share of income and expenses of their respective Portfolio. |
| (2) | Per share numbers have been calculated using average shares outstanding, which more appropriately presents the per share data for the period. |
| (3) | Amounts shown in this caption for a share outstanding may not accord with the change in aggregate gains and losses in securities for the fiscal period because of the timing of sales and repurchases of Fund shares in relation to fluctuating market values for the Fund. |
| (4) | Total return is calculated assuming a purchase of shares at net asset value on the first day and a sale at net asset value on the last day of each period reported. Distributions are assumed, for the purpose of this calculation, to be reinvested at net asset value per share on the respective payment dates of each Fund. Total return for periods of less than one year is not annualized. Broker commission charges are not included in this calculation. |
| (6) | Portfolio turnover rate is from their respective Portfolio. |
16
| | | | | | | | | | |
SPDR SSgA Global
Allocation ETF | | | SPDR Blackstone / GSO
Senior Loan ETF | |
Year Ended
6/30/13 | | | For the Period
4/25/12* -
6/30/12 | | | For the Period
4/3/13* -
6/30/13 | |
| $ | 29.19 | | | $ | 30.00 | | | $ | 50.00 | |
| | | | | | | | | | |
| | | | | | | | | | |
| | 1.03 | | | | 0.24 | | | | 0.24 | |
| | 1.77 | | | | (0.77 | ) | | | (0.65 | ) |
| | | | | | | | | | |
| | 2.80 | | | | (0.53 | ) | | | (0.41 | ) |
| | | | | | | | | | |
| | 0.09 | | | | (0.02 | ) | | | 0.06 | |
| | | | | | | | | | |
| | — | | | | — | | | | 0.10 | |
| | | | | | | | | | |
| | | | | | | | | | |
| | (0.90 | ) | | | (0.26 | ) | | | (0.10 | ) |
| | | | | | | | | | |
| | (0.90 | ) | | | (0.26 | ) | | | (0.10 | ) |
| | | | | | | | | | |
| $ | 31.18 | | | $ | 29.19 | | | $ | 49.65 | |
| | | | | | | | | | |
| | 9.91 | % | | | (1.82 | )% | | | (0.48 | )% |
| | | | | | | | | | |
| $ | 51,484 | | | $ | 4,411 | | | $ | 332,654 | |
| | | | | | | | | | |
| | 0.20 | % | | | 0.20 | %(5) | | | 0.90 | %(5) |
| | 0.04 | % | | | 0.05 | %(5) | | | 0.90 | %(5) |
| | 3.23 | % | | | 4.48 | %(5) | | | 1.97 | %(5) |
| | 123 | % | | | 25 | % | | | 4 | % |
17
SSgA ACTIVE ETF TRUST
NOTES TO FINANCIAL STATEMENTS
June 30, 2013
SSgA Active ETF Trust (the “Trust”), which is registered under the Investment Company Act of 1940, as amended (“1940 Act”), is an open-end investment management company that was organized as a Massachusetts business trust on March 30, 2011.
As of June 30, 2013, the Trust offered four (4) portfolios, each of which represents a separate series of beneficial interest in the Trust (each referred to as a “Fund”, collectively as the “Funds”). The financial statements herein relate to the following four (4) Funds: SPDR SSgA Multi-Asset Real Return ETF, SPDR SSgA Income Allocation ETF, SPDR SSgA Global Allocation ETF and SPDR Blackstone / GSO Senior Loan ETF.
The Trust is part of a master-feeder structure and each Fund invests substantially all of its assets in interests of its respective master portfolio; the SSgA Multi-Asset Real Return Portfolio, SSgA Income Allocation Portfolio, SSgA Global Allocation Portfolio and Blackstone / GSO Senior Loan Portfolio (each referred to as a “Portfolio”; collectively as “Portfolios”), each of which is a series of a separately registered investment company called SSgA Master Trust (“Master Trust”). The investment objective and policies of each Fund are substantially similar to those of its respective Portfolio. The value of each Fund’s investment in its respective Portfolio reflects the Fund’s proportionate interest in the net assets of that Portfolio (99.99% for SPDR SSgA Multi-Asset Real Return ETF, 99.99% for SPDR SSgA Income Allocation ETF, 99.99% for SPDR SSgA Global Allocation ETF and 99.99% for SPDR Blackstone / GSO Senior Loan ETF at June 30, 2013). The performance of each Fund is directly affected by the performance of its respective Portfolio. The financial statements of the Portfolios, including their Schedules of Investments, are attached to this report and should be read in conjunction with the Fund’s financial statements.
Under the Trust’s organizational documents, its officers and trustees are indemnified against certain liabilities arising out of the performance of their duties to the Trust. Additionally, in the normal course of business, the Trust enters into contracts with service providers that contain general indemnification clauses. The Trust’s maximum exposure under these arrangements is unknown as this could involve future claims that may be made against the Trust that have not yet occurred. However, based on experience, the Trust expects the risk of loss to be remote.
| 2. | Summary of Significant Accounting Policies |
The following is a summary of significant accounting policies followed by the Trust in the preparation of its financial statements:
The preparation of financial statements in accordance with U.S. generally accepted accounting principles requires management to make estimates and assumptions that affect the reported amounts and disclosures in the financial statements. Actual results could differ from those estimates. These financial statements are presented in United States dollars.
Security Valuation
Each Fund records its investments in its respective Portfolio at value each business day. The valuation policies of the Portfolios are discussed in Note 2 of the Portfolios’ Notes to Financial Statements, which are attached to this report.
The Portfolios adopted provisions surrounding fair value measurements and disclosures that define fair value, establish a framework for measuring fair value in generally accepted accounting principles and expand disclosures about fair value measurements. This applies to fair value measurements that are already required or permitted by other accounting standards and is intended to increase consistency of those measurements and applies broadly to securities and other types of assets and liabilities. The summary of the inputs used for each Portfolio, as of June 30, 2013, in valuing each Portfolio’s securities carried at fair value are discussed in Note 2 of the Portfolio’s Notes to Financial Statements, which are attached to this report.
Investment Income
Net investment income consists of a Fund’s pro-rata share of the net investment income of its respective Portfolio, less expenses of the Fund.
18
SSgA ACTIVE ETF TRUST
NOTES TO FINANCIAL STATEMENTS (continued)
June 30, 2013
Expenses
Advisory fees and other expenses, which are directly identifiable to a specific Fund, are applied to that Fund. Trustees’ fees and other expenses which cannot be attributed to a specific Fund are allocated in such a manner as deemed equitable, taking into consideration the nature and type of expense and the relative net assets of the Funds. The Fund’s are allocated a pro-rata share of the expenses of its respective Portfolio.
Equalization
The Funds follow the accounting practice known as “Equalization” by which a portion of the proceeds from sales and costs of reacquiring Fund shares, equivalent on a per share basis to the amount of distributable net investment income on the date of the transaction, is credited or charged to undistributed net investment income. As a result, undistributed net investment income per share is unaffected by sales or reacquisition of Fund shares. Amounts related to Equalization can be found on the Statements of Changes in Net Assets.
Investment Transactions
Investment transactions are recorded as of the trade date. Realized gains and losses from security transactions consist of a Fund’s pro-rata share of its respective Portfolio’s realized gains and losses. Realized gains and losses from security transactions are recorded on the identified cost basis. Corporate actions (including cash dividends) are recorded net of foreign tax withholdings on the ex-dividend date.
Federal Income Tax
The Funds have qualified and intend to continue to qualify for and elect treatment as “regulated investment companies” under Subchapter M of the Internal Revenue Code of 1986, as amended. By so qualifying and electing, each Fund will not be subject to federal income taxes to the extent it distributes its taxable income, including any net realized capital gains, for each fiscal year. In addition, by distributing during each calendar year substantially all of their net investment income and capital gains, if any, the Funds will not be subject to federal excise tax. Income and capital gain distributions are determined in accordance with income tax regulations which may differ from U.S. generally accepted accounting principles. These book-tax differences are primarily due to differing treatments for tax equalization, in-kind transactions for financial statement purposes and losses deferred due to wash sales.
Additionally, based on the Funds’ understanding of the tax rules and rates related to income, gains and transactions for the foreign jurisdictions in which the applicable Funds invest, the Funds will provide for foreign taxes and, where appropriate, deferred foreign taxes. The Funds have reviewed the tax positions for the open tax years as of June 30, 2013 and have determined that no provision for income tax is required in the Funds’ Financial Statements. The Funds’ federal tax returns are subject to examination by the Funds’ major tax jurisdictions, which include the United States of America and the Commonwealth of Massachusetts. The Funds recognized interest and penalties, if any, related to tax liabilities as income tax expense in the Statements of Operations.
For the year ended June 30, 2013, the following Funds reclassified non-taxable security gains and losses realized on the in-kind redemption of Creation Units (Note 4) as an increase or decrease to paid in capital in the Statements of Assets and Liabilities as follows:
| | | | |
| | | Net Gain (Loss)
Reclassified
to Paid in Capital | |
SPDR SSgA Multi-Asset Real Return ETF | | $ | 89,690 | |
SPDR SSgA Income Allocation ETF | | | — | |
SPDR SSgA Global Allocation ETF | | | 285,159 | |
SPDR Blackstone / GSO Senior Loan ETF | | | — | |
19
SSgA ACTIVE ETF TRUST
NOTES TO FINANCIAL STATEMENTS (continued)
June 30, 2013
At June 30, 2013, the Funds had capital loss carryforwards which may be utilized to offset any net realized capital gains. These losses will not expire and are treated as though the losses were incurred on the first day of the next fiscal year:
| | | | | | | | |
| | | Short Term | | | Long Term | |
SPDR SSgA Multi-Asset Real Return ETF | | $ | 636,237 | | | $ | 60,440 | |
SPDR SSgA Income Allocation ETF | | | 949,441 | | | | — | |
SPDR SSgA Global Allocation ETF | | | 159,781 | | | | 19,428 | |
SPDR Blackstone / GSO Senior Loan ETF | | | 12,487 | | | | — | |
For the year ended June 30, 2013, there were no significant differences between the book basis and the tax basis character of distributions to shareholders.
The tax character of distributions paid during the years ended June 30, 2012 and June 30, 2013 was as follows:
| | | | | | | | | | | | | | | | |
| | | Distributions Paid in 2013 | | | Distributions Paid in 2012 | |
| | | Ordinary
Income | | | Long-term
Capital Gains | | | Ordinary
Income | | | Long-term
Capital Gains | |
SPDR SSgA Multi-Asset Real Return ETF | | $ | 1,773,687 | | | $ | — | | | $ | 39,652 | | | $ | — | |
SPDR SSgA Income Allocation ETF | | | 3,792,817 | | | | — | | | | 122,565 | | | | — | |
SPDR SSgA Global Allocation ETF | | | 768,378 | | | | — | | | | 39,306 | | | | — | |
SPDR Blackstone / GSO Senior Loan ETF | | | 519,534 | | | | — | | | | — | | | | — | |
For the year ended June 30, 2013, there were no significant differences between the book basis and the tax basis of components of net assets other than differences in the net unrealized appreciation (depreciation) in the value of investments attributable to the tax deferral of losses on wash sales, the cumulative return of capital payment, PFICs (Passive Foreign Investment Companies), redemptions in-kind, dividend payables and the deferral of post-October losses.
As of June 30, 2013, the components of distributable earnings on a tax basis were as follows:
| | | | | | | | | | | | |
| | | Undistributed
Ordinary Income | | | Undistributed
Long-Term
Capital Gains | | | Net Unrealized
Appreciation
(Depreciation) | |
SPDR SSgA Multi-Asset Real Return ETF | | $ | 1,078,131 | | | $ | — | | | $ | (10,938,624 | ) |
SPDR SSgA Income Allocation ETF | | | 1,911,699 | | | | — | | | | (6,305,198 | ) |
SPDR SSgA Global Allocation ETF | | | 391,864 | | | | — | | | | (633,014 | ) |
SPDR Blackstone / GSO Senior Loan ETF | | | 425,759 | | | | — | | | | (3,078,590 | ) |
Distributions
Each Fund declares and distributes dividends from net investment income, if any, to its shareholders quarterly (monthly for SPDR Blackstone / GSO Senior Loan ETF). Each Fund declares and distributes net realized capital gains, if any, at least annually. Distributions are recorded on the ex-dividend date. Income and capital gain distributions are determined in accordance with income tax regulations, which may differ from U.S. generally accepted accounting principles.
| 3. | Fees and Compensation Paid to Affiliates and Other Related Party Transactions |
Advisory Fee
Each Fund has entered into an Investment Advisory Agreement with SSgA Funds Management, Inc. (the “Adviser” or “SSgA FM”). As compensation for the services rendered, facilities furnished, and expenses borne by the Adviser, each
20
SSgA ACTIVE ETF TRUST
NOTES TO FINANCIAL STATEMENTS (continued)
June 30, 2013
Fund pays the Adviser a fee accrued daily and paid monthly, based on a percentage of each Fund’s average daily net assets as shown in the following table:
| | | | |
| | | Annual Rate* | |
SPDR SSgA Multi-Asset Real Return ETF | | | 0.70 | % |
SPDR SSgA Income Allocation ETF | | | 0.70 | |
SPDR SSgA Global Allocation ETF | | | 0.35 | |
SPDR Blackstone / GSO Senior Loan ETF | | | 0.90 | |
| * | The Advisory fee is reduced by the proportional amount of the advisory fee, as well as, for SPDR SSgA Multi-Asset Real Return ETF, SPDR SSgA Income Allocation ETF and the SPDR SSgA Global Allocation ETF, acquired fund fees and expenses of each Fund’s respective Portfolio. For the period ended June 30, 2013, the net annualized advisory fee was 0.04%, 0.15%, (0.16)% and 0.60% for the SPDR SSgA Multi-Asset Real Return ETF, SPDR SSgA Income Allocation ETF, SPDR SSgA Global Allocation ETF and SPDR Blackstone / GSO Senior Loan ETF, respectively. For the SPDR SSgA Global Allocation ETF the reduction resulted in a fee reimbursement which is identified on the Statement of Operations. |
The Adviser pays all operating expenses of each Fund other than management fee, distribution fee pursuant to each Fund’s Distribution and Service Plan, if any, brokerage, taxes, interest, fees and expenses of the Independent Trustees (including any Trustees’ counsel fees), litigation expenses, and other extraordinary expenses.
State Street Bank and Trust Company (“State Street”), an affiliate of the Adviser, receives fees for its services as Custodian, Administrator and Transfer Agent from the Adviser.
State Street Global Markets, LLC (the “Distributor”), an affiliate of the Adviser, serves as the distributor of the shares of each Fund. Pursuant to a Distribution and Service Plan adopted in accordance with Rule 12b-1 under the 1940 Act, each Fund is authorized to pay an amount of up to 0.25% of its average daily net assets for certain distribution-related activities. However, the Board of Trustees has determined that no such payments will be made through at least October 31, 2013 and therefore no such payments have been made.
The Distributor has established an assisted trading program to aid Authorized Participants in certain creation and redemption activity for which the Distributor receives commissions from Authorized Participants. In addition, the Distributor receives compensation from State Street associated with on-line creation and redemption activity of Authorized Participants.
Trustees’ Fees
The Trust, SSgA Master Trust, SPDR Series Trust and SPDR Index Shares Funds pay, in the aggregate, each Independent Trustee an annual fee of $150,000 plus $10,000 per in-person meeting attended and $1,250 for each telephonic or video conference meeting attended. The Chairman of the Board receives an additional annual fee of $50,000 and the Chairman of the Audit Committee receives an additional annual fee of $20,000. The Trust also reimburses each Independent Trustee for travel and other out-of-pocket expenses incurred by him/her in connection with attending such meetings and in connection with attending industry seminars and meetings. Trustee fees are allocated among the Trusts and each of their respective series in such a manner as deemed equitable, taking into consideration the relative net assets of the series.
| 4. | Shareholder Transactions |
Shares are issued and redeemed by a Fund only in Creation Unit size aggregations of 50,000 shares. Such transactions are generally permitted on an in-kind basis, with a separate cash payment, which is a balancing cash component to equate the transaction to the net asset value per unit of the Fund on the transaction date. Transaction fees ranging from of $100 to $400 per Creation Unit for each Fund, regardless of the number of Creation Units that are created or redeemed on the same day, are charged to those persons creating or redeeming Creation Units. An additional variable fee may be charged for certain transactions. Transaction fees are received by the Trust and/or Custodian and are used to defray related expenses. The Custodian also receives amounts earned on cash collateral provided by Authorized Participants pending delivery of missing deposit securities. The amounts are included in Other Capital on the Statements of Changes in Net Assets.
21
SSgA ACTIVE ETF TRUST
REPORT OF INDEPENDENT REGISTERED PUBLIC ACCOUNTING FIRM
June 30, 2013
To the Shareholders and Board of Trustees of
SSgA Active ETF Trust
We have audited the accompanying statements of assets and liabilities of SSgA Active ETF Trust (comprising, respectively, SPDR SSgA Multi-Asset Real Return ETF, SPDR SSgA Income Allocation ETF, SPDR SSgA Global Allocation ETF, and SPDR Blackstone / GSO Senior Loan ETF) (collectively, the “Funds”) as of June 30, 2013, and the related statements of operations, statements of changes in net assets and financial highlights for each of the periods indicated therein. These financial statements and financial highlights are the responsibility of the Funds’ management. Our responsibility is to express an opinion on these financial statements and financial highlights based on our audits.
We conducted our audits in accordance with the standards of the Public Company Accounting Oversight Board (United States). Those standards require that we plan and perform the audit to obtain reasonable assurance about whether the financial statements and financial highlights are free of material misstatement. We were not engaged to perform an audit of the Funds’ internal control over financial reporting. Our audits included consideration of internal control over financial reporting as a basis for designing audit procedures that are appropriate in the circumstances, but not for the purpose of expressing an opinion on the effectiveness of the Funds’ internal control over financial reporting. Accordingly, we express no such opinion. An audit also includes examining, on a test basis, evidence supporting the amounts and disclosures in the financial statements and financial highlights, assessing the accounting principles used and significant estimates made by management, and evaluating the overall financial statement presentation. We believe that our audits provide a reasonable basis for our opinion.
In our opinion, the financial statements and financial highlights referred to above present fairly, in all material respects, the financial position of each of the respective Funds constituting SSgA Active ETF Trust at June 30, 2013, and the results of their operations, the changes in their net assets and their financial highlights for each of the periods indicated therein, in conformity with U.S. generally accepted accounting principles.
Boston, Massachusetts
August 29, 2013
22
SSgA ACTIVE ETF TRUST
OTHER INFORMATION
June 30, 2013 (Unaudited)
Shareholder Expense Example
As a shareholder of a Fund, you incur two types of costs: (1) transaction costs, which may include creation and redemption fees or brokerage charges and (2) ongoing costs, including management fees, trustee fees, and other Fund expenses. This Example is intended to help you understand your ongoing costs (in dollars) of investing in a Fund and to compare these costs with the ongoing costs of investing in other funds. It is based on an investment of $1,000 invested on January 1, 2013 and held for the six months ended June 30, 2013.
Actual Expenses
The first table below provides information about actual account values and actual expenses. You may use the information in this table, together with the amount you invested, to estimate the expenses that you incurred over the period. Simply divide your account value by $1,000 (for example, an $8,600 account value divided by $1,000 = 8.6), then multiply the result by the number in the first table under the heading entitled “Expenses Paid During Period” to estimate the expenses attributable to your investment during this period.
Hypothetical Example for Comparison Purposes
The second table below provides information about hypothetical account values and hypothetical expenses based on a Fund’s actual expense ratio and an assumed rate of return of 5% per year before expenses, which is not a Fund’s actual return. Thus, you should not use the hypothetical account values and expenses to estimate the actual ending account balance or your expenses for the period. Rather, these figures are provided to enable you to compare the ongoing costs of investing in a Fund and other funds. To do so, compare this 5% hypothetical example with the 5% hypothetical examples that appear in the shareholder reports of the other funds. The Funds charge transaction fees at scheduled amounts ranging from $100 to $400 per Creation Unit to those persons creating or redeeming Creation Units. If you buy or sell the Funds’ shares in the secondary market, you will incur customary brokerage commissions and charges.
Please note that the expenses shown in the table are meant to highlight your ongoing costs only and do not reflect any transaction costs, such as creation and redemption fees, or brokerage charges. Therefore, the second table is useful in comparing ongoing costs only, and will not help you determine the relative total costs of owning different funds. In addition, if these transaction costs were included, your costs would have been higher.
| | | | | | | | | | | | | | | | |
Actual | | Annualized
Expense Ratio | | | Beginning Account
Value
1/1/13 | | | Ending Account
Value
6/30/13 | | | Expenses Paid
During Period*
1/1/13 to
6/30/13 | |
SPDR SSgA Multi-Asset Real Return ETF | | | 0.25 | % | | $ | 1,000 | | | $ | 913.90 | | | $ | 1.19 | |
SPDR SSgA Income Allocation ETF | | | 0.35 | | | | 1,000 | | | | 983.70 | | | | 1.72 | |
SPDR SSgA Global Allocation ETF | | | 0.04 | | | | 1,000 | | | | 1,019.50 | | | | 0.20 | |
SPDR Blackstone / GSO Senior Loan ETF** | | | 0.90 | | | | 1,000 | | | | 995.20 | | | | 2.16 | |
| | | | | | | | | | | | | | | | |
Hypothetical
(assuming a 5% return before expenses) | | Annualized
Expense Ratio | | | Beginning Account
Value
1/1/13 | | | Ending Account
Value
6/30/13 | | | Expenses Paid
During Period*
1/1/13 to
6/30/13 | |
SPDR SSgA Multi-Asset Real Return ETF | | | 0.25 | % | | $ | 1,000 | | | $ | 1,023.56 | | | $ | 1.25 | |
SPDR SSgA Income Allocation ETF | | | 0.35 | | | | 1,000 | | | | 1,023.06 | | | | 1.76 | |
SPDR SSgA Global Allocation ETF | | | 0.04 | | | | 1,000 | | | | 1,024.60 | | | | 0.20 | |
SPDR Blackstone / GSO Senior Loan ETF** | | | 0.90 | | | | 1,000 | | | | 1,020.34 | | | | 4.51 | |
| * | Expenses are equal to the Fund’s annualized net expense ratio multiplied by the average account value of the period, multiplied by the number of days in the most recent six month period, then divided by 365. |
| ** | Actual period is from commencement of operations 4/3/13. Hypothetical period is from 1/1/13. |
23
SSgA ACTIVE ETF TRUST
OTHER INFORMATION (continued)
June 30, 2013 (Unaudited)
Premium/Discount Information
Information regarding how often the Shares of each Fund traded on the Exchange at a price above (i.e. at a premium) or below (i.e. at a discount) the net asset value of the Fund for the past calendar year can be found on the Funds’ website at www.spdrs.com.
Tax Information
For federal income tax purposes, the following information is furnished with respect to the distributions of the Trust for its fiscal year ended June 30, 2013.
Qualified Dividend Income
A portion of dividends distributed by the Funds during the fiscal year ended June 30, 2013, are considered qualified dividend income, and are eligible for reduced tax rates. These lower rates range from 5% to 15% depending on the individual’s tax bracket. These amounts are noted below:
| | | | |
| | | Amount | |
SPDR SSgA Multi-Asset Real Return ETF | | $ | 767,262 | |
SPDR SSgA Income Allocation ETF | | | 977,824 | |
SPDR SSgA Global Allocation ETF | | | 125,926 | |
Qualified Interest Income
The Funds designated a portion of dividends distributed during the fiscal year ended June 30, 2013, as qualified interest income. These amounts are noted below:
| | | | |
| | | Amount | |
SPDR Blackstone / GSO Senior Loan ETF | | $ | 115,745 | |
At June 30, 2013, the Funds had foreign source income. These amounts are noted below:
| | | | |
| | | Amount | |
SPDR SSgA Multi-Asset Real Return ETF | | $ | 1,220,163 | |
SPDR SSgA Income Allocation ETF | | | 1,436,358 | |
SPDR SSgA Global Allocation ETF | | | 320,893 | |
Foreign Tax Credit
The Trust has made an election under Internal Revenue Code Section 853 to pass through foreign taxes paid by a Fund to its shareholders. For the year ended June 30, 2013, the total amount of foreign taxes that will be passed through are:
| | | | |
| | | Amount | |
SPDR SSgA Multi-Asset Real Return ETF | | $ | 13,006 | |
SPDR SSgA Income Allocation ETF | | | 21,557 | |
SPDR SSgA Global Allocation ETF | | | 3,862 | |
Percentage of distributions which qualify for the corporate dividends received deduction:
| | | | |
| | | Percentage | |
SPDR SSgA Multi-Asset Real Return ETF | | | 12.45 | % |
SPDR SSgA Income Allocation ETF | | | 11.83 | |
SPDR SSgA Global Allocation ETF | | | 20.84 | |
SPDR Blackstone / GSO Senior Loan ETF | | | 0.00 | |
24
SSgA ACTIVE ETF TRUST
OTHER INFORMATION (continued)
June 30, 2013 (Unaudited)
Proxy Voting Policies and Procedures and Records
A description of the Trust’s proxy voting policies and procedures that are used by the Funds’ investment adviser to vote proxies relating to the Funds’ portfolio of securities are available (i) without charge, upon request by calling 1-866-787-2257 (toll free) or (ii) on the website of the Securities and Exchange Commission, at www.sec.gov. Information regarding how the investment advisor voted for the prior 12-months period ended June 30 is available by August 31 of each year by calling the same number and on the SEC’s website, at www.sec.gov, and on the Funds’ website at www.spdrs.com.
Quarterly Portfolio Schedule
The Funds file a complete schedule of portfolio holdings with the SEC for the first and third quarters of each fiscal year on Form N-Q. The Fund’s Forms N-Q are available on the SEC’s website at www.sec.gov and may be reviewed and copied at the SEC’s Public Reference Room in Washington DC. Information on the operation of the Public Reference Room may be obtained by calling 1-800-SEC-0330. The information on the Form N-Q is available upon request, without charge, by calling 1-866-787-2257 (toll free) and on the Funds’ website at www.spdrs.com.
Approval of Advisory Agreement
At in-person meetings held prior to June 30, 2013, the Board of Trustees of the Trust (the “Board”) evaluated various proposals related to advisory arrangements for new series of the Trusts, including a proposal to approve the Investment Advisory Agreements (the “Agreement”) with respect to the SPDR Blackstone / GSO Senior Loan ETF, a new series of the Trust (the “New ETF”), and its underlying master fund, the Blackstone / GSO Senior Loan Portfolio, both of which commenced operations during the most recent fiscal half-year period covered by this Annual Report. The Trustees who are not “interested persons” of the Trust within the meaning of the Investment Company Act of 1940, as amended (the “Independent Trustees”) also met separately with their independent legal counsel to consider the Agreement.
In evaluating the Agreement, the Board drew on materials provided to them by the Adviser and on other materials provided by State Street Bank and Trust Company, the Trust’s Administrator, Transfer Agent and Custodian (“State Street”). In deciding whether to approve the Agreement, the Board considered various factors, including (i) the nature, extent and quality of services to be provided by the Adviser with respect to the New ETF under the Agreement, (ii) costs to the Adviser of its services, and (iii) the extent to which economies of scale would be realized if and as the New ETF grows and whether the fee in the Agreement reflects these economies of scale.
The Board considered the nature, extent and quality of services to be provided by the Adviser. In doing so, they relied on their prior experience with the Trust and materials provided prior to and at the meeting. The Board reviewed the Agreement and the Adviser’s anticipated responsibilities for managing investment operations of the New ETF, in accordance with the New ETF’s investment objective and policies, and applicable legal and regulatory requirements. The Board appreciated the relatively unique nature of the New ETF, as an exchange-traded fund in a master-feeder structure, and the experience and expertise of the Adviser with exchange-traded funds. The Board considered the background and experience of the Adviser’s senior management, including those individuals responsible for oversight of the sub-adviser for, and compliance of, the New ETF. The Board also considered the portfolio oversight resources, structures and practices of the Adviser, including those associated with monitoring and securing the New ETF’s compliance with its investment objectives and policies and with applicable laws and regulations. The Board also considered information about the Adviser’s overall investment management business, noting that the Adviser serves a wide range of clients across a broad spectrum of asset classes. The Board looked at the Adviser’s general knowledge of the investment business and that of its affiliates which make up State Street Global Advisors, with which the Adviser shares all of its senior personnel. The Board considered that the Adviser and its affiliates constitute one of the world’s largest investment management enterprises for ETFs. The Board also considered the Adviser’s experience in active management, in managing exchange-traded funds, in overseeing third-party sub-advisers, and in master-feeder structures.
The Board considered whether the Adviser benefited in other ways from its relationship with the Trust, noting that the Adviser does not maintain soft-dollar arrangements in connection with the Trust’s brokerage transactions.
The Board reviewed information regarding economies of scale or other efficiencies that may result as the New ETF’s assets grow in size. The Board noted that the Agreement did not provide for breakpoints in the Fund’s advisory fee rates
25
SSgA ACTIVE ETF TRUST
OTHER INFORMATION (continued)
June 30, 2013 (Unaudited)
as assets of the Fund increase. However, the Board further noted the Adviser’s assertion that future economies of scale had been taken into consideration for the New ETF by fixing relatively low advisory fees, effectively sharing the benefits of lower fees with the New Fund from inception. The Board noted that it intends to continue to monitor fees as the New ETF grows in size and assess whether fee breakpoints may be warranted.
The Board evaluated the New ETF’s unitary fee through review of comparative information with respect to fees paid by similar funds — i.e., exchange-traded funds that are actively managed, as applicable. The Board reviewed the universe of similar exchange-traded funds for the New ETF based upon data from Lipper Analytical Services and related comparative information for similar exchange-traded funds. The Board also reviewed the estimated expense ratio for the New ETF, noting the differences in fees between the feeder and corresponding master fund in connection with the master-feeder structure.
The Board, including the Independent Trustees voting separately, approved the Agreement for the New ETF after weighing the foregoing factors, none of which was dispositive in itself and may have been weighed differently by each Trustee. The Board’s conclusions with respect to the Agreement were as follows: (a) the nature and extent of the services expected to be provided by the Adviser with respect to the New ETF were appropriate; (b) the Adviser’s fee for the New ETF and the unitary fee, considered in relation to services expected to be provided, were fair and reasonable; (c) any additional benefits to the Adviser were not of a magnitude materially to affect the Board’s conclusions; and (d) fees expected to be paid to the Adviser were expected to share economies of scale with respect to the New ETF by way of the relatively low fee structure of the Trust.
At in-person meetings held prior to June 30, 2013, the Board also considered the approval of a Sub-Advisory Agreement (the “Blackstone / GSO Sub-Advisory Agreement”) between the SSgA Master Trust and GSO / Blackstone Debt Funds Management LLC (“Blackstone / GSO”) with respect to the Blackstone / GSO Senior Loan Portfolio (the “New Portfolio”) which would serve as the master fund for the New ETF.
In evaluating the Blackstone / GSO Sub-Advisory Agreement, the Board drew on materials provided to them by Blackstone / GSO and the Adviser. In deciding whether to approve the Blackstone / GSO Sub-Advisory Agreement, the Board considered various factors, including: (i) the nature, extent and quality of services expected to be provided by Blackstone / GSO with respect to the New Portfolio under the Blackstone / GSO Sub-Advisory Agreement; and (ii) investment performance of customized credit strategies, including senior secured loan strategies, managed by Blackstone / GSO. The Board was apprised of the portion of the current advisory fee that the Adviser would pay to Blackstone / GSO under the Blackstone / GSO Sub-Advisory Agreement and also considered that such fees would be paid directly by the Adviser and would not result in increased fees payable by the New Portfolio.
The Board considered the background and experience of Blackstone / GSO’s senior management and in particular Blackstone / GSO’s experience in investing in senior secured loans. The Board noted that Blackstone / GSO would bring significant senior secured loan experience to bear in managing the New Portfolio. The Board noted that Blackstone / GSO has extensive experience in managing senior loan portfolios and reviewed Blackstone / GSO’s assets under management in portfolios of senior loans for a wide array of closed-end funds, hedge funds and other accounts.
The Board, including the Independent Trustees voting separately, approved the Blackstone / GSO Sub-Advisory Agreement for the New Portfolio after weighing the foregoing factors, none of which was dispositive in itself and may have been weighed differently by each Trustee. The Board’s conclusions with respect to the Agreement were as follows: (a) the nature and extent of the services expected to be provided by Blackstone / GSO to the New Portfolio were adequate and appropriate; and (b) Blackstone / GSO’s experience in managing senior loan portfolios is extensive.
26
SSgA ACTIVE ETF TRUST
OTHER INFORMATION (continued)
June 30, 2013 (Unaudited)
TRUSTEES
| | | | | | | | | | | | |
Name, Address and Year of Birth | | Position(s)
with Fund | | Term of
Office and
Length of
Time Served | | Principal
Occupation(s)
During Past
5 Years | | Number of
Portfolios
in Fund
Complex
Overseen
by Trustee | | | Other
Directorships
Held by Trustee |
Independent Trustees | | | | | | | | | | | | |
FRANK NESVET
c/o SSgA Active ETF Trust
State Street Financial Center
One Lincoln Street
Boston, MA 02111-2900
1943 | | Independent
Trustee,
Chairman,
Trustee
Committee
Chair | | Term: Unlimited Served: since March 2011 | | Chief Executive Officer, Libra Group, Inc. (1998-present) (a financial services consulting company). | | | 170 | | | SPDR Series Trust (Trustee); SPDR Index Shares Funds (Trustee); SSgA Master Trust (Trustee). |
DAVID M. KELLY
c/o SSgA Active ETF Trust
State Street Financial Center
One Lincoln Street
Boston, MA 02111-2900
1938 | | Independent
Trustee,
Audit
Committee
Chair | | Term: Unlimited Served: since March 2011 | | Retired. | | | 170 | | | Penson Worldwide Inc. (Director) (retired in March 2013); SPDR Series Trust (Trustee); SPDR Index Shares Funds (Trustee); SSgA Master Trust (Trustee). |
BONNY EUGENIA BOATMAN
c/o SSgA Active ETF Trust
State Street Financial Center
One Lincoln Street
Boston, MA 02111-2900
1950 | | Independent
Trustee | | Term: Unlimited Served: since March 2011 | | Retired; Managing Director, Columbia Management Group, Bank of America (1984-2005). | | | 170 | | | SPDR Series Trust (Trustee); SPDR Index Shares Funds (Trustee); SSgA Master Trust (Trustee). |
DWIGHT D. CHURCHILL
c/o SSgA Active ETF Trust
State Street Financial Center
One Lincoln Street
Boston, MA 02111-2900
1953 | | Independent
Trustee | | Term: Unlimited Served: since March 2011 | | Self-employed consultant since 2010; Head of Fixed Income and other Senior Management roles, Fidelity Investments (1993-2009). | | | 170 | | | Affiliated Managers Group, Inc. (Director); SPDR Series Trust (Trustee); SPDR Index Shares Funds (Trustee); SSgA Master Trust (Trustee). |
CARL G. VERBONCOEUR
c/o SSgA Active ETF Trust
State Street Financial Center
One Lincoln Street
Boston, MA 02111-2900
1952 | | Independent
Trustee | | Term: Unlimited Served: since March 2011 | | Self-employed consultant since 2009; Chief Executive Officer, Rydex Investments (2003-2009). | | | 170 | | | The Motley Fool Funds Trust (Trustee); SPDR Series Trust (Trustee); SPDR Index Shares Funds (Trustee); SSgA Master Trust (Trustee). |
27
SSgA ACTIVE ETF TRUST
OTHER INFORMATION (continued)
June 30, 2013 (Unaudited)
| | | | | | | | | | | | |
Name, Address and Year of Birth | | Position(s)
with Fund | | Term of
Office and
Length of
Time Served | | Principal
Occupation(s)
During Past
5 Years | | Number of
Portfolios
in Fund
Complex
Overseen
by Trustee | | | Other
Directorships
Held by Trustee |
Interested Trustee | | | | | | | | | | | | |
JAMES E. ROSS*
SSgA Funds Management, Inc.
State Street Financial Center
One Lincoln Street
Boston, MA 02111
1965 | | Interested
Trustee | | Term: Unlimited Served: since March 2011 | | Chairman and Director, SSgA Funds Management, Inc. (2005-present); President, SSgA Funds Management, Inc. (2005-2012); Senior Managing Director, State Street Global Advisors (2006-present); Principal State Street Global Advisors (2006-present). | | | 201 | | | SPDR Series Trust (Trustee); SPDR Index Shares Funds (Trustee); SSgA Master Trust (Trustee); Select Sector SPDR Trust (Trustee); State Street Master Funds (Trustee); and State Street Institutional Investment Trust (Trustee). |
| * | Mr. Ross is an Interested Trustee because of his employment with the Adviser and ownership interest in an affiliate of the Adviser. Mr. Ross previously served as an Interested Trustee from November 2005 to December 2009. |
OFFICERS
| | | | | | |
Name, Address
and Year of Birth | | Position(s)
with Fund | | Term of Office and Length of Time Served | | Principal Occupation(s) During Past 5 Years |
ELLEN M. NEEDHAM
SSgA Funds Management, Inc.
State Street Financial Center
One Lincoln Street
Boston, MA 02111
1967 | | President | | Term: Unlimited Served: since March 2011 | | President and Director, SSgA Funds Management, Inc. (June 2012-present); Chief Operating Officer, SSgA Funds Management, Inc. (May 2010-June 2012); Senior Managing Director, SSgA Funds Management, Inc. (1992-2012)*; Senior Managing Director, State Street Global Advisors (1992-present).* |
ANN M. CARPENTER
SSgA Funds Management, Inc.
State Street Financial Center
One Lincoln Street
Boston, MA 02111
1966 | | Vice President | | Term: Unlimited Served: since August 2012 | | Vice President, State Street Global Advisors and SSgA Funds Management, Inc. (2005-present).* |
MICHAEL P. RILEY
SSgA Funds Management, Inc.
State Street Financial Center
One Lincoln Street
Boston, MA 02111
1969 | | Vice President | | Term: Unlimited Served: since March 2011 | | Vice President, State Street Global Advisors and SSgA Funds Management, Inc. (2008-present); Principal, State Street Global Advisors and SSgA Funds Management, Inc. (2005-2008). |
CHRISTOPHER A. MADDEN**
State Street Bank and Trust Company
Four Copley Place, CPH0326
Boston, MA 02116
1967 | | Secretary | | Term: Unlimited Served: since August 2013 | | Vice President and Managing Counsel, State Street Bank and Trust Company (2013-present); Counsel, Atlantic Fund Services (2009-2013); Vice President, Citigroup Fund Services, LLC (2005-2009).* |
28
SSgA ACTIVE ETF TRUST
OTHER INFORMATION (continued)
June 30, 2013 (Unaudited)
| | | | | | |
Name, Address
and Year of Birth | | Position(s)
with Fund | | Term of Office and Length of Time Served | | Principal Occupation(s) During Past 5 Years |
DANIO MASTROPIERI**
State Street Bank and Trust Company
Four Copley Place, CPH0326
Boston, MA 02116
1972 | | Assistant
Secretary | | Term: Unlimited Served: since August 2013 | | Vice President and Counsel, State Street Bank and Trust Company (2013-present); Vice President, Citi Fund Services Ohio, Inc. (2007-2013).* |
MARK E. TUTTLE
State Street Bank and Trust Company
Four Copley Place, CPH0326
Boston, MA 02116
1970 | | Assistant
Secretary | | Term: Unlimited Served: since March 2011 | | Vice President and Counsel, State Street Bank and Trust Company (2007-present)*; Assistant Counsel, BISYS Group, Inc. (2005-2007)* (a financial services company). |
CHAD C. HALLETT
State Street Bank and Trust Company
Four Copley Place, CPH0328
Boston, MA 02116
1969 | | Treasurer | | Term: Unlimited Served: since March 2011 | | Vice President, State Street Bank and Trust Company (2001-present).* |
MATTHEW FLAHERTY
State Street Bank and Trust Company
Four Copley Place, CPH0328
Boston, MA 02116
1971 | | Assistant
Treasurer | | Term: Unlimited Served: since March 2011 | | Vice President, State Street Bank and Trust Company (1994-present).* |
LAURA F. DELL
State Street Bank and Trust Company
Four Copley Place, CPH0328
Boston, MA 02116
1964 | | Assistant
Treasurer | | Term: Unlimited Served: since March 2011 | | Vice President, State Street Bank and Trust Company (2002-present).* |
JACQUELINE ANGELL
State Street Bank and Trust Company
20 Churchill Place
London, UK E14 5HJ
1974 | | Chief Compliance
Officer | | Term: Unlimited Served: since March 2011 | | Head of UK Compliance, State Street Bank and Trust Company (July 2012-present); Vice President, State Street Global Advisors and SSgA Funds Management, Inc. (2008-2012); Director of Investment Adviser Oversight, Fidelity Investments (2006-2008). |
| * | Served in various capacities and/or with various affiliated companies during noted time period. |
| ** | The Officers table is reflective of information as of August 21, 2013. |
29
The SPDR® Family of Exchange Traded Funds
The following is a list of SPDR ETFs being offered, along with their respective exchange trading symbols. Please call 1-866-787-2257 to obtain a prospectus for any SPDR ETF. The prospectus contains more complete information, including charges, expenses, investment objectives and risk factors that should be carefully considered to determine if the Fund(s) are an appropriate investment for you. Read the prospectus(es) carefully before investing. Investing involves risk, including possible loss of principal.
SPDR Series Trust
SPDR Russell 3000® ETF (THRK)
SPDR Russell 1000 ETF (ONEK)
SPDR Russell 2000 ETF (TWOK)
SPDR S&P 500 Growth ETF (SPYG)
SPDR S&P 500 Value ETF (SPYV)
SPDR Russell Small Cap Completeness ETF (RSCO)
SPDR S&P 400 Mid Cap Growth ETF (MDYG)
SPDR S&P 400 Mid Cap Value ETF (MDYV)
SPDR S&P 600 Small Cap ETF (SLY)
SPDR S&P 600 Small Cap Growth ETF (SLYG)
SPDR S&P 600 Small Cap Value ETF (SLYV)
SPDR Global Dow ETF (DGT)
SPDR Dow Jones REIT ETF (RWR)
SPDR S&P Bank ETF (KBE)
SPDR S&P Capital Markets ETF (KCE)
SPDR S&P Insurance ETF (KIE)
SPDR S&P Mortgage Finance ETF (KME)
SPDR S&P Regional Banking ETF (KRE)
SPDR Morgan Stanley Technology ETF (MTK)
SPDR S&P Dividend ETF (SDY)
SPDR S&P Aerospace & Defense ETF (XAR)
SPDR S&P Biotech ETF (XBI)
SPDR S&P Health Care Equipment ETF (XHE)
SPDR S&P Health Care Services ETF (XHS)
SPDR S&P Homebuilders ETF (XHB)
SPDR S&P Metals & Mining ETF (XME)
SPDR S&P Oil & Gas Equipment & Services ETF (XES)
SPDR S&P Oil & Gas Exploration & Production ETF (XOP)
SPDR S&P Pharmaceuticals ETF (XPH)
SPDR S&P Retail ETF (XRT)
SPDR S&P Semiconductor ETF (XSD)
SPDR S&P Software & Services ETF (XSW)
SPDR S&P Telecom ETF (XTL)
SPDR S&P Transportation ETF (XTN)
SPDR S&P 1500 Momentum Tilt ETF (MMTM)
SPDR S&P 1500 Value Tilt ETF (VLU)
SPDR Russell 1000 Low Volatility ETF (LGLV)
SPDR Russell 2000 Low Volatility ETF (SMLV)
SPDR Wells Fargo Preferred Stock ETF (PSK)
SPDR Barclays 1-3 Month T-Bill ETF (BIL)
SPDR Barclays TIPS ETF (IPE)
SPDR Barclays 1-10 Year TIPS ETF (TIPX)
SPDR Barclays Short Term Treasury ETF (SST)
SPDR Barclays Intermediate Term Treasury ETF (ITE)
SPDR Barclays Long Term Treasury ETF (TLO)
SDPR Barclays Short Term Corporate Bond ETF (SCPB)
SPDR Barclays Intermediate Term Corporate Bond ETF (ITR)
SPDR Barclays Long Term Corporate Bond ETF (LWC)
SPDR Barclays Issuer Scored Corporate Bond ETF (CBND)
SPDR Barclays Convertible Securities ETF (CWB)
SPDR Barclays Mortgage Backed Bond ETF (MBG)
SPDR Barclays Aggregate Bond ETF (LAG)
SPDR Nuveen Barclays Municipal Bond ETF (TFI)
SPDR Nuveen Barclays California Municipal Bond ETF (CXA)
SPDR Nuveen Barclays New York Municipal Bond ETF (INY)
SPDR Nuveen Barclays Short Term Municipal Bond ETF (SHM)
SPDR Nuveen S&P VRDO Municipal Bond ETF (VRD)
SPDR Nuveen S&P High Yield Municipal Bond ETF (HYMB)
SPDR Nuveen Barclays Build America Bond ETF (BABS)
SPDR DB International Government Inflation-Protected Bond ETF (WIP)
SPDR Barclays Short Term International Treasury Bond ETF (BWZ)
SPDR Barclays International Treasury Bond ETF (BWX)
SPDR Barclays International Corporate Bond ETF (IBND)
SPDR Barclays Emerging Markets Local Bond ETF (EBND)
SPDR Barclays High Yield Bond ETF (JNK)
SPDR Barclays Short Term High Yield Bond ETF (SJNK)
SPDR Barclays Investment Grade Floating Rate ETF (FLRN)
SPDR BofA Merrill Lynch Emerging Markets Corporate Bond ETF (EMCD)
SPDR BofA Merrill Lynch Crossover Corporate Bond ETF (XOVR)
SPDR Index Shares Funds
SPDR STOXX Europe 50 ETF (FEU)
SPDR EURO STOXX 50 ETF (FEZ)
SPDR S&P Emerging Asia Pacific ETF (GMF)
SPDR S&P Small Cap Emerging Asia Pacific ETF (GMFS)
SPDR S&P Russia ETF (RBL)
SPDR S&P China ETF (GXC)
SPDR S&P Emerging Markets ETF (GMM)
SPDR S&P Emerging Markets Dividend ETF (EDIV)
SPDR S&P BRIC 40 ETF (BIK)
SPDR S&P Emerging Europe ETF (GUR)
SPDR S&P Emerging Latin America ETF (GML)
SPDR S&P Emerging Middle East & Africa ETF (GAF)
SPDR S&P World ex-US ETF (GWL)
SPDR S&P International Small Cap ETF (GWX)
SPDR Dow Jones International Real Estate ETF (RWX)
SPDR S&P Global Infrastructure ETF (GII)
SPDR S&P Global Natural Resources ETF (GNR)
SPDR MSCI ACWI ex-US ETF (CWI)
SPDR MSCI ACWI IMI ETF (ACIM)
SPDR MSCI EM 50 ETF (EMFT)
SPDR Russell/Nomura PRIMETM Japan ETF (JPP)
SPDR Russell/Nomura Small CapTM Japan ETF (JSC)
SPDR S&P Global Dividend ETF (WDIV)
SPDR S&P International Dividend ETF (DWX)
SPDR S&P International Mid Cap ETF (MDD)
SPDR S&P Emerging Markets Small Cap ETF (EWX)
SPDR Dow Jones Global Real Estate ETF (RWO)
SPDR S&P International Consumer Discretionary Sector ETF (IPD)
SPDR S&P International Consumer Staples Sector ETF (IPS)
SPDR S&P International Energy Sector ETF (IPW)
SPDR S&P International Financial Sector ETF (IPF)
SPDR S&P International Health Care Sector ETF (IRY)
SPDR S&P International Industrial Sector ETF (IPN)
SPDR S&P International Materials Sector ETF (IRV)
SPDR S&P International Technology Sector ETF (IPK)
SPDR S&P International Telecommunications Sector ETF (IST)
SPDR S&P International Utilities Sector ETF (IPU)
The Select Sector SPDR Trust
The Consumer Discretionary Select Sector SPDR Fund (XLY)
The Consumer Staples Select Sector SPDR Fund (XLP)
The Energy Select Sector SPDR Fund (XLE)
The Financial Select Sector SPDR Fund (XLF)
The Health Care Select Sector SPDR Fund (XLV)
The Industrial Select Sector SPDR Fund (XLI)
The Materials Select Sector SPDR Fund (XLB)
The Technology Select Sector SPDR Fund (XLK)
The Utilities Select Sector SPDR Fund (XLU)
SSgA Active ETF Trust
SPDR SSgA Multi-Asset Real Return ETF (RLY)
SPDR SSgA Income Allocation ETF (INKM)
SPDR SSgA Global Allocation ETF (GAL)
SPDR Blackstone / GSO Senior Loan ETF (SRLN)
SPDR Dow Jones Industrial Average ETF Trust (DIA)
SPDR S&P 500 ETF Trust (SPY)
State Street Global Markets, LLC, member FINRA, SIPC, is distributor for all investment portfolios of SPDR Series Trust, SPDR Index Shares Funds, and SSgA Active ETF Trust. ALPS Distributors, Inc., a registered broker-dealer, is distributor for SPDR S&P 500 ETF Trust (SPY) and SPDR Dow Jones Industrial Average ETF Trust (DIA), both unit investment trusts, and all investment portfolios of The Select Sector SPDR Trust.
SSgA Active ETF Trust
TRUSTEES
Bonny E. Boatman
Dwight D. Churchill
David M. Kelly
Frank Nesvet, Chairman
James E. Ross
Carl G. Verboncoeur
OFFICERS
Ellen M. Needham, President
Ann Carpenter, Vice President
Michael P. Riley, Vice President
Chad C. Hallett, Treasurer
Matthew W. Flaherty, Assistant Treasurer
Laura F. Dell, Assistant Treasurer
Christopher A. Madden, Secretary
Mark E. Tuttle, Assistant Secretary
Danio Mastropieri, Assistant Secretary
Jacqueline Angell, Chief Compliance Officer
INVESTMENT MANAGER
SSgA Funds Management, Inc.
State Street Financial Center
One Lincoln Street
Boston, MA 02111
DISTRIBUTOR
State Street Global Markets, LLC
One Lincoln Street
Boston, MA 02111
CUSTODIAN, ADMINISTRATORAND TRANSFER AGENT
State Street Bank and Trust Company
One Lincoln Street
Boston, MA 02111
LEGAL COUNSEL
Bingham McCutchen LLP
2020 K Street, NW
Washington, DC 20006
INDEPENDENT REGISTERED PUBLIC ACCOUNTING FIRM
Ernst & Young LLP
200 Clarendon Street
Boston, MA 02116
Fund Shares are distributed by State Street Global Markets, LLC, a wholly-owned subsidiary of State Street
Corporation. State Street Global Markets, LLC; member FINRA, SIPC.
The information contained in this report is intended for the general information of shareholders of the Trust. This report is not authorized for distribution to prospective investors unless preceded or accompanied by a current Trust prospectus which contains important information concerning the Trust. You may obtain a current prospectus and SAI from the Distributor by calling 1-866-787-2257 or visiting www.spdrs.com Please read the prospectus carefully before you invest.
SSgA Master Trust
Annual Report June 30, 2013
TABLE OF CONTENTS
SSgA MULTI-ASSET REAL RETURN PORTFOLIO
TOP FIVE HOLDINGS AS OF JUNE 30, 2013
| | | | | | | | | | | | | | |
| | | | | | | | | | | | | | | |
| | | DESCRIPTION | | SPDR S&P GLOBAL
NATURAL
RESOURCES ETF | | SPDR BARCLAYS
TIPS ETF | | SPDR DOW JONES
INTERNATIONAL
REAL ESTATE ETF | | SPDR DOW JONES
REIT ETF | | POWERSHARES DB
COMMODITY INDEX
TRACKING FUND | | |
| | | MARKET VALUE | | $38,987,974 | | 16,006,716 | | 14,743,808 | | 13,035,147 | | 12,120,350 | | |
| | | % OF NET ASSETS | | 32.1 | | 13.2 | | 12.1 | | 10.7 | | 10.0 | | |
| | | | | | | | | | | | | | | |
(The five largest holdings are subject to change, and there are no guarantees the Portfolio will continue to remain invested in a particular Fund.)
ASSET ALLOCATION AS OF JUNE 30, 2013*
| | | | | | | | |
| | | | | PERCENT OF
NET ASSETS | | | |
| | Natural Resources | | | 43.6 | % | | |
| | Real Estate | | | 22.9 | | | |
| | Inflation Linked | | | 21.7 | | | |
| | Commodities | | | 10.9 | | | |
| | Short Term Investments | | | 0.1 | | | |
| | | Other Assets & Liabilities | | | 0.8 | | | |
| | | TOTAL | | | 100.0 | % | | |
| | * | The Portfolio’s asset allocation is expressed as a percentage of net assets and may change over time. |
1
SSgA INCOME ALLOCATION PORTFOLIO
TOP FIVE HOLDINGS AS OF JUNE 30, 2013
| | | | | | | | | | | | | | |
| | | | | | | | | | | | | | | |
| | | DESCRIPTION | | SPDR BARCLAYS
LONG TERM
CORPORATE
BOND ETF | | SPDR S&P
DIVIDEND ETF | | SPDR WELLS
FARGO PREFERRED
STOCK ETF | | SPDR BARCLAYS
LONG TERM
TREASURY ETF | | SPDR S&P
INTERNATIONAL
DIVIDEND ETF | | |
| | | MARKET VALUE | | $26,924,923 | | 26,492,087 | | 19,949,383 | | 13,616,919 | | 10,340,074 | | |
| | | % OF NET ASSETS | | 15.5 | | 15.2 | | 11.4 | | 7.8 | | 5.9 | | |
| | | | | | | | | | | | | | | |
(The five largest holdings are subject to change, and there are no guarantees the Portfolio will continue to remain invested in a particular Fund.)
ASSET ALLOCATION AS OF JUNE 30, 2013*
| | | | | | | | |
| | | | | PERCENT OF NET ASSETS | | | |
| | Domestic Fixed Income | | | 30.2 | % | | |
| | Domestic Equity | | | 28.7 | | | |
| | International Equity | | | 21.1 | | | |
| | Real Estate | | | 8.4 | | | |
| | International Fixed Income | | | 5.4 | | | |
| | Inflation Linked | | | 4.8 | | | |
| | Short Term Investments | | | 0.4 | | | |
| | | Other Assets & Liabilities | | | 1.0 | | | |
| | | TOTAL | | | 100.0 | % | | |
| | * | The Portfolio’s asset allocation is expressed as a percentage of net assets and may change over time. |
2
SSgA GLOBAL ALLOCATION PORTFOLIO
TOP FIVE HOLDINGS AS OF JUNE 30, 2013
| | | | | | | | | | | | | | |
| | | | | | | | | | | | | | | |
| | | DESCRIPTION | | SPDR S&P
WORLD EX-US ETF | | SPDR S&P
500 ETF TRUST | | SPDR BARCLAYS
AGGREGATE
BOND ETF | | SPDR RUSSELL/
NOMURA PRIME
JAPAN ETF | | SPDR WELLS
FARGO PREFERRED
STOCK ETF | | |
| | | MARKET VALUE | | $9,519,923 | | 7,152,447 | | 6,243,757 | | 2,698,669 | | 2,572,381 | | |
| | | % OF NET ASSETS | | 18.3 | | 13.8 | | 12.0 | | 5.2 | | 5.0 | | |
| | | | | | | | | | | | | | | |
(The five largest holdings are subject to change, and there are no guarantees the Portfolio will continue to remain invested in a particular Fund.)
ASSET ALLOCATION AS OF JUNE 30, 2013*
| | | | | | | | |
| | | | | PERCENT OF
NET ASSETS | | | |
| | Domestic Equity | | | 31.9 | % | | |
| | International Equity | | | 31.4 | | | |
| | Domestic Fixed Income | | | 20.1 | | | |
| | Inflation Linked | | | 4.9 | | | |
| | Real Estate | | | 4.0 | | | |
| | International Fixed Income | | | 3.9 | | | |
| | Short Term Investments | | | 3.2 | | | |
| | | Other Assets & Liabilities | | | 0.6 | | | |
| | | TOTAL | | | 100.0 | % | | |
| | * | The Portfolio’s asset allocation is expressed as a percentage of net assets and may change over time. |
3
BLACKSTONE / GSO SENIOR LOAN PORTFOLIO
TOP FIVE HOLDINGS AS OF JUNE 30, 2013
| | | | | | | | | | | | | | |
| | | | | | | | | | | | | | | |
| | | DESCRIPTION | | ONEX CARESTREAM
FINANCE LP,
SENIOR SECURED
FIRST LIEN
TERM LOAN,
5.00%, 6/7/19 | | ALPHA D2, LTD.,
SENIOR SECURED
TERM LOAN B,
LIBOR + 3.50%,
4/30/19 | | SEQUA CORP.,
SENIOR SECURED
TERM LOAN B,
5.25%, 6/19/17 | | US FOODS, INC.,
SENIOR SECURED
TERM LOAN,
LIBOR + 3.50%,
3/29/19 | | BASS PRO GROUP LLC,
SENIOR SECURED
TERM LOAN, 4.00%, 11/20/19 | | |
| | | MARKET VALUE | | $4,698,060 | | 4,596,737 | | 4,512,451 | | 4,426,699 | | 3,998,812 | | |
| | | % OF NET ASSETS | | 1.4 | | 1.4 | | 1.4 | | 1.3 | | 1.2 | | |
| | | | | | | | | | | | | | | |
(The five largest holdings are subject to change, and there are no guarantees the Portfolio will continue to remain invested in a particular company.)
INDUSTRY BREAKDOWN AS OF JUNE 30, 2013*
| | | | | | | | |
| | | INDUSTRY | | PERCENT OF NET ASSETS | | | |
| | Media | | | 8.0 | % | | |
| | Hotels, Restaurants & Leisure | | | 6.2 | | | |
| | Health Care Providers & Services | | | 5.8 | | | |
| | Specialty Retail | | | 4.9 | | | |
| | Commercial Services & Supplies | | | 4.4 | | | |
| | Diversified Telecommunication Services | | | 4.3 | | | |
| | Health Care Equipment & Supplies | | | 3.8 | | | |
| | Food & Staples Retailing | | | 3.4 | | | |
| | Software | | | 3.2 | | | |
| | Independent Power Producers & Energy Traders | | | 3.1 | | | |
| | Diversified Consumer Services | | | 2.4 | | | |
| | Oil, Gas & Consumable Fuels | | | 2.4 | | | |
| | Airlines | | | 2.2 | | | |
| | Insurance | | | 2.2 | | | |
| | Containers & Packaging | | | 1.9 | | | |
| | Food Products | | | 1.8 | | | |
| | Aerospace & Defense | | | 1.5 | | | |
| | Building Products | | | 1.5 | | | |
| | Capital Markets | | | 1.5 | | | |
| | Leisure Equipment & Products | | | 1.5 | | | |
| | Life Sciences Tools & Services | | | 1.5 | | | |
| | Professional Services | | | 1.5 | | | |
| | Industrial Conglomerates | | | 1.4 | | | |
| | Chemicals | | | 1.2 | | | |
| | Communications Equipment | | | 1.2 | | | |
| | IT Services | | | 1.2 | | | |
| | | | | | | | |
| | | INDUSTRY | | PERCENT OF NET ASSETS | | | |
| | Internet Software & Services | | | 1.2 | % | | |
| | Auto Components | | | 1.0 | | | |
| | Household Durables | | | 1.1 | | | |
| | Biotechnology | | | 0.9 | | | |
| | Health Care Technology | | | 0.9 | | | |
| | Multiline Retail | | | 0.9 | | | |
| | Personal Products | | | 0.8 | | | |
| | Wireless Telecommunication Services | | | 0.8 | | | |
| | Automobiles | | | 0.6 | | | |
| | Diversified Financial Services | | | 0.6 | | | |
| | Metals & Mining | | | 0.6 | | | |
| | Real Estate Management & Development | | | 0.6 | | | |
| | Road & Rail | | | 0.6 | | | |
| | Semiconductors & Semiconductor Equipment | | | 0.6 | | | |
| | Textiles, Apparel & Luxury Goods | | | 0.6 | | | |
| | Trading Companies & Distributors | | | 0.6 | | | |
| | Air Freight & Logistics | | | 0.5 | | | |
| | Beverages | | | 0.5 | | | |
| | Electrical Equipment | | | 0.3 | | | |
| | Pharmaceuticals | | | 0.3 | | | |
| | Electric Utilities | | | 0.2 | | | |
| | Multi-Utilities | | | 0.2 | | | |
| | Short Term Investments | | | 28.9 | | | |
| | | Other Assets & Liabilities | | | (17.3 | ) | | |
| | | TOTAL | | | 100.0 | % | | |
| | * | The Portfolio’s industry breakdown is expressed as a percentage of net assets and may change over time. |
4
SSgA Multi-Asset Real Return Portfolio
SCHEDULE OF INVESTMENTS
June 30, 2013
| | | | | | | | |
Security Description | | Shares | | | Value | |
| | | | | | | | |
|
EXCHANGE TRADED PRODUCTS — 99.1% | |
COMMODITIES — 10.9% | |
PowerShares DB Commodity Index Tracking Fund (a) | | | 482,306 | | | $ | 12,120,350 | |
PowerShares DB Gold Fund (a) | | | 26,625 | | | | 1,109,730 | |
PowerShares DB Oil Fund (a) | | | 632 | | | | 16,381 | |
| | | | | | | | |
| | | | | | | 13,246,461 | |
| | | | | | | | |
INFLATION LINKED — 21.7% | |
SPDR Barclays TIPS ETF (b) | | | 288,046 | | | | 16,006,716 | |
SPDR DB International Government Inflation-Protected Bond ETF (b) | | | 179,144 | | | | 10,313,320 | |
| | | | | | | | |
| | | | | | | 26,320,036 | |
| | | | | | | | |
NATURAL RESOURCES — 43.6% | |
Market Vectors Gold Miners ETF | | | 43,285 | | | | 1,056,587 | |
PowerShares Global Agriculture Portfolio | | | 162,756 | | | | 4,760,613 | |
SPDR S&P Global Natural Resources ETF (b) | | | 866,592 | | | | 38,987,974 | |
SPDR S&P International Energy Sector ETF (b) | | | 103,539 | | | | 2,396,928 | |
SPDR S&P Metals & Mining ETF (b) | | | 103,088 | | | | 3,415,306 | |
The Energy Select Sector SPDR
Fund (b) | | | 31,198 | | | | 2,444,675 | |
| | | | | | | | |
| | | | | | | 53,062,083 | |
| | | | | | | | |
REAL ESTATE — 22.9% | |
SPDR Dow Jones International Real Estate ETF (b) | | | 369,519 | | | | 14,743,808 | |
SPDR Dow Jones REIT ETF (b) | | | 171,628 | | | | 13,035,147 | |
| | | | | | | | |
| | | | | | | 27,778,955 | |
| | | | | | | | |
TOTAL EXCHANGE TRADED PRODUCTS —
(Cost $131,016,414) | | | | | | | 120,407,535 | |
| | | | | | | | |
SHORT TERM INVESTMENT — 0.1% | |
MONEY MARKET FUND — 0.1% | |
State Street Institutional Liquid Reserves Fund 0.09% (b) (c)
(Cost $154,629) | | | 154,629 | | | | 154,629 | |
| | | | | | | | |
TOTAL INVESTMENTS — 99.2% (d)
(Cost $131,171,043) | | | | | | | 120,562,164 | |
OTHER ASSETS &
LIABILITIES — 0.8% | | | | | | | 1,021,820 | |
| | | | | | | | |
NET ASSETS — 100.0% | | | | | | $ | 121,583,984 | |
| | | | | | | | |
| (a) | Qualified Publicly Traded Partnerships. |
| (b) | Affiliated Fund managed by SSgA Funds Management, Inc. (Note 3) |
| (c) | The rate shown is the annualized seven-day yield at period end. |
| (d) | Unless otherwise indicated, the values of the securities of the Portfolio are determined based on Level 1 inputs. (Note 2) |
See accompanying notes to financial statements.
5
SSgA Income Allocation Portfolio
SCHEDULE OF INVESTMENTS
June 30, 2013
| | | | | | | | |
Security Description | | Shares | | | Value | |
| | | | | | | | |
|
EXCHANGE TRADED PRODUCTS — 98.6% | |
DOMESTIC EQUITY — 28.7% | |
SPDR S&P Dividend ETF (a) | | | 399,579 | | | $ | 26,492,087 | |
SPDR Wells Fargo Preferred Stock ETF (a) | | | 458,923 | | | | 19,949,383 | |
The Financial Select Sector SPDR Fund (a) | | | 91,613 | | | | 1,785,537 | |
The Technology Select Sector SPDR Fund (a) | | | 59,725 | | | | 1,826,988 | |
| | | | | | | | |
| | | | | | | 50,053,995 | |
| | | | | | | | |
DOMESTIC FIXED INCOME — 30.2% | |
SPDR Barclays Convertible Securities ETF (a) | | | 20,742 | | | | 885,269 | |
SPDR Barclays High Yield Bond ETF (a) | | | 174,086 | | | | 6,874,656 | |
SPDR Barclays Long Term Corporate Bond ETF (a) | | | 713,243 | | | | 26,924,923 | |
SPDR Barclays Long Term Treasury ETF (a) | | | 212,247 | | | | 13,616,919 | |
SPDR Barclays Short Term High Yield Bond ETF (a) | | | 58,976 | | | | 1,779,896 | |
SPDR Nuveen Barclays Build America Bond ETF (a) | | | 46,701 | | | | 2,591,438 | |
| | | | | | | | |
| | | | | | | 52,673,101 | |
| | | | | | | | |
INFLATION LINKED — 4.8% | |
SPDR Barclays TIPS ETF (a) | | | 149,424 | | | | 8,303,492 | |
| | | | | | | | |
INTERNATIONAL EQUITY — 21.1% | | | | | | | | |
SPDR S&P Global Infrastructure ETF (a) | | | 249,730 | | | | 10,158,767 | |
SPDR S&P Emerging Markets Dividend
ETF (a) | | | 224,002 | | | | 8,693,517 | |
SPDR S&P International Dividend ETF (a) | | | 236,886 | | | | 10,340,074 | |
SPDR S&P International Telecommunications Sector ETF (a) | | | 106,930 | | | | 2,476,499 | |
SPDR STOXX Europe 50 ETF (a) | | | 152,694 | | | | 5,041,956 | |
| | | | | | | | |
| | | | | | | 36,710,813 | |
| | | | | | | | |
INTERNATIONAL FIXED INCOME — 5.4% | |
SPDR Barclays Emerging Markets Local Bond ETF (a) | | | 175,002 | | | | 5,188,809 | |
SPDR Barclays International Corporate Bond ETF (a) | | | 122,066 | | | | 4,192,967 | |
| | | | | | | | |
| | | | | | | 9,381,776 | |
| | | | | | | | |
REAL ESTATE — 8.4% | |
SPDR Dow Jones International Real Estate ETF (a) | | | 214,867 | | | | 8,573,193 | |
SPDR Dow Jones REIT ETF (a) | | | 81,004 | | | | 6,152,254 | |
| | | | | | | | |
| | | | | | | 14,725,447 | |
| | | | | | | | |
TOTAL EXCHANGE TRADED PRODUCTS —
(Cost $178,006,328) | | | | | | | 171,848,624 | |
| | | | | | | | |
| | | | | | | | |
Security Description | | Shares | | | Value | |
| | | | | | | | |
|
SHORT TERM INVESTMENT — 0.4% | |
MONEY MARKET FUND — 0.4% | |
State Street Institutional Liquid Reserves Fund 0.09% (a) (b)
(Cost $620,536) | | | 620,536 | | | $ | 620,536 | |
| | | | | | | | |
TOTAL INVESTMENTS — 99.0% (c) (Cost $178,626,864) | | | | | | | 172,469,160 | |
OTHER ASSETS &
LIABILITIES — 1.0% | | | | | | | 1,785,668 | |
| | | | | | | | |
NET ASSETS — 100.0% | | | | | | $ | 174,254,828 | |
| | | | | | | | |
| (a) | Affiliated Fund managed by SSgA Funds Management, Inc. (Note 3) |
| (b) | The rate shown is the annualized seven-day yield at period end. |
| (c) | Unless otherwise indicated, the values of the securities of the Portfolio are determined based on Level 1 inputs. (Note 2) |
See accompanying notes to financial statements.
6
SSgA Global Allocation Portfolio
SCHEDULE OF INVESTMENTS
June 30, 2013
| | | | | | | | |
Security Description | | Shares | | | Value | |
| | | | | | | | |
|
EXCHANGE TRADED PRODUCTS — 96.2% | |
DOMESTIC EQUITY — 31.9% | |
SPDR S&P 500 ETF Trust (a) | | | 44,700 | | | $ | 7,152,447 | |
SPDR S&P 500 Value ETF (a) | | | 18,869 | | | | 1,550,088 | |
SPDR S&P 600 Small Cap ETF (a) | | | 18,111 | | | | 1,572,578 | |
SPDR S&P Dividend ETF (a) | | | 8,746 | | | | 579,860 | |
SPDR S&P MidCap 400 ETF Trust (a) | | | 4,927 | | | | 1,036,542 | |
SPDR Wells Fargo Preferred Stock ETF (a) | | | 59,176 | | | | 2,572,381 | |
The Consumer Discretionary Select Sector SPDR Fund (a) | | | 18,730 | | | | 1,056,372 | |
The Financial Select Sector SPDR Fund (a) | | | 53,233 | | | | 1,037,511 | |
| | | | | | | | |
| | | | | | | 16,557,779 | |
| | | | | | | | |
DOMESTIC FIXED INCOME — 20.1% | |
SPDR Barclays Aggregate Bond ETF (a) | | | 109,790 | | | | 6,243,757 | |
SPDR Barclays High Yield Bond ETF (a) | | | 25,999 | | | | 1,026,701 | |
SPDR Barclays Intermediate Term Corporate Bond ETF (a) | | | 46,629 | | | | 1,566,035 | |
SPDR Barclays Long Term Corporate Bond ETF (a) | | | 28,079 | | | | 1,059,982 | |
SPDR Barclays Short Term High Yield Bond ETF (a) | | | 17,294 | | | | 521,933 | |
| | | | | | | | |
| | | | | | | 10,418,408 | |
| | | | | | | | |
INFLATION LINKED — 4.9% | |
SPDR Barclays TIPS ETF (a) | | | 32,448 | | | | 1,803,136 | |
SPDR DB International Government Inflation-Protected Bond ETF (a) | | | 13,281 | | | | 764,587 | |
| | | | | | | | |
| | | | | | | 2,567,723 | |
| | | | | | | | |
INTERNATIONAL EQUITY — 31.4% | |
SPDR Russell/Nomura PRIME Japan ETF (a) | | | 63,112 | | | | 2,698,669 | |
SPDR S&P Emerging Markets ETF (a) | | | 26,308 | | | | 1,568,220 | |
SPDR S&P International Small Cap ETF (a) | | | 53,091 | | | | 1,531,144 | |
SPDR S&P World ex-US ETF (a) | | | 378,827 | | | | 9,519,923 | |
SPDR STOXX Europe 50 ETF (a) | | | 30,060 | | | | 992,581 | |
| | | | | | | | |
| | | | | | | 16,310,537 | |
| | | | | | | | |
INTERNATIONAL FIXED INCOME — 3.9% | |
SPDR Barclays Emerging Markets Local Bond ETF (a) | | | 1,014 | | | | 30,065 | |
SPDR Barclays International Corporate Bond ETF (a) | | | 44,149 | | | | 1,516,518 | |
SPDR Barclays International Treasury Bond ETF (a) | | | 8,626 | | | | 485,472 | |
| | | | | | | | |
| | | | | | | 2,032,055 | |
| | | | | | | | |
REAL ESTATE — 4.0% | |
SPDR Dow Jones International Real Estate ETF (a) | | | 25,764 | | | | 1,027,983 | |
SPDR Dow Jones REIT ETF (a) | | | 13,662 | | | | 1,037,629 | |
| | | | | | | | |
| | | | | | | 2,065,612 | |
| | | | | | | | |
TOTAL EXCHANGE TRADED PRODUCTS —
(Cost $50,474,287) | | | | | | | 49,952,114 | |
| | | | | | | | |
| | | | | | | | |
Security Description | | Shares | | | Value | |
| | | | | | | | |
|
SHORT TERM INVESTMENT — 3.2% | |
MONEY MARKET FUND — 3.2% | |
State Street Institutional Liquid Reserves Fund 0.09% (a) (b)
(Cost $1,648,718) | | | 1,648,718 | | | $ | 1,648,718 | |
| | | | | | | | |
TOTAL INVESTMENTS — 99.4% (c)
(Cost $52,123,005) | | | | | | | 51,600,832 | |
OTHER ASSETS &
LIABILITIES — 0.6% | | | | | | | 334,777 | |
| | | | | | | | |
NET ASSETS — 100.0% | | | | | | $ | 51,935,609 | |
| | | | | | | | |
| (a) | Affiliated Fund managed by SSgA Funds Management, Inc. (Note 3) |
| (b) | The rate shown is the annualized seven-day yield at period end. |
| (c) | Unless otherwise indicated, the values of the securities of the Portfolio are determined based on Level 1 inputs. (Note 2) |
See accompanying notes to financial statements.
7
Blackstone / GSO Senior Loan Portfolio
SCHEDULE OF INVESTMENTS
June 30, 2013
| | | | | | | | |
Security Description | | Principal
Amount | | | Value | |
| | | | | | | | |
| |
SENIOR FLOATING RATE LOANS* — 84.6% | | | | | |
AEROSPACE & DEFENSE — 1.5% | | | | | |
Booz Allen Hamilton, Inc., Senior Secured Term Loan B, 4.50%, 7/31/19 | | $ | 1,994,975 | | | $ | 1,998,097 | |
DigitalGlobe, Inc., Senior Secured Term Loan B, 3.75%, 1/31/20 | | | 1,995,000 | | | | 1,992,506 | |
Spirit Aerosystems, Inc., Senior Secured Term Loan B, LIBOR + 3.00%, 4/18/19 | | | 1,000,000 | | | | 1,009,795 | |
| | | | | | | | |
| | | | | | | 5,000,398 | |
| | | | | | | | |
AIR FREIGHT & LOGISTICS — 0.5% | | | | | |
Kenan Advantage Group, Inc., Senior Secured Term Loan, 3.75%, 6/10/16 | | | 1,705,144 | | | | 1,712,963 | |
| | | | | | | | |
AIRLINES — 2.2% | | | | | |
Delta Air Lines, Inc. | | | | | | | | |
Senior Secured Term Loan B, LIBOR + 3.25%, 4/20/17 | | | 2,000,000 | | | | 2,011,870 | |
Senior Secured Term Loan B1, 4.00%, 10/18/18 | | | 1,000,000 | | | | 1,001,965 | |
United Airlines, Inc., Senior Secured Term Loan B, 4.00%, 3/22/19 | | | 2,000,000 | | | | 2,001,250 | |
US Airways Group, Inc., Senior Secured Term Loan B1, 4.25%, 5/23/19 | | | 2,287,402 | | | | 2,263,796 | |
| | | | | | | | |
| | | | | | | 7,278,881 | |
| | | | | | | | |
AUTO COMPONENTS — 1.0% | | | | | |
Affinia Group Intermediate Holdings, Inc., Senior Secured Term Loan B2, LIBOR + 3.50%, 4/15/20 | | | 2,000,000 | | | | 1,997,500 | |
Allison Transmission, Inc., Senior Secured Term Loan B3, 4.25%, 8/23/19 | | | 1,496,231 | | | | 1,503,248 | |
| | | | | | | | |
| | | | | | | 3,500,748 | |
| | | | | | | | |
AUTOMOBILES — 0.6% | | | | | |
Chrysler Group LLC, Senior Secured Term Loan B, 4.25%, 5/24/17 | | | 2,000,000 | | | | 2,010,630 | |
| | | | | | | | |
BEVERAGES — 0.5% | | | | | |
Constellation Brands, Inc., Senior Secured Term Loan, 2.75%, 5/1/20 | | | 1,600,000 | | | | 1,597,848 | |
| | | | | | | | |
BIOTECHNOLOGY — 0.9% | | | | | |
Grifols, Inc., Senior Secured Term Loan B, LIBOR + 3.25%, 6/1/17 | | | 2,990,135 | | | | 3,007,896 | |
| | | | | | | | |
BUILDING PRODUCTS — 1.5% | | | | | |
ABC Supply Co., Inc., Senior Secured Term Loan, 3.50%, 4/16/20 | | | 2,082,164 | | | | 2,070,973 | |
Apex Tool Group LLC, Senior Secured Term Loan B, 4.50%, 1/31/20 | | | 2,000,000 | | | | 2,004,000 | |
Armstrong World Industries, Inc., Senior Secured Term Loan B, 3.50%, 3/16/20 | | | 997,500 | | | | 999,011 | |
| | | | | | | | |
| | | | | | | 5,073,984 | |
| | | | | | | | |
CAPITAL MARKETS — 1.5% | | | | | |
LPL Holdings, Inc., Senior Secured Increment Trench Term Loan B, 3.25%, 3/29/19 | | | 1,926,782 | | | | 1,924,373 | |
| | | | | | | | |
Security Description | | Principal
Amount | | | Value | |
| | | | | | | | |
| | |
RPI Finance Trust | | | | | | | | |
Senior Secured Term Loan, 3.50%, 5/9/18 | | $ | 1,990,715 | | | $ | 1,998,678 | |
Senior Secured Term Loan, 4.00%, 11/9/18 | | | 990,719 | | | | 993,820 | |
| | | | | | | | |
| | | | | | | 4,916,871 | |
| | | | | | | | |
CHEMICALS — 1.2% | | | | | |
Axalta Coating Systems US Holdings, Inc., Senior Secured Term Loan, 4.75%, 2/3/20 | | | 1,995,000 | | | | 1,998,252 | |
Ineos US Finance LLC, Senior Secured 6 Year Term Loan, 4.00%, 5/4/18 | | | 1,979,178 | | | | 1,942,385 | |
| | | | | | | | |
| | | | | | | 3,940,637 | |
| | | | | | | | |
COMMERCIAL SERVICES & SUPPLIES — 4.1% | |
ADS Waste Holdings, Inc., Senior Secured Term Loan B, 4.25%, 10/9/19 | | | 1,994,987 | | | | 1,992,993 | |
Aramark Corp. | | | | | | | | |
Senior Secured Term Loan D, LIBOR + 3.00%, 3.78%, 9/9/19 | | | 2,000,000 | | | | 2,000,000 | |
Senior Secured Extended Term Loan C, 3.78%, 7/26/16 | | | 2,000,000 | | | | 2,003,240 | |
Asurion LLC, Senior Secured Term Loan B1, 4.50%, 5/24/19 | | | 2,493,734 | | | | 2,475,655 | |
KAR Auction Services, Inc., Senior Secured Term Loan B, 3.75%, 5/19/17 | | | 3,000,000 | | | | 3,028,380 | |
West Corp., Senior Secured Term Loan B8, 3.75%, 6/29/18 | | | 1,998,821 | | | | 1,995,493 | |
| | | | | | | | |
| | | | | | | 13,495,761 | |
| | | | | | | | |
COMMUNICATIONS EQUIPMENT — 1.2% | | | | | |
Alcatel-Lucent USA, Inc., Senior Secured Term Loan C, 7.25%, 1/30/19 | | | 1,994,987 | | | | 2,017,850 | |
Blue Coat Systems, Inc., Senior Secured Term Loan, 4.50%, 5/31/19 | | | 2,063,393 | | | | 2,057,368 | |
| | | | | | | | |
| | | | | | | 4,075,218 | |
| | | | | | | | |
CONTAINERS & PACKAGING — 1.9% | | | | | |
Berry Plastics Holding Corp., Senior Secured Term Loan D, 3.50%, 2/7/20 | | | 1,995,000 | | | | 1,976,736 | |
Consolidated Container Co. LLC, Senior Secured Term Loan, 5.00%, 7/3/19 | | | 1,994,975 | | | | 2,006,885 | |
Reynolds Group Holdings, Inc., Senior Secured New Dollar Term Loan, 4.75%, 9/28/18 | | | 2,493,719 | | | | 2,504,366 | |
| | | | | | | | |
| | | | | | | 6,487,987 | |
| | | | | | | | |
|
DIVERSIFIED CONSUMER SERVICES — 2.1% | |
Bright Horizons Family Solutions, Inc., Senior Secured Term Loan B, LIBOR + 3.00%, 1/30/20 | | | 2,992,481 | | | | 3,007,070 | |
ServiceMaster Co. | | | | | | | | |
Senior Secured Term Loan, 4.25%, 1/31/17 | | | 997,494 | | | | 987,105 | |
Senior Secured Extended Term Loan, 4.45%, 1/31/17 | | | 997,481 | | | | 989,795 | |
See accompanying notes to financial statements.
8
Blackstone / GSO Senior Loan Portfolio
SCHEDULE OF INVESTMENTS (continued)
June 30, 2013
| | | | | | | | |
Security Description | | Principal
Amount | | | Value | |
| | | | | | | | |
| | |
Weight Watchers International, Inc., Senior Secured Term Loan B2, 3.75%, 4/2/20 | | $ | 2,000,000 | | | $ | 1,991,750 | |
| | | | | | | | |
| | | | | | | 6,975,720 | |
| | | | | | | | |
DIVERSIFIED FINANCIAL SERVICES — 0.6% | |
AlixPartners LLP, Senior Secured Term Loan B2, 4.50%, 6/28/19 | | | 1,994,987 | | | | 2,004,344 | |
| | | | | | | | |
DIVERSIFIED TELECOMMUNICATION SERVICES — 4.3% | |
Global Tel*Link Corp., Senior Secured First Lien Term Loan, 5.00%, 5/22/20 | | | 1,928,571 | | | | 1,924,955 | |
Intelsat Jackson Holdings, Ltd., Senior Secured Term Loan B1, 4.25%, 4/2/18 | | | 1,997,494 | | | | 2,004,235 | |
Light Tower Fiber LLC, Senior Secured First Lien Term Loan, 4.50%, 4/13/20 | | | 2,500,000 | | | | 2,489,075 | |
Telesat LLC, Senior Secured Term Loan B, LIBOR + 2.75%, 4.25%, 3/28/19 | | | 1,995,000 | | | | 2,001,235 | |
Virgin Media Investment Holdings, Ltd., Senior Secured Term Loan B, LIBOR + 2.75%, 6/8/20 | | | 2,000,000 | | | | 1,981,950 | |
Windstream Corp., Senior Secured Term Loan B4, 3.50%, 1/23/20 | | | 2,000,000 | | | | 2,005,940 | |
Zayo Group LLC, Senior Secured Term Loan B, 4.50%, 7/2/19 | | | 1,994,962 | | | | 1,996,618 | |
| | | | | | | | |
| | | | | | | 14,404,008 | |
| | | | | | | | |
ELECTRIC UTILITIES — 0.2% | |
Calpine Construction Finance Company LP, Senior Secured Term Loan B2, 3.25%, 1/31/22 | | | 793,651 | | | | 780,758 | |
| | | | | | | | |
ELECTRICAL EQUIPMENT — 0.3% | |
Generac Power Systems, Inc., Senior Secured Term Loan B, 3.50%, 5/29/20 | | | 1,006,197 | | | | 1,001,166 | |
| | | | | | | | |
FOOD & STAPLES RETAILING — 3.4% | |
BJ’s Wholesale Club, Inc., Senior Secured Replacement Term Loan, 4.25%, 9/26/19 | | | 2,495,000 | | | | 2,490,322 | |
Sprouts Farmers Markets Holdings LLC, Senior Secured Term Loan, 4.50%, 4/23/20 | | | 2,000,000 | | | | 2,002,500 | |
Supervalu, Inc., Senior Secured Term Loan B, LIBOR + 4.00%, 3/21/19 | | | 2,492,203 | | | | 2,481,299 | |
US Foods, Inc., Senior Secured Term Loan, LIBOR + 3.50%, 3/29/19 | | | 4,463,523 | | | | 4,426,699 | |
| | | | | | | | |
| | | | | | | 11,400,820 | |
| | | | | | | | |
FOOD PRODUCTS — 1.8% | |
AdvancePierre Foods, Inc., Senior Secured Term Loan, 5.75%, 7/10/17 | | | 2,000,000 | | | | 2,011,250 | |
Del Monte Foods Co., Senior Secured Term Loan, 4.00%, 3/8/18 | | | 1,944,443 | | | | 1,941,205 | |
| | | | | | | | |
Security Description | | Principal
Amount | | | Value | |
| | | | | | | | |
| | |
H.J. Heinz Co., Senior Secured Term Loan B2, LIBOR + 2.50%, 6/5/20 | | $ | 2,000,000 | | | $ | 2,002,160 | |
| | | | | | | | |
| | | | | | | 5,954,615 | |
| | | | | | | | |
HEALTH CARE EQUIPMENT & SUPPLIES — 3.8% | |
Hologic, Inc., Senior Secured Term Loan B, 4.50%, 8/1/19 | | | 2,033,290 | | | | 2,042,053 | |
Immucor, Inc., Senior Secured Term Loan B2, 5.00%, 8/17/18 | | | 2,997,494 | | | | 3,013,980 | |
Kinetic Concepts, Inc., Senior Secured Term Loan D1, 4.50%, 5/4/18 | | | 2,934,077 | | | | 2,943,980 | |
Onex Carestream Finance LP, Senior Secured First Lien Term Loan, 5.00%, 6/7/19 | | | 4,741,779 | | | | 4,698,060 | |
| | | | | | | | |
| | | | | | | 12,698,073 | |
| | | | | | | | |
HEALTH CARE PROVIDERS & SERVICES — 5.8% | |
Air Medical Group Holdings, Inc., Senior Unsecured Term Loan, 6.50%, 6/30/18 (a) | | | 997,494 | | | | 1,014,327 | |
CHG Buyer Corp., Senior Secured First Lien Term Loan, 5.00%, 11/22/19 | | | 2,862,957 | | | | 2,879,948 | |
DaVita, Inc., Senior Secured Term Loan B, 4.50%, 10/20/16 | | | 2,992,327 | | | | 3,009,159 | |
HCA, Inc. | | | | | | | | |
Senior Secured Extended Term Loan, 2.95%, 5/1/18 | | | 1,764,706 | | | | 1,758,909 | |
Senior Secured Term Loan B5, 3.03%, 3/31/17 | | | 1,000,000 | | | | 996,565 | |
Health Management Associates, Inc., Senior Secured Term Loan B, 3.50%, 11/16/18 | | | 3,092,152 | | | | 3,088,936 | |
Iasis Healthcare LLC, Senior Secured Term Loan B2, 4.50%, 5/3/18 | | | 2,997,494 | | | | 2,996,744 | |
Sheridan Holdings, Inc., Senior Secured Term Loan, 4.50%, 6/29/18 | | | 1,569,650 | | | | 1,575,536 | |
Truven Health Analytics, Inc., Senior Secured Term Loan B, 4.50%, 6/1/19 | | | 1,882,029 | | | | 1,880,863 | |
| | | | | | | | |
| | | | | | | 19,200,987 | |
| | | | | | | | |
HEALTH CARE TECHNOLOGY — 0.9% | |
IMS Health, Inc., Senior Secured Term Loan B1, 3.75%, 9/1/17 | | | 3,000,000 | | | | 3,003,120 | |
| | | | | | | | |
|
HOTELS, RESTAURANTS & LEISURE — 6.2% | |
Alpha D2, Ltd., Senior Secured Term Loan B, LIBOR + 3.50%, 4/30/19 | | | 4,595,588 | | | | 4,596,737 | |
California Pizza Kitchen, Inc., Senior Secured Term Loan, 5.26%, 3/29/18 | | | 1,000,000 | | | | 1,002,500 | |
DineEquity, Inc., Senior Secured Term Loan B2, 3.75%, 10/19/17 | | | 775,924 | | | | 778,970 | |
Dunkin’ Brands, Inc., Senior Secured Term Loan B3, 3.75%, 2/14/20 | | | 2,000,000 | | | | 1,997,950 | |
Four Seasons Holdings, Inc., Senior Secured First Lien Term Loan, LIBOR + 3.75%, 6/30/20 | | | 1,470,588 | | | | 1,479,779 | |
OSI Restaurant Partners LLC, Senior Secured Term Loan, 3.50%, 10/25/19 | | | 1,000,000 | | | | 998,380 | |
See accompanying notes to financial statements.
9
Blackstone / GSO Senior Loan Portfolio
SCHEDULE OF INVESTMENTS (continued)
June 30, 2013
| | | | | | | | |
Security Description | | Principal
Amount | | | Value | |
| | | | | | | | |
| | |
PGA Holdings, Inc., Senior Secured First Lien Term Loan, LIBOR + 3.25%, 4/20/18 | | $ | 2,992,500 | | | $ | 2,986,261 | |
Scientific Games International, Inc., Senior Secured Term Loan B, LIBOR + 3.25%, 5/22/20 | | | 3,000,000 | | | | 2,963,760 | |
Seminole Tribe of Florida, Senior Secured Term Loan, 3.03%, 4/29/20 | | | 1,182,524 | | | | 1,181,537 | |
Six Flags Theme Parks, Inc., Senior Secured Term Loan B, 4.00%, 12/20/18 | | | 1,994,987 | | | | 2,008,703 | |
Wendy’s International, Inc., Senior Secured Term Loan B, 3.25%, 5/15/19 | | | 687,326 | | | | 686,714 | |
| | | | | | | | |
| | | | | | | 20,681,291 | |
| | | | | | | | |
HOUSEHOLD DURABLES — 1.1% | |
Spin Holdco, Inc., Senior Secured Term Loan B, 4.25%, 11/14/19 | | | 2,000,000 | | | | 1,995,630 | |
Tempur-Pedic International, Inc., Senior Secured Term Loan B, 3.50%, 3/18/20 | | | 1,707,644 | | | | 1,696,971 | |
| | | | | | | | |
| | | | | | | 3,692,601 | |
| | | | | | | | |
INDEPENDENT POWER PRODUCERS & ENERGY TRADERS — 3.1% | |
AES Corp., Senior Secured Term Loan B, 3.75%, 6/1/18 | | | 1,994,987 | | | | 2,002,598 | |
Calpine Corp., Senior Secured Term Loan B1, 4.00%, 4/2/18 | | | 1,994,898 | | | | 1,995,437 | |
Dynegy Holdings, Inc., Senior Secured Term Loan B2, 4.00%, 4/23/20 | | | 2,356,764 | | | | 2,344,992 | |
NRG Energy, Inc., Senior Secured Term Loan B, 2.75%, 7/2/18 | | | 3,963,069 | | | | 3,931,285 | |
| | | | | | | | |
| | | | | | | 10,274,312 | |
| | | | | | | | |
|
INDUSTRIAL CONGLOMERATES — 1.4% | |
Sequa Corp., Senior Secured Term Loan B, 5.25%, 6/19/17 | | | 4,493,734 | | | | 4,512,451 | |
| | | | | | | | |
INSURANCE — 2.2% | |
Alliant Holdings I, Inc., Senior Secured Term Loan B, LIBOR + 3.75%, 12/20/19 | | | 3,000,000 | | | | 3,005,625 | |
CCC Information Services, Inc., Senior Secured Term Loan, LIBOR + 3.00%, 12/20/19 | | | 1,994,987 | | | | 1,985,013 | |
Sedgwick CMS Holdings, Inc., Senior Secured First Lien Term Loan, 4.50%, 6/12/18 | | | 2,444,232 | | | | 2,451,357 | |
| | | | | | | | |
| | | | | | | 7,441,995 | |
| | | | | | | | |
INTERNET SOFTWARE & SERVICES — 1.2% | |
Sabre, Inc., Senior Secured Term Loan B, LIBOR + 4.00%, 2/19/19 | | | 1,994,987 | | | | 2,010,359 | |
SurveyMonkey.com LLC, Senior Secured Term Loan B, LIBOR + 4.25%, 2/5/19 | | | 1,995,000 | | | | 2,002,481 | |
| | | | | | | | |
| | | | | | | 4,012,840 | |
| | | | | | | | |
| | | | | | | | |
Security Description | | Principal
Amount | | | Value | |
| | | | | | | | |
|
IT SERVICES — 1.2% | |
SunGard Data Systems, Inc. | | | | | | | | |
Senior Secured Term Loan E, LIBOR + 3.00%, 3/8/20 | | $ | 1,000,000 | | | $ | 1,001,750 | |
Senior Secured Term Loan D, 3.50%, 1/31/20 | | | 2,000,000 | | | | 2,010,630 | |
Vantiv LLC, Senior Secured Term Loan A, LIBOR + 1.75%, 5/15/18 | | | 1,000,000 | | | | 1,002,000 | |
| | | | | | | | |
| | | | | | | 4,014,380 | |
| | | | | | | | |
LEISURE EQUIPMENT & PRODUCTS — 0.9% | |
SRAM LLC, Senior Secured Term Loan B, LIBOR + 3.00%, 4/10/20 | | | 3,100,676 | | | | 3,073,545 | |
| | | | | | | | |
LIFE SCIENCES TOOLS & SERVICES — 1.5% | |
Pharmaceutical Product Development, Inc., Senior Secured Term Loan B, 4.25%, 12/5/18 | | | 2,993,734 | | | | 3,002,820 | |
Quintiles Transnational Corp., Senior Secured Term Loan B, 4.50%, 6/8/18 | | | 2,000,000 | | | | 2,003,500 | |
| | | | | | | | |
| | | | | | | 5,006,320 | |
| | | | | | | | |
MEDIA — 6.2% | |
AMC Entertainment, Inc., Senior Secured Term Loan, 3.50%, 4/30/20 | | | 1,569,680 | | | | 1,568,110 | |
Charter Communications Operating LLC, Senior Secured Term Loan E, LIBOR + 2.25%, 4/10/20 | | | 3,658,537 | | | | 3,621,951 | |
| | | | | | | | |
Getty Images, Inc., Senior Secured Term Loan B, 4.75%, 10/18/19 | | | 1,994,987 | | | | 1,975,866 | |
Interactive Data Corp., Senior Secured Term Loan B, 3.75%, 2/11/18 | | | 2,000,000 | | | | 1,993,330 | |
Kabel Deutschland GMBH, Senior Secured Term Loan F1, 3.25%, 2/1/19 | | | 3,000,000 | | | | 2,997,450 | |
Mediacom Communications Corp., Senior Secured Term Loan H, 3.25%, 1/29/21 | | | 1,601,067 | | | | 1,592,261 | |
Regal Cinemas, Inc., Senior Secured Term Loan B, 2.72%, 8/23/17 | | | 1,994,885 | | | | 1,998,486 | |
Univision Communications, Inc. | | | | | | | | |
Senior Secured Term Loan, LIBOR + 3.25%, 3/2/20 | | | 997,500 | | | | 990,019 | |
Senior Secured Term Loan C3, 4.00%, 3/2/20 | | | 2,021,959 | | | | 1,984,472 | |
WideOpenWest Finance LLC, Senior Secured Term Loan B, 4.75%, 3/26/19 | | | 1,995,000 | | | | 2,004,147 | |
| | | | | | | | |
| | | | | | | 20,726,092 | |
| | | | | | | | |
METALS & MINING — 0.6% | | | | | | | | |
Fairmount Minerals, Ltd., Senior Secured Term Loan B, 5.25%, 3/15/17 | | | 2,000,000 | | | | 2,004,500 | |
| | | | | | | | |
MULTI-UTILITIES — 0.2% | | | | | | | | |
Power Team Services LLC Senior Secured Delayed Draw Term Loan, 4.25%, 5/6/20 (b) | | | 59,259 | | | | 58,815 | |
Senior Secured First Lien Term Loan, 4.25%, 5/6/20 | | | 474,074 | | | | 470,518 | |
| | | | | | | | |
| | | | | | | 529,333 | |
| | | | | | | | |
See accompanying notes to financial statements.
10
Blackstone / GSO Senior Loan Portfolio
SCHEDULE OF INVESTMENTS (continued)
June 30, 2013
| | | | | | | | |
Security Description | | Principal
Amount | | | Value | |
| | | | | | | | |
| | |
MULTILINE RETAIL — 0.9% | | | | | | | | |
The Neiman Marcus Group, Inc., Senior Secured Extended Term Loan, 4.00%, 5/16/18 | | $ | 3,000,000 | | | $ | 2,995,155 | |
| | | | | | | | |
OIL, GAS & CONSUMABLE FUELS — 2.1% | | | | | |
EMG Utica LLC, Senior Secured Term Loan, 4.75%, 3/27/20 | | | 2,000,000 | | | | 1,995,000 | |
Energy Transfer Equity LP, Senior Secured Term Loan B, 3.75%, 3/24/17 | | | 900,000 | | | | 904,221 | |
EP Energy LLC
Senior Secured Term Loan B3, 3.50%, 5/24/18 | | | 2,000,000 | | | | 1,986,670 | |
Senior Secured Term Loan B2, 4.50%, 4/26/19 | | | 1,000,000 | | | | 1,003,570 | |
| | | | | | | | |
MEG Energy Corp., Senior Secured Term Loan, 3.75%, 3/31/20 | | | 997,469 | | | | 998,217 | |
| | | | | | | | |
| | | | | | | 6,887,678 | |
| | | | | | | | |
PERSONAL PRODUCTS — 0.8% | | | | | | | | |
NBTY, Inc., Senior Secured Term Loan B2, 3.50%, 10/1/17 | | | 2,500,000 | | | | 2,502,537 | |
| | | | | | | | |
PHARMACEUTICALS — 0.3% | | | | | | | | |
Valeant Pharmaceuticals International, Inc., Senior Secured Term Loan D1, 3.50%, 2/13/19 | | | 997,494 | | | | 992,297 | |
| | | | | | | | |
| |
PROFESSIONAL SERVICES — 1.5% | | | | | |
Advantage Sales & Marketing, Inc., Senior Secured First Lien Term Loan, 4.25%, 12/18/17 | | | 2,000,674 | | | | 2,004,675 | |
SymphonyIRI Group, Inc., Senior Secured Term Loan B, LIBOR + 3.25%, 12/1/17 | | | 2,874,725 | | | | 2,876,536 | |
| | | | | | | | |
| | | | | | | 4,881,211 | |
| | | | | | | | |
REAL ESTATE MANAGEMENT & DEVELOPMENT — 0.6% | |
Realogy Corp., Senior Secured Extended Term Loan, 4.50%, 3/5/20 | | | 1,997,500 | | | | 2,003,992 | |
| | | | | | | | |
ROAD & RAIL — 0.6% | | | | | | | | |
Avis Budget Car Rental, LLC, Senior Secured Term Loan B, 3.00%, 3/15/19 | | | 1,995,000 | | | | 2,001,982 | |
| | | | | | | | |
SEMICONDUCTORS & SEMICONDUCTOR EQUIPMENT — 0.6% | |
NXP B.V., Senior Secured Term Loan C, 4.75%, 1/11/20 | | | 1,994,987 | | | | 2,027,406 | |
| | | | | | | | |
SOFTWARE — 3.2% | | | | | | | | |
Epicor Software Corp., Senior Secured Term Loan B-1, 4.50%, 5/16/18 | | | 2,000,000 | | | | 2,007,500 | |
Infor (US), Inc.
Senior Secured Term Loan B3, 3.75%, 5/29/20 | | | 1,790,698 | | | | 1,769,442 | |
Senior Secured Term Loan B2, 5.25%, 4/5/18 | | | 2,815,061 | | | | 2,829,136 | |
Rovi Solutions Corp., Senior Secured Term Loan B3, LIBOR + 2.75%, 3/29/19 (a) | | | 1,995,000 | | | | 1,992,507 | |
| | | | | | | | |
Security Description | | Principal
Amount | | | Value | |
| | | | | | | | |
| | |
Vertafore, Inc., Senior Secured First Lien Term Loan, 4.25%, 10/2/19 | | $ | 1,995,000 | | | $ | 2,003,479 | |
| | | | | | | | |
| | | | | | | 10,602,064 | |
| | | | | | | | |
| | |
SPECIALTY RETAIL — 4.9% | | | | | | | | |
Bass Pro Group LLC, Senior Secured Term Loan, 4.00%, 11/20/19 | | | 3,994,897 | | | | 3,998,812 | |
Burlington Coat Factory Warehouse Corp., Senior Secured Term Loan B2, 4.25%, 2/23/17 | | | 2,000,000 | | | | 2,004,000 | |
J Crew Group, Inc., Senior Secured Term Loan B1, 4.00%, 3/7/18 | | | 2,494,911 | | | | 2,487,114 | |
Michaels Stores, Inc., Senior Secured Term Loan, LIBOR + 2.75%, 1/28/20 | | | 2,000,000 | | | | 1,997,710 | |
| | | | | | | | |
Party City Holdings, Inc., Senior Secured Term Loan B, 4.25%, 7/29/19 | | | 1,997,494 | | | | 1,987,926 | |
Pilot Travel Centers LLC, Senior Secured Term Loan B, 3.75%, 3/30/18 | | | 1,305,025 | | | | 1,288,308 | |
Serta Simmons Holdings LLC, Senior Secured Term Loan, 5.00%, 10/1/19 | | | 2,498,747 | | | | 2,502,495 | |
| | | | | | | | |
| | | | | | | 16,266,365 | |
| | | | | | | | |
| | | | | | | | |
|
TEXTILES, APPAREL & LUXURY GOODS — 0.6% | |
Phillips-Van Heusen Corp., Senior Secured Term Loan B, 3.25%, 2/13/20 | | | 1,995,000 | | | | 1,995,628 | |
| | | | | | | | |
TRADING COMPANIES & DISTRIBUTORS — 0.6% | |
WESCO Distribution, Inc., Senior Secured Term Loan B, 4.50%, 12/12/19 | | | 1,994,987 | | | | 2,003,307 | |
| | | | | | | | |
WIRELESS TELECOMMUNICATION SERVICES — 0.3% | |
Syniverse Holdings, Inc., Senior Secured Term Loan, 5.00%, 4/23/19 | | | 997,481 | | | | 996,863 | |
| | | | | | | | |
TOTAL SENIOR FLOATING RATE LOANS
(Cost $284,091,694) | | | | | | | 281,649,578 | |
| | | | | | | | |
CORPORATE BONDS AND NOTES — 3.8% | |
COMMERCIAL SERVICES & SUPPLIES — 0.3% | |
Aramark Corp., 5.75%, 3/15/20 (c) | | | 1,000,000 | | | | 1,022,500 | |
| | | | | | | | |
DIVERSIFIED CONSUMER SERVICES — 0.3% | |
Reynolds Group Issuer, Inc., 7.13%, 4/15/19 | | | 1,000,000 | | | | 1,056,250 | |
| | | | | | | | |
LEISURE EQUIPMENT & PRODUCTS — 0.6% | |
Cedar Fair LP, 5.25%, 3/15/21 (c) | | | 2,000,000 | | | | 1,920,000 | |
| | | | | | | | |
MEDIA — 1.8% | | | | | | | | |
Cablevision Systems Corp., 5.88%, 9/15/22 | | | 2,000,000 | | | | 1,935,000 | |
CCO Holdings LLC, 5.75%, 1/15/24 | | | 1,000,000 | | | | 965,000 | |
Sinclair Television Group, Inc., 6.13%, 10/1/22 | | | 2,000,000 | | | | 2,000,000 | |
Univision Communications, Inc., 6.88%, 5/15/19 (c) | | | 1,000,000 | | | | 1,050,000 | |
| | | | | | | | |
| | | | | | | 5,950,000 | |
| | | | | | | | |
OIL, GAS & CONSUMABLE FUELS — 0.3% | |
Atlas Pipeline Partners LP, 5.88%, 8/1/23 (c) | | | 1,000,000 | | | | 950,000 | |
| | | | | | | | |
See accompanying notes to financial statements.
11
Blackstone / GSO Senior Loan Portfolio
SCHEDULE OF INVESTMENTS (continued)
June 30, 2013
| | | | | | | | |
Security Description | | Principal
Amount | | | Value | |
| | | | | | | | |
|
WIRELESS TELECOMMUNICATION SERVICES — 0.5% | |
Avaya, Inc., 7.00%, 4/1/19 (c) | | $ | 2,000,000 | | | $ | 1,805,000 | |
| | | | | | | | |
TOTAL CORPORATE
BONDS AND NOTES
(Cost $13,334,097) | | | | | | | 12,703,750 | |
| | | | | | | | |
| | |
| | | Shares | | | | |
| | | | | | | | |
SHORT TERM INVESTMENTS — 28.9% | |
MONEY MARKET FUND — 28.9% | |
State Street Institutional Liquid Reserves Fund 0.09% (d) (e) (f) | | | 96,122,680 | | | | 96,122,680 | |
| | | | | | | | |
TOTAL SHORT TERM INVESTMENTS
(Cost $96,122,680) | | | | | | | 96,122,680 | |
| | | | | | | | |
TOTAL INVESTMENTS — 117.3% (Cost $393,548,471) | | | | | | | 390,476,008 | |
| | | | | | | | |
LESS UNFUNDED LOAN COMMITMENTS — (0.0)% (g)
(Cost $58,966) | | | | | | | (59,259 | ) |
| | | | | | | | |
NET INVESTMENTS — 117.3% (h) | | | | | |
(Cost $393,489,505) | | | | | | | 390,416,749 | |
| | | | | | | | |
OTHER ASSETS &
LIABILITIES — (17.3)% | | | | | | | (57,624,265 | ) |
| | | | | | | | |
NET ASSETS — 100.0% | | | | | | $ | 332,792,484 | |
| | | | | | | | |
| * | The interest rate shown represents the rate at period end. |
| (a) | Securities are valued at fair value as determined in good faith by the Trust’s Pricing and Investment Committee in accordance with procedures approved by the Board of Trustees. (Note 2) |
| (b) | Unfunded or partially unfunded loan commitments. |
| (c) | Securities purchased pursuant to Rule 144A of the Securities Act of 1933. These securities, which represent 2.0% of net assets as of June 30, 2013, are considered liquid and may be resold in transactions exempt from registration, normally to qualified institutional buyers. |
| (d) | Affiliated Fund managed by SSgA Funds Management, Inc. (Note 3) |
| (e) | The rate shown is the annualized seven-day yield at period end. |
| (f) | Value is determined based on Level 1 inputs. (Note 2) |
| (g) | Amount shown represents less than 0.05% of net assets. |
| (h) | Unless otherwise indicated, the values of the securities of the Portfolio are determined based on Level 2 inputs. (Note 2) |
See accompanying notes to financial statements.
12
SSgA MASTER TRUST
STATEMENTS OF ASSETS AND LIABILITIES
June 30, 2013
| | | | | | | | | | | | | | | | |
| | | SSgA Multi-Asset
Real Return
Portfolio | | | SSgA Income
Allocation
Portfolio | | | SSgA Global
Allocation
Portfolio | | | Blackstone / GSO
Senior Loan
Portfolio | |
ASSETS | | | | | | | | | | | | | | | | |
Investments in securities of unaffiliated issuers, at value | | $ | 19,063,661 | | | $ | — | | | $ | — | | | $ | 294,294,069 | |
Investments in securities of affiliated issuers, at value | | | 101,498,503 | | | | 172,469,160 | | | | 51,600,832 | | | | 96,122,680 | |
| | | | | | | | | | | | | | | | |
Total Investments | | | 120,562,164 | | | | 172,469,160 | | | | 51,600,832 | | | | 390,416,749 | |
Cash | | | 9,192 | | | | 1,140,800 | | | | — | | | | 5,013 | |
Receivable for investment securities sold | | | — | | | | — | | | | 448,567 | | | | 94,464 | |
Receivable for fund shares sold | | | — | | | | — | | | | — | | | | 42,193,372 | |
Dividends receivable from affiliated issuers (Note 4) | | | 1,032,811 | | | | 1,813,801 | | | | 343,233 | | | | 7,690 | |
Interest receivable from unaffiliated issuers | | | — | | | | — | | | | — | | | | 724,364 | |
| | | | | | | | | | | | | | | | |
TOTAL ASSETS | | | 121,604,167 | | | | 175,423,761 | | | | 52,392,632 | | | | 433,441,652 | |
| | | | | | | | | | | | | | | | |
LIABILITIES | | | | | | | | | | | | | | | | |
Payable for investments purchased | | | — | | | | 1,140,800 | | | | 448,575 | | | | 100,580,267 | |
Accrued advisory fees (Note 3) | | | 20,135 | | | | 28,071 | | | | 8,431 | | | | 68,856 | |
Accrued trustees’ fees and expenses (Note 3) | | | 48 | | | | 62 | | | | 17 | | | | 45 | |
| | | | | | | | | | | | | | | | |
TOTAL LIABILITIES | | | 20,183 | | | | 1,168,933 | | | | 457,023 | | | | 100,649,168 | |
| | | | | | | | | | | | | | | | |
NET ASSETS | | $ | 121,583,984 | | | $ | 174,254,828 | | | $ | 51,935,609 | | | $ | 332,792,484 | |
| | | | | | | | | | | | | | | | |
COST OF INVESTMENTS | | | | | | | | | | | | | | | | |
Unaffiliated issuers | | $ | 21,321,165 | | | $ | — | | | $ | — | | | $ | 297,366,825 | |
Affiliated issuers | | | 109,849,878 | | | | 178,626,864 | | | | 52,123,005 | | | | 96,122,680 | |
| | | | | | | | | | | | | | | | |
Total cost of investments | | $ | 131,171,043 | | | $ | 178,626,864 | | | $ | 52,123,005 | | | $ | 393,489,505 | |
| | | | | | | | | | | | | | | | |
See accompanying notes to financial statements.
13
SSgA MASTER TRUST
STATEMENTS OF OPERATIONS
Periods Ended June 30, 2013
| | | | | | | | | | | | | | | | |
| | | SSgA Multi-Asset
Real Return
Portfolio | | | SSgA Income
Allocation
Portfolio | | | SSgA Global
Allocation
Portfolio | | |
Blackstone / GSO
Senior Loan
Portfolio* | |
INVESTMENT INCOME | | | | | | | | | | | | | | | | |
Dividend and interest income on securities of unaffiliated issuers (Note 2) | | $ | 41,282 | | | $ | — | | | $ | — | | | $ | 1,356,067 | |
Dividend income on securities of affiliated issuers (Note 4) | | | 1,819,510 | | | | 3,763,463 | | | | 716,613 | | | | 22,147 | |
| | | | | | | | | | | | | | | | |
TOTAL INVESTMENT INCOME | | | 1,860,792 | | | | 3,763,463 | | | | 716,613 | | | | 1,378,214 | |
| | | | | | | | | | | | | | | | |
EXPENSES | | | | | | | | | | | | | | | | |
Advisory fees (Note 3) | | | 119,802 | | | | 155,323 | | | | 43,792 | | | | 144,209 | |
Trustees’ fees (Note 3) | | | 522 | | | | 733 | | | | 210 | | | | 167 | |
Other expenses | | | 30 | | | | 36 | | | | 9 | | | | — | |
| | | | | | | | | | | | | | | | |
TOTAL EXPENSES | | | 120,354 | | | | 156,092 | | | | 44,011 | | | | 144,376 | |
| | | | | | | | | | | | | | | | |
NET INVESTMENT INCOME | | | $ 1,740,438 | | | $ | 3,607,371 | | | $ | 672,602 | | | $ | 1,233,838 | |
| | | | | | | | | | | | | | | | |
REALIZED AND UNREALIZED GAIN (LOSS) ON INVESTMENTS | | | | | | | | | | | | | | | | |
Net realized gain (loss) on investments in securities of unaffiliated issuers | | | (605,115 | ) | | | — | | | | (161,682 | ) | | | (18,345 | ) |
Net realized gain (loss) on investments in securities of affiliated issuers | | | (319,225 | ) | | | (1,103,424 | ) | | | 193,232 | | | | — | |
Net change in unrealized appreciation (depreciation) on investments | | | (10,378,172 | ) | | | (6,205,334 | ) | | | (434,591 | ) | | | (3,072,756 | ) |
| | | | | | | | | | | | | | | | |
NET REALIZED AND UNREALIZED LOSS ON INVESTMENTS | | | (11,302,512 | ) | | | (7,308,758 | ) | | | (403,041 | ) | | | (3,091,101 | ) |
| | | | | | | | | | | | | | | | |
NET INCREASE (DECREASE) IN NET ASSETS RESULTING FROM OPERATIONS | | $ | (9,562,074 | ) | | $ | (3,701,387 | ) | | $ | 269,561 | | | $ | (1,857,263 | ) |
| | | | | | | | | | | | | | | | |
| * | For the period April 3, 2013 (commencement of operations) to June 30, 2013. |
See accompanying notes to financial statements.
14
[This Page Intentionally Left Blank]
15
SSgA MASTER TRUST
STATEMENTS OF CHANGES IN NET ASSETS
| | | | | | | | | | | | | | | | |
| | |
SSgA Multi-Asset Real Return Portfolio | | | SSgA Income Allocation Portfolio | |
| | | Year Ended
6/30/13 | | | For the Period
4/25/12* -
6/30/12 | | | Year Ended
6/30/13 | | | For the Period
4/25/12* -
6/30/12 | |
INCREASE (DECREASE) IN NET ASSETS FROM OPERATIONS: | | | | | | | | | | | | | | | | |
Net investment income (loss) | | $ | 1,740,438 | | | $ | 41,553 | | | $ | 3,607,371 | | | $ | 99,208 | |
Net realized gain (loss) on investments | | | (924,340 | ) | | | (6,835 | ) | | | (1,103,424 | ) | | | (17,903 | ) |
Net change in unrealized appreciation (depreciation) on investments | | | (10,378,172 | ) | | | (230,707 | ) | | | (6,205,334 | ) | | | 47,630 | |
| | | | | | | | | | | | | | | | |
Net increase (decrease) in net assets resulting from operations | | | (9,562,074 | ) | | | (195,989 | ) | | | (3,701,387 | ) | | | 128,935 | |
| | | | | | | | | | | | | | | | |
CAPITAL TRANSACTIONS | | | | | | | | | | | | | | | | |
Contributions | | | 130,398,415 | | | | 7,426,949 | | | | 170,596,375 | | | | 8,984,674 | |
Withdrawals | | | (5,079,121 | ) | | | (1,404,196 | ) | | | (1,753,769 | ) | | | — | |
Other capital | | | — | | | | — | | | | — | | | | — | |
| | | | | | | | | | | | | | | | |
Net increase in net assets from capital transactions | | | 125,319,294 | | | | 6,022,753 | | | | 168,842,606 | | | | 8,984,674 | |
| | | | | | | | | | | | | | | | |
Net increase in net assets during the period | | | 115,757,220 | | | | 5,826,764 | | | | 165,141,219 | | | | 9,113,609 | |
NET ASSETS | | | | | | | | | | | | | | | | |
Net assets at beginning of period | | | 5,826,764 | | | | — | | | | 9,113,609 | | | | — | |
| | | | | | | | | | | | | | | | |
NET ASSETS END OF PERIOD | | $ | 121,583,984 | | | $ | 5,826,764 | | | $ | 174,254,828 | | | $ | 9,113,609 | |
| | | | | | | | | | | | | | | | |
| * | Commencement of operations |
See accompanying notes to financial statements.
16
| | | | | | | | | | |
SSgA Global Allocation
Portfolio | | | Blackstone / GSO
Senior Loan
Portfolio | |
Year Ended
6/30/13 | | | For the Period
4/25/12* -
6/30/12 | | | For the Period
4/3/13* -
6/30/13 | |
| | | | | | | | | | |
| $ | 672,602 | | | $ | 40,985 | | | $ | 1,233,838 | |
| | 31,550 | | | | (140,424 | ) | | | (18,345 | ) |
|
(434,591) |
| | | (87,582 | ) | | | (3,072,756 | ) |
| | | | | | | | | | |
|
269,561 |
| | | (187,021 | ) | | | (1,857,263 | ) |
| | | | | | | | | | |
| | | | | | | | | | |
| | 50,799,932 | | | | 6,035,173 | | | | 334,915,199 | |
| | (3,584,635 | ) | | | (1,397,401 | ) | | | (670,323 | ) |
| | — | | | | — | | | | 404,871 | |
| | | | | | | | | | |
|
47,215,297 |
| | | 4,637,772 | | | | 334,649,747 | |
| | | | | | | | | | |
|
47,484,858 |
| | | 4,450,751 | | | | 332,792,484 | |
| | | | | | | | | | |
| | 4,450,751 | | | | — | | | | — | |
| | | | | | | | | | |
| $ | 51,935,609 | | | $ | 4,450,751 | | | $ | 332,792,484 | |
| | | | | | | | | | |
17
SSgA MASTER TRUST
FINANCIAL HIGHLIGHTS
The following table includes selected supplemental data and ratios to average net assets:
| | | | | | | | | | | | | | | | |
| | | SSgA Multi-Asset Real Return Portfolio | | |
SSgA Income Allocation Portfolio | |
| | | Year Ended
6/30/13 | | | For the Period
4/25/12* -
6/30/12 | | | Year Ended
6/30/13 | | | For the Period
4/25/12* -
6/30/12 | |
Supplemental Data and Ratios: | | | | | | | | | | | | | | | | |
Net assets, end of period (000s) | | $ | 121,584 | | | $ | 5,827 | | | $ | 174,255 | | | $ | 9,114 | |
| | | | | | | | | | | | | | | | |
Ratios to average net assets: | | | | | | | | | | | | | | | | |
Operating expenses | | | 0.20 | % | | | 0.20 | %(1) | | | 0.20 | % | | | 0.20 | %(1) |
Net investment income | | | 2.91 | % | | | 3.84 | %(1) | | | 4.65 | % | | | 8.39 | %(1) |
Portfolio turnover rate | | | 31 | % | | | 10 | % | | | 80 | % | | | 15 | % |
Total return | | | (1.63 | )% | | | (3.42 | )%(2) | | | 4.39 | % | | | 0.92 | %(2) |
| * | Commencement of operations |
| (2) | Total return for periods of less than one year is not annualized. |
The Portfolio invests in other underlying Portfolios and indirectly bears its proportionate share of fees and expenses incurred by such Portfolios. The ratios presented do not reflect the indirect expenses of the underlying Portfolios in which the Portfolio invests.
18
| | | | | | | | | | |
SSgA Global Allocation
Portfolio | | | Blackstone / GSO
Senior Loan Portfolio | |
Year Ended
6/30/13 | | | For the Period
4/25/12* -
6/30/12 | | | For the Period
4/3/13* -
6/30/13 | |
| | | | | | | | | | |
| $ | 51,936 | | | $ | 4,451 | | | $ | 332,792 | |
| | | | | | | | | | |
| | |
|
0.20 |
% | | | 0.20 | %(1) | | | 0.30 | %(1) |
| | 3.07 | % | | | 4.34 | %(1) | | | 2.57 | %(1) |
| | 123 | % | | | 25 | % | | | 4 | % |
| | 9.92 | % | | | (1.82 | )%(2) | | | (0.31 | )%(2) |
19
SSgA MASTER TRUST
NOTES TO FINANCIAL STATEMENTS
June 30, 2013
SSgA Master Trust (the “Trust”), which is registered under the Investment Company Act of 1940, as amended (“1940 Act”), is an open-end investment management company that was organized as a Massachusetts business trust on March 30, 2011.
As of June 30, 2013, the Trust offered four (4) portfolios, each of which represents a separate series of beneficial interest in the Trust (each referred to as a “Portfolio”, collectively as the “Portfolios”). The financial statements herein relate to the following four (4) Portfolios: SSgA Multi-Asset Real Return Portfolio, SSgA Income Allocation Portfolio, SSgA Global Allocation Portfolio and Blackstone / GSO Senior Loan Portfolio. Each Portfolio serves as a master fund in a master feeder structure.
Under the Trust’s organizational documents, its officers and trustees are indemnified against certain liabilities arising out of the performance of their duties to the Trust. Additionally, in the normal course of business, the Trust enters into contracts with service providers that contain general indemnification clauses. The Trust’s maximum exposure under these arrangements is unknown as this could involve future claims that may be made against the Trust that have not yet occurred. However, based on experience, the Trust expects the risk of loss to be remote.
The Trust invests in various investments which are exposed to risks, such as market risk. Due to the level of risk associated with certain investments it is at least reasonably possible that changes in the values of investment securities will occur in the near term and that such changes could be material.
The SSgA Multi-Asset Real Return Portfolio, SSgA Income Allocation Portfolio and SSgA Global Allocation Portfolio invests their assets in other exchange-traded products (referred to as “underlying Funds”). The underlying Funds, in turn, may engage in a number of investment techniques and practices, which involve certain risks. Certain underlying Funds invest their portfolios in debt securities. Investments in debt securities may increase or decrease as a result of the following: market fluctuations, increases in interest rates, inability of issuers to repay principal and interest or illiquidity in the debt securities markets; the risk of low rates of return due to reinvestment of securities during periods of falling interest rates or repayment by issuers with higher coupon or interest rates; and/or the risk of low income due to falling interest rates. Certain underlying Funds invest their portfolios in foreign securities including emerging markets. Foreign investments involve certain risks that are greater than those associated with investments in securities of U.S. issuers. Returns on investments in foreign securities could be more volatile than, or trail the returns on, investments in U.S. securities. Investments in securities issued by entities based outside the United States pose distinct risks since political and economic events unique to a country or region will affect those markets and their issuers. Investment in emerging markets involves greater risk of loss than investments in a developed market. This is due to, among other things, greater market volatility, lower trading volume, political and economic instability, high levels of inflation, deflation or currency devaluation, greater risk of market shut down, and more governmental limitations on foreign investment policy than those typically found in a developed market. Certain underlying Funds invest their portfolios in commodities markets. Commodities are subject to substantial price fluctuations over short periods of time and may be affected by unpredictable economic, political and environmental events. Factors that may significantly affect the prices of commodities include, but are not limited to: global supply and demand; domestic and international interest rates and investors’ expectations of interest rates; inflation rates and investors’ expectations of inflation rates; the investment and trading activities of commodity futures contracts; political, economic, or financial events, both globally and regionally.
The Blackstone / GSO Senior Loan Portfolio invests its assets in senior loans. Investments in senior loans are subject to credit risks which may include delay in receiving payments of principal and interest paid by the borrower to the agent or by the agent to the lender or offsets against payments received from the borrower.
| 2. | Summary of Significant Accounting Policies |
The following is a summary of significant accounting policies followed by the Trust in the preparation of its financial statements:
The preparation of financial statements in accordance with U.S. generally accepted accounting principles requires management to make estimates and assumptions that affect the reported amounts and disclosures in the financial
20
SSgA MASTER TRUST
NOTES TO FINANCIAL STATEMENTS (continued)
June 30, 2013
statements. Actual results could differ from those estimates. These financial statements are presented in United States dollars.
Security Valuation
The value of each Portfolio’s portfolio securities and other financial instruments is based on the market price of the securities, which generally means a valuation obtained from an exchange or other market (or based on a price quotation or other equivalent indication of value supplied by an exchange or other market) or a valuation obtained from an independent pricing service. Investments in underlying funds are valued at their market price each business day. Loans are primarily valued by using a composite loan price from a loan pricing service. The methodology used by the Portfolios’ loan pricing provider for composite loan prices is to value loans at the mean of the bid and ask prices from one or more brokers or dealers. If a security’s market price is not readily available or does not otherwise accurately reflect the fair value of the security, the security will be valued by another method that the Board of Trustees of the Trust (the “Board”) believes will better reflect fair value in accordance with the Trust’s valuation policies and procedures. The Board has delegated the process of valuing securities for which market quotations are not readily available or do not otherwise accurately reflect the fair value of the security to the Pricing and Investment Committee (the “Committee”). The Committee, subject to oversight by the Board, may use fair value pricing in a variety of circumstances, including but not limited to, situations when trading in a security has been suspended or halted. Accordingly, a Portfolio’s net asset value may reflect certain portfolio securities’ fair values rather than their market prices. Fair value pricing involves subjective judgments and it is possible that the fair value determination for a security is materially different than the value that could be received on the sale of the security.
The Portfolios follow the authoritative guidance for fair value measurements and the fair value option for financial assets and financial liabilities. The guidance establishes a hierarchy for inputs used in measuring fair value that maximizes the use of observable inputs and minimizes the use of unobservable inputs by requiring that the most observable inputs be used when available. The guidance establishes three levels of inputs that may be used to measure fair value:
| • | | Level 1 — quoted prices in active markets for identical investments. |
| • | | Level 2 — other significant observable inputs (including, but not limited to, quoted prices for similar investments, interest rates, prepayment speeds, credit risk, etc.) |
| • | | Level 3 — significant unobservable inputs (including the Portfolios’ own assumptions in determining the fair value of investments) |
The valuation of senior floating rate loans held by the Funds are obtained from an independent loan pricing service and categorized as Level 2 based on the use of other significant observable inputs. Investments that use Level 2 or Level 3 inputs may include, but are not limited to: (i) an unlisted security related to corporate actions; (ii) a restricted security (e.g., one that may not be publicly sold without registration under the Securities Act of 1933, as amended); (iii) a security whose trading has been suspended or which has been de-listed from its primary trading exchange; (iv) a security that is thinly traded; (v) a security in default or bankruptcy proceedings for which there is no current market quotation; (vi) a security affected by currency controls or restrictions; and (vii) a security affected by a significant event (e.g., an event that occurs after the close of the markets on which the security is traded but before the time as of which the Portfolios’ net assets are computed and that may materially affect the value of the Portfolios’ investments). Examples of events that may be “significant events” are government actions, natural disasters, armed conflicts, acts of terrorism, and significant market fluctuations.
Fair value pricing could result in a difference between the prices used to calculate a Portfolio’s net asset value and the prices used by the Portfolio’s benchmark index, which, in turn, could result in a difference between the Portfolio’s performance and the performance of the Portfolio’s benchmark index. The inputs or methodology used for valuation are not necessarily an indication of the risk associated with investing in those investments.
The type of inputs used to value each security is identified in the Schedule of Investments, which also includes a breakdown of the Portfolio’s investments by category.
21
SSgA MASTER TRUST
NOTES TO FINANCIAL STATEMENTS (continued)
June 30, 2013
The following table summarizes the inputs used in valuing the Portfolios’ investments as of June 30, 2013:
| | | | | | | | | | | | | | | | |
| | Level 1 —
Quoted
Prices | | | Level 2 —
Other Significant
Observable
Inputs | | | Level 3 —
Significant
Unobservable
Inputs | | | Total | |
SSgA Multi-Asset Real Return Portfolio | | $ | 120,562,164 | | | $ | — | | | $ | — | | | $ | 120,562,164 | |
SSgA Income Allocation Portfolio | | | 172,469,160 | | | | — | | | | — | | | | 172,469,160 | |
SSgA Global Allocation Portfolio | | | 51,600,832 | | | | — | | | | — | | | | 51,600,832 | |
Blackstone / GSO Senior Loan Portfolio | | | 96,122,680 | | | | 294,294,069* | | | | — | | | | 390,416,749 | |
| * | Less Unfunded Loan Committments |
There were no transfers between levels for the periods ended June 30, 2013.
Investment Income
Interest income is recorded on the accrual basis. Dividend income is recorded on the ex-dividend date. The value of additional securities received as dividend payments is recorded as income and as an increase to the cost basis of such securities.
Expenses
Advisory fees and other expenses, which are directly identifiable to a specific Portfolio, are applied to that Portfolio. Trustees’ fees and other expenses which cannot be attributed to a specific Portfolio are allocated in such a manner as deemed equitable, taking into consideration the nature and type of expense and the relative net assets of the Portfolios. In addition to the these direct expenses, the Portfolios bear certain expenses indirectly, such as fees of underlying Portfolios in which the Portfolio invest that are reflected in the reported value of such Portfolios.
Investment Transactions
Investment transactions are recorded as of the trade date. Realized gains and losses from the sale or disposition of securities are recorded on the identified cost basis. Corporate actions (including cash dividends) are recorded net of foreign tax withholdings on the ex-dividend date.
Federal Income Tax
The Portfolios are not required to pay federal income taxes on their net investment income and net capital gains because they are treated as partnerships for federal income tax purposes. All interest, gains and losses of the Portfolios are deemed to have been “passed through” to the Portfolios’ partners in proportion to their holdings in the respective Portfolio, regardless of whether such items have been distributed by the Portfolios. Each partner is responsible for tax liability based on its distributive share; therefore, no provision has been made for federal income taxes. The Portfolios have reviewed the tax positions for the open tax years as of June 30, 2013 and have determined that no provision for income tax is required in the Portfolios’ Financial Statements. The Portfolios’ federal tax returns are subject to examination by the Portfolios’ major tax jurisdictions, which include the United States of America and the Commonwealth of Massachusetts. The Portfolios’ recognized interest and penalties, if any, related to tax liabilities as income tax expense in the Statements of Operations.
| 3. | Fees and Compensation Paid to Affiliates and Other Related Party Transactions |
Advisory Fee
Each Portfolio has entered into an Investment Advisory Agreement with SSgA Funds Management, Inc. (the “Adviser” or “SSgA FM”). As compensation for the services rendered, facilities furnished, and expenses borne by the Adviser,
22
SSgA MASTER TRUST
NOTES TO FINANCIAL STATEMENTS (continued)
June 30, 2013
each Portfolio pays the Adviser a fee accrued daily and paid monthly, based on a percentage of each Portfolio’s average daily net assets as shown in the following table:
| | | | |
| | | Annual Rate | |
SSgA Multi-Asset Real Return Portfolio | | | 0.20 | % |
SSgA Income Allocation Portfolio | | | 0.20 | |
SSgA Global Allocation Portfolio | | | 0.20 | |
Blackstone / GSO Senior Loan Portfolio | | | 0.30 | |
The Adviser pays all operating expenses of each Portfolio other than management fee, distribution fee pursuant to each Portfolio’s Distribution and Service Plan, if any, brokerage, taxes, interest, fees and expenses of the Independent Trustees (including any Trustees’ counsel fees), litigation expenses, acquired fund fees and expenses and other extraordinary expenses.
GSO / Blackstone Debt Funds Management LLC receives fees for its services as the sub-adviser to the Blackstone / GSO Senior Loan Portfolio from the Adviser.
State Street Bank and Trust Company (“State Street”), an affiliate of the Adviser, receives fees for its services as Custodian, Administrator and Transfer Agent from the Adviser.
Trustees’ Fees
The Trust, SSgA Active ETF Trust, SPDR Series Trust and SPDR Index Shares Funds pay, in the aggregate, each Independent Trustee an annual fee of $150,000 plus $10,000 per in-person meeting attended and $1,250 for each telephonic or video conference meeting attended. The Chairman of the Board receives an additional annual fee of $50,000 and the Chairman of the Audit Committee receives an additional annual fee of $20,000. The Trust also reimburses each Independent Trustee for travel and other out-of-pocket expenses incurred by him/her in connection with attending such meetings and in connection with attending industry seminars and meetings. Trustee fees are allocated among the Trusts and each of their respective series in such a manner as deemed equitable, taking into consideration the relative net assets of the series.
Transactions with Affiliates
Each Portfolio may invest in certain money market funds and underlying Funds affiliated with the Adviser. Amounts related to investments in affiliated underlying Funds at June 30, 2013, and for the period then ended are:
| | | | | | | | | | | | | | | | | | | | | | | | | | | | | | | | | | | | | | | | |
| | | Number of
Shares Held
at 6/30/12 | | | Value at
6/30/12 | | | Purchased | | | Sold | | | Number of
Shares Held
at 6/30/13 | | | Value at
6/30/13 | | | Dividend
Income | | | Realized
Gain (Loss) | |
SSgA Multi-Asset Real Return Portfolio | | | | Cost | | | Shares | | | Proceeds | | | Shares | | | | | |
SPDR Barclays TIPS ETF | | | 15,983 | | | $ | 952,587 | | | $ | 17,642,114 | | | | 292,238 | | | $ | 1,219,568 | | | | 20,175 | | | | 288,046 | | | $ | 16,006,716 | | | $ | 103,216 | | | $ | (1,410 | ) |
SPDR DB International Government Inflation-Protected Bond ETF | | | 6,282 | | | | 369,884 | | | | 12,313,399 | | | | 197,782 | | | | 1,554,803 | | | | 24,920 | | | | 179,144 | | | | 10,313,320 | | | | 139,912 | | | | (8,203 | ) |
SPDR S&P Global Natural Resources ETF | | | 29,315 | | | | 1,394,690 | | | | 47,513,444 | | | | 935,934 | | | | 4,790,384 | | | | 98,657 | | | | 866,592 | | | | 38,987,974 | | | | 808,805 | | | | (350,863 | ) |
SPDR S&P International Energy Sector ETF | | | 4,935 | | | | 115,479 | | | | 2,662,046 | | | | 107,620 | | | | 220,083 | | | | 9,016 | | | | 103,539 | | | | 2,396,928 | | | | 46,468 | | | | (9,650 | ) |
SPDR S&P Metals & Mining ETF | | | 4,199 | | | | 174,007 | | | | 4,388,032 | | | | 104,790 | | | | 243,616 | | | | 5,901 | | | | 103,088 | | | | 3,415,306 | | | | 32,638 | | | | (27,227 | ) |
The Energy Select Sector SPDR Fund | | | 4,377 | | | | 290,501 | | | | 4,854,592 | | | | 66,415 | | | | 2,923,262 | | | | 39,594 | | | | 31,198 | | | | 2,444,675 | | | | 36,559 | | | | 33,214 | |
SPDR Dow Jones International Real Estate ETF | | | 12,828 | | | | 471,814 | | | | 15,923,816 | | | | 383,013 | | | | 1,108,728 | | | | 26,322 | | | | 369,519 | | | | 14,743,808 | | | | 440,058 | | | | 29,621 | |
SPDR Dow Jones REIT ETF | | | 12,160 | | | | 886,342 | | | | 13,347,409 | | | | 178,271 | | | | 1,388,642 | | | | 18,803 | | | | 171,628 | | | | 13,035,147 | | | | 211,595 | | | | 6,099 | |
State Street Institutional Liquid Reserves Fund | | | 41,023 | | | | 41,023 | | | | 7,166,994 | | | | 7,166,994 | | | | 7,053,387 | | | | 7,053,387 | | | | 154,629 | | | | 154,629 | | | | 259 | | | | — | |
23
SSgA MASTER TRUST
NOTES TO FINANCIAL STATEMENTS (continued)
June 30, 2013
| | | | | | | | | | | | | | | | | | | | | | | | | | | | | | | | | | | | | | | | |
| | | Number of
Shares Held
at 6/30/12 | | | Value at
6/30/12 | | | Purchased | | | Sold | | | Number of
Shares Held
at 6/30/13 | | | Value at
6/30/13 | | | Dividend
Income | | | Realized
Gain (Loss) | |
SSgA Income Allocation Portfolio | | | | Cost | | | Shares | | | Proceeds | | | Shares | | | | | |
SPDR S&P Dividend ETF | | | 30,590 | | | $ | 1,702,334 | | | $ | 27,045,556 | | | | 431,361 | | | $ | 3,822,132 | | | | 62,372 | | | | 399,579 | | | $ | 26,492,087 | | | $ | 339,626 | | | $ | (23,439 | ) |
SPDR Wells Fargo Preferred Stock ETF | | | 11,963 | | | | 541,326 | | | | 20,773,878 | | | | 456,997 | | | | 455,729 | | | | 10,037 | | | | 458,923 | | | | 19,949,383 | | | | 539,914 | | | | (8,985 | ) |
The Consumer Staples Select Sector SPDR Fund | | | — | | | | — | | | | 1,200,431 | | | | 31,904 | | | | 1,231,049 | | | | 31,904 | | | | — | | | | — | | | | — | | | | 30,618 | |
The Financial Select Sector SPDR Fund | | | — | | | | — | | | | 3,635,022 | | | | 193,107 | | | | 1,993,996 | | | | 101,494 | | | | 91,613 | | | | 1,785,537 | | | | 11,296 | | | | 41,576 | |
The Health Care Select Sector SPDR Fund | | | — | | | | — | | | | 1,418,268 | | | | 31,751 | | | | 1,471,470 | | | | 31,751 | | | | — | | | | — | | | | 5,410 | | | | 53,202 | |
The Industrial Select Sector SPDR Fund | | | — | | | | — | | | | 1,820,487 | | | | 42,541 | | | | 1,838,377 | | | | 42,541 | | | | — | | | | — | | | | — | | | | 17,890 | |
The Technology Select Sector SPDR Fund | | | — | | | | — | | | | 1,817,998 | | | | 59,725 | | | | — | | | | — | | | | 59,725 | | | | 1,826,988 | | | | 14,335 | | | | — | |
SPDR Barclays Convertible Securities ETF | | | 4,649 | | | | 174,616 | | | | 1,012,673 | | | | 24,724 | | | | 343,095 | | | | 8,631 | | | | 20,742 | | | | 885,269 | | | | 15,595 | | | | 86 | |
SPDR Barclays High Yield Bond ETF | | | 22,084 | | | | 871,435 | | | | 13,433,171 | | | | 332,815 | | | | 7,424,670 | | | | 180,813 | | | | 174,086 | | | | 6,874,656 | | | | 203,452 | | | | 34,331 | |
SPDR Barclays Long Term Corporate Bond ETF | | | 31,334 | | | | 1,278,427 | | | | 32,814,908 | | | | 802,950 | | | | 4,998,940 | | | | 121,041 | | | | 713,243 | | | | 26,924,923 | | | | 521,980 | | | | (85,380 | ) |
SPDR Barclays Long Term Treasury Bond ETF | | | 11,918 | | | | 861,195 | | | | 15,353,145 | | | | 223,181 | | | | 1,564,570 | | | | 22,852 | | | | 212,247 | | | | 13,616,919 | | | | 123,164 | | | | (99,137 | ) |
SPDR Barclays Short Term High Yield Bond | | | — | | | | — | | | | 3,209,922 | | | | 104,445 | | | | 1,399,368 | | | | 45,469 | | | | 58,976 | | | | 1,779,896 | | | | 41,277 | | | | (1,912 | ) |
SPDR Nuveen Barclays Build America Bond ETF | | | 3,008 | | | | 180,528 | | | | 3,019,958 | | | | 51,025 | | | | 457,397 | | | | 7,332 | | | | 46,701 | | | | 2,591,438 | | | | 35,426 | | | | 3,837 | |
SPDR Barclays TIPS ETF | | | 7,366 | | | | 439,013 | | | | 13,202,328 | | | | 218,781 | | | | 4,637,975 | | | | 76,723 | | | | 149,424 | | | | 8,303,492 | | | | 53,370 | | | | (11,130 | ) |
SPDR EURO STOXX 50 ETF | | | — | | | | — | | | | 3,993,305 | | | | 115,688 | | | | 3,904,273 | | | | 115,688 | | | | — | | | | — | | | | 11,238 | | | | (89,032 | ) |
SPDR S&P Global Infrastructure ETF | | | 11,312 | | | | 448,973 | | | | 11,776,994 | | | | 285,917 | | | | 1,944,308 | | | | 47,499 | | | | 249,730 | | | | 10,158,767 | | | | 317,943 | | | | 2,861 | |
SPDR S&P Emerging Markets Dividend ETF | | | 10,804 | | | | 488,017 | | | | 14,629,879 | | | | 322,501 | | | | 4,609,791 | | | | 109,303 | | | | 224,002 | | | | 8,693,517 | | | | 365,406 | | | | (552,996 | ) |
SPDR S&P International Dividend ETF | | | 13,900 | | | | 619,106 | | | | 18,224,395 | | | | 378,817 | | | | 7,413,025 | | | | 155,831 | | | | 236,886 | | | | 10,340,074 | | | | 579,937 | | | | (278,341 | ) |
SPDR S&P International Telecommunications Sector ETF | | | 8,217 | | | | 179,541 | | | | 4,188,208 | | | | 182,719 | | | | 2,057,001 | | | | 84,006 | | | | 106,930 | | | | 2,476,499 | | | | 78,822 | | | | 110,777 | |
SPDR STOXX Europe 50 ETF | | | 14,518 | | | | 429,733 | | | | 7,248,453 | | | | 216,212 | | | | 2,640,746 | | | | 78,036 | | | | 152,694 | | | | 5,041,956 | | | | 138,715 | | | | (11,446 | ) |
SPDR Barclays Emerging Markets Local Bond ETF | | | 2,864 | | | | 89,214 | | | | 7,721,324 | | | | 239,217 | | | | 2,171,032 | | | | 67,079 | | | | 175,002 | | | | 5,188,809 | | | | 72,675 | | | | (8,550 | ) |
SPDR Barclays International Corporate Bond ETF | | | 191 | | | | 6,188 | | | | 6,093,641 | | | | 173,604 | | | | 1,755,636 | | | | 51,729 | | | | 122,066 | | | | 4,192,967 | | | | 11,662 | | | | (84,162 | ) |
SPDR Dow Jones International Real Estate ETF | | | 9,970 | | | | 366,697 | | | | 10,265,455 | | | | 240,988 | | | | 1,435,354 | | | | 36,091 | | | | 214,867 | | | | 8,573,193 | | | | 183,771 | | | | (138,610 | ) |
SPDR S&P World ex-US ETF | | | — | | | | — | | | | 2,148,217 | | | | 82,882 | | | | 2,165,869 | | | | 82,882 | | | | — | | | | — | | | | — | | | | 17,652 | |
SPDR Dow Jones REIT ETF | | | 4,398 | | | | 320,570 | | | | 6,809,301 | | | | 89,652 | | | | 960,645 | | | | 13,046 | | | | 81,004 | | | | 6,152,254 | | | | 98,047 | | | | (23,134 | ) |
State Street Institutional Liquid Reserves Fund | | | 117,900 | | | | 117,900 | | | | 8,657,746 | | | | 8,657,746 | | | | 8,155,110 | | | | 8,155,110 | | | | 620,536 | | | | 620,536 | | | | 402 | | | | — | |
| | | | | | | | |
| | | Number of
Shares Held
at 6/30/12 | | | Value at
6/30/12 | | | Purchased | | | Sold | | | Number of
Shares Held
at 6/30/13 | | | Value at
6/30/13 | | | Dividend
Income | | | Realized
Gain (Loss) | |
SSgA Global Allocation Portfolio | | | | Cost | | | Shares | | | Proceeds | | | Shares | | | | | |
SPDR S&P 500 ETF Trust | | | 6,882 | | | $ | 937,810 | | | $ | 8,218,120 | | | | 53,120 | | | $ | 2,280,944 | | | | 15,302 | | | | 44,700 | | | $ | 7,152,447 | | | $ | 70,919 | | | $ | 73,544 | |
SPDR S&P 500 Value ETF | | | — | | | | — | | | | 1,879,425 | | | | 23,316 | | | | 370,587 | | | | 4,447 | | | | 18,869 | | | | 1,550,088 | | | | 12,197 | | | | 7,344 | |
SPDR S&P 600 Small Cap ETF | | | 2,533 | | | | 178,653 | | | | 1,556,170 | | | | 19,422 | | | | 312,061 | | | | 3,844 | | | | 18,111 | | | | 1,572,578 | | | | 10,305 | | | | 15,681 | |
SPDR S&P Dividend ETF | | | 5,525 | | | | 307,466 | | | | 1,835,584 | | | | 29,475 | | | | 1,696,245 | | | | 26,254 | | | | 8,746 | | | | 579,860 | | | | 19,672 | | | | 63,648 | |
SPDR S&P MidCap 400 ETF Trust | | | 507 | | | | 86,849 | | | | 1,016,809 | | | | 5,097 | | | | 139,263 | | | | 677 | | | | 4,927 | | | | 1,036,542 | | | | 6,687 | | | | 8,474 | |
24
SSgA MASTER TRUST
NOTES TO FINANCIAL STATEMENTS (continued)
June 30, 2013
| | | | | | | | | | | | | | | | | | | | | | | | | | | | | | | | | | | | | | | | |
| | | Number of
Shares Held
at 6/30/12 | | | Value at
6/30/12 | | | Purchased | | | Sold | | | Number of
Shares Held
at 6/30/13 | | | Value at
6/30/13 | | | Dividend
Income | | | Realized
Gain (Loss) | |
SSgA Global Allocation Portfolio | | | | Cost | | | Shares | | | Proceeds | | | Shares | | | | | |
SPDR Wells Fargo Preferred Stock ETF | | | — | | | $ | — | | | $ | 3,087,239 | | | | 67,616 | | | $ | 385,880 | | | | 8,440 | | | | 59,176 | | | $ | 2,572,381 | | | $ | 59,577 | | | $ | 570 | |
The Consumer Staples Select Sector SPDR Fund | | | — | | | | — | | | | 603,245 | | | | 16,133 | | | | 621,382 | | | | 16,133 | | | | — | | | | — | | | | — | | | | 18,137 | |
The Consumer Discretionary Select Sector SPDR Fund | | | — | | | | — | | | | 1,654,287 | | | | 31,767 | | | | 669,052 | | | | 13,037 | | | | 18,730 | | | | 1,056,372 | | | | 3,302 | | | | 14,565 | |
The Energy Select Sector SPDR Fund | | | — | | | | — | | | | 543,213 | | | | 7,320 | | | | 566,757 | | | | 7,320 | | | | — | | | | — | | | | — | | | | 23,545 | |
The Financial Select Sector SPDR Fund | | | — | | | | — | | | | 1,089,172 | | | | 60,237 | | | | 136,368 | | | | 7,004 | | | | 53,233 | | | | 1,037,511 | | | | 6,390 | | | | 4,534 | |
The Health Care Select Sector SPDR Fund | | | — | | | | — | | | | 765,423 | | | | 17,933 | | | | 830,291 | | | | 17,933 | | | | — | | | | — | | | | 2,927 | | | | 64,868 | |
The Industrial Select Sector SPDR Fund | | | — | | | | — | | | | 1,112,382 | | | | 26,856 | | | | 1,167,621 | | | | 26,856 | | | | | | | | — | | | | — | | | | 55,239 | |
The Technology Select Sector SPDR Fund | | | — | | | | — | | | | 735,935 | | | | 24,366 | | | | 729,136 | | | | 24,366 | | | | — | | | | — | | | | 2,767 | | | | (6,799 | ) |
SPDR Barclays Aggregate Bond ETF | | | 2,963 | | | | 173,750 | | | | 6,577,009 | | | | 113,091 | | | | 366,916 | | | | 6,264 | | | | 109,790 | | | | 6,243,757 | | | | 21,289 | | | | 867 | |
SPDR Barclays High Yield Bond ETF | | | 7,815 | | | | 308,380 | | | | 3,447,555 | | | | 84,756 | | | | 2,696,296 | | | | 66,572 | | | | 25,999 | | | | 1,026,701 | | | | 61,821 | | | | (26,803 | ) |
SPDR Barclays Intermediate Term Corporate Bond ETF | | | 11,454 | | | | 390,925 | | | | 3,160,411 | | | | 91,068 | | | | 1,935,868 | | | | 55,893 | | | | 46,629 | | | | 1,566,035 | | | | 33,439 | | | | (4,556 | ) |
SPDR Barclays Long Term Corporate Bond ETF | | | 4,332 | | | | 176,745 | | | | 3,404,526 | | | | 83,342 | | | | 2,423,732 | | | | 59,595 | | | | 28,079 | | | | 1,059,982 | | | | 44,520 | | | | (28,056 | ) |
SPDR Barclays Short Term High Yield Bond ETF | | | — | | | | — | | | | 950,668 | | | | 30,913 | | | | 419,248 | | | | 13,619 | | | | 17,294 | | | | 521,933 | | | | 10,974 | | | | 117 | |
SPDR Barclays TIPS ETF | | | 2,866 | | | | 170,814 | | | | 2,055,555 | | | | 34,080 | | | | 270,868 | | | | 4,498 | | | | 32,448 | | | | 1,803,136 | | | | 10,225 | | | | 1,273 | |
SPDR DB International Government Inflation-Protected Bond ETF | | | — | | | | — | | | | 958,128 | | | | 15,434 | | | | 133,661 | | | | 2,153 | | | | 13,281 | | | | 764,587 | | | | 9,343 | | | | 3,716 | |
SPDR Russell/Nomura PRIME Japan ETF | | | — | | | | — | | | | 3,183,442 | | | | 75,063 | | | | 505,690 | | | | 11,951 | | | | 63,112 | | | | 2,698,669 | | | | 5,561 | | | | (23,653 | ) |
SPDR EURO STOXX 50 ETF | | | — | | | | — | | | | 1,701,701 | | | | 49,740 | | | | 1,710,739 | | | | 49,740 | | | | — | | | | — | | | | 4,017 | | | | 9,039 | |
SPDR S&P Emerging Markets ETF | | | 5,132 | | | | 307,869 | | | | 4,316,901 | | | | 65,310 | | | | 2,875,324 | | | | 44,134 | | | | 26,308 | | | | 1,568,220 | | | | 27,501 | | | | (80,479 | ) |
SPDR S&P International Dividend ETF | | | 3,983 | | | | 177,403 | | | | 1,006,074 | | | | 21,106 | | | | 1,176,123 | | | | 25,089 | | | | — | | | | — | | | | 7,993 | | | | (3,287 | ) |
SPDR S&P International Small Cap ETF | | | 1,693 | | | | 43,696 | | | | 1,913,098 | | | | 65,291 | | | | 414,707 | | | | 13,893 | | | | 53,091 | | | | 1,531,144 | | | | 17,200 | | | | 16,394 | |
SPDR S&P World ex-US ETF | | | 23,954 | | | | 536,809 | | | | 10,413,921 | | | | 402,071 | | | | 1,224,097 | | | | 47,198 | | | | 378,827 | | | | 9,519,923 | | | | 178,597 | | | | 83,775 | |
SPDR STOXX Europe 50 ETF | | | — | | | | — | | | | 2,195,757 | | | | 65,381 | | | | 1,207,869 | | | | 35,321 | | | | 30,060 | | | | 992,581 | | | | 29,727 | | | | 13,004 | |
SPDR Barclays Emerging Markets Local Bond ETF | | | — | | | | — | | | | 1,615,308 | | | | 49,605 | | | | 1,493,331 | | | | 48,591 | | | | 1,014 | | | | 30,065 | | | | 8,337 | | | | (91,425 | ) |
SPDR Barclays International Corporate Bond ETF | | | 5,377 | | | | 174,215 | | | | 1,591,773 | | | | 45,453 | | | | 223,375 | | | | 6,681 | | | | 44,149 | | | | 1,516,518 | | | | 3,232 | | | | 859 | |
SPDR Barclays International Treasury Bond ETF | | | — | | | | — | | | | 499,552 | | | | 8,626 | | | | — | | | | — | | | | 8,626 | | | | 485,472 | | | | — | | | | — | |
SPDR Dow Jones International Real Estate ETF | | | 1,230 | | | | 45,239 | | | | 1,855,146 | | | | 44,744 | | | | 834,044 | | | | 20,210 | | | | 25,764 | | | | 1,027,983 | | | | 30,064 | | | | (9,388 | ) |
SPDR Dow Jones REIT ETF | | | 3,098 | | | | 225,813 | | | | 1,752,628 | | | | 22,960 | | | | 926,234 | | | | 12,396 | | | | 13,662 | | | | 1,037,629 | | | | 17,768 | | | | (11,515 | ) |
State Street Institutional Liquid Reserves Fund | | | 158,815 | | | | 158,815 | | | | 5,489,084 | | | | 5,489,084 | | | | 3,999,181 | | | | 3,999,181 | | | | 1,648,718 | | | | 1,648,718 | | | | 262 | | | | — | |
25
SSgA MASTER TRUST
NOTES TO FINANCIAL STATEMENTS (continued)
June 30, 2013
| | | | | | | | | | | | | | | | | | | | | | | | | | | | | | | | | | | | | | | | |
| | | Number of
Shares Held
at 6/30/12 | | | Value at
6/30/12 | | | Purchased | | | Sold | | | Number of
Shares Held
at 6/30/13 | | | Value at
6/30/13 | | | Dividend
Income | | | Realized
Gain (Loss) | |
Blackstone / GSO Senior Loan
Portfolio | | | | Cost | | | Shares | | | Proceeds | | | Shares | | | | | |
State Street Institutional Liquid Reserves Fund | | | — | | | $ | — | | | $ | 359,957,147 | | | | 359,957,147 | | | $ | 263,834,467 | | | | 263,834,467 | | | | 96,122,680 | | | $ | 96,122,680 | | | $ | 22,147 | | | $ | — | |
| 4. | Aggregate Unrealized Appreciation and Depreciation |
The identified cost of investments in securities owned by each Portfolio for federal income tax purposes and the gross unrealized appreciation and depreciation at June 30, 2013, was as follows:
| | | | | | | | | | | | | | | | |
| | | Identified
Cost | | | Gross
Unrealized
Appreciation | | | Gross
Unrealized
Depreciation | | | Net Unrealized
Appreciation
(Depreciation) | |
SSgA Multi-Asset Real Return Portfolio | | $ | 132,521,659 | | | $ | — | | | $ | 10,938,624 | | | $ | (10,938,624 | ) |
SSgA Income Allocation Portfolio | | | 180,558,974 | | | | — | | | | 6,305,198 | | | | (6,305,198 | ) |
SSgA Global Allocation Portfolio | | | 52,567,546 | | | | — | | | | 633,014 | | | | (633,014 | ) |
Blackstone / GSO Senior Loan Portfolio | | | 335,870,090 | | | | — | | | | 3,078,590 | | | | (3,078,590 | ) |
| 5. | Investment Transactions |
For the period ended June 30, 2013, the Portfolios had purchases and sales of investment securities as follows:
| | | | | | | | | | | | | | | | |
Purchases | | SSgA Multi-Asset
Real Return
Portfolio | | | SSgA Income
Allocation
Portfolio | | | SSgA Global
Allocation
Portfolio | | | Blackstone / GSO
Senior Loan
Portfolio | |
Short Term | | $ | 7,166,994 | | | $ | 8,657,745 | | | $ | 5,489,084 | | | $ | 359,957,148 | |
Long Term | | | 148,160,370 | | | | 232,856,916 | | | | 77,861,251 | | | | 342,672,060 | |
| | | | |
Sales | | | | | | | | | | | | |
Short Term | | | 7,053,387 | | | | 8,155,110 | | | | 3,999,181 | | | | 263,834,468 | |
Long Term | | | 22,227,890 | | | | 62,696,447 | | | | 31,793,780 | | | | 45,176,466 | |
For the year ended June 30, 2013, the Trust did not pay any commissions to an affiliate of the Adviser for investment transactions.
Although the Portfolios do not intend to concentrate their investments in any particular industry, if a Portfolio focuses in a single industry, group of industries or type of instrument, it may be more susceptible to any single economic, market, political or regulatory occurrence affecting that industry, group of industries or type of instrument.
| 7. | Recent Accounting Pronouncements |
In December 2011, FASB issued ASU No. 2011-11 “Disclosures about Offsetting Assets and Liabilities.” These common disclosure requirements are intended to help investors and other financial statement users to better assess the effect or potential effect of offsetting arrangements on a portfolio’s financial position. They are also intended to improve transparency in the reporting of how companies mitigate credit risk, including disclosure of related collateral pledged or received. In addition, ASU 2011-11 is intended to facilitate comparison between those entities that prepare their financial statements on the basis of U.S. GAAP and those entities that prepare their financial statements on the basis of International Financial Reporting Standards. ASU 2011-11 requires entities to disclose both gross and net information about both instruments and transactions eligible for offset in the financial position; and disclose instruments and transactions subject to an agreement similar to a master netting agreement. ASU 2011-11 is effective for fiscal years beginning on or after January 1, 2013, and interim periods within those annual periods. Management is currently evaluating the implications of ASU 2011-11 and its impact on financial statement disclosures.
26
SSgA MASTER TRUST
NOTES TO FINANCIAL STATEMENTS (continued)
June 30, 2013
In January 2013, Accounting Standard Update 2013-01 (ASU 2013-01), Clarifying the Scope of Disclosures about Offsetting Assets and Liabilities, replaced Accounting Standards Update 2011-11 (ASU 2011-11), Disclosures about Offsetting Assets and Liabilities. ASU 2013-01 is effective for fiscal years beginning on or after January 1, 2013, and interim periods within those annual periods. As described above, ASU 2011-11 was intended to enhance disclosure requirements on the offsetting of financial assets and liabilities. The ASU 2013-01 limits the scope of the new balance sheet offsetting disclosures to derivatives, repurchase agreements, and securities lending transactions to the extent that they are (1) offset in the financial statements or (2) subject to an enforceable master netting arrangement or similar agreement. Management is currently evaluating the application of ASU 2013-01 and its impact, if any, on the Portfolios’ financial statements.
27
SSgA MASTER TRUST
REPORT OF INDEPENDENT REGISTERED PUBLIC ACCOUNTING FIRM
June 30, 2013
To the Owners of Beneficial Interest and Board of Trustees of
SSgA Master Trust
We have audited the accompanying statements of assets and liabilities, including the schedules of investments, of SSgA Master Trust (comprising, respectively, SSgA Multi-Asset Real Return Portfolio, SSgA Income Allocation Portfolio, SSgA Global Allocation Portfolio, and Blackstone / GSO Senior Loan Portfolio) (collectively, the “Portfolios”) as of June 30, 2013, and the related statements of operations, statements of changes in net assets and financial highlights for each of the periods indicated therein. These financial statements and financial highlights are the responsibility of the Portfolios’ management. Our responsibility is to express an opinion on these financial statements and financial highlights based on our audits.
We conducted our audits in accordance with the standards of the Public Company Accounting Oversight Board (United States). Those standards require that we plan and perform the audit to obtain reasonable assurance about whether the financial statements and financial highlights are free of material misstatement. We were not engaged to perform an audit of the Portfolios’ internal control over financial reporting. Our audits included consideration of internal control over financial reporting as a basis for designing audit procedures that are appropriate in the circumstances, but not for the purpose of expressing an opinion on the effectiveness of the Portfolios’ internal control over financial reporting. Accordingly, we express no such opinion. An audit also includes examining, on a test basis, evidence supporting the amounts and disclosures in the financial statements and financial highlights, assessing the accounting principles used and significant estimates made by management, and evaluating the overall financial statement presentation. Our procedures included confirmation of securities owned as of June 30, 2013 by correspondence with the custodian and others or by other appropriate auditing procedures where replies from others were not received. We believe that our audits provide a reasonable basis for our opinion.
In our opinion, the financial statements and financial highlights referred to above present fairly, in all material respects, the financial position of each of the respective Portfolios constituting SSgA Master Trust at June 30, 2013, and the results of their operations, the changes in their net assets and their financial highlights for each of the periods indicated therein, in conformity with U.S. generally accepted accounting principles.
Boston, Massachusetts
August 29, 2013
28
SSgA MASTER TRUST
OTHER INFORMATION
June 30, 2013 (Unaudited)
Proxy Voting Policies and Procedures and Records
A description of the Trust’s proxy voting policies and procedures that are used by the Funds’ investment adviser to vote proxies relating to the Funds’ portfolio of securities are available (i) without charge, upon request by calling 1-866-787-2257 (toll free) or (ii) on the website of the Securities and Exchange Commission, at www.sec.gov. Information regarding how the investment advisor voted for the prior 12-months period ended June 30 is available by August 31 of each year by calling the same number and on the SEC’s website, at www.sec.gov, and on the Funds’ website at www.spdrs.com.
Quarterly Portfolio Schedule
The Funds file a complete schedule of portfolio holdings with the SEC for the first and third quarters of each fiscal year on Form N-Q. The Fund’s Forms N-Q are available on the SEC’s website at www.sec.gov and may be reviewed and copied at the SEC’s Public Reference Room in Washington DC. Information on the operation of the Public Reference Room may be obtained by calling 1-800-SEC-0330. The information on the Form N-Q is available upon request, without charge, by calling 1-866-787-2257 (toll free) and on the Funds’ website at www.spdrs.com.
Approval of Advisory Agreement
At in-person meetings held prior to June 30, 2013, the Board of Trustees of the Trust (the “Board”) evaluated various proposals related to advisory arrangements for new series of the Trusts, including a proposal to approve the Investment Advisory Agreements (the “Agreement”) with respect to the SPDR Blackstone / GSO Senior Loan ETF, a new series of the Trust (the “New ETF”), and its underlying master fund, the Blackstone/GSO Senior Loan Portfolio, both of which commenced operations during the most recent fiscal half-year period covered by this Annual Report. The Trustees who are not “interested persons” of the Trust within the meaning of the Investment Company Act of 1940, as amended (the “Independent Trustees”) also met separately with their independent legal counsel to consider the Agreement.
In evaluating the Agreement, the Board drew on materials provided to them by the Adviser and on other materials provided by State Street Bank and Trust Company, the Trust’s Administrator, Transfer Agent and Custodian (“State Street”). In deciding whether to approve the Agreement, the Board considered various factors, including (i) the nature, extent and quality of services to be provided by the Adviser with respect to the New ETF under the Agreement, (ii) costs to the Adviser of its services, and (iii) the extent to which economies of scale would be realized if and as the New ETF grows and whether the fee in the Agreement reflects these economies of scale.
The Board considered the nature, extent and quality of services to be provided by the Adviser. In doing so, they relied on their prior experience with the Trust and materials provided prior to and at the meeting. The Board reviewed the Agreement and the Adviser’s anticipated responsibilities for managing investment operations of the New ETF, in accordance with the New ETF’s investment objective and policies, and applicable legal and regulatory requirements. The Board appreciated the relatively unique nature of the New ETF, as an exchange-traded fund in a master-feeder structure, and the experience and expertise of the Adviser with exchange-traded funds. The Board considered the background and experience of the Adviser’s senior management, including those individuals responsible for oversight of the sub-adviser for, and compliance of, the New ETF. The Board also considered the portfolio oversight resources, structures and practices of the Adviser, including those associated with monitoring and securing the New ETF’s compliance with its investment objectives and policies and with applicable laws and regulations. The Board also considered information about the Adviser’s overall investment management business, noting that the Adviser serves a wide range of clients across a broad spectrum of asset classes. The Board looked at the Adviser’s general knowledge of the investment business and that of its affiliates which make up State Street Global Advisors, with which the Adviser shares all of its senior personnel. The Board considered that the Adviser and its affiliates constitute one of the world’s largest investment management enterprises for ETFs. The Board also considered the Adviser’s experience in active management, in managing exchange-traded funds, in overseeing third-party sub-advisers, and in master-feeder structures.
The Board considered whether the Adviser benefited in other ways from its relationship with the Trust, noting that the Adviser does not maintain soft-dollar arrangements in connection with the Trust’s brokerage transactions.
29
SSgA MASTER TRUST
OTHER INFORMATION (continued)
June 30, 2013 (Unaudited)
The Board reviewed information regarding economies of scale or other efficiencies that may result as the New ETF’s assets grow in size. The Board noted that the Agreement did not provide for breakpoints in the Fund’s advisory fee rates as assets of the Fund increase. However, the Board further noted the Adviser’s assertion that future economies of scale had been taken into consideration for the New ETF by fixing relatively low advisory fees, effectively sharing the benefits of lower fees with the New Fund from inception. The Board noted that it intends to continue to monitor fees as the New ETF grows in size and assess whether fee breakpoints may be warranted.
The Board evaluated the New ETF’s unitary fee through review of comparative information with respect to fees paid by similar funds — i.e., exchange-traded funds that are actively managed, as applicable. The Board reviewed the universe of similar exchange-traded funds for the New ETF based upon data from Lipper Analytical Services and related comparative information for similar exchange-traded funds. The Board also reviewed the estimated expense ratio for the New ETF, noting the differences in fees between the feeder and corresponding master fund in connection with the master-feeder structure.
The Board, including the Independent Trustees voting separately, approved the Agreement for the New ETF after weighing the foregoing factors, none of which was dispositive in itself and may have been weighed differently by each Trustee. The Board’s conclusions with respect to the Agreement were as follows: (a) the nature and extent of the services expected to be provided by the Adviser with respect to the New ETF were appropriate; (b) the Adviser’s fee for the New ETF and the unitary fee, considered in relation to services expected to be provided, were fair and reasonable; (c) any additional benefits to the Adviser were not of a magnitude materially to affect the Board’s conclusions; and (d) fees expected to be paid to the Adviser were expected to share economies of scale with respect to the New ETF by way of the relatively low fee structure of the Trust.
At in-person meetings held prior to June 30, 2013, the Board also considered the approval of a Sub-Advisory Agreement (the “Blackstone/GSO Sub-Advisory Agreement”) between the SSgA Master Trust and GSO/Blackstone Debt Funds Management LLC (“Blackstone/GSO”) with respect to the Blackstone / GSO Senior Loan Portfolio (the “New Portfolio”) which would serve as the master fund for the New ETF.
In evaluating the Blackstone/GSO Sub-Advisory Agreement, the Board drew on materials provided to them by Blackstone/GSO and the Adviser. In deciding whether to approve the Blackstone/GSO Sub-Advisory Agreement, the Board considered various factors, including: (i) the nature, extent and quality of services expected to be provided by Blackstone/GSO with respect to the New Portfolio under the Blackstone/GSO Sub-Advisory Agreement; and (ii) investment performance of customized credit strategies, including senior secured loan strategies, managed by Blackstone/GSO. The Board was apprised of the portion of the current advisory fee that the Adviser would pay to Blackstone/GSO under the Blackstone/GSO Sub-Advisory Agreement and also considered that such fees would be paid directly by the Adviser and would not result in increased fees payable by the New Portfolio.
The Board considered the background and experience of Blackstone/GSO’s senior management and in particular Blackstone/GSO’s experience in investing in senior secured loans. The Board noted that Blackstone/GSO would bring significant senior secured loan experience to bear in managing the New Portfolio. The Board noted that Blackstone/GSO has extensive experience in managing senior loan portfolios and reviewed Blackstone/GSO’s assets under management in portfolios of senior loans for a wide array of closed-end funds, hedge funds and other accounts.
The Board, including the Independent Trustees voting separately, approved the Blackstone/GSO Sub-Advisory Agreement for the New Portfolio after weighing the foregoing factors, none of which was dispositive in itself and may have been weighed differently by each Trustee. The Board’s conclusions with respect to the Agreement were as follows: (a) the nature and extent of the services expected to be provided by Blackstone/GSO to the New Portfolio were adequate and appropriate; and (b) Blackstone/GSO’s experience in managing senior loan portfolios is extensive.
30
SSgA MASTER TRUST
OTHER INFORMATION
June 30, 2013 (Unaudited)
TRUSTEES
| | | | | | | | | | | | |
Name, Address and Year of Birth | | Position(s)
with Fund | | Term of
Office and
Length of
Time Served | | Principal
Occupation(s)
During Past
5 Years | | Number of
Portfolios
in Fund
Complex
Overseen
by Trustee | | | Other
Directorships
Held by Trustee |
Independent Trustees | | | | | | | | | | | | |
FRANK NESVET
c/o SSgA Active ETF Trust
State Street Financial Center
One Lincoln Street
Boston, MA 02111-2900
1943 | | Independent
Trustee,
Chairman,
Trustee
Committee
Chair | | Term: Unlimited Served: since March 2011 | | Chief Executive Officer, Libra Group, Inc. (1998-present) (a financial services consulting company). | | | 170 | | | SPDR Series Trust (Trustee); SPDR Index Shares Funds (Trustee); SSgA Active ETF Trust (Trustee). |
DAVID M. KELLY
c/o SSgA Active ETF Trust
State Street Financial Center
One Lincoln Street
Boston, MA 02111-2900
1938 | | Independent
Trustee,
Audit
Committee
Chair | | Term: Unlimited Served: since March 2011 | | Retired. | | | 170 | | | Penson Worldwide Inc. (Director) (retired in March 2013); SPDR Series Trust (Trustee); SPDR Index Shares Funds (Trustee); SSgA Active ETF Trust (Trustee). |
BONNY EUGENIA BOATMAN
c/o SSgA Active ETF Trust
State Street Financial Center
One Lincoln Street
Boston, MA 02111-2900
1950 | | Independent
Trustee | | Term: Unlimited Served: since March 2011 | | Retired; Managing Director, Columbia Management Group, Bank of America (1984-2005). | | | 170 | | | SPDR Series Trust (Trustee); SPDR Index Shares Funds (Trustee); SSgA Active ETF Trust (Trustee). |
DWIGHT D. CHURCHILL
c/o SSgA Active ETF Trust
State Street Financial Center
One Lincoln Street
Boston, MA 02111-2900
1953 | | Independent
Trustee | | Term: Unlimited Served: since March 2011 | | Self-employed consultant since 2010; Head of Fixed Income and other Senior Management roles, Fidelity Investments (1993-2009). | | | 170 | | | Affiliated Managers Group, Inc. (Director); SPDR Series Trust (Trustee); SPDR Index Shares Funds (Trustee); SSgA Active ETF Trust (Trustee). |
CARL G. VERBONCOEUR
c/o SSgA Active ETF Trust
State Street Financial Center
One Lincoln Street
Boston, MA 02111-2900
1952 | | Independent
Trustee | | Term: Unlimited Served: since March 2011 | | Self-employed consultant since 2009; Chief Executive Officer, Rydex Investments (2003-2009). | | | 170 | | | The Motley Fool Funds Trust (Trustee); SPDR Series Trust (Trustee); SPDR Index Shares Funds (Trustee); SSgA Active ETF Trust (Trustee). |
31
SSgA MASTER TRUST
OTHER INFORMATION (continued)
June 30, 2013 (Unaudited)
| | | | | | | | | | | | |
Name, Address and Year of Birth | | Position(s)
with Fund | | Term of
Office and
Length of
Time Served | | Principal
Occupation(s)
During Past
5 Years | | Number of
Portfolios
in Fund
Complex
Overseen
by Trustee | | | Other
Directorships
Held by Trustee |
Interested Trustee | | | | | | | | | | | | |
JAMES E. ROSS*
SSgA Funds Management, Inc.
State Street Financial Center
One Lincoln Street
Boston, MA 02111
1965 | | Interested
Trustee | | Term: Unlimited Served: since March 2011 | | Chairman and Director, SSgA Funds Management, Inc. (2005-present); President, SSgA Funds Management, Inc. (2005-2012); Senior Managing Director, State Street Global Advisors (2006-present); Principal State Street Global Advisors (2006-present). | | | 201 | | | SPDR Series Trust (Trustee); SPDR Index Shares Funds (Trustee); SSgA Active ETF Trust (Trustee); Select Sector SPDR Trust (Trustee); State Street Master Funds (Trustee); and State Street Institutional Investment Trust (Trustee). |
| * | Mr. Ross is an Interested Trustee because of his employment with the Adviser and ownership interest in an affiliate of the Adviser. Mr. Ross previously served as an Interested Trustee from November 2005 to December 2009. |
OFFICERS
| | | | | | |
Name, Address
and Year of Birth | | Position(s)
with Fund | | Term of Office and Length of Time Served | | Principal Occupation(s) During Past 5 Years |
ELLEN M. NEEDHAM
SSgA Funds Management, Inc.
State Street Financial Center
One Lincoln Street
Boston, MA 02111
1967 | | President | | Term: Unlimited Served: since March 2011 | | President and Director, SSgA Funds Management, Inc. (June 2012-present); Chief Operating Officer, SSgA Funds Management, Inc. (May 2010-June 2012); Senior Managing Director, SSgA Funds Management, Inc. (1992-2012)*; Senior Managing Director, State Street Global Advisors (1992-present).* |
ANN M. CARPENTER
SSgA Funds Management, Inc.
State Street Financial Center
One Lincoln Street
Boston, MA 02111
1966 | | Vice
President | | Term: Unlimited Served: since August 2012 | | Vice President, State Street Global Advisors and SSgA Funds Management, Inc. (2005-present).* |
MICHAEL P. RILEY
SSgA Funds Management, Inc.
State Street Financial Center
One Lincoln Street
Boston, MA 02111
1969 | | Vice
President | | Term: Unlimited Served: since March 2011 | | Vice President, State Street Global Advisors and SSgA Funds Management, Inc. (2008-present); Principal, State Street Global Advisors and SSgA Funds Management, Inc. (2005-2008). |
CHRISTOPHER A. MADDEN**
State Street Bank and Trust Company
Four Copley Place, CPH0326
Boston, MA 02116
1967 | | Secretary | | Term: Unlimited Served: since August 2013 | | Vice President and Managing Counsel, State Street Bank and Trust Company (2013-present); Counsel, Atlantic Fund Services (2009-2013); Vice President, Citigroup Fund Services, LLC (2005-2009).* |
32
SSgA MASTER TRUST
OTHER INFORMATION (continued)
June 30, 2013 (Unaudited)
| | | | | | |
Name, Address
and Year of Birth | | Position(s)
with Fund | | Term of Office and Length of Time Served | | Principal Occupation(s) During Past 5 Years |
DANIO MASTROPIERI**
State Street Bank and Trust Company
Four Copley Place, CPH0326
Boston, MA 02116
1972 | | Assistant
Secretary | | Term: Unlimited Served: since August 2013 | | Vice President and Counsel, State Street Bank and Trust Company (2013-present); Vice President, Citi Fund Services Ohio, Inc. (2007-2013).* |
MARK E. TUTTLE
State Street Bank and Trust Company
Four Copley Place, CPH0326
Boston, MA 02116
1970 | | Assistant
Secretary | | Term: Unlimited Served: since March 2011 | | Vice President and Counsel, State Street Bank and Trust Company (2007-present)*; Assistant Counsel, BISYS Group, Inc. (2005-2007)* (a financial services company). |
CHAD C. HALLETT
State Street Bank and Trust Company
Four Copley Place, CPH0328
Boston, MA 02116
1969 | | Treasurer | | Term: Unlimited Served: since March 2011 | | Vice President, State Street Bank and Trust Company (2001-present).* |
MATTHEW FLAHERTY
State Street Bank and Trust Company
Four Copley Place, CPH0328
Boston, MA 02116
1971 | | Assistant
Treasurer | | Term: Unlimited Served: since March 2011 | | Vice President, State Street Bank and Trust Company (1994-present).* |
LAURA F. DELL
State Street Bank and Trust Company
Four Copley Place, CPH0328
Boston, MA 02116
1964 | | Assistant
Treasurer | | Term: Unlimited Served: since March 2011 | | Vice President, State Street Bank and Trust Company (2002-present).* |
JACQUELINE ANGELL
State Street Bank and Trust Company
20 Churchill Place
London, UK E14 5HJ
1974 | | Chief
Compliance Officer | | Term: Unlimited Served: since March 2011 | | Head of UK Compliance, State Street Bank and Trust Company (July 2012-present); Vice President, State Street Global Advisors and SSgA Funds Management, Inc. (2008-2012); Director of Investment Adviser Oversight, Fidelity Investments (2006-2008). |
| * | Served in various capacities and/or with various affiliated companies during noted time period. |
| ** | The Officers table is reflective of information as of August 21, 2013. |
33
The SPDR® Family of Exchange Traded Funds
The following is a list of SPDR ETFs being offered, along with their respective exchange trading symbols. Please call 1-866-787-2257 to obtain a prospectus for any SPDR ETF. The prospectus contains more complete information, including charges, expenses, investment objectives and risk factors that should be carefully considered to determine if the Fund(s) are an appropriate investment for you. Read the prospectus(es) carefully before investing. Investing involves risk, including possible loss of principal.
SPDR Series Trust
SPDR Russell 3000® ETF (THRK)
SPDR Russell 1000 ETF (ONEK)
SPDR Russell 2000 ETF (TWOK)
SPDR S&P 500 Growth ETF (SPYG)
SPDR S&P 500 Value ETF (SPYV)
SPDR Russell Small Cap Completeness ETF (RSCO)
SPDR S&P 400 Mid Cap Growth ETF (MDYG)
SPDR S&P 400 Mid Cap Value ETF (MDYV)
SPDR S&P 600 Small Cap ETF (SLY)
SPDR S&P 600 Small Cap Growth ETF (SLYG)
SPDR S&P 600 Small Cap Value ETF (SLYV)
SPDR Global Dow ETF (DGT)
SPDR Dow Jones REIT ETF (RWR)
SPDR S&P Bank ETF (KBE)
SPDR S&P Capital Markets ETF (KCE)
SPDR S&P Insurance ETF (KIE)
SPDR S&P Mortgage Finance ETF (KME)
SPDR S&P Regional Banking ETF (KRE)
SPDR Morgan Stanley Technology ETF (MTK)
SPDR S&P Dividend ETF (SDY)
SPDR S&P Aerospace & Defense ETF (XAR)
SPDR S&P Biotech ETF (XBI)
SPDR S&P Health Care Equipment ETF (XHE)
SPDR S&P Health Care Services ETF (XHS)
SPDR S&P Homebuilders ETF (XHB)
SPDR S&P Metals & Mining ETF (XME)
SPDR S&P Oil & Gas Equipment & Services ETF (XES)
SPDR S&P Oil & Gas Exploration & Production ETF (XOP)
SPDR S&P Pharmaceuticals ETF (XPH)
SPDR S&P Retail ETF (XRT)
SPDR S&P Semiconductor ETF (XSD)
SPDR S&P Software & Services ETF (XSW)
SPDR S&P Telecom ETF (XTL)
SPDR S&P Transportation ETF (XTN)
SPDR S&P 1500 Momentum Tilt ETF (MMTM)
SPDR S&P 1500 Value Tilt ETF (VLU)
SPDR Russell 1000 Low Volatility ETF (LGLV)
SPDR Russell 2000 Low Volatility ETF (SMLV)
SPDR Wells Fargo Preferred Stock ETF (PSK)
SPDR Barclays 1-3 Month T-Bill ETF (BIL)
SPDR Barclays TIPS ETF (IPE)
SPDR Barclays 1-10 Year TIPS ETF (TIPX)
SPDR Barclays Short Term Treasury ETF (SST)
SPDR Barclays Intermediate Term Treasury ETF (ITE)
SPDR Barclays Long Term Treasury ETF (TLO)
SDPR Barclays Short Term Corporate Bond ETF (SCPB)
SPDR Barclays Intermediate Term Corporate Bond ETF (ITR)
SPDR Barclays Long Term Corporate Bond ETF (LWC)
SPDR Barclays Issuer Scored Corporate Bond ETF (CBND)
SPDR Barclays Convertible Securities ETF (CWB)
SPDR Barclays Mortgage Backed Bond ETF (MBG)
SPDR Barclays Aggregate Bond ETF (LAG)
SPDR Nuveen Barclays Municipal Bond ETF (TFI)
SPDR Nuveen Barclays California Municipal Bond ETF (CXA)
SPDR Nuveen Barclays New York Municipal Bond ETF (INY)
SPDR Nuveen Barclays Short Term Municipal Bond ETF (SHM)
SPDR Nuveen S&P VRDO Municipal Bond ETF (VRD)
SPDR Nuveen S&P High Yield Municipal Bond ETF (HYMB)
SPDR Nuveen Barclays Build America Bond ETF (BABS)
SPDR DB International Government Inflation-Protected Bond ETF (WIP)
SPDR Barclays Short Term International Treasury Bond ETF (BWZ)
SPDR Barclays International Treasury Bond ETF (BWX)
SPDR Barclays International Corporate Bond ETF (IBND)
SPDR Barclays Emerging Markets Local Bond ETF (EBND)
SPDR Barclays High Yield Bond ETF (JNK)
SPDR Barclays Short Term High Yield Bond ETF (SJNK)
SPDR Barclays Investment Grade Floating Rate ETF (FLRN)
SPDR BofA Merrill Lynch Emerging Markets Corporate Bond ETF (EMCD)
SPDR BofA Merrill Lynch Crossover Corporate Bond ETF (XOVR)
SPDR Index Shares Funds
SPDR STOXX Europe 50 ETF (FEU)
SPDR EURO STOXX 50 ETF (FEZ)
SPDR S&P Emerging Asia Pacific ETF (GMF)
SPDR S&P Small Cap Emerging Asia Pacific ETF (GMFS)
SPDR S&P Russia ETF (RBL)
SPDR S&P China ETF (GXC)
SPDR S&P Emerging Markets ETF (GMM)
SPDR S&P Emerging Markets Dividend ETF (EDIV)
SPDR S&P BRIC 40 ETF (BIK)
SPDR S&P Emerging Europe ETF (GUR)
SPDR S&P Emerging Latin America ETF (GML)
SPDR S&P Emerging Middle East & Africa ETF (GAF)
SPDR S&P World ex-US ETF (GWL)
SPDR S&P International Small Cap ETF (GWX)
SPDR Dow Jones International Real Estate ETF (RWX)
SPDR S&P Global Infrastructure ETF (GII)
SPDR S&P Global Natural Resources ETF (GNR)
SPDR MSCI ACWI ex-US ETF (CWI)
SPDR MSCI ACWI IMI ETF (ACIM)
SPDR MSCI EM 50 ETF (EMFT)
SPDR Russell/Nomura PRIMETM Japan ETF (JPP)
SPDR Russell/Nomura Small CapTM Japan ETF (JSC)
SPDR S&P Global Dividend ETF (WDIV)
SPDR S&P International Dividend ETF (DWX)
SPDR S&P International Mid Cap ETF (MDD)
SPDR S&P Emerging Markets Small Cap ETF (EWX)
SPDR Dow Jones Global Real Estate ETF (RWO)
SPDR S&P International Consumer Discretionary Sector ETF (IPD)
SPDR S&P International Consumer Staples Sector ETF (IPS)
SPDR S&P International Energy Sector ETF (IPW)
SPDR S&P International Financial Sector ETF (IPF)
SPDR S&P International Health Care Sector ETF (IRY)
SPDR S&P International Industrial Sector ETF (IPN)
SPDR S&P International Materials Sector ETF (IRV)
SPDR S&P International Technology Sector ETF (IPK)
SPDR S&P International Telecommunications Sector ETF (IST)
SPDR S&P International Utilities Sector ETF (IPU)
The Select Sector SPDR Trust
The Consumer Discretionary Select Sector SPDR Fund (XLY)
The Consumer Staples Select Sector SPDR Fund (XLP)
The Energy Select Sector SPDR Fund (XLE)
The Financial Select Sector SPDR Fund (XLF)
The Health Care Select Sector SPDR Fund (XLV)
The Industrial Select Sector SPDR Fund (XLI)
The Materials Select Sector SPDR Fund (XLB)
The Technology Select Sector SPDR Fund (XLK)
The Utilities Select Sector SPDR Fund (XLU)
SSgA Active ETF Trust
SPDR SSgA Multi-Asset Real Return ETF (RLY)
SPDR SSgA Income Allocation ETF (INKM)
SPDR SSgA Global Allocation ETF (GAL)
SPDR Blackstone / GSO Senior Loan ETF (SRLN)
SPDR Dow Jones Industrial Average ETF Trust (DIA)
SPDR S&P 500 ETF Trust (SPY)
State Street Global Markets, LLC, member FINRA, SIPC, is distributor for all investment portfolios of SPDR Series Trust, SPDR Index Shares Funds, and SSgA Active ETF Trust. ALPS Distributors, Inc., a registered broker-dealer, is distributor for SPDR S&P 500 ETF Trust (SPY) and SPDR Dow Jones Industrial Average ETF Trust (DIA), both unit investment trusts, and all investment portfolios of The Select Sector SPDR Trust.
SSgA Master Trust
TRUSTEES
Bonny E. Boatman
Dwight D. Churchill
David M. Kelly
Frank Nesvet, Chairman
James E. Ross
Carl G. Verboncoeur
OFFICERS
Ellen M. Needham, President
Ann Carpenter, Vice President
Michael P. Riley, Vice President
Chad C. Hallett, Treasurer
Matthew W. Flaherty, Assistant Treasurer
Laura F. Dell, Assistant Treasurer
Christopher A. Madden, Secretary
Mark E. Tuttle, Assistant Secretary
Danio Mastropieri, Assistant Secretary
Jacqueline Angell, Chief Compliance Officer
INVESTMENT MANAGER
SSgA Funds Management, Inc.
State Street Financial Center
One Lincoln Street
Boston, MA 02111
CUSTODIAN, ADMINISTRATORAND TRANSFER AGENT
State Street Bank and Trust Company
One Lincoln Street
Boston, MA 02111
LEGAL COUNSEL
Bingham McCutchen LLP
2020 K Street, NW
Washington, DC 20006
INDEPENDENT REGISTERED PUBLIC ACCOUNTING FIRM
Ernst & Young LLP
200 Clarendon Street
Boston, MA 02116

State Street Global Advisors
State Street Financial Center
One Lincoln Street
Boston, MA 02111
ETFs trade like stocks, are subject to investment risk, fluctuate in market value and may trade at prices above or below the ETFs net asset value. Brokerage commissions and ETF expenses will reduce returns.
Because the SPDR SSgA Active Asset Allocation ETFs are actively managed, they are therefore subject to the risk that the investments selected by SSgA may cause the ETFs to underperform relative to their benchmarks or other funds with similar investment objectives. Actively managed ETFs do not seek to replicate the performance of a specified index.
Foreign investments involve greater risks than U.S. investments, including political and economic risks and the risk of currency fluctuations, all of which may be magnified in emerging markets.
Bond funds contain interest rate risk (as interest rates rise bond prices usually fall); the risk of issuer default; issuer credit risk; liquidity risk; and inflation risk.
Commodities investing entail significant risk as commodity prices can be extremely volatile due to wide range of factors.
“SPDR” is a registered trademark of Standard & Poor Financial Services LLC (“S&P”) and has been licensed for use by State Street Corporation. No financial product offered by State Street Corporation or its affiliates is sponsored, endorsed, sold or promoted by S&P or its Affiliates, and S&P and its affiliates make no representation, warranty or condition regarding the advisability of buying, selling or holding units/shares in such products. Further limitations and important information that could affect investors’ rights are described in the prospectus for the applicable product.
Before investing, consider the fund’s investment objectives, risks, charges and expenses. To obtain a prospectus or summary prospectus which contains this and other information, call 866.787.2257 or visit www.spdrs.com. Read it carefully.
IBG-9496
For more complete information, please call 866.787.2257 or visit www.spdrs.com today SPDRACTAR
Item 2. Code of Ethics.
As of the end of the period covered by this report, the registrant has adopted a code of ethics that applies to the registrant’s principal executive officer, principal financial officer, principal accounting officer or controller, or persons performing similar functions, regardless of whether these individuals are employed by the registrant or a third party (the “Code of Ethics”). During the period covered by this report, no substantive amendments were made to the Code of Ethics. During the period covered by this report, the registrant did not grant any waivers, including any implicit waivers, from any provision of the Code of Ethics.
The Code of Ethics is attached hereto as Exhibit 12(a)(1).
Item 3. Audit Committee Financial Expert.
(a)(1) The Board of Trustees of the registrant has determined that the registrant has five Board members serving on the Audit Committee that possess the attributes identified in Instructions 2(b) of Item 3 to Form N-CSR to qualify as an “audit committee financial expert.”
(2) Bonny Eugenia Boatman, Dwight D. Churchill, David M. Kelly, Frank Nesvet and Carl G. Verboncoeur are the registrant’s audit committee financial experts. The Board also determined that each of the foregoing persons are not “interested person(s)” of the registrant as that term is defined in Section 2(a)(19) of the Investment Company Act of 1940, as amended.
Item 4. Principal Accountant Fees and Services.
(a) Audit Fees.
For the fiscal year ending June 30, 2013 and for the fiscal period from the commencement of operations April 25, 2012 to June 30, 2012, the aggregate audit fees billed for professional services rendered by the principal accountant were $38,160 and $27,000, respectively. Audit fees include the performance of the annual audits and routine regulatory filings (one for each SEC registrant). The amount provided for the 2012 aggregate audit fees is an estimate provided by the principal accountant.
(b) Audit-Related Fees.
For the fiscal year ending June 30, 2013 and for the fiscal period from the commencement of operations April 25, 2012 to June 30, 2012, the principal accountant did not bill the registrant any fees for assurances and related services that are reasonably related to the performance of the audit of the registrant’s financial statements and are not reported under paragraph (a) of this Item.
(c) Tax Fees.
For the fiscal year ending June 30, 2013 and for the fiscal period from the commencement of operations April 25, 2012 to June 30, 2012, the aggregate tax fees billed for professional services rendered by the principal accountant were $32,960 and $24,000, respectively. Tax fees represent services related to the review of year-end distribution requirements, as well as the review and signing as preparer of all federal, state and excise income tax returns for the series of the registrant.
(d) All Other Fees.
There were no other fees billed by the principal accountant for the fiscal year ending June 30, 2013 and for the fiscal period from the commencement of operations April 25, 2012 to June 30, 2012.
(e)(1) Audit Committee Pre-Approval Policies and Procedures.
The registrant’s Audit Committee Charter states the following with respect to pre-approval procedures:
Before the independent auditors are engaged by the Trust to render audit or non-audit services, either:
| | a. | The Audit Committee shall pre-approve all auditing services and permissible non-audit services (e.g., tax services) provided to the Trust. The Audit Committee may delegate to one or more of its members the authority to grant pre-approvals. Any decision of any member to whom authority is delegated under this section shall be presented to the full Audit Committee at its next regularly scheduled meeting; |
or
| | b. | The engagement to render the auditing service or permissible non-audit service is entered into pursuant to pre-approval policies and procedures established by the Audit Committee. Any such policies and procedures must (1) be detailed as to the particular service and (2) not involve any delegation of the Audit Committee’s responsibilities to the investment adviser. The Audit Committee must be informed of each service entered into pursuant to the policies and procedures. A copy of any such policies and procedures shall be attached as an exhibit to the Audit Committee Charter. |
| | c. | De Minimis Exceptions to Pre-Approval Requirements. Pre-Approval for a service provided to the Trust other than audit, review or attest services is not required if: (1) the aggregate amount of all such non-audit services provided to the Trust constitutes not more than 5 percent of the total amount of revenues paid by the Trust to the independent auditors during the fiscal year in which the non-audit services are provided; (2) such services were not recognized by the Trust at the time of the engagement to be non-audit services; and (3) such services are promptly brought to the attention of the Audit Committee and are approved by the Audit Committee or by one or more members of the Audit Committee to whom authority to grant such approvals has been delegated by the Audit Committee prior to the completion of the audit. |
| | d. | Pre-Approval of Non-Audit Services Provided to the investment adviser and Certain Control Persons. The Audit Committee shall pre-approve any non-audit services proposed to be provided by the independent auditors to (a) the investment adviser and (b) any entity controlling, controlled by, or under common control with the investment adviser that provides ongoing services to the Trust, if the independent auditors’ engagement with the investment adviser or any such control persons relates directly to the operations and financial reporting of the Trust. It shall be the responsibility of the independent auditors to notify the Audit Committee of any non-audit services that need to be pre-approved. |
| | e. | Application of De Minimis Exception: The De Minimis exception set forth above applies to pre-approvals under this Section as well, except that the “total amount of revenues” calculation is based on the total amount of revenues paid to the independent auditors by the Trust and any other entity that has its services approved under this Section (i.e., the investment adviser or any control person). |
(e)(2) Percentage of Services.
One hundred percent of the services described in each of paragraphs (b) through (d) of this Item were approved by the registrant’s Audit Committee pursuant to paragraph (c)(7)(i)(C) of Rule 2-01 of Regulation S-X.
(f) Not applicable.
(g) The aggregate non-audit fees billed for by the registrant’s accountant for services rendered to the registrant, and rendered to the registrant’s investment adviser (not including any sub-adviser whose role is primarily portfolio management and is subcontracted with or overseen by another investment adviser), and any entity controlling, controlled by, or under common control with the adviser were as follows:
| | | | | | | | |
| | | FY 2013
(in millions) | | | FY 2012
(in millions) | |
Non audit services billed to: | | | | | | | | |
Registrant: | | | See Item 4 | (c) | | | See Item 4 | (c) |
Investment Adviser: | | | — | | | | — | |
| | |
Other entities in the Investment Company
Complex (1)(2): | | | | | | | | |
Audit Related Fees | | $ | 15.9 | | | $ | 7.4 | |
Tax Fees | | | 3.9 | | | | 6.0 | |
All Other Fees | | | 3.6 | | | | 1.5 | |
| (1) | Information is for the calendar year 2012 and 2011, respectively. |
| (2) | Services under the caption Audit-Related Fees consisted principally of reports on the processing of transactions by servicing organizations, audits of employee benefit plan, non-statutory audits and due diligence procedures. Services under the caption Tax Fees consisted principally of expatriate, compliance and corporate tax advisory services. Services under the caption All Other Fees consisted of advisory services related to certain regulatory initiatives. |
(h) The registrant’s principal accountant notified the registrant’s Audit Committee of all non-audit services that were rendered by the principal accountant to the Adviser and any entity controlling, controlled by, or under common control with the Adviser that provides services to the registrant, which services were not required to be pre-approved pursuant to paragraph (c)(7)(ii) of Rule 2-01 of Regulation S-X, allowing the registrant’s Audit Committee to consider whether such services were compatible with maintaining the principal accountant’s independence.
Item 5. Disclosure of Audit Committees for Listed Companies.
The registrant has an audit committee which was established by the Board of Trustees of the Trust in accordance with
Section 3(a)(58)(A) of the Securities Exchange Act of 1934, as amended. The members of the registrant’s audit committee are Bonny Eugenia Boatman, Dwight D. Churchill, David M. Kelly, Frank Nesvet and Carl G. Verboncoeur.
Item 6. Schedule of Investments.
A Schedule of Investments for each series of the Registrant, is included as a part of the reports to shareholders filed under Item 1 of this Form N-CSR.
Item 7. Disclosure of Proxy Voting Policies and Procedures for Closed-End Management Investment Companies.
Not applicable to the registrant.
Item 8. Portfolio Managers of Closed-End Management Investment Companies.
Not applicable to the registrant.
Item 9. Purchases of Equity Securities by Closed-End Management Investment Company and Affiliated Purchasers.
Not applicable to the registrant.
Item 10. Submission of Matters to a Vote of Security Holders.
Registrant has not adopted any material changes to the procedures by which shareholders may recommend nominees to the registrant’s Board.
Item 11. Controls and Procedures.
(a) Within 90 days of the filing date of this Form N-CSR, Ellen M. Needham, the registrant’s President and Principal Executive Officer, and Chad C. Hallett, the registrant’s Treasurer and Principal Financial Officer, reviewed the registrant’s disclosure controls and procedures and evaluated their effectiveness. Based on their review, Ms. Needham and Mr. Hallett determined that the disclosure controls and procedures adequately ensure that information required to be disclosed by the registrant in its periodic reports is recorded, processed, summarized and reported within the time periods required by the Securities and Exchange Commission.
(b) There were no significant changes in the registrant’s internal controls or in other factors that could significantly affect these controls subsequent to the date of their evaluation, including any corrective actions with regard to significant deficiencies and material weaknesses.
Item 12. Exhibits.
(a)(1) Code of Ethics referred to in Item 2.
(a)(2) Separate certifications required by Rule 30a-2 under the Investment Company Act of 1940 for each principal executive officer and principal financial officer of the registrant are attached.
(a)(3) Not applicable
(b) A single certification required by Rule 30a-2(b) under the Investment Company Act of 1940, Rule 13a-14(b) or Rule 15d-14(b) under the Securities Exchange Act of 1934 and Section 1350 of Chapter 63 of Title 18 of the United States Code for the principal executive officer and principal financial officer of the registrant is attached.
SIGNATURES
Pursuant to the requirements of the Securities Exchange Act of 1934 and the Investment Company Act of 1940, the registrant has duly caused this report to be signed on its behalf by the undersigned, thereunto duly authorized.
| | |
| SSgA Active ETF Trust |
| |
| By: | | /s/ Ellen M. Needham |
| | Ellen M. Needham |
| | President and Principal Executive Officer |
| |
| Date: | | September 6, 2013 |
Pursuant to the requirements of the Securities Exchange Act of 1934 and the Investment Company Act of 1940, this report has been signed below by the following persons on behalf of the registrant and in the capacities and on the dates indicated.
| | |
| By: | | /s/ Ellen M. Needham |
| | Ellen M. Needham |
| | President and Principal Executive Officer |
| |
| Date: | | September 6, 2013 |
| |
| By: | | /s/ Chad C. Hallett |
| | Chad C. Hallett |
| | Treasurer and Principal Financial Officer |
| |
| Date: | | September 6, 2013 |