UNITED STATES
SECURITIES AND EXCHANGE COMMISSION
Washington, D.C. 20549
FORM N-CSR
CERTIFIED SHAREHOLDER REPORT OF REGISTERED
MANAGEMENT INVESTMENT COMPANIES
Investment Company Act file number: 811-22542
SSGA ACTIVE ETF TRUST
(Exact name of registrant as specified in charter)
One Lincoln Street,
Boston, Massachusetts 02111
(Address of principal executive offices) (zip code)
Christopher Madden, Esq.
State Street Bank and Trust Company
One Lincoln Street/CPH0326
Boston, Massachusetts 02111
(Name and address of agent for service)
Copy to:
W. John McGuire, Esq.
Bingham McCutchen LLP
2020 K Street, N.W.
Washington, DC 20006
Registrant’s telephone number, including area code: (866) 787-2257
Date of fiscal year end: June 30
Date of reporting period: June 30, 2014
Item 1. Reports to Shareholders.

TABLE OF CONTENTS

PRESIDENT’S LETTERTO SHAREHOLDERS
Dear Shareholders:
The past year unfolded contrary to expectations. Rather than continuing last year’s upward trajectory without interruption, equities faltered early in the year before recovering, bonds rallied, and interest rates fell. In countering these events, the market was supported by some important constants, including globally accommodative monetary policies and increasing investor confidence. World markets continue to grow at a slow but steady pace, with the United States and Europe leading the way.
While current volatility remains low, investors should be wary as recent geopolitical developments, including sectarian violence in Iraq, U.S. and European sanctions against Russia, and the conflict between Israel and Hamas, may produce future market turbulence.
With these uncertainties underscoring the need to implement investment decisions with precision, investors continued to embrace a broad array of ETFs for their ability to provide transparent, low cost and liquid access to global markets. Of particular note, the ETF industry’s overall assets under management are at an all-time high.
As part of our continued commitment to provide investment products to help achieve your investment goals, State Street Global Advisors introduced active ETFs to complement our passive funds. Since July 2013, State Street Global Advisors launched the following active SPDR ETFs:
SPDR SSgA Ultra Short Term Bond ETF (Ticker Symbol: ULST) seeks to provide current income consistent with preservation of capital and daily liquidity through short duration high quality investments. Each of SPDR MFS Systematic Core Equity ETF (Ticker Symbol: SYE), SPDR MFS Systematic Growth Equity ETF (Ticker Symbol: SYG), and SPDR MFS Systematic Value Equity ETF (Ticker Symbol: SYV) seeks capital appreciation.
We take great pride in these new additions to our SPDR family. You will find additional information on the SSgA Active ETF Trust Exchange Traded Funds, including Management’s Discussion of Fund Performance, in the enclosed June 30, 2014 Annual Report.
On behalf of the SSgA Active ETF Trust, I thank you for your continued support.
Sincerely,

Ellen M. Needham
President
1
SPDR SSgA MULTI-ASSET REAL RETURN ETF — MANAGEMENT’S DISCUSSIONOF FUND PERFORMANCE
The SPDR SSgA Multi-Asset Real Return ETF (the “Fund”) normally invests substantially all of its assets in the SSgA Multi-Asset Real Return Portfolio (the “Portfolio”), which seeks to achieve real return consisting of capital appreciation and current income. As a result, the Fund invests indirectly through the Portfolio.
For the 12-month period ended June 30, 2014 (the “Reporting Period”), the total return for the Fund was 13.85%, and the total return for the Barclays U.S. Government Inflation-linked Bond Index (the “Index”) was 4.72%. The Fund and Index returns reflect the reinvestment of dividends and other income. The Fund’s performance reflects the expenses of managing the Fund, including brokerage and advisory expenses. The Index is unmanaged and Index returns do not reflect fees and expenses of any kind, which would have a negative impact on returns.
The Fund outperformed the Index during the Reporting Period. Developed economies globally experienced robust gains over the period. Though tame inflation and smaller advances in commodity prices could make returns more difficult in the real asset space, the Fund’s diverse exposure, including equities and REITs, allowed it to capture more of the upside enjoyed by risk markets.
Accommodative policies along with an optimistic shift in global growth expectations served to broadly benefit real assets during the Reporting Period. Commentary from the US Federal Reserve (the “Fed”) related to reduction in bond purchases prompted turmoil in the markets during May and June of 2013. However, after digesting the commentary and accepting that policymakers across the globe intended to carry on, accommodative yields slowly trended lower following the infamous “taper-tantrum.” Securitized Real Estate in the United States was a considerable beneficiary as investors sought attractive valuations and higher yields. Macroeconomic prints remained mixed during much of the period, but data demonstrated enough improvement to benefit market optimism for global growth. Despite risks to global growth such as the weather induced slowdown in the United States and potential for a Chinese hard landing, the market sentiment improved. This benefitted resource equities as investors began to tilt towards more economically sensitive sectors such as energy and materials, which were among top S&P sector performers over the period.
Allocations to broad natural resource equities, securitized real estate, along with targeted exposures to US energy and metals and mining equities provided positive contributions to the Fund’s performance over the period. Following the initial half of 2013, the market shifted focus from the potential for Fed tapering of bond purchases to glimmers of positive economic data. As unemployment and industrial production improved in the US, the market allocated to more economically sensitive sectors within the Fund’s resource equity exposure. The materials sector, which tends to perform well in periods of economic acceleration, represented the strongest S&P 500 sector performer over the one-year period. Battered mining companies benefited from attractive valuations and the potential for improved demand prospects in industrial metals benefited earnings prospects. The Portfolio’s targeted overweight to the US energy sector offered an additional boost to Portfolio returns. Oil prices were supported by a confluence of fundamental supply and demand factors, as geopolitical risks in the Middle East prompted consternation regarding oil supplies, and an uncharacteristically cold snap across the US increased demand. As oil prices trended upward, increased hydraulic fracturing “fracking” in US shale fields generated the largest domestic oil production in over two decades. These factors aided the S&P energy sector in outperforming the broader S&P 500 Index over the period as earnings prospects improved. REIT valuations improved markedly following the Fed’s tapering commentary during the middle months of 2013. Securitized real estate garnered a tailwind from declining government bond yields renewing investor interest for greater yields. Broadly speaking, the rally in REIT prices was also supported by increased lease rates across a number of sectors, improving growth in funds from operations.
Broadly speaking, Portfolio holdings predominantly offered positive returns during the fiscal year with the exception of agricultural commodities. Agricultural commodities were lead lower by corn, as 2013 yielded
2
SPDR SSgA MULTI-ASSET REAL RETURN ETF — MANAGEMENT’S DISCUSSIONOF FUND PERFORMANCE (CONTINUED)
a record corn harvest in the US, along with supportive planting conditions during 2014, which alleviated supply related concerns. US Treasury inflation-protected securities (TIPS) offered positive contribution to overall portfolio returns, but results lagged the majority of other portfolio holdings. Fundamentals for US inflation-linked bonds appeared less convincing, as negative to low real yields across the term structure of the real yield curve and low inflation expectations did not generate significant support for the asset class.
The views expressed above reflect those of the Fund’s portfolio manager only through the Reporting Period, and do not necessarily represent the views of the Adviser as a whole. Any such views are subject to change at any time based upon market or other conditions and the Adviser disclaims any responsibility to update such views. These views may not be relied on as investment advice and, because investment decisions for a fund are based on numerous factors, may not be relied on as an indication of trading intent on behalf of any fund.
3
SPDR SSgA MULTI-ASSET REAL RETURN ETF — PERFORMANCE SUMMARY
The following performance chart of the Fund’s total return at net asset value, the total return based on market price and its benchmark index is provided for comparative purposes only and represents the periods noted. The Fund’s per share net asset value (“NAV”) is the value of one share of the Fund and is calculated by dividing the value of total assets less total liabilities by the number of shares outstanding. The NAV return is based on the NAV of the Fund and the market return is based on the market price per share of the Fund. The market price used to calculate the market return is determined by using the midpoint between the highest bid and the lowest offer on the exchange on which the shares of the Fund are listed for trading, as of the time that the Fund’s NAV is calculated. Since shares of the Fund did not trade in the secondary market until one day after the Fund’s inception, for the period from inception to the first day of secondary market trading in shares of the Fund (4/25/12, 4/26/12, respectively), the NAV of the Fund is used as a proxy for the secondary market trading price to calculate market returns. NAV and market returns assume that dividends and capital gain distributions have been reinvested in the Fund at NAV. Market returns do not include brokerage commissions that may be payable on secondary market transactions. If brokerage commissions were included market returns would be lower.
An index is a statistical measure of a specified financial market or sector. An index does not actually hold a portfolio of securities and therefore does not reflect deductions for fees or expenses. In comparison, the Fund’s performance is negatively impacted by these deductions.
Performance quoted represents past performance, which is no guarantee of future results. Investment return and principal value will fluctuate, so you may have a gain or loss when shares are sold. Current performance may be higher or lower than that quoted. Visit www.spdrs.com for most recent month-end performance. The returns do not reflect the deduction of taxes that a shareholder would pay on Fund distributions or on the redemption or sale of Fund shares. The total expense ratio for SPDR SSgA Multi-Asset Real Return ETF as stated in the Fees and Expenses table of the prospectus dated October 31, 2013 is 0.70%.
PERFORMANCE AS OF JUNE 30, 2014
| | | | | | | | | | | | | | | | | | | | | | | | | | | | | | | | | | | | | | |
| | | | | | | | | | | | | |
| | | | | CUMULATIVE TOTAL RETURN | | | | | AVERAGE ANNUAL TOTAL RETURN | | | |
| | | | | NET ASSET
VALUE | | | MARKET
VALUE | | | PRIMARY
BENCH
MARK:
BARCLAYS
US
GOVERNMENT
INFLATION-
LINKED
BOND
INDEX | | | SECONDARY
BENCH
MARK:
DBIQ
OPTIMUM
YIELD
DIVERSIFIED
COMMODITY
INDEX
EXCESS
RETURN | | | | | NET ASSET
VALUE | | | MARKET
VALUE | | | PRIMARY
BENCH
MARK:
BARCLAYS
US
GOVERN
MENT
INFLATION-
LINKED
BOND
INDEX | | | SECONDARY
BENCH
MARK:
DBIQ
OPTIMUM
YIELD
DIVERSIFIED
COMMODITY
INDEX
EXCESS
RETURN | | | |
| | | ONE YEAR | | | 13.85% | | | | 13.93% | | | | 4.72% | | | | 6.38% | | | | | | 13.85% | | | | 13.93% | | | | 4.72% | | | | 6.38% | | | |
| | | SINCE INCEPTION
(1) | | | 8.10% | | | | 8.21% | | | | 0.95% | | | | -3.83% | | | | | | 3.63% | | | | 3.68% | | | | 0.43% | | | | -1.78% | | | |
| | | | | | | | | | | | | | | | | | | | | | | | | | | | | | | |
| | (1) | For the period April 25, 2012 to June 30, 2014. |
4
SPDR SSgA MULTI-ASSET REAL RETURN ETF — PERFORMANCE SUMMARY (CONTINUED)
COMPARISON OF CHANGE IN VALUE OF A $10,000 INVESTMENT (BASED ON NET ASSET VALUE)
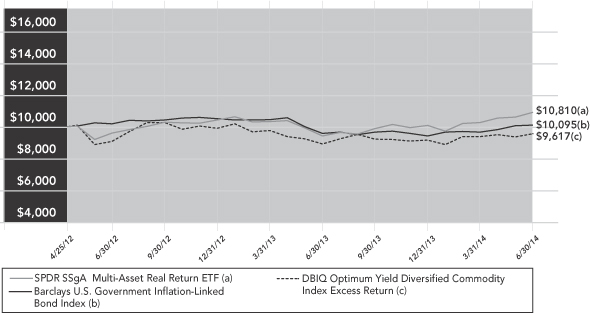
Past performance is not a guarantee of future results.
Index returns are unmanaged and do not reflect the deduction of any fees or expenses. Index returns reflect all items of income, gain and loss and the reinvestment of dividends and other income.
5
SPDR SSgA INCOME ALLOCATION ETF — MANAGEMENT’S DISCUSSIONOF FUND PERFORMANCE
The SPDR SSgA Income Allocation ETF (the “Fund”) normally invests substantially all of its assets in the SSgA Income Allocation Portfolio (the “Portfolio”), which seeks to provide total return by focusing on investments in income and yield-generating assets. As a result, the Fund invests indirectly through the Portfolio.
For the 12-month period ended June 30, 2014 (the “Reporting Period”), the total return for the Fund was 13.57%, and the total return for the MSCI World Index (the “Index”) was 24.05%. The Fund and Index returns reflect the reinvestment of dividends and other income. The Fund’s performance reflects the expenses of managing the Fund, including brokerage and advisory expenses. The Index is unmanaged and Index returns do not reflect fees and expenses of any kind, which would have a negative impact on returns.
The Fund’s focus on income and yield-generating investments contributed to its underperformance relative to the Index during the Reporting Period. During the second half of 2013, interest rate volatility led to weak returns in the longer term government issues held in the Portfolio, but steady economic growth helped to lift the Portfolio’s equity investments and also served to compress credit spreads, which had a favorable impact on the performance of both investment grade and below investment grade exposures held in the Portfolio. The turn of the year brought indigestion to certain pockets of the global markets — most notably in emerging markets as fears of slower growth in China caused emerging market equities and currencies to tumble. However, most developed markets were able to recoup early 2014 losses and generate solid performance through the end of the Reporting Period. And in contrast to 2013, the assumption of interest rate risk proved a significant source of return as longer duration fixed-income instruments were among the best performing assets held in the Portfolio. Although the Portfolio was not able to maintain the same pace as its Index, its performance was comparable to a multi-asset portfolio of income-generating stocks and bonds.
During the Reporting Period, financial assets had to contend with the introduction of the Federal Reserve’s tapering of asset purchases, as well as a change in leadership as Janet Yellen assumed her role as Chair of the Board of Governors of the Federal Reserve System. The anticipation of lessened bond market support caused the longer duration fixed-income instruments held in the Portfolio to struggle, but by the time formal plans to reduce bond purchases were made in late 2013, those assets were poised to sustain an extended rally. Riskier assets had to contend with severe winter weather in the United States as well as geopolitical conflicts in Syria and the Ukraine. Yet the underlying growth of earnings and support from policymakers helped assets such as income equities and REITs deliver strong returns. Additionally, the Portfolio maintained a healthy diversification into non-US securities, which were bolstered by moderate weakness in the US dollar against broad averages of major currencies.
The top positive contributor to the Fund’s performance was the SPDR S&P Dividend ETF, which advanced steadily during the period and exhibited a maximum drawdown of just over 5%. This was the largest holding for the Portfolio on average, and it benefited from the low level of volatility exhibited in the markets, which helped to facilitate strong performance across equities in general. Other holdings that supported the Fund’s performance included longer term corporate bonds via the SPDR Barclays Long Term Corporate Bond ETF and international dividend payers via the SPDR S&P International Dividend ETF. Longer term corporates benefited from investor preference for credit assets, which was exemplified by a consistent trend of tighter credit spreads during the fiscal year, and they also benefited greatly from improved sentiment towards longer duration assets in the first half of 2014. International dividend stocks rode the same wave of equity market appreciation as US dividend payers, and were able to produce relatively better results as some of the countries and currencies represented in the ETF came back into favor.
In terms of negative contributions, the healthy market environment over the past fiscal year helped many asset classes deliver positive absolute returns, and the only holding in the Portfolio to demonstrate negative returns from an absolute return perspective was the SPDR Russell/Nomura PRIME Japan ETF. This holding did not have a particularly large impact on the Fund, as it was only held for a brief period in
6
SPDR SSgA INCOME ALLOCATION ETF — MANAGEMENT’S DISCUSSIONOF FUND PERFORMANCE (CONTINUED)
early 2014. Nonetheless, Japanese equities struggled with concerns over the upcoming VAT hike and as slower growth in China weighted on the market. Other holdings in the Portfolio with below average performance included the SPDR Barclays TIPS ETF and the SPDR Barclays Long Term Treasury ETF. Both of these ETFs delivered positive mid-single digit performance over the period, but lagged most other assets held in the Portfolio.
The views expressed above reflect those of the Fund’s portfolio manager only through the Reporting Period, and do not necessarily represent the views of the Adviser as a whole. Any such views are subject to change at any time based upon market or other conditions and the Adviser disclaims any responsibility to update such views. These views may not be relied on as investment advice and, because investment decisions for a fund are based on numerous factors, may not be relied on as an indication of trading intent on behalf of any fund.
7
SPDR SSgA INCOME ALLOCATION ETF — PERFORMANCE SUMMARY
The following performance chart of the Fund’s total return at net asset value, the total return based on market price and its benchmark index is provided for comparative purposes only and represents the periods noted. The Fund’s per share net asset value (“NAV”) is the value of one share of the Fund and is calculated by dividing the value of total assets less total liabilities by the number of shares outstanding. The NAV return is based on the NAV of the Fund and the market return is based on the market price per share of the Fund. The market price used to calculate the market return is determined by using the midpoint between the highest bid and the lowest offer on the exchange on which the shares of the Fund are listed for trading, as of the time that the Fund’s NAV is calculated. Since shares of the Fund did not trade in the secondary market until one day after the Fund’s inception, for the period from inception to the first day of secondary market trading in shares of the Fund (4/25/12, 4/26/12, respectively), the NAV of the Fund is used as a proxy for the secondary market trading price to calculate market returns. NAV and market returns assume that dividends and capital gain distributions have been reinvested in the Fund at NAV. Market returns do not include brokerage commissions that may be payable on secondary market transactions. If brokerage commissions were included market returns would be lower.
An index is a statistical measure of a specified financial market or sector. An index does not actually hold a portfolio of securities and therefore does not reflect deductions for fees or expenses. In comparison, the Fund’s performance is negatively impacted by these deductions.
Performance quoted represents past performance, which is no guarantee of future results. Investment return and principal value will fluctuate, so you may have a gain or loss when shares are sold. Current performance may be higher or lower than that quoted. Visit www.spdrs.com for most recent month-end performance. The returns do not reflect the deduction of taxes that a shareholder would pay on Fund distributions or on the redemption or sale of Fund shares. The total expense ratio for SPDR SSgA Income Allocation ETF as stated in the Fees and Expenses table of the prospectus dated October 31, 2013 is 0.70%.
PERFORMANCE AS OF JUNE 30, 2014
| | | | | | | | | | | | | | | | | | | | | | | | | | | | | | | | | | | | | | |
| | | | | | | | | | | | | |
| | | | | CUMULATIVE TOTAL RETURN | | | | | AVERAGE ANNUAL TOTAL RETURN | | | |
| | | | | NET
ASSET
VALUE | | | MARKET
VALUE | | | PRIMARY
BENCH
MARK:
MSCI
WORLD
INDEX | | | SECONDARY
BENCHMARK:
BARCLAYS US
LONG
GOVE
RNMENT/
CREDIT
BOND
INDEX | | | | | NET
ASSET
VALUE | | | MARKET
VALUE | | | PRIMARY
BENCH
MARK:
MSCI
WORLD
INDEX | | | SECONDARY
BENCH
MARK:
BARCLAYS US
LONG
GOVERN
MENT/
CREDIT BOND
INDEX | | | |
| | | ONE YEAR | | | 13.57% | | | | 13.59% | | | | 24.05% | | | | 10.77% | | | | | | 13.57% | | | | 13.59% | | | | 24.05% | | | | 10.77% | | | |
| | | SINCE INCEPTION (1) | | | 19.39% | | | | 19.40% | | | | 42.26% | | | | 10.50% | | | | | | 8.45% | | | | 8.46% | | | | 17.55% | | | | 4.69% | | | |
| | | | | | | | | | | | | | | | | | | | | | | | | | | | | | | |
| | (1) | For the period April 25, 2012 to June 30, 2014. |
8
SPDR SSgA INCOME ALLOCATION ETF — PERFORMANCE SUMMARY (CONTINUED)
COMPARISON OF CHANGE IN VALUE OF A $10,000 INVESTMENT (BASED ON NET ASSET VALUE)
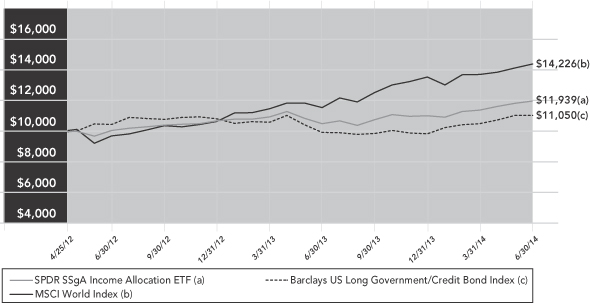
Past performance is not a guarantee of future results.
Index returns are unmanaged and do not reflect the deduction of any fees or expenses. Index returns reflect all items of income, gain and loss and the reinvestment of dividends and other income.
9
SPDR SSgA GLOBAL ALLOCATION ETF — MANAGEMENT’S DISCUSSIONOF FUND PERFORMANCE
The SPDR SSgA Global Allocation ETF (the “Fund”) normally invests substantially all of its assets in the SSgA Global Allocation Portfolio (the “Portfolio”), which seeks to provide capital appreciation. As a result, the Fund invests indirectly through the Portfolio.
For the 12-month period ended June 30, 2014 (the “Reporting Period”), the total return for the Fund was 16.81%, and the total return for the MSCI ACWI IMI Index (the “Index”) was 23.35%. The Fund and Index returns reflect the reinvestment of dividends and other income. The Fund’s performance reflects the expenses of managing the Fund, including brokerage and advisory expenses. The Index is unmanaged and Index returns do not reflect fees and expenses of any kind, which would have a negative impact on returns.
The Portfolio invests broadly across regions and asset classes. During the Reporting Period, the Fund’s diversified investment exposures contributed to its underperformance relative to the equity only Index. Financial conditions over the last year remained relatively stable, bolstered largely by the accommodative policies coming from the central banks of many of the major developed markets. In turn, credit spreads narrowed, while volatility generally decreased across most equity markets. The already rosy environment for financial assets also drew support from a steady improvement in economic data.
With a favorable backdrop for risk assets firmly in place, equity markets experienced sound gains over the Reporting Period, particularly in the United States and Europe. Doubts in emerging economies persisted throughout, as these markets failed to keep pace with their developed counterparts. Still, the emerging markets as a whole were able to shrug off domestic and geopolitical risk to post very respectable gains. Higher global growth prospects combined with a sustained low interest rate environment also proved profitable for REIT securities, which overcame a sluggish end to 2013. And in contrast to 2013, the assumption of interest rate risk proved a significant source of return, as longer duration fixed-income instruments were among the best performing assets among the Portfolio’s fixed-income holdings.
Reflecting both the global exposures of the Fund and our tactical preference for risky assets in the past year, the Fund had overweight exposures to equities compared to bonds. The top positive contributor to performance over the Reporting Period was the SPDR S&P World ex-US ETF. Close behind was the SPDR S&P 500 ETF. Relative weightings in the SPDR Barclays Long Term Bond ETF also proved positive.
The SPDR Wells Fargo Preferred Stock ETF was the largest negative contributor to the Fund’s returns. Other detractors from performance were the SPDR Barclays Emerging Markets Local Bond ETF and the SPDR Barclays Aggregate Bond ETF. Lastly, an allocation to cash negatively impacted overall Fund performance.
The views expressed above reflect those of the Fund’s portfolio manager only through the Reporting Period, and do not necessarily represent the views of the Adviser as a whole. Any such views are subject to change at any time based upon market or other conditions and the Adviser disclaims any responsibility to update such views. These views may not be relied on as investment advice and, because investment decisions for a fund are based on numerous factors, may not be relied on as an indication of trading intent on behalf of any fund.
10
SPDR SSgA GLOBAL ALLOCATION ETF — PERFORMANCE SUMMARY
The following performance chart of the Fund’s total return at net asset value, the total return based on market price and its benchmark index is provided for comparative purposes only and represents the periods noted. The Fund’s per share net asset value (“NAV”) is the value of one share of the Fund and is calculated by dividing the value of total assets less total liabilities by the number of shares outstanding. The NAV return is based on the NAV of the Fund and the market return is based on the market price per share of the Fund. The market price used to calculate the market return is determined by using the midpoint between the highest bid and the lowest offer on the exchange on which the shares of the Fund are listed for trading, as of the time that the Fund’s NAV is calculated. Since shares of the Fund did not trade in the secondary market until one day after the Fund’s inception, for the period from inception to the first day of secondary market trading in shares of the Fund (4/25/12, 4/26/12, respectively), the NAV of the Fund is used as a proxy for the secondary market trading price to calculate market returns. NAV and market returns assume that dividends and capital gain distributions have been reinvested in the Fund at NAV. Market returns do not include brokerage commissions that may be payable on secondary market transactions. If brokerage commissions were included market returns would be lower.
An index is a statistical measure of a specified financial market or sector. An index does not actually hold a portfolio of securities and therefore does not reflect deductions for fees or expenses. In comparison, the Fund’s performance is negatively impacted by these deductions.
Performance quoted represents past performance, which is no guarantee of future results. Investment return and principal value will fluctuate, so you may have a gain or loss when shares are sold. Current performance may be higher or lower than that quoted. Visit www.spdrs.com for most recent month-end performance. The returns do not reflect the deduction of taxes that a shareholder would pay on Fund distributions or on the redemption or sale of Fund shares. The total expense ratio for SPDR SSgA Global Allocation ETF as stated in the Fees and Expenses table of the prospectus dated October 31, 2013 is 0.35%.
PERFORMANCE AS OF JUNE 30, 2014
| | | | | | | | | | | | | | | | | | | | | | | | | | | | | | | | |
| | | | | | | | | | | | | | | | | | | | | | | | | | | | |
| | | | | CUMULATIVE TOTAL RETURN | | | | | AVERAGE ANNUAL TOTAL RETURN | | |
| | | | | NET
ASSET
VALUE | | | MARKET
VALUE | | | PRIMARY
BENCH
MARK:
MSCI ACWI
IMI INDEX | | | SECONDARY
BENCH
MARK:
BARCLAYS US
AGGREGATE
INDEX | | | | | NET
ASSET
VALUE | | | MARKET
VALUE | | PRIMARY
BENCH
MARK:
MSCI ACWI
IMI INDEX | | SECONDARY
BENCH
MARK:
BARCLAYS
US
AGGREGATE
INDEX | | |
| | | ONE YEAR | | | 16.81% | | | | 16.84% | | | | 23.35% | | | | 4.37% | | | | | | 16.81% | | | 16.84% | | 23.35% | | 4.37% | | |
| | | SINCE INCEPTION (1) | | | 26.04% | | | | 26.06% | | | | 38.89% | | | | 4.88% | | | | | | 11.18% | | | 11.19% | | 16.27% | | 2.21% | | |
| | | | | | | | | | | | | | | | | | | | | | | | | | | | |
| | (1) | For the period April 25, 2012 to June 30, 2014. |
11
SPDR SSgA GLOBAL ALLOCATION ETF — PERFORMANCE SUMMARY (CONTINUED)
COMPARISON OF CHANGE IN VALUE OF A $10,000 INVESTMENT (BASED ON NET ASSET VALUE)
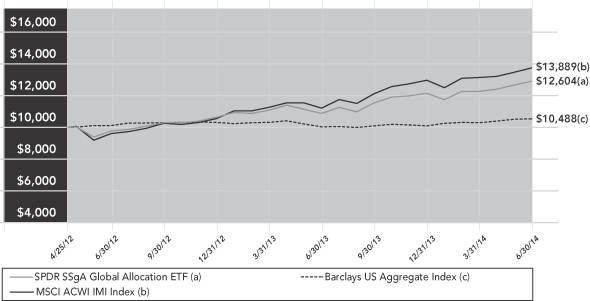
Past performance is not a guarantee of future results.
Index returns are unmanaged and do not reflect the deduction of any fees or expenses. Index returns reflect all items of income, gain and loss and the reinvestment of dividends and other income.
12
SPDR BLACKSTONE / GSO SENIOR LOAN ETF — MANAGEMENT’S DISCUSSIONOF FUND PERFORMANCE
The SPDR Blackstone / GSO Senior Loan ETF (the “Fund”) normally invests substantially all of its assets in the Blackstone / GSO Senior Loan Portfolio (the “Portfolio”), which seeks to provide current income consistent with the preservation of capital. As a result, the Fund invests indirectly through the Portfolio.
For the 12-month period ended June 30, 2014 (the “Reporting Period”), the total return for the Fund was 3.77%, and the total return for the Markit iBoxx USD Liquid Leveraged Loan Index (the “Index”) was 5.46%. The Fund and Index returns reflect the reinvestment of dividends and other income. The Fund’s performance reflects the expenses of managing the Fund, including brokerage and advisory expenses. The Index is unmanaged and Index returns do not reflect fees and expenses of any kind, which would have a negative impact on returns.
The Fund underperformed the Index during the Reporting Period, due primarily to (i) credit selection, as higher credit risk (as measured by corporate ratings) outperformed the less risky credits, and (ii) a higher cash balance, which was maintained to help meet potential liquidity needs. A benign credit environment (measured by a very low default rate versus the long-term average), coupled with significant interest in the leverage loan asset class (as represented by fund flows and issuance activity for collateralized loan obligations), was very supportive of secondary market prices, but also led to compression of credit spreads, as better rated companies refinanced at lower total interest costs. Lower quality loans rated CCC grossly outperformed high quality segments of the market. During this fiscal year, the return of loans rated CCC almost doubled those of B and BB rated loans. Since the Portfolio maintained a quality bias, and was underweighted in CCC and below rated assets throughout the year, it was unable to capture this return.
On an individual security level, the top positive contributors to the Fund’s performance were Weight Watchers (“WTW”), Caesars Entertainment Resort Properties (“CERP”) and Education Management. The Fund’s performance benefitted from the Portfolio’s decision to sell Weight Watchers early this year after a re-evaluation on the fundamental business model. WTW loans continued to decline in value after the Portfolio’s exit. The Portfolio purchased CERP through the primary refinancing transaction at a significant discount to par value. The CERP loans appreciated by more than 5 points prior to inclusion in the Index, contributing to both positive Portfolio performance and excess return versus the Index. The Portfolio’s full underweight to Education Management also contributed meaningfully to performance as the asset suffered a severe price decline after the company announced that it expected to breach its covenants. The top negative contributors were Texas Competitive Electric (“TXU”), Clear Channel, and Caesars Entertainment Operating Company (“CEOC”). The Portfolio had no exposure to TXU as the view was that the company would file bankruptcy and might not pay its pre-petition interest. However, TXU traded up considerably after filing for Chapter 11. The Portfolio added a position in Clear Channel, a generally high-beta credit on the belief that there are near-term catalysts for continued price appreciation. Local gaming authorities are currently reviewing recent amendments to the CEOC outstanding loans. The regulatory delay caused the CEOC loans in the Portfolio to underperform expectations.
The views expressed above reflect those of the Fund’s portfolio manager only through the Reporting Period, and do not necessarily represent the views of the Adviser as a whole. Any such views are subject to change at any time based upon market or other conditions and the Adviser disclaims any responsibility to update such views. These views may not be relied on as investment advice and, because investment decisions for a fund are based on numerous factors, may not be relied on as an indication of trading intent on behalf of any fund.
13
SPDR BLACKSTONE / GSO SENIOR LOAN ETF — PERFORMANCE SUMMARY
The following performance chart of the Fund’s total return at net asset value, the total return based on market price and its benchmark index is provided for comparative purposes only and represents the periods noted. The Fund’s per share net asset value (“NAV”) is the value of one share of the Fund and is calculated by dividing the value of total assets less total liabilities by the number of shares outstanding. The NAV return is based on the NAV of the Fund and the market return is based on the market price per share of the Fund. The market price used to calculate the market return is determined by using the midpoint between the highest bid and the lowest offer on the exchange on which the shares of the Fund are listed for trading, as of the time that the Fund’s NAV is calculated. Since shares of the Fund did not trade in the secondary market until one day after the Fund’s inception, for the period from inception to the first day of secondary market trading in shares of the Fund (4/3/13, 4/4/13, respectively), the NAV of the Fund is used as a proxy for the secondary market trading price to calculate market returns. NAV and market returns assume that dividends and capital gain distributions have been reinvested in the Fund at NAV. Market returns do not include brokerage commissions that may be payable on secondary market transactions. If brokerage commissions were included market returns would be lower.
An index is a statistical measure of a specified financial market or sector. An index does not actually hold a portfolio of securities and therefore does not reflect deductions for fees or expenses. In comparison, the Fund’s performance is negatively impacted by these deductions.
Performance quoted represents past performance, which is no guarantee of future results. Investment return and principal value will fluctuate, so you may have a gain or loss when shares are sold. Current performance may be higher or lower than that quoted. Visit www.spdrs.com for most recent month-end performance. The returns do not reflect the deduction of taxes that a shareholder would pay on Fund distributions or on the redemption or sale of Fund shares. The total expense ratio for SPDR Blackstone/GSO Senior Loan ETF as stated in the Fees and Expenses table of the prospectus dated October 31, 2013 (as supplemented on April 1, 2014) is 0.70%.
PERFORMANCE AS OF JUNE 30, 2014
| | | | | | | | | | | | | | | | | | | | | | | | | | | | | | | | | | | | | | |
| | | | | | | | | | | | | | | | | | | | | | | | | | | | | | | |
| | | | | CUMULATIVE TOTAL RETURN | | | | | AVERAGE ANNUAL TOTAL RETURN | | | |
| | | | | NET ASSET
VALUE | | | MARKET
VALUE | | | PRIMARY
BENCHMARK:
MARKIT
IBOXX USD
LIQUID
LEVERAGED
LOAN INDEX | | | SECONDARY
BENCHMARK:
S&P/LSTA U.S.
LEVERAGED
LOAN
100 INDEX | | | | | NET ASSET
VALUE | | | MARKET
VALUE | | | PRIMARY
BENCHMARK:
MARKIT
IBOXX USD
LIQUID
LEVERAGED
LOAN INDEX | | | SECONDARY
BENCHMARK:
S&P/LSTA
U.S.
LEVERAGED
LOAN
100 INDEX | | | |
| | | ONE YEAR | | | 3.77% | | | | 3.61% | | | | 5.46% | | | | 5.56% | | | | | | 3.77% | | | | 3.61% | | | | 5.46% | | | | 5.56% | | | |
| | | SINCE INCEPTION (1) | | | 3.27% | | | | 3.26% | | | | 5.04% | | | | 5.32% | | | | | | 2.62% | | | | 2.62% | | | | 4.04% | | | | 4.27% | | | |
| | | | | | | | | | | | | | | | | | | | | | | | | | | | | | | |
| | (1) | For the period April 3, 2013 to June 30, 2014. |
14
SPDR BLACKSTONE / GSO SENIOR LOAN ETF — PERFORMANCE SUMMARY (CONTINUED)
COMPARISON OF CHANGE IN VALUE OF A $10,000 INVESTMENT (BASED ON NET ASSET VALUE)
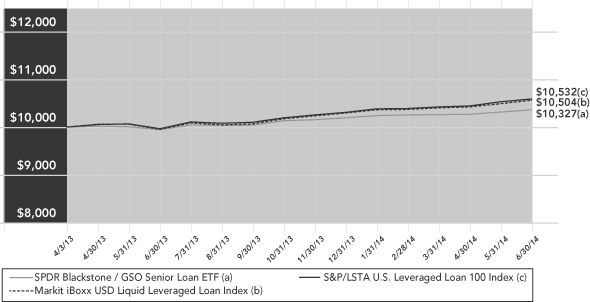
Past performance is not a guarantee of future results.
Index returns are unmanaged and do not reflect the deduction of any fees or expenses. Index returns reflect all items of income, gain and loss and the reinvestment of dividends and other income.
15
SPDR SSgA ULTRA SHORT TERM BOND ETF — MANAGEMENT’S DISCUSSIONOF FUND PERFORMANCE
The SPDR SSgA Ultra Short Term Bond ETF (the “Fund”) normally invests substantially all of its assets in the SSgA Ultra Short Term Bond Portfolio (the “Portfolio”), which seeks to provide current income consistent with preservation of capital and daily liquidity through short duration high quality investments. As a result, the Fund invests indirectly through the Portfolio.
For the period that began October 9, 2013, and ended June 30, 2014 (the “Reporting Period”), the total return for the Fund was 0.46%, and the total return for the Barclays US Treasury Bellwether 3 Month Index (the “Index”) was 0.06%. The Fund and Index returns reflect the reinvestment of dividends and other income. The Fund’s performance reflects the expenses of managing the Fund, including brokerage and advisory expenses. The Index is unmanaged and Index returns do not reflect fees and expenses of any kind, which would have a negative impact on returns.
The Fund outperformed the Index during the Reporting Period. The Portfolio maintained a duration of approximately 0.5 years during the period versus the benchmark’s duration of 0.25 years. As of quarter end, the Portfolio’s asset allocation consisted of corporate bonds (72.8%), asset-backed securities (ABS) (25.3%) and cash (1.9%). 42.9% of fund assets had fixed rates and 57.1% had floating rate coupons. The Portfolio’s use of floating rate bonds allowed for substantial exposure to corporate bonds and ABS without adding significant interest rate risk. The Portfolio’s long duration stance and yield curve positioning was responsible for approximately half of the outperformance against the benchmark, while the Portfolio’s sector exposure (corporates and ABS) contributed the other half. The Federal Open Market Committee continued its accommodative monetary policy during the period by leaving the target federal funds rate unchanged at 0% – 0.25% and continuing with its Large Scale Asset Purchase (LSAP) program. As a result, yields in the front end (0-1 year) of the yield curve were virtually unchanged during the period. The Portfolio’s focus on corporate bonds and ABS allowed for a yield advantage compared to the benchmark. Further, credit spreads on corporate bonds and ABS narrowed during the period, giving the Portfolio another return advantage versus its benchmark. Overall, corporate bond credit spreads narrowed more than ABS. Generally speaking, longer maturity bonds in the portfolio performed better than shorter maturity bonds due to the combination of higher yields and more pronounced spread narrowing. The Fund maintained a weighted average maturity near the 1.5-year area in order to take advantage of the higher yields available in 2–5 year corporate bonds and ABS.
The views expressed above reflect those of the Fund’s portfolio manager only through the Reporting Period, and do not necessarily represent the views of the Adviser as a whole. Any such views are subject to change at any time based upon market or other conditions and the Adviser disclaims any responsibility to update such views. These views may not be relied on as investment advice and, because investment decisions for a fund are based on numerous factors, may not be relied on as an indication of trading intent on behalf of any fund.
16
SPDR SSgA ULTRA SHORT TERM BOND ETF — PERFORMANCE SUMMARY
The following performance chart of the Fund’s total return at net asset value, the total return based on market price and its benchmark index is provided for comparative purposes only and represents the periods noted. The Fund’s per share net asset value (“NAV”) is the value of one share of the Fund and is calculated by dividing the value of total assets less total liabilities by the number of shares outstanding. The NAV return is based on the NAV of the Fund and the market return is based on the market price per share of the Fund. The market price used to calculate the market return is determined by using the midpoint between the highest bid and the lowest offer on the exchange on which the shares of the Fund are listed for trading, as of the time that the Fund’s NAV is calculated. Since shares of the Fund did not trade in the secondary market until one day after the Fund’s inception, for the period from inception to the first day of secondary market trading in shares of the Fund (10/9/13, 10/10/13, respectively), the NAV of the Fund is used as a proxy for the secondary market trading price to calculate market returns. NAV and market returns assume that dividends and capital gain distributions have been reinvested in the Fund at NAV. Market returns do not include brokerage commissions that may be payable on secondary market transactions. If brokerage commissions were included market returns would be lower.
An index is a statistical measure of a specified financial market or sector. An index does not actually hold a portfolio of securities and therefore does not reflect deductions for fees or expenses. In comparison, the Fund’s performance is negatively impacted by these deductions.
Performance quoted represents past performance, which is no guarantee of future results. Investment return and principal value will fluctuate, so you may have a gain or loss when shares are sold. Current performance may be higher or lower than that quoted. Visit www.spdrs.com for most recent month-end performance. The returns do not reflect the deduction of taxes that a shareholder would pay on Fund distributions or on the redemption or sale of Fund shares. The total expense ratio for SPDR SSgA Ultra Short Term Bond ETF as stated in the Fees and Expenses table of the prospectus dated October 31, 2013 is 0.20%.
PERFORMANCE AS OF JUNE 30, 2014
| | | | | | | | | | | | | | | | | | | | | | | | | | | | | | |
| | | | | | | | | | | | | |
| | | | | CUMULATIVE TOTAL RETURN | | | | | AVERAGE ANNUAL TOTAL RETURN (2) | | | |
| | | | | NET ASSET
VALUE | | | MARKET
VALUE | | | BARCLAYS
US TREASURY
BELLWETHER
3 MONTH
INDEX | | | | | NET ASSET
VALUE | | | MARKET
VALUE | | | BARCLAYS
US TREASURY
BELLWETHER
3 MONTH
INDEX | | | |
| | | SINCE INCEPTION (1) | | | 0.46% | | | | 0.39% | | | | 0.06% | | | | | | N/A | | | | N/A | | | | N/A | | | |
| | | | | | | | | | | | | | | | | | | | | | | | | |
| | (1) | For the period October 9, 2013 to June 30, 2014. |
| | (2) | Total returns for periods of less than one year are not annualized. |
17
SPDR SSgA ULTRA SHORT TERM BOND ETF — PERFORMANCE SUMMARY
COMPARISON OF CHANGE IN VALUE OF A $10,000 INVESTMENT (BASED ON NET ASSET VALUE)
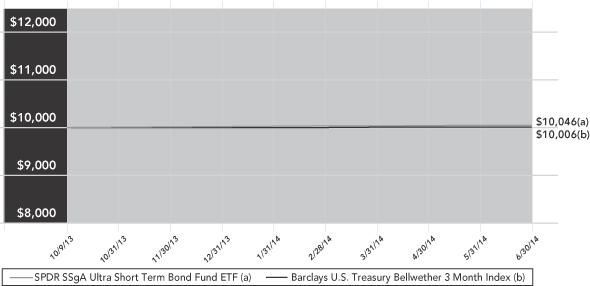
Past Performance is not a guarantee of future results.
Index returns are unmanaged and do not reflect the deduction of any fees or expenses. Index returns reflect all items of income, gain and loss and the reinvestment of dividends and other income.
18
SPDR SSgA MFS Systematic Core Equity ETF
SPDR SSgA MFS Systematic Growth Equity ETF
SPDR SSgA MFS Systematic Value Equity ETF — PERFORMANCE SUMMARY
These Funds had less than six months of operations at reporting period end and therefore do not have performance history to provide in this report.
19
SSgA ACTIVE ETF TRUST
STATEMENTS OF ASSETS AND LIABILITIES
June 30, 2014
| | | | | | | | | | | | |
| | |
SPDR SSgA
Multi-Asset Real
Return ETF | | | SPDR SSgA
Income Allocation
ETF | | | SPDR SSgA
Global Allocation
ETF | |
ASSETS | | | | | | | | | | | | |
Investments in corresponding Portfolio, at market value (Note 1) | | $ | 164,633,907 | | | $ | 104,029,182 | | | $ | 98,490,352 | |
Due from Advisor | | | 1,030 | | | | — | | | | 11,204 | |
Receivable for fund shares sold | | | 24,685,995 | | | | — | | | | — | |
| | | | | | | | | | | | |
TOTAL ASSETS | | | 189,320,932 | | | | 104,029,182 | | | | 98,501,556 | |
| | | | | | | | | | | | |
LIABILITIES | | | | | | | | | | | | |
Payable to Master Portfolio | | | 24,685,995 | | | | — | | | | — | |
Income distributions payable | | | 1,054,507 | | | | 981,401 | | | | 912,654 | |
Accrued Advisory fees | | | — | | | | 12,885 | | | | — | |
Accrued trustees’ fees and expenses | | | 77 | | | | 63 | | | | 34 | |
| | | | | | | | | | | | |
TOTAL LIABILITIES | | | 25,740,579 | | | | 994,349 | | | | 912,688 | |
| | | | | | | | | | | | |
NET ASSETS | | $ | 163,580,353 | | | $ | 103,034,833 | | | $ | 97,588,868 | |
| | | | | | | | | | | | |
NET ASSETS CONSIST OF: | | | | | | | | | | | | |
Paid-in capital (Note 4) | | $ | 162,658,930 | | | $ | 101,878,090 | | | $ | 90,729,373 | |
Undistributed (distributions in excess of) net investment income | | | (217,343 | ) | | | (264,228 | ) | | | (113,125 | ) |
Accumulated net realized gain (loss) on investments | | | (4,385,807 | ) | | | (3,830,418 | ) | | | 557,108 | |
Net unrealized appreciation (depreciation) on investments | | | 5,524,573 | | | | 5,251,389 | | | | 6,415,512 | |
| | | | | | | | | | | | |
NET ASSETS | | $ | 163,580,353 | | | $ | 103,034,833 | | | $ | 97,588,868 | |
| | | | | | | | | | | | |
NET ASSET VALUE PER SHARE | | | | | | | | | | | | |
Net asset value per share | | $ | 30.86 | | | $ | 32.70 | | | $ | 35.47 | |
| | | | | | | | | | | | |
Shares outstanding (unlimited amount authorized, $0.00 par value) | | | 5,301,111 | | | | 3,151,111 | | | | 2,751,111 | |
| | | | | | | | | | | | |
See Notes to Financial Statements and Financial Statements of the Master Portfolios.
20
| | | | | | | | | | | | | | | | | | |
SPDR Blackstone /
GSO Senior
Loan ETF | | | SPDR SSgA Ultra
Short Term Bond
ETF | | | SPDR MFS
Systematic Core
Equity ETF | | | SPDR MFS
Systematic
Growth Equity
ETF | | | SPDR MFS
Systematic Value
Equity ETF | |
| | | | | | | | | | | | | | | | | | |
| $ | 610,475,920 | | | $ | 14,034,928 | | | $ | 5,376,904 | | | $ | 5,371,501 | | | $ | 5,285,262 | |
| | — | | | | — | | | | — | | | | — | | | | — | |
| | — | | | | — | | | | — | | | | — | | | | — | |
| | | | | | | | | | | | | | | | | | |
| | 610,475,920 | | | | 14,034,928 | | | | 5,376,904 | | | | 5,371,501 | | | | 5,285,262 | |
| | | | | | | | | | | | | | | | | | |
| | | | | | | | | | | | | | | | | | |
| | — | | | | — | | | | — | | | | — | | | | — | |
| | — | | | | — | | | | 15,957 | | | | 14,294 | | | | 16,870 | |
| | 200,342 | | | | — | | | | 1,323 | | | | 1,322 | | | | 1,298 | |
| | 299 | | | | 11 | | | | 10 | | | | 10 | | | | 10 | |
| | | | | | | | | | | | | | | | | | |
| | 200,641 | | | | 11 | | | | 17,290 | | | | 15,626 | | | | 18,178 | |
| | | | | | | | | | | | | | | | | | |
| $ | 610,275,279 | | | $ | 14,034,917 | | | $ | 5,359,614 | | | $ | 5,355,875 | | | $ | 5,267,084 | |
| | | | | | | | | | | | | | | | | | |
| | | | | | | | | | | | | | | | | | |
| $ | 610,197,772 | | | $ | 14,019,568 | | | $ | 5,000,000 | | | $ | 5,000,000 | | | $ | 5,000,000 | |
| | 1,246,787 | | | | 4,155 | | | | 710 | | | | 967 | | | | 679 | |
| | (2,786,254 | ) | | | 715 | | | | 68,567 | | | | 10,974 | | | | 4,237 | |
| | 1,616,974 | | | | 10,479 | | | | 290,337 | | | | 343,934 | | | | 262,168 | |
| | | | | | | | | | | | | | | | | | |
| $ | 610,275,279 | | | $ | 14,034,917 | | | $ | 5,359,614 | | | $ | 5,355,875 | | | $ | 5,267,084 | |
| | | | | | | | | | | | | | | | | | |
| | | | | | | | | | | | | | | | | | |
| $ | 50.02 | | | $ | 40.10 | | | $ | 53.60 | | | $ | 53.56 | | | $ | 52.67 | |
| | | | | | | | | | | | | | | | | | |
| | 12,200,000 | | | | 350,000 | | | | 100,000 | | | | 100,000 | | | | 100,000 | |
| | | | | | | | | | | | | | | | | | |
21
SSgA ACTIVE ETF TRUST
STATEMENTS OF OPERATIONS
For the Year Ended June 30, 2014
| | | | | | | | | | | | |
| | |
SPDR SSgA
Multi-Asset Real
Return ETF | | | SPDR SSgA
Income Allocation
ETF | | | SPDR SSgA
Global Allocation
ETF | |
INCOME AND EXPENSES ALLOCATED FROM PORTFOLIO | | | | | | | | | | | | |
Dividend income allocated from Portfolio (Note 2) | | $ | 2,847,611 | | | $ | 4,309,792 | | | $ | 2,012,056 | |
Expenses allocated from Portfolio (Note 2) | | | (260,599 | ) | | | (212,962 | ) | | | (137,182 | ) |
| | | | | | | | | | | | |
TOTAL INCOME | | | 2,587,012 | | | | 4,096,830 | | | | 1,874,874 | |
| | | | | | | | | | | | |
EXPENSES | | | | | | | | | | | | |
Advisory fees (Note 3) | | | 43,345 | | | | 163,921 | | | | — | |
Trustee Fees (Note 3) | | | 2,565 | | | | 2,315 | | | | 1,094 | |
| | | | | | | | | | | | |
TOTAL EXPENSES | | | 45,910 | | | | 166,236 | | | | 1,094 | |
| | | | | | | | | | | | |
Fees reimbursed by Adviser | | | — | | | | — | | | | (102,164 | ) |
| | | | | | | | | | | | |
NET INVESTMENT INCOME | | $ | 2,541,102 | | | $ | 3,930,594 | | | $ | 1,975,944 | |
| | | | | | | | | | | | |
REALIZED AND UNREALIZED GAIN (LOSS)
ON INVESTMENTS | | | | | | | | | | | | |
Net realized gain (loss) allocated from Portfolio | | | (2,207,376 | ) | | | (1,346,776 | ) | | | 1,718,544 | |
Net change in unrealized appreciation (depreciation) from corresponding Portfolio | | | 16,133,379 | | | | 11,409,099 | | | | 6,937,749 | |
| | | | | | | | | | | | |
NET REALIZED AND UNREALIZED GAIN (LOSS) ON INVESTMENTS | | | 13,926,003 | | | | 10,062,323 | | | | 8,656,293 | |
| | | | | | | | | | | | |
NET INCREASE (DECREASE) IN NET ASSETS RESULTING FROM OPERATIONS | | $ | 16,467,105 | | | $ | 13,992,917 | | | $ | 10,632,237 | |
| | | | | | | | | | | | |
| * | For the period October 9, 2013 (commencement of operations) to June 30, 2014. |
| ** | For the period January 8, 2014 (commencement of operations) to June 30, 2014. |
See Notes to Financial Statements and Financial Statements of the Master Portfolios.
22
| | | | | | | | | | | | | | | | | | |
SPDR Blackstone /
GSO Senior
Loan ETF | | | SPDR SSgA Ultra
Short Term Bond
ETF* | | | SPDR MFS
Systematic Core
Equity ETF** | | | SPDR MFS
Systematic
Growth Equity
ETF** | | | SPDR MFS
Systematic Value
Equity ETF** | |
| | | | | | | | | | | | | | | | | | |
| $ | 22,057,579 | | | $ | 51,616 | | | $ | 45,331 | | | $ | 43,055 | | | $ | 48,907 | |
| | (1,692,806 | ) | | | (19,265 | ) | | | (7,334 | ) | | | (7,332 | ) | | | (7,211 | ) |
| | | | | | | | | | | | | | | | | | |
| | 20,364,773 | | | | 32,351 | | | | 37,997 | | | | 35,723 | | | | 41,696 | |
| | | | | | | | | | | | | | | | | | |
| | | | | | | | | | | | | | | | | | |
| | 3,056,063 | | | | — | | | | 7,309 | | | | 7,310 | | | | 7,189 | |
| | 9,412 | | | | 78 | | | | 20 | | | | 19 | | | | 20 | |
| | | | | | | | | | | | | | | | | | |
| | 3,065,475 | | | | 78 | | | | 7,329 | | | | 7,329 | | | | 7,209 | |
| | | | | | | | | | | | | | | | | | |
| | — | | | | — | | | | — | | | | — | | | | — | |
| | | | | | | | | | | | | | | | | | |
| $ | 17,299,298 | | | $ | 32,273 | | | $ | 30,668 | | | $ | 28,394 | | | $ | 34,487 | |
| | | | | | | | | | | | | | | | | | |
| | | | | | | | | | | | | | | | | | |
| | (2,767,908 | ) | | | 888 | | | | 68,567 | | | | 10,974 | | | | 4,237 | |
| 4,689,705 | | | | 10,479 | | | | 290,337 | | | | 343,934 | | | | 262,168 | |
| | | | | | | | | | | | | | | | | | |
| 1,921,797 | | | | 11,367 | | | | 358,904 | | | | 354,908 | | | | 266,405 | |
| | | | | | | | | | | | | | | | | | |
$ | 19,221,095 | | | $ | 43,640 | | | $ | 389,572 | | | $ | 383,302 | | | $ | 300,892 | |
| | | | | | | | | | | | | | | | | | |
23
SSgA ACTIVE ETF TRUST
STATEMENTS OF CHANGES IN NET ASSETS
| | | | | | | | | | | | | | | | |
| | |
SPDR SSgA Multi-Asset Real Return ETF | | | SPDR SSgA Income Allocation ETF | |
| | |
Year Ended
6/30/14 | | | Year Ended
6/30/13 | | | Year Ended
6/30/14 | | | Year Ended
6/30/13 | |
INCREASE (DECREASE) IN NET ASSETS FROM OPERATIONS: | | | | | | | | | | | | | | | | |
Net investment income (loss) | | $ | 2,541,102 | | | $ | 1,713,977 | | | $ | 3,930,594 | | | $ | 3,492,721 | |
Net realized gain (loss) on
investments | | | (2,207,376 | ) | | | (924,336 | ) | | | (1,346,776 | ) | | | (1,103,415 | ) |
Net change in unrealized appreciation (depreciation) on investments | | | 16,133,379 | | | | (10,378,139 | ) | | | 11,409,099 | | | | (6,205,343 | ) |
| | | | | | | | | | | | | | | | |
Net increase (decrease) in net assets resulting from operations | | | 16,467,105 | | | | (9,588,498 | ) | | | 13,992,917 | | | | (3,816,037 | ) |
| | | | | | | | | | | | | | | | |
Net equalization credits and charges | | | 44,917 | | | | 57,257 | | | | (85,229 | ) | | | 300,070 | |
| | | | | | | | | | | | | | | | |
DISTRIBUTIONS TO
SHAREHOLDERS FROM: | | | | | | | | | | | | | | | | |
Net investment income | | | (2,582,680 | ) | | | (1,773,687 | ) | | | (3,845,121 | ) | | | (3,792,817 | ) |
| | | | | | | | | | | | | | | | |
FROM BENEFICIAL INTEREST TRANSACTIONS: | | | | | | | | | | | | | | | | |
Proceeds from sale of shares | | | 91,367,609 | | | | 130,398,415 | | | | 7,804,637 | | | | 170,596,375 | |
Cost of shares redeemed | | | (62,105,980 | ) | | | (4,387,694 | ) | | | (86,894,211 | ) | | | — | |
Net income equalization (Note 2) | | | (44,917 | ) | | | (57,257 | ) | | | 85,229 | | | | (300,070 | ) |
Other capital (Note 4) | | | — | | | | — | | | | — | | | | — | |
| | | | | | | | | | | | | | | | |
Net increase (decrease) in net assets from beneficial interest transactions | | | 29,216,712 | | | | 125,953,464 | | | | (79,004,345 | ) | | | 170,296,305 | |
| | | | | | | | | | | | | | | | |
Net increase (decrease) in net assets during the period | | | 43,146,054 | | | | 114,648,536 | | | | (68,941,778 | ) | | | 162,987,521 | |
Net assets at beginning of period | | | 120,434,299 | | | | 5,785,763 | | | | 171,976,611 | | | | 8,989,090 | |
| | | | | | | | | | | | | | | | |
NET ASSETS END OF PERIOD (1) | | $ | 163,580,353 | | | $ | 120,434,299 | | | $ | 103,034,833 | | | $ | 171,976,611 | |
| | | | | | | | | | | | | | | | |
SHARES OF BENEFICIAL INTEREST | | | | | | | | | | | | | | | | |
Shares sold | | | 3,100,000 | | | | 4,300,000 | | | | 250,000 | | | | 5,450,000 | |
Shares redeemed | | | (2,150,000 | ) | | | (150,000 | ) | | | (2,850,000 | ) | | | — | |
| | | | | | | | | | | | | | | | |
Net increase (decrease) in shares | | | 950,000 | | | | 4,150,000 | | | | (2,600,000 | ) | | | 5,450,000 | |
| | | | | | | | | | | | | | | | |
(1) Undistributed (distributions in excess of) net investment income | | $ | (217,343 | ) | | $ | (66,390 | ) | | $ | (264,228 | ) | | $ | (349,701 | ) |
| | | | | | | | | | | | | | | | |
| * | Commencement of operations |
See Notes to Financial Statements and Financial Statements of the Master Portfolios.
24
| | | | | | | | | | | | | | | | | | | | | | |
| SPDR SSgA Global Allocation ETF | | | SPDR Blackstone / GSO Senior Loan ETF | | | SPDR SSgA Ultra
Short Term Bond
ETF | | | SPDR MFS
Systematic Core
Equity ETF | |
Year Ended
6/30/14 | | | Year Ended
6/30/13 | | | Year Ended
6/30/14 | | | For the Period
4/3/13* -
6/30/13 | | | For the Period
10/9/13* -
6/30/14 | | | For the Period
1/8/14* -
6/30/14 | |
| | | | | | | | | | | | | | | | | | | | | | |
| $ | 1,975,944 | | | $ | 707,900 | | | $ | 17,299,298 | | | $ | 945,293 | | | $ | 32,273 | | | $ | 30,668 | |
|
1,718,544 |
| | | 31,543 | | | | (2,767,908 | ) | | | (18,346 | ) | | | 888 | | | | 68,567 | |
|
6,937,749 |
| | | (434,651 | ) | | | 4,689,705 | | | | (3,072,731 | ) | | | 10,479 | | | | 290,337 | |
| | | | | | | | | | | | | | | | | | | | | | |
|
10,632,237 |
| | | 304,792 | | | | 19,221,095 | | | | (2,145,784 | ) | | | 43,640 | | | | 389,572 | |
| | | | | | | | | | | | | | | | | | | | | | |
| | 45,650 | | | | 59,672 | | | | 381,936 | | | | 232,911 | | | | 134 | | | | — | |
| | | | | | | | | | | | | | | | | | | | | | |
| | | | | | | | | | | | | | | | | | | | | | |
| | (2,021,720 | ) | | | (768,378 | ) | | | (16,478,270 | ) | | | (519,534 | ) | | | (28,118 | ) | | | (29,958 | ) |
| | | | | | | | | | | | | | | | | | | | | | |
| | | | | | | | | | | | | | | | | | | | | | |
| | 47,337,163 | | | | 50,769,956 | | | | 286,897,792 | | | | 334,914,199 | | | | 16,009,331 | | | | 5,000,000 | |
| | (9,842,556 | ) | | | (3,233,657 | ) | | | (12,480,635 | ) | | | — | | | | (2,005,142 | ) | | | — | |
| | (45,650 | ) | | | (59,672 | ) | | | (381,936 | ) | | | (232,911 | ) | | | (134 | ) | | | — | |
| | — | | | | — | | | | 461,547 | | | | 404,869 | | | | 15,206 | | | | — | |
| | | | | | | | | | | | | | | | | | | | | | |
|
37,448,957 |
| | | 47,476,627 | | | | 274,496,768 | | | | 335,086,157 | | | | 14,019,261 | | | | 5,000,000 | |
| | | | | | | | | | | | | | | | | | | | | | |
|
46,105,124 |
| | | 47,072,713 | | | | 277,621,529 | | | | 332,653,750 | | | | 14,034,917 | | | | 5,359,614 | |
| | 51,483,744 | | | | 4,411,031 | | | | 332,653,750 | | | | — | | | | — | | | | — | |
| | | | | | | | | | | | | | | | | | | | | | |
| $ | 97,588,868 | | | $ | 51,483,744 | | | $ | 610,275,279 | | | $ | 332,653,750 | | | $ | 14,034,917 | | | $ | 5,359,614 | |
| | | | | | | | | | | | | | | | | | | | | | |
| | | | | | | | | | | | | | | | | | | | | | |
| | 1,400,000 | | | | 1,600,000 | | | | 5,750,000 | | | | 6,700,000 | | | | 400,000 | | | | 100,000 | |
| | (300,000 | ) | | | (100,000 | ) | | | (250,000 | ) | | | — | | | | (50,000 | ) | | | — | |
| | | | | | | | | | | | | | | | | | | | | | |
| | 1,100,000 | | | | 1,500,000 | | | | 5,500,000 | | | | 6,700,000 | | | | 350,000 | | | | 100,000 | |
| | | | | | | | | | | | | | | | | | | | | | |
| | | | | |
| $ | (113,125 | ) | | $ | (65,033 | ) | | $ | 1,246,787 | | | $ | 425,759 | | | $ | 4,155 | | | $ | 710 | |
| | | | | | | | | | | | | | | | | | | | | | |
25
SSgA ACTIVE ETF TRUST
STATEMENTS OF CHANGES IN NET ASSETS (continued)
| | | | | | | | |
| | | SPDR MFS
Systematic Growth
Equity ETF | | | SPDR MFS
Systematic Value
Equity ETF | |
| | | For the Period
1/8/14* -
6/30/14 | | | For the Period
1/8/14* -
6/30/14 | |
INCREASE (DECREASE) IN NET ASSETS FROM OPERATIONS: | | | | | | | | |
Net investment income (loss) | | $ | 28,394 | | | $ | 34,487 | |
Net realized gain (loss) on investments | | | 10,974 | | | | 4,237 | |
Net change in unrealized appreciation (depreciation) on investments | | | 343,934 | | | | 262,168 | |
| | | | | | | | |
Net increase (decrease) in net assets resulting from operations | | | 383,302 | | | | 300,892 | |
| | | | | | | | |
Net equalization credits and charges | | | — | | | | — | |
| | | | | | | | |
DISTRIBUTIONS TO SHAREHOLDERS FROM: | | | | | | | | |
Net investment income | | | (27,427 | ) | | | (33,808 | ) |
| | | | | | | | |
FROM BENEFICIAL INTEREST TRANSACTIONS: | | | | | | | | |
Proceeds from sale of shares | | | 5,000,000 | | | | 5,000,000 | |
Cost of shares redeemed | | | — | | | | — | |
Net income equalization (Note 2) | | | — | | | | — | |
Other capital (Note 4) | | | — | | | | — | |
| | | | | | | | |
Net increase (decrease) in net assets from beneficial interest transactions | | | 5,000,000 | | | | 5,000,000 | |
| | | | | | | | |
Net increase (decrease) in net assets during the period | | | 5,355,875 | | | | 5,267,084 | |
Net assets at beginning of period | | | — | | | | — | |
| | | | | | | | |
NET ASSETS END OF PERIOD (1) | | $ | 5,355,875 | | | $ | 5,267,084 | |
| | | | | | | | |
SHARES OF BENEFICIAL INTEREST | | | | | | | | |
Shares sold | | | 100,000 | | | | 100,000 | |
Shares redeemed | | | — | | | | — | |
| | | | | | | | |
Net increase (decrease) in shares | | | 100,000 | | | | 100,000 | |
| | | | | | | | |
(1) Undistributed (distributions in excess of) net investment income | | $ | 967 | | | $ | 679 | |
| | | | | | | | |
| * | Commencement of operations |
See Notes to Financial Statements and Financial Statements of the Master Portfolios.
26
[This Page Intentionally Left Blank]
27
SSgA ACTIVE ETF TRUST
FINANCIAL HIGHLIGHTS
Selected data for a share of beneficial interest outstanding throughout each period is presented below (1):
| | | | | | | | | | | | | | | | | | | | | | | | |
| | |
SPDR SSgA Multi-Asset Real Return ETF | | | SPDR SSgA Income Allocation ETF | |
| | | Year Ended
6/30/14 | | | Year Ended
6/30/13 | | |
For the Period
4/25/12* -
6/30/12 | | | Year Ended
6/30/14 | | | Year Ended
6/30/13 | | | For the Period
4/25/12* -
6/30/12 | |
Net asset value, beginning of period | | $ | 27.68 | | | $ | 28.77 | | | $ | 30.00 | | | $ | 29.90 | | | $ | 29.85 | | | $ | 30.00 | |
| | | | | | | | | | | | | | | | | | | | | | | | |
Income (loss) from investment operations: | | | | | | | | | | | | | | | | | | | | | | | | |
Net investment income (loss) (2) | | | 0.57 | | | | 0.86 | | | | 0.20 | | | | 1.16 | | | | 1.41 | | | | 0.44 | |
Net realized and unrealized gain (loss) on investments (3) | | | 3.22 | | | | (1.33 | ) | | | (1.22 | ) | | | 2.86 | | | | (0.25 | ) | | | (0.29 | ) |
| | | | | | | | | | | | | | | | | | | | | | | | |
Total from investment operations | | | 3.79 | | | | (0.47 | ) | | | (1.02 | ) | | | 4.02 | | | | 1.16 | | | | 0.15 | |
| | | | | | | | | | | | | | | | | | | | | | | | |
Net equalization credits and charges (2) | | | 0.01 | | | | 0.03 | | | | (0.01 | ) | | | (0.03 | ) | | | 0.12 | | | | 0.11 | |
| | | | | | | | | | | | | | | | | | | | | | | | |
Other capital | | | — | | | | — | | | | — | | | | — | | | | — | | | | — | |
| | | | | | | | | | | | | | | | | | | | | | | | |
Distributions to shareholders from: | | | | | | | | | | | | | | | | | | | | | | | | |
Net investment income | | | (0.62 | ) | | | (0.65 | ) | | | (0.20 | ) | | | (1.19 | ) | | | (1.23 | ) | | | (0.41 | ) |
| | | | | | | | | | | | | | | | | | | | | | | | |
Net asset value, end of period | | $ | 30.86 | | | $ | 27.68 | | | $ | 28.77 | | | $ | 32.70 | | | $ | 29.90 | | | $ | 29.85 | |
| | | | | | | | | | | | | | | | | | | | | | | | |
Total Return (5) | | | 13.85 | % | | | (1.67 | )% | | | (3.44 | )% | | | 13.57 | % | | | 4.22 | % | | | 0.87 | % |
Ratios and Supplemental Data: | | | | | | | | | | | | | | | | | | | | | | | | |
Net Assets, End of Period (000s) | | $ | 163,580 | | | $ | 120,434 | | | $ | 5,786 | | | $ | 103,035 | | | $ | 171,977 | | | $ | 8,989 | |
Ratios to average net assets: | | | | | | | | | | | | | | | | | | | | | | | | |
Total expenses | | | 0.24 | % | | | 0.25 | % | | | 0.27 | %(6) | | | 0.36 | % | | | 0.35 | % | | | 0.36 | %(6) |
Net operating expenses | | | 0.24 | % | | | 0.25 | % | | | 0.27 | %(6) | | | 0.36 | % | | | 0.35 | % | | | 0.36 | %(6) |
Net investment income | | | 1.97 | % | | | 2.86 | % | | | 3.77 | %(6) | | | 3.73 | % | | | 4.50 | % | | | 8.24 | %(6) |
Portfolio turnover rate (7) | | | 40 | % | | | 31 | % | | | 10 | % | | | 63 | % | | | 80 | % | | | 15 | % |
| * | Commencement of operations |
| (1) | The per share amounts and percentages include each Fund’s proportionate share of income and expenses of their respective Portfolio. |
| (2) | Per share numbers have been calculated using average shares outstanding, which more appropriately presents the per share data for the period. |
| (3) | Amounts shown in this caption for a share outstanding may not accord with the change in aggregate gains and losses in securities for the fiscal period because of the timing of sales and repurchases of Fund shares in relation to fluctuating market values for the Fund. |
| (4) | Amount is less that $0.005 per share. |
| (5) | Total return is calculated assuming a purchase of shares at net asset value on the first day and a sale at net asset value on the last day of each period reported. Distributions are assumed, for the purpose of this calculation, to be reinvested at net asset value per share on the respective payment dates of each Fund. Total return for periods of less than one year is not annualized. Broker commission charges are not included in this calculation. |
| (7) | Portfolio turnover rate is from their respective Portfolio. |
See Notes to Financial Statements and Financial Statements of the Master Portfolios.
28
| | | | | | | | | | | | | | | | | | | | | | | | | | | | | | | | | | |
| SPDR SSgA Global Allocation ETF | | | SPDR Blackstone /
GSO
Senior Loan ETF | | | SPDR SSgA
Ultra Short
Term Bond
ETF | | | SPDR MFS
Systematic
Core Equity
ETF | | | SPDR MFS
Systematic
Growth
Equity ETF | | | SPDR MFS
Systematic
Value Equity
ETF | |
Year Ended
6/30/14 | | | Year Ended
6/30/13 | | | For the
Period
4/25/12* -
6/30/12 | | | Year Ended
6/30/14 | | | For the
Period
4/3/13* -
6/30/13 | | | For the
Period
10/9/13* -
6/30/14 | | | For the
Period
1/8/14* -
6/30/14 | | | For the
Period
1/8/14* -
6/30/14 | | | For the
Period
1/8/14* -
6/30/14 | |
| $ | 31.18 | | | $ | 29.19 | | | $ | 30.00 | | | $ | 49.65 | | | $ | 50.00 | | | $ | 40.00 | | | $ | 50.00 | | | $ | 50.00 | | | $ | 50.00 | |
| | | | | | | | | | | | | | | | | | | | | | | | | | | | | | | | | | |
| | | | | | | | | | | | | | | | | | | | | | | | | | | | | | | | | | |
| | 0.98 | | | | 1.03 | | | | 0.24 | | | | 1.54 | | | | 0.24 | | | | 0.10 | | | | 0.31 | | | | 0.28 | | | | 0.34 | |
|
4.20 |
| | | 1.77 | | | | (0.77 | ) | | | 0.24 | | | | (0.65 | ) | | | 0.03 | | | | 3.59 | | | | 3.55 | | | | 2.67 | |
| | | | | | | | | | | | | | | | | | | | | | | | | | | | | | | | | | |
| | 5.18 | | | | 2.80 | | | | (0.53 | ) | | | 1.78 | | | | (0.41 | ) | | | 0.13 | | | | 3.90 | | | | 3.83 | | | | 3.01 | |
| | | | | | | | | | | | | | | | | | | | | | | | | | | | | | | | | | |
| | 0.02 | | | | 0.09 | | | | (0.02 | ) | | | 0.03 | | | | 0.06 | | | | 0.00 | (4) | | | — | | | | — | | | | — | |
| | | | | | | | | | | | | | | | | | | | | | | | | | | | | | | | | | |
| | — | | | | — | | | | — | | | | 0.04 | | | | 0.10 | | | | 0.05 | | | | — | | | | — | | | | — | |
| | | | | | | | | | | | | | | | | | | | | | | | | | | | | | | | | | |
| | | | | | | | | | | | | | | | | | | | | | | | | | | | | | | | | | |
| | (0.91 | ) | | | (0.90 | ) | | | (0.26 | ) | | | (1.48 | ) | | | (0.10 | ) | | | (0.08 | ) | | | (0.30 | ) | | | (0.27 | ) | | | (0.34 | ) |
| | | | | | | | | | | | | | | | | | | | | | | | | | | | | | | | | | |
| $ | 35.47 | | | $ | 31.18 | | | $ | 29.19 | | | $ | 50.02 | | | $ | 49.65 | | | $ | 40.10 | | | $ | 53.60 | | | $ | 53.56 | | | $ | 52.67 | |
| | | | | | | | | | | | | | | | | | | | | | | | | | | | | | | | | | |
| | 16.81 | % | | | 9.91 | % | | | (1.82 | )% | | | 3.77 | % | | | (0.48 | )% | | | 0.46 | % | | | 7.81 | % | | | 7.68 | % | | | 6.04 | % |
| | | | | | | | | | | | | | | | | | | | | | | | | | | | | | | | | | |
| $ | 97,589 | | | $ | 51,484 | | | $ | 4,411 | | | $ | 610,275 | | | $ | 332,654 | | | $ | 14,035 | | | $ | 5,360 | | | $ | 5,356 | | | $ | 5,267 | |
| | | | | | | | | | | | | | | | | | | | | | | | | | | | | | | | | | |
| | 0.20 | % | | | 0.20 | % | | | 0.20 | %(6) | | | 0.85 | % | | | 0.90 | %(6) | | | 0.20 | %(6) | | | 0.60 | %(6) | | | 0.60 | %(6) | | | 0.60 | %(6) |
| | 0.05 | % | | | 0.04 | % | | | 0.05 | %(6) | | | 0.85 | % | | | 0.90 | %(6) | | | 0.20 | %(6) | | | 0.60 | %(6) | | | 0.60 | %(6) | | | 0.60 | %(6) |
| | 2.91 | % | | | 3.23 | % | | | 4.48 | %(6) | | | 3.09 | % | | | 1.97 | %(6) | | | 0.34 | %(6) | | | 1.25 | %(6) | | | 1.16 | %(6) | | | 1.43 | %(6) |
| | 89 | % | | | 123 | % | | | 25 | % | | | 77 | % | | | 4 | % | | | 39 | % | | | 27 | % | | | 20 | % | | | 23 | % |
29
SSgA ACTIVE ETF TRUST
NOTES TO FINANCIAL STATEMENTS
June 30, 2014
SSgA Active ETF Trust (the “Trust”), which is registered under the Investment Company Act of 1940, as amended (“1940 Act”), is an open-end investment management company that was organized as a Massachusetts business trust on March 30, 2011.
As of June 30, 2014, the Trust offered eight (8) portfolios, each of which represents a separate series of beneficial interest in the Trust (each, a “Fund” and collectively, the “Funds”). The financial statements herein relate to the following eight (8) Funds: SPDR SSgA Multi-Asset Real Return ETF, SPDR SSgA Income Allocation ETF, SPDR SSgA Global Allocation ETF, SPDR Blackstone / GSO Senior Loan ETF, SPDR SSgA Ultra Short Term Bond ETF, SPDR MFS Systematic Core Equity ETF, SPDR MFS Systematic Growth Equity ETF and SPDR MFS Systematic Value Equity ETF.
The Trust is part of a master-feeder structure and each Fund invests substantially all of its assets in interests of its respective master portfolio: the SSgA Multi-Asset Real Return Portfolio, SSgA Income Allocation Portfolio, SSgA Global Allocation Portfolio, Blackstone / GSO Senior Loan Portfolio, SSgA Ultra Short Term Bond Portfolio, SSgA MFS Systematic Core Equity Portfolio, SSgA MFS Systematic Growth Equity Portfolio and SSgA MFS Systematic Value Equity Portfolio (each, a “Portfolio” and collectively, the “Portfolios”), each Portfolio is a series of a separately registered investment company called SSgA Master Trust (“Master Trust”). The investment objective and policies of each Fund are substantially similar to those of its respective Portfolio. The value of each Fund’s investment in its respective Portfolio reflects the Fund’s proportionate interest in the net assets of that Portfolio (99.99% for SPDR SSgA Multi-Asset Real Return ETF, 99.99% for SPDR SSgA Income Allocation ETF, 99.99% for SPDR SSgA Global Allocation ETF, 99.99% for SPDR Blackstone/GSO Senior Loan ETF, 99.99% for SPDR SSgA Ultra Short Term Bond ETF, 99.98% for SPDR MFS Systematic Core Equity ETF, 99.98% for SPDR MFS Systematic Growth Equity ETF and 99.98% for SPDR MFS Systematic Value Equity ETF at June 30, 2014). The performance of each Fund is directly affected by the performance of its respective Portfolio. The financial statements of the Portfolios, including their Schedules of Investments, are attached to this report and should be read in conjunction with the Fund’s financial statements.
Under the Trust’s organizational documents, its officers and trustees are indemnified against certain liabilities arising out of the performance of their duties to the Trust. Additionally, in the normal course of business, the Trust enters into contracts with service providers that contain general indemnification clauses. The Trust’s maximum exposure under these arrangements is unknown as this could involve future claims that may be made against the Trust that have not yet occurred. However, based on experience, the Trust expects the risk of loss to be remote.
| 2. | Summary of Significant Accounting Policies |
The following is a summary of significant accounting policies followed by the Trust in the preparation of its financial statements:
The preparation of financial statements in accordance with U.S. generally accepted accounting principles requires management to make estimates and assumptions that affect the reported amounts and disclosures in the financial statements. Actual results could differ from those estimates. These financial statements are presented in United States dollars.
Security Valuation
Each Fund records its investments in its respective Portfolio at fair value each business day. The valuation policies of the Portfolios are discussed in Note 2 of the Portfolios’ Notes to Financial Statements, which are attached to this report.
The Portfolios adopted provisions surrounding fair value measurements and disclosures that define fair value, establish a framework for measuring fair value in generally accepted accounting principles and expand disclosures about fair value measurements. This applies to fair value measurements that are already required or permitted by other accounting standards and is intended to increase consistency of those measurements and applies broadly to securities and other types of assets and liabilities. The summary of the inputs used for each Portfolio, as of June 30, 2014, in valuing each Portfolio’s securities carried at fair value are discussed in Note 2 of the Portfolio’s Notes to Financial Statements, which are attached to this report.
30
SSgA ACTIVE ETF TRUST
NOTES TO FINANCIAL STATEMENTS (continued)
June 30, 2014
Investment Income
Net investment income consists of a Fund’s pro-rata share of the net investment income of its respective Portfolio less expenses of the Fund.
Expenses
Advisory fees and other expenses, which are directly identifiable to a specific Fund, are applied to that Fund. Trustees’ fees and other expenses which cannot be attributed to a specific Fund are allocated in such a manner as deemed equitable, taking into consideration the nature and type of expense and the relative net assets of the Funds. The Fund’s are allocated a pro-rata share of the expense of its respective Portfolio.
Equalization
The Funds follow the accounting practice known as “Equalization” by which a portion of the proceeds from sales and costs of reacquiring Fund shares, equivalent on a per share basis to the amount of distributable net investment income on the date of the transaction, is credited or charged to undistributed net investment income. As a result, undistributed net investment income per share is unaffected by sales or reacquisition of Fund shares. Amounts related to Equalization can be found on the Statements of Changes in Net Assets.
Investment Transactions
Investment transactions are recorded as of the trade date. Realized gains and losses from security transactions consist of a Fund’s pro-rata share of its respective Portfolio’s realized gains and losses. Realized gains and losses from security transactions are recorded on the identified cost basis. Corporate actions (including cash dividends) are recorded net of foreign tax withholdings on the ex-dividend date.
Federal Income Tax
The Funds have qualified and intend to continue to qualify for and elect treatment as “regulated investment companies” under Subchapter M of the Internal Revenue Code of 1986, as amended. By so qualifying and electing, each Fund will not be subject to federal income taxes to the extent it distributes its taxable income, including any net realized capital gains, for each fiscal year. In addition, by distributing during each calendar year substantially all of their net investment income and capital gains, if any, the Funds will not be subject to federal excise tax. Income and capital gain distributions are determined in accordance with income tax regulations which may differ from U.S. generally accepted accounting principles. These book-tax differences are primarily due to differing treatments for tax equalization, in-kind transactions for financial statement purposes and losses deferred due to wash sales.
Additionally, based on the Funds’ understanding of the tax rules and rates related to income, gains and transactions for the foreign jurisdictions in which the applicable Funds invest, the Funds will provide for foreign taxes and, where appropriate, deferred foreign taxes. The Funds have reviewed the tax positions for the open tax years as of June 30, 2014 and have determined that no provision for income tax is required in the Funds’ Financial Statements. The Funds’ federal tax returns are subject to examination by the Funds’ major tax jurisdictions, which include the United States of America and the Commonwealth of Massachusetts. The Funds recognized interest and penalties, if any, related to tax liabilities as income tax expense in the Statements of Operations.
31
SSgA ACTIVE ETF TRUST
NOTES TO FINANCIAL STATEMENTS (continued)
June 30, 2014
For the year ended June 30, 2014, the following Funds reclassified non-taxable security gains and losses realized on the in-kind redemption of Creation Units (Note 4) as an increase or decrease to paid in capital in the Statements of Assets and Liabilities as follows:
| | | | |
| | | Net Gain (Loss)
Reclassified
to Paid in Capital | |
SPDR SSgA Multi-Asset Real Return ETF | | $ | 1,261,307 | |
SPDR SSgA Income Allocation ETF | | | 1,386,705 | |
SPDR SSgA Global Allocation ETF | | | 758,876 | |
SPDR Blackstone/GSO Senior Loan ETF | | | — | |
SPDR SSgA Ultra Short Term Bond ETF | | | — | |
SPDR MFS Systematic Core Equity ETF | | | — | |
SPDR MFS Systematic Growth Equity ETF | | | — | |
SPDR MFS Systematic Value Equity ETF | | | — | |
At June 30, 2014, the Funds had capital loss carryforwards which may be utilized to offset any net short-term realized capital gains. These losses will not expire and are treated as though the losses were incurred on the first day of the next fiscal year:
| | | | | | | | |
| | | Short Term | | | Long Term | |
SPDR SSgA Multi-Asset Real Return ETF | | $ | 2,983,519 | | | $ | 2,241,562 | |
SPDR SSgA Income Allocation ETF | | | 3,138,967 | | | | 554,763 | |
SPDR SSgA Global Allocation ETF | | | — | | | | — | |
SPDR Blackstone/GSO Senior Loan ETF | | | 2,647,283 | | | | 136,659 | |
SPDR SSgA Ultra Short Term Bond ETF | | | — | | | | — | |
SPDR MFS Systematic Core Equity ETF | | | — | | | | — | |
SPDR MFS Systematic Growth Equity ETF | | | — | | | | — | |
SPDR MFS Systematic Value Equity ETF | | | — | | | | — | |
For the year ended June 30, 2014, there were no significant differences between the book basis and the tax basis character of distributions to shareholders other than partnership adjustments.
The tax character of distributions paid during the years ended June 30, 2014 and June 30, 2013 was as follows:
| | | | | | | | | | | | | | | | |
| | | Distributions Paid in 2014 | | | Distributions Paid in 2013 | |
| | | Ordinary
Income | | | Long-term
Capital Gains | | | Ordinary
Income | | | Long-term
Capital Gains | |
SPDR SSgA Multi-Asset Real Return ETF | | $ | 2,582,680 | | | $ | — | | | $ | 1,773,687 | | | $ | — | |
SPDR SSgA Income Allocation ETF | | | 3,845,121 | | | | — | | | | 3,792,817 | | | | — | |
SPDR SSgA Global Allocation ETF | | | 2,021,720 | | | | — | | | | 768,378 | | | | — | |
SPDR Blackstone/GSO Senior Loan ETF | | | 16,478,270 | | | | — | | | | 519,534 | | | | — | |
SPDR SSgA Ultra Short Term Bond ETF | | | 28,118 | | | | — | | | | — | | | | — | |
SPDR MFS Systematic Core Equity ETF | | | 29,958 | | | | — | | | | — | | | | — | |
SPDR MFS Systematic Growth Equity ETF | | | 27,427 | | | | — | | | | — | | | | — | |
SPDR MFS Systematic Value Equity ETF | | | 33,808 | | | | — | | | | — | | | | — | |
For the year ended June 30, 2014, there were no significant differences between the book basis and the tax basis of components of net assets other than differences in the net unrealized appreciation (depreciation) in the value of investments attributable to the tax deferral of losses on wash sales, redemptions in-kind, dividend payables and partnership adjustments.
32
SSgA ACTIVE ETF TRUST
NOTES TO FINANCIAL STATEMENTS (continued)
June 30, 2014
As of June 30, 2014, the components of distributable earnings on a tax basis were as follows:
| | | | | | | | | | | | |
| | | Undistributed
Ordinary Income | | | Undistributed
Long-Term
Capital Gains | | | Net Unrealized
Appreciation
(Depreciation) | |
SPDR SSgA Multi-Asset Real Return ETF | | $ | 837,164 | | | $ | — | | | $ | 6,363,847 | |
SPDR SSgA Income Allocation ETF | | | 717,173 | | | | — | | | | 5,114,694 | |
SPDR SSgA Global Allocation ETF | | | 943,193 | | | | 439,569 | | | | 6,389,387 | |
SPDR Blackstone/GSO Senior Loan ETF | | | 1,246,787 | | | | — | | | | 1,614,662 | |
SPDR SSgA Ultra Short Term Bond ETF | | | 4,870 | | | | — | | | | 10,479 | |
SPDR MFS Systematic Core Equity ETF | | | 85,234 | | | | — | | | | 290,337 | |
SPDR MFS Systematic Growth Equity ETF | | | 26,235 | | | | — | | | | 343,934 | |
SPDR MFS Systematic Value Equity ETF | | | 21,786 | | | | — | | | | 262,168 | |
Distributions
Each Fund declares and distributes dividends from net investment income, if any, to its shareholders quarterly (monthly for SPDR Blackstone / GSO Senior Loan ETF and SPDR SSgA Ultra Short Term Bond ETF). Each Fund declares and distributes net realized capital gains, if any, at least annually. Distributions are recorded on the ex-dividend date. Income and capital gain distributions are determined in accordance with income tax regulations, which may differ from U.S. generally accepted accounting principles.
| 3. | Fees and Compensation Paid to Affiliates and Other Related Party Transactions |
Advisory Fee
Each Fund has entered into an Investment Advisory Agreement with SSgA Funds Management, Inc. (the “Adviser” or “SSgA FM”). As compensation for the services rendered, facilities furnished, and expenses borne by the Adviser, each Fund pays the Adviser a fee accrued daily and paid monthly, based on a percentage of each Fund’s average daily net assets as shown in the following table:
| | | | |
| | | Annual Rate* | |
SPDR SSgA Multi-Asset Real Return ETF | | | 0.70 | % |
SPDR SSgA Income Allocation ETF | | | 0.70 | |
SPDR SSgA Global Allocation ETF | | | 0.35 | |
SPDR Blackstone/GSO Senior Loan ETF | | | 0.70 | ** |
SPDR SSgA Ultra Short Term Bond ETF | | | 0.20 | |
SPDR MFS Systematic Core Equity ETF | | | 0.60 | |
SPDR MFS Systematic Growth Equity ETF | | | 0.60 | |
SPDR MFS Systematic Value Equity ETF | | | 0.60 | |
| * | The Advisory fee is reduced by the proportional amount of the advisory fee, as well as for SPDR SSgA Multi-Asset Real Return ETF, SPDR SSgA Income Allocation ETF and SPDR SSgA Global Allocation ETF acquired fund fees and expenses of each Fund’s respective Portfolio. For the period ended June 30, 2014, the net annualized advisory fee was 0.03%, 0.16%,(0.15)%, 0.55%, 0.00%, 0.30%, 0.30% and 0.30% for the SPDR SSgA Multi-Asset Real Return ETF, SPDR SSgA Income Allocation ETF, SPDR SSgA Global Allocation ETF, SPDR Blackstone / GSO Senior Loan ETF, SPDR SSgA Ultra Short Term Bond ETF, SPDR MFS Systematic Core Equity ETF, SPDR MFS Systematic Growth Equity ETF and SPDR MFS Systematic Value Equity ETF, respectively. For the SPDR SSgA Global Allocation ETF the reduction resulted in a fee reimbursement which is identified on the Statements of Operations. |
| ** | Effective April 1, 2014, the SPDR Blackstone / GSO Senior Loan ETF changed its advisory fee from 0.90% to 0.70%. |
The Adviser pays all operating expenses of each Fund other than management fee, distribution fee pursuant to each Fund’s Distribution and Service Plan, if any, brokerage, taxes, interest, fees and expenses of the Independent Trustees (including any Trustees’ counsel fees), litigation expenses, and other extraordinary expenses.
33
SSgA ACTIVE ETF TRUST
NOTES TO FINANCIAL STATEMENTS (continued)
June 30, 2014
State Street Bank and Trust Company (“State Street”), an affiliate of the Adviser, receives fees for its services as Custodian, Administrator and Transfer Agent from the Adviser.
State Street Global Markets, LLC (the “Distributor”), an affiliate of the Adviser, serves as the distributor of the shares of each Fund. Pursuant to a Distribution and Service Plan adopted in accordance with Rule 12b-1 under the 1940 Act, each Fund is authorized to pay an amount of up to 0.25% of its average daily net assets for certain distribution-related activities. However, the Board of Trustees has determined that no such payments will be made through at least October 31, 2014 and therefore no such payments have been made.
The Distributor has established an assisted trading program to aid Authorized Participants in certain creation and redemption activity for which the Distributor receives commissions from Authorized Participants. In addition, the Distributor receives compensation from State Street associated with on-line creation and redemption activity of Authorized Participants.
Trustees’ Fees
The Trust, SSgA Master Trust, SPDR Series Trust and SPDR Index Shares Funds pay, in the aggregate, each Independent Trustee an annual fee of $170,000 plus $10,000 per in-person meeting attended and $1,250 for each telephonic or video conference meeting attended. The Chairman of the Board receives an additional annual fee of $50,000 and the Chairman of the Audit Committee receives an additional annual fee of $20,000. The Trust also reimburses each Independent Trustee for travel and other out-of-pocket expenses incurred by him/her in connection with attending such meetings and in connection with attending industry seminars and meetings. Independent Trustee fees are allocated among the Trusts and each of their respective series in such a manner as deemed equitable, taking into consideration the relative net assets of the series.
| 4. | Shareholder Transactions |
Shares are issued and redeemed by a Fund only in Creation Unit size aggregations of 50,000 shares. Such transactions are generally permitted on an in-kind basis, with a separate cash payment, which is a balancing cash component to equate the transaction to the net asset value per unit of the Fund on the transaction date. Transaction fees ranging from of $100 to $400 per Creation Unit for each Fund, regardless of the number of Creation Units that are created or redeemed on the same day, are charged to those persons creating or redeeming Creation Units. An additional variable fee may be charged for certain transactions. Transaction fees are received by the Trust and/or Custodian and are used to defray related expenses. The Custodian also receives amounts earned on cash collateral provided by Authorized Participants pending delivery of missing deposit securities. The amounts are included in Other Capital on the Statements of Changes in Net Assets.
34
SSgA ACTIVE ETF TRUST
REPORT OF INDEPENDENT REGISTERED PUBLIC ACCOUNTING FIRM
To the Shareholders and Board of Trustees of
SSgA Active ETF Trust
We have audited the accompanying statements of assets and liabilities of SSgA Active ETF Trust (comprising, respectively, SPDR SSgA Multi-Asset Real Return ETF, SPDR SSgA Income Allocation ETF, SPDR SSgA Global Allocation ETF, SPDR Blackstone/GSO Senior Loan ETF, SPDR SSgA Ultra Short Term Bond ETF, SPDR MFS Systematic Core Equity ETF, SPDR MFS Systematic Value Equity ETF and SPDR MFS Systematic Growth Equity ETF) (collectively, the “Funds”) as of June 30, 2014, and the related statements of operations, changes in net assets and the financial highlights for each of the periods indicated therein. These financial statements and financial highlights are the responsibility of the Funds’ management. Our responsibility is to express an opinion on these financial statements and financial highlights based on our audits.
We conducted our audits in accordance with the standards of the Public Company Accounting Oversight Board (United States). Those standards require that we plan and perform the audit to obtain reasonable assurance about whether the financial statements and financial highlights are free of material misstatement. We were not engaged to perform an audit of the Funds’ internal control over financial reporting. Our audits included consideration of internal control over financial reporting as a basis for designing audit procedures that are appropriate in the circumstances, but not for the purpose of expressing an opinion on the effectiveness of the Funds’ internal control over financial reporting. Accordingly, we express no such opinion. An audit also includes examining, on a test basis, evidence supporting the amounts and disclosures in the financial statements and financial highlights, assessing the accounting principles used and significant estimates made by management, and evaluating the overall financial statement presentation. We believe that our audits provide a reasonable basis for our opinion.
In our opinion, the financial statements and financial highlights referred to above present fairly, in all material respects, the financial position of each of the above mentioned Funds of SSgA Active ETF Trust at June 30, 2014, and the results of their operations, the changes in their net assets, and the financial highlights for each of the periods indicated therein, in conformity with U.S. generally accepted accounting principles.

Boston, Massachusetts
August 28, 2014
35
SSgA ACTIVE ETF TRUST
OTHER INFORMATION
June 30, 2014 (Unaudited)
Shareholder Expense Example
As a shareholder of a Fund, you incur two types of costs: (1) transaction costs, which may include creation and redemption fees or brokerage charges and (2) ongoing costs, including management fees, trustee fees, and other Fund expenses. The following examples are intended to help you understand your ongoing costs (in dollars) of investing in a Fund and to compare these costs with the ongoing costs of investing in other funds. It is based on an investment of $1,000 invested on January 1, 2014 and held for the six months ended June 30, 2014.
Actual Expenses
The first table below provides information about actual account values and actual expenses. You may use the information in this table, together with the amount you invested, to estimate the expenses that you incurred over the period. Simply divide your account value by $1,000 (for example, an $8,600 account value divided by $1,000 = 8.6), then multiply the result by the number in the first table under the heading entitled “Expenses Paid During Period” to estimate the expenses attributable to your investment during this period.
Hypothetical Example for Comparison Purposes
The second table below provides information about hypothetical account values and hypothetical expenses based on a Fund’s actual expense ratio and an assumed rate of return of 5% per year before expenses, which is not a Fund’s actual return. Thus, you should not use the hypothetical account values and expenses to estimate the actual ending account balance or your expenses for the period. Rather, these figures are provided to enable you to compare the ongoing costs of investing in a Fund and other funds. To do so, compare this 5% hypothetical example with the 5% hypothetical examples that appear in the shareholder reports of the other funds. The Funds charge transaction fees at scheduled amounts ranging from $100 to $400 per Creation Unit to those persons creating or redeeming Creation Units. If you buy or sell the Funds’ shares in the secondary market, you will incur customary brokerage commissions and charges.
Please note that the expenses shown in the table are meant to highlight your ongoing costs only and do not reflect any transaction costs, such as creation and redemption fees, or brokerage charges. Therefore, the second table is useful in comparing ongoing costs only, and will not help you determine the relative total costs of owning different funds. In addition, if these transaction costs were included, your costs would have been higher.
| | | | | | | | | | | | | | | | |
Actual | | Annualized
Expense Ratio | | | Beginning Account
Value
1/1/14 | | | Ending Account
Value
6/30/14 | | | Expenses Paid
During Period*
1/1/14 to
6/30/14 | |
SPDR SSgA Multi-Asset Real Return ETF | | | 0.23 | % | | $ | 1,000 | | | $ | 1,073.30 | | | $ | 1.18 | |
SPDR SSgA Income Allocation ETF | | | 0.36 | | | | 1,000 | | | | 1,084.30 | | | | 1.86 | |
SPDR SSgA Global Allocation ETF | | | 0.05 | | | | 1,000 | | | | 1,056.70 | | | | 0.25 | |
SPDR Blackstone / GSO Senior Loan ETF | | | 0.80 | | | | 1,000 | | | | 1,014.60 | | | | 4.00 | |
SPDR SSgA Ultra Short Term Bond ETF | | | 0.20 | | | | 1,000 | | | | 1,002.80 | | | | 0.99 | |
SPDR MFS Systematic Core Equity ETF** | | | 0.60 | | | | 1,000 | | | | 1,078.10 | | | | 2.97 | |
SPDR MFS Systematic Growth Equity ETF** | | | 0.60 | | | | 1,000 | | | | 1,076.80 | | | | 2.97 | |
SPDR MFS Systematic Value Equity ETF** | | | 0.60 | | | | 1,000 | | | | 1,060.40 | | | | 2.95 | |
| | | | |
Hypothetical
(assuming a 5% return before expenses) | | | | | | | | | | | | |
SPDR SSgA Multi-Asset Real Return ETF | | | 0.23 | | | | 1,000 | | | | 1,023.66 | | | | 1.15 | |
SPDR SSgA Income Allocation ETF | | | 0.36 | | | | 1,000 | | | | 1,023.01 | | | | 1.81 | |
SPDR SSgA Global Allocation ETF | | | 0.05 | | | | 1,000 | | | | 1,024.55 | | | | 0.25 | |
SPDR Blackstone / GSO Senior Loan ETF | | | 0.80 | | | | 1,000 | | | | 1,020.83 | | | | 4.01 | |
SPDR SSgA Ultra Short Term Bond ETF | | | 0.20 | | | | 1,000 | | | | 1,023.81 | | | | 1.00 | |
SPDR MFS Systematic Core Equity ETF** | | | 0.60 | | | | 1,000 | | | | 1,021.82 | | | | 3.01 | |
36
SSgA ACTIVE ETF TRUST
OTHER INFORMATION (continued)
June 30, 2014 (Unaudited)
| | | | | | | | | | | | | | | | |
Hypothetical
(assuming a 5% return before expenses) | | Annualized
Expense Ratio | | | Beginning Account
Value
1/1/14 | | | Ending Account
Value
6/30/14 | | | Expenses Paid
During Period*
1/1/14 to
6/30/14 | |
SPDR MFS Systematic Growth Equity ETF** | | | 0.60 | % | | $ | 1,000 | | | $ | 1,021.82 | | | $ | 3.01 | |
SPDR MFS Systematic Value Equity ETF** | | | 0.60 | | | | 1,000 | | | | 1,021.82 | | | | 3.01 | |
| * | Expenses are equal to the Fund’s annualized net expense ratio multiplied by the average account value of the period, multiplied by the number of days in the most recent six month period, then divided by 365. |
| ** | Actual period is from commencement of operations 1/8/14. Hypothetical period is from 1/1/14. |
Premium/Discount Information
Information regarding how often the Shares of each Fund traded on the Exchange at a price above (i.e. at a premium) or below (i.e. at a discount) the net asset value of the Fund for the past calendar year can be found on the Funds’ website at www.spdrs.com.
Tax Information
For federal income tax purposes, the following information is furnished with respect to the distributions of the Trust for its fiscal year ended June 30, 2014.
Qualified Dividend Income
A portion of dividends distributed by the Funds during the fiscal year ended June 30, 2014, are considered qualified dividend income, and are eligible for reduced tax rates. These lower rates range from 5% to 20% depending on the individual’s tax bracket. These amounts are noted below:
| | | | |
| | | Amount | |
SPDR SSgA Multi-Asset Real Return ETF | | $ | 1,367,540 | |
SPDR SSgA Income Allocation ETF | | | 1,094,761 | |
SPDR SSgA Global Allocation ETF | | | 774,179 | |
SPDR Blackstone/GSO Senior Loan ETF | | | — | |
SPDR SSgA Ultra Short Term Bond ETF | | | — | |
SPDR MFS Systematic Core Equity ETF | | | 38,443 | |
SPDR MFS Systematic Growth Equity ETF | | | 38,241 | |
SPDR MFS Systematic Value Equity ETF | | | 44,852 | |
Qualified Interest Income
The Funds designated a portion of dividends distributed during the fiscal year ended June 30, 2014, as qualified interest income. These amounts are noted below:
| | | | |
| | | Amount | |
SPDR SSgA Multi-Asset Real Return ETF | | $ | 174,179 | |
SPDR SSgA Income Allocation ETF | | | 1,290,018 | |
SPDR SSgA Global Allocation ETF | | | 372,574 | |
SPDR Blackstone/GSO Senior Loan ETF | | | 1,393,337 | |
SPDR SSgA Ultra Short Term Bond ETF | | | 39,688 | |
SPDR MFS Systematic Core Equity ETF | | | — | |
SPDR MFS Systematic Growth Equity ETF | | | — | |
SPDR MFS Systematic Value Equity ETF | | | — | |
37
SSgA ACTIVE ETF TRUST
OTHER INFORMATION (continued)
June 30, 2014 (Unaudited)
Long term capital gains dividends were paid from the following Funds during the year ended June 30, 2014:
| | | | |
| | | Amount | |
SPDR SSgA Global Allocation ETF | | $ | 115,180 | |
At June 30, 2014 the Funds had foreign source income. These amounts are noted below:
| | | | |
| | | Amount | |
SPDR SSgA Multi-Asset Real Return ETF | | $ | 1,759,593 | |
SPDR SSgA Income Allocation ETF | | | 1,320,963 | |
SPDR SSgA Global Allocation ETF | | | 1,035,075 | |
SPDR Blackstone/GSO Senior Loan ETF | | | — | |
SPDR SSgA Ultra Short Term Bond ETF | | | — | |
SPDR MFS Systematic Core Equity ETF | | | — | |
SPDR MFS Systematic Growth Equity ETF | | | — | |
SPDR MFS Systematic Value Equity ETF | | | — | |
Foreign Tax Credit
The Trust has made an election under Internal Revenue Code Section 853 to pass through foreign taxes paid by a Fund to its shareholders. For the year ended June 30, 2014, the total amount of foreign taxes that will be passed through are:
| | | | |
| | | Amount | |
SPDR SSgA Multi-Asset Real Return ETF | | $ | 115,291 | |
SPDR SSgA Income Allocation ETF | | | 104,492 | |
SPDR SSgA Global Allocation ETF | | | 26,796 | |
SPDR Blackstone/GSO Senior Loan ETF | | | — | |
SPDR SSgA Ultra Short Term Bond ETF | | | — | |
SPDR MFS Systematic Core Equity ETF | | | — | |
SPDR MFS Systematic Growth Equity ETF | | | — | |
SPDR MFS Systematic Value Equity ETF | | | — | |
Percentage of distributions which qualify for the corporate dividends received deduction:
| | | | |
| | | Percentage | |
SPDR SSgA Multi-Asset Real Return ETF | | | 14.03 | % |
SPDR SSgA Income Allocation ETF | | | 13.69 | |
SPDR SSgA Global Allocation ETF | | | 17.81 | |
SPDR Blackstone/GSO Senior Loan ETF | | | — | |
SPDR SSgA Ultra Short Term Bond ETF | | | — | |
SPDR MFS Systematic Core Equity ETF | | | 40.89 | |
SPDR MFS Systematic Growth Equity ETF | | | 87.50 | |
SPDR MFS Systematic Value Equity ETF | | | 100.00 | |
38
SSgA ACTIVE ETF TRUST
OTHER INFORMATION (continued)
June 30, 2014 (Unaudited)
Proxy Voting Policies and Procedures and Records
A description of the Trust’s proxy voting policies and procedures that are used by the Funds’ investment adviser to vote proxies relating to the Funds’ portfolio of securities are available (i) without charge, upon request by calling 1-866-787-2257 (toll free) or (ii) on the website of the U.S. Securities and Exchange Commission, at www.sec.gov. Information regarding how the investment advisor voted for the prior 12-months period ended June 30 is available by August 31 of each year by calling the same number and on the SEC’s website, at www.sec.gov, and on the Funds’ website at www.spdrs.com.
Quarterly Portfolio Schedule
The Funds file a complete schedule of portfolio holdings with the SEC for the first and third quarters of each fiscal year on Form N-Q. The Fund’s Forms N-Q are available on the SEC’s website at www.sec.gov and may be reviewed and copied at the SEC’s Public Reference Room in Washington DC. Information on the operation of the Public Reference Room may be obtained by calling 1-800-SEC-0330. The information on the Form N-Q is available upon request, without charge, by calling 1-866-787-2257 (toll free) and on the Funds’ website at www.spdrs.com.
Approval of Advisory Agreements
At in-person meetings held prior to June 30, 2014, the Board of Trustees of the Trusts (the “Board”) evaluated various proposals related to advisory arrangements for certain new series of the Trusts, including a proposal to approve separate Investment Advisory Agreements (the “Agreements”) between SSgA Funds Management, Inc. (the “Adviser”) and (1) the SSgA Active ETF Trust with respect to the SPDR MFS Systematic Core Equity ETF, SPDR MFS Systematic Growth Equity ETF and SPDR MFS Systematic Value Equity ETF (the “New ETFs”) and (2) SSgA Master Trust with respect to the New ETFs’ corresponding master funds, the SSgA MFS Systematic Core Equity Portfolio, SSgA MFS Systematic Growth Equity Portfolio and SSgA MFS Systematic Value Equity Portfolio (together with the New ETFs, the “New Funds”), each of which commenced operations during the most recent fiscal half-year period covered by this Annual Report. The Trustees who are not “interested persons” of the Trusts within the meaning of the Investment Company Act of 1940, as amended (the “Independent Trustees”) also met separately with their independent legal counsel to consider the Agreements.
In evaluating the Agreements, the Board drew on materials provided to them by the Adviser and on other materials provided by State Street Bank and Trust Company, the Trusts’ Administrator, Transfer Agent and Custodian (“State Street”). In deciding whether to approve the Agreements, the Board considered various factors, including the (i) nature, extent and quality of services to be provided by the Adviser with respect to the New Funds under the Agreements, (ii) costs to the Adviser of its services, and (iii) extent to which economies of scale would be realized if and as the New Funds grow and whether the fees in the Agreements reflects these economies of scale.
The Board considered the nature, extent and quality of services expected to be provided by the Adviser. In doing so, the Trustees relied on their prior experience in overseeing the management of the Trusts and materials provided prior to and at the meeting. The Board reviewed the Agreements and the Adviser’s anticipated responsibilities for managing investment operations of the New Funds, in accordance with the New Funds’ investment objectives, investment policies, and applicable legal and regulatory requirements. The Board appreciated the relatively unique nature of the New ETFs, as an exchange-traded fund in a master-feeder structure, and the experience and expertise of the Adviser with exchange-traded funds. The Board considered the background and experience of the Adviser’s senior management, including those individuals responsible for oversight of the sub-adviser for, and compliance of, the New Funds. The Board also considered the portfolio oversight resources, structures and practices of the Adviser, including those associated with monitoring and securing each New Funds’ compliance with its investment objectives and policies and with applicable laws and regulations. The Board also considered information about the Adviser’s overall investment management business, noting that the Adviser serves a wide range of clients across a broad spectrum of asset classes. The Board looked at the Adviser’s general knowledge of the investment business and that of its affiliates which make up State Street Global Advisors, through which the Adviser shares all of its senior personnel. The Board considered that the Adviser and its affiliates constitute one of the world’s largest investment management enterprises for ETFs. The Board also considered the Adviser’s experience in active management, in overseeing third-party sub-advisers and in managing exchange-traded funds in master-feeder structures.
39
SSgA ACTIVE ETF TRUST
OTHER INFORMATION (continued)
June 30, 2014 (Unaudited)
The Board considered whether the Adviser or its affiliates benefited in other ways from its relationship with the Trusts, noting that the Adviser does not maintain soft-dollar arrangements in connection with the Trusts’ brokerage transactions.
The Board reviewed information regarding economies of scale or other efficiencies that may result as each New Fund’s assets grow in size. The Board noted that the Agreements did not provide for breakpoints in the each New Fund’s advisory fee rates as assets of a New Fund increase. However, the Board further noted the Adviser’s assertion that future economies of scale (among several factors) had been taken into consideration for the New Funds by fixing relatively low advisory fees, effectively sharing the benefits of lower fees with the New Fund from inception. The Board noted that it intends to continue to monitor fees as the New Funds grow in size and assess whether fee breakpoints may be warranted.
The Board evaluated the New ETFs’ unitary fee through review of comparative information with respect to fees paid by similar funds — i.e., exchange-traded funds that are actively managed, as applicable. The Board reviewed the universe of similar exchange-traded funds for the New ETFs based upon data from Lipper Analytical Services and related comparative information for similar ETFs. The Board also reviewed the fee structure of the New Funds in connection with the master-feeder structure.
The Board, including the Independent Trustees voting separately, approved the Agreements for each New Fund after weighing the foregoing factors, none of which was dispositive in itself and may have been weighed differently by each Trustee. The Board’s conclusions with respect to each Agreements were as follows: (a) the nature and extent of the services expected to be provided by the Adviser with respect to the New Funds were appropriate; (b) the Adviser’s fee for the New Funds and the unitary fee, considered in relation to services expected to be provided, were fair and reasonable; (c) any additional benefits to the Adviser or its affiliates were not of a magnitude materially to affect the Board’s conclusions; and (d) fees expected to be paid to the Adviser were expected to share economies of scale with respect to the New Funds by way of the relatively low fee structure of the Trusts.
At in-person meetings held prior to June 30, 2014, the Board also considered the approval of separate Sub-Advisory Agreements (the “MFS Sub-Advisory Agreements”) between the Adviser and MFS Investment Management (“MFS”) with respect to the New Funds.
In evaluating the MFS Sub-Advisory Agreements, the Board drew on materials provided to them by MFS and the Adviser. In deciding whether to approve the MFS Sub-Advisory Agreements, the Board considered various factors, including: (i) the nature, extent and quality of services expected to be provided by MFS with respect to the New Funds under the MFS Sub-Advisory Agreements; and (ii) investment performance of other actively managed mandates managed by MFS. The Board was apprised of the portion of the current advisory fee that the Adviser would pay to MFS under the MFS Sub-Advisory Agreements and also considered that such fees would be paid directly by the Adviser and would not result in increased fees payable by the New Funds.
The Board considered the background and experience of MFS’s senior management and in particular MFS’s experience in investing in equity securities. The Board noted that MFS would bring significant actively managed equity experience to bear in managing the New Funds. The Board noted that MFS has extensive experience in managing equity securities and reviewed MFS’s assets under management in similar portfolios of securities.
The Board, including the Independent Trustees voting separately, approved the MFS Sub-Advisory Agreements for the New Funds after weighing the foregoing factors, none of which was dispositive in itself and may have been weighed differently by each Trustee. The Board’s conclusions with respect to the Agreements were as follows: (a) the nature and extent of the services expected to be provided by MFS to the New Funds were adequate and appropriate; and (b) MFS’s experience in managing equity securities is extensive; (c) MFS’s fees for the New Funds and the unitary fee, considered in relation to the services provided or expected to be provided, were fair and reasonable; (d) any additional benefits to MFS was not of a magnitude to materially affect the Board’s conclusions; and (e) fees expected to be paid to MFS were expected to share economies of scale with the New Funds.
40
SSgA ACTIVE ETF TRUST
OTHER INFORMATION (continued)
June 30, 2014 (Unaudited)
TRUSTEES AND OFFICERS OF THE TRUST
| | | | | | | | | | | | |
Name, Address and Year of Birth | | Position(s)
with Funds | | Term of
Office and
Length of
Time Served | | Principal
Occupation(s)
During Past
5 Years | | Number of
Portfolios
in Fund
Complex
Overseen
by Trustee | | | Other
Directorships
Held by Trustee |
Independent Trustees | | | | | | | | | | | | |
FRANK NESVET
c/o SPDR Series Trust
State Street Financial Center
One Lincoln Street
Boston, MA 02111-2900
1943 | | Independent Trustee, Chairman, Trustee Committee Chair | | Term: Unlimited Served: since September 2000 | | Chief Executive Officer, Libra Group, Inc. (1998-present) (a financial services consulting company). | | | 179 | | | SPDR Index Shares Funds (Trustee); SPDR Series Trust (Trustee); SSgA Master Trust (Trustee). |
DAVID M. KELLY
c/o SPDR Series Trust
State Street Financial Center
One Lincoln Street
Boston, MA 02111-2900
1938 | | Independent Trustee, Audit Committee Chair | | Term: Unlimited Served: since September 2000 | | Retired. | | | 179 | | | SPDR Index Shares Funds (Trustee); SPDR Series Trust (Trustee); SSgA Master Trust (Trustee). |
BONNY EUGENIA BOATMAN
c/o SPDR Series Trust
State Street Financial Center
One Lincoln Street
Boston, MA 02111-2900
1950 | | Independent Trustee | | Term: Unlimited Served: since April 2010 | | Retired (2005-present); Managing Director, Columbia Management Group, Bank of America (1984-2005). | | | 179 | | | SPDR Index Shares Funds (Trustee); SPDR Series Trust (Trustee); SSgA Master Trust (Trustee). |
DWIGHT D. CHURCHILL
c/o SPDR Series Trust
State Street Financial Center
One Lincoln Street
Boston, MA 02111-2900
1953 | | Independent Trustee | | Term: Unlimited Served: since April 2010 | | Chief Executive Officer and President, CFA Institute (2014-present); Self-employed consultant since 2010; Head of Fixed Income and other Senior Management roles, Fidelity Investments (1993-2009). | | | 179 | | | SPDR Index Shares Funds (Trustee); SPDR Series Trust (Trustee); SSgA Master Trust (Trustee); Affiliated Managers Group, Inc. (Director). |
CARL G. VERBONCOEUR
c/o SPDR Series Trust
State Street Financial Center
One Lincoln Street
Boston, MA 02111-2900
1952 | | Independent Trustee | | Term: Unlimited Served: since April 2010 | | Self-employed consultant since 2009; Chief Executive Officer, Rydex Investments (2003-2009). | | | 179 | | | The Motley Fool Funds Trust (Trustee); SPDR Index Shares Funds (Trustee); SPDR Series Trust (Trustee); SSgA Master Trust (Trustee). |
41
SSgA ACTIVE ETF TRUST
OTHER INFORMATION (continued)
June 30, 2014 (Unaudited)
| | | | | | | | | | | | |
Name, Address and Year of Birth | | Position(s)
with Funds | | Term of
Office and
Length of
Time Served | | Principal
Occupation(s)
During Past
5 Years | | Number of
Portfolios
in Fund
Complex
Overseen
by Trustee | | | Other
Directorships
Held by Trustee |
Interested Trustee | | | | | | | | | | | | |
JAMES E. ROSS*
SSgA Funds Management, Inc.
State Street Financial Center
One Lincoln Street
Boston, MA 02111
1965 | | Interested Trustee | | Term: Unlimited Served: since April 2010 | | Chairman and Director, SSgA Funds Management Inc. (2005-present); President, SSgA Funds Management Inc. (2005-2012); Senior Managing Director and Principal, State Street Global Advisors (2006-present).** | | | 209 | | | SPDR Index Shares Funds (Trustee); SPDR Series Trust (Trustee); SSgA Master Trust (Trustee); The Select Sector SPDR Trust (Trustee); State Street Master Funds (Trustee); and State Street Institutional Investment Trust (Trustee). |
| * | Mr. Ross is an Interested Trustee because of his employment with the Adviser and ownership interest in an affiliate of the Adviser. Mr. Ross previously served as an Interested Trustee from November 2005 to December 2009. |
| ** | Served in various capacities and/or with affiliated companies during noted time period. |
OFFICERS
| | | | | | |
Name, Address
and Year of Birth | | Position(s) with Funds | | Term of Office and Length of Time Served | | Principal Occupation(s) During Past 5 Years |
ELLEN M. NEEDHAM
SSgA Funds Management, Inc.
State Street Financial Center
One Lincoln Street
Boston, MA 02111
1967 | | President | | Term: Unlimited Served: since October 2012 | | President and Director, SSgA Funds Management, Inc. (June 2012-present); Chief Operating Officer, SSgA Funds Management, Inc. (May 2010-June 2012); Senior Managing Director, SSgA Funds Management, Inc. (1992-2012)*; Senior Managing Director, State Street Global Advisors (1992-present).* |
ANN M. CARPENTER
SSgA Funds Management, Inc.
State Street Financial Center
One Lincoln Street
Boston, MA 02111
1966 | | Vice President | | Term: Unlimited Served: since August 2012 | | Chief Operating Officer, SSgA Funds Management, Inc. (April 2014-present); Vice President, State Street Global Advisors and SSgA Funds Management, Inc. (2005-present).* |
MICHAEL P. RILEY
SSgA Funds Management, Inc.
State Street Financial Center
One Lincoln Street
Boston, MA 02111
1969 | | Vice President | | Term: Unlimited Served: since February 2005 | | Vice President, State Street Global Advisors and SSgA Funds Management, Inc. (2008-present); Principal, State Street Global Advisors and SSgA Funds Management, Inc. (2005-2008). |
42
SSgA ACTIVE ETF TRUST
OTHER INFORMATION (continued)
June 30, 2014 (Unaudited)
| | | | | | |
Name, Address
and Year of Birth | | Position(s) with Funds | | Term of Office and Length of Time Served | | Principal Occupation(s) During Past 5 Years |
CHRISTOPHER A. MADDEN
State Street Bank and Trust Company
Four Copley Place, CPH0326
Boston, MA 02116
1967 | | Secretary | | Term: Unlimited Served: since August 2013 | | Vice President and Senior Counsel, State Street Bank and Trust Company (2013-present); Counsel, Atlantic Fund Services (2009-2013); Vice President, Citigroup Fund Services, LLC (2005-2009).* |
DANIO MASTROPIERI
State Street Bank and Trust Company
Four Copley Place, CPH0326
Boston, MA 02116
1972 | | Assistant Secretary | | Term: Unlimited Served: since August 2013 | | Vice President and Counsel, State Street Bank and Trust Company (2013-present); Vice President, Citi Fund Services Ohio, Inc. (2007-2013).*, ** |
CHAD C. HALLETT
State Street Bank and Trust Company
Four Copley Place, CPH0328
Boston, MA 02116
1969 | | Treasurer | | Term: Unlimited Served: since November 2010 | | Vice President, State Street Bank and Trust Company (2001-present).* |
MATTHEW FLAHERTY
State Street Bank and Trust Company
Four Copley Place, CPH0328
Boston, MA 02116
1971 | | Assistant Treasurer | | Term: Unlimited Served: since May 2005 | | Vice President, State Street Bank and Trust Company (1994-present).* |
LAURA F. DELL
State Street Bank and Trust Company
Four Copley Place, CPH0328
Boston, MA 02116
1964 | | Assistant Treasurer | | Term: Unlimited Served: since November 2007 | | Vice President, State Street Bank and Trust Company (2002-present).* |
BRIAN HARRIS
SSgA Funds Management, Inc.
State Street Financial Center
One Lincoln Street
Boston, MA 02111
1973 | | Chief Compliance Officer | | Term: Unlimited Served: since November 2013 | | Vice President, State Street Global Advisors and SSgA Funds Management, Inc. (2013-Present); Senior Vice President and Global Head of Investment Compliance, BofA Global Capital Management (2010-2013); Director of Compliance, AARP Financial Inc. (2008-2010). |
| * | Served in various capacities and/or with various affiliated entities during noted time period. |
| ** | Served in various capacities and/or with unaffiliated mutual funds or closed-end funds for which State Street Bank and Trust Company or its affiliates act as a provider of services during the noted time period. |
The Statement of Additional Information includes additional information about the Trustees and is available, without charge, upon request, by calling (toll free) 1-866-787-2257.
43
The SPDR® Family of Exchange Traded Funds
The following is a list of SPDR ETFs being offered, along with their respective exchange trading symbols. Please call 1-866-787-2257 to obtain a prospectus for any SPDR ETF. The prospectus contains more complete information, including charges, expenses, investment objectives and risk factors that should be carefully considered to determine if the Fund(s) are an appropriate investment for you. Read the prospectus(es) carefully before investing. Investing involves risk, including possible loss of principal.
SPDR Series Trust
SPDR Russell 3000® ETF (THRK)
SPDR Russell 1000® ETF (ONEK)
SPDR Russell 2000® ETF (TWOK)
SPDR S&P 500 Growth ETF (SPYG)
SPDR S&P 500 Value ETF (SPYV)
SPDR Russell Small Cap Completeness ETF (RSCO)
SPDR S&P 400 Mid Cap Growth ETF (MDYG)
SPDR S&P 400 Mid Cap Value ETF (MDYV)
SPDR S&P 600 Small Cap ETF (SLY)
SPDR S&P 600 Small Cap Growth ETF (SLYG)
SPDR S&P 600 Small Cap Value ETF (SLYV)
SPDR Global Dow ETF (DGT)
SPDR Dow Jones REIT ETF (RWR)
SPDR S&P Bank ETF (KBE)
SPDR S&P Capital Markets ETF (KCE)
SPDR S&P Insurance ETF (KIE)
SPDR S&P Mortgage Finance ETF (KME)
SPDR S&P Regional Banking ETF (KRE)
SPDR Morgan Stanley Technology ETF (MTK)
SPDR S&P Dividend ETF (SDY)
SPDR S&P Aerospace & Defense ETF (XAR)
SPDR S&P Biotech ETF (XBI)
SPDR S&P Health Care Equipment ETF (XHE)
SPDR S&P Health Care Services ETF (XHS)
SPDR S&P Homebuilders ETF (XHB)
SPDR S&P Metals & Mining ETF (XME)
SPDR S&P Oil & Gas Equipment & Services ETF (XES)
SPDR S&P Oil & Gas Exploration & Production ETF (XOP)
SPDR S&P Pharmaceuticals ETF (XPH)
SPDR S&P Retail ETF (XRT)
SPDR S&P Semiconductor ETF (XSD)
SPDR S&P Software & Services ETF (XSW)
SPDR S&P Telecom ETF (XTL)
SPDR S&P Transportation ETF (XTN)
SPDR S&P 1500 Value Tilt ETF (VLU)
SPDR S&P 1500 Momentum Tilt ETF (MMTM)
SPDR Russell 1000 Low Volatility ETF (LGLV)
SPDR Russell 2000 Low Volatility ETF (SMLV)
SPDR Wells Fargo Preferred Stock ETF (PSK)
SPDR Barclays 1-3 Month T-Bill ETF (BIL)
SPDR Barclays TIPS ETF (IPE)
SPDR Barclays 0-5 Year TIPS ETF (SIPE)
SPDR Barclays 1-10 Year TIPS ETF (TIPX)
SPDR Barclays Short Term Treasury ETF (SST)
SPDR Barclays Intermediate Term Treasury ETF (ITE)
SPDR Barclays Long Term Treasury ETF (TLO)
SPDR Barclays Short Term Corporate Bond ETF (SCPB)
SPDR Barclays Intermediate Term Corporate Bond ETF (ITR)
SPDR Barclays Long Term Corporate Bond ETF (LWC)
SPDR Barclays Issuer Scored Corporate Bond ETF (CBND)
SPDR Barclays Convertible Securities ETF (CWB)
SPDR Barclays Mortgage Backed Bond ETF (MBG)
SPDR Barclays Aggregate Bond ETF (LAG)
SPDR Nuveen Barclays Municipal Bond ETF (TFI)
SPDR Nuveen Barclays California Municipal Bond ETF (CXA)
SPDR Nuveen Barclays New York Municipal Bond ETF (INY)
SPDR Nuveen Barclays Short Term Municipal Bond ETF (SHM)
SPDR Nuveen S&P VRDO Municipal Bond ETF (VRD)
SPDR Nuveen S&P High Yield Municipal Bond ETF (HYMB)
SPDR Nuveen Barclays Build America Bond ETF (BABS)
SPDR DB International Government Inflation-Protected Bond ETF (WIP)
SPDR Barclays Short Term International Treasury Bond ETF (BWZ)
SPDR Barclays International Treasury Bond ETF (BWX)
SPDR Barclays International Corporate Bond ETF (IBND)
SPDR Barclays Emerging Markets Local Bond ETF (EBND)
SPDR Barclays International High Yield Bond ETF (IJNK)
SPDR Barclays High Yield Bond ETF (JNK)
SPDR Barclays Short Term High Yield Bond ETF (SJNK)
SPDR Barclays Investment Grade Floating Rate ETF (FLRN)
SPDR BofA Merrill Lynch Emerging Markets Corporate Bond ETF (EMCD)
SPDR BofA Merrill Lynch Crossover Corporate Bond ETF (XOVR)
SPDR Index Shares Funds
SPDR STOXX Europe 50 ETF (FEU)
SPDR EURO STOXX 50 ETF (FEZ)
SPDR EURO STOXX Small Cap ETF (SMEZ)
SPDR S&P Emerging Asia Pacific ETF (GMF)
SPDR S&P Small Cap Emerging Asia Pacific ETF (GMFS)
SPDR S&P Russia ETF (RBL)
SPDR S&P China ETF (GXC)
SPDR S&P Emerging Markets ETF (GMM)
SPDR S&P Emerging Markets Dividend ETF (EDIV)
SPDR S&P BRIC 40 ETF (BIK)
SPDR S&P Emerging Europe ETF (GUR)
SPDR S&P Emerging Latin America ETF (GML)
SPDR S&P Emerging Middle East & Africa ETF (GAF)
SPDR S&P World ex-US ETF (GWL)
SPDR S&P International Small Cap ETF (GWX)
SPDR Dow Jones International Real Estate ETF (RWX)
SPDR S&P Global Infrastructure ETF (GII)
SPDR S&P Global Natural Resources ETF (GNR)
SPDR MSCI ACWI ex-US ETF (CWI)
SPDR MSCI ACWI IMI ETF (ACIM)
SPDR MSCI EM 50 ETF (EMFT)
SPDR MSCI EM Beyond BRIC ETF (EMBB)
SPDR MSCI EAFE Quality Mix ETF (QEFA)
SPDR MSCI Emerging Markets Quality Mix ETF (QEMM)
SPDR MSCI World Quality Mix ETF (QWLD)
SPDR MSCI Australia Quality Mix ETF (QAUS)
SPDR MSCI Canada Quality Mix ETF (QCAN)
SPDR MSCI Germany Quality Mix ETF (QDEU)
SPDR MSCI Japan Quality Mix ETF (QJPN)
SPDR MSCI Spain Quality Mix ETF (QESP)
SPDR MSCI United Kingdom Quality Mix ETF (QGBR)
SPDR Russell/Nomura PRIMETM Japan ETF (JPP)
SPDR Russell/Nomura Small CapTM Japan ETF (JSC)
SPDR S&P Global Dividend ETF (WDIV)
SPDR S&P International Dividend ETF (DWX)
SPDR S&P International Mid Cap ETF (MDD)
SPDR S&P Emerging Markets Small Cap ETF (EWX)
SPDR Dow Jones Global Real Estate ETF (RWO)
SPDR S&P International Consumer Discretionary Sector ETF (IPD)
SPDR S&P International Consumer Staples Sector ETF (IPS)
SPDR S&P International Energy Sector ETF (IPW)
SPDR S&P International Financial Sector ETF (IPF)
SPDR S&P International Health Care Sector ETF (IRY)
SPDR S&P International Industrial Sector ETF (IPN)
SPDR S&P International Materials Sector ETF (IRV)
SPDR S&P International Technology Sector ETF (IPK)
SPDR S&P International Telecommunications Sector ETF (IST)
SPDR S&P International Utilities Sector ETF (IPU)
The Select Sector SPDR Trust
The Consumer Discretionary Select Sector SPDR Fund (XLY)
The Consumer Staples Select Sector SPDR Fund (XLP)
The Energy Select Sector SPDR Fund (XLE)
The Financial Select Sector SPDR Fund (XLF)
The Health Care Select Sector SPDR Fund (XLV)
The Industrial Select Sector SPDR Fund (XLI)
The Materials Select Sector SPDR Fund (XLB)
The Technology Select Sector SPDR Fund (XLK)
The Utilities Select Sector SPDR Fund (XLU)
SSgA Active ETF Trust
SPDR SSgA Multi-Asset Real Return ETF (RLY)
SPDR SSgA Income Allocation ETF (INKM)
SPDR SSgA Global Allocation ETF (GAL)
SPDR Blackstone/GSO Senior Loan ETF (SRLN)
SPDR SSgA Ultra Short Term Bond ETF (ULST)
SPDR MFS Systematic Core Equity ETF (SYE)
SPDR MFS Systematic Growth Equity ETF (SYG)
SPDR MFS Systematic Value Equity ETF (SYV)
SPDR Dow Jones Industrial Average ETF Trust (DIA)
SPDR S&P 500 ETF Trust (SPY)
State Street Global Markets, LLC, member FINRA, SIPC, is distributor for all investment portfolios of SPDR Series Trust, SPDR Index Shares Funds, and SSgA Active ETF Trust. ALPS Distributors, Inc., a registered broker-dealer, is distributor for SPDR S&P 500 ETF Trust (SPY) and SPDR Dow Jones Industrial Average ETF Trust (DIA), both unit investment trusts. ALPS Portfolio Solutions Distributor, Inc. is the distributor for all investment portfolios of The Select Sector SPDR Trust.
SSgA Active ETF Trust
TRUSTEES
Bonny E. Boatman
Dwight D. Churchill
David M. Kelly
Frank Nesvet, Chairman
James E. Ross
Carl G. Verboncoeur
OFFICERS
Ellen M. Needham, President
Ann Carpenter, Vice President
Michael P. Riley, Vice President
Chad C. Hallett, Treasurer
Matthew W. Flaherty, Assistant Treasurer
Laura F. Dell, Assistant Treasurer
Christopher A. Madden, Secretary
Danio Mastropieri, Assistant Secretary
Brian Harris, Chief Compliance Officer
INVESTMENT MANAGER
SSgA Funds Management, Inc.
State Street Financial Center
One Lincoln Street
Boston, MA 02111
DISTRIBUTOR
State Street Global Markets, LLC
One Lincoln Street
Boston, MA 02111
CUSTODIAN, ADMINISTRATORAND TRANSFER AGENT
State Street Bank and Trust Company
One Lincoln Street
Boston, MA 02111
LEGAL COUNSEL
Bingham McCutchen LLP
2020 K Street, NW
Washington, DC 20006
INDEPENDENT REGISTERED PUBLIC ACCOUNTING FIRM
Ernst & Young LLP
200 Clarendon Street
Boston, MA 02116
Fund Shares are distributed by State Street Global Markets, LLC, a wholly-owned subsidiary of State Street Corporation. State Street Global Markets, LLC; member FINRA, SIPC.
The information contained in this report is intended for the general information of shareholders of the Trust. This report is not authorized for distribution to prospective investors unless preceded or accompanied by a current Trust prospectus which contains important information concerning the Trust. You may obtain a current prospectus and SAI from the Distributor by calling 1-866-787-2257 or visiting www.spdrs.com Please read the prospectus carefully before you invest.
SSgA Master Trust
Annual Report June 30, 2014
TABLE OF CONTENTS
SSgA MULTI-ASSET REAL RETURN PORTFOLIO
TOP FIVE HOLDINGS AS OF JUNE 30, 2014
| | | | | | | | | | | | | | |
| | | | | | | | | | | | | | | |
| | | DESCRIPTION | | SPDR S&P GLOBAL
NATURAL
RESOURCES ETF | | POWERSHARES DB
COMMODITY INDEX
TRACKING FUND | | SPDR DOW
JONES REIT
ETF | | SPDR DOW JONES
INTERNATIONAL
REAL ESTATE ETF | | SPDR BARCLAYS
TIPS ETF | | |
| | | MARKET VALUE | | $51,368,509 | | 36,188,431 | | 20,131,235 | | 18,510,945 | | 13,941,705 | | |
| | | % OF NET ASSETS | | 31.2 | | 22.0 | | 12.2 | | 11.2 | | 8.5 | | |
| | | | | | | | | | | | | | | |
(The five largest holdings are subject to change, and there are no guarantees the Portfolio will continue to remain invested in any particular Fund.)
ASSET ALLOCATION AS OF JUNE 30, 2014*
| | | | | | | | |
| | | | | PERCENT
OF NET
ASSET | | | |
| | Natural Resources | | | 43.9 | % | | |
| | Real Estate | | | 23.5 | | | |
| | Commodities | | | 22.0 | | | |
| | Inflation Linked | | | 9.9 | | | |
| | Short Term Investments | | | 0.2 | | | |
| | | Other Assets & Liabilities | | | 0.5 | | | |
| | | TOTAL | | | 100.0 | % | | |
| | * | The Portfolio’s asset allocation is expressed as a percentage of net assets and may change over time. |
1
SSgA INCOME ALLOCATION PORTFOLIO
TOP FIVE HOLDINGS AS OF JUNE 30, 2014
| | | | | | | | | | | | | | |
| | | | | | | | | | | | | | | |
| | | DESCRIPTION | | SPDR S&P
DIVIDEND ETF | | SPDR BARCLAYS
LONG TERM
CORPORATE
BOND ETF | | SPDR BARCLAYS
HIGH YIELD
BOND ETF | | SPDR BARCLAYS
LONG TERM
TREASURY ETF | | SPDR DOW JONES
REIT ETF | | |
| | | MARKET VALUE | | $15,996,281 | | 14,133,063 | | 7,674,773 | | 7,354,924 | | 7,169,374 | | |
| | | % OF NET ASSETS | | 15.4 | | 13.6 | | 7.4 | | 7.1 | | 6.9 | | |
| | | | | | | | | | | | | | | |
(The five largest holdings are subject to change, and there are no guarantees the Portfolio will continue to remain invested in any particular Fund.)
ASSET ALLOCATION AS OF JUNE 30, 2014*
| | | | | | | | |
| | | | | PERCENT
OF NET
ASSET | | | |
| | Domestic Fixed Income | | | 30.6 | % | | |
| | Domestic Equity | | | 26.3 | | | |
| | International Equity | | | 21.0 | | | |
| | Real Estate | | | 12.7 | | | |
| | International Fixed Income | | | 5.0 | | | |
| | Inflation Linked | | | 3.5 | | | |
| | Short Term Investments | | | 0.5 | | | |
| | | Other Assets & Liabilities | | | 0.4 | | | |
| | | TOTAL | | | 100.0 | % | | |
| | * | The Portfolio’s asset allocation is expressed as a percentage of net assets and may change over time. |
2
SSgA GLOBAL ALLOCATION PORTFOLIO
TOP FIVE HOLDINGS AS OF JUNE 30, 2014
| | | | | | | | | | | | | | |
| | | | | | | | | | | | | | | |
| | | DESCRIPTION | | SPDR S&P 500
ETF TRUST | | SPDR S&P WORLD
ex-US ETF | | SPDR DOW JONES
REIT ETF | | SPDR BARCLAYS
LONG TERM
CORPORATE
BOND ETF | | SPDR DOW JONES
INTERNATIONAL
REAL ESTATE ETF | | |
| | | MARKET VALUE | | $19,599,009 | | 19,315,257 | | 6,332,817 | | 5,951,067 | | 5,339,370 | | |
| | | % OF NET ASSETS | | 19.9 | | 19.6 | | 6.4 | | 6.0 | | 5.4 | | |
| | | | | | | | | | | | | | | |
(The five largest holdings are subject to change, and there are no guarantees the Portfolio will continue to remain invested in any particular Fund.)
ASSET ALLOCATION AS OF JUNE 30, 2014*
| | | | | | | | |
| | | | | PERCENT
OF NET
ASSET | | | |
| | International Equity | | | 37.5 | % | | |
| | Domestic Equity | | | 29.8 | | | |
| | Real Estate | | | 11.9 | | | |
| | Domestic Fixed Income | | | 11.0 | | | |
| | Inflation Linked | | | 5.0 | | | |
| | International Fixed Income | | | 2.0 | | | |
| | Short Term Investments | | | 2.1 | | | |
| | | Other Assets & Liabilities | | | 0.7 | | | |
| | | TOTAL | | | 100.0 | % | | |
| | * | The Portfolio’s asset allocation is expressed as a percentage of net assets and may change over time. |
3
BLACKSTONE / GSO SENIOR LOAN PORTFOLIO
TOP FIVE HOLDINGS AS OF JUNE 30, 2014
| | | | | | | | | | | | | | |
| | | | | | | | | | | | | | | |
| | | DESCRIPTION | | DELL, INC.,
SENIOR SECURED
TERM LOAN B,
4.50%, 4/29/20 | | CLEAR CHANNEL
COMMUNICATIONS,
INC., 9.00%, 12/15/19 | | CAESARS
ENTERTAINMENT
RESORT
PROPERTIES LLC,
SENIOR
SECURED TERM
LOAN B,
7.00%, 10/12/20 | | LAS VEGAS SANDS LLC,
SENIOR SECURED
TERM LOAN B,
3.25%, 12/19/20 | | MPH
ACQUISITION
HOLDINGS
LLC, SENIOR
SECURED
TERM LOAN,
4.00%, 3/31/21 | | |
| | | MARKET VALUE | | $12,109,074 | | 11,728,750 | | 8,698,498 | | 8,322,506 | | 7,887,148 | | |
| | | % OF NET ASSETS | | 2.0 | | 1.9 | | 1.4 | | 1.4 | | 1.3 | | |
| | | | | | | | | | | | | | | |
(The five largest holdings are subject to change, and there are no guarantees the Portfolio will continue to remain invested in any particular company.)
INDUSTRY BREAKDOWN AS OF JUNE 30, 2014*
| | | | | | | | |
| | | | | PERCENT OF
NET ASSET | | | |
| | Media | | | 9.1 | % | | |
| | Hotels, Restaurants & Leisure | | | 8.6 | | | |
| | Specialty Retail | | | 5.0 | | | |
| | Health Care Providers & Services | | | 4.5 | | | |
| | Chemicals | | | 4.2 | | | |
| | Commercial Services & Supplies | | | 4.0 | | | |
| | Software | | | 3.9 | | | |
| | Health Care Equipment & Supplies | | | 3.7 | | | |
| | Diversified Consumer Services | | | 3.4 | | | |
| | Diversified Telecommunication Services | | | 3.0 | | | |
| | Wireless Telecommunication Services | | | 3.0 | | | |
| | Food & Staples Retailing | | | 2.6 | | | |
| | Internet Software & Services | | | 2.5 | | | |
| | Auto Components | | | 2.2 | | | |
| | Food Products | | | 2.0 | | | |
| | Oil, Gas & Consumable Fuels | | | 2.0 | | | |
| | Semiconductors & Semiconductor Equipment | | | 2.0 | | | |
| | Technology Hardware, Storage & Peripherals | | | 2.0 | | | |
| | Pharmaceuticals | | | 1.9 | | | |
| | Electric Utilities | | | 1.8 | | | |
| | Machinery | | | 1.8 | | | |
| | Independent Power & Renewable Electricity Producers | | | 1.7 | | | |
| | Building Products | | | 1.6 | | | |
| | Insurance | | | 1.6 | | | |
| | | | | | | | |
| | | | | PERCENT OF
NET ASSET | | | |
| | Life Sciences Tools & Services | | | 1.6 | % | | |
| | Containers & Packaging | | | 1.5 | | | |
| | Airlines | | | 1.4 | | | |
| | Communications Equipment | | | 1.4 | | | |
| | Diversified Financial Services | | | 1.4 | | | |
| | Metals & Mining | | | 1.4 | | | |
| | Multiline Retail | | | 1.2 | | | |
| | Personal Products | | | 1.0 | | | |
| | Electronic Equipment, Instruments & Components | | | 0.9 | | | |
| | It Services | | | 0.8 | | | |
| | Automobiles | | | 0.7 | | | |
| | Biotechnology | | | 0.7 | | | |
| | Health Care Technology | | | 0.7 | | | |
| | Household Durables | | | 0.7 | | | |
| | Industrial Conglomerates | | | 0.7 | | | |
| | Energy Equipment & Services | | | 0.6 | | | |
| | Professional Services | | | 0.6 | | | |
| | Aerospace & Defense | | | 0.3 | | | |
| | Leisure Products | | | 0.3 | | | |
| | Real Estate Management & Development | | | 0.3 | | | |
| | Trading Companies & Distributors | | | 0.3 | | | |
| | Multi-utilities | | | 0.2 | | | |
| | Distributors | | | 0.1 | | | |
| | Short Term Investments | | | 6.5 | | | |
| | | Other Assets & Liabilities | | | (3.4 | ) | | |
| | | TOTAL | | | 100.0 | % | | |
| | * | The Portfolio’s industry breakdown is expressed as a percentage of net assets and may change over time. |
4
SSgA ULTRA SHORT TERM BOND PORTFOLIO
TOP FIVE HOLDINGS AS OF JUNE 30, 2014
| | | | | | | | | | | | | | |
| | | | | | | | | | | | | | | |
| | | DESCRIPTION | | TOYOTA MOTOR
CREDIT CORP.,
0.43%, 5/16/17 | | SLM STUDENT
LOAN TRUST,
0.40%, 7/25/19 | | BOEING CAPITAL
CORP.,
3.25%, 10/27/14 | | CISCO SYSTEMS,
INC.,
0.51%, 3/3/17 | | GE DEALER
FLOORPLAN
MASTER NOTE
TRUST,
0.64%, 6/20/17 | | |
| | | MARKET VALUE | | $400,107 | | 373,841 | | 353,343 | | 351,390 | | 350,888 | | |
| | | % OF NET ASSETS | | 2.9 | | 2.7 | | 2.5 | | 2.5 | | 2.5 | | |
| | | | | | | | | | | | | | | |
(The five largest holdings are subject to change, and there are no guarantees the Portfolio will continue to remain invested in any particular company.)
INDUSTRY BREAKDOWN AS OF JUNE 30, 2014*
| | | | | | | | |
| | | | | PERCENT
OF NET
ASSET | | | |
| | Automobiles | | | 24.4 | % | | |
| | Banks | | | 21.5 | | | |
| | Diversified Financial Services | | | 20.8 | | | |
| | Credit Card Receivables | | | 3.9 | | | |
| | Metals & Mining | | | 3.6 | | | |
| | Media | | | 3.2 | | | |
| | Diversified Telecommunication Services | | | 3.1 | | | |
| | Beverages | | | 2.8 | | | |
| | Student Loan ABS | | | 2.7 | | | |
| | Chemicals | | | 2.5 | | | |
| | Communications Equipment | | | 2.5 | | | |
| | Health Care Providers & Services | | | 2.5 | | | |
| | Consumer Finance | | | 1.6 | | | |
| | Pharmaceuticals | | | 1.1 | | | |
| | Aerospace & Defense | | | 0.8 | | | |
| | Road & Rail | | | 0.8 | | | |
| | Short Term Investments | | | 3.7 | | | |
| | | Other Assets & Liabilities | | | (1.5 | ) | | |
| | | TOTAL | | | 100.0 | % | | |
| | * | The Portfolio’s industry breakdown is expressed as a percentage of net assets and may change over time. |
5
SSgA MFS SYSTEMATIC CORE EQUITY PORTFOLIO
TOP FIVE HOLDINGS AS OF JUNE 30, 2014
| | | | | | | | | | | | | | |
| | | | | | | | | | | | | | | |
| | | DESCRIPTION | | EXXON MOBIL
CORP. | | JPMORGAN
CHASE & CO. | | VERIZON
COMMUNICATIONS,
INC. | | APPLE, INC. | | FACEBOOK, INC.
(CLASS A) | | |
| | | MARKET VALUE | | $242,639 | | 223,854 | | 217,641 | | 215,969 | | 205,907 | | |
| | | % OF NET ASSETS | | 4.5 | | 4.2 | | 4.0 | | 4.0 | | 3.8 | | |
| | | | | | | | | | | | | | | |
(The five largest holdings are subject to change, and there are no guarantees the Portfolio will continue to remain invested in any particular company.)
INDUSTRY BREAKDOWN AS OF JUNE 30, 2014*
| | | | | | | | |
| | | | | PERCENT
OF NET
ASSET | | | |
| | Health Care Providers & Services | | | 11.0 | % | | |
| | Oil, Gas & Consumable Fuels | | | 9.1 | | | |
| | Banks | | | 8.3 | | | |
| | Technology Hardware, Storage & Peripherals | | | 7.7 | | | |
| | Internet Software & Services | | | 7.6 | | | |
| | Insurance | | | 7.3 | | | |
| | Software | | | 6.6 | | | |
| | Diversified Telecommunication Services | | | 4.0 | | | |
| | Tobacco | | | 3.8 | | | |
| | Food & Staples Retailing | | | 3.7 | | | |
| | Pharmaceuticals | | | 3.6 | | | |
| | Aerospace & Defense | | | 3.4 | | | |
| | Hotels, Restaurants & Leisure | | | 3.0 | | | |
| | Independent Power & Renewable Electricity Producers | | | 2.8 | | | |
| | Textiles, Apparel & Luxury Goods | | | 2.6 | | | |
| | Media | | | 2.3 | | | |
| | Consumer Finance | | | 2.0 | | | |
| | Diversified Consumer Services | | | 2.0 | | | |
| | Electric Utilities | | | 1.8 | | | |
| | Biotechnology | | | 1.5 | | | |
| | Containers & Packaging | | | 1.5 | | | |
| | Household Products | | | 1.4 | | | |
| | Specialty Retail | | | 1.0 | | | |
| | Food Products | | | 0.8 | | | |
| | Short Term Investments | | | 1.1 | | | |
| | | Other Assets & Liabilities | | | 0.1 | | | |
| | | TOTAL | | | 100.0 | % | | |
| | * | The Portfolio’s industry breakdown is expressed as a percentage of net assets and may change over time. |
6
SSgA MFS SYSTEMATIC GROWTH EQUITY PORTFOLIO
TOP FIVE HOLDINGS AS OF JUNE 30, 2014
| | | | | | | | | | | | | | |
| | | | | | | | | | | | | | | |
| | | DESCRIPTION | | ORACLE CORP. | | FACEBOOK, INC.
(CLASS A) | | COMCAST CORP.
(CLASS A) | | McKESSON CORP. | | THE KROGER CO. | | |
| | | MARKET VALUE | | $246,341 | | 232,150 | | 213,861 | | 185,838 | | 181,606 | | |
| | | % OF NET ASSETS | | 4.6 | | 4.3 | | 4.0 | | 3.5 | | 3.4 | | |
| | | | | | | | | | | | | | | |
(The five largest holdings are subject to change, and there are no guarantees the Portfolio will continue to remain invested in any particular company.)
INDUSTRY BREAKDOWN AS OF JUNE 30, 2014*
| | | | | | | | |
| | | | | PERCENT
OF NET
ASSET | | | |
| | Software | | | 10.5 | % | | |
| | Internet Software & Services | | | 10.4 | | | |
| | Health Care Providers & Services | | | 9.9 | | | |
| | Media | | | 6.5 | | | |
| | Aerospace & Defense | | | 6.1 | | | |
| | It Services | | | 5.9 | | | |
| | Tobacco | | | 5.6 | | | |
| | Food & Staples Retailing | | | 5.3 | | | |
| | Textiles, Apparel & Luxury Goods | | | 4.3 | | | |
| | Auto Components | | | 3.4 | | | |
| | Beverages | | | 3.2 | | | |
| | Chemicals | | | 3.2 | | | |
| | Diversified Telecommunication Services | | | 2.9 | | | |
| | Insurance | | | 2.9 | | | |
| | Machinery | | | 2.8 | | | |
| | Oil, Gas & Consumable Fuels | | | 2.6 | | | |
| | Pharmaceuticals | | | 1.7 | | | |
| | Biotechnology | | | 1.5 | | | |
| | Technology Hardware, Storage & Peripherals | | | 1.5 | | | |
| | Containers & Packaging | | | 1.4 | | | |
| | Real Estate Investment Trusts | | | 1.4 | | | |
| | Consumer Finance | | | 1.2 | | | |
| | Multiline Retail | | | 1.2 | | | |
| | Airlines | | | 1.0 | | | |
| | Specialty Retail | | | 0.9 | | | |
| | Communications Equipment | | | 0.6 | | | |
| | Road & Rail | | | 0.6 | | | |
| | Short Term Investments | | | 1.4 | | | |
| | | Other Assets & Liabilities | | | 0.1 | | | |
| | | TOTAL | | | 100.0 | % | | |
| | * | The Portfolio’s industry breakdown is expressed as a percentage of net assets and may change over time. |
7
SSgA MFS SYSTEMATIC VALUE EQUITY PORTFOLIO
TOP FIVE HOLDINGS AS OF JUNE 30, 2014
| | | | | | | | | | | | | | |
| | | | | | | | | | | | | | | |
| | | DESCRIPTION | | EXXON MOBIL CORP. | | WELLS FARGO & CO. | | JPMORGAN
CHASE & CO. | | HEWLETT-
PACKARD CO. | | WELLPOINT, INC. | | |
| | | MARKET VALUE | | $304,456 | | 254,811 | | 242,926 | | 198,981 | | 188,963 | | |
| | | % OF NET ASSETS | | 5.8 | | 4.8 | | 4.6 | | 3.8 | | 3.6 | | |
| | | | | | | | | | | | | | | |
(The five largest holdings are subject to change, and there are no guarantees the Portfolio will continue to remain invested in any particular company.)
INDUSTRY BREAKDOWN AS OF JUNE 30, 2014*
| | | | | | | | |
| | | | | PERCENT
OF NET
ASSET | | | |
| | Banks | | | 13.3 | % | | |
| | Oil, Gas & Consumable Fuels | | | 13.1 | | | |
| | Health Care Providers & Services | | | 10.5 | | | |
| | Insurance | | | 8.6 | | | |
| | Pharmaceuticals | | | 5.5 | | | |
| | Independent Power & Renewable Electricity Producers | | | 5.1 | | | |
| | Technology Hardware, Storage & Peripherals | | | 4.8 | | | |
| | Aerospace & Defense | | | 4.5 | | | |
| | Internet Software & Services | | | 3.3 | | | |
| | Hotels, Restaurants & Leisure | | | 2.6 | | | |
| | Multiline Retail | | | 2.6 | | | |
| | Media | | | 2.4 | | | |
| | Electric Utilities | | | 2.0 | | | |
| | Auto Components | | | 1.9 | | | |
| | Food Products | | | 1.9 | | | |
| | Capital Markets | | | 1.7 | | | |
| | Food & Staples Retailing | | | 1.7 | | | |
| | Software | | | 1.7 | | | |
| | Consumer Finance | | | 1.6 | | | |
| | Automobiles | | | 1.3 | | | |
| | Chemicals | | | 1.3 | | | |
| | Diversified Consumer Services | | | 1.3 | | | |
| | Machinery | | | 1.3 | | | |
| | Beverages | | | 1.2 | | | |
| | Real Estate Investment Trusts | | | 1.2 | | | |
| | Diversified Telecommunication Services | | | 1.0 | | | |
| | Tobacco | | | 1.0 | | | |
| | Short Term Investments | | | 1.5 | | | |
| | | Other Assets & Liabilities | | | 0.1 | | | |
| | | TOTAL | | | 100.0 | % | | |
| | * | The Portfolio’s industry breakdown is expressed as a percentage of net assets and may change over time. |
8
SSgA Multi-Asset Real Return Portfolio
SCHEDULE OF INVESTMENTS
June 30, 2014
| | | | | | | | |
Security Description | | Shares | | | Value | |
| | | | | | | | |
|
EXCHANGE TRADED PRODUCTS — 99.3% | |
COMMODITIES — 22.0% | |
PowerShares DB Commodity Index Tracking Fund (a) | | | 1,361,491 | | | $ | 36,188,431 | |
PowerShares DB Oil Fund (a) | | | 765 | | | | 23,531 | |
| | | | | | | | |
| | | | | | | 36,211,962 | |
| | | | | | | | |
INFLATION LINKED — 9.9% | |
SPDR Barclays TIPS ETF (b) | | | 243,141 | | | | 13,941,705 | |
SPDR DB International Government Inflation-Protected Bond ETF (b) | | | 39,783 | | | | 2,466,944 | |
| | | | | | | | |
| | | | | | | 16,408,649 | |
| | | | | | | | |
NATURAL RESOURCES — 43.9% | |
Market Vectors Gold Miners ETF | | | 36,502 | | | | 965,478 | |
PowerShares Global Agriculture Portfolio | | | 157,310 | | | | 4,854,587 | |
SPDR S&P Global Natural Resources ETF (b) | | | 971,968 | | | | 51,368,509 | |
SPDR S&P International Energy Sector ETF (b) | | | 114,255 | | | | 3,376,235 | |
SPDR S&P Metals & Mining ETF (b) | | | 118,602 | | | | 5,010,934 | |
The Energy Select Sector SPDR Fund (b) | | | 67,060 | | | | 6,712,706 | |
| | | | | | | | |
| | | | | | | 72,288,449 | |
| | | | | | | | |
REAL ESTATE — 23.5% | |
SPDR Dow Jones International Real Estate ETF (b) | | | 418,421 | | | | 18,510,945 | |
SPDR Dow Jones REIT ETF (b) | | | 242,545 | | | | 20,131,235 | |
| | | | | | | | |
| | | | | | | 38,642,180 | |
| | | | | | | | |
TOTAL EXCHANGE TRADED PRODUCTS
(Cost $158,026,611) | | | | | | | 163,551,240 | |
| | | | | | | | |
SHORT TERM INVESTMENTS — 0.2% | |
MONEY MARKET FUND — 0.2% | |
State Street Institutional Liquid Reserves Fund 0.06% (b) (c)
(Cost $334,186) | | | 334,186 | | | | 334,186 | |
| | | | | | | | |
TOTAL INVESTMENTS — 99.5% (d)
(Cost $158,360,797) | | | | | | | 163,885,426 | |
OTHER ASSETS & LIABILITIES — 0.5% | | | | | | | 749,561 | |
| | | | | | | | |
NET ASSETS — 100.0% | | | | | | $ | 164,634,987 | |
| | | | | | | | |
| (a) | Qualified Publicly Traded Partnerships |
| (b) | Affiliated Fund managed by SSgA Funds Management, Inc. (Note 3). |
| (c) | The rate shown is the annualized seven-day yield at period end. |
| (d) | Unless otherwise indicated, the values of the securities of the Portfolio are determined based on Level 1 inputs (Note 2). |
See accompanying notes to financial statements.
9
SSgA Income Allocation Portfolio
SCHEDULE OF INVESTMENTS
June 30, 2014
| | | | | | | | |
Security Description | | Shares | | | Value | |
| | | | | | | | |
|
EXCHANGE TRADED PRODUCTS — 99.1% | |
DOMESTIC EQUITY — 26.3% | | | | | | | | |
SPDR S&P Dividend ETF (a) | | | 208,856 | | | $ | 15,996,281 | |
SPDR Wells Fargo Preferred Stock ETF (a) | | | 118,540 | | | | 5,174,271 | |
The Health Care Select Sector SPDR Fund (a) | | | 34,459 | | | | 2,096,141 | |
The Industrial Select Sector SPDR Fund (a) | | | 37,178 | | | | 2,009,843 | |
The Technology Select Sector SPDR Fund (a) | | | 53,943 | | | | 2,068,714 | |
| | | | | | | | |
| | | | | | | 27,345,250 | |
| | | | | | | | |
DOMESTIC FIXED INCOME — 30.6% | |
SPDR Barclays Convertible Securities ETF (a) | | | 51,996 | | | | 2,625,798 | |
SPDR Barclays High Yield Bond ETF (a) | | | 183,915 | | | | 7,674,773 | |
SPDR Barclays Long Term Corporate Bond ETF (a) | | | 348,105 | | | | 14,133,063 | |
SPDR Barclays Long Term Treasury ETF (a) | | | 110,934 | | | | 7,354,924 | |
| | | | | | | | |
| | | | | | | 31,788,558 | |
| | | | | | | | |
INFLATION LINKED — 3.5% | |
SPDR Barclays TIPS ETF (a) | | | 64,001 | | | | 3,669,817 | |
| | | | | | | | |
INTERNATIONAL EQUITY— 21.0% | |
SPDR EURO STOXX 50 ETF (a) | | | 34,566 | | | | 1,495,671 | |
SPDR S&P Emerging Markets Dividend ETF (a) | | | 101,157 | | | | 4,055,384 | |
SPDR S&P Global Infrastructure ETF (a) | | | 81,481 | | | | 4,145,753 | |
SPDR S&P International Dividend ETF (a) | | | 118,992 | | | | 6,104,290 | |
SPDR STOXX Europe 50 ETF (a) | | | 154,452 | | | | 6,080,775 | |
| | | | | | | | |
| | | | | | | 21,881,873 | |
| | | | | | | | |
INTERNATIONAL FIXED INCOME — 5.0% | |
SPDR Barclays Emerging Markets Local Bond ETF (a) | | | 99,028 | | | | 3,091,654 | |
SPDR Barclays International Corporate Bond ETF (a) | | | 55,214 | | | | 2,087,090 | |
| | | | | | | | |
| | | | | | | 5,178,744 | |
| | | | | | | | |
REAL ESTATE — 12.7% | |
SPDR Dow Jones International Real Estate ETF (a) | | | 136,457 | | | | 6,036,858 | |
SPDR Dow Jones REIT ETF (a) | | | 86,378 | | | | 7,169,374 | |
| | | | | | | | |
| | | | | | | 13,206,232 | |
| | | | | | | | |
TOTAL EXCHANGE TRADED PRODUCTS
(Cost $97,818,963) | | | | | | | 103,070,474 | |
| | | | | | | | |
SHORT TERM INVESTMENTS — 0.5% | |
MONEY MARKET FUND — 0.5% | | | | | | | | |
State Street Institutional Liquid Reserves Fund 0.06% (a) (b)
(Cost $519,279) | | | 519,279 | | | | 519,279 | |
| | | | | | | | |
TOTAL INVESTMENTS — 99.6% (c)
(Cost $98,338,242) | | | | | | | 103,589,753 | |
OTHER ASSETS &
LIABILITIES — 0.4% | | | | | | | 440,625 | |
| | | | | | | | |
NET ASSETS — 100.0% | | | | | | $ | 104,030,378 | |
| | | | | | | | |
| (a) | Affiliated Fund managed by SSgA Funds Management, Inc. (Note 3). |
| (b) | The rate shown is the annualized seven-day yield at period end. |
| (c) | Unless otherwise indicated, the values of the securities of the Portfolio are determined based on Level 1 inputs (Note 2). |
See accompanying notes to financial statements.
10
SSgA Global Allocation Portfolio
SCHEDULE OF INVESTMENTS
June 30, 2014
| | | | | | | | |
Security Description | | Shares | | | Value | |
| | | | | | | | |
|
EXCHANGE TRADED PRODUCTS — 97.2% | |
DOMESTIC EQUITY— 29.8% | | | | | | | | |
SPDR S&P 500 ETF Trust (a) | | | 100,138 | | | $ | 19,599,009 | |
SPDR S&P 500 Growth ETF (a) | | | 21,483 | | | | 1,954,309 | |
SPDR S&P MidCap 400 ETF Trust (a) | | | 7,604 | | | | 1,981,298 | |
The Health Care Select Sector SPDR Fund (a) | | | 32,724 | | | | 1,990,601 | |
The Industrial Select Sector SPDR Fund (a) | | | 35,237 | | | | 1,904,912 | |
The Technology Select Sector SPDR Fund (a) | | | 51,139 | | | | 1,961,181 | |
| | | | | | | | |
| | | | | | | 29,391,310 | |
| | | | | | | | |
DOMESTIC FIXED INCOME — 11.0% | |
SPDR Barclays Aggregate Bond ETF (a) | | | 50,949 | | | | 2,953,004 | |
SPDR Barclays High Yield Bond ETF (a) | | | 47,109 | | | | 1,965,858 | |
SPDR Barclays Long Term Corporate Bond ETF (a) | | | 146,578 | | | | 5,951,067 | |
| | | | | | | | |
| | | | | | | 10,869,929 | |
| | | | | | | | |
INFLATION LINKED — 5.0% | |
SPDR Barclays TIPS ETF (a) | | | 60,632 | | | | 3,476,639 | |
SPDR DB International Government Inflation-Protected Bond ETF (a) | | | 23,868 | | | | 1,480,055 | |
| | | | | | | | |
| | | | | | | 4,956,694 | |
| | | | | | | | |
INTERNATIONAL EQUITY— 37.5% | |
SPDR EURO STOXX 50 ETF (a) | | | 65,373 | | | | 2,828,690 | |
SPDR Russell/Nomura PRIME Japan ETF (a) | | | 86,174 | | | | 4,002,782 | |
SPDR S&P Emerging Markets ETF (a) | | | 72,046 | | | | 4,871,390 | |
SPDR S&P International Small Cap ETF (a) | | | 84,669 | | | | 2,990,509 | |
SPDR S&P World ex-US ETF (a) | | | 638,099 | | | | 19,315,257 | |
SPDR STOXX Europe 50 ETF (a) | | | 73,112 | | | | 2,878,419 | |
| | | | | | | | |
| | | | | | | 36,887,047 | |
| | | | | | | | |
INTERNATIONAL FIXED INCOME — 2.0% | |
SPDR Barclays International Corporate Bond ETF (a) | | | 26,163 | | | | 988,961 | |
SPDR Barclays International Treasury Bond
ETF (a) | | | 16,302 | | | | 990,999 | |
| | | | | | | | |
| | | | | | | 1,979,960 | |
| | | | | | | | |
REAL ESTATE — 11.9% | |
SPDR Dow Jones International Real Estate ETF (a) | | | 120,691 | | | | 5,339,370 | |
SPDR Dow Jones REIT ETF (a) | | | 76,299 | | | | 6,332,817 | |
| | | | | | | | |
| | | | | | | 11,672,187 | |
| | | | | | | | |
TOTAL EXCHANGE TRADED PRODUCTS
(Cost $89,341,431) | | | | | | | 95,757,127 | |
| | | | | | | | |
| | | | | | | | |
Security Description | | Shares | | | Value | |
| | | | | | | | |
|
SHORT TERM INVESTMENTS — 2.1% | |
MONEY MARKET FUND — 2.1% | | | | | | | | |
State Street Institutional Liquid Reserves Fund 0.06% (a) (b)
(Cost $2,055,704) | | | 2,055,704 | | | $ | 2,055,704 | |
| | | | | | | | |
TOTAL INVESTMENTS — 99.3% (c)
(Cost $91,397,135) | | | | | | | 97,812,831 | |
OTHER ASSETS &
LIABILITIES — 0.7% | | | | | | | 678,776 | |
| | | | | | | | |
NET ASSETS — 100.0% | | | | | | $ | 98,491,607 | |
| | | | | | | | |
| (a) | Affiliated Fund managed by SSgA Funds Management, Inc. (Note 3). |
| (b) | The rate shown is the annualized seven-day yield at period end. |
| (c) | Unless otherwise indicated, the values of the securities of the Portfolio are determined based on Level 1 inputs (Note 2). |
See accompanying notes to financial statements.
11
Blackstone / GSO Senior Loan Portfolio
SCHEDULE OF INVESTMENTS
June 30, 2014
| | | | | | | | |
Security Description | | Principal
Amount | | | Value | |
|
SENIOR FLOATING RATE LOANS* — 89.2% | |
AEROSPACE & DEFENSE — 0.3% | |
DigitalGlobe, Inc., Senior Secured Term Loan B, 3.75%, 1/31/20 | | $ | 1,975,000 | | | $ | 1,980,560 | |
| | | | | | | | |
AIRLINES — 1.4% | |
Delta Air Lines, Inc. | | | | | | | | |
Senior Secured Term Loan B, 3.50%, 4/20/17 | | | 1,974,555 | | | | 1,977,734 | |
Senior Secured Term Loan B1, 3.50%, 10/18/18 | | | 2,967,368 | | | | 2,970,009 | |
US Airways Group, Inc., Senior Secured Term Loan B1, 3.50%, 5/23/19 | | | 3,254,528 | | | | 3,257,587 | |
| | | | | | | | |
| | | | | | | 8,205,330 | |
| | | | | | | | |
AUTO COMPONENTS — 2.2% | |
Affinia Group Intermediate Holdings, Inc., Senior Secured Term Loan B2, 4.75%, 4/27/20 | | | 1,756,064 | | | | 1,775,820 | |
Allison Transmission, Inc., Senior Secured Term Loan B3, 3.75%, 8/23/19 | | | 3,956,369 | | | | 3,970,711 | |
Federal-Mogul Holdings Corp., Senior Secured Term Loan C, 4.75%, 4/15/21 | | | 5,000,000 | | | | 5,013,025 | |
Harbor Freight Tools USA, Inc., Senior Secured First Lien Term Loan, 4.75%, 7/26/19 | | | 2,661,470 | | | | 2,686,141 | |
| | | | | | | | |
| | | | | | | 13,445,697 | |
| | | | | | | | |
AUTOMOBILES — 0.7% | |
Chrysler Group LLC, Senior Secured Term Loan B, 3.25%, 12/31/18 | | | 4,156,250 | | | | 4,148,893 | |
| | | | | | | | |
BIOTECHNOLOGY — 0.7% | |
Grifols Worldwide Operations USA, Inc., Senior Secured Term Loan B, 3.15%, 2/27/21 | | | 4,137,172 | | | | 4,137,544 | |
| | | | | | | | |
BUILDING PRODUCTS — 1.6% | |
ABC Supply Co., Inc., Senior Secured Term Loan, 3.50%, 4/16/20 | | | 3,059,048 | | | | 3,054,980 | |
Ply Gem Industries, Inc., Senior Secured Term Loan, 4.00%, 2/1/21 | | | 804,435 | | | | 800,614 | |
Quikrete Holdings, Inc., Senior Secured First Lien Term Loan, 4.00%, 9/28/20 | | | 5,957,487 | | | | 5,973,781 | |
| | | | | | | | |
| | | | | | | 9,829,375 | |
| | | | | | | | |
CHEMICALS — 4.2% | |
Axalta Coating Systems US Holdings, Inc., Senior Secured Term Loan, 4.00%, 2/1/20 | | | 5,697,475 | | | | 5,707,445 | |
Huntsman International LLC, Senior Secured Incremental Term Loan, 3.75%, 10/15/20 | | | 2,398,524 | | | | 2,403,621 | |
Ineos US Finance LLC, Senior Secured 6 Year Term Loan, 3.75%, 5/4/18 | | | 6,928,030 | | | | 6,921,137 | |
Minerals Technologies, Inc., Senior Secured Term Loan B, 4.00%, 5/9/21 | | | 7,386,364 | | | | 7,434,855 | |
Univar, Inc., Senior Secured Term Loan B, 5.00%, 6/30/17 | | | 2,976,905 | | | | 2,993,412 | |
| | | | | | | | |
| | | | | | | 25,460,470 | |
| | | | | | | | |
| | | | | | | | |
Security Description | | Principal
Amount | | | Value | |
|
COMMERCIAL SERVICES & SUPPLIES — 3.8% | |
ADS Waste Holdings, Inc., Senior Secured
Term Loan, 3.75%, 10/9/19 | | $ | 3,954,837 | | | $ | 3,942,043 | |
Aramark Corp. | | | | | | | | |
Senior Secured Term Loan E,
3.25%, 9/7/19 | | | 1,995,000 | | | | 1,984,027 | |
Senior Secured Term Loan F, 3.25%, 2/24/21 | | | 1,995,000 | | | | 1,984,277 | |
Asurion LLC | | | | | | | | |
Senior Secured Term Loan B1, 5.00%, 5/24/19 | | | 3,110,197 | | | | 3,133,850 | |
Senior Secured Term Loan B2, 4.25%, 7/8/20 | | | 2,589,231 | | | | 2,591,393 | |
Senior Secured Second Lien Term Loan, 8.50%, 3/3/21 | | | 1,276,596 | | | | 1,326,862 | |
KAR Auction Services, Inc., Senior Secured Term Loan B2, 3.50%, 3/11/21 | | | 990,259 | | | | 990,105 | |
Lineage Logistics Holdings, LLC, Senior Secured Term Loan, 4.50%, 4/7/21 | | | 3,069,231 | | | | 3,057,076 | |
Monitronics International, Inc., Senior Secured Term Loan B, 4.25%, 3/23/18 | | | 2,123,289 | | | | 2,130,583 | |
West Corp., Senior Secured Term Loan B10, 3.25%, 6/30/18 | | | 1,973,711 | | | | 1,964,829 | |
| | | | | | | | |
| | | | | | | 23,105,045 | |
| | | | | | | | |
COMMUNICATIONS EQUIPMENT — 1.1% | |
Blue Coat Systems, Inc., Senior Secured First Lien Term Loan, 4.00%, 5/31/19 | | | 5,025,422 | | | | 5,036,930 | |
Penton Media, Inc., Senior Secured First Lien Term Loan, 5.50%, 10/1/19 | | | 1,588,000 | | | | 1,604,277 | |
| | | | | | | | |
| | | | | | | 6,641,207 | |
| | | | | | | | |
CONTAINERS & PACKAGING — 1.4% | |
Berry Plastics Holding Corp. | | | | | | | | |
Senior Secured Term Loan D, 3.50%, 2/8/20 | | | 2,964,975 | | | | 2,944,443 | |
Senior Secured Term Loan E, 3.75%, 1/6/21 | | | 1,217,002 | | | | 1,214,514 | |
Multi Packaging Solutions, Inc., Senior Secured Term Loan B, 4.25%, 9/30/20 | | | 1,995,000 | | | | 2,001,234 | |
Reynolds Group Issuer, Inc., Senior Secured New Dollar Term Loan, 4.00%, 12/1/18 | | | 2,475,000 | | | | 2,481,843 | |
| | | | | | | | |
| | | | | | | 8,642,034 | |
| | | | | | | | |
DISTRIBUTORS — 0.1% | |
Exopack Holdings SA, Senior Secured Term Loan B, 5.25%, 5/8/19 | | | 746,250 | | | | 759,078 | |
| | | | | | | | |
DIVERSIFIED CONSUMER SERVICES — 3.0% | |
Bright Horizons Family Solutions, Inc., Senior Secured Term Loan B, 3.75%, 1/30/20 | | | 3,952,356 | | | | 3,958,126 | |
ServiceMaster Co.
Senior Secured Extended Term Loan, 6.50%, 1/31/17 | | | 3,957,102 | | | | 3,962,187 | |
See accompanying notes to financial statements.
12
Blackstone / GSO Senior Loan Portfolio
SCHEDULE OF INVESTMENTS (continued)
June 30, 2014
| | | | | | | | |
Security Description | | Principal
Amount | | | Value | |
| | |
Senior Secured Term Loan, 5.50%, 1/31/17 | | $ | 3,957,318 | | | $ | 3,959,613 | |
Senior Secured Term Loan B,
4.25%, 6/25/21 | | | 6,146,789 | | | | 6,147,773 | |
| | | | | | | | |
| | | | | | | 18,027,699 | |
| | | | | | | | |
DIVERSIFIED FINANCIAL SERVICES — 1.4% | |
AlixPartners LLP, Senior Secured Term Loan B2, 4.00%, 7/10/20 | | | 2,463,800 | | | | 2,465,648 | |
Opal Acquisition, Inc., Senior Secured First Lien Term Loan, 5.00%, 11/27/20 | | | 1,659,102 | | | | 1,665,581 | |
TransUnion LLC, Senior Secured Term Loan, 4.00%, 4/9/21 | | | 4,566,867 | | | | 4,575,841 | |
| | | | | | | | |
| | | | | | | 8,707,070 | |
| | | | | | | | |
DIVERSIFIED TELECOMMUNICATION SERVICES — 2.6% | |
Crown Castle Operating Co., Senior Secured Term Loan B2, 3.00%, 1/31/21 | | | 2,970,050 | | | | 2,973,362 | |
Intelsat Jackson Holdings, Ltd., Senior Secured Term Loan B2, 3.75%, 6/30/19 | | | 2,891,243 | | | | 2,899,974 | |
LTS Buyer LLC, Senior Secured First Lien Term Loan, 4.00%, 4/13/20 | | | 3,243,305 | | | | 3,241,862 | |
Telesat LLC, Senior Secured Term Loan B2, 3.50%, 3/28/19 | | | 1,975,000 | | | | 1,975,316 | |
Virgin Media Investment Holdings, Ltd., Senior Secured Term Loan B, 3.50%, 6/5/20 | | | 2,000,000 | | | | 1,996,200 | |
Zayo Group LLC, Senior Secured Term Loan B, 4.00%, 7/2/19 | | | 2,528,971 | | | | 2,535,824 | |
| | | | | | | | |
| | | | | | | 15,622,538 | |
| | | | | | | | |
ELECTRIC UTILITIES — 1.8% | |
Calpine Construction Finance Company LP, Senior Secured Term Loan B2, 3.25%, 1/31/22 | | | 4,377,954 | | | | 4,345,120 | |
EFS Cogen Holdings I, Inc., Senior Secured Term Loan B, 3.75%, 12/17/20 | | | 2,687,821 | | | | 2,699,029 | |
La Frontera Generation LLC, Senior Secured Term Loan, 4.50%, 9/30/20 | | | 3,847,556 | | | | 3,866,312 | |
| | | | | | | | |
| | | | | | | 10,910,461 | |
| | | | | | | | |
ELECTRONIC EQUIPMENT, INSTRUMENTS &
COMPONENTS — 0.9% | |
CDW LLC, Senior Secured Term Loan, 3.25%, 4/29/20 | | | 5,112,699 | | | | 5,066,684 | |
Pelican Products, Inc., Senior Secured Term Loan, 5.25%, 4/10/20 | | | 375,853 | | | | 379,611 | |
| | | | | | | | |
| | | | | | | 5,446,295 | |
| | | | | | | | |
ENERGY EQUIPMENT & SERVICES — 0.6% | |
Sandy Creek Energy Associates LP, Senior Secured Term Loan B, 5.00%, 11/6/20 | | | 3,779,642 | | | | 3,818,743 | |
| | | | | | | | |
FOOD & STAPLES RETAILING — 2.6% | |
Albertson’s LLC, Senior Secured Term Loan B2, 4.75%, 3/21/19 | | | 4,647,015 | | | | 4,677,987 | |
| | | | | | | | |
Security Description | | Principal
Amount | | | Value | |
| | |
Sprouts Farmers Markets Holdings LLC, Senior Secured Term Loan, 4.00%, 4/23/20 | | $ | 1,565,000 | | | $ | 1,570,869 | |
Supervalu, Inc., Senior Secured Term Loan B, 4.50%, 3/21/19 | | | 2,943,978 | | | | 2,945,273 | |
US Foods, Inc., Senior Secured Term Loan, 4.50%, 3/29/19 (a) | | | 6,646,388 | | | | 6,665,364 | |
| | | | | | | | |
| | | | | | | 15,859,493 | |
| | | | | | | | |
FOOD PRODUCTS — 2.0% | |
Dole Food Co., Inc., Senior Secured Term Loan B, 4.50%, 11/1/18 | | | 2,318,185 | | | | 2,324,942 | |
H.J. Heinz Co., Senior Secured Term Loan B2, 3.50%, 6/5/20 | | | 3,960,000 | | | | 3,994,195 | |
New HB Acquisition LLC, Senior Secured Term Loan, 6.75%, 4/9/20 (a) | | | 3,990,000 | | | | 4,144,612 | |
Pinnacle Foods Finance LLC, Senior Secured Term Loan G, 3.25%, 4/29/20 | | | 1,979,950 | | | | 1,972,367 | |
| | | | | | | | |
| | | | | | | 12,436,116 | |
| | | | | | | | |
HEALTH CARE EQUIPMENT & SUPPLIES — 3.7% | |
Accellent, Inc., Senior Secured First Lien Term Loan, 4.50%, 3/12/21 | | | 2,432,927 | | | | 2,428,377 | |
Immucor, Inc., Senior Secured Term Loan B2, 5.00%, 8/17/18 | | | 3,457,381 | | | | 3,479,543 | |
Kinetic Concepts, Inc., Senior Secured Term Loan E1, 4.00%, 5/4/18 | | | 5,524,125 | | | | 5,537,245 | |
Onex Carestream Finance LP, Senior Secured First Lien Term Loan, 5.00%, 6/7/19 | | | 4,369,381 | | | | 4,383,035 | |
Ortho-Clinical Diagnostics, Inc., Senior Secured Term Loan B,
LIBOR + 3.75%, 0.00%, 5/21/21 | | | 6,870,229 | | | | 6,932,233 | |
| | | | | | | | |
| | | | | | | 22,760,433 | |
| | | | | | | | |
HEALTH CARE PROVIDERS & SERVICES — 3.9% | |
Air Medical Group Holdings, Inc., Senior Unsecured Term Loan, 5.00%, 6/30/18 (a) | | | 3,059,588 | | | | 3,074,886 | |
CHG Buyer Corp., Senior Secured Term Loan, 4.25%, 11/19/19 | | | 3,840,918 | | | | 3,863,310 | |
Community Health Systems, Inc., Senior Secured Term Loan D, 4.25%, 1/27/21 | | | 4,020,202 | | | | 4,047,841 | |
MPH Acquisition Holdings LLC, Senior Secured Term Loan, 4.00%, 3/31/21 | | | 7,898,838 | | | | 7,887,148 | |
National Mentor Holdings, Inc., Senior Secured Term Loan B, 4.75%, 1/31/21 | | | 723,575 | | | | 728,778 | |
Sheridan Holdings, Inc., Senior Secured First Lien Term Loan, 4.50%, 6/29/18 | | | 1,553,888 | | | | 1,556,218 | |
Truven Health Analytics, Inc.,
Senior Secured Term Loan B, 4.50%, 6/6/19 (a) | | | 2,853,137 | | | | 2,833,521 | |
| | | | | | | | |
| | | | | | | 23,991,702 | |
| | | | | | | | |
See accompanying notes to financial statements.
13
Blackstone / GSO Senior Loan Portfolio
SCHEDULE OF INVESTMENTS (continued)
June 30, 2014
| | | | | | | | |
Security Description | | Principal
Amount | | | Value | |
|
HEALTH CARE TECHNOLOGY — 0.7% | |
IMS Health, Inc., Senior Secured Term Loan, 3.50%, 3/17/21 | | $ | 4,485,124 | | | $ | 4,467,049 | |
| | | | | | | | |
HOTELS, RESTAURANTS & LEISURE — 8.6% | |
Caesars Entertainment Operating Co., Inc. | | | | | | | | |
Senior Secured Extended Term Loan B5, 4.53%, 1/26/18 | | | 8,312,091 | | | | 7,692,175 | |
Senior Secured Extended Term Loan B6, 4.40%, 1/26/18 | | | 6,885,246 | | | | 6,439,874 | |
Caesars Entertainment Resort Properties LLC, Senior Secured Term Loan B, 7.00%, 10/12/20 | | | 8,631,047 | | | | 8,698,498 | |
CEC Entertainment, Inc., Senior Secured Term Loan, 4.25%, 2/14/21 | | | 3,415,353 | | | | 3,398,276 | |
Delta 2 (LUX) S.A.R.L., Senior Secured Term Loan B, 4.50%, 4/30/19 | | | 6,518,093 | | | | 6,541,624 | |
Hilton Worldwide Finance LLC, Senior Secured Term Loan B2, 3.50%, 10/26/20 | | | 4,625,000 | | | | 4,622,687 | |
Las Vegas Sands LLC, Senior Secured Term Loan B, 3.25%, 12/19/20 | | | 8,315,770 | | | | 8,322,506 | |
PGA Holdings, Inc., Senior Secured First Lien Term Loan, 4.25%, 4/20/18 (a) | | | 4,213,073 | | | | 4,225,585 | |
Pinnacle Entertainment, Inc., Senior Secured Term Loan B2, 3.75%, 8/13/20 | | | 2,582,723 | | | | 2,592,137 | |
| | | | | | | | |
| | | | | | | 52,533,362 | |
| | | | | | | | |
HOUSEHOLD DURABLES — 0.7% | | | | | | | | |
Spin Holdco, Inc., Senior Secured Term Loan B, 4.25%, 11/14/19 | | | 3,910,350 | | | | 3,922,218 | |
| | | | | | | | |
INDEPENDENT POWER & RENEWABLE ELECTRICITY PRODUCERS — 0.9% | |
Atlantic Power LP, Senior Secured Term Loan B, 4.75%, 2/24/21 | | | 812,833 | | | | 823,506 | |
Calpine Corp. | | | | | | | | |
Senior Secured Term Loan B1, 4.00%, 4/1/18 | | | 2,469,375 | | | | 2,481,462 | |
Senior Secured Term Loan B3, 4.00%, 10/9/19 | | | 2,375,819 | | | | 2,385,880 | |
| | | | | | | | |
| | | | | | | 5,690,848 | |
| | | | | | | | |
INDUSTRIAL CONGLOMERATES — 0.7% | |
Sequa Corp., Senior Secured Term Loan B, 5.25%, 6/19/17 | | | 4,448,571 | | | | 4,415,674 | |
| | | | | | | | |
INSURANCE — 1.6% | | | | | | | | |
Alliant Holdings I, Inc., Senior Secured Term Loan B, 4.25%, 12/20/19 | | | 2,928,632 | | | | 2,937,417 | |
National Financial Partners Corp., Senior Secured Term Loan, 5.25%, 7/1/20 | | | 3,377,047 | | | | 3,401,531 | |
Sedgwick CMS Holdings, Inc., Senior Secured First Lien Term Loan, 3.75%, 3/1/21 | | | 3,649,390 | | | | 3,600,634 | |
| | | | | | | | |
| | | | | | | 9,939,582 | |
| | | | | | | | |
INTERNET SOFTWARE & SERVICES — 2.5% | |
Go Daddy Operating Co. LLC, Senior Secured Term Loan B, 4.75%, 5/13/21 | | | 1,383,333 | | | | 1,379,011 | |
| | | | | | | | |
Security Description | | Principal
Amount | | | Value | |
| | |
Inmar, Inc., Senior Secured First Lien Term Loan, 4.25%, 1/27/21 | | $ | 3,181,818 | | | $ | 3,153,977 | |
Leonardo Acquisition Corp., Senior Secured Term Loan,
4.25%, 1/31/21 (a) | | | 3,145,962 | | | | 3,152,851 | |
Sabre, Inc., Senior Secured Term Loan B, 4.25%, 2/19/19 | | | 5,443,502 | | | | 5,465,031 | |
SurveyMonkey.com LLC, Senior Secured Term Loan B, 5.50%, 2/5/19 | | | 1,937,191 | | | | 1,955,352 | |
| | | | | | | | |
| | | | | | | 15,106,222 | |
| | | | | | | | |
IT SERVICES — 0.8% | | | | | | | | |
Information Resources, Inc., Senior Secured Term Loan B, 4.75%, 9/30/20 | | | 3,051,664 | | | | 3,078,366 | |
SunGard Data Systems, Inc., Senior Secured Term Loan E, 4.00%, 3/8/20 | | | 1,745,566 | | | | 1,752,094 | |
| | | | | | | | |
| | | | | | | 4,830,460 | |
| | | | | | | | |
LIFE SCIENCES TOOLS & SERVICES — 1.6% | |
Pharmaceutical Product Development, Inc., Senior Secured Term Loan B, 4.00%, 12/5/18 | | | 2,963,647 | | | | 2,975,457 | |
Quintiles Transnational Corp., Senior Secured Term Loan B3, 3.75%, 6/8/18 | | | 7,000,000 | | | | 7,010,500 | |
| | | | | | | | |
| | | | | | | 9,985,957 | |
| | | | | | | | |
MACHINERY — 1.8% | | | | | | | | |
Doosan Infracore International, Inc., Senior Secured Term Loan B, 4.50%, 5/28/21 | | | 2,808,989 | | | | 2,831,812 | |
Gardner Denver, Inc., Senior Secured Term Loan, 4.25%, 7/30/20 | | | 2,984,962 | | | | 2,986,962 | |
Rexnord LLC, Senior Secured First Lien Term Loan B, 4.00%, 8/21/20 | | | 5,387,857 | | | | 5,391,575 | |
| | | | | | | | |
| | | | | | | 11,210,349 | |
| | | | | | | | |
MEDIA — 6.7% | | | | | | | | |
Acosta, Inc., Senior Secured Term Loan B, 4.25%, 3/2/18 | | | 4,088,171 | | | | 4,112,189 | |
AMC Entertainment, Inc., Senior Secured Term Loan, 3.50%, 4/30/20 | | | 3,038,906 | | | | 3,043,328 | |
Clear Channel Communications, Inc. | | | | | | | | |
Senior Secured Term Loan B, 3.80%, 1/29/16 | | | 6,082,558 | | | | 6,051,324 | |
Senior Secured Term Loan D, 6.90%, 1/30/19 | | | 5,000,000 | | | | 4,983,025 | |
Cumulus Media Holdings, Inc., Senior Secured Term Loan, 4.25%, 12/23/20 | | | 6,195,057 | | | | 6,226,032 | |
Interactive Data Corp., Senior Secured Term Loan, 4.75%, 5/2/21 | | | 7,539,856 | | | | 7,615,293 | |
Univision Communications, Inc. | | | | | | | | |
Senior Secured Term Loan C4, 4.00%, 3/1/20 | | | 2,972,537 | | | | 2,973,563 | |
Senior Secured Term Loan C3, 4.00%, 3/2/20 | | | 2,001,689 | | | | 2,004,061 | |
See accompanying notes to financial statements.
14
Blackstone / GSO Senior Loan Portfolio
SCHEDULE OF INVESTMENTS (continued)
June 30, 2014
| | | | | | | | |
Security Description | | Principal
Amount | | | Value | |
| | |
WideOpenWest Finance LLC, Senior Secured Term Loan B, 4.75%, 4/1/19 | | $ | 3,954,950 | | | $ | 3,972,253 | |
| | | | | | | | |
| | | | | | | 40,981,068 | |
| | | | | | | | |
METALS & MINING — 0.5% | | | | | | | | |
Fairmount Minerals, Ltd., Senior Secured Term Loan B2, 4.50%, 9/5/19 | | | 2,977,500 | | | | 3,012,396 | |
| | | | | | | | |
MULTI-UTILITIES — 0.2% | | | | | | | | |
Power Team Services LLC | | | | | | | | |
Senior Secured Delayed Draw Term Loan, 4.25%, 5/6/20 | | | 71,789 | | | | 70,353 | |
Senior Secured First Lien Term Loan, 4.25%, 5/6/20 | | | 1,351,293 | | | | 1,324,268 | |
| | | | | | | | |
| | | | | | | 1,394,621 | |
| | | | | | | | |
MULTILINE RETAIL — 1.2% | | | | | | | | |
Hudsons Bay Co., Senior Secured First Lien Term Loan, 4.75%, 11/4/20 | | | 3,700,000 | | | | 3,750,875 | |
The Neiman Marcus Group, Inc., Senior Secured Term Loan, 4.25%, 10/25/20 | | | 3,530,667 | | | | 3,527,949 | |
| | | | | | | | |
| | | | | | | 7,278,824 | |
| | | | | | | | |
OIL, GAS & CONSUMABLE FUELS — 2.0% | |
EMG Utica LLC, Senior Secured Term Loan, 4.75%, 3/27/20 (a) | | | 3,000,000 | | | | 3,011,250 | |
EP Energy LLC | | | | | | | | |
Senior Secured Term Loan B3, 3.50%, 5/24/18 | | | 2,000,000 | | | | 1,998,250 | |
Senior Secured Term Loan B2, 4.50%, 4/30/19 | | | 750,000 | | | | 755,719 | |
Fieldwood Energy LLC, Senior Secured Second Lien Term Loan,
8.375%, 9/30/20 | | | 6,389,590 | | | | 6,601,245 | |
| | | | | | | | |
| | | | | | | 12,366,464 | |
| | | | | | | | |
PERSONAL PRODUCTS — 1.0% | | | | | | | | |
Revlon Consumer Products Corp., Senior Secured Acquisition Term Loan, 4.00%, 10/8/19 | | | 5,978,728 | | | | 5,998,159 | |
| | | | | | | | |
PHARMACEUTICALS — 1.9% | | | | | | | | |
CCC Information Services, Inc., Senior Secured Term Loan, 4.00%, 12/20/19 | | | 2,964,887 | | | | 2,962,411 | |
Par Pharmaceutical Cos., Inc., Senior Secured Term Loan B2, 4.00%, 9/30/19 | | | 1,402,326 | | | | 1,402,326 | |
PRA Holdings, Inc., Senior Secured First Lien Term Loan, 4.50%, 9/23/20 | | | 3,389,712 | | | | 3,379,119 | |
Valeant Pharmaceuticals International, Inc., Senior Secured Term Loan B, 3.75%, 8/5/20 | | | 3,980,000 | | | | 3,981,990 | |
| | | | | | | | |
| | | | | | | 11,725,846 | |
| | | | | | | | |
|
PROFESSIONAL SERVICES — 0.6% | |
Advantage Sales & Marketing, Inc., Senior Secured First Lien Term Loan, 4.25%, 12/17/17 | | | 3,390,966 | | | | 3,398,121 | |
| | | | | | | | |
| | | | | | | | |
Security Description | | Principal
Amount | | | Value | |
|
REAL ESTATE MANAGEMENT & DEVELOPMENT — 0.3% | |
Realogy Corp., Senior Secured Term Loan B, 3.75%, 3/5/20 | | $ | 1,975,075 | | | $ | 1,977,544 | |
| | | | | | | | |
SEMICONDUCTORS & SEMICONDUCTOR
EQUIPMENT — 2.0% | |
Avago Technologies, Ltd., Senior Secured Term Loan B, 3.75%, 5/6/21 | | | 6,445,313 | | | | 6,472,770 | |
Freescale Acquisition Corp. | | | | | | | | |
Senior Secured Term Loan B4, 4.25%, 2/28/20 | | | 2,972,525 | | | | 2,976,865 | |
Senior Secured Term Loan B5, 5.00%, 1/15/21 | | | 2,481,250 | | | | 2,496,559 | |
| | | | | | | | |
| | | | | | | 11,946,194 | |
| | | | | | | | |
SOFTWARE — 3.9% | | | | | | | | |
Applied Systems, Inc., Senior Secured First Lien Term Loan, 4.25%, 1/25/21 | | | 1,658,333 | | | | 1,666,235 | |
BMC Software Finance, Inc., Senior Secured Term Loan, 5.00%, 9/10/20 | | | 6,887,071 | | | | 6,887,794 | |
Eagle Parent, Inc., Senior Secured Term Loan, 4.00%, 5/16/18 | | | 1,948,708 | | | | 1,954,067 | |
Infor (US), Inc. | | | | | | | | |
Senior Secured Term Loan B5, 3.75%, 6/3/20 | | | 2,758,959 | | | | 2,744,598 | |
Senior Secured Term Loan B5, 3.75%, 6/3/20 | | | 2,738,362 | | | | 2,722,615 | |
Magic Newco LLC, Senior Secured First Lien Term Loan, 5.00%, 12/12/18 | | | 726,079 | | | | 733,158 | |
Mitchell International, Inc., Senior Secured First Lien Term Loan, 4.50%, 10/12/20 | | | 2,853,386 | | | | 2,870,022 | |
Vertafore, Inc., Senior Secured First Lien Term Loan, 4.25%, 10/3/19 | | | 4,369,096 | | | | 4,384,934 | |
| | | | | | | | |
| | | | | | | 23,963,423 | |
| | | | | | | | |
SPECIALTY RETAIL — 4.9% | | | | | | | | |
Burlington Coat Factory Warehouse Corp., Senior Secured Term Loan B2, 4.25%, 2/23/17 | | | 3,816,460 | | | | 3,845,084 | |
General Nutrition Centers, Inc., Senior Secured Term Loan, 3.25%, 3/4/19 | | | 1,996,630 | | | | 1,981,974 | |
J Crew Group, Inc., Senior Secured Term Loan B, 4.00%, 3/5/21 | | | 4,881,647 | | | | 4,824,434 | |
Michaels Stores, Inc., Senior Secured Term Loan, 3.75%, 1/28/20 | | | 1,980,000 | | | | 1,977,070 | |
Party City Holdings, Inc., Senior Secured Term Loan, 4.00%, 7/27/19 | | | 5,942,519 | | | | 5,915,599 | |
Pilot Travel Centers LLC, Senior Secured Term Loan B, 3.75%, 3/30/18 | | | 4,266,662 | | | | 4,279,953 | |
Serta Simmons Holdings LLC, Senior Secured Term Loan, 4.25%, 10/1/19 | | | 3,404,545 | | | | 3,416,886 | |
The Men’s Wearhouse, Inc., Senior Secured Term Loan B, 4.50%, 6/18/21 | | | 3,902,439 | | | | 3,929,678 | |
| | | | | | | | |
| | | | | | | 30,170,678 | |
| | | | | | | | |
See accompanying notes to financial statements.
15
Blackstone / GSO Senior Loan Portfolio
SCHEDULE OF INVESTMENTS (continued)
June 30, 2014
| | | | | | | | |
Security Description | | Principal
Amount | | | Value | |
|
TECHNOLOGY HARDWARE, STORAGE & PERIPHERALS — 2.0% | |
Dell, Inc., Senior Secured Term Loan B, 4.50%, 4/29/20 | | $ | 12,030,455 | | | $ | 12,109,074 | |
| | | | | | | | |
TRADING COMPANIES & DISTRIBUTORS — 0.3% | |
WESCO Distribution, Inc., Senior Secured Term Loan B, 3.75%, 12/12/19 (a) | | | 1,504,126 | | | | 1,506,947 | |
| | | | | | | | |
WIRELESS TELECOMMUNICATION SERVICES — 1.8% | |
Avaya, Inc., Senior Secured Term Loan B6, 6.50%, 3/30/18 | | | 5,964,984 | | | | 5,979,896 | |
Syniverse Holdings, Inc. | | | | | | | | |
Senior Secured Term Loan, 4.00%, 4/23/19 | | | 1,967,079 | | | | 1,968,309 | |
Senior Secured Term Loan B, 4.00%, 4/23/19 (a) | | | 2,908,564 | | | | 2,913,291 | |
| | | | | | | | |
| | | | | | | 10,861,496 | |
| | | | | | | | |
TOTAL SENIOR FLOATING RATE LOANS
(Cost $543,537,029) | | | | | | | 544,728,359 | |
| | | | | | | | |
|
CORPORATE BONDS & NOTES — 7.7% | |
COMMERCIAL SERVICES & SUPPLIES — 0.2% | |
Aramark Corp., 5.75%, 3/15/20 | | | 1,000,000 | | | | 1,057,500 | |
| | | | | | | | |
COMMUNICATIONS EQUIPMENT — 0.3% | |
Alcatel-Lucent USA, Inc., 4.63%, 7/1/17 (b) | | | 2,000,000 | | | | 2,065,000 | |
| | | | | | | | |
CONTAINERS & PACKAGING — 0.1% | |
Beverage Packaging Holdings Luxembourg II SA/Beverage Packaging Holdings II Is, 6.00%, 6/15/17 (b) | | | 700,000 | | | | 717,500 | |
| | | | | | | | |
DIVERSIFIED CONSUMER SERVICES — 0.4% | |
Reynolds Group Issuer, Inc./Reynolds Group Issuer LLC/Reynolds Group Issuer Lu, 7.13%, 4/15/19 | | | 2,000,000 | | | | 2,090,000 | |
| | | | | | | | |
DIVERSIFIED TELECOMMUNICATION SERVICES — 0.4% | |
Numericable Group SA, 6.00%, 5/15/22 (b) | | | 2,250,000 | | | | 2,340,000 | |
| | | | | | | | |
HEALTH CARE PROVIDERS & SERVICES — 0.6% | |
HCA, Inc., 3.75%, 3/15/19 | | | 3,500,000 | | | | 3,530,625 | |
| | | | | | | | |
INDEPENDENT POWER & RENEWABLE ELECTRICITY PRODUCERS — 0.8% | |
AES Corp., 3.23%, 6/1/19 | | | 5,000,000 | | | | 5,037,500 | |
| | | | | | | | |
LEISURE PRODUCTS — 0.3% | |
Cedar Fair LP/Canada’s Wonderland Co./Magnum Management Corp., 5.25%, 3/15/21 | | | 2,000,000 | | | | 2,060,000 | |
| | | | | | | | |
MEDIA — 2.5% | |
Allbritton Communications Co., 8.00%, 5/15/18 | | | 2,000,000 | | | | 2,090,000 | |
Clear Channel Communications, Inc., 9.00%, 12/15/19 | | | 11,000,000 | | | | 11,728,750 | |
Univision Communications, Inc., 6.88%, 5/15/19 (b) | | | 1,000,000 | | | | 1,067,500 | |
| | | | | | | | |
| | | | | | | 14,886,250 | |
| | | | | | | | |
| | | | | | | | |
Security Description | | Principal
Amount | | | Value | |
| | |
METALS & MINING — 0.9% | | | | | | | | |
Schaeffler Finance BV,
4.25%, 5/15/21 | | $ | 5,700,000 | | | $ | 5,700,000 | |
| | | | | | | | |
WIRELESS TELECOMMUNICATION SERVICES — 1.2% | |
Avaya, Inc. | | | | | | | | |
7.00%, 4/1/19 (b) | | | 3,000,000 | | | | 3,000,000 | |
9.00%, 4/1/19 (b) | | | 4,000,000 | | | | 4,155,000 | |
| | | | | | | | |
| | | | | | | 7,155,000 | |
| | | | | | | | |
TOTAL CORPORATE BONDS & NOTES
(Cost $46,213,731) | | | | | | | 46,639,375 | |
| | | | | | | | |
SHORT TERM INVESTMENTS — 6.5% | |
MONEY MARKET FUNDS — 6.5% | |
| | | Shares | | | Value | |
State Street Institutional Liquid Reserves Fund 0.06% (c) (d) (e)
(Cost $39,685,659) | | | 39,685,659 | | | | 39,685,659 | |
| | | | | | | | |
TOTAL INVESTMENTS —103.4% (f) (Cost $629,436,419) | | | | | | | 631,053,393 | |
OTHER ASSETS &
LIABILITIES — (3.4)% | | | | | | | (20,576,431 | ) |
| | | | | | | | |
NET ASSETS — 100.0% | | | | | | $ | 610,476,962 | |
| | | | | | | | |
| * | The interest rate shown represents the rate at period end. |
| (a) | Securities are valued at fair value as determined in good faith by the Trust’s Oversight Committee in accordance with procedures approved by the Board of Trustees (Note 2). |
| (b) | Securities purchased pursuant to Rule 144A of the Securities Act of 1933. These securities, which represent 3.1% of net assets as of June 30, 2014, are considered liquid and may be resold in transactions exempt from registration, normally to qualified institutional buyers. |
| (c) | Affiliated Fund managed by SSgA Funds Management, Inc. (Note 3). |
| (d) | The rate shown is the annualized seven-day yield at period end. |
| (e) | Value is determined based on Level 1 inputs (Note 2). |
| (f) | Unless otherwise indicated, the values of the securities of the Portfolio are determined based on Level 2 inputs (Note 2). |
See accompanying notes to financial statements.
16
SSgA Ultra Short Term Bond Portfolio
SCHEDULE OF INVESTMENTS
June 30, 2014
| | | | | | | | |
Security Description | | Principal
Amount | | | Value | |
|
ASSET BACKED SECURITIES — 25.2% | |
AUTOMOBILES — 18.6% | |
Ally Master Owner Trust, 1.54%, 9/15/16 | | $ | 350,000 | | | $ | 350,810 | |
BMW Vehicle Lease Trust, 0.54%, 9/21/15 | | | 300,000 | | | | 300,262 | |
Chrysler Capital Auto Receivables Trust, 0.61%, 11/15/16 (a) | | | 251,141 | | | | 251,241 | |
Ford Credit Auto Lease Trust, 0.46%, 5/15/15 | | | 89,149 | | | | 89,153 | |
Ford Credit Auto Owner Trust,
0.48%, 11/15/16 | | | 295,841 | | | | 295,918 | |
Ford Credit Floorplan Master Owner Trust, 0.55%, 2/15/19 (b) | | | 200,000 | | | | 200,081 | |
GE Dealer Floorplan Master Note Trust,
0.64%, 6/20/17 (b) | | | 350,000 | | | | 350,888 | |
Honda Auto Receivables Owner Trust,
0.70%, 2/16/16 | | | 234,849 | | | | 235,206 | |
Santander Drive Auto Receivables Trust
0.55%, 9/15/16 | | | 112,784 | | | | 112,819 | |
0.80%, 10/17/16 (a) | | | 73,371 | | | | 73,441 | |
Toyota Auto Receivables Owner Trust,
0.75%, 2/16/16 | | | 178,249 | | | | 178,536 | |
Volkswagen Auto Lease Trust, 0.87%, 7/20/15 | | | 179,411 | | | | 179,595 | |
| | | | | | | | |
| | | | | | | 2,617,950 | |
| | | | | | | | |
CREDIT CARD RECEIVABLES — 3.9% | |
Barclays Dryrock Issuance Trust
0.49%, 3/16/20 (b) | | | 100,000 | | | | 100,000 | |
0.51%, 12/16/19 (b) | | | 200,000 | | | | 200,212 | |
Citibank Credit Card Issuance Trust,
0.58%, 9/10/20 (b) | | | 250,000 | | | | 251,033 | |
| | | | | | | | |
| | | | | | | 551,245 | |
| | | | | | | | |
STUDENT LOAN ABS — 2.7% | |
SLM Student Loan Trust, 0.40%, 7/25/19 (b) | | | 373,839 | | | | 373,841 | |
| | | | | | | | |
TOTAL ASSET BACKED SECURITIES
(Cost $3,543,381) | | | | | | | 3,543,036 | |
| | | | | | | | |
CORPORATE BONDS & NOTES — 72.6% | |
AEROSPACE & DEFENSE — 0.8% | |
The Boeing Co., 3.50%, 2/15/15 | | | 110,000 | | | | 112,129 | |
| | | | | | | | |
AUTOMOBILES — 5.8% | | | | | | | | |
Daimler Finance North America LLC 1.88%, 9/15/14 (a) | | | 325,000 | | | | 326,007 | |
0.91%, 8/1/16 (a) (b) | | | 160,000 | | | | 161,459 | |
Volkswagen International Finance NV,
1.63%, 3/22/15 (a) | | | 325,000 | | | | 328,133 | |
| | | | | | | | |
| | | | | | | 815,599 | |
| | | | | | | | |
BANKS — 21.5% | | | | | | | | |
American Express Centurion Bank,
0.67%, 11/13/15 (b) | | | 160,000 | | | | 160,708 | |
Bank of America NA, 0.70%, 2/14/17 (b) | | | 250,000 | | | | 250,261 | |
Bank of Montreal, 0.75%, 7/15/16 (b) | | | 175,000 | | | | 176,135 | |
| | | | | | | | |
Security Description | | Principal
Amount | | | Value | |
Cooperatieve Centrale Raiffeisen-Boerenleenbank BA/Netherlands,
0.71%, 3/18/16 (b) | | $ | 325,000 | | | $ | 326,838 | |
National Australia Bank Ltd.,
0.52%, 6/30/17 (a) (b) | | | 250,000 | | | | 249,933 | |
Nederlandse Waterschapsbank NV,
0.43%, 10/18/16 (a) (b) | | | 200,000 | | | | 200,366 | |
Royal Bank of Canada, 0.60%, 3/8/16 (b) | | | 250,000 | | | | 250,798 | |
Standard Chartered PLC, 5.50%, 11/18/14 (a) | | | 300,000 | | | | 305,670 | |
Svenska Handelsbanken AB,
0.68%, 3/21/16 (b) | | | 250,000 | | | | 251,265 | |
US Bancorp, 0.71%, 11/15/18 (b) | | | 150,000 | | | | 150,711 | |
US Bank NA, 4.80%, 4/15/15 | | | 100,000 | | | | 103,599 | |
Wells Fargo & Co.
0.53%, 6/2/17 (b) | | | 150,000 | | | | 150,042 | |
1.50%, 7/1/15 | | | 120,000 | | | | 121,353 | |
Westpac Banking Corp., 0.66%, 11/25/16 (b) | | | 320,000 | | | | 321,063 | |
| | | | | | | | |
| | | | | | | 3,018,742 | |
| | | | | | | | |
BEVERAGES — 2.8% | |
Anheuser-Busch InBev Worldwide, Inc.,
5.38%, 11/15/14 | | | 150,000 | | | | 152,697 | |
PepsiCo, Inc., 0.70%, 8/13/15 | | | 240,000 | | | | 240,673 | |
| | | | | | | | |
| | | | | | | 393,370 | |
| | | | | | | | |
CHEMICALS — 2.5% | |
EI du Pont de Nemours & Co., 4.75%, 3/15/15 | | | 340,000 | | | | 350,185 | |
| | | | | | | | |
COMMUNICATIONS EQUIPMENT — 2.5% | |
Cisco Systems, Inc., 0.51%, 3/3/17 (b) | | | 350,000 | | | | 351,390 | |
| | | | | | | | |
CONSUMER FINANCE — 1.6% | |
Caterpillar Financial Services Corp.,
0.47%, 2/26/16 (b) | | | 225,000 | | | | 225,425 | |
| | | | | | | | |
DIVERSIFIED FINANCIAL SERVICES — 20.8% | |
American Express Credit Corp.,
5.13%, 8/25/14 | | | 200,000 | | | | 201,426 | |
American Honda Finance Corp.,
0.60%, 5/26/16 (a) (b) | | | 320,000 | | | | 321,379 | |
Boeing Capital Corp., 3.25%, 10/27/14 | | | 350,000 | | | | 353,343 | |
BP Capital Markets PLC
0.55%, 11/6/15 (b) | | | 150,000 | | | | 150,442 | |
1.70%, 12/5/14 | | | 200,000 | | | | 201,164 | |
General Electric Capital Corp.
1.09%, 5/9/16 (b) | | | 150,000 | | | | 151,911 | |
0.61%, 7/10/15 (b) | | | 70,000 | | | | 70,236 | |
0.42%, 5/11/16 (b) | | | 300,000 | | | | 299,976 | |
JPMorgan Chase & Co.
3.70%, 1/20/15 | | | 140,000 | | | | 142,480 | |
0.68%, 4/23/15 (b) | | | 325,000 | | | | 325,714 | |
PACCAR Financial Corp.,
0.49%, 2/8/16 (b) | | | 300,000 | | | | 300,876 | |
Toyota Motor Credit Corp.,
0.43%, 5/16/17 (b) | | | 400,000 | | | | 400,107 | |
| | | | | | | | |
| | | | | | | 2,919,054 | |
| | | | | | | | |
See accompanying notes to financial statements.
17
SSgA Ultra Short Term Bond Portfolio
SCHEDULE OF INVESTMENTS (continued)
June 30, 2014
| | | | | | | | |
Security Description | | Principal
Amount | | | Value | |
|
DIVERSIFIED TELECOMMUNICATION SERVICES — 3.1% | |
AT&T, Inc.
0.88%, 2/13/15 | | $ | 100,000 | | | $ | 100,317 | |
5.10%, 9/15/14 | | | 325,000 | | | | 327,830 | |
| | | | | | | | |
| | | | | | | 428,147 | |
| | | | | | | | |
HEALTH CARE PROVIDERS & SERVICES — 2.5% | |
UnitedHealth Group, Inc.
4.88%, 3/15/15 | | | 140,000 | | | | 144,527 | |
5.00%, 8/15/14 | | | 200,000 | | | | 201,093 | |
| | | | | | | | |
| | | | | | | 345,620 | |
| | | | | | | | |
MEDIA — 3.2% | |
NBCUniversal Enterprise, Inc.
0.91%, 4/15/18 (a) (b) | | | 150,000 | | | | 151,670 | |
0.76%, 4/15/16 (a) (b) | | | 300,000 | | | | 301,615 | |
| | | | | | | | |
| | | | | | | 453,285 | |
| | | | | | | | |
METALS & MINING — 3.6% | |
Rio Tinto Finance USA PLC
1.07%, 6/17/16 (b) | | | 300,000 | | | | 302,586 | |
1.13%, 3/20/15 | | | 200,000 | | | | 201,041 | |
| | | | | | | | |
| | | | | | | 503,627 | |
| | | | | | | | |
PHARMACEUTICALS — 1.1% | |
Merck & Co., Inc., 0.59%, 5/18/18 (b) | | | 150,000 | | | | 150,525 | |
| | | | | | | | |
ROAD & RAIL — 0.8% | |
Canadian National Railway Co.,
0.42%, 11/6/15 (b) | | | 119,000 | | | | 119,032 | |
| | | | | | | | |
TOTAL CORPORATE BONDS & NOTES
(Cost $10,175,306) | | | | | | | 10,186,130 | |
| | | | | | | | |
SHORT TERM INVESTMENTS — 3.7% | |
MONEY MARKET FUNDS — 3.7% | |
| | | Shares | | | Value | |
State Street Institutional Liquid Reserves Fund 0.06% (c) (d) (e)
(Cost $518,551) | | | 518,551 | | | | 518,551 | |
| | | | | | | | |
TOTAL INVESTMENTS — 101.5% (f)
(Cost $14,237,238) | | | | | | | 14,247,717 | |
OTHER ASSETS &
LIABILITIES — (1.5)% | | | | | | | (211,786 | ) |
| | | | | | | | |
NET ASSETS — 100.0% | | | | | | $ | 14,035,931 | |
| | | | | | | | |
| (a) | Securities purchased pursuant to Rule 144A of the Securities Act of 1933. These securities, which represent 19.0% of net assets as of June 30, 2014, are considered liquid and may be resold in transactions exempt from registration, normally to qualified institutional buyers. |
| (b) | Variable rate security. Rate shown is rate in effect at June 30, 2014. Maturity date disclosed is the ultimate maturity. |
| (c) | Affiliated Fund managed by SSgA Funds Management, Inc. (Note 3). |
| (d) | The rate shown is the annualized seven-day yield at period end. |
| (e) | Value is determined based on Level 1 inputs (Note 2). |
| (f) | Unless otherwise indicated, the values of the securities of the Portfolio are determined based on Level 2 inputs (Note 2). |
See accompanying notes to financial statements.
18
SSgA MFS Systematic Core Equity Portfolio
SCHEDULE OF INVESTMENTS
June 30, 2014
| | | | | | | | |
Security Description | | Shares | | | Value | |
|
COMMON STOCKS — 98.8% | |
AEROSPACE & DEFENSE — 3.4% | |
Lockheed Martin Corp. | | | 604 | | | $ | 97,081 | |
Raytheon Co. | | | 950 | | | | 87,638 | |
| | | | | | | | |
| | | | | | | 184,719 | |
| | | | | | | | |
BANKS — 8.3% | |
Citigroup, Inc. | | | 2,452 | | | | 115,489 | |
JPMorgan Chase & Co. | | | 3,885 | | | | 223,854 | |
Wells Fargo & Co. | | | 2,012 | | | | 105,751 | |
| | | | | | | | |
| | | | | | | 445,094 | |
| | | | | | | | |
BIOTECHNOLOGY — 1.5% | |
Amgen, Inc. | | | 678 | | | | 80,255 | |
| | | | | | | | |
CONSUMER FINANCE — 2.0% | |
Discover Financial Services | | | 1,270 | | | | 78,715 | |
SLM Corp. | | | 3,176 | | | | 26,392 | |
| | | | | | | | |
| | | | | | | 105,107 | |
| | | | | | | | |
CONTAINERS & PACKAGING — 1.5% | |
Packaging Corp. of America | | | 1,140 | | | | 81,499 | |
| | | | | | | | |
DIVERSIFIED CONSUMER SERVICES — 2.0% | |
Apollo Education Group, Inc. (a) | | | 3,446 | | | | 107,688 | |
| | | | | | | | |
DIVERSIFIED TELECOMMUNICATION SERVICES — 4.0% | |
Verizon Communications, Inc. | | | 4,448 | | | | 217,641 | |
| | | | | | | | |
ELECTRIC UTILITIES — 1.8% | |
Edison International | | | 1,046 | | | | 60,783 | |
OGE Energy Corp. | | | 929 | | | | 36,305 | |
| | | | | | | | |
| | | | | | | 97,088 | |
| | | | | | | | |
FOOD & STAPLES RETAILING — 3.7% | |
The Kroger Co. | | | 3,476 | | | | 171,819 | |
Wal-Mart Stores, Inc. | | | 376 | | | | 28,226 | |
| | | | | | | | |
| | | | | | | 200,045 | |
| | | | | | | | |
FOOD PRODUCTS — 0.8% | |
The JM Smucker Co. | | | 391 | | | | 41,669 | |
| | | | | | | | |
HEALTH CARE PROVIDERS & SERVICES — 11.0% | |
Aetna, Inc. | | | 1,002 | | | | 81,242 | |
Cardinal Health, Inc. | | | 2,300 | | | | 157,688 | |
McKesson Corp. | | | 948 | | | | 176,527 | |
WellPoint, Inc. | | | 1,632 | | | | 175,620 | |
| | | | | | | | |
| | | | | | | 591,077 | |
| | | | | | | | |
HOTELS, RESTAURANTS & LEISURE — 3.0% | |
Royal Caribbean Cruises, Ltd. | | | 2,875 | | | | 159,850 | |
| | | | | | | | |
HOUSEHOLD PRODUCTS — 1.4% | |
The Procter & Gamble Co. | | | 958 | | | | 75,289 | |
| | | | | | | | |
INDEPENDENT POWER & RENEWABLE ELECTRICITY PRODUCERS — 2.8% | |
The AES Corp. | | | 9,728 | | | | 151,270 | |
| | | | | | | | |
INSURANCE — 7.3% | |
Everest Re Group, Ltd. | | | 625 | | | | 100,306 | |
Prudential Financial, Inc. | | | 1,612 | | | | 143,097 | |
Validus Holdings, Ltd. | | | 3,866 | | | | 147,836 | |
| | | | | | | | |
| | | | | | | 391,239 | |
| | | | | | | | |
INTERNET SOFTWARE & SERVICES — 7.6% | |
Facebook, Inc. (Class A) (a) | | | 3,060 | | | | 205,907 | |
Google, Inc. (Class A) (a) | | | 177 | | | | 103,487 | |
| | | | | | | | |
Security Description | | Shares | | | Value | |
| | |
Google, Inc. (Class C) (a) | | | 177 | | | $ | 101,824 | |
| | | | | | | | |
| | | | | | | 411,218 | |
| | | | | | | | |
MEDIA — 2.3% | |
Comcast Corp. (Class A) | | | 990 | | | | 53,143 | |
Time Warner Cable, Inc. | | | 488 | | | | 71,883 | |
| | | | | | | | |
| | | | | | | 125,026 | |
| | | | | | | | |
OIL, GAS & CONSUMABLE FUELS — 9.1% | |
Chevron Corp. | | | 580 | | | | 75,719 | |
Exxon Mobil Corp. | | | 2,410 | | | | 242,639 | |
Valero Energy Corp. | | | 3,362 | | | | 168,436 | |
| | | | | | | | |
| | | | | | | 486,794 | |
| | | | | | | | |
PHARMACEUTICALS — 3.6% | |
Johnson & Johnson | | | 1,842 | | | | 192,710 | |
| | | | | | | | |
SOFTWARE — 6.6% | |
Electronic Arts, Inc. (a) | | | 4,489 | | | | 161,020 | |
Oracle Corp. | | | 4,726 | | | | 191,545 | |
| | | | | | | | |
| | | | | | | 352,565 | |
| | | | | | | | |
SPECIALTY RETAIL — 1.0% | |
Advance Auto Parts, Inc. | | | 386 | | | | 52,079 | |
| | | | | | | | |
TECHNOLOGY HARDWARE, STORAGE & PERIPHERALS — 7.7% | |
Apple, Inc. | | | 2,324 | | | | 215,969 | |
Hewlett-Packard Co. | | | 5,944 | | | | 200,194 | |
| | | | | | | | |
| | | | | | | 416,163 | |
| | | | | | | | |
TEXTILES, APPAREL & LUXURY GOODS — 2.6% | |
Michael Kors Holdings, Ltd. (a) | | | 1,600 | | | | 141,840 | |
| | | | | | | | |
TOBACCO — 3.8% | |
Altria Group, Inc. | | | 1,263 | | | | 52,970 | |
Philip Morris International, Inc. | | | 1,822 | | | | 153,613 | |
| | | | | | | | |
| | | | | | | 206,583 | |
| | | | | | | | |
TOTAL COMMON STOCKS
(Cost $5,024,113) | | | | | | | 5,314,508 | |
| | | | | | | | |
SHORT TERM INVESTMENTS — 1.1% | |
MONEY MARKET FUND — 1.1% | | | | | | | | |
State Street Institutional Liquid Reserves
Fund 0.6% (b) (c)
(Cost $58,605) | | | 58,605 | | | | 58,605 | |
| | | | | | | | |
TOTAL INVESTMENTS — 99.9% (d)
(Cost $5,082,718) | | | | | | | 5,373,113 | |
OTHER ASSETS & LIABILITIES — 0.1% | | | | | | | 4,870 | |
| | | | | | | | |
NET ASSETS — 100.0% | | | | | | $ | 5,377,983 | |
| | | | | | | | |
| (a) | Non-income producing security |
| (b) | Affiliated Fund managed by SSgA Funds Management, Inc. (Note 3). |
| (c) | The rate shown is the annualized seven-day yield at period end. |
| (d) | Unless otherwise indicated, the values of the securities of the Portfolio are determined based on Level 1 inputs (Note 2). |
See accompanying notes to financial statements.
19
SSgA MFS Systematic Growth Equity Portfolio
SCHEDULE OF INVESTMENTS
June 30, 2014
| | | | | | | | |
Security Description | | Shares | | | Value | |
|
COMMON STOCKS — 98.5% | |
AEROSPACE & DEFENSE — 6.1% | |
Huntington Ingalls Industries, Inc. | | | 749 | | | $ | 70,848 | |
Lockheed Martin Corp. | | | 1,082 | | | | 173,910 | |
Raytheon Co. | | | 260 | | | | 23,985 | |
The Boeing Co. | | | 464 | | | | 59,034 | |
| | | | | | | | |
| | | | | | | 327,777 | |
| | | | | | | | |
AIRLINES — 1.0% | |
Copa Holdings SA | | | 384 | | | | 54,747 | |
| | | | | | | | |
AUTO COMPONENTS — 3.4% | |
The Goodyear Tire & Rubber Co. | | | 6,492 | | | | 180,348 | |
| | | | | | | | |
BEVERAGES — 3.2% | |
Dr Pepper Snapple Group, Inc. | | | 730 | | | | 42,764 | |
The Coca-cola Co. | | | 3,092 | | | | 130,977 | |
| | | | | | | | |
| | | | | | | 173,741 | |
| | | | | | | | |
BIOTECHNOLOGY — 1.5% | |
Amgen, Inc. | | | 687 | | | | 81,320 | |
| | | | | | | | |
CHEMICALS — 3.2% | |
LyondellBasell Industries NV | | | 1,775 | | | | 173,329 | |
| | | | | | | | |
COMMUNICATIONS EQUIPMENT — 0.6% | |
QUALCOMM, Inc. | | | 428 | | | | 33,898 | |
| | | | | | | | |
CONSUMER FINANCE — 1.2% | |
Discover Financial Services | | | 1,022 | | | | 63,344 | |
| | | | | | | | |
CONTAINERS & PACKAGING — 1.4% | |
Packaging Corp. of America | | | 1,024 | | | | 73,206 | |
| | | | | | | | |
DIVERSIFIED TELECOMMUNICATION SERVICES — 2.9% | |
Verizon Communications, Inc. | | | 3,198 | | | | 156,478 | |
| | | | | | | | |
FOOD & STAPLES RETAILING — 5.3% | |
CVS Caremark Corp. | | | 916 | | | | 69,039 | |
The Kroger Co. | | | 3,674 | | | | 181,606 | |
Wal-Mart Stores, Inc. | | | 482 | | | | 36,183 | |
| | | | | | | | |
| | | | | | | 286,828 | |
| | | | | | | | |
HEALTH CARE PROVIDERS & SERVICES — 9.9% | |
Cardinal Health, Inc. | | | 2,176 | | | | 149,186 | |
HCA Holdings, Inc. (a) | | | 2,798 | | | | 157,751 | |
McKesson Corp. | | | 998 | | | | 185,838 | |
WellPoint, Inc. | | | 344 | | | | 37,018 | |
| | | | | | | | |
| | | | | | | 529,793 | |
| | | | | | | | |
INSURANCE — 2.9% | |
Validus Holdings, Ltd. | | | 4,104 | | | | 156,937 | |
| | | | | | | | |
INTERNET SOFTWARE & SERVICES — 10.4% | |
Akamai Technologies, Inc. (a) | | | 510 | | | | 31,141 | |
Facebook, Inc. (Class A) (a) | | | 3,450 | | | | 232,150 | |
Google, Inc. (Class A) (a) | | | 127 | | | | 74,253 | |
Google, Inc. (Class C) (a) | | | 127 | | | | 73,061 | |
VeriSign, Inc. (a) | | | 3,036 | | | | 148,187 | |
| | | | | | | | |
| | | | | | | 558,792 | |
| | | | | | | | |
IT SERVICES — 5.9% | |
Cognizant Technology Solutions Corp. (a) | | | 2,080 | | | | 101,733 | |
FleetCor Technologies, Inc. (a) | | | 1,290 | | | | 170,022 | |
International Business Machines Corp. | | | 257 | | | | 46,586 | |
| | | | | | | | |
| | | | | | | 318,341 | |
| | | | | | | | |
MACHINERY — 2.8% | |
Caterpillar, Inc. | | | 1,400 | | | | 152,138 | |
| | | | | | | | |
| | | | | | | | |
Security Description | | Shares | | | Value | |
|
MEDIA — 6.5% | |
Comcast Corp. (Class A) | | | 3,984 | | | $ | 213,861 | |
Time Warner Cable, Inc. | | | 926 | | | | 136,400 | |
| | | | | | | | |
| | | | | | | 350,261 | |
| | | | | | | | |
MULTILINE RETAIL — 1.2% | |
Macy’s, Inc. | | | 1,134 | | | | 65,795 | |
| | | | | | | | |
OIL, GAS & CONSUMABLE FUELS — 2.6% | |
Marathon Petroleum Corp. | | | 1,768 | | | | 138,028 | |
| | | | | | | | |
PHARMACEUTICALS — 1.7% | |
Johnson & Johnson | | | 849 | | | | 88,822 | |
| | | | | | | | |
REAL ESTATE INVESTMENT TRUSTS (REITS) — 1.4% | |
Simon Property Group, Inc. | | | 442 | | | | 73,496 | |
| | | | | | | | |
ROAD & RAIL — 0.6% | |
Union Pacific Corp. | | | 312 | | | | 31,122 | |
| | | | | | | | |
SOFTWARE — 10.5% | |
Adobe Systems, Inc. (a) | | | 670 | | | | 48,481 | |
Intuit, Inc. | | | 656 | | | | 52,828 | |
Microsoft Corp. | | | 2,958 | | | | 123,349 | |
Oracle Corp. | | | 6,078 | | | | 246,341 | |
PTC, Inc. (a) | | | 2,410 | | | | 93,508 | |
| | | | | | | | |
| | | | | | | 564,507 | |
| | | | | | | | |
SPECIALTY RETAIL — 0.9% | |
The Home Depot, Inc. | | | 566 | | | | 45,823 | |
| | | | | | | | |
TECHNOLOGY HARDWARE, STORAGE &
PERIPHERALS — 1.5% | |
Apple, Inc. | | | 840 | | | | 78,061 | |
| | | | | | | | |
TEXTILES, APPAREL & LUXURY GOODS — 4.3% | |
Hanesbrands, Inc. | | | 846 | | | | 83,280 | |
Michael Kors Holdings, Ltd. (a) | | | 1,666 | | | | 147,691 | |
| | | | | | | | |
| | | | | | | 230,971 | |
| | | | | | | | |
TOBACCO — 5.6% | |
Altria Group, Inc. | | | 1,808 | | | | 75,828 | |
Lorillard, Inc. | | | 1,524 | | | | 92,918 | |
Philip Morris International, Inc. | | | 1,598 | | | | 134,727 | |
| | | | | | | | |
| | | | | | | 303,473 | |
| | | | | | | | |
TOTAL COMMON STOCKS
(Cost $4,947,373) | | | | | | | 5,291,376 | |
| | | | | | | | |
SHORT TERM INVESTMENTS — 1.4% | |
MONEY MARKET FUND — 1.4% | |
State Street Institutional Liquid Reserves Fund 0.06% (b) (c)
(Cost $75,976) | | | 75,976 | | | | 75,976 | |
| | | | | | | | |
TOTAL INVESTMENTS — 99.9% (d)
(Cost $5,023,349) | | | | | | | 5,367,352 | |
OTHER ASSETS & LIABILITIES — 0.1% | | | | | | | 5,228 | |
| | | | | | | | |
NET ASSETS — 100.0% | | | | | | $ | 5,372,580 | |
| | | | | | | | |
| (a) | Non-income producing security |
| (b) | Affiliated Fund managed by SSgA Funds Management, Inc. (Note 3). |
| (c) | The rate shown is the annualized seven-day yield at period end. |
| (d) | Unless otherwise indicated, the values of the securities of the Portfolio are determined based on Level 1 inputs (Note 2). |
See accompanying notes to financial statements.
20
SSgA MFS Systematic Value Equity Portfolio
SCHEDULE OF INVESTMENTS
June 30, 2014
| | | | | | | | |
Security Description | | Shares | | | Value | |
|
COMMON STOCKS — 98.4% | |
AEROSPACE & DEFENSE — 4.5% | |
Northrop Grumman Corp. | | | 1,316 | | | $ | 157,433 | |
Raytheon Co. | | | 852 | | | | 78,597 | |
| | | | | | | | |
| | | | | | | 236,030 | |
| | | | | | | | |
AUTO COMPONENTS — 1.9% | |
Gentex Corp. | | | 1,320 | | | | 38,399 | |
The Goodyear Tire & Rubber Co. | | | 2,310 | | | | 64,172 | |
| | | | | | | | |
| | | | | | | 102,571 | |
| | | | | | | | |
AUTOMOBILES — 1.3% | |
General Motors Co. | | | 1,880 | | | | 68,244 | |
| | | | | | | | |
BANKS — 13.3% | |
Citigroup, Inc. | | | 2,580 | | | | 121,518 | |
JPMorgan Chase & Co. | | | 4,216 | | | | 242,926 | |
The Pnc Financial Services Group, Inc. | | | 940 | | | | 83,707 | |
Wells Fargo & Co. | | | 4,848 | | | | 254,811 | |
| | | | | | | | |
| | | | | | | 702,962 | |
| | | | | | | | |
BEVERAGES — 1.2% | |
Molson Coors Brewing Co. (Class B) | | | 890 | | | | 66,002 | |
| | | | | | | | |
CAPITAL MARKETS — 1.7% | |
The Goldman Sachs Group, Inc. | | | 528 | | | | 88,408 | |
| | | | | | | | |
CHEMICALS — 1.3% | |
CF Industries Holdings, Inc. | | | 276 | | | | 66,386 | |
| | | | | | | | |
CONSUMER FINANCE — 1.6% | |
Discover Financial Services | | | 1,370 | | | | 84,913 | |
| | | | | | | | |
DIVERSIFIED CONSUMER SERVICES — 1.3% | |
Apollo Education Group, Inc. (a) | | | 2,232 | | | | 69,750 | |
| | | | | | | | |
DIVERSIFIED TELECOMMUNICATION SERVICES — 1.0% | |
Verizon Communications, Inc. | | | 1,070 | | | | 52,355 | |
| | | | | | | | |
ELECTRIC UTILITIES — 2.0% | |
Edison International | | | 1,860 | | | | 108,085 | |
| | | | | | | | |
FOOD & STAPLES RETAILING — 1.7% | |
The Kroger Co. | | | 1,812 | | | | 89,567 | |
| | | | | | | | |
FOOD PRODUCTS — 1.9% | |
Mondelez International, Inc. (Class A) | | | 2,610 | | | | 98,162 | |
| | | | | | | | |
HEALTH CARE PROVIDERS & SERVICES — 10.5% | |
Cardinal Health, Inc. | | | 2,340 | | | | 160,430 | |
HCA Holdings, Inc. (a) | | | 1,938 | | | | 109,265 | |
McKesson Corp. | | | 510 | | | | 94,967 | |
WellPoint, Inc. | | | 1,756 | | | | 188,963 | |
| | | | | | | | |
| | | | | | | 553,625 | |
| | | | | | | | |
HOTELS, RESTAURANTS & LEISURE — 2.6% | |
MGM Resorts International (a) | | | 2,240 | | | | 59,136 | |
Royal Caribbean Cruises, Ltd. | | | 1,380 | | | | 76,728 | |
| | | | | | | | |
| | | | | | | 135,864 | |
| | | | | | | | |
INDEPENDENT POWER & RENEWABLE ELECTRICITY PRODUCERS — 5.1% | |
NRG Energy, Inc. | | | 2,680 | | | | 99,696 | |
The AES Corp. | | | 11,094 | | | | 172,512 | |
| | | | | | | | |
| | | | | | | 272,208 | |
| | | | | | | | |
INSURANCE — 8.6% | |
Everest Re Group, Ltd. | | | 1,036 | | | | 166,268 | |
Prudential Financial, Inc. | | | 1,870 | | | | 166,000 | |
The Travelers Cos, Inc. | | | 480 | | | | 45,153 | |
| | | | | | | | |
Security Description | | Shares | | | Value | |
| | |
Validus Holdings, Ltd. | | | 2,024 | | | $ | 77,398 | |
| | | | | | | | |
| | | | | | | 454,819 | |
| | | | | | | | |
INTERNET SOFTWARE & SERVICES — 3.3% | |
VeriSign, Inc. (a) | | | 1,356 | | | | 66,186 | |
Yahoo!, Inc. (a) | | | 3,144 | | | | 110,449 | |
| | | | | | | | |
| | | | | | | 176,635 | |
| | | | | | | | |
MACHINERY — 1.3% | |
Caterpillar, Inc. | | | 630 | | | | 68,462 | |
| | | | | | | | |
MEDIA — 2.4% | |
Comcast Corp. (Class A) | | | 1,108 | | | | 59,477 | |
Time Warner Cable, Inc. | | | 450 | | | | 66,285 | |
| | | | | | | | |
| | | | | | | 125,762 | |
| | | | | | | | |
MULTILINE RETAIL — 2.6% | |
Macy’s, Inc. | | | 2,336 | | | | 135,535 | |
| | | | | | | | |
OIL, GAS & CONSUMABLE FUELS — 13.1% | |
Chesapeake Energy Corp. | | | 1,992 | | | | 61,911 | |
Chevron Corp. | | | 936 | | | | 122,195 | |
Exxon Mobil Corp. | | | 3,024 | | | | 304,456 | |
Marathon Petroleum Corp. | | | 1,060 | | | | 82,754 | |
Valero Energy Corp. | | | 2,454 | | | | 122,946 | |
| | | | | | | | |
| | | | | | | 694,262 | |
| | | | | | | | |
PHARMACEUTICALS — 5.5% | |
Johnson & Johnson | | | 1,204 | | | | 125,963 | |
Merck & Co, Inc. | | | 1,298 | | | | 75,089 | |
Pfizer, Inc. | | | 3,080 | | | | 91,414 | |
| | | | | | | | |
| | | | | | | 292,466 | |
| | | | | | | | |
REAL ESTATE INVESTMENT TRUSTS (REITS) — 1.2% | |
Vornado Realty Trust | | | 598 | | | | 63,825 | |
| | | | | | | | |
SOFTWARE — 1.7% | |
PTC, Inc. (a) | | | 2,250 | | | | 87,300 | |
| | | | | | | | |
TECHNOLOGY HARDWARE, STORAGE & PERIPHERALS — 4.8% | |
Hewlett-Packard Co. | | | 5,908 | | | | 198,981 | |
SanDisk Corp. | | | 542 | | | | 56,601 | |
| | | | | | | | |
| | | | | | | 255,582 | |
| | | | | | | | |
TOBACCO — 1.0% | |
Lorillard, Inc. | | | 846 | | | | 51,581 | |
| | | | | | | | |
TOTAL COMMON STOCKS
(Cost $4,939,141) | | | | | | | 5,201,361 | |
| | | | | | | | |
SHORT TERM INVESTMENTS — 1.5% | |
MONEY MARKET FUND — 1.5% | |
State Street Institutional Liquid Reserves
Fund 0.06% (b) (c)
(Cost $81,360) | | | 81,360 | | | | 81,360 | |
| | | | | | | | |
TOTAL INVESTMENTS — 99.9% (d)
(Cost $5,020,501) | | | | | | | 5,282,721 | |
OTHER ASSETS &
LIABILITIES — 0.1% | | | | | | | 3,603 | |
| | | | | | | | |
NET ASSETS — 100.0% | | | | | | $ | 5,286,324 | |
| | | | | | | | |
| (a) | Non-income producing security |
| (b) | Affiliated Fund managed by SSgA Funds Management, Inc. (Note 3). |
| (c) | The rate shown is the annualized seven-day yield at period end. |
| (d) | Unless otherwise indicated, the values of the securities of the Portfolio are determined based on Level 1 inputs (Note 2). |
See accompanying notes to financial statements.
21
SSgA MASTER TRUST
STATEMENTS OF ASSETS AND LIABILITIES
June 30, 2014
| | | | | | | | | | | | |
| | |
SSgA Multi-Asset
Real Return
Portfolio | | | SSgA Income
Allocation
Portfolio | | | SSgA Global
Allocation
Portfolio | |
ASSETS | | | | | | | | | | | | |
Investments in securities of unaffiliated issuers, at value | | $ | 42,032,027 | | | $ | — | | | $ | — | |
Investments in securities of affiliated issuers, at value | | | 121,853,399 | | | | 103,589,753 | | | | 97,812,831 | |
| | | | | | | | | | | | |
Total investments | | | 163,885,426 | | | | 103,589,753 | | | | 97,812,831 | |
Receivable from Feeder | | | 24,685,995 | | | | — | | | | — | |
Receivable for investment securities sold | | | — | | | | — | | | | — | |
Dividends receivable from affiliated issuers (Note 3) | | | 772,145 | | | | 457,443 | | | | 694,729 | |
Dividends receivable from unaffiliated issuers | | | — | | | | — | | | | — | |
Interest receivable from unaffiliated issuers | | | — | | | | — | | | | — | |
| | | | | | | | | | | | |
TOTAL ASSETS | | | 189,343,566 | | | | 104,047,196 | | | | 98,507,560 | |
| | | | | | | | | | | | |
LIABILITIES | | | | | | | | | | | | |
Payable for investments purchased | | | 24,686,279 | | | | — | | | | — | |
Accrued advisory fees (Note 3) | | | 22,222 | | | | 16,755 | | | | 15,918 | |
Accrued trustees’ fees and expenses (Note 3) | | | 78 | | | | 63 | | | | 35 | |
| | | | | | | | | | | | |
TOTAL LIABILITIES | | | 24,708,579 | | | | 16,818 | | | | 15,953 | |
| | | | | | | | | | | | |
NET ASSETS | | $ | 164,634,987 | | | $ | 104,030,378 | | | $ | 98,491,607 | |
| | | | | | | | | | | | |
COST OF INVESTMENTS | | | | | | | | | | | | |
Unaffiliated issuers | | $ | 41,821,980 | | | $ | — | | | $ | — | |
Affiliated issuers | | | 116,538,817 | | | | 98,338,242 | | | | 91,397,135 | |
| | | | | | | | | | | | |
Total cost of investments | | $ | 158,360,797 | | | $ | 98,338,242 | | | $ | 91,397,135 | |
| | | | | | | | | | | | |
See accompanying notes to financial statements.
22
| | | | | | | | | | | | | | | | | | |
Blackstone / GSO
Senior Loan
Portfolio | | | SSgA Ultra Short
Term Bond
Portfolio | | | SSgA MFS
Systematic Core
Equity Portfolio | | | SSgA MFS
Systematic
Growth Equity
Portfolio | | | SSgA MFS
Systematic Value
Equity Portfolio | |
| | | | | | | | | | | | | | | | | | |
| $ | 591,367,734 | | | $ | 13,729,166 | | | $ | 5,314,508 | | | $ | 5,291,376 | | | $ | 5,201,361 | |
| | 39,685,659 | | | | 518,551 | | | | 58,605 | | | | 75,976 | | | | 81,360 | |
| | | | | | | | | | | | | | | | | | |
| | 631,053,393 | | | | 14,247,717 | | | | 5,373,113 | | | | 5,367,352 | | | | 5,282,721 | |
| | 133,695 | | | | — | | | | — | | | | — | | | | — | |
| | 17,985,016 | | | | — | | | | — | | | | — | | | | — | |
| | — | | | | — | | | | 3 | | | | 4 | | | | 4 | |
| | — | | | | — | | | | 6,201 | | | | 6,557 | | | | 4,908 | |
| | 2,772,121 | | | | 40,530 | | | | — | | | | — | | | | — | |
| | | | | | | | | | | | | | | | | | |
| | 651,944,295 | | | | 14,288,247 | | | | 5,379,317 | | | | 5,373,913 | | | | 5,287,633 | |
| | | | | | | | | | | | | | | | | | |
| | | | | | | | | | | | | | | | | | |
| | 41,316,516 | | | | 250,000 | | | | — | | | | — | | | | — | |
| | 150,445 | | | | 2,307 | | | | 1,324 | | | | 1,323 | | | | 1,298 | |
| | 302 | | | | 9 | | | | 10 | | | | 10 | | | | 11 | |
| | | | | | | | | | | | | | | | | | |
| | 41,467,263 | | | | 252,316 | | | | 1,334 | | | | 1,333 | | | | 1,309 | |
| | | | | | | | | | | | | | | | | | |
| $ | 610,476,962 | | | $ | 14,035,931 | | | $ | 5,377,983 | | | $ | 5,372,580 | | | $ | 5,286,324 | |
| | | | | | | | | | | | | | | | | | |
| | | | | | | | | | | | | | | | | | |
| $ | 589,750,760 | | | $ | 13,718,687 | | | $ | 5,024,113 | | | $ | 4,947,373 | | | $ | 4,939,141 | |
| | 39,685,659 | | | | 518,551 | | | | 58,605 | | | | 75,976 | | | | 81,360 | |
| | | | | | | | | | | | | | | | | | |
| $ | 629,436,419 | | | $ | 14,237,238 | | | $ | 5,082,718 | | | $ | 5,023,349 | | | $ | 5,020,501 | |
| | | | | | | | | | | | | | | | | | |
23
SSgA MASTER TRUST
STATEMENTS OF OPERATIONS
For the Year Ended June 30, 2014
| | | | | | | | | | | | |
| | |
SSgA Multi-Asset
Real Return
Portfolio | | | SSgA Income
Allocation
Portfolio | | | SSgA Global
Allocation
Portfolio | |
INVESTMENT INCOME | | | | | | | | | | | | |
Dividend and interest income on securities of unaffiliated issuers (Note 2) | | $ | 116,885 | | | $ | — | | | $ | — | |
Dividend income on securities of affiliated issuers (Note 3) | | | 2,730,747 | | | | 4,309,839 | | | | 2,012,089 | |
| | | | | | | | | | | | |
TOTAL INVESTMENT INCOME | | | 2,847,632 | | | | 4,309,839 | | | | 2,012,089 | |
| | | | | | | | | | | | |
EXPENSES | | | | | | | | | | | | |
Advisory fees (Note 3) | | | 258,050 | | | | 210,670 | | | | 136,101 | |
Trustees’ fees (Note 3) | | | 2,552 | | | | 2,296 | | | | 1,084 | |
Other expenses | | | 9 | | | | 8 | | | | 7 | |
| | | | | | | | | | | | |
TOTAL EXPENSES | | | 260,611 | | | | 212,974 | | | | 137,192 | |
| | | | | | | | | | | | |
NET INVESTMENT INCOME | | $ | 2,587,021 | | | $ | 4,096,865 | | | $ | 1,874,897 | |
| | | | | | | | | | | | |
REALIZED AND UNREALIZED GAIN (LOSS) ON INVESTMENTS | | | | | | | | | | | | |
Net realized gain (loss) on investments in securities of unaffiliated issuers | | | (1,735,130 | ) | | | — | | | | — | |
Net realized gain (loss) on investments in securities of affiliated issuers | | | (472,264 | ) | | | (1,346,791 | ) | | | 1,718,573 | |
Net change in unrealized appreciation (depreciation) on investments | | | 16,133,508 | | | | 11,409,215 | | | | 6,937,869 | |
| | | | | | | | | | | | |
NET REALIZED AND UNREALIZED GAIN ON INVESTMENTS | | | 13,926,114 | | | | 10,062,424 | | | | 8,656,442 | |
| | | | | | | | | | | | |
NET INCREASE IN NET ASSETS RESULTING FROM OPERATIONS | | $ | 16,513,135 | | | $ | 14,159,289 | | | $ | 10,531,339 | |
| | | | | | | | | | | | |
| * | For the period October 9, 2013 (commencement of operations) to June 30, 2014. |
| ** | For the period January 8, 2014 (commencement of operations) to June 30, 2014. |
See accompanying notes to financial statements.
24
| | | | | | | | | | | | | | | | | | |
Blackstone / GSO
Senior Loan
Portfolio | | | SSgA Ultra Short
Term Bond
Portfolio* | | | SSgA MFS
Systematic Core
Equity Portfolio** | | | SSgA MFS
Systematic
Growth Equity
Portfolio** | | | SSgA MFS
Systematic Value
Equity Portfolio** | |
| | | | | | | | | | | | | | | | | | |
| | | | |
| $ | 22,005,518 | | | $ | 51,466 | | | $ | 45,322 | | | $ | 43,045 | | | $ | 48,900 | |
| | 52,102 | | | | 154 | | | | 18 | | | | 18 | | | | 17 | |
| | | | | | | | | | | | | | | | | | |
| | 22,057,620 | | | | 51,620 | | | | 45,340 | | | | 43,063 | | | | 48,917 | |
| | | | | | | | | | | | | | | | | | |
| | | | | | | | | | | | | | | | | | |
| | 1,683,374 | | | | 19,193 | | | | 7,315 | | | | 7,314 | | | | 7,194 | |
| | 9,436 | | | | 75 | | | | 19 | | | | 19 | | | | 19 | |
| | 49 | | | | 1 | | | | — | | | | — | | | | — | |
| | | | | | | | | | | | | | | | | | |
| | 1,692,859 | | | | 19,269 | | | | 7,334 | | | | 7,333 | | | | 7,213 | |
| | | | | | | | | | | | | | | | | | |
| $ | 20,364,761 | | | $ | 32,351 | | | $ | 38,006 | | | $ | 35,730 | | | $ | 41,704 | |
| | | | | | | | | | | | | | | | | | |
| | | | | | | | | | | | | | | | | | |
| | (2,767,913 | ) | |
|
888 |
| | | 68,581 | | | | 10,976 | | | | 4,238 | |
|
— |
| | | — | | | | — | | | | — | | | | — | |
| | 4,689,730 | | | | 10,479 | | | | 290,395 | | | | 344,003 | | | | 262,220 | |
| | | | | | | | | | | | | | | | | | |
|
1,921,817 |
| | | 11,367 | | | | 358,976 | | | | 354,979 | | | | 266,458 | |
| | | | | | | | | | | | | | | | | | |
| | | | |
| $ | 22,286,578 | | | $ | 43,718 | | | $ | 396,982 | | | $ | 390,709 | | | $ | 308,162 | |
| | | | | | | | | | | | | | | | | | |
25
SSgA MASTER TRUST
STATEMENTS OF CHANGES IN NET ASSETS
| | | | | | | | | | | | | | | | |
| | | SSgA Multi-Asset Real Return Portfolio | | |
SSgA Income Allocation Portfolio | |
| | | Year Ended
6/30/14 | | | Year Ended
6/30/13 | | | Year Ended
6/30/14 | | |
Year Ended
6/30/13 | |
INCREASE (DECREASE) IN NET ASSETS FROM OPERATIONS: | | | | | | | | | | | | | | | | |
Net investment income (loss) | | $ | 2,587,021 | | | $ | 1,740,438 | | | $ | 4,096,865 | | | $ | 3,607,371 | |
Net realized gain (loss) on investments | | | (2,207,394 | ) | | | (924,340 | ) | | | (1,346,791 | ) | | | (1,103,424 | ) |
Net change in unrealized appreciation (depreciation) on investments | | | 16,133,508 | | | | (10,378,172 | ) | | | 11,409,215 | | | | (6,205,334 | ) |
| | | | | | | | | | | | | | | | |
Net increase (decrease) in net assets resulting from operations | | | 16,513,135 | | | | (9,562,074 | ) | | | 14,159,289 | | | | (3,701,387 | ) |
| | | | | | | | | | | | | | | | |
CAPITAL TRANSACTIONS | | | | | | | | | | | | | | | | |
Contributions | | | 91,367,610 | | | | 130,398,415 | | | | 7,804,636 | | | | 170,596,375 | |
Withdrawals | | | (64,829,742 | ) | | | (5,079,121 | ) | | | (92,188,375 | ) | | | (1,753,769 | ) |
Other capital | | | — | | | | — | | | | — | | | | — | |
| | | | | | | | | | | | | | | | |
Net increase (decrease) in net assets from capital transactions | | | 26,537,868 | | | | 125,319,294 | | | | (84,383,739 | ) | | | 168,842,606 | |
| | | | | | | | | | | | | | | | |
Net increase (decrease) in net assets during the period | | | 43,051,003 | | | | 115,757,220 | | | | (70,224,450 | ) | | | 165,141,219 | |
NET ASSETS | | | | | | | | | | | | | | | | |
Net assets at beginning of period | | | 121,583,984 | | | | 5,826,764 | | | | 174,254,828 | | | | 9,113,609 | |
| | | | | | | | | | | | | | | | |
NET ASSETS END OF PERIOD | | $ | 164,634,987 | | | $ | 121,583,984 | | | $ | 104,030,378 | | | $ | 174,254,828 | |
| | | | | | | | | | | | | | | | |
| * | Commencement of operations |
See accompanying notes to financial statements.
26
| | | | | | | | | | | | | | | | | | |
| SSgA Global Allocation Portfolio | | | Blackstone / GSO Senior Loan Portfolio | | | SSgA Ultra Short
Term Bond Portfolio | |
Year Ended
6/30/14 | | | Year Ended
6/30/13 | | | Year Ended
6/30/14 | | | For the Period
4/3/13* -
6/30/13 | | | For the Period
10/9/13* -
6/30/14 | |
| | | | |
| | | | | | | | | | | | | | | | | | |
| $ | 1,874,897 | | | $ | 672,602 | | | $ | 20,364,761 | | | $ | 1,233,838 | | | $ | 32,351 | |
| | 1,718,573 | | | | 31,550 | | | | (2,767,913 | ) | | | (18,345 | ) | | | 888 | |
| | | | |
| | 6,937,869 | | | | (434,591 | ) | | | 4,689,730 | | | | (3,072,756 | ) | | | 10,479 | |
| | | | | | | | | | | | | | | | | | |
| | | | |
| | 10,531,339 | | | | 269,561 | | | | 22,286,578 | | | | (1,857,263 | ) | | | 43,718 | |
| | | | | | | | | | | | | | | | | | |
| | | | | | | | | | | | | | | | | | |
| | 47,337,163 | | | | 50,799,932 | | | | 286,897,792 | | | | 334,915,199 | | | | 16,010,331 | |
| | (11,312,504 | ) | | | (3,584,635 | ) | | | (31,961,441 | ) | | | (670,323 | ) | | | (2,033,325 | ) |
| | — | | | | — | | | | 461,549 | | | | 404,871 | | | | 15,207 | |
| | | | | | | | | | | | | | | | | | |
| | | | |
| | 36,024,659 | | | | 47,215,297 | | | | 255,397,900 | | | | 334,649,747 | | | | 13,992,213 | |
| | | | | | | | | | | | | | | | | | |
| | | | |
| | 46,555,998 | | | | 47,484,858 | | | | 277,684,478 | | | | 332,792,484 | | | | 14,035,931 | |
| | | | | | | | | | | | | | | | | | |
| | 51,935,609 | | | | 4,450,751 | | | | 332,792,484 | | | | — | | | | — | |
| | | | | | | | | | | | | | | | | | |
| $ | 98,491,607 | | | $ | 51,935,609 | | | $ | 610,476,962 | | | $ | 332,792,484 | | | $ | 14,035,931 | |
| | | | | | | | | | | | | | | | | | |
27
SSgA MASTER TRUST
STATEMENTS OF CHANGES IN NET ASSETS (continued)
| | | | | | | | | | | | |
| | | SSgA MFS
Systematic Core
Equity Portfolio | | | SSgA MFS
Systematic Growth
Equity Portfolio | | | SSgA MFS
Systematic Value
Equity Portfolio | |
| | | For the Period
1/8/14* -
6/30/14 | | | For the Period
1/8/14* -
6/30/14 | | | For the Period
1/8/14* -
6/30/14 | |
INCREASE (DECREASE) IN NET ASSETS FROM OPERATIONS: | | | | | | | | | | | | |
Net investment income (loss) | | $ | 38,006 | | | $ | 35,730 | | | $ | 41,704 | |
Net realized gain (loss) on investments | | | 68,581 | | | | 10,976 | | | | 4,238 | |
Net change in unrealized appreciation (depreciation) on investments | | | 290,395 | | | | 344,003 | | | | 262,220 | |
| | | | | | | | | | | | |
Net increase (decrease) in net assets resulting from operations | | | 396,982 | | | | 390,709 | | | | 308,162 | |
| | | | | | | | | | | | |
CAPITAL TRANSACTIONS | | | | | | | | | | | | |
Contributions | | | 5,001,000 | | | | 5,001,000 | | | | 5,001,000 | |
Withdrawals | | | (19,999 | ) | | | (19,129 | ) | | | (22,838 | ) |
Other capital | | | — | | | | — | | | | — | |
| | | | | | | | | | | | |
Net increase (decrease) in net assets from capital transactions | | | 4,981,001 | | | | 4,981,871 | | | | 4,978,162 | |
| | | | | | | | | | | | |
Net increase (decrease) in net assets during the period | | | 5,377,983 | | | | 5,372,580 | | | | 5,286,324 | |
NET ASSETS | | | | | | | | | | | | |
Net assets at beginning of period | | | — | | | | — | | | | — | |
| | | | | | | | | | | | |
NET ASSETS END OF PERIOD | | $ | 5,377,983 | | | $ | 5,372,580 | | | $ | 5,286,324 | |
| | | | | | | | | | | | |
| * | Commencement of operations |
See accompanying notes to financial statements.
28
[This Page Intentionally Left Blank]
29
SSgA MASTER TRUST
FINANCIAL HIGHLIGHTS
The following table includes selected supplemental data and ratios to average net assets:
| | | | | | | | | | | | | | | | | | | | | | | | |
| | |
SSgA Multi-Asset Real Return Portfolio* | | | SSgA Income Allocation Portfolio* | |
| | | Year Ended
6/30/14 | | | Year Ended
6/30/13 | | | For the Period
4/25/12** -
6/30/12 | | | Year Ended
6/30/14 | | | Year Ended
6/30/13 | | | For the Period
4/25/12** -
6/30/12 | |
Supplemental Data and Ratios: | | | | | | | | | | | | | | | | | | | | | | | | |
Net assets, end of period (000s) | | $ | 164,635 | | | $ | 121,584 | | | $ | 5,827 | | | $ | 104,030 | | | $ | 174,255 | | | $ | 9,114 | |
| | | | | | | | | | | | | | | | | | | | | | | | |
Ratios to average net assets: | | | | | | | | | | | | | | | | | | | | | | | | |
Operating expenses | | | 0.20 | % | | | 0.20 | % | | | 0.20 | %(1) | | | 0.20 | % | | | 0.20 | % | | | 0.20 | %(1) |
Net investment income | | | 2.01 | % | | | 2.91 | % | | | 3.84 | %(1) | | | 3.89 | % | | | 4.65 | % | | | 8.39 | %(1) |
Portfolio turnover rate | | | 40 | % | | | 31 | % | | | 10 | % | | | 63 | % | | | 80 | % | | | 15 | % |
Total return | | | 13.93 | % | | | (1.63 | )% | | | (3.42 | )%(2) | | | 13.84 | % | | | 4.39 | % | | | 0.92 | %(2) |
| * | The Portfolio invests in other underlying Portfolios and indirectly bears its proportionate share of fees and expenses incurred by such Portfolios. The ratios presented do not reflect the indirect expenses of the underlying Portfolios in which the Portfolio invests. |
| ** | Commencement of operations |
| (2) | Total return for periods of less than one year is not annualized. |
See accompanying notes to financial statements.
30
| | | | | | | | | | | | | | | | | | | | | | | | | | | | | | | | | | |
SSgA Global Allocation
Portfolio* | | | Blackstone /
GSO Senior
Loan Portfolio | | | SSgA Ultra
Short Term
Bond Portfolio | | | SSgA MFS
Systematic
Core Equity
Portfolio | | | SSgA MFS
Systematic
Growth Equity
Portfolio | | | SSgA MFS
Systematic
Value Equity
Portfolio | |
Year
Ended
6/30/14 | | | Year
Ended
6/30/13 | | | For the
Period
4/25/12** -
6/30/12 | | | Year
Ended
6/30/14 | | | For the
Period
4/3/13** -
6/30/13 | | | For the Period
10/9/13** -
6/30/14 | | | For the Period
1/8/14** -
6/30/14 | | | For the Period
1/8/14** -
6/30/14 | | | For the Period
1/8/14** -
6/30/14 | |
| | | | | | | | | | | | | | | | | | | | | | | | | | | | | | | | | | |
| $ | 98,492 | | | $ | 51,936 | | | $ | 4,451 | | | $ | 610,477 | | | $ | 332,792 | | | $ | 14,036 | | | $ | 5,378 | | | $ | 5,373 | | | $ | 5,286 | |
| | | | | | | | | | | | | | | | | | | | | | | | | | | | | | | | | | |
| | | | | | | | | | | | | | | | | | | | | | | | | | | | | | | | | | |
| | 0.20 | % | | | 0.20 | % | | | 0.20 | %(1) | | | 0.30 | % | | | 0.30 | %(1) | | | 0.20 | %(1) | | | 0.30 | %(1) | | | 0.30 | %(1) | | | 0.30 | %(1) |
| | 2.76 | % | | | 3.07 | % | | | 4.34 | %(1) | | | 3.63 | % | | | 2.57 | %(1) | | | 0.34 | %(1) | | | 1.55 | %(1) | | | 1.46 | %(1) | | | 1.73 | %(1) |
| | 89 | % | | | 123 | % | | | 25 | % | | | 77 | % | | | 4 | % | | | 39 | % | | | 27 | % | | | 20 | % | | | 23 | % |
| | 16.80 | % | | | 9.92 | % | | | (1.82 | )%(2) | | | 4.00 | % | | | (0.31 | )%(2) | | | 0.47 | %(2) | | | 7.92 | %(2) | | | 7.85 | %(2) | | | 6.20 | %(2) |
31
SSgA MASTER TRUST
NOTES TO FINANCIAL STATEMENTS
June 30, 2014
SSgA Master Trust (the “Trust”), which is registered under the Investment Company Act of 1940, as amended (“1940 Act”), is an open-end investment management company that was organized as a Massachusetts business trust on March 30, 2011.
As of June 30, 2014, the Trust offered eight (8) portfolios, each of which represents a separate series of beneficial interest in the Trust (each a “Portfolio” and collectively; the “Portfolios”). The financial statements herein relate to the following eight (8) Portfolios: SSgA Multi-Asset Real Return Portfolio, SSgA Income Allocation Portfolio, SSgA Global Allocation Portfolio, Blackstone/GSO Senior Loan Portfolio, SSgA Ultra Short Term Bond Portfolio, SSgA MFS Systematic Core Equity Portfolio, SSgA MFS Systematic Growth Equity Portfolio and SSgA MFS Systematic Value Equity Portfolio. Each Portfolio serves as a master fund in a master feeder structure.
Under the Trust’s organizational documents, its officers and trustees are indemnified against certain liabilities arising out of the performance of their duties to the Trust. Additionally, in the normal course of business, the Trust enters into contracts with service providers that contain general indemnification clauses. The Trust’s maximum exposure under these arrangements is unknown as this could involve future claims that may be made against the Trust that have not yet occurred. However, based on experience, the Trust expects the risk of loss to be remote.
The Trust invests in various investments which are exposed to risks, such as market risk. Due to the level of risk associated with certain investments it is at least reasonably possible that changes in the values of investment securities will occur in the near term and that such changes could be material.
SSgA Multi-Asset Real Return Portfolio, SSgA Income Allocation Portfolio and SSgA Global Allocation Portfolio invest their assets in other exchange-traded products (referred to as “underlying Funds”). The underlying Funds, in turn, may engage in a number of investment techniques and practices, which involve certain risks. Certain underlying Funds invest their portfolios in debt securities. Investments in debt securities may increase or decrease as a result of the following: market fluctuations, increases in interest rates, inability of issuers to repay principal and interest or illiquidity in the debt securities markets; the risk of low rates of return due to reinvestment of securities during periods of falling interest rates or repayment by issuers with higher coupon or interest rates; and/or the risk of low income due to falling interest rates. Certain underlying Funds invest their portfolios in foreign securities including emerging markets. Foreign investments involve certain risks that are greater than those associated with investments in securities of U.S. issuers. Returns on investments in foreign securities could be more volatile than, or trail the returns on, investments in U.S. securities. Investments in securities issued by entities based outside the United States pose distinct risks since political and economic events unique to a country or region will affect those markets and their issuers. Investment in emerging markets involves greater risk of loss than investments in a developed market. This is due to, among other things, greater market volatility, lower trading volume, political and economic instability, high levels of inflation, deflation or currency devaluation, greater risk of market shut down, and more governmental limitations on foreign investment policy than those typically found in a developed market. Certain underlying Funds invest their portfolios in commodities markets. Commodities are subject to substantial price fluctuations over short periods of time and may be affected by unpredictable economic, political and environmental events. Factors that may significantly affect the prices of commodities include, but are not limited to: global supply and demand; domestic and international interest rates and investors’ expectations of interest rates; inflation rates and investors’ expectations of inflation rates; the investment and trading activities of commodity futures contracts; political, economic, or financial events, both globally and regionally.
The Blackstone / GSO Senior Loan Portfolio invests its assets in senior loans. Investments in senior loans are subject to credit risks which may include delay in receiving payments of principal and interest paid by the borrower to the agent or by the agent to the lender or offsets against payments received from the borrower.
SSgA Ultra Short Term Bond Portfolio invests in investment grade debt securities with varying maturities. Investments in debt securities may increase or decrease as a result of the following: market fluctuations, increases in interest rates, inability of issuers to repay principal and interest or illiquidity in the debt securities markets; the risk of low rates of return due to reinvestment of securities during periods of falling interest rates or repayment by issuers with higher coupon or interest rates; and/or the risk of low income due to falling interest rates.
SSgA MFS Systematic Core Equity ETF, SSgA MFS Systematic Growth Equity ETF and SSgA MFS Systematic Value Equity ETF invest in various investments which are exposed to risks, such as market risk. Due to the level of risk
32
SSgA MASTER TRUST
NOTES TO FINANCIAL STATEMENTS (continued)
June 30, 2014
associated with certain investments it is at least reasonably possible that changes in the values of investment securities will occur in the near term and that such changes could be material.
An investment in a Fund involves risks similar to those of investing in any fund, such as market fluctuations caused by such factors as economic and political developments, changes in interest rates and perceived trends in security prices. The values of securities could decline generally or could underperform other investments. Different types of securities tend to go through cycles of out-performance and underperformance in comparison to the general securities markets. In addition, securities may decline in value due to factors affecting a specific issuer, market or securities markets generally.
| 2. | Summary of Significant Accounting Policies |
The following is a summary of significant accounting policies followed by the Trust in the preparation of its financial statements:
The preparation of financial statements in accordance with U.S. generally accepted accounting principles requires management to make estimates and assumptions that affect the reported amounts and disclosures in the financial statements. Actual results could differ from those estimates. These financial statements are presented in United States dollars.
Security Valuation
The fair value of each Portfolio’s portfolio securities and other financial instruments is based on the market price of the securities, which generally means a valuation obtained from an exchange or other market (or based on a price quotation or other equivalent indication of value supplied by an exchange or other market) or a valuation obtained from an independent pricing service. Investments in underlying funds are valued at their market price each business day. Loans are primarily valued by using a composite loan price from a loan pricing service. The methodology used by the Portfolios’ loan pricing provider for composite loan prices is to value loans at the mean of the bid and ask prices from one or more brokers or dealers. U.S. fixed income securities may be valued as of the announced closing time for trading in fixed income instruments on any day that the Securities Industry and Financial Markets Association announces an early closing time. If a security’s market price is not readily available or does not otherwise accurately reflect the fair value of the security, the security will be valued by another method that the Board of Trustees of the Trust (the “Board”) believes will better reflect fair value in accordance with the Trust’s valuation policies and procedures. The Board has adopted procedures concerning securities valuation, under which an Oversight Committee makes determinations as to whether market quotations are not readily available or do not otherwise accurately reflect the fair value of the security. The Oversight Committee, or a subgroup thereof, subject to oversight by the Board, may use fair value pricing in a variety of circumstances, including but not limited to, situations when trading in a security has been suspended or halted. Fair value pricing involves subjective judgments and it is possible that the fair value determination for a security is materially different than the value that could be received on the sale of the security
The Portfolios follow the authoritative guidance for fair value measurements and the fair value option for financial assets and financial liabilities. The guidance establishes a hierarchy for inputs used in measuring fair value that maximizes the use of observable inputs and minimizes the use of unobservable inputs by requiring that the most observable inputs be used when available. The guidance establishes three levels of inputs that may be used to measure fair value:
| • | | Level 1 — quoted prices in active markets for identical investments |
| • | | Level 2 — other significant observable inputs (including, but not limited to, quoted prices for similar investments, interest rates, prepayment speeds, credit risk, etc.) |
| • | | Level 3 — significant unobservable inputs (including the Portfolios’ own assumptions in determining the fair value of investments) |
Investments that use Level 2 or Level 3 inputs may include, but are not limited to: (i) an unlisted security related to corporate actions; (ii) a restricted security (e.g., one that may not be publicly sold without registration under the Securities Act of 1933, as amended); (iii) a security whose trading has been suspended or which has been de-listed from its primary trading exchange; (iv) a security that is thinly traded; (v) a security in default or bankruptcy proceedings for
33
SSgA MASTER TRUST
NOTES TO FINANCIAL STATEMENTS (continued)
June 30, 2014
which there is no current market quotation; (vi) a security affected by currency controls or restrictions; and (vii) a security affected by a significant event (e.g., an event that occurs after the close of the markets on which the security is traded but before the time as of which the Portfolios’ net assets are computed and that may materially affect the value of the Portfolios’ investments). Examples of events that may be “significant events” are government actions, natural disasters, armed conflicts, acts of terrorism, and significant market fluctuations. The valuation of senior floating rate loans held by the Funds are obtained from an independent loan pricing service and categorized as Level 2 based on the use of other significant observable inputs.
Fair value pricing could result in a difference between the prices used to calculate a Portfolio’s net asset value and the prices used by such Portfolio’s benchmark index, which, in turn, could result in a difference between a Portfolio’s performance and the performance of such Portfolio’s benchmark index. The inputs or methodology used for valuation are not necessarily an indication of the risk associated with investing in those investments.
The type of inputs used to value each security is identified in the Schedule of Investments, which also includes a breakdown of a Portfolio’s investments by category.
The following table summarizes the inputs used in valuing the Portfolios’ investments as of June 30, 2014:
| | | | | | | | | | | | | | | | |
| | | Level 1 —
Quoted
Prices | | | Level 2 —
Other Significant
Observable
Inputs | | | Level 3 —
Significant
Unobservable
Inputs | | | Total | |
SSgA Multi-Asset Real Return Portfolio | | $ | 163,885,426 | | | $ | — | | | $ | — | | | $ | 163,885,426 | |
SSgA Income Allocation Portfolio | | | 103,589,753 | | | | — | | | | — | | | | 103,589,753 | |
SSgA Global Allocation Portfolio | | | 97,812,831 | | | | — | | | | — | | | | 97,812,831 | |
Blackstone / GSO Senior Loan Portfolio | | | 39,685,659 | | | | 591,501,615 | | | | — | | | | 631,187,274 | |
SSgA Ultra Short Term Bond Portfolio | | | 518,551 | | | | 13,729,166 | | | | — | | | | 14,247,717 | |
SSgA MFS Systematic Core Equity Portfolio | | | 5,373,113 | | | | — | | | | — | | | | 5,373,113 | |
SSgA MFS Systematic Growth Equity Portfolio | | | 5,367,352 | | | | — | | | | — | | | | 5,367,352 | |
SSgA MFS Systematic Value Equity Portfolio | | | 5,282,721 | | | | — | | | | — | | | | 5,282,721 | |
There were no transfers between levels for the period ended June 30, 2014.
Investment Income
Interest income is recorded on the accrual basis. Dividend income is recorded on the ex-dividend date. The value of additional securities received as dividend payments is recorded as income and as an increase to the cost basis of such securities.
Expenses
Advisory fees and other expenses, which are directly identifiable to a specific Portfolio, are applied to that Portfolio. Trustees’ fees and other expenses which cannot be attributed to a specific Portfolio are allocated in such a manner as deemed equitable, taking into consideration the nature and type of expense and the relative net assets of the Portfolios. In addition to the these direct expenses, the Portfolios bear certain expenses indirectly, such as fees of underlying Portfolios in which the Portfolio invest that are reflected in the reported value of such Portfolios.
Investment Transactions
Investment transactions are recorded as of the trade date. Realized gains and losses from the sale or disposition of securities are recorded on the identified cost basis. Corporate actions (including cash dividends) are recorded net of foreign tax withholdings on the ex-dividend date.
Federal Income Tax
The Portfolios are not required to pay federal income taxes on their net investment income and net capital gains because they are treated as partnerships for federal income tax purposes. All interest, gains and losses of the Portfolios are
34
SSgA MASTER TRUST
NOTES TO FINANCIAL STATEMENTS (continued)
June 30, 2014
deemed to have been “passed through” to the Portfolios’ partners in proportion to their holdings in the respective Portfolio, regardless of whether such items have been distributed by the Portfolios. Each partner is responsible for tax liability based on its distributive share; therefore, no provision has been made for federal income taxes. The Portfolios have reviewed the tax positions for the open tax years as of June 30, 2014 and have determined that no provision for income tax is required in the Portfolios’ Financial Statements. The Portfolios’ federal tax returns are subject to examination by the Portfolios’ major tax jurisdictions, which include the United States of America and the Commonwealth of Massachusetts. The Portfolios’ recognized interest and penalties, if any, related to tax liabilities as income tax expense in the Statements of Operations.
| 3. | Fees and Compensation Paid to Affiliates and Other Related Party Transactions |
Advisory Fee
Each Portfolio has entered into an Investment Advisory Agreement with SSgA Funds Management, Inc. (the “Adviser” or “SSgA FM”). As compensation for the services rendered, facilities furnished, and expenses borne by the Adviser, each Portfolio pays the Adviser a fee accrued daily and paid monthly, based on a percentage of each Portfolio’s average daily net assets as shown in the following table:
| | | | |
| | | Annual Rate | |
SSgA Multi-Asset Real Return Portfolio | | | 0.20 | % |
SSgA Income Allocation Portfolio | | | 0.20 | |
SSgA Global Allocation Portfolio | | | 0.20 | |
Blackstone/GSO Senior Loan Portfolio | | | 0.30 | |
SSgA Ultra Short Term Bond Portfolio | | | 0.20 | |
SSgA MFS Systematic Core Equity Portfolio | | | 0.30 | |
SSgA MFS Systematic Growth Equity Portfolio | | | 0.30 | |
SSgA MFS Systematic Value Equity Portfolio | | | 0.30 | |
The Adviser pays all operating expenses of each Portfolio other than management fee, brokerage, taxes, interest, fees and expenses of the Independent Trustees (including any Trustees’ counsel fees), litigation expenses, acquired fund fees and expenses and other extraordinary expenses.
GSO / Blackstone Debt Funds Management LLC receives fees for its services as the sub-adviser to the SPDR Blackstone/GSO Senior Loan Portfolio from the Adviser.
Massachusetts Financial Services Company receives fees for its services as sub-adviser to the SSgA MFS Systematic Core Equity Portfolio, SSgA MFS Systematic Growth Equity Portfolio and SSgA Systematic Value Equity Portfolio from the Adviser.
State Street Bank and Trust Company (“State Street”), an affiliate of the Adviser, receives fees for its services as Custodian, Administrator and Transfer Agent from the Adviser.
Trustees’ Fees
The Trust, SSgA Master Trust, SPDR Series Trust and SPDR Index Shares Funds pay, in the aggregate, each Independent Trustee an annual fee of $170,000 plus $10,000 per in-person meeting attended and $1,250 for each telephonic or video conference meeting attended. The Chairman of the Board receives an additional annual fee of $50,000 and the Chairman of the Audit Committee receives an additional annual fee of $20,000. The Trust also reimburses each Independent Trustee for travel and other out-of-pocket expenses incurred by him/her in connection with attending such meetings and in connection with attending industry seminars and meetings. Independent Trustee fees are allocated among the Trusts and each of their respective series in such a manner as deemed equitable, taking into consideration the relative net assets of the series.
35
SSgA MASTER TRUST
NOTES TO FINANCIAL STATEMENTS (continued)
June 30, 2014
Transactions with Affiliates
Each Portfolio may invest in certain money market funds and underlying Funds affiliated with the Adviser. Amounts related to investments in affiliated underlying Funds at June 30, 2014, and for the period then ended are:
| | | | | | | | | | | | | | | | | | | | | | | | | | | | | | | | | | | | | | | | |
SPDR SSgA Multi-Asset Real
Return Portfolio | | Number of
Shares Held
at 6/30/13 | | | Value at
6/30/13 | | | Purchased | | | Sold | | | Number of
Shares Held
at 6/30/14 | | | Value at
6/30/14 | | | Dividend
Income | | | Realized
Gain (Loss) | |
| | | | Cost | | | Shares | | | Proceeds | | | Shares | | | | | |
SPDR Barclays TIPS ETF | | | 288,046 | | | $ | 16,006,716 | | | $ | 13,669,491 | | | | 244,777 | | | $ | 15,974,692 | | | | 289,682 | | | | 243,141 | | | $ | 13,941,705 | | | $ | 198,201 | | | $ | (826,517 | ) |
SPDR DB International Government Inflation-Protected Bond ETF | | | 179,144 | | | | 10,313,320 | | | | 6,303,694 | | | | 107,016 | | | | 14,636,881 | | | | 246,377 | | | | 39,783 | | | | 2,466,944 | | | | 178,227 | | | | (422,588 | ) |
SPDR S&P Global Natural Resources ETF | | | 866,592 | | | | 38,987,974 | | | | 41,269,211 | | | | 834,171 | | | | 35,863,782 | | | | 728,795 | | | | 971,968 | | | | 51,368,509 | | | | 1,059,052 | | | | 163,885 | |
SPDR S&P International Energy Sector ETF | | | 103,539 | | | | 2,396,928 | | | | 1,807,399 | | | | 67,766 | | | | 1,470,178 | | | | 57,050 | | | | 114,255 | | | | 3,376,235 | | | | 89,368 | | | | 76,836 | |
SPDR S&P Metals & Mining ETF | | | 103,088 | | | | 3,415,306 | | | | 5,196,777 | | | | 132,402 | | | | 4,786,123 | | | | 116,888 | | | | 118,602 | | | | 5,010,934 | | | | 59,972 | | | | 115,339 | |
The Energy Select Sector SPDR Fund | | | 31,198 | | | | 2,444,675 | | | | 5,449,175 | | | | 61,135 | | | | 2,200,408 | | | | 25,273 | | | | 67,060 | | | | 6,712,706 | | | | 80,371 | | | | 323,908 | |
SPDR Dow Jones International Real Estate ETF | | | 369,519 | | | | 14,743,808 | | | | 12,344,419 | | | | 292,013 | | | | 9,896,196 | | | | 243,111 | | | | 418,421 | | | | 18,510,945 | | | | 634,997 | | | | (83,269 | ) |
SPDR Dow Jones REIT ETF | | | 171,628 | | | | 13,035,147 | | | | 14,295,658 | | | | 183,172 | | | | 8,202,012 | | | | 112,255 | | | | 242,545 | | | | 20,131,235 | | | | 430,433 | | | | (143,766 | ) |
State Street Institutional Liquid Reserves Fund | | | 154,629 | | | | 154,629 | | | | 11,579,921 | | | | 11,579,921 | | | | 11,400,364 | | | | 11,400,364 | | | | 334,186 | | | | 334,186 | | | | 126 | | | | — | |
| | | | | | | | | | | | | | | | | | | | | | | | | | | | | | | | | | | | | | | | |
SPDR SSgA Income Allocation
Portfolio | | Number of
Shares Held
at 6/30/13 | | | Value at
6/30/13 | | | Purchased | | | Sold | | | Number of
Shares Held
at 6/30/14 | | | Value at
6/30/14 | | | Dividend
Income | | | Realized
Gain (Loss) | |
| | | | Cost | | | Shares | | | Proceeds | | | Shares | | | | | |
SPDR S&P Dividend ETF | | | 399,579 | | | $ | 26,492,087 | | | $ | 5,158,820 | | | | 72,148 | | | $ | 18,422,346 | | | | 262,871 | | | | 208,856 | | | $ | 15,996,281 | | | $ | 627,299 | | | $ | 2,234,996 | |
SPDR Wells Fargo Preferred Stock ETF | | | 458,923 | | | | 19,949,383 | | | | 738,742 | | | | 17,542 | | | | 15,162,894 | | | | 357,925 | | | | 118,540 | | | | 5,174,271 | | | | 439,269 | | | | (1,027,219 | ) |
The Consumer Discretionary Select Sector SPDR Fund | | | — | | | | — | | | | 2,149,296 | | | | 32,964 | | | | 2,201,300 | | | | 32,964 | | | | — | | | | — | | | | 5,879 | | | | 52,005 | |
The Financial Select Sector SPDR Fund | | | 91,613 | | | | 1,785,537 | | | | 1,560,490 | | | | 74,863 | | | | 3,507,549 | | | | 166,476 | | | | — | | | | — | | | | 7,059 | | | | 264,457 | |
The Health Care Select Sector SPDR Fund | | | — | | | | — | | | | 4,040,594 | | | | 69,788 | | | | 2,004,054 | | | | 35,329 | | | | 34,459 | | | | 2,096,141 | | | | 11,757 | | | | 27,552 | |
The Industrial Select Sector SPDR Fund | | | — | | | | — | | | | 3,114,294 | | | | 62,108 | | | | 1,295,353 | | | | 24,930 | | | | 37,178 | | | | 2,009,843 | | | | 22,348 | | | | 58,889 | |
The Technology Select Sector SPDR Fund | | | 59,725 | | | | 1,826,988 | | | | 3,154,499 | | | | 90,493 | | | | 3,155,188 | | | | 96,275 | | | | 53,943 | | | | 2,068,714 | | | | 17,592 | | | | 91,231 | |
The Utilities Select Sector SPDR Fund | | | — | | | | — | | | | 2,139,504 | | | | 57,707 | | | | 2,181,083 | | | | 57,707 | | | | — | | | | — | | | | 31,309 | | | | 41,579 | |
SPDR Barclays Aggregate Bond ETF | | | — | | | | — | | | | 980,471 | | | | 17,399 | | | | 984,602 | | | | 17,399 | | | | — | | | | — | | | | 4,199 | | | | 4,131 | |
SPDR Barclays Convertible Securities ETF | | | 20,742 | | | | 885,269 | | | | 2,258,256 | | | | 48,791 | | | | 801,228 | | | | 17,537 | | | | 51,996 | | | | 2,625,798 | | | | 58,139 | | | | 77,133 | |
SPDR Barclays High Yield Bond ETF | | | 174,086 | | | | 6,874,656 | | | | 9,306,918 | | | | 232,556 | | | | 9,023,779 | | | | 222,727 | | | | 183,915 | | | | 7,674,773 | | | | 477,996 | | | | 157,852 | |
SPDR Barclays Long Term Corporate Bond ETF | | | 713,243 | | | | 26,924,923 | | | | 5,027,685 | | | | 129,134 | | | | 18,528,848 | | | | 494,272 | | | | 348,105 | | | | 14,133,063 | | | | 669,528 | | | | (1,282,391 | ) |
SPDR Barclays Long Term Treasury Bond ETF | | | 212,247 | | | | 13,616,919 | | | | 4,437,721 | | | | 71,487 | | | | 10,814,467 | | | | 172,800 | | | | 110,934 | | | | 7,354,924 | | | | 250,289 | | | | (598,847 | ) |
SPDR Barclays Short Term High Yield Bond | | | 58,976 | | | | 1,779,896 | | | | 15,492 | | | | 514 | | | | 1,792,876 | | | | 59,490 | | | | — | | | | — | | | | 7,885 | | | | (31,259 | ) |
36
SSgA MASTER TRUST
NOTES TO FINANCIAL STATEMENTS (continued)
June 30, 2014
| | | | | | | | | | | | | | | | | | | | | | | | | | | | | | | | | | | | | | | | |
SPDR SSgA Income Allocation
Portfolio | | Number of
Shares Held
at 6/30/13 | | | Value at
6/30/13 | | | Purchased | | | Sold | | | Number of
Shares Held
at 6/30/14 | | | Value at
6/30/14 | | | Dividend
Income | | | Realized
Gain (Loss) | |
| | | | Cost | | | Shares | | | Proceeds | | | Shares | | | | | |
SPDR Nuveen Barclays Build America Bond ETF | | | 46,701 | | | $ | 2,591,438 | | | $ | 167,201 | | | | 3,075 | | | $ | 2,799,940 | | | | 49,776 | | | | — | | | $ | — | | | $ | 65,106 | | | $ | (113,231 | ) |
SPDR Barclays TIPS ETF | | | 149,424 | | | | 8,303,492 | | | | 4,159,492 | | | | 75,051 | | | | 8,940,224 | | | | 160,474 | | | | 64,001 | | | | 3,669,817 | | | | 58,383 | | | | (628,895 | ) |
SPDR EURO STOXX 50 ETF | | | — | | | | — | | | | 3,620,474 | | | | 102,028 | | | | 2,544,373 | | | | 67,462 | | | | 34,566 | | | | 1,495,671 | | | | 45,586 | | | | 92,958 | |
SPDR Russell/Nomura PRIME Japan ETF | | | — | | | | — | | | | 2,078,506 | | | | 45,334 | | | | 1,955,849 | | | | 45,334 | | | | — | | | | — | | | | — | | | | (122,657 | ) |
SPDR S&P Emerging Markets Dividend ETF | | | 224,002 | | | | 8,693,517 | | | | 3,465,521 | | | | 86,091 | | | | 8,054,024 | | | | 208,936 | | | | 101,157 | | | | 4,055,384 | | | | 189,965 | | | | (1,171,169 | ) |
SPDR S&P Global Infrastructure 100 ETF | | | 249,730 | | | | 10,158,767 | | | | 431,227 | | | | 9,645 | | | | 7,590,899 | | | | 177,894 | | | | 81,481 | | | | 4,145,753 | | | | 148,344 | | | | 267,366 | |
SPDR S&P International Dividend ETF | | | 236,886 | | | | 10,340,074 | | | | 1,199,492 | | | | 25,592 | | | | 6,557,642 | | | | 143,486 | | | | 118,992 | | | | 6,104,290 | | | | 337,915 | | | | (64,080 | ) |
SPDR S&P International Telecommunications Sector ETF | | | 106,930 | | | | 2,476,499 | | | | 52,408 | | | | 2,099 | | | | 2,739,890 | | | | 109,029 | | | | — | | | | — | | | | 3,376 | | | | 266,963 | |
SPDR STOXX Europe 50 ETF | | | 152,694 | | | | 5,041,956 | | | | 3,360,878 | | | | 89,799 | | | | 3,114,929 | | | | 88,041 | | | | 154,452 | | | | 6,080,775 | | | | 286,944 | | | | 304,684 | |
SPDR Barclays Emerging Markets Local Bond ETF | | | 175,002 | | | | 5,188,809 | | | | 1,409,025 | | | | 47,708 | | | | 3,685,982 | | | | 123,682 | | | | 99,028 | | | | 3,091,654 | | | | 60,196 | | | | (235,765 | ) |
SPDR Barclays International Corporate Bond ETF | | | 122,066 | | | | 4,192,967 | | | | 3,569,547 | | | | 97,359 | | | | 5,759,898 | | | | 164,211 | | | | 55,214 | | | | 2,087,090 | | | | 19,913 | | | | (65,775 | ) |
SPDR Dow Jones International Real Estate ETF | | | 214,867 | | | | 8,573,193 | | | | 3,601,990 | | | | 85,882 | | | | 6,756,493 | | | | 164,292 | | | | 136,457 | | | | 6,036,858 | | | | 272,279 | | | | (109,865 | ) |
SPDR Dow Jones REIT ETF | | | 81,004 | | | | 6,152,254 | | | | 4,003,611 | | | | 52,666 | | | | 3,659,114 | | | | 47,292 | | | | 86,378 | | | | 7,169,374 | | | | 190,950 | | | | 162,566 | |
State Street Institutional Liquid Reserves Fund | | | 620,536 | | | | 620,536 | | | | 15,286,330 | | | | 15,286,330 | | | | 15,387,587 | | | | 15,387,587 | | | | 519,279 | | | | 519,279 | | | | 330 | | | | — | |
| | | | | | | | | | | | | | | | | | | | | | | | | | | | | | | | | | | | | | | | |
| | | | | | | | |
SPDR SSgA Global Allocation Portfolio | | Number of
Shares Held
at 6/30/13 | | | Value at
6/30/13 | | | Purchased | | | Sold | | | Number of
Shares Held
at 6/30/14 | | | Value at
6/30/14 | | | Dividend
Income | | | Realized
Gain (Loss) | |
| | | | Cost | | | Shares | | | Proceeds | | | Shares | | | | | |
SPDR S&P 500 ETF Trust | | | 44,700 | | | $ | 7,152,447 | | | $ | 14,161,228 | | | | 75,925 | | | $ | 3,472,866 | | | | 20,487 | | | | 100,138 | | | $ | 19,599,009 | | | $ | 205,639 | | | $ | 236,276 | |
SPDR S&P 500 Growth ETF | | | — | | | | — | | | | 3,815,353 | | | | 44,035 | | | | 2,041,293 | | | | 22,552 | | | | 21,483 | | | | 1,954,309 | | | | 12,304 | | | | 59,164 | |
SPDR S&P 500 Value ETF | | | 18,869 | | | | 1,550,088 | | | | 3,364,887 | | | | 36,342 | | | | 5,248,480 | | | | 55,211 | | | | — | | | | — | | | | 26,413 | | | | 367,410 | |
SPDR S&P 600 Small Cap ETF | | | 18,111 | | | | 1,572,578 | | | | 2,811,832 | | | | 28,070 | | | | 4,710,915 | | | | 46,181 | | | | — | | | | — | | | | 46,400 | | | | 493,404 | |
SPDR S&P Dividend ETF | | | 8,746 | | | | 579,860 | | | | 363,955 | | | | 5,087 | | | | 1,005,193 | | | | 13,833 | | | | — | | | | — | | | | 17,046 | | | | 127,012 | |
SPDR S&P MidCap 400 ETF Trust | | | 4,927 | | | | 1,036,542 | | | | 1,024,890 | | | | 4,248 | | | | 369,174 | | | | 1,571 | | | | 7,604 | | | | 1,981,298 | | | | 17,026 | | | | 45,330 | |
SPDR Wells Fargo Preferred Stock ETF | | | 59,176 | | | | 2,572,381 | | | | 95,350 | | | | 2,210 | | | | 2,593,705 | | | | 61,386 | | | | — | | | | — | | | | — | | | | (203,575 | ) |
The Consumer Discretionary Select Sector SPDR Fund | | | 18,730 | | | | 1,056,372 | | | | 1,066,581 | | | | 16,698 | | | | 2,336,130 | | | | 35,428 | | | | — | | | | — | | | | 13,071 | | | | 269,749 | |
The Financial Select Sector SPDR Fund | | | 53,233 | | | | 1,037,511 | | | | 1,208,672 | | | | 61,181 | | | | 2,353,035 | | | | 114,414 | | | | — | | | | — | | | | — | | | | 187,025 | |
The Health Care Select Sector SPDR Fund | | | — | | | | — | | | | 4,372,948 | | | | 78,829 | | | | 2,470,404 | | | | 46,105 | | | | 32,724 | | | | 1,990,601 | | | | 16,692 | | | | 57,142 | |
The Industrial Select Sector SPDR Fund | | | | | | | — | | | | 4,489,014 | | | | 91,911 | | | | 2,852,988 | | | | 56,674 | | | | 35,237 | | | | 1,904,912 | | | | 26,952 | | | | 154,736 | |
The Technology Select Sector SPDR Fund | | | — | | | | — | | | | 3,040,736 | | | | 87,166 | | | | 1,260,630 | | | | 36,027 | | | | 51,139 | | | | 1,961,181 | | | | 16,148 | | | | 36,205 | |
SPDR Barclays Aggregate Bond ETF | | | 109,790 | | | | 6,243,757 | | | | 6,964,534 | | | | 122,557 | | | | 10,287,967 | | | | 181,398 | | | | 50,949 | | | | 2,953,004 | | | | 120,251 | | | | (165,245 | ) |
SPDR Barclays High Yield Bond ETF | | | 25,999 | | | | 1,026,701 | | | | 6,165,114 | | | | 153,399 | | | | 5,407,791 | | | | 132,289 | | | | 47,109 | | | | 1,965,858 | | | | 219,591 | | | | 79,120 | |
37
SSgA MASTER TRUST
NOTES TO FINANCIAL STATEMENTS (continued)
June 30, 2014
| | | | | | | | | | | | | | | | | | | | | | | | | | | | | | | | | | | | | | | | |
| | | | | | | | |
SPDR SSgA Global Allocation
Portfolio | | Number of
Shares Held
at 6/30/13 | | | Value at
6/30/13 | | | Purchased | | | Sold | | | Number of
Shares Held
at 6/30/14 | | | Value at
6/30/14 | | | Dividend
Income | | | Realized
Gain (Loss) | |
| | | | Cost | | | Shares | | | Proceeds | | | Shares | | | | | |
SPDR Barclays Intermediate Term Corporate Bond ETF | | | 46,629 | | | $ | 1,566,035 | | | $ | 174,705 | | | | 5,168 | | | $ | 1,743,136 | | | | 51,797 | | | | — | | | $ | — | | | $ | 11,014 | | | $ | (41,220 | ) |
SPDR Barclays Long Term Corporate Bond ETF | | | 28,079 | | | | 1,059,982 | | | | 5,058,524 | | | | 127,452 | | | | 338,070 | | | | 8,953 | | | | 146,578 | | | | 5,951,067 | | | | 69,760 | | | | (9,080 | ) |
SPDR Barclays Short Term High Yield Bond ETF | | | 17,294 | | | | 521,933 | | | | | | | | | | | | 521,172 | | | | 17,294 | | | | — | | | | — | | | | 2,312 | | | | (10,366 | ) |
SPDR Barclays TIPS ETF | | | 32,448 | | | | 1,803,136 | | | | 3,348,438 | | | | 60,286 | | | | 1,803,752 | | | | 32,102 | | | | 60,632 | | | | 3,476,639 | | | | 48,124 | | | | (112,771 | ) |
SPDR DB International Government Inflation-Protected Bond ETF | | | 13,281 | | | | 764,587 | | | | 1,277,301 | | | | 21,602 | | | | 664,285 | | | | 11,015 | | | | 23,868 | | | | 1,480,055 | | | | 33,384 | | | | (20,157 | ) |
SPDR EURO STOXX 50 ETF | | | — | | | | — | | | | 3,483,693 | | | | 83,537 | | | | 746,012 | | | | 18,164 | | | | 65,373 | | | | 2,828,690 | | | | 65,712 | | | | (10,695 | ) |
SPDR Russell/Nomura PRIME Japan ETF | | | 63,112 | | | | 2,698,669 | | | | 5,355,687 | | | | 119,876 | | | | 4,204,073 | | | | 96,814 | | | | 86,174 | | | | 4,002,782 | | | | 49,351 | | | | (112,844 | ) |
SPDR S&P Emerging Markets ETF | | | 26,308 | | | | 1,568,220 | | | | 6,530,782 | | | | 101,444 | | | | 3,438,301 | | | | 55,706 | | | | 72,046 | | | | 4,871,390 | | | | 57,763 | | | | (64,069 | ) |
SPDR S&P International Small Cap ETF | | | 53,091 | | | | 1,531,144 | | | | 1,498,797 | | | | 45,040 | | | | 428,341 | | | | 13,462 | | | | 84,669 | | | | 2,990,509 | | | | 56,814 | | | | 41,962 | |
SPDR S&P World ex-US ETF | | | 378,827 | | | | 9,519,923 | | | | 10,599,872 | | | | 369,289 | | | | 3,047,006 | | | | 110,017 | | | | 638,099 | | | | 19,315,257 | | | | 472,824 | | | | 213,465 | |
SPDR STOXX Europe 50 ETF | | | 30,060 | | | | 992,581 | | | | 2,610,256 | | | | 69,154 | | | | 987,109 | | | | 26,102 | | | | 73,112 | | | | 2,878,419 | | | | 128,138 | | | | 33,137 | |
SPDR Barclays Emerging Markets Local Bond ETF | | | 1,014 | | | | 30,065 | | | | — | | | | — | | | | 29,906 | | | | 1,014 | | | | — | | | | — | | | | — | | | | (646 | ) |
SPDR Barclays International Corporate Bond ETF | | | 44,149 | | | | 1,516,518 | | | | 2,417,323 | | | | 66,411 | | | | 3,074,615 | | | | 84,397 | | | | 26,163 | | | | 988,961 | | | | 24,104 | | | | 31,302 | |
SPDR Barclays International Treasury Bond ETF | | | 8,626 | | | | 485,472 | | | | 2,627,133 | | | | 45,234 | | | | 2,196,474 | | | | 37,558 | | | | 16,302 | | | | 990,999 | | | | 19,529 | | | | 9,362 | |
SPDR Dow Jones International Real Estate ETF | | | 25,764 | | | | 1,027,983 | | | | 4,250,716 | | | | 101,032 | | | | 256,949 | | | | 6,105 | | | | 120,691 | | | | 5,339,370 | | | | 127,187 | | | | 19,179 | |
SPDR Dow Jones REIT ETF | | | 13,662 | | | | 1,037,629 | | | | 5,247,487 | | | | 67,222 | | | | 350,032 | | | | 4,585 | | | | 76,299 | | | | 6,332,817 | | | | 107,618 | | | | 8,261 | |
State Street Institutional Liquid Reserves Fund | | | 1,648,718 | | | | 1,648,718 | | | | 17,012,952 | | | | 17,012,952 | | | | 16,605,966 | | | | 16,605,966 | | | | 2,055,704 | | | | 2,055,704 | | | | 923 | | | | — | |
| | | | | | | | | | | | | | | | | | | | | | | | | | | | | | | | | | | | | | | | |
Blackstone/GSO Senior Loan
Portfolio | | Number of
Shares Held
at 6/30/13 | | | Value at
6/30/13 | | | Purchased | | | Sold | | | Number of
Shares Held
at 6/30/14 | | | Value at
6/30/14 | | | Dividend
Income | | | Realized
Gain (Loss) | |
| | | | Cost | | | Shares | | | Proceeds | | | Shares | | | | | |
State Street Institutional Liquid Reserves Fund | | | 96,122,680 | | | $ | 96,122,680 | | | $ | 345,553,142 | | | | 345,553,142 | | | $ | 401,990,163 | | | | 401,990,163 | | | | 39,685,659 | | | $ | 39,685,659 | | | $ | 52,102 | | | $ | — | |
| | | | | | | | | | | | | | | | | | | | | | | | | | | | | | | | | | | | | | | | |
SSgA Ultra Short Term Bond
Portfolio | | Number of
Shares Held
at 6/30/13 | | | Value at
6/30/13 | | | Purchased | | | Sold | | | Number of
Shares Held
at 6/30/14 | | | Value at
6/30/14 | | | Dividend
Income | | | Realized
Gain (Loss) | |
| | | | Cost | | | Shares | | | Proceeds | | | Shares | | �� | | | |
State Street Institutional Liquid Reserves Fund | | | — | | | $ | — | | | $ | 8,138,786 | | | | 8,138,786 | | | $ | 7,620,235 | | | | 7,620,235 | | | | 518,551 | | | $ | 518,551 | | | $ | 154 | | | $ | — | |
| | | | | | | | | | | | | | | | | | | | | | | | | | | | | | | | | | | | | | | | |
SSgA MFS Systematic Core Equity
Portfolio | | Number of
Shares Held
at 6/30/13 | | | Value at
6/30/13 | | | Purchased | | | Sold | | | Number of
Shares Held
at 6/30/14 | | | Value at
6/30/14 | | | Dividend
Income | | | Realized
Gain (Loss) | |
| | | | Cost | | | Shares | | | Proceeds | | | Shares | | | | | |
State Street Institutional Liquid Reserves Fund | | | — | | | $ | — | | | $ | 89,468 | | | | 89,468 | | | $ | 30,863 | | | | 30,863 | | | | 58,605 | | | $ | 58,605 | | | $ | 18 | | | $ | — | |
| | | | | | | | | | | | | | | | | | | | | | | | | | | | | | | | | | | | | | | | |
SSgA MFS Systematic Growth Equity
Portfolio | | Number of
Shares Held
at 6/30/13 | | | Value at
6/30/13 | | | Purchased | | | Sold | | | Number of
Shares Held
at 6/30/14 | | | Value at
6/30/14 | | | Dividend
Income | | | Realized
Gain (Loss) | |
| | | | Cost | | | Shares | | | Proceeds | | | Shares | | | | | |
State Street Institutional Liquid Reserves Fund | | | — | | | $ | — | | | $ | 99,457 | | | | 99,457 | | | $ | 23,481 | | | | 23,481 | | | | 75,976 | | | $ | 75,976 | | | $ | 18 | | | $ | — | |
38
SSgA MASTER TRUST
NOTES TO FINANCIAL STATEMENTS (continued)
June 30, 2014
| | | | | | | | | | | | | | | | | | | | | | | | | | | | | | | | | | | | | | | | |
SSgA MFS Systematic Value Equity
Portfolio | | Number of
Shares Held
at 6/30/13 | | | Value at
6/30/13 | | | Purchased | | | Sold | | | Number of
Shares Held
at 6/30/14 | | | Value at
6/30/14 | | | Dividend
Income | | | Realized
Gain (Loss) | |
| | | | Cost | | | Shares | | | Proceeds | | | Shares | | | | | |
State Street Institutional Liquid
Reserves Fund | | | — | | | $ | — | | | $ | 109,589 | | | | 109,589 | | | $ | 28,229 | | | | 28,229 | | | | 81,360 | | | $ | 81,360 | | | $ | 17 | | | $ | — | |
| 4. | Aggregate Unrealized Appreciation and Depreciation |
The identified cost of investments in securities owned by each Portfolio for federal income tax purposes and the gross unrealized appreciation and depreciation at June 30, 2014, was as follows:
| | | | | | | | | | | | | | | | |
| | | Identified
Cost | | | Gross
Unrealized
Appreciation | | | Gross
Unrealized
Depreciation | | | Net Unrealized
Appreciation
(Depreciation) | |
SSgA Multi-Asset Real Return Portfolio | | $ | 158,270,064 | | | $ | 6,363,843 | | | $ | — | | | $ | 6,363,843 | |
SSgA Income Allocation Portfolio | | | 98,914,488 | | | | 5,114,694 | | | | — | | | | 5,114,694 | |
SSgA Global Allocation Portfolio | | | 92,100,965 | | | | 6,389,387 | | | | — | | | | 6,389,387 | |
Blackstone / GSO Senior Loan Portfolio | | | 608,861,258 | | | | 1,614,848 | | | | — | | | | 1,614,848 | |
SSgA Ultra Short Term Bond Portfolio | | | 14,024,449 | | | | 10,479 | | | | — | | | | 10,479 | |
SSgA MFS Systematic Core Equity Portfolio | | | 5,086,567 | | | | 290,337 | | | | — | | | | 290,337 | |
SSgA MFS Systematic Growth Equity Portfolio | | | 5,027,567 | | | | 343,934 | | | | — | | | | 343,934 | |
SSgA MFS Systematic Value Equity Portfolio | | | 5,023,094 | | | | 262,168 | | | | — | | | | 262,168 | |
| 5. | Investment Transactions |
For the year ended June 30, 2014, the Portfolios had purchases and sales of investment securities as follows:
| | | | | | | | | | | | | | | | |
| | | Purchases | | | Sales | |
| | | Short Term | | | Long Term | | | Short Term | | | Long Term | |
SSgA Multi-Asset Real Return Portfolio | | $ | 11,579,921 | | | $ | 141,552,018 | | | $ | 11,400,363 | | | $ | 112,334,428 | |
SSgA Income Allocation Portfolio | | | 15,286,330 | | | | 75,202,155 | | | | 15,387,587 | | | | 154,034,826 | |
SSgA Global Allocation Portfolio | | | 17,012,952 | | | | 107,425,808 | | | | 16,605,966 | | | | 70,239,802 | |
Blackstone / GSO Senior Loan Portfolio | | | 345,553,142 | | | | 914,589,368 | | | | 401,990,163 | | | | 602,355,311 | |
SSgA Ultra Short Term Bond Portfolio | | | 8,138,786 | | | | 19,080,114 | | | | 7,620,235 | | | | 4,214,817 | |
SSgA MFS Systematic Core Equity Portfolio | | | 89,468 | | | | 6,326,832 | | | | 30,863 | | | | 1,371,300 | |
SSgA MFS Systematic Growth Equity Portfolio | | | 99,457 | | | | 5,975,143 | | | | 23,481 | | | | 1,038,747 | |
SSgA MFS Systematic Value Equity Portfolio | | | 109,589 | | | | 6,183,027 | | | | 28,230 | | | | 1,248,124 | |
For the year ended June 30, 2014, the Portfolios had purchases and sales of U.S. Government obligations as follows:
| | | | | | | | | | | | | | | | |
| | | Purchases | | | Sales | |
| | | Short Term | | | Long Term | | | Short Term | | | Long Term | |
SSgA Ultra Short Term Bond Portfolio | | $ | 1,751,168 | | | $ | — | | | $ | 1,751,154 | | | $ | — | |
For the year ended June 30, 2014, the Trust did not pay any commissions to an affiliate of the Adviser for investment transactions.
Although the Portfolios do not intend to concentrate their investments in any particular industry, if a Portfolio concentrates in a single industry, group of industries or type of instrument, it may be more susceptible to any single economic, market, political or regulatory occurrence affecting that industry, group of industries or type of instrument.
39
SSgA MASTER TRUST
REPORT OF INDEPENDENT REGISTERED PUBLIC ACCOUNTING FIRM
To the Owners of Beneficial Interest and Board of Trustees of
SSgA Master Trust
We have audited the accompanying statements of assets and liabilities, including the schedules of investments, of SSgA Master Trust (comprising, respectively, SSgA Multi-Asset Real Return Portfolio, SSgA Income Allocation Portfolio, SSgA Global Allocation Portfolio, Blackstone/GSO Senior Loan Portfolio, SSgA Ultra Short Term Bond Portfolio, SSgA MFS Systematic Core Equity Portfolio, SSgA MFS Systematic Value Equity Portfolio and SSgA MFS Systematic Growth Equity Portfolio) (collectively, the “Portfolios”) as of June 30, 2014, and the related statements of operations, changes in net assets and the financial highlights for each of the periods indicated therein. These financial statements and financial highlights are the responsibility of the Portfolios’ management. Our responsibility is to express an opinion on these financial statements and financial highlights based on our audits.
We conducted our audits in accordance with the standards of the Public Company Accounting Oversight Board (United States). Those standards require that we plan and perform the audit to obtain reasonable assurance about whether the financial statements and financial highlights are free of material misstatement. We were not engaged to perform an audit of the Portfolios’ internal control over financial reporting. Our audits included consideration of internal control over financial reporting as a basis for designing audit procedures that are appropriate in the circumstances, but not for the purpose of expressing an opinion on the effectiveness of the Portfolios’ internal control over financial reporting. Accordingly, we express no such opinion. An audit also includes examining, on a test basis, evidence supporting the amounts and disclosures in the financial statements and financial highlights, assessing the accounting principles used and significant estimates made by management, and evaluating the overall financial statement presentation. Our procedures included confirmation of securities owned as of June 30, 2014 by correspondence with the custodian and others or by other appropriate auditing procedures where replies from others were not received. We believe that our audits provide a reasonable basis for our opinion.
In our opinion, the financial statements and financial highlights referred to above present fairly, in all material respects, the financial position of each of the above mentioned Portfolios of SSgA Master Trust at June 30, 2014, and the results of their operations, the changes in their net assets, and the financial highlights for each of the periods indicated therein, in conformity with U.S. generally accepted accounting principles.

Boston, Massachusetts
August 28, 2014
40
SSgA MASTER TRUST
OTHER INFORMATION
June 30, 2014 (Unaudited)
Proxy Voting Policies and Procedures and Records
A description of the Trust’s proxy voting policies and procedures that are used by the Funds’ investment adviser to vote proxies relating to the Funds’ portfolio of securities are available (i) without charge, upon request by calling 1-866-787-2257 (toll free) or (ii) on the website of the U.S. Securities and Exchange Commission, at www.sec.gov. Information regarding how the investment advisor voted for the prior 12-months period ended June 30 is available by August 31 of each year by calling the same number and on the SEC’s website, at www.sec.gov, and on the Funds’ website at www.spdrs.com.
Quarterly Portfolio Schedule
The Funds file a complete schedule of portfolio holdings with the SEC for the first and third quarters of each fiscal year on Form N-Q. The Fund’s Forms N-Q are available on the SEC’s website at www.sec.gov and may be reviewed and copied at the SEC’s Public Reference Room in Washington DC. Information on the operation of the Public Reference Room may be obtained by calling 1-800-SEC-0330. The information on the Form N-Q is available upon request, without charge, by calling 1-866-787-2257 (toll free) and on the Funds’ website at www.spdrs.com.
Approval of Advisory Agreements
At in-person meetings held prior to June 30, 2014, the Board of Trustees of the Trusts (the “Board”) evaluated various proposals related to advisory arrangements for certain new series of the Trusts, including a proposal to approve separate Investment Advisory Agreements (the “Agreements”) between SSgA Funds Management, Inc. (the “Adviser”) and (1) the SSgA Active ETF Trust with respect to the SPDR MFS Systematic Core Equity ETF, SPDR MFS Systematic Growth Equity ETF and SPDR MFS Systematic Value Equity ETF (the “New ETFs”) and (2) SSgA Master Trust with respect to the New ETFs’ corresponding master funds, the SSgA MFS Systematic Core Equity Portfolio, SSgA MFS Systematic Growth Equity Portfolio and SSgA MFS Systematic Value Equity Portfolio (together with the New ETFs, the “New Funds”), each of which commenced operations during the most recent fiscal half-year period covered by this Annual Report. The Trustees who are not “interested persons” of the Trusts within the meaning of the Investment Company Act of 1940, as amended (the “Independent Trustees”) also met separately with their independent legal counsel to consider the Agreements.
In evaluating the Agreements, the Board drew on materials provided to them by the Adviser and on other materials provided by State Street Bank and Trust Company, the Trusts’ Administrator, Transfer Agent and Custodian (“State Street”). In deciding whether to approve the Agreements, the Board considered various factors, including the (i) nature, extent and quality of services to be provided by the Adviser with respect to the New Funds under the Agreements, (ii) costs to the Adviser of its services, and (iii) extent to which economies of scale would be realized if and as the New Funds grow and whether the fees in the Agreements reflects these economies of scale.
The Board considered the nature, extent and quality of services expected to be provided by the Adviser. In doing so, the Trustees relied on their prior experience in overseeing the management of the Trusts and materials provided prior to and at the meeting. The Board reviewed the Agreements and the Adviser’s anticipated responsibilities for managing investment operations of the New Funds, in accordance with the New Funds’ investment objectives, investment policies, and applicable legal and regulatory requirements. The Board appreciated the relatively unique nature of the New ETFs, as an exchange-traded fund in a master-feeder structure, and the experience and expertise of the Adviser with exchange-traded funds. The Board considered the background and experience of the Adviser’s senior management, including those individuals responsible for oversight of the sub-adviser for, and compliance of, the New Funds. The Board also considered the portfolio oversight resources, structures and practices of the Adviser, including those associated with monitoring and securing each New Funds’ compliance with its investment objectives and policies and with applicable laws and regulations. The Board also considered information about the Adviser’s overall investment management business, noting that the Adviser serves a wide range of clients across a broad spectrum of asset classes. The Board looked at the Adviser’s general knowledge of the investment business and that of its affiliates which make up State Street Global Advisors, through which the Adviser shares all of its senior personnel. The Board considered that the Adviser and its affiliates constitute one of the world’s largest investment management enterprises for ETFs. The Board also considered the Adviser’s experience in active management, in overseeing third-party sub-advisers and in managing exchange-traded funds in master-feeder structures.
41
SSgA MASTER TRUST
OTHER INFORMATION (continued)
June 30, 2014 (Unaudited)
The Board considered whether the Adviser or its affiliates benefited in other ways from its relationship with the Trusts, noting that the Adviser does not maintain soft-dollar arrangements in connection with the Trusts’ brokerage transactions.
The Board reviewed information regarding economies of scale or other efficiencies that may result as each New Fund’s assets grow in size. The Board noted that the Agreements did not provide for breakpoints in the each New Fund’s advisory fee rates as assets of a New Fund increase. However, the Board further noted the Adviser’s assertion that future economies of scale (among several factors) had been taken into consideration for the New Funds by fixing relatively low advisory fees, effectively sharing the benefits of lower fees with the New Fund from inception. The Board noted that it intends to continue to monitor fees as the New Funds grow in size and assess whether fee breakpoints may be warranted.
The Board evaluated the New ETFs’ unitary fee through review of comparative information with respect to fees paid by similar funds — i.e., exchange-traded funds that are actively managed, as applicable. The Board reviewed the universe of similar exchange-traded funds for the New ETFs based upon data from Lipper Analytical Services and related comparative information for similar ETFs. The Board also reviewed the fee structure of the New Funds in connection with the master-feeder structure.
The Board, including the Independent Trustees voting separately, approved the Agreements for each New Fund after weighing the foregoing factors, none of which was dispositive in itself and may have been weighed differently by each Trustee. The Board’s conclusions with respect to each Agreements were as follows: (a) the nature and extent of the services expected to be provided by the Adviser with respect to the New Funds were appropriate; (b) the Adviser’s fee for the New Funds and the unitary fee, considered in relation to services expected to be provided, were fair and reasonable; (c) any additional benefits to the Adviser or its affiliates were not of a magnitude materially to affect the Board’s conclusions; and (d) fees expected to be paid to the Adviser were expected to share economies of scale with respect to the New Funds by way of the relatively low fee structure of the Trusts.
At in-person meetings held prior to June 30, 2014, the Board also considered the approval of separate Sub-Advisory Agreements (the “MFS Sub-Advisory Agreements”) between the Adviser and MFS Investment Management (“MFS”) with respect to the New Funds.
In evaluating the MFS Sub-Advisory Agreements, the Board drew on materials provided to them by MFS and the Adviser. In deciding whether to approve the MFS Sub-Advisory Agreements, the Board considered various factors, including: (i) the nature, extent and quality of services expected to be provided by MFS with respect to the New Funds under the MFS Sub-Advisory Agreements; and (ii) investment performance of other actively managed mandates managed by MFS. The Board was apprised of the portion of the current advisory fee that the Adviser would pay to MFS under the MFS Sub-Advisory Agreements and also considered that such fees would be paid directly by the Adviser and would not result in increased fees payable by the New Funds.
The Board considered the background and experience of MFS’s senior management and in particular MFS’s experience in investing in equity securities. The Board noted that MFS would bring significant actively managed equity experience to bear in managing the New Funds. The Board noted that MFS has extensive experience in managing equity securities and reviewed MFS’s assets under management in similar portfolios of securities.
The Board, including the Independent Trustees voting separately, approved the MFS Sub-Advisory Agreements for the New Funds after weighing the foregoing factors, none of which was dispositive in itself and may have been weighed differently by each Trustee. The Board’s conclusions with respect to the Agreements were as follows: (a) the nature and extent of the services expected to be provided by MFS to the New Funds were adequate and appropriate; and (b) MFS’s experience in managing equity securities is extensive; (c) MFS’s fees for the New Funds and the unitary fee, considered in relation to the services provided or expected to be provided, were fair and reasonable; (d) any additional benefits to MFS was not of a magnitude to materially affect the Board’s conclusions; and (e) fees expected to be paid to MFS were expected to share economies of scale with the New Funds.
42
SSgA MASTER TRUST
OTHER INFORMATION (continued)
June 30, 2014
TRUSTEES AND OFFICERS OF THE TRUST
| | | | | | | | | | | | |
Name, Address
and Year of Birth | | Position(s)
with Funds | | Term of
Office and
Length of
Time Served | | Principal
Occupation(s)
During Past
5 Years | | Number of
Portfolios
in Fund
Complex
Overseen
by Trustee | | | Other
Directorships
Held by Trustee |
Independent Trustees | | | | | | | | | | | | |
FRANK NESVET
c/o SPDR Series Trust
State Street Financial Center One Lincoln Street
Boston, MA 02111-2900
1943 | | Independent Trustee, Chairman, Trustee Committee Chair | | Term: Unlimited Served: since September 2000 | | Chief Executive Officer, Libra Group, Inc. (1998-present) (a financial services consulting company). | | | 179 | | | SPDR Index Shares Funds (Trustee); SSgA Active ETF Trust (Trustee); SPDR Series Trust (Trustee). |
DAVID M. KELLY
c/o SPDR Series Trust
State Street Financial Center One Lincoln Street
Boston, MA 02111-2900
1938 | | Independent Trustee, Audit Committee Chair | | Term: Unlimited Served: since September 2000 | | Retired. | | | 179 | | | SPDR Index Shares Funds (Trustee); SSgA Active ETF Trust (Trustee); SPDR Series Trust (Trustee). |
BONNY EUGENIA BOATMAN
c/o SPDR Series Trust
State Street Financial Center One Lincoln Street
Boston, MA 02111-2900
1950 | | Independent Trustee | | Term: Unlimited Served: since April 2010 | | Retired (2005-present); Managing Director, Columbia Management Group, Bank of America (1984-2005). | | | 179 | | | SPDR Index Shares Funds (Trustee); SSgA Active ETF Trust (Trustee); SPDR Series Trust (Trustee). |
DWIGHT D. CHURCHILL
c/o SPDR Series Trust
State Street Financial Center One Lincoln Street
Boston, MA 02111-2900
1953 | | Independent Trustee | | Term: Unlimited Served: since April 2010 | | Chief Executive Officer and President, CFA Institute (2014-present); Self-employed consultant since 2010; Head of Fixed Income and other Senior Management roles, Fidelity Investments (1993-2009). | | | 179 | | | SPDR Index Shares Funds (Trustee); SSgA Active ETF Trust (Trustee); SPDR Series Trust (Trustee); Affiliated Managers Group, Inc. (Director). |
CARL G. VERBONCOEUR
c/o SPDR Series Trust
State Street Financial Center One Lincoln Street
Boston, MA 02111-2900
1952 | | Independent Trustee | | Term: Unlimited Served: since April 2010 | | Self-employed consultant since 2009; Chief Executive Officer, Rydex Investments (2003-2009). | | | 179 | | | The Motley Fool Funds Trust (Trustee); SPDR Index Shares Funds (Trustee); SSgA Active ETF Trust (Trustee); SPDR Series Trust (Trustee). |
43
SSgA MASTER TRUST
OTHER INFORMATION (continued)
June 30, 2014
| | | | | | | | | | | | |
Name, Address
and Year of Birth | | Position(s)
with Funds | | Term of
Office and
Length of
Time Served | | Principal
Occupation(s)
During Past
5 Years | | Number of
Portfolios
in Fund
Complex
Overseen
by Trustee | | | Other
Directorships
Held by Trustee |
Interested Trustee | | | | | | | | | | | | |
JAMES E. ROSS*
SSgA Funds Management, Inc. State Street Financial Center One Lincoln Street
Boston, MA 02111
1965 | | Interested Trustee | | Term: Unlimited Served: since April 2010 | | Chairman and Director, SSgA Funds Management Inc. (2005-present); President, SSgA Funds Management Inc. (2005-2012); Senior Managing Director and Principal, State Street Global Advisors (2006-present).** | | | 209 | | | SPDR Index Shares Funds (Trustee); SSgA Active ETF Trust (Trustee); SPDR Series Trust (Trustee); The Select Sector SPDR Trust (Trustee); State Street Master Funds (Trustee); and State Street Institutional Investment Trust (Trustee). |
| * | Mr. Ross is an Interested Trustee because of his employment with the Adviser and ownership interest in an affiliate of the Adviser. Mr. Ross previously served as an Interested Trustee from November 2005 to December 2009. |
| ** | Served in various capacities and/or with affiliated companies during noted time period. |
OFFICERS
| | | | | | |
Name, Address
and Year of Birth | | Position(s) with Funds | | Term of Office and Length of Time Served | | Principal Occupation(s) During Past 5 Years |
ELLEN M. NEEDHAM
SSgA Funds Management, Inc.
State Street Financial Center
One Lincoln Street
Boston, MA 02111
1967 | | President | | Term: Unlimited Served: since October 2012 | | President and Director, SSgA Funds Management, Inc. (June 2012-present); Chief Operating Officer, SSgA Funds Management, Inc. (May 2010-June 2012); Senior Managing Director, SSgA Funds Management, Inc. (1992-2012)*; Senior Managing Director, State Street Global Advisors (1992-present).* |
ANN M. CARPENTER
SSgA Funds Management, Inc.
State Street Financial Center
One Lincoln Street
Boston, MA 02111
1966 | | Vice President | | Term: Unlimited Served: since August 2012 | | Chief Operating Officer, SSgA Funds Management, Inc. (April 2014-present); Vice President, State Street Global Advisors and SSgA Funds Management, Inc. (2005-present).* |
MICHAEL P. RILEY
SSgA Funds Management, Inc.
State Street Financial Center
One Lincoln Street
Boston, MA 02111
1969 | | Vice President | | Term: Unlimited Served: since February 2005 | | Vice President, State Street Global Advisors and SSgA Funds Management, Inc. (2008-present); Principal, State Street Global Advisors and SSgA Funds Management, Inc. (2005-2008). |
44
SSgA MASTER TRUST
OTHER INFORMATION (continued)
June 30, 2014
| | | | | | |
Name, Address
and Year of Birth | | Position(s) with Funds | | Term of Office and Length of Time Served | | Principal Occupation(s) During Past 5 Years |
CHRISTOPHER A. MADDEN
State Street Bank and Trust Company
Four Copley Place, CPH0326
Boston, MA 02116
1967 | | Secretary | | Term: Unlimited Served: since August 2013 | | Vice President and Senior Counsel, State Street Bank and Trust Company (2013-present); Counsel, Atlantic Fund Services (2009-2013); Vice President, Citigroup Fund Services, LLC (2005-2009).* |
DANIO MASTROPIERI
State Street Bank and Trust Company
Four Copley Place, CPH0326
Boston, MA 02116
1972 | | Assistant Secretary | | Term: Unlimited Served: since August 2013 | | Vice President and Counsel, State Street Bank and Trust Company (2013-present); Vice President, Citi Fund Services Ohio, Inc. (2007-2013).*, ** |
CHAD C. HALLETT
State Street Bank and Trust Company
Four Copley Place, CPH0328
Boston, MA 02116
1969 | | Treasurer | | Term: Unlimited Served: since November 2010 | | Vice President, State Street Bank and Trust Company (2001-present).* |
MATTHEW FLAHERTY
State Street Bank and Trust Company
Four Copley Place, CPH0328
Boston, MA 02116
1971 | | Assistant Treasurer | | Term: Unlimited Served: since May 2005 | | Vice President, State Street Bank and Trust Company (1994-present).* |
LAURA F. DELL
State Street Bank and Trust Company
Four Copley Place, CPH0328
Boston, MA 02116
1964 | | Assistant Treasurer | | Term: Unlimited Served: since November 2007 | | Vice President, State Street Bank and Trust Company (2002-present).* |
BRIAN HARRIS
SSgA Funds Management, Inc.
State Street Financial Center
One Lincoln Street
Boston, MA 02111
1973 | | Chief Compliance Officer | | Term: Unlimited Served: since November 2013 | | Vice President, State Street Global Advisors and SSgA Funds Management, Inc. (2013-Present); Senior Vice President and Global Head of Investment Compliance, BofA Global Capital Management (2010-2013); Director of Compliance, AARP Financial Inc. (2008-2010). |
| * | Served in various capacities and/or with various affiliated entities during noted time period. |
| ** | Served in various capacities and/or with unaffiliated mutual funds or closed-end funds for which State Street Bank and Trust Company or its affiliates act as a provider of services during the noted time period. |
The Statement of Additional Information includes additional information about the Trustees and is available, without charge, upon request, by calling (toll free) 1-866-787-2257.
45
The SPDR® Family of Exchange Traded Funds
The following is a list of SPDR ETFs being offered, along with their respective exchange trading symbols. Please call 1-866-787-2257 to obtain a prospectus for any SPDR ETF. The prospectus contains more complete information, including charges, expenses, investment objectives and risk factors that should be carefully considered to determine if the Fund(s) are an appropriate investment for you. Read the prospectus(es) carefully before investing. Investing involves risk, including possible loss of principal.
SPDR Series Trust
SPDR Russell 3000® ETF (THRK)
SPDR Russell 1000® ETF (ONEK)
SPDR Russell 2000® ETF (TWOK)
SPDR S&P 500 Growth ETF (SPYG)
SPDR S&P 500 Value ETF (SPYV)
SPDR Russell Small Cap Completeness ETF (RSCO)
SPDR S&P 400 Mid Cap Growth ETF (MDYG)
SPDR S&P 400 Mid Cap Value ETF (MDYV)
SPDR S&P 600 Small Cap ETF (SLY)
SPDR S&P 600 Small Cap Growth ETF (SLYG)
SPDR S&P 600 Small Cap Value ETF (SLYV)
SPDR Global Dow ETF (DGT)
SPDR Dow Jones REIT ETF (RWR)
SPDR S&P Bank ETF (KBE)
SPDR S&P Capital Markets ETF (KCE)
SPDR S&P Insurance ETF (KIE)
SPDR S&P Mortgage Finance ETF (KME)
SPDR S&P Regional Banking ETF (KRE)
SPDR Morgan Stanley Technology ETF (MTK)
SPDR S&P Dividend ETF (SDY)
SPDR S&P Aerospace & Defense ETF (XAR)
SPDR S&P Biotech ETF (XBI)
SPDR S&P Health Care Equipment ETF (XHE)
SPDR S&P Health Care Services ETF (XHS)
SPDR S&P Homebuilders ETF (XHB)
SPDR S&P Metals & Mining ETF (XME)
SPDR S&P Oil & Gas Equipment & Services ETF (XES)
SPDR S&P Oil & Gas Exploration & Production ETF (XOP)
SPDR S&P Pharmaceuticals ETF (XPH)
SPDR S&P Retail ETF (XRT)
SPDR S&P Semiconductor ETF (XSD)
SPDR S&P Software & Services ETF (XSW)
SPDR S&P Telecom ETF (XTL)
SPDR S&P Transportation ETF (XTN)
SPDR S&P 1500 Value Tilt ETF (VLU)
SPDR S&P 1500 Momentum Tilt ETF (MMTM)
SPDR Russell 1000 Low Volatility ETF (LGLV)
SPDR Russell 2000 Low Volatility ETF (SMLV)
SPDR Wells Fargo Preferred Stock ETF (PSK)
SPDR Barclays 1-3 Month T-Bill ETF (BIL)
SPDR Barclays TIPS ETF (IPE)
SPDR Barclays 0-5 Year TIPS ETF (SIPE)
SPDR Barclays 1-10 Year TIPS ETF (TIPX)
SPDR Barclays Short Term Treasury ETF (SST)
SPDR Barclays Intermediate Term Treasury ETF (ITE)
SPDR Barclays Long Term Treasury ETF (TLO)
SPDR Barclays Short Term Corporate Bond ETF (SCPB)
SPDR Barclays Intermediate Term Corporate Bond ETF (ITR)
SPDR Barclays Long Term Corporate Bond ETF (LWC)
SPDR Barclays Issuer Scored Corporate Bond ETF (CBND)
SPDR Barclays Convertible Securities ETF (CWB)
SPDR Barclays Mortgage Backed Bond ETF (MBG)
SPDR Barclays Aggregate Bond ETF (LAG)
SPDR Nuveen Barclays Municipal Bond ETF (TFI)
SPDR Nuveen Barclays California Municipal Bond ETF (CXA)
SPDR Nuveen Barclays New York Municipal Bond ETF (INY)
SPDR Nuveen Barclays Short Term Municipal Bond ETF (SHM)
SPDR Nuveen S&P VRDO Municipal Bond ETF (VRD)
SPDR Nuveen S&P High Yield Municipal Bond ETF (HYMB)
SPDR Nuveen Barclays Build America Bond ETF (BABS)
SPDR DB International Government Inflation-Protected Bond ETF (WIP)
SPDR Barclays Short Term International Treasury Bond ETF (BWZ)
SPDR Barclays International Treasury Bond ETF (BWX)
SPDR Barclays International Corporate Bond ETF (IBND)
SPDR Barclays Emerging Markets Local Bond ETF (EBND)
SPDR Barclays International High Yield Bond ETF (IJNK)
SPDR Barclays High Yield Bond ETF (JNK)
SPDR Barclays Short Term High Yield Bond ETF (SJNK)
SPDR Barclays Investment Grade Floating Rate ETF (FLRN)
SPDR BofA Merrill Lynch Emerging Markets Corporate Bond ETF (EMCD)
SPDR BofA Merrill Lynch Crossover Corporate Bond ETF (XOVR)
SPDR Index Shares Funds
SPDR STOXX Europe 50 ETF (FEU)
SPDR EURO STOXX 50 ETF (FEZ)
SPDR EURO STOXX Small Cap ETF (SMEZ)
SPDR S&P Emerging Asia Pacific ETF (GMF)
SPDR S&P Small Cap Emerging Asia Pacific ETF (GMFS)
SPDR S&P Russia ETF (RBL)
SPDR S&P China ETF (GXC)
SPDR S&P Emerging Markets ETF (GMM)
SPDR S&P Emerging Markets Dividend ETF (EDIV)
SPDR S&P BRIC 40 ETF (BIK)
SPDR S&P Emerging Europe ETF (GUR)
SPDR S&P Emerging Latin America ETF (GML)
SPDR S&P Emerging Middle East & Africa ETF (GAF)
SPDR S&P World ex-US ETF (GWL)
SPDR S&P International Small Cap ETF (GWX)
SPDR Dow Jones International Real Estate ETF (RWX)
SPDR S&P Global Infrastructure ETF (GII)
SPDR S&P Global Natural Resources ETF (GNR)
SPDR MSCI ACWI ex-US ETF (CWI)
SPDR MSCI ACWI IMI ETF (ACIM)
SPDR MSCI EM 50 ETF (EMFT)
SPDR MSCI EM Beyond BRIC ETF (EMBB)
SPDR MSCI EAFE Quality Mix ETF (QEFA)
SPDR MSCI Emerging Markets Quality Mix ETF (QEMM)
SPDR MSCI World Quality Mix ETF (QWLD)
SPDR MSCI Australia Quality Mix ETF (QAUS)
SPDR MSCI Canada Quality Mix ETF (QCAN)
SPDR MSCI Germany Quality Mix ETF (QDEU)
SPDR MSCI Japan Quality Mix ETF (QJPN)
SPDR MSCI Spain Quality Mix ETF (QESP)
SPDR MSCI United Kingdom Quality Mix ETF (QGBR)
SPDR Russell/Nomura PRIMETM Japan ETF (JPP)
SPDR Russell/Nomura Small CapTM Japan ETF (JSC)
SPDR S&P Global Dividend ETF (WDIV)
SPDR S&P International Dividend ETF (DWX)
SPDR S&P International Mid Cap ETF (MDD)
SPDR S&P Emerging Markets Small Cap ETF (EWX)
SPDR Dow Jones Global Real Estate ETF (RWO)
SPDR S&P International Consumer Discretionary Sector ETF (IPD)
SPDR S&P International Consumer Staples Sector ETF (IPS)
SPDR S&P International Energy Sector ETF (IPW)
SPDR S&P International Financial Sector ETF (IPF)
SPDR S&P International Health Care Sector ETF (IRY)
SPDR S&P International Industrial Sector ETF (IPN)
SPDR S&P International Materials Sector ETF (IRV)
SPDR S&P International Technology Sector ETF (IPK)
SPDR S&P International Telecommunications Sector ETF (IST)
SPDR S&P International Utilities Sector ETF (IPU)
The Select Sector SPDR Trust
The Consumer Discretionary Select Sector SPDR Fund (XLY)
The Consumer Staples Select Sector SPDR Fund (XLP)
The Energy Select Sector SPDR Fund (XLE)
The Financial Select Sector SPDR Fund (XLF)
The Health Care Select Sector SPDR Fund (XLV)
The Industrial Select Sector SPDR Fund (XLI)
The Materials Select Sector SPDR Fund (XLB)
The Technology Select Sector SPDR Fund (XLK)
The Utilities Select Sector SPDR Fund (XLU)
SSgA Active ETF Trust
SPDR SSgA Multi-Asset Real Return ETF (RLY)
SPDR SSgA Income Allocation ETF (INKM)
SPDR SSgA Global Allocation ETF (GAL)
SPDR Blackstone/GSO Senior Loan ETF (SRLN)
SPDR SSgA Ultra Short Term Bond ETF (ULST)
SPDR MFS Systematic Core Equity ETF (SYE)
SPDR MFS Systematic Growth Equity ETF (SYG)
SPDR MFS Systematic Value Equity ETF (SYV)
SPDR Dow Jones Industrial Average ETF Trust (DIA)
SPDR S&P 500 ETF Trust (SPY)
State Street Global Markets, LLC, member FINRA, SIPC, is distributor for all investment portfolios of SPDR Series Trust, SPDR Index Shares Funds, and SSgA Active ETF Trust. ALPS Distributors, Inc., a registered broker-dealer, is distributor for SPDR S&P 500 ETF Trust (SPY) and SPDR Dow Jones Industrial Average ETF Trust (DIA), both unit investment trusts. ALPS Portfolio Solutions Distributor, Inc. is the distributor for all investment portfolios of The Select Sector SPDR Trust.
SSgA Master Trust
TRUSTEES
Bonny E. Boatman
Dwight D. Churchill
David M. Kelly
Frank Nesvet, Chairman
James E. Ross
Carl G. Verboncoeur
OFFICERS
Ellen M. Needham, President
Ann Carpenter, Vice President
Michael P. Riley, Vice President
Chad C. Hallett, Treasurer
Matthew W. Flaherty, Assistant Treasurer
Laura F. Dell, Assistant Treasurer
Christopher A. Madden, Secretary
Danio Mastropieri, Assistant Secretary
Brian Harris, Chief Compliance Officer
INVESTMENT MANAGER
SSgA Funds Management, Inc.
State Street Financial Center
One Lincoln Street
Boston, MA 02111
CUSTODIAN, ADMINISTRATORAND TRANSFER AGENT
State Street Bank and Trust Company
One Lincoln Street
Boston, MA 02111
LEGAL COUNSEL
Bingham McCutchen LLP
2020 K Street, NW
Washington, DC 20006
INDEPENDENT REGISTERED PUBLIC ACCOUNTING FIRM
Ernst & Young LLP
200 Clarendon Street
Boston, MA 02116

Item 2. Code of Ethics.
As of the end of the period covered by this report, the registrant has adopted a code of ethics that applies to the registrant’s principal executive officer, principal financial officer, principal accounting officer or controller, or persons performing similar functions, regardless of whether these individuals are employed by the registrant or a third party (the “Code of Ethics”). During the period covered by this report, no substantive amendments were made to the Code of Ethics. During the period covered by this report, the registrant did not grant any waivers, including any implicit waivers, from any provision of the Code of Ethics.
The Code of Ethics is attached hereto as Exhibit 12(a)(1).
Item 3. Audit Committee Financial Expert.
(a)(1) The Board of Trustees of the registrant has determined that the registrant has five Board members serving on the Audit Committee that possess the attributes identified in Instructions 2(b) of Item 3 to Form N-CSR to qualify as an “audit committee financial expert.”
(2) Bonny Boatman, Dwight Churchill, David M. Kelly, Frank Nesvet and Carl Verboncoeur are the registrant’s audit committee financial experts. The Board also determined that each of the foregoing persons are not “interested person(s)” of the registrant as that term is defined in Section 2(a)(19) of the Investment Company Act of 1940, as amended.
Item 4. Principal Accountant Fees and Services.
(a) Audit Fees.
For the fiscal years ending June 30, 2014 and June 30, 2013, the aggregate audit fees billed for professional services rendered by the principal accountant were $76,320 and $38,160, respectively. Audit fees include the performance of the annual audits and routine regulatory filings (one for each SEC registrant).
(b) Audit-Related Fees.
For the fiscal years ending June 30, 2014 and June 30, 2013, the principal accountant did not bill the registrant any fees for assurances and related services that are reasonably related to the performance of the audit of the registrant’s financial statements and are not reported under paragraph (a) of this Item.
(c) Tax Fees.
For the fiscal years ending June 30, 2014 and June 30, 2013, the aggregate tax fees billed for professional services rendered by the principal accountant were $65,920 and $32,960, respectively. Tax fees represent services related to the review of year-end distribution requirements, as well as the review and signing as preparer of all federal, state and excise income tax returns for the series of the registrant.
(d) All Other Fees.
There were no other fees billed by the principal accountant for the fiscal years ending June 30, 2014 and June 30, 2013.
(e)(1) Audit Committee Pre-Approval Policies and Procedures.
The registrant’s Audit Committee Charter states the following with respect to pre-approval procedures:
Before the independent auditors are engaged by the Trust to render audit or non-audit services, either:
| | a. | The Audit Committee shall pre-approve all auditing services and permissible non-audit services (e.g., tax services) provided to the Trust. The Audit Committee may delegate to one or more of its members the authority to grant pre-approvals. Any decision of any member to whom authority is delegated under this section shall be presented to the full Audit Committee at its next regularly scheduled meeting; |
or
| | b. | The engagement to render the auditing service or permissible non-audit service is entered into pursuant to pre-approval policies and procedures established by the Audit Committee. Any such policies and procedures must (1) be detailed as to the particular service and (2) not involve any delegation of the Audit Committee’s responsibilities to the investment adviser. The Audit Committee must be informed of each service entered into pursuant to the policies and procedures. A copy of any such policies and procedures shall be attached as an exhibit to the Audit Committee Charter. |
| | c. | De Minimis Exceptions to Pre-Approval Requirements. Pre-Approval for a service provided to the Trust other than audit, review or attest services is not required if: (1) the aggregate amount of all such non-audit services provided to the Trust constitutes not more than 5 percent of the total amount of revenues paid by the Trust to the independent auditors during the fiscal year in which the non-audit services are provided; (2) such services were not recognized by the Trust at the time of the engagement to be non-audit services; and (3) such services are promptly brought to the attention of the Audit Committee and are approved by the Audit Committee or by one or more members of the Audit Committee to whom authority to grant such approvals has been delegated by the Audit Committee prior to the completion of the audit. |
| | d. | Pre-Approval of Non-Audit Services Provided to the investment adviser and Certain Control Persons. The Audit Committee shall pre-approve any non-audit services proposed to be provided by the independent auditors to (a) the investment adviser and (b) any entity controlling, controlled by, or under common control with the investment adviser that provides ongoing services to the Trust, if the independent auditors’ engagement with the investment adviser or any such control persons relates directly to the operations and financial reporting of the Trust. It shall be the responsibility of the independent auditors to notify the Audit Committee of any non-audit services that need to be pre-approved. |
| | e. | Application of De Minimis Exception: The De Minimis exception set forth above applies to pre-approvals under this Section as well, except that the “total amount of revenues” calculation is based on the total amount of revenues paid to the independent auditors by the Trust and any other entity that has its services approved under this Section (i.e., the investment adviser or any control person). |
(e)(2) Percentage of Services.
One hundred percent of the services described in each of paragraphs (b) through (d) of this Item were approved by the registrant’s Audit Committee pursuant to paragraph (c)(7)(i)(C) of Rule 2-01 of Regulation S-X.
(f) Not applicable.
(g) The aggregate non-audit fees billed for by the registrant’s accountant for services rendered to the registrant, and rendered to the registrant’s investment adviser (not including any sub-adviser whose role is primarily portfolio management and is subcontracted with or overseen by another investment adviser), and any entity controlling, controlled by, or under common control with the adviser were as follows:
| | | | | | | | |
| | | FY 2014
(in millions) | | | FY 2013
(in millions) | |
Non audit services billed to: | | | | | | | | |
Registrant: | | | See Item 4(c) | | | | See Item 4(c) | |
Investment Adviser: | | | — | | | | — | |
| | |
Other entities in the Investment Company Complex (1)(2): | | | | | | | | |
Audit Related Fees | | $ | 16.3 | | | $ | 15.9 | |
Tax Fees | | | 4.7 | | | | 3.9 | |
All Other Fees | | | 1.4 | | | | 3.6 | |
| | | | | | | | |
(1) Information is for the calendar year 2013 and 2012, respectively.
(2) Services under the caption Audit-Related Fees consisted principally of reports on the processing of transactions by servicing organizations, audits of employee benefit plan, non-statutory audits and due diligence procedures. Services under the caption Tax Fees consisted principally of expatriate, compliance and corporate tax advisory services. Services under the caption All Other Fees consisted of advisory services related to certain regulatory initiatives.
(h) The registrant’s principal accountant notified the registrant’s Audit Committee of all non-audit services that were rendered by the principal accountant to the Adviser and any entity controlling, controlled by, or under common control with the Adviser that provides services to the registrant, which services were not required to be pre-approved pursuant to paragraph (c)(7)(ii) of Rule 2-01 of Regulation S-X, allowing the registrant’s Audit Committee to consider whether such services were compatible with maintaining the principal accountant’s independence.
Item 5. Disclosure of Audit Committees for Listed Companies.
The registrant has an audit committee which was established by the Board of Trustees of the Trust in accordance with Section 3(a)(58)(A) of the Securities Exchange Act of 1934, as amended. The members of the registrant’s audit committee are Bonny Boatman, Dwight Churchill, David M. Kelly, Frank Nesvet and Carl Verboncoeur.
Item 6. Schedule of Investments.
(a) A Schedule of Investments for each series of the Registrant, is included as a part of the reports to shareholders filed under Item 1 of this Form N-CSR.
(b) Not applicable to the registrant.
Item 7. Disclosure of Proxy Voting Policies and Procedures for Closed-End Management Investment Companies.
Not applicable to the registrant.
Item 8. Portfolio Managers of Closed-End Management Investment Companies.
Not applicable to the registrant.
Item 9. Purchases of Equity Securities by Closed-End Management Investment Company and Affiliated Purchasers.
Not applicable to the registrant.
Item 10. Submission of Matters to a Vote of Security Holders.
Registrant has not adopted any material changes to the procedures by which shareholders may recommend nominees to the registrant’s Board.
Item 11. Controls and Procedures.
(a) Within 90 days of the filing date of this Form N-CSR, Ellen M. Needham, the registrant’s President and Principal Executive Officer, and Chad C. Hallett, the registrant’s Treasurer and Principal Financial Officer, reviewed the registrant’s disclosure controls and procedures and evaluated their effectiveness. Based on their review, Ms. Needham and Mr. Hallett determined that the disclosure controls and procedures adequately ensure that information required to be disclosed by the registrant in its periodic reports is recorded, processed, summarized and reported within the time periods required by the Securities and Exchange Commission.
(b) In the registrant’s second fiscal quarter covered by this form N-CSR filing, there were no significant changes in the registrant’s internal controls or in other factors that have materially affected, or are reasonably likely to materially affect, its controls over financial reporting subsequent to the date of their evaluation, including any corrective actions with regard to significant deficiencies and material weaknesses.
Item 12. Exhibits.
(a)(1) Code of Ethics referred to in Item 2.
(a)(2) Separate certifications required by Rule 30a-2(a) under the Investment Company Act of 1940 for each principal executive officer and principal financial officer of the registrant are attached.
(a)(3) Not applicable to the registrant.
(b) A single certification required by Rule 30a-2(b) under the Investment Company Act of 1940, Rule 13a-14(b) or Rule 15d-14(b) under the Securities Exchange Act of 1934 and Section 1350 of Chapter 63 of Title 18 of the United States Code for the principal executive officer and principal financial officer of the registrant is attached.
SIGNATURES
Pursuant to the requirements of the Securities Exchange Act of 1934 and the Investment Company Act of 1940, the registrant has duly caused this report to be signed on its behalf by the undersigned, thereunto duly authorized.
SSgA Active ETF Trust
| | |
| By: | | /s/ Ellen M. Needham |
| | Ellen M. Needham |
| | President and Principal Executive Officer |
Date: September 8, 2014
Pursuant to the requirements of the Securities Exchange Act of 1934 and the Investment Company Act of 1940, this report has been signed below by the following persons on behalf of the registrant and in the capacities and on the dates indicated.
| | |
| By: | | /s/ Ellen M. Needham |
| | Ellen M. Needham |
| | President and Principal Executive Officer |
Date: September 8, 2014
| | |
| By: | | /s/ Chad C. Hallett |
| | Chad C. Hallett |
| | Treasurer and Principal Financial Officer |
Date: September 8, 2014