Table of Contents
UNITED STATES
SECURITIES AND EXCHANGE COMMISSION
Washington, D.C. 20549
FORM N-CSR
CERTIFIED SHAREHOLDER REPORT OF REGISTERED
MANAGEMENT INVESTMENT COMPANIES
Investment Company Act file number: 811-22542
SSGA ACTIVE TRUST
(Exact name of registrant as specified in charter)
One Lincoln Street, Boston, Massachusetts 02111
(Address of principal executive offices) (zip code)
Christopher Madden, Esq.
State Street Bank and Trust Company
One Lincoln Street/CPH0326
Boston, Massachusetts 02111
(Name and address of agent for service)
Copy to:
W. John McGuire, Esq.
Morgan, Lewis & Bockius LLP
2020 K Street, N.W.
Washington, DC 20006
Registrant’s telephone number, including area code: (866) 787-2257
Date of fiscal year end: June 30
Date of reporting period: June 30, 2015
Table of Contents
Item 1. Reports to Shareholders.
Table of Contents
Annual Report
30 June 2015
SSGA Active Trust

Table of Contents
Management’s Discussion of Fund Performance & Performance Summary | ||||
| 1 | ||||
| 5 | ||||
| 8 | ||||
| 11 | ||||
| 14 | ||||
| 17 | ||||
| 18 | ||||
| 22 | ||||
| 26 | ||||
| 31 | ||||
| 34 | ||||
| 42 | ||||
| 46 | ||||
| 52 | ||||
| 53 |
Table of Contents

SPDR SSGA MULTI-ASSET REAL RETURN ETF — MANAGEMENT’S DISCUSSIONOF FUND PERFORMANCE
The SPDR SSGA Multi-Asset Real Return ETF (the “Fund”) normally invests substantially all of its assets in the SSGA Multi-Asset Real Return Portfolio (the “Portfolio”), which seeks to achieve real return consisting of capital appreciation and current income. As a result, this Fund invests indirectly through the Portfolio.
For the 12-month period ending June 30, 2015 (the “Reporting Period”), the total return for the Fund was -14.84%, and the total return for the primary Barclays U.S. Government Inflation-linked Bond Index (the “Index”) benchmark index was -1.68%. The secondary DBIQ Optimum Yield Diversified Commodity Index Excess Return benchmark index yielded returns of -30.30% for the one year period. The Fund and Index returns reflect the reinvestment of dividends and other income. The Fund’s performance reflects the expenses of managing the Fund, including brokerage and advisory expenses. Each Index is unmanaged and Index returns do not reflect fees and expenses of any kind, which would have a negative impact on returns.
The Reporting Period observed a number of headline risks that elevated concerns for the overall global growth outlook. Expectations for divergence in monetary policy increased worries of tighter monetary conditions in the United States and United Kingdom, whereas, Europe and Japan along with many emerging economies were expected to remain accommodative. Despite aggressive easing from the European Central Bank (ECB), concerns over Greek finances and their long term prospects within the European Union prompted bouts of volatility and uncertainty for regional growth. More germane to the real assets universe was an imposing overhang in supply for energy products and industrial metals while demand did not demonstrate offsetting growth. During the Reporting Period, headline U.S. inflation measured by U.S. Consumer Price Index for All Items was 0.1% year over year on a non-seasonally adjusted basis. However core inflation which excludes more volatile energy and food costs was up 1.8% which reflects the disinflationary pressures put forth by commodity weakness over the period. Overall, continued lackluster global growth and tepid inflation pressures posed a rather unfavorable environment for inflation hedging, real assets.
The Reporting Period saw severe declines in oil prices as well as headwinds for commodities more broadly. Concerns over excess supply roiled energy markets following Organization of the Petroleum Exporting Countries (OPEC) decision during fourth quarter of 2014 to continue to produce at elevated levels. This further compounded implications of already elevated non-OPEC production generated from US shale formations. Bearish supply demand fundamentals were not isolated to the energy complex as production increases combined with tepid demand growth presented an overhang in a number of core commodity sectors. The period also saw a profound strengthening in the US dollar compared to global currencies, exacerbating declines in dollar-financed commodities. Concerns regarding sustained growth in the Chinese economy provided further pain on the demand side of the equation for many commodities, impacting industrial metals particularly hard. Given the fragile environment in the commodities space, commodity producers also felt the pinch of lower prices and demand weakness.
During the fiscal period, U.S. Real Estate Investment Trusts (REITs) performance demonstrated a stark contrast between the first and second half of the period. During the second half of 2014 U.S. REITs offered double digit returns. However, as U.S. macro data improved during the second quarter of 2015 and the market began to capitulate towards a potential 2015 interest rate hike by the U.S. Federal Reserve Bank, REITs struggled as bond yields rose. For the period in its entirety, U.S. REITs benefited from strong fundamentals and predominantly benign interest rate conditions over much of the period. U.S. inflation linked bonds struggled during the second half of 2014 as real yields trended higher but inflation expectations deteriorated with declining break-evens following broad commodity weakness. U.S. Treasury Inflation Protected Securities (TIPS) essentially treaded water during the first half of 2015 as an increase in real yields was offset by beneficial carry.
Observing favorable outcomes within the real asset universe proved challenging during the Reporting Period as many of the asset classes including commodities, resource equities, and inflation linked bonds
1
Table of Contents
SPDR SSGA MULTI-ASSET REAL RETURN ETF — MANAGEMENT’S DISCUSSIONOF FUND PERFORMANCE (CONTINUED)
produced negative returns. U.S. REITs were a positive contributor to portfolio performance over the period supported by a low interest rate environment coupled with rising commercial property values and beneficial dividend growth. In addition allocating to cash proved beneficial over the period. Although cash offered little in the way of returns, the conservative allocation proved favorable as it offered a more beneficial outcome relative to many of the asset classes in the real asset universe and relative to the primary and secondary benchmark indexes.
Natural resource equities were the largest negative contributor to the Fund over the period. Sharp declines in energy prices were the most notable, but many growth dependent commodities joined in the move downward. Producers of these resources faced declining revenues and shrinking margins, all of which were translated to their share prices. Broad commodities provided the second largest negative contribution to the return of the Fund. As noted above, the changing supply and demand picture, a strengthening U.S. dollar, and growth concerns in China were negatives for the space. Inflation linked bonds were the third-most negative contributor to the funds returns. A challenged inflation environment and low real yield levels were reflected in the poor performance of these assets globally. The impact from global inflation linked bonds was magnified by dollar strength relative to many other currencies.
The views expressed above reflect those of the Fund’s portfolio manager only through the Reporting Period, and do not necessarily represent the views of the Adviser as a whole. Any such views are subject to change at any time based upon market or other conditions and the Adviser disclaims any responsibility to update such views. These views may not be relied on as investment advice and, because investment decisions for a fund are based on numerous factors, may not be relied on as an indication of trading intent on behalf of any fund.
2
Table of Contents
SPDR SSGA MULTI-ASSET REAL RETURN ETF —
PERFORMANCE SUMMARY
The following performance chart of the Fund’s total return at net asset value, the total return based on market price and its benchmark index is provided for comparative purposes only and represents the periods noted. The Fund’s per share net asset value (“NAV”) is the value of one share of the Fund and is calculated by dividing the value of total assets less total liabilities by the number of shares outstanding. The NAV return is based on the NAV of the Fund and the market return is based on the market price per share of the Fund. The market price used to calculate the market return is determined by using the midpoint between the highest bid and the lowest offer on the exchange on which the shares of the Fund are listed for trading, as of the time that the Fund’s NAV is calculated. Since shares of the Fund did not trade in the secondary market until one day after the Fund’s inception, for the period from inception to the first day of secondary market trading in shares of the Fund (4/25/12, 4/26/12, respectively), the NAV of the Fund is used as a proxy for the secondary market trading price to calculate market returns. NAV and market returns assume that dividends and capital gain distributions have been reinvested in the Fund at NAV. Market returns do not include brokerage commissions that may be payable on secondary market transactions. If brokerage commissions were included market returns would be lower.
An index is a statistical measure of a specified financial market or sector. An index does not actually hold a portfolio of securities and therefore does not reflect deductions for fees or expenses. In comparison, the Fund’s performance is negatively impacted by these deductions.
Performance quoted represents past performance, which is no guarantee of future results. Investment return and principal value will fluctuate, so you may have a gain or loss when shares are sold. Current performance may be higher or lower than that quoted. Visit www.spdrs.com for most recent month-end performance. The returns do not reflect the deduction of taxes that a shareholder would pay on Fund distributions or on the redemption or sale of Fund shares. The total expense ratio for SPDR SSGA Multi-Asset Real Return ETF as stated in the Fees and Expenses table of the prospectus dated October 31, 2014 (as supplemented May 14, 2015) is 0.70%.
PERFORMANCE AS OF JUNE 30, 2015
| CUMULATIVE TOTAL RETURN | AVERAGE ANNUAL TOTAL RETURN | |||||||||||||||||||||||||||||||||||||
NET ASSET VALUE | MARKET PRICE | PRIMARY BENCHMARK:
BARCLAYS US | SECONDARY BENCHMARK:
DBIQ OPTIMUM YIELD DIVERSIFIED COMMODITY YIELD INDEX EXCESS RETURN | NET ASSET VALUE | MARKET PRICE | PRIMARY BENCHMARK:
BARCLAYS US GOVERNMENT INFLATION- LINKED BOND INDEX | SECONDARY BENCHMARK:
DBIQ OPTIMUM YIELD DIVERSIFIED COMMODITY YIELD INDEX EXCESS RETURN | |||||||||||||||||||||||||||||||
| ONE YEAR | –14.84% | –14.95% | –1.68% | –30.30% | –14.84% | –14.95% | –1.68% | –30.30% | ||||||||||||||||||||||||||||||
| THREE YEAR | –4.66% | –4.62% | –2.35% | –27.03% | –1.58% | –1.56% | –0.79% | –9.98% | ||||||||||||||||||||||||||||||
| SINCE INCEPTION (1) | –7.94% | –7.96% | –0.75% | –32.97% | –2.56% | –2.57% | –0.24% | –11.82% | ||||||||||||||||||||||||||||||
| (1) | For the period April 25, 2012 to June 30, 2015. |
3
Table of Contents
SPDR SSGA MULTI-ASSET REAL RETURN ETF —
PERFORMANCE SUMMARY (CONTINUED)
COMPARISON OF CHANGE IN VALUE OF A $10,000 INVESTMENT (BASED ON NET ASSET VALUE)
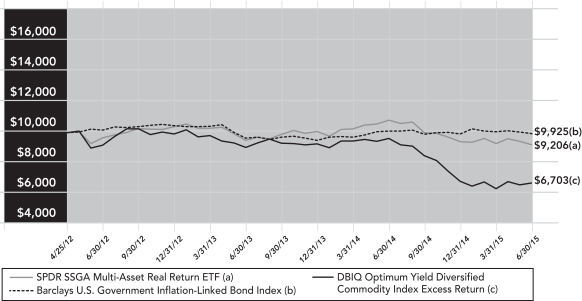
Past performance is not a guarantee of future results.
Index returns are unmanaged and do not reflect the deduction of any fees or expenses. Index returns reflect all items of income, gain and loss and the reinvestment of dividends and other income.
4
Table of Contents
SPDR SSGA INCOME ALLOCATION ETF — MANAGEMENT’S DISCUSSIONOF FUND PERFORMANCE
The SPDR SSGA Income Allocation ETF (the “Fund”) normally invests substantially all of its assets in the SSGA Income Allocation Portfolio (the “Portfolio”), which seeks to provide total return by focusing on investments in income and yield-generating assets. As a result, this Fund invests indirectly through the Portfolio.
For the 12-month period ended June 30, 2015 (the “Reporting Period”), the total return for the Fund was –1.59%, and the total return for the MSCI World Index (the “Index”) was 1.43%. The Fund and Index returns reflect the reinvestment of dividends and other income. The Fund’s performance reflects the expenses of managing the Fund, including brokerage and advisory expenses. The Index is unmanaged and Index returns do not reflect fees and expenses of any kind, which would have a negative impact on returns.
The Fund’s focus on income and yield-generating investments contributed to its underperformance relative to the Index during the Reporting Period. Persistently low, but fluctuating, interest rates over the past year presented the Fund with opportunities as well as challenges. During the first half of the Reporting Period, steadily declining interest rates flattered interest rate sensitive assets held in the Portfolio including longer term government and corporate bonds as well as securitized real estate. However, the second half of the Reporting Period marked a swift reversal in the rates markets as interest rates marched steadily higher beginning in February 2015 — taking back much of the aforementioned positive performance in those asset classes. Additionally, the influence of currency exposure played a large role in the performance of international assets held in the Fund. With policy divergences becoming quite pronounced, particularly between the United States, Europe and Japan, the dollar strengthened significantly over the period, which provided a headwind to non-US dollar denominated assets. To mitigate some of these impacts, the Fund implemented positions in hedged vehicles with exposure to Europe and Japan to better realize the markets’ returns without taking on currency risk. Concerns about global growth were again a trend throughout the year and a number of countries started, continued, or bolstered accommodative policies to spur growth. Towards the end of the period, signs of risk aversion in global markets picked up. Uncertainty surrounding Greece and China led to an uptick in market volatility and negatively impacted most equity markets — including the dividend oriented equity vehicles held in the Fund.
From an asset class standpoint, the top positive contributors to the Fund were positions within US equities. Healthy returns in US dividend equities (SPDR S&P Dividend ETF) were supplemented by positions driven by our sector rotation model, which helped the Fund maintain exposure to outperforming sectors such as health care (Health Care Select Sector SPDR Fund) and technology (Technology Select Sector SPDR Fund) throughout much of the Reporting Period. Allocations to US REITs via the SPDR Dow Jones REIT ETF throughout the period were the second largest positive contributor to return, with the asset class performing particularly well in the second half of 2014. The third largest contributor to return for the Fund was our hedged allocation to Japanese equities (WisdomTree Japan Hedged Equity Fund) as accelerated accommodative policies supported by a plan for pro-growth reforms resulted in strong returns for that market.
The largest negative contributor to the Fund was our exposure to international dividend equities. The SPDR S&P International Dividend ETF performed poorly compared to other international indices, and dragged the Fund’s performance down as a result. It was a similar story with the Fund’s second largest negative contributor, emerging market dividend equities (SPDR S&P Emerging Markets Dividend ETF), as this exposure also performed poorly compared to other indices tracking emerging market stocks. The Fund’s exposure to emerging market debt was the third largest negative contributor to return overall; rising rates and a strengthening US dollar led to poor performance in the space.
The views expressed above reflect those of the Fund’s portfolio manager only through the Reporting Period, and do not necessarily represent the views of the Adviser as a whole. Any such views are subject to change at any time based upon market or other conditions and the Adviser disclaims any responsibility to update such views. These views may not be relied on as investment advice and, because investment decisions for a fund are based on numerous factors, may not be relied on as an indication of trading intent on behalf of any fund.
5
Table of Contents
SPDR SSGA INCOME ALLOCATION ETF —
PERFORMANCE SUMMARY
The following performance chart of the Fund’s total return at net asset value, the total return based on market price and its benchmark index is provided for comparative purposes only and represents the periods noted. The Fund’s per share net asset value (“NAV”) is the value of one share of the Fund and is calculated by dividing the value of total assets less total liabilities by the number of shares outstanding. The NAV return is based on the NAV of the Fund and the market return is based on the market price per share of the Fund. The market price used to calculate the market return is determined by using the midpoint between the highest bid and the lowest offer on the exchange on which the shares of the Fund are listed for trading, as of the time that the Fund’s NAV is calculated. Since shares of the Fund did not trade in the secondary market until one day after the Fund’s inception, for the period from inception to the first day of secondary market trading in shares of the Fund (4/25/12, 4/26/12, respectively), the NAV of the Fund is used as a proxy for the secondary market trading price to calculate market returns. NAV and market returns assume that dividends and capital gain distributions have been reinvested in the Fund at NAV. Market returns do not include brokerage commissions that may be payable on secondary market transactions. If brokerage commissions were included market returns would be lower.
An index is a statistical measure of a specified financial market or sector. An index does not actually hold a portfolio of securities and therefore does not reflect deductions for fees or expenses. In comparison, the Fund’s performance is negatively impacted by these deductions.
Performance quoted represents past performance, which is no guarantee of future results. Investment return and principal value will fluctuate, so you may have a gain or loss when shares are sold. Current performance may be higher or lower than that quoted. Visit www.spdrs.com for most recent month-end performance. The returns do not reflect the deduction of taxes that a shareholder would pay on Fund distributions or on the redemption or sale of Fund shares. The total expense ratio for SPDR SSGA Income Allocation ETF as stated in the Fees and Expenses table of the prospectus dated October 31, 2014 (as supplemented May 14, 2015) is 0.70%.
PERFORMANCE AS OF JUNE 30, 2015
| CUMULATIVE TOTAL RETURN | AVERAGE ANNUAL TOTAL RETURN | |||||||||||||||||||||||||||||||||||||
NET ASSET VALUE | MARKET VALUE | PRIMARY
| SECONDARY
BARCLAYS US | NET ASSET VALUE | MARKET VALUE | PRIMARY
| SECONDARY
BARCLAYS US | |||||||||||||||||||||||||||||||
| ONE YEAR | –1.59% | –1.64% | 1.43% | 1.94% | –1.59% | –1.64% | 1.43% | 1.94% | ||||||||||||||||||||||||||||||
| THREE YEAR | 16.49% | 16.40% | 49.20% | 7.62% | 5.22% | 5.19% | 14.28% | 2.48% | ||||||||||||||||||||||||||||||
| SINCE INCEPTION (1) | 17.50% | 17.44% | 44.29% | 12.64% | 5.20% | 5.18% | 12.23% | 3.82% | ||||||||||||||||||||||||||||||
| (1) | For the period April 25, 2012 to June 30, 2015. |
6
Table of Contents
SPDR SSGA INCOME ALLOCATION ETF —
PERFORMANCE SUMMARY (CONTINUED)
COMPARISON OF CHANGE IN VALUE OF A $10,000 INVESTMENT (BASED ON NET ASSET VALUE)
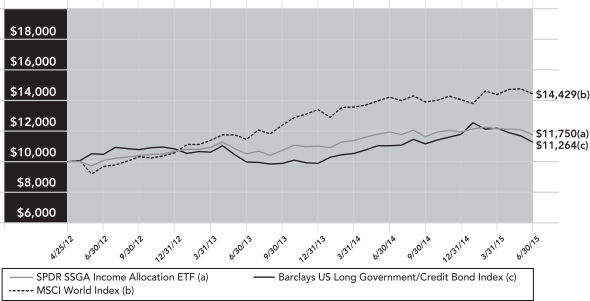
Past performance is not a guarantee of future results.
Index returns are unmanaged and do not reflect the deduction of any fees or expenses. Index returns reflect all items of income, gain and loss and the reinvestment of dividends and other income.
7
Table of Contents
SPDR SSGA GLOBAL ALLOCATION ETF — MANAGEMENT’S DISCUSSIONOF FUND PERFORMANCE
The SPDR SSGA Global Allocation ETF (the “Fund”) normally invests substantially all of its assets in the SSGA Global Allocation Portfolio (the “Portfolio”), which seeks to provide capital appreciation. As a result, this Fund invests indirectly through the Portfolio.
For the 12-month period ended June 30, 2015 (the “Reporting Period”), the total return for the Fund was 0.66%, and the total return for the MSCI ACWI IMI Index (the “Index”) was 0.81%. The Fund and Index returns reflect the reinvestment of dividends and other income. The Fund’s performance reflects the expenses of managing the Fund, including brokerage and advisory expenses. The Index is unmanaged and Index returns do not reflect fees and expenses of any kind, which would have a negative impact on returns.
The Fund invests broadly across regions and asset classes. During the Reporting Period, the Fund’s diversified investment exposures contributed to its underperformance relative to the equity only Index. US equities enjoyed a year of solid performance amid a backdrop of sound earnings growth and a relatively robust economic landscape. The period was characterized by persistently low interest rates, benefitting US REITs; dividend yields remained relatively attractive and valuations reasonable throughout. Decisions to increase allocations to long-duration government and corporate debt proved more mixed, as credit spreads widened while rates whipsawed. The spread widening constrained our realized upside return in the credit space and the rise in rates beginning in February also impacted the Fund negatively. The dollar strengthened significantly over the period, which provided a headwind to our non-US dollar denominated assets. To mitigate some of these impacts, the Fund implemented positions in hedged vehicles with exposure to Europe and Japan to better realize the markets’ returns without realizing the currency effects. Concerns about global growth were again a trend throughout the year and a number of countries started, continued, or bolstered accommodative policies to spur growth. Towards the end of the period, signs of risk aversion in global markets picked up. Uncertainty surrounding Greece and China led to an uptick on market volatility and negatively impacted equity markets.
US equities were the largest positive contributing asset class for the Fund over the course of the year. Solid growth overall combined with the success of our sector rotation model helped to provide the positive impact. The second largest contribution to return for the Fund came from allocations to Japanese equities; continued accommodative policies supported by a plan for pro-growth reforms resulted in strong performance by the country for the period. The third largest contributor to positive return was our allocation to US REITs; the positive effects of a low-rate environment and appreciating commercial property values provided a lift for the asset class.
The largest negative contributor to return came from our allocation to non-US developed equities. After a relatively flat year, particularly in Europe, international stocks fell in the last few days on the uncertainty surrounding Greece. Additionally, exposure to Canadian equities added further detriment, as the country’s performance mirrored that of oil over the period. Our position in long US treasury bonds was the second largest negative contributor to return for the Fund, as rising rates in the latter end of the period delivered an undesirable impact. The third most negative contributor to return came from the Fund’s allocations to emerging market equities, where political and policy concerns regionally helped limit capital market growth across the asset class more broadly.
The views expressed above reflect those of the Fund’s portfolio manager only through the Reporting Period, and do not necessarily represent the views of the Adviser as a whole. Any such views are subject to change at any time based upon market or other conditions and the Adviser disclaims any responsibility to update such views. These views may not be relied on as investment advice and, because investment decisions for a fund are based on numerous factors, may not be relied on as an indication of trading intent on behalf of any fund.
8
Table of Contents
SPDR SSGA GLOBAL ALLOCATION ETF —
PERFORMANCE SUMMARY
The following performance chart of the Fund’s total return at net asset value, the total return based on market price and its benchmark index is provided for comparative purposes only and represents the periods noted. The Fund’s per share net asset value (“NAV”) is the value of one share of the Fund and is calculated by dividing the value of total assets less total liabilities by the number of shares outstanding. The NAV return is based on the NAV of the Fund and the market return is based on the market price per share of the Fund. The market price used to calculate the market return is determined by using the midpoint between the highest bid and the lowest offer on the exchange on which the shares of the Fund are listed for trading, as of the time that the Fund’s NAV is calculated. Since shares of the Fund did not trade in the secondary market until one day after the Fund’s inception, for the period from inception to the first day of secondary market trading in shares of the Fund (4/25/12, 4/26/12, respectively), the NAV of the Fund is used as a proxy for the secondary market trading price to calculate market returns. NAV and market returns assume that dividends and capital gain distributions have been reinvested in the Fund at NAV. Market returns do not include brokerage commissions that may be payable on secondary market transactions. If brokerage commissions were included market returns would be lower.
An index is a statistical measure of a specified financial market or sector. An index does not actually hold a portfolio of securities and therefore does not reflect deductions for fees or expenses. In comparison, the Fund’s performance is negatively impacted by these deductions.
Performance quoted represents past performance, which is no guarantee of future results. Investment return and principal value will fluctuate, so you may have a gain or loss when shares are sold. Current performance may be higher or lower than that quoted. Visit www.spdrs.com for most recent month-end performance. The returns do not reflect the deduction of taxes that a shareholder would pay on Fund distributions or on the redemption or sale of Fund shares. The total expense ratio for SPDR SSGA Global Allocation ETF as stated in the Fees and Expenses table of the prospectus dated October 31, 2014 (as supplemented May 14, 2015) is 0.35%.
PERFORMANCE AS OF JUNE 30, 2015
| CUMULATIVE TOTAL RETURN | AVERAGE ANNUAL TOTAL RETURN | |||||||||||||||||||||||||||||||||||||
NET ASSET VALUE | MARKET VALUE | PRIMARY
| SECONDARY
BARCLAYS US | NET ASSET VALUE | MARKET VALUE | PRIMARY
| SECONDARY
BARCLAYS US | |||||||||||||||||||||||||||||||
| ONE YEAR | 0.66% | 0.74% | 0.81% | 1.86% | 0.66% | 0.74% | 0.81% | 1.86% | ||||||||||||||||||||||||||||||
| THREE YEAR | 29.23% | 29.49% | 45.59% | 5.58% | 8.92% | 9.00% | 13.35% | �� | 1.83% | |||||||||||||||||||||||||||||
| SINCE INCEPTION (1) | 26.88% | 27.00% | 40.02% | 6.83% | 7.76% | 7.80% | 11.17% | 2.10% | ||||||||||||||||||||||||||||||
| (1) | For the period April 25, 2012 to June 30, 2015. |
9
Table of Contents
SPDR SSGA GLOBAL ALLOCATION ETF —
PERFORMANCE SUMMARY (CONTINUED)
COMPARISON OF CHANGE IN VALUE OF A $10,000 INVESTMENT (BASED ON NET ASSET VALUE)
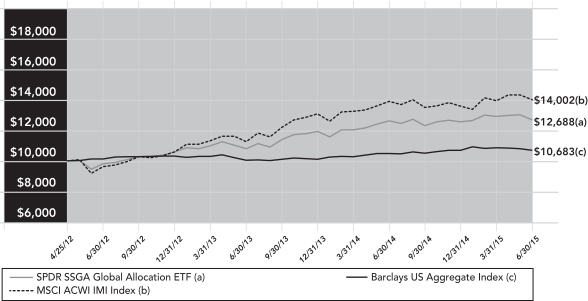
Past performance is not a guarantee of future results.
Index returns are unmanaged and do not reflect the deduction of any fees or expenses. Index returns reflect all items of income, gain and loss and the reinvestment of dividends and other income.
10
Table of Contents
SPDR BLACKSTONE/GSO SENIOR LOAN ETF — MANAGEMENT’S DISCUSSIONOF FUND PERFORMANCE
The SPDR Blackstone/GSO Senior Loan ETF (the “Fund”) normally invests substantially all of its assets in the Blackstone/GSO Senior Loan Portfolio (the “Portfolio”). The investment objective of the Fund and the Portfolio is to provide current income consistent with the preservation of capital. As a result, the Fund invests indirectly through the Portfolio.
For the 12-month period ended June 30, 2015 (the “Reporting Period”), the total return for the Fund was 2.38%, and the total return for the Markit iBoxx USD Liquid Leveraged Loan Index (the “Index”) was 0.55%. The Fund and Index returns reflect the reinvestment of dividends and other income. The Fund’s performance reflects the expenses of managing the Fund, including brokerage and advisory expenses. The Index is unmanaged and Index returns do not reflect fees and expenses of any kind, which would have a negative impact on returns.
The Fund outperformed the Index during the Reporting Period primarily due to credit selection, and in particular due to the avoidance of certain loans in the Index that significantly underperformed, as further described below. The Fund also benefitted from its selective exposure to high yield bonds, which are predominantly low duration and/or secured.
On an issuer level, the top positive contributors to the Fund’s relative performance were its avoidance of Energy Future Holdings (“TXU”), Weight Watchers (“WTW”), and Getty Images (“Getty”). Though TXU, which accounted for 3.3% of the Index over the past twelve months, traded up considerably after filing for Chapter 11 last April, prices fell 30% during the Reporting Period as the company has been unable to develop a reorganization plan acceptable to its creditors. The Fund continued to benefit from its decision to sell WTW in 2013 as the company is teetering on the brink of default, which caused the loan prices to fall to distressed levels. Getty underperformed significantly as the company continued to lose market share to competitors. The top negative contributors to the Fund’s relative performance were Fieldwood Energy (“Fieldwood”), Arch Coal, and Fortescue Metals Group (“FMG”). The Fund held modestly overweight positions in each of these issuers versus the Index. The energy sector generally underperformed as oil prices fell and Fieldwood was not sheltered from the market-wide volatility. Arch Coal underperformed during the Reporting Period as coal prices remained soft and the company began exploring unsecured-for-secured debt exchanges. Similarly, FMG underperformed as the company incurred additional secured debt to refinance shorter-dated unsecured notes amid steadily declining iron ore prices.
The views expressed above reflect those of the Fund’s portfolio manager only through the Reporting Period, and do not necessarily represent the views of the GSO/Blackstone Debt Funds Management LLC (the “Adviser”) as a whole. Any such views are subject to change at any time based upon market or other conditions and the Adviser disclaims any responsibility to update such views. These views may not be relied on as investment advice and, because investment decisions for a fund are based on numerous factors, may not be relied on as an indication of trading intent on behalf of any fund. Past performance is not an indication of future performance and there can be no assurance that the Fund will achieve results comparable to any other funds or accounts managed, advised or sub-advised by the Adviser or its affiliates, or that the Fund will be able to implement its investment strategy or achieve its investment objectives.
11
Table of Contents
SPDR BLACKSTONE/GSO SENIOR LOAN ETF —
PERFORMANCE SUMMARY
The following performance chart of the Fund’s total return at net asset value, the total return based on market price and its benchmark index is provided for comparative purposes only and represents the periods noted. The Fund’s per share net asset value (“NAV”) is the value of one share of the Fund and is calculated by dividing the value of total assets less total liabilities by the number of shares outstanding. The NAV return is based on the NAV of the Fund and the market return is based on the market price per share of the Fund. The market price used to calculate the market return is determined by using the midpoint between the highest bid and the lowest offer on the exchange on which the shares of the Fund are listed for trading, as of the time that the Fund’s NAV is calculated. Since shares of the Fund did not trade in the secondary market until one day after the Fund’s inception, for the period from inception to the first day of secondary market trading in shares of the Fund (4/3/13, 4/4/13, respectively), the NAV of the Fund is used as a proxy for the secondary market trading price to calculate market returns. NAV and market returns assume that dividends and capital gain distributions have been reinvested in the Fund at NAV. Market returns do not include brokerage commissions that may be payable on secondary market transactions. If brokerage commissions were included market returns would be lower.
An index is a statistical measure of a specified financial market or sector. An index does not actually hold a portfolio of securities and therefore does not reflect deductions for fees or expenses. In comparison, the Fund’s performance is negatively impacted by these deductions.
Performance quoted represents past performance, which is no guarantee of future results. Investment return and principal value will fluctuate, so you may have a gain or loss when shares are sold. Current performance may be higher or lower than that quoted. Visit www.spdrs.com for most recent month-end performance. The returns do not reflect the deduction of taxes that a shareholder would pay on Fund distributions or on the redemption or sale of Fund shares. The total expense ratio for SPDR Blackstone/GSO Senior Loan ETF as stated in the Fees and Expenses table of the prospectus dated October 31, 2014 (as supplemented May 14, 2015) is 0.70%.
PERFORMANCE AS OF JUNE 30, 2015
| CUMULATIVE TOTAL RETURN | AVERAGE ANNUAL TOTAL RETURN | |||||||||||||||||||||||||||||||||||||
NET ASSET VALUE | MARKET VALUE | PRIMARY
MARKIT IBOXX | SECONDARY
| NET ASSET VALUE | MARKET VALUE | PRIMARY
MARKIT IBOXX | SECONDARY
| |||||||||||||||||||||||||||||||
| ONE YEAR | 2.38% | 2.39% | 0.55% | 0.28% | 2.38% | 2.39% | 0.55% | 0.28% | ||||||||||||||||||||||||||||||
| SINCE INCEPTION (1) | 5.73% | 5.73% | 5.62% | 5.62% | 2.51% | 2.52% | 2.47% | 2.47% | ||||||||||||||||||||||||||||||
| (1) | For the period April 3, 2013 to June 30, 2015. |
12
Table of Contents
SPDR BLACKSTONE/GSO SENIOR LOAN ETF —
PERFORMANCE SUMMARY (CONTINUED)
COMPARISON OF CHANGE IN VALUE OF A $10,000 INVESTMENT (BASED ON NET ASSET VALUE)
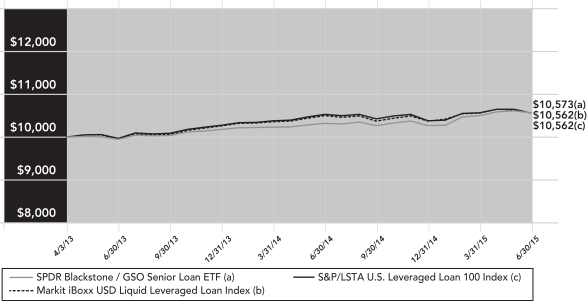
Past performance is not a guarantee of future results.
Index returns are unmanaged and do not reflect the deduction of any fees or expenses. Index returns reflect all items of income, gain and loss and the reinvestment of dividends and other income.
13
Table of Contents
SPDR SSGA ULTRA SHORT TERM BOND ETF —
MANAGEMENT’S DISCUSSIONOF FUND PERFORMANCE
The SPDR SSGA Ultra Short Term Bond ETF (the “Fund”) normally invests substantially all of its assets in the SSGA Ultra Short Term Bond Portfolio (the “Portfolio”), which seeks to provide current income consistent with preservation of capital and daily liquidity through short duration high quality investments. As a result, this Fund invests indirectly through the Portfolio.
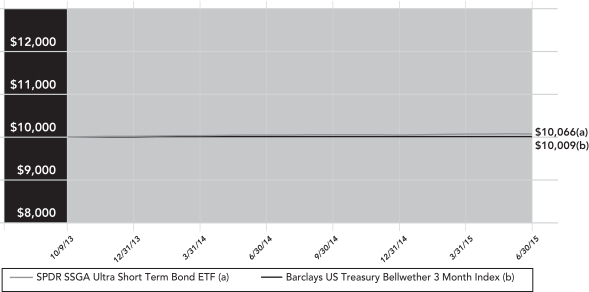
For the 12-month period ended June 30, 2015 (the “Reporting Period”), the total return for the Fund was 0.20%, and the total return for the Barclays US Treasury Bellwether 3 Month Index (the “Index”) was 0.03%. The Fund and Index returns reflect the reinvestment of dividends and other income. The Fund’s performance reflects the expenses of managing the Fund, including brokerage and advisory expenses. The Index is unmanaged and Index returns do not reflect fees and expenses of any kind, which would have a negative impact on returns.
The Fund outperformed the Index during the Reporting Period. The Portfolio maintained duration of approximately 0.30 years during the period, very close to the benchmark duration of 0.25 years. As of fiscal year end, the Portfolio’s asset allocation consisted of corporate bonds (64.4%), asset-backed securities (ABS) (21.9%), U.S. government obligations (10.5%) and cash (3.1%). 30% of fund assets had fixed rates while 70% had floating rate coupons. The Portfolio’s use of floating rate bonds allowed for substantial exposure to corporate bonds and ABS without adding significant interest rate risk. The Portfolio’s exposure to corporate bonds and asset backed securities was responsible for the Portfolio’s outperformance versus its benchmark during the period. The Portfolio benefitted from the yield advantage over T-Bills that those sectors provide. Credit spreads widened during the period but not by enough to negate the positive impact of the yield advantage. Heavy corporate issuance and expectations for the removal of policy accommodation by the Fed were the main catalysts for the move wider in credit spreads.
The Federal Open Market Committee continued its accommodative monetary policy during the period by leaving the target federal funds rate unchanged at 0%–0.25%. However, the Committee ended the period in a “data dependent” mode as they contemplate their first rate hike in 9 years potentially occurring during the second half of 2015. Given the outlook for a rate hike in the coming months, yields in the front end (0-3 year) of the yield curve moved higher during the period. The long end of the yield curve saw yields fall as investors questioned the strength of the economy and the needed pace and amount of tightening that will ultimately be required. The Fund maintained a weighted average maturity near the 1.5-year area in order to take advantage of the higher yields available in 2–5 year corporate bonds and ABS.
The views expressed above reflect those of the Fund’s portfolio manager only through the Reporting Period, and do not necessarily represent the views of the Adviser as a whole. Any such views are subject to change at any time based upon market or other conditions and the Adviser disclaims any responsibility to update such views. These views may not be relied on as investment advice and, because investment decisions for a fund are based on numerous factors, may not be relied on as an indication of trading intent on behalf of any fund.
14
Table of Contents
SPDR SSGA ULTRA SHORT TERM BOND ETF —
PERFORMANCE SUMMARY
The following performance chart of the Fund’s total return at net asset value, the total return based on market price and its benchmark index is provided for comparative purposes only and represents the periods noted. The Fund’s per share net asset value (“NAV”) is the value of one share of the Fund and is calculated by dividing the value of total assets less total liabilities by the number of shares outstanding. The NAV return is based on the NAV of the Fund and the market return is based on the market price per share of the Fund. The market price used to calculate the market return is determined by using the midpoint between the highest bid and the lowest offer on the exchange on which the shares of the Fund are listed for trading, as of the time that the Fund’s NAV is calculated. Since shares of the Fund did not trade in the secondary market until one day after the Fund’s inception, for the period from inception to the first day of secondary market trading in shares of the Fund (10/9/13, 10/10/13, respectively), the NAV of the Fund is used as a proxy for the secondary market trading price to calculate market returns. NAV and market returns assume that dividends and capital gain distributions have been reinvested in the Fund at NAV. Market returns do not include brokerage commissions that may be payable on secondary market transactions. If brokerage commissions were included market returns would be lower.
An index is a statistical measure of a specified financial market or sector. An index does not actually hold a portfolio of securities and therefore does not reflect deductions for fees or expenses. In comparison, the Fund’s performance is negatively impacted by these deductions.
Performance quoted represents past performance, which is no guarantee of future results. Investment return and principal value will fluctuate, so you may have a gain or loss when shares are sold. Current performance may be higher or lower than that quoted. Visit www.spdrs.com for most recent month-end performance. The returns do not reflect the deduction of taxes that a shareholder would pay on Fund distributions or on the redemption or sale of Fund shares. The total expense ratio for SPDR SSGA Ultra Short Term Bond ETF as stated in the Fees and Expenses table of the prospectus dated October 31, 2014 (as supplemented May 14, 2015) is 0.20%.
PERFORMANCE AS OF JUNE 30, 2015
| CUMULATIVE TOTAL RETURN | AVERAGE ANNUAL TOTAL RETURN | |||||||||||||||||||||||||||||
NET ASSET VALUE | MARKET VALUE | BARCLAYS US TREASURY BELLWETHER 3 MONTH INDEX | NET ASSET VALUE | MARKET VALUE | BARCLAYS US TREASURY BELLWETHER 3 MONTH INDEX | |||||||||||||||||||||||||
| ONE YEAR | 0.20% | 0.29% | 0.03% | 0.20% | 0.29% | 0.03% | ||||||||||||||||||||||||
| SINCE INCEPTION (1) | 0.66% | 0.67% | 0.09% | 0.38% | 0.39% | 0.05% | ||||||||||||||||||||||||
| (1) | For the period October 9, 2013 to June 30, 2015. |
15
Table of Contents
SPDR SSGA ULTRA SHORT TERM BOND ETF —
PERFORMANCE SUMMARY (CONTINUED)
COMPARISON OF CHANGE IN VALUE OF A $10,000 INVESTMENT (BASED ON NET ASSET VALUE)
Past performance is not a guarantee of future results.
Index returns are unmanaged and do not reflect the deduction of any fees or expenses. Index returns reflect all items of income, gain and loss and the reinvestment of dividends and other income.
16
Table of Contents
SPDR DOUBLELINE TOTAL RETURN TACTICAL ETF — PERFORMANCE SUMMARY
The Fund had less than six months of operations at reporting period end and therefore does not have performance history to provide in this report.
17
Table of Contents
SPDR MFS SYSTEMATIC CORE EQUITY ETF —
MANAGEMENT’S DISCUSSIONOF FUND PERFORMANCE
The SPDR MFS Systematic Core Equity ETF (the “Fund”) normally invests substantially all of its assets in the MFS Systematic Core Equity Portfolio (the “Portfolio”), which seeks to achieve capital appreciation. As a result, this Fund invests indirectly through the Portfolio.
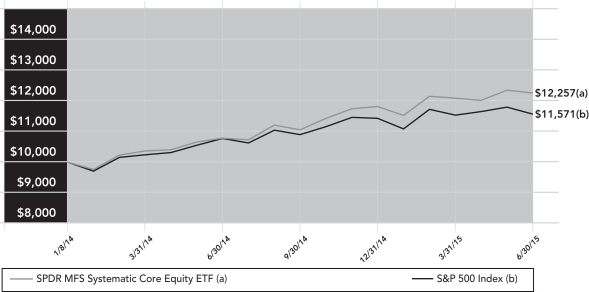
For the 12-month period ended June 30, 2015 (the “Reporting Period”), the total return for the Fund was 13.70%, and the total return for the S&P 500 Index (the “Index”) was 7.42%. The Fund and Index returns reflect the reinvestment of dividends and other income. The Fund’s performance reflects the expenses of managing the Fund, including brokerage and advisory expenses. The Index is unmanaged and Index returns do not reflect fees and expenses of any kind, which would have a negative impact on returns.
A generally risk-friendly environment prevailed in the first half of the period and any market setbacks, triggered by global growth concerns, were short-lived as central banks responded and kept monetary policy accommodative. For example, the US tempered rate hike expectations while Japan, Europe and China provided fresh stimulus measures which ultimately supported risk assets. Early in the second half of the period, the European Central Bank cut policy interest rates and announced non-conventional easing measures, pushing yields on a significant portion of Euro zone sovereign bonds deeper into negative territory, a notable highlight amid a mini-wave of global easing due to declining inflation and inflation expectations.
A dominant trend for most of the period was the ongoing rise in US equities. Until early in the second half of the period, this was paired with a decline in US and global bond yields. The uptrend in US corporate margins and profits continued throughout the second half of 2014, but a rising dollar and a sharp decline in commodity prices, particularly crude oil prices, negatively impacted credit markets, notably US high yield and emerging market debt. The higher weightings of oil and gas credits in these asset classes resulted in widening spreads and increased volatility. In the second half of the period, global sovereign bond yields rose, shrugging off concerns over a Greek debt default. The rise tempered the equity advance, as odds of a 2015 US Federal Reserve rate hike increased. At the end of the period, the stronger US dollar slowed revenues in many US-based multinational companies.
Stock selection in the leisure and energy sectors contributed to performance relative to the S&P 500 Index. Within the leisure sector, an overweight position in digital gaming firm Electronic Arts and the timing of ownership in cruise line company Royal Caribbean Cruises aided relative results. Within the energy sector, an overweight position in manufacturer and marketer of transportation fuels Valero Energy benefited relative returns.
In other sectors, overweight positions in health insurer Anthem, retailer Kroger, health care services company Cardinal Health(h), pharmaceuticals company McKesson, global financial services firm JPMorgan Chase, social networking service provider Facebook and computer and personal electronics maker Apple supported relative performance.
Stock selection in the utilities and communications and special products and services sectors detracted from relative performance. Within the utilities and communications sector, overweight positions in power company AES Corporation and broadband and telecommunications company Verizon weighed on relative performance. Within the special products and services sector, holding shares of education and training company Apollo Education(b)(h) detracted from relative performance.
Elsewhere, holding shares of internet-based professional network site LinkedIn(b)(h) and overweight positions in oil and gas company Exxon Mobil, information technology company Hewlett-Packard, storage and information management services provider Iron Mountain and diversified medical products maker Johnson & Johnson hurt relative returns. Additionally, not owning biotech firm Gilead Sciences and media conglomerate Walt Disney detracted from relative performance.
| (b) | Security is not a benchmark constituent. |
| (h) | Security was not held in the Portfolio at period end. |
18
Table of Contents
SPDR MFS SYSTEMATIC CORE EQUITY ETF —
MANAGEMENT’S DISCUSSIONOF FUND PERFORMANCE (CONTINUED)
The views expressed above reflect those of the Fund’s portfolio manager only through the Reporting Period, and do not necessarily represent the views of the Adviser as a whole. Any such views are subject to change at any time based upon market or other conditions and the Adviser disclaims any responsibility to update such views. These views may not be relied on as investment advice and, because investment decisions for a fund are based on numerous factors, may not be relied on as an indication of trading intent on behalf of any fund.
19
Table of Contents
SPDR MFS SYSTEMATIC CORE EQUITY ETF —
PERFORMANCE SUMMARY
The following performance chart of the Fund’s total return at net asset value, the total return based on market price and its benchmark index is provided for comparative purposes only and represents the periods noted. The Fund’s per share net asset value (“NAV”) is the value of one share of the Fund and is calculated by dividing the value of total assets less total liabilities by the number of shares outstanding. The NAV return is based on the NAV of the Fund and the market return is based on the market price per share of the Fund. The market price used to calculate the market return is determined by using the midpoint between the highest bid and the lowest offer on the exchange on which the shares of the Fund are listed for trading, as of the time that the Fund’s NAV is calculated. Since shares of the Fund did not trade in the secondary market until one day after the Fund’s inception, for the period from inception to the first day of secondary market trading in shares of the Fund (1/8/14, 1/9/14, respectively), the NAV of the Fund is used as a proxy for the secondary market trading price to calculate market returns. NAV and market returns assume that dividends and capital gain distributions have been reinvested in the Fund at NAV. Market returns do not include brokerage commissions that may be payable on secondary market transactions. If brokerage commissions were included market returns would be lower.
An index is a statistical measure of a specified financial market or sector. An index does not actually hold a portfolio of securities and therefore does not reflect deductions for fees or expenses. In comparison, the Fund’s performance is negatively impacted by these deductions.
Performance quoted represents past performance, which is no guarantee of future results. Investment return and principal value will fluctuate, so you may have a gain or loss when shares are sold. Current performance may be higher or lower than that quoted. Visit www.spdrs.com for most recent month-end performance. The returns do not reflect the deduction of taxes that a shareholder would pay on Fund distributions or on the redemption or sale of Fund shares. The total expense ratio for SPDR MFS Systematic Core Equity ETF as stated in the Fees and Expenses table of the prospectus dated October 31, 2014 (as supplemented May 14, 2015) is 0.60%.
PERFORMANCE AS OF JUNE 30, 2015
| CUMULATIVE TOTAL RETURN | AVERAGE ANNUAL TOTAL RETURN | |||||||||||||||||||||||||||||
NET ASSET VALUE | MARKET VALUE | S&P 500 INDEX | NET ASSET VALUE | MARKET VALUE | S&P 500 | |||||||||||||||||||||||||
| ONE YEAR | 13.70% | 13.41% | 7.42% | 13.70% | 13.41% | 7.42% | ||||||||||||||||||||||||
| SINCE INCEPTION (1) | 22.57% | 22.25% | 15.71% | 14.78% | 14.57% | 10.41% | ||||||||||||||||||||||||
| (1) | For the period January 8, 2014 to June 30, 2015. |
20
Table of Contents
SPDR MFS SYSTEMATIC CORE EQUITY ETF —
PERFORMANCE SUMMARY (CONTINUED)
COMPARISON OF CHANGE IN VALUE OF A $10,000 INVESTMENT (BASED ON NET ASSET VALUE)
Past performance is not a guarantee of future results.
Index returns are unmanaged and do not reflect the deduction of any fees or expenses. Index returns reflect all items of income, gain and loss and the reinvestment of dividends and other income.
21
Table of Contents
SPDR MFS SYSTEMATIC GROWTH EQUITY ETF —
MANAGEMENT’S DISCUSSIONOF FUND PERFORMANCE
The SPDR MFS Systematic Growth Equity ETF (the “Fund”) normally invests substantially all of its assets in the MFS Systematic Growth Equity Portfolio (the “Portfolio”), which seeks to achieve capital appreciation. As a result, this Fund invests indirectly through the Portfolio.
For the 12-month period ended June 30, 2015 (the “Reporting Period”), the total return for the Fund was 17.53%, and the total return for the Russell 1000 Growth Index (the “Index”) was 10.56%. The Fund and Index returns reflect the reinvestment of dividends and other income. The Fund’s performance reflects the expenses of managing the Fund, including brokerage and advisory expenses. The Index is unmanaged and Index returns do not reflect fees and expenses of any kind, which would have a negative impact on returns.
A generally risk-friendly environment prevailed in the first half of the period and any market setbacks, triggered by global growth concerns, were short-lived as central banks responded and kept monetary policy accommodative. For example, the US tempered rate hike expectations while Japan, Europe and China provided fresh stimulus measures which ultimately supported risk assets. Early in the second half of the period, the European Central Bank cut policy interest rates and announced non-conventional easing measures, pushing yields on a significant portion of Euro zone sovereign bonds deeper into negative territory, a notable highlight amid a mini-wave of global easing due to declining inflation and inflation expectations.
A dominant trend for most of the period was the ongoing rise in US equities. Until early in the second half of the period, this was paired with a decline in US and global bond yields. The uptrend in US corporate margins and profits continued throughout the second half of 2014, but a rising dollar and a sharp decline in commodity prices, particularly crude oil prices, negatively impacted credit markets, notably US high yield and emerging market debt. The higher weightings of oil and gas credits in these asset classes resulted in widening spreads and increased volatility. In the second half of the period, global sovereign bond yields rose, shrugging off concerns over a Greek debt default. The rise tempered the equity advance, as odds of a 2015 US Federal Reserve rate hike increased. At the end of the period, the stronger US dollar slowed revenues in many US-based multinational companies.
Stock selection in the leisure sector positively impacted performance relative to the Russell 1000 Growth Index. The Fund’s overweight position in video game maker Electronic Arts and holdings of global cruise vacation company Royal Caribbean Cruises(b) benefited relative returns.
Stock selection and an underweight position in the energy sector also contributed to relative performance as this sector was the worst-performing sector over the Reporting Period. Most notably, an overweight position in strong-performing petroleum products company Marathon Petroleum and not owning shares of oil field services company Schlumberger boosted relative performance as the company turned in poor performance.
Elsewhere, the Fund’s overweight positions in shares of retailer Kroger, health care company HCA Holdings, heart and cardiovascular technology company Edwards Lifesciences, internet services company VeriSign, drugstore retailer CVS Health and healthcare services provider Cardinal Health(h) bolstered relative returns as all of the companies outperformed the Fund’s benchmark over the Reporting Period.
Stock selection in the consumer staples sector was a primary detractor for relative performance. There were no individual securities within this sector that were among the Fund’s top relative detractors.
Elsewhere, the Fund’s underweight position in computer and personal electronics maker Apple was a notable detractor for relative performance as its shares outpaced the benchmark over the Reporting Period. Other stocks that were detractors for relative performance included an overweight position in construction and mining equipment manufacturer Caterpillar, information storage solutions company Iron Mountain, luxury goods and apparel company Michael Kors Holdings(h), enterprise software products maker Oracle, electronic retailer Best Buy and airline services provider Copa Holdings(h). Not owning shares of media conglomerate Walt Disney Company and the timing of the Fund’s ownership in online professional network LinkedIn(h) and internet retailer Amazon.com also detracted from relative performance.
| (b) | Security is not a benchmark constituent. |
| (h) | Security was not held in the Portfolio at period end. |
22
Table of Contents
SPDR MFS SYSTEMATIC GROWTH EQUITY ETF —
MANAGEMENT’S DISCUSSIONOF FUND PERFORMANCE (CONTINUED)
The views expressed above reflect those of the Fund’s portfolio manager only through the Reporting Period, and do not necessarily represent the views of the Adviser as a whole. Any such views are subject to change at any time based upon market or other conditions and the Adviser disclaims any responsibility to update such views. These views may not be relied on as investment advice and, because investment decisions for a fund are based on numerous factors, may not be relied on as an indication of trading intent on behalf of any fund.
23
Table of Contents
SPDR MFS SYSTEMATIC GROWTH EQUITY ETF —
PERFORMANCE SUMMARY
The following performance chart of the Fund’s total return at net asset value, the total return based on market price and its benchmark index is provided for comparative purposes only and represents the periods noted. The Fund’s per share net asset value (“NAV”) is the value of one share of the Fund and is calculated by dividing the value of total assets less total liabilities by the number of shares outstanding. The NAV return is based on the NAV of the Fund and the market return is based on the market price per share of the Fund. The market price used to calculate the market return is determined by using the midpoint between the highest bid and the lowest offer on the exchange on which the shares of the Fund are listed for trading, as of the time that the Fund’s NAV is calculated. Since shares of the Fund did not trade in the secondary market until one day after the Fund’s inception, for the period from inception to the first day of secondary market trading in shares of the Fund (1/8/14, 1/9/14, respectively), the NAV of the Fund is used as a proxy for the secondary market trading price to calculate market returns. NAV and market returns assume that dividends and capital gain distributions have been reinvested in the Fund at NAV. Market returns do not include brokerage commissions that may be payable on secondary market transactions. If brokerage commissions were included market returns would be lower.
An index is a statistical measure of a specified financial market or sector. An index does not actually hold a portfolio of securities and therefore does not reflect deductions for fees or expenses. In comparison, the Fund’s performance is negatively impacted by these deductions.
Performance quoted represents past performance, which is no guarantee of future results. Investment return and principal value will fluctuate, so you may have a gain or loss when shares are sold. Current performance may be higher or lower than that quoted. Visit www.spdrs.com for most recent month-end performance. The returns do not reflect the deduction of taxes that a shareholder would pay on Fund distributions or on the redemption or sale of Fund shares. The total expense ratio for SPDR MFS Systematic Growth Equity ETF as stated in the Fees and Expenses table of the prospectus dated October 31, 2014 (as supplemented May 14, 2015) is 0.60%.
PERFORMANCE AS OF JUNE 30, 2015
| CUMULATIVE TOTAL RETURN | AVERAGE ANNUAL TOTAL RETURN | |||||||||||||||||||||||||||||
NET ASSET VALUE | MARKET VALUE | RUSSELL 1000 GROWTH INDEX | NET ASSET VALUE | MARKET VALUE | RUSSELL 1000 GROWTH INDEX | |||||||||||||||||||||||||
| ONE YEAR | 17.53% | 17.84% | 10.56% | 17.53% | 17.84% | 10.56% | ||||||||||||||||||||||||
| SINCE INCEPTION (1) | 26.56% | 26.83% | 18.33% | 17.29% | 17.46% | 12.11% | ||||||||||||||||||||||||
| (1) | For the period January 8, 2014 to June 30, 2015. |
24
Table of Contents
SPDR MFS SYSTEMATIC GROWTH EQUITY ETF —
PERFORMANCE SUMMARY (CONTINUED)
COMPARISON OF CHANGE IN VALUE OF A $10,000 INVESTMENT (BASED ON NET ASSET VALUE)

Past performance is not a guarantee of future results.
Index returns are unmanaged and do not reflect the deduction of any fees or expenses. Index returns reflect all items of income, gain and loss and the reinvestment of dividends and other income.
25
Table of Contents
SPDR MFS SYSTEMATIC VALUE EQUITY ETF —
MANAGEMENT’S DISCUSSIONOF FUND PERFORMANCE
The SPDR MFS Systematic Value Equity ETF (the “Fund”) normally invests substantially all of its assets in the MFS Systematic Value Equity Portfolio (the “Portfolio”), which seeks to achieve capital appreciation. As a result, this Fund invests indirectly through the Portfolio.
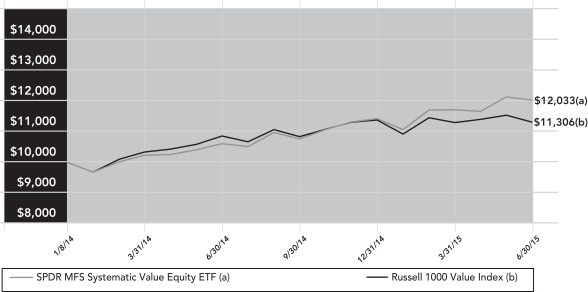
For the 12-month period ended June 30, 2015 (the “Reporting Period”), the total return for the Fund was 13.47%, and the total return for the Russell 1000 Value Index (the “Index”) was 4.13%. The Fund and Index returns reflect the reinvestment of dividends and other income. The Fund’s performance reflects the expenses of managing the Fund, including brokerage and advisory expenses. The Index is unmanaged and Index returns do not reflect fees and expenses of any kind, which would have a negative impact on returns.
A generally risk-friendly environment prevailed in the first half of the period and any market setbacks, triggered by global growth concerns, were short-lived as central banks responded and kept monetary policy accommodative. For example, the US tempered rate hike expectations while Japan, Europe and China provided fresh stimulus measures which ultimately supported risk assets. Early in the second half of the period, the European Central Bank cut policy interest rates and announced non-conventional easing measures, pushing yields on a significant portion of Euro zone sovereign bonds deeper into negative territory, a notable highlight amid a mini-wave of global easing due to declining inflation and inflation expectations.
A dominant trend for most of the period was the ongoing rise in US equities. Until early in the second half of the period, this was paired with a decline in US and global bond yields. The uptrend in US corporate margins and profits continued throughout the second half of 2014, but a rising dollar and a sharp decline in commodity prices, particularly crude oil prices, negatively impacted credit markets, notably US high yield and emerging market debt. The higher weightings of oil and gas credits in these asset classes resulted in widening spreads and increased volatility. In the second half of the period, global sovereign bond yields rose, shrugging off concerns over a Greek debt default. The rise tempered the equity advance, as odds of a 2015 US Federal Reserve rate hike increased. At the end of the period, the stronger US dollar slowed revenues in many US-based multinational companies.
Security selection and an overweight allocation to the leisure sector contributed to relative performance with overweight positions in video game maker Electronic Arts and global cruise vacation company Royal Caribbean Cruises aiding comparative results.
Stock selection in the energy sector, driven by overweight positions in independent oil refiner Valero Energy and refiner and transporter Marathon Petroleum, further boosted relative performance.
Security selection and an overweight allocation to the health care sector aided relative performance. Overweight positions in insurance plan provider Anthem and benefits provider Aetna contributed positively in this sector.
Elsewhere, the industrial goods & services sector also benefited from strong security selection with an overweight position in shares of Northrop Grumman outperforming the benchmark.
Individual stocks that benefited relative performance included overweight positions in broadband communications and networking services provider Broadcom Corp and global financial services firm JPMorgan Chase. Holdings of grocery store chain Kroger(a) also contributed to relative results.
Security selection within the utilities & communications sector was the primary detractor from relative results. The Fund’s overweight positions in integrated electric power company AES and power generation company NRG dampened relative results as both stocks lagged the benchmark.
Individual stocks that hurt relative performance included overweight positions in oil and gas company Chesapeake Energy(b), real estate invest trust Washington Prime and online information portal Yahoo!.
| (a) | Security is not a benchmark constituent. |
| (b) | Security was not held in the Portfolio at period end. |
26
Table of Contents
SPDR MFS SYSTEMATIC VALUE EQUITY ETF —
MANAGEMENT’S DISCUSSIONOF FUND PERFORMANCE (CONTINUED)
Not holding drugstore retailer CVS Health, pharmaceutical company Eli Lilly, and global pharmaceutical company Bristol Myers Squibb weakened results. Lastly, the timing of the Fund’s ownership in shares of multinational retailer Best Buy and an underweight position in UnitedHealth Group detracted from relative results.
The views expressed above reflect those of the Fund’s portfolio manager only through the Reporting Period, and do not necessarily represent the views of the Adviser as a whole. Any such views are subject to change at any time based upon market or other conditions and the Adviser disclaims any responsibility to update such views. These views may not be relied on as investment advice and, because investment decisions for a fund are based on numerous factors, may not be relied on as an indication of trading intent on behalf of any fund.
27
Table of Contents
SPDR MFS SYSTEMATIC VALUE EQUITY ETF —
PERFORMANCE SUMMARY
The following performance chart of the Fund’s total return at net asset value, the total return based on market price and its benchmark index is provided for comparative purposes only and represents the periods noted. The Fund’s per share net asset value (“NAV”) is the value of one share of the Fund and is calculated by dividing the value of total assets less total liabilities by the number of shares outstanding. The NAV return is based on the NAV of the Fund and the market return is based on the market price per share of the Fund. The market price used to calculate the market return is determined by using the midpoint between the highest bid and the lowest offer on the exchange on which the shares of the Fund are listed for trading, as of the time that the Fund’s NAV is calculated. Since shares of the Fund did not trade in the secondary market until one day after the Fund’s inception, for the period from inception to the first day of secondary market trading in shares of the Fund (1/8/14, 1/9/14, respectively), the NAV of the Fund is used as a proxy for the secondary market trading price to calculate market returns. NAV and market returns assume that dividends and capital gain distributions have been reinvested in the Fund at NAV. Market returns do not include brokerage commissions that may be payable on secondary market transactions. If brokerage commissions were included market returns would be lower.
An index is a statistical measure of a specified financial market or sector. An index does not actually hold a portfolio of securities and therefore does not reflect deductions for fees or expenses. In comparison, the Fund’s performance is negatively impacted by these deductions.
Performance quoted represents past performance, which is no guarantee of future results. Investment return and principal value will fluctuate, so you may have a gain or loss when shares are sold. Current performance may be higher or lower than that quoted. Visit www.spdrs.com for most recent month-end performance. The returns do not reflect the deduction of taxes that a shareholder would pay on Fund distributions or on the redemption or sale of Fund shares. The total expense ratio for SPDR MFS Systematic Value Equity ETF as stated in the Fees and Expenses table of the prospectus dated October 31, 2014 (as supplemented May 14, 2015) is 0.60%.
PERFORMANCE AS OF JUNE 30, 2015
| CUMULATIVE TOTAL RETURN | AVERAGE ANNUAL TOTAL RETURN | |||||||||||||||||||||||||||||
NET ASSET VALUE | MARKET VALUE | RUSSELL 1000 VALUE INDEX | NET ASSET VALUE | MARKET VALUE | RUSSELL 1000 | |||||||||||||||||||||||||
| ONE YEAR | 13.47% | 13.49% | 4.13% | 13.47% | 13.49% | 4.13% | ||||||||||||||||||||||||
| SINCE INCEPTION (1) | 20.33% | 20.32% | 13.06% | 13.35% | 13.34% | 8.69% | ||||||||||||||||||||||||
| (1) | For the period January 8, 2014 to June 30, 2015. |
28
Table of Contents
SPDR MFS SYSTEMATIC VALUE EQUITY ETF —
PERFORMANCE SUMMARY (CONTINUED)
COMPARISON OF CHANGE IN VALUE OF A $10,000 INVESTMENT (BASED ON NET ASSET VALUE)
Past performance is not a guarantee of future results.
Index returns are unmanaged and do not reflect the deduction of any fees or expenses. Index returns reflect all items of income, gain and loss and the reinvestment of dividends and other income.
29
Table of Contents
SPDR SSGA RISK AWARE ETF —
MANAGEMENT’S DISCUSSIONOF FUND PERFORMANCE
The SPDR SSGA Risk Aware ETF (the “Fund”) normally invests substantially all of its assets in the SSGA Risk Aware Portfolio (the “Portfolio”), which seeks to provide competitive returns compared to the broad U.S. equity market and capital appreciation. As a result, this Fund invests indirectly through the Portfolio.
From September 9, 2014 (the Fund’s inception) through June 30, 2015 (the “Reporting Period”), the total return for the Fund was –0.99%, and the total return for the Russell 3000 Index (the “Index”) was 5.82%. The Fund and Index returns reflect the reinvestment of dividends and other income. The Fund’s performance reflects the expenses of managing the Fund, including brokerage and advisory expenses. The Index is unmanaged and Index returns do not reflect fees and expenses of any kind, which would have a negative impact on returns.
The Fund underperformed the Index during the Reporting Period primarily due to the challenges of aligning the portfolio exposure to the forecasted risk signal. At Fund inception, the Portfolio was significantly exposed to a “risk-on” profile in a market environment that was becoming increasingly defensive. As a result, the Portfolio significantly lagged its benchmark in September and October of 2014. However, as the third quarter drew to a close, the Fund correctly anticipated investor preference for lower risk as large caps outperformed small caps, oil prices plunged, and global growth data was mixed. By the December/January time period, the Fund had established appropriate positions in stocks that the market deemed defensive (or “risk-off”) and as a result, relative monthly performance improved. Then in February, expectations of continued flight to safety evaporated when oil prices recovered and risk assets staged a rally. In this environment, the Fund’s exposure to “safe” names became a liability and the Fund again underperformed. The next couple of months produced mixed economic and macro data, reflecting doubts regarding whether or not the U.S. economy was growing and speculation on when the Federal Reserve might raise interest rates. At this point, the Fund’s risk signal took a more neutral stance, although still with a slight bias towards “safety”. The resulting portfolio exposures paid off in March, but reversed in April as risk assets again staged a rally on the back of improving U.S. housing data, low inflation, and continually improving oil prices. The portfolio did move towards riskier stocks in May, but it was too late and the Fund underperformed as questions about the strength of the U.S. economy persisted and safe stocks outperformed risky stocks. The Fund finished the first half of the year with a very neutral stance regarding risk and only slightly underperformed its benchmark in June as neither safe or risky stocks showed any advantage.
The views expressed above reflect those of the Fund’s portfolio manager only through the Reporting Period, and do not necessarily represent the views of the Adviser as a whole. Any such views are subject to change at any time based upon market or other conditions and the Adviser disclaims any responsibility to update such views. These views may not be relied on as investment advice and, because investment decisions for a fund are based on numerous factors, may not be relied on as an indication of trading intent on behalf of any fund.
30
Table of Contents
PERFORMANCE SUMMARY
The following performance chart of the Fund’s total return at net asset value, the total return based on market price and its benchmark index is provided for comparative purposes only and represents the periods noted. The Fund’s per share net asset value (“NAV”) is the value of one share of the Fund and is calculated by dividing the value of total assets less total liabilities by the number of shares outstanding. The NAV return is based on the NAV of the Fund and the market return is based on the market price per share of the Fund. The market price used to calculate the market return is determined by using the midpoint between the highest bid and the lowest offer on the exchange on which the shares of the Fund are listed for trading, as of the time that the Fund’s NAV is calculated. Since shares of the Fund did not trade in the secondary market until one day after the Fund’s inception, for the period from inception to the first day of secondary market trading in shares of the Fund (9/9/14, 9/10/14, respectively), the NAV of the Fund is used as a proxy for the secondary market trading price to calculate market returns. NAV and market returns assume that dividends and capital gain distributions have been reinvested in the Fund at NAV. Market returns do not include brokerage commissions that may be payable on secondary market transactions. If brokerage commissions were included market returns would be lower.
An index is a statistical measure of a specified financial market or sector. An index does not actually hold a portfolio of securities and therefore does not reflect deductions for fees or expenses. In comparison, the Fund’s performance is negatively impacted by these deductions.
Performance quoted represents past performance, which is no guarantee of future results. Investment return and principal value will fluctuate, so you may have a gain or loss when shares are sold. Current performance may be higher or lower than that quoted. Visit www.spdrs.com for most recent month-end performance. The returns do not reflect the deduction of taxes that a shareholder would pay on Fund distributions or on the redemption or sale of Fund shares. The total expense ratio for SPDR SSGA Risk Aware ETF as stated in the Fees and Expenses table of the prospectus dated October 31, 2014 (as supplemented May 14, 2015) is 0.50%.
PERFORMANCE AS OF JUNE 30, 2015
| CUMULATIVE TOTAL RETURN | AVERAGE ANNUAL TOTAL RETURN | |||||||||||||||||||||||
NET ASSET VALUE | MARKET VALUE | RUSSELL | NET ASSET VALUE | MARKET VALUE | RUSSELL | |||||||||||||||||||
| SINCE INCEPTION (1) | –0.99% | –1.07% | 5.82% | N/A | N/A | N/A | ||||||||||||||||||
| (1) | For the period September 9, 2014 to June 30, 2015. |
31
Table of Contents
SPDR SSGA RISK AWARE ETF —
PERFORMANCE SUMMARY (CONTINUED)
COMPARISON OF CHANGE IN VALUE OF A $10,000 INVESTMENT (BASED ON NET ASSET VALUE)
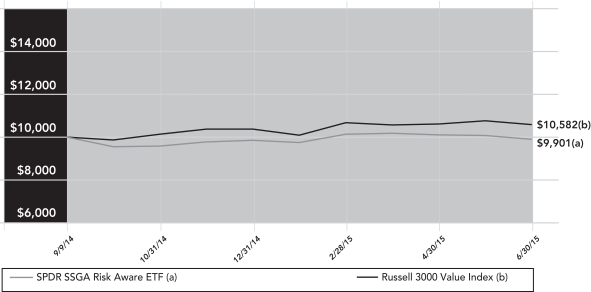
Past performance is not a guarantee of future results.
Index returns are unmanaged and do not reflect the deduction of any fees or expenses. Index returns reflect all items of income, gain and loss and the reinvestment of dividends and other income.
32
Table of Contents
[This Page Intentionally Left Blank]
33
Table of Contents
SSGA ACTIVE TRUST
STATEMENTS OF ASSETS AND LIABILITIES
June 30, 2015
| SPDR SSGA Multi-Asset Real Return ETF | SPDR SSGA Income Allocation ETF | SPDR SSGA Global Allocation ETF | SPDR Blackstone/ GSO Senior Loan ETF | |||||||||||||
ASSETS | ||||||||||||||||
Investments in corresponding Portfolio, at market value (Note 1) | $ | 141,994,613 | $ | 121,147,609 | $ | 144,774,137 | $ | 672,262,632 | ||||||||
Due from Advisor | 285 | 179 | 41,276 | 1,123 | ||||||||||||
|
|
|
|
|
|
|
| |||||||||
TOTAL ASSETS | 141,994,898 | 121,147,788 | 144,815,413 | 672,263,755 | ||||||||||||
|
|
|
|
|
|
|
| |||||||||
LIABILITIES | ||||||||||||||||
Income distributions payable | 1,092,665 | 1,093,485 | 1,159,949 | — | ||||||||||||
Accrued Advisory fees | 7,157 | 34,224 | — | 451,841 | ||||||||||||
Accrued trustees’ fees and expenses | 385 | 273 | 289 | 1,432 | ||||||||||||
|
|
|
|
|
|
|
| |||||||||
TOTAL LIABILITIES | 1,100,207 | 1,127,982 | 1,160,238 | 453,273 | ||||||||||||
|
|
|
|
|
|
|
| |||||||||
NET ASSETS | $ | 140,894,691 | $ | 120,019,806 | $ | 143,655,175 | $ | 671,810,482 | ||||||||
|
|
|
|
|
|
|
| |||||||||
NET ASSETS CONSIST OF: | ||||||||||||||||
Paid-in capital (Note 4) | $ | 169,371,660 | $ | 125,552,968 | $ | 142,751,485 | $ | 682,308,139 | ||||||||
Undistributed (distributions in excess of) net investment income | (455,607 | ) | (554,739 | ) | (554,214 | ) | 2,035,485 | |||||||||
Accumulated net realized gain (loss) on investments | (10,103,544 | ) | (3,909,816 | ) | 307,878 | (3,536,865 | ) | |||||||||
Net unrealized appreciation (depreciation) on investments | (17,917,818 | ) | (1,068,607 | ) | 1,150,026 | (8,996,277 | ) | |||||||||
|
|
|
|
|
|
|
| |||||||||
NET ASSETS | $ | 140,894,691 | $ | 120,019,806 | $ | 143,655,175 | $ | 671,810,482 | ||||||||
|
|
|
|
|
|
|
| |||||||||
NET ASSET VALUE PER SHARE | ||||||||||||||||
Net asset value per share | $ | 25.85 | $ | 31.16 | $ | 34.61 | $ | 49.22 | ||||||||
|
|
|
|
|
|
|
| |||||||||
Shares outstanding (unlimited amount authorized, $0.00 par value) | 5,451,111 | 3,851,111 | 4,151,111 | 13,650,000 | ||||||||||||
|
|
|
|
|
|
|
| |||||||||
See Notes to Financial Statements and Financial Statements of the Master Portfolios.
34
Table of Contents
| SPDR SSGA Ultra Short Term Bond ETF | SPDR DoubleLine Total Return Tactical ETF | SPDR MFS Systematic Core Equity ETF | SPDR MFS Systematic Growth Equity ETF | SPDR MFS Systematic Value Equity ETF | SPDR SSGA Risk Aware ETF | |||||||||||||||||
$ | 16,018,114 |
| $ | 746,693,064 | $ | 2,939,064 | $ | 6,043,704 | $ | 2,908,381 | $ | 1,966,047 | ||||||||||
| 27 | 48 | 5 | 6 | 5 | 4 | |||||||||||||||||
|
|
|
|
|
|
|
|
|
|
|
| |||||||||||
| 16,018,141 | 746,693,112 | 2,939,069 | 6,043,710 | 2,908,386 | 1,966,051 | |||||||||||||||||
|
|
|
|
|
|
|
|
|
|
|
| |||||||||||
| — | — | 11,293 | 16,513 | 11,719 | 5,488 | |||||||||||||||||
| — | 249,705 | 1,480 | 3,040 | 1,462 | 841 | |||||||||||||||||
| 38 | 293 | 7 | 8 | 7 | 5 | |||||||||||||||||
|
|
|
|
|
|
|
|
|
|
|
| |||||||||||
| 38 | 249,998 | 12,780 | 19,561 | 13,188 | 6,334 | |||||||||||||||||
|
|
|
|
|
|
|
|
|
|
|
| |||||||||||
| $ | 16,018,103 | $ | 746,443,114 | $ | 2,926,289 | $ | 6,024,149 | $ | 2,895,198 | $ | 1,959,717 | |||||||||||
|
|
|
|
|
|
|
|
|
|
|
| |||||||||||
| $ | 16,028,372 | $ | 752,955,016 | $ | 2,524,162 | $ | 5,507,323 | $ | 2,508,242 | $ | 2,080,969 | |||||||||||
| 2,775 |
| 645,258 | 310 | 107 | (996 | ) | (1,035 | ) | |||||||||||||
| (3,330 | ) | (489,538 | ) | 62,744 | 137,085 | 84,347 | (131,089 | ) | |||||||||||||
| (9,714 | ) | (6,667,622 | ) | 339,073 | 379,634 | 303,605 | 10,872 | ||||||||||||||
|
|
|
|
|
|
|
|
|
|
|
| |||||||||||
| $ | 16,018,103 | $ | 746,443,114 | $ | 2,926,289 | $ | 6,024,149 | $ | 2,895,198 | $ | 1,959,717 | |||||||||||
|
|
|
|
|
|
|
|
|
|
|
| |||||||||||
| $ | 40.05 | $ | 49.43 | $ | 58.53 | $ | 60.24 | $ | 57.90 | $ | 39.19 | |||||||||||
|
|
|
|
|
|
|
|
|
|
|
| |||||||||||
| 400,000 |
| 15,100,000 | 50,000 | 100,000 | 50,000 | 50,000 | |||||||||||||||
|
|
|
|
|
|
|
|
|
|
|
| |||||||||||
35
Table of Contents
SSGA ACTIVE TRUST
STATEMENTS OF OPERATIONS
For the Year Ended June 30, 2015
SPDR SSGA | SPDR SSGA | SPDR SSGA | SPDR Blackstone/ | |||||||||||||
INCOME AND EXPENSES ALLOCATED FROM PORTFOLIO | ||||||||||||||||
Dividend and interest income allocated from Portfolio (Note 2) | $ | 2,860,859 | $ | 3,899,440 | $ | 3,288,889 | $ | 29,282,489 | ||||||||
Expenses allocated from Portfolio (Note 2) | (327,264 | ) | (234,890 | ) | (250,571 | ) | (1,846,499 | ) | ||||||||
|
|
|
|
|
|
|
| |||||||||
| 2,533,595 | 3,664,550 | 3,038,318 | 27,435,990 | |||||||||||||
|
|
|
|
|
|
|
| |||||||||
EXPENSES | ||||||||||||||||
Advisory fees (Note 3) | 46,937 | 172,398 | — | 2,443,194 | ||||||||||||
Trustee Fees (Note 3) | 3,971 | 2,599 | 2,723 | 14,389 | ||||||||||||
Miscellaneous expenses | — | — | — | 17,792 | ||||||||||||
|
|
|
|
|
|
|
| |||||||||
TOTAL EXPENSES | 50,908 | 174,997 | 2,723 | 2,475,375 | ||||||||||||
|
|
|
|
|
|
|
| |||||||||
Fees reimbursed by Adviser (Note 3) | — | — | (193,355 | ) | — | |||||||||||
|
|
|
|
|
|
|
| |||||||||
NET INVESTMENT INCOME | $ | 2,482,687 | $ | 3,489,553 | $ | 3,228,950 | $ | 24,960,615 | ||||||||
|
|
|
|
|
|
|
| |||||||||
REALIZED AND UNREALIZED GAIN (LOSS) ON INVESTMENTS | ||||||||||||||||
Net realized gain (loss) allocated from Portfolio | (4,468,232 | ) | (47,249 | ) | 2,370,761 | (750,611 | ) | |||||||||
Net realized gain from capital gains distributions allocated from Portfolio | 36,098 | 592,142 | 392,999 | — | ||||||||||||
Net change in unrealized appreciation (depreciation) allocated from corresponding Portfolio | (23,442,391 | ) | (6,319,996 | ) | (5,265,486 | ) | (10,613,251 | ) | ||||||||
|
|
|
|
|
|
|
| |||||||||
NET REALIZED AND UNREALIZED GAIN (LOSS) ON INVESTMENTS | (27,874,525 | ) | (5,775,103 | ) | (2,501,726 | ) | (11,363,862 | ) | ||||||||
|
|
|
|
|
|
|
| |||||||||
NET INCREASE (DECREASE) IN NET ASSETS RESULTING FROM OPERATIONS | $ | (25,391,838 | ) | $ | (2,285,550 | ) | $ | 727,224 | $ | 13,596,753 | ||||||
|
|
|
|
|
|
|
| |||||||||
| * | For the period February 23, 2015 (commencement of operations) to June 30, 2015. |
| ** | For the period September 9, 2014 (commencement of operations) to June 30, 2015. |
See Notes to Financial Statements and Financial Statements of the Master Portfolios.
36
Table of Contents
| SPDR SSGA Ultra Short Term Bond ETF | SPDR DoubleLine | SPDR MFS | SPDR MFS | SPDR MFS | SPDR SSGA Risk Aware ETF** | |||||||||||||||||
$ | 86,465 |
| $ | 5,291,586 | $ | 62,065 | $ | 63,289 | $ | 58,901 | $ | 30,931 | ||||||||||
| (32,621 | ) | (422,924 | ) | (9,260 | ) | (10,974 | ) | (9,032 | ) | (4,560 | ) | |||||||||||
|
|
|
|
|
|
|
|
|
|
|
| |||||||||||
| 53,844 | 4,868,662 | 52,805 | 52,315 | 49,869 | 26,371 | |||||||||||||||||
|
|
|
|
|
|
|
|
|
|
|
| |||||||||||
| — | 499,745 | 9,186 | 10,921 | 8,961 | 4,505 | |||||||||||||||||
| 384 | 1,523 | 58 | 60 | 75 | 41 | |||||||||||||||||
| 1 | 12 | — | — | — | — | |||||||||||||||||
|
|
|
|
|
|
|
|
|
|
|
| |||||||||||
| 385 | 501,280 | 9,244 | 10,981 | 9,036 | 4,546 | |||||||||||||||||
|
|
|
|
|
|
|
|
|
|
|
| |||||||||||
| — | (135,884 | ) | — | — | — | — | ||||||||||||||||
|
|
|
|
|
|
|
|
|
|
|
| |||||||||||
| $ | 53,459 | $ | 4,503,266 | $ | 43,561 | $ | 41,334 | $ | 40,833 | $ | 21,825 | |||||||||||
|
|
|
|
|
|
|
|
|
|
|
| |||||||||||
| (4,836 | ) | (1,029,738 | ) | 313,374 | 451,772 | 294,126 | (232,419 | ) | |||||||||||||
| — |
| — | — | — | — | — | |||||||||||||||
| (20,193 | ) | (6,667,622 | ) | 48,736 | 35,700 | 41,437 | 10,872 | ||||||||||||||
|
|
|
|
|
|
|
|
|
|
|
| |||||||||||
| (25,029 | ) | (7,697,360 | ) | 362,110 | 487,472 | 335,563 | (221,547 | ) | |||||||||||||
|
|
|
|
|
|
|
|
|
|
|
| |||||||||||
$ | 28,430 |
| $ | (3,194,094 | ) | $ | 405,671 | $ | 528,806 | $ | 376,396 | $ | (199,722 | ) | ||||||||
|
|
|
|
|
|
|
|
|
|
|
| |||||||||||
37
Table of Contents
SSGA ACTIVE TRUST
STATEMENTS OF CHANGES IN NET ASSETS
| SPDR SSGA Multi-Asset Real Return ETF | SPDR SSGA Income Allocation ETF | |||||||||||||||
| Year Ended 6/30/15 | Year Ended 6/30/14 | Year Ended 6/30/15 | Year Ended 6/30/14 | |||||||||||||
INCREASE (DECREASE) IN NET ASSETS FROM OPERATIONS: | ||||||||||||||||
Net investment income (loss) | $ | 2,482,687 | $ | 2,541,102 | $ | 3,489,553 | $ | 3,930,594 | ||||||||
Net realized gain (loss) on investments | (4,432,134 | ) | (2,207,376 | ) | 544,893 | (1,346,776 | ) | |||||||||
Net change in unrealized appreciation (depreciation) on investments | (23,442,391 | ) | 16,133,379 | (6,319,996 | ) | 11,409,099 | ||||||||||
|
|
|
|
|
|
|
| |||||||||
Net increase (decrease) in net assets resulting from operations | (25,391,838 | ) | 16,467,105 | (2,285,550 | ) | 13,992,917 | ||||||||||
|
|
|
|
|
|
|
| |||||||||
Net equalization credits and charges | 42,131 | 44,917 | 56,314 | (85,229 | ) | |||||||||||
|
|
|
|
|
|
|
| |||||||||
DISTRIBUTIONS TO | ||||||||||||||||
Net investment income | (2,527,694 | ) | (2,582,680 | ) | (3,780,064 | ) | (3,845,121 | ) | ||||||||
Net realized gain (loss) on investments | — | — | — | — | ||||||||||||
|
|
|
|
|
|
|
| |||||||||
Total distributions to shareholders | (2,527,694 | ) | (2,582,680 | ) | (3,780,064 | ) | (3,845,121 | ) | ||||||||
|
|
|
|
|
|
|
| |||||||||
FROM BENEFICIAL INTEREST | ||||||||||||||||
Proceeds from sale of shares | 66,337,576 | 91,367,609 | 34,191,856 | 7,804,637 | ||||||||||||
Cost of shares redeemed | (61,103,706 | ) | (62,105,980 | ) | (11,141,269 | ) | (86,894,211 | ) | ||||||||
Net income equalization (Note 2) | (42,131 | ) | (44,917 | ) | (56,314 | ) | 85,229 | |||||||||
Other capital (Note 4) | — | — | — | — | ||||||||||||
|
|
|
|
|
|
|
| |||||||||
Net increase (decrease) in net assets from beneficial interest transactions | 5,191,739 | 29,216,712 | 22,994,273 | (79,004,345 | ) | |||||||||||
|
|
|
|
|
|
|
| |||||||||
Net increase (decrease) in net assets during the period | (22,685,662 | ) | 43,146,054 | 16,984,973 | (68,941,778 | ) | ||||||||||
Net assets at beginning of period | 163,580,353 | 120,434,299 | 103,034,833 | 171,976,611 | ||||||||||||
|
|
|
|
|
|
|
| |||||||||
NET ASSETS END OF PERIOD (1) | $ | 140,894,691 | $ | 163,580,353 | $ | 120,019,806 | $ | 103,034,833 | ||||||||
|
|
|
|
|
|
|
| |||||||||
SHARES OF BENEFICIAL INTEREST | ||||||||||||||||
Shares sold | 2,400,000 | 3,100,000 | 1,050,000 | 250,000 | ||||||||||||
Shares redeemed | (2,250,000 | ) | (2,150,000 | ) | (350,000 | ) | (2,850,000 | ) | ||||||||
|
|
|
|
|
|
|
| |||||||||
Net increase (decrease) in shares | 150,000 | 950,000 | 700,000 | (2,600,000 | ) | |||||||||||
|
|
|
|
|
|
|
| |||||||||
(1) Undistributed (distributions in excess of) net investment income | $ | (455,607 | ) | $ | (217,343 | ) | $ | (554,739 | ) | $ | (264,228 | ) | ||||
|
|
|
|
|
|
|
| |||||||||
| * | Commencement of operations |
See Notes to Financial Statements and Financial Statements of the Master Portfolios.
38
Table of Contents
| SPDR SSGA Global Allocation ETF | SPDR Blackstone/GSO Senior Loan ETF | SPDR SSGA Ultra Short Term Bond ETF | ||||||||||||||||||||
| Year Ended 6/30/15 | Year Ended 6/30/14 | Year Ended 6/30/15 | Year Ended 6/30/14 | Year Ended 6/30/15 | For the Period 10/9/13* - 6/30/14 | |||||||||||||||||
| $ | 3,228,950 | $ | 1,975,944 | $ | 24,960,615 | $ | 17,299,298 | $ | 53,459 | $ | 32,273 | |||||||||||
| 2,763,760 | 1,718,544 | (750,611 | ) | (2,767,908 | ) | (4,836 | ) | 888 | ||||||||||||||
| (5,265,486 | ) | 6,937,749 | (10,613,251 | ) | 4,689,705 | (20,193 | ) | 10,479 | |||||||||||||
|
|
|
|
|
|
|
|
|
|
|
| |||||||||||
| | 727,224 | | 10,632,237 | 13,596,753 | 19,221,095 | 28,430 | 43,640 | |||||||||||||||
|
|
|
|
|
|
|
|
|
|
|
| |||||||||||
| 172,315 | 45,650 | 126,497 | 381,936 | 166 | 134 | |||||||||||||||||
|
|
|
|
|
|
|
|
|
|
|
| |||||||||||
| (3,503,154 | ) | (2,021,720 | ) | (24,171,917 | ) | (16,478,270 | ) | (53,333 | ) | (28,118 | ) | |||||||||||
| (713,037 | ) | — | — | — | (715 | ) | — | |||||||||||||||
|
|
|
|
|
|
|
|
|
|
|
| |||||||||||
| (4,216,191 | ) | (2,021,720 | ) | (24,171,917 | ) | (16,478,270 | ) | (54,048 | ) | (28,118 | ) | |||||||||||
|
|
|
|
|
|
|
|
|
|
|
| |||||||||||
| 72,106,656 | 47,337,163 | 123,474,946 | 286,897,792 | 6,012,275 | 16,009,331 | |||||||||||||||||
| (22,551,382 | ) | (9,842,556 | ) | (51,558,641 | ) | (12,480,635 | ) | (4,007,078 | ) | (2,005,142 | ) | |||||||||||
| (172,315 | ) | (45,650 | ) | (126,497 | ) | (381,936 | ) | (166 | ) | (134 | ) | |||||||||||
| — | — | 194,062 | 461,547 | 3,607 | 15,206 | |||||||||||||||||
|
|
|
|
|
|
|
|
|
|
|
| |||||||||||
| 49,382,959 |
| 37,448,957 | 71,983,870 | 274,496,768 | 2,008,638 | 14,019,261 | |||||||||||||||
|
|
|
|
|
|
|
|
|
|
|
| |||||||||||
| | 46,066,307 | | 46,105,124 | 61,535,203 | 277,621,529 | 1,983,186 | 14,034,917 | |||||||||||||||
| 97,588,868 | 51,483,744 | 610,275,279 | 332,653,750 | 14,034,917 | — | |||||||||||||||||
|
|
|
|
|
|
|
|
|
|
|
| |||||||||||
| $ | 143,655,175 | $ | 97,588,868 | $ | 671,810,482 | $ | 610,275,279 | $ | 16,018,103 | $ | 14,034,917 | |||||||||||
|
|
|
|
|
|
|
|
|
|
|
| |||||||||||
| 2,050,000 | 1,400,000 | 2,500,000 | 5,750,000 | 150,000 | 400,000 | |||||||||||||||||
| (650,000 | ) | (300,000 | ) | (1,050,000 | ) | (250,000 | ) | (100,000 | ) | (50,000 | ) | |||||||||||
|
|
|
|
|
|
|
|
|
|
|
| |||||||||||
| 1,400,000 | 1,100,000 | 1,450,000 | 5,500,000 | 50,000 | 350,000 | |||||||||||||||||
|
|
|
|
|
|
|
|
|
|
|
| |||||||||||
| $ | (554,214 | ) | $ | (113,125 | ) | $ | 2,035,485 | $ | 1,246,787 | $ | 2,775 | $ | 4,155 | |||||||||
|
|
|
|
|
|
|
|
|
|
|
| |||||||||||
39
Table of Contents
SSGA ACTIVE TRUST
STATEMENTS OF CHANGES IN NET ASSETS (continued)
SPDR DoubleLine | SPDR MFS Systematic Core Equity ETF | |||||||||||
| For the Period 2/23/15* - 6/30/15 | Year Ended 6/30/15 | For the Period 1/8/14* - 6/30/14 | ||||||||||
INCREASE (DECREASE) IN NET ASSETS FROM OPERATIONS: | ||||||||||||
Net investment income (loss) | $ | 4,503,266 | $ | 43,561 | $ | 30,668 | ||||||
Net realized gain (loss) on investments | (1,029,738 | ) | 313,374 | 68,567 | ||||||||
Net change in unrealized appreciation (depreciation) on investments | (6,667,622 | ) | 48,736 | 290,337 | ||||||||
|
|
|
|
|
| |||||||
Net increase (decrease) in net assets resulting from operations | (3,194,094 | ) | 405,671 | 389,572 | ||||||||
|
|
|
|
|
| |||||||
Net equalization credits and charges | 840,772 | (2,028 | ) | — | ||||||||
|
|
|
|
|
| |||||||
DISTRIBUTIONS TO SHAREHOLDERS FROM: | ||||||||||||
Net investment income | (3,317,808 | ) | (43,961 | ) | (29,958 | ) | ||||||
Net realized gain (loss) on investments | — | (72,014 | ) | — | ||||||||
|
|
|
|
|
| |||||||
Total distributions to shareholders | (3,317,808 | ) | (115,975 | ) | (29,958 | ) | ||||||
|
|
|
|
|
| |||||||
FROM BENEFICIAL INTEREST TRANSACTIONS: | ||||||||||||
Proceeds from sale of shares | 752,576,239 | — | 5,000,000 | |||||||||
Cost of shares redeemed | — | (2,723,021 | ) | — | ||||||||
Net income equalization (Note 2) | (840,772 | ) | 2,028 | — | ||||||||
Other capital (Note 4) | 378,777 | — | — | |||||||||
|
|
|
|
|
| |||||||
Net increase (decrease) in net assets from beneficial interest transactions | 752,114,244 | (2,720,993 | ) | 5,000,000 | ||||||||
|
|
|
|
|
| |||||||
Net increase (decrease) in net assets during the period | 746,443,114 | (2,433,325 | ) | 5,359,614 | ||||||||
Net assets at beginning of period | — | 5,359,614 | — | |||||||||
|
|
|
|
|
| |||||||
NET ASSETS END OF PERIOD (1) | $ | 746,443,114 | $ | 2,926,289 | $ | 5,359,614 | ||||||
|
|
|
|
|
| |||||||
SHARES OF BENEFICIAL INTEREST | ||||||||||||
Shares sold | 15,100,000 | — | 100,000 | |||||||||
Shares redeemed | — | (50,000 | ) | — | ||||||||
|
|
|
|
|
| |||||||
Net increase (decrease) in shares | 15,100,000 | (50,000 | ) | 100,000 | ||||||||
|
|
|
|
|
| |||||||
(1) Undistributed (distributions in excess of) net investment income | $ | 645,258 | $ | 310 | $ | 710 | ||||||
|
|
|
|
|
| |||||||
| * | Commencement of operations |
See Notes to Financial Statements and Financial Statements of the Master Portfolios.
40
Table of Contents
| SPDR MFS Systematic Growth Equity ETF | SPDR MFS Systematic Value Equity ETF | SPDR SSGA Risk Aware ETF | ||||||||||||||||
| Year Ended 6/30/15 | For the Period 1/8/14* - 6/30/14 | Year Ended 6/30/15 | For the Period 1/8/14* - 6/30/14 | For the Period 9/9/14* - 6/30/15 | ||||||||||||||
| $ | 41,334 | $ | 28,394 | $ | 40,833 | $ | 34,487 | $ | 21,825 | |||||||||
| 451,772 | 10,974 | 294,126 | 4,237 | (232,419 | ) | |||||||||||||
| 35,700 |
| 343,934 | 41,437 | 262,168 | 10,872 | ||||||||||||
|
|
|
|
|
|
|
|
|
| |||||||||
| 528,806 |
| 383,302 | 376,396 | 300,892 | (199,722 | ) | |||||||||||
|
|
|
|
|
|
|
|
|
| |||||||||
| 30 | — | (1,662 | ) | — | (437 | ) | ||||||||||||
|
|
|
|
|
|
|
|
|
| |||||||||
| (42,194 | ) | (27,427 | ) | (42,508 | ) | (33,808 | ) | (22,860 | ) | |||||||||
| (94,899 | ) | — | (45,876 | ) | — | — | ||||||||||||
|
|
|
|
|
|
|
|
|
| |||||||||
| (137,093 | ) | (27,427 | ) | (88,384 | ) | (33,808 | ) | (22,860 | ) | |||||||||
|
|
|
|
|
|
|
|
|
| |||||||||
| 3,023,489 | 5,000,000 | — | 5,000,000 | 4,000,000 | ||||||||||||||
| (2,746,928 | ) | — | (2,659,898 | ) | — | (1,817,701 | ) | |||||||||||
| (30 | ) | — | 1,662 | — | 437 | |||||||||||||
| — | — | — | — | — | ||||||||||||||
|
|
|
|
|
|
|
|
|
| |||||||||
| 276,531 |
| 5,000,000 | (2,658,236 | ) | 5,000,000 | 2,182,736 | |||||||||||
|
|
|
|
|
|
|
|
|
| |||||||||
| 668,274 | 5,355,875 | (2,371,886 | ) | 5,267,084 | 1,959,717 | |||||||||||||
| 5,355,875 | — | 5,267,084 | — | — | ||||||||||||||
|
|
|
|
|
|
|
|
|
| |||||||||
| $ | 6,024,149 | $ | 5,355,875 | $ | 2,895,198 | $ | 5,267,084 | $ | 1,959,717 | |||||||||
|
|
|
|
|
|
|
|
|
| |||||||||
| 50,000 | 100,000 | — | 100,000 | 100,000 | ||||||||||||||
| (50,000 | ) | — | (50,000 | ) | — | (50,000 | ) | |||||||||||
|
|
|
|
|
|
|
|
|
| |||||||||
| — | 100,000 | (50,000 | ) | 100,000 | 50,000 | |||||||||||||
|
|
|
|
|
|
|
|
|
| |||||||||
$ | 107 |
| $ | 967 | $ | (996 | ) | $ | 679 | $ | (1,035 | ) | ||||||
|
|
|
|
|
|
|
|
|
| |||||||||
41
Table of Contents
SSGA ACTIVE TRUST
Selected data for a share of beneficial interest outstanding throughout each period is presented below (1):
| SPDR SSGA Multi-Asset Real Return ETF | ||||||||||||||||
| Year Ended 6/30/15 | Year Ended 6/30/14 | Year Ended 6/30/13 | For the Period 4/25/12* - 6/30/12 | |||||||||||||
Net asset value, beginning of period | $ | 30.86 | $ | 27.68 | $ | 28.77 | $ | 30.00 | ||||||||
|
|
|
|
|
|
|
| |||||||||
Income (loss) from investment operations: | ||||||||||||||||
Net investment income (loss) (2) | 0.43 | 0.57 | 0.86 | 0.20 | ||||||||||||
Net realized and unrealized gain (loss) on investments (3) | (5.02 | ) | 3.22 | (1.33 | ) | (1.22 | ) | |||||||||
|
|
|
|
|
|
|
| |||||||||
Total from investment operations | (4.59 | ) | 3.79 | (0.47 | ) | (1.02 | ) | |||||||||
|
|
|
|
|
|
|
| |||||||||
Net equalization credits and charges (2) | 0.01 | 0.01 | 0.03 | (0.01 | ) | |||||||||||
|
|
|
|
|
|
|
| |||||||||
Distributions to shareholders from: | ||||||||||||||||
Net investment income | (0.43 | ) | (0.62 | ) | (0.65 | ) | (0.20 | ) | ||||||||
Net realized gains | — | — | — | — | ||||||||||||
|
|
|
|
|
|
|
| |||||||||
Total distributions | (0.43 | ) | (0.62 | ) | (0.65 | ) | (0.20 | ) | ||||||||
|
|
|
|
|
|
|
| |||||||||
Net asset value, end of period | $ | 25.85 | $ | 30.86 | $ | 27.68 | $ | 28.77 | ||||||||
|
|
|
|
|
|
|
| |||||||||
Total Return (4) | (14.84 | )% | 13.85 | % | (1.67 | )% | (3.44 | )% | ||||||||
Ratios and Supplemental Data: | ||||||||||||||||
Net Assets, End of Period (000s) | $ | 140,895 | $ | 163,580 | $ | 120,434 | $ | 5,786 | ||||||||
Ratios to average net assets: | ||||||||||||||||
Total expenses | 0.23 | % | 0.24 | % | 0.25 | % | 0.27 | %(5) | ||||||||
Net operating expenses | 0.23 | % | 0.24 | % | 0.25 | % | 0.27 | %(5) | ||||||||
Net investment income | 1.53 | % | 1.97 | % | 2.86 | % | 3.77 | %(5) | ||||||||
Portfolio turnover rate (6) | 33 | % | 40 | % | 31 | % | 10 | % | ||||||||
| * | Commencement of operations |
| (1) | The per share amounts and percentages include each Fund’s proportionate share of income and expenses of their respective Portfolio. |
| (2) | Per share numbers have been calculated using average shares outstanding, which more appropriately presents the per share data for the period. |
| (3) | Amounts shown in this caption for a share outstanding may not accord with the change in aggregate gains and losses in securities for the fiscal period because of the timing of sales and repurchases of Fund shares in relation to fluctuating market values for the Fund. |
| (4) | Total return is calculated assuming a purchase of shares at net asset value on the first day and a sale at net asset value on the last day of each period reported. Distributions are assumed, for the purpose of this calculation, to be reinvested at net asset value per share on the respective payment dates of each Fund. Total return for periods of less than one year is not annualized. Broker commission charges are not included in this calculation. |
| (5) | Annualized. |
| (6) | Portfolio turnover rate is from each Fund’s respective Portfolio. |
See Notes to Financial Statements and Financial Statements of the Master Portfolios.
42
Table of Contents
| SPDR SSGA Income Allocation ETF | SPDR SSGA Global Allocation ETF | |||||||||||||||||||||||||||||
| Year Ended 6/30/15 | Year Ended 6/30/14 | Year Ended 6/30/13 | For the Period 4/25/12* - 6/30/12 | Year Ended 6/30/15 | Year Ended 6/30/14 | Year Ended 6/30/13 | For the Period 4/25/12* - 6/30/12 | |||||||||||||||||||||||
| $ | 32.70 | $ | 29.90 | $ | 29.85 | $ | 30.00 | $ | 35.47 | $ | 31.18 | $ | 29.19 | $ | 30.00 | |||||||||||||||
|
|
|
|
|
|
|
|
|
|
|
|
|
|
|
| |||||||||||||||
| 0.97 | 1.16 | 1.41 | 0.44 | 0.92 | 0.98 | 1.03 | 0.24 | |||||||||||||||||||||||
| (1.51 | ) | 2.86 | (0.25 | ) | (0.29 | ) | (0.73 | ) | 4.20 | 1.77 | (0.77 | ) | ||||||||||||||||||
|
|
|
|
|
|
|
|
|
|
|
|
|
|
|
| |||||||||||||||
| (0.54 | ) | 4.02 | 1.16 | 0.15 | 0.19 | 5.18 | 2.80 | (0.53 | ) | |||||||||||||||||||||
|
|
|
|
|
|
|
|
|
|
|
|
|
|
|
| |||||||||||||||
| 0.02 | (0.03 | ) | 0.12 | 0.11 | 0.05 | 0.02 | 0.09 | (0.02 | ) | |||||||||||||||||||||
|
|
|
|
|
|
|
|
|
|
|
|
|
|
|
| |||||||||||||||
| (1.02 | ) | (1.19 | ) | (1.23 | ) | (0.41 | ) | (0.91 | ) | (0.91 | ) | (0.90 | ) | (0.26 | ) | |||||||||||||||
| — | — | — | — | (0.19 | ) | — | — | — | ||||||||||||||||||||||
|
|
|
|
|
|
|
|
|
|
|
|
|
|
|
| |||||||||||||||
| (1.02 | ) | (1.19 | ) | (1.23 | ) | (0.41 | ) | (1.10 | ) | (0.91 | ) | (0.90 | ) | (0.26 | ) | |||||||||||||||
|
|
|
|
|
|
|
|
|
|
|
|
|
|
|
| |||||||||||||||
| $ | 31.16 | $ | 32.70 | $ | 29.90 | $ | 29.85 | $ | 34.61 | $ | 35.47 | $ | 31.18 | $ | 29.19 | |||||||||||||||
|
|
|
|
|
|
|
|
|
|
|
|
|
|
|
| |||||||||||||||
| (1.59 | )% | 13.57 | % | 4.22 | % | 0.87 | % | 0.66 | % | 16.81 | % | 9.91 | % | (1.82 | )% | |||||||||||||||
| $ | 120,020 | $ | 103,035 | $ | 171,977 | $ | 8,989 | $ | 143,655 | $ | 97,589 | $ | 51,484 | $ | 4,411 | |||||||||||||||
| 0.35 | % | 0.36 | % | 0.35 | % | 0.36 | %(5) | 0.20 | % | 0.20 | % | 0.20 | % | 0.20 | %(5) | |||||||||||||||
| 0.35 | % | 0.36 | % | 0.35 | % | 0.36 | %(5) | 0.05 | % | 0.05 | % | 0.04 | % | 0.05 | %(5) | |||||||||||||||
| 3.00 | % | 3.73 | % | 4.50 | % | 8.24 | %(5) | 2.60 | % | 2.91 | % | 3.23 | % | 4.48 | %(5) | |||||||||||||||
| 64 | % | 63 | % | 80 | % | 15 | % | 98 | % | 89 | % | 123 | % | 25 | % | |||||||||||||||
43
Table of Contents
SSGA ACTIVE TRUST
FINANCIAL HIGHLIGHTS
Selected data for a share of beneficial interest outstanding throughout each period is presented below (1):
| SPDR Blackstone/GSO Senior Loan ETF | SPDR SSGA Ultra Short Term Bond ETF | |||||||||||||||||||
| Year Ended 6/30/15 | Year Ended 6/30/14 | For the Period 4/3/13* - 6/30/13 | Year Ended 6/30/15 | For the Period 10/9/13* - 6/30/14 | ||||||||||||||||
Net asset value, beginning of period | $ | 50.02 | $ | 49.65 | $ | 50.00 | $ | 40.10 | $ | 40.00 | ||||||||||
|
|
|
|
|
|
|
|
|
| |||||||||||
Income (loss) from investment operations: | ||||||||||||||||||||
Net investment income (loss) (2) | 2.01 | 1.54 | 0.24 | 0.13 | 0.10 | |||||||||||||||
Net realized and unrealized gain (loss) on investments (3) | (0.88 | ) | 0.24 | (0.65 | ) | (0.05 | ) | 0.03 | ||||||||||||
|
|
|
|
|
|
|
|
|
| |||||||||||
Total from investment operations | 1.13 | 1.78 | (0.41 | ) | 0.08 | 0.13 | ||||||||||||||
|
|
|
|
|
|
|
|
|
| |||||||||||
Net equalization credits and charges (2) | 0.01 | 0.03 | 0.06 | 0.00 | (4) | 0.00 | (4) | |||||||||||||
|
|
|
|
|
|
|
|
|
| |||||||||||
Other capital | 0.02 | 0.04 | 0.10 | 0.01 | 0.05 | |||||||||||||||
|
|
|
|
|
|
|
|
|
| |||||||||||
Distributions to shareholders from: | ||||||||||||||||||||
Net investment income | (1.96 | ) | (1.48 | ) | (0.10 | ) | (0.14 | ) | (0.08 | ) | ||||||||||
Net realized gains | — | — | — | — | — | |||||||||||||||
|
|
|
|
|
|
|
|
|
| |||||||||||
Total distributions | (1.96 | ) | (1.48 | ) | (0.10 | ) | (0.14 | ) | (0.08 | ) | ||||||||||
|
|
|
|
|
|
|
|
|
| |||||||||||
Net asset value, end of period | $ | 49.22 | $ | 50.02 | $ | 49.65 | $ | 40.05 | $ | 40.10 | ||||||||||
|
|
|
|
|
|
|
|
|
| |||||||||||
Total Return (5) | 2.38 | % | 3.77 | % | (0.48 | )% | 0.20 | % | 0.46 | % | ||||||||||
Ratios and Supplemental Data: | ||||||||||||||||||||
Net Assets, End of Period (000s) | $ | 671,810 | $ | 610,275 | $ | 332,654 | $ | 16,018 | $ | 14,035 | ||||||||||
Ratios to average net assets: | ||||||||||||||||||||
Total expenses | 0.71 | % | 0.85 | % | 0.90 | %(6) | 0.20 | % | 0.20 | %(6) | ||||||||||
Net operating expenses | 0.71 | % | 0.85 | % | 0.90 | %(6) | 0.20 | % | 0.20 | %(6) | ||||||||||
Net investment income | 4.09 | % | 3.09 | % | 1.97 | %(6) | 0.33 | % | 0.34 | %(6) | ||||||||||
Portfolio turnover rate (7) | 65 | % | 77 | % | 4 | % | 79 | % | 39 | % | ||||||||||
| * | Commencement of operations |
| (1) | The per share amounts and percentages include each Fund’s proportionate share of income and expenses of their respective Portfolio. |
| (2) | Per share numbers have been calculated using average shares outstanding, which more appropriately presents the per share data for the period. |
| (3) | Amounts shown in this caption for a share outstanding may not accord with the change in aggregate gains and losses in securities for the fiscal period because of the timing of sales and repurchases of Fund shares in relation to fluctuating market values for the Fund. |
| (4) | Amount is less that $0.005 per share. |
| (5) | Total return is calculated assuming a purchase of shares at net asset value on the first day and a sale at net asset value on the last day of each period reported. Distributions are assumed, for the purpose of this calculation, to be reinvested at net asset value per share on the respective payment dates of each Fund. Total return for periods of less than one year is not annualized. Broker commission charges are not included in this calculation. |
| (6) | Annualized. |
| (7) | Portfolio turnover rate is from each Fund’s respective Portfolio. |
See Notes to Financial Statements and Financial Statements of the Master Portfolios.
44
Table of Contents
| SPDR DoubleLine Total Return Tactical ETF | SPDR MFS Systematic Core Equity ETF | SPDR MFS Systematic Growth Equity ETF | SPDR MFS Systematic Value Equity ETF | SPDR SSGA Risk Aware ETF | ||||||||||||||||||||||||||
| For the Period 2/23/15* - 6/30/15 | Year Ended 6/30/15 | For the Period 1/8/14* - 6/30/14 | Year Ended 6/30/15 | For the Period 1/8/14* - 6/30/14 | Year Ended 6/30/15 | For the Period 1/8/14* - 6/30/14 | For the Period 9/9/14* - 6/30/15 | |||||||||||||||||||||||
| $ | 50.00 | $ | 53.60 | $ | 50.00 | $ | 53.56 | $ | 50.00 | $ | 52.67 | $ | 50.00 | $ | 40.00 | |||||||||||||||
|
|
|
|
|
|
|
|
|
|
|
|
|
|
|
| |||||||||||||||
| 0.55 | 0.81 | 0.31 | 0.66 | 0.28 | 0.75 | 0.34 | 0.38 | |||||||||||||||||||||||
| (0.88 | ) | 6.48 | 3.59 | 8.60 | 3.55 | 6.28 | 2.67 | (0.77 | ) | ||||||||||||||||||||
|
|
|
|
|
|
|
|
|
|
|
|
|
|
|
| |||||||||||||||
| (0.33 | ) | 7.29 | 3.90 | 9.26 | 3.83 | 7.03 | 3.01 | (0.39 | ) | |||||||||||||||||||||
|
|
|
|
|
|
|
|
|
|
|
|
|
|
|
| |||||||||||||||
| 0.10 | (0.04 | ) | — | 0.00 | (4) | — | (0.03 | ) | — | (0.01 | ) | |||||||||||||||||||
|
|
|
|
|
|
|
|
|
|
|
|
|
|
|
| |||||||||||||||
| 0.05 | — | — | — | — | — | — | — | |||||||||||||||||||||||
|
|
|
|
|
|
|
|
|
|
|
|
|
|
|
| |||||||||||||||
| (0.39 | ) | (0.88 | ) | (0.30 | ) | (0.68 | ) | (0.27 | ) | (0.85 | ) | (0.34 | ) | (0.41 | ) | |||||||||||||||
| — | (1.44 | ) | — | (1.90 | ) | — | (0.92 | ) | — | — | ||||||||||||||||||||
|
|
|
|
|
|
|
|
|
|
|
|
|
|
|
| |||||||||||||||
| (0.39 | ) | (2.32 | ) | (0.30 | ) | (2.58 | ) | (0.27 | ) | (1.77 | ) | (0.34 | ) | (0.41 | ) | |||||||||||||||
|
|
|
|
|
|
|
|
|
|
|
|
|
|
|
| |||||||||||||||
| $ | 49.43 | $ | 58.53 | $ | 53.60 | $ | 60.24 | $ | 53.56 | $ | 57.90 | $ | 52.67 | $ | 39.19 | |||||||||||||||
|
|
|
|
|
|
|
|
|
|
|
|
|
|
|
| |||||||||||||||
| (0.34 | )% | 13.70 | % | 7.81 | % | 17.53 | % | 7.68 | % | 13.47 | % | 6.04 | % | (0.99 | )% | |||||||||||||||
| $ | 746,443 | $ | 2,926 | $ | 5,360 | $ | 6,024 | $ | 5,356 | $ | 2,895 | $ | 5,267 | $ | 1,960 | |||||||||||||||
| 0.65 | %(6) | 0.60 | % | 0.60 | %(6) | 0.60 | % | 0.60 | %(6) | 0.60 | % | 0.60 | %(6) | 0.50 | %(6) | |||||||||||||||
| 0.56 | %(6) | 0.60 | % | 0.60 | %(6) | 0.60 | % | 0.60 | %(6) | 0.60 | % | 0.60 | %(6) | 0.50 | %(6) | |||||||||||||||
| 3.18 | %(6) | 1.42 | % | 1.25 | %(6) | 1.14 | % | 1.16 | %(6) | 1.36 | % | 1.43 | %(6) | 1.21 | %(6) | |||||||||||||||
| 14 | % | 54 | % | 27 | % | 67 | % | 20 | % | 61 | % | 23 | % | 122 | % | |||||||||||||||
45
Table of Contents
SSGA ACTIVE TRUST
June 30, 2015
| 1. | Organization |
SSGA Active Trust (the “Trust”), which is registered under the Investment Company Act of 1940, as amended (“1940 Act”), is an open-end management investment management company that was organized as a Massachusetts business trust on March 30, 2011.
As of June 30, 2015, the Trust offered ten (10) portfolios, each of which represents a separate series of beneficial interest in the Trust (each, a “Fund” and collectively, the “Funds”). The financial statements herein relate to the following ten (10) Funds: SPDR SSGA Multi-Asset Real Return ETF, SPDR SSGA Income Allocation ETF, SPDR SSGA Global Allocation ETF, SPDR Blackstone/GSO Senior Loan ETF, SPDR SSGA Ultra Short Term Bond ETF, SPDR DoubleLine Total Return Tactical ETF, SPDR MFS Systematic Core Equity ETF, SPDR MFS Systematic Growth Equity ETF, SPDR MFS Systematic Value Equity ETF and SPDR SSGA Risk Aware ETF, each a “diversified” investment company, with the exception of SPDR SSGA Ultra Short Term Bond ETF and SPDR SSGA Risk Aware ETF which are each a “non-diversified” investment company.
The SPDR DoubleLine Total Return Tactical ETF commenced operations on February 23, 2015 and the SPDR SSGA Risk Aware ETF commenced operations on September 9, 2014.
Each fund is part of a master-feeder structure and each Fund invests substantially all of its assets in interests of its respective master portfolio; the SSGA Multi-Asset Real Return Portfolio, SSGA Income Allocation Portfolio, SSGA Global Allocation Portfolio, Blackstone/GSO Senior Loan Portfolio, SSGA Ultra Short Term Bond Portfolio, State Street DoubleLine Total Return Tactical Portfolio, SSGA MFS Systematic Core Equity Portfolio, SSGA MFS Systematic Growth Equity Portfolio, SSGA MFS Systematic Value Equity Portfolio and SSGA Risk Aware Portfolio (each a “Portfolio” and collectively, the “Portfolios”). Each Portfolio is a series of a separately registered investment company called SSGA Master Trust (“Master Trust”). The investment objective and policies of each Fund are substantially similar to those of its respective Portfolio. The value of each Fund’s investment in its respective Portfolio reflects the Fund’s proportionate interest in the net assets of that Portfolio (100.00% for SPDR SSGA Multi-Asset Real Return ETF, 100.00% for SPDR SSGA Income Allocation ETF, 100.00% for SPDR SSGA Global Allocation ETF, 100.00% for SPDR Blackstone/GSO Senior Loan ETF, 99.99% for SPDR SSGA Ultra Short Term Bond ETF, 100.00% for SPDR DoubleLine Total Return Tactical ETF, 99.96% for SPDR MFS Systematic Core Equity ETF, 99.98% for SPDR MFS Systematic Growth Equity ETF, 99.96% for SPDR MFS Systematic Value Equity ETF and 99.95% for SPDR SSGA Risk Aware ETF at June 30, 2015). The performance of each Fund is directly affected by the performance of its respective Portfolio. The financial statements of the Portfolios, including their Schedules of Investments, are attached to this report and should be read in conjunction with the Funds’ financial statements.
Under the Trust’s organizational documents, its officers and trustees are indemnified against certain liabilities arising out of the performance of their duties to the Trust. Additionally, in the normal course of business, the Trust enters into contracts with service providers that contain general indemnification clauses. The Trust’s maximum exposure under these arrangements is unknown as this could involve future claims that may be made against the Trust that have not yet occurred. However, based on experience, the Trust expects the risk of loss to be remote.
| 2. | Summary of Significant Accounting Policies |
The following is a summary of significant accounting policies followed by the Trust in the preparation of its financial statements:
The preparation of financial statements in accordance with generally accepted accounting principles in the United States of America (“U.S. GAAP”) requires management to make estimates and assumptions that affect the reported amounts and disclosures in the financial statements. Actual results could differ from those estimates. Each fund is an investment company under U.S. GAAP and follows the accounting and reporting guidance applicable to investment companies in Financial Accounting Standards Board (“FASB”), Accounting Standards Codification (“ASC”) 946, Financial Services Investment Companies (“ASC 946”).
Security Valuation
Each Fund records its investments in its respective Portfolio at fair value each business day. The valuation policies of the Portfolios are discussed in Note 2 of the Portfolios’ Notes to Financial Statements, which are attached to this report.
46
Table of Contents
SSGA ACTIVE TRUST
NOTES TO FINANCIAL STATEMENTS (continued)
June 30, 2015
The Portfolios adopted provisions surrounding fair value measurements and disclosures that define fair value, establish a framework for measuring fair value in generally accepted accounting principles and expand disclosures about fair value measurements. This applies to fair value measurements that are already required or permitted by other accounting standards and is intended to increase consistency of those measurements and applies broadly to securities and other types of assets and liabilities. The summary of the inputs used for each Portfolio, as of June 30, 2015, in valuing each Portfolio’s securities carried at fair value are discussed in Note 2 of the Portfolio’s Notes to Financial Statements, which are attached to this report.
Investment Transactions and Income Recognition
Investment transactions are accounted for on the trade date for financial reporting purposes. Net investment income consists of a Fund’s pro-rata share of the net investment income of its respective Portfolio less expenses of the Fund. Realized gains and losses from security transactions consist of a Fund’s pro-rata share of its respective Portfolio’s realized gains and losses.
Expenses
Advisory fees and other expenses, which are directly identifiable to a specific Fund, are applied to that Fund. Trustees’ fees and other expenses which cannot be attributed to a specific Fund are allocated in such a manner as deemed equitable, taking into consideration the nature and type of expense and the relative net assets of the Funds. Each Fund is allocated a pro-rata share of the expense of its respective Portfolio.
Equalization
The Funds follow the accounting practice known as “Equalization” by which a portion of the proceeds from sales and costs of reacquiring Fund shares, equivalent on a per share basis to the amount of distributable net investment income on the date of the transaction, is credited or charged to undistributed net investment income. As a result, undistributed net investment income per share is unaffected by sales or reacquisition of Fund shares. Amounts related to Equalization can be found on the Statements of Changes in Net Assets.
Federal Income Tax
The Funds have qualified and intend to continue to qualify for and elect treatment as “regulated investment companies” under Subchapter M of the Internal Revenue Code of 1986, as amended. By so qualifying and electing, each Fund will not be subject to federal income taxes to the extent it distributes its taxable income, including any net realized capital gains, for each fiscal year. In addition, by distributing during each calendar year substantially all of their net investment income and capital gains, if any, the Funds will not be subject to federal excise tax. Income and capital gain distributions are determined in accordance with income tax regulations which may differ from U.S. generally accepted accounting principles. These book-tax differences are primarily due to differing treatments for tax equalization, in-kind transactions for financial statement purposes and losses deferred due to wash sales.
Additionally, based on the Funds’ understanding of the tax rules and rates related to income, gains and transactions for the foreign jurisdictions in which the applicable Funds invest, the Funds will provide for foreign taxes and, where appropriate, deferred foreign taxes. The Funds have reviewed the tax positions for the open tax years as of June 30, 2015 and have determined that no provision for income tax is required in the Funds’ Financial Statements.
The Funds’ federal tax returns are subject to examination by the Funds’ major tax jurisdictions, which include the United States of America and the Commonwealth of Massachusetts. The Funds recognized interest and penalties, if any, related to tax liabilities as income tax expense in the Statements of Operations.
47
Table of Contents
SSGA ACTIVE TRUST
NOTES TO FINANCIAL STATEMENTS (continued)
June 30, 2015
For the year ended June 30, 2015, the following Funds reclassified non-taxable security gains and losses realized on the in-kind redemption of Creation Units (Note 4) as an increase or decrease to paid in capital in the Statements of Assets and Liabilities as follows:
| Net Gain (Loss) Reclassified to Paid in Capital | ||||
SPDR SSGA Multi-Asset Real Return ETF | $ | 1,478,858 | ||
SPDR SSGA Income Allocation ETF | 624,291 | |||
SPDR SSGA Global Allocation ETF | 1,910,112 | |||
SPDR Blackstone/GSO Senior Loan ETF | — | |||
SPDR SSGA Ultra Short Term Bond ETF | — | |||
SPDR DoubleLine Total Return Tactical ETF | — | |||
SPDR MFS Systematic Core Equity ETF | 201,601 | |||
SPDR MFS Systematic Growth Equity ETF | 205,141 | |||
SPDR MFS Systematic Value Equity ETF | 151,743 | |||
SPDR SSGA Risk Aware ETF | (101,330 | ) | ||
At June 30, 2015, the Funds had capital loss carryforwards which may be utilized to offset any net short-term realized capital gains. These losses will not expire and are treated as though the losses were incurred on the first day of the next fiscal year:
| Short Term | Long Term | |||||||
SPDR SSGA Multi-Asset Real Return ETF | $ | 8,975,715 | $ | 7,779,421 | ||||
SPDR SSGA Income Allocation ETF | 3,969,091 | — | ||||||
SPDR SSGA Global Allocation ETF | — | — | ||||||
SPDR Blackstone/GSO Senior Loan ETF | 2,214,894 | 1,320,543 | ||||||
SPDR SSGA Ultra Short Term Bond ETF | 3,248 | — | ||||||
SPDR DoubleLine Total Return Tactical ETF | 453,461 | — | ||||||
SPDR MFS Systematic Core Equity ETF | — | — | ||||||
SPDR MFS Systematic Growth Equity ETF | — | — | ||||||
SPDR MFS Systematic Value Equity ETF | — | — | ||||||
SPDR SSGA Risk Aware ETF | 131,089 | — | ||||||
For the year ended June 30, 2015, there were no significant differences between the book basis and the tax basis character of distributions to shareholders other than partnership adjustments.
The tax character of distributions paid during the years ended June 30, 2015 and June 30, 2014 was as follows:
| Distributions Paid in 2015 | Distributions Paid in 2014 | |||||||||||||||
| Ordinary Income | Long-term Capital Gains | Ordinary Income | Long-term Capital Gains | |||||||||||||
SPDR SSGA Multi-Asset Real Return ETF | $ | 2,527,694 | $ | — | $ | 2,582,680 | $ | — | ||||||||
SPDR SSGA Income Allocation ETF | 3,780,064 | — | 3,845,121 | — | ||||||||||||
SPDR SSGA Global Allocation ETF | 3,658,288 | 557,903 | 2,021,720 | — | ||||||||||||
SPDR Blackstone/GSO Senior Loan ETF | 24,171,917 | — | 16,478,270 | — | ||||||||||||
SPDR SSGA Ultra Short Term Bond ETF | 54,048 | — | 28,118 | — | ||||||||||||
SPDR DoubleLine Total Return Tactical ETF | 3,317,808 | — | — | — | ||||||||||||
SPDR MFS Systematic Core Equity ETF | 115,975 | — | 29,958 | — | ||||||||||||
SPDR MFS Systematic Growth Equity ETF | 137,093 | — | 27,427 | — | ||||||||||||
48
Table of Contents
SSGA ACTIVE TRUST
NOTES TO FINANCIAL STATEMENTS (continued)
June 30, 2015
| Distributions Paid in 2015 | Distributions Paid in 2014 | |||||||||||||||
| Ordinary Income | Long-term Capital Gains | Ordinary Income | Long-term Capital Gains | |||||||||||||
SPDR MFS Systematic Value Equity ETF | $ | 88,384 | $ | — | $ | 33,808 | $ | — | ||||||||
SPDR SSGA Risk Aware ETF | 22,860 | — | — | — | ||||||||||||
For the year ended June 30, 2015, there were no significant differences between the book basis and the tax basis of components of net assets other than differences in the net unrealized appreciation (depreciation) in the value of investments attributable to the tax deferral of losses on wash sales, the cumulative return of capital payment, PFICs (Passive Foreign Investment Companies), redemptions in-kind, dividend payables and the deferral of post-October losses.
As of June 30, 2015, the components of distributable earnings on a tax basis were as follows:
| Undistributed Ordinary Income | Undistributed Long-Term Capital Gains | Net Unrealized Appreciation (Depreciation) | ||||||||||
SPDR SSGA Multi-Asset Real Return ETF | $ | 637,225 | $ | — | $ | (11,266,393 | ) | |||||
SPDR SSGA Income Allocation ETF | 770,757 | — | (1,241,343 | ) | ||||||||
SPDR SSGA Global Allocation ETF | 780,028 | 310,384 | 973,267 | |||||||||
SPDR Blackstone/GSO Senior Loan ETF | 2,035,485 | — | (8,997,705 | ) | ||||||||
SPDR SSGA Ultra Short Term Bond ETF | 2,775 | — | (9,796 | ) | ||||||||
SPDR DoubleLine Total Return Tactical ETF | 645,258 | — | (6,703,699 | ) | ||||||||
SPDR MFS Systematic Core Equity ETF | 41,821 | 33,016 | 338,583 | |||||||||
SPDR MFS Systematic Growth Equity ETF | 54,952 | 98,753 | 379,634 | |||||||||
SPDR MFS Systematic Value Equity ETF | 83,463 | 11,927 | 303,285 | |||||||||
SPDR SSGA Risk Aware ETF Equity ETF | 4,453 | — | 10,872 | |||||||||
Distributions
Each Fund declares and distributes dividends from net investment income, if any, to its shareholders quarterly (monthly for SPDR Blackstone/GSO Senior Loan ETF and SPDR SSGA Ultra Short Term Bond ETF). Each Fund declares and distributes net realized capital gains, if any, at least annually. Distributions are recorded on the ex-dividend date. Income and capital gain distributions are determined in accordance with income tax regulations, which may differ from U.S. GAAP.
| 3. | Fees and Compensation Paid to Affiliates and Other Related Party Transactions |
Advisory Fee
Each Fund has entered into an Investment Advisory Agreement with SSGA Funds Management, Inc. (the “Adviser” or “SSGA FM”). As compensation for the services rendered, facilities furnished, and expenses borne by the Adviser, each Fund pays the Adviser a fee accrued daily and paid monthly, based on a percentage of each Fund’s average daily net assets as shown in the following table:
| Annual Rate* | ||||
SPDR SSGA Multi-Asset Real Return ETF | 0.70 | % | ||
SPDR SSGA Income Allocation ETF | 0.70 | % | ||
SPDR SSGA Global Allocation ETF | 0.35 | % | ||
SPDR Blackstone/GSO Senior Loan ETF | 0.70 | % | ||
SPDR SSGA Ultra Short Term Bond ETF | 0.20 | % | ||
SPDR DoubleLine Total Return Tactical ETF | 0.65 | %** | ||
SPDR MFS Systematic Core Equity ETF | 0.60 | % | ||
49
Table of Contents
SSGA ACTIVE TRUST
NOTES TO FINANCIAL STATEMENTS (continued)
June 30, 2015
| Annual Rate* | ||||
SPDR MFS Systematic Growth Equity ETF | 0.60 | % | ||
SPDR MFS Systematic Value Equity ETF | 0.60 | % | ||
SPDR SSGA Risk Aware ETF | 0.50 | % | ||
| * | The Advisory fee is reduced by the proportional amount of the advisory fee, as well as for SPDR SSGA Multi-Asset Real Return ETF, SPDR SSGA Income Allocation ETF and SPDR SSGA Global Allocation ETF acquired fund fees and expenses of each Fund’s respective Portfolio. For the year ended June 30, 2015, the net annualized advisory fee was 0.03%, 0.15%, (0.16)%, 0.40%, 0.00%, 0.25%, 0.30%, 0.30%, 0.30%, and 0.25% for the SPDR SSGA Multi-Asset Real Return ETF, SPDR SSGA Income Allocation ETF, SPDR SSGA Global Allocation ETF, SPDR Blackstone/GSO Senior Loan ETF, SPDR SSGA Ultra Short Term Bond ETF, SPDR DoubleLine Total Return Tactical ETF, SPDR MFS Systematic Core Equity ETF, SPDR MFS Systematic Growth Equity ETF, SPDR MFS Systematic Value Equity ETF and SPDR SSGA Risk Aware ETF, respectively. For the SPDR SSGA Global Allocation ETF, the reduction resulted in a fee reimbursement which is identified on the Statement of Operations. |
| ** | The Adviser has contractually agreed to limit its management fee to the extent necessary to limit annual operating expenses to 0.55% until October 31, 2016 for the SPDR DoubleLine Total Return Tactical ETF. |
The Adviser pays all operating expenses of each Fund other than management fee, distribution fee pursuant to each Fund’s Distribution and Service Plan, if any, brokerage, taxes, interest, fees and expenses of the Independent Trustees (including any Trustees’ counsel fees), litigation expenses, and other extraordinary expenses.
Effective June 1, 2015, SSGA FM serves as Administrator and State Street Bank and Trust Company (“State Street”) serves as sub-administrator. State Street, an affiliate of the Adviser, receives fees for its services as Custodian, Sub-Administrator and Transfer Agent from the Adviser. Prior to June 1, 2015, State Street served as Administrator.
State Street Global Markets, LLC (the “Distributor”), an affiliate of the Adviser, serves as the distributor of the shares of each Fund. Pursuant to a Distribution and Service Plan adopted in accordance with Rule 12b-1 under the 1940 Act, each Fund is authorized to pay an amount of up to 0.25% of its average daily net assets for certain distribution-related activities. However, the Board of Trustees has determined that no such payments will be made through at least October 31, 2015 and therefore no such payments have been made.
The Distributor has established an assisted trading program to aid Authorized Participants in certain creation and redemption activity for which the Distributor receives commissions from Authorized Participants. In addition, the Distributor receives compensation from State Street associated with on-line creation and redemption activity of Authorized Participants.
Trustees’ Fees
The Trust, SSGA Master Trust, SPDR Series Trust and SPDR Index Shares Funds pay (together with the Trust, the “Trusts”), in the aggregate, each Independent Trustee an annual fee of $185,000 plus $10,000 per in-person meeting attended and $1,250 for each telephonic or video conference meeting attended. The Chairman of the Board receives an additional annual fee of $50,000 and the Chairman of the Audit Committee receives an additional annual fee of $20,000. The Trust also reimburses each Independent Trustee for travel and other out-of-pocket expenses incurred by him/her in connection with attending such meetings and in connection with attending industry seminars and meetings. Trustee fees are allocated among the Trusts and each of their respective series in such a manner as deemed equitable, taking into consideration the relative net assets of the series.
| 4. | Shareholder Transactions |
Shares are issued and redeemed by a Fund only in Creation Unit size aggregations of 50,000 shares. Such transactions are generally permitted on an in-kind basis, with a separate cash payment, which is a balancing cash component to equate the transaction to the net asset value per unit of the Fund on the transaction date. Transaction fees ranging from of $50 to $1,350 per Creation Unit for each Fund, regardless of the number of Creation Units that are created or redeemed on the same day, are charged to those persons creating or redeeming Creation Units. An additional variable fee may be charged for certain transactions. Transaction fees are received by the Trust and/or Custodian and are used to defray related expenses. The Custodian also receives amounts earned on cash collateral provided by Authorized Participants pending delivery of missing deposit securities. The amounts are included in Other Capital on the Statements of Changes in Net Assets.
50
Table of Contents
SSGA ACTIVE TRUST
NOTES TO FINANCIAL STATEMENTS (continued)
June 30, 2015
| 5. | Subsequent Events |
Management has evaluated the impact of all subsequent events on the Funds through the date the financial statements were available to be issued and has determined that there were no subsequent events requiring adjustment or disclosure in the financial statements.
51
Table of Contents
SSGA ACTIVE TRUST
REPORT OF INDEPENDENT REGISTERED PUBLIC ACCOUNTING FIRM
To the Shareholders and Board of Trustees of
SSGA Active Trust
We have audited the accompanying statements of assets and liabilities of SPDR SSGA Multi-Asset Real Return ETF, SPDR SSGA Income Allocation ETF, SPDR SSGA Global Allocation ETF, SPDR Blackstone/GSO Senior Loan ETF, SPDR SSGA Ultra Short Term Bond ETF, SPDR DoubleLine Total Return Tactical ETF, SPDR MFS Systematic Core Equity ETF, SPDR MFS Systematic Growth Equity ETF, SPDR MFS Systematic Value Equity ETF and SPDR SSGA Risk Aware ETF (collectively, the “Funds”) (ten of the funds constituting SSGA Active Trust) as of June 30, 2015, and the related statements of operations, statements of changes in net assets and the financial highlights for each of the periods indicated therein. These financial statements and financial highlights are the responsibility of the Funds’ management. Our responsibility is to express an opinion on these financial statements and financial highlights based on our audits.
We conducted our audits in accordance with the standards of the Public Company Accounting Oversight Board (United States). Those standards require that we plan and perform the audit to obtain reasonable assurance about whether the financial statements and financial highlights are free of material misstatement. We were not engaged to perform an audit of the Funds’ internal control over financial reporting. Our audits included consideration of internal control over financial reporting as a basis for designing audit procedures that are appropriate in the circumstances, but not for the purpose of expressing an opinion on the effectiveness of the Funds’ internal control over financial reporting. Accordingly, we express no such opinion. An audit also includes examining, on a test basis, evidence supporting the amounts and disclosures in the financial statements and financial highlights, assessing the accounting principles used and significant estimates made by management, and evaluating the overall financial statement presentation. We believe that our audits provide a reasonable basis for our opinion.
In our opinion, the financial statements and financial highlights referred to above present fairly, in all material respects, the financial position of each of the above mentioned Funds of SSGA Active Trust at June 30, 2015, and the results of their operations, the changes in their net assets, and the financial highlights for each of the periods indicated therein, in conformity with U.S. generally accepted accounting principles.

Boston, Massachusetts
August 31, 2015
52
Table of Contents
SSGA ACTIVE TRUST
June 30, 2015 (Unaudited)
Shareholder Expense Example
As a shareholder of a Fund, you incur two types of costs: (1) transaction costs, which may include creation and redemption fees or brokerage charges and (2) ongoing costs, including management fees, trustee fees, and other Fund expenses. The following examples are intended to help you understand your ongoing costs (in dollars) of investing in a Fund and to compare these costs with the ongoing costs of investing in other funds. It is based on an investment of $1,000 invested on January 1, 2015 and held for the six months ended June 30, 2015.
Actual Expenses
The first table below provides information about actual account values and actual expenses. You may use the information in this table, together with the amount you invested, to estimate the expenses that you incurred over the period. Simply divide your account value by $1,000 (for example, an $8,600 account value divided by $1,000 = 8.6), then multiply the result by the number in the first table under the heading entitled “Expenses Paid During Period” to estimate the expenses attributable to your investment during this period.
Hypothetical Example for Comparison Purposes
The second table below provides information about hypothetical account values and hypothetical expenses based on a Fund’s actual expense ratio and an assumed rate of return of 5% per year before expenses, which is not a Fund’s actual return. Thus, you should not use the hypothetical account values and expenses to estimate the actual ending account balance or your expenses for the period. Rather, these figures are provided to enable you to compare the ongoing costs of investing in a Fund and other funds. To do so, compare this 5% hypothetical example with the 5% hypothetical examples that appear in the shareholder reports of the other funds. The Funds charge transaction fees at scheduled amounts ranging from $50 to $1,350 per Creation Unit to those persons creating or redeeming Creation Units. If you buy or sell the Funds’ shares in the secondary market, you will incur customary brokerage commissions and charges.
Please note that the expenses shown in the table are meant to highlight your ongoing costs only and do not reflect any transaction costs, such as creation and redemption fees, or brokerage charges. Therefore, the second table is useful in comparing ongoing costs only, and will not help you determine the relative total costs of owning different funds. In addition, if these transaction costs were included, your costs would have been higher.
Actual | Annualized Expense Ratio | Beginning Account Value 1/1/15 | Ending Account Value 6/30/15 | Expenses Paid During Period* 1/1/15 to 6/30/15 | ||||||||||||
SPDR SSGA Multi-Asset Real Return ETF | 0.23 | % | $ | 1,000 | $ | 977.80 | $ | 1.13 | ||||||||
SPDR SSGA Income Allocation ETF | 0.35 | 1,000 | 984.00 | 1.72 | ||||||||||||
SPDR SSGA Global Allocation ETF | 0.05 | 1,000 | 1,010.80 | 0.25 | ||||||||||||
SPDR Blackstone/GSO Senior Loan ETF | 0.71 | 1,000 | 1,029.40 | 3.57 | ||||||||||||
SPDR SSGA Ultra Short Term Bond ETF | 0.20 | 1,000 | 1,002.00 | 0.99 | ||||||||||||
SPDR DoubleLine Total Return Tactical ETF** | 0.56 | 1,000 | 996.60 | 1.95 | ||||||||||||
SPDR MFS Systematic Core Equity ETF | 0.60 | 1,000 | 1,036.70 | 3.03 | ||||||||||||
SPDR MFS Systematic Growth Equity ETF | 0.60 | 1,000 | 1,055.40 | 3.06 | ||||||||||||
SPDR MFS Systematic Value Equity ETF | 0.60 | 1,000 | 1,053.40 | 3.05 | ||||||||||||
SPDR SSGA Risk Aware ETF | 0.50 | 1,000 | 1,004.00 | 2.48 | ||||||||||||
Hypothetical | ||||||||||||||||
SPDR SSGA Multi-Asset Real Return ETF | 0.23 | 1,000 | 1,023.66 | 1.15 | ||||||||||||
SPDR SSGA Income Allocation ETF | 0.35 | 1,000 | 1,023.11 | 1.76 | ||||||||||||
SPDR SSGA Global Allocation ETF | 0.05 | 1,000 | 1,024.65 | 0.25 | ||||||||||||
SPDR Blackstone/GSO Senior Loan ETF | 0.71 | 1,000 | 1,021.33 | 3.56 | ||||||||||||
53
Table of Contents
SSGA ACTIVE TRUST
OTHER INFORMATION (continued)
June 30, 2015 (Unaudited)
Hypothetical | Annualized Expense Ratio | Beginning Account Value 1/1/15 | Ending Account Value 6/30/15 | Expenses Paid During Period* 1/1/15 to 6/30/15 | ||||||||||||
SPDR SSGA Ultra Short Term Bond ETF | 0.20 | % | $ | 1,000 | $ | 1,023.81 | $ | 1.00 | ||||||||
SPDR DoubleLine Total Return Tactical ETF** | 0.56 | 1,000 | 1,022.07 | 2.81 | ||||||||||||
SPDR MFS Systematic Core Equity ETF | 0.60 | 1,000 | 1,021.82 | 3.01 | ||||||||||||
SPDR MFS Systematic Growth Equity ETF | 0.60 | 1,000 | 1,021.82 | 3.01 | ||||||||||||
SPDR MFS Systematic Value Equity ETF | 0.60 | 1,000 | 1,021.82 | 3.01 | ||||||||||||
SPDR SSGA Risk Aware ETF | 0.50 | 1,000 | 1,022.32 | 2.51 | ||||||||||||
| * | Expenses are equal to the Fund’s annualized net expense ratio multiplied by the average account value of the period, multiplied by the number of days in the most recent six month period, then divided by 365. |
| ** | Actual period is from commencement of operations 2/23/15. Hypothetical period is from 1/1/15. |
Premium/Discount Information
Information regarding how often the Shares of each Fund traded on the Exchange at a price above (i.e. at a premium) or below (i.e. at a discount) the net asset value of the Fund for the past calendar year can be found on the Funds’ website at www.spdrs.com.
Tax Information
For federal income tax purposes, the following information is furnished with respect to the distributions of the Trust for its fiscal year ended June 30, 2015.
Qualified Dividend Income
A portion of dividends distributed by the Funds during the fiscal year ended June 30, 2015, are considered qualified dividend income, and are eligible for reduced tax rates. These lower rates range from 5% to 20% depending on the individual’s tax bracket. These amounts are noted below:
| Amount | ||||
SPDR SSGA Multi-Asset Real Return ETF | $ | 1,345,127 | ||
SPDR SSGA Income Allocation ETF | 1,028,515 | |||
SPDR SSGA Global Allocation ETF | 1,280,291 | |||
SPDR Blackstone/GSO Senior Loan ETF | — | |||
SPDR SSGA Ultra Short Term Bond ETF | — | |||
SPDR DoubleLine Total Return Tactical ETF | — | |||
SPDR MFS Systematic Core Equity ETF | 53,885 | |||
SPDR MFS Systematic Growth Equity ETF | 52,852 | |||
SPDR MFS Systematic Value Equity ETF | 48,893 | |||
SPDR SSGA Risk Aware ETF | 22,860 | |||
Qualified Interest Income
The Funds designated a portion of dividends distributed during the fiscal year ended June 30, 2015, as qualified interest income. These amounts are noted below:
| Amount | ||||
SPDR SSGA Multi-Asset Real Return ETF | $ | 126,539 | ||
SPDR SSGA Income Allocation ETF | 1,400,655 | |||
SPDR SSGA Global Allocation ETF | — | |||
54
Table of Contents
SSGA ACTIVE TRUST
OTHER INFORMATION (continued)
June 30, 2015 (Unaudited)
| Amount | ||||
SPDR Blackstone/GSO Senior Loan ETF | $ | 3,102,973 | ||
SPDR SSGA Ultra Short Term Bond ETF | 64,022 | |||
SPDR DoubleLine Total Return Tactical ETF | 3,317,808 | |||
SPDR MFS Systematic Core Equity ETF | — | |||
SPDR MFS Systematic Growth Equity ETF | — | |||
SPDR MFS Systematic Value Equity ETF | — | |||
SPDR SSGA Risk Aware ETF | — | |||
Long term capital gains dividends were paid from the following Funds during the year ended June 30, 2015:
| Amount | ||||
SPDR SSGA Global Allocation ETF | $ | 1,114,629 | ||
SPDR MFS Systematic Core Equity ETF | 45,581 | |||
SPDR MFS Systematic Growth Equity ETF | 25,621 | |||
SPDR MFS Systematic Value Equity ETF | 16,397 | |||
Short term capital gains dividends were paid from the following Funds during the year ended June 30, 2015:
| Amount | ||||
SPDR SSGA Income Allocation ETF | $ | — | ||
SPDR MFS Systematic Core Equity ETF | 72,014 | |||
The Funds designate the following amount of ordinary income distributions paid during the fiscal year ended June 30, 2015 for qualified short term capital gains:
| Amount | ||||
SPDR SSGA Multi-Asset Real Return ETF | $ | — | ||
SPDR SSGA Income Allocation ETF | — | |||
SPDR SSGA Global Allocation ETF | 155,134 | |||
SPDR Blackstone/GSO Senior Loan ETF | — | |||
SPDR SSGA Ultra Short Term Bond ETF | 715 | |||
SPDR DoubleLine Total Return Tactical ETF | — | |||
SPDR MFS Systematic Core Equity ETF | 72,014 | |||
SPDR MFS Systematic Growth Equity ETF | 94,899 | |||
SPDR MFS Systematic Value Equity ETF | 45,876 | |||
SPDR SSGA Risk Aware ETF | — | |||
At June 30, 2015 the Funds had foreign source income. These amounts are noted below:
| Amount | ||||
SPDR SSGA Multi-Asset Real Return ETF | $ | 1,713,303 | ||
SPDR SSGA Income Allocation ETF | 802,689 | |||
SPDR SSGA Global Allocation ETF | 876,164 | |||
SPDR Blackstone/GSO Senior Loan ETF | — | |||
SPDR SSGA Ultra Short Term Bond ETF | — | |||
SPDR DoubleLine Total Return Tactical ETF | — | |||
SPDR MFS Systematic Core Equity ETF | — | |||
SPDR MFS Systematic Growth Equity ETF | — | |||
SPDR MFS Systematic Value Equity ETF | — | |||
SPDR SSGA Risk Aware ETF | — | |||
55
Table of Contents
SSGA ACTIVE TRUST
OTHER INFORMATION (continued)
June 30, 2015 (Unaudited)
Foreign Tax Credit
The Trust has made an election under Internal Revenue Code Section 853 to pass through foreign taxes paid by a Fund to its shareholders. For the year ended June 30, 2015, the total amount of foreign taxes that will be passed through are:
| Amount | ||||
SPDR SSGA Multi-Asset Real Return ETF | $ | 99,734 | ||
SPDR SSGA Income Allocation ETF | 66,089 | |||
SPDR SSGA Global Allocation ETF | 52,692 | |||
SPDR Blackstone/GSO Senior Loan ETF | — | |||
SPDR SSGA Ultra Short Term Bond ETF | — | |||
SPDR DoubleLine Total Return Tactical ETF | — | |||
SPDR MFS Systematic Core Equity ETF | — | |||
SPDR MFS Systematic Growth Equity ETF | — | |||
SPDR MFS Systematic Value Equity ETF | — | |||
SPDR SSGA Risk Aware ETF | — | |||
Percentage of distributions which qualify for the corporate dividends received deduction:
| Percentage | ||||
SPDR SSGA Multi-Asset Real Return ETF | 19.88 | % | ||
SPDR SSGA Income Allocation ETF | 12.91 | |||
SPDR SSGA Global Allocation ETF | 18.10 | |||
SPDR Blackstone/GSO Senior Loan ETF | — | |||
SPDR SSGA Ultra Short Term Bond ETF | — | |||
SPDR DoubleLine Total Return Tactical ETF | — | |||
SPDR MFS Systematic Core Equity ETF | 48.62 | |||
SPDR MFS Systematic Growth Equity ETF | 41.17 | |||
SPDR MFS Systematic Value Equity ETF | 46.63 | |||
SPDR SSGA Risk Aware ETF | 100.00 | |||
56
Table of Contents
SSGA ACTIVE TRUST
OTHER INFORMATION (continued)
June 30, 2015 (Unaudited)
Proxy Voting Policies and Procedures and Records
A description of the Trust’s proxy voting policies and procedures that are used by the Funds’ investment adviser to vote proxies relating to the Funds’ portfolio of securities are available (i) without charge, upon request by calling 1-866-787-2257 (toll free) or (ii) on the website of the U.S. Securities and Exchange Commission, at www.sec.gov. Information regarding how the investment advisor voted for the prior 12-months period ended June 30 is available by August 31 of each year by calling the same number and on the SEC’s website, at www.sec.gov, and on the Funds’ website at www.spdrs.com.
Quarterly Portfolio Schedule
The Funds file a complete schedule of investments with the SEC for the first and third quarters of each fiscal year on Form N-Q. The Fund’s Forms N-Q are available on the SEC’s website at www.sec.gov and may be reviewed and copied at the SEC’s Public Reference Room in Washington DC. Information on the operation of the Public Reference Room may be obtained by calling 1-800-SEC-0330. The information on the Form N-Q is available upon request, without charge, by calling 1-866-787-2257 (toll free) and on the Funds’ website at www.spdrs.com.
Approval of Advisory Agreements
At in-person meetings held prior to June 30, 2015, the Board of Trustees of the Trusts (the “Board”) evaluated proposals (1) to continue the separate Investment Advisory Agreements (the “Agreements”) between each Trust and SSGA Funds Management, Inc. (the “Adviser” or “SSGA FM”) with respect to the operational series of SSGA Active Trust (the “Current ETFs”) and SSGA Master Trust (together with the Current ETFs, the “Current Funds”), and (2) to approve the separate Agreements between the Adviser and (a) the SSGA Active Trust with respect to the SPDR DoubleLine Total Return Tactical ETF (the “New ETF” and, together with the Current ETFs, the “ETFs”), a new series of the SSGA Active Trust, and (b) SSGA Master Trust with respect to the New ETF’s corresponding master fund, the State Street DoubleLine Total Return Tactical Portfolio (together with the New ETF, the “New Funds”) (with the Current Funds and New Funds collectively being referred to hereafter as the “Funds”), each of which commenced operations during the period covered by this Annual Report. The Trustees who are not “interested persons” of the Trust within the meaning of the Investment Company Act of 1940, as amended (the “Independent Trustees”) also met separately with their independent legal counsel to consider the Agreements.
In evaluating the Agreements, the Board drew on materials provided to them by SSGA FM, the Trust’s investment adviser and administrator, and other materials provided by State Street Bank and Trust Company, the Trusts’ sub-administrator, transfer agent and custodian (“State Street”). In deciding whether to approve the Agreements, the Board considered various factors, including the (i) nature, extent and quality of services provided by, or expected to be provided by, the Adviser with respect to the Funds under the Agreements, (ii) investment performance of the Current Funds, (iii) profits realized by the Adviser and its affiliates from its relationship with the Trusts, (iv) fees charged to comparable funds, (v) other benefits to the Adviser, and (vi) extent to which economies of scale would be shared as the Funds grow.
Nature, Extent and Quality of Services
The Board considered the nature, extent and quality of services provided by, or expected to be provided by, the Adviser. In doing so, the Trustees relied on their prior experience in overseeing the management of the Trusts and materials provided prior to and at the meeting. The Board reviewed the Agreements and the Adviser’s responsibilities for managing investment operations of each of the Funds in accordance with each Fund’s investment objectives and policies, and applicable legal and regulatory requirements. The Board appreciated the relatively unique nature of the ETFs as exchange-traded funds in a master-feeder structure and the experience and expertise of the Adviser with exchange-traded funds. The Board considered the background and experience of the Adviser’s senior management, including those individuals responsible for portfolio management, oversight of sub-advisers and regulatory compliance of the Funds. The Board also considered the portfolio management and oversight resources, structures and practices of the Adviser, including those associated with monitoring and securing each Fund’s compliance with its investment objectives and policies and with applicable laws and regulations. The Board also considered information about the Adviser’s best execution procedures and overall investment management business, noting that the Adviser serves a wide range of clients across a broad spectrum of asset classes. The Board looked at the Adviser’s general knowledge of the
57
Table of Contents
SSGA ACTIVE TRUST
OTHER INFORMATION (continued)
June 30, 2015 (Unaudited)
investment business and that of its affiliates which make up State Street Global Advisors, through which the Adviser shares all of its senior personnel. The Board considered that the Adviser and its affiliates constitute one of the world’s largest investment management enterprises for exchange-traded funds. The Board also considered the Adviser’s experience in active management, managing exchange-traded funds in master-feeder structures and overseeing third-party sub-advisers, as applicable.
Investment Performance
The Board then reviewed the Current Funds’ performance. The Board compared each Current Fund’s investment performance to the performance of an appropriate benchmark and universe of comparable funds, noting that the performance of each Current Fund was satisfactory.
Profits Realized by Adviser
The Board considered the profitability of the advisory arrangement with the Funds to the Adviser, including data on the Current Funds’ historical profitability to the Adviser. The Independent Trustees, through their counsel, had the opportunity to discuss, with representatives of the Adviser and State Street, methodologies used in computing costs that formed the bases of profitability calculations and determined that these methodologies were reasonable.
Fees Charged to Comparable Funds
The Board evaluated the Funds’ unitary fee through review of comparative information with respect to fees paid by similar funds – i.e., exchange-traded funds that are actively managed, as applicable. The Board reviewed the universe of similar exchange-traded funds for the ETFs based upon data independently obtained from Lipper Analytical Services and related comparative information for similar exchange-traded funds. The Board also reviewed the fee structure of the Funds in connection with the master-feeder structure, the historical expense ratios of the Current Funds and the estimated expense ratios for the New Funds. In doing so, the Board used a fund by fund analysis of the data.
Other Benefits
The Board considered whether the Adviser or its affiliates benefited in other ways from its relationship with the Trusts, noting that the Adviser does not maintain soft-dollar arrangements in connection with the Trusts’ brokerage transactions.
Economies of Scale
The Board reviewed information regarding economies of scale or other efficiencies that may result as each Fund’s assets grow in size. The Board noted that the Agreements did not provide for breakpoints in each Fund’s advisory fee rates as assets of a Fund increase. However, the Board further noted the Adviser’s assertion that future economies of scale (among several factors) had been taken into consideration for the Funds by fixing relatively low advisory fees, effectively sharing the benefits of lower fees with the Funds from inception. The Adviser also asserted that one of the benefits of the unitary fee was to provide an unvarying expense structure, which could be lost or diluted with the addition of breakpoints. The Board noted that it intends to continue to monitor fees as the Funds grow in size and assess whether fee breakpoints may be warranted.
The Board, including the Independent Trustees voting separately, approved the Agreements for each Fund after weighing the foregoing factors, none of which was dispositive in itself and may have been weighed differently by each Trustee. The Board’s conclusions with respect to each Agreement were as follows: (a) the nature and extent of the services provided, or expected to be provided, by the Adviser with respect to the Funds were appropriate; (b) the performance of each Current Fund had been satisfactory; (c) the Adviser’s unitary fee for each Fund, considered in relation to services provided or expected to be provided, and in relation to fees charged to comparable funds, was fair and reasonable; (d) profitability of the Trusts’ relationship with the Adviser was not excessive; (e) any additional potential benefits to the Adviser or its affiliates were not of a magnitude to materially affect the Board’s conclusions; and (f) fees paid to the Adviser shared economies of scale with respect to the Current Funds by way of the relatively low fee structure of the Trusts.
58
Table of Contents
SSGA ACTIVE TRUST
OTHER INFORMATION (continued)
June 30, 2015 (Unaudited)
Approval of GSO / Blackstone Debt Funds Management LLC Sub-Advisory Agreements
At an in-person meeting held prior to June 30, 2015, the Board also evaluated proposals to continue the separate Sub-Advisory Agreements (the “GSO / Blackstone Sub-Advisory Agreements”) between the Adviser and GSO / Blackstone Debt Funds Management LLC (“GSO / Blackstone”) with respect to the SPDR Blackstone / GSO Senior Loan ETF, a series of the SSGA Active Trust, and Blackstone / GSO Senior Loan Portfolio, a series of the SSGA Master Trust, each sub-advised by GSO / Blackstone (the “GSO / Blackstone Funds”). The Trustees who are not “interested persons” of the Trusts within the meaning of the Investment Company Act of 1940, as amended (the “Independent Trustees”) also met separately with their independent legal counsel to consider the GSO / Blackstone Sub-Advisory Agreements.
In evaluating the GSO / Blackstone Sub-Advisory Agreements, the Board drew on materials provided to them by GSO / Blackstone and the Adviser. In deciding whether to approve the GSO / Blackstone Sub-Advisory Agreements, the Board considered various factors, including the (i) nature, extent and quality of services provided by GSO / Blackstone with respect to the GSO / Blackstone Funds under the GSO / Blackstone Sub-Advisory Agreements and (ii) investment performance of the GSO / Blackstone Funds. The Board was apprised of the portion of the current advisory fee that the Adviser would pay to GSO / Blackstone under the GSO / Blackstone Sub-Advisory Agreements and also considered that such fees would be paid directly by the Adviser and would not result in increased fees payable by the GSO / Blackstone Funds.
The Board considered the background and experience of GSO / Blackstone’s senior management and, in particular, GSO / Blackstone’s experience in investing in senior loan securities. The Board reviewed the GSO / Blackstone Funds’ performance, noting that that the performance of the GSO / Blackstone Funds was satisfactory. The Board also considered the unitary fee paid to the Adviser by each GSO / Blackstone Fund and GSO / Blackstone’s fees paid by the Adviser.
The Board, including the Independent Trustees voting separately, approved the GSO / Blackstone Sub-Advisory Agreements for each GSO / Blackstone Fund after weighing the foregoing factors, none of which was dispositive in itself and may have been weighed differently by each Trustee. The Board’s conclusions with respect to each GSO / Blackstone Sub-Advisory Agreement were as follows: (a) the nature and extent of the services provided by GSO / Blackstone with respect to the GSO / Blackstone Funds were appropriate; (b) the performance of the GSO / Blackstone Funds had been satisfactory; (c) GSO / Blackstone’s fees for the GSO / Blackstone Funds and the unitary fee, considered in relation to the services provided, were fair and reasonable; (d) any additional potential benefits to GSO / Blackstone were not of a magnitude to materially affect the Board’s conclusions; and (e) fees paid to GSO / Blackstone adequately shared the economies of scale with each applicable GSO / Blackstone Fund by way of the relatively low fee structure of the Trusts.
Approval of Massachusetts Financial Services Company Sub-Advisory Agreements
At an in-person meeting held prior to June 30, 2015, the Board also evaluated proposals to continue the separate Sub-Advisory Agreements (the “MFS Sub-Advisory Agreements”) between the Adviser and Massachusetts Financial Services Company (“MFS”) with respect to the SPDR MFS Systematic Core Equity ETF, SPDR MFS Systematic Growth Equity ETF and SPDR MFS Systematic Value Equity ETF, each a series of the SSGA Active Trust, and SSGA MFS Systematic Core Equity Portfolio, SSGA Systematic Growth Equity Portfolio and SSGA MFS Systematic Value Equity Portfolio, each a series of the SSGA Master Trust, each sub-advised by MFS (the “MFS Funds”). The Trustees who are not “interested persons” of the Trusts within the meaning of the Investment Company Act of 1940, as amended (the “Independent Trustees”) also met separately with their independent legal counsel to consider the MFS Sub-Advisory Agreements.
In evaluating the MFS Sub-Advisory Agreements, the Board drew on materials provided to them by MFS and the Adviser. In deciding whether to approve the MFS Sub-Advisory Agreements, the Board considered various factors, including the (i) nature, extent and quality of services provided by MFS with respect to the MFS Funds under the MFS Sub-Advisory Agreements and (ii) investment performance of the MFS Funds. The Board was apprised of the portion of the current advisory fee that the Adviser would pay to MFS under the MFS Sub-Advisory Agreements and also considered that such fees would be paid directly by the Adviser and would not result in increased fees payable by the MFS Funds.
The Board considered the background and experience of MFS’s senior management and, in particular, MFS’s experience in investing in equity securities. The Board reviewed the MFS Funds’ performance, noting that that the performance of the MFS Funds was satisfactory. The Board also considered the unitary fee paid to the Adviser by each MFS Fund and MFS’s fees paid by the Adviser.
59
Table of Contents
SSGA ACTIVE TRUST
OTHER INFORMATION (continued)
June 30, 2015
The Board, including the Independent Trustees voting separately, approved the MFS Sub-Advisory Agreements for each MFS Fund after weighing the foregoing factors, none of which was dispositive in itself and may have been weighed differently by each Trustee. The Board’s conclusions with respect to each MFS Sub-Advisory Agreement were as follows: (a) the nature and extent of the services provided by MFS with respect to the MFS Funds were appropriate; (b) the performance of the MFS Funds had been satisfactory; (c) MFS’s fees for the MFS Funds and the unitary fee, considered in relation to the services provided, were fair and reasonable; (d) any additional potential benefits to MFS were not of a magnitude to materially affect the Board’s conclusions; and (e) fees paid to MFS adequately shared the economies of scale with each applicable MFS Fund by way of the relatively low fee structure of the Trusts.
Approval of DoubleLine Capital LP Sub-Advisory Agreements
At an in-person meeting held prior to June 30, 2015, the Board also considered the approval of separate Sub-Advisory Agreements (the “DoubleLine Sub-Advisory Agreements”) between the Adviser and DoubleLine Capital LP (“DoubleLine”) with respect to the SPDR DoubleLine Total Return Tactical ETF, a series of the SSGA Active Trust, and State Street DoubleLine Total Return Tactical Portfolio, a series of the SSGA Master Trust (together with the SPDR DoubleLine Total Return Tactical ETF, the “DoubleLine Funds”), under which each of the DoubleLine Funds would be sub-advised by DoubleLine. The Trustees who are not “interested persons” of the Trusts within the meaning of the Investment Company Act of 1940, as amended (the “Independent Trustees”) also met separately with their independent legal counsel to consider the DoubleLine Sub-Advisory Agreements.
In evaluating the DoubleLine Sub-Advisory Agreements, the Board drew on materials provided to them by DoubleLine and the Adviser. In deciding whether to approve the DoubleLine Sub-Advisory Agreements, the Board considered various factors, including the (i) nature, extent and quality of services expected to be provided by DoubleLine with respect to the DoubleLine Funds under the DoubleLine Sub-Advisory Agreements; and (ii) investment performance of other actively managed mandates managed by DoubleLine. The Board was apprised of the portion of the advisory fee that the Adviser would pay to DoubleLine under the DoubleLine Sub-Advisory Agreements and also considered that such fees would be paid directly by the Adviser and would not result in increased fees payable by the DoubleLine Funds.
The Board considered the background and experience of DoubleLine’s senior management and in particular DoubleLine’s experience in investing in fixed income securities. The Board noted that DoubleLine would bring significant actively managed fixed income experience to bear in managing the DoubleLine Funds. The Board noted that DoubleLine has extensive experience in managing fixed income securities and reviewed DoubleLine’s assets under management in similar portfolios of securities.
The Board, including the Independent Trustees voting separately, approved the DoubleLine Sub-Advisory Agreements for the DoubleLine Funds after weighing the foregoing factors, none of which was dispositive in itself and may have been weighed differently by each Trustee. The Board’s conclusions with respect to each of the DoubleLine Sub-Advisory Agreements were as follows: (a) the nature and extent of the services expected to be provided by DoubleLine with respect to the DoubleLine Funds were adequate and appropriate; and (b) DoubleLine’s experience in managing fixed income securities is extensive; (c) DoubleLine’s fees for the DoubleLine Funds and the unitary fee, considered in relation to the services expected to be provided, were fair and reasonable; (d) any additional potential benefits to DoubleLine were not of a magnitude to materially affect the Board’s conclusions; and (e) fees expected to be paid to DoubleLine were expected to share economies of scale with each applicable DoubleLine Fund by way of the relatively low fee structure of the Trusts.
60
Table of Contents
SSGA ACTIVE TRUST
OTHER INFORMATION (continued)
June 30, 2015
TRUSTEES AND OFFICERS OF THE TRUST
Name, Address and Year of Birth | Position(s) with funds | Term of Office and Length of Time Served | Principal Occupation(s) During Past 5 Years | Number of Portfolios In Fund Complex Overseen By Trustee | Other Directorships Held By Trustee | |||||||
Independent Trustees | ||||||||||||
FRANK NESVET | Independent Trustee, Chairman, Trustee Committee Chair | Term: Unlimited Served: since March 2011 | Chief Executive Officer, Libra Group, Inc. (a financial services consulting company) (1998-present). | 192 | SPDR Index Shares Funds (Trustee); SPDR Series Trust (Trustee); SSGA Master Trust (Trustee). | |||||||
DAVID M. KELLY | Independent Trustee, Audit Committee Chair | Term: Unlimited Served: since March 2011 | Retired. | 192 | Chicago Stock Exchange (Former Director, retired); Penson Worldwide Inc. (Former Director, retired); SPDR Index Shares Funds (Trustee); SPDR Series Trust (Trustee); SSGA Master Trust (Trustee). | |||||||
BONNY EUGENIA BOATMAN c/o SSGA Active Trust | Independent Trustee | Term: Unlimited Served: since March 2011 | Retired. | 192 | SPDR Index Shares Funds (Trustee); SPDR Series Trust (Trustee); SSGA Master Trust (Trustee). | |||||||
DWIGHT D. CHURCHILL | Independent Trustee | Term: Unlimited Served: since March 2011 | Self-employed consultant since 2010; CEO and President, CFA Institute (June 2014-January 2015). | 192 | SPDR Index Shares Funds (Trustee); SPDR Series Trust (Trustee); SSGA Master Trust (Trustee); Affiliated Managers Group, Inc. (Director). | |||||||
CARL G. VERBONCOEUR | Independent Trustee | Term: Unlimited Served: since March 2011 | Self-employed consultant since 2009. | 192 | The Motley Fool Funds Trust (Trustee); SPDR Index Shares Funds (Trustee); SPDR Series Trust (Trustee); SSGA Master Trust (Trustee). | |||||||
61
Table of Contents
SSGA ACTIVE TRUST
OTHER INFORMATION (continued)
June 30, 2015
Name, Address and Year of Birth | Position(s) with funds | Term of Office and Length of Time Served | Principal Occupation(s) During Past 5 Years | Number of Portfolios In Fund Complex Overseen By Trustee | Other Directorships Held By Trustee | |||||||
INTERESTED TRUSTEE | ||||||||||||
JAMES E. ROSS* | Interested Trustee | Term: Unlimited Served as Trustee: since March 2011 | Chairman and Director, SSGA Funds Management, Inc. (2005-present); Senior Managing Director and Principal, State Street Global Advisors (2006-present); President, SSGA Funds Management, Inc. (2005-2012). | 256 | SPDR Index Shares Funds (Trustee); SPDR Series Trust (Trustee); SSGA Master Trust (Trustee); Select Sector SPDR Trust (Trustee); State Street Master Funds (Trustee); and State Street Institutional Investment Trust (Trustee). | |||||||
| * | Mr. Ross is an Interested Trustee because of his employment with the Adviser and ownership interest in an affiliate of the Adviser. |
OFFICERS
Name, Address and Year of Birth | Position(s) with Funds | Term of Office and Length of Time Served | Principal Occupation(s) During Past 5 Years | |||
ELLEN M. NEEDHAM | President | Term: Unlimited Served: since October 2012 | President and Director, SSGA Funds Management, Inc. (June 2012-present); Chief Operating Officer, SSGA Funds Management, Inc. (May 2010-June 2012); Senior Managing Director, SSGA Funds Management, Inc. (1992-2012)*; Senior Managing Director, State Street Global Advisors (1992-present).* | |||
ANN M. CARPENTER | Vice President; Assistant Treasurer | Term: Unlimited Served: since August 2012; Term: Unlimited Served: since April 2015 | Chief Operating Officer, SSGA Funds Management, Inc. (April 2014-present); Vice President, State Street Global Advisors and SSGA Funds Management, Inc. (2005-present).* | |||
MICHAEL P. RILEY | Vice President | Term: Unlimited Served: since March 2011 | Vice President, State Street Global Advisors and SSGA Funds Management, Inc. (2008-present); Principal, State Street Global Advisors and SSGA Funds Management, Inc. (2005-2008). | |||
JOSHUA A. WEINBERG | Chief Legal Officer | Term: Unlimited Served: since February 2015 | Vice President and Managing Counsel, State Street Global Advisors (2011 – present); Clerk, SSGA Funds Management, Inc. (2013 – present); Associate, Financial Services Group, Dechert LLP (2006 – 2011). |
62
Table of Contents
SSGA ACTIVE TRUST
OTHER INFORMATION (continued)
June 30, 2015
Name, Address and Year of Birth | Position(s) with Funds | Term of Office and Length of Time Served | Principal Occupation(s) During Past 5 Years | |||
CHRISTOPHER A. MADDEN | Secretary | Term: Unlimited Served: since August 2013 | Vice President and Senior Counsel, State Street Bank and Trust Company (2013-present); Counsel, Atlantic Fund Services (2009-2013); Vice President, Citigroup Fund Services, LLC (2005-2009).* | |||
PATRICIA A. MORISETTE | Assistant Secretary | Term: Unlimited Served: since February 2015 | Vice President and Counsel, State Street Bank and Trust Company (2014-present); Assistant Vice President and Counsel, John Hancock Financial Services (2011-2013); Independent legal consultant (2009-2011); Associate, Bingham McCutchen LLP (2003-2009).*,** | |||
CHAD C. HALLETT | Treasurer | Term: Unlimited Served: since March 2011 | Vice President, State Street Global Advisors and SSGA Funds Management, Inc. (November 2014 – present); Vice President, State Street Bank and Trust Company (2001-November 2014).* | |||
BRIAN HARRIS | Chief Compliance Officer | Term: Unlimited Served: since November 2013 | Vice President, State Street Global Advisors and SSGA Funds Management, Inc. (2013-Present); Senior Vice President and Global Head of Investment Compliance, BofA Global Capital Management (2010-2013); Director of Compliance, AARP Financial Inc. (2008-2010). |
| * | Served in various capacities and/or with various affiliated entities during noted time period. |
| ** | Served in various capacities and/or with unaffiliated mutual funds or closed-end funds for which State Street Bank and Trust Company or its affiliates act as a provider of services during the noted time period. |
63
Table of Contents
The SPDR® Family of Exchange Traded Funds
The following is a list of SPDR ETFs being offered, along with their respective exchange trading symbols. Please call 1-866-787-2257 to obtain a prospectus for any SPDR ETF. The prospectus contains more complete information, including charges, expenses, investment objectives and risk factors that should be carefully considered to determine if the Fund(s) are an appropriate investment for you. Read the prospectus(es) carefully before investing. Investing involves risk, including possible loss of principal.
SPDR Series Trust
SPDR Russell 3000® ETF (THRK)
SPDR Russell 1000® ETF (ONEK)
SPDR Russell 2000® ETF (TWOK)
SPDR S&P 500 Buyback ETF (SPYB)
SPDR S&P 500 Growth ETF (SPYG)
SPDR S&P 500 Value ETF (SPYV)
SPDR Russell Small Cap Completeness ETF (RSCO)
SPDR S&P 400 Mid Cap Growth ETF (MDYG)
SPDR S&P 400 Mid Cap Value ETF (MDYV)
SPDR S&P 600 Small Cap ETF (SLY)
SPDR S&P 600 Small Cap Growth ETF (SLYG)
SPDR S&P 600 Small Cap Value ETF (SLYV)
SPDR Global Dow ETF (DGT)
SPDR Dow Jones REIT ETF (RWR)
SPDR S&P Bank ETF (KBE)
SPDR S&P Capital Markets ETF (KCE)
SPDR S&P Insurance ETF (KIE)
SPDR S&P Regional Banking ETF (KRE)
SPDR Morgan Stanley Technology ETF (MTK)
SPDR S&P Dividend ETF (SDY)
SPDR S&P Aerospace & Defense ETF (XAR)
SPDR S&P Biotech ETF (XBI)
SPDR S&P Health Care Equipment ETF (XHE)
SPDR S&P Health Care Services ETF (XHS)
SPDR S&P Homebuilders ETF (XHB)
SPDR S&P Metals & Mining ETF (XME)
SPDR S&P Oil & Gas Equipment & Services ETF (XES)
SPDR S&P Oil & Gas Exploration & Production ETF (XOP)
SPDR S&P Pharmaceuticals ETF (XPH)
SPDR S&P Retail ETF (XRT)
SPDR S&P Semiconductor ETF (XSD)
SPDR S&P Software & Services ETF (XSW)
SPDR S&P Telecom ETF (XTL)
SPDR S&P Transportation ETF (XTN)
SPDR S&P 1500 Value Tilt ETF (VLU)
SPDR S&P 1500 Momentum Tilt ETF (MMTM)
SPDR Russell 1000 Low Volatility ETF (LGLV)
SPDR Russell 2000 Low Volatility ETF (SMLV)
SPDR MSCI USA Quality Mix ETF (QUS)
SPDR Wells Fargo Preferred Stock ETF (PSK)
SPDR Barclays 1-3 Month T-Bill ETF (BIL)
SPDR Barclays TIPS ETF (IPE)
SPDR Barclays 0-5 Year TIPS ETF (SIPE)
SPDR Barclays 1-10 Year TIPS ETF (TIPX)
SPDR Barclays Short Term Treasury ETF (SST)
SPDR Barclays Intermediate Term Treasury ETF (ITE)
SPDR Barclays Long Term Treasury ETF (TLO)
SPDR Barclays Short Term Corporate Bond ETF (SCPB)
SPDR Barclays Intermediate Term Corporate Bond ETF (ITR)
SPDR Barclays Long Term Corporate Bond ETF (LWC)
SPDR Barclays Issuer Scored Corporate Bond ETF (CBND)
Table of Contents
SPDR Barclays Convertible Securities ETF (CWB)
SPDR Barclays Mortgage Backed Bond ETF (MBG)
SPDR Barclays Aggregate Bond ETF (LAG)
SPDR Nuveen Barclays Municipal Bond ETF (TFI)
SPDR Nuveen Barclays California Municipal Bond ETF (CXA)
SPDR Nuveen Barclays New York Municipal Bond ETF (INY)
SPDR Nuveen Barclays Short Term Municipal Bond ETF (SHM)
SPDR Nuveen S&P High Yield Municipal Bond ETF (HYMB)
SPDR Nuveen Barclays Build America Bond ETF (BABS)
SPDR DB International Government Inflation-Protected Bond ETF (WIP)
SPDR Barclays Short Term International Treasury Bond ETF (BWZ)
SPDR Barclays International Treasury Bond ETF (BWX)
SPDR Barclays International Corporate Bond ETF (IBND)
SPDR Barclays Emerging Markets Local Bond ETF (EBND)
SPDR Barclays International High Yield Bond ETF (IJNK)
SPDR Barclays High Yield Bond ETF (JNK)
SPDR Barclays Short Term High Yield Bond ETF (SJNK)
SPDR Barclays Investment Grade Floating Rate ETF (FLRN)
SPDR BofA Merrill Lynch Emerging Markets Corporate Bond ETF (EMCD)
SPDR BofA Merrill Lynch Crossover Corporate Bond ETF (CJNK)
SPDR Index Shares Funds
SPDR STOXX Europe 50 ETF (FEU)
SPDR EURO STOXX 50 ETF (FEZ)
SPDR EURO STOXX Small Cap ETF (SMEZ)
SPDR EURO STOXX 50 Currency Hedged ETF (HFEZ)
SPDR S&P Emerging Asia Pacific ETF (GMF)
SPDR S&P Russia ETF (RBL)
SPDR S&P China ETF (GXC)
SPDR S&P Emerging Markets ETF (GMM)
SPDR S&P Emerging Markets Dividend ETF (EDIV)
SPDR S&P BRIC 40 ETF (BIK)
SPDR S&P Emerging Europe ETF (GUR)
SPDR S&P Emerging Latin America ETF (GML)
SPDR S&P Emerging Middle East & Africa ETF (GAF)
SPDR S&P World ex-US ETF (GWL)
SPDR S&P International Small Cap ETF (GWX)
SPDR Dow Jones International Real Estate ETF (RWX)
SPDR S&P Global Infrastructure ETF (GII)
SPDR S&P Global Natural Resources ETF (GNR)
SPDR MSCI ACWI ex-US ETF (CWI)
SPDR MSCI ACWI IMI ETF (ACIM)
SPDR MSCI ACWI Low Carbon Target ETF (LOWC)
SPDR MSCI EM 50 ETF (EMFT)
SPDR MSCI EM Beyond BRIC ETF (EMBB)
SPDR MSCI EAFE Quality Mix ETF (QEFA)
SPDR MSCI Emerging Markets Quality Mix ETF (QEMM)
SPDR MSCI World Quality Mix ETF (QWLD)
SPDR MSCI Australia Quality Mix ETF (QAUS)
SPDR MSCI Canada Quality Mix ETF (QCAN)
SPDR MSCI Germany Quality Mix ETF (QDEU)
SPDR MSCI Japan Quality Mix ETF (QJPN)
SPDR MSCI Mexico Quality Mix ETF (QMEX)
SPDR MSCI South Korea Quality Mix ETF (QKOR)
SPDR MSCI Spain Quality Mix ETF (QESP)
SPDR MSCI Taiwan Quality Mix ETF (QTWN)
SPDR MSCI United Kingdom Quality Mix ETF (QGBR)
SPDR Russell/Nomura PRIME™ Japan ETF (JPP)
SPDR Russell/Nomura Small Cap™ Japan ETF (JSC)
SPDR S&P Global Dividend ETF (WDIV)
Table of Contents
SPDR S&P International Dividend ETF (DWX)
SPDR S&P International Mid Cap ETF (MDD)
SPDR S&P Emerging Markets Small Cap ETF (EWX)
SPDR Dow Jones Global Real Estate ETF (RWO)
SPDR S&P International Consumer Discretionary Sector ETF (IPD)
SPDR S&P International Consumer Staples Sector ETF (IPS)
SPDR S&P International Energy Sector ETF (IPW)
SPDR S&P International Financial Sector ETF (IPF)
SPDR S&P International Health Care Sector ETF (IRY)
SPDR S&P International Industrial Sector ETF (IPN)
SPDR S&P International Materials Sector ETF (IRV)
SPDR S&P International Technology Sector ETF (IPK)
SPDR S&P International Telecommunications Sector ETF (IST)
SPDR S&P International Utilities Sector ETF (IPU)
The Select Sector SPDR Trust
The Consumer Discretionary Select Sector SPDR Fund (XLY)
The Consumer Staples Select Sector SPDR Fund (XLP)
The Energy Select Sector SPDR Fund (XLE)
The Financial Select Sector SPDR Fund (XLF)
The Health Care Select Sector SPDR Fund (XLV)
The Industrial Select Sector SPDR Fund (XLI)
The Materials Select Sector SPDR Fund (XLB)
The Technology Select Sector SPDR Fund (XLK)
The Utilities Select Sector SPDR Fund (XLU)
SSGA Active Trust
SPDR SSGA Multi-Asset Real Return ETF (RLY)
SPDR SSGA Income Allocation ETF (INKM)
SPDR SSGA Global Allocation ETF (GAL)
SPDR Blackstone/GSO Senior Loan ETF (SRLN)
SPDR SSGA Ultra Short Term Bond ETF (ULST)
SPDR DoubleLine Total Return Tactical ETF (TOTL)
State Street Clarion Global Infrastructure & MLP Portfolio (SSIDX)
SPDR MFS Systematic Core Equity ETF (SYE)
SPDR MFS Systematic Growth Equity ETF (SYG)
SPDR MFS Systematic Value Equity ETF (SYV)
SPDR SSGA Risk Aware ETF (RORO)
SPDR Dow Jones Industrial Average ETF Trust (DIA)
SPDR S&P 500 ETF Trust (SPY)
State Street Global Markets, LLC, member FINRA, SIPC, is distributor for all investment portfolios of SPDR Series Trust, SPDR Index Shares Funds, and SSGA Active Trust. ALPS Distributors, Inc., a registered broker-dealer, is distributor for SPDR S&P 500 ETF Trust (SPY) and SPDR Dow Jones Industrial Average ETF Trust (DIA), both unit investment trusts, and ALPS Portfolio Solutions Distributors, Inc. is the distributor for all investment portfolios of The Select Sector SPDR Trust. ALPS Distributors, Inc. and ALPS Portfolio Solutions Distributor, Inc. are not affiliated with State Street Global Markets, LLC.
Table of Contents
SSGA Active Trust
Trustees
Bonny E. Boatman
Dwight D. Churchill
David M. Kelly
Frank Nesvet, Chairman
James E. Ross
Carl G. Verboncoeur
Officers
Ellen M. Needham, President
Ann Carpenter, Vice President and Assistant Treasurer
Michael P. Riley, Vice President
Chad C. Hallett, Treasurer
Christopher A. Madden, Secretary
Patricia A. Morisette, Assistant Secretary
Brian Harris, Chief Compliance Officer
Joshua A. Weinberg, Chief Legal Officer
Investment Manager and Administrator
SSGA Funds Management, Inc.
State Street Financial Center
One Lincoln Street
Boston, MA 02111
Distributor
State Street Global Markets, LLC
One Lincoln Street
Boston, MA 02111
Custodian, Sub-Administrator and Transfer Agent
State Street Bank and Trust Company
One Lincoln Street
Boston, MA 02111
Legal Counsel
Morgan, Lewis & Bockius LLP
2020 K Street, NW
Washington, DC 20006
Independent Registered Public Accounting Firm
Ernst & Young LLP
200 Clarendon Street
Boston, MA 02116
Fund Shares are distributed by State Street Global Markets, LLC, a wholly-owned subsidiary of State Street Corporation. State Street Global Markets, LLC; member FINRA, SIPC.
The information contained in this report is intended for the general information of shareholders of the Trust. This report is not authorized for distribution to prospective investors unless preceded or accompanied by a current Trust prospectus which contains important information concerning the Trust. You may obtain a current prospectus and SAI from the Distributor by calling 1-866-787-2257 or visiting www.spdrs.com Please read the prospectus carefully before you invest.
Table of Contents
SSGA Master Trust
Annual Report June 30, 2015
Table of Contents
| 1 | ||||
| 2 | ||||
| 3 | ||||
| 4 | ||||
| 5 | ||||
| 6 | ||||
| 7 | ||||
| 8 | ||||
| 9 | ||||
| 10 | ||||
| 11 | ||||
| 12 | ||||
| 13 | ||||
| 14 | ||||
| 20 | ||||
| 22 | ||||
| 30 | ||||
| 31 | ||||
| 33 | ||||
| 34 | ||||
| 36 | ||||
| 44 | ||||
| 50 | ||||
| 59 | ||||
| 60 |
Table of Contents
SSGA MULTI-ASSET REAL RETURN PORTFOLIO
PORTFOLIO SUMMARY
TOP FIVE HOLDINGS AS OF JUNE 30, 2015
| DESCRIPTION | SPDR S&P GLOBAL NATURAL RESOURCES ETF | POWERSHARES DB | SPDR BARCLAYS TIPS ETF | SPDR DOW JONES REIT ETF | SPDR DOW JONES INTERNATIONAL REAL ESTATE ETF | |||||||||
| MARKET VALUE | $39,483,520 | 26,344,008 | 22,321,147 | 13,345,286 | 12,000,886 | |||||||||
| % OF NET ASSETS | 27.8 | 18.6 | 15.7 | 9.4 | 8.5 | |||||||||
(The five largest holdings are subject to change, and there are no guarantees the Portfolio will continue to remain invested in any particular Fund.)
ASSET ALLOCATION AS OF JUNE 30, 2015*
PERCENT OF NET ASSETS | ||||||||
Natural Resources | 37.9 | % | ||||||
Inflation Linked | 20.3 | |||||||
Commodities | 18.6 | |||||||
Real Estate | 17.8 | |||||||
Short Term Investments | 4.7 | |||||||
Other Assets & Liabilities | 0.7 | |||||||
TOTAL | 100.0 | % | ||||||
| * | The Portfolio’s asset allocation is expressed as a percentage of net assets and may change over time. |
1
Table of Contents
SSGA INCOME ALLOCATION PORTFOLIO
PORTFOLIO SUMMARY
TOP FIVE HOLDINGS AS OF JUNE 30, 2015
| DESCRIPTION | SPDR BARCLAYS | SPDR BARCLAYS LONG TERM CORPORATE BOND ETF | SPDR BARCLAYS | SPDR DOW JONES REIT ETF | WISDOMTREE | |||||||||
| MARKET VALUE | $20,028,371 | 17,006,197 | 8,556,943 | 8,318,855 | 7,159,037 | |||||||||
| % OF NET ASSETS | 16.5 | 14.0 | 7.1 | 6.9 | 5.9 | |||||||||
(The five largest holdings are subject to change, and there are no guarantees the Portfolio will continue to remain invested in any particular Fund.)
ASSET ALLOCATION AS OF JUNE 30, 2015*
PERCENT OF NET ASSETS | ||||||||
Domestic Fixed Income | 44.6 | % | ||||||
International Equity | 22.5 | |||||||
Domestic Equity | 15.0 | |||||||
Real Estate | 10.9 | |||||||
International Fixed Income | 3.0 | |||||||
Short Term Investments | 2.3 | |||||||
Inflation Linked | 1.5 | |||||||
Other Assets & Liabilities | 0.2 | |||||||
TOTAL | 100.0 | % | ||||||
| * | The Portfolio’s asset allocation is expressed as a percentage of net assets and may change over time. |
2
Table of Contents
SSGA GLOBAL ALLOCATION PORTFOLIO
PORTFOLIO SUMMARY
TOP FIVE HOLDINGS AS OF JUNE 30, 2015
| DESCRIPTION | SPDR BARCLAYS HIGH YIELD BOND ETF | SPDR S&P | SPDR S&P 500 | SPDR BARCLAYS LONG TERM CORPORATE BOND ETF | WISDOMTREE | |||||||||
| MARKET VALUE | $23,038,516 | 22,075,634 | 12,987,076 | 11,596,510 | 10,670,431 | |||||||||
| % OF NET ASSETS | 15.9 | 15.2 | 9.0 | 8.0 | 7.4 | |||||||||
(The five largest holdings are subject to change, and there are no guarantees the Portfolio will continue to remain invested in any particular Fund.)
ASSET ALLOCATION AS OF JUNE 30, 2015*
PERCENT OF NET ASSETS | ||||||||
International Equity | 33.5 | % | ||||||
Domestic Fixed Income | 30.0 | |||||||
Domestic Equity | 15.0 | |||||||
Real Estate | 8.9 | |||||||
Inflation Linked | 2.0 | |||||||
Short Term Investments | 10.4 | |||||||
Other Assets & Liabilities | 0.2 | |||||||
TOTAL | 100.0 | % | ||||||
| * | The Portfolio’s asset allocation is expressed as a percentage of net assets and may change over time. |
3
Table of Contents
BLACKSTONE/GSO SENIOR LOAN PORTFOLIO
PORTFOLIO SUMMARY
TOP FIVE HOLDINGS AS OF JUNE 30, 2015
| DESCRIPTION | AVAYA, INC. | SCIENTIFIC GAMES | DELL, INC. | H.J. HEINZ CO. | FIRST DATA CORP. | |||||||||
| MARKET VALUE | $13,445,201 | 12,886,192 | 11,961,085 | 11,809,175 | 10,965,388 | |||||||||
| % OF NET ASSETS | 2.0 | 1.9 | 1.8 | 1.8 | 1.6 | |||||||||
(The five largest holdings are subject to change, and there are no guarantees the Portfolio will continue to remain invested in any particular Fund.)
INDUSTRY BREAKDOWN AS OF JUNE 30, 2015*
PERCENT OF NET ASSETS | ||||||||
Software | 11.2 | % | ||||||
Hotels, Restaurants & Leisure | 7.6 | |||||||
Media | 6.6 | |||||||
Specialty Retail | 4.5 | |||||||
Commercial Services & Supplies | 3.7 | |||||||
Health Care Providers & Services | 3.6 | |||||||
Pharmaceuticals | 3.5 | |||||||
Wireless Telecommunication Services | 3.5 | |||||||
Food & Staples Retailing | 3.3 | |||||||
Machinery | 3.1 | |||||||
Food Products | 3.0 | |||||||
Metals & Mining | 3.0 | |||||||
IT Services | 2.9 | |||||||
Oil, Gas & Consumable Fuels | 2.9 | |||||||
Health Care Equipment & Supplies | 2.7 | |||||||
Chemicals | 2.6 | |||||||
Containers & Packaging | 2.6 | |||||||
Multiline Retail | 2.4 | |||||||
Insurance | 2.1 | |||||||
Technology Hardware, Storage & Peripherals | 2.1 | |||||||
Internet Software & Services | 1.9 | |||||||
Semiconductors & Semiconductor Equipment | 1.7 | |||||||
Diversified Consumer Services | 1.6 | |||||||
Energy Equipment & Services | 1.6 | |||||||
Personal Products | 1.6 | |||||||
PERCENT OF NET ASSETS | ||||||||
Real Estate Management & Development | 1.6 | % | ||||||
Diversified Financial Services | 1.5 | |||||||
Electronic Equipment, Instruments & Components | 1.4 | |||||||
Independent Power & Renewable Electricity Producers | 1.4 | |||||||
Communications Equipment | 1.2 | |||||||
Electric Utilities | 1.2 | |||||||
Life Sciences Tools & Services | 1.2 | |||||||
Professional Services | 1.2 | |||||||
Airlines | 1.1 | |||||||
Auto Components | 0.7 | |||||||
Health Care Technology | 0.7 | |||||||
Automobiles | 0.6 | |||||||
Diversified Telecommunication Services | 0.6 | |||||||
Household Durables | 0.6 | |||||||
Marine | 0.6 | |||||||
Distributors | 0.4 | |||||||
Internet & Catalog Retail | 0.4 | |||||||
Multi-utilities | 0.4 | |||||||
Leisure Products | 0.3 | |||||||
Short Term Investments | 1.8 | |||||||
Other Assets & Liabilities | (4.2 | ) | ||||||
TOTAL | 100.0 | % | ||||||
| * | The Portfolio’s industry breakdown is expressed as a percentage of net assets and may change over time. |
4
Table of Contents
SSGA ULTRA SHORT TERM BOND PORTFOLIO
PORTFOLIO SUMMARY
TOP FIVE HOLDINGS AS OF JUNE 30, 2015
| DESCRIPTION | TREASURY | GOLDEN CREDIT | TREASURY | MERCEDES-BENZ | DIAGEO | |||||||||
| MARKET VALUE | $623,148 | 583,450 | 553,180 | 500,136 | 492,069 | |||||||||
| % OF NET ASSETS | 3.9 | 3.6 | 3.5 | 3.1 | 3.1 | |||||||||
(The five largest holdings are subject to change, and there are no guarantees the Portfolio will continue to remain invested in any particular Fund.)
INDUSTRY BREAKDOWN AS OF JUNE 30, 2015*
PERCENT OF NET ASSETS | ||||||||
Banks | 23.3 | % | ||||||
Automobiles | 21.2 | |||||||
U.S. Treasury Obligations | 10.5 | |||||||
Credit Card Receivables | 8.9 | |||||||
Diversified Financial Services | 8.4 | |||||||
Beverages | 6.1 | |||||||
Oil, Gas & Consumable Fuels | 5.3 | |||||||
Consumer Finance | 2.5 | |||||||
Media | 2.2 | |||||||
Aerospace & Defense | 1.6 | |||||||
Communications Equipment | 1.6 | |||||||
Chemicals | 1.3 | |||||||
Metals & Mining | 1.2 | |||||||
Student Loan ABS | 1.1 | |||||||
Internet Software & Services | 1.0 | |||||||
Road & Rail | 0.7 | |||||||
Short Term Investments | 3.0 | |||||||
Other Assets & Liabilities | 0.1 | |||||||
TOTAL | 100.0 | % | ||||||
| * | The Portfolio’s industry breakdown is expressed as a percentage of net assets and may change over time. |
5
Table of Contents
STATE STREET DOUBLELINE TOTAL RETURN TACTICAL PORTFOLIO
PORTFOLIO SUMMARY
TOP FIVE HOLDINGS AS OF JUNE 30, 2015
| DESCRIPTION | FREDDIE MAC REMICS 3.00%, 6/15/44 | FREDDIE MAC GOLD POOL 3.00%, 4/1/45 | FREDDIE MAC GOLD POOL 3.50%, 4/1/45 | FANNIE MAE POOL 3.00%, 4/1/45 | FREDDIE MAC | |||||||||
| MARKET VALUE | $20,187,500 | 19,738,964 | 18,399,830 | 17,635,878 | 14,942,502 | |||||||||
| % OF NET ASSETS | 2.7 | 2.6 | 2.0 | 2.4 | 1.6 | |||||||||
(The five largest holdings are subject to change, and there are no guarantees the Portfolio will continue to remain invested in any particular Fund.)
INDUSTRY BREAKDOWN AS OF JUNE 30, 2015*
PERCENT OF NET ASSETS | ||||||||
U.S. Government Agency Obligations | 35.0 | % | ||||||
Commercial Mortgage Backed Securities | 18.9 | |||||||
U.S. Treasury Obligations | 4.7 | |||||||
Banks | 3.2 | |||||||
Oil, Gas & Consumable Fuels | 2.2 | |||||||
Diversified Financial Services | 2.1 | |||||||
Media | 1.7 | |||||||
Hotels, Restaurants & Leisure | 1.7 | |||||||
Electric Utilities | 1.6 | |||||||
Food Products | 1.3 | |||||||
Software | 1.1 | |||||||
Chemicals | 1.1 | |||||||
Specialty Retail | 1.0 | |||||||
Sovereign | 0.9 | |||||||
Health Care Providers & Services | 0.9 | |||||||
Machinery | 0.7 | |||||||
Telecommunications | 0.7 | |||||||
Metals & Mining | 0.7 | |||||||
Containers & Packaging | 0.6 | |||||||
Trading Companies & Distributors | 0.6 | |||||||
Commercial Services & Supplies | 0.5 | |||||||
Insurance | 0.5 | |||||||
Auto Components | 0.5 | |||||||
Airlines | 0.4 | |||||||
Diversified Telecommunication Services | 0.4 | |||||||
Capital Markets | 0.4 | |||||||
Industrial | 0.4 | |||||||
Electronic Equipment, Instruments & Components | 0.4 | |||||||
PERCENT OF NET ASSETS | ||||||||
Internet Retail | 0.3 | % | ||||||
Agriculture | 0.3 | |||||||
Transportation | 0.3 | |||||||
Life Sciences, Tools & Services | 0.2 | |||||||
Paper & Forest Products | 0.2 | |||||||
Pharmaceuticals | 0.2 | |||||||
Food & Staples Retailing | 0.2 | |||||||
Real Estate Investment Trusts | 0.2 | |||||||
Distributors | 0.2 | |||||||
IT Services | 0.2 | |||||||
Household Durables | 0.2 | |||||||
Multiline Retail | 0.2 | |||||||
Road & Rail | 0.2 | |||||||
Health Care Equipment & Supplies | 0.2 | |||||||
Communications | 0.1 | |||||||
Building Materials | 0.1 | |||||||
Aerospace & Defense | 0.1 | |||||||
Personal Products | 0.1 | |||||||
Independent Power & Renewable Electricity Producers | 0.1 | |||||||
Beverages | 0.1 | |||||||
Semiconductors & Semiconductor Equipment | 0.1 | |||||||
Building Products | 0.0 | ** | ||||||
Construction & Engineering | 0.0 | ** | ||||||
Short Term Investment | 20.5 | |||||||
Other Assets & Liabilities | (8.5 | ) | ||||||
TOTAL | 100.0 | % | ||||||
| * | The Portfolio’s industry breakdown is expressed as a percentage of net assets and may change over time. |
| ** | Amount shown represents less than 0.05% of net assets. |
6
Table of Contents
SSGA MFS SYSTEMATIC CORE EQUITY PORTFOLIO
PORTFOLIO SUMMARY
TOP FIVE HOLDINGS AS OF JUNE 30, 2015
| DESCRIPTION | APPLE, INC. | JPMORGAN CHASE & CO. | VALERO ENERGY | ANTHEM, INC. | ELECTRONIC | |||||||||
| MARKET VALUE | $158,914 | 127,795 | 117,125 | 115,226 | 111,720 | |||||||||
| % OF NET ASSETS | 5.4 | 4.3 | 4.0 | 3.9 | 3.8 | |||||||||
(The five largest holdings are subject to change, and there are no guarantees the Portfolio will continue to remain invested in any particular Fund.)
INDUSTRY BREAKDOWN AS OF JUNE 30, 2015*
PERCENT OF NET ASSETS | ||||||||
Health Care Providers & Services | 8.4 | % | ||||||
Insurance | 7.9 | |||||||
Pharmaceuticals | 7.8 | |||||||
Technology Hardware, Storage & Peripherals | 7.4 | |||||||
Oil, Gas & Consumable Fuels | 7.3 | |||||||
Software | 7.2 | |||||||
Aerospace & Defense | 6.8 | |||||||
Banks | 6.8 | |||||||
Food & Staples Retailing | 3.8 | |||||||
Hotels, Restaurants & Leisure | 3.5 | |||||||
Tobacco | 3.4 | |||||||
Chemicals | 3.3 | |||||||
Specialty Retail | 2.9 | |||||||
Internet Software & Services | 2.9 | |||||||
Media | 2.4 | |||||||
Diversified Telecommunication Services | 2.3 | |||||||
Real Estate Investment Trusts | 2.2 | |||||||
Independent Power & Renewable Electricity Producers | 2.1 | |||||||
Internet & Catalog Retail | 2.0 | |||||||
Biotechnology | 1.7 | |||||||
Health Care Equipment & Supplies | 1.3 | |||||||
Household Products | 1.2 | |||||||
Building Products | 1.2 | |||||||
Consumer Finance | 1.2 | |||||||
Food Products | 1.1 | |||||||
Multiline Retail | 0.9 | |||||||
Short Term Investments | 0.9 | |||||||
Other Assets & Liabilities | 0.1 | |||||||
TOTAL | 100.0 | % | ||||||
| * | The Portfolio’s industry breakdown is expressed as a percentage of net assets and may change over time. |
7
Table of Contents
SSGA MFS SYSTEMATIC GROWTH EQUITY PORTFOLIO
PORTFOLIO SUMMARY
TOP FIVE HOLDINGS AS OF JUNE 30, 2015
| DESCRIPTION | APPLE, INC. | LYONDELLBASELL | ELECTRONIC | COMCAST | KROGER CO. | |||||||||
| MARKET VALUE | $376,400 | 246,792 | 233,681 | 232,441 | 220,576 | |||||||||
| % OF NET ASSETS | 6.2 | 4.1 | 3.9 | 3.8 | 3.6 | |||||||||
(The five largest holdings are subject to change, and there are no guarantees the Portfolio will continue to remain invested in any particular Fund.)
INDUSTRY BREAKDOWN AS OF JUNE 30, 2015*
PERCENT OF NET ASSETS | ||||||||
Software | 10.2 | % | ||||||
Technology Hardware, Storage & Peripherals | 6.2 | |||||||
IT Services | 5.7 | |||||||
Internet Software & Services | 5.7 | |||||||
Food & Staples Retailing | 5.2 | |||||||
Hotels, Restaurants & Leisure | 4.7 | |||||||
Media | 4.6 | |||||||
Biotechnology | 4.5 | |||||||
Health Care Providers & Services | 4.5 | |||||||
Pharmaceuticals | 4.4 | |||||||
Specialty Retail | 4.3 | |||||||
Chemicals | 4.1 | |||||||
Oil, Gas & Consumable Fuels | 4.0 | |||||||
Tobacco | 4.0 | |||||||
Insurance | 3.7 | |||||||
Health Care Equipment & Supplies | 3.2 | |||||||
Diversified Telecommunication Services | 2.6 | |||||||
Internet & Catalog Retail | 2.5 | |||||||
Food Products | 2.3 | |||||||
Beverages | 2.0 | |||||||
Machinery | 1.9 | |||||||
Real Estate Investment Trusts | 1.9 | |||||||
Auto Components | 1.3 | |||||||
Multiline Retail | 1.2 | |||||||
Aerospace & Defense | 1.1 | |||||||
Household Durables | 1.1 | |||||||
Road & Rail | 0.9 | |||||||
Consumer Finance | 0.6 | |||||||
Communications Equipment | 0.4 | |||||||
Short Term Investments | 1.1 | |||||||
Other Assets & Liabilities | 0.1 | |||||||
TOTAL | 100.0 | % | ||||||
| * | The Portfolio’s industry breakdown is expressed as a percentage of net assets and may change over time. |
8
Table of Contents
SSGA MFS SYSTEMATIC VALUE EQUITY PORTFOLIO
PORTFOLIO SUMMARY
TOP FIVE HOLDINGS AS OF JUNE 30, 2015
| DESCRIPTION | JPMORGAN CHASE & CO. | WELLS FARGO & CO. | ANTHEM, INC. | EXXON MOBIL CORP. | ELECTRONIC ARTS, INC. | |||||||||
| MARKET VALUE | $154,832 | 133,514 | 112,764 | 111,155 | 106,067 | |||||||||
| % OF NET ASSETS | 5.3 | 4.6 | 3.9 | 3.8 | 3.6 | |||||||||
(The five largest holdings are subject to change, and there are no guarantees the Portfolio will continue to remain invested in any particular Fund.)
INDUSTRY BREAKDOWN AS OF JUNE 30, 2015*
PERCENT OF NET ASSETS | ||||||||
Banks | 12.5 | % | ||||||
Insurance | 12.3 | |||||||
Oil, Gas & Consumable Fuels | 11.2 | |||||||
Health Care Providers & Services | 8.5 | |||||||
Pharmaceuticals | 7.3 | |||||||
Aerospace & Defense | 6.1 | |||||||
Hotels, Restaurants & Leisure | 3.9 | |||||||
Software | 3.7 | |||||||
Chemicals | 3.4 | |||||||
Real Estate Investment Trusts | 3.2 | |||||||
Semiconductors & Semiconductor Equipment | 3.1 | |||||||
Specialty Retail | 2.7 | |||||||
Auto Components | 2.6 | |||||||
Independent Power & Renewable Electricity Producers | 2.5 | |||||||
Food Products | 2.4 | |||||||
Internet Software & Services | 2.3 | |||||||
Multi-utilities | 2.0 | |||||||
Food & Staples Retailing | 1.9 | |||||||
Consumer Finance | 1.3 | |||||||
Electric Utilities | 1.2 | |||||||
Beverages | 1.1 | |||||||
Capital Markets | 0.9 | |||||||
Technology Hardware, Storage & Peripherals | 0.9 | |||||||
Health Care Equipment & Supplies | 0.7 | |||||||
Household Durables | 0.7 | |||||||
Multiline Retail | 0.6 | |||||||
Short Term Investments | 0.9 | |||||||
Other Assets & Liabilities | 0.1 | |||||||
TOTAL | 100.0 | % | ||||||
| * | The Portfolio’s industry breakdown is expressed as a percentage of net assets and may change over time. |
9
Table of Contents
STATE STREET RISK AWARE PORTFOLIO
PORTFOLIO SUMMARY
TOP FIVE HOLDINGS AS OF JUNE 30, 2015
| DESCRIPTION | CAPITAL BANK | STERICYCLE, INC. | MCDONALD’S CORP. | PROCTER & | AUTOZONE, INC. | |||||||||
| MARKET VALUE | $106,484 | 97,486 | 95,545 | 88,568 | 84,696 | |||||||||
| % OF NET ASSETS | 5.4 | 5.0 | 4.9 | 4.5 | 4.3 | |||||||||
(The five largest holdings are subject to change, and there are no guarantees the Portfolio will continue to remain invested in any particular Fund.)
INDUSTRY BREAKDOWN AS OF JUNE 30, 2015*
PERCENT OF NET ASSETS | ||||||||
Pharmaceuticals | 11.6 | % | ||||||
Banks | 7.1 | |||||||
Machinery | 5.9 | |||||||
Oil, Gas & Consumable Fuels | 5.8 | |||||||
Beverages | 5.4 | |||||||
Commercial Services & Supplies | 5.4 | |||||||
Diversified Telecommunication Services | 5.4 | |||||||
Hotels, Restaurants & Leisure | 4.9 | |||||||
Household Products | 4.5 | |||||||
Specialty Retail | 4.3 | |||||||
Food Products | 4.2 | |||||||
Diversified Financial Services | 4.0 | |||||||
Biotechnology | 3.5 | |||||||
Multiline Retail | 2.9 | |||||||
Multi-utilities | 2.7 | |||||||
Software | 2.6 | |||||||
Real Estate Investment Trusts | 2.5 | |||||||
Health Care Equipment & Supplies | 2.1 | |||||||
Chemicals | 1.4 | |||||||
Food & Staples Retailing | 1.4 | |||||||
Insurance | 1.4 | |||||||
Communications Equipment | 1.3 | |||||||
Semiconductors & Semiconductor Equipment | 1.3 | |||||||
Professional Services | 1.1 | |||||||
Media | 1.0 | |||||||
Energy Equipment & Services | 0.9 | |||||||
Road & Rail | 0.9 | |||||||
Electrical Equipment | 0.6 | |||||||
Trading Companies & Distributors | 0.6 | |||||||
Household Durables | 0.5 | |||||||
Metals & Mining | 0.5 | |||||||
Internet Software & Services | 0.4 | |||||||
Capital Markets | 0.3 | |||||||
Aerospace & Defense | 0.3 | |||||||
Electronic Equipment, Instruments & Components | 0.2 | |||||||
IT Services | 0.2 | |||||||
Technology Hardware, Storage & Peripherals | 0.2 | |||||||
Diversified Consumer Services | 0.1 | |||||||
Paper & Forest Products | 0.1 | |||||||
Short Term Investments | 0.4 | |||||||
Other Assets & Liabilities | 0.1 | |||||||
TOTAL | 100.0 | % | ||||||
| * | The Portfolio’s industry breakdown is expressed as a percentage of net assets and may change over time. |
| ** | Amount shown represents less than 0.05% of net assets. |
10
Table of Contents
SSGA Multi-Asset Real Return Portfolio
June 30, 2015
Security Description | Shares | Value | ||||||
EXCHANGE TRADED PRODUCTS — 94.6% |
| |||||||
COMMODITIES — 18.6% |
| |||||||
PowerShares DB Commodity Index Tracking Fund (a) (b) | 1,463,556 | $ | 26,344,008 | |||||
PowerShares DB Oil Fund (a) (b) | 786 | 11,476 | ||||||
|
| |||||||
| 26,355,484 | ||||||||
|
| |||||||
INFLATION LINKED — 20.3% | ||||||||
SPDR Barclays TIPS ETF (c) | 400,523 | 22,321,147 | ||||||
SPDR DB International Government Inflation-Protected Bond ETF (c) | 119,100 | 6,539,781 | ||||||
|
| |||||||
| 28,860,928 | ||||||||
|
| |||||||
NATURAL RESOURCES — 37.9% | ||||||||
Energy Select Sector SPDR Fund (c) | 88,920 | 6,683,227 | ||||||
PowerShares Global Agriculture Portfolio | 140,571 | 4,169,336 | ||||||
SPDR S&P Global Natural Resources ETF (c) | 938,966 | 39,483,520 | ||||||
SPDR S&P International Energy Sector ETF (c) | 144,816 | 2,802,190 | ||||||
SPDR S&P Metals & Mining ETF (c) | 25,451 | 619,223 | ||||||
|
| |||||||
| 53,757,496 | ||||||||
|
| |||||||
REAL ESTATE — 17.8% | ||||||||
SPDR Dow Jones International Real Estate ETF (c) | 286,691 | 12,000,886 | ||||||
SPDR Dow Jones REIT ETF (c) | 158,157 | 13,345,286 | ||||||
|
| |||||||
| 25,346,172 | ||||||||
|
| |||||||
TOTAL EXCHANGE TRADED PRODUCTS | 134,320,080 | |||||||
|
| |||||||
SHORT TERM INVESTMENT — 4.7% | ||||||||
MONEY MARKET FUND — 4.7% | ||||||||
State Street Institutional Liquid Reserves Fund, Premier Class 0.11% (c) (d) (Cost $6,724,192) | 6,724,192 | 6,724,192 | ||||||
|
| |||||||
TOTAL INVESTMENTS — 99.3% (e) | 141,044,272 | |||||||
OTHER ASSETS & LIABILITIES — 0.7% | 951,260 | |||||||
|
| |||||||
NET ASSETS — 100.0% | $ | 141,995,532 | ||||||
|
| |||||||
| (a) | Qualified Publicly Traded Partnerships |
| (b) | Non-income producing security |
| (c) | Affiliated Fund managed by SSGA Funds Management, Inc. (Note 3). |
| (d) | The rate shown is the annualized seven-day yield at period end. |
| (e) | Unless otherwise indicated, the values of the investments of the Portfolio are determined based on Level 1 inputs (Note 2). |
REIT = Real Estate Investment Trust
See accompanying notes to financial statements.
11
Table of Contents
SSGA Income Allocation Portfolio
SCHEDULE OF INVESTMENTS
June 30, 2015
Security Description | Shares | Value | ||||||
EXCHANGE TRADED PRODUCTS — 97.5% |
| |||||||
DOMESTIC EQUITY — 15.0% |
| |||||||
Consumer Discretionary Select Sector SPDR Fund (a) | 32,130 | $ | 2,457,303 | |||||
Health Care Select Sector SPDR Fund (a) | 33,002 | 2,455,019 | ||||||
SPDR S&P Dividend ETF (a) | 63,111 | 4,809,689 | ||||||
SPDR Wells Fargo Preferred Stock ETF (a) | 138,428 | 6,006,391 | ||||||
Technology Select Sector SPDR Fund (a) | 57,368 | 2,375,035 | ||||||
|
| |||||||
| 18,103,437 | ||||||||
|
| |||||||
DOMESTIC FIXED INCOME — 44.6% |
| |||||||
SPDR Barclays Convertible Securities ETF (a) | 126,174 | 6,002,097 | ||||||
SPDR Barclays High Yield Bond ETF (a) | 521,165 | 20,028,371 | ||||||
SPDR Barclays Intermediate Term Corporate Bond ETF (a) | 72,189 | 2,449,373 | ||||||
SPDR Barclays Long Term Corporate Bond ETF (a) | 444,142 | 17,006,197 | ||||||
SPDR Barclays Long Term Treasury ETF (a) | 125,248 | 8,556,943 | ||||||
|
| |||||||
| 54,042,981 | ||||||||
|
| |||||||
INFLATION LINKED — 1.5% |
| |||||||
SPDR Barclays TIPS ETF (a) | 33,157 | 1,847,840 | ||||||
|
| |||||||
INTERNATIONAL EQUITY — 22.5% |
| |||||||
SPDR S&P Emerging Markets Dividend ETF (a) | 36,433 | 1,192,452 | ||||||
SPDR S&P Global Infrastructure ETF (a) | 76,611 | 3,573,137 | ||||||
SPDR S&P International Dividend ETF (a) | 85,886 | 3,561,693 | ||||||
SPDR STOXX Europe 50 ETF (a) | 136,012 | 4,729,137 | ||||||
WisdomTree Europe Hedged Equity Fund | 116,237 | 7,159,037 | ||||||
WisdomTree Japan Hedged Equity Fund | 123,670 | 7,073,924 | ||||||
|
| |||||||
| 27,289,380 | ||||||||
|
| |||||||
INTERNATIONAL FIXED INCOME — 3.0% |
| |||||||
SPDR Barclays Emerging Markets Local Bond ETF (a) | 135,253 | 3,662,651 | ||||||
|
| |||||||
REAL ESTATE — 10.9% |
| |||||||
SPDR Dow Jones International Real Estate ETF (a) | 116,337 | 4,869,867 | ||||||
SPDR Dow Jones REIT ETF (a) | 98,588 | 8,318,855 | ||||||
|
| |||||||
| 13,188,722 | ||||||||
|
| |||||||
TOTAL EXCHANGE TRADED PRODUCTS | 118,135,011 | |||||||
|
| |||||||
Security Description | Shares | Value | ||||||
SHORT TERM INVESTMENT — 2.3% |
| |||||||
MONEY MARKET FUND — 2.3% |
| |||||||
State Street Institutional Liquid Reserves Fund, Premier Class 0.11% (a) (b) | 2,787,882 | $ | 2,787,882 | |||||
|
| |||||||
TOTAL INVESTMENTS — 99.8% (c) | 120,922,893 | |||||||
OTHER ASSETS & LIABILITIES — 0.2% | 225,894 | |||||||
|
| |||||||
NET ASSETS — 100.0% | $ | 121,148,787 | ||||||
|
| |||||||
| (a) | Affiliated Fund managed by SSGA Funds Management, Inc. (Note 3). |
| (b) | The rate shown is the annualized seven-day yield at period end. |
| (c) | Unless otherwise indicated, the values of the investments of the Portfolio are determined based on Level 1 inputs (Note 2). |
REIT = Real Estate Investment Trust
See accompanying notes to financial statements.
12
Table of Contents
SSGA Global Allocation Portfolio
SCHEDULE OF INVESTMENTS
June 30, 2015
Security Description | Shares | Value | ||||||
EXCHANGE TRADED PRODUCTS — 89.4% |
| |||||||
DOMESTIC EQUITY — 15.0% |
| |||||||
Consumer Discretionary Select Sector SPDR Fund (a) | 38,328 | $ | 2,931,325 | |||||
Health Care Select Sector SPDR Fund (a) | 39,379 | 2,929,404 | ||||||
SPDR S&P 500 ETF Trust (a) | 63,090 | 12,987,076 | ||||||
Technology Select Sector SPDR Fund (a) | 68,939 | 2,854,075 | ||||||
|
| |||||||
| 21,701,880 | ||||||||
|
| |||||||
DOMESTIC FIXED INCOME — 30.0% |
| |||||||
SPDR Barclays Aggregate Bond ETF (a) | 50,686 | 2,909,377 | ||||||
SPDR Barclays High Yield Bond ETF (a) | 599,493 | 23,038,516 | ||||||
SPDR Barclays Intermediate Term Corporate Bond ETF (a) | 41,866 | 1,420,513 | ||||||
SPDR Barclays Long Term Corporate Bond ETF (a) | 302,860 | 11,596,510 | ||||||
SPDR Barclays Long Term Treasury ETF (a) | 65,248 | 4,457,743 | ||||||
|
| |||||||
| 43,422,659 | ||||||||
|
| |||||||
INFLATION LINKED — 2.0% |
| |||||||
SPDR Barclays TIPS ETF (a) | 52,369 | 2,918,525 | ||||||
|
| |||||||
INTERNATIONAL EQUITY — 33.5% |
| |||||||
SPDR S&P Emerging Markets ETF (a) | 22,137 | 1,426,508 | ||||||
SPDR S&P International Small Cap ETF (a) | 143,131 | 4,368,358 | ||||||
SPDR S&P World ex-US ETF (a) | 785,051 | 22,075,634 | ||||||
WisdomTree Europe Hedged Equity Fund | 161,626 | 9,954,546 | ||||||
WisdomTree Japan Hedged Equity Fund | 186,546 | 10,670,431 | ||||||
|
| |||||||
| 48,495,477 | ||||||||
|
| |||||||
REAL ESTATE — 8.9% |
| |||||||
SPDR Dow Jones International Real Estate ETF (a) | 68,930 | 2,885,410 | ||||||
SPDR Dow Jones REIT ETF (a) | 117,788 | 9,938,950 | ||||||
|
| |||||||
| 12,824,360 | ||||||||
|
| |||||||
TOTAL EXCHANGE TRADED PRODUCTS | 129,362,901 | |||||||
|
| |||||||
SHORT TERM INVESTMENT — 10.4% |
| |||||||
MONEY MARKET FUND — 10.4% |
| |||||||
State Street Institutional Liquid Reserves Fund, Premier Class 0.11% (a) (b) | 15,054,957 | 15,054,957 | ||||||
|
| |||||||
TOTAL INVESTMENTS — 99.8% (c) | 144,417,858 | |||||||
OTHER ASSETS & | 357,546 | |||||||
|
| |||||||
NET ASSETS — 100.0% | $ | 144,775,404 | ||||||
|
| |||||||
| (a) | Affiliated Fund managed by SSGA Funds Management, Inc. (Note 3). |
| (b) | The rate shown is the annualized seven-day yield at period end. |
| (c) | Unless otherwise indicated, the values of the investments of the Portfolio are determined based on Level 1 inputs (Note 2). |
REIT = Real Estate Investment Trust
See accompanying notes to financial statements.
13
Table of Contents
Blackstone/GSO Senior Loan Portfolio
SCHEDULE OF INVESTMENTS
June 30, 2015
Security Description | Principal | Value | ||||||
SENIOR FLOATING RATE LOANS* — 94.3% |
| |||||||
AIRLINES — 1.1% | ||||||||
Air Canada, Senior Secured Term Loan B, 4.00%, 9/26/19 | $ | 484,898 | $ | 486,869 | ||||
American Airlines, Inc., Senior Secured Term Loan B, 3.50%, 10/10/21 | 3,750,000 | 3,744,731 | ||||||
US Airways Group, Inc., Senior Secured Term Loan B1, 3.50%, 5/23/19 | 3,221,654 | 3,218,126 | ||||||
|
| |||||||
| 7,449,726 | ||||||||
|
| |||||||
AUTO COMPONENTS — 0.7% | ||||||||
Federal-Mogul Holdings Corp., Senior Secured Term Loan C, 4.75%, 4/15/21 | 4,962,500 | 4,920,641 | ||||||
AUTOMOBILES — 0.6% | ||||||||
Chrysler Group LLC, Senior Secured Term Loan B, 3.25%, 12/31/18 | 4,114,583 | 4,111,436 | ||||||
CHEMICALS — 2.1% | ||||||||
Axalta Coating Systems US Holdings, Inc., Senior Secured Term Loan, | 5,389,706 | 5,390,730 | ||||||
Ineos US Finance LLC, Senior Secured 6 Year Term Loan, 3.75%, 5/4/18 | 4,039,901 | 4,033,943 | ||||||
Univar, Inc., Senior Secured Term Loan B, 5.00%, 6/30/22 | 4,948,610 | 4,949,402 | ||||||
|
| |||||||
| 14,374,075 | ||||||||
|
| |||||||
COMMERCIAL SERVICES & SUPPLIES — 3.5% |
| |||||||
Acosta Holdco, Inc., Senior Secured Term Loan, 4.25%, 9/26/21 | 1,840,462 | 1,837,444 | ||||||
ADS Waste Holdings, Inc., Senior Secured Term Loan, 3.75%, 10/9/19 | 3,847,768 | 3,806,886 | ||||||
Aramark Services, Inc., Senior Secured Term Loan F, 3.25%, 2/24/21 | 1,975,000 | 1,970,418 | ||||||
Asurion LLC Senior Secured Second Lien Term Loan, 8.50%, 3/3/21 | 6,276,596 | 6,392,336 | ||||||
Senior Secured Term Loan B1, | 3,055,322 | 3,066,565 | ||||||
EnergySolutions LLC, Senior Secured Term Loan, 6.75%, 5/29/20 | 1,875,714 | 1,886,659 | ||||||
Lineage Logistics Holdings LLC, Senior Secured Term Loan, 4.50%, 4/7/21 | 3,038,462 | 2,989,087 | ||||||
West Corp., Senior Secured Term Loan B10, 3.25%, 6/30/18 | 1,734,560 | 1,732,513 | ||||||
|
| |||||||
| 23,681,908 | ||||||||
|
| |||||||
COMMUNICATIONS EQUIPMENT — 1.2% |
| |||||||
Blue Coat Systems, Inc., Senior Secured Term Loan, 4.50%, 5/20/22 | 5,341,246 | 5,337,908 | ||||||
CommScope, Inc., Senior Secured Term Loan B5, 3.75%, 12/29/22 | 1,405,547 | 1,406,137 | ||||||
Penton Media, Inc., Senior Secured Term Loan, 5.00%, 10/3/19 | 1,386,468 | 1,395,141 | ||||||
|
| |||||||
| 8,139,186 | ||||||||
|
| |||||||
Security Description | Principal | Value | ||||||
CONTAINERS & PACKAGING — 1.8% |
| |||||||
Berry Plastics Holding Corp. |
| |||||||
Senior Secured Term Loan E, 3.75%, 1/6/21 | $ | 1,105,503 | $ | 1,103,662 | ||||
Senior Secured Term Loan D, | 2,934,950 | 2,925,778 | ||||||
Hilex Poly Co. LLC, Senior Secured Term Loan B, 6.00%, 12/5/21 | 1,217,961 | 1,230,141 | ||||||
Multi Packaging Solutions, Inc., Senior Secured Term Loan B, 4.25%, 9/30/20 (a) | 1,975,000 | 1,972,531 | ||||||
Reynolds Group Issuer, Inc., Senior Secured New Dollar Term Loan, | 2,400,190 | 2,411,447 | ||||||
Tekni-Plex, Inc., Senior Secured Term Loan B, 4.50%, 6/1/22 | 2,236,025 | 2,240,777 | ||||||
|
| |||||||
| 11,884,336 | ||||||||
|
| |||||||
DISTRIBUTORS — 0.4% |
| |||||||
American Tire Distributors Holdings, Inc., Senior Secured Term Loan, | 1,948,207 | 1,968,917 | ||||||
Exopack Holdings SA, Senior Secured Term Loan B1, 4.50%, 5/8/19 | 596,555 | 598,666 | ||||||
|
| |||||||
| 2,567,583 | ||||||||
|
| |||||||
DIVERSIFIED CONSUMER SERVICES — 1.5% |
| |||||||
Nord Anglia Education Finance LLC, Senior Secured Term Loan, | 2,823,529 | 2,828,838 | ||||||
ServiceMaster Co., Senior Secured Term Loan B, 4.25%, 7/1/21 | 6,462,679 | 6,472,793 | ||||||
WASH Multifamily Laundry Systems LLC |
| |||||||
Senior Secured First Lien Term Loan, 4.25%, 5/14/22 | 499,325 | 498,068 | ||||||
Senior Secured Term Loan B1, | 88,911 | 87,226 | ||||||
|
| |||||||
| 9,886,925 | ||||||||
|
| |||||||
DIVERSIFIED FINANCIAL SERVICES — 1.5% |
| |||||||
AlixPartners LLP, Senior Secured Term Loan B2, 4.00%, 7/10/20 | 2,451,793 | 2,445,283 | ||||||
Opal Acquisition, Inc., Senior Secured First Lien Term Loan, 5.00%, 11/27/20 | 1,643,204 | 1,620,101 | ||||||
Tech Finance & Co., SCA, Senior Secured Term Loan B, LIBOR + | 1,650,827 | 1,657,711 | ||||||
TransUnion LLC, Senior Secured Term Loan B2, 3.75%, 4/9/21 | 4,521,084 | 4,490,703 | ||||||
|
| |||||||
| 10,213,798 | ||||||||
|
| |||||||
DIVERSIFIED TELECOMMUNICATION SERVICES — 0.6% |
| |||||||
Intelsat Jackson Holdings, Ltd., Senior Secured Term Loan B2, | 4,141,243 | 4,115,795 | ||||||
|
| |||||||
ELECTRIC UTILITIES — 1.2% |
| |||||||
Calpine Construction Finance Company LP, Senior Secured Term Loan B2, 3.25%, 1/31/22 | 1,979,858 | 1,954,367 | ||||||
See accompanying notes to financial statements.
14
Table of Contents
Blackstone/GSO Senior Loan Portfolio
SCHEDULE OF INVESTMENTS (continued)
June 30, 2015
Security Description | Principal | Value | ||||||
La Frontera Generation LLC, Senior Secured Term Loan, 4.50%, 9/30/20 | $ | 3,518,074 | $ | 3,498,285 | ||||
Panda Temple II Power LLC, Senior Secured Term Loan B, 7.25%, 4/3/19 | 3,000,000 | 2,850,000 | ||||||
|
| |||||||
| 8,302,652 | ||||||||
|
| |||||||
ELECTRONIC EQUIPMENT, INSTRUMENTS & COMPONENTS — 1.4% |
| |||||||
CDW LLC, Senior Secured Term Loan, 3.25%, 4/29/20 | 4,071,064 | 4,044,622 | ||||||
Pelican Products, Inc., Senior Secured Term Loan, 5.25%, 4/10/20 (a) | 1,004,085 | 1,004,090 | ||||||
Zebra Technologies Corp., Senior Secured Term Loan B, 4.75%, 10/27/21 | 4,430,512 | 4,485,916 | ||||||
|
| |||||||
| 9,534,628 | ||||||||
|
| |||||||
ENERGY EQUIPMENT & SERVICES — 1.6% |
| |||||||
Expro FinServices S.A.R.L., Senior Secured Term Loan, 5.75%, 9/2/21 (a) | 5,582,813 | 4,955,611 | ||||||
Granite Acquisition, Inc. | ||||||||
Senior Secured Term Loan B, 5.00%, 12/19/21 | 2,242,506 | 2,270,515 | ||||||
Senior Secured Term Loan C, 5.00%, 12/19/21 | 99,166 | 100,405 | ||||||
Sandy Creek Energy Associates LP, Senior Secured Term Loan B, 5.00%, 11/8/20 | 3,615,544 | 3,616,195 | ||||||
|
| |||||||
| 10,942,726 | ||||||||
|
| |||||||
FOOD & STAPLES RETAILING — 3.3% |
| |||||||
Albertson’s LLC, |
| |||||||
Senior Secured Term Loan B2, 5.38%, 3/21/19 | 3,965,132 | 3,985,712 | ||||||
Senior Secured Term Loan B4, 5.50%, 8/25/21 | 5,663,533 | 5,698,675 | ||||||
BJ’s Wholesale Club, Inc., Senior Secured First Lien Term Loan, 4.50%, 9/26/19 | 2,994,984 | 2,996,661 | ||||||
Supervalu, Inc., Senior Secured Term Loan B, 4.50%, 3/21/19 | 2,917,793 | 2,927,086 | ||||||
US Foods, Inc., Senior Secured Term Loan, 4.50%, 3/31/19 | 6,579,253 | 6,597,971 | ||||||
|
| |||||||
| 22,206,105 | ||||||||
|
| |||||||
FOOD PRODUCTS — 3.0% |
| |||||||
Dole Food Co., Inc., Senior Secured Term Loan B, 4.50%, 11/1/18 | 2,722,713 | 2,730,364 | ||||||
H.J. Heinz Co., Senior Secured Term Loan B2, 3.25%, 6/5/20 | 11,793,666 | 11,809,175 | ||||||
New HB Acquisition LLC, Senior Secured Term Loan, 6.75%, 4/9/20 (a) | 4,125,000 | 4,197,188 | ||||||
Pinnacle Foods Finance LLC, Senior Secured Term Loan G, 3.00%, 4/29/20 | 1,733,936 | 1,729,358 | ||||||
|
| |||||||
| 20,466,085 | ||||||||
|
| |||||||
Security Description | Principal | Value | ||||||
HEALTH CARE EQUIPMENT & SUPPLIES — 2.7% |
| |||||||
Accellent, Inc., Senior Secured First Lien Term Loan, 4.50%, 3/12/21 | $ | 2,408,537 | $ | 2,398,505 | ||||
Immucor, Inc., Senior Secured Term Loan B2, 5.00%, 8/17/18 (a) | 3,422,281 | 3,439,392 | ||||||
Kinetic Concepts, Inc., Senior Secured Term Loan E1, 4.50%, 5/4/18 | 5,468,606 | 5,497,481 | ||||||
Ortho-Clinical Diagnostics, Inc., Senior Secured Term Loan B, 4.75%, 6/30/21 | 6,801,527 | 6,680,697 | ||||||
|
| |||||||
| 18,016,075 | ||||||||
|
| |||||||
HEALTH CARE PROVIDERS & SERVICES — 2.8% |
| |||||||
CHG Healthcare Services, Inc., Senior Secured Term Loan, 4.25%, 11/19/19 | 2,122,420 | 2,124,086 | ||||||
Community Health Systems, Inc. | ||||||||
Senior Secured Term Loan G, 3.75%, 12/31/19 | 1,665,703 | 1,668,027 | ||||||
Senior Secured Term Loan H, 4.00%, 1/27/21 | 3,064,849 | 3,073,906 | ||||||
Concordia Healthcare Corp., Senior Secured Term Loan B, 4.75%, 4/21/22 | 525,773 | 529,004 | ||||||
FHC Health Systems, Inc., Senior Secured Term Loan, 5.00%, 12/23/21 | 5,231,985 | 5,194,053 | ||||||
MPH Acquisition Holdings LLC, Senior Secured Term Loan, 3.75%, 3/31/21 | 2,749,927 | 2,737,649 | ||||||
National Mentor Holdings, Inc., Senior Secured Term Loan B, 4.25%, 1/31/21 (a) | 716,321 | 715,204 | ||||||
Truven Health Analytics, Inc., Senior Secured Term Loan B, 4.50%, 6/6/19 | 2,488,140 | 2,481,919 | ||||||
|
| |||||||
| 18,523,848 | ||||||||
|
| |||||||
HEALTH CARE TECHNOLOGY — 0.7% |
| |||||||
CT Technologies Intermediate Holdings, Inc., Senior Secured First Lien Term Loan, 5.25%, 12/1/21 | 461,538 | 463,846 | ||||||
IMS Health, Inc., Senior Secured Term Loan, 3.50%, 3/17/21 | 4,440,161 | 4,425,486 | ||||||
|
| |||||||
| 4,889,332 | ||||||||
|
| |||||||
HOTELS, RESTAURANTS & LEISURE — 6.9% |
| |||||||
Alpha Topco (Delta 2 (LUX) S.A.R.L.) |
| |||||||
Senior Secured Term Loan B3, 4.75%, 7/30/21 | 7,018,093 | 6,987,389 | ||||||
Senior Secured Second Lien Term Loan, 7.75%, 7/31/22 | 2,561,701 | 2,564,365 | ||||||
Caesars Entertainment Operating Co., Inc. |
| |||||||
Senior Secured Extended Term Loan B6, 11.00%, 3/1/17 | 6,508,462 | 5,850,164 | ||||||
Senior Secured Extended Term Loan B5, 10.00%, 3/1/17 | 2,392,225 | 2,131,616 | ||||||
Caesars Entertainment Resort Properties LLC, Senior Secured Term Loan B, 7.00%, 10/11/20 | 4,554,429 | 4,155,917 | ||||||
See accompanying notes to financial statements.
15
Table of Contents
Blackstone/GSO Senior Loan Portfolio
SCHEDULE OF INVESTMENTS (continued)
June 30, 2015
Security Description | Principal | Value | ||||||
CEC Entertainment, Inc., Senior Secured Term Loan, 4.00%, 2/14/21 | $ | 5,874,801 | $ | 5,730,369 | ||||
Hilton Worldwide Finance LLC, Senior Secured Term Loan B2, 3.50%, 10/26/20 | 3,895,833 | 3,901,930 | ||||||
PGA Holdings, Inc., Senior Secured First Lien Term Loan, 4.25%, 4/20/18 | 1,880,987 | 1,883,348 | ||||||
Scientific Games International, Inc., Senior Secured Term Loan B2, 6.00%, 10/1/21 | 12,876,471 | 12,886,192 | ||||||
|
| |||||||
| 46,091,290 | ||||||||
|
| |||||||
HOUSEHOLD DURABLES — 0.6% |
| |||||||
Spin Holdco, Inc., Senior Secured Term Loan B, 4.25%, 11/14/19 | 3,871,247 | 3,863,988 | ||||||
|
| |||||||
INDEPENDENT POWER & RENEWABLE ELECTRICITY PRODUCERS — 1.0% |
| |||||||
Astoria Energy LLC, Senior Secured Term Loan B, 5.00%, 12/24/21 | 1,094,206 | 1,103,780 | ||||||
Calpine Corp., Senior Secured Term Loan B3, 4.00%, 10/9/19 | 2,351,637 | 2,354,765 | ||||||
Panda Sherman Power LLC, Senior Secured Term Loan, 9.00%, 9/14/18 | 2,992,465 | 2,966,281 | ||||||
|
| |||||||
| 6,424,826 | ||||||||
|
| |||||||
INSURANCE — 2.1% |
| |||||||
Alliant Holdings I, Inc., Senior Secured Term Loan B, 5.00%, 12/20/19 | 2,901,741 | 2,912,623 | ||||||
AmWINS Group LLC, Senior Secured Second Lien Term Loan, 9.50%, 9/4/20 | 3,071,429 | 3,102,143 | ||||||
Hub International, Ltd., Senior Secured Term Loan B, 4.00%, 10/2/20 | 4,477,330 | 4,450,757 | ||||||
National Financial Partners Corp., Senior Secured Term Loan B, 4.50%, 7/1/20 | 3,933,594 | 3,932,984 | ||||||
|
| |||||||
| 14,398,507 | ||||||||
|
| |||||||
INTERNET & CATALOG RETAIL — 0.4% |
| |||||||
Harbor Freight Tools USA, Inc., Senior Secured First Lien Term Loan, 4.75%, 7/26/19 | 2,534,095 | 2,548,019 | ||||||
|
| |||||||
INTERNET SOFTWARE & SERVICES — 1.8% |
| |||||||
Go Daddy Operating Co. LLC, Senior Secured Term Loan B, 4.25%, 5/13/21 | 1,359,550 | 1,362,419 | ||||||
Inmar, Inc., Senior Secured First Lien Term Loan, 4.25%, 1/27/21 | 3,150,000 | 3,117,508 | ||||||
Sabre, Inc., Senior Secured Term Loan B, 4.00%, 2/19/19 | 5,388,238 | 5,389,935 | ||||||
SurveyMonkey.com LLC, Senior Secured Term Loan B, 5.50%, 2/5/19 | 1,917,574 | 1,924,765 | ||||||
|
| |||||||
| 11,794,627 | ||||||||
|
| |||||||
Security Description | Principal | Value | ||||||
IT SERVICES — 2.9% |
| |||||||
First Data Corp. |
| |||||||
Senior Secured Extended Term Loan, 3.69%, 3/24/18 | $ | 10,987,969 | $ | 10,965,388 | ||||
Senior Secured Term Loan, 3.69%, 9/24/18 | 3,960,401 | 3,955,095 | ||||||
Senior Secured Term Loan, | 4,705,882 | 4,688,235 | ||||||
|
| |||||||
| 19,608,718 | ||||||||
|
| |||||||
LIFE SCIENCES TOOLS & SERVICES — 1.0% |
| |||||||
Pharmaceutical Product Development, Inc., Senior Secured Term Loan B, 4.00%, 12/5/18 | 3,931,001 | 3,933,772 | ||||||
PRA Holdings, Inc., Senior Secured First Lien Term Loan, 4.50%, 9/23/20 | 2,682,375 | 2,689,497 | ||||||
|
| |||||||
| 6,623,269 | ||||||||
|
| |||||||
MACHINERY — 3.1% |
| |||||||
Allison Transmission, Inc., Senior Secured Term Loan B3, 3.50%, 8/23/19 | 3,916,606 | 3,930,197 | ||||||
Doosan Infracore International, Inc., Senior Secured Term Loan B, 4.50%, 5/28/21 | 2,564,823 | 2,580,853 | ||||||
Gardner Denver, Inc., Senior Secured Term Loan, 4.25%, 7/30/20 | 2,954,887 | 2,887,383 | ||||||
Gates Global, Inc., Senior Secured Term Loan B, 4.25%, 7/5/21 | 6,114,074 | 6,030,433 | ||||||
Rexnord LLC, Senior Secured First Lien Term Loan B, 4.00%, 8/21/20 | 5,333,571 | 5,326,157 | ||||||
|
| |||||||
| 20,755,023 | ||||||||
|
| |||||||
MARINE — 0.6% |
| |||||||
Drillships Ocean Ventures, Inc., Senior Secured Term Loan B, 5.50%, 7/25/21 | 4,999,534 | 4,274,601 | ||||||
|
| |||||||
MEDIA — 4.3% |
| |||||||
AMC Entertainment, Inc., Senior Secured Term Loan, 3.50%, 4/30/20 | 3,008,132 | 3,001,740 | ||||||
Cengage Learning Acquisitions, Inc., Senior Secured First Lien Term Loan, 7.00%, 3/31/20 | 2,900,452 | 2,908,616 | ||||||
Clear Channel Communications, Inc., Senior Secured Term Loan D, 6.94%, 1/30/19 | 5,000,000 | 4,632,400 | ||||||
Cumulus Media Holdings, Inc., Senior Secured Term Loan, 4.25%, 12/23/20 | 5,915,423 | 5,634,440 | ||||||
Interactive Data Corp., Senior Secured Term Loan, 4.75%, 5/2/21 | 7,464,458 | 7,497,115 | ||||||
Univision Communications, Inc. | ||||||||
Senior Secured Term Loan C4, 4.00%, 3/1/20 | 2,941,824 | 2,922,908 | ||||||
Senior Secured Term Loan C3, 4.00%, 3/1/20 | 1,980,850 | 1,969,361 | ||||||
|
| |||||||
| 28,566,580 | ||||||||
|
| |||||||
See accompanying notes to financial statements.
16
Table of Contents
Blackstone/GSO Senior Loan Portfolio
SCHEDULE OF INVESTMENTS (continued)
June 30, 2015
Security Description | Principal | Value | ||||||
METALS & MINING — 2.8% |
| |||||||
Fairmount Minerals, Ltd., Senior Secured Term Loan B2, 4.50%, 9/5/19 | $ | 2,947,500 | $ | 2,802,895 | ||||
FMG Resources August 2006 Pty, Ltd., Senior Secured Term Loan B, 3.75%, 6/30/19 | 12,246,869 | 10,905,286 | ||||||
Novelis, Inc., Senior Secured Term Loan B, 4.00%, 6/2/22 | 5,000,000 | 4,985,150 | ||||||
|
| |||||||
| 18,693,331 | ||||||||
|
| |||||||
MULTI-UTILITIES — 0.4% |
| |||||||
Power Team Services LLC | ||||||||
Senior Secured First Lien Term Loan, 4.25%, 5/6/20 (a) | 2,747,587 | 2,751,022 | ||||||
Senior Secured Delayed Draw Term Loan, 4.25%, 5/6/20 (a) | 147,458 | 147,643 | ||||||
|
| |||||||
| 2,898,665 | ||||||||
|
| |||||||
MULTILINE RETAIL — 2.4% |
| |||||||
Dollar Tree, Inc., Senior Secured Term Loan B1, 3.50%, 3/9/22 | 6,600,971 | 6,608,563 | ||||||
Neiman Marcus Group, Inc., Senior Secured Term Loan, 4.25%, 10/25/20 | 9,363,331 | 9,321,289 | ||||||
|
| |||||||
| 15,929,852 | ||||||||
|
| |||||||
OIL, GAS & CONSUMABLE FUELS — 2.9% |
| |||||||
Arch Coal, Inc., Senior Secured Term Loan B, 6.25%, 5/16/18 | 6,928,735 | 4,777,605 | ||||||
EMG Utica LLC, Senior Secured Term Loan, 4.75%, 3/27/20 (a) | 2,807,047 | 2,747,398 | ||||||
Fieldwood Energy LLC, Senior Secured Second Lien Term Loan, 8.38%, 9/30/20 | 6,389,590 | 4,922,988 | ||||||
Murray Energy Corp. | ||||||||
Senior Secured Term Loan B2, 7.50%, 3/19/21 | 2,068,966 | 1,923,807 | ||||||
Senior Secured Term Loan B1, 7.00%, 4/7/17 | 3,923,077 | 3,908,365 | ||||||
Penn Products Terminals LLC, Senior Secured Term Loan B, 4.75%, 3/19/22 | 1,496,250 | 1,502,332 | ||||||
|
| |||||||
| 19,782,495 | ||||||||
|
| |||||||
PERSONAL PRODUCTS — 1.6% |
| |||||||
Energizer SpinCo, Inc., Senior Secured Term Loan B, 3.25%, 5/14/22 | 1,612,903 | 1,620,282 | ||||||
NBTY, Inc., Senior Secured Term Loan B2, 3.50%, 10/1/17 | 3,000,000 | 2,989,125 | ||||||
Revlon Consumer Products Corp., Senior Secured Acquisition Term Loan, 4.00%, 10/8/19 | 5,812,209 | 5,821,305 | ||||||
|
| |||||||
| 10,430,712 | ||||||||
|
| |||||||
PHARMACEUTICALS — 3.5% |
| |||||||
Endo Luxembourg Finance Co. I (S.A.R.L.) | ||||||||
Senior Secured Term Loan B, | 4,085,106 | 4,099,486 | ||||||
Security Description | Principal | Value | ||||||
Senior Secured Term Loan, | $ | 4,285,714 | $ | 4,285,714 | ||||
Par Pharmaceutical Cos., Inc. | ||||||||
Senior Secured Term Loan B2, 4.00%, 9/30/19 | 1,389,590 | 1,391,077 | ||||||
Senior Secured Incremental Term Loan B3, 4.25%, 9/30/19 | 829,167 | 829,996 | ||||||
Valeant Pharmaceuticals International, Inc. | ||||||||
Senior Secured Term Loan B, 4.00%, 4/1/22 | 9,772,804 | 9,772,266 | ||||||
Senior Secured Term Loan B, 3.50%, 8/5/20 | 3,454,684 | 3,445,650 | ||||||
|
| |||||||
| 23,824,189 | ||||||||
|
| |||||||
PROFESSIONAL SERVICES — 1.2% |
| |||||||
Advantage Sales & Marketing, Inc., Senior Secured First Lien Term Loan, 4.25%, 7/23/21 | 4,912,279 | 4,896,928 | ||||||
Information Resources, Inc., Senior Secured Term Loan B, 4.75%, 9/30/20 | 3,020,916 | 3,041,066 | ||||||
|
| |||||||
| 7,937,994 | ||||||||
|
| |||||||
REAL ESTATE MANAGEMENT & DEVELOPMENT — 1.6% |
| |||||||
Communications Sales & Leasing, Inc., Senior Secured Term Loan B, 5.00%, 10/24/22 | 8,965,517 | 8,808,621 | ||||||
Realogy Corp., Senior Secured Term Loan B, 3.75%, 3/5/20 | 1,955,225 | 1,953,397 | ||||||
|
| |||||||
| 10,762,018 | ||||||||
|
| |||||||
SEMICONDUCTORS & SEMICONDUCTOR EQUIPMENT — 1.7% |
| |||||||
Avago Technologies, Ltd., Senior Secured Term Loan B, 3.75%, 5/6/21 | 5,549,522 | 5,564,617 | ||||||
Freescale Semiconductor, Inc. | ||||||||
Senior Secured Term Loan B4, 4.25%, 2/28/20 | 3,166,514 | 3,172,008 | ||||||
Senior Secured Term Loan B5, 5.00%, 1/15/21 | 2,456,250 | 2,468,531 | ||||||
|
| |||||||
| 11,205,156 | ||||||||
|
| |||||||
SOFTWARE — 11.2% |
| |||||||
Applied Systems, Inc., Senior Secured First Lien Term Loan, 4.25%, 1/25/21 | 1,641,595 | 1,641,390 | ||||||
Aspect Software, Inc., Senior Secured Term Loan B, 7.25%, 5/7/16 (a) | 8,923,152 | 8,856,228 | ||||||
BMC Software Finance, Inc., Senior Secured Term Loan, 5.00%, 9/10/20 | 10,602,878 | 10,011,449 | ||||||
CCC Information Services, Inc., Senior Secured Term Loan, 4.00%, 12/20/19 | 2,934,787 | 2,925,616 | ||||||
Compuware Corp. | ||||||||
Senior Secured Term Loan B2, 6.25%, 12/15/21 | 4,488,722 | 4,394,750 | ||||||
Senior Secured Second Lien Term Loan, 9.25%, 12/9/22 | 2,000,000 | 1,871,670 | ||||||
See accompanying notes to financial statements.
17
Table of Contents
Blackstone/GSO Senior Loan Portfolio
SCHEDULE OF INVESTMENTS (continued)
June 30, 2015
Security Description | Principal | Value | ||||||
Epicor Software Corp., Senior Secured First Lien Term Loan, 4.75%, 5/8/22 | $ | 5,725,490 | $ | 5,720,881 | ||||
Infor (US), Inc. | ||||||||
Senior Secured Term Loan B5, 3.75%, 6/3/20 | 2,678,137 | 2,646,615 | ||||||
Senior Secured Term Loan B3, 3.75%, 6/3/20 | 1,682,054 | 1,660,767 | ||||||
Italics Merger Sub, Inc., Senior Secured Term Loan, LIBOR + 3.50%, 5/29/22 | 4,936,709 | 4,935,179 | ||||||
Kronos, Inc. | ||||||||
Senior Secured Second Lien Term Loan, 9.75%, 4/30/20 | 4,094,695 | 4,232,891 | ||||||
Senior Secured Incremental Term Loan, 4.50%, 10/30/19 | 3,000,000 | 3,006,000 | ||||||
MA FinanceCo., LLC, Senior Secured Term Loan B, 5.25%, 11/19/21 | 4,394,327 | 4,408,828 | ||||||
Mitchell International, Inc., Senior Secured First Lien Term Loan, 4.50%, 10/12/20 | 2,786,050 | 2,787,207 | ||||||
Mitel US Holdings, Inc., Senior Secured Term Loan, 5.00%, 3/31/22 | 4,754,717 | 4,791,875 | ||||||
TIBCO Software, Inc., Senior Secured Term Loan B, 6.50%, 12/4/20 | 8,716,102 | 8,726,997 | ||||||
Vertafore, Inc., Senior Secured First Lien Term Loan, 4.25%, 10/3/19 | 2,905,539 | 2,908,445 | ||||||
|
| |||||||
| 75,526,788 | ||||||||
|
| |||||||
SPECIALTY RETAIL — 4.5% |
| |||||||
Academy, Ltd., Senior Secured Term Loan B, 5.00%, 6/2/22 | 5,941,624 | 5,949,051 | ||||||
Bass Pro Group LLC, Senior Secured Term Loan, 4.00%, 6/5/20 | 3,181,371 | 3,186,207 | ||||||
Men’s Wearhouse, Inc., Senior Secured Term Loan B, 4.50%, 6/18/21 | 2,457,650 | 2,467,640 | ||||||
Michaels Stores, Inc., Senior Secured Term Loan B, 3.75%, 1/28/20 | 1,960,000 | 1,957,275 | ||||||
Party City Holdings, Inc., Senior Secured Term Loan, 4.00%, 7/27/19 | 5,882,795 | 5,884,177 | ||||||
PetSmart, Inc., Senior Secured Term Loan B, 4.25%, 3/11/22 | 7,699,115 | 7,693,341 | ||||||
Serta Simmons Holdings LLC, Senior Secured Term Loan, 4.25%, 10/1/19 | 3,109,704 | 3,114,695 | ||||||
|
| |||||||
| 30,252,386 | ||||||||
|
| |||||||
TECHNOLOGY HARDWARE, STORAGE & PERIPHERALS — 2.1% |
| |||||||
BWAY Holding Co., Inc., Senior Secured Term Loan B, 5.50%, 8/14/20 | 2,121,429 | 2,127,613 | ||||||
Dell, Inc., Senior Secured Term Loan B2, 4.00%, 4/29/20 | 11,939,773 | 11,961,085 | ||||||
|
| |||||||
| 14,088,698 | ||||||||
|
| |||||||
Security Description | Principal | Value | ||||||
WIRELESS TELECOMMUNICATION SERVICES — 2.0% |
| |||||||
Avaya, Inc., Senior Secured Term Loan B7, 6.25%, 5/29/20 | $ | 13,871,257 | $ | 13,445,201 | ||||
|
| |||||||
TOTAL SENIOR FLOATING RATE LOANS | 633,953,793 | |||||||
|
| |||||||
CORPORATE BONDS & NOTES — 8.1% |
| |||||||
CHEMICALS — 0.5% |
| |||||||
PQ Corp., 8.75%, 11/1/18 (b) | 3,242,000 | 3,274,420 | ||||||
|
| |||||||
COMMERCIAL SERVICES & SUPPLIES — 0.2% |
| |||||||
Aramark Services, Inc., 5.75%, 3/15/20 | 1,000,000 | 1,044,000 | ||||||
|
| |||||||
CONTAINERS & PACKAGING — 0.8% |
| |||||||
Beverage Packaging Holdings Luxembourg II SA/Beverage Packaging Holdings II Is, 6.00%, 6/15/17 (b) | 3,000,000 | 3,000,000 | ||||||
Coveris Holdings SA, 7.88%, 11/1/19 (b) | 2,600,000 | 2,587,000 | ||||||
|
| |||||||
| 5,587,000 | ||||||||
|
| |||||||
DIVERSIFIED CONSUMER SERVICES — 0.2% |
| |||||||
Reynolds Group Issuer, Inc./Reynolds Group Issuer LLC/Reynolds Group Issuer Lu, 5.75%, 10/15/20 | 1,000,000 | 1,025,000 | ||||||
|
| |||||||
HEALTH CARE PROVIDERS & SERVICES — 0.8% |
| |||||||
Tenet Healthcare Corp., 3.79%, 6/15/20 (b) | 5,000,000 | 5,043,750 | ||||||
|
| |||||||
HOTELS, RESTAURANTS & LEISURE — 0.7% |
| |||||||
Caesars Entertainment Resort Properties LLC, 8.00%, 10/1/20 | 1,465,000 | 1,379,853 | ||||||
Scientific Games International, Inc., 7.00%, 1/1/22 (b) | 3,400,000 | 3,510,500 | ||||||
|
| |||||||
| 4,890,353 | ||||||||
|
| |||||||
INDEPENDENT POWER & RENEWABLE ELECTRICITY PRODUCERS — 0.4% |
| |||||||
AES Corp., 3.28%, 6/1/19 | 3,000,000 | 3,000,000 | ||||||
|
| |||||||
INTERNET SOFTWARE & SERVICES — 0.1% |
| |||||||
Sabre, Inc., 5.38%, 4/15/23 (b) | 950,000 | 935,750 | ||||||
|
| |||||||
LEISURE PRODUCTS — 0.3% |
| |||||||
Cedar Fair LP/Canada’s Wonderland Co./Magnum Management Corp., 5.25%, 3/15/21 (a) | 2,000,000 | 2,055,000 | ||||||
|
| |||||||
LIFE SCIENCES TOOLS & SERVICES — 0.2% |
| |||||||
Quintiles Transnational Corp., 4.88%, 5/15/23 (b) | 1,650,000 | 1,658,250 | ||||||
|
| |||||||
MEDIA — 2.2% |
| |||||||
iHeartCommunications, Inc., 9.00%, 12/15/19 | 10,000,000 | 9,530,000 | ||||||
MHGE Parent LLC/MHGE Parent Finance, Inc., 8.50%, 8/1/19 (b) | 5,000,000 | 5,037,500 | ||||||
|
| |||||||
| 14,567,500 | ||||||||
|
| |||||||
METALS & MINING — 0.2% |
| |||||||
FMG Resources August 2006 Pty, Ltd., 9.75%, 3/1/22 (b) | 1,000,000 | 1,032,500 | ||||||
|
| |||||||
See accompanying notes to financial statements.
18
Table of Contents
Blackstone/GSO Senior Loan Portfolio
SCHEDULE OF INVESTMENTS (continued)
June 30, 2015
Security Description | Principal | Value | ||||||
WIRELESS TELECOMMUNICATION SERVICES — 1.5% |
| |||||||
Avaya, Inc. | ||||||||
10.50%, 3/1/21 (b) | $ | 3,850,000 | $ | 3,176,250 | ||||
9.00%, 4/1/19 (b) | 4,000,000 | 4,080,000 | ||||||
7.00%, 4/1/19 (b) | 3,000,000 | 2,932,500 | ||||||
|
| |||||||
| 10,188,750 | ||||||||
|
| |||||||
TOTAL CORPORATE BONDS & NOTES | 54,302,273 | |||||||
|
| |||||||
Shares | ||||||||
SHORT TERM INVESTMENT — 1.8% |
| |||||||
MONEY MARKET FUNDS — 1.8% |
| |||||||
State Street Institutional Liquid Reserves Fund, Premier Class, 0.11% (c) (d) (e) | 11,996,420 | 11,996,420 | ||||||
|
| |||||||
TOTAL INVESTMENTS —104.2% (f) | 700,252,486 | |||||||
OTHER ASSETS & | (27,988,784 | ) | ||||||
|
| |||||||
NET ASSETS — 100.0% | $ | 672,263,702 | ||||||
|
| |||||||
| * | The interest rate shown represents the rate at period end. |
| (a) | Securities are valued at fair value as determined in good faith by the Trust’s Oversight Committee in accordance with procedures approved by the Board of Trustees (Note 2). |
| (b) | Securities purchased pursuant to Rule 144A of the Securities Act of 1933. These securities, which represent 5.4% of net assets as of June 30, 2015, are considered liquid and may be resold in transactions exempt from registration, normally to qualified institutional buyers. |
| (c) | Affiliated Fund managed by SSGA Funds Management, Inc. (Note 3). |
| (d) | The rate shown is the annualized seven-day yield at period end. |
| (e) | Value is determined based on Level 1 inputs (Note 2). |
| (f) | Unless otherwise indicated, the values of the investments of the Portfolio are determined based on Level 2 inputs (Note 2). |
See accompanying notes to financial statements.
19
Table of Contents
SSGA Ultra Short Term Bond Portfolio
SCHEDULE OF INVESTMENTS
June 30, 2015
Security Description | Principal | Value | ||||||
ASSET BACKED SECURITIES — 21.9% |
| |||||||
AUTOMOBILES — 11.9% |
| |||||||
Ford Credit Auto Lease Trust, 0.76%, 9/15/16 | $ | 181,715 | $ | 181,797 | ||||
Ford Credit Auto Owner Trust, 0.48%, 11/15/16 | 22,745 | 22,744 | ||||||
Ford Credit Floorplan Master Owner Trust, 0.59%, 2/15/19 (a) | 200,000 | 200,007 | ||||||
GE Dealer Floorplan Master Note Trust, 0.57%, 7/20/19 (a) | 250,000 | 248,656 | ||||||
John Deere Owner Trust, 0.54%, 7/17/17 | 332,338 | 332,361 | ||||||
Mercedes-Benz Master Owner Trust, 0.51%, 4/15/19 (a) (b) | 500,000 | 500,136 | ||||||
Santander Drive Auto Receivables Trust, 0.82%, 2/15/18 | 242,480 | 242,502 | ||||||
World Omni Auto Receivables Trust, 0.60%, 1/16/18 | 178,080 | 178,095 | ||||||
|
| |||||||
| 1,906,298 | ||||||||
|
| |||||||
CREDIT CARD RECEIVABLES — 8.9% |
| |||||||
BA Credit Card Trust, 0.47%, 1/15/20 (a) | 300,000 | 299,811 | ||||||
Barclays Dryrock Issuance Trust 0.55%, 12/16/19 (a) | 200,000 | 200,001 | ||||||
0.53%, 3/16/20 (a) | 100,000 | 99,981 | ||||||
Citibank Credit Card Issuance Trust, 0.62%, 9/10/20 (a) | 250,000 | 250,498 | ||||||
Golden Credit Card Trust, 0.53%, 3/15/19 (a) (b) | 585,000 | 583,450 | ||||||
|
| |||||||
| 1,433,741 | ||||||||
|
| |||||||
STUDENT LOAN ABS — 1.1% |
| |||||||
SLM Student Loan Trust, | 173,275 | 173,253 | ||||||
|
| |||||||
TOTAL ASSET BACKED SECURITIES | 3,513,292 | |||||||
|
| |||||||
CORPORATE BONDS & NOTES — 64.4% |
| |||||||
AEROSPACE & DEFENSE — 1.6% |
| |||||||
Boeing Co., 0.40%, 10/30/17 (a) | 250,000 | 250,135 | ||||||
|
| |||||||
AUTOMOBILES — 9.3% |
| |||||||
American Honda Finance Corp. 0.41%, 9/2/16 (a) | 100,000 | 99,948 | ||||||
0.66%, 5/26/16 (a) (b) | 220,000 | 220,517 | ||||||
Daimler Finance North America LLC 0.96%, 8/1/16 (a) (b) | 160,000 | 160,668 | ||||||
1.25%, 1/11/16 (b) | 350,000 | 351,028 | ||||||
Harley-Davidson Financial Services, Inc., 1.15%, 9/15/15 (b) | 400,000 | 400,171 | ||||||
Volkswagen International Finance NV, 1.15%, 11/20/15 (b) | 250,000 | 250,563 | ||||||
|
| |||||||
| 1,482,895 | ||||||||
|
| |||||||
BANKS — 23.3% |
| |||||||
American Express Centurion Bank, 0.73%, 11/13/15 (a) | 60,000 | 60,056 | ||||||
Bank of America NA | 125,000 | 125,034 | ||||||
0.70%, 5/8/17 (a) | 400,000 | 399,389 | ||||||
Bank of Montreal, | 175,000 | 175,666 | ||||||
Security Description | Principal | Value | ||||||
Canadian Imperial Bank of Commerce, 0.80%, 7/18/16 (a) | $ | 100,000 | $ | 100,353 | ||||
Cooperatieve Centrale Raiffeisen-Boerenleenbank BA/NY, 0.77%, 3/18/16 (a) | 225,000 | 225,638 | ||||||
JPMorgan Chase & Co. 0.73%, 11/18/16 (a) | 225,000 | 225,077 | ||||||
2.60%, 1/15/16 | 250,000 | 251,983 | ||||||
National Australia Bank, Ltd., | 250,000 | 250,148 | ||||||
Nederlandse Waterschapsbank NV, 0.48%, 10/18/16 (a) (b) | 200,000 | 200,409 | ||||||
Royal Bank of Canada, 0.53%, 6/16/17 (a) | 320,000 | 319,469 | ||||||
Svenska Handelsbanken AB, 0.73%, 3/21/16 (a) | 250,000 | 250,714 | ||||||
Toronto-Dominion Bank, 0.52%, 5/2/17 (a) | 380,000 | 379,776 | ||||||
US Bancorp, 0.76%, 11/15/18 (a) | 150,000 | 150,441 | ||||||
US Bank NA, 0.58%, 1/26/18 (a) | 250,000 | 249,677 | ||||||
Wells Fargo & Co., 0.58%, 6/2/17 (a) | 150,000 | 149,759 | ||||||
Westpac Banking Corp., 0.71%, 11/25/16 (a) | 220,000 | 220,778 | ||||||
|
| |||||||
| 3,734,367 | ||||||||
|
| |||||||
BEVERAGES — 6.1% |
| |||||||
Anheuser-Busch InBev Finance, Inc., 0.68%, 2/1/19 (a) | 250,000 | 246,836 | ||||||
Diageo Finance BV, 5.30%, 10/28/15 | 485,000 | 492,069 | ||||||
PepsiCo, Inc., 0.70%, 8/13/15 | 240,000 | 240,092 | ||||||
|
| |||||||
| 978,997 | ||||||||
|
| |||||||
CHEMICALS — 1.2% |
| |||||||
Praxair, Inc., 3.25%, 9/15/15 | 200,000 | 201,093 | ||||||
|
| |||||||
COMMUNICATIONS EQUIPMENT — 1.6% |
| |||||||
Cisco Systems, Inc., 0.56%, 3/3/17 (a) | 250,000 | 250,351 | ||||||
|
| |||||||
CONSUMER FINANCE — 2.5% |
| |||||||
Caterpillar Financial Services Corp. | ||||||||
0.42%, 3/3/17 (a) | 200,000 | 199,892 | ||||||
0.46%, 6/9/17 (a) | 200,000 | 199,922 | ||||||
|
| |||||||
| 399,814 | ||||||||
|
| |||||||
DIVERSIFIED FINANCIAL SERVICES — 8.4% |
| |||||||
American Express Credit Corp., 0.58%, 9/22/17 (a) | 250,000 | 249,146 | ||||||
BP Capital Markets PLC, 0.61%, 11/6/15 (a) | 150,000 | 150,004 | ||||||
General Electric Capital Corp. 0.48%, 5/11/16 (a) | 300,000 | 300,559 | ||||||
1.15%, 5/9/16 (a) | 150,000 | 151,041 | ||||||
Toyota Motor Credit Corp. | 400,000 | 399,598 | ||||||
0.38%, 9/23/16 (a) | 100,000 | 100,061 | ||||||
|
| |||||||
| 1,350,409 | ||||||||
|
| |||||||
INTERNET SOFTWARE & SERVICES — 1.0% |
| |||||||
eBay, Inc., 0.76%, 8/1/19 (a) | 160,000 | 156,757 | ||||||
|
| |||||||
MEDIA — 2.2% |
| |||||||
NBCUniversal Enterprise, Inc. | ||||||||
0.81%, 4/15/16 (a) (b) | 200,000 | 200,574 | ||||||
See accompanying notes to financial statements.
20
Table of Contents
SSGA Ultra Short Term Bond Portfolio
SCHEDULE OF INVESTMENTS (continued)
June 30, 2015
Security Description | Principal | Value | ||||||
0.96%, 4/15/18 (a) (b) | $ | 150,000 | $ | 150,681 | ||||
|
| |||||||
| 351,255 | ||||||||
|
| |||||||
METALS & MINING — 1.2% |
| |||||||
Rio Tinto Finance USA PLC, 1.12%, 6/17/16 (a) | 200,000 | 200,508 | ||||||
|
| |||||||
OIL, GAS & CONSUMABLE FUELS — 5.3% |
| |||||||
Chevron Corp., 0.45%, 3/2/18 (a) | 250,000 | 249,132 | ||||||
ConocoPhillips Co., 0.61%, 5/15/18 (a) | 250,000 | 249,925 | ||||||
Statoil ASA, 0.48%, 11/9/17 (a) | 350,000 | 348,513 | ||||||
|
| |||||||
| 847,570 | ||||||||
|
| |||||||
ROAD & RAIL — 0.7% |
| |||||||
Canadian National Railway Co., | 119,000 | 119,020 | ||||||
|
| |||||||
TOTAL CORPORATE BONDS & NOTES | 10,323,171 | |||||||
|
| |||||||
U.S. TREASURY OBLIGATIONS — 10.5% |
| |||||||
Treasury Bill, 0.00%, 9/10/15 | 400,000 | 400,012 | ||||||
Treasury Notes | ||||||||
0.88%, 4/30/17 | 620,000 | 623,148 | ||||||
0.38%, 1/31/16 | 100,000 | 100,134 | ||||||
0.88%, 9/15/16 | 550,000 | 553,180 | ||||||
|
| |||||||
TOTAL U.S. TREASURY OBLIGATIONS | 1,676,474 | |||||||
|
| |||||||
Shares | ||||||||
SHORT TERM INVESTMENT — 3.1% |
| |||||||
MONEY MARKET FUND — 3.1% |
| |||||||
State Street Institutional Liquid Reserves Fund, Premier Class 0.11% (c) (d) (e) | 487,918 | 487,918 | ||||||
|
| |||||||
TOTAL INVESTMENTS — 99.9% (f) | 16,000,855 | |||||||
OTHER ASSETS & LIABILITIES — 0.1% | 18,263 | |||||||
|
| |||||||
NET ASSETS — 100.0% | $ | 16,019,118 | ||||||
|
| |||||||
| (a) | Variable rate security. Rate shown is rate in effect at June 30, 2015. Maturity date disclosed is the ultimate maturity. |
| (b) | Securities purchased pursuant to Rule 144A of the Securities Act of 1933. These securities, which represent 20.4% of net assets as of June 30, 2015, are considered liquid and may be resold in transactions exempt from registration, normally to qualified institutional buyers. |
| (c) | Affiliated Fund managed by SSGA Funds Management, Inc. (Note 3). |
| (d) | The rate shown is the annualized seven-day yield at period end. |
| (e) | Value is determined based on Level 1 inputs (Note 2). |
| (f) | Unless otherwise indicated, the values of the investments of the Portfolio are determined based on Level 2 inputs (Note 2). |
PLC = Public Limited Company
See accompanying notes to financial statements.
21
Table of Contents
State Street DoubleLine Total Return Tactical Portfolio
SCHEDULE OF INVESTMENTS
June 30, 2015
Security Description | Principal | Value | ||||||
CORPORATE BONDS & NOTES — 18.9% |
| |||||||
AUSTRALIA — 0.2% |
| |||||||
CNOOC Finance 2015 Australia Pty, Ltd., 2.63%, 5/5/20 | $ | 1,500,000 | $ | 1,480,226 | ||||
|
| |||||||
AUSTRIA — 0.1% |
| |||||||
ESAL GmbH, 6.25%, 2/5/23 | 200,000 | 197,000 | ||||||
JBS Investments GmbH, 7.75%, 10/28/20 | 400,000 | 435,000 | ||||||
|
| |||||||
| 632,000 | ||||||||
|
| |||||||
BERMUDA — 0.3% |
| |||||||
Inkia Energy, Ltd. | 200,000 | 214,960 | ||||||
8.38%, 4/4/21 | 200,000 | 214,960 | ||||||
NCL Corp., Ltd., 5.25%, 11/15/19 (a) | 1,000,000 | 1,023,750 | ||||||
Viking Cruises, Ltd., 8.50%, 10/15/22 (a) | 1,050,000 | 1,165,500 | ||||||
|
| |||||||
| 2,619,170 | ||||||||
|
| |||||||
BRAZIL — 0.2% |
| |||||||
Banco do Brasil SA, 9.00%, 6/29/49 (b) | 200,000 | 180,440 | ||||||
Cosan Overseas, Ltd., 8.25%, 11/29/49 | 600,000 | 597,000 | ||||||
Globo Comunicacao e Participacoes SA, | 700,000 | 721,000 | ||||||
|
| |||||||
| 1,498,440 | ||||||||
|
| |||||||
BRITISH VIRGIN ISLANDS — 0.3% |
| |||||||
Central American Bottling Corp., | 500,000 | 531,250 | ||||||
CNPC HK Overseas Capital, Ltd., | 400,000 | 426,105 | ||||||
Sinopec Group Overseas Development 2014, Ltd., 2.75%, 4/10/19 | 287,000 | 288,872 | ||||||
Sinopec Group Overseas Development 2015, Ltd. | 500,000 | 492,470 | ||||||
2.50%, 4/28/20 (a) | 500,000 | 492,470 | ||||||
|
| |||||||
| 2,231,167 | ||||||||
|
| |||||||
CANADA — 0.4% |
| |||||||
Gibson Energy, Inc., 6.75%, 7/15/21 (a) | 250,000 | 258,125 | ||||||
Pacific Rubiales Energy Corp., | 400,000 | 328,000 | ||||||
Seven Generations Energy, Ltd., | 1,255,000 | 1,331,555 | ||||||
Ultra Petroleum Corp. | 1,000,000 | 960,000 | ||||||
6.13%, 10/1/24 (a) | 145,000 | 127,237 | ||||||
|
| |||||||
| 3,004,917 | ||||||||
|
| |||||||
CAYMAN ISLANDS — 0.5% |
| |||||||
AES Andres Dominicana, Ltd. / Itabo Dominicana, Ltd., 9.50%, 11/12/20 | 300,000 | 315,000 | ||||||
Agromercantil Senior Trust, | 1,100,000 | 1,133,000 | ||||||
Guanay Finance, Ltd., 6.00%, 12/10/20 | 1,500,000 | 1,548,300 | ||||||
Security Description | Principal | Value | ||||||
Industrial Senior Trust, 5.50%, 11/1/22 | $ | 400,000 | $ | 387,000 | ||||
Marfrig Overseas, Ltd., 9.50%, 5/4/20 | 250,000 | 255,425 | ||||||
|
| |||||||
| 3,638,725 | ||||||||
|
| |||||||
CHILE — 1.0% |
| |||||||
AES Gener SA, 5.25%, 8/15/21 | 1,500,000 | 1,585,708 | ||||||
Banco de Credito e Inversiones, | 300,000 | 297,056 | ||||||
Cencosud SA | 400,000 | 403,056 | ||||||
4.88%, 1/20/23 | 200,000 | 201,043 | ||||||
Colbun SA, 6.00%, 1/21/20 | 700,000 | 772,524 | ||||||
Corpbanca SA, 3.88%, 9/22/19 | 600,000 | 608,750 | ||||||
CorpGroup Banking SA, 6.75%, 3/15/23 | 750,000 | 745,790 | ||||||
Empresa Electrica Guacolda SA, | 900,000 | 869,415 | ||||||
Entel Chile SA, 4.75%, 8/1/26 | 200,000 | 196,330 | ||||||
Latam Airlines Group SA, 7.25%, 6/9/20 (a) | 800,000 | 824,166 | ||||||
Tanner Servicios Financieros SA, | 1,100,000 | 1,120,266 | ||||||
Telefonica Chile SA, 3.88%, 10/12/22 | 200,000 | 196,060 | ||||||
|
| |||||||
| 7,820,164 | ||||||||
|
| |||||||
COLUMBIA — 0.5% |
| |||||||
Banco GNB Sudameris SA, 7.50%, 7/30/22 | 400,000 | 420,600 | ||||||
Ecopetrol SA, 5.88%, 5/28/45 | 500,000 | 441,250 | ||||||
Empresas Publicas de Medellin ESP, | 600,000 | 699,000 | ||||||
GrupoSura Finance SA, 5.70%, 5/18/21 | 800,000 | 851,760 | ||||||
Transportadora de Gas Internacional SA ESP | 200,000 | 209,750 | ||||||
5.70%, 3/20/22 | 1,000,000 | 1,048,750 | ||||||
|
| |||||||
| 3,671,110 | ||||||||
|
| |||||||
COSTA RICA — 0.3% |
| |||||||
Banco de Costa Rica, 5.25%, 8/12/18 | 650,000 | 666,575 | ||||||
Banco Nacional de Costa Rica | 200,000 | 201,000 | ||||||
4.88%, 11/1/18 | 700,000 | 705,250 | ||||||
Instituto Costarricense de Electricidad, | 400,000 | 419,500 | ||||||
|
| |||||||
| 1,992,325 | ||||||||
|
| |||||||
DOMINICAN REPUBLIC — 0.1% |
| |||||||
Aeropuertos Dominicanos Siglo XXI SA, | 400,000 | 408,000 | ||||||
|
| |||||||
GUATEMALA — 0.1% |
| |||||||
Cementos Progreso Trust, 7.13%, 11/6/23 | 500,000 | 532,343 | ||||||
Comcel Trust via Comunicaciones Celulares SA, 6.88%, 2/6/24 | 300,000 | 315,750 | ||||||
|
| |||||||
| 848,093 | ||||||||
|
| |||||||
HONG KONG — 0.2% | ||||||||
Hutchison Whampoa International 12, Ltd., 6.00%, 5/29/49 (b) | 1,000,000 | 1,061,540 | ||||||
See accompanying notes to financial statements.
22
Table of Contents
State Street DoubleLine Total Return Tactical Portfolio
SCHEDULE OF INVESTMENTS (continued)
June 30, 2015
Security Description | Principal | Value | ||||||
Hutchison Whampoa International 12 II, Ltd., 3.25%, 11/8/22 | $ | 500,000 | $ | 497,449 | ||||
|
| |||||||
| 1,558,989 | ||||||||
|
| |||||||
INDIA — 0.1% | ||||||||
ONGC Videsh, Ltd., 3.25%, 7/15/19 | 500,000 | 501,865 | ||||||
|
| |||||||
ISRAEL — 0.5% | ||||||||
B Communications, Ltd., 7.38%, 2/15/21 (a) | 300,000 | 321,750 | ||||||
Delek & Avner Tamar Bond, Ltd., 4.44%, 12/30/20 (a) | 1,400,000 | 1,426,250 | ||||||
Israel Electric Corp., Ltd. 5.63%, 6/21/18 | 1,000,000 | 1,063,120 | ||||||
5.00%, 11/12/24 (a) | 600,000 | 607,800 | ||||||
|
| |||||||
| 3,418,920 | ||||||||
|
| |||||||
JAMAICA — 0.2% | ||||||||
Digicel Group, Ltd., 7.13%, 4/1/22 | 1,300,000 | 1,234,610 | ||||||
|
| |||||||
LUXEMBOURG — 0.2% | ||||||||
ArcelorMittal, 5.13%, 6/1/20 | 400,000 | 405,500 | ||||||
Gol LuxCo SA, 8.88%, 1/24/22 | 200,000 | 161,500 | ||||||
Minerva Luxembourg SA, 8.75%, 12/29/49 (b) | 1,300,000 | 1,300,000 | ||||||
|
| |||||||
| 1,867,000 | ||||||||
|
| |||||||
MEXICO — 1.4% | ||||||||
Banco Inbursa SA Institucion de Banca Multiple, 4.13%, 6/6/24 | 900,000 | 864,450 | ||||||
Banco Santander Mexico SA Institucion de Banca Multiple Grupo Financiero Santand, 5.95%, 1/30/24 (b) | 1,300,000 | 1,361,750 | ||||||
BBVA Bancomer SA, 5.35%, 11/12/29 (b) | 880,000 | 875,600 | ||||||
BBVA Bancomer SA, 6.01%, 5/17/22 (b) | 200,000 | 205,700 | ||||||
Comision Federal de Electricidad, | 1,200,000 | 1,254,000 | ||||||
Credito Real SAB de CV SOFOM ER, | 200,000 | 210,000 | ||||||
Fermaca Enterprises S de RL de CV, | 297,821 | 302,288 | ||||||
Grupo Bimbo SAB de CV, 4.50%, 1/25/22 | 600,000 | 628,800 | ||||||
Grupo Elektra SAB DE CV, 7.25%, 8/6/18 | 900,000 | 927,000 | ||||||
Grupo Idesa SA de CV, 7.88%, 12/18/20 | 850,000 | 898,875 | ||||||
Grupo Posadas SAB de CV 7.88%, 6/30/22 (a) | 400,000 | 405,000 | ||||||
Mexico Generadora de Energia S de rl, 5.50%, 12/6/32 | 196,824 | 191,903 | ||||||
Petroleos Mexicanos, 5.50%, 1/21/21 | 700,000 | 760,375 | ||||||
Sixsigma Networks Mexico SA de CV, 8.25%, 11/7/21 | 200,000 | 206,740 | ||||||
TV Azteca SAB de CV | 600,000 | 619,440 | ||||||
7.63%, 9/18/20 | 300,000 | 315,375 | ||||||
Security Description | Principal | Value | ||||||
Unifin Financiera SAPI de CV SOFOM ENR, 6.25%, 7/22/19 | $ | 400,000 | $ | 395,500 | ||||
|
| |||||||
| 10,422,796 | ||||||||
|
| |||||||
NETHERLANDS — 0.2% | ||||||||
Ajecorp BV, 6.50%, 5/14/22 | 150,000 | 109,500 | ||||||
CIMPOR Financial Operations BV, | 700,000 | 567,000 | ||||||
Marfrig Holding Europe BV, 6.88%, 6/24/19 | 1,000,000 | 952,500 | ||||||
|
| |||||||
| 1,629,000 | ||||||||
|
| |||||||
PANAMA — 0.8% | ||||||||
Aeropuerto Internacional de Tocumen SA, 5.75%, 10/9/23 | 1,000,000 | 1,040,000 | ||||||
Avianca Holdings SA / Avianca Leasing LLC / Grupo Taca Holdings, Ltd., | 1,000,000 | 1,007,500 | ||||||
Banco Latinoamericano de Comercio Exterior SA, 3.25%, 5/7/20 (a) | 1,500,000 | 1,492,500 | ||||||
ENA Norte Trust, 4.95%, 4/25/28 | 799,956 | 828,955 | ||||||
Global Bank Corp. | ||||||||
4.75%, 10/5/17 | 400,000 | 409,600 | ||||||
5.13%, 10/30/19 | 1,100,000 | 1,117,050 | ||||||
5.13%, 10/30/19 (a) | 200,000 | 203,100 | ||||||
|
| |||||||
| 6,098,705 | ||||||||
|
| |||||||
PARAGUAY — 0.2% | ||||||||
Banco Continental SAECA, | 423,000 | 444,996 | ||||||
Banco Regional SAECA, | 550,000 | 590,562 | ||||||
Telefonica Celular del Paraguay SA, | 700,000 | 724,500 | ||||||
|
| |||||||
| 1,760,058 | ||||||||
|
| |||||||
PERU — 0.8% | ||||||||
Abengoa Transmision Sur SA, 6.88%, 4/30/43 | 400,000 | 443,500 | ||||||
Banco Internacional del Peru SAA Interbank, 6.63%, 3/19/29 (b) | 400,000 | 425,800 | ||||||
BBVA Banco Continental SA, 5.25%, 9/22/29 (b) | 500,000 | 506,875 | ||||||
Cia Minera Ares SAC, 7.75%, 1/23/21 | 600,000 | 615,750 | ||||||
Corp Azucarera del Peru SA, 6.38%, 8/2/22 | 300,000 | 268,534 | ||||||
Corp Financiera de Desarrollo SA, | 1,000,000 | 1,005,900 | ||||||
InRetail Shopping Malls, 6.50%, 7/9/21 | 700,000 | 743,960 | ||||||
Peru Enhanced Pass-Through Finance, Ltd., 0.00%, 6/2/25 (c) | 500,000 | 374,605 | ||||||
Union Andina de Cementos SAA, | 1,000,000 | 1,011,250 | ||||||
Volcan Cia Minera SAA, 5.38%, 2/2/22 | 400,000 | 389,500 | ||||||
|
| |||||||
| 5,785,674 | ||||||||
|
| |||||||
QATAR — 0.1% | ||||||||
Ras Laffan Liquefied Natural Gas Co., Ltd. II, 5.30%, 9/30/20 | 515,430 | 555,376 | ||||||
|
| |||||||
See accompanying notes to financial statements.
23
Table of Contents
State Street DoubleLine Total Return Tactical Portfolio
SCHEDULE OF INVESTMENTS (continued)
June 30, 2015
Security Description | Principal | Value | ||||||
SINGAPORE — 0.4% | ||||||||
Oversea-Chinese Banking Corp., Ltd., | $ | 1,500,000 | $ | 1,535,977 | ||||
United Overseas Bank, Ltd., | 1,500,000 | 1,529,265 | ||||||
|
| |||||||
| 3,065,242 | ||||||||
|
| |||||||
UNITED KINGDOM — 0.1% | ||||||||
Vedanta Resources PLC, 8.25%, 6/7/21 | 500,000 | 509,098 | ||||||
|
| |||||||
UNITED STATES — 9.7% | ||||||||
Activision Blizzard, Inc., 5.63%, 9/15/21 (a) | 823,000 | 862,092 | ||||||
Alere, Inc., 6.50%, 6/15/20 | 785,000 | 808,550 | ||||||
Amazon.com, Inc., 2.60%, 12/5/19 | 1,825,000 | 1,832,595 | ||||||
American Axle & Manufacturing, Inc., | 805,000 | 845,250 | ||||||
Audatex North America, Inc., 6.00%, 6/15/21 (a) | 1,080,000 | 1,109,700 | ||||||
Avis Budget Car Rental LLC / Avis Budget Finance, Inc., 5.50%, 4/1/23 | 1,200,000 | 1,185,000 | ||||||
Bank of America Corp., 2.00%, 1/11/18 | 1,815,000 | 1,819,698 | ||||||
Berry Plastics Corp., 5.50%, 5/15/22 | 600,000 | 602,250 | ||||||
Burlington Northern Santa Fe LLC, | 1,840,000 | 1,822,174 | ||||||
CCO Holdings LLC / CCO Holdings Capital Corp. | 940,000 | 925,900 | ||||||
5.13%, 5/1/23 (a) | 95,000 | 92,388 | ||||||
CDW LLC / CDW Finance Corp., | 1,200,000 | 1,239,000 | ||||||
Cequel Communications Holdings I LLC / Cequel Capital Corp., 6.38%, 9/15/20 (a) | 605,000 | 600,916 | ||||||
Comcast Corp. | 395,000 | 381,263 | ||||||
4.40%, 8/15/35 | 1,460,000 | 1,440,428 | ||||||
CommScope, Inc., 5.00%, 6/15/21 (a) | 1,000,000 | 975,000 | ||||||
Dow Chemical Co., 3.00%, 11/15/22 | 1,905,000 | 1,832,215 | ||||||
Duke Energy Corp., 3.75%, 4/15/24 | 1,805,000 | 1,824,182 | ||||||
Family Tree Escrow LLC, 5.75%, 3/1/23 (a) | 850,000 | 888,250 | ||||||
Freeport-McMoRan, Inc. | 300,000 | 248,071 | ||||||
3.88%, 3/15/23 | 800,000 | 726,978 | ||||||
Gates Global LLC / Gates Global Co., 6.00%, 7/15/22 (a) | 906,000 | 819,930 | ||||||
General Electric Capital Corp., 2.90%, 1/9/17 | 1,750,000 | 1,801,755 | ||||||
Georgia-Pacific LLC, 3.60%, 3/1/25 (a) | 1,773,000 | 1,755,607 | ||||||
Goldman Sachs Group, Inc., 2.60%, 4/23/20 | 1,840,000 | 1,829,383 | ||||||
Goodyear Tire & Rubber Co., 7.00%, 5/15/22 | 800,000 | 869,800 | ||||||
HCA, Inc., 4.25%, 10/15/19 | 640,000 | 655,200 | ||||||
HD Supply, Inc., 7.50%, 7/15/20 | 800,000 | 846,000 | ||||||
Icahn Enterprises LP / Icahn Enterprises Finance Corp., 4.88%, 3/15/19 | 800,000 | 806,000 | ||||||
Security Description | Principal | Value | ||||||
JPMorgan Chase & Co., 1.35%, 2/15/17 | $ | 1,780,000 | $ | 1,780,318 | ||||
Kindred Healthcare, Inc., 8.00%, 1/15/20 (a) | 1,000,000 | 1,070,000 | ||||||
Level 3 Communications, Inc., 5.75%, 12/1/22 | 1,000,000 | 992,500 | ||||||
Levi Strauss & Co., 5.00%, 5/1/25 (a) | 1,000,000 | 967,500 | ||||||
LifePoint Health, Inc., 5.50%, 12/1/21 | 1,000,000 | 1,032,500 | ||||||
Memorial Production Partners LP / Memorial Production Finance Corp., 6.88%, 8/1/22 | 1,300,000 | 1,175,850 | ||||||
MetLife, Inc., 3.60%, 4/10/24 | 1,825,000 | 1,831,186 | ||||||
MGM Resorts International, 6.63%, 12/15/21 | 780,000 | 815,100 | ||||||
Morgan Stanley, 2.65%, 1/27/20 | 1,820,000 | 1,816,220 | ||||||
Oracle Corp. | ||||||||
2.38%, 1/15/19 | 700,000 | 709,923 | ||||||
2.25%, 10/8/19 | 1,125,000 | 1,128,253 | ||||||
Platform Specialty Products Corp., | 800,000 | 826,000 | ||||||
Quintiles Transnational Corp., | 1,000,000 | 1,005,000 | ||||||
Regal Entertainment Group, 5.75%, 3/15/22 | 900,000 | 910,080 | ||||||
Reliance Holding USA, Inc., | 250,000 | 264,792 | ||||||
Revlon Consumer Products Corp., | 800,000 | 784,000 | ||||||
Reynolds American, Inc., 4.00%, 6/12/22 | 1,785,000 | 1,825,077 | ||||||
Sally Holdings LLC / Sally Capital, Inc., | 1,200,000 | 1,251,000 | ||||||
SBA Communications Corp., 5.63%, 10/1/19 | 1,000,000 | 1,040,000 | ||||||
Scientific Games International, Inc., | 805,000 | 831,162 | ||||||
Select Medical Corp., 6.38%, 6/1/21 | 1,000,000 | 1,010,000 | ||||||
Service Corp. International, 5.38%, 1/15/22 | 1,000,000 | 1,050,000 | ||||||
Signode Industrial Group Lux SA/Signode Industrial Group US, Inc., | 900,000 | 873,000 | ||||||
Southern Copper Corp., 3.88%, 4/23/25 | 100,000 | 96,668 | ||||||
Southern Star Central Corp., 5.13%, 7/15/22 (a) | 400,000 | 406,000 | ||||||
Station Casinos LLC, 7.50%, 3/1/21 | 950,000 | 1,016,500 | ||||||
Steel Dynamics, Inc., 5.13%, 10/1/21 | 1,000,000 | 1,002,000 | ||||||
Tesoro Logistics LP / Tesoro Logistics Finance Corp., 6.25%, 10/15/22 (a) | 1,000,000 | 1,035,000 | ||||||
Thermo Fisher Scientific, Inc., | 1,840,000 | 1,817,171 | ||||||
TIAA Asset Management Finance Co. LLC, 4.13%, 11/1/24 (a) | 1,825,000 | 1,838,067 | ||||||
TransDigm, Inc., 6.00%, 7/15/22 | 970,000 | 957,875 | ||||||
Tribune Media Co., 5.88%, 7/15/22 (a) | 60,000 | 60,450 | ||||||
Tyson Foods, Inc., 3.95%, 8/15/24 | 1,800,000 | 1,802,114 | ||||||
United Rentals North America, Inc., | 800,000 | 866,000 | ||||||
See accompanying notes to financial statements.
24
Table of Contents
State Street DoubleLine Total Return Tactical Portfolio
SCHEDULE OF INVESTMENTS (continued)
June 30, 2015
Security Description | Principal | Value | ||||||
Verizon Communications, Inc., | $ | 1,875,000 | $ | 1,827,597 | ||||
Walgreens Boots Alliance, Inc., | 1,825,000 | 1,829,286 | ||||||
Wells Fargo & Co., 3.50%, 3/8/22 | 1,785,000 | 1,831,656 | ||||||
|
| |||||||
| 72,821,420 | ||||||||
|
| |||||||
TOTAL CORPORATE BONDS & NOTES | 141,073,090 | |||||||
|
| |||||||
FOREIGN GOVERNMENT OBLIGATIONS — 0.9% |
| |||||||
Colombia Government International Bond, 4.38%, 7/12/21 | 2,700,000 | 2,825,550 | ||||||
Fondo MIVIVIENDA SA, | 1,000,000 | 1,007,500 | ||||||
Mexico Government International Bond, | 650,000 | 662,350 | ||||||
Panama Government International Bond, | 2,000,000 | 2,197,000 | ||||||
|
| |||||||
TOTAL FOREIGN GOVERNMENT OBLIGATIONS | 6,692,400 | |||||||
|
| |||||||
SENIOR FLOATING RATE LOANS — 9.6% |
| |||||||
AEROSPACE & DEFENSE — 0.1% |
| |||||||
BE Aerospace, Inc., Senior Secured Term Loan B, 4.00%, 12/16/21 | 996,247 | 1,003,250 | ||||||
|
| |||||||
AUTO COMPONENTS — 0.2% |
| |||||||
Federal-Mogul Holdings Corp., Senior Secured Term Loan C, 4.75%, 4/15/21 | 1,497,487 | 1,484,856 | ||||||
TI Group Automotive Systems LLC, Senior Secured Term Loan, | 350,000 | 349,563 | ||||||
|
| |||||||
| 1,834,419 | ||||||||
|
| |||||||
BUILDING PRODUCTS — 0.0% |
| |||||||
Jeld-Wen, Inc., Senior Secured Incremental Term Loan, | 350,000 | 350,875 | ||||||
|
| |||||||
CAPITAL MARKETS — 0.4% |
| |||||||
Guggenheim Partners LLC, Senior Secured Term Loan , 4.25%, 7/22/20 | 1,496,193 | 1,505,529 | ||||||
RCS Capital Corp., Senior Secured First Lien Term Loan, 6.50%, 4/29/19 | 1,461,039 | 1,475,649 | ||||||
|
| |||||||
| 2,981,178 | ||||||||
|
| |||||||
CHEMICALS — 0.6% |
| |||||||
AZ Chem US, Inc., Senior Secured First Lien Term Loan, LIBOR + 3.50%, 6/12/21 | 1,500,000 | 1,501,875 | ||||||
Chemours Company Co., Senior Secured Term Loan B, 3.75%, 5/22/22 | 145,000 | 144,759 | ||||||
Klockner-Pentaplast of America, Inc., Senior Secured Term Loan, | 777,665 | 781,164 | ||||||
MacDermid, Inc., Senior Secured Term Loan B2, LIBOR + 3.75%, 6/7/20 | 1,500,000 | 1,508,565 | ||||||
Security Description | Principal | Value | ||||||
Univar, Inc., Senior Secured Term Loan, 4.25%, 7/1/22 | $ | 350,000 | $ | 350,056 | ||||
|
| |||||||
| 4,286,419 | ||||||||
|
| |||||||
COMMERCIAL SERVICES & SUPPLIES — 0.3% |
| |||||||
Asurion LLC, Senior Secured Term Loan B1, 5.00%, 5/24/19 | 1,493,461 | 1,498,957 | ||||||
Protection One, Inc., Senior Secured First Lien Term Loan, 5.00%, 6/16/21 | 620,000 | 621,550 | ||||||
|
| |||||||
| 2,120,507 | ||||||||
|
| |||||||
CONSTRUCTION & ENGINEERING — 0.0% |
| |||||||
Summit Materials Cos. I LLC, Senior Secured Term Loan B, | 350,000 | 350,329 | ||||||
|
| |||||||
CONTAINERS & PACKAGING — 0.6% |
| |||||||
Ardagh Holdings USA, Inc., Senior Secured Incremental Term Loan, 4.00%, 12/17/19 | 1,500,000 | 1,499,527 | ||||||
KP Germany Erste GmbH, Senior Secured First Lien Term Loan, 5.00%, 4/22/20 | 332,335 | 333,831 | ||||||
Reynolds Group Issuer, Inc., Senior Secured New Dollar Term Loan, 4.50%, 12/1/18 | 1,474,671 | 1,481,588 | ||||||
Signode Industrial Group US, Inc., Senior Secured Term Loan B, 3.75%, 5/1/21 | 1,458,904 | 1,444,315 | ||||||
|
| |||||||
| 4,759,261 | ||||||||
|
| |||||||
DISTRIBUTORS — 0.2% |
| |||||||
Exopack Holdings SA, Senior Secured Term Loan B1, 4.50%, 5/8/19 | 1,496,203 | 1,501,499 | ||||||
|
| |||||||
DIVERSIFIED FINANCIAL SERVICES — 0.2% |
| |||||||
TransUnion LLC, Senior Secured Term Loan B2, 3.75%, 4/9/21 | 1,494,956 | 1,484,910 | ||||||
|
| |||||||
DIVERSIFIED TELECOMMUNICATION SERVICES — 0.4% |
| |||||||
Intelsat Jackson Holdings, Ltd., Senior Secured Term Loan B2, 3.75%, 6/30/19 | 1,500,000 | 1,490,782 | ||||||
Italics Merger Sub, Inc., Senior Secured Term Loan, LIBOR + 3.50%, 5/29/22 | 185,000 | 184,943 | ||||||
Level 3 Financing, Inc., Senior Secured Term Loan B2, 3.50%, 5/31/22 | 1,500,000 | 1,491,720 | ||||||
|
| |||||||
| 3,167,445 | ||||||||
|
| |||||||
ELECTRIC UTILITIES — 0.2% |
| |||||||
EFS Cogen Holdings I LLC, Senior Secured Term Loan B, 3.75%, 12/17/20 | 1,440,401 | 1,445,802 | ||||||
|
| |||||||
ELECTRONIC EQUIPMENT, INSTRUMENTS & COMPONENTS — 0.2% |
| |||||||
Allflex Holdings III, Inc., Senior Secured First Lien Term Loan, 4.25%, 7/17/20 | 1,496,193 | 1,493,694 | ||||||
|
| |||||||
FOOD & STAPLES RETAILING — 0.2% |
| |||||||
Albertson’s LLC, Senior Secured Term Loan B4, 5.50%, 8/25/21 | 1,496,250 | 1,505,534 | ||||||
|
| |||||||
See accompanying notes to financial statements.
25
Table of Contents
State Street DoubleLine Total Return Tactical Portfolio
SCHEDULE OF INVESTMENTS (continued)
June 30, 2015
Security Description | Principal | Value | ||||||
FOOD PRODUCTS — 0.4% |
| |||||||
Candy Intermediate Holdings, Inc., Senior Secured Term Loan, 7.50%, 6/18/18 | $ | 1,493,601 | $ | 1,489,867 | ||||
CSM Bakery Solutions LLC, Senior Secured First Lien Term Loan, | 1,500,000 | 1,500,240 | ||||||
|
| |||||||
| 2,990,107 | ||||||||
|
| |||||||
HEALTH CARE EQUIPMENT & SUPPLIES — 0.1% |
| |||||||
Alere, Inc., Senior Secured Term Loan B, | 375,000 | 375,788 | ||||||
|
| |||||||
HEALTH CARE PROVIDERS & SERVICES — 0.5% |
| |||||||
Air Medical Group Holdings, Inc., Senior Secured Term Loan B, 4.50%, 4/6/22 | 570,000 | 566,914 | ||||||
American Renal Holdings, Inc., Senior Secured First Lien Term Loan, | 1,269,152 | 1,270,739 | ||||||
Concordia Healthcare Corp., Senior Secured Term Loan B, | 145,000 | 145,891 | ||||||
U.S. Renal Care, Inc., Senior Secured Term Loan, 4.25%, 7/3/19 | 1,494,930 | 1,495,244 | ||||||
|
| |||||||
| 3,478,788 | ||||||||
|
| |||||||
HOTELS, RESTAURANTS & LEISURE — 1.0% |
| |||||||
Burger King 1011778 B.C. Unlimited Liability Co., Senior Secured Term Loan B, 3.75%, 12/10/21 | 379,489 | 379,673 | ||||||
Four Seasons Holdings, Inc., Senior Secured First Lien Term Loan, | 1,498,679 | 1,500,867 | ||||||
Hilton Worldwide Finance LLC, Senior Secured Term Loan B2, | 949,459 | 950,945 | ||||||
Scientific Games International, Inc., Senior Secured Term Loan B2, | 1,493,747 | 1,494,874 | ||||||
Station Casinos LLC, Senior Secured Term Loan B, 4.25%, 3/2/20 | 1,474,890 | 1,476,468 | ||||||
Travelport Finance (Luxembourg) S.A.R.L., Senior Secured Term Loan B, 5.75%, 9/2/21 | 1,496,241 | 1,501,717 | ||||||
|
| |||||||
| 7,304,544 | ||||||||
|
| |||||||
HOUSEHOLD DURABLES — 0.2% |
| |||||||
Spin Holdco, Inc., Senior Secured Term Loan B, 4.25%, 11/14/19 | 1,494,994 | 1,492,191 | ||||||
|
| |||||||
INDEPENDENT POWER & RENEWABLE ELECTRICITY PRODUCERS — 0.1% |
| |||||||
Calpine Corp., Senior Secured Term Loan B5, 3.50%, 5/27/22 | 750,000 | 744,750 | ||||||
|
| |||||||
IT SERVICES — 0.2% |
| |||||||
First Data Corp., Senior Secured Extended Term Loan, 3.69%, 3/24/18 | 1,500,000 | 1,496,918 | ||||||
|
| |||||||
MACHINERY — 0.7% |
| |||||||
Doosan Infracore International, Inc., Senior Secured Term Loan B, | 1,493,189 | 1,502,521 | ||||||
Security Description | Principal | Value | ||||||
Dynacast International LLC, Senior Secured Term Loan B, 4.50%, 1/28/22 | $ | 1,496,250 | $ | 1,497,656 | ||||
Gates Global, Inc., Senior Secured Term Loan B, 4.25%, 7/5/21 | 1,493,731 | 1,473,297 | ||||||
Milacron LLC, Senior Secured Term Loan B, 4.50%, 9/28/20 | 990,411 | 992,887 | ||||||
|
| |||||||
| 5,466,361 | ||||||||
|
| |||||||
MEDIA — 0.7% |
| |||||||
Live Nation Entertainment, Inc., Senior Secured Term Loan B1, | 1,496,193 | 1,499,305 | ||||||
Media General, Inc., Senior Secured Term Loan B, 4.00%, 7/31/20 | 1,400,293 | 1,402,044 | ||||||
TWCC Holding Corp., Senior Secured Extended Term Loan, 5.75%, 2/13/20 | 748,125 | 739,940 | ||||||
Univision Communications, Inc., Senior Secured Term Loan C3, 4.00%, 3/1/20 | 1,494,713 | 1,486,044 | ||||||
|
| |||||||
| 5,127,333 | ||||||||
|
| |||||||
MULTILINE RETAIL — 0.2% |
| |||||||
Neiman Marcus Group, Inc., Senior Secured Term Loan, 4.25%, 10/25/20 | 1,496,212 | 1,489,494 | ||||||
|
| |||||||
OIL, GAS & CONSUMABLE FUELS — 0.3% |
| |||||||
Energy Transfer Equity LP, Senior Secured Term Loan, 4.00%, 12/2/19 | 1,394,118 | 1,396,474 | ||||||
Murray Energy Corp., Senior Secured Term Loan B2, 7.50%, 3/19/21 | 1,000,000 | 929,840 | ||||||
|
| |||||||
| 2,326,314 | ||||||||
|
| |||||||
PHARMACEUTICALS — 0.1% |
| |||||||
Endo Luxembourg Finance Co. I S.A.R.L., Senior Secured Term Loan B, LIBOR + 3.00%, 6/11/22 | 600,000 | 602,112 | ||||||
|
| |||||||
REAL ESTATE INVESTMENT TRUSTS — 0.2% |
| |||||||
Capital Automotive LP, Senior Secured Term Loan B, 4.00%, 4/10/19 | 1,495,981 | 1,502,930 | ||||||
|
| |||||||
SEMICONDUCTORS & SEMICONDUCTOR EQUIPMENT — 0.1% |
| |||||||
Freescale Semiconductor, Inc., Senior Secured Term Loan B5, | 497,468 | 499,956 | ||||||
|
| |||||||
SOFTWARE — 0.6% |
| |||||||
Applied Systems, Inc., Senior Secured Second Lien Term Loan, | 1,500,000 | 1,507,500 | ||||||
BMC Software Finance, Inc., Senior Secured Term Loan, 5.00%, 9/10/20 | 1,493,454 | 1,410,149 | ||||||
Mitchell International, Inc., Senior Secured Second Lien Term Loan, | 1,500,000 | 1,501,875 | ||||||
|
| |||||||
| 4,419,524 | ||||||||
|
| |||||||
See accompanying notes to financial statements.
26
Table of Contents
State Street DoubleLine Total Return Tactical Portfolio
SCHEDULE OF INVESTMENTS (continued)
June 30, 2015
Security Description | Principal | Value | ||||||
SPECIALTY RETAIL — 0.2% |
| |||||||
Michaels Stores, Inc., Senior Secured Incremental Term Loan B2, | $ | 1,500,000 | $ | 1,504,222 | ||||
|
| |||||||
TRADING COMPANIES & DISTRIBUTORS — 0.4% |
| |||||||
Interline Brands, Inc., Senior Secured Term Loan, LIBOR + 3.00%, 3/17/21 | 1,496,212 | 1,485,926 | ||||||
North American Lifting Holdings, Inc., Senior Secured First Lien Term Loan, LIBOR + 4.50%, 11/27/20 | 1,496,207 | 1,449,450 | ||||||
|
| |||||||
| 2,935,376 | ||||||||
|
| |||||||
TOTAL SENIOR FLOATING RATE LOANS | 72,041,830 | |||||||
|
| |||||||
COMMERCIAL MORTGAGE BACKED SECURITIES — 18.9% |
| |||||||
Ajax Mortgage Loan Trust 2015-B, | 8,000,000 | 7,982,937 | ||||||
Alternative Loan Trust 2006-24CB, | 7,196,888 | 6,567,016 | ||||||
Alternative Loan Trust 2007-11T1, | 2,894,422 | 2,402,703 | ||||||
BAMLL Commercial Mortgage Securities Trust 2015-200P, | 30,000,000 | 990,000 | ||||||
BAMLL Re-REMIC Trust 2011-07C1, | 550,000 | 568,851 | ||||||
Banc of America Commercial Mortgage Trust 2006-6, 5.39%, 10/10/45 | 500,000 | 523,395 | ||||||
Banc of America Funding 2005-5 Trust, | 3,171,469 | 3,269,981 | ||||||
BCAP LLC 2012-RR1 Trust, | 7,081,068 | 6,046,891 | ||||||
Bear Stearns Commercial Mortgage Securities Trust 2007-PWR15, | 1,500,000 | 1,551,391 | ||||||
BXHTL Mortgage Trust 2015-JWRZ, | 1,500,000 | 1,500,000 | ||||||
CD 2007-CD5 Mortgage Trust, | 800,000 | 856,854 | ||||||
CHL Mortgage Pass-Through Trust 2005-J2, 5.50%, 8/25/35 | 2,660,976 | 2,479,761 | ||||||
CHL Mortgage Pass-Through Trust 2007-HY1, 2.66%, 4/25/37 (b) | 2,817,982 | 2,622,924 | ||||||
Citigroup Commercial Mortgage Trust 2007-C6, 0.53%, 12/10/49 (a) (b) | 750,000 | 791,736 | ||||||
Citigroup Commercial Mortgage Trust 2015-GC27, 4.58%, 2/10/48 (a) (b) | 943,700 | 813,483 | ||||||
Citigroup Commercial Mortgage Trust 2015-GC31, 4.20%, 6/10/45 | 1,500,000 | 1,407,450 | ||||||
Citigroup Mortgage Loan Trust | 5,444,773 | 4,908,545 | ||||||
Citigroup Mortgage Loan Trust 2009-7, | 6,717,988 | 4,419,275 | ||||||
Commercial Mortgage Trust 2007-GG11 | 3,000,000 | 3,120,579 | ||||||
5.87%, 12/10/49 (b) | 225,000 | 241,346 | ||||||
Security Description | Principal | Value | ||||||
Commercial Mortgage Trust 2014-KYO, | $ | 750,000 | $ | 750,707 | ||||
Commercial Mortgage Trust 2015-CCRE22 | 1,500,000 | 1,270,722 | ||||||
1.17%, 3/10/48 (b) | 10,981,733 | 744,067 | ||||||
Commercial Mortgage Trust | 900,000 | 763,517 | ||||||
Commercial Mortgage Trust | 9,237,384 | 715,796 | ||||||
4.50%, 2/10/48 (a) (b) | 750,000 | 653,485 | ||||||
Commercial Mortgage Trust 2015-LC19, | 1,200,000 | 929,336 | ||||||
Countrywide Commercial Mortgage Trust 2007-MF1, | 910,490 | 947,183 | ||||||
Credit Suisse Commercial Mortgage Trust | 1,500,000 | 1,606,891 | ||||||
6.17%, 2/15/41 (a) (b) | 1,700,000 | 1,853,729 | ||||||
Csail 2015-C2 Commercial Mortgage Trust, 3.85%, 6/15/57 | 900,000 | 910,016 | ||||||
CSMC 2015-RPL1 Trust, | 4,864,694 | 4,853,627 | ||||||
CSMC Mortgage-Backed Trust 2006-7, | 5,334,904 | 4,805,773 | ||||||
CSMC Mortgage-Backed Trust 2006-8, | 10,038,574 | 8,598,945 | ||||||
CSMC Trust 2013-6, | 4,007,305 | 3,985,702 | ||||||
GS Mortgage Securities Corp. II, | 16,362,969 | 1,486,396 | ||||||
GS Mortgage Securities Trust 2006-GG6, 5.71%, 4/10/38 (b) | 1,000,000 | 1,015,712 | ||||||
GS Mortgage Securities Trust | 1,000,000 | 1,015,151 | ||||||
GS Mortgage Securities Trust | 19,743,435 | 1,420,817 | ||||||
GSAA Home Equity Trust 2007-10, | 4,079,611 | 3,137,625 | ||||||
JP Morgan Chase Commercial Mortgage Securities Trust 2006-LDP9, | 1,465,000 | 1,513,625 | ||||||
JP Morgan Chase Commercial Mortgage Securities Trust 2007-C1, | 1,000,000 | 1,071,006 | ||||||
JP Morgan Chase Commercial Mortgage Securities Trust 2007-LDP12, | 700,000 | 752,946 | ||||||
JP Morgan Chase Commercial Mortgage Securities Trust 2015-COSMO, | 1,500,000 | 1,495,530 | ||||||
JPMBB Commercial Mortgage Securities Trust 2014-C25, 1.16%, 11/15/47 (b) | 6,482,228 | 430,517 | ||||||
JPMBB Commercial Mortgage Securities Trust 2015-C27, 1.54%, 2/15/48 (b) | 7,975,206 | 688,420 | ||||||
See accompanying notes to financial statements.
27
Table of Contents
State Street DoubleLine Total Return Tactical Portfolio
SCHEDULE OF INVESTMENTS (continued)
June 30, 2015
Security Description | Principal | Value | ||||||
JPMBB Commercial Mortgage Securities Trust 2015-C28, 1.35%, 10/15/48 (b) | $ | 11,989,623 | $ | 904,617 | ||||
LB-UBS Commercial Mortgage Trust 2007-C1, 5.48%, 2/15/40 | 1,500,000 | 1,554,088 | ||||||
LB-UBS Commercial Mortgage Trust 2007-C7, 6.46%, 9/15/45 (b) | 750,000 | 792,929 | ||||||
Merrill Lynch Mortgage Investors Trust, 6.25%, 10/25/36 | 5,339,250 | 4,642,286 | ||||||
Morgan Stanley Bank of America Merrill Lynch Trust 2013-C12, 1.15%, 10/15/46 (b) | 19,567,888 | 922,293 | ||||||
Morgan Stanley Bank of America Merrill Lynch Trust 2015-C20, | 500,000 | 493,991 | ||||||
Morgan Stanley Capital I Trust 2015-XLF1, 3.19%, 8/13/16 (a) (b) | 750,000 | 750,057 | ||||||
Residential Asset Securitization Trust 2005-A13, 5.50%, 10/25/35 | 4,643,660 | 4,276,263 | ||||||
Structured Adjustable Rate Mortgage Loan Trust | 3,686,124 | 2,910,707 | ||||||
5.14%, 9/25/36 (b) | 2,989,068 | 2,683,376 | ||||||
Towd Point Mortgage Trust 2015-1, | 3,700,361 | 3,707,433 | ||||||
Wachovia Bank Commercial Mortgage Trust | 1,500,000 | 1,527,648 | ||||||
5.38%, 12/15/43 | 1,750,000 | 1,839,943 | ||||||
Washington Mutual Mortgage Pass-Through Certificates WMALT | 4,183,540 | 4,235,207 | ||||||
6.00%, 7/25/36 | 3,863,215 | 2,101,264 | ||||||
Wells Fargo Commercial Mortgage Trust 2015-C26, 3.59%, 2/15/48 (a) | 900,000 | 732,557 | ||||||
Wells Fargo Commercial Mortgage Trust 2015-C27, 3.89%, 2/15/48 | 750,000 | 697,951 | ||||||
Wells Fargo Commercial Mortgage Trust 2015-C28, 4.28%, 5/15/48 (b) | 1,500,000 | 1,443,997 | ||||||
Wells Fargo Commercial Mortgage Trust 2015-LC20, 1.56%, 4/15/50 (b) | 7,987,401 | 752,829 | ||||||
Wells Fargo Commercial Mortgage Trust 2015-NXS1, 1.35%, 5/15/48 (b) | 9,987,562 | 800,943 | ||||||
Wells Fargo Commercial Mortgage Trust 2015-NXS2, 0.96%, 7/15/58 (b) | 30,000,000 | 1,597,920 | ||||||
WFRBS Commercial Mortgage Trust 2014-C21, 1.19%, 8/15/47 (b) | 19,834,492 | 1,496,532 | ||||||
|
| |||||||
TOTAL COMMERCIAL MORTGAGE BACKED SECURITIES | 141,347,190 | |||||||
|
| |||||||
U.S. GOVERNMENT AGENCY OBLIGATIONS — 35.0% |
| |||||||
Fannie Mae Pool | 6,659,770 | 6,776,734 | ||||||
3.00%, 4/1/35 | 10,887,388 | 11,079,932 | ||||||
3.00%, 5/1/35 | 5,962,521 | 6,067,968 | ||||||
3.00%, 1/1/45 | 4,486,854 | 4,429,325 | ||||||
3.00%, 2/1/45 | 4,821,429 | 4,758,627 | ||||||
Security Description | Principal | Value | ||||||
3.00%, 3/1/45 | $ | 3,955,460 | $ | 3,942,812 | ||||
3.00%, 4/1/45 | 17,871,130 | 17,635,878 | ||||||
3.50%, 9/1/34 | 5,120,456 | 5,346,270 | ||||||
3.50%, 11/1/34 | 4,636,051 | 4,840,503 | ||||||
3.50%, 2/1/35 | 2,900,811 | 3,029,791 | ||||||
3.50%, 2/1/45 | 9,866,748 | 10,174,869 | ||||||
4.50%, 3/1/44 | 6,935,854 | 7,498,409 | ||||||
4.50%, 6/1/44 | 3,893,314 | 4,209,093 | ||||||
4.50%, 7/1/44 | 3,977,962 | 4,300,608 | ||||||
4.50%, 2/1/45 | 4,482,525 | 4,846,094 | ||||||
Fannie Mae REMICS | ||||||||
3.00%, 3/25/44 | 11,894,941 | 12,114,450 | ||||||
3.00%, 4/25/44 | 5,734,006 | 5,134,166 | ||||||
5.72%, 1/25/43 (b) | 1,616,409 | 1,469,084 | ||||||
Freddie Mac Gold Pool | ||||||||
3.00%, 1/1/45 | 4,312,373 | 4,289,524 | ||||||
3.00%, 2/1/45 | 2,953,922 | 2,938,271 | ||||||
3.00%, 3/1/45 | 2,972,831 | 2,957,080 | ||||||
3.00%, 4/1/45 | 19,844,106 | 19,738,964 | ||||||
3.00%, 5/1/45 | 9,973,908 | 9,921,062 | ||||||
3.00%, 7/1/45 | 5,000,000 | 4,973,508 | ||||||
3.50%, 2/1/45 | 5,909,642 | 6,082,638 | ||||||
3.50%, 4/1/45 | 17,876,519 | 18,399,830 | ||||||
4.50%, 6/1/44 | 4,025,209 | 4,346,536 | ||||||
Freddie Mac REMICS | ||||||||
3.00%, 6/15/41 | 3,385,028 | 3,468,611 | ||||||
3.00%, 12/15/41 | 9,957,561 | 10,099,118 | ||||||
3.00%, 12/15/42 | 10,000,000 | 10,088,750 | ||||||
3.00%, 2/15/44 | 14,885,372 | 14,942,502 | ||||||
3.00%, 6/15/44 | 20,000,000 | 20,187,500 | ||||||
3.00%, 2/15/45 | 3,030,113 | 2,681,747 | ||||||
3.00%, 3/15/45 | 3,667,141 | 3,239,402 | ||||||
6.46%, 5/15/41 (b) | 6,606,180 | 1,132,850 | ||||||
Government National Mortgage Association | 6,783,950 | 960,454 | ||||||
5.99%, 7/20/42 (b) | 20,373,778 | 3,263,260 | ||||||
|
| |||||||
TOTAL U.S. GOVERNMENT AGENCY OBLIGATIONS | 261,366,220 | |||||||
|
| |||||||
U.S. TREASURY OBLIGATIONS — 4.7% |
| |||||||
United States Treasury Note/Bond | 9,000,000 | 9,005,040 | ||||||
2.13%, 1/31/21 | 11,200,000 | 11,386,369 | ||||||
2.50%, 5/15/24 | 7,250,000 | 7,373,467 | ||||||
3.13%, 2/15/43 | 4,850,000 | 4,855,528 | ||||||
4.50%, 2/15/36 | 1,900,000 | 2,389,173 | ||||||
|
| |||||||
TOTAL U.S. TREASURY OBLIGATIONS | 35,009,577 | |||||||
|
| |||||||
See accompanying notes to financial statements.
28
Table of Contents
State Street DoubleLine Total Return Tactical Portfolio
SCHEDULE OF INVESTMENTS (continued)
June 30, 2015
Security Description | Shares | Value | ||||||
SHORT TERM INVESTMENT — 20.5% |
| |||||||
MONEY MARKET FUND — 20.5% |
| |||||||
State Street Institutional Liquid Reserves Fund, Premier Class 0.11% (d) (e) (f) | $ | 152,859,462 | $ | 152,859,462 | ||||
|
| |||||||
TOTAL INVESTMENTS — 108.5% (g) |
| |||||||
(Cost $817,057,405) | 810,389,769 | |||||||
OTHER ASSETS��& LIABILITIES — (8.5)% | (63,695,707 | ) | ||||||
|
| |||||||
NET ASSETS — 100.0% | $ | 746,694,062 | ||||||
|
| |||||||
| (a) | Securities purchased pursuant to Rule 144A of the Securities Act of 1933. These securities, which represent 9.8% of net assets as of June 30, 2015, are considered liquid and may be resold in transactions exempt from registration, normally to qualified institutional buyers. |
| (b) | Variable rate security. Rate shown is rate in effect at June 30, 2015. Maturity date disclosed is the ultimate maturity. |
| (c) | Zero coupon security. Payment received at maturity. |
| (d) | Affiliated Fund managed by SSGA Funds Management, Inc. (Note 3). |
| (e) | The rate shown is the annualized seven-day yield at period end. |
| (f) | Value is determined based on Level 1 inputs (Note 2). |
| (g) | Unless otherwise indicated, the values of the investments of the Portfolio are determined based on Level 2 inputs (Note 2). |
REMICS Real Estate Mortgage Investment Conduits
S.A.R.L. Societe A Responsibilite Limitee
See accompanying notes to financial statements.
29
Table of Contents
SSGA MFS Systematic Core Equity Portfolio
SCHEDULE OF INVESTMENTS
June 30, 2015
Security Description | Shares | Value | ||||||
COMMON STOCKS — 99.0% |
| |||||||
AEROSPACE & DEFENSE — 6.8% |
| |||||||
General Dynamics Corp. | 659 | $ | 93,374 | |||||
Huntington Ingalls Industries, Inc. | 124 | 13,961 | ||||||
Northrop Grumman Corp. | 585 | 92,798 | ||||||
|
| |||||||
| 200,133 | ||||||||
|
| |||||||
BANKS — 6.8% |
| |||||||
JPMorgan Chase & Co. | 1,886 | 127,795 | ||||||
Wells Fargo & Co. | 1,300 | 73,112 | ||||||
|
| |||||||
| 200,907 | ||||||||
|
| |||||||
BIOTECHNOLOGY — 1.7% |
| |||||||
Amgen, Inc. | 329 | 50,508 | ||||||
|
| |||||||
BUILDING PRODUCTS — 1.2% |
| |||||||
Owens Corning | 850 | 35,063 | ||||||
|
| |||||||
CHEMICALS — 3.3% |
| |||||||
LyondellBasell Industries NV (Class A) | 925 | 95,756 | ||||||
|
| |||||||
CONSUMER FINANCE — 1.2% |
| |||||||
Discover Financial Services | 617 | 35,552 | ||||||
|
| |||||||
DIVERSIFIED TELECOMMUNICATION SERVICES — 2.3% |
| |||||||
Verizon Communications, Inc. | 1,417 | 66,046 | ||||||
|
| |||||||
FOOD & STAPLES RETAILING — 3.8% |
| |||||||
Kroger Co. | 1,538 | 111,520 | ||||||
|
| |||||||
FOOD PRODUCTS — 1.1% |
| |||||||
Mondelez International, Inc. (Class A) | 767 | 31,554 | ||||||
|
| |||||||
HEALTH CARE EQUIPMENT & SUPPLIES — 1.3% |
| |||||||
Alere, Inc. (a) | 713 | 37,611 | ||||||
|
| |||||||
HEALTH CARE PROVIDERS & SERVICES — 8.4% |
| |||||||
Anthem, Inc. | 702 | 115,226 | ||||||
McKesson Corp. | 461 | 103,638 | ||||||
UnitedHealth Group, Inc. | 240 | 29,280 | ||||||
|
| |||||||
| 248,144 | ||||||||
|
| |||||||
HOTELS, RESTAURANTS & LEISURE — 3.5% |
| |||||||
Royal Caribbean Cruises, Ltd. | 1,299 | 102,218 | ||||||
|
| |||||||
HOUSEHOLD PRODUCTS — 1.2% |
| |||||||
Procter & Gamble Co. | 465 | 36,382 | ||||||
|
| |||||||
INDEPENDENT POWER & RENEWABLE ELECTRICITY PRODUCERS — 2.1% |
| |||||||
AES Corp. | 4,722 | 62,614 | ||||||
|
| |||||||
INSURANCE — 7.9% | ||||||||
MetLife, Inc. | 1,884 | 105,485 | ||||||
Prudential Financial, Inc. | 1,105 | 96,710 | ||||||
Validus Holdings, Ltd. | 714 | 31,409 | ||||||
|
| |||||||
| 233,604 | ||||||||
|
| |||||||
INTERNET & CATALOG RETAIL — 2.0% |
| |||||||
Amazon.com, Inc. (a) | 138 | 59,904 | ||||||
|
| |||||||
INTERNET SOFTWARE & SERVICES — 2.9% |
| |||||||
Facebook, Inc. (Class A) (a) | 330 | 28,303 | ||||||
Google, Inc. (Class A) (a) | 77 | 41,583 | ||||||
Google, Inc. (Class C) (a) | 28 | 14,574 | ||||||
|
| |||||||
| 84,460 | ||||||||
|
| |||||||
Security Description | Shares | Value | ||||||
MEDIA — 2.4% |
| |||||||
Charter Communications, Inc. (Class A) (a) | 245 | $ | 41,956 | |||||
Comcast Corp. (Class A) | 481 | 28,928 | ||||||
|
| |||||||
| 70,884 | ||||||||
|
| |||||||
MULTILINE RETAIL — 0.9% |
| |||||||
Target Corp. | 307 | 25,060 | ||||||
|
| |||||||
OIL, GAS & CONSUMABLE FUELS — 7.3% |
| |||||||
Exxon Mobil Corp. | 1,170 | 97,344 | ||||||
Valero Energy Corp. | 1,871 | 117,125 | ||||||
|
| |||||||
| 214,469 | ||||||||
|
| |||||||
PHARMACEUTICALS — 7.8% | ||||||||
Eli Lilly & Co. | 817 | 68,211 | ||||||
Johnson & Johnson | 894 | 87,129 | ||||||
Merck & Co., Inc. | 1,321 | 75,205 | ||||||
|
| |||||||
| 230,545 | ||||||||
|
| |||||||
REAL ESTATE INVESTMENT TRUSTS — 2.2% |
| |||||||
Iron Mountain, Inc. | 2,044 | 63,364 | ||||||
|
| |||||||
SOFTWARE — 7.2% |
| |||||||
Electronic Arts, Inc. (a) | 1,680 | 111,720 | ||||||
Intuit, Inc. | 314 | 31,642 | ||||||
Oracle Corp. | 1,698 | 68,429 | ||||||
|
| |||||||
| 211,791 | ||||||||
|
| |||||||
SPECIALTY RETAIL — 2.9% | ||||||||
Best Buy Co., Inc. | 2,630 | 85,764 | ||||||
|
| |||||||
TECHNOLOGY HARDWARE, STORAGE & PERIPHERALS —7.4% |
| |||||||
Apple, Inc. | 1,267 | 158,914 | ||||||
Hewlett-Packard Co. | 1,942 | 58,279 | ||||||
|
| |||||||
| 217,193 | ||||||||
|
| |||||||
TOBACCO — 3.4% |
| |||||||
Altria Group, Inc. | 613 | 29,982 | ||||||
Philip Morris International, Inc. | 884 | 70,870 | ||||||
|
| |||||||
| 100,852 | ||||||||
|
| |||||||
TOTAL COMMON STOCKS | 2,911,898 | |||||||
|
| |||||||
SHORT TERM INVESTMENT — 0.9% |
| |||||||
MONEY MARKET FUND — 0.9% |
| |||||||
State Street Institutional Liquid Reserves Fund, Premier Class 0.11% (b) (c) | 26,105 | 26,105 | ||||||
|
| |||||||
TOTAL INVESTMENTS — 99.9% (d) | 2,938,003 | |||||||
OTHER ASSETS & | 2,292 | |||||||
|
| |||||||
NET ASSETS — 100.0% | $ | 2,940,295 | ||||||
|
| |||||||
| (a) | Non-income producing security |
| (b) | Affiliated Fund managed by SSGA Funds Management, Inc. (Note 3). |
| (c) | The rate shown is the annualized seven-day yield at period end. |
| (d) | Unless otherwise indicated, the values of the investments of the Portfolio are determined based on Level 1 inputs (Note 2). |
See accompanying notes to financial statements.
30
Table of Contents
SSGA MFS Systematic Growth Equity Portfolio
SCHEDULE OF INVESTMENTS
June 30, 2015
Security Description | Shares | Value | ||||||
COMMON STOCKS — 98.8% |
| |||||||
AEROSPACE & DEFENSE — 1.1% |
| |||||||
General Dynamics Corp. | 474 | $ | 67,161 | |||||
|
| |||||||
AUTO COMPONENTS — 1.3% | ||||||||
Goodyear Tire & Rubber Co. | 888 | 26,773 | ||||||
Lear Corp. | 442 | 49,619 | ||||||
|
| |||||||
| 76,392 | ||||||||
|
| |||||||
BEVERAGES — 2.0% |
| |||||||
Coca-Cola Co. | 3,002 | 117,768 | ||||||
|
| |||||||
BIOTECHNOLOGY — 4.5% |
| |||||||
Amgen, Inc. | 796 | 122,202 | ||||||
Gilead Sciences, Inc. | 1,292 | 151,267 | ||||||
|
| |||||||
| 273,469 | ||||||||
|
| |||||||
CHEMICALS — 4.1% |
| |||||||
LyondellBasell Industries NV (Class A) | 2,384 | 246,792 | ||||||
|
| |||||||
COMMUNICATIONS EQUIPMENT — 0.4% |
| |||||||
QUALCOMM, Inc. | 414 | 25,929 | ||||||
|
| |||||||
CONSUMER FINANCE — 0.6% |
| |||||||
American Express Co. | 448 | 34,819 | ||||||
|
| |||||||
DIVERSIFIED TELECOMMUNICATION SERVICES — 2.6% |
| |||||||
Verizon Communications, Inc. | 3,353 | 156,283 | ||||||
|
| |||||||
FOOD & STAPLES RETAILING — 5.2% |
| |||||||
CVS Health Corp. | 898 | 94,182 | ||||||
Kroger Co. | 3,042 | 220,576 | ||||||
|
| |||||||
| 314,758 | ||||||||
|
| |||||||
FOOD PRODUCTS — 2.3% | ||||||||
Ingredion, Inc. | 1,762 | 140,625 | ||||||
|
| |||||||
HEALTH CARE EQUIPMENT & SUPPLIES — 3.2% |
| |||||||
Edwards Lifesciences Corp. (a) | 1,352 | 192,565 | ||||||
|
| |||||||
HEALTH CARE PROVIDERS & SERVICES — 4.5% |
| |||||||
HCA Holdings, Inc. (a) | 576 | 52,255 | ||||||
McKesson Corp. | 968 | 217,616 | ||||||
|
| |||||||
| 269,871 | ||||||||
|
| |||||||
HOTELS, RESTAURANTS & LEISURE — 4.7% |
| |||||||
Carnival Corp. | 1,607 | 79,369 | ||||||
Norwegian Cruise Line Holdings, Ltd. (a) | 550 | 30,822 | ||||||
Royal Caribbean Cruises, Ltd. | 2,233 | 175,715 | ||||||
|
| |||||||
| 285,906 | ||||||||
|
| |||||||
HOUSEHOLD DURABLES — 1.1% | ||||||||
PulteGroup, Inc. | 3,246 | 65,407 | ||||||
|
| |||||||
INSURANCE — 3.7% | ||||||||
Prudential Financial, Inc. | 770 | 67,390 | ||||||
Validus Holdings, Ltd. | 3,521 | 154,889 | ||||||
|
| |||||||
| 222,279 | ||||||||
|
| |||||||
INTERNET & CATALOG RETAIL — 2.5% | ||||||||
Amazon.com, Inc. (a) | 343 | 148,893 | ||||||
|
| |||||||
INTERNET SOFTWARE & SERVICES — 5.7% |
| |||||||
Facebook, Inc. (Class A) (a) | 1,149 | 98,544 | ||||||
Google, Inc. (Class A) (a) | 124 | 66,965 | ||||||
VeriSign, Inc. (a) | 2,946 | 181,827 | ||||||
|
| |||||||
| 347,336 | ||||||||
|
| |||||||
Security Description | Shares | Value | ||||||
IT SERVICES — 5.7% | ||||||||
Cognizant Technology Solutions Corp. (Class A) (a) | 2,933 | $ | 179,177 | |||||
FleetCor Technologies, Inc. (a) | 1,069 | 166,828 | ||||||
|
| |||||||
| 346,005 | ||||||||
|
| |||||||
MACHINERY — 1.9% | ||||||||
Caterpillar, Inc. | 1,358 | 115,186 | ||||||
|
| |||||||
MEDIA — 4.6% |
| |||||||
Charter Communications, Inc. (Class A) (a) | 281 | 48,121 | ||||||
Comcast Corp. (Class A) | 3,865 | 232,441 | ||||||
|
| |||||||
| 280,562 | ||||||||
|
| |||||||
MULTILINE RETAIL — 1.2% | ||||||||
Kohl’s Corp. | 1,184 | 74,130 | ||||||
|
| |||||||
OIL, GAS & CONSUMABLE FUELS — 4.0% |
| |||||||
Marathon Petroleum Corp. | 3,784 | 197,941 | ||||||
Valero Energy Corp. | 738 | 46,199 | ||||||
|
| |||||||
| 244,140 | ||||||||
|
| |||||||
PHARMACEUTICALS — 4.4% | ||||||||
Bristol-Myers Squibb Co. | 1,428 | 95,019 | ||||||
Johnson & Johnson | 824 | 80,307 | ||||||
Merck & Co., Inc. | 1,558 | 88,697 | ||||||
|
| |||||||
| 264,023 | ||||||||
|
| |||||||
REAL ESTATE INVESTMENT TRUSTS — 1.9% |
| |||||||
Iron Mountain, Inc. | 1,385 | 42,935 | ||||||
Simon Property Group, Inc. | 428 | 74,053 | ||||||
|
| |||||||
| 116,988 | ||||||||
|
| |||||||
ROAD & RAIL — 0.9% | ||||||||
Union Pacific Corp. | 548 | 52,263 | ||||||
|
| |||||||
SOFTWARE — 10.2% |
| |||||||
Electronic Arts, Inc. (a) | 3,514 | 233,681 | ||||||
Microsoft Corp. | 789 | 34,834 | ||||||
Oracle Corp. | 5,103 | 205,651 | ||||||
Tableau Software, Inc. (Class A) (a) | 1,238 | 142,742 | ||||||
|
| |||||||
| 616,908 | ||||||||
|
| |||||||
SPECIALTY RETAIL — 4.3% | ||||||||
AutoZone, Inc. (a) | 90 | 60,021 | ||||||
Best Buy Co., Inc. | 5,095 | 166,148 | ||||||
Home Depot, Inc. | 282 | 31,339 | ||||||
|
| |||||||
| 257,508 | ||||||||
|
| |||||||
TECHNOLOGY HARDWARE, STORAGE & |
| |||||||
Apple, Inc. | 3,001 | 376,400 | ||||||
|
| |||||||
TOBACCO — 4.0% |
| |||||||
Altria Group, Inc. | 1,756 | 85,886 | ||||||
Philip Morris International, Inc. | 1,974 | 158,255 | ||||||
|
| |||||||
| 244,141 | ||||||||
|
| |||||||
TOTAL COMMON STOCKS | 5,974,507 | |||||||
|
| |||||||
See accompanying notes to financial statements.
31
Table of Contents
SSGA MFS Systematic Growth Equity Portfolio
SCHEDULE OF INVESTMENTS (continued)
June 30, 2015
Security Description | Shares | Value | ||||||
SHORT TERM INVESTMENT — 1.1% |
| |||||||
MONEY MARKET FUND — 1.1% |
| |||||||
State Street Institutional Liquid Reserves Fund, Premier Class 0.11% (b) (c) | 63,671 | $ | 63,671 | |||||
|
| |||||||
TOTAL INVESTMENTS — 99.9% (d) | 6,038,178 | |||||||
OTHER ASSETS & LIABILITIES — 0.1% | 6,795 | |||||||
|
| |||||||
NET ASSETS — 100.0% | $ | 6,044,973 | ||||||
|
| |||||||
| (a) | Non-income producing security |
| (b) | Affiliated Fund managed by SSGA Funds Management, Inc. (Note 3). |
| (c) | The rate shown is the annualized seven-day yield at period end. |
| (d) | Unless otherwise indicated, the values of the investments of the Portfolio are determined based on Level 1 inputs (Note 2). |
See accompanying notes to financial statements.
32
Table of Contents
SSGA MFS Systematic Value Equity Portfolio
SCHEDULE OF INVESTMENTS
June 30, 2015
Security Description | Shares | Value | ||||||
COMMON STOCKS — 99.0% |
| |||||||
AEROSPACE & DEFENSE — 6.1% |
| |||||||
General Dynamics Corp. | 599 | $ | 84,872 | |||||
Northrop Grumman Corp. | 579 | 91,847 | ||||||
|
| |||||||
| 176,719 | ||||||||
|
| |||||||
AUTO COMPONENTS — 2.6% |
| |||||||
Gentex Corp. | 1,294 | 21,247 | ||||||
Goodyear Tire & Rubber Co. | 1,800 | 54,270 | ||||||
|
| |||||||
| 75,517 | ||||||||
|
| |||||||
BANKS — 12.5% |
| |||||||
Citigroup, Inc. | 1,356 | 74,905 | ||||||
JPMorgan Chase & Co. | 2,285 | 154,832 | ||||||
Wells Fargo & Co. | 2,374 | 133,514 | ||||||
|
| |||||||
| 363,251 | ||||||||
|
| |||||||
BEVERAGES — 1.1% |
| |||||||
Molson Coors Brewing Co. (Class B) | 436 | 30,437 | ||||||
|
| |||||||
CAPITAL MARKETS — 0.9% |
| |||||||
Goldman Sachs Group, Inc. | 121 | 25,264 | ||||||
|
| |||||||
CHEMICALS — 3.4% |
| |||||||
LyondellBasell Industries NV (Class A) | 950 | 98,344 | ||||||
|
| |||||||
CONSUMER FINANCE — 1.3% |
| |||||||
Discover Financial Services | 671 | 38,663 | ||||||
|
| |||||||
ELECTRIC UTILITIES — 1.2% |
| |||||||
Edison International | 631 | 35,071 | ||||||
|
| |||||||
FOOD & STAPLES RETAILING — 1.9% |
| |||||||
Kroger Co. | 767 | 55,615 | ||||||
|
| |||||||
FOOD PRODUCTS — 2.4% |
| |||||||
Mondelez International, Inc. (Class A) | 1,680 | 69,115 | ||||||
|
| |||||||
HEALTH CARE EQUIPMENT & SUPPLIES — 0.7% |
| |||||||
Abbott Laboratories | 432 | 21,203 | ||||||
|
| |||||||
HEALTH CARE PROVIDERS & SERVICES — 8.5% |
| |||||||
Aetna, Inc. | 274 | 34,924 | ||||||
Anthem, Inc. | 687 | 112,764 | ||||||
Cardinal Health, Inc. | 327 | 27,354 | ||||||
McKesson Corp. | 82 | 18,434 | ||||||
UnitedHealth Group, Inc. | 450 | 54,900 | ||||||
|
| |||||||
| 248,376 | ||||||||
|
| |||||||
HOTELS, RESTAURANTS & LEISURE — 3.9% |
| |||||||
Norwegian Cruise Line Holdings, Ltd. (a) | 1,040 | 58,282 | ||||||
Royal Caribbean Cruises, Ltd. | 718 | 56,499 | ||||||
|
| |||||||
| 114,781 | ||||||||
|
| |||||||
HOUSEHOLD DURABLES — 0.7% |
| |||||||
PulteGroup, Inc. | 992 | 19,989 | ||||||
|
| |||||||
INDEPENDENT POWER & RENEWABLE ELECTRICITY PRODUCERS — 2.5% |
| |||||||
AES Corp. | 5,433 | 72,042 | ||||||
|
| |||||||
INSURANCE — 12.3% |
| |||||||
Everest Re Group, Ltd. | 389 | 70,802 | ||||||
MetLife, Inc. | 1,848 | 103,469 | ||||||
Prudential Financial, Inc. | 1,163 | 101,786 | ||||||
Travelers Cos., Inc. | 401 | 38,761 | ||||||
Validus Holdings, Ltd. | 991 | 43,594 | ||||||
|
| |||||||
| 358,412 | ||||||||
|
| |||||||
INTERNET SOFTWARE & SERVICES — 2.3% |
| |||||||
Yahoo!, Inc. (a) | 1,730 | 67,972 | ||||||
|
| |||||||
Security Description | Shares | Value | ||||||
MULTI-UTILITIES — 2.0% |
| |||||||
PG&E Corp. | 1,190 | 58,429 | ||||||
|
| |||||||
MULTILINE RETAIL — 0.6% |
| |||||||
Burlington Stores, Inc. (a) | 360 | 18,432 | ||||||
|
| |||||||
OIL, GAS & CONSUMABLE FUELS — 11.2% |
| |||||||
Chevron Corp. | 309 | 29,809 | ||||||
Exxon Mobil Corp. | 1,336 | 111,155 | ||||||
Marathon Petroleum Corp. | 1,038 | 54,298 | ||||||
Occidental Petroleum Corp. | 280 | 21,776 | ||||||
Valero Energy Corp. | 1,219 | 76,309 | ||||||
WPX Energy, Inc. (a) | 2,660 | 32,665 | ||||||
|
| |||||||
| 326,012 | ||||||||
|
| |||||||
PHARMACEUTICALS — 7.3% |
| |||||||
AbbVie, Inc. | 860 | 57,784 | ||||||
Johnson & Johnson | 668 | 65,103 | ||||||
Merck & Co., Inc. | 1,558 | 88,697 | ||||||
|
| |||||||
| 211,584 | ||||||||
|
| |||||||
REAL ESTATE INVESTMENT TRUSTS — 3.2% |
| |||||||
AvalonBay Communities, Inc. | 186 | 29,736 | ||||||
Iron Mountain, Inc. | 1,237 | 38,347 | ||||||
WP GLIMCHER, Inc. | 1,786 | 24,164 | ||||||
|
| |||||||
| 92,247 | ||||||||
|
| |||||||
SEMICONDUCTORS & SEMICONDUCTOR EQUIPMENT — 3.1% |
| |||||||
Broadcom Corp. (Class A) | 1,761 | 90,674 | ||||||
|
| |||||||
SOFTWARE — 3.7% |
| |||||||
Electronic Arts, Inc. (a) | 1,595 | 106,067 | ||||||
|
| |||||||
SPECIALTY RETAIL — 2.7% |
| |||||||
Best Buy Co., Inc. | 2,439 | 79,536 | ||||||
|
| |||||||
TECHNOLOGY HARDWARE, STORAGE & PERIPHERALS — 0.9% |
| |||||||
Hewlett-Packard Co. | 853 | 25,598 | ||||||
|
| |||||||
TOTAL COMMON STOCKS | 2,879,350 | |||||||
|
| |||||||
SHORT TERM INVESTMENT — 0.9% |
| |||||||
MONEY MARKET FUND — 0.9% |
| |||||||
State Street Institutional Liquid Reserves Fund, Premier Class 0.11% (b) (c) (Cost $27,610) | 27,610 | 27,610 | ||||||
|
| |||||||
TOTAL INVESTMENTS — 99.9% (d) |
| 2,906,960 | ||||||
OTHER ASSETS & LIABILITIES — 0.1% |
| 2,649 | ||||||
|
| |||||||
NET ASSETS — 100.0% |
| $ | 2,909,609 | |||||
|
| |||||||
| (a) | Non-income producing security |
| (b) | The rate shown is the annualized seven-day yield at period end. |
| (c) | Affiliated Fund managed by SSGA Funds Management, Inc. (Note 3). |
| (d) | Unless otherwise indicated, the values of the investments of the Portfolio are determined based on Level 1 inputs (Note 2). |
See accompanying notes to financial statements.
33
Table of Contents
State Street Risk Aware Portfolio
SCHEDULE OF INVESTMENTS
June 30, 2015
Security Description | Shares | Value | ||||||
COMMON STOCKS — 99.5% |
| |||||||
AEROSPACE & DEFENSE — 0.3% |
| |||||||
DigitalGlobe, Inc. (a) | 169 | $ | 4,696 | |||||
|
| |||||||
BANKS — 7.1% |
| |||||||
Capital Bank Financial Corp. (Class A) (a) | 3,663 | 106,484 | ||||||
First Connecticut Bancorp, Inc. | 144 | 2,285 | ||||||
HomeTrust Bancshares, Inc. (a) | 1,070 | 17,933 | ||||||
People’s United Financial, Inc. | 759 | 12,303 | ||||||
|
| |||||||
| 139,005 | ||||||||
|
| |||||||
BEVERAGES — 5.4% |
| |||||||
Coca-Cola Co. | 1,011 | 39,662 | ||||||
Dr Pepper Snapple Group, Inc. | 226 | 16,475 | ||||||
PepsiCo, Inc. | 535 | 49,937 | ||||||
|
| |||||||
| 106,074 | ||||||||
|
| |||||||
BIOTECHNOLOGY — 3.5% |
| |||||||
ACADIA Pharmaceuticals, Inc. (a) | 109 | 4,565 | ||||||
Amgen, Inc. | 357 | 54,806 | ||||||
NewLink Genetics Corp. (a) | 47 | 2,081 | ||||||
OvaScience, Inc. (a) | 217 | 6,278 | ||||||
|
| |||||||
| 67,730 | ||||||||
|
| |||||||
CAPITAL MARKETS — 0.3% |
| |||||||
FXCM, Inc. | 3,445 | 4,995 | ||||||
|
| |||||||
CHEMICALS — 1.4% |
| |||||||
Axiall Corp. | 305 | 10,995 | ||||||
Flotek Industries, Inc. (a) | 792 | 9,924 | ||||||
Rentech, Inc. (a) | 6,626 | 7,090 | ||||||
|
| |||||||
| 28,009 | ||||||||
|
| |||||||
COMMERCIAL SERVICES & SUPPLIES — 5.4% |
| |||||||
Rollins, Inc. | 315 | 8,987 | ||||||
Stericycle, Inc. (a) | 728 | 97,486 | ||||||
|
| |||||||
| 106,473 | ||||||||
|
| |||||||
COMMUNICATIONS EQUIPMENT — 1.3% |
| |||||||
Ubiquiti Networks, Inc. | 785 | 25,053 | ||||||
|
| |||||||
DIVERSIFIED CONSUMER SERVICES — 0.1% |
| |||||||
LifeLock, Inc. (a) | 144 | 2,362 | ||||||
|
| |||||||
DIVERSIFIED FINANCIAL SERVICES — 4.0% |
| |||||||
Berkshire Hathaway, Inc. (Class B) (a) | 573 | 77,991 | ||||||
|
| |||||||
DIVERSIFIED TELECOMMUNICATION SERVICES — 5.4% |
| |||||||
AT&T, Inc. | 1,925 | 68,376 | ||||||
Globalstar, Inc. (a) | 1,307 | 2,758 | ||||||
Verizon Communications, Inc. | 762 | 35,517 | ||||||
|
| |||||||
| 106,651 | ||||||||
|
| |||||||
ELECTRICAL EQUIPMENT — 0.6% |
| |||||||
Enphase Energy, Inc. (a) | 1,643 | 12,503 | ||||||
|
| |||||||
ELECTRONIC EQUIPMENT, INSTRUMENTS & COMPONENTS — 0.2% |
| |||||||
Kemet Corp. (a) | 1,469 | 4,231 | ||||||
|
| |||||||
ENERGY EQUIPMENT & SERVICES — 0.9% |
| |||||||
Basic Energy Services, Inc. (a) | 313 | 2,363 | ||||||
Hercules Offshore, Inc. (a) | 3,820 | 893 | ||||||
ION Geophysical Corp. (a) | 1,939 | 2,075 | ||||||
Key Energy Services, Inc. (a) | 540 | 972 | ||||||
North Atlantic Drilling Ltd. | 2,404 | 2,861 | ||||||
Pioneer Energy Services Corp. (a) | 391 | 2,479 | ||||||
Security Description | Shares | Value | ||||||
Seventy Seven Energy, Inc. (a) | 247 | $ | 1,060 | |||||
US Silica Holdings, Inc. | 187 | 5,490 | ||||||
|
| |||||||
| 18,193 | ||||||||
|
| |||||||
FOOD & STAPLES RETAILING — 1.4% |
| |||||||
Wal-Mart Stores, Inc. | 380 | 26,953 | ||||||
|
| |||||||
FOOD PRODUCTS — 4.2% |
| |||||||
General Mills, Inc. | 1,010 | 56,277 | ||||||
Hershey Co. | 151 | 13,414 | ||||||
TreeHouse Foods, Inc. (a) | 144 | 11,668 | ||||||
|
| |||||||
| 81,359 | ||||||||
|
| |||||||
HEALTH CARE EQUIPMENT & SUPPLIES — 2.1% |
| |||||||
Cooper Cos, Inc. | 236 | 42,001 | ||||||
|
| |||||||
HOTELS, RESTAURANTS & LEISURE — 4.9% |
| |||||||
McDonald’s Corp. | 1,005 | 95,545 | ||||||
|
| |||||||
HOUSEHOLD DURABLES — 0.5% |
| |||||||
Beazer Homes USA, Inc. (a) | 518 | 10,334 | ||||||
|
| |||||||
HOUSEHOLD PRODUCTS — 4.5% |
| |||||||
Procter & Gamble Co. | 1,132 | 88,568 | ||||||
|
| |||||||
INSURANCE — 1.4% |
| |||||||
Allied World Assurance Co. Holdings AG | 640 | 27,661 | ||||||
|
| |||||||
INTERNET SOFTWARE & SERVICES — 0.4% |
| |||||||
Travelzoo, Inc. (a) | 750 | 8,460 | ||||||
|
| |||||||
IT SERVICES — 0.2% |
| |||||||
Unisys Corp. (a) | 203 | 4,058 | ||||||
|
| |||||||
MACHINERY — 5.9% |
| |||||||
American Railcar Industries, Inc. | 151 | 7,345 | ||||||
Greenbrier Cos., Inc. | 81 | 3,795 | ||||||
Manitowoc Co., Inc. | 1,281 | 25,107 | ||||||
NN, Inc. | 250 | 6,380 | ||||||
Terex Corp. | 296 | 6,882 | ||||||
Titan International, Inc. | 1,066 | 11,449 | ||||||
Xerium Technologies, Inc. (a) | 3,037 | 55,273 | ||||||
|
| |||||||
| 116,231 | ||||||||
|
| |||||||
MEDIA — 1.0% |
| |||||||
Central European Media Enterprises, Ltd. (Class A) (a) | 4,625 | 10,083 | ||||||
Eros International PLC (a) | 293 | 7,360 | ||||||
Gray Television, Inc. (a) | 184 | 2,885 | ||||||
|
| |||||||
| 20,328 | ||||||||
|
| |||||||
METALS & MINING — 0.5% |
| |||||||
Newmont Mining Corp. | 430 | 10,045 | ||||||
|
| |||||||
MULTI-UTILITIES — 2.7% |
| |||||||
CenterPoint Energy, Inc. | 246 | 4,681 | ||||||
Dominion Resources, Inc. | 525 | 35,107 | ||||||
PG&E Corp. | 271 | 13,306 | ||||||
|
| |||||||
| 53,094 | ||||||||
|
| |||||||
MULTILINE RETAIL — 2.9% |
| |||||||
Dollar General Corp. | 475 | 36,927 | ||||||
Dollar Tree, Inc. (a) | 261 | 20,616 | ||||||
|
| |||||||
| 57,543 | ||||||||
|
| |||||||
OIL, GAS & CONSUMABLE FUELS — 5.8% |
| |||||||
Approach Resources, Inc. (a) | 187 | 1,281 | ||||||
Cheniere Energy, Inc. (a) | 313 | 21,678 | ||||||
Emerald Oil, Inc. (a) | 105 | 446 | ||||||
See accompanying notes to financial statements.
34
Table of Contents
State Street Risk Aware Portfolio
SCHEDULE OF INVESTMENTS (continued)
June 30, 2015
Security Description | Shares | Value | ||||||
Energy XXI, Ltd. | 204 | $ | 537 | |||||
Gastar Exploration, Inc. (a) | 1,294 | 3,999 | ||||||
Halcon Resources Corp. (a) | 2,670 | 3,097 | ||||||
Hallador Energy Co. | 1,047 | 8,732 | ||||||
Kinder Morgan, Inc. | 1,452 | 55,742 | ||||||
Magnum Hunter Resources Corp. (a) | 459 | 858 | ||||||
Pacific Ethanol, Inc. (a) | 945 | 9,752 | ||||||
Resolute Energy Corp. (a) | 3,958 | 3,826 | ||||||
Rex Energy Corp. (a) | 293 | 1,638 | ||||||
SandRidge Energy, Inc. (a) | 1,085 | 952 | ||||||
Stone Energy Corp. (a) | 90 | 1,133 | ||||||
W&T Offshore, Inc. | 154 | 844 | ||||||
|
| |||||||
| 114,515 | ||||||||
|
| |||||||
PAPER & FOREST PRODUCTS — 0.1% |
| |||||||
Clearwater Paper Corp. (a) | 43 | 2,464 | ||||||
|
| |||||||
PHARMACEUTICALS — 11.6% |
| |||||||
Allergan PLC (a) | 246 | 74,651 | ||||||
Bristol-Myers Squibb Co. | 490 | 32,605 | ||||||
Johnson & Johnson | 442 | 43,077 | ||||||
Merck & Co., Inc. | 982 | 55,905 | ||||||
Perrigo Co. PLC | 119 | 21,995 | ||||||
|
| |||||||
| 228,233 | ||||||||
|
| |||||||
PROFESSIONAL SERVICES — 1.1% |
| |||||||
Advisory Board Co. (a) | 156 | 8,528 | ||||||
Verisk Analytics, Inc. (Class A) (a) | 176 | 12,806 | ||||||
|
| |||||||
| 21,334 | ||||||||
|
| |||||||
REAL ESTATE INVESTMENT TRUSTS — 2.5% |
| |||||||
American Tower Corp. | 80 | 7,463 | ||||||
RAIT Financial Trust | 6,803 | 41,567 | ||||||
|
| |||||||
| 49,030 | ||||||||
|
| |||||||
ROAD & RAIL — 0.9% |
| |||||||
YRC Worldwide, Inc. (a) | 1,313 | 17,043 | ||||||
|
| |||||||
SEMICONDUCTORS & SEMICONDUCTOR EQUIPMENT — 1.3% |
| |||||||
Axcelis Technologies, Inc. (a) | 1,003 | 2,969 | ||||||
SunPower Corp. (a) | 793 | 22,529 | ||||||
|
| |||||||
| 25,498 | ||||||||
|
| |||||||
SOFTWARE — 2.6% |
| |||||||
Glu Mobile, Inc. (a) | 1,209 | 7,508 | ||||||
Infoblox, Inc. (a) | 1,674 | 43,875 | ||||||
|
| |||||||
| 51,383 | ||||||||
|
| |||||||
SPECIALTY RETAIL — 4.3% |
| |||||||
AutoZone, Inc. (a) | 127 | 84,696 | ||||||
|
| |||||||
TECHNOLOGY HARDWARE, STORAGE & PERIPHERALS — 0.2% |
| |||||||
3D Systems Corp. (a) | 236 | 4,607 | ||||||
|
| |||||||
TRADING COMPANIES & DISTRIBUTORS — 0.6% |
| |||||||
H&E Equipment Services, Inc. | 148 | 2,956 | ||||||
United Rentals, Inc. (a) | 103 | 9,025 | ||||||
|
| |||||||
| 11,981 | ||||||||
|
| |||||||
TOTAL COMMON STOCKS | 1,956,930 | |||||||
|
| |||||||
Security Description | Shares | Value | ||||||
SHORT TERM INVESTMENT — 0.4% | ||||||||
MONEY MARKET FUND — 0.4% | ||||||||
State Street Institutional Liquid Reserves Fund, Premier Class 0.11% (b) (c) | 9,120 | $ | 9,120 | |||||
|
| |||||||
TOTAL INVESTMENTS — 99.9% (d) | 1,966,050 | |||||||
OTHER ASSETS & LIABILITIES — 0.1% | 984 | |||||||
|
| |||||||
NET ASSETS — 100.0% | $ | 1,967,034 | ||||||
|
| |||||||
| (a) | Non-income producing security |
| (b) | Affiliated Fund managed by SSGA Funds Management, Inc. (Note 3). |
| (c) | The rate shown is the annualized seven-day yield at period end. |
| (d) | Unless otherwise indicated, the values of the investments of the Portfolio are determined based on Level 1 inputs (Note 2). |
PLC Public Limited Company
See accompanying notes to financial statements.
35
Table of Contents
SSGA MASTER TRUST
STATEMENTS OF ASSETS AND LIABILITIES
June 30, 2015
| SSGA Multi-Asset Real Return Portfolio | SSGA Income Allocation Portfolio | SSGA Global Allocation Portfolio | Blackstone/GSO Senior Loan Portfolio | |||||||||||||
ASSETS | ||||||||||||||||
Investments in securities of unaffiliated issuers, at value | $ | 30,524,820 | $ | 14,232,961 | $ | 20,624,977 | $ | 688,256,066 | ||||||||
Investments in securities of affiliated issuers, at value | 110,519,452 | 106,689,932 | 123,792,881 | 11,996,420 | ||||||||||||
|
|
|
|
|
|
|
| |||||||||
Total investments | 141,044,272 | 120,922,893 | 144,417,858 | 700,252,486 | ||||||||||||
|
|
|
|
|
|
|
| |||||||||
Cash | 31,331 | — | — | — | ||||||||||||
Receivable for investment securities sold | — | — | — | 11,278,222 | ||||||||||||
Dividends receivable from affiliated issuers (Note 3) | 968,894 | 269,005 | 406,143 | — | ||||||||||||
Dividends receivable from unaffiliated issuers | — | — | — | — | ||||||||||||
Interest receivable from unaffiliated issuers | — | — | — | 3,239,393 | ||||||||||||
Prepaid expenses and other assets | 278 | 188 | 199 | 932 | ||||||||||||
|
|
|
|
|
|
|
| |||||||||
TOTAL ASSETS | 142,044,775 | 121,192,086 | 144,824,200 | 714,771,033 | ||||||||||||
|
|
|
|
|
|
|
| |||||||||
LIABILITIES | ||||||||||||||||
Payable for investments purchased | — | — | — | 42,166,583 | ||||||||||||
Due to custodian | — | — | — | — | ||||||||||||
Accrued advisory fees (Note 3) | 48,871 | 43,035 | 48,516 | 339,399 | ||||||||||||
Accrued trustees’ fees and expenses (Note 3) | 372 | 264 | 280 | 1,349 | ||||||||||||
|
|
|
|
|
|
|
| |||||||||
TOTAL LIABILITIES | 49,243 | 43,299 | 48,796 | 42,507,331 | ||||||||||||
|
|
|
|
|
|
|
| |||||||||
NET ASSETS | $ | 141,995,532 | $ | 121,148,787 | $ | 144,775,404 | $ | 672,263,702 | ||||||||
|
|
|
|
|
|
|
| |||||||||
COST OF INVESTMENTS | ||||||||||||||||
Unaffiliated issuers | $ | 37,626,615 | $ | 14,109,919 | $ | 20,549,658 | $ | 697,252,360 | ||||||||
Affiliated issuers | 121,335,569 | 107,881,519 | 122,718,043 | 11,996,420 | ||||||||||||
|
|
|
|
|
|
|
| |||||||||
Total cost of investments | $ | 158,962,184 | $ | 121,991,438 | $ | 143,267,701 | $ | 709,248,780 | ||||||||
|
|
|
|
|
|
|
| |||||||||
See accompanying notes to financial statements.
36
Table of Contents
| SSGA Ultra Short Term Bond Portfolio | State Street DoubleLine Total Return Tactical Portfolio | SSGA MFS Systematic Core Equity Portfolio | SSGA MFS Systematic Growth Equity Portfolio | SSGA MFS Systematic Value Equity Portfolio | State Street Risk Aware Portfolio | |||||||||||||||||
| $ | 15,512,937 | $ | 657,530,307 | $ | 2,911,898 | $ | 5,974,507 | $ | 2,879,350 | $ | 1,956,930 | |||||||||||
| 487,918 | 152,859,462 | 26,105 | 63,671 | 27,610 | 9,120 | |||||||||||||||||
|
|
|
|
|
|
|
|
|
|
|
| |||||||||||
| 16,000,855 | 810,389,769 | 2,938,003 | 6,038,178 | 2,906,960 | 1,966,050 | |||||||||||||||||
|
|
|
|
|
|
|
|
|
|
|
| |||||||||||
| 352 | — | 229 | 1,428 | 562 | 436 | |||||||||||||||||
| — | 918,738 | — | — | — | — | |||||||||||||||||
| — | — | 2 | 5 | 2 | 1,392 | |||||||||||||||||
| — | — | 3,545 | 8,406 | 3,550 | — | |||||||||||||||||
| 23,280 | 3,767,790 | — | — | — | — | |||||||||||||||||
| 26 | 724 | 8 | 10 | 9 | 6 | |||||||||||||||||
|
|
|
|
|
|
|
|
|
|
|
| |||||||||||
| 16,024,513 | 815,077,021 | 2,941,787 | 6,048,027 | 2,911,083 | 1,967,884 | |||||||||||||||||
|
|
|
|
|
|
|
|
|
|
|
| |||||||||||
| — | 67,924,897 | — | — | — | — | |||||||||||||||||
| — | 167,214 | — | — | — | — | |||||||||||||||||
| 5,358 | 289,884 | 1,482 | 3,042 | 1,463 | 842 | |||||||||||||||||
| 37 | 964 | 10 | 12 | 11 | 8 | |||||||||||||||||
|
|
|
|
|
|
|
|
|
|
|
| |||||||||||
| 5,395 | 68,382,959 | 1,492 | 3,054 | 1,474 | 850 | |||||||||||||||||
|
|
|
|
|
|
|
|
|
|
|
| |||||||||||
| $ | 16,019,118 | $ | 746,694,062 | $ | 2,940,295 | $ | 6,044,973 | $ | 2,909,609 | $ | 1,967,034 | |||||||||||
|
|
|
|
|
|
|
|
|
|
|
| |||||||||||
| $ | 15,522,652 | $ | 664,197,943 | $ | 2,572,763 | $ | 5,594,789 | $ | 2,575,677 | $ | 1,946,031 | |||||||||||
| 487,918 | 152,859,462 | 26,105 | 63,671 | 27,610 | 9,120 | |||||||||||||||||
|
|
|
|
|
|
|
|
|
|
|
| |||||||||||
| $ | 16,010,570 | $ | 817,057,405 | $ | 2,598,868 | $ | 5,658,460 | $ | 2,603,287 | $ | 1,955,151 | |||||||||||
|
|
|
|
|
|
|
|
|
|
|
| |||||||||||
37
Table of Contents
SSGA MASTER TRUST
STATEMENTS OF OPERATIONS
For the Year Ended June 30, 2015
| SSGA Multi-Asset Real Return Portfolio | SSGA Income Allocation Portfolio | SSGA Global Allocation Portfolio | Blackstone/GSO Senior Loan Portfolio | |||||||||||||
INVESTMENT INCOME | ||||||||||||||||
Dividend and interest income on securities of unaffiliated issuers (Note 2) | $ | 91,317 | $ | 156,259 | $ | 513,327 | $ | 29,258,069 | ||||||||
Dividend income on securities of affiliated issuers (Note 3) | 2,769,559 | 3,743,224 | 2,775,595 | 24,468 | ||||||||||||
|
|
|
|
|
|
|
| |||||||||
TOTAL INVESTMENT INCOME | 2,860,876 | 3,899,483 | 3,288,922 | 29,282,537 | ||||||||||||
|
|
|
|
|
|
|
| |||||||||
EXPENSES | ||||||||||||||||
Advisory fees (Note 3) | 324,150 | 232,856 | 248,448 | 1,835,102 | ||||||||||||
Trustees’ fees (Note 3) | 3,118 | 2,037 | 2,125 | 11,400 | ||||||||||||
|
|
|
|
|
|
|
| |||||||||
TOTAL EXPENSES | 327,268 | 234,893 | 250,573 | 1,846,502 | ||||||||||||
|
|
|
|
|
|
|
| |||||||||
NET INVESTMENT INCOME | $ | 2,533,608 | $ | 3,664,590 | $ | 3,038,349 | $ | 27,436,035 | ||||||||
|
|
|
|
|
|
|
| |||||||||
REALIZED AND UNREALIZED GAIN (LOSS) | ||||||||||||||||
Net realized gain (loss) on investments in securities of unaffiliated issuers | $ | (2,117,979 | ) | $ | 71,509 | $ | (31,018 | ) | $ | (750,613 | ) | |||||
Net realized gain (loss) on investments in securities of affiliated issuers | (2,350,279 | ) | (118,760 | ) | 2,401,805 | — | ||||||||||
Net realized gain on capital gains distributions from affiliated issuers | 36,098 | 592,146 | 393,002 | — | ||||||||||||
Net change in unrealized appreciation (depreciation) on investments | (23,442,541 | ) | (6,320,056 | ) | (5,265,539 | ) | (10,613,268 | ) | ||||||||
|
|
|
|
|
|
|
| |||||||||
NET REALIZED AND UNREALIZED GAIN (LOSS) ON INVESTMENTS | (27,874,701 | ) | (5,775,161 | ) | (2,501,750 | ) | (11,363,881 | ) | ||||||||
|
|
|
|
|
|
|
| |||||||||
NET INCREASE (DECREASE) IN NET ASSETS RESULTING FROM OPERATIONS | $ | (25,341,093 | ) | $ | (2,110,571 | ) | $ | 536,599 | $ | 16,072,154 | ||||||
|
|
|
|
|
|
|
| |||||||||
| * | For the period February 23, 2015 (commencement of operations) to June 30, 2015. |
| ** | For the period September 9, 2014 (commencement of operations) to June 30, 2015. |
See accompanying notes to financial statements.
38
Table of Contents
| SSGA Ultra Short Term Bond Portfolio | State Street DoubleLine Total Return Tactical Portfolio* | SSGA MFS Systematic Core Equity Portfolio | SSGA MFS Systematic Growth Equity Portfolio | SSGA MFS Systematic Value Equity Portfolio | State Street Risk Aware Portfolio** | |||||||||||||||||
$ | 86,206 |
| $ | 5,258,752 | $ | 62,067 | $ | 63,283 | $ | 58,901 | $ | 30,935 | ||||||||||
| | 265 | | 32,846 | 22 | 27 | 24 | 8 | |||||||||||||||
|
|
|
|
|
|
|
|
|
|
|
| |||||||||||
| 86,471 | 5,291,598 | 62,089 | 63,310 | 58,925 | $ | 30,943 | ||||||||||||||||
|
|
|
|
|
|
|
|
|
|
|
| |||||||||||
| 32,323 | 421,453 | 9,206 | 10,918 | 8,978 | 4,534 | |||||||||||||||||
| 301 | 1,472 | 58 | 60 | 57 | 28 | |||||||||||||||||
|
|
|
|
|
|
|
|
|
|
|
| |||||||||||
| 32,624 | 422,925 | 9,264 | 10,978 | 9,035 | 4,562 | |||||||||||||||||
|
|
|
|
|
|
|
|
|
|
|
| |||||||||||
| $ | 53,847 | $ | 4,868,673 | $ | 52,825 | $ | 52,332 | $ | 49,890 | $ | 26,381 | |||||||||||
|
|
|
|
|
|
|
|
|
|
|
| |||||||||||
$ | (4,837 | ) | $ | (1,029,740 | ) | $ | 313,500 | $ | 451,931 | $ | 294,237 | $ | (232,469 | ) | ||||||||
| — |
| — | — | — | — | — | |||||||||||||||
| — |
| — | — | — | — | — | |||||||||||||||
| (20,194 | ) | (6,667,636 | ) | 48,740 | 35,715 | 41,453 | 10,899 | ||||||||||||||
|
|
|
|
|
|
|
|
|
|
|
| |||||||||||
| (25,031 | ) | (7,697,376 | ) | 362,240 | 487,646 | 335,690 | $ | (221,570 | ) | ||||||||||||
|
|
|
|
|
|
|
|
|
|
|
| |||||||||||
$ | 28,816 |
| $ | (2,828,703 | ) | $ | 415,065 | $ | 539,978 | $ | 385,580 | $ | (195,189 | ) | ||||||||
|
|
|
|
|
|
|
|
|
|
|
| |||||||||||
39
Table of Contents
SSGA MASTER TRUST
STATEMENTS OF CHANGES IN NET ASSETS
| SSGA Multi-Asset Real Return Portfolio | SSGA Income Allocation Portfolio | |||||||||||||||
| Year Ended 6/30/15 | Year Ended 6/30/14 | Year Ended 6/30/15 | Year Ended 6/30/14 | |||||||||||||
INCREASE (DECREASE) IN NET ASSETS FROM OPERATIONS: | ||||||||||||||||
Net investment income (loss) | $ | 2,533,608 | $ | 2,587,021 | $ | 3,664,590 | $ | 4,096,865 | ||||||||
Net realized gain (loss) on investments | (4,432,160 | ) | (2,207,394 | ) | 544,895 | (1,346,791 | ) | |||||||||
Net change in unrealized appreciation (depreciation) on investments | (23,442,541 | ) | 16,133,508 | (6,320,056 | ) | 11,409,215 | ||||||||||
|
|
|
|
|
|
|
| |||||||||
Net increase (decrease) in net assets resulting from operations | (25,341,093 | ) | 16,513,135 | (2,110,571 | ) | 14,159,289 | ||||||||||
|
|
|
|
|
|
|
| |||||||||
CAPITAL TRANSACTIONS | ||||||||||||||||
Contributions | 66,337,576 | 91,367,610 | 34,191,856 | 7,804,636 | ||||||||||||
Withdrawals | (63,635,938 | ) | (64,829,742 | ) | (14,962,876 | ) | (92,188,375 | ) | ||||||||
Other capital | — | — | — | — | ||||||||||||
|
|
|
|
|
|
|
| |||||||||
Net increase (decrease) in net assets from capital transactions | 2,701,638 | 26,537,868 | 19,228,980 | (84,383,739 | ) | |||||||||||
|
|
|
|
|
|
|
| |||||||||
Net increase (decrease) in net assets during the period | (22,639,455 | ) | 43,051,003 | 17,118,409 | (70,224,450 | ) | ||||||||||
NET ASSETS | ||||||||||||||||
Net assets at beginning of period | 164,634,987 | 121,583,984 | 104,030,378 | 174,254,828 | ||||||||||||
|
|
|
|
|
|
|
| |||||||||
NET ASSETS END OF PERIOD | $ | 141,995,532 | $ | 164,634,987 | $ | 121,148,787 | $ | 104,030,378 | ||||||||
|
|
|
|
|
|
|
| |||||||||
| * | Commencement of operations |
See accompanying notes to financial statements.
40
Table of Contents
| SSGA Global Allocation Portfolio | Blackstone/GSO Senior Loan Portfolio | SSGA Ultra Short Term Bond Portfolio | ||||||||||||||||||||
| Year Ended 6/30/15 | Year Ended 6/30/14 | Year Ended 6/30/15 | Year Ended 6/30/14 | Year Ended 6/30/15 | For the Period 10/9/13* - 6/30/14 | |||||||||||||||||
| $ | 3,038,349 | $ | 1,874,897 | $ | 27,436,035 | $ | 20,364,761 | $ | 53,847 | $ | 32,351 | |||||||||||
| 2,763,789 | 1,718,573 | (750,613 | ) | (2,767,913 | ) | (4,837 | ) | 888 | ||||||||||||||
| (5,265,539 | ) | 6,937,869 | (10,613,268 | ) | 4,689,730 | (20,194 | ) | 10,479 | |||||||||||||
|
|
|
|
|
|
|
|
|
|
|
| |||||||||||
| 536,599 |
| 10,531,339 | 16,072,154 | 22,286,578 | 28,816 | 43,718 | |||||||||||||||
|
|
|
|
|
|
|
|
|
|
|
| |||||||||||
| 72,106,656 | 47,337,163 | 123,474,946 | 286,897,792 | 6,012,275 | 16,010,331 | |||||||||||||||||
| (26,359,458 | ) | (11,312,504 | ) | (77,954,422 | ) | (31,961,441 | ) | (4,061,512 | ) | (2,033,325 | ) | |||||||||||
| — | — | 194,062 | 461,549 | 3,608 | 15,207 | |||||||||||||||||
|
|
|
|
|
|
|
|
|
|
|
| |||||||||||
| 45,747,198 |
| 36,024,659 | 45,714,586 | 255,397,900 | 1,954,371 | 13,992,213 | |||||||||||||||
|
|
|
|
|
|
|
|
|
|
|
| |||||||||||
| 46,283,797 |
| 46,555,998 | 61,786,740 | 277,684,478 | 1,983,187 | 14,035,931 | |||||||||||||||
| 98,491,607 | 51,935,609 | 610,476,962 | 332,792,484 | 14,035,931 | — | |||||||||||||||||
|
|
|
|
|
|
|
|
|
|
|
| |||||||||||
| $ | 144,775,404 | $ | 98,491,607 | $ | 672,263,702 | $ | 610,476,962 | $ | 16,019,118 | $ | 14,035,931 | |||||||||||
|
|
|
|
|
|
|
|
|
|
|
| |||||||||||
41
Table of Contents
SSGA MASTER TRUST
STATEMENTS OF CHANGES IN NET ASSETS (continued)
| State Street DoubleLine Total Return Tactical Portfolio | SSGA MFS Systematic Core Equity Portfolio | |||||||||||
| For the Period 2/23/15* - 6/30/15 | Year Ended 6/30/15 | For the Period 1/8/14* - 6/30/14 | ||||||||||
INCREASE (DECREASE) IN NET ASSETS FROM OPERATIONS: | ||||||||||||
Net investment income (loss) | $ | 4,868,673 | $ | 52,825 | $ | 38,006 | ||||||
Net realized gain (loss) on investments | (1,029,740 | ) | 313,500 | 68,581 | ||||||||
Net change in unrealized appreciation (depreciation) on investments | (6,667,636 | ) | 48,740 | 290,395 | ||||||||
|
|
|
|
|
| |||||||
Net increase (decrease) in net assets resulting from operations | (2,828,703 | ) | 415,065 | 396,982 | ||||||||
|
|
|
|
|
| |||||||
CAPITAL TRANSACTIONS | ||||||||||||
Contributions | 749,143,987 | — | 5,001,000 | |||||||||
Withdrawals | — | (2,852,753 | ) | (19,999 | ) | |||||||
Other capital | 378,778 | — | — | |||||||||
|
|
|
|
|
| |||||||
Net increase (decrease) in net assets from capital transactions | 749,522,765 | (2,852,753 | ) | 4,981,001 | ||||||||
|
|
|
|
|
| |||||||
Net increase (decrease) in net assets during the period | 746,694,062 | (2,437,688 | ) | 5,377,983 | ||||||||
NET ASSETS | ||||||||||||
Net assets at beginning of period | — | 5,377,983 | — | |||||||||
|
|
|
|
|
| |||||||
NET ASSETS END OF PERIOD | $ | 746,694,062 | $ | 2,940,295 | $ | 5,377,983 | ||||||
|
|
|
|
|
| |||||||
| * | Commencement of operations |
See accompanying notes to financial statements.
42
Table of Contents
| SSGA MFS Systematic Growth Equity Portfolio | SSGA MFS Systematic Value Equity Portfolio | State Street Risk Aware Portfolio | ||||||||||||||||
| Year Ended 6/30/15 | For the Period 1/8/14* - 6/30/14 | Year Ended 6/30/15 | For the Period 1/8/14* - 6/30/14 | For the Period 9/9/14* - 6/30/15 | ||||||||||||||
$ | 52,332 |
| $ | 35,730 | $ | 49,890 | $ | 41,704 | $ | 26,381 | ||||||||
| 451,931 | 10,976 | 294,237 | 4,238 | (232,469 | ) | |||||||||||||
| 35,715 |
| 344,003 | 41,453 | 262,220 | 10,899 | ||||||||||||
|
|
|
|
|
|
|
|
|
| |||||||||
| 539,978 | 390,709 | 385,580 | 308,162 | (195,189 | ) | |||||||||||||
|
|
|
|
|
|
|
|
|
| |||||||||
| 3,023,489 | 5,001,000 | — | 5,001,000 | 4,000,000 | ||||||||||||||
| (2,891,074 | ) | (19,129 | ) | (2,762,295 | ) | (22,838 | ) | (1,837,777 | ) | |||||||||
| — | — | — | — | — | ||||||||||||||
|
|
|
|
|
|
|
|
|
| |||||||||
| 132,415 | 4,981,871 | (2,762,295 | ) | 4,978,162 | 2,162,223 | |||||||||||||
|
|
|
|
|
|
|
|
|
| |||||||||
| 672,393 | 5,372,580 | (2,376,715 | ) | 5,286,324 | 1,967,034 | |||||||||||||
| 5,372,580 | — | 5,286,324 | — | — | ||||||||||||||
|
|
|
|
|
|
|
|
|
| |||||||||
| $ | 6,044,973 | $ | 5,372,580 | $ | 2,909,609 | $ | 5,286,324 | $ | 1,967,034 | |||||||||
|
|
|
|
|
|
|
|
|
| |||||||||
43
Table of Contents
SSGA MASTER TRUST
The following table includes selected supplemental data and ratios to average net assets:
| SSGA Multi-Asset Real Return Portfolio* | ||||||||||||||||
| Year Ended 6/30/15 | Year Ended 6/30/14 | Year Ended 6/30/13 | For the Period 4/25/12** - 6/30/12 | |||||||||||||
Supplemental Data and Ratios: | ||||||||||||||||
Net assets, end of period (000s) | $ | 141,996 | $ | 164,635 | $ | 121,584 | $ | 5,827 | ||||||||
|
|
|
|
|
|
|
| |||||||||
Ratios to average net assets: | ||||||||||||||||
Operating expenses | 0.20 | % | 0.20 | % | 0.20 | % | 0.20 | %(1) | ||||||||
Net investment income | 1.56 | % | 2.01 | % | 2.91 | % | 3.84 | %(1) | ||||||||
Portfolio turnover rate | 33 | % | 40 | % | 31 | % | 10 | % | ||||||||
Total return | (14.80 | )% | 13.93 | % | (1.63 | )% | (3.42 | )%(2) | ||||||||
| * | The Portfolio invests in other underlying funds and indirectly bears its proportionate share of fees and expenses incurred by such funds. The ratios presented do not reflect the indirect expenses of the underlying funds in which the Portfolio invests. |
| ** | Commencement of operations |
| (1) | Annualized. |
| (2) | Total return for periods of less than one year is not annualized. |
See accompanying notes to financial statements.
44
Table of Contents
| SSGA Income Allocation Portfolio* | SSGA Global Allocation Portfolio* | |||||||||||||||||||||||||||||
| Year Ended 6/30/15 | Year Ended 6/30/14 | Year Ended 6/30/13 | For the Period 4/25/12** - 6/30/12 | Year Ended 6/30/15 | Year Ended 6/30/14 | Year Ended 6/30/13 | For the Period 4/25/12** - 6/30/12 | |||||||||||||||||||||||
| $ | 121,149 | $ | 104,030 | $ | 174,255 | $ | 9,114 | $ | 144,775 | $ | 98,492 | $ | 51,936 | $ | 4,451 | |||||||||||||||
|
|
|
|
|
|
|
|
|
|
|
|
|
|
|
| |||||||||||||||
| 0.20 | % | 0.20 | % | 0.20 | % | 0.20 | %(1) | 0.20 | % | 0.20 | % | 0.20 | % | 0.20 | %(1) | |||||||||||||||
| 3.15 | % | 3.89 | % | 4.65 | % | 8.39 | %(1) | 2.45 | % | 2.76 | % | 3.07 | % | 4.34 | %(1) | |||||||||||||||
| 64 | % | 63 | % | 80 | % | 15 | % | 98 | % | 89 | % | 123 | % | 25 | % | |||||||||||||||
| (1.42 | )% | 13.84 | % | 4.39 | % | 0.92 | %(2) | 0.49 | % | 16.80 | % | 9.92 | % | (1.82 | )%(2) | |||||||||||||||
45
Table of Contents
SSGA MASTER TRUST
FINANCIAL HIGHLIGHTS
The following table includes selected supplemental data and ratios to average net assets:
| Blackstone/GSO Senior Loan Portfolio* | ||||||||||||
| Year Ended 6/30/15 | Year Ended 6/30/14 | For the Period 4/3/13** - 6/30/13 | ||||||||||
Supplemental Data and Ratios: | ||||||||||||
Net assets, end of period (000s) | $ | 672,264 | $ | 610,477 | $ | 332,792 | ||||||
|
|
|
|
|
| |||||||
Ratios to average net assets: | ||||||||||||
Operating expenses | 0.31 | % | 0.30 | % | 0.30 | %(1) | ||||||
Net investment income | 4.49 | % | 3.63 | % | 2.57 | %(1) | ||||||
Portfolio turnover rate | 65 | % | 77 | % | 4 | % | ||||||
Total return | 2.98 | % | 4.00 | % | (0.31 | )%(2) | ||||||
| * | The Portfolio invests in other underlying funds and indirectly bears its proportionate share of fees and expenses incurred by such funds. The ratios presented do not reflect the indirect expenses of the underlying funds in which the Portfolio invests. |
| ** | Commencement of operations |
| (1) | Annualized. |
| (2) | Total return for periods of less than one year is not annualized. |
See accompanying notes to financial statements.
46
Table of Contents
| SSGA Ultra Short Term Bond Portfolio* | State Street DoubleLine Total Return Tactical Portfolio* | SSGA MFS Systematic Core Equity Portfolio* | ||||||||||||||||
| Year Ended 6/30/15 | For the Period 10/9/13** - 6/30/14 | For the Period 2/23/15** - 6/30/15 | Year Ended 6/30/15 | For the Period 1/8/14** - 6/30/14 | ||||||||||||||
| $ | 16,019 | $ | 14,036 | $ | 746,694 | $ | 2,940 | $ | 5,378 | |||||||||
|
|
|
|
|
|
|
|
|
| |||||||||
| 0.20 | % | 0.20 | %(1) | 0.30 | %(1) | 0.30 | % | 0.30 | %(1) | |||||||||
| 0.33 | % | 0.34 | %(1) | 3.46 | %(1) | 1.72 | % | —(1) | ||||||||||
| 79 | % | 39 | % | 14 | % | 54 | % | 27 | % | |||||||||
| 0.21 | % | 0.47 | %(2) | (0.36 | )%(2) | 14.00 | % | 7.92 | %(2) | |||||||||
47
Table of Contents
SSGA MASTER TRUST
FINANCIAL HIGHLIGHTS
The following table includes selected supplemental data and ratios to average net assets:
| SSGA MFS Systematic Growth Equity Portfolio* | ||||||||
| Year Ended 6/30/15 | For the Period 1/8/14** - 6/30/14 | |||||||
Supplemental Data and Ratios: | ||||||||
Net assets, end of period (000s) | $ | 6,045 | $ | 5,373 | ||||
|
|
|
| |||||
Ratios to average net assets: | ||||||||
Operating expenses | 0.30 | % | 0.30 | %(1) | ||||
Net investment income | 1.44 | % | 1.46 | %(1) | ||||
Portfolio turnover rate | 67 | % | 20 | % | ||||
Total return | 17.85 | % | 7.85 | %(2) | ||||
| * | The Portfolio invests in other underlying funds and indirectly bears its proportionate share of fees and expenses incurred by such funds. The ratios presented do not reflect the indirect expenses of the underlying funds in which the Portfolio invests. |
| ** | Commencement of operations |
| (1) | Annualized. |
| (2) | Total return for periods of less than one year is not annualized. |
See accompanying notes to financial statements.
48
Table of Contents
| SSGA MFS Systematic Value Equity Portfolio* | State Street Risk Aware Portfolio* | |||||||||
| Year Ended 6/30/15 | For the Period 1/8/14** - 6/30/14 | For the Period 9/9/14** - 6/30/15 | ||||||||
| $ | 2,910 | $ | 5,286 | $ | 1,967 | |||||
|
|
|
|
|
| |||||
| 0.30 | % | 0.30 | %(1) | 0.25 | %(1) | |||||
| 1.67 | % | 1.73 | %(1) | 1.46 | %(1) | |||||
| 61 | % | 23 | % | 122 | % | |||||
| 13.79 | % | 6.20 | %(2) | (0.46 | )%(2) | |||||
49
Table of Contents
SSGA MASTER TRUST
June 30, 2015
| 1. | Organization |
SSGA Master Trust (the “Trust”), which is registered under the Investment Company Act of 1940, as amended (“1940 Act”), is an open-end management investment company that was organized as a Massachusetts business trust on March 30, 2011.
As of June 30, 2015, the Trust offered ten (10) portfolios, each of which represents a separate series of beneficial interest in the Trust (each a “Portfolio” and collectively; the “Portfolios”). The financial statements herein relate to the following ten (10) Portfolios: SSGA Multi-Asset Real Return Portfolio, SSGA Income Allocation Portfolio, SSGA Global Allocation Portfolio, Blackstone/GSO Senior Loan Portfolio, SSGA Ultra Short Term Bond Portfolio, State Street DoubleLine Total Return Tactical Portfolio, SSGA MFS Systematic Core Equity Portfolio, SSGA MFS Systematic Growth Equity Portfolio, SSGA MFS Systematic Value Equity Portfolio and State Street Risk Aware Portfolio, each a “diversified” investment company, with the exception of SSGA Ultra Short Term Bond Portfolio and the State Street Risk Aware Portfolio, which are each a “non-diversified” investment company. Each Portfolio serves as a master fund in a master feeder structure.
Under the Trust’s organizational documents, its officers and trustees are indemnified against certain liabilities arising out of the performance of their duties to the Trust. Additionally, in the normal course of business, the Trust enters into contracts with service providers that contain general indemnification clauses. The Trust’s maximum exposure under these arrangements is unknown as this could involve future claims that may be made against the Trust that have not yet occurred.
| 2. | Summary of Significant Accounting Policies |
The following is a summary of significant accounting policies followed by the Trust in the preparation of its financial statements:
The preparation of financial statements in accordance with generally accepted accounting principles in the United States of America (“U.S. GAAP”) which requires management to make estimates and assumptions that affect the reported amounts and disclosures in the financial statements. Actual results could differ from those estimates. Each Portfolio is an investment company under U.S. GAAP and follows the accounting and reporting guidance applicable to investment companies in Financial Accounting Standards Board (“FASB”) Accounting Codification (“ASC”) 946, Financial Services Investment Companies (“ASC 946”).
Security Valuation
Each Portfolio’s investments are valued at fair value each day that the Portfolio’s listing exchange is open and, for financial reporting purposes, as of the report date should the reporting period end on a day that the Portfolio’s listing exchange is not open. Fair value is generally defined as the price a fund would receive to sell an asset or pay to transfer a liability in an orderly transaction between market participants at the measurement date. By its nature, a fair value price is a good faith estimate of the valuation in a current sale and may not reflect an actual market price. The investments of each Portfolio are valued pursuant to policies and procedures developed by the Oversight Committee (the “Committee”) and approved by the Board of Trustees of the Trust (the “Board”). The Committee provides oversight of the valuation of investments for the Portfolios. The Board has responsibilty for determining the fair value of investments. The members of the Committee are approved by the Board.
Valuation techniques used to value each Portfolio’s investments by major category are as follows:
| • | Equity investments (including registered investment companies that are exchange-traded or closed-end funds) traded on a recognized securities exchange for which market quotations are readily available are valued at the last sale price or official closing price, as applicable, on the primary market or exchange on which they trade. Equity investments traded on a recognized exchange for which there were no sales on that day are valued at the last published sale price or at fair value. |
| • | Short-term investments maturing within sixty days at the time of purchase are valued using the amortized cost method as long as the amortized cost value of a particular portfolio instrument is reasonably determined to approximate the fair value of that investment established using market-based and issuer-specific factors. |
50
Table of Contents
SSGA MASTER TRUST
NOTES TO FINANCIAL STATEMENTS (continued)
June 30, 2015
| • | Debt obligations (both governmental and non- governmental) purchased with greater than sixty days to maturity and not investment grade are valued at last reported evaluated bid prices obtained from independent pricing services or brokers. In determining the value of a fixed income investment, pricing services may use certain information with respect to transactions in such investments, quotations from dealers, pricing matrixes, market transactions in comparable investments, various relationships observed in the market between investments, and calculated yield measures. |
| • | Investments in registered investment companies (including money market funds) or other unitized pooled investment vehicles that are not traded on an exchange are valued at that day’s published net asset value per share or unit. Money market funds generally value portfolio investments using the amortized cost method as set forth in Rule 2a-7 under the 1940 Act and in accordance with the Portfolios procedures to stabilize net asset value. |
Senior or other loans are valued at evaluated mid prices supplied by an independent pricing service, if available. Senior loans and other loans in which the committee determines that there are no reliable valuations available from pricing sources or brokers will be initially valued at cost and adjusted for amortization of principal until remeasurement is warranted due to a credit or economic event or other factors effecting the loan.
In the event prices or quotations are not readily available or that application of these methods of valuation results in a price for an investment which is deemed not to be representative of the fair value of such investment, fair value will be determined in good faith by the Committee, in accordance with valuation policy and procedures approved by the Board.
Various inputs are used in determining the value of Portfolios’ investments. These inputs are categorized into a fair value hierarchy consisting of three broad levels for financial reporting purposes. The Portfolios value its assets and liabilities at fair value using a hierarchy that prioritizes the inputs to valuation techniques giving the highest priority to readily available unadjusted quoted prices in active markets for identical assets or liabilities (Level 1 measurements) and the lowest priority to unobservable inputs (Level 3 measurements) when market prices are not readily available or reliable. The categorization of a value determined for an investment within the hierarchy is based upon the pricing transparency of the investment and is not necessarily an indication of the risk associated with investing in it.
The three levels of the fair value hierarchy are as follows:
| • | Level 1 — Unadjusted quoted prices in active markets for identical assets or liabilities; |
| • | Level 2 — Inputs other than quoted prices included within Level 1 that are observable for the asset or liability either directly or indirectly, including quoted prices for similar assets or liabilities in active markets, quoted prices for identical or similar assets or liabilities in markets that are not considered to be active, inputs other than quoted prices that are observable for the asset or liability (such as exchange rates, financing terms, interest rates, yield curves, volatilities, prepayment speeds, loss severities, credit risks and default rates) or other market-corroborated inputs; and |
| • | Level 3 — Unobservable inputs for the asset or liability, including the Committee’s assumptions used in determining the fair value of investments. |
51
Table of Contents
SSGA MASTER TRUST
NOTES TO FINANCIAL STATEMENTS (continued)
June 30, 2015
The following table summarizes the value of each of the Portfolio’s investments according to the fair value hierarchy as of June 30, 2015.
| Level 1 — Quoted Prices | Level 2 — Other Significant Observable Inputs | Level 3 — Significant Unobservable Inputs | Total | ||||||||||||
SSGA Multi-Asset Real Return Portfolio | $ | 141,044,272 | $ | — | $ | — | $ | 141,044,272 | ||||||||
SSGA Income Allocation Portfolio | 120,922,893 | — | — | 120,922,893 | ||||||||||||
SSGA Global Allocation Portfolio | 144,417,858 | — | — | 144,417,858 | ||||||||||||
Blackstone/GSO Senior Loan Portfolio | 11,996,420 | 688,256,066 | — | 700,252,486 | ||||||||||||
SSGA Ultra Short Term Bond Portfolio | 487,918 | 15,512,937 | — | 16,000,855 | ||||||||||||
State Street DoubleLine Total Return Tactical Portfolio | 152,859,462 | 657,530,307 | — | 810,389,769 | ||||||||||||
SSGA MFS Systematic Core Equity Portfolio | 2,938,003 | — | — | 2,938,003 | ||||||||||||
SSGA MFS Systematic Growth Equity Portfolio | 6,038,178 | — | — | 6,038,178 | ||||||||||||
SSGA MFS Systematic Value Equity Portfolio | 2,906,960 | — | — | 2,906,960 | ||||||||||||
State Street Risk Aware Portfolio | 1,966,050 | — | — | 1,966,050 | ||||||||||||
Changes in valuation techniques may result in transfers in or out of an assigned level within the disclosure hierarchy. Transfers between different levels of the fair value hierarchy are recognized at the end of the reporting period.
The Portfolios had no transfers between levels for period ended June 30, 2015.
Investment Transactions and Income Recognition
Investment transactions are accounted for on the trade date for financial reporting purposes. Dividend income and capital gains distributions, if any, are recognized on the ex-dividend date. Interest income is recorded daily on an accrual basis. Non-cash dividends received in the form of stock, if any, are received as dividend income at fair value. Distributions received by a Portfolio may include a return of capital that is estimated by management. Such amounts are recorded as a reduction of the cost of investments or reclassified to capital gains. Realized gains and losses from the sale or disposition of securities are determined using the identified cost method.
Expenses
Advisory fees and other expenses, which are directly identifiable to a specific Portfolio, are applied to that Portfolio. Trustees’ fees and other expenses which cannot be attributed to a specific Portfolio are allocated in such a manner as deemed equitable, taking into consideration the nature and type of expense and the relative net assets of the Portfolios. In addition to the these direct expenses, the Portfolios bear certain expenses indirectly, such as fees of underlying Portfolios in which the Portfolio invest that are reflected in the reported value of such Portfolios.
Foreign Currency Translation
The accounting records of the Portfolios are maintained in U.S. dollars. Foreign currencies as well as investment securities and other assets and liabilities denominated in a foreign currency are translated to U.S. dollars using exchange rates deemed appropriate pursuant to the valuation policy at period end. Purchases and sales of securities, income receipts and expense payments are translated into U.S. dollars on the respective dates of transactions. The Portfolio does not isolate the effect of fluctuations in foreign exchange rates from the effect of fluctuations in the market prices of securities. Such fluctuations are reflected by the Portfolio as a component of realized and unrealized gains and losses from investments for financial reporting purposes.
Federal Income Tax
The Portfolios are not required to pay federal income taxes on their net investment income and net capital gains because they are treated as partnerships for federal income tax purposes. All interest, gains and losses of the Portfolios are deemed to have been “passed through” to the Portfolios’ partners in proportion to their holdings in the respective
52
Table of Contents
SSGA MASTER TRUST
NOTES TO FINANCIAL STATEMENTS (continued)
June 30, 2015
Portfolio, regardless of whether such items have been distributed by the Portfolios. Each partner is responsible for tax liability based on its distributive share; therefore, no provision has been made for federal income taxes. The Portfolios have reviewed the tax positions for the open tax years as of June 30, 2015 and have determined that no provision for income tax is required in the Portfolios’ Financial Statements. The Portfolios’ federal tax returns are subject to examination by the Portfolios’ major tax jurisdictions, which include the United States of America and the Commonwealth of Massachusetts. The Portfolios’ recognized interest and penalties, if any, related to tax liabilities as income tax expense in the Statements of Operations.
| 3. | Fees and Compensation Paid to Affiliates and Other Related Party Transactions |
Advisory Fee
Each Portfolio has entered into an Investment Advisory Agreement with SSGA Funds Management, Inc. (the “Adviser” or “SSGA FM”). For its advisory services to the Portfolios, facilities furnished, and expenses borne by the Adviser, each Portfolio pays the Adviser a fee accrued daily and paid monthly, based on a percentage of each Portfolio’s average daily net assets as shown in the following table:
| Annual Rate | ||||
SSGA Multi-Asset Real Return Portfolio | 0.20 | % | ||
SSGA Income Allocation Portfolio | 0.20 | % | ||
SSGA Global Allocation Portfolio | 0.20 | % | ||
Blackstone/GSO Senior Loan Portfolio | 0.30 | % | ||
SSGA Ultra Short Term Bond Portfolio | 0.20 | % | ||
State Street DoubleLine Total Return Tactical Portfolio | 0.30 | % | ||
SSGA MFS Systematic Core Equity Portfolio | 0.30 | % | ||
SSGA MFS Systematic Growth Equity Portfolio | 0.30 | % | ||
SSGA MFS Systematic Value Equity Portfolio | 0.30 | % | ||
State Street Risk Aware Portfolio | 0.25 | % | ||
The Adviser pays all operating expenses of each Portfolio other than management fee, brokerage, taxes, interest, fees and expenses of the Independent Trustees (including any Trustees’ counsel fees), litigation expenses, acquired fund fees and expenses and other extraordinary expenses.
GSO/Blackstone Debt Funds Management LLC receives fees for its services as the sub-adviser to the SPDR Blackstone/GSO Senior Loan Portfolio from the Adviser.
Massachusetts Financial Services Company receives fees for its services as sub-adviser to the SSGA MFS Systematic Core Equity Portfolio, SSGA MFS Systematic Growth Equity Portfolio and SSGA Systematic Value Equity Portfolio from the Adviser.
DoubleLine Capital LP receives fees for its services as the sub-adviser to the SPDR DoubleLine Total Return Portfolio from the Adviser.
Effective June 1, 2015, SSGA FM serves as Administrator and State Street Bank and Trust Company (“State Street”) serves as sub-administrator. State Street, an affiliate of the Adviser, receives fees for its services as Custodian, Sub-Administrator and Transfer Agent from the Adviser.
| Trustees’ | Fees |
The Trust, SSGA Master Trust, SPDR Series Trust and SPDR Index Shares Funds (together with the Trust, the “Trusts”) pay, in the aggregate, each Independent Trustee an annual fee of $185,000 plus $10,000 per in-person meeting attended and $1,250 for each telephonic or video conference meeting attended. The Chairman of the Board receives an additional annual fee of $50,000 and the Chairman of the Audit Committee receives an additional annual fee of $20,000. The Trust also reimburses each Trustee for travel and other out-of-pocket expenses incurred by him/her in connection with attending such meetings and in connection with attending industry seminars and meetings. Trustee fees are allocated
53
Table of Contents
SSGA MASTER TRUST
NOTES TO FINANCIAL STATEMENTS (continued)
June 30, 2015
among the Trusts and each of their respective series in such a manner as deemed equitable, taking into consideration the relative net assets of the series.
| Transactions | with Affiliates |
Each Portfolio may invest in certain money market funds and underlying funds affiliated with the Adviser. Amounts related to investments in affiliated underlying funds at June 30, 2015, and for the period then ended are:
SSGA Multi-Asset | Number of Shares Held at 6/30/14 | Value at 6/30/14 | Purchased | Sold | Number of Shares Held at 6/30/15 | Value at 6/30/15 | Dividend Income | Realized Gain (Loss) | ||||||||||||||||||||||||||||||||
| Cost | Shares | Proceeds | Shares | |||||||||||||||||||||||||||||||||||||
Barclays TIPS ETF | 243,141 | $ | 13,941,705 | $ | 19,231,767 | 337,986 | $ | 10,212,852 | 180,604 | 400,523 | $ | 22,321,147 | $ | 131,187 | $ | (90,423 | ) | |||||||||||||||||||||||
DB International | 39,783 | 2,466,944 | 7,689,708 | 127,908 | 2,755,651 | 48,591 | 119,100 | 6,539,781 | 75,496 | (60,873 | ) | |||||||||||||||||||||||||||||
S&P Global Natural Resources ETF | 971,968 | 51,368,509 | 26,346,652 | 556,456 | 26,870,357 | 589,458 | 938,966 | 39,483,520 | 1,307,005 | (1,495,268 | ) | |||||||||||||||||||||||||||||
S&P International Energy Sector ETF | 114,255 | 3,376,235 | 1,764,205 | 81,111 | 1,094,840 | 50,550 | 144,816 | 2,802,190 | 114,301 | 33,640 | ||||||||||||||||||||||||||||||
S&P Metals & Mining ETF | 118,602 | 5,010,934 | 2,595,346 | 78,454 | 4,880,868 | 171,605 | 25,451 | 619,223 | 69,214 | (1,791,856 | ) | |||||||||||||||||||||||||||||
Energy Select Sector Fund | 67,060 | 6,712,706 | 7,017,014 | 84,255 | 5,280,902 | 62,395 | 88,920 | 6,683,227 | 166,496 | (94,834 | ) | |||||||||||||||||||||||||||||
Dow Jones | 418,421 | 18,510,945 | 7,168,673 | 165,898 | 12,815,453 | 297,628 | 286,691 | 12,000,886 | 399,269 | 21,396 | ||||||||||||||||||||||||||||||
Dow Jones REIT ETF | 242,545 | 20,131,235 | 10,373,595 | 115,886 | 17,519,011 | 200,274 | 158,157 | 13,345,286 | 537,459 | 1,127,939 | ||||||||||||||||||||||||||||||
State Street Institutional Liquid Reserves Fund | 334,186 | 334,186 | 30,856,850 | 30,856,850 | 24,466,844 | 24,466,844 | 6,724,192 | 6,724,192 | 5,230 | — | ||||||||||||||||||||||||||||||
SSGA Income Allocation | Number of Shares Held at 6/30/14 | Value at 6/30/14 | Purchased | Sold | Number of Shares Held at 6/30/15 | Value at 6/30/15 | Dividend Income | Realized Gain (Loss) | ||||||||||||||||||||||||||||||||
| Cost | Shares | Proceeds | Shares | |||||||||||||||||||||||||||||||||||||
S&P Dividend ETF | 208,856 | $ | 15,996,281 | $ | 5,829,636 | 74,944 | $ | 17,125,995 | 220,689 | 63,111 | $ | 4,809,689 | $ | 739,224 | $ | 1,498,458 | ||||||||||||||||||||||||
Wells Fargo | 118,540 | 5,174,271 | 1,782,911 | 40,270 | 899,824 | 20,382 | 138,428 | 6,006,391 | 328,155 | (2,981 | ) | |||||||||||||||||||||||||||||
Consumer Discretionary Select Sector Fund | — | — | 2,627,218 | 34,676 | 194,700 | 2,546 | 32,130 | 2,457,303 | 7,936 | 1,928 | ||||||||||||||||||||||||||||||
Financial Select Sector Fund | — | — | 4,927,921 | 206,843 | 4,922,719 | 206,843 | — | — | 30,777 | (5,202 | ) | |||||||||||||||||||||||||||||
Health Care Select Sector Fund | 34,459 | 2,096,141 | 773,124 | 11,146 | 870,199 | 12,603 | 33,002 | 2,455,019 | 32,355 | 52,303 | ||||||||||||||||||||||||||||||
Industrial Select Sector Fund | 37,178 | 2,009,843 | 2,179,956 | 41,946 | 4,304,210 | 79,124 | — | — | — | 246,424 | ||||||||||||||||||||||||||||||
Material Select Fund | — | — | 2,105,540 | 42,763 | 2,125,650 | 42,763 | — | — | — | 20,110 | ||||||||||||||||||||||||||||||
Technology Select Sector Fund | 53,943 | 2,068,714 | 691,333 | 16,752 | 551,982 | 13,327 | 57,368 | 2,375,035 | 43,122 | 35,454 | ||||||||||||||||||||||||||||||
Barclays Convertible Securities ETF | 51,996 | 2,625,798 | 4,606,055 | 93,281 | 929,345 | 19,103 | 126,174 | 6,002,097 | 394,327 | 42,385 | ||||||||||||||||||||||||||||||
Barclays High Yield Bond ETF | 183,915 | 7,674,773 | 17,020,214 | 432,634 | 3,834,348 | 95,384 | 521,165 | 20,028,371 | 620,385 | 37,692 | ||||||||||||||||||||||||||||||
Barclays Long Term Corporate Bond ETF | 348,105 | 14,133,063 | 8,808,965 | 214,325 | 4,785,586 | 118,288 | 444,142 | 17,006,197 | 726,264 | (41,765 | ) | |||||||||||||||||||||||||||||
Barclays Long | 110,934 | 7,354,924 | 7,436,868 | 101,482 | 5,900,898 | 87,168 | 125,248 | 8,556,943 | 215,390 | (271,270 | ) | |||||||||||||||||||||||||||||
Barclays TIPS ETF | 64,001 | 3,669,817 | 1,581,838 | 27,839 | 3,321,555 | 58,683 | 33,157 | 1,847,840 | 27,583 | 32,005 | ||||||||||||||||||||||||||||||
EURO STOXX 50 ETF | 34,566 | 1,495,671 | 631,181 | 16,439 | 1,908,484 | 51,005 | — | — | 12,164 | 108,244 | ||||||||||||||||||||||||||||||
S&P Emerging Markets Dividend ETF | 101,157 | 4,055,384 | 4,575,072 | 121,467 | 6,344,993 | 186,191 | 36,433 | 1,192,452 | 155,200 | (1,136,905 | ) | |||||||||||||||||||||||||||||
54
Table of Contents
SSGA MASTER TRUST
NOTES TO FINANCIAL STATEMENTS (continued)
June 30, 2015
SSGA Income Allocation | Number of Shares Held at 6/30/14 | Value at 6/30/14 | Purchased | Sold | Number of Shares Held at 6/30/15 | Value at 6/30/15 | Dividend Income | Realized Gain (Loss) | ||||||||||||||||||||||||||||||||
| Cost | Shares | Proceeds | Shares | |||||||||||||||||||||||||||||||||||||
S&P Global | 81,481 | $ | 4,145,753 | $ | 1,295,850 | 26,467 | $ | 1,548,618 | 31,337 | 76,611 | $ | 3,573,137 | $ | 101,408 | $ | 185,960 | ||||||||||||||||||||||||
S&P International Dividend ETF | 118,992 | 6,104,290 | 2,904,056 | 64,682 | 4,087,524 | 97,788 | 85,886 | 3,561,693 | 245,172 | (625,774 | ) | |||||||||||||||||||||||||||||
STOXX Europe 50 ETF | 154,452 | 6,080,775 | 2,365,459 | 66,245 | 3,150,372 | 84,685 | 136,012 | 4,729,137 | 162,914 | (32,210 | ) | |||||||||||||||||||||||||||||
Barclays Emerging Markets Local Bond ETF | 99,028 | 3,091,654 | 2,370,627 | 79,776 | 1,238,387 | 43,551 | 135,253 | 3,662,651 | — | (118,862 | ) | |||||||||||||||||||||||||||||
Barclays International Corporate Bond ETF | 55,214 | 2,087,090 | 1,133,247 | 34,028 | 2,866,001 | 89,242 | — | — | 20,921 | (270,943 | ) | |||||||||||||||||||||||||||||
Dow Jones International Real Estate ETF | 136,457 | 6,036,858 | 2,923,253 | 67,924 | 3,762,474 | 88,044 | 116,337 | 4,869,867 | 170,768 | (49,819 | ) | |||||||||||||||||||||||||||||
Barclays Intermediate Term Corporate Bond ETF | — | — | 3,699,736 | 107,996 | 1,220,497 | 35,807 | 72,189 | 2,449,373 | 7,725 | (11,501 | ) | |||||||||||||||||||||||||||||
Dow Jones REIT ETF | 86,378 | 7,169,374 | 8,537,323 | 95,476 | 7,519,590 | 83,266 | 98,588 | 8,318,855 | 290,941 | 187,509 | ||||||||||||||||||||||||||||||
State Street Institutional Liquid Reserves Fund | 519,279 | 519,279 | 15,385,237 | 15,385,237 | 13,116,634 | 13,116,634 | 2,787,882 | 2,787,882 | 2,639 | — | ||||||||||||||||||||||||||||||
SSGA Global Allocation | Number of Shares Held at 6/30/14 | Value at 6/30/14 | Purchased | Sold | Number of Shares Held at 6/30/15 | Value at 6/30/15 | Dividend Income | Realized Gain (Loss) | ||||||||||||||||||||||||||||||||
| Cost | Shares | Proceeds | Shares | |||||||||||||||||||||||||||||||||||||
S&P 500 ETF Trust | 100,138 | $ | 19,599,009 | $ | 25,405,561 | 127,207 | $ | 33,824,563 | 164,255 | 63,090 | $ | 12,987,076 | $ | 490,778 | $ | 2,098,427 | ||||||||||||||||||||||||
S&P 500 Growth ETF | 21,483 | 1,954,309 | 2,857,797 | 29,722 | 4,840,809 | 51,205 | — | — | 10,311 | 149,789 | ||||||||||||||||||||||||||||||
S&P 500 Value ETF | — | — | 1,001,342 | 10,229 | 987,607 | 10,229 | — | — | 2 | (13,735 | ) | |||||||||||||||||||||||||||||
S&P MidCap 400 ETF Trust | 7,604 | 1,981,298 | 3,068,181 | 11,728 | 5,005,845 | 19,332 | — | — | 10,427 | 259,724 | ||||||||||||||||||||||||||||||
Consumer Discretionary Select Sector Fund | — | — | 2,945,595 | 38,868 | 40,880 | 540 | 38,328 | 2,931,325 | 9,467 | (755 | ) | |||||||||||||||||||||||||||||
Financial Select Sector Fund | — | — | 5,640,392 | 235,859 | 5,631,647 | 235,859 | — | — | 32,267 | (8,745 | ) | |||||||||||||||||||||||||||||
Health Care Select Sector Fund | 32,724 | 1,990,601 | 1,549,710 | 22,905 | 1,109,472 | 16,250 | 39,379 | 2,929,404 | 35,645 | 63,337 | ||||||||||||||||||||||||||||||
Industrial Select Sector Fund | 35,237 | 1,904,912 | 2,507,174 | 48,258 | 4,546,345 | 83,495 | — | — | — | 248,409 | ||||||||||||||||||||||||||||||
Material Select Fund | — | — | 2,139,726 | 43,420 | 2,155,966 | 43,420 | — | — | 348 | 16,240 | ||||||||||||||||||||||||||||||
Technology Select Sector Fund | 51,139 | 1,961,181 | 1,628,926 | 39,691 | 895,762 | 21,891 | 68,939 | 2,854,075 | 47,534 | 53,069 | ||||||||||||||||||||||||||||||
Barclays Aggregate Bond ETF | 50,949 | 2,953,004 | 3,487,306 | 59,869 | 3,485,347 | 60,132 | 50,686 | 2,909,377 | 38,095 | 58,154 | ||||||||||||||||||||||||||||||
Barclays High Yield Bond ETF | 47,109 | 1,965,858 | 24,945,773 | 635,743 | 3,329,800 | 83,359 | 599,493 | 23,038,516 | 377,156 | 47,238 | ||||||||||||||||||||||||||||||
Barclays Intermediate Term Corporate Bond ETF | — | — | 2,503,135 | 72,998 | 1,061,850 | 31,132 | 41,866 | 1,420,513 | 5,265 | (10,379 | ) | |||||||||||||||||||||||||||||
Barclays Long Term Corporate Bond ETF | 146,578 | 5,951,067 | 14,557,191 | 356,691 | 8,286,120 | 200,409 | 302,860 | 11,596,510 | 453,236 | 96,328 | ||||||||||||||||||||||||||||||
Barclays Long Term Treasury ETF | — | — | 11,673,979 | 159,785 | 6,480,792 | 94,537 | 65,248 | 4,457,743 | 80,891 | (551,971 | ) | |||||||||||||||||||||||||||||
Barclays TIPS ETF | 60,632 | 3,476,639 | 2,558,910 | 45,556 | 3,031,572 | 53,819 | 52,369 | 2,918,525 | 28,701 | 6,241 | ||||||||||||||||||||||||||||||
DB International Government Inflation-Protected Bond ETF | 23,868 | 1,480,055 | 161,046 | 2,619 | 1,594,025 | 26,487 | — | — | 6,627 | 11,937 | ||||||||||||||||||||||||||||||
EURO STOXX 50 ETF | 65,373 | 2,828,690 | 369,489 | 9,103 | 3,000,462 | 74,476 | — | — | 1,278 | (96,012 | ) | |||||||||||||||||||||||||||||
Russell/Nomura PRIME Japan ETF | 86,174 | 4,002,782 | 883,218 | 19,785 | 4,746,518 | 105,959 | — | — | — | 170,431 | ||||||||||||||||||||||||||||||
S&P Emerging Markets ETF | 72,046 | 4,871,390 | 3,686,528 | 53,575 | 6,841,816 | 103,484 | 22,137 | 1,426,508 | 10,182 | (69,286 | ) | |||||||||||||||||||||||||||||
55
Table of Contents
SSGA MASTER TRUST
NOTES TO FINANCIAL STATEMENTS (continued)
June 30, 2015
SSGA Global Allocation | Number of Shares Held at 6/30/14 | Value at 6/30/14 | Purchased | Sold | Number of Shares Held at 6/30/15 | Value at 6/30/15 | Dividend Income | Realized Gain (Loss) | ||||||||||||||||||||||||||||||||
| Cost | Shares | Proceeds | Shares | |||||||||||||||||||||||||||||||||||||
S&P Emerging Markets Small Cap ETF | — | $ | — | $ | 1,137,450 | 22,783 | $ | 1,090,796 | 22,783 | — | $ | — | $ | — | $ | (46,654 | ) | |||||||||||||||||||||||
S&P International Small Cap ETF | 84,669 | 2,990,509 | 2,859,938 | 94,822 | 1,049,244 | 36,360 | 143,131 | 4,368,358 | 446,769 | (65,382 | ) | |||||||||||||||||||||||||||||
S&P World ex-US ETF | 638,099 | 19,315,257 | 14,905,065 | 529,019 | 10,659,511 | 382,067 | 785,051 | 22,075,634 | 591,383 | (134,434 | ) | |||||||||||||||||||||||||||||
STOXX Europe 50 ETF | 73,112 | 2,878,419 | 377,847 | 9,807 | 3,127,970 | 82,919 | — | — | 365 | 92,946 | ||||||||||||||||||||||||||||||
Barclays Emerging Markets Local Bond ETF | — | — | 1,334,965 | 43,371 | 1,243,385 | 43,371 | — | — | — | (91,580 | ) | |||||||||||||||||||||||||||||
Barclays International Corporate Bond ETF | 26,163 | 988,961 | 973,507 | 28,690 | 1,775,042 | 54,853 | — | — | 11,230 | (121,933 | ) | |||||||||||||||||||||||||||||
Barclays International Treasury Bond ETF | 16,302 | 990,999 | 1,871,858 | 32,795 | 2,739,161 | 49,097 | — | — | 13,787 | (72,037 | ) | |||||||||||||||||||||||||||||
Dow Jones International Real Estate ETF | 120,691 | 5,339,370 | 5,109,624 | 118,747 | 7,209,275 | 170,508 | 68,930 | 2,885,410 | 132,089 | (106,213 | ) | |||||||||||||||||||||||||||||
Dow Jones REIT ETF | 76,299 | 6,332,817 | 13,032,207 | 145,515 | 9,462,007 | 104,026 | 117,788 | 9,938,950 | 325,402 | 418,651 | ||||||||||||||||||||||||||||||
State Street Institutional Liquid Reserves Fund | 2,055,704 | 2,055,704 | 30,820,158 | 30,820,158 | 17,820,905 | 17,820,905 | 15,054,957 | 15,054,957 | 9,362 | — | ||||||||||||||||||||||||||||||
Blackstone/GSO Senior Loan | Number of Shares Held at 6/30/14 | Value at 6/30/14 | Purchased | Sold | Number of Shares Held at 6/30/15 | Value at 6/30/15 | Dividend Income | Realized Gain (Loss) | ||||||||||||||||||||||||||||||||
| Cost | Shares | Proceeds | Shares | |||||||||||||||||||||||||||||||||||||
State Street Institutional Liquid Reserves Fund | 39,685,659 | $ | 39,685,659 | $ | 304,550,814 | 304,550,814 | $ | 332,240,053 | 332,240,053 | 11,996,420 | $ | 11,996,420 | $ | 24,468 | $ | — | ||||||||||||||||||||||||
SSGA Ultra Short Term Bond Portfolio | Number of Shares Held at 6/30/14 | Value at 6/30/14 | Purchased | Sold | Number of Shares Held at 6/30/15 | Value at 6/30/15 | Dividend Income | Realized Gain (Loss) | ||||||||||||||||||||||||||||||||
| Cost | Shares | Proceeds | Shares | |||||||||||||||||||||||||||||||||||||
State Street Institutional Liquid Reserves Fund | 518,551 | $ | 518,551 | $ | 9,480,119 | 9,480,119 | $ | 9,510,752 | 9,510,752 | 487,918 | $ | 487,918 | $ | 265 | $ | — | ||||||||||||||||||||||||
State Street DoubleLine Total | Number of Shares Held at 6/30/14 | Value at 6/30/14 | Purchased | Sold | Number of Shares Held at 6/30/15 | Value at 6/30/15 | Dividend Income | Realized Gain (Loss) | ||||||||||||||||||||||||||||||||
| Cost | Shares | Proceeds | Shares | |||||||||||||||||||||||||||||||||||||
State Street Institutional Liquid Reserves Fund | — | $ | — | $ | 659,335,107 | 659,335,107 | $ | 506,475,645 | 506,475,645 | 152,859,462 | $ | 152,859,462 | $ | 32,846 | $ | — | ||||||||||||||||||||||||
SSGA MFS Systematic Core Equity Portfolio | Number of Shares Held at 6/30/14 | Value at 6/30/14 | Purchased | Sold | Number of Shares Held at 6/30/15 | Value at 6/30/15 | Dividend Income | Realized Gain (Loss) | ||||||||||||||||||||||||||||||||
| Cost | Shares | Proceeds | Shares | |||||||||||||||||||||||||||||||||||||
State Street Institutional Liquid Reserves Fund | 58,605 | $ | 58,605 | $ | 80,747 | 80,747 | $ | 113,247 | 113,247 | 26,105 | $ | 26,105 | $ | 22 | $ | — | ||||||||||||||||||||||||
SSGA MFS Systematic Growth Equity Portfolio | Number of Shares Held at 6/30/14 | Value at 6/30/14 | Purchased | Sold | Number of Shares Held at 6/30/15 | Value at 6/30/15 | Dividend Income | Realized Gain (Loss) | ||||||||||||||||||||||||||||||||
| Cost | Shares | Proceeds | Shares | |||||||||||||||||||||||||||||||||||||
State Street Institutional Liquid Reserves Fund | 75,976 | $ | 75,976 | $ | 103,471 | 103,471 | $ | 115,776 | 115,776 | 63,671 | $ | 63,671 | $ | 27 | $ | — | ||||||||||||||||||||||||
SSGA MFS Systematic Value Equity Portfolio | Number of Shares Held at 6/30/14 | Value at 6/30/14 | Purchased | Sold | Number of Shares Held at 6/30/15 | Value at 6/30/15 | Dividend Income | Realized Gain (Loss) | ||||||||||||||||||||||||||||||||
| Cost | Shares | Proceeds | Shares | |||||||||||||||||||||||||||||||||||||
State Street Institutional Liquid Reserves Fund | 81,360 | $ | 81,360 | $ | 80,996 | 80,996 | $ | 134,746 | 134,746 | 27,610 | $ | 27,610 | $ | 24 | $ | — | ||||||||||||||||||||||||
State Street Risk Aware Portfolio | Number of Shares Held at 6/30/14 | Value at 6/30/14 | Purchased | Sold | Number of Shares Held at 6/30/15 | Value at 6/30/15 | Dividend Income | Realized Gain (Loss) | ||||||||||||||||||||||||||||||||
| Cost | Shares | Proceeds | Shares | |||||||||||||||||||||||||||||||||||||
State Street Institutional Liquid Reserves Fund | — | $ | — | $ | 157,581 | 157,581 | $ | 148,461 | 148,461 | 9,120 | $ | 9,120 | $ | 8 | $ | — | ||||||||||||||||||||||||
56
Table of Contents
SSGA MASTER TRUST
NOTES TO FINANCIAL STATEMENTS (continued)
June 30, 2015
| 4. | Aggregate Unrealized Appreciation and Depreciation |
As of June 30, 2015, gross unrealized appreciation and gross unrealized depreciation based on cost for federal income tax purposes were as follows:
| Tax Cost | Gross Unrealized Appreciation | Gross Unrealized Depreciation | Net Unrealized Appreciation (Depreciation) | |||||||||||||
SSGA Multi-Asset Real Return Portfolio | $ | 153,261,006 | $ | — | $ | (11,266,393 | ) | $ | (11,266,393 | ) | ||||||
SSGA Income Allocation Portfolio | 122,388,952 | — | (1,241,343 | ) | (1,241,343 | ) | ||||||||||
SSGA Global Allocation Portfolio | 143,800,870 | 973,267 | — | 973,267 | ||||||||||||
Blackstone/GSO Senior Loan Portfolio | 709,250,208 | — | (8,997,705 | ) | (8,997,705 | ) | ||||||||||
SSGA Ultra Short Term Bond Portfolio | 16,027,910 | — | (9,796 | ) | (9,796 | ) | ||||||||||
State Street DoubleLine Total Return Tactical Portfolio | 753,396,763 | — | (6,703,699 | ) | (6,703,699 | ) | ||||||||||
SSGA MFS Systematic Core Equity Portfolio | 2,600,481 | 338,583 | — | 338,583 | ||||||||||||
SSGA MFS Systematic Growth Equity Portfolio | 5,664,070 | 379,634 | — | 379,634 | ||||||||||||
SSGA MFS Systematic Value Equity Portfolio | 2,605,096 | 303,285 | — | 303,285 | ||||||||||||
State Street Risk Aware Portfolio | 1,955,175 | 10,872 | — | 10,872 | ||||||||||||
| 5. | Investment Transactions |
For the year ended June 30, 2015, the Portfolios had purchases and sales of investment securities as follows:
| SSGA Multi-Asset Real Return Portfolio | SSGA Income Allocation Portfolio | SSGA Global Allocation Portfolio | Blackstone/ GSO Senior Loan Portfolio | SSGA Ultra Short Term Bond Portfolio | State Street DoubleLine Total Return Tactical Portfolio | SSGA MFS Systematic Core Equity Portfolio | SSGA MFS Systematic Growth Equity Portfolio | SSGA MFS Systematic Value Equity Portfolio | State Street Risk Aware Portfolio | |||||||||||||||||||||||||||||||
Purchases | ||||||||||||||||||||||||||||||||||||||||
Long Term | 109,561,936 | 105,787,559 | 177,029,302 | 573,696,454 | 12,186,323 | 56,914,298 | 1,625,194 | 5,510,390 | 1,802,138 | 6,619,855 | ||||||||||||||||||||||||||||||
Sales | ||||||||||||||||||||||||||||||||||||||||
Long Term | 110,882,297 | 84,355,715 | 140,528,776 | 465,779,121 | 9,511,050 | 21,329,834 | 4,387,926 | 5,314,693 | 4,456,843 | 4,439,922 | ||||||||||||||||||||||||||||||
For the year ended June 30, 2015, the Portfolios had no long term purchases and sales of U.S. Government obligations.
For the year ended June 30, 2015, the Trust did not pay any commissions to an affiliate of the Adviser for investment transactions.
| 6. | Line of Credit |
Blackstone/GSO Senior Loan Portfolio and other affiliated funds (each a “Participant” and, collectively, the “Participants”) share in a $300 million revolving credit facility provided by a syndication of banks. Blackstone/GSO Senior Loan Portfolio has exclusive access to $100 million of the total credit facility. The Participants may borrow for the purpose of meeting shareholder redemption requests that otherwise might require the untimely disposition of securities. The Participants are charged an annual commitment fee which is calculated based on the unused portion of the shared credit line. Blackstone/GSO Senior Loan Portfolio pays the commitment fee for its exclusive portion of the credit line. Commitment fees on the shared credit line are allocated among each of the Participants based on net assets. Commitment fees are ordinary fund operating expenses and are paid by the Adviser. A Participant incurs and pays the interest expense related to its borrowing. Interest is calculated at a rate per annum equal to the sum of the Federal Funds Rate plus 1%. Blackstone/GSO Senior Loan Portfolio may borrow up to a maximum of 25 percent of its assets. Blackstone/GSO Senior Loan Portfolio had no outstanding loans during the year ended June 30, 2015.
| 7. | Risks |
Although the Portfolios do not intend to concentrate their investments in any particular industry, if a Portfolio concentrates in a single industry, group of industries or type of instrument, it may be more susceptible to any single economic, market, political or regulatory occurrence affecting that industry, group of industries or type of instrument.
57
Table of Contents
SSGA MASTER TRUST
NOTES TO FINANCIAL STATEMENTS (continued)
June 30, 2015
The Trust invests in various investments which are exposed to risks, such as market risk. Due to the level of risk associated with certain investments it is at least reasonably possible that changes in the values of investment securities will occur in the near term and that such changes could be material.
SSGA Multi-Asset Real Return Portfolio, SSGA Income Allocation Portfolio and SSGA Global Allocation Portfolio invest their assets in other exchange-traded products (referred to as “underlying funds). The underlying funds, in turn, may engage in a number of investment techniques and practices, which involve certain risks. Certain underlying funds invest their portfolios in debt securities. Investments in debt securities may increase or decrease as a result of the following: market fluctuations, increases in interest rates, inability of issuers to repay principal and interest or illiquidity in the debt securities markets; the risk of low rates of return due to reinvestment of securities during periods of falling interest rates or repayment by issuers with higher coupon or interest rates; and/or the risk of low income due to falling interest rates. Certain underlying funds invest their portfolios in foreign securities including emerging markets. Foreign investments involve certain risks that are greater than those associated with investments in securities of U.S. issuers. Returns on investments in foreign securities could be more volatile than, or trail the returns on, investments in U.S. securities. Investments in securities issued by entities based outside the United States pose distinct risks since political and economic events unique to a country or region will affect those markets and their issuers. Investment in emerging markets involves greater risk of loss than investments in a developed market. This is due to, among other things, greater market volatility, lower trading volume, political and economic instability, high levels of inflation, deflation or currency devaluation, greater risk of market shut down, and more governmental limitations on foreign investment policy than those typically found in a developed market. Certain underlying funds invest their portfolios in commodities markets. Commodities are subject to substantial price fluctuations over short periods of time and may be affected by unpredictable economic, political and environmental events. Factors that may significantly affect the prices of commodities include, but are not limited to: global supply and demand; domestic and international interest rates and investors’ expectations of interest rates; inflation rates and investors’ expectations of inflation rates; the investment and trading activities of commodity futures contracts; political, economic, or financial events, both globally and regionally.
The Blackstone/GSO Senior Loan Portfolio and DoubleLine Total Return Tactical Portfolio invest their assets in senior loans. Investments in senior loans are subject to credit risks which may include delay in receiving payments of principal and interest paid by the borrower to the agent or by the agent to the lender or offsets against payments received from the borrower.
SSGA Ultra Short Term Bond Portfolio invests primarily in investment grade debt securities with varying maturities. Investments in debt securities may increase or decrease as a result of the following: market fluctuations, increases in interest rates, inability of issuers to repay principal and interest or illiquidity in the debt securities markets; the risk of low rates of return due to reinvestment of securities during periods of falling interest rates or repayment by issuers with higher coupon or interest rates; and/or the risk of low income due to falling interest rates.
SSGA MFS Systematic Core Equity Portfolio, SSGA MFS Systematic Growth Equity Portfolio, SSGA MFS Systematic Value Equity Portfolio and State Street Risk Aware Portfolio invest in various investments which are exposed to risks, such as market risk. Due to the level of risk associated with certain investments it is at least reasonably possible that changes in the values of investment securities will occur in the near term and that such changes could be material.
An investment in a Portfolio involves risks similar to those of investing in any fund, such as market fluctuations caused by such factors as economic and political developments, changes in interest rates and perceived trends in security prices. The values of securities could decline generally or could underperform other investments. Different types of securities tend to go through cycles of out-performance and underperformance in comparison to the general securities market. In addition, securities may decline in value due to factors affecting a specific issuer, market or securities markets generally.
| 8. | Subsequent Events |
Management has evaluated the impact of all subsequent events on the Portfolios through the date the financial statements were available to be issued and has determined that there were no subsequent events requiring adjustment or disclosure in the financial statements.
58
Table of Contents
SSGA MASTER TRUST
REPORT OF INDEPENDENT REGISTERED PUBLIC ACCOUNTING FIRM
To the Owners of Beneficial Interest and Board of Trustees of
SSGA Master Trust
We have audited the accompanying statements of assets and liabilities, including the schedules of investments, of SSGA Master Trust (comprising, respectively, SSGA Multi-Asset Real Return Portfolio, SSGA Income Allocation Portfolio, SSGA Global Allocation Portfolio, Blackstone/GSO Senior Loan Portfolio, SSGA Ultra Short Term Bond Portfolio, State Street DoubleLine Total Return Tactical Portfolio, SSGA MFS Systematic Core Equity Portfolio, SSGA MFS Systematic Growth Equity Portfolio, SSGA MFS Systematic Value Equity Portfolio and State Street Risk Aware Portfolio) (collectively, the “Portfolios”) as of June 30, 2015, and the related statements of operations, statements of changes in net assets and the financial highlights for each of the periods indicated therein. These financial statements and financial highlights are the responsibility of the Portfolios’ management. Our responsibility is to express an opinion on these financial statements and financial highlights based on our audits.
We conducted our audits in accordance with the standards of the Public Company Accounting Oversight Board (United States). Those standards require that we plan and perform the audit to obtain reasonable assurance about whether the financial statements and financial highlights are free of material misstatement. We were not engaged to perform an audit of the Portfolios’ internal control over financial reporting. Our audits included consideration of internal control over financial reporting as a basis for designing audit procedures that are appropriate in the circumstances, but not for the purpose of expressing an opinion on the effectiveness of the Portfolios’ internal control over financial reporting. Accordingly, we express no such opinion. An audit also includes examining, on a test basis, evidence supporting the amounts and disclosures in the financial statements and financial highlights, assessing the accounting principles used and significant estimates made by management, and evaluating the overall financial statement presentation. Our procedures included confirmation of securities owned as of June 30, 2015 by correspondence with the custodian and others or by other appropriate auditing procedures where replies from others were not received. We believe that our audits provide a reasonable basis for our opinion.
In our opinion, the financial statements and financial highlights referred to above present fairly, in all material respects, the financial position of each of the respective Portfolios constituting SSGA Master Trust at June 30, 2015, and the results of their operations, the changes in their net assets, and the financial highlights for each of the periods indicated therein, in conformity with U.S. generally accepted accounting principles.
Boston, Massachusetts
August 31, 2015
59
Table of Contents
SSGA MASTER TRUST
June 30, 2015 (Unaudited)
Proxy Voting Policies and Procedures and Records
A description of the Trust’s proxy voting policies and procedures that are used by the Portfolios’ investment adviser to vote proxies relating to the Portfolios’ portfolio of securities are available (i) without charge, upon request by calling 1-866-787-2257 (toll free) or (ii) on the website of the U.S. Securities and Exchange Commission, at www.sec.gov. Information regarding how the investment advisor voted for the prior 12-months period ended June 30 is available by August 31 of each year by calling the same number and on the SEC’s website, at www.sec.gov, and on the Portfolios’ website at www.spdrs.com.
Quarterly Portfolio Schedule
The Portfolios file a complete schedule of portfolio holdings with the SEC for the first and third quarters of each fiscal year on Form N-Q. The Portfolio’s Forms N-Q are available on the SEC’s website at www.sec.gov and may be reviewed and copied at the SEC’s Public Reference Room in Washington DC. Information on the operation of the Public Reference Room may be obtained by calling 1-800-SEC-0330. The information on the Form N-Q is available upon request, without charge, by calling 1-866-787-2257 (toll free) and on the Portfolios’ website at www.spdrs.com.
Approval of Advisory Agreements
At in-person meetings held prior to June 30, 2015, the Board of Trustees of the Trusts (the “Board”) evaluated proposals (1) to continue the separate Investment Advisory Agreements (the “Agreements”) between each Trust and SSGA Funds Management, Inc. (the “Adviser” or “SSGA FM”) with respect to the operational series of SSGA Active Trust (the “Current ETFs”) and SSGA Master Trust (together with the Current ETFs, the “Current Funds”), and (2) to approve the separate Agreements between the Adviser and (a) the SSGA Active Trust with respect to the SPDR DoubleLine Total Return Tactical ETF (the “New ETF” and, together with the Current ETFs, the “ETFs”), a new series of the SSGA Active Trust, and (b) SSGA Master Trust with respect to the New ETF’s corresponding master fund, the State Street DoubleLine Total Return Tactical Portfolio (together with the New ETF, the “New Funds”) (with the Current Funds and New Funds collectively being referred to hereafter as the “Funds”), each of which commenced operations during the period covered by this Annual Report. The Trustees who are not “interested persons” of the Trust within the meaning of the Investment Company Act of 1940, as amended (the “Independent Trustees”) also met separately with their independent legal counsel to consider the Agreements.
In evaluating the Agreements, the Board drew on materials provided to them by SSGA FM, the Trust’s investment adviser and administrator, and other materials provided by State Street Bank and Trust Company, the Trusts’ sub-administrator, transfer agent and custodian (“State Street”). In deciding whether to approve the Agreements, the Board considered various factors, including the (i) nature, extent and quality of services provided by, or expected to be provided by, the Adviser with respect to the Funds under the Agreements, (ii) investment performance of the Current Funds, (iii) profits realized by the Adviser and its affiliates from its relationship with the Trusts, (iv) fees charged to comparable funds, (v) other benefits to the Adviser, and (vi) extent to which economies of scale would be shared as the Funds grow.
Nature, Extent and Quality of Services
The Board considered the nature, extent and quality of services provided by, or expected to be provided by, the Adviser. In doing so, the Trustees relied on their prior experience in overseeing the management of the Trusts and materials provided prior to and at the meeting. The Board reviewed the Agreements and the Adviser’s responsibilities for managing investment operations of each of the Funds in accordance with each Fund’s investment objectives and policies, and applicable legal and regulatory requirements. The Board appreciated the relatively unique nature of the ETFs as exchange-traded funds in a master-feeder structure and the experience and expertise of the Adviser with exchange-traded funds. The Board considered the background and experience of the Adviser’s senior management, including those individuals responsible for portfolio management, oversight of sub-advisers and regulatory compliance of the Funds. The Board also considered the portfolio management and oversight resources, structures and practices of the Adviser, including those associated with monitoring and securing each Fund’s compliance with its investment objectives and policies and with applicable laws and regulations. The Board also considered information about the Adviser’s best execution procedures and overall investment management business, noting that the Adviser serves a wide range of clients across a broad spectrum of asset classes. The Board looked at the Adviser’s general knowledge of the
60
Table of Contents
SSGA ACTIVE TRUST
OTHER INFORMATION (continued)
June 30, 2015 (Unaudited)
investment business and that of its affiliates which make up State Street Global Advisors, through which the Adviser shares all of its senior personnel. The Board considered that the Adviser and its affiliates constitute one of the world’s largest investment management enterprises for exchange-traded funds. The Board also considered the Adviser’s experience in active management, managing exchange-traded funds in master-feeder structures and overseeing third-party sub-advisers, as applicable.
Investment Performance
The Board then reviewed the Current Funds’ performance. The Board compared each Current Fund’s investment performance to the performance of an appropriate benchmark and universe of comparable funds, noting that the performance of each Current Fund was satisfactory.
Profits Realized by Adviser
The Board considered the profitability of the advisory arrangement with the Funds to the Adviser, including data on the Current Funds’ historical profitability to the Adviser. The Independent Trustees, through their counsel, had the opportunity to discuss, with representatives of the Adviser and State Street, methodologies used in computing costs that formed the bases of profitability calculations and determined that these methodologies were reasonable.
Fees Charged to Comparable Funds
The Board evaluated the Funds’ unitary fee through review of comparative information with respect to fees paid by similar funds – i.e., exchange-traded funds that are actively managed, as applicable. The Board reviewed the universe of similar exchange-traded funds for the ETFs based upon data independently obtained from Lipper Analytical Services and related comparative information for similar exchange-traded funds. The Board also reviewed the fee structure of the Funds in connection with the master-feeder structure, the historical expense ratios of the Current Funds and the estimated expense ratios for the New Funds. In doing so, the Board used a fund by fund analysis of the data.
Other Benefits
The Board considered whether the Adviser or its affiliates benefited in other ways from its relationship with the Trusts, noting that the Adviser does not maintain soft-dollar arrangements in connection with the Trusts’ brokerage transactions.
Economies of Scale
The Board reviewed information regarding economies of scale or other efficiencies that may result as each Fund’s assets grow in size. The Board noted that the Agreements did not provide for breakpoints in each Fund’s advisory fee rates as assets of a Fund increase. However, the Board further noted the Adviser’s assertion that future economies of scale (among several factors) had been taken into consideration for the Funds by fixing relatively low advisory fees, effectively sharing the benefits of lower fees with the Funds from inception. The Adviser also asserted that one of the benefits of the unitary fee was to provide an unvarying expense structure, which could be lost or diluted with the addition of breakpoints. The Board noted that it intends to continue to monitor fees as the Funds grow in size and assess whether fee breakpoints may be warranted.
The Board, including the Independent Trustees voting separately, approved the Agreements for each Fund after weighing the foregoing factors, none of which was dispositive in itself and may have been weighed differently by each Trustee. The Board’s conclusions with respect to each Agreement were as follows: (a) the nature and extent of the services provided, or expected to be provided, by the Adviser with respect to the Funds were appropriate; (b) the performance of each Current Fund had been satisfactory; (c) the Adviser’s unitary fee for each Fund, considered in relation to services provided or expected to be provided, and in relation to fees charged to comparable funds, was fair and reasonable; (d) profitability of the Trusts’ relationship with the Adviser was not excessive; (e) any additional potential benefits to the Adviser or its affiliates were not of a magnitude to materially affect the Board’s conclusions; and (f) fees paid to the Adviser shared economies of scale with respect to the Current Funds by way of the relatively low fee structure of the Trusts.
61
Table of Contents
SSGA ACTIVE TRUST
OTHER INFORMATION (continued)
June 30, 2015 (Unaudited)
Approval of GSO / Blackstone Debt Funds Management LLC Sub-Advisory Agreements
At an in-person meeting held prior to June 30, 2015, the Board also evaluated proposals to continue the separate Sub-Advisory Agreements (the “GSO / Blackstone Sub-Advisory Agreements”) between the Adviser and GSO / Blackstone Debt Funds Management LLC (“GSO / Blackstone”) with respect to the SPDR Blackstone / GSO Senior Loan ETF, a series of the SSGA Active Trust, and Blackstone / GSO Senior Loan Portfolio, a series of the SSGA Master Trust, each sub-advised by GSO / Blackstone (the “GSO / Blackstone Funds”). The Trustees who are not “interested persons” of the Trusts within the meaning of the Investment Company Act of 1940, as amended (the “Independent Trustees”) also met separately with their independent legal counsel to consider the GSO / Blackstone Sub-Advisory Agreements.
In evaluating the GSO / Blackstone Sub-Advisory Agreements, the Board drew on materials provided to them by GSO / Blackstone and the Adviser. In deciding whether to approve the GSO / Blackstone Sub-Advisory Agreements, the Board considered various factors, including the (i) nature, extent and quality of services provided by GSO / Blackstone with respect to the GSO / Blackstone Funds under the GSO / Blackstone Sub-Advisory Agreements and (ii) investment performance of the GSO / Blackstone Funds. The Board was apprised of the portion of the current advisory fee that the Adviser would pay to GSO / Blackstone under the GSO / Blackstone Sub-Advisory Agreements and also considered that such fees would be paid directly by the Adviser and would not result in increased fees payable by the GSO / Blackstone Funds.
The Board considered the background and experience of GSO / Blackstone’s senior management and, in particular, GSO / Blackstone’s experience in investing in senior loan securities. The Board reviewed the GSO / Blackstone Funds’ performance, noting that that the performance of the GSO / Blackstone Funds was satisfactory. The Board also considered the unitary fee paid to the Adviser by each GSO / Blackstone Fund and GSO / Blackstone’s fees paid by the Adviser.
The Board, including the Independent Trustees voting separately, approved the GSO / Blackstone Sub-Advisory Agreements for each GSO / Blackstone Fund after weighing the foregoing factors, none of which was dispositive in itself and may have been weighed differently by each Trustee. The Board’s conclusions with respect to each GSO / Blackstone Sub-Advisory Agreement were as follows: (a) the nature and extent of the services provided by GSO / Blackstone with respect to the GSO / Blackstone Funds were appropriate; (b) the performance of the GSO / Blackstone Funds had been satisfactory; (c) GSO / Blackstone’s fees for the GSO / Blackstone Funds and the unitary fee, considered in relation to the services provided, were fair and reasonable; (d) any additional potential benefits to GSO / Blackstone were not of a magnitude to materially affect the Board’s conclusions; and (e) fees paid to GSO / Blackstone adequately shared the economies of scale with each applicable GSO / Blackstone Fund by way of the relatively low fee structure of the Trusts.
Approval of Massachusetts Financial Services Company Sub-Advisory Agreements
At an in-person meeting held prior to June 30, 2015, the Board also evaluated proposals to continue the separate Sub-Advisory Agreements (the “MFS Sub-Advisory Agreements”) between the Adviser and Massachusetts Financial Services Company (“MFS”) with respect to the SPDR MFS Systematic Core Equity ETF, SPDR MFS Systematic Growth Equity ETF and SPDR MFS Systematic Value Equity ETF, each a series of the SSGA Active Trust, and SSGA MFS Systematic Core Equity Portfolio, SSGA Systematic Growth Equity Portfolio and SSGA MFS Systematic Value Equity Portfolio, each a series of the SSGA Master Trust, each sub-advised by MFS (the “MFS Funds”). The Trustees who are not “interested persons” of the Trusts within the meaning of the Investment Company Act of 1940, as amended (the “Independent Trustees”) also met separately with their independent legal counsel to consider the MFS Sub-Advisory Agreements.
In evaluating the MFS Sub-Advisory Agreements, the Board drew on materials provided to them by MFS and the Adviser. In deciding whether to approve the MFS Sub-Advisory Agreements, the Board considered various factors, including the (i) nature, extent and quality of services provided by MFS with respect to the MFS Funds under the MFS Sub-Advisory Agreements and (ii) investment performance of the MFS Funds. The Board was apprised of the portion of the current advisory fee that the Adviser would pay to MFS under the MFS Sub-Advisory Agreements and also considered that such fees would be paid directly by the Adviser and would not result in increased fees payable by the MFS Funds.
The Board considered the background and experience of MFS’s senior management and, in particular, MFS’s experience in investing in equity securities. The Board reviewed the MFS Funds’ performance, noting that that the performance of the MFS Funds was satisfactory. The Board also considered the unitary fee paid to the Adviser by each MFS Fund and MFS’s fees paid by the Adviser.
62
Table of Contents
SSGA ACTIVE TRUST
OTHER INFORMATION (continued)
June 30, 2015 (Unaudited)
The Board, including the Independent Trustees voting separately, approved the MFS Sub-Advisory Agreements for each MFS Fund after weighing the foregoing factors, none of which was dispositive in itself and may have been weighed differently by each Trustee. The Board’s conclusions with respect to each MFS Sub-Advisory Agreement were as follows: (a) the nature and extent of the services provided by MFS with respect to the MFS Funds were appropriate; (b) the performance of the MFS Funds had been satisfactory; (c) MFS’s fees for the MFS Funds and the unitary fee, considered in relation to the services provided, were fair and reasonable; (d) any additional potential benefits to MFS were not of a magnitude to materially affect the Board’s conclusions; and (e) fees paid to MFS adequately shared the economies of scale with each applicable MFS Fund by way of the relatively low fee structure of the Trusts.
Approval of DoubleLine Capital LP Sub-Advisory Agreements
At an in-person meeting held prior to June 30, 2015, the Board also considered the approval of separate Sub-Advisory Agreements (the “DoubleLine Sub-Advisory Agreements”) between the Adviser and DoubleLine Capital LP (“DoubleLine”) with respect to the SPDR DoubleLine Total Return Tactical ETF, a series of the SSGA Active Trust, and State Street DoubleLine Total Return Tactical Portfolio, a series of the SSGA Master Trust (together with the SPDR DoubleLine Total Return Tactical ETF, the “DoubleLine Funds”), under which each of the DoubleLine Funds would be sub-advised by DoubleLine. The Trustees who are not “interested persons” of the Trusts within the meaning of the Investment Company Act of 1940, as amended (the “Independent Trustees”) also met separately with their independent legal counsel to consider the DoubleLine Sub-Advisory Agreements.
In evaluating the DoubleLine Sub-Advisory Agreements, the Board drew on materials provided to them by DoubleLine and the Adviser. In deciding whether to approve the DoubleLine Sub-Advisory Agreements, the Board considered various factors, including the (i) nature, extent and quality of services expected to be provided by DoubleLine with respect to the DoubleLine Funds under the DoubleLine Sub-Advisory Agreements; and (ii) investment performance of other actively managed mandates managed by DoubleLine. The Board was apprised of the portion of the advisory fee that the Adviser would pay to DoubleLine under the DoubleLine Sub-Advisory Agreements and also considered that such fees would be paid directly by the Adviser and would not result in increased fees payable by the DoubleLine Funds.
The Board considered the background and experience of DoubleLine’s senior management and in particular DoubleLine’s experience in investing in fixed income securities. The Board noted that DoubleLine would bring significant actively managed fixed income experience to bear in managing the DoubleLine Funds. The Board noted that DoubleLine has extensive experience in managing fixed income securities and reviewed DoubleLine’s assets under management in similar portfolios of securities.
The Board, including the Independent Trustees voting separately, approved the DoubleLine Sub-Advisory Agreements for the DoubleLine Funds after weighing the foregoing factors, none of which was dispositive in itself and may have been weighed differently by each Trustee. The Board’s conclusions with respect to each of the DoubleLine Sub-Advisory Agreements were as follows: (a) the nature and extent of the services expected to be provided by DoubleLine with respect to the DoubleLine Funds were adequate and appropriate; and (b) DoubleLine’s experience in managing fixed income securities is extensive; (c) DoubleLine’s fees for the DoubleLine Funds and the unitary fee, considered in relation to the services expected to be provided, were fair and reasonable; (d) any additional potential benefits to DoubleLine were not of a magnitude to materially affect the Board’s conclusions; and (e) fees expected to be paid to DoubleLine were expected to share economies of scale with each applicable DoubleLine Fund by way of the relatively low fee structure of the Trusts.
63
Table of Contents
SSGA MASTER TRUST
OTHER INFORMATION (continued)
June 30, 2015
TRUSTEES AND OFFICERS OF THE TRUST
Name, Address and Year of Birth | Position(s) with Funds | Term of Office and Length of Time Served | Principal Occupation(s) During Past 5 Years | Number of Portfolios In Fund Complex Overseen by Trustee | Other Directorships Held by Trustee | |||||||
Independent Trustees | ||||||||||||
FRANK NESVET | Independent Trustee, Chairman, Trustee Committee Chair | Term: Unlimited Served: since March 2011 | Chief Executive Officer, Libra Group, Inc. (a financial services consulting company) (1998-present). | 192 | SPDR Index Shares Funds (Trustee); SPDR Series Trust (Trustee); SSGA Active Trust (Trustee). | |||||||
DAVID M. KELLY | Independent Trustee, Audit Committee Chair | Term: Unlimited Served: since March 2011 | Retired. | 192 | Chicago Stock Exchange (Former Director, retired); Penson Worldwide Inc. (Former Director, retired); SPDR Index Shares Funds (Trustee); SPDR Series Trust (Trustee); SSGA Active Trust (Trustee). | |||||||
BONNY EUGENIA BOATMAN | Independent Trustee | Term: Unlimited Served: since March 2011 | Retired. | 192 | SPDR Index Shares Funds (Trustee); SPDR Series Trust (Trustee); SSGA Active Trust (Trustee). | |||||||
DWIGHT D. CHURCHILL | Independent Trustee | Term: Unlimited Served: since March 2011 | Self-employed consultant since 2010; CEO and President, CFA Institute (June 2014-January 2015). | 192 | SPDR Index Shares Funds (Trustee); SPDR Series Trust (Trustee); SSGA Active Trust (Trustee); Affiliated Managers Group, Inc. (Director). | |||||||
CARL G. VERBONCOEUR | Independent Trustee | Term: Unlimited Served: since March 2011 | Self-employed consultant since 2009. | 192 | The Motley Fool Funds Trust (Trustee); SPDR Index Shares Funds (Trustee); SPDR Series Trust (Trustee); SSGA Active Trust (Trustee). | |||||||
64
Table of Contents
SSGA MASTER TRUST
OTHER INFORMATION (continued)
June 30, 2015
Name, Address and Year of Birth | Position(s) with Funds | Term of Office and Length of Time Served | Principal Occupation(s) During Past 5 Years | Number of Portfolios In Fund Complex Overseen by Trustee | Other Directorships Held by Trustee | |||||||
INTERESTED TRUSTEE | ||||||||||||
JAMES E. ROSS* | Interested Trustee | Term: Unlimited Served as Trustee: since March 2011 | Chairman and Director, SSGA Funds Management, Inc. (2005-present); Senior Managing Director and Principal, State Street Global Advisors (2006-present); President, SSGA Funds Management, Inc. (2005-2012). | 256 | SPDR Index Shares Funds (Trustee); SPDR Series Trust (Trustee); SSGA Active Trust (Trustee); Select Sector SPDR Trust (Trustee); State Street Master Funds (Trustee); and State Street Institutional Investment Trust (Trustee). | |||||||
| * | Mr. Ross is an Interested Trustee because of his employment with the Adviser and ownership interest in an affiliate of the Adviser. |
OFFICERS
Name, Address and Year Of Birth | Position(s) with Funds | Term of Office and Length of Time Served | Principal Occupation(s) During Past 5 Years | |||
ELLEN M. NEEDHAM | President | Term: Unlimited Served: since October 2012 | President and Director, SSGA Funds Management, Inc. (June 2012-present); Chief Operating Officer, SSGA Funds Management, Inc. (May 2010-June 2012); Senior Managing Director, SSGA Funds Management, Inc. (1992-2012)*; Senior Managing Director, State Street Global Advisors (1992-present).* | |||
ANN M. CARPENTER | Vice President; Assistant Treasurer | Term: Unlimited Served: since August 2012; Term: Unlimited Served: since April 2015 | Chief Operating Officer, SSGA Funds Management, Inc. (April 2014-present); Vice President, State Street Global Advisors and SSGA Funds Management, Inc. (2005-present).* | |||
MICHAEL P. RILEY | Vice President | Term: Unlimited Served: since March 2011 | Vice President, State Street Global Advisors and SSGA Funds Management, Inc. (2008-present); Principal, State Street Global Advisors and SSGA Funds Management, Inc. (2005-2008). |
65
Table of Contents
SSGA MASTER TRUST
OTHER INFORMATION (continued)
June 30, 2015
Name, Address and Year Of Birth | Position(s) with Funds | Term of Office and Length of Time Served | Principal Occupation(s) During Past 5 Years | |||
JOSHUA A. WEINBERG | Chief Legal Officer | Term: Unlimited Served: since February 2015 | Vice President and Managing Counsel, State Street Global Advisors (2011 – present); Clerk, SSGA Funds Management, Inc. (2013 – present); Associate, Financial Services Group, Dechert LLP (2006 – 2011). | |||
CHRISTOPHER A. MADDEN | Secretary | Term: Unlimited Served: since August 2013 | Vice President and Senior Counsel, State Street Bank and Trust Company (2013-present); Counsel, Atlantic Fund Services (2009-2013); Vice President, Citigroup Fund Services, LLC (2005-2009).* | |||
PATRICIA A. MORISETTE | Assistant Secretary | Term: Unlimited Served: since February 2015 | Vice President and Counsel, State Street Bank and Trust Company (2014-present); Assistant Vice President and Counsel, John Hancock Financial Services (2011-2013); Independent legal consultant (2009-2011); Associate, Bingham McCutchen LLP (2003-2009).*,** | |||
CHAD C. HALLETT | Treasurer | Term: Unlimited Served: since March 2011 | Vice President, State Street Global Advisors and SSGA Funds Management, Inc. (November 2014 – present); Vice President, State Street Bank and Trust Company (2001-November 2014).* | |||
BRIAN HARRIS | Chief Compliance Officer | Term: Unlimited Served: since November 2013 | Vice President, State Street Global Advisors and SSGA Funds Management, Inc. (2013-Present); Senior Vice President and Global Head of Investment Compliance, BofA Global Capital Management (2010-2013); Director of Compliance, AARP Financial Inc. (2008-2010). |
| * | Served in various capacities and/or with various affiliated entities during noted time period. |
| ** | Served in various capacities and/or with unaffiliated mutual funds or closed-end funds for which State Street Bank and Trust Company or its affiliates act as a provider of services during the noted time period. |
66
Table of Contents
The SPDR® Family of Exchange Traded Funds
The following is a list of SPDR ETFs being offered, along with their respective exchange trading symbols. Please call 1-866-787-2257 to obtain a prospectus for any SPDR ETF. The prospectus contains more complete information, including charges, expenses, investment objectives and risk factors that should be carefully considered to determine if the Fund(s) are an appropriate investment for you. Read the prospectus(es) carefully before investing. Investing involves risk, including possible loss of principal.
SPDR Series Trust
SPDR Russell 3000® ETF (THRK)
SPDR Russell 1000® ETF (ONEK)
SPDR Russell 2000® ETF (TWOK)
SPDR S&P 500 Buyback ETF (SPYB)
SPDR S&P 500 Growth ETF (SPYG)
SPDR S&P 500 Value ETF (SPYV)
SPDR Russell Small Cap Completeness ETF (RSCO)
SPDR S&P 400 Mid Cap Growth ETF (MDYG)
SPDR S&P 400 Mid Cap Value ETF (MDYV)
SPDR S&P 600 Small Cap ETF (SLY)
SPDR S&P 600 Small Cap Growth ETF (SLYG)
SPDR S&P 600 Small Cap Value ETF (SLYV)
SPDR Global Dow ETF (DGT)
SPDR Dow Jones REIT ETF (RWR)
SPDR S&P Bank ETF (KBE)
SPDR S&P Capital Markets ETF (KCE)
SPDR S&P Insurance ETF (KIE)
SPDR S&P Regional Banking ETF (KRE)
SPDR Morgan Stanley Technology ETF (MTK)
SPDR S&P Dividend ETF (SDY)
SPDR S&P Aerospace & Defense ETF (XAR)
SPDR S&P Biotech ETF (XBI)
SPDR S&P Health Care Equipment ETF (XHE)
SPDR S&P Health Care Services ETF (XHS)
SPDR S&P Homebuilders ETF (XHB)
SPDR S&P Metals & Mining ETF (XME)
SPDR S&P Oil & Gas Equipment & Services ETF (XES)
SPDR S&P Oil & Gas Exploration & Production ETF (XOP)
SPDR S&P Pharmaceuticals ETF (XPH)
SPDR S&P Retail ETF (XRT)
SPDR S&P Semiconductor ETF (XSD)
SPDR S&P Software & Services ETF (XSW)
SPDR S&P Telecom ETF (XTL)
SPDR S&P Transportation ETF (XTN)
SPDR S&P 1500 Value Tilt ETF (VLU)
SPDR S&P 1500 Momentum Tilt ETF (MMTM)
SPDR Russell 1000 Low Volatility ETF (LGLV)
SPDR Russell 2000 Low Volatility ETF (SMLV)
SPDR MSCI USA Quality Mix ETF (QUS)
SPDR Wells Fargo Preferred Stock ETF (PSK)
SPDR Barclays 1-3 Month T-Bill ETF (BIL)
SPDR Barclays TIPS ETF (IPE)
SPDR Barclays 0-5 Year TIPS ETF (SIPE)
SPDR Barclays 1-10 Year TIPS ETF (TIPX)
SPDR Barclays Short Term Treasury ETF (SST)
SPDR Barclays Intermediate Term Treasury ETF (ITE)
SPDR Barclays Long Term Treasury ETF (TLO)
SPDR Barclays Short Term Corporate Bond ETF (SCPB)
SPDR Barclays Intermediate Term Corporate Bond ETF (ITR)
SPDR Barclays Long Term Corporate Bond ETF (LWC)
SPDR Barclays Issuer Scored Corporate Bond ETF (CBND)
Table of Contents
SPDR Barclays Convertible Securities ETF (CWB)
SPDR Barclays Mortgage Backed Bond ETF (MBG)
SPDR Barclays Aggregate Bond ETF (LAG)
SPDR Nuveen Barclays Municipal Bond ETF (TFI)
SPDR Nuveen Barclays California Municipal Bond ETF (CXA)
SPDR Nuveen Barclays New York Municipal Bond ETF (INY)
SPDR Nuveen Barclays Short Term Municipal Bond ETF (SHM)
SPDR Nuveen S&P High Yield Municipal Bond ETF (HYMB)
SPDR Nuveen Barclays Build America Bond ETF (BABS)
SPDR DB International Government Inflation-Protected Bond ETF (WIP)
SPDR Barclays Short Term International Treasury Bond ETF (BWZ)
SPDR Barclays International Treasury Bond ETF (BWX)
SPDR Barclays International Corporate Bond ETF (IBND)
SPDR Barclays Emerging Markets Local Bond ETF (EBND)
SPDR Barclays International High Yield Bond ETF (IJNK)
SPDR Barclays High Yield Bond ETF (JNK)
SPDR Barclays Short Term High Yield Bond ETF (SJNK)
SPDR Barclays Investment Grade Floating Rate ETF (FLRN)
SPDR BofA Merrill Lynch Emerging Markets Corporate Bond ETF (EMCD)
SPDR BofA Merrill Lynch Crossover Corporate Bond ETF (CJNK)
SPDR Index Shares Funds
SPDR STOXX Europe 50 ETF (FEU)
SPDR EURO STOXX 50 ETF (FEZ)
SPDR EURO STOXX Small Cap ETF (SMEZ)
SPDR EURO STOXX 50 Currency Hedged ETF (HFEZ)
SPDR S&P Emerging Asia Pacific ETF (GMF)
SPDR S&P Russia ETF (RBL)
SPDR S&P China ETF (GXC)
SPDR S&P Emerging Markets ETF (GMM)
SPDR S&P Emerging Markets Dividend ETF (EDIV)
SPDR S&P BRIC 40 ETF (BIK)
SPDR S&P Emerging Europe ETF (GUR)
SPDR S&P Emerging Latin America ETF (GML)
SPDR S&P Emerging Middle East & Africa ETF (GAF)
SPDR S&P World ex-US ETF (GWL)
SPDR S&P International Small Cap ETF (GWX)
SPDR Dow Jones International Real Estate ETF (RWX)
SPDR S&P Global Infrastructure ETF (GII)
SPDR S&P Global Natural Resources ETF (GNR)
SPDR MSCI ACWI ex-US ETF (CWI)
SPDR MSCI ACWI IMI ETF (ACIM)
SPDR MSCI ACWI Low Carbon Target ETF (LOWC)
SPDR MSCI EM 50 ETF (EMFT)
SPDR MSCI EM Beyond BRIC ETF (EMBB)
SPDR MSCI EAFE Quality Mix ETF (QEFA)
SPDR MSCI Emerging Markets Quality Mix ETF (QEMM)
SPDR MSCI World Quality Mix ETF (QWLD)
SPDR MSCI Australia Quality Mix ETF (QAUS)
SPDR MSCI Canada Quality Mix ETF (QCAN)
SPDR MSCI Germany Quality Mix ETF (QDEU)
SPDR MSCI Japan Quality Mix ETF (QJPN)
SPDR MSCI Mexico Quality Mix ETF (QMEX)
SPDR MSCI South Korea Quality Mix ETF (QKOR)
SPDR MSCI Spain Quality Mix ETF (QESP)
SPDR MSCI Taiwan Quality Mix ETF (QTWN)
SPDR MSCI United Kingdom Quality Mix ETF (QGBR)
SPDR Russell/Nomura PRIME™ Japan ETF (JPP)
SPDR Russell/Nomura Small Cap™ Japan ETF (JSC)
Table of Contents
SPDR S&P Global Dividend ETF (WDIV)
SPDR S&P International Dividend ETF (DWX)
SPDR S&P International Mid Cap ETF (MDD)
SPDR S&P Emerging Markets Small Cap ETF (EWX)
SPDR Dow Jones Global Real Estate ETF (RWO)
SPDR S&P International Consumer Discretionary Sector ETF (IPD)
SPDR S&P International Consumer Staples Sector ETF (IPS)
SPDR S&P International Energy Sector ETF (IPW)
SPDR S&P International Financial Sector ETF (IPF)
SPDR S&P International Health Care Sector ETF (IRY)
SPDR S&P International Industrial Sector ETF (IPN)
SPDR S&P International Materials Sector ETF (IRV)
SPDR S&P International Technology Sector ETF (IPK)
SPDR S&P International Telecommunications Sector ETF (IST)
SPDR S&P International Utilities Sector ETF (IPU)
The Select Sector SPDR Trust
The Consumer Discretionary Select Sector SPDR Fund (XLY)
The Consumer Staples Select Sector SPDR Fund (XLP)
The Energy Select Sector SPDR Fund (XLE)
The Financial Select Sector SPDR Fund (XLF)
The Health Care Select Sector SPDR Fund (XLV)
The Industrial Select Sector SPDR Fund (XLI)
The Materials Select Sector SPDR Fund (XLB)
The Technology Select Sector SPDR Fund (XLK)
The Utilities Select Sector SPDR Fund (XLU)
SSGA Active Trust
SPDR SSGA Multi-Asset Real Return ETF (RLY)
SPDR SSGA Income Allocation ETF (INKM)
SPDR SSGA Global Allocation ETF (GAL)
SPDR Blackstone/GSO Senior Loan ETF (SRLN)
SPDR SSGA Ultra Short Term Bond ETF (ULST)
SPDR DoubleLine Total Return Tactical ETF (TOTL)
State Street Clarion Global Infrastructure & MLP Portfolio (SSIDX)
SPDR MFS Systematic Core Equity ETF (SYE)
SPDR MFS Systematic Growth Equity ETF (SYG)
SPDR MFS Systematic Value Equity ETF (SYV)
SPDR SSGA Risk Aware ETF (RORO)
SPDR Dow Jones Industrial Average ETF Trust (DIA)
SPDR S&P 500 ETF Trust (SPY)
State Street Global Markets, LLC, member FINRA, SIPC, is distributor for all investment portfolios of SPDR Series Trust, SPDR Index Shares Funds, and SSGA Active Trust. ALPS Distributors, Inc., a registered broker-dealer, is distributor for SPDR S&P 500 ETF Trust (SPY) and SPDR Dow Jones Industrial Average ETF Trust (DIA), both unit investment trusts, and ALPS Portfolio Solutions Distributors, Inc. is the distributor for all investment portfolios of The Select Sector SPDR Trust. ALPS Distributors, Inc. and ALPS Portfolio Solutions Distributor, Inc. are not affiliated with State Street Global Markets, LLC.
Table of Contents
SSGA Master Trust
Trustees
Bonny E. Boatman
Dwight D. Churchill
David M. Kelly
Frank Nesvet, Chairman
James E. Ross
Carl G. Verboncoeur
Officers
Ellen M. Needham, President
Ann Carpenter, Vice President and Assistant Treasurer
Michael P. Riley, Vice President
Chad C. Hallett, Treasurer
Christopher A. Madden, Secretary
Patricia A. Morisette, Assistant Secretary
Brian Harris, Chief Compliance Officer
Joshua A. Weinberg, Chief Legal Officer
Investment Manager and Administrator
SSGA Funds Management, Inc.
State Street Financial Center
One Lincoln Street
Boston, MA 02111
Custodian, Sub-Administrator and Transfer Agent
State Street Bank and Trust Company
One Lincoln Street
Boston, MA 02111
Legal Counsel
Morgan, Lewis & Bockius LLP
2020 K Street, NW
Washington, DC 20006
Independent Registered Public Accounting Firm
Ernst & Young LLP
200 Clarendon Street
Boston, MA 02116
Table of Contents
For more complete information, please call 866.787.2257 or
visit www.spdrs.com today.
State Street Global Advisors, State Street Financial Center One Lincoln Street Boston, MA 02111
ETFs trade like stocks, are subject to investment risk, fluctuate in market value and may trade at prices above or below the ETFs net asset value. Brokerage commissions and ETF expenses will reduce returns.
Because the SPDR SSGA Active Asset Allocation ETFs are actively managed, they are therefore subject to the risk that the investments selected by SSGA may cause the ETFs to underperform relative to their benchmarks or other funds with similar investment objectives. Actively managed ETFs do not seek to replicate the performance of a specified index.
Foreign investments involve greater risks than U.S. investments, including political and economic risks and the risk of currency fluctuations, all of which may be magnified in emerging markets.
Bonds generally present less short-term risk and volatility than stocks, but contain interest rate risk (as interest rates rise bond prices usually fall); issuer default risk; issuer credit risk; liquidity risk; and inflation risk. These effects are usually pronounced for longer-term securities. Any fixed income security sold or redeemed prior to maturity may be subject to a substantial gain or loss.
Investing in commodities entail significant risk and is not appropriate for all investors. Commodities investing entail significant risk as commodity prices can be extremely volatile due to wide range of factors. A few such factors include overall market movements, real or perceived inflationary trends, commodity index volatility, international, economic and political changes, change in interest and currency exchange rates.
Past performance is no guarantee of future results. It is not possible to invest directly in an index. Index performance does not reflect charges and
expenses associated with the fund or brokerage commissions associated with buying and selling a fund. Index performance is not meant to represent that of any particular fund.
Standard & Poor’s, S&P and SPDR are registered trademarks of Standard & Poor’s Financial Services LLC (S&P); Dow Jones is a registered trademark of Dow Jones Trademark Holdings LLC (Dow Jones); and these trademarks have been licensed for use by S&P Dow Jones Indices LLC (SPDJI) and sublicensed for certain purposes by State Street Corporation. State Street Corporation’s financial products are not sponsored, endorsed, sold or promoted by SPDJI, Dow Jones, S&P, their respective affiliates and third party licensors and none of such parties make any representation regarding the advisability of investing in such product(s) nor do they have any liability in relation thereto, including for any errors, omissions, or interruptions of any index.
Distributor: State Street Global Markets, LLC, member FINRA, SIPC, a wholly owned subsidiary of State Street Corporation. References to State Street may include State Street Corporation and its affiliates. Certain State Street affiliates provide services and receive fees from the SPDR ETFs.
State Street Global Markets, LLC is the distributor for all registered products on behalf of the advisor. SSGA Funds Management has retained GSO Capital Partners, Massachusetts Financial Services Company & DoubleLine Capital LP as the sub-advisor.
Before investing, consider the fund’s investment objectives, risks, charges and expenses. To obtain a prospectus or summary prospectus which contains this and other information, call 866.787.2257 or visit www.spdrs.com. Read it carefully.
Not FDIC Insured. No Bank Guarantee. May Lose Value
| State Street Global Advisors | © 2015 State Street Corporation SPDRACTAR IBG-16216 |
Table of Contents
Annual Report
30 June 2015
SSGA Active Trust
State Street Clarion Global Infrastructure & MLP Portfolio

Table of Contents
| 1 | ||||
| 2 | ||||
| 3 | ||||
| 6 | ||||
| 7 | ||||
| 13 | ||||
| 14 |
Table of Contents

STATE STREET CLARION GLOBAL INFRASTRUCTURE & MLP PORTFOLIO — PORTFOLIO SUMMARY
The Portfolio had less than six months of operations at reporting period end and therefore does not have performance history to provide in this report.
TOP FIVE HOLDINGS AS OF JUNE 30, 2015
| DESCRIPTION | CROWN CASTLE INTERNATIONAL CORP. | EAST JAPAN RAILWAY CO. | UNION PACIFIC CORP. | NATIONAL GRID PLC | VINCI SA | |||||||||
| MARKET VALUE | $773,691 | 728,811 | 628,870 | 598,780 | 593,307 | |||||||||
| % OF NET ASSETS | 4.9 | 4.6 | 3.9 | 3.8 | 3.7 | |||||||||
(The five largest holdings are subject to change, and there are no guarantees the Portfolio will continue to remain invested in any particular security.)
INDUSTRY BREAKDOWN AS OF JUNE 30, 2015*
| PERCENT OF NET ASSETS | ||||||||
Oil, Gas & Consumable Fuels | 23.4 | % | ||||||
Electric Utilities | 15.3 | |||||||
Multi-utilities | 14.1 | |||||||
Road & Rail | 13.8 | |||||||
Transportation Infrastructure | 10.6 | |||||||
Construction & Engineering | 7.4 | |||||||
Real Estate Investment Trusts | 4.9 | |||||||
Independent Power & Renewable Electricity Producers | 4.1 | |||||||
Water Utilities | 2.2 | |||||||
Gas Utilities | 1.8 | |||||||
Industrial Conglomerates | 1.1 | |||||||
Short Term Investment | 1.8 | |||||||
Other Assets & Liabilities | (0.5 | ) | ||||||
TOTAL | 100.0 | % | ||||||
| * | The Portfolio’s industry breakdown is expressed as a percentage of net assets and may change over time. |
1
Table of Contents
SSGA Active Trust
State Street Clarion Global Infrastructure & MLP Portfolio
June 30, 2015
Security Description | Shares | Value | ||||||
COMMON STOCKS — 98.7% | ||||||||
AUSTRALIA — 5.8% | ||||||||
Aurizon Holdings, Ltd. | 93,230 | $ | 367,598 | |||||
Transurban Group | 76,527 | 547,014 | ||||||
|
| |||||||
| 914,612 | ||||||||
|
| |||||||
CANADA — 4.1% | ||||||||
TransCanada Corp. | 10,640 | 432,606 | ||||||
Veresen, Inc. | 16,200 | 219,166 | ||||||
|
| |||||||
| 651,772 | ||||||||
|
| |||||||
FRANCE — 5.4% | ||||||||
Suez Environnement Co. | 13,817 | 256,864 | ||||||
Vinci SA | 10,264 | 593,307 | ||||||
|
| |||||||
| 850,171 | ||||||||
|
| |||||||
GERMANY — 0.8% | ||||||||
Hamburger Hafen und Logistik AG | 6,530 | 132,055 | ||||||
|
| |||||||
HONG KONG — 4.7% | ||||||||
Beijing Enterprises Holdings, Ltd. | 23,500 | 176,874 | ||||||
China Resources Gas Group, Ltd. | 25,500 | 75,653 | ||||||
COSCO Pacific, Ltd. | 172,700 | 234,349 | ||||||
Power Assets Holdings, Ltd. | 29,300 | 267,204 | ||||||
|
| |||||||
| 754,080 | ||||||||
|
| |||||||
ITALY — 4.7% | ||||||||
Atlantia SpA | 15,314 | 378,113 | ||||||
Enel SpA | 82,465 | 373,410 | ||||||
|
| |||||||
| 751,523 | ||||||||
|
| |||||||
JAPAN — 7.5% | ||||||||
Central Japan Railway Co. | 2,600 | 469,685 | ||||||
East Japan Railway Co. | 8,100 | 728,811 | ||||||
|
| |||||||
| 1,198,496 | ||||||||
|
| |||||||
MEXICO — 1.5% | ||||||||
Grupo Aeroportuario del Pacifico SAB de CV (Class B) | 35,100 | 240,970 | ||||||
|
| |||||||
SPAIN — 6.4% | ||||||||
Enagas SA | 7,429 | 201,927 | ||||||
Ferrovial SA | 26,761 | 579,943 | ||||||
Red Electrica Corp. SA | 2,935 | 235,060 | ||||||
|
| |||||||
| 1,016,930 | ||||||||
|
| |||||||
SWITZERLAND — 1.0% | ||||||||
Flughafen Zuerich AG | 197 | 152,511 | ||||||
|
| |||||||
UNITED KINGDOM — 7.1% | ||||||||
National Grid PLC | 46,590 | 598,780 | ||||||
Severn Trent PLC | 4,933 | 161,447 | ||||||
United Utilities Group PLC | 13,900 | 194,996 | ||||||
VTTI Energy Partners LP (a) | 7,116 | 178,184 | ||||||
|
| |||||||
| 1,133,407 | ||||||||
|
| |||||||
UNITED STATES — 49.7% | ||||||||
Cone Midstream Partners LP (a) | 17,716 | 313,573 | ||||||
Crown Castle International Corp. | 9,635 | 773,691 | ||||||
Dominion Resources, Inc. | 5,968 | 399,080 | ||||||
DTE Energy Co. | 5,584 | 416,790 | ||||||
Edison International | 5,009 | 278,400 | ||||||
Energy Transfer Equity LP (a) | 4,765 | 305,770 | ||||||
Security Description | Shares | Value | ||||||
Energy Transfer Partners LP (a) | 10,029 | $ | 523,514 | |||||
EnLink Midstream Partners LP (a) | 4,931 | 108,334 | ||||||
EQT GP Holdings LP (a) (b) | 4,859 | 165,157 | ||||||
EQT Midstream Partners LP (a) | 3,960 | 322,898 | ||||||
Eversource Energy | 6,662 | 302,522 | ||||||
Exelon Corp. | 9,298 | 292,143 | ||||||
ITC Holdings Corp. | 6,300 | 202,734 | ||||||
NextEra Energy Partners LP (a) | 5,900 | 233,758 | ||||||
NextEra Energy, Inc. | 4,910 | 481,327 | ||||||
NiSource, Inc. | 5,719 | 260,729 | ||||||
NRG Yield, Inc. (Class A) | 7,200 | 158,328 | ||||||
Plains GP Holdings LP (Class A) (a) | 10,600 | 273,904 | ||||||
Sempra Energy | 3,105 | 307,209 | ||||||
Summit Midstream Partners LP (a) | 9,277 | 306,512 | ||||||
Sunoco Logistics Partners LP (a) | 9,271 | 352,576 | ||||||
TerraForm Power, Inc. (Class A) (b) | 6,700 | 254,466 | ||||||
Union Pacific Corp. | 6,594 | 628,870 | ||||||
Valero Energy Partners LP (a) | 4,750 | 242,629 | ||||||
|
| |||||||
| 7,904,914 | ||||||||
|
| |||||||
TOTAL COMMON STOCKS | 15,701,441 | |||||||
|
| |||||||
SHORT TERM INVESTMENT — 1.8% |
| |||||||
MONEY MARKET FUND — 1.8% |
| |||||||
State Street Institutional Liquid Reserves Fund, Premier Class 0.11% (c) (d) | 284,165 | 284,165 | ||||||
|
| |||||||
TOTAL INVESTMENTS — 100.5% (e) | 15,985,606 | |||||||
OTHER ASSETS & | (74,661 | ) | ||||||
|
| |||||||
NET ASSETS — 100.0% | $ | 15,910,945 | ||||||
|
| |||||||
| (a) | Master Limited Partnership. Represents $3,326,809 or 20.91% of net assets. |
| (b) | Non-income producing security |
| (c) | Affiliated Fund managed by SSGA Funds Management, Inc. (Note 3). |
| (d) | The rate shown is the annualized seven-day yield at period end. |
| (e) | Unless otherwise indicated, the values of the securities of the Portfolio are determined based on Level 1 inputs (Note 2). |
PLC = Public Limited Company
See accompanying notes to financial statements.
2
Table of Contents
SSGA Active Trust
State Street Clarion Global Infrastructure & MLP Portfolio
STATEMENT OF ASSETS AND LIABILITIES
June 30, 2015
ASSETS | ||||
Investments in securities of unaffiliated issuers, at value | $ | 15,701,441 | ||
Investments in securities of affiliated issuers, at value | 284,165 | |||
Foreign currency, at value | 25,303 | |||
Dividends receivable from unaffiliated issuers (Note 3) | 54,109 | |||
Dividends receivable from affiliated issuers (Note 3) | 30 | |||
Receivable for foreign taxes recoverable | 6,968 | |||
Receivable from Adviser (Note 3) | 21,589 | |||
|
| |||
TOTAL ASSETS | 16,093,605 | |||
|
| |||
LIABILITIES | ||||
Payable for investments purchased | 160,836 | |||
Payable for Fund shares repurchased | 235 | |||
Advisory fees payable (Note 3) | 21,589 | |||
|
| |||
TOTAL LIABILITIES | 182,660 | |||
|
| |||
NET ASSETS | $ | 15,910,945 | ||
|
| |||
NET ASSETS CONSIST OF: | ||||
Paid-in capital | $ | 15,939,961 | ||
Undistributed net investment income | 26,377 | |||
Accumulated net realized gain | 421,536 | |||
Net unrealized (depreciation) on: | ||||
Investments in securities of unaffiliated issuers | (476,974 | ) | ||
Foreign currency transactions | 45 | |||
|
| |||
NET ASSETS | $ | 15,910,945 | ||
|
| |||
NET ASSETS | $ | 15,910,945 | ||
Shares of beneficial interest outstanding | 1,593,481 | |||
|
| |||
Net asset value and redemption price per share | $ | 9.99 | ||
|
| |||
Investments in securities of unaffiliated issuers, at cost | $ | 16,178,415 | ||
Investments in securities of affiliated issuers, at cost | 284,165 | |||
|
| |||
Total Cost of Investments | $ | 16,462,580 | ||
|
| |||
Foreign currency, at cost | $ | 25,644 | ||
|
|
See accompanying notes to financial statements.
3
Table of Contents
SSGA Active Trust
State Street Clarion Global Infrastructure & MLP Portfolio
STATEMENT OF OPERATIONS
Period Ended June 30, 2015*
INVESTMENT INCOME |
| |||
Dividend income from unaffiliated issuers | $ | 220,246 | ||
Dividend income from master limited partnerships and related companies | 58,205 | |||
Return of capital on dividends from master limited partnerships and related companies (Note 2) | (49,137 | ) | ||
|
| |||
Net dividend income from master limited partnerships and related companies | 9,068 | |||
|
| |||
Interest income on securities of affiliated issuers (Note 2 and Note 3) | 135 | |||
Foreign taxes withheld | (15,887 | ) | ||
|
| |||
TOTAL INVESTMENT INCOME | 213,562 | |||
|
| |||
EXPENSES | ||||
Advisory fee (Note 3) | 21,589 | |||
Trustees’ fees and expenses (Note 3) | 69 | |||
|
| |||
TOTAL EXPENSES | 21,658 | |||
|
| |||
Less: Expenses reimbursed by the Adviser (Note 3) | (21,589 | ) | ||
|
| |||
Net expenses | 69 | |||
|
| |||
NET INVESTMENT INCOME | $ | 213,493 | ||
|
| |||
REALIZED AND UNREALIZED GAIN (LOSS) ON INVESTMENTS | ||||
Net realized gain on: | ||||
Investments in securities of unaffiliated issuers | 410,113 | |||
Foreign currency transactions | 5,124 | |||
Net change in unrealized appreciation (depreciation) on: | ||||
Investments in securities of unaffiliated issuers | (476,974 | ) | ||
Foreign currency transactions | 45 | |||
|
| |||
NET REALIZED AND UNREALIZED LOSS ON INVESTMENTS AND FOREIGN CURRENCY TRANSACTIONS | (61,692 | ) | ||
|
| |||
NET INCREASE IN NET ASSETS RESULTING FROM OPERATIONS | $ | 151,801 | ||
|
| |||
| * | For the period from January 21, 2015 (commencement of operations) to June 30, 2015. |
See accompanying notes to financial statements.
4
Table of Contents
SSGA Active Trust
State Street Clarion Global Infrastructure & MLP Portfolio
STATEMENT OF CHANGES IN NET ASSETS
| Period Ended 6/30/15* | ||||
INCREASE (DECREASE) IN NET ASSETS FROM OPERATIONS: | ||||
Net investment income | $ | 213,493 | ||
Net realized gain on investments and foreign currency transactions | 415,237 | |||
Change in net unrealized appreciation (depreciation) on investments and foreign currency transactions | (476,929 | ) | ||
|
| |||
Net increase in net assets from operations | 151,801 | |||
|
| |||
DISTRIBUTIONS TO SHAREHOLDERS FROM: | ||||
Net investment income | (180,817 | ) | ||
|
| |||
Total distributions to shareholders | (180,817 | ) | ||
|
| |||
FROM BENEFICIAL INTEREST TRANSACTIONS: | ||||
In-kind transfer from CBRE Clarion Global Listed Infrastructure Fund, LP | 11,569,962 | |||
Contribution from SSGA Funds Management, Inc. (Note 1) | 4,000,100 | |||
Proceeds from shares sold | 348,304 | |||
Reinvestment of distributions | 180,817 | |||
Cost of redemptions | (159,222 | ) | ||
|
| |||
Net increase (decrease) in net assets from beneficial interest transactions | 15,939,961 | |||
|
| |||
Net increase in net assets | 15,910,945 | |||
NET ASSETS END OF PERIOD (1) | ||||
Beginning of period | — | |||
|
| |||
End of period | $ | 15,910,945 | ||
|
| |||
SHARES OF BENEFICIAL INTEREST: | ||||
In-kind transfer from CBRE Clarion Global Listed Infrastructure Fund, LP (Note 1) | 1,176,596 | |||
Shares sold | 414,875 | |||
Reinvestment of distributions | 17,385 | |||
Shares redeemed | (15,375 | ) | ||
|
| |||
Net increase in shares | 1,593,481 | |||
|
| |||
(1) Undistributed net investment income | $ | 26,377 | ||
|
| |||
| * | For the period from January 21, 2015 (commencement of operations) to June 30, 2015. |
See accompanying notes to financial statements.
5
Table of Contents
SSGA Active Trust
State Street Clarion Global Infrastructure & MLP Portfolio
Selected data for a share of beneficial interest outstanding throughout the period is presented below:
| Period Ended 6/30/15* | ||||
Net asset value, beginning of period | $ | 10.00 | ||
|
| |||
Income (loss) from investment operations: | ||||
Net investment income(1) | 0.14 | |||
Net realized and unrealized gain (loss) on investments | (0.04 | ) | ||
|
| |||
Total from investment operations | 0.10 | |||
|
| |||
Less Distributions to Shareholders From: | ||||
Net investment income | (0.11 | ) | ||
|
| |||
Total distributions to shareholders | (0.11 | ) | ||
|
| |||
Net decrease in net assets | (0.01 | ) | ||
|
| |||
Net Asset Value, End of Period | $ | 9.99 | ||
|
| |||
Total Return(2) | 1.00 | % | ||
Ratios and Supplemental Data: | ||||
Net Assets, End of Period (000s) | $ | 15,911 | ||
Ratios to average net assets: | ||||
Gross operating expenses | 0.30 | %(3) | ||
Expense waiver | (0.30 | )%(3) | ||
Net operating expenses | 0.00 | %(3)(4) | ||
Net investment income | 2.97 | %(3) | ||
Portfolio turnover rate | 37 | % | ||
| * | For the period from January 21, 2015 (commencement of operations) to June 30, 2015. |
| (1) | Net investment income per share is calculated using the average shares method. |
| (2) | Total return is calculated assuming a purchase of shares at net asset value on the first day and a sale at net asset value on the last day of each period reported. Distributions are assumed, for the purpose of this calculation, to be reinvested at net asset value per share on the respective payment dates. Total return for periods of less than one year are not annualized. Broker commission charges are not included in this calculation. |
| (3) | Annualized. |
| (4) | Less than 0.005% |
See accompanying notes to financial statements.
6
Table of Contents
SSGA Active Trust
State Street Clarion Global Infrastructure & MLP Portfolio
June 30, 2015
| 1. | Organization |
SSGA Active Trust (the “Trust”), which is registered under the Investment Company Act of 1940, as amended (“1940 Act”), is an open-end management investment company that was organized as a Massachusetts business trust on March 30, 2011.
As of June 30, 2015, the Trust offered eleven (11) funds, 10 feeders and 1 master portfolio. The financial statements herein relate to the State Street Clarion Global Infrastructure & MLP Portfolio (the “Portfolio”), a separate non-diversified series of the Active Trust. The Portfolio operates as the master portfolio in a master feeder structure.
The investment objective of the Portfolio is to seek long-term total return. The Portfolio invests in infrastructure companies located worldwide including infrastructure companies organized as Master Limited Partnerships (“MLPs”). The Portfolio is part of a master feeder structure where State Street Clarion Infrastructure & MLP Fund (the “Feeder Fund”) invests substantially all of its assets in the Portfolio. SSGA Funds Management, Inc. (the “Adviser” or “SSGA FM”) serves as the investment adviser and CBRE Clarion Securities LLC serves as the subadviser.
The Portfolio commenced operations on January 21, 2015, after it acquired the net assets of the CBRE Clarion Global Listed Infrastructure Fund, LP (the “Partnership”), via the Feeder Fund. The acquisition of net assets of the Partnership was accomplished by an in-kind transfer of all of the Partnership’s net assets amounting to $11,569,962 and a cash transfer of $196,000 by the Partnership in exchange for 1,176,596 shares of the Feeder Fund (the “transaction”). The Partnership elected to make a deemed sale election related to the transaction, pursuant to the subscription agreement. SSGA FM contributed initial capital of $4,000,100 to the Feeder Fund in exchange for the Feeder Fund’s shares. Immediately prior to the acquisition, the Portfolio did not have any assets or liabilities nor operations or investment activities.
Under the Trust’s organizational documents, its officers and trustees are indemnified against certain liabilities arising out of the performance of their duties to the Trust. Additionally, in the normal course of business, the Trust enters into contracts with service providers that contain general indemnification clauses. The Trust’s maximum exposure under these arrangements is unknown as this could involve future claims that may be made against the Trust that have not yet occurred.
| 2. | Summary of Significant Accounting Policies |
The following is a summary of significant accounting policies followed by the Trust in the preparation of its financial statements:
The preparation of financial statements in accordance with accounting principles generally accepted in the United States of America (“U.S. GAAP”) requires management to make estimates and assumptions that affect the reported amounts and disclosures in the financial statements. Actual results could differ from those estimates.
The Portfolio is an investment company under U.S. GAAP and follows the accounting and reporting guidance applicable to investment companies in Financial Accounting Standards Board (“FASB”) Accounting Standards Codification (“ASC”) 946, Financial Services—Investment Companies (“ASC 946”).
Security Valuation
The Portfolio’s investments are valued at fair value each day that the Portfolio’s listing exchange is open and, for financial reporting purposes, as of the report date should the reporting period end on a day that the Portfolio’s listing exchange is not open. Fair value is generally defined as the price a fund would receive to sell an asset or pay to transfer a liability in an orderly transaction between market participants at the measurement date. By its nature, a fair value price is a good faith estimate of the valuation in a current sale and may not reflect an actual market price. The investments of the Portfolio are valued pursuant to policies and procedures developed by the Oversight Committee (the “Committee”) and approved by the Board of Trustees of the Trust (the “Board”). The Committee provides oversight of the valuation of investments for the Portfolio. The Board has responsibility for determining the fair value of investments. The members of the Committee are approved by the Board.
7
Table of Contents
SSGA Active Trust
State Street Clarion Global Infrastructure & MLP Portfolio
NOTES TO FINANCIAL STATEMENTS (continued)
June 30, 2015
Valuation techniques used to value the Portfolio’s investments by major category are as follows:
| • | Equity investments (including registered investment companies that are exchange-traded funds) traded on a recognized securities exchange for which market quotations are readily available are valued at the last sale price or official closing price, as applicable, on the primary market or exchange on which they trade. Equity investments traded on a recognized exchange for which there were no sales on that day are valued at the last published sale price or at fair value. |
| • | Investments in registered investment companies (including money market funds) or other unitized pooled investment vehicles that are not traded on an exchange are valued at that day’s published net asset value per share or unit. Money market funds generally value portfolio investments using the amortized cost method as set forth in Rule 2a-7 under the 1940 Act and in accordance with Portfolio procedures to stabilize net asset value. |
In the event prices or quotations are not readily available or that application of these methods of valuation results in a price for an investment which is deemed not to be representative of the fair value of such investment, fair value will be determined in good faith by the Committee, in accordance with valuation policy and procedures approved by the Board.
Fair value pricing could result in a difference between the prices used to calculate the Portfolio’s net asset value and the prices used by the Portfolio’s underlying index, which in turn could result in a difference between the Portfolio’s performance and the performance of the Portfolio’s underlying index. Various inputs are used in determining the value of the Portfolio’s investments. These inputs are categorized into a fair value hierarchy consisting of three broad levels for financial reporting purposes. The Portfolio values its assets and liabilities at fair value using a hierarchy that prioritizes the inputs to valuation techniques giving the highest priority to readily available unadjusted quoted prices in active markets for identical assets or liabilities (Level 1 measurements) and the lowest priority to unobservable inputs (Level 3 measurements) when market prices are not readily available or reliable. The categorization of a value determined for an investment within the hierarchy is based upon the pricing transparency of the investment and is not necessarily an indication of the risk associated with investing in it.
The three levels of the fair value hierarchy are as follows:
| • | Level 1 — Unadjusted quoted prices in active markets for identical assets or liabilities; |
| • | Level 2 — Inputs other than quoted prices included within Level 1 that are observable for the asset or liability either directly or indirectly, including quoted prices for similar assets or liabilities in active markets, quoted prices for identical or similar assets or liabilities in markets that are not considered to be active, inputs other than quoted prices that are observable for the asset or liability (such as exchange rates, financing terms, interest rates, yield curves, volatilities, prepayment speeds, loss severities, credit risks and default rates) or other market-corroborated inputs; and |
| • | Level 3 — Unobservable inputs for the asset or liability, including the Committee’s assumptions used in determining the fair value of investments. |
Changes in valuation techniques may result in transfers in or out of an assigned level within the disclosure hierarchy. Transfers between different levels of the fair value hierarchy are recognized at the end of the reporting period. The Portfolio had no transfers between levels for the period ended June 30, 2015.
As of June 30, 2015, all of the Portfolio’s assets were valued using Level 1 inputs.
Investment Transactions and Income Recognition
Investment transactions are accounted for on trade date for financial reporting purposes. Interest income, if any, is recorded daily on an accrual basis. Dividend income and capital gain distributions received, if any, are recognized on the ex-dividend dates, net of any foreign taxes withheld at the source. Non-cash dividends received in the form of stock, if any, are recorded as dividend income at fair value. Distributions received by the portfolio may include a return of capital that is estimated by SSGA FM. Such amounts are recorded as a reduction of the cost of investments or reclassified as capital gains. Realized gains and losses from investment transactions are determined using identified cost method.
8
Table of Contents
SSGA Active Trust
State Street Clarion Global Infrastructure & MLP Portfolio
NOTES TO FINANCIAL STATEMENTS (continued)
June 30, 2015
Distributions received from the Portfolio’s investments in master limited partnerships or limited liability companies that have economic characteristics substantially similar to master limited partnerships (collectively, “MLPs”) generally are comprised of ordinary income and return of capital from the MLPs. The Portfolio records distributions from MLPs as dividend income and redesignates between income and return of capital at year end. Such estimates are based on information provided by each MLP and other industry sources. These estimates may subsequently be revised based on actual allocations received from MLPs after their tax reporting periods are concluded, as the actual character of these distributions is not known until after the fiscal year end of the Portfolio. For the period ended June 30, 2015, the Portfolio estimated the allocation of investment income and return of capital for the distributions received from MLPs within the Statement of Operations. For this period, the Portfolio has estimated approximately 82.4% as income and approximately 17.6% as return of capital.
Foreign Currency Translation
The accounting records of the Portfolio are maintained in U.S. dollars. Foreign currencies as well as investment securities and other assets and liabilities denominated in a foreign currency are translated to U.S. dollars using exchange rates deemed appropriate pursuant to the valuation policy at period end. Purchases and sales of securities, income receipts and expense payments are translated into U.S. dollars on the respective dates of transactions. The Portfolio does not isolate the effect of fluctuations in foreign exchange rates from the effect of fluctuations in the market prices of securities. Such fluctuations are reflected by the Portfolio as a component of realized and unrealized gains and losses from investments for financial reporting purposes.
Foreign Taxes
The Portfolio may be subject to foreign taxes (a portion of which may be reclaimable) on income, stock dividends, capital gains on investments, or certain foreign currency transactions. All foreign taxes are recorded in accordance with the applicable foreign tax regulations and rates that exist in the foreign jurisdictions in which the Portfolio invests. These foreign taxes, if any, are paid by the Portfolio and are reflected in its statements of operations as follows: foreign taxes withheld at source are presented as a reduction of income, and foreign taxes on capital gains from sales of investments and foreign taxes on foreign currency transactions are included in their respective net realized gain (loss) categories. Foreign taxes payable or deferred and foreign taxes recoverable as of June 30, 2015, if any, are disclosed in the Portfolio’s statements of assets and liabilities.
Expenses
Advisory fees and other expenses, which are directly identifiable to the Portfolio, are applied to the Portfolio. Trustees’ fees and other expenses which cannot be attributed directly to the Portfolio are allocated in such a manner as deemed equitable, taking into consideration the nature and type of expense and the relative net assets of the Portfolio.
Federal Income Tax
The Portfolio intends to qualify for and elect treatment as a “regulated investment company” under Subchapter M of the Internal Revenue Code of 1986, as amended. By so qualifying and electing, the Portfolio will not be subject to federal income taxes to the extent it distributes its taxable income, including any net realized capital gains, for each fiscal year. In addition, by distributing during each calendar year substantially all of net investment income and capital gains, if any, the Portfolio will not be subject to federal excise tax. Income and capital gain distributions are determined in accordance with income tax regulations which may differ from U.S. GAAP.
| Paid-In Capital | Accumulated Gain (Loss) | Undistributed Net Investment Income (Loss) | ||||||
| $— | $ | 6,299 | $ | (6,299 | ) | |||
These book-tax differences are primarily due to differing treatments for foreign currencies, return of capital securities and losses deferred due to wash sales.
9
Table of Contents
SSGA Active Trust
State Street Clarion Global Infrastructure & MLP Portfolio
NOTES TO FINANCIAL STATEMENTS (continued)
June 30, 2015
The tax character of distributions paid during the period ended June 30, 2015 was as follows:
| Ordinary Income | Long-Term Capital Gains | Tax Return of Capital | ||||||
| $180,817 | $ | — | $ | — | ||||
For the period ended June 30, 2015, there were no significant differences between the book basis and the tax basis character of distributions to shareholders.
For the period ended June 30, 2015, there were no significant differences between the book basis and the tax basis of components of net assets other than differences in the net unrealized appreciation (depreciation) in the value of investments attributable to the tax deferral of losses on wash sales, foreign currency gains and losses and distributions from MLPs.
As of June 30, 2015, the components of distributable earnings on a tax basis were as follows:
| Undistributed Ordinary Income | Undistributed Long-Term Capital Gains | Net Unrealized Appreciation (Depreciation) | ||||||
| $439,427 | $ | — | $ | (468,443 | ) | |||
As a limited partner in the MLPs, the Portfolio reports its allocable share of the MLP’s taxable income in computing its own taxable income. The distributions paid by the MLPs generally do not constitute income for tax purposes. Each MLP may allocate losses to the Portfolio which are generally not deductible in computing the Portfolio’s taxable income until such time as that particular MLP either generates income to offset those losses or the Portfolio disposes of units in that MLP. This may result in the Portfolio’s taxable income being substantially different than its book income in any given year. As a result, the Portfolio may have insufficient taxable income to support its distributions paid resulting in a return of capital to shareholders. A return of capital distribution is generally not treated as taxable income to shareholders and instead reduces a shareholder’s basis in their shares of the Portfolio.
SSGA FM has analyzed the Portfolio’s tax positions it will take on its income tax returns and has concluded that as of June 30, 2015, no provision for income tax is required in the Portfolio’s financial statements. The Portfolio’s federal and state income and federal excise tax returns for tax years for which the applicable statutes of limitations have not expired are subject to examination by the Internal Revenue Service and state departments of revenue.
Under the applicable foreign tax laws, a withholding tax may be imposed on interest, dividends and capital gains at various rates.
Dividends and Distributions
Dividends from net investment income, if any, are generally declared and paid quarterly. Distributions of net realized capital gains, if any, are generally declared and paid at least annually, unless otherwise required to be compliant with applicable tax regulations. The Portfolio currently intends to pay distributions out of its distributable cash flow, which generally consists of cash and paid-in-kind distributions from MLPs or their affiliates, dividends from common stocks and income from other investments held by the Portfolio less current or accrued operating expenses of the Portfolio, including taxes on Portfolio taxable income. Dividends and distributions paid by the Portfolio are recorded on the ex-dividend dates. Income and capital gain distributions are determined in accordance with income tax regulations, which may differ from U.S. GAAP.
| 3. | Fees and Compensation Paid to Affiliates and Other Related Party Transactions |
Advisory Fee
The Trust, on behalf of the Portfolio has entered into an Investment Advisory Agreement with SSGA FM. For its advisory services to the Portfolio, the Adviser is paid a management fee by the Portfolio at an annual rate of 0.30% of its average daily net assets. The Adviser has contractually agreed to waive the entire amount of the advisory fee until the later of April 30, 2016, or such time as the shares of the Portfolio cease to be the only investment security held by the State Street Clarion Global Infrastructure & MLP Fund series of the State Street Institutional Investment Trust. The waiver may be terminated only by the Portfolio’s Board of Trustees.
10
Table of Contents
SSGA Active Trust
State Street Clarion Global Infrastructure & MLP Portfolio
NOTES TO FINANCIAL STATEMENTS (continued)
June 30, 2015
The Adviser pays all operating expenses of the Portfolio other than management fee, distribution fee pursuant to the Portfolio’s Distribution and Service Plan, if any, brokerage, taxes, interest, fees and expenses of the Independent Trustees (including any Trustees’ counsel fees), litigation expenses, and other extraordinary expenses.
Effective June 1, 2015, SSGA FM serves as Administrator and State Street Bank and Trust Company (“State Street”) serves as Sub-Administrator. State Street, an affiliate of the Adviser, receives fees for its services as Custodian, Sub-Administrator and Transfer Agent from the Adviser. CBRE Clarion Securities LLC serves as the subadviser for the Portfolio. Prior to June 1, 2015, State Street served as Administrator.
Trustees’ Fees
The Trust, SSGA Master Trust, SPDR Series Trust and SPDR Index Shares Funds (together with the Trust, the “Trusts”) pay, in the aggregate, each Independent Trustee an annual fee of $185,000 (effective July 1, 2015, the annual fee is $200,000) plus $10,000 per in-person meeting attended and $1,250 for each telephonic or video conference meeting attended. The Chairman of the Board receives an additional annual fee of $50,000 and the Chairman of the Audit Committee receives an additional annual fee of $20,000. The Trust also reimburses each Independent Trustee for travel and other out-of-pocket expenses incurred by him/her in connection with attending such meetings and in connection with attending industry seminars and meetings. Independent Trustee fees are allocated among the Trusts and each of their respective series in such a manner as deemed equitable, taking into consideration the relative net assets of the series.
Transactions with Affiliates
The Portfolio may invest in certain money market funds affiliated with the Adviser. Amounts related to investments in affiliated underlying Portfolio at June 30, 2015, and for the period then ended are:
State Street Clarion Global Infrastructure & MLP Portfolio | Value at 1/21/15* | Shares Purchased | Shares Sold | Value at 6/30/15 | Income | Realized Gain/(Loss) | ||||||||||||||||||
State Street Institutional Liquid Reserves Fund, | $ | 0 | 7,144,133 | 6,859,968 | $ | 284,165 | $ | 135 | $ | 0 | ||||||||||||||
| * | Commencement of operations |
| 4. | Aggregate Unrealized Appreciation and Depreciation |
As of June 30, 2015, gross unrealized appreciation and gross unrealized depreciation based on cost for federal income tax purposes were as follows:
| Tax Cost | Gross Unrealized Appreciation | Gross Unrealized Depreciation | Net Unrealized Appreciation (Depreciation) | |||||||||||||
State Street Clarion Global Infrastructure & MLP Portfolio | $ | 16,454,094 | $ | 399,773 | $ | (868,261 | ) | $ | (468,488 | ) | ||||||
| 5. | Investment Transactions |
For the period ended June 30, 2015, the Portfolio had purchases and sales of investments (excluding in-kind transactions and short-term investments) that aggregated to $10,159,693 and $5,924,235, respectively.
| 6. | Concentration of Ownership |
From time to time, the Portfolio may have a concentration of one or more accounts constituting a significant percentage of shares outstanding. Investment activities by holders of such accounts could have material impacts on the Portfolio. As of June 30, 2015, based on management’s evaluation of the shareholder account base, the Portfolio had accounts representing controlling ownership of more than 5% of the Portfolio’s total outstanding shares. The number of such
11
Table of Contents
SSGA Active Trust
State Street Clarion Global Infrastructure & MLP Portfolio
NOTES TO FINANCIAL STATEMENTS (continued)
June 30, 2015
accounts, based on accounts that represent more than 5% of an individual class of shares, and the aggregate percentage of net assets represented by such holdings were as follows:
Fund | Number of 5% Non-Affiliated Account Holders | Percentage of Non-Affiliated Ownership | Percentage of Affiliated Ownership | Total Percentage of Ownership | ||||||||||||
State Street Clarion Global Infrastructure & MLP Fund | 0 | 0 | % | 100 | % | 100 | % | |||||||||
| 7. | Concentration of Risk |
The Portfolio concentrates its investments in the infrastructure sector. Because the Portfolio concentrates its investments in infrastructure-related securities, the Portfolio has greater exposure to adverse economic, regulatory, political, legal, and other conditions or events affecting the issuers of such securities. Additionally, infrastructure-related entities may be subject to regulation by various governmental authorities and may also be affected by governmental regulation of rates charged to customers, service interruption and or legal challenges due to environmental, operational or other conditions or events and the imposition of special tariffs and changes in tax laws, regulatory policies and accounting standards.
| 8. | Subsequent Events |
Management has evaluated the impact of all subsequent events on the Portfolio through the date the financial statements were available to be issued and has determined that there were no subsequent events requiring adjustment or disclosure in the financial statements.
12
Table of Contents
SSGA Active Trust
State Street Clarion Global Infrastructure & MLP Portfolio
REPORT OF INDEPENDENT REGISTERED PUBLIC ACCOUNTING FIRM
To the Shareholders and Board of Trustees of
SSGA Active Trust
We have audited the accompanying statement of assets and liabilities, including the schedule of investments, of State Street Clarion Global Infrastructure & MLP Portfolio (the “Portfolio”) (one of the portfolios constituting SSGA Active Trust) as of June 30, 2015, and the related statement of operations, statement of changes in net assets, and the financial highlights for the period from January 21, 2015 (commencement of operations) to June 30, 2015. These financial statements and financial highlights are the responsibility of the Portfolio’s management. Our responsibility is to express an opinion on these financial statements and financial highlights based on our audit.
We conducted our audit in accordance with the standards of the Public Company Accounting Oversight Board (United States). Those standards require that we plan and perform the audit to obtain reasonable assurance about whether the financial statements and financial highlights are free of material misstatement. We were not engaged to perform an audit of the Portfolio’s internal control over financial reporting. Our audit included consideration of internal control over financial reporting as a basis for designing audit procedures that are appropriate in the circumstances, but not for the purpose of expressing an opinion on the effectiveness of the Portfolio’s internal control over financial reporting. Accordingly, we express no such opinion. An audit also includes examining, on a test basis, evidence supporting the amounts and disclosures in the financial statements and financial highlights, assessing the accounting principles used and significant estimates made by management, and evaluating the overall financial statement presentation. Our procedures included confirmation of securities owned as of June 30, 2015, by correspondence with the custodian and others or by other appropriate auditing procedures where replies from others were not received. We believe that our audit provides a reasonable basis for our opinion.
In our opinion, the financial statements and financial highlights referred to above present fairly, in all material respects, the financial position of State Street Clarion Global Infrastructure & MLP Portfolio (one of the portfolios constituting SSGA Active Trust) at June 30, 2015, and the results of its operations, the changes in its net assets and the financial highlights for the period from January 21, 2015 (commencement of operations) to June 30, 2015, in conformity with U.S. generally accepted accounting principles.

Boston, Massachusetts
August 31, 2015
13
Table of Contents
SSGA Active Trust
State Street Clarion Global Infrastructure & MLP Portfolio
June 30, 2015 (Unaudited)
Expense Example
As a shareholder of the Portfolio, you incur ongoing costs, which include costs for administrative services and to the extent applicable, distribution (12b-1) fees, among others. This example is intended to help you understand your ongoing costs (in dollars) of investing in the Portfolio and to compare these costs with the ongoing costs of investing in other mutual funds. It is based on an investment of $1,000 made at the beginning of the period shown and held for the entire period from January 1, 2015 to June 30, 2015.
Actual Expenses
The first table below provides information about actual account values and actual expenses. You may use the information in this table, together with the amount you invested, to estimate the expenses that you incurred over the period. Simply divide your account value by $1,000 (for example, an $8,600 account value divided by $1,000 = 8.6), then multiply the result by the number in the first table under the heading entitled “Expenses Paid During Period” to estimate the expenses attributable to your investment during this period.
Hypothetical Example for Comparison Purposes
The second table below also provides information about hypothetical account values and hypothetical expenses based on the Portfolio’s actual expense ratio and an assumed rate of return of 5% per year before expenses, which is not the Portfolio’s actual return. Thus, you should not use the hypothetical account values and expenses to estimate the actual ending account balance or your expenses for the period. Rather, these figures are provided to enable you to compare the ongoing costs of investing in the Portfolio and other funds. To do so, compare this 5% hypothetical example with the 5% hypothetical examples that appear in the shareholder reports of the other funds. The Portfolio charges transaction fees at scheduled amounts ranging from $50 to $1,350 per Creation Unit to those persons creating or redeeming Creation Units. If you buy or sell the Portfolio’s shares in the secondary market, you will incur customary brokerage commissions and charges.
Please note that the expenses shown in the table are meant to highlight your ongoing costs only and do not reflect any transaction costs, such as creation and redemption fees, or brokerage charges. Therefore, the second table is useful in comparing ongoing costs only, and will not help you determine the relative total costs of owning different funds. In addition, if these transaction costs were included, your costs would have been higher.
| Annualized Expense Ratio | Beginning Account Value 1/1/15 | Ending Account Value 6/30/15 | Expenses Paid During Period* 1/1/15 to 6/30/15 | |||||||||||||
Actual** | 0.00 | % | $ | 1,000 | $ | 1,010.00 | $ | 0.00 | ||||||||
Hypothetical** (assuming a 5% return before expenses) | 0.00 | % | $ | 1,000 | $ | 1,024.80 | $ | 0.00 | ||||||||
| * | Expenses are equal to the Portfolio’s annualized net expense ratio multiplied by the average account value of the period, multiplied by the number of days in the most recent six month period, then divided by 365. |
| ** | Actual period is from commencement of operations 1/21/15. Hypothetical period is from 1/1/15. |
14
Table of Contents
SSGA Active Trust
State Street Clarion Global Infrastructure & MLP Portfolio
OTHER INFORMATION (continued)
June 30, 2015 (Unaudited)
Tax Information
For federal income tax purposes, the following information is furnished with respect to the distributions of the Portfolio for its fiscal period ended June 30, 2015.
For U.S. federal income tax purposes, the percentage of distributions that qualify for the corporate dividends received deduction for the fiscal period ended June 30, 2015 is 9.95%.
Qualified Dividend Income
A portion of dividends distributed by the Portfolio during the fiscal period ended June 30, 2015, are considered qualified dividend income, and are eligible for reduced tax rates. These lower rates range from 5% to 20% depending on the individual’s tax bracket. These amounts were $183,136 for the fiscal period ended June 30, 2015.
Proxy Voting Policies and Procedures and Records
A description of the Trust’s proxy voting policies and procedures that are used by the Portfolio’s investment adviser to vote proxies relating to the portfolio of securities are available (i) without charge, upon request by calling 1-866-787-2257 (toll free) or (ii) on the website of the U.S. Securities and Exchange Commission, at www.sec.gov. Information regarding how the investment advisor voted for the prior 12-months period ended June 30 is available by August 31 of each year by calling the same number and on the SEC’s website, at www.sec.gov, and on the Portfolio’s website at www.ssgafunds.com.
Quarterly Portfolio Schedule
The Portfolio files a complete schedule of portfolio holdings with the SEC for the first and third quarters of each fiscal year on Form N-Q. The Portfolio’s Form N-Q is available on the SEC’s website at www.sec.gov and may be reviewed and copied at the SEC’s Public Reference Room in Washington DC. Information on the operation of the Public Reference Room may be obtained by calling 1-800-SEC-0330. The information on the Form N-Q is available upon request, without charge, by calling 1-866-787-2257 (toll free) and on the Portfolio’s website at www.ssgafunds.com.
Advisory Agreement Renewal
Approval of Advisory Agreement
At an in-person meeting held prior to June 30, 2015, the Board of Trustees of the Trust (the “Board”) evaluated a proposal to approve the Investment Advisory Agreement (the “Agreement”) between SSGA Active Trust (the “Trust”) and SSGA Funds Management, Inc. (the “Adviser” or “SSGA FM”) with respect to the State Street Clarion Global Infrastructure & MLP Portfolio, a new series of the Trust (the “New Fund”), which commenced operations during the period covered by this Annual Report. The Trustees who are not “interested persons” of the Trust within the meaning of the Investment Company Act of 1940, as amended (the “Independent Trustees”) also met separately with their independent legal counsel to consider the Agreement.
In evaluating the Agreement, the Board drew on materials provided to them by SSGA FM, the Trust’s investment adviser and administrator, and other materials provided by State Street Bank and Trust Company, the Trust’s sub-administrator, transfer agent and custodian (“State Street”). In deciding whether to approve the Agreement, the Board considered various factors, including the (i) nature, extent and quality of services expected to be provided by the Adviser with respect to the New Fund under the Agreement, (ii) fees charged to comparable funds, (iii) other benefits to the Adviser, and (iv) extent to which economies of scale would be shared as the New Fund grows.
Nature, Extent and Quality of Services
The Board considered the nature, extent and quality of services expected to be provided by the Adviser. In doing so, the Trustees relied on their prior experience in overseeing the management of the Trust and materials provided prior to and at the meeting. The Board reviewed the Agreement and the Adviser’s anticipated responsibilities for managing investment operations of the New Fund in accordance with its investment objective and policies, and applicable legal
15
Table of Contents
SSGA Active Trust
State Street Clarion Global Infrastructure & MLP Portfolio
OTHER INFORMATION (continued)
June 30, 2015 (Unaudited)
and regulatory requirements. The Board appreciated the nature of the New Fund in a master-feeder structure and the experience and expertise of the Adviser. The Board considered the background and experience of the Adviser’s senior management, including those individuals responsible for portfolio management, oversight of sub-advisers and regulatory compliance of the New Fund. The Board also considered the portfolio management and oversight resources, structures and practices of the Adviser, including those associated with monitoring and securing the New Fund’s compliance with its investment objective and policies and with applicable laws and regulations. The Board also considered information about the Adviser’s best execution procedures and overall investment management business, noting that the Adviser serves a wide range of clients across a broad spectrum of asset classes. The Board looked at the Adviser’s general knowledge of the investment business and that of its affiliates which make up State Street Global Advisors, through which the Adviser shares all of its senior personnel. The Board considered that the Adviser and its affiliates constitute one of the world’s largest investment management enterprises. The Board also considered the Adviser’s experience in active management, managing funds in master-feeder structures and overseeing third-party sub-advisers.
Fees Charged to Comparable Funds
The Board evaluated the New Fund’s unitary fee through review of comparative information with respect to fees paid by similar funds. The Board reviewed the universe of similar funds based upon data independently obtained from Lipper Analytical Services and related comparative information for similar funds. The Board also reviewed the fee structure of the New Fund in connection with the master-feeder structure and the estimated expense ratio for the New Fund.
Other Benefits
The Board considered whether the Adviser or its affiliates benefited in other ways from its relationship with the Trust, noting that the Adviser does not maintain soft-dollar arrangements in connection with the Trust’s brokerage transactions.
Economies of Scale
The Board reviewed information regarding economies of scale or other efficiencies that may result as the New Fund’s assets grow in size. The Board noted that the Agreement did not provide for breakpoints in the New Fund’s advisory fee rate as assets of the New Fund increase. However, the Board further noted the Adviser’s assertion that future economies of scale (among several factors) had been taken into consideration for the New Fund by fixing relatively low advisory fees, effectively sharing the benefits of lower fees with the New Fund from inception. The Adviser also asserted that one of the benefits of the unitary fee was to provide an unvarying expense structure, which could be lost or diluted with the addition of breakpoints. The Board noted that it intends to continue to monitor fees as the New Fund grows in size and assess whether fee breakpoints may be warranted.
The Board, including the Independent Trustees voting separately, approved the Agreement for the New Fund after weighing the foregoing factors, none of which was dispositive in itself and may have been weighed differently by each Trustee. The Board’s conclusions with respect to the Agreement were as follows: (a) the nature and extent of the services expected to be provided by the Adviser with respect to the New Fund were appropriate; (b) the Adviser’s unitary fee for the New Fund, considered in relation to services expected to be provided, and in relation to fees charged to comparable funds, was fair and reasonable; and (c) any additional potential benefits to the Adviser or its affiliates were not of a magnitude to materially affect the Board’s conclusions.
Approval of CBRE Clarion Securities LLC Sub-Advisory Agreement
At an in-person meeting held prior to June 30, 2015, the Board also considered the approval of the Sub-Advisory Agreement (the “Clarion Sub-Advisory Agreement”) between the Adviser and CBRE Clarion Securities LLC (“Clarion”) with respect to the State Street Clarion Global Infrastructure & MLP Portfolio (the “Clarion Portfolio”), a series of the SSGA Active Trust. The Trustees who are not “interested persons” of the Trust within the meaning of the Investment Company Act of 1940, as amended (the “Independent Trustees”) also met separately with their independent legal counsel to consider the Clarion Sub-Advisory Agreement.
16
Table of Contents
SSGA Active Trust
State Street Clarion Global Infrastructure & MLP Portfolio
OTHER INFORMATION (continued)
June 30, 2015 (Unaudited)
In evaluating the Clarion Sub-Advisory Agreement, the Board drew on materials provided to them by Clarion and the Adviser. In deciding whether to approve the Clarion Sub-Advisory Agreement, the Board considered various factors, including the (i) nature, extent and quality of services expected to be provided by Clarion with respect to the Clarion Portfolio under the Clarion Sub-Advisory Agreement; and (ii) investment performance of other actively managed mandates managed by Clarion. The Board was apprised of the portion of the advisory fee that the Adviser would pay to Clarion under the Clarion Sub-Advisory Agreement and also considered that such fees would be paid directly by the Adviser and would not result in increased fees payable by the Clarion Portfolio.
The Board considered the background and experience of Clarion’s senior management and in particular Clarion’s experience in investing in infrastructure companies. The Board noted that Clarion would bring significant actively managed experience to bear in managing the Clarion Portfolio. The Board noted that Clarion has extensive experience in managing securities of infrastructure companies and reviewed Clarion’s assets under management in similar portfolios of securities.
The Board, including the Independent Trustees voting separately, approved the Clarion Sub-Advisory Agreement for the Clarion Portfolio after weighing the foregoing factors, none of which was dispositive in itself and may have been weighed differently by each Trustee. The Board’s conclusions with respect to the Clarion Agreement were as follows: (a) the nature and extent of the services expected to be provided by Clarion with respect to the Clarion Portfolio were adequate and appropriate; and (b) Clarion’s experience in managing securities of infrastructure companies is extensive; (c) Clarion’s fees for the Clarion Portfolio and the unitary fee, considered in relation to the services expected to be provided, were fair and reasonable; (d) any additional potential benefits to Clarion were not of a magnitude to materially affect the Board’s conclusions; and (e) fees expected to be paid to Clarion were expected to share economies of scale with the Clarion Portfolio by way of the relatively low fee structure of the Trusts.
17
Table of Contents
SSGA Active Trust
State Street Clarion Global Infrastructure & MLP Portfolio
TRUSTEES AND OFFICERS INFORMATION
June 30, 2015 (Unaudited)
TRUSTEES
Name, Address and Year of Birth | Position(s) with Funds | Term of Office and Length of Time Served | Principal Occupation(s) During Past 5 Years | Number of Portfolios in Fund Complex Overseen by Trustee | Other Directorships Held by Trustee | |||||||
Independent Trustees | ||||||||||||
FRANK NESVET | Independent Trustee, Chairman, Trustee Committee Chair | Term: Unlimited Served: since March 2011 | Chief Executive Officer, Libra Group, Inc. (a financial services consulting company) (1998-present). | 192 | SPDR Index Shares Funds (Trustee); SPDR Series Trust (Trustee); SSGA Master Trust (Trustee). | |||||||
DAVID M. KELLY | Independent Trustee, Audit Committee Chair | Term: Unlimited Served: since March 2011 | Retired. | 192 | Chicago Stock Exchange (Former Director, retired); Penson Worldwide Inc. (Former Director, retired); SPDR Index Shares Funds (Trustee); SPDR Series Trust (Trustee); SSGA Master Trust (Trustee). | |||||||
BONNY EUGENIA BOATMAN c/o SSGA Active Trust | Independent Trustee | Term: Unlimited Served: since March 2011 | Retired. | 192 | SPDR Index Shares Funds (Trustee); SPDR Series Trust (Trustee); SSGA Master Trust (Trustee). | |||||||
DWIGHT D. CHURCHILL | Independent Trustee | Term: Unlimited Served: since March 2011 | Self-employed consultant since 2010; CEO and President, CFA Institute (June 2014-January 2015). | 192 | SPDR Index Shares Funds (Trustee); SPDR Series Trust (Trustee); SSGA Master Trust (Trustee); Affiliated Managers Group, Inc. (Director). | |||||||
CARL G. VERBONCOEUR | Independent Trustee | Term: Unlimited Served: since March 2011 | Self-employed consultant since 2009. | 192 | The Motley Fool Funds Trust (Trustee); SPDR Index Shares Funds (Trustee); SPDR Series Trust (Trustee); SSGA Master Trust (Trustee). | |||||||
18
Table of Contents
SSGA Active Trust
State Street Clarion Global Infrastructure & MLP Portfolio
TRUSTEES AND OFFICERS INFORMATION (continued)
June 30, 2015 (Unaudited)
Name, Address and Year of Birth | Position(s) with Funds | Term of Office and Length of Time Served | Principal Occupation(s) During Past 5 Years | Number of Portfolios in Fund Complex Overseen by Trustee | Other Directorships Held by Trustee | |||||||
Interested Trustee | ||||||||||||
JAMES E. ROSS* | Interested Trustee | Term: Unlimited Served as Trustee: since March 2011 | Chairman and Director, SSGA Funds Management, Inc. (2005-present); Senior Managing Director and Principal, State Street Global Advisors (2006-present); President, SSGA Funds Management, Inc. (2005-2012). | 256 | SPDR Index Shares Funds (Trustee); SPDR Series Trust (Trustee); SSGA Master Trust (Trustee); Select Sector SPDR Trust (Trustee); State Street Master Funds (Trustee); and State Street Institutional Investment Trust (Trustee). | |||||||
| * | Mr. Ross is an Interested Trustee because of his employment with the Adviser and ownership interest in an affiliate of the Adviser. |
OFFICERS
Name, Address and Year of Birth | Position(s) with Funds | Term of Office and Length of Time Served | Principal Occupation(s) During Past 5 Years | |||
ELLEN M. NEEDHAM | President | Term: Unlimited Served: since October 2012 | President and Director, SSGA Funds Management, Inc. (June 2012-present); Chief Operating Officer, SSGA Funds Management, Inc. (May 2010-June 2012); Senior Managing Director, SSGA Funds Management, Inc. (1992-2012)*; Senior Managing Director, State Street Global Advisors (1992-present).* | |||
ANN M. CARPENTER | Vice President; Assistant Treasurer | Term: Unlimited Served: since August 2012; Term: Unlimited Served: since April 2015 | Chief Operating Officer, SSGA Funds Management, Inc. (April 2014-present); Vice President, State Street Global Advisors and SSGA Funds Management, Inc. (2005-present).* | |||
MICHAEL P. RILEY | Vice President | Term: Unlimited Served: since March 2011 | Vice President, State Street Global Advisors and SSGA Funds Management, Inc. (2008-present); Principal, State Street Global Advisors and SSGA Funds Management, Inc. (2005-2008). | |||
JOSHUA A. WEINBERG | Chief Legal Officer | Term: Unlimited Served: since February 2015 | Vice President and Managing Counsel, State Street Global Advisors (2011-present); Clerk, SSGA Funds Management, Inc. (2013-present); Associate, Financial Services Group, Dechert LLP (2006-2011). |
19
Table of Contents
SSGA Active Trust
State Street Clarion Global Infrastructure & MLP Portfolio
TRUSTEES AND OFFICERS INFORMATION (continued)
June 30, 2015 (Unaudited)
Name, Address and Year of Birth | Position(s) with Funds | Term of Office and Length of Time Served | Principal Occupation(s) During Past 5 Years | |||
CHRISTOPHER A. MADDEN | Secretary | Term: Unlimited Served: since August 2013 | Vice President and Senior Counsel, State Street Bank and Trust Company (2013-present); Counsel, Atlantic Fund Services (2009-2013); Vice President, Citigroup Fund Services, LLC (2005-2009).* | |||
PATRICIA A. MORISETTE | Assistant Secretary | Term: Unlimited Served: since February 2015 | Vice President and Counsel, State Street Bank and Trust Company (2014-present); Assistant Vice President and Counsel, John Hancock Financial Services (2011-2013); Independent legal consultant (2009-2011); Associate, Bingham McCutchen LLP (2003-2009).*,** | |||
CHAD C. HALLETT | Treasurer | Term: Unlimited Served: since March 2011 | Vice President, State Street Global Advisors and SSGA Funds Management, Inc. (November 2014-present); Vice President, State Street Bank and Trust Company (2001-November 2014).* | |||
BRIAN HARRIS | Chief Compliance Officer | Term: Unlimited Served: since November 2013 | Vice President, State Street Global Advisors and SSGA Funds Management, Inc. (2013-Present); Senior Vice President and Global Head of Investment Compliance, BofA Global Capital Management (2010-2013); Director of Compliance, AARP Financial Inc. (2008-2010). |
| * | Served in various capacities and/or with various affiliated entities during noted time period. |
| ** | Served in various capacities and/or with unaffiliated mutual funds or closed-end funds for which State Street Bank and Trust Company or its affiliates act as a provider of services during the noted time period. |
20
Table of Contents
SSGA Active Trust
Trustees
Bonny E. Boatman
Dwight D. Churchill
David M. Kelly
Frank Nesvet, Chairman
James E. Ross
Carl G. Verboncoeur
Officers
Ellen M. Needham, President
Ann Carpenter, Vice President and Assistant Treasurer
Michael P. Riley, Vice President
Joshua A. Weinberg, Chief Legal Officer
Chad C. Hallett, Treasurer
Christopher A. Madden, Secretary
Patricia A. Morisette, Assistant Secretary
Brian Harris, Chief Compliance Officer
Investment Manager and Administrator
SSGA Funds Management, Inc.
State Street Financial Center
One Lincoln Street
Boston, MA 02111
Distributor
State Street Global Markets, LLC
One Lincoln Street
Boston, MA 02111
Custodian, Sub-Administrator and Transfer Agent
State Street Bank and Trust Company
One Lincoln Street
Boston, MA 02111
Legal Counsel
Morgan, Lewis & Bockius LLP
2020 K Street, NW
Washington, DC 20006
Independent Registered Public Accounting Firm
Ernst & Young LLP
200 Clarendon Street
Boston, MA 02116
Distributor: State Street Global Markets, LLC, member FINRA, SIPC, a wholly owned subsidiary of State Street Corporation. References to State Street may include State Street Corporation and its affiliates. The SSGA Funds pay State Street Bank and Trust Company for its services as custodian, transfer agent and shareholder servicing agent and pays SSGA Funds Management, Inc. for investment advisory services.
Before investing, consider the funds’ investment objectives, risks, charges and expenses. To obtain a prospectus or summary prospectus which contains this and other information, call 1-800-997-7327 or visit www.SSGAfunds.com. Read it carefully.
Fund Shares are distributed by State Street Global Markets, LLC, a wholly-owned subsidiary of State Street Corporation. State Street Global Markets, LLC; member FINRA, SIPC.
The information contained in this report is intended for the general information of shareholders of the Trust. This report is not authorized for distribution to prospective investors unless preceded or accompanied by a current Trust prospectus which contains important information concerning the Trust. You may obtain a current prospectus and SAI from the Distributor by calling 1-866-787-2257 or visiting www.ssgafunds.com Please read the prospectus carefully before you invest.
| Not FDIC Insured — No Bank Guarantee — May Lose Value | © 2015 State Street Corporation — All Rights Reserved IBG-16220 |
Table of Contents
Item 2. Code of Ethics.
As of the end of the period covered by this report, the registrant has adopted a code of ethics that applies to the registrant’s principal executive officer, principal financial officer, principal accounting officer or controller, or persons performing similar functions, regardless of whether these individuals are employed by the registrant or a third party (the “Code of Ethics”). During the period covered by this report, no substantive amendments were made to the Code of Ethics. During the period covered by this report, the registrant did not grant any waivers, including any implicit waivers, from any provision of the Code of Ethics.
The Code of Ethics is attached hereto as Exhibit 12(a)(1).
Item 3. Audit Committee Financial Expert.
(a)(1) The Board of Trustees of the registrant has determined that the registrant has five Board members serving on the Audit Committee that possess the attributes identified in Instructions 2(b) of Item 3 to Form N-CSR to qualify as an “audit committee financial expert.”
(2) Bonny Boatman, Dwight Churchill, David M. Kelly, Frank Nesvet and Carl Verboncoeur are the registrant’s audit committee financial experts. The Board also determined that each of the foregoing persons are not “interested person(s)” of the registrant as that term is defined in Section 2(a)(19) of the Investment Company Act of 1940, as amended.
Item 4. Principal Accountant Fees and Services.
(a) Audit Fees.
For the fiscal years ending June 30, 2015 and June 30, 2014, the aggregate audit fees billed for professional services rendered by the principal accountant were $113,203 and $76,320, respectively. Audit fees include the performance of the annual audits and routine regulatory filings (one for each SEC registrant).
(b) Audit-Related Fees.
For the fiscal years ending June 30, 2015 and June 30, 2014, the principal accountant did not bill the registrant any fees for assurances and related services that are reasonably related to the performance of the audit of the registrant’s financial statements and are not reported under paragraph (a) of this Item.
(c) Tax Fees.
For the fiscal years ending June 30, 2015 and June 30, 2014, the aggregate tax fees billed for professional services rendered by the principal accountant were $96,657 and $65,920, respectively. Tax fees represent services related to the review of year-end distribution requirements, as well as the review and signing as preparer of all federal, state and excise income tax returns for the series of the registrant.
(d) All Other Fees.
There were no other fees billed by the principal accountant for the fiscal years ending June 30, 2015 and June 30, 2014.
Table of Contents
(e)(1) Audit Committee Pre-Approval Policies and Procedures.
The registrant’s Audit Committee Charter states the following with respect to pre-approval procedures:
Before the independent auditors are engaged by the Trust to render audit or non-audit services, either:
| a. | The Audit Committee shall pre-approve all auditing services and permissible non-audit services (e.g., tax services) provided to the Trust. The Audit Committee may delegate to one or more of its members the authority to grant pre-approvals. Any decision of any member to whom authority is delegated under this section shall be presented to the full Audit Committee at its next regularly scheduled meeting; |
or
| b. | The engagement to render the auditing service or permissible non-audit service is entered into pursuant to pre-approval policies and procedures established by the Audit Committee. Any such policies and procedures must (1) be detailed as to the particular service and (2) not involve any delegation of the Audit Committee’s responsibilities to the investment adviser. The Audit Committee must be informed of each service entered into pursuant to the policies and procedures. A copy of any such policies and procedures shall be attached as an exhibit to the Audit Committee Charter. |
| c. | De Minimis Exceptions to Pre-Approval Requirements. Pre-Approval for a service provided to the Trust other than audit, review or attest services is not required if: (1) the aggregate amount of all such non-audit services provided to the Trust constitutes not more than 5 percent of the total amount of revenues paid by the Trust to the independent auditors during the fiscal year in which the non-audit services are provided; (2) such services were not recognized by the Trust at the time of the engagement to be non-audit services; and (3) such services are promptly brought to the attention of the Audit Committee and are approved by the Audit Committee or by one or more members of the Audit Committee to whom authority to grant such approvals has been delegated by the Audit Committee prior to the completion of the audit. |
| d. | Pre-Approval of Non-Audit Services Provided to the investment adviser and Certain Control Persons. The Audit Committee shall pre-approve any non-audit services proposed to be provided by the independent auditors to (a) the investment adviser and (b) any entity controlling, controlled by, or under common control with the investment adviser that provides ongoing services to the Trust, if the independent auditors’ engagement with the investment adviser or any such control persons relates directly to the operations and financial reporting of the Trust. It shall be the responsibility of the independent auditors to notify the Audit Committee of any non-audit services that need to be pre-approved. |
Table of Contents
| e. | Application of De Minimis Exception: The De Minimis exception set forth above applies to pre-approvals under this Section as well, except that the “total amount of revenues” calculation is based on the total amount of revenues paid to the independent auditors by the Trust and any other entity that has its services approved under this Section (i.e., the investment adviser or any control person). |
(e)(2) Percentage of Services.
One hundred percent of the services described in each of paragraphs (b) through (d) of this Item were approved by the registrant’s Audit Committee pursuant to paragraph (c)(7)(i)(C) of Rule 2-01 of Regulation S-X.
(f) Not applicable.
(g) The aggregate non-audit fees billed for by the registrant’s accountant for services rendered to the registrant, and rendered to the registrant’s investment adviser (not including any sub-adviser whose role is primarily portfolio management and is subcontracted with or overseen by another investment adviser), and any entity controlling, controlled by, or under common control with the adviser were as follows:
| FY 2015 (in millions) | FY 2014 (in millions) | |||||||
Non audit services billed to: | ||||||||
Registrant: | See Item 4(c) | See Item 4(c) | ||||||
Investment Adviser: | — | — | ||||||
Other entities in the Investment Company Complex (1)(2): | ||||||||
Audit Related Fees | $ | 16.0 | $ | 16.3 | ||||
Tax Fees | 6.0 | 4.7 | ||||||
All Other Fees | 0.8 | 1.4 | ||||||
| (1) | Information is for the calendar year 2014 and 2013, respectively. |
| (2) | Services under the caption Audit-Related Fees consisted principally of reports on the processing of transactions by servicing organizations, audits of employee benefit plan, non-statutory audits and due diligence procedures. Services under the caption Tax Fees consisted principally of expatriate, compliance and corporate tax advisory services. Services under the caption All Other Fees consisted of advisory services related to certain regulatory initiatives. |
(h) The registrant’s principal accountant notified the registrant’s Audit Committee of all non-audit services that were rendered by the principal accountant to the Adviser and any entity controlling, controlled by, or under common control with the Adviser that provides services to the registrant, which services were not required to be pre-approved pursuant to paragraph (c)(7)(ii) of Rule 2-01 of Regulation S-X, allowing the registrant’s Audit Committee to consider whether such services were compatible with maintaining the principal accountant’s independence.
Item 5. Audit Committees of Listed Registrants.
The registrant has an audit committee which was established by the Board of Trustees of the Trust in accordance with Section 3(a)(58)(A) of the Securities Exchange Act of 1934, as amended. The members of the registrant’s audit committee are Bonny Boatman, Dwight Churchill, David M. Kelly, Frank Nesvet and Carl Verboncoeur.
Table of Contents
Item 6. Investments.
(a) A Schedule of Investments for each series of the registrant, is included as a part of the reports to shareholders filed under Item 1 of this Form N-CSR.
(b) Not applicable to the registrant.
Item 7. Disclosure of Proxy Voting Policies and Procedures for Closed-End Management Investment Companies.
Not applicable to the registrant.
Item 8. Portfolio Managers of Closed-End Management Investment Companies.
Not applicable to the registrant.
Item 9. Purchases of Equity Securities by Closed-End Management Investment Company and Affiliated Purchasers.
Not applicable to the registrant.
Item 10. Submission of Matters to a Vote of Security Holders.
The registrant has not adopted any material changes to the procedures by which shareholders may recommend nominees to the registrant’s Board.
Item 11. Controls and Procedures.
(a) Within 90 days of the filing date of this Form N-CSR, Ellen M. Needham, the registrant’s President and Principal Executive Officer, and Chad C. Hallett, the registrant’s Treasurer and Principal Financial Officer, reviewed the registrant’s disclosure controls and procedures and evaluated their effectiveness. Based on their review, Ms. Needham and Mr. Hallett determined that the disclosure controls and procedures adequately ensure that information required to be disclosed by the registrant in its periodic reports is recorded, processed, summarized and reported within the time periods required by the U.S. Securities and Exchange Commission.
(b) In the registrant’s second fiscal quarter covered by this form N-CSR filing, there were no significant changes in the registrant’s internal controls or in other factors that have materially affected, or are reasonably likely to materially affect, its controls over financial reporting subsequent to the date of their evaluation, including any corrective actions with regard to significant deficiencies and material weaknesses.
Item 12. Exhibits.
(a)(1) Code of Ethics referred to in Item 2.
(a)(2) Separate certifications required by Rule 30a-2(a) under the Investment Company Act of 1940, as amended, for each principal executive officer and principal financial officer of the registrant are attached.
Table of Contents
(a)(3) Not applicable to the registrant.
(b) A single certification required by Rule 30a-2(b) under the Investment Company Act of 1940, as amended, Rule 13a-14(b) or Rule 15d-14(b) under the Securities Exchange Act of 1934, as amended, and Section 1350 of Chapter 63 of Title 18 of the United States Code for the principal executive officer and principal financial officer of the registrant is attached.
Table of Contents
SIGNATURES
Pursuant to the requirements of the Securities Exchange Act of 1934, as amended, and the Investment Company Act of 1940, as amended, the registrant has duly caused this report to be signed on its behalf by the undersigned, thereunto duly authorized.
SSGA Active Trust
| By: | /s/ Ellen M. Needham | |
| Ellen M. Needham | ||
| President and Principal Executive Officer |
Date: September 8, 2015
Pursuant to the requirements of the Securities Exchange Act of 1934, as amended, and the Investment Company Act of 1940, as amended, this report has been signed below by the following persons on behalf of the registrant and in the capacities and on the dates indicated.
| By: | /s/ Ellen M. Needham | |
| Ellen M. Needham | ||
| President and Principal Executive Officer |
Date: September 8, 2015
| By: | /s/ Chad C. Hallett | |
| Chad C. Hallett | ||
| Treasurer and Principal Financial Officer |
Date: September 8, 2015