UNITED STATES
SECURITIES AND EXCHANGE COMMISSION
Washington, D.C. 20549
FORM N-CSR
CERTIFIED SHAREHOLDER REPORT OF REGISTERED
MANAGEMENT INVESTMENT COMPANIES
Investment Company Act file number: 811-22538
Advisers Investment Trust
(Exact name of registrant as specified in charter)
50 S. LaSalle Street
Chicago, Illinois 60603
(Address of principal executive offices) (Zip code)
The Northern Trust Company
50 S. LaSalle Street
Chicago, Illinois 60603
(Name and address of agent for service)
Registrant’s telephone number, including area code: (312) 557-4100
Date of fiscal year end: September 30
Date of reporting period: September 30, 2020
Form N-CSR is to be used by management investment companies to file reports with the Commission not later than 10 days after the transmission to stockholders of any report that is required to be transmitted to stockholders under Rule 30e-1 under the Investment Company Act of 1940 (17 CFR 270.30e-1). The Commission may use the information provided on Form N-CSR in its regulatory, disclosure review, inspection, and policymaking roles.
A registrant is required to disclose the information specified by Form N-CSR, and the Commission will make this information public. A registrant is not required to respond to the collection of information contained in Form N-CSR unless the Form displays a currently valid Office of Management and Budget (“OMB”) control number. Please direct comments concerning the accuracy of the information collection burden estimate and any suggestions for reducing the burden to Secretary, Securities and Exchange Commission, 450 Fifth Street, NW, Washington, DC 20549-0609. The OMB has reviewed this collection of information under the clearance requirements of 44 U.S.C. § 3507.
| Item 1. | Reports to Stockholders. |
(a) The following are copies of reports transmitted to shareholders pursuant to Rule 30e-1 under the Investment Company Act of 1940 (17 CFR 270.30e-1).
| | | | | | | | |
| |  | |  | | |
| | | |
| | | | | | |
| | | |
| | | | | | |
| | | | INDEPENDENT FRANCHISE PARTNERS US EQUITY FUND | | |
| | | |
| | | | | | |
| | | | ANNUAL REPORT September 30, 2020 | | |
| | | |
| | | | | | |
This report is submitted for the general information of the shareholders of the Fund. It is not authorized for the distribution to prospective investors unless preceded or accompanied by an effective prospectus.
ADVISERS INVESTMENT TRUST
INDEPENDENT FRANCHISE PARTNERS US EQUITY FUND
TABLE OF CONTENTS
September 30, 2020
ADVISERS INVESTMENT TRUST
INDEPENDENT FRANCHISE PARTNERS US EQUITY FUND
SHAREHOLDER LETTER
September 30, 2020
Dear Shareholder:
We are pleased to present to shareholders the September 30, 2020 Annual Report for the Independent Franchise Partners US Equity Fund (the “Fund”), a series of the Advisers Investment Trust. This report contains the results of Fund operations for the year ended September 30, 2020.
We appreciate the trust and confidence you have placed in us by choosing the Fund and its Investment Adviser, Independent Franchise Partners, LLP, and we look forward to continuing to serve your investing needs.
Sincerely,
| | | | | | |
 | | | |  | | |
| | | |
| Barbara J. Nelligan | | | | Sandeep Ghela | | |
| President | | | | Chief Operating Officer | | |
| Advisers Investment Trust | | | | Independent Franchise Partners, LLP | | |
1
ADVISERS INVESTMENT TRUST
INDEPENDENT FRANCHISE PARTNERS US EQUITY FUND
PORTFOLIO COMMENTARY
September 30, 2020 (Unaudited)
Independent Franchise Partners US Equity Fund
Value of a hypothetical $3,000,000 investment in the Fund from inception on December 20, 2011 to September 30, 2020
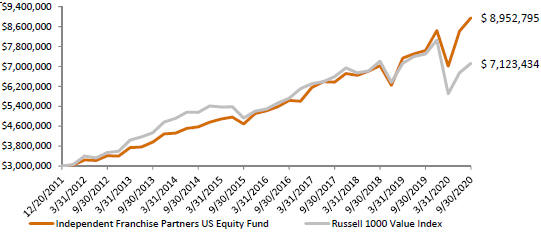
Average Annual Total Returns as of September 30, 2020
| | | | | | | | | | | | | | | | | | | | |
| | | Independent Franchise Partners US Equity Fund (without redemption fee) | | Independent Franchise Partners US Equity Fund (with redemption fee) | | Russell 1000 Value Index | | S&P 500 Index |
Q4 2019 | | | | 10.47 | % | | | | 10.22 | % | | | | 7.41 | % | | | | 9.07 | % |
Q1 2020 | | | | -16.94 | % | | | | -17.14 | % | | | | -26.73 | % | | | | -19.60 | % |
Q2 2020 | | | | 20.13 | % | | | | 19.83 | % | | | | 14.29 | % | | | | 20.54 | % |
Q3 2020 | | | | 6.59 | % | | | | 6.33 | % | | | | 5.59 | % | | | | 8.93 | % |
Year to Date | | | | 6.36 | % | | | | 6.10 | % | | | | -11.58 | % | | | | 5.57 | % |
1 Year | | | | 17.50 | % | | | | 17.24 | % | | | | -5.02 | % | | | | 15.15 | % |
3 Years (Annualized) | | | | 12.11 | % | | | | 12.03 | % | | | | 2.63 | % | | | | 12.28 | % |
5 Years (Annualized) | | | | 13.87 | % | | | | 13.83 | % | | | | 7.66 | % | | | | 14.15 | % |
Since Inception (Annualized) | | | | 13.29 | % | | | | 13.29 | % | | | | 10.35 | % | | | | 14.36 | % |
The Fund’s performance reflects the reinvestment of dividends as well as the impact of transaction costs (including the Fund’s 0.25% redemption fee unless noted otherwise) and the deduction of fees and expenses. The Fund’s Total Annual Operating Expense, per the Prospectus dated January 28, 2020, was 0.76%. Effective October 1, 2020, the Fund’s Total Annual Operating Expense is 0.72%.
The performance data quoted represents past performance; past performance does not guarantee future results. The investment return and principal value of an investment will fluctuate so that an investor’s shares, when redeemed, may be worth more or less than their original cost. The Fund’s current performance may be lower or higher than the performance data quoted. Investors may obtain performance information current to the most recent month-end, within 7 business days, by calling 855-233-0437 or 312-557-7902.
Data as at September 30, 2020. The Inception date of the Fund is December 20, 2011. Performance is shown net of fees and periods greater than one year are annualized. The performance does not reflect taxes that a shareholder would pay on fund distributions or on the redemption of fund shares.
2
ADVISERS INVESTMENT TRUST
INDEPENDENT FRANCHISE PARTNERS US EQUITY FUND
PORTFOLIO COMMENTARY
September 30, 2020 (Unaudited)
The Fund’s primary benchmark for performance comparison purposes is the Russell 1000 Value Index. The secondary benchmark is the S&P 500 Index. Benchmark returns reflect dividends reinvested gross of any withholding taxes. The impact of transaction costs and the deduction of expenses associated with a mutual fund, such as investment management and administration fees, are not reflected in the Index calculations. It is not possible to invest directly in an index. Please refer to the Fund’s Prospectus for further information.
Frank Russell Company (“Russell”) is the source and owner of the trademarks, service marks and copyrights related to the Russell Indexes. Russell® is a trademark of the Frank Russell Company. Neither Russell nor its licensors accept any liability for any errors or omissions in the Russell Indexes and / or Russell ratings or underlying data and no party may rely on any Russell Indexes and / or Russell ratings and / or underlying data contained in this communication. No further distribution of Russell Data is permitted without Russell’s express written consent. Russell does not promote, sponsor or endorse the content of this communication. Please refer to the Fund’s Prospectus for further information.
Capacity Status
Client assets in the US Franchise strategy are $3.8bn at September 30, 2020. Mindful of the $5bn capacity limit for US Franchise we set in 2009, we have some capacity available in the strategy for existing or new clients.
Portfolio Commentary
For the fiscal year ended September 30, 2020, the Fund delivered a return of 17.50% (assuming no redemption fee). This is an attractive absolute return and compares favorably against the Russell 1000 Value Index and S&P 500 Index, which fell 5.02% and rose 15.15% respectively. Although the Fund has generated strong returns over the period, if markets continue to rise appreciably from these levels, we would not expect the Fund to keep pace.
The Fund benefitted from exposure to certain stocks that possess durable intangible assets, notably Apple and Microsoft in the information technology sector, Nintendo and Electronic Arts in the communication services sector, and S&P Global in the financials sector.
The Fund’s lack of exposure to energy, real estate and the broader financials sector, the weakest sectors in the review period, benefitted relative returns. The energy, real estate and financials sectors fell 45%, 18% and 17% respectively compared to the 5% decline for the Russell 1000 Value Index. Companies in the energy and real estate sectors tend to be highly capital intensive and operate in an environment in which it is hard to exercise pricing power. Further, they tend to be highly cyclical. While financials tend to be highly leveraged and experience commoditization of their product offering. These attributes do not fit our long-term, buy and hold investment approach.
Consumer staples was the weakest sector for the Fund. As noted in previous reports, we have historically found many franchise companies within the consumer staples sector. Weak returns from some consumer staples companies, particularly Molson Coors, detracted from the Fund’s relative return.
Companies, such as Booking Holdings and Fox, whose revenues are particularly exposed to the impact of COVID-19, also detracted from the Fund’s returns during the review period.
We consistently encourage clients to assess returns over longer intervals, like a full market cycle, in line with our investment horizon. We caution that Franchise returns will likely lag if markets are led by sectors where we do not find Franchise opportunities. As always, we continue to design Franchise portfolios with the goal of protecting capital better than the broader market should there be a major fall. Experience has taught us that this is a key ingredient in compounding wealth over the long term.
Investment Returns and Contribution to Fund Return – 1 Year ending September 30, 2020
| | | | | | | | | | | | | | | | | | | | | | |
| US Equity Fund – Stock Returns (%) | | | | | US Equity Fund – Contribution to Fund Return (bps) | |
| Top | | | | | Bottom | | | | | Top | | | | | Bottom | | | |
Apple | | | +110% | | | Molson Coors | | | -31% | | | Apple | | | +432 | | | Molson Coors | | | -122 | |
Autodesk | | | +81% | | | IBM | | | -19% | | | Nintendo | | | +285 | | | IBM | | | -89 | |
Facebook | | | +67% | | | WWE | | | -16% | | | Microsoft | | | +285 | | | Booking | | | -77 | |
Microsoft | | | +55% | | | Booking | | | -13% | | | S&P Global | | | +202 | | | Fox | | | -69 | |
Nintendo | | | +53% | | | Chipotle Mexican Grill | | | -12% | | | Electronic Arts | | | +161 | | | Chipotle Mexican Grill | | | -50 | |
Stock returns reflect total returns and are presented in US Dollars for the period the stock was held during the year ending September 30, 2020. Contribution to Fund return reflects contribution to gross return and is presented in US Dollars for the period the stocks were held during the year to September 30, 2020. Source: FactSet, Independent Franchise Partners, LLP. For complete attribution and methodology, please contact clientservice@franchisepartners.com.
3
ADVISERS INVESTMENT TRUST
INDEPENDENT FRANCHISE PARTNERS US EQUITY FUND
PORTFOLIO COMMENTARY
September 30, 2020 (Unaudited)
Significant Contributors to the Fund’s Return
Among the top contributors to the Fund’s return were Apple, Nintendo and Microsoft.
Apple’s revenues have continued their strong growth, particularly in its high margin Services division which has shown double digit growth over the past few quarters. The company also reported 550 million paid Services subscribers for the first time. This is a useful indication of the strength of customer loyalty to the Apple ecosystem. Anticipation continues to build about the next generation iPhone and the potential opportunities that 5G will offer. We reduced the position during the review period given the substantial increase in Apple’s share price and the commensurate reduction in its free cash flow yield.
Sales of Nintendo’s Switch console appear to be well ahead of company guidance. Furthermore, its latest Animal Crossing game was released to wide acclaim and continues to be a top selling software game. Media reports suggest that the next generation Switch console will be released in 2021 and that it will feature enhanced graphics and streaming capabilities. A successful launch should extend the Switch platform’s lifecycle. We continue to believe that Nintendo can benefit from the shift towards mobile gaming and further monetize its intellectual property. Nintendo’s shares trade on an estimated 5.8% free cash flow yield, after adjusting for its considerable net cash position.
Microsoft continues to grow revenues, led by its Office365 and Azure cloud platform businesses. As these high-margin businesses grow, they are improving Microsoft’s total gross and operating margins. We are mindful that the valuation is at the lower end of the portfolio, but continue to balance this against the company’s strong execution and potential for growth in its cloud services.
Notable Detractors from the Fund’s Return
Among the detractors from the Fund’s return were Molson Coors, Booking Holdings and Fox.
Molson Coors continues to wrestle with weaker demand. The company has meaningful exposure to on-trade beer consumption in the US, and the decline in demand from this channel has not been offset by off-trade growth. This has been a disappointing investment and, as described in detail in the final sales section below, we completed the final sale of Molson Coors in June.
Demand for Booking’s services has been significantly affected by COVID-19, with travel and hotel occupancy very low in many of its key markets. The travel industry will return, and we think that Booking will emerge from the pandemic-related disruption in a stronger position relative to its competitors and its hotel supplier base. Booking’s hotel suppliers should be more reliant on its leisure customers to improve occupancy, while the company’s strong balance sheet and margin structure leave it better placed to maintain investment than its competitors. The company’s shares trade on a 4.3% estimated free cash flow yield, after adjusting for the cash on its balance sheet.
Fox is exposed to advertising weakness due to COVID-19, with advertising accounting for 44% of Fox’s revenues in the last financial year. However, several factors give us comfort that Fox should be able to withstand an advertising downturn. First, the majority of its revenue comes from high-margin affiliate fee contracts. At its third quarter results announced in May, affiliate fee revenues improved 10%, reflecting the brand strength and pricing power of its channel portfolio. Second, the company has robust operating margins which should enable it to absorb the expected decline in advertising revenue. Third, it has a strong liquidity profile. As such we retain our long-term investment thesis and quality assessment of the Fox franchise. The company’s shares trade on an 11.9% estimated free cash flow yield, after adjusting for the cash on its balance sheet.
Significant Portfolio Changes During the Year
Portfolio activity has once again been higher than usual, primarily due to the increased dispersion of valuations across the universe of Franchise stocks. During the year, we initiated positions in Alphabet, Aon, Autodesk, Corteva, Facebook, IAA, IBM, ServiceMaster and World Wrestling Entertainment (“WWE”). We sold the positions in Chipotle Mexican Grill, Facebook, Imperial Brands, Molson Coors and Tiffany.
Initial Purchases
We initiated a position in Alphabet in March. Alphabet comprises two businesses: Google and OtherBets. Google contains the company’s core products and platforms such as Android, Chrome, Gmail, Google Cloud, Google Maps, Search, and YouTube. This is the jewel of the franchise that offers the potential for high free cash flow compounding. It benefits from a combination of powerful intangible assets: network effects, proprietary data, switching costs, and brands. OtherBets is a collection of earlier stage technologies – like autonomous vehicles, drone technology and life sciences – that are further afield from the core Google. This part of the business offers long-term optionality but is not core to our investment thesis.
Search and video advertising are core to the Google business. Once the COVID-19 disruption passes, we think Google can grow revenues in this category at a double-digit rate over the next few years. We expect search activity to continue to shift from desktop to mobile, which is under-monetized and offers attractive pricing potential. In addition, Google should be able to capture more of the value stream in popular search categories, like shopping and travel, and increase the monetization of video content on YouTube. Longer-term, Google should be able to increase its Search value proposition even further by combining its machine learning intelligence with other services such as Maps, Assistant and Gmail.
4
ADVISERS INVESTMENT TRUST
INDEPENDENT FRANCHISE PARTNERS US EQUITY FUND
PORTFOLIO COMMENTARY
September 30, 2020 (Unaudited)
The main risks to the investment thesis are the long-term relevance of search, and increased regulation. It is well known that regulators are investigating Alphabet’s monopoly position in search and whether it uses this to benefit other parts of its Google business. This could lead to fines, as seen in Europe, or, in a worst-case scenario, a break-up of Google. We think the arrival of the COVID-19 virus alters government and agency priorities and this likely becomes a medium- to long-term risk rather than a short-term concern. The impact of COVID-19 does, however, introduce a risk of disruption to near-term advertising revenues.
We initiated a smaller than average position in Alphabet at a 4.8% estimated free cash flow yield, adjusting for the company’s net cash position and early-stage business costs.
We initiated a position in Aon in July. Aon is a leading global provider of insurance and reinsurance broking services, as well as retirement and health solutions. Aon’s key intangible asset has historically been its customer relationships but its single corporate brand and heavy investment in data capabilities are increasingly important additional sources of competitive advantage.
Aon’s insurance and reinsurance broking business accounts for around 70% of operating profit. The company is the joint number one insurance broker globally and boasts annual retention rates in this business of more than 90%. Property and Casualty (“P&C”) insurance and reinsurance broking are particularly attractive categories. P&C insurance is a mandatory purchase with good revenue visibility, wide margins and low capital intensity. This makes it an attractive and sticky business.
The opportunity to purchase the shares came from the company’s decision to acquire the number three insurance broker, Willis Tower Watson (“WTW”), in March. The market appears overly concerned that a complex integration and extended deal review process could weaken Aon’s operating performance. We recognize these concerns but take a more positive long-term view of the combined business.
Our research suggests that Aon should be able to successfully execute the acquisition and integration of WTW once it receives anti-trust approval. Over the past few years, it has succeeded in accelerating organic growth while undertaking an ambitious restructuring program to unify its brands and operating businesses. Increased scale should also strengthen Aon’s data advantages and accelerate its long-term transition from insurance broker to the preeminent global supplier of insurance risk data and analytics. We think this transition should result in a more profitable and valuable business.
We initiated the position at an estimated 5.3% free cash flow yield, adjusting for the cash on its balance sheet, a valuation which does not factor in any potential upside from the WTW transaction.
We began building a position in Autodesk in March. The company provides the dominant software tool used by architects and engineers to design buildings. It also has an attractive challenger position in manufacturing design software. Its intangible assets are a combination of high switching costs and network effects. Architects and engineers train for several years on Autodesk tools, often at university. This creates meaningful barriers to switching to other software tools. In addition, the company’s dominance means that its software has become the de facto standard to share and collaborate on architectural and engineering drawings.
Autodesk is approaching the final stage of a transition from a license to a subscription software model, which should lead to meaningful margin improvements in the next few years. There is also significant penetration and upsell opportunity through AI-led design and automation of construction workflow. Finally, we see an additional growth opportunity in market share gains in manufacturing software. We think the company is well-invested and well-run, and capital allocation has been impressive.
Autodesk’s end markets are cyclical and economic disruption due to COVID-19 may modestly curb revenue growth in the near term. Most of the company’s revenue comes from subscriptions, which should limit that impact. In the long term, the emergence of AI-enabled design tools could disrupt Autodesk’s dominance. However, this risk is mitigated by the company’s high levels of R&D investment and early investment in AI-enabled tools. There was a short window of opportunity to begin purchasing the shares during the market nadir in mid-March at an estimated 5.5% free cash flow yield.
We began building a position in Corteva, a global seed and agrochemical company, in October and completed the purchase in November. Corteva was spun out of DowDuPont in June 2019 and the company operates across two segments, Seed and Crop Protection Chemicals (CPC). It is the number one global producer of corn and soybean seeds, and the number four company in CPC. The key intangible asset in Seed is a patented, difficult-to-replicate library of high-quality seed germplasm and genetic traits. In CPC, patents are again the key intangible asset. We believe Corteva has a promising pipeline of new products that should help improve its competitive position over the medium term.
5
ADVISERS INVESTMENT TRUST
INDEPENDENT FRANCHISE PARTNERS US EQUITY FUND
PORTFOLIO COMMENTARY
September 30, 2020 (Unaudited)
The company has the opportunity to deliver low double-digit free cash flow compounding in the medium term through a combination of modest revenue growth and significant margin improvement. We believe there are still meaningful synergies to be harvested from the merged Dow and DuPont cost base. In addition, Corteva’s roll-out of new traits should reduce its reliance on in-licensing seed traits and lower costs further.
The main risks are Corteva’s exposure to the agricultural cycle and the launches of its new products. We purchased the company’s shares at an estimated 5.8% free cash flow yield after factoring in some margin improvement. We think this valuation is attractive and helps compensate for these risks.
We initiated a position in Facebook, the leading global social media platform, in March. The company’s core intangible assets are the Facebook, Instagram, Messenger and WhatsApp brands, its extensive direct networks, proprietary and highly personalized advertising user data, and broad patent portfolios.
Once we pass through the economic disruption created by COVID-19, Facebook has the potential to deliver attractive long-term revenue growth and operating margin expansion. Revenue growth is supported by continued user growth, greater monetization of the Messenger, WhatsApp and Instagram platforms, and increasing international advertising yields. For example, total users across the platforms grew 11% year-on-year last quarter to 2.26bn daily users, and the Messenger, WhatsApp and Instagram platforms are all still under monetized.
There is also a long-term opportunity to improve operating margins. Operating margins have declined considerably over the past two years – from around 50% in 2017 to a little over 30% in 2019 – as the company has invested heavily in platform security and content moderation. These margins should begin to improve once the company’s investment phase moderates and the global economy normalizes.
The key risks to the investment thesis are a deep recession and increased regulation. Advertising comprises 98% of Facebook’s revenues and is skewed to small-to-medium sized businesses. Should COVID-19 result in a deep economic malaise, near-term advertising revenues will be depressed. However, Facebook’s advertising proposition benefits from the immediacy, measurability and flexibility it offers its customers and should emerge even stronger from the downturn. Regulation also presents a risk. However, it is possible this will be deprioritized by governments and agencies given the political focus on the coronavirus outbreak.
We initiated a small position in Facebook at an estimated 5.4% free cash flow yield. However, we subsequently sold the position in July. This is an unusually short holding period for a Franchise investment. We continue to view Facebook as a high-quality company with the potential to deliver attractive long-term revenue growth and operating margin expansion. However, given the rapid share price appreciation since we initiated the position, the valuation no longer provided adequate compensation for the risks the company faces.
We began building a position in IAA in late September 2019. The company provides an auction platform for US insurance companies to sell cars damaged in accidents. The US auto salvage auction industry benefits from a strong network effect and a supportive duopoly market structure: IAA and its main competitor, Copart, each have 40-45% market share. IAA has two key competitive advantages. First, it owns a network of nearly 200 salvage yards across the US. Each yard is around 50 acres and, because of strict planning permission and local opposition, it can take several years to find and obtain approval for new yards. This creates a high barrier for new entrants. Insurers prefer to deal with companies that operate nationwide and we estimate it would take around a decade for a competitor to replicate a national network of salvage yards. Second, the customer base purchasing salvage autos is highly fragmented which makes it hard for any single insurer to disintermediate the auction platforms.
The number of cars sent to salvage in the US has been increasing at high single-digit rates, driven by an increase in hard-to-repair electronic parts, an aging auto fleet and increased miles driven. In addition, the buyer base from outside of the US has expanded significantly, boosting salvage car prices and making it incrementally more compelling to sell a car at salvage than to repair a damaged car.
IAA was spun out of an automotive conglomerate in June 2019 and our research suggests that it has an opportunity to improve its operations as an independent company. Its EBITDA margin, while attractive at around 29%, is considerably lower than Copart’s despite a broadly similar business model. We think there is an opportunity for significant improvement in its margins and return on capital employed over the medium term.
The main risk to the investment thesis is the potential for the loss of a large auto insurer to Copart. The auto insurers on the supply-side of the network are relatively concentrated and there have been a few switches to Copart over the past 15 years.
6
ADVISERS INVESTMENT TRUST
INDEPENDENT FRANCHISE PARTNERS US EQUITY FUND
PORTFOLIO COMMENTARY
September 30, 2020 (Unaudited)
Geico is IAA’s largest insurance relationship. We estimate it supplies around 15-20% of IAA volumes and has been a customer since 2003. Leading up to our initial purchase, there had been rumours that Geico was exploring the use of Copart in certain geographies. Indeed, it was this speculation that gave us the opportunity to initiate a position in IAA at an attractive valuation. We initiated the purchase of IAA at an estimated 5.0% free cash flow yield after factoring in some margin improvement.
In February, we initiated a position in IBM, a leading technology infrastructure, application software and consulting company. The company’s key intangible asset is the high switching costs arising from the mission-critical software it provides to its customers.
We have followed IBM for close to a decade but historically felt that its valuation did not compensate us sufficiently for the risks associated with the stagnant state of its business. However, we view the company’s 2019 acquisition of Red Hat as transformational. Red Hat is the dominant provider of enterprise Linux and has a leading share in the provision of container platforms, which we believe to be the future of software application development.
The combination of Red Hat’s early lead in containers with IBM’s salesforce and customer relationships has the potential to accelerate IBM’s revenue growth and foster low-single-digit free cash flow compounding. When combined with the ongoing turnaround in IBM’s Global Business Services division and the positive impact of IBM’s senior management changes, we see the potential for further free cash flow compounding and a re-rating of the company’s stock price.
There are two main risks to the thesis. The first is that IBM fails to properly integrate Red Hat, particularly because of Red Hat’s unique culture. Our research into the calibre of the new management team at IBM gives us confidence that they should be able to execute sufficiently well to minimize this risk.
The second risk is that the hyper-scale cloud players – Amazon, Microsoft and Google – provide their own container management platforms and that clients prefer them. We expect Red Hat to co-exist alongside these larger cloud providers’ offerings; some customers prefer to have a single container platform and toolkit across all public cloud players, rather than training their developers on multiple hyperscale container platforms.
At the time of purchase, IBM’s shares traded on a 7.1% estimated free cash flow yield, after adjusting for its operational debt and pension. We think this valuation helps to compensate for the risks, particularly given the opportunity for revenue growth to accelerate.
We initiated a position in ServiceMaster in February. The company provides pest control, cleaning and restoration services. The company’s key asset is the Terminix pest control business, which accounts for 80% of the company’s profits and is the second largest pest control company in the U.S. Its intangible assets are a combination of brand power and a network of branches that enables it to serve national commercial accounts across the U.S.
We think ServiceMaster can sustainably improve its free cash flow compounding, which should lead to a re-rating of its shares. The company is in the midst of a turnaround, having previously been mismanaged and underinvested. The turnaround began in 2017. Since then, management and the board have overhauled its senior executive team, spun-off its warranty business (now trading as Frontdoor), separated the residential and commercial pest control businesses, and changed the compensation structure to encourage a greater focus on service levels and greater equity ownership.
In January of this year, the company announced plans to become a pure play pest control company by selling its cleaning and restoration services business. It completed the sale in September. We think all these actions should help the company improve organic revenue growth, margins and the balance sheet.
There are three main risks to the investment thesis. The first is the impact of COVID-19. However, pest control tends to be a non-discretionary expenditure, and the category held up relatively well in the 2008/ 2009 Global Financial crisis. The second is that the turnaround stalls or falters and the company is unable to sell its cleaning and restoration services business. The third is that elevated termite litigation claims in Mobile, Alabama, end up being higher than expected or spread to other regions. We have factored these claims into our forecasts.
It was the market’s reaction to the third risk that gave us the opportunity to purchase the shares at a 6.0% estimated free cash flow yield. We began with a relatively small position size to reflect the risks posed by the ongoing termite claims, and the company’s ability to sell the cleaning and restoration services business given the impact of COVID-19 on the economy and credit conditions.
We initiated a position in WWE, the leading global wrestling entertainment company, in January. WWE is a well-invested business with unique, fully integrated media content production and distribution assets: the WWE brand, its cast and characters, and its distribution rights.
7
ADVISERS INVESTMENT TRUST
INDEPENDENT FRANCHISE PARTNERS US EQUITY FUND
PORTFOLIO COMMENTARY
September 30, 2020 (Unaudited)
We think WWE has attractive long-term growth prospects based on a combination of its expanding global presence, its brand-enhancing investments, and the increasing value of its TV rights. For example, in 2018 WWE returned to U.S. broadcast TV for the first time in a decade with a 360% increase in the value of its TV rights. There is an opportunity to increase future U.S. TV rights renewal rates given the good value they offer relative to other top tier sports rights.
Internationally, WWE is broadcast in 25 languages in 180 countries. By creating resonant, localized content, the company should be able to continue to increase the value of its international media rights. If successful, WWE should be able to increase revenue and operating margins. Encouragingly, WWE announced a five-year extension of its broadcast rights in India, a top 5 market, with Sony Pictures Network at the end of March.
The opportunity to purchase the shares came with the departure of the company’s two co-presidents at the end of January. The departures raised market concerns about the company’s capital allocation priorities. WWE’s share price fell 22% on the day of the announcement to a level approximately 50% below its April 2019 peak. We assessed this to be an overreaction that created an opportunity to invest in a unique business with a strong net cash balance sheet and highly visible revenues at an attractive valuation. We purchased the shares at a 5.1% estimated free cash flow yield.
After our purchase in January, COVID-19 has clearly affected the company, disrupting its live events. The company is continuing to deliver its key Raw, Smackdown and NXT programs to its broadcast partners, however, the lack of ringside fans appears to have curbed WWE’s television appeal. We do not expect this to have a long-term impact on the company or our investment thesis. Financially, WWE has a strong balance sheet that is net cash.
Final Sales
We completed the final sale of Chipotle Mexican Grill in November. We established the position in November 2017. The company has performed well, recovering not only from the food safety scares of 2015 but also making several operational improvements that have helped same-store-sales and restaurant-level-margins return to close to their pre-2015 levels. We continue to see opportunity for further sales, profit and cash flow growth. However, given the strong share price appreciation, Chipotle’s shares traded below our valuation hurdle and so we sold the position.
As discussed in the section on initial purchases, we sold the position in Facebook in July. Given the rapid share price appreciation since we initiated the position in March, the valuation no longer provided adequate compensation for the risks the company faces.
We sold the position in Imperial Brands in May. It has been a disappointing and costly investment since we established the position in March 2017. Imperial remains highly free cash generative and offers a well-covered dividend yield of 9.4%. However, the company’s ability to compound free cash flow has become increasingly constrained due to the strategic and execution challenges in its next generation product (“NGP”) portfolio, as well as the geographic mix of its core tobacco business.
New CEO Stefan Bomhard joined the company at the start of July. We think he can further rationalize NGP investment, simplify the company’s overly complex geographic footprint, and rebuild investor confidence through improved transparency. Imperial Brands’ shares trade on an estimated 11.0% free cash flow yield, after adjusting for the debt on its balance sheet.
Despite the attractive valuation, we decided there are better risk/reward options available for the US Franchise portfolio, particularly given the limited capacity to hold non-US listed businesses. Non-US securities effectively have to cross a higher hurdle to be included in the Fund.
We completed the final sale of Molson Coors in June. The company’s shares held up better than we felt was warranted during the initial phase of the market downturn in late February and early March, particularly given the company’s exposure to the lockdown in the US. Having completed a substantial portion of the disposal early on, we were price sensitive sellers and tried to take advantage of the stock’s comparatively high volatility to complete the rest of the sale in mid-June.
We initiated the position in April 2017. Margins at the company have expanded in line with our original thesis. However, Molson Coors has faced two unexpected headwinds. First, US beer category volume growth in the past three years has deteriorated relative to long-term historic category volume trends, despite the generally healthier economy over most of that period. Second, innovation in the company’s premium beer portfolio has lagged and its premium beers have failed to grow ahead of its mainstream and economy beer segments. As a result, profits stagnated instead of growing in the low-single-digits as we had originally anticipated.
Looking back, we made a number of mistakes. We over-emphasized margin expansion in our thesis and under-estimated the burden of the moderately stretched balance sheet. We also assumed that family ownership would drive alignment and lead to improved execution. This has not happened and there are a handful of lessons here to help shape how we balance these sorts of risks with valuation in the future.
8
ADVISERS INVESTMENT TRUST
INDEPENDENT FRANCHISE PARTNERS US EQUITY FUND
PORTFOLIO COMMENTARY
September 30, 2020 (Unaudited)
We sold the position in Tiffany in March. We established the position in February 2019, following the market correction in the fourth quarter of 2018. Tiffany’s unique position in the luxury jewelry market was underscored by LVMH’s $135 per share bid for the company in November 2019. With that agreed bid acting as a floor to the share price, the shares held up relatively well in the first quarter of 2020. Given the limited upside potential, we sold the position and used the proceeds to fund the initial purchases outlined above.
We remain completely dedicated to investing our clients’ portfolios in keeping with the rigors of the Franchise quality and value criteria. As ever, we measure our success through long-term investment results and enduring client relationships. We thank you for your support and look forward to serving you in the coming years.

Hassan Elmasry, CFA
Lead Portfolio Manager of the Fund and Partner of Independent Franchise Partners, LLP
Michael Allison, CFA
Portfolio Manager of the Fund and Partner of Independent Franchise Partners, LLP
Richard Crosthwaite
Portfolio Manager of the Fund and Partner of Independent Franchise Partners, LLP
Sandeep Ghela
Chief Operating Officer and Partner of Independent Franchise Partners, LLP
Karim Ladha, CFA
Portfolio Manager of the Fund and Partner of Independent Franchise Partners, LLP
Jayson Vowles, CFA
Portfolio Manager of the Fund and Partner of Independent Franchise Partners, LLP
Principal Investment Risks: Fund holdings are subject to change and should not be considered a recommendation to buy or sell any security. All investments carry a certain amount of risk, and the Fund cannot guarantee that it will achieve its investment objective. The value of the Fund’s investments will fluctuate with market conditions, and the value of your investment in the Fund also will vary. You could lose money on your investment in the Fund, or the Fund could perform worse than other investments. Investments in the Fund are not deposits of a bank and are not insured or guaranteed by the Federal Deposit Insurance Corporation (FDIC) or any other government agency. The main risks of investing in the Fund are set out in the Fund’s Prospectus, which can be obtained at www.franchisepartners.com/funds or by calling 855-233-0437 or 312-557-7902.
The comments and free cash flow yield estimates reflect the views of Independent Franchise Partners, LLP at the time of writing, unless otherwise indicated, and are subject to change without notice to the recipients of this document. Free cash flow yield estimates are based on the firm’s proprietary research and methodology.
9
ADVISERS INVESTMENT TRUST
IFP US EQUITY FUND
SCHEDULE OF INVESTMENTS
September 30, 2020
| | | | | | | | | | | | | | |
| |
| | | | |
| | | Percentage of Net Assets | | | | | Shares | | | Value | |
| |
COMMON STOCKS | | | 98.3% | | | | | | | | | | | |
Biotechnology | | | 4.1% | | | | | | | | | | | |
Corteva Inc. | | | | | | | | | 2,356,119 | | | $ | 67,879,788 | |
| | | | | | | | | | | | | | |
Commercial Services | | | 2.1% | | | | | | | | | | | |
ServiceMaster Global Holdings Inc.(a) | | | | | | | | | 898,608 | | | | 35,836,487 | |
| | | | | | | | | | | | | | |
Computers & Peripherals | | | 7.7% | | | | | | | | | | | |
Apple Inc. | | | | | | | | | 529,334 | | | | 61,302,171 | |
International Business Machines Corp. | | | | | | | | | 550,094 | | | | 66,929,937 | |
| | | | | | | | | | | | | | |
| | | | | | | | | | | | | 128,232,108 | |
| | | | | | | | | | | | | | |
Diversified Financials | | | 6.2% | | | | | | | | | | | |
S&P Global Inc. | | | | | | | | | 152,952 | | | | 55,154,491 | |
Western Union Co. | | | | | | | | | 2,284,138 | | | | 48,949,078 | |
| | | | | | | | | | | | | | |
| | | | | | | | | | | | | 104,103,569 | |
| | | | | | | | | | | | | | |
Diversified Support Services | | | 2.0% | | | | | | | | | | | |
IAA Inc.(a) | | | | | | | | | 650,130 | | | | 33,852,269 | |
| | | | | | | | | | | | | | |
Health Care Equipment & Supplies | | | 2.3% | | | | | | | | | | | |
Alcon Inc.(a) | | | | | | | | | 688,792 | | | | 39,111,689 | |
| | | | | | | | | | | | | | |
Information Services | | | 0.8% | | | | | | | | | | | |
Equifax Inc. | | | | | | | | | 85,640 | | | | 13,436,916 | |
| | | | | | | | | | | | | | |
Insurance | | | 4.1% | | | | | | | | | | | |
Aon PLC - Class A | | | | | | | | | 332,496 | | | | 68,593,925 | |
| | | | | | | | | | | | | | |
Internet Software & Services | | | 9.8% | | | | | | | | | | | |
Alphabet Inc. - Class A(a) | | | | | | | | | 25,606 | | | | 37,528,154 | |
Booking Holdings Inc.(a) | | | | | | | | | 42,421 | | | | 72,568,756 | |
eBay Inc. | | | | | | | | | 1,032,808 | | | | 53,809,297 | |
| | | | | | | | | | | | | | |
| | | | | | | | | | | | | 163,906,207 | |
| | | | | | | | | | | | | | |
IT Services | | | 3.7% | | | | | | | | | | | |
Accenture PLC - Class A | | | | | | | | | 271,368 | | | | 61,326,454 | |
| | | | | | | | | | | | | | |
Media | | | 11.6% | | | | | | | | | | | |
Fox Corp. - Class A | | | | | | | | | 2,725,370 | | | | 75,847,047 | |
News Corp. - Class A | | | | | | | | | 4,106,804 | | | | 57,577,392 | |
News Corp. - Class B | | | | | | | | | 1,566,403 | | | | 21,898,314 | |
World Wrestling Entertainment Inc. - Class A | | | | | | | | | 982,350 | | | | 39,755,705 | |
| | | | | | | | | | | | | | |
| | | | | | | | | | | | | 195,078,458 | |
| | | | | | | | | | | | | | |
Pharmaceuticals | | | 11.5% | | | | | | | | | | | |
Bristol-Myers Squibb Co. | | | | | | | | | 1,070,421 | | | | 64,535,682 | |
Johnson & Johnson | | | | | | | | | 504,944 | | | | 75,176,063 | |
Novartis AG - REG | | | | | | | | | 612,436 | | | | 53,134,749 | |
| | | | | | | | | | | | | | |
| | | | | | | | | | | | | 192,846,494 | |
| | | | | | | | | | | | | | |
Software | | | 13.5% | | | | | | | | | | | |
Autodesk Inc.(a) | | | | | | | | | 64,579 | | | | 14,918,395 | |
Electronic Arts Inc.(a) | | | | | | | | | 428,838 | | | | 55,924,763 | |
Microsoft Corp. | | | | | | | | | 343,981 | | | | 72,349,524 | |
Oracle Corp. | | | | | | | | | 1,398,361 | | | | 83,482,152 | |
| | | | | | | | | | | | | | |
| | | | | | | | | | | | | 226,674,834 | |
| | | | | | | | | | | | | | |
See Notes to Financial Statements.
10
ADVISERS INVESTMENT TRUST
IFP US EQUITY FUND
SCHEDULE OF INVESTMENTS
September 30, 2020
| | | | | | | | | | | | | | |
| |
| | | | |
| | | Percentage of Net Assets | | | | | Shares | | | Value | |
| |
Tobacco | | | 12.7% | | | | | | | | | | | |
Altria Group Inc. | | | | | | | | | 1,409,133 | | | $ | 54,448,899 | |
British American Tobacco PLC | | | | | | | | | 1,860,469 | | | | 66,678,228 | |
Philip Morris International Inc. | | | | | | | | | 1,230,516 | | | | 92,276,395 | |
| | | | | | | | | | | | | | |
| | | | | | | | | | | | | 213,403,522 | |
| | | | | | | | | | | | | | |
Toys/Games/Hobbies | | | 6.2% | | | | | | | | | | | |
Nintendo Co. Ltd. | | | | | | | | | 184,917 | | | | 104,604,828 | |
| | | | | | | | | | | | | | |
TOTAL COMMON STOCKS (Cost $1,330,527,643) | | | | | | | | | | | | | 1,648,887,548 | |
| | | | | | | | | | | | | | |
TOTAL INVESTMENTS
(Cost $1,330,527,643) | | | 98.3% | | | | | | | | | | 1,648,887,548 | |
NET OTHER ASSETS (LIABILITIES) | | | 1.7% | | | | | | | | | | 29,037,450 | |
| | | | | | | | | | | | | | |
NET ASSETS | | | 100.0% | | | | | | | | | $ | 1,677,924,998 | |
| | | | | | | | | | | | | | |
(a)Non-income producing security.
Abbreviations:
REG – Registered
At September 30, 2020, the Fund’s investments were concentrated in the following countries:
| | | | |
| Country Allocation (Unaudited) | | Percentage of Net Assets | |
| |
United States | | | 82.6% | |
Japan | | | 6.2 | |
Switzerland | | | 5.5 | |
United Kingdom | | | 4.0 | |
| |
Total | | | 98.3% | |
| |
See Notes to Financial Statements.
11
ADVISERS INVESTMENT TRUST
STATEMENT OF ASSETS & LIABILITIES
September 30, 2020
| | | | |
| | | Independent Franchise Partners US Equity Fund | |
| |
Assets: | | | | |
Investments, at value (Cost: $1,330,527,643) | | $ | 1,648,887,548 | |
Cash | | | 33,598,032 | |
Foreign currency (Cost: $1,692) | | | 1,645 | |
Receivable for dividends | | | 4,105,018 | |
Reclaims receivable | | | 2,764,662 | |
Receivable for investments sold | | | 2,324,050 | |
Prepaid expenses | | | 6,573 | |
| | | | |
Total Assets | | | 1,691,687,528 | |
Liabilities: | | | | |
Securities purchased payable | | | 12,063,971 | |
Capital shares redeemed payable | | | 200,000 | |
Investment advisory fees payable | | | 956,693 | |
Accounting and Administration fees payable | | | 469,753 | |
Regulatory and Compliance fees payable | | | 13,814 | |
Risk Officer fees payable | | | 8,000 | |
Accrued expenses and other payables | | | 50,299 | |
| | | | |
Total Liabilities | | | 13,762,530 | |
| | | | |
Net Assets | | $ | 1,677,924,998 | |
| | | | |
Net assets | | $ | 1,677,924,998 | |
Shares of common stock outstanding | | | 85,071,919 | |
| | | | |
Net asset value per share | | $ | 19.72 | |
| | | | |
Net Assets: | | | | |
Paid in capital | | $ | 1,199,432,998 | |
Distributable earnings (loss) | | | 478,492,000 | |
| | | | |
Net Assets | | $ | 1,677,924,998 | |
| | | | |
See Notes to Financial Statements.
12
ADVISERS INVESTMENT TRUST
STATEMENT OF OPERATIONS
For the year ended September 30, 2020
| | | | |
| | | Independent Franchise Partners US Equity Fund | |
| |
Investment Income: | | | | |
Dividend income (Net of foreign withholding tax of $559,373) | | $ | 36,094,896 | |
Operating expenses: | | | | |
Investment advisory | | | 10,906,679 | |
Accounting and Administration | | | 933,508 | |
Regulatory and Compliance | | | 164,844 | |
Risk Officer | | | 28,546 | |
Trustees | | | 52,830 | |
Other | | | 143,887 | |
| | | | |
Total expenses | | | 12,230,294 | |
| | | | |
Net investment income | | | 23,864,602 | |
| | | | |
Realized and Unrealized Gains (Losses) from Investment Activities: | | | | |
Net realized gains from investment transactions | | | 349,104,887 | |
Net increase from payments by affiliates | | | 271,684 | |
Net realized gains from foreign currency transactions | | | 37,029 | |
Change in unrealized appreciation (depreciation) on investments | | | (116,273,609 | ) |
Change in unrealized appreciation (depreciation) on foreign currency | | | 189,122 | |
| | | | |
Net realized and unrealized gains from investment activities | | | 233,329,113 | |
| | | | |
Change in Net Assets Resulting from Operations | | $ | 257,193,715 | |
| | | | |
|
| |
See Notes to Financial Statements.
13
ADVISERS INVESTMENT TRUST
STATEMENTS OF CHANGES IN NET ASSETS
For the years ended September 30, 2020 and 2019
| | | | | | | | |
| | | Independent Franchise Partners
US Equity Fund | |
| | | 2020 | | | 2019 | |
| |
Increase (decrease) in net assets: | | | | | | | | |
Operations: | | | | | | | | |
Net investment income | | $ | 23,864,602 | | | $ | 33,123,824 | |
Net realized gains (losses) from investment and foreign currency transactions | | | 349,413,600 | | | | 111,691,667 | |
Change in unrealized appreciation (depreciation) on investments and foreign currency | | | (116,084,487 | ) | | | 25,037,278 | |
| | | | | | | | |
Change in net assets resulting from operations | | | 257,193,715 | | | | 169,852,769 | |
| | | | | | | | |
Dividends paid to shareholders: | | | | | | | | |
From distributable earnings | | | (165,226,614 | ) | | | (135,851,949 | ) |
| | | | | | | | |
Total dividends paid to shareholders | | | (165,226,614 | ) | | | (135,851,949 | ) |
| | | | | | | | |
Capital Transactions: | | | | | | | | |
Proceeds from sale of shares | | | 84,665,411 | | | | 106,291,312 | |
Value of shares issued to shareholders in reinvestment of dividends | | | 158,832,872 | | | | 130,469,928 | |
Value of shares redeemed | | | (786,062,798 | ) | | | (267,284,191 | ) |
| | | | | | | | |
Change in net assets from capital transactions | | | (542,564,515 | ) | | | (30,522,951 | ) |
| | | | | | | | |
Change in net assets | | | (450,597,414 | ) | | | 3,477,869 | |
Net assets: | | | | | | | | |
Beginning of year | | | 2,128,522,412 | | | | 2,125,044,543 | |
| | | | | | | | |
End of year | | $ | 1,677,924,998 | | | $ | 2,128,522,412 | |
| | | | | | | | |
Share Transactions: | | | | | | | | |
Sold | | | 4,371,881 | | | | 5,806,665 | |
Reinvested | | | 8,693,644 | | | | 8,384,957 | |
Redeemed | | | (42,009,553 | ) | | | (14,716,739 | ) |
| | | | | | | | |
Change | | | (28,944,028 | ) | | | (525,117 | ) |
| | | | | | | | |
|
| |
See Notes to Financial Statements.
14
ADVISERS INVESTMENT TRUST
FINANCIAL HIGHLIGHTS
For the years indicated
| | | | | | | | | | | | | | | | | | | | |
| | | Independent Franchise Partners
US Equity Fund | |
| | | Year Ended September 30, 2020 | | | Year Ended September 30, 2019 | | | Year Ended September 30, 2018 | | | Year Ended September 30, 2017 | | | Year Ended September 30, 2016 | |
| |
Net asset value, beginning of year | | $ | 18.67 | | | $ | 18.55 | | | $ | 17.66 | | | $ | 16.21 | | | $ | 14.57 | |
| | | | | | | | | | | | | | | | | | | | |
Income (loss) from operations: | | | | | | | | | | | | | | | | | | | | |
Net investment income | | | 0.37 | | | | 0.30 | | | | 0.28 | | | | 0.23 | | | | 0.22 | |
Net realized and unrealized gains from investments | | | 2.72 | | | | 1.06 | | | | 1.51 | | | | 1.80 | | | | 2.59 | |
| | | | | | | | | | | | | | | | | | | | |
Total from investment operations | | | 3.09 | | | | 1.36 | | | | 1.79 | | | | 2.03 | | | | 2.81 | |
| | | | | | | | | | | | | | | | | | | | |
Less distributions paid: | | | | | | | | | | | | | | | | | | | | |
From net investment income | | | (0.37 | ) | | | (0.31 | ) | | | (0.24 | ) | | | (0.22 | ) | | | (0.24 | ) |
From net realized gains on investments | | | (1.68 | ) | | | (0.93 | ) | | | (0.66 | ) | | | (0.36 | ) | | | (0.93 | ) |
| | | | | | | | | | | | | | | | | | | | |
Total distributions paid | | | (2.05 | ) | | | (1.24 | ) | | | (0.90 | ) | | | (0.58 | ) | | | (1.17 | ) |
| | | | | | | | | | | | | | | | | | | | |
Increase from redemption fees | | | 0.01 | | | | — | (a) | | | — | (a) | | | — | (a) | | | — | (a) |
| | | | | | | | | | | | | | | | | | | | |
Change in net asset value | | | 1.05 | | | | 0.12 | | | | 0.89 | | | | 1.45 | | | | 1.64 | |
| | | | | | | | | | | | | | | | | | | | |
Net asset value, end of year | | $ | 19.72 | | | $ | 18.67 | | | $ | 18.55 | | | $ | 17.66 | | | $ | 16.21 | |
| | | | | | | | | | | | | | | | | | | | |
Total return(b) | | | 17.50 | %(c) | | | 8.67 | % | | | 10.34 | % | | | 12.99 | % | | | 20.23 | % |
Ratios/Supplemental data: | | | | | | | | | | | | | | | | | | | | |
Net assets, end of year (000’s) | | $ | 1,677,925 | | | $ | 2,128,522 | | | $ | 2,125,045 | | | $ | 1,929,030 | | | $ | 1,558,064 | |
Ratio of net expenses to average net assets | | | 0.76 | % | | | 0.76 | % | | | 0.76 | % | | | 0.77 | % | | | 0.79 | % |
Ratio of net investment income to average net assets | | | 1.49 | % | | | 1.62 | % | | | 1.54 | % | | | 1.42 | % | | | 1.64 | % |
Ratio of gross expenses to average net assets | | | 0.76 | % | | | 0.76 | %(d) | | | 0.76 | %(d) | | | 0.77 | % | | | 0.79 | % |
Portfolio turnover rate(e) | | | 43.46 | % | | | 37.99 | % | | | 38.63 | % | | | 30.72 | % | | | 19.29 | % |
| |
| (a) | Redemption fees were less than $0.005 per share. |
| (b) | Total return excludes redemption fees. |
| (c) | During the period, the Adviser reimbursed the fund for a loss realized in connection with a trade error. Such payment represented 0.02% to the Fund’s total return. |
| (d) | During the years shown, certain fees were reduced. If such fee reductions had not occurred, the ratio would have been as indicated. |
| (e) | Portfolio turnover rate includes applicable corporate action activity and securities trading as a result of investor subscription and redemption activity. |
See Notes to Financial Statements.
15
ADVISERS INVESTMENT TRUST
IFP US EQUITY FUND
NOTES TO FINANCIAL STATEMENTS
September 30, 2020
Advisers Investment Trust (the “Trust”) is a Delaware statutory trust operating under a Second Amended and Restated Agreement and Declaration of Trust (the “Trust Agreement”) dated June 21, 2018. The Trust was formerly an Ohio business trust, which commenced operations on December 20, 2011. On March 31, 2017, the Trust was converted to a Delaware statutory trust. As an open-end registered investment company, as defined in Financial Accounting Standards Board (“FASB”) Accounting Standards Update (“ASU”) 2013-08, the Trust follows accounting and reporting guidance under FASB Accounting Standards Codification (“ASC”) Topic 946, “Financial Services-Investment Companies”. The Trust Agreement permits the Board of Trustees (the “Trustees” or “Board”) to authorize and issue an unlimited number of shares of beneficial interest, at no par value, in separate series of the Trust. The Independent Franchise Partners US Equity Fund (the “IFP US Equity Fund” or “Fund”) is a series of the Trust. These financial statements and notes only relate to the IFP US Equity Fund.
The Fund is a non-diversified fund, meaning it may invest in a smaller number of companies than a diversified fund, and seeks to achieve an attractive long-term rate of return.
Under the Trust’s organizational documents, its officers and Trustees are indemnified against certain liabilities arising out of the performance of their duties to the Trust and Fund. In addition, in the normal course of business, the Trust enters into contracts with its vendors and others that provide for general indemnifications. The Fund’s maximum exposure under these arrangements is unknown, as this would involve future claims that may be made against the Fund.
| A. | Significant accounting policies are as follows: |
INVESTMENT VALUATION
Investments are recorded at fair value. Fair value is defined as the price that would be received to sell an asset or paid to transfer a liability in an orderly transaction between market participants at the measurement date. The valuation techniques employed by the Fund, as described below, maximize the use of observable inputs and minimize the use of unobservable inputs in determining fair value. These inputs are summarized in the following three broad levels:
| • | | Level 1 — quoted prices in active markets for identical assets |
| • | | Level 2 — other significant observable inputs (including quoted prices of similar securities, interest rates, prepayment speeds, credit risk, etc.) |
| • | | Level 3 — significant unobservable inputs (including the Fund’s own assumptions in determining the fair value of investments) |
The inputs or methodology used for valuing securities are not necessarily an indication of the risk associated with investing in those securities. For example, certain short-term debt securities may be valued using amortized cost. Generally, amortized cost approximates the current value of a security, but since this valuation is not obtained from a quoted price in an active market, such securities would be reflected as Level 2 in the fair value hierarchy.
Security prices are generally provided by an independent third party pricing service approved by the Trustees as of the close of the New York Stock Exchange, normally at 4:00 p.m. Eastern Time, each business day on which the share price of the Fund is calculated. Equity securities listed or traded on a primary exchange are valued at the closing price, if available, or the last sales price on the primary exchange. If no sale occurred on the valuation date, the securities will be valued at the latest quotations as of the close of the primary exchange. Investments in other open-end registered investment companies are valued at their respective net asset value as reported by such companies. In these types of situations, valuations are typically categorized as Level 1 in the fair value hierarchy.
Debt and other fixed income securities, if any, are generally valued at an evaluated price provided by an independent pricing source approved by the Trustees. To value debt securities, pricing services may use various pricing techniques, which take into account appropriate factors such as market activity, yield, quality, coupon rate, maturity, type of issue, trading characteristics, call features, credit
16
ADVISERS INVESTMENT TRUST
IFP US EQUITY FUND
NOTES TO FINANCIAL STATEMENTS
September 30, 2020
ratings and other data, as well as broker quotes. Short-term debt securities of sufficient credit quality that mature within sixty days may be valued at amortized cost, which approximates fair value. In each of these situations, valuations are typically categorized as Level 2 in the fair value hierarchy.
When the price of a security is not readily available or deemed unreliable (e.g., an approved pricing service does not provide a price, a furnished price is in error, certain stale prices, or an event occurs that materially affects the furnished price), the Fund’s Fair Value Committee may in good faith establish a fair value for that security in accordance with procedures established by and under the general supervision of the Trustees. In addition, fair value pricing may be used if events materially affecting the value of foreign securities occur between the time when the exchange on which they are traded closes and the time when the Fund’s net asset value is calculated. The Fund identifies possible fluctuations in international securities by monitoring the increase or decrease in the value of a designated benchmark index. In the event of an increase or decrease greater than predetermined levels, the Fund may use a systematic valuation model provided by an independent third party pricing service to fair value its international equity securities.
In the fair value situations noted above, while the Trust’s valuation policy is intended to result in a calculation of the Fund’s net asset value that fairly reflects security values as of the time of pricing, the Trust cannot ensure that fair values determined pursuant to these guidelines would accurately reflect the price that the Fund could obtain for a security if it were to dispose of that security as of the time of pricing (for instance, in a forced or distressed sale). The prices used by the Fund may differ from the value that would be realized if the securities were sold, and these differences could be material to the financial statements. Depending on the source and relative significance of the valuation inputs in these instances, the instruments may be classified as Level 2 or Level 3 in the fair value hierarchy.
The following is a summary of the valuation inputs used as of September 30, 2020 in valuing the Fund’s investments based upon the three fair value levels defined above:
| | | | | | | | | | | | | | | | |
| Fund | | Level 1 – Quoted Prices | | | Level 2 – Other Significant Observable Inputs | | | Level 3 – Significant Unobservable Inputs | | | Total | |
| |
IFP US Equity Fund | | | | | | | | | | | | | | | | |
Common Stocks(1) | | $ | 1,648,887,548 | | | $ | — | | | $ | — | | | $ | 1,648,887,548 | |
| | | | |
Total Investments | | $ | 1,648,887,548 | | | $ | — | | | $ | — | | | $ | 1,648,887,548 | |
| | | | |
| (1) | See investment industries in the Schedule of Investments. |
As of September 30, 2020, there were no Level 2 or Level 3 securities held by the Fund. There were no transfers to or from Level 3 during the year ended September 30, 2020.
CURRENCY TRANSACTIONS
The Fund may engage in spot currency transactions for the purpose of foreign security settlement and operational processes. Changes in foreign currency exchange rates will affect the value of the Fund’s securities and the price of the Fund’s shares. Generally, when the value of the U.S. dollar rises in value relative to a foreign currency, an investment in that country loses value because that currency is worth fewer U.S. dollars. Devaluation of a currency by a country’s government or banking authority also may have a significant impact on the value of any investments denominated in that currency. Currency markets generally are not as regulated as securities markets.
INVESTMENT TRANSACTIONS AND INCOME
Investment transactions are accounted for no later than one business day after trade date. At financial reporting period ends, investments are reported as of the trade date. The Fund determines the gain or loss realized from investment transactions by using an identified cost basis method. Dividend income is recognized on the ex-dividend date. Dividends from foreign securities are recorded on the ex-dividend date, or as soon as the information is available.
17
ADVISERS INVESTMENT TRUST
IFP US EQUITY FUND
NOTES TO FINANCIAL STATEMENTS
September 30, 2020
EXPENSE ALLOCATIONS
Expenses directly attributable to a fund in the Trust are charged to that fund, while expenses that are attributable to more than one fund in the Trust are allocated among the applicable funds on a pro-rata basis to each adviser’s series of funds based on relative net assets or another reasonable basis.
DIVIDENDS AND DISTRIBUTIONS
The Fund intends to distribute substantially all of its net investment income as dividends to shareholders on an annual basis. The Fund intends to distribute its net realized long-term capital gains and its net realized short-term capital gains at least once a year.
Distributions from net investment income and from net realized capital gain are determined in accordance with Federal income tax regulations, which may differ from accounting principles generally accepted in the United States of America (“GAAP”). These “book/tax” differences are either considered temporary or permanent in nature. To the extent these differences are permanent in nature (e.g. treatment of certain dividend distributions, gains/losses, return of capital etc.), such amounts are reclassified within the composition of net assets based on their federal tax-basis treatment; temporary differences do not require reclassification. Distributions to shareholders that exceed net investment income and net realized capital gains for tax purposes are reported as return of capital.
REDEMPTION FEES
The Fund will charge a redemption fee of up to 0.25% of the total redemption amount if you sell your shares, regardless of the length of time you have held your shares and subject to certain exceptions and limitations described in the prospectus. The redemption fee is paid directly to the Fund and is intended to encourage long-term investment in the Fund, to facilitate portfolio management and to avoid (or compensate the Fund for the impact of) transaction and other Fund expenses incurred as a result of shareholder redemptions. Redemption fees charged for the years ended September 30, 2020 and 2019 were $860,901 and $564,454, respectively, and are reflected within the value of shares redeemed on the Statements of Changes in Net Assets.
FEDERAL INCOME TAX INFORMATION
No provision is made for Federal income taxes as the Fund intends to qualify each year as a “regulated investment company” under Subchapter M of the Internal Revenue Code of 1986, as amended (the “Code”), and distribute substantially all of its net investment income and net realized capital gain in accordance with the Code.
As of September 30, 2020, the Fund did not have material uncertain tax positions that would require financial statement recognition or disclosure based on an evaluation of all open tax years for all major tax jurisdictions. The Fund’s Federal tax returns for the tax years ended September 30, 2017, 2018, 2019 and 2020 remain subject to examination by the Internal Revenue Service. Interest or penalties incurred, if any, on future unknown, uncertain tax positions taken by the Fund will be recorded as interest expense on the Statement of Operations.
Management is not aware of any tax positions for which it is reasonably possible that the total amounts of unrecognized tax benefits will change materially in the next 12 months.
USE OF ESTIMATES
The preparation of financial statements in conformity with GAAP requires management to make estimates and assumptions that affect the reported amounts of assets and liabilities and disclosure of contingent assets and liabilities at the date of the financial statements and the reported amounts of revenues and expenses during the reporting period. Actual results could differ from these estimates.
18
ADVISERS INVESTMENT TRUST
IFP US EQUITY FUND
NOTES TO FINANCIAL STATEMENTS
September 30, 2020
| B. | Fees and Transactions with Affiliates and Other Parties |
The Trust, on behalf of the Fund, has entered into an Investment Advisory Agreement (the “Agreement”) with Independent Franchise Partners, LLP (the “Adviser” or “IFP”) to provide investment management services to the Fund. Total fees incurred pursuant to the Agreement are reflected as “Investment advisory” fees on the Statement of Operations. Under the terms of the Agreement, the Fund pays the Adviser a monthly fee based on the Fund’s daily net assets at the following annualized rates:
| | | | | | |
Adviser’s Assets Under Management(1) | | Scale Discount for Assets in each Range(1) | | Annualized Rate(1) | | Effective Overall Annual Fee(1) |
|
First $1 billion | | — | | 0.88% | | 0.88% |
$1 - 2 billion | | 0.10% | | 0.78% | | at $2 billion 0.83% |
$2 - 3 billion | | 0.20% | | 0.68% | | at $3 billion 0.78% |
$3 - 4 billion | | 0.30% | | 0.58% | | at $4 billion 0.73% |
$4 - 5 billion | | 0.40% | | 0.48% | | at $5 billion 0.68% |
Above $5 billion | | — | | — | | 0.68% |
| (1) | The Adviser’s total assets under management at the end of each calendar quarter are used to calculate the effective annual fee to be applied during the next calendar quarter. During the year ended September 30, 2020, the effective annualized rate was 0.68% given the Adviser’s total assets under management were in excess of $5 billion during the year. Effective October 1, 2020 the Adviser reduced its management fee annual rate by 0.04% for each asset tier. |
Foreside Financial Services, LLC (the “Distributor”) provides distribution services to the Fund pursuant to a distribution agreement with the Trust, on behalf of the Fund. Under its agreement with the Trust, the Distributor acts as an agent of the Trust in connection with the offering of the shares of the Fund on a continuous basis. The Adviser, at its own expense, pays the Distributor an annual $5,000 fee for these services and reimbursement for certain expenses incurred on behalf of the Fund.
The Northern Trust Company (“Northern Trust”) serves as the administrator, transfer agent, custodian and fund accounting agent for the Fund pursuant to written agreements between the Trust, on behalf of the Fund, and Northern Trust. The Fund has agreed to pay Northern Trust certain annual and transaction-based fees, a tiered basis-point fee based on the Fund’s daily net assets, subject to a minimum annual fee of $175,000 relating to these services, and reimburse for certain expenses incurred on behalf of the Fund as well as other charges for additional service activities. Total fees paid to Northern Trust pursuant to these agreements are reflected as “Accounting and Administration” fees on the Statement of Operations.
Foreside Fund Officer Services, LLC (“Foreside”) provides compliance and financial control services for the Fund pursuant to a written agreement with the Trust, on behalf of the Fund, including providing certain officers to the Fund. The Fund pays Foreside an annual base fee, a basis-point fee based on the Fund’s daily net assets and reimburses for certain expenses incurred on behalf of the Fund. Total fees paid to Foreside pursuant to these agreements are reflected as “Regulatory and Compliance” fees on the Statement of Operations.
Carne Global Financial Services (US) LLC (“Carne”) provides Risk Management and Oversight Services for the Fund pursuant to a written agreement between the Trust, on behalf of the Fund, and Carne, including providing the Risk Officer to the Fund to administer the Fund risk program and oversee the analysis of investment performance and performance of service providers. The Fund has agreed to pay Carne an annual fee of $30,000 for these services, and reimburse for certain expenses incurred on behalf of the Fund. Total fees paid to Carne pursuant to this agreement are reflected as “Risk Officer” fees on the Statement of Operations.
Certain officers and Trustees of the Trust are affiliated with Foreside, Northern Trust, Carne or the Distributor and receive no compensation directly from the Fund for serving in their respective roles. Through March 31, 2020, the Trust paid each Independent Trustee compensation for their services based on an annual retainer of $120,000 and reimbursement for certain expenses. Effective April 1, 2020, the Trust pays an annual retainer of $125,000 and reimbursement for certain expenses. If there are more than six meetings in a year, additional meeting fees may apply. For the year ended September 30, 2020, the aggregate Trustee compensation paid by the Trust was $367,500. The amount of total Trustee compensation and reimbursement of out-of-pocket expenses allocated from the Trust to the Fund is reflected as “Trustees” expenses on the Statement of Operations.
19
ADVISERS INVESTMENT TRUST
IFP US EQUITY FUND
NOTES TO FINANCIAL STATEMENTS
September 30, 2020
The Adviser has contractually agreed to waive fees or reimburse expenses to the extent necessary to limit total annual fund operating expenses (exclusive of brokerage costs, interest, taxes, dividends on short positions, litigation and indemnification expenses, expenses associated with investments in underlying investment companies and extraordinary expenses) to 0.85% of the average daily net assets of the Fund until January 28, 2021. For the year ended September 30, 2020, there were no expenses reduced by the Adviser. Any fees waived or expenses reimbursed during a fiscal year are not subject to repayment from the Fund to the Adviser in subsequent fiscal years.
During the year, the Adviser made a payment of $271,684 to the Fund as disclosed on the Statement of Operations to reimburse for a loss realized in connection with a trade error. Such payment represented 0.02% to the Fund’s total return.
| C. | Investment Transactions |
For the year ended September 30, 2020, the aggregate costs of purchases and proceeds from sales of securities (excluding short-term investments) for the Fund were as follows:
| | | | | | | | |
| Fund | | Cost of Purchases | | | Proceeds from sales | |
| |
IFP US Equity Fund | | $ | 684,947,254 | | | $ | 711,100,070 | |
As of September 30, 2020, the cost, gross unrealized appreciation and gross unrealized depreciation on investments, for Federal income tax purposes, were as follows:
| | | | | | | | | | | | | | | | |
| Fund | | Tax Cost | | | Tax Unrealized Appreciation | | | Tax Unrealized (Depreciation) | | | Net Unrealized Appreciation (Depreciation) | |
| |
IFP US Equity Fund | | $ | 1,340,777,759 | | | $ | 402,831,200 | | | $ | (94,721,411 | ) | | $ | 308,109,789 | |
The tax character of distributions paid to shareholders during the latest tax years ended September 30, 2020 and September 30, 2019 for the Fund was as follows:
| | | | | | | | | | | | | | | | | | | | |
| IFP US Equity Fund | | Ordinary Income | | | Net Long Term Gains | | | Total Taxable Distributions | | | Tax Return of Capital | | | Total Distributions Paid | |
| |
2020 | | $ | 36,780,971 | | | $ | 128,445,643 | | | $ | 165,226,614 | | | $ | — | | | $ | 165,226,614 | |
2019 | | | 51,861,949 | | | | 83,990,000 | | | | 135,851,949 | | | | — | | | | 135,851,949 | |
As of the latest tax year ended September 30, 2020, the components of accumulated earnings on a tax basis were as follows:
| | | | | | | | | | | | | | | | | | | | | | | | | | | | |
| Fund | | Undistributed Ordinary Income | | | Undistributed Long Term Capital Gains | | | Accumulated Earnings | | | Distributions Payable | | | Accumulated Capital and Other Losses | | | Unrealized Appreciation | | | Total Accumulated Earnings | |
| |
IFP US Equity Fund | | | $36,085,921 | | | | $134,151,187 | | | | $170,237,108 | | | | $ — | | | | $ — | | | | $308,254,892 | | | | $478,492,000 | |
At September 30 2020, the latest tax year end, the Fund had no capital loss carry-forwards available to offset future net capital gains.
Certain shareholders in the Fund received securities rather than cash for their redemption amounts in accordance with the provisions of the Fund. These shareholders received securities with a fair value equal to the value of the number of shares they owned at the current net asset value at the redemption date.
20
ADVISERS INVESTMENT TRUST
IFP US EQUITY FUND
NOTES TO FINANCIAL STATEMENTS
September 30, 2020
In-kind withdrawals of $611,922,128 are reflected within the “Value of shares redeemed” on the Statement of Changes in Net Assets, and net gains of $183,574,687 on the securities distributed to shareholders are reflected within the “Net realized gains from investment transactions” on the Statement of Operations.
| F. | Concentration of Ownership Risk |
A significant portion of the Fund’s shares may be held in a limited number of shareholder accounts. To the extent that a shareholder or group of shareholders redeem a significant portion of the shares issued by the Fund, this could have a disruptive impact on the efficient implementation of the Fund’s investment strategy.
The recent global outbreak of COVID-19 has disrupted economies and markets, and the prolonged duration and economic impact is uncertain. These events can have a significant impact on the Fund’s operations and performance.
21

Report of Independent Registered Public Accounting Firm
To the Board of Trustees of Advisers Investment Trust and Shareholders of Independent Franchise Partners US Equity Fund:
Opinion on the Financial Statements
We have audited the accompanying statement of assets and liabilities, including the schedule of investments, of Independent Franchise Partners US Equity Fund (one of the funds constituting Advisers Investment Trust, hereafter referred to as the “Fund”) as of September 30, 2020, the related statement of operations for the year ended September 30, 2020, the statements of changes in net assets for each of the two years in the period ended September 30, 2020, including the related notes, and the financial highlights for each of the five years in the period ended September 30, 2020 (collectively referred to as the “financial statements”). In our opinion, the financial statements present fairly, in all material respects, the financial position of the Fund as of September 30, 2020, the results of its operations for the year then ended, the changes in its net assets for each of the two years in the period ended September 30, 2020 and the financial highlights for each of the five years in the period ended September 30, 2020 in conformity with accounting principles generally accepted in the United States of America.
Basis for Opinion
These financial statements are the responsibility of the Fund’s management. Our responsibility is to express an opinion on the Fund’s financial statements based on our audit. We are a public accounting firm registered with the Public Company Accounting Oversight Board (United States) (“PCAOB”) and are required to be independent with respect to the Fund in accordance with the U.S. federal securities laws and the applicable rules and regulations of the Securities and Exchange Commission and the PCAOB.
We conducted our audit of these financial statements in accordance with the standards of the PCAOB. Those standards require that we plan and perform the audit to obtain reasonable assurance about whether the financial statements are free of material misstatement, whether due to error or fraud.
Our audit included performing procedures to assess the risks of material misstatement of the financial statements, whether due to error or fraud, and performing procedures that respond to those risks. Such procedures included examining, on a test basis, evidence regarding the amounts and disclosures in the financial statements. Our audit also included evaluating the accounting principles used and significant estimates made by management, as well as evaluating the overall presentation of the financial statements. Our procedures included confirmation of securities owned as of September 30, 2020 by correspondence with the custodian. We believe that our audit provides a reasonable basis for our opinion.

Chicago, Illinois
November 20, 2020
We have served as the auditor of one or more investment companies in Advisers Investment Trust since 2011.
|
| PricewaterhouseCoopers LLP, One North Wacker, Chicago, IL 60606 |
| T:(312) 298 2000 , F:(312) 298 2001, www.pwc.com/us |
22
ADVISERS INVESTMENT TRUST
IFP US EQUITY FUND
ADDITIONAL INFORMATION
September 30, 2020 (Unaudited)
| A. | Other Federal Tax Information |
Under the Jobs and Growth Tax Relief Reconciliation Act of 2003 (the “Act”), the following percentages of ordinary dividends paid during the fiscal year ended September 30, 2020 are designated as Qualified Dividend Income (“QDI”), as defined in the Act, subject to reduced tax rates in 2020:
| | | | |
| Fund | | QDI Percentage | |
| |
IFP US Equity Fund | | | 73.48 | % |
A percentage of the dividends distributed during the fiscal year for the Fund qualifies for the Dividends-Received Deduction (“DRD”) for corporate shareholders:
| | | | |
| Fund | | Corporate DRD Percentage | |
| |
IFP US Equity Fund | | | 66.61 | % |
| B. | Summary of Fund Holdings as of September 30, 2020 |
| | | | |
| Market Exposure | |
| |
| Equity Securities | | % of Net Assets | |
| |
Software | | | 13.5% | |
Tobacco | | | 12.7 | |
Media | | | 11.6 | |
Pharmaceuticals | | | 11.6 | |
Internet Software & Services | | | 9.7 | |
Computers & Peripherals | | | 7.7 | |
Toys/Games/Hobbies | | | 6.2 | |
Diversified Financials | | | 6.2 | |
Insurance | | | 4.1 | |
Biotechnology | | | 4.1 | |
IT Services | | | 3.7 | |
Health Care Equipment & Supplies | | | 2.3 | |
Commercial Services | | | 2.1 | |
Diversified Support Services | | | 2.0 | |
Information Services | | | 0.8 | |
| |
Total | | | 98.3% | |
| |
23
ADVISERS INVESTMENT TRUST
IFP US EQUITY FUND
ADDITIONAL INFORMATION
September 30, 2020 (Unaudited)
| | | | |
| 5 Largest Security Positions | |
| |
| Issuer | | % of Net Assets | |
| |
Nintendo Co. Ltd. | | | 6.2% | |
Philip Morris International Inc. | | | 5.5 | |
Oracle Corp. | | | 5.0 | |
Fox Corp. - Class A | | | 4.5 | |
Johnson & Johnson | | | 4.5 | |
| |
Total | | | 25.7% | |
|
| |
As a Fund shareholder, you may incur two types of costs: (1) transaction costs, including redemption fees; and (2) ongoing costs, including management fees and other Fund expenses. The examples below are intended to help you understand your ongoing costs (in dollars) of investing in the Fund and to compare these costs with the ongoing costs of investing in other mutual funds. Please note that the expenses shown in the tables are meant to highlight your ongoing costs only and do not reflect any transactional costs. Therefore, the examples are useful in comparing ongoing costs only and will not help you determine the relative total cost of owning different funds. In addition, if these transactional costs were included, your costs would have been higher.
The examples below are based on an investment of $1,000 invested at April 1, 2020 and held for the entire period through September 30, 2020.
The Actual Expense Example below provides information about actual account values and actual expenses. You may use this information, together with the amount you invested, to estimate the expenses that you paid over the period. Simply divide your account value by $1,000 (for example, an $8,600 account value divided by $1,000 = 8.6), then multiply the result by the number in the table under the heading entitled “Expenses Paid” to estimate the expenses you paid on your account during this period.
The Hypothetical Expense Example below provides information about hypothetical account values and hypothetical expenses based on the Fund’s actual expense ratio and an assumed rate of return of 5% per year before expenses, which is not the Fund’s actual return. The hypothetical account values and expenses may not be used to estimate the actual ending account balance or expenses you paid for the period. You may use this information to compare the ongoing costs of investing in the Fund and other funds. To do so, compare this 5% hypothetical example with the 5% hypothetical examples that appear in the shareholder reports of the other funds.
| | | | | | | | | | | | | | | | |
| | | Expense Ratio | | | Beginning Account Value 4/1/2020 | | | Ending Account Value 9/30/2020 | | | Expenses Paid 4/1/20–9/30/20* | |
| |
Actual | | | 0.76% | | | $ | 1,000.00 | | | $ | 1,280.50 | | | $ | 4.33 | |
Hypothetical | | | 0.76% | | | $ | 1,000.00 | | | $ | 1,021.20 | | | $ | 3.84 | |
| * | Expenses are calculated using the annualized expense ratio (as disclosed in the table), multiplied by the average account value for the period, multiplied by the number of days in the most recent half fiscal year (183), and divided by the number of days in the current year (366). |
| D. | Board Approval of Investment Advisory Agreement |
Section 15 of the Investment Company Act of 1940, as amended (the “1940 Act”) requires that the Amended and Restated Investment Advisory Agreement (the “Agreement”) between Advisers Investment Trust (the “Trust”) and Independent Franchise Partners, LLP (the “Adviser”) with respect to the Independent Franchise Partners US Equity Fund (the “Fund”) be approved by a majority of the Board of Trustees of the Trust (the “Board”), including a majority of the Trustees who are not “interested persons,” as that term is defined in the 1940 Act (“Independent Trustees”). It is the duty of the Board to request as much information as is reasonably necessary to evaluate the terms of the Agreement to determine whether the Agreement is fair to the Fund and its shareholders. The Board considered and approved
24
ADVISERS INVESTMENT TRUST
IFP US EQUITY FUND
ADDITIONAL INFORMATION
September 30, 2020 (Unaudited)
the Investment Advisory Agreement for the Fund at a meeting held via videoconference on June 11, 2020 in accordance with the U.S. Securities and Exchange Commission’s order extending no-action relief from the requirements in Sections 15(c) and 32(a) of the 1940 Act and Rules 12b-1(b)(2) and 15a-4(b)(2)(ii) that votes of the Board be cast at a meeting held in-person.
The Board requested, and the Adviser provided, both written and oral reports containing information and data related to the following: (i) the nature, extent, and quality of the services provided by the Adviser to the Fund; (ii) the investment performance of the Fund and the Adviser; (iii) the costs of the services to be provided and the profits to be realized by the Adviser from the relationship with the Fund; (iv) the extent to which economies of scale will be realized as the Fund grows; and (v) whether the fee level reflects these economies of scale to the benefit of the Fund’s shareholders.
The Board examined the nature, extent, and quality of the advisory services provided by the Adviser. The Board considered the terms of the Agreement, information and reports provided by the Adviser on its business, personnel and operations, and advisory services provided to the Fund. The Board reviewed the Adviser’s investment philosophy and portfolio construction processes, the Adviser’s compliance program, pending material litigation (or lack thereof), insurance coverage, business continuity program, and information security practices. The Board noted that, as set forth in the reports provided by the Adviser, there had been no material compliance issues or concerns raised or encountered since the last renewal of the Agreement and that there had been no material compliance issues in the past 36 months with respect to the Fund or any other fund managed by the Adviser. The Board then considered key risks associated with the Fund and ways in which those risks are mitigated. Taking in to account the personnel involved in servicing the Fund as well as the materials provided by the Adviser, the Board expressed satisfaction with the quality, extent, and nature of the services expected from the Adviser.
The Board reviewed the investment performance of the Fund and examined the selected peer groups and benchmark for the Fund. The Board reviewed the Fund’s performance compared to a peer selection based on the eVestment Large Cap Value universe and the eVestment Large Cap US Equity universe for one-month, three-month, one-year, three-year, five-year, and since inception periods through March 31, 2020. The Board also reviewed the performance of another fund advised by the Adviser with a similar investment mandate for one-month, three-month, one-year, three-year, five-year, and since inception periods through March 31, 2020. After considering the information presented to it, the Board expressed satisfaction with the performance of the Fund and the Adviser.
The Board reviewed the cost of services provided and the profits realized by the Adviser, including assertions related to compensation and profitability. The Board discussed the advisory fee paid by the Fund and the total operating expenses of the Fund. The Board noted that the Adviser received a management fee of 0.68% of the Fund’s average daily net assets. The Board reviewed the investment advisory fee paid by the Fund in comparison to the investment advisory fees paid by the funds within the appropriate peer group, noting that the fee was competitive with the fees paid by its peers. The Board then reviewed the advisory fees paid by the other fund and accounts managed by the Adviser with similar investment mandates and noted that the Fund paid the same investment advisory fee as the fund and accounts. The Board then considered the expense cap for the Fund noting that the Adviser had contractually agreed to waive fees and or reimburse expenses to limit total annual fund operating expenses to 0.85% of the Fund’s average daily net assets. After considering the comparative data provided by the Adviser, the Board concluded that the advisory fee and expense ratio were reasonable.
The Board considered the profitability of the Adviser’s relationship with the Fund and considered the information provided by the Adviser. Among other things, the Board considered the overall financial condition of the Adviser and representations made thereto and to the overall importance of the Fund’s relationship to the Adviser’s business strategy. The Board examined the Fund’s profit margin and the Adviser’s overall profitability. The Board concluded that, based on both the written and oral reports provided by the Adviser, the profit margin was reasonable.
In considering the economies of scale for the Fund, the Board considered the marketing and distribution plans for the Fund, its capacity, and breakeven point. The Board noted than other than the investment advisory fee, the Adviser derived no other fees or monetary benefits from the Fund. The Board also noted that the Fund does not assess and the Adviser does not receive Rule 12b-1 fees, that soft dollars are not a consideration for broker selection, and that the Adviser paid all third-party research expenses directly.
In its deliberations, the Board did not identify any particular factor or factors that were all-important or controlling; and each Trustee assigned different weights to various factors considered.
25
ADVISERS INVESTMENT TRUST
IFP US EQUITY FUND
ADDITIONAL INFORMATION
September 30, 2020 (Unaudited)
On September 9, 2020 the Board of Trustees of Advisers Investment Trust considered a proposal from the Adviser to lower the management fee for the Fund from 0.88% of the Fund’s average daily net assets to 0.84% of the Fund’s average daily net assets effective October 1, 2020 through September 30, 2021, less a scale discount based on the Adviser’s combined total assets under management, and from 0.84% of the Fund’s average daily net assets to 0.80% of the Fund’s average daily net assets effective October 1, 2021, less a scale discount based on the Adviser’s combined total assets under management. In its deliberations, the Board considered information submitted by IFP in connection with the previous renewal of the Agreement on June 11, 2020 as well as performance and fee information provided by IFP regarding the reduction in fees. Among other things, the Board considered information presented to it related to the Fund’s performance and management fee compared to its peers and the impact of the management fee on profitability. The Board further noted that while the Adviser’s total assets under management remain above $5 billion, the effective overall annual fee for the Fund will be 0.64% for the period October 1, 2020 through September 30, 2021.The Board further noted that effective October 1, 2021, provided the Adviser’s total assets under management remained above $5 billion, the effective overall annual fee for the Fund would be 0.60%. The Adviser’s total assets under management at the end of each calendar quarter will be used to calculate the effective annual fee to be applied during the next calendar quarter. The Board reviewed the management fee paid by the Fund and the total operating expenses of the Fund. After considering the information provided by IFP, the Board concluded that lowering the management fee, as proposed, was reasonable.
A description of the policies and procedures that the Fund uses to determine how to vote proxies relating to portfolio securities is available (i) without charge, upon request, by writing to the Fund at Independent Franchise Partners US Equity Fund c/o The Northern Trust Company, P.O. Box 4766, Chicago, Illinois 60680-4766 or by calling the Fund at 855-351-4583 (toll free); and (ii) on the U.S. Securities and Exchange Commission’s (the “SEC”) website at www.sec.gov. Information regarding how the Fund voted proxies relating to portfolio securities during the most recent 12-month period ended June 30 is available (i) without charge, by calling the Fund at 855-351-4583 (toll free); and (ii) on the SEC’s website at www.sec.gov.
The Fund files its complete schedule of portfolio holdings with the SEC for the first and third quarters of each fiscal year as an exhibit to its reports on Form N-PORT (or on Form N-PORT’s predecessor form, Form N-Q). The Fund’s Form N-PORT reports are available on the SEC’s website at www.sec.gov. The information on Form N-PORT is also available to shareholders upon written request or by calling the Fund at 855-351-4583 (toll free).
The following table provides information regarding each Trustee who is not an “interested person” of the Trust, as defined in the 1940 Act.
| | | | | | | | | | |
Name, Address and Year of Birth1 | | Position(s) Held with the Trust | | Term of Office /Length of Time Served | | Principal Occupation(s) During Past 5 Years | | Number of Portfolios in the Trust Overseen by Trustee | | Other Directorships Held by Trustee During Past 5 Years |
D’Ray Moore Year of Birth: 1959 | | Trustee | | Indefinite/July 2011 to present | | Independent Trustee, Diamond Hill Funds 2007 to present; Chairperson, Diamond Hill Funds 2014 to present. | | 12 | | Diamond Hill Funds |
Steven R. Sutermeister Year of Birth: 1954 | | Trustee | | Indefinite/July 2011 to present | | President, Vadar Capital LLC, 2008 to 2017. | | 12 | | None |
Michael M. Van Buskirk Year of Birth: 1947 | | Trustee | | Indefinite/July 2011 to present | | Independent Trustee, Boston Trust Walden Funds 1992 to present. | | 12 | | Boston Trust Walden Funds |
1 The mailing address of each Trustee is 50 S. LaSalle Street, Chicago, Illinois 60603.
26
ADVISERS INVESTMENT TRUST
IFP US EQUITY FUND
ADDITIONAL INFORMATION
September 30, 2020 (Unaudited)
The following table provides information regarding each Trustee who is an “interested person” of the Trust, as defined in the 1940Act, and each officer of the Trust.
| | | | | | | | | | |
Name, Address and Year of Birth1 | | Position(s) Held with the Trust | | Term of Office/ Length of Time Served | | Principal Occupation(s) During Past 5 Years | | Number of Portfolios in the Trust Overseen by Trustee | | Other Directorships Held by Trustee During Past 5 Years |
David M. Whitaker2 Year of Birth: 1971 | | Trustee | | Indefinite/ July 2017 to present | | President, Foreside Financial Group, LLC, 2011 to present; Director, Portland Air Freight, 2011 to present; Director, National Investment Company Service Association (NICSA) 2018 to present. | | 12 | | PAF Transportation |
Daniel P. Houlihan3 Year of Birth: 1966 | | Trustee | | Indefinite/ March 2016 to present | | Executive Vice President, The Northern Trust Company, 2008 to present; Chairman, National Investment Company Service Association (NICSA) 2017 to present; Vice Chairman, National Investment Company Service Association (NICSA) 2014 to 2017. | | 12 | | None |
Barbara J. Nelligan Year of Birth: 1969 | | President | | Indefinite/ August 2017 to present | | Senior Vice President, Global Fund Services Fund Governance Solutions, The Northern Trust Company, 2018 to present; Senior Vice President, Global Fund Services Product Management, The Northern Trust Company, 2007 to 2018; Vice President of Advisers Investment Trust, 2012 to 2017. | | N/A | | N/A |
Scott Craven Jones Year of Birth: 1962 | | Risk Officer | | Indefinite/ July 2014 to present | | Director, Carne Global Financial Services, Inc., 2013 to present. | | N/A | | N/A |
Rodney L. Ruehle Year of Birth: 1968 | | Chief Compliance Officer and AML Officer | | Indefinite/ March 2019 to present | | Director, Foreside Fund Officer Services, LLC (formerly Foreside Compliance Services, LLC) (financial services) (2016 to present); Director, Beacon Hill Fund Services, LLC (April 2008 to July 2016). | | N/A | | N/A |
Troy Sheets Year of Birth: 1971 | | Treasurer | | Indefinite/ July 2011 to present | | Senior Director, Foreside Financial Group, LLC, 2016 to present; Director, Beacon Hill Fund Services, Inc., 2009 to 2016. | | N/A | | N/A |
27
ADVISERS INVESTMENT TRUST
IFP US EQUITY FUND
ADDITIONAL INFORMATION
September 30, 2020 (Unaudited)
| | | | | | | | | | |
Name, Address and Year of Birth1 | | Position(s) Held with the Trust | | Term of Office/ Length of Time Served | | Principal Occupation(s) During Past 5 Years | | Number of Portfolios in the Trust Overseen by Trustee | | Other Directorships Held by Trustee During Past 5 Years |
Trent Statczar Year of Birth: 1971 | | Assistant Treasurer | | Indefinite/ July 2011 to present | | Senior Director, Foreside Financial Group, LLC, 2016 to present; Director, Beacon Hill Fund Services, Inc., 2008 to 2016. | | N/A | | N/A |
Toni M. Bugni Year of Birth: 1973 | | Secretary | | Indefinite/ March 2018 to present | | Senior Vice President, Global Fund Services Fund Governance Solutions, The Northern Trust Company, 2011 to present. | | N/A | | N/A |
Deanna Y. Pellack Year of Birth: 1987 | | Assistant Secretary | | Indefinite/ March 2018 to present | | Vice President, Global Fund Services, Fund Governance Solutions, The Northern Trust Company 2019 to present; Second Vice President, Global Fund Services Fund Governance Solutions, The Northern Trust Company 2014 to 2019. | | N/A | | N/A |
1The mailing address of Messrs. Whitaker, Ruehle, Sheets, and Statczar is 690 Taylor Road, Suite 210, Gahanna, Ohio 43230. The mailing address of Messrs. Houlihan and Jones and Mses. Nelligan, Bugni, and Pellack is 50 S. LaSalle Street, Chicago, IL 60603.
2 Mr. Whitaker is the President of Foreside Financial Group, LLC and is therefore deemed to be an “interested person” of the Trust, as defined in the 1940 Act.
3 Mr. Houlihan is an Executive Vice President of the Northern Trust Company and is therefore deemed to be an “interested person” of the Trust, as defined in the 1940 Act.
The Fund’s Statement of Additional Information includes additional information about the Trust’s Trustees and Officers. To receive your free copy of the Statement of Additional Information, call toll-free 855-233-0437.
28
Independent Franchise Partners US Equity Fund
(Series of the Advisers Investment Trust)
Privacy Policy
SAFEGUARDING PRIVACY
We recognize and respect the privacy expectations of each of our investors and we believe the confidentiality and protection of investor information is one of our fundamental responsibilities. New technologies have dramatically changed the way information is gathered and used, but our continuing commitment to preserving the security and confidentiality of investor information has remained a core value of the Independent Franchise Partners US Equity Fund.
INFORMATION WE COLLECT AND SOURCES OF INFORMATION
We may collect information about our customers to help identify you, evaluate your application, service and manage your account and offer services and products you may find valuable. We collect this information from a variety of sources including:
| · | | Information we receive from you on applications or other forms (e.g. your name, address, date of birth, social security number and investment information); |
| · | | Information about your transactions and experiences with us and our affiliates (e.g. your account balance, transaction history and investment selections); and |
| · | | Information we obtain from third parties regarding their brokerage, investment advisory, custodial or other relationship with you (e.g. your account number, account balance and transaction history. |
INFORMATION WE SHARE WITH SERVICE PROVIDERS
We may disclose all non-public personal information we collect, as described above, to companies (including affiliates) that perform services on our behalf, including those that assist us in responding to inquiries, processing transactions, preparing and mailing account statements and other forms of shareholder services provided they use the information solely for these purposes and they enter into a confidentiality agreements regarding the information.
INFORMATION WE MAY SHARE WITH AFFILIATES
If we have affiliates which are financial service providers that offer investment advisory, brokerage and other financial services, we may (subject to Board approval) share information among our affiliates to better assist you in achieving your financial goals.
SAFEGUARDING CUSTOMER INFORMATION
We will safeguard, according to federal standards of security and confidentiality, any non-public personal information our customers share with us.
We will limit the collection and use of non-public customer information to the minimum necessary to deliver superior service to our customers which includes advising our customers about our products and services and to administer our business.
We will permit only authorized employees who are trained in the proper handling of non-public customer information to have access to that information.
We will not reveal non-public customer information to any external organization unless we have previously informed the customer in disclosures or agreements, have been authorized by the customer or are required by law or our regulators.
We value you as a customer and take your personal privacy seriously. We will inform you of our policies for collecting, using, securing and sharing nonpublic personal information the first time we do business and every year that you are a customer of the Independent Franchise Partners US Equity Fund or anytime we make a material change to our privacy policy.
Investment Adviser
Independent Franchise Partners, LLP
Level 1, 10 Portman Square
London, W1H 6AZ
United Kingdom
Custodian
The Northern Trust Company
50 South LaSalle Street
Chicago, Illinois 60603
Independent Registered Public
Accounting Firm
PricewaterhouseCoopers LLP
One North Wacker Drive
Chicago, Illinois 60606
Legal Counsel
Thompson Hine LLP
41 South High Street, Suite 1700
Columbus, Ohio 43215-6101
Distributor
Foreside Financial Services, LLC
3 Canal Plaza, Suite 100
Portland, ME 04101
For Additional Information, call
855-233-0437 or 312-557-7902

VONTOBEL U.S. EQUITY INSTITUTIONAL FUND
ANNUAL REPORT
September 30, 2020
This report is submitted for the general information of the shareholders of the Fund. It is not authorized for the distribution to prospective investors unless preceded or accompanied by an effective prospectus.
ADVISERS INVESTMENT TRUST
VONTOBEL U.S. EQUITY INSTITUTIONAL FUND
TABLE OF CONTENTS
September 30, 2020
ADVISERS INVESTMENT TRUST
VONTOBEL U.S. EQUITY INSTITUTIONAL FUND
PORTFOLIO COMMENTARY
September 30, 2020
Vontobel U.S. Equity Institutional Fund
Value of a hypothetical $1,000,000 investment in the Fund Class I Shares from inception on March 27, 2018 to September 30, 2020
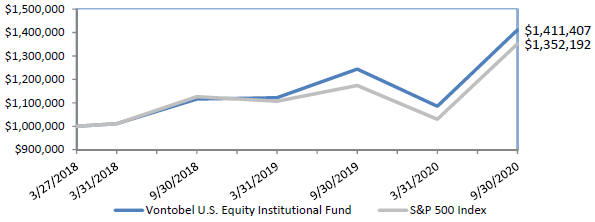
Average Annual Total Returns as of September 30, 2020
| | | | | | | | |
| | | One Year Return | | Since Inception Return | | Gross Expense Ratio * | | Net Expense Ratio * |
Vontobel U.S. Equity Institutional Fund – Class I | | 13.47% | | 14.70% | | 3.16% | | 0.66% |
S&P 500 Index | | 15.15% | | 12.76% | | - | | - |
Data as of September 30, 2020. The Fund’s performance reflects the reinvestment of dividends as well as the impact of transaction costs and the deduction of fees and expenses. The performance does not reflect taxes that a shareholder would pay on fund distributions or on the redemption of fund shares.
The Fund commenced operations on March 27, 2018.
* Expense ratios are per the most recent Fund Prospectus dated January 28, 2020. The Adviser has entered into a contractual expense limitation agreement with respect to Fund until January 28, 2021.
The performance data quoted represents past performance; past performance does not guarantee future results. The investment return and principal value of an investment will fluctuate so that an investor’s shares, when redeemed, may be worth more or less than their original cost. The Fund’s current performance may be lower or higher than the performance data quoted. Investors may obtain performance information current to the most recent month-end, within 7 business days, by calling 866-252-5393 or 312-630-6583.
The Fund’s benchmark for performance comparison purposes is the Standard and Poor’s (“S&P”) 500 Index an unmanaged index consisting of securities listed on exchanges in the United States of America. The index is calculated on a total return basis with dividends reinvested, but does not reflect fees, brokerage commissions, or other investment expenses, and is expressed in U.S. Dollars. The table reflects the theoretical reinvestment of dividends on securities in the Index. The impact of transaction costs and the deduction of expenses associated with a mutual fund, such as investment management and administration fees, are not reflected in the Index calculations. It is not possible to invest directly in an index.
1
ADVISERS INVESTMENT TRUST
VONTOBEL U.S. EQUITY INSTITUTIONAL FUND
PORTFOLIO COMMENTARY
September 30, 2020
Portfolio Commentary
For the 12 months ending September 30, 2020, the Vontobel U.S. Equity Institutional Fund underperformed its benchmark, the S&P 500 Index (Total Return Net Dividends). Our lack of exposure to energy, a sector that was down 45% for the 12 months period, was the leading contributor to relative results. Our underweight to industrials also added to relative performance. Stock selection to consumer staples was the largest detractor from relative performance followed by our underweight to information technology.
Leading contributors to Fund absolute performance during the period were Amazon.com Inc., Microsoft Corp., and Paypal Holdings Inc.
Amazon held up well earlier this year thanks in part to the increased demand for fresh food and household goods during the Covid-19 outbreak. The company has invested heavily in one-day shipping logistics and is well-placed to meet the surge in demand for e-commerce in the U.S. and globally. The company reported stronger than expected results for 2Q and guidance into 3Q as NA e-commerce growth rates have continued to remain strong. Amazon Web Services (AWS) also sustained at a high growth level. Amazon is the leading player in ecommerce in North America, and has leading positions in several markets in Europe, as well as India and Japan. Amazon was able to do this by offering very competitive pricing, free shipping for Prime members, and convenience. Amazon also has the leading position globally in Cloud services with AWS.
Microsoft stock likely benefited from expectations for continued strong trends in its Azure business, as cloud computing remains a critical resource for businesses. The company’s core software franchises (e.g. Office, Windows) should remain important despite near-term economic disruption. The company was also beneficiary of accelerated e-commerce adoption post-COVID. Once defined by its reliance on a PC-centric world, Microsoft has successfully transformed into more of a cloud first company. The company has built Azure into a leading public cloud provider, with natural strengths in hybrid cloud and ability to sell to enterprises. In addition, the shift to cloud computing is driving growth in its traditional franchises, as the company is shifting to more of a SaaS (software as a service) model. Under CEO Satya Nadella, we believe MSFT has become a much more open technology company that is now able to go after larger, addressable markets. In our view, MSFT offers an attractive combination of durable franchises and strong earnings growth.
Paypal was a beneficiary of accelerated e-commerce adoption post-COVID. PayPal has established itself as the dominant on-line digital payments business, operating in a space where many competitors have come and gone over the years. There is a long, highly visible secular tailwind of businesses moving from off-line to on-line, and PayPal is participating in that growth with a strong competitive advantage driven by its two-sided network. PayPal has successfully created closer partnerships with networks and issuers and built a more platform-based business model to get more deeply entrenched with clients and improve its value proposition. The company has also made savvy acquisitions to further bolster its product offerings and competitive position.
Leading detractors from Fund absolute performance during the period were Constellation Brands Inc., Wells Fargo & Co. and Anheuser-Busch Inbev.
Constellation Brands was down in a broad market sell-off earlier this year. We exited the position on the news that Constellation Brands’ Mexico plants would be closed for an undefined period under Mexico’s COVID-19 restrictions, putting key supply at risk.
Wells Fargo’s performance was impacted by the delays in implementing operational risk enhancements to the satisfaction of the regulators. We exited the position in late 2019.
2
ADVISERS INVESTMENT TRUST
VONTOBEL U.S. EQUITY INSTITUTIONAL FUND
PORTFOLIO COMMENTARY
September 30, 2020
Covid hit alcohol companies hard as bars, restaurants were closed and social gatherings discouraged. Anheuser-Busch InBev (ABI) is the world’s largest brewer and dominates the beer market in most of the countries in which it operates. Globally, it has roughly one fourth of beer volumes and close to one half of global beer profits. We believe ABI is best in class on costs among Consumer Staples companies, not just brewers. Management has historically executed well on its acquisitions and generates high levels of free cash.
3
ADVISERS INVESTMENT TRUST
VONTOBEL U.S. EQUITY INSTITUTIONAL FUND
SCHEDULE OF INVESTMENTS
September 30, 2020
| | | | | | | | | | |
| | | Percentage of Net Assets | | Shares | | | Value | |
COMMON STOCKS | | 99.8% | | | | | | | | |
Communication Services | | 10.6% | | | | | | | | |
Alphabet, Inc. - Class C(a) | | | | | 511 | | | $ | 750,966 | |
Comcast Corp. - Class A | | | | | 10,109 | | | | 467,642 | |
Electronic Arts, Inc.(a) | | | | | 3,854 | | | | 502,600 | |
Walt Disney (The) Co. | | | | | 2,985 | | | | 370,379 | |
| | | | | | | | | | |
| | | | | | | | | 2,091,587 | |
| | | | | | | | | | |
Consumer Discretionary | | 16.3% | | | | | | | | |
Amazon.com, Inc.(a) | | | | | 337 | | | | 1,061,122 | |
Booking Holdings, Inc.(a) | | | | | 174 | | | | 297,658 | |
Dollar General Corp. | | | | | 2,343 | | | | 491,140 | |
Home Depot (The), Inc. | | | | | 1,076 | | | | 298,816 | |
NIKE, Inc. - Class B | | | | | 1,879 | | | | 235,890 | |
O’Reilly Automotive, Inc.(a) | | | | | 436 | | | | 201,031 | |
Ross Stores, Inc. | | | | | 4,849 | | | | 452,509 | |
Starbucks Corp. | | | | | 2,247 | | | | 193,062 | |
| | | | | | | | | | |
| | | | | | | | | 3,231,228 | |
| | | | | | | | | | |
Consumer Staples | | 17.2% | | | | | | | | |
Alimentation Couche-Tard, Inc. - Class B | | | | | 18,065 | | | | 629,097 | |
Anheuser-Busch InBev S.A./N.V. - ADR | | | | | 4,411 | | | | 237,665 | |
Casey’s General Stores, Inc. | | | | | 1,784 | | | | 316,928 | |
Coca-Cola (The) Co. | | | | | 12,173 | | | | 600,981 | |
Hershey (The) Co. | | | | | 2,437 | | | | 349,319 | |
Mondelez International, Inc. - Class A | | | | | 13,421 | | | | 771,036 | |
PepsiCo, Inc. | | | | | 3,595 | | | | 498,267 | |
| | | | | | | | | | |
| | | | | | | | | 3,403,293 | |
| | | | | | | | | | |
Financials | | 7.1% | | | | | | | | |
Berkshire Hathaway, Inc. - Class B(a) | | | | | 4,070 | | | | 866,666 | |
CME Group, Inc. | | | | | 2,183 | | | | 365,237 | |
M&T Bank Corp. | | | | | 1,853 | | | | 170,643 | |
| | | | | | | | | | |
| | | | | | | | | 1,402,546 | |
| | | | | | | | | | |
Health Care | | 18.4% | | | | | | | | |
Abbott Laboratories | | | | | 2,862 | | | | 311,471 | |
Becton Dickinson and Co. | | | | | 2,168 | | | | 504,450 | |
Boston Scientific Corp.(a) | | | | | 13,347 | | | | 509,989 | |
Intuitive Surgical, Inc.(a) | | | | | 506 | | | | 359,027 | |
Johnson & Johnson | | | | | 5,065 | | | | 754,077 | |
Medtronic PLC | | | | | 4,317 | | | | 448,623 | |
UnitedHealth Group, Inc. | | | | | 2,458 | | | | 766,331 | |
| | | | | | | | | | |
| | | | | | | | | 3,653,968 | |
| | | | | | | | | | |
Industrials | | 3.6% | | | | | | | | |
Copart, Inc.(a) | | | | | 1,970 | | | | 207,165 | |
Graco, Inc. | | | | | 3,458 | | | | 212,148 | |
Northrop Grumman Corp. | | | | | 946 | | | | 298,454 | |
| | | | | | | | | | |
| | | | | | | | | 717,767 | |
| | | | | | | | | | |
See Notes to Financial Statements.
4
ADVISERS INVESTMENT TRUST
VONTOBEL U.S. EQUITY INSTITUTIONAL FUND
SCHEDULE OF INVESTMENTS
September 30, 2020
| | | | | | | | | | | | |
| | | Percentage of Net Assets | | | Shares | | | Value | |
Information Technology | | | 24.9% | | | | | | | | | |
Adobe, Inc.(a) | | | | | | | 820 | | | $ | 402,153 | |
Keysight Technologies, Inc.(a) | | | | | | | 4,218 | | | | 416,654 | |
Mastercard, Inc. - Class A | | | | | | | 2,048 | | | | 692,572 | |
Microsoft Corp. | | | | | | | 6,078 | | | | 1,278,386 | |
Motorola Solutions, Inc. | | | | | | | 2,478 | | | | 388,575 | |
PayPal Holdings, Inc.(a) | | | | | | | 2,033 | | | | 400,562 | |
salesforce.com, Inc.(a) | | | | | | | 812 | | | | 204,072 | |
Synopsys, Inc.(a) | | | | | | | 967 | | | | 206,919 | |
Teradyne, Inc. | | | | | | | 3,337 | | | | 265,158 | |
Visa, Inc. - Class A | | | | | | | 3,448 | | | | 689,496 | |
| | | | | | | | | | | | |
| | | | | | | | | | | 4,944,547 | |
| | | | | | | | | | | | |
Materials | | | 1.7% | | | | | | | | | |
Sherwin-Williams (The) Co. | | | | | | | 488 | | | | 340,009 | |
| | | | | | | | | | | | |
TOTAL COMMON STOCKS (Cost $15,347,552) | | | | | | | | | | | 19,784,945 | |
| | | | | | | | | | | | |
SHORT-TERM INVESTMENTS | | | 0.1% | | | | | | | | | |
Northern Institutional U.S. Government Select Portfolio – Shares Class, 0.03%(b) | | | | | | | 10,826 | | | | 10,826 | |
| | | | | | | | | | | | |
TOTAL SHORT-TERM INVESTMENTS (Cost $10,826) | | | | | | | | | | | 10,826 | |
| | | | | | | | | | | | |
TOTAL INVESTMENTS
(Cost $15,358,378) | | | 99.9% | | | | | | | | 19,795,771 | |
NET OTHER ASSETS (LIABILITIES) | | | 0.1% | | | | | | | | 20,638 | |
| | | | | | | | | | | | |
NET ASSETS | | | 100.0% | | | | | | | $ | 19,816,409 | |
| | | | | | | | | | | | |
(a)Non-income producing security.
(b)7-day current yield as of September 30, 2020 is disclosed.
Abbreviations:
ADR – American Depositary Receipt
At September 30, 2020, the Vontobel U.S. Equity Institutional Fund’s investments (excluding short-term investments) were domiciled in the following countries:
| | |
| CONCENTRATION BY COUNTRY | | % OF NET ASSETS |
United States | | 93.2% |
Canada | | 3.2 |
Ireland | | 2.2 |
All other countries less than 2% | | 1.2 |
Total | | 99.8% |
See Notes to Financial Statements.
5
ADVISERS INVESTMENT TRUST
STATEMENT OF ASSETS & LIABILITIES
September 30, 2020
| | | | |
| | | Vontobel U.S. Equity Institutional Fund | |
| |
Assets: | | | | |
Investments, at value (Cost: $15,358,378) | | $ | 19,795,771 | |
Receivable for dividends | | | 13,147 | |
Reclaims receivable | | | 3,363 | |
Receivable for investments sold | | | 77,035 | |
Receivable from Investment Adviser | | | 54,522 | |
Prepaid expenses | | | 3,992 | |
| | | | |
Total Assets | | | 19,947,830 | |
Liabilities: | | | | |
Accounting and Administration fees payable | | | 74,041 | |
Regulatory and Compliance fees payable | | | 12,295 | |
Accrued expenses and other payables | | | 45,085 | |
| | | | |
Total Liabilities | | | 131,421 | |
| | | | |
Net Assets | | $ | 19,816,409 | |
| | | | |
| |
Class I Shares: | | | | |
Net assets | | $ | 19,816,409 | |
Shares of common stock outstanding | | | 1,439,443 | |
| | | | |
Net asset value per share | | $ | 13.77 | |
| | | | |
Net Assets: | | | | |
Paid in capital | | $ | 15,019,368 | |
Distributable earnings (loss) | | | 4,797,041 | |
| | | | |
Net Assets | | $ | 19,816,409 | |
| | | | |
See Notes to Financial Statements.
6
ADVISERS INVESTMENT TRUST
STATEMENT OF OPERATIONS
For the year ended September 30, 2020
| | | | |
| | | Vontobel U.S. Equity Institutional Fund | |
| |
Investment Income: | | | | |
Dividend income (Net of foreign withholding tax of $2,411) | | $ | 207,022 | |
Operating expenses: | | | | |
Investment advisory | | | 87,237 | |
Accounting and Administration | | | 166,870 | |
Regulatory and Compliance | | | 150,103 | |
Trustees | | | 52,830 | |
Legal | | | 33,711 | |
Other | | | 89,867 | |
| | | | |
Total expenses before reductions | | | 580,618 | |
Expenses reduced by Adviser | | | (467,284 | ) |
| | | | |
Net expenses | | | 113,334 | |
| | | | |
Net investment income | | | 93,688 | |
| | | | |
Realized and Unrealized Gains (Losses) from Investment Activities: | | | | |
Net realized gains from investment transactions | | | 379,659 | |
Net realized losses from foreign currency transactions | | | (314 | ) |
Change in unrealized appreciation (depreciation) on investments | | | 2,030,417 | |
Change in unrealized appreciation (depreciation) on foreign currency | | | 1 | |
| | | | |
Net realized and unrealized gains from investment activities | | | 2,409,763 | |
| | | | |
Change in Net Assets Resulting from Operations | | $ | 2,503,451 | |
| | | | |
See Notes to Financial Statements.
7
ADVISERS INVESTMENT TRUST
STATEMENTS OF CHANGES IN NET ASSETS
For the years ended September 30, 2020 and 2019
| | | | | | | | |
| | | Vontobel
U.S. Equity
Institutional Fund | |
| | | 2020 | | | 2019 | |
| |
Increase (decrease) in net assets: | | | | | | | | |
Operations: | | | | | | | | |
Net investment income | | $ | 93,688 | | | $ | 105,426 | |
Net realized gains (losses) from investment and foreign currency transactions | | | 379,345 | | | | 150,010 | |
Change in unrealized appreciation (depreciation) on investments and foreign currency | | | 2,030,418 | | | | 1,241,764 | |
| | | | | | | | |
Change in net assets resulting from operations | | | 2,503,451 | | | | 1,497,200 | |
| | | | | | | | |
Dividends paid to shareholders: | | | | | | | | |
From distributable earnings | | | (300,442 | ) | | | (76,471 | ) |
| | | | | | | | |
Total dividends paid to shareholders | | | (300,442 | ) | | | (76,471 | ) |
| | | | | | | | �� |
Capital Transactions (Class I Shares): | | | | | | | | |
Proceeds from sale of shares | | | 1,715,528 | | | | 3,069,595 | |
Value of shares issued to shareholders in reinvestment of dividends | | | 38,536 | | | | 3,538 | |
Value of shares redeemed | | | (61,399 | ) | | | (43 | ) |
| | | | | | | | |
Change in net assets from capital transactions | | | 1,692,665 | | | | 3,073,090 | |
| | | | | | | | |
Change in net assets | | | 3,895,674 | | | | 4,493,819 | |
Net assets: | | | | | | | | |
Beginning of year | | | 15,920,735 | | | | 11,426,916 | |
| | | | | | | | |
End of year | | $ | 19,816,409 | | | $ | 15,920,735 | |
| | | | | | | | |
Share Transactions (Class I Shares): | | | | | | | | |
Sold | | | 151,580 | | | | 265,460 | |
Reinvested | | | 3,001 | | | | 349 | |
Redeemed | | | (4,570 | ) | | | (4 | ) |
| | | | | | | | |
Change | | | 150,011 | | | | 265,805 | |
| | | | | | | | |
See Notes to Financial Statements.
8
ADVISERS INVESTMENT TRUST
FINANCIAL HIGHLIGHTS
For the periods indicated
| | | | | | | | | | | | | | | | |
| Vontobel U.S. Equity Institutional Fund | | | | | Year Ended September 30, 2020 | | | Year Ended September 30, 2019 | | | Period Ended September 30, 2018(a) | |
| |
Net asset value, beginning of period | | | | | | $ | 12.35 | | | $ | 11.16 | | | $ | 10.00 | |
| | | | | | | | | | | | | | | | |
Income (loss) from investment operations: | | | | | | | | | | | | | | | | |
Net investment income(b) | | | | | | | 0.07 | | | | 0.09 | | | | 0.05 | |
Net realized and unrealized gains from investments | | | | | | | 1.58 | | | | 1.17 | | | | 1.11 | |
| | | | | | | | | | | | | | | | |
Total from investment operations | | | | | | | 1.65 | | | | 1.26 | | | | 1.16 | |
| | | | | | | | | | | | | | | | |
Less distributions paid: | | | | | | | | | | | | | | | | |
From net investment income | | | | | | | (0.09 | ) | | | (0.07 | ) | | | — | |
From net realized gains | | | | | | | (0.14 | ) | | | — | | | | — | |
| | | | | | | | | | | | | | | | |
Total distributions paid | | | | | | | (0.23 | ) | | | (0.07 | ) | | | — | |
| | | | | | | | | | | | | | | | |
Change in net asset value | | | | | | | 1.42 | | | | 1.19 | | | | 1.16 | |
| | | | | | | | | | | | | | | | |
Net asset value, end of period | | | | | | $ | 13.77 | | | $ | 12.35 | | | $ | 11.16 | |
| | | | | | | | | | | | | | | | |
| | | | |
Total return(c) | | | | | | | 13.47 | % | | | 11.46 | % | | | 11.60 | % |
Ratios/Supplemental data: | | | | | | | | | | | | | | | | |
Net assets, end of period (000’s) | | | | | | $ | 19,816 | | | $ | 15,921 | | | $ | 11,427 | |
Ratio of net expenses to average net assets(d) | | | | | | | 0.65 | % | | | 0.65 | % | | | 0.65 | % |
Ratio of net investment income to average net assets(d) | | | | | | | 0.54 | % | | | 0.82 | % | | | 0.84 | % |
Ratio of gross expenses to average net assets(d) | | | | | | | 3.33 | % | | | 3.15 | % | | | 2.93 | % |
Portfolio turnover rate(c) | | | | | | | 57.97 | % | | | 27.31 | % | | | 20.78 | % |
| (a) | For the period from March 27, 2018, commencement of operations, to September 30, 2018. |
| (b) | Net investment income (loss) for the period ended was calculated using the average shares outstanding method. |
| (c) | Not annualized for periods less than one year. |
| (d) | Annualized for periods less than one year. |
See Notes to Financial Statements.
9
ADVISERS INVESTMENT TRUST
VONTOBEL U.S. EQUITY INSTITUTIONAL FUND
NOTES TO FINANCIAL STATEMENTS
September 30, 2020
Advisers Investment Trust (the “Trust”) is a Delaware statutory trust operating under a Second Amended and Restated Agreement and Declaration of Trust (the “Trust Agreement”) dated June 21, 2018. The Trust was formerly an Ohio business trust, which commenced operations on December 20, 2011. On March 31, 2017, the Trust was converted to a Delaware statutory trust. As an open-end registered investment company, as defined in Financial Accounting Standards Board (“FASB”) Accounting Standards Update (“ASU”) 2013-08, the Trust follows accounting and reporting guidance under FASB Accounting Standards Codification (“ASC”) Topic 946, “Financial Services – Investment Companies”. The Trust Agreement permits the Board of Trustees (the “Trustees” or “Board”) to authorize and issue an unlimited number of shares of beneficial interest, at no par value, in separate series of the Trust. The Vontobel U.S. Equity Institutional Fund (the “Fund”) is a series of the Trust and commenced operations on March 27, 2018. These financial statements and notes only relate to the Fund.
The Fund is a diversified fund. The investment objective of the Fund is to provide long-term capital appreciation.
Under the Trust’s organizational documents, its officers and Trustees are indemnified against certain liabilities arising out of the performance of their duties to the Trust and Fund. In addition, in the normal course of business, the Trust enters into contracts with its vendors and others that provide for general indemnifications. The Fund’s maximum exposure under these arrangements is unknown, as this would involve future claims that may be made against the Fund.
| A. | Significant accounting policies are as follows: |
INVESTMENT VALUATION
Investments are recorded at fair value. Fair value is defined as the price that would be received to sell an asset or paid to transfer a liability in an orderly transaction between market participants at the measurement date. The valuation techniques employed by the Fund, as described below, maximize the use of observable inputs and minimize the use of unobservable inputs in determining fair value. These inputs are summarized in the following three broad levels:
| • | | Level 1 — quoted prices in active markets for identical assets |
| • | | Level 2 — other significant observable inputs (including quoted prices of similar securities, interest rates, prepayment speeds, credit risk, etc.) |
| • | | Level 3 — significant unobservable inputs (including the Fund’s own assumptions in determining the fair value of investments) |
The inputs or methodology used for valuing securities are not necessarily an indication of the risk associated with investing in those securities. For example, certain short-term debt securities may be valued using amortized cost. Generally, amortized cost approximates the current value of a security, but since this valuation is not obtained from a quoted price in an active market, such securities would be reflected as Level 2 in the fair value hierarchy.
Security prices are generally provided by an independent third party pricing service approved by the Trustees as of the close of the New York Stock Exchange, normally at 4:00 p.m. Eastern Time, each business day on which the share price of the Fund is calculated. Equity securities listed or traded on a primary exchange are valued at the closing price, if available, or the last sales price on the primary exchange. If no sale occurred on the valuation date, the securities will be valued at the latest quotations as of the close of the primary exchange. Investments in other open-end registered investment companies are valued at their respective net asset value as reported by such companies. In these types of situations, valuations are typically categorized as Level 1 in the fair value hierarchy.
Debt and other fixed income securities, if any, are generally valued at an evaluated price provided by an independent pricing source approved by the Trustees. To value debt securities, pricing services may use various pricing techniques, which take into account appropriate factors such as market activity, yield, quality, coupon rate, maturity, type of issue, trading characteristics, call features, credit ratings and other data, as well as broker quotes. Short-term debt securities of sufficient credit quality that mature within sixty days may be valued at amortized cost, which approximates fair value. In each of these situations, valuations are typically categorized as Level 2 in the fair value hierarchy.
10
ADVISERS INVESTMENT TRUST
VONTOBEL U.S. EQUITY INSTITUTIONAL FUND
NOTES TO FINANCIAL STATEMENTS
September 30, 2020
When the price of a security is not readily available or deemed unreliable (e.g., an approved pricing service does not provide a price, a furnished price is in error, certain stale prices, or an event occurs that materially affects the furnished price), the Fund’s Fair Value Committee may in good faith establish a fair value for that security in accordance with procedures established by and under the general supervision of the Trustees. In addition, fair value pricing may be used if events materially affecting the value of foreign securities occur between the time when the exchange on which they are traded closes and the time when the Fund’s net asset value is calculated. The Fund identifies possible fluctuations in international securities by monitoring the increase or decrease in the value of a designated benchmark index. In the event of an increase or decrease greater than predetermined levels, the Fund may use a systematic valuation model provided by an independent third party pricing service to fair value its international equity securities.
In the fair value situations noted above, while the Trust’s valuation policy is intended to result in a calculation of the Fund’s net asset value that fairly reflects security values as of the time of pricing, the Trust cannot ensure that fair values determined pursuant to these guidelines would accurately reflect the price that the Fund could obtain for a security if it were to dispose of that security as of the time of pricing (for instance, in a forced or distressed sale). The prices used by the Fund may differ from the value that would be realized if the securities were sold, and these differences could be material to the financial statements. Depending on the source and relative significance of the valuation inputs in these instances, the instruments may be classified as Level 2 or Level 3 in the fair value hierarchy.
The following is a summary of the valuation inputs used as of September 30, 2020 in valuing the Fund’s investments based upon the three fair value levels defined above:
| | | | | | | | | | | | | | | | |
| Fund | | Level 1 - Quoted Prices | | | Level 2 - Other Significant Observable Inputs | | | Level 3 - Significant Unobservable Inputs | | | Total | |
| |
Vontobel U.S. Equity Institutional Fund | | | | | | | | | | | | | | | | |
Common Stocks* | | $ | 19,784,945 | | | $ | — | | | $ | — | | | $ | 19,784,945 | |
Short-Term Investments | | | 10,826 | | | | — | | | | — | | | | 10,826 | |
| | | | |
Total Investments | | $ | 19,795,771 | | | $ | — | | | $ | — | | | $ | 19,795,771 | |
| | | | |
*See additional categories in the Schedule of Investments.
As of September 30, 2020 there were no Level 2 or Level 3 securities held by the Fund. There were no transfers to or from Level 3 during the year ended September 30, 2020.
CURRENCY TRANSACTIONS
The functional and reporting currency for the Fund is the U.S. dollar. The market values of foreign securities, currency holdings and other assets and liabilities are translated into U.S. dollars based on the current exchange rates each business day. Purchases and sales of securities and income and expense items denominated in foreign currencies are translated into U.S. dollars at the exchange rate in effect on the transaction date. The Fund does not separately report the effects of changes in foreign exchange rates from changes in market prices on securities held. Such changes are included in Net realized and unrealized gains (losses) from investment activities on the Statements of Operations. The Fund may invest in foreign currency-denominated securities and may engage in foreign currency transactions either on a spot (cash) basis at the rate prevailing in the currency exchange market at the time or through a forward foreign currency contract. Realized foreign exchange gains or losses arising from sales of spot foreign currencies, currency gains or losses realized between the trade and settlement dates on securities transactions and the difference between the recorded amounts of dividends, interest, and foreign withholding taxes and the U.S. dollar equivalent of the amounts actually received or paid are included in Net realized gains (losses) from foreign currency transactions on the Statements of Operations. Net unrealized foreign exchange gains (losses) arising from changes in foreign exchange rates on foreign denominated assets and liabilities other than investments in securities held at the end of the reporting period are included in Change in unrealized appreciation (depreciation) on foreign currency on the Statement of Operations.
11
ADVISERS INVESTMENT TRUST
VONTOBEL U.S. EQUITY INSTITUTIONAL FUND
NOTES TO FINANCIAL STATEMENTS
September 30, 2020
The Fund may engage in spot currency transactions for the purpose of foreign security settlement and operational processes. Changes in foreign currency exchange rates will affect the value of the Fund’s securities and the price of the Fund’s shares. Generally, when the value of the U.S. dollar rises in value relative to a foreign currency, an investment in that country loses value because that currency is worth fewer U.S. dollars. Devaluation of a currency by a country’s government or banking authority also may have a significant impact on the value of any investments denominated in that currency. Currency markets generally are not as regulated as securities markets.
INVESTMENT TRANSACTIONS AND INCOME
Investment transactions are accounted for no later than one business day after trade date. For financial reporting purposes, investments are reported as of the trade date. The Fund determines the gain or loss realized from investment transactions by using an identified cost basis method. Interest income is recognized on an accrual basis and includes, where applicable, the amortization of premium or accretion of discount. Dividend income is recognized on the ex-dividend date. Dividends from foreign securities are recorded on the ex-dividend date, or as soon as the information is available.
EXPENSE ALLOCATIONS
Expenses directly attributable to a fund in the Trust are charged to that fund, while expenses that are attributable to more than one fund in the Trust are allocated among the applicable funds on a pro-rata basis to each adviser’s series of funds based on relative net assets or another reasonable basis.
DIVIDENDS AND DISTRIBUTIONS
The Fund intends to distribute substantially all of its net investment income as dividends to shareholders on an annual basis. The Fund intends to distribute its net realized long-term capital gains and its net realized short-term capital gains at least once a year.
Distributions from net investment income and from net realized capital gain are determined in accordance with Federal income tax regulations, which may differ from accounting principles generally accepted in the United States of America (“GAAP”). These “book/tax” differences are either considered temporary or permanent in nature. To the extent these differences are permanent in nature (e.g. treatment of certain dividend distributions, gains/losses, return of capital etc.), such amounts are reclassified within the composition of net assets based on their federal tax-basis treatment; temporary differences do not require reclassification. Distributions to shareholders that exceed net investment income and net realized capital gains for tax purposes are reported as return of capital.
FEDERAL INCOME TAX INFORMATION
No provision is made for Federal income taxes as the Fund intends to qualify each year as a “regulated investment company” under Subchapter M of the Internal Revenue Code of 1986, as amended (the “Code”), and distribute substantially all of its net investment income and net realized capital gain in accordance with the Code.
As of September 30, 2020, the Fund did not have uncertain tax positions that would require financial statement recognition or disclosure based on an evaluation of all open tax years for all major tax jurisdictions. The Fund’s tax return for the tax years ended September 30, 2020, 2019, and 2018 remain subject to examination by the Internal Revenue Service. Interest or penalties incurred, if any, on future unknown, uncertain tax positions taken by the Fund will be recorded as interest expense on the Statement of Operations.
Management is not aware of any tax positions for which it is reasonably possible that the total amounts of unrecognized tax benefits will change materially in the next 12 months.
USE OF ESTIMATES
The preparation of financial statements in conformity with GAAP requires management to make estimates and assumptions that affect the reported amounts of assets and liabilities and disclosure of contingent assets and liabilities at the date of the financial statements and the reported amounts of revenues and expenses during the reporting period. Actual results could differ from these estimates.
12
ADVISERS INVESTMENT TRUST
VONTOBEL U.S. EQUITY INSTITUTIONAL FUND
NOTES TO FINANCIAL STATEMENTS
September 30, 2020
OTHER RISKS
Securities markets outside the United States (“U.S.”), while growing in volume, have for the most part substantially less volume than U.S. markets, and many securities traded on these foreign markets are less liquid and their prices are more volatile than securities of comparable U.S. companies. In addition, settlement of trades in some non-U.S. markets is much slower and more subject to failure than in U.S. markets. Other risks associated with investing in foreign securities include, among other things, imposition of exchange control regulation by the U.S. or foreign governments, U.S. and foreign withholding taxes, limitations on the removal of funds or other assets, policies of governments with respect to possible nationalization of their industries, and economic or political instability in foreign nations. There may be less publicly available information about certain foreign companies than would be the case for comparable companies in the U.S., and certain foreign companies may not be subject to accounting, auditing and financial reporting standards and requirements comparable to or as uniform as those of U.S. companies.
The recent global outbreak of COVID-19 has disrupted economies and markets, and the prolonged duration and economic impact is uncertain. These events can have a significant impact to the Fund’s operations and performance.
| B. | Fees and Transactions with Affiliates and Other Parties |
The Trust, on behalf of the Fund, has entered into an Amended and Restated Investment Advisory Agreement (the “Agreement”) with Vontobel Asset Management, Inc. (the “Adviser” or “Vontobel”) to provide investment advisory services to the Fund. Under the terms of the Agreement, the Fund pays the Adviser an annual fee based on the Fund’s daily net assets as set forth in the following table. The total fees incurred by the Fund pursuant to the Agreement is reflected as “Investment advisory” fees on the Statements of Operations. In addition, the Adviser has contractually agreed to waive fees and reimburse expenses to the extent that Total Annual Operating Expenses (exclusive of brokerage and other transaction expenses relating to the purchase or sale of portfolio investments, interest, taxes, short sale dividends and financing costs associated with the use of the cash proceeds on securities sold short, litigation and indemnification expenses, expenses with underlying investment companies and extraordinary expenses) exceed the rates in the table below.
| | | | | | |
| Fund | | Class | | Advisory Fee | | Expense Limitation |
|
Vontobel U.S. Equity Institutional Fund | | Class I | | 0.50% on First $500 million | | 0.65% |
| | | | 0.45% on assets over $500 million | | |
The expense limitation agreement is effective until January 28, 2021 for the Fund at which time it will be subject to automatic renewal upon the effective date of the annual update to the the Fund’s registration statement. If it becomes unnecessary for the Adviser to waive fees or make reimbursements, the Adviser may recapture any of its prior waivers or reimbursements for a period not to exceed three years from the date on which the waiver or reimbursement was made to the extent that such a recapture does not cause the Total Annual Fund Operating Expenses (exclusive of brokerage and other transaction expenses relating to the purchase or sale of portfolio investments, interest, taxes, short sale dividends and financing costs associated with the use of the cash proceeds on securities sold short, litigation and indemnification expenses, expenses associated with the investments in underlying investment companies and extraordinary expenses) to exceed the current expense limitation at the time of repayment or the applicable expense limitation that was in effect at the time of the waiver or reimbursement. The agreement to waive fees and reimburse expenses may be terminated by the Board at any time and will terminate automatically upon termination of the Agreement.
13
ADVISERS INVESTMENT TRUST
VONTOBEL U.S. EQUITY INSTITUTIONAL FUND
NOTES TO FINANCIAL STATEMENTS
September 30, 2020
For the year ended September 30, 2020, the Fund incurred advisory fees payable to Vontobel, expense waivers/reimbursements from Vontobel and paid expense recoupments to Vontobel as follows:
| | | | | | | | | | | | |
| Fund | | Advisory Fee to Vontobel | | | Expenses Reduced by Vontobel | | | Advisory Fees Recouped by Vontobel | |
| |
Vontobel U.S. Equity Institutional Fund | | $ | 87,237 | | | $ | 467,286 | | | $ | — | |
The balances of recoverable expenses to Vontobel by the Fund at September 30, 2020 were as follows:
| | | | | | | | | | | | |
| For the: | | Expiring | | | | | | Vontobel | |
| |
Year Ended September 30 , 2018 | | | September 30, 2021 | | | | | | | $ | 112,057 | |
Year Ended September 30, 2019 | | | September 30, 2022 | | | | | | | | 308,332 | |
Year ended September 30, 2020 | | | September 30, 2023 | | | | | | | | 467,284 | |
| | | | | | | | | | | | |
Balances of Recoverable Expenses to the Adviser | | | | | | | | | | $ | 887,673 | |
| | | | | | | | | | | | |
Foreside Financial Services, LLC (the “Distributor”) provides distribution services to the Fund pursuant to a distribution agreement with the Trust, on behalf of the Fund. Under its agreement with the Trust, the Distributor acts as an agent of the Trust in connection with the offering of the shares of the Fund on a continuous basis. The Adviser, at its own expense, pays the Distributor $50,000 annually and reimburses for certain out-of-pocket expenses incurred on behalf of the Fund.
The Northern Trust Company (“Northern Trust”) serves as the administrator, transfer agent, custodian and fund accounting agent for the Fund pursuant to written agreements with the Trust, on behalf of the Fund. The Fund has agreed to pay Northern Trust a tiered basis-point fee based on the Fund’s daily net assets, and certain per account and transaction charges. The Fund is subject to a minimum annual fee of $150,000 relating to these services, and reimbursement for certain expenses incurred on behalf of the Fund, as well as other charges for additional service activities. Total fees paid to Northern Trust pursuant to these agreements are reflected as “Accounting and Administration” fees on the Statement of Operations.
Foreside Fund Officer Services, LLC (“Foreside”) provides compliance and financial control services for the Fund pursuant to a written agreement with the Trust, on behalf of the Fund, including providing certain officers to the Fund. The Fund has agreed to pay Foreside a tiered basis-point fee based on the Fund’s daily net assets, subject to an overall minimum annual fee of $150,000 for these services, and reimburse for certain expenses incurred on behalf of the Fund. Total fees paid to Foreside pursuant to these agreements are reflected as “Regulatory and Compliance” fees on the Statement of Operations.
Certain officers and Trustees of the Trust are affiliated with Foreside, Northern Trust, or the Distributor and receive no compensation directly from the Fund for serving in their respective roles. Through March 31, 2020 the Trust paid each Independent Trustee compensation for their services based on an annual retainer of $120,000 and reimbursement for certain expenses. Effective April 1, 2020, the Trust pays an annual retainer of $125,000 and reimbursement for certain expenses. If there are more than six meetings in a year, additional meeting fees may apply. For the year ended September 30, 2020, the aggregate Trustee compensation paid by the Trust was $367,500. The amount of total Trustee compensation and reimbursement of out-of-pocket expenses allocated from the Trust to the Fund is reflected as “Trustees” expenses on the Statements of Operations.
| C. | Investment Transactions |
For the year ended September 30, 2020, the aggregate costs of purchases and proceeds from sales of securities (excluding short-term investments) for the Fund were as follows:
| | | | | | | | |
| Fund | | Cost of Purchases | | | Proceeds from sales | |
| |
Vontobel U.S. Equity Institutional Fund | | $ | 11,641,350 | | | $ | 9,932,824 | |
14
ADVISERS INVESTMENT TRUST
VONTOBEL U.S. EQUITY INSTITUTIONAL FUND
NOTES TO FINANCIAL STATEMENTS
September 30, 2020
As of September 30, 2020, the cost, gross unrealized appreciation and gross unrealized depreciation on investments, for Federal income tax purposes, were as follows:
| | | | | | | | | | | | | | | | |
| Fund | | Tax Cost | | | Tax Unrealized Appreciation | | | Tax Unrealized (Depreciation) | | | Net Unrealized Appreciation (Depreciation) | |
| |
Vontobel U.S. Equity Institutional Fund | | $ | 15,423,290 | | | $ | 4,507,109 | | | $ | (134,628 | ) | | $ | 4,372,481 | |
The difference between the tax cost of portfolio investments and the financial statement cost is primarily due to wash sale loss deferrals.
The tax character of distributions paid to shareholders during the latest tax years ended September 30, 2020 and September 30, 2019 for the Fund were as follows:
| | | | | | | | | | | | | | | | | | | | |
| Vontobel U.S. Equity Institutional Fund | | Ordinary Income | | | Net Long Term Gains | | | Total Taxable Distributions | | | Tax Return of Capital | | | Total Distributions Paid | |
| |
| 2020 | | $ | 130,710 | | | $ | 169,732 | | | $ | 300,442 | | | $ | — | | | $ | 300,442 | |
| 2019 | | | 76,471 | | | | — | | | | 76,471 | | | | — | | | | 76,471 | |
As of the latest tax year ended September 30, 2020, the components of accumulated earnings on a tax basis were as follows:
| | | | | | | | | | | | | | | | | | | | | | | | | | | | |
| Fund | | Undistributed Ordinary Income | | | Undistributed Long Term Capital Gains | | | Accumulated Earnings | | | Distributions Payable | | | Accumulated Capital and Other Losses | | | Unrealized Appreciation | | | Total Accumulated Earnings | |
| |
Vontobel U.S. Equity Institutional Fund | | | 37,283 | | | | 387,277 | | | | 424,560 | | | | — | | | | — | | | | 4,372,481 | | | | 4,797,041 | |
| E. | Concentration by Ownership |
A significant portion of the Fund’s shares may be held in a limited number of shareholder accounts including in certain omnibus or institutional accounts which typically hold shares for the benefit of other underlying investors. To the extent that a shareholder or group of shareholders redeem a significant portion of the shares issued by the Fund, this could have a disruptive impact on the efficient implementation of the Fund’s investment strategy.
15
Report of Independent Registered Public Accounting Firm
To the Shareholders and the Board of Trustees of Vontobel U.S. Equity Institutional Fund
Opinion on the Financial Statements
We have audited the accompanying statement of assets and liabilities of Vontobel U.S. Equity Institutional Fund (the “Fund”) (one of the funds constituting Advisers Investment Trust (the “Trust”), including the schedule of investments, as of September 30, 2020, and the related statement of operations for the year ended September 30, 2020, and the statements of changes in net assets for the years ended September 30, 2020 and September 30, 2019, the financial highlights for the years ended September 30, 2020 and September 30, 2019, and the period from March 27, 2018 (commencement of operations) through September 30, 2018 and the related notes (collectively referred to as the “financial statements”). In our opinion, the financial statements present fairly, in all material respects, the financial position of the Fund (one of the funds constituting Advisers Investment Trust) at September 30, 2020, the results of its operations for the year ended September 30, 2020, the changes in its net assets for the years ended September 30, 2020 and September 30, 2019 and its financial highlights for the years ended September 30, 2020 and September 30, 2019, and the period from March 27, 2018 (commencement of operations) through September 30, 2018, in conformity with U.S. generally accepted accounting principles.
Basis for Opinion
These financial statements are the responsibility of the Trust’s management. Our responsibility is to express an opinion on the Fund’s financial statements based on our audits. We are a public accounting firm registered with the Public Company Accounting Oversight Board (United States) (“PCAOB”) and are required to be independent with respect to the Trust in accordance with the U.S. federal securities laws and the applicable rules and regulations of the Securities and Exchange Commission and the PCAOB.
We conducted our audits in accordance with the standards of the PCAOB. Those standards require that we plan and perform the audit to obtain reasonable assurance about whether the financial statements are free of material misstatement, whether due to error or fraud. The Trust is not required to have, nor were we engaged to perform, an audit of the Trust’s internal control over financial reporting. As part of our audits we are required to obtain an understanding of internal control over financial reporting but not for the purpose of expressing an opinion on the effectiveness of the Trust’s internal control over financial reporting. Accordingly, we express no such opinion.
Our audits included performing procedures to assess the risks of material misstatement of the financial statements, whether due to error or fraud, and performing procedures that respond to those risks. Such procedures included examining, on a test basis, evidence regarding the amounts and disclosures in the financial statements. Our procedures included confirmation of securities owned as of September 30, 2020, by correspondence with the custodian. Our audits also included evaluating the accounting principles used and significant estimates made by management, as well as evaluating the overall presentation of the financial statements. We believe that our audits provide a reasonable basis for our opinion.

We have served as the auditor on one or more investment companies in the Trust since 2013
New York, New York
November 20, 2020
16
ADVISERS INVESTMENT TRUST
VONTOBEL U.S. EQUITY INSTITUTIONAL FUND
ADDITIONAL INFORMATION
September 30, 2020 (Unaudited)
| A. | Other Federal Tax Information |
Under the Jobs and Growth Tax Relief Reconciliation Act of 2003 (the “Act”), the following percentages of ordinary dividends paid during the fiscal year ended September 30, 2020 are designated as Qualified Dividend Income (“QDI”), as defined in the Act, subject to reduced tax rates in 2020:
| | | | |
| | | QDI Percentage | |
| |
US Equity Institutional Fund | | | 100.00 | % |
A percentage of the dividends distributed during the fiscal year for the Fund qualifies for the Dividends-Received Deduction (“DRD”) for corporate shareholders:
| | | | |
| | | Corporate DRD Percentage | |
| |
US Equity Institutional Fund | | | 100.00 | % |
| B. | Summary of Fund Holdings as of September 30, 2020 |
Vontobel U.S. Equity Institutional Fund
| | |
| Market Exposure |
|
| Equity Securities | | % of Net Assets |
|
Software | | 13.1% |
Retail | | 13.0 |
Internet | | 10.6 |
Diversified Financial Services | | 8.8 |
Healthcare-Products | | 8.2 |
Beverages | | 6.7 |
Pharmaceuticals | | 6.4 |
Food | | 5.7 |
Insurance | | 4.4 |
Media | | 4.2 |
Healthcare-Services | | 3.9 |
Electronics | | 2.1 |
Commercial Services | | 2.0 |
Telecommunications | | 2.0 |
Chemicals | | 1.7 |
Aerospace/Defense | | 1.5 |
|
| | |
| Market Exposure |
|
| Equity Securities | | % of Net Assets |
|
Semiconductors | | 1.3% |
Apparel | | 1.2 |
Machinery-Diversified | | 1.1 |
Distribution/Wholesale | | 1.0 |
Banks | | 0.9 |
|
Total | | 99.8% |
|
| 5 Largest Security Positions |
|
| Issuer | | % of Net Assets |
|
Microsoft Corp. | | 6.4% |
Amazon.com, Inc. | | 5.4 |
Berkshire Hathaway, Inc. - Class B | | 4.4 |
Mondelez International, Inc. - Class A | | 3.9 |
UnitedHealth Group, Inc. | | 3.9 |
|
Total | | 24.0% |
|
As a Fund shareholder, you may incur two types of costs: (1) transaction costs, and (2) ongoing costs, including management fees and other Fund expenses. The examples below are intended to help you understand your ongoing costs (in dollars) of investing in the Fund and to compare these costs with the ongoing costs of investing in other mutual funds. Please note that the expenses shown in the tables are meant to highlight your ongoing costs only and do not reflect any transactional costs. Therefore, the examples are useful in comparing ongoing costs only and will not help you determine the relative total cost of owning different funds. In addition, if these transactional costs were included, your costs would have been higher.
The examples below are based on an investment of $1,000 invested at April 1, 2020 and held for the entire period through September 30, 2020.
17
ADVISERS INVESTMENT TRUST
VONTOBEL U.S. EQUITY INSTITUTIONAL FUND
ADDITIONAL INFORMATION
September 30, 2020 (Unaudited)
The Actual Expense Example below provides information about actual account values and actual expenses. You may use this information, together with the amount you invested, to estimate the expenses that you paid over the period. Simply divide your account value by $1,000 (for example, an $8,600 account value divided by $1,000 = 8.6), then multiply the result by the number in the table under the heading entitled “Expenses Paid” to estimate the expenses you paid on your account during this period.
The Hypothetical Expense Example below provides information about hypothetical account values and hypothetical expenses based on the Fund’s actual expense ratio and an assumed rate of return of 5% per year before expenses, which is not the Fund’s actual return. The hypothetical account values and expenses may not be used to estimate the actual ending account balance or expenses you paid for the period. You may use this information to compare the ongoing costs of investing in the Fund and other funds. To do so, compare this 5% hypothetical example with the 5% hypothetical examples that appear in the shareholder reports of the other funds.
| | | | | | | | | | | | | | | | |
| | | Expense Ratio | | | Beginning Account Value 4/1/2020 | | | Ending Account Value 9/30/2020 | | | *Expenses Paid 4/1/20–9/30/20 | |
| |
Actual | | | 0.65% | | | $ | 1,000.00 | | | $ | 1,300.30 | | | $ | 3.74 | |
Hypothetical | | | 0.65% | | | $ | 1,000.00 | | | $ | 1,021.75 | | | $ | 3.29 | |
*Expenses are calculated using the annualized expense ratio (as disclosed in the table), multiplied by the average account value for the period, multiplied by the number of days in the most recent half fiscal year (183), and divided by the number of days in the current year (366).
Investors may obtain a copy of the proxy voting policies and procedures by writing to the Trust in the name of the Fund c/o The Northern Trust Company, P.O. Box 4766, Chicago, Illinois 60680-4766 or by calling the Fund at 866-252-5393 (toll free) or 312-630-6583. Information about how the Fund voted proxies relating to portfolio securities for each 12 month period ending June 30th is available without charge, upon request, by calling the Trust at 866-252-5393 (toll free) or 312-630-6583 and on the U.S. Securities and Exchange Commissions (the “SEC”) website at www.sec.gov.
The Fund files its complete schedule of portfolio holdings with the SEC for the first and third quarters of each fiscal year as an exhibit to its reports on Form N-PORT (or on Form N-PORT’s predecessor form, Form N-Q). The Fund’s Form N-PORT reports are available on the SEC’s website at www.sec.gov. The information on Form N-PORT is also available to shareholders upon written request or by calling the Fund at 866-252-5393 (toll free).
The following table provides information regarding each Trustee who is not an “interested person” of the Trust, as defined in the 1940 Act.
| | | | | | | | | | |
Name, Address and Year of Birth1 | | Position(s) Held with the Trust | | Term of Office/Length of Time Served | | Principal Occupation(s) During Past 5 Years | | Number of Portfolios in the Trust Overseen by Trustee | | Other Directorships Held by Trustee During Past 5 Years |
D’Ray Moore Year of Birth: 1959 | | Trustee | | Indefinite/July 2011 to present | | Independent Trustee, Diamond Hill Funds 2007 to present; Chairperson, Diamond Hill Funds 2014 to present. | | 12 | | Diamond Hill Funds |
Steven R. Sutermeister Year of Birth: 1954 | | Trustee | | Indefinite/July 2011 to present | | President, Vadar Capital LLC, 2008 to 2017. | | 12 | | |
18
ADVISERS INVESTMENT TRUST
VONTOBEL U.S. EQUITY INSTITUTIONAL FUND
ADDITIONAL INFORMATION
September 30, 2020 (Unaudited)
| | | | | | | | | | |
Name, Address and Year of Birth1 | | Position(s) Held with the Trust | | Term of Office/Length of Time Served | | Principal Occupation(s) During Past 5 Years | | Number of Portfolios in the Trust Overseen by Trustee | | Other Directorships Held by Trustee During Past 5 Years |
Michael M. Van Buskirk Year of Birth: 1947 | | Trustee | | Indefinite/July 2011 to present | | Independent Trustee, Boston Trust Walden Funds 1992 to present. | | 12 | | Boston Trust Walden Funds |
| 1 | The mailing address of each Trustee is 50 S. LaSalle Street, Chicago, Illinois 60603. |
The following table provides information regarding each Trustee who is an “interested person” of the Trust, as defined in the 1940 Act, and each officer of the Trust.
| | | | | | | | | | |
Name, Address and Year of Birth1 | | Position(s) Held with the Trust | | Term of Office/ Length of Time Served | | Principal Occupation(s) During Past 5 Years | | Number of Portfolios in the Trust Overseen by Trustee | | Other Directorships Held by Trustee During Past 5 Years |
David M. Whitaker2 Year of Birth: 1971 | | Trustee | | Indefinite/ July 2017 to present | | President, Foreside Financial Group, LLC, 2011 to present; Director, Portland Air Freight, 2011 to present; Director, National Investment Company Service Association (NICSA) 2018 to present. | | 12 | | PAF Transportation |
Daniel P. Houlihan3 Year of Birth: 1966 | | Trustee | | Indefinite/ March 2016 to present | | Executive Vice President, The Northern Trust Company, 2008 to present; Chairman, National Investment Company Service Association (NICSA) 2017 to present; Vice Chairman, National Investment Company Service Association (NICSA) 2014 to 2017. | | 12 | | None |
Barbara J. Nelligan Year of Birth: 1969 | | President | | Indefinite/ August 2017 to present | | Senior Vice President, Global Fund Services Fund Governance Solutions, The Northern Trust Company, 2018 to present; Senior Vice President, Global Fund Services Product Management, The Northern Trust Company, 2007 to 2018; Vice President of Advisers Investment Trust, 2012 to 2017. | | N/A | | N/A |
19
ADVISERS INVESTMENT TRUST
VONTOBEL U.S. EQUITY INSTITUTIONAL FUND
ADDITIONAL INFORMATION
September 30, 2020 (Unaudited)
| | | | | | | | | | |
Name, Address and Year of Birth1 | | Position(s) Held with the Trust | | Term of Office/ Length of Time Served | | Principal Occupation(s) During Past 5 Years | | Number of Portfolios in the Trust Overseen by Trustee | | Other Directorships Held by Trustee During Past 5 Years |
Rodney Ruehle Year of Birth: 1968 | | Chief Compliance Officer | | Indefinite/March 2019 to present | | Director, Foreside Financial, Group, LLC (formerly Foreside Compliance Services, LLC) (financial services), 2016 to present; Director, Beacon Hill Fund Services, LLC, April 2008 to July 2016. | | N/A | | N/A |
Troy Sheets Year of Birth: 1971 | | Treasurer | | Indefinite/ July 2011 to present | | Senior Director, Foreside Financial Group, LLC, 2016 to present; Director, Beacon Hill Fund Services, Inc. 2009 to 2016. | | N/A | | N/A |
Trent Statczar Year of Birth: 1971 | | Assistant Treasurer | | Indefinite/July 2011 to present | | Senior Director, Foreside Financial Group, LLC, 2016 to present; Director, Beacon Hill Fund Services, Inc. 2008 to 2016. | | N/A | | N/A |
Toni M. Bugni Year of Birth: 1973 | | Secretary | | Indefinite/March 2018 to present | | Senior Vice President, Global Fund Services Fund Governance Solutions, The Northern Trust Company, 2011 to present. | | N/A | | N/A |
Deanna Y. Pellack Year of Birth: 1987 | | Assistant Secretary | | Indefinite/ March 2018 to present | | Vice President, Global Fund Services Fund Governance Solutions, The Northern Trust Company 2019 to present; Second Vice President, Global Fund Services Fund Governance Solutions, The Northern Trust Company 2014 to 2019. | | N/A | | N/A |
1The mailing address of Messrs. Whitaker, Ruehle, Sheets, and Statczar is 690 Taylor Road, Suite 210, Gahanna, Ohio 43230. The mailing address of Messr. Houlihan and Mses. Nelligan, Bugni, and Pellack is 50 S. LaSalle Street, Chicago, IL 60603.
2 Mr. Whitaker is the President of Foreside Financial Group, LLC and is therefore deemed to be an "interested person" of the Trust, as defined in the 1940 Act.
3 Mr. Houlihan is an Executive Vice President of the Northern Trust Company and is therefore deemed to be an "interested person" of the Trust, as defined in the 1940 Act.
The Fund’s Statement of Additional Information includes additional information about the Trust’s Trustees and Officers. To receive your free copy of the Statement of Additional Information, call toll-free 866-252-5393.
20
Vontobel U.S. Equity
Institutional Fund
(A series of the Advisers Investment Trust)
Privacy Policy
SAFEGUARDING PRIVACY
We recognize and respect the privacy expectations of each of our investors and we believe the confidentiality and protection of investor information is one of our fundamental responsibilities. New technologies have dramatically changed the way information is gathered and used, but our continuing commitment to preserving the security and confidentiality of investor information has remained a core value of the Vontobel U.S. Equity Institutional Fund.
INFORMATION WE COLLECT AND SOURCES OF INFORMATION
We may collect information about our customers to help identify you, evaluate your application, service and manage your account and offer services and products you may find valuable. We collect this information from a variety of sources including:
| • | | Information we receive from you on applications or other forms (e.g. your name, address, date of birth, social security number and investment information); |
| • | | Information about your transactions and experiences with us and our affiliates (e.g. your account balance, transaction history and investment selections); and |
| • | | Information we obtain from third parties regarding their brokerage, investment advisory, custodial or other relationship with you (e.g. your account number, account balance and transaction history. |
INFORMATION WE SHARE WITH SERVICE PROVIDERS
We may disclose all non-public personal information we collect, as described above, to companies (including affiliates) that perform services on our behalf, including those that assist us in responding to inquiries, processing transactions, preparing and mailing account statements and other forms of shareholder services provided they use the information solely for these purposes and they enter into a confidentiality agreements regarding the information.
INFORMATION WE MAY SHARE WITH AFFILIATES
If we have affiliates which are financial service providers that offer investment advisory, brokerage and other financial services, we may (subject to Board approval) share information among our affiliates to better assist you in achieving your financial goals.
SAFEGUARDING CUSTOMER INFORMATION
We will safeguard, according to federal standards of security and confidentiality, any non-public personal information our customers share with us.
We will limit the collection and use of non-public customer information to the minimum necessary to deliver superior service to our customers which includes advising our customers about our products and services and to administer our business.
We will permit only authorized employees who are trained in the proper handling of non-public customer information to have access to that information.
We will not reveal non-public customer information to any external organization unless we have previously informed the customer in disclosures or agreements, have been authorized by the customer or are required by law or our regulators.
We value you as a customer and take your personal privacy seriously. We will inform you of our policies for collecting, using, securing and sharing nonpublic personal information the first time we do business and every year that you are a customer of the Vontobel U.S. Equity Institutional Fund or anytime we make a material change to our privacy policy.
Investment Adviser
Vontobel Asset Management, Inc.
1540 Broadway
38th Floor
New York, NY 10036
Custodian
The Northern Trust Company
50 South LaSalle Street
Chicago, Illinois 60603
Independent Registered
Public Accounting Firm
Ernst & Young LLP
5 Times Square
New York, NY 10036
Legal Counsel
Thompson Hine LLP
41 South High Street, Suite 1700
Columbus, Ohio 43215-6101
Distributor
Foreside Financial Services, LLC
3 Canal Plaza, Suite 100
Portland, ME 04101
For Additional Information, call
866-252-5393 (toll free) or 312-630-6583

ANNUAL REPORT
SEPTEMBER 30, 2020
Beginning on January 28, 2021, as permitted by regulations adopted by the Securities and Exchange Commission, paper copies of the Fund’s shareholder reports will no longer be sent by mail unless you specifically request paper copies of the reports from the Fund or from your financial intermediary, such as a broker-dealer. Instead, the reports will be made available on a website, and you will be notified by mail each time a report is posted and provided with a website link to access the report. You may elect to receive all future reports in paper free of charge. You can inform the Fund that you wish to continue receiving paper copies of your shareholder reports by calling toll-free 866-260-9549 or 312-557-5913. If you own your shares through a financial intermediary, you may contact your financial intermediary or follow instructions included with this disclosure to elect to continue to receive paper copies of your shareholder reports. Your election to receive reports in paper will apply to all funds held with the fund complex or your financial intermediary. If you already elected to receive shareholder reports electronically, you will not be affected by this change and you need not take any action. You may elect to receive shareholder reports and other communications from the Fund by calling toll-free 866-260-9549 or 312-557-5913 or by contacting your financial intermediary.
This report is submitted for the general information of the shareholders of the Funds. It is not authorized for the distribution to prospective investors unless preceded or accompanied by an effective prospectus.
ADVISERS INVESTMENT TRUST
JOHCM FUNDS
TABLE OF CONTENTS
September 30, 2020
ADVISERS INVESTMENT TRUST
JOHCM FUNDS
SHAREHOLDER LETTER
September 30, 2020
Dear Shareholder:
We are pleased to present the September 30, 2020 Annual Report for the JOHCM Funds (the “Funds”), each a series of the Advisers Investment Trust. This report contains the results of operations during the year ended September 30, 2020.
We appreciate the trust and confidence you have placed in us by choosing the Funds and the Investment Adviser, J O Hambro Capital Management Limited, and we look forward to continuing to serve your investing needs.
Sincerely,
| | |
 | |  |
| Barbara J. Nelligan | | Jonathan Weitz |
| President | | Senior Vice President – Business Manager |
| Advisers Investment Trust | | J O Hambro Capital Management Limited |
i
ADVISERS INVESTMENT TRUST
JOHCM FUNDS
PORTFOLIO COMMENTARY
September 30, 2020 (Unaudited)
JOHCM Emerging Markets Opportunities Fund
Value of a hypothetical $1,000,000 investment in the Fund Institutional Shares from inception on November 20, 2012 to September 30, 2020
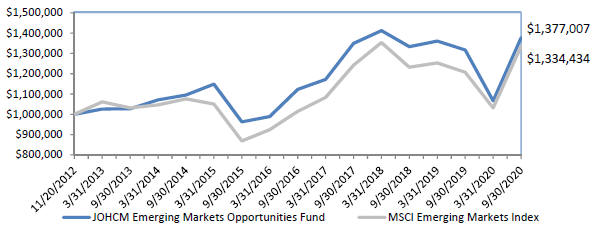
Average Annual Total Returns as of September 30, 2020
| | | | | | | | | | |
| | | One Year
Return | | Five Year
Return | | Since
Inception
Return | | Gross
Expense
Ratio * | | Net Expense
Ratio * |
Fund Institutional Shares | | 4.56% | | 7.42% | | 4.15% | | 1.07% | | 1.07% |
Fund Class I Shares | | 4.37% | | 7.31% | | 4.06% | | 1.17% | | 1.17% |
Fund Class II Shares | | 4.26% | | 7.18% | | 3.93% | | 1.32% | | 1.32% |
MSCI Emerging Markets Index | | 10.54% | | 8.97% | | 3.74% | | - | | - |
Data as of September 30, 2020. The Fund’s performance reflects the performance of the predecessor Scotia Institutional Fund for periods prior to the reorganization into the Trust. The performance also reflects the reinvestment of dividends as well as the impact of transaction costs and the deduction of fees and expenses. The performance does not reflect taxes that a shareholder would pay on fund distributions or on the redemption of fund shares.
The Institutional Class Shares and Class I Shares of the Fund commenced operations on November 20, 2012. Class II Shares commenced operations on December 17, 2013. Historical performance for Class II Shares prior to its inception is based on the performance of Class I Shares, the share class most similar to Class II. The performance of Class II Shares has been adjusted to reflect differences in expenses.
* Expense ratios are per the most recent Fund Prospectus dated January 28, 2020. The Adviser has entered into a contractual expense limitation agreement with respect to Fund until January 28, 2021.
The performance data quoted represents past performance; past performance does not guarantee future results. The investment return and principal value of an investment will fluctuate so that an investor’s shares, when redeemed, may be worth more or less than their original cost. The Fund’s current performance may be lower or higher than the performance data quoted. Investors may obtain performance information current to the most recent month-end, within 7 business days, by calling 866-260-9549 or 312-557-5913.
ii
ADVISERS INVESTMENT TRUST
JOHCM FUNDS
PORTFOLIO COMMENTARY
September 30, 2020 (Unaudited)
The Fund’s benchmark for performance comparison purposes is the Morgan Stanley Capital International (“MSCI”) Emerging Markets Index. The Index is a free float-adjusted market capitalization index that is designed to measure equity market performance in the global emerging markets. The table reflects the theoretical reinvestment of dividends on securities in the Index. The impact of transaction costs and the deduction of expenses associated with a mutual fund, such as investment management and administration fees, are not reflected in the Index calculations. It is not possible to invest directly in an index.
Investment Philosophy and Process
The Fund seeks to outperform its benchmark through a combination of top-down (country level) and bottom-up (stock level) active positions. The fund managers believe in the importance of understanding the investment drivers and risks at the country level. They believe in only investing in companies that benefit from the top-down environment that they can foresee. The Fund buys quality growth stocks at attractive valuations leading to a focused portfolio of 40-60 emerging markets stocks.
Performance
The Fund’s Institutional share class returned 4.56% for the 12-month period to September 30, 2020 versus a return of 10.54% achieved by its benchmark, the MSCI Emerging Markets NR Index, for the same period.
The portfolio lagged the benchmark over the period as the positive relative contribution from our country tilts, the driver of our top-down process, was eclipsed by negative stock selection. Our underweights in Thailand and Brazil provided a tailwind as concern over the fiscal outlook dampened risk appetite in Brazil while in Thailand, an upsurge in anti-establishment protests began in February when the Election Commission banned the progressive Future Forward Party.
Our Chinese names were the main source of weakness over the year. In China we have a substantial allocation to companies that are beneficiaries of a policy-led recovery in domestic economic activity in China while maintaining a zero-weighting in the expensive, US-listed, consumer and technology names which have re-rated this year. Not owning the likes of Alibaba hurt relative returns while the portfolio’s holding in Sinopec lagged. We believe that recent Chinese economic data points to a fairly strong Chinese economy (certainly compared with other major economies), but also that the nature of that recovery is that it is being driven (as in previous recoveries in 2009-10, 2013 and 2015-16) by centrally-mandated liquidity and credit provision, and the feed-through of that into the construction, real estate and financial sectors. Although there is some positive effect on Chinese consumers, we do not see signs of a strong recovery, and do not share the consensus enthusiasm for expensive Chinese consumer stocks. Instead, we have substantial exposure to the real estate sector, both developers and also service providers and companies with investment portfolios. We continue to look for opportunity in this part of the economy: construction, cement, real estate, infrastructure, and financials and asset reflation plays. It is where we find policy support, positive macro-economic momentum, positive fundamental momentum and attractive valuations, and, although our relative country weight in China does not show it, it is one of our strongest conviction ideas.
iii
ADVISERS INVESTMENT TRUST
JOHCM FUNDS
PORTFOLIO COMMENTARY
September 30, 2020 (Unaudited)
JOHCM Emerging Markets Small Mid Cap Equity Fund
Value of a hypothetical $1,000,000 investment in the Fund Institutional Shares from inception on December 17, 2014 to September 30, 2020
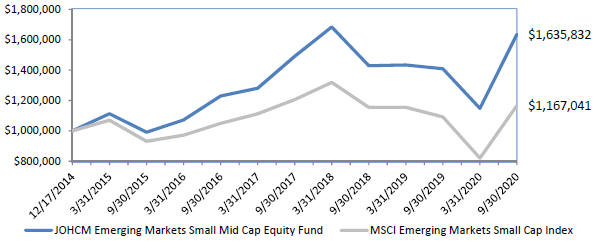
Average Annual Total Returns as of September 30, 2020
| | | | | | | | | | |
| | | One Year
Return | | Five Year
Return | | Since Inception
Return | | Gross Expense
Ratio * | | Net Expense
Ratio * |
Fund Institutional Shares | | 16.09% | | 10.54% | | 8.88% | | 2.56% | | 1.54% |
Fund Class I Shares | | 15.95% | | 10.43% | | 8.77% | | 2.66% | | 1.64% |
| MSCI Emerging Markets Small Cap Index | | 6.89% | | 4.60% | | 2.71% | | - | | - |
Data as of September 30, 2020. The Fund’s performance reflects the reinvestment of dividends as well as the impact of transaction costs and the deduction of fees and expenses. The performance does not reflect taxes that a shareholder would pay on fund distributions or on the redemption of fund shares.
The Institutional Class Shares of the Fund commenced operations on December 17, 2014. Class I Shares commenced operations on January 28, 2016. Historical performance for Class I Shares prior to its inception is based on the performance of Institutional Class Shares. The performance of Class I Shares has been adjusted to reflect differences in expenses.
* Expense ratios are per the most recent Fund Prospectus dated January 28, 2020. The Adviser has entered into a contractual expense limitation agreement with respect to Fund until January 28, 2021.
The performance data quoted represents past performance; past performance does not guarantee future results. The investment return and principal value of an investment will fluctuate so that an investor’s shares, when redeemed, may be worth more or less than their original cost. The Fund’s current performance may be lower or higher than the performance data quoted. Investors may obtain performance information current to the most recent month-end, within 7 business days, by calling 866-260-9549 or 312-557-5913.
iv
ADVISERS INVESTMENT TRUST
JOHCM FUNDS
PORTFOLIO COMMENTARY
September 30, 2020 (Unaudited)
The Fund’s benchmark for performance comparison purposes is the Morgan Stanley Capital International (“MSCI”) Emerging Markets Small Cap Index. The Index includes small cap representation across 26 Emerging Markets countries and covers approximately 14% of the free float-adjusted market capitalization in each country. The table reflects the theoretical reinvestment of dividends on securities in the Index. The impact of transaction costs and the deduction of expenses associated with a mutual fund, such as investment management and administration fees, are not reflected in the Index calculations. It is not possible to invest directly in an index.
Investment Philosophy and Process
The investment objective of the JOHCM Emerging Markets Small Mid Cap Equity Fund (the “Fund”) is to seek long-term capital appreciation. The Fund invests, under normal market conditions, at least 80% of its assets (net assets plus the amount of borrowings for investment purposes) in equity securities issued by small and medium capitalization companies that are listed in, or whose principal business activities are located in, emerging markets, including frontier markets.
Performance
The Fund’s Institutional share class returned 16.09% for the 12-month period to September 30, 2020 versus a return of 6.89% achieved by its benchmark, the MSCI Emerging Markets Small Cap NR Index, for the same period.
The portfolio’s strong showing was largely down to strong stock selection in a number of sectors, notably within materials, consumer discretionary, technology and real estate. Sector allocation effects were modestly positive. The benefits from being overweight technology were broadly cancelled out by our cash position as the market rose.
Taiwanese designer of integrated circuits, ASMedia Technology was the top performer over the year. The company continues to benefit from market share gains for AMD, a major customer. PC sales have also been strong due to work-from-home demand. Staying within the same sector, Silergy also performed well. The company saw significant order growth over the year as tensions between the US and China increased and localization in the tech supply chain took hold.
Chinese economic data has been improving while at the same time the country has refrained from massive stimulus which suggests a position of relative strength in comparison to larger developed markets such as the US and Europe. Although Chinese authorities have accelerated lending and infrastructure spending, the pace has been measured and targeted - leaving plenty of room to maneuver in the future.
v
ADVISERS INVESTMENT TRUST
JOHCM FUNDS
PORTFOLIO COMMENTARY
September 30, 2020 (Unaudited)
JOHCM Global Equity Fund
Value of a hypothetical $1,000,000 investment in the Fund Institutional Shares from inception on March 21, 2013 to September 30, 2020
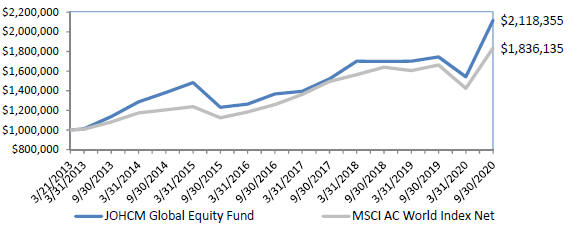
Average Annual Total Returns as of September 30, 2020
| | | | | | | | | | |
| | | One Year
Return | | Five Year
Return | | Since
Inception
Return | | Gross
Expense
Ratio * | | Net Expense
Ratio * |
Fund Institutional Shares | | 21.43% | | 11.47% | | 10.48% | | 1.07% | | 1.07% |
Fund Class I Shares | | 21.26% | | 11.35% | | 10.39% | | 1.17% | | 1.17% |
MSCI ACWI | | 10.44% | | 10.30% | | 8.41% | | - | | - |
Data as of September 30, 2020. The Fund’s performance reflects the performance of the predecessor Scotia Institutional Fund for periods prior to the reorganization into the Trust. The performance also reflects the reinvestment of dividends as well as the impact of transaction costs and the deduction of fees and expenses. The performance does not reflect taxes that a shareholder would pay on fund distributions or on the redemption of fund shares.
The Institutional Class Shares and Class I Shares of the Fund commenced operations on March 21, 2013.
* Expense ratios are per the most recent Fund Prospectus dated January 28, 2020. The Adviser has entered into a contractual expense limitation agreement with respect to Fund until January 28, 2021.
The performance data quoted represents past performance; past performance does not guarantee future results. The investment return and principal value of an investment will fluctuate so that an investor’s shares, when redeemed, may be worth more or less than their original cost. The Fund’s current performance may be lower or higher than the performance data quoted. Investors may obtain performance information current to the most recent month-end, within 7 business days, by calling 866-260-9549 or 312-557-5913.
The Fund’s benchmark for performance comparison purposes is the Morgan Stanley Capital International (“MSCI”) All Country World Index (ACWI). The Index is a free float-adjusted market capitalization weighted index that is designed to measure the equity market performance of developed and emerging markets. The table reflects the theoretical reinvestment of dividends on securities in the Index. The impact of transaction costs and the deduction of expenses associated with a mutual fund, such as investment management and administration fees, are not reflected in the Index calculations. It is not possible to invest directly in an index.
vi
ADVISERS INVESTMENT TRUST
JOHCM FUNDS
PORTFOLIO COMMENTARY
September 30, 2020 (Unaudited)
Investment Philosophy and Process
To seek to achieve its investment objective of long-term capital appreciation, the Fund employs a growth at a reasonable price (GARP) investment philosophy, which is sometimes described as a core focus with a growth bias. The Fund seeks to own stocks, sectors and countries with positive earnings surprise, sustainably high or increasing return on equity, and attractive valuations. The Fund managers believe they can increase the probability of finding an attractive stock by looking where traditional growth investors tend to ignore. While the Fund’s managers seek to own stocks with idiosyncratic return patterns, they also recognize that many stocks have varying degrees of beta or correlation to their sector or country, so they also maintain a top-down research focus when constructing the portfolio. The Fund’s management team offers the unique capability of blending both a bottom-up and a top-down investment research approach to the portfolio construction process.
Performance
The Fund’s Institutional share class returned 21.43% for the 12-month period to September 30, 2020 versus a return of 10.44% achieved by its benchmark, the MSCI AC World NR Index, for the same period.
It was a good year for the portfolio which significantly outperformed the benchmark, falling less than the index in the market crisis of the first quarter, then rising more than the index during the recovery in the second and third quarters. This was achieved by focusing on structural growth stocks with rock solid balance sheets while avoiding most cyclical companies with leveraged balance sheets.
Our industrials and financials picks were the main winners while our overweight allocation in technology and zero-weighting in energy proved helpful. In the industrial sector, owning the renewable wind energy related stocks such as Vestas (and Orsted in the Utilities sector) boosted performance. Equally, in the financial sector, owning the digital banks and exchanges such as SBI Holdings and Hong Kong Exchange helped. In the Healthcare sector, life-sciences companies Medpace and Thermo Fischer did well.
We remain very happy with the overall shape of the portfolio (sector/geographic positioning) and the majority of our stock holdings. However, we continue to look to buy the dips in any structural winners within three of the biggest structural/fundamental trends we can see globally over the next 5-10 years: decarbonization, digitization and deglobalization.
vii
ADVISERS INVESTMENT TRUST
JOHCM FUNDS
PORTFOLIO COMMENTARY
September 30, 2020 (Unaudited)
JOHCM Global Income Builder Fund
Value of a hypothetical $1,000,000 investment in the Fund Institutional Shares from inception on September 29, 2016 to September 30, 2020
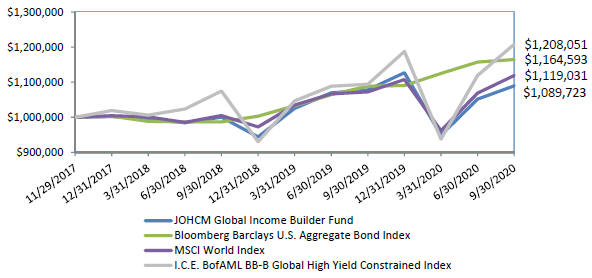
Cumulative Total Returns as of September 30, 2020
| | | | | | | | |
| | | One Year
Return | | Since Inception
Return | | Gross Expense
Ratio * | | Net Expense
Ratio * |
| Fund Institutional Shares | | 1.09% | | 3.08% | | 1.10% | | 0.75% |
| Fund Class I Shares | | 0.99% | | 2.97% | | 1.20% | | 0.85% |
| Fund Class II Shares | | 0.86% | | 2.83% | | 1.35% | | 1.00% |
| Bloomberg Barclays US Aggregate Bond Index | | 6.98% | | 5.52% | | - | | - |
| ICE BofAML BB-B Global High Yield Constrained Index | | 4.37% | | 4.05% | | - | | - |
| MSCI World Index | | 10.41% | | 6.89% | | - | | - |
Data as of September 30, 2020. The Fund’s performance reflects the reinvestment of dividends as well as the impact of transaction costs and the deduction of fees and expenses. The performance does not reflect taxes that a shareholder would pay on fund distributions or on the redemption of fund shares.
The Institutional Class and Class I Shares of the Fund commenced operations on November 29, 2017. Class II Shares commenced operations on June 28, 2019. Historical performance for Class II Shares prior to its inception is based on the performance of Institutional Class Shares. The performance of Class II Shares has been adjusted to reflect differences in expenses.
* Expense ratios are per the most recent Fund Prospectus dated January 28, 2020 as supplemented September 14, 2020. The Adviser has entered into a contractual expense limitation agreement with respect to Fund until January 28, 2023.
viii
ADVISERS INVESTMENT TRUST
JOHCM FUNDS
PORTFOLIO COMMENTARY
September 30, 2020 (Unaudited)
The performance data quoted represents past performance; past performance does not guarantee future results. The investment return and principal value of an investment will fluctuate so that an investor’s shares, when redeemed, may be worth more or less than their original cost. The Fund’s current performance may be lower or higher than the performance data quoted. Investors may obtain performance information current to the most recent month-end, within 7 business days, by calling 866-260-9549 or 312-557-5913.
The Fund’s benchmarks for performance comparison purposes are the: Bloomberg Barclays US Aggregate Bond Index, ICE BofAML BB-B Global High Yield Constrained Index, and Morgan Stanley Capital International (“MSCI”) World Index. The Bloomberg Barclays US Aggregate Bond Index is a broad-based benchmark that measures the investment grade U.S. dollar-denominated, fixed-rate taxable bond market, including Treasuries, government-related and corporate securities, MBS (agency fixed-rate and hybrid ARM passthroughs), ABS, and CMBS. The ICE BofAML BB-B Global High Yield Constrained Index contains all securities in The ICE BofAML Global High Yield Index rated BB1 through B3, based on an average of Moody’s, S&P and Fitch, but caps issuer exposure at 2%. The MSCI World Index is a broad global equity index that represents large and mid-cap equity performance across 23 developed market countries. The table reflects the theoretical reinvestment of dividends on securities in the Indices. The impact of transaction costs and the deduction of expenses associated with a mutual fund, such as investment management and administration fees, are not reflected in the Indices calculations. It is not possible to invest directly in an index.
Investment Philosophy and Process
The Fund aims to generate meaningful monthly income distributions and long-term capital appreciation by applying a global value investment philosophy to income-generative assets. The Fund invests in global equities and fixed income but may also hold cash and hedging assets e.g. commodity-linked investment instruments such as exchange traded funds that invest in gold and precious metals. The investment team has a long-term, absolute return-oriented investment philosophy and believes their highest priority is to protect the capital they manage from permanent impairment.
Performance
The Fund’s Institutional share class returned 1.09% for the 12-month period to September 30, 2020.
The technology sector has been the star stock market performer this year after recovering well from the volatility faced at the start of the pandemic. Within this sector, Microsoft and Facebook were key contributors. The Q1 sell-off provided us the opportunity to add capital to world-leading tech businesses at compelling prices. Our gold holdings have proved to be a useful hedge in this year of pronounced volatility, with both miners, such as Barrick Gold, and bullion investments, such as SPDR Gold Trust, adding value. With the prospect of unfettered and continued central bank money printing, we believe gold will have an important ongoing role to play in any portfolio that seeks resilience. Given these dynamics, we had elected to increase our exposure to gold during Q1 as part of our defensive component of the portfolio.
Within equities, we have continued to add capital to our “green value” theme. We added to electric utilities and industrial gases. We believe these holdings should benefit from the European Green Deal and other de-carbonization efforts. The last decade was driven by IT firms. The next one may also be driven by the physical capital providers for de-carbonization, many of whom pay dividends. We also added to beverage companies, which should continue to recover over the next 12-18 months, once vaccines become widely available. We try to balance such recovery stocks with stable growers and defensives. Lastly, we trimmed technology investments by roughly 10% as valuations improved.
With traditional bond yields low, the environment remains challenging for income investors. We advise income investors to remember the lessons of the 2013 Taper Tantrum, when bond yields rose sharply and traditional fixed income suffered loses. We believe there is value in dividend stocks and preferred shares and they may offer some protection against inflation. With rates near zero, it may be equities and credit that are needed to diversify income portfolios from the risk of traditional bonds.
ix
ADVISERS INVESTMENT TRUST
JOHCM FUNDS
PORTFOLIO COMMENTARY
September 30, 2020 (Unaudited)
JOHCM International Opportunities Fund
Value of a hypothetical $1,000,000 investment in the Fund Institutional Shares from inception on September 29, 2016 to September 30, 2020
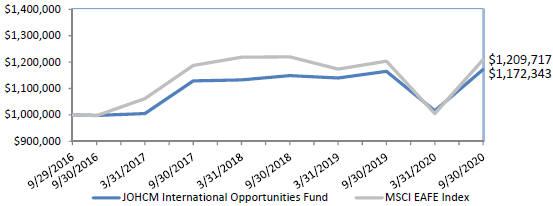
Average Annual Total Returns as of September 30, 2020
| | | | | | | | |
| | | One Year
Return | | Since
Inception
Return | | Gross Expense
Ratio * | | Net Expense
Ratio * |
Fund Institutional Shares | | 0.62% | | 4.05% | | 8.61% | | 0.89% |
MSCI EAFE Index | | 0.49% | | 4.87% | | - | | - |
Data as of September 30, 2020. The Fund’s performance reflects the reinvestment of dividends as well as the impact of transaction costs and the deduction of fees and expenses. The performance does not reflect taxes that a shareholder would pay on fund distributions or on the redemption of fund shares.
The Institutional Class Shares of the Fund commenced operations on September 29, 2016.
* Expense ratios are per the most recent Fund Prospectus dated January 28, 2020. The Adviser has entered into a contractual expense limitation agreement with respect to Fund until January 28, 2021.
The performance data quoted represents past performance; past performance does not guarantee future results. The investment return and principal value of an investment will fluctuate so that an investor’s shares, when redeemed, may be worth more or less than their original cost. The Fund’s current performance may be lower or higher than the performance data quoted. Investors may obtain performance information current to the most recent month-end, within 7 business days, by calling 866-260-9549 or 312-557-5913.
The Fund’s benchmark for performance comparison purposes is the Morgan Stanley Capital International (“MSCI”) Europe, Australasia and Far East (“EAFE”) Index. The Index is a free float-adjusted market capitalization index that is designed to measure the equity market performance of developed markets, excluding the US & Canada. The table reflects the theoretical reinvestment of dividends on securities in the Index. The impact of transaction costs and the deduction of expenses associated with a mutual fund, such as investment management and administration fees, are not reflected in the Index calculations. It is not possible to invest directly in an index.
x
ADVISERS INVESTMENT TRUST
JOHCM FUNDS
PORTFOLIO COMMENTARY
September 30, 2020 (Unaudited)
Investment Philosophy and Process
The investment objective of the JOHCM International Opportunities Fund (the “Fund”) is to achieve long-term total return by investing in a concentrated portfolio of international equity securities. The Fund invests, under normal market conditions, primarily in equity securities of companies headquartered outside the US, including those in emerging markets. The Fund may invest in foreign companies of any size, including small- and mid-capitalization companies, in order to achieve its objective. Equity securities include common and preferred stocks, rights and warrants. The Fund may also invest in equity related instruments, such as equity linked notes and participation notes, all of which derive their value from equities. The portfolio typically contains 25 to 40 stocks.
Performance
The Fund’s Institutional share class returned 0.62% for the 12-month period to September 30, 2020 versus a return of 0.49% achieved by its benchmark, the MSCI EAFE NR Index, for the same period.
The portfolio’s marginal outperformance came chiefly from sector allocation effects as our significant underweights in the financials and real estate sectors added value, alongside our cash position. Stock selection provided a modest drag on relative returns as strength in our utilities holdings was outweighed by weakness in our communication services and industrials.
Looking at individual stock drivers, our Japanese names did well with utility holding Nippon gas and Drugstore operator Sugi Holdings among the top performers. Foodservice company Compass Group and Galp Energia were the main laggards. Many of the weaker-performing holdings have tremendous competitive advantages over their peers, in our view, and are well placed to continue growing market share as well as benefiting from growth tailwinds. We feel the share price declines this year present patient investors with a rare opportunity.
We continue to believe that the best value available to equity investors at this moment is in the forgotten category of Covid-disrupted structural winners. Lockdowns have undoubtedly accelerated pre-existing and mostly technology-driven structural trends. Markets have therefore concluded that Covid winners must be long-term structural winners by definition, and any company which has been facing disruption recently must be a structural loser. We think this is too simplistic.
xi
ADVISERS INVESTMENT TRUST
JOHCM FUNDS
PORTFOLIO COMMENTARY
September 30, 2020 (Unaudited)
JOHCM International Select Fund
Value of a hypothetical $10,000 investment in the Fund Class I Shares from September 30, 2010 to September 30, 2020
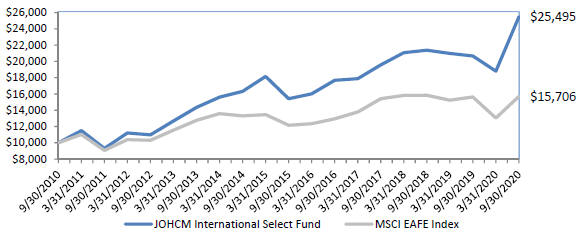
Average Annual Total Returns as of September 30, 2020
| | | | | | | | | | |
| | | One Year
Return | | Five Year
Return | | Ten Year
Return | | Gross
Expense
Ratio * | | Net
Expense
Ratio * |
Fund Class I Shares | | 23.30% | | 10.58% | | 9.81% | | 0.99% | | 0.99% |
Fund Class II Shares | | 23.02% | | 10.30% | | 9.56% | | 1.24% | | 1.24% |
MSCI EAFE Index | | 0.49% | | 5.26% | | 4.62% | | - | | - |
Data as of September 30, 2020. The Fund’s performance reflects the performance of the predecessor Scotia Institutional Fund for periods prior to the reorganization into the Trust. The performance also reflects the reinvestment of dividends as well as the impact of transaction costs and the deduction of fees and expenses. The performance does not reflect taxes that a shareholder would pay on fund distributions or on the redemption of fund shares.
While Class I Shares of the Fund commenced operations on July 29, 2009, Class I Shares began investing consistent with its investment objective on July 30, 2009. Class II Shares commenced operations on March 31, 2010. Historical performance for Class II Shares prior to its inception is based on the performance of Class I Shares. The performance of Class II Shares has been adjusted to reflect differences in expenses.
* Expense ratios are per the most recent Fund Prospectus dated January 28, 2020. The Adviser has entered into a contractual expense limitation agreement with respect to Fund until January 28, 2021.
The performance data quoted represents past performance; past performance does not guarantee future results. The investment return and principal value of an investment will fluctuate so that an investor’s shares, when redeemed, may be worth more or less than their original cost. The Fund’s current performance may be lower or higher than the performance data quoted. Investors may obtain performance information current to the most recent month-end, within 7 business days, by calling 866-260-9549 or 312-557-5913.
xii
ADVISERS INVESTMENT TRUST
JOHCM FUNDS
PORTFOLIO COMMENTARY
September 30, 2020 (Unaudited)
The Fund’s benchmark for performance comparison purposes is the Morgan Stanley Capital International (“MSCI”) Europe, Australasia and Far East (“EAFE”) Index. The Index is a free float-adjusted market capitalization index that is designed to measure the equity market performance of developed markets, excluding the US & Canada. The table reflects the theoretical reinvestment of dividends on securities in the Index. The impact of transaction costs and the deduction of expenses associated with a mutual fund, such as investment management and administration fees, are not reflected in the Index calculations. It is not possible to invest directly in an index.
Investment Philosophy and Process
To seek to achieve its investment objective of long-term capital appreciation, the Fund employs a growth at a reasonable price (GARP) investment philosophy, which is sometimes described as a core focus with a growth bias. The Fund seeks to own stocks, sectors and countries with positive earnings surprise, sustainably high or increasing return on equity, and attractive valuations. The Fund managers believe they can increase the probability of finding an attractive stock by looking where traditional growth investors tend to ignore. While the Fund’s managers seek to own stocks with idiosyncratic return patterns, they also recognize that many stocks have varying degrees of beta or correlation to their sector or country, so they also maintain a top-down research focus when constructing the portfolio. The Fund’s management team offers the unique capability of blending both a bottom-up and a top-down investment research approach to the portfolio construction process.
Performance
The Fund’s class I share class returned 23.30% for the 12-month period to September 30, 2020 versus a return of 0.49% achieved by its benchmark, the MSCI EAFE NR Index, for the same period.
It was a strong year for the portfolio which significantly outperformed the benchmark, falling less than the index in the market crisis of the first quarter, then rising more than the index during the recovery in the second and third quarters. This was achieved by focusing on structural growth stocks with rock solid balance sheets while avoiding most cyclical companies with leveraged balance sheets.
Our industrials and financials picks were the main winners while our overweight allocation in technology and zero-weighting in energy proved helpful. In the industrial sector, owning the renewable wind energy related stocks such as Vestas and Siemens Gamesa (plus Orsted in the Utilities sector) boosted performance. Equally, in the financial sector, owning the digital banks and exchanges such as SBI Holdings, Japan and Hong Kong Exchanges helped. In the communication services sector, the digital companies Z holdings and Cyberagent did well.
We remain very happy with the overall shape of the portfolio (sector/geographic positioning) and the majority of our stock holdings. However, we continue to look to buy the dips in any structural winners within three of the biggest structural/fundamental trends we can see globally over the next 5-10 years: decarbonization, digitization and deglobalization.
xiii
ADVISERS INVESTMENT TRUST
JOHCM FUNDS
PORTFOLIO COMMENTARY
September 30, 2020 (Unaudited)
JOHCM International Small Cap Equity Fund
Value of a hypothetical $1,000,000 investment in the Fund Institutional Shares from inception on October 1, 2013 to September 30, 2020
Average Annual Total Returns as of September 30, 2020
| | | | | | | | | | |
| | | One Year
Return | | Five Year
Return | | Since Inception
Return | | Gross Expense
Ratio * | | Net Expense
Ratio * |
Fund Institutional Shares | | 2.79% | | 5.34% | | 3.53% | | 1.24% | | 1.24% |
Fund Class I Shares | | 2.73% | | 5.25% | | 3.46% | | 1.34% | | 1.34% |
Fund Class II Shares | | 2.59% | | 5.11% | | 3.29% | | 1.49% | | 1.49% |
| MSCI ACWI ex USA Small Cap Index | | 6.97% | | 6.80% | | 4.44% | | - | | - |
Data as of September 30, 2020. The Fund’s performance reflects the reinvestment of dividends as well as the impact of transaction costs and the deduction of fees and expenses. The performance does not reflect taxes that a shareholder would pay on fund distributions or on the redemption of fund shares.
The Institutional Class Shares of the Fund commenced operations on October 1, 2013. Class II Shares commenced operations on November 18, 2013 and Class I Shares commenced operations on January 2, 2014. Historical performance for Class I and Class II Shares prior to their inception is based on the performance of the Institutional Class Shares. The performance of Class I and Class II Shares have been adjusted to reflect differences in expenses.
* Expense ratios are per the most recent Fund Prospectus dated January 28, 2020. The Adviser has entered into a contractual expense limitation agreement with respect to Fund until January 28, 2021.
The performance data quoted represents past performance; past performance does not guarantee future results. The investment return and principal value of an investment will fluctuate so that an investor’s shares, when redeemed, may be worth more or less than their original cost. The Fund’s current performance may be lower or higher than the performance data quoted. Investors may obtain performance information current to the most recent month-end, within 7 business days, by calling 866-260-9549 or 312-557-5913.
xiv
ADVISERS INVESTMENT TRUST
JOHCM FUNDS
PORTFOLIO COMMENTARY
September 30, 2020 (Unaudited)
The Fund’s benchmark for performance comparison purposes is the Morgan Stanley Capital International (“MSCI”) All Country World Index (“ACWI”) ex USA Small Cap Index. The Index is a free float-adjusted market capitalization weighted index that is designed to measure the small cap equity market performance of developed and emerging markets, excluding the US. The table reflects the theoretical reinvestment of dividends on securities in the Index. The impact of transaction costs and the deduction of expenses associated with a mutual fund, such as investment management and administration fees, are not reflected in the Index calculations. It is not possible to invest directly in an index.
Investment Philosophy and Process
The investment objective of the JOHCM International Small Cap Equity Fund is to seek long-term capital appreciation. The Fund invests at least 80% of its assets in equity securities such as common stocks, preferred stock, rights, and warrants issued by small companies that are based outside the United States, including companies in emerging and frontier as well as in developed markets. The Fund may also invest up to 20% of the value of its assets in fixed income securities. Under normal circumstances, the Fund will hold 70-80 investments across 12 countries.
The Fund may invest in securities of small U.S. companies that derive, or are expected to derive, a significant portion of their revenues from their foreign operations, although under normal circumstances not more than 15% of the Fund’s total assets will be invested in securities of U.S. companies. The Fund will generally initiate the sale of securities whose market capitalization grows to exceed $3 billion.
Performance
The Fund’s Institutional share class returned 2.79% for the 12-month period to September 30, 2020 versus a return of 6.97% achieved by its benchmark, the MSCI AC World ex US Small and Mid Cap Index, for the same period.
The portfolio’s underperformance came largely from stock selection, particularly within the healthcare and communication services sectors. Sector tilts provided a positive boost to relative returns with our underweight in real estate and overweight in healthcare both adding value. But these positives were unable to offset the negatives from challenging stock selection.
Looking at individual stock performers, Avanza Bank was the top performer. Sweden’s largest online savings and investments platform announced higher income citing strong customer inflows, good trading and corporate finance activity and robust demand for their new mortgage products. Canadian oilfield services company Shawcor was the main laggard. Its shares suffered a sharp fall during the market crisis of February/March as Covid-19-induced demand concerns hit the sector hard.
Markets have recovered from the first quarter lows in anticipation of a quick economic recovery, with governments providing small business relief schemes, employment support programs and cash payments to households. Meanwhile, central banks are providing significant liquidity including commercial asset purchase policies. Markets will continue to be buoyed by the ample liquidity and continued government stimulus.
xv
ADVISERS INVESTMENT TRUST
JOHCM CREDIT INCOME FUND
SCHEDULE OF INVESTMENTS
September 30, 2020
| | | | | | | | | | | | |
| | | Percentage of Net Assets | | | Principal Amount | | | Value | |
CORPORATE BONDS | | | 61.8% | | | | | | | | | |
Agriculture | | | 2.2% | | | | | | | | | |
BAT Capital Corp. | | | | | | | | | | | | |
3.56%, 08/15/27 | | | | | | $ | 100,000 | | | $ | 108,001 | |
| | | | | | | | | | | | |
Banks | | | 6.5% | | | | | | | | | |
Bank of America Corp. | | | | | | | | | | | | |
(Variable, ICE LIBOR USD 3M + 2.66%) 4.30%, 01/28/25(a) | | | | | | | 105,000 | | | | 101,850 | |
JPMorgan Chase & Co. | | | | | | | | | | | | |
(Variable, U.S. SOFR + 2.75%) 4.00%, 04/01/25(a) | | | | | | | 105,000 | | | | 99,225 | |
Morgan Stanley | | | | | | | | | | | | |
(Variable, ICE LIBOR USD 3M + 3.61%) 3.89%, 01/15/21(a) | | | | | | | 130,000 | | | | 122,687 | |
| | | | | | | | | | | | |
| | | | | | | | | | | 323,762 | |
| | | | | | | | | | | | |
Beverages | | | 4.0% | | | | | | | | | |
Anheuser-Busch Cos. LLC/Anheuser-Busch InBev Worldwide, Inc. | | | | | | | | | | | | |
4.70%, 02/01/36 | | | | | | | 100,000 | | | | 120,802 | |
Molson Coors Beverage Co., | | | | | | | | | | | | |
3.50%, 05/01/22 | | | | | | | 50,000 | | | | 51,985 | |
4.20%, 07/15/46 | | | | | | | 25,000 | | | | 26,371 | |
| | | | | | | | | | | | |
| | | | | | | | | | | 199,158 | |
| | | | | | | | | | | | |
Commercial Services | | | 2.1% | | | | | | | | | |
Service Corp International | | | | | | | | | | | | |
8.00%, 11/15/21 | | | | | | | 100,000 | | | | 106,250 | |
| | | | | | | | | | | | |
Diversified Financial Services | | | 3.2% | | | | | | | | | |
Charles Schwab Corp. (The) | | | | | | | | | | | | |
(Variable, U.S. Treasury Yield Curve Rate CMT 5Y + 4.97%) 5.38%, 06/01/25(a) | | | | | | | 150,000 | | | | 162,533 | |
| | | | | | | | | | | | |
Electrical Component & Equipments | | | 3.2% | | | | | | | | | |
Energizer Holdings, Inc., | | | | | | | | | | | | |
6.38%, 07/15/26(b) | | | | | | | 100,000 | | | | 107,520 | |
7.75%, 01/15/27(b) | | | | | | | 50,000 | | | | 54,625 | |
| | | | | | | | | | | | |
| | | | | | | | | | | 162,145 | |
| | | | | | | | | | | | |
Food | | | 6.8% | | | | | | | | | |
JBS U.S.A. LUX S.A./JBS U.S.A. Food Co./JBS U.S.A. Finance, Inc. | | | | | | | | | | | | |
6.50%, 04/15/29(b) | | | | | | | 100,000 | | | | 110,997 | |
Kraft Heinz Foods Co. | | | | | | | | | | | | |
4.38%, 06/01/46 | | | | | | | 100,000 | | | | 102,743 | |
Pilgrim’s Pride Corp. | | | | | | | | | | | | |
5.75%, 03/15/25(b) | | | | | | | 60,000 | | | | 61,125 | |
Post Holdings, Inc. | | | | | | | | | | | | |
5.75%, 03/01/27(b) | | | | | | | 60,000 | | | | 63,075 | |
| | | | | | | | | | | | |
| | | | | | | | | | | 337,940 | |
| | | | | | | | | | | | |
Healthcare-Services | | | 4.1% | | | | | | | | | |
Charles River Laboratories International, Inc. | | | | | | | | | | | | |
5.50%, 04/01/26(b) | | | | | | | 50,000 | | | | 52,625 | |
|
| See Notes to Financial Statements. |
| 1 |
ADVISERS INVESTMENT TRUST
JOHCM CREDIT INCOME FUND
SCHEDULE OF INVESTMENTS
September 30, 2020
| | | | | | | | | | | | |
| | | Percentage of Net Assets | | | Principal Amount | | | Value | |
Fresenius Medical Care U.S. Finance, Inc. | | | | | | | | | | | | |
5.75%, 02/15/21 | | | | | | $ | 100,000 | | | $ | 101,812 | |
IQVIA, Inc. | | | | | | | | | | | | |
5.00%, 10/15/26(b) | | | | | | | 50,000 | | | | 52,250 | |
| | | | | | | | | | | | |
| | | | | | | | | | | 206,687 | |
| | | | | | | | | | | | |
Internet | | | 2.6% | | | | | | | | | |
Netflix, Inc. | | | | | | | | | | | | |
5.50%, 02/15/22 | | | | | | | 125,000 | | | | 130,938 | |
| | | | | | | | | | | | |
Lodging | | | 3.5% | | | | | | | | | |
Marriott International, Inc. | | | | | | | | | | | | |
5.75%, 05/01/25 | | | | | | | 155,000 | | | | 172,983 | |
| | | | | | | | | | | | |
Machinery-Diversified | | | 1.0% | | | | | | | | | |
Flowserve Corp. | | | | | | | | | | | | |
3.50%, 10/01/30 | | | | | | | 50,000 | | | | 49,510 | |
| | | | | | | | | | | | |
Media | | | 15.4% | | | | | | | | | |
CCO Holdings LLC/CCO Holdings Capital Corp., | | | | | | | | | | | | |
4.00%, 03/01/23(b) | | | | | | | 50,000 | | | | 50,606 | |
5.75%, 02/15/26(b) | | | | | | | 100,000 | | | | 104,000 | |
CSC Holdings LLC, | | | | | | | | | | | | |
6.75%, 11/15/21 | | | | | | | 31,000 | | | | 32,511 | |
5.50%, 04/15/27(b) | | | | | | | 100,000 | | | | 105,260 | |
NBCUniversal Enterprise, Inc. | | | | | | | | | | | | |
5.25%, 03/19/21(b) | | | | | | | 200,000 | | | | 202,000 | |
Time Warner Cable LLC | | | | | | | | | | | | |
4.00%, 09/01/21 | | | | | | | 150,000 | | | | 153,249 | |
ViacomCBS, Inc., | | | | | | | | | | | | |
(Variable, ICE LIBOR USD 3M + 3.90%)
5.88%, 02/28/57(a)(c) | | | | | | | 10,000 | | | | 10,123 | |
(Variable, ICE LIBOR USD 3M + 3.90%)
6.25%, 02/28/57(a) | | | | | | | 100,000 | | | | 109,750 | |
| | | | | | | | | | | | |
| | | | | | | | | | | 767,499 | |
| | | | | | | | | | | | |
Packing & Containers | | | 2.1% | | | | | | | | | |
Berry Global, Inc. | | | | | | | | | | | | |
4.88%, 07/15/26(b) | | | | | | | 75,000 | | | | 78,750 | |
Plastipak Holdings, Inc. | | | | | | | | | | | | |
6.25%, 10/15/25(b) | | | | | | | 25,000 | | | | 25,000 | |
| | | | | | | | | | | | |
| | | | | | | | | | | 103,750 | |
| | | | | | | | | | | | |
Pharmaceuticals | | | 1.2% | | | | | | | | | |
AbbVie, Inc. | | | | | | | | | | | | |
4.30%, 05/14/36 | | | | | | | 50,000 | | | | 58,893 | |
| | | | | | | | | | | | |
Pipelines | | | 0.3% | | | | | | | | | |
DCP Midstream L.P. | | | | | | | | | | | | |
(Variable, ICE LIBOR USD 3M + 5.15%) 7.38%, 12/15/22(a) | | | | | | | 25,000 | | | | 16,375 | |
| | | | | | | | | | | | |
|
| See Notes to Financial Statements. |
| 2 |
ADVISERS INVESTMENT TRUST
JOHCM CREDIT INCOME FUND
SCHEDULE OF INVESTMENTS
September 30, 2020
| | | | | | | | | | | | |
| | | Percentage of Net Assets | | | Principal Amount | | | Value | |
Real Estate Investment Trusts | | | 2.1% | | | | | | | | | |
American Tower Corp. | | | | | | | | | | | | |
4.70%, 03/15/22 | | | | | | $ | 50,000 | | | $ | 52,990 | |
Office Properties Income Trust | | | | | | | | | | | | |
4.15%, 02/01/22 | | | | | | | 50,000 | | | | 50,381 | |
| | | | | | | | | | | | |
| | | | | | | | | | | 103,371 | |
| | | | | | | | | | | | |
Software | | | 1.5% | | | | | | | | | |
MSCI, Inc., | | | | | | | | | | | | |
4.75%, 08/01/26(b) | | | | | | | 50,000 | | | | 51,875 | |
5.38%, 05/15/27(b) | | | | | | | 20,000 | | | | 21,350 | |
| | | | | | | | | | | | |
| | | | | | | | | | | 73,225 | |
| | | | | | | | | | | | |
TOTAL CORPORATE BONDS (Cost $3,098,878) | | | | | | | | | | | 3,083,020 | |
| | | | | | | | | | | | |
FOREIGN ISSUER BONDS | | | 25.9% | | | | | | | | | |
Agriculture | | | 4.3% | | | | | | | | | |
BAT International Finance PLC | | | | | | | | | | | | |
3.50%, 06/15/22(b) | | | | | | | 50,000 | | | | 52,388 | |
Imperial Brands Finance PLC | | | | | | | | | | | | |
3.88%, 07/26/29(b) | | | | | | | 150,000 | | | | 162,477 | |
| | | | | | | | | | | | |
| | | | | | | | | | | 214,865 | |
| | | | | | | | | | | | |
Banks | | | 3.3% | | | | | | | | | |
Intesa Sanpaolo S.p.A. | | | | | | | | | | | | |
5.71%, 01/15/26(b) | | | | | | | 150,000 | | | | 163,540 | |
| | | | | | | | | | | | |
Beverages | | | 2.3% | | | | | | | | | |
Bacardi Ltd. | | | | | | | | | | | | |
4.70%, 05/15/28(b) | | | | | | | 100,000 | | | | 116,213 | |
| | | | | | | | | | | | |
Electric | | | 5.5% | | | | | | | | | |
Electricite de France S.A., | | | | | | | | | | | | |
2.35%, 10/13/20 | | | | | | | 50,000 | | | | 50,030 | |
(Variable, USD Swap 10Y + 3.04%)
5.63%, 01/22/24(a) | | | | | | | 100,000 | | | | 104,750 | |
Enel S.p.A. | | | | | | | | | | | | |
(Variable, USD Swap 5Y + 5.88%) 8.75%, 09/24/73(a)(b) | | | | | | | 100,000 | | | | 116,718 | |
| | | | | | | | | | | | |
| | | | | | | | | | | 271,498 | |
| | | | | | | | | | | | |
Media | | | 2.6% | | | | | | | | | |
Videotron Ltd. | | | | | | | | | | | | |
5.00%, 07/15/22 | | | | | | | 126,000 | | | | 131,513 | |
| | | | | | | | | | | | |
Oil & Gas | | | 2.1% | | | | | | | | | |
BP Capital Markets PLC | | | | | | | | | | | | |
(Variable, U.S. Treasury Yield Curve Rate CMT 5Y + 4.04%) 4.38%, 06/22/25(a) | | | | | | | 100,000 | | | | 104,250 | |
| | | | | | | | | | | | |
Packing & Containers | | | 1.0% | | | | | | | | | |
OI European Group B.V. | | | | | | | | | | | | |
4.00%, 03/15/23(b) | | | | | | | 50,000 | | | | 50,750 | |
| | | | | | | | | | | | |
|
| See Notes to Financial Statements. |
| 3 |
ADVISERS INVESTMENT TRUST
JOHCM CREDIT INCOME FUND
SCHEDULE OF INVESTMENTS
September 30, 2020
| | | | | | | | | | | | |
| | | Percentage of Net Assets | | | Principal Amount | | | Value | |
Telecommunications | | | 4.8% | | | | | | | | | |
Altice France S.A. | | | | | | | | | | | | |
8.13%, 02/01/27(b) | | | | | | $ | 110,000 | | | $ | 119,900 | |
Vodafone Group PLC | | | | | | | | | | | | |
(Variable, USD Swap 5Y + 4.87%) 7.00%, 04/04/79(a) | | | | | | | 100,000 | | | | 118,662 | |
| | | | | | | | | | | | |
| | | | | | | | | | | 238,562 | |
| | | | | | | | | | | | |
TOTAL FOREIGN ISSUER BONDS (Cost $1,305,734) | | | | | | | | | | | 1,291,191 | |
| | | | | | | | | | | | |
| | | Percentage of Net Assets | | | Shares | | | Value | |
PREFERRED STOCKS | | | 9.2% | | | | | | | | | |
Closed-End Funds | | | 1.5% | | | | | | | | | |
Gabelli Dividend & Income Trust (The), 5.38% | | | | | | | 2,750 | | | | 73,970 | |
| | | | | | | | | | | | |
Electric | | | 1.7% | | | | | | | | | |
Duke Energy Corp., 5.63% | | | | | | | 3,000 | | | | 83,460 | |
| | | | | | | | | | | | |
Real Estate Investment Trusts | | | 4.0% | | | | | | | | | |
Boston Properties, Inc., 5.25% | | | | | | | 500 | | | | 12,590 | |
Public Storage(c) | | | | | | | 4,000 | | | | 103,720 | |
Public Storage, 4.63% | | | | | | | 400 | | | | 10,768 | |
Vornado Realty Trust, 5.70% | | | | | | | 3,000 | | | | 76,110 | |
| | | | | | | | | | | | |
| | | | | | | | | | | 203,188 | |
| | | | | | | | | | | | |
Telecommunications | | | 2.0% | | | | | | | | | |
AT&T, Inc., 4.75% | | | | | | | 4,000 | | | | 102,000 | |
| | | | | | | | | | | | |
TOTAL PREFERRED STOCKS (Cost $459,535) | | | | | | | | | | | 462,618 | |
| | | | | | | | | | | | |
SHORT-TERM INVESTMENTS | | | 0.7% | | | | | | | | | |
Northern Institutional Treasury Portfolio (Premier Class), 0.00%(d) | | | | | | | 33,879 | | | | 33,879 | |
| | | | | | | | | | | | |
TOTAL SHORT-TERM INVESTMENTS (Cost $33,879) | | | | | | | | | | | 33,879 | |
| | | | | | | | | | | | |
TOTAL INVESTMENTS
(Cost $4,898,026) | | | 97.6% | | | | | | | | 4,870,708 | |
NET OTHER ASSETS (LIABILITIES) | | | 2.4% | | | | | | | | 118,178 | |
| �� | | | | | | | | | | | |
NET ASSETS | | | 100.0% | | | | | | | $ | 4,988,886 | |
| | | | | | | | | | | | |
(a)Floating rate security. The rate presented is the rate in effect at September 30, 2020, and the related index and spread are shown parenthetically for each security.
(b)Securities purchased in a transaction exempt from registration under Rule 144A of the Securities Act of 1933. These securities may not be publicly traded without registration under the Securities Act of 1933. The value of these securities is determined by valuations supplied by a pricing service or brokers.
(c)Non-income producing security.
(d)7-day current yield as of September 30, 2020 is disclosed.
|
| See Notes to Financial Statements. |
| 4 |
ADVISERS INVESTMENT TRUST
JOHCM CREDIT INCOME FUND
SCHEDULE OF INVESTMENTS
September 30, 2020
At September 30, 2020, the JOHCM Credit Income Fund’s investments were concentrated as follows:
| | | | |
| Country Allocation (Unaudited) | | Percentage of Net Assets | |
United States | | | 71.8 | % |
| |
United Kingdom | | | 8.8 | |
| |
Italy | | | 5.6 | |
| |
France | | | 5.5 | |
| |
Canada | | | 2.6 | |
| |
Bermuda | | | 2.3 | |
| |
Netherlands | | | 1.0 | |
Total | | | 97.6 | % |
| | | | |
| 5 Largest Security Positions | |
| | |
| Issuer | | % of Net Assets | |
NBCUniversal Enterprise, Inc.
5.25%, 3/19/21 | | | 4.0 | % |
| |
Marriott International, Inc.
5.75%, 5/1/25 | | | 3.5 | |
| |
Intesa Sanpaolo S.p.A.
5.71%, 1/15/26 | | | 3.3 | |
| |
Charles Schwab Corp. (The)
5.38%, 6/1/25 | | | 3.3 | |
| |
Imperial Brands Finance PLC
3.88%, 7/26/29 | | | 3.3 | |
Total | | | 17.4 | % |
|
| See Notes to Financial Statements. |
| 5 |
ADVISERS INVESTMENT TRUST
JOHCM EMERGING MARKETS OPPORTUNITIES FUND
SCHEDULE OF INVESTMENTS
September 30, 2020
| | | | | | | | | | | | |
| | | Percentage
of Net
Assets | | | Shares | | | Value | |
COMMON STOCKS | | | 95.7% | | | | | | | | | |
Canada | | | 3.2% | | | | | | | | | |
Barrick Gold Corp. | | | | | | | 727,404 | | | $ | 20,447,326 | |
| | | | | | | | | | | | |
China | | | 28.3% | | | | | | | | | |
Anhui Conch Cement Co, Ltd. - Class H | | | | | | | 1,872,000 | | | | 12,874,446 | |
China Construction Bank Corp. - Class H | | | | | | | 9,579,502 | | | | 6,205,005 | |
China Petroleum & Chemical Corp. - ADR | | | | | | | 114,512 | | | | 4,633,156 | |
China Petroleum & Chemical Corp. - Class H | | | | | | | 15,577,745 | | | | 6,251,158 | |
Country Garden Services Holdings Co. Ltd. | | | | | | | 1,313,000 | | | | 8,445,500 | |
ENN Energy Holdings Ltd. | | | | | | | 1,691,716 | | | | 18,423,214 | |
Industrial & Commercial Bank of China Ltd. - Class H | | | | | | | 11,484,003 | | | | 5,956,825 | |
Jiangsu Expressway Co. Ltd. - Class H | | | | | | | 4,548,982 | | | | 4,578,301 | |
Longfor Group Holdings Ltd. | | | | | | | 3,071,372 | | | | 17,239,203 | |
Tencent Holdings Ltd. | | | | | | | 809,575 | | | | 53,431,605 | |
TravelSky Technology Ltd. - Class H | | | | | | | 3,109,000 | | | | 6,635,165 | |
Xinyi Energy Holdings Ltd. | | | | | | | 1,654,948 | | | | 869,109 | |
Xinyi Solar Holdings Ltd. | | | | | | | 16,459,440 | | | | 26,080,080 | |
Zhejiang Expressway Co. Ltd. - Class H | | | | | | | 11,243,315 | | | | 8,109,642 | |
| | | | | | | | | | | | |
| | | | | | | | | | | 179,732,409 | |
| | | | | | | | | | �� | | |
Czech Republic | | | 0.8% | | | | | | | | | |
Komercni Banka A.S.(a) | | | | | | | 236,690 | | | | 4,984,146 | |
| | | | | | | | | | | | |
Hong Kong | | | 9.5% | | | | | | | | | |
China Mobile Ltd. - ADR | | | | | | | 138,843 | | | | 4,465,191 | |
China Overseas Land & Investment Ltd. | | | | | | | 4,789,757 | | | | 11,989,766 | |
China Overseas Property Holdings Ltd. | | | | | | | 11,936,308 | | | | 9,733,804 | |
China Resources Land Ltd. | | | | | | | 2,669,971 | | | | 12,023,404 | |
Chow Tai Fook Jewellery Group Ltd. | | | | | | | 5,521,009 | | | | 7,195,075 | |
Hong Kong Exchanges & Clearing Ltd. | | | | | | | 320,523 | | | | 14,963,158 | |
| | | | | | | | | | | | |
| | | | | | | | | | | 60,370,398 | |
| | | | | | | | | | | | |
India | | | 11.5% | | | | | | | | | |
Apollo Tyres Ltd. | | | | | | | 1,105,844 | | | | 1,961,232 | |
Container Corp. of India Ltd. | | | | | | | 1,092,043 | | | | 5,401,750 | |
HDFC Bank Ltd. - ADR(a) | | | | | | | 475,369 | | | | 23,749,435 | |
Larsen & Toubro Ltd. | | | | | | | 784,134 | | | | 9,582,207 | |
Mahindra & Mahindra Ltd. | | | | | | | 1,392,831 | | | | 11,476,036 | |
Reliance Industries Ltd. | | | | | | | 603,819 | | | | 18,286,026 | |
State Bank of India(a) | | | | | | | 910,602 | | | | 2,288,230 | |
| | | | | | | | | | | | |
| | | | | | | | | | | 72,744,916 | |
| | | | | | | | | | | | |
Jersey | | | 1.6% | | | | | | | | | |
Centamin PLC | | | | | | | 4,006,478 | | | | 10,468,762 | |
| | | | | | | | | | | | |
Mexico | | | 3.1% | | | | | | | | | |
Bolsa Mexicana de Valores S.A.B. de C.V. | | | | | | | 2,295,122 | | | | 5,201,301 | |
Wal-Mart de Mexico S.A.B. de C.V. | | | | | | | 5,937,204 | | | | 14,244,564 | |
| | | | | | | | | | | | |
| | | | | | | | | | | 19,445,865 | |
| | | | | | | | | | | | |
|
| See Notes to Financial Statements. |
| 6 |
ADVISERS INVESTMENT TRUST
JOHCM EMERGING MARKETS OPPORTUNITIES FUND
SCHEDULE OF INVESTMENTS
September 30, 2020
| | | | | | | | | | | | |
| | | Percentage
of Net
Assets | | | Shares | | | Value | |
Netherlands | | | 4.3% | | | | | | | | | |
Prosus N.V.(a) | | | | | | | 294,173 | | | $ | 27,143,878 | |
| | | | | | | | | | | | |
Russia | | | 3.4% | | | | | | | | | |
Globaltrans Investment PLC - REG - GDR | | | | | | | 743,960 | | | | 4,538,156 | |
Sberbank of Russia PJSC - ADR(a) | | | | | | | 72,042 | | | | 840,730 | |
Sberbank of Russia PJSC - ADR (London International Exchange)(a) | | | | | | | 1,386,186 | | | | 16,197,584 | |
| | | | | | | | | | | | |
| | | | | | | | | | | 21,576,470 | |
| | | | | | | | | | | | |
South Africa | | | 2.1% | | | | | | | | | |
Naspers Ltd. - Class N | | | | | | | 75,208 | | | | 13,290,488 | |
| | | | | | | | | | | | |
South Korea | | | 19.5% | | | | | | | | | |
Cheil Worldwide, Inc. | | | | | | | 517,049 | | | | 9,253,846 | |
Com2uS Corp. | | | | | | | 14,965 | | | | 1,467,724 | |
NCSoft Corp. | | | | | | | 19,425 | | | | 13,378,258 | |
Samsung Electronics Co. Ltd. | | | | | | | 1,100,084 | | | | 55,428,473 | |
Samsung Electronics Co. Ltd. - REG - GDR(b) | | | | | | | 1,264 | | | | 1,601,488 | |
SK Hynix, Inc. | | | | | | | 231,370 | | | | 16,601,198 | |
SK Telecom Co. Ltd. | | | | | | | 118,272 | | | | 24,054,665 | |
SK Telecom Co. Ltd. - ADR | | | | | | | 93,950 | | | | 2,106,359 | |
| | | | | | | | | | | | |
| | | | | | | | | | | 123,892,011 | |
| | | | | | | | | | | | |
Taiwan | | | 4.2% | | | | | | | | | |
Primax Electronics Ltd. | | | | | | | 1,817,384 | | | | 2,682,590 | |
Taiwan Cement Corp. | | | | | | | 4,228,000 | | | | 6,043,754 | |
Tong Yang Industry Co. Ltd. | | | | | | | 5,618,643 | | | | 6,945,218 | |
Win Semiconductors Corp. | | | | | | | 500,000 | | | | 4,946,136 | |
Yuanta Financial Holding Co. Ltd. | | | | | | | 9,924,000 | | | | 6,099,275 | |
| | | | | | | | | | | | |
| | | | | | | | | | | 26,716,973 | |
| | | | | | | | | | | | |
Turkey | | | 2.0% | | | | | | | | | |
BIM Birlesik Magazalar A.S. | | | | | | | 963,247 | | | | 8,681,104 | |
Coca-Cola Icecek A.S. | | | | | | | 659,812 | | | | 3,827,597 | |
| | | | | | | | | | | | |
| | | | | | | | | | | 12,508,701 | |
| | | | | | | | | | | | |
United Arab Emirates | | | 2.2% | | | | | | | | | |
Emaar Malls PJSC(a) | | | | | | | 19,222,211 | | | | 7,797,420 | |
Emaar Properties PJSC(a) | | | | | | | 7,763,682 | | | | 5,897,029 | |
| | | | | | | | | | | | |
| | | | | | | | | | | 13,694,449 | |
| | | | | | | | | | | | |
TOTAL COMMON STOCKS (Cost $551,192,300) | | | | | | | | | | | 607,016,792 | |
| | | | | | | | | | | | |
TOTAL INVESTMENTS
(Cost $551,192,300) | | | 95.7% | | | | | | | | 607,016,792 | |
NET OTHER ASSETS (LIABILITIES) | | | 4.3% | | | | | | | | 27,209,019 | |
| | | | | | | | | | | | |
NET ASSETS | | | 100.0% | | | | | | | $ | 634,225,811 | |
| | | | | | | | | | | | |
(a) Non-income producing security.
(b) Securities purchased in a transaction exempt from registration under Rule 144A of the Securities Act of 1933. These securities may not be publicly traded without registration under the Securities Act of 1933. The value of these securities is determined by valuations supplied by a pricing service or brokers.
Abbreviations:
ADR – American Depositary Receipt
GDR – Global Depositary Receipt
REG – Registered
|
| See Notes to Financial Statements. |
| 7 |
ADVISERS INVESTMENT TRUST
JOHCM EMERGING MARKETS OPPORTUNITIES FUND
SCHEDULE OF INVESTMENTS
September 30, 2020
At September 30, 2020 the industry sectors for the JOHCM Emerging Markets Opportunities Fund were:
| | |
| Sector Allocation (Unaudited) | | % of Net Assets |
Communication Services | | 17.1% |
Consumer Discretionary | | 10.7 |
Consumer Staples | | 4.2 |
Energy | | 4.6 |
Financials | | 13.6 |
Industrials | | 6.4 |
Information Technology | | 18.0 |
Materials | | 7.9 |
Real Estate | | 10.2 |
Utilities | | 3.0 |
Total | | 95.7% |
|
| See Notes to Financial Statements. |
| 8 |
ADVISERS INVESTMENT TRUST
JOHCM EMERGING MARKETS OPPORTUNITIES FUND
SCHEDULE OF INVESTMENTS
September 30, 2020
| | | | |
| Market Exposure (Unaudited) | |
| Equity Securities | | % of Net Assets | |
Internet | | | 16.9 | % |
Semiconductors | | | 12.4 | |
Real Estate | | | 11.5 | |
Banks | | | 9.5 | |
Mining | | | 4.9 | |
Telecommunications | | | 4.8 | |
Oil & Gas | | | 4.6 | |
Energy-Alternate Sources | | | 4.3 | |
Diversified Financial Services | | | 4.1 | |
Retail | | | 3.4 | |
Building Materials | | | 3.0 | |
Gas | | | 2.9 | |
Commercial Services | | | 2.0 | |
Auto Manufacturers | | | 1.8 | |
Transportation | | | 1.6 | |
Engineering & Construction | | | 1.5 | |
Advertising | | | 1.5 | |
Auto Parts & Equipment | | | 1.4 | |
Food | | | 1.4 | |
Leisure Time | | | 1.0 | |
Beverages | | | 0.6 | |
Computers | | | 0.4 | |
Software | | | 0.2 | |
Total | | | 95.7 | % |
| | | | |
| 5 Largest Security Positions | |
| Issuer | | % of Net Assets | |
Samsung Electronics Co. Ltd. | | | 8.8 | % |
Tencent Holdings Ltd. | | | 8.4 | |
Prosus N.V. | | | 4.3 | |
Xinyi Solar Holdings Ltd. | | | 4.1 | |
SK Telecom Co. Ltd. | | | 3.8 | |
Total | | | 29.4 | % |
|
| See Notes to Financial Statements. |
| 9 |
ADVISERS INVESTMENT TRUST
JOHCM EMERGING MARKETS SMALL MID CAP EQUITY FUND
SCHEDULE OF INVESTMENTS
September 30, 2020
| | | | | | | | | | |
| | | Percentage
of Net
Assets | | Shares | | | Value | |
COMMON STOCKS | | 94.2% | | | | | | | | |
Brazil | | 4.4% | | | | | | | | |
Cyrela Brazil Realty SA Empreendimentos e Participacoes | | | | | 74,700 | | | $ | 309,127 | |
Grupo SBF S.A.(a) | | | | | 42,800 | | | | 193,503 | |
Lojas Quero Quero S.A.(a) | | | | | 150,932 | | | | 374,918 | |
Movida Participacoes S.A.(a) | | | | | 103,796 | | | | 300,526 | |
Sul America S.A. | | | | | 33,600 | | | | 237,107 | |
TOTVS S.A. | | | | | 53,865 | | | | 259,930 | |
Vasta Platform Ltd.(a) | | | | | 14,766 | | | | 227,839 | |
| | | | | | | | | | |
| | | | | | | | | 1,902,950 | |
| | | | | | | | | | |
Canada | | 1.3% | | | | | | | | |
Dundee Precious Metals, Inc. | | | | | 81,145 | | | | 581,370 | |
| | | | | | | | | | |
Chile | | 0.5% | | | | | | | | |
Vina Concha y Toro S.A. | | | | | 129,578 | | | | 212,226 | |
| | | | | | | | | | |
China | | 14.0% | | | | | | | | |
AsiaInfo Technologies Ltd.(b) | | | | | 208,000 | | | | 325,820 | |
Bright Dairy & Food Co. Ltd. - Class A | | | | | 68,200 | | | | 168,197 | |
Changzhou Xingyu Automotive Lighting Systems Co. Ltd. - Class A | | | | | 20,400 | | | | 450,273 | |
China Building Material Test & Certification Group Co. Ltd. - Class A | | | | | 85,408 | | | | 241,607 | |
China Yongda Automobiles Services Holdings Ltd. | | | | | 354,000 | | | | 418,859 | |
China Yuhua Education Corp. Ltd.(b) | | | | | 524,000 | | | | 447,595 | |
Chongqing Fuling Zhacai Group Co. Ltd. - Class A | | | | | 86,300 | | | | 598,686 | |
Laobaixing Pharmacy Chain JSC - Class A | | | | | 34,840 | | | | 426,175 | |
Livzon Pharmaceutical Group, Inc. - Class H | | | | | 47,700 | | | | 217,880 | |
Sany Heavy Equipment International Holdings Co. Ltd. | | | | | 667,000 | | | | 391,591 | |
Shandong Weigao Group Medical Polymer Co. Ltd. - Class H | | | | | 152,000 | | | | 302,821 | |
Silergy Corp. | | | | | 8,613 | | | | 507,049 | |
Skshu Paint Co. Ltd. - Class A | | | | | 26,520 | | | | 627,654 | |
Xinyi Energy Holdings Ltd. | | | | | 848,000 | | | | 445,334 | |
Zhou Hei Ya International Holdings Co. Ltd.(a)(b) | | | | | 511,000 | | | | 532,755 | |
| | | | | | | | | | |
| | | | | | | | | 6,102,296 | |
| | | | | | | | | | |
Czech Republic | | 0.5% | | | | | | | | |
Moneta Money Bank A.S.(b) | | | | | 90,592 | | | | 208,822 | |
| | | | | | | | | | |
Greece | | 1.1% | | | | | | | | |
JUMBO S.A. | | | | | 13,829 | | | | 243,207 | |
OPAP S.A. | | | | | 25,927 | | | | 246,225 | |
| | | | | | | | | | |
| | | | | | | | | 489,432 | |
| | | | | | | | | | |
Hong Kong | | 4.1% | | | | | | | | |
Bosideng International Holdings Ltd. | | | | | 836,000 | | | | 258,889 | |
China Overseas Grand Oceans Group Ltd. | | | | | 605,000 | | | | 345,043 | |
Kingboard Laminates Holdings Ltd. | | | | | 177,500 | | | | 242,773 | |
Lee & Man Paper Manufacturing Ltd. | | | | | 225,000 | | | | 162,579 | |
SITC International Holdings Co. Ltd. | | | | | 454,000 | | | | 626,809 | |
Vinda International Holdings Ltd. | | | | | 51,000 | | | | 167,147 | |
| | | | | | | | | | |
| | | | | | | | | 1,803,240 | |
| | | | | | | | | | |
|
| See Notes to Financial Statements. |
| 10 |
ADVISERS INVESTMENT TRUST
JOHCM EMERGING MARKETS SMALL MID CAP EQUITY FUND
SCHEDULE OF INVESTMENTS
September 30, 2020
| | | | | | | | | | |
| | | Percentage
of Net
Assets | | Shares | | | Value | |
Hungary | | 1.4% | | | | | | | | |
Richter Gedeon Nyrt | | | | | 28,217 | | | $ | 596,172 | |
| | | | | | | | | | |
India | | 11.2% | | | | | | | | |
Bata India Ltd. | | | | | 14,940 | | | | 266,958 | |
Dixon Technologies India Ltd. | | | | | 3,449 | | | | 409,600 | |
Dr Lal PathLabs Ltd.(b) | | | | | 23,236 | | | | 592,002 | |
Godrej Properties Ltd.(a) | | | | | 26,007 | | | | 303,303 | |
Info Edge India Ltd. | | | | | 12,836 | | | | 632,353 | |
Ipca Laboratories Ltd. | | | | | 29,417 | | | | 863,791 | |
Multi Commodity Exchange of India Ltd. | | | | | 11,675 | | | | 272,617 | |
Persistent Systems Ltd. | | | | | 28,213 | | | | 512,885 | |
Varun Beverages Ltd. | | | | | 44,463 | | | | 420,821 | |
WNS Holdings Ltd. - ADR(a) | | | | | 9,654 | | | | 617,470 | |
| | | | | | | | | | |
| | | | | | | | | 4,891,800 | |
| | | | | | | | | | |
Indonesia | | 0.9% | | | | | | | | |
Merdeka Copper Gold Tbk PT(a) | | | | | 3,656,000 | | | | 396,804 | |
| | | | | | | | | | |
Malaysia | | 0.8% | | | | | | | | |
TIME dotCom Bhd. | | | | | 80,800 | | | | 233,329 | |
V.S. Industry Bhd. | | | | | 238,300 | | | | 130,175 | |
| | | | | | | | | | |
| | | | | | | | | 363,504 | |
| | | | | | | | | | |
Mexico | | 2.2% | | | | | | | | |
Bolsa Mexicana de Valores S.A.B. de C.V. | | | | | 122,000 | | | | 276,482 | |
Corp. Inmobiliaria Vesta S.A.B. de C.V. | | | | | 144,500 | | | | 217,748 | |
Genomma Lab Internacional S.A.B. de C.V. - Series B(a) | | | | | 371,165 | | | | 363,250 | |
Industrias Penoles S.A.B de C.V. | | | | | 7,251 | | | | 117,166 | |
| | | | | | | | | | |
| | | | | | | | | 974,646 | |
| | | | | | | | | | |
Philippines | | 0.6% | | | | | | | | |
Wilcon Depot, Inc. | | | | | 835,600 | | | | 275,775 | |
| | | | | | | | | | |
Poland | | 2.5% | | | | | | | | |
Asseco Poland S.A. | | | | | 17,717 | | | | 318,552 | |
Bank Polska Kasa Opieki S.A.(a) | | | | | 18,473 | | | | 240,483 | |
Dino Polska S.A.(a)(b) | | | | | 8,728 | | | | 514,368 | |
| | | | | | | | | | |
| | | | | | | | | 1,073,403 | |
| | | | | | | | | | |
Russia | | 3.3% | | | | | | | | |
Globaltrans Investment PLC - REG - GDR | | | | | 51,272 | | | | 312,759 | |
Mail.Ru Group Ltd. - REG - GDR(a) | | | | | 21,452 | | | | 587,785 | |
Sistema PJSC - REG - GDR | | | | | 101,138 | | | | 542,100 | |
| | | | | | | | | | |
| | | | | | | | | 1,442,644 | |
| | | | | | | | | | |
Saudi Arabia | | 0.5% | | | | | | | | |
United Electronics Co. | | | | | 12,122 | | | | 225,253 | |
| | | | | | | | | | |
South Africa | | 3.5% | | | | | | | | |
African Rainbow Minerals Ltd. | | | | | 32,590 | | | | 376,488 | |
AngloGold Ashanti Ltd. - ADR | | | | | 7,989 | | | | 210,750 | |
Aspen Pharmacare Holdings Ltd.(a) | | | | | 31,916 | | | | 227,280 | |
Mediclinic International PLC | | | | | 71,117 | | | | 260,946 | |
|
| See Notes to Financial Statements. |
| 11 |
ADVISERS INVESTMENT TRUST
JOHCM EMERGING MARKETS SMALL MID CAP EQUITY FUND
SCHEDULE OF INVESTMENTS
September 30, 2020
| | | | | | | | | | |
| | | Percentage
of Net
Assets | | Shares | | | Value | |
Ninety One Ltd.(a) | | | | | 60,582 | | | $ | 159,141 | |
Northam Platinum Ltd.(a) | | | | | 29,137 | | | | 296,136 | |
| | | | | | | | | | |
| | | | | | | | | 1,530,741 | |
| | | | | | | | | | |
South Korea | | 18.0% | | | | | | | | |
Chunbo Co. Ltd. | | | | | 2,676 | | | | 389,105 | |
Cosmax, Inc. | | | | | 3,740 | | | | 370,613 | |
D&C Media Co. Ltd.(a) | | | | | 14,732 | | | | 451,238 | |
DB HiTek Co. Ltd. | | | | | 15,624 | | | | 500,281 | |
Douzone Bizon Co. Ltd. | | | | | 5,610 | | | | 503,412 | |
Duk San Neolux Co. Ltd.(a) | | | | | 19,277 | | | | 521,067 | |
Echo Marketing, Inc. | | | | | 14,213 | | | | 334,507 | |
Ecopro Co. Ltd. | | | | | 11,103 | | | | 425,137 | |
E-MART, Inc. | | | | | 1,817 | | | | 217,820 | |
Eugene Technology Co. Ltd. | | | | | 15,929 | | | | 382,192 | |
Hanwha Solutions Corp. | | | | | 10,669 | | | | 356,240 | |
Hugel, Inc.(a) | | | | | 2,767 | | | | 436,678 | |
Iljin Materials Co. Ltd. | | | | | 4,254 | | | | 164,030 | |
KINX, Inc. | | | | | 5,619 | | | | 421,389 | |
Mando Corp. | | | | | 14,137 | | | | 430,299 | |
NICE Information Service Co. Ltd. | | | | | 18,898 | | | | 318,829 | |
Park Systems Corp. | | | | | 5,168 | | | | 310,910 | |
PSK, Inc. | | | | | 15,242 | | | | 415,786 | |
Webcash Corp. | | | | | 8,456 | | | | 504,939 | |
WONIK IPS Co. Ltd.(a) | | | | | 13,787 | | | | 392,592 | |
| | | | | | | | | | |
| | | | | | | | | 7,847,064 | |
| | | | | | | | | | |
Switzerland | | 0.6% | | | | | | | | |
Wizz Air Holdings PLC(a)(b) | | | | | 5,891 | | | | 236,709 | |
| | | | | | | | | | |
Taiwan | | 18.5% | | | | | | | | |
Accton Technology Corp. | | | | | 48,000 | | | | 368,759 | |
ASMedia Technology, Inc. | | | | | 8,000 | | | | 401,906 | |
Chailease Holding Co. Ltd. | | | | | 80,340 | | | | 363,391 | |
Chicony Power Technology Co. Ltd. | | | | | 215,000 | | | | 492,922 | |
Elan Microelectronics Corp. | | | | | 112,000 | | | | 562,668 | |
Epistar Corp.(a) | | | | | 159,000 | | | | 194,070 | |
Global PMX Co. Ltd.(a) | | | | | 37,000 | | | | 212,710 | |
Grand Pacific Petrochemical(a) | | | | | 532,000 | | | | 341,662 | |
Hiwin Technologies Corp. | | | | | 38,110 | | | | 375,021 | |
Kaori Heat Treatment Co. Ltd. | | | | | 87,000 | | | | 158,608 | |
Kindom Development Co. Ltd. | | | | | 337,000 | | | | 454,965 | |
King’s Town Bank Co. Ltd. | | | | | 256,000 | | | | 327,049 | |
Merida Industry Co. Ltd. | | | | | 41,000 | | | | 329,846 | |
momo.com, Inc. | | | | | 12,000 | | | | 291,278 | |
Nan Liu Enterprise Co. Ltd. | | | | | 21,000 | | | | 170,033 | |
Pan Jit International, Inc. | | | | | 240,000 | | | | 300,808 | |
Parade Technologies Ltd. | | | | | 15,540 | | | | 563,393 | |
|
| See Notes to Financial Statements. |
| 12 |
ADVISERS INVESTMENT TRUST
JOHCM EMERGING MARKETS SMALL MID CAP EQUITY FUND
SCHEDULE OF INVESTMENTS
September 30, 2020
| | | | | | | | | | |
| | | Percentage
of Net
Assets | | Shares | | | Value | |
Realtek Semiconductor Corp. | | | | | 62,000 | | | $ | 788,861 | |
Topkey Corp. | | | | | 17,000 | | | | 83,938 | |
Unimicron Technology Corp. | | | | | 184,000 | | | | 472,675 | |
Voltronic Power Technology Corp. | | | | | 17,850 | | | | 605,847 | |
Yeong Guan Energy Technology Group Co. Ltd. | | | | | 69,000 | | | | 211,322 | |
| | | | | | | | | | |
| | | | | | | | | 8,071,732 | |
| | | | | | | | | | |
Thailand | | 2.8% | | | | | | | | |
Com7 PCL - REG | | | | | 277,700 | | | | 346,167 | |
JMT Network Services PCL - REG | | | | | 446,800 | | | | 451,206 | |
Mega Lifesciences PCL - REG | | | | | 396,100 | | | | 434,382 | |
| | | | | | | | | | |
| | | | | | | | | 1,231,755 | |
| | | | | | | | | | |
United Kingdom | | 0.8% | | | | | | | | |
Avast PLC(b) | | | | | 48,158 | | | | 327,481 | |
| | | | | | | | | | |
United States | | 0.7% | | | | | | | | |
QIWI PLC - ADR | | | | | 17,921 | | | | 310,929 | |
| | | | | | | | | | |
TOTAL COMMON STOCKS (Cost $34,616,005) | | | | | | | | | 41,096,748 | |
| | | | | | | | | | |
EQUITY-LINKED SECURITIES | | 0.9% | | | | | | | | |
India | | 0.9% | | | | | | | | |
Voltas Ltd., Issued by CLSA Global Markets Pte. Ltd., Maturity Date
6/30/25(a)(b) | | | | | 42,916 | | | | 395,743 | |
| | | | | | | | | | |
TOTAL EQUITY-LINKED SECURITIES (Cost $364,384) | | | | | | | | | 395,743 | |
| | | | | | | | | | |
PREFERRED STOCKS | | 1.0% | | | | | | | | |
Brazil | | 1.0% | | | | | | | | |
Gerdau S.A. - ADR, 0.68%(c) | | | | | 117,737 | | | | 435,627 | |
| | | | | | | | | | |
TOTAL PREFERRED STOCKS (Cost $297,539) | | | | | | | | | 435,627 | |
| | | | | | | | | | |
TOTAL INVESTMENTS
(Cost $35,277,928) | | 96.1% | | | | | | | 41,928,118 | |
NET OTHER ASSETS (LIABILITIES) | | 3.9% | | | | | | | 1,718,982 | |
| | | | | | | | | | |
NET ASSETS | | 100.0% | | | | | | $ | 43,647,100 | |
| | | | | | | | | | |
(a) Non-income producing security.
(b) Securities purchased in a transaction exempt from registration under Rule 144A of the Securities Act of 1933. These securities may not be publicly traded without registration under the Securities Act of 1933. The value of these securities is determined by valuations supplied by a pricing service or brokers.
(c) Current yield is disclosed. Dividends are calculated based on a percentage of issuer’s net income.
Abbreviations:
ADR – American Depositary Receipt
GDR – Global Depositary Receipt
REG – Registered
|
| See Notes to Financial Statements. |
| 13 |
ADVISERS INVESTMENT TRUST
JOHCM EMERGING MARKETS SMALL MID CAP EQUITY FUND
SCHEDULE OF INVESTMENTS
September 30, 2020
At September 30, 2020 the industry sectors for the JOHCM Emerging Markets Small Mid Cap Equity Fund were:
| | | | |
| Sector Allocation (Unaudited) | | % of Net Assets | |
Communication Services | | | 7.3 | % |
Consumer Discretionary | | | 14.2 | |
Consumer Staples | | | 8.3 | |
Financials | | | 4.8 | |
Health Care | | | 9.9 | |
Industrials | | | 11.3 | |
Information Technology | | | 23.8 | |
Materials | | | 12.5 | |
Real Estate | | | 3.0 | |
Utilities | | | 1.0 | |
Total | | | 96.1 | % |
|
| See Notes to Financial Statements. |
| 14 |
ADVISERS INVESTMENT TRUST
JOHCM EMERGING MARKETS SMALL MID CAP EQUITY FUND
SCHEDULE OF INVESTMENTS
September 30, 2020
| | | | |
| Market Exposure (Unaudited) | |
| Equity and Equity-Linked Securities | | % of Net Assets | |
Semiconductors | | | 10.8 | % |
Retail | | | 7.8 | |
Pharmaceuticals | | | 6.2 | |
Software | | | 5.5 | |
Commercial Services | | | 4.7 | |
Chemicals | | | 4.6 | |
Mining | | | 4.5 | |
Electronics | | | 4.2 | |
Food | | | 4.2 | |
Computers | | | 4.1 | |
Real Estate | | | 3.7 | |
Telecommunications | | | 2.6 | |
Diversified Financial Services | | | 2.5 | |
Electrical Component & Equipments | | | 2.4 | |
Internet | | | 2.4 | |
Transportation | | | 2.2 | |
Miscellaneous Manufacturing | | | 2.1 | |
Healthcare-Services | | | 2.0 | |
Banks | | | 1.8 | |
Auto Parts & Equipment | | | 1.5 | |
Beverages | | | 1.4 | |
Cosmetics/Personal Care | | | 1.2 | |
Healthcare-Products | | | 1.1 | |
Media | | | 1.0 | |
Energy-Alternate Sources | | | 1.0 | |
Biotechnology | | | 1.0 | |
Iron/Steel | | | 1.0 | |
Home Furnishings | | | 0.9 | |
Engineering & Construction | | | 0.9 | |
Machinery-Construction & Mining | | | 0.9 | |
Distribution/Wholesale | | | 0.9 | |
Hand/Machine Tools | | | 0.8 | |
Advertising | | | 0.8 | |
Leisure Time | | | 0.8 | |
Apparel | | | 0.6 | |
Entertainment | | | 0.6 | |
Insurance | | | 0.5 | |
Airlines | | | 0.5 | |
Packing & Containers | | | 0.4 | |
Total | | | 96.1 | % |
| | | | |
| 5 Largest Security Positions | |
| Issuer | | % of Net Assets | |
Ipca Laboratories Ltd. | | | 2.0 | % |
Realtek Semiconductor Corp. | | | 1.8 | |
Info Edge India Ltd. | | | 1.4 | |
Skshu Paint Co. Ltd. - Class A | | | 1.4 | |
SITC International Holdings Co. Ltd. | | | 1.4 | |
Total | | | 8.0 | % |
|
| See Notes to Financial Statements. |
| 15 |
ADVISERS INVESTMENT TRUST
JOHCM GLOBAL EQUITY FUND
SCHEDULE OF INVESTMENTS
September 30, 2020
| | | | | | | | | | |
| | | Percentage
of Net
Assets | | Shares | | | Value | |
COMMON STOCKS | | 98.5% | | | | | | | | |
Australia | | 4.7% | | | | | | | | |
Atlassian Corp. PLC - Class A(a) | | | | | 64,558 | | | $ | 11,735,999 | |
Newcrest Mining Ltd. | | | | | 454,291 | | | | 10,165,057 | |
| | | | | | | | | | |
| | | | | | | | | 21,901,056 | |
| | | | | | | | | | |
Denmark | | 5.4% | | | | | | | | |
Orsted A/S(b) | | | | | 86,035 | | | | 11,860,823 | |
Vestas Wind Systems A/S | | | | | 79,510 | | | | 12,897,101 | |
| | | | | | | | | | |
| | | | | | | | | 24,757,924 | |
| | | | | | | | | | |
Germany | | 2.3% | | | | | | | | |
SAP S.E. | | | | | 69,493 | | | | 10,816,896 | |
| | | | | | | | | | |
Hong Kong | | 2.5% | | | | | | | | |
Hong Kong Exchanges & Clearing Ltd. | | | | | 245,757 | | | | 11,472,814 | |
| | | | | | | | | | |
Ireland | | 7.7% | | | | | | | | |
Accenture PLC - Class A | | | | | 52,305 | | | | 11,820,407 | |
Aptiv PLC | | | | | 136,489 | | | | 12,513,311 | |
Medtronic PLC | | | | | 108,706 | | | | 11,296,728 | |
| | | | | | | | | | |
| | | | | | | | | 35,630,446 | |
| | | | | | | | | | |
Israel | | 0.0% | | | | | | | | |
JFrog Ltd.(a) | | | | | 333 | | | | 28,188 | |
| | | | | | | | | | |
Japan | | 13.2% | | | | | | | | |
Kao Corp. | | | | | 143,300 | | | | 10,716,419 | |
PeptiDream, Inc.(a) | | | | | 255,100 | | | | 11,900,554 | |
Rakuten, Inc. | | | | | 1,043,700 | | | | 11,202,469 | |
Recruit Holdings Co. Ltd. | | | | | 341,500 | | | | 13,470,251 | |
SBI Holdings, Inc. | | | | | 532,100 | | | | 13,687,833 | |
| | | | | | | | | | |
| | | | | | | | | 60,977,526 | |
| | | | | | | | | | |
Netherlands | | 7.7% | | | | | | | | |
ASML Holding N.V. | | | | | 30,937 | | | | 11,414,826 | |
Koninklijke DSM N.V. | | | | | 77,887 | | | | 12,839,397 | |
Prosus N.V.(a) | | | | | 123,188 | | | | 11,366,781 | |
| | | | | | | | | | |
| | | | | | | | | 35,621,004 | |
| | | | | | | | | | |
New Zealand | | 2.1% | | | | | | | | |
a2 Milk Co. Ltd.(a) | | | | | 960,559 | | | | 9,666,406 | |
| | | | | | | | | | |
South Korea | | 2.6% | | | | | | | | |
NAVER Corp. | | | | | 47,380 | | | | 11,996,188 | |
| | | | | | | | | | |
Taiwan | | 2.7% | | | | | | | | |
MediaTek, Inc. | | | | | 585,540 | | | | 12,272,039 | |
| | | | | | | | | | |
United Kingdom | | 5.0% | | | | | | | | |
IHS Markit Ltd. | | | | | 148,920 | | | | 11,691,709 | |
Linde PLC | | | | | 48,033 | | | | 11,438,099 | |
| | | | | | | | | | |
| | | | | | | | | 23,129,808 | |
| | | | | | | | | | |
United States | | 42.6% | | | | | | | | |
Agilent Technologies, Inc. | | | | | 125,772 | | | | 12,695,425 | |
Cboe Global Markets, Inc. | | | | | 103,171 | | | | 9,052,224 | |
|
| See Notes to Financial Statements. |
| 16 |
ADVISERS INVESTMENT TRUST
JOHCM GLOBAL EQUITY FUND
SCHEDULE OF INVESTMENTS
September 30, 2020
| | | | | | | | | | |
| | | Percentage
of Net
Assets | | Shares | | | Value | |
CME Group, Inc. | | | | | 55,215 | | | $ | 9,238,022 | |
Cree, Inc.(a) | | | | | 182,527 | | | | 11,634,271 | |
Estee Lauder Cos. (The), Inc. - Class A | | | | | 54,737 | | | | 11,946,350 | |
Intercontinental Exchange, Inc. | | | | | 115,802 | | | | 11,585,990 | |
Intuit, Inc. | | | | | 35,788 | | | | 11,674,403 | |
Keysight Technologies, Inc.(a) | | | | | 117,452 | | | | 11,601,909 | |
Medpace Holdings, Inc.(a) | | | | | 91,811 | | | | 10,259,879 | |
Micron Technology, Inc.(a) | | | | | 248,749 | | | | 11,681,253 | |
Microsoft Corp. | | | | | 61,674 | | | | 12,971,892 | |
Nasdaq, Inc. | | | | | 91,456 | | | | 11,222,566 | |
NVIDIA Corp. | | | | | 22,970 | | | | 12,431,823 | |
Oracle Corp. | | | | | 200,399 | | | | 11,963,820 | |
PayPal Holdings, Inc.(a) | | | | | 60,933 | | | | 12,005,629 | |
PRA Health Sciences, Inc.(a) | | | | | 116,048 | | | | 11,771,909 | |
Snowflake, Inc. - Class A(a) | | | | | 28 | | | | 7,028 | |
Thermo Fisher Scientific, Inc. | | | | | 29,838 | | | | 13,174,074 | |
| | | | | | | | | | |
| | | | | | | | | 196,918,467 | |
| | | | | | | | | | |
TOTAL COMMON STOCKS (Cost $323,885,123) | | | | | | | | | 455,188,762 | |
| | | | | | | | | | |
TOTAL INVESTMENTS
(Cost $323,885,123) | | 98.5% | | | | | | | 455,188,762 | |
NET OTHER ASSETS (LIABILITIES) | | 1.5% | | | | | | | 6,770,097 | |
| | | | | | | | | | |
NET ASSETS | | 100.0% | | | | | | $ | 461,958,859 | |
| | | | | | | | | | |
(a) Non-income producing security.
(b) Securities purchased in a transaction exempt from registration under Rule 144A of the Securities Act of 1933. These securities may not be publicly traded without registration under the Securities Act of 1933. The value of these securities is determined by valuations supplied by a pricing service or brokers.
At September 30, 2020 the industry sectors for the JOHCM Global Equity Fund were:
| | | | |
| Sector Allocation (Unaudited) | | % of Net Assets | |
Communication Services | | | 2.6 | % |
Consumer Discretionary | | | 7.6 | |
Consumer Staples | | | 7.0 | |
Financials | | | 14.3 | |
Health Care | | | 15.4 | |
Industrials | | | 8.2 | |
Information Technology | | | 33.3 | |
Materials | | | 7.5 | |
Utilities | | | 2.6 | |
Total | | | 98.5 | % |
|
| See Notes to Financial Statements. |
| 17 |
ADVISERS INVESTMENT TRUST
JOHCM GLOBAL EQUITY FUND
SCHEDULE OF INVESTMENTS
September 30, 2020
| | | | |
| Market Exposure (Unaudited) | |
| Equity Securities | | % of Net Assets | |
Diversified Financial Services | | | 14.3 | % |
Semiconductors | | | 12.9 | |
Software | | | 12.8 | |
Commercial Services | | | 8.0 | |
Internet | | | 7.5 | |
Healthcare-Products | | | 5.3 | |
Electronics | | | 5.3 | |
Chemicals | | | 5.2 | |
Cosmetics/Personal Care | | | 4.9 | |
Healthcare-Services | | | 4.8 | |
Energy-Alternate Sources | | | 2.8 | |
Auto Parts & Equipment | | | 2.7 | |
Electric | | | 2.6 | |
Computers | | | 2.6 | |
Pharmaceuticals | | | 2.5 | |
Mining | | | 2.2 | |
Food | | | 2.1 | |
Total | | | 98.5 | % |
| | | | |
| 5 Largest Security Positions | |
| Issuer | | % of Net Assets | |
SBI Holdings, Inc. | | | 3.0 | % |
Recruit Holdings Co. Ltd. | | | 2.9 | |
Thermo Fisher Scientific, Inc. | | | 2.9 | |
Microsoft Corp. | | | 2.8 | |
Vestas Wind Systems A/S | | | 2.8 | |
Total | | | 14.4 | % |
|
| See Notes to Financial Statements. |
| 18 |
ADVISERS INVESTMENT TRUST
JOHCM GLOBAL INCOME BUILDER FUND
SCHEDULE OF INVESTMENTS
September 30, 2020
| | | | | | | | | | |
| | | Percentage
of Net
Assets | | Shares | | | Value | |
COMMON STOCKS | | 56.2% | | | | | | | | |
Agriculture | | 1.9% | | | | | | | | |
British American Tobacco PLC | | | | | 20,854 | | | $ | 747,396 | |
Philip Morris International, Inc. | | | | | 10,920 | | | | 818,891 | |
| | | | | | | | | | |
| | | | | | | | | 1,566,287 | |
| | | | | | | | | | |
Banks | | 2.1% | | | | | | | | |
FinecoBank Banca Fineco S.p.A.(a) | | | | | 16,594 | | | | 228,701 | |
JPMorgan Chase & Co. | | | | | 6,786 | | | | 653,288 | |
Lloyds Banking Group PLC(a) | | | | | 419,509 | | | | 142,663 | |
Truist Financial Corp. | | | | | 10,167 | | | | 386,855 | |
Wells Fargo & Co. | | | | | 14,674 | | | | 344,986 | |
| | | | | | | | | | |
| | | | | | | | | 1,756,493 | |
| | | | | | | | | | |
Beverages | | 2.1% | | | | | | | | |
Coca-Cola (The) Co. | | | | | 8,917 | | | | 440,232 | |
Coca-Cola European Partners PLC | | | | | 13,648 | | | | 529,679 | |
Diageo PLC | | | | | 23,325 | | | | 797,582 | |
| | | | | | | | | | |
| | | | | | | | | 1,767,493 | |
| | | | | | | | | | |
Building Materials | | 1.2% | | | | | | | | |
CRH PLC | | | | | 16,710 | | | | 602,867 | |
Vulcan Materials Co. | | | | | 3,202 | | | | 433,999 | |
| | | | | | | | | | |
| | | | | | | | | 1,036,866 | |
| | | | | | | | | | |
Chemicals | | 3.0% | | | | | | | | |
Air Liquide S.A. | | | | | 3,792 | | | | 602,423 | |
Air Products & Chemicals, Inc. | | | | | 3,459 | | | | 1,030,298 | |
Linde PLC | | | | | 3,544 | | | | 843,933 | |
| | | | | | | | | | |
| | | | | | | | | 2,476,654 | |
| | | | | | | | | | |
Commercial Services | | 1.4% | | | | | | | | |
Amadeus IT Group S.A. | | | | | 10,394 | | | | 579,953 | |
Bureau Veritas S.A.(a) | | | | | 25,759 | | | | 581,674 | |
| | | | | | | | | | |
| | | | | | | | | 1,161,627 | |
| | | | | | | | | | |
Cosmetics/Personal Care | | 1.2% | | | | | | | | |
Unilever PLC | | | | | 15,962 | | | | 983,692 | |
| | | | | | | | | | |
Diversified Financial Services | | 3.3% | | | | | | | | |
Azimut Holding S.p.A. | | | | | 22,483 | | | | 406,474 | |
Charles Schwab (The) Corp. | | | | | 12,466 | | | | 451,643 | |
Julius Baer Group Ltd. | | | | | 13,717 | | | | 584,840 | |
Mastercard, Inc. - Class A | | | | | 1,184 | | | | 400,394 | |
Visa, Inc. - Class A | | | | | 4,561 | | | | 912,063 | |
| | | | | | | | | | |
| | | | | | | | | 2,755,414 | |
| | | | | | | | | | |
Electric | | 3.6% | | | | | | | | |
Ameren Corp. | | | | | 8,576 | | | | 678,190 | |
Consolidated Edison, Inc. | | | | | 6,222 | | | | 484,071 | |
Duke Energy Corp. | | | | | 8,894 | | | | 787,653 | |
|
| See Notes to Financial Statements. |
| 19 |
ADVISERS INVESTMENT TRUST
JOHCM GLOBAL INCOME BUILDER FUND
SCHEDULE OF INVESTMENTS
September 30, 2020
| | | | | | | | | | |
| | | Percentage
of Net
Assets | | Shares | | | Value | |
Enel S.p.A. | | | | | 42,585 | | | $ | 370,372 | |
WEC Energy Group, Inc. | | | | | 6,880 | | | | 666,672 | |
| | | | | | | | | | |
| | | | | | | | | 2,986,958 | |
| | | | | | | | | | |
Electronics | | 1.0% | | | | | | | | |
ABB Ltd. - REG | | | | | 16,036 | | | | 408,278 | |
Honeywell International, Inc. | | | | | 2,679 | | | | 440,990 | |
| | | | | | | | | | |
| | | | | | | | | 849,268 | |
| | | | | | | | | | |
Engineering & Construction | | 0.7% | | | | | | | | |
Bouygues S.A. | | | | | 16,001 | | | | 555,682 | |
| | | | | | | | | | |
Food | | 4.7% | | | | | | | | |
Danone S.A. | | | | | 13,085 | | | | 847,158 | |
Mondelez International, Inc. - Class A | | | | | 12,188 | | | | 700,201 | |
Nestle S.A. - REG | | | | | 10,591 | | | | 1,257,282 | |
Sligro Food Group N.V.(a) | | | | | 30,551 | | | | 546,606 | |
Sysco Corp. | | | | | 8,955 | | | | 557,180 | |
| | | | | | | | | | |
| | | | | | | | | 3,908,427 | |
| | | | | | | | | | |
Food Service | | 0.9% | | | | | | | | |
Aramark | | | | | 12,371 | | | | 327,213 | |
Compass Group PLC | | | | | 25,552 | | | | 385,431 | |
| | | | | | | | | | |
| | | | | | | | | 712,644 | |
| | | | | | | | | | |
Healthcare-Products | | 0.5% | | | | | | | | |
EssilorLuxottica S.A.(a) | | | | | 3,034 | | | | 413,170 | |
| | | | | | | | | | |
Holding Companies-Diversified | | 0.4% | | | | | | | | |
Jardine Matheson Holdings Ltd. | | | | | 8,500 | | | | 337,280 | |
| | | | | | | | | | |
Home Builders | | 0.7% | | | | | | | | |
Sekisui House Ltd. | | | | | 31,500 | | | | 554,793 | |
| | | | | | | | | | |
Household Products/Wares | | 0.6% | | | | | | | | |
Reckitt Benckiser Group PLC | | | | | 5,054 | | | | 493,020 | |
| | | | | | | | | | |
Insurance | | 0.7% | | | | | | | | |
Allianz S.E. - REG | | | | | 3,182 | | | | 610,423 | |
| | | | | | | | | | |
Internet | | 1.4% | | | | | | | | |
Alphabet, Inc. - Class C(a) | | | | | 255 | | | | 374,748 | |
Facebook, Inc. - Class A(a) | | | | | 2,948 | | | | 772,081 | |
| | | | | | | | | | |
| | | | | | | | | 1,146,829 | |
| | | | | | | | | | |
Lodging | | 0.6% | | | | | | | | |
Mandarin Oriental International Ltd.(a) | | | | | 132,700 | | | | 238,860 | |
Marriott International, Inc. - Class A | | | | | 2,665 | | | | 246,726 | |
| | | | | | | | | | |
| | | | | | | | | 485,586 | |
| | | | | | | | | | |
Machinery-Diversified | | 1.4% | | | | | | | | |
Duerr A.G. | | | | | 9,762 | | | | 300,558 | |
FANUC Corp. | | | | | 2,200 | | | | 419,703 | |
Flowserve Corp. | | | | | 9,012 | | | | 245,937 | |
Rockwell Automation, Inc. | | | | | 1,085 | | | | 239,438 | |
| | | | | | | | | | |
| | | | | | | | | 1,205,636 | |
| | | | | | | | | | |
|
| See Notes to Financial Statements. |
| 20 |
ADVISERS INVESTMENT TRUST
JOHCM GLOBAL INCOME BUILDER FUND
SCHEDULE OF INVESTMENTS
September 30, 2020
| | | | | | | | | | | | |
| | | Percentage of Net Assets | | | Shares | | | Value | |
Mining | | | 2.9% | | | | | | | | | |
Agnico Eagle Mines Ltd. | | | | | | | 6,627 | | | $ | 527,576 | |
Barrick Gold Corp. | | | | | | | 18,886 | | | | 530,462 | |
Franco-Nevada Corp. | | | | | | | 3,434 | | | | 479,865 | |
Newmont Corp. | | | | | | | 7,869 | | | | 499,288 | |
Royal Gold, Inc. | | | | | | | 3,025 | | | | 363,514 | |
| | | | | | | | | | | | |
| | | | | | | | | | | 2,400,705 | |
| | | | | | | | | | | | |
Oil & Gas | | | 2.1% | | | | | | | | | |
Chevron Corp. | | | | | | | 7,642 | | | | 550,224 | |
Exxon Mobil Corp. | | | | | | | 16,251 | | | | 557,897 | |
TOTAL S.E. | | | | | | | 19,821 | | | | 678,583 | |
| | | | | | | | | | | | |
| | | | | | | | | | | 1,786,704 | |
| | | | | | | | | | | | |
Pharmaceuticals | | | 4.3% | | | | | | | | | |
GlaxoSmithKline PLC | | | | | | | 44,948 | | | | 842,140 | |
Pfizer, Inc. | | | | | | | 28,235 | | | | 1,036,225 | |
Roche Holding A.G. - ADR | | | | | | | 14,116 | | | | 604,306 | |
Sanofi | | | | | | | 10,893 | | | | 1,089,792 | |
| | | | | | | | | | | | |
| | | | | | | | | | | 3,572,463 | |
| | | | | | | | | | | | |
Real Estate | | | 1.7% | | | | | | | | | |
Great Eagle Holdings Ltd. | | | | | | | 75,000 | | | | 170,515 | |
Hang Lung Properties Ltd. | | | | | | | 151,343 | | | | 382,358 | |
Hongkong Land Holdings Ltd. | | | | | | | 24,679 | | | | 91,559 | |
Hysan Development Co. Ltd. | | | | | | | 85,000 | | | | 253,902 | |
Mitsubishi Estate Co. Ltd. | | | | | | | 24,600 | | | | 370,172 | |
Realogy Holdings Corp.(a) | | | | | | | 13,009 | | | | 122,805 | |
| | | | | | | | | | | | |
| | | | | | | | | | | 1,391,311 | |
| | | | | | | | | | | | |
Real Estate Investment Trusts | | | 2.8% | | | | | | | | | |
Boston Properties, Inc. | | | | | | | 8,179 | | | | 656,774 | |
Columbia Property Trust, Inc. | | | | | | | 37,544 | | | | 409,605 | |
Frasers Logistics & Commercial Trust | | | | | | | 379,649 | | | | 386,588 | |
JBG SMITH Properties | | | | | | | 14,142 | | | | 378,157 | |
Weyerhaeuser Co. | | | | | | | 17,176 | | | | 489,859 | |
| | | | | | | | | | | | |
| | | | | | | | | | | 2,320,983 | |
| | | | | | | | | | | | |
Retail | | | 0.5% | | | | | | | | | |
Cie Financiere Richemont S.A. - REG | | | | | | | 5,840 | | | | 391,214 | |
| | | | | | | | | | | | |
Semiconductors | | | 2.2% | | | | | | | | | |
NXP Semiconductors N.V. | | | | | | | 4,622 | | | | 576,872 | |
Taiwan Semiconductor Manufacturing Co. Ltd. - ADR | | | | | | | 6,689 | | | | 542,277 | |
Texas Instruments, Inc. | | | | | | | 4,969 | | | | 709,524 | |
| | | | | | | | | | | | |
| | | | | | | | | | | 1,828,673 | |
| | | | | | | | | | | | |
Software | | | 3.4% | | | | | | | | | |
Microsoft Corp. | | | | | | | 5,036 | | | | 1,059,222 | |
Oracle Corp. | | | | | | | 17,022 | | | | 1,016,213 | |
SAP S.E. | | | | | | | 5,041 | | | | 784,654 | |
| | | | | | | | | | | | |
| | | | | | | | | | | 2,860,089 | |
| | | | | | | | | | | | |
|
| See Notes to Financial Statements. |
| 21 |
ADVISERS INVESTMENT TRUST
JOHCM GLOBAL INCOME BUILDER FUND
SCHEDULE OF INVESTMENTS
September 30, 2020
| | | | | | | | | | | | |
| | | Percentage of Net Assets | | | Shares | | | Value | |
Telecommunications | | | 2.9% | | | | | | | | | |
Altice Europe N.V.(a) | | | | | | | 38,596 | | | $ | 185,170 | |
Cisco Systems, Inc. | | | | | | | 10,582 | | | | 416,825 | |
KDDI Corp. | | | | | | | 86 | | | | 2,166 | |
Verizon Communications, Inc. | | | | | | | 21,653 | | | | 1,288,137 | |
Vodafone Group PLC | | | | | | | 394,455 | | | | 522,626 | |
| | | | | | | | | | | | |
| | | | | | | | | | | 2,414,924 | |
| | | | | | | | | | | | |
TOTAL COMMON STOCKS (Cost $41,774,238) | | | | | | | | | | | 46,731,308 | |
| | | | | | | | | | | | |
| | | Percentage of Net Assets | | | Principal
Amount | | | Value | |
CORPORATE BONDS | | | 15.0% | | | | | | | | | |
Agriculture | | | 1.5% | | | | | | | | | |
BAT Capital Corp. | | | | | | | | | | | | |
3.46%, 09/06/29 | | | | | | $ | 1,200,000 | | | | 1,277,740 | |
| | | | | | | | | | | | |
Banks | | | 1.6% | | | | | | | | | |
Bank of America Corp. | | | | | | | | | | | | |
(Variable, ICE LIBOR USD 3M + 2.66%) 4.30%, 01/28/25(b) | | | | | | | 450,000 | | | | 436,500 | |
JPMorgan Chase & Co. | | | | | | | | | | | | |
(Variable, U.S. SOFR + 2.75%) 4.00%, 04/01/25(b) | | | | | | | 900,000 | | | | 850,500 | |
| | | | | | | | | | | | |
| | | | | | | | | | | 1,287,000 | |
| | | | | | | | | | | | |
Beverages | | | 0.5% | | | | | | | | | |
Anheuser-Busch Cos. LLC/Anheuser-Busch InBev Worldwide, Inc. | | | | | | | | | | | | |
4.70%, 02/01/36 | | | | | | | 150,000 | | | | 181,203 | |
Molson Coors Beverage Co. | | | | | | | | | | | | |
4.20%, 07/15/46 | | | | | | | 200,000 | | | | 210,968 | |
| | | | | | | | | | | | |
| | | | | | | | | | | 392,171 | |
| | | | | | | | | | | | |
Commercial Services | | | 0.2% | | | | | | | | | |
Service Corp International | | | | | | | | | | | | |
8.00%, 11/15/21 | | | | | | | 150,000 | | | | 159,375 | |
| | | | | | | | | | | | |
Diversified Financial Services | | | 0.5% | | | | | | | | | |
Charles Schwab Corp. (The) | | | | | | | | | | | | |
(Variable, U.S. Treasury Yield Curve Rate CMT 5Y + 4.97%) 5.38%, 06/01/25(b) | | | | | | | 350,000 | | | | 379,242 | |
| | | | | | | | | | | | |
Electrical Component & Equipments | | | 0.3% | | | | | | | | | |
Energizer Holdings, Inc. | | | | | | | | | | | | |
7.75%, 01/15/27(c) | | | | | | | 200,000 | | | | 218,500 | |
| | | | | | | | | | | | |
Food | | | 0.9% | | | | | | | | | |
Kraft Heinz Foods Co. | | | | | | | | | | | | |
4.38%, 06/01/46 | | | | | | | 250,000 | | | | 256,857 | |
Pilgrim’s Pride Corp. | | | | | | | | | | | | |
5.75%, 03/15/25(c) | | | | | | | 300,000 | | | | 305,625 | |
Post Holdings, Inc. | | | | | | | | | | | | |
5.75%, 03/01/27(c) | | | | | | | 200,000 | | | | 210,250 | |
| | | | | | | | | | | | |
| | | | | | | | | | | 772,732 | |
| | | | | | | | | | | | |
|
| See Notes to Financial Statements. |
| 22 |
ADVISERS INVESTMENT TRUST
JOHCM GLOBAL INCOME BUILDER FUND
SCHEDULE OF INVESTMENTS
September 30, 2020
| | | | | | | | | | | | |
| | | Percentage of Net Assets | | | Principal
Amount | | | Value | |
Healthcare-Services | | | 0.7% | | | | | | | | | |
Fresenius Medical Care U.S. Finance, Inc. | | | | | | | | | | | | |
5.75%, 02/15/21 | | | | | | $ | 428,000 | | | $ | 435,757 | |
IQVIA, Inc. | | | | | | | | | | | | |
5.00%, 10/15/26(c) | | | | | | | 150,000 | | | | 156,750 | |
| | | | | | | | | | | | |
| | | | | | | | | | | 592,507 | |
| | | | | | | | | | | | |
Internet | | | 0.5% | | | | | | | | | |
Netflix, Inc. | | | | | | | | | | | | |
5.50%, 02/15/22 | | | | | | | 400,000 | | | | 419,000 | |
| | | | | | | | | | | | |
Lodging | | | 1.1% | | | | | | | | | |
Marriott International, Inc. | | | | | | | | | | | | |
5.75%, 05/01/25 | | | | | | | 850,000 | | | | 948,617 | |
| | | | | | | | | | | | |
Machinery-Diversified | | | 0.5% | | | | | | | | | |
Flowserve Corp. | | | | | | | | | | | | |
3.50%, 10/01/30 | | | | | | | 450,000 | | | | 445,594 | |
| | | | | | | | | | | | |
Media | | | 5.0% | | | | | | | | | |
CCO Holdings LLC/CCO Holdings Capital Corp. | | | | | | | | | | | | |
4.00%, 03/01/23(c) | | | | | | | 1,650,000 | | | | 1,669,998 | |
CSC Holdings LLC, | | | | | | | | | | | | |
6.75%, 11/15/21 | | | | | | | 728,000 | | | | 763,490 | |
5.50%, 04/15/27(c) | | | | | | | 150,000 | | | | 157,890 | |
NBCUniversal Enterprise, Inc. | | | | | | | | | | | | |
5.25%, 03/19/21(c) | | | | | | | 400,000 | | | | 404,000 | |
Time Warner Cable LLC, | | | | | | | | | | | | |
4.13%, 02/15/21 | | | | | | | 480,000 | | | | 481,875 | |
4.00%, 09/01/21 | | | | | | | 195,000 | | | | 199,224 | |
ViacomCBS, Inc., | | | | | | | | | | | | |
(Variable, ICE LIBOR USD 3M + 3.90%)
5.88%, 02/28/57(a)(b) | | | | | | | 200,000 | | | | 202,451 | |
(Variable, ICE LIBOR USD 3M + 3.90%)
6.25%, 02/28/57(b) | | | | | | | 250,000 | | | | 274,375 | |
| | | | | | | | | | | | |
| | | | | | | | | | | 4,153,303 | |
| | | | | | | | | | | | |
Packing & Containers | | | 0.6% | | | | | | | | | |
Berry Global, Inc. | | | | | | | | | | | | |
4.88%, 07/15/26(c) | | | | | | | 300,000 | | | | 315,000 | |
Plastipak Holdings, Inc. | | | | | | | | | | | | |
6.25%, 10/15/25(c) | | | | | | | 200,000 | | | | 200,000 | |
| | | | | | | | | | | | |
| | | | | | | | | | | 515,000 | |
| | | | | | | | | | | | |
Pharmaceuticals | | | 0.3% | | | | | | | | | |
AbbVie, Inc. | | | | | | | | | | | | |
4.30%, 05/14/36 | | | | | | | 200,000 | | | | 235,573 | |
| | | | | | | | | | | | |
Pipelines | | | 0.6% | | | | | | | | | |
DCP Midstream L.P. | | | | | | | | | | | | |
(Variable, ICE LIBOR USD 3M + 5.15%) 7.38%, 12/15/22(b) | | | | | | | 800,000 | | | | 524,000 | |
| | | | | | | | | | | | |
|
| See Notes to Financial Statements. |
| 23 |
ADVISERS INVESTMENT TRUST
JOHCM GLOBAL INCOME BUILDER FUND
SCHEDULE OF INVESTMENTS
September 30, 2020
| | | | | | | | | | | | |
| | | Percentage of Net Assets | | | Principal
Amount | | | Value | |
Software | | | 0.2% | | | | | | | | | |
MSCI, Inc. | | | | | | | | | | | | |
5.38%, 05/15/27(c) | | | | | | $ | 150,000 | | | $ | 160,125 | |
| | | | | | | | | | | | |
TOTAL CORPORATE BONDS (Cost $12,698,475) | | | | | | | | | | | 12,480,479 | |
| | | | | | | | | | | | |
| | | Percentage
of Net
Assets | | | Shares | | | Value | |
EXCHANGE TRADED FUNDS | | | 3.8% | | | | | | | | | |
iShares Gold Trust | | | | | | | 68,588 | | | | 1,233,898 | |
SPDR Gold Shares | | | | | | | 10,682 | | | | 1,891,996 | |
| | | | | | | | | | | | |
TOTAL EXCHANGE TRADED FUNDS (Cost $2,387,381) | | | | | | | | | | | 3,125,894 | |
| | | | | | | | | | | | |
| | | Percentage
of Net
Assets | | | Principal
Amount | | | Value | |
FOREIGN ISSUER BONDS | | | 9.1% | | | | | | | | | |
Agriculture | | | 1.6% | | | | | | | | | |
Imperial Brands Finance PLC, | | | | | | | | | | | | |
4.25%, 07/21/25(c) | | | | | | | 700,000 | | | | 774,663 | |
3.88%, 07/26/29(c) | | | | | | | 500,000 | | | | 541,592 | |
| | | | | | | | | | | | |
| | | | | | | | | | | 1,316,255 | |
| | | | | | | | | | | | |
Banks | | | 1.6% | | | | | | | | | |
Intesa Sanpaolo S.p.A., | | | | | | | | | | | | |
5.02%, 06/26/24(c) | | | | | | | 1,200,000 | | | | 1,261,120 | |
5.71%, 01/15/26(c) | | | | | | | 50,000 | | | | 54,513 | |
| | | | | | | | | | | | |
| | | | | | | | | | | 1,315,633 | |
| | | | | | | | | | | | |
Beverages | | | 0.6% | | | | | | | | | |
Bacardi Ltd. | | | | | | | | | | | | |
2.75%, 07/15/26(c) | | | | | | | 450,000 | | | | 470,481 | |
| | | | | | | | | | | | |
Electric | | | 1.3% | | | | | | | | | |
Electricite de France S.A. | | | | | | | | | | | | |
(Variable, USD Swap 10Y + 3.04%) 5.63%, 01/22/24(b) | | | | | | | 250,000 | | | | 261,875 | |
Enel S.p.A. | | | | | | | | | | | | |
(Variable, USD Swap 5Y + 5.88%) 8.75%, 09/24/73(b)(c) | | | | | | | 675,000 | | | | 787,847 | |
| | | | | | | | | | | | |
| | | | | | | | | | | 1,049,722 | |
| | | | | | | | | | | | |
Insurance | | | 0.2% | | | | | | | | | |
Allianz S.E. | | | | | | | | | | | | |
3.88%, 03/07/22 | | | | | | | 200,000 | | | | 197,805 | |
| | | | | | | | | | | | |
Media | | | 2.1% | | | | | | | | | |
Videotron Ltd., | | | | | | | | | | | | |
5.00%, 07/15/22 | | | | | | | 1,000,000 | | | | 1,043,750 | |
5.13%, 04/15/27(c) | | | | | | | 700,000 | | | | 736,400 | |
| | | | | | | | | | | | |
| | | | | | | | | | | 1,780,150 | |
| | | | | | | | | | | | |
Oil & Gas | | | 0.3% | | | | | | | | | |
BP Capital Markets PLC | | | | | | | | | | | | |
(Variable, U.S. Treasury Yield Curve Rate CMT 5Y + 4.04%) 4.38%, 06/22/25(b) | | | | | | | 200,000 | | | | 208,500 | |
| | | | | | | | | | | | |
|
| See Notes to Financial Statements. |
| 24 |
ADVISERS INVESTMENT TRUST
JOHCM GLOBAL INCOME BUILDER FUND
SCHEDULE OF INVESTMENTS
September 30, 2020
| | | | | | | | | | | | |
| | | Percentage of Net Assets | | | Principal
Amount | | | Value | |
Packing & Containers | | | 0.5% | | | | | | | | | |
OI European Group B.V. | | | | | | | | | | | | |
4.00%, 03/15/23(c) | | | | | | $ | 450,000 | | | $ | 456,750 | |
| | | | | | | | | | | | |
Telecommunications | | | 0.9% | | | | | | | | | |
Altice France S.A., | | | | | | | | | | | | |
8.13%, 02/01/27(c) | | | | | | | 250,000 | | | | 272,500 | |
5.50%, 01/15/28(c) | | | | | | | 200,000 | | | | 202,500 | |
Vodafone Group PLC | | | | | | | | | | | | |
(Variable, USD Swap 5Y + 4.87%) 7.00%, 04/04/79(b) | | | | | | | 250,000 | | | | 296,656 | |
| | | | | | | | | | | | |
| | | | | | | | | | | 771,656 | |
| | | | | | | | | | | | |
TOTAL FOREIGN ISSUER BONDS (Cost $7,432,508) | | | | | | | | | | | 7,566,952 | |
| | | | | | | | | | | | |
| | | Percentage
of Net
Assets | | | Shares | | | Value | |
PREFERRED STOCKS | | | 5.2% | | | | | | | | | |
Banks | | | 0.7% | | | | | | | | | |
JPMorgan Chase & Co., 6.00% | | | | | | | 7,500 | | | | 205,800 | |
Morgan Stanley | | | | | | | | | | | | |
(Variable, ICE LIBOR USD 3M + 3.94%), 6.88%(b) | | | | | | | 7,525 | | | | 204,304 | |
Morgan Stanley | | | | | | | | | | | | |
(Variable, ICE LIBOR USD 3M + 4.32%), 7.13%(b) | | | | | | | 7,550 | | | | 208,380 | |
| | | | | | | | | | | | |
| | | | | | | | | | | 618,484 | |
| | | | | | | | | | | | |
Diversified Financial Services | | | 0.2% | | | | | | | | | |
Charles Schwab (The) Corp., 6.00% | | | | | | | 7,925 | | | | 201,691 | |
| | | | | | | | | | | | |
Electric | | | 0.5% | | | | | | | | | |
Duke Energy Corp., 5.63% | | | | | | | 7,513 | | | | 209,012 | |
Duke Energy Corp., 5.75% | | | | | | | 7,500 | | | | 206,175 | |
| | | | | | | | | | | | |
| | | | | | | | | | | 415,187 | |
| | | | | | | | | | | | |
Real Estate Investment Trusts | | | 1.4% | | | | | | | | | |
Boston Properties, Inc., 5.25% | | | | | | | 4,578 | | | | 115,274 | |
Public Storage, 4.63% | | | | | | | 7,600 | | | | 204,592 | |
Public Storage, 5.40% | | | | | | | 3,150 | | | | 80,419 | |
Public Storage, 5.60% | | | | | | | 7,750 | | | | 218,550 | |
Vornado Realty Trust, 5.70% | | | | | | | 20,375 | | | | 516,914 | |
| | | | | | | | | | | | |
| | | | | | | | | | | 1,135,749 | |
| | | | | | | | | | | | |
Semiconductors | | | 0.8% | | | | | | | | | |
Samsung Electronics Co. Ltd., 2.81%(d) | | | | | | | 16,323 | | | | 704,225 | |
| | | | | | | | | | | | |
Telecommunications | | | 1.6% | | | | | | | | | |
AT&T, Inc., 4.75% | | | | | | | 34,500 | | | | 879,750 | |
AT&T, Inc., 5.35% | | | | | | | 15,650 | | | | 413,629 | |
| | | | | | | | | | | | |
| | | | | | | | | | | 1,293,379 | |
| | | | | | | | | | | | |
TOTAL PREFERRED STOCKS (Cost $4,084,858) | | | | | | | | | | | 4,368,715 | |
| | | | | | | | | | | | |
|
| See Notes to Financial Statements. |
| 25 |
ADVISERS INVESTMENT TRUST
JOHCM GLOBAL INCOME BUILDER FUND
SCHEDULE OF INVESTMENTS
September 30, 2020
| | | | | | | | | | | | |
| | | Percentage of Net Assets | | | Principal
Amount | | | Value | |
U.S. TREASURY OBLIGATIONS | | | 7.4% | | | | | | | | | |
U.S. Treasury Notes | | | 7.4% | | | | | | | | | |
2.50%, 02/28/21 | | | | | | $ | 1,400,000 | | | $ | 1,413,727 | |
1.50%, 10/31/21 | | | | | | | 1,000,000 | | | | 1,014,766 | |
0.38%, 03/31/22 | | | | | | | 1,111,200 | | | | 1,115,237 | |
0.50%, 03/15/23 | | | | | | | 1,821,000 | | | | 1,836,791 | |
2.13%, 09/30/24 | | | | | | | 750,000 | | | | 807,246 | |
| | | | | | | | | | | | |
| | | | | | | | | | | 6,187,767 | |
| | | | | | | | | | | | |
TOTAL U.S. TREASURY OBLIGATIONS (Cost $6,105,363) | | | | | | | | | | | 6,187,767 | |
| | | | | | | | | | | | |
| | | Percentage of Net Assets | | | Shares | | | Value | |
SHORT-TERM INVESTMENTS | | | 1.8% | | | | | | | | | |
Northern Institutional Treasury Portfolio (Premier Class), 0.00%(e) | | | | | | | 1,526,309 | | | | 1,526,309 | |
| | | | | | | | | | | | |
TOTAL SHORT-TERM INVESTMENTS (Cost $1,526,309) | | | | | | | | | | | 1,526,309 | |
| | | | | | | | | | | | |
TOTAL INVESTMENTS
(Cost $76,009,132) | | | 98.5% | | | | | | | | 81,987,424 | |
NET OTHER ASSETS (LIABILITIES) | | | 1.5% | | | | | | | | 1,213,274 | |
| | | | | | | | | | | | |
NET ASSETS | | | 100.0% | | | | | | | $ | 83,200,698 | |
| | | | | | | | | | | | |
(a) Non-income producing security.
(b) Floating rate security. The rate presented is the rate in effect at September 30, 2020, and the related index and spread are shown parenthetically for each security.
(c) Securities purchased in a transaction exempt from registration under Rule 144A of the Securities Act of 1933. These securities may not be publicly traded without registration under the Securities Act of 1933. The value of these securities is determined by valuations supplied by a pricing service or brokers.
(d) Current yield is disclosed. Dividends are calculated based on a percentage of the issuer’s net income.
(e) 7-day current yield as of September 30, 2020 is disclosed.
Abbreviations:
ADR – American Depositary Receipt
REG – Registered
At September 30, 2020, the Fund had outstanding forward foreign currency exchange contracts as follows:
| | | | | | | | | | | | | | | | | | | | | | | | |
| COUNTERPARTY | | CONTRACTS
TO DELIVER
CURRENCY | | | AMOUNT
(LOCAL
CURRENCY) | | | IN EXCHANGE FOR CURRENCY | | | AMOUNT
(LOCAL
CURRENCY) | | | SETTLEMENT
DATE | | | UNREALIZED
APPRECIATION
(DEPRECIATION) | |
Goldman Sachs | | | Euro | | | | 1,422,981 | | | | United States Dollar | | | | 1,689,021 | | | | 12/23/2020 | | | $ | 17,209 | |
Total | | | | | | | | | | | | | | | | | | | | | | $ | 17,209 | |
|
| See Notes to Financial Statements. |
| 26 |
ADVISERS INVESTMENT TRUST
JOHCM GLOBAL INCOME BUILDER FUND
SCHEDULE OF INVESTMENTS
September 30, 2020
At September 30, 2020, the JOHCM Global Income Builder Fund’s investments were concentrated as follows:
| | | | |
| Country Allocation (Unaudited) | | Percentage
of Net Assets | |
United States | | | 58.8 | % |
| |
United Kingdom | | | 9.7 | |
| |
France | | | 6.6 | |
| |
Canada | | | 4.0 | |
| |
Switzerland | | | 3.9 | |
| |
Italy | | | 3.7 | |
| |
Germany | | | 2.3 | |
| |
Netherlands | | | 2.1 | |
| |
Hong Kong | | | 1.8 | |
| |
Japan | | | 1.6 | |
| |
South Korea | | | 0.8 | |
| |
Ireland | | | 0.7 | |
| |
Spain | | | 0.7 | |
| |
Taiwan | | | 0.7 | |
| |
Bermuda | | | 0.6 | |
| |
Singapore | | | 0.5 | |
Total | | | 98.5 | % |
| | | | |
| 5 Largest Security Positions | |
| |
| Issuer | | % of Net Assets | |
SPDR Gold Shares | | | 2.3 | % |
| |
U.S. Treasury Notes | | | | |
0.50%, 3/15/23 | | | 2.2 | |
| |
CCO Holdings LLC/CCO Holdings Capital Corp. | | | | |
4.00%, 3/1/23 | | | 2.0 | |
| |
U.S. Treasury Notes | | | | |
2.50%, 2/28/21 | | | 1.7 | |
| |
Verizon Communications, Inc. | | | 1.6 | |
Total | | | 9.8 | % |
|
| See Notes to Financial Statements. |
| 27 |
ADVISERS INVESTMENT TRUST
JOHCM INTERNATIONAL OPPORTUNITIES FUND
SCHEDULE OF INVESTMENTS
September 30, 2020
| | | | | | | | | | | | |
| | | Percentage
of Net
Assets | | | Shares | | | Value | |
COMMON STOCKS | | | 85.5% | | | | | | | | | |
Belgium | | | 2.2% | | | | | | | | | |
Proximus SADP | | | | | | | 3,468 | | | $ | 63,329 | |
| | | | | | | | | | | | |
Finland | | | 4.6% | | | | | | | | | |
Nokian Renkaat OYJ | | | | | | | 2,288 | | | | 64,784 | |
Wartsila OYJ Abp | | | | | | | 9,121 | | | | 71,842 | |
| | | | | | | | | | | | |
| | | | | | | | | | | 136,626 | |
| | | | | | | | | | | | |
France | | | 11.9% | | | | | | | | | |
Bureau Veritas S.A.(a) | | | | | | | 1,133 | | | | 25,585 | |
Coface S.A.(a) | | | | | | | 7,650 | | | | 53,546 | |
Safran S.A.(a) | | | | | | | 753 | | | | 74,548 | |
Sanofi | | | | | | | 1,388 | | | | 138,863 | |
Thales S.A. | | | | | | | 773 | | | | 58,148 | |
| | | | | | | | | | | | |
| | | | | | | | | | | 350,690 | |
| | | | | | | | | | | | |
Germany | | | 6.2% | | | | | | | | | |
Continental A.G. | | | | | | | 407 | | | | 44,130 | |
Henkel A.G. & Co. KGaA | | | | | | | 485 | | | | 45,434 | |
SAP S.E. | | | | | | | 597 | | | | 92,926 | |
| | | | | | | | | | | | |
| | | | | | | | | | | 182,490 | |
| | | | | | | | | | | | |
Hong Kong | | | 2.1% | | | | | | | | | |
China Mobile Ltd. | | | | | | | 9,560 | | | | 60,999 | |
| | | | | | | | | | | | |
Italy | | | 4.7% | | | | | | | | | |
Enel S.p.A. | | | | | | | 15,872 | | | | 138,042 | |
| | | | | | | | | | | | |
Japan | | | 15.0% | | | | | | | | | |
Daiichikosho Co. Ltd. | | | | | | | 1,500 | | | | 48,002 | |
KDDI Corp. | | | | | | | 3,764 | | | | 94,791 | |
Nippon Gas Co. Ltd. | | | | | | | 1,500 | | | | 75,807 | |
Nippon Telegraph & Telephone Corp. | | | | | | | 3,604 | | | | 73,471 | |
Pola Orbis Holdings, Inc. | | | | | | | 2,815 | | | | 52,929 | |
Sugi Holdings Co. Ltd. | | | | | | | 1,360 | | | | 95,941 | |
| | | | | | | | | | | | |
| | | | | | | | | | | 440,941 | |
| | | | | | | | | | | | |
Netherlands | | | 2.1% | | | | | | | | | |
SBM Offshore N.V. | | | | | | | 3,902 | | | | 62,493 | |
| | | | | | | | | | | | |
Portugal | | | 2.5% | | | | | | | | | |
Galp Energia SGPS S.A. | | | | | | | 7,772 | | | | 72,096 | |
| | | | | | | | | | | | |
Spain | | | 2.9% | | | | | | | | | |
Amadeus IT Group S.A. | | | | | | | 696 | | | | 38,835 | |
Industria de Diseno Textil S.A. | | | | | | | 1,620 | | | | 45,205 | |
| | | | | | | | | | | | |
| | | | | | | | | | | 84,040 | |
| | | | | | | | | | | | |
Switzerland | | | 2.8% | | | | | | | | | |
Roche Holding A.G. (Genusschein) | | | | | | | 125 | | | | 42,770 | |
Schindler Holding A.G. - REG | | | | | | | 147 | | | | 39,996 | |
| | | | | | | | | | | | |
| | | | | | | | | | | 82,766 | |
| | | | | | | | | | | | |
United Kingdom | | | 25.1% | | | | | | | | | |
B&M European Value Retail S.A. | | | | | | | 17,181 | | | | 109,673 | |
|
| See Notes to Financial Statements. |
| 28 |
ADVISERS INVESTMENT TRUST
JOHCM INTERNATIONAL OPPORTUNITIES FUND
SCHEDULE OF INVESTMENTS
September 30, 2020
| | | | | | | | | | | | |
| | | Percentage
of Net
Assets | | | Shares | | | Value | |
Compass Group PLC | | | | | | | 3,930 | | | $ | 59,281 | |
Ferguson PLC | | | | | | | 753 | | | | 75,904 | |
Johnson Matthey PLC | | | | | | | 2,062 | | | | 62,713 | |
Lancashire Holdings Ltd. | | | | | | | 5,876 | | | | 52,468 | |
Rio Tinto PLC | | | | | | | 1,308 | | | | 78,575 | |
RSA Insurance Group PLC(a) | | | | | | | 19,008 | | | | 110,788 | |
Sage Group (The) PLC | | | | | | | 1,386 | | | | 12,891 | |
Smith & Nephew PLC | | | | | | | 2,769 | | | | 54,184 | |
Unilever N.V. | | | | | | | 1,992 | | | | 120,279 | |
| | | | | | | | | | | | |
| | | | | | | | | | | 736,756 | |
| | | | | | | | | | | | |
United States | | | 3.4% | | | | | | | | | |
Philip Morris International, Inc. | | | | | | | 1,332 | | | | 99,887 | |
| | | | | | | | | | | | |
TOTAL COMMON STOCKS (Cost $2,423,213) | | | | | | | | | | | 2,511,155 | |
| | | | | | | | | | | | |
EQUITY-LINKED SECURITIES | | | 2.4% | | | | | | | | | |
India | | | 2.4% | | | | | | | | | |
ITC Ltd., Issued by CLSA Global Markets Pte. Ltd., Maturity Date 6/30/25(b) | | | | | | | 30,181 | | | | 70,237 | |
| | | | | | | | | | | | |
TOTAL EQUITY-LINKED SECURITIES (Cost $77,405) | | | | | | | | | | | 70,237 | |
| | | | | | | | | | | | |
TOTAL INVESTMENTS
(Cost $2,500,618) | | | 87.9% | | | | | | | | 2,581,392 | |
NET OTHER ASSETS (LIABILITIES) | | | 12.1% | | | | | | | | 354,078 | |
| | | | | | | | | | | | |
NET ASSETS | | | 100.0% | | | | | | | $ | 2,935,470 | |
| | | | | | | | | | | | |
(a) Non-income producing security.
(b) Securities purchased in a transaction exempt from registration under Rule 144A of the Securities Act of 1933. These securities may not be publicly traded without registration under the Securities Act of 1933. The value of these securities is determined by valuations supplied by a pricing service or brokers.
Abbreviations:
REG – Registered
At September 30, 2020 the industry sectors for the JOHCM International Opportunities Fund were:
| | | | |
| Sector Allocation (Unaudited) | | % of Net Assets | |
Communication Services | | | 11.6 | % |
| |
Consumer Discretionary | | | 11.0 | |
| |
Consumer Staples | | | 16.5 | |
| |
Energy | | | 4.6 | |
| |
Financials | | | 7.4 | |
| |
Health Care | | | 8.0 | |
| |
Industrials | | | 11.8 | |
| |
Information Technology | | | 4.9 | |
| |
Materials | | | 4.8 | |
| |
Utilities | | | 7.3 | |
Total | | | 87.9 | % |
|
| See Notes to Financial Statements. |
| 29 |
ADVISERS INVESTMENT TRUST
JOHCM INTERNATIONAL OPPORTUNITIES FUND
SCHEDULE OF INVESTMENTS
September 30, 2020
| | | | |
| Market Exposure (Unaudited) | |
| |
| Equity and Equity-Linked Securities | | % of Net Assets | |
Telecommunications | | | 10.0 | % |
| |
Retail | | | 8.5 | |
| |
Insurance | | | 7.4 | |
| |
Pharmaceuticals | | | 6.2 | |
| |
Cosmetics/Personal Care | | | 5.9 | |
| |
Distribution/Wholesale | | | 5.2 | |
| |
Electric | | | 4.7 | |
| |
Aerospace/Defense | | | 4.5 | |
| |
Auto Parts & Equipment | | | 3.7 | |
| |
Software | | | 3.6 | |
| |
Agriculture | | | 3.4 | |
| |
Mining | | | 2.7 | |
| |
Oil & Gas | | | 2.5 | |
| |
Shipbuilding | | | 2.4 | |
| |
Diversified Financial Services | | | 2.4 | |
| |
Commercial Services | | | 2.2 | |
| |
Chemicals | | | 2.1 | |
| |
Oil & Gas Services | | | 2.1 | |
| |
Food Service | | | 2.0 | |
| |
Healthcare-Products | | | 1.8 | |
| |
Leisure Time | | | 1.6 | |
| |
Household Products/Wares | | | 1.6 | |
| |
Hand/Machine Tools | | | 1.4 | |
Total | | | 87.9 | % |
| | | | |
| 5 Largest Security Positions | |
| |
| Issuer | | % of Net Assets | |
Sanofi | | | 4.7 | % |
| |
Enel S.p.A. | | | 4.7 | |
| |
Unilever N.V | | | 4.1 | |
| |
RSA Insurance Group PLC | | | 3.8 | |
| |
B&M European Value Retail S.A. | | | 3.8 | |
Total | | | 21.1 | % |
|
| See Notes to Financial Statements. |
| 30 |
ADVISERS INVESTMENT TRUST
JOHCM INTERNATIONAL SELECT FUND
SCHEDULE OF INVESTMENTS
September 30, 2020
| | | | | | | | | | | | |
| | | Percentage of Net Assets | | | Shares | | | Value | |
COMMON STOCKS | | | 98.0% | | | | | | | | | |
Australia | | | 4.9% | | | | | | | | | |
Atlassian Corp. PLC - Class A(a) | | | | | | | 1,430,634 | | | $ | 260,074,955 | |
Newcrest Mining Ltd. | | | | | | | 10,736,525 | | | | 240,236,735 | |
| | | | | | | | | | | | |
| | | | | | | | | | | 500,311,690 | |
| | | | | | | | | | | | |
Denmark | | | 5.3% | | | | | | | | | |
Orsted A/S(b) | | | | | | | 1,862,553 | | | | 256,772,374 | |
Vestas Wind Systems A/S | | | | | | | 1,762,086 | | | | 285,823,175 | |
| | | | | | | | | | | | |
| | | | | | | | | | | 542,595,549 | |
| | | | | | | | | | | | |
France | | | 4.8% | | | | | | | | | |
L’Oreal S.A. | | | | | | | 760,876 | | | | 247,643,935 | |
Schneider Electric S.E. | | | | | | | 2,010,806 | | | | 250,020,256 | |
| | | | | | | | | | | | |
| | | | | | | | | | | 497,664,191 | |
| | | | | | | | | | | | |
Germany | | | 4.7% | | | | | | | | | |
Deutsche Boerse A.G. | | | | | | | 1,420,798 | | | | 249,539,040 | |
SAP S.E. | | | | | | | 1,500,304 | | | | 233,529,022 | |
| | | | | | | | | | | | |
| | | | | | | | | | | 483,068,062 | |
| | | | | | | | | | | | |
Hong Kong | | | 2.4% | | | | | | | | | |
Hong Kong Exchanges & Clearing Ltd. | | | | | | | 5,319,651 | | | | 248,340,299 | |
| | | | | | | | | | | | |
Ireland | | | 10.2% | | | | | | | | | |
Accenture PLC - Class A | | | | | | | 1,133,554 | | | | 256,171,869 | |
Aptiv PLC | | | | | | | 2,928,943 | | | | 268,525,494 | |
ICON PLC(a) | | | | | | | 1,424,187 | | | | 272,147,894 | |
Medtronic PLC | | | | | | | 2,404,084 | | | | 249,832,409 | |
| | | | | | | | | | | | |
| | | | | | | | | | | 1,046,677,666 | |
| | | | | | | | | | | | |
Italy | | | 2.4% | | | | | | | | | |
FinecoBank Banca Fineco S.p.A.(a) | | | | | | | 17,578,872 | | | | 242,274,657 | |
| | | | | | | | | | | | |
Japan | | | 34.0% | | | | | | | | | |
Advantest Corp. | | | | | | | 5,337,000 | | | | 257,576,732 | |
CyberAgent, Inc. | | | | | | | 4,308,200 | | | | 264,296,724 | |
Fujitsu Ltd. | | | | | | | 1,970,555 | | | | 267,934,942 | |
Japan Exchange Group, Inc. | | | | | | | 9,391,800 | | | | 261,632,849 | |
Kao Corp. | | | | | | | 3,175,200 | | | | 237,451,310 | |
ORIX Corp. | | | | | | | 17,377,800 | | | | 215,028,957 | |
PeptiDream, Inc.(a) | | | | | | | 5,702,500 | | | | 266,024,747 | |
Rakuten, Inc. | | | | | | | 23,357,200 | | | | 250,702,607 | |
Recruit Holdings Co. Ltd. | | | | | | | 7,123,500 | | | | 280,981,937 | |
SBI Holdings, Inc. | | | | | | | 11,390,000 | | | | 292,998,341 | |
Sekisui House Ltd. | | | | | | | 7,812,764 | | | | 137,602,135 | |
Takeda Pharmaceutical Co. Ltd. | | | | | | | 6,657,400 | | | | 236,337,227 | |
Terumo Corp. | | | | | | | 6,104,600 | | | | 241,949,727 | |
Z Holdings Corp. | | | | | | | 42,095,800 | | | | 279,002,173 | |
| | | | | | | | | | | | |
| | | | | | | | | | | 3,489,520,408 | |
| | | | | | | | | | | | |
Netherlands | | | 10.0% | | | | | | | | | |
ASML Holding N.V. | | | | | | | 685,678 | | | | 252,994,633 | |
|
| See Notes to Financial Statements. |
| 31 |
ADVISERS INVESTMENT TRUST
JOHCM INTERNATIONAL SELECT FUND
SCHEDULE OF INVESTMENTS
September 30, 2020
| | | | | | | | | | | | |
| | | Percentage
of Net
Assets | | | Shares | | | Value | |
Koninklijke Ahold Delhaize N.V. | | | | | | | 8,643,801 | | | $ | 255,894,229 | |
Koninklijke DSM N.V. | | | | | | | 1,715,548 | | | | 282,802,044 | |
Prosus N.V.(a) | | | | | | | 2,603,765 | | | | 240,254,132 | |
| | | | | | | | | | | | |
| | | | | | | | | | | 1,031,945,038 | |
| | | | | | | | | | | | |
New Zealand | | | 2.0% | | | | | | | | | |
a2 Milk Co. Ltd.(a) | | | | | | | 20,549,458 | | | | 206,795,626 | |
| | | | | | | | | | | | |
South Korea | | | 2.5% | | | | | | | | | |
SK Hynix, Inc. | | | | | | | 3,532,197 | | | | 253,441,245 | |
| | | | | | | | | | | | |
Spain | | | 2.5% | | | | | | | | | |
Siemens Gamesa Renewable Energy S.A. | | | | | | | 9,517,837 | | | | 257,665,662 | |
| | | | | | | | | | | | |
Switzerland | | | 5.0% | | | | | | | | | |
Lonza Group A.G. - REG | | | | | | | 428,999 | | | | 264,837,774 | |
Roche Holding A.G. (Genusschein) | | | | | | | 728,823 | | | | 249,376,872 | |
| | | | | | | | | | | | |
| | | | | | | | | | | 514,214,646 | |
| | | | | | | | | | | | |
Taiwan | | | 2.5% | | | | | | | | | |
MediaTek, Inc. | | | | | | | 12,335,515 | | | | 258,533,858 | |
| | | | | | | | | | | | |
United Kingdom | | | 4.8% | | | | | | | | | |
IHS Markit Ltd. | | | | | | | 3,178,652 | | | | 249,555,969 | |
Linde PLC | | | | | | | 1,031,989 | | | | 244,290,026 | |
| | | | | | | | | | | | |
| | | | | | | | | | | 493,845,995 | |
| | | | | | | | | | | | |
TOTAL COMMON STOCKS (Cost $7,483,220,308) | | | | | | | | | | | 10,066,894,592 | |
| | | | | | | | | | | | |
TOTAL INVESTMENTS
(Cost $7,483,220,308) | | | 98.0% | | | | | | | | 10,066,894,592 | |
NET OTHER ASSETS (LIABILITIES) | | | 2.0% | | | | | | | | 208,595,732 | |
| | | | | | | | | | | | |
NET ASSETS | | | 100.0% | | | | | | | $ | 10,275,490,324 | |
| | | | | | | | | | | | |
(a) Non-income producing security.
(b) Securities purchased in a transaction exempt from registration under Rule 144A of the Securities Act of 1933. These securities may not be publicly traded without registration under the Securities Act of 1933. The value of these securities is determined by valuations supplied by a pricing service or brokers.
Abbreviations:
REG – Registered
At September 30, 2020 the industry sectors for the JOHCM International Select Fund were:
| | |
| Sector Allocation (Unaudited) | | % of Net Assets |
Communication Services | | 5.3% |
Consumer Discretionary | | 8.7 |
Consumer Staples | | 9.2 |
Financials | | 14.7 |
Health Care | | 17.3 |
Industrials | | 12.9 |
Information Technology | | 19.9 |
Materials | | 7.5 |
Utilities | | 2.5 |
Total | | 98.0% |
|
| See Notes to Financial Statements. |
| 32 |
ADVISERS INVESTMENT TRUST
JOHCM INTERNATIONAL SELECT FUND
SCHEDULE OF INVESTMENTS
September 30, 2020
| | | | |
| Market Exposure (Unaudited) | |
| Equity Securities | | % of Net Assets | |
Diversified Financial Services | | | 12.3 | % |
Internet | | | 10.1 | |
Semiconductors | | | 10.0 | |
Healthcare-Services | | | 7.8 | |
Energy-Alternate Sources | | | 5.3 | |
Commercial Services | | | 5.2 | |
Chemicals | | | 5.1 | |
Computers | | | 5.1 | |
Software | | | 4.8 | |
Healthcare-Products | | | 4.8 | |
Pharmaceuticals | | | 4.7 | |
Cosmetics/Personal Care | | | 4.7 | |
Food | | | 4.5 | |
Auto Parts & Equipment | | | 2.6 | |
Electric | | | 2.5 | |
Electrical Component & Equipments | | | 2.4 | |
Banks | | | 2.4 | |
Mining | | | 2.3 | |
Home Builders | | | 1.4 | |
Total | | | 98.0 | % |
| | | | |
| 5 Largest Security Positions | |
| Issuer | | % of Net Assets | |
SBI Holdings, Inc. | | | 2.9 | % |
Vestas Wind Systems A/S | | | 2.8 | |
Koninklijke DSM N.V. | | | 2.8 | |
Recruit Holdings Co. Ltd. | | | 2.7 | |
Z Holdings Corp. | | | 2.7 | |
Total | | | 13.9 | % |
|
| See Notes to Financial Statements. |
| 33 |
ADVISERS INVESTMENT TRUST
JOHCM INTERNATIONAL SMALL CAP EQUITY FUND
SCHEDULE OF INVESTMENTS
September 30, 2020
| | | | | | | | | | | | |
| | | Percentage
of Net
Assets | | | Shares | | | Value | |
COMMON STOCKS | | | 97.8% | | | | | | | | | |
Australia | | | 1.5% | | | | | | | | | |
GWA Group Ltd. | | | | | | | 1,393,267 | | | $ | 2,774,239 | |
| | | | | | | | | | | | |
Canada | | | 3.4% | | | | | | | | | |
Heroux-Devtek, Inc.(a) | | | | | | | 289,685 | | | | 2,010,206 | |
Laurentian Bank of Canada | | | | | | | 64,493 | | | | 1,324,684 | |
Linamar Corp. | | | | | | | 95,722 | | | | 2,847,470 | |
| | | | | | | | | | | | |
| | | | | | | | | | | 6,182,360 | |
| | | | | | | | | | | | |
China | | | 0.3% | | | | | | | | | |
Greatview Aseptic Packaging Co. Ltd. | | | | | | | 1,151,000 | | | | 442,575 | |
| | | | | | | | | | | | |
Finland | | | 3.8% | | | | | | | | | |
Ahlstrom-Munksjo OYJ | | | | | | | 190,405 | | | | 4,013,862 | |
Vaisala OYJ - Class A | | | | | | | 66,718 | | | | 2,890,359 | |
| | | | | | | | | | | | |
| | | | | | | | | | | 6,904,221 | |
| | | | | | | | | | | | |
France | | | 7.5% | | | | | | | | | |
Coface S.A.(a) | | | | | | | 341,895 | | | | 2,393,103 | |
Eutelsat Communications S.A. | | | | | | | 227,819 | | | | 2,222,325 | |
IPSOS | | | | | | | 107,512 | | | | 2,691,220 | |
Lectra | | | | | | | 133,988 | | | | 3,173,304 | |
Robertet S.A. | | | | | | | 2,687 | | | | 3,062,163 | |
| | | | | | | | | | | | |
| | | | | | | | | | | 13,542,115 | |
| | | | | | | | | | | | |
Germany | | | 3.5% | | | | | | | | | |
Gerresheimer A.G. | | | | | | | 27,353 | | | | 3,061,084 | |
KWS Saat S.E. & Co. KGaA | | | | | | | 38,142 | | | | 3,219,810 | |
| | | | | | | | | | | | |
| | | | | | | | | | | 6,280,894 | |
| | | | | | | | | | | | |
Hong Kong | | | 6.3% | | | | | | | | | |
Bosideng International Holdings Ltd. | | | | | | | 3,208,000 | | | | 993,439 | |
Mandarin Oriental International Ltd.(a) | | | | | | | 1,615,725 | | | | 2,908,305 | |
Pico Far East Holdings Ltd. | | | | | | | 7,666,000 | | | | 910,022 | |
SITC International Holdings Co. Ltd. | | | | | | | 2,095,000 | | | | 2,892,433 | |
SmarTone Telecommunications Holdings Ltd. | | | | | | | 2,478,000 | | | | 1,314,131 | |
Vinda International Holdings Ltd. | | | | | | | 726,000 | | | | 2,379,391 | |
| | | | | | | | | | | | |
| | | | | | | | | | | 11,397,721 | |
| | | | | | | | | | | | |
Ireland | | | 2.7% | | | | | | | | | |
Grafton Group PLC(a) | | | | | | | 308,935 | | | | 2,692,775 | |
Irish Continental Group PLC(a) | | | | | | | 572,723 | | | | 2,130,299 | |
| | | | | | | | | | | | |
| | | | | | | | | | | 4,823,074 | |
| | | | | | | | | | | | |
Japan | | | 18.7% | | | | | | | | | |
Ariake Japan Co. Ltd. | | | | | | | 41,300 | | | | 2,792,102 | |
Daiseki Co. Ltd. | | | | | | | 109,000 | | | | 2,708,851 | |
EPS Holdings, Inc. | | | | | | | 97,900 | | | | 965,401 | |
Furuno Electric Co. Ltd. | | | | | | | 225,100 | | | | 2,127,954 | |
Iwatani Corp. | | | | | | | 81,400 | | | | 3,044,830 | |
Kintetsu World Express, Inc. | | | | | | | 153,700 | | | | 3,246,988 | |
Kurita Water Industries Ltd. | | | | | | | 74,200 | | | | 2,434,286 | |
|
| See Notes to Financial Statements. |
| 34 |
ADVISERS INVESTMENT TRUST
JOHCM INTERNATIONAL SMALL CAP EQUITY FUND
SCHEDULE OF INVESTMENTS
September 30, 2020
| | | | | | | | | | | | |
| | | Percentage
of Net
Assets | | | Shares | | | Value | |
Mani, Inc. | | | | | | | 99,900 | | | $ | 2,715,719 | |
Rion Co. Ltd. | | | | | | | 127,700 | | | | 2,909,620 | |
Rohto Pharmaceutical Co. Ltd. | | | | | | | 50,800 | | | | 1,664,192 | |
Sakata Seed Corp. | | | | | | | 79,900 | | | | 2,856,142 | |
SHO-BOND Holdings Co. Ltd. | | | | | | | 62,900 | | | | 3,113,241 | |
Tayca Corp. | | | | | | | 33,800 | | | | 461,820 | |
Transcosmos, Inc. | | | | | | | 101,200 | | | | 2,740,504 | |
| | | | | | | | | | | | |
| | | | | | | | | | | 33,781,650 | |
| | | | | | | | | | | | |
Mexico | | | 1.7% | | | | | | | | | |
Genomma Lab Internacional S.A.B. de C.V. - Series B(a) | | | | | | | 3,205,854 | | | | 3,137,493 | |
| | | | | | | | | | | | |
Netherlands | | | 3.1% | | | | | | | | | |
Corbion N.V. | | | | | | | 76,911 | | | | 3,539,342 | |
Sligro Food Group N.V.(a) | | | | | | | 117,265 | | | | 2,098,057 | |
| | | | | | | | | | | | |
| | | | | | | | | | | 5,637,399 | |
| | | | | | | | | | | | |
Norway | | | 3.2% | | | | | | | | | |
Borregaard ASA | | | | | | | 230,499 | | | | 3,528,840 | |
Norway Royal Salmon ASA | | | | | | | 97,012 | | | | 2,225,738 | |
| | | | | | | | | | | | |
| | | | | | | | | | | 5,754,578 | |
| | | | | | | | | | | | |
South Korea | | | 6.6% | | | | | | | | | |
Binggrae Co. Ltd. | | | | | | | 37,287 | | | | 1,890,287 | |
Choong Ang Vaccine Laboratory | | | | | | | 158,941 | | | | 2,424,132 | |
Koh Young Technology, Inc. | | | | | | | 28,682 | | | | 2,193,303 | |
Samwha Capacitor Co. Ltd. | | | | | | | 48,691 | | | | 2,320,005 | |
SK Materials Co. Ltd. | | | | | | | 15,761 | | | | 3,099,077 | |
| | | | | | | | | | | | |
| | | | | | | | | | | 11,926,804 | |
| | | | | | | | | | | | |
Sweden | | | 9.8% | | | | | | | | | |
AAK AB(a) | | | | | | | 143,772 | | | | 2,683,329 | |
Avanza Bank Holding AB | | | | | | | 145,637 | | | | 2,858,800 | |
BioGaia AB - Class B | | | | | | | 48,609 | | | | 3,158,879 | |
Cloetta AB - Class B(a) | | | | | | | 954,171 | | | | 2,770,083 | |
IAR Systems Group AB(a) | | | | | | | 152,846 | | | | 2,747,724 | |
Thule Group AB(b) | | | | | | | 102,078 | | | | 3,382,900 | |
| | | | | | | | | | | | |
| | | | | | | | | | | 17,601,715 | |
| | | | | | | | | | | | |
Switzerland | | | 8.9% | | | | | | | | | |
Bobst Group S.A. - REG | | | | | | | 40,721 | | | | 2,535,529 | |
Gurit Holding A.G. - Bearer | | | | | | | 1,445 | | | | 3,071,830 | |
Huber + Suhner A.G. - REG | | | | | | | 29,238 | | | | 2,196,699 | |
LEM Holding S.A. - REG | | | | | | | 1,912 | | | | 3,582,989 | |
Valiant Holding A.G. - REG | | | | | | | 26,038 | | | | 2,193,745 | |
Valora Holding A.G. - REG(a) | | | | | | | 12,947 | | | | 2,412,144 | |
| | | | | | | | | | | | |
| | | | | | | | | | | 15,992,936 | |
| | | | | | | | | | | | |
Taiwan | | | 5.6% | | | | | | | | | |
ASPEED Technology, Inc. | | | | | | | 23,000 | | | | 901,353 | |
Merida Industry Co. Ltd. | | | | | | | 361,000 | | | | 2,904,254 | |
Sinmag Equipment Corp. | | | | | | | 323,667 | | | | 853,814 | |
|
| See Notes to Financial Statements. |
| 35 |
ADVISERS INVESTMENT TRUST
JOHCM INTERNATIONAL SMALL CAP EQUITY FUND
SCHEDULE OF INVESTMENTS
September 30, 2020
| | | | | | | | | | | | |
| | | Percentage
of Net
Assets | | | Shares | | | Value | |
Tong Yang Industry Co. Ltd. | | | | | | | 2,051,000 | | | $ | 2,535,246 | |
TOPBI International Holdings Ltd. | | | | | | | 1,165,850 | | | | 1,376,703 | |
Walsin Technology Corp. | | | | | | | 276,000 | | | | 1,472,343 | |
| | | | | | | | | | | | |
| | | | | | | | | | | 10,043,713 | |
| | | | | | | | | | | | |
United Kingdom | | | 11.2 | % | | | | | | | | |
Bloomsbury Publishing PLC | | | | | | | 955,140 | | | | 2,452,606 | |
First Derivatives PLC | | | | | | | 76,749 | | | | 3,282,946 | |
Gamma Communications PLC | | | | | | | 140,879 | | | | 2,999,423 | |
Genus PLC | | | | | | | 59,570 | | | | 2,962,422 | |
JET2 PLC | | | | | | | 203,119 | | | | 1,759,965 | |
Paragon Banking Group PLC | | | | | | | 522,531 | | | | 2,245,246 | |
Porvair PLC | | | | | | | 355,611 | | | | 2,340,200 | |
SThree PLC | | | | | | | 722,515 | | | | 2,237,513 | |
| | | | | | | | | | | | |
| | | | | | | | | | | 20,280,321 | |
| | | | | | | | | | | | |
TOTAL COMMON STOCKS (Cost $164,377,604) | | | | | | | | | | | 176,503,808 | |
| | | | | | | | | | | | |
TOTAL INVESTMENTS
(Cost $164,377,604) | | | 97.8 | % | | | | | | | 176,503,808 | |
NET OTHER ASSETS (LIABILITIES) | | | 2.2 | % | | | | | | | 3,911,338 | |
| | | | | | | | | | | | |
NET ASSETS | | | 100.0 | % | | | | | | $ | 180,415,146 | |
| | | | | | | | | | | | |
(a) Non-income producing security.
(b) Securities purchased in a transaction exempt from registration under Rule 144A of the Securities Act of 1933. These securities may not be publicly traded without registration under the Securities Act of 1933. The value of these securities is determined by valuations supplied by a pricing service or brokers.
Abbreviations:
REG – Registered
At September 30, 2020 the industry sectors for the JOHCM International Small Cap Equity Fund were:
| | | | |
| Sector Allocation (Unaudited) | | % of Net Assets | |
Communication Services | | | 7.0 | % |
Consumer Discretionary | | | 10.7 | |
Consumer Staples | | | 13.6 | |
Energy | | | 1.7 | |
Financials | | | 6.1 | |
Health Care | | | 11.8 | |
Industrials | | | 19.9 | |
Information Technology | | | 15.2 | |
Materials | | | 11.8 | |
Total | | | 97.8 | % |
|
| See Notes to Financial Statements. |
| 36 |
ADVISERS INVESTMENT TRUST
JOHCM INTERNATIONAL SMALL CAP EQUITY FUND
SCHEDULE OF INVESTMENTS
September 30, 2020
| | | | |
| Market Exposure (Unaudited) | |
| Equity Securities | | % of Net Assets | |
Food | | | 10.0 | % |
Miscellaneous Manufacturing | | | 7.9 | |
Electronics | | | 6.8 | |
Pharmaceuticals | | | 5.8 | |
Chemicals | | | 5.7 | |
Software | | | 5.1 | |
Retail | | | 5.1 | |
Transportation | | | 4.6 | |
Telecommunications | | | 3.6 | |
Leisure Time | | | 3.5 | |
Agriculture | | | 3.2 | |
Banks | | | 3.2 | |
Auto Parts & Equipment | | | 3.0 | |
Environmental Control | | | 2.8 | |
Forest Products & Paper | | | 2.2 | |
Packing & Containers | | | 1.9 | |
Machinery-Diversified | | | 1.9 | |
Semiconductors | | | 1.8 | |
Commercial Services | | | 1.7 | |
Engineering & Construction | | | 1.7 | |
Lodging | | | 1.6 | |
Diversified Financial Services | | | 1.6 | |
Internet | | | 1.5 | |
Healthcare-Products | | | 1.5 | |
Advertising | | | 1.5 | |
Media | | | 1.4 | |
Insurance | | | 1.3 | |
Cosmetics/Personal Care | | | 1.3 | |
Electrical Component & Equipments | | | 1.2 | |
Aerospace/Defense | | | 1.1 | |
Airlines | | | 1.0 | |
Apparel | | | 0.8 | |
Healthcare-Services | | | 0.5 | |
Total | | | 97.8 | % |
| | | | |
| 5 Largest Security Positions | |
| Issuer | | % of Net Assets | |
Ahlstrom-Munksjo OYJ | | | 2.2 | % |
LEM Holding S.A. - REG | | | 2.0 | |
Corbion N.V. | | | 2.0 | |
Borregaard ASA | | | 2.0 | |
Thule Group AB | | | 1.9 | |
Total | | | 10.1 | % |
|
| See Notes to Financial Statements. |
| 37 |
(This page has been intentionally left blank)
ADVISERS INVESTMENT TRUST
JOHCM FUNDS
STATEMENTS OF ASSETS & LIABILITIES
September 30, 2020
| | | | | | | | | | | | | | | | |
| | | JOHCM
Credit Income
Fund | | | JOHCM
Emerging Markets
Opportunities Fund | | | JOHCM
Emerging Markets
Small Mid Cap
Equity Fund | | | JOHCM Global Equity Fund | |
| |
Assets: | | | | | | | | | | | | | | | | |
Investments, at cost | | $ | 4,898,026 | | | $ | 551,192,300 | | | $ | 35,277,928 | | | $ | 323,885,123 | |
Investments, at value | | | 4,870,708 | | | | 607,016,792 | | | | 41,928,118 | | | | 455,188,762 | |
Cash | | | — | | | | 14,578,664 | | | | 2,105,658 | | | | 6,210,455 | |
Foreign currency (Cost: $0, $270, $87,127, $0, $465,975, $0, $37,898,256 and $29,982, respectively) | | | — | | | | 269 | | | | 87,112 | | | | — | |
Receivable for interest | | | 51,149 | | | | — | | | | — | | | | — | |
Receivable for dividends | | | 1,069 | | | | 897,158 | | | | 59,809 | | | | 201,798 | |
Reclaims receivable | | | — | | | | 126,999 | | | | 5,784 | | | | 666,705 | |
Receivable for investments sold | | | 26,536 | | | | — | | | | 182,789 | | | | 1,045,549 | |
Receivable for capital shares sold | | | — | | | | 12,735,491 | | | | 45,000 | | | | 25,000 | |
Receivable from service providers | | | 25,598 | | | | — | | | | — | | | | 1,750 | |
Unrealized appreciation on forward foreign currency exchange contracts | | | — | | | | — | | | | — | | | | — | |
Prepaid expenses | | | 49,766 | | | | 982 | | | | 239 | | | | 3,128 | |
| | | | | | | | | | | | | | | | |
Total Assets | | | 5,024,826 | | | | 635,356,355 | | | | 44,414,509 | | | | 463,343,147 | |
Liabilities: | | | | | | | | | | | | | | | | |
Securities purchased payable | | | 10,205 | | | | — | | | | 445,910 | | | | 850,050 | |
Capital shares redeemed payable | | | — | | | | 298,958 | | | | 45,107 | | | | 1,035 | |
Distributions payable to shareholders | | | 2,054 | | | | — | | | | — | | | | — | |
Investment advisory fees payable | | | 2,250 | | | | 457,420 | | | | 96,754 | | | | 357,331 | |
Accounting and Administration fees payable | | | 19,262 | | | | 314,504 | | | | 111,023 | | | | 138,792 | |
Distribution (Rule 12b-1) fees payable | | | — | | | | 9,164 | | | | 1,194 | | | | 3,202 | |
Regulatory and Compliance fees payable | | | 56 | | | | 6,870 | | | | 489 | | | | 5,084 | |
Risk Officer fees payable | | | 43 | | | | 1,313 | | | | 95 | | | | 969 | |
Trustee fees payable | | | 23 | | | | — | | | | — | | | | — | |
Deferred foreign capital gains tax payable | | | — | | | | — | | | | 38,024 | | | | — | |
Accrued expenses and other payables | | | 2,047 | | | | 42,315 | | | | 28,813 | | | | 27,825 | |
| | | | | | | | | | | | | | | | |
Total Liabilities | | | 35,940 | | | | 1,130,544 | | | | 767,409 | | | | 1,384,288 | |
| | | | | | | | | | | | | | | | |
Net Assets | | $ | 4,988,886 | | | $ | 634,225,811 | | | $ | 43,647,100 | | | $ | 461,958,859 | |
| | | | | | | | | | | | | | | | |
Net Assets: | | | | | | | | | | | | | | | | |
Paid in capital | | $ | 5,014,558 | | | $ | 628,333,371 | | | $ | 38,342,484 | | | $ | 308,902,420 | |
Distributable earnings (loss) | | | (25,672 | ) | | | 5,892,440 | | | | 5,304,616 | | | | 153,056,439 | |
| | | | | | | | | | | | | | | | |
Net Assets | | $ | 4,988,886 | | | $ | 634,225,811 | | | $ | 43,647,100 | | | $ | 461,958,859 | |
| | | | | | | | | | | | | | | | |
Net Assets: | | | | | | | | | | | | | | | | |
Class I | | $ | — | | | $ | 75,970,418 | | | $ | 14,364,626 | | | $ | 39,213,422 | |
Class II | | | — | | | | 14,268,124 | | | | — | | | | — | |
Institutional | | | 4,988,886 | | | | 543,987,269 | | | | 29,282,474 | | | | 422,745,437 | |
Share of Common Stock Outstanding: | | | | | | | | | | | | | | | | |
Class I | | | — | | | | 7,027,357 | | | | 1,071,802 | | | | 2,269,220 | |
Class II | | | — | | | | 1,321,308 | | | | — | | | | — | |
Institutional | | | 501,532 | | | | 50,159,487 | | | | 2,182,455 | | | | 24,410,937 | |
Net Asset Value per Share: | | | | | | | | | | | | | | | | |
Class I | | $ | — | | | $ | 10.81 | | | $ | 13.40 | | | $ | 17.28 | |
Class II | | | — | | | | 10.80 | | | | — | | | | — | |
Institutional | | | 9.95 | | | | 10.85 | | | | 13.42 | | | | 17.32 | |
| | | | | | | | | | | | | | | | |
| | |
| |
|
| See Notes to Financial Statements. |
| 39 |
| | | | | | | | | | | | | | |
JOHCM
Global Income
Builder Fund | | | JOHCM
International
Opportunities Fund | | | JOHCM
International Select Fund | | | JOHCM
International Small
Cap Equity Fund | |
| | |
| | | |
| $ | 76,009,132 | | | $ | 2,500,618 | | | $ | 7,483,220,308 | | | $ | 164,377,604 | |
| | 81,987,424 | | | | 2,581,392 | | | | 10,066,894,592 | | | | 176,503,808 | |
| | — | | | | 371,990 | | | | 295,866,308 | | | | 3,244,943 | |
| | | |
| | 469,805 | | | | — | | | | 37,898,262 | | | | 30,013 | |
| | 239,618 | | | | — | | | | — | | | | — | |
| | 134,292 | | | | 6,526 | | | | 20,192,890 | | | | 211,775 | |
| | 163,978 | | | | 6,595 | | | | 16,240,460 | | | | 575,481 | |
| | 917,836 | | | | 2,950 | | | | 25,233,082 | | | | — | |
| | 11,380 | | | | — | | | | 6,152,718 | | | | 99,051 | |
| | 41,923 | | | | 81,322 | | | | 1,756 | | | | 1,750 | |
| | | |
| | 17,209 | | | | — | | | | — | | | | — | |
| | 18,636 | | | | 261 | | | | 11,601 | | | | 18,323 | |
| | | | | | | | | | | | | | |
| | 84,002,101 | | | | 3,051,036 | | | | 10,468,491,669 | | | | 180,685,144 | |
| | | |
| | 557,013 | | | | 33,520 | | | | 179,424,670 | | | | 2 | |
| | 42,479 | | | | — | | | | 2,666,364 | | | | 10,676 | |
| | 62,918 | | | | — | | | | — | | | | — | |
| | 45,735 | | | | 1,788 | | | | 7,419,625 | | | | 155,370 | |
| | 79,353 | | | | 73,873 | | | | 2,778,162 | | | | 81,096 | |
| | 620 | | | | — | | | | 131,058 | | | | 3,087 | |
| | 923 | | | | 32 | | | | 112,684 | | | | 2,000 | |
| | 176 | | | | 8 | | | | 21,462 | | | | 384 | |
| | — | | | | — | | | | — | | | | — | |
| | — | | | | — | | | | — | | | | — | |
| | 12,186 | | | | 6,345 | | | | 447,320 | | | | 17,383 | |
| | | | | | | | | | | | | | |
| | 801,403 | | | | 115,566 | | | | 193,001,345 | | | | 269,998 | |
| | | | | | | | | | | | | | |
| $ | 83,200,698 | | | $ | 2,935,470 | | | $ | 10,275,490,324 | | | $ | 180,415,146 | |
| | | | | | | | | | | | | | |
| | | |
| $ | 79,496,424 | | | $ | 2,845,603 | | | $ | 7,476,992,171 | | | $ | 188,259,464 | |
| | 3,704,274 | | | | 89,867 | | | | 2,798,498,153 | | | | (7,844,318 | ) |
| | | | | | | | | | | | | | |
| $ | 83,200,698 | | | $ | 2,935,470 | | | $ | 10,275,490,324 | | | $ | 180,415,146 | |
| | | | | | | | | | | | | | |
| | | |
| $ | 7,284,792 | | | $ | — | | | $ | 9,631,883,513 | | | $ | 33,852,691 | |
| | 80,987 | | | | — | | | | 643,606,811 | | | | 1,529,440 | |
| | 75,834,919 | | | | 2,935,470 | | | | — | | | | 145,033,015 | |
| | | |
| | 736,663 | | | | — | | | | 349,850,491 | | | | 3,094,356 | |
| | 8,189 | | | | — | | | | 23,379,361 | | | | 139,090 | |
| | 7,667,892 | | | | 280,121 | | | | — | | | | 13,269,107 | |
| | | |
| $ | 9.89 | | | $ | — | | | $ | 27.53 | | | $ | 10.94 | |
| | 9.89 | | | | — | | | | 27.53 | | | | 11.00 | |
| | 9.89 | | | | 10.48 | | | | — | | | | 10.93 | |
| | | | | | | | | | | | | | |
| | |
| | |
|
| See Notes to Financial Statements. |
| 40 |
ADVISERS INVESTMENT TRUST
JOHCM FUNDS
STATEMENTS OF OPERATIONS
For the year ended September 30, 2020
| | | | | | | | | | | | | | | | |
| | | JOHCM
Credit Income
Fund(a) | | | JOHCM
Emerging Markets
Opportunities Fund | | | JOHCM
Emerging Markets
Small Mid Cap
Equity Fund | | | JOHCM Global
Equity Fund | |
| |
Investment Income: | | | | | | | | | | | | | | | | |
Dividend income (Net of foreign withholding tax of $0, $1,562,677, $68,952, $208,791, $83,868, $6,924, $13,131,210 and $374,144) | | $ | 2,420 | | | $ | 12,543,638 | | | $ | 650,715 | | | $ | 4,247,820 | |
Interest income | | | 18,586 | | | | 16,881 | | | | 474 | | | | 23,339 | |
| | | | | | | | | | | | | | | | |
Total investment income | | | 21,006 | | | | 12,560,519 | | | | 651,189 | | | | 4,271,159 | |
| | | | | | | | | | | | | | | | |
Operating expenses: | | | | | | | | | | | | | | | | |
Investment advisory | | | 3,301 | | | | 5,506,266 | | | | 412,692 | | | | 3,913,672 | |
Distribution (Rule 12b-1) fees - Class I | | | — | | | | 75,200 | | | | 6,043 | | | | 75,114 | |
Distribution (Rule 12b-1) fees - Class II | | | — | | | | 34,574 | | | | — | | | | — | |
Accounting and Administration | | | 20,945 | | | | 726,112 | | | | 213,825 | | | | 287,283 | |
Investment advisory recoupment | | | — | | | | — | | | | — | | | | — | |
Regulatory and Compliance | | | 82 | | | | 86,245 | | | | 4,595 | | | | 60,048 | |
Risk Officer | | | 43 | | | | 5,332 | | | | 285 | | | | 3,730 | |
Trustees | | | 39 | | | | 9,335 | | | | 510 | | | | 6,496 | |
Legal | | | 1,838 | | | | 3,882 | | | | 220 | | | | 2,731 | |
Registration | | | 3,861 | | | | 76,686 | | | | 35,148 | | | | 40,183 | |
Interest expense | | | — | | | | 3,500 | | | | 11 | | | | 4,912 | |
Other | | | 2,715 | | | | 104,564 | | | | 27,148 | | | | 37,357 | |
| | | | | | | | | | | | | | | | |
Total expenses before reductions | | | 32,824 | | | | 6,631,696 | | | | 700,477 | | | | 4,431,526 | |
Expenses reduced by Service Providers | | | (28,915 | ) | | | — | | | | (205,473 | ) | | | — | |
| | | | | | | | | | | | | | | | |
Net expenses | | | 3,909 | | | | 6,631,696 | | | | 495,004 | | | | 4,431,526 | |
| | | | | | | | | | | | | | | | |
Net investment income (loss) | | | 17,097 | | | | 5,928,823 | | | | 156,185 | | | | (160,367 | ) |
| | | | | | | | | | | | | | | | |
Realized and Unrealized Gains (Losses) from Investment Activities: | | | | | | | | | | | | | | | | |
Net realized gains (losses) from investment transactions | | | 1,801 | | | | (50,892,694 | ) | | | 2,274,305 | | | | 26,181,906 | |
Net realized gains (losses) from foreign currency transactions | | | — | | | | (218,494 | ) | | | (56,808 | ) | | | (113,970 | ) |
Net realized gains from forward foreign currency exchange contracts | | | — | | | | — | | | | — | | | | — | |
Change in unrealized appreciation (depreciation) on investments | | | (27,318 | ) | | | 71,486,593 | | | | 4,805,121 | | | | 60,610,263 | |
Change in unrealized appreciation (depreciation) on foreign currency | | | — | | | | 5,994 | | | | (660 | ) | | | 33,777 | |
Change in unrealized appreciation (depreciation) on forward foreign currency exchange contracts | | | — | | | | — | | | | — | | | | — | |
| | | | | | | | | | | | | | | | |
Net realized and unrealized gains (losses) from investment activities | | | (25,517 | ) | | | 20,381,399 | | | | 7,021,958 | | | | 86,711,976 | |
| | | | | | | | | | | | | | | | |
Change in Net Assets Resulting from Operations | | $ | (8,420 | ) | | $ | 26,310,222 | | | $ | 7,178,143 | | | $ | 86,551,609 | |
| | | | | | | | | | | | | | | | |
| | | | | | | | | | | | | |
| |
(a) For the period from August 17, 2020, commencement of operations, to September 30, 2020.
|
| See Notes to Financial Statements. |
| 41 |
| | | | | | | | | | | | | | |
JOHCM
Global Income
Builder Fund | | | JOHCM
International
Opportunities Fund | | | JOHCM
International
Select Fund | | | JOHCM
International Small
Cap Equity Fund | |
| | |
| | | |
| $ | 1,531,565 | | | $ | 58,395 | | | $ | 125,560,445 | | | $ | 2,794,960 | |
| | 1,244,454 | | | | 325 | | | | 329,528 | | | | 2,512 | |
| | | | | | | | | | | | | | |
| | 2,776,019 | | | | 58,720 | | | | 125,889,973 | | | | 2,797,472 | |
| | | | | | | | | | | | | | |
| | | |
| | 615,746 | | | | 17,707 | | | | 78,431,569 | | | | 2,030,993 | |
| | 7,201 | | | | — | | | | — | | | | 33,341 | |
| | 246 | | | | — | | | | 1,483,238 | | | | 3,815 | |
| | 182,634 | | | | 173,289 | | | | 5,517,310 | | | | 173,299 | |
| | — | | | | — | | | | — | | | | 25,988 | |
| | 13,425 | | | | 295 | | | | 1,283,236 | | | | 28,253 | |
| | 811 | | | | 21 | | | | 80,074 | | | | 1,744 | |
| | 1,440 | | | | 32 | | | | 138,779 | | | | 3,058 | |
| | 590 | | | | 15 | | | | 58,878 | | | | 1,253 | |
| | 60,866 | | | | 24,833 | | | | 87,272 | | | | 54,959 | |
| | 792 | | | | — | | | | 37,185 | | | | 502 | |
| | 26,067 | | | | 5,968 | | | | 943,371 | | | | 30,999 | |
| | | | | | | | | | | | | | |
| | 909,818 | | | | 222,160 | | | | 88,060,912 | | | | 2,388,204 | |
| | (139,114 | ) | | | (201,146 | ) | | | — | | | | (27,281 | ) |
| | | | | | | | | | | | | | |
| | 770,704 | | | | 21,014 | | | | 88,060,912 | | | | 2,360,923 | |
| | | | | | | | | | | | | | |
| | 2,005,315 | | | | 37,706 | | | | 37,829,061 | | | | 436,549 | |
| | | | | | | | | | | | | | |
| | | |
| | (1,378,288 | ) | | | (26,504 | ) | | | 312,626,901 | | | | (19,081,687 | ) |
| | | |
| | 50,277 | | | | 2,504 | | | | (1,801,534 | ) | | | (4,719 | ) |
| | | |
| | 88,461 | | | | — | | | | — | | | | — | |
| | | |
| | 2,607,381 | | | | (16,447 | ) | | | 1,522,250,840 | | | | 19,128,447 | |
| | | |
| | 15,799 | | | | 437 | | | | 727,690 | | | | 37,278 | |
| | | |
| | (61,475 | ) | | | — | | | | — | | | | — | |
| | | | | | | | | | | | | | |
| | | |
| | 1,322,155 | | | | (40,010 | ) | | | 1,833,803,897 | | | | 79,319 | |
| | | | | | | | | | | | | | |
| $ | 3,327,470 | | | $ | (2,304 | ) | | $ | 1,871,632,958 | | | $ | 515,868 | |
| | | | | | | | | | | | | | |
| | | | | | | | | | | |
| | |
|
| See Notes to Financial Statements. |
| 42 |
ADVISERS INVESTMENT TRUST
JOHCM FUNDS
STATEMENTS OF CHANGES IN NET ASSETS
For the years ended September 30, 2020 and 2019
| | | | | | | | | | | | | | | | | | | | |
| | | JOHCM
Credit Income
Fund | | | JOHCM
Emerging Markets
Opportunities Fund | | | JOHCM
Emerging Markets
Small Mid Cap
Equity Fund | |
| | | 2020(a) | | | 2020 | | | 2019 | | | 2020 | | | 2019 | |
Increase (decrease) in net assets: | | | | | | | | | | | | | | | | | | | | |
Operations: | | | | | | | | | | | | | | | | | | | | |
Net investment income (loss) | | $ | 17,097 | | | $ | 5,928,823 | | | $ | 22,300,479 | | | $ | 156,185 | | | $ | 85,053 | |
Net realized gains (losses) from investments and foreign currency transactions | | | 1,801 | | | | (51,111,188 | ) | | | (3,383,072 | ) | | | 2,217,497 | | | | (3,235,106 | ) |
Change in unrealized appreciation (depreciation) on investments and foreign currency | | | (27,318 | ) | | | 71,492,587 | | | | (26,040,831 | ) | | | 4,804,461 | | | | 2,788,089 | |
| | | | | | | | | | | | | | | | | | | | |
Change in net assets resulting from operations | | | (8,420 | ) | | | 26,310,222 | | | | (7,123,424 | ) | | | 7,178,143 | | | | (361,964 | ) |
| | | | | | | | | | | | | | | | | | | | |
Dividends paid to shareholders: | | | | | | | | | | | | | | | | | | | | |
From distributable earnings | | | | | | | | | | | | | | | | | | | | |
Class I | | | — | | | | (3,215,212 | ) | | | (3,842,442 | ) | | | (2,460 | ) | | | (2,137 | ) |
Class II | | | — | | | | (513,302 | ) | | | (312,740 | ) | | | — | | | | — | |
Institutional Class | | | (17,962 | ) | | | (19,514,553 | ) | | | (16,260,685 | ) | | | (175,677 | ) | | | (116,205 | ) |
| | | | | | | | | | | | | | | | | | | | |
Total dividends paid to shareholders | | | (17,962 | ) | | | (23,243,067 | ) | | | (20,415,867 | ) | | | (178,137 | ) | | | (118,342 | ) |
| | | | | | | | | | | | | | | | | | | | |
Capital Transactions: | | | | | | | | | | | | | | | | | | | | |
Change in net assets from capital transactions from Class I transactions | | | — | | | | (3,464,722 | ) | | | (9,704,832 | ) | | | 10,867,243 | | | | (306,309 | ) |
Change in net assets from capital transactions from Class II transactions | | | — | | | | 960,552 | | | | 5,091,479 | | | | — | | | | — | |
Change in net assets from capital transactions from Institutional transactions | | | 5,015,268 | | | | 50,387,584 | | | | 119,702,512 | | | | 1,495,200 | | | | 227,448 | |
| | | | | | | | | | | | | | | | | | | | |
Change in net assets from capital transactions | | | 5,015,268 | | | | 47,883,414 | | | | 115,089,159 | | | | 12,362,443 | | | | (78,861 | ) |
| | | | | | | | | | | | | | | | | | | | |
Change in net assets | | | 4,988,886 | | | | 50,950,569 | | | | 87,549,868 | | | | 19,362,449 | | | | (559,167 | ) |
Net assets: | | | | | | | | | | | | | | | | | | | | |
Beginning of year | | | — | | | | 583,275,242 | | | | 495,725,374 | | | | 24,284,651 | | | | 24,843,818 | |
| | | | | | | | | | | | | | | | | | | | |
End of year | | $ | 4,988,886 | | | $ | 634,225,811 | | | $ | 583,275,242 | | | $ | 43,647,100 | | | $ | 24,284,651 | |
| | | | | | | | | | | | | | | | | | | | |
| | | | | | | | | | | | | | | | |
| |
(a) For the period from August 17, 2020, commencement of operations, to September 30, 2020.
|
| See Notes to Financial Statements. |
| 43 |
| | | | | | | | | | | | | | | | | | | | | | | | | | | | | | |
JOHCM
Global
Equity Fund | | | JOHCM
Global Income
Builder Fund | | | JOHCM
International
Opportunities Fund | | | JOHCM
International
Select Fund | |
| 2020 | | | 2019 | | | 2020 | | | 2019 | | | 2020 | | | 2019 | | | 2020 | | | 2019 | |
| | | | | | | |
| $ | | (160,367) | | $ | 2,740,703 | | | $ | 2,005,315 | | | $ | 2,481,049 | | | $ | 37,706 | | | $ | 50,853 | | | $ | 37,829,061 | | | $ | 100,676,827 | |
| | | | | | | |
| | 26,067,936 | | | | 50,784,370 | | | | (1,239,550 | ) | | | 123,616 | | | | (24,000 | ) | | | (97 | ) | | | 310,825,367 | | | | (15,994,472 | ) |
| | | | | | | |
| | 60,644,040 | | | | (47,271,077 | ) | | | 2,561,705 | | | | 4,133,697 | | | | (16,010 | ) | | | (20,176 | ) | | | 1,522,978,530 | | | | (363,469,530 | ) |
| | | | | | | | | | | | | | | | | | | | | | | | | | | | | | |
| | | | | | | |
| | 86,551,609 | | | | 6,253,996 | | | | 3,327,470 | | | | 6,738,362 | | | | (2,304 | ) | | | 30,580 | | | | 1,871,632,958 | | | | (278,787,175 | ) |
| | | | | | | | | | | | | | | | | | | | | | | | | | | | | | |
| | | | | | | |
| | (21,676,588 | ) | | | (7,485,629 | ) | | | (216,406 | ) | | | (205,650 | ) | | | — | | | | — | | | | (78,543,873 | ) | | | (102,099,543 | ) |
| | — | | | | — | | | | (3,037 | ) | | | (201 | ) | | | — | | | | — | | | | (4,463,461 | ) | | | (6,729,002 | ) |
| | (31,391,428 | ) | | | (10,781,494 | ) | | | (2,660,890 | ) | | | (2,437,268 | ) | | | (53,453 | ) | | | (40,554 | ) | | | — | | | | — | |
| | | | | | | | | | | | | | | | | | | | | | | | | | | | | | |
| | (53,068,016 | ) | | | (18,267,123 | ) | | | (2,880,333 | ) | | | (2,643,119 | ) | | | (53,453 | ) | | | (40,554 | ) | | | (83,007,334 | ) | | | (108,828,545 | ) |
| | | | | | | | | | | | | | | | | | | | | | | | | | | | | | |
| | | | | | | |
| | (113,508,495 | ) | | | (29,252,618 | ) | | | 490,238 | | | | 1,174,537 | | | | — | | | | — | | | | 134,382,072 | | | | 565,520,424 | |
| | | | | | | |
| | — | | | | — | | | | 12,370 | | | | 76,309 | | | | — | | | | — | | | | (58,985,362 | ) | | | 62,343,549 | |
| | | | | | | |
| | 158,647,691 | | | | (100,351,156 | ) | | | (30,393,091 | ) | | | 73,575,868 | | | | 690,598 | | | | 34,954 | | | | — | | | | — | |
| | | | | | | | | | | | | | | | | | | | | | | | | | | | | | |
| | | | | | | |
| | 45,139,196 | | | | (129,603,774 | ) | | | (29,890,483 | ) | | | 74,826,714 | | | | 690,598 | | | | 34,954 | | | | 75,396,710 | | | | 627,863,973 | |
| | | | | | | | | | | | | | | | | | | | | | | | | | | | | | |
| | 78,622,789 | | | | (141,616,901 | ) | | | (29,443,346 | ) | | | 78,921,957 | | | | 634,841 | | | | 24,980 | | | | 1,864,022,334 | | | | 240,248,253 | |
| | | | | | | |
| | 383,336,070 | | | | 524,952,971 | | | | 112,644,044 | | | | 33,722,087 | | | | 2,300,629 | | | | 2,275,649 | | | | 8,411,467,990 | | | | 8,171,219,737 | |
| | | | | | | | | | | | | | | | | | | | | | | | | | | | | | |
| $ | 461,958,859 | | | $ | 383,336,070 | | | $ | 83,200,698 | | | $ | 112,644,044 | | | $ | 2,935,470 | | | $ | 2,300,629 | | | $ | 10,275,490,324 | | | $ | 8,411,467,990 | |
| | | | | | | | | | | | | | | | | | | | | | | | | | | | | | |
| | | | | | | | | | | | | | | | | | | | | | | | | | | | | | |
| | |
|
| See Notes to Financial Statements. |
| 44 |
ADVISERS INVESTMENT TRUST
JOHCM FUNDS
STATEMENTS OF CHANGES IN NET ASSETS
For the years ended September 30, 2020 and 2019
| | | | | | | | |
| | | JOHCM
International Small
Cap Equity Fund | |
| | | 2020 | | | 2019 | |
Increase (decrease) in net assets: | | | | | | | | |
Operations: | | | | | | | | |
Net investment income | | $ | 436,549 | | | $ | 2,793,782 | |
Net realized gains (losses) from investments and foreign currency transactions | | | (19,086,406 | ) | | | 4,742,682 | |
Change in unrealized appreciation (depreciation) on investments and foreign currency | | | 19,165,725 | | | | (36,114,343 | ) |
| | | | | | | | |
Change in net assets resulting from operations | | | 515,868 | | | | (28,577,879 | ) |
| | | | | | | | |
Dividends paid to shareholders: | | | | | | | | |
From distributable earnings | | | | | | | | |
Class I | | | (1,289,585 | ) | | | (2,357,616 | ) |
Class II | | | (51,613 | ) | | | (90,907 | ) |
Institutional Class | | | (6,233,059 | ) | | | (10,990,066 | ) |
| | | | | | | | |
Total dividends paid to shareholders | | | (7,574,257 | ) | | | (13,438,589 | ) |
| | | | | | | | |
Capital Transactions: | | | | | | | | |
Change in net assets from capital transactions from Class I transactions | | | 6,208,040 | | | | (10,592,293 | ) |
Change in net assets from capital transactions from Class II transactions | | | (72,503 | ) | | | 397,413 | |
Change in net assets from capital transactions from Institutional transactions | | | (26,688,964 | ) | | | (7,861,402 | ) |
| | | | | | | | |
Change in net assets from capital transactions | | | (20,553,427 | ) | | | (18,056,282 | ) |
| | | | | | | | |
Change in net assets | | | (27,611,816 | ) | | | (60,072,750 | ) |
Net assets: | | | | | | | | |
Beginning of year | | | 208,026,962 | | | | 268,099,712 | |
| | | | | | | | |
End of year | | $ | 180,415,146 | | | $ | 208,026,962 | |
| | | | | | | | |
| | | | | | | |
| |
|
| See Notes to Financial Statements. |
| 45 |
ADVISERS INVESTMENT TRUST
JOHCM FUNDS
FINANCIAL HIGHLIGHTS
For the periods indicated
| | | | |
| | | Institutional Class | |
| JOHCM Credit Income Fund | | Period Ended
September 30, 2020(a) | |
| |
Net asset value, beginning of period | | $ | 10.00 | |
| | | | |
Income (loss) from investment operations: | | | | |
Net investment income(b) | | | 0.03 | |
Net realized and unrealized losses from investments | | | (0.04 | ) |
| | | | |
Total from investment operations | | | (0.01 | ) |
| | | | |
Less distributions paid: | | | | |
From net investment income | | | (0.04 | ) |
| | | | |
Total distributions paid | | | (0.04 | ) |
| | | | |
Change in net asset value | | | (0.05 | ) |
| | | | |
Net asset value, end of period | | $ | 9.95 | |
| | | | |
Total return(c) | | | (0.14 | %) |
Ratios/Supplemental data: | | | | |
Net assets, end of period (000’s) | | $ | 4,989 | |
Ratio of net expenses to average net assets | | | 0.65 | %(d) |
Ratio of net investment income to average net assets | | | 2.85 | %(d) |
Ratio of gross expenses to average net assets | | | 5.47 | %(d) |
Portfolio turnover rate(e) | | | 5.72 | %(c) |
| | | | |
| |
| (a) | For the period from August 17, 2020, commencement of operations, to September 30, 2020. |
| (b) | Net investment income (loss) for the period ended was calculated using the average shares outstanding method. |
| (c) | Not annualized for periods less than one year. |
| (d) | Annualized for periods less than one year. |
| (e) | Portfolio turnover is calculated at the fund level without regard to each class of shares. |
|
| See Notes to Financial Statements. |
| 46 |
ADVISERS INVESTMENT TRUST
JOHCM FUNDS
FINANCIAL HIGHLIGHTS
For the periods indicated
| | | | | | | | | | | | | | | | | | | | |
| | | Class I | |
| | | Year Ended | | | Year Ended | | | Year Ended | | | Year Ended | | | Year Ended | |
| JOHCM Emerging Markets | | September 30, | | | September 30, | | | September 30, | | | September 30, | | | September 30, | |
| Opportunities Fund | | 2020 | | | 2019 | | | 2018 | | | 2017 | | | 2016 | |
| |
Net asset value, beginning of year | | $ | 10.75 | | | $ | 11.38 | | | $ | 11.96 | | | $ | 10.04 | | | $ | 9.19 | |
| | | | | | | | | | | | | | | | | | | | |
Income (loss) from investment operations: | | | | | | | | | | | | | | | | | | | | |
Net investment income(a) | | | 0.08 | | | | 0.40 | | | | 0.14 | | | | 0.10 | | | | 0.19 | |
Net realized and unrealized gains (losses) from investments | | | 0.40 | | | | (0.59 | ) | | | (0.27 | ) | | | 1.89 | | | | 1.25 | |
| | | | | | | | | | | | | | | | | | | | |
Total from investment operations | | | 0.48 | | | | (0.19 | ) | | | (0.13 | ) | | | 1.99 | | | | 1.44 | |
| | | | | | | | | | | | | | | | | | | | |
Less distributions paid: | | | | | | | | | | | | | | | | | | | | |
From net investment income | | | (0.42 | ) | | | (0.10 | ) | | | (0.07 | ) | | | (0.07 | ) | | | (0.08 | ) |
From net realized gains | | | — | | | | (0.34 | ) | | | (0.38 | ) | | | — | | | | (0.51 | ) |
| | | | | | | | | | | | | | | | | | | | |
Total distributions paid | | | (0.42 | ) | | | (0.44 | ) | | | (0.45 | ) | | | (0.07 | ) | | | (0.59 | ) |
| | | | | | | | | | | | | | | | | | | | |
Change in net asset value | | | 0.06 | | | | (0.63 | ) | | | (0.58 | ) | | | 1.92 | | | | 0.85 | |
| | | | | | | | | | | | | | | | | | | | |
Net asset value, end of year | | $ | 10.81 | | | $ | 10.75 | | | $ | 11.38 | | | $ | 11.96 | | | $ | 10.04 | |
| | | | | | | | | | | | | | | | | | | | |
Total return | | | 4.37 | % | | | (1.31 | %) | | | (1.30 | %) | | | 20.09 | % | | | 16.54 | % |
Ratios/Supplemental data: | | | | | | | | | | | | | | | | | | | | |
Net assets, end of year (000’s) | | $ | 75,971 | | | $ | 83,555 | | | $ | 99,577 | | | $ | 71,650 | | | $ | 29,446 | |
Ratio of net expenses to average net assets | | | 1.20 | % | | | 1.32 | % | | | 1.34 | % | | | 1.38 | % | | | 1.37 | % |
Ratio of net investment income to average net assets | | | 0.81 | % | | | 3.71 | % | | | 1.15 | % | | | 0.92 | % | | | 2.09 | % |
Ratio of gross expenses to average net assets | | | 1.20 | % | | | 1.32 | % | | | 1.34 | % | | | 1.38 | % | | | 1.37 | % |
Ratio of expense recoupment to average net assets | | | — | | | | — | (b) | | | 0.02 | % | | | 0.01 | % | | | — | |
Portfolio turnover rate(c) | | | 53.30 | % | | | 35.35 | % | | | 31.87 | % | | | 22.62 | % | | | 40.75 | % |
| |
| (a) | Net investment income (loss) for the period ended was calculated using the average shares outstanding method. |
| (b) | Amount rounds to less 0.005%. |
| (c) | Portfolio turnover is calculated at the fund level without regard to each class of shares. |
|
| See Notes to Financial Statements. |
| 47 |
ADVISERS INVESTMENT TRUST
JOHCM FUNDS
FINANCIAL HIGHLIGHTS
For the periods indicated
| | | | | | | | | | | | | | | | | | | | |
| | | Class II | |
| | | Year Ended | | | Year Ended | | | Year Ended | | | Year Ended | | | Year Ended | |
| JOHCM Emerging Markets | | September 30, | | | September 30, | | | September 30, | | | September 30, | | | September 30, | |
| Opportunities Fund | | 2020 | | | 2019 | | | 2018 | | | 2017 | | | 2016 | |
| |
Net asset value, beginning of year | | $ | 10.74 | | | $ | 11.36 | | | $ | 11.95 | | | $ | 10.03 | | | $ | 9.19 | |
| | | | | | | | | | | | | | | | | | | | |
Income (loss) from investment operations: | | | | | | | | | | | | | | | | | | | | |
Net investment income(a) | | | 0.08 | | | | 0.41 | | | | 0.12 | | | | 0.08 | | | | 0.05 | |
Net realized and unrealized gains (losses) from investments | | | 0.38 | | | | (0.60 | ) | | | (0.27 | ) | | | 1.90 | | | | 1.38 | |
| | | | | | | | | | | | | | | | | | | | |
Total from investment operations | | | 0.46 | | | | (0.19 | ) | | | (0.15 | ) | | | 1.98 | | | | 1.43 | |
| | | | | | | | | | | | | | | | | | | | |
Less distributions paid: | | | | | | | | | | | | | | | | | | | | |
From net investment income | | | (0.40 | ) | | | (0.09 | ) | | | (0.06 | ) | | | (0.06 | ) | | | (0.08 | ) |
From net realized gains | | | — | | | | (0.34 | ) | | | (0.38 | ) | | | — | | | | (0.51 | ) |
| | | | | | | | | | | | | | | | | | | | |
Total distributions paid | | | (0.40 | ) | | | (0.43 | ) | | | (0.44 | ) | | | (0.06 | ) | | | (0.59 | ) |
| | | | | | | | | | | | | | | | | | | | |
Change in net asset value | | | 0.06 | | | | (0.62 | ) | | | (0.59 | ) | | | 1.92 | | | | 0.84 | |
| | | | | | | | | | | | | | | | | | | | |
Net asset value, end of year | | $ | 10.80 | | | $ | 10.74 | | | $ | 11.36 | | | $ | 11.95 | | | $ | 10.03 | |
| | | | | | | | | | | | | | | | | | | | |
Total return | | | 4.26 | % | | | (1.37 | %) | | | (1.47 | %) | | | 19.89 | % | | | 16.42 | % |
Ratios/Supplemental data: | | | | | | | | | | | | | | | | | | | | |
Net assets, end of year (000’s) | | $ | 14,268 | | | $ | 13,348 | | | $ | 8,020 | | | $ | 5,668 | | | $ | 1,953 | |
Ratio of net expenses to average net assets | | | 1.35 | % | | | 1.47 | % | | | 1.49 | % | | | 1.54 | % | | | 1.50 | % |
Ratio of net investment income to average net assets | | | 0.76 | % | | | 3.86 | % | | | 1.01 | % | | | 0.71 | % | | | 0.54 | % |
Ratio of gross expenses to average net assets | | | 1.35 | % | | | 1.47 | % | | | 1.49 | % | | | 1.54 | % | | | 1.56 | % |
Ratio of expense recoupment to average net assets | | | — | | | | — | (b) | | | 0.02 | % | | | 0.02 | % | | | — | |
Portfolio turnover rate(c) | | | 53.30 | % | | | 35.35 | % | | | 31.87 | % | | | 22.62 | % | | | 40.75 | % |
| |
| (a) | Net investment income (loss) for the period ended was calculated using the average shares outstanding method. |
| (b) | Amount rounds to less 0.005%. |
| (c) | Portfolio turnover is calculated at the fund level without regard to each class of shares. |
|
| See Notes to Financial Statements. |
| 48 |
ADVISERS INVESTMENT TRUST
JOHCM FUNDS
FINANCIAL HIGHLIGHTS
For the periods indicated
| | | | | | | | | | | | | | | | | | | | |
| | | Institutional Class | |
| | | Year Ended | | | Year Ended | | | Year Ended | | | Year Ended | | | Year Ended | |
| JOHCM Emerging Markets | | September 30, | | | September 30, | | | September 30, | | | September 30, | | | September 30, | |
| Opportunities Fund | | 2020 | | | 2019 | | | 2018 | | | 2017 | | | 2016 | |
| |
Net asset value, beginning of year | | $ | 10.78 | | | $ | 11.41 | | | $ | 11.99 | | | $ | 10.06 | | | $ | 9.20 | |
| | | | | | | | | | | | | | | | | | | | |
Income (loss) from investment operations: | | | | | | | | | | | | | | | | | | | | |
Net investment income(a) | | | 0.11 | | | | 0.48 | | | | 0.15 | | | | 0.13 | | | | 0.10 | |
Net realized and unrealized gains (losses) from investments | | | 0.39 | | | | (0.66 | ) | | | (0.27 | ) | | | 1.88 | | | | 1.35 | |
| | | | | | | | | | | | | | | | | | | | |
Total from investment operations | | | 0.50 | | | | (0.18 | ) | | | (0.12 | ) | | | 2.01 | | | | 1.45 | |
| | | | | | | | | | | | | | | | | | | | |
Less distributions paid: | | | | | | | | | | | | | | | | | | | | |
From net investment income | | | (0.43 | ) | | | (0.11 | ) | | | (0.08 | ) | | | (0.08 | ) | | | (0.08 | ) |
From net realized gains | | | — | | | | (0.34 | ) | | | (0.38 | ) | | | — | | | | (0.51 | ) |
| | | | | | | | | | | | | | | | | | | | |
Total distributions paid | | | (0.43 | ) | | | (0.45 | ) | | | (0.46 | ) | | | (0.08 | ) | | | (0.59 | ) |
| | | | | | | | | | | | | | | | | | | | |
Change in net asset value | | | 0.07 | | | | (0.63 | ) | | | (0.58 | ) | | | 1.93 | | | | 0.86 | |
| | | | | | | | | | | | | | | | | | | | |
Net asset value, end of year | | $ | 10.85 | | | $ | 10.78 | | | $ | 11.41 $ | | | | 11.99 | | | $ | 10.06 | |
| | | | | | | | | | | | | | | | | | | | |
Total return | | | 4.56 | % | | | (1.21 | %) | | | (1.23 | %) | | | 20.21 | % | | | 16.64 | % |
Ratios/Supplemental data: | | | | | | | | | | | | | | | | | | | | |
Net assets, end of year (000’s) | | $ | 543,987 | | | $ | 486,372 | | | $ | 388,129 | | | $ | 269,622 | | | $ | 110,330 | |
Ratio of net expenses to average net assets | | | 1.10 | % | | | 1.22 | % | | | 1.24 | % | | | 1.29 | % | | | 1.27 | % |
Ratio of net investment income to average net assets | | | 1.04 | % | | | 4.46 | % | | | 1.26 | % | | | 1.23 | % | | | 1.14 | % |
Ratio of gross expenses to average net assets | | | 1.10 | % | | | 1.22 | % | | | 1.24 | % | | | 1.29 | % | | | 1.29 | % |
Ratio of expense recoupment to average net assets | | | — | | | | — | (b) | | | 0.02 | % | | | 0.01 | % | | | — | |
Portfolio turnover rate(c) | | | 53.30 | % | | | 35.35 | % | | | 31.87 | % | | | 22.62 | % | | | 40.75 | % |
| |
| (a) | Net investment income (loss) for the period ended was calculated using the average shares outstanding method. |
| (b) | Amount rounds to less 0.005%. |
| (c) | Portfolio turnover is calculated at the fund level without regard to each class of shares. |
|
| See Notes to Financial Statements. |
| 49 |
ADVISERS INVESTMENT TRUST
JOHCM FUNDS
FINANCIAL HIGHLIGHTS
For the periods indicated
| | | | | | | | | | | | | | | | | | | | |
| | | Class I | |
| | | Year Ended | | | Year Ended | | | Year Ended | | | Year Ended | | | Period Ended | |
| JOHCM Emerging Markets Small Mid | | September 30, | | | September 30, | | | September 30, | | | September 30, | | | September 30, | |
| Cap Equity Fund | | 2020 | | | 2019 | | | 2018 | | | 2017 | | | 2016(a) | |
| |
Net asset value, beginning of period | | $ | 11.62 | | | $ | 11.85 | | | $ | 14.00 | | | $ | 11.78 | | | $ | 9.20 | |
| | | | | | | | | | | | | | | | | | | | |
Income (loss) from investment operations: | | | | | | | | | | | | | | | | | | | | |
Net investment income(b) | | | 0.15 | | | | 0.02 | | | | 0.09 | | | | 0.06 | | | | 0.08 | |
Net realized and unrealized gains (losses) from investments | | | 1.70 | | | | (0.20 | ) | | | (0.56 | ) | | | 2.38 | | | | 2.50 | |
| | | | | | | | | | | | | | | | | | | | |
Total from investment operations | | | 1.85 | | | | (0.18 | ) | | | (0.47 | ) | | | 2.44 | | | | 2.58 | |
| | | | | | | | | | | | | | | | | | | | |
Less distributions paid: | | | | | | | | | | | | | | | | | | | | |
From net investment income | | | (0.07 | ) | | | (0.05 | ) | | | (0.13 | ) | | | (0.22 | ) | | | — | |
From net realized gains | | | — | | | | — | | | | (1.55 | ) | | | — | | | | — | |
| | | | | | | | | | | | | | | | | | | | |
Total distributions paid | | | (0.07 | ) | | | (0.05 | ) | | | (1.68 | ) | | | (0.22 | ) | | | — | |
| | | | | | | | | | | | | | | | | | | | |
Change in net asset value | | | 1.78 | | | | (0.23 | ) | | | (2.15 | ) | | | 2.22 | | | | 2.58 | |
| | | | | | | | | | | | | | | | | | | | |
Net asset value, end of period | | $ | 13.40 | | | $ | 11.62 | | | $ | 11.85 | | | $ | 14.00 | | | $ | 11.78 | |
| | | | | | | | | | | | | | | | | | | | |
Total return | | | 15.95 | % | | | (1.51 | %) | | | (4.50 | %) | | | 21.37 | % | | | 28.04 | %(c) |
Ratios/Supplemental data: | | | | | | | | | | | | | | | | | | | | |
Net assets, end of period (000’s) . | | $ | 14,365 | | | $ | 415 | | | $ | 751 | | | $ | 149 | | | $ | 147 | |
Ratio of net expenses to average net assets | | | 1.64 | % | | | 1.64 | % | | | 1.64 | % | | | 1.64 | % | | | 1.64 | %(d) |
Ratio of net investment income to average net assets | | | 1.21 | % | | | 0.15 | % | | | 0.69 | % | | | 0.47 | % | | | 1.11 | %(d) |
Ratio of gross expenses to average net assets | | | 2.29 | % | | | 2.66 | % | | | 2.65 | % | | | 4.37 | % | | | 5.72 | %(d) |
Portfolio turnover rate(e) | | | 136.73 | % | | | 133.43 | % | | | 127.34 | % | | | 174.08 | % | | | 162.74 | %(c) |
| |
| (a) | For the period from January 28, 2016, commencement of operations, to September 30, 2016. |
| (b) | Net investment income (loss) for the period ended was calculated using the average shares outstanding method. |
| (c) | Not annualized for periods less than one year. |
| (d) | Annualized for periods less than one year. |
| (e) | Portfolio turnover is calculated at the fund level without regard to each class of shares. |
|
| See Notes to Financial Statements. |
| 50 |
ADVISERS INVESTMENT TRUST
JOHCM FUNDS
FINANCIAL HIGHLIGHTS
For the periods indicated
| | | | | | | | | | | | | | | | | | | | |
| | | Institutional Class | |
| | | Year Ended | | | Year Ended | | | Year Ended | | | Year Ended | | | Year Ended | |
| JOHCM Emerging Markets Small Mid | | September 30, | | | September 30, | | | September 30, | | | September 30, | | | September 30, | |
| Cap Equity Fund | | 2020 | | | 2019 | | | 2018 | | | 2017 | | | 2016 | |
| |
Net asset value, beginning of year | | $ | 11.64 | | | $ | 11.87 | | | $ | 14.02 | | | $ | 11.78 | | | $ | 9.91 | |
| | | | | | | | | | | | | | | | | | | | |
Income (loss) from investment operations: | | | | | | | | | | | | | | | | | | | | |
Net investment income(a) | | | 0.04 | | | | 0.04 | | | | 0.09 | | | | 0.05 | | | | 0.03 | |
Net realized and unrealized gains (losses) from investments | | | 1.83 | | | | (0.21 | ) | | | (0.55 | ) | | | 2.42 | | | | 2.28 | |
| | | | | | | | | | | | | | | | | | | | |
Total from investment operations | | | 1.87 | | | | (0.17 | ) | | | (0.46 | ) | | | 2.47 | | | | 2.31 | |
| | | | | | | | | | | | | | | | | | | | |
Less distributions paid: | | | | | | | | | | | | | | | | | | | | |
From net investment income | | | (0.09 | ) | | | (0.06 | ) | | | (0.14 | ) | | | (0.23 | ) | | | (0.06 | ) |
From net realized gains | | | — | | | | — | | | | (1.55 | ) | | | — | | | | (0.38 | ) |
| | | | | | | | | | | | | | | | | | | | |
Total distributions paid | | | (0.09 | ) | | | (0.06 | ) | | | (1.69 | ) | | | (0.23 | ) | | | (0.44 | ) |
| | | | | | | | | | | | | | | | | | | | |
Change in net asset value | | | 1.78 | | | | (0.23 | ) | | | (2.15 | ) | | | 2.24 | | | | 1.87 | |
| | | | | | | | | | | | | | | | | | | | |
Net asset value, end of year | | $ | 13.42 | | | $ | 11.64 | | | $ | 11.87 | | | $ | 14.02 | | | $ | 11.78 | |
| | | | | | | | | | | | | | | | | | | | |
Total return | | | 16.09 | % | | | (1.42 | %) | | | (4.43 | %) | | | 21.59 | % | | | 24.13 | % |
Ratios/Supplemental data: | | | | | | | | | | | | | | | | | | | | |
Net assets, end of year (000’s) | | $ | 29,282 | | | $ | 23,870 | | | $ | 24,093 | | | $ | 7,406 | | | $ | 6,114 | |
Ratio of net expenses to average net assets | | | 1.54 | % | | | 1.54 | % | | | 1.54 | % | | | 1.54 | % | | | 1.54 | % |
Ratio of net investment income to average net assets | | | 0.33 | % | | | 0.36 | % | | | 0.69 | % | | | 0.40 | % | | | 0.27 | % |
Ratio of gross expenses to average net assets | | | 2.19 | % | | | 2.56 | % | | | 2.48 | % | | | 4.38 | % | | | 4.63 | % |
Portfolio turnover rate(b) | | | 136.73 | % | | | 133.43 | % | | | 127.34 | % | | | 174.08 | % | | | 162.74 | % |
| |
| (a) | Net investment income (loss) for the period ended was calculated using the average shares outstanding method. |
| (b) | Portfolio turnover is calculated at the fund level without regard to each class of shares. |
|
| See Notes to Financial Statements. |
| 51 |
ADVISERS INVESTMENT TRUST
JOHCM FUNDS
FINANCIAL HIGHLIGHTS
For the periods indicated
| | | | | | | | | | | | | | | | | | | | |
| | | Class I | |
| | | Year Ended | | | Year Ended | | | Year Ended | | | Year Ended | | | Year Ended | |
| | | September 30, | | | September 30, | | | September 30, | | | September 30, | | | September 30, | |
| JOHCM Global Equity Fund | | 2020 | | | 2019 | | | 2018 | | | 2017 | | | 2016 | |
| |
Net asset value, beginning of year | | $ | 16.41 | | | $ | 16.73 | | | $ | 15.05 | | | $ | 13.58 | | | $ | 12.24 | |
| | | | | | | | | | | | | | | | | | | | |
Income (loss) from investment operations: | | | | | | | | | | | | | | | | | | | | |
Net investment income (loss)(a) | | | (0.04 | ) | | | 0.10 | | | | 0.07 | | | | 0.07 | | | | 0.06 | |
Net realized and unrealized gains from investments | | | 3.17 | | | | 0.25 | | | | 1.67 | | | | 1.43 | | | | 1.28 | |
| | | | | | | | | | | | | | | | | | | | |
Total from investment operations | | | 3.13 | | | | 0.35 | | | | 1.74 | | | | 1.50 | | | | 1.34 | |
| | | | | | | | | | | | | | | | | | | | |
Less distributions paid: | | | | | | | | | | | | | | | | | | | | |
From net investment income | | | (0.02 | ) | | | (0.18 | ) | | | (0.06 | ) | | | (0.03 | ) | | | — | |
From net realized gains | | | (2.24 | ) | | | (0.49 | ) | | | — | | | | — | | | | — | |
| | | | | | | | | | | | | | | | | | | | |
Total distributions paid | | | (2.26 | ) | | | (0.67 | ) | | | (0.06 | ) | | | (0.03 | ) | | | — | |
| | | | | | | | | | | | | | | | | | | | |
Change in net asset value | | | 0.87 | | | | (0.32 | ) | | | 1.68 | | | | 1.47 | | | | 1.34 | |
| | | | | | | | | | | | | | | | | | | | |
Net asset value, end of year | | $ | 17.28 | | | $ | 16.41 | | | $ | 16.73 | | | $ | 15.05 | | | $ | 13.58 | |
| | | | | | | | | | | | | | | | | | | | |
Total return | | | 21.26 | % | | | 2.66 | % | | | 11.61 | % | | | 11.06 | % | | | 10.95 | % |
Ratios/Supplemental data: | | | | | | | | | | | | | | | | | | | | |
Net assets, end of year (000’s) | | $ | 39,213 | | | $ | 157,452 | | | $ | 189,317 | | | $ | 216,867 | | | $ | 171,464 | |
Ratio of net expenses to average net assets | | | 1.16 | % | | | 1.16 | % | | | 1.17 | % | | | 1.18 | % | | | 1.18 | % |
Ratio of net investment income (loss) to average net assets | | | (0.28 | %) | | | 0.63 | % | | | 0.39 | % | | | 0.49 | % | | | 0.50 | % |
Ratio of gross expenses to average net assets | | | 1.16 | % | | | 1.17 | % | | | 1.17 | % | | | 1.18 | % | | | 1.20 | % |
Ratio of expense recoupment to average net assets | | | — | | | | — | (b) | | | — | (b) | | | — | (b) | | | — | |
Portfolio turnover rate(c) | | | 40.21 | % | | | 46.36 | % | | | 24.81 | % | | | 51.44 | % | | | 124.32 | % |
| |
| (a) | Net investment income (loss) for the period ended was calculated using the average shares outstanding method. |
| (b) | Amount rounds to less 0.005%. |
| (c) | Portfolio turnover is calculated at the fund level without regard to each class of shares. |
|
| See Notes to Financial Statements. |
| 52 |
ADVISERS INVESTMENT TRUST
JOHCM FUNDS
FINANCIAL HIGHLIGHTS
For the periods indicated
| | | | | | | | | | | | | | | | | | | | |
| | | Institutional Class | |
| | | Year Ended | | | Year Ended | | | Year Ended | | | Year Ended | | | Year Ended | |
| | | September 30, | | | September 30, | | | September 30, | | | September 30, | | | September 30, | |
| JOHCM Global Equity Fund | | 2020 | | | 2019 | | | 2018 | | | 2017 | | | 2016 | |
| |
Net asset value, beginning of year | | $ | 16.44 | | | $ | 16.76 | | | $ | 15.08 | | | $ | 13.61 | | | $ | 12.25 | |
| | | | | | | | | | | | | | | | | | | | |
Income from investment operations: | | | | | | | | | | | | | | | | | | | | |
Net investment income(a) | | | — | (b) | | | 0.10 | | | | 0.09 | | | | 0.08 | | | | 0.07 | |
Net realized and unrealized gains from investments | | | 3.15 | | | | 0.26 | | | | 1.67 | | | | 1.43 | | | | 1.29 | |
| | | | | | | | | | | | | | | | | | | | |
Total from investment operations | | | 3.15 | | | | 0.36 | | | | 1.76 | | | | 1.51 | | | | 1.36 | |
| | | | | | | | | | | | | | | | | | | | |
Less distributions paid: | | | | | | | | | | | | | | | | | | | | |
From net investment income | | | (0.04 | ) | | | (0.19 | ) | | | (0.08 | ) | | | (0.04 | ) | | | — | |
From net realized gains | | | (2.23 | ) | | | (0.49 | ) | | | — | | | | — | | | | — | |
| | | | | | | | | | | | | | | | | | | | |
Total distributions paid | | | (2.27 | ) | | | (0.68 | ) | | | (0.08 | ) | | | (0.04 | ) | | | — | |
| | | | | | | | | | | | | | | | | | | | |
Change in net asset value | | | 0.88 | | | | (0.32 | ) | | | 1.68 | | | | 1.47 | | | | 1.36 | |
| | | | | | | | | | | | | | | | | | | | |
Net asset value, end of year | | $ | 17.32 | | | $ | 16.44 | | | $ | 16.76 | | | $ | 15.08 | | | $ | 13.61 | |
| | | | | | | | | | | | | | | | | | | | |
Total return | | | 21.43 | % | | | 2.76 | % | | | 11.76 | % | | | 11.15 | % | | | 11.10 | % |
| | | | | | | | | | | | | | | | | | | | |
Ratios/Supplemental data: | | | | | | | | | | | | | | | | | | | | |
Net assets, end of year (000’s) | | $ | 422,745 | | | $ | 225,884 | | | $ | 335,636 | | | $ | 287,089 | | | $ | 245,918 | |
Ratio of net expenses to average net assets | | | 1.06 | % | | | 1.06 | % | | | 1.07 | % | | | 1.08 | % | | | 1.08 | % |
Ratio of net investment income to average net assets | | | 0.01 | % | | | 0.66 | % | | | 0.57 | % | | | 0.57 | % | | | 0.52 | % |
Ratio of gross expenses to average net assets | | | 1.06 | % | | | 1.07 | % | | | 1.07 | % | | | 1.08 | % | | | 1.10 | % |
Ratio of expense recoupment to average net assets | | | — | | | | — | (c) | | | — | (c) | | | — | (c) | | | — | |
Portfolio turnover rate(d) | | | 40.21 | % | | | 46.36 | % | | | 24.81 | % | | | 51.44 | % | | | 124.32 | % |
| |
| (a) | Net investment income (loss) for the period ended was calculated using the average shares outstanding method. |
| (b) | Amount is less than $0.005 per share. |
| (c) | Amount rounds to less 0.005%. |
| (d) | Portfolio turnover is calculated at the fund level without regard to each class of shares. |
|
| See Notes to Financial Statements. |
| 53 |
ADVISERS INVESTMENT TRUST
JOHCM FUNDS
FINANCIAL HIGHLIGHTS
For the periods indicated
| | | | | | | | | | | | |
| | | Class I | |
| | | Year Ended | | | Year Ended | | | Period Ended | |
| | | September 30, | | | September 30, | | | September 30, | |
| JOHCM Global Income Builder Fund | | 2020 | | | 2019 | | | 2018(a) | |
| |
Net asset value, beginning of period | | $ | 10.09 | | | $ | 9.71 | | | $ | 10.00 | |
| | | | | | | | | | | | |
Income (loss) from investment operations: | | | | | | | | | | | | |
Net investment income(b) | | | 0.21 | | | | 0.31 | | | | 0.29 | |
Net realized and unrealized gains (losses) from investments | | | (0.11 | ) | | | 0.41 | | | | (0.30 | ) |
| | | | | | | | | | | | |
Total from investment operations | | | 0.10 | | | | 0.72 | | | | (0.01 | ) |
| | | | | | | | | | | | |
Less distributions paid: | | | | | | | | | | | | |
From net investment income | | | (0.25 | ) | | | (0.34 | ) | | | (0.28 | ) |
From net realized gains | | | (0.05 | ) | | | — | | | | — | |
| | | | | | | | | | | | |
Total distributions paid | | | (0.30 | ) | | | (0.34 | ) | | | (0.28 | ) |
| | | | | | | | | | | | |
Change in net asset value | | | (0.20 | ) | | | 0.38 | | | | (0.29 | ) |
| | | | | | | | | | | | |
Net asset value, end of period | | $ | 9.89 | | | $ | 10.09 | | | $ | 9.71 | |
| | | | | | | | | | | | |
Total return | | | 0.99 | % | | | 7.66 | % | | | (0.06 | %)(c) |
Ratios/Supplemental data: | | | | | | | | | | | | |
Net assets, end of period (000’s) | | $ | 7,285 | | | $ | 6,933 | | | $ | 5,516 | |
Ratio of net expenses to average net assets | | | 0.93 | % | | | 0.98 | % | | | 0.98 | %(d) |
Ratio of net investment income to average net assets | | | 2.14 | % | | | 3.14 | % | | | 3.50 | %(d) |
Ratio of gross expenses to average net assets | | | 1.08 | % | | | 1.18 | % | | | 1.56 | %(d) |
Portfolio turnover rate(e) | | | 141.42 | %(c) | | | 54.70 | %(c) | | | 41.93 | %(c) |
| |
| (a) | For the period from November 29, 2017, commencement of operations, to September 30, 2018. |
| (b) | Net investment income (loss) for the period ended was calculated using the average shares outstanding method. |
| (c) | Not annualized for periods less than one year. |
| (d) | Annualized for periods less than one year. |
| (e) | Portfolio turnover is calculated at the fund level without regard to each class of shares. |
|
| See Notes to Financial Statements. |
| 54 |
ADVISERS INVESTMENT TRUST
JOHCM FUNDS
FINANCIAL HIGHLIGHTS
For the periods indicated
| | | | | | | | |
| | | Class II | |
| | | Year Ended | | | Period Ended | |
| | | September 30, | | | September 30, | |
| JOHCM Global Income Builder Fund | | 2020 | | | 2019(a) | |
| |
Net asset value, beginning of period | | $ | 10.09 | | | $ | 10.08 | |
| | | | | | | | |
Income (loss) from investment operations: | | | | | | | | |
Net investment income(b) | | | 0.20 | | | | 0.06 | |
Net realized and unrealized gains (losses) from investments | | | (0.12 | ) | | | 0.01 | |
| | | | | | | | |
Total from investment operations | | | 0.08 | | | | 0.07 | |
| | | | | | | | |
Less distributions paid: | | | | | | | | |
From net investment income | | | (0.23 | ) | | | (0.06 | ) |
From net realized gains | | | (0.05 | ) | | | — | |
| | | | | | | | |
Total distributions paid | | | (0.28 | ) | | | (0.06 | ) |
| | | | | | | | |
Change in net asset value | | | (0.20 | ) | | | 0.01 | |
| | | | | | | | |
Net asset value, end of period | | $ | 9.89 | | | $ | 10.09 | |
| | | | | | | | |
Total return | | | 0.86 | % | | | 0.75 | %(c) |
Ratios/Supplemental data: | | | | | | | | |
Net assets, end of period (000’s) | | $ | 81 | | | $ | 77 | |
Ratio of net expenses to average net assets | | | 1.08 | % | | | 1.13 | %(d) |
Ratio of net investment income to average net assets | | | 2.01 | % | | | 2.70 | %(d) |
Ratio of gross expenses to average net assets | | | 1.23 | % | | | 1.63 | %(d) |
Portfolio turnover rate(e) | | | 141.42 | %(c) | | | 54.70 | %(c) |
| |
| (a) | For the period from June 28, 2019, commencement of operations, to September 30, 2019. |
| (b) | Net investment income (loss) for the period ended was calculated using the average shares outstanding method. |
| (c) | Not annualized for periods less than one year. |
| (d) | Annualized for periods less than one year. |
| (e) | Portfolio turnover is calculated at the fund level without regard to each class of shares. |
|
| See Notes to Financial Statements. |
| 55 |
ADVISERS INVESTMENT TRUST
JOHCM FUNDS
FINANCIAL HIGHLIGHTS
For the periods indicated
| | | | | | | | | | | | |
| | | Institutional Class | |
| | | Year Ended | | | Year Ended | | | Period Ended | |
| | | September 30, | | | September 30, | | | September 30, | |
| JOHCM Global Income Builder Fund | | 2020 | | | 2019 | | | 2018(a) | |
| |
Net asset value, beginning of period | | $ | 10.09 | | | $ | 9.71 | | | $ | 10.00 | |
| | | | | | | | | | | | |
Income (loss) from investment operations: | | | | | | | | | | | | |
Net investment income(b) | | | 0.22 | | | | 0.33 | | | | 0.30 | |
Net realized and unrealized gains (losses) from investments | | | (0.11 | ) | | | 0.40 | | | | (0.30 | ) |
| | | | | | | | | | | | |
Total from investment operations | | | 0.11 | | | | 0.73 | | | | — | |
| | | | | | | | | | | | |
Less distributions paid: | | | | | | | | | | | | |
From net investment income | | | (0.26 | ) | | | (0.35 | ) | | | (0.29 | ) |
From net realized gains | | | (0.05 | ) | | | — | | | | — | |
| | | | | | | | | | | | |
Total distributions paid | | | (0.31 | ) | | | (0.35 | ) | | | (0.29 | ) |
| | | | | | | | | | | | |
Change in net asset value | | | (0.20 | ) | | | 0.38 | | | | (0.29 | ) |
| | | | | | | | | | | | |
Net asset value, end of period | | $ | 9.89 | | | $ | 10.09 | | | $ | 9.71 | |
| | | | | | | | | | | | |
Total return | | | 1.09 | % | | | 7.77 | % | | | 0.03 | %(c) |
Ratios/Supplemental data: | | | | | | | | | | | | |
Net assets, end of period (000’s) | | $ | 75,835 | | | $ | 105,634 | | | $ | 28,206 | |
Ratio of net expenses to average net assets | | | 0.83 | % | | | 0.88 | % | | | 0.88 | %(d) |
Ratio of net investment income to average net assets | | | 2.19 | % | | | 3.42 | % | | | 3.62 | %(d) |
Ratio of gross expenses to average net assets | | | 0.98 | % | | | 1.08 | % | | | 1.47 | %(d) |
Portfolio turnover rate(e) | | | 141.42 | %(c) | | | 54.70 | %(c) | | | 41.93 | %(c) |
| |
| (a) | For the period from November 29, 2017, commencement of operations, to September 30, 2018. |
| (b) | Net investment income (loss) for the period ended was calculated using the average shares outstanding method. |
| (c) | Not annualized for periods less than one year. |
| (d) | Annualized for periods less than one year. |
| (e) | Portfolio turnover is calculated at the fund level without regard to each class of shares. |
|
| See Notes to Financial Statements. |
| 56 |
ADVISERS INVESTMENT TRUST
JOHCM FUNDS
FINANCIAL HIGHLIGHTS
For the periods indicated
| | | | | | | | | | | | | | | | | | | | |
| | | Institutional Class | |
| | | Year Ended | | | Year Ended | | | Year Ended | | | Year Ended | | | Period Ended | |
JOHCM International Opportunities Fund | | September 30,
2020 | | | September 30,
2019 | | | September 30,
2018 | | | September 30,
2017 | | | September 30,
2016(a) | |
| |
Net asset value, beginning of period | | $ | 10.65 | | | $ | 10.71 | | | $ | 11.19 | | | $ | 9.98 | | | $ | 10.00 | |
| | | | | | | | | | | | | | | | | | | | |
Income (loss) from investment operations: | | | | | | | | | | | | | | | | | | | | |
Net investment income(b) | | | 0.17 | | | | 0.24 | | | | 0.20 | | | | 0.20 | | | | (— | )(c) |
Net realized and unrealized gains (losses) from investments | | | (0.09 | ) | | | (0.10 | ) | | | (0.02 | ) | | | 1.09 | | | | (0.02 | ) |
| | | | | | | | | | | | | | | | | | | | |
Total from investment operations | | | 0.08 | | | | 0.14 | | | | 0.18 | | | | 1.29 | | | | (0.02 | ) |
| | | | | | | | | | | | | | | | | | | | |
Less distributions paid: | | | | | | | | | | | | | | | | | | | | |
From net investment income | | | (0.23 | ) | | | (0.18 | ) | | | (0.29 | ) | | | (0.08 | ) | | | — | |
From net realized gains | | | (0.02 | ) | | | (0.02 | ) | | | (0.37 | ) | | | — | | | | — | |
| | | | | | | | | | | | | | | | | | | | |
Total distributions paid | | | (0.25 | ) | | | (0.20 | ) | | | (0.66 | ) | | | (0.08 | ) | | | — | |
| | | | | | | | | | | | | | | | | | | | |
Change in net asset value | | | (0.17 | ) | | | (0.06 | ) | | | (0.48 | ) | | | 1.21 | | | | (0.02 | ) |
| | | | | | | | | | | | | | | | | | | | |
Net asset value, end of period | | $ | 10.48 | | | $ | 10.65 | | | $ | 10.71 | | | $ | 11.19 | | | $ | 9.98 | |
| | | | | | | | | | | | | | | | | | | | |
Total return(d) | | | 0.62 | % | | | 1.42 | % | | | 1.76 | % | | | 13.12 | % | | | (0.20 | %) |
Ratios/Supplemental data: | | | | | | | | | | | | | | | | | | | | |
Net assets, end of period (000’s) . | | $ | 2,935 | | | $ | 2,301 | | | $ | 2,276 | | | $ | 2,254 | | | $ | 1,995 | |
Ratio of net expenses to average net assets | | | 0.89 | % | | | 0.89 | % | | | 0.89 | % | | | 0.89 | % | | | 0.89 | %(e) |
Ratio of net investment income (loss) to average net assets | | | 1.60 | % | | | 2.29 | % | | | 1.86 | % | | | 1.94 | % | | | (0.89 | %)(e) |
Ratio of gross expenses to average net assets | | | 9.42 | % | | | 8.61 | % | | | 8.23 | % | | | 9.03 | % | | | 72.58 | %(e) |
Portfolio turnover rate(f) | | | 64.62 | % | | | 34.58 | % | | | 57.05 | % | | | 68.89 | % | | | — | (d) |
| |
| (a) | For the period from September 29, 2016, commencement of operations, to September 30, 2016. |
| (b) | Net investment income (loss) for the period ended was calculated using the average shares outstanding method. |
| (c) | Amount was less than $0.005 per share. |
| (d) | Not annualized for periods less than one year. |
| (e) | Annualized for periods less than one year. |
| (f) | Portfolio turnover is calculated at the fund level without regard to each class of shares. |
|
| See Notes to Financial Statements. |
| 57 |
ADVISERS INVESTMENT TRUST
JOHCM FUNDS
FINANCIAL HIGHLIGHTS
For the periods indicated
| | | | | | | | | | | | | | | | | | | | |
| | | Class I | |
| JOHCM International Select Fund | | Year Ended
September 30,
2020 | | | Year Ended
September 30,
2019 | | | Year Ended
September 30,
2018 | | | Year Ended
September 30,
2017 | | | Year Ended
September 30,
2016 | |
| |
Net asset value, beginning of year | | $ | 22.54 | | | $ | 23.66 | | | $ | 21.92 | | | $ | 19.94 | | | $ | 17.45 | |
| | | | | | | | | | | | | | | | | | | | |
Income (loss) from investment operations: | | | | | | | | | | | | | | | | | | | | |
Net investment income(a) | | | 0.11 | | | | 0.28 | | | | 0.27 | | | | 0.30 | | | | 0.19 | |
Net realized and unrealized gains (losses) from investments | | | 5.11 | | | | (1.09 | ) | | | 1.73 | | | | 1.81 | | | | 2.37 | |
| | | | | | | | | | | | | | | | | | | | |
Total from investment operations | | | 5.22 | | | | (0.81 | ) | | | 2.00 | | | | 2.11 | | | | 2.56 | |
| | | | | | | | | | | | | | | | | | | | |
Less distributions paid: | | | | | | | | | | | | | | | | | | | | |
From net investment income | | | (0.23 | ) | | | (0.31 | ) | | | (0.26 | ) | | | (0.13 | ) | | | (0.07 | ) |
| | | | | | | | | | | | | | | | | | | | |
Total distributions paid | | | (0.23 | ) | | | (0.31 | ) | | | (0.26 | ) | | | (0.13 | ) | | | (0.07 | ) |
| | | | | | | | | | | | | | | | | | | | |
Change in net asset value | | | 4.99 | | | | (1.12 | ) | | | 1.74 | | | | 1.98 | | | | 2.49 | |
| | | | | | | | | | | | | | | | | | | | |
Net asset value, end of year | | $ | 27.53 | | | $ | 22.54 | | | $ | 23.66 | | | $ | 21.92 | | | $ | 19.94 | |
| | | | | | | | | | | | | | | | | | | | |
Total return | | | 23.30 | % | | | (3.31 | %) | | | 9.22 | % | | | 10.72 | % | | | 14.70 | % |
Ratios/Supplemental data: | | | | | | | | | | | | | | | | | | | | |
Net assets, end of year (000’s) | | $ | 9,631,884 | | | $ | 7,822,739 | | | $ | 7,619,731 | | | $ | 6,081,384 | | | $ | 4,003,594 | |
Ratio of net expenses to average net assets | | | 0.98 | % | | | 0.99 | % | | | 1.00 | % | | | 1.01 | % | | | 1.01 | % |
Ratio of net investment income to average net assets | | | 0.45 | % | | | 1.27 | % | | | 1.16 | % | | | 1.49 | % | | | 1.04 | % |
Ratio of gross expenses to average net assets | | | 0.98 | % | | | 0.99 | % | | | 1.00 | % | | | 1.01 | % | | | 1.01 | % |
Portfolio turnover rate(b) | | | 43.51 | % | | | 33.06 | % | | | 26.06 | % | | | 34.96 | % | | | 107.37 | % |
| |
| (a) | Net investment income (loss) for the period ended was calculated using the average shares outstanding method. |
| (b) | Portfolio turnover is calculated at the fund level without regard to each class of shares. |
|
| See Notes to Financial Statements. |
| 58 |
ADVISERS INVESTMENT TRUST
JOHCM FUNDS
FINANCIAL HIGHLIGHTS
For the periods indicated
| | | | | | | | | | | | | | | | | | | | |
| | | Class II | |
| JOHCM International Select Fund | | Year Ended
September 30,
2020 | | | Year Ended
September 30,
2019 | | | Year Ended
September 30,
2018 | | | Year Ended
September 30,
2017 | | | Year Ended
September 30,
2016 | |
| |
Net asset value, beginning of year | | $ | 22.54 | | | $ | 23.68 | | | $ | 21.93 | | | $ | 19.96 | | | $ | 17.48 | |
| | | | | | | | | | | | | | | | | | | | |
Income (loss) from investment operations: | | | | | | | | | | | | | | | | | | | | |
Net investment income(a) | | | 0.05 | | | | 0.23 | | | | 0.19 | | | | 0.26 | | | | 0.14 | |
Net realized and unrealized gains (losses) from investments | | | 5.11 | | | | (1.10 | ) | | | 1.76 | | | | 1.81 | | | | 2.37 | |
| | | | | | | | | | | | | | | | | | | | |
Total from investment operations | | | 5.16 | | | | (0.87 | ) | | | 1.95 | | | | 2.07 | | | | 2.51 | |
| | | | | | | | | | | | | | | | | | | | |
Less distributions paid: | | | | | | | | | | | | | | | | | | | | |
From net investment income | | | (0.17 | ) | | | (0.27 | ) | | | (0.20 | ) | | | (0.10 | ) | | | (0.03 | ) |
| | | | | | | | | | | | | | | | | | | | |
Total distributions paid | | | (0.17 | ) | | | (0.27 | ) | | | (0.20 | ) | | | (0.10 | ) | | | (0.03 | ) |
| | | | | | | | | | | | | | | | | | | | |
Change in net asset value | | | 4.99 | | | | (1.14 | ) | | | 1.75 | | | | 1.97 | | | | 2.48 | |
| | | | | | | | | | | | | | | | | | | | |
Net asset value, end of year | | $ | 27.53 | | | $ | 22.54 | | | $ | 23.68 | | | $ | 21.93 | | | $ | 19.96 | |
| | | | | | | | | | | | | | | | | | | | |
Total return | | | 23.02 | % | | | (3.59 | %) | | | 8.97 | % | | | 10.45 | % | | | 14.37 | % |
Ratios/Supplemental data: | | | | | | | | | | | | | | | | | | | | |
Net assets, end of year (000’s) | | $ | 643,607 | | | $ | 588,729 | | | $ | 551,489 | | | $ | 400,294 | | | $ | 297,486 | |
Ratio of net expenses to average net assets | | | 1.23 | % | | | 1.24 | % | | | 1.25 | % | | | 1.27 | % | | | 1.30 | % |
Ratio of net investment income to average net assets | | | 0.20 | % | | | 1.03 | % | | | 0.83 | % | | | 1.29 | % | | | 0.78 | % |
Ratio of gross expenses to average net assets | | | 1.23 | % | | | 1.24 | % | | | 1.25 | % | | | 1.27 | % | | | 1.30 | % |
Ratio of expense recoupment to average net assets | | | — | | | | — | | | | — | | | | 0.01 | % | | | — | |
Portfolio turnover rate(b) | | | 43.51 | % | | | 33.06 | % | | | 26.06 | % | | | 34.96 | % | | | 107.37 | % |
| |
| (a) | Net investment income (loss) for the period ended was calculated using the average shares outstanding method. |
| (b) | Portfolio turnover is calculated at the fund level without regard to each class of shares. |
|
| See Notes to Financial Statements. |
| 59 |
ADVISERS INVESTMENT TRUST
JOHCM FUNDS
FINANCIAL HIGHLIGHTS
For the periods indicated
| | | | | | | | | | | | | | | | | | | | |
| | | Class I | |
JOHCM International Small Cap Equity Fund | | Year Ended
September 30,
2020 | | | Year Ended
September 30,
2019 | | | Year Ended
September 30,
2018 | | | Year Ended
September 30,
2017 | | | Year Ended
September 30,
2016 | |
| |
Net asset value, beginning of year | | $ | 11.00 | | | $ | 13.03 | | | $ | 12.75 | | | $ | 10.64 | | | $ | 9.66 | |
| | | | | | | | | | | | | | | | | | | | |
Income (loss) from investment operations: | | | | | | | | | | | | | | | | | | | | |
Net investment income(a) | | | 0.02 | | | | 0.12 | | | | 0.10 | | | | 0.11 | | | | 0.12 | |
Net realized and unrealized gains (losses) from investments | | | 0.31 | | | | (1.51 | ) | | | 0.37 | | | | 2.13 | | | | 0.97 | |
| | | | | | | | | | | | | | | | | | | | |
Total from investment operations | | | 0.33 | | | | (1.39 | ) | | | 0.47 | | | | 2.24 | | | | 1.09 | |
| | | | | | | | | | | | | | | | | | | | |
Less distributions paid: | | | | | | | | | | | | | | | | | | | | |
From net investment income | | | (0.12 | ) | | | (0.13 | ) | | | (0.09 | ) | | | (0.13 | ) | | | (0.11 | ) |
From net realized gains | | | (0.27 | ) | | | (0.51 | ) | | | (0.10 | ) | | | — | | | | — | |
| | | | | | | | | | | | | | | | | | | | |
Total distributions paid | | | (0.39 | ) | | | (0.64 | ) | | | (0.19 | ) | | | (0.13 | ) | | | (0.11 | ) |
| | | | | | | | | | | | | | | | | | | | |
Change in net asset value | | | (0.06 | ) | | | (2.03 | ) | | | 0.28 | | | | 2.11 | | | | 0.98 | |
| | | | | | | | | | | | | | | | | | | | |
Net asset value, end of year | | $ | 10.94 | | | $ | 11.00 | | | $ | 13.03 | | | $ | 12.75 | | | $ | 10.64 | |
| | | | | | | | | | | | | | | | | | | | |
Total return | | | 2.73 | % | | | (10.27 | %) | | | 3.66 | % | | | 21.30 | % | | | 11.44 | % |
Ratios/Supplemental data: | | | | | | | | | | | | | | | | | | | | |
Net assets, end of year (000’s) | | $ | 33,853 | | | $ | 29,053 | | | $ | 46,852 | | | $ | 62,965 | | | $ | 43,997 | |
Ratio of net expenses to average net assets | | | 1.30 | % | | | 1.34 | % | | | 1.31 | % | | | 1.34 | % | | | 1.34 | % |
Ratio of net investment income to average net assets | | | 0.17 | % | | | 1.04 | % | | | 0.79 | % | | | 0.97 | % | | | 1.17 | % |
Ratio of gross expenses to average net assets | | | 1.32 | % | | | 1.34 | % | | | 1.32 | % | | | 1.36 | % | | | 1.41 | % |
Ratio of expense recoupment to average net assets | | | 0.01 | % | | | — | (b) | | | 0.02 | % | | | — | | | | — | |
Portfolio turnover rate(c) | | | 24.72 | % | | | 23.66 | % | | | 17.61 | % | | | 16.01 | % | | | 39.39 | % |
| |
| (a) | Net investment income (loss) for the period ended was calculated using the average shares outstanding method. |
| (b) | Amount rounds to less 0.005%. |
| (c) | Portfolio turnover is calculated at the fund level without regard to each class of shares. |
|
| See Notes to Financial Statements. |
| 60 |
ADVISERS INVESTMENT TRUST
JOHCM FUNDS
FINANCIAL HIGHLIGHTS
For the periods indicated
| | | | | | | | | | | | | | | | | | | | |
| | | Class II | |
JOHCM International Small Cap Equity Fund | | Year Ended
September 30,
2020 | | | Year Ended
September 30,
2019 | | | Year Ended
September 30,
2018 | | | Year Ended
September 30,
2017 | | | Year Ended
September 30,
2016 | |
| |
Net asset value, beginning of year | | $ | 11.06 | | | $ | 13.09 | | | $ | 12.83 | | | $ | 10.70 | | | $ | 9.71 | |
| | | | | | | | | | | | | | | | | | | | |
Income (loss) from investment operations: | | | | | | | | | | | | | | | | | | | | |
Net investment income(a) | | | 0.01 | | | | 0.11 | | | | 0.11 | | | | 0.09 | | | | 0.09 | |
Net realized and unrealized gains (losses) from investments | | | 0.30 | | | | (1.51 | ) | | | 0.33 | | | | 2.15 | | | | 1.00 | |
| | | | | | | | | | | | | | | | | | | | |
Total from investment operations | | | 0.31 | | | | (1.40 | ) | | | 0.44 | | | | 2.24 | | | | 1.09 | |
| | | | | | | | | | | | | | | | | | | | |
Less distributions paid: | | | | | | | | | | | | | | | | | | | | |
From net investment income | | | (0.10 | ) | | | (0.12 | ) | | | (0.08 | ) | | | (0.11 | ) | | | (0.10 | ) |
From net realized gains | | | (0.27 | ) | | | (0.51 | ) | | | (0.10 | ) | | | — | | | | — | |
| | | | | | | | | | | | | | | | | | | | |
Total distributions paid | | | (0.37 | ) | | | (0.63 | ) | | | (0.18 | ) | | | (0.11 | ) | | | (0.10 | ) |
| | | | | | | | | | | | | | | | | | | | |
Change in net asset value | | | (0.06 | ) | | | (2.03 | ) | | | 0.26 | | | | 2.13 | | | | 0.99 | |
| | | | | | | | | | | | | | | | | | | | |
Net asset value, end of year | | $ | 11.00 | | | $ | 11.06 | | | $ | 13.09 | | | $ | 12.83 | | | $ | 10.70 | |
| | | | | | | | | | | | | | | | | | | | |
Total return | | | 2.59 | % | | | (10.35 | %) | | | 3.43 | % | | | 21.21 | % | | | 11.28 | % |
Ratios/Supplemental data: | | | | | | | | | | | | | | | | | | | | |
Net assets, end of year (000’s) | | $ | 1,529 | | | $ | 1,609 | | | $ | 1,474 | | | $ | 1,230 | | | $ | 430 | |
Ratio of net expenses to average net assets | | | 1.45 | % | | | 1.49 | % | | | 1.47 | % | | | 1.49 | % | | | 1.49 | % |
Ratio of net investment income to average net assets | | | 0.04 | % | | | 1.02 | % | | | 0.87 | % | | | 0.76 | % | | | 0.94 | % |
Ratio of gross expenses to average net assets | | | 1.47 | % | | | 1.49 | % | | | 1.47 | % | | | 1.53 | % | | | 1.63 | % |
Ratio of expense recoupment to average net assets | | | 0.01 | % | | | — | (b) | | | 0.02 | % | | | — | | | | — | |
Portfolio turnover rate(c) | | | 24.72 | % | | | 23.66 | % | | | 17.61 | % | | | 16.01 | % | | | 39.39 | % |
| |
| (a) | Net investment income (loss) for the period ended was calculated using the average shares outstanding method. |
| (b) | Amount rounds to less 0.005%. |
| (c) | Portfolio turnover is calculated at the fund level without regard to each class of shares. |
|
| See Notes to Financial Statements. |
| 61 |
ADVISERS INVESTMENT TRUST
JOHCM FUNDS
FINANCIAL HIGHLIGHTS
For the periods indicated
| | | | | | | | | | | | | | | | | | | | |
| | | Institutional Class | |
JOHCM International Small Cap Equity Fund | | Year Ended
September 30,
2020 | | | Year Ended
September 30,
2019 | | | Year Ended
September 30,
2018 | | | Year Ended
September 30,
2017 | | | Year Ended
September 30,
2016 | |
| |
Net asset value, beginning of year | | $ | 10.99 | | | $ | 13.02 | | | $ | 12.74 | | | $ | 10.64 | | | $ | 9.66 | |
| | | | | | | | | | | | | | | | | | | | |
Income (loss) from investment operations: | | | | | | | | | | | | | | | | | | | | |
Net investment income(a) | | | 0.03 | | | | 0.14 | | | | 0.15 | | | | 0.14 | | | | 0.13 | |
Net realized and unrealized gains (losses) from investments | | | 0.30 | | | | (1.51 | ) | | | 0.33 | | | | 2.10 | | | | 0.97 | |
| | | | | | | | | | | | | | | | | | | | |
Total from investment operations | | | 0.33 | | | | (1.37 | ) | | | 0.48 | | | | 2.24 | | | | 1.10 | |
| | | | | | | | | | | | | | | | | | | | |
Less distributions paid: | | | | | | | | | | | | | | | | | | | | |
From net investment income | | | (0.12 | ) | | | (0.15 | ) | | | (0.10 | ) | | | (0.14 | ) | | | (0.12 | ) |
From net realized gains | | | (0.27 | ) | | | (0.51 | ) | | | (0.10 | ) | | | — | | | | — | |
| | | | | | | | | | | | | | | | | | | | |
Total distributions paid | | | (0.39 | ) | | | (0.66 | ) | | | (0.20 | ) | | | (0.14 | ) | | | (0.12 | ) |
| | | | | | | | | | | | | | | | | | | | |
Change in net asset value | | | (0.06 | ) | | | (2.03 | ) | | | 0.28 | | | | 2.10 | | | | 0.98 | |
| | | | | | | | | | | | | | | | | | | | |
Net asset value, end of year | | $ | 10.93 | | | $ | 10.99 | | | $ | 13.02 | | | $ | 12.74 | | | $ | 10.64 | |
| | | | | | | | | | | | | | | | | | | | |
Total return | | | 2.79 | % | | | (10.13 | %) | | | 3.73 | % | | | 21.37 | % | | | 11.54 | % |
Ratios/Supplemental data: | | | | | | | | | | | | | | | | | | | | |
Net assets, end of year (000’s) | | $ | 145,033 | | | $ | 177,365 | | | $ | 219,774 | | | $ | 164,092 | | | $ | 75,799 | |
Ratio of net expenses to average net assets | | | 1.20 | % | | | 1.24 | % | | | 1.22 | % | | | 1.24 | % | | | 1.24 | % |
Ratio of net investment income to average net assets | | | 0.24 | % | | | 1.29 | % | | | 1.17 | % | | | 1.24 | % | | | 1.29 | % |
Ratio of gross expenses to average net assets | | | 1.22 | % | | | 1.24 | % | | | 1.22 | % | | | 1.27 | % | | | 1.28 | % |
Ratio of expense recoupment to average net assets | | | 0.01 | % | | | — | (b) | | | 0.02 | % | | | — | | | | — | |
Portfolio turnover rate(c) | | | 24.72 | % | | | 23.66 | % | | | 17.61 | % | | | 16.01 | % | | | 39.39 | % |
| |
| (a) | Net investment income (loss) for the period ended was calculated using the average shares outstanding method. |
| (b) | Amount rounds to less 0.005%. |
| (c) | Portfolio turnover is calculated at the fund level without regard to each class of shares. |
|
| See Notes to Financial Statements. |
| 62 |
ADVISERS INVESTMENT TRUST
JOHCM FUNDS
NOTES TO FINANCIAL STATEMENTS
September 30, 2020
Advisers Investment Trust (the “Trust”) is a Delaware statutory trust operating under a Second Amended and Restated Agreement and Declaration of Trust (the “Trust Agreement”) dated June 21, 2018. The Trust was formerly an Ohio business trust, which commenced operations on December 20, 2011. On March 31, 2017, the Trust was converted to a Delaware statutory trust. As an open-end registered investment company (as defined in Financial Accounting Standards Board (“FASB”) Accounting Standards Update (“ASU”) 2013-08), the Trust follows accounting and reporting guidance under FASB Accounting Standards Codification (“ASC”) Topic 946, “Financial Services - Investment Companies”). The JOHCM Credit Income Fund, the JOHCM Emerging Markets Opportunities Fund, the JOHCM Emerging Markets Small Mid Cap Equity Fund, the JOHCM Global Equity Fund, the JOHCM Global Income Builder Fund, the JOHCM International Opportunities Fund, the JOHCM International Select Fund, and the JOHCM International Small Cap Equity Fund (referred to individually as a “Fund” and collectively as the “Funds” or the “JOHCM Funds”) are each a diversified fund and a series of the Trust. The Trust Agreement permits the Board of Trustees (the “Trustees” or “Board”) to authorize and issue an unlimited number of shares of beneficial interest, at no par value, in separate series of the Trust. These financial statements and notes only relate to the JOHCM Funds.
Each JOHCM Fund, except for the JOHCM Emerging Markets Small Mid Cap Equity Fund and the JOHCM International Select Fund, is authorized to issue three classes of shares: Class I Shares, Class II Shares, and Institutional Shares. The JOHCM International Select Fund is authorized to issue two classes of shares: Class I Shares and Class II Shares. The JOHCM Emerging Markets Small Mid Cap Equity Fund is authorized to issue four classes of shares: Class I Shares, Class II Shares, Class III Shares, and Institutional Shares. Each class is distinguished by the class-specific shareholder servicing and distribution (Rule 12b-1) fees incurred, as applicable. As of September 30, 2020, the following classes were in operation:
| | | | |
| Fund | | Commencement Date | | Investment Objective |
JOHCM Credit Income Fund | | Institutional Shares: August 17, 2020 | | to preserve capital and deliver returns through a combination of income and modest capital appreciation. |
JOHCM Emerging Markets Opportunities Fund | | Class I Shares: November 21, 2012 Class II Shares: December 18, 2013 Institutional Shares: November 21, 2012 | | to seek long-term capital appreciation |
JOHCM Emerging Markets Small Mid Cap Equity Fund | | Class I Shares: January 28, 2016 Institutional Shares: December 17, 2014 | | to seek long-term capital appreciation |
JOHCM Global Equity Fund | | Class I Shares: March 22, 2013 Institutional Shares: March 22, 2013 | | to seek long-term capital appreciation |
JOHCM Global Income Builder Fund | | Class I Shares: November 29, 2017 Class II Shares: June 28, 2019 Institutional Shares: November 29, 2017 | | to seek a level of current income that is consistent with the preservation and long-term growth of capital in inflation-adjusted terms |
JOHCM International Opportunities Fund | | Institutional Shares: September 29, 2016 | | to achieve long-term total return by investing in a concentrated portfolio of international equity securities |
JOHCM International Select Fund | | Class I Shares: July 29, 2009 Class II Shares: March 31, 2010 | | to seek long-term capital appreciation |
JOHCM International Small Cap Equity Fund | | Class I Shares: January 2, 2014 Class II Shares: November 18, 2013 Institutional Shares: October 1, 2013 | | to seek long-term capital appreciation |
63
ADVISERS INVESTMENT TRUST
JOHCM FUNDS
NOTES TO FINANCIAL STATEMENTS
September 30, 2020
Under the Trust’s organizational documents, its officers and Trustees are indemnified against certain liabilities arising out of the performance of their duties to the Trust and Funds. In addition, in the normal course of business, the Trust enters into contracts with its vendors and others that provide for general indemnifications. The Funds’ maximum exposure under these arrangements is unknown, as this would involve future claims that may be made against the Funds.
A. Significant accounting policies related to Investments are as follows:
INVESTMENT VALUATION
Investments are recorded at fair value. Fair value is defined as the price that would be received to sell an asset or paid to transfer a liability in an orderly transaction between market participants at the measurement date. The valuation techniques employed by the Funds, as described below, maximize the use of observable inputs and minimize the use of unobservable inputs in determining fair value. These inputs are summarized in the following three broad levels:
| • | | Level 1 — quoted prices in active markets for identical assets |
| • | | Level 2 — other significant observable inputs (including quoted prices of similar securities, interest rates, prepayment speeds, credit risk, etc.) |
| • | | Level 3 — significant unobservable inputs (including the Fund’s own assumptions in determining the fair value of investments) |
The inputs or methodology used for valuing securities are not necessarily an indication of the risk associated with investing in those securities. For example, certain short-term debt securities may be valued using amortized cost. Generally, amortized cost approximates the current value of a security, but since this valuation is not obtained from a quoted price in an active market, such securities would be reflected as Level 2 in the fair value hierarchy.
Security prices are generally provided by an independent third party pricing service approved by the Trustees as of the close of the New York Stock Exchange, normally at 4:00 p.m. Eastern Time, each business day on which the share price of the Funds are calculated. Equity securities listed or traded on a primary exchange are valued at the closing price, if available, or the last sales price on the primary exchange. If no sale occurred on the valuation date, the securities will be valued at the latest quotations as of the close of the primary exchange. Investments in other open-end registered investment companies are valued at their respective net asset value as reported by such companies. In these types of situations, valuations are typically categorized as Level 1 in the fair value hierarchy.
Debt and other fixed income securities, if any, are generally valued at an evaluated price provided by an independent pricing source approved by the Trustees. To value debt securities, pricing services may use various pricing techniques, which take into account appropriate factors such as market activity, yield, quality, coupon rate, maturity, type of issue, trading characteristics, call features, credit ratings and other data, as well as broker quotes. Short-term debt securities of sufficient credit quality that mature within sixty days may be valued at amortized cost, which approximates fair value. In each of these situations, valuations are typically categorized as Level 2 in the fair value hierarchy.
When the price of a security is not readily available or deemed unreliable (e.g., an approved pricing service does not provide a price, a furnished price is in error, certain stale prices, or an event occurs that materially affects the furnished price), a Funds’ Fair Value Committee may in good faith establish a fair value for that security in accordance with procedures established by and under the general supervision of the Trustees. In addition, fair value pricing may be used if events materially affecting the value of foreign securities occur between the time when the exchange on which they are traded closes and the time when a Funds’ net asset value is calculated. The Funds identify possible fluctuations in international securities by monitoring the increase or decrease in the value of a designated benchmark index. In the event of an increase or decrease greater than predetermined levels, the Funds may use a systematic valuation model provided by an independent third party pricing service to fair value their international equity securities.
64
ADVISERS INVESTMENT TRUST
JOHCM FUNDS
NOTES TO FINANCIAL STATEMENTS
September 30, 2020
In the fair value situations noted above, while the Trust’s valuation policy is intended to result in a calculation of each Fund’s net asset value that fairly reflects security values as of the time of pricing, the Trust cannot ensure that fair values determined pursuant to these guidelines would accurately reflect the price that the Fund could obtain for a security if it were to dispose of that security as of the time of pricing (for instance, in a forced or distressed sale). The prices used by the Funds may differ from the value that would be realized if the securities were sold, and these differences could be material to the financial statements. Depending on the source and relative significance of the valuation inputs in these instances, the instruments may be classified as Level 2 or Level 3 in the fair value hierarchy.
The following is a summary of the valuation inputs used as of September 30, 2020 in valuing each Fund’s investments based upon the three fair value levels defined above:
| | | | | | | | | | | | | | | | |
| | | | | | | | | Level 3 - | | | | |
| | | | | | Level 2 - | | | Significant | | | | |
| | | Level 1 - | | | Other Significant | | | Unobservable | | | | |
| Fund | | Quoted Prices | | | Observable Inputs | | | Inputs | | | Total | |
JOHCM Credit Income Fund | | | | | | | | | | | | | | | | |
Corporate Bonds* | | $ | — | | | $ | 3,083,020 | | | $ | — | | | $ | 3,083,020 | |
Foreign Issuer Bonds* | | | — | | | | 1,291,191 | | | | — | | | | 1,291,191 | |
Preferred stocks* | | | 379,158 | | | | 83,460 | | | | — | | | | 462,618 | |
Short-Term Investments | | | 33,879 | | | | — | | | | — | | | | 33,879 | |
| | | | |
Total Investments | | $ | 413,037 | | | $ | 4,457,671 | | | $ | — | | | $ | 4,870,708 | |
| | | | |
JOHCM Emerging Markets Opportunities Fund | | | | | | | | | | | | | | | | |
Common Stocks: | | | | | | | | | | | | | | | | |
South Korea | | $ | 3,707,847 | | | $ | 120,184,164 | | | $ | — | | | $ | 123,892,011 | |
Other* | | | 483,124,781 | | | | — | | | | — | | | | 483,124,781 | |
| | | | |
Total common stocks | | $ | 486,832,628 | | | $ | 120,184,164 | | | $ | — | | | $ | 607,016,792 | |
| | | | |
Total Investments | | $ | 486,832,628 | | | $ | 120,184,164 | | | $ | — | | | $ | 607,016,792 | |
| | | | |
JOHCM Emerging Markets Small Mid Cap Equity Fund | | | | | | | | | | | | | | | | |
Common Stocks: | | | | | | | | | | | | | | | | |
South Korea | | $ | — | | | $ | 7,847,064 | | | $ | — | | | $ | 7,847,064 | |
Thailand | | | — | | | | 1,231,755 | | | | — | | | | 1,231,755 | |
Other* | | | 32,017,929 | | | | — | | | | — | | | | 32,017,929 | |
| | | | |
Total common stocks | | $ | 32,017,929 | | | $ | 9,078,819 | | | $ | — | | | $ | 41,096,748 | |
| | | | |
Equity-Linked Securities | | | — | | | | 395,743 | | | | — | | | | 395,743 | |
Preferred stocks | | | 435,627 | | | | — | | | | — | | | | 435,627 | |
| | | | |
Total Investments | | $ | 32,453,556 | | | $ | 9,474,562 | | | $ | — | | | $ | 41,928,118 | |
| | | | |
JOHCM Global Equity Fund | | | | | | | | | | | | | | | | |
Common Stocks: | | | | | | | | | | | | | | | | |
South Korea | | $ | — | | | $ | 11,996,188 | | | $ | — | | | $ | 11,996,188 | |
Other* | | | 443,192,574 | | | | — | | | | — | | | | 443,192,574 | |
| | | | |
Total common stocks | | $ | 443,192,574 | | | $ | 11,996,188 | | | $ | — | | | $ | 455,188,762 | |
| | | | |
Total Investments | | $ | 443,192,574 | | | $ | 11,996,188 | | | $ | — | | | $ | 455,188,762 | |
| | | | |
JOHCM Global Income Builder Fund | | | | | | | | | | | | | | | | |
Common Stocks* | | $ | 46,731,308 | | | $ | — | | | $ | — | | | $ | 46,731,308 | |
Corporate Bonds* | | | — | | | | 12,480,479 | | | | — | | | | 12,480,479 | |
Exchange Traded Funds* | | | 3,125,894 | | | | — | | | | — | | | | 3,125,894 | |
Foreign Issuer Bonds* | | | — | | | | 7,566,952 | | | | — | | | | 7,566,952 | |
Preferred stocks: | | | | | | | | | | | | | | | | |
South Korea | | | — | | | | 704,225 | | | | — | | | | 704,225 | |
United States | | | 3,455,478 | | | | 209,012 | | | | — | | | | 3,664,490 | |
| | | | |
Total preferred stocks | | $ | 3,455,478 | | | $ | 913,237 | | | $ | — | | | $ | 4,368,715 | |
| | | | |
65
ADVISERS INVESTMENT TRUST
JOHCM FUNDS
NOTES TO FINANCIAL STATEMENTS
September 30, 2020
| | | | | | | | | | | | | | | | |
| | | | | | | | | Level 3 - | | | | |
| | | | | | Level 2 - | | | Significant | | | | |
| | | Level 1 - | | | Other Significant | | | Unobservable | | | | |
| Fund | | Quoted Prices | | | Observable Inputs | | | Inputs | | | Total | |
U.S. Treasury Obligations* | | $ | — | | | $ | 6,187,767 | | | $ | — | | | $ | 6,187,767 | |
Short-Term Investments | | | 1,526,309 | | | | — | | | | — | | | | 1,526,309 | |
| | | | |
Total Investments | | $ | 54,838,989 | | | $ | 27,148,435 | | | $ | — | | | $ | 81,987,424 | |
| | | | |
Other Financial Instruments | | | | | | | | | | | | | | | | |
Assets: | | | | | | | | | | | | | | | | |
Unrealized appreciation on forward currency exchange contracts | | $ | — | | | $ | 17,209 | | | $ | — | | | $ | 17,209 | |
| | | | |
Total Other Financial Instruments | | $ | — | | | $ | 17,209 | | | $ | — | | | $ | 17,209 | |
| | | | |
JOHCM International Opportunities Fund | | | | | | | | | | | | | | | | |
Common Stocks* | | $ | 2,511,155 | | | $ | — | | | $ | — | | | $ | 2,511,155 | |
Equity-Linked Securities | | | — | | | | 70,237 | | | | — | | | | 70,237 | |
| | | | |
Total Investments | | $ | 2,511,155 | | | $ | 70,237 | | | $ | — | | | $ | 2,581,392 | |
| | | | |
JOHCM International Select Fund | | | | | | | | | | | | | | | | |
Common Stocks: | | | | | | | | | | | | | | | | |
South Korea | | $ | — | | | $ | 253,441,245 | | | $ | — | | | $ | 253,441,245 | |
Other* | | | 9,813,453,347 | | | | — | | | | — | | | | 9,813,453,347 | |
| | | | |
Total common stocks | | $ | 9,813,453,347 | | | $ | 253,441,245 | | | $ | — | | | $ | 10,066,894,592 | |
| | | | |
Total Investments | | $ | 9,813,453,347 | | | $ | 253,441,245 | | | $ | — | | | $ | 10,066,894,592 | |
| | | | |
JOHCM International Small Cap Equity Fund | | | | | | | | | | | | | | | | |
Common Stocks: | | | | | | | | | | | | | | | | |
South Korea | | $ | — | | | $ | 11,926,804 | | | $ | — | | | $ | 11,926,804 | |
Other* | | | 164,577,004 | | | | — | | | | — | | | | 164,577,004 | |
| | | | |
Total common stocks | | $ | 164,577,004 | | | $ | 11,926,804 | | | $ | — | | | $ | 176,503,808 | |
| | | | |
Total Investments | | $ | 164,577,004 | | | $ | 11,926,804 | | | $ | — | | | $ | 176,503,808 | |
| | | | |
| * | See additional categories in the Schedule of Investments. |
As of September 30, 2020 there were no Level 3 securities held by the Funds. There were no transfers to or from Level 3 during the year ended September 30, 2020.
EQUITY-LINKED SECURITIES
The Funds may invest in equity-linked securities, also known as participation notes. The Funds may use these instruments as an alternate means to gain exposure to what is generally an emerging securities market, such as countries in which it does not have local accounts. These instruments represent interests in securities listed on certain foreign exchanges, and thus present similar risks to investing directly in such equity securities. These instruments are generally issued by the associates of foreign-based foreign brokerages and domestic institutional brokerages. Accordingly, the equity-linked securities also expose investors to counterparty risk, which is the risk that the entity issuing the note may not be able to honor its financial commitments.
At September 30, 2020, the Funds held equity-linked securities issued by counterparties as follows:
| | | | | | | | |
| Fund | | Counterparty | | Fair value | | | % of
Net Assets |
JOHCM Emerging Markets Small Mid Cap Equity Fund | | CLSA Global Markets Pte Ltd. | | $ | 395,743 | | | 0.9% |
JOHCM International Opportunities Fund | | CLSA Global Markets Pte Ltd. | | $ | 70,237 | | | 2.4% |
66
ADVISERS INVESTMENT TRUST
JOHCM FUNDS
NOTES TO FINANCIAL STATEMENTS
September 30, 2020
CURRENCY TRANSACTIONS
The functional and reporting currency for the Funds is the U.S. dollar. The market values of foreign securities, currency holdings and other assets and liabilities are translated into U.S. dollars based on the current exchange rates each business day. Purchases and sales of securities and income and expense items denominated in foreign currencies are translated into U.S. dollars at the exchange rate in effect on the transaction date. The Funds do not separately report the effects of changes in foreign exchange rates from changes in market prices on securities held. Such changes are included in Net realized and unrealized gains (losses) from investment activities on the Statements of Operations. The Funds may invest in foreign currency-denominated securities and may engage in foreign currency transactions either on a spot (cash) basis at the rate prevailing in the currency exchange market at the time or through a forward foreign currency contract. Realized foreign exchange gains or losses arising from sales of spot foreign currencies, currency gains or losses realized between the trade and settlement dates on securities transactions and the difference between the recorded amounts of dividends, interest, and foreign withholding taxes and the U.S. dollar equivalent of the amounts actually received or paid are included in Net realized gains (losses) from foreign currency transactions on the Statements of Operations. Net unrealized foreign exchange gains (losses) arising from changes in foreign exchange rates on foreign denominated assets and liabilities other than investments in securities held at the end of the reporting period are included in Change in unrealized appreciation (depreciation) on foreign currency on the Statements of Operations.
The Funds may engage in spot currency transactions for the purpose of foreign security settlement and operational processes. Certain Funds are authorized to enter into forward foreign currency exchange contracts, for the purchase or sale of a specific foreign currency at a specified exchange rate on a future date as a hedge against either specific transactions or portfolio positions, or as a cross-hedge transaction or for speculative purposes. The objective of a Fund’s foreign currency hedging transactions is to reduce the risk that the U.S. dollar value of a Fund’s foreign currency denominated securities will decline in value due to change in foreign currency exchange rates. Changes in foreign currency exchange rates will affect the value of a Funds’ securities and the price of a Funds’ shares. Generally, when the value of the U.S. dollar rises in value relative to a foreign currency, an investment in that country loses value because that currency is worth fewer U.S. dollars. Devaluation of a currency by a country’s government or banking authority also may have a significant impact on the value of any investments denominated in that currency. Currency markets generally are not as regulated as securities markets.
All forward foreign currency exchange contracts are marked-to-market daily at the applicable exchange rates. Any unrealized gains or losses are recorded in Net change in unrealized appreciation (depreciation) on forward foreign currency exchange contracts in the Statements of Operations. Gains or losses are recorded for financial statement purposes as unrealized until settlement date. Realized gains or losses, if any, are included in Net realized gains (losses) on forward foreign exchange contracts in the Statements of Operations.
Risks may arise upon entering into these contracts from the potential inability of counterparties to meet the terms of their contracts and from unanticipated movements in the value of a foreign currency relative to the U.S. dollar. The contractual amounts of forward foreign currency exchange contracts do not necessarily represent the amounts potentially subject to risk. The Funds bear the market risk from changes in forward foreign currency exchange rates and the credit risk if the counterparty to the contract fails to perform. The institutions that deal in forward foreign currency exchange contracts are not required to continue to make markets in the currencies they trade and these markets can experience periods of illiquidity.
Below are the types of derivatives by primary risk exposure as presented in the Statements of Assets & Liabilities as of September 30, 2020:
| | | | | | | | | | | | | | |
| | | | | Assets | | | Liabilities | |
| | | | | Statement of | | | | | Statement of | | | |
| Fund | | Contract Type | | Assets Location | | Value | | | Liabilities Location | | Value | |
| |
JOHCM Global Income Builder Fund | | Foreign exchange contracts | | Unrealized appreciation on forward foreign currency exchange contracts | | $ | 17,209 | | | Unrealized depreciation on forward foreign currency exchange contracts | | $ | — | |
As of September 30, 2020, gross amounts of assets and liabilities for forward foreign exchange contracts not offset in the Statements of Assets and Liabilities are as follows:
67
ADVISERS INVESTMENT TRUST
JOHCM FUNDS
NOTES TO FINANCIAL STATEMENTS
September 30, 2020
| | | | | | | | | | | | | | | | | | |
| | | | | | | | Gross Amounts Not Offset in the
Statements of Assets & Liabilities | |
| | | | | Gross Amounts of | | | | | | | | | | |
| | | | | Assets Presented | | | | | | | | | | |
| | | | | in Statement of | | | Financial | | | Cash Collateral | | | | |
| Fund | | Counterparty | | Assets & Liabilities | | | Instruments | | | Received | | | Net Amount | |
| |
JOHCM Global Income Builder | | Goldman Sachs | | $ | 17,209 | | | $ | — | | | $ | — | | | $ | 17,209 | |
The following table, set forth by primary risk exposure, displays the Fund’s realized gains (losses) and change in unrealized appreciation (depreciation) by type of derivative contract for the year ended September 30, 2020:
| | | | | | |
| | | | | | | Amount of Realized Gain |
| Fund | | Contract Type | | Statement of Operations Location | | (Loss) on Derivative Contracts |
JOHCM Global Income Builder Fund | | Foreign exchange contracts | | Net realized gains (losses) on forward foreign currency exchange contracts | | $ 88,461 |
| | | |
| | | | | | | Change in Unrealized Appreciation |
| Fund | | Contract Type | | Statement of Operations Location | | (Depreciation) on Derivative Contracts |
JOHCM Global Income Builder Fund | | Foreign exchange contracts | | Change in unrealized appreciation (depreciation) on forward foreign currency exchange contracts | | $ (61,475) |
Volume of derivative activity for the fiscal year ended September 30, 2020*:
| | | | | | |
| | | Foreign | |
| | | Exchange Contracts | |
| | | Number | | Average | |
| | | Of | | Notional | |
| Fund | | Trades | | Amount | |
| |
JOHCM Global Income Builder Fund | | 4 | | $ | 2,036,826 | |
| * | Activity for the period is measured by number of trades during the period and average notional amount for foreign currency exchange. |
INVESTMENT TRANSACTIONS AND INCOME
Investment transactions are accounted for no later than one business day after trade date. For financial reporting purposes, investments are reported as of the trade date. The Funds determines the gain or loss realized from investment transactions by using an identified cost basis method. Interest income is recognized on an accrual basis and includes, where applicable, the amortization of premium or accretion of discount. Dividend income is recognized on the ex-dividend date. Dividends from foreign securities are recorded on the ex-dividend date, or as soon as the information is available.
EXPENSE ALLOCATIONS
Expenses directly attributable to a fund in the Trust are charged to that fund, while expenses that are attributable to more than one fund in the Trust are allocated among the applicable funds on a pro-rata basis to each adviser’s series of funds based on relative net assets or another reasonable basis. Expenses incurred which do not specifically relate to an individual JOHCM Fund are allocated among all Funds in the JOHCM Funds in proportion to each Fund’s relative net assets or another reasonable basis. Certain expenses that arise in connection with a class of shares are charged to that class of shares.
68
ADVISERS INVESTMENT TRUST
JOHCM FUNDS
NOTES TO FINANCIAL STATEMENTS
September 30, 2020
The investment income, expenses (other than class-specific expenses charged to a class), and realized/unrealized gains/losses on investments are allocated to each class of shares based upon relative net assets on the date income is earned or expenses and realized/unrealized gains/losses are incurred.
DIVIDENDS AND DISTRIBUTIONS
Distributions of dividends from net investment income, if any, are declared and paid as follows:
| | | | |
| | | Declaration and | |
| | | Payment Frequency | |
JOHCM Credit Income Fund | | | Daily/Monthly | |
JOHCM Emerging Markets Opportunities Fund | | | Annually | |
JOHCM Emerging Markets Small Mid Cap Equity Fund | | | Annually | |
JOHCM Global Equity Fund | | | Annually | |
JOHCM Global Income Builder Fund | | | Daily/Monthly | |
JOHCM International Opportunities Fund | | | Annually | |
JOHCM International Select Fund | | | Annually | |
JOHCM International Small Cap Equity Fund | | | Annually | |
The Funds intend to distribute their net realized long-term capital gains and their net realized short-term capital gains at least once a year.
Distributions from net investment income and from net realized capital gain are determined in accordance with Federal income tax regulations, which may differ from accounting principles generally accepted in the United States of America (“GAAP”). These “book/tax” differences are either considered temporary or permanent in nature. To the extent these differences are permanent in nature (e.g. treatment of certain dividend distributions, gains/losses, return of capital etc.), such amounts are reclassified within the composition of net assets based on their federal tax-basis treatment; temporary differences do not require reclassification. Distributions to shareholders that exceed net investment income and net realized capital gains for tax purposes are reported as return of capital.
FEDERAL INCOME TAX INFORMATION
No provision is made for Federal income taxes as each Fund intends to qualify each year as a “regulated investment company” under Subchapter M of the Internal Revenue Code of 1986, as amended (the “Code”), and distribute substantially all of its net investment income and net realized capital gain in accordance with the Code.
The Funds analyzed all open tax years, as defined by the Statute of Limitations, for all major jurisdictions that remain subject to examination. The Funds’ Federal tax returns for the tax years ended September 30, 2017 through September 30, 2020, as applicable, remain subject to examination by the Internal Revenue Service. Interest or penalties incurred, if any, on future unknown or uncertain tax positions taken by the Funds will be recorded as interest expense on the Statements of Operations.
Management is not aware of any tax positions for which it is reasonably possible that the total amounts of unrecognized tax benefits will significantly change in the next twelve months.
USE OF ESTIMATES
The preparation of financial statements in conformity with GAAP requires management to make estimates and assumptions that affect the reported amounts of assets and liabilities and disclosure of contingent assets and liabilities at the date of the financial statements and the reported amounts of revenues and expenses during the reporting period. Actual results could differ from these estimates.
69
ADVISERS INVESTMENT TRUST
JOHCM FUNDS
NOTES TO FINANCIAL STATEMENTS
September 30, 2020
CAPITAL GAIN TAXES
Investments in certain foreign securities may subject the Funds to capital gain taxes on the disposal of those securities. Any capital gains assessed will reduce the proceeds received on the sale and be reflected in net realized gain/loss on the transaction. The Funds estimate and accrue foreign capital gain taxes on certain investments held which impact the amount of unrealized appreciation/depreciation on such investments. The JOHCM Emerging Markets Opportunities Fund paid $355 and the JOHCM Emerging Markets Small Mid Cap Fund paid $10,243 in capital gain taxes during the year. These amounts are included in the net realized gains (losses) from investment transactions on the Statement of Operations.
OTHER RISKS
Securities markets outside the United States (“U.S.”), while growing in volume, have for the most part substantially less volume than U.S. markets, and many securities traded on these foreign markets are less liquid and their prices are more volatile than securities of comparable U.S. companies. In addition, settlement of trades in some non-U.S. markets is much slower and more subject to failure than in U.S. markets. Other risks associated with investing in foreign securities include, among other things, imposition of exchange control regulation by the U.S. or foreign governments, U.S. and foreign withholding taxes, limitations on the removal of funds or other assets, policies of governments with respect to possible nationalization of their industries, and economic or political instability in foreign nations. There may be less publicly available information about certain foreign companies than would be the case for comparable companies in the U.S., and certain foreign companies may not be subject to accounting, auditing and financial reporting standards and requirements comparable to or as uniform as those of U.S. companies.
Certain Funds may invest in emerging market securities. Investing in emerging market securities involves risks which are in addition to the usual risks inherent in foreign investments. These countries generally are located in the Asia and Pacific regions, the Middle East, Eastern Europe, Central America, South America and Africa. Some countries with emerging securities markets have experienced substantial, and in some periods extremely high, rates of inflation for many years. Inflation and rapid fluctuations in inflation rates have had and may continue to have negative effects on the economies and securities markets of certain countries. Moreover, the economies of some countries may differ favorably or unfavorably from the U.S. economy in such respects as rate of growth of gross domestic product, rate of inflation, capital reinvestment, resource self-sufficiency, number and depth of industries forming the economy’s base, condition and stability of financial institutions, governmental controls and investment restrictions that are subject to political change and balance of payments position. Further, a Fund may face greater difficulties or restrictions with respect to investments made in emerging markets countries than in the U.S. Satisfactory custodial services may not be available in some emerging markets countries, which may result in a Fund incurring additional costs and delays in the trading and custody of such securities.
The recent global outbreak of COVID-19 has disrupted economies and markets, and the prolonged duration and economic impact is uncertain. These events can have a significant impact to the Fund’s operations and performance.
The JOHCM Credit Income Fund and the JOHCM Global Income Builder Fund may be exposed to financial instruments that are tied to the London Interbank Offered Rate (“LIBOR”) to determine payment obligations, financing terms, or investment value. The Funds’ investments may pay interest at floating rates based on LIBOR or may be subject to interest caps or floors based on LIBOR. The Funds may also obtain financing at floating rates based on LIBOR. In 2017, the head of the United Kingdom’s Financial Conduct Authority announced a desire to phase out the use of LIBOR by the end of 2021, and it is expected that LIBOR will cease to be published after that time. The Funds may have investments linked to other interbank offered rates, such as the Euro Overnight Index Average (“EONIA”), which may also cease to be published. Various financial industry groups have begun planning for the transition away from LIBOR, but there are challenges to converting certain securities and transactions to a new reference rate (e.g., the Secured Overnight Financing Rate (“SOFR”), which is intended to replace the U.S. dollar LIBOR). Neither the effect of the LIBOR transition process nor its ultimate success can yet be known. The transition process might lead to increase volatility and illiquidity in markets for instruments whose terms currently include LIBOR. While some existing LIBOR-based instruments may contemplate a scenario where LIBOR is no longer available by providing for an alternative rate-setting methodology, there may be significant uncertainty regarding the effectivenss of any such alternative methodologies to replicate LIBOR. Not all existing LIBOR-based instruments may have alternative rate-setting provisions and
70
ADVISERS INVESTMENT TRUST
JOHCM FUNDS
NOTES TO FINANCIAL STATEMENTS
September 30, 2020
there remains uncertainty regarding the willingness and ability of issuers to add alternative rate-setting provisions in certain existing instruments. In addition, a liquid market for newly-issued instruments that use a reference rate other than LIBOR still may be developing. All of the aforementioned may adversely affect the Funds’ performance or NAV.
B. Fees and Transactions with Affiliates and Other Parties
The Funds have entered into an Investment Advisory Agreement (the “Agreement”) with JO Hambro Capital Management Limited (the “Adviser” or “JOHCM”) to provide investment management services to the Funds. Total fees incurred pursuant to the Agreement are reflected as “Investment advisory” fees on the Statement of Operations. Under the terms of the Agreement, the Adviser receives an annual fee, computed daily and payable monthly, at the annual rates set forth in the following table (expressed as a percentage of each Fund’s respective average daily net assets). The Adviser has contractually agreed to waive fees and reimburse expenses to the extent that Total Annual Operating Expenses (excluding taxes, extraordinary expenses, expenses associated with investments in underlying investment companies, brokerage commissions, interest, dividends, litigation and indemnification expenses) exceed the rates in the table below (expressed as a percentage of each Fund’s respective average daily net assets).
| | | | | | | | | | |
| | | | | | | | Expense | |
| Fund | | Class | | Advisory Fee | | | Limitation | |
| |
JOHCM Credit Income Fund | | Institutional | | | 0.55 | % | | | 0.59 | %(a) |
JOHCM Emerging Markets Opportunities Fund | | Class I | | | 0.90 | %(b) | | | 1.19 | %(c) |
JOHCM Emerging Markets Opportunities Fund | | Class II | | | 0.90 | %(b) | | | 1.34 | %(c) |
JOHCM Emerging Markets Opportunities Fund | | Institutional | | | 0.90 | %(b) | | | 1.09 | %(c) |
JOHCM Emerging Markets Small Mid Cap Equity Fund | | Class I | | | 1.30 | % | | | 1.64 | % |
JOHCM Emerging Markets Small Mid Cap Equity Fund | | Institutional | | | 1.30 | % | | | 1.54 | % |
JOHCM Global Equity Fund | | Class I | | | 0.95 | % | | | 1.18 | % |
JOHCM Global Equity Fund | | Institutional | | | 0.95 | % | | | 1.08 | % |
JOHCM Global Income Builder Fund | | Class I | | | 0.67 | % | | | 0.83 | %(d) |
JOHCM Global Income Builder Fund | | Class II | | | 0.67 | % | | | 0.98 | %(d) |
JOHCM Global Income Builder Fund | | Institutional | | | 0.67 | % | | | 0.73 | %(d) |
JOHCM International Opportunities Fund | | Institutional | | | 0.75 | % | | | 0.89 | % |
JOHCM International Select Fund | | Class I | | | 0.89 | % | | | 1.05 | % |
JOHCM International Select Fund | | Class II | | | 0.89 | % | | | 1.30 | % |
JOHCM International Small Cap Equity Fund | | Class I | | | 1.05 | % | | | 1.34 | % |
JOHCM International Small Cap Equity Fund | | Class II | | | 1.05 | % | | | 1.49 | % |
JOHCM International Small Cap Equity Fund | | Institutional | | | 1.05 | % | | | 1.24 | % |
| (a) | Prior to September 14, 2020 the expense limit was 0.69%. |
| (b) | Prior to December 16, 2019 the advisory fee was 1.05%. |
| (c) | Prior to December 16, 2019 the expense limits were 1.29%, 1.39%, and 1.54% for the Institutional, Class I, and Class II shares, respectively. |
| (d) | Prior to September 14, 2020 the expense limits were 0.83%, 0.93%, and 1.08% for Institutional, Class I, and Class II shares, respectively. |
The expense limitation agreement is effective until January 28, 2021 for the Funds, except for the JOHCM Credit Income Fund and JOHCM Global Income Builder Fund which are effective until January 28, 2023, at which time it will be subject to automatic renewal upon the effective date of the annual update to the a Funds’ registration statement. If it becomes unnecessary for the Adviser to waive fees or make reimbursements, the Adviser may recapture any of its prior waivers or reimbursements for a period not to exceed three years from the date on which the waiver or reimbursement was made to the extent that such a recapture does not cause the Total Annual Fund Operating Expenses (exclusive of brokerage and other transaction expenses relating to the purchase or sale of portfolio investments, interest, taxes, short sale dividends and financing costs associated with the use of the cash proceeds on securities sold short, litigation and indemnification expenses, expenses associated with the investments in underlying investment companies and extraordinary expenses) to exceed the current expense limitation at the time of repayment or the applicable expense limitation that was in effect at the time of the waiver or reimbursement. The agreement to waive fees and reimburse expenses may be terminated by the Board at any time and will terminate automatically upon termination of the Agreement.
71
ADVISERS INVESTMENT TRUST
JOHCM FUNDS
NOTES TO FINANCIAL STATEMENTS
September 30, 2020
JOHCM (USA), Inc. (the “Sub-Adviser”) serves as the investment sub-adviser to the JOHCM Credit Income Fund, the JOHCM Global Income Builder Fund and the JOHCM International Small Cap Equity Fund. For its services, the Sub-Adviser is paid a fee of 0.55%, 0.67% and 1.05%, based on average daily net assets of the JOHCM Credit Income Fund, the JOHCM Global Income Builder Fund and the JOHCM International Small Cap Equity Fund, respectively, by the Adviser.
For the year ended September 30, 2020, the JOHCM Funds incurred advisory fees payable to JOHCM, expense waivers/reimbursements from JOHCM, and paid expense recoupments to JOHCM as follows:
| | | | | | | | | | | | |
| Fund | | Advisory Fee to JOHCM | | | Expenses
Reduced
by JOHCM | | | Advisory Fees
Recouped by JOHCM | |
JOHCM Credit Income Fund | | $ | 3,301 | | | $ | 10,656 | | | $ | — | |
JOHCM Emerging Markets Opportunities Fund | | | 5,506,266 | | | | — | | | | — | |
JOHCM Emerging Markets Small Mid Cap Equity Fund | | | 412,692 | | | | 201,003 | | | | — | |
JOHCM Global Equity Fund | | | 3,913,672 | | | | — | | | | — | |
JOHCM Global Income Builder Fund | | | 615,746 | | | | 123,468 | | | | — | |
JOHCM International Opportunities Fund | | | 17,707 | | | | 80,299 | | | | — | |
JOHCM International Select Fund | | | 78,431,569 | | | | — | | | | — | |
JOHCM International Small Cap Equity Fund | | | 2,030,993 | | | | — | | | | 25,988 | |
The balances of recoverable expenses to JOHCM by Funds at September 30, 2020 were as follows:
| | | | | | | | | | | | | | | | | | | | | | | | | | | | | | | | | | | | |
| For the: | | Expiring | | | JOHCM
Credit
Income Fund | | | JOHCM
Emerging
Markets
Opportunities
Fund | | | JOHCM
Emerging
Markets
Small Mid Cap
Equity Fund | | | JOHCM
Global
Equity
Fund | | | JOHCM
Global
Income
Builder
Fund | | | JOHCM
International
Opportunities
Fund | | | JOHCM
International
Select Fund | | | JOHCM
International
Small Cap
Equity Fund | |
Year ended September 30, 2018 | |
| September
30, 2021 |
| | $ | — | | | | $ — | | | | $186,928 | | | | $ — | | | $ | 53,449 | | | | $ 43,552 | | | | $ — | | | | $ — | |
Year ended September 30, 2019 | |
| September
30, 2022 |
| | | — | | | | — | | | | 238,798 | | | | — | | | | 28,639 | | | | 21,181 | | | | — | | | | — | |
Year ended September 30, 2020 | |
| September
30, 2023 |
| | | 10,656 | | | | — | | | | 201,003 | | | | — | | | | 123,468 | | | | 80,299 | | | | — | | | | — | |
| | | | | | | | | | | | | | | | | | | | | | | | | | | | | | | | | | | | |
Balances of Recoverable Expenses to the Adviser | | | | | | $ | 10,656 | | | | $ — | | | | $626,729 | | | | $ — | | | $ | 205,556 | | | | $145,032 | | | | $ — | | | | $ — | |
| | | | | | | | | | | | | | | | | | | | | | | | | | | | | | | | | | | | |
Foreside Financial Services, LLC (the “Distributor”), provides distribution services to the Funds pursuant to a distribution agreement with the Trust, on behalf of the Funds. Under its agreement with the Trust, the Distributor acts as an agent of the Trust in connection with the offering of the shares of the Funds on a continuous basis. Currently, the Adviser, at its own expense, pays the Distributor an annual fee of $285,000, 0.006% of average daily net assets of the Funds, and reimbursement for certain expenses and out-of-pocket costs incurred on behalf of the Funds.
The Northern Trust Company (“Northern Trust”) serves as the administrator, transfer agent, custodian and fund accounting agent for the Funds pursuant to written agreements with the Trust on behalf of the Funds. The Funds have agreed to pay Northern Trust a tiered basis-point fee based on the JOHCM Funds’ complex level net assets and certain per account and transaction charges. The total fee is
72
ADVISERS INVESTMENT TRUST
JOHCM FUNDS
NOTES TO FINANCIAL STATEMENTS
September 30, 2020
subject to a minimum annual fee of $160,000 per Fund relating to these services, and reimbursement for certain expenses incurred on behalf of the Funds, as well as other charges for additional service activities. Fees paid to Northern Trust for their services are reflected as “Accounting and Administration” fees on the Statements of Operations. Northern Trust has agreed to voluntarily waive its minimum fees and certain other expenses. The waiver agreement may be terminated at any time and the waivers are not subject to recoupment. Amounts waived by Northern Trust are included in “Expenses reduced by Service Providers” on the Statement of Operations.
For the year ended September 30, 2020, Northern Trust voluntarily waived expenses as follows:
| | | | |
| Fund | | Expenses
Waived by
Northern
Trust | |
JOHCM Credit Income Fund | | $ | 18,259 | |
JOHCM Emerging Markets Small Mid Cap Equity Fund | | | 4,470 | |
JOHCM Global Income Builder Fund | | | 15,646 | |
JOHCM International Opportunities Fund | | | 120,847 | |
JOHCM International Small Cap Equity Fund | | | 27,281 | |
Foreside Fund Officer Services, LLC (“Foreside”) provides compliance and financial control Services for the Funds pursuant to a written agreement with the Trust on behalf of the Funds, including providing certain officers to the Funds. The Funds have agreed to pay Foreside an annual base fee, a fee based on the JOHCM Funds ‘complex level net assets, subject to an overall minimum annual fee of $200,000 for these services, and reimburse for certain expenses incurred on behalf of the Funds. Total fees paid to Foreside pursuant to these agreements are reflected as “Regulatory and Compliance” fees on the Statements of Operations.
Carne Global Financial Services (US) LLC (“Carne”) provides Risk Management and Oversight Services for the JOHCM Funds pursuant to a written agreement with the Trust, on behalf of the JOHCM Funds, including providing the Risk Officer to the JOHCM Funds to administer the Fund risk program and oversee the analysis of investment performance and performance of service providers. The JOHCM Funds have agreed to pay Carne an annual fee of $50,000 for the first fund and an additional $5,000 per fund thereafter for these services, and reimburse for certain expenses incurred on behalf of the JOHCM Funds. Total fees paid to Carne pursuant to this agreement are reflected as “Risk Officer” fees on the Statements of Operations.
Certain officers and Trustees of the Trust are affiliated with Foreside, Northern Trust, Carne or the Distributor and receive no compensation directly from the Funds for serving in their respective roles. Through March 31, 2020, the Trust paid each Independent Trustee compensation for their services based on an annual retainer of $120,000 and reimbursement for certain expenses. Effective April 1, 2020, the Trust pays an annual retainer of $125,000 and reimbursement for certain expenses. If there are more than six meetings in a year, additional meeting fees may apply. For the year ended September 30, 2020, the aggregate Trustee compensation paid by the Trust was $367,500. The amount of total Trustee compensation and reimbursement of out-of-pocket expenses allocated from the Trust to the Funds are reflected as “Trustees” expenses on the Statements of Operations.
C. Rule 12b-1 Plan
The JOHCM Funds adopted an amended plan under Rule 12b-1 that is applicable to Class I, Class II and Class III Shares of all JOHCM Funds, except Class I Shares of the JOHCM International Select Fund, to pay for certain distribution and promotion activities related to marketing of their shares. Each Fund will pay the Distributor a fee for the principal underwriter’s services in connection with the sales and promotion of the Funds, including its expenses in connection there with at annual rates of 0.10%, 0.25%, and 0.50% of the average daily net assets of the outstanding Class I Shares, Class II Shares and Class III Shares, respectively. Total fees paid pursuant to these agreements are reflected as “12b-1 Fees” on the Statements of Operations.
73
ADVISERS INVESTMENT TRUST
JOHCM FUNDS
NOTES TO FINANCIAL STATEMENTS
September 30, 2020
D. Credit Agreement
The Trust, on behalf of the JOHCM Funds, and Northern Trust, entered into a $100 million revolving Credit Agreement for liquidity and other purposes effective as of December 22, 2017 and as amended December 20, 2019. The Credit Agreement is scheduled to mature on December 20, 2020. The Credit Agreement may be extended subject to appropriate approvals.
Any advance under the Credit Agreement will accrue interest at a rate that is equal to the greater of (i) the Funds’ option of the daily London Interbank Offered Rate plus 1.50% or the Federal funds (effective) interest rate plus 1.50% and (ii) 2.00%. In addition, there is a usage fee on the undrawn portion of the $100 million maximum commitment amount in an amount equal to the product of the difference between the maximum commitment amount and the sum of the average daily balance of the loans multiplied by 0.30% per annum.
During the year ended September 30, 2020, the following Fund had borrowings with the average loan and weighted interest rate as disclosed below:
| | | | | | | | | | | | |
| Fund | | Dollar Amount | | | Days Outstanding | | | Rate | |
JOHCM Emerging Markets Opportunities Fund | | $ | 3,767,222 | | | | 18 | | | | 1.86 | |
JOHCM Emerging Markets Small Mid Cap Equity Fund | | | 134,000 | | | | 1 | | | | 3.05 | |
JOHCM Global Equity Fund | | | 9,219,821 | | | | 12 | | | | 1.60 | |
JOHCM Global Income Builder Fund | | | 4,650,000 | | | | 2 | | | | 3.06 | |
JOHCM International Select Fund | | | 48,766,667 | | | | 9 | | | | 3.05 | |
JOHCM International Small Cap Equity Fund | | | 1,654,286 | | | | 7 | | | | 1.56 | |
The JOHCM Emerging Markets Opportunities Fund, JOHCM Emerging Markets Small Mid Cap Fund, JOHCM Global Equity Fund, JOHCM Global Income Builder Fund, JOHCM International Select Fund, and JOHCM International Small Cap Equity Fund incurred interest expense of $3,500, $11, $4,912, $792, $37,185 and $502 related to borrowings under the Credit Agreement during the year ended September 30, 2020, respectively. The amounts are included in the “Interest expense" on the Statement of Operations.
E. Investment Transactions
For the year ended September 30, 2020, the aggregate costs of purchases and proceeds from sales of securities (excluding short-term investments) for the Funds were as follows:
| | | | | | | | |
| Fund | | Cost of Purchases | | | Proceeds from sales | |
JOHCM Credit Income Fund | | $ | 4,982,331 | | | $ | 265,366 | |
JOHCM Emerging Markets Opportunities Fund | | | 331,797,414 | | | | 304,348,595 | |
JOHCM Emerging Markets Small Mid Cap Equity Fund | | | 53,890,834 | | | | 42,803,539 | |
JOHCM Global Equity Fund | | | 173,260,972 | | | | 159,371,267 | |
JOHCM Global Income Builder Fund | | | 122,471,850 | | | | 150,452,515 | |
JOHCM International Opportunities Fund | | | 1,994,341 | | | | 1,311,204 | |
JOHCM International Select Fund | | | 4,197,939,461 | | | | 3,719,469,011 | |
JOHCM International Small Cap Equity Fund | | | 47,104,900 | | | | 76,487,113 | |
74
ADVISERS INVESTMENT TRUST
JOHCM FUNDS
NOTES TO FINANCIAL STATEMENTS
September 30, 2020
F. Federal Income Tax
As of September 30, 2020, the cost, gross unrealized appreciation and gross unrealized depreciation on investments, for Federal income tax purposes, were as follows:
| | | | | | | | | | | | | | | | |
| Fund | | Tax Cost | | | Tax Unrealized Appreciation | | | Tax Unrealized (Depreciation) | | | Net Unrealized
Appreciation
(Depreciation) | |
JOHCM Credit Income Fund | | $ | 4,898,026 | | | $ | 10,386 | | | $ | (37,704 | ) | | $ | (27,318 | ) |
JOHCM Emerging Markets Opportunities Fund | | | 554,994,488 | | | | 109,127,375 | | | | (57,105,071 | ) | | | 52,022,304 | |
JOHCM Emerging Markets Small Mid Cap Equity Fund | | | 35,596,090 | | | | 7,018,549 | | | | (686,521 | ) | | | 6,332,028 | |
JOHCM Global Equity Fund | | | 324,555,459 | | | | 132,965,889 | | | | (2,332,586 | ) | | | 130,633,303 | |
JOHCM Global Income Builder Fund | | | 77,365,779 | | | | 6,452,721 | | | | (1,831,076 | ) | | | 4,621,645 | |
JOHCM International Opportunities Fund | | | 2,555,885 | | | | 202,109 | | | | (176,602 | ) | | | 25,507 | |
JOHCM International Select Fund | | | 7,488,707,463 | | | | 2,673,016,403 | | | | (94,829,274 | ) | | | 2,578,187,129 | |
JOHCM International Small Cap Equity Fund | | | 164,963,405 | | | | 30,659,203 | | | | (19,118,800 | ) | | | 11,540,403 | |
The tax character of distributions paid by the Funds during the latest tax years ended September 30, 2020 and September 30, 2019 were as follows: | |
| | | Distributions From | |
| Fund | | Ordinary Income* 2020 | | | Long-Term Capital Gains 2020 | | | Ordinary Income* 2019 | | | Long-Term Capital Gains 2019 | |
JOHCM Credit Income Fund | | $ | 15,908 | | | $ | — | | | $ | — | | | $ | — | |
JOHCM Emerging Markets Opportunities Fund | | | 23,243,067 | | | | — | | | | 7,125,670 | | | | 13,290,197 | |
JOHCM Emerging Markets Small Mid Cap Equity Fund | | | 178,137 | | | | — | | | | 118,342 | | | | — | |
JOHCM Global Equity Fund | | | 4,522,375 | | | | 48,545,641 | | | | 5,049,812 | | | | 13,217,311 | |
JOHCM Global Income Builder Fund | | | 2,723,962 | | | | 93,453 | | | | 2,643,119 | | | | — | |
JOHCM International Opportunities Fund | | | 49,029 | | | | 4,424 | | | | 37,334 | | | | 3,220 | |
JOHCM International Select Fund | | | 83,007,334 | | | | — | | | | 108,828,545 | | | | — | |
JOHCM International Small Cap Equity Fund | | | 2,585,125 | | | | 4,989,132 | | | | 5,877,361 | | | | 7,561,228 | |
| * | Ordinary income includes short-term capital gains, if any. |
75
ADVISERS INVESTMENT TRUST
JOHCM FUNDS
NOTES TO FINANCIAL STATEMENTS
September 30, 2020
As of the latest tax year ended September 30, 2020, the components of accumulated earnings on a tax basis were as follows:
| | | | | | | | | | | | | | | | | | | | | | | | | | | | | | | | |
| | | JOHCM
Credit
Income
Fund | | | JOHCM
Emerging
Markets
Opportunities
Fund | | | JOHCM
Emerging
Markets
Small Mid Cap
Equity Fund | | | JOHCM
Global Equity Fund | | | JOHCM
Global
Income
Builder
Fund | | | JOHCM
International
Opportunities
Fund | | | JOHCM
International
Select Fund | | | JOHCM
International
Small Cap
Equity Fund | |
| |
Undistributed Ordinary Income | | $ | 2,923 | | | $ | 7,134,443 | | | $ | 116,500 | | | $ | 98,675 | | | $ | 434,428 | | | $ | 40,210 | | | $ | 38,033,297 | | | $ | 431,823 | |
Undistributed Long-Term Capital Gains | | | 777 | | | | — | | | | — | | | | 22,299,190 | | | | — | | | | 23,850 | | | | 181,708,320 | | | | — | |
Accumulated Capital Losses and Other Items | | | (2,054 | ) | | | (53,312,266 | ) | | | (1,104,666 | ) | | | — | | | | (1,362,727 | ) | | | — | | | | — | | | | (19,844,261 | ) |
Unrealized Appreciation (Depreciation) | | | (27,318 | ) | | | 52,070,263 | | | | 6,292,782 | | | | 130,658,573 | | | | 4,632,573 | | | | 25,807 | | | | 2,578,756,536 | | | | 11,568,120 | |
| | | | |
Total Accumulated Earnings (Deficit) | | $ | (25,672 | ) | | $ | 5,892,440 | | | $ | 5,304,616 | | | $ | 153,056,438 | | | $ | 3,704,274 | | | $ | 89,867 | | | $ | 2,798,498,153 | | | $ | (7,844,318 | ) |
| | | | |
For the period subsequent to October 31, 2019, through the fiscal year ended September 30, 2020, the JOHCM Global Income Builder and JOHCM International Small Cap Equity Funds incurred net capital losses and/or late year ordinary loss deferral in the amount of $1,299,809 and $19,844,261, respectively, which the Funds intend to treat as having been incurred in the following fiscal year.
As of the tax year ended September 30, 2020, capital losses incurred by the Funds are carried forward indefinitely under the provisions of the Regulated Investment Company Modernization Act of 2010 and are as follows:
| | | | | | | | |
| Fund | | Short-Term
Capital Loss
Carry-Forward | | | Long-Term
Capital Loss
Carry-Forward | |
| |
JOHCM Emerging Markets Opportunities Fund | | $ | (35,661,586 | ) | | $ | (17,650,680 | ) |
JOHCM Emerging Markets Small Mid Cap Equity Fund | | | (1,104,666 | ) | | | — | |
During the tax year ended September 30, 2020 the JOHCM Emerging Markets Small Mid Cap Equity, JOHCM Global Income Builder and JOHCM International Select Funds utilized $2,208,493, $40,693 and $117,957,311, respectively, in capital loss carry forwards.
76
ADVISERS INVESTMENT TRUST
JOHCM FUNDS
NOTES TO FINANCIAL STATEMENTS
September 30, 2020
G. Capital Share Transactions
Transactions in dollars for common stock for the year ended September 30, 2020, were as follows:
| | | | | | | | | | | | | | | | | | |
| Fund | | Class | | Proceeds from
Shares Sold | | | Reinvestments
of Dividends | | | Payments for Shares
Redeemed | | | Net Increase
(Decrease) in
Net Assets | |
JOHCM Credit Income Fund | | Institutional | | $ | 5,000,000 | | | $ | 15,268 | | | $ | — | | | $ | 5,015,268 | |
JOHCM Emerging Markets Opportunities Fund | | Class I | | | 42,325,858 | | | | 2,251,441 | | | | (48,042,021 | ) | | | (3,464,722 | ) |
JOHCM Emerging Markets Opportunities Fund | | Class II | | | 4,664,808 | | | | 490,550 | | | | (4,194,806 | ) | | | 960,552 | |
JOHCM Emerging Markets Opportunities Fund | | Institutional | | | 207,211,534 | | | | 16,812,678 | | | | (173,636,628 | ) | | | 50,387,584 | |
JOHCM Emerging Markets Small Mid Cap Equity Fund | | Class I | | | 12,428,029 | | | | 2,281 | | | | (1,563,067 | ) | | | 10,867,243 | |
JOHCM Emerging Markets Small Mid Cap Equity Fund | | Institutional | | | 1,440,265 | | | | 149,464 | | | | (94,529 | ) | | | 1,495,200 | |
JOHCM Global Equity Fund | | Class I | | | 3,519,510 | | | | 21,656,693 | | | | (138,684,698 | ) | | | (113,508,495 | ) |
JOHCM Global Equity Fund | | Institutional | | | 180,931,654 | | | | 24,584,456 | | | | (46,868,419 | ) | | | 158,647,691 | |
JOHCM Global Income Builder Fund | | Class I | | | 529,712 | | | | 183,020 | | | | (222,494 | ) | | | 490,238 | |
JOHCM Global Income Builder Fund | | Class II | | | 50,021 | | | | 3,030 | | | | (40,681 | ) | | | 12,370 | |
JOHCM Global Income Builder Fund | | Institutional | | | 41,158,360 | | | | 1,535,764 | | | | (73,087,215 | ) | | | (30,393,091 | ) |
JOHCM International Opportunities Fund | | Institutional | | | 644,500 | | | | 46,098 | | | | — | | | | 690,598 | |
JOHCM International Select Fund | | Class I | | | 2,271,244,666 | | | | 44,215,407 | | | | (2,181,078,001 | ) | | | 134,382,072 | |
JOHCM International Select Fund | | Class II | | | 30,925,107 | | | | 4,417,494 | | | | (94,327,963 | ) | | | (58,985,362 | ) |
JOHCM International Small Cap Equity Fund | | Class I | | | 14,734,283 | | | | 1,221,856 | | | | (9,738,099 | ) | | | 6,218,040 | |
JOHCM International Small Cap Equity Fund | | Class II | | | 1,218,535 | | | | 47,818 | | | | (1,338,856 | ) | | | (72,503 | ) |
JOHCM International Small Cap Equity Fund | | Institutional | | | 14,528,116 | | | | 5,436,494 | | | | (46,653,574 | ) | | | (26,688,964 | ) |
77
ADVISERS INVESTMENT TRUST
JOHCM FUNDS
NOTES TO FINANCIAL STATEMENTS
September 30, 2020
Transactions in shares of common stock for the year ended September 30, 2020, were as follows:
| | | | | | | | | | | | | | | | | | |
| Fund | | Class | | Shares Sold | | | Shares From
Reinvested
Dividends | | | Shares
Redeemed | | | Net Increase
(Decrease) in Shares | |
JOHCM Credit Income Fund | | Institutional | | | 499,999 | | | | 1,533 | | | | — | | | | 501,532 | |
JOHCM Emerging Markets Opportunities Fund | | Class I | | | 4,379,135 | | | | 204,863 | | | | (5,332,623 | ) | | | (748,625 | ) |
JOHCM Emerging Markets Opportunities Fund | | Class II | | | 464,763 | | | | 44,636 | | | | (431,403 | ) | | | 77,996 | |
JOHCM Emerging Markets Opportunities Fund | | Institutional | | | 20,713,201 | | | | 1,525,651 | | | | (17,205,000 | ) | | | 5,033,852 | |
JOHCM Emerging Markets Small Mid Cap Equity Fund | | Class I | | | 1,160,131 | | | | 184 | | | | (124,216 | ) | | | 1,036,099 | |
JOHCM Emerging Markets Small Mid Cap Equity Fund | | Institutional | | | 126,808 | | | | 12,015 | | | | (7,448 | ) | | | 131,375 | |
JOHCM Global Equity Fund | | Class I | | | 238,693 | | | | 1,454,445 | | | | (9,021,228 | ) | | | (7,328,090 | ) |
JOHCM Global Equity Fund | | Institutional | | | 11,976,963 | | | | 1,648,857 | | | | (2,953,515 | ) | | | 10,672,305 | |
JOHCM Global Income Builder Fund | | Class I | | | 53,475 | | | | 18,484 | | | | (22,580 | ) | | | 49,379 | |
JOHCM Global Income Builder Fund | | Class II | | | 4,861 | | | | 305 | | | | (4,609 | ) | | | 557 | |
JOHCM Global Income Builder Fund | | Institutional | | | 4,191,551 | | | | 154,829 | | | | (7,150,407 | ) | | | (2,804,027 | ) |
JOHCM International Opportunities Fund | | Institutional | | | 59,897 | | | | 4,192 | | | | — | | | | 64,089 | |
JOHCM International Select Fund | | Class I | | | 96,311,415 | | | | 1,850,017 | | | | (95,350,810 | ) | | | 2,810,622 | |
JOHCM International Select Fund | | Class II | | | 1,294,591 | | | | 184,524 | | | | (4,214,374 | ) | | | (2,735,259 | ) |
JOHCM International Small Cap Equity Fund | | Class I | | | 1,350,188 | | | | 104,881 | | | | (1,001,642 | ) | | | 453,427 | |
JOHCM International Small Cap Equity Fund | | Class II | | | 117,970 | | | | 4,080 | | | | (128,462 | ) | | | (6,412 | ) |
JOHCM International Small Cap Equity Fund | | Institutional | | | 1,514,927 | | | | 467,454 | | | | (4,855,798 | ) | | | (2,873,417 | ) |
78
ADVISERS INVESTMENT TRUST
JOHCM FUNDS
NOTES TO FINANCIAL STATEMENTS
September 30, 2020
Transactions in dollars for common stock for the year ended September 30, 2019, were as follows:
| | | | | | | | | | | | | | | | | | |
| Fund | | Class | | Proceeds from
Shares Sold | | | Reinvestments
of Dividends | | | Payments for Shares
Redeemed | | | Net Increase
(Decrease) in
Net Assets | |
JOHCM Emerging Markets Opportunities Fund | | Class I | | $ | 61,405,755 | | | $ | 2,882,032 | | | $ | (73,992,619 | ) | | $ | (9,704,832 | ) |
JOHCM Emerging Markets Opportunities Fund | | Class II | | | 12,585,163 | | | | 307,463 | | | | (7,801,147 | ) | | | 5,091,479 | |
JOHCM Emerging Markets Opportunities Fund | | Institutional | | | 249,369,503 | | | | 15,568,147 | | | | (145,235,138 | ) | | | 119,702,512 | |
JOHCM Emerging Markets Small Mid Cap Equity Fund | | Class I | | | 108,896 | | | | 1,944 | | | | (417,149 | ) | | | (306,309 | ) |
JOHCM Emerging Markets Small Mid Cap Equity Fund | | Institutional | | | 169,037 | | | | 98,827 | | | | (40,416 | ) | | | 227,448 | |
JOHCM Global Equity Fund | | Class I | | | 39,390,979 | | | | 7,476,383 | | | | (76,119,980 | ) | | | (29,252,618 | ) |
JOHCM Global Equity Fund | | Institutional | | | 29,578,158 | | | | 8,109,357 | | | | (138,038,671 | ) | | | (100,351,156 | ) |
JOHCM Global Income Builder Fund | | Class I | | | 1,374,630 | | | | 173,665 | | | | (373,758 | ) | | | 1,174,537 | |
JOHCM Global Income Builder Fund | | Class II | | | 76,000 | | | | 309 | | | | — | | | | 76,309 | |
JOHCM Global Income Builder Fund | | Institutional | | | 74,698,016 | | | | 964,622 | | | | (2,086,770 | ) | | | 73,575,868 | |
JOHCM International Opportunities Fund | | Institutional | | | — | | | | 34,954 | | | | — | | | | 34,954 | |
JOHCM International Select Fund | | Class I | | | 2,250,373,560 | | | | 54,505,951 | | | | (1,739,359,087 | ) | | | 565,520,424 | |
JOHCM International Select Fund | | Class II | | | 100,012,354 | | | | 6,663,586 | | | | (44,332,391 | ) | | | 62,343,549 | |
JOHCM International Small Cap Equity Fund | | Class I | | | 8,399,685 | | | | 2,243,756 | | | | (21,235,734 | ) | | | (10,592,293 | ) |
JOHCM International Small Cap Equity Fund | | Class II | | | 607,525 | | | | 86,101 | | | | (296,213 | ) | | | 397,413 | |
JOHCM International Small Cap Equity Fund | | Institutional | | | 60,819,030 | | | | 9,631,411 | | | | (78,311,843 | ) | | | (7,861,402 | ) |
79
ADVISERS INVESTMENT TRUST
JOHCM FUNDS
NOTES TO FINANCIAL STATEMENTS
September 30, 2020
Transactions in shares of common stock for the year ended September 30, 2019, were as follows:
| | | | | | | | | | | | | | | | | | |
| Fund | | Class | | Shares Sold | | | Shares From
Reinvested
Dividends | | | Shares
Redeemed | | | Net Increase
(Decrease) in Shares | |
JOHCM Emerging Markets Opportunities Fund | | Class I | | | 5,777,842 | | | | 288,203 | | | | (7,042,235 | ) | | | (976,190 | ) |
JOHCM Emerging Markets Opportunities Fund | | Class II | | | 1,229,780 | | | | 30,746 | | | | (722,932 | ) | | | 537,594 | |
JOHCM Emerging Markets Opportunities Fund | | Institutional | | | 23,340,942 | | | | 1,553,707 | | | | (13,792,016 | ) | | | 11,102,633 | |
JOHCM Emerging Markets Small Mid Cap Equity Fund | | Class I | | | 9,837 | | | | 181 | | | | (37,672 | ) | | | (27,654 | ) |
JOHCM Emerging Markets Small Mid Cap Equity Fund | | Institutional | | | 15,077 | | | | 9,185 | | | | (3,664 | ) | | | 20,598 | |
JOHCM Global Equity Fund | | Class I | | | 2,635,119 | | | | 526,877 | | | | (4,881,091 | ) | | | (1,719,095 | ) |
JOHCM Global Equity Fund | | Institutional | | | 1,906,010 | | | | 570,680 | | | | (8,758,786 | ) | | | (6,282,096 | ) |
JOHCM Global Income Builder Fund | | Class I | | | 140,114 | | | | 17,949 | | | | (38,613 | ) | | | 119,450 | |
JOHCM Global Income Builder Fund | | Class II | | | 7,601 | | | | 31 | | | | — | | | | 7,632 | |
JOHCM Global Income Builder Fund | | Institutional | | | 7,678,540 | | | | 99,597 | | | | (209,706 | ) | | | 7,568,431 | |
JOHCM International Opportunities Fund | | Institutional | | | — | | | | 3,641 | | | | — | | | | 3,641 | |
JOHCM International Select Fund | | Class I | | | 101,798,585 | | | | 2,657,530 | | | | (79,432,812 | ) | | | 25,023,303 | |
JOHCM International Select Fund | | Class II | | | 4,499,344 | | | | 324,105 | | | | (2,001,530 | ) | | | 2,821,919 | |
JOHCM International Small Cap Equity Fund | | Class I | | | 771,931 | | | | 218,052 | | | | (1,945,888 | ) | | | (955,905 | ) |
JOHCM International Small Cap Equity Fund | | Class II | | | 51,782 | | | | 8,319 | | | | (27,227 | ) | | | 32,874 | |
JOHCM International Small Cap Equity Fund | | Institutional | | | 5,581,996 | | | | 937,820 | | | | (7,259,190 | ) | | | (739,374 | ) |
H. Concentration of Ownership
A significant portion of a Fund’s shares may be held in a limited number of shareholder accounts, including in certain omnibus or institutional accounts which typically hold shares for the benefit of other underlying investors. To the extent that a shareholder or group of shareholders redeem a significant portion of the shares issued by a Fund, this could have a disruptive impact on the efficient implementation of a Fund’s investment strategy.
In addition, as of September 30, 2020, the Adviser or Adviser affiliates held outstanding shares of the Funds as follows:
| | | | | | | | |
| Fund | | Class | | | %
Ownership | |
JOHCM Emerging Markets Small Mid Cap Equity Fund | | | Institutional | | | | 93.9 | |
JOHCM International Opportunities Fund | | | Institutional | | | | 78.6 | |
80

Report of Independent Registered Public Accounting Firm
To the Board of Trustees of Advisers Investment Trust and Shareholders of JOHCM Credit Income Fund, JOHCM Emerging Markets Opportunities Fund, JOHCM Emerging Markets Small Mid Cap Equity Fund, JOHCM Global Equity Fund, JOHCM Global Income Builder Fund, JOHCM International Opportunities Fund, JOHCM International Select Fund, and JOHCM International Small Cap Equity Fund.
Opinions on the Financial Statements
We have audited the accompanying statements of assets and liabilities, including the schedules of investments, of JOHCM Credit Income Fund, JOHCM Emerging Markets Opportunities Fund, JOHCM Emerging Markets Small Mid Cap Equity Fund, JOHCM Global Equity Fund, JOHCM Global Income Builder Fund, JOHCM International Opportunities Fund, JOHCM International Select Fund, and JOHCM International Small Cap Equity Fund (eight of the funds constituting Advisers Investment Trust, hereafter collectively referred to as the “Funds”) as of September 30, 2020, the related statements of operations for the year ended September 30, 2020 (for the period August 17, 2020 (commencement of operations) through September 30, 2020 for JOHCM Credit Income Fund), the statements of changes in net assets for each of the two years in the period ended September 30, 2020 (for the period August 17, 2020 (commencement of operations) through September 30, 2020 for JOHCM Credit Income Fund), including the related notes, and the financial highlights for each of the periods indicated therein (collectively referred to as the “financial statements”). In our opinion, the financial statements present fairly, in all material respects, the financial position of each of the Funds as of September 30, 2020, the results of each of their operations for the year then ended (for the period August 17, 2020 (commencement of operations) through September 30, 2020 for JOHCM Credit Income Fund), the changes in each of their net assets for each of the two years in the period ended September 30, 2020 (for the period August 17, 2020 (commencement of operations) through September 30, 2020 for JOHCM Credit Income Fund) and each of the financial highlights for each of the periods indicated therein, in conformity with accounting principles generally accepted in the United States of America.
Basis for Opinions
These financial statements are the responsibility of the Funds’ management. Our responsibility is to express an opinion on the Funds’ financial statements based on our audits. We are a public accounting firm registered with the Public Company Accounting Oversight Board (United States) (PCAOB) and are required to be independent with respect to the Funds in accordance with the U.S. federal securities laws and the applicable rules and regulations of the Securities and Exchange Commission and the PCAOB.
We conducted our audits of these financial statements in accordance with the standards of the PCAOB. Those standards require that we plan and perform the audit to obtain reasonable assurance about whether the financial statements are free of material misstatement, whether due to error or fraud.
Our audits included performing procedures to assess the risks of material misstatement of the financial statements, whether due to error or fraud, and performing procedures that respond to those risks. Such
| | |
| |
| | PricewaterhouseCoopers LLP, One North Wacker, Chicago, IL 60606 T:(312) 298 2000, www.pwc.com/us |
81
procedures included examining, on a test basis, evidence regarding the amounts and disclosures in the financial statements. Our audits also included evaluating the accounting principles used and significant estimates made by management, as well as evaluating the overall presentation of the financial statements. Our procedures included confirmation of securities owned as of September 30, 2020 by correspondence with the custodian, and brokers; when replies were not received from brokers, we performed other auditing procedures. We believe that our audits provide a reasonable basis for our opinions.

Chicago, IL
November 20, 2020
We have served as the auditor of one or more investment companies in Advisers Investment Trust since 2011.
82
ADVISERS INVESTMENT TRUST
JOHCM FUNDS
ADDITIONAL INFORMATION
September 30, 2020 (Unaudited)
A. Expense Examples
As a Fund shareholder, you may incur two types of costs: (1) transaction costs, and (2) ongoing costs, including management fees and other Fund expenses. The examples below are intended to help you understand your ongoing costs (in dollars) of investing in the Funds and to compare these costs with the ongoing costs of investing in other mutual funds. Please note that the expenses shown in the tables are meant to highlight your ongoing costs only and do not reflect any transactional costs. Therefore, the examples are useful in comparing ongoing costs only and will not help you determine the relative total cost of owning different funds. In addition, if these transactional costs were included, your costs would have been higher.
The examples below are based on an investment of $1,000 invested at April 1, 2020 and held for the entire period through September 30, 2020.
The Actual Expense Example below provides information about actual account values and actual expenses. You may use this information, together with the amount you invested, to estimate the expenses that you paid over the period. Simply divide your account value by $1,000 (for example, an $8,600 account value divided by $1,000 = 8.6), then multiply the result by the number in the table under the heading entitled “Expenses Paid” to estimate the expenses you paid on your account during this period.
The Hypothetical Expense Example below provides information about hypothetical account values and hypothetical expenses based on a Funds’ actual expense ratio and an assumed rate of return of 5% per year before expenses, which is not a Funds’ actual return. The hypothetical account values and expenses may not be used to estimate the actual ending account balance or expenses you paid for the period. You may use this information to compare the ongoing costs of investing in the Funds and other funds. To do so, compare this 5% hypothetical example with the 5% hypothetical examples that appear in the shareholder reports of the other funds.
Actual Expense Example
| | | | | | | | | | | | | | | | | | |
| | | | | | | | Beginning | | | Ending | | | *Expenses | |
| | | | | Expense | | | Account Value | | | Account Value | | | Paid | |
| Fund | | Class | | Ratio | | | 4/1/2020 | | | 9/30/2020 | | | 4/1/20–9/30/20 | |
JOHCM Credit Income Fund | | Institutional** | | | 0.65% | | | $ | 1,000.00 | | | $ | 998.60 | | | $ | 0.78 | |
JOHCM Emerging Markets Opportunities Fund | | Class I | | | 1.18% | | | | 1,000.00 | | | | 1,290.00 | | | | 6.76 | |
JOHCM Emerging Markets Opportunities Fund | | Class II | | | 1.33% | | | | 1,000.00 | | | | 1,288.80 | | | | 7.61 | |
JOHCM Emerging Markets Opportunities Fund | | Institutional | | | 1.08% | | | | 1,000.00 | | | | 1,291.70 | | | | 6.19 | |
JOHCM Emerging Markets Small Mid Cap Equity Fund | | Class I | | | 1.64% | | | | 1,000.00 | | | | 1,424.00 | | | | 9.95 | |
JOHCM Emerging Markets Small Mid Cap Equity Fund | | Institutional | | | 1.54% | | | | 1,000.00 | | | | 1,424.60 | | | | 9.34 | |
JOHCM Global Equity Fund | | Class I | | | 1.15% | | | | 1,000.00 | | | | 1,373.60 | | | | 6.82 | |
JOHCM Global Equity Fund | | Institutional | | | 1.05% | | | | 1,000.00 | | | | 1,373.50 | | | | 6.23 | |
JOHCM Global Income Builder Fund | | Class I | | | 0.90% | | | | 1,000.00 | | | | 1,147.50 | | | | 4.85 | |
JOHCM Global Income Builder Fund | | Class II | | | 1.05% | | | | 1,000.00 | | | | 1,147.00 | | | | 5.64 | |
JOHCM Global Income Builder Fund | | Institutional | | | 0.80% | | | | 1,000.00 | | | | 1,148.10 | | | | 4.31 | |
JOHCM International Opportunities Fund | | Institutional | | | 0.89% | | | | 1,000.00 | | | | 1,154.20 | | | | 4.79 | |
JOHCM International Select Fund | | Class I | | | 0.98% | | | | 1,000.00 | | | | 1,355.50 | | | | 5.78 | |
JOHCM International Select Fund | | Class II | | | 1.23% | | | | 1,000.00 | | | | 1,353.50 | | | | 7.25 | |
JOHCM International Small Cap Equity Fund | | Class I | | | 1.29% | | | | 1,000.00 | | | | 1,297.70 | | | | 7.41 | |
83
ADVISERS INVESTMENT TRUST
JOHCM FUNDS
ADDITIONAL INFORMATION
September 30, 2020 (Unaudited)
| | | | | | | | | | | | | | | | | | |
| | | | | | | | Beginning | | | Ending | | | *Expenses | |
| | | | | Expense | | | Account Value | | | Account Value | | | Paid | |
| Fund | | Class | | Ratio | | | 4/1/2020 | | | 9/30/2020 | | | 4/1/20–9/30/20 | |
JOHCM International Small Cap Equity Fund | | Class II | | | 1.44 | % | | $ | 1,000.00 | | | $ | 1,297.20 | | | $ | 8.26 | |
JOHCM International Small Cap Equity Fund | | Institutional | | | 1.19 | % | | | 1,000.00 | | | | 1,298.10 | | | | 6.85 | |
* Actual expenses are calculated using each Fund’s annualized expense ratio (as disclosed in the table), multiplied by the average account value for the period, multiplied by the actual number of operational days in the most recent half fiscal year (183), and divided by the number of days in the current year (366).
** JOHCM Credit Income Fund Institutional class launched on August 17, 2020, and expenses paid represent amounts for the actual number of days of operation.
Hypothetical Expense Example
| | | | | | | | | | | | | | | | | | |
| | | | | | | | Beginning | | | Ending | | | | |
| | | | | Expense | | | Account Value | | | Account Value | | | *Expenses Paid | |
| Fund | | Class | | Ratio | | | 4/1/2020 | | | 9/30/2020 | | | 4/1/20–9/30/20 | |
JOHCM Credit Income Fund | | Institutional** | | | 0.65 | % | | $ | 1,000.00 | | | $ | 1,021.74 | | | $ | 3.29 | |
JOHCM Emerging Markets Opportunities Fund | | Class I | | | 1.18 | % | | | 1,000.00 | | | | 1,019.10 | | | | 5.96 | |
JOHCM Emerging Markets Opportunities Fund | | Class II | | | 1.33 | % | | | 1,000.00 | | | | 1,018.35 | | | | 6.71 | |
JOHCM Emerging Markets Opportunities Fund | | Institutional | | | 1.08 | % | | | 1,000.00 | | | | 1,019.60 | | | | 5.45 | |
JOHCM Emerging Markets Small Mid Cap Equity Fund | | Class I | | | 1.64 | % | | | 1,000.00 | | | | 1,016.79 | | | | 8.27 | |
JOHCM Emerging Markets Small Mid Cap Equity Fund | | Institutional | | | 1.54 | % | | | 1,000.00 | | | | 1,017.29 | | | | 7.77 | |
JOHCM Global Equity Fund | | Class I | | | 1.15 | % | | | 1,000.00 | | | | 1,019.25 | | | | 5.80 | |
JOHCM Global Equity Fund | | Institutional | | | 1.05 | % | | | 1,000.00 | | | | 1,019.75 | | | | 5.30 | |
JOHCM Global Income Builder Fund | | Class I | | | 0.90 | % | | | 1,000.00 | | | | 1,020.48 | | | | 4.56 | |
JOHCM Global Income Builder Fund | | Class II | | | 1.05 | % | | | 1,000.00 | | | | 1,019.75 | | | | 5.30 | |
JOHCM Global Income Builder Fund | | Institutional | | | 0.80 | % | | | 1,000.00 | | | | 1,020.98 | | | | 4.06 | |
JOHCM International Opportunities Fund | | Institutional | | | 0.89 | % | | | 1,000.00 | | | | 1,020.55 | | | | 4.50 | |
JOHCM International Select Fund | | Class I | | | 0.98 | % | | | 1,000.00 | | | | 1,020.09 | | | | 4.96 | |
JOHCM International Select Fund | | Class II | | | 1.23 | % | | | 1,000.00 | | | | 1,018.84 | | | | 6.22 | |
JOHCM International Small Cap Equity Fund | | Class I | | | 1.29 | % | | | 1,000.00 | | | | 1,018.55 | | | | 6.51 | |
JOHCM International Small Cap Equity Fund | | Class II | | | 1.44 | % | | | 1,000.00 | | | | 1,017.81 | | | | 7.25 | |
JOHCM International Small Cap Equity Fund | | Institutional | | | 1.19 | % | | | 1,000.00 | | | | 1,019.04 | | | | 6.01 | |
*Hypothetical expenses are calculated using each Fund’s annualized expense ratio (as disclosed in the table), multiplied by the average account value for the period, multiplied by the number of days in the most recent half fiscal year (183), and divided by the number of days in the current year (366).
**JOHCM Credit Income Fund Institutional class launched on August 17, 2020.
84
ADVISERS INVESTMENT TRUST
JOHCM FUNDS
ADDITIONAL INFORMATION
September 30, 2020 (Unaudited)
B. Qualified Dividend Income (QDI)
Under the Jobs and Growth Tax Relief Reconciliation Act of 2003 (the “Act”), the following percentages of ordinary dividends paid during the fiscal year ended September 30, 2020 are designated as Qualified Dividend Income (“QDI”), as defined in the Act, subject to reduced tax rates in 2020:
| | | | |
| Fund | | QDI Percentage | |
| |
JOHCM Emerging Markets Opportunities Fund | | | 50.61 | % |
JOHCM Emerging Markets Small Mid Cap Equity Fund | | | 100.00 | % |
JOHCM Global Equity Fund | | | 16.76 | % |
JOHCM Global Income Builder Fund | | | 36.18 | % |
JOHCM International Opportunities Fund | | | 100.00 | % |
JOHCM International Select Fund | | | 100.00 | % |
JOHCM International Small Cap Equity Fund | | | 93.11 | % |
C. Corporate Dividends Received Deduction (DRD)
A percentage of the dividends distributed during the fiscal year for the Fund qualifies for the Dividends-Received Deduction (“DRD”) for corporate shareholders:
| | | | |
| Fund | | Corporate DRD Percentage | |
| |
JOHCM Global Equity Fund | | | 16.76 | % |
JOHCM Global Income Builder Fund | | | 15.84 | % |
JOHCM International Opportunities Fund | | | 6.91 | % |
D. Foreign Tax Credit
The Funds below intends to make an election that will allow shareholders to treat their proportionate share of foreign taxes paid by the Funds as having been paid by them. The amounts per share which represent income from sources within, and taxes paid to, foreign countries are as follows:
| | | | | | | | |
| Fund | | Foreign Tax Credit | | | Foreign Source Income | |
| |
JOHCM Emerging Markets Opportunities Fund | | | $0.0177 | | | | $0.1279 | |
JOHCM Emerging Markets Small Mid Cap Equity Fund | | | $0.0219 | | | | $0.0691 | |
JOHCM International Opportunities Fund | | | $0.0193 | | | | $0.1465 | |
JOHCM International Select Fund | | | $0.0307 | | | | $0.1318 | |
JOHCM International Small Cap Equity Fund | | | $0.0192 | | | | $0.0491 | |
E. Board Approval of Investment Advisory and Sub-Advisory Agreements
Section 15 of the Investment Company Act of 1940 (the “1940 Act”) requires that the Amended and Restated Investment Advisory Agreement (the “Investment Advisory Agreement”) between Advisers Investment Trust (the “Trust”) and JO Hambro Capital Management Limited (the “Adviser”) and the Amended and Restated Investment Sub-Advisory Agreement (the “Investment Sub-Advisory Agreement”) between the Adviser and JOHCM (USA) Inc. (the “Sub-Adviser”) with respect to the JOHCM Credit Income Fund (the “Fund”) be approved by a majority of the Board of Trustees of the Trust (the “Board”), including a majority of the Trustees who are not “interested persons,” as that term is defined in the 1940 Act (“Independent Trustees”). It is the duty of the Board to request as much information as is reasonably necessary to evaluate the terms of the Investment Advisory Agreement and Investment Sub-Advisory Agreement (collectively the “Agreements”) to determine whether the Agreements are fair to the Fund and its shareholders. The Board considered and approved the Agreements for the Fund at an in-person meeting held on March 4, 2020.
85
ADVISERS INVESTMENT TRUST
JOHCM FUNDS
ADDITIONAL INFORMATION
September 30, 2020 (Unaudited)
The Board requested, and the Adviser and Sub-Adviser, as applicable, provided, both written and oral reports containing information and data related to the following: (i) the nature, extent, and quality of the services expected to be provided by the Adviser and Sub-Adviser to the Fund; (ii) the investment performance of the Fund, the Adviser, and the Sub-Adviser; (iii) the costs of the services expected to be provided and the profits to be realized by the Adviser and Sub-Adviser from their respective relationship with the Fund; (iv) the extent to which economies of scale will be realized as the Fund grow; and (v) whether the fee levels reflect these economies of scale to the benefit of the Fund’s potential shareholders.
The Board examined the nature, extent, and quality of the advisory services provided by the Adviser and Sub-Adviser. The Board considered the terms of the Investment Advisory Agreement and Investment Sub-Advisory Agreement, information and reports provided by the Adviser and Sub-Adviser on their business, personnel and operations, and proposed advisory services to be provided to the Fund. The Board noted that the Sub-Adviser was a wholly owned subsidiary of the Adviser. The Board reviewed the Adviser’s and Sub-Adviser’s investment philosophy and portfolio construction process, the Adviser’s and Sub-Adviser’s compliance program, pending material litigation (if any), insurance coverage, business continuity program, and information security practices. The Board noted that, as set forth in the reports provided by the Adviser and Sub-Adviser that there had been no material compliance issues in the past 36 months with respect to other funds managed by the Adviser or Sub-Adviser. The Board then considered key risks associated with the Fund and ways in which those risks were expected to be mitigated. Taking into account the personnel expected to be involved in servicing the Fund as well as the materials provided by the Adviser and Sub-Adviser, the Board expressed satisfaction with the quality, extent, and nature of the services expected from the Adviser and Sub-Adviser.
The Board reviewed the investment performance for the Fund’s strategy compared to the selected peer groups and benchmarks for the Fund. The Board determined that because the Fund had not yet commenced operations, the Trustees would review performance over time. The Board reviewed the performance of the peer group for the Fund, as identified by the Adviser and was satisfied with the proposed benchmark for the Fund.
The Board reviewed the cost of services provided and the profits realized by the Adviser, including assertions related to compensation and profitability. The Board discussed the proposed advisory fee to be paid by the Fund and the total expected expenses of the Fund. The Board noted that the Adviser would receive a management fee of 0.55% of the average daily net assets of the Fund. The Board reviewed the investment advisory fees paid by the Fund in comparison to the average investment advisory fee paid by the Fund’s peer group, noting that the fee was competitive. The Board then reviewed the sub-advisory fee to be paid to the Sub-Adviser and determined it to be fair and commensurate with the services provided by the Sub-Adviser. The Board then considered the proposed expense cap for the Fund noting that the Adviser had contractually agreed to waive fees and or reimburse expenses to limit total annual fund operating expenses. After considering the comparative data provided by the Adviser and Sub-Adviser, the Board concluded that the advisory fee and expense ratio was reasonable.
The Board considered the expected profitability of the Adviser’s relationship with the Fund and considered the information provided by the Adviser. Among other things, the Board considered the overall financial condition of the Adviser and representations made thereto and to the overall importance of the Fund’s relationship to the Adviser’s business strategy. The Board again took into account that the Sub-Adviser was a wholly owned subsidiary of the Adviser. The Board concluded that, based on both the written and oral reports provided by the Adviser, the expected profit margin was reasonable.
In considering the economies of scale for the Fund, the Board considered the marketing and distribution plans for the Fund, the Fund’s capacity, and its breakeven point. The Board noted that other than the investment advisory fees, the Adviser’s relationship with the Fund raises the Adviser’s profile within the United States and provides additional business opportunities for the Adviser.
In its deliberations, the Board did not identify any particular factor or factors that were all-important or controlling; and each Trustee assigned different weights to various factors considered.
86
ADVISERS INVESTMENT TRUST
JOHCM FUNDS
ADDITIONAL INFORMATION
September 30, 2020 (Unaudited)
F. Other Information
Investors may obtain a copy of the proxy voting policies and procedures by writing to the Trust in the name of the Fund c/o The Northern Trust Company, P.O. Box 4766, Chicago, Illinois 60680-4766 or by calling the Fund at 866-260-9549 (toll free) or 312-557-5913. Information about how the Funds voted proxies relating to portfolio securities for each 12 month period ending June 30 is available without charge, upon request, by calling the Trust at 866-260-9549 (toll free) or 312-557-5913 and on the U.S. Securities and Exchange Commission’s (The “SEC”) website at www.sec.gov.
Beginning with the quarter ended June 30, 2019 the Funds file their complete schedule of portfolio holdings with the SEC for the first and third quarters of each fiscal year as an exhibit to their reports on Form N-PORT. The Funds’ Form N-PORT reports are available on the SEC website at www.sec.gov.
Previously, the Funds filed their complete scheduled of portfolio holdings with the SEC for the first and third quarters of each fiscal year on Form N-Q. The Funds’ Form N-Q are available on the SEC’s website at www.sec.gov.
G. Trustees and Officers
The following table provides information regarding each Trustee who is not an “interested person” of the Trust, as defined in the 1940 Act.
| | | | | | | | | | |
| | | | | | | | | | | Other |
| | | | | | | | | Number of | | Directorships |
| | | Position(s) | | Term of | | | | Portfolios in the | | Held by Trustee |
| Name, Address and | | Held with | | Office/Length of | | Principal Occupation(s) During | | Trust Overseen | | During Past 5 |
| Year of Birth1 | | the Trust | | Time Served | | Past 5 Years | | by Trustee | | Years |
D’Ray Moore
Year of Birth: 1959 | | Trustee | | Indefinite/July
2011 to present | | Independent Trustee, Diamond Hill Funds 2007 to present; Chairperson, Diamond Hill Funds 2014 to present. | | 12 | | Diamond Hill Funds |
Steven R. Sutermeister
Year of Birth: 1954 | | Trustee | | Indefinite/July
2011 to present | | President, Vadar Capital LLC, 2008 to 2017. | | 12 | | None |
Michael M. Van Buskirk
Year of Birth: 1947 | | Trustee | | Indefinite/July
2011 to present | | Independent Trustee, Boston Trust Walden Funds 1992 to present. | | 12 | | Boston Trust Walden Funds |
1 The mailing address of each Trustee is 50 S. LaSalle Street, Chicago, Illinois 60603.
The following table provides information regarding each Trustee who is an “interested person” of the Trust, as defined in the 1940 Act, and each officer of the Trust.
| | | | | | | | | | |
| | | | | | | | | Number of | | |
| | | | | | | | | Portfolios | | |
| | | Position(s) | | Term of | | | | in the Trust | | Other Directorships |
| Name, Address and | | Held with | | Office/Length | | Principal Occupation(s) | | Overseen by | | Held by Trustee |
| Year of Birth1 | | the Trust2 | | of Time Served | | During Past 5 Years | | Trustee | | During Past 5 Years |
David M. Whitaker2
Year of Birth: 1971 | | Trustee | | Indefinite/
July 2017
to present | | President, Foreside Financial Group, LLC, 2011 to present; Director, Portland Air Freight, 2011 to present; Director, National Investment Company Service Association (NICSA) 2018 to present. | | 12 | | PAF Transportation |
87
ADVISERS INVESTMENT TRUST
JOHCM FUNDS
ADDITIONAL INFORMATION
September 30, 2020 (Unaudited)
| | | | | | | | | | |
| | | | | | | | | Number of | | |
| | | | | | | | | Portfolios | | |
| | | Position(s) | | Term of | | | | in the Trust | | Other Directorships |
| Name, Address and | | Held with | | Office/Length | | Principal Occupation(s) | | Overseen by | | Held by Trustee |
| Year of Birth1 | | the Trust2 | | of Time Served | | During Past 5 Years | | Trustee | | During Past 5 Years |
Daniel P. Houlihan3
Year of Birth: 1966 | | Trustee | | Indefinite/
March 2016
to present | | Executive Vice President, The Northern Trust Company, 2008 to present; Chairman, National Investment Company Service Association (NICSA) 2017 to present; Vice Chairman, National Investment Company Service Association (NICSA) 2014 to 2017. | | 12 | | None |
Barbara J. Nelligan
Year of Birth: 1969 | | President | | Indefinite/
August 2017
to present | | Senior Vice President, Global Fund Services Fund Governance Solutions, The Northern Trust Company, 2018 to present; Senior Vice President, Global Fund Services Product Management, The Northern Trust Company, 2007 to 2018; Vice President of Advisers Investment Trust, 2012 to 2017. | | N/A | | N/A |
Scott Craven Jones
Year of Birth: 1962 | | Risk Officer | | Indefinite/
July 2014
to present | | Director, Carne Global Financial Services, Inc., 2013 to present. | | N/A | | N/A |
Rodney L. Ruehle
Year of Birth: 1968 | | Chief Compliance Officer and AML Officer | | Indefinite/
March 2019
to present | | Director, Foreside Fund Services, LLC (formerly Foreside Compliance Services, LLC) (financial services) (2016 to present); Director, Beacon Hill Fund Services, LLC (April 2008 to July 2016). | | N/A | | N/A |
Troy Sheets
Year of Birth: 1971 | | Treasurer | | Indefinite/
July 2011
to present | | Senior Director, Foreside Financial Group, LLC, 2016 to present; Director, Beacon Hill Fund Services, Inc., 2009 to 2016. | | N/A | | N/A |
Trent Statczar
Year of Birth: 1971 | | Assistant Treasurer | | Indefinite/
July 2011
to present | | Senior Director, Foreside Financial Group, LLC, 2016 to present; Director, Beacon Hill Fund Services, Inc., 2008 to 2016. | | N/A | | N/A |
Toni M. Bugni
Year of Birth: 1973 | | Secretary | | Indefinite/
March 2018
to present | | Senior Vice President, Global Fund Services Fund Governance Solutions, The Northern Trust Company, 2011 to present. | | N/A | | N/A |
88
ADVISERS INVESTMENT TRUST
JOHCM FUNDS
ADDITIONAL INFORMATION
September 30, 2020 (Unaudited)
| | | | | | | | | | |
| | | | | | | | | Number of | | |
| | | | | | | | | Portfolios | | |
| | | Position(s) | | Term of | | | | in the Trust | | Other Directorships |
| Name, Address and | | Held with | | Office/Length | | Principal Occupation(s) | | Overseen by | | Held by Trustee |
| Year of Birth1 | | the Trust2 | | of Time Served | | During Past 5 Years | | Trustee | | During Past 5 Years |
Deanna Y. Pellack Year of Birth: 1987 | | Assistant Secretary | | Indefinite/ March 2018 to present | | Vice President, Global Fund Services Fund Governance Solutions, The Northern Trust Company 2019 to present; Second Vice President, Global Fund Services Fund Governance Solutions, The Northern Trust Company 2014 to 2019. | | N/A | | N/A |
1 The mailing address of Messrs. Whitaker, Ruehle, Sheets, and Statczar is 690 Taylor Road, Suite 210, Gahanna, Ohio 43230. The mailing address of Messrs. Houlihan and Jones and Mses. Nelligan, Bugni, and Pellack is 50 S. LaSalle Street, Chicago, IL 60603.
2 Mr. Whitaker is the President of Foreside Financial Group, LLC and is therefore deemed to be an “interested person” of the Trust, as defined in the 1940 Act.
3 Mr. Houlihan is an Executive Vice President of the Northern Trust Company and is therefore deemed to be an “interested person” of the Trust, as defined in the 1940 Act.
The Funds’ Statement of Additional Information includes additional information about the Trust’s Trustees and Officers. To receive your free copy of the Statement of Additional Information, call toll-free 866-260-9549.
89
(This page has been intentionally left blank)
JOHCM Funds
(Series of the Advisers Investment Trust)
Notice of Privacy Policy & Practices
SAFEGUARDING PRIVACY
The Funds recognizes and respects the privacy concerns and expectations of our customers1. We are committed to maintaining the privacy and security of the personal confidential information we collect about you. We provide this notice so that you will know what kinds of information we collect and the circumstances in which that information may be disclosed to third parties.
INFORMATION WE COLLECT AND SOURCES OF INFORMATION
We collect nonpublic personal information about our customers from the following sources:
| · | | Account Applications and other forms, which may include a customer’s name, address, social security number, and information about a customer’s investment goals and risk tolerance; |
| · | | Account History, including information about the transactions and balances in a customer’s account(s); and |
| · | | Correspondences including written, telephonic or electronic between a customer and the Funds or service providers to the Funds. |
INFORMATION WE SHARE WITH SERVICE PROVIDERS
The Funds may disclose all non-public personal information we collect, as described above, to companies that perform services on our behalf, including those that assist us in responding to inquiries, processing transactions, preparing and mailing account statements and other forms of shareholder services, provided they use the information solely for these purposes and they enter into a confidentiality agreement regarding the information. The Funds also may disclose non-public personal information as otherwise permitted by law.
SAFEGUARDING CUSTOMER INFORMATION
We will safeguard, according to federal standards of security and confidentiality, any non-public personal information our customers share with us.
We require service providers to the Funds:
| · | | to maintain policies and procedures designed to assure only appropriate access to, and use of information about customers of the Funds; and |
| · | | to maintain physical, electronic and procedural safeguards that comply with federal standards to guard nonpublic personal information of customers of the Funds. |
We will adhere to the policies and practices described in this notice regardless of whether you are a current or former shareholder of the Funds.
| 1 | For purposes of this notice, the term “customer” or “customers” include individuals who provide nonpublic personal information to the Funds, but do not invest in Fund shares. |
Investment Adviser
J O Hambro Capital Management Limited
Level 3
1 St Jame’s Market
London, SW1Y 4AH
Custodian
The Northern Trust Company
50 South LaSalle Street
Chicago, Illinois 60603
Independent Registered Public Accounting Firm
PricewaterhouseCoopers LLP
One North Wacker Drive
Chicago, IL 60606
Legal Counsel
Thompson Hine LLP
41 South High Street, Suite 1700
Columbus, Ohio 43215-6101
Distributor
Foreside Financial Services, LLC
3 Canal Plaza, Suite 100
Portland, ME 04101
For Additional Information, call
866-260-9549 (toll free) or 312-557-5913

RIVER CANYON TOTAL RETURN
BOND FUND
ANNUAL REPORT
September 30, 2020
Beginning on January 28, 2021, as permitted by regulations adopted by the Securities and Exchange Commission, paper copies of the Fund’s shareholder reports will no longer be sent by mail unless you specifically request paper copies of the reports from the Fund or from your financial intermediary, such as a broker-dealer. Instead, the reports will be made available on a website, and you will be notified by mail each time a report is posted and provided with a website link to access the report. You may elect to receive all future reports in paper free of charge. You can inform the Fund that you wish to continue receiving paper copies of your shareholder reports by calling toll-free 800-245-0371 or 312-557-0164. If you own your shares through a financial intermediary, you may contact your financial intermediary or follow instructions included with this disclosure to elect to continue to receive paper copies of your shareholder reports. Your election to receive reports in paper will apply to all funds held with the fund complex or your financial intermediary. If you have already elected to receive shareholder reports electronically, you will not be affected by this change and you need not take any action. You may elect to receive shareholder reports and other communications from the Fund by calling toll-free 800-245-0371 or 312-557-0164 or by contacting your financial intermediary.
This report is submitted for the general information of the shareholders of the Fund. It is not authorized for the distribution to prospective investors unless preceded or accompanied by an effective prospectus.
ADVISERS INVESTMENT TRUST
RIVER CANYON TOTAL RETURN BOND FUND
TABLE OF CONTENTS
September 30, 2020
ADVISERS INVESTMENT TRUST
RIVER CANYON TOTAL RETURN BOND FUND
SHAREHOLDER LETTER
September 30, 2020
Dear Shareholder:
We are pleased to present to shareholders the September 30, 2020 Annual Report for the River Canyon Total Return Bond Fund (the “Fund”), a series of the Advisers Investment Trust. This report contains the results of Fund operations for the year ended September 30, 2020.
We appreciate the trust and confidence you have placed in us by choosing the Fund and its Investment Adviser, River Canyon Fund Management LLC, and we look forward to continuing to serve your investing needs.
Sincerely,

Barbara J. Nelligan
President
Advisers Investment Trust
1
ADVISERS INVESTMENT TRUST
RIVER CANYON TOTAL RETURN BOND FUND
PORTFOLIO COMMENTARY
September 30, 2020 (Unaudited)
River Canyon Total Return Bond Fund
Value of a hypothetical $100,000 investment in the Fund’s Institutional Shares from inception on December 30, 2014 to September 30, 2020
Average Annual Total Returns as of September 30, 2020
| | | | | | | | | | | | |
| | | One Year Return | | 3 Year Return | | 5 Year Return | | Since Inception Return | | Gross Expense Ratio* | | Net Expense Ratio* |
River Canyon Total Return Bond Fund – Institutional Shares | | 3.20% | | 6.08% | | 5.84% | | 5.95% | | 1.53% | | 0.70% |
Bloomberg Barclays U.S. Aggregate Bond Index | | 6.98% | | 5.24% | | 4.18% | | 3.84% | | - | | - |
| | |
Allocation Breakdown as of 9/30/2020 | | |
| | |
RMBS Non-Agency | | 19% |
| | |
Corporate | | 18% |
| | |
ABS | | 13% |
| | |
Agency CMO | | 15% |
| | |
CLO 2.0 | | 9% |
| | |
CMBS | | 8% |
| | |
Municipals | | 8% |
| | |
RMBS Agency | | 7% |
| | |
Mortgage REIT | | 3% |
2
ADVISERS INVESTMENT TRUST
RIVER CANYON TOTAL RETURN BOND FUND
PORTFOLIO COMMENTARY
September 30, 2020 (Unaudited)
The Fund’s performance reflects the reinvestment of dividends as well as the impact of any transaction costs and the deduction of fees and expenses. The performance does not reflect taxes that a shareholder would pay on Fund distributions or on the redemption of Fund shares. 3 year, 5 year, and since inception returns are annualized.
The Inception date of the Fund is December 30, 2014.
* Expense ratios are per the most recent Fund Prospectus. The Adviser has entered into a contractual expense limitation agreement with respect to the Fund until January 28, 2021.
The performance data quoted represents past performance; past performance does not guarantee future results. The investment return and principal value of an investment will fluctuate so that an investor’s shares, when redeemed, may be worth more or less than their original cost. The Fund’s current performance may be lower or higher than the performance data quoted. Investors may obtain performance information current to the most recent month-end, within 7 business days, by calling 800-245-0371 or 312-557-0164.
The Fund’s benchmark for performance comparison purposes is the Bloomberg Barclays U.S. Aggregate Bond Index. The index is an unmanaged index that measures the investment grade, US dollar-denominated, fixed-rate taxable bond market. The index includes Treasuries, government-related and corporate securities, MBS (agency fixed-rate and hybrid ARM pass-throughs), ABS and CMBS (agency and non-agency). The table reflects the theoretical reinvestment of dividends on securities in the index. The impact of any transaction costs and the deduction of expenses associated with a mutual fund, such as investment management and administration fees, are not reflected in the index calculations. It is not possible to invest directly in an index.
Market Commentary (for Fiscal year ending September 30, 2020)
The fiscal year began favorably as the US economy achieved record low unemployment, steady GDP growth and low inflation amid indications from the Fed that rates would remain low following three rate cuts in 2019. Risk assets performed well in 2019, with the S&P 500 up 31.5% for the year and the Bloomberg Barclays US Bond Aggregate up 8.72%. The positive sentiment was quickly extinguished by the end of the first quarter of 2020, as the Covid-19 virus spread and government-imposed lockdowns followed. Global economic activity came to a halt, triggering an unprecedented flight to safety and a corresponding decline in risk assets. Central Banks, particularly the Federal Reserve, acted swiftly with supportive measures including 150 bps of rate cuts, a new round quantitative easing (QE), and implementation of several programs to support and increase liquidity in credit markets. Stimulus action from Congress and the Federal Reserve’s commitment to using its full range of tools to support households, businesses, and the US economy, triggered a swift rebound in risk assets from the lows and, in some cases, to new all-time highs. Treasury rates across the yield curve moved significantly lower throughout the fiscal year as the 10-year treasury yield fell from 1.92% to 0.63%, while the 30- year Treasury yield fell from 2.39% to 1.65%.
Although financial markets quickly rebounded and stabilized, the economic impact and headlines from Covid-19 dominated the remainder of the fiscal year. Significant portions of the US economy, including airlines, hotels, brick and mortar retail, and many small businesses who found themselves in the eye of the Covid-19 storm, continue to suffer significant headwinds. Most developed nations remain with portions of their economies on lockdown to various degrees. Expected annualized US GDP growth is forecasted to fall -3.5% for 2020, after a -31.4% collapse in the second quarter. The unemployment rate spiked from 4% to 14% and has recovered to 8%. US inflation expectations have been subdued, undershooting the Central Bank’s inflation target and prompting the Fed to change its inflation targeting policy to an average of 2% over a longer time frame rather than the previous policy guidance of aiming to prevent inflation from rising above 2% at any point. Through advancements in therapeutics and progress toward a vaccine, the worst of the Covid-19 virus’ economic impact is potentially in the past and there is reason to be optimistic that global economic activity can normalize over the fiscal year.
3
ADVISERS INVESTMENT TRUST
RIVER CANYON TOTAL RETURN BOND FUND
PORTFOLIO COMMENTARY
September 30, 2020 (Unaudited)
Fund Insights
The Fund entered the year with an elevated cash position and a bias towards higher-quality liquid structured credit securities, anchored by an allocation to Agency MBS and AAA CLOs. The Fund’s refrain from large exposures in junior securities provided resiliency during the spring’s historic market disruption, driven by the forced and swift unwind of many levered investment vehicles and structures. While the Fund sustained some negative mark to market performance in late March, the Fund’s ultimate staying power was affirmed as prices rebounded throughout the year for higher quality, senior securities with durable underlying assets. The Fund’s defensive posture and cash allocation placed it in a favorable position to capitalize on the wide-scale dislocation across many credit sectors including ABS, CMBS, CLOs and corporate debt. Security selection in the Non-Agency RMBS and ABS sectors were the primary drivers of fiscal year performance. The Fund’s duration posture and income generation were also material positive performance drivers.
Looking Forward
We continue to manage the portfolio with a focus on delivering strong relative and absolute returns across a variety of interest rate and economic environments while effectively managing credit, prepayment, and duration risks. The increased volatility in markets has allowed us to identify and purchase securities that fit the Fund’s long-term investment profile of asymmetric upside with robust downside protection. The Fund’s fiscal year performance supports momentum in the Fund’s growth as fixed-income investors facing historically low yields and significant duration risk seek alternatives to traditional core bond allocations. Our investment philosophy and process remain unchanged. We continue to believe that our research process, security level analysis, size, and experience in the structured product markets position us favorably in managing the Fund’s future prospects.
Disclaimer
Any investment in the Fund involves significant risk, including the risk of loss of all or a portion of your investment. The results indicated herein include both realized and unrealized gains and losses, and actual results when realized may differ materially from those set forth herein. Total returns include reinvestment of dividends and distributions. Current performance may be lower or higher than the performance data presented. Investment returns and principal value will fluctuate with market conditions. The value of an investment in the Fund, when redeemed, may be worth more or less than its original purchase cost. You should consider the investment objectives, risks, charges and expenses of a mutual fund carefully before investing.
Certain information contained herein constitutes “forward-looking statements”, which can be identified by the use of forward-looking terminology such as “may,” “will,” “should,” “expect,” “anticipate,” “target,” “project,” “estimate,” “intend,” “continue” or “believe” or the negatives thereof or other variations thereon or comparable terminology. Due to various risks and uncertainties, actual events or results or the actual performance of an individual investment, an asset class or the Fund may differ materially from those reflected or contemplated in such forward-looking statements. Past performance is not indicative of future results.
Certain Investment Risks
It is important to note that the Fund is not guaranteed by the U.S. Government. Fixed income investments involve interest rate risk, issuer credit risk and risk of default, prepayment risk, duration, risk and price volatility risk. Funds investing in bonds can lose their value as interest rates rise, and investors participating in such Funds can suffer a partial or total loss of their principal.
Mortgage-backed and other asset-backed securities involve risks that are different from or more acute than risks associated with other types of debt instruments. For example, rising interest rates tend to extend the duration of fixed-rate MBS, making them more sensitive to changes in interest rates and causing funds investing in such securities (such as the Fund) to exhibit additional volatility. Conversely, declining interest rates may cause borrowers to pay off their mortgages sooner than expected, thereby reducing returns
4
ADVISERS INVESTMENT TRUST
RIVER CANYON TOTAL RETURN BOND FUND
PORTFOLIO COMMENTARY
September 30, 2020 (Unaudited)
because the Fund may be required to reinvest the return of borrower principal at the lower prevailing interest rate. MBS related to floating rate loans may exhibit greater price volatility than a fixed rate obligation of similar credit quality. With respect to non-agency MBS, there are no direct or indirect government or agency guarantees of payments in pools created by non-governmental issuers. Non-agency MBS also are not subject to the same underwriting requirements for the underlying mortgages that are applicable to those mortgage-related securities that have a government or government-sponsored entity guarantee.
For a more complete list of Fund risks, please see the Prospectus.
5
ADVISERS INVESTMENT TRUST
RIVER CANYON TOTAL RETURN BOND FUND
SCHEDULE OF INVESTMENTS
September 30, 2020
| | | | | | | | | | | | |
| | | Percentage of Net Assets | | Shares | | | Value | |
| |
COMMON STOCKS | | | 3.0 | % | | | | | | | | |
AGNC Investment Corp. | | | | | | | | | | | | |
| | | | | | | 362,951 | | | $ | 5,048,648 | |
| | | | | | | | | | | | |
TOTAL COMMON STOCKS
(Cost $5,046,992) | | | | | | | | | | | 5,048,648 | |
| | | | | | | | | | | | |
| | | Percentage of Net Assets | | Principal Amount | | | Value | |
| |
MORTGAGE-BACKED SECURITIES | | | 119.0 | % | | | | | | | | |
PRIVATE(a) | | | 63.8 | % | | | | | | | | |
Home Equity | | | 63.8 | % | | | | | | | | |
Argent Securities, Inc. Asset-Backed Pass-Through Certificates Series 2005-W5
(Floating, ICE LIBOR USD 1M + 0.46%, 0.46% Floor)(b) | | | | | | | | | |
0.61%, 01/25/36 | | | | | | $ | 3,550,000 | | | $ | 3,384,891 | |
Bella Vista Mortgage Trust Series 2004-1
(Floating, ICE LIBOR USD 1M + 0.70%, 0.35% Floor, 11.25% Cap)(b) | | | | | | | | | | | | |
0.86%, 11/20/34 | | | | | | | 344,605 | | | | 347,045 | |
Boeing (The) Co. | | | | | | | | | | | | |
5.81%, 05/01/50 | | | | | | | 5,500,000 | | | | 6,653,791 | |
Boeing (The) Co. | | | | | | | | | | | | |
5.93%, 05/01/60 | | | | | | | 1,475,000 | | | | 1,825,518 | |
Business Jet Securities LLC Series 2018-1(c) | | | | | | | | | | | | |
7.75%, 02/15/33 | | | | | | | 1,859,301 | | | | 1,871,953 | |
Business Jet Securities LLC Series 2018-2(c) | | | | | | | | | | | | |
6.66%, 06/15/33 | | | | | | | 1,835,416 | | | | 1,838,300 | |
Business Jet Securities LLC Series 2019-1(c) | | | | | | | | | | | | |
4.21%, 07/15/34 | | | | | | | 1,804,866 | | | | 1,809,195 | |
Business Jet Securities LLC Series 2019-1(c) | | | | | | | | | | | | |
5.19%, 07/15/34 | | | | | | | 809,297 | | | | 809,998 | |
Chase Funding Trust Series 2003-3
(Floating, ICE LIBOR USD 1M + 0.54%, 0.27% Floor)(b) | | | | | | | | | | | | |
0.69%, 04/25/33 | | | | | | | 280,355 | | | | 267,895 | |
Chase Funding Trust Series 2004-2
(Floating, ICE LIBOR USD 1M + 0.50%, 0.25% Floor)(b) | | | | | | | | | | | | |
0.65%, 02/26/35 | | | | | | | 1,531,944 | | | | 1,464,139 | |
CHL GMSR Issuer Trust Series 2018-GT1
(Floating, ICE LIBOR USD 1M + 2.75%)(b)(c) | | | | | | | | | | | | |
2.90%, 05/25/23 | | | | | | | 1,975,000 | | | | 1,895,918 | |
Clear Channel Worldwide Holdings, Inc.(c) | | | | | | | | | | | | |
5.13%, 08/15/27 | | | | | | | 5,265,000 | | | | 5,055,716 | |
Countrywide Asset-Backed Certificates Series 2006-S3
(Step to 6.61% on 11/25/20)(d) | | | | | | | | | | | | |
6.53%, 06/25/21 | | | | | | | 3,482 | | | | 409,674 | |
CSMC Trust Series 2020-LOTS
(Floating, ICE LIBOR USD 1M + 3.97%, 4.73% Floor)(b)(c) | | | | | | | | | | | | |
4.72%, 07/15/22 | | | | | | | 6,825,000 | | | | 6,868,514 | |
CWHEQ Home Equity Loan Trust Series 2006-S2 | | | | | | | | | | | | |
5.84%, 07/25/27 | | | | | | | 275,234 | | | | 165,168 | |
CWHEQ Home Equity Loan Trust Series 2006-S5 | | | | | | | | | | | | |
5.75%, 06/25/35 | | | | | | | 6,977 | | | | 1,260,584 | |
See Notes to Financial Statements.
6
ADVISERS INVESTMENT TRUST
RIVER CANYON TOTAL RETURN BOND FUND
SCHEDULE OF INVESTMENTS
September 30, 2020
| | | | | | | | | | | | |
| | | Percentage
of Net
Assets | | | Principal Amount | | | Value | |
| |
Genworth Mortgage Holdings, Inc.(c) | | | | | | | | | | | | |
6.50%, 08/15/25 | | | | | | $ | 4,000,000 | | | $ | 4,178,800 | |
GE-WMC Asset-Backed Pass Through Certificates Series 2005-1
(Floating, ICE LIBOR USD 1M + 0.69%, 0.46% Floor)(b) | | | | | | | | | | | | |
0.84%, 10/25/35 | | | | | | | 315,244 | | | | 274,032 | |
GS Mortgage-Backed Securities Corp. Trust 2019-PJ3(c)(e)(f)(g) | | | | | | | | | | | | |
0.22%, 03/25/50 | | | | | | | 172,927,721 | | | | 311,270 | |
Hertz Vehicle Financing II LP Series 2015-3A(c) | | | | | | | | | | | | |
2.67%, 09/25/21 | | | | | | | 763,404 | | | | 766,389 | |
Hertz Vehicle Financing II LP Series 2015-3A(c) | | | | | | | | | | | | |
3.71%, 09/25/21 | | | | | | | 3,000,000 | | | | 3,008,755 | |
Hertz Vehicle Financing II LP Series 2016-2A(c) | | | | | | | | | | | | |
3.94%, 03/25/22 | | | | | | | 3,000,000 | | | | 3,019,657 | |
Hertz Vehicle Financing II LP Series 2017-1A(c) | | | | | | | | | | | | |
2.96%, 10/25/21 | | | | | | | 488,035 | | | | 490,457 | |
Home Equity Mortgage Loan Asset-Backed Trust Series 2007-A
(Floating, ICE LIBOR USD 1M + 0.45%, 0.45% Floor)(b) | | | | | | | | | | | | |
0.60%, 04/25/37 | | | | | | | 10,000,000 | | | | 4,313,018 | |
Home Equity Mortgage Trust Series 2005-3
(Floating, ICE LIBOR USD 1M + 1.08%, 0.72% Floor)(b) | | | | | | | | | | | | |
1.23%, 11/25/35 | | | | | | | 52,786 | | | | 52,726 | |
Horizon Aircraft Finance I Ltd. Series 2018-1(c) | | | | | | | | | | | | |
4.46%, 12/15/38 | | | | | | | 3,550,537 | | | | 3,354,143 | |
Indymac Residential Mortgage-Backed Trust Series 2005-L3
(Floating, ICE LIBOR USD 1M + 0.44%, 0.22% Floor)(b) | | | | | | | | | | | | |
0.59%, 12/25/38 | | | | | | | 1,298,959 | | | | 896,282 | |
Jamestown CLO XI Ltd. Series 2018-11A
(Floating, ICE LIBOR USD 3M + 1.70%)(b)(c) | | | | | | | | | | | | |
1.97%, 07/14/31 | | | | | | | 3,000,000 | | | | 2,939,745 | |
JP Morgan Mortgage Acquisition Trust Series 2007-CH1(h) | | | | | | | | | | | | |
4.85%, 11/25/36 | | | | | | | 357,475 | | | | 281,560 | |
JP Morgan Resecuritization Trust Series 2009-7(c)(f)(g) | | | | | | | | | | | | |
7.00%, 09/27/37 | | | | | | | 9,698,142 | | | | 6,291,369 | |
LCM XXIII Ltd. Series 23A
(Floating, ICE LIBOR USD 3M + 3.30%, 3.30% Floor)(b)(c) | | | | | | | | | | | | |
3.57%, 10/20/29 | | | | | | | 1,110,000 | | | | 1,008,962 | |
Lehman Mortgage Trust Series 2008-4
(Floating, ICE LIBOR USD 1M + 0.38%, 0.38% Floor, 7.00% Cap)(b) | | | | | | | | | | | | |
0.53%, 01/25/37 | | | | | | | 568,521 | | | | 125,960 | |
Midocean Credit CLO IX Series 2018-9A
(Floating, ICE LIBOR USD 3M + 1.75%, 1.75% Floor)(b)(c) | | | | | | | | | | | | |
2.02%, 07/20/31 | | | | | | | 2,500,000 | | | | 2,446,229 | |
Mileage Plus Holdings LLC(c) | | | | | | | | | | | | |
6.50%, 06/20/27 | | | | | | | 5,000,000 | | | | 5,206,250 | |
Morgan Stanley ABS Capital I, Inc. Series 2002-HE3
(Floating, ICE LIBOR USD 1M + 1.08%, 0.54% Floor)(b) | | | | | | | | | | | | |
1.23%, 03/25/33 | | | | | | | 49,094 | | | | 48,188 | |
Morgan Stanley ABS Capital I, Inc. Trust Series 2004-HE9
(Floating, ICE LIBOR USD 1M + 0.89%, 0.59% Floor)(b) | | | | | | | | | | | | |
1.03%, 11/25/34 | | | | | | | 1,952,999 | | | | 1,847,484 | |
See Notes to Financial Statements.
7
ADVISERS INVESTMENT TRUST
RIVER CANYON TOTAL RETURN BOND FUND
SCHEDULE OF INVESTMENTS
September 30, 2020
| | | | | | | | | | | | |
| | | Percentage of Net Assets | | Principal Amount | | | Value | |
| |
Nationstar HECM Loan Trust Series 2020-1A(c)(f)(g) | | | | | | | | | | | | |
2.82%, 09/25/30 | | | | | | $ | 1,000,000 | | | $ | 1,000,000 | |
New Residential Investment Corp.(c) | | | | | | | | | | | | |
6.25%, 10/15/25 | | | | | | | 7,000,000 | | | | 6,898,360 | |
Nomura Asset Acceptance Corp. Alternative Loan Trust Series 2007-1(h) | | | | | | | | | | | | |
5.82%, 03/25/47 | | | | | | | 860,176 | | | | 895,329 | |
NP SPE II LLC Series 2019-2A(c) | | | | | | | | | | | | |
6.44%, 11/19/49 | | | | | | | 2,842,420 | | | | 2,836,910 | |
Residential Asset Securitization Trust Series 2006-A6
(Floating, 5.90% - ICE LIBOR USD 1M, 5.90% Cap)(b)(e) | | | | | | | | | | | | |
5.75%, 07/25/36 | | | | | | | 11,992,146 | | | | 2,790,638 | |
Start Ltd. Series 2018-1(c) | | | | | | | | | | | | |
4.09%, 05/15/43 | | | | | | | 2,179,951 | | | | 2,015,253 | |
TBW Mortgage-Backed Trust Series 2006-5 | | | | | | | | | | | | |
6.20%, 11/25/36 | | | | | | | 9,215,000 | | | | 2,234,300 | |
Venture 32 CLO Ltd. Series 2018-32A
(Floating, ICE LIBOR USD 3M + 1.10%, 1.10% Floor)(b)(c) | | | | | | | | | | | | |
1.37%, 07/18/31 | | | | | | | 2,000,000 | | | | 1,977,662 | |
Venture XXVII CLO Ltd. Series 2017-27A
(Floating, ICE LIBOR USD 3M + 1.30%)(b)(c) | | | | | | | | | | | | |
1.57%, 07/20/30 | | | | | | | 3,145,000 | | | | 3,120,344 | |
Vericrest Opportunity Loan Trust Series 2019-NPL2
(Step to 6.97% on 03/25/22)(c)(d) | | | | | | | | | | | | |
3.97%, 02/25/49 | | | | | | | 1,526,625 | | | | 1,527,701 | |
Vibrant CLO VI Ltd. Series 2017-6A
(Floating, ICE LIBOR USD 3M + 1.24%)(b)(c) | | | | | | | | | | | | |
1.47%, 06/20/29 | | | | | | | 3,000,000 | | | | 2,981,611 | |
WaMu Mortgage Pass-Through Certificates Trust Series 2005-AR2
(Floating, ICE LIBOR USD 1M + 0.35%, 0.35% Floor, 10.50% Cap)(b) | | | | | | | | | | | | |
0.50%, 01/25/45 | | | | | | | 148,931 | | | | 142,210 | |
Wellfleet CLO Ltd. Series 2018-2
(Floating, ICE LIBOR USD 3M + 1.20%, 1.20% Floor)(b)(c) | | | | | | | | | | | | |
1.47%, 10/20/31 | | | | | | | 1,000,000 | | | | 989,980 | |
| | | | | | | | | | | | |
| | | | | | | | | | | 106,199,873 | |
| | | | | | | | | | | | |
U.S. GOVERNMENT AGENCIES | | | 55.2 | % | | | | | | | | |
Fannie Mae REMICS Series 2017-4(e) | | | | | | | | | | | | |
3.50%, 05/25/41 | | | | | | | 3,707,388 | | | | 143,588 | |
Freddie Mac REMICS(e) | | | | | | | | | | | | |
3.50%, 05/15/40 | | | | | | | 4,754,668 | | | | 131,210 | |
Freddie Mac REMICS(e) | | | | | | | | | | | | |
4.00%, 07/15/47 | | | | | | | 13,996,075 | | | | 1,436,036 | |
Freddie Mac REMICS
(Floating, 6.15% - ICE LIBOR USD 1M, 6.15% Cap)(b)(e) | | | | | | | | | | | | |
6.00%, 12/15/38 | | | | | | | 5,769,149 | | | | 97,954 | |
Government National Mortgage Association Pool TBA | | | | | | | | | | | | |
3.50%, 10/01/50 | | | | | | | 57,100,000 | | | | 60,122,285 | |
Government National Mortgage Association Series 2016-116(e) | | | | | | | | | | | | |
3.50%, 11/20/44 | | | | | | | 15,243,688 | | | | 1,556,990 | |
Government National Mortgage Association Series 2016-60(e) | | | | | | | | | | | | |
3.50%, 05/20/46 | | | | | | | 6,774,122 | | | | 1,017,871 | |
See Notes to Financial Statements.
8
ADVISERS INVESTMENT TRUST
RIVER CANYON TOTAL RETURN BOND FUND
SCHEDULE OF INVESTMENTS
September 30, 2020
| | | | | | | | | | | | |
| | | Percentage
of Net
Assets | | | Principal Amount | | | Value | |
| |
Government National Mortgage Association Series 2017-117
(Floating, 6.20% - ICE LIBOR USD 1M, 6.20% Cap)(b)(e) | | | | | | | | | | | | |
6.04%, 08/20/47 | | | | | | $ | 4,336,499 | | | $ | 892,745 | |
Government National Mortgage Association Series 2017-68
(Floating, 6.15% - ICE LIBOR USD 1M, 6.15% Cap)(b)(e) | | | | | | | | | | | | |
5.99%, 05/20/47 | | | | | | | 13,938,485 | | | | 2,851,479 | |
Government National Mortgage Association Series 2019-112(e) | | | | | | | | | | | | |
3.50%, 04/20/49 | | | | | | | 829,182 | | | | 51,791 | |
Government National Mortgage Association Series 2019-112(e) | | | | | | | | | | | | |
3.50%, 09/20/49 | | | | | | | 2,548,905 | | | | 176,104 | |
Government National Mortgage Association Series 2019-121
(Floating, 6.05% - ICE LIBOR USD 1M, 6.05% Cap)(b)(e) | | | | | | | | | | | | |
5.89%, 10/20/49 | | | | | | | 14,303,277 | | | | 2,073,523 | |
Government National Mortgage Association Series 2019-128(e) | | | | | | | | | | | | |
4.00%, 10/20/49 | | | | | | | 23,761,119 | | | | 2,369,841 | |
Government National Mortgage Association Series 2019-145(e) | | | | | | | | | | | | |
3.50%, 08/20/49 | | | | | | | 20,611,947 | | | | 904,452 | |
Government National Mortgage Association Series 2019-151(e) | | | | | | | | | | | | |
3.00%, 12/20/49 | | | | | | | 20,470,640 | | | | 2,221,034 | |
Government National Mortgage Association Series 2019-156(e)(f)(g) | | | | | | | | | | | | |
0.78%, 11/16/61 | | | | | | | 13,190,386 | | | | 962,926 | |
Government National Mortgage Association Series 2019-81(e)(f)(g) | | | | | | | | | | | | |
0.94%, 02/16/61 | | | | | | | 32,400,051 | | | | 2,632,138 | |
Government National Mortgage Association Series 2020-104(e) | | | | | | | | | | | | |
3.00%, 07/20/50 | | | | | | | 11,065,335 | | | | 1,300,913 | |
Government National Mortgage Association Series 2020-105(e)(f)(g) | | | | | | | | | | | | |
0.98%, 03/16/62 | | | | | | | 42,895,322 | | | | 3,529,950 | |
Government National Mortgage Association Series 2020-107(e) | | | | | | | | | | | | |
3.00%, 07/20/50 | | | | | | | 3,582,956 | | | | 473,038 | |
Government National Mortgage Association Series 2020-123(e) | | | | | | | | | | | | |
2.50%, 08/20/50 | | | | | | | 28,542,572 | | | | 3,620,728 | |
Government National Mortgage Association Series 2020-133(e) | | | | | | | | | | | | |
2.50%, 09/20/50 | | | | | | | 11,296,926 | | | | 1,412,116 | |
Government National Mortgage Association Series 2020-47(e) | | | | | | | | | | | | |
3.50%, 04/20/50 | | | | | | | 11,812,317 | | | | 443,666 | |
Government National Mortgage Association Series 2020-62
(Floating, 6.15% - ICE LIBOR USD 1M, 6.15% Cap)(b)(e) | | | | | | | | | | | | |
5.99%, 05/20/50 | | | | | | | 5,084,029 | | | | 1,102,033 | |
Government National Mortgage Association Series 2020-93(e) | | | | | | | | | | | | |
3.00%, 04/20/50 | | | | | | | 4,952,166 | | | | 240,449 | |
| | | | | | | | | | | | |
| | | | | | | | | | | 91,764,860 | |
| | | | | | | | | | | | |
TOTAL MORTGAGE-BACKED SECURITIES
(Cost $200,291,965) | | | | | | | | | | | 197,964,733 | |
| | | | | | | | | | | | |
See Notes to Financial Statements.
9
ADVISERS INVESTMENT TRUST
RIVER CANYON TOTAL RETURN BOND FUND
SCHEDULE OF INVESTMENTS
September 30, 2020
| | | | | | | | | | | | |
| | | Percentage of Net Assets | | Principal Amount | | | Value | |
| |
MUNICIPAL BONDS | | | 7.5 | % | | | | | | | | |
GDB Debt Recovery Authority of Commonwealth Puerto Rico Taxable Revenue Bond(i) | | | | | | | | | | | | |
7.50%, (41% PIK), 08/20/40 | | | | | | $ | 10,027,397 | | | $ | 6,893,836 | |
Puerto Rico Sales Tax Financing Corp. Sales Tax Revenue Capital Appreciation Restructured Series | | | | | | | | | | | | |
0.00%, 07/01/51 | | | | | | | 27,409,000 | | | | 5,601,577 | |
| | | | | | | | | | | | |
TOTAL MUNICIPAL BONDS
(Cost $12,491,532) | | | | | | | | | | | 12,495,413 | |
| | | | | | | | | | | | |
| | | Percentage of Net Assets | | Shares | | | Value | |
| |
SHORT-TERM INVESTMENTS(a) | | | 6.3 | % | | | | | | | | |
Northern Institutional Treasury Portfolio (Premier Class), 0.00%(j) | | | | | | | 10,380,526 | | | | 10,380,526 | |
| | | | | | | | | | | | |
TOTAL SHORT-TERM INVESTMENTS
(Cost $10,380,526) | | | | | | | | | | | 10,380,526 | |
| | | | | | | | | | | | |
TOTAL INVESTMENTS
(Cost $228,211,015) | | | 135.8 | % | | | | | | | 225,889,320 | |
| | | | | | | | | | | | |
| | | Percentage of Net Assets | | Principal Amount | | | Value | |
| |
TBA SALE COMMITMENTS | | | (29.4 | %) | | | | | | | | |
Fannie Mae TBA | | | | | | | | | | | | |
2.50%, 10/01/50 | | | | | | | (46,650,000 | ) | | | (48,933,299 | ) |
| | | | | | | | | | | | |
TOTAL TBA SALE COMMITMENTS
(Cost $(49,002,545)) | | | | | | | | | | | (48,933,299 | ) |
| | | | | | | | | | | | |
NET OTHER ASSETS (LIABILITIES) | | | (6.4 | %) | | | | | | | (10,653,778 | ) |
| | | | | | | | | | | | |
NET ASSETS | | | 100.0 | % | | | | | | $ | 166,302,243 | |
| | | | | | | | | | | | |
(a)All or a portion of this security is designated as collateral for the TBA security at September 30, 2020.
(b)Floating rate security. The rate presented is the rate in effect at September 30, 2020, and the related index and spread are shown parenthetically for each security.
(c)Securities purchased in a transaction exempt from registration under Rule 144A of the Securities Act of 1933. These securities may not be publicly traded without registration under the Securities Act of 1933. The value of these securities is determined by valuations supplied by a pricing service or brokers.
(d)Step coupon bond. Rate as of September 30, 2020 is disclosed.
(e)Interest only security.
(f)Variable rate security. Rate as of September 30, 2020 is disclosed.
(g)Variable or floating rate security, the interest rate of which adjusts periodically based on changes in current interest rates and prepayments on the underlying pool of assets.
(h)The interest rate on this certificate may increase 0.50% per annum after the first possible optional termination date.
(i)Security is a payment in-kind (PIK) bond and may pay all of or a portion of its coupon interest in-kind in lieu of cash. The percentage disclosed above represents the most recent PIK percentage relative to total interest paid.
(j)7-day current yield as of September 30, 2020 is disclosed.
Abbreviations:
CLO – Collateralized Loan Obligation
TBA – To be announced
See Notes to Financial Statements.
10
ADVISERS INVESTMENT TRUST
STATEMENT OF ASSETS & LIABILITIES
September 30, 2020
| | | | |
| | | River Canyon Total Return Bond Fund | |
| |
Assets: | | | | |
Investments, at value (Cost: $228,211,015) | | $ | 225,889,320 | |
Collateral due from broker | | | 230,000 | |
Receivable for interest | | | 1,289,281 | |
Receivable for dividends | | | 43,584 | |
Receivable for investments sold | | | 49,044,660 | |
Receivable for capital shares sold | | | 602,435 | |
Receivable from Investment Adviser | | | 9,853 | |
Prepaid expenses | | | 4,730 | |
| | | | |
Total Assets | | | 277,113,863 | |
Liabilities: | | | | |
Securities purchased payable | | | 61,725,706 | |
TBA sale commitments, at value (Cost: $49,002,545) | | | 48,933,299 | |
Capital shares redeemed payable | | | 2,826 | |
Accounting and Administration fees payable | | | 74,794 | |
Regulatory and Compliance fees payable | | | 10,160 | |
Accrued expenses and other payables | | | 64,835 | |
| | | | |
Total Liabilities | | | 110,811,620 | |
| | | | |
Net Assets | | $ | 166,302,243 | |
| | | | |
Institutional Shares: | | | | |
Net assets | | $ | 166,302,243 | |
Shares of common stock outstanding | | | 15,227,890 | |
| | | | |
Net asset value per share | | $ | 10.92 | |
| | | | |
Net Assets: | | | | |
Paid in capital | | $ | 165,272,324 | |
Distributable earnings (loss) | | | 1,029,919 | |
| | | | |
Net Assets | | $ | 166,302,243 | |
| | | | |
| | | | |
| |
See Notes to Financial Statements.
11
ADVISERS INVESTMENT TRUST
STATEMENT OF OPERATIONS
For the year ended September 30, 2020
| | | | |
| |
| | | River Canyon Total Return Bond Fund | |
| |
Investment Income: | | | | |
Dividend income | | $ | 26,362 | |
Interest income | | | 4,893,618 | |
Non-cash interest income | | | 141,510 | |
| | | | |
Total investment income | | | 5,061,490 | |
| | | | |
Operating expenses: | | | | |
Investment advisory | | | 898,289 | |
Accounting and Administration | | | 178,841 | |
Regulatory and Compliance | | | 125,394 | |
Trustees | | | 52,830 | |
Other | | | 212,227 | |
| | | | |
Total expenses before reductions | | | 1,467,581 | |
Expenses reduced by Adviser | | | (569,246 | ) |
| | | | |
Net expenses | | | 898,335 | |
| | | | |
Net investment income | | | 4,163,155 | |
| | | | |
Realized and Unrealized Gains (Losses) from Investment Activities: | | | | |
Net realized gains from investment transactions | | | 4,063,845 | |
Net realized gains on investments sold short | | | 728,674 | |
Change in unrealized appreciation (depreciation) on investments | | | (5,566,667 | ) |
Change in unrealized appreciation (depreciation) on investments sold short | | | 69,246 | |
| | | | |
Net realized and unrealized losses from investment activities | | | (704,902 | ) |
| | | | |
Change in Net Assets Resulting from Operations | | $ | 3,458,253 | |
| | | | |
| | | | |
| |
See Notes to Financial Statements.
12
ADVISERS INVESTMENT TRUST
STATEMENTS OF CHANGES IN NET ASSETS
For the years ended September 30, 2020 and 2019
| | | | | | | | |
| |
| | | River Canyon Total Return Bond Fund | |
| | | 2020 | | | 2019 | |
| |
Increase (decrease) in net assets: | | | | | | | | |
Operations: | | | | | | | | |
Net investment income | | $ | 4,163,155 | | | $ | 1,443,726 | |
Net realized gains (losses) from investment transactions | | | 4,792,519 | | | | 1,953,013 | |
Change in unrealized appreciation (depreciation) on investments | | | (5,497,421 | ) | | | 1,890,037 | |
| | | | | | | | |
Change in net assets resulting from operations | | | 3,458,253 | | | | 5,286,776 | |
| | | | | | | | |
Dividends paid to shareholders: | | | | | | | | |
From distributable earnings | | | (7,517,436 | ) | | | (1,539,441 | ) |
| | | | | | | | |
Total dividends paid to shareholders | | | (7,517,436 | ) | | | (1,539,441 | ) |
| | | | | | | | |
Capital Transactions: | | | | | | | | |
Proceeds from sale of shares | | | 144,873,311 | | | | 91,985,857 | |
Value of shares issued to shareholders in reinvestment of dividends | | | 5,734,465 | | | | 1,249,510 | |
Value of shares redeemed | | | (95,432,695 | ) | | | (8,074,617 | ) |
| | | | | | | | |
Change in net assets from capital transactions | | | 55,175,081 | | | | 85,160,750 | |
| | | | | | | | |
Change in net assets | | | 51,115,898 | | | | 88,908,085 | |
Net assets: | | | | | | | | |
Beginning of year | | | 115,186,345 | | | | 26,278,260 | |
| | | | | | | | |
End of year | | $ | 166,302,243 | | | $ | 115,186,345 | |
| | | | | | | | |
Share Transactions: | | | | | | | | |
Sold | | | 13,412,142 | | | | 8,400,510 | |
Reinvested | | | 529,424 | | | | 115,344 | |
Redeemed | | | (9,021,402 | ) | | | (731,990 | ) |
| | | | | | | | |
Change | | | 4,920,164 | | | | 7,783,864 | |
| | | | | | | | |
| | | | | | | | |
| |
See Notes to Financial Statements.
13
ADVISERS INVESTMENT TRUST
FINANCIAL HIGHLIGHTS
For the years indicated
| | | | | | | | | | | | | | | | | | | | |
| |
| | | River Canyon Total Return Bond Fund | |
| | | Year Ended September 30, 2020 | | | Year Ended September 30, 2019 | | | Year Ended September 30, 2018 | | | Year Ended September 30, 2017 | | | Year Ended September 30, 2016 | |
| | | | | | | | | | | | | | | | |
| |
Net asset value, beginning of year | | $ | 11.17 | | | $ | 10.41 | | | $ | 10.35 | | | $ | 10.23 | | | $ | 10.04 | |
| | | | | | | | | | | | | | | | | | | | |
Income (loss) from operations: | | | | | | | | | | | | | | | | | | | | |
Net investment income | | | 0.33 | | | | 0.24 | | | | 0.46 | | | | 0.38 | | | | 0.29 | |
Net realized and unrealized gains from investments | | | 0.02 | | | | 0.79 | | | | 0.05 | | | | 0.25 | | | | 0.16 | |
| | | | | | | | | | | | | | | | | | | | |
Total from investment operations | | | 0.35 | | | | 1.03 | | | | 0.51 | | | | 0.63 | | | | 0.45 | |
| | | | | | | | | | | | | | | | | | | | |
Less distributions paid: | | | | | | | | | | | | | | | | | | | | |
From net investment income | | | (0.35 | ) | | | (0.27 | ) | | | (0.45 | ) | | | (0.39 | ) | | | (0.26 | ) |
From net realized gains on investments | | | (0.25 | ) | | | — | | | | — | | | | (0.12 | ) | | | — | |
| | | | | | | | | | | | | | | | | | | | |
Total distributions paid | | | (0.60 | ) | | | (0.27 | ) | | | (0.45 | ) | | | (0.51 | ) | | | (0.26 | ) |
| | | | | | | | | | | | | | | | | | | | |
Change in net asset value | | | (0.25 | ) | | | 0.76 | | | | 0.06 | | | | 0.12 | | | | 0.19 | |
| | | | | | | | | | | | | | | | | | | | |
Net asset value, end of year | | $ | 10.92 | | | $ | 11.17 | | | $ | 10.41 | | | $ | 10.35 | | | $ | 10.23 | |
| | | | | | | | | | | | | | | | | | | | |
Total return | | | 3.20 | % | | | 10.16 | % | | | 5.00 | % | | | 6.41 | % | | | 4.55 | % |
Ratios/Supplemental data: | | | | | | | | | | | | | | | | | | | | |
Net assets, end of period (000’s) | | $ | 166,302 | | | $ | 115,186 | | | $ | 26,278 | | | $ | 28,635 | | | $ | 26,898 | |
Ratio of net expenses to average net assets | | | 0.65 | % | | | 0.65 | % | | | 0.65 | % | | | 0.65 | % | | | 0.65 | % |
Ratio of net investment income to average net assets | | | 3.02 | % | | | 2.60 | % | | | 4.39 | % | | | 3.81 | % | | | 2.90 | % |
Ratio of gross expenses to average net assets(a) | | | 1.06 | % | | | 1.48 | % | | | 2.43 | % | | | 1.98 | % | | | 1.81 | % |
Portfolio turnover rate | | | 44.82 | % | | | 30.46 | % | | | 46.78 | % | | | 47.85 | % | | | 18.57 | % |
| |
| (a) | During the years shown, certain fees were reduced. If such fee reductions had not occurred, the ratio would have been as indicated. |
See Notes to Financial Statements.
14
ADVISERS INVESTMENT TRUST
RIVER CANYON TOTAL RETURN BOND FUND
NOTES TO FINANCIAL STATEMENTS
September 30, 2020
Advisers Investment Trust (the “Trust”) is a Delaware statutory trust operating under a Second Amended and Restated Agreement and Declaration of Trust (the “Trust Agreement”) dated June 21, 2018. The Trust was formerly an Ohio business trust, which commenced operations on December 20, 2011. On March 31, 2017, the Trust was converted to a Delaware statutory trust. As an open-end registered investment company, as defined in Financial Accounting Standards Board (“FASB”) Accounting Standards Update (“ASU”) 2013-08, the Trust follows accounting and reporting guidance under FASB Accounting Standards Codification (“ASC”) Topic 946, “Financial Services-Investment Companies”. The Trust Agreement permits the Board of Trustees (the “Trustees” or “Board”) to authorize and issue an unlimited number of shares of beneficial interest, at no par value, in separate series of the Trust. The River Canyon Total Return Bond Fund (the “Fund”) is a series of the Trust, and the Fund’s Institutional Shares class commenced operations on December 30, 2014. Prior to April 6, 2015 shares of the Fund were not registered under the Securities Act of 1933, as amended (the “1933 Act”). During that time, investments in the Fund were made only by individuals or entities that were “accredited investors” within the meaning of Regulation D under the 1933 Act, and shares were issued solely in private placement transactions that did not involve any “public offering” within the meaning of Section 4(a)(2) of the 1933 Act. Effective April 6, 2015, the Fund became publicly available for investment.
The Fund is a non-diversified fund, meaning it may invest in a smaller number of companies than a diversified fund. The investment objective of the Fund is to seek to maximize total return.
Under the Trust’s organizational documents, its officers and Trustees are indemnified against certain liabilities arising out of the performance of their duties to the Trust and Fund. In addition, in the normal course of business, the Trust enters into contracts with its vendors and others that provide for general indemnifications. The Fund’s maximum exposure under these arrangements is unknown, as this would involve future claims that may be made against the Fund.
| A. | Significant accounting policies related to Investments are as follows: |
INVESTMENT VALUATION
Investments are recorded at fair value. Fair value is defined as the price that would be received to sell an asset or paid to transfer a liability in an orderly transaction between market participants at the measurement date. The valuation techniques employed by the Fund, as described below, maximize the use of observable inputs and minimize the use of unobservable inputs in determining fair value. These inputs are summarized in the following three broad levels:
• Level 1 —quoted prices in active markets for identical assets
• Level 2 —other significant observable inputs (including quoted prices of similar securities, interest rates, prepayment speeds, credit risk, etc.)
• Level 3 —significant unobservable inputs (including the Fund’s own assumptions in determining the fair value of investments)
The inputs or methodology used for valuing securities are not necessarily an indication of the risk associated with investing in those securities. For example, certain short-term debt securities may be valued using amortized cost. Generally, amortized cost approximates the current value of a security, but since this valuation is not obtained from a quoted price in an active market, such securities would be reflected as Level 2 in the fair value hierarchy.
Security prices are generally provided by an independent third party pricing service approved by the Trustees as of the close of the New York Stock Exchange, normally at 4:00 p.m. Eastern Time, each business day on which the share price of the Fund is calculated.
Debt and other fixed income securities are generally valued at an evaluated price provided by an independent pricing source approved by the Trustees. To value debt securities, pricing services may use various pricing techniques which take into account appropriate factors such as market activity, yield, quality, coupon rate, maturity, type of issue, trading characteristics, call features, credit ratings and other data, as well as broker quotes. Short-term debt securities of sufficient credit quality that mature within sixty days may be valued at amortized cost, which approximates fair value. In each of these situations, valuations are typically categorized as Level 2 in the fair value hierarchy.
15
ADVISERS INVESTMENT TRUST
RIVER CANYON TOTAL RETURN BOND FUND
NOTES TO FINANCIAL STATEMENTS
September 30, 2020
Equity securities listed or traded on a primary exchange are valued at the closing price, if available, or the last sales price on the primary exchange. If no sale occurred on the valuation date, the securities will be valued at the latest quotations as of the close of the primary exchange. Investments in other open-end registered investment companies are valued at their respective net asset value as reported by such companies. In these types of situations, valuations are typically categorized as a Level 1 in the fair value hierarchy.
When the price of a security is not readily available or deemed unreliable (e.g., an approved pricing service does not provide a price, a furnished price is in error, certain stale prices, or an event occurs that materially affects the furnished price), the Fund’s Fair Value Committee may in good faith establish a fair value for that security in accordance with procedures established by and under the general supervision of the Trustees.
In the fair value situations as noted above, while the Trust’s valuation policy is intended to result in a calculation of the Fund’s net asset value that fairly reflects security values as of the time of pricing, the Trust cannot ensure that fair values determined pursuant to these guidelines would accurately reflect the price that the Fund could obtain for a security if it were to dispose of that security as of the time of pricing (for instance, in a forced or distressed sale). The prices used by the Fund may differ from the value that would be realized if the securities were sold, and these differences could be material to the financial statements. Depending on the source and relative significance of the valuation inputs in these instances, the instruments may be classified as Level 2 or Level 3 in the fair value hierarchy.
The following is a summary of the valuation inputs used as of September 30, 2020 in valuing the Fund’s investments based upon the three fair value levels defined above:
| | | | | | | | | | | | | | | | |
| | | Level 1 - Quoted Prices | | | Level 2 - Other Significant Observable Inputs | | | Level 3 - Significant Unobservable Inputs | | | Total | |
| |
Assets: | | | | | | | | | | | | | | | | |
Investments in Securities: | | | | | | | | | | | | | | | | |
Common Stocks | | $ | 5,048,648 | | | $ | — | | | $ | — | | | $ | 5,048,648 | |
Mortgage-Backed Securities* | | | — | | | | 197,964,733 | | | | — | | | | 197,964,733 | |
Municipal Bonds | | | — | | | | 12,495,413 | | | | — | | | | 12,495,413 | |
Short-Term Investments | | | 10,380,526 | | | | — | | | | — | | | | 10,380,526 | |
| | | | |
Total Assets - Investment in Securities | | $ | 15,429,174 | | | $ | 210,460,146 | | | $ | — | | | $ | 225,889,320 | |
| | | | |
| | | | |
Liabilities: | | | | | | | | | | | | | | | | |
Investments in Securities: | | | | | | | | | | | | | | | | |
TBA Sale Commitments | | $ | — | | | $ | (48,933,299 | ) | | $ | — | | | $ | (48,933,299 | ) |
| | | | |
Total Investments | | $ | 15,429,174 | | | $ | 161,526,847 | | | $ | — | | | $ | 176,956,021 | |
| | | | |
| * | See additional categories in the Schedule of Investments. |
As of September 30, 2020, there were no Level 3 securities held by the Fund. There were no transfers to or from Level 3 during the year ended September 30, 2020.
FORWARD COMMITMENTS
The Fund may contract to purchase securities for a fixed price at a transaction date beyond the customary settlement period (i.e., “when issued,” “delayed delivery,” “forward commitment,” or “TBA transaction”) consistent with the Fund’s ability to manage its investment portfolio. No interest will be earned by the Fund on such purchases until the securities are delivered, however the market value may change prior to delivery. When the Fund makes a commitment to purchase a security on a forward commitment basis, cash or liquid securities equal to the amount of such Fund’s commitments will be reserved for payment of the commitment.
The Fund may enter into TBA sale commitments to help manage portfolio duration, hedge its positions or to sell mortgage-backed securities it owns under delayed delivery arrangements. Proceeds of TBA sale commitments are not received until the contractual settlement date. During the time a TBA sale commitment is outstanding, equivalent deliverable securities, or an offsetting TBA purchase commitment deliverable on or before the sale commitment date, are held as “cover” for the transaction.
16
ADVISERS INVESTMENT TRUST
RIVER CANYON TOTAL RETURN BOND FUND
NOTES TO FINANCIAL STATEMENTS
September 30, 2020
Unsettled TBA sale (purchase) commitments are valued at the current market value of the underlying securities. The contract is adjusted to market value daily and the change in market value is recorded by the Fund as an unrealized gain or loss. If the TBA sale (purchase) commitment is closed through the acquisition of an offsetting purchase (sale) commitment, the Fund realizes a gain or loss from the sale of the securities based upon the unit price established at the date the commitment was entered.
INVESTMENT TRANSACTIONS AND INCOME
Investment transactions are accounted for no later than one business day after trade date. For financial reporting purposes, investments are reported as of the trade date. The Fund determines the gain or loss realized from investment transactions by using an identified cost basis method. Interest income is recognized on an accrual basis and includes, where applicable, the amortization of premium or accretion of discount. Dividend income is recognized on the ex-dividend date.
EXPENSE ALLOCATIONS
Expenses directly attributable to a fund in the Trust are charged to that fund, while expenses that are attributable to more than one fund in the Trust are allocated among the applicable funds on a pro-rata basis to each adviser’s series of funds based on relative net assets or another reasonable basis.
DIVIDENDS AND DISTRIBUTIONS
The Fund intends to distribute substantially all of its net investment income as dividends to shareholders on a monthly basis. The Fund intends to distribute its net realized long-term capital gains and its net realized short-term capital gains at least once a year. Prior to July 2019, the income dividends were made on a quarterly basis.
Distributions from net investment income and from net realized capital gain are determined in accordance with Federal income tax regulations, which may differ from accounting principles generally accepted in the United States of America (“GAAP”). These “book/tax” differences are either considered temporary or permanent in nature. To the extent these differences are permanent in nature (e.g. treatment of certain dividend distributions, gains/losses, return of capital etc.), such amounts are reclassified within the composition of net assets based on their federal tax-basis treatment; temporary differences do not require reclassification. Distributions to shareholders that exceed net investment income and net realized capital gains for tax purposes are reported as return of capital.
FEDERAL INCOME TAX INFORMATION
No provision is made for Federal income taxes as the Fund intends to qualify each year as a “regulated investment company” under Subchapter M of the Internal Revenue Code of 1986, as amended (the “Code”), and distribute substantially all of its net investment income and net realized capital gain in accordance with the Code.
As of September 30, 2020, the Fund did not have uncertain tax positions that would require financial statement recognition or disclosure based on an evaluation of all open tax years for all major tax jurisdictions. The Fund’s Federal tax returns for the tax years ended September 30, 2017, 2018, 2019 and 2020 remain subject to examination by the Internal Revenue Service. Interest or penalties incurred, if any, on future unknown, uncertain tax positions taken by the Fund will be recorded as interest expense on the Statement of Operations.
Management is not aware of any tax positions for which it is reasonably possible that the total amounts of unrecognized tax benefits will change materially in the next 12 months.
USE OF ESTIMATES
The preparation of financial statements in conformity with GAAP requires management to make estimates and assumptions that affect the reported amounts of assets and liabilities and disclosure of contingent assets and liabilities at the date of the financial statements and the reported amounts of revenues and expenses during the reporting period. Actual results could differ from these estimates.
17
ADVISERS INVESTMENT TRUST
RIVER CANYON TOTAL RETURN BOND FUND
NOTES TO FINANCIAL STATEMENTS
September 30, 2020
| B. | Fees and Transactions with Affiliates and Other Parties |
River Canyon Fund Management LLC (the “Adviser” or “River Canyon”) serves as the investment adviser to the Fund. Under the terms of the Trust’s Investment Advisory Agreement (the “Agreement”) with the Adviser, the Fund paid the Adviser a fee computed and accrued daily and paid monthly at the annual rate of 0.65% of average daily net assets. Total fees incurred pursuant to the Agreement are reflected as “Investment advisory” fees on the Statement of Operations.
Foreside Financial Services, LLC (the “Distributor”) provides distribution services to the Fund pursuant to a distribution agreement with the Trust, on behalf of the Fund. Under its agreement with the Trust, the Distributor acts as an agent of the Trust in connection with the offering of the shares of the Fund on a continuous basis. The Adviser, at its own expense, pays the Distributor an annual $25,000 fee for these services and reimbursement for certain expenses incurred on behalf of the Fund.
The Northern Trust Company (“Northern Trust”) serves as the administrator, transfer agent, custodian and fund accounting agent for the Fund pursuant to written agreements between the Trust, on behalf of the Fund, and Northern Trust. The Fund has agreed to pay Northern Trust a tiered basis-point fee based on the Fund’s daily net assets, subject to a minimum annual fee of $150,000 relating to these services, as well as other charges for additional service activities. Total fees paid to Northern Trust pursuant to these agreements are reflected as “Accounting and Administration” fees on the Statement of Operations.
Foreside Fund Officer Services, LLC (“Foreside”) provides compliance and financial control services for the Fund pursuant to a written agreement with the Trust, on behalf of the Fund, including providing certain officers to the Fund. The Fund pays Foreside an annual asset-based fee, a basis-point fee based on the Fund’s daily net assets, subject to an overall annual minimum fee of $125,000 for these services, and reimburses for certain expenses incurred on behalf of the Fund. Total fees paid to Foreside pursuant to these agreements are reflected as “Regulatory and Compliance” fees on the Statement of Operations.
Certain officers and Trustees of the Trust are affiliated with Foreside, Northern Trust, or the Distributor and receive no compensation directly from the Fund for serving in their respective roles. Through March 31, 2020, the Trust paid each Independent Trustee compensation for their services based on an annual retainer of $120,000 and reimbursement for certain expenses. Effective April 1, 2020 the Trust pays an annual retainer of $125,000 and reimbursement for certain expenses. If there are more than six meetings in a year, additional meeting fees may apply. For the year ended September 30, 2020, the aggregate Trustee compensation paid by the Trust was $367,500. The amount of total Trustee compensation and reimbursement of out-of-pocket expenses allocated from the Trust to the Fund is reflected as “Trustees” expenses on the Statement of Operations.
The Adviser has contractually agreed to waive fees or reimburse expenses to the extent necessary to limit total annual fund operating expenses (exclusive of brokerage costs, interest, taxes, dividends, expenses on short positions, litigation and indemnification expenses, expenses associated with investments in underlying investment companies and extraordinary expenses) to 0.65% of the average daily net assets of the Fund until January 28, 2021. If it becomes unnecessary for the Adviser to waive fees or make reimbursements, the Adviser may recapture any of its prior waivers or reimbursements for a period not to exceed three years from the date in which the waiver or reimbursement was made to the extent that such a recapture does not cause the Total Annual Fund Operating Expenses (excluding taxes, extraordinary expenses, expenses associated with investments in underlying investment companies, brokerage costs, interest, taxes, dividends, expenses on short positions, litigation and indemnification expenses) to exceed the applicable expense limitation in effect at the time of repayment or the applicable expense limitation that was in effect at the time of the waiver or reimbursement. The agreement to waive fees and reimburse expenses may be terminated by the Board at any time and will terminate automatically upon termination of the Agreement.
For the year ended September 30, 2020, the Fund incurred advisory fees payable to River Canyon, expense waivers/reimbursements from River Canyon, and paid expense recoupments to River Canyon as follows:
18
ADVISERS INVESTMENT TRUST
RIVER CANYON TOTAL RETURN BOND FUND
NOTES TO FINANCIAL STATEMENTS
September 30, 2020
| | | | | | | | | | | | |
| Fund | | Advisory Fee to River Canyon | | | Expenses Reduced by River Canyon | | | Advisory Fees Recouped by River Canyon | |
| |
River Canyon Total Return Bond Fund | | $ | 898,289 | | | $ | 569,246 | | | $ | — | |
The balances of recoverable expenses to River Canyon by the Fund at September 30, 2020 were as follows:
| | | | | | |
| For the: | | Expiring | | River Canyon | |
| |
Year Ended September 30 , 2018 | | September 30, 2021 | | $ | 472,932 | |
Year Ended September 30, 2019 | | September 30, 2022 | | | 451,131 | |
Year ended September 30, 2020 | | September 30, 2023 | | | 569,246 | |
| | | | | | |
Balances of Recoverable Expenses to the Adviser | | | | $ | 1,493,309 | |
| | | | | | |
| C. | Investment Transactions |
For the year ended September 30, 2020, the aggregate costs of purchases and proceeds from sales of securities (excluding short-term investments) for the Fund were as follows:
| | | | | | | | |
| Fund | | Cost of Purchases | | | Proceeds from sales | |
| |
River Canyon Total Return Bond Fund | | $ | 134,947,132 | | | $ | 47,933,979 | |
As of September 30, 2020, the cost, gross unrealized appreciation and gross unrealized depreciation on investments, for Federal income tax purposes, were as follows:
| | | | | | | | | | | | | | | | |
| Fund | | Tax Cost | | | Tax Unrealized Appreciation | | | Tax Unrealized (Depreciation) | | | Net Unrealized Appreciation (Depreciation) | |
| |
River Canyon Total Return Bond Fund | | $ | 179,679,853 | | | $ | 6,892,450 | | | $ | (9,616,282 | ) | | $ | (2,723,832 | ) |
The tax character of distributions paid to shareholders during the latest tax years ended September 30, 2020 and September 30, 2019 for the Fund was as follows:
| | | | | | | | | | | | | | | | | | | | |
| River Canyon Total Return Bond Fund | | Ordinary Income | | | Net Long Term Gains | | | Total Taxable Distributions | | | Tax Return of Capital | | | Total Distributions Paid | |
| |
2020 | | $ | 4,996,188 | | | $ | 2,521,248 | | | $ | 7,517,436 | | | $ | — | | | $ | 7,517,436 | |
2019 | | | 1,539,441 | | | | — | | | | 1,539,441 | | | | — | | | | 1,539,441 | |
As of the tax year ended September 30, 2020, the components of accumulated earnings on a tax basis were as follows:
| | | | | | | | | | | | | | | | | | | | | | | | | | |
| Fund | | Undistributed Ordinary Income | | | Undistributed Long Term Capital Gains | | | Accumulated Earnings | | | Distributions Payable | | | Accumulated Capital and Other Losses | | | Unrealized (Depreciation) | | | Total Accumulated Earnings |
|
River Canyon Total Return Bond Fund | | | $1,781,914 | | | | $1,971,837 | | | | $3,753,751 | | | | $ — | | | | $ — | | | | $(2,723,832 | ) | | $1,029,919 |
19
ADVISERS INVESTMENT TRUST
RIVER CANYON TOTAL RETURN BOND FUND
NOTES TO FINANCIAL STATEMENTS
September 30, 2020
| E. | Concentration of Ownership |
A significant portion of the Fund’s shares may be held in a limited number of shareholder accounts. To the extent that a shareholder or group of shareholders redeem a significant portion of the shares issued by the Fund, this could have a disruptive impact on the efficient implementation of the Fund’s investment strategy.
The recent global outbreak of COVID-19 has disrupted economies and markets, and the prolonged duration and economic impact is uncertain. These events can have a significant impact on the Fund’s operations and performance.
The Fund may be exposed to financial instruments that are tied to the London Interbank Offered Rate (“LIBOR”) to determine payment obligations, financing terms, or investment value. The Fund’s investments may pay interest at floating rates based on LIBOR or may be subject to interest caps or floors based on LIBOR. The Fund may also obtain financing at floating rates based on LIBOR. In 2017, the head of the United Kingdom’s Financial Conduct Authority announced a desire to phase out the use of LIBOR by the end of 2021, and it is expected that LIBOR will cease to be published after that time. The Fund may have investments linked to other interbank offered rates, such as the Euro Overnight Index Average (“EONIA”), which may also cease to be published. Various financial industry groups have begun planning for the transition away from LIBOR, but there are challenges to converting certain securities and transactions to a new reference rate (e.g., the Secured Overnight Financing Rate (“SOFR”), which is intended to replace the U.S. dollar LIBOR). Neither the effect of the LIBOR transition process nor its ultimate success can yet be known. The transition process might lead to increase volatility and illiquidity in markets for instruments whose terms currently include LIBOR. While some existing LIBOR-based instruments may contemplate a scenario where LIBOR is no longer available by providing for an alternative rate-setting methodology, there may be significant uncertainty regarding the effectivenss of any such alternative methodologies to replicate LIBOR. Not all existing LIBOR-based instruments may have alternative rate-setting provisions and there remains uncertainty regarding the willingness and ability of issuers to add alternative rate-setting provisions in certain existing instruments. In addition, a liquid market for newly-issued instruments that use a reference rate other than LIBOR still may be developing. All of the aforementioned may adversely affect the Fund’s performance or NAV.
20
| | |
 | | Deloitte & Touche LLP 111 South Wacker Drive Chicago, IL 60606-4301 USA Tel:+1 312 486 1000 Fax:+1 312 486 1486 www.deloitte.com |
REPORT OF INDEPENDENT REGISTERED PUBLIC ACCOUNTING FIRM
To the shareholders of the River Canyon Total Return Bond Fund and the Board of Trustees of Advisers Investment Trust:
Opinion on the Financial Statements and Financial Highlights
We have audited the accompanying statement of assets and liabilities, including the schedule of investments, of the River Canyon Total Return Bond Fund (the “Fund”), one of the portfolios constituting Advisers Investment Trust (the “Trust”), as of September 30, 2020, the related statement of operations for the year then ended, the statements of changes in net assets for each of the two years in the period then ended, the financial highlights for each of the five years in the period then ended, and the related notes. In our opinion, the financial statements and financial highlights present fairly, in all material respects, the financial position of the River Canyon Total Return Bond Fund of the Trust as of September 30, 2020, and the results of its operations, the changes in its net assets for each of the two years in the period then ended, and the financial highlights for each of the five years in the period then ended in conformity with accounting principles generally accepted in the United States of America.
Basis for Opinion
These financial statements and financial highlights are the responsibility of the Fund’s management. Our responsibility is to express an opinion on the Fund’s financial statements and financial highlights based on our audits. We are a public accounting firm registered with the Public Company Accounting Oversight Board (United States) (PCAOB) and are required to be independent with respect to the Fund in accordance with the U.S. federal securities laws and the applicable rules and regulations of the Securities and Exchange Commission and the PCAOB.
We conducted our audits in accordance with the standards of the PCAOB. Those standards require that we plan and perform the audit to obtain reasonable assurance about whether the financial statements and financial highlights are free of material misstatement, whether due to error or fraud. The Fund is not required to have, nor were we engaged to perform, an audit of its internal control over financial reporting. As part of our audits we are required to obtain an understanding of internal control over financial reporting but not for the purpose of expressing an opinion on the effectiveness of the Fund’s internal control over financial reporting. Accordingly, we express no such opinion.
Our audits included performing procedures to assess the risks of material misstatement of the financial statements and financial highlights, whether due to error or fraud, and performing procedures that respond to those risks. Such procedures included examining, on a test basis, evidence regarding the amounts and disclosures in the financial statements and financial highlights. Our audits also included evaluating the accounting principles used and significant estimates made by management, as well as evaluating the overall presentation of the financial statements and financial highlights. Our procedures included confirmation of securities owned as of September 30, 2020, by correspondence with the
21
custodian and brokers; when replies were not received from brokers, we performed other auditing procedures. We believe that our audits provide a reasonable basis for our opinion.

November 20, 2020
We have served as the auditor of one or more River Canyon Fund Management LLC investment companies since 2015.
22
ADVISERS INVESTMENT TRUST
RIVER CANYON TOTAL RETURN BOND FUND
ADDITIONAL INFORMATION
September 30, 2020 (Unaudited)
| A. | Security Allocation as of September 30, 2020 |
| | |
| Market Exposure |
|
| Securities | | % of Net Assets |
|
Home Equity | | 63.8% |
U.S. Government Agencies | | 25.8 |
Municipal Bonds | | 7.5 |
Real Estate Investment Trust | | 3.0 |
|
Total | | 100.2% |
|
| | |
| 5 Largest Security Positions |
|
| Issuer | | % of Net Assets |
|
Government National Mortgage
Association Pool TBA | | |
3.50%, 10/1/50 | | 36.2% |
Fannie Mae TBA | | |
2.50%, 10/1/50 | | 29.4 |
New Residential Investment Corp. | | |
6.25%, 10/15/25 | | 4.2 |
GDB Debt Recovery Authority of Commonwealth Puerto Rico Taxable Revenue Bond | | |
7.50%, 8/20/40 | | 4.2 |
CSMC Trust Series 2020-LOTS | | |
4.72%, 7/15/22 | | 4.1 |
|
Total | | 78.1% |
|
As a Fund shareholder, you may incur two types of costs: (1) transaction costs, and (2) ongoing costs, including management fees and other Fund expenses. The examples below are intended to help you understand your ongoing costs (in dollars) of investing in the Fund and to compare these costs with the ongoing costs of investing in other mutual funds. Please note that the expenses shown in the tables are meant to highlight your ongoing costs only and do not reflect any transactional costs. Therefore, the examples are useful in comparing ongoing costs only and will not help you determine the relative total cost of owning different funds. In addition, if these transactional costs were included, your costs would have been higher.
The examples below are based on an investment of $1,000 invested at April 1, 2020 and held for the entire period through September 30, 2020.
The Actual Expense Example below provides information about actual account values and actual expenses. You may use this information, together with the amount you invested, to estimate the expenses that you paid over the period. Simply divide your account value by $1,000 (for example, an $8,600 account value divided by $1,000 = 8.6), then multiply the result by the number in the table under the heading entitled “Expenses Paid” to estimate the expenses you paid on your account during this period.
The Hypothetical Expense Example below provides information about hypothetical account values and hypothetical expenses based on the Fund’s actual expense ratio and an assumed rate of return of 5% per year before expenses, which is not the Fund’s actual return. The hypothetical account values and expenses may not be used to estimate the actual ending account balance or expenses you paid for the period. You may use this information to compare the ongoing costs of investing in the Fund and other funds. To do so, compare this 5% hypothetical example with the 5% hypothetical examples that appear in the shareholder reports of the other funds.
| | | | | | | | | | | | | | |
| | | Expense Ratio | | Beginning Account Value 4/1/2020 | | | Ending Account Value 9/30/2020 | | | *Expenses Paid 4/1/20–9/30/20 | |
| |
Actual | | 0.65% | | $ | 1,000.00 | | | $ | 1,089.50 | | | $ | 3.40 | |
Hypothetical | | 0.65% | | $ | 1,000.00 | | | $ | 1,021.75 | | | $ | 3.29 | |
* Expenses are calculated using each Portfolio’s annualized expense ratio (as disclosed in the table), multiplied by the average account value for the period, multiplied by the number of days in the most recent half fiscal year (183), and divided by the number of days in the current year (366).
23
ADVISERS INVESTMENT TRUST
RIVER CANYON TOTAL RETURN BOND FUND
ADDITIONAL INFORMATION
September 30, 2020 (Unaudited)
Investors may obtain a copy of the proxy voting policies and procedures by writing to the Trust in the name of the Fund c/o The Northern Trust Company, P.O. Box 4766, Chicago, Illinois 60680-4766 or by calling the Fund at 800-245-0371 (toll free) or 312-557-0164. Information about how the Fund voted proxies relating to portfolio securities for each 12 month period ending June 30 is available without charge, upon request, by calling the Trust at 800-245-0371 (toll free) or 312-557-0164 and on the SEC website at www.sec.gov.
The Fund files its complete schedule of portfolio holdings with the SEC for the first and third quarters of each fiscal year as an exhibit to its reports on Form N-PORT (or on Form N-PORT’s predecessor form, Form N-Q). The Fund’s Form N-PORT reports are available on the SEC’s website at www.sec.gov. The information on Form N-PORT is also available to shareholders upon written request or by calling the Fund at 800-245-0371 (toll free).
The following table provides information regarding each Trustee who is not an “interested person” of the Trust, as defined in the 1940 Act.
| | | | | | | | | | |
Name, Address and Year of Birth1 | | Position(s) Held with the Trust | | Term of Office/Length of Time Served | | Principal Occupation(s) During Past 5 Years | | Number of Portfolios in the Trust Overseen by Trustee | | Other Directorships Held by Trustee During Past 5 Years |
D’Ray Moore Year of Birth: 1959 | | Trustee | | Indefinite/July 2011 to present | | Independent Trustee, Diamond Hill Funds 2007 to present; Chairperson, Diamond Hill Funds 2014 to present. | | 12 | | Diamond Hill Funds |
| | | | | |
Steven R. Sutermeister Year of Birth: 1954 | | Trustee | | Indefinite/July 2011 to present | | President, Vadar Capital LLC, 2008 to 2017. | | 12 | | None |
| | | | | |
Michael M. Van Buskirk Year of Birth: 1947 | | Trustee | | Indefinite/July 2011 to present | | Independent Trustee, Boston Trust Walden Funds 1992 to present. | | 12 | | Boston Trust Walden Funds |
1 The mailing address of each Trustee is 50 S. LaSalle Street, Chicago, Illinois 60603.
24
ADVISERS INVESTMENT TRUST
RIVER CANYON TOTAL RETURN BOND FUND
ADDITIONAL INFORMATION
September 30, 2020 (Unaudited)
The following table provides information regarding each Trustee who is an “interested person” of the Trust, as defined in the 1940Act, and each officer of the Trust.
| | | | | | | | | | |
Name, Address and Year of Birth1 | | Position(s) Held with the Trust | | Term of Office/ Length of Time Served | | Principal Occupation(s) During Past 5 Years | | Number of Portfolios in the Trust Overseen by Trustee | | Other Directorships Held by Trustee During Past 5 Years |
| | | | | |
David M. Whitaker Year of Birth: 19712 | | Trustee | | Indefinite/ July 2017 to present | | President, Foreside Financial Group, LLC, 2011 to present; Director, Portland Air Freight, 2011 to present; Director, National Investment Company Service Association (NICSA) 2018 to present. | | 12 | | PAF
Transportation |
| | | | | |
Daniel P. Houlihan Year of Birth: 19663 | | Trustee | | Indefinite/ March 2016 to present | | Executive Vice President, The Northern Trust Company, 2008 to present; Chairman, National Investment Company Service Association (NICSA) 2017 to present; Vice Chairman, National Investment Company Service Association (NICSA) 2014 to 2017. | | 12 | | None |
| | | | | |
Barbara J. Nelligan Year of Birth: 1969 | | President | | Indefinite/ August 2017 to present | | Senior Vice President, Global Fund Services Fund Governance Solutions, The Northern Trust Company, 2018 to present; Senior Vice President, Global Fund Services Product Management, The Northern Trust Company, 2007 to 2018; Vice President of Advisers Investment Trust, 2012 to 2017. | | N/A | | N/A |
| | | | | |
Rodney Ruehle Year of Birth: 1968 | | Chief
Compliance
Officer and
AML Officer | | Indefinite/March 2019 to present | | Director, Foreside Financial Group, LLC (formerly Foreside Compliance Services, LLC) (financial services), 2016 to present; Director, Beacon Hill Fund Services, LLC, April 2008 to July 2016. | | N/A | | N/A |
| | | | | |
Troy Sheets Year of Birth: 1971 | | Treasurer | | Indefinite/ July 2011 to present | | Senior Director, Foreside Financial Group, LLC, 2016 to present; Director, Beacon Hill Fund Services, Inc., 2009 to 2016. | | N/A | | N/A |
| | | | | |
| Trent Statczar Year of Birth: 1971 | | Assistant
Treasurer | | Indefinite/July 2011 to present | | Senior Director, Foreside Financial Group, LLC, 2016 to present; Director, Beacon Hill Fund Services, Inc., 2008 to 2016. | | N/A | | N/A |
25
ADVISERS INVESTMENT TRUST
RIVER CANYON TOTAL RETURN BOND FUND
ADDITIONAL INFORMATION
September 30, 2020 (Unaudited)
| | | | | | | | | | |
Name, Address and Year of Birth1 | | Position(s) Held with the Trust | | Term of Office/ Length of Time Served | | Principal Occupation(s) During Past 5 Years | | Number of Portfolios in the Trust Overseen by Trustee | | Other Directorships Held by Trustee During Past 5 Years |
| | | | | |
Toni M. Bugni Year of Birth: 1973 | | Secretary | | Indefinite/ March 2018 to present | | Senior Vice President, Global Fund Services Fund Governance Solutions, The Northern Trust Company, 2011 to present. | | N/A | | N/A |
| | | | | |
Deanna Y. Pellack Year of Birth: 1987 | | Assistant Secretary | | Indefinite/March 2018 to present | | Vice President, Global Fund Services Fund Governance Solutions, The Northern Trust Company 2019 to present; Second Vice President, Global Fund Services Fund Governance Solutions, The Northern Trust Company 2014 to 2019. | | N/A | | N/A |
1The mailing address of Messrs. Whitaker, Ruehle, Sheets, and Statczar is 690 Taylor Road, Suite 210, Gahanna, Ohio 43230. The mailing address of Messr. Houlihan and Mses. Nelligan, Bugni, and Pellack is 50 S. LaSalle Street, Chicago, IL 60603.
2 Mr. Whitaker is the President of Foreside Financial Group, LLC and is therefore deemed to be an “interested person” of the Trust, as defined in the 1940 Act.
3 Mr. Houlihan is an Executive Vice President of the Northern Trust Company and is therefore deemed to be an “interested person” of the Trust, as defined in the 1940 Act.
The Fund’s Statement of Additional Information includes additional information about the Trust’s Trustees and Officers. To receive your free copy of the Statement of Additional Information, call toll-free 800-245-0371.
26
(This page intentionally left blank)
(This page intentionally left blank)
River Canyon Total Return Bond Fund
Notice of Privacy Policy & Practices
SAFEGUARDING PRIVACY
The Fund recognizes and respects the privacy concerns and expectations of our customers. We are committed to maintaining the privacy and security of the personal confidential information we collect about you. We provide this notice so that you will know what kinds of information we collect and the circumstances in which that information may be disclosed to third parties.
INFORMATION WE COLLECT AND SOURCES OF INFORMATION
We collect nonpublic personal information about our customers from the following sources:
| | • | | Account Applications and other forms, which may include a customer’s name, address, social security number, and information about a customer’s investment goals and risk tolerance; |
| | • | | Account History, including information about the transactions and balances in a customer’s account(s); and |
| | • | | Correspondences including written, telephonic or electronic between a customer and the Funds or service providers to the Funds. |
INFORMATION WE SHARE WITH SERVICE PROVIDERS
The Fund may disclose all non-public personal information we collect, as described above, to companies that perform services on our behalf, including those that assist us in responding to inquiries, processing transactions, preparing and mailing account statements and other forms of shareholder services, provided they use the information solely for these purposes and they enter into a confidentiality agreement regarding the information. The Fund also may disclose non-public personal information as otherwise permitted by law.
SAFEGUARDING CUSTOMER INFORMATION
We will safeguard, according to federal standards of security and confidentiality, any non-public personal information our customers share with us.
We require service providers to the Fund:
| | • | | to maintain policies and procedures designed to assure only appropriate access to, and use of information about customers of the Funds; and |
| | • | | to maintain physical, electronic and procedural safeguards that comply with federal standards to guard nonpublic personal information of customers of the Funds. |
We will adhere to the policies and practices described in this notice regardless of whether you are a current or former shareholder of the Fund.
Investment Adviser
River Canyon Fund Management LLC
2000 Avenue of the Stars, 11th Floor
Los Angeles, California, 90067
Custodian
The Northern Trust Company
50 South LaSalle Street
Chicago, Illinois 60603
Independent Registered
Public Accounting Firm
Deloitte & Touche LLP
111 S. Wacker Drive
Chicago, Illinois 60606
Legal Counsel
Thompson Hine LLP
41 South High Street, Suite 1700
Columbus, Ohio 43215-6101
Distributor
Foreside Financial Services, LLC
3 Canal Plaza, Suite 100
Portland, ME 04101
For Additional Information, call
800-245-0371 (toll free) or 312-557-0164


NTAM TREASURY ASSETS FUND
ANNUAL REPORT
SEPTEMBER 30, 2020
This report is submitted for the general information of the shareholders of the Fund. It is not authorized for the distribution to prospective investors unless preceded or accompanied by an effective prospectus.
ADVISERS INVESTMENT TRUST
NTAM TREASURY ASSETS FUND
TABLE OF CONTENTS
September 30, 2020
ADVISERS INVESTMENT TRUST
NTAM TREASURY ASSETS FUND
SCHEDULE OF INVESTMENTS
September 30, 2020
| | | | | | | | | | | | |
| | | | |
| | | Percentage of Net Assets | | | Principal Amount (000s) | | | Value (000s) | |
U.S. TREASURY OBLIGATIONS | | | 76.6% | | | | | | | | | |
U.S. Treasury Bills | | | 58.4% | | | | | | | | | |
0.14%, 10/13/20(a) | | | | | | $ | 10,000 | | | $ | 10,000 | |
0.15%, 10/13/20(a) | | | | | | | 79,500 | | | | 79,496 | |
0.09%, 10/15/20(a) | | | | | | | 246,000 | | | | 245,991 | |
0.29%, 10/15/20(a) | | | | | | | 63,650 | | | | 63,643 | |
0.07%, 10/20/20(a) | | | | | | | 50,000 | | | | 49,998 | |
0.15%, 10/20/20(a) | | | | | | | 65,000 | | | | 64,995 | |
0.11%, 10/22/20(a) | | | | | | | 19,000 | | | | 18,999 | |
0.16%, 10/22/20(a) | | | | | | | 50,000 | | | | 49,995 | |
0.16%, 11/5/20(a) | | | | | | | 57,000 | | | | 56,991 | |
0.11%, 11/10/20(a) | | | | | | | 11,500 | | | | 11,499 | |
0.12%, 11/10/20(a) | | | | | | | 73,800 | | | | 73,790 | |
0.14%, 11/12/20(a) | | | | | | | 250,000 | | | | 249,959 | |
0.19%, 11/17/20(a) | | | | | | | 17,000 | | | | 16,996 | |
0.10%, 11/19/20(a) | | | | | | | 436,000 | | | | 435,940 | |
0.13%, 11/19/20(a) | | | | | | | 202,000 | | | | 201,965 | |
0.10%, 11/24/20(a) | | | | | | | 147,800 | | | | 147,777 | |
0.18%, 11/24/20(a) | | | | | | | 50,000 | | | | 49,986 | |
0.16%, 12/1/20(a) | | | | | | | 115,000 | | | | 114,968 | |
0.10%, 12/3/20(a) | | | | | | | 398,600 | | | | 398,527 | |
0.17%, 12/3/20(a) | | | | | | | 35,000 | | | | 34,990 | |
0.18%, 12/3/20(a) | | | | | | | 32,000 | | | | 31,990 | |
0.15%, 12/8/20(a) | | | | | | | 60,000 | | | | 59,982 | |
0.11%, 12/10/20(a) | | | | | | | 161,150 | | | | 161,114 | |
0.19%, 12/10/20(a) | | | | | | | 30,000 | | | | 29,989 | |
0.11%, 12/17/20(a) | | | | | | | 250,000 | | | | 249,941 | |
0.19%, 12/17/20(a) | | | | | | | 100,000 | | | | 99,960 | |
0.10%, 12/24/20(a) | | | | | | | 6,000 | | | | 5,999 | |
0.18%, 12/24/20(a) | | | | | | | 25,000 | | | | 24,990 | |
0.12%, 1/7/21(a) | | | | | | | 45,000 | | | | 44,985 | |
0.16%, 1/7/21(a) | | | | | | | 50,000 | | | | 49,978 | |
0.17%, 1/7/21(a) | | | | | | | 50,000 | | | | 49,978 | |
0.11%, 1/12/21(a) | | | | | | | 70,000 | | | | 69,978 | |
0.15%, 1/14/21(a) | | | | | | | 187,000 | | | | 186,920 | |
0.13%, 1/21/21(a) | | | | | | | 145,000 | | | | 144,941 | |
0.17%, 1/28/21(a) | | | | | | | 50,000 | | | | 49,973 | |
0.12%, 2/16/21(a) | | | | | | | 250,000 | | | | 249,884 | |
0.12%, 2/18/21(a) | | | | | | | 103,500 | | | | 103,452 | |
0.13%, 3/11/21(a) | | | | | | | 33,200 | | | | 33,181 | |
0.14%, 7/15/21(a) | | | | | | | 25,000 | | | | 24,973 | |
0.14%, 8/12/21(a) | | | | | | | 50,000 | | | | 49,939 | |
| | | | | | | | | | | | |
| | | | | | | | | | | 4,098,652 | |
| | | | | | | | | | | | |
U.S. Treasury Floating Rate Notes | | | 13.6% | | | | | | | | | |
(Floating, U.S. Treasury 3M Bill MMY + 0.05%) 0.15%, 10/1/20(b) | | | | | | | 35,000 | | | | 34,997 | |
See Notes to Financial Statements.
1
ADVISERS INVESTMENT TRUST
NTAM TREASURY ASSETS FUND
SCHEDULE OF INVESTMENTS
September 30, 2020
| | | | | | | | | | | | |
| | | | |
| | | Percentage
of Net
Assets | | | Principal
Amount (000s) | | | Value (000s) | |
(Floating, U.S. Treasury 3M Bill MMY + 0.06%) 0.16%, 10/1/20(b) | | | | | | $ | 250,000 | | | $ | 249,992 | |
(Floating, U.S. Treasury 3M Bill MMY + 0.11%) 0.21%, 10/1/20(b) | | | | | | | 150,000 | | | | 149,965 | |
(Floating, U.S. Treasury 3M Bill MMY + 0.12%) 0.22%, 10/1/20(b) | | | | | | | 99,000 | | | | 99,028 | |
(Floating, U.S. Treasury 3M Bill MMY + 0.14%) 0.24%, 10/1/20(b) | | | | | | | 92,000 | | | | 91,954 | |
(Floating, U.S. Treasury 3M Bill MMY + 0.15%) 0.25%, 10/1/20(b) | | | | | | | 25,000 | | | | 24,997 | |
(Floating, U.S. Treasury 3M Bill MMY + 0.30%) 0.40%, 10/1/20(b) | | | | | | | 300,000 | | | | 300,691 | |
| | | | | | | | | | | | |
| | | | | | | | | | | 951,624 | |
| | | | | | | | | | | | |
U.S. Treasury Notes | | | 4.6% | | | | | | | | | |
1.75%, 11/15/20 | | | | | | | 30,000 | | | | 30,004 | |
2.75%, 11/30/20 | | | | | | | 80,000 | | | | 80,140 | |
1.88%, 12/15/20 | | | | | | | 99,500 | | | | 99,547 | |
2.00%, 2/28/21 | | | | | | | 55,000 | | | | 55,142 | |
2.38%, 3/15/21 | | | | | | | 1,000 | | | | 1,009 | |
1.63%, 6/30/21 | | | | | | | 54,500 | | | | 55,106 | |
| | | | | | | | | | | | |
| | | | | | | | | | | 320,948 | |
| | | | | | | | | | | | |
TOTAL U.S. TREASURY OBLIGATIONS (Cost $5,371,224) | | | | | | | | | | | 5,371,224 | |
| | | | | | | | | | | | |
REPURCHASE AGREEMENTS | | | 22.5% | | | | | | | | | |
Repurchase Agreements | | | 22.5% | | | | | | | | | |
BNP Paribas S.A., dated 9/30/20, repurchase price $300,001, 0.06%, 10/1/20(c) | | | | | | | 300,000 | | | | 300,000 | |
Citigroup Global Markets, Inc., dated 9/30/20, repurchase price $300,001,
0.06%, 10/1/20(d) | | | | | | | 300,000 | | | | 300,000 | |
Fixed Income Clearing Corp., dated 9/30/20, repurchase price $675,001,
0.07%, 10/1/20(e) | | | | | | | 675,000 | | | | 675,000 | |
JPMorgan Securities LLC, dated 9/30/20, repurchase price $300,001,
0.06%, 10/1/20(f) | | | | | | | 300,000 | | | | 300,000 | |
| | | | | | | | | | | | |
| | | | | | | | | | | 1,575,000 | |
| | | | | | | | | | | | |
TOTAL REPURCHASE AGREEMENTS (Cost $1,575,000) | | | | | | | | | | | 1,575,000 | |
| | | | | | | | | | | | |
TOTAL INVESTMENTS
(Cost $6,946,224) | | | 99.1% | | | | | | | | 6,946,224 | |
NET OTHER ASSETS (LIABILITIES) | | | 0.9% | | | | | | | | 66,616 | |
| | | | | | | | | | | | |
NET ASSETS | | | 100.0% | | | | | | | $ | 7,012,840 | |
| | | | | | | | | | | | |
| (a) | Discount rate at the time of purchase. |
| (b) | Variable rate security. Rate as of September 30, 2020 is disclosed. Maturity date represents the next interest reset date. The security’s legal final maturity date is longer than the reset date. Securities with longer maturity dates have a greater sensitivity to changes in liquidity, interest rate risk and/or credit risk. |
| (c) | The nature and terms of the collateral received for the repurchase agreements are as follows: |
| | | | | | | | | | | | |
| BNP Paribas S.A. | | Value (000s) | | | Coupon Rates | | | Maturity Dates | |
U.S. Treasury Bills | | $ | 3,818 | | | | 0.00% | | | | 11/17/20 — 9/9/21 | |
U.S. Treasury Bonds | | $ | 37,736 | | | | 0.00% -2.75% | | | | 8/15/25 — 2/15/48 | |
U.S. Treasury Notes | | $ | 264,601 | | | | 0.63% — 1.13% | | | | 2/28/25 — 1/15/26 | |
Total | | $ | 306,155 | | | | | | | | | |
| | | | | | | | | | | | | |
(d) The nature and terms of the collateral received for the repurchase agreements are as follows: | | | | | | | | | | | | |
| Citigroup Global Markets, Inc. | | Value (000s) | | | Coupon Rates | | | Maturity Dates | |
U.S. Treasury Bonds | | $ | 306,000 | | | | 1.00% — 3.38% | | | | 11/15/47 — 2/15/49 | |
| | | | | | | | | | | | | |
See Notes to Financial Statements.
2
ADVISERS INVESTMENT TRUST
NTAM TREASURY ASSETS FUND
SCHEDULE OF INVESTMENTS
September 30, 2020
| | | | | | | | | | | | |
|
| (e) The nature and terms of the collateral received for the repurchase agreements are as follows: | |
| Fixed Income Clearing Corp. | | Value (000s) | | | Coupon Rates | | | Maturity Dates | |
U.S. Treasury Notes | | $ | 688,500 | | | | 0.38% | | | | 9/30/2027 | |
| | | | | | | | | | | | | |
|
| (f) The nature and terms of the collateral received for the repurchase agreements are as follows: | |
| JPMorgan Securities LLC | | Value (000s) | | | Coupon Rates | | | Maturity Dates | |
U.S. Treasury Notes | | $ | 306,000 | | | | 0.38% — 2.75% | | | | 7/15/21 — 3/31/22 | |
| | | | | | | | | | | | | |
|
| At September 30, 2020 the asset allocations for the NTAM Treasury Assets Fund were: | |
| |
| Asset Allocation (Unaudited) | | | % of Net Assets | |
U.S. Treasury Bills | | | | | | | | | | | 58.4% | |
U.S. Treasury Floating Rate Notes | | | | | | | | | | | 13.6 | |
U.S. Treasury Notes | | | | | | | | | | | 4.6 | |
Repurchase Agreements | | | | | | | | | | | 22.5 | |
Total | | | | | | | | | | | 99.1% | |
See Notes to Financial Statements.
3
ADVISERS INVESTMENT TRUST
STATEMENT OF ASSETS & LIABILITIES
September 30, 2020
| | | | |
| Amounts in thousands | | NTAM Treasury Assets Fund | |
|
| |
Assets: | | | | |
Investments, at value (Cost: $5,371,224) | | $ | 5,371,224 | |
Repurchase agreements, cost equals fair value | | | 1,575,000 | |
Cash | | | 916 | |
Receivable for interest | | | 2,240 | |
Receivable for investments sold | | | 64,999 | |
Prepaid expenses | | | 21 | |
| | | | |
Total Assets | | | 7,014,400 | |
Liabilities: | | | | |
Distributions payable to shareholders | | | 562 | |
Investment advisory fees payable | | | 484 | |
Accounting and Administration fees payable | | | 450 | |
Regulatory and Compliance fees payable | | | 19 | |
Trustee fees payable | | | 1 | |
Accrued expenses and other payable | | | 44 | |
| | | | |
Total Liabilities | | | 1,560 | |
| | | | |
Net Assets | | $ | 7,012,840 | |
| | | | |
| | | | |
Net assets | | $ | 7,012,840 | |
Shares of common stock outstanding | | | 7,012,259 | |
| | | | |
Net asset value per share | | $ | 1.00 | |
| | | | |
| | | | |
Net Assets: | | | | |
Paid in capital | | $ | 7,012,205 | |
Distributable earnings | | | 635 | |
| | | | |
Net Assets | | $ | 7,012,840 | |
| | | | |
| | | | |
| | | | |
| |
See Notes to Financial Statements.
4
ADVISERS INVESTMENT TRUST
STATEMENT OF OPERATIONS
For the year ended September 30, 2020
| | | | |
| Amounts in thousands | | NTAM Treasury Assets Fund | |
| |
Investment Income: | | | | |
Interest income | | $ | 72,976 | |
Operating expenses: | | | | |
Investment advisory | | | 7,769 | |
Accounting and Administration | | | 940 | |
Regulatory and Compliance | | | 351 | |
Trustees | | | 54 | |
Other | | | 127 | |
| | | | |
Total expenses | | | 9,241 | |
Expenses reduced by Adviser | | | (2,108 | ) |
| | | | |
Net expenses | | | 7,133 | |
| | | | |
Net investment income | | | 65,843 | |
| | | | |
Realized Gains from Investment Activities: | | | | |
Net realized gains from investment transactions | | | 8,486 | |
| | | | |
Net realized gains from investment activities | | | 8,486 | |
| | | | |
Change in Net Assets Resulting from Operations | | $ | 74,329 | |
| | | | |
| | | | |
| | | | |
| |
See Notes to Financial Statements.
5
ADVISERS INVESTMENT TRUST
STATEMENTS OF CHANGES IN NET ASSETS
For the years ended September 30, 2020 and 2019
| | | | | | | | |
| | | NTAM Treasury Assets Fund | |
| | | | |
| Amounts in thousands | | September 30,
2020 | | | September 30,
2019 | |
| |
Increase (decrease) in net assets: | | | | | | | | |
Operations: | | | | | | | | |
Net investment income | | $ | 65,843 | | | $ | 176,703 | |
Net realized gains from investment transactions | | | 8,486 | | | | 183 | |
| | | | | | | | |
Change in net assets resulting from operations | | | 74,329 | | | | 176,886 | |
| | | | | | | | |
Dividends paid to shareholders: | | | | | | | | |
From distributable earnings | | | (73,936 | ) | | | (176,854 | ) |
| | | | | | | | |
Total dividends paid to shareholders | | | (73,936 | ) | | | (176,854 | ) |
| | | | | | | | |
Capital Transactions: | | | | | | | | |
Proceeds from sale of shares | | | 6,703,717 | | | | 888,750 | |
Value of shares issued to shareholders in reinvestment of dividends | | | 87,022 | | | | 175,880 | |
Value of shares redeemed | | | (7,815,887 | ) | | | (956,789 | ) |
| | | | | | | | |
Change in net assets from capital transactions | | | (1,025,148 | ) | | | 107,841 | |
| | | | | | | | |
Change in net assets | | | (1,024,755 | ) | | | 107,873 | |
Net assets: | | | | | | | | |
Beginning of year | | | 8,037,595 | | | | 7,929,722 | |
| | | | | | | | |
End of year | | $ | 7,012,840 | | | $ | 8,037,595 | |
| | | | | | | | |
| | | | | | | | |
Share Transactions | | | | | | | | |
Sold | | | 6,703,717 | | | | 888,750 | |
Reinvested | | | 87,022 | | | | 175,880 | |
Redeemed | | | (7,815,887 | ) | | | (956,789 | ) |
| | | | | | | | |
Change | | | (1,025,148 | ) | | | 107,841 | |
| | | | | | | | |
| | | | | | | | |
| | | | | | | | |
| |
See Notes to Financial Statements.
6
ADVISERS INVESTMENT TRUST
FINANCIAL HIGHLIGHTS
For the periods indicated
| | | | | | | | | | | | |
| | | NTAM Treasury Assets Fund | |
| | | | |
| | | Year Ended | | | Year Ended | | | Period Ended | |
| | | September 30, | | | September 30, | | | September 30, | |
| | | 2020 | | | 2019 | | | 2018(a) | |
| |
Net asset value, beginning of period | | $ | 1.00 | | | $ | 1.00 | | | $ | 1.00 | |
| | | | | | | | | | | | |
Income (loss) from operations: | | | | | | | | | | | | |
Net investment income | | | 0.01 | | | | 0.02 | | | | 0.01 | |
Net realized gains from investments(b) | | | — | | | | — | | | | — | |
| | | | | | | | | | | | |
Total from investment operations | | | 0.01 | | | | 0.02 | | | | 0.01 | |
| | | | | | | | | | | | |
Less distributions paid: | | | | | | | | | | | | |
From net investment income | | | (0.01 | ) | | | (0.02 | ) | | | (0.01 | ) |
From net realized gains on investments | | | (— | )(b) | | | (— | )(b) | | | — | |
| | | | | | | | | | | | |
Total distributions paid | | | (0.01 | ) | | | (0.02 | ) | | | (0.01 | ) |
| | | | | | | | | | | | |
Change in net asset value | | | — | | | | — | | | | — | |
| | | | | | | | | | | | |
Net asset value, end of period | | $ | 1.00 | | | $ | 1.00 | | | $ | 1.00 | |
| | | | | | | | | | | | |
| | | | | | | | | | | | |
Total return(c) | | | 1.06 | % | | | 2.28 | % | | | 0.88 | % |
Ratios/Supplemental data: | | | | | | | | | | | | |
Net assets, end of period (000’s) | | $ | 7,012,840 | | | $ | 8,037,595 | | | $ | 7,929,722 | |
Ratio of net expenses to average net assets(d) | | | 0.10 | % | | | 0.10 | % | | | 0.10 | % |
Ratio of net investment income to average net assets(d) | | | 0.93 | % | | | 2.25 | % | | | 1.81 | % |
Ratio of gross expenses to average net assets(d), (e) | | | 0.13 | % | | | 0.13 | % | | | 0.13 | % |
| | | | | | | | | | | | |
| |
| (a) | For the period from April 4, 2018, commencement of operations, to September 30, 2018. |
| (b) | Amount is less than $0.005 per share. |
| (c) | Not annualized for periods less than one year. |
| (d) | Annualized for periods less than one year. |
| (e) | During the period shown, certain fees were reduced. If such fee reductions had not occurred, the ratio would have been as indicated. |
See Notes to Financial Statements.
7
ADVISERS INVESTMENT TRUST
NTAM TREASURY ASSETS FUND
NOTES TO FINANCIAL STATEMENTS
September 30, 2020
Advisers Investment Trust (the “Trust”) is a Delaware statutory trust operating under a Second Amended and Restated Agreement and Declaration of Trust (the “Trust Agreement”) dated June 21, 2018. The Trust was formerly an Ohio business trust, which commenced operations on December 20, 2011. On March 31, 2017, The Trust was converted to a Delaware Statutory Trust. As an open-end registered investment company, as defined in Financial Accounting Standards Board (“FASB”) Accounting Standards Update (“ASU”) 2013-08, the Trust follows accounting and reporting guidance under FASB Accounting Standards Codification (“ASC”) Topic 946, “Financial Services-Investment Companies”. The Trust Agreement permits the Board of Trustees (the “Trustees” or “Board”) to authorize and issue an unlimited number of shares of beneficial interest, at no par value, in separate series of the Trust. The NTAM Treasury Assets Fund (the “Fund”) is a series of the Trust, and commenced operations on April 4, 2018. Shares of the Fund are not registered under the Securities Act of 1933, as amended (the “1933 Act”). Investments in the Fund may be made only by individuals or entities that were “accredited investors” within the meaning of Regulation D under the 1933 Act.
The Fund is a diversified fund. The investment objective of the Fund is to seek to maximize current income to the extent consistent with the preservation of capital and maintenance of liquidity by investing its net assets, under normal market conditions, exclusively in United States (“U.S.”) Treasury securities and related repurchase agreements and other securities that limit their investments to, or are backed by, U.S. Treasury securities.
The Fund operates as a “government money market fund” under Rule 2a-7 of the Investment Company Act of 1940, as amended (the “1940 Act”).
Under the Trust’s organizational documents, its officers and Trustees are indemnified against certain liabilities arising out of the performance of their duties to the Trust and Fund. In addition, in the normal course of business, the Trust enters into contracts with its vendors and others that provide for general indemnifications. The Fund’s maximum exposure under these arrangements is unknown, as this would involve future claims that may be made against the Fund.
| A. | Significant accounting policies are as follows: |
INVESTMENT VALUATION
Investments are recorded at amortized cost, which approximates fair value. Under this method, investments purchased at a discount or premium are valued by accruing or amortizing the difference between the original purchase price and maturity value of the issue over the period to effective maturity. If amortized cost does not approximate fair value, such securities will be fair valued in good faith by the Fund’s Fair Value Committee in accordance with procedures established by and under the general supervision of the Trustees.
The following is a summary of the valuation inputs used as of September 30, 2020 in valuing the Fund’s investments based upon the three fair value levels as follows:
| • | | Level 1 —quoted prices in active markets for identical assets |
| • | | Level 2 —other significant observable inputs (including quoted prices of similar securities, interest rates, prepayment speeds, credit risk, etc.) |
| • | | Level 3 —significant unobservable inputs (including the Fund’s own assumptions in determining the fair value of investments) |
| | | | | | | | | | | | | | | | |
| Amounts in thousands | | Level 1 -
Quoted Prices | | | Level 2 -
Other Significant
Observable Inputs | | | Level 3 - Significant Unobservable Inputs | | | Total | |
| |
Investments held by the NTAM Treasury Assets Fund* | | $ | — | | | $ | 6,946,224 | | | $ | — | | | $ | 6,946,224 | |
| | | | |
* See additional categories in the Schedule of Investments.
8
ADVISERS INVESTMENT TRUST
NTAM TREASURY ASSETS FUND
NOTES TO FINANCIAL STATEMENTS
September 30, 2020
As of September 30, 2020, there were no Level 1 or Level 3 securities held by the Fund. There were no transfers to or from Level 3 during the year ended September 30, 2020.
REPURCHASE AGREEMENTS
The Fund may enter into repurchase agreements under the terms of a master repurchase agreement by which they purchase securities for cash from a seller and agree to resell those securities to the same seller at a specific price within a specified time or with an indefinite life and a liquidity feature which allows the Fund to resell the security quarterly. The interest rate on such repurchase agreements resets daily. During the term of a repurchase agreement, the fair value of the underlying collateral, including accrued interest, is required to equal or exceed the fair value of the repurchase agreement. The Fund is subject to credit risk on repurchase agreements to the extent that the counterparty fails to perform under the agreement and the value of the collateral received falls below the agreed repurchase price. If the seller defaults and the value of the collateral declines or if bankruptcy proceedings are commenced with respect to the seller of the security, realization of collateral by the Fund may be delayed or limited. The Fund has entered into such repurchase agreements at September 30, 2020, as reflected in the accompanying Schedule of Investments.
| | | | | | | | | | | | |
| Amounts in thousands | | Gross Amounts not Offset in the Statement of Assets and Liabilities | | | | |
| |
| | | |
| Counterparty | | Gross Amounts of Assets Presented in Statements of Assets and Liablities | | | Financial Instruments* | | | Net Amount | |
| |
BNP Paribas S.A. | | $ | 300,000 | | | $ | (300,000 | ) | | $ | — | |
Citigroup Global Markets, Inc. | | | 300,000 | | | | (300,000 | ) | | | — | |
Fixed Income Clearing Corp | | | 675,000 | | | | (675,000 | ) | | | — | |
JPMorgan Securities LLC | | | 300,000 | | | | (300,000 | ) | | | — | |
| | | | |
| | $ | 1,575,000 | | | $ | (1,575,000 | ) | | $ | — | |
| | | | |
* Collateral received is reflected up to the fair market value of the repurchase agreement.
INVESTMENT TRANSACTIONS AND INCOME
Investment transactions are accounted for no later than one business day after trade date. For financial reporting purposes, investments are reported as of the trade date. The Fund determines the gain or loss realized from investment transactions by using an identified cost basis method. Interest income is recognized on an accrual basis and includes, where applicable, the amortization of premium or accretion of discount.
EXPENSE ALLOCATIONS
Expenses directly attributable to a fund in the Trust are charged to that fund, while expenses that are attributable to more than one fund in the Trust are allocated among the applicable funds on a pro-rata basis to each adviser’s series of funds based on relative net assets or another reasonable basis.
DIVIDENDS AND DISTRIBUTIONS
Dividends from net income are declared daily and paid monthly by the Fund to its shareholders. Net income includes the interest accrued on the Fund’s assets less estimated expenses. The Fund’s net realized short-term capital gains, if any, are distributed at least annually.
Distributions from net investment income and from net realized capital gain are determined in accordance with Federal income tax regulations, which may differ from accounting principles generally accepted in the United States of America (“GAAP”). These “book/tax” differences are either considered temporary or permanent in nature. To the extent these differences are permanent in nature (e.g. treatment
9
ADVISERS INVESTMENT TRUST
NTAM TREASURY ASSETS FUND
NOTES TO FINANCIAL STATEMENTS
September 30, 2020
of certain dividend distributions, gains/losses, return of capital etc.), such amounts are reclassified within the composition of net assets based on their federal tax-basis treatment; temporary differences do not require reclassification. Distributions to shareholders that exceed net investment income and net realized capital gains for tax purposes are reported as return of capital.
FEDERAL INCOME TAX INFORMATION
No provision is made for Federal income taxes as the Fund intends to qualify each year as a “regulated investment company” under Subchapter M of the Internal Revenue Code of 1986, as amended (the “Code”), and distribute substantially all of its net investment income and net realized capital gain in accordance with the Code.
As of September 30, 2020, the Fund did not have uncertain tax positions that would require financial statement recognition or disclosure based on an evaluation of all open tax years for all major tax jurisdictions. The Fund’s Federal tax returns for the tax years ended September 30, 2020, 2019, and 2018 remain subject to examination by the Internal Revenue Service. Interest or penalties incurred, if any, on future unknown or uncertain tax positions taken by the Fund will be recorded as interest expense on the Statement of Operations.
Management is not aware of any tax positions for which it is reasonably possible that the total amounts of unrecognized tax benefits will change materially in the next 12 months.
USE OF ESTIMATES
The preparation of financial statements in conformity with GAAP requires management to make estimates and assumptions that affect the reported amounts of assets and liabilities and disclosure of contingent assets and liabilities at the date of the financial statements and the reported amounts of revenues and expenses during the reporting period. Actual results could differ from these estimates.
| B. | Fees and Transactions with Affiliates and Other Parties |
The Trust, on behalf of the Fund, has entered into an Investment Advisory Agreement (the “Agreement”) with Northern Trust Investments, Inc. (the “Adviser” or “NTI”) to provide investment management services to the Fund. Total fees incurred pursuant to the Agreement are reflected as “Investment advisory” fees on the Statement of Operations. Under the terms of the Agreement, the Fund pays the Adviser a monthly fee based on the Fund’s daily net assets at the annualized rate of 0.11%.
Foreside Financial Services, LLC (the “Placement Agent”), provides private placement services to the Fund pursuant to a placement agent agreement with the Trust, on behalf of the Fund. Under its agreement with the Trust, the Placement Agent acts as an agent of the Trust in connection with the offering of the shares of the Fund on a private placement basis to eligible investors only. The Adviser, at its own expense, pays the Placement Agent an asset-based fee, which is calculated and billed monthly, for these services and reimbursement for certain expenses incurred on behalf of the Fund.
The Northern Trust Company (“Northern Trust”), an affiliate to NTI, serves as the administrator, transfer agent, custodian and fund accounting agent for the Fund pursuant to written agreements between the Trust, on behalf of the Fund, and Northern Trust. The Fund agreed to pay Northern Trust certain annual and transaction-based fees, a tiered basis-point fee based on the Fund’s daily net assets, and reimburse for certain expenses incurred on behalf of the Fund. Total fees paid to Northern Trust pursuant to these agreements are reflected as “Accounting and Administration” fees on the Statement of Operations.
Foreside Fund Officer Services, LLC (“Foreside”) provides compliance and financial control services for the Fund pursuant to a written agreement with the Trust, on behalf of the Fund, including providing certain officers to the Fund. The Fund pays Foreside an annual base fee, a basis-point fee based on the Fund’s daily net assets and reimburses for certain expenses incurred on behalf of the Fund. Total fees paid to Foreside pursuant to these agreements are reflected as “Regulatory and Compliance” fees on the Statement of Operations.
Certain officers and Trustees of the Trust are affiliated with Foreside, Northern Trust, or the Placement Agent and receive no compensation directly from the Fund for serving in their respective roles. Through March 31, 2020, the Trust paid each Independent Trustee compensation for their services based on an annual retainer of $120,000 and reimbursement for certain expenses. Effective April 1, 2020,
10
ADVISERS INVESTMENT TRUST
NTAM TREASURY ASSETS FUND
NOTES TO FINANCIAL STATEMENTS
September 30, 2020
the Trust pays an annual retainer of $125,000 and reimbursement for certain expenses. If there are more than six meetings in a year, additional meeting fees may apply. For the year ended September 30, 2020, the aggregate Trustee compensation paid by the Trust was $367,500. The amount of total Trustee compensation and reimbursement of out-of-pocket expenses allocated from the Trust to the Fund is reflected as “Trustees” expenses on the Statement of Operations.
The Adviser has contractually agreed to waive fees or reimburse expenses to the extent necessary to limit total annual fund operating expenses (exclusive of the compensation paid to each Trustee, expenses associated with each Trustee’s attendance at Board of Trustees meetings and other Trust related travel, expenses of third party consultants engaged by the Board, membership dues paid to the Investment Company Institute, brokerage costs, interest, taxes, dividends, litigation and indemnification expenses, expenses associated with investments in underlying investment companies and extraordinary expenses) to 0.10% of the average daily net assets of the Fund until January 28, 2021. If it becomes unnecessary for the Adviser to waive fees or make reimbursements, the Adviser may recapture any of its prior waivers or reimbursements for a period not to exceed three fiscal years from the date on which the waiver or reimbursement was made to the extent that such a recapture does not cause the Total Annual Fund Operating Expenses (exclusive of the compensation paid to each Trustee, expenses associated with each Trustee’s attendance at Board of Trustees meetings and other Trust related travel, expenses of third party consultants engaged by the Board, membership dues paid to the Investment Company Institute, brokerage costs, interest, taxes, dividends, litigation and indemnification expenses, expenses associated with investments in underlying investment companies and extraordinary expenses) to exceed the applicable expense limitation in effect at the time of repayment or the applicable expense limitation that was in effect at the time of the waiver or reimbursement. The agreement to waive fees and reimburse expenses may be terminated by the Board at any time and will terminate automatically upon termination of the Agreement.
For the year ended September 30, 2020, the Fund incurred advisory fees payable to NTI, expense waivers and/or reimbursements from NTI, and paid expense recoupments to NTI, as follows:
| | | | | | | | | | | | |
| Amounts in thousands | | Advisory Fee to NTI | | | Expenses Reduced by NTI | | | Advisory Fees Recouped by NTI | |
| |
NTAM Treasury Assets Fund | | $ | 7,769 | | | $ | 2,108 | | | $ | — | |
The balances of recoverable expenses to NTI by the Fund at September 30, 2020 were as follows (in thousands):
| | | | | | | | |
| For the: | | Expiring | | | NTAM Treasury Assets Fund | |
| |
Period ended September 30, 2018 | | | September 30, 2021 | | | | $1,178 | |
Year ended September 30, 2019 | | | September 30, 2022 | | | | 2,246 | |
Year ended September 30, 2020 | | | September 30, 2023 | | | | 2,108 | |
| | | | | | | | |
Balances of Recoverable Expenses to the Adviser | | | | | | | 5,532 | |
| | | | | | | | |
The recent global outbreak of COVID-19 has disrupted economies and markets, and the prolonged duration and economic impact is uncertain. These events can have a significant impact on the Fund’s operations and performance.
11
ADVISERS INVESTMENT TRUST
NTAM TREASURY ASSETS FUND
NOTES TO FINANCIAL STATEMENTS
September 30, 2020
As of September 30, 2020, the cost, gross unrealized appreciation and gross unrealized depreciation on investments, for Federal income tax purposes, were as follows:
| | | | | | | | | | | | | | | | |
| Amounts in thousands | | Tax Cost | | | Tax Unrealized
Appreciation | | | Tax Unrealized (Depreciation) | | | Net Unrealized Appreciation (Depreciation) | |
| |
NTAM Treasury Assets Fund | | $ | 6,946,382 | | | $ | — | | | $ | (158 | ) | | $ | (158 | ) |
The tax character of distributions paid to shareholders during the latest tax periods ended September 30, 2020 and September 30, 2019 for the Fund were as follows:
| | | | | | | | | | | | | | | | | | | | |
| Amounts in thousands | | Ordinary Income | | | Net Long Term Gains | | | Total Taxable Distributions Paid | | | Tax Return of Capital | | | Total Distributions Paid | |
| |
2020 | | $ | 87,018 | | | $ | — | | | $ | 87,018 | | | $ | — | | | $ | 87,018 | |
2019 | | | 175,874 | | | | — | | | | 175,874 | | | | — | | | | 175,874 | |
As of the latest tax year ended September 30, 2020, the components of accumulated earnings on a tax basis were as follows:
| | | | | | | | | | | | | | | | | | | | | | | | | | | | |
| Amounts in thousands | | Undistributed Ordinary Income | | | Undistributed Long- Term Capital Gains | | | Accumulated Earnings | | | Distributions Payable | | | Accumulated Capital and Other Losses | | | Unrealized Depreciation | | | Total Accumulated Earnings | |
| |
NTAM Treasury Assets Fund | | | 1,355 | | | | — | | | | 1,355 | | | | | (562) | | | — | | | | | (158) | | | 635 | |
12

REPORT OF INDEPENDENT REGISTERED PUBLIC ACCOUNTING FIRM
To the shareholders and the Board of Trustees of Advisers Investment Trust:
Opinion on the Financial Statements and Financial Highlights
We have audited the accompanying statement of assets and liabilities, including the schedule of investments, of the NTAM Treasury Assets Fund (the “Fund”), one of the portfolios constituting Advisers Investment Trust (the “Trust”), as of September 30, 2020, the related statement of operations for the year then ended, the statements of changes in net assets for each of the two years then ended, the financial highlights for each of the two years then ended and for the period April 4, 2018 (commencement of operations) through September 30, 2018, and the related notes.
In our opinion, the financial statements and financial highlights present fairly, in all material respects, the financial position of the NTAM Treasury Assets Fund of the Trust as of September 30, 2020, and the results of its operations for the year then ended, the changes in its net assets for each of the two years in the period then ended, and the financial highlights for each of the two years in the period then ended and for the period from April 4, 2018 (commencement of operations) through September 30, 2018, in conformity with accounting principles generally accepted in the United States of America.
Basis for Opinion
These financial statements and financial highlights are the responsibility of the Fund’s management. Our responsibility is to express an opinion on the Fund’s financial statements and financial highlights based on our audits. We are a public accounting firm registered with the Public Company Accounting Oversight Board (United States) (PCAOB) and are required to be independent with respect to the Fund in accordance with the U.S. federal securities laws and the applicable rules and regulations of the Securities and Exchange Commission and the PCAOB.
We conducted our audits in accordance with the standards of the PCAOB. Those standards require that we plan and perform the audit to obtain reasonable assurance about whether the financial statements and financial highlights are free of material misstatement, whether due to error or fraud. The Fund is not required to have, nor were we engaged to perform, an audit of its internal control over financial reporting. As part of our audits we are required to obtain an understanding of internal control over financial reporting but not for the purpose of expressing an opinion on the effectiveness of the Fund’s internal control over financial reporting. Accordingly, we express no such opinion.
Our audits included performing procedures to assess the risks of material misstatement of the financial statements and financial highlights, whether due to error or fraud, and performing procedures that respond to those risks. Such procedures included examining, on a test basis, evidence regarding the amounts and disclosures in the financial statements and financial highlights. Our audits also included evaluating the accounting principles used and significant estimates made by management, as well as evaluating the overall presentation of the financial statements and financial highlights. Our procedures
13
included confirmation of securities owned as of September 30, 2020, by correspondence with the custodian and brokers; when replies were not received from brokers, we performed other auditing procedures. We believe that our audits provide a reasonable basis for our opinion.

November 20, 2020
We have served as the auditor of one or more Northern Trust investment companies since 2002.
14
ADVISERS INVESTMENT TRUST
NTAM TREASURY ASSETS FUND
ADDITIONAL INFORMATION
September 30, 2020 (Unaudited)
As a Fund shareholder, you may incur two types of costs: (1) transaction costs, and (2) ongoing costs, including management fees and other Fund expenses. The examples below are intended to help you understand your ongoing costs (in dollars) of investing in the Fund and to compare these costs with the ongoing costs of investing in other mutual funds. Please note that the expenses shown in the tables are meant to highlight your ongoing costs only and do not reflect any transactional costs. Therefore, the examples are useful in comparing ongoing costs only and will not help you determine the relative total cost of owning different funds. In addition, if these transactional costs were included, your costs would have been higher.
The examples below are based on an investment of $1,000 invested at April 1, 2020 and held for the entire period through September 30, 2020.
The Actual Expense Example below provides information about actual account values and actual expenses. You may use this information, together with the amount you invested, to estimate the expenses that you paid over the period. Simply divide your account value by $1,000 (for example, an $8,600 account value divided by $1,000 = 8.6), then multiply the result by the number in the table under the heading entitled “Expenses Paid” to estimate the expenses you paid on your account during this period.
The Hypothetical Expense Example below provides information about hypothetical account values and hypothetical expenses based on the Fund’s actual expense ratio and an assumed rate of return of 5% per year before expenses, which is not the Fund’s actual return. The hypothetical account values and expenses may not be used to estimate the actual ending account balance or expenses you paid for the period. You may use this information to compare the ongoing costs of investing in the Fund and other funds. To do so, compare this 5% hypothetical example with the 5% hypothetical examples that appear in the shareholder reports of the other funds.
| | | | | | | | | | | | | | | | |
| | | Expense Ratio | | | Beginning Account Value 4/1/2020 | | | Ending Account Value 9/30/2020 | | | Expenses Paid 4/1/20–9/30/20* | |
| |
Actual | | | 0.10% | | | $ | 1,000.00 | | | $ | 1,000.90 | | | $ | 0.50 | |
Hypothetical | | | 0.10% | | | $ | 1,000.00 | | | $ | 1,024.50 | | | $ | 0.51 | |
| * | Expenses are calculated using the annualized expense ratio (as disclosed in the table), multiplied by the average account value for the period, multiplied by the number of days in the most recent half fiscal year (183), and divided by the number of days in the current year (366). |
A description of the policies and procedures that the Fund uses to determine how to vote proxies relating to portfolio securities is available (i) without charge, upon request, by writing to the Fund at NTAM Treasury Assets Fund c/o The Northern Trust Company, P.O. Box 4766, Chicago, Illinois 60680-4766 or by calling the Fund at 855-351-4583 (toll free); and (ii) on the U.S. Securities and Exchange Commission’s (the “SEC”) website at www.sec.gov. Information regarding how the Fund voted proxies relating to portfolio securities during the most recent 12-month period ended June 30 is available (i) without charge, by calling the Fund at 855-351-4583 (toll free); and (ii) on the SEC’s website at www.sec.gov.
For relevant periods ended December 31, 2018 and prior, the Fund filed a complete Schedule of Portfolio Holdings with the SEC for the first and third quarters of each fiscal year on Form N-Q, which is available without charge on the SEC’s website at www.sec.gov.
15
ADVISERS INVESTMENT TRUST
NTAM TREASURY ASSETS FUND
ADDITIONAL INFORMATION
September 30, 2020 (Unaudited)
The following table provides information regarding each Trustee who is not an “interested person” of the Trust, as defined in the 1940 Act.
| | | | | | | | | | |
Name, Address and Year of Birth1 | | Position(s) Held with the Trust | | Term of Office/Length of Time Served | | Principal Occupation(s) During Past 5 Years | | Number of Portfolios in the Trust Overseen by Trustee | | Other
Directorships Held by Trustee During Past 5 Years |
D’Ray Moore Year of Birth: 1959 | | Trustee | | Indefinite/July 2011 to present | | Independent Trustee, Diamond Hill Funds 2007 to present; Chairperson, Diamond Hill Funds 2014 to present. | | 12 | | Diamond Hill Funds |
| | | | | |
| Steven R. Sutermeister Year of Birth: 1954 | | Trustee | | Indefinite/July 2011 to present | | President, Vadar Capital LLC, 2008 to 2017. | | 12 | | None |
| | | | | |
Michael M. Van Buskirk Year of Birth: 1947 | | Trustee | | Indefinite/July 2011 to present | | Independent Trustee, Boston Trust Walden Funds 1992 to present. | | 12 | | Boston Trust Walden Funds |
| | | | | |
Name, Address and Year of Birth1 | | Position(s) Held with the Trust | | Term of Office/ Length of Time Served | | Principal Occupation(s) During Past 5 Years | | Number of Portfolios in the Trust Overseen by Trustee | | Other Directorships Held by Trustee During Past 5 Years |
| David M. Whitaker Year of Birth: 19712 | | Trustee | | Indefinite/ July 2017 to present | | President, Foreside Financial Group, LLC, 2011 to present; Director, Portland Air Freight, 2011 to present; Director, National Investment Company Service Association (NICSA) 2018 to present. | | 12 | | PAF Transportation |
| | | | | |
| Daniel P. Houlihan Year of Birth: 19663 | | Trustee | | Indefinite/ March 2016 to present | | Executive Vice President, The Northern Trust Company, 2008 to present; Chairman, National Investment Company Service Association (NICSA) 2017 to present; Vice Chairman, National Investment Company Service Association (NICSA) 2014 to 2017. | | 12 | | None |
| | | | | |
| Barbara J. Nelligan Year of Birth: 1969 | | President | | Indefinite/ August 2017 to present | | Senior Vice President, Global Fund Services Fund Governance Solutions, The Northern Trust Company, 2018 to present; Senior Vice President, Global Fund Services Product Management, The Northern Trust Company, 2007 to 2018; Vice President of Advisers Investment Trust, 2012 to 2017. | | N/A | | N/A |
16
ADVISERS INVESTMENT TRUST
NTAM TREASURY ASSETS FUND
ADDITIONAL INFORMATION
September 30, 2020 (Unaudited)
| | | | | | | | | | |
| | | | | |
Name, Address and Year of Birth1 | | Position(s) Held with the Trust | | Term of Office/ Length of Time Served | | Principal Occupation(s) During Past 5 Years | | Number of Portfolios in the Trust Overseen by Trustee | | Other Directorships Held by Trustee During Past 5 Years |
Rodney Ruehle Year of Birth: 1968 | | Chief Compliance Officer and AML Officer | | Indefinite/March 2019 to present | | Director, Foreside Financial Group, LLC (formerly Foreside Compliance Services, LLC) (financial services), 2016 to present; Director, Beacon Hill Fund Services, LLC, April 2008 to July 2016. | | N/A | | N/A |
| | | | | |
Troy Sheets Year of Birth: 1971 | | Treasurer | | Indefinite/ July 2011 to present | | Senior Director, Foreside Financial Group, LLC, 2016 to present; Director, Beacon Hill Fund Services, Inc., 2009 to 2016. | | N/A | | N/A |
| | | | | |
Trent Statczar Year of Birth: 1971 | | Assistant Treasurer | | Indefinite/July 2011 to present | | Senior Director, Foreside Financial Group, LLC, 2016 to present; Director, Beacon Hill Fund Services, Inc., 2008 to 2016. | | N/A | | N/A |
| | | | | |
Toni M. Bugni Year of Birth: 1973 | | Secretary | | Indefinite/ March 2018 to present | | Senior Vice President, Global Fund Services Fund Governance Solutions, The Northern Trust Company, 2011 to present. | | N/A | | N/A |
| | | | | |
Deanna Y. Pellack Year of Birth: 1987 | | Assistant Secretary | | Indefinite/March 2018 to present | | Vice President, Global Fund Services Fund Governance Solutions, The Northern Trust Company 2019 to present; Second Vice President, Global Fund Services Fund Governance Solutions, The Northern Trust Company 2014 to 2019. | | N/A | | N/A |
1The mailing address of Messrs. Whitaker, Ruehle, Sheets, and Statczar is 690 Taylor Road, Suite 210, Gahanna, Ohio 43230. The mailing address of Messr. Houlihan and Mses. Nelligan, Bugni, and Pellack is 50 S. LaSalle Street, Chicago, IL 60603.
2 Mr. Whitaker is the President of Foreside Financial Group, LLC and is therefore deemed to be an “interested person” of the Trust, as defined in the 1940 Act.
3 Mr. Houlihan is an Executive Vice President of the Northern Trust Company and is therefore deemed to be an “interested person” of the Trust, as defined in the 1940 Act.
The Fund’s Statement of Additional Information includes additional information about the Trust’s Trustees and Officers. To receive your free copy of the Statement of Additional Information, call toll-free 855-351-4583.
17
(This page intentionally left blank)
(This page intentionally left blank)
(This page intentionally left blank)
NTAM Treasury Assets Fund
(Series of the Advisers Investment Trust)
Privacy Policy
SAFEGUARDING PRIVACY
We recognize and respect the privacy expectations of each of our investors and we believe the confidentiality and protection of investor information is one of our fundamental responsibilities. New technologies have dramatically changed the way information is gathered and used, but our continuing commitment to preserving the security and confidentiality of investor information has remained a core value of the Advisers Investment Trust.
INFORMATION WE COLLECT AND SOURCES OF INFORMATION
We may collect information about our customers to help identify you, evaluate your application, service and manage your account and offer services and products you may find valuable. We collect this information from a variety of sources including:
| · | | Information we receive from you on applications or other forms (e.g. your name, address, date of birth, social security number and investment information); |
| · | | Information about your transactions and experiences with us and our affiliates (e.g. your account balance, transaction history and investment selections); and |
| · | | Information we obtain from third parties regarding their brokerage, investment advisory, custodial or other relationship with you (e.g. your account number, account balance and transaction history. |
INFORMATION WE SHARE WITH SERVICE PROVIDERS
We may disclose all non-public personal information we collect, as described above, to companies (including affiliates) that perform services on our behalf, including those that assist us in responding to inquiries, processing transactions, preparing and mailing account statements and other forms of shareholder services provided they use the information solely for these purposes and they enter into a confidentiality agreements regarding the information.
INFORMATION WE MAY SHARE WITH AFFILIATES
If we have affiliates which are financial service providers that offer investment advisory, brokerage and other financial services, we may (subject to Board approval) share information among our affiliates to better assist you in achieving your financial goals.
SAFEGUARDING CUSTOMER INFORMATION
We will safeguard, according to federal standards of security and confidentiality, any non-public personal information our customers share with us.
We will limit the collection and use of non-public customer information to the minimum necessary to deliver superior service to our customers which includes advising our customers about our products and services and to administer our business.
We will permit only authorized employees who are trained in the proper handling of non-public customer information to have access to that information.
We will not reveal non-public customer information to any external organization unless we have previously informed the customer in disclosures or agreements, have been authorized by the customer or are required by law or our regulators.
We value you as a customer and take your personal privacy seriously. We will inform you of our policies for collecting, using, securing and sharing nonpublic personal information the first time we do business and every year that you are a customer of the Advisers Investment Trust or anytime we make a material change to our privacy policy.
Investment Adviser
Northern Trust Investments, Inc.
50 South LaSalle Street
Chicago, Illinois 60603
Custodian
The Northern Trust Company
50 South LaSalle Street
Chicago, Illinois 60603
Independent Registered
Public Accounting Firm
Deloitte & Touche LLP
111 S. Wacker Drive
Chicago, Illinois 60606
Legal Counsel
Thompson Hine LLP
41 South High Street, Suite 1700
Columbus, Ohio 43215-6101
Placement Agent
Foreside Financial Services, LLC
3 Canal Plaza, Suite 100
Portland, ME 04101
For Additional Information, call
855-351-4583 (toll free)
(b) Not applicable.
As of September 30, 2020, the registrant had adopted a “code of ethics” (as such term is defined in Item 2 of Form N-CSR) that applies to the registrant’s principal executive officer and principal financial officer. This code is filed as Exhibit 13(a)(1) hereto. There were no substantive amendments or waivers to the code of ethics during the period covered by this report.
| Item 3. | Audit Committee Financial Expert. |
The registrant’s Board of Trustees has determined the registrant has at least one “audit committee financial expert” (as such term is defined in Item 3 of Form N-CSR) serving on its Audit Committee. The “audit committee financial expert” is Mr. Steven R. Sutermeister, who is “independent” for purposes of this Item 3 of Form N-CSR.
| Item 4. | Principal Accountant Fees and Services. |
Independent Franchise Partners US Equity Fund
2020 $22,000
2019 $20,000
JOHCM Funds
2020 $220,000
2019 $229,500
The fees paid to PricewaterhouseCoopers LLP relate to the audit of the registrant’s annual financial statements and letters for the filings of the registrant’s Form N-CEN and Form N-1A.
Vontobel U.S Equity Institutional Fund
2020 $22,432
2019 $21,263
The fees paid to Ernst & Young LLP relate to the audit of the registrant’s annual financial statements and letters for the filings of the registrant’s Form N-CEN and Form N-1A.
River Canyon Total Return Bond Fund
2020 $29,800
2019 $29,800
NTAM Treasury Assets Fund
2020 $26,500
2019 $26,500
The fees paid to Deloitte & Touche LLP relate to the audit of the registrant’s annual financial statements and letters for the filings of the registrant’s Form N-CEN and Form N-1A.
Independent Franchise Partners US Equity Fund
2020 $0
2019 $0
JOHCM Funds
2020 $0
2019 $0
Vontobel U.S. Equity Institutional Fund
2020 $0
2019 $0
River Canyon Total Return Bond Fund
2020 $0
2019 $0
NTAM Treasury Assets Fund
2020 $0
2019 $0
Independent Franchise Partners US Equity Fund
2020 $5,525
2019 $5,300
JOHCM Funds
2020 $56,745
2019 $57,825
The fees to PricewaterhouseCoopers LLP relate to the preparation of the registrant’s tax returns, review of annual distributions, and additional tax provision support fees. The 2019 JOHCM Funds’ amount has been updated for final billings.
Vontobel Funds
2020 $5,735
2019 $50,260
The fees to Ernst & Young LLP relate to the preparation of the registrant’s tax returns, review of annual distributions, and additional tax provision support fees. The 2019 amounts include fees paid for the final tax returns for three Vontobel Funds that reorganized out of the Trust.
River Canyon Total Return Bond Fund
2020 $6,200
2019 $6,200
NTAM Treasury Assets Fund
2020 $3,300
2019 $3,300
The fees to Deloitte & Touche LLP relate to the preparation of the registrant’s tax returns and review of annual distributions.
Independent Franchise Partners US Equity Fund
2020 $0
2019 $0
JOHCM Funds
2020 $0
2019 $0
Vontobel Funds
2020 $0
2019 $0
River Canyon Total Return Bond Fund
2020 $0
2019 $0
NTAM Treasury Assets Fund
2020 $0
2019 $0
(e)(1) Except as permitted by rule 2-01(c)(7)(i)(C) of regulation S-X the registrant’s audit committee must pre-approve all audit and non-audit services provided by the independent
| | accountants relating to the operations or financial reporting of the registrant. Prior to the commencement of any audit or non-audit services to the registrant, the audit committee reviews the services to determine whether they are appropriate and permissible under applicable law. |
| (e)(2) | Independent Franchise Partners US Equity Fund |
2020 0%
2019 0%
JOHCM Funds
2020 0%
2019 0%
Vontobel U.S. Equity Institutional Fund
2020 0%
2019 0%
River Canyon Total Return Bond Fund
2020 0%
2019 0%
NTAM Treasury Assets Fund
2020 0%
2019 0%
| (g) | Independent Franchise Partners US Equity Fund |
2020 $5,525
2019 $5,300
JOHCM Funds
2020 $56,745
2019 $57,825
Vontobel Funds
2020 $5,735
2019 $50,260
River Canyon Total Return Bond Fund
2020 $6,200
2019 $6,200
NTAM Treasury Assets Fund
2020 $3,300
2019 $3,300
(h) The Audit Committee considered the non-audit services rendered to the registrant’s investment adviser and believes the services are compatible with the principal accountant’s independence.
| Item 5. | Audit Committee of Listed Registrants. |
Not applicable.
| (a) | The Schedule of Investments in securities of unaffiliated issuers is included in the report to shareholders filed under Item 1 of this Form. |
| Item 7. | Disclosure of Proxy Voting Policies and Procedures for Closed-End Management Investment Companies. |
Not applicable.
| Item 8. | Portfolio Managers of Closed-End Management Investment Companies. |
Not applicable.
| Item 9. | Purchases of Equity Securities by Closed-End Management Investment Company and Affiliated Purchasers. |
Not applicable.
| Item 10. | Submission of Matters to a Vote of Security Holders. |
Not applicable.
| Item 11. | Controls and Procedures. |
| (a) | The registrant’s principal executive officer and principal financial officer have concluded, based on their evaluation of the registrant’s disclosure controls and procedures as conducted within 90 days of the filing date of this report, that these disclosure controls and procedures are adequately designed and are operating effectively to ensure that information required to be disclosed by the registrant on Form N-CSR is recorded, processed, summarized and reported within the time periods specified in the Securities and Exchange Commission’s rules and forms. |
| (b) | There were no changes in the registrant’s internal control over financial reporting (as defined in Rule 30a-3(d) under the Investment Company Act of 1940) that occurred |
| | during the period covered by this report that have materially affected or are reasonably likely to materially affect, the registrant’s internal control over financial reporting. |
| Item 12. | Disclosure of Securities Lending Activities for Closed-End Management Investment Companies. |
Not applicable.
SIGNATURES
Pursuant to the requirements of the Securities Exchange Act of 1934 and the Investment Company Act of 1940, the registrant has duly caused this report to be signed on its behalf by the undersigned, thereunto duly authorized.
| | |
| Advisers Investment Trust |
| |
| By: | | /s/ Troy A. Sheets |
| | Troy A. Sheets |
| | Treasurer and Principal Financial Officer |
| |
| Date: | | December 3, 2020 |
Pursuant to the requirements of the Securities Exchange Act of 1934 and the Investment Company Act of 1940, this report has been signed below by the following persons on behalf of the registrant and in the capacities and on the dates indicated.
| | |
| By: | | /s/ Barbara J. Nelligan |
| | Barbara J. Nelligan |
| | President and Principal Executive Officer |
| |
| Date: | | December 3, 2020 |
| |
| By: | | /s/ Troy A. Sheets |
| | Troy A. Sheets |
| | Treasurer and Principal Financial Officer |
| |
| Date: | | December 3, 2020 |