UNITED STATES
SECURITIES AND EXCHANGE COMMISSION
Washington, D.C. 20549
FORM N-CSR
CERTIFIED SHAREHOLDER REPORT OF REGISTERED
MANAGEMENT INVESTMENT COMPANIES
Investment Company Act file number: 811-22538
Advisers Investment Trust
(Exact name of registrant as specified in charter)
50 S. LaSalle Street
Chicago, Illinois 60603
(Address of principal executive offices) (Zip code)
The Northern Trust Company
50 S. LaSalle Street
Chicago, Illinois 60603
(Name and address of agent for service)
Registrant’s telephone number, including area code: 866-638-5859
Date of fiscal year end: September 30
Date of reporting period: September 30, 2023
Form N-CSR is to be used by management investment companies to file reports with the Commission not later than 10 days after the transmission to stockholders of any report that is required to be transmitted to stockholders under Rule 30e-1 under the Investment Company Act of 1940 (17 CFR 270.30e-1). The Commission may use the information provided on Form N-CSR in its regulatory, disclosure review, inspection, and policymaking roles.
A registrant is required to disclose the information specified by Form N-CSR, and the Commission will make this information public. A registrant is not required to respond to the collection of information contained in Form N-CSR unless the Form displays a currently valid Office of Management and Budget (“OMB”) control number. Please direct comments concerning the accuracy of the information collection burden estimate and any suggestions for reducing the burden to Secretary, Securities and Exchange Commission, 450 Fifth Street, NW, Washington, DC 20549-0609. The OMB has reviewed this collection of information under the clearance requirements of 44 U.S.C. § 3507.
Item 1. Reports to Stockholders.
(a) The following are copies of reports transmitted to shareholders pursuant to Rule 30e-1 under the Investment Company Act of 1940 (17 CFR 270.30e-1).

INDEPENDENT FRANCHISE PARTNERS
US EQUITY FUND
ANNUAL REPORT
September 30, 2023
This report is submitted for the general information of the shareholders of the Fund. It is not authorized for the distribution to prospective investors unless preceded or accompanied by an effective prospectus.
ADVISERS INVESTMENT TRUST
INDEPENDENT FRANCHISE PARTNERS US EQUITY FUND
TABLE OF CONTENTS
September 30, 2023
ADVISERS INVESTMENT TRUST
INDEPENDENT FRANCHISE PARTNERS US EQUITY FUND
SHAREHOLDER LETTER
September 30, 2023
Dear Shareholder:
We are pleased to present to shareholders the September 30, 2023 Annual Report for the Independent Franchise Partners US Equity Fund (the “Fund”), a series of the Advisers Investment Trust. This report contains the results of Fund operations for the year ended September 30, 2023.
We appreciate the trust and confidence you have placed in us by choosing the Fund and its Investment Adviser, Independent Franchise Partners, LLP, and we look forward to continuing to serve your investing needs.
| | | | |
Sincerely, | | | | |
| | |
 | |  | | |
| | |
Barbara J. Nelligan | | Sandeep Ghela | | |
President | | Chief Operating Officer | | |
Advisers Investment Trust | | Independent Franchise Partners, LLP | | |
1
ADVISERS INVESTMENT TRUST
INDEPENDENT FRANCHISE PARTNERS US EQUITY FUND
PORTFOLIO COMMENTARY
September 30, 2023 (Unaudited)
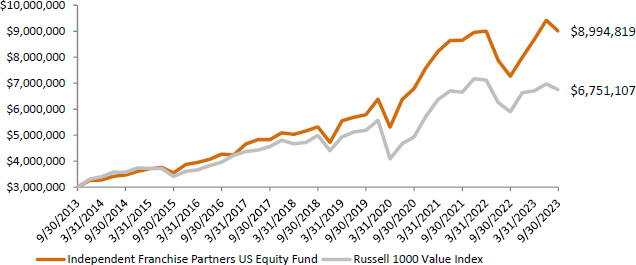
Independent Franchise Partners US Equity Fund
Value of a hypothetical $3,000,000 investment in the Fund from September 30, 2013 to September 30, 2023
Average Annual Total Returns as of September 30, 2023
| | | | | | | | |
| | | Independent Franchise
Partners US Equity Fund (without redemption fee) | | Independent Franchise Partners US Equity Fund (with redemption fee) | | Russell 1000 Value Index | | S&P 500 Index |
Q4 2022 | | 9.94% | | 9.70% | | 12.42% | | 7.56% |
Q1 2023 | | 8.59% | | 8.32% | | 1.01% | | 7.50% |
Q2 2023 | | 8.52% | | 8.25% | | 4.07% | | 8.74% |
Q3 2023 | | -4.31% | | -4.55% | | -3.17% | | -3.27% |
Year to Date | | 12.76% | | 12.48% | | 1.79% | | 13.07% |
1 Year | | 23.97% | | 23.70% | | 14.44% | | 21.62% |
3 Years (Annualized) | | 9.89% | | 9.83% | | 11.05% | | 10.15% |
5 Years (Annualized) | | 11.13% | | 11.09% | | 6.23% | | 9.92% |
10 Years (Annualized) | | 11.63% | | 11.62% | | 8.45% | | 11.91% |
Since Inception | | | | | | | | |
(Annualized) | | 12.42% | | 12.41% | | 10.53% | | 13.27% |
The Fund’s performance reflects the reinvestment of dividends as well as the impact of transaction costs (including the Fund’s 0.25% redemption fee unless noted otherwise) and the deduction of fees and expenses. The Fund’s Total Annual Operating Expense, per the most recent Prospectus, is 0.68%.
The performance data quoted represents past performance; past performance does not guarantee future results. The investment return and principal value of an investment will fluctuate so that an investor’s shares, when redeemed, may be worth more or less than their original cost. The Fund’s current performance may be lower or higher than the performance data quoted. Investors may obtain performance information current to the most recent month-end, within 7 business days, by calling 855-233-0437 or 312-557-7902.
Data as at September 30, 2023. The Inception date of the Fund is December 20, 2011. Performance is shown net of fees and periods greater than one year are annualized. The performance does not reflect taxes that a shareholder would pay on fund distributions or on the redemption of fund shares.
The Fund’s primary benchmark for performance comparison purposes is the Russell 1000 Value Index. The Russell 1000 Value Index measures the return of the large-cap value segment of the US equity universe. It includes those Russell 1000 companies with lower price-to-book ratios and lower expected growth values. The Russell 1000 Value Index is constructed to provide a comprehensive and unbiased barometer for the large-cap value segment of the US economy. The Index is completely
2
ADVISERS INVESTMENT TRUST
INDEPENDENT FRANCHISE PARTNERS US EQUITY FUND
PORTFOLIO COMMENTARY
September 30, 2023 (Unaudited)
reconstituted annually to ensure new and growing equities are included and that the represented companies continue to reflect value characteristics. Benchmark returns are calculated with dividends reinvested gross of withholding tax. The index reflects the returns of approximately 1000 holdings. The secondary benchmark is the S&P 500 Index. The S&P 500 Index is a capitalisation-weighted index of 500 US stocks. The benchmark is designed to measure the return of the broad domestic US economy through changes in the aggregate market value of 500 stocks representing all major industries. Sources of foreign exchange rates may be different between composites and the benchmark. Benchmark returns are calculated with dividends reinvested gross of withholding tax. The impact of transaction costs and the deduction of expenses associated with a mutual fund, such as investment management and administration fees, are not reflected in the Index calculations. It is not possible to invest directly in an index. Please refer to the Fund’s Prospectus for further information.
Frank Russell Company (“Russell”) is the source and owner of the trademarks, service marks and copyrights related to the Russell Indexes. Russell® is a trademark of the Frank Russell Company. Neither Russell nor its licensors accept any liability for any errors or omissions in the Russell Indexes and / or Russell ratings or underlying data and no party may rely on any Russell Indexes and / or Russell ratings and / or underlying data contained in this communication. No further distribution of Russell Data is permitted without Russell’s express written consent. Russell does not promote, sponsor or endorse the content of this communication. Please refer to the Fund’s Prospectus for further information.
Portfolio Commentary
In the year to September 30, 2023, the Fund returned 23.97% (assuming no redemption fee). This is an attractive absolute return and compares favorably against the Russell 1000 Value Index and S&P 500 Index which rose 14.44% and 21.62%, respectively. We are pleased with the Fund’s return although it is unusual for the US Franchise strategy to outpace such a rapidly rising market. If these strong market returns continue, it is reasonable to expect the Fund’s returns to start to lag the broader equity market.
The Fund benefitted from exposure to certain stocks that possess durable intangible assets, notably Oracle in the information technology sector, Booking Holdings and Richemont in the consumer discretionary sector, Zillow in the real estate sector, and News Corp in the communication services sector.
The Fund’s lack of exposure to the utilities sector, which was the only sector to fall during the review period, benefited returns relative to the Russell 1000 Value Index. Companies in the utilities sector tend to be highly capital intensive and operate in a regulated environment in which it is hard to exercise pricing power. These attributes do not fit our long-term, buy and hold investment approach.
Materials was the weakest sector for the Fund, driven by weaker returns from Corteva, which detracted from the Fund’s return. Companies such as Bristol Myers Squibb and British American Tobacco (BAT), in the health care and consumer staples sectors, respectively, also detracted from the Fund’s returns during the period.
We encourage clients to assess returns over longer intervals, like a full market cycle, in line with our investment horizon. We caution that Franchise returns will likely lag if markets are led by sectors where we do not find Franchise opportunities. As always, we continue to design Franchise portfolios with the dual goals of earning an attractive long-term rate of return while insulating clients from the worst of equity market drawdowns.
Investment Returns and Contribution to Fund Return – 1 Year ended September 30, 2023
| | | | | | | | | | | | | | | | | | | | | | |
| US Equity Fund – Stock Returns (%) | | | | | US Equity Fund – Contribution to Fund Return (bps) | | | |
| Top | | | | | Bottom | | | | | Top | | | | | Bottom | | | |
Booking | | | +86% | | | Bristol Myers Squibb | | | -16% | | | Oracle | | | +359 | | | Bristol Myers Squibb | | | -81 | |
Oracle | | | +78% | | | Corteva | | | -9% | | | Booking | | | +322 | | | Corteva | | | -27 | |
Zillow | | | +61% | | | BAT | | | -6% | | | Zillow | | | +234 | | | BAT | | | -10 | |
Salesforce | | | +41% | | | Estée Lauder | | | -5% | | | Richemont | | | +173 | | | Estée Lauder | | | -8 | |
Novartis | | | +37% | | | Johnson & Johnson | | | -2% | | | News Corp | | | +170 | | | Johnson & Johnson | | | 0 | |
Stock returns reflect total returns and are presented in US Dollars for the period the stock was held during the year ended September 30, 2023. Contribution to Fund return reflects contribution to gross return and is presented in US Dollars for the period the stocks were held during the year to September 30, 2023. Source: FactSet, Independent Franchise Partners, LLP. For complete attribution and methodology, please contact clientservice@franchisepartners.com.
3
ADVISERS INVESTMENT TRUST
INDEPENDENT FRANCHISE PARTNERS US EQUITY FUND
PORTFOLIO COMMENTARY
September 30, 2023 (Unaudited)
Significant Contributors to the Fund’s Return
Among the top contributors to the Fund’s return were Oracle, Booking and Zillow.
Oracle is making strong progress in transitioning both its application and database businesses to the cloud. Oracle’s cloud infrastructure solutions are performing well ahead of market expectations. The company is now gaining market share in the Infrastructure-as-a-Service market, albeit from a low base. We think these share gains can continue in the medium term. We reduced the position size in June 2023 given the strong share price performance since the start of 2023 as the market starts to recognise the improved competitive position and revenue growth acceleration. Oracle’s shares trade on a 4.6% estimated free cash flow yield.
Booking’s quarterly results releases in February and August 2023 demonstrated that it is benefitting from greater demand for travel and higher hotel prices. Booking has emerged from the COVID-19 travel downturn in a stronger competitive position as it starts to realise the benefits of its investment in its “Connected Trip” or one-stop, travel solution. The company revealed that an increasing proportion of its total bookings come through its apps, growing from 32% in 2019 to 48% by mid-2023. This is a further indication of the strength of the Booking.com brand. We continue to think Booking is well placed to further increase its market share given the strength of its brand, the broad geographic footprint of its listings, and its continued investment to improve the customer experience. Booking’s shares trade on a 6.3% estimated free cash flow yield.
Zillow’s shares benefitted from a stabilisation in U.S. home buying interest in the first half of 2023 following steady declines for much of 2022. We think Zillow is well placed to improve medium-term revenues and margins by better monetising its strong brand. Almost 70% of U.S. consumers start their home search on Zillow, but the company currently only monetises around 3% of housing transactions. Zillow is making progress on several near-term product development initiatives in touring, mortgage, and seller services that should help to close this gap. The company’s shares trade on a 5.5% estimated free cash flow yield. While we are mindful of the shorter-term cyclical headwinds driven by higher interest rates, we think this is an attractive valuation given Zillow’s leading market position and its secular growth opportunity.
Notable Detractors from the Fund’s Return
Among the largest detractors from the Fund’s return were Bristol Myers Squibb, Corteva and BAT.
Bristol’s shares were affected by some modest clinical trial setbacks and disappointing second quarter 2023 results, with a reduction in full year guidance due to lower-than-expected revenues for its off-patent drug Revlimid. In addition, the company announced the failure of a clinical trial for the use of its drug Sotyktu. Uncertainty also emerged over the U.S. Food and Drug Administration’s upcoming approval for Reblozyl. Bristol also announced the pending retirement of CEO Giovanni Caforio in November 2023. Caforio will be replaced by Chief Commercialisation Officer Christopher Boerner. We do not expect the company’s strategic priorities to change materially, and the transition appears to be orderly.
We are not overly concerned by the Sotyktu clinical trial failure and Reblozyl uncertainty. These are just two of a number of strong new therapy launches for the company and Reblozyl already has good traction as a second-line treatment. The weakness in Revlimid’s revenues does not materially affect our investment thesis as the drug is now off patent and therefore represents a smaller proportion of the company’s expected future revenues. The company’s shares trade on an estimated 12.1% free cash flow yield, which we think underestimates the strength of its new drug launches and pipeline.
Corteva reported better-than-expected first quarter results, and second quarter results that were in line with the market’s expectations. However, management indicated that industry-wide de-stocking in crop protection chemicals (CPC) would weigh on full year results. We think this is a short-term concern. We remain encouraged by Corteva’s strong execution of its newly launched CPC products, the continued increase in the penetration of its Enlist seeds trait platform, and the market share gains that Corteva has made in key geographies. Corteva’s shares trade on a 7.1% estimated free cash flow yield.
BAT announced a 12-month suspension of its share buybacks. In addition, weak U.S. cigarette volumes, concerns that BAT’s strong market share gains in the U.S. may abate following Altria’s acquisition of a smaller U.S. vaping competitor, and the unanticipated announcement that CEO Jack Bowles has been replaced by CFO Tadeu Marroco also weighed on the stock.
We expect the suspension of the share buybacks to be a temporary move to bolster the company’s balance sheet in relation to litigation payments that are finally coming due. We believe BAT’s U.S. business should benefit from
4
ADVISERS INVESTMENT TRUST
INDEPENDENT FRANCHISE PARTNERS US EQUITY FUND
PORTFOLIO COMMENTARY
September 30, 2023 (Unaudited)
the continued reduction in synthetic nicotine volumes as regulatory scrutiny increases on this part of the market, and also from the continued significant operational weakness at next generation product competitor Juul. This should offset any potential slowing of market share gains.
We understand the market’s negative reaction to the CEO’s unexpected departure. However, we believe Marroco is a solid appointment and think the company’s strategy is unlikely to change significantly. Bowles’ departure follows a recent large fine from the U.S. Department of Justice for engaging in commercial activity in sanctioned countries in the Asia-Pacific region in the early-to-mid-2010s. The company has subsequently overhauled its global compliance function and increased senior executive oversight to help prevent a repeat of this activity. BAT continues to deliver attractive compounding due to its strong pricing power and remains well-positioned in less harmful products, especially in the U.S., where it has a consistent track record of taking market share. The company’s shares trade on a 10.0% estimated free cash flow yield.
Significant Portfolio Changes During the Year
During the year, we initiated positions in Aspen Technology, Estée Lauder and The New York Times. We sold the positions in Accenture, Alphabet, Microsoft and Western Union.
Initial Purchases
We began building a position in Aspen Technology in June and completed the initial purchase in July. The company sells complex software to optimise the construction and operation of process manufacturing facilities such as chemical plants and oil refineries. Aspen is the clear industry leader with a strong track record of innovation and, we believe, market share gains.
The software’s complexity creates powerful barriers to entry; there have been no meaningful new market entrants in the past two decades. The key intangible asset is the high switching costs from the significant disruption and re-training involved when a client changes software provider. We have followed the company for close to a decade and management has a strong track record of execution, innovation and capital allocation. We think Aspen has the opportunity to generate double digit top-line growth, as well as significantly increase margins due to operating leverage and acquisition synergies in the next few years.
There are three main risks to the investment thesis. The first is the potential for poor capital allocation. However, Aspen’s management team has a history of financial discipline, and of successfully acquiring and integrating companies with niche capabilities. The second risk is the long-term outlook for upstream and downstream oil-related capital expenditure due to decarbonisation. We actually think decarbonisation should be positive for Aspen in the medium and potentially even the long term as customers invest to improve the efficiency of their existing plants. The third risk is short-term economic headwinds.
Short-term economic concerns gave us the opportunity to initiate the position. The share price fell 25% in April following management’s downgrade of its 2023 full year guidance, primarily due to economic weakness in its chemical end markets. We think the company’s long-term competitive position remains unchanged. At the time we started building the position, the shares traded on a 5.4% estimated free cash flow yield.
We began building a position in Estée Lauder, the second largest company in the global prestige beauty industry, in August and completed the initial purchase in September. We’ve followed the company for many years, and previously owned a position in our Global Franchise portfolio between 2005 and 2011.
Estée Lauder, founded in 1946, has leading market positions across all major luxury sub-categories of skincare, make-up and fragrances. Its key intangible asset is its brands, which include Clinique, Estée Lauder, La Mer and M·A·C. The prestige beauty industry has enjoyed solid mid-single digit revenue growth over the past 15 years. Leading into 2023, the company had consistently grown ahead of the industry.
The opportunity to initiate the position arose from the 60% share price decline price from its April 2022 peak. This decline was driven by a rapid slowdown in the company’s most profitable travel retail channel, particularly in Asia. We view this slowdown as transitory and expect profits, margins and cash flows to revert towards historic levels in the years ahead. This recovery is underpinned by long term demographic trends that are supportive of Asian travel retail, including growing female workforce participation in Asia, a growing middle-class population, and increased international travel.
There are two key risks to the investment thesis. The first is the risk of under-investment in marketing and innovation. Despite current pressure on profits, our research indicates there is no evidence of such short-term
5
ADVISERS INVESTMENT TRUST
INDEPENDENT FRANCHISE PARTNERS US EQUITY FUND
PORTFOLIO COMMENTARY
September 30, 2023 (Unaudited)
practices and the brands remain well invested. The founding family’s alignment with shareholders provides further comfort that the business will continue to be run in the long-term interests of all stakeholders. The second risk is that there is limited visibility on near-term market trends. Prestige cosmetics are a discretionary purchase at a time when the macro-economic climate and disposable incomes are under pressure. This could lead to further share price volatility in the coming quarters.
At the time we began building the position, Estée Lauder’s shares offered a 4.5% estimated free cash flow yield on what we estimate to be a sustainable level of free cash flow. We think this is an attractive valuation for a high-quality franchise with strong topline and margin growth prospects.
We began building a position in The New York Times in January, completing the initial purchase in June. The Times, founded in 1851, is the leading consumer newspaper in the U.S. It has a strong brand, underpinned by a reputation for outstanding journalism. The Times has won 132 Pulitzer Prizes, more than double the next highest winner, The Washington Post.
The company has been controlled by the Sulzberger family for over a century. This has led to a long-term focus and sustained newsroom investment. Following two decades of internet disruption of its traditional print newspaper business model, The Times has emerged as a higher quality, digital subscription business – over 90% of subscribers are digital – and as the clear market leader in an improved market structure.
Our long-term thesis is that the company should start to benefit from the potential for significant operating leverage now that it is a digital-first publication. We think there is significant margin opportunity given the more favourable market structure and digital subscription model. Current operating margins of nearly 13% are well below the peak of around 30% in 2000. The Times is initiating a bundling strategy of its news, sports, games and cookery content to improve per-subscriber economics through better pricing and lower customer churn rates. Our analysis of third party data suggests this strategy is gaining traction. Together with more disciplined spending on technology and marketing, we think this should significantly improve profitability over the long term.
The primary structural risk to the investment thesis is the potential for a lack of editorial integrity in an increasingly politicised news and opinion industry. However, we think the Sulzberger’s ownership and strict editorial guidelines help to mitigate this risk. In the short term, the main risk is the cyclicality of the advertising market.
The opportunity to initiate the position arose due to shorter-term investors’ disappointment at last year’s investor day about the pace of expected profitability improvements, as well as near-term concerns about the health of the advertising market. At the time we started building the position, the shares traded on a 4.7% 2023 estimated free cash flow yield, based on what we believe to be significantly depressed margins.
Final Sales
We completed the final sale of Accenture in October. We have held the stock since the inception of the Fund in December 2011. Accenture has transitioned from more commoditised IT services – like enterprise resource planning implementation – towards faster growth, premium-priced services like cloud software implementation and digital marketing. In doing so, it has consistently gained market share and compounded revenue and free cash flow at a mid- to high-single digit rate.
We think Accenture can continue to grow and gain market share. However, at a 4.7% estimated free cash flow yield, we felt the valuation no longer provided adequate compensation for the risks the company faces.
We completed the final sale of the small remaining position in Alphabet in June, having substantially reduced the position size in the first quarter of the year. Google Search’s sheer size means that it will be challenging for the company to meet consensus expectations of continued double-digit growth. We think it will be difficult for Google to gain further significant market share in the online advertising market over the next decade. Finally, while the short-term impact of ChatGPT on Bing and Google search revenue is likely to be limited, the competitive threat posed by the shift to AI-driven search likely limits margin expansion from current levels. Given these factors, we felt the estimated free cash flow yield below 4.0% no longer represented a compelling risk/reward trade-off.
We completed the final sale of Microsoft in September. When we initiated the position over a decade ago, the market was concerned that the company would struggle to migrate its dominance in desktop software into a more cloud-centric office software environment. This was reflected in the stock’s 10% estimated free cash flow yield.
6
ADVISERS INVESTMENT TRUST
INDEPENDENT FRANCHISE PARTNERS US EQUITY FUND
PORTFOLIO COMMENTARY
September 30, 2023 (Unaudited)
Our research at the time gave us confidence that Microsoft had the building blocks in place to navigate the transition.
Since then, Microsoft has successfully migrated the majority of its commercial customers to Office365 and, in Azure, built a successful cloud business. Operating margins have improved, with operating profit and free cash flow compounding in the mid-teens on average over the last decade. In addition, the company has allocated its capital judiciously. Notwithstanding the large acquisitions of LinkedIn and, more recently, Activision Blizzard, most of its free cash flow has been returned to shareholders through dividends and share buybacks.
This progress has been recognised by the market. We sold the remaining position at an estimated 3.3% free cash flow yield, having significantly reduced the position size over the past two years. We continue to admire the quality of the business although this valuation no longer represents an attractive risk/reward proposition.
We completed the final sale of Western Union in January, having initiated the position in March 2019. This was a frustrating investment for us. We continue to think Western Union has a strong, globally recognised brand and network of exclusive retail affiliates. However, it has become increasingly clear that it needs to make significant progress in its digital operations. COVID-19 accelerated the uptake of digital operations in the money transfer business. While Western Union’s new management team, which we rate highly, has detailed plans to address these gaps, we are concerned about the pace of the transition given the increasingly competitive digital money transfer market. Despite the optically attractive estimated free cash flow yield in excess of 11%, we felt there were better risk/reward opportunities and sold the position.
Capacity Status
Client assets in the US Franchise strategy are $3.9bn at September 30, 2023. We have capacity available in the strategy for existing or new clients.
We remain completely dedicated to investing our clients’ portfolios in keeping with the rigors of the Franchise quality and value criteria. As ever, we measure our success through long-term investment results and enduring client relationships. We thank you for your support and look forward to serving you in the coming years.


Jayson Vowles, CFA
Co-Lead Portfolio Manager of the Fund and Partner of Independent Franchise Partners, LLP
Michael Allison, CFA
Co-Lead Portfolio Manager of the Fund and Partner of Independent Franchise Partners, LLP
Richard Crosthwaite
Portfolio Manager of the Fund and Partner of Independent Franchise Partners, LLP
Sandeep Ghela
Chief Operating Officer and Partner of Independent Franchise Partners, LLP
Karim Ladha, CFA
Portfolio Manager of the Fund and Partner of Independent Franchise Partners, LLP
7
ADVISERS INVESTMENT TRUST
INDEPENDENT FRANCHISE PARTNERS US EQUITY FUND
PORTFOLIO COMMENTARY
September 30, 2023 (Unaudited)
Principal Investment Risks: Fund holdings are subject to change and should not be considered a recommendation to buy or sell any security. All investments carry a certain amount of risk, and the Fund cannot guarantee that it will achieve its investment objective. The value of the Fund’s investments will fluctuate with market conditions, and the value of your investment in the Fund also will vary. You could lose money on your investment in the Fund, or the Fund could perform worse than other investments. Investments in the Fund are not deposits of a bank and are not insured or guaranteed by the Federal Deposit Insurance Corporation (FDIC) or any other government agency. The main risks of investing in the Fund are set out in the Fund’s Prospectus, which can be obtained at www.franchisepartners.com/funds or by calling 855-233-0437 or 312-557-7902.
The comments and free cash flow yield estimates reflect the views of Independent Franchise Partners, LLP at the time of writing, unless otherwise indicated, and are subject to change without notice to the recipients of this document. Free cash flow yield estimates are based on the firm’s proprietary research and methodology.
•Free cash flow yield: A valuation ratio that measures the operating cash flow after capital expenditure and expenses, relative to the company’s market capitalization.
8
ADVISERS INVESTMENT TRUST
INDEPENDENT FRANCHISE PARTNERS US EQUITY FUND
SCHEDULE OF INVESTMENTS
September 30, 2023
| | | | | | | | | | | | | | | |
| | | | |
| | | Percentage
of Net
Assets | | Shares | | Value |
COMMON STOCKS | | | | 96.7% | | | | | | | | | | | |
Biotechnology | | | | 4.2% | | | | | | | | | | | |
Corteva Inc. | | | | | | | | | 1,494,495 | | | | $ | 76,458,364 | |
| | | | | | | | | | | | | | | |
Commercial Services | | | | 9.3% | | | | | | | | | | | |
RB Global Inc. | | | | | | | | | 1,834,351 | | | | | 114,646,937 | |
TransUnion | | | | | | | | | 776,272 | | | | | 55,728,567 | |
| | | | | | | | | | | | | | | |
| | | | | | | | | | | | | | 170,375,504 | |
| | | | | | | | | | | | | | | |
Cosmetics/Personal Care | | | | 2.4% | | | | | | | | | | | |
Estee Lauder Cos. Inc. - Class A | | | | | | | | | 300,409 | | | | | 43,424,121 | |
| | | | | | | | | | | | | | | |
Diversified Financials | | | | 7.2% | | | | | | | | | | | |
Intercontinental Exchange Inc. | | | | | | | | | 741,879 | | | | | 81,621,528 | |
S&P Global Inc. | | | | | | | | | 137,354 | | | | | 50,190,525 | |
| | | | | | | | | | | | | | | |
| | | | | | | | | | | | | | 131,812,053 | |
| | | | | | | | | | | | | | | |
Entertainment | | | | 3.5% | | | | | | | | | | | |
TKO Group Holdings Inc. | | | | | | | | | 767,701 | | | | | 64,532,946 | |
| | | | | | | | | | | | | | | |
Insurance | | | | 4.2% | | | | | | | | | | | |
Aon PLC - Class A | | | | | | | | | 236,628 | | | | | 76,719,530 | |
| | | | | | | | | | | | | | | |
Internet Software & Services | | | | 12.2% | | | | | | | | | | | |
Booking Holdings Inc.(a) | | | | | | | | | 24,145 | | | | | 74,461,973 | |
eBay Inc. | | | | | | | | | 1,223,378 | | | | | 53,938,736 | |
Zillow Group Inc. - Class A(a) | | | | | | | | | 253,418 | | | | | 11,350,592 | |
Zillow Group Inc. - Class C(a) | | | | | | | | | 1,809,046 | | | | | 83,505,563 | |
| | | | | | | | | | | | | | | |
| | | | | | | | | | | | | | 223,256,864 | |
| | | | | | | | | | | | | | | |
Media | | | | 11.9% | | | | | | | | | | | |
Fox Corp. - Class A | | | | | | | | | 2,146,289 | | | | | 66,964,217 | |
Fox Corp. - Class B | | | | | | | | | 391,598 | | | | | 11,309,350 | |
New York Times Co. - Class A | | | | | | | | | 903,787 | | | | | 37,236,024 | |
News Corp. - Class A | | | | | | | | | 3,528,815 | | | | | 70,788,029 | |
News Corp. - Class B | | | | | | | | | 1,445,086 | | | | | 30,158,945 | |
| | | | | | | | | | | | | | | |
| | | | | | | | | | | | | | 216,456,565 | |
| | | | | | | | | | | | | | | |
Pharmaceuticals | | | | 12.9% | | | | | | | | | | | |
Bristol-Myers Squibb Co. | | | | | | | | | 1,753,286 | | | | | 101,760,719 | |
Johnson & Johnson | | | | | | | | | 273,185 | | | | | 42,548,564 | |
Novartis AG - REG | | | | | | | | | 882,807 | | | | | 90,532,685 | |
| | | | | | | | | | | | | | | |
| | | | | | | | | | | | | | 234,841,968 | |
| | | | | | | | | | | | | | | |
Software | | | | 13.7% | | | | | | | | | | | |
Aspen Technology Inc.(a) | | | | | | | | | 206,028 | | | | | 42,083,279 | |
Electronic Arts Inc. | | | | | | | | | 560,622 | | | | | 67,498,889 | |
Oracle Corp. | | | | | | | | | 682,717 | | | | | 72,313,385 | |
Salesforce Inc.(a) | | | | | | | | | 330,042 | | | | | 66,925,917 | |
| | | | | | | | | | | | | | | |
| | | | | | | | | | | | | | 248,821,470 | |
| | | | | | | | | | | | | | | |
Textiles, Apparel & Luxury Goods | | | | 2.6% | | | | | | | | | | | |
Cie Financiere Richemont S.A. - Class A - REG | | | | | | | | | 381,595 | | | | | 46,691,036 | |
| | | | | | | | | | | | | | | |
See Notes to Financial Statements.
9
ADVISERS INVESTMENT TRUST
INDEPENDENT FRANCHISE PARTNERS US EQUITY FUND
SCHEDULE OF INVESTMENTS
September 30, 2023
| | | | | | | | | | | | | | | |
| | | | |
| | | Percentage
of Net
Assets | | Shares | | Value |
Tobacco | | | | 8.5% | | | | | | | | | | | |
British American Tobacco PLC | | | | | | | | | 2,030,567 | | | | $ | 63,845,045 | |
Philip Morris International Inc. | | | | | | | | | 974,948 | | | | | 90,260,686 | |
| | | | | | | | | | | | | | | |
| | | | | | | | | | | | | | 154,105,731 | |
| | | | | | | | | | | | | | | |
Toys/Games/Hobbies | | | | 4.1% | | | | | | | | | | | |
Nintendo Co. Ltd. | | | | | | | | | 1,808,870 | | | | | 75,409,931 | |
| | | | | | | | | | | | | | | |
TOTAL COMMON STOCKS (Cost $1,463,697,635) | | | | | | | | | | | | | | 1,762,906,083 | |
| | | | | | | | | | | | | | | |
TOTAL INVESTMENTS
(Cost $1,463,697,635) | | | | 96.7% | | | | | | | | | | 1,762,906,083 | |
NET OTHER ASSETS (LIABILITIES) | | | | 3.3% | | | | | | | | | | 59,480,031 | |
| | | | | | | | | | | | | | | |
NET ASSETS | | | | 100.0% | | | | | | | | | $ | 1,822,386,114 | |
| | | | | | | | | | | | | | | |
(a)Non-income producing security.
Abbreviations:
REG – Registered
At September 30, 2023, the Fund’s investments were concentrated in the following countries:
| | | | |
| Country Allocation (Unaudited) | | Percentage of Net Assets | |
| | |
United States | | | 75.3 | % |
Switzerland | | | 7.5 | |
Canada(b) | | | 6.3 | |
Japan | | | 4.1 | |
United Kingdom | | | 3.5 | |
| | |
Total | | | 96.7 | % |
| | |
(b)Ritchie Bros. Auctioneers is incorporated in Canada; however, its primary listing is on the New York Stock Exchange (NYSE) in the United States. We therefore define Ritchie Bros. Auctioneers as a United States equity, consistent with the terms set out in the prospectus.
See Notes to Financial Statements.
10
ADVISERS INVESTMENT TRUST
STATEMENT OF ASSETS & LIABILITIES
September 30, 2023
| | | | |
| | | Independent
Franchise Partners
US Equity Fund | |
Assets: | | | | |
Investments, at value (Cost:$1,463,697,635) | | $ | 1,762,906,083 | |
Cash | | | 64,058,589 | |
Receivable for dividends | | | 3,840,617 | |
Reclaims receivable | | | 2,869,540 | |
Prepaid expenses | | | 20,654 | |
| | | | |
Total Assets | | | 1,833,695,483 | |
| | | | |
Liabilities: | | | | |
Securities purchased payable | | | 8,600,835 | |
Capital shares redeemed payable | | | 500,000 | |
Investment advisory fees payable | | | 925,128 | |
Accounting and Administration fees payable | | | 1,160,171 | |
Regulatory and Compliance fees payable | | | 43,211 | |
Risk Officer fees payable | | | 15,000 | |
Trustee fees payable | | | 596 | |
Accrued expenses and other payables | | | 64,428 | |
| | | | |
Total Liabilities | | | 11,309,369 | |
| | | | |
Net Assets | | $ | 1,822,386,114 | |
| | | | |
Net assets | | $ | 1,822,386,114 | |
Shares of common stock outstanding | | | 97,788,202 | |
| | | | |
Net asset value per share | | $ | 18.64 | |
| | | | |
Net Assets: | | | | |
Paid in capital | | $ | 1,402,508,280 | |
Distributable earnings (loss) | | | 419,877,834 | |
| | | | |
Net Assets | | $ | 1,822,386,114 | |
| | | | |
| | | | | |
See Notes to Financial Statements.
11
ADVISERS INVESTMENT TRUST
STATEMENT OF OPERATIONS
For the year ended September 30, 2023
| | | | |
| | | Independent Franchise Partners US Equity Fund | |
Investment Income: | | | | |
Dividend income (Net of foreign withholding tax of $1,255,974) | | $ | 35,437,832 | |
Operating expenses: | | | | |
Investment advisory | | | 10,546,917 | |
Accounting and Administration | | | 836,728 | |
Regulatory and Compliance | | | 168,950 | |
Trustees | | | 70,970 | |
Legal | | | 52,118 | |
Risk Officer | | | 35,846 | |
Other | | | 119,744 | |
| | | | |
Total expenses | | | 11,831,273 | |
| | | | |
Net investment income | | | 23,606,559 | |
| | | | |
Realized and Unrealized Gains (Losses) from Investment Activities: | | | | |
Net realized gains from investment transactions | | | 118,172,861 | |
Net realized losses from foreign currency transactions | | | (119,010 | ) |
Change in unrealized appreciation (depreciation) on investments | | | 212,082,948 | |
Change in unrealized appreciation (depreciation) on foreign currency | | | 65,548 | |
| | | | |
Net realized and unrealized gains from investment activities | | | 330,202,347 | |
| | | | |
Change in Net Assets Resulting from Operations | | $ | 353,808,906 | |
| | | | |
| | | | | |
See Notes to Financial Statements.
12
ADVISERS INVESTMENT TRUST
STATEMENTS OF CHANGES IN NET ASSETS
For the years ended September 30, 2023 and 2022
| | | | | | | | |
| | | Independent Franchise Partners US Equity Fund | |
| | | 2023 | | | 2022 | |
Increase (decrease) in net assets: | | | | | | | | |
Operations: | | | | | | | | |
Net investment income | | $ | 23,606,559 | | | $ | 19,641,833 | |
Net realized gains (losses) from investment and foreign currency transactions | | | 118,053,851 | | | | 212,430,625 | |
Change in unrealized appreciation (depreciation) on investments and foreign currency | | | 212,148,496 | | | | (512,018,179 | ) |
| | | | | | | | |
Change in net assets resulting from operations | | | 353,808,906 | | | | (279,945,721 | ) |
| | | | | | | | |
Dividends paid to shareholders: | | | | | | | | |
From distributable earnings | | | (235,042,088 | ) | | | (137,522,026 | ) |
| | | | | | | | |
Total dividends paid to shareholders | | | (235,042,088 | ) | | | (137,522,026 | ) |
| | | | | | | | |
Capital Transactions: | | | | | | | | |
Proceeds from sale of shares | | | 127,417,010 | | | | 63,964,242 | |
Value of shares issued to shareholders in reinvestment of dividends | | | 203,432,724 | | | | 131,436,175 | |
Value of shares redeemed | | | (117,449,197 | ) | | | (315,038,992 | ) |
| | | | | | | | |
Change in net assets from capital transactions | | | 213,400,537 | | | | (119,638,575 | ) |
| | | | | | | | |
Change in net assets | | | 332,167,355 | | | | (537,106,322 | ) |
Net assets: | | | | | | | | |
Beginning of year | | | 1,490,218,759 | | | | 2,027,325,081 | |
| | | | | | | | |
End of year | | $ | 1,822,386,114 | | | $ | 1,490,218,759 | |
| | | | | | | | |
Share Transactions: | | | | | | | | |
Sold | | | 7,004,971 | | | | 3,008,252 | |
Reinvested | | | 11,882,753 | | | | 6,238,072 | |
Redeemed | | | (6,417,654 | ) | | | (15,006,072 | ) |
| | | | | | | | |
Change | | | 12,470,070 | | | | (5,759,748 | ) |
| | | | | | | | |
| | | | | | | | | |
See Notes to Financial Statements.
13
ADVISERS INVESTMENT TRUST
FINANCIAL HIGHLIGHTS
For the years indicated
| | | | | | | | | | | | | | | | | | | | |
| | | Independent Franchise Partners US Equity Fund | |
| | | Year Ended
September 30,
2023 | | | Year Ended
September 30,
2022 | | | Year Ended
September 30,
2021 | | | Year Ended
September 30,
2020 | | | Year Ended
September 30,
2019 | |
Net asset value, beginning of year | | $ | 17.47 | | | $ | 22.26 | | | $ | 19.72 | | | $ | 18.67 | | | $ | 18.55 | |
| | | | | | | | | | | | | | | | | | | | |
Income (loss) from operations: | | | | | | | | | | | | | | | | | | | | |
Net investment income | | | 0.25 | | | | 0.23 | | | | 0.31 | | | | 0.37 | | | | 0.30 | |
Net realized and unrealized gains (losses) from investments | | | 3.69 | | | | (3.52 | ) | | | 4.70 | | | | 2.72 | | | | 1.06 | |
| | | | | | | | | | | | | | | | | | | | |
Total from investment operations | | | 3.94 | | | | (3.29 | ) | | | 5.01 | | | | 3.09 | | | | 1.36 | |
| | | | | | | | | | | | | | | | | | | | |
Less distributions paid: | | | | | | | | | | | | | | | | | | | | |
From net investment income | | | (0.20 | ) | | | (0.26 | ) | | | (0.30 | ) | | | (0.37 | ) | | | (0.31 | ) |
From net realized gains on investments | | | (2.57 | ) | | | (1.24 | ) | | | (2.17 | ) | | | (1.68 | ) | | | (0.93 | ) |
| | | | | | | | | | | | | | | | | | | | |
Total distributions paid | | | (2.77 | ) | | | (1.50 | ) | | | (2.47 | ) | | | (2.05 | ) | | | (1.24 | ) |
| | | | | | | | | | | | | | | | | | | | |
Increase from redemption fees | | | — | (a) | | | — | (a) | | | — | (a) | | | 0.01 | | | | — | (a) |
| | | | | | | | | | | | | | | | | | | | |
Change in net asset value | | | 1.17 | | | | (4.79 | ) | | | 2.54 | | | | 1.05 | | | | 0.12 | |
| | | | | | | | | | | | | | | | | | | | |
Net asset value, end of year | | $ | 18.64 | | | $ | 17.47 $ | | | | 22.26 | | | $ | 19.72 | | | $ | 18.67 | |
| | | | | | | | | | | | | | | | | | | | |
Total return(b) | | | 23.97 | % | | | (15.93 | %) | | | 27.34 | % | | | 17.50 | %(c) | | | 8.67 | % |
Ratios/Supplemental data: | | | | | | | | | | | | | | | | | | | | |
Net assets, end of year (000’s) | | $ | 1,822,386 | | | $ | 1,490,219 | | | $ | 2,027,325 | | | $ | 1,677,925 | | | $ | 2,128,522 | |
Ratio of net expenses to average net assets | | | 0.67 | % | | | 0.68 | % | | | 0.72 | % | | | 0.76 | % | | | 0.76 | % |
Ratio of net investment income to average net assets | | | 1.34 | % | | | 1.06 | % | | | 1.42 | % | | | 1.49 | % | | | 1.62 | % |
Ratio of gross expenses to average net assets | | | 0.67 | % | | | 0.68 | % | | | 0.72 | % | | | 0.76 | % | | | 0.76 | %(d) |
Portfolio turnover rate(e) | | | 21.75 | % | | | 25.80 | % | | | 23.67 | % | | | 43.46 | % | | | 37.99 | % |
| (a) | Redemption fees were less than $0.005 per share. |
| (b) | Total return excludes redemption fees. |
| (c) | During the period, the Adviser reimbursed the Fund for a loss realized in connection with a trade error. Such payment represented 0.02% to the Fund’s total return. |
| (d) | During the years shown, certain fees were reduced. If such fee reductions had not occurred, the ratio would have been as indicated. |
| (e) | Portfolio turnover rate includes applicable corporate action activity and securities trading as a result of investor subscription and redemption activity. |
See Notes to Financial Statements.
14
ADVISERS INVESTMENT TRUST
INDEPENDENT FRANCHISE PARTNERS US EQUITY FUND
NOTES TO FINANCIAL STATEMENTS
September 30, 2023
Advisers Investment Trust (the “Trust”) is a Delaware statutory trust operating under a Fifth Amended and Restated Agreement and Declaration of Trust (the “Trust Agreement”) dated March 9, 2023. The Trust was formerly an Ohio business trust, which commenced operations on December 20, 2011. On March 31, 2017, the Trust was converted to a Delaware statutory trust. As an open-end registered investment company, as defined in Financial Accounting Standards Board (“FASB”) Accounting Standards Update (“ASU”) 2013-08, the Trust follows accounting and reporting guidance under FASB Accounting Standards Codification (“ASC”) Topic 946, “Financial Services-Investment Companies”. The Trust Agreement permits the Board of Trustees (the “Trustees” or “Board”) to authorize and issue an unlimited number of shares of beneficial interest, at no par value, in separate series of the Trust. The Independent Franchise Partners US Equity Fund (the “IFP US Equity Fund” or the “Fund”) is a series of the Trust which is registered under the Investment Company Act of 1940, as amended (the “1940 Act”). These financial statements and notes only relate to the Fund.
The Fund is a non-diversified fund, meaning it may invest in a smaller number of companies than a diversified fund, and seeks to achieve an attractive long-term rate of return.
Under the Trust’s organizational documents, its officers and Trustees are indemnified against certain liabilities arising out of the performance of their duties to the Trust and Fund. In addition, in the normal course of business, the Trust enters into contracts with its vendors and others that provide for general indemnifications. The Fund’s maximum exposure under these arrangements is unknown, as this would involve future claims that may be made against the Fund.
| A. | Significant accounting policies are as follows: |
INVESTMENT VALUATION
Investments are recorded at fair value. Fair value is defined as the price that would be received to sell an asset or paid to transfer a liability in an orderly transaction between market participants at the measurement date. The valuation techniques employed by the Fund, as described below, maximize the use of observable inputs and minimize the use of unobservable inputs in determining fair value. These inputs are summarized in the following three broad levels:
Level 1 —quoted prices in active markets for identical assets
Level 2 — other significant observable inputs (including quoted prices of similar securities, interest rates, prepayment speeds, credit risk, etc.)
Level 3 — significant unobservable inputs (including the Fund’s own assumptions in determining the fair value of investments)
The inputs or methodology used for valuing securities are not necessarily an indication of the risk associated with investing in those securities. For example, certain short-term debt securities may be valued using amortized cost. Generally, amortized cost approximates the current value of a security, but since this valuation is not obtained from a quoted price in an active market, such securities would be reflected as Level 2 in the fair value hierarchy.
Security prices are generally provided by an approved independent third party pricing service as of the close of the New York Stock Exchange, normally at 4:00 p.m. Eastern Time, each business day on which the share price of the Fund is calculated. Equity securities listed or traded on a primary exchange are valued at the closing price, if available, or the last sales price on the primary exchange. If no sale occurred on the valuation date, the securities will be valued at the latest quotations as of the close of the primary exchange. Investments in other open-end registered investment companies are valued at their respective net asset value as reported by such companies. In these types of situations, valuations are typically categorized as Level 1 in the fair value hierarchy.
Debt and other fixed income securities, if any, are generally valued at an evaluated price provided by an approved independent pricing source. To value debt securities, pricing services may use various pricing techniques, which take into account appropriate factors such as market activity, yield, quality, coupon rate, maturity, type of issue, trading characteristics, call features, credit ratings and other data, as well as broker quotes. Short-term debt securities of sufficient credit quality that mature within sixty days may be valued at amortized cost, which approximates fair value. In each of these situations, valuations are typically categorized as Level 2 in the fair value hierarchy.
15
ADVISERS INVESTMENT TRUST
INDEPENDENT FRANCHISE PARTNERS US EQUITY FUND
NOTES TO FINANCIAL STATEMENTS
September 30, 2023
The Trustees have designated Independent Franchise Partners, LLP, as investment adviser to the Fund, as the Fund’s Valuation Designee with responsibility for establishing fair value when the price of a security is not readily available or deemed unreliable (e.g., an approved pricing service does not provide a price, a furnished price is in error, certain stale prices, or an event occurs that materially affects the furnished price) according to policies approved by the Board. In addition, fair value pricing may be used if events materially affecting the value of foreign securities occur between the time when the exchange on which they are traded closes and the time when the Fund’s net asset value is calculated. The Fund identifies possible fluctuations in international securities by monitoring the increase or decrease in the value of a designated benchmark index. In the event of an increase or decrease greater than predetermined levels, the Fund may use a systematic valuation model provided by an approved independent third party pricing service to fair value its international equity securities.
In the fair value situations noted above, while the Trust’s valuation policy is intended to result in a calculation of the Fund’s net asset value that fairly reflects security values as of the time of pricing, the Trust cannot ensure that fair values determined pursuant to these guidelines would accurately reflect the price that the Fund could obtain for a security if it were to dispose of that security as of the time of pricing (for instance, in a forced or distressed sale). The prices used by the Fund may differ from the value that would be realized if the securities were sold, and these differences could be material to the financial statements. Depending on the source and relative significance of the valuation inputs in these instances, the instruments may be classified as Level 2 or Level 3 in the fair value hierarchy.
The following is a summary of the valuation inputs used as of September 30, 2023 in valuing the Fund’s investments based upon the three fair value levels defined above:
| | | | | | | | | | | | | | | | |
| Fund | | Level 1 - Quoted Prices | | | Level 2 - Other Significant
Observable Inputs | | | Level 3 - Significant Unobservable Inputs | | | Total | |
| | | | | | | | | | | | | | | | | |
Independent Franchise Partners US Equity Fund | | | | | | | | | | | | | | | | |
Common Stocks(1) | | $ | 1,762,906,083 | | | $ | — | | | $ | — | | | $ | 1,762,906,083 | |
| | | | |
Total Investments | | $ | 1,762,906,083 | | | $ | — | | | $ | — | | | $ | 1,762,906,083 | |
| | | | |
| (1) | See investment industries in the Schedule of Investments. |
As of September 30, 2023, there were no Level 2 or Level 3 securities held by the Fund. There were no transfers to or from Level 3 during the year ended September 30, 2023.
CURRENCY TRANSACTIONS
The functional and reporting currency for the Fund is the U.S. dollar. The Fund may engage in spot currency transactions for the purpose of foreign security settlement and operational processes. Changes in foreign currency exchange rates will affect the value of the Fund’s securities and the price of the Fund’s shares. Generally, when the value of the U.S. dollar rises in value relative to a foreign currency, an investment in that country loses value because that currency is worth fewer U.S. dollars. Devaluation of a currency by a country’s government or banking authority also may have a significant impact on the value of any investments denominated in that currency. Currency markets generally are not as regulated as securities markets.
The market values of foreign securities, currency holdings and other assets and liabilities are translated into U.S. dollars based on the current exchange rates each business day. Purchases and sales of securities and income and expense items denominated in foreign currencies are translated into U.S. dollars at the exchange rate in effect on the transaction date. The Fund does not separately report the effects of changes in foreign exchange rates from changes in market prices on securities held. Such changes are included in Net realized and unrealized gains (losses) from investment activities on the Statement of Operations.
INVESTMENT TRANSACTIONS AND INCOME
Investment transactions are accounted for no later than one business day after trade date. At financial reporting period ends, investments are reported as of the trade date. The Fund determines the gain or loss realized from investment transactions by using an identified cost basis method. Dividend income is recognized on the ex-dividend date. Dividends from foreign securities are recorded on the ex-dividend date, or as soon as the information is available.
16
ADVISERS INVESTMENT TRUST
INDEPENDENT FRANCHISE PARTNERS US EQUITY FUND
NOTES TO FINANCIAL STATEMENTS
September 30, 2023
EXPENSE ALLOCATIONS
Expenses directly attributable to a fund in the Trust are charged to that fund, while expenses that are attributable to more than one fund in the Trust are allocated among the applicable funds on a pro-rata basis to each adviser’s series of funds based on relative net assets or another reasonable basis.
DIVIDENDS AND DISTRIBUTIONS
The Fund intends to distribute substantially all of its net investment income as dividends to shareholders on an annual basis. The Fund intends to distribute its net realized long-term capital gains and its net realized short-term capital gains at least once a year.
Distributions from net investment income and from net realized capital gain are determined in accordance with Federal income tax regulations, which may differ from accounting principles generally accepted in the United States of America (“GAAP”). These “book/tax” differences are either considered temporary or permanent in nature. To the extent these differences are permanent in nature (e.g. treatment of certain dividend distributions, gains/losses, return of capital, redemption in-kind, etc.), such amounts are reclassified within the composition of net assets based on their federal tax-basis treatment; temporary differences do not require reclassification. Distributions to shareholders that exceed net investment income and net realized capital gains for tax purposes are reported as return of capital.
REDEMPTION FEES
The Fund will charge a redemption fee of up to 0.25% of the total redemption amount if you sell your shares, regardless of the length of time you have held your shares and subject to certain exceptions and limitations described in the prospectus. The redemption fee is paid directly to the Fund and is intended to encourage long-term investment in the Fund, to facilitate portfolio management and to avoid (or compensate the Fund for the impact of) transaction and other Fund expenses incurred as a result of shareholder redemptions. Redemption fees charged for the years ended September 30, 2023 and September 30, 2022 were $173,557 and $450,889, respectively, and are reflected within the value of shares redeemed on the Statements of Changes in Net Assets.
FEDERAL INCOME TAX INFORMATION
No provision is made for Federal income taxes as the Fund intends to qualify each year as a “regulated investment company” under Subchapter M of the Internal Revenue Code of 1986, as amended (the “Code”), and distribute substantially all of its net investment income and net realized capital gain in accordance with the Code.
As of September 30, 2023, the Fund did not have material uncertain tax positions that would require financial statement recognition or disclosure based on an evaluation of all open tax years for all major tax jurisdictions. The Fund’s Federal tax returns for the tax years ended September 30, 2020, 2021, 2022 and 2023 remain subject to examination by the Internal Revenue Service. Interest or penalties incurred, if any, on future unknown, uncertain tax positions taken by the Fund will be recorded as interest expense on the Statement of Operations.
Management is not aware of any tax positions for which it is reasonably possible that the total amounts of unrecognized tax benefits will change materially in the next 12 months.
USE OF ESTIMATES
The preparation of financial statements in conformity with GAAP requires management to make estimates and assumptions that affect the reported amounts of assets and liabilities and disclosure of contingent assets and liabilities at the date of the financial statements and the reported amounts of revenues and expenses during the reporting period. Actual results could differ from these estimates.
17
ADVISERS INVESTMENT TRUST
INDEPENDENT FRANCHISE PARTNERS US EQUITY FUND
NOTES TO FINANCIAL STATEMENTS
September 30, 2023
| B. | Fees and Transactions with Affiliates and Other Parties |
The Trust, on behalf of the Fund, has entered into an Investment Advisory Agreement (the “Agreement”) with Independent Franchise Partners, LLP (the “Adviser”), which is registered under the Investment Advisers Act of 1940, as amended, to provide investment management services to the Fund. Total fees incurred pursuant to the Agreement are reflected as “Investment advisory” fees on the Statement of Operations. Under the terms of the Agreement, and for the year ended September 30, 2023, the Fund paid the Adviser a monthly fee based on the Fund’s daily net assets at the following annualized rates:
| | | | | | |
Adviser’s Assets Under Management(1) | | Scale Discount for Assets in each Range(1) | | Annualized Rate(1)
| | Effective Overall Annual Fee(1) |
First $1 billion | | — | | 0.80% | | 0.80% |
$1 - 2 billion | | 0.10% | | 0.70% | | at $2 billion 0.75% |
$2 - 3 billion | | 0.20% | | 0.60% | | at $3 billion 0.70% |
$3 - 4 billion | | 0.30% | | 0.50% | | at $4 billion 0.65% |
$4 - 5 billion | | 0.40% | | 0.40% | | at $5 billion 0.60% |
Above $5 billion | | — | | — | | 0.60% |
| (1) | The Adviser’s total assets under management at the end of each calendar quarter are used to calculate the effective annual fee to be applied during the next calendar quarter. During the year ended September 30, 2023, the effective annualized rate was 0.60% given the Adviser’s total assets under management were in excess of $5 billion during the year. |
Foreside Financial Services, LLC (the “Distributor”) provides distribution services to the Fund pursuant to a distribution agreement with the Trust, on behalf of the Fund. Under its agreement with the Trust, the Distributor acts as an agent of the Trust in connection with the offering of the shares of the Fund on a continuous basis. The Adviser, at its own expense, pays the Distributor an annual $5,000 fee for these services and reimbursement for certain expenses incurred on behalf of the Fund.
The Northern Trust Company (“Northern Trust”) serves as the administrator, transfer agent, custodian and fund accounting agent for the Fund pursuant to written agreements between the Trust, on behalf of the Fund, and Northern Trust. The Fund has agreed to pay Northern Trust certain annual and transaction-based fees, a tiered basis-point fee based on the Fund’s daily net assets, subject to a minimum annual fee of $175,000 relating to these services, and reimburse for certain expenses incurred on behalf of the Fund as well as other charges for additional service activities. Total fees paid to Northern Trust pursuant to these agreements are reflected as “Accounting and Administration” fees on the Statement of Operations.
Foreside Fund Officer Services, LLC (“Foreside”, d/b/a ACA Group) provides compliance and financial control services for the Fund pursuant to a written agreement with the Trust, on behalf of the Fund, including providing certain officers to the Fund. The Fund pays Foreside an annual base fee, a basis-point fee based on the Fund’s daily net assets and reimburses for certain expenses incurred on behalf of the Fund. Total fees paid to Foreside pursuant to these agreements are reflected as “Regulatory and Compliance” fees on the Statement of Operations.
Carne Global Financial Services (US) LLC (“Carne”) provides risk management and oversight services for the Fund pursuant to a written agreement between the Trust, on behalf of the Fund, and Carne, including providing the Risk Officer to the Fund to administer the Fund’s risk program and oversee the analysis of investment performance and performance of service providers. The Fund has agreed to pay Carne an annual fee of $30,000 for these services, and reimburse for certain expenses incurred on behalf of the Fund. Total fees paid to Carne pursuant to this agreement are reflected as “Risk Officer” fees on the Statement of Operations.
The officers of the Trust are affiliated with Foreside, Northern Trust, Carne or the Distributor and receive no compensation directly from the Fund for serving in their respective roles. Through March 31, 2023, the Trust paid each Trustee who is not an “interested person,” as that term is defined in the 1940 Act (each, an “Independent Trustee” and, collectively, the “Independent Trustees”) compensation for their services based on an annual retainer of $125,000 and reimbursement for certain expenses. Effective April 1, 2023, the Trust pays an annual retainer of $132,000 and reimbursement for certain expenses. If there are more than six meetings in a year, additional meeting fees may
18
ADVISERS INVESTMENT TRUST
INDEPENDENT FRANCHISE PARTNERS US EQUITY FUND
NOTES TO FINANCIAL STATEMENTS
September 30, 2023
apply. For the year ended September 30, 2023, the aggregate Trustee compensation paid by the Trust was $416,750. The amount of total Trustee compensation and reimbursement of out-of-pocket expenses allocated from the Trust to the Fund is reflected as “Trustees” fees on the Statement of Operations.
The Adviser has contractually agreed to waive fees and/or reimburse expenses to the extent necessary to limit the Fund’s total annual fund operating expenses (exclusive of brokerage costs, interest, taxes, dividends on short positions, litigation and indemnification expenses, fees and expenses associated with investments in underlying investment companies and extraordinary expenses) to 0.85% of the average daily net assets of the Fund until January 28, 2024. For the year ended September 30, 2023, there were no expenses reduced by the Adviser. Any fees waived or expenses reimbursed during a fiscal year are not subject to repayment from the Fund to the Adviser in subsequent fiscal years.
| C. | Investment Transactions |
For the year ended September 30, 2023, the aggregate costs of purchases and proceeds from sales of securities (excluding short-term investments) for the Fund were as follows:
| | | | | | | | |
| Fund | | Cost of Purchases | | | Proceeds from sales | |
Independent Franchise Partners US Equity Fund | | $ | 373,002,885 | | | $ | 418,852,936 | |
As of September 30, 2023, the cost, gross unrealized appreciation and gross unrealized depreciation on investments, for Federal income tax purposes, were as follows:
| | | | | | | | | | | | | | | | |
| Fund | | Cost | | | Gross Unrealized
Appreciation | | | Gross Unrealized
(Depreciation) | | | Net Unrealized
Appreciation
(Depreciation) | |
Independent Franchise Partners US Equity Fund | | $ | 1,484,476,026 | | | $ | 331,714,218 | | | $ | (53,284,161 | ) | | $ | 278,430,057 | |
The tax character of distributions paid to shareholders during the latest tax years ended September 30, 2023 and September 30, 2022 for the Fund was as follows:
| | | | | | | | | | | | | | | | | | | | |
Independent Franchise Partners US Equity Fund | | Ordinary Income | | | Net Long Term Gains | | | Total Taxable
Distributions | | | Tax Return
of Capital | | | Total Distributions
Paid | |
2023 | | $ | 24,755,886 | | | $ | 210,286,202 | | | $ | 235,042,088 | | | $ | — | | | $ | 235,042,088 | |
2022 | | $ | 38,179,775 | | | $ | 99,342,251 | | | $ | 137,522,026 | | | $ | — | | | $ | 137,522,026 | |
As of the latest tax year ended September 30, 2023, the components of accumulated earnings on a tax basis were as follows:
| | | | | | | | | | | | | | | | | | | | | | | | | | | | |
| Fund | | Undistributed
Ordinary Income | | | Undistributed Long
Term Capital Gains | | | Accumulated
Earnings | | | Distributions
Payable | | | Accumulated
Capital and
Other Losses | | | Unrealized
Appreciation | | | Total
Accumulated
Earnings | |
Independent Franchise Partners US Equity Fund | | | $40,989,104 | | | | $100,553,742 | | | | $141,542,846 | | | | $— | | | | $— | | | | $278,334,988 | | | | $419,877,834 | |
At September 30, 2023, the latest tax year end, the Fund had no capital loss carry-forwards available to offset future net capital gains.
19
ADVISERS INVESTMENT TRUST
INDEPENDENT FRANCHISE PARTNERS US EQUITY FUND
NOTES TO FINANCIAL STATEMENTS
September 30, 2023
Shareholders in the Fund may receive securities rather than cash for their redemption amounts in accordance with the provisions of the Fund. In such cases, shareholders will receive securities with a fair value equal to the value of the number of shares they owned at the current net asset value at the redemption date.
For the year ended September 30, 2022, in-kind withdrawals of $1,258,761 occurred and are reflected within the “Value of shares redeemed” on the Statements of Changes in Net Assets, and net gains of $466,945 on the securities distributed to shareholders are reflected within the “Net realized gains (losses) from investment and foreign currency transactions” on the Statements of Changes in Net Assets.
There were no in-kind transactions for the year ended September 30, 2023.
| F. | Concentration of Ownership Risk |
A significant portion of the Fund’s shares may be held in a limited number of shareholder accounts. To the extent that a shareholder or group of shareholders redeem a significant portion of the shares issued by the Fund, this could have a disruptive impact on the efficient implementation of the Fund’s investment strategy.
The Fund is subject to market risk, which is the risk related to investments in securities in general and the daily fluctuations in the securities markets. The Fund’s investment return per share will change daily based on many factors, including fluctuation in interest rates, the quality of the instruments in the Fund’s investment portfolio, national and international economic conditions, disruptions to business operations and supply chains, staffing shortages, and general market conditions. The increasing interconnectivity between global economies and financial markets increases the likelihood that events or conditions in one region or financial market may adversely impact issuers in a different country, region or financial market. Political events, including armed conflict, tariffs and economic sanctions also contribute to market volatility. Securities in the Fund’s portfolio may be impacted by inflation (or expectations for inflation), interest rates, global demand for particular products or resources, natural disasters, pandemics (e.g., COVID-19), climate change and climate-related events, epidemics, terrorism, regulatory events and governmental or quasi-governmental actions. These events can have a significant impact on the Fund’s operations and performance.
20
Report of Independent Registered Public Accounting Firm
To the Board of Trustees of Advisers Investment Trust and Shareholders of Independent Franchise Partners US Equity Fund
Opinion on the Financial Statements
We have audited the accompanying statement of assets and liabilities, including the schedule of investments, of Independent Franchise Partners US Equity Fund (one of the funds constituting Advisers Investment Trust, hereafter referred to as the “Fund”) as of September 30, 2023, the related statement of operations for the year ended September 30, 2023, the statement of changes in net assets for each of the two years in the period ended September 30, 2023, including the related notes, and the financial highlights for each of the five years in the period ended September 30, 2023 (collectively referred to as the “financial statements”). In our opinion, the financial statements present fairly, in all material respects, the financial position of the Fund as of September 30, 2023, the results of its operations for the year then ended, the changes in its net assets for each of the two years in the period ended September 30, 2023 and the financial highlights for each of the five years in the period ended September 30, 2023 in conformity with accounting principles generally accepted in the United States of America.
Basis for Opinion
These financial statements are the responsibility of the Fund’s management. Our responsibility is to express an opinion on the Fund’s financial statements based on our audit. We are a public accounting firm registered with the Public Company Accounting Oversight Board (United States) (PCAOB) and are required to be independent with respect to the Fund in accordance with the U.S. federal securities laws and the applicable rules and regulations of the Securities and Exchange Commission and the PCAOB.
We conducted our audit of these financial statements in accordance with the standards of the PCAOB. Those standards require that we plan and perform the audit to obtain reasonable assurance about whether the financial statements are free of material misstatement, whether due to error or fraud.
Our audit included performing procedures to assess the risks of material misstatement of the financial statements, whether due to error or fraud, and performing procedures that respond to those risks. Such procedures included examining, on a test basis, evidence regarding the amounts and disclosures in the financial statements. Our audit also included evaluating the accounting principles used and significant estimates made by management, as well as evaluating the overall presentation of the financial statements. Our procedures included confirmation of securities owned as of September 30, 2023 by correspondence with the custodian and brokers; when replies were not received from brokers, we performed other auditing procedures. We believe that our audit provides a reasonable basis for our opinion.
/s/ PricewaterhouseCoopers LLP
Chicago, Illinois
November 17, 2023
We have served as the auditor of one or more investment companies in Advisers Investment Trust since 2011.
21
ADVISERS INVESTMENT TRUST
INDEPENDENT FRANCHISE PARTNERS US EQUITY FUND
ADDITIONAL INFORMATION
September 30, 2023 (Unaudited)
| A. | Other Federal Tax Information |
Under the Jobs and Growth Tax Relief Reconciliation Act of 2003 (the “Act”), the following percentages of ordinary dividends paid during the fiscal year ended September 30, 2023 are designated as Qualified Dividend Income (“QDI”), as defined in the Act, subject to reduced tax rates in 2023:
| | | | |
| Fund | | QDI Percentage | |
IFP US Equity Fund | | | 67.46 | % |
A percentage of the dividends distributed during the fiscal year for the Fund qualifies for the Dividends-Received Deduction (“DRD”) for corporate shareholders:
| | | | |
| Fund | | Corporate
DRD Percentage | |
IFP US Equity Fund | | | 45.53 | % |
| B. | Summary of Fund Holdings as of September 30, 2023 |
| | | | |
| Market Exposure | |
| Equity Securities | | % of Net Assets | |
Software | | | 13.7 | % |
Pharmaceuticals | | | 12.9 | |
Internet Software & Services | | | 12.2 | |
Media | | | 11.9 | |
Commercial Services | | | 9.3 | |
Tobacco | | | 8.5 | |
Diversified Financials | | | 7.2 | |
Insurance | | | 4.2 | |
Biotechnology | | | 4.2 | |
Toys/Games/Hobbies | | | 4.1 | |
Entertainment | | | 3.5 | |
Textiles, Apparel & Luxury Goods | | | 2.6 | |
Cosmetics/Personal Care | | | 2.4 | |
Total | | | 96.7 | % |
| | | | | |
| | | | |
| 5 Largest Security Positions | |
| Issuer | | % of Net Assets | |
RB Global Inc. | | | 6.3 | % |
Bristol-Myers Squibb Co. | | | 5.6 | |
Novartis AG - REG | | | 5.0 | |
Philip Morris International Inc. | | | 4.9 | |
Zillow Group Inc. - Class C | | | 4.6 | |
Total | | | 26.4 | % |
As a Fund shareholder, you may incur two types of costs: (1) transaction costs, including redemption fees; and (2) ongoing costs, including management fees and other Fund expenses. The examples below are intended to help you understand your ongoing costs (in dollars) of investing in the Fund and to compare these costs with the ongoing costs of investing in other mutual funds. Please note that the expenses
22
ADVISERS INVESTMENT TRUST
INDEPENDENT FRANCHISE PARTNERS US EQUITY FUND
ADDITIONAL INFORMATION
September 30, 2023 (Unaudited)
shown in the tables are meant to highlight your ongoing costs only and do not reflect any transactional costs. Therefore, the examples are useful in comparing ongoing costs only and will not help you determine the relative total cost of owning different funds. In addition, if these transactional costs were included, your costs would have been higher.
The examples below are based on an investment of $1,000 invested at April 1, 2023 and held for the entire period through September 30, 2023.
The Actual Expense Example below provides information about actual account values and actual expenses. You may use this information, together with the amount you invested, to estimate the expenses that you paid over the period. Simply divide your account value by $1,000 (for example, an $8,600 account value divided by $1,000 = 8.6), then multiply the result by the number in the table under the heading entitled “Expenses Paid” to estimate the expenses you paid on your account during this period.
The Hypothetical Expense Example below provides information about hypothetical account values and hypothetical expenses based on the Fund’s actual expense ratio and an assumed rate of return of 5% per year before expenses, which is not the Fund’s actual return. The hypothetical account values and expenses may not be used to estimate the actual ending account balance or expenses you paid for the period. You may use this information to compare the ongoing costs of investing in the Fund and other funds. To do so, compare this 5% hypothetical example with the 5% hypothetical examples that appear in the shareholder reports of the other funds.
| | | | | | | | | | | | | | | | |
| | | Expense
Ratio | | | Beginning Account
Value 4/1/2023 | | | Ending Account
Value
9/30/2023 | | | Expenses Paid
4/1/23–9/30/23* | |
Actual | | | 0.68 | % | | $ | 1,000.00 | | | $ | 1,038.40 | | | $ | 3.47 | |
Hypothetical | | | 0.68 | % | | $ | 1,000.00 | | | $ | 1,021.66 | | | $ | 3.45 | |
| * | Expenses are calculated using the annualized expense ratio (as disclosed in the table), multiplied by the average account value for the period, multiplied by the number of days in the most recent half fiscal year (183), and divided by the number of days in the current year (365). |
| D. | Board Approval of Investment Advisory Agreement |
Section 15 of the 1940 Act requires that the Agreement between the Trust and the Adviser with respect to the Fund be approved by a majority of the Board, including a majority of the Independent Trustees. It is the duty of the Board to request as much information as is reasonably necessary to evaluate the terms of the Agreement to determine whether the Agreement is fair to the Fund and its shareholders. The Board considered and approved the Agreement for the Fund at an in-person meeting held on June 14, 2023.
The Board requested, and the Adviser provided, both written and oral reports containing information and data related to the following: (i) the nature, extent, and quality of the services provided by the Adviser to the Fund; (ii) the investment performance of the Fund and the Adviser; (iii) the costs of the services to be provided and the profits to be realized by the Adviser from the relationship with the Fund; (iv) the extent to which economies of scale will be realized as the Fund grows; and (v) whether the fee level reflects these economies of scale to the benefit of the Fund’s shareholders
The Board examined the nature, extent, and quality of the advisory services provided by the Adviser. The Board considered the terms of the Agreement, information and reports provided by the Adviser on its business, personnel and operations, and advisory services provided to the Fund. The Board reviewed the Adviser’s investment philosophy and portfolio construction processes, the Adviser’s compliance program, pending material litigation (or lack thereof), insurance coverage, business continuity program, and information security practices. The Board noted that, as set forth in the reports provided by the Adviser, there had been no material compliance issues or concerns raised or encountered since the last renewal of the Agreement that impacted the Fund and that there had been no material compliance issues since the last renewal of the Agreement with respect to the Fund. The Board then considered key risks associated with the Fund and ways in which those risks are mitigated. Taking into account the personnel involved in servicing the Fund as well as the materials provided by the Adviser, the Board expressed satisfaction with the quality, extent, and nature of the services expected from the Adviser.
23
ADVISERS INVESTMENT TRUST
INDEPENDENT FRANCHISE PARTNERS US EQUITY FUND
ADDITIONAL INFORMATION
September 30, 2023 (Unaudited)
The Board reviewed the investment performance of the Fund. As part of this analysis, the Board reviewed an independent report prepared by FUSE Research Network, LLC (the “FUSE Report”). The FUSE Report consisted of comparisons of the performance of the Fund to the performance of (i) its selected benchmark, (ii) 15 other large blend funds selected by FUSE with similar pricing characteristics (the “Peer Group”), and (iii) the Peer Group and all other large blend funds with similar pricing features (the “Peer Universe”). The Board reviewed the methodology used to select the Peer Group and the Peer Universe.
The Board reviewed the performance of the Fund compared to the selected benchmark, the Peer Group and the Peer Universe for the three-month, one-year, three-year, five-year, ten-year and since inception periods ended March 31, 2023. The Board also reviewed the performance of another investment fund and separate accounts advised by the Adviser with a similar investment mandate for one-month, three-month, one-year, three-year, five-year, ten-year, and since inception periods ended March 31, 2023. After considering the information presented to it, the Board expressed satisfaction with the performance of the Fund and the Adviser.
The Board reviewed the cost of services provided and the profits realized by the Adviser, including assertions related to compensation and profitability. The Board discussed the advisory fee paid by the Fund and the total operating expenses of the Fund. The Board noted that the Adviser received a management fee of 0.60% of the Fund’s average daily net assets. The Board reviewed the investment advisory fee and the total net expenses paid by the Fund in comparison to the investment advisory fees and the total net expenses paid by the Peer Group and Peer Universe. The Board then reviewed the advisory fees paid by the other fund and accounts managed by the Adviser with similar investment mandates and noted that the Fund paid the same investment advisory fee as the fund and accounts. The Board then considered the expense cap for the Fund noting that the Adviser had contractually agreed to waive fees and or reimburse expenses to limit total annual fund operating expenses to 0.85% of the Fund’s average daily net assets. After considering the comparative data provided by the Adviser, the Board concluded that the advisory fee and expense ratio were reasonable.
The Board considered the profitability of the Adviser’s relationship with the Fund and considered the information provided by the Adviser. Among other things, the Board considered the overall financial condition of the Adviser and representations made thereto and to the overall importance of the Fund’s relationship to the Adviser’s business strategy. The Board examined the Fund’s profit margin and the Adviser’s overall profitability. The Board concluded that, based on both the written and oral reports provided by the Adviser, the profit margin was reasonable.
In considering the economies of scale for the Fund, the Board considered the marketing and distribution plans for the Fund, its capacity, and breakeven point. The Board noted that, other than the investment advisory fee, the Adviser derived no other fees or monetary benefits from the Fund. The Board also noted that the Fund does not assess and the Adviser does not receive Rule 12b-1 fees, that soft dollars are not a consideration for broker selection, and that the Adviser paid all third-party research expenses directly.
In its deliberations, the Board did not identify any particular factor or factors that were all-important or controlling; and each Trustee assigned different weights to various factors considered.
A description of the policies and procedures that the Fund uses to determine how to vote proxies relating to portfolio securities is available (i) without charge, upon request, by writing to the Fund at Independent Franchise Partners US Equity Fund c/o The Northern Trust Company, P.O. Box 4766, Chicago, Illinois 60680-4766 or by calling the Fund at 855-233-0437 (toll free); and (ii) on the U.S. Securities and Exchange Commission’s (the “SEC”) website at www.sec.gov. Information regarding how the Fund voted proxies relating to portfolio securities during the most recent 12-month period ended June 30 is available (i) without charge, by calling the Fund at 855-233-0437 (toll free); and (ii) on the SEC’s website at www.sec.gov.
The Fund files its complete schedule of portfolio holdings with the SEC for the first and third quarters of each fiscal year as an exhibit to its reports on Form N-PORT. The Fund’s Form N-PORT reports are available on the SEC’s website at www.sec.gov. The information on Form N-PORT is also available to shareholders upon written request or by calling the Fund at 855-233-0437 (toll free).
24
ADVISERS INVESTMENT TRUST
INDEPENDENT FRANCHISE PARTNERS US EQUITY FUND
ADDITIONAL INFORMATION
September 30, 2023 (Unaudited)
The following table provides information regarding each Independent Trustee.
| | | | | | | | | | |
Name, Address and Year of Birth1 | | Position(s)
Held with
the Trust | | Term of
Office /Length of
Time Served | | Principal Occupation(s) During Past 5 Years | | Number of
Portfolios in the
Trust Overseen
by Trustee | | Other
Directorships
Held by Trustee
During Past 5
Years |
Robert Gordon Year of Birth: 1961 | | Trustee | | Indefinite/January 2022 to present | | Independent Director, VAM Funds Luxembourg, 2018 to present; Independent Director, Anchor Capital Advisors, 2020 to present; Independent Director, Trust Company of Illinois, 2019 to 2021; President and Chief Executive Officer, Driehaus Capital Management, 2006 to 2017. | | 9 | | VAM Funds Luxembourg, Anchor Capital Advisors, Trust Company of Illinois |
| | | | | |
D’Ray Moore Year of Birth: 1959 | | Trustee | | Indefinite/July 2011 to present | | Independent Trustee, Diamond Hill Funds, 2007 to 2022; Chairperson, Diamond Hill Funds, 2014 to 2022. | | 9 | | Diamond Hill Funds (retired 2022) |
| | | | | |
Steven R. Sutermeister Year of Birth: 1954 | | Trustee | | Indefinite/July 2011 to present | | President, Vadar Capital LLC, 2008 to 2017. | | 9 | | None |
| 1 | The mailing address of each Trustee is 50 S. LaSalle Street, Chicago, IL 60603. |
The following table provides information regarding each officer of the Trust.
| | | | | | | | | | |
Name, Address and Year of Birth1 | | Position(s) Held with the Trust | | Term of Office/ Length of Time Served | | Principal Occupation(s) During Past 5 Years | | Number of
Portfolios in the
Trust Overseen
by Trustee | | Other
Directorships
Held by Trustee
During Past 5
Years |
Barbara J. Nelligan Year of Birth: 1969 | | President | | Indefinite/ August 2017 to present | | Senior Vice President, Global Fund Services Fund Governance Solutions, The Northern Trust Company, 2018 to present; Senior Vice President, Global Fund Services Product Management, The Northern Trust Company, 2007 to 2018; Vice President of Advisers Investment Trust, 2012 to 2017. | | N/A | | N/A |
| | | | | |
Scott Craven Jones Year of Birth: 1962 | | Risk Officer | | Indefinite/July 2014 to present | | Director, Carne Global Financial Services, Inc., 2013 to present. | | N/A | | N/A |
25
ADVISERS INVESTMENT TRUST
INDEPENDENT FRANCHISE PARTNERS US EQUITY FUND
ADDITIONAL INFORMATION
September 30, 2023 (Unaudited)
| | | | | | | | | | |
Name, Address and Year of Birth1 | | Position(s) Held with the Trust | | Term of Office/ Length of Time Served | | Principal Occupation(s) During Past 5 Years | | Number of
Portfolios in the
Trust Overseen
by Trustee | | Other
Directorships
Held by Trustee
During Past 5
Years |
Rodney L. Ruehle Year of Birth: 1968 | | Chief Compliance Officer and AML Officer | | Indefinite/ March 2019 to present | | Senior Principal Consultant, ACA Group, 2022 to present; Director, Foreside Fund Officer Services, LLC (formerly Foreside Compliance Services, LLC) (financial services), 2016 to 2022. | | N/A | | N/A |
| | | | | |
Kara M. Schneider Year of Birth: 1973 | | Secretary | | Indefinite/ March 2023 to present | | Second Vice President, Global Fund Services Fund Governance Solutions, The Northern Trust Company, 2021 to present; Manager, Ultimus Fund Solutions LLC, 2017 to 2021; Assistant Secretary of Advisers Investment Trust, 2021 to March 2023. | | N/A | | N/A |
| | | | | |
Troy A. Sheets Year of Birth: 1971 | | Treasurer | | Indefinite/January 2022 to present | | Senior Principal Consultant, ACA Group, 2022 to present; Senior Director, Foreside Fund Officer Services, LLC, 2016 to 2022; Treasurer of Advisers Investment Trust, 2011 to 2021; Assistant Treasurer of Advisers Investment Trust, May 2021 to December 2021. | | N/A | | N/A |
| | | | | |
Tracy L. Dotolo Year of Birth: 1976 | | Assistant Treasurer | | Indefinite/January 2022 to present | | Senior Principal Consultant, ACA Group, 2022 to present; Director, Foreside Fund Officer Services, LLC, 2016 to 2022; Treasurer of Advisers Investment Trust, May 2021 to December 2021. | | N/A | | N/A |
| | | | | |
Stefania C. Suciu Year of Birth: 1979 | | Assistant Secretary | | Indefinite/ March 2023 to present | | Second Vice President, Global Fund Services Fund Governance Solutions, The Northern Trust Company, 2015 to present | | N/A | | N/A |
1 The mailing address of Messrs. Ruehle and Sheets and Ms. Dotolo is 3 Canal Plaza, Suite 100, Portland, ME 04101. The mailing address of Mr. Jones and Mses. Nelligan, Schneider, and Suciu is 333 S. Wabash Avenue, Chicago, IL 60604.
The Fund’s Statement of Additional Information includes additional information about the Trust’s Trustees and Officers. To receive your free copy of the Statement of Additional Information, call toll-free 855-233-0437.
26
Independent Franchise Partners US Equity Fund
(Series of the Advisers Investment Trust)
Privacy Policy
SAFEGUARDING PRIVACY
We recognize and respect the privacy expectations of each of our investors and we believe the confidentiality and protection of investor information is one of our fundamental responsibilities. New technologies have dramatically changed the way information is gathered and used, but our continuing commitment to preserving the security and confidentiality of investor information has remained a core value of the Independent Franchise Partners US Equity Fund.
INFORMATION WE COLLECT AND SOURCES OF INFORMATION
We may collect information about our customers to help identify you, evaluate your application, service and manage your account and offer services and products you may find valuable. We collect this information from a variety of sources including:
| • | | Information we receive from you on applications or other forms (e.g. your name, address, date of birth, social security number and investment information); |
| • | | Information about your transactions and experiences with us and our affiliates (e.g. your account balance, transaction history and investment selections); and |
| • | | Information we obtain from third parties regarding their brokerage, investment advisory, custodial or other relationship with you (e.g. your account number, account balance and transaction history. |
INFORMATION WE SHARE WITH SERVICE PROVIDERS
We may disclose all non-public personal information we collect, as described above, to companies (including affiliates) that perform services on our behalf, including those that assist us in responding to inquiries, processing transactions, preparing and mailing account statements and other forms of shareholder services provided they use the information solely for these purposes and they enter into a confidentiality agreements regarding the information.
INFORMATION WE MAY SHARE WITH AFFILIATES
If we have affiliates which are financial service providers that offer investment advisory, brokerage and other financial services, we may (subject to Board approval) share information among our affiliates to better assist you in achieving your financial goals.
SAFEGUARDING CUSTOMER INFORMATION
We will safeguard, according to federal standards of security and confidentiality, any non-public personal information our customers share with us.
We will limit the collection and use of non-public customer information to the minimum necessary to deliver superior service to our customers which includes advising our customers about our products and services and to administer our business.
We will permit only authorized employees who are trained in the proper handling of non-public customer information to have access to that information.
We will not reveal non-public customer information to any external organization unless we have previously informed the customer in disclosures or agreements, have been authorized by the customer or are required by law or our regulators.
We value you as a customer and take your personal privacy seriously. We will inform you of our policies for collecting, using, securing and sharing nonpublic personal information the first time we do business and every year that you are a customer of the Independent Franchise Partners US Equity Fund or anytime we make a material change to our privacy policy.
(This page has been intentionally left blank)
(This page has been intentionally left blank)
Investment Adviser
Independent Franchise Partners, LLP
Level 1, 10 Portman Square
London, W1H 6AZ
United Kingdom
Custodian
The Northern Trust Company
50 South LaSalle Street
Chicago, Illinois 60603
Independent Registered Public
Accounting Firm
PricewaterhouseCoopers LLP
One North Wacker Drive
Chicago, Illinois 60606
Legal Counsel
Thompson Hine LLP
41 South High Street, Suite 1700
Columbus, Ohio 43215-6101
Distributor
Foreside Financial Services, LLC
3 Canal Plaza, Suite 100
Portland, Maine 04101
For Additional Information, call
855-233-0437 or 312-557-7902
IFP 09/23

NTAM TREASURY ASSETS FUND
ANNUAL REPORT
SEPTEMBER 30, 2023
This report is submitted for the general information of the shareholders of the NTAM Treasury Assets Fund (the “Fund”). It is not authorized for the distribution to prospective investors unless preceded or accompanied by an effective prospectus.
ADVISERS INVESTMENT TRUST
NTAM TREASURY ASSETS FUND
TABLE OF CONTENTS
September 30, 2023
ADVISERS INVESTMENT TRUST
NTAM TREASURY ASSETS FUND
SCHEDULE OF INVESTMENTS
September 30, 2023
| | | | | | | | | | | | |
| | | Percentage | | | Principal | | | | |
| | | of Net | | | Amount | | | Value | |
| | | Assets | | | (000s) | | | (000s) | |
| |
U.S. TREASURY OBLIGATIONS | | | 27.8% | | | | | | | | | |
U.S. Treasury Bills | | | 18.3% | | | | | | | | | |
5.05%, 10/10/23(a) | | | | | | $ | 75,000 | | | $ | 74,903 | |
5.09%, 10/10/23(a) | | | | | | | 25,000 | | | | 24,968 | |
4.97%, 10/17/23(a) | | | | | | | 125,000 | | | | 124,714 | |
5.04%, 10/24/23(a) | | | | | | | 61,610 | | | | 61,404 | |
5.00%, 10/31/23(a) | | | | | | | 90,000 | | | | 89,608 | |
5.19%, 11/9/23(a) | | | | | | | 110,000 | | | | 109,370 | |
5.29%, 11/21/23(a) | | | | | | | 10,000 | | | | 9,925 | |
5.20%, 11/24/23(a) | | | | | | | 110,000 | | | | 109,125 | |
4.96%, 11/28/23(a) | | | | | | | 75,000 | | | | 74,378 | |
5.28%, 12/7/23(a) | | | | | | | 10,000 | | | | 9,901 | |
5.22%, 12/14/23(a) | | | | | | | 120,000 | | | | 118,688 | |
5.12%, 12/19/23(a) | | | | | | | 70,000 | | | | 69,185 | |
5.19%, 12/21/23(a) | | | | | | | 117,640 | | | | 116,272 | |
5.13%, 12/26/23(a) | | | | | | | 75,000 | | | | 74,048 | |
5.20%, 12/28/23(a) | | | | | | | 55,000 | | | | 54,292 | |
5.23%, 12/28/23(a) | | | | | | | 80,000 | | | | 78,970 | |
5.28%, 12/28/23(a) | | | | | | | 50,000 | | | | 49,356 | |
5.17%, 1/9/24(a) | | | | | | | 25,000 | | | | 24,631 | |
5.14%, 1/16/24(a) | | | | | | | 75,000 | | | | 73,812 | |
5.15%, 1/16/24(a) | | | | | | | 75,000 | | | | 73,812 | |
5.16%, 1/30/24(a) | | | | | | | 75,000 | | | | 73,675 | |
5.29%, 3/28/24(a) | | | | | | | 55,000 | | | | 53,548 | |
5.30%, 3/28/24(a) | | | | | | | 55,000 | | | | 53,548 | |
| | | | | | | | | | | | |
| | | | | | | | | | | 1,602,133 | |
| | | | | | | | | | | | |
U.S. Treasury Floating Rate Notes | | | 9.5% | | | | | | | | | |
(Floating, U.S. Treasury 3M Bill MMY - 0.08%) 5.33%, 10/2/23(b) | | | | | | | 190,000 | | | | 189,939 | |
(Floating, U.S. Treasury 3M Bill MMY + 0.04%) 5.44%, 10/2/23(b) | | | | | | | 96,500 | | | | 96,496 | |
(Floating, U.S. Treasury 3M Bill MMY + 0.13%) 5.53%, 10/2/23(b) | | | | | | | 80,000 | | | | 79,970 | |
(Floating, U.S. Treasury 3M Bill MMY + 0.14%) 5.54%, 10/2/23(b) | | | | | | | 295,000 | | | | 295,194 | |
(Floating, U.S. Treasury 3M Bill MMY + 0.17%) 5.57%, 10/2/23(b) | | | | | | | 110,000 | | | | 110,107 | |
(Floating, U.S. Treasury 3M Bill MMY + 0.20%) 5.60%, 10/2/23(b) | | | | | | | 59,140 | | | | 59,239 | |
| | | | | | | | | | | | |
| | | | | | | | | | | 830,945 | |
| | | | | | | | | | | | |
TOTAL U.S. TREASURY OBLIGATIONS (Cost $2,433,078) | | | | | | | | | | | 2,433,078 | |
| | | | | | | | | | | | |
REPURCHASE AGREEMENTS | | | 74.2% | | | | | | | | | |
Citigroup Global Markets, Inc., dated 9/29/23, repurchase price $1,401, 5.30%, 10/2/23(c) | | | | | | | 1,400 | | | | 1,400 | |
Citigroup Global Markets, Inc., dated 9/29/23, repurchase price $850,375, 5.30%, 10/2/23(c) | | | | | | | 850,000 | | | | 850,000 | |
See Notes to Financial Statements.
1
ADVISERS INVESTMENT TRUST
NTAM TREASURY ASSETS FUND
SCHEDULE OF INVESTMENTS
September 30, 2023
| | | | | | | | | | | | |
| | | Percentage | | | Principal | | | | |
| | | of Net | | | Amount | | | Value | |
| | | Assets | | | (000s) | | | (000s) | |
| |
Federal Reserve Bank of New York, dated 9/29/23, repurchase price $4,157,836, 5.30%, 10/2/23(d) | | | | | | $ | 4,156,000 | | | $ | 4,156,000 | |
JPMorgan Securities LLC, dated 9/29/23, repurchase price $1,500,663, 5.30%, 10/2/23(e) | | | | | | | 1,500,000 | | | | 1,500,000 | |
| | | | | | | | | | | | |
TOTAL REPURCHASE AGREEMENTS (Cost $6,507,400) | | | | | | | | | | | 6,507,400 | |
| | | | | | | | | | | | |
TOTAL INVESTMENTS
(Cost $8,940,478) | | | 102.0% | | | | | | | | 8,940,478 | |
NET OTHER ASSETS (LIABILITIES) | | | (2.0% | ) | | | | | | | (177,899 | ) |
| | | | | | | | | | | | |
NET ASSETS | | | 100.0% | | | | | | | $ | 8,762,579 | |
| | | | | | | | | | | | |
| (a) | Discount rate at the time of purchase. |
| (b) | Variable rate security. Rate as of September 30, 2023 is disclosed. Maturity date represents the next interest reset date. The security’s legal final maturity date is longer than the reset date. Securities with longer maturity dates have a greater sensitivity to changes in liquidity, interest rate risk and/or credit risk. |
| (c) | The nature and terms of the collateral received for the repurchase agreements are as follows: |
| | | | | | | | | | | | |
| | | Value | | | Coupon | | | Maturity | |
| Citigroup Global Markets Inc. | | (000s) | | | Rates | | | Dates | |
| |
U.S. Treasury Floating Rate Notes | | $ | 868,428 | | | | 0.50% — 1.75% | | | | 10/31/23 — 1/31/29 | |
| |
(d) The nature and terms of the collateral received for the repurchase agreements are as follows: | |
| | | Value | | | Coupon | | | Maturity | |
| Federal Reserve Bank of New York | | (000s) | | | Rates | | | Dates | |
| |
U.S. Treasury Bonds | | $ | 12,878 | | | | 2.25% | | | | 5/15/41 | |
U.S. Treasury Notes | | $ | 4,144,958 | | | | 1.25% — 3.13% | | | | 8/15/25 — 2/15/32 | |
| |
Total | | $ | 4,157,836 | | | | | | | | | |
| |
| | | | | | | | | | | | |
| |
(e) The nature and terms of the collateral received for the repurchase agreements are as follows: | |
| | | Value | | | Coupon | | | Maturity | |
| JP Morgan | | (000s) | | | Rates | | | Dates | |
| |
U.S. Treasury Bills | | $ | 27,616 | | | | — % | | | | 11/14/23 | |
U.S. Treasury Notes | | $ | 1,502,384 | | | | 0.25% — 2.88% | | | | 9/30/23 — 2/28/26 | |
| |
Total | | $ | 1,530,000 | | | | | | | | | |
| |
| | | | | | | | | | | | |
| |
At September 30, 2023 the asset allocations for the NTAM Treasury Assets Fund were:
| | | | |
| Asset Allocation | | % of Net Assets | |
| |
U.S. Treasury Bills | | | 18.3% | |
U.S. Treasury Floating Rate Notes | | | 9.5 | |
Repurchase Agreements | | | 74.2 | |
| |
Total | | | 102.0% | |
| |
See Notes to Financial Statements.
2
ADVISERS INVESTMENT TRUST
STATEMENT OF ASSETS & LIABILITIES
September 30, 2023
| | | | |
| | | NTAM | |
| | | Treasury | |
| Amounts in thousands | | Assets Fund | |
| |
Assets: | | | | |
Investments, at value (Cost: $2,433,078) | | $ | 2,433,078 | |
Repurchase agreements, cost equals fair value | | | 6,507,400 | |
Cash | | | 95 | |
Receivable for interest | | | 9,735 | |
Prepaid expenses | | | 26 | |
| | | | |
Total Assets | | | 8,950,334 | |
| | | | |
Liabilities: | | | | |
Securities purchased payable | | | 148,053 | |
Distributions payable to shareholders | | | 38,227 | |
Investment advisory fees payable | | | 589 | |
Accounting and Administration fees payable | | | 736 | |
Regulatory and Compliance fees payable | | | 70 | |
Accrued expenses and other payable | | | 80 | |
| | | | |
Total Liabilities | | | 187,755 | |
| | | | |
Net Assets | | $ | 8,762,579 | |
| | | | |
Net Assets | | $ | 8,762,579 | |
Shares of common stock outstanding | | | 8,762,673 | |
| | | | |
Net asset value per share | | $ | 1.00 | |
| | | | |
Net Assets: | | | | |
Paid in capital | | $ | 8,762,619 | |
Distributable earnings | | | (40 | ) |
| | | | |
Net Assets | | $ | 8,762,579 | |
| | | | |
| | | | |
| |
See Notes to Financial Statements.
3
ADVISERS INVESTMENT TRUST
STATEMENT OF OPERATIONS
For the year ended September 30, 2023
| | | | |
| | | NTAM | |
| | | Treasury | |
| Amounts in thousands | | Assets Fund | |
| |
Investment Income: | | | | |
Interest income | | $ | 348,238 | |
Operating expenses: | | | | |
Investment advisory | | | 8,399 | |
Accounting and Administration | | | 989 | |
Regulatory and Compliance | | | 246 | |
Trustees | | | 71 | |
Other | | | 326 | |
| | | | |
Total expenses | | | 10,031 | |
Expenses reduced by Service Providers | | | (2,337 | ) |
| | | | |
Net expenses | | | 7,694 | |
| | | | |
Net investment income | | | 340,544 | |
| | | | |
Realized Gains from Investment Activities: | | | | |
Net realized gains from investment transactions | | | 18 | |
| | | | |
Net realized gains from investment activities | | | 18 | |
| | | | |
Change in Net Assets Resulting from Operations | | $ | 340,562 | |
| | | | |
| |
See Notes to Financial Statements.
4
ADVISERS INVESTMENT TRUST
STATEMENTS OF CHANGES IN NET ASSETS
For the years ended September 30, 2023 and 2022
| | | | | | | | |
| | | NTAM | |
| | | Treasury | |
| | | Assets Fund | |
| | | September 30, | | | September 30, | |
| Amounts in thousands | | 2023 | | | 2022 | |
| |
Increase (decrease) in net assets: | | | | | | | | |
Operations: | | | | | | | | |
Net investment income | | $ | 340,544 | | | $ | 53,190 | |
Net realized gains from investment transactions | | | 18 | | | | 26 | |
| | | | | | | | |
Change in net assets resulting from operations | | | 340,562 | | | | 53,216 | |
| | | | | | | | |
Dividends paid to shareholders: | | | | | | | | |
From distributable earnings | | | (340,545 | ) | | | (53,247 | ) |
| | | | | | | | |
Total dividends paid to shareholders | | | (340,545 | ) | | | (53,247 | ) |
| | | | | | | | |
Capital Transactions: | | | | | | | | |
Proceeds from sale of shares | | | 11,275,000 | | | | 5,362,000 | |
Value of shares issued to shareholders in reinvestment of dividends | | | 316,678 | | | | 38,953 | |
Value of shares redeemed | | | (10,514,955 | ) | | | (5,444,442 | ) |
| | | | | | | | |
Change in net assets from capital transactions | | | 1,076,723 | | | | (43,489 | ) |
| | | | | | | | |
Change in net assets | | | 1,076,740 | | | | (43,520 | ) |
Net assets: | | | | | | | | |
Beginning of year | | | 7,685,839 | | | | 7,729,359 | |
| | | | | | | | |
End of year | | $ | 8,762,579 | | | $ | 7,685,839 | |
| | | | | | | | |
Share Transactions | | | | | | | | |
Sold | | | 11,275,000 | | | | 5,362,000 | |
Reinvested | | | 316,678 | | | | 38,953 | |
Redeemed | | | (10,514,955 | ) | | | (5,444,442 | ) |
| | | | | | | | |
Change | | | 1,076,723 | | | | (43,489 | ) |
| | | | | | | | |
| |
See Notes to Financial Statements.
5
ADVISERS INVESTMENT TRUST
FINANCIAL HIGHLIGHTS
For the periods indicated
| | | | | | | | | | | | | | | | | | | | |
| | | NTAM | |
| | | Treasury | |
| | | Assets Fund | |
| | | Year Ended | | | Year Ended | | | Year Ended | | | Year Ended | | | Year Ended | |
| | | September 30, | | | September 30, | | | September 30, | | | September 30, | | | September 30, | |
| | | 2023 | | | 2022 | | | 2021 | | | 2020 | | | 2019 | |
| |
Net asset value, beginning of period | | $ | 1.00 | | | $ | 1.00 | | | $ | 1.00 | | | $ | 1.00 | | | $ | 1.00 | |
| | | | | | | | | | | | | | | | | | | | |
Income (loss) from operations: | | | | | | | | | | | | | | | | | | | | |
Net investment income | | | 0.04 | | | | 0.01 | | | | — | (a) | | | 0.01 | | | | 0.02 | |
Net realized gains from investments(a) | | | — | | | | — | | | | — | | | | — | | | | — | |
| | | | | | | | | | | | | | | | | | | | |
Total from investment operations | | | 0.04 | | | | 0.01 | | | | — | | | | 0.01 | | | | 0.02 | |
| | | | | | | | | | | | | | | | | | | | |
Less distributions paid: | | | | | | | | | | | | | | | | | | | | |
From net investment income | | | (0.04 | ) | | | (0.01 | ) | | | (— | )(a) | | | (0.01 | ) | | | (0.02 | ) |
From net realized gains on investments(a) | | | — | | | | — | | | | (— | ) | | | (— | ) | | | (— | ) |
| | | | | | | | | | | | | | | | | | | | |
Total distributions paid | | | (0.04 | ) | | | (0.01 | ) | | | — | | | | (0.01 | ) | | | (0.02 | ) |
| | | | | | | | | | | | | | | | | | | | |
Change in net asset value | | | — | | | | — | | | | — | | | | — | | | | — | |
| | | | | | | | | | | | | | | | | | | | |
Net asset value, end of period | | $ | 1.00 | | | $ | 1.00 | | | $ | 1.00 | | | $ | 1.00 | | | $ | 1.00 | |
| | | | | | | | | | | | | | | | | | | | |
Total return | | | 4.47 | % | | | 0.66 | % | | | 0.03 | % | | | 1.06 | % | | | 2.28 | % |
Ratios/Supplemental data: | | | | | | | | | | | | | | | | | | | | |
Net assets, end of period (000’s) | | $ | 8,762,579 | | | $ | 7,685,839 | | | $ | 7,729,359 | | | $ | 7,012,840 | | | $ | 8,037,595 | |
Ratio of net expenses to average net assets | | | 0.10 | % | | | 0.09 | % | | | 0.07 | % | | | 0.10 | % | | | 0.10 | % |
Ratio of net investment income to average net assets | | | 4.46 | % | | | 0.68 | % | | | 0.02 | % | | | 0.93 | % | | | 2.25 | % |
Ratio of gross expenses to average net assets(b) | | | 0.13 | % | | | 0.13 | % | | | 0.13 | % | | | 0.13 | % | | | 0.13 | % |
| |
| (a) | Amount is less than $0.005 per share. |
| (b) | During the period shown, certain fees were reduced. If such fee reductions had not occurred, the ratio would have been as indicated. |
See Notes to Financial Statements.
6
ADVISERS INVESTMENT TRUST
NTAM TREASURY ASSETS FUND
NOTES TO FINANCIAL STATEMENTS
September 30, 2023
Advisers Investment Trust (the “Trust”) is a Delaware statutory trust operating under a Fifth Amended and Restated Agreement and Declaration of Trust (the “Trust Agreement”) dated March 9, 2023. The Trust was formerly an Ohio business trust, which commenced operations on December 20, 2011. On March 31, 2017, the Trust was converted to a Delaware statutory trust. As an open-end registered investment company, as defined in Financial Accounting Standards Board (“FASB”) Accounting Standards Update (“ASU”) 2013-08, the Trust follows accounting and reporting guidance under FASB Accounting Standards Codification (“ASC”) Topic 946, “Financial Services-Investment Companies”. The Trust Agreement permits the Board of Trustees (the “Trustees” or “Board”) to authorize and issue an unlimited number of shares of beneficial interest, at no par value, in separate series of the Trust. The NTAM Treasury Assets Fund (the “Fund”) is a series of the Trust which is registered under the Investment Company Act of 1940, as amended (the “1940 Act”), and commenced operations on April 4, 2018. Shares of the Fund are not registered under the Securities Act of 1933, as amended (the “1933 Act”). Investments in the Fund may be made only by individuals or entities that are “accredited investors” within the meaning of Regulation D under the 1933 Act.
The Fund is a diversified fund. The investment objective of the Fund is to seek to maximize current income to the extent consistent with the preservation of capital and maintenance of liquidity by investing its net assets, under normal market conditions, exclusively in United States (“U.S.”) Treasury securities and related repurchase agreements and other securities that limit their investments to, or are backed by, U.S. Treasury securities.
The Fund operates as a “government money market fund” under Rule 2a-7 of the 1940 Act.
Under the Trust’s organizational documents, its officers and Trustees are indemnified against certain liabilities arising out of the performance of their duties to the Trust and Fund. In addition, in the normal course of business, the Trust enters into contracts with its vendors and others that provide for general indemnifications. The Fund’s maximum exposure under these arrangements is unknown, as this would involve future claims that may be made against the Fund.
| A. | Significant accounting policies are as follows: |
INVESTMENT VALUATION
Investments are recorded at amortized cost, which approximates fair value. Under this method, investments purchased at a discount or premium are valued by accruing or amortizing the difference between the original purchase price and maturity value of the issue over the period to effective maturity. The Trustees have designated Northern Trust Investments, Inc., as investment adviser to the Fund, as the Fund’s Valuation Designee with responsibility for establishing fair value when amortized cost does not approximate fair value.
The following is a summary of the valuation inputs used as of September 30, 2023 in valuing the Fund’s investments based upon the three fair value levels as follows:
• Level 1 —quoted prices in active markets for identical assets
• Level 2 —other significant observable inputs (including quoted prices of similar securities, interest rates, prepayment speeds, credit risk, etc.)
• Level 3 —significant unobservable inputs (including the Fund’s own assumptions in determining the fair value of investments)
| | | | | | | | | | | | | | | | |
| | | | | | Level 2 - | | | Level 3 - | | | | |
| | | Level 1 - | | | Other Significant | | | Significant | | | | |
| Amounts in thousands | | Quoted Prices | | | Observable Inputs | | | Unobservable Inputs | | | Total | |
| |
Investments held by the NTAM Treasury Assets Fund* | | $ | — | | | $ | 8,940,478 | | | $ | — | | | $ | 8,940,478 | |
| | | | |
| * | See additional categories in the Schedule of Investments. |
7
ADVISERS INVESTMENT TRUST
NTAM TREASURY ASSETS FUND
NOTES TO FINANCIAL STATEMENTS
September 30, 2023
As of September 30, 2023, there were no Level 1 or Level 3 securities held by the Fund. There were no transfers to or from Level 3 during the year ended September 30, 2023.
REPURCHASE AGREEMENTS
The Fund may enter into repurchase agreements under the terms of a master repurchase agreement by which it purchases securities for cash from a seller and agrees to resell those securities to the same seller at a specific price within a specified time or with an indefinite life and a liquidity feature which allows the Fund to resell the security quarterly. The interest rate on such repurchase agreements resets daily. During the term of a repurchase agreement, the fair value of the underlying collateral, including accrued interest, is required to equal or exceed the fair value of the repurchase agreement. The Fund is subject to credit risk on repurchase agreements to the extent that the counterparty fails to perform under the agreement and the value of the collateral received falls below the agreed repurchase price. If the seller defaults and the value of the collateral declines or if bankruptcy proceedings are commenced with respect to the seller of the security, realization of collateral by the Fund may be delayed or limited. The Fund has entered into such repurchase agreements at September 30, 2023, as reflected in the accompanying Schedule of Investments.
| | | | | | | | | | | | |
| | | Gross Amounts not Offset in the | | | | |
| Amounts in thousands | | Statement of Assets and Liabilities | | | | |
| |
| | | Gross Amounts of Assets | | | | | | | |
| | | Presented in Statements of | | | Financial | | | Net | |
| Counterparty | | Assets and Liabilities | | | Instruments* | | | Amount | |
| |
Citigroup Global Markets, Inc. | | $ | 851,400 | | | $ | (851,400 | ) | | $ | — | |
Federal Reserve Bank of New York | | | 4,156,000 | | | | (4,156,000 | ) | | | — | |
JP Morgan Securities LLC | | | 1,500,000 | | | | (1,500,000 | ) | | | — | |
| | | | |
| | $ | 6,507,400 | | | $ | (6,507,400 | ) | | $ | — | |
| | | | |
*Collateral received is reflected up to the fair market value of the repurchase agreement.
INVESTMENT TRANSACTIONS AND INCOME
Investment transactions are accounted for no later than one business day after trade date. For financial reporting purposes, investments are reported as of the trade date. The Fund determines the gain or loss realized from investment transactions by using an identified cost basis method. Interest income is recognized on an accrual basis and includes, where applicable, the amortization of premium or accretion of discount.
EXPENSE ALLOCATIONS
Expenses directly attributable to a fund in the Trust are charged to that fund, while expenses that are attributable to more than one fund in the Trust are allocated among the applicable funds on a pro-rata basis to each adviser’s series of funds based on relative net assets or another reasonable basis.
DIVIDENDS AND DISTRIBUTIONS
Dividends from net income are declared daily and paid monthly by the Fund to its shareholders. Net income includes the interest accrued on the Fund’s assets less estimated expenses. The Fund’s net realized short-term capital gains, if any, are distributed at least annually.
Distributions from net investment income and from net realized capital gain are determined in accordance with Federal income tax regulations, which may differ from accounting principles generally accepted in the United States of America (“GAAP”). These “book/tax” differences are either considered temporary or permanent in nature. To the extent these differences are permanent in nature (e.g. treatment of certain dividend distributions, gains/losses, return of capital, etc.), such amounts are reclassified within the composition of net assets based on their federal tax-basis treatment; temporary differences do not require reclassification. Distributions to shareholders that exceed net investment income and net realized capital gains for tax purposes are reported as return of capital.
8
ADVISERS INVESTMENT TRUST
NTAM TREASURY ASSETS FUND
NOTES TO FINANCIAL STATEMENTS
September 30, 2023
FEDERAL INCOME TAX INFORMATION
No provision is made for Federal income taxes as the Fund intends to qualify each year as a “regulated investment company” under Subchapter M of the Internal Revenue Code of 1986, as amended (the “Code”), and distribute substantially all of its net investment income and net realized capital gain in accordance with the Code.
As of September 30, 2023, the Fund did not have uncertain tax positions that would require financial statement recognition or disclosure based on an evaluation of all open tax years for all major tax jurisdictions. The Fund’s Federal tax returns for the tax years ended September 30, 2023, 2022, 2021, and 2020 remain subject to examination by the Internal Revenue Service. Interest or penalties incurred, if any, on future unknown or uncertain tax positions taken by the Fund will be recorded as interest expense on the Statement of Operations.
Management is not aware of any tax positions for which it is reasonably possible that the total amounts of unrecognized tax benefits will change materially in the next 12 months.
USE OF ESTIMATES
The preparation of financial statements in conformity with GAAP requires management to make estimates and assumptions that affect the reported amounts of assets and liabilities and disclosure of contingent assets and liabilities at the date of the financial statements and the reported amounts of revenues and expenses during the reporting period. Actual results could differ from these estimates.
B. Fees and Transactions with Affiliates and Other Parties
The Trust, on behalf of the Fund, has entered into an Investment Advisory Agreement (the “Agreement”) with Northern Trust Investments, Inc. (the “Adviser” or “NTI”), which is registered under the Investment Advisers Act of 1940, as amended, to provide investment management services to the Fund. Total fees incurred pursuant to the Agreement are reflected as “Investment advisory” fees on the Statement of Operations. Under the terms of the Agreement, the Fund pays the Adviser a monthly fee based on the Fund’s average daily net assets at the annualized rate of 0.11%.
Foreside Financial Services, LLC (the “Placement Agent”) provides private placement services to the Fund pursuant to a placement agent agreement with the Trust, on behalf of the Fund. Under its agreement with the Trust, the Placement Agent acts as an agent of the Trust in connection with the offering of the shares of the Fund on a private placement basis to eligible investors only. The Adviser, at its own expense, pays the Placement Agent an asset-based fee, which is calculated and billed monthly, for these services and reimbursement for certain expenses incurred on behalf of the Fund.
The Northern Trust Company (“Northern Trust”), an affiliate to NTI, serves as the administrator, transfer agent, custodian, and fund accounting agent for the Fund pursuant to written agreements between the Trust, on behalf of the Fund, and Northern Trust. The Fund pays Northern Trust certain annual and transaction-based fees, a tiered basis-point fee based on the Fund’s daily net assets, and reimburse for certain expenses incurred on behalf of the Fund. Total fees paid to Northern Trust pursuant to these agreements are reflected as “Accounting and Administration” fees on the Statement of Operations. During the year ended September 30, 2023, Northern Trust voluntarily reimbursed $39,987 in expenses. This amount is included in “Expenses Reduced by Service Providers” in the Statement of Operations.
Foreside Fund Officer Services, LLC (“Foreside”, d/b/a ACA Group) provides compliance and financial control services for the Fund pursuant to a written agreement with the Trust, on behalf of the Fund, including providing certain officers to the Fund. The Fund pays Foreside an annual base fee, a basis-point fee based on the Fund’s daily net assets and reimburses for certain expenses incurred on behalf of the Fund. Total fees paid to Foreside pursuant to these agreements are reflected as “Regulatory and Compliance” fees on the Statement of Operations.
The officers of the Trust are affiliated with Foreside, Northern Trust, or the Placement Agent and receive no compensation directly from the Fund for serving in their respective roles. Through March 31, 2023, the Trust paid each Trustee who is not an “interested person,” as that term is defined in the 1940 Act (each, an “Independent Trustee” and, collectively, the “Independent Trustees”) compensation for their
9
ADVISERS INVESTMENT TRUST
NTAM TREASURY ASSETS FUND
NOTES TO FINANCIAL STATEMENTS
September 30, 2023
services based on an annual retainer of $125,000 and reimbursement for certain expenses. Effective April 1, 2023, the Trust pays an annual retainer of $132,000 and reimbursement for certain expenses. If there are more than six meetings in a year, additional meeting fees may apply. For the year ended September 30, 2023, the aggregate Trustee compensation paid by the Trust was $416,750. The amount of total Trustee compensation and reimbursement of out-of-pocket expenses allocated from the Trust to the Fund is reflected as “Trustees” fees on the Statement of Operations.
The Adviser has contractually agreed to waive fees and/or reimburse expenses to the extent necessary to limit total annual fund operating expenses (exclusive of the compensation paid to each Independent Trustee, expenses associated with an Independent Trustee’s attendance at Board meetings and other Trust related travel, expenses of third party consultants engaged by the Board, any membership dues paid to the Investment Company Institute and Mutual Fund Directors Forum, brokerage costs, interest, taxes, dividends, litigation and indemnification expenses, expenses associated with the investments in underlying investment companies and extraordinary expenses) to 0.10% of the average daily net assets of the Fund until January 28, 2024. If it becomes unnecessary for the Adviser to waive fees or make reimbursements, the Adviser may recapture any of its prior waivers or reimbursements for a period not to exceed three years from the date on which the waiver or reimbursement was made to the extent that such a recapture does not cause the total annual fund operating expenses (exclusive of the compensation paid to each Independent Trustee, expenses associated with an Independent Trustee’s attendance at Board meetings and other Trust related travel, expenses of third party consultants engaged by the Board, any membership dues paid to the Investment Company Institute and Mutual Fund Directors Forum, brokerage costs, interest, taxes, dividends, litigation and indemnification expenses, expenses associated with the investments in underlying investment companies and extraordinary expenses) to exceed the applicable expense limitation in effect at the time of repayment or the applicable expense limitation that was in effect at the time of the waiver or reimbursement. The agreement to waive fees and/or reimburse expenses automatically renews annually from year to year on the effective date of each subsequent annual update to the Fund’s registration statement, until such time as the Adviser provide written notice of non-renewal.
The Adviser may reimburse additional expenses or waive all or a portion of the management fee of the Fund from time to time, including to avoid a negative yield, and such amounts are not subject to recoupment in future periods. Any such additional expense reimbursement or waiver would be voluntary and could be implemented, increased or decreased or discontinued at any time.
For the year ended September 30, 2023, the Fund incurred advisory fees payable to NTI, contractual expense waivers and/or reimbursements from NTI, and paid expense recoupments to NTI, as follows:
| | | | | | | | | | | | | | | | |
| Amounts in thousands | | Advisory Fee to NTI | | | Expenses Reduced by NTI | | | Advisory Fees Recouped by NTI | |
| |
NTAM Treasury Assets Fund | | $ | 8,399 | | | | | | | $ | 2,297 | | | $ | — | |
The balances of recoverable expenses to NTI by the Fund at September 30, 2023 were as follows (in thousands):
| | | | | | | | | | |
| For the: | | Expiring | | | | | NTAM
Treasury
Assets Fund | |
| |
Year ended September 30, 2021 | | September 30, 2024 | | | | | | | $2,217 | |
Year ended September 30, 2022 | | September 30, 2025 | | | | | | | 2,305 | |
Year ended September 30, 2023 | | September 30, 2026 | | | | | | | 2,297 | |
| | | | | | | | | | |
Balances of Recoverable Expenses to the Adviser | | | | | | | | | $6,819 | |
| | | | | | | | | | |
C. Other Risks
General market conditions, such as real or perceived adverse economic or political conditions, inflation, changes in interest rates, lack of liquidity in the bond markets, disruptions to business operations and supply chains, staffing shortages, or adverse investor sentiment could cause the value of your investment in the Fund, or its yield, to decline. The market value of the securities in which the Fund invests may be impacted in response to the prospects of particular sectors or governments, general economic conditions, and/or other events (such as
10
ADVISERS INVESTMENT TRUST
NTAM TREASURY ASSETS FUND
NOTES TO FINANCIAL STATEMENTS
September 30, 2023
pandemics, terrorism, etc.) throughout the world due to increasingly interconnected global economies and financial markets. Political events, including armed conflict, tariffs and economic sanctions also contribute to market volatility. These events can have a significant impact on the Fund’s operations and performance.
D. Federal Income Tax
As of September 30, 2023, the cost, gross unrealized appreciation and gross unrealized depreciation on investments, for Federal income tax purposes, were as follows:
| | | | | | | | | | | | | | | | |
| Amounts in thousands | | Cost | | | Gross Unrealized
Appreciation | | | Gross Unrealized
(Depreciation) | | | Net Unrealized
Appreciation
(Depreciation) | |
| |
NTAM Treasury Assets Fund | | $ | 8,940,478 | | | $ | — | | | $ | — | | | $ | — | |
The tax character of distributions paid to shareholders during the latest tax periods ended September 30, 2023 and September 30, 2022 for the Fund were as follows:
| | | | | | | | | | | | | | | | | | | | |
| Amounts in thousands | | Ordinary Income | | | Net Long
Term Gains | | | Total Taxable
Distributions Paid | | | Tax Return
of Capital | | | Total Distributions
Paid | |
| |
2023 | | $ | 316,676 | | | $ | — | | | $ | 316,676 | | | $ | — | | | $ | 316,676 | |
2022 | | | 38,953 | | | | — | | | | 38,953 | | | | — | | | | 38,953 | |
As of the latest tax year ended September 30, 2023, the components of accumulated earnings on a tax basis were as follows:
| | | | | | | | | | | | | | | | | | | | | | | | | | | | |
| Amounts in thousands | | Undistributed
Ordinary Income | | | Undistributed Long-
Term Capital Gains | | | Accumulated
Earnings | | | Distributions
Payable | | | Accumulated
Capital and
Other Losses | | | Unrealized Depreciation | | | Total
Accumulated
Earnings | |
| |
NTAM Treasury Assets Fund | | | $38,228 | | | | $— | | | | $38,228 | | | | $(38,227) | | | | $(40) | | | | $— | | | | $(39 | ) |
At September 30, 2023, non-expiring capital losses incurred by the Fund are carried forward indefinitely under the provisions of the
Regulated Investment Company Modernization Act of 2010 are as follows:
| | | | | | | | |
| Fund | | Short-Term Capital Loss Carry-Forward | | | Long-Term
Capital Loss
Carry-Forward | |
| |
NTAM Treasury Assets Fund | | $ | (40 | ) | | $ | — | |
During the fiscal year ended September 30, 2023, the following amount of capital loss carryforwards was utilized: $18.
11
REPORT OF INDEPENDENT REGISTERED PUBLIC ACCOUNTING FIRM
To the shareholders of the NTAM Treasury Assets Fund and the Board of Trustees of Advisers Investment Trust
Opinion on the Financial Statements and Financial Highlights
We have audited the accompanying statement of assets and liabilities of the NTAM Treasury Assets Fund (the “Fund”), one of the portfolios constituting Advisers Investment Trust (the “Trust”), including the schedule of investments, as of September 30, 2023, the related statement of operations for the year then ended, the statements of changes in net assets for each of the two years in the period then ended, the financial highlights for each of the five years in the period then ended, and the related notes.
In our opinion, the financial statements and financial highlights present fairly, in all material respects, the financial position of the NTAM Treasury Assets Fund of the Trust as of September 30, 2023, and the results of its operations for the year then ended, the changes in its net assets for each of the two years in the period then ended, and the financial highlights for each of the five years in the period then ended, in conformity with accounting principles generally accepted in the United States of America.
Basis for Opinion
These financial statements and financial highlights are the responsibility of the Fund’s management. Our responsibility is to express an opinion on the Fund’s financial statements and financial highlights based on our audits. We are a public accounting firm registered with the Public Company Accounting Oversight Board (United States) (PCAOB) and are required to be independent with respect to the Fund in accordance with the U.S. federal securities laws and the applicable rules and regulations of the Securities and Exchange Commission and the PCAOB.
We conducted our audits in accordance with the standards of the PCAOB. Those standards require that we plan and perform the audit to obtain reasonable assurance about whether the financial statements and financial highlights are free of material misstatement, whether due to error or fraud. The Fund is not required to have, nor were we engaged to perform, an audit of its internal control over financial reporting. As part of our audits we are required to obtain an understanding of internal control over financial reporting but not for the purpose of expressing an opinion on the effectiveness of the Fund’s internal control over financial reporting. Accordingly, we express no such opinion.
Our audits included performing procedures to assess the risks of material misstatement of the financial statements and financial highlights, whether due to error or fraud, and performing procedures that respond to those risks. Such procedures included examining, on a test basis, evidence regarding the amounts and disclosures in the financial statements and financial highlights. Our audits also included evaluating the accounting principles used and significant estimates made by management, as well as evaluating the overall presentation of the financial statements and financial highlights. Our procedures included confirmation of securities owned as of September 30, 2023, by correspondence with the
12
custodian and brokers; when replies were not received from brokers, we performed other auditing procedures. We believe that our audits provide a reasonable basis for our opinion.

November 17, 2023
We have served as the auditor of one or more Northern Trust investment companies since 2002.
13
ADVISERS INVESTMENT TRUST
NTAM TREASURY ASSETS FUND
ADDITIONAL INFORMATION
September 30, 2023 (Unaudited)
As a Fund shareholder, you may incur two types of costs: (1) transaction costs, and (2) ongoing costs, including management fees and other Fund expenses. The examples below are intended to help you understand your ongoing costs (in dollars) of investing in the Fund and to compare these costs with the ongoing costs of investing in other mutual funds. Please note that the expenses shown in the tables are meant to highlight your ongoing costs only and do not reflect any transactional costs. Therefore, the examples are useful in comparing ongoing costs only and will not help you determine the relative total cost of owning different funds. In addition, if these transactional costs were included, your costs would have been higher.
The examples below are based on an investment of $1,000 invested at April 1, 2023 and held for the entire period through September 30, 2023.
The Actual Expense Example below provides information about actual account values and actual expenses. You may use this information, together with the amount you invested, to estimate the expenses that you paid over the period. Simply divide your account value by $1,000 (for example, an $8,600 account value divided by $1,000 = 8.6), then multiply the result by the number in the table under the heading entitled “Expenses Paid” to estimate the expenses you paid on your account during this period.
The Hypothetical Expense Example below provides information about hypothetical account values and hypothetical expenses based on the Fund’s actual expense ratio and an assumed rate of return of 5% per year before expenses, which is not the Fund’s actual return. The hypothetical account values and expenses may not be used to estimate the actual ending account balance or expenses you paid for the period. You may use this information to compare the ongoing costs of investing in the Fund and other funds. To do so, compare this 5% hypothetical example with the 5% hypothetical examples that appear in the shareholder reports of the other funds.
| | | | | | | | | | | | | | |
| | | Expense Ratio | | Beginning Account
Value 4/1/2023 | | | Ending Account
Value 9/30/2023 | | | Expenses Paid
4/1/23–9/30/23* | |
Actual | | 0.10% | | $ | 1,000.00 | | | $ | 1,025.60 | | | $ | 0.51 | |
Hypothetical | | 0.10% | | $ | 1,000.00 | | | $ | 1,024.57 | | | $ | 0.51 | |
| * | Expenses are calculated using the annualized expense ratio (as disclosed in the table), multiplied by the average account value for the period, multiplied by the number of days in the most recent half fiscal year (183), and divided by the number of days in the current year (365). |
A description of the policies and procedures that the Fund uses to determine how to vote proxies relating to portfolio securities is available (i) without charge, upon request, by writing to the Fund at NTAM Treasury Assets Fund c/o The Northern Trust Company, P.O. Box 4766, Chicago, Illinois 60680-4766 or by calling the Fund at 855-351-4583 (toll free); and (ii) on the U.S. Securities and Exchange Commission’s (the “SEC”) website at www.sec.gov. Information regarding how the Fund voted proxies relating to portfolio securities during the most recent 12-month period ended June 30 is available (i) without charge, by calling the Fund at 855-351-4583 (toll free); and (ii) on the SEC’s website at www.sec.gov.
The Fund files its complete Schedule of Portfolio Holdings with the SEC each month on Form N-MFP, which is available without charge on the SEC’s website at www.sec.gov. The Fund makes portfolio holdings information available to shareholders at https://www.northerntrust.com/united-states/what-we-do/investment-management/northern-funds/ntam-treasury-assets-fund.
14
ADVISERS INVESTMENT TRUST
NTAM TREASURY ASSETS FUND
ADDITIONAL INFORMATION
September 30, 2023 (Unaudited)
C. Trustees and Officers
The following table provides information regarding each Independent Trustee.
| | | | | | | | | | |
Name, Address and Year of Birth1 | | Position(s) Held with the Trust | | Term of Office/Length of
Time Served | | Principal Occupation(s) During Past 5 Years | | Number of
Portfolios in the
Trust Overseen
by Trustee | | Other Directorships Held by Trustee During Past 5 |
| | | | | | | | | | | Years |
Robert Gordon Year of Birth: 1961 | | Trustee | | Indefinite/January 2022 to present | | Independent Director, VAM Funds Luxembourg, 2018 to present; Independent Director, Anchor Capital Advisors, 2020 to present; Independent Director, Trust Company of Illinois, 2019 to 2021; President and Chief Executive Officer, Driehaus Capital Management, 2006 to 2017. | | 9 | | VAM Funds Luxembourg, Anchor Capital Advisors, Trust Company of Illinois |
D’Ray Moore Year of Birth: 1959 | | Trustee | | Indefinite/July 2011 to present | | Independent Trustee, Diamond Hill Funds, 2007 to 2022; Chairperson, Diamond Hill Funds, 2014 to 2022. | | 9 | | Diamond Hill Funds (retired 2022) |
Steven R. Sutermeister Year of Birth: 1954 | | Trustee | | Indefinite/July 2011 to present | | President, Vadar Capital LLC, 2008 to 2017. | | 9 | | None |
1 The mailing address of each Trustee is 50 S. LaSalle Street, Chicago, IL 60603.
The following table provides information regarding each officer of the Trust.
| | | | | | | | | | |
Name, Address and Year of Birth1 | | Position(s) Held with the Trust | | Term of Office/ Length of Time Served | | Principal Occupation(s) During Past 5 Years | | Number of
Portfolios in the
Trust Overseen by Trustee | | Other Directorships
Held by Trustee
During Past 5 Years |
Barbara J. Nelligan Year of Birth: 1969 | | President | | Indefinite/August 2017 to present | | Senior Vice President, Global Fund Services Fund Governance Solutions, The Northern Trust Company, 2018 to present; Senior Vice President, Global Fund Services Product Management, The Northern Trust Company, 2007 to 2018. | | N/A | | N/A |
15
ADVISERS INVESTMENT TRUST
NTAM TREASURY ASSETS FUND
ADDITIONAL INFORMATION
September 30, 2023 (Unaudited)
| | | | | | | | | | |
Name, Address and Year of Birth1 | | Position(s) Held with the Trust | | Term of Office/ Length of Time Served | | Principal Occupation(s) During Past 5 Years | | Number of
Portfolios in the
Trust Overseen by Trustee | | Other Directorships
Held by Trustee
During Past 5 Years |
Rodney L. Ruehle Year of Birth: 1968 | | Chief Compliance Officer and AML Officer | | Indefinite/March 2019 to present | | Senior Principal Consultant, ACA Group, 2022 to present; Director, Foreside Fund Officer Services, LLC (formerly Foreside Compliance Services, LLC) (financial services), 2016 to 2022. | | N/A | | N/A |
Kara M. Schneider Year of Birth: 1973 | | Secretary | | Indefinite/March 2023 to present | | Second Vice President, Global Fund Services Fund Governance Solutions, The Northern Trust Company, 2021 to present; Manager, Ultimus Fund Solutions LLC, 2017 to 2021; Assistant Secretary of Advisers Investment Trust, 2021 to March 2023. | | N/A | | N/A |
Troy A. Sheets Year of Birth: 1971 | | Treasurer | | Indefinite/January 2022 to present | | Senior Principal Consultant, ACA Group, 2022 to present; Senior Director, Foreside Fund Officer Services, LLC, 2016 to 2022; Treasurer of Advisers Investment Trust, 2011 to 2021; Assistant Treasurer of Advisers Investment Trust, May 2021 to December 2021. | | N/A | | N/A |
Tracy L. Dotolo Year of Birth: 1976 | | Assistant Treasurer | | Indefinite/January 2022 to present | | Senior Principal Consultant, ACA Group, 2022 to present; Director, Foreside Fund Officer Services, LLC, 2016 to 2022; Treasurer of Advisers Investment Trust, May 2021 to December 2021. | | N/A | | N/A |
Stefania C. Suciu Year of Birth: 1979 | | Assistant Secretary | | Indefinite/March 2023 to present | | Second Vice President, Global Fund Services Fund Governance Solutions, The Northern Trust Company, 2015 to present. | | N/A | | N/A |
1 The mailing address of Messrs. Ruehle and Sheets and Ms. Dotolo is 3 Canal Plaza, Suite 100, Portland, ME 04101. The mailing address of Mses. Nelligan, Schneider, and Suciu is 333 S. Wabash Avenue, Chicago, IL 60604.
The Fund’s Statement of Additional Information includes additional information about the Trust’s Trustees and Officers. To receive your free copy of the Statement of Additional Information, call toll-free 855-351-4583.
16
NTAM Treasury Assets Fund
(Series of the Advisers Investment Trust)
Privacy Policy
SAFEGUARDING PRIVACY
We recognize and respect the privacy expectations of each of our investors and we believe the confidentiality and protection of investor information is one of our fundamental responsibilities. New technologies have dramatically changed the way information is gathered and used, but our continuing commitment to preserving the security and confidentiality of investor information has remained a core value of the Advisers Investment Trust.
INFORMATION WE COLLECT AND SOURCES OF INFORMATION
We may collect information about our customers to help identify you, evaluate your application, service and manage your account and offer services and products you may find valuable. We collect this information from a variety of sources including:
| ● | | Information we receive from you on applications or other forms (e.g. your name, address, date of birth, social security number and investment information); |
| ● | | Information about your transactions and experiences with us and our affiliates (e.g. your account balance, transaction history and investment selections); and |
| ● | | Information we obtain from third parties regarding their brokerage, investment advisory, custodial or other relationship with you (e.g. your account number, account balance and transaction history. |
INFORMATION WE SHARE WITH SERVICE PROVIDERS
We may disclose all non-public personal information we collect, as described above, to companies (including affiliates) that perform services on our behalf, including those that assist us in responding to inquiries, processing transactions, preparing and mailing account statements and other forms of shareholder services provided they use the information solely for these purposes and they enter into a confidentiality agreements regarding the information.
INFORMATION WE MAY SHARE WITH AFFILIATES
If we have affiliates which are financial service providers that offer investment advisory, brokerage and other financial services, we may (subject to Board approval) share information among our affiliates to better assist you in achieving your financial goals.
SAFEGUARDING CUSTOMER INFORMATION
We will safeguard, according to federal standards of security and confidentiality, any non-public personal information our customers share with us.
We will limit the collection and use of non-public customer information to the minimum necessary to deliver superior service to our customers which includes advising our customers about our products and services and to administer our business.
We will permit only authorized employees who are trained in the proper handling of non-public customer information to have access to that information.
We will not reveal non-public customer information to any external organization unless we have previously informed the customer in disclosures or agreements, have been authorized by the customer or are required by law or our regulators.
We value you as a customer and take your personal privacy seriously. We will inform you of our policies for collecting, using, securing and sharing nonpublic personal information the first time we do business and every year that you are a customer of the Advisers Investment Trust or anytime we make a material change to our privacy policy.
Investment Adviser
Northern Trust Investments, Inc.
50 South LaSalle Street
Chicago, Illinois 60603
Custodian
The Northern Trust Company
50 South LaSalle Street
Chicago, Illinois 60603
Independent Registered
Public Accounting Firm
Deloitte & Touche LLP
111 S. Wacker Drive
Chicago, Illinois 60606
Legal Counsel
Thompson Hine LLP
41 South High Street, Suite 1700
Columbus, Ohio 43215-6101
Placement Agent
Foreside Financial Services, LLC
3 Canal Plaza, Suite 100
Portland, Maine 04101
For Additional Information, call
855-351-4583 (toll free)
NT 09/23

RIVER CANYON TOTAL RETURN
BOND FUND
ANNUAL REPORT
September 30, 2023
This report is submitted for the general information of the shareholders of River Canyon Total Return Bond Fund (the “Fund”). It is not authorized for the distribution to prospective investors unless preceded or accompanied by an effective prospectus.
ADVISERS INVESTMENT TRUST
RIVER CANYON TOTAL RETURN BOND FUND
TABLE OF CONTENTS
September 30, 2023
ADVISERS INVESTMENT TRUST
RIVER CANYON TOTAL RETURN BOND FUND
SHAREHOLDER LETTER
September 30, 2023
Dear Shareholder:
We are pleased to present to shareholders the September 30, 2023 Annual Report for the River Canyon Total Return Bond Fund (the “Fund”), a series of the Advisers Investment Trust. This report contains the results of Fund operations for the year ended September 30, 2023.
We appreciate the trust and confidence you have placed in us by choosing the Fund and its Investment Adviser, River Canyon Fund Management LLC, and we look forward to continuing to serve your investing needs.
Sincerely,

Barbara J. Nelligan
President
Advisers Investment Trust
1
ADVISERS INVESTMENT TRUST
RIVER CANYON TOTAL RETURN BOND FUND
PORTFOLIO COMMENTARY
September 30, 2023 (Unaudited)
River Canyon Total Return Bond Fund
Value of a hypothetical $100,000 investment in the Fund’s Institutional Shares from inception on December 30, 2014 to September 30, 2023
Average Annual Total Returns as of September 30, 2023
| | | | | | | | | | |
| | | 1-Year Return | | 5-Year Return | | Since Inception Return | | Gross Expense Ratio * | | Net Expense Ratio * |
| River Canyon Total Return Bond Fund – Institutional Shares | | 6.70% | | 4.36% | | 4.88% | | 0.83% | | 0.66% |
| Bloomberg U.S. Aggregate Bond Index | | 0.64% | | 0.10% | | 0.64% | | - | | - |
*The Institutional Shares Gross and Net Annual Operating Expense Ratio are 0.83% and 0.66%, respectively, as per the most recent Prospectus. The Adviser has entered into a contractual expense limitation agreement with respect to the Fund to limit expenses to 0.65% until January 28, 2024, which is exclusive of the Acquired Fund Fees and Expenses reflected in the Prospectus.
Data as of September 30, 2023. The Inception date of the Fund is December 30, 2014. The Fund’s performance reflects the reinvestment of dividends as well as the impact of any transaction costs and the deduction of fees and expenses. The performance does not reflect taxes that a shareholder would pay on Fund distributions or on the redemption of Fund shares.
The performance data quoted represents past performance; past performance does not guarantee future results. The investment return and principal value of an investment will fluctuate so that an investor’s shares, when redeemed, may be worth more or less than their original cost. The Fund’s current performance may be lower or higher than the performance data quoted. Investors may obtain performance information current to the most recent month-end, within 7 business days, by calling 800-245-0371 or 312-557-0164.
The Fund’s benchmark for performance comparison purposes is the Bloomberg U.S. Aggregate Bond Index. The index is an unmanaged index that measures the investment grade, US dollar-denominated, fixed-rate taxable bond market. The index includes Treasuries, government-related and corporate securities, MBS (agency fixed-rate and hybrid ARM pass-throughs), ABS and CMBS (agency and non-agency). The table reflects the theoretical reinvestment of dividends on securities in the index. The impact of any transaction costs and the deduction of expenses associated with a mutual fund, such as investment management and administration fees, are not reflected in the index calculations. It is not possible to invest directly in an index.
2
ADVISERS INVESTMENT TRUST
RIVER CANYON TOTAL RETURN BOND FUND
PORTFOLIO COMMENTARY
September 30, 2023 (Unaudited)
Market Commentary (for fiscal year ended September 30, 2023)
As the nation’s central bank, the Federal Reserve (the “Fed”) operates under a dual mandate to promote price stability and maximum sustainable employment. This is a balancing act because an economy without inflation is typically stagnant with a weak employment climate, while a booming economy with plenty of jobs is susceptible to high inflation. The Federal Open Market Committee (FOMC), responsible for setting monetary policy in line with the Fed’s mandate, has established a 2% annual inflation target based on the personal consumption expenditures (PCE) price index. This dual mandate drove the sharp reversal in Fed policy in June 2022, setting the tone for the Fund’s fiscal year. The Fund’s fiscal year started with the FOMC in the midst of its fastest and greatest tightening cycle in the last 30 years, as the Fed Funds rate would increase over 525 basis points between the middle of 2022 and the end of the Fund’s fiscal year in September 2023. In addition to increasing rates, the Fed continued its Quantitative Tightening by reducing its balance sheet of Treasury and Agency MBS holdings, further tightening financial conditions. Mortgage Rates climbed to over 7%, significantly impacting home affordability and the supply of existing homes for sale, as homeowners who locked in low mortgage rates over the past few years opted not to move or sell. The rapid rate shift and Quantitative Tightening produced what many have called “pretty much the worst bond market ever,” as many fixed-income asset classes produced negative returns. For most of the year, the yield curve remained significantly inverted, with 2-year Treasury rates substantially higher than 10-year Treasury rates, reaching its most significant differential in July 2022 at -108bps, but by the end of the year, the curve was notably less inverted at -48bps, on the back of the investor’s recognition that Treasury rates were likely to stay higher for longer.
Adding to the volatility during the year were the contagion worries for the regional banking system after the collapse of Silicon Valley Bank in March 2023, one of the largest bank failures in US history and the largest since the Global Financial Crisis of 2007-2008. Regulators stepped in to backstop depositors and were able to limit the damage to a handful of other regional banks, but the fear of deposit flight forced many regional banks to pull back on lending as the year progressed. Although many prognosticators were forecasting a recession throughout the year, it never came to pass, as unemployment stayed low, consumer spending remained strong, and the economy grew at a reasonable rate. The stock market indices performed well, led by the seven largest technology stocks (Microsoft, Amazon, Meta, Apple, Alphabet, Nvidia, and Tesla) that became known as the “The Magnificent Seven,” but under the surface, most stocks produced negative returns.
Toward the end of the fiscal year, the PCE index was steadily trending lower, but still at an elevated level near 3.5%, stubbornly above the Fed’s 2% target, nonetheless, the Fed began signaling that they were close to the end of the rate tightening cycle, but gave no indication that they would be reversing course any time soon. We would be remiss if we didn’t comment on the US Fiscal situation as total US Federal Debt is on pace to be $33T by the end of 2023, up from $23T at the end of 2019 and $9T at the end of 2007. Expressed as a percentage of GDP held by the public, projections are that Federal Debt will be over 100% by the end of 2023, up from 79% at the end of 2019 and 35% at the end of 2007. The current US Federal Budget Deficit at -8% is the highest in history outside of war or recession. According to the Office of Management & Budget, the fiscal deficit is expected to be $1.6T this year, rising to $1.8T next year, and if Quantitative Tightening stays in place, that will add $720B in issuance.
Fund Insights
The Fund navigated the volatility during the fiscal year, outperforming its benchmark and producing positive mid-single digit positive returns. The portfolio management team was able to strategically and tactically reposition the portfolio during the year, particularly increasing the funds allocation to the corporate credit sector. The Fund’s sector allocation to structured credit and corporate credit, focus on floating rate coupons and shorter duration securities, positioned it well for the volatile fixed income market and were the primary drivers of its top decile performance in the Morningstar Multi-Sector bond category based on Total Return. The Fund enjoyed strong inflows in a fixed-income mutual fund market where many funds saw significant outflows.
3
ADVISERS INVESTMENT TRUST
RIVER CANYON TOTAL RETURN BOND FUND
PORTFOLIO COMMENTARY
September 30, 2023 (Unaudited)
Looking Forward
The Fund’s portfolio management team of Sam Reid, Todd Lemkin, and Adam Rizkalla continue to manage the portfolio, focusing on delivering strong relative and absolute returns across a turbulent interest rate and economic environment. They effectively managed the Fund’s credit and duration risks throughout the year. We believe the Fund is well-positioned to earn a defensive real return going forward. At the same time, fund inflows and our current cash position should allow us to capitalize on dislocations, providing good entry points to capture long-term returns. The Fund’s fiscal year performance supports momentum in the Fund’s growth as fixed-income investors reassess traditional bond allocations, which have delivered near-record negative returns for the past three fiscal years. Our research process, security level analysis, size, and experience in the corporate and structured product markets position us favorably in managing the Fund’s prospects.
The River Canyon Total Return Bond Fund is offered only by prospectus. The prospectus contains important information, including investment objectives, risks, advisory fees and expenses. Please read the Prospectus carefully before investing or sending money. For a current Prospectus please call 800-245-0371.
Distributed by Foreside Financial Services, LLC.
Disclaimer
Any investment in the Fund involves significant risk, including the risk of loss of all or a portion of your investment. The results indicated herein include both realized and unrealized gains and losses, and actual results when realized may differ materially from those set forth herein. Total returns include reinvestment of dividends and distributions. Current performance may be lower or higher than the performance data presented. Investment returns and principal value will fluctuate with market conditions. The value of an investment in the Fund, when redeemed, may be worth more or less than its original purchase cost. You should consider the investment objectives, risks, charges and expenses of a mutual fund carefully before investing.
Certain information contained herein constitutes “forward-looking statements”, which can be identified by the use of forward-looking terminology such as “may,” “will,” “should,” “expect,” “anticipate,” “target,” “project,” “estimate,” “intend,” “continue” or “believe” or the negatives thereof or other variations thereon or comparable terminology. Due to various risks and uncertainties, actual events or results or the actual performance of an individual investment, an asset class or the Fund may differ materially from those reflected or contemplated in such forward-looking statements. Past performance is not indicative of future results.
Certain Investment Risks
It is important to note that the Fund is not guaranteed by the U.S. Government. Fixed income investments involve interest rate risk, issuer credit risk and risk of default, prepayment risk, duration, risk and price volatility risk. Funds investing in bonds can lose their value as interest rates rise, and investors participating in such Funds can suffer a partial or total loss of their principal.
Mortgage-backed and other asset-backed securities involve risks that are different from or more acute than risks associated with other types of debt instruments. For example, rising interest rates tend to extend the duration of fixed-rate MBS, making them more sensitive to changes in interest rates and causing funds investing in such securities (such as the Fund) to exhibit additional volatility. Conversely, declining interest rates may cause borrowers to pay off their mortgages sooner than expected, thereby reducing returns because the Fund may be required to reinvest the return of borrower principal at the lower prevailing interest rate. MBS related to floating rate loans may exhibit greater price volatility than a fixed rate obligation of similar credit quality. With respect to non-agency MBS, there are no direct or indirect government or agency guarantees of payments in pools created by non-governmental issuers. Non-agency MBS also are not subject to the same underwriting requirements for the underlying mortgages that are applicable to those mortgage-related securities that have a government or government-sponsored entity guarantee.
For a more complete list of Fund risks, please see the Prospectus.
4
ADVISERS INVESTMENT TRUST
RIVER CANYON TOTAL RETURN BOND FUND
PORTFOLIO COMMENTARY
September 30, 2023 (Unaudited)
Duration: A measurement of the portfolio’s bonds’ sensitivity to interest rate changes. “Duration” represents Effective Duration for the Fund and Modified Adjusted Duration for the Index.
MBS: Mortgage-Backed Securities
CMBS: Commercial Mortgage-Backed Securities
RMBS: Residential Mortgage-Backed Securities
ABS: Asset Backed Securities
CLO: Collateralized Loan Obligation
Bps: Basis Points (bps) are a unit of measure used in finance to describe the percentage change in the value of a financial instrument. One basis point is equivalent to 0.01% (1/100th of a percent).
Quantitative tightening refers to monetary policies that contract, or reduce, the Federal Reserve System (Fed) balance sheet. This process is also known as balance sheet normalization.
5
ADVISERS INVESTMENT TRUST
RIVER CANYON TOTAL RETURN BOND FUND
SCHEDULE OF INVESTMENTS
September 30, 2023
| | | | | | | | | | | | |
| | | Percentage
of Net
Assets | | | Principal Amount | | | Value | |
| |
ASSET-BACKED SECURITIES | | | 34.4% | | | | | | | | | |
ACC Auto Trust Series 2022-A(a)
4.58%, 07/15/26 | | | | | | $ | 3,300,126 | | | $ | 3,262,532 | |
ACM Auto Trust Series 2023-1A(a)
8.59%, 01/22/30 | | | | | | | 3,000,000 | | | | 2,998,557 | |
Business Jet Securities LLC Series 2021-1A(a)
5.07%, 04/15/36 | | | | | | | 1,355,011 | | | | 1,261,250 | |
Clsec Holdings 22t LLC Series 2021-1(a)
6.17%, 05/11/37 | | | | | | | 13,931,725 | | | | 10,872,050 | |
CP EF Asset Securitization I LLC Series 2022-1A(a)
5.96%, 04/15/30 | | | | | | | 2,588,974 | | | | 2,549,074 | |
FAT Brands Fazoli’s Native I LLC Series 2021-1(a)
7.00%, 07/25/51 | | | | | | | 15,900,000 | | | | 13,851,301 | |
FAT Brands GFG Royalty I LLC Series 2021-1A(a)
6.00%, 07/25/51 | | | | | | | 15,700,000 | | | | 13,768,304 | |
Foundation Finance Trust Series 2023-2A(a)
9.10%, 06/15/49 | | | | | | | 2,944,000 | | | | 2,943,377 | |
Goldman Home Improvement Issuer Trust Series 2022-GRN1(a)(b)(c)
0.00%, 06/25/52 | | | | | | | 50,000 | | | | 6,470,755 | |
HOA Funding LLC Series 2021-1A(a)
4.72%, 08/20/51 | | | | | | | 3,920,000 | | | | 3,210,127 | |
Horizon Aircraft Finance I Ltd. Series 2018-1(a)
4.46%, 12/15/38 | | | | | | | 4,387,428 | | | | 3,756,902 | |
ICG U.S. CLO Ltd. Series 2020-1A(a)(d)
9.19%, 01/20/35 | | | | | | | 3,000,000 | | | | 2,806,556 | |
L.P. LMS Asset Securitization Trust Series 2023-1A(a)
7.48%, 10/17/33 | | | | | | | 3,000,000 | | | | 2,830,074 | |
Lendingpoint Asset Securitization Trust Series 2022-C(a)
13.09%, 02/15/30 | | | | | | | 6,400,000 | | | | 5,257,740 | |
Lendmark Funding Trust Series 2021-2A(a)
3.09%, 04/20/32 | | | | | | | 3,160,000 | | | | 2,573,217 | |
MAPS Ltd. Series 2019-1A(a)
4.46%, 03/15/44 | | | | | | | 924,435 | | | | 816,304 | |
Mariner Finance Issuance Trust Series 2021-BA(a)
3.42%, 11/20/36 | | | | | | | 1,980,000 | | | | 1,630,366 | |
Marlette Funding Trust Series 2023-3A(a)
8.04%, 09/15/33 | | | | | | | 3,000,000 | | | | 3,005,417 | |
Mercury Financial Credit Card Master Trust Series 2022-3A(a)
13.44%, 06/21/27 | | | | | | | 3,550,000 | | | | 3,567,889 | |
Mission Lane Credit Card Master Trust Series 2022-A(a)
6.92%, 09/15/27 | | | | | | | 3,000,000 | | | | 2,968,504 | |
Mission Lane Credit Card Master Trust Series 2023-A(a)
10.03%, 07/17/28 | | | | | | | 3,500,000 | | | | 3,500,277 | |
NRZ Excess Spread-Collateralized Notes Series 2021-GTN1(a)
3.47%, 11/25/26 | | | | | | | 9,724,481 | | | | 8,758,266 | |
Oasis Securitization Funding LLC Series 2021-2A(a)
2.14%, 10/15/33 | | | | | | | 2,428,288 | | | | 2,419,880 | |
OnDeck Asset Securitization Trust IV LLC Series 2023-1A(a)
9.93%, 08/19/30 | | | | | | | 6,000,000 | | | | 5,902,135 | |
See Notes to Financial Statements.
6
ADVISERS INVESTMENT TRUST
RIVER CANYON TOTAL RETURN BOND FUND
SCHEDULE OF INVESTMENTS
September 30, 2023
| | | | | | | | | | | | |
| | | Percentage
of Net
Assets | | | Principal Amount | | | Value | |
| |
Oportun Issuance Trust Series 2021-B(a)
5.41%, 05/08/31 | | | | | | $ | 4,910,000 | | | $ | 4,442,206 | |
Oportun Issuance Trust Series 2021-C(a)
3.61%, 10/08/31 | | | | | | | 2,659,000 | | | | 2,365,908 | |
PAGAYA AI Debt Trust Series 2022-2(a)
4.97%, 01/15/30 | | | | | | | 4,234,414 | | | | 4,192,565 | |
PAGAYA AI Debt Trust Series 2023-6(a)
9.00%, 06/16/31 | | | | | | | 2,750,000 | | | | 2,541,464 | |
PMT Issuer Trust - FMSR Series 2022-FT1
(Floating, U.S. 30-Day Average SOFR + 4.19%, 4.19% Floor)(a)(e)
9.50%, 06/25/27 | | | | | | | 8,000,000 | | | | 7,995,675 | |
PNMAC GMSR ISSUER TRUST Series 2022-GT1
(Floating, U.S. 30-Day Average SOFR + 4.25%)(a)(e)
9.56%, 05/25/27 | | | | | | | 12,000,000 | | | | 12,007,675 | |
Project Silver Series 2019-1(a)
3.97%, 07/15/44 | | | | | | | 3,059,001 | | | | 2,593,360 | |
SAFCO Auto Receivables Trust Series 2022-1A(a)
8.62%, 11/19/29 | | | | | | | 3,000,000 | | | | 2,977,859 | |
Santander Bank Auto Credit-Linked Notes Series 2022-A(a)
9.97%, 05/15/32 | | | | | | | 2,250,000 | | | | 2,249,027 | |
Santander Bank Auto Credit-Linked Notes Series 2022-A(a)
12.66%, 05/15/32 | | | | | | | 8,250,000 | | | | 8,214,401 | |
Santander Bank Auto Credit-Linked Notes Series 2023-A(a)
7.08%, 06/15/33 | | | | | | | 2,171,939 | | | | 2,166,404 | |
Service Experts Issuer LLC Series 2021-1A(a)
5.37%, 02/02/32 | | | | | | | 3,000,000 | | | | 2,244,341 | |
Skyline Aircraft Series 2006-S3(c)
6.17%, 08/17/33 | | | | | | | 4,508,040 | | | | 3,880,670 | |
Sound Point CLO XXX Ltd. Series 2021-2A(a)(d)
8.96%, 07/25/34 | | | | | | | 4,000,000 | | | | 3,738,583 | |
Sound Point CLO XXXI Ltd. Series 2021-3A(a)(d)
8.86%, 10/25/34 | | | | | | | 2,750,000 | | | | 2,568,699 | |
U.S. Auto Funding Trust Series 2022-1A(a)
3.98%, 04/15/25 | | | | | | | 2,092,741 | | | | 2,040,001 | |
U.S. Auto Funding Trust Series 2022-1A(a)(c)
11.79%, 06/15/29 | | | | | | | 5,000,000 | | | | 2,500,000 | |
Upstart Securitization Trust Series 2022-2(a)
4.37%, 05/20/32 | | | | | | | 2,838,527 | | | | 2,818,043 | |
Upstart Securitization Trust Series 2022-3(a)(b)(c)
0.00%, 06/20/32 | | | | | | | 5,575 | | | | 806,817 | |
| | | | | | | | | | | | |
TOTAL ASSET-BACKED SECURITIES
(Cost $193,850,800) | | | | | | | | | | | 183,324,552 | |
| | | | | | | | | | | | |
BANK DEBTS | | | 12.3% | | | | | | | | | |
CT Technologies Intermediate Holdings, Inc.
9.57%, 12/16/25 | | | | | | | 19,548,827 | | | | 18,655,250 | |
Imperva, Inc.
9.39%, 01/12/25 | | | | | | | 20,000,000 | | | | 20,017,800 | |
Intelsat Jackson Holdings S.A.
9.78%, 12/08/28 | | | | | | | 4,220,723 | | | | 4,207,302 | |
See Notes to Financial Statements.
7
ADVISERS INVESTMENT TRUST
RIVER CANYON TOTAL RETURN BOND FUND
SCHEDULE OF INVESTMENTS
September 30, 2023
| | | | | | | | | | | | |
| | | Percentage
of Net
Assets | | | Principal Amount | | | Value | |
| |
PREIT Associates L.P.
11.16%, 12/10/23 | | | | | | $ | 2,397,380 | | | $ | 2,319,465 | |
Staples, Inc.
10.07%, 09/12/24 | | | | | | | 2,393,531 | | | | 2,374,574 | |
Verscend Holding Corp.
9.32%, 08/27/25 | | | | | | | 17,870,520 | | | | 17,851,398 | |
| | | | | | | | | | | | |
TOTAL BANK DEBTS
(Cost $65,531,329) | | | | | | | | | | | 65,425,789 | |
| | | | | | | | | | | | |
CORPORATE BONDS | | | 22.4% | | | | | | | | | |
Ahead DB Holdings LLC(a)
6.63%, 05/01/28 | | | | | | | 1,000,000 | | | | 844,679 | |
Ardagh Metal Packaging Finance U.S.A. LLC(a)
4.00%, 09/01/29 | | | | | | | 2,000,000 | | | | 1,565,142 | |
Arrow Bidco LLC(a)
9.50%, 03/15/24 | | | | | | | 2,070,000 | | | | 2,070,000 | |
Azul Secured Finance LLP(a)
11.93%, 08/28/28 | | | | | | | 9,000,000 | | | | 8,913,494 | |
Centene Corp.
4.25%, 12/15/27 | | | | | | | 5,000,000 | | | | 4,609,550 | |
Charter Communications Operating LLC
4.91%, 07/23/25 | | | | | | | 5,000,000 | | | | 4,885,762 | |
CSC Holdings LLC(a)
7.50%, 04/01/28 | | | | | | | 5,000,000 | | | | 3,246,475 | |
HCA, Inc.
5.00%, 03/15/24 | | | | | | | 10,325,000 | | | | 10,271,660 | |
LABL, Inc.(a)
10.50%, 07/15/27 | | | | | | | 22,629,000 | | | | 21,268,609 | |
Mauser Packaging Solutions Holding Co.(a)
9.25%, 04/15/27 | | | | | | | 3,000,000 | | | | 2,622,255 | |
Mauser Packaging Solutions Holding Co.(a)
7.88%, 08/15/26 | | | | | | | 3,000,000 | | | | 2,894,208 | |
MPT Operating Partnership L.P.
2.55%, 12/05/23 | | | | | | | 12,747,000 | | | | 15,148,092 | |
Prime Healthcare Services, Inc.(a)
7.25%, 11/01/25 | | | | | | | 10,000,000 | | | | 9,246,300 | |
Surgery Center Holdings, Inc.(a)
10.00%, 04/15/27 | | | | | | | 7,638,000 | | | | 7,723,927 | |
Viasat, Inc.(a)
7.50%, 05/30/31 | | | | | | | 4,955,000 | | | | 3,272,777 | |
VICI Properties L.P./VICI Note Co., Inc.(a)
4.25%, 12/01/26 | | | | | | | 10,000,000 | | | | 9,317,511 | |
VICI Properties L.P./VICI Note Co., Inc.(a)
3.50%, 02/15/25 | | | | | | | 2,000,000 | | | | 1,913,559 | |
VICI Properties L.P./VICI Note Co., Inc.(a)
4.63%, 06/15/25 | | | | | | | 7,089,000 | | | | 6,845,776 | |
Vistra Operations Co. LLC(a)
3.55%, 07/15/24 | | | | | | | 3,000,000 | | | | 2,925,805 | |
| | | | | | | | | | | | |
TOTAL CORPORATE BONDS
(Cost $123,093,108) | | | | | | | | | | | 119,585,581 | |
| | | | | | | | | | | | |
See Notes to Financial Statements.
8
ADVISERS INVESTMENT TRUST
RIVER CANYON TOTAL RETURN BOND FUND
SCHEDULE OF INVESTMENTS
September 30, 2023
| | | | | | | | | | | | |
| | | Percentage
of Net
Assets | | | Principal Amount | | | Value | |
| |
MORTGAGE-BACKED SECURITIES | | | 18.0% | | | | | | | | | |
PRIVATE | | | 8.6% | | | | | | | | | |
Home Equity | | | 7.8% | | | | | | | | | |
Angel Oak Mortgage Trust Series 2022-3(a)(d)
4.14%, 01/10/67 | | | | | | $ | 6,160,834 | | | $ | 5,415,806 | |
Barclays Mortgage Loan Trust Series 2022-INV1(a)(d)
4.56%, 02/25/62 | | | | | | | 8,472,800 | | | | 5,497,640 | |
CFMT LLC Series 2023-H12(a)
4.25%, 04/25/33 | | | | | | | 5,000,000 | | | | 3,952,815 | |
CWHEQ Home Equity Loan Trust Series 2006-S2(c)
5.64%, 07/25/27 | | | | | | | 272,073 | | | | 204,055 | |
CWHEQ Home Equity Loan Trust Series 2006-S3
(Step to 6.26% on 11/25/23)(f)(g)(h)
5.56%, 06/25/21 | | | | | | | 3 | | | | 545,600 | |
CWHEQ Home Equity Loan Trust Series 2006-S5(g)(h)
5.75%, 06/25/35 | | | | | | | 8 | | | | 1,320,000 | |
Home Equity Mortgage Trust Series 2006-3
(Floating, CME Term SOFR 1M + 0.57%, 0.46% Floor)(c)(e)
5.89%, 09/25/36 | | | | | | | 2,708,000 | | | | 863 | |
Home Equity Mortgage Trust Series 2006-3
(Step to 5.63% on 10/25/23)(c)(f)
6.09%, 09/25/36 | | | | | | | 2,590,482 | | | | 100,511 | |
Home Equity Mortgage Trust Series 2006-4(c)(h)
0.00%, 11/25/36 | | | | | | | 4,391,000 | | | | 128 | |
Home Equity Mortgage Trust Series 2006-4
(Floating, CME Term SOFR 1M + 0.61%, 0.50% Floor)(c)(e)
5.93%, 11/25/36 | | | | | | | 1,354,000 | | | | 501 | |
Home Equity Mortgage Trust Series 2006-4(c)
6.23%, 11/25/36 | | | | | | | 1,614,800 | | | | 76,703 | |
Home Equity Mortgage Trust Series 2006-5
(Floating, CME Term SOFR 1M + 0.51%, 0.40% Floor)(c)(e)(h)
5.83%, 01/25/37 | | | | | | | 259,263 | | | | 12,963 | |
Imperial Fund Mortgage Trust Series 2022-NQM4
(Step to 5.02% on 11/25/23)(a)(f)
5.04%, 06/25/67 | | | | | | | 4,000,000 | | | | 2,922,723 | |
Imperial Fund Mortgage Trust Series 2022-NQM5
(Step to 6.35% on 08/25/26)(a)(f)
6.25%, 08/25/67 | | | | | | | 4,125,000 | | | | 3,856,119 | |
Indymac Residential Mortgage-Backed Trust Series 2005-L3
(Floating, CME Term SOFR 1M + 0.55%, 0.44% Floor)(e)
5.87%, 12/16/35 | | | | | | | 1,085,275 | | | | 781,398 | |
JP Morgan Resecuritization Trust Series 2009-7(a)(d)
7.00%, 09/27/37 | | | | | | | 9,586,710 | | | | 4,125,607 | |
PRPM Trust Series 2022-INV1(a)(d)
4.44%, 04/25/67 | | | | | | | 2,600,000 | | | | 1,851,378 | |
See Notes to Financial Statements.
9
ADVISERS INVESTMENT TRUST
RIVER CANYON TOTAL RETURN BOND FUND
SCHEDULE OF INVESTMENTS
September 30, 2023
| | | | | | | | | | | | |
| | | |
| | | Percentage
of Net
Assets | | | Principal Amount | | | Value | |
| |
Residential Asset Securitization Trust Series 2006-A6
(Floating, 5.79% - CME Term SOFR 1M, 5.90% Floor)(e)(i)
0.47%, 07/25/36 | | | | | | $ | 12,022,249 | | | $ | 655,855 | |
Saluda Grade Alternative Mortgage Trust Series 2023-SEQ3(a)(d)
10.25%, 06/01/53 | | | | | | | 10,502,250 | | | | 10,442,384 | |
| | | | | | | | | | | | |
Total Home Equity
(Cost $48,507,900) | | | | | | | | | | | 41,763,049 | |
| | | | | | | | | | | | |
Commercial Mortgage-Backed Securities | | | 0.8% | | | | | | | | | |
CSMC Trust Series 2022-NQM4
(Step to 5.29% on 7/25/26)(a)(f)
4.82%, 06/25/67 | | | | | | | 4,511,328 | | | | 4,279,962 | |
| | | | | | | | | | | | |
Total Commercial Mortgage-Backed Securities
(Cost $4,335,131) | | | | | | | | | | | 4,279,962 | |
| | | | | | | | | | | | |
SOVEREIGN AGENCIES | | | 1.5% | | | | | | | | | |
U.S. Government Agencies | | | 1.5% | | | | | | | | | |
Government National Mortgage Association Series 2022-190
(Floating, 5.99% - CME Term SOFR 1M, 6.10% Floor)(e)(h)(i)
0.66%, 08/20/49 | | | | | | | 34,415,975 | | | | 2,660,624 | |
Government National Mortgage Association Series 2023-135
(Floating, 28.17% - U.S. 30-Day Average SOFR, 28.17% Cap)(e)
5.47%, 09/20/53 | | | | | | | 5,000,000 | | | | 5,081,250 | |
| | | | | | | | | | | | |
Total U.S. Government Agencies
(Cost $8,138,691) | | | | | | | | | | | 7,741,874 | |
| | | | | | | | | | | | |
U.S. GOVERNMENT AGENCIES | | | 7.9% | | | | | | | | | |
Fannie Mae REMICS Series 2013-67
(Floating, 5.99% - U.S. 30-Day Average SOFR, 6.10% Cap)(e)(i)
0.67%, 07/25/43 | | | | | | | 8,859,123 | | | | 747,228 | |
Fannie Mae REMICS Series 2020-27
(Floating, 5.84% - U.S. 30-Day Average SOFR, 5.95% Cap)(e)(h)(i)
0.52%, 05/25/50 | | | | | | | 18,605,279 | | | | 1,487,611 | |
Fannie Mae REMICS Series 2022-19
(Floating, 5.60% - U.S. 30-Day Average SOFR, 5.60% Cap)(e)(h)(i)
0.29%, 04/25/52 | | | | | | | 34,451,536 | | | | 2,639,032 | |
FREMF Mortgage Trust Series 2019-KF59
(Floating, U.S. 30-Day Average SOFR + 6.11%, 6.00% Floor)(a)(e)
11.43%, 02/25/29 | | | | | | | 19,291,012 | | | | 19,117,105 | |
Government National Mortgage Association Series 2021-160
(Floating, 6.19% - CME Term SOFR 1M, 6.30% Floor)(e)(h)(i)
0.86%, 09/20/51 | | | | | | | 14,374,704 | | | | 1,575,353 | |
Government National Mortgage Association Series 2021-205
(Floating, 3.20% - U.S. 30-Day Average SOFR, 3.20% Cap)(e)(h)(i)
0.00%, 11/20/51 | | | | | | | 171,885,013 | | | | 1,294,466 | |
Government National Mortgage Association Series 2021-70(d)(h)(i)
0.71%, 04/16/63 | | | | | | | 283,007,016 | | | | 15,382,705 | |
| | | | | | | | | | | | |
TOTAL U.S. GOVERNMENT AGENCIES
(Cost $60,635,385) | | | | | | | | | | | 42,243,500 | |
| | | | | | | | | | | | |
TOTAL MORTGAGE-BACKED SECURITIES
(Cost $121,617,107) | | | | | | | | | | | 96,028,385 | |
| | | | | | | | | | | | |
See Notes to Financial Statements.
10
ADVISERS INVESTMENT TRUST
RIVER CANYON TOTAL RETURN BOND FUND
SCHEDULE OF INVESTMENTS
September 30, 2023
| | | | | | | | | | | | |
| | | |
| | | Percentage
of Net
Assets | | | Principal Amount | | | Value | |
| |
U.S. GOVERNMENT OBLIGATIONS | | | 0.9% | | | | | | | | | |
U.S. Treasury Note
4.00%, 08/15/33 | | | | | | | 5,000,000 | | | | 4,724,219 | |
| | | | | | | | | | | | |
TOTAL U.S. GOVERNMENT OBLIGATIONS
(Cost $4,861,907) | | | | | | | | | | | 4,724,219 | |
| | | | | | | | | | | | |
MUNICIPAL BONDS | | | 4.5% | | | | | | | | | |
GDB Debt Recovery Authority of Commonwealth Puerto Rico Taxable Revenue Bond
7.50%, 08/20/40 | | | | | | $ | 23,539,083 | | | $ | 19,007,809 | |
Puerto Rico Commonwealth Notes, Subseries CW(j)
0.00%, 11/01/43 | | | | | | | 9,482,569 | | | | 4,919,083 | |
| | | | | | | | | | | | |
TOTAL MUNICIPAL BONDS
(Cost $26,177,709) | | | | | | | | | | | 23,926,892 | |
| | | | | | | | | | | | |
| | | |
| | | Percentage
of Net
Assets | | | Shares | | | Value | |
| |
SHORT-TERM INVESTMENTS | | | 6.4% | | | | | | | | | |
Northern Institutional Treasury Portfolio (Premier Class), 5.20%(k) | | | | | | | 34,001,974 | | | | 34,001,974 | |
| | | | | | | | | | | | |
TOTAL SHORT-TERM INVESTMENTS
(Cost $34,001,974) | | | | | | | | | | | 34,001,974 | |
| | | | | | | | | | | | |
TOTAL INVESTMENTS
(Cost $569,133,934) | | | 98.9% | | | | | | | | 527,017,392 | |
| | | | | | | | | | | | |
NET OTHER ASSETS (LIABILITIES) | | | 1.1% | | | | | | | | 6,037,124 | |
| | | | | | | | | | | | |
NET ASSETS | | | 100.0% | | | | | | | $ | 533,054,516 | |
| | | | | | | | | | | | |
(a)Securities purchased in a transaction exempt from registration under Rule 144A of the Securities Act of 1933. These securities may not be publicly traded without registration under the Securities Act of 1933. The value of these securities is determined by valuations supplied by a pricing service or brokers.
(b)Equity tranche security.
(c)Security valued pursuant to Level 3 unobservable inputs.
(d)Variable or floating rate security, the interest rate of which adjusts periodically based on changes in current interest rates and prepayments on the underlying pool of assets.
(e)Floating rate security. The rate presented is the rate in effect at September 30, 2023, and the related index and spread are shown parenthetically for each security.
(f)Step coupon bond. Rate as of September 30, 2023 is disclosed.
(g)FGIC insured bond in which the current value primarily relates to pending insurance payments.
(h)Non-income producing security.
(i)Interest only security.
(j)These securities are remarketed by an agent, and the interest rate is determined by general market conditions and supply and demand.
(k)7-day current yield as of September 30, 2023 is disclosed.
Abbreviations:
CLO – Collateralized Loan Obligation
USD – United States Dollar
GBP – British Pound
See Notes to Financial Statements.
11
ADVISERS INVESTMENT TRUST
RIVER CANYON TOTAL RETURN BOND FUND
SCHEDULE OF INVESTMENTS
September 30, 2023
Forward foreign currency exchange contracts at September 30, 2023:
| | | | | | | | | | | | | | | | | | | | |
| Counterparty | | Settlement
Date | | | Currency
Purchased | | Currency
Purchased
Amount | | | Currency
Sold | | Currency
Sold
Amount | | | Unrealized
Appreciation
(Depreciation) | |
| |
Goldman Sachs International | | | 12/05/2023 | | | USD | | | 15,156,342 | | | GBP | | | 12,428,325 | | | $ | (13,767 | ) |
| | | | | | | | | | | | | | | | | | | | |
Swap Agreements outstanding at September 30, 2023:
| | | | | | | | | | | | | | | | | | | | |
Counterparty | | Fund Pays | | Fund
Receives | | Maturity
Date | | Currency | | Notional
Amount | | | Market Value | | | Unrealized
Appreciation
(Depreciation) | |
Goldman Sachs International | | SPDR S&P 500 ETF
return | | 1-Day
SOFR-0.25% | | 08/12/2024 | | USD | | | 15,002,914 | | | $ | 629,652 | | | $ | 629,652 | |
| | | | | | | | | | | | | | | | | | | | |
See Notes to Financial Statements.
12
ADVISERS INVESTMENT TRUST
STATEMENT OF ASSETS & LIABILITIES
September 30, 2023
| | | | |
| | | River Canyon
Total Return
Bond Fund | |
| |
Assets: | | | | |
Investments, at value (Cost:$569,133,934) | | $ | 527,017,392 | |
Foreign currencies (Cost:$172) | | | 169 | |
Cash collateral for derivatives | | | 1,870,914 | |
Receivable for interest | | | 4,390,603 | |
Receivable for dividends | | | 225,960 | |
Receivable for investments sold | | | 7,059,905 | |
Receivables for capital shares sold | | | 1,175,353 | |
Unrealized appreciation on total return swaps | | | 629,652 | |
Prepaid expenses | | | 31,202 | |
| | | | |
Total Assets | | | 542,401,150 | |
| | | | |
Liabilities: | | | | |
Cash Overdraft | | | 1,034,230 | |
Unrealized depreciation on forward foreign currency exchange contracts | | | 13,767 | |
Securities purchased payable | | | 6,424,008 | |
Capital shares redeemed payable | | | 1,150,555 | |
Investment advisory fees payable | | | 209,917 | |
Accounting and Administration fees payable | | | 371,626 | |
Regulatory and Compliance fees payable | | | 63,556 | |
Trustee fees payable | | | 596 | |
Accrued expenses and other payables | | | 78,379 | |
| | | | |
Total Liabilities | | | 9,346,634 | |
| | | | |
Net Assets | | $ | 533,054,516 | |
| | | | |
| |
Institutional Shares: | | | | |
Net assets | | $ | 533,054,516 | |
Shares of common stock outstanding | | | 53,938,587 | |
| | | | |
Net asset value per share | | $ | 9.88 | |
| | | | |
Net Assets: | | | | |
Paid in capital | | $ | 618,732,656 | |
Distributable earnings (loss) | | | (85,678,140 | ) |
| | | | |
Net Assets | | $ | 533,054,516 | |
| | | | |
| |
See Notes to Financial Statements.
13
ADVISERS INVESTMENT TRUST
STATEMENT OF OPERATIONS
For the year ended September 30, 2023
| | | | |
| | | River Canyon Total Return Bond Fund | |
| |
Investment Income: | | | | |
Dividend income | | $ | 1,851,125 | |
Interest income | | | 37,176,647 | |
| | | | |
Total investment income | | | 39,027,772 | |
| | | | |
Operating expenses: | | | | |
Investment advisory | | | 2,930,744 | |
Accounting and Administration | | | 444,135 | |
Regulatory and Compliance | | | 224,629 | |
Trustees | | | 70,970 | |
Legal | | | 50,544 | |
Interest expense | | | 77,884 | |
Other | | | 182,958 | |
| | | | |
Total expenses before reductions | | | 3,981,864 | |
Expenses reduced by Adviser | | | (973,234 | ) |
| | | | |
Net expenses | | | 3,008,630 | |
| | | | |
Net investment income | | | 36,019,142 | |
| | | | |
Realized and Unrealized Gains (Losses) from Investment Activities: | | | | |
Net realized gain (loss) from: | | | | |
Investments | | | (29,277 | ) |
Forward foreign currency exchange contracts | | | 219,874 | |
Foreign currency | | | 79,652 | |
| | | | |
Net realized gain (loss) | | | 270,249 | |
| | | | |
Net change in unrealized appreciation (depreciation) on: | | | | |
Investments | | | (9,070,788 | ) |
Foreign currency translations | | | (8,966 | ) |
Forward foreign currency exchange contracts | | | (13,767 | ) |
Swap agreements | | | 629,652 | |
| | | | |
Net change in unrealized appreciation (depreciation) | | | (8,463,869 | ) |
| | | | |
Net realized and unrealized losses from investment activities | | | (8,193,620 | ) |
| | | | |
Change in Net Assets Resulting from Operations | | $ | 27,825,522 | |
| | | | |
|
| |
See Notes to Financial Statements.
14
ADVISERS INVESTMENT TRUST
STATEMENTS OF CHANGES IN NET ASSETS
For the years ended September 30, 2023 and 2022
| | | | | | | | |
| | | River Canyon Total Return Bond Fund | |
| | | | |
| | | 2023 | | | 2022 | |
| |
Increase (decrease) in net assets: | | | | | | | | |
Operations: | | | | | | | | |
Net investment income | | $ | 36,019,142 | | | $ | 37,897,711 | |
Net realized gains (losses) from investment transactions | | | 270,249 | | | | (40,159,695 | ) |
Change in unrealized appreciation (depreciation) on investments | | | (8,463,869 | ) | | | (45,030,505 | ) |
| | | | | | | | |
Change in net assets resulting from operations | | | 27,825,522 | | | | (47,292,489 | ) |
| | | | | | | | |
Dividends paid to shareholders: | | | | | | | | |
From distributable earnings | | | (37,841,846 | ) | | | (35,831,722 | ) |
| | | | | | | | |
Total dividends paid to shareholders | | | (37,841,846 | ) | | | (35,831,722 | ) |
| | | | | | | | |
Capital Transactions: | | | | | | | | |
Proceeds from sale of shares | | | 330,916,265 | | | | 727,783,543 | |
Value of shares issued to shareholders in reinvestment of dividends | | | 34,625,289 | | | | 32,442,475 | |
Value of shares redeemed | | | (323,047,552 | ) | | | (1,045,178,807 | ) |
| | | | | | | | |
Change in net assets from capital transactions | | | 42,494,002 | | | | (284,952,789 | ) |
| | | | | | | | |
Change in net assets | | | 32,477,678 | | | | (368,077,000 | ) |
Net assets: | | | | | | | | |
Beginning of year | | | 500,576,838 | | | | 868,653,838 | |
| | | | | | | | |
End of year | | $ | 533,054,516 | | | $ | 500,576,838 | |
| | | | | | | | |
| | |
Share Transactions: | | | | | | | | |
Sold | | | 32,914,124 | | | | 66,569,894 | |
Reinvested | | | 3,468,184 | | | | 3,039,952 | |
Redeemed | | | (32,158,774 | ) | | | (97,903,369 | ) |
| | | | | | | | |
Change | | | 4,223,534 | | | | (28,293,523 | ) |
| | | | | | | | |
|
| |
See Notes to Financial Statements.
15
ADVISERS INVESTMENT TRUST
FINANCIAL HIGHLIGHTS
For the years indicated
| | | | | | | | | | | | | | | | | | | | |
| | | River Canyon Total Return Bond Fund | |
| | | | |
| | | Year Ended
September 30,
2023 | | | Year Ended
September 30, 2022 | | | Year Ended
September 30,
2021 | | | Year Ended
September 30,
2020 | | | Year Ended
September 30,
2019 | |
| |
Net asset value, beginning of year | | $ | 10.07 | | | $ | 11.14 | | | $ | 10.92 | | | $ | 11.17 | | | $ | 10.41 | |
| | | | | | | | | | | | | | | | | | | | |
Income (loss) from operations: | | | | | | | | | | | | | | | | | | | | |
Net investment income | | | 0.80 | | | | 0.49 | | | | 0.40 | | | | 0.33 | | | | 0.24 | |
Net realized and unrealized gains (losses) from investments | | | (0.16 | ) | | | (1.09 | ) | | | 0.46 | | | | 0.02 | | | | 0.79 | |
| | | | | | | | | | | | | | | | | | | | |
Total from investment operations | | | 0.64 | | | | (0.60 | ) | | | 0.86 | | | | 0.35 | | | | 1.03 | |
| | | | | | | | | | | | | | | | | | | | |
Less distributions paid: | | | | | | | | | | | | | | | | | | | | |
From net investment income | | | (0.83 | ) | | | (0.47 | ) | | | (0.40 | ) | | | (0.35 | ) | | | (0.27 | ) |
From net realized gains on investments | | | — | | | | — | | | | (0.24 | ) | | | (0.25 | ) | | | — | |
| | | | | | | | | | | | | | | | | | | | |
Total distributions paid | | | (0.83 | ) | | | (0.47 | ) | | | (0.64 | ) | | | (0.60 | ) | | | (0.27 | ) |
| | | | | | | | | | | | | | | | | | | | |
Change in net asset value | | | (0.19 | ) | | | (1.07 | ) | | | 0.22 | | | | (0.25 | ) | | | 0.76 | |
| | | | | | | | | | | | | | | | | | | | |
Net asset value, end of year | | $ | 9.88 | | | $ | 10.07 | | | $ | 11.14 | | | $ | 10.92 | | | $ | 11.17 | |
| | | | | | | | | | | | | | | | | | | | |
Total return | | | 6.70 | %(a) | | | (5.60 | %) | | | 8.10 | % | | | 3.20 | % | | | 10.16 | % |
Ratios/Supplemental data: | | | | | | | | | | | | | | | | | | | | |
Net assets, end of period (000’s) | | $ | 533,055 | | | $ | 500,577 | | | $ | 868,654 | | | $ | 166,302 | | | $ | 115,186 | |
Ratio of net expenses to average net assets | | | 0.67 | %(b) | | | 0.65 | % | | | 0.66 | %(b) | | | 0.65 | % | | | 0.65 | % |
Ratio of net investment income to average net assets | | | 7.99 | % | | | 4.41 | % | | | 3.51 | % | | | 3.02 | % | | | 2.60 | % |
Ratio of gross expenses to average net assets(c) | | | 0.89 | % | | | 0.82 | % | | | 0.88 | % | | | 1.06 | % | | | 1.48 | % |
Portfolio turnover rate | | | 71.33 | % | | | 122.12 | %(d) | | | 55.64 | % | | | 44.82 | % | | | 30.46 | % |
|
| |
| (a) | The Adviser reimbursed the Fund $67,395 during the period in connection with an error. Such reimbursement was 0.02% to the Fund’s total return on the payment date. |
| (b) | Expenses include interest expense on reverse repurchase agreements of 0.01% and 0.02% for the years ended September 30, 2021 and September 30, 2023, respectively, which is excluded from the Fund’s contractual expense limit. |
| (c) | During the years shown, certain fees were reduced. If such fee reductions had not occurred, the ratio would have been as indicated. |
| (d) | The portfolio turnover rate increased during the year in connection with increased shareholder activity in the Fund. |
See Notes to Financial Statements.
16
ADVISERS INVESTMENT TRUST
RIVER CANYON TOTAL RETURN BOND FUND
NOTES TO FINANCIAL STATEMENTS
September 30, 2023
Advisers Investment Trust (the “Trust”) is a Delaware statutory trust operating under a Fifth Amended and Restated Agreement and Declaration of Trust (the “Trust Agreement”) dated March 9, 2023. The Trust was formerly an Ohio business trust, which commenced operations on December 20, 2011. On March 31, 2017, the Trust was converted to a Delaware statutory trust. As an open-end registered investment company, as defined in Financial Accounting Standards Board (“FASB”) Accounting Standards Update (“ASU”) 2013-08, the Trust follows accounting and reporting guidance under FASB Accounting Standards Codification (“ASC”) Topic 946, “Financial Services-Investment Companies”. The Trust Agreement permits the Board of Trustees (the “Trustees” or “Board”) to authorize and issue an unlimited number of shares of beneficial interest, at no par value, in separate series of the Trust. The River Canyon Total Return Bond Fund (the “Fund”) is a series of the Trust which is registered under the Investment Company Act of 1940, as amended (the “1940 Act”), and the Fund’s Institutional Shares class commenced operations on December 30, 2014. Prior to April 6, 2015 shares of the Fund were not registered under the Securities Act of 1933, as amended (the “1933 Act”). During that time, investments in the Fund were made only by individuals or entities that were “accredited investors” within the meaning of Regulation D under the 1933 Act, and shares were issued solely in private placement transactions that did not involve any “public offering” within the meaning of Section 4(a)(2) of the 1933 Act. Effective April 6, 2015, the Fund became publicly available for investment.
The investment objective of the Fund is to seek to maximize total return. The Fund has been managed as a diversified fund pursuant to Section 5(b) of the 1940 Act since July 2018. Effective April 26, 2021, the Fund determined to continue to be managed as a diversified fund.
Under the Trust’s organizational documents, its officers and Trustees are indemnified against certain liabilities arising out of the performance of their duties to the Trust and Fund. In addition, in the normal course of business, the Trust enters into contracts with its vendors and others that provide for general indemnifications. The Fund’s maximum exposure under these arrangements is unknown, as this would involve future claims that may be made against the Fund.
A. Significant accounting policies are as follows:
INVESTMENT VALUATION
Investments are recorded at fair value. Fair value is defined as the price that would be received to sell an asset or paid to transfer a liability in an orderly transaction between market participants at the measurement date. The valuation techniques employed by the Fund, as described below, maximize the use of observable inputs and minimize the use of unobservable inputs in determining fair value. These inputs are summarized in the following three broad levels:
• Level 1 —quoted prices in active markets for identical assets
• Level 2 —other significant observable inputs (including quoted prices of similar securities, interest rates, prepayment speeds, credit risk, etc.)
• Level 3 —significant unobservable inputs (including the Fund’s own assumptions in determining the fair value of investments)
The inputs or methodology used for valuing securities are not necessarily an indication of the risk associated with investing in those securities. For example, certain short-term debt securities may be valued using amortized cost. Generally, amortized cost approximates the current value of a security, but since this valuation is not obtained from a quoted price in an active market, such securities would be reflected as Level 2 in the fair value hierarchy.
Security prices are generally provided by an approved independent third party pricing service as of the close of the New York Stock Exchange, normally at 4:00 p.m. Eastern Time, each business day on which the share price of the Fund is calculated.
17
ADVISERS INVESTMENT TRUST
RIVER CANYON TOTAL RETURN BOND FUND
NOTES TO FINANCIAL STATEMENTS
September 30, 2023
Debt and other fixed income securities, if any, are generally valued at an evaluated price provided by an approved independent pricing source. To value debt securities, pricing services may use various pricing techniques, which take into account appropriate factors such as market activity, yield, quality, coupon rate, maturity, type of issue, trading characteristics, call features, credit ratings and other data, as well as broker quotes. Short-term debt securities of sufficient credit quality that mature within sixty days may be valued at amortized cost, which approximates fair value. In each of these situations, valuations are typically categorized as Level 2 in the fair value hierarchy.
Equity securities listed or traded on a primary exchange are valued at the closing price, if available, or the last sales price on the primary exchange. If no sale occurred on the valuation date, the securities will be valued at the latest quotations as of the close of the primary exchange. Investments in other open-end registered investment companies are valued at their respective net asset value as reported by such companies. In these types of situations, valuations are typically categorized as a Level 1 in the fair value hierarchy.
Spot and forward foreign currency exchange contracts are generally valued using an independent pricing service. Forward contracts are typically classified within Level 2 of the fair value hierarchy.
Swap agreements are valued daily based upon the terms specific to each agreement with its counterparty as noted in the “Swap Contracts” note in these notes to financial statements.
The Trustees have designated River Canyon Fund Management LLC, as investment adviser to the Fund, as the Fund’s Valuation Designee with responsibility for establishing fair value when the price of a security is not readily available or deemed unreliable (e.g., an approved pricing service does not provide a price, a furnished price is in error, certain stale prices, or an event occurs that materially affects the furnished price) according to policies approved by the Board.
In the fair value situations noted above, while the Trust’s valuation policy is intended to result in a calculation of the Fund’s net asset value that fairly reflects security values as of the time of pricing, the Trust cannot ensure that fair values determined pursuant to these guidelines would accurately reflect the price that the Fund could obtain for a security if it were to dispose of that security as of the time of pricing (for instance, in a forced or distressed sale). The prices used by the Fund may differ from the value that would be realized if the securities were sold, and these differences could be material to the financial statements. Depending on the source and relative significance of the valuation inputs in these instances, the instruments may be classified as Level 2 or Level 3 in the fair value hierarchy.
The following is a summary of the valuation inputs used as of September 30, 2023 in valuing the Fund’s investments based upon the three fair value levels defined above:
| | | | | | | | | | | | | | | | |
| | | Level 1 - Quoted Prices | | | Level 2 - Other Significant
Observable Inputs | | | Level 3 - Significant Unobservable Inputs | | | Total | |
| |
Investments in Securities: | | | | | | | | | | | | | | | | |
Asset-Backed Securities | | $ | — | | | $ | 169,666,310 | | | $ | 13,658,242 | | | $ | 183,324,552 | |
Bank Debts | | | — | | | | 65,425,789 | | | | — | | | | 65,425,789 | |
Corporate Bonds | | | — | | | | 119,585,581 | | | | — | | | | 119,585,581 | |
Mortgage-Backed Securities | | | — | | | | 95,632,661 | | | | 395,724 | | | | 96,028,385 | |
U.S. Government Obligations | | | — | | | | 4,724,219 | | | | — | | | | 4,724,219 | |
Municipal Bonds | | | — | | | | 23,926,892 | | | | — | | | | 23,926,892 | |
Short-Term Investments | | | 34,001,974 | | | | — | | | | — | | | | 34,001,974 | |
| | | | |
Total Investments in Securities | | $ | 34,001,974 | | | $ | 478,961,452 | | | $ | 14,053,966 | | | $ | 527,017,392 | |
| | | | |
Other Financial Instruments: | | | | | | | | | | | | | | | | |
Total Return Swaps* | | | — | | | | 629,652 | | | | — | | | | 629,652 | |
Forward Foreign Currency Contracts* | | | — | | | | (13,767 | ) | | | — | | | | (13,767 | ) |
| | | | |
Total Other Financial Instruments | | $ | — | | | $ | 615,885 | | | $ | — | | | $ | 615,885 | |
| | | | |
Total Investments | | $ | 34,001,974 | | | $ | 479,577,337 | | | $ | 14,053,966 | | | $ | 527,633,277 | |
| | | | |
| * | These investments are reflected in the financial statements at the unrealized gain or loss on the investment. |
18
ADVISERS INVESTMENT TRUST
RIVER CANYON TOTAL RETURN BOND FUND
NOTES TO FINANCIAL STATEMENTS
September 30, 2023
The Level 3 securities noted above were held at the prior year end or transferred into Level 3 during the current year ended September 30, 2023. The value of these securities compared to the total Fund net assets is not material and, therefore, the reconciliation of Level 3 securities and related valuation techniques are not disclosed.
FORWARD COMMITMENTS
The Fund may contract to purchase securities for a fixed price at a transaction date beyond the customary settlement period (i.e., “when issued,” “delayed delivery,” “forward commitment,” or “TBA transaction”) consistent with the Fund’s ability to manage its investment portfolio. No interest will be earned by the Fund on such purchases until the securities are delivered, however the market value may change prior to delivery. When the Fund makes a commitment to purchase a security on a forward commitment basis, cash or liquid securities equal to the amount of such Fund’s commitments will be reserved for payment of the commitment.
The Fund may enter into TBA sale commitments to help manage portfolio duration, hedge its positions or to sell mortgage-backed securities it owns under delayed delivery arrangements. Proceeds of TBA sale commitments are not received until the contractual settlement date. During the time a TBA sale commitment is outstanding, equivalent deliverable securities, or an offsetting TBA purchase commitment deliverable on or before the sale commitment date, are held as “cover” for the transaction.
Unsettled TBA sale (purchase) commitments are valued at the current market value of the underlying securities. The contract is adjusted to market value daily and the change in market value is recorded by the Fund as an unrealized gain or loss. If the TBA sale (purchase) commitment is closed through the acquisition of an offsetting purchase (sale) commitment, the Fund realizes a gain or loss from the sale of the securities based upon the unit price established at the date the commitment was entered.
REVERSE REPURCHASE AGREEMENTS
The Fund may enter into reverse repurchase agreements. In a reverse repurchase agreement, the Fund delivers securities in exchange for cash to a counterparty, with a simultaneous agreement to repurchase the same or substantially same securities at an agreed upon price and date. The Fund is entitled to receive principal and interest payments, if any, made on the securities delivered to the counterparty during the term of the agreement. Cash received in exchange for the securities delivered will accrue interest to be paid by the Fund to the counterparty and is recorded as a component of interest expense on the Statement of Operations. The Fund will earmark and reserve Fund assets, in cash or liquid securities, in an amount at least equal to its purchase obligations under the agreements. As of September 30, 2023, there were no reverse repurchase agreements held by the Fund.
DERIVATIVE FINANCIAL INSTRUMENTS
The Fund may engage in various portfolio strategies to seek to increase their return by hedging the portfolio against adverse movements in the equity, debt and currency markets. Losses may arise due to changes in the value of the contract if the counterparty does not perform under the contract. The Fund, in its normal course of business, may enter into contracts that contain a variety of representations and warranties and which provide general indemnifications. The Fund’s exposure may include future claims that may be made against the Fund that have not yet occurred.
FASB “Derivatives and Hedging” includes required disclosure for (i) the nature and terms of the derivative, reasons for entering into the derivative, the events or circumstances that would require the seller to perform under the derivative, and the current status of the payment/performance risk of the derivative, (ii) the maximum potential amount of future payments (undiscounted) the seller could be required to make under the derivative, (iii) the fair value of the derivative and (iv) the nature of any recourse provisions and assets held either as collateral or by third parties. FASB “Guarantees” requires additional disclosures about the current status of the payment/performance risk of a guarantee. All of this information has been incorporated for the current period as part of the Schedule of Investments and in the Notes to Financial Statements.
Forward Foreign Currency Contracts — The Fund may enter into forward foreign currency contracts to hedge against adverse exchange rate fluctuation to the U.S. dollar or between different foreign currencies in connection with either specific security transactions or portfolio positions. Each contract is valued daily and the change in value is recorded as an unrealized gain or loss. When the contract is
19
ADVISERS INVESTMENT TRUST
RIVER CANYON TOTAL RETURN BOND FUND
NOTES TO FINANCIAL STATEMENTS
September 30, 2023
closed, a realized gain or loss is recorded equal to the difference between the opening value and the closing value of the contract. These contracts may involve market risk in excess of the unrealized gain or loss reflected on the Statement of Assets and Liabilities. The Fund could be exposed to risk if the counterparties to the contracts are unable to meet the terms of the contract and from unanticipated movements in the value of a foreign currency relative to the U.S. dollar.
Swap Contracts — The Fund may enter into swap agreements, such as total return swaps.
Swap agreements are privately negotiated agreements between the Fund and a counterparty to exchange or swap investment cash flows, assets, foreign currencies or market-linked returns at specified, future intervals. A swap may be entered into in order to, among other things, change the maturity of the Fund’s portfolio, to protect the Fund’s value from changes in interest rates, to expose the Fund to a different security or market or to help the Fund achieve a strategy relative to an index or other benchmark. By entering into a swap agreement, the Fund is exposed to the risk of unanticipated movements in interest rates or in the value of an underlying security or index (or the risk that the counterparty will not fulfill its obligation under the agreement).
Swaps are marked-to-market daily based upon values from third party vendors or quotations from market makers to the extent available; and the change in value, if any, is recorded as an unrealized gain or loss on the Statement of Assets and Liabilities. In the event that market quotations are not readily available or deemed reliable, certain swap agreements may be valued pursuant to guidelines established by the Board. In the event that market quotes are not readily available and the swap cannot be valued pursuant to one of the valuation methods, the value of the swap will be determined in good faith by the Fund’s Valuation Designee.
Payments received or made at the beginning of the measurement period are reflected as such on the Statement of Assets and Liabilities and represent payments made or received upon entering into the swap agreement to compensate for differences between the stated terms of the swap agreement and prevailing market conditions (credit spreads, currency exchange rates, interest rates, and other relevant factors). These upfront payments are recorded as realized gains or losses on the Statement of Operations upon termination or maturity of the swap. A liquidation payment received or made at the termination of the swap is recorded as realized gain or loss on the Statement of Operations. Net periodic payments received or paid by the Fund are included as part of realized gains or losses on the Statement of Operations. If any, realized gains/losses on swap agreements would be included in Net realized gain (loss) on swap agreements in the Statement of Operations.
Entering into these agreements involves, to varying degrees, elements of credit, market and documentation risk in excess of the amounts recognized on the Statement of Assets and Liabilities. Such risks involve the possibility that there will be no liquid market for these agreements, that the counterparty to the agreements may default on its obligation to perform or disagree as to the meaning of contractual terms in the agreements and that there may be unfavorable changes in interest rates.
INVESTMENT TRANSACTIONS AND INCOME
Investment transactions are accounted for no later than one business day after trade date. For financial reporting purposes, investments are reported as of the trade date. The Fund determines the gain or loss realized from investment transactions by using an identified cost basis method. Interest income is recognized on an accrual basis and includes, where applicable, the amortization of premium or accretion of discount. Dividend income is recognized on the ex-dividend date.
EXPENSE ALLOCATIONS
Expenses directly attributable to a fund in the Trust are charged to that fund, while expenses that are attributable to more than one fund in the Trust are allocated among the applicable funds on a pro-rata basis to each adviser’s series of funds based on relative net assets or another reasonable basis.
DIVIDENDS AND DISTRIBUTIONS
The Fund intends to distribute substantially all of its net investment income as dividends to shareholders on a monthly basis. The Fund intends to distribute its net realized long-term capital gains and its net realized short-term capital gains at least once a year.
20
ADVISERS INVESTMENT TRUST
RIVER CANYON TOTAL RETURN BOND FUND
NOTES TO FINANCIAL STATEMENTS
September 30, 2023
Distributions from net investment income and from net realized capital gain are determined in accordance with Federal income tax regulations, which may differ from accounting principles generally accepted in the United States of America (“GAAP”). These “book/tax” differences are either considered temporary or permanent in nature. To the extent these differences are permanent in nature (e.g. treatment of certain dividend distributions, gains/losses, return of capital, redemption in-kind, etc.), such amounts are reclassified within the composition of net assets based on their federal tax-basis treatment; temporary differences do not require reclassification. Distributions to shareholders that exceed net investment income and net realized capital gains for tax purposes are reported as return of capital.
FEDERAL INCOME TAX INFORMATION
No provision is made for Federal income taxes as the Fund intends to qualify each year as a “regulated investment company” under Subchapter M of the Internal Revenue Code of 1986, as amended (the “Code”), and distribute substantially all of its net investment income and net realized capital gain in accordance with the Code.
As of September 30, 2023, the Fund did not have uncertain tax positions that would require financial statement recognition or disclosure based on an evaluation of all open tax years for all major tax jurisdictions. The Fund’s tax return for the tax years ended September 30, 2023, 2022, 2021 and 2020 remain subject to examination by the Internal Revenue Service. Interest or penalties incurred, if any, on future unknown, uncertain tax positions taken by the Fund will be recorded as interest expense on the Statement of Operations.
Management is not aware of any tax positions for which it is reasonably possible that the total amounts of unrecognized tax benefits will change materially in the next 12 months.
USE OF ESTIMATES
The preparation of financial statements in conformity with GAAP requires management to make estimates and assumptions that affect the reported amounts of assets and liabilities and disclosure of contingent assets and liabilities at the date of the financial statements and the reported amounts of revenues and expenses during the reporting period. Actual results could differ from these estimates.
B. Fees and Transactions with Affiliates and Other Parties
River Canyon Fund Management LLC (the “Adviser” or “River Canyon”), which is registered under the Investment Advisers Act of 1940, as amended, serves as the investment adviser to the Fund. Under the terms of the Trust’s Second Amended and Restated Investment Advisory Agreement (the “Agreement”) with the Adviser, the Fund pays the Adviser an advisory fee computed and accrued daily and paid monthly at the annual rate of 0.65% of average daily net assets. Total fees incurred pursuant to the Agreement are reflected as “Investment advisory” expenses on the Statement of Operations.
Foreside Financial Services, LLC (the “Distributor”) provides distribution services to the Fund pursuant to a distribution agreement with the Trust, on behalf of the Fund. Under its agreement with the Trust, the Distributor acts as an agent of the Trust in connection with the offering of the shares of the Fund on a continuous basis. The Adviser, at its own expense, pays the Distributor an annual $25,000 fee for these services and reimbursement for certain expenses incurred on behalf of the Fund.
The Northern Trust Company (“Northern Trust”) serves as the administrator, transfer agent, custodian and fund accounting agent for the Fund pursuant to written agreements between the Trust, on behalf of the Fund, and Northern Trust. The Fund has agreed to pay Northern Trust a tiered basis-point fee based on the Fund’s daily net assets, subject to a minimum annual fee of $150,000 relating to these services, as well as other charges for additional service activities. Total fees paid to Northern Trust pursuant to these agreements are reflected as “Accounting and Administration” expenses on the Statement of Operations.
Foreside Fund Officer Services, LLC (“Foreside”, d/b/a ACA Group) provides compliance and financial control services for the Fund pursuant to a written agreement with the Trust, on behalf of the Fund, including providing certain officers to the Fund. The Fund pays Foreside an annual asset-based fee, a basis-point fee based on the Fund’s daily net assets, subject to an overall annual minimum fee of $125,000 for these services, and reimburses for certain expenses incurred on behalf of the Fund. Total fees paid to Foreside pursuant to these agreements are reflected as “Regulatory and Compliance” fees on the Statement of Operations.
21
ADVISERS INVESTMENT TRUST
RIVER CANYON TOTAL RETURN BOND FUND
NOTES TO FINANCIAL STATEMENTS
September 30, 2023
The officers of the Trust are affiliated with Foreside, NorthernTrust, or the Distributor and receive no compensation directly from the Fund for serving in their respective roles. Through March 31, 2023, the Trust paid each Trustee who is not an “interested person,” as that term is defined in the 1940 Act (each, an “Independent Trustee” and, collectively, the “Independent Trustees”) compensation for their services based on an annual retainer of $125,000 and reimbursement for certain expenses. Effective April 1, 2023, the Trust pays an annual retainer of $132,000 and reimbursement for certain expenses. If there are more than six meetings in a year, additional meeting fees may apply. For the year ended September 30, 2023, the aggregate Trustee compensation paid by the Trust was $416,750. The amount of total Trustee compensation and reimbursement of out-of-pocket expenses allocated from the Trust to the Fund is reflected as “Trustees” fees on the Statement of Operations.
The Adviser has contractually agreed to waive fees or reimburse expenses to the extent necessary to limit total annual fund operating expenses (exclusive of brokerage costs, interest, taxes, dividend expense on short positions, litigation and indemnification expenses, expenses associated with investments in underlying investment companies and extraordinary expenses) to 0.65% of the average daily net assets of the Fund until January 28, 2024. If it becomes unnecessary for the Adviser to waive fees or make reimbursements, the Adviser may recapture any of its prior waivers or reimbursements for a period not to exceed three years from the date in which the waiver or reimbursement was made to the extent that such a recapture does not cause the Total Annual Fund Operating Expenses (exclusive of brokerage costs, interest, taxes, dividend expense on short positions, litigation and indemnification expenses, expenses associated with investments in underlying investment companies and extraordinary expenses) to exceed the applicable expense limitation in effect at the time of repayment or the applicable expense limitation that was in effect at the time of the waiver or reimbursement. The agreement to waive fees and reimburse expenses may be terminated by the Board at any time and will terminate automatically upon termination of the Agreement.
For the year ended September 30, 2023, the Fund incurred advisory fees payable to River Canyon, expense waivers/reimbursements from River Canyon, and paid expense recoupments to River Canyon as follows:
| | | | | | | | | | | | |
| | | Advisory | | | Expenses | | | Advisory Waivers | |
| | | Fee to | | | Reduced | | | Recouped | |
| Fund | | River Canyon | | | by River Canyon | | | by River Canyon | |
| |
River Canyon Total Return Bond Fund | | $ | 2,930,744 | | | $ | 973,234 | | | $ | — | |
The balances of recoverable expenses to River Canyon by the Fund at September 30, 2023 were as follows:
| | | | | | |
| For the: | | Expiring | | River Canyon | |
| |
Year Ended September 30, 2021 | | September 30, 2024 | | $ | 932,666 | |
Year Ended September 30, 2022 | | September 30, 2025 | | | 1,483,301 | |
Year Ended September 30, 2023 | | September 30, 2026 | | | 973,234 | |
| | | | | | |
Balances of Recoverable Expenses to the Adviser | | | | $ | 3,389,201 | |
| | | | | | |
C. Investment Transactions
For the year ended September 30, 2023, the aggregate costs of purchases and proceeds from sales of securities (excluding short-term investments) for the Fund were as follows:
| | | | | | | | |
| Fund | | Cost of Purchases | | | Proceeds from sales | |
River Canyon Total Return Bond Fund | | $ | 291,952,236 | | | $ | 307,670,219 | |
22
ADVISERS INVESTMENT TRUST
RIVER CANYON TOTAL RETURN BOND FUND
NOTES TO FINANCIAL STATEMENTS
September 30, 2023
D. Derivative Instruments
Below are the types of derivatives by primary risk exposure as presented in the Statement of Assets & Liabilities as of September 30, 2023:
| | | | | | | | | | | | | | |
| | | | | Assets | | | Liabilities | |
| | | | | Statement of | | | | | Statement of | | | |
| Fund | | Contract Type | | Assets Location | | Value | | | Liabilities Location | | Value | |
| |
River Canyon Total Return Bond Fund | | Foreign exchange contracts | | Unrealized appreciation on forward foreign currency exchange contracts | | $ | — | | | Unrealized depreciation on forward foreign currency exchange contracts | | $ | 13,767 | |
| | Equity contracts | | Unrealized appreciation on swap agreements | | | 629,652 | | | Unrealized depreciation on swap agreements | | | — | |
The following table, set forth by primary risk exposure, displays the Fund’s realized gains (losses) and change in unrealized appreciation (depreciation) by type of derivative contract for the year ended September 30, 2023:
| | | | | | | | |
| | | | | | | Amount of Realized Gain | |
| Fund | | Contract Type | | Statement of Operations Location | | (Loss) on Derivative Contracts | |
| |
River Canyon Total Return Bond Fund | | Foreign exchange contracts | | Net realized gain (loss) on forward foreign currency exchange contracts | | | $ 219,874 | |
| | Equity contracts | | Net realized gain (loss) on swap agreements | | | — | |
| | | |
| Fund | | Contract Type | | Statement of Operations Location | | Change in Unrealized Appreciation
(Depreciation) on Derivative Contracts | |
| |
River Canyon Total Return Bond Fund | | Foreign exchange contracts | | Change in unrealized appreciation (depreciation) on forward foreign currency exchange contracts | | | $ (13,767) | |
| | Equity contracts | | Change in unrealized appreciation (depreciation) on swap agreements | | | 629,652 | |
Volume of derivative activity for the fiscal year ended September 30, 2023:
| | | | | | | | | | | | |
| | | Foreign Exchange | | | Equity | |
| | | Contracts | | | Contracts | |
| | | Number | | Average | | | Number | | Average | |
| | | Of | | Notional | | | Of | | Notional | |
| Fund | | Trades | | Amount | | | Trades | | Amount | |
| |
River Canyon Total Return Bond Fund | | 6 | | $ | 7,382,008 | | | 4 | | $ | 3,750,729 | |
At September 30, 2023, derivative assets and liabilities by counterparty net of amounts available for offset under an ISDA Master Agreement and net of the related collateral (received)/pledged by the Trust are as follows:
| | | | | | | | | | | | | | | | | | | | | | | | | | | | | | | | | | | | |
| | | Derivative Assets | | | Derivative Liabilities | | | | | | | | | | |
| | | | | | | | | | | | | | | | | | | | | Net | | | | | | | |
| | | Foreign | | | | | | | | | Foreign | | | | | | | | | Derivatives | | | Collateral | | | | |
| | | exchange | | | | | | | | | exchange | | | | | | | | | Assets | | | (Received)/ | | | Net | |
| Counterparty | | contracts | | | Swaps | | | Total | | | contracts | | | Swaps | | | Total | | | (Liabilities) | | | Pledged | | | Exposure | |
Goldman Sachs International | | | $– | | | $ | 629,652 | | | $ | 629,652 | | | $ | (13,757 | ) | | $ | – | | | $ | (13,757 | ) | | $ | 615,895 | | | $ | 2,770,914 | | | $ | 3,386,809 | |
| | | | | | | | | | | | | | | | | | | | | | | | | | | | | | | | | | | | |
23
ADVISERS INVESTMENT TRUST
RIVER CANYON TOTAL RETURN BOND FUND
NOTES TO FINANCIAL STATEMENTS
September 30, 2023
E. Federal Income Tax
As of September 30, 2023, the cost, gross unrealized appreciation and gross unrealized depreciation on investments, for Federal income tax purposes, were as follows:
| | | | | | | | | | | | | | | | |
| Fund | | Cost | | | Gross Unrealized
Appreciation | | | Gross Unrealized
(Depreciation) | | | Net Unrealized
Appreciation
(Depreciation) | |
| |
River Canyon Total Return Bond Fund | | $ | 570,848,053 | | | $ | 3,190,321 | | | $ | (47,020,982 | ) | | $ | (43,830,661 | ) |
The tax character of distributions paid to shareholders during the latest tax years ended September 30, 2023 and September 30, 2022 for the Fund was as follows:
| | | | | | | | | | | | | | | | | | | | |
| River Canyon Total Return Bond Fund | | Ordinary Income | | | Net Long
Term Gains | | | Total Taxable
Distributions | | | Tax Return of Capital | | | Total Distributions
Paid | |
| |
2023 | | $ | 37,841,846 | | | $ | — | | | $ | 37,841,846 | | | $ | — | | | $ | 37,841,846 | |
2022 | | $ | 35,831,722 | | | $ | — | | | $ | 35,831,722 | | | $ | — | | | $ | 35,831,722 | |
As of the tax year ended September 30, 2023, the components of accumulated earnings on a tax basis were as follows:
| | | | | | | | | | | | | | | | | | | | | | | | | | | | |
| Fund | | Undistributed
Ordinary Income | | | Undistributed Long
Term Capital
Gains | | | Accumulated
Earnings | | | Distributions
Payable | | | Accumulated Capital and
Other Losses | | | Unrealized
(Depreciation) | | | Total Accumulated
(Deficit) | |
| |
River Canyon Total Return Bond Fund | | $ | 1,700,739 | | | | $— | | | $ | 1,700,739 | | | | $— | | | $ | (43,525,484 | ) | | $ | (43,853,395 | ) | | $ | (85,678,140 | ) |
As of the tax year ended September 30, 2023, non-expiring capital losses incurred by the Fund are carried forward indefinitely under the provisions of the Regulated Investment Company Modernization Act of 2010 and are as follows:
| | | | | | | | |
| Fund | | Short-Term Capital Loss
Carry-Forward | | | Long-Term Capital Loss Carry-Forward | |
| |
River Canyon Total Return Bond Fund | | $ | 36,119,452 | | | $ | 7,406,032 | |
F. Concentration of Ownership
A significant portion of the Fund’s shares may be held in a limited number of shareholder accounts. To the extent that a shareholder or group of shareholders redeem a significant portion of the shares issued by the Fund, this could have a disruptive impact on the efficient implementation of the Fund’s investment strategy.
G. Other Risks
The Fund is subject to market risk, which is the risk related to investments in securities in general and the daily fluctuations in the securities markets. The market prices of the Fund’s securities may go up or down, sometimes rapidly or unpredictably, due to many factors, including fluctuation in interest rates, lack of liquidity in the bond market, national and international economic conditions, adverse investor sentiment, natural disasters, pandemics (e.g., COVID-19), climate change and climate-related events, disruptions to business operations and supply chains, staffing shortages, regulatory events and governmental or quasi-governmental actions and general market conditions. Global economies and financial markets are increasingly interconnected and events or conditions in one region or financial market may adversely impact issuers in a different country, region or financial market. Political events, including armed conflict, tariffs and economic sanctions also contribute to market volatility. These events can have a significant impact on the Fund’s operations and performance.
24
REPORT OF INDEPENDENT REGISTERED PUBLIC ACCOUNTING FIRM
To the shareholders of the River Canyon Total Return Bond Fund and the Board of Trustees of Advisers Investment Trust
Opinion on the Financial Statements and Financial Highlights
We have audited the accompanying statement of assets and liabilities of the River Canyon Total Return Bond Fund (the “Fund”), one of the portfolios constituting Advisers Investment Trust (the “Trust”), including the schedule of investments, as of September 30, 2023, the related statement of operations for the year then ended, the statements of changes in net assets for each of the two years in the period then ended, the financial highlights for each of the five years in the period then ended, and the related notes.
In our opinion, the financial statements and financial highlights present fairly, in all material respects, the financial position of the River Canyon Total Return Bond Fund of the Trust as of September 30, 2023, and the results of its operations, the changes in its net assets for each of the two years in the period then ended, and the financial highlights for each of the five years in the period then ended in conformity with accounting principles generally accepted in the United States of America.
Basis for Opinion
These financial statements and financial highlights are the responsibility of the Fund’s management. Our responsibility is to express an opinion on the Fund’s financial statements and financial highlights based on our audits. We are a public accounting firm registered with the Public Company Accounting Oversight Board (United States) (PCAOB) and are required to be independent with respect to the Fund in accordance with the U.S. federal securities laws and the applicable rules and regulations of the Securities and Exchange Commission and the PCAOB.
We conducted our audits in accordance with the standards of the PCAOB. Those standards require that we plan and perform the audit to obtain reasonable assurance about whether the financial statements and financial highlights are free of material misstatement, whether due to error or fraud. The Fund is not required to have, nor were we engaged to perform, an audit of its internal control over financial reporting. As part of our audits we are required to obtain an understanding of internal control over financial reporting but not for the purpose of expressing an opinion on the effectiveness of the Fund’s internal control over financial reporting. Accordingly, we express no such opinion.
Our audits included performing procedures to assess the risks of material misstatement of the financial statements and financial highlights, whether due to error or fraud, and performing procedures that respond to those risks. Such procedures included examining, on a test basis, evidence regarding the amounts and disclosures in the financial statements and financial highlights. Our audits also included evaluating the accounting principles used and significant estimates made by management, as well as evaluating the overall presentation of the financial statements and financial highlights. Our procedures included confirmation of securities owned as of September 30, 2023, by correspondence with the
25
custodian and brokers; when replies were not received from brokers, we performed other auditing procedures. We believe that our audits provide a reasonable basis for our opinion.

November 17, 2023
We have served as the auditor of one or more River Canyon Fund Management LLC investment companies since 2015.
26
ADVISERS INVESTMENT TRUST
RIVER CANYON TOTAL RETURN BOND FUND
ADDITIONAL INFORMATION
September 30, 2023 (Unaudited)
| A. | Security Allocation as of September 30, 2023 |
| | | | |
| Market Exposure | |
| Securities | | % of Net Assets | |
Asset-Backed Securities | | | 34.4 | % |
Corporate Bonds | | | 22.4 | |
Mortgage-Backed Securities | | | 18.0 | |
Bank Debts | | | 12.3 | |
Municipal Bonds | | | 4.5 | |
U.S. Government Obligations | | | 0.9 | |
Total Securities | | | 92.5 | % |
Total Return Swaps | | | 0.1 | |
Forward Foreign Currency Contracts | | | 0.0 | |
Total Investments | | | 92.6 | % |
| | | | |
| 5 Largest Security Positions | |
| Issuer | | % of Net Assets | |
LABL, Inc. | | | | |
10.50%, 7/15/27 | | | 4.0 | % |
Imperva, Inc. | | | | |
9.39%, 1/12/25 | | | 3.7 | |
FREMF Mortgage Trust Series 2019-KF59 | | | | |
11.43%, 2/25/29 | | | 3.6 | |
GDB Debt Recovery Authority of Commonwealth Puerto Rico Taxable Revenue Bond | | | | |
7.50%, 8/20/40 | | | 3.6 | |
CT Technologies Intermediate Holdings, Inc. | | | | |
9.57%, 12/16/25 | | | 3.5 | |
Total | | | 18.4 | % |
As a Fund shareholder, you may incur two types of costs: (1) transaction costs, and (2) ongoing costs, including management fees and other Fund expenses. The examples below are intended to help you understand your ongoing costs (in dollars) of investing in the Fund and to compare these costs with the ongoing costs of investing in other mutual funds. Please note that the expenses shown in the tables are meant to highlight your ongoing costs only and do not reflect any transactional costs. Therefore, the examples are useful in comparing ongoing costs only and will not help you determine the relative total cost of owning different funds. In addition, if these transactional costs were included, your costs would have been higher.
The examples below are based on an investment of $1,000 invested at April 1, 2023 and held for the entire period through September 30, 2023.
The Actual Expense Example below provides information about actual account values and actual expenses. You may use this information, together with the amount you invested, to estimate the expenses that you paid over the period. Simply divide your account value by $1,000 (for example, an $8,600 account value divided by $1,000 = 8.6), then multiply the result by the number in the table under the heading entitled “Expenses Paid” to estimate the expenses you paid on your account during this period.
The Hypothetical Expense Example below provides information about hypothetical account values and hypothetical expenses based on the Fund’s actual expense ratio and an assumed rate of return of 5% per year before expenses, which is not the Fund’s actual return. The hypothetical account values and expenses may not be used to estimate the actual ending account balance or expenses you paid for the period. You may use this information to compare the ongoing costs of investing in the Fund and other funds. To do so, compare this 5% hypothetical example with the 5% hypothetical examples that appear in the shareholder reports of the other funds.
| | | | | | | | | | | | | | |
| | | Expense Ratio | | Beginning Account Value 4/1/2023 | | | Ending Account Value 9/30/2023 | | | Expenses Paid 4/1/23–9/30/23* | |
Actual | | 0.65% | | $ | 1,000.00 | | | $ | 1,024.20 | | | $ | 3.30 | |
Hypothetical | | 0.65% | | $ | 1,000.00 | | | $ | 1,021.81 | | | $ | 3.29 | |
| * | Expenses are calculated using the annualized expense ratio (as disclosed in the table), multiplied by the average account value for the period, multiplied by the number of days in the most recent half fiscal year (183), and divided by the number of days in the current year (365). |
27
ADVISERS INVESTMENT TRUST
RIVER CANYON TOTAL RETURN BOND FUND
ADDITIONAL INFORMATION
September 30, 2023 (Unaudited)
| C. | Board Approval of Investment Advisory Agreement |
Section 15 of the 1940 Act requires that the Agreement between the Trust and the Adviser with respect to the Fund be approved by a majority of the Board including a majority of Independent Trustees. It is the duty of the Board to request as much information as is reasonably necessary to evaluate the terms of the Agreement to determine whether the Agreement is fair to the Fund and its shareholders. The Board considered and approved the Agreement for the Fund at a meeting held on September 13, 2023.
The Board requested, and the Adviser provided, both written and oral reports containing information and data related to the following: (i) the nature, extent, and quality of the services provided by the Adviser to the Fund; (ii) the investment performance of the Fund and the Adviser (iii) the costs of the services to be provided and the profits to be realized by the Adviser from its relationship with the Fund; (iv) the extent to which economies of scale will be realized as the Fund grows; and (v) whether the fee levels reflect these economies of scale to the benefit of the Fund’s shareholders.
The Board examined the nature, extent, and quality of the advisory services provided by the Adviser. The Board considered the terms of the Agreement, information and reports provided by the Adviser regarding its business, personnel and operations, and advisory services provided to the Fund. The Board reviewed the Adviser’s investment philosophy and portfolio construction processes, the Adviser’s compliance program, pending material litigation (if any), insurance coverage, business continuity program, and information security practices. The Board noted that, as set forth in the reports provided by the Adviser, there had been no material compliance issues or concerns raised or encountered since the last renewal of the Agreement with respect to the Fund or any other fund managed by the Adviser. The Board then considered key risks associated with the Fund and ways in which those risks were mitigated. Taking into account the personnel involved in servicing the Fund, as well as the materials provided by the Adviser, the Board expressed satisfaction with the quality, extent, and nature of the services received from the Adviser.
The Board reviewed the investment performance for the Fund. As part of this analysis, the Board reviewed an independent report prepared by FUSE Research Network, LLC (the “FUSE Report”). The FUSE Report consisted of comparisons of the performance of the Fund to the performance of (i) its selected benchmark; (ii) 14 other multisector bond funds selected by FUSE with similar pricing characteristics (the “Peer Group”); and (iii) the Peer Group and all other multisector bond funds with similar pricing features (the “Peer Universe”). The Board reviewed the methodology used to select the Peer Group and the Peer Universe. The Board reviewed the performance of the River Canyon Fund for the three-month, one-year, three-year, five-year, and since inception periods ended June 30, 2023 compared to the Peer Group, Peer Universe, and the selected benchmark and noted the River Canyon Fund’s outperformance for all periods. After considering the information presented to it, the Board expressed satisfaction with the performance of the Fund and the Adviser.
The Board reviewed the cost of services provided and the profits realized by the Adviser, including assertions related to compensation and profitability. The Board discussed the advisory fee paid by the Fund and the total operating expenses of the Fund. The Board noted that the Adviser received a management fee of 0.65% of average daily net assets of the Fund. The Board reviewed the investment advisory fee and the total net expenses paid by the River Canyon Fund in comparison to the median investment advisory fees and the median total net expenses paid by the Peer Group and Peer Universe and noted that the River Canyon Fund advisory fee was higher than the median paid by the Peer Group and that the River Canyon Fund’s total net operating expenses were in line with the median for the Peer Group and lower than the Peer Universe as set forth in the FUSE Report. The Board then considered the expense cap in place for the Fund, noting that the Adviser had contractually agreed to waive fees and/or reimburse expenses to limit total annual fund operating expenses to 0.65% of average daily net assets. After considering the comparative fee and expense data, as well as performance data, provided by the Adviser, the Board concluded that the advisory fees and expense ratios were reasonable.
The Board examined the profitability of the Adviser’s relationship with the Fund and considered the information provided by the Adviser. Among other things, the Board considered the overall financial condition and profitability of the Adviser and representations made thereto and to overall importance of the Fund’s relationship to the Adviser’s business strategy. The Board concluded that, based on both the written and oral reports provided by the Adviser, River Canyon did not expect to earn a profit with respect to its management of the River Canyon Fund.
28
ADVISERS INVESTMENT TRUST
RIVER CANYON TOTAL RETURN BOND FUND
ADDITIONAL INFORMATION
September 30, 2023 (Unaudited)
In considering the economies of scale for the Fund, the Board considered the marketing and distribution plans for the Fund, the Fund’s capacity, and the Fund’s breakeven point. The Board noted than other than the investment advisory fee, the Adviser derived no other fees or monetary benefits from the Fund.
In its deliberations, the Board did not identify any particular factor or factors that were all-important or controlling; and each Trustee assigned different weights to various factors considered.
Investors may obtain a copy of the proxy voting policies and procedures of the Fund by writing to the Trust in the name of the Fund c/o The Northern Trust Company, P.O. Box 4766, Chicago, Illinois 60680-4766 or by calling the Fund at 800-245-0371 (toll free) or 312-557-0164. Information about how the Fund voted proxies relating to portfolio securities for the most recent 12-month period ended June 30 is available without charge, upon request, by calling the Trust at 800-245-0371 (toll free) or 312-557-0164 and on the SEC website at www.sec.gov.
The Fund files its complete schedule of portfolio holdings with the SEC for the first and third quarters of each fiscal year as an exhibit to its reports on Form N-PORT. The Fund’s Form N-PORT reports are available on the SEC’s website at www.sec.gov. The information on Form N-PORT is also available to shareholders upon written request or by calling the Fund at 800-245-0371 (toll free).
The following table provides information regarding each Independent Trustee.
| | | | | | | | | | |
Name, Address and Year of Birth1 | | Position(s) Held with the Trust | | Term of Office/Length of Time Served | | Principal Occupation(s) During Past 5 Years | | Number of Portfolios in the Trust Overseen by Trustee | | Other Directorships Held by Trustee During Past 5 Years |
| | | | | |
Robert Gordon Year of Birth: 1961 | | Trustee | | Indefinite/ January 2022 to present | | Independent Director, VAM Funds Luxembourg, 2018 to present; Independent Director, Anchor Capital Advisors, 2020 to present; Independent Director, Trust Company of Illinois, 2019 to 2021; President and Chief Executive Officer, Driehaus Capital Management, 2006 to 2017. | | 9 | | VAM Funds Luxembourg, Anchor Capital Advisors, Trust Company of Illinois |
| | | | | |
D’Ray Moore Year of Birth: 1959 | | Trustee | | Indefinite/July 2011 to present | | Independent Trustee, Diamond Hill Funds, 2007 to 2022; Chairperson, Diamond Hill Funds, 2014 to 2022. | | 9 | | Diamond Hill Funds (retired 2022) |
| | | | | |
Steven R. Sutermeister Year of Birth: 1954 | | Trustee | | Indefinite/July 2011 to present | | President, Vadar Capital LLC, 2008 to 2017. | | 9 | | None |
| 1 | The mailing address of each Trustee is 50 S. LaSalle Street, Chicago, IL 60603. |
29
ADVISERS INVESTMENT TRUST
RIVER CANYON TOTAL RETURN BOND FUND
ADDITIONAL INFORMATION
September 30, 2023 (Unaudited)
The following table provides information regarding each officer of the Trust.
| | | | | | | | | | |
Name, Address and Year of Birth1 | | Position(s) Held with the Trust | | Term of Office/ Length of Time Served | | Principal Occupation(s) During Past 5 Years | | Number of Portfolios in the Trust Overseen by Trustee | | Other Directorships Held by Trustee During Past 5 Years |
Barbara J. Nelligan Year of Birth: 1969 | | President | | Indefinite/August 2017 to present | | Senior Vice President, Global Fund Services Fund Governance Solutions, The Northern Trust Company, 2018 to present; Senior Vice President, Global Fund Services Product Management, The Northern Trust Company, 2007 to 2018; Vice President of Advisers Investment Trust, 2012 to 2017. | | N/A | | N/A |
| | | | | |
Rodney Ruehle Year of Birth: 1968 | | Chief Compliance Officer and AML Officer | | Indefinite/March 2019 to present | | Senior Principal Consultant, ACA Group, 2022 to present; Director, Foreside Fund Officer Services, LLC (formerly Foreside Compliance Services, LLC) (financial services), 2016 to 2022. | | N/A | | N/A |
| | | | | |
Kara M. Scheider Year of Birth: 1973 | | Secretary | | Indefinite/March 2023 to present | | Second Vice President, Global Fund Services Fund Governance Solutions, The Northern Trust Company, 2021 to present; Manager, Ultimus Fund Solutions LLC, 2017 to 2021; Assistant Secretary of Advisers Investment Trust, 2021 to March 2023. | | N/A | | N/A |
| | | | | |
Troy Sheets Year of Birth: 1971 | | Treasurer | | Indefinite January 2022 to present | | Senior Principal Consultant, ACA Group, 2022 to present; Senior Director, Foreside Fund Officer Services, LLC, 2016 to 2022; Treasurer of Advisers Investment Trust, 2011 to 2021; Assistant Treasurer of Advisers Investment Trust, May 2021 to December 2021. | | N/A | | N/A |
| | | | | |
Tracy L. Dotolo Year of Birth: 1976 | | Assistant Treasurer | | Indefinite/January 2022 to present | | Senior Principal Consultant, ACA Group, 2022 to present; Director, Foreside Fund Officer Services, LLC, 2016 to 2022; Treasurer of Advisers Investment Trust, May 2021 to December 2021. | | N/A | | N/A |
30
ADVISERS INVESTMENT TRUST
RIVER CANYON TOTAL RETURN BOND FUND
ADDITIONAL INFORMATION
September 30, 2023 (Unaudited)
| | | | | | | | | | |
Name, Address and Year of Birth1 | | Position(s) Held with the Trust | | Term of Office/ Length of Time Served | | Principal Occupation(s) During Past 5 Years | | Number of
Portfolios in the
Trust Overseen
by Trustee | | Other
Directorships
Held by Trustee
During Past 5
Years |
|
Stefania C. Suciu Year of Birth: 1979 | | Assistant Secretary | | Indefinite/March 2023 to present | | Second Vice President, Global Fund Services Fund Governance Solutions, The Northern Trust Company, 2015 to present. | | N/A | | N/A |
1 The mailing address of Messrs. Ruehle and Sheets and Ms. Dotolo is 3 Canal Plaza, Suite 100, Portland, ME 04101. The mailing address of Mses. Nelligan, Schneider, and Suciu is 333 S. Wabash Avenue, Chicago, IL 60604.
The Fund’s Statement of Additional Information includes additional information about the Trust’s Trustees and Officers. To receive your free copy of the Statement of Additional Information, call toll-free 800-245-0371.
31
River Canyon Total Return Bond Fund
Notice of Privacy Policy & Practices
SAFEGUARDING PRIVACY
The Fund recognizes and respects the privacy concerns and expectations of our customers. We are committed to maintaining the privacy and security of the personal confidential information we collect about you. We provide this notice so that you will know what kinds of information we collect and the circumstances in which that information may be disclosed to third parties.
INFORMATION WE COLLECT AND SOURCES OF INFORMATION
We collect nonpublic personal information about our customers from the following sources:
| | ● | | Account Applications and other forms, which may include a customer’s name, address, social security number, and information about a customer’s investment goals and risk tolerance; |
| | ● | | Account History, including information about the transactions and balances in a customer’s account(s); and |
| | ● | | Correspondences including written, telephonic or electronic between a customer and the Funds or service providers to the Funds. |
INFORMATION WE SHARE WITH SERVICE PROVIDERS
The Fund may disclose all non-public personal information we collect, as described above, to companies that perform services on our behalf, including those that assist us in responding to inquiries, processing transactions, preparing and mailing account statements and other forms of shareholder services, provided they use the information solely for these purposes and they enter into a confidentiality agreement regarding the information. The Fund also may disclose non-public personal information as otherwise permitted by law.
SAFEGUARDING CUSTOMER INFORMATION
We will safeguard, according to federal standards of security and confidentiality, any non-public personal information our customers share with us.
We require service providers to the Fund:
| | ● | | to maintain policies and procedures designed to assure only appropriate access to, and use of information about customers of the Funds; and |
| | ● | | to maintain physical, electronic and procedural safeguards that comply with federal standards to guard nonpublic personal information of customers of the Funds. |
We will adhere to the policies and practices described in this notice regardless of whether you are a current or former shareholder of the Fund.
(This page has been intentionally left blank)
Investment Adviser
River Canyon Fund Management LLC
2728 North Harwood Street, 2nd Floor
Dallas, Texas 75201
Custodian
The Northern Trust Company
50 South LaSalle Street
Chicago, Illinois 60603
Independent Registered
Public Accounting Firm
Deloitte & Touche LLP
111 S. Wacker Drive
Chicago, Illinois 60606
Legal Counsel
Thompson Hine LLP
41 South High Street, Suite 1700
Columbus, Ohio 43215-6101
Distributor
Foreside Financial Services, LLC
3 Canal Plaza, Suite 100
Portland, Maine 04101
For Additional Information, call
800-245-0371 (toll free) or 312-557-0164
RC 09/23
September 30, 2023
This report is submitted for the general information of the shareholders of the Funds. It is not authorized for the distribution to prospective investors unless preceded or accompanied by an effective prospectus.
Investors may obtain a copy of the proxy voting policies and procedures by writing to Advisers Investment Trust in the name of the respective Fund, P.O. Box 182330, Columbus, OH 43218-2330 or by calling the Fund at 800-477-0740 (toll free), 866-342-2418 (toll free) or 501-255-1812. Information about how the Funds voted proxies relating to portfolio securities for the most recent 12-month period ended June 30 is available without charge, upon request, by calling 800-477-0740 (toll free), 866-342-2418 (toll free) or 501-255-1812 and on the U.S. Securities and Exchange Commission’s (the “SEC”) website at www.sec.gov.
The Funds file their respective complete schedule of portfolio holdings with the SEC for the first and third quarters of each fiscal year as an exhibit to their respective reports on Form N-PORT. The Funds’ Form N-PORT reports are available on the SEC’s website at www.sec.gov. The information on Form N-PORT is also available to shareholders upon written request or by calling 800-477-0740 (toll free), 866-342-2418 (toll free) or 501-255-1812.
ADVISERS INVESTMENT TRUST
STATE FARM FUNDS
MESSAGE TO SHAREHOLDERS
September 30, 2023
Dear Shareholders,
Thank you for investing with State Farm Funds®. Enclosed is the Annual Report for the 12-month period ended September 30, 2023, for the State Farm Growth Fund, the State Farm Balanced Fund, the State Farm Interim Fund, and the State Farm Municipal Bond Fund (the “State Farm Funds” or the “Funds”), each a series of Advisers Investment Trust (“the Trust”). In this report you will find management’s discussion of the investment philosophy and process for each of the State Farm Funds in the Trust, factors that affected each Fund’s performance over the 12-month period, and benchmark index comparisons that are designed to put that performance into context.
The State Farm Funds are advised by State Farm Investment Management Corp. with Northern Trust Investments, Inc. providing day-to-day portfolio management as the sub-adviser. The Northern Trust Company serves as the Funds’ administrator, fund accountant, custodian, and transfer agent.
State Farm Investment Management Corp. has consistently maintained a long-term, disciplined approach to managing investment risk and providing competitive investment products that can help you, our valued shareholder, with your investment goals.1 We believe that remaining focused on your long-term goals and maintaining an appropriate asset allocation mix are important elements in pursuing investment success.2
|
| Sincerely, |
|
 |
|
| Sarah Mineau |
| Vice President |
| State Farm Investment Management Corp. |
| 1 | Investing involves risk, including potential for loss. |
| 2 | Asset allocation does not assure a profit or protect against loss. |
1
ADVISERS INVESTMENT TRUST
STATE FARM GROWTH FUND
MANAGEMENT’S DISCUSSION OF FUND PERFORMANCE
September 30, 2023 (Unaudited)
Overview
Describe the Fund’s investment objective and philosophy.
The State Farm Growth Fund is managed with a long-term investment orientation. State Farm Investment Management Corp., investment adviser to the Fund, has selected Northern Trust Investments, Inc. (the “Sub-Adviser”) as sub-adviser to the Fund. In general, the Sub-Adviser employs a long-term ownership strategy, which emphasizes buying securities as long-term investments. While the Fund seeks to maintain sector weights consistent within 3% to 5% of each sector’s weight in the S&P 500 Index (the “Index”), the Fund’s benchmark index, in making investment decisions on specific securities, the Sub-Adviser uses statistical modeling and research to look for companies with strong profitability and cash flows within their sector and strong management efficiency.
Describe the relevant market environment as it related to the Fund for the reporting period.
Global markets finished the 4th quarter of 2022 higher, with investor sentiment buoyed by easing inflationary pressures. However, most major asset classes finished calendar year 2022 with double-digit losses. Declining inflation levels allowed the U.S. Federal Reserve (the “Fed”) and European Central Bank to slow the pace of interest rate increases, but a significant amount of uncertainty remained surrounding the ultimate level of global interest rates and the duration of restrictive monetary policy. Economic cross-currents added to intra-quarter volatility as sluggish manufacturing and U.S. housing data was at odds with continued strength in the global labor market.
Global equity markets posted mid-single-digit gains in the first quarter of 2023, despite additional central bank tightening and the second-largest bank failure in U.S. history. Throughout the first two months of the quarter, investor focus gradually drifted from a more optimistic view on the path of inflation in January to concerns of further central bank tightening (February through early-March). Attention quickly pivoted to the banking sector in mid-March, following the collapse of Silicon Valley Bank and Signature Bank in the U.S., as well as the rescue acquisition of Credit Suisse by Swiss competitor UBS. Central banks responded to the banking issues with emergency liquidity measures, but continued raising rates later in the quarter. During the first quarter, higher dividend payers gave back some gains following very strong performance in 2022, and low volatility names significantly underperformed high volatility names, thus the high dividend yield and low volatility emphasis of the Fund underperformed in the first quarter.
The equity market continued to post robust gains in the second quarter of 2023, but it was a narrowly led rally driven by a few mega cap technology names. Underlying fundamental measures such as high margins and return on equity (ROE) lagged and strong sales growth was in favor. As higher volatility growth stocks rallied and valuations widened, the equity portfolio’s low volatility and high dividend yield emphasis continued to underperform.
The market in the third quarter experienced a dramatic mood shift as the mega cap growth rally unwound and fundamental measures such as return on invested capital and stable earnings moved in favor. The first half of the year was driven primarily by outperformance of lower quality and higher volatility names, and this trend reversed in the third quarter resulting in favorable performance from the Fund’s emphasized factors. The S&P 500 index modestly declined in the third quarter as rising oil prices and interest rates weighed on investor sentiment. Energy was the best performing sector, benefiting from rising oil prices. Real Estate, Utilities and Consumer Staples sectors lagged, negatively impacted by rising interest rates. Sector performance remained highly reversionary with continued prominent sector dispersion and the growth factor only working in a few sectors. The multiple expansion that drove U.S. equity performance on a year to date basis began to reverse in the third quarter, and factors turned a corner with low volatility and quality ultimately outperforming. Sector neutral positioning and risk controls in the quantitative strategies supported relative returns in a market that saw significant dispersion between top and bottom performers.
How did the Fund perform during the reporting period?
For the 12-month period ended September 30, 2023, the State Farm Growth Fund experienced a total return of 18.58% after expenses, compared to a 21.62% total return for the S&P 500 Index. The S&P 500 Index was up significantly (+7.56%) to close 2022 and the Growth Fund outperformed by 2.92% during that timeframe. The Index then continued to climb 7.50% and 8.74%, respectively, for the first and second quarters of 2023. During that timeframe, the Growth Fund’s bias toward higher quality, lower volatility, and higher dividend-yielding stocks led to underperformance as much of the market’s momentum was temporarily propelled by a relatively small number of higher volatility, non-dividend paying mega-cap names. During the third quarter of 2023, the S&P 500 Index declined 3.27% and the Growth Fund’s performance slightly underperformed (down -3.38%) relative to the benchmark.
2
ADVISERS INVESTMENT TRUST
STATE FARM GROWTH FUND
MANAGEMENT’S DISCUSSION OF FUND PERFORMANCE (continued)
September 30, 2023 (Unaudited)
The line graph below provides additional perspective on the Fund’s long term results.
Comparison of change in value of a hypothetical $10,000 investment
for the years ended September 30
Average Annual Total Returns as of September 30, 2023**
| | | | | | | | | | | | | | | | | | | | | | | | | |
| | | Total Returns
1-Year | | Total Returns
5-Years | | Total Returns
10-Years | | Gross Expense
Ratio*** | | Net Expense
Ratio*** |
State Farm Growth Fund | | | | 18.58 | % | | | | 9.95 | % | | | | 10.50 | % | | | | 0.16 | % | | | | 0.12 | % |
| Benchmark: S&P 500 Index | | | | 21.62 | % | | | | 9.92 | % | | | | 11.91 | % | | | | — | | | | | — | |
The performance data quoted above represents past performance and does not guarantee future results. Investment return and principal value will fluctuate and Fund shares, when redeemed, may be worth more or less than their original cost. Recent performance may be less than the figures shown. Obtain total returns current to the most recent month-end by calling 866-342-2418 (toll free) or 312-557-7940. These figures do not reflect the deduction of taxes that a shareholder would pay on Fund distributions or the redemption of Fund shares.
| * | The S&P 500 Index is a capitalization-weighted measure of the common stocks of 500 large U.S. companies. |
The S&P 500 Index represents an unmanaged group of stocks that differs from the composition of the Growth Fund. Unlike an investment in the Growth Fund, a theoretical investment in the Index does not reflect any expenses. It is not possible to invest directly in an index.
| ** | The Fund is the successor to the State Farm Growth Fund, a series of the State Farm Associates’ Funds Trust (the “Growth Predecessor Fund”), a mutual fund with similar investment objectives, policies, and restrictions. The Growth Predecessor Fund reorganized into the Fund on August 23, 2021. The performance in the charts above includes that of the Growth Predecessor Fund for the periods prior to the reorganization. |
| *** | Expense ratios are per the most recent Fund Prospectus dated January 28, 2023. The Adviser has entered into a contractual expense limitation agreement with respect to the Fund until January 28, 2025. |
3
ADVISERS INVESTMENT TRUST
STATE FARM BALANCED FUND
MANAGEMENT’S DISCUSSION OF FUND PERFORMANCE
September 30, 2023 (Unaudited)
Overview
Describe the Fund’s investment objective and philosophy.
The State Farm Balanced Fund is invested in a combination of stocks and bonds in pursuit of long-term growth of principal while providing some current income. State Farm Investment Management Corp., investment adviser to the Fund, has selected Northern Trust Investments, Inc. (the “Sub-Adviser”) as sub-adviser to the Fund. The Balanced Fund seeks to achieve its objective by investing under normal market conditions approximately 65% of its total assets in common stocks, and ordinarily limits its common stock investments to no more than 75% of its total assets. The Sub-Adviser chooses stocks for the Fund’s portfolio for their long-term potential to generate capital gains, but may also consider a stock’s long-term potential to generate income. Under normal market conditions, the Fund invests approximately 35% and at least 25% of its total assets in a representative sample of fixed income securities in the Bloomberg Intermediate U.S. Government/Credit Bond Index (the “Index”). The Fund will buy and sell fixed income securities with the goal of achieving overall duration and total return similar to that of the Index.
Describe the relevant market environment as it related to the Fund for the reporting period.
Global equity markets and fixed income assets finished the 4th quarter of 2022 higher, with investor sentiment buoyed by easing inflationary pressures. Declining inflation levels allowed the U.S. Federal Reserve and European Central Bank to slow the pace of interest rate increases, but a significant amount of uncertainty remained surrounding the ultimate level of global interest rates and the duration of restrictive monetary policy. Economic cross-currents added to intra-quarter volatility as sluggish manufacturing and U.S. housing data was at odds with continued strength in the global labor market.
Global equity markets and fixed income assets posted positive results the first quarter of 2023, despite additional central bank tightening and the second-largest bank failure in U.S. history. Throughout the first two months of the quarter, investor focus gradually drifted from a more optimistic view on the path of inflation in January to concerns of further central bank tightening (February through early-March). Attention quickly pivoted to the banking sector in mid-March, following the collapse of Silicon Valley Bank and Signature Bank in the U.S., as well as the rescue acquisition of Credit Suisse by Swiss competitor UBS. Central banks responded to the banking issues with emergency liquidity measures, but continued raising rates later in the quarter. During the first quarter, higher dividend payers gave back some gains following very strong performance in 2022, and low volatility names significantly underperformed high volatility names, thus the high dividend yield and low volatility emphasis of the Fund underperformed in the first quarter. Fixed income assets rallied into quarter end as investors sought relative safety and systematic banking concerns alleviated.
The equity market continued to post robust gains in the second quarter of 2023, but it was a narrowly led rally driven by a few mega cap technology names. Underlying fundamental measures such as high margins and ROE lagged and strong sales growth was in favor. As higher volatility growth stocks rallied and valuations widened, the equity portfolio’s low volatility and high dividend yield emphasis continued to underperform.
Fixed income assets generally posted negative results in the second quarter. The spread between the 2-year and 10-year treasury yield curve further inverted to end the quarter at -1.06%. April brought the Federal Deposit Insurance Corporation (FDIC) takeover and subsequent sale to JP Morgan of First Republic Bank, but systemic banking sector concerns eased as deposit outflows slowed and bank earnings came in better than expected. Volatility returned as the U.S. Treasury federal debt ceiling approached but a deal was eventually reached in early June. Amid the uncertain risk backdrop, the Federal Open Market Committee (FOMC) raised rates once during the quarter by 25 basis points (0.25%) to a range of 5.00%-5.25% in May. The committee paused in June, but the dot plot signaled more hikes on the horizon with most members seeing a year end Fed Funds rate of 5.6%. Finally, credit markets responded well to economic data during the quarter that pointed to a tight labor market implying a resilient consumer and indications that inflation continues to ease. Spreads broadly tightened, providing some relief to rising rates.
The market in the third quarter experienced a dramatic mood shift as the mega cap growth rally unwound and fundamental measures such as return on invested capital and stable earnings moved in favor. The first half of the year was driven primarily by outperformance of lower quality and higher volatility names, and this trend reversed in the third quarter resulting in favorable performance from the Fund’s emphasized factors. Sector performance remained highly reversionary with continued prominent sector dispersion and the growth factor only working in a few sectors. The multiple expansion that drove US equity performance on a year to date basis began to reverse in the third quarter, and factors turned a corner with low volatility and quality ultimately outperforming. Sector neutral positioning and risk controls in the quantitative strategies supported relative returns in a market that saw significant dispersion between top and bottom performers. Fixed Income assets generally posted negative results in the third quarter amid a volatile rate environment where the yield curve became substantially less inverted. The two-year U.S. Treasury rose 15 basis points (0.15%) while the 10-year U.S. Treasury moved higher by 73 basis points (0.73%) ending the quarter inverted -0.48%. Underlying inflation, while still elevated, eased a bit and the labor market remained robust. Market sentiment turned negative during the quarter amid the Fitch downgrade of U.S. Sovereign debt and rising concern about the effects of a
4
ADVISERS INVESTMENT TRUST
STATE FARM BALANCED FUND
MANAGEMENT’S DISCUSSION OF FUND PERFORMANCE (continued)
September 30, 2023 (Unaudited)
U.S. government shutdown on the growth outlook. The FOMC resumed its hiking cycle and raised the federal funds rate to a target range of 5.25%-5.50% in July, before pausing again in September
How did the Fund perform during the reporting period?
For the 12-month period ended September 30, 2023, the State Farm Balanced Fund experienced a total return of 13.87% after expenses, compared to a 14.71% return of the blended benchmark of the Fund. The Balanced Fund’s 12-month underperformance was driven primarily by the equity portion of the Fund. The S&P 500 Index was up significantly (+7.56%) to close 2022 and equity portion of the Fund outperformed during that timeframe. The Index then continued to climb 7.50% and 8.74%, respectively, for the first and second quarters of 2023. During that timeframe, the equity portion of the Balanced Fund’s bias toward higher quality, lower volatility, and higher dividend-yielding stocks led to underperformance as much of the market’s momentum was temporarily propelled by a relatively small number of higher volatility, non-dividend paying mega-cap names. During the third quarter of 2023, the S&P 500 Index declined 3.27% and the Balanced Fund’s equity performance slightly underperformed relative to the benchmark. The fixed income portion of the Balanced Fund underperformed the Fund’s fixed income benchmark due to the Fund’s security selection.
The line graph below provides additional perspective on the Fund’s long term results.
Comparison of change in value of a hypothetical $10,000 investment
for the years ended September 30

| * | The S&P 500 Index is a capitalization-weighted measure of the common stocks of 500 large U.S. companies. |
| ** | The Bloomberg Intermediate U.S. Government/Credit Index contains 5,307 U.S. Treasury, corporate and other securities with an average maturity of about 4.40 years. |
| *** | The Northern Trust Company computes the Blended Benchmark using 65% S&P 500 Index and 35% Bloomberg Intermediate U.S. Gov/Credit Index (rebalanced on a monthly basis). |
The S&P 500 Index and the Bloomberg Intermediate U.S. Gov/Credit Index represent unmanaged groups of stocks and bonds that differ from the composition of the Balanced Fund. Unlike an investment in the Balanced Fund, theoretical investments in the Indices or Blended Benchmark do not reflect any expenses. It is not possible to invest directly in an index or the Blended Benchmark.
5
ADVISERS INVESTMENT TRUST
STATE FARM BALANCED FUND
MANAGEMENT’S DISCUSSION OF FUND PERFORMANCE (continued)
September 30, 2023 (Unaudited)
Average Annual Total Returns as of September 30, 2023****
| | | | | | | | | | | | | | | | | | | | | | | | | |
| | | Total Returns
1-Year | | Total Returns
5-Years | | Total Returns
10-Years | | Gross Expense
Ratio***** | | Net Expense
Ratio***** |
State Farm Balanced Fund | | | | 13.87 | % | | | | 7.69 | % | | | | 7.75 | % | | | | 0.18 | % | | | | 0.14 | % |
Benchmark: S&P 500 Index | | | | 21.62 | % | | | | 9.92 | % | | | | 11.91 | % | | | | — | | | | | — | |
Benchmark: Bloomberg Intermediate | | | | | | | | | | | | | | | | | | | | | | | | | |
U.S. Government/Credit Index | | | | 2.20 | % | | | | 1.02 | % | | | | 1.27 | % | | | | — | | | | | — | |
Benchmark: Blended Benchmark | | | | 14.71 | % | | | | 7.11 | % | | | | 8.33 | % | | | | — | | | | | — | |
The performance data quoted above represents past performance and does not guarantee future results. Investment return and principal value will fluctuate and Fund shares, when redeemed, may be worth more or less than their original cost. Recent performance may be less than the figures shown. Obtain total returns current to the most recent month-end by calling by calling 866-342-2418 (toll free) or 312-557-7940. These figures do not reflect the deduction of taxes that a shareholder would pay on Fund distributions or the redemption of Fund shares.
| **** | The Fund is the successor to the State Farm Balanced Fund, a series of the State Farm Associates’ Funds Trust (the “Balanced Predecessor Fund”), a mutual fund with similar investment objectives, policies, and restrictions. The Balanced Predecessor Fund reorganized into the Fund on August 23, 2021. The performance in the charts above includes that of the Balanced Predecessor Fund for the periods prior to the reorganization. |
| ***** | Expense ratios are per the most recent Fund Prospectus dated January 28, 2023. The Adviser has entered into a contractual expense limitation agreement with respect to the Fund until January 28, 2025. |
6
ADVISERS INVESTMENT TRUST
STATE FARM INTERIM FUND
MANAGEMENT’S DISCUSSION OF FUND PERFORMANCE
September 30, 2023 (Unaudited)
Overview
Describe the Fund’s investment objective and philosophy.
The State Farm Interim Fund is managed in a manner that seeks to provide investment results approximating the performance of the Bloomberg 1-5 Year U.S. Treasury Index. State Farm Investment Management Corp., investment adviser to the Fund, has selected Northern Trust Investments, Inc. (the “Sub-Adviser”) as sub-adviser to the Fund. Under normal circumstances, the Fund invests substantially all its net assets in a representative sample of the U.S. Treasury obligations included in the Bloomberg 1-5 Year U.S. Treasury Index (the “Index”). The Sub-Adviser tries to replicate the investment composition and performance of the Index using computer programs and statistical procedures. The Fund will buy and sell securities with the goal of achieving an overall duration and total return for the Fund similar to that of the Index.
Describe the relevant market environment as it related to the Fund for the reporting period.
Following three negative quarters, fixed income assets posted positive results in the fourth quarter of 2022. Though not in a linear fashion, credit spreads were broadly tighter, and the treasury yield curve moved lower and flatter. Markets hoped softer economic data reported during the quarter would pave the way for the Fed to slow the pace of rate hikes and pause its hiking cycle early. During the quarter, the Fed increased the Federal Funds target range to 4.25-4.50% via a 75 and 50 basis point hike in November and December, respectively. Importantly, the Summary of Economic Projections reflected a peak Fed Funds Rate of 5.1%, half a percentage point higher than September projections and higher than the market is pricing. The labor market remained tight as the unemployment rate ticked up only slightly to 3.7% during the quarter. While uncertainty still existed, markets embraced the overall softer economic data during the quarter.
Fixed income assets posted positive results in the first quarter of 2023; however, it was not without volatility. Interest rates ended the quarter lower and credit spreads were broadly tighter contributing to positive results amidst near unprecedented interest rate volatility. Ultimately, the two-year and 10-year treasury yield fell in parallel down 40 basis points (0.40%) in the quarter while the Fed raised rates twice during the quarter via two 25 basis point (0.25%) hikes. January had positive economic data as inflation continued to tick down, and Gross Domestic Product came in higher than expected. Markets hoped this was a sign the economy could avoid a recession and the Fed would be closer to ending its rate hiking cycle. However, February payroll exceeded expectations while the core personal consumption expenditures came in hotter than expected. Markets reversed all gains earned in January as the likelihood for a “higher-for-longer” rate environment increased. Finally, markets entered a period of intense volatility in March following the collapse of Silicon Valley Bank (SVB), Signature Bank and Credit Suisse, which introduced fears regarding banking sector stability. The ICE BofA Move Index, which measures bond market volatility, spiked hitting a high price of 198 on March 15th, the highest since the Great Financial Crisis. Fixed income assets rallied into quarter end as investors sought relative safety and systematic banking concerns alleviated.
Fixed income assets generally posted negative results in the second quarter. The spread between the two year and 10-year treasury yield curve further inverted to end the quarter at -1.06%. April brought the FDIC takeover and subsequent sale to JP Morgan of First Republic Bank, but systemic banking sector concerns eased as deposit outflows slowed and bank earnings came in better than expected. Volatility returned as the U.S. Treasury federal debt ceiling approached but a deal was eventually reached in early June. Amid the uncertain risk backdrop, the FOMC raised rates once during the quarter by 25 basis points (0.25%) to a range of 5.00%-5.25% in May. The committee paused in June, but the dot plot signaled more hikes on the horizon with most members seeing a year end Fed Funds rate of 5.6%. Markets dramatically lowered their expectations for rate cuts by year end following the June meeting. Finally, credit markets responded well to economic data during the quarter that pointed to a tight labor market implying a resilient consumer and indications that inflation continues to ease. Spreads broadly tightened, providing some relief to rising rates.
Fixed Income assets generally posted negative results in the third quarter amid a volatile rate environment where the yield curve became substantially less inverted. The two-year U.S. Treasury rose 15 basis points (0.15%) while the 10-year U.S. Treasury moved higher by 73 basis points (0.73%) ending the quarter inverted -0.48%. Economic data cooled off some but remained resilient. Underlying inflation, while still elevated, eased a bit and the labor market remained robust. Market sentiment turned negative during the quarter amid the Fitch downgrade of U.S. Sovereign debt and rising concern about the effects of a U.S. government shutdown on the growth outlook. The FOMC resumed its hiking cycle and raised the federal funds rate to a target range of 5.25%-5.50% in July, before pausing again in September. Importantly, FOMC participants reduced the number of rate cuts expected in 2024, reinforcing the “higher for longer” message and likely contributing to the run-up in U.S. Treasury yields.
How did the Fund perform during the reporting period?
For the 12-month period ended September 30, 2023, the State Farm Interim Fund experienced a total return of 1.92% after expenses, compared to a 2.07% return for the Bloomberg 1-5 Year U.S. Treasury Index. The impact of expenses, and to a smaller
7
ADVISERS INVESTMENT TRUST
STATE FARM INTERIM FUND
MANAGEMENT’S DISCUSSION OF FUND PERFORMANCE (continued)
September 30, 2023 (Unaudited)
extent the duration and security selection effects associated with sampling from the benchmark, the Bloomberg 1-5 Year U.S. Treasury Index, contributed to the Fund’s overall relative underperformance.
The line graph below provides additional perspective on the Fund’s long term results.
Comparison of change in value of a hypothetical $10,000 investment
for the years ended September 30
Average Annual Total Returns as of September 30, 2023**
| | | | | | | | | | | | | | | | | | | | | | | | | |
| | | Total Returns
1-Year | | Total Returns
5-Years | | Total Returns
10-Years | | Gross Expense
Ratio*** | | Net Expense
Ratio*** |
State Farm Interim Fund | | 1.92% | | 0.70% | | 0.65% | | 0.22% | | 0.16% |
| Benchmark: Bloomberg 1-5 Year U.S. Treasury Index | | 2.07% | | 0.90% | | 0.79% | | — | | — |
The performance data quoted above represents past performance and does not guarantee future results. Investment return and principal value will fluctuate and Fund shares, when redeemed, may be worth more or less than their original cost. Recent performance may be less than the figures shown. Obtain total returns current to the most recent month-end by calling 866-342-2418 (toll free) or 312-557-7940. These figures do not reflect the deduction of taxes that a shareholder would pay on Fund distributions or the redemption of Fund shares.
| * | The Bloomberg 1-5 Year U.S. Treasury Index measures the performance of short-term U.S. Treasury Securities maturing within one to five years. |
The Bloomberg 1-5 Year U.S. Treasury Index represents an unmanaged group of bonds that differs from the composition of the Interim Fund. Unlike an investment in the Interim Fund, a theoretical investment in the Index does not reflect any expenses. It is not possible to invest directly in an index.
| ** | The Fund is the successor to the State Farm Interim Fund, a series of the State Farm Associates’ Funds Trust (the “Interim Predecessor Fund”), a mutual fund with similar investment objectives, policies, and restrictions. The Interim Predecessor Fund reorganized into the Fund on August 23, 2021. The performance in the charts above includes that of the Interim Predecessor Fund for the periods prior to the reorganization. |
| *** | Expense ratios are per the most recent Fund Prospectus dated January 28, 2023. The Adviser has entered into a contractual expense limitation agreement with respect to the Fund until January 28, 2025. |
8
ADVISERS INVESTMENT TRUST
STATE FARM MUNICIPAL BOND FUND
MANAGEMENT’S DISCUSSION OF FUND PERFORMANCE
September 30, 2023 (Unaudited)
Overview
Describe the Fund’s investment objective and philosophy.
The State Farm Municipal Bond Fund seeks as high a rate of income exempt from federal income taxes as is consistent with prudent investment management. Under normal circumstances, the Fund invests so that either (1) at least 80% of the Fund’s net investment income is exempt from regular federal income tax or (2) at least 80% of the Fund’s net assets are invested in securities that produce income exempt from federal income tax. State Farm Investment Management Corp., investment adviser to the Fund, has selected Northern Trust Investments, Inc. (the “Sub-Adviser”) as sub-adviser to the Fund. The Sub-Adviser will invest the Fund’s assets primarily in a diversified selection of municipal bonds with maturities of one to 17 years, although from time to time the Sub-Adviser may purchase issues with longer maturities. A majority of the Fund’s investments are in issues with maturities longer than five years.
Describe the relevant market environment as it related to the fund for the reporting period.
The municipal bond market experienced volatility throughout the fiscal year as hopes for a “soft landing” economic outlook collided with regional banking concerns, Treasury debt limits, and geopolitical conflict. Amid elevated, yet slowing inflation and resilient economic data, the FOMC raised the Federal Funds rate six times while continuing to reduce its balance sheet on a consistent monthly basis. The FOMC entered a holding pattern following its July meeting and the Federal Funds rate ended the fiscal year at a range of 5.25%-5.50%. Longer term interest rates generally fell during the first half of the fiscal year before reversing course and rising into fiscal year end. The Municipal yield curve flattened as 2-year and 10-year AAA Municipal yields rose 58 and 18 basis points (bps), respectively. Comparatively, the 2-year and 10-year US Treasury rose 77 and 74 bps, respectively. The relative interest rate move pushed Municipal/Treasury ratios lower with Municipals ending the fiscal year at relatively more expensive levels than the start of the fiscal year.
Municipal bond mutual fund outflows continued during the reporting period at a measured pace but slowed significantly compared to fiscal year 2022 as higher yields and expectations for the end of the FOMC hiking cycle tempered outflows relative to the previous year. New issuance in the primary market continued to slow on a year over year basis, as strong balance sheets, robust revenue, stimulus cash and higher rates resulted in less borrowing and refinancings. Municipal bond credit spreads tightened over the course of the fiscal year as investors were attracted to yields amid a benign economic environment. Lower rated credit spreads tightened by a greater degree than higher rated counterparts, pushing credit spreads for the lowest rated issuers significantly below the one-year averages.
How did the Fund perform during the reporting period?
For the 12-month period ended September 30, 2023, the State Farm Municipal Bond Fund experienced a total return of 2.64% after expenses, compared to a 2.23% return for the Bloomberg 7-Year Municipal Bond Index. Duration positioning was the largest contributor to outperformance as the Fund carried an overall longer duration than the benchmark and duration positioning moved lower to neutral during the year. Credit quality allocation and selection detracted marginally from performance. The Fund was overweight higher credit quality names versus its benchmark during the fiscal year which dragged on performance as the lower rated segment outperformed as credit spreads tightened.
9
ADVISERS INVESTMENT TRUST
STATE FARM MUNICIPAL BOND FUND
MANAGEMENT’S DISCUSSION OF FUND PERFORMANCE (continued)
September 30, 2023 (Unaudited)
The line graph below provides additional perspective on the Fund’s long term results.
Comparison of change in value of a hypothetical $10,000 investment
for the years ended September 30
Average Annual Total Returns as of September 30, 2023**
| | | | | | | | | | | | | | | | | | | | | | | | | |
| | | Total Returns
1-Year | | Total Returns
5-Years | | Total Returns
10-Years | | Gross Expense
Ratio*** | | Net Expense
Ratio*** |
State Farm Municipal Bond Fund | | 2.64% | | 1.17% | | 1.91% | | 0.19% | | 0.17% |
| Benchmark: Bloomberg 7-Year Municipal Bond Index | | 2.23% | | 1.27% | | 1.94% | | — | | — |
The performance data quoted above represents past performance and does not guarantee future results. Investment return and principal value will fluctuate and Fund shares, when redeemed, may be worth more or less than their original cost. Recent performance may be less than the figures shown. Obtain total returns current to the most recent month-end by calling 1-800-447-0740. These figures do not reflect the deduction of taxes that a shareholder would pay on Fund distributions or the redemption of Fund shares.
| * | The Bloomberg Barclays 7-Year Municipal Bond Index is an unmanaged index comprised of investment grade municipal bonds with maturities of six to eight years. |
The Bloomberg Barclays 7-Year Municipal Bond Index differs from the composition of the Municipal Bond Fund. Unlike an investment in the Municipal Bond Fund, a theoretical investment in the Index does not reflect any expenses. It is not possible to invest directly in an index.
| ** | The Fund is the successor to the State Farm Municipal Bond Fund, a series of the State Farm Associates’ Funds Trust (the “Municipal Bond Predecessor Fund”), a mutual fund with similar investment objectives, policies, and restrictions. The Municipal Bond Predecessor Fund reorganized into the Fund on August 23, 2021. The performance in the charts above includes that of the Municipal Bond Predecessor Fund for the periods prior to the reorganization. |
| *** | Expense ratios are per the most recent Fund Prospectus dated January 28, 2023. The Adviser has entered into a contractual expense limitation agreement with respect to Fund until January 28, 2025. |
10
ADVISERS INVESTMENT TRUST
STATE FARM GROWTH FUND
SCHEDULE OF INVESTMENTS
September 30, 2023
| | | | | | | | |
| | | Shares | | | Value | |
Common Stocks (99.10%) | | | | | | | | |
| |
Advertising & Marketing (0.23%) | | | | | |
Interpublic Group of Cos. Inc., The | | | 528,100 | | | $ | 15,135,346 | |
| | | | | | | | |
Aerospace & Defense (0.20%) | | | | | | | | |
Lockheed Martin Corp. | | | 32,100 | | | | 13,127,616 | |
| | | | | | | | |
Apparel & Textile Products (0.42%) | |
NIKE Inc., Class B | | | 6,400 | | | | 611,968 | |
Ralph Lauren Corp. | | | 113,900 | | | | 13,222,651 | |
Tapestry Inc. | | | 455,200 | | | | 13,087,000 | |
| | | | | | | | |
| | | | | | | 26,921,619 | |
| | | | | | | | |
Asset Management (0.61%) | | | | | | | | |
BlackRock Inc. | | | 23,800 | | | | 15,386,462 | |
Invesco Ltd. | | | 100 | | | | 1,452 | |
Janus Henderson Group PLC | | | 584,200 | | | | 15,084,044 | |
Voya Financial Inc. | | | 130,300 | | | | 8,658,435 | |
| | | | | | | | |
| | | | | | | 39,130,393 | |
| | | | | | | | |
Automotive (0.56%) | | | | | | | | |
Tesla Inc.(a) | | | 144,800 | | | | 36,231,856 | |
| | | | | | | | |
Banking (1.81%) | | | | | | | | |
Bank of America Corp. | | | 76,000 | | | | 2,080,880 | |
Citigroup Inc. | | | 20,600 | | | | 847,278 | |
Comerica Inc. | | | 100 | | | | 4,155 | |
JPMorgan Chase & Co. | | | 97,500 | | | | 14,139,450 | |
M&T Bank Corp. | | | 62,000 | | | | 7,839,900 | |
Pinnacle Financial Partners Inc. | | | 46,000 | | | | 3,083,840 | |
Wells Fargo & Co. | | | 2,178,700 | | | | 89,021,682 | |
Zions Bancorp NA | | | 100 | | | | 3,489 | |
| | | | | | | | |
| | | | | | | 117,020,674 | |
| | | | | | | | |
Beverages (2.07%) | | | | | | | | |
Coca-Cola Co., The | | | 847,000 | | | | 47,415,060 | |
Constellation Brands Inc., Class A | | | 7,200 | | | | 1,809,576 | |
PepsiCo Inc. | | | 496,000 | | | | 84,042,240 | |
| | | | | | | | |
| | | | | | | 133,266,876 | |
| | | | | | | | |
Biotechnology & Pharmaceuticals (17.52%) | |
AbbVie Inc. | | | 636,000 | | | | 94,802,160 | |
Amgen Inc. | | | 176,485 | | | | 47,432,109 | |
Bristol-Myers Squibb Co. | | | 18,800 | | | | 1,091,152 | |
Eli Lilly & Co. | | | 738,000 | | | | 396,401,940 | |
Gilead Sciences Inc. | | | 189,800 | | | | 14,223,612 | |
Johnson & Johnson | | | 2,303,620 | | | | 358,788,815 | |
Merck & Co. Inc. | | | 82,250 | | | | 8,467,638 | |
Organon & Co. | | | 17,103 | | | | 296,908 | |
Pfizer Inc. | | | 2,214,832 | | | | 73,465,977 | |
Regeneron Pharmaceuticals Inc.(a) | | | 1,500 | | | | 1,234,440 | |
Vertex Pharmaceuticals Inc.(a) | | | 31,300 | | | | 10,884,262 | |
Zoetis Inc. | | | 705,396 | | | | 122,724,796 | |
| | | | | | | | |
| | | | | | | 1,129,813,809 | |
| | | | | | | | |
| | | | | | | | |
| | | Shares | | | Value | |
Common Stocks (Cont.) | | | | | | | | |
| |
Cable & Satellite (0.18%) | | | | | |
Comcast Corp., Class A | | | 84,300 | | | $ | 3,737,862 | |
Sirius XM Holdings Inc. | | | 1,756,100 | | | | 7,937,572 | |
| | | | | | | | |
| | | | | | | 11,675,434 | |
| | | | | | | | |
Chemicals (4.71%) | | | | | | | | |
Air Products and Chemicals Inc. | | | 829,800 | | | | 235,165,320 | |
Avery Dennison Corp. | | | 53,700 | | | | 9,809,379 | |
International Flavors & Fragrances Inc. | | | 524,541 | | | | 35,757,960 | |
Linde PLC | | | 59,000 | | | | 21,968,650 | |
Sherwin-Williams Co., The | | | 4,700 | | | | 1,198,735 | |
| | | | | | | | |
| | | | | | | 303,900,044 | |
| | | | | | | | |
Commercial Support Services (0.55%) | |
Cintas Corp. | | | 16,600 | | | | 7,984,766 | |
H&R Block Inc. | | | 547,700 | | | | 23,583,962 | |
Republic Services Inc. | | | 28,200 | | | | 4,018,782 | |
| | | | | | | | |
| | | | | | | 35,587,510 | |
| | | | | | | | |
Construction Materials (3.26%) | |
Vulcan Materials Co. | | | 1,039,200 | | | | 209,939,184 | |
| | | | | | | | |
Consumer Services (0.07%) | | | | | | | | |
Grand Canyon Education Inc.(a) | | | 39,500 | | | | 4,616,760 | |
| | | | | | | | |
Containers & Packaging (0.79%) | |
AptarGroup Inc. | | | 409,497 | | | | 51,203,505 | |
| | | | | | | | |
Diversified Industrials (3.00%) | |
3M Co. | | | 164,400 | | | | 15,391,128 | |
Emerson Electric Co. | | | 126,400 | | | | 12,206,448 | |
Honeywell International Inc. | | | 82,800 | | | | 15,296,472 | |
Illinois Tool Works Inc. | | | 652,300 | | | | 150,231,213 | |
| | | | | | | | |
| | | | | | | 193,125,261 | |
| | | | | | | | |
E-Commerce Discretionary (0.37%) | |
Amazon.com Inc.(a) | | | 188,800 | | | | 24,000,256 | |
Etsy Inc.(a) | | | 100 | | | | 6,458 | |
| | | | | | | | |
| | | | | | | 24,006,714 | |
| | | | | | | | |
Electric Utilities (0.68%) | | | | | | | | |
Consolidated Edison Inc. | | | 91,200 | | | | 7,800,336 | |
Duke Energy Corp. | | | 17,400 | | | | 1,535,724 | |
Evergy Inc. | | | 182,200 | | | | 9,237,540 | |
OGE Energy Corp. | | | 254,300 | | | | 8,475,819 | |
Pinnacle West Capital Corp. | | | 103,500 | | | | 7,625,880 | |
Public Service Enterprise Group Inc. | | | 165,900 | | | | 9,441,369 | |
| | | | | | | | |
| | | | | | | 44,116,668 | |
| | | | | | | | |
Electrical Equipment (0.08%) | |
AMETEK Inc. | | | 36,000 | | | | 5,319,360 | |
| | | | | | | | |
Entertainment Content (3.33%) | |
Electronic Arts Inc. | | | 27,200 | | | | 3,274,880 | |
| | |
| See accompanying notes to financial statements. | | 11 |
ADVISERS INVESTMENT TRUST
STATE FARM GROWTH FUND
SCHEDULE OF INVESTMENTS (continued)
September 30, 2023
| | | | | | | | |
| | | Shares | | | Value | |
Common Stocks (Cont.) | |
|
Entertainment Content (Cont.) | |
Walt Disney Co., The(a) | | | 2,609,440 | | | $ | 211,495,112 | |
Warner Bros Discovery Inc.(a) | | | 100 | | | | 1,086 | |
| | | | | | | | |
| | | | | | | 214,771,078 | |
| | | | | | | | |
Food (1.31%) | | | | | | | | |
General Mills Inc. | | | 135,500 | | | | 8,670,645 | |
Kellogg Co. | | | 179,400 | | | | 10,676,094 | |
McCormick & Co. Inc. | | | 856,600 | | | | 64,793,224 | |
| | | | | | | | |
| | | | | | | 84,139,963 | |
| | | | | | | | |
Health Care Facilities & Services (0.75%) | |
Cardinal Health Inc. | | | 114,700 | | | | 9,958,254 | |
Chemed Corp. | | | 18,700 | | | | 9,718,390 | |
Cigna Group, The | | | 11,200 | | | | 3,203,984 | |
CVS Health Corp. | | | 5,300 | | | | 370,046 | |
Elevance Health Inc. | | | 12,100 | | | | 5,268,582 | |
McKesson Corp. | | | 26,800 | | | | 11,653,980 | |
Quest Diagnostics Inc. | | | 47,400 | | | | 5,776,164 | |
UnitedHealth Group Inc. | | | 5,000 | | | | 2,520,950 | |
| | | | | | | | |
| | | | | | | 48,470,350 | |
| | | | | | | | |
Home & Office Products (0.77%) | |
HNI Corp. | | | 1,439,200 | | | | 49,839,496 | |
| | | | | | | | |
Household Products (2.62%) | | | | | | | | |
Clorox Co., The | | | 11,500 | | | | 1,507,190 | |
Colgate-Palmolive Co. | | | 466,300 | | | | 33,158,593 | |
Kenvue Inc. | | | 1,427,196 | | | | 28,658,096 | |
Procter & Gamble Co., The | | | 724,755 | | | | 105,712,764 | |
| | | | | | | | |
| | | | | | | 169,036,643 | |
| | | | | | | | |
Industrial Support Services (0.09%) | |
MSC Industrial Direct Co. Inc., | | | | | | | | |
Class A | | | 22,700 | | | | 2,228,005 | |
Watsco Inc. | | | 9,200 | | | | 3,475,024 | |
| | | | | | | | |
| | | | | | | 5,703,029 | |
| | | | | | | | |
Institutional Financial Services (0.31%) | |
Cboe Global Markets Inc. | | | 6,500 | | | | 1,015,365 | |
Goldman Sachs Group Inc., The | | | 3,500 | | | | 1,132,495 | |
Intercontinental Exchange Inc. | | | 104,200 | | | | 11,464,084 | |
Northern Trust Corp. | | | 20,600 | | | | 1,431,288 | |
SEI Investments Co. | | | 9,400 | | | | 566,162 | |
Virtu Financial Inc., Class A, Class A | | | 270,000 | | | | 4,662,900 | |
| | | | | | | | |
| | | | | | | 20,272,294 | |
| | | | | | | | |
Insurance (0.91%) | |
Allstate Corp., The | | | 28,700 | | | | 3,197,467 | |
Aon PLC, Class A | | | 12,800 | | | | 4,150,016 | |
Berkshire Hathaway Inc., Class B(a) | | | 23,800 | | | | 8,337,140 | |
Chubb Ltd. | | | 56,500 | | | | 11,762,170 | |
Lincoln National Corp. | | | 599,300 | | | | 14,796,717 | |
Travelers Cos. Inc., The | | | 66,700 | | | | 10,892,777 | |
Willis Towers Watson PLC | | | 25,300 | | | | 5,286,688 | |
| | | | | | | | |
| | | | | | | 58,422,975 | |
| | | | | | | | |
| | | | | | | | |
| | | Shares | | | Value | |
Common Stocks (Cont.) | | | | | | | | |
|
Internet Media & Services (4.33%) | |
Alphabet Inc., Class A(a) | | | 1,534,300 | | | $ | 200,778,498 | |
Alphabet Inc., Class C(a) | | | 118,320 | | | | 15,600,492 | |
Booking Holdings Inc.(a) | | | 400 | | | | 1,233,580 | |
Meta Platforms Inc., Class A(a) | | | 128,870 | | | | 38,688,063 | |
Netflix Inc.(a) | | | 61,400 | | | | 23,184,640 | |
| | | | | | | | |
| | | | | | | 279,485,273 | |
| | | | | | | | |
Leisure Facilities & Services (1.35%) | |
Carnival Corp.(a) | | | 68,700 | | | | 942,564 | |
Domino’s Pizza Inc. | | | 9,500 | | | | 3,598,505 | |
Las Vegas Sands Corp. | | | 100 | | | | 4,584 | |
Madison Square Garden Sports Corp. | | | 40,100 | | | | 7,069,630 | |
McDonald’s Corp. | | | 84,600 | | | | 22,287,024 | |
MGM Resorts International | | | 27,600 | | | | 1,014,576 | |
Norwegian Cruise Line Holdings
Ltd.(a) | | | 100 | | | | 1,648 | |
Royal Caribbean Cruises Ltd.(a) | | | 40,800 | | | | 3,759,312 | |
Starbucks Corp. | | | 277,600 | | | | 25,336,552 | |
TKO Group Holdings Inc. | | | 200,100 | | | | 16,820,406 | |
Travel + Leisure Co. | | | 138,700 | | | | 5,094,451 | |
Wynn Resorts Ltd. | | | 14,600 | | | | 1,349,186 | |
| | | | | | | | |
| | | | | | | 87,278,438 | |
| | | | | | | | |
Machinery (3.82%) | |
Caterpillar Inc. | | | 892,321 | | | | 243,603,633 | |
Snap-on Inc. | | | 9,400 | | | | 2,397,564 | |
| | | | | | | | |
| | | | | | | 246,001,197 | |
| | | | | | | | |
Medical Equipment & Devices (2.35%) | |
Abbott Laboratories | | | 847,500 | | | | 82,080,375 | |
Agilent Technologies Inc. | | | 548,071 | | | | 61,285,299 | |
Danaher Corp. | | | 5,900 | | | | 1,463,790 | |
QIAGEN NV(a) | | | 159,100 | | | | 6,443,550 | |
| | | | | | | | |
| | | | | | | 151,273,014 | |
| | | | | | | | |
Metals & Mining (0.89%) | |
Freeport-McMoRan Inc. | | | 268,400 | | | | 10,008,636 | |
Rio Tinto PLC Sponsored ADR | | | 739,300 | | | | 47,049,052 | |
| | | | | | | | |
| | | | | | | 57,057,688 | |
| | | | | | | | |
Oil & Gas Producers (4.09%) | |
APA Corp. | | | 188,200 | | | | 7,735,020 | |
Cheniere Energy Inc. | | | 35,500 | | | | 5,891,580 | |
Chevron Corp. | | | 1,095,600 | | | | 184,740,072 | |
ConocoPhillips | | | 26,000 | | | | 3,114,800 | |
Devon Energy Corp. | | | 40,600 | | | | 1,936,620 | |
Diamondback Energy Inc. | | | 24,200 | | | | 3,748,096 | |
EOG Resources Inc. | | | 100 | | | | 12,676 | |
Exxon Mobil Corp. | | | 265,600 | | | | 31,229,248 | |
Marathon Oil Corp. | | | 104,600 | | | | 2,798,050 | |
Occidental Petroleum Corp. | | | 197,500 | | | | 12,813,800 | |
Pioneer Natural Resources Co. | | | 1,200 | | | | 275,460 | |
Targa Resources Corp. | | | 108,200 | | | | 9,274,904 | |
| | | | | | | | |
| | | | | | | 263,570,326 | |
| | | | | | | | |
| | |
| 12 | | See accompanying notes to financial statements. |
ADVISERS INVESTMENT TRUST
STATE FARM GROWTH FUND
SCHEDULE OF INVESTMENTS (continued)
September 30, 2023
| | | | | | | | |
| | | Shares | | | Value | |
Common Stocks (Cont.) | |
|
Oil, Gas Services & Equipment (0.00%) | |
Halliburton Co. | | | 1,400 | | | $ | 56,700 | |
| | | | | | | | |
Publishing & Broadcasting (0.02%) | |
Nexstar Media Group Inc. | | | 9,700 | | | | 1,390,689 | |
| | | | | | | | |
Real Estate Investment Trusts (1.00%) | |
AvalonBay Communities Inc. | | | 65,900 | | | | 11,317,666 | |
Boston Properties Inc. | | | 204,100 | | | | 12,139,868 | |
Equity Residential | | | 31,200 | | | | 1,831,752 | |
Essex Property Trust Inc. | | | 7,300 | | | | 1,548,257 | |
Highwoods Properties Inc. | | | 317,100 | | | | 6,535,431 | |
Iron Mountain Inc. | | | 129,400 | | | | 7,692,830 | |
Lamar Advertising Co., Class A | | | 120,400 | | | | 10,049,788 | |
Medical Properties Trust Inc. | | | 195,400 | | | | 1,064,930 | |
Mid-America Apartment Communities Inc. | | | 58,300 | | | | 7,500,295 | |
Public Storage | | | 18,700 | | | | 4,927,824 | |
| | | | | | | | |
| | | | | | | 64,608,641 | |
| | | | | | | | |
Retail - Consumer Staples (2.81%) | |
Costco Wholesale Corp. | | | 13,100 | | | | 7,400,976 | |
Walmart Inc. | | | 1,088,600 | | | | 174,099,798 | |
| | | | | | | | |
| | | | | | | 181,500,774 | |
| | | | | | | | |
Retail - Discretionary (0.95%) | |
AutoZone Inc.(a) | | | 4,700 | | | | 11,937,953 | |
Bath & Body Works Inc. | | | 81,100 | | | | 2,741,180 | |
Dick’s Sporting Goods Inc. | | | 7,400 | | | | 803,492 | |
Home Depot Inc., The | | | 99,747 | | | | 30,139,553 | |
Lowe’s Cos. Inc. | | | 5,400 | | | | 1,122,336 | |
O’Reilly Automotive Inc.(a) | | | 14,600 | | | | 13,269,356 | |
TJX Cos. Inc., The | | | 9,700 | | | | 862,136 | |
Ulta Beauty Inc.(a) | | | 900 | | | | 359,505 | |
| | | | | | | | |
| | | | | | | 61,235,511 | |
| | | | | | | | |
Semiconductors (5.72%) | |
Advanced Micro Devices Inc.(a) | | | 3,600 | | | | 370,152 | |
Analog Devices Inc. | | | 3,300 | | | | 577,797 | |
Applied Materials Inc. | | | 6,900 | | | | 955,305 | |
ASML Holding NV NY Reg. Shares | | | 334,633 | | | | 196,985,062 | |
Broadcom Inc. | | | 35,000 | | | | 29,070,300 | |
KLA Corp. | | | 33,000 | | | | 15,135,780 | |
Lam Research Corp. | | | 14,600 | | | | 9,150,842 | |
Microchip Technology Inc. | | | 80,000 | | | | 6,244,000 | |
NVIDIA Corp. | | | 187,400 | | | | 81,517,126 | |
QUALCOMM Inc. | | | 4,300 | | | | 477,558 | |
Texas Instruments Inc. | | | 178,407 | | | | 28,368,497 | |
| | | | | | | | |
| | | | | | | 368,852,419 | |
| | | | | | | | |
Software (4.00%) | |
Adobe Inc.(a) | | | 9,516 | | | | 4,852,208 | |
ANSYS Inc.(a) | | | 24,000 | | | | 7,141,200 | |
Intuit Inc. | | | 41,500 | | | | 21,204,010 | |
Microsoft Corp. | | | 701,169 | | | | 221,394,112 | |
Roper Technologies Inc. | | | 6,400 | | | | 3,099,392 | |
| | | | | | | | |
| | | | | | | 257,690,922 | |
| | | | | | | | |
| | | | | | | | |
| | | Shares | | | Value | |
Common Stocks (Cont.) | |
|
Specialty Finance (0.50%) | |
AGNC Investment Corp. | | | 541,400 | | | $ | 5,110,816 | |
Ally Financial Inc. | | | 16,200 | | | | 432,216 | |
Credit Acceptance Corp.(a) | | | 6,700 | | | | 3,082,804 | |
MGIC Investment Corp. | | | 683,200 | | | | 11,402,608 | |
OneMain Holdings Inc. | | | 253,200 | | | | 10,150,788 | |
UWM Holdings Corp. | | | 367,719 | | | | 1,783,437 | |
| | | | | | | | |
| | | | | | | 31,962,669 | |
| | | | | | | | |
Steel (1.18%) | |
Nucor Corp. | | | 486,500 | | | | 76,064,275 | |
| | | | | | | | |
Technology Hardware (13.08%) | |
Apple Inc. | | | 4,563,868 | | | | 781,379,840 | |
Cisco Systems Inc. | | | 74,100 | | | | 3,983,616 | |
Corning Inc. | | | 1,284,600 | | | | 39,141,762 | |
Motorola Solutions Inc. | | | 30,300 | | | | 8,248,872 | |
Teledyne Technologies Inc.(a) | | | 26,200 | | | | 10,704,796 | |
| | | | | | | | |
| | | | | | | 843,458,886 | |
| | | | | | | | |
Technology Services (1.86%) | |
Accenture PLC, Class A | | | 79,400 | | | | 24,384,534 | |
Amdocs Ltd. | | | 93,500 | | | | 7,899,815 | |
Automatic Data Processing Inc. | | | 109,900 | | | | 26,439,742 | |
Broadridge Financial Solutions Inc. | | | 33,900 | | | | 6,069,795 | |
DXC Technology Co.(a) | | | 100 | | | | 2,083 | |
Fidelity National Information Services Inc. | | | 1,300 | | | | 71,851 | |
Fiserv Inc.(a) | | | 55,100 | | | | 6,224,096 | |
Genpact Ltd. | | | 26,600 | | | | 962,920 | |
Mastercard Inc., Class A | | | 6,964 | | | | 2,757,117 | |
Paychex Inc. | | | 15,400 | | | | 1,776,082 | |
Science Applications International Corp. | | | 102,200 | | | | 10,786,188 | |
Verisk Analytics Inc. | | | 57,300 | | | | 13,536,552 | |
Visa Inc., Class A | | | 24,912 | | | | 5,730,009 | |
Western Union Co., The | | | 1,014,000 | | | | 13,364,520 | |
| | | | | | | | |
| | | | | | | 120,005,304 | |
| | | | | | | | |
Telecommunications (0.22%) | |
AT&T Inc. | | | 830,600 | | | | 12,475,612 | |
Verizon Communications Inc. | | | 42,400 | | | | 1,374,184 | |
| | | | | | | | |
| | | | | | | 13,849,796 | |
| | | | | | | | |
Tobacco & Cannabis (0.03%) | |
Altria Group Inc. | | | 34,400 | | | | 1,446,520 | |
Philip Morris International Inc. | | | 3,800 | | | | 351,804 | |
| | | | | | | | |
| | | | | | | 1,798,324 | |
| | | | | | | | |
Transportation & Logistics (0.50%) | |
C.H. Robinson Worldwide Inc. | | | 11,000 | | | | 947,430 | |
Delta Air Lines Inc. | | | 100 | | | | 3,700 | |
Expeditors International of Washington Inc. | | | 6,500 | | | | 745,095 | |
Landstar System Inc. | | | 61,000 | | | | 10,793,340 | |
Norfolk Southern Corp. | | | 44,100 | | | | 8,684,613 | |
Ryder System Inc. | | | 31,000 | | | | 3,315,450 | |
| | |
| See accompanying notes to financial statements. | | 13 |
ADVISERS INVESTMENT TRUST
STATE FARM GROWTH FUND
SCHEDULE OF INVESTMENTS (continued)
September 30, 2023
| | | | | | | | |
| | | Shares | | | Value | |
Common Stocks (Cont.) | |
|
Transportation & Logistics (Cont.) | |
Union Pacific Corp. | | | 36,600 | | | $ | 7,452,858 | |
United Airlines Holdings Inc.(a) | | | 7,300 | | | | 308,790 | |
| | | | | | | | |
| | | | | | | 32,251,276 | |
| | | | | | | | |
Wholesale - Consumer Staples (3.20%) | |
Archer-Daniels-Midland Co. | | | 2,733,954 | | | | 206,194,811 | |
| | | | | | | | |
Total Common Stocks (cost $1,701,051,038) | | | | 6,390,381,390 | |
| | | | | | | | |
| | |
| | | Principal
amount | | | Value | |
U.S. Treasury Obligations (0.02%) | |
U.S. Treasury Bill 5.100%, 10/26/2023(b),(c) | | $ | 1,435,000 | | | | 1,429,946 | |
| | | | | | | | |
Total U.S. Treasury Obligations (cost $1,430,076) | | | | 1,429,946 | |
| | | | | | | | |
| | |
| | | Shares | | | Value | |
Short-term Investments (0.86%) | |
Northern Institutional Treasury Portfolio (Premier Class), 5.20%(d) | | | 55,512,131 | | | | 55,512,131 | |
| | | | | | | | |
Total Short-term Investments (cost $55,512,131) | | | | 55,512,131 | |
| | | | | | | | |
TOTAL INVESTMENTS (99.98%) (cost $1,757,993,245) | | | | 6,447,323,467 | |
OTHER ASSETS, NET OF LIABILITIES (0.02%) | | | | | | | 1,259,557 | |
| | | | | | | | |
NET ASSETS (100.00%) | | | | | | $ | 6,448,583,024 | |
| | | | | | | | |
| (a) | Non-income producing security. |
| (b) | Security pledged as collateral to cover margin requirements for open futures contracts. |
| (c) | Discount rate at the time of purchase. |
| (d) | Rate shown is the 7-day yield as of September 30, 2023. |
PLC – Public Limited Company
ADR – American Depositary Receipt
At September 30, 2023, the Fund had open futures contracts as follows:
| | | | | | | | | | | | | | | | | | | | | | | | | |
Description | | Number
of
Contracts | | Expiration
Date | | Trading
Currency | | Notional
Amount | | Unrealized
Appreciation
(Depreciation)* |
Long Contracts | | | | | | | | | | | | | | | | | | | | | |
E-Mini S&P 500 | | | | 126 | | | | | 12/15/2023 | | | | | USD | | | | | 27,250,650 | | | | $ | (1,156,499 | ) |
*Includes cumulative appreciation/depreciation on futures contracts. Only the current day’s variation margin is reported within the Statements of Assets and Liabilities.
| | |
| 14 | | See accompanying notes to financial statements. |
ADVISERS INVESTMENT TRUST
STATE FARM BALANCED FUND
SCHEDULE OF INVESTMENTS
September 30, 2023
| | | | | | | | |
| | | Shares | | | Value | |
Common Stocks (69.39%) | |
|
Aerospace & Defense (0.15%) | |
Lockheed Martin Corp. | | | 7,900 | | | $ | 3,230,784 | |
| | | | | | | | |
Apparel & Textile Products (0.01%) | |
NIKE Inc., Class B | | | 2,500 | | | | 239,050 | |
| | | | | | | | |
Asset Management (0.27%) | |
BlackRock Inc. | | | 5,300 | | | | 3,426,397 | |
Voya Financial Inc. | | | 35,800 | | | | 2,378,910 | |
| | | | | | | | |
| | | | | | | 5,805,307 | |
| | | | | | | | |
Automotive (0.09%) | |
Tesla Inc.(a) | | | 7,600 | | | | 1,901,672 | |
| | | | | | | | |
Banking (1.63%) | | | | | | | | |
Bank of America Corp. | | | 23,700 | | | | 648,906 | |
Citigroup Inc. | | | 16,900 | | | | 695,097 | |
JPMorgan Chase & Co. | | | 20,100 | | | | 2,914,902 | |
M&T Bank Corp. | | | 19,000 | | | | 2,402,550 | |
Pinnacle Financial Partners Inc. | | | 13,400 | | | | 898,336 | |
Wells Fargo & Co. | | | 676,300 | | | | 27,633,618 | |
| | | | | | | | |
| | | | | | | 35,193,409 | |
| | | | | | | | |
Beverages (0.82%) | |
Coca-Cola Co., The | | | 177,257 | | | | 9,922,847 | |
Constellation Brands Inc., Class A | | | 200 | | | | 50,266 | |
PepsiCo Inc. | | | 46,400 | | | | 7,862,016 | |
| | | | | | | | |
| | | | | | | 17,835,129 | |
| | | | | | | | |
Biotechnology & Pharmaceuticals (12.85%) | |
AbbVie Inc. | | | 51,900 | | | | 7,736,214 | |
Amgen Inc. | | | 70,750 | | | | 19,014,770 | |
Bristol-Myers Squibb Co. | | | 2,300 | | | | 133,492 | |
Eli Lilly & Co. | | | 209,100 | | | | 112,313,883 | |
Gilead Sciences Inc. | | | 48,900 | | | | 3,664,566 | |
Johnson & Johnson | | | 391,909 | | | | 61,039,827 | |
Merck & Co. Inc. | | | 71,600 | | | | 7,371,220 | |
Moderna Inc.(a) | | | 100 | | | | 10,329 | |
Organon & Co. | | | 7,162 | | | | 124,332 | |
Pfizer Inc. | | | 727,540 | | | | 24,132,502 | |
Vertex Pharmaceuticals Inc.(a) | | | 7,400 | | | | 2,573,276 | |
Zoetis Inc. | | | 229,295 | | | | 39,892,744 | |
| | | | | | | | |
| | | | | | | 278,007,155 | |
| | | | | | | | |
Cable & Satellite (0.13%) | |
Charter Communications Inc., Class A(a) | | | 1,200 | | | | 527,784 | |
Comcast Corp., Class A | | | 14,800 | | | | 656,232 | |
DISH Network Corp., Class A(a) | | | 100 | | | | 586 | |
Sirius XM Holdings Inc. | | | 355,600 | | | | 1,607,312 | |
| | | | | | | | |
| | | | | | | 2,791,914 | |
| | | | | | | | |
Chemicals (3.79%) | |
Air Products and Chemicals Inc. | | | 229,900 | | | | 65,153,660 | |
Avery Dennison Corp. | | | 15,100 | | | | 2,758,317 | |
Dow Inc. | | | 19,570 | | | | 1,009,029 | |
| | | | | | | | |
| | | Shares | | | Value | |
Common Stocks (Cont.) | |
| | |
Chemicals (Cont.) | | | | | | | | |
International Flavors & Fragrances Inc. | | | 119,888 | | | $ | 8,172,765 | |
Linde PLC | | | 13,100 | | | | 4,877,785 | |
| | | | | | | | |
| | | | | | | 81,971,556 | |
| | | | | | | | |
Commercial Support Services (0.10%) | |
Cintas Corp. | | | 4,100 | | | | 1,972,141 | |
Republic Services Inc. | | | 2,100 | | | | 299,271 | |
| | | | | | | | |
| | | | | | | 2,271,412 | |
| | | | | | | | |
Construction Materials (1.49%) | |
Vulcan Materials Co. | | | 160,000 | | | | 32,323,200 | |
| | | | | | | | |
Consumer Services (0.07%) | |
Grand Canyon Education Inc.(a) | | | 12,200 | | | | 1,425,936 | |
Service Corp. International | | | 1,700 | | | | 97,138 | |
| | | | | | | | |
| | | | | | | 1,523,074 | |
| | | | | | | | |
Containers & Packaging (0.62%) | |
AptarGroup Inc. | | | 106,800 | | | | 13,354,272 | |
| | | | | | | | |
Diversified Industrials (2.13%) | |
3M Co. | | | 77,200 | | | | 7,227,464 | |
Emerson Electric Co. | | | 62,400 | | | | 6,025,968 | |
Honeywell International Inc. | | | 15,100 | | | | 2,789,574 | |
Illinois Tool Works Inc. | | | 130,400 | | | | 30,032,424 | |
| | | | | | | | |
| | | | | | | 46,075,430 | |
| | | | | | | | |
E-Commerce Discretionary (0.23%) | |
Amazon.com Inc.(a) | | | 38,900 | | | | 4,944,968 | |
Etsy Inc.(a) | | | 100 | | | | 6,458 | |
| | | | | | | | |
| | | | | | | 4,951,426 | |
| | | | | | | | |
Electric Utilities (0.51%) | | | | | | | | |
Consolidated Edison Inc. | | | 23,400 | | | | 2,001,402 | |
Duke Energy Corp. | | | 11,633 | | | | 1,026,728 | |
Evergy Inc. | | | 38,200 | | | | 1,936,740 | |
OGE Energy Corp. | | | 67,700 | | | | 2,256,441 | |
Pinnacle West Capital Corp. | | | 20,900 | | | | 1,539,912 | |
Public Service Enterprise Group Inc. | | | 38,200 | | | | 2,173,962 | |
| | | | | | | | |
| | | | | | | 10,935,185 | |
| | | | | | | | |
Electrical Equipment (0.04%) | |
AMETEK Inc. | | | 5,900 | | | | 871,784 | |
| | | | | | | | |
Entertainment Content (3.33%) | |
Electronic Arts Inc. | | | 6,100 | | | | 734,440 | |
Walt Disney Co., The(a) | | | 879,595 | | | | 71,291,175 | |
Warner Bros Discovery Inc.(a) | | | 100 | | | | 1,086 | |
| | | | | | | | |
| | | | | | | 72,026,701 | |
| | | | | | | | |
Food (0.47%) | |
General Mills Inc. | | | 31,800 | | | | 2,034,882 | |
Kellogg Co. | | | 136,100 | | | | 8,099,311 | |
Nestle SA Sponsored ADR | | | 100 | | | | 11,317 | |
| | | | | | | | |
| | | | | | | 10,145,510 | |
| | | | | | | | |
| | |
| See accompanying notes to financial statements. | | 15 |
ADVISERS INVESTMENT TRUST
STATE FARM BALANCED FUND
SCHEDULE OF INVESTMENTS (continued)
September 30, 2023
| | | | | | | | |
| | | Shares | | | Value | |
Common Stocks (Cont.) | | | | | | | | |
| | |
Gas & Water Utilities (0.00%) | | | | | | | | |
American Water Works Co. Inc. | | | 400 | | | $ | 49,532 | |
| | | | | | | | |
Health Care Facilities & Services (0.43%) | |
Chemed Corp. | | | 4,800 | | | | 2,494,560 | |
Cigna Group, The | | | 2,400 | | | | 686,568 | |
CVS Health Corp. | | | 1,200 | | | | 83,784 | |
Elevance Health Inc. | | | 2,800 | | | | 1,219,176 | |
Humana Inc. | | | 300 | | | | 145,956 | |
McKesson Corp. | | | 6,900 | | | | 3,000,465 | |
Quest Diagnostics Inc. | | | 7,900 | | | | 962,694 | |
UnitedHealth Group Inc. | | | 1,200 | | | | 605,028 | |
| | | | | | | | |
| | | | | | | 9,198,231 | |
| | | | | | | | |
Home & Office Products (0.26%) | |
HNI Corp. | | | 160,000 | | | | 5,540,800 | |
| | | | | | | | |
Household Products (3.43%) | |
Clorox Co., The | | | 1,900 | | | | 249,014 | |
Colgate-Palmolive Co. | | | 12,300 | | | | 874,653 | |
Kenvue Inc. | | | 205,557 | | | | 4,127,584 | |
Procter & Gamble Co., The | | | 472,600 | | | | 68,933,436 | |
| | | | | | | | |
| | | | | | | 74,184,687 | |
| | | | | | | | |
Industrial Support Services (0.06%) | |
MSC Industrial Direct Co. Inc., Class A | | | 3,700 | | | | 363,155 | |
Watsco Inc. | | | 2,200 | | | | 830,984 | |
| | | | | | | | |
| | | | | | | 1,194,139 | |
| | | | | | | | |
Institutional Financial Services (0.17%) | |
Cboe Global Markets Inc. | | | 1,600 | | | | 249,936 | |
Goldman Sachs Group Inc., The | | | 800 | | | | 258,856 | |
Intercontinental Exchange Inc. | | | 27,000 | | | | 2,970,540 | |
Northern Trust Corp. | | | 3,400 | | | | 236,232 | |
| | | | | | | | |
| | | | | | | 3,715,564 | |
| | | | | | | | |
Insurance (0.56%) | |
Allstate Corp., The | | | 6,700 | | | | 746,447 | |
Aon PLC, Class A | | | 3,000 | | | | 972,660 | |
Berkshire Hathaway Inc., Class B(a) | | | 5,300 | | | | 1,856,590 | |
Chubb Ltd. | | | 6,800 | | | | 1,415,624 | |
Hartford Financial Services Group Inc., The | | | 2,000 | | | | 141,820 | |
Lincoln National Corp. | | | 119,200 | | | | 2,943,048 | |
Travelers Cos. Inc., The | | | 16,400 | | | | 2,678,284 | |
Willis Towers Watson PLC | | | 6,900 | | | | 1,441,824 | |
| | | | | | | | |
| | | | | | | 12,196,297 | |
| | | | | | | | |
Internet Media & Services (3.86%) | |
Alphabet Inc., Class A(a) | | | 431,640 | | | | 56,484,410 | |
Alphabet Inc., Class C(a) | | | 71,180 | | | | 9,385,083 | |
Match Group Inc.(a) | | | 100 | | | | 3,918 | |
Meta Platforms Inc., Class A(a) | | | 58,930 | | | | 17,691,375 | |
Netflix Inc.(a) | | | 100 | | | | 37,760 | |
| | | | | | | | |
| | | | | | | 83,602,546 | |
| | | | | | | | |
| | | | | | | | |
| | | Shares | | | Value | |
Common Stocks (Cont.) | | | | | | | | |
|
Leisure Facilities & Services (0.49%) | |
Caesars Entertainment Inc.(a) | | | 100 | | | $ | 4,635 | |
Carnival Corp.(a) | | | 100 | | | | 1,372 | |
Madison Square Garden Sports Corp. | | | 11,400 | | | | 2,009,820 | |
McDonald’s Corp. | | | 18,900 | | | | 4,979,016 | |
MGM Resorts International | | | 100 | | | | 3,676 | |
Norwegian Cruise Line Holdings Ltd.(a) | | | 100 | | | | 1,648 | |
Royal Caribbean Cruises Ltd.(a) | | | 100 | | | | 9,214 | |
Starbucks Corp. | | | 27,400 | | | | 2,500,798 | |
Travel + Leisure Co. | | | 32,400 | | | | 1,190,052 | |
Wynn Resorts Ltd. | | | 100 | | | | 9,241 | |
| | | | | | | | |
| | | | | | | 10,709,472 | |
| | | | | | | | |
Machinery (4.18%) | |
Caterpillar Inc. | | | 264,300 | | | | 72,153,900 | |
Deere & Co. | | | 41,002 | | | | 15,473,335 | |
Donaldson Co. Inc. | | | 36,517 | | | | 2,177,874 | |
Snap-on Inc. | | | 2,200 | | | | 561,132 | |
| | | | | | | | |
| | | | | | | 90,366,241 | |
| | | | | | | | |
Medical Equipment & Devices (1.23%) | |
Abbott Laboratories | | | 104,075 | | | | 10,079,664 | |
Agilent Technologies Inc. | | | 143,587 | | | | 16,055,898 | |
QIAGEN NV(a) | | | 9,900 | | | | 400,950 | |
| | | | | | | | |
| | | | | | | 26,536,512 | |
| | | | | | | | |
Metals & Mining (0.59%) | |
Rio Tinto PLC Sponsored ADR | | | 200,000 | | | | 12,728,000 | |
| | | | | | | | |
Oil & Gas Producers (3.68%) | | | | | | | | |
APA Corp. | | | 100 | | | | 4,110 | |
Cheniere Energy Inc. | | | 8,200 | | | | 1,360,872 | |
Chevron Corp. | | | 274,000 | | | | 46,201,880 | |
ConocoPhillips | | | 1,100 | | | | 131,780 | |
EOG Resources Inc. | | | 400 | | | | 50,704 | |
Exxon Mobil Corp. | | | 271,000 | | | | 31,864,180 | |
Occidental Petroleum Corp. | | | 100 | | | | 6,488 | |
Pioneer Natural Resources Co. | | | 200 | | | | 45,910 | |
| | | | | | | | |
| | | | | | | 79,665,924 | |
| | | | | | | | |
Real Estate Investment Trusts (0.28%) | |
AvalonBay Communities Inc. | | | 10,400 | | | | 1,786,096 | |
Equity Residential | | | 3,600 | | | | 211,356 | |
Essex Property Trust Inc. | | | 1,300 | | | | 275,717 | |
Medical Properties Trust Inc. | | | 46,200 | | | | 251,790 | |
Mid-America Apartment Communities Inc. | | | 7,400 | | | | 952,010 | |
Prologis Inc. | | | 2,600 | | | | 291,746 | |
Public Storage | | | 8,600 | | | | 2,266,272 | |
| | | | | | | | |
| | | | | | | 6,034,987 | |
| | | | | | | | |
| | |
| 16 | | See accompanying notes to financial statements. |
ADVISERS INVESTMENT TRUST
STATE FARM BALANCED FUND
SCHEDULE OF INVESTMENTS (continued)
September 30, 2023
| | | | | | | | |
| | | Shares | | | Value | |
Common Stocks (Cont.) | |
|
Retail - Consumer Staples (0.75%) | |
Costco Wholesale Corp. | | | 1,900 | | | $ | 1,073,424 | |
Walmart Inc. | | | 95,200 | | | | 15,225,336 | |
| | | | | | | | |
| | | | | | | 16,298,760 | |
| | | | | | | | |
Retail - Discretionary (0.59%) | |
AutoZone Inc.(a) | | | 1,100 | | | | 2,793,989 | |
Bath & Body Works Inc. | | | 100 | | | | 3,380 | |
Home Depot Inc., The | | | 18,860 | | | | 5,698,738 | |
Lowe’s Cos. Inc. | | | 1,400 | | | | 290,976 | |
O’Reilly Automotive Inc.(a) | | | 3,700 | | | | 3,362,782 | |
TJX Cos. Inc., The | | | 2,400 | | | | 213,312 | |
Ulta Beauty Inc.(a) | | | 900 | | | | 359,505 | |
| | | | | | | | |
| | | | | | | 12,722,682 | |
| | | | | | | | |
Semiconductors (0.95%) | |
Advanced Micro Devices Inc.(a) | | | 100 | | | | 10,282 | |
Applied Materials Inc. | | | 100 | | | | 13,845 | |
ASML Holding NV NY Reg. Shares | | | 14,821 | | | | 8,724,530 | |
Broadcom Inc. | | | 4,000 | | | | 3,322,320 | |
Micron Technology Inc. | | | 100 | | | | 6,803 | |
NVIDIA Corp. | | | 10,400 | | | | 4,523,896 | |
ON Semiconductor Corp.(a) | | | 100 | | | | 9,295 | |
Qorvo Inc.(a) | | | 100 | | | | 9,547 | |
Skyworks Solutions Inc. | | | 100 | | | | 9,859 | |
Texas Instruments Inc. | | | 24,373 | | | | 3,875,551 | |
| | | | | | | | |
| | | | | | | 20,505,928 | |
| | | | | | | | |
Software (2.63%) | |
ANSYS Inc.(a) | | | 5,700 | | | | 1,696,035 | |
Ceridian HCM Holding Inc.(a) | | | 100 | | | | 6,785 | |
Intuit Inc. | | | 9,500 | | | | 4,853,930 | |
Microsoft Corp. | | | 157,321 | | | | 49,674,106 | |
Oracle Corp. | | | 1,800 | | | | 190,656 | |
Roper Technologies Inc. | | | 800 | | | | 387,424 | |
| | | | | | | | |
| | | | | | | 56,808,936 | |
| | | | | | | | |
Specialty Finance (0.19%) | |
Credit Acceptance Corp.(a) | | | 400 | | | | 184,048 | |
GATX Corp. | | | 4,200 | | | | 457,086 | |
MGIC Investment Corp. | | | 166,600 | | | | 2,780,554 | |
OneMain Holdings Inc. | | | 6,000 | | | | 240,540 | |
UWM Holdings Corp. | | | 85,270 | | | | 413,559 | |
| | | | | | | | |
| | | | | | | 4,075,787 | |
| | | | | | | | |
Steel (3.15%) | | | | | | | | |
Nucor Corp. | | | 436,500 | | | | 68,246,775 | |
| | | | | | | | |
Technology Hardware (9.52%) | |
Apple Inc. | | | 1,115,004 | | | | 190,899,835 | |
Cisco Systems Inc. | | | 5,700 | | | | 306,432 | |
Corning Inc. | | | 335,292 | | | | 10,216,347 | |
Motorola Solutions Inc. | | | 6,500 | | | | 1,769,560 | |
Teledyne Technologies Inc.(a) | | | 6,700 | | | | 2,737,486 | |
| | | | | | | | |
| | | | | | | 205,929,660 | |
| | | | | | | | |
| | | | | | | | |
| | | Shares | | | Value | |
Common Stocks (Cont.) | |
|
Technology Services (1.31%) | |
Accenture PLC, Class A | | | 18,700 | | | $ | 5,742,957 | |
Amdocs Ltd. | | | 26,800 | | | | 2,264,332 | |
Automatic Data Processing Inc. | | | 38,600 | | | | 9,286,388 | |
Broadridge Financial Solutions Inc. | | | 3,700 | | | | 662,485 | |
DXC Technology Co.(a) | | | 100 | | | | 2,083 | |
Fiserv Inc.(a) | | | 14,200 | | | | 1,604,032 | |
Genpact Ltd. | | | 8,600 | | | | 311,320 | |
Jack Henry & Associates Inc. | | | 1,300 | | | | 196,482 | |
Mastercard Inc., Class A | | | 2,039 | | | | 807,261 | |
Paychex Inc. | | | 5,400 | | | | 622,782 | |
Science Applications International Corp. | | | 22,000 | | | | 2,321,880 | |
Verisk Analytics Inc. | | | 13,500 | | | | 3,189,240 | |
Visa Inc., Class A | | | 5,730 | | | | 1,317,957 | |
| | | | | | | | |
| | | | | | | 28,329,199 | |
| | | | | | | | |
Telecommunications (0.10%) | |
AT&T Inc. | | | 143,700 | | | | 2,158,374 | |
| | | | | | | | |
Tobacco & Cannabis (0.00%) | |
Altria Group Inc. | | | 1,400 | | | | 58,870 | |
| | | | | | | | |
Transportation & Logistics (0.31%) | |
American Airlines Group
Inc.(a) | | | 100 | | | | 1,281 | |
C.H. Robinson Worldwide Inc. | | | 2,800 | | | | 241,164 | |
Expeditors International of Washington Inc. | | | 4,800 | | | | 550,224 | |
Landstar System Inc. | | | 12,800 | | | | 2,264,832 | |
Norfolk Southern Corp. | | | 6,300 | | | | 1,240,659 | |
Union Pacific Corp. | | | 12,066 | | | | 2,457,000 | |
| | | | | | | | |
| | | | | | | 6,755,160 | |
| | | | | | | | |
Transportation Equipment (0.00%) | |
Westinghouse Air Brake Technologies Corp. | | | 676 | | | | 71,838 | |
| | | | | | | | |
Wholesale - Consumer Staples (1.94%) | |
Archer-Daniels-Midland Co. | | | 556,461 | | | | 41,968,289 | |
| | | | | | | | |
Total Common Stocks (cost $330,326,972) | | | | | | | 1,501,107,160 | |
| | | | | | | | |
| | |
| | | Principal
amount | | | Value | |
Corporate Bonds (8.92%) | | | | | | | | |
|
Aerospace & Defense (0.14%) | |
General Dynamics Corp. 3.250%, 04/01/2025 | | $ | 200,000 | | | | 193,400 | |
Boeing Co., The | | | | | | | | |
4.875%, 05/01/2025 | | | 250,000 | | | | 245,705 | |
2.196%, 02/04/2026 | | | 350,000 | | | | 321,364 | |
3.250%, 02/01/2028 | | | 250,000 | | | | 225,446 | |
5.150%, 05/01/2030 | | | 250,000 | | | | 238,875 | |
3.625%, 02/01/2031 | | | 150,000 | | | | 129,569 | |
Lockheed Martin Corp. | | | | | | | | |
4.950%, 10/15/2025 | | | 100,000 | | | | 99,237 | |
| | |
| See accompanying notes to financial statements. | | 17 |
ADVISERS INVESTMENT TRUST
STATE FARM BALANCED FUND
SCHEDULE OF INVESTMENTS (continued)
September 30, 2023
| | | | | | | | |
| | | Principal
amount | | | Value | |
Corporate Bonds (Cont.) | |
|
Aerospace & Defense (Cont.) | |
5.100%, 11/15/2027 | | $ | 250,000 | | | $ | 248,550 | |
4.450%, 05/15/2028 | | | 250,000 | | | | 241,954 | |
5.250%, 01/15/2033 | | | 250,000 | | | | 246,943 | |
RTX Corp. | | | | | | | | |
5.000%, 02/27/2026 | | | 150,000 | | | | 148,173 | |
5.150%, 02/27/2033 | | | 250,000 | | | | 236,741 | |
L3Harris Technologies Inc. | | | | | | | | |
5.400%, 01/15/2027 | | | 150,000 | | | | 148,695 | |
5.400%, 07/31/2033 | | | 100,000 | | | | 96,127 | |
HEICO Corp. | | | | | | | | |
5.250%, 08/01/2028 | | | 150,000 | | | | 146,332 | |
| | | | | | | | |
| | | | | | | 2,967,111 | |
| | | | | | | | |
Asset Management (0.06%) | |
Charles Schwab Corp., The | | | | | | | | |
0.900%, 03/11/2026 | | | 250,000 | | | | 221,609 | |
5.853%, 05/19/2034 | | | 150,000 | | | | 142,634 | |
Blue Owl Credit Income Corp. | | | | | �� | | | |
7.750%, 09/16/2027 | | | 250,000 | | | | 247,990 | |
BlackRock Inc. | | | | | | | | |
2.400%, 04/30/2030 | | | 250,000 | | | | 208,359 | |
4.750%, 05/25/2033 | | | 150,000 | | | | 140,769 | |
Ameriprise Financial Inc. | | | | | | | | |
4.500%, 05/13/2032 | | | 250,000 | | | | 229,233 | |
5.150%, 05/15/2033 | | | 100,000 | | | | 94,455 | |
Brookfield Capital Finance LLC | | | | | | | | |
6.087%, 06/14/2033 | | | 100,000 | | | | 97,173 | |
| | | | | | | | |
| | | | | | | 1,382,222 | |
| | | | | | | | |
Automotive (0.21%) | |
Toyota Motor Credit Corp. | | | | | | | | |
4.800%, 01/10/2025 | | | 250,000 | | | | 247,640 | |
1.450%, 01/13/2025 | | | 250,000 | | | | 237,368 | |
3.650%, 08/18/2025 | | | 250,000 | | | | 241,823 | |
4.550%, 09/20/2027 | | | 250,000 | | | | 243,201 | |
American Honda Finance Corp. | | | | | | | | |
4.600%, 04/17/2025 | | | 250,000 | | | | 245,999 | |
5.000%, 05/23/2025 | | | 250,000 | | | | 247,287 | |
5.250%, 07/07/2026 | | | 250,000 | | | | 248,455 | |
5.125%, 07/07/2028 | | | 250,000 | | | | 246,095 | |
General Motors Financial Co. Inc. | | | | | | | | |
6.050%, 10/10/2025 | | | 250,000 | | | | 248,893 | |
5.400%, 04/06/2026 | | | 250,000 | | | | 244,827 | |
5.000%, 04/09/2027 | | | 250,000 | | | | 239,969 | |
6.000%, 01/09/2028 | | | 250,000 | | | | 246,939 | |
5.800%, 06/23/2028 | | | 250,000 | | | | 244,231 | |
5.850%, 04/06/2030 | | | 250,000 | | | | 239,468 | |
6.400%, 01/09/2033 | | | 250,000 | | | | 244,151 | |
Toyota Motor Corp. | | | | | | | | |
5.275%, 07/13/2026 | | | 250,000 | | | | 249,491 | |
5.118%, 07/13/2028 | | | 250,000 | | | | 248,652 | |
5.123%, 07/13/2033 | | | 250,000 | | | | 243,905 | |
Magna International Inc. | | | | | | | | |
5.500%, 03/21/2033 | | | 200,000 | | | | 195,428 | |
| | | | | | | | |
| | | | | | | 4,603,822 | |
| | | | | | | | |
| | | | | | | | |
| | | Principal
amount | | | Value | |
Corporate Bonds (Cont.) | |
|
Banking (2.18%) | |
Westpac Banking Corp. | | | | | | | | |
5.350%, 10/18/2024 | | $ | 250,000 | | | $ | 249,003 | |
3.735%, 08/26/2025 | | | 250,000 | | | | 241,889 | |
4.043%, 08/26/2027 | | | 250,000 | | | | 239,546 | |
5.457%, 11/18/2027 | | | 250,000 | | | | 250,191 | |
Royal Bank of Canada | | | | | | | | |
5.660%, 10/25/2024 | | | 250,000 | | | | 249,111 | |
1.600%, 01/21/2025 | | | 150,000 | | | | 142,002 | |
3.375%, 04/14/2025 | | | 150,000 | | | | 144,718 | |
4.950%, 04/25/2025 | | | 250,000 | | | | 246,379 | |
4.875%, 01/12/2026 | | | 100,000 | | | | 98,140 | |
5.200%, 07/20/2026 | | | 250,000 | | | | 247,273 | |
4.240%, 08/03/2027 | | | 150,000 | | | | 142,532 | |
6.000%, 11/01/2027 | | | 250,000 | | | | 251,804 | |
4.900%, 01/12/2028 | | | 150,000 | | | | 145,694 | |
5.200%, 08/01/2028 | | | 150,000 | | | | 145,996 | |
5.000%, 02/01/2033 | | | 150,000 | | | | 139,764 | |
5.000%, 05/02/2033 | | | 125,000 | | | | 116,134 | |
National Australia Bank Ltd. | | | | | | | | |
5.132%, 11/22/2024 | | | 250,000 | | | | 248,543 | |
5.200%, 05/13/2025 | | | 250,000 | | | | 248,451 | |
3.500%, 06/09/2025 | | | 250,000 | | | | 241,637 | |
4.966%, 01/12/2026 | | | 250,000 | | | | 247,032 | |
3.905%, 06/09/2027 | | | 250,000 | | | | 236,377 | |
4.944%, 01/12/2028 | | | 250,000 | | | | 244,796 | |
4.900%, 06/13/2028 | | | 250,000 | | | | 242,836 | |
Bank of Nova Scotia, The | | | | | | | | |
5.250%, 12/06/2024 | | | 250,000 | | | | 247,700 | |
1.450%, 01/10/2025 | | | 150,000 | | | | 141,741 | |
3.450%, 04/11/2025 | | | 150,000 | | | | 144,425 | |
5.450%, 06/12/2025 | | | 150,000 | | | | 148,559 | |
4.750%, 02/02/2026 | | | 250,000 | | | | 244,035 | |
5.250%, 06/12/2028 | | | 150,000 | | | | 146,059 | |
4.850%, 02/01/2030 | | | 250,000 | | | | 235,423 | |
4.588%, 05/04/2037 | | | 150,000 | | | | 125,018 | |
Bank of Montreal | | | | | | | | |
5.200%, 12/12/2024 | | | 250,000 | | | | 247,827 | |
1.500%, 01/10/2025 | | | 150,000 | | | | 141,787 | |
3.700%, 06/07/2025 | | | 150,000 | | | | 144,574 | |
5.300%, 06/05/2026 | | | 250,000 | | | | 246,633 | |
2.650%, 03/08/2027 | | | 150,000 | | | | 134,947 | |
4.700%, 09/14/2027 | | | 150,000 | | | | 143,748 | |
5.203%, 02/01/2028 | | | 150,000 | | | | 146,413 | |
3.088%, 01/10/2037 | | | 150,000 | | | | 111,776 | |
Cooperatieve Rabobank U.A. | | | | | | | | |
1.375%, 01/10/2025 | | | 250,000 | | | | 236,531 | |
5.000%, 01/13/2025 | | | 250,000 | | | | 247,750 | |
5.500%, 07/18/2025 | | | 250,000 | | | | 248,874 | |
Toronto-Dominion Bank, The | | | | | | | | |
1.450%, 01/10/2025 | | | 150,000 | | | | 142,002 | |
3.766%, 06/06/2025 | | | 150,000 | | | | 145,078 | |
0.750%, 01/06/2026 | | | 250,000 | | | | 223,061 | |
5.103%, 01/09/2026 | | | 250,000 | | | | 246,654 | |
5.532%, 07/17/2026 | | | 250,000 | | | | 248,178 | |
4.108%, 06/08/2027 | | | 150,000 | | | | 141,584 | |
4.693%, 09/15/2027 | | | 250,000 | | | | 240,427 | |
| | |
| 18 | | See accompanying notes to financial statements. |
ADVISERS INVESTMENT TRUST
STATE FARM BALANCED FUND
SCHEDULE OF INVESTMENTS (continued)
September 30, 2023
| | | | | | | | |
| | | Principal
amount | | | Value | |
Corporate Bonds (Cont.) | |
|
Banking (Cont.) | |
5.156%, 01/10/2028 | | $ | 150,000 | | | $ | 146,399 | |
5.523%, 07/17/2028 | | | 150,000 | | | | 148,056 | |
Commonwealth Bank of Australia | | | | | | | | |
5.079%, 01/10/2025 | | | 250,000 | | | | 248,468 | |
5.316%, 03/13/2026 | | | 250,000 | | | | 249,029 | |
National Bank of Canada | | | | | | | | |
5.250%, 01/17/2025 | | | 250,000 | | | | 248,046 | |
JPMorgan Chase & Co. | | | | | | | | |
3.125%, 01/23/2025 | | | 250,000 | | | | 241,332 | |
1.561%, 12/10/2025 | | | 250,000 | | | | 236,270 | |
5.546%, 12/15/2025 | | | 250,000 | | | | 248,257 | |
2.595%, 02/24/2026 | | | 150,000 | | | | 142,805 | |
3.300%, 04/01/2026 | | | 250,000 | | | | 236,037 | |
4.080%, 04/26/2026 | | | 250,000 | | | | 242,616 | |
2.947%, 02/24/2028 | | | 250,000 | | | | 226,788 | |
4.323%, 04/26/2028 | | | 150,000 | | | | 142,320 | |
4.851%, 07/25/2028 | | | 250,000 | | | | 240,991 | |
5.299%, 07/24/2029 | | | 250,000 | | | | 243,246 | |
3.702%, 05/06/2030 | | | 250,000 | | | | 222,970 | |
4.565%, 06/14/2030 | | | 250,000 | | | | 233,209 | |
1.953%, 02/04/2032 | | | 250,000 | | | | 189,593 | |
2.580%, 04/22/2032 | | | 250,000 | | | | 197,206 | |
2.545%, 11/08/2032 | | | 250,000 | | | | 193,474 | |
2.963%, 01/25/2033 | | | 250,000 | | | | 199,032 | |
4.586%, 04/26/2033 | | | 500,000 | | | | 450,723 | |
4.912%, 07/25/2033 | | | 500,000 | | | | 460,025 | |
5.717%, 09/14/2033 | | | 250,000 | | | | 240,320 | |
5.350%, 06/01/2034 | | | 250,000 | | | | 237,069 | |
HSBC U.S.A. Inc. | | | | | | | | |
5.625%, 03/17/2025 | | | 250,000 | | | | 248,520 | |
Banco Santander SA | | | | | | | | |
3.496%, 03/24/2025 | | | 200,000 | | | | 192,239 | |
5.147%, 08/18/2025 | | | 200,000 | | | | 195,801 | |
5.294%, 08/18/2027 | | | 200,000 | | | | 193,375 | |
4.175%, 03/24/2028 | | | 200,000 | | | | 184,676 | |
5.588%, 08/08/2028 | | | 200,000 | | | | 195,648 | |
6.921%, 08/08/2033 | | | 200,000 | | | | 191,097 | |
Canadian Imperial Bank of Commerce | | | | | | | | |
3.300%, 04/07/2025 | | | 150,000 | | | | 144,177 | |
5.144%, 04/28/2025 | | | 250,000 | | | | 246,740 | |
3.945%, 08/04/2025 | | | 150,000 | | | | 144,817 | |
5.615%, 07/17/2026 | | | 150,000 | | | | 149,280 | |
3.450%, 04/07/2027 | | | 150,000 | | | | 138,490 | |
5.001%, 04/28/2028 | | | 150,000 | | | | 144,010 | |
Deutsche Bank AG | | | | | | | | |
4.162%, 05/13/2025 | | | 250,000 | | | | 242,419 | |
6.119%, 07/14/2026 | | | 200,000 | | | | 197,847 | |
7.146%, 07/13/2027 | | | 250,000 | | | | 251,692 | |
5.371%, 09/09/2027 | | | 250,000 | | | | 244,132 | |
2.552%, 01/07/2028 | | | 250,000 | | | | 218,165 | |
6.720%, 01/18/2029 | | | 250,000 | | | | 248,514 | |
3.742%, 01/07/2033 | | | 250,000 | | | | 179,399 | |
PNC Bank N.A. | | | | | | | | |
3.250%, 06/01/2025 | | | 250,000 | | | | 238,870 | |
3.100%, 10/25/2027 | | | 250,000 | | | | 225,183 | |
| | | | | | | | |
| | | Principal
amount | | | Value | |
Corporate Bonds (Cont.) | |
|
Banking (Cont.) | |
Australia & New Zealand Banking Group Ltd. | | | | | | | | |
5.375%, 07/03/2025 | | $ | 250,000 | | | $ | 249,038 | |
5.088%, 12/08/2025 | | | 250,000 | | | | 247,561 | |
Morgan Stanley Bank N.A. | | | | | | | | |
5.479%, 07/16/2025 | | | 250,000 | | | | 249,104 | |
4.754%, 04/21/2026 | | | 250,000 | | | | 244,363 | |
Wells Fargo Bank N.A. | | | | | | | | |
5.550%, 08/01/2025 | | | 250,000 | | | | 249,177 | |
5.450%, 08/07/2026 | | | 250,000 | | | | 248,326 | |
KeyBank N.A. | | | | | | | | |
4.150%, 08/08/2025 | | | 250,000 | | | | 235,427 | |
4.700%, 01/26/2026 | | | 250,000 | | | | 237,059 | |
5.850%, 11/15/2027 | | | 250,000 | | | | 237,750 | |
Bank of America N.A. | | | | | | | | |
5.650%, 08/18/2025 | | | 250,000 | | | | 249,348 | |
5.526%, 08/18/2026 | | | 250,000 | | | | 248,787 | |
Fifth Third Bank N.A. | | | | | | | | |
5.852%, 10/27/2025(b) | | | 250,000 | | | | 245,942 | |
PNC Financial Services Group Inc.,
The (Variable, U.S. SOFR + 1.09%)(b) | | | | | | | | |
5.671%, 10/28/2025 | | | 150,000 | | | | 148,842 | |
4.758%, 01/26/2027 | | | 250,000 | | | | 243,022 | |
5.582%, 06/12/2029 | | | 250,000 | | | | 242,528 | |
6.037%, 10/28/2033 | | | 150,000 | | | | 145,571 | |
5.939%, 08/18/2034 | | | 150,000 | | | | 144,123 | |
Huntington National Bank, The | | | | | | | | |
5.699%, 11/18/2025(b) | | | 250,000 | | | | 244,353 | |
Bank of New York Mellon,
The (Variable, U.S. SOFR + 0.80%)(b) | | | | | | | | |
5.224%, 11/21/2025 | | | 250,000 | | | | 247,763 | |
5.148%, 05/22/2026 | | | 250,000 | | | | 247,651 | |
HSBC Holdings PLC (Variable,
U.S. SOFR + 1.51%)(b) | | | | | | | | |
4.180%, 12/09/2025 | | | 250,000 | | | | 243,244 | |
2.999%, 03/10/2026 | | | 200,000 | | | | 190,592 | |
7.336%, 11/03/2026 | | | 200,000 | | | | 204,155 | |
5.887%, 08/14/2027 | | | 250,000 | | | | 246,950 | |
4.755%, 06/09/2028 | | | 250,000 | | | | 236,535 | |
5.210%, 08/11/2028 | | | 250,000 | | | | 240,692 | |
7.390%, 11/03/2028 | | | 250,000 | | | | 258,636 | |
6.161%, 03/09/2029 | | | 250,000 | | | | 247,486 | |
5.402%, 08/11/2033 | | | 250,000 | | | | 230,379 | |
8.113%, 11/03/2033 | | | 250,000 | | | | 262,908 | |
6.254%, 03/09/2034 | | | 250,000 | | | | 244,337 | |
6.547%, 06/20/2034 | | | 200,000 | | | | 189,673 | |
Sumitomo Mitsui Financial Group Inc. | | | | | | | | |
5.464%, 01/13/2026 | | | 200,000 | | | | 198,010 | |
5.880%, 07/13/2026 | | | 250,000 | | | | 249,703 | |
5.520%, 01/13/2028 | | | 250,000 | | | | 246,586 | |
5.800%, 07/13/2028 | | | 250,000 | | | | 248,264 | |
5.710%, 01/13/2030 | | | 250,000 | | | | 244,605 | |
| | |
| See accompanying notes to financial statements. | | 19 |
ADVISERS INVESTMENT TRUST
STATE FARM BALANCED FUND
SCHEDULE OF INVESTMENTS (continued)
September 30, 2023
| | | | | | | | |
| | | Principal
amount | | | Value | |
Corporate Bonds (Cont.) | |
|
Banking (Cont.) | |
5.766%, 01/13/2033 | | $ | 250,000 | | | $ | 244,329 | |
Citigroup Inc. (Variable, U.S. SOFR + 0.69%)(b) | | | | | | | | |
2.014%, 01/25/2026 | | | 250,000 | | | | 236,075 | |
3.290%, 03/17/2026 | | | 250,000 | | | | 239,245 | |
5.610%, 09/29/2026 | | | 250,000 | | | | 247,458 | |
3.070%, 02/24/2028 | | | 250,000 | | | | 226,775 | |
4.658%, 05/24/2028 | | | 150,000 | | | | 143,372 | |
2.561%, 05/01/2032 | | | 250,000 | | | | 193,524 | |
3.057%, 01/25/2033 | | | 500,000 | | | | 395,268 | |
3.785%, 03/17/2033 | | | 500,000 | | | | 417,118 | |
4.910%, 05/24/2033 | | | 500,000 | | | | 454,953 | |
6.270%, 11/17/2033 | | | 250,000 | | | | 249,261 | |
6.174%, 05/25/2034 | | | 250,000 | | | | 238,906 | |
Manufacturers & Traders Trust Co. | | | | | | | | |
4.650%, 01/27/2026 | | | 250,000 | | | | 238,270 | |
4.700%, 01/27/2028 | | | 250,000 | | | | 230,888 | |
Mitsubishi UFJ Financial Group Inc. (Variable, U.S. Treasury Yield Curve Rate CMT 1Y + 1.08%)(b) | | | | | | | | |
5.719%, 02/20/2026 | | | 250,000 | | | | 248,520 | |
5.541%, 04/17/2026 | | | 200,000 | | | | 198,243 | |
2.341%, 01/19/2028 | | | 250,000 | | | | 222,390 | |
5.017%, 07/20/2028 | | | 250,000 | | | | 241,881 | |
Lloyds Banking Group PLC (Variable, U.S. Treasury Yield Curve Rate CMT 1Y + 1.60%)(b) | | | | | | | | |
3.511%, 03/18/2026 | | | 200,000 | | | | 191,814 | |
5.985%, 08/07/2027 | | | 250,000 | | | | 247,749 | |
3.750%, 03/18/2028 | | | 250,000 | | | | 229,577 | |
ING Groep N.V. (Variable, U.S. SOFR + 1.64%)(b) | | | | | | | | |
3.869%, 03/28/2026 | | | 200,000 | | | | 193,019 | |
4.017%, 03/28/2028 | | | 200,000 | | | | 185,675 | |
Bank of America Corp. (Variable, U.S. SOFR + 1.33%)(b) | | | | | | | | |
3.384%, 04/02/2026 | | | 250,000 | | | | 239,274 | |
4.827%, 07/22/2026 | | | 250,000 | | | | 243,722 | |
5.080%, 01/20/2027 | | | 250,000 | | | | 244,363 | |
1.734%, 07/22/2027 | | | 250,000 | | | | 221,540 | |
2.551%, 02/04/2028 | | | 250,000 | | | | 222,919 | |
4.376%, 04/27/2028 | | | 250,000 | | | | 236,064 | |
4.948%, 07/22/2028 | | | 150,000 | | | | 144,129 | |
6.204%, 11/10/2028 | | | 250,000 | | | | 251,129 | |
5.202%, 04/25/2029 | | | 250,000 | | | | 240,826 | |
2.087%, 06/14/2029 | | | 250,000 | | | | 209,284 | |
3.974%, 02/07/2030 | | | 250,000 | | | | 224,525 | |
3.194%, 07/23/2030 | | | 250,000 | | | | 213,693 | |
2.572%, 10/20/2032 | | | 250,000 | | | | 192,098 | |
2.972%, 02/04/2033 | | | 500,000 | | | | 394,278 | |
4.571%, 04/27/2033 | | | 500,000 | | | | 443,917 | |
5.015%, 07/22/2033 | | | 500,000 | | | | 460,023 | |
5.288%, 04/25/2034 | | | 250,000 | | | | 232,628 | |
5.872%, 09/15/2034 | | | 175,000 | | | | 170,307 | |
| | | | | | | | |
| | | Principal
amount | | | Value | |
Corporate Bonds (Cont.) | |
|
Banking (Cont.) | |
2.482%, 09/21/2036 | | $ | 250,000 | | | $ | 181,919 | |
3.846%, 03/08/2037 | | | 250,000 | | | | 203,339 | |
Wells Fargo & Co. | | | | | | | | |
3.000%, 04/22/2026 | | | 250,000 | | | | 232,873 | |
3.908%, 04/25/2026 | | | 150,000 | | | | 144,533 | |
4.540%, 08/15/2026 | | | 250,000 | | | | 242,815 | |
3.000%, 10/23/2026 | | | 250,000 | | | | 229,598 | |
3.526%, 03/24/2028 | | | 250,000 | | | | 229,593 | |
3.584%, 05/22/2028 | | | 364,000 | | | | 333,239 | |
4.150%, 01/24/2029 | | | 186,000 | | | | 170,785 | |
5.574%, 07/25/2029 | | | 200,000 | | | | 195,118 | |
3.350%, 03/02/2033 | | | 500,000 | | | | 404,172 | |
4.897%, 07/25/2033 | | | 500,000 | | | | 452,500 | |
5.389%, 04/24/2034 | | | 150,000 | | | | 140,236 | |
5.557%, 07/25/2034 | | | 150,000 | | | | 142,033 | |
U.S. Bancorp | | | | | | | | |
2.375%, 07/22/2026 | | | 250,000 | | | | 228,192 | |
5.727%, 10/21/2026 | | | 100,000 | | | | 99,168 | |
3.150%, 04/27/2027 | | | 250,000 | | | | 228,419 | |
3.900%, 04/26/2028 | | | 250,000 | | | | 230,218 | |
4.548%, 07/22/2028 | | | 150,000 | | | | 140,896 | |
4.653%, 02/01/2029 | | | 150,000 | | | | 140,377 | |
5.775%, 06/12/2029 | | | 250,000 | | | | 243,345 | |
4.839%, 02/01/2034 | | | 150,000 | | | | 132,069 | |
5.836%, 06/12/2034 | | | 250,000 | | | | 235,787 | |
Barclays PLC (Variable, U.S. Treasury Yield Curve Rate CMT 1Y + 3.05%)(b) | | | | | | | | |
7.325%, 11/02/2026 | | | 200,000 | | | | 203,038 | |
5.829%, 05/09/2027 | | | 250,000 | | | | 245,520 | |
5.746%, 08/09/2033 | | | 250,000 | | | | 230,716 | |
7.437%, 11/02/2033 | | | 250,000 | | | | 256,720 | |
6.224%, 05/09/2034 | | | 250,000 | | | | 236,822 | |
7.119%, 06/27/2034 | | | 250,000 | | | | 240,783 | |
NatWest Group PLC (Variable, U.S. SOFR + 2.85%)(b) | | | | | | | | |
7.472%, 11/10/2026 | | | 200,000 | | | | 204,022 | |
5.847%, 03/02/2027 | | | 200,000 | | | | 197,393 | |
Truist Financial Corp. (Variable, U.S. SOFR + 2.05%)(b) | | | | | | | | |
6.047%, 06/08/2027 | | | 250,000 | | | | 247,281 | |
5.867%, 06/08/2034 | | | 150,000 | | | | 141,183 | |
Santander Holdings U.S.A. Inc. | | | | | | | | |
2.490%, 01/06/2028(b) | | | 250,000 | | | | 217,069 | |
Santander UK Group Holdings PLC (Variable, U.S. SOFR + 1.22%)(b) | | | | | | | | |
2.469%, 01/11/2028 | | | 250,000 | | | | 217,577 | |
6.534%, 01/10/2029 | | | 250,000 | | | | 247,686 | |
Fifth Third Bancorp (Variable, U.S. SOFR + 2.34%)(b) | | | | | | | | |
6.339%, 07/27/2029 | | | 150,000 | | | | 148,180 | |
| | |
| 20 | | See accompanying notes to financial statements. |
ADVISERS INVESTMENT TRUST
STATE FARM BALANCED FUND
SCHEDULE OF INVESTMENTS (continued)
September 30, 2023
| | | | | | | | |
| | | Principal
amount | | | Value | |
Corporate Bonds (Cont.) | |
|
Banking (Cont.) | |
4.772%, 07/28/2030 | | $ | 150,000 | | | $ | 136,170 | |
Mizuho Financial Group Inc. | | | | | | | | |
5.748%, 07/06/2034(b) | | | 200,000 | | | | 190,914 | |
| | | | | | | | |
| | | | | | | 47,139,841 | |
| | | | | | | | |
Beverages (0.12%) | |
Diageo Capital PLC | | | | | | | | |
5.200%, 10/24/2025 | | | 200,000 | | | | 199,042 | |
5.300%, 10/24/2027 | | | 250,000 | | | | 249,576 | |
5.500%, 01/24/2033 | | | 200,000 | | | | 200,460 | |
Constellation Brands Inc. | | | | | | | | |
5.000%, 02/02/2026 | | | 250,000 | | | | 245,490 | |
4.350%, 05/09/2027 | | | 250,000 | | | | 239,222 | |
4.750%, 05/09/2032 | | | 250,000 | | | | 231,593 | |
4.900%, 05/01/2033 | | | 100,000 | | | | 92,811 | |
PepsiCo Inc. | | | | | | | | |
4.550%, 02/13/2026 | | | 250,000 | | | | 247,331 | |
3.600%, 02/18/2028 | | | 250,000 | | | | 236,553 | |
4.450%, 05/15/2028 | | | 250,000 | | | | 245,437 | |
3.900%, 07/18/2032 | | | 100,000 | | | | 91,121 | |
4.450%, 02/15/2033 | | | 100,000 | | | | 95,819 | |
Keurig Dr. Pepper Inc. | | | | | | | | |
4.050%, 04/15/2032 | | | 250,000 | | | | 221,005 | |
Brown-Forman Corp. | | | | | | | | |
4.750%, 04/15/2033 | | | 100,000 | | | | 95,046 | |
| | | | | | | | |
| | | | | | | 2,690,506 | |
| | | | | | | | |
Biotechnology & Pharmaceuticals (0.36%) | |
Amgen Inc. | | | | | | | | |
5.250%, 03/02/2025 | | | 250,000 | | | | 248,129 | |
5.507%, 03/02/2026 | | | 250,000 | | | | 248,491 | |
2.600%, 08/19/2026 | | | 250,000 | | | | 230,738 | |
5.150%, 03/02/2028 | | | 250,000 | | | | 245,874 | |
3.000%, 02/22/2029 | | | 250,000 | | | | 222,155 | |
4.050%, 08/18/2029 | | | 250,000 | | | | 232,052 | |
5.250%, 03/02/2030 | | | 250,000 | | | | 244,247 | |
3.350%, 02/22/2032 | | | 150,000 | | | | 126,701 | |
4.200%, 03/01/2033 | | | 150,000 | | | | 133,361 | |
5.250%, 03/02/2033 | | | 250,000 | | | | 238,990 | |
Pfizer Investment Enterprises Pte. Ltd. | | | | | | | | |
4.650%, 05/19/2025 | | | 250,000 | | | | 246,545 | |
4.450%, 05/19/2026 | | | 250,000 | | | | 244,227 | |
4.450%, 05/19/2028 | | | 250,000 | | | | 241,029 | |
4.650%, 05/19/2030 | | | 250,000 | | | | 239,576 | |
4.750%, 05/19/2033 | | | 250,000 | | | | 236,319 | |
Royalty Pharma PLC | | | | | | | | |
1.200%, 09/02/2025 | | | 250,000 | | | | 227,188 | |
Zoetis Inc. | | | | | | | | |
5.400%, 11/14/2025 | | | 250,000 | | | | 248,928 | |
5.600%, 11/16/2032 | | | 250,000 | | | | 248,860 | |
AstraZeneca PLC | | | | | | | | |
3.375%, 11/16/2025 | | | 150,000 | | | | 143,926 | |
Novartis Capital Corp. | | | | | | | | |
3.000%, 11/20/2025 | | | 150,000 | | | | 142,957 | |
| | | | | | | | |
| | | Principal
amount | | | Value | |
Corporate Bonds (Cont.) | |
|
Biotechnology & Pharmaceuticals (Cont.) | |
Eli Lilly & Co. | | | | | | | | |
5.000%, 02/27/2026 | | $ | 250,000 | | | $ | 249,050 | |
3.375%, 03/15/2029 | | | 207,000 | | | | 190,558 | |
4.700%, 02/27/2033 | | | 150,000 | | | | 144,400 | |
Johnson & Johnson | | | | | | | | |
2.450%, 03/01/2026 | | | 150,000 | | | | 140,891 | |
Astrazeneca Finance LLC | | | | | | | | |
1.200%, 05/28/2026 | | | 250,000 | | | | 224,607 | |
4.875%, 03/03/2028 | | | 250,000 | | | | 245,618 | |
4.900%, 03/03/2030 | | | 250,000 | | | | 243,566 | |
4.875%, 03/03/2033 | | | 150,000 | | | | 144,727 | |
GlaxoSmithKline Capital Inc. | | | | | | | | |
3.875%, 05/15/2028 | | | 250,000 | | | | 236,720 | |
Merck & Co. Inc. | | | | | | | | |
4.050%, 05/17/2028 | | | 250,000 | | | | 240,565 | |
3.400%, 03/07/2029 | | | 150,000 | | | | 137,092 | |
4.300%, 05/17/2030 | | | 250,000 | | | | 236,277 | |
4.500%, 05/17/2033 | | | 150,000 | | | | 140,374 | |
Sanofi | | | | | | | | |
3.625%, 06/19/2028 | | | 150,000 | | | | 141,308 | |
Pfizer Inc. | | | | | | | | |
3.450%, 03/15/2029 | | | 150,000 | | | | 138,109 | |
AbbVie Inc. | | | | | | | | |
3.200%, 11/21/2029 | | | 250,000 | | | | 220,612 | |
Bristol-Myers Squibb Co. | | | | | | | | |
2.950%, 03/15/2032 | | | 250,000 | | | | 208,660 | |
| | | | | | | | |
| | | | | | | 7,673,427 | |
| | | | | | | | |
Cable & Satellite (0.10%) | |
Comcast Corp. | | | | | | | | |
5.250%, 11/07/2025 | | | 250,000 | | | | 248,860 | |
3.300%, 04/01/2027 | | | 200,000 | | | | 186,197 | |
5.350%, 11/15/2027 | | | 250,000 | | | | 249,869 | |
4.550%, 01/15/2029 | | | 250,000 | | | | 240,085 | |
5.500%, 11/15/2032 | | | 250,000 | | | | 247,116 | |
4.650%, 02/15/2033 | | | 250,000 | | | | 234,054 | |
4.800%, 05/15/2033 | | | 250,000 | | | | 234,535 | |
Charter Communications Operating LLC/Charter Communications Operating Capital | | | | | | | | |
2.250%, 01/15/2029 | | | 250,000 | | | | 203,895 | |
4.400%, 04/01/2033 | | | 250,000 | | | | 212,635 | |
| | | | | | | | |
| | | | | | | 2,057,246 | |
| | | | | | | | |
Chemicals (0.13%) | |
Linde Inc. | | | | | | | | |
4.800%, 12/05/2024 | | | 100,000 | | | | 99,276 | |
Celanese U.S. Holdings LLC | | | | | | | | |
6.050%, 03/15/2025 | | | 150,000 | | | | 149,461 | |
6.165%, 07/15/2027 | | | 150,000 | | | | 147,910 | |
6.350%, 11/15/2028 | | | 150,000 | | | | 148,115 | |
6.330%, 07/15/2029 | | | 150,000 | | | | 147,032 | |
6.550%, 11/15/2030 | | | 150,000 | | | | 146,795 | |
6.379%, 07/15/2032 | | | 150,000 | | | | 144,528 | |
| | |
| See accompanying notes to financial statements. | | 21 |
ADVISERS INVESTMENT TRUST
STATE FARM BALANCED FUND
SCHEDULE OF INVESTMENTS (continued)
September 30, 2023
| | | | | | | | |
| | | Principal
amount | | | Value | |
Corporate Bonds (Cont.) | |
|
Chemicals (Cont.) | |
Sherwin-Williams Co., The | | | | | | | | |
4.250%, 08/08/2025 | | $ | 150,000 | | | $ | 145,864 | |
Nutrien Ltd. | | | | | | | | |
5.950%, 11/07/2025 | | | 150,000 | | | | 150,162 | |
4.900%, 03/27/2028 | | | 150,000 | | | | 144,873 | |
E.I. du Pont de Nemours and Co. | | | | | | | | |
4.500%, 05/15/2026 | | | 150,000 | | | | 146,104 | |
FMC Corp. | | | | | | | | |
5.150%, 05/18/2026 | | | 150,000 | | | | 145,730 | |
Albemarle Corp. | | | | | | | | |
4.650%, 06/01/2027 | | | 150,000 | | | | 143,024 | |
5.050%, 06/01/2032 | | | 150,000 | | | | 136,084 | |
Ecolab Inc. | | | | | | | | |
5.250%, 01/15/2028 | | | 150,000 | | | | 149,729 | |
Cabot Corp. | | | | | | | | |
5.000%, 06/30/2032 | | | 150,000 | | | | 137,118 | |
Air Products and Chemicals Inc. | | | | | | | | |
4.800%, 03/03/2033 | | | 100,000 | | | | 95,936 | |
Eastman Chemical Co. | | | | | | | | |
5.750%, 03/08/2033 | | | 100,000 | | | | 95,549 | |
Avery Dennison Corp. | | | | | | | | |
5.750%, 03/15/2033 | | | 100,000 | | | | 97,949 | |
Dow Chemical Co., The | | | | | | | | |
6.300%, 03/15/2033 | | | 150,000 | | | | 154,718 | |
| | | | | | | | |
| | | | | | | 2,725,957 | |
| | | | | | | | |
Commercial Support Services (0.03%) | |
Cintas Corp. No. 2 | | | | | | | | |
3.450%, 05/01/2025 | | | 100,000 | | | | 96,596 | |
Waste Management Inc. | | | | | | | | |
4.875%, 02/15/2029 | | | 150,000 | | | | 146,670 | |
4.625%, 02/15/2030 | | | 100,000 | | | | 95,510 | |
4.150%, 04/15/2032 | | | 100,000 | | | | 91,018 | |
4.625%, 02/15/2033 | | | 100,000 | | | | 93,117 | |
Republic Services Inc. | | | | | | | | |
4.875%, 04/01/2029 | | | 150,000 | | | | 145,779 | |
2.375%, 03/15/2033 | | | 100,000 | | | | 76,832 | |
| | | | | | | | |
| | | | | | | 745,522 | |
| �� | | | | | | | |
Construction Materials (0.00%) | |
Vulcan Materials Co. | | | | | | | | |
5.800%, 03/01/2026 | | | 100,000 | | | | 99,509 | |
| | | | | | | | |
| | | | | | | 99,509 | |
| | | | | | | | |
Containers & Packaging (0.01%) | |
Amcor Flexibles North America Inc. | | | | | | | | |
4.000%, 05/17/2025 | | | 100,000 | | | | 96,714 | |
Berry Global Inc. | | | | | | | | |
5.500%, 04/15/2028(c) | | | 100,000 | | | | 96,596 | |
Amcor Finance U.S.A. Inc. | | | | | | | | |
5.625%, 05/26/2033 | | | 100,000 | | | | 96,017 | |
| | | | | | | | |
| | | | | | | 289,327 | |
| | | | | | | | |
| | | | | | | | |
| | | Principal
amount | | | Value | |
Corporate Bonds (Cont.) | |
|
Diversified Industrials (0.06%) | |
Honeywell International Inc. | | | | | | | | |
4.850%, 11/01/2024 | | $ | 250,000 | | | $ | 248,296 | |
4.950%, 02/15/2028 | | | 150,000 | | | | 149,403 | |
4.250%, 01/15/2029 | | | 150,000 | | | | 143,249 | |
5.000%, 02/15/2033 | | | 125,000 | | | | 121,357 | |
3M Co. | | | | | | | | |
3.000%, 08/07/2025 | | | 250,000 | | | | 238,097 | |
Parker-Hannifin Corp. | | | | | | | | |
4.250%, 09/15/2027 | | | 150,000 | | | | 143,307 | |
4.500%, 09/15/2029 | | | 150,000 | | | | 141,978 | |
| | | | | | | | |
| | | | | | | 1,185,687 | |
| | | | | | | | |
E-Commerce Discretionary (0.13%) | |
Amazon.com Inc. | | | | | | | | |
4.700%, 11/29/2024 | | | 250,000 | | | | 247,676 | |
3.000%, 04/13/2025 | | | 250,000 | | | | 241,536 | |
4.600%, 12/01/2025 | | | 150,000 | | | | 148,086 | |
3.300%, 04/13/2027 | | | 150,000 | | | | 141,135 | |
4.550%, 12/01/2027 | | | 250,000 | | | | 244,827 | |
3.450%, 04/13/2029 | | | 250,000 | | | | 230,847 | |
4.650%, 12/01/2029 | | | 150,000 | | | | 146,309 | |
2.100%, 05/12/2031 | | | 150,000 | | | | 120,251 | |
3.600%, 04/13/2032 | | | 250,000 | | | | 221,687 | |
4.700%, 12/01/2032 | | | 250,000 | | | | 238,693 | |
eBay Inc. | | | | | | | | |
5.900%, 11/22/2025 | | | 250,000 | | | | 250,454 | |
5.950%, 11/22/2027 | | | 250,000 | | | | 252,368 | |
6.300%, 11/22/2032 | | | 250,000 | | | | 254,537 | |
| | | | | | | | |
| | | | | | | 2,738,406 | |
| | | | | | | | |
Electric Utilities (0.56%) | |
NextEra Energy Capital Holdings Inc. | | | | | | | | |
6.051%, 03/01/2025 | | | 150,000 | | | | 150,227 | |
4.450%, 06/20/2025 | | | 150,000 | | | | 146,310 | |
5.749%, 09/01/2025 | | | 150,000 | | | | 149,579 | |
4.625%, 07/15/2027 | | | 150,000 | | | | 144,579 | |
4.900%, 02/28/2028 | | | 150,000 | | | | 145,174 | |
5.000%, 02/28/2030 | | | 150,000 | | | | 143,302 | |
5.000%, 07/15/2032 | | | 150,000 | | | | 140,180 | |
5.050%, 02/28/2033 | | | 150,000 | | | | 139,969 | |
Sempra | | | | | | | | |
3.300%, 04/01/2025 | | | 100,000 | | | | 96,124 | |
5.400%, 08/01/2026 | | | 100,000 | | | | 98,939 | |
3.700%, 04/01/2029 | | | 100,000 | | | | 90,097 | |
5.500%, 08/01/2033 | | | 200,000 | | | | 191,332 | |
Southern California Edison Co. | | | | | | | | |
4.200%, 06/01/2025 | | | 150,000 | | | | 146,019 | |
4.900%, 06/01/2026 | | | 150,000 | | | | 147,337 | |
4.700%, 06/01/2027 | | | 150,000 | | | | 145,533 | |
5.850%, 11/01/2027 | | | 150,000 | | | | 150,805 | |
5.300%, 03/01/2028 | | | 150,000 | | | | 148,051 | |
5.950%, 11/01/2032 | | | 150,000 | | | | 149,600 | |
Pacific Gas and Electric Co. | | | | | | | | |
4.950%, 06/08/2025 | | | 150,000 | | | | 146,470 | |
5.450%, 06/15/2027 | | | 150,000 | | | | 144,365 | |
| | |
| 22 | | See accompanying notes to financial statements. |
ADVISERS INVESTMENT TRUST
STATE FARM BALANCED FUND
SCHEDULE OF INVESTMENTS (continued)
September 30, 2023
| | | | | | | | |
| | | Principal
amount | | | Value | |
Corporate Bonds (Cont.) | |
|
Electric Utilities (Cont.) | |
4.400%, 03/01/2032 | | $ | 150,000 | | | $ | 127,053 | |
5.900%, 06/15/2032 | | | 150,000 | | | | 140,085 | |
6.400%, 06/15/2033 | | | 150,000 | | | | 144,575 | |
National Rural Utilities Cooperative Finance Corp. | | | | | | | | |
3.450%, 06/15/2025 | | | 150,000 | | | | 144,327 | |
5.450%, 10/30/2025 | | | 150,000 | | | | 149,812 | |
4.450%, 03/13/2026 | | | 150,000 | | | | 146,515 | |
4.800%, 03/15/2028 | | | 150,000 | | | | 146,269 | |
Edison International | | | | | | | | |
4.700%, 08/15/2025 | | | 150,000 | | | | 145,965 | |
WEC Energy Group Inc. | | | | | | | | |
5.000%, 09/27/2025 | | | 150,000 | | | | 147,801 | |
4.750%, 01/09/2026 | | | 150,000 | | | | 146,938 | |
5.150%, 10/01/2027 | | | 150,000 | | | | 147,486 | |
4.750%, 01/15/2028 | | | 150,000 | | | | 145,038 | |
Southern Co., The | | | | | | | | |
5.150%, 10/06/2025 | | | 150,000 | | | | 148,485 | |
5.113%, 08/01/2027 | | | 150,000 | | | | 146,995 | |
4.850%, 06/15/2028 | | | 150,000 | | | | 144,939 | |
5.700%, 10/15/2032 | | | 150,000 | | | | 147,334 | |
5.200%, 06/15/2033 | | | 150,000 | | | | 141,782 | |
Wisconsin Public Service Corp. | | | | | | | | |
5.350%, 11/10/2025 | | | 150,000 | | | | 149,527 | |
Duke Energy Corp. | | | | | | | | |
5.000%, 12/08/2025 | | | 150,000 | | | | 147,893 | |
5.000%, 12/08/2027 | | | 150,000 | | | | 146,435 | |
4.300%, 03/15/2028 | | | 150,000 | | | | 142,230 | |
Florida Power & Light Co. | | | | | | | | |
4.450%, 05/15/2026 | | | 150,000 | | | | 146,782 | |
5.050%, 04/01/2028 | | | 150,000 | | | | 148,093 | |
4.400%, 05/15/2028 | | | 150,000 | | | | 144,637 | |
4.625%, 05/15/2030 | | | 150,000 | | | | 143,120 | |
5.100%, 04/01/2033 | | | 150,000 | | | | 145,109 | |
4.800%, 05/15/2033 | | | 150,000 | | | | 141,787 | |
Eversource Energy | | | | | | | | |
4.750%, 05/15/2026 | | | 150,000 | | | | 146,630 | |
2.900%, 03/01/2027 | | | 150,000 | | | | 136,972 | |
4.600%, 07/01/2027 | | | 150,000 | | | | 144,270 | |
5.450%, 03/01/2028 | | | 150,000 | | | | 148,262 | |
5.125%, 05/15/2033 | | | 150,000 | | | | 139,518 | |
CenterPoint Energy Inc. | | | | | | | | |
5.250%, 08/10/2026 | | | 150,000 | | | | 148,071 | |
Exelon Corp. | | | | | | | | |
2.750%, 03/15/2027 | | | 150,000 | | | | 136,213 | |
5.150%, 03/15/2028 | | | 150,000 | | | | 147,205 | |
5.300%, 03/15/2033 | | | 150,000 | | | | 143,036 | |
Virginia Electric and Power Co. | | | | | | | | |
3.750%, 05/15/2027 | | | 150,000 | | | | 141,570 | |
5.000%, 04/01/2033 | | | 150,000 | | | | 140,621 | |
5.300%, 08/15/2033 | | | 150,000 | | | | 143,668 | |
Alabama Power Co. | | | | | | | | |
3.750%, 09/01/2027 | | | 150,000 | | | | 141,705 | |
American Electric Power Co. Inc. | | | | | | | | |
5.750%, 11/01/2027 | | | 150,000 | | | | 150,866 | |
| | | | | | | | |
| | | Principal
amount | | | Value | |
Corporate Bonds (Cont.) | |
|
Electric Utilities (Cont.) | |
5.950%, 11/01/2032 | | $ | 150,000 | | | $ | 149,558 | |
Public Service Enterprise Group Inc. | | | | | | | | |
5.850%, 11/15/2027 | | | 150,000 | | | | 150,897 | |
Consumers Energy Co. | | | | | | | | |
4.650%, 03/01/2028 | | | 150,000 | | | | 146,496 | |
4.625%, 05/15/2033 | | | 150,000 | | | | 139,634 | |
Constellation Energy Generation LLC | | | | | | | | |
5.600%, 03/01/2028 | | | 150,000 | | | | 148,981 | |
Black Hills Corp. | | | | | | | | |
5.950%, 03/15/2028 | | | 150,000 | | | | 149,946 | |
Georgia Power Co. | | | | | | | | |
4.650%, 05/16/2028 | | | 150,000 | | | | 144,710 | |
4.700%, 05/15/2032 | | | 150,000 | | | | 138,977 | |
4.950%, 05/17/2033 | | | 150,000 | | | | 140,601 | |
DTE Energy Co. | | | | | | | | |
4.875%, 06/01/2028 | | | 150,000 | | | | 144,966 | |
AES Corp., The | | | | | | | | |
5.450%, 06/01/2028 | | | 150,000 | | | | 144,797 | |
National Grid PLC | | | | | | | | |
5.602%, 06/12/2028 | | | 150,000 | | | | 148,366 | |
5.809%, 06/12/2033 | | | 150,000 | | | | 145,698 | |
San Diego Gas & Electric Co. | | | | | | | | |
4.950%, 08/15/2028 | | | 150,000 | | | | 146,025 | |
Puget Energy Inc. | | | | | | | | |
4.224%, 03/15/2032 | | | 150,000 | | | | 127,994 | |
AEP Texas Inc. | | | | | | | | |
4.700%, 05/15/2032 | | | 150,000 | | | | 137,260 | |
Xcel Energy Inc. | | | | | | | | |
4.600%, 06/01/2032 | | | 150,000 | | | | 136,118 | |
5.450%, 08/15/2033 | | | 150,000 | | | | 143,149 | |
Dominion Energy Inc. | | | | | | | | |
5.375%, 11/15/2032 | | | 150,000 | | | | 143,207 | |
Duke Energy Carolinas LLC | | | | | | | | |
4.950%, 01/15/2033 | | | 150,000 | | | | 142,527 | |
PPL Electric Utilities Corp. | | | | | | | | |
5.000%, 05/15/2033 | | | 150,000 | | | | 143,165 | |
Ameren Illinois Co. | | | | | | | | |
4.950%, 06/01/2033 | | | 150,000 | | | | 141,925 | |
Public Service Electric and Gas Co. | | | | | | | | |
5.200%, 08/01/2033 | | | 150,000 | | | | 146,498 | |
Arizona Public Service Co. | | | | | | | | |
5.550%, 08/01/2033 | | | 150,000 | | | | 145,406 | |
| | | | | | | | |
| | | | | | | 12,186,512 | |
| | | | | | | | |
Electrical Equipment (0.05%) | |
Tyco Electronics Group SA | | | | | | | | |
4.500%, 02/13/2026 | | | 150,000 | | | | 146,679 | |
Amphenol Corp. | | | | | | | | |
4.750%, 03/30/2026 | | | 150,000 | | | | 147,329 | |
Vontier Corp. | | | | | | | | |
1.800%, 04/01/2026 | | | 150,000 | | | | 134,352 | |
2.950%, 04/01/2031 | | | 150,000 | | | | 115,692 | |
Otis Worldwide Corp. | | | | | | | | |
5.250%, 08/16/2028 | | | 150,000 | | | | 147,446 | |
| | |
| See accompanying notes to financial statements. | | 23 |
ADVISERS INVESTMENT TRUST
STATE FARM BALANCED FUND
SCHEDULE OF INVESTMENTS (continued)
September 30, 2023
| | | | | | | | |
| | | Principal
amount | | | Value | |
Corporate Bonds (Cont.) | |
|
Electrical Equipment (Cont.) | |
Lennox International Inc. | | | | | | | | |
5.500%, 09/15/2028 | | $ | 100,000 | | | $ | 98,143 | |
Allegion U.S. Holding Co. Inc. | | | | | | | | |
5.411%, 07/01/2032 | | | 150,000 | | | | 141,076 | |
Trane Technologies Financing Ltd. | | | | | | | | |
5.250%, 03/03/2033 | | | 100,000 | | | | 96,685 | |
| | | | | | | | |
| | | | | | | 1,027,402 | |
| | | | | | | | |
Engineering & Construction (0.02%) | |
Ste Transcore Holdings Inc. | | | | | | | | |
4.125%, 05/23/2026 | | | 250,000 | | | | 242,246 | |
Jacobs Engineering Group Inc. | | | | | | | | |
6.350%, 08/18/2028 | | | 100,000 | | | | 99,709 | |
| | | | | | | | |
| | | | | | | 341,955 | |
| | | | | | | | |
Entertainment Content (0.08%) | |
Warnermedia Holdings Inc. | | | | | | | | |
3.638%, 03/15/2025 | | | 500,000 | | | | 482,245 | |
3.788%, 03/15/2025 | | | 250,000 | | | | 241,414 | |
6.412%, 03/15/2026 | | | 500,000 | | | | 499,917 | |
4.279%, 03/15/2032 | | | 500,000 | | | | 424,409 | |
| | | | | | | | |
| | | | | | | 1,647,985 | |
| | | | | | | | |
Food (0.14%) | |
General Mills Inc. | | | | | | | | |
5.241%, 11/18/2025 | | | 200,000 | | | | 198,198 | |
4.950%, 03/29/2033 | | | 100,000 | | | | 93,697 | |
Conagra Brands Inc. | | | | | | | | |
5.300%, 10/01/2026 | | | 250,000 | | | | 247,461 | |
JBS U.S.A. LUX SA/JBS U.S.A. Food Co./JBS U.S.A. Finance Inc. | | | | | | | | |
2.500%, 01/15/2027 | | | 250,000 | | | | 220,830 | |
5.125%, 02/01/2028 | | | 250,000 | | | | 237,901 | |
3.000%, 02/02/2029 | | | 250,000 | | | | 209,797 | |
5.500%, 01/15/2030 | | | 250,000 | | | | 233,384 | |
3.625%, 01/15/2032 | | | 250,000 | | | | 199,053 | |
5.750%, 04/01/2033 | | | 100,000 | | | | 91,456 | |
Mondelez International Inc. | | | | | | | | |
2.625%, 03/17/2027 | | | 250,000 | | | | 227,546 | |
Kraft Heinz Foods Co. | | | | | | | | |
3.750%, 04/01/2030 | | | 250,000 | | | | 223,136 | |
Pilgrim’s Pride Corp. | | | | | | | | |
4.250%, 04/15/2031 | | | 250,000 | | | | 208,551 | |
3.500%, 03/01/2032 | | | 250,000 | | | | 193,326 | |
6.250%, 07/01/2033 | | | 100,000 | | | | 93,979 | |
Kellogg Co. | | | | | | | | |
5.250%, 03/01/2033 | | | 100,000 | | | | 95,553 | |
McCormick & Co. Inc. | | | | | | | | |
4.950%, 04/15/2033 | | | 100,000 | | | | 93,046 | |
Hershey Co., The | | | | | | | | |
4.500%, 05/04/2033 | | | 100,000 | | | | 94,349 | |
| | | | | | | | |
| | | | | | | 2,961,263 | |
| | | | | | | | |
| | | | | | | | |
| | | Principal
amount | | | Value | |
Corporate Bonds (Cont.) | |
|
Gas & Water Utilities (0.04%) | |
National Fuel Gas Co. | | | | | | | | |
5.500%, 10/01/2026 | | $ | 250,000 | | | $ | 246,565 | |
Southern California Gas Co. | | | | | | | | |
2.950%, 04/15/2027 | | | 100,000 | | | | 91,733 | |
5.200%, 06/01/2033 | | | 100,000 | | | | 94,602 | |
CenterPoint Energy Resources Corp. | | | | | | | | |
5.250%, 03/01/2028 | | | 100,000 | | | | 98,686 | |
5.400%, 03/01/2033 | | | 100,000 | | | | 96,184 | |
NiSource Inc. | | | | | | | | |
5.250%, 03/30/2028 | | | 100,000 | | | | 98,004 | |
Southwest Gas Corp. | | | | | | | | |
4.050%, 03/15/2032 | | | 100,000 | | | | 86,381 | |
American Water Capital Corp. | | | | | | | | |
4.450%, 06/01/2032 | | | 100,000 | | | | 92,408 | |
| | | | | | | | |
| | | | | | | 904,563 | |
| | | | | | | | |
Health Care Facilities & Services (0.33%) | |
UnitedHealth Group Inc. | | | | | | | | |
5.000%, 10/15/2024 | | | 500,000 | | | | 497,768 | |
5.150%, 10/15/2025 | | | 250,000 | | | | 249,263 | |
3.700%, 05/15/2027 | | | 250,000 | | | | 236,968 | |
5.250%, 02/15/2028 | | | 250,000 | | | | 250,425 | |
4.000%, 05/15/2029 | | | 250,000 | | | | 233,967 | |
5.300%, 02/15/2030 | | | 250,000 | | | | 248,446 | |
4.200%, 05/15/2032 | | | 250,000 | | | | 228,180 | |
Elevance Health Inc. | | | | | | | | |
5.350%, 10/15/2025 | | | 250,000 | | | | 248,423 | |
4.900%, 02/08/2026 | | | 500,000 | | | | 490,452 | |
5.500%, 10/15/2032 | | | 250,000 | | | | 246,059 | |
4.750%, 02/15/2033 | | | 250,000 | | | | 232,696 | |
McKesson Corp. | | | | | | | | |
5.250%, 02/15/2026 | | | 250,000 | | | | 247,219 | |
4.900%, 07/15/2028 | | | 150,000 | | | | 146,585 | |
5.100%, 07/15/2033 | | | 100,000 | | | | 95,546 | |
CVS Health Corp. | | | | | | | | |
5.000%, 02/20/2026 | | | 250,000 | | | | 246,119 | |
5.000%, 01/30/2029 | | | 150,000 | | | | 145,110 | |
5.125%, 02/21/2030 | | | 250,000 | | | | 240,456 | |
5.250%, 01/30/2031 | | | 250,000 | | | | 240,206 | |
5.250%, 02/21/2033 | | | 100,000 | | | | 94,741 | |
5.300%, 06/01/2033 | | | 100,000 | | | | 94,716 | |
Cigna Group, The | | | | | | | | |
5.685%, 03/15/2026 | | | 150,000 | | | | 149,068 | |
Universal Health Services Inc. | | | | | | | | |
1.650%, 09/01/2026 | | | 250,000 | | | | 220,366 | |
2.650%, 10/15/2030 | | | 250,000 | | | | 194,855 | |
HCA Inc. | | | | | | | | |
3.125%, 03/15/2027 | | | 150,000 | | | | 136,288 | |
5.200%, 06/01/2028 | | | 150,000 | | | | 144,970 | |
3.375%, 03/15/2029 | | | 150,000 | | | | 131,425 | |
3.625%, 03/15/2032 | | | 100,000 | | | | 82,889 | |
5.500%, 06/01/2033 | | | 100,000 | | | | 94,572 | |
CommonSpirit Health | | | | | | | | |
6.073%, 11/01/2027 | | | 150,000 | | | | 151,339 | |
| | |
| 24 | | See accompanying notes to financial statements. |
ADVISERS INVESTMENT TRUST
STATE FARM BALANCED FUND
SCHEDULE OF INVESTMENTS (continued)
September 30, 2023
| | | | | | | | |
| | | Principal
amount | | | Value | |
Corporate Bonds (Cont.) | |
|
Health Care Facilities & Services (Cont.) | |
Humana Inc. | | | | | | | | |
5.750%, 03/01/2028 | | $ | 250,000 | | | $ | 250,890 | |
3.700%, 03/23/2029 | | | 250,000 | | | | 228,056 | |
IQVIA Inc. | | | | | | | | |
5.700%, 05/15/2028(c) | | | 200,000 | | | | 194,308 | |
Centene Corp. | | | | | | | | |
2.450%, 07/15/2028 | | | 250,000 | | | | 211,211 | |
Adventist Health System | | | | | | | | |
5.430%, 03/01/2032 | | | 150,000 | | | | 145,003 | |
Sutter Health | | | | | | | | |
5.164%, 08/15/2033 | | | 100,000 | | | | 95,991 | |
| | | | | | | | |
| | | | | | | 7,144,576 | |
| | | | | | | | |
Home & Office Products (0.00%) | |
Whirlpool Corp. | | | | | | | | |
4.700%, 05/14/2032 | | | 100,000 | | | | 91,468 | |
| | | | | | | | |
| | | | | | | 91,468 | |
| | | | | | | | |
Home Construction (0.03%) | |
D.R. Horton Inc. | | | | | | | | |
2.600%, 10/15/2025 | | | 100,000 | | | | 93,570 | |
1.300%, 10/15/2026 | | | 100,000 | | | | 87,686 | |
1.400%, 10/15/2027 | | | 100,000 | | | | 84,944 | |
MDC Holdings Inc. | | | | | | | | |
2.500%, 01/15/2031 | | | 100,000 | | | | 74,674 | |
Fortune Brands Innovations Inc. | | | | | | | | |
4.000%, 03/25/2032 | | | 150,000 | | | | 127,871 | |
5.875%, 06/01/2033 | | | 100,000 | | | | 96,309 | |
| | | | | | | | |
| | | | | | | 565,054 | |
| | | | | | | | |
Household Products (0.10%) | |
Kenvue Inc.(c) | | | | | | | | |
5.500%, 03/22/2025 | | | 100,000 | | | | 99,762 | |
5.350%, 03/22/2026 | | | 100,000 | | | | 99,763 | |
5.050%, 03/22/2028 | | | 100,000 | | | | 98,676 | |
5.000%, 03/22/2030 | | | 100,000 | | | | 97,429 | |
4.900%, 03/22/2033 | | | 100,000 | | | | 95,570 | |
Haleon UK Capital PLC | | | | | | | | |
3.125%, 03/24/2025 | | | 250,000 | | | | 240,121 | |
Procter & Gamble Co., The | | | | | | | | |
4.100%, 01/26/2026 | | | 100,000 | | | | 97,800 | |
1.900%, 02/01/2027 | | | 100,000 | | | | 90,599 | |
3.950%, 01/26/2028 | | | 100,000 | | | | 96,738 | |
2.300%, 02/01/2032 | | | 100,000 | | | | 82,382 | |
4.050%, 01/26/2033 | | | 100,000 | | | | 93,127 | |
Colgate-Palmolive Co. | | | | | | | | |
4.800%, 03/02/2026 | | | 100,000 | | | | 99,532 | |
3.100%, 08/15/2027 | | | 100,000 | | | | 93,579 | |
4.600%, 03/01/2028 | | | 100,000 | | | | 98,878 | |
Haleon U.S. Capital LLC | | | | | | | | |
3.375%, 03/24/2027 | | | 250,000 | | | | 231,937 | |
3.625%, 03/24/2032 | | | 250,000 | | | | 214,413 | |
Clorox Co., The | | | | | | | | |
4.600%, 05/01/2032 | | | 100,000 | | | | 93,117 | |
| | | | | | | | |
| | | Principal
amount | | | Value | |
Corporate Bonds (Cont.) | |
|
Household Products (Cont.) | |
Church & Dwight Co. Inc. | | | | | | | | |
5.600%, 11/15/2032 | | $ | 100,000 | | | $ | 100,282 | |
Estee Lauder Cos. Inc., The | | | | | | | | |
4.650%, 05/15/2033 | | | 100,000 | | | | 93,273 | |
| | | | | | | | |
| | | | | | | 2,216,978 | |
| | | | | | | | |
Industrial Intermediate Products (0.01%) | |
Timken Co., The | | | | | | | | |
4.125%, 04/01/2032 | | | 150,000 | | | | 127,793 | |
| | | | | | | | |
| | | | | | | 127,793 | |
| | | | | | | | |
Institutional Financial Services (0.64%) | |
Goldman Sachs Group Inc., The | | | | | | | | |
5.700%, 11/01/2024 | | | 250,000 | | | | 249,045 | |
3.500%, 04/01/2025 | | | 250,000 | | | | 240,718 | |
5.798%, 08/10/2026 | | | 150,000 | | | | 148,853 | |
4.387%, 06/15/2027 | | | 250,000 | | | | 240,563 | |
2.640%, 02/24/2028 | | | 250,000 | | | | 222,926 | |
3.615%, 03/15/2028 | | | 250,000 | | | | 230,668 | |
4.482%, 08/23/2028 | | | 250,000 | | | | 236,628 | |
2.615%, 04/22/2032 | | | 250,000 | | | | 195,269 | |
2.383%, 07/21/2032 | | | 250,000 | | | | 190,397 | |
3.102%, 02/24/2033 | | | 500,000 | | | | 399,853 | |
State Street Corp. | | | | | | | | |
3.300%, 12/16/2024 | | | 250,000 | | | | 242,352 | |
3.550%, 08/18/2025 | | | 250,000 | | | | 240,123 | |
4.857%, 01/26/2026 | | | 250,000 | | | | 245,812 | |
5.104%, 05/18/2026 | | | 250,000 | | | | 246,840 | |
2.650%, 05/19/2026 | | | 250,000 | | | | 233,342 | |
5.272%, 08/03/2026 | | | 150,000 | | | | 148,591 | |
2.203%, 02/07/2028 | | | 150,000 | | | | 133,677 | |
5.159%, 05/18/2034 | | | 150,000 | | | | 139,503 | |
Blackstone Private Credit Fund | | | | | | | | |
4.700%, 03/24/2025 | | | 250,000 | | | | 242,527 | |
7.050%, 09/29/2025 | | | 500,000 | | | | 500,767 | |
3.250%, 03/15/2027 | | | 500,000 | | | | 434,317 | |
4.000%, 01/15/2029 | | | 250,000 | | | | 212,518 | |
Intercontinental Exchange Inc. | | | | | | | | |
3.650%, 05/23/2025 | | | 250,000 | | | | 241,653 | |
4.000%, 09/15/2027 | | | 250,000 | | | | 236,602 | |
4.350%, 06/15/2029 | | | 250,000 | | | | 235,218 | |
4.600%, 03/15/2033 | | | 250,000 | | | | 229,649 | |
Nomura Holdings Inc. | | | | | | | | |
5.099%, 07/03/2025 | | | 250,000 | | | | 245,230 | |
5.709%, 01/09/2026 | | | 250,000 | | | | 247,355 | |
5.842%, 01/18/2028 | | | 500,000 | | | | 492,801 | |
6.181%, 01/18/2033 | | | 250,000 | | | | 247,000 | |
Morgan Stanley (Variable, U.S. SOFR +0.56%)(b) | | | | | | | | |
1.164%, 10/21/2025 | | | 250,000 | | | | 235,992 | |
2.630%, 02/18/2026 | | | 150,000 | | | | 142,774 | |
4.679%, 07/17/2026 | | | 250,000 | | | | 243,543 | |
6.138%, 10/16/2026 | | | 100,000 | | | | 100,095 | |
5.050%, 01/28/2027 | | | 250,000 | | | | 245,058 | |
1.512%, 07/20/2027 | | | 250,000 | | | | 220,898 | |
| | |
| See accompanying notes to financial statements. | | 25 |
ADVISERS INVESTMENT TRUST
STATE FARM BALANCED FUND
SCHEDULE OF INVESTMENTS (continued)
September 30, 2023
| | | | | | | | |
| | | Principal
amount | | | Value | |
Corporate Bonds (Cont.) | | | | | | | | |
Institutional Financial Services (Cont.) | |
2.475%, 01/21/2028 | | $ | 250,000 | | | $ | 222,905 | |
4.210%, 04/20/2028 | | | 250,000 | | | | 235,070 | |
5.123%, 02/01/2029 | | | 250,000 | | | | 240,754 | |
5.164%, 04/20/2029 | | | 250,000 | | | | 240,514 | |
5.449%, 07/20/2029 | | | 250,000 | | | | 243,617 | |
4.431%, 01/23/2030 | | | 250,000 | | | | 231,286 | |
2.699%, 01/22/2031 | | | 250,000 | | | | 204,403 | |
2.239%, 07/21/2032 | | | 250,000 | | | | 188,421 | |
2.943%, 01/21/2033 | | | 250,000 | | | | 196,877 | |
4.889%, 07/20/2033 | | | 500,000 | | | | 454,313 | |
6.342%, 10/18/2033 | | | 500,000 | | | | 502,850 | |
5.250%, 04/21/2034 | | | 150,000 | | | | 139,272 | |
5.424%, 07/21/2034 | | | 150,000 | | | | 141,494 | |
2.484%, 09/16/2036 | | | 250,000 | | | | 181,597 | |
5.297%, 04/20/2037 | | | 250,000 | | | | 222,754 | |
5.948%, 01/19/2038 | | | 250,000 | | | | 233,669 | |
Bank of New York Mellon Corp., The | | | | | | | | |
2.800%, 05/04/2026 | | | 250,000 | | | | 233,560 | |
2.450%, 08/17/2026 | | | 250,000 | | | | 230,070 | |
4.947%, 04/26/2027 | | | 100,000 | | | | 97,609 | |
3.400%, 01/29/2028 | | | 250,000 | | | | 229,839 | |
3.992%, 06/13/2028 | | | 150,000 | | | | 141,412 | |
5.834%, 10/25/2033 | | | 150,000 | | | | 147,449 | |
4.706%, 02/01/2034 | | | 150,000 | | | | 135,422 | |
CME Group Inc. | | | | | | | | |
2.650%, 03/15/2032 | | | 100,000 | | | | 81,482 | |
| | | | | | | | |
| | | | | | | 13,915,796 | |
| | | | | | | | |
Insurance (0.16%) | | | | | | | | |
Berkshire Hathaway Finance Corp. | | | | | | | | |
2.300%, 03/15/2027 | | | 250,000 | | | | 229,334 | |
Progressive Corp., The | | | | | | | | |
2.500%, 03/15/2027 | | | 250,000 | | | | 227,004 | |
Aon Corp./Aon Global Holdings PLC | | | | | | | | |
2.850%, 05/28/2027 | | | 250,000 | | | | 227,012 | |
5.350%, 02/28/2033 | | | 250,000 | | | | 239,664 | |
Willis North America Inc. | | | | | | | | |
4.650%, 06/15/2027 | | | 250,000 | | | | 239,288 | |
F&G Annuities & Life Inc. | | | | | | | | |
7.400%, 01/13/2028 | | | 250,000 | | | | 249,392 | |
Corebridge Financial Inc. | | | | | | | | |
3.850%, 04/05/2029 | | | 250,000 | | | | 224,571 | |
3.900%, 04/05/2032 | | | 250,000 | | | | 210,374 | |
6.875%, 12/15/2052 | | | 250,000 | | | | 239,497 | |
MetLife Inc. | | | | | | | | |
4.550%, 03/23/2030 | | | 250,000 | | | | 237,139 | |
Aflac Inc. | | | | | | | | |
3.600%, 04/01/2030 | | | 250,000 | | | | 221,402 | |
American International Group Inc. | | | | | | | | |
5.125%, 03/27/2033 | | | 250,000 | | | | 232,615 | |
Allstate Corp., The | | | | | | | | |
5.250%, 03/30/2033 | | | 250,000 | | | | 235,678 | |
| | | | | | | | |
| | | Principal
amount | | | Value | |
Corporate Bonds (Cont.) | | | | | | | | |
Insurance (Cont.) | |
Prudential Financial Inc. (Variable, | | | | | | | | |
U.S. SOFR + 3.16%)(b) | | | | | | | | |
5.125%, 03/01/2052 | | $ | 250,000 | | | $ | 215,286 | |
6.000%, 09/01/2052 | | | 250,000 | | | | 228,862 | |
| | | | | | | | |
| | | | | | | 3,457,118 | |
| | | | | | | | |
Internet Media & Services (0.11%) | |
Alphabet Inc. | | | | | | | | |
1.998%, 08/15/2026 | | | 150,000 | | | | 138,018 | |
Meta Platforms Inc. | | | | | | | | |
3.500%, 08/15/2027 | | | 500,000 | | | | 471,554 | |
4.600%, 05/15/2028 | | | 500,000 | | | | 489,107 | |
4.800%, 05/15/2030 | | | 500,000 | | | | 487,020 | |
3.850%, 08/15/2032 | | | 500,000 | | | | 443,597 | |
4.950%, 05/15/2033 | | | 250,000 | | | | 239,587 | |
| | | | | | | | |
| | | | | | | 2,268,883 | |
| | | | | | | | |
Leisure Facilities & Services (0.06%) | |
Starbucks Corp. | | | | | | | | |
4.750%, 02/15/2026 | | | 250,000 | | | | 246,321 | |
2.250%, 03/12/2030 | | | 100,000 | | | | 81,914 | |
4.800%, 02/15/2033 | | | 100,000 | | | | 94,095 | |
Hyatt Hotels Corp. | | | | | | | | |
5.750%, 01/30/2027 | | | 250,000 | | | | 248,397 | |
McDonald’s Corp. | | | | | | | | |
4.800%, 08/14/2028 | | | 250,000 | | | | 244,528 | |
3.600%, 07/01/2030 | | | 150,000 | | | | 133,913 | |
4.950%, 08/14/2033 | | | 100,000 | | | | 95,388 | |
Marriott International Inc. | | | | | | | | |
4.900%, 04/15/2029 | | | 250,000 | | | | 238,362 | |
| | | | | | | | |
| | | | | | | 1,382,918 | |
| | | | | | | | |
Machinery (0.17%) | | | | | | | | |
John Deere Capital Corp. | | | | | | | | |
1.250%, 01/10/2025 | | | 100,000 | | | | 94,760 | |
5.150%, 03/03/2025 | | | 100,000 | | | | 99,712 | |
4.950%, 06/06/2025 | | | 150,000 | | | | 149,018 | |
4.800%, 01/09/2026 | | | 100,000 | | | | 98,838 | |
5.050%, 03/03/2026 | | | 100,000 | | | | 99,398 | |
4.750%, 06/08/2026 | | | 100,000 | | | | 98,657 | |
4.150%, 09/15/2027 | | | 100,000 | | | | 96,367 | |
4.900%, 03/03/2028 | | | 100,000 | | | | 98,574 | |
4.950%, 07/14/2028 | | | 100,000 | | | | 98,619 | |
4.850%, 10/11/2029 | | | 150,000 | | | | 147,207 | |
4.700%, 06/10/2030 | | | 150,000 | | | | 144,245 | |
4.350%, 09/15/2032 | | | 100,000 | | | | 92,997 | |
Caterpillar Financial Services Corp. | | | | | | | | |
4.900%, 01/17/2025 | | | 100,000 | | | | 99,296 | |
5.400%, 03/10/2025 | | | 150,000 | | | | 150,209 | |
5.150%, 08/11/2025 | | | 150,000 | | | | 149,197 | |
4.800%, 01/06/2026 | | | 100,000 | | | | 98,892 | |
4.350%, 05/15/2026 | | | 100,000 | | | | 97,756 | |
3.600%, 08/12/2027 | | | 100,000 | | | | 94,346 | |
Stanley Black & Decker Inc. | | | | | | | | |
2.300%, 02/24/2025 | | | 150,000 | | | | 142,720 | |
| | |
| 26 | | See accompanying notes to financial statements. |
ADVISERS INVESTMENT TRUST
STATE FARM BALANCED FUND
SCHEDULE OF INVESTMENTS (continued)
September 30, 2023
| | | | | | | | |
| | | Principal
amount | | | Value | |
Corporate Bonds (Cont.) | | | | | | | | |
Machinery (Cont.) | | | | | | | | |
6.000%, 03/06/2028 | | $ | 150,000 | | | $ | 151,167 | |
Regal Rexnord Corp.(c) | | | | | | | | |
6.050%, 02/15/2026 | | | 150,000 | | | | 148,328 | |
6.050%, 04/15/2028 | | | 150,000 | | | | 145,900 | |
6.300%, 02/15/2030 | | | 150,000 | | | | 144,896 | |
6.400%, 04/15/2033 | | | 250,000 | | | | 240,802 | |
CNH Industrial Capital LLC | | | | | | | | |
4.550%, 04/10/2028 | | | 100,000 | | | | 95,009 | |
Eaton Corp. | | | | | | | | |
4.350%, 05/18/2028 | | | 150,000 | | | | 144,330 | |
4.150%, 03/15/2033 | | | 100,000 | | | | 90,395 | |
Ingersoll Rand Inc. | | | | | | | | |
5.400%, 08/14/2028 | | | 150,000 | | | | 147,474 | |
5.700%, 08/14/2033 | | | 100,000 | | | | 96,512 | |
Veralto Corp. | | | | | | | | |
5.350%, 09/18/2028(c) | | | 100,000 | | | | 98,869 | |
Pentair Finance S.a.r.l. | | | | | | | | |
5.900%, 07/15/2032 | | | 100,000 | | | | 97,674 | |
| | | | | | | | |
| | | | | | | 3,752,164 | |
| | | | | | | | |
Medical Equipment & Devices (0.15%) | | | | | |
GE HealthCare Technologies Inc. | | | | | | | | |
5.550%, 11/15/2024 | | | 250,000 | | | | 248,747 | |
5.600%, 11/15/2025 | | | 250,000 | | | | 248,557 | |
5.650%, 11/15/2027 | | | 150,000 | | | | 149,754 | |
5.857%, 03/15/2030 | | | 250,000 | | | | 248,009 | |
5.905%, 11/22/2032 | | | 250,000 | | | | 248,025 | |
Baxter International Inc. | | | | | | | | |
1.322%, 11/29/2024 | | | 250,000 | | | | 236,652 | |
1.915%, 02/01/2027 | | | 150,000 | | | | 132,293 | |
2.539%, 02/01/2032 | | | 100,000 | | | | 77,438 | |
Illumina Inc. | | | | | | | | |
5.800%, 12/12/2025 | | | 250,000 | | | | 248,386 | |
5.750%, 12/13/2027 | | | 150,000 | | | | 147,487 | |
Thermo Fisher Scientific Inc. | | | | | | | | |
4.953%, 08/10/2026 | | | 250,000 | | | | 247,461 | |
4.800%, 11/21/2027 | | | 150,000 | | | | 148,260 | |
4.977%, 08/10/2030 | | | 250,000 | | | | 243,337 | |
5.086%, 08/10/2033 | | | 100,000 | | | | 96,695 | |
Bio-Rad Laboratories Inc. | | | | | | | | |
3.300%, 03/15/2027 | | | 150,000 | | | | 138,245 | |
Becton Dickinson & Co. | | | | | | | | |
4.693%, 02/13/2028 | | | 150,000 | | | | 145,422 | |
Medtronic Global Holdings SCA | | | | | | | | |
4.250%, 03/30/2028 | | | 150,000 | | | | 143,575 | |
4.500%, 03/30/2033 | | | 100,000 | | | | 93,156 | |
| | | | | | | | |
| | | | | | | 3,241,499 | |
| | | | | | | | |
Metals & Mining (0.04%) | | | | | | | | |
BHP Billiton Finance U.S.A. Ltd. | | | | | | | | |
4.875%, 02/27/2026 | | | 150,000 | | | | 147,908 | |
4.750%, 02/28/2028 | | | 150,000 | | | | 146,039 | |
5.100%, 09/08/2028 | | | 100,000 | | | | 98,148 | |
4.900%, 02/28/2033 | | | 100,000 | | | | 94,971 | |
| | | | | | | | |
| | | Principal
amount | | | Value | |
Corporate Bonds (Cont.) | | | | | | | | |
Metals & Mining (Cont.) | | | | | | | | |
Yamana Gold Inc. | | | | | | | | |
2.630%, 08/15/2031 | | $ | 150,000 | | | $ | 115,098 | |
Rio Tinto Finance U.S.A. PLC | | | | | | | | |
5.000%, 03/09/2033 | | | 100,000 | | | | 95,982 | |
Vale Overseas Ltd. | | | | | | | | |
6.125%, 06/12/2033 | | | 100,000 | | | | 96,578 | |
| | | | | | | | |
| | | | | | | 794,724 | |
| | | | | | | | |
Oil & Gas Producers (0.49%) | | | | | | | | |
Chevron U.S.A. Inc. | | | | | | | | |
3.900%, 11/15/2024 | | | 250,000 | | | | 245,833 | |
1.018%, 08/12/2027 | | | 250,000 | | | | 214,861 | |
3.850%, 01/15/2028 | | | 250,000 | | | | 237,597 | |
3.250%, 10/15/2029 | | | 250,000 | | | | 225,305 | |
Enbridge Inc. | | | | | | | | |
2.500%, 02/14/2025 | | | 250,000 | | | | 238,212 | |
5.969%, 03/08/2026 | | | 250,000 | | | | 248,766 | |
5.700%, 03/08/2033 | | | 150,000 | | | | 143,700 | |
Exxon Mobil Corp. | | | | | | | | |
2.992%, 03/19/2025 | | | 150,000 | | | | 144,844 | |
3.294%, 03/19/2027 | | | 250,000 | | | | 236,069 | |
2.610%, 10/15/2030 | | | 250,000 | | | | 211,094 | |
Shell International Finance B.V. | | | | | | | | |
3.250%, 05/11/2025 | | | 150,000 | | | | 144,907 | |
2.875%, 05/10/2026 | | | 150,000 | | | | 141,498 | |
Ovintiv Inc. | | | | | | | | |
5.650%, 05/15/2025 | | | 250,000 | | | | 248,569 | |
5.650%, 05/15/2028 | | | 250,000 | | | | 244,535 | |
6.250%, 07/15/2033 | | | 250,000 | | | | 241,729 | |
Chevron Corp. | | | | | | | | |
3.326%, 11/17/2025 | | | 150,000 | | | | 144,161 | |
2.236%, 05/11/2030 | | | 250,000 | | | | 208,403 | |
Enterprise Products Operating LLC | | | | | | | | |
5.050%, 01/10/2026 | | | 250,000 | | | | 247,278 | |
5.350%, 01/31/2033 | | | 100,000 | | | | 97,765 | |
TransCanada PipeLines Ltd. | | | | | | | | |
4.875%, 01/15/2026 | | | 150,000 | | | | 146,931 | |
6.203%, 03/09/2026 | | | 250,000 | | | | 249,589 | |
4.250%, 05/15/2028 | | | 150,000 | | | | 140,533 | |
Williams Cos. Inc., The | | | | | | | | |
5.400%, 03/02/2026 | | | 250,000 | | | | 248,060 | |
5.300%, 08/15/2028 | | | 250,000 | | | | 244,535 | |
2.600%, 03/15/2031 | | | 250,000 | | | | 199,114 | |
5.650%, 03/15/2033 | | | 100,000 | | | | 96,629 | |
Pioneer Natural Resources Co. | | | | | | | | |
5.100%, 03/29/2026 | | | 250,000 | | | | 246,787 | |
Phillips 66 Co. | | | | | | | | |
3.550%, 10/01/2026 | | | 250,000 | | | | 235,472 | |
4.950%, 12/01/2027 | | | 125,000 | | | | 122,496 | |
3.750%, 03/01/2028 | | | 100,000 | | | | 92,854 | |
3.150%, 12/15/2029 | | | 150,000 | | | | 129,750 | |
5.300%, 06/30/2033 | | | 150,000 | | | | 143,540 | |
ONEOK Inc. | | | | | | | | |
5.550%, 11/01/2026 | | | 250,000 | | | | 248,370 | |
5.650%, 11/01/2028 | | | 250,000 | | | | 246,762 | |
| | |
| See accompanying notes to financial statements. | | 27 |
ADVISERS INVESTMENT TRUST
STATE FARM BALANCED FUND
SCHEDULE OF INVESTMENTS (continued)
September 30, 2023
| | | | | | | | |
| | | Principal
amount | | | Value | |
Corporate Bonds (Cont.) | | | | | | | | |
Oil & Gas Producers (Cont.) | | | | | |
5.800%, 11/01/2030 | | $ | 250,000 | | | $ | 244,763 | |
6.100%, 11/15/2032 | | | 150,000 | | | | 148,104 | |
Kinder Morgan Inc. | | | | | | | | |
1.750%, 11/15/2026 | | | 250,000 | | | | 222,347 | |
5.200%, 06/01/2033 | | | 100,000 | | | | 92,492 | |
Coterra Energy Inc. | | | | | | | | |
3.900%, 05/15/2027 | | | 250,000 | | | | 234,769 | |
4.375%, 03/15/2029 | | | 250,000 | | | | 231,207 | |
Targa Resources Corp. | | | | | | | | |
5.200%, 07/01/2027 | | | 250,000 | | | | 244,981 | |
6.125%, 03/15/2033 | | | 100,000 | | | | 98,030 | |
Energy Transfer L.P. | | | | | | | | |
5.550%, 02/15/2028 | | | 250,000 | | | | 245,579 | |
5.750%, 02/15/2033 | | | 100,000 | | | | 96,126 | |
EQT Corp. | | | | | | | | |
5.700%, 04/01/2028 | | | 250,000 | | | | 245,021 | |
Cheniere Energy Inc. | | | | | | | | |
4.625%, 10/15/2028 | | | 250,000 | | | | 229,863 | |
Eastern Gas Transmission & Storage Inc. | | | | | | | | |
3.000%, 11/15/2029 | | | 150,000 | | | | 127,506 | |
Cheniere Corp.us Christi Holdings LLC | | | | | | | | |
3.700%, 11/15/2029 | | | 250,000 | | | | 221,780 | |
BP Capital Markets America Inc. | | | | | | | | |
2.721%, 01/12/2032 | | | 250,000 | | | | 202,912 | |
4.812%, 02/13/2033 | | | 250,000 | | | | 233,970 | |
Targa Resources Partners L.P./Targa Resources Partners Finance Corp. | | | | | | | | |
4.000%, 01/15/2032 | | | 250,000 | | | | 210,370 | |
MPLX L.P. | | | | | | | | |
5.000%, 03/01/2033 | | | 100,000 | | | | 91,124 | |
Diamondback Energy Inc. | | | | | | | | |
6.250%, 03/15/2033 | | | 250,000 | | | | 250,143 | |
Western Midstream Operating L.P. | | | | | | | | |
6.150%, 04/01/2033 | | | 250,000 | | | | 241,102 | |
Cheniere Energy Partners L.P. | | | | | | | | |
5.950%, 06/30/2033(c) | | | 100,000 | | | | 96,447 | |
| | | | | | | | |
| | | | | | | 10,665,184 | |
| | | | | | | | |
Oil, Gas Services & Equipment (0.02%) | |
Schlumberger Investment SA | | | | | | | | |
4.500%, 05/15/2028 | | | 150,000 | | | | 145,315 | |
2.650%, 06/26/2030 | | | 100,000 | | | | 84,655 | |
4.850%, 05/15/2033 | | | 100,000 | | | | 94,425 | |
Helmerich & Payne Inc. | | | | | | | | |
2.900%, 09/29/2031 | | | 100,000 | | | | 79,089 | |
| | | | | | | | |
| | | | | | | 403,484 | |
| | | | | | | | |
Real Estate Investment Trusts (0.43%) | |
VICI Properties L.P. | | | | | | | | |
4.375%, 05/15/2025 | | | 250,000 | | | | 241,630 | |
4.750%, 02/15/2028 | | | 250,000 | | | | 233,817 | |
5.125%, 05/15/2032 | | | 250,000 | | | | 223,768 | |
| | | | | | | | |
| | | Principal
amount | | | Value | |
Corporate Bonds (Cont.) | | | | | | | | |
Real Estate Investment Trusts (Cont.) | |
Realty Income Corp. | | | | | | | | |
4.625%, 11/01/2025 | | $ | 250,000 | | | $ | 244,469 | |
5.050%, 01/13/2026 | | | 250,000 | | | | 246,438 | |
4.875%, 06/01/2026 | | | 250,000 | | | | 245,338 | |
4.700%, 12/15/2028 | | | 250,000 | | | | 238,384 | |
4.850%, 03/15/2030 | | | 250,000 | | | | 235,612 | |
5.625%, 10/13/2032 | | | 250,000 | | | | 241,689 | |
Weyerhaeuser Co. | | | | | | | | |
4.750%, 05/15/2026 | | | 150,000 | | | | 146,381 | |
3.375%, 03/09/2033 | | | 100,000 | | | | 81,844 | |
Prologis L.P. | | | | | | | | |
3.250%, 06/30/2026 | | | 250,000 | | | | 235,653 | |
3.375%, 12/15/2027 | | | 250,000 | | | | 229,862 | |
4.000%, 09/15/2028 | | | 250,000 | | | | 233,248 | |
2.875%, 11/15/2029 | | | 250,000 | | | | 214,421 | |
1.750%, 07/01/2030 | | | 250,000 | | | | 194,318 | |
4.750%, 06/15/2033 | | | 250,000 | | | | 230,318 | |
Extra Space Storage L.P. | | | | | | | | |
3.500%, 07/01/2026 | | | 250,000 | | | | 233,907 | |
5.700%, 04/01/2028 | | | 250,000 | | | | 247,056 | |
3.900%, 04/01/2029 | | | 250,000 | | | | 224,543 | |
5.500%, 07/01/2030 | | | 250,000 | | | | 241,743 | |
2.200%, 10/15/2030 | | | 100,000 | | | | 77,542 | |
2.400%, 10/15/2031 | | | 100,000 | | | | 76,557 | |
Public Storage Operating Co. | | | | | | | | |
1.500%, 11/09/2026 | | | 250,000 | | | | 223,328 | |
Boston Properties L.P. | | | | | | | | |
6.750%, 12/01/2027 | | | 250,000 | | | | 251,321 | |
Digital Realty Trust L.P. | | | | | | | | |
5.550%, 01/15/2028 | | | 250,000 | | | | 244,490 | |
Hudson Pacific Properties L.P. | | | | | | | | |
5.950%, 02/15/2028 | | | 250,000 | | | | 208,707 | |
American Tower Corp. | | | | | | | | |
5.500%, 03/15/2028 | | | 500,000 | | | | 490,544 | |
5.250%, 07/15/2028 | | | 500,000 | | | | 482,822 | |
5.650%, 03/15/2033 | | | 500,000 | | | | 480,633 | |
Rexford Industrial Realty L.P. | | | | | | | | |
5.000%, 06/15/2028 | | | 250,000 | | | | 238,982 | |
Kimco Realty OP LLC | | | | | | | | |
3.200%, 04/01/2032 | | | 250,000 | | | | 201,223 | |
American Homes 4 Rent L.P. | | | | | | | | |
3.625%, 04/15/2032 | | | 250,000 | | | | 206,859 | |
Equinix Inc. | | | | | | | | |
3.900%, 04/15/2032 | | | 150,000 | | | | 128,174 | |
Invitation Homes Operating Partnership L.P. | | | | | | | | |
4.150%, 04/15/2032 | | | 250,000 | | | | 215,018 | |
Welltower OP LLC | | | | | | | | |
3.850%, 06/15/2032 | | | 250,000 | | | | 213,242 | |
Healthpeak OP LLC | | | | | | | | |
5.250%, 12/15/2032 | | | 250,000 | | | | 232,517 | |
Sun Communities Operating L.P. | | | | | | | | |
5.700%, 01/15/2033 | | | 250,000 | | | | 236,229 | |
| | |
| 28 | | See accompanying notes to financial statements. |
ADVISERS INVESTMENT TRUST
STATE FARM BALANCED FUND
SCHEDULE OF INVESTMENTS (continued)
September 30, 2023
| | | | | | | | |
| | | Principal
amount | | | Value | |
Corporate Bonds (Cont.) | | | | | | | | |
Real Estate Investment Trusts (Cont.) | |
Simon Property Group L.P. | | | | | | | | |
5.500%, 03/08/2033 | | $ | 250,000 | | | $ | 237,190 | |
Crown Castle Inc. | | | | | | | | |
5.100%, 05/01/2033 | | | 250,000 | | | | 231,137 | |
| | | | | | | | |
| | | | | | | 9,340,954 | |
| | | | | | | | |
Retail - Consumer Staples (0.11%) | |
Walmart Inc. | | | | | | | | |
3.900%, 09/09/2025 | | | 150,000 | | | | 146,219 | |
4.000%, 04/15/2026 | | | 250,000 | | | | 243,411 | |
3.950%, 09/09/2027 | | | 150,000 | | | | 144,743 | |
3.900%, 04/15/2028 | | | 250,000 | | | | 238,666 | |
4.000%, 04/15/2030 | | | 250,000 | | | | 234,799 | |
4.150%, 09/09/2032 | | | 250,000 | | | | 232,772 | |
4.100%, 04/15/2033 | | | 250,000 | | | | 228,654 | |
Target Corp. | | | | | | | | |
1.950%, 01/15/2027 | | | 250,000 | | | | 225,784 | |
6.350%, 11/01/2032 | | | 100,000 | | | | 105,688 | |
4.400%, 01/15/2033 | | | 250,000 | | | | 230,509 | |
Dollar General Corp. | | | | | | | | |
5.200%, 07/05/2028 | | | 250,000 | | | | 242,513 | |
Kroger Co., The | | | | | | | | |
1.700%, 01/15/2031 | | | 250,000 | | | | 188,375 | |
| | | | | | | | |
| | | | | | | 2,462,133 | |
| | | | | | | | |
Retail - Discretionary (0.10%) | |
Home Depot Inc., The | | | | | | | | |
2.700%, 04/15/2025 | | | 150,000 | | | | 144,065 | |
4.000%, 09/15/2025 | | | 150,000 | | | | 146,377 | |
2.875%, 04/15/2027 | | | 150,000 | | | | 138,870 | |
4.500%, 09/15/2032 | | | 250,000 | | | | 235,868 | |
Lowe’s Cos. Inc. | | | | | | | | |
4.400%, 09/08/2025 | | | 150,000 | | | | 146,639 | |
4.800%, 04/01/2026 | | | 250,000 | | | | 245,302 | |
3.350%, 04/01/2027 | | | 150,000 | | | | 139,649 | |
1.300%, 04/15/2028 | | | 150,000 | | | | 125,003 | |
3.750%, 04/01/2032 | | | 150,000 | | | | 129,885 | |
5.150%, 07/01/2033 | | | 250,000 | | | | 237,158 | |
AutoZone Inc. | | | | | | | | |
5.050%, 07/15/2026 | | | 150,000 | | | | 147,811 | |
4.500%, 02/01/2028 | | | 150,000 | | | | 143,865 | |
AutoNation Inc. | | | | | | | | |
3.850%, 03/01/2032 | | | 150,000 | | | | 121,920 | |
O’Reilly Automotive Inc. | | | | | | | | |
4.700%, 06/15/2032 | | | 150,000 | | | | 137,460 | |
| | | | | | | | |
| | | | | | | 2,239,872 | |
| | | | | | | | |
Semiconductors (0.22%) | | | | | | | | |
Texas Instruments Inc. | | | | | | | | |
4.700%, 11/18/2024 | | | 250,000 | | | | 247,355 | |
1.125%, 09/15/2026 | | | 150,000 | | | | 133,891 | |
2.900%, 11/03/2027 | | | 150,000 | | | | 137,553 | |
4.900%, 03/14/2033 | | | 250,000 | | | | 241,776 | |
Qorvo Inc. | | | | | | | | |
1.750%, 12/15/2024(c) | | | 250,000 | | | | 234,892 | |
| | | | | | | | |
| | | Principal
amount | | | Value | |
Corporate Bonds (Cont.) | | | | | | | | |
Semiconductors (Cont.) | | | | | | | | |
NXP B.V./NXP Funding LLC/NXP U.S.A. Inc. | | | | | | | | |
2.700%, 05/01/2025 | | $ | 250,000 | | | $ | 237,428 | |
3.150%, 05/01/2027 | | | 150,000 | | | | 136,774 | |
3.400%, 05/01/2030 | | | 150,000 | | | | 128,270 | |
2.500%, 05/11/2031 | | | 100,000 | | | | 78,081 | |
Intel Corp. | | | | | | | | |
3.700%, 07/29/2025 | | | 150,000 | | | | 145,185 | |
4.875%, 02/10/2026 | | | 250,000 | | | | 247,002 | |
3.750%, 08/05/2027 | | | 150,000 | | | | 141,500 | |
1.600%, 08/12/2028 | | | 250,000 | | | | 211,375 | |
4.000%, 08/05/2029 | | | 150,000 | | | | 140,023 | |
5.125%, 02/10/2030 | | | 150,000 | | | | 147,192 | |
5.200%, 02/10/2033 | | | 250,000 | | | | 242,059 | |
NXP B.V./NXP Funding LLC | | | | | | | | |
5.350%, 03/01/2026 | | | 100,000 | | | | 98,512 | |
TSMC Arizona Corp. | | | | | | | | |
1.750%, 10/25/2026 | | | 200,000 | | | | 179,416 | |
3.875%, 04/22/2027 | | | 200,000 | | | | 190,441 | |
QUALCOMM Inc. | | | | | | | | |
3.250%, 05/20/2027 | | | 150,000 | | | | 139,924 | |
5.400%, 05/20/2033 | | | 250,000 | | | | 250,769 | |
Micron Technology Inc. | | | | | | | | |
5.375%, 04/15/2028 | | | 250,000 | | | | 241,337 | |
6.750%, 11/01/2029 | | | 150,000 | | | | 152,407 | |
5.875%, 02/09/2033 | | | 250,000 | | | | 238,815 | |
Broadcom Inc.(c) | | | | | | | | |
4.000%, 04/15/2029 | | | 150,000 | | | | 135,359 | |
2.450%, 02/15/2031 | | | 150,000 | | | | 117,241 | |
4.150%, 04/15/2032 | | | 150,000 | | | | 130,172 | |
| | | | | | | | |
| | | | | | | 4,724,749 | |
| | | | | | | | |
Software (0.13%) | | | | | | | | |
Oracle Corp. | | | | | | | | |
5.800%, 11/10/2025 | | | 250,000 | | | | 250,937 | |
1.650%, 03/25/2026 | | | 100,000 | | | | 90,579 | |
2.650%, 07/15/2026 | | | 150,000 | | | | 138,299 | |
3.250%, 11/15/2027 | | | 150,000 | | | | 136,699 | |
4.500%, 05/06/2028 | | | 250,000 | | | | 238,279 | |
6.150%, 11/09/2029 | | | 150,000 | | | | 152,273 | |
4.650%, 05/06/2030 | | | 150,000 | | | | 140,277 | |
2.875%, 03/25/2031 | | | 100,000 | | | | 81,683 | |
6.250%, 11/09/2032 | | | 250,000 | | | | 253,088 | |
4.900%, 02/06/2033 | | | 250,000 | | | | 230,433 | |
Concentrix Corp. | | | | | | | | |
6.650%, 08/02/2026 | | | 150,000 | | | | 149,097 | |
Microsoft Corp. | | | | | | | | |
2.400%, 08/08/2026 | | | 250,000 | | | | 232,241 | |
3.300%, 02/06/2027 | | | 250,000 | | | | 237,193 | |
VMware Inc. | | | | | | | | |
1.400%, 08/15/2026 | | | 150,000 | | | | 132,316 | |
Workday Inc. | | | | | | | | |
3.500%, 04/01/2027 | | | 150,000 | | | | 139,955 | |
3.800%, 04/01/2032 | | | 150,000 | | | | 128,613 | |
| | | | | | | | |
| | | | | | | 2,731,962 | |
| | | | | | | | |
| | |
| See accompanying notes to financial statements. | | 29 |
ADVISERS INVESTMENT TRUST
STATE FARM BALANCED FUND
SCHEDULE OF INVESTMENTS (continued)
September 30, 2023
| | | | | | | | |
| | | Principal
amount | | | Value | |
Corporate Bonds (Cont.) | | | | | | | | |
Specialty Finance (0.19%) | | | | | | | | |
AerCap Ireland Capital DAC/AerCap Global Aviation Trust | | | | | | | | |
1.650%, 10/29/2024 | | $ | 500,000 | | | $ | 475,621 | |
1.750%, 01/30/2026 | | | 250,000 | | | | 225,617 | |
2.450%, 10/29/2026 | | | 500,000 | | | | 447,848 | |
3.300%, 01/30/2032 | | | 500,000 | | | | 397,456 | |
American Express Co. | | | | | | | | |
2.250%, 03/04/2025 | | | 250,000 | | | | 237,570 | |
3.950%, 08/01/2025 | | | 250,000 | | | | 241,842 | |
4.900%, 02/13/2026 | | | 250,000 | | | | 245,270 | |
4.990%, 05/01/2026 | | | 250,000 | | | | 245,615 | |
2.550%, 03/04/2027 | | | 150,000 | | | | 135,243 | |
5.389%, 07/28/2027 | | | 250,000 | | | | 246,501 | |
5.850%, 11/05/2027 | | | 150,000 | | | | 151,083 | |
5.282%, 07/27/2029 | | | 150,000 | | | | 146,240 | |
5.043%, 05/01/2034 | | | 150,000 | | | | 138,293 | |
Capital One Financial Corp.(Variable, U.S. SOFR + 1.29%)(b) | | | | | | | | |
2.636%, 03/03/2026 | | | 150,000 | | | | 141,565 | |
4.927%, 05/10/2028 | | | 150,000 | | | | 142,359 | |
5.247%, 07/26/2030 | | | 150,000 | | | | 139,052 | |
6.377%, 06/08/2034 | | | 150,000 | | | | 141,557 | |
Air Lease Corp. | | | | | | | | |
5.300%, 02/01/2028 | | | 250,000 | | | | 241,535 | |
| | | | | | | | |
| | | | | | | 4,140,267 | |
| | | | | | | | |
Steel (0.03%) | | | | | | | | |
Nucor Corp. | | | | | | | | |
3.950%, 05/23/2025 | | | 150,000 | | | | 145,493 | |
4.300%, 05/23/2027 | | | 150,000 | | | | 143,958 | |
3.125%, 04/01/2032 | | | 150,000 | | | | 123,992 | |
ArcelorMittal SA | | | | | | | | |
6.550%, 11/29/2027 | | | 150,000 | | | | 152,156 | |
6.800%, 11/29/2032 | | | 150,000 | | | | 148,972 | |
| | | | | | | | |
| | | | | | | 714,571 | |
| | | | | | | | |
Technology Hardware (0.22%) | |
Hewlett Packard Enterprise Co. | | | | | | | | |
5.900%, 10/01/2024 | | | 250,000 | | | | 249,797 | |
6.102%, 04/01/2026 | | | 250,000 | | | | 249,674 | |
Cisco Systems Inc. | | | | | | | | |
3.500%, 06/15/2025 | | | 150,000 | | | | 145,333 | |
2.950%, 02/28/2026 | | | 150,000 | | | | 142,465 | |
Dell International LLC/EMC Corp. | | | | | | | | |
5.850%, 07/15/2025 | | | 250,000 | | | | 249,667 | |
4.900%, 10/01/2026 | | | 150,000 | | | | 146,348 | |
5.300%, 10/01/2029 | | | 150,000 | | | | 145,615 | |
6.200%, 07/15/2030 | | | 150,000 | | | | 151,228 | |
5.750%, 02/01/2033 | | | 250,000 | | | | 242,906 | |
Apple Inc. | | | | | | | | |
0.700%, 02/08/2026 | | | 250,000 | | | | 225,396 | |
4.421%, 05/08/2026 | | | 250,000 | | | | 246,009 | |
4.000%, 05/10/2028 | | | 250,000 | | | | 240,053 | |
1.400%, 08/05/2028 | | | 250,000 | | | | 211,795 | |
3.250%, 08/08/2029 | | | 150,000 | | | | 136,893 | |
| | | | | | | | |
| | | Principal
amount | | | Value | |
Corporate Bonds (Cont.) | | | | | | | | |
Technology Hardware (Cont.) | |
4.150%, 05/10/2030 | | $ | 150,000 | | | $ | 143,094 | |
1.650%, 02/08/2031 | | | 150,000 | | | | 118,824 | |
4.300%, 05/10/2033 | | | 250,000 | | | | 235,994 | |
Arrow Electronics Inc. | | | | | | | | |
6.125%, 03/01/2026 | | | 250,000 | | | | 248,964 | |
TD SYNNEX Corp. | | | | | | | | |
1.750%, 08/09/2026 | | | 150,000 | | | | 131,815 | |
CDW LLC/CDW Finance Corp. | | | | | | | | |
2.670%, 12/01/2026 | | | 150,000 | | | | 135,286 | |
Jabil Inc. | | | | | | | | |
4.250%, 05/15/2027 | | | 150,000 | | | | 141,853 | |
5.450%, 02/01/2029 | | | 250,000 | | | | 243,112 | |
Teledyne Technologies Inc. | | | | | | | | |
2.750%, 04/01/2031 | | | 250,000 | | | | 201,847 | |
HP Inc. | | | | | | | | |
2.650%, 06/17/2031 | | | 150,000 | | | | 117,205 | |
4.200%, 04/15/2032 | | | 150,000 | | | | 129,764 | |
Motorola Solutions Inc. | | | | | | | | |
5.600%, 06/01/2032 | | | 150,000 | | | | 143,498 | |
| | | | | | | | |
| | | | | | | 4,774,435 | |
| | | | | | | | |
Technology Services (0.27%) | | | | | | | | |
Global Payments Inc. | | | | | | | | |
1.500%, 11/15/2024 | | | 250,000 | | | | 237,468 | |
2.150%, 01/15/2027 | | | 150,000 | | | | 132,244 | |
5.400%, 08/15/2032 | | | 150,000 | | | | 140,603 | |
Fidelity National Information | | | | | | | | |
Services Inc. | | | | | | | | |
4.500%, 07/15/2025 | | | 250,000 | | | | 243,896 | |
5.100%, 07/15/2032 | | | 150,000 | | | | 141,665 | |
International Business Machines Corp. | | | | | | | | |
4.000%, 07/27/2025 | | | 250,000 | | | | 243,422 | |
4.500%, 02/06/2026 | | | 250,000 | | | | 244,535 | |
2.200%, 02/09/2027 | | | 150,000 | | | | 134,939 | |
4.150%, 07/27/2027 | | | 150,000 | | | | 143,156 | |
1.950%, 05/15/2030 | | | 200,000 | | | | 160,641 | |
4.750%, 02/06/2033 | | | 250,000 | | | | 235,220 | |
Automatic Data Processing Inc. | | | | | | | | |
3.375%, 09/15/2025 | | | 150,000 | | | | 144,602 | |
Visa Inc. | | | | | | | | |
3.150%, 12/14/2025 | | | 250,000 | | | | 238,613 | |
1.100%, 02/15/2031 | | | 250,000 | | | | 188,676 | |
CGI Inc. | | | | | | | | |
1.450%, 09/14/2026 | | | 150,000 | | | | 132,316 | |
Kyndryl Holdings Inc. | | | | | | | | |
2.050%, 10/15/2026 | | | 150,000 | | | | 130,933 | |
2.700%, 10/15/2028 | | | 250,000 | | | | 205,531 | |
3.150%, 10/15/2031 | | | 150,000 | | | | 113,609 | |
Mastercard Inc. | | | | | | | | |
2.950%, 11/21/2026 | | | 150,000 | | | | 140,461 | |
4.875%, 03/09/2028 | | | 250,000 | | | | 248,120 | |
4.850%, 03/09/2033 | | | 250,000 | | | | 241,470 | |
S&P Global Inc. | | | | | | | | |
2.450%, 03/01/2027 | | | 150,000 | | | | 136,630 | |
| | |
| 30 | | See accompanying notes to financial statements. |
ADVISERS INVESTMENT TRUST
STATE FARM BALANCED FUND
SCHEDULE OF INVESTMENTS (continued)
September 30, 2023
| | | | | | | | |
| | | Principal
amount | | | Value | |
Corporate Bonds (Cont.) | | | | | | | | |
Technology Services (Cont.) | |
4.250%, 05/01/2029 | | $ | 150,000 | | | $ | 141,602 | |
2.500%, 12/01/2029 | | | 150,000 | | | | 127,438 | |
1.250%, 08/15/2030 | | | 250,000 | | | | 190,827 | |
FactSet Research Systems Inc. | | | | | | | | |
2.900%, 03/01/2027 | | | 150,000 | | | | 136,783 | |
PayPal Holdings Inc. | | | | | | | | |
3.900%, 06/01/2027 | | | 100,000 | | | | 95,534 | |
4.400%, 06/01/2032 | | | 150,000 | | | | 138,669 | |
Fiserv Inc. | | | | | | | | |
5.450%, 03/02/2028 | | | 250,000 | | | | 247,802 | |
5.600%, 03/02/2033 | | | 250,000 | | | | 242,296 | |
Equifax Inc. | | | | | | | | |
5.100%, 06/01/2028 | | | 250,000 | | | | 241,576 | |
RELX Capital Inc. | | | | | | | | |
4.000%, 03/18/2029 | | | 150,000 | | | | 139,820 | |
3.000%, 05/22/2030 | | | 150,000 | | | | 128,413 | |
Booz Allen Hamilton Inc. | | | | | | | | |
5.950%, 08/04/2033 | | | 100,000 | | | | 97,560 | |
| | | | | | | | |
| | | | | | | 5,907,070 | |
| | | | | | | | |
Telecommunications (0.26%) | |
Rogers Communications Inc. | | | | | | | | |
2.950%, 03/15/2025 | | | 500,000 | | | | 476,860 | |
T-Mobile U.S.A. Inc. | | | | | | | | |
3.500%, 04/15/2025 | | | 250,000 | | | | 241,227 | |
4.950%, 03/15/2028 | | | 500,000 | | | | 485,232 | |
4.800%, 07/15/2028 | | | 500,000 | | | | 480,513 | |
2.400%, 03/15/2029 | | | 500,000 | | | | 420,733 | |
2.700%, 03/15/2032 | | | 500,000 | | | | 391,118 | |
5.050%, 07/15/2033 | | | 250,000 | | | | 231,953 | |
AT&T Inc. | | | | | | | | |
1.650%, 02/01/2028 | | | 1,000,000 | | | | 843,996 | |
4.350%, 03/01/2029 | | | 500,000 | | | | 465,312 | |
Verizon Communications Inc. | | | | | | | | |
4.329%, 09/21/2028 | | | 1,012,000 | | | | 950,908 | |
3.875%, 02/08/2029 | | | 500,000 | | | | 457,874 | |
5.050%, 05/09/2033 | | | 250,000 | | | | 233,548 | |
| | | | | | | | |
| | | | | | | 5,679,274 | |
| | | | | | | | |
Tobacco & Cannabis (0.10%) | |
Philip Morris International Inc. | | | | | | | | |
5.125%, 11/15/2024 | | | 250,000 | | | | 248,214 | |
5.000%, 11/17/2025 | | | 150,000 | | | | 148,214 | |
4.875%, 02/13/2026 | | | 200,000 | | | | 196,716 | |
5.125%, 11/17/2027 | | | 150,000 | | | | 146,879 | |
4.875%, 02/15/2028 | | | 150,000 | | | | 145,316 | |
5.625%, 11/17/2029 | | | 150,000 | | | | 148,299 | |
5.125%, 02/15/2030 | | | 150,000 | | | | 143,856 | |
5.750%, 11/17/2032 | | | 150,000 | | | | 146,359 | |
5.375%, 02/15/2033 | | | 150,000 | | | | 142,176 | |
BAT International Finance PLC | | | | | | | | |
4.448%, 03/16/2028 | | | 150,000 | | | | 139,878 | |
5.931%, 02/02/2029 | | | 150,000 | | | | 147,262 | |
| | | | | | | | |
| | | Principal
amount | | | Value | |
Corporate Bonds (Cont.) | | | | | | | | |
Tobacco & Cannabis (Cont.) | |
BAT Capital Corp. | | | | | | | | |
6.343%, 08/02/2030 | | $ | 150,000 | | | $ | 147,746 | |
6.421%, 08/02/2033 | | | 150,000 | | | | 145,785 | |
| | | | | | | | |
| | | | | | | 2,046,700 | |
| | | | | | | | |
Transportation & Logistics (0.13%) | |
Canadian Pacific Railway Co. | | | | | | | | |
1.350%, 12/02/2024 | | | 150,000 | | | | 142,204 | |
1.750%, 12/02/2026 | | | 150,000 | | | | 133,827 | |
2.875%, 11/15/2029 | | | 150,000 | | | | 129,111 | |
2.450%, 12/02/2031 | | | 100,000 | | | | 86,422 | |
Union Pacific Corp. | | | | | | | | |
3.250%, 08/15/2025 | | | 150,000 | | | | 144,014 | |
4.750%, 02/21/2026 | | | 250,000 | | | | 246,867 | |
3.700%, 03/01/2029 | | | 250,000 | | | | 231,968 | |
2.800%, 02/14/2032 | | | 100,000 | | | | 82,521 | |
4.500%, 01/20/2033 | | | 100,000 | | | | 93,105 | |
United Airlines Pass Through Trust, Series 2020-1, Class B | | | | | | | | |
4.875%, 01/15/2026 | | | 96,975 | | | | 93,879 | |
GXO Logistics Inc. | | | | | | | | |
1.650%, 07/15/2026 | | | 250,000 | | | | 219,670 | |
2.650%, 07/15/2031 | | | 150,000 | | | | 113,808 | |
Ryder System Inc. | | | | | | | | |
2.850%, 03/01/2027 | | | 150,000 | | | | 136,490 | |
4.300%, 06/15/2027 | | | 150,000 | | | | 142,837 | |
5.250%, 06/01/2028 | | | 150,000 | | | | 145,986 | |
United Parcel Service Inc. | | | | | | | | |
2.500%, 09/01/2029 | | | 150,000 | | | | 129,091 | |
4.875%, 03/03/2033 | | | 100,000 | | | | 96,335 | |
Norfolk Southern Corp. | | | | | | | | |
5.050%, 08/01/2030 | | | 150,000 | | | | 144,525 | |
3.000%, 03/15/2032 | | | 100,000 | | | | 82,393 | |
Canadian National Railway Co. | | | | | | | | |
3.850%, 08/05/2032 | | | 100,000 | | | | 89,072 | |
CSX Corp. | | | | | | | | |
4.100%, 11/15/2032 | | | 100,000 | | | | 89,925 | |
| | | | | | | | |
| | | | | | | 2,774,050 | |
| | | | | | | | |
Wholesale - Consumer Staples (0.00%) | |
Archer-Daniels-Midland Co. | | | | | | | | |
4.500%, 08/15/2033 | | | 100,000 | | | | 92,952 | |
| | | | | | | | |
| | | | | | | 92,952 | |
| | | | | | | | |
Total Corporate Bonds (cost $197,190,348) | | | | | | | 193,024,891 | |
| | | | | | | | |
Foreign Government Bonds (1.41%) | |
Austria (0.02%) | | | | | | | | |
Oesterreichische Kontrollbank AG | | | | | | | | |
4.625%, 11/03/2025 | | | 250,000 | | | | 247,288 | |
3.625%, 09/09/2027 | | | 250,000 | | | | 239,381 | |
| | | | | | | | |
| | | | | | | 486,669 | |
| | | | | | | | |
| | |
| See accompanying notes to financial statements. | | 31 |
ADVISERS INVESTMENT TRUST
STATE FARM BALANCED FUND
SCHEDULE OF INVESTMENTS (continued)
September 30, 2023
| | | | | | | | |
| | | Principal
amount | | | Value | |
Foreign Government Bonds (Cont.) | |
Canada (0.15%) | | | | | | | | |
Canada Government International Bond | | | | | | | | |
1.625%, 01/22/2025 | | $ | 250,000 | | | $ | 238,185 | |
0.750%, 05/19/2026 | | | 250,000 | | | | 224,306 | |
Province of Quebec Canada | | | | | | | | |
1.500%, 02/11/2025 | | | 250,000 | | | | 236,865 | |
1.350%, 05/28/2030 | | | 250,000 | | | | 199,153 | |
Export Development Canada | | | | | | | | |
3.375%, 08/26/2025 | | | 250,000 | | | | 241,899 | |
Province of Ontario Canada | | | | | | | | |
0.625%, 01/21/2026 | | | 250,000 | | | | 225,383 | |
1.050%, 04/14/2026 | | | 250,000 | | | | 226,027 | |
3.100%, 05/19/2027 | | | 250,000 | | | | 234,732 | |
1.800%, 10/14/2031 | | | 250,000 | | | | 198,080 | |
2.125%, 01/21/2032 | | | 250,000 | | | | 201,690 | |
Province of British Columbia Canada | | | | | | | | |
0.900%, 07/20/2026 | | | 250,000 | | | | 223,195 | |
Province of Alberta Canada | | | | | | | | |
3.300%, 03/15/2028 | | | 250,000 | | | | 233,448 | |
1.300%, 07/22/2030 | | | 250,000 | | | | 196,446 | |
Province of Manitoba Canada | | | | | | | | |
4.300%, 07/27/2033 | | | 250,000 | | | | 235,199 | |
| | | | | | | | |
| | | | | | | 3,114,608 | |
| | | | | | | | |
Chile (0.02%) | | | | | | | | |
Chile Government International Bond | | | | | | | | |
2.750%, 01/31/2027 | | | 250,000 | | | | 229,463 | |
3.240%, 02/06/2028 | | | 250,000 | | | | 229,099 | |
| | | | | | | | |
| | | | | | | 458,562 | |
| | | | | | | | |
Germany (0.24%) | | | | | | | | |
Kreditanstalt fuer Wiederaufbau | | | | | | | | |
1.250%, 01/31/2025 | | | 1,000,000 | | | | 946,435 | |
3.125%, 06/10/2025 | | | 1,000,000 | | | | 965,148 | |
0.375%, 07/18/2025 | | | 1,000,000 | | | | 917,914 | |
0.625%, 01/22/2026 | | | 250,000 | | | | 226,092 | |
4.625%, 08/07/2026 | | | 500,000 | | | | 495,812 | |
1.000%, 10/01/2026 | | | 250,000 | | | | 223,287 | |
2.875%, 04/03/2028 | | | 500,000 | | | | 461,754 | |
1.750%, 09/14/2029 | | | 250,000 | | | | 212,197 | |
Landwirtschaftliche Rentenbank | | | | | | | | |
0.875%, 03/30/2026 | | | 250,000 | | | | 225,877 | |
3.875%, 09/28/2027 | | | 250,000 | | | | 242,203 | |
0.875%, 09/03/2030 | | | 250,000 | | | | 192,581 | |
| | | | | | | | |
| | | | | | | 5,109,300 | |
| | | | | | | | |
Indonesia (0.05%) | | | | | | | | |
Indonesia Government International Bond | | | | | | | | |
4.550%, 01/11/2028 | | | 250,000 | | | | 242,029 | |
4.100%, 04/24/2028 | | | 250,000 | | | | 235,663 | |
4.750%, 02/11/2029 | | | 250,000 | | | | 239,688 | |
4.850%, 01/11/2033 | | | 250,000 | | | | 237,867 | |
| | | | | | | | |
| | | | | | | 955,247 | |
| | | | | | | | |
| | | | | | | | |
| | | Principal
amount | | | Value | |
Foreign Government Bonds (Cont.) | | | | | |
Israel (0.01%) | | | | | | | | |
Israel Government International Bond | | | | | | | | |
2.750%, 07/03/2030 | | $ | 250,000 | | | $ | 212,219 | |
| | | | | | | | |
| | | | | | | 212,219 | |
| | | | | | | | |
Italy (0.02%) | | | | | | | | |
Republic of Italy Government International Bond | | | | | | | | |
1.250%, 02/17/2026 | | | 250,000 | | | | 224,767 | |
2.875%, 10/17/2029 | | | 250,000 | | | | 213,850 | |
| | | | | | | | |
| | | | | | | 438,617 | |
| | | | | | | | |
Japan (0.03%) | | | | | | | | |
Japan Bank for International Cooperation | | | | | | | | |
4.625%, 07/19/2028 | | | 250,000 | | | | 245,472 | |
3.250%, 07/20/2028 | | | 250,000 | | | | 230,491 | |
2.125%, 02/16/2029 | | | 250,000 | | | | 214,901 | |
| | | | | | | | |
| | | | | | | 690,864 | |
| | | | | | | | |
Mexico (0.07%) | | | | | | | | |
Mexico Government International Bond | | | | | | | | |
4.150%, 03/28/2027 | | | 250,000 | | | | 240,010 | |
5.400%, 02/09/2028 | | | 250,000 | | | | 246,111 | |
4.500%, 04/22/2029 | | | 250,000 | | | | 232,954 | |
2.659%, 05/24/2031 | | | 1,000,000 | | | | 789,034 | |
| | | | | | | | |
| | | | | | | 1,508,109 | |
| | | | | | | | |
Panama (0.01%) | | | | | | | | |
Panama Government International Bond | | | | | | | | |
3.298%, 01/19/2033 | | | 250,000 | | | | 194,814 | |
| | | | | | | | |
| | | | | | | 194,814 | |
| | | | | | | | |
Philippines (0.03%) | | | | | | | | |
Philippine Government International Bond | | | | | | | | |
5.170%, 10/13/2027 | | | 250,000 | | | | 247,561 | |
3.750%, 01/14/2029 | | | 250,000 | | | | 230,946 | |
5.609%, 04/13/2033 | | | 250,000 | | | | 250,492 | |
| | | | | | | | |
| | | | | | | 728,999 | |
| | | | | | | | |
Poland (0.01%) | | | | | | | | |
Republic of Poland Government International Bond | | | | | | | | |
5.750%, 11/16/2032 | | | 250,000 | | | | 250,263 | |
| | | | | | | | |
| | | | | | | 250,263 | |
| | | | | | | | |
South Korea (0.03%) | | | | | | | | |
Export-Import Bank of Korea | | | | | | | | |
4.250%, 09/15/2027 | | | 250,000 | | | | 240,438 | |
| | |
| 32 | | See accompanying notes to financial statements. |
ADVISERS INVESTMENT TRUST
STATE FARM BALANCED FUND
SCHEDULE OF INVESTMENTS (continued)
September 30, 2023
| | | | | | | | |
| | | Principal
amount | | | Value | |
Foreign Government Bonds (Cont.) | | | | | |
South Korea (Cont.) | | | | | | | | |
5.000%, 01/11/2028 | | $ | 250,000 | | | $ | 247,007 | |
5.125%, 01/11/2033 | | | 250,000 | | | | 244,944 | |
| | | | | | | | |
| | | | | | | 732,389 | |
| | | | | | | | |
Supranational (0.71%) | | | | | | | | |
International Bank for Reconstruction & Development | | | | | | | | |
1.625%, 01/15/2025 | | | 250,000 | | | | 238,133 | |
0.625%, 04/22/2025 | | | 1,000,000 | | | | 929,335 | |
0.375%, 07/28/2025 | | | 1,000,000 | | | | 916,242 | |
0.500%, 10/28/2025 | | | 250,000 | | | | 227,514 | |
3.125%, 11/20/2025 | | | 250,000 | | | | 239,878 | |
0.875%, 07/15/2026 | | | 250,000 | | | | 223,752 | |
3.125%, 06/15/2027 | | | 250,000 | | | | 235,804 | |
0.750%, 11/24/2027 | | | 250,000 | | | | 212,881 | |
1.750%, 10/23/2029 | | | 250,000 | | | | 211,600 | |
0.875%, 05/14/2030 | | | 250,000 | | | | 194,995 | |
4.000%, 07/25/2030 | | | 250,000 | | | | 238,556 | |
1.250%, 02/10/2031 | | | 250,000 | | | | 196,359 | |
European Investment Bank | | | | | | | | |
1.625%, 03/14/2025 | | | 250,000 | | | | 237,052 | |
2.750%, 08/15/2025 | | | 250,000 | | | | 239,342 | |
0.375%, 12/15/2025 | | | 250,000 | | | | 225,915 | |
0.375%, 03/26/2026 | | | 250,000 | | | | 223,480 | |
2.125%, 04/13/2026 | | | 250,000 | | | | 233,192 | |
0.750%, 10/26/2026 | | | 250,000 | | | | 221,087 | |
0.625%, 10/21/2027 | | | 250,000 | | | | 212,664 | |
4.500%, 10/16/2028 | | | 500,000 | | | | 495,700 | |
1.625%, 10/09/2029 | | | 250,000 | | | | 210,976 | |
1.250%, 02/14/2031 | | | 250,000 | | | | 197,416 | |
Inter-American Development Bank | | | | | | | | |
1.750%, 03/14/2025 | | | 250,000 | | | | 237,366 | |
0.875%, 04/20/2026 | | | 250,000 | | | | 225,582 | |
4.500%, 05/15/2026 | | | 250,000 | | | | 247,177 | |
1.500%, 01/13/2027 | | | 250,000 | | | | 224,627 | |
2.375%, 07/07/2027 | | | 250,000 | | | | 229,608 | |
0.625%, 09/16/2027 | | | 250,000 | | | | 213,262 | |
4.000%, 01/12/2028 | | | 250,000 | | | | 242,358 | |
1.125%, 07/20/2028 | | | 250,000 | | | | 211,259 | |
3.500%, 09/14/2029 | | | 250,000 | | | | 234,689 | |
1.125%, 01/13/2031 | | | 500,000 | | | | 389,304 | |
Inter-American Investment Corp. | | | | | | | | |
2.625%, 04/22/2025 | | | 250,000 | | | | 239,316 | |
Asian Development Bank | | | | | | | | |
0.625%, 04/29/2025 | | | 250,000 | | | | 232,385 | |
2.875%, 05/06/2025 | | | 250,000 | | | | 240,681 | |
0.500%, 02/04/2026 | | | 250,000 | | | | 225,085 | |
1.000%, 04/14/2026 | | | 250,000 | | | | 226,426 | |
1.500%, 01/20/2027 | | | 250,000 | | | | 224,678 | |
1.250%, 06/09/2028 | | | 250,000 | | | | 213,396 | |
4.500%, 08/25/2028 | | | 250,000 | | | | 247,174 | |
3.125%, 09/26/2028 | | | 250,000 | | | | 231,997 | |
1.875%, 03/15/2029 | | | 250,000 | | | | 215,783 | |
1.750%, 09/19/2029 | | | 250,000 | | | | 211,959 | |
1.875%, 01/24/2030 | | | 250,000 | | | | 210,533 | |
3.125%, 04/27/2032 | | | 250,000 | | | | 221,382 | |
| | | | | | | | |
| | | Principal
amount | | | Value | |
Foreign Government Bonds (Cont.) | | | | | |
Supranational (Cont.) | | | | | | | | |
Council of Europe Development Bank | | | | | | | | |
3.000%, 06/16/2025 | | $ | 250,000 | | | $ | 240,443 | |
0.875%, 09/22/2026 | | | 250,000 | | | | 222,003 | |
3.625%, 01/26/2028 | | | 250,000 | | | | 238,689 | |
Asian Infrastructure Investment Bank, The | | | | | | | | |
3.375%, 06/29/2025 | | | 250,000 | | | | 241,388 | |
0.500%, 01/27/2026 | | | 250,000 | | | | 224,460 | |
African Development Bank | | | | | | | | |
3.375%, 07/07/2025 | | | 250,000 | | | | 242,216 | |
0.875%, 03/23/2026 | | | 250,000 | | | | 225,879 | |
0.875%, 07/22/2026 | | | 250,000 | | | | 223,464 | |
4.375%, 11/03/2027 | | | 250,000 | | | | 246,398 | |
International Finance Corp. | | | | | | | | |
3.625%, 09/15/2025 | | | 250,000 | | | | 242,967 | |
0.750%, 10/08/2026 | | | 250,000 | | | | 221,215 | |
0.750%, 08/27/2030 | | | 250,000 | | | | 191,428 | |
Corp. Andina de Fomento | | | | | | | | |
5.250%, 11/21/2025 | | | 250,000 | | | | 246,632 | |
European Bank for Reconstruction & Development | | | | | | | | |
0.500%, 11/25/2025 | | | 250,000 | | | | 226,826 | |
Nordic Investment Bank | | | | | | | | |
3.375%, 09/08/2027 | | | 250,000 | | | | 237,741 | |
| | | | | | | | |
| | | | | | | 15,429,649 | |
| | | | | | | | |
Sweden (0.01%) | | | | | | | | |
Svensk Exportkredit AB | | | | | | | | |
4.000%, 07/15/2025 | | | 250,000 | | | | 244,200 | |
| | | | | | | | |
| | | | | | | 244,200 | |
| | | | | | | | |
Total Foreign Government Bonds (cost $30,790,516) | | | | 30,554,509 | |
| | | | | | | | |
Agency Securities (d) (0.59%) | | | | | |
Federal Farm Credit Banks | | | | | | | | |
4.500%, 08/14/2026 | | | 2,000,000 | | | | 1,980,201 | |
Federal Home Loan Banks | | | | | | | | |
0.900%, 02/26/2027 | | | 250,000 | | | | 217,354 | |
0.500%, 04/14/2025 | | | 1,770,000 | | | | 1,646,432 | |
4.625%, 12/13/2024 | | | 5,000,000 | | | | 4,953,416 | |
5.125%, 06/13/2025 | | | 250,000 | | | | 249,554 | |
4.000%, 06/30/2028 | | | 1,000,000 | | | | 970,803 | |
Federal Home Loan Mortgage Corp. | | | | | | | | |
6.750%, 03/15/2031 | | | 250,000 | | | | 280,184 | |
6.250%, 07/15/2032 | | | 250,000 | | | | 276,600 | |
Federal National Mortgage Association | | | | | | | | |
7.125%, 01/15/2030 | | | 250,000 | | | | 281,202 | |
6.625%, 11/15/2030 | | | 250,000 | | | | 276,736 | |
7.250%, 05/15/2030 | | | 250,000 | | | | 284,335 | |
| | |
| See accompanying notes to financial statements. | | 33 |
ADVISERS INVESTMENT TRUST
STATE FARM BALANCED FUND
SCHEDULE OF INVESTMENTS (continued)
September 30, 2023
| | | | | | | | |
| | | Principal
amount | | | Value | |
Agency Securities (Cont.) | | | | | | | | |
Federal National Mortgage Association (Cont.) | |
0.500%, 06/17/2025 | | $ | 1,007,000 | | | $ | 931,070 | |
0.750%, 10/08/2027 | | | 500,000 | | | | 427,563 | |
| | | | | | | | |
Total Agency Securities (cost $12,780,866) | | | | | | | 12,775,450 | |
| | | | | | | | |
U.S. Treasury Obligations (18.28%) | |
U.S. Treasury Bill | | | | | | | | |
5.100%, 10/26/2023(e),(f) | | | 775,000 | | | | 772,270 | |
U.S. Treasury Notes | | | | | | | | |
1.500%, 10/31/2024 | | | 1,500,000 | | | | 1,438,594 | |
4.375%, 10/31/2024 | | | 1,000,000 | | | | 988,789 | |
2.250%, 10/31/2024 | | | 1,000,000 | | | | 966,758 | |
0.750%, 11/15/2024 | | | 2,500,000 | | | | 2,374,609 | |
1.500%, 11/30/2024 | | | 10,000,000 | | | | 9,567,578 | |
1.000%, 12/15/2024 | | | 2,000,000 | | | | 1,899,141 | |
1.375%, 01/31/2025 | | | 15,000,000 | | | | 14,242,969 | |
1.125%, 02/28/2025 | | | 19,500,000 | | | | 18,406,172 | |
4.625%, 02/28/2025 | | | 1,000,000 | | | | 990,938 | |
1.750%, 03/15/2025 | | | 2,000,000 | | | | 1,901,875 | |
3.875%, 03/31/2025 | | | 2,000,000 | | | | 1,960,234 | |
2.625%, 04/15/2025 | | | 5,000,000 | | | | 4,808,789 | |
0.375%, 04/30/2025 | | | 2,000,000 | | | | 1,854,141 | |
2.750%, 05/15/2025 | | | 5,000,000 | | | | 4,809,961 | |
2.125%, 05/15/2025 | | | 2,000,000 | | | | 1,904,922 | |
0.250%, 05/31/2025 | | | 5,000,000 | | | | 4,610,547 | |
2.875%, 06/15/2025 | | | 2,000,000 | | | | 1,925,469 | |
0.250%, 06/30/2025 | | | 2,000,000 | | | | 1,838,125 | |
3.000%, 07/15/2025 | | | 5,000,000 | | | | 4,818,359 | |
0.250%, 07/31/2025 | | | 2,000,000 | | | | 1,831,250 | |
2.875%, 07/31/2025 | | | 1,000,000 | | | | 960,859 | |
2.000%, 08/15/2025 | | | 3,000,000 | | | | 2,834,648 | |
3.125%, 08/15/2025 | | | 2,000,000 | | | | 1,929,453 | |
5.000%, 08/31/2025 | | | 3,000,000 | | | | 2,993,906 | |
0.250%, 08/31/2025 | | | 2,000,000 | | | | 1,824,922 | |
2.750%, 08/31/2025 | | | 1,000,000 | | | | 957,305 | |
3.500%, 09/15/2025 | | | 2,000,000 | | | | 1,941,406 | |
0.250%, 09/30/2025 | | | 3,000,000 | | | | 2,730,000 | |
0.250%, 10/31/2025 | | | 2,000,000 | | | | 1,813,516 | |
2.250%, 11/15/2025 | | | 2,000,000 | | | | 1,889,688 | |
0.375%, 11/30/2025 | | | 2,000,000 | | | | 1,812,109 | |
0.375%, 12/31/2025 | | | 7,000,000 | | | | 6,328,164 | |
3.875%, 01/15/2026 | | | 2,000,000 | | | | 1,952,969 | |
0.375%, 01/31/2026 | | | 2,000,000 | | | | 1,800,391 | |
0.500%, 02/28/2026 | | | 10,000,000 | | | | 9,003,125 | |
0.750%, 03/31/2026 | | | 10,000,000 | | | | 9,042,969 | |
0.750%, 04/30/2026 | | | 10,000,000 | | | | 9,008,203 | |
0.750%, 05/31/2026 | | | 10,000,000 | | | | 8,980,859 | |
0.875%, 06/30/2026 | | | 10,000,000 | | | | 8,997,656 | |
0.625%, 07/31/2026 | | | 10,000,000 | | | | 8,900,391 | |
1.125%, 10/31/2026 | | | 5,000,000 | | | | 4,480,078 | |
1.250%, 11/30/2026 | | | 2,500,000 | | | | 2,243,164 | |
1.625%, 11/30/2026 | | | 1,000,000 | | | | 907,930 | |
1.250%, 12/31/2026 | | | 2,500,000 | | | | 2,239,453 | |
1.750%, 12/31/2026 | | | 1,000,000 | | | | 910,117 | |
1.500%, 01/31/2027 | | | 2,000,000 | | | | 1,800,781 | |
| | | | | | | | |
| | | Principal
amount | | | Value | |
U.S. Treasury Obligations (Cont.) | |
U.S. Treasury Notes (Cont.) | | | | | | | | |
1.125%, 02/28/2027 | | $ | 10,000,000 | | | $ | 8,875,391 | |
0.625%, 03/31/2027 | | | 10,000,000 | | | | 8,688,281 | |
0.500%, 04/30/2027 | | | 10,000,000 | | | | 8,621,875 | |
2.750%, 04/30/2027 | | | 2,000,000 | | | | 1,870,234 | |
2.625%, 05/31/2027 | | | 5,000,000 | | | | 4,648,047 | |
0.375%, 09/30/2027 | | | 10,000,000 | | | | 8,441,016 | |
4.125%, 09/30/2027 | | | 2,000,000 | | | | 1,958,359 | |
2.250%, 11/15/2027 | | | 2,000,000 | | | | 1,818,906 | |
0.625%, 11/30/2027 | | | 5,000,000 | | | | 4,240,039 | |
0.625%, 12/31/2027 | | | 5,000,000 | | | | 4,227,734 | |
3.500%, 01/31/2028 | | | 5,000,000 | | | | 4,771,680 | |
0.750%, 01/31/2028 | | | 5,000,000 | | | | 4,239,453 | |
2.750%, 02/15/2028 | | | 5,000,000 | | | | 4,624,219 | |
1.250%, 03/31/2028 | | | 5,000,000 | | | | 4,315,430 | |
3.625%, 04/30/2028 | | | 5,000,000 | | | | 4,765,625 | |
2.875%, 05/15/2028 | | | 5,000,000 | | | | 4,633,594 | |
1.250%, 06/30/2028 | | | 5,000,000 | | | | 4,281,641 | |
2.875%, 08/15/2028 | | | 5,000,000 | | | | 4,616,992 | |
4.375%, 08/31/2028 | | | 7,000,000 | | | | 6,930,547 | |
1.250%, 09/30/2028 | | | 3,000,000 | | | | 2,549,648 | |
3.125%, 11/15/2028 | | | 5,000,000 | | | | 4,655,664 | |
1.375%, 12/31/2028 | | | 4,000,000 | | | | 3,397,344 | |
2.625%, 02/15/2029 | | | 4,000,000 | | | | 3,618,438 | |
2.875%, 04/30/2029 | | | 10,000,000 | | | | 9,132,422 | |
2.375%, 05/15/2029 | | | 5,000,000 | | | | 4,443,359 | |
2.750%, 05/31/2029 | | | 5,000,000 | | | | 4,529,687 | |
2.625%, 07/31/2029 | | | 8,000,000 | | | | 7,177,812 | |
1.625%, 08/15/2029 | | | 5,000,000 | | | | 4,242,969 | |
1.750%, 11/15/2029 | | | 6,000,000 | | | | 5,103,281 | |
1.500%, 02/15/2030 | | | 15,000,000 | | | | 12,433,594 | |
0.875%, 11/15/2030 | | | 20,000,000 | | | | 15,559,375 | |
1.625%, 05/15/2031 | | | 12,000,000 | | | | 9,742,500 | |
1.250%, 08/15/2031 | | | 8,000,000 | | | | 6,252,812 | |
1.375%, 11/15/2031 | | | 7,000,000 | | | | 5,486,797 | |
1.875%, 02/15/2032 | | | 12,000,000 | | | | 9,747,656 | |
4.000%, 08/15/2033 | | | 9,000,000 | | | | 8,503,594 | |
| | | | | | | | |
Total U.S. Treasury Obligations (cost $398,921,035) | | | | 395,341,567 | |
| | | | | | | | |
Long-term Municipal Bonds (0.03%) | | | | | |
California (0.02%) | | | | | | | | |
California State Taxable Various Purpose, General Obligation Bonds | | | | | | | | |
6.000%, 03/01/2033 | | | 250,000 | | | | 260,083 | |
University of California Regents Medical Center Pooled Taxable Revenue Bonds | | | | | | | | |
4.132%, 05/15/2032 | | | 250,000 | | | | 227,239 | |
| | | | | | | | |
| | | | | | | 487,322 | |
| | | | | | | | |
| | |
| 34 | | See accompanying notes to financial statements. |
ADVISERS INVESTMENT TRUST
STATE FARM BALANCED FUND
SCHEDULE OF INVESTMENTS (continued)
September 30, 2023
| | | | | | | | |
Long-term Municipal Bonds (Cont.) | | | | | |
Louisiana (0.01%) | | | | | | | | |
Louisiana State Local Government Environmental Facilities & Community Development Authority Taxable Revenue Bonds, Louisiana Utilities Restoration Corp. Project | | | | | | | | |
4.145%, 02/01/2033 | | $ | 250,000 | | | $ | 234,508 | |
| | | | | | | | |
| | | | | | | 234,508 | |
| | | | | | | | |
Total Long-term Municipal Bonds (cost $729,031) | | | | 721,830 | |
| | | | | | | | |
| | |
| | | Shares | | | Value | |
Short-term Investments (1.37%) | |
Northern Institutional Treasury Portfolio (Premier Class), 5.20%(g) | | | 29,706,555 | | | | 29,706,555 | |
| | | | | | | | |
Total Short-term Investments (cost $29,706,555) | | | | 29,706,555 | |
| | | | | | | | |
TOTAL INVESTMENTS (99.99%) (cost $1,000,445,323) | | | | 2,163,231,962 | |
| | |
CASH AND OTHER ASSETS, NET OF LIABILITIES (0.01%) | | | | | | | 172,421 | |
| | | | | | | | |
NET ASSETS (100.00%) | | | | | | $ | 2,163,404,383 | |
| | | | | | | | |
| (a) | Non-income producing security. |
| (b) | Floating rate security. The rate presented is the rate in effect at September 30, 2023, and the related index and spread are shown parenthetically for each security. |
| (c) | Securities exempt from registration pursuant to Rule 144A under the Securities Act of 1933. These securities may be resold in transactions exempt from registration, normally to qualified institutional buyers. At September 30, 2023, the value of these securities amounted to $2,275,010 or 0.10% of net assets. |
| (d) | The obligations of these U.S. Government-sponsored entities are neither issued nor guaranteed by the United States Treasury. On September 6, 2008, the Federal Housing Finance Agency placed the Federal National Mortgage Association (“Fannie Mae”) and the Federal Home Loan Mortgage Corp. (“Freddie Mac”) into conservatorship. The United States Treasury has put in place a set of financing agreements to help ensure that these entities continue to meet their obligations to holders of bonds they have issued or guaranteed. |
| (e) | Security pledged as collateral to cover margin requirements for open futures contracts. |
| (f) | Discount rate at the time of purchase. |
| (g) | Rate shown is the 7-day yield as of September 30, 2023. |
PLC – Public Limited Company
ADR – American Depositary Receipt
LLC – Limited Liability Company
| | | | | | | | | | | | | | | | | | |
Description | | Number
of
Contracts | | Expiration
Date | | | Trading
Currency | | | Notional
Amount | | | Unrealized
Appreciation
(Depreciation)* | |
Long Contracts | | | | | | | | | | | | | | | | |
E-Mini S&P 500 | | 68 | | | 12/15/2023 | | | | USD | | | | 14,706,700 | | | | $(638,622) | |
*Includes cumulative appreciation/depreciation on futures contracts. Only the current day’s variation margin is reported within the Statements of Assets and Liabilities.
| | |
| See accompanying notes to financial statements. | | 35 |
ADVISERS INVESTMENT TRUST
STATE FARM INTERIM FUND
SCHEDULE OF INVESTMENTS
September 30, 2023
| | | | | | | | |
| | | Principal
amount | | | Value | |
U.S. Treasury Obligations (99.28%) | | | | | |
U.S. Treasury Notes | | | | | | | | |
0.625%, 10/15/2024 | | $ | 2,908,000 | | | $ | 2,767,825 | |
4.375%, 10/31/2024 | | | 2,000,000 | | | | 1,977,578 | |
2.250%, 10/31/2024 | | | 1,500,000 | | | | 1,450,137 | |
1.500%, 10/31/2024 | | | 1,168,000 | | | | 1,120,185 | |
2.250%, 11/15/2024 | | | 2,939,000 | | | | 2,839,120 | |
0.750%, 11/15/2024 | | | 2,425,000 | | | | 2,303,371 | |
4.500%, 11/30/2024 | | | 2,000,000 | | | | 1,979,922 | |
1.500%, 11/30/2024 | | | 1,500,000 | | | | 1,435,137 | |
2.125%, 11/30/2024 | | | 1,000,000 | | | | 963,438 | |
1.000%, 12/15/2024 | | | 2,100,000 | | | | 1,994,098 | |
2.250%, 12/31/2024 | | | 2,022,000 | | | | 1,947,123 | |
1.750%, 12/31/2024 | | | 2,000,000 | | | | 1,913,594 | |
4.250%, 12/31/2024 | | | 1,500,000 | | | | 1,479,785 | |
1.125%, 01/15/2025 | | | 3,707,000 | | | | 3,514,410 | |
4.125%, 01/31/2025 | | | 2,500,000 | | | | 2,461,328 | |
1.375%, 01/31/2025 | | | 2,165,000 | | | | 2,055,735 | |
2.000%, 02/15/2025 | | | 4,592,000 | | | | 4,392,356 | |
1.500%, 02/15/2025 | | | 2,735,000 | | | | 2,598,036 | |
1.125%, 02/28/2025 | | | 2,395,000 | | | | 2,260,655 | |
4.625%, 02/28/2025 | | | 1,000,000 | | | | 990,938 | |
1.750%, 03/15/2025 | | | 3,502,000 | | | | 3,330,183 | |
0.500%, 03/31/2025 | | | 2,000,000 | | | | 1,863,672 | |
2.625%, 04/15/2025 | | | 3,249,000 | | | | 3,124,751 | |
4.125%, 04/30/2025 | | | 3,500,000 | | | | 3,428,770 | |
2.125%, 05/15/2025 | | | 6,157,000 | | | | 5,864,302 | |
2.750%, 05/15/2025 | | | 4,000,000 | | | | 3,847,969 | |
4.250%, 05/31/2025 | | | 3,000,000 | | | | 2,955,469 | |
2.875%, 06/15/2025 | | | 3,079,000 | | | | 2,964,259 | |
2.750%, 06/30/2025 | | | 3,259,000 | | | | 3,129,149 | |
4.625%, 06/30/2025 | | | 3,250,000 | | | | 3,222,197 | |
3.000%, 07/15/2025 | | | 4,550,000 | | | | 4,384,707 | |
4.750%, 07/31/2025 | | | 1,500,000 | | | | 1,490,039 | |
3.125%, 08/15/2025 | | | 5,440,000 | | | | 5,248,112 | |
2.000%, 08/15/2025 | | | 4,699,000 | | | | 4,440,004 | |
5.000%, 08/31/2025 | | | 2,000,000 | | | | 1,995,937 | |
0.250%, 09/30/2025 | | | 4,500,000 | | | | 4,095,000 | |
5.125%, 09/30/2025 | | | 4,000,000 | | | | 3,996,250 | |
4.250%, 10/15/2025 | | | 4,000,000 | | | | 3,937,344 | |
2.250%, 11/15/2025 | | | 8,500,000 | | | | 8,031,172 | |
4.500%, 11/15/2025 | | | 3,500,000 | | | | 3,462,949 | |
4.000%, 12/15/2025 | | | 1,500,000 | | | | 1,468,770 | |
2.625%, 12/31/2025 | | | 4,409,000 | | | | 4,190,617 | |
0.375%, 12/31/2025 | | | 1,000,000 | | | | 904,023 | |
3.875%, 01/15/2026 | | | 1,000,000 | | | | 976,484 | |
2.625%, 01/31/2026 | | | 7,000,000 | | | | 6,644,258 | |
1.625%, 02/15/2026 | | | 6,000,000 | | | | 5,557,969 | |
4.000%, 02/15/2026 | | | 1,000,000 | | | | 978,867 | |
0.500%, 02/28/2026 | | | 700,000 | | | | 630,219 | |
2.250%, 03/31/2026 | | | 5,000,000 | | | | 4,692,187 | |
3.750%, 04/15/2026 | | | 2,000,000 | | | | 1,945,312 | |
2.375%, 04/30/2026 | | | 1,000,000 | | | | 939,609 | |
3.625%, 05/15/2026 | | | 5,000,000 | | | | 4,846,680 | |
1.625%, 05/15/2026 | | | 5,000,000 | | | | 4,602,734 | |
4.125%, 06/15/2026 | | | 2,000,000 | | | | 1,962,969 | |
1.875%, 06/30/2026 | | | 4,500,000 | | | | 4,162,852 | |
1.875%, 07/31/2026 | | | 5,338,000 | | | | 4,924,305 | |
| | | | | | | | |
| | | Principal
amount | | | Value | |
U.S. Treasury Obligations (Cont.) | | | | | |
U.S. Treasury Notes (Cont.) | | | | | | | | |
4.500%, 08/15/2026 | | $ | 1,000,000 | | | $ | 987,578 | |
0.750%, 08/31/2026 | | | 3,712,000 | | | | 3,305,565 | |
1.375%, 08/31/2026 | | | 2,000,000 | | | | 1,814,609 | |
4.625%, 09/15/2026 | | | 1,000,000 | | | | 995,078 | |
0.875%, 09/30/2026 | | | 3,500,000 | | | | 3,123,203 | |
1.625%, 09/30/2026 | | | 1,314,000 | | | | 1,199,487 | |
1.625%, 10/31/2026 | | | 3,775,000 | | | | 3,434,955 | |
1.125%, 10/31/2026 | | | 3,357,000 | | | | 3,007,924 | |
1.250%, 11/30/2026 | | | 5,485,000 | | | | 4,921,502 | |
1.250%, 12/31/2026 | | | 5,580,000 | | | | 4,998,459 | |
1.500%, 01/31/2027 | | | 6,896,000 | | | | 6,209,094 | |
1.875%, 02/28/2027 | | | 5,222,000 | | | | 4,752,836 | |
2.500%, 03/31/2027 | | | 4,611,000 | | | | 4,283,007 | |
2.750%, 04/30/2027 | | | 3,426,000 | | | | 3,203,711 | |
2.625%, 05/31/2027 | | | 5,792,000 | | | | 5,384,298 | |
3.250%, 06/30/2027 | | | 6,500,000 | | | | 6,175,762 | |
2.750%, 07/31/2027 | | | 3,500,000 | | | | 3,260,332 | |
3.125%, 08/31/2027 | | | 6,000,000 | | | | 5,662,734 | |
4.125%, 09/30/2027 | | | 6,212,000 | | | | 6,082,664 | |
4.125%, 10/31/2027 | | | 5,000,000 | | | | 4,893,555 | |
3.875%, 11/30/2027 | | | 6,000,000 | | | | 5,816,250 | |
3.875%, 12/31/2027 | | | 4,650,000 | | | | 4,506,686 | |
3.500%, 01/31/2028 | | | 7,000,000 | | | | 6,680,352 | |
4.000%, 02/29/2028 | | | 8,250,000 | | | | 8,036,660 | |
3.625%, 03/31/2028 | | | 5,000,000 | | | | 4,793,359 | |
3.625%, 04/30/2028 | | | 5,000,000 | | | | 4,765,625 | |
2.875%, 05/15/2028 | | | 5,000,000 | | | | 4,633,594 | |
3.625%, 05/31/2028 | | | 6,000,000 | | | | 5,750,625 | |
4.000%, 06/30/2028 | | | 4,750,000 | | | | 4,623,271 | |
4.125%, 07/31/2028 | | | 4,500,000 | | | | 4,402,969 | |
2.875%, 08/15/2028 | | | 3,500,000 | | | | 3,231,895 | |
4.375%, 08/31/2028 | | | 6,000,000 | | | | 5,940,469 | |
4.625%, 09/30/2028 | | | 5,000,000 | | | | 5,003,125 | |
| | | | | | | | |
Total U.S. Treasury Obligations (cost $329,918,191) | | | | 312,566,094 | |
| | | | | | | | |
| | |
| | | Shares | | | Value | |
Short-term Investments (0.95%) | |
Northern Institutional Treasury Portfolio (Premier Class),
5.20%(a) | | | 2,991,975 | | | | 2,991,975 | |
| | | | | | | | |
Total Short-term Investments (cost $2,991,975) | | | | 2,991,975 | |
| | | | | | | | |
TOTAL INVESTMENTS (100.23%) (cost $332,910,166) | | | | 315,558,069 | |
| | |
OTHER LIABILITIES, NET OF ASSETS ((0.23)%) | | | | | | | (721,377 | ) |
| | | | | | | | |
NET ASSETS (100.00%) | | | | | | $ | 314,836,692 | |
| | | | | | | | |
| (a) | Rate shown is the 7-day yield as of September 30, 2023. |
| | |
| 36 | | See accompanying notes to financial statements. |
ADVISERS INVESTMENT TRUST
STATE FARM MUNICIPAL BOND FUND
SCHEDULE OF INVESTMENTS
September 30, 2023
| | | | | | | | | | | | | | | | |
| | | Coupon
rate | | | Maturity
date | | | Principal
amount | | | Value | |
Long-term Municipal Bond (94.46%) | | | | | | | | | | | | | | | | |
Alabama (2.19%) | | | | | | | | | | | | | | | | |
City of Athens, Alabama, Electric Revenue Warrants | | | 3.250% | | | | 06/01/2025 | | | $ | 600,000 | | | $ | 586,059 | |
City of Athens, Alabama, Electric Revenue Warrants | | | 3.500% | | | | 06/01/2026 | | | | 220,000 | | | | 214,347 | |
City of Athens, Alabama, Electric Revenue Warrants | | | 3.750% | | | | 06/01/2027 | | | | 645,000 | | | | 631,379 | |
City of Athens, Alabama, Water & Sewer Revenue Refunding Warrants | | | 3.000% | | | | 05/01/2028 | | | | 980,000 | | | | 930,455 | |
City of Athens, Alabama, Electric Revenue Warrants | | | 4.000% | | | | 06/01/2028 | | | | 665,000 | | | | 653,646 | |
Madison Water & Wastewater Board Revenue Refunding Bonds | | | 4.000% | | | | 12/01/2028 | | | | 2,165,000 | | | | 2,148,377 | |
City of Athens, Alabama, Water & Sewer Revenue Refunding Warrants | | | 3.125% | | | | 05/01/2029 | | | | 1,010,000 | | | | 945,997 | |
Alabama Federal Aid Highway Finance Authority Revenue Bonds (Prerefunded to 09-01-2024 @ 100)(a) | | | 4.000% | | | | 09/01/2032 | | | | 1,000,000 | | | | 1,001,869 | |
Madison Water & Wastewater Board Revenue Refunding Bonds | | | 4.000% | | | | 12/01/2035 | | | | 215,000 | | | | 211,069 | |
Madison Water & Wastewater Board Revenue Refunding Bonds | | | 4.000% | | | | 12/01/2036 | | | | 310,000 | | | | 296,132 | |
Mobile County Board of School Commissioners Special Tax Warrants, Series B | | | 5.000% | | | | 03/01/2037 | | | | 1,000,000 | | | | 1,037,714 | |
Madison Water & Wastewater Board Revenue Refunding Bonds | | | 4.000% | | | | 12/01/2037 | | | | 270,000 | | | | 254,479 | |
Black Belt Energy Gas District Revenue Bonds, Series C-1(b) | | | 5.250% | | | | 02/01/2053 | | | | 1,000,000 | | | | 1,014,757 | |
Black Belt Energy Gas District Revenue Bonds, Series B(c) | | | 5.250% | | | | 12/01/2053 | | | | 2,000,000 | | | | 2,051,426 | |
| | | | | | | | | | | | | | | | |
| | | | | | | | | | | | | | | 11,977,706 | |
| | | | | | | | | | | | | | | | |
Alaska (1.52%) | | | | | | | | | | | | | | | | |
Municipality of Anchorage, Alaska, General Obligation Bonds, Series A | | | 3.250% | | | | 09/01/2028 | | | | 1,095,000 | | | | 1,065,986 | |
Municipality of Anchorage, Alaska, General Obligation Bonds, Series B | | | 3.250% | | | | 09/01/2028 | | | | 1,050,000 | | | | 1,022,179 | |
Municipality of Anchorage, Alaska, General Obligation Bonds, Series A | | | 3.500% | | | | 09/01/2029 | | | | 1,390,000 | | | | 1,379,026 | |
Municipality of Anchorage, Alaska, General Obligation Bonds, Series B | | | 3.500% | | | | 09/01/2029 | | | | 1,090,000 | | | | 1,081,395 | |
Municipality of Anchorage, Alaska, General Obligation Bonds, Series A | | | 3.500% | | | | 09/01/2030 | | | | 1,440,000 | | | | 1,428,435 | |
Municipality of Anchorage, Alaska, General Obligation Bonds, Series B | | | 3.500% | | | | 09/01/2030 | | | | 1,125,000 | | | | 1,115,965 | |
Borough of Matanuska-Susitna, Alaska, General Obligation Bonds, Series A | | | 5.000% | | | | 08/01/2031 | | | | 1,225,000 | | | | 1,225,475 | |
| | | | | | | | | | | | | | | | |
| | | | | | | | | | | | | | | 8,318,461 | |
| | | | | | | | | | | | | | | | |
Arizona (1.44%) | | | | | | | | | | | | | | | | |
Maricopa County Union High School District No. 210 Phoenix, General Obligation Bonds, Series A | | | 4.000% | | | | 07/01/2024 | | | | 1,165,000 | | | | 1,165,140 | |
County of Pima, Arizona, General Obligation Bonds, Series A | | | 4.000% | | | | 07/01/2026 | | | | 2,000,000 | | | | 1,907,978 | |
Pima County Unified School District No. 10 Amphitheater, Arizona, General Obligation Bonds, Project of 2007, Series D | | | 5.000% | | | | 07/01/2026 | | | | 555,000 | | | | 555,391 | |
Maricopa County Unified School District No. 93 Cave Creek, Arizona, General Obligation Bonds, Project of 2014, Series A | | | 4.000% | | | | 07/01/2027 | | | | 1,100,000 | | | | 1,103,785 | |
Pima County Unified School District No. 10 Amphitheater, Arizona, General Obligation Bonds, Project of 2007, Series D | | | 5.000% | | | | 07/01/2027 | | | | 400,000 | | | | 400,282 | |
Salt River Project Agricultural Improvement & Power District Revenue Refunding Bonds, Series A | | | 4.000% | | | | 12/01/2033 | | | | 2,000,000 | | | | 1,981,657 | |
Kyrene Elementary School District No. 28, General Obligation Bonds, Series C | | | 5.000% | | | | 07/01/2034 | | | | 710,000 | | | | 772,507 | |
| | | | | | | | | | | | | | | | |
| | | | | | | | | | | | | | | 7,886,740 | |
| | | | | | | | | | | | | | | | |
Arkansas (1.48%) | | | | | | | | | | | | | | | | |
State of Arkansas, General Obligation Refunding Bonds | | | 4.000% | | | | 06/01/2027 | | | | 3,000,000 | | | | 2,983,585 | |
University of Arkansas Revenue Bonds (Prerefunded to 11-01-2024 @ 100)(a) | | | 5.000% | | | | 11/01/2028 | | | | 365,000 | | | | 369,489 | |
Rogers School District No. 30, General Obligation Refunding Bonds | | | 3.125% | | | | 02/01/2030 | | | | 2,880,000 | | | | 2,646,225 | |
University of Arkansas Revenue Bonds (Prerefunded to 11-01-2024 @ 100)(a) | | | 5.000% | | | | 11/01/2030 | | | | 785,000 | | | | 794,654 | |
Rogers School District No. 30, General Obligation Refunding Bonds | | | 3.000% | | | | 02/01/2033 | | | | 1,500,000 | | | | 1,307,096 | |
| | | | | | | | | | | | | | | | |
| | | | | | | | | | | | | | | 8,101,049 | |
| | | | | | | | | | | | | | | | |
California (4.91%) | | | | | | | | | | | | | | | | |
Atascadero Unified School District, General Obligation Bonds, Election of 2010, Series B | | | 5.000% | | | | 08/01/2025 | | | | 225,000 | | | | 227,048 | |
Atascadero Unified School District, General Obligation Bonds, Election of 2010, Series B | | | 5.000% | | | | 08/01/2027 | | | | 1,080,000 | | | | 1,089,104 | |
East Side Union High School District, General Obligation Refunding Bonds | | | 3.500% | | | | 08/01/2027 | | | | 1,000,000 | | | | 983,834 | |
Newark Unified School District, General Obligation Bonds, Election of 2011, Series C | | | 3.000% | | | | 08/01/2028 | | | | 750,000 | | | | 713,869 | |
| | |
| See accompanying notes to financial statements. | | 37 |
ADVISERS INVESTMENT TRUST
STATE FARM MUNICIPAL BOND FUND
SCHEDULE OF INVESTMENTS (continued)
September 30, 2023
| | | | | | | | | | | | | | | | |
| | | Coupon
rate | | | Maturity
date | | | Principal
amount | | | Value | |
Long-term Municipal Bond (Cont.) | | | | | | | | | | | | | | | | |
California (Cont.) | | | | | | | | | | | | | | | | |
Santee School District, General Obligation Refunding Bonds | | | 3.500% | | | | 08/01/2028 | | | $ | 1,565,000 | | | $ | 1,537,931 | |
Campbell Union High School District, General Obligation Refunding Bonds | | | 3.250% | | | | 08/01/2029 | | | | 1,965,000 | | | | 1,854,208 | |
City of La Mesa, California, General Obligation Refunding Bonds | | | 3.500% | | | | 08/01/2029 | | | | 1,190,000 | | | | 1,159,520 | |
Santee School District, General Obligation Refunding Bonds | | | 3.500% | | | | 08/01/2029 | | | | 1,725,000 | | | | 1,680,116 | |
Sonoma County Junior College District, General Obligation Refunding Bonds | | | 3.250% | | | | 08/01/2029 | | | | 2,835,000 | | | | 2,708,358 | |
City of La Mesa, California, General Obligation Refunding Bonds | | | 4.000% | | | | 08/01/2030 | | | | 540,000 | | | | 543,037 | |
Marin Community College District, General Obligation Bonds, Election of 2016, Series A (Prerefunded to 08-01-2026 @ 100)(a) | | | 4.000% | | | | 08/01/2030 | | | | 1,095,000 | | | | 1,115,140 | |
Sonoma County Junior College District, General Obligation Bonds, Election of 2014, Series A | | | 4.000% | | | | 08/01/2030 | | | | 1,600,000 | | | | 1,613,702 | |
Sequoia Union High School District, General Obligation Bonds, Election of 2014 | | | 3.000% | | | | 07/01/2031 | | | | 2,000,000 | | | | 1,872,130 | |
City of La Mesa, California, General Obligation Refunding Bonds | | | 4.000% | | | | 08/01/2031 | | | | 400,000 | | | | 402,083 | |
Redondo Beach Unified School District, General Obligation Refunding Bonds, Election of 2008, Series D | | | 3.000% | | | | 08/01/2031 | | | | 750,000 | | | | 688,537 | |
City of La Mesa, California, General Obligation Refunding Bonds | | | 4.000% | | | | 08/01/2032 | | | | 500,000 | | | | 502,295 | |
Tustin Unified School District, General Obligation Refunding Bonds | | | 4.000% | | | | 08/01/2032 | | | | 510,000 | | | | 517,323 | |
Tustin Unified School District, General Obligation Refunding Bonds | | | 4.000% | | | | 08/01/2033 | | | | 600,000 | | | | 608,487 | |
Anaheim Housing & Public Improvements Authority Revenue Refunding Bonds, Series A | | | 5.000% | | | | 10/01/2033 | | | | 1,000,000 | | | | 1,055,314 | |
Kentfield School District, General Obligation Bonds, Election of 2014, Series B | | | 5.000% | | | | 08/01/2034 | | | | 200,000 | | | | 205,759 | |
Antioch Unified School District, General Obligation Bonds, Election of 2008, Series E | | | 3.000% | | | | 08/01/2035 | | | | 1,150,000 | | | | 973,784 | |
Central Unified School District, General Obligation Bonds, Election of 2016, Series C | | | 3.000% | | | | 08/01/2035 | | | | 300,000 | | | | 258,422 | |
Gavilan Joint Community College District, General Obligation Bonds, Series B | | | 3.000% | | | | 08/01/2035 | | | | 1,000,000 | | | | 861,406 | |
Kentfield School District, General Obligation Bonds, Election of 2014, Series B | | | 5.000% | | | | 08/01/2035 | | | | 355,000 | | | | 363,485 | |
Antioch Unified School District, General Obligation Bonds, Election of 2008, Series E | | | 3.000% | | | | 08/01/2036 | | | | 600,000 | | | | 493,656 | |
Gavilan Joint Community College District, General Obligation Bonds, Series B | | | 3.000% | | | | 08/01/2036 | | | | 1,000,000 | | | | 836,559 | |
Kentfield School District, General Obligation Bonds, Election of 2014, Series B | | | 5.000% | | | | 08/01/2036 | | | | 400,000 | | | | 408,759 | |
Central Unified School District, General Obligation Bonds, Election of 2016, Series C | | | 3.000% | | | | 08/01/2037 | | | | 755,000 | | | | 615,007 | |
Kentfield School District, General Obligation Bonds, Election of 2014, Series B | | | 5.000% | | | | 08/01/2037 | | | | 500,000 | | | | 509,638 | |
Mountain View-Whisman School District, General Obligation Bonds, Series B | | | 4.000% | | | | 09/01/2038 | | | | 500,000 | | | | 481,159 | |
| | | | | | | | | | | | | | | | |
| | | | | | | | | | | | | | | 26,879,670 | |
| | | | | | | | | | | | | | | | |
Colorado (2.93%) | | | | | | | | | | | | | | | | |
Arapahoe County School District No. 5 Cherry Creek, General Obligation Bonds, Series B | | | 3.000% | | | | 12/15/2023 | | | | 3,300,000 | | | | 3,290,519 | |
El Paso County School District No. 20 Academy, General Obligation Refunding Bonds | | | 4.000% | | | | 12/15/2025 | | | | 1,000,000 | | | | 1,001,382 | |
Garfield Pitkin & Eagle Counties School District No. RE-1 Roaring Fork, General Obligation | | | | | | | | | | | | | | | | |
Refunding Bonds, Series B | | | 2.500% | | | | 12/15/2027 | | | | 3,000,000 | | | | 2,814,934 | |
Eagle River Water & Sanitation District, General Obligation Bonds | | | 4.000% | | | | 12/01/2030 | | | | 465,000 | | | | 467,530 | |
Gunnison Watershed School District No. RE-1J, General Obligation Refunding Bonds, Series A (Prerefunded to 12-01-2024 @ 100)(a) | | | 4.000% | | | | 12/01/2031 | | | | 1,000,000 | | | | 1,000,911 | |
Town of Estes Park Colorado Power & Communications Enterprise Revenue Refunding Bonds, Series A | | | 4.000% | | | | 11/01/2034 | | | | 1,805,000 | | | | 1,802,393 | |
Adams 12 Five Star Schools, General Obligation Refunding Bonds, Series B | | | 5.000% | | | | 12/15/2034 | | | | 3,500,000 | | | | 3,592,660 | |
Town of Estes Park Colorado Power & Communications Enterprise Revenue Refunding Bonds, Series A | | | 4.000% | | | | 11/01/2035 | | | | 980,000 | | | | 965,756 | |
Rangeview Library District, Certificate of Participation, Series A | | | 5.000% | | | | 12/15/2037 | | | | 650,000 | | | | 664,061 | |
Gunnison Watershed School District No. Re 1J, General Obligation Bonds | | | 5.000% | | | | 12/01/2038 | | | | 450,000 | | | | 478,801 | |
| | | | | | | | | | | | | | | | |
| | | | | | | | | | | | | | | 16,078,947 | |
| | | | | | | | | | | | | | | | |
Connecticut (0.97%) | | | | | | | | | | | | | | | | |
Connecticut State Health & Educational Facilities Authority Revenue Refunding Bonds, Series A(d) | | | 2.000% | | | | 07/01/2042 | | | | 5,700,000 | | | | 5,314,695 | |
| | | | | | | | | | | | | | | | |
District of Columbia (0.79%) | | | | | | | | | | | | | | | | |
District of Columbia, General Obligation Bonds, Series A | | | 5.000% | | | | 06/01/2034 | | | | 1,500,000 | | | | 1,521,678 | |
| | |
| 38 | | See accompanying notes to financial statements. |
ADVISERS INVESTMENT TRUST
STATE FARM MUNICIPAL BOND FUND
SCHEDULE OF INVESTMENTS (continued)
September 30, 2023
| | | | | | | | | | | | | | | | |
| | | Coupon
rate | | | Maturity
date | | | Principal
amount | | | Value | |
Long-term Municipal Bond (Cont.) | | | | | | | | | | | | | | | | |
District of Columbia (Cont.) | | | | | | | | | | | | | | | | |
District of Columbia G.O. Unlimited Bonds, Series C | | | 5.000% | | | | 06/01/2038 | | | $ | 1,500,000 | | | $ | 1,503,834 | |
District of Columbia Revenue Bonds, Series A | | | 5.000% | | | | 07/01/2039 | | | | 1,250,000 | | | | 1,322,918 | |
| | | | | | | | | | | | | | | | |
| | | | | | | | | | | | | | | 4,348,430 | |
| | | | | | | | | | | | | | | | |
Florida (2.46%) | | | | | | | | | | | | | | | | |
County of Lee County Water & Sewer Revenue Bonds, Series A (Prerefunded to 10-01-2023 @ 100)(a) | | | 5.000% | | | | 10/01/2026 | | | | 400,000 | | | | 400,000 | |
City of Pembroke Pines, Florida, General Obligation Refunding Bonds | | | 5.000% | | | | 09/01/2031 | | | | 2,100,000 | | | | 2,143,817 | |
Florida Municipal Loan Council Revenue Bonds, Series A | | | 3.000% | | | | 08/01/2032 | | | | 520,000 | | | | 461,668 | |
City of Miami Beach, Florida, Water & Sewer Revenue Refunding Bonds | | | 4.000% | | | | 09/01/2032 | | | | 540,000 | | | | 543,145 | |
County of Lee County Water & Sewer Revenue Bonds, Series A (Prerefunded to 10-01-2023 @ 100)(a) | | | 5.000% | | | | 10/01/2032 | | | | 750,000 | | | | 750,000 | |
Collier County Water-Sewer District Revenue Bonds | | | 3.000% | | | | 07/01/2033 | | | | 5,080,000 | | | | 4,621,860 | |
Florida Municipal Loan Council Revenue Bonds, Series A | | | 3.250% | | | | 08/01/2033 | | | | 535,000 | | | | 483,505 | |
City of Miami Beach, Florida, Water & Sewer Revenue Refunding Bonds | | | 5.000% | | | | 09/01/2033 | | | | 750,000 | | | | 787,890 | |
Florida Municipal Loan Council Revenue Bonds, Series A | | | 4.000% | | | | 08/01/2034 | | | | 555,000 | | | | 555,062 | |
City of Miami Beach, Florida, Water & Sewer Revenue Refunding Bonds | | | 5.000% | | | | 09/01/2034 | | | | 750,000 | | | | 785,405 | |
Florida Department of Management Services, Certificate of Participation, Series A | | | 3.000% | | | | 11/01/2035 | | | | 1,000,000 | | | | 860,794 | |
County of Sarasota Utility System Revenue Bonds | | | 5.250% | | | | 10/01/2039 | | | | 1,000,000 | | | | 1,083,472 | |
| | | | | | | | | | | | | | | | |
| | | | | | | | | | | | | | | 13,476,618 | |
| | | | | | | | | | | | | | | | |
Georgia (0.54%) | | | | | | | | | | | | | | | | |
Bartow County Development Authority Revenue Refunding Bonds | | | 1.800% | | | | 09/01/2029 | | | | 1,000,000 | | | | 814,819 | |
Harris County School District, General Obligation Bonds | | | 3.000% | | | | 03/01/2035 | | | | 250,000 | | | | 215,961 | |
Coweta County Public Facilities Authority Revenue Bonds | | | 5.000% | | | | 09/01/2035 | | | | 550,000 | | | | 603,332 | |
Georgia Ports Authority Revenue Bonds | | | 5.250% | | | | 07/01/2039 | | | | 1,250,000 | | | | 1,341,442 | |
| | | | | | | | | | | | | | | | |
| | | | | | | | | | | | | | | 2,975,554 | |
| | | | | | | | | | | | | | | | |
Idaho (1.10%) | | | | | | | | | | | | | | | | |
Nez Perce County Independent School District No 1., General Obligation Bonds | | | 4.000% | | | | 09/15/2031 | | | | 2,880,000 | | | | 2,884,732 | |
Boise State University Revenue Bonds, Series A | | | 4.000% | | | | 04/01/2032 | | | | 445,000 | | | | 445,359 | |
Boise State University Revenue Refunding Bonds, Series A | | | 3.000% | | | | 04/01/2033 | | | | 545,000 | | | | 496,732 | |
Idaho State University Revenue Bonds | | | 4.000% | | | | 04/01/2033 | | | | 180,000 | | | | 175,519 | |
Idaho Health Facilities Authority Revenue Refunding Bonds | | | 4.000% | | | | 03/01/2034 | | | | 400,000 | | | | 376,360 | |
Boise State University Revenue Bonds, Series A | | | 5.000% | | | | 04/01/2034 | | | | 240,000 | | | | 250,239 | |
Idaho State University Revenue Bonds | | | 4.000% | | | | 04/01/2034 | | | | 255,000 | | | | 248,072 | |
Boise State University Revenue Bonds, Series A | | | 5.000% | | | | 04/01/2035 | | | | 250,000 | | | | 259,852 | |
Boise State University Revenue Refunding Bonds, Series A | | | 3.000% | | | | 04/01/2035 | | | | 300,000 | | | | 264,853 | |
Idaho State University Revenue Bonds | | | 4.000% | | | | 04/01/2035 | | | | 175,000 | | | | 168,315 | |
Idaho State University Revenue Bonds | | | 4.000% | | | | 04/01/2036 | | | | 200,000 | | | | 190,066 | |
Boise State University Revenue Refunding Bonds, Series A | | | 3.000% | | | | 04/01/2037 | | | | 310,000 | | | | 260,169 | |
| | | | | | | | | | | | | | | | |
| | | | | | | | | | | | | | | 6,020,268 | |
| | | | | | | | | | | | | | | | |
Illinois (2.97%) | | | | | | | | | | | | | | | | |
DeWitt Ford & Livingston Etc. Counties Community College District No. 540 Heartland, General Obligation Refunding Bonds | | | 3.000% | | | | 12/01/2032 | | | | 1,500,000 | | | | 1,321,941 | |
Chicago Wastewater Transmission Second Lien Revenue Bonds | | | 5.000% | | | | 01/01/2033 | | | | 1,000,000 | | | | 999,818 | |
County of Sangamon, Illinois, General Obligation Refunding Bonds | | | 3.000% | | | | 12/15/2033 | | | | 800,000 | | | | 690,715 | |
Cook County Community Consolidated School District No. 64 Park Ridge-Niles, General Obligation Bonds | | | 3.000% | | | | 12/01/2034 | | | | 1,000,000 | | | | 877,828 | |
Village of Schaumburg, Illinois, General Obligation Refunding Bonds | | | 4.000% | | | | 12/01/2034 | | | | 2,500,000 | | | | 2,397,630 | |
Chicago Midway International Airport Revenue Refunding Bonds, Series B | | | 5.000% | | | | 01/01/2035 | | | | 2,000,000 | | | | 1,998,318 | |
Sangamon County School District No. 186 Springfield, General Obligation Bonds | | | 3.000% | | | | 02/01/2035 | | | | 1,000,000 | | | | 847,621 | |
Chicago O’Hare International Airport Revenue Refunding Bonds, Series C | | | 5.000% | | | | 01/01/2038 | | | | 1,050,000 | | | | 1,053,843 | |
Illinois State Toll Highway Authority Revenue Bonds, Series B | | | 5.000% | | | | 01/01/2038 | | | | 1,000,000 | | | | 999,962 | |
| | |
| See accompanying notes to financial statements. | | 39 |
ADVISERS INVESTMENT TRUST
STATE FARM MUNICIPAL BOND FUND
SCHEDULE OF INVESTMENTS (continued)
September 30, 2023
| | | | | | | | | | | | | | | | |
| | | Coupon
rate | | | Maturity
date | | | Principal
amount | | | Value | |
Long-term Municipal Bond (Cont.) | | | | | | | | | | | | | | | | |
Illinois (Cont.) | | | | | | | | | | | | | | | | |
Illinois Finance Authority Revenue Refunding Bonds | | | 4.000 | % | | | 08/01/2038 | | | $ | 1,000,000 | | | $ | 906,015 | |
Illinois State Finance Authority Revenue Refunding Bonds, Series A, Rush University Medical Center | | | 5.000 | % | | | 11/15/2038 | | | | 2,000,000 | | | | 1,955,815 | |
Cook County Community Consolidated School District No. 65 Evanston Revenue Bonds | | | 5.000 | % | | | 12/01/2039 | | | | 1,000,000 | | | | 1,039,316 | |
Village of Mundelein, Illinois, General Obligation Bonds | | | 4.000 | % | | | 12/15/2039 | | | | 1,355,000 | | | | 1,203,568 | |
| | | | | | | | | | | | | | | | |
| | | | | | | | | | | | | | | 16,292,390 | |
| | | | | | | | | | | | | | | | |
Indiana (3.37%) | | | | | | | | | | | | | | | | |
East Noble School Building Corporation Revenue Bonds | | | 2.000 | % | | | 01/15/2027 | | | | 1,205,000 | | | | 1,099,087 | |
Hamilton Southeastern Consolidated School Building Corporation Revenue Bonds, Series G | | | 4.000 | % | | | 07/15/2027 | | | | 1,190,000 | | | | 1,192,591 | |
Hamilton Southeastern Consolidated School Building Corporation Revenue Bonds, Series G | | | 4.500 | % | | | 07/15/2028 | | | | 500,000 | | | | 505,855 | |
Warsaw Multi-School Building Corporation Revenue Bonds | | | 4.000 | % | | | 07/15/2028 | | | | 1,000,000 | | | | 1,004,256 | |
City of West Lafayette, Indiana, Sewer Revenue Bonds | | | 3.750 | % | | | 07/01/2029 | | | | 220,000 | | | | 218,033 | |
Valparaiso Multi-Schools Building Corporation Revenue Bonds | | | 5.000 | % | | | 07/15/2029 | | | | 3,000,000 | | | | 3,069,356 | |
City of West Lafayette, Indiana, Sewer Revenue Bonds | | | 4.000 | % | | | 07/01/2030 | | | | 750,000 | | | | 744,854 | |
Munster School Building Corporation Revenue Bonds | | | 3.375 | % | | | 01/15/2031 | | | | 1,095,000 | | | | 1,053,045 | |
City of Fort Wayne, Indiana, Waterworks Utility Revenue Bonds, Series A | | | 3.000 | % | | | 12/01/2033 | | | | 650,000 | | | | 565,994 | |
City of Lebanon, Indiana, Sewage Works Revenue Bonds | | | 4.000 | % | | | 07/01/2034 | | | | 865,000 | | | | 844,819 | |
Borden-Henryville Multi-School Building Corporation Revenue Bonds | | | 5.000 | % | | | 07/15/2034 | | | | 1,270,000 | | | | 1,363,938 | |
Hamilton Southeastern Consolidated School Building Corporation Revenue Bonds | | | 5.000 | % | | | 07/15/2034 | | | | 335,000 | | | | 352,269 | |
City of Fort Wayne, Indiana, Waterworks Utility Revenue Bonds, Series A | | | 3.000 | % | | | 12/01/2034 | | | | 675,000 | | | | 580,052 | |
City of Lebanon, Indiana, Sewage Works Revenue Bonds | | | 4.000 | % | | | 07/01/2035 | | | | 895,000 | | | | 862,617 | |
City of Fort Wayne, Indiana, Waterworks Utility Revenue Bonds, Series A | | | 3.000 | % | | | 12/01/2035 | | | | 700,000 | | | | 587,605 | |
Hamilton Southeastern Consolidated School Building Corporation Revenue Bonds | | | 5.000 | % | | | 07/15/2036 | | | | 700,000 | | | | 733,773 | |
Indiana State Finance Authority Revolving Revenue Refunding Bonds, Green Bonds | | | 5.000 | % | | | 02/01/2039 | | | | 1,000,000 | | | | 1,065,202 | |
Tippecanoe Valley Akron School Building Corporation Revenue Bonds | | | 5.000 | % | | | 07/15/2039 | | | | 1,000,000 | | | | 1,025,110 | |
Indiana Finance Authority Revenue Refunding Bonds | | | 4.000 | % | | | 10/01/2039 | | | | 1,750,000 | | | | 1,615,186 | |
| | | | | | | | | | | | | | | | |
| | | | | | | | | | | | | | | 18,483,642 | |
| | | | | | | | | | | | | | | | |
Iowa (1.26%) | | | | | | | | | | | | | | | | |
Des Moines Metropolitan Wastewater Reclamation Authority Revenue Refunding Bonds, Series E | | | 3.000 | % | | | 06/01/2027 | | �� | | 1,610,000 | | | | 1,535,958 | |
Waukee Community School District, General Obligation Refunding Bonds, Series B | | | 2.000 | % | | | 06/01/2027 | | | | 2,100,000 | | | | 1,899,826 | |
City of Cedar Rapids Water Revenue Refunding Bonds, Series D | | | 3.000 | % | | | 06/01/2029 | | | | 950,000 | | | | 870,917 | |
City of Council Bluffs, Iowa, General Obligation Refunding Bonds, Series A | | | 3.000 | % | | | 06/01/2029 | | | | 1,050,000 | | | | 980,520 | |
City of West Des Moines, Iowa, General Obligation Bonds, Series D | | | 3.000 | % | | | 06/01/2031 | | | | 1,770,000 | | | | 1,599,362 | |
| | | | | | | | | | | | | | | | |
| | | | | | | | | | | | | | | 6,886,583 | |
| | | | | | | | | | | | | | | | |
Kansas (2.31%) | | | | | | | | | | | | | | | | |
Johnson County Unified School District No. 233 Olathe, General Obligation Bonds, Series A (Prerefunded to 09-01-2024 @ 100)(a) | | | 3.000 | % | | | 09/01/2026 | | | | 2,740,000 | | | | 2,716,476 | |
Johnson County Unified School District No. 233 Olathe, General Obligation Bonds, Series A (Prerefunded to 09-01-2024 @ 100)(a) | | | 3.000 | % | | | 09/01/2027 | | | | 1,490,000 | | | | 1,477,208 | |
Johnson County Unified School District No. 512 Shawnee Mission, General Obligation Refunding Bonds, Series A | | | 3.000 | % | | | 10/01/2027 | | | | 1,000,000 | | | | 948,975 | |
Johnson County Water District No. 1 Revenue Refunding Bonds, Series A | | | 3.000 | % | | | 01/01/2032 | | | | 2,500,000 | | | | 2,288,879 | |
State of Kansas Department of Transportation Revenue Bonds, Series A | | | 5.000 | % | | | 09/01/2033 | | | | 5,000,000 | | | | 5,198,903 | |
| | | | | | | | | | | | | | | | |
| | | | | | | | | | | | | | | 12,630,441 | |
| | | | | | | | | | | | | | | | |
Kentucky (3.26%) | | | | | | | | | | | | | | | | |
Northern Kentucky Water District Revenue Bonds, Series A | | | 4.000 | % | | | 02/01/2028 | | | | 1,110,000 | | | | 1,110,057 | |
City of Owensboro, Kentucky, Water Revenue Refunding Bonds | | | 3.250 | % | | | 09/15/2029 | | | | 1,735,000 | | | | 1,615,703 | |
Lexington-Fayette Urban County Government, General Obligation Bonds, Series A | | | 3.000 | % | | | 10/01/2029 | | | | 1,060,000 | | | | 958,475 | |
City of Owensboro, Kentucky, Water Revenue Refunding Bonds | | | 3.375 | % | | | 09/15/2030 | | | | 1,800,000 | | | | 1,685,084 | |
Lexington-Fayette Urban County Government, General Obligation Bonds, Series A | | | 3.125 | % | | | 10/01/2030 | | | | 1,095,000 | | | | 989,529 | |
| | |
| 40 | | See accompanying notes to financial statements. |
ADVISERS INVESTMENT TRUST
STATE FARM MUNICIPAL BOND FUND
SCHEDULE OF INVESTMENTS (continued)
September 30, 2023
| | | | | | | | | | | | | | | | |
| | | Coupon
rate | | | Maturity
date | | | Principal
amount | | | Value | |
Long-term Municipal Bond (Cont.) | | | | | | | | | | | | | | | | |
Kentucky (Cont.) | | | | | | | | | | | | | | | | |
Northern Kentucky Water District Revenue Refunding Bonds | | | 3.000 | % | | | 02/01/2031 | | | $ | 3,660,000 | | | $ | 3,336,340 | |
City of Owensboro, Kentucky, Water Revenue Refunding Bonds | | | 3.500 | % | | | 09/15/2031 | | | | 1,860,000 | | | | 1,736,389 | |
Kenton County School District Finance Corporation Revenue Bonds | | | 2.000 | % | | | 12/01/2031 | | | | 1,565,000 | | | | 1,261,062 | |
Kenton County School District Finance Corporation Revenue Bonds | | | 2.000 | % | | | 02/01/2032 | | | | 1,770,000 | | | | 1,421,101 | |
City of Bowling Green, Kentucky, Water & Sewer System Revenue Bonds | | | 3.000 | % | | | 06/01/2033 | | | | 3,115,000 | | | | 2,718,720 | |
Woodford County School District Finance Corporation Revenue Bonds, Series A | | | 5.000 | % | | | 08/01/2039 | | | | 1,000,000 | | | | 1,022,859 | |
| | | | | | | | | | | | | | | | |
| | | | | | | | | | | | | | | 17,855,319 | |
| | | | | | | | | | | | | | | | |
Louisiana (0.62%) | | | | | | | | | | | | | | | | |
St. John the Baptist Parish School District No. 1, General Obligation Bonds | | | 5.250 | % | | | 03/01/2037 | | | | 1,500,000 | | | | 1,543,094 | |
Louisiana Local Government Environmental Facilities & Community Development Authority Revenue Bonds | | | 5.000 | % | | | 08/15/2037 | | | | 1,000,000 | | | | 1,009,088 | |
City of West Monroe, Louisiana, Sales & Use Tax Revenue Bonds, Series A | | | 5.000 | % | | | 12/01/2039 | | | | 830,000 | | | | 847,689 | |
| | | | | | | | | | | | | | | | |
| | | | | | | | | | | | | | | 3,399,871 | |
| | | | | | | | | | | | | | | | |
Maryland (0.69%) | | | | | | | | | | | | | | | | |
County of Caroline, Maryland, General Obligation Refunding Bonds | | | 3.000 | % | | | 01/15/2032 | | | | 1,150,000 | | | | 1,044,754 | |
City of Baltimore Revenue Bonds, Series A | | | 5.000 | % | | | 07/01/2035 | | | | 1,000,000 | | | | 1,092,722 | |
County of Baltimore, General Obligation Bonds | | | 4.000 | % | | | 03/01/2038 | | | | 1,750,000 | | | | 1,669,644 | |
| | | | | | | | | | | | | | | | |
| | | | | | | | | | | | | | | 3,807,120 | |
| | | | | | | | | | | | | | | | |
Massachusetts (0.90%) | | | | | | | | | | | | | | | | |
Town of Swampscott, Massachusetts, General Obligation Bonds | | | 3.000 | % | | | 03/01/2034 | | | | 1,000,000 | | | | 881,542 | |
Massachusetts State Development Finance Agency Revenue Refunding Bonds, Partners Healthcare System | | | 5.000 | % | | | 07/01/2035 | | | | 1,400,000 | | | | 1,427,715 | |
Commonwealth of Massachusetts, General Obligation Bonds, Series J | | | 5.000 | % | | | 12/01/2038 | | | | 1,000,000 | | | | 1,024,513 | |
Commonwealth of Massachusetts General Obligation Refunding Bonds, Series B | | | 5.000 | % | | | 05/01/2039 | | | | 1,480,000 | | | | 1,579,854 | |
| | | | | | | | | | | | | | | | |
| | | | | | | | | | | | | | | 4,913,624 | |
| | | | | | | | | | | | | | | | |
Michigan (4.63%) | | | | | | | | | | | | | | | | |
East Grand Rapids Public School District, General Obligation Refunding Bonds, Series A (Prerefunded to 05-01-2024 @ 100)(a) | | | 5.000 | % | | | 05/01/2027 | | | | 1,000,000 | | | | 1,005,908 | |
Hamilton Community School District, General Obligation Refunding Bonds | | | 4.000 | % | | | 05/01/2027 | | | | 500,000 | | | | 502,352 | |
Mattawan Consolidated School District, General Obligation Bonds, Series I (Prerefunded to 05-01-2025 @ 100)(a) | | | 5.000 | % | | | 05/01/2027 | | | | 1,005,000 | | | | 1,024,290 | |
Michigan State Finance Authority Senior Lien Revenue Bonds, Great Lakes Water | | | 5.000 | % | | | 07/01/2027 | | | | 1,650,000 | | | | 1,655,917 | |
East Grand Rapids Public School District, General Obligation Refunding Bonds, Series A (Prerefunded to 05-01-2024 @ 100)(a) | | | 5.000 | % | | | 05/01/2028 | | | | 765,000 | | | | 769,520 | |
Hamilton Community School District, General Obligation Refunding Bonds | | | 4.000 | % | | | 05/01/2028 | | | | 300,000 | | | | 301,594 | |
Mattawan Consolidated School District, General Obligation Bonds, Series I (Prerefunded to 05-01-2025 @ 100)(a) | | | 5.000 | % | | | 05/01/2028 | | | | 600,000 | | | | 611,516 | |
Zeeland Public Schools, General Obligation Bonds, Series A | | | 5.000 | % | | | 05/01/2029 | | | | 700,000 | | | | 709,685 | |
Zeeland Public Schools, General Obligation Bonds, Series A | | | 5.000 | % | | | 05/01/2030 | | | | 1,100,000 | | | | 1,114,883 | |
City of Grosse Pointe, Michigan, General Obligation Bonds | | | 4.000 | % | | | 10/01/2032 | | | | 595,000 | | | | 600,885 | |
City of Grosse Pointe, Michigan, General Obligation Bonds | | | 4.000 | % | | | 10/01/2033 | | | | 630,000 | | | | 633,859 | |
City of Grosse Pointe, Michigan, General Obligation Bonds | | | 4.000 | % | | | 10/01/2034 | | | | 670,000 | | | | 674,962 | |
Lowell Area Schools, General Obligation Bonds | | | 4.000 | % | | | 05/01/2035 | | | | 400,000 | | | | 397,200 | |
Rockford Public Schools, General Obligation Bonds, Series I | | | 4.000 | % | | | 05/01/2035 | | | | 1,755,000 | | | | 1,737,922 | |
Great Lakes Water Authority Water Supply System Revenue Bonds, Series A | | | 5.000 | % | | | 07/01/2035 | | | | 750,000 | | | | 806,359 | |
Van Buren Public Schools, General Obligation Refunding Bonds | | | 4.000 | % | | | 11/01/2035 | | | | 1,000,000 | | | | 958,768 | |
Grosse Pointe Public School System, General Obligation Refunding Bonds | | | 5.000 | % | | | 05/01/2036 | | | | 1,635,000 | | | | 1,736,349 | |
Lowell Area Schools, General Obligation Bonds | | | 4.000 | % | | | 05/01/2036 | | | | 865,000 | | | | 854,266 | |
West Bloomfield School District, General Obligation Bonds | | | 3.000 | % | | | 05/01/2036 | | | | 3,825,000 | | | | 3,158,153 | |
Dundee Community Schools, General Obligation Bonds | | | 5.000 | % | | | 05/01/2037 | | | | 1,000,000 | | | | 1,048,297 | |
Fowlerville Community Schools, General Obligation Refunding Bonds | | | 4.000 | % | | | 05/01/2038 | | | | 1,470,000 | | | | 1,375,403 | |
| | |
| See accompanying notes to financial statements. | | 41 |
ADVISERS INVESTMENT TRUST
STATE FARM MUNICIPAL BOND FUND
SCHEDULE OF INVESTMENTS (continued)
September 30, 2023
| | | | | | | | | | | | | | | | |
| | | Coupon
rate | | | Maturity
date | | | Principal
amount | | | Value | |
Long-term Municipal Bond (Cont.) | | | | | | | | | | | | | | | | |
Michigan (Cont.) | | | | | | | | | | | | | | | | |
Portage Public Schools, General Obligation Bonds | | | 3.000 | % | | | 11/01/2038 | | | $ | 1,000,000 | | | $ | 777,601 | |
Wayne-Westland Community Schools, General Obligation Bonds | | | 4.000 | % | | | 11/01/2038 | | | | 1,000,000 | | | | 945,783 | |
Lake Orion Community School District, General Obligation Bonds | | | 4.000 | % | | | 05/01/2039 | | | | 1,000,000 | | | | 938,447 | |
Michigan State Building Authority Revenue Bonds, Series I | | | 5.000 | % | | | 10/15/2039 | | | | 1,000,000 | | | | 1,047,956 | |
| | | | | | | | | | | | | | | | |
| | | | | | | | | | | | | | | 25,387,875 | |
| | | | | | | | | | | | | | | | |
Minnesota (3.65%) | | | | | | | | | | | | | | | | |
Shakopee Independent School District No. 720, General Obligation Bonds, Series A(a) | | | 3.250 | % | | | 02/01/2026 | | | | 3,860,000 | | | | 3,848,075 | |
City of Eagan, Minnesota, General Obligation Bonds, Series A | | | 3.250 | % | | | 02/01/2032 | | | | 1,245,000 | | | | 1,195,217 | |
Metropolitan Council, General Obligation Bonds, Series C | | | 3.750 | % | | | 03/01/2032 | | | | 5,500,000 | | | | 5,335,029 | |
University of Minnesota Revenue Bonds, Series B | | | 4.000 | % | | | 01/01/2033 | | | | 2,230,000 | | | | 2,175,729 | |
Big Lake Independent School District No. 727, General Obligation Bonds, Series A | | | 3.000 | % | | | 02/01/2033 | | | | 570,000 | | | | 512,132 | |
North St. Paul-Maplewood-Oakdale Independent School District No. 622, General Obligation Bonds, Series B | | | 3.000 | % | | | 02/01/2034 | | | | 3,300,000 | | | | 2,919,590 | |
Red Rock Central Independent School District No. 2884, General Obligation Bonds, Series A | | | 3.000 | % | | | 02/01/2034 | | | | 1,000,000 | | | | 884,724 | |
City of Minneapolis, Minnesota, General Obligation Bonds | | | 3.000 | % | | | 12/01/2035 | | | | 2,000,000 | | | | 1,729,884 | |
Jordan Independent School District No. 717 General Obligation Bonds, Series A | | | 4.000 | % | | | 02/01/2041 | | | | 1,500,000 | | | | 1,380,490 | |
| | | | | | | | | | | | | | | | |
| | | | | | | | | | | | | | | 19,980,870 | |
| | | | | | | | | | | | | | | | |
Mississippi (0.95%) | | | | | | | | | | | | | | | | |
State of Mississippi, General Obligation Bonds, Series F | | | 3.000 | % | | | 11/01/2026 | | | | 3,000,000 | | | | 2,892,270 | |
Mississippi Development Bank Revenue Bonds (Prerefunded to 12-01-2025 @ 100)(a) | | | 4.250 | % | | | 12/01/2028 | | | | 2,305,000 | | | | 2,329,355 | |
| | | | | | | | | | | | | | | | |
| | | | | | | | | | | | | | | 5,221,625 | |
| | | | | | | | | | | | | | | | |
Missouri (2.59%) | | | | | | | | | | | | | | | | |
Fort Zumwalt School District, General Obligation Refunding Bonds | | | 4.000 | % | | | 03/01/2027 | | | | 465,000 | | | | 465,366 | |
Fort Zumwalt School District, General Obligation Refunding Bonds | | | 4.000 | % | | | 03/01/2028 | | | | 400,000 | | | | 400,307 | |
Fort Zumwalt School District, General Obligation Refunding Bonds | | | 4.000 | % | | | 03/01/2029 | | | | 425,000 | | | | 424,408 | |
Liberty Public School District No. 53, General Obligation Bonds | | | 4.000 | % | | | 03/01/2033 | | | | 1,000,000 | | | | 989,889 | |
Liberty Public School District No. 53, General Obligation Bonds | | | 4.000 | % | | | 03/01/2034 | | | | 2,500,000 | | | | 2,470,333 | |
St. Charles County School District No. R-IV Wentzville, General Obligation Refunding Bonds | | | 4.000 | % | | | 03/01/2034 | | | | 3,000,000 | | | | 3,006,051 | |
Jackson County School District No. R-5 Grain Valley, General Obligation Bonds, Series A | | | 5.000 | % | | | 03/01/2035 | | | | 2,000,000 | | | | 2,063,367 | |
City of Columbia Water & Electric System Revenue Refunding Bonds, Series B | | | 3.000 | % | | | 10/01/2035 | | | | 2,520,000 | | | | 2,143,022 | |
Jackson County Reorganized School District No. 7, General Obligation Bonds | | | 5.000 | % | | | 03/01/2036 | | | | 1,000,000 | | | | 1,003,807 | |
Nixa Public Schools General Obligation Bonds | | | 5.000 | % | | | 03/01/2039 | | | | 1,170,000 | | | | 1,216,335 | |
| | | | | | | | | | | | | | | | |
| | | | | | | | | | | | | | | 14,182,885 | |
| | | | | | | | | | | | | | | | |
Montana (2.99%) | | | | | | | | | | | | | | | | |
Hellgate School District No. 4, General Obligation Bonds | | | 3.500 | % | | | 06/15/2025 | | | | 860,000 | | | | 850,347 | |
Hellgate School District No. 4, General Obligation Bonds | | | 5.000 | % | | | 06/15/2032 | | | | 945,000 | | | | 975,771 | |
Missoula High School District No. 1, General Obligation Bonds | | | 4.000 | % | | | 07/01/2032 | | | | 1,010,000 | | | | 1,013,770 | |
Hellgate School District No. 4, General Obligation Bonds | | | 5.000 | % | | | 06/15/2033 | | | | 1,005,000 | | | | 1,036,679 | |
Flathead County School District No. 44 Whitefish, General Obligation Bonds | | | 4.000 | % | | | 07/01/2033 | | | | 520,000 | | | | 520,796 | |
Lewis & Clark County K-12 School District No. 9 East Helena, General Obligation Bonds | | | 4.500 | % | | | 07/01/2033 | | | | 560,000 | | | | 575,296 | |
Hellgate School District No. 4, General Obligation Bonds | | | 5.000 | % | | | 06/15/2034 | | | | 505,000 | | | | 521,269 | |
Cascade County High School District A Great Falls, General Obligation Bonds | | | 5.000 | % | | | 07/01/2034 | | | | 725,000 | | | | 767,086 | |
Flathead County School District No. 44 Whitefish, General Obligation Bonds | | | 4.000 | % | | | 07/01/2034 | | | | 565,000 | | | | 566,060 | |
Flathead County School District No. 6 Columbia Falls, General Obligation Bonds | | | 4.000 | % | | | 07/01/2034 | | | | 1,000,000 | | | | 996,914 | |
Hellgate School District No. 4, General Obligation Bonds | | | 5.250 | % | | | 06/15/2035 | | | | 880,000 | | | | 914,916 | |
Flathead County School District No. 44 Whitefish, General Obligation Bonds | | | 4.000 | % | | | 07/01/2035 | | | | 845,000 | | | | 844,284 | |
Flathead County School District No. 6 Columbia Falls, General Obligation Bonds | | | 4.000 | % | | | 07/01/2035 | | | | 750,000 | | | | 738,314 | |
Lewis & Clark County K-12 School District No. 9 East Helena, General Obligation Bonds | | | 5.000 | % | | | 07/01/2035 | | | | 1,925,000 | | | | 2,045,489 | |
Montana State Board of Regents Revenue Refunding Bonds | | | 3.000 | % | | | 11/15/2035 | | | | 3,660,000 | | | | 3,076,716 | |
| | |
| 42 | | See accompanying notes to financial statements. |
ADVISERS INVESTMENT TRUST
STATE FARM MUNICIPAL BOND FUND
SCHEDULE OF INVESTMENTS (continued)
September 30, 2023
| | | | | | | | | | | | | | | | |
| | | Coupon
rate | | | Maturity
date | | | Principal
amount | | | Value | |
Long-term Municipal Bond (Cont.) | | | | | | | | | | | | | | | | |
Montana (Cont.) | | | | | | | | | | | | | | | | |
Flathead County School District No. 44 Whitefish, General Obligation Bonds | | | 4.000 | % | | | 07/01/2036 | | | $ | 585,000 | | | $ | 577,647 | |
Broadwater County K-12 School District No. 1 Townsend, General Obligation Bonds | | | 3.000 | % | | | 07/01/2037 | | | | 465,000 | | | | 379,403 | |
| | | | | | | | | | | | | | | | |
| | | | | | | | | | | | | | | 16,400,757 | |
| | | | | | | | | | | | | | | | |
Nebraska (1.42%) | | | | | | | | | | | | | | | | |
Gretna Public Schools, General Obligation Refunding Bonds | | | 3.000 | % | | | 12/15/2024 | | | | 145,000 | | | | 142,695 | |
Gretna Public Schools, General Obligation Refunding Bonds | | | 4.000 | % | | | 12/15/2025 | | | | 180,000 | | | | 180,631 | |
City of Columbus, Nebraska, Combined Utilities System Revenue Refunding Bonds | | | 4.000 | % | | | 12/15/2028 | | | | 150,000 | | | | 150,579 | |
Gretna Public Schools, General Obligation Refunding Bonds (Prerefunded to 12-15-2025 @ 100)(a) | | | 5.000 | % | | | 12/15/2028 | | | | 250,000 | | | | 256,876 | |
City of Columbus, Nebraska, Combined Utilities System Revenue Refunding Bonds | | | 4.000 | % | | | 12/15/2029 | | | | 250,000 | | | | 250,083 | |
Gretna Public Schools, General Obligation Refunding Bonds (Prerefunded to 12-15-2025 @ 100)(a) | | | 5.000 | % | | | 12/15/2029 | | | | 260,000 | | | | 267,151 | |
City of Columbus, Nebraska, Combined Utilities System Revenue Refunding Bonds | | | 4.000 | % | | | 12/15/2030 | | | | 325,000 | | | | 323,658 | |
Grand Island Public Schools, General Obligation Bonds (Prerefunded to 12-15-2024 @ 100)(a) | | | 5.000 | % | | | 12/15/2030 | | | | 700,000 | | | | 709,599 | |
Grand Island Public Schools, General Obligation Bonds (Prerefunded to 12-15-2024 @ 100)(a) | | | 5.000 | % | | | 12/15/2032 | | | | 565,000 | | | | 572,747 | |
City of Lincoln Sanitary Sewer Revenue Bonds | | | 3.000 | % | | | 06/15/2034 | | | | 1,105,000 | | | | 983,524 | |
City of Kearney, Nebraska, General Obligation Bonds | | | 4.000 | % | | | 05/15/2035 | | | | 500,000 | | | | 473,221 | |
City of Lincoln Sanitary Sewer Revenue Bonds | | | 3.000 | % | | | 06/15/2035 | | | | 1,140,000 | | | | 993,582 | |
Omaha Public Power District Revenue Bonds, Series A | | | 5.000 | % | | | 02/01/2036 | | | | 750,000 | | | | 819,501 | |
County of Sarpy, Nebraska, General Obligation Bonds | | | 3.500 | % | | | 06/01/2037 | | | | 1,000,000 | | | | 893,756 | |
City of La Vista, Nebraska, General Obligation Bonds | | | 3.000 | % | | | 09/15/2041 | | | | 1,000,000 | | | | 748,539 | |
| | | | | | | | | | | | | | | | |
| | | | | | | | | | | | | | | 7,766,142 | |
| | | | | | | | | | | | | | | | |
Nevada (1.28%) | | | | | | | | | | | | | | | | |
Nevada System of Higher Education Revenue Refunding Bonds | | | 4.000 | % | | | 07/01/2030 | | | | 3,045,000 | | | | 3,053,370 | |
Clark County School District, General Obligation Refunding Bonds, Series C | | | 4.000 | % | | | 06/15/2037 | | | | 2,000,000 | | | | 1,856,795 | |
Clark County School District, General Obligation Bonds, Series A | | | 5.000 | % | | | 06/15/2039 | | | | 2,000,000 | | | | 2,105,233 | |
| | | | | | | | | | | | | | | | |
| | | | | | | | | | | | | | | 7,015,398 | |
| | | | | | | | | | | | | | | | |
New Jersey (1.14%) | | | | | | | | | | | | | | | | |
Hopewell Valley Regional School District, General Obligation Bonds | | | 3.500 | % | | | 01/15/2027 | | | | 3,330,000 | | | | 3,250,465 | |
Livingston Township School District, General Obligation Refunding Bonds | | | 4.000 | % | | | 07/15/2029 | | | | 1,000,000 | | | | 1,002,349 | |
Hopewell Valley Regional School District, General Obligation Bonds | | | 4.000 | % | | | 01/15/2032 | | | | 2,000,000 | | | | 1,994,525 | |
| | | | | | | | | | | | | | | | |
| | | | | | | | | | | | | | | 6,247,339 | |
| | | | | | | | | | | | | | | | |
New Mexico (3.48%) | | | | | | | | | | | | | | | | |
County of Bernalillo, New Mexico, General Obligation Refunding Bonds, Series A | | | 2.250 | % | | | 08/15/2024 | | | | 1,050,000 | | | | 1,028,942 | |
County of Bernalillo, New Mexico, General Obligation Bonds | | | 3.000 | % | | | 08/15/2025 | | | | 1,235,000 | | | | 1,204,977 | |
City of Santa Fe, New Mexico, General Obligation Bonds | | | 4.000 | % | | | 08/01/2026 | | | | 225,000 | | | | 225,036 | |
City of Santa Fe, New Mexico, General Obligation Bonds | | | 4.000 | % | | | 08/01/2027 | | | | 700,000 | | | | 700,156 | |
Las Cruces School District No. 2, General Obligation Bonds, Series C | | | 3.250 | % | | | 08/01/2027 | | | | 900,000 | | | | 877,219 | |
Rio Rancho Public School District No. 94, General Obligation Bonds, Series A | | | 3.000 | % | | | 08/01/2027 | | | | 1,515,000 | | | | 1,449,257 | |
City of Santa Fe, New Mexico, General Obligation Bonds | | | 4.000 | % | | | 08/01/2028 | | | | 725,000 | | | | 725,171 | |
Las Cruces School District No. 2, General Obligation Bonds, Series C | | | 3.500 | % | | | 08/01/2028 | | | | 900,000 | | | | 884,983 | |
Rio Rancho Public School District No. 94, General Obligation Bonds, Series A | | | 3.125 | % | | | 08/01/2028 | | | | 1,515,000 | | | | 1,447,370 | |
City of Santa Fe, New Mexico, General Obligation Bonds | | | 4.000 | % | | | 08/01/2029 | | | | 750,000 | | | | 750,149 | |
Santa Fe Public School District, General Obligation Bonds | | | 3.625 | % | | | 08/01/2029 | | | | 3,075,000 | | | | 3,018,235 | |
Santa Fe Public School District, General Obligation Bonds | | | 4.000 | % | | | 08/01/2030 | | | | 1,000,000 | | | | 1,002,162 | |
Albuquerque Municipal School District No. 12, General Obligation Bonds | | | 5.000 | % | | | 08/01/2034 | | | | 1,800,000 | | | | 1,901,004 | |
City of Albuquerque Gross Receipts Tax Revenue Bonds, Series B | | | 5.000 | % | | | 07/01/2035 | | | | 1,000,000 | | | | 1,096,439 | |
Albuquerque Municipal School District No. 12, General Obligation Bonds | | | 5.000 | % | | | 08/01/2035 | | | | 2,600,000 | | | | 2,728,844 | |
| | | | | | | | | | | | | | | | |
| | | | | | | | | | | | | | | 19,039,944 | |
| | | | | | | | | | | | | | | | |
| | |
| See accompanying notes to financial statements. | | 43 |
ADVISERS INVESTMENT TRUST
STATE FARM MUNICIPAL BOND FUND
SCHEDULE OF INVESTMENTS (continued)
September 30, 2023
| | | | | | | | | | | | | | | | |
| | | Coupon
rate | | | Maturity
date | | | Principal
amount | | | Value | |
Long-term Municipal Bond (Cont.) | | | | | | | | | | | | | | | | |
New York (2.78%) | | | | | | | | | | | | | | | | |
Port Authority of New York & New Jersey Revenue Bonds, Series 179 | | | 5.000 | % | | | 12/01/2032 | | | $ | 3,000,000 | | | $ | 3,005,525 | |
State of New York Mortgage Agency Revenue Refunding Bonds, Series 220 | | | 2.400 | % | | | 10/01/2034 | | | | 1,000,000 | | | | 797,147 | |
New York State Urban Development Corporation Revenue Refunding Bonds, Series A | | | 5.000 | % | | | 03/15/2035 | | | | 2,000,000 | | | | 2,030,585 | |
New York City Water & Sewer System Revenue Bonds, Series DD | | | 5.000 | % | | | 06/15/2035 | | | | 2,500,000 | | | | 2,509,478 | |
New York City Transitional Finance Authority Future Tax Secured Revenue Refunding Bonds, Series B-1 | | | 5.250 | % | | | 11/01/2036 | | | | 1,500,000 | | | | 1,631,855 | |
New York City Transitional Finance Authority Future Tax Secured Subordinate Revenue Bonds, Series B1 | | | 5.000 | % | | | 11/01/2036 | | | | 1,500,000 | | | | 1,505,451 | |
New York City Transitional Finance Authority Future Tax Secured Revenue Bonds | | | 5.000 | % | | | 02/01/2039 | | | | 1,060,000 | | | | 1,061,088 | |
New York State Housing Finance Agency Variable Revenue Bonds, Series J(e) | | | 1.100 | % | | | 11/01/2061 | | | | 2,000,000 | | | | 1,739,462 | |
New York State Housing Finance Agency Variable Revenue Bonds(f) | | | 3.800 | % | | | 11/01/2062 | | | | 1,000,000 | | | | 962,942 | |
| | | | | | | | | | | | | | | | |
| | | | | | | | | | | | | | | 15,243,533 | |
| | | | | | | | | | | | | | | | |
North Carolina (1.57%) | | | | | | | | | | | | | | | | |
Buncombe County Metropolitan Sewerage District Revenue Refunding Bonds | | | 4.000 | % | | | 07/01/2027 | | | | 1,210,000 | | | | 1,209,480 | |
City of Gastonia, North Carolina, Combined Utilities System Revenue Bonds | | | 5.000 | % | | | 05/01/2028 | | | | 700,000 | | | | 710,069 | |
City of Gastonia, North Carolina, Combined Utilities System Revenue Bonds | | | 5.000 | % | | | 05/01/2029 | | | | 265,000 | | | | 268,883 | |
County of Union, North Carolina, Enterprise System Revenue Bonds | | | 3.000 | % | | | 06/01/2031 | | | | 2,850,000 | | | | 2,585,404 | |
County of Forsyth, North Carolina, General Obligation Bonds, Series B | | | 3.000 | % | | | 03/01/2032 | | | | 1,000,000 | | | | 910,105 | |
City of Salisbury, North Carolina, Combined Enterprise System Revenue Refunding Bonds | | | 5.000 | % | | | 02/01/2033 | | | | 750,000 | | | | 804,010 | |
City of Salisbury, North Carolina, Combined Enterprise System Revenue Refunding Bonds | | | 5.000 | % | | | 02/01/2035 | | | | 1,000,000 | | | | 1,068,226 | |
City of Salisbury, North Carolina, Combined Enterprise System Revenue Refunding Bonds | | | 5.000 | % | | | 02/01/2037 | | | | 1,000,000 | | | | 1,053,912 | |
| | | | | | | | | | | | | | | | |
| | | | | | | | | | | | | | | 8,610,089 | |
| | | | | | | | | | | | | | | | |
North Dakota (1.41%) | | | | | | | | | | | | | | | | |
City of Bismarck, North Dakota, General Obligation Refunding Bonds, Series L | | | 3.125 | % | | | 05/01/2028 | | | | 845,000 | | | | 814,009 | |
City of Bismarck, North Dakota, General Obligation Refunding Bonds, Series L | | | 3.250 | % | | | 05/01/2029 | | | | 835,000 | | | | 801,511 | |
Bismarck Public School District No. 1, General Obligation Bonds | | | 3.125 | % | | | 05/01/2030 | | | | 1,695,000 | | | | 1,627,879 | |
City of Bismarck, North Dakota, General Obligation Refunding Bonds, Series M | | | 3.125 | % | | | 05/01/2031 | | | | 1,015,000 | | | | 938,371 | |
City of Bismarck, North Dakota, General Obligation Refunding Bonds, Series M | | | 3.125 | % | | | 05/01/2032 | | | | 1,060,000 | | | | 965,061 | |
City of Fargo, North Dakota, General Obligation Refunding Bonds, Series A | | | 3.000 | % | | | 05/01/2033 | | | | 1,350,000 | | | | 1,202,228 | |
City of Fargo, North Dakota, General Obligation Refunding Bonds, Series A | | | 3.000 | % | | | 05/01/2034 | | | | 1,550,000 | | | | 1,357,462 | |
| | | | | | | | | | | | | | | | |
| | | | | | | | | | | | | | | 7,706,521 | |
| | | | | | | | | | | | | | | | |
Ohio (3.70%) | | | | | | | | | | | | | | | | |
Lake Local School District/Stark County, General Obligation Bonds | | | 3.000 | % | | | 12/01/2025 | | | | 190,000 | | | | 185,886 | |
Lake County Community College District, General Obligation Bonds, Series A | | | 3.000 | % | | | 12/01/2026 | | | | 355,000 | | | | 344,019 | |
Northwest Local School District/Hamilton & Butler Counties, General Obligation Bonds | | | 5.000 | % | | | 12/01/2027 | | | | 175,000 | | | | 175,270 | |
Perrysburg Exempted Village School District, General Obligation Bonds (Prerefunded to 12-01-2024 @ 100)(a) | | | 4.000 | % | | | 12/01/2027 | | | | 1,250,000 | | | | 1,251,843 | |
Northwest Local School District/Hamilton & Butler Counties, General Obligation Bonds (Prerefunded to 12-01-2023 @ 100)(a) | | | 5.000 | % | | | 12/01/2028 | | | | 225,000 | | | | 225,355 | |
Fairfield City School District, General Obligation Bonds (Prerefunded to 11-01-2023 @ 100)(a) | | | 5.000 | % | | | 11/01/2029 | | | | 800,000 | | | | 800,629 | |
Northwest Local School District/Hamilton & Butler Counties, General Obligation Bonds (Prerefunded to 12-01-2023 @ 100)(a) | | | 5.000 | % | | | 12/01/2029 | | | | 200,000 | | | | 200,315 | |
Fairfield City School District, General Obligation Bonds (Prerefunded to 11-01-2023 @ 100)(a) | | | 5.000 | % | | | 11/01/2030 | | | | 1,335,000 | | | | 1,336,049 | |
Lakewood City School District, General Obligation Refunding Bonds, Series B | | | 4.000 | % | | | 11/01/2030 | | | | 235,000 | | | | 237,110 | |
Hudson City School District, Ohio, General Obligation Bonds | | | 4.000 | % | | | 12/01/2030 | | | | 750,000 | | | | 754,596 | |
Northwest Local School District/Hamilton & Butler Counties, General Obligation Bonds | | | 4.000 | % | | | 12/01/2030 | | | | 365,000 | | | | 365,142 | |
Lakewood City School District, General Obligation Refunding Bonds, Series B | | | 4.000 | % | | | 11/01/2031 | | | | 220,000 | | | | 221,536 | |
Hudson City School District, Ohio, General Obligation Bonds | | | 4.000 | % | | | 12/01/2031 | | | | 350,000 | | | | 351,789 | |
Lakewood City School District, General Obligation Refunding Bonds, Series B | | | 4.000 | % | | | 11/01/2032 | | | | 220,000 | | | | 220,794 | |
City of Marysville, Ohio, Water System Revenue Bonds | | | 4.000 | % | | | 12/01/2032 | | | | 315,000 | | | | 315,465 | |
Cuyahoga Community College District, General Obligation Bonds | | | 4.000 | % | | | 12/01/2032 | | | | 1,750,000 | | | | 1,753,228 | |
Hudson City School District, Ohio, General Obligation Bonds | | | 4.000 | % | | | 12/01/2032 | | | | 375,000 | | | | 376,728 | |
Lakewood City School District, General Obligation Refunding Bonds, Series B | | | 4.000 | % | | | 11/01/2033 | | | | 370,000 | | | | 370,705 | |
| | |
| 44 | | See accompanying notes to financial statements. |
ADVISERS INVESTMENT TRUST
STATE FARM MUNICIPAL BOND FUND
SCHEDULE OF INVESTMENTS (continued)
September 30, 2023
| | | | | | | | | | | | | | | | |
| | | Coupon
rate | | | Maturity
date | | | Principal
amount | | | Value | |
Long-term Municipal Bond (Cont.) | | | | | | | | | | | | | | | | |
Ohio (Cont.) | | | | | | | | | | | | | | | | |
City of Marysville, Ohio, Water System Revenue Bonds | | | 4.000 | % | | | 12/01/2033 | | | $ | 235,000 | | | $ | 234,974 | |
Dublin City School District, General Obligation Bonds, Series A | | | 4.000 | % | | | 12/01/2033 | | | | 500,000 | | | | 505,777 | |
Hudson City School District, Ohio, General Obligation Bonds | | | 4.000 | % | | | 12/01/2033 | | | | 400,000 | | | | 401,479 | |
Worthington City School District, General Obligation Bonds | | | 4.000 | % | | | 12/01/2033 | | | | 790,000 | | | | 796,847 | |
City of Toledo, Ohio, General Obligation Bonds | | | 5.250 | % | | | 12/01/2034 | | | | 1,000,000 | | | | 1,083,630 | |
Cuyahoga Community College District, General Obligation Bonds | | | 4.000 | % | | | 12/01/2034 | | | | 1,000,000 | | | | 1,002,183 | |
Dublin City School District, General Obligation Bonds, Series A | | | 4.000 | % | | | 12/01/2034 | | | | 500,000 | | | | 504,753 | |
Hudson City School District, Ohio, General Obligation Bonds | | | 4.000 | % | | | 12/01/2034 | | | | 875,000 | | | | 876,690 | |
City of Marysville, Ohio, Water System Revenue Bonds | | | 4.000 | % | | | 12/01/2035 | | | | 1,870,000 | | | | 1,854,856 | |
Dublin City School District, General Obligation Bonds, Series A | | | 4.000 | % | | | 12/01/2035 | | | | 500,000 | | | | 501,723 | |
Worthington City School District, General Obligation Bonds | | | 4.000 | % | | | 12/01/2035 | | | | 475,000 | | | | 472,053 | |
Dublin City School District, General Obligation Bonds, Series A | | | 4.000 | % | | | 12/01/2036 | | | | 1,000,000 | | | | 988,437 | |
Ohio Water Development Authority Revenue Bonds, Series A | | | 5.000 | % | | | 12/01/2039 | | | | 1,470,000 | | | | 1,548,412 | |
| | | | | | | | | | | | | | | | |
| | | | | | | | | | | | | | | 20,258,273 | |
| | | | | | | | | | | | | | | | |
Oklahoma (1.62%) | | | | | | | | | | | | | | | | |
City of Tulsa, Oklahoma, General Obligation Bonds | | | 3.000 | % | | | 04/01/2028 | | | | 3,000,000 | | | | 2,843,891 | |
Grand River Dam Authority Revenue Bonds, Series A | | | 5.000 | % | | | 06/01/2031 | | | | 1,835,000 | | | | 1,845,402 | |
Edmond Public Works Authority Revenue Bonds | | | 5.000 | % | | | 07/01/2032 | | | | 1,500,000 | | | | 1,572,579 | |
Oklahoma County Finance Authority Revenue Bonds | | | 5.000 | % | | | 09/01/2036 | | | | 2,500,000 | | | | 2,600,816 | |
| | | | | | | | | | | | | | | | |
| | | | | | | | | | | | | | | 8,862,688 | |
| | | | | | | | | | | | | | | | |
Oregon (0.94%) | | | | | | | | | | | | | | | | |
State of Oregon, General Obligation Refunding Bonds, Series J | | | 2.800 | % | | | 06/01/2025 | | | | 155,000 | | | | 151,942 | |
Clackamas County School District No. 12 North Clackamas, General Obligation Refunding Bonds (Prerefunded to 06-15-2024 @ 100)(a) | | | 5.000 | % | | | 06/15/2028 | | | | 2,500,000 | | | | 2,518,950 | |
Deschutes County Administrative School District No. 1 Bend-La Pine, General Obligation Bonds | | | 3.000 | % | | | 06/15/2035 | | | | 2,865,000 | | | | 2,475,739 | |
| | | | | | | | | | | | | | | | |
| | | | | | | | | | | | | | | 5,146,631 | |
| | | | | | | | | | | | | | | | |
Pennsylvania (1.76%) | | | | | | | | | | | | | | | | |
Township of Upper St. Clair, Pennsylvania, General Obligation Refunding Bonds, Series A | | | 4.000 | % | | | 06/01/2028 | | | | 340,000 | | | | 343,410 | |
Township of Upper St. Clair, Pennsylvania, General Obligation Refunding Bonds, Series A | | | 4.000 | % | | | 06/01/2029 | | | | 305,000 | | | | 307,587 | |
West View Municipal Authority Water Revenue Bonds (Prerefunded to 11-15-2024 @ 100)(a) | | | 5.000 | % | | | 11/15/2031 | | | | 1,365,000 | | | | 1,381,619 | |
Pennsylvania Housing Finance Agency Revenue Bonds, Series 137 | | | 2.200 | % | | | 04/01/2033 | | | | 2,785,000 | | | | 2,211,796 | |
Pennsylvania Housing Finance Agency Revenue Bonds, Series 138A | | | 2.700 | % | | | 04/01/2033 | | | | 1,500,000 | | | | 1,262,846 | |
County of Jefferson, Pennsylvania, General Obligation Refunding Bonds | | | 3.000 | % | | | 12/15/2033 | | | | 400,000 | | | | 347,353 | |
Twin Valley School District, General Obligation Bonds, Series B | | | 3.000 | % | | | 04/01/2034 | | | | 1,300,000 | | | | 1,113,554 | |
Delaware River Port Authority Revenue Bonds | | | 5.000 | % | | | 01/01/2037 | | | | 1,000,000 | | | | 1,001,232 | |
County of Jefferson, Pennsylvania, General Obligation Refunding Bonds | | | 3.000 | % | | | 12/15/2037 | | | | 770,000 | | | | 611,685 | |
Southeastern Pennsylvania Transportation Authority Revenue Bonds | | | 5.000 | % | | | 06/01/2038 | | | | 1,000,000 | | | | 1,057,462 | |
| | | | | | | | | | | | | | | | |
| | | | | | | | | | | | | | | 9,638,544 | |
| | | | | | | | | | | | | | | | |
Rhode Island (0.11%) | | | | | | | | | | | | | | | | |
Rhode Island Housing & Mortgage Finance Corporation Revenue Bonds, Series 76-A | | | 2.200 | % | | | 10/01/2033 | | | | 780,000 | | | | 602,305 | |
| | | | | | | | | | | | | | | | |
South Carolina (0.72%) | | | | | | | | | | | | | | | | |
Town of Fort Mill Water & Sewer System Revenue Bonds | | | 3.500 | % | | | 12/01/2027 | | | | 380,000 | | | | 366,960 | |
Town of Fort Mill Water & Sewer System Revenue Bonds | | | 4.000 | % | | | 12/01/2028 | | | | 520,000 | | | | 513,394 | |
City of Columbia Waterworks & Sewer System Revenue Refunding Bonds, Series B | | | 4.000 | % | | | 02/01/2029 | | | | 1,045,000 | | | | 1,053,791 | |
Town of Fort Mill Water & Sewer System Revenue Bonds | | | 4.000 | % | | | 12/01/2030 | | | | 535,000 | | | | 525,581 | |
City of Columbia Waterworks & Sewer System Revenue Bonds, Series A | | | 3.000 | % | | | 02/01/2035 | | | | 1,750,000 | | | | 1,514,247 | |
| | | | | | | | | | | | | | | | |
| | | | | | | | | | | | | | | 3,973,973 | |
| | | | | | | | | | | | | | | | |
Tennessee (0.89%) | | | | | | | | | | | | | | | | |
City of Knoxville Water System Revenue Refunding Bonds, Series BB | | | 3.000 | % | | | 03/01/2025 | | | | 1,170,000 | | | | 1,146,156 | |
| | |
| See accompanying notes to financial statements. | | 45 |
ADVISERS INVESTMENT TRUST
STATE FARM MUNICIPAL BOND FUND
SCHEDULE OF INVESTMENTS (continued)
September 30, 2023
| | | | | | | | | | | | | | | | |
| | | Coupon
rate | | | Maturity
date | | | Principal
amount | | | Value | |
Long-term Municipal Bond (Cont.) | | | | | | | | | | | | | | | | |
Tennessee (Cont.) | | | | | | | | | | | | | | | | |
County of Washington, Tennessee, General Obligation Bonds, Series B | | | 3.000 | % | | | 06/01/2030 | | | $ | 850,000 | | | $ | 784,924 | |
Harpeth Valley Utilities District of Davidson and Williamson Counties Revenue Bonds | | | 5.000 | % | | | 09/01/2031 | | | | 1,065,000 | | | | 1,074,027 | |
County of Knox, Tennessee, General Obligation Refunding Bonds, Series B | | | 3.000 | % | | | 06/01/2032 | | | | 1,105,000 | | | | 995,511 | |
City of Memphis Electric System Revenue Bonds, Series A | | | 3.000 | % | | | 12/01/2035 | | | | 1,000,000 | | | | 864,791 | |
| | | | | | | | | | | | | | | | |
| | | | | | | | | | | | | | | 4,865,409 | |
| | | | | | | | | | | | | | | | |
Texas (6.33%) | | | | | | | | | | | | | | | | |
Eanes Independent School District, General Obligation Bonds, Series A | | | 3.500 | % | | | 08/01/2026 | | | | 1,670,000 | | | | 1,643,062 | |
University of North Texas Revenue Refunding Bonds, Series A | | | 5.000 | % | | | 04/15/2027 | | | | 1,000,000 | | | | 1,012,420 | |
Upper Brushy Creek Water Control and Improvement District, General Obligation Bonds | | | 3.000 | % | | | 08/15/2031 | | | | 1,000,000 | | | | 899,958 | |
State of Texas, General Obligation Refunding Bonds, Series B | | | 2.250 | % | | | 08/01/2032 | | | | 750,000 | | | | 605,207 | |
Lake Travis Independent School District, General Obligation Refunding Bonds | | | 4.000 | % | | | 02/15/2033 | | | | 1,000,000 | | | | 1,004,673 | |
City of Laredo, Texas, Waterworks & Sewer System Revenue Bonds | | | 5.000 | % | | | 03/01/2033 | | | | 200,000 | | | | 207,220 | |
North Texas Tollway Authority Revenue Refunding Bonds, Series B | | | 5.000 | % | | | 01/01/2034 | | | | 1,220,000 | | | | 1,226,166 | |
San Antonio Electric & Gas Junior Lien Revenue Bonds | | | 5.000 | % | | | 02/01/2034 | | | | 2,500,000 | | | | 2,503,300 | |
City of Laredo, Texas, Waterworks & Sewer System Revenue Bonds | | | 4.000 | % | | | 03/01/2034 | | | | 280,000 | | | | 270,004 | |
City of Laredo, Texas, Waterworks & Sewer System Revenue Bonds | | | 4.000 | % | | | 03/01/2035 | | | | 200,000 | | | | 192,119 | |
Klein Independent School District, General Obligation Bonds | | | 5.000 | % | | | 08/01/2035 | | | | 1,000,000 | | | | 1,088,030 | |
Texas State Technical College Revenue Bonds | | | 5.250 | % | | | 08/01/2035 | | | | 1,000,000 | | | | 1,088,100 | |
Texas State Transportation Commission Mobility Fund, General Obligation Refunding Bonds | | | 4.000 | % | | | 10/01/2035 | | | | 2,655,000 | | | | 2,534,832 | |
Pecos Barstow Toyah Independent School District, General Obligation Bonds | | | 5.000 | % | | | 02/15/2036 | | | | 1,745,000 | | | | 1,811,857 | |
Richardson Independent School District, General Obligation Bonds, Series A | | | 5.000 | % | | | 02/15/2036 | | | | 1,000,000 | | | | 1,080,632 | |
City of Laredo, Texas, Waterworks & Sewer System Revenue Bonds | | | 4.000 | % | | | 03/01/2036 | | | | 325,000 | | | | 307,632 | |
Texas A&M University Revenue Bonds | | | 5.250 | % | | | 05/15/2036 | | | | 1,000,000 | | | | 1,103,575 | |
Trinity River Authority Central Regional Wastewater System Revenue Bonds | | | 3.500 | % | | | 08/01/2036 | | | | 1,000,000 | | | | 895,163 | |
Texas Water Development Board Revenue Bonds | | | 4.450 | % | | | 10/15/2036 | | | | 1,000,000 | | | | 1,011,410 | |
Texas Water Development Board Revenue Bonds | | | 4.000 | % | | | 10/15/2036 | | | | 1,000,000 | | | | 970,719 | |
City of Cedar Park, General Obligation Bonds | | | 5.000 | % | | | 02/15/2037 | | | | 1,000,000 | | | | 1,055,928 | |
Waller Consolidated Independent School District, General Obligation Bonds | | | 5.000 | % | | | 02/15/2037 | | | | 1,000,000 | | | | 1,066,042 | |
City of Sugar Land, General Obligation Bonds | | | 5.000 | % | | | 02/15/2038 | | | | 635,000 | | | | 661,493 | |
Sanger Independent School District, General Obligation Bonds | | | 4.000 | % | | | 08/15/2038 | | | | 1,250,000 | | | | 1,160,104 | |
Aubrey Independent School District, General Obligation Bonds | | | 5.000 | % | | | 02/15/2039 | | | | 1,000,000 | | | | 1,048,403 | |
City of Pflugerville, General Obligation Bonds | | | 4.000 | % | | | 08/01/2039 | | | | 1,580,000 | | | | 1,466,835 | |
Harlandale Independent School District, General Obligation Bonds, Series A | | | 5.250 | % | | | 08/15/2039 | | | | 1,000,000 | | | | 1,079,910 | |
Smith County, General Obligation Bonds | | | 5.000 | % | | | 08/15/2039 | | | | 1,000,000 | | | | 1,051,684 | |
Houston Combined Utility System First Lien Revenue Refunding Bonds, Series D | | | 5.000 | % | | | 11/15/2039 | | | | 1,725,000 | | | | 1,728,897 | |
Permanent University Fund - University of Texas System Revenue Refunding Bonds, Series A | | | 5.000 | % | | | 07/01/2040 | | | | 1,750,000 | | | | 1,861,997 | |
Tarrant County Cultural Education Facilities Finance Corporation Revenue Bonds(g) | | | 5.000 | % | | | 11/15/2052 | | | | 1,000,000 | | | | 1,018,473 | |
| | | | | | | | | | | | | | | | |
| | | | | | | | | | | | | | | 34,655,845 | |
| | | | | | | | | | | | | | | | |
Utah (1.23%) | | | | | | | | | | | | | | | | |
Snyderville Basin Special Recreation District, General Obligation Bonds, Series A | | | 3.000 | % | | | 12/15/2025 | | | | 1,260,000 | | | | 1,228,341 | |
Central Utah Water Conservancy District Revenue Refunding Bonds, Series B | | | 4.000 | % | | | 10/01/2033 | | | | 2,500,000 | | | | 2,488,998 | |
Wasatch County School District Local Building Authority Revenue Bonds | | | 5.000 | % | | | 06/01/2034 | | | | 750,000 | | | | 812,129 | |
Jordan Valley Water Conservancy District Revenue Refunding Bonds, Series B | | | 4.000 | % | | | 10/01/2034 | | | | 1,000,000 | | | | 1,000,527 | |
Duchesne County School District Revenue Bonds | | | 5.000 | % | | | 06/01/2036 | | | | 1,150,000 | | | | 1,190,606 | |
| | | | | | | | | | | | | | | | |
| | | | | | | | | | | | | | | 6,720,601 | |
| | | | | | | | | | | | | | | | |
Vermont (0.59%) | | | | | | | | | | | | | | | | |
City of Burlington, Vermont, General Obligation Bonds, Series A | | | 5.000 | % | | | 11/01/2032 | | | | 175,000 | | | | 185,923 | |
City of Burlington, Vermont, General Obligation Bonds, Series A | | | 5.000 | % | | | 11/01/2033 | | | | 190,000 | | | | 201,538 | |
City of Burlington, Vermont, General Obligation Bonds, Series A | | | 5.000 | % | | | 11/01/2034 | | | | 255,000 | | | | 269,929 | |
City of Burlington, Vermont, General Obligation Bonds, Series B | | | 5.000 | % | | | 11/01/2034 | | | | 410,000 | | | | 434,003 | |
City of Burlington, Vermont, General Obligation Bonds, Series A | | | 5.000 | % | | | 11/01/2035 | | | | 265,000 | | | | 279,274 | |
City of Burlington, Vermont, General Obligation Bonds, Series B | | | 5.000 | % | | | 11/01/2035 | | | | 435,000 | | | | 458,431 | |
| | |
| 46 | | See accompanying notes to financial statements. |
ADVISERS INVESTMENT TRUST
STATE FARM MUNICIPAL BOND FUND
SCHEDULE OF INVESTMENTS (continued)
September 30, 2023
| | | | | | | | | | | | | | | | |
| | | Coupon
rate | | | Maturity
date | | | Principal
amount | | | Value | |
Long-term Municipal Bond (Cont.) | | | | | | | | | | | | | | | | |
Vermont (Cont.) | | | | | | | | | | | | | | | | |
City of Burlington, Vermont, General Obligation Bonds, Series B | | | 5.000 | % | | | 11/01/2036 | | | $ | 910,000 | | | $ | 952,686 | |
City of Burlington, Vermont, General Obligation Bonds, Series A | | | 5.000 | % | | | 11/01/2037 | | | | 440,000 | | | | 458,303 | |
| | | | | | | | | | | | | | | | |
| | | | | | | | | | | | | | | 3,240,087 | |
| | | | | | | | | | | | | | | | |
Virginia (0.50%) | | | | | | | | | | | | | | | | |
County of Stafford, Virginia, General Obligation Bonds | | | 4.000 | % | | | 07/01/2030 | | | | 1,205,000 | | | | 1,205,043 | |
City of Danville, General Obligation Bonds | | | 4.000 | % | | | 09/01/2039 | | | | 1,625,000 | | | | 1,528,393 | |
| | | | | | | | | | | | | | | | |
| | | | | | | | | | | | | | | 2,733,436 | |
| | | | | | | | | | | | | | | | |
Washington (5.96%) | | | | | | | | | | | | | | | | |
City of Spokane, Washington, General Obligation Bonds | | | 3.000 | % | | | 12/01/2025 | | | | 1,295,000 | | | | 1,258,406 | |
King County School District No 414 Lake Washington, General Obligation Refunding Bonds | | | 3.500 | % | | | 12/01/2025 | | | | 1,000,000 | | | | 994,935 | |
Clark County School District No. 98 Hockinson, General Obligation Bonds | | | 4.000 | % | | | 12/01/2027 | | | | 1,090,000 | | | | 1,093,203 | |
City of Camas, Washington, Water & Sewer Revenue Refunding Bonds | | | 4.000 | % | | | 12/01/2028 | | | | 1,050,000 | | | | 1,054,356 | |
City of Tacoma, Washington, Sewer Revenue Refunding Bonds, Series A | | | 3.250 | % | | | 12/01/2028 | | | | 350,000 | | | | 339,623 | |
Public Utility District No. 1 of Cowlitz County, Washington, Revenue Refunding Bonds | | | 5.000 | % | | | 09/01/2029 | | | | 1,000,000 | | | | 1,002,667 | |
City of Camas, Washington, Water & Sewer Revenue Refunding Bonds | | | 3.125 | % | | | 12/01/2029 | | | | 2,000,000 | | | | 1,898,944 | |
Clark County Public Utility District No. 1 Revenue Refunding Bonds(a) | | | 5.000 | % | | | 01/01/2030 | | | | 985,000 | | | | 987,187 | |
Energy Northwest Revenue Refunding Bonds | | | 5.000 | % | | | 07/01/2030 | | | | 5,000,000 | | | | 5,091,650 | |
Public Utility District No. 1 of Cowlitz County, Washington, Revenue Refunding Bonds | | | 5.000 | % | | | 09/01/2030 | | | | 2,100,000 | | | | 2,105,430 | |
King County School District No 414 Lake Washington, General Obligation Bonds | | | 4.000 | % | | | 12/01/2033 | | | | 5,000,000 | | | | 5,009,789 | |
King County School District No. 405 Bellevue, General Obligation Bonds | | | 3.000 | % | | | 12/01/2033 | | | | 5,095,000 | | | | 4,561,557 | |
Kitsap County School District No. 303 Bainbridge Island, General Obligation Bonds, Series A | | | 4.000 | % | | | 12/01/2033 | | | | 840,000 | | | | 841,929 | |
Clark County Public Utility District No. 1 Revenue Refunding Bonds | | | 5.000 | % | | | 01/01/2034 | | | | 1,010,000 | | | | 1,037,505 | |
City of Shoreline, Washington, General Obligation Refunding Bonds | | | 4.000 | % | | | 12/01/2034 | | | | 1,000,000 | | | | 1,008,504 | |
Kitsap County School District No. 303 Bainbridge Island, General Obligation Bonds, Series A | | | 4.000 | % | | | 12/01/2034 | | | | 510,000 | | | | 511,105 | |
Yakima & Kittitas Counties School District No. 119 Selah, General Obligation Bonds | | | 4.375 | % | | | 12/01/2034 | | | | 1,040,000 | | | | 1,062,397 | |
Lakehaven Water & Sewer District Revenue Bonds | | | 3.000 | % | | | 10/01/2035 | | | | 700,000 | | | | 601,948 | |
Okanogan County Public Utility District No. 1 Revenue Bonds, Series A | | | 4.000 | % | | | 12/01/2035 | | | | 500,000 | | | | 497,128 | |
Seattle Drainage & Wastewater Improvement Revenue Refunding Bonds | | | 4.000 | % | | | 05/01/2036 | | | | 1,000,000 | | | | 957,817 | |
Okanogan County Public Utility District No. 1 Revenue Bonds, Series A | | | 4.000 | % | | | 12/01/2037 | | | | 800,000 | | | | 749,758 | |
| | | | | | | | | | | | | | | | |
| | | | | | | | | | | | | | | 32,665,838 | |
| | | | | | | | | | | | | | | | |
West Virginia (0.07%) | | | | | | | | | | | | | | | | |
Braxton County Board of Education, General Obligation Refunding Bonds | | | 4.000 | % | | | 05/01/2026 | | | | 250,000 | | | | 250,789 | |
Braxton County Board of Education, General Obligation Refunding Bonds | | | 2.250 | % | | | 05/01/2026 | | | | 125,000 | | | | 117,686 | |
| | | | | | | | | | | | | | | | |
| | | | | | | | | | | | | | | 368,475 | |
| | | | | | | | | | | | | | | | |
Wisconsin (6.44%) | | | | | | | | | | | | | | | | |
Milwaukee Metropolitan Sewerage District, General Obligation Refunding Bonds, Series C | | | 2.500 | % | | | 10/01/2024 | | | | 2,000,000 | | | | 1,961,144 | |
Ellsworth Community School District, Wisconsin, General Obligation Bonds (Prerefunded to 04-01-2024 @ 100)(a) | | | 4.000 | % | | | 04/01/2027 | | | | 340,000 | | | | 340,224 | |
Ellsworth Community School District, Wisconsin, General Obligation Bonds (Prerefunded to 04-01-2024 @ 100)(a) | | | 4.000 | % | | | 04/01/2028 | | | | 275,000 | | | | 275,181 | |
Ellsworth Community School District, Wisconsin, General Obligation Bonds (Prerefunded to 04-01-2024 @ 100)(a) | | | 4.000 | % | | | 04/01/2029 | | | | 400,000 | | | | 400,263 | |
Central Brown County Water Authority Revenue Refunding Bonds, Series A | | | 5.000 | % | | | 11/01/2029 | | | | 1,000,000 | | | | 1,009,080 | |
Wisconsin-Dells School District, General Obligation Bonds | | | 3.125 | % | | | 03/01/2030 | | | | 1,595,000 | | | | 1,479,391 | |
Central Brown County Water Authority Revenue Refunding Bonds, Series A | | | 5.000 | % | | | 11/01/2030 | | | | 2,000,000 | | | | 2,021,528 | |
City of Fond Du Lac, Wisconsin, General Obligation Refunding Bonds, Series A | | | 2.000 | % | | | 03/01/2031 | | | | 895,000 | | | | 736,626 | |
County of Waupaca, Wisconsin, General Obligation Bonds, Series A | | | 3.250 | % | | | 03/01/2031 | | | | 1,160,000 | | | | 1,079,770 | |
Wisconsin-Dells School District, General Obligation Bonds | | | 3.250 | % | | | 03/01/2031 | | | | 1,395,000 | | | | 1,306,326 | |
Burlington Area School District, General Obligation Bonds | | | 3.125 | % | | | 04/01/2031 | | | | 1,000,000 | | | | 922,821 | |
D. C. Everest Area School District, General Obligation Bonds | | | 3.375 | % | | | 04/01/2031 | | | | 3,900,000 | | | | 3,662,397 | |
Poynette School District, General Obligation Bonds | | | 3.000 | % | | | 04/01/2031 | | | | 850,000 | | | | 768,575 | |
Western Technical College District, General Obligation Bonds, Series C | | | 4.000 | % | | | 04/01/2031 | | | | 1,000,000 | | | | 998,505 | |
| | |
| See accompanying notes to financial statements. | | 47 |
ADVISERS INVESTMENT TRUST
STATE FARM MUNICIPAL BOND FUND
SCHEDULE OF INVESTMENTS (continued)
September 30, 2023
| | | | | | | | | | | | | | | | |
| | | Coupon
rate | | | Maturity
date | | | Principal
amount | | | Value | |
Long-term Municipal Bond (Cont.) | | | | | | | | | | | | | | | | |
Wisconsin (Cont.) | | | | | | | | | | | | | | | | |
City of Muskego, Wisconsin, General Obligation Refunding Bonds, Series A | | | 4.000 | % | | | 06/01/2031 | | | $ | 300,000 | | | $ | 300,508 | |
Central Brown County Water Authority Revenue Refunding Bonds, Series A | | | 5.000 | % | | | 11/01/2031 | | | | 2,200,000 | | | | 2,223,681 | |
Burlington Area School District, General Obligation Bonds | | | 3.250 | % | | | 04/01/2032 | | | | 1,120,000 | | | | 1,020,013 | |
Hamilton School District, Wisconsin, General Obligation Bonds | | | 3.250 | % | | | 04/01/2032 | | | | 3,390,000 | | | | 3,207,548 | |
Poynette School District, General Obligation Bonds | | | 3.125 | % | | | 04/01/2032 | | | | 1,520,000 | | | | 1,366,952 | |
Western Technical College District, General Obligation Refunding Bonds, Series F | | | 3.000 | % | | | 04/01/2032 | | | | 2,240,000 | | | | 2,039,930 | |
City of Muskego, Wisconsin, General Obligation Refunding Bonds, Series A | | | 4.000 | % | | | 06/01/2032 | | | | 675,000 | | | | 675,266 | |
City of Muskego, Wisconsin, General Obligation Refunding Bonds, Series A | | | 4.000 | % | | | 06/01/2034 | | | | 1,390,000 | | | | 1,364,114 | |
Sun Prairie Area School District, Wisconsin, General Obligation Refunding Bonds | | | 3.000 | % | | | 03/01/2035 | | | | 1,405,000 | | | | 1,192,590 | |
Sun Prairie Area School District, Wisconsin, General Obligation Refunding Bonds | | | 3.000 | % | | | 03/01/2036 | | | | 1,535,000 | | | | 1,280,992 | |
Platteville School District, General Obligation Refunding Bonds | | | 4.000 | % | | | 03/01/2038 | | | | 775,000 | | | | 723,964 | |
Wisconsin Health & Educational Facilities Authority Revenue Refunding Bonds | | | 5.000 | % | | | 07/01/2038 | | | | 1,000,000 | | | | 1,008,045 | |
Two Rivers Public School District, General Obligation Refunding Bonds | | | 4.000 | % | | | 03/01/2039 | | | | 1,000,000 | | | | 921,625 | |
Wisconsin Health & Educational Facilities Authority Revenue Refunding Bonds | | | 5.000 | % | | | 11/15/2039 | | | | 1,000,000 | | | | 1,006,095 | |
| | | | | | | | | | | | | | | | |
| | | | | | | | | | | | | | | 35,293,154 | |
| | | | | | | | | | | | | | | | |
Total Long-term Municipal Bond (cost $548,675,320) | | | | | | | | | | | | | | | 517,475,365 | |
| | | | | | | | | | | | | | | | |
| | | | |
| | | | | | | | | Shares | | | Value | |
Short-term Investments (4.61%) | | | | | | | | | | | | | | | | |
Northern Institutional Treasury Portfolio (Premier Class), 5.20%(h) | | | | | | | | | | | 25,271,462 | | | | 25,271,462 | |
| | | | | | | | | | | | | | | | |
Total Short-term Investments (cost $25,271,462) | | | | | | | | | | | | | | | 25,271,462 | |
| | | | | | | | | | | | | | | | |
TOTAL INVESTMENTS (99.07%) (cost $573,946,782) | | | | | | | | | | | | | | | 542,746,827 | |
OTHER ASSETS, NET OF LIABILITIES (0.93%) | | | | | | | | | | | | | | | 5,096,592 | |
| | | | | | | | | | | | | | | | |
NET ASSETS (100.00%) | | | | | | | | | | | | | | $ | 547,843,419 | |
| | | | | | | | | | | | | | | | |
| (a) | Advanced Refunded Bonds are backed by an escrow or trust containing U.S. Government, U.S. Government Agency or other securities to support the timely payment of principal and interest. |
| (b) | Rate shown is fixed until mandatory tender date of June 1, 2029. |
| (c) | Rate shown is fixed until mandatory tender date of December 1, 2030. |
| (d) | Rate shown is fixed until mandatory tender date of July 1, 2026. |
| (e) | Rate shown is fixed until mandatory tender date of May 1, 2027. |
| (f) | Rate shown is fixed until mandatory tender date of May 1, 2029. |
| (g) | Rate shown is fixed until mandatory tender date of May 15, 2026. |
| (h) | Rate shown is the 7-day yield as of September 30, 2023. |
| | |
| 48 | | See accompanying notes to financial statements. |
(This page intentionally left blank.)
ADVISERS INVESTMENT TRUST
STATE FARM FUNDS
STATEMENTS OF ASSETS AND LIABILITIES
September 30, 2023
| | | | | | | | | | | | | | | | |
| | | State Farm
Growth Fund | | | State Farm
Balanced Fund | | | State Farm
Interim Fund | | | State Farm
Municipal Bond Fund | |
Assets | | | | | | | | | | | | | | | | |
Investments in securities at identified cost | | $ | 1,757,993,245 | | | | 1,000,445,323 | | | | 332,910,166 | | | | 573,946,782 | |
| | | | | | | | | | | | | | | | |
Investments in securities at market value | | $ | 6,447,323,467 | | | | 2,163,231,962 | | | | 315,558,069 | | | | 542,746,827 | |
Cash | | | — | | | | 477,028 | | | | — | | | | — | |
Foreign currency (Cost: $0, $18, $0, and $0, respectively) | | | — | | | | 19 | | | | — | | | | — | |
Receivables: | | | | | | | | | | | | | | | | |
Dividends and interest | | | 5,037,718 | | | | 5,794,159 | | | | 2,502,589 | | | | 5,735,906 | |
Reclaims | | | 285,620 | | | | 228,283 | | | | — | | | | — | |
Securities sold | | | 741,972 | | | | 2,360,064 | | | | 7,071,175 | | | | 160,183 | |
Shares of the Fund sold | | | 182,398 | | | | 249,630 | | | | 639,504 | | | | 1,147,952 | |
Prepaid expenses | | | 236,054 | | | | 92,102 | | | | 32,444 | | | | 29,248 | |
| | | | | | | | | | | | | | | | |
Total assets | | | 6,453,807,229 | | | | 2,172,433,247 | | | | 325,803,781 | | | | 549,820,116 | |
| | | | | | | | | | | | | | | | |
| | | | |
Liabilities and Net Assets | | | | | | | | | | | | | | | | |
Distributions to shareholders | | | — | | | | — | | | | 642,278 | | | | 1,591,050 | |
Payables: | | | | | | | | | | | | | | | | |
Securities purchased | | | 741,972 | | | | 7,440,028 | | | | 10,000,571 | | | | — | |
Shares of the Fund redeemed | | | 1,389,298 | | | | 356,649 | | | | 27,710 | | | | 31,824 | |
Investment advisory fees | | | 547,468 | | | | 200,340 | | | | 31,118 | | | | 50,490 | |
Accounting and Administration fees | | | 2,299,488 | | | | 904,661 | | | | 218,125 | | | | 252,405 | |
Trustees’ fees and expenses | | | 1,808 | | | | — | | | | — | | | | — | |
Regulatory and Compliance fees | | | 73,605 | | | | 23,747 | | | | 2,938 | | | | 5,551 | |
Variation margin on futures contracts | | | 75,600 | | | | 40,800 | | | | — | | | | — | |
Accrued expenses and other payables | | | 94,966 | | | | 62,639 | | | | 44,349 | | | | 45,377 | |
| | | | | | | | | | | | | | | | |
Total liabilities | | | 5,224,205 | | | | 9,028,864 | | | | 10,967,089 | | | | 1,976,697 | |
| | | | | | | | | | | | | | | | |
Net assets applicable to shares outstanding of common stock | | $ | 6,448,583,024 | | | | 2,163,404,383 | | | | 314,836,692 | | | | 547,843,419 | |
| | | | | | | | | | | | | | | | |
| Fund shares outstanding (no par value, unlimited number of shares authorized) | | | 62,944,356 | | | | 26,085,115 | | | | 33,653,393 | | | | 70,105,348 | |
| Net asset value, offering price and redemption price per share | | $ | 102.45 | | | | 82.94 | | | | 9.36 | | | | 7.81 | |
| | | | | | | | | | | | | | | | |
| | | | |
Analysis of Net Assets | | | | | | | | | | | | | | | | |
Paid-in-capital | | $ | 1,750,422,845 | | | | 983,057,954 | | | | 344,466,314 | | | | 591,187,950 | |
Total distributable earnings (loss) | | | 4,698,160,179 | | | | 1,180,346,429 | | | | (29,629,622 | ) | | | (43,344,531 | ) |
| | | | | | | | | | | | | | | | |
Net assets applicable to shares outstanding | | $ | 6,448,583,024 | | | | 2,163,404,383 | | | | 314,836,692 | | | | 547,843,419 | |
| | | | | | | | | | | | | | | | |
| | |
| 50 | | See accompanying notes to financial statements. |
ADVISERS INVESTMENT TRUST
STATE FARM FUNDS
STATEMENTS OF OPERATIONS
Year ended September 30, 2023
| | | | | | | | | | | | | | | | |
| | | State Farm
Growth Fund | | | State Farm
Balanced Fund | | | State Farm
Interim Fund | | | State Farm
Municipal Bond Fund | |
Investment Income: | | | | | | | | | | | | | | | | |
Dividends | | $ | 119,598,896 | | | | 27,649,147 | | | | 32,410 | | | | 1,403,116 | |
Interest | | | 168,467 | | | | 24,722,369 | | | | 7,358,557 | | | | 16,955,535 | |
| | | | | | | | | | | | | | | | |
| | | 119,767,363 | | | | 52,371,516 | | | | 7,390,967 | | | | 18,358,651 | |
Less: foreign withholding taxes | | | (239,478 | ) | | | (49,329 | ) | | | — | | | | — | |
| | | | | | | | | | | | | | | | |
Total investment income | | | 119,527,885 | | | | 52,322,187 | | | | 7,390,967 | | | | 18,358,651 | |
| | | | |
Expenses: | | | | | | | | | | | | | | | | |
Investment advisory fees | | | 6,419,110 | | | | 2,386,982 | | | | 411,298 | | | | 641,984 | |
Accounting and Administration fees | | | 2,999,062 | | | | 1,186,108 | | | | 289,771 | | | | 332,287 | |
Trustees’ fees and expenses | | | 102,084 | | | | 33,776 | | | | 4,777 | | | | 8,474 | |
Insurance fees | | | 69,236 | | | | 24,295 | | | | 4,389 | | | | 6,975 | |
Regulatory and Compliance fees | | | 279,670 | | | | 94,164 | | | | 14,523 | | | | 25,007 | |
Registration fees | | | 24,389 | | | | 24,452 | | | | 21,494 | | | | 22,503 | |
Other | | | 194,843 | | | | 104,383 | | | | 51,747 | | | | 54,557 | |
| | | | | | | | | | | | | | | | |
Total expenses | | | 10,088,394 | | | | 3,854,160 | | | | 797,999 | | | | 1,091,787 | |
Less: expense reductions by Adviser | | | (2,385,389 | ) | | | (816,185 | ) | | | (249,606 | ) | | | (157,992 | ) |
| | | | | | | | | | | | | | | | |
Net expenses | | | 7,703,005 | | | | 3,037,975 | | | | 548,393 | | | | 933,795 | |
| | | | | | | | | | | | | | | | |
Net investment income | | | 111,824,880 | | | | 49,284,212 | | | | 6,842,574 | | | | 17,424,856 | |
| | | | |
Realized and unrealized gain (loss): | | | | | | | | | | | | | | | | |
Net realized gain (loss) on sales of investments | | | (8,651,100 | ) | | | 18,943,353 | | | | (8,232,646 | ) | | | (4,287,871 | ) |
Net realized gain (loss) on futures contracts | | | 1,350,575 | | | | 1,017,560 | | | | — | | | | — | |
Net realized gain (loss) on foreign currency transactions | | | 259 | | | | 107 | | | | — | | | | — | |
Change in net unrealized appreciation (depreciation) on investments and foreign currency transactions | | | 943,417,092 | | | | 205,725,707 | | | | 8,164,675 | | | | 3,772,585 | |
Change in net unrealized appreciation (depreciation) on futures contracts | | | 2,988,909 | | | | 250,520 | | | | — | | | | — | |
| | | | | | | | | | | | | | | | |
| Net realized and unrealized gain (loss) on investments | | | 939,105,735 | | | | 225,937,247 | | | | (67,971 | ) | | | (515,286 | ) |
| | | | | | | | | | | | | | | | |
| Net change in net assets resulting from operations | | $ | 1,050,930,615 | | | | 275,221,459 | | | | 6,774,603 | | | | 16,909,570 | |
| | | | | | | | | | | | | | | | |
| | |
| See accompanying notes to financial statements. | | 51 |
ADVISERS INVESTMENT TRUST
STATE FARM FUNDS
STATEMENTS OF CHANGES IN NET ASSETS
| | | | | | | | |
| | | State Farm
Growth Fund | |
Year ended September 30, 2023 and year ended September 30, 2022 | | 2023 | | | 2022 | |
From operations: | | | | | | | | |
Net investment income | | $ | 111,824,880 | | | | 108,219,435 | |
Net realized gain (loss) | | | (7,300,266 | ) | | | (17,456,138 | ) |
Change in net unrealized appreciation or depreciation | | | 946,406,001 | | | | (639,229,389 | ) |
| | | | | | | | |
Net change in net assets resulting from operations | | | 1,050,930,615 | | | | (548,466,092 | ) |
Distributions to shareholders from: | | | | | | | | |
Distributable earnings (Net investment income, Net realized gain) | | | (111,552,599 | ) | | | (977,372,639 | ) |
| | | | | | | | |
Total distributions to shareholders | | | (111,552,599 | ) | | | (977,372,639 | ) |
From Fund share transactions: | | | | | | | | |
Proceeds from shares sold | | | 190,715,078 | | | | 269,135,832 | |
Reinvestment of distributions | | | 102,728,019 | | | | 913,433,616 | |
Less payments for shares redeemed | | | (492,194,611 | ) | | | (537,745,932 | ) |
| | | | | | | | |
Net increase (decrease) in net assets from Fund share transactions | | | (198,751,514 | ) | | | 644,823,516 | |
| | | | | | | | |
Total increase (decrease) in net assets | | | 740,626,502 | | | | (881,015,215 | ) |
| | | | | | | | |
Net assets: | | | | | | | | |
Beginning of period | | | 5,707,956,522 | | | | 6,588,971,737 | |
| | | | | | | | |
End of period | | $ | 6,448,583,024 | | | | 5,707,956,522 | |
| | | | | | | | |
| | |
Share Information | | | | | | | | |
Sold | | | 1,893,455 | | | | 2,564,044 | |
Issued in reinvestment of distributions | | | 1,025,466 | | | | 8,649,458 | |
Redeemed | | | (4,900,431 | ) | | | (5,105,548 | ) |
| | | | | | | | |
Net increase (decrease) | | | (1,981,510 | ) | | | 6,107,954 | |
| | | | | | | | |
| | |
| 52 | | See accompanying notes to financial statements. |
ADVISERS INVESTMENT TRUST
STATE FARM FUNDS
STATEMENTS OF CHANGES IN NET ASSETS (continued)
| | | | | | | | | | | | | | | | | | | | | | |
State Farm Balanced Fund | | | State Farm Interim Fund | | | State Farm Municipal Bond Fund | |
| | | | | | | | | | |
| | | | | |
| 2023 | | | 2022 | | | 2023 | | | 2022 | | | 2023 | | | 2022 | |
| | | | | | | | | | | | | | | | | | | | | | | |
| | 49,284,212 | | | | 37,575,119 | | | | 6,842,574 | | | | 3,981,455 | | | | 17,424,856 | | | | 16,029,369 | |
| | 19,961,020 | | | | (3,366,774 | ) | | | (8,232,646 | ) | | | (3,877,824 | ) | | | (4,287,871 | ) | | | (7,856,828 | ) |
| | 205,976,227 | | | | (234,842,330 | ) | | | 8,164,675 | | | | (29,731,655 | ) | | | 3,772,585 | | | | (71,463,953 | ) |
| | | | | | | | | | | | | | | | | | | | | | |
| | 275,221,459 | | | | (200,633,985 | ) | | | 6,774,603 | | | | (29,628,024 | ) | | | 16,909,570 | | | | (63,291,412 | ) |
| | | | | | | | | | | | | | | | | | | | | | | |
| | (46,060,194 | ) | | | (214,292,681 | ) | | | (6,842,453 | ) | | | (4,203,011 | ) | | | (17,424,600 | ) | | | (16,706,754 | ) |
| | | | | | | | | | | | | | | | | | | | | | |
| | (46,060,194 | ) | | | (214,292,681 | ) | | | (6,842,453 | ) | | | (4,203,011 | ) | | | (17,424,600 | ) | | | (16,706,754 | ) |
| | | | | | | | | | | | | | | | | | | | | | | |
| | 85,554,058 | | | | 119,468,092 | | | | 33,167,368 | | | | 82,629,066 | | | | 20,689,465 | | | | 41,897,137 | |
| | 43,403,536 | | | | 203,958,348 | | | | 6,791,042 | | | | 4,172,888 | | | | 13,976,756 | | | | 13,676,775 | |
| | (202,578,102 | ) | | | (260,859,337 | ) | | | (93,247,882 | ) | | | (131,751,080 | ) | | | (66,615,266 | ) | | | (98,411,611 | ) |
| | | | | | | | | | | | | | | | | | | | | | |
| | (73,620,508 | ) | | | 62,567,103 | | | | (53,289,472 | ) | | | (44,949,126 | ) | | | (31,949,045 | ) | | | (42,837,699 | ) |
| | | | | | | | | | | | | | | | | | | | | | |
| | 155,540,757 | | | | (352,359,563 | ) | | | (53,357,322 | ) | | | (78,780,161 | ) | | | (32,464,075 | ) | | | (122,835,865 | ) |
| | | | | | | | | | | | | | | | | | | | | | |
| | | | | | | | | | | | | | | | | | | | | | | |
| | 2,007,863,626 | | | | 2,360,223,189 | | | | 368,194,014 | | | | 446,974,175 | | | | 580,307,494 | | | | 703,143,359 | |
| | | | | | | | | | | | | | | | | | | | | | |
| | 2,163,404,383 | | | | 2,007,863,626 | | | | 314,836,692 | | | | 368,194,014 | | | | 547,843,419 | | | | 580,307,494 | |
| | | | | | | | | | | | | | | | | | | | | | |
| | | | | |
| | | | | | | | | | | | | | | | | | | | | | | |
| | 1,037,103 | | | | 1,394,136 | | | | 3,514,463 | | | | 8,398,828 | | | | 2,549,329 | | | | 4,908,002 | |
| | 532,309 | | | | 2,348,663 | | | | 719,768 | | | | 426,714 | | | | 1,728,311 | | | | 1,619,903 | |
| | (2,470,945 | ) | | | (3,042,227 | ) | | | (9,873,776 | ) | | | (13,358,520 | ) | | | (8,205,775 | ) | | | (11,615,394 | ) |
| | | | | | | | | | | | | | | | | | | | | | |
| | (901,533 | ) | | | 700,572 | | | | (5,639,545 | ) | | | (4,532,978 | ) | | | (3,928,135 | ) | | | (5,087,489 | ) |
| | | | | | | | | | | | | | | | | | | | | | |
| | |
| See accompanying notes to financial statements. | | 53 |
ADVISERS INVESTMENT TRUST
STATE FARM FUNDS
FINANCIAL HIGHLIGHTS
The financial highlights table is intended to help you understand the financial performance of each Fund for the past five years. Prior to August 23, 2021, each State Farm Fund operated as a series of State Farm Associates’ Funds Trust (each a “Predecessor Fund” and together the “Predecessor Funds”). On August 23, 2021, the Predecessor Funds were reorganized into the Trust, pursuant to an Agreement and Plan of Reorganization approved by the State Farm Associates’ Funds’ Board of Trustees on March 11, 2021 and by the Predecessor Funds’ shareholders on June 17, 2021. Because each Fund is a continuation of its respective Predecessor Fund, the following financial information includes results of each Fund’s respective Predecessor Fund for periods prior to August 23, 2021. Certain information reflects financial results for a single Fund share. The total returns within each table represent the rate that an investor would have earned (or lost) on an investment in the Fund (assuming reinvestment of all dividends and distributions).
STATE FARM GROWTH FUND
(For a share outstanding throughout each period)
| | | | | | | | | | | | | | | | | | | | | | |
| | | Year ended September 30, | | | 10-month period ended
September 30,
2021 | | Year ended November 30, | |
| | | 2023 | | | 2022 | | | 2020 | | | 2019 | | | 2018 | |
| | | | | | |
Net asset value, beginning of period | | | $ 87.92 | | | | 112.02 | | | 97.62 | | | 89.37 | | | | 81.06 | | | | 80.41 | |
| | | | | | |
Income from Investment Operations | | | | | | | | | | | | | | | | | | | | | | |
Net investment income(a) | | | 1.75 | | | | 1.70 | | | 1.67 | | | 1.99 | | | | 2.13 | | | | 1.93 | |
Net gain (loss) on investments (both realized and unrealized) | | | 14.53 | | | | (9.06) | | | 15.56 | | | 9.22 | | | | 9.30 | | | | 1.51 | |
| | | | | | | | | | | | | | | | | | | | | | |
Total from investment operations | | | 16.28 | | | | (7.36) | | | 17.23 | | | 11.21 | | | | 11.43 | | | | 3.44 | |
| | | | | | | | | | | | | | | | | | | | | | |
| | | | | | |
Less Distributions | | | | | | | | | | | | | | | | | | | | | | |
Net investment income | | | (1.75) | | | | (1.83) | | | (1.97) | | | (2.11 | ) | | | (2.09 | ) | | | (1.90 | ) |
Net realized gain | | | — | | | | (14.91) | | | (0.86) | | | (0.85 | ) | | | (1.03 | ) | | | (0.89 | ) |
| | | | | | | | | | | | | | | | | | | | | | |
Total distributions | | | (1.75) | | | | (16.74) | | | (2.83) | | | (2.96 | ) | | | (3.12 | ) | | | (2.79 | ) |
| | | | | | | | | | | | | | | | | | | | | | |
Net asset value, end of period | | | $ 102.45 | | | | 87.92 | | | 112.02 | | | 97.62 | | | | 89.37 | | | | 81.06 | |
| | | | | | | | | | | | | | | | | | | | | | |
| | | | | | |
Total Return | | | 18.58 | % | | | (8.99) | % | | 17.89%(b) | | | 12.96 | % | | | 14.91 | % | | | 4.41 | % |
| | | | | | |
Ratios/Supplemental Data | | | | | | | | | | | | | | | | | | | | | | |
Net assets, end of period (millions) | | | $6,448.6 | | | | 5,708.0 | | | 6,589.0 | | | 5,819.8 | | | | 5,502.5 | | | | 4,992.6 | |
| | | | | | |
Average net asset ratios | | | | | | | | | | | | | | | | | | | | | | |
Expenses, net of waivers and reimbursements | | | 0.12 | % | | | 0.12% | | | 0.12%(c) | | | 0.12 | % | | | 0.12 | % | | | 0.12 | % |
Expenses, gross of waivers and reimburements | | | 0.16 | % | | | 0.16% | | | 0.13%(c) | | | 0.12 | % | | | 0.12 | % | | | 0.12 | % |
Net investment income, net of waivers and reimbursements | | | 1.74 | % | | | 1.63% | | | 1.81%(c) | | | 2.29 | % | | | 2.62 | % | | | 2.42 | % |
| | | | | | |
Portfolio turnover rate | | | 22 | % | | | 28% | | | 23%(b),(d),(e) | | | 0 | %(f) | | | 1 | % | | | 0 | %(f) |
| (a) | Average shares outstanding for the period were used to calculate net investment income per share. |
| (b) | Not annualized for periods that are less than a full year. |
| (c) | Determined on an annualized basis. |
| (d) | The portfolio turnover rate excludes securities delivered from processing redemptions in-kind. |
| (e) | The portfolio turnover rate increased due to certain investment activity in connection with the Reorganization of the Fund from the State Farm Associates’ Fund Trust into the Advisers Investment Trust. |
| (f) | Portfolio turnover rate rounds to less than 1% for the year ended November 30, 2018 and 2020. |
| | |
| 54 | | See accompanying notes to financial statements. |
ADVISERS INVESTMENT TRUST
STATE FARM FUNDS
FINANCIAL HIGHLIGHTS (continued)
STATE FARM BALANCED FUND
(For a share outstanding throughout each period)
| | | | | | | | | | | | | | | | | | | | | | |
| | | Year ended September 30, | | | 10-month period ended
September 30,
2021 | | Year ended November 30, | |
| | | 2023 | | | 2022 | | | 2020 | | | 2019 | | | 2018 | |
| | | | | | |
Net asset value, beginning of period | | | $ 74.40 | | | | 89.79 | | | 81.66 | | | 75.35 | | | | 68.52 | | | | 68.84 | |
| | | | | | |
Income from Investment Operations | | | | | | | | | | | | | | | | | | | | | | |
Net investment income(a) | | | 1.86 | | | | 1.39 | | | 1.41 | | | 1.69 | | | | 1.81 | | | | 1.70 | |
Net gain (loss) on investments (both realized and unrealized) | | | 8.43 | | | | (8.53) | | | 9.03 | | | 6.62 | | | | 7.30 | | | | (0.03 | ) |
| | | | | | | | | | | | | | | | | | | | | | |
Total from investment operations | | | 10.29 | | | | (7.14) | | | 10.44 | | | 8.31 | | | | 9.11 | | | | 1.67 | |
| | | | | | | | | | | | | | | | | | | | | | |
| | | | | | |
Less Distributions | | | | | | | | | | | | | | | | | | | | | | |
Net investment income | | | (1.75) | | | | (1.50) | | | (1.68) | | | (1.78 | ) | | | (1.79 | ) | | | (1.68 | ) |
Net realized gain | | | — | | | | (6.75) | | | (0.63) | | | (0.22 | ) | | | (0.49 | ) | | | (0.31 | ) |
| | | | | | | | | | | | | | | | | | | | | | |
Total distributions | | | (1.75) | | | | (8.25) | | | (2.31) | | | (2.00 | ) | | | (2.28 | ) | | | (1.99 | ) |
| | | | | | | | | | | | | | | | | | | | | | |
Net asset value, end of period | | | $ 82.94 | | | | 74.40 | | | 89.79 | | | 81.66 | | | | 75.35 | | | | 68.52 | |
| | | | | | | | | | | | | | | | | | | | | | |
| | | | | | |
Total Return | | | 13.87 | % | | | (9.20) | % | | 12.95%(b) | | | 11.31 | % | | | 13.82 | % | | | 2.49 | % |
| | | | | | |
Ratios/Supplemental Data | | | | | | | | | | | | | | | | | | | | | | |
Net assets, end of period (millions) | | | $2,163.4 | | | | 2,007.9 | | | 2,360.2 | | | 2,251.1 | | | | 2,121.8 | | | | 1,935.4 | |
| | | | | | |
Average net asset ratios | | | | | | | | | | | | | | | | | | | | | | |
Expenses, net of waivers and reimbursements | | | 0.14 | % | | | 0.14% | | | 0.13%(c) | | | 0.14 | % | | | 0.13 | % | | | 0.13 | % |
Expenses, gross of waivers and reimburements | | | 0.18 | % | | | 0.18% | | | 0.14%(c) | | | 0.14 | % | | | 0.13 | % | | | 0.13 | % |
Net investment income, net of waivers and reimbursements | | | 2.27 | % | | | 1.63% | | | 1.90%(c) | | | 2.27 | % | | | 2.59 | % | | | 2.50 | % |
| | | | | | |
Portfolio turnover rate | | | 38 | % | | | 40% | | | 22%(b),(d),(e) | | | 3 | % | | | 4 | % | | | 5 | % |
| (a) | Average shares outstanding for the period were used to calculate net investment income per share. |
| (b) | Not annualized for periods that are less than a full year. |
| (c) | Determined on an annualized basis. |
| (d) | The portfolio turnover rate excludes securities delivered from processing redemptions in-kind. |
| (e) | The portfolio turnover rate increased due to certain investment activity in connection with the Reorganization of the Fund from the State Farm Associates’ Fund Trust into the Advisers Investment Trust. |
| | |
| See accompanying notes to financial statements. | | 55 |
ADVISERS INVESTMENT TRUST
STATE FARM FUNDS
FINANCIAL HIGHLIGHTS (continued)
STATE FARM INTERIM FUND
(For a share outstanding throughout each period)
| | | | | | | | | | | | | | | | | | | | | | |
| | | Year ended September 30, | | | 10-month period ended
September 30,
2021 | | Year ended November 30, | |
| | | 2023 | | | 2022 | | | 2020 | | | 2019 | | | 2018 | |
| | | | | | |
Net asset value, beginning of period | | | $9.37 | | | | 10.20 | | | 10.36 | | | 10.10 | | | | 9.76 | | | | 9.87 | |
| | | | | | |
Income from Investment Operations | | | | | | | | | | | | | | | | | | | | | | |
Net investment income | | | 0.19 | | | | 0.10 | | | 0.09 | | | 0.14 | | | | 0.17 | | | | 0.14 | |
Net gain (loss) on investments (both realized and unrealized) | | | (0.01) | | | | (0.83) | | | (0.16) | | | 0.26 | | | | 0.34 | | | | (0.11 | ) |
| | | | | | | | | | | | | | | | | | | | | | |
Total from investment operations | | | 0.18 | | | | (0.73) | | | (0.07) | | | 0.40 | | | | 0.51 | | | | 0.03 | |
| | | | | | | | | | | | | | | | | | | | | | |
| | | | | | |
Less Distributions | | | | | | | | | | | | | | | | | | | | | | |
Net investment income | | | (0.19) | | | | (0.10) | | | (0.09) | | | (0.14 | ) | | | (0.17 | ) | | | (0.14 | ) |
Net realized gain | | | — | | | | — | | | — | | | — | | | | — | | | | — | |
| | | | | | | | | | | | | | | | | | | | | | |
Total distributions | | | (0.19) | | | | (0.10) | | | (0.09) | | | (0.14 | ) | | | (0.17 | ) | | | (0.14 | ) |
| | | | | | | | | | | | | | | | | | | | | | |
Net asset value, end of period | | | $9.36 | | | | 9.37 | | | 10.20 | | | 10.36 | | | | 10.10 | | | | 9.76 | |
| | | | | | | | | | | | | | | | | | | | | | |
| | | | | | |
Total Return | | | 1.92 | % | | | (7.17) | % | | (0.71)%(a) | | | 4.02 | % | | | 5.26 | % | | | 0.33 | % |
| | | | | | |
Ratios/Supplemental Data | | | | | | | | | | | | | | | | | | | | | | |
Net assets, end of period (millions) | | | $314.8 | | | | 368.2 | | | 447.0 | | | 495.2 | | | | 350.7 | | | | 337.9 | |
| | | | | | |
Average net asset ratios | | | | | | | | | | | | | | | | | | | | | | |
Expenses, net of waivers and reimbursements | | | 0.16 | % | | | 0.16% | | | 0.16%(b) | | | 0.16 | % | | | 0.17 | % | | | 0.17 | % |
Expenses, gross of waivers and reimburements | | | 0.23 | % | | | 0.22% | | | 0.18%(b) | | | 0.16 | % | | | 0.17 | % | | | 0.17 | % |
Net investment income, net of waivers and reimbursements | | | 2.00 | % | | | 0.99% | | | 1.02%(b) | | | 1.38 | % | | | 1.71 | % | | | 1.45 | % |
| | | | | | |
Portfolio turnover rate | | | 39 | % | | | 45% | | | 36%(a) | | | 20 | % | | | 20 | % | | | 16 | % |
| (a) | Not annualized for periods that are less than a full year. |
| (b) | Determined on an annualized basis. |
| | |
| 56 | | See accompanying notes to financial statements. |
ADVISERS INVESTMENT TRUST
STATE FARM FUNDS
FINANCIAL HIGHLIGHTS (continued)
STATE FARM MUNICIPAL BOND FUND
(For a share outstanding throughout each period)
| | | | | | | | | | | | | | | | | | | | | | |
| | | Year ended September 30, | | | 10-month period ended
September 30,
2021 | | Year ended November 30, | |
| | | 2023 | | | 2022 | | | 2020 | | | 2019 | | | 2018 | |
| | | | | | |
Net asset value, beginning of period | | | $7.84 | | | | 8.89 | | | 9.04 | | | 8.80 | | | | 8.44 | | | | 8.61 | |
| | | | | | |
Income from Investment Operations | | | | | | | | | | | | | | | | | | | | | | |
Net investment income | | | 0.24 | | | | 0.21 | | | 0.18 | | | 0.23 | | | | 0.24 | | | | 0.25 | |
Net gain (loss) on investments (both realized and unrealized) | | | (0.03) | | | | (1.04) | | | (0.14) | | | 0.24 | | | | 0.36 | | | | (0.17 | ) |
| | | | | | | | | | | | | | | | | | | | | | |
Total from investment operations | | | 0.21 | | | | (0.83) | | | 0.04 | | | 0.47 | | | | 0.60 | | | | 0.08 | |
| | | | | | | | | | | | | | | | | | | | | | |
| | | | | | |
Less Distributions | | | | | | | | | | | | | | | | | | | | | | |
Net investment income | | | (0.24) | | | | (0.21) | | | (0.18) | | | (0.23 | ) | | | (0.24 | ) | | | (0.25 | ) |
Net realized gain(a) | | | — | | | | (0.01) | | | (0.01) | | | — | | | | — | | | | — | |
| | | | | | | | | | | | | | | | | | | | | | |
Total distributions | | | (0.24) | | | | (0.22) | | | (0.19) | | | (0.23 | ) | | | (0.24 | ) | | | (0.25 | ) |
| | | | | | | | | | | | | | | | | | | | | | |
Net asset value, end of period | | | $7.81 | | | | 7.84 | | | 8.89 | | | 9.04 | | | | 8.80 | | | | 8.44 | |
| | | | | | | | | | | | | | | | | | | | | | |
| | | | | | |
Total Return | | | 2.64 | % | | | (9.51)% | | | 0.37%(b) | | | 5.40 | % | | | 7.19 | % | | | 0.99 | % |
| | | | | | |
Ratios/Supplemental Data | | | | | | | | | | | | | | | | | | | | | | |
Net assets, end of period (millions) | | | $547.8 | | | | 580.3 | | | 703.1 | | | 741.0 | | | | 710.9 | | | | 675.4 | |
| | | | | | |
Average net asset ratios | | | | | | | | | | | | | | | | | | | | | | |
Expenses, net of waivers and reimbursements | | | 0.16 | % | | | 0.16% | | | 0.17%(c) | | | 0.16 | % | | | 0.16 | % | | | 0.16 | % |
Expenses, gross of waivers and reimburements | | | 0.19 | % | | | 0.18% | | | 0.18%(c) | | | 0.16 | % | | | 0.16 | % | | | 0.16 | % |
Net investment income, net of waivers and reimbursements | | | 2.99 | % | | | 2.47% | | | 2.34%(c) | | | 2.53 | % | | | 2.74 | % | | | 2.93 | % |
| | | | | | |
Portfolio turnover rate | | | 16 | % | | | 31% | | | 11%(b) | | | 10 | % | | | 14 | % | | | 12 | % |
| (a) | Net realized gain distributions represent less than $0.01 per share for the years ended November 30, 2020, 2019 and 2018. |
| (b) | Not annualized for periods that are less than a full year. |
| (c) | Determined on an annualized basis. |
| | |
| See accompanying notes to financial statements. | | 57 |
ADVISERS INVESTMENT TRUST
STATE FARM FUNDS
NOTES TO FINANCIAL STATEMENTS
September 30, 2023
Advisers Investment Trust (the “Trust” or “AIT”) is a Delaware statutory trust operating under a Fifth Amended and Restated Agreement and Declaration of Trust (the “Trust Agreement”) dated March 9, 2023. The Trust was formerly an Ohio business trust, which commenced operations on December 20, 2011. On March 31, 2017, the Trust was converted to a Delaware statutory trust. As an open-end registered investment company, as defined in Financial Accounting Standards Board (“FASB”) Accounting Standards Update (“ASU”) 2013-08, the Trust follows accounting and reporting guidance under FASB Accounting Standards Codification (“ASC”) Topic 946, “Financial Services-Investment Companies.” The Trust Agreement permits the Board of Trustees (the “Trustees” or “Board”) to authorize and issue an unlimited number of shares of beneficial interest, at no par value, in separate series of the Trust. The State Farm Growth Fund, the State Farm Balanced Fund, the State Farm Interim Fund, and the State Farm Municipal Bond Fund (referred to individually as a “Fund” and collectively as the “Funds” or the “State Farm Funds”) are each a diversified fund and are each a series of the Trust which is registered under the Investment Company Act of 1940, as amended (the “1940 Act”). These financial statements and notes only relate to the State Farm Funds.
Under the Trust’s organizational documents, its officers and Trustees are indemnified against certain liabilities arising out of the performance of their duties to the Trust and Funds. In addition, in the normal course of business, the Trust enters into contracts with its vendors and others that provide for general indemnifications. The Funds’ maximum exposure under these arrangements is unknown, as this would involve future claims that may be made against the Funds.
Prior to August 23, 2021, each State Farm Fund operated as a series of State Farm Associates’ Funds Trust (each a “Predecessor Fund” and together the “Predecessor Funds”). On August 23, 2021, the Predecessor Funds were reorganized into the Trust, pursuant to an Agreement and Plan of Reorganization approved by the State Farm Associates’ Funds’ Board of Trustees on March 11, 2021 and by the Predecessor Funds’ shareholders on June 17, 2021 (each a “Reorganization” and collectively, the “Reorganizations”).
At the time of the Reorganizations, each Predecessor Fund transferred all of its assets to its corresponding State Farm Fund in exchange for shares of the corresponding State Farm Fund and the assumption of all of the liabilities of the Predecessor Fund by the corresponding State Farm Fund. Upon closing of the Reorganizations, holders of a Predecessor Fund’s shares received shares of the corresponding State Farm Fund’s shares. The Reorganizations were tax-free for U.S federal income tax purposes.
Prior to the Reorganizations, the State Farm Funds had no net assets or operations in the Trust, and therefore, activity shown in the Statements of Changes in Net Assets and Financial Highlights prior to the Reorganization represents the operations and changes in net assets of each Predecessor Fund. The cost basis of the investments transferred from each Predecessor Fund was carried forward to the corresponding Fund for accounting and tax purposes.
As part of each Reorganization, the Board approved a September 30 fiscal year end for each State Farm Fund. Prior to each Reorganization, each Predecessor Fund had a November 30 fiscal year end.
1. Investment Objective
The State Farm Growth Fund (the “Growth Fund”) seeks long-term growth of capital, which may be supplemented by income. For information on the specific strategies of the Growth Fund, please refer to the Fund’s Prospectus.
The State Farm Balanced Fund (the “Balanced Fund”) seeks long-term growth of capital while providing some current income. For information on the specific strategies of the Balanced Fund, please refer to the Fund’s Prospectus.
The State Farm Interim Fund (the “Interim Fund”) seeks to provide investment results approximating the performance of the Bloomberg 1-5 Year U.S. Treasury Index. For information on the specific strategies of the Interim Fund, please refer to the Fund’s Prospectus.
The State Farm Municipal Bond Fund (the “Municipal Bond Fund”) seeks as high rate of income exempt from federal income taxes as is consistent with prudent investment management. For information on the specific strategies of the Municipal Bond Fund, please refer to the Fund’s Prospectus.
2. Significant Accounting Policies
Investment Valuation
All investments are recorded at their fair value. For more information see Note 3 Investment Valuation.
When-Issued Securities
The Municipal Bond Fund may purchase municipal bonds on a “when-issued” basis. Delivery and payment for these securities may be a month or more after the purchase date, during which time such securities are subject to market fluctuations. The Municipal Bond Fund identifies and holds specific liquid assets with a market value at least equal to the amount of the when-issued purchase commitments in order to ensure that it can meet
ADVISERS INVESTMENT TRUST
STATE FARM FUNDS
NOTES TO FINANCIAL STATEMENTS (continued)
September 30, 2023
those commitments. It is possible that the securities will never be issued and the commitment cancelled. At September 30, 2023, the Municipal Bond Fund had no commitments for when-issued securities.
Futures Contracts
Certain Funds invest in stock index futures contracts for hedging purposes, to increase total return (i.e., for speculative purposes), to maintain liquidity to meet potential shareholder redemptions, to invest cash balances or dividends, or to minimize trading costs. When used as a hedge, a Fund may sell a futures contract in order to offset a decrease in the fair value of its portfolio securities that might otherwise result from a market decline. A Fund may do so either to hedge the value of its portfolio securities as a whole, or to protect against declines occurring prior to sales of securities in the value of the securities to be sold. Conversely, a Fund may purchase a futures contract as a hedge in anticipation of purchases of securities. In addition, a Fund may utilize futures contracts in anticipation of changes in the composition of its portfolio holdings. A Fund bears the market risk arising from changes in the value of these financial instruments. At the time a Fund enters into a futures contract, it is generally required to make a margin deposit with the custodian of a specified amount of liquid assets. Futures are marked-to-market each day with the change in value reflected in the unrealized gains or losses. Risk may arise as a result of the potential inability of the counterparties to meet the terms of their contracts. Credit risk is mitigated to the extent that the exchange on which a particular futures contract is traded assumes the risk of a counterparty defaulting on its obligations under the contract. The Statements of Operations include any realized gains or losses on closed futures contracts in Net realized gain (loss) on futures contracts, and any unrealized gains or losses on open futures contracts in Change in net unrealized appreciation (depreciation) on futures contracts.
Further information on the impact of these positions on the Funds’ financial statements can be found in Note 7.
Currency Transactions
The functional and reporting currency for the Funds is the U.S. dollar. The market values of foreign securities, currency holdings and other assets and liabilities are translated into U.S. dollars based on the current exchange rates each business day. Purchases and sales of securities and income and expense items denominated in foreign currencies are translated into U.S. dollars at the exchange rate in effect on the transaction date. The Funds do not separately report the effects of changes in foreign exchange rates from changes in market prices on securities held. Such changes are included in Net realized and unrealized gains (losses) from investment activities on the Statements of Operations.
Investment Transactions and Income
Investment transactions are accounted for no later than one business day after trade date. For financial reporting purposes, investments are reported as of the trade date. The Funds determine the gain or loss realized from investment transactions by using an identified cost basis method. Interest income is recognized on an accrual basis and includes, where applicable, the amortization of premium or accretion of discount. Dividend income is recognized on the ex-dividend date. Dividends from foreign securities are recorded on the ex-dividend date, or as soon as the information is available.
Expense Allocations
Expenses directly attributable to a fund in the Trust are charged to that fund, while expenses that are attributable to more than one fund in the Trust are allocated among the applicable funds on a pro-rata basis, based on relative net assets, or another reasonable basis.
Dividends and Distributions
Each Fund intends to distribute substantially all of its net investment income as dividends to its shareholders on an annual basis. The Growth Fund and Balanced Fund declare and pay dividends, and capital gain distributions, if any, at least annually. The Interim Fund and Municipal Bond Fund declare dividends daily and pay them monthly on the last business day of the month. Shares of the Interim Fund and Municipal Bond Fund begin to earn dividends on the day after they are purchased. The Interim Fund and Municipal Bond Fund distribute net realized capital gain, if any, at least annually.
The Funds intend to distribute their net realized long-term capital gains and their net realized short-term capital gains at least once a year.
Distributions from net investment income and from net realized capital gain are determined in accordance with Federal income tax regulations, which may differ from accounting principles generally accepted in the United States of America (“GAAP”). These “book/tax” differences are either considered temporary or permanent in nature. To the extent these differences are permanent in nature (e.g. treatment of certain dividend distributions, gains/losses, return of capital, etc.), such amounts are reclassified within the composition of net assets based on their federal tax-basis treatment; temporary differences do not require reclassification. Distributions to shareholders that exceed net investment income and net realized capital gains for tax purposes are reported as return of capital.
Federal Income Tax Information
No provision is made for Federal income taxes as the Fund intends to qualify each year as a “regulated investment company” under Subchapter M of the Internal Revenue Code of 1986, as amended (the “Code”), and distribute substantially all of its net investment income and net realized capital gain in accordance with the Code.
ADVISERS INVESTMENT TRUST
STATE FARM FUNDS
NOTES TO FINANCIAL STATEMENTS (continued)
September 30, 2023
The Funds analyzed all open tax years, as defined by the Statute of Limitations, for all major jurisdictions that remain subject to examination. The Funds’ Federal tax returns for the tax years ended November 30, 2020 and September 30, 2021, 2022 and 2023, as applicable, remain subject to examination by the Internal Revenue Service. Interest or penalties incurred, if any, on future unknown or uncertain tax positions taken by the Funds will be recorded as interest expense on the Statements of Operations.
Management is not aware of any tax positions for which it is reasonably possible that the total amounts of unrecognized tax benefits will significantly change in the next twelve months.
Use of Estimates
The preparation of financial statements in conformity with GAAP requires management to make estimates and assumptions that affect the reported amounts of assets and liabilities and disclosure of contingent assets and liabilities at the date of the financial statements and the reported amounts of revenues and expenses during the reporting period. Actual results could differ from these estimates.
3. Investment Valuation
Investments are recorded at fair value. Fair value is defined as the price that would be received to sell an asset or paid to transfer a liability in an orderly transaction between market participants at the measurement date. The valuation techniques employed by the Funds, as described below, maximize the use of observable inputs and minimize the use of unobservable inputs in determining fair value. These inputs are summarized in the following three broad levels:
| | ● | | Level 1 - quoted prices in active markets for identical assets |
| | ● | | Level 2 - other significant observable inputs (including quoted prices of similar securities, interest rates, prepayment speeds, credit risk, etc.) |
| | ● | | Level 3 - significant unobservable inputs (including the Fund’s own assumptions in determining the fair value of investments) |
The inputs or methodology used for valuing securities are not necessarily an indication of the risk associated with investing in those securities. For example, certain short-term debt securities may be valued using amortized cost. Generally, amortized cost approximates the current value of a security, but since this valuation is not obtained from a quoted price in an active market, such securities would be reflected as Level 2 in the fair value hierarchy.
Security prices are generally provided by an approved independent third party pricing service as of the close of the New York Stock Exchange, normally at 4:00 p.m. Eastern Time, each business day on which the share price of the Fund is calculated. Equity securities listed or traded on a primary exchange are valued at the closing price, if available, or the last sales price on the primary exchange. If no sale occurred on the valuation date, the securities will be valued at the latest quotations as of the close of the primary exchange. Investments in other open-end registered investment companies are valued at their respective net asset value as reported by such companies. In these types of situations, valuations are typically categorized as Level 1 in the fair value hierarchy.
Debt and other fixed income securities, if any, are generally valued at an evaluated price provided by an approved independent pricing source. To value debt securities, pricing services may use various pricing techniques, which take into account appropriate factors such as market activity, yield, quality, coupon rate, maturity, type of issue, trading characteristics, call features, credit ratings and other data, as well as broker quotes. Short-term debt securities of sufficient credit quality that mature within sixty days may be valued at amortized cost, which approximates fair value. In each of these situations, valuations are typically categorized as Level 2 in the fair value hierarchy.
The Trustees have designated State Farm Investment Management Corp., as investment adviser to the Funds, as the Funds’ Valuation Designee with responsibility for establishing fair value when the price of a security is not readily available or deemed unreliable (e.g., an approved pricing service does not provide a price, a furnished price is in error, certain stale prices, or an event occurs that materially affects the furnished price). In addition, fair value pricing may be used if events materially affecting the value of foreign securities occur between the time when the exchange on which they are traded closes and the time when the Fund’s net asset value is calculated.
In the fair value situations noted above, while the Trust’s valuation policy is intended to result in a calculation of each Fund’s net asset value that fairly reflects security values as of the time of pricing, the Trust cannot ensure that fair values determined pursuant to these guidelines would accurately reflect the price that a Fund could obtain for a security if it were to dispose of that security as of the time of pricing (for instance, in a forced or distressed sale). The prices used by the Funds may differ from the value that would be realized if the securities were sold, and these differences could be material to the financial statements. Depending on the source and relative significance of the valuation inputs in these instances, the instruments may be classified as Level 2 or Level 3 in the fair value hierarchy.
ADVISERS INVESTMENT TRUST
STATE FARM FUNDS
NOTES TO FINANCIAL STATEMENTS (continued)
September 30, 2023
The following is a summary of the valuation inputs used as of September 30, 2023 in valuing each Fund’s investments based upon the three fair value levels defined above:
| | | | | | | | | | | | | | | | |
Fund | | Level 1 | | | Level 2 | | | Level 3 | | | Total | |
State Farm Growth Fund | | | | | | | | | | | | | | | | |
Investments in Securities: | | | | | | | | | | | | | | | | |
Common Stocks (a) | | $ | 6,390,381,390 | | | $ | — | | | | $— | | | $ | 6,390,381,390 | |
U.S. Treasury Obligations | | | — | | | | 1,429,946 | | | | — | | | | 1,429,946 | |
Short-term Investments | | | 55,512,131 | | | | — | | | | — | | | | 55,512,131 | |
| | | | | | | | | | | | | | | | |
Total Investments in Securities | | | 6,445,893,521 | | | | 1,429,946 | | | | — | | | | 6,447,323,467 | |
| | | | | | | | | | | | | | | | |
Other Financial Instruments | | | | | | | | | | | | | | | | |
Liabilities: | | | | | | | | | | | | | | | | |
Futures Contracts | | | (1,156,499 | ) | | | — | | | | — | | | | (1,156,499 | ) |
| | | | |
State Farm Balanced Fund | | | | | | | | | | | | | | | | |
Investments in Securities: | | | | | | | | | | | | | | | | |
Common Stocks (a) | | | 1,501,107,160 | | | | — | | | | — | | | | 1,501,107,160 | |
Corporate Bonds (a) | | | — | | | | 193,024,891 | | | | — | | | | 193,024,891 | |
Foreign Government Bonds | | | — | | | | 30,554,509 | | | | — | | | | 30,554,509 | |
Agency Securities | | | — | | | | 12,775,450 | | | | — | | | | 12,775,450 | |
Long-term Municipal Bonds | | | — | | | | 721,830 | | | | — | | | | 721,830 | |
U.S. Treasury Obligations | | | — | | | | 395,341,567 | | | | — | | | | 395,341,567 | |
Short-term Investments | | | 29,706,555 | | | | — | | | | — | | | | 29,706,555 | |
| | | | | | | | | | | | | | | | |
Total Investments in Securities | | | 1,530,813,715 | | | | 632,418,247 | | | | — | | | | 2,163,231,962 | |
| | | | | | | | | | | | | | | | |
Other Financial Instruments | | | | | | | | | | | | | | | | |
Liabilities: | | | | | | | | | | | | | | | | |
Futures Contracts | | | (638,622 | ) | | | — | | | | — | | | | (638,622 | ) |
| | | | |
State Farm Interim Fund | | | | | | | | | | | | | | | | |
Investments in Securities: | | | | | | | | | | | | | | | | |
U.S. Treasury Obligations | | | — | | | | 312,566,094 | | | | — | | | | 312,566,094 | |
Short-term Investments | | | 2,991,975 | | | | — | | | | — | | | | 2,991,975 | |
| | | | | | | | | | | | | | | | |
Total Investments in Securities | | | 2,991,975 | | | | 312,566,094 | | | | — | | | | 315,558,069 | |
| | | | | | | | | | | | | | | | |
State Farm Municipal Bond Fund | | | | | | | | | | | | | | | | |
Investments in Securities: | | | | | | | | | | | | | | | | |
Long-term Municipal Bonds | | | — | | | | 517,475,365 | | | | — | | | | 517,475,365 | |
Short-term Investments | | | 25,271,462 | | | | — | | | | — | | | | 25,271,462 | |
| | | | | | | | | | | | | | | | |
Total Investments in Securities | | | 25,271,462 | | | | 517,475,365 | | | | — | | | | 542,746,827 | |
| | | | | | | | | | | | | | | | |
(a) Industry classification is disclosed in the Schedules of Investments.
As of September 30, 2023, there were no Level 3 securities held by the Funds. There were no transfers to or from Level 3 during the year ended September 30, 2023.
61
ADVISERS INVESTMENT TRUST
STATE FARM FUNDS
NOTES TO FINANCIAL STATEMENTS (continued)
September 30, 2023
4. Federal Income Tax
As of September 30, 2023, each Fund’s aggregate unrealized gains and losses for all investments based on cost for federal income tax purposes were as follows:
| | | | | | | | | | | | | | | | | | | | |
Fund | | Cost of Investments for
Federal Tax Purposes | | Gross Unrealized
Appreciation | | Gross Unrealized
(Depreciation) | | Net Unrealized
Appreciation (Depreciation) |
State Farm Growth Fund | | | $ | 1,756,837,001 | | | | $ | 4,712,938,203 | | | | $ | (23,608,237 | ) | | | $ | 4,689,329,966 | |
State Farm Balanced Fund | | | | 999,807,400 | | | | | 1,174,992,843 | | | | | (12,206,903 | ) | | | | 1,162,785,940 | |
State Farm Interim Fund | | | | 332,912,616 | | | | | — | | | | | (17,354,547 | ) | | | | (17,354,547 | ) |
State Farm Municipal Bond Fund | | | | 573,946,783 | | | | | 104,270 | | | | | (31,304,226 | ) | | | | (31,199,956 | ) |
As of the latest tax period ended September 30, 2023, the following Funds had unused capital loss carryforwards available for federal income tax purposes to be applied against future capital gains realized after September 30, 2023, if any. Future capital loss carryforward utilization in any given year may be subject to Internal Revenue Code limitations. If not applied, the capital losses will carryforward indefinitely as follows:
| | | | | | | | | | | | |
| | | | | Unused Non Expiring Capital Loss Carryforwards | |
Fund | | Loss Carryforwards Utilized in 2023 | | Short-term | | | Long-term | | Total | |
State Farm Growth Fund | | $— | | | $24,268,163 | | | $ — | | | $24,268,163 | |
State Farm Interim Fund | | — | | | 2,675,178 | | | 9,600,008 | | | 12,275,186 | |
State Farm Municipal Bond Fund | | — | | | 7,124,051 | | | 5,020,648 | | | 12,144,699 | |
As of the latest tax period ended September 30, 2023, in accordance with federal tax regulations, the components of distributable earnings on a tax basis were as follows:
| | | | | | | | | | | | | | | | | | | | | | | | |
Fund | | Undistributed
Tax Exempt Income | | | Undistributed
Ordinary Income | | | Undistributed
Long-term Gain | | | Unrealized
Appreciation
(Depreciation) | | | Accumulated
Capital and
Other Losses | | | Total | |
State Farm Growth Fund | | | $ — | | | | $33,115,240 | | | | $ — | | | | $4,689,313,102 | | | | $(24,268,163) | | | | $4,698,160,179 | |
State Farm Balanced Fund | | | — | | | | 14,654,870 | | | | 2,913,803 | | | | 1,162,777,756 | | | | — | | | | 1,180,346,429 | |
State Farm Interim Fund | | | — | | | | 642,389 | | | | — | | | | (17,354,547 | ) | | | (12,917,464) | | | | (29,629,622 | ) |
State Farm Municipal Bond Fund | | | 1,591,176 | | | | — | | | | — | | | | (31,199,956 | ) | | | (13,735,751) | | | | (43,344,531 | ) |
The tax character of distributions was designated as follows for the latest tax periods ended September 30, 2023 and September 30, 2022:
| | | | | | | | | | | | | | | | | | | | |
2023 | | Tax-Exempt Income | | Ordinary Income | | Long-term Capital Gain | | Total |
State Farm Growth Fund | | | $ | — | | | | $ | 111,552,599 | | | | $ | — | | | | $ | 111,552,599 | |
State Farm Balanced Fund | | | | — | | | | | 46,037,202 | | | | | 22,992 | | | | | 46,060,194 | |
State Farm Interim Fund | | | | — | | | | | 6,202,900 | | | | | — | | | | | 6,202,900 | |
State Farm Municipal Bond Fund | | | | 14,719,378 | | | | | 1,377,496 | | | | | — | | | | | 16,096,874 | |
| | | | | | | | | | | | | | | | | | | | |
2022 | | Tax-Exempt Income | | Ordinary Income | | Long-term Capital Gain | | Total |
State Farm Growth Fund | | | $ | — | | | | $ | 112,654,247 | | | | $ | 864,718,392 | | | | $ | 977,372,639 | |
State Farm Balanced Fund | | | | — | | | | | 42,657,973 | | | | | 171,634,708 | | | | | 214,292,681 | |
State Farm Interim Fund | | | | — | | | | | 3,981,466 | | | | | 221,545 | | | | | 4,203,011 | |
State Farm Municipal Bond Fund | | | | 15,860,525 | | | | | 197,664 | | | | | 648,565 | | | | | 16,706,754 | |
62
ADVISERS INVESTMENT TRUST
STATE FARM FUNDS
NOTES TO FINANCIAL STATEMENTS (continued)
September 30, 2023
5. Fees and Transactions with Affiliates and Other Parties
Investment Adviser
The Trust, on behalf of the Funds, has entered into an Investment Advisory Agreement (the “Advisory Agreement”) with State Farm Investment Management Corp. (the “Adviser” or “State Farm”), which is registered under the Investment Advisers Act of 1940, (as amended), to provide investment advisory services to the Funds, including oversight of Northern Trust Investments, Inc. (the “Sub-Adviser” or “NTI”). Total fees incurred pursuant to the Advisory Agreement are reflected as “Investment advisory” fees on the Statements of Operations. Under the terms of the Advisory Agreement, the Funds pay the Adviser a monthly fee based on each Fund’s daily net assets at the following annualized rates:
| | | | |
Fund | | Management Fee
(as percentage of
average daily net assets) | |
State Farm Growth Fund | | | 0.10% | |
State Farm Balanced Fund | | | 0.11% | |
State Farm Interim Fund | | | 0.12% | |
State Farm Municipal Bond Fund | | | 0.11% | |
The Advisory Agreement continues for an initial term of two years, and on a year-to-year basis thereafter, provided that continuance is approved at least annually by specific approval of the Board or by vote of the holders of a majority of the outstanding voting securities of each Fund. In either event, it must also be approved by a majority of the Trustees who are neither parties to the Advisory Agreement nor interested persons, as defined in the 1940 Act, at a meeting called for the purpose of voting on such approval. The Advisory Agreement may be terminated as to a particular Fund at any time on 60 days’ written notice, without the payment of any penalty, by the Trust (by vote of the Board or by vote of a majority of the outstanding voting securities of such Fund) or by the Adviser. In the event of its assignment, the Advisory Agreement will terminate automatically.
Expense Limitation Agreement
The Adviser has contractually agreed to waive fees and/or reimburse expenses to the extent necessary to limit the total annual operating expenses of each Fund (excluding brokerage costs, interest, taxes, dividends and other expenses in connection with the short sale of securities, litigation and indemnification expenses, expenses associated with investments in underlying investment companies, and extraordinary expenses as determined under generally accepted principles) to amounts specified in the table below:
| | | | |
Fund | | Expense Limitation | |
State Farm Growth Fund | | | 0.12% | |
State Farm Balanced Fund | | | 0.14% | |
State Farm Interim Fund | | | 0.16% | |
State Farm Municipal Bond Fund | | | 0.16% | |
The expense limitation agreement is effective until January 28, 2025 for the Funds at which time it will be subject to automatic renewal upon the effective date of the Funds’ registration statement. If it becomes unnecessary for the Adviser to waive fees or make reimbursements, the Adviser may recapture any of its prior waivers or reimbursements for a period not to exceed three years from the date on which the waiver or reimbursement was made to the extent that such a recapture does not cause the total annual fund operating expenses (excluding brokerage costs, interest, taxes, dividends and other expenses in connection with the short sale of securities, litigation and indemnification expenses, expenses associated with investments in underlying investment companies, and extraordinary expenses) to exceed the lesser of the current expense limitation or the applicable expense limitation that was in effect at the time of the waiver or reimbursement. The agreement to waive fees and reimburse expenses may be terminated by the Board at any time and will terminate automatically upon termination of the Advisory Agreement.
63
ADVISERS INVESTMENT TRUST
STATE FARM FUNDS
NOTES TO FINANCIAL STATEMENTS (continued)
September 30, 2023
The balances of recoverable expenses to State Farm by the Funds at September 30, 2023 were as follows:
| | | | | | | | | | | | |
| | | Expiring | |
Fund | | 2024 | | | 2025 | | | 2026 | |
State Farm Growth Fund | | $ | 267,169 | | | $ | 2,447,711 | | | $ | 2,385,389 | |
State Farm Balanced Fund | | | 99,813 | | | | 837,229 | | | | 816,185 | |
State Farm Interim Fund | | | 41,335 | | | | 241,310 | | | | 249,606 | |
State Farm Municipal Bond Fund | | | 28,333 | | | | 127,994 | | | | 157,992 | |
Investment Sub-Adviser
NTI serves as the Sub-Adviser to the Funds. For its services to the Funds, NTI does not directly receive a fee from the Funds. NTI receives a fee from the Adviser which is computed and accrued daily and paid monthly as follows:
| | | | |
| | | Management Fee | |
Fund | | (as percentage of average daily net assets) | |
State Farm Growth Fund | | | 0.085% | |
State Farm Balanced Fund | | | 0.080% | |
State Farm Interim Fund | | | 0.075% | |
State Farm Municipal Bond Fund | | | 0.080% | |
The Sub-Adviser is responsible for the day-to-day investment management of the Funds’ assets, including making investment decisions and placing orders for the purchase and sale of securities for the Funds directly with the issuers or with brokers or dealers selected by the Sub-Adviser in its discretion. The investment advisory services of the Sub-Adviser are not exclusive under the terms of its sub-advisory agreement. The Sub-Adviser is free to render investment advisory services to others. The Sub-Adviser also furnishes to the Adviser and to the Board, which has overall responsibility for the business and affairs of the Trust, periodic reports on its services and the investment performance of the Funds.
Distribution Agreement
Foreside Financial Services, LLC (the “Distributor”), provides distribution services to the Funds pursuant to a distribution agreement with the Trust. Under its agreement with the Trust, the Distributor acts as an agent of the Trust in connection with the offering of the shares of the Funds on a continuous basis. The Distributor has no obligation to sell any specific quantity of Fund shares. The Distributor, and its officers, have no role in determining each Fund’s investment policies or which securities to buy or sell. The Adviser, at its own expense, pays the Distributor a fee for distribution-related services.
Custody, Transfer Agency, and Fund Administration and Accounting Services Agreements with the Northern Trust Company
The Northern Trust Company (“Northern Trust”) serves as the administrator, transfer agent, custodian, and fund accounting agent for the Funds pursuant to written agreements between the Trust, on behalf of the Funds, and Northern Trust. The Funds have agreed to pay Northern Trust certain annual and transaction-based fees, a tiered basis-point fee based on each Fund’s daily net assets, subject to a minimum annual fee relating to these services, and reimburse for certain expenses incurred on behalf of the Funds as well as other charges for additional service activities. Total fees paid to Northern Trust pursuant to these agreements are reflected as “Accounting and Administration” fees on the Statements of Operations.
Services Agreement with Foreside Fund Officer Services, LLC
Foreside Fund Officer Services, LLC (“Foreside”, d/b/a ACA Group) provides compliance and financial control services for the Funds pursuant to a written agreement with the Trust on behalf of the Funds, including providing certain officers to the Funds. The Funds pay Foreside an annual base fee, a basis-point fee based on each Fund’s daily net assets and reimburses for certain expenses incurred on behalf of the Fund. Total fees paid to Foreside pursuant to this agreement are reflected as “Regulatory and Compliance” fees on the Statements of Operations.
Trustee Compensation
Officers of the Trust receive no compensation directly from the Funds for serving in their respective roles. The Trust has no retirement or pension plans. Through March 31, 2023, the Trust paid an annual retainer of $125,000 and reimbursement for certain expenses to each Trustee who is not an “interested person,” as that term is defined in the 1940 Act (each, an “Independent Trustee” and, collectively, the “Independent Trustees”). Effective April 1, 2023, the Trust pays an annual retainer of $132,000 and reimbursement for certain expenses. If there are more than six meetings in a year, additional meeting fees may apply. For the year ended September 30, 2023, the aggregate Independent Trustee compensation paid by the Trust was
64
ADVISERS INVESTMENT TRUST
STATE FARM FUNDS
NOTES TO FINANCIAL STATEMENTS (continued)
September 30, 2023
$416,750. The amount of total Trustee compensation and reimbursement of out-of pocket expenses allocated from the Trust to the Funds are reflected as “Trustees’ fees and expenses” on the Statements of Operations.
6. Investment Transactions
For the year ended September 30, 2023, investment transactions (exclusive of futures contracts and short-term instruments) were as follows:
| | | | | | | | | | | | | | | | | | | | |
Fund | | Purchases (excluding U.S.
Government Obligations) | | Sales/Maturities (excluding U.S.
Government Obligations) | | Purchases of U.S.
Government Obligations | | Sales/Maturities of U.S.
Government Obligations |
State Farm Growth Fund | | | $ | 1,417,465,721 | | | | $ | 1,598,062,911 | | | | $ | — | | | | $ | — | |
State Farm Balanced Fund | | | | 440,110,854 | | | | | 532,599,730 | | | | | 369,873,914 | | | | | 354,981,177 | |
State Farm Interim Fund | | | | — | | | | | — | | | | | 132,125,590 | | | | | 184,595,873 | |
| State Farm Municipal Bond Fund | | | | 88,160,054 | | | | | 119,294,961 | | | | | — | | | | | — | |
7. Derivative Instruments
Information concerning the types of derivatives in which the Funds invest, the objectives for using them and their related risks can be found in Note 2.
Below are the types of derivatives by primary risk exposure as presented in the Statements of Assets and Liabilities as of September 30, 2023:
| | | | | | | | | | | | | | |
| | | | | Assets | | | Liabilities | |
Fund | | Contract Type | | Statements of
Assets Location | | Value | | | Statements of
Liabilities Location | | Value | |
| State Farm Growth Fund | | Equity risk | | Net Assets - Net unrealized appreciation | | | $— | | | Net Assets - Net unrealized depreciation | | $ | (1,156,499 | )* |
| State Farm Balanced Fund | | Equity risk | | Net Assets - Net unrealized appreciation | | | — | | | Net Assets - Net unrealized depreciation | | | (638,622 | )* |
*Includes cumulative appreciation/depreciation on future contracts as reported in the Schedule of Investments’ footnotes. Only the current day’s variation margin is separately reported within the Statements of Assets and Liabilities.
The following tables set forth, by primary risk exposure, the Funds’ realized gains (losses) and change in unrealized appreciation (depreciation) by type of derivative contract for the fiscal year ended September 30, 2023:
| | | | | | | | |
| | | | | Amount of Realized Gain (Loss) on Derivative Contracts | |
Fund | | Contract Type | | Statements of Operations Location | | Value | |
State Farm Growth Fund | | Equity risk | | Net realized gain (loss) on futures contracts | | $ | 1,350,575 | |
State Farm Balanced Fund | | Equity risk | | Net realized gain (loss) on futures contracts | | | 1,017,560 | |
| | | | | | | | |
| | | | | Change in Unrealized Appreciation (Depreciation) on Derivative Contracts | |
Fund | | Contract Type | | Statements of Operations Location | | Value | |
State Farm Growth Fund | | Equity risk | | Change in net unrealized appreciation (depreciation) on futures contracts | | $ | 2,988,909 | |
State Farm Balanced Fund | | Equity risk | | Change in net unrealized appreciation (depreciation) on futures contracts | | | 250,520 | |
Volume of derivative activity for the fiscal year ended September 30, 2023:*
| | | | |
| | | Equity Contracts |
Fund | | Number of Trades | | Average Notional Amount |
State Farm Growth Fund | | 21 | | $14,989,537 |
State Farm Balanced Fund | | 23 | | 5,570,203 |
*Activity for the fiscal year is measured by number of trades during the fiscal year and average notional amount for futures equity contracts.
65
ADVISERS INVESTMENT TRUST
STATE FARM FUNDS
NOTES TO FINANCIAL STATEMENTS (continued)
September 30, 2023
8. Principal Investment Risks
Investing in a Fund may involve certain risks including, but not limited to, those described below. Please refer to the Funds’ prospectus and statement of additional information for more information on risks associated with investing in the Funds.
Management Risk
The assessment by the Sub-Adviser of the securities to be purchased or sold by the Funds may prove incorrect, resulting in losses or poor performance, even in a rising market. This may be as a result of the factors used by the Sub-Adviser in building a multifactor quantitative model. Whenever a model is used, there is also a risk that the model will not work as planned. In addition, there may be periods when quality investing is out of favor and during which time the Funds’ performance may suffer.
Market Risk
The risk that the value of the Funds’ investments may increase or decrease in response to expected, real or perceived economic, political or financial events in the U.S. or global markets. The frequency and magnitude of such changes in value cannot be predicted. The increasing interconnectivity between global economies and financial markets increases the likelihood that events or conditions in one region or financial market may adversely impact issuers in a different country, region or financial market. Political events, including armed conflict, tariffs and economic sanctions also contribute to market volatility. Securities in the Funds’ portfolio may underperform due to inflation (or expectations for inflation), interest rates, global demand for particular products or resources, natural disasters, pandemics (including COVID-19), epidemics, climate change and climate-related events, terrorism, regulatory events and governmental or quasi-governmental actions.
Tracking Risk
The Sub-Adviser invests in fixed income securities to try to duplicate the investment composition and performance of a Fund’s respective index. There is a risk that a Fund’s performance may vary substantially from the performance of its respective index as a result of share purchases and redemptions, transaction costs, expenses and other factors.
Liquidity Risk
The Sub-Adviser may have difficulty selling securities the Funds hold at the time it would like to sell, and at the value the Funds have placed on those securities.
High Yield Risk
High yield securities and unrated securities of similar credit quality (securities rated below investment grade, commonly known as “junk bonds”) are subject to greater levels of credit, call, and liquidity risks. High yield securities are considered primarily speculative with respect to the issuer’s continuing ability to make principal and interest payments and may be more volatile than higher-rated securities of similar maturity.
Long-term Ownership Strategy Risk
The Funds’ investment approach generally emphasizes buying and holding securities over long periods. As such, the Funds could continue to hold certain securities through adverse cycles for those securities rather than selling them, which could cause the Funds to underperform compared to a fund that has invested in similar securities but actively shifts its portfolio assets to take advantage of market opportunities and that does not seek reduced portfolio turnover.
Tax Risk
The Funds’ long-term ownership strategy historically has resulted in a low rate of turnover in its portfolio. Therefore, the Funds have accumulated a large amount of unrealized capital gains, and distribution of such gains to shareholders may be larger than the capital gain distributions made by other similar mutual funds. Should the Sub-Adviser sell any appreciated assets in the Funds, shareholders generally will receive their proportional share of the resulting realized capital gains regardless of how long they owned such shares. As a result, unless you are purchasing shares of the Funds through a tax-advantaged account (such as an IRA), buying shares at a time when the Funds have unrealized gains might eventually cost you money in taxes.
Large Cap Risk
The risk that returns on investments in stocks of large companies could trail the returns on investments in stocks of smaller and mid-sized companies.
Mid Cap Stock Risk
The risk that stocks of mid-sized companies may be subject to more abrupt or erratic market movements than stocks of larger, more established companies, and may lack sufficient market liquidity. Generally, the smaller the company size, the greater the risk.
66
ADVISERS INVESTMENT TRUST
STATE FARM FUNDS
NOTES TO FINANCIAL STATEMENTS (continued)
September 30, 2023
Interest Rate Risk
The risk that during periods of rising interest rates, the Funds’ yield (and the market value of its securities) will tend to be lower than prevailing market rates; in periods of falling interest rates, the Funds’ yield (and the market value of its securities) will tend to be higher. Securities with longer maturities tend to be more sensitive to changes in interest rates, causing them to be more volatile than securities with shorter maturities. Securities with shorter maturities tend to provide lower returns and be less volatile than securities with longer maturities.
Prepayment (or Call) Risk
The risk that an issuer could exercise its right to pay principal on an obligation held by the Funds (such as an asset-backed security) earlier than expected. The exercise of such right may result in a decreased rate of return and a decline in value of those obligations and, accordingly, a decline in the Funds’ net asset value.
U.S. Government Securities Risk
The risk that the U.S. government will not provide financial support to its agencies, instrumentalities or sponsored enterprises if it is not obligated to do so by law. Certain U.S. government securities purchased by the Funds are neither issued nor guaranteed by the U.S. Treasury and, therefore, may not be backed by the full faith and credit of the United States.
Municipal Securities Risks
The municipal market can be significantly affected by adverse tax, legislative, political or public health changes and the financial condition of issuers of municipal securities. In recent years an increasing number of municipal issuers have defaulted on obligations, been downgraded or commenced insolvency proceedings. The Funds may be more sensitive to adverse economic, business, political or public health developments if it invests more than 25% of its assets in the debt securities of similar projects (such as those relating to education, health care, housing, transportation, and utilities), industrial development bonds, or in particular types of municipal securities (such as general obligation bonds, private activity bonds and moral obligation bonds). While interest earned on municipal securities is generally not subject to federal tax, any interest earned on taxable municipal securities is fully taxable at the federal level and may be subject to tax at the state level. Municipal securities may be fully or partially backed or enhanced by the taxing authority of a local government, by the current or anticipated revenues from a specific project or specific assets, or by the credit of, or liquidity enhancement provided by, a private issuer. Special factors, such as legislative changes, and state and local economic and business developments, may adversely affect the yield and/or value of the Fund’s investments in municipal securities. For example, the adverse events mentioned above can significantly stress the financial resources of many municipal issuers, which may impair a municipal issuer’s ability to meet its financial obligations and could adversely impact the value of its bonds, which in turn could negatively impact the performance of the Funds. The secondary market for municipal obligations also tends to be less well developed and less liquid than many other securities markets, which may limit the Funds’ ability to sell its municipal obligations at attractive prices.
Credit (or Default) Risk
The risk that the inability or unwillingness of an issuer or a counterparty to meet its principal or interest payments or other financial obligations will adversely affect the value of the Funds’ investments and their returns. The credit quality of a debt security or of the issuer of a debt security held by the Funds could deteriorate rapidly, which may impair the Funds’ liquidity or cause a deterioration in the Funds’ net asset value.
Debt Extension Risk
The risk that an issuer will exercise its right to pay principal on an obligation held by the Funds later than expected. Under these circumstances, the value of the obligation will decrease.
Inflation Risk
The risk that the value of the assets or income from an investment will be worth less in the future as inflation decreases the value of money.
Income Risk
The risk that the income from the bonds the Funds holds will decline. This risk applies when the Funds invest the proceeds from new share sales, or from matured or called bonds, at market interest rates that are below the portfolio’s current earnings rate.
Valuation Risk
The risk that the sale price the Funds could receive for a portfolio security may differ from the Funds’ valuation of the security, particularly for securities that trade in low volume or volatile markets or that are valued using a fair value methodology. Fair valuation of the Funds’ investments involves subjective judgment. The Funds’ ability to value their investments may be impacted by technological issues and/or errors by pricing services
67
ADVISERS INVESTMENT TRUST
STATE FARM FUNDS
NOTES TO FINANCIAL STATEMENTS (continued)
September 30, 2023
or other third-party service providers. In addition, the value of the securities in the Funds’ portfolios may change on days when shareholders will not be able to purchase or sell the Funds’ shares.
Stock Index Futures Risk
The risk arising from the Funds’ use of futures and includes: the risk that there will be imperfect correlation between the change in market value of the Funds’ securities and the price of futures contracts; the possible inability of the Funds to close a futures contract when desired; losses due to unanticipated market movements, which potentially are unlimited; and the possible inability of the Funds’ investment sub-adviser to correctly predict the direction of securities prices, interest rates, currency exchange rates and other economic factors.
Geographic and Sector Risk
The risk that if a Fund invests a significant portion of its total assets in certain issuers within the same state, geographic region or economic sector, an adverse economic, business or political development affecting that state, region or sector may affect the value of the Fund’s investments more, and the Fund’s investments may be more volatile, than if its investments were not so concentrated in such geographic region or economic sector.
68
Report of Independent Registered Public Accounting Firm
To the Board of Trustees of Advisers Investment Trust and Shareholders of State Farm Growth Fund, State Farm Balanced Fund, State Farm Interim Fund and State Farm Municipal Bond Fund
Opinions on the Financial Statements
We have audited the accompanying statements of assets and liabilities, including the schedules of investments, of State Farm Growth Fund, State Farm Balanced Fund, State Farm Interim Fund and State Farm Municipal Bond Fund (four of the funds constituting Advisers Investment Trust, hereafter collectively referred to as the “Funds”) as of September 30, 2023, the related statements of operations for the year ended September 30, 2023, the statements of changes in net assets for each of the two years in the period ended September 30, 2023, including the related notes, and the financial highlights for each of the periods indicated therein (collectively referred to as the “financial statements”). In our opinion, the financial statements present fairly, in all material respects, the financial position of each of the Funds as of September 30, 2023, the results of each of their operations for the year then ended, the changes in each of their net assets for each of the two years in the period ended September 30, 2023 and each of the financial highlights for each of the periods indicated therein in conformity with accounting principles generally accepted in the United States of America.
Basis for Opinions
These financial statements are the responsibility of the Funds’ management. Our responsibility is to express an opinion on the Funds’ financial statements based on our audits. We are a public accounting firm registered with the Public Company Accounting Oversight Board (United States) (PCAOB) and are required to be independent with respect to the Funds in accordance with the U.S. federal securities laws and the applicable rules and regulations of the Securities and Exchange Commission and the PCAOB.
We conducted our audits of these financial statements in accordance with the standards of the PCAOB. Those standards require that we plan and perform the audit to obtain reasonable assurance about whether the financial statements are free of material misstatement, whether due to error or fraud.
Our audits included performing procedures to assess the risks of material misstatement of the financial statements, whether due to error or fraud, and performing procedures that respond to those risks. Such procedures included examining, on a test basis, evidence regarding the amounts and disclosures in the financial statements. Our audits also included evaluating the accounting principles used and significant estimates made by management, as well as evaluating the overall presentation of the financial statements. Our procedures included confirmation of securities owned as of September 30, 2023 by correspondence with the custodian and brokers; when replies were not received from brokers, we performed other auditing procedures. We believe that our audits provide a reasonable basis for our opinions.
/s/ PricewaterhouseCoopers LLP
Chicago, Illinois
November 17, 2023
We have served as the auditor of one or more investment companies in Advisers Investment Trust since 2011.
69
ADVISERS INVESTMENT TRUST
STATE FARM FUNDS
FEDERAL INCOME TAX INFORMATION
September 30, 2023 (Unaudited)
The following information is provided as required by the Internal Revenue Code for dividends paid by each Fund during the year ended September 30, 2023.
| | | | | | | | |
| | | | | | Total Distributions | |
| | | Total Qualified | | | Qualifying for the | |
Fund | | Dividend Income Distributed | | | Dividends-Received Deduction | |
State Farm Growth Fund | | | $111,552,599 | | | | $105,909,722 | |
State Farm Balanced Fund | | | 26,620,610 | | | | 25,101,873 | |
State Farm Interim Fund | | | — | | | | — | |
State Farm Municipal Bond Fund | | | — | | | | — | |
Shareholders are advised to consult their own tax advisor with respect to the tax consequences of their investment in the Funds. Individual shareholders should refer to their Form 1099 to determine the amounts to be included on their federal income tax return.
DISTRIBUTION INFORMATION
For purposes of Section 19 of the 1940 Act, the Funds estimated the periodic sources of any dividends paid during the period covered by this report in accordance with good accounting practice. The State Farm Balanced Fund did not issue a Section 19(a) notice because at the time the Fund did not believe that such a notice was necessary. Pursuant to Rule 19a-1(e) under the 1940 Act, the information in the table below includes the sources of the State Farm Balanced Fund’s distributions paid on record date June 22, 2023. Please note that the information in the table below is for financial accounting purposes only. Form 1099-DIV received by shareholders for the calendar year specifies how shareholders should characterize and report distributions paid by the Fund during the year for U.S. federal income tax purposes.
The Fund’s distributions were paid from:
| | | | | | | | |
| | | Record Date | | | Ordinary Income | | Long-term Capital Gains |
State Farm Balanced Fund | | | June 22, 2023 | | | .883067 | | .000880 |
ADVISERS INVESTMENT TRUST
STATE FARM FUNDS
PORTFOLIO SUMMARY
September 30, 2023 (Unaudited)
State Farm Growth Fund
Fund Composition*
| | * | Illustrated by Sector and based on total net assets as of September 30, 2023. Please refer to the Schedule of Investments in this report for details concerning Fund holdings. |
State Farm Balanced Fund
Fund Composition*
| | * | Illustrated by Type of Security and based on total net assets as of September 30, 2023. Please refer to the Schedule of Investments in this report for details concerning Fund holdings. |
71
ADVISERS INVESTMENT TRUST
STATE FARM FUNDS
PORTFOLIO SUMMARY (continued)
September 30, 2023 (Unaudited)
State Farm Interim Fund
Fund Composition*
| | * | Illustrated by Maturity and based on total net assets as of September 30, 2023. Please refer to the Schedule of Investments in this report for details concerning Fund holdings. |
| | ** | Includes a 0.23% allocation for net other assets/liabilities. |
State Farm Municipal Bond Fund
Fund Composition*
| | * | Illustrated by Maturity and based on total net assets as of September 30, 2023. Please refer to the Schedule of Investments in this report for details concerning Fund holdings. |
| | ** | Includes a 0.93% allocation for net other assets/liabilities |
72
ADVISERS INVESTMENT TRUST
STATE FARM FUNDS
EXPENSE EXAMPLES
September 30, 2023 (Unaudited)
As a Fund shareholder, you may incur two types of costs: (1) transaction costs, and (2) ongoing costs, including management fees and other Fund expenses. The examples below are intended to help you understand your ongoing costs (in dollars) of investing in the Funds and to compare these costs with the ongoing costs of investing in other mutual funds. Please note that the expenses shown in the tables are meant to highlight your ongoing costs only and do not reflect any transactional costs. Therefore, the examples are useful in comparing ongoing costs only and will not help you determine the relative total cost of owning different funds. In addition, if these transactional costs were included, your costs would have been higher.
The examples below are based on an investment of $1,000 invested at April 1, 2023 and held for the entire period through September 30, 2023.
The Actual Expense Example below provides information about actual account values and actual expenses. You may use this information, together with the amount you invested, to estimate the expenses that you paid over the period. Simply divide your account value by $1,000 (for example, an $8,600 account value divided by $1,000 = 8.6), then multiply the result by the number in the table under the heading entitled “Expenses Paid” to estimate the expenses you paid on your account during this period.
The Hypothetical Expense Example below provides information about hypothetical account values and hypothetical expenses based on a Fund’s actual expense ratio and an assumed rate of return of 5% per year before expenses, which is not a Fund’s actual return. The hypothetical account values and expenses may not be used to estimate the actual ending account balance or expenses you paid for the period. You may use this information to compare the ongoing costs of investing in the Funds and other funds. To do so, compare this 5% hypothetical example with the 5% hypothetical examples that appear in the shareholder reports of the other funds.
| | | | | | | | | | | | | | | | | | | | |
| | | | | | | Annualized Expense | | |
| | | | | | | Ratio Based | | Expenses Paid |
| | | Beginning | | Ending | | on the Period | | During Period |
| | | Account Value | | Account Value | | April 01, 2023 to | | April 01, 2023 to |
| | | April 01, 2023 | | September 30, 2023 | | September 30, 2023 | | September 30, 2023* |
| | | | |
State Farm Growth Fund | | | | | | | | | | | | | | | | | | | | |
| | | | |
Actual | | | | $1,000.00 | | | | | $1,039.30 | | | | | 0.12 | % | | | | $0.61 | |
| | | | |
Hypothetical (5% return before expenses) | | | | $1,000.00 | | | | | $1,024.47 | | | | | 0.12 | % | | | | $0.61 | |
| | | | |
State Farm Balanced Fund | | | | | | | | | | | | | | | | | | | | |
| | | | |
Actual | | | | $1,000.00 | | | | | $1,026.10 | | | | | 0.14 | % | | | | $0.71 | |
| | | | |
Hypothetical (5% return before expenses) | | | | $1,000.00 | | | | | $1,024.37 | | | | | 0.14 | % | | | | $0.71 | |
| | | | |
State Farm Interim Fund | | | | | | | | | | | | | | | | | | | | |
| | | | |
Actual | | | | $1,000.00 | | | | | $ 992.20 | | | | | 0.16 | % | | | | $0.80 | |
| | | | |
Hypothetical (5% return before expenses) | | | | $1,000.00 | | | | | $1,024.27 | | | | | 0.16 | % | | | | $0.81 | |
| | | | |
State Farm Municipal Bond Fund | | | | | | | | | | | | | | | | | | | | |
| | | | |
Actual | | | | $1,000.00 | | | | | $ 963.70 | | | | | 0.16 | % | | | | $0.79 | |
| | | | |
Hypothetical (5% return before expenses) | | | | $1,000.00 | | | | | $1,024.27 | | | | | 0.16 | % | | | | $0.81 | |
| * | Expenses are calculated using the applicable Fund’s annualized expense ratio (as disclosed in the table), multiplied by the average account value for the period, multiplied by the number of days in the most recent half fiscal year (183), and divided by the number of days in the current year (365). |
73
ADVISERS INVESTMENT TRUST
STATE FARM FUNDS
MANAGEMENT INFORMATION
September 30, 2023 (Unaudited)
Trustees & Officers
The following table provides information regarding each Independent Trustee.
| | | | | | | | | | |
| | | | | | | | | Number of | | Other |
| | | | | | | | | Portfolios | | Directorships |
| | | | | | | | | in | | Held by |
| | | Position(s) | | Term of Office/ | | | | the Trust | | Trustee |
| Name, Address, and | | Held with | | Length of | | Principal Occupation(s) During | | Overseen | | During Past 5 |
Year of Birth1 | | the Trust | | Time Served | | Past 5 Years | | by Trustee | | Years |
| | | | | |
Robert Gordon Year of Birth: 1961 | | Trustee | | Indefinite/January 2022 to present | | Independent Director, VAM Funds Luxembourg, 2018 to present; Independent Director, Anchor Capital Advisors, 2020 to present; Independent Director, Trust Company of Illinois, 2019 to 2021; President and Chief Executive Officer, Driehaus Capital Management, 2006 to 2017. | | 9 | | VAM Funds Luxembourg, Anchor Capital Advisors, Trust Company of Illinois |
| | | | | |
D’Ray Moore Year of Birth: 1959 | | Trustee | | Indefinite/July, 2011 to present | | Independent Trustee, Diamond Hill Funds, 2007 to 2022; Chairperson, Diamond Hill Funds, 2014 to 2022. | | 9 | | Diamond Hill Funds (retired 2022) |
| | | | | |
Steven R. Sutermeister Year of Birth: 1954 | | Trustee | | Indefinite/July, 2011 to present | | President, Vadar Capital LLC, 2008 to 2017. | | 9 | | None |
| 1 | The mailing address of each Trustee is 50 S. LaSalle Street, Chicago, IL 60603. |
74
ADVISERS INVESTMENT TRUST
STATE FARM FUNDS
MANAGEMENT INFORMATION (continued)
September 30, 2023 (Unaudited)
The following table provides information regarding each officer of the Trust.
| | | | | | | | | | |
| | | | | | | | | Number of | | Other |
| | | | | | | | | Portfolios | | Directorships |
| | | | | | | | | in | | Held by |
| | | Position(s) | | Term of Office/ | | | | the Trust | | Trustee |
| Name, Address and | | Held with | | Length of | | Principal Occupation(s) During | | Overseen | | During Past 5 |
Year of Birth1 | | the Trust | | Time Served | | Past 5 Years | | by Trustee | | Years |
| | | | | |
Barbara J. Nelligan Year of Birth: 1969 | | President | | Indefinite/August 2017 to present | | Senior Vice President, Global Fund Services Fund Governance Solutions, The Northern Trust Company, 2018 to present; Senior Vice President, Global Fund Services Product Management, The Northern Trust Company, 2007 to 2018. | | N/A | | N/A |
| | | | | |
Rodney L. Ruehle Year of Birth: 1968 | | Chief Compliance Officer and AML Officer | | Indefinite/March 2019 to present | | Senior Principal Consultant, ACA Group, 2022 to present; Director, Foreside Fund Officer Services, LLC (formerly Foreside Compliance Services, LLC) (financial services), 2016 to 2022. | | N/A | | N/A |
| | | | | |
Kara M. Schneider Year of Birth: 1973 | | Secretary | | Indefinite/March 2023 to present | | Second Vice President, Global Fund Services Fund Governance Solutions, The Northern Trust Company, 2021 to present; Manager, Ultimus Fund Solutions LLC, 2017 to 2021; Assistant Secretary of Advisers Investment Trust, 2021 to March 2023 | | N/A | | N/A |
| | | | | |
Troy A. Sheets Year of Birth: 1971 | | Treasurer | | Indefinite/January 2022 to present | | Senior Principal Consultant, ACA Group, 2022 to present; Senior Director, Foreside Fund Officer Services, LLC, 2016 to 2022; Treasurer of Advisers Investment Trust, 2011 to May 2021; Assistant Treasurer of Advisers Investment Trust, May 2021 to December 2021. | | N/A | | N/A |
| | | | | |
Tracy L. Dotolo Year of Birth: 1976 | | Assistant Treasurer | | Indefinite/January 2022 to present | | Senior Principal Consultant, ACA Group, 2022 to present; Director, Foreside Fund Officer Services, LLC, 2016 to 2022; Treasurer of Advisers Investment Trust, May 2021 to December 2021 | | N/A | | N/A |
| | | | | |
Stefania C. Suciu Year of Birth: 1979 | | Assistant Secretary | | Indefinite/March 2023 to present | | Second Vice President, Global Fund Services Fund Governance Solutions, The Northern Trust Company, 2015 to present. | | N/A | | N/A |
1The mailing address of Messrs. Ruehle and Sheets and Ms. Dotolo is 3 Canal Plaza, Suite 100, Portland, ME 04101. The mailing address of Mses. Nelligan, Schneider, and Suciu is 333 S. Wabash Avenue, Chicago, IL 60604.
The Funds’ Statement of Additional Information includes additional information about the Trust’s Trustees and Officers. To receive your free copy of the Statement of Additional Information, call toll-free 866-342-2418 or 312-557-7940.
75
STATE FARM FUNDS
(Series of the Advisers Investment Trust)
NOTICE OF PRIVACY POLICY & PRACTICES
SAFEGUARDING PRIVACY
The Funds recognizes and respects the privacy concerns and expectations of our customers1. We are committed to maintaining the privacy and security of the personal confidential information we collect about you. We provide this notice so that you will know what kinds of information we collect and the circumstances in which that information may be disclosed to third parties.
INFORMATION WE COLLECT AND SOURCES OF INFORMATION
We collect nonpublic personal information about our customers from the following sources:
| ● | | Account Applications and other forms, which may include a customer’s name, address, social security number, and information about a customer’s investment goals and risk tolerance; |
| ● | | Account History, including information about the transactions and balances in a customer’s account(s); and |
| ● | | Correspondences including written, telephonic or electronic between a customer and the Funds or service providers to the Funds. |
INFORMATION WE SHARE WITH SERVICE PROVIDERS
The Funds may disclose all non-public personal information we collect, as described above, to companies that perform services on our behalf, including those that assist us in responding to inquiries, processing transactions, preparing and mailing account statements and other forms of shareholder services, provided they use the information solely for these purposes and they enter into a confidentiality agreement regarding the information. The Funds also may disclose non-public personal information as otherwise permitted by law.
SAFEGUARDING CUSTOMER INFORMATION
We will safeguard, according to federal standards of security and confidentiality, any non-public personal information our customers share with us.
We require service providers to the Funds:
| ● | | to maintain policies and procedures designed to assure only appropriate access to, and use of information about customers of the Funds; and |
| ● | | to maintain physical, electronic and procedural safeguards that comply with federal standards to guard nonpublic personal information of customers of the Funds. |
We will adhere to the policies and practices described in this notice regardless of whether you are a current or former shareholder of the Funds.
1 For purposes of this notice, the term “customer” or “customers” include individuals who provide nonpublic personal information to the Funds, but do not invest in Fund shares.
76
[THIS PAGE INTENTIONALLY LEFT BLANK]
[THIS PAGE INTENTIONALLY LEFT BLANK]
Investment Adviser
State Farm Investment Management Corp.
One State Farm Plaza, B-2
Bloomington, IL 61710
Investment Sub-Adviser
Northern Trust Investments, Inc.
50 South LaSalle Street
Chicago, IL 60603
Custodian
The Northern Trust Company
50 South LaSalle Street
Chicago, IL 60603
Independent Registered Public
Accounting Firm
PricewaterhouseCoopersLLP
One North Wacker
Chicago, IL 60606
Legal Counsel
Thompson Hine LLP
41 South High Street, Suite 1700
Columbus, OH 43215-6101
Distributor
Foreside Financial Services, LLC
3 Canal Plaza, Suite 100
Portland, ME 04101
For Additional Information, call
800-447-0740 (toll free), 866-342-2418 (toll free) or 501-255-1812
SF 9/23

VONTOBEL U.S. EQUITY INSTITUTIONAL FUND
ANNUAL REPORT
September 30, 2023
This report is submitted for the general information of the shareholders of the Vontobel U.S. Equity Institutional Fund (the “Fund”). It is not authorized for the distribution to prospective investors unless preceded or accompanied by an effective prospectus.
ADVISERS INVESTMENT TRUST
VONTOBEL U.S. EQUITY INSTITUTIONAL FUND
TABLE OF CONTENTS
September 30, 2023
ADVISERS INVESTMENT TRUST
VONTOBEL U.S. EQUITY INSTITUTIONAL FUND
PORTFOLIO COMMENTARY
September 30, 2023 (Unaudited)
Vontobel U.S. Equity Institutional Fund
Value of a hypothetical $1,000,000 investment in the Fund Class I Shares from inception on March 27, 2018 to September 30, 2023
Average Annual Total Returns as of September 30, 2023
| | | | | | | | | | |
| | | | | | |
| | | One Year
Return | | Five Year
Return | | Since Inception
Return | | Gross Expense
Ratio * | | Net Expense
Ratio * |
| | | | | | |
Vontobel U.S. Equity Institutional Fund – Class I | | 26.15% | | 10.25% | | 11.45% | | 2.74% | | 0.65% |
| | | | | | |
S&P 500 Index | | 21.62% | | 9.92% | | 11.33% | | - | | - |
Data as of September 30, 2023. The Fund’s performance reflects the reinvestment of dividends as well as the impact of transaction costs and the deduction of fees and expenses. The performance does not reflect taxes that a shareholder would pay on Fund distributions or on the redemption of Fund shares.
The Fund commenced operations on March 27, 2018.
* Expense ratios are per the most recent Fund Prospectus dated January 28, 2023. The Adviser has entered into a contractual expense limitation agreement with respect to the Fund until January 28, 2024.
The performance data quoted represents past performance; past performance does not guarantee future results. The investment return and principal value of an investment will fluctuate so that an investor’s shares, when redeemed, may be worth more or less than their original cost. The Fund’s current performance may be lower or higher than the performance data quoted. Investors may obtain performance information current to the most recent month-end, within 7 business days, by calling 866-252-5393 or 312-630-6583.
The Fund’s benchmark for performance comparison purposes is the Standard and Poor’s (“S&P”) 500 Index which is an unmanaged index consisting of securities listed on exchanges in the United States of America. The index is calculated on a total return basis with dividends reinvested, but does not reflect fees, brokerage commissions, or other investment expenses, and is expressed in U.S. Dollars. The table reflects the theoretical reinvestment of dividends on securities in the index. The impact of transaction costs and the deduction of expenses associated with a mutual fund, such as investment management and administration fees, are not reflected in the index calculations. It is not possible to invest directly in an index.
1
ADVISERS INVESTMENT TRUST
VONTOBEL U.S. EQUITY INSTITUTIONAL FUND
PORTFOLIO COMMENTARY
September 30, 2023 (Unaudited)
Portfolio Commentary
For the 12 months ended September 30, 2023, the Vontobel U.S. Equity Institutional Fund delivered a net return of 26.15%, outperforming the S&P 500 benchmark return of 21.62%. Positive stock selection in financials was the largest contributor to relative performance side, followed positive stock selection combined with an underweight to consumer discretionary. However, lack of exposure to the energy sector was the largest detractor to relative returns, followed by negative stock selection in industrials.
Leading contributors to Fund absolute performance during the period were Adobe Systems Inc., Microsoft Corp., and Comcast Corp.
Adobe Systems Inc.
The company saw price recovery after seeing pressure around the narrative of negative AI implications. The company has been releasing AI features and demonstrating its capabilities that highlight how Adobe will remain an important part of the creative users’ toolkit. In a subsequent earnings update reported in June, the company reported good results which were above expectations. While valuations remain top of mind given the macro environment, Adobe remains a high-quality name with durable growth expected going forward and various positive catalysts including their AI offerings and subsequent user growth. Adobe is a leading software solutions provider in the content creation and digital marketing space. Adobe’s advantage comes from a comprehensive offering of services (e.g., well-established and well-known like Photoshop) that companies, individuals or anyone engaged in creating digital content, can easily access. In our opinion, its broad offering in the content creation business is unrivaled and is a nice complement to the digital marketing space where Adobe allows users to tailor marketing campaigns across all channels. As a key player in the fast-growing digital content and digital marketing space, we believe Adobe continues to deliver high and reliable growth with a highly recurring revenue base.
Microsoft Corp. (MSFT)
Microsoft’s stock performance has been aided by optimism over the potential of generative AI, where the company has established itself as a leader with its partnership with OpenAI. We expect Microsoft’s leadership in providing AI models to further bolster the competitive position of its Azure public cloud. In addition, the company’s broad portfolio of applications have opportunities to further monetize through the introduction of AI “Copilots”. The ability to offer AI capabilities at different levels of the overall technology stack should further strengthen the company’s already strong relationships with business enterprises. The stock has also benefited from the broader rally in mega cap technology stocks. Once defined by its reliance on a PC-centric world, Microsoft has successfully transformed into more of a cloud first company. The company has built Azure into a leading public cloud provider, with natural strengths in hybrid cloud and ability to sell to enterprises. In addition, the shift to cloud computing is driving growth in its traditional franchises, as the company is shifting to more of a SaaS (software as a service) model. Under CEO Satya Nadella, we believe MSFT has become a much more open technology company that is now able to go after larger, addressable markets. In our view, MSFT offers an attractive combination of durable franchises and strong earnings growth.
Comcast Corp. (CMCSA)
Comcast cited better broadband margins and overall media results (Universal theme parks stronger) along with containing costs on loss making streaming business Peacock. Comcast Corp. is a Philadelphia-based cable TV conglomerate operating with two main divisions: Xfinity brand for cable/internet/phone service and NBCUniversal for TV/movie/theme park content and production. The cable company also owns the Philadelphia Flyers NHL team and arena. CMCSA has proven to be a strong compounder on its record of earnings (double-digit) and returns, and we believe the company has a superior business/network mix. Management has a solid track record in cable and shareholder value creation. CMCSA also has the optional scope to drive further national consolidation of industry and new areas of growth (home security, commercial apps, Internet of Things).
Leading detractors from Fund absolute performance were Keysight Technologies, Estée Lauder Companies, and RB Global.
2
ADVISERS INVESTMENT TRUST
VONTOBEL U.S. EQUITY INSTITUTIONAL FUND
PORTFOLIO COMMENTARY
September 30, 2023 (Unaudited)
Keysight Technologies
The company saw weak results after the outperformance seen during the pandemic impacted period. A combination of demand normalization and negative impact from China contributed to the pull back. Their execution during this weakness seems good, and the secular drivers still seem exciting, and in our view Keysight is still positioned well for the long term. Keysight Technologies is a leading provider in the testing and measurement of signals, with the broadest and highest quality solutions. Their capabilities require continued research and are difficult to replicate. We believe testing and measurement to be generally stable as it’s a mission critical and low-cost aspect of customers’ businesses. This stability is supported by a diversified customer base and the exposure to the entire life cycle of electronics. While the near-term growth is supported by the gaining traction in 5G, the proliferation of electronic devices and the usage of data should support robust growth for Keysight’s business for the long term. In addition, as software has become a bigger component of the network and electronics, Keysight is seeing margin expansion and higher recurring revenue.
Estée Lauder Companies
Estée has been very adversely impacted by the slowdown in the Chinese economy on the mainland. In addition, with fewer Chinese travelling, Estée’s travel retail business has also been hurt. A final problem has been excess inventory in the retail channel. After COVID-19, retailers assumed there would be a big bounce in the Chinese economy and stocked up inventories. The rebound in the economy has been subpar so it will take some time for these excess inventories to be worked off. Estée Lauder Cos., Inc. manufactures and markets skin care, makeup, fragrance and hair care products. Estée Lauder sell products under the brands Estée Lauder, Aramis, Clinique, Prescriptives, Lab Series, Origins, Bobbi Brown, Tommy Hilfiger, Kiton, La Mer, Donna Karan, Aveda, Jo Malone, Bumble and Bumble, Darphin, Michael Kors, American Beauty, Flirt!, GoodSkin Labs, Grassroots Research Labs, Sean John, Missoni, Tom Ford, Coach, Ojon, Smashbox and Ermenegildo Zegna. The company was founded by Estée Lauder and Joseph Lauder in 1946 and is headquartered in New York, NY.
RB Global
There was a negative reaction to the IAA acquisition announced by the company late last year. That and the subsequent management change created some headwinds around the stock price, but RB Global has continued to deliver good results. We feel the company will continue to execute on its integration and is well positioned in both is legacy business as well as the new auto salvage business. The company provides a market for selling & buying equipment through auctions and other channels. It is the dominant player in fragmented market and benefits from a scaling effect through its auction model with operational leverage as its gross auction proceeds grow. Revenue is mostly through commissions with extra revenue from auction fees and services provided at the auction (administrative, financing, inspections, etc.). It is a capital light business, generates good cash flow with double digit returns. The recent acquisition of IAA adds an opportunity in the auto salvage market, where IAA is in a duopolistic position, in a similar 2 sided network model.
Opinions expressed are subject to change at any time, are not guaranteed and should not be considered investment advice.
Investing involves risk, including the possible loss of principal. The market price of equity securities may be affected by financial market, industry, or issuer-specific events. Focus on a particular style or on small or medium sized companies may enhance that risk. Larger companies value may not rise as much as smaller companies and larger companies may be unable to respond quickly to competitive challenges. A fund that focuses its investments in a particular industry or sector will be more sensitive to conditions that affect that industry or sector than a non-concentrated fund. Investing internationally, especially in emerging markets, involves additional risks such as currency, political, accounting, economic, and market risk.
Fund holdings and sector allocations are subject to change at any time and should not be considered a recommendation to buy or sell any security. Please refer to the Schedule of Investments in this report for a complete list of Fund holdings.
3
ADVISERS INVESTMENT TRUST
VONTOBEL U.S. EQUITY INSTITUTIONAL FUND
SCHEDULE OF INVESTMENTS
September 30, 2023
| | | | | | | | | | | | | | | |
| | | Percentage
of Net
Assets | | Shares | | Value |
COMMON STOCKS | | | | 98.7 | % | | | | | | | | | | |
Communication Services | | | | 8.9 | % | | | | | | | | | | |
Alphabet, Inc. - Class A(a) | | | | | | | | | 3,260 | | | | $ | 426,604 | |
Alphabet, Inc. - Class C(a) | | | | | | | | | 8,698 | | | | | 1,146,831 | |
Comcast Corp. - Class A | | | | | | | | | 24,731 | | | | | 1,096,572 | |
| | | | | | | | | | | | | | | |
| | | | | | | | | | | | | | 2,670,007 | |
| | | | | | | | | | | | | | | |
Consumer Discretionary | | | | 7.0 | % | | | | | | | | | | |
Amazon.com, Inc.(a) | | | | | | | | | 8,782 | | | | | 1,116,368 | |
Booking Holdings, Inc.(a) | | | | | | | | | 118 | | | | | 363,906 | |
Floor & Decor Holdings, Inc. - Class A(a) | | | | | | | | | 1,153 | | | | | 104,347 | |
Home Depot (The), Inc. | | | | | | | | | 932 | | | | | 281,613 | |
NIKE, Inc. - Class B | | | | | | | | | 2,423 | | | | | 231,687 | |
| | | | | | | | | | | | | | | |
| | | | | | | | | | | | | | 2,097,921 | |
| | | | | | | | | | | | | | | |
Consumer Staples | | | | 18.6 | % | | | | | | | | | | |
Casey’s General Stores, Inc. | | | | | | | | | 3,867 | | | | | 1,049,968 | |
Coca-Cola (The) Co. | | | | | | | | | 21,413 | | | | | 1,198,700 | |
Hershey (The) Co. | | | | | | | | | 2,571 | | | | | 514,406 | |
Mondelez International, Inc. - Class A | | | | | | | | | 18,386 | | | | | 1,275,988 | |
PepsiCo, Inc. | | | | | | | | | 4,998 | | | | | 846,861 | |
Walmart, Inc. | | | | | | | | | 4,292 | | | | | 686,419 | |
| | | | | | | | | | | | | | | |
| | | | | | | | | | | | | | 5,572,342 | |
| | | | | | | | | | | | | | | |
Financials | | | | 20.4 | % | | | | | | | | | | |
Berkshire Hathaway, Inc. - Class B(a) | | | | | | | | | 2,541 | | | | | 890,112 | |
CME Group, Inc. | | | | | | | | | 6,824 | | | | | 1,366,301 | |
Intercontinental Exchange, Inc. | | | | | | | | | 11,176 | | | | | 1,229,584 | |
Mastercard, Inc. - Class A | | | | | | | | | 3,085 | | | | | 1,221,383 | |
Progressive (The) Corp. | | | | | | | | | 3,957 | | | | | 551,210 | |
Visa, Inc. - Class A | | | | | | | | | 3,601 | | | | | 828,266 | |
| | | | | | | | | | | | | | | |
| | | | | | | | | | | | | | 6,086,856 | |
| | | | | | | | | | | | | | | |
Health Care | | | | 18.7 | % | | | | | | | | | | |
Abbott Laboratories | | | | | | | | | 9,543 | | | | | 924,240 | |
Becton Dickinson and Co. | | | | | | | | | 3,479 | | | | | 899,426 | |
Boston Scientific Corp.(a) | | | | | | | | | 16,109 | | | | | 850,555 | |
Humana, Inc. | | | | | | | | | 1,485 | | | | | 722,482 | |
Intuitive Surgical, Inc.(a) | | | | | | | | | 260 | | | | | 75,995 | |
Thermo Fisher Scientific, Inc. | | | | | | | | | 1,829 | | | | | 925,785 | |
UnitedHealth Group, Inc. | | | | | | | | | 2,394 | | | | | 1,207,031 | |
| | | | | | | | | | | | | | | |
| | | | | | | | | | | | | | 5,605,514 | |
| | | | | | | | | | | | | | | |
Industrials | | | | 4.3 | % | | | | | | | | | | |
Copart, Inc.(a) | | | | | | | | | 2,118 | | | | | 91,265 | |
Graco, Inc. | | | | | | | | | 3,733 | | | | | 272,061 | |
RB Global, Inc. | | | | | | | | | 14,518 | | | | | 907,375 | |
| | | | | | | | | | | | | | | |
| | | | | | | | | | | | | | 1,270,701 | |
| | | | | | | | | | | | | | | |
Information Technology | | | | 18.1 | % | | | | | | | | | | |
Adobe, Inc.(a) | | | | | | | | | 2,279 | | | | | 1,162,062 | |
See Notes to Financial Statements.
4
ADVISERS INVESTMENT TRUST
VONTOBEL U.S. EQUITY INSTITUTIONAL FUND
SCHEDULE OF INVESTMENTS
September 30, 2023
| | | | | | | | | | | | | | | |
| | | Percentage
of Net
Assets | | Shares | | Value |
Amphenol Corp. - Class A | | | | | | | | | 5,410 | | | | $ | 454,386 | |
Intuit, Inc. | | | | | | | | | 1,687 | | | | | 861,956 | |
Keysight Technologies, Inc.(a) | | | | | | | | | 1,167 | | | | | 154,406 | |
KLA Corp. | | | | | | | | | 603 | | | | | 276,572 | |
Microsoft Corp. | | | | | | | | | 5,185 | | | | | 1,637,163 | |
ServiceNow, Inc.(a) | | | | | | | | | 927 | | | | | 518,156 | |
Synopsys, Inc.(a) | | | | | | | | | 729 | | | | | 334,589 | |
| | | | | | | | | | | | | | | |
| | | | | | | | | | | | | | 5,399,290 | |
| | | | | | | | | | | | | | | |
Materials | | | | 2.7 | % | | | | | | | | | | |
Sherwin-Williams (The) Co. | | | | | | | | | 1,117 | | | | | 284,891 | |
Vulcan Materials Co. | | | | | | | | | 2,647 | | | | | 534,747 | |
| | | | | | | | | | | | | | | |
| | | | | | | | | | | | | | 819,638 | |
| | | | | | | | | | | | | | | |
TOTAL COMMON STOCKS (Cost $23,427,709) | | | | | | | | | | | | | | 29,522,269 | |
| | | | | | | | | | | | | | | |
SHORT-TERM INVESTMENTS | | | | 2.8 | % | | | | | | | | | | |
Northern Institutional U.S. Government Select Portfolio – Shares Class, 5.22%(b) | | | | | | | | | 839,085 | | | | | 839,085 | |
| | | | | | | | | | | | | | | |
TOTAL SHORT-TERM INVESTMENTS (Cost $839,085) | | | | | | | | | | | | | | 839,085 | |
| | | | | | | | | | | | | | | |
TOTAL INVESTMENTS
(Cost $24,266,794) | | | | 101.5 | % | | | | | | | | | 30,361,354 | |
NET OTHER ASSETS (LIABILITIES) | | | | (1.5 | %) | | | | | | | | | (449,350 | ) |
| | | | | | | | | | | | | | | |
NET ASSETS | | | | 100.0 | % | | | | | | | | $ | 29,912,004 | |
| | | | | | | | | | | | | | | |
(a)Non-income producing security.
(b)7-day current yield as of September 30, 2023 is disclosed.
At September 30, 2023, the Fund’s investments (excluding short-term investments) were domiciled in the following countries:
| | |
| CONCENTRATION BY COUNTRY | | % OF NET ASSETS |
United States | | 95.7% |
Canada | | 3.0 |
Total | | 98.7% |
See Notes to Financial Statements.
5
ADVISERS INVESTMENT TRUST
STATEMENT OF ASSETS & LIABILITIES
September 30, 2023
| | | | |
| | | Vontobel
U.S. Equity
Institutional Fund | |
Assets: | | | | |
Investments, at value (Cost:$24,266,794) | | $ | 30,361,354 | |
Receivable for dividends | | | 23,313 | |
Reclaims receivable | | | 2,527 | |
Receivable from investment adviser | | | 27,603 | |
Prepaid expenses | | | 11,678 | |
| | | | |
Total Assets | | | 30,426,475 | |
| | | | |
Liabilities: | | | | |
Securities purchased payable | | | 271,683 | |
Accounting and Administration fees payable | | | 151,445 | |
Regulatory and Compliance fees payable | | | 37,808 | |
Trustee fees payable | | | 596 | |
Accrued expenses and other payables | | | 52,939 | |
| | | | |
Total Liabilities | | | 514,471 | |
| | | | |
Net Assets | | $ | 29,912,004 | |
| | | | |
| |
Class I Shares: | | | | |
Net assets | | $ | 29,912,004 | |
Shares of common stock outstanding | | | 2,006,809 | |
| | | | |
Net asset value per share | | $ | 14.91 | |
| | | | |
Net Assets: | | | | |
Paid in capital | | $ | 23,682,096 | |
Distributable earnings (loss) | | | 6,229,908 | |
| | | | |
Net Assets | | $ | 29,912,004 | |
| | | | |
|
| |
See Notes to Financial Statements.
6
ADVISERS INVESTMENT TRUST
STATEMENT OF OPERATIONS
For the year ended September 30, 2023
| | | | |
| | | Vontobel
U.S. Equity
Institutional Fund | |
Investment Income: | | | | |
Dividend income (Net of foreign withholding tax of $5,472) | | $ | 308,060 | |
Operating expenses: | | | | |
Investment advisory | | | 116,726 | |
Accounting and Administration | | | 161,000 | |
Regulatory and Compliance | | | 149,911 | |
Audit fees | | | 34,930 | |
Trustees | | | 70,970 | |
Legal | | | 52,663 | |
Other | | | 53,570 | |
| | | | |
Total expenses before reductions | | | 639,770 | |
Expenses reduced by Adviser | | | (488,025 | ) |
| | | | |
Net expenses | | | 151,745 | |
| | | | |
Net investment income | | | 156,315 | |
| | | | |
Realized and Unrealized Gains (Losses) from Investment Activities: | | | | |
Net realized gains from investment transactions | | | 214,843 | |
Net realized losses from foreign currency transactions | | | (2 | ) |
Change in unrealized appreciation (depreciation) on investments | | | 4,499,907 | |
Change in unrealized appreciation (depreciation) on foreign currency | | | 10 | |
| | | | |
Net realized and unrealized gains from investment activities | | | 4,714,758 | |
| | | | |
Change in Net Assets Resulting from Operations | | $ | 4,871,073 | |
| | | | |
|
| |
See Notes to Financial Statements.
7
ADVISERS INVESTMENT TRUST
STATEMENTS OF CHANGES IN NET ASSETS
For the years ended September 30, 2023 and 2022
| | | | | | | | |
| | | Vontobel
U.S. Equity
Institutional Fund | |
| | | 2023 | | | 2022 | |
Increase (decrease) in net assets: | | | | | | | | |
Operations: | | | | | | | | |
Net investment income | | $ | 156,315 | | | $ | 117,348 | |
Net realized gains (losses) from investment and foreign currency transactions | | | 214,841 | | | | 1,045,059 | |
Change in unrealized appreciation (depreciation) on investments and foreign currency | | | 4,499,917 | | | | (4,711,952 | ) |
| | | | | | | | |
Change in net assets resulting from operations | | | 4,871,073 | | | | (3,549,545 | ) |
| | | | | | | | |
Dividends paid to shareholders: | | | | | | | | |
From distributable earnings | | | (982,719 | ) | | | (2,462,623 | ) |
| | | | | | | | |
Total dividends paid to shareholders | | | (982,719 | ) | | | (2,462,623 | ) |
| | | | | | | | |
Capital Transactions (Class I Shares): | | | | | | | | |
Proceeds from sale of shares | | | 7,698,838 | | | | 1,562,920 | |
Value of shares issued to shareholders in reinvestment of dividends | | | 292,582 | | | | 643,635 | |
Value of shares redeemed | | | (1,314,528 | ) | | | (850,379 | ) |
| | | | | | | | |
Change in net assets from capital transactions | | | 6,676,892 | | | | 1,356,176 | |
| | | | | | | | |
Change in net assets | | | 10,565,246 | | | | (4,655,992 | ) |
Net assets: | | | | | | | | |
Beginning of year | | | 19,346,758 | | | | 24,002,750 | |
| | | | | | | | |
End of year | | $ | 29,912,004 | | | $ | 19,346,758 | |
| | | | | | | | |
Share Transactions (Class I Shares): | | | | | | | | |
Sold | | | 520,220 | | | | 100,684 | |
Reinvested | | | 22,805 | | | | 41,022 | |
Redeemed | | | (98,074 | ) | | | (57,551 | ) |
| | | | | | | | |
Change | | | 444,951 | | | | 84,155 | |
| | | | | | | | |
|
| |
See Notes to Financial Statements.
8
ADVISERS INVESTMENT TRUST
FINANCIAL HIGHLIGHTS
For the periods indicated
| | | | | | | | | | | | | | | | | | | | |
| | | I shares | |
| Vontobel U.S. Equity Institutional Fund | | Year Ended
September 30,
2023 | | | Year Ended
September 30,
2022 | | | Year Ended
September 30,
2021 | | | Year Ended
September 30,
2020 | | | Year Ended
September 30,
2019 | |
Net asset value, beginning of year | | $ | 12.39 | | | $ | 16.24 | | | $ | 13.77 | | | $ | 12.35 | | | $ | 11.16 | |
| | | | | | | | | | | | | | | | | | | | |
Income (loss) from investment operations: | | | | | | | | | | | | | | | | | | | | |
Net investment income(a) | | | 0.09 | | | | 0.08 | | | | 0.05 | | | | 0.07 | | | | 0.09 | |
Net realized and unrealized gains (losses) from investments and foreign currency | | | 3.05 | | | | (2.29 | ) | | | 2.81 | | | | 1.58 | | | | 1.17 | |
| | | | | | | | | | | | | | | | | | | | |
Total from investment operations | | | 3.14 | | | | (2.21 | ) | | | 2.86 | | | | 1.65 | | | | 1.26 | |
| | | | | | | | | | | | | | | | | | | | |
Less distributions paid: | | | | | | | | | | | | | | | | | | | | |
From net investment income | | | (0.05 | ) | | | (0.06 | ) | | | (0.04 | ) | | | (0.09 | ) | | | (0.07 | ) |
From net realized gains | | | (0.57 | ) | | | (1.58 | ) | | | (0.35 | ) | | | (0.14 | ) | | | — | |
| | | | | | | | | | | | | | | | | | | | |
Total distributions paid | | | (0.62 | ) | | | (1.64 | ) | | | (0.39 | ) | | | (0.23 | ) | | | (0.07 | ) |
| | | | | | | | | | | | | | | | | | | | |
Change in net asset value | | | 2.52 | | | | (3.85 | ) | | | 2.47 | | | | 1.42 | | | | 1.19 | |
| | | | | | | | | | | | | | | | | | | | |
Net asset value, end of year | | $ | 14.91 | | | $ | 12.39 | | | $ | 16.24 | | | $ | 13.77 | | | $ | 12.35 | |
| | | | | | | | | | | | | | | | | | | | |
Total return | | | 26.15 | % | | | (15.76 | %) | | | 21.18 | % | | | 13.47 | % | | | 11.46 | % |
Ratios/Supplemental data: | | | | | | | | | | | | | | | | | | | | |
Net assets, end of year (000’s) | | $ | 29,912 | | | $ | 19,347 | | | $ | 24,003 | | | $ | 19,816 | | | $ | 15,921 | |
Ratio of net expenses to average net assets | | | 0.65 | % | | | 0.65 | % | | | 0.65 | % | | | 0.65 | % | | | 0.65 | % |
Ratio of net investment income to average net assets | | | 0.67 | % | | | 0.51 | % | | | 0.34 | % | | | 0.54 | % | | | 0.82 | % |
Ratio of gross expenses to average net assets | | | 2.74 | % | | | 2.74 | % | | | 2.61 | % | | | 3.33 | % | | | 3.15 | % |
Portfolio turnover rate | | | 30.34 | % | | | 50.11 | % | | | 43.97 | % | | | 57.97 | % | | | 27.31 | % |
| |
| (a) | Net investment income (loss) for the period ended was calculated using the average shares outstanding method. |
See Notes to Financial Statements.
9
ADVISERS INVESTMENT TRUST
VONTOBEL U.S. EQUITY INSTITUTIONAL FUND
NOTES TO FINANCIAL STATEMENTS
September 30, 2023
Advisers Investment Trust (the “Trust”) is a Delaware statutory trust operating under a Fifth Amended and Restated Agreement and Declaration of Trust (the “Trust Agreement”) dated March 9, 2023. The Trust was formerly an Ohio business trust, which commenced operations on December 20, 2011. On March 31, 2017, the Trust was converted to a Delaware statutory trust. As an open-end registered investment company, as defined in Financial Accounting Standards Board (“FASB”) Accounting Standards Update (“ASU”) 2013-08, the Trust follows accounting and reporting guidance under FASB Accounting Standards Codification (“ASC”) Topic 946, “Financial Services – Investment Companies”. The Trust Agreement permits the Board of Trustees (the “Trustees” or “Board”) to authorize and issue an unlimited number of shares of beneficial interest, at no par value, in separate series of the Trust. The Vontobel U.S. Equity Institutional Fund (the “Fund”) is a series of the Trust which is registered under the Investment Company Act of 1940, as amended (the “1940 Act”), and commenced operations on March 27, 2018. These financial statements and notes only relate to the Fund.
The Fund is a diversified fund. The investment objective of the Fund is to provide long-term capital appreciation.
Under the Trust’s organizational documents, its officers and Trustees are indemnified against certain liabilities arising out of the performance of their duties to the Trust and Fund. In addition, in the normal course of business, the Trust enters into contracts with its vendors and others that provide for general indemnifications. The Fund’s maximum exposure under these arrangements is unknown, as this would involve future claims that may be made against the Fund.
| A. | Significant accounting policies are as follows: |
INVESTMENT VALUATION
Investments are recorded at fair value. Fair value is defined as the price that would be received to sell an asset or paid to transfer a liability in an orderly transaction between market participants at the measurement date. The valuation techniques employed by the Fund, as described below, maximize the use of observable inputs and minimize the use of unobservable inputs in determining fair value. These inputs are summarized in the following three broad levels:
Level 1 — quoted prices in active markets for identical assets
Level 2 — other significant observable inputs (including quoted prices of similar securities, interest rates, prepayment speeds, credit risk, etc.)
Level 3 — significant unobservable inputs (including the Fund’s own assumptions in determining the fair value of investments)
The inputs or methodology used for valuing securities are not necessarily an indication of the risk associated with investing in those securities. For example, certain short-term debt securities may be valued using amortized cost. Generally, amortized cost approximates the current value of a security, but since this valuation is not obtained from a quoted price in an active market, such securities would be reflected as Level 2 in the fair value hierarchy.
Security prices are generally provided by an approved independent third party pricing service as of the close of the New York Stock Exchange, normally at 4:00 p.m. Eastern Time, each business day on which the share price of the Fund is calculated. Equity securities listed or traded on a primary exchange are valued at the closing price, if available, or the last sales price on the primary exchange. If no sale occurred on the valuation date, the securities will be valued at the latest quotations as of the close of the primary exchange. Investments in other open-end registered investment companies are valued at their respective net asset value as reported by such companies. In these types of situations, valuations are typically categorized as Level 1 in the fair value hierarchy.
Debt and other fixed income securities, if any, are generally valued at an evaluated price provided by an approved independent pricing source. To value debt securities, pricing services may use various pricing techniques, which take into account appropriate factors such as market activity, yield, quality, coupon rate, maturity, type of issue, trading characteristics, call features, credit ratings and other data, as well as broker quotes. Short-term debt securities of sufficient credit quality that mature within sixty days may be valued at amortized cost, which approximates fair value. In each of these situations, valuations are typically categorized as Level 2 in the fair value hierarchy.
10
ADVISERS INVESTMENT TRUST
VONTOBEL U.S. EQUITY INSTITUTIONAL FUND
NOTES TO FINANCIAL STATEMENTS
September 30, 2023
The Trustees have designated Vontobel Asset Management, Inc., as investment adviser to the Fund, as the Fund’s Valuation Designee with responsibility for establishing fair value when the price of a security is not readily available or deemed unreliable (e.g., an approved pricing service does not provide a price, a furnished price is in error, certain stale prices, or an event occurs that materially affects the furnished price) according to policies approved by the Board. In addition, fair value pricing may be used if events materially affecting the value of foreign securities occur between the time when the exchange on which they are traded closes and the time when the Fund’s net asset value is calculated. The Fund identifies possible fluctuations in international securities by monitoring the increase or decrease in the value of a designated benchmark index. In the event of an increase or decrease greater than predetermined levels, the Fund may use a systematic valuation model provided by an approved independent third party pricing service to fair value its international equity securities.
In the fair value situations noted above, while the Trust’s valuation policy is intended to result in a calculation of the Fund’s net asset value that fairly reflects security values as of the time of pricing, the Trust cannot ensure that fair values determined pursuant to these guidelines would accurately reflect the price that the Fund could obtain for a security if it were to dispose of that security as of the time of pricing (for instance, in a forced or distressed sale). The prices used by the Fund may differ from the value that would be realized if the securities were sold, and these differences could be material to the financial statements. Depending on the source and relative significance of the valuation inputs in these instances, the instruments may be classified as Level 2 or Level 3 in the fair value hierarchy.
The following is a summary of the valuation inputs used as of September 30, 2023 in valuing the Fund’s investments based upon the three fair value levels defined above:
| | | | | | | | | | | | | | | | |
| Fund | | Level 1 -
Quoted Prices | | | Level 2 -
Other Significant
Observable Inputs | | | Level 3 -
Significant
Unobservable
Inputs | | | Total | |
Vontobel U.S. Equity Institutional Fund | | | | | | | | | | | | | | | | |
Common Stocks* | | $ | 29,522,269 | | | $ | — | | | $ | — | | | $ | 29,522,269 | |
Short-Term Investments | | | 839,085 | | | | — | | | | — | | | | 839,085 | |
| | | | |
Total Investments | | $ | 30,361,354 | | | $ | — | | | $ | — | | | $ | 30,361,354 | |
| | | | |
*See additional categories in the Schedule of Investments.
As of September 30, 2023 there were no Level 2 or Level 3 securities held by the Fund. There were no transfers to or from Level 3 during the year ended September 30, 2023.
CURRENCY TRANSACTIONS
The functional and reporting currency for the Fund is the U.S. dollar. The market values of foreign securities, currency holdings and other assets and liabilities are translated into U.S. dollars based on the current exchange rates each business day. Purchases and sales of securities and income and expense items denominated in foreign currencies are translated into U.S. dollars at the exchange rate in effect on the transaction date. The Fund does not separately report the effects of changes in foreign exchange rates from changes in market prices on securities held. Such changes are included in Net realized and unrealized gains (and losses) from investment activities on the Statement of Operations. The Fund may invest in foreign currency-denominated securities and may engage in foreign currency transactions either on a spot (cash) basis at the rate prevailing in the currency exchange market at the time or through a forward foreign currency contract. Realized foreign exchange gains or losses arising from sales of spot foreign currencies, currency gains or losses realized between the trade and settlement dates on securities transactions and the difference between the recorded amounts of dividends, interest, and foreign withholding taxes and the U.S. dollar equivalent of the amounts actually received or paid are included in Net realized gains (losses) from foreign currency transactions on the Statement of Operations. Net unrealized foreign exchange gains (losses) arising from changes in foreign exchange rates on foreign denominated assets and liabilities other than investments in securities held at the end of the reporting period are included in Change in unrealized appreciation (depreciation) on foreign currency on the Statement of Operations.
11
ADVISERS INVESTMENT TRUST
VONTOBEL U.S. EQUITY INSTITUTIONAL FUND
NOTES TO FINANCIAL STATEMENTS
September 30, 2023
The Fund may engage in spot currency transactions for the purpose of foreign security settlement and operational processes. Changes in foreign currency exchange rates will affect the value of the Fund’s securities and the price of the Fund’s shares. Generally, when the value of the U.S. dollar rises in value relative to a foreign currency, an investment in that country loses value because that currency is worth fewer U.S. dollars. Devaluation of a currency by a country’s government or banking authority also may have a significant impact on the value of any investments denominated in that currency. Currency markets generally are not as regulated as securities markets.
INVESTMENT TRANSACTIONS AND INCOME
Investment transactions are accounted for no later than one business day after trade date. For financial reporting purposes, investments are reported as of the trade date. The Fund determines the gain or loss realized from investment transactions by using an identified cost basis method. Interest income is recognized on an accrual basis and includes, where applicable, the amortization of premium or accretion of discount. Dividend income is recognized on the ex-dividend date. Dividends from foreign securities are recorded on the ex-dividend date, or as soon as the information is available.
EXPENSE ALLOCATIONS
Expenses directly attributable to a fund in the Trust are charged to that fund, while expenses that are attributable to more than one fund in theTrust are allocated among the applicable funds on a pro-rata basis to each adviser’s series of funds based on relative net assets or another reasonable basis.
DIVIDENDS AND DISTRIBUTIONS
The Fund intends to distribute substantially all of its net investment income as dividends to shareholders on an annual basis. The Fund intends to distribute its net realized long-term capital gains and its net realized short-term capital gains at least once a year.
Distributions from net investment income and from net realized capital gain are determined in accordance with Federal income tax regulations, which may differ from accounting principles generally accepted in the United States of America (“GAAP”). These “book/tax” differences are either considered temporary or permanent in nature. To the extent these differences are permanent in nature (e.g. treatment of certain dividend distributions, gains/losses, return of capital, redemption in-kind, etc.), such amounts are reclassified within the composition of net assets based on their federal tax-basis treatment; temporary differences do not require reclassification. Distributions to shareholders that exceed net investment income and net realized capital gains for tax purposes are reported as return of capital.
FEDERAL INCOME TAX INFORMATION
No provision is made for Federal income taxes as the Fund intends to qualify each year as a “regulated investment company” under Subchapter M of the Internal Revenue Code of 1986, as amended (the “Code”), and distribute substantially all of its net investment income and net realized capital gain in accordance with the Code.
As of September 30, 2023, the Fund did not have uncertain tax positions that would require financial statement recognition or disclosure based on an evaluation of all open tax years for all major tax jurisdictions. The Fund’s tax return for the tax years ended September 30, 2023, 2022, 2021 and 2020 remain subject to examination by the Internal Revenue Service. Interest or penalties incurred, if any, on future unknown, uncertain tax positions taken by the Fund will be recorded as interest expense on the Statement of Operations.
Management is not aware of any tax positions for which it is reasonably possible that the total amounts of unrecognized tax benefits will change materially in the next 12 months.
USE OF ESTIMATES
The preparation of financial statements in conformity with GAAP requires management to make estimates and assumptions that affect the reported amounts of assets and liabilities and disclosure of contingent assets and liabilities at the date of the financial statements and the reported amounts of revenues and expenses during the reporting period. Actual results could differ from these estimates.
12
ADVISERS INVESTMENT TRUST
VONTOBEL U.S. EQUITY INSTITUTIONAL FUND
NOTES TO FINANCIAL STATEMENTS
September 30, 2023
OTHER RISKS
The Fund is subject to market risk, which is the risk that the value of the securities in which the Fund invests may go up or down in response to the prospects of individual companies and/or general economic conditions, disruptions to business operations and supply chains, and staffing shortages. The net asset value of the Fund will fluctuate based on changes in the value of the securities in which the Fund invests. The price of securities may rise or fall because of economic or political changes. Security prices in general may decline over short or even extended periods of time. Factors such as domestic and international economic growth and market conditions, interest rate levels and political events affect the securities markets. The increasing interconnectivity between global economies and financial markets increases the likelihood that events or conditions in one region or financial market may adversely impact issuers in a different country, region or financial market. Continuing uncertainties about interest rates, armed conflicts, rising government debt, political events, trade tensions and economic sanctions also contribute to market volatility. Securities in the Fund’s portfolio may underperform due to inflation (or expectations for inflation), interest rates, global demand for particular products or resources, natural disasters, pandemics (such as COVID-19), epidemics, climate change or climate-related events, terrorism, regulatory events and governmental or quasi-governmental actions.
| B. | Fees and Transactions with Affiliates and Other Parties |
The Trust, on behalf of the Fund, has entered into an Amended and Restated Investment Advisory Agreement (the “Agreement”) with Vontobel Asset Management, Inc. (the “Adviser” or “Vontobel”), which is registered under the Investment Advisers Act of 1940, as amended, to provide investment advisory services to the Fund. Under the terms of the Agreement, the Fund pays the Adviser an annual fee based on the Fund’s daily net assets as set forth in the following table. The total fees incurred by the Fund pursuant to the Agreement is reflected as “Investment advisory” fees on the Statement of Operations. In addition, the Adviser has contractually agreed to waive fees and/or reimburse expenses to the extent that Total Annual Operating Expenses (exclusive of brokerage and other transaction expenses relating to the purchase or sale of portfolio investments, interest, taxes, short sale dividends and financing costs associated with the use of the cash proceeds on securities sold short, litigation and indemnification expenses, expenses associated with the investments in underlying investment companies and extraordinary expenses) exceed the rate in the table below.
| | | | | | |
| Fund | | Class | | Advisory Fee | | Expense
Limitation |
Vontobel U.S. Equity Institutional Fund | | Class I | | 0.50% on first $500 million | | 0.65% |
| | | | 0.45% on assets over $500 million | | |
The expense limitation agreement is effective until January 28, 2024. If it becomes unnecessary for the Adviser to waive fees or make reimbursements, the Adviser may recapture any of its prior waivers or reimbursements for a period not to exceed three years from the date on which the waiver or reimbursement was made to the extent that such a recapture does not cause the Total Annual Fund Operating Expenses (exclusive of brokerage and other transaction expenses relating to the purchase or sale of portfolio investments, interest, taxes, short sale dividends and financing costs associated with the use of the cash proceeds on securities sold short, litigation and indemnification expenses, expenses associated with the investments in underlying investment companies and extraordinary expenses as determined under generally accepted principles) to exceed the current expense limitation at the time of repayment or the applicable expense limitation that was in effect at the time of the waiver or reimbursement. The agreement to waive fees and/or reimburse expenses automatically renews annually from year to year on the effective date of each subsequent annual update to the Fund’s registration statement, until such time as the Adviser provides written notice of non-renewal, and will terminate automatically upon termination of the Agreement.
13
ADVISERS INVESTMENT TRUST
VONTOBEL U.S. EQUITY INSTITUTIONAL FUND
NOTES TO FINANCIAL STATEMENTS
September 30, 2023
For the year ended September 30, 2023, the Fund incurred advisory fees payable to Vontobel, expense waivers/reimbursements from Vontobel and paid expense recoupments to Vontobel as follows:
| | | | | | | | | | | | |
| Fund | | Advisory
Fee to
Vontobel | | | Expenses
Reduced
by Vontobel | | | Advisory Waivers
Recouped
by Vontobel | |
Vontobel U.S. Equity Institutional Fund | | $ | 116,726 | | | $ | 488,025 | | | $ | — | |
The balances of recoverable expenses to Vontobel by the Fund at September 30, 2023 were as follows:
| | | | | | |
| For the: | | Expiring | | Vontobel | |
Year Ended September 30, 2021 | | September 30, 2024 | | $ | 444,141 | |
Year Ended September 30, 2022 | | September 30, 2025 | | | 481,888 | |
Year Ended September 30, 2023 | | September 30, 2026 | | | 488,025 | |
| | | | | | |
Balances of Recoverable Expenses to the Adviser | | | | $ | 1,414,054 | |
| | | | | | |
Foreside Financial Services, LLC (the “Distributor”) provides distribution services to the Fund pursuant to a distribution agreement with the Trust, on behalf of the Fund. Under its agreement with the Trust, the Distributor acts as an agent of the Trust in connection with the offering of the shares of the Fund on a continuous basis. The Adviser, at its own expense, pays the Distributor $50,000 annually and reimburses for certain out-of-pocket expenses incurred on behalf of the Fund.
The Northern Trust Company (“Northern Trust”) serves as the administrator, transfer agent, custodian, and fund accounting agent for the Fund pursuant to written agreements with the Trust, on behalf of the Fund. The Fund has agreed to pay Northern Trust a tiered basis-point fee based on the Fund’s daily net assets, and certain per account and transaction charges. The Fund is subject to a minimum annual fee of $150,000 relating to these services, and reimbursement for certain expenses incurred on behalf of the Fund, as well as other charges for additional service activities. Total fees paid to Northern Trust pursuant to these agreements are reflected as “Accounting and Administration” fees on the Statement of Operations.
Foreside Fund Officer Services, LLC (“Foreside”, d/b/a ACA Group) provides compliance and financial control services for the Fund pursuant to a written agreement with the Trust, on behalf of the Fund, d/b/a ACA Group including providing certain officers to the Fund. The Fund has agreed to pay Foreside a tiered basis-point fee based on the Fund’s daily net assets, subject to an overall minimum annual fee of $150,000 for these services, and reimburse for certain expenses incurred on behalf of the Fund. Total fees paid to Foreside pursuant to these agreements are reflected as “Regulatory and Compliance” fees on the Statement of Operations.
The officers of theTrust are affiliated with Foreside, NorthernTrust, or the Distributor and receive no compensation directly from the Fund for serving in their respective roles. Through March 31, 2023, the Trust paid each Trustee who is not an “interested person,” as that term is defined in the 1940 Act (each, an “Independent Trustee” and, collectively, the “Independent Trustees”) compensation for their services based on an annual retainer of $125,000 and reimbursement for certain expenses. Effective April 1, 2023, the Trust pays an annual retainer of $132,000 and reimbursement for certain expenses. If there are more than six meetings in a year, additional meeting fees may apply. For the year ended September 30, 2023, the aggregate Trustee compensation paid by the Trust was $416,750. The amount of total Trustee compensation and reimbursement of out-of-pocket expenses allocated from the Trust to the Fund is reflected as “Trustees” fees on the Statement of Operations.
| C. | Investment Transactions |
For the year ended September 30, 2023, the aggregate costs of purchases and proceeds from sales of securities (excluding short-term investments) for the Fund were as follows:
| | | | | | | | |
| Fund | | Cost of Purchases | | | Proceeds from sales | |
Vontobel U.S. Equity Institutional Fund | | $ | 12,561,684 | | | $ | 7,066,084 | |
14
ADVISERS INVESTMENT TRUST
VONTOBEL U.S. EQUITY INSTITUTIONAL FUND
NOTES TO FINANCIAL STATEMENTS
September 30, 2023
As of September 30, 2023, the cost, gross unrealized appreciation and gross unrealized depreciation on investments, for Federal income tax purposes, were as follows:
| | | | | | | | | | | | | | | | |
| Fund | | Cost | | | Gross Unrealized
Appreciation | | | Gross
Unrealized
(Depreciation) | | | Net Unrealized
Appreciation
(Depreciation) | |
Vontobel U.S. Equity Institutional Fund | | $ | 24,409,769 | | | $ | 6,042,139 | | | $ | (90,554 | ) | | $ | 5,951,585 | |
The difference between the tax cost of portfolio investments and the financial statement cost is primarily due to wash sale loss deferrals.
The tax character of distributions paid to shareholders during the latest tax years ended September 30, 2023 and September 30, 2022 for the Fund were as follows:
| | | | | | | | | | | | | | | | | | | | |
| Vontobel U.S. Equity Institutional Fund | | Ordinary Income | | | Net Long
Term Gains | | | Total Taxable
Distributions | | | Tax Return
of Capital | | | Total Distributions
Paid | |
2023 | | $ | 74,211 | | | $ | 908,508 | | | $ | 982,719 | | | $ | — | | | $ | 982,719 | |
2022 | | $ | 625,176 | | | $ | 1,837,447 | | | $ | 2,462,623 | | | $ | — | | | $ | 2,462,623 | |
As of the latest tax year ended September 30, 2023, the components of accumulated earnings on a tax basis were as follows:
| | | | | | | | | | | | | | | | | | | | | | | | | | | | |
| Fund | | Undistributed
Ordinary Income | | | Undistributed Long
Term Capital
Gains | | | Accumulated
Earnings | | | Distributions
Payable | | | Accumulated
Capital and
Other Losses | | | Unrealized
Appreciation | | | Total
Accumulated
Earnings | |
Vontobel U.S. Equity Institutional Fund | | | $104,526 | | | | $173,797 | | | | $278,323 | | | | $ — | | | | $ — | | | | $5,951,585 | | | | $6,229,908 | |
| E. | Concentration by Ownership |
A significant portion of the Fund’s shares may be held in a limited number of shareholder accounts including in certain omnibus or institutional accounts which typically hold shares for the benefit of other underlying investors. To the extent that a shareholder or group of shareholders redeem a significant portion of the shares issued by the Fund, this could have a disruptive impact on the efficient implementation of the Fund’s investment strategy.
In addition, as of September 30, 2023, the Adviser or Adviser affiliates held outstanding shares of the Fund as follows:
| | | | | | | | |
| Fund | | Class | | | %
Ownership | |
Vontobel U.S. Equity Institutional Fund | | | I shares | | | | 63.5 | |
15
Report of Independent Registered Public Accounting Firm
To the Shareholders and the Board of Trustees of Vontobel U.S. Equity Institutional Fund
Opinion on the Financial Statements
We have audited the accompanying statement of assets and liabilities of Vontobel U.S. Equity Institutional Fund (the “Fund”) (one of the funds constituting Advisers Investment Trust (the “Trust”)), including the schedule of investments, as of September 30, 2023, and the related statement of operations for the year then ended, the statements of changes in net assets for each of the two years in the period then ended, the financial highlights for each of the five years in the period then ended and the related notes (collectively referred to as the “financial statements”). In our opinion, the financial statements present fairly, in all material respects, the financial position of the Fund (one of the funds constituting Advisers Investment Trust) at September 30, 2023, the results of its operations for the year then ended, the changes in its net assets for each of the two years in the period then ended and its financial highlights for each of the five years in the period then ended, in conformity with U.S. generally accepted accounting principles.
Basis for Opinion
These financial statements are the responsibility of the Trust’s management. Our responsibility is to express an opinion on the Fund’s financial statements based on our audits. We are a public accounting firm registered with the Public Company Accounting Oversight Board (United States) (“PCAOB”) and are required to be independent with respect to the Trust in accordance with the U.S. federal securities laws and the applicable rules and regulations of the Securities and Exchange Commission and the PCAOB.
We conducted our audits in accordance with the standards of the PCAOB. Those standards require that we plan and perform the audit to obtain reasonable assurance about whether the financial statements are free of material misstatement, whether due to error or fraud. The Trust is not required to have, nor were we engaged to perform, an audit of the Trust’s internal control over financial reporting. As part of our audits, we are required to obtain an understanding of internal control over financial reporting but not for the purpose of expressing an opinion on the effectiveness of the Trust’s internal control over financial reporting. Accordingly, we express no such opinion.
Our audits included performing procedures to assess the risks of material misstatement of the financial statements, whether due to error or fraud, and performing procedures that respond to those risks. Such procedures included examining, on a test basis, evidence regarding the amounts and disclosures in the financial statements. Our procedures included confirmation of securities owned as of September 30, 2023, by correspondence with the custodian. Our audits also included evaluating the accounting principles used and significant estimates made by management, as well as evaluating the overall presentation of the financial statements. We believe that our audits provide a reasonable basis for our opinion.

We have served as the auditor on one or more investment companies in the Trust since 2013.
New York, New York
November 17, 2023
16
ADVISERS INVESTMENT TRUST
VONTOBEL U.S. EQUITY INSTITUTIONAL FUND
ADDITIONAL INFORMATION
September 30, 2023 (Unaudited)
| A. | Other Federal Tax Information |
Under the Jobs and Growth Tax Relief Reconciliation Act of 2003 (the “Act”), the following percentages of ordinary dividends paid during the fiscal year ended September 30, 2023 are designated as Qualified Dividend Income (“QDI”), as defined in the Act, subject to reduced tax rates in 2023:
| | | | |
| | | QDI Percentage | |
Vontobel U.S. Equity Institutional Fund | | | 100 | % |
A percentage of the dividends distributed during the fiscal year for the Fund qualifies for the Dividends-Received Deduction (“DRD”) for corporate shareholders:
| | | | |
| | | Corporate
DRD Percentage | |
US Equity Institutional Fund | | | 100 | % |
| B. | Summary of Fund Holdings as of September 30, 2023 |
Vontobel U.S. Equity Institutional Fund
| | | | |
| Market Exposure | |
| |
| Equity Securities | | % of Net Assets | |
Software | | | 15.1 | % |
Medical Equipment & Devices | | | 12.4 | |
Institutional Financial Services | | | 8.7 | |
Technology Services | | | 6.9 | |
Beverages | | | 6.8 | |
Internet Media & Services | | | 6.4 | |
Health Care Facilities & Services | | | 6.4 | |
Food | | | 6.0 | |
Retail - Consumer Staples | | | 5.8 | |
Insurance | | | 4.8 | |
Cable & Satellite | | | 3.7 | |
E-Commerce Discretionary | | | 3.7 | |
Industrial Support Services | | | 3.0 | |
Electrical Equipment | | | 2.0 | |
Construction Materials | | | 1.8 | |
| |
Retail - Discretionary | | | 1.3 | |
| | | | |
| Market Exposure | |
| |
| Equity Securities | | % of Net Assets | |
Chemicals | | | 1.0 | % |
Machinery | | | 0.9 | |
Semiconductors | | | 0.9 | |
Apparel & Textile Products | | | 0.8 | |
Wholesale - Discretionary | | | 0.3 | |
| |
Total | | | 98.7 | % |
|
| Equity | |
| |
| Issuer | | % of Net Assets | |
Microsoft Corp. | | | 5.5 | % |
CME Group, Inc. | | | 4.6 | |
Mondelez International, Inc. - Class A | | | 4.3 | |
Intercontinental Exchange, Inc. | | | 4.1 | |
Mastercard, Inc. - Class A | | | 4.1 | |
| |
Total | | | 22.6 | % |
As a Fund shareholder, you may incur two types of costs: (1) transaction costs, and (2) ongoing costs, including management fees and other Fund expenses. The examples below are intended to help you understand your ongoing costs (in dollars) of investing in the Fund and to compare these costs with the ongoing costs of investing in other mutual funds. Please note that the expenses shown in the tables are meant to highlight your ongoing costs only and do not reflect any transactional costs. Therefore, the examples are useful in comparing ongoing costs only and will not help you determine the relative total cost of owning different funds. In addition, if these transactional costs were included, your costs would have been higher.
The examples below are based on an investment of $1,000 invested at April 1, 2023 and held for the entire period through September 30, 2023.
17
ADVISERS INVESTMENT TRUST
VONTOBEL U.S. EQUITY INSTITUTIONAL FUND
ADDITIONAL INFORMATION
September 30, 2023 (Unaudited)
The Actual Expense Example below provides information about actual account values and actual expenses. You may use this information, together with the amount you invested, to estimate the expenses that you paid over the period. Simply divide your account value by $1,000 (for example, an $8,600 account value divided by $1,000 = 8.6), then multiply the result by the number in the table under the heading entitled “Expenses Paid” to estimate the expenses you paid on your account during this period.
The Hypothetical Expense Example below provides information about hypothetical account values and hypothetical expenses based on the Fund’s actual expense ratio and an assumed rate of return of 5% per year before expenses, which is not the Fund’s actual return. The hypothetical account values and expenses may not be used to estimate the actual ending account balance or expenses you paid for the period. You may use this information to compare the ongoing costs of investing in the Fund and other funds. To do so, compare this 5% hypothetical example with the 5% hypothetical examples that appear in the shareholder reports of the other funds.
| | | | | | | | | | | | | | |
| | | Expense
Ratio | | Beginning Account
Value 4/1/2023 | | | Ending Account
Value 9/30/2023 | | | Expenses Paid 4/1/23–9/30/23* | |
Actual | | 0.65% | | $ | 1,000.00 | | | $ | 1,085.10 | | | $ | 3.40 | |
Hypothetical | | 0.65% | | $ | 1,000.00 | | | $ | 1,021.81 | | | $ | 3.29 | |
*Actual expenses are calculated using each Fund’s annualized expense ratio (as disclosed in the table), multiplied by the average account value for the period, multiplied by the actual number of operational days in the most recent half fiscal year (183), and divided by the number of days in the current year (365).
Investors may obtain a copy of the proxy voting policies and procedures by writing to the Trust in the name of the Fund c/o The Northern Trust Company, P.O. Box 4766, Chicago, Illinois 60680-4766 or by calling the Fund at 866-252-5393 (toll free) or 312-630-6583. Information about how the Fund voted proxies relating to portfolio securities during the most recent 12-month period ended June 30th is available without charge, upon request, by calling the Trust at 866-252-5393 (toll free) or 312-630-6583 and on the SEC’s website at www.sec.gov.
The Fund files its complete schedule of portfolio holdings with the SEC for the first and third quarters of each fiscal year as an exhibit to its reports on Form N-PORT. The Fund’s Form N-PORT reports are available on the SEC’s website at www.sec.gov. The information on Form N-PORT is also available to shareholders upon written request or by calling the Fund at 866-252-5393 (toll free).
18
ADVISERS INVESTMENT TRUST
VONTOBEL U.S. EQUITY INSTITUTIONAL FUND
ADDITIONAL INFORMATION
September 30, 2023 (Unaudited)
The following table provides information regarding each Independent Trustee.
| | | | | | | | | | |
Name, Address and Year of Birth1 | | Position(s) Held with
the Trust | | Term of Office/Length of Time Served | | Principal Occupation(s) During
Past 5 Years | | Number of
Portfolios in the
Trust Overseen
by Trustee | | Other Directorships Held by Trustee During Past 5 Years |
Robert Gordon Year of Birth: 1961 | | Trustee | | Indefinite/January 2022 to present | | Independent Director, VAM Funds Luxembourg, 2018 to present; Independent Director, Anchor Capital Advisors, 2020 to present; Independent Director, Trust Company of Illinois, 2019 to 2021; President and Chief Executive Officer, Driehaus Capital Management, 2006 to 2017. | | 9 | | VAM Funds Luxembourg, Anchor Capital Advisors, Trust Company of Illinois |
D’Ray Moore Year of Birth: 1959 | | Trustee | | Indefinite/July 2011 to present | | Independent Trustee, Diamond Hill Funds, 2007 to 2022; Chairperson, Diamond Hill Funds, 2014 to 2022. | | 9 | | Diamond Hill Funds (retired 2022) |
Steven R. Sutermeister Year of Birth: 1954 | | Trustee | | Indefinite/July 2011 to present | | President, Vadar Capital LLC, 2008 to 2017. | | 9 | | None |
| 1 | The mailing address of each Trustee is 50 S. LaSalle Street, Chicago, IL 60603. |
The following table provides information regarding each officer of the Trust.
| | | | | | | | | | |
Name, Address and Year of Birth1 | | Position(s) Held with
the Trust | | Term of Office/ Length of Time Served | | Principal Occupation(s) During
Past 5 Years | | Number of
Portfolios in the
Trust Overseen
by Trustee | | Other Directorships Held by Trustee During Past 5 Years |
Barbara J. Nelligan Year of Birth: 1969 | | President | | Indefinite/ August 2017 to present | | Senior Vice President, Global Fund Services Fund Governance Solutions, The Northern Trust Company, 2018 to present; Senior Vice President, Global Fund Services Product Management, The Northern Trust Company, 2007 to 2018. | | N/A | | N/A |
Rodney L. Ruehle Year of Birth: 1968 | | Chief Compliance Officer and AML Officer | | Indefinite/March 2019 to present | | Senior Principal Consultant, ACA Group, 2022 to present; Director, Foreside Fund Officer Services, LLC (formerly Foreside Compliance Services, LLC) (financial services), 2016 to 2022. | | N/A | | N/A |
19
ADVISERS INVESTMENT TRUST
VONTOBEL U.S. EQUITY INSTITUTIONAL FUND
ADDITIONAL INFORMATION
September 30, 2023 (Unaudited)
| | | | | | | | | | |
Name, Address and Year of Birth1 | | Position(s)
Held with the Trust | | Term of Office/ Length of Time Served | | Principal Occupation(s) During Past 5 Years | | Number of
Portfolios in the
Trust Overseen
by Trustee | | Other
Directorships Held by Trustee
During Past 5
Years |
Kara M. Schneider Year of Birth: 1973 | | Secretary | | Indefinite/ March 2023 to present | | Second Vice President, Global Fund Services Fund Governance Solutions, The Northern Trust Company, 2021 to present; Manager, Ultimus Fund Solutions LLC, 2017 to 2021; Assistant Secretary of Advisers Investment Trust, 2021 to March 2023. | | N/A | | N/A |
Troy A. Sheets Year of Birth: 1971 | | Treasurer | | Indefinite/January 2022 to present | | Senior Principal Consultant, ACA Group, 2022 to present; Senior Director, Foreside Fund Officer Services, LLC, 2016 to 2022; Treasurer of Advisers Investment Trust, 2011 to 2021; Assistant Treasurer of Advisers Investment Trust, May 2021 to December 2021. | | N/A | | N/A |
Tracy L. Dotolo Year of Birth: 1976 | | Assistant Treasurer | | Indefinite/ January 2022 to present | | Senior Principal Consultant, ACA Group, 2022 to present; Director, Foreside Fund Officer Services, LLC, 2016 to 2022; Treasurer of Advisers Investment Trust, May 2021 to December 2021. | | N/A | | N/A |
Stefania C. Suciu Year of Birth: 1979 | | Assistant Secretary | | Indefinite/March 2023 to present | | Second Vice President, Global Fund Services Fund Governance Solutions, The Northern Trust Company, 2015 to present. | | N/A | | N/A |
| 1 | The mailing address of Messrs. Ruehle and Sheets and Ms. Dotolo is 3 Canal Plaza, Suite 100, Portland, ME 04101. The mailing address of Mses. Nelligan, Schneider, and Suciu is 333 S. Wabash Avenue, Chicago, IL 60604. |
The Fund’s Statement of Additional Information includes additional information about the Trust’s Trustees and Officers. To receive your free copy of the Statement of Additional Information, call toll-free 866-252-5393.
20
Vontobel U.S. Equity
Institutional Fund
(A series of the Advisers Investment Trust)
Privacy Policy
SAFEGUARDING PRIVACY
We recognize and respect the privacy expectations of each of our investors and we believe the confidentiality and protection of investor information is one of our fundamental responsibilities. New technologies have dramatically changed the way information is gathered and used, but our continuing commitment to preserving the security and confidentiality of investor information has remained a core value of the Vontobel U.S. Equity Institutional Fund.
INFORMATION WE COLLECT AND SOURCES OF INFORMATION
We may collect information about our customers to help identify you, evaluate your application, service and manage your account and offer services and products you may find valuable. We collect this information from a variety of sources including:
| • | | Information we receive from you on applications or other forms (e.g. your name, address, date of birth, social security number and investment information); |
| • | | Information about your transactions and experiences with us and our affiliates (e.g. your account balance, transaction history and investment selections); and |
| • | | Information we obtain from third parties regarding their brokerage, investment advisory, custodial or other relationship with you (e.g. your account number, account balance and transaction history. |
INFORMATION WE SHARE WITH SERVICE PROVIDERS
We may disclose all non-public personal information we collect, as described above, to companies (including affiliates) that perform services on our behalf, including those that assist us in responding to inquiries, processing transactions, preparing and mailing account statements and other forms of shareholder services provided they use the information solely for these purposes and they enter into a confidentiality agreements regarding the information.
INFORMATION WE MAY SHARE WITH AFFILIATES
If we have affiliates which are financial service providers that offer investment advisory, brokerage and other financial services, we may (subject to Board approval) share information among our affiliates to better assist you in achieving your financial goals.
SAFEGUARDING CUSTOMER INFORMATION
We will safeguard, according to federal standards of security and confidentiality, any non-public personal information our customers share with us.
We will limit the collection and use of non-public customer information to the minimum necessary to deliver superior service to our customers which includes advising our customers about our products and services and to administer our business.
We will permit only authorized employees who are trained in the proper handling of non-public customer information to have access to that information.
We will not reveal non-public customer information to any external organization unless we have previously informed the customer in disclosures or agreements, have been authorized by the customer or are required by law or our regulators.
We value you as a customer and take your personal privacy seriously. We will inform you of our policies for collecting, using, securing and sharing nonpublic personal information the first time we do business and every year that you are a customer of the Vontobel U.S. Equity Institutional Fund or anytime we make a material change to our privacy policy.
Investment Adviser
Vontobel Asset Management, Inc.
1540 Broadway
38th Floor
New York, New York 10036
Custodian
The Northern Trust Company
50 South LaSalle Street
Chicago, Illinois 60603
Independent Registered
Public Accounting Firm
Ernst & Young LLP
One Manhattan West
New York, New York 10001-8604
Legal Counsel
Thompson Hine LLP
41 South High Street, Suite 1700
Columbus, Ohio 43215-6101
Distributor
Foreside Financial Services, LLC
3 Canal Plaza, Suite 100
Portland, Maine 04101
For Additional Information, call
866-252-5393 (toll free) or 312-630-6583
(b) Not applicable.
Item 2. Code of Ethics.
As of September 30, 2023, the registrant had adopted a “code of ethics” (as such term is defined in Item 2 of Form N-CSR) that applies to the registrant’s principal executive officer and principal financial officer. This code is filed as Exhibit 13(a)(1) hereto. There were no substantive amendments or waivers to the code of ethics during the period covered by this report.
Item 3. Audit Committee Financial Expert.
The registrant’s Board of Trustees has determined the registrant has at least one “audit committee financial expert” (as such term is defined in Item 3 of Form N-CSR) serving on its Audit Committee. The “audit committee financial expert” is Mr. Steven R. Sutermeister, who is “independent” for purposes of this Item 3 of Form N-CSR.
Item 4. Principal Accountant Fees and Services.
Independent Franchise Partners US Equity Fund
2023: $24,200
2022: $23,050
State Farm Funds
2023: $128,940
2022: $122,800
The fees paid to PricewaterhouseCoopers LLP relate to the audit of the registrant’s annual financial statements and letters for the filings of the registrant’s Form N-CEN and Form N-1A.
Vontobel U.S Equity Institutional Fund
2023: $29,000
2022: $28,000
The fees paid to Ernst & Young LLP relate to the audit of the registrant’s annual financial statements and letters for the filings of the registrant’s Form N-CEN and Form N-1A.
River Canyon Total Return Bond Fund
2023: $40,000
2022: $34,400
NTAM Treasury Assets Fund
2023: $28,600
2022: $27,300
The fees paid to Deloitte & Touche LLP relate to the audit of the registrant’s annual financial statements and letters for the filings of the registrant’s Form N-CEN and Form N-1A.
Independent Franchise Partners US Equity Fund
2023: $0
2022: $0
State Farm Funds
2023: $0
2022: $0
Vontobel U.S. Equity Institutional Fund
2023: $0
2022: $0
River Canyon Total Return Bond Fund
2023: $0
2022: $0
NTAM Treasury Assets Fund
2023: $0
2022: $0
Independent Franchise Partners US Equity Fund
2023: $6,115
2022: $5,825
State Farm Funds
2023: $27,760
2022: $26,040
The fees to PricewaterhouseCoopers LLP relate to the preparation of the registrant’s tax returns, review of annual distributions, and additional tax provision support fees.
Vontobel U.S. Equity Institutional Fund
2023: $7,150
2022: $6,930
The fees to Ernst & Young LLP relate to the preparation of the registrant’s tax returns, review of annual distributions, and additional tax provision support fees.
River Canyon Total Return Bond Fund
2023: $7,000
2022: $6,700
NTAM Treasury Assets Fund
2023: $3,600
2022: $3,400
The fees to Deloitte & Touche LLP relate to the preparation of the registrant’s tax returns, review of annual distributions and additional tax provision support services.
Independent Franchise Partners US Equity Fund
2023: $0
2022: $0
State Farm Funds
2023: $0
2022: $0
Vontobel U.S. Equity Institutional Fund
2023: $0
2022: $0
River Canyon Total Return Bond Fund
2023: $0
2022: $0
NTAM Treasury Assets Fund
2023: $0
2022: $0
(e)(1) Except as permitted by rule 2-01(c)(7)(i)(C) of regulation S-X the registrant’s audit committee must pre-approve all audit and non-audit services provided by the independent accountants relating to the operations or financial reporting of the registrant. Prior to the commencement of any audit or non-audit services to the registrant, the audit committee reviews the services to determine whether they are appropriate and permissible under applicable law.
| (e)(2) | Independent Franchise Partners US Equity Fund |
2023: 0%
2022: 0%
State Farm Funds
2023: 0%
2022: 0%
Vontobel U.S. Equity Institutional Fund
2023: 0%
2022: 0%
River Canyon Total Return Bond Fund
2023: 0%
2022: 0%
NTAM Treasury Assets Fund
2023: 0%
2022: 0%
| (g) | Independent Franchise Partners US Equity Fund |
2023: $6,115
2022: $5,825
State Farm Funds
2023:$27,760
2022: $26,040
Vontobel U.S. Equity Institutional Fund
2023: $7,150
2022: $6,930
River Canyon Total Return Bond Fund
2023: $7,000
2022: $6,700
NTAM Treasury Assets Fund
2023: $3,600
2022: $3,400
(h) The Audit Committee considered the non-audit services rendered to each of the registrant’s investment advisers and believes the services are compatible with each principal accountant’s independence.
(i) The registrant has not been identified by the U.S. Securities and Exchange Commission as having filed an annual report issued by a registered public accounting firm branch or office that is located in a foreign jurisdiction where the Public Company Accounting Oversight Board is unable to inspect or completely investigate because of a position taken by an authority in that jurisdiction.
(j) The registrant is not a foreign issuer.
Item 5. Audit Committee of Listed Registrants.
Not applicable.
Item 6. Investments.
| (a) | The Schedule of Investments in securities of unaffiliated issuers is included in the report to shareholders filed under Item 1 of this Form. |
Item 7. Disclosure of Proxy Voting Policies and Procedures for Closed-End Management Investment Companies.
Not applicable.
Item 8. Portfolio Managers of Closed-End Management Investment Companies.
Not applicable.
Item 9. Purchases of Equity Securities by Closed-End Management Investment Company and Affiliated Purchasers.
Not applicable.
Item 10. Submission of Matters to a Vote of Security Holders.
Not applicable.
Item 11. Controls and Procedures.
| (a) | The registrant’s principal executive officer and principal financial officer have concluded, based on their evaluation of the registrant’s disclosure controls and procedures as conducted within 90 days of the filing date of this report, that these disclosure controls and procedures are adequately designed and are operating effectively to ensure that information required to be disclosed by the registrant on Form N-CSR is recorded, processed, summarized and reported within the time periods specified in the Securities and Exchange Commission’s rules and forms. |
| (b) | There were no changes in the registrant’s internal control over financial reporting (as defined in Rule 30a-3(d) under the Investment Company Act of 1940) that occurred during the period covered by this report that have materially affected or are reasonably likely to materially affect, the registrant’s internal control over financial reporting. |
Item 12. Disclosure of Securities Lending Activities for Closed-End Management Investment Companies.
Not applicable.
Item 13. Exhibits.
SIGNATURES
Pursuant to the requirements of the Securities Exchange Act of 1934 and the Investment Company Act of 1940, the registrant has duly caused this report to be signed on its behalf by the undersigned, thereunto duly authorized.
Advisers Investment Trust
| | |
| By: | | /s/Troy A. Sheets |
| | Troy A. Sheets |
| | Treasurer and Principal Financial Officer |
| |
| Date: | | November 29, 2023 |
Pursuant to the requirements of the Securities Exchange Act of 1934 and the Investment Company Act of 1940, this report has been signed below by the following persons on behalf of the registrant and in the capacities and on the dates indicated.
| | |
| By: | | /s/Barbara J. Nelligan |
| | Barbara J. Nelligan |
| | President and Principal Executive Officer |
| |
| Date: | | November 29, 2023 |
| |
| By: | | /s/Troy A. Sheets |
| | Troy A. Sheets |
| | Treasurer and Principal Financial Officer |
| |
| Date: | | November 29, 2023 |