UNITED STATES
SECURITIES AND EXCHANGE COMMISSION
Washington, D.C. 20549
FORM N-CSR
CERTIFIED SHAREHOLDER REPORT OF REGISTERED
MANAGEMENT INVESTMENT COMPANIES
Investment Company Act file number: 811-22545
DREXEL HAMILTON MUTUAL FUNDS
(exact name of registrant as specified in charter)
45 Rockefeller Plaza, Suite 2000, New York, New York 10111
(Address of principal executive offices) (Zip code)
Andrew Bang
45 Rockefeller Plaza, Suite 2000
New York, New York 10111
(Name and address of agent for service)
Registrant’s telephone number, including area code: (855) 298.4236
Date of fiscal year end: September 30
Date of reporting period: December 21, 2011 – September 30, 2012
| Item 1. | Reports to Stockholders. |
| | |
Drexel Hamilton Mutual Funds | | Shareholder Letter |
| | September 30, 2012 (Unaudited) |
November 2012
Dear Shareholders,
With pleasure and excitement, we publish the inaugural annual report of the Drexel Hamilton Mutual Funds covering their inception on December 21, 2011 through our fiscal year ended September 30, 2012.
For the fiscal year ending September 30, 2012, the Net Asset Value (“NAV”) of the Drexel Hamilton Centre American Fund (DHAMX) increased 17.90% since inception and 16.16% year to date and the NAV of the Drexel Hamilton Centre Global Fund (DHGLX) increased 14.30% since inception and 13.06% year to date. Additional performance and fund information is available in the following Manager Commentary sections.
Of particular note and distinction is that our Drexel Hamilton Centre American Equity Fund was recognized as a WSJ’s Category King.
As of this letter, the Drexel Hamilton Multi-Asset Real Return Fund received SEC effectiveness and was launched on October 9, 2012 with backing of initial investors. The Multi-Asset Real Return Fund complements our equity funds and seeks total return that exceeds U.S. inflation over a full inflation cycle (typically 5 years) by using flexible tactical allocation strategy diversified across various asset classes to include equity, fixed income, commodities and cash. While navigating changing market conditions, the Fund will endeavor to dynamically shift allocation mix to maximize risk-adjusted returns and to preserve invested capital. Drexel Hamilton Investment Partners LLC serves as the Multi-Asset Real Return Fund adviser.
In an effort to focus the business on our core products, the Board of Trustees of the Drexel Hamilton Mutual Funds approved the liquidation and closure of the Drexel Hamilton 8IP Asia Pacific Equity Fund (DHAPX) and the Drexel Hamilton FOUR European Equity Fund (DHEUX) with effect on September 13, 2012. Based on investor feedback and business development efforts, it was determined that these funds were unlikely to attract sufficient new investment in the near future. We have reluctantly taken the decision to close the Funds as they would not be economically viable on an ongoing basis with disproportionately high fixed costs of operating such Funds borne by investors. The Drexel Hamilton Mutual Funds are committed to continued long-term management and growth of our core offerings of mutual funds: the Drexel Hamilton Centre American Equity, the Drexel Hamilton Centre Global Equity and the new Drexel Hamilton Multi-Asset Real Return Funds.
| | — | | Drexel Hamilton Centre American Equity Fund (DHAMX) |
| | — | | Drexel Hamilton Centre Global Equity Fund (DHGLX) |
| | — | | Drexel Hamilton Multi-Asset Real Return Fund (DHMUX) |
On September 17, 2012, the Board of Trustees of Drexel Hamilton Mutual Funds unanimously approved an agreement among the Trust, on behalf of Drexel Hamilton Centre American Equity Fund, to acquire Ameristock Mutual Fund, Inc. (“Ameristock Fund”). The proposed reorganization would involve (1) the Ameristock Fund transferring all of its assets to the Drexel Hamilton Centre American Equity Fund and assuming all of the Ameristock Fund’s liabilities; (2) the Ameristock Fund distributing pro rata to its shareholders shares of the Drexel Hamilton Centre American Equity Fund in exchange for such shareholders’ Ameristock Fund shares and in connection with the complete liquidation of the Ameristock Fund; and (3) the dissolution and termination of the Ameristock Fund. The Plan was unanimously approved by the Ameristock Fund Board on September 19, 2012 and will be submitted to the Ameristock Fund shareholders for approval at a Special Meeting of Shareholders expected to be held on or about December 12, 2012. The proposed reorganization is subject to various conditions to its consummation, including (among others) the approval of the Ameristock Fund shareholders. If the Plan is approved at the special meeting, it is currently anticipated that the reorganization would be consummated as of the close of business on or about December 28, 2012. We expect the completion of this transaction will enhance Drexel Hamilton Centre American Equity Fund’s overall capability by acquiring additional securities consistent with investment objective and having additional assets in the portfolio should create a larger, more viable fund with the potential for greater efficiencies and investment opportunities and other long-term benefits.
During this challenging and uncertain market, political and economic environment, Drexel Hamilton Mutual Funds’ equity strategies will continue to focus on fundamentals and stock selection skills within disciplined and research intensive processes. The Fund Managers have laid the building blocks in keeping with the investment objectives of seeking
long-term growth of capital and will build on the strong foundations laid during this initial year. The Multi-Asset Real Return Fund will look to actively allocate between asset classes using a fundamentally-driven disciplined model framework. Consistent, steady, proven and differentiated investment processes based on fundamentals across our funds will allow for insight and investment with conviction.
Drexel Hamilton Investment Partners LLC, the Adviser, offers funds management to clients, intermediaries, advisers and distributors as a leading Service Disabled Veteran Owned Small Business (“SDVOSB”) investment manager. We continue to see many state and municipal pension plans as well as other investors seeking to lead in implementing mandates and preference for SDVOSBs, a key focus of our expected growth as institutional investors may benefit or receive business credit for engaging DHIP as an investment manager per federal mandates and state/local regulations.
| | |
Annual Report | September 30, 2012 | | 1 |
| | |
Drexel Hamilton Funds | | Shareholder Letter |
| | September 30, 2012 (Unaudited) |
As an Investment Manager with expertise in asset allocation and manager selection, Drexel Hamilton Investment Partners LLC’s business model is committed to:
| | — | | provide access to specialist single manager equity fund strategies that we believe demonstrate a competitive advantage in their region/style as well as a distinctive multi-asset capability; |
| | — | | aim to deliver results for our clients using a selection of highly talented investment fund managers, in-house and external sub-advisers; |
| | — | | dedication to risk management and the highest institutional standards; |
| | — | | offer funds with competitive fees, liquidity and transparency; and |
| | — | | working in partnership with our clients in the education and adherence regarding federal, state and local laws mandating use of Disabled Veteran Owned firms. |
In our inaugural year of the Funds’ operation, many significant milestones have been achieved and our Drexel Hamilton Centre American Equity Fund has received accolades. We believe that the Funds are off to strong start and look forward to continuing the goal of providing differentiation, value and performance for many years to come.
Sincerely yours,
Andrew Bang
President
Liquidity: The fund can be bought or sold on a daily basis.
Transparency: The fund posts its holdings 30 days after fiscal quarter end.
Andrew Bang is a registered representative of ALPS Distributors, Inc.
The statements and opinions expressed are those of the Adviser and are as of the date of this report.
| | |
Drexel Hamilton Centre American Equity Fund | | Manager Commentary |
| | September 30, 2012 (Unaudited) |
Performance:
Since inception (December 21, 2011) to September 30, 2012, the Drexel Hamilton Centre American Equity Fund returned 17.90% and outperformed its benchmark, the S&P 500 Index, which returned 17.81%.
From inception to September 30, 2012, sectors such as Telecom, Technology and Financials were market leaders whilst sectors such as Utilities, Energy, and Industrials lagged. Stocks that were strong performers within the Fund over this period included Apple (Technology), Huntsman (Materials), and Amazon.com (Consumer Discretionary); stocks that were laggards included Coach (Consumer Discretionary), McDonald’s (Consumer Discretionary), and Caterpillar (Industrials), all of which remain in the Fund.
Our principal overweight sectors over the period were Technology and Industrials driven by bottom-up stock level opportunities. We have, however, materially increased our positions within the Health Care and Staples sectors recently after harvesting gains in the Materials and Industrials sectors. In Health Care, we continue to add opportunistically to our existing core holdings such as Johnson & Johnson, Merck and Abbott Labs, as well as new positions in medical device manufacturer Zimmer and biotechnology concern Amgen. On the margin, our stock sales since the early part of the year are in more cyclical stocks, namely Alcoa, Dell, KLA-Tencor and Parker Hannifin due to recent loss of positive profit margin and return on capital momentum.
We maintain our general underweight of the large “too big to fail” financial stocks as regulatory scrutiny and increased capital requirements continue to depress returns on equity and intrinsic values. Our stock selection success in names such as Zions Bancorp and Capital One, part of our stock focus on the regional banking group, offset partially for the sector underweight versus the Index.
Economic and Market Review:
Over the period since inception through September 2012, U.S. stocks generated double digit returns as measured by the S&P 500 Index. The U.S. stock market rebounded from the low in the summer and fall of 2011 then fell sharply in May and June of 2012 due to the re-emergence of sovereign default worries and their impact on global economic growth. Since the summer months however, the U.S. stock market witnessed a reversal due to confidence in a positive impact from quantitative easing actions by the Federal Reserve and ECB. Despite the recent rally ignited by the Federal Reserve, what is unique and troubling about this economic and stock market cycle is that the U.S. appears to be on its way to joining Europe in economic slowdown despite monetary policy at its most accommodative posture. Normally, it’s the Federal Reserve and restrictive monetary policy via higher interest rates that slow the economy down. Given the uniqueness and the deterioration in profit margins generally across the S&P 500, we continue to move the Fund towards less cyclical and mega-capitalization type stocks and view large U.S. multinationals as one of the best opportunities amongst investment choices.
Despite the continuing bleak employment figures in the U.S. since the onset of recession in late 2007, economic expansion as measured by the ISM Index, a national purchasing manager survey, has experienced one of the longest post WWII periods of economic growth, 34 months. This said, three out of the past five recent sub-50 Index readings since June indicate economic contraction and portend a possible recession on the horizon. Looking back, stock markets rallying to new highs in January 2007 based upon confidence of a “goldilocks” economy, a term describing conditions that are neither too hot nor too cold, taking hold in the U.S. despite the ISM Index piercing the below 50 threshold was a warning shot about the imminent recession to follow. This was after being in expansion above 50, a level that indicates economic growth, from July 2003. At other times when the ISM Index fell below 50 after expansion such as August 2000, June 1998, May 1989 and August 1979, foretold of further economic contraction, consistent in most cases with outright recessions that followed. Today, aside from the broad ISM index moving average decelerating, employment, supplier deliveries, production, new orders and inventories all decreased as well. Even the bright spot in the economy, manufacturing activity, is decelerating because it is no longer being driven by businesses rebuilding their inventories and even capital expansion plans remain tentative as election year uncertainty contributes to delays in decision making for large projects. We’re likely to see growth rates to continue dropping off until corporations as well as consumers regain confidence and start spending again. Perhaps the one bright spot is that because many employers already cut their workforces so deeply during the last recession, they simply can’t cut any more.
The major difference between prior points when the U.S. economy began periods of economic contraction and today is that, outside of instigating a high inflation policy through further quantitative easing, the Federal Reserve seems impotent in trying to combat the current contraction and massaging the business cycle; U.S. rates are already at record lows across the yield spectrum and, in fact, higher rates may be the necessary tonic to bring long-term recovery hopes but we see no chance in that happening. Housing construction, notably absent during the current economic expansion, seems stable but not yet at a point of re-accelerating despite the record low mortgage rates. On the positive, many of the excesses typically seen at the start of recessions, excessive reinvestment rates, booming mergers and acquisitions activity, etc. are not evident.
| | |
Annual Report | September 30, 2012 | | 3 |
| | |
Drexel Hamilton Centre American Equity Fund | | Manager Commentary |
| | September 30, 2012 (Unaudited) |
Portfolio Structure:
Our focus in the Fund remains on companies ‘wisely contracting’, remaining disciplined in their capital expenditures and headcount growth and staying ahead of their peers by doing so. Continued profit margin expansion and more rapid asset turns will allow these companies to maintain the positive momentum in their returns on capital and, as we believe, related stock returns. Bar-belled against these types of companies, we are focused on those ‘wealth creators’ that have business models that are able to continue to power through the macro environment by expanding market share and their global sales presence, many of which can be classified as ‘Nifty-Fifty’ type stocks concentrated in the Technology, Industrial and Consumer sectors.
Outlook:
We believe the best strategy to employ in the current environment is one comprised mainly of leading mega-capitalization blue chips with those attributes that render them undervalued based upon their current multiples. These companies, whose fundamentals will stand out increasingly as the business cycle matures and will distinguish themselves from the broad market through organic growth from innovation and pricing power. U.S. companies such as Apple, Caterpillar, and Google typify these attributes. Combined with this portfolio component in a barbell approach, there remain selective companies in the U.S. that continue to harvest growth in earnings and took the initiative during the most recent recession to enhance operations by streamlining labor forces and optimizing assets. U.S. companies such as Textron, Harley-Davidson, and St. Jude Medical typify these attributes.
When the U.S. stock market’s main driver for performance is multiple expansion, rather than earnings growth, it accrues mainly to blue-chip growth stocks historically. Many Large and Mega-Cap stocks represent the best investment area of the U.S. stock market due to their potential for valuation re-ratings versus peers even as the broad stock market rating stays steady. We recommend a barbell approach within portfolios that concentrates on those companies whose growth or valuation profiles will distinguish them from the broad market. Specifically, the rating of U.S. shares is still inexpensive relative to the past twenty years with the price to earnings ratio (P/E) of the S&P 500 Index now at around 14 times forward earnings and even lower for the largest 100 stocks within the S&P 500. This said, our thesis for the U.S. market is that a further re-rating of shares will be very selective and concentrated on those blue-chip shares that have dominant market shares, are globally positioned to benefit from emerging markets growth, leaders in innovation, or those companies that are driving margin expansion despite rising headwinds from higher energy and other input costs.
While there are no easy answers in this macro environment and the U.S. presidential election holds some hope for a turnaround in business, consumer and investor confidence, the recent economic figures portend the formal declaration of a recession in the U.S. before year-end as a possibility. The good news is that investors aren’t buying shares of the ISM index or frankly even the U.S. economy when they invest in the U.S. stock market; they’re buying leading dynamic businesses that allocate capital where it will generate the best operating returns around the globe as well as be proactive in reducing costs in anticipation of reduced demand. For now, a defensive sector bias seems warranted with emphasis on leading blue-chips in the Health Care and Staples sectors as well as certain industries within Technology. We see genuine value in many large-capitalisation stocks in these areas and anticipate investors to further embrace them as the U.S. economy lurches toward slowdown regardless of the Federal Reserve’s accommodations.
As always, our process in managing the Fund is to focus bottom-up on each individual company’s growth outlook, not just on earnings but understanding the capital allocation decisions being made today and how they will lead to future earnings growth. In other words, we expect companies to invest in productive assets of the business, organically and through opportunistic purchases, which, in turn provides the foundation for future revenue and profits growth that will create shareholder value. Alternatively, if companies cannot invest in productive assets due to a cyclical downturn or existing excess capacity, we expect these companies to “wisely contract” through the restructuring of their assets and other resources to regain their footing for future shareholder value creation. Our top-down views on interest rates, etc. are important as many of those are inputs into our company models and, at the end of the day, are reconciled to the bottom-up information we gather and process from company performance. The end result is our attempt to find the best 45-70 stocks within the S&P and weight those securities in a manner that delivers a Fund with risk adjusted returns. We see profits moving higher and stock prices have ample room to reflect this growth in profits as well as re-rate positively to reflect this and diminished risk aversion. From a bottom-up perspective, we see continuing profit and return on capital momentum and, most importantly, tremendous upside versus downside asymmetry in price targets in the Fund’s stock positions.
| | |
Drexel Hamilton Centre American Equity Fund | | Manager Commentary |
| | September 30, 2012 (Unaudited) |
Bar-belled: A strategy that balances aggressive stocks on one side with defensive stocks on the other.
Blue chip: A nationally recognized well-established and financially sound company. Blue chips generally sell high-quality, widely accepted products and services. Blue chip companies are known to weather downturns and operate profitably in the face of adverse economic conditions, which help to contribute to their long record of stable and reliable growth.
ECB: The central bank responsible for the monetary system of the European Union (EU) and the euro currency. The bank was formed in Germany in June 1998 and works with the other national banks of each of the EU members to formulate the monetary policy that helps maintain price stability in the European Union.
Nifty-fifty: The 50 Stocks that were most favored by institutional investors in the 1960s and 1970s. Companies in this group were usually characterized by consistent earnings growth and high P/E ratios.
Price to earnings ratio: A valuation ratio of a company’s current share price compared to its per-share earnings.
Quantitative easing: A government monetary policy occasionally used to increase the money supply by buying government securities of other securities from the market. Quantitative easing increases the money supply by flooding financial institutions with capital, in an effort to promote increased lending and liquidity.
Sub-50 Index Readings: When a major economic indicator, such as PMI (Purchasing Manager Index), drops below the level 50 or “sub” 50 it can be interpreted as a down of contraction in the economy/industry.
The statements and opinions expressed are those of the Sub-Adviser and are of the date of this report.
| | |
Annual Report | September 30, 2012 | | 5 |
| | |
Drexel Hamilton Centre American Equity Fund | | Manager Commentary |
| | September 30, 2012 (Unaudited) |
| | | | | | | | | | | | | | | | | | | | |
SECTOR WEIGHTINGS | | GROWTH OF HYPOTHETICAL $10,000 INVESTMENT AS OF SEPTEMBER 30, 2012 | | |
As a percentage of Net Assets | | 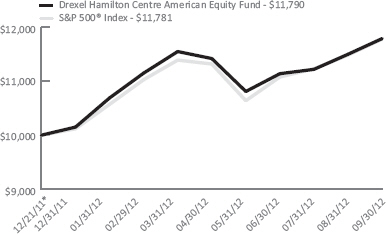
| | |
Information Technology | | | 28.28 | % | | | | | |
Health Care | | | 16.50 | % | | | | | |
Consumer Staples | | | 13.04 | % | | | | |
Industrials | | | 11.17 | % | | | | |
Consumer Discretionary | | | 10.63 | % | | | | |
Energy | | | 8.12 | % | | | | |
Financials | | | 7.16 | % | | | | |
Materials | | | 2.63 | % | | | | |
Telecommunication Services | | | 0.99 | % | | | | |
Utilities | | | 0.74 | % | | | | |
Cash & Equivalents | | | 0.74 | % | | | | |
Total | | | 100.00 | % | | | | |
These allocations may not reflect the current or future positions of the portfolio. | | | | | |
| | | | | | This graph assumes an initial investment of $10,000 at December 21, 2011, the Fund’s inception date, and that any dividends and distributions are reinvested. This graph depicts the performance of the Fund versus the S&P 500® Index. It is important to note that the Fund is a professionally managed mutual fund while the index is not available for investment and is unmanaged and does not have expenses that affect the results. The comparison is shown for illustrative purposes only. | | |
| | | | | | | | | | CUMULATIVE TOTAL RETURNS – FOR THE PERIOD ENDED SEPTEMBER 30, 2012 | | |
| | | | | | | | | | | | 1
Month | | 3
Month | | YTD | | Since
Inception* | | |
| | | | | | | | | | Drexel Hamilton Centre American Equity Fund | | 2.52% | | 5.83% | | 16.16% | | 17.90% | | |
| | | | | | | | | | S&P 500® Index | | 2.58% | | 6.35% | | 16.44% | | 17.81% | | |
| | | | | |
| | | | | | | | | | The performance information quoted above represents past performance, which is not a guarantee of future results, and does not reflect the deduction of taxes that a shareholder would pay on Fund distributions or the redemption of Fund shares. Investment return and principal value of an investment will fluctuate so that an investor’s shares, when redeemed, may be worth more or less than their original cost. Total return includes reinvestment of dividends and capital gains. Current performance may be lower or higher than the performance data quoted. For the most current month-end performance data please call
855-298-4236 or visit www.dhipfunds.com. | | |
| | | | | | | | | | The total annual operating expense ratio (after expense reimbursements) as stated in the fee table of the most recent prospectus, dated November 16, 2011, was 1.25%. | | |
| | | | | | | | | | The Adviser has entered into a written expense limitation agreement through November 17, 2012 under which it has agreed to limit the total expenses of the Fund (excluding interest, taxes, litigation, brokerage, extraordinary expenses, and any transactions costs associated with short sales which may include but are not limited to brokerage commissions and dividends that are paid to persons from whom the Fund borrows securities) to an annual rate of 1.25% of the average net assets of the Fund. Without this waiver the total annual fund operating expenses of the fund would be 2.19%. | | |
| | | | | | | | | | The S&P 500® Index is a commonly recognized, market-capitalization weighted index of 500 widely held securities, designed to measure broad U.S. equity performance. You cannot invest directly in an index. | | |
| | | | | | | | | | * The Fund’s inception date was December 21, 2011. | | |
| | | | | | | | | | | | | | | | | | | | |
| | |
| Drexel Hamilton Centre Global Equity Fund | | Manager Commentary |
| | September 30, 2012 (Unaudited) |
Performance:
Since inception (December 21, 2011) to September 30, 2012, the Drexel Hamilton Centre Global Equity Fund returned 14.30% and marginally underperformed its benchmark, the MSCI All Country (ACWI) Index, which returned 15.03%.
Global equities started the current year with a bull-run gaining more than 12% from January to March. In the following period from April to June, worries of global economic slowdown and European sovereign debt crisis led to a market
sell-off dragging down the global equity market average by more than 13% to touch new lows in June, as measured by MSCI ACWI. However, by mid-September, anticipating easing monetary policies from the European Central Bank (ECB) and the U.S. Federal Reserve (Fed), the global equity markets, as measured by MSCI ACWI, made a new high for the year in September.
From inception to September 30, 2012, good stock selection in Asia Pacific, U.S., Western Europe and Latin America contributed positively to the Fund’s performance. The Fund’s performance also benefited from its overweight posture in Asia and Europe. On the other hand, regional underweight posture in South America and overweight posture in Eastern Europe detracted from the Fund’s performance. During this period, North America outperformed the global equity market average (MSCI ACWI), whereas, Europe and Asia Pacific underperformed. Within Europe, Belgium, Denmark and Germany were among the best performing markets globally whilst Greece, Spain and Italy were some of the worst performing. In Asia Pacific, Philippines, Thailand, India and Singapore outperformed while China and Japan underperformed. Emerging markets as a group underperformed the MSCI ACWI but with mixed results. Egypt, Turkey and Philippines outperformed materially both their emerging market peers and the global average whereas Argentina, Brazil, Indonesia and China underperformed.
Among the Fund’s holdings, SABESP in Brazil; Inditex in Spain; Tencent and Hengan International in China; Advanced Info Service in Thailand; Anheuser-Busch in Belgium; Syngenta in Switzerland; Telstra in Australia and Fast Retailing in Japan were large contributors to Fund’s positive Fund’s performance. On the negative side, Banco do Brasil and Vale in Brazil; Li & Fung in Hong Kong; Canon in Japan; Generali and Enel in Italy and Belle International in China detracted from Fund’s performance.
Economic and Market Outlook:
Looking ahead, we are cautiously optimistic. As always, the Fund focuses on large market capitalization blue chips in the developed markets and emerging blue chips in the developing countries. The Fund’s holdings continue to emphasize on high quality large market capitalization stocks with impressive track records of creating shareholder value in good times and bad.
In the near-term, results of the general election in the U.S. and once-in-a-decade leadership transition in China will have a bearing on market movement. Following this the global investors will be closely scrutinizing how the leaders in the U.S., China and Europe will be dealing with the European sovereign debt crisis, the economic slowdown in China and the fiscal cliff in the U.S.
We expect that after the transition of leadership in early November in China, there will be more policy adjustments by the new Chinese leaders to safeguard the Chinese economy from slowing export demand globally and to restructure the economy so that in the long run the economic growth is less dependent on exports. This, however, will likely to be a slow and gradual process.
Finally, we think that the markets have already discounted many of the uncertainties and risks facing the global equity investors. Moreover, we see numerous investment opportunities for long-term global equity investors among the many attractively valued blue-chip large market capitalization multi-national companies all over the world. We believe that
long-term global equity investors will be rewarded by focusing their investments, as we do in the Fund, in high quality blue chip stocks that have impressive track records of creating shareholder value, growing dividends in challenging operating environments, maintaining strong balance sheets, and are well positioned competitively in their respective industries.
Portfolio Structure & Strategy:
The Drexel Hamilton Centre Global Equity Fund offers a unique investment vehicle for investors by focusing on large capitalization blue chips in the developed world and emerging blue chips in the developing countries. The Fund’s investment process combines bottom-up stock selection with structured portfolio construction and risk management that’s cognizant of secular growth forces.
Our approach in managing the Fund is to focus bottom-up on each individual company’s growth outlook, not just on earnings but understanding the capital allocation decisions being made today and how they will lead to future earnings growth. Our top-down views on macro outlooks of various markets, regions and global sectors etc. are important as many of those are inputs into our company models and at the end of the day, are reconciled to the bottom-up information we gather and process from company performance and operating results.
| | |
Annual Report | September 30, 2012 | | 7 |
| | |
| Drexel Hamilton Centre Global Equity Fund | | Manager Commentary |
| | September 30, 2012 (Unaudited) |
Our unique and disciplined economic-value-added based investment process and unique dynamic GDP-adjusted focused portfolio construction process insure that the Fund is unencumbered by traditional market capitalization weighted benchmarks and goes where the bottom-up stock opportunities are globally. Consequently, the Fund is well positioned to benefit and profit from the positive demographics and long-term economic growth in many developing economies as well as attractive investment opportunities in developed countries across the globe.
We remain cautiously optimistic for the global equity markets over the long-run. Currently, the Fund maintains its above benchmark dividend yield, its overweight postures in Technology, Telecommunication Services, Consume Discretionary and Consumer Staples; and underweight postures in Industrials, Financials and Materials. The Fund has close to neutral postures in Healthcare, Energy and Utilities.
Going forward, the Fund will continue to be anchored with shareholder value creators who 1) have long track records of growing their cash earnings and dividends in both good times and bad, 2) are in excellent competitive positions locally or globally in their respective industries and markets, and 3) are likely to be the main beneficiaries of good fundamental long-term economic growth and demographics in various parts of the world, such as Apple, AmBev, Inditex and China Mobile.
Blue chip: A nationally recognized well-established and financially sound company. Blue chips generally sell high-quality, widely accepted products and services. Blue chip companies are known to weather downturns and operate profitably in the face of adverse economic conditions, which help to contribute to their long record of stable and reliable growth.
GDP: The monetary value of all finished goods and services produced within a country’s borders in a specific time period, though GDP is usually calculated on an annual basis. It includes all of private and public consumption, government outlays, investments and exports less imports that occur within a defined territory.
Sovereign debt: Bonds issued by a national government in a foreign currency, in order to finance the issuing country’s growth. Sovereign debt is generally a riskier investment when it comes from a developing country and a safer investment when it comes from a developed country The stability of the issuing government is an important factor to consider, when assessing the risk of investing in sovereign debt, and sovereign credit ratings help investors weigh this risk.
The statements and opinions expressed are those of the Sub-Adviser and are as of the date of this report.
| | |
| Drexel Hamilton Centre Global Equity Fund | | Manager Commentary |
| | September 30, 2012 (Unaudited) |
| | | | |
SECTOR WEIGHTINGS | | | | |
As a percentage of Net Assets | |
| |
Financials | | | 16.91 | % |
Information Technology | | | 16.16 | % |
Consumer Discretionary | | | 12.14 | % |
Consumer Staples | | | 12.04 | % |
Energy | | | 11.07 | % |
Health Care | | | 9.90 | % |
Telecommunication Services | | | 7.23 | % |
Materials | | | 6.21 | % |
Industrials | | | 4.00 | % |
Utilities | | | 3.14 | % |
Cash and Cash Equivalents | | | 1.20 | % |
Total | | | 100.00 | % |
| |
COUNTRY WEIGHTINGS | | | | |
As a percentage of Net Assets | |
| |
United States | | | 26.61 | % |
China | | | 12.22 | % |
Germany | | | 8.01 | % |
Brazil | | | 7.25 | % |
Japan | | | 4.86 | % |
Switzerland | | | 4.59 | % |
France | | | 4.49 | % |
Italy | | | 3.50 | % |
Australia | | | 3.32 | % |
Great Britain | | | 3.19 | % |
Spain | | | 3.16 | % |
Russia | | | 2.74 | % |
Netherlands | | | 1.93 | % |
Taiwan | | | 1.75 | % |
Denmark | | | 1.64 | % |
Hong Kong | | | 1.57 | % |
Korea | | | 1.31 | % |
Mexico | | | 1.25 | % |
Thailand | | | 1.09 | % |
Belgium | | | 0.98 | % |
India | | | 0.95 | % |
Norway | | | 0.93 | % |
Singapore | | | 0.76 | % |
Israel | | | 0.70 | % |
Cash & Equivalents | | | 1.20 | % |
Total | | | 100.00 | % |
|
| These sector and country allocations may not reflect the current or future positions of the portfolio. | |
GROWTH OF HYPOTHETICAL $10,000 INVESTMENT AS OF SEPTEMBER 30, 2012
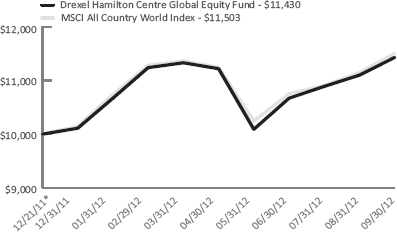
This graph assumes an initial investment of $10,000 at December 21, 2011, the Fund’s inception date, and that any dividends and distributions are reinvested. This graph depicts the performance of the Fund versus the MSCI All Country World Index. It is important to note that the Fund is a professionally managed mutual fund while the index is not available for investment and is unmanaged and does not have expenses that affect the results. The comparison is shown for illustrative purposes only.
CUMULATIVE TOTAL RETURNS – FOR THE PERIOD ENDED SEPTEMBER 30, 2012
| | | | | | | | |
| | | 1 Month | | 3 Month | | YTD | | Since
Inception* |
Drexel Hamilton Centre Global Equity Fund | | 2.97% | | 7.12% | | 13.06% | | 14.30% |
MSCI All Country World Index | | 3.19% | | 6.97% | | 13.39% | | 15.03% |
The performance information quoted above represents past performance, which is not a guarantee of future results, and does not reflect the deduction of taxes that a shareholder would pay on Fund distributions or the redemption of Fund shares. Investment return and principal value of an investment will fluctuate so that an investor’s shares, when redeemed, may be worth more or less than their original cost. Total return includes reinvestment of dividends and capital gains. Current performance may be lower or higher than the performance data quoted. For the most current month-end performance data please call 855-298-4236 or visit www.dhipfunds.com.
The total annual operating expense ratio (after expense reimbursements) as stated in the fee table of the most recent prospectus, dated November 16, 2011, was 1.25%.
The Adviser has entered into a written expense limitation agreement through November 17, 2012 under which it has agreed to limit the total expenses of the Fund (excluding interest, taxes, litigation, brokerage, extraordinary expenses, and any transactions costs associated with short sales which may include but are not limited to brokerage commissions and dividends that are paid to persons from whom the Fund borrows securities) to an annual rate of 1.25% of the average net assets of the Fund. Without this waiver the total annual fund operating expenses of the fund would be 2.68%.
Investing in the securities of foreign companies generally involves greater risk than investing in larger, more established domestic companies. Therefore, investments in the Fund may involve a greater degree of risk than investments in other mutual funds that invest in larger, more established domestic companies.
The MSCI (Morgan Stanley Capital International) All Country World Index is an unmanaged, free float-adjusted market capitalization weighted index composed of stocks of companies located in countries throughout the world. It is designed to measure equity market performance in global developed and emerging markets. The index includes reinvestment of dividends, net of foreign withholding taxes. You cannot invest directly in an index.
* The Fund’s inception date was December 21, 2011.
| | |
Annual Report | September 30, 2012 | | 9 |
| | |
| Drexel Hamilton Funds | | Disclosure of Fund Expenses |
| | September 30, 2012 (Unaudited) |
As a shareholder of a series of Drexel Hamilton Mutual Funds (each series, a “Fund” and together, the “Funds”), you will incur two types of costs: (1) transaction costs, including applicable redemption fees; and (2) ongoing costs, including management fees and other Fund expenses. The following examples are intended to help you understand your ongoing costs (in dollars) of investing in the Fund and to compare these costs with the ongoing costs of investing in other mutual funds. The examples are based on an investment of $1,000 invested on April 1, 2012 and held until September 30, 2012.
Actual Expenses. The first line of each table below provides information about actual account values and actual expenses. You may use the information in this line, together with the amount you invested, to estimate the expenses that you paid over the period. Simply divide your account value by $1,000 (for example, an $8,600 account value divided by $1,000 = 8.6), then multiply the result by the number in the first line under the heading “Expenses Paid During Period” to estimate the expenses you paid on your account during this period.
Hypothetical Example for Comparison Purposes. The second line of the table below provides information about hypothetical account values and hypothetical expenses based on the Fund’s actual expense ratio and an assumed rate of return of 5% per year before expenses, which is not the Fund’s actual return. The hypothetical account values and expenses may not be used to estimate the actual ending account balance or expenses you paid for the period. You may use this information to compare the ongoing costs of investing in the Fund and other funds. To do so, compare this 5% hypothetical example with the 5% hypothetical examples that appear in the shareholder reports of the other funds. The expenses shown in the table are meant to highlight ongoing Fund costs only and do not reflect transaction fees, such as redemption fees or exchange fees. Therefore, the second line of each table below is useful in comparing ongoing costs only, and may not help you determine the relative total costs of owning different funds. In addition, if these transactional costs were included, your costs would have been higher.
Please note that the expenses shown in the table below are meant to highlight your ongoing costs only and do not reflect any transactional costs, such as redemption fees. Therefore, the second line for each Fund within the table is useful in comparing ongoing costs only, and will not help you determine the relative total costs of owning different funds. If these transactional costs were included, your costs would have been higher.
| | | | | | | | |
| | | BEGINNING ACCOUNT VALUE 04/01/12 | | ENDING ACCOUNT VALUE 09/30/12 | | EXPENSE RATIO(a) | | EXPENSES PAID DURING PERIOD 04/01/12-09/30/12 |
Drexel Hamilton Centre American Equity Fund |
Actual | | $ 1,000.00 | | $ 1,020.80 | | 1.25% | | $ 6.32 |
Hypothetical (5% return before expenses)(b) | | $ 1,000.00 | | $ 1,018.75 | | 1.25% | | $ 6.31 |
|
Drexel Hamilton Centre Global Equity Fund |
Actual | | $ 1,000.00 | | $ 1,008.80 | | 1.25% | | $ 6.28 |
Hypothetical (5% return before expenses)(b) | | $ 1,000.00 | | $ 1,018.75 | | 1.25% | | $ 6.31 |
| (a) | Annualized, based on the Fund’s most recent fiscal half year expenses. |
| (b) | Expenses are equal to the Portfolios’ annualized expense ratio multiplied by the average account value over the period, multiplied by the number of days in the most recent fiscal half year (183), then divided by 366. |
| | |
Drexel Hamilton Centre American Equity Fund | | Schedule of Investments |
| | September 30, 2012 |
| | | | | | | | |
| | | Shares | | | Value | |
COMMON STOCKS (99.26%) | | | | | | | | |
Consumer Discretionary (10.63%) | | | | | | | | |
Advertising (1.74%) | | | | | | | | |
Interpublic Group of Cos., Inc. | | | 15,860 | | | $ | 176,363 | |
Omnicom Group, Inc. | | | 4,770 | | | | 245,941 | |
| | | | | | | | |
| | | | | | | 422,304 | |
| | | | | | | | |
Apparel (0.95%) | | | | | | | | |
Coach, Inc. | | | 4,120 | | | | 230,802 | |
| | | | | | | | |
| | |
Internet (1.67%) | | | | | | | | |
Amazon.com, Inc.(a) | | | 1,590 | | | | 404,369 | |
| | | | | | | | |
| | |
Leisure Time (0.84%) | | | | | | | | |
Harley-Davidson, Inc. | | | 4,810 | | | | 203,800 | |
| | | | | | | | |
| | |
Lodging (1.60%) | | | | | | | | |
Marriott International, Inc., Class A | | | 4,810 | | | | 188,071 | |
MGM Resorts International(a) | | | 18,520 | | | | 199,090 | |
| | | | | | | | |
| | | | | | | 387,161 | |
| | | | | | | | |
Retail (3.83%) | | | | | | | | |
Macy’s, Inc. | | | 4,980 | | | | 187,348 | |
McDonald’s Corp. | | | 3,770 | | | | 345,897 | |
Starbucks Corp. | | | 7,770 | | | | 394,328 | |
| | | | | | | | |
| | | | | | | 927,573 | |
| | | | | | | | |
Total Consumer Discretionary | | | | | | | 2,576,009 | |
| | | | | | | | |
| | |
Consumer Staples (13.04%) | | | | | | | | |
Agriculture (3.23%) | | | | | | | | |
Philip Morris International, Inc. | | | 6,280 | | | | 564,823 | |
Reynolds American, Inc. | | | 5,010 | | | | 217,134 | |
| | | | | | | | |
| | | | | | | 781,957 | |
| | | | | | | | |
Beverages (4.29%) | | | | | | | | |
Coca-Cola Co. | | | 15,310 | | | | 580,708 | |
PepsiCo, Inc. | | | 6,480 | | | | 458,590 | |
| | | | | | | | |
| | | | | | | 1,039,298 | |
| | | | | | | | |
Cosmetics & Personal Care (4.21%) | | | | | |
Colgate-Palmolive Co. | | | 4,590 | | | | 492,140 | |
Procter & Gamble Co. | | | 7,610 | | | | 527,829 | |
| | | | | | | | |
| | | | | | | 1,019,969 | |
| | | | | | | | |
Retail (1.31%) | | | | | | | | |
Wal-Mart Stores, Inc. | | | 4,300 | | | | 317,340 | |
| | | | | | | | |
| | |
Total Consumer Staples | | | | | | | 3,158,564 | |
| | | | | | | | |
| | |
Energy (8.12%) | | | | | | | | |
Oil & Gas (8.12%) | | | | | | | | |
Chevron Corp. | | | 3,680 | | | | 428,941 | |
Exxon Mobil Corp. | | | 10,170 | | | | 930,047 | |
Occidental Petroleum Corp. | | | 2,370 | | | | 203,962 | |
Schlumberger, Ltd. | | | 5,570 | | | | 402,878 | |
| | | | | | | | |
| | | | | | | 1,965,828 | |
| | | | | | | | |
Total Energy | | | | | | | 1,965,828 | |
| | | | | | | | |
| | | | | | | | |
| | | Shares | | | Value | |
Financials (7.16%) | | | | | | | | |
Banks (7.16%) | | | | | | | | |
BB&T Corp. | | | 6,360 | | | $ | 210,898 | |
Capital One Financial Corp. | | | 3,160 | | | | 180,152 | |
Citigroup, Inc. | | | 5,310 | | | | 173,743 | |
Fifth Third Bancorp | | | 11,710 | | | | 181,622 | |
Goldman Sachs Group, Inc. | | | 1,800 | | | | 204,624 | |
SunTrust Banks, Inc. | | | 7,540 | | | | 213,156 | |
US Bancorp | | | 5,360 | | | | 183,848 | |
Wells Fargo & Co. | | | 5,260 | | | | 181,628 | |
Zions Bancorporation | | | 9,860 | | | | 203,658 | |
| | | | | | | 1,733,329 | |
| | | | | | | | |
Total Financials | | | | | | | 1,733,329 | |
| | | | | | | | |
| | |
Health Care (16.50%) | | | | | | | | |
Biotechnology (1.91%) | | | | | | | | |
Amgen, Inc. | | | 5,480 | | | | 462,074 | |
| | | | | | | | |
| | |
Healthcare-Products (5.23%) | | | | | | | | |
Boston Scientific Corp.(a) | | | 31,750 | | | | 182,245 | |
Medtronic, Inc. | | | 6,770 | | | | 291,922 | |
St Jude Medical, Inc. | | | 5,820 | | | | 245,197 | |
Stryker Corp. | | | 5,750 | | | | 320,045 | |
Zimmer Holdings, Inc. | | | 3,360 | | | | 227,203 | |
| | | | | | | | |
| | | | | | | 1,266,612 | |
Healthcare-Services (0.92%) | | | | | | | | |
UnitedHealth Group, Inc. | | | 4,010 | | | | 222,194 | |
| | | | | | | | |
| | |
Pharmaceuticals (8.44%) | | | | | | | | |
Abbott Laboratories | | | 9,580 | | | | 656,805 | |
Johnson & Johnson | | | 12,490 | | | | 860,686 | |
Merck & Co., Inc. | | | 11,710 | | | | 528,121 | |
| | | | | | | | |
| | | | | | | 2,045,612 | |
| | | | | | | | |
Total Health Care | | | | | | | 3,996,492 | |
| | | | | | | | |
| | |
Industrials (11.17%) | | | | | | | | |
Aerospace/Defense (0.88%) | | | | | | | | |
United Technologies Corp. | | | 2,740 | | | | 214,515 | |
| | | | | | | | |
| |
Airlines (1.69%) | | | | | |
Delta Air Lines, Inc.(a) | | | 23,270 | | | | 213,153 | |
United Continental Holdings, Inc.(a) | | | 10,020 | | | | 195,390 | |
| | | | | | | | |
| | | | | | | 408,543 | |
| | | | | | | | |
| | |
Auto Manufacturers (0.80%) | | | | | | | | |
PACCAR, Inc. | | | 4,820 | | | | 192,921 | |
| | | | | | | | |
| | |
Commercial Services (0.90%) | | | | | | | | |
Robert Half International, Inc. | | | 8,210 | | | | 218,632 | |
| | |
Electronics (1.25%) | | | | | | | | |
Honeywell International, Inc. | | | 5,090 | | | | 304,127 | |
| | | | | | | | |
| | |
Machinery, Construction &
Mining (1.27%) | | | | | | | | |
Caterpillar, Inc. | | | 3,570 | | | | 307,163 | |
| | | | | | | | |
| | |
Annual Report | September 30, 2012 | | 11 |
| | |
Drexel Hamilton Centre American Equity Fund | | Schedule of Investments |
| | September 30, 2012 |
| | | | | | | | |
| | | Shares | | | Value | |
Industrials (continued) | | | | | | | | |
Miscellaneous Manufacturing (1.53%) | | | | | | | | |
General Electric Co. | | | 8,460 | | | $ | 192,126 | |
Textron, Inc. | | | 6,810 | | | | 178,218 | |
| | | | | | | | |
| | | | | | | 370,344 | |
| | | | | | | | |
Textiles (0.79%) | | | | | | | | |
Cintas Corp. | | | 4,610 | | | | 191,084 | |
| | | | | | | | |
| | |
Transportation (2.06%) | | | | | | | | |
Union Pacific Corp. | | | 1,910 | | | | 226,717 | |
United Parcel Service, Inc., Class B | | | 3,810 | | | | 272,682 | |
| | | | | | | | |
| | | | | | | 499,399 | |
| | | | | | | | |
Total Industrials | | | | | | | 2,706,728 | |
| | | | | | | | |
| | |
Information Technology (28.28%) | | | | | | | | |
Commercial Services (1.17%) | | | | | | | | |
Total System Services, Inc. | | | 11,970 | | | | 283,689 | |
| | | | | | | | |
| | |
Computers (12.49%) | | | | | | | | |
Apple, Inc. | | | 3,180 | | | | 2,121,887 | |
International Business Machines Corp. | | | 4,350 | | | | 902,407 | |
| | | | | | | | |
| | | | | | | 3,024,294 | |
| | | | | | | | |
Diversified Financial Services (1.26%) | | | | | | | | |
Visa, Inc. | | | 2,280 | | | | 306,158 | |
| | | | | | | | |
| | |
Internet (4.83%) eBay, Inc.(a) | | | 8,710 | | | | 421,651 | |
Google, Inc., Class A(a) | | | 990 | | | | 746,955 | |
| | | | | | | | |
| | | | | | | 1,168,606 | |
| | | | | | | | |
Semiconductors (2.62%) | | | | | | | | |
Intel Corp. | | | 8,730 | | | | 197,997 | |
QUALCOMM, Inc. | | | 6,990 | | | | 436,805 | |
| | | | | | | | |
| | | | | | | 634,802 | |
| | | | | | | | |
Software (5.16%) | | | | | | | | |
Intuit, Inc. | | | 5,950 | | | | 350,336 | |
Microsoft Corp. | | | 15,880 | | | | 472,907 | |
Oracle Corp. | | | 13,560 | | | | 427,004 | |
| | | | | | | | |
| | | | | | | 1,250,247 | |
| | | | | | | | |
Telecommunications (0.75%) | | | | | | | | |
Cisco Systems, Inc. | | | 9,480 | | | | 180,973 | |
| | | | | | | | |
| |
Total Information Technology | | | | 6,848,769 | |
| | | | | | | | |
| | |
Materials (2.63%) | | | | | | | | |
Chemicals (2.63%) | | | | | | | | |
Huntsman Corp. | | | 11,320 | | | | 169,007 | |
Monsanto Co. | | | 5,140 | | | | 467,843 | |
| | | | | | | | |
| | | | | | | 636,850 | |
| | | | | | | | |
Total Materials | | | | | | | 636,850 | |
| | | | | | | | |
| | | | | | | | | | | | |
| | | | Shares | | | Value | |
Telecommunication Services (0.99%) | | | | | | | | | |
Telecommunications (0.99%) | | | | | | | | | |
Verizon Communications, Inc. | | | | 5,260 | | | $ | 239,698 | |
| | | | | | | | | |
| | |
Total Telecommunication Services | | | | | | | | 239,698 | |
| | | | | | | | | | | | |
| | |
Utilities (0.74%) | | | | | | | | | |
Electric (0.74%) | | | | | | | | | |
Calpine Corp.(a) | | | | 10,330 | | | | 178,709 | |
| | | | | | | | | | | | |
| | |
Total Utilities | | | | | | | | 178,709 | |
| | | | | | | | | | | | |
| | | | | | | | | |
TOTAL COMMON STOCKS (Cost $21,076,609) | | | | | | | | 24,040,976 | |
| | | |
| | | 7-Day Yield | | | Shares | | | Value | |
SHORT TERM INVESTMENTS (0.82%) | |
Money Market Fund (0.82%) | | | | | |
Dreyfus Treasury Prime Cash Management, Institutional Class | | | 0.00004 | % | | | 197,924 | | | | 197,924 | |
| | | | | | | | | | | | |
| | | | | |
TOTAL SHORT TERM INVESTMENTS (Cost $197,924) | | | | 197,924 | |
| |
TOTAL INVESTMENTS (Cost $21,274,533) (100.08%) | | | $ | 24,238,900 | |
| |
Liabilities in Excess of Other Assets (- 0.08%) | | | | (18,500 | ) |
NET ASSETS (100.00%) | | | | | | | $ | 24,220,400 | |
| | |
| (a) | Non-income producing security. |
Common Abbreviations:
Ltd. - Limited.
| | |
Drexel Hamilton Centre Global Equity Fund | | Schedule of Investments |
| | September 30, 2012 |
| | | | | | | | |
| | | Shares | | | Value | |
COMMON STOCKS (95.90%) | | | | | | | | |
ASIA (27.83%) | | | | | | | | |
Australia (3.32%) | | | | | | | | |
Financials (1.01%) | | | | | | | | |
Commonwealth Bank of Australia | | | 2,090 | | | | $ 120,907 | |
| | |
Materials (0.90%) | | | | | | | | |
BHP Billiton, Ltd. | | | 3,157 | | | | 108,198 | |
| | | | | | | | |
| | |
Telecommunication
Services (1.41%) | | | | | | | | |
Telstra Corp., Ltd. | | | 41,540 | | | | 168,911 | |
| | | | | | | | |
| | |
Total Australia | | | | | | | 398,016 | |
| | | | | | | | |
| | |
China (12.22%) | | | | | | | | |
Consumer Staples (1.70%) | | | | | | | | |
Want Want China Holdings, Ltd. | | | 160,000 | | | | 204,074 | |
| | | | | | | | |
| | |
Energy (2.99%) | | | | | | | | |
China Petroleum & Chemical Corp., Class H | | | 112,500 | | | | 105,042 | |
CNOOC, Ltd. | | | 64,000 | | | | 131,235 | |
PetroChina Co., Ltd., Class H | | | 93,200 | | | | 122,118 | |
| | | | | | | 358,395 | |
| | | | | | | | |
Financials (5.30%) | | | | | | | | |
Bank of China, Ltd., Class H | | | 350,300 | | | | 133,270 | |
China Construction Bank Corp., Class H | | | 221,500 | | | | 153,684 | |
China Life Insurance Co., Ltd., Class H | | | 41,000 | | | | 118,441 | |
Industrial & Commercial Bank of China, Class H | | | 222,900 | | | | 131,658 | |
Ping An Insurance Group Co., Class H | | | 13,000 | | | | 98,246 | |
| | | | | | | 635,299 | |
| | | | | | | | |
Information Technology (0.57%) | | | | | | | | |
Tencent Holdings, Ltd. | | | 2,000 | | | | 68,145 | |
| | |
Telecommunication
Services (1.66%) | | | | | | | | |
China Mobile, Ltd. | | | 17,900 | | | | 198,413 | |
| | | | | | | | |
| | |
Total China | | | | | | | 1,464,326 | |
| | | | | | | | |
| | |
Hong Kong (1.57%) | | | | | | | | |
Consumer Discretionary (1.57%) | | | | | | | | |
Li & Fung, Ltd. | | | 54,000 | | | | 83,709 | |
Sands China, Ltd. | | | 27,800 | | | | 103,792 | |
| | | | | | | | |
| | | | | | | 187,501 | |
| | | | | | | | |
Total Hong Kong | | | | | | | 187,501 | |
| | | | | | | | |
| | |
India (0.95%) | | | | | | | | |
Information Technology (0.95%) | | | | | |
Infosys, Ltd., Sponsored ADR | | | 2,350 | | | | 114,069 | |
| | |
Total India | | | | | | | 114,069 | |
| | | | | | | | |
| | | | | | | | |
| | | Shares | | | Value | |
Japan (4.86%) | | | | | | | | |
Consumer Discretionary (3.96%) | | | | | | | | |
Fast Retailing Co., Ltd. | | | 1,030 | | | $ | 239,550 | |
Honda Motor Co., Ltd. | | | 3,300 | | | | 101,359 | |
Toyota Motor Corp. | | | 3,450 | | | | 134,393 | |
| | | | | | | 475,302 | |
| | | | | | | | |
Financials (0.90%) | | | | | | | | |
Mitsubishi UFJ Financial Group, Inc. | | | 22,900 | | | | 107,399 | |
| | |
Total Japan | | | | | | | 582,701 | |
| | | | | | | | |
| | |
Korea (1.31%) | | | | | | | | |
Information Technology (1.31%) | | | | | | | | |
Samsung Electronics Co., Ltd. | | | 130 | | | | 157,437 | |
| | |
Total Korea | | | | | | | 157,437 | |
| | | | | | | | |
| | |
Singapore (0.76%) | | | | | | | | |
Financials (0.76%) | | | | | | | | |
DBS Group Holdings, Ltd. | | | 7,800 | | | | 91,462 | |
| | |
Total Singapore | | | | | | | 91,462 | |
| | | | | | | | |
| | |
Taiwan (1.75%) | | | | | | | | |
Information Technology (1.75%) | | | | | | | | |
Delta Electronics, Inc. | | | 24,000 | | | | 92,926 | |
Taiwan Semiconductor
Manufacturing Co., Ltd. | | | 38,100 | | | | 116,717 | |
| | | | | | | | |
| | | | | | | 209,643 | |
| | | | | | | | |
Total Taiwan | | | | | | | 209,643 | |
| | | | | | | | |
| | |
Thailand (1.09%) | | | | | | | | |
Financials (1.09%) | | | | | | | | |
Kasikornbank Pcl | | | 22,100 | | | | 131,035 | |
| | | | | | | | |
| | |
Total Thailand | | | | | | | 131,035 | |
| | | | | | | | |
| | |
TOTAL ASIA (Cost $3,089,112) | | | | | | | 3,336,190 | |
| | |
EUROPE (35.86%) | | | | | | | | |
Belgium (0.98%) | | | | | | | | |
Consumer Staples (0.98%) | | | | | | | | |
Anheuser-Busch InBev NV | | | 1,378 | | | | 117,174 | |
| | | | | | | | |
| | |
Total Belgium | | | | | | | 117,174 | |
| | |
Denmark (1.64%) | | | | | | | | |
Health Care (1.64%) | | | | | | | | |
Coloplast A/S, Class B | | | 500 | | | | 104,111 | |
Novo Nordisk A/S, Class B | | | 582 | | | | 91,942 | |
| | | | | | | 196,053 | |
Total Denmark | | | | | | | 196,053 | |
| | | | | | | | |
| | |
Annual Report | September 30, 2012 | | 13 |
| | |
| Drexel Hamilton Centre Global Equity Fund | | Schedule of Investments |
| | September 30, 2012 |
| | | | | | | | |
| | | Shares | | | Value | |
France (4.49%) | | | | | | | | |
Energy (1.21%) | | | | | | | | |
Total SA | | | 2,917 | | | $ | 144,692 | |
| | | | | | | | |
| | |
Health Care (2.13%) | | | | | | | | |
Cie Generale d’Optique Essilor International SA | | | 1,350 | | | | 126,416 | |
Sanofi | | | 1,513 | | | | 129,003 | |
| | | | | | | | |
| | | | | | | 255,419 | |
| | | | | | | | |
| | |
Information Technology (1.15%) | | | | | | | | |
Dassault Systemes SA | | | 1,310 | | | | 137,636 | |
| | | | | | | | |
| | |
Total France | | | | | | | 537,747 | |
| | | | | | | | |
| | |
Germany (8.01%) | | | | | | | | |
Consumer Discretionary (1.61%) | | | | | | | | |
Adidas AG | | | 1,300 | | | | 106,649 | |
Daimler AG | | | 1,774 | | | | 85,864 | |
| | | | | | | | |
| | | | | | | 192,513 | |
| | | | | | | | |
| | |
Financials (0.88%) | | | | | | | | |
Allianz SE | | | 883 | | | | 105,062 | |
| | | | | | | | |
| | |
Health Care (1.01%) | | | | | | | | |
Bayer AG | | | 1,415 | | | | 121,520 | |
| | | | | | | | |
| | |
Industrials (1.11%) | | | | | | | | |
Siemens AG | | | 1,336 | | | | 133,243 | |
| | | | | | | | |
| | |
Information Technology (1.08%) | | | | | | | | |
SAP AG | | | 1,832 | | | | 129,741 | |
| | | | | | | | |
| | |
Materials (1.31%) | | | | | | | | |
BASF SE | | | 1,860 | | | | 156,916 | |
| | | | | | | | |
| | |
Telecommunication Services (0.54%) | | | | | | | | |
Deutsche Telekom AG | | | 5,300 | | | | 65,213 | |
| | | | | | | | |
| | |
Utilities (0.47%) | | | | | | | | |
E.ON AG | | | 2,367 | | | | 56,165 | |
| | | | | | | | |
| | |
Total Germany | | | | | | | 960,373 | |
| | | | | | | | |
| | |
Great Britain (3.19%) | | | | | | | | |
Consumer Staples (1.88%) | | | | | | | | |
Diageo Plc | | | 8,040 | | | | 225,840 | |
| | | | | | | | |
| | |
Financials (0.80%) | | | | | | | | |
HSBC Holdings Plc | | | 10,388 | | | | 96,169 | |
| | | | | | | | |
| | |
Telecommunication Services (0.51%) | | | | | | | | |
Vodafone Group Plc | | | 21,500 | | | | 61,017 | |
| | | | | | | | |
| | |
Total Great Britain | | | | | | | 383,026 | |
| | | | | | | | |
| | | | | | | | |
| | | Shares | | | Value | |
Israel (0.70%) | | | | | | | | |
Health Care (0.70%) | | | | | | | | |
Teva Pharmaceutical Industries, Ltd., Sponsored ADR | | | 2,040 | | | $ | 84,476 | |
| | | | | | | | |
| | |
Total Israel | | | | | | | 84,476 | |
| | | | | | | | |
| | |
Italy (3.50%) | | | | | | | | |
Energy (1.33%) | | | | | | | | |
Eni SpA | | | 7,299 | | | | 159,640 | |
| | | | | | | | |
| | |
Financials (1.15%) | | | | | | | | |
Assicurazioni Generali SpA | | | 6,800 | | | | 97,782 | |
Intesa Sanpaolo SpA | | | 26,400 | | | | 40,134 | |
| | | | | | | | |
| | | | | | | 137,916 | |
| | | | | | | | |
| | |
Utilities (1.02%) | | | | | | | | |
Enel SpA | | | 34,520 | | | | 122,079 | |
| | | | | | | | |
| | |
Total Italy | | | | | | | 419,635 | |
| | | | | | | | |
| | |
Netherlands (1.93%) | | | | | | | | |
Consumer Staples (0.81%) | | | | | | | | |
Unilever NV | | | 2,744 | | | | 97,076 | |
| | | | | | | | |
| | |
Information Technology (1.12%) | | | | | | | | |
ASML Holding NV | | | 2,510 | | | | 134,147 | |
| | | | | | | | |
| | |
Total Netherlands | | | | | | | 231,223 | |
| | | | | | | | |
| | |
Norway (0.93%) | | | | | | | | |
Energy (0.93%) | | | | | | | | |
Statoil ASA | | | 4,330 | | | | 111,785 | |
| | | | | | | | |
| | |
Total Norway | | | | | | | 111,785 | |
| | | | | | | | |
| | |
Russia (2.74%) | | | | | | | | |
Energy (2.01%) | | | | | | | | |
Gazprom OAO, Sponsored ADR | | | 11,515 | | | | 115,496 | |
Lukoil OAO, Sponsored ADR | | | 2,034 | | | | 125,294 | |
| | | | | | | | |
| | | | | | | 240,790 | |
| | | | | | | | |
| | |
Financials (0.73%) | | | | | | | | |
Sberbank of Russia, Sponsored ADR | | | 7,567 | | | | 87,554 | |
| | | | | | | | |
| | |
Total Russia | | | | | | | 328,344 | |
| | | | | | | | |
| | |
Spain (3.16%) | | | | | | | | |
Consumer Discretionary (0.88%) | | | | | | | | |
Inditex SA | | | 850 | | | | 105,548 | |
| | | | | | | | |
| | |
Financials (1.39%) | | | | | | | | |
Banco Bilbao Vizcaya Argentaria SA | | | 6,730 | | | | 52,868 | |
Banco Santander SA(a) | | | 15,199 | | | | 113,185 | |
| | | | | | | | |
| | | | | | | 166,053 | |
| | | | | | | | |
| | |
| Drexel Hamilton Centre Global Equity Fund | | Schedule of Investments |
| | September 30, 2012 |
| | | | | | | | |
| | | Shares | | | Value | |
Spain (continued) | | | | | | | | |
Telecommunication Services (0.89%) | | | | | | | | |
Telefonica SA | | | 8,030 | | | $ | 107,059 | |
| | | | | | | | |
| | |
Total Spain | | | | | | | 378,660 | |
| | | | | | | | |
| | |
Switzerland (4.59%) | | | | | | | | |
Consumer Discretionary (0.75%) | | | | | | | | |
Cie Financiere Richemont SA, Class A | | | 1,500 | | | | 89,952 | |
| | | | | | | | |
| | |
Consumer Staples (0.53%) | | | | | | | | |
Nestle SA | | | 1,000 | | | | 63,051 | |
| | | | | | | | |
| | |
Health Care (1.91%) | | | | | | | | |
Novartis AG | | | 1,910 | | | | 116,875 | |
Roche Holding AG | | | 600 | | | | 112,089 | |
| | | | | | | | |
| | | | | | | 228,964 | |
| | | | | | | | |
| | |
Materials (1.40%) | | | | | | | | |
Syngenta AG | | | 450 | | | | 168,182 | |
| | | | | | | | |
| | |
Total Switzerland | | | | | | | 550,149 | |
| | | | | | | | |
| | |
TOTAL EUROPE (Cost $3,963,702) | | | | | | | 4,298,645 | |
| | |
NORTH AMERICA (27.86%) | | | | | | | | |
Mexico (1.25%) | | | | | | | | |
Telecommunication Services (1.25%) | | | | | | | | |
America Movil, Series L | | | 117,900 | | | | 150,217 | |
| | | | | | | | |
| | |
Total Mexico | | | | | | | 150,217 | |
| | | | | | | | |
| | |
United States (26.61%) | | | | | | | | |
Consumer Discretionary (3.37%) | | | | | | | | |
Home Depot, Inc. | | | 3,400 | | | | 205,258 | |
Walt Disney Co. | | | 3,800 | | | | 198,664 | |
| | | | | | | | |
| | | | | | | 403,922 | |
| | | | | | | | |
| | |
Consumer Staples (4.44%) | | | | | | | | |
Coca-Cola Co. | | | 2,790 | | | | 105,825 | |
Philip Morris International, Inc. | | | 1,400 | | | | 125,916 | |
Procter & Gamble Co. | | | 1,360 | | | | 94,329 | |
Whole Foods Market, Inc. | | | 2,120 | | | | 206,488 | |
| | | | | | | | |
| | | | | | | 532,558 | |
| | | | | | | | |
| | |
Energy (2.14%) | | | | | | | | |
Chevron Corp. | | | 950 | | | | 110,732 | |
Exxon Mobil Corp. | | | 1,600 | | | | 146,320 | |
| | | | | | | | |
| | | | | | | 257,052 | |
| | | | | | | | |
| | |
Financials (2.05%) | | | | | | | | |
JPMorgan Chase & Co. | | | 3,010 | | | | 121,845 | |
Wells Fargo & Co. | | | 3,580 | | | | 123,617 | |
| | | | | | | | |
| | | | | | | 245,462 | |
| | | | | | | | |
| | |
Health Care (2.51%) | | | | | | | | |
Johnson & Johnson | | | 1,900 | | | | 130,929 | |
Merck & Co., Inc. | | | 1,290 | | | | 58,179 | |
Pfizer, Inc. | | | 4,500 | | | | 111,825 | |
| | | | | | | | |
| | | | | | | 300,933 | |
| | | | | | | | |
| | | | | | | | |
| | | Shares | | | Value | |
United States (continued) | | | | | | | | |
Industrials (1.00%) | | | | | | | | |
General Electric Co. | | | 5,280 | | | $ | 119,909 | |
| | | | | | | | |
| | |
Information Technology (8.23%) | | | | | | | | |
Apple, Inc. | | | 360 | | | | 240,214 | |
Cisco Systems, Inc. | | | 7,200 | | | | 137,448 | |
Google, Inc., Class A(a) | | | 180 | | | | 135,810 | |
Intel Corp. | | | 3,700 | | | | 83,916 | |
International Business Machines Corp. | | | 430 | | | | 89,204 | |
Microsoft Corp. | | | 3,810 | | | | 113,462 | |
Oracle Corp. | | | 2,360 | | | | 74,316 | |
QUALCOMM, Inc. | | | 1,800 | | | | 112,482 | |
| | | | | | | | |
| | | | | | | 986,852 | |
| | | | | | | | |
| | |
Materials (1.90%) | | | | | | | | |
Monsanto Co. | | | 2,500 | | | | 227,550 | |
| | | | | | | | |
| | |
Telecommunication Services (0.97%) | | | | | | | | |
AT&T, Inc. | | | 3,080 | | | | 116,116 | |
| | | | | | | | |
| | |
Total United States | | | | | | | 3,190,354 | |
| | | | | | | | |
| | |
TOTAL NORTH AMERICA (Cost $2,935,829) | | | | | | | 3,340,571 | |
| | |
SOUTH AMERICA (4.35%) | | | | | | | | |
Brazil (4.35%) | | | | | | | | |
Consumer Staples (0.81%) | | | | | | | | |
Natura Cosmeticos SA | | | 3,600 | | | | 97,492 | |
| | | | | | | | |
| | |
Industrials (1.89%) | | | | | | | | |
CCR SA | | | 25,500 | | | | 226,918 | |
| | | | | | | | |
| | |
Utilities (1.65%) | | | | | | | | |
Cia de Saneamento Basico do Estado de Sao Paulo | | | 4,850 | | | | 197,349 | |
| | | | | | | | |
| | |
Total Brazil | | | | | | | 521,759 | |
| | | | | | | | |
| | |
TOTAL SOUTH AMERICA (Cost $445,520) | | | | | | | 521,759 | |
| | | | | | | | |
TOTAL COMMON STOCKS (Cost $10,434,163) | | | | | | | 11,497,165 | |
| | |
PREFERRED STOCKS (2.90%) | | | | | | | | |
SOUTH AMERICA (2.90%) | | | | | | | | |
Brazil (2.90%) | | | | | | | | |
Consumer Staples (0.89%) | | | | | | | | |
Cia de Bebidas das Americas | | | 2,800 | | | | 106,696 | |
| | | | | | | | |
| | |
Energy (0.46%) | | | | | | | | |
Petroleo Brasileiro SA | | | 5,000 | | | | 55,124 | |
| | | | | | | | |
| | |
Financials (0.85%) | | | | | | | | |
Banco Bradesco SA | | | 3,000 | | | | 48,080 | |
| | |
Annual Report | September 30, 2012 | | 15 |
| | |
| Drexel Hamilton Centre Global Equity Fund | | Schedule of Investments |
| | September 30, 2012 |
| | | | | | | | | | | | |
| | | | | | Shares | | | Value | |
Brazil (continued) | | | | | | | | | | | | |
Itau Unibanco Holding SA | | | | | | | 3,510 | | | $ | 53,154 | |
| | | | | | | | | | | | |
| | | | | | | | | | | 101,234 | |
| | | | | | | | | | | | |
| | | |
Materials (0.70%) | | | | | | | | | | | | |
Vale SA | | | | | | | 4,840 | | | | 84,111 | |
| | | | | | | | | | | | |
| | | |
Total Brazil | | | | | | | | | | | 347,165 | |
| | | | | | | | | | | | |
| | |
TOTAL SOUTH AMERICA (Cost $368,943) | | | | | | | | 347,165 | |
| | | | | | | | | | | | |
TOTAL PREFERRED STOCKS (Cost $368,943) | | | | | | | | 347,165 | |
| | | |
| | | 7-Day Yield | | | Shares | | | Value | |
SHORT TERM INVESTMENTS (0.87%) | |
Money Market Fund (0.87%) | | | | | |
Dreyfus Treasury Prime Cash Management, Institutional Class | | | 0.00004% | | | | 104,944 | | | | 104,944 | |
| | | | | | | | | | | | |
| | | | | | | | | | | | |
TOTAL SHORT TERM INVESTMENTS (Cost $104,944) | | | | 104,944 | |
| |
TOTAL INVESTMENTS (Cost $10,908,050) (99.67%) | | | $ | 11,949,274 | |
| |
Other Assets In Excess Of Liabilities (0.33%) | | | | 39,016 | |
NET ASSETS (100.00%) | | | | | | | | | | $ | 11,988,290 | |
| |
| (a) | Non-income producing security. |
Common Abbreviations:
| ADR - | American Depository Receipt. |
| AG - | Aktiengesellschaft is a German term that refers to a corporation that is limited by shares, i.e., owned by shareholders. |
| ASA - | Allmennaksjeselskap is the Norwegian term for public limited company. |
| A/S - | Aktieselskab is the Danish term for Joint Stock Company. |
| NV - | Naamloze Vennootschap is the Dutch term for a public limited liability corporation. |
| OAO - | Otkrytoe Aktsionernoe Obschestvo (a Russian open joint stock corporation) |
| Pcl | - Public Company Limited. |
| Plc - | Public Limited Company. |
| SA - | Generally designates corporations in various countries, mostly those employing the civil law. |
| SE - | SE Regulation. A European Company which can operate on a Europe-wide basis and be governed by Community law directly applicable in all Member States. |
| SpA - | Societa Per Azioni is an Italian shared company. |
| UFJ - | United Financial of Japan. |
See Notes to Financial Statements.
| | |
| Drexel Hamilton Mutual Funds | | Statements of Assets and Liabilities |
| | September 30, 2012 |
| | | | | | | | |
| | | Drexel Hamilton Centre
American Equity Fund | | | Drexel Hamilton Centre Global Equity Fund | |
| | | | |
ASSETS: | | | | | | | | |
| | |
Investments, at value | | $ | 24,238,900 | | | $ | 11,949,274 | |
Foreign currency, at value (Cost $– and $8,131, respectively) | | | – | | | | 8,156 | |
Dividends | | | 35,707 | | | | 32,484 | |
Receivable due from investment advisor | | | 48,601 | | | | 65,908 | |
Deferred offering cost | | | 2,054 | | | | 1,243 | |
| | | | | | | | |
Total Assets | | | 24,325,262 | | | | 12,057,065 | |
| | | | | | | | |
| | |
LIABILITIES: | | | | | | | | |
| | |
Payable to administrator | | | 27,870 | | | | 16,493 | |
Payable to transfer agency | | | 4,237 | | | | 4,209 | |
Payable to custodian | | | 1,667 | | | | 6,527 | |
Payable for printing | | | 2,558 | | | | 1,257 | |
Payable for legal and audit fees | | | 54,885 | | | | 33,468 | |
Payable to trustees | | | 4,948 | | | | 2,438 | |
Payable to chief compliance officer | | | 6,187 | | | | 3,049 | |
Other payables | | | 2,510 | | | | 1,334 | |
| | | | | | | | |
Total Liabilities | | | 104,862 | | | | 68,775 | |
| | | | | | | | |
NET ASSETS | | $ | 24,220,400 | | | $ | 11,988,290 | |
| | | | | | | | |
| | |
NET ASSETS CONSIST OF: | | | | | | | | |
| | |
Paid-in capital | | $ | 20,542,095 | | | $ | 10,487,858 | |
Accumulated net investment income | | | 131,605 | | | | 171,696 | |
Accumulated net realized gain on investments and foreign currency transactions | | | 582,333 | | | | 287,498 | |
Net unrealized appreciation on investments and translation of assets and liabilities denominated in foreign currencies | | | 2,964,367 | | | | 1,041,238 | |
| | | | | | | | |
NET ASSETS | | $ | 24,220,400 | | | $ | 11,988,290 | |
| | | | | | | | |
INVESTMENTS, AT COST | | $ | 21,274,533 | | | $ | 10,908,050 | |
| | |
PRICING OF SHARES | | | | | | | | |
Net Assets | | $ | 24,220,400 | | | $ | 11,988,290 | |
Shares outstanding | | | 2,054,881 | | | | 1,048,994 | |
Net Asset Value, offering and redemption price per share | | | $11.79 | | | | $11.43 | |
See Notes to Financial Statements.
| | |
Annual Report | September 30, 2012 | | 17 |
| | |
| Drexel Hamilton Mutual Funds | | Statements of Operations |
| For the Period December 21, 2011 (Inception) to September 30, 2012 |
| | | | | | | | |
| | | Drexel Hamilton Centre
American Equity Fund | | | Drexel Hamilton Centre
Global Equity Fund | |
| | | | |
INVESTMENT INCOME: | | | | | | | | |
Dividends | | $ | 343,221 | | | $ | 316,273 | |
Foreign taxes withheld | | | – | | | | (24,988 | ) |
| | | | | | | | |
Total Investment Income | | | 343,221 | | | | 291,285 | |
| | | | | | | | |
| | |
EXPENSES: | | | | | | | | |
Investment advisory fees | | | 132,915 | | | | 88,020 | |
Administration fees | | | 110,565 | | | | 61,966 | |
Transfer agent fees | | | 18,562 | | | | 18,515 | |
Custodian fees | | | 4,167 | | | | 18,752 | |
Legal fees | | | 49,845 | | | | 24,473 | |
Audit fees | | | 18,169 | | | | 15,400 | |
Trustees’ fees and expenses | | | 11,395 | | | | 5,643 | |
Chief compliance officer fees | | | 28,328 | | | | 14,058 | |
Offering costs | | | 25,381 | | | | 14,928 | |
Miscellaneous expenses | | | 11,300 | | | | 5,992 | |
| | | | | | | | |
Total expenses before waivers | | | 410,627 | | | | 267,747 | |
Fees waived/reimbursed by investment advisor (Note 5) | | | (189,101 | ) | | | (157,721 | ) |
Net Expenses | | | 221,526 | | | | 110,026 | |
| | | | | | | | |
Net Investment Income | | | 121,695 | | | | 181,259 | |
| | | | | | | | |
| | |
Net realized gain on investments | | | 582,333 | | | | 287,517 | |
Net realized loss on foreign currencies | | | – | | | | (14,391 | ) |
Net change in unrealized appreciation on investments | | | 2,964,367 | | | | 1,041,224 | |
Net change in unrealized appreciation on translation of assets and liabilities denominated in foreign currency transactions | | | – | | | | 14 | |
| | | | | | | | |
NET REALIZED AND UNREALIZED GAIN ON INVESTMENTS AND FOREIGN CURRENCIES | | | 3,546,700 | | | | 1,314,364 | |
| | | | | | | | |
NET INCREASE IN NET ASSETS RESULTING FROM OPERATIONS | | $ | 3,668,395 | | | $ | 1,495,623 | |
| | | | | | | | |
See Notes to Financial Statements.
| | |
| Drexel Hamilton Mutual Funds | | Statements of Changes in Net Assets |
| | |
| | | | | | | | |
| | | Drexel Hamilton Centre
American Equity Fund | | | Drexel Hamilton Centre
Global Equity Fund | |
| | | | |
| | | For the Period
December 21, 2011
(Inception) to
September 30, 2012 | | | For the Period
December 21, 2011
(Inception) to
September 30, 2012 | |
OPERATIONS: | | | | | | | | |
Net investment income | | $ | 121,695 | | | $ | 181,259 | |
Net realized gain on investments | | | 582,333 | | | | 287,517 | |
Net realized loss on foreign currency transactions | | | – | | | | (14,391) | |
Net change in unrealized appreciation on investments and translation of assets and liabilities denominated in foreign currencies | | | 2,964,367 | | | | 1,041,238 | |
| | | | | | | | |
Net increase in net assets resulting from operations | | | 3,668,395 | | | | 1,495,623 | |
| | | | | | | | |
CAPITAL SHARE TRANSACTIONS: | | | | | | | | |
Proceeds from sale of shares | | | 20,527,005 | | | | 10,467,667 | |
| | | | | | | | |
Net increase from capital share transactions | | | 20,527,005 | | | | 10,467,667 | |
| | | | | | | | |
| | |
Net increase in net assets | | | 24,195,400 | | | | 11,963,290 | |
| | | | | | | | |
NET ASSETS: | | | | | | | | |
Beginning of period | | | 25,000 | | | | 25,000 | |
| | | | | | | | |
End of period* | | $ | 24,220,400 | | | $ | 11,988,290 | |
| | | | | | | | |
*Including accumulated net investment income of: | | $ | 131,605 | | | $ | 171,696 | |
| | |
OTHER INFORMATION: | | | | | | | | |
Share Transactions: | | | | | | | | |
Beginning shares | | | 2,500 | | | | 2,500 | |
Shares sold | | | 2,052,381 | | | | 1,046,494 | |
| | | | | | | | |
Ending Shares | | | 2,054,881 | | | | 1,048,994 | |
| | | | | | | | |
See Notes to Financial Statements.
| | |
Annual Report | September 30, 2012 | | 19 |
| | |
Drexel Hamilton Centre American Equity Fund | | Financial Highlights |
| | For a share outstanding throughout the period presented. |
| | | | | | |
| | | | | For the Period
December 21, 2011
(inception) to
September 30, 2012 | |
| | |
NET ASSET VALUE, BEGINNING OF PERIOD | | $ | | | 10.00 | |
INCOME FROM INVESTMENT OPERATIONS: | | | | | | |
Net investment income(a) | | | | | 0.07 | |
Net realized and unrealized gain on investments | | | | | 1.72 | |
Total income from investment operations | | | | | 1.79 | |
| | |
DISTRIBUTIONS: | | | | | | |
Net investment income | | | | | – | |
Net realized gain | | | | | – | |
Total distributions | | | | | – | |
REDEMPTION FEES ADDED TO PAID-IN CAPITAL (NOTE 2) | | | | | – | |
NET INCREASE IN NET ASSET VALUE | | | | | 1.79 | |
NET ASSET VALUE, END OF PERIOD | | $ | | | 11.79 | |
| | |
| | |
Total Return(b) | | | | | 17.90% | |
| | |
RATIOS/SUPPLEMENTAL DATA: | | | | | | |
Net assets, end of period (000) | | $ | | | 24,220 | |
| | |
RATIOS TO AVERAGE NET ASSETS: | | | | | | |
Net investment income including reimbursement/waiver | | | | | 0.69%(c) | |
Operating expenses excluding reimbursement/waiver | | | | | 2.32%(c) | |
Operating expenses including reimbursement/waiver | | | | | 1.25%(c) | |
PORTFOLIO TURNOVER RATE(d) | | | | | 67% | |
| (a) | Calculated using the average shares method. |
| (b) | Total returns are for the period indicated and have not been annualized. Total returns would have been lower had certain expenses not been waived during the period. Returns shown do not reflect the deduction of taxes that a shareholder would pay on fund distributions or the redemption of fund shares. |
| (d) | Portfolio turnover rate for periods less than one full year have not been annualized. |
See Notes to Financial Statements.
| | |
| Drexel Hamilton Centre Global Equity Fund | | Financial Highlights |
| For a share outstanding throughout the period presented. |
| | | | |
| | | | | For the Period
December 21, 2011
(inception) to
September 30, 2012 |
| | |
NET ASSET VALUE, BEGINNING OF PERIOD | | $ | | 10.00 |
INCOME FROM INVESTMENT OPERATIONS: | | | | |
Net investment income(a) | | | | 0.21 |
Net realized and unrealized gain on investments and foreign currency transactions | | | | 1.22 |
Total income from investment operations | | | | 1.43 |
| | |
DISTRIBUTIONS: | | | | |
Net investment income | | | | – |
Net realized gain | | | | – |
Total distributions | | | | – |
REDEMPTION FEES ADDED TO PAID-IN CAPITAL (NOTE 2) | | | | – |
NET INCREASE IN NET ASSET VALUE | | | | 1.43 |
NET ASSET VALUE, END OF PERIOD | | $ | | 11.43 |
| |
| | |
Total Return(b) | | | | 14.30% |
| | |
RATIOS/SUPPLEMENTAL DATA: | | | | |
Net assets, end of period (000) | | $ | | 11,988 |
| | |
RATIOS TO AVERAGE NET ASSETS: | | | | |
Net investment income including reimbursement/waiver | | | | 2.06%(c) |
Operating expenses excluding reimbursement/waiver | | | | 3.04%(c) |
Operating expenses including reimbursement/waiver | | | | 1.25%(c) |
PORTFOLIO TURNOVER RATE(d) | | | | 87% |
| (a) | Calculated using the average shares method. |
| (b) | Total returns are for the period indicated and have not been annualized. Total returns would have been lower had certain expenses not been waived during the period. Returns shown do not reflect the deduction of taxes that a shareholder would pay on fund distributions or the redemption of fund shares. |
| (d) | Portfolio turnover rate for periods less than one full year have not been annualized. |
See Notes to Financial Statements.
| | |
Annual Report | September 30, 2012 | | 21 |
| | |
| Drexel Hamilton Mutual Funds | | Notes to Financial Statements |
| | September 30, 2012 |
1. ORGANIZATION
Drexel Hamilton Mutual Funds (the “Trust”) was organized on March 17, 2011 as a Delaware statutory trust and is registered as an open-end management investment company under the Investment Company Act of 1940, as amended (the “1940 Act”). The Trust currently offers shares of beneficial interest (“shares”) of Drexel Hamilton Centre American Equity Fund and Drexel Hamilton Centre Global Equity Fund (the “Funds”). Each Fund is a diversified portfolio with an investment objective seeking long-term growth of capital. Each Fund offers Institutional Class Shares and is only offered and available to institutional investors. Retail customers may not purchase Institutional Class shares of the Funds. The affairs of the Trust are managed by a Board of Trustees (the “Board”). The Declaration of Trust permits the Trustees to create additional series of the Trust and share classes. Drexel Hamilton Investment Partners, LLC (the “Adviser”) serves as investment adviser to the Funds.
2. SIGNIFICANT ACCOUNTING POLICIES
The following is a summary of significant accounting policies followed by the Funds in the preparation of the Financial Statements:
| (a) | Portfolio securities traded on a national securities exchange or in the over-the-counter market are valued at the closing price on the principal exchange or market as of the close of regular trading hours on the day the securities are being valued. Foreign securities are valued on the basis of quotations from the primary market in which they are traded, and are translated from the local currency into U.S. dollars using exchange rates as of the close of the New York Stock Exchange (“the Exchange”) or using methods determined by the Board. Debt securities having maturities of 60 days or less may be valued at acquisition cost, plus or minus any amortization or accretion. Securities and other assets for which quotations are not readily available or deemed unreliable are valued at their fair value using methods determined by the Board. Fair valuation of a particular security is an inherently subjective process, with no single standard to utilize when determining a security’s fair value. As such, different mutual funds could reasonably arrive at a different fair value price for the same security. In each case where a security is fair valued, consideration is given to the facts and circumstances relevant to the particular situation. This consideration includes reviewing various factors set forth in the pricing procedures adopted by the Board and other factors as warranted. In making a fair value determination, factors that may be considered, among others, include: the type and structure of the security; unusual events or circumstances relating to the security’s issuer; general market conditions; prior day’s valuation; fundamental analytical data; size of the holding; cost of the security on the date of purchase; nature and duration of any restriction on disposition; trading activities and prices of similar securities or financial instruments. |
| (b) | The net asset value (the ��NAV”) is generally calculated as of the close of trading on the Exchange (normally 4:00 p.m. Eastern time) every day the Exchange is open. The NAV is calculated by taking the total value of each Fund’s assets, subtracting the Fund’s liabilities, and then dividing by the total number of shares outstanding, rounded to the nearest cent. The offering price and redemption price per share is equal to the net asset value per share, except that shares of each Fund are subject to a redemption fee of 2% if redeemed within 90 days of purchase. |
| (c) | The Trust treats each Fund as a separate entity for Federal income tax purposes. Each Fund intends to continue to qualify each year as a “regulated investment company” under Subchapter M of the Internal Revenue Code. By so qualifying, each Fund will not be subject to Federal income taxes to the extent that it distributes substantially all of its taxable or tax-exempt income, if any, for its tax year ending December 31. In addition, by distributing in each calendar year substantially all of its net investment income, capital gains and certain other amounts, if any, each Fund will not be subject to a Federal excise tax. Therefore, no provision is made by the Funds for Federal income or excise taxes. Withholding taxes on foreign dividends are paid or provided for in accordance with the applicable country’s tax rules and rates. |
As of and during the period ended September 30, 2012, the Funds did not have a liability for any unrecognized tax benefits in the accompanying financial statements. The Funds recognize the interest and penalties, if any, related to the unrecognized tax benefits as income tax expense in the Statement of Operations. During the period, the Funds did not incur any interest or penalties.
Each of the Fund’s Federal tax returns for the period ended September 30, 2012, remains subject to examination by the Internal Revenue Service.
| (d) | For financial reporting purposes, transactions on the last business day of the reporting period are accounted for on the trade date. Net realized gains and losses on investments are computed on the identified cost basis. The portion of security gains and losses resulting from changes in foreign exchange rates is included with net realized and unrealized gains or losses from investments. Dividend income is recognized on the ex-dividend date or for certain foreign securities, as soon as information is available, and interest income is recognized on an accrual basis. The Funds amortize premium and accrete discount on investments utilizing the effective interest method. Foreign dividend income may be subject to foreign withholding taxes. |
| (e) | A restricted security is a security that has been purchased through a private offering and cannot be resold to the general public without prior registration under the Securities Act of 1933 (the “Act”) or pursuant to the resale limitations provided by Rule 144 under the Act, or an exemption from the registration requirements of the Act. Whether a restricted security is illiquid is determined pursuant to guidelines |
| | |
| Drexel Hamilton Mutual Funds | | Notes to Financial Statements |
| | September 30, 2012 |
| | established by the Board. Not all restricted securities are considered to be illiquid. As of September 30, 2012, the Funds did not hold any restricted securities. |
| (f) | The preparation of financial statements in conformity with accounting standards generally accepted in the United States of America (“GAAP”) requires management to make estimates and assumptions that affect the amounts reported in financial statements during the reporting period. Management believes the estimates and security valuations are appropriate; however, actual results may differ from those estimates, and the security valuations reflected in the financial statements may differ from the value the Funds ultimately realize upon sale of the securities. The financial statements have been prepared as of the close of the New York Stock Exchange (“NYSE”) on September 30, 2012. |
| (g) | The Funds bear expenses incurred specifically on each Funds’ respective behalf as well as a portion of general Trust expenses, which may be allocated on the basis of relative net assets or the nature of the services performed relative to applicability to each Fund. |
| (h) | Dividends from net investment income and distributions of net realized capital gains, if any, will be declared and paid at least annually. Income and capital gains distributions are determined in accordance with income tax regulations, which may differ from GAAP. Distributions to shareholders are recorded on the ex-dividend date. |
| (i) | Each Fund may directly purchase securities of foreign issuers. Investing in securities of foreign issuers involves special risks not typically associated with investing in securities of U.S. issuers. The risks include possible reevaluation of currencies, the inability to repatriate foreign currency, less complete financial information about companies and possible future adverse political and economic developments. Moreover, securities of many foreign issuers and their markets may be less liquid and their prices more volatile than those of securities of comparable U.S. issuers. |
| (j) | The books and records of the Funds are maintained in U.S. dollars. Investment valuations and other assets and liabilities initially expressed in foreign currencies are converted each business day into U.S. dollars based upon current exchange rates. The portion of realized and unrealized gains or losses on investments due to fluctuations in foreign currency exchange rates is not separately disclosed and is included in realized and unrealized gains or losses on investments, when applicable. |
| (k) | Offering costs, including costs of printing initial prospectuses, legal and registration fees, are being amortized over twelve months from the inception date of the Funds. As of September 30, 2012, $2,054 of offering costs remain to be amortized for the Drexel Hamilton Centre American Equity Fund and $1,243 of offering costs remain to be amortized for the Drexel Hamilton Centre Global Equity Fund. |
3. FAIR VALUE MEASUREMENTS
A three-tier hierarchy has been established to classify fair value measurements for disclosure purposes. Inputs refer broadly to the assumptions that market participants would use in pricing the asset or liability, including assumptions about risk. Inputs may be observable or unobservable. Observable inputs are inputs that reflect the assumptions market participants would use in pricing the asset or liability that are developed based on market data obtained from sources independent of the reporting entity. Unobservable inputs are inputs that reflect the reporting entity’s own assumptions about the assumptions market participants would use in pricing the asset or liability that are developed based on the best information available.
Various inputs are used in determining the value of each Fund’s investments as of the reporting period end. These inputs are categorized in the following hierarchy under applicable financial accounting standards:
| | | | |
| | Level 1 - | | Unadjusted quoted prices in active markets for identical, unrestricted assets or liabilities that a Fund has the ability to access at the measurement date. |
| | Level 2 - | | Quoted prices which are not active, quoted prices for similar assets or liabilities in active markets or input other than quoted prices that are observable (either directly or indirectly) for substantially the full term of the asset or liability. |
| | Level 3 - | | Significant unobservable prices or inputs (including the Board of Trustees’ and Pricing Committee’s own assumptions in determining the fair value of investments) where there is little or no market activity for the asset or liability at measurement date. |
The inputs or methodology used for valuing securities are not necessarily an indication of the risk associated with investing in those securities.
| | |
Annual Report | September 30, 2012 | | 23 |
| | |
| Drexel Hamilton Mutual Funds | | Notes to Financial Statements |
| | September 30, 2012 |
The following is a summary of each Fund’s investments in the fair value hierarchy as of September 30, 2012:
Drexel Hamilton Centre American Equity Fund
| | | | | | | | | | | | | | | | |
Investments in Securities at Value(a) | | Level 1 - Quoted Prices | | | Level 2 - Other Significant Observable Inputs | | | Level 3 - Significant Unobservable Inputs | | | Total | |
Common Stocks | | $ | 24,040,976 | | | $ | – | | | $ | – | | | $ | 24,040,976 | |
Short Term Investments | | | 197,924 | | | | – | | | | – | | | | 197,924 | |
Total | | $ | 24,238,900 | | | $ | – | | | $ | – | | | $ | 24,238,900 | |
| | |
Drexel Hamilton Centre Global Equity Fund
| | | | | | | | | | | | | | | | |
Investments in Securities at Value(a) | | Level 1 -
Quoted Prices | | | Level 2 -
Other Significant
Observable Inputs | | | Level 3 -
Significant
Unobservable
Inputs | | | Total | |
Common Stocks | | $ | 11,497,165 | | | $ | – | | | $ | – | | | $ | 11,497,165 | |
Preferred Stocks | | | 347,165 | | | | – | | | | – | | | | 347,165 | |
Short Term Investments | | | 104,944 | | | | – | | | | – | | | | 104,944 | |
Total | | $ | 11,949,274 | | | $ | – | | | $ | – | | | $ | 11,949,274 | |
| | |
| (a) | For detailed descriptions of sectors, industries and countries, see the accompanying Schedule of Investments. |
The Funds did not hold any investments at the beginning or end of the period in which significant unobservable inputs were used in determining fair value; therefore, no reconciliation of Level 3 securities is included for this reporting period. The Funds recognize transfers between levels as of the beginning of the fiscal year. There were no transfers between Level 1 and Level 2 as of September 30, 2012.
4. BENEFICIAL INTEREST TRANSACTIONS
On September 30, 2012, there was unlimited number of no par value shares of beneficial interest authorized for each Fund. Transaction in shares of beneficial interest are shown in the Statement of Changes in Net Assets.
Shares redeemed within 90 days of purchase may incur a 2% short-term redemption fee deducted from the redemption amount. For the period ended September 30, 2012, there were no redemption fees retained by the Funds.
Beneficial Ownership: The beneficial ownership, either directly or indirectly, of more than 25% of the voting securities of any of the Funds creates a presumption of control of the Fund under Section 2(a)(9) of the 1940 Act. As of September 30, 2012, the following entities owned beneficially 25% or greater of the Fund’s outstanding shares. The shares are held under omnibus accounts (whereby the transactions of two or more shareholders are combined and carried in the name of the originating broker rather than designated separately).
Drexel Hamilton Centre American Equity Fund
| | |
| Entity | | Percentage |
Sanlam Global Equity Fund | | 99.77% |
Drexel Hamilton Centre Global Equity Fund
| | |
| Entity | | Percentage |
Sanlam Global Equity Fund | | 99.53% |
| | |
| Drexel Hamilton Mutual Funds | | Notes to Financial Statements |
| | September 30, 2012 |
5. INVESTMENT ADVISORY AGREEMENTS AND RELATED-PARTY TRANSACTIONS
The Adviser serves as the investment adviser to each Fund pursuant to an Investment Advisory Agreement with the Trust. Subject to the general oversight of the Board, the Adviser is responsible for among other things, developing a continuing investment program for the Funds in accordance with their respective investment objectives, reviewing the investment strategies and policies of each Fund and advising the Board on the selection of sub-advisers. In this capacity, the Adviser advises and assists the officers of the Trust in conducting the business of the Funds and is responsible for providing general investment advice and guidance to the Funds, although the Adviser has delegated its responsibility for the selection and ongoing monitoring of the securities in the Funds’ investment portfolio to each Fund’s sub-adviser.
As compensation for the investment advisory services provided to the Funds, the Adviser receives monthly compensation based on each Fund’s average daily net assets at the annual rate of:
| | |
| Fund | | Management Fee Rate |
Drexel Hamilton Centre American Equity Fund | | 0.75% |
Drexel Hamilton Centre Global Equity Fund | | 1.00% |
Centre Asset Management, LLC serves as sub-adviser to the Drexel Hamilton Centre American Equity Fund and Drexel Hamilton Centre Global Equity Fund. The investment sub-advisers make the day-to-day investment decisions and continuously review, supervise and administer the Fund’s investment programs. As compensation for the sub-investment advisory services provided to each Fund, each sub-adviser receives a monthly fee from the Adviser based on each Fund’s average daily net assets.
The Adviser has entered into a written expense limitation agreement under which it has agreed to limit the total expenses of each Fund (excluding interest, taxes, litigation, brokerage, extraordinary expenses, and any transactions costs associated with short sales which may include but are not limited to brokerage commissions and dividends that are paid to persons from whom the Fund borrows securities) to an annual rate of 1.25% of the average net assets of each Fund. This expense limitation and fee waiver agreement may be terminated by the Adviser at any time after November 17, 2012. Prior to November 17, 2012, the expense limitation and fee waiver agreement may only be terminated by the Board of Trustees of Drexel Hamilton Mutual Funds. The Adviser may recoup any waived amount, including organizational fees, from each Fund pursuant to this agreement if such reimbursement does not cause the Fund to exceed then existing expense limitations, at the time the waiver or reimbursement is made, within three years after the year in which the Adviser incurred the expense.
During the period ended September 30, 2012, the fee waivers and/or reimbursements were as follows:
| | |
| | | Fees Waived/
Reimbursed by
Adviser |
Drexel Hamilton Centre American Equity Fund | | $ 189,101 |
Drexel Hamilton Centre Global Equity Fund | | 157,721 |
As of September 30, 2012, the balances of recoupable expenses for each Fund were as follows:
| | | | |
| | | Expires 2015 | | Total |
Drexel Hamilton Centre American Equity Fund | | $ 189,101 | | $ 189,101 |
Drexel Hamilton Centre Global Equity Fund | | 157,721 | | 157,721 |
ALPS Fund Services, Inc. (“ALPS” or the “Administrator”) serves as administrator to the Funds. ALPS receives a monthly fee paid by the Funds subject to a minimum monthly fee. Pursuant to an administrative agreement, ALPS will provide operational services to the Funds including, but not limited to fund accounting and fund administration and generally assist in each Fund’s operations.
ALPS, pursuant to a Transfer Agency and Services agreement with the Trust, serves as Transfer Agent for the Funds. Under the Transfer Agency and Services Agreement, ALPS receives from the Trust an annual minimum fee per Fund and a fee based upon each shareholder account and reimbursed for out-of-pocket expenses.
ALPS provides Chief Compliance Officer services to the Funds. Additionally, ALPS provides services in monitoring and testing the policies and procedures of the Trust in conjunction with requirements under Rule 38a-1 under the 1940 Act. ALPS is compensated under the Chief Compliance Officer Services Agreement.
| | |
Annual Report | September 30, 2012 | | 25 |
| | |
| Drexel Hamilton Mutual Funds | | Notes to Financial Statements |
| | September 30, 2012 |
ALPS Distributors, Inc. (the “Distributor”) acts as the sole distributor of the Funds. There were no payments to the Distributor by the Funds during the period ended September 30, 2012.
Officers of the Trust and Trustees who are “interested persons” of the Trust or the Adviser will receive no salary or fees from the Trust. Each Trustee who is not an “interested person” receives a fee of $3,750 each year per fund. The Trust reimburses each Trustee and Officer for his or her travel and other expenses relating to attendance at such meetings.
Certain Trustees and Officers of the Trust are also officers of the Adviser.
6. FEDERAL INCOME TAX AND TAX BASIS INFORMATION
Components of Distributable Earnings on a Tax Basis: At September 30, 2012, permanent differences in book and tax accounting were reclassified. These differences had no effect on net assets and were primarily attributed to differences in the book and tax treatment of non-deductible expenses and currency transactions. The reclassifications were as follows:
| | | | | | |
| Fund | | Accumulated Net
Investment Income | | Accumulated Net
Realized Gain | | Paid-in Capital |
Drexel Hamilton Centre American Equity Fund | | $ 9,910 | | $ 0 | | $ (9,910) |
Drexel Hamilton Centre Global Equity Fund | | (9,563) | | 14,372 | | (4,809) |
As of September 30, 2012, the components of distributable earnings on a tax basis were as follows:
| | | | | | | | |
| Fund | | Accumulated Capital
Gain/(Loss)
Undistributed | | Ordinary Income
Undistributed | | Net Unrealized
Appreciation/
(Depreciation) | | Other Cumulative
Effect of Timing
Differences |
Drexel Hamilton Centre American Equity Fund | | $ 0 | | $ 719,672 | | $ 2,964,367 | | $ (5,734) |
Drexel Hamilton Centre Global Equity Fund | | 0
| | 459,194 | | 1,041,238 | | 0 |
Management reviewed the tax positions in the open tax year of 2012 determined that the implementation of ASC Topic 740 “Accounting for Uncertainty in Income Taxes” had no impact on the Funds’ net assets or results of operations. As of and during the year ending September 30, 2012, the Funds do not have a liability for uncertain tax positions. The Funds recognize interest and penalties, if any, related to unrecognized tax benefits as income tax expense in the Statements of Operations. During the year, the Funds did not incur any interest or penalties.”
Capital Losses: The funds do not have capital losses deferred to next tax year.
Elective Deferrals: The Funds did not elect to defer to the period ending September 30, 2013, capital losses recognized during the period December 21, 2011 to September 30, 2012.
Unrealized Appreciation and Depreciation on Investments: The amount of net unrealized appreciation/(depreciation) and the cost of investment securities for tax purposes, including short-term securities at September 30, 2012, are displayed in the table below. There were no differences between book and tax basis unrealized appreciation/(depreciation) for the Funds.
| | | | | | | | | | |
| Fund | | Tax Cost of Investments | | Gross Unrealized Appreciation | | Gross Unrealized Depreciation | | Net Appreciation of Foreign Currency and Derivatives | | Net Tax Unrealized Appreciation on Investments |
Drexel Hamilton Centre American Equity Fund | | $ 21,274,533 | | $ 3,213,857 | | $ (249,490) | | $ 0 | | $ 2,964,367 |
Drexel Hamilton Centre Global Equity Fund | | 10,908,050 | | 1,237,895 | | (196,671) | | 14 | | 1,041,238 |
| | |
| Drexel Hamilton Mutual Funds | | Notes to Financial Statements |
| | September 30, 2012 |
7. PURCHASES AND SALES OF INVESTMENT SECURITIES
For the period ended September 30, 2012, the aggregate cost of purchases and proceeds from sales of investment securities (excluding any short-term securities) were as follows:
| | | | |
| Fund | | Purchases of Securities | | Proceeds From Sales of
Securities |
Drexel Hamilton Centre American Equity Fund | | $ 35,736,404 | | $ 15,242,126 |
Drexel Hamilton Centre Global Equity Fund | | 20,159,440 | | 9,633,514 |
8. INDEMNIFICATIONS
Under the Trust’s organizational documents, its officers and Trustees are indemnified against certain liability arising out of the performance of their duties to the Trust. Additionally, in the normal course of business, the Trust enters into contracts with service providers that may contain general indemnification clauses. The Trust’s maximum exposure under these arrangements is unknown, as this would involve future claims that may be made against the Trust that have not yet occurred.
9. SUBSEQUENT EVENTS
In September 2012, the Board of Trustees of the Trust approved an Agreement and Plan of Reorganization and Termination related to a proposed reorganization of the Ameristock Mutual Fund, Inc., a diversified open-end investment company organized as a Maryland corporation (“Ameristock”), into the Drexel Hamilton Centre American Equity Fund (the “Reorganization”) as a tax-free merger of investment companies. The proposed Reorganization would be accomplished by an acquisition of the net assets of the Ameristock in exchange for shares of the Drexel Hamilton Centre American Equity Fund at net asset value with the Drexel Hamilton Centre American Equity Fund as the accounting survivor. As of the date of the issuance of these financial statements, the proposed Reorganization has not been completed and is subject to approval by the shareholders of Ameristock.
For the period October 1, 2012 through the date of the issuance of these financial statements, there were approximately $3,000,000 of shares sold and $16,000,000 of shares redeemed from the Drexel Hamilton Centre American Equity Fund.
| | |
Annual Report | September 30, 2012 | | 27 |
| | |
| Drexel Hamilton Mutual Funds | | Report of Independent Registered Public Accountant |
| | September 30, 2012 |
To the Board of Trustees and Shareholders of Drexel Hamilton Mutual Funds
We have audited the accompanying statements of assets and liabilities, including the schedules of investments, of Drexel Hamilton Centre American Equity Fund and Drexel Hamilton Centre Global Equity Fund (the “Funds”), each a series of Drexel Hamilton Mutual Funds (the “Trust”), as of September 30, 2012, and the related statements of operations, changes in net assets, and financial highlights for the period December 21, 2011 (Inception) to September 30, 2012. These financial statements and financial highlights are the responsibility of the Funds’ management. Our responsibility is to express an opinion on these financial statements and financial highlights based on our audits.
We conducted our audits in accordance with the standards of the Public Company Accounting Oversight Board (United States). Those standards require that we plan and perform the audits to obtain reasonable assurance about whether the financial statements and financial highlights are free of material misstatement. The Funds are not required to have, nor were we engaged to perform, an audit of the Funds’ internal control over financial reporting. Our audits included consideration of internal control over financial reporting as a basis for designing audit procedures that are appropriate in the circumstances, but not for the purpose of expressing an opinion on the effectiveness of the Funds’ internal control over financial reporting. Accordingly, we express no such opinion. An audit also includes examining, on a test basis, evidence supporting the amounts and disclosures in the financial statements and financial highlights. Our procedures included confirmation of securities owned as of September 30, 2012 by correspondence with the custodian and brokers. An audit also includes assessing the accounting principles used and significant estimates made by management, as well as evaluating the overall financial statement presentation. We believe that our audits provide a reasonable basis for our opinion.
In our opinion, the financial statements and financial highlights referred to above present fairly, in all material respects, the financial position of Drexel Hamilton Centre American Equity Fund and Drexel Hamilton Centre Global Equity Fund as of September 30, 2012, and the results of their operations, the changes in their net assets, and the financial highlights for the period December 21, 2011 (Inception) to September 30, 2012, in conformity with accounting principles generally accepted in the United States of America.

Walnut Creek, California
November 28, 2012
| | |
| Drexel Hamilton Mutual Funds | | Additional Information |
| | September 30, 2012 |
PROXY VOTING GUIDELINES
A description of the policies and procedures that the Funds used to determine how to vote proxies relating to portfolio securities and information regarding how the Funds voted proxies during the most recent 12-month period ended June 30, will be available without charge upon request by (1) calling the Funds at (888) 848-7569 and (2) from Form N-PX filed by the Funds with the Securities and Exchange Commission (“SEC”) on the SEC’s website at www.sec.gov.
PORTFOLIO HOLDINGS DISCLOSURE POLICY
The Funds file a complete schedule of investments with the SEC for the first and third quarter of each fiscal year on Form N-Q. The Funds’ first and third fiscal quarters end on December 31 and June 30. The Form N-Q filing must be made within 60 days of the end of the quarter, and the Funds’ first Form N-Q was filed with the SEC on February 27, 2012. The Funds’ Forms N-Q are available on the SEC’s website at www.sec.gov, or they may be reviewed and copied at the SEC’s Public Reference Room in Washington, DC (call 1-800-732-0330 for information on the operations of the Public Reference Room). You may also obtain copies by calling the Funds at 1-855-298-4236.
| | |
Annual Report | September 30, 2012 | | 29 |
| | |
| Drexel Hamilton Mutual Funds | | Trustees and Officers |
| | September 30, 2012 (Unaudited) |
The following tables provide certain information regarding the Trustees and Officers of Drexel Hamilton Mutual Funds as of September 30, 2012. Set forth below are the names, age, position held with Funds or Trust, length of time served, and the principal occupations for the last five years of each of the persons currently serving as a Trustee or Officer of the Trust. Unless otherwise noted, the business address of each Trustee or Officer is 45 Rockefeller Plaza, Suite 2000, New York, NY 10111.
INDEPENDENT TRUSTEES1
| | | | | | | | | | |
Name, Address & Age | | Position(s) Held with Funds or Trust | | Length of Time Served | | Principal Occupation(s) During Past 5 Years | | Number of Portfolios in Fund Complex Overseen by Trustee | | Other Directorships Held by Trustee During Past 5 Years |
Dr. James L. Grant Age: 62 | | Trustee,
Chairman | | Since 6/2011 | | President of JLG Research from 1999–present; Assistant Professor of Accounting and Finance at University of Massachusetts Boston from 2005–2011; Advisory Analyst at major Wall Street firms from 1999- present; Ph.D in Business from the University of Chicago Booth School of Business; member of Editorial Advisory Boards of The Journal of Portfolio Management and Journal of Investing; author of Foundations of Economic Value Added Second Edition; co-author of Focus on Value: A Corporate and Investor Guide to Wealth Creation; co-author and co-editor (with Frank J. Fabozzi) of Equity Portfolio Management and Value-Based Metrics: Foundations and Practice. | | 3 | | None |
Dr. Aloke Ghosh Age: 48 | | Trustee | | Since 6/2011 | | Professor of Accountancy at the Zicklin School of Business, Baruch College, The City University of New York from 1993-present; Director of the Executive MS in Financial Statement Analysis and Securities Valuation from 2008-present; Doctoral Program Coordinator of Accountancy at the Zicklin School of Business of Baruch College from 2005-2011; Accounting Academic Fellow at the U.S. Securities and Exchange Commission from 2003-2005; Visiting Associate Professor at the Goizueta Business School of Emory University from 1999-2005; accounting consultant to several leading hedge funds in the U.S. and around the world including acting as a consultant for Gerson Lehrman Group; Ph.D. in Business and Economics from Tulane University. | | 3 | | None |
Joseph M. Marinaro Age: 54 | | Trustee | | Since 6/2012 | | Executive Vice President, AltX Group, Inc. (financial technology) 2012 to present; Managing Director at Surge Trading, Inc. 2009 to 2011; Managing Director, JMM Capital, Inc. 2008 to 2009; Managing Director, Morgan Stanley 2006 to 2008. | | 3 | | None |
| 1 | An “Independent Trustee” is one who is not considered an “interested person” of the Trust, as that term is defined in Section 2(a)(19) of the 1940 Act. |
| | |
| Drexel Hamilton Mutual Funds | | Trustees and Officers |
| | September 30, 2012 (Unaudited) |
INTERESTED TRUSTEES
| | | | | | | | | | |
Name, Address & Age | | Position(s) Held with Funds or Trust | | Length of Time Served | | Principal Occupation(s) During Past 5 Years | | Number of Portfolios in Fund Complex Overseen by Trustee | | Other Directorships Held by Trustee During Past 5 Years |
James A. Abate Age: 47 | | Trustee | | Since 6/2011 | | Managing Director, Centre Asset Management and Fund Manager for Centre’s American Equity and US Hedge strategies from 2006-present; US Investment Director for GAM from 2001-2006; Managing Director and Portfolio Manager at Credit Suisse Asset Management from 1995- 2000; Manager in Price Waterhouse’s Valuation/Corporate Finance Group from 1987-1993; BS in Accounting from Fairleigh Dickinson University and an MBA in Finance from St. John’s University; Visiting Professor in the graduate program at the Zicklin School of Business, Baruch College; commissioned officer in the U.S. Army (and Reserves) from 1983-1990. | | 3 | | None |
| | | | | |
OFFICERS | | | | | | | | | | |
| | | | | |
Name, Address & Age | | Position(s) Held with Funds or Trust | | Length of Time Served | | Principal Occupation(s) During Past 5 Years | | Number of
Portfolios in Fund Complex Overseen by Trustee | | Other Directorships Held by Trustee During Past 5 Years |
Theodore J. Uhl Age: 37 1290 Broadway, Suite 1100 Denver, CO 80203 | | Chief Compliance Officer | | Since 6/2011 | | Mr. Uhl joined ALPS Fund Services in October 2006, and is currently Deputy Compliance Officer of ALPS. Prior to his current role, Mr. Uhl served as Senior Risk Manager for ALPS from October 2006 until June 2010. Before joining ALPS, Mr. Uhl served a Sr. Analyst with Enenbach and Associates (RIA), and a Sr. Financial Analyst at Sprint. | | N/A | | N/A |
Andrew Bang Age: 43 | | President and Treasurer | | Since 6/2011 | | Partner and Managing Director of the Adviser from 2010- present; Consultant (Business Development for private equity and hedge funds) from 2008-2010; Senior Vice President at Shinhan Investment America from 2007- 2008; Vice President, Relationship Manager at AIG Global Investments from 2006-2007;Client Portfolio Manager at GE Asset Management (GEAM) pension group from 2001- 2005; Client Relationship Manager at GE Equity’s start-up private equity group, Venturemine.com from 2000-2001; Manager, International Equity at UBS from 1998-2000; Captain in the U.S. Army from 1992-1998; United States Military Academy at West Point, B.S.; Johnson Graduate School of Management, Cornell University, MBA. | | N/A | | N/A |
| | |
Annual Report | September 30, 2012 | | 31 |

Item 2. Code of Ethics.
| | (a) | The Registrant, as of the end of the period covered by the report, has adopted a code of ethics that applies to the Registrant’s principal executive officer, principal financial officer, principal accounting officer or controller or any persons performing similar functions on behalf of the Registrant. |
| | (c) | During the period covered by this report, no amendments were made to the provisions of the code of ethics adopted in 2(a) above. |
| | (d) | During the period covered by this report, no implicit or explicit waivers to the provisions of the code of ethics adopted in 2(a) above were granted. |
| | (f) | The Registrant’s Code of Ethics is attached as an Exhibit hereto. |
Item 3. Audit Committee Financial Expert.
The Board of Trustees of the Registrant has determined that the Registrant has at least one audit committee financial expert serving on its audit committee. The Board of Trustees has designated Dr. Aloke Ghosh as the Trust’s “audit committee financial expert,” as defined in Form N-CSR under the 1940 Act, based on the Board’s review of their qualifications.
Dr. Ghosh is “independent” as defined in paragraph (a)(2) of Item 3 to Form N-CSR
Item 4. Principal Accountant Fees and Services.
| | | | |
| | (a) | | Audit Fees: For the Registrant’s fiscal year ended September 30, 2012, the aggregate fees billed for professional services rendered by the principal accountant for the audit of the Registrant’s annual financial statements was $15,550. |
| | |
| | (b) | | Audit-Related Fees: For the Registrant’s fiscal year ended September 30, 2012 the aggregate fees billed for assurance and related services by the principal accountant that are reasonably related to the performance of the audit of the Registrant’s annual financial statements and are not reported under paragraph a of this Item was $0. |
| | |
| | (c) | | Tax Fees: For the Registrant’s fiscal year ended September 30, 2012, aggregate fees of $7,000 , was billed for professional services rendered by the principal accountant for tax compliance, tax advice, and tax planning. The fiscal year 2012 tax fees were for services for dividend calculation, excise tax preparation and tax return preparation. |
| | |
| | (d) | | All Other Fees: For the Registrant’s initial fiscal year ended September 30, 2012, fees billed to Registrant by the principal accountant for services other than the services reported in paragraphs (a) through (c) of this item was $0. |
| | |
| | (e)(1) | | Audit Committee Pre-Approval Policies and Procedures: All services to be performed by the Registrant’s principal auditors must be pre-approved by the Registrant’s audit committee. |
| | |
| | (e)(2) | | No services described in paragraphs (b) through (d) were approved pursuant to paragraph (c)(7)(i)(C) of Rule 2-01 of Regulation S-X. |
| | |
| | (f) | | Not applicable. |
| | |
| | (g) | | The aggregate non-audit fees billed by the Registrant’s principle accountant for the fiscal year ended September 30, 2012 was $0. |
| | |
| | (h) | | Not applicable. |
Item 5. Audit Committee of Listed Registrants.
Not applicable.
Item 6. Schedule of Investments.
The Schedule of Investments is included as part of the Report to Stockholders filed under Item 1 of this form.
Item 7. Disclosure of Proxy Voting Policies and Procedures for Closed-End Management
Investment Companies.
Not applicable.
Item 8. Portfolio Managers of Closed-End Management Investment Companies.
Not applicable.
Item 9. Purchases of Equity Securities by Closed-End Management Investment Company and Affiliated Purchasers.
Not applicable.
Item 10. Submission of Matters to Vote of Security Holders.
There have been no material changes to the procedures by which shareholders may recommend nominees to the registrant’s Board of Trustees.
Item 11. Controls and Procedures.
| | (a) | The Registrant’s principal executive and principal financial officers, or persons performing similar functions, have concluded that the Registrant’s disclosure controls and procedures (as defined in Rule 30a-3(c) under the Investment Company Act of 1940, as amended (the “1940 Act”) (17 CFR 270.30a-3(c))) are effective, as of a date within 90 days of the filing date of the report that includes the disclosure required by this paragraph, based on their evaluation of these controls and procedures required by Rule 30a-3(b) under the 1940 Act (17 CFR 270.30a-3(b)) and Rules 13a-15(b) or 15d-15(b) under the Securities Exchange Act of 1934, as amended (17 CFR 240.13a-15(b) or 240.15d-15(b)). |
| | (b) | No changes in the Registrant’s internal control over financial reporting (as defined in Rule 30a-3(d) under the 1940 Act (17 CFR 270.30a-3(d)) occurred during the Registrant’s second fiscal quarter of the period covered by this report that have materially affected, or are reasonably likely to materially affect, the Registrant’s internal control over financial reporting. |
Item 12. Exhibits.
| | | | |
| | (a)(1) | | The code of ethics that applies to the registrant’s principal executive officer and principal financial officer is attached hereto as EX-12.A.1. |
| | |
| | (a)(2) | | The certifications required by Rule 30a-2(a) under the Investment Company Act of 1940, as amended, and Section 302 of the Sarbanes-Oxley Act of 2002 are attached hereto as Ex99.Cert. |
| | | | |
| | (a)(3) | | Not applicable. |
| | |
| | (b) | | The certifications by the registrant’s principal executive officer and principal financial officer, as required by Rule 30a-2(b) under the Investment Company Act of 1940, as amended, and Section 906 of the Sarbanes-Oxley Act of 2002 are attached hereto as Ex99.906Cert. |
SIGNATURES
Pursuant to the requirements of the Securities Exchange Act of 1934 and the Investment Company Act of 1940, the registrant has duly caused this report to be signed on its behalf by the undersigned, thereunto duly authorized.
| | |
DREXEL HAMILTON MUTUAL FUNDS |
| |
By: | | /s/ Andrew Bang |
| | Andrew Bang |
| | President (Principal Executive Officer) |
| |
Date: | | December 7, 2012 |
Pursuant to the requirements of the Securities Exchange Act of 1934 and the Investment Company Act of 1940, this report has been signed below by the following persons on behalf of the registrant and in the capacities and on the dates indicated.
| | |
By: | | /s/ Andrew Bang |
| | Andrew Bang |
| | President (Principal Executive Officer) |
| |
Date: | | December 7, 2012 |
| |
By: | | /s/ Andrew Bang |
| | Andrew Bang |
| | Treasurer |
| | (Principal Financial Officer) |
| |
Date: | | December 7, 2012 |