UNITED STATES
SECURITIES AND EXCHANGE COMMISSION
Washington, D.C. 20549
FORM N-CSR
CERTIFIED SHAREHOLDER REPORT OF REGISTERED
MANAGEMENT INVESTMENT COMPANIES
Investment Company Act file number: 811-22545
DREXEL HAMILTON MUTUAL FUNDS
(Exact name of registrant as specified in charter)
48 Wall Street, Suite 1100, New York, New York 10005
(Address of principal executive offices) (Zip code)
James A. Abate
48 Wall Street, Suite 1100
New York, New York 10005
(Name and address of agent for service)
Registrant’s telephone number, including area code: (855) 298-4236
Date of fiscal year end: September 30
Date of reporting period: October 1, 2012 – September 30, 2013
Item 1. Reports to Stockholders.
n Drexel Hamilton Centre American Equity Fund
(Ticker: DHAMX)
n Drexel Hamilton Centre Global Equity Fund
(Ticker: DHGLX)
n Drexel Hamilton Multi-Asset Real Return Fund
Investor Class (Ticker: DHMRX)
Institutional Class (Ticker: DHMUX)
Each a series of DREXEL HAMILTON MUTUAL FUNDS
| | |
| Drexel Hamilton Mutual Funds | | Shareholder Letter |
| | September 30, 2013 (Unaudited) |
November 2013
Dear Shareholder,
We present the annual report for the series of Drexel Hamilton Mutual Funds (the “Trust”) for the twelve-month period ending September 30, 2013.
The Net Asset Value (“NAV”) of the Drexel Hamilton Centre American Equity Fund (DHAMX) increased 12.30% for the twelve-month period ended September 30, 2013 and 32.40% since inception, and the NAV of the Drexel Hamilton Centre Global Equity Fund (DHGLX) increased 12.19% for the twelve-month period ended September 30, 2013 and 28.23% since inception. The Drexel Hamilton Multi-Asset Real Return Fund, Institutional Class, (DHMUX), launched on October 9, 2012, has returned 3.51% for the three-month period ended September 30, 2013 and 0.05% since inception. Additional performance and Fund information is available in the following Manager Commentary sections.
On September 13, 2013, the Board of Trustees approved and appointed Centre Asset Management, LLC (“Centre”) as the interim investment adviser to each series of the Trust (each, a “Fund” and together, the “Funds”). On September 14, 2013, the owners of Drexel Hamilton Investment Partners, LLC (“DHIP”), the Funds’ previous investment adviser, sold all of the membership units of DHIP to Centre. This transaction resulted in a change of control of DHIP, with Centre becoming sole owner of DHIP. The transaction also resulted in assignments of investment advisory agreement between DHIP and the Trust, on behalf of each Funds and the automatic termination of those agreements. In anticipation of the Centre acquisition, the Board of Trustees approved interim investment advisory agreements between Centre and the Trust on behalf of the Funds. Additionally, the Board of Trustees recommended shareholder approval of new investment advisory agreements. Centre has served as the investment sub-adviser to two of the Funds since their inception and James Abate and Jing Sun, two of Centre’s principals, have served as portfolio manager of the Drexel Hamilton Centre American Equity Fund and the Drexel Hamilton Centre Global Equity Fund, respectively, since their inception. The Board of Trustees believes that engaging Centre to serve as the investment adviser will maintain stability and continuity for the Funds. Each Fund’s investment advisory fee under that Fund’s interim advisory agreement and, if approved by Fund shareholders, the new investment advisory agreement will remain the same as the investment advisory fee under the Fund’s previous investment advisory agreement.
A Special Meeting of the Shareholders was held on October 31, 2013, at which shareholders of each Fund approved a new investment advisory agreement between the Trust, on behalf of the Fund, and Centre as the new investment adviser to the Fund.
The new investment advisory agreement does not result in changes to a Fund’s investment objectives or principal investment strategies, and does not cause any increase in the Fund’s investment advisory fee rates or total expenses. There will be continuity to management and service providers to the Trust and/or the Funds, including the administrator, transfer agent, custodian, independent registered public accounting firm and distributor of the Funds.
We have accomplished many significant milestones during this reporting period. By the time you receive this report, our newest fund, the Drexel Hamilton Multi-Asset Real Return Fund, launched on October 9, 2012, will have enjoyed its one year anniversary. The Drexel Hamilton Multi-Asset Real Return Fund seeks total return that exceeds U.S. inflation over a full inflation cycle by using a flexible allocation investment strategy that is diversified across various asset classes by dynamically shifting its allocation mix to maximize risk-adjusted returns and to preserve invested capital. The Drexel Hamilton Centre American Equity Fund and the Drexel Hamilton Centre Global Equity Fund are approaching their two year anniversaries in December 2013; each seeks capital growth through differentiated, fundamental investment processes.
Looking ahead to the upcoming months, the Trust intends to add a new actively managed U.S. Treasury fund to the stable of funds. We believe the addition of this new fixed income asset class product will add to our existing equity and multi-asset real return capabilities consistent with the Funds’ objective of offering fundamentally-driven, specialist active funds. Furthermore, the American and Global Equity Funds intend to offer two classes of shares so that all Funds offer Investor and Institutional Classes.
The Funds will continue to focus on high conviction, disciplined and research intensive processes in seeking long-term growth of capital or real return. We are committed to our shareholders for the long term by continuing to endeavor to provide consistent, risk-adjusted returns for our shareholders. We believe that the Funds are on the right track and look forward to striving to provide differentiation, value and performance.
Sincerely yours,
Andrew Bang
President
Past performance is no guarantee of future results and investment returns and principal value of each Fund will fluctuate so that shares, when redeemed, may be worth more or less than their original cost.
Andrew Bang is a registered representative of ALPS Distributors, Inc.
The statements and opinions expressed are those of the Adviser and are as of the date of this report.
| | |
| Annual Report | September 30, 2013 | | 1 |
| | |
| Drexel Hamilton Centre American Equity Fund | | Manager Commentary |
| | September 30, 2013 (Unaudited) |
Performance:
For the one year period ended September 30, 2013, the Drexel Hamilton Centre American Equity Fund delivered a positive absolute return but trailed its benchmark, the S&P 500® Index, on a relative basis mainly due to our mega-capitalization size bias and implementation of certain hedges and other investments that we deemed to be capital protective in nature. Despite being four plus years into economic expansion and exhaustion of further sustainable growth in revenue and earnings for most companies, early cycle sectors such as Consumer Discretionary and Financials, as well as mid-sized and smaller companies were the market leaders over the period. In fact, the equal-weighted1 S&P 500® Index delivered a total return nearly eight percentage points higher than the market capitalization weighted2 benchmark S&P 500® Index3 ; a situation normally associated with a robust economic backdrop.
Stocks that were strong performers within the Fund over this period included Delta Air Lines, Boston Scientific, LyondellBasell Industries, United Continental, Starbucks, Harley-Davidson, Citigroup, Visa, Honeywell, and Goldman Sachs. Stocks that were laggards included those mainly in the Materials and Technology sectors, such as Kinross Gold, Eldorado Gold, Goldcorp, Apple, and Broadcom, all of which remain in the Fund except for Broadcom.
Our principal overweight sectors were Technology and Health Care driven by bottom-up stock level opportunities and, from a performance impact perspective, the biased allocation attribution to Technology hurt while to Health Care helped the Fund. Our underweight posture in Financials hurt, but aside from very select opportunities, we maintain our general avoidance of most financial stocks as long-term investments, as regulatory scrutiny and increased capital requirements continue to depress returns on equity and intrinsic values.
As always, our process in managing the Fund is to focus bottom-up on each individual company’s growth outlook and capacity to create shareholder value. We analyze not only earnings, but we also strive to understand and link the capital allocation decisions being made today by each company and how they will lead to future earnings growth. In other words, we expect companies to invest in productive assets of the business, organically and through opportunistic purchases which, in turn, should provide the foundation for future revenue and profits growth that will create shareholder value. Alternatively, if companies cannot invest in productive assets due to a cyclical downturn or existing excess capacity, we expect these companies to “wisely contract” through the restructuring of their assets and other resources to regain their footing for future shareholder value creation. Our top-down views on interest rates and other fundamental economic indicators are important as many of those are inputs into our company models and, at the end of the day, reconciled with bottom-up information we gather and process from company performance. The end result is our attempt to find the best 45-70 stocks or so within the S&P 500® and weight those securities in a manner that delivers the Fund with competitive risk adjusted returns.
Economic and Market Review:
Despite the tepidness of US and global economic growth, we have not been surprised by the strength of the US stock market so far this year given that the Federal Reserve has continued to provide liquidity which, in turn, has translated into the overall price-earnings ratio4 (P/E) expanding against flat earnings. In simple terms, stocks have gone from being inexpensive to near fair value when compared to historical data, as the current P/E is around 17 times based on trailing earnings, up from around 14 times earnings one year ago.
The question to ask oneself now is whether the P/E can continue to expand on sheer monetary liquidity or will earnings growth revive heading into 2014 justifying the recent multiple expansion. In addressing the former, it has become a convention that the Federal Reserve’s distortive monetary policies are forcing investors into stocks as there is simply no other investment options to equities to achieve yield and capital growth relative to the liquid alternatives of cash, bonds, or commodities. Unlike the 1990’s, when a strong secular re-rating5 case could be made that transformational events, namely the fall of communism and opening up of vast international markets for growth and access to labor that would reduce costs, lower business cycle volatility due to automation and shift away from capital intensive industries, as well as the perception of better monetary and fiscal policies by the US government, this re-rating and crowding into equities seems more driven by stick rather than the carrot. Intertwined with this “there is no
| 1 | Equal Weighted – Index construction methodology, whereby all constituent stocks regardless of their size as measured by their market capitalization, are given equal weight inside the index. |
| 2 | Weighted Average Market Capitalization – Index construction methodology, whereby constituent stocks are given weights according to their weighted average market capitalization. Larger stocks therefore constitute a large portion of the index. The S&P 500 is an example of a well-known weighted average market capitalization index. |
| 3 | S&P 500 Index – The S&P 500 Index is a market capitalization weighted index consisting of 500 actively traded stocks in the U.S. equity markets. The index is designed to be the leading indicator of performance of the large capitalization U.S. equities universe. You cannot invest directly into an index. |
| 4 | Price to Earnings ratio – A valuation ratio of company’s current market share price compared to its earnings per share. |
| 5 | Re-rating – When the market changes its view of a company sufficiently to make calculation ratios or similar metrics higher or lower. |
| | |
| Drexel Hamilton Centre American Equity Fund | | Manager Commentary |
| | September 30, 2013 (Unaudited) |
alternative - TINA” environment has been the inconsistency that thus far this year, cyclicals have beaten more stable defensives as a style and smaller companies have outperformed larger companies; neither of which is consistent historically with a stock market rising due to a re-rating while earnings stagnate and inflation is low. The inference that we make from this observation is that investors are discounting a significant pickup in economic activity as well as a sharp re-acceleration of earnings. We find little evidence, top-down or bottom-up, of a consumer resurgence or corporate capital spending wave on the horizon to ignite higher revenue growth. Given this, we expect stock indexes to struggle to make further gains and the relative style and size performance winners of late to revert to losers, as profit margins and returns on equity seem to have peaked given a stagnant revenue backdrop and the hedges and other investments that we deemed to be capital protection in nature to be prudent.
Actions by the US Federal Reserve under its Chairman, Ben Bernanke, have been unprecedented in terms of using both the cost (interest rate) and quantity of money as stimulus tools. To fight the most recent recession, the Federal Reserve followed the standard prescription for a central bank and lowered its target short-term interest rate, attempting to ease financial conditions and support economic growth. In terms of existing non-traditional stimuli, the Federal Reserve has embarked on three distinct asset purchase programs, all in an effort to push down long-term interest rates as well as absorb lower quality assets from commercial banks. The latest version, QE3, has the Federal Reserve buying $85 billion worth of Treasury securities and other bonds from banks and primary dealers per month. In fact, the Federal Reserve alone has been the majority buyer of new treasury bonds issuance since the QE6 programs started. While QE has been effective in pushing long term interest rates down to record levels, it has not ignited commensurate loan growth nor inflation as the majority of the funds provided by the Federal Reserve have made their way right back to them as interest paying reserves; these deposits with Federal Reserve Banks now exceed $2.3 trillion dollars. In other words, QE stimulus has not made its way into the economy but has rather allowed the banks and primary dealers to capture the interest rate spread risk-free and boost financial assets in general. Unless the Federal Reserve discontinues paying interest on such deposits, it’s unlikely that banks will promote private sector lending in a meaningful way, particularly given new bank capital constraints such as Basel III7 and other anti-lending regulations, so this liquidity should continue to find its way into financial assets rather than being lent for productive assets. In fact, recent readings of commercial lending statistics by banks point to a contraction of new loans.
We are confident in our view that the Federal Reserve is unlikely to raise its target short-term interest rate and, although it may taper the level bond purchases or make them variable based on monthly conditions; it will maintain some type of QE program for the foreseeable future.
The natural question to ask oneself is then “What’s different this time?” The recoveries that followed the 2001 and 2008 recessions were uncharacteristically lackluster both in terms of economic growth and job creation. Indeed, the moniker given to these two recoveries has been “jobless.” Are there common threads between these recoveries? Moreover, has the U.S. economy fundamentally changed, resulting in a different pattern of growth during recoveries?
As students of demographics and natalism, we believe that, in a number of industrialized countries (including the US), assuming that fertility rates remain at or close to present levels, populations will start to decline and, in some cases, quite rapidly in the near future. The impact of this development on developed societies is that the aggregate demand for goods and services will decrease and increasing pension liabilities that can be crushing in terms of taxation on younger workers. Japan, the pathfinder of this phenomenon as it embraced Western family planning even before Europe and the US, shows the debilitative impact from an aging society and need to resort to new radical macroeconomic policies to combat its ill effects. With regard to near-term relevance to Federal Reserve policies, we see that the US Civilian Labor Force Participation Rate has dropped below a level that we last saw thirty years ago, as women began to join the workforce in earnest. A large part of the current fall in the unemployment rate from 10.0% to 7.3% has been due to this “dropping out” of the labor force, either due to discouragement, early retirement, or public assistance best evidenced by the fact that more persons have joined the rolls for social security disability payments than private sector payrolls since 2009. This collapse in the civilian workforce participation rate since the recovery began in June 2009 has never happened before during previous recoveries. Furthermore, productivity and the growth in average hourly wages have fallen significantly as inflation has slowed and competition for jobs domestically and from overseas limiting consumer consumption as evidenced by the latest drop in consumer spending being consistent only with past recessions.
Increasingly, we have more affinity to the “new normal” concept whereby economic growth in developed economies remain retarded by cyclical and secular influences and monetary policies remain hyper-active and non-traditional relative to anything seen by our generation of investors.
| 6 | QE – Quantitative Easing is a monetary policy by the government that is used to increase the money supply by buying government securities and other assets from the market. The goal is to decrease the interest rate and promote economic growth. |
| 7 | Basel III – A set of reforms and regulations designed to improve the supervision and risk management within the financial and banking sector. It is published by the Basel Committee on Banking Supervision. |
| | |
| Annual Report | September 30, 2013 | | 3 |
| | |
| Drexel Hamilton Centre American Equity Fund | | Manager Commentary |
| | September 30, 2013 (Unaudited) |
Outlook:
Given our outlook for earnings, valuation, and interest rates, we believe the best strategy to employ in the current environment where profitability will likely continue to come under pressure is a barbell one comprised mainly of leading mega-capitalization blue chips with the attributes that render them undervalued based upon their current multiples despite the recent re-rating. These companies, whose fundamentals we believe will stand out increasingly as the business cycle matures further, will distinguish themselves from the broad market through organic growth from innovation, pricing power and their global reach. US companies such as Exxon-Mobil, Johnson & Johnson, Proctor & Gamble, Nike, Starbucks, and Coca-Cola all exhibit these attributes. In addition, these US-listed global multi-national companies are an excellent way to capture the secular demand benefits from emerging economies. Combined with this portfolio component in a barbell approach, there remain selective companies in the US that continue to harvest growth in earnings and continue to enhance operations by streamlining labor forces and optimizing assets. US companies such as Lam Research, SanDisk, Avon Products, Urban Outfitters, Juniper Networks, Boston Scientific, NVidia, Sealed Air, Noble Corp., Express Scripts, Cardinal Health, Bemis, EOG Resources, HCA, Calpine, Cardinal Health, Bemis, IGT, Network Appliance, Schlumberger, and Devon Energy exhibit these attributes as do certain gold miners, which have curtailed capacity additions, namely Kinross and Goldcorp and we believe provide inverse positive optionality to potential stock market weakness in the event of a monetary or governmental policy mistake. Currently our mix between the former and latter groupings of companies is 70/30 versus 50/50 eighteen months ago.
Moving forward we are increasingly cautious about the overall market as the “stick rather than carrot driven TINA trade” into equities matures as well as our inference of the stock markets’ dependence upon a 2014 economic and profit recovery, which we do not see any evidence of. Furthermore, the ineffectiveness of traditional tools of macroeconomic policy, an oncoming demographic crisis, and other secular influences can lead to further non-traditional policies in developed economies, as most recently implemented in Japan that, in turn, could lead to mistakes and unintended consequences, especially if embraced collectively by the developed countries. Even if one were to ignore the top-down influences, our bottom-up selection highlights most favorably those leading mega-capitalization blue chips8 well exposed to global growth opportunities with defensive value attributes as well as those companies that continue to harvest growth in earnings and enhance operations by streamlining labor forces and optimizing assets in a company-specific manner.
| 8 | Blue Chips – A well-known, established and financially sound company. Blue chip companies are usually large capitalization companies with a track record of stable earnings and cash flow generation, as well as long term reliable growth prospects. |
| | |
| Drexel Hamilton Centre American Equity Fund | | Manager Commentary |
| | September 30, 2013 (Unaudited) |
SECTOR WEIGHTINGS
As a percentage of Net Assets
| | |
Information Technology | | 29.27% |
Health Care | | 17.05% |
Consumer Discretionary | | 13.30% |
Consumer Staples | | 10.03% |
Financials | | 8.64% |
Energy | | 7.46% |
Materials | | 6.39% |
Industrials | | 5.49% |
Telecommunication Services | | 1.06% |
Utilities | | 0.84% |
Calls | | 0.01% |
Cash and Cash Equivalents | | 0.46% |
Total | | 100.00% |
These allocations may not reflect the current or future positions of the portfolio.
GROWTH OF HYPOTHETICAL $10,000 INVESTMENT THROUGH
SEPTEMBER 30, 2013

This graph assumes an initial investment of $10,000 at December 21, 2011, the Fund’s inception date, and that any dividends ® and distributions are reinvested. This graph depicts the performance of the Fund versus the S&P 500 Index. Taxes on any Fund distributions or when shares are redeemed, if any, are not reflected. Unlike the Fund, an index is not available for investment, is unmanaged and does not have expenses that affect the results. The comparison is shown for illustrative purposes only.
TOTAL RETURNS – FOR THE PERIOD ENDED SEPTEMBER 30, 2013
| | | | | | | | | | | | | | | | | | | | | | | | | | | | | | |
| | | 1 Month | | 3 Month | | YTD | | 1 Year | | Since Inception* | | |
| Drexel Hamilton Centre American Equity Fund | | | | 2.67 | % | | | | 5.27 | % | | | | 15.21 | % | | | | 12.30 | % | | | | 17.10 | % | | |
S&P 500® Index | | | | 3.14 | % | | | | 5.25 | % | | | | 19.79 | % | | | | 19.34 | % | | | | 21.12 | % | | |
The performance information quoted above represents past performance, which is not a guarantee of future results, and does not reflect the deduction of taxes that a shareholder would pay on Fund distributions or the redemption of Fund shares. Investment return and principal value of an investment will fluctuate so that an investor’s shares, when redeemed, may be worth more or less than their original cost. Total return includes reinvestment of dividends and capital gains, if any. Current performance may be lower or higher than the performance data quoted. For the most current month-end performance data please call 855-298-4236.
The total annual operating expense ratio (after expense reimbursements) as stated in the fee table of the most currently effective prospectus of the Fund, dated January 14, 2013, was 1.05%.
The Adviser has entered into a written expense limitation agreement under which it has agreed to limit for a period of two years from January 11, 2013 the total expenses of the existing class of shares of the Fund (including (but not limited to) investment advisory fees of the Adviser and distribution/service (Rule 12b-1) fees, but excluding interest, taxes, litigation, brokerage commissions, and extraordinary expenses not incurred in the ordinary course of the Fund’s business) to an annual rate of 1.05% of the average daily net assets of the Fund. This limitation may not be terminated and will remain in place through the end of the two-year period beginning after January 11, 2013. Without this waiver the total annual fund operating expenses of the Fund would have been 1.15%.
The S&P 500® Index is a commonly recognized, market-capitalization weighted index of 500 widely held securities, designed to measure broad U.S. equity performance. You cannot invest directly in an index.
* The Fund’s inception date was December 21, 2011.
| | |
| Annual Report | September 30, 2013 | | 5 |
| | |
| Drexel Hamilton Centre Global Equity Fund | | Manager Commentary |
| | September 30, 2013 (Unaudited) |
Performance:
For the one year period ended September 30, 2013, the Drexel Hamilton Centre Global Equity Fund delivered a positive absolute return but underperformed its benchmark, the MSCI All Country World (ACWI) Index1, on a relative basis. In general, the Fund’s underweighting of developed markets, particularly the US, and its bias towards higher growth, better valuation-supported emerging markets contributed to the relative underperformance. We maintain our bias and expect the future to reverse past fortunes.
Greece, Finland, Netherlands and Japan were some of the best performing markets globally during the 12-month period, while Indonesia, India, Brazil and South Africa were some of the worst performing markets. Regionally, Europe, followed by North America, outperformed the global market average as measured by the ACWI Index, while Asia Pacific ex-Japan underperformed the global market average. As noted, emerging markets as a group underperformed the global average but with mixed results: Indonesia, India, Brazil, Russia and South Africa were some of the worst performing markets while Greece and Argentina were some of the best performing markets globally.
During this period, our stock selection in Latin America contributed positively to the Fund’s relative performance. On the other hand, our stock selections in Asia, Europe, the U.S. and overweight posture in South America detracted from the Fund’s relative performance. Among the Fund’s stock holdings, Toyota Motor, Daiwa Securities and Fast Retailing of Japan; Daimler of Germany; Sands China and Tencent of China; and Compagnie Financiere Richemont of Switzerland all contributed positively to the Fund’s performance. On the negative side, America Movil of Mexico; Gazprom of Russia; SABESP, Vale and Petrobras of Brazil; China Shenhua Energy and China Life Insurance of China all detracted from Fund’s performance.
The Fund offers a unique investment vehicle for investors by focusing on large capitalization blue chips2 in the developed world and emerging blue chips in the developing countries. The Fund’s investment process combines bottom-up stock selection with structured portfolio construction and risk management that’s cognizant of secular growth forces. Our approach in managing the Fund is to focus bottom-up on each individual company’s growth outlook, not just on earnings, by understanding the capital allocation decisions being made today and how they will lead to future earnings growth. Our top-down views on macro outlooks of various markets, regions and global sectors etc. are important as many of those are inputs into our company models, and at the end of the day, are reconciled with the bottom-up information we gather and process from company performance and operating results.
Our disciplined economic-value-added3 based investment stock selection process and the unique dynamic GDP4-adjusted focused portfolio construction process ensure that the Fund is unencumbered by traditional market capitalization weighted benchmarks and goes where the bottom-up stock opportunities are globally. Consequently, the Fund is well positioned to extract value from the positive demographic trends and long-term economic growth in many developing economies as well as attractive investment opportunities in developed countries across the globe that we believe will lead to capital growth over a long-term investment horizon.
Economic and Market Review:
As we start the final quarter of 2013, global equity markets are on track to have another outstanding year. Although the bull market in global stocks that started in early 2009 is aging, it is still going strong. The 2008-2009 global financial crisis and the ensuing loose monetary policies and liquidity injections from the central banks of major economies all over the world have ushered in the age of the “new normal” with low interest rates, slow economic growth and anemic job creation. Nevertheless, there are signs of economic recovery in Europe and continued improvements in Japan, and even in some emerging markets, such as South Korea. In addition, China’s economy seems to have stabilized although the structural reforms needed for sustained long-term economic growth in China have not yet begun. With the determination of nearly all of the major central banks in the world to keep the interest rates super low for years to come, and valuations of fixed income assets looking unattractive, equities remain an attractive asset class for global investors in the foreseeable future. As the times are changing, investors must adapt with the changing times. It is no longer prudent to merely look at various regions and markets as monolithic groups. Rather it is more critical than ever before that
| 1 | MSCI All Country World Index (ACWI) – A market capitalization weighted index designed to track the performance of the broad global equity-market. The index is maintained by Morgan Stanley and the index constituents include both stocks from developing and emerging markets. |
| 2 | Blue Chips – A well-known, established and financially sound company. Blue chip companies are usually large capitalization companies with a track record of stable earnings and cash flow generation, as well as long term reliable growth prospects. |
| 3 | Economic Value Added (EVA) – An estimate of a firm’s economic profit – being the value created in excess of the required return of the company’s investors (being shareholders and debt holders). Quite simply, EVA is the profit earned by the firm less the cost of financing the firm’s capital. The idea is that value is created when the return on the firm’s economic capital employed is greater than the cost of that capital. |
| 4 | Gross Domestic Product (GDP) – The monetary value of all the finished goods and services produced within a country’s borders in a specific time period, though GDP is usually calculated on an annual basis. |
| | |
| Drexel Hamilton Centre Global Equity Fund | | Manager Commentary |
| | September 30, 2013 (Unaudited) |
investors focus on individual companies and pick the right stocks. With changes come new risks, but also new opportunities. That is exactly how we approach investing globally. In line with our economic-value-added investment principle, we believe that a company’s ultimate worth is related to its propensity to create or destroy wealth in economic risk-adjusted terms rather than strictly nominal accounting terms. Furthermore, the company-specific cost of capital is a required component to the value today of that propensity for wealth creation or destruction. Based on our research within the economic-value-added investment principle framework, we identified many attractively valued, large capitalization blue chips in all corners of the world.
For instance, Companhia de Bebidas das Americas (AmBev) is one of our favorite stocks in Brazil. AmBev is the largest Latin American brewery and the sole distributor of Pepsi products in Brazil. We believe that Ambev’s leading market position, top-notch management, and strong cash flow generation will likely result in improved earnings growth despite the current tough operating environment. We think that AmBev will continue to focus on execution at the point of sales level and that sales volume will gradually improve from the very low base reported in the first quarter of 2013. Finally, we consider AmBev one of the major beneficiaries of the growing middle class and their increasing purchasing power, not only in Brazil but in many other developing markets as well.
In China, despite recent market declines, especially for stocks of large state-owned-enterprises (SOEs), we find a number of attractive investment opportunities in privately owned companies such as Hengan International Group. Hengan International Group is the largest producer of sanitary napkins and baby diapers in China. The company makes sanitary napkins, disposable baby diapers, adult diapers and other personal hygiene products and it is a private rather than state-owned company. We tend to stay away from SOEs since they are often very large, but persistent shareholder-value destroyers, caused by the state mandated over-investment. For Hengan International Group, safely outside the state control, we expect revenue growth to regain momentum this year and next and its profit margin should expand, especially in sanitary napkins product segment. Furthermore, we believe that Hengan International Group represents very attractive long-term risk-reward opportunity with excellent long-term growth potential, as the living standards of the Chinese population continue to improve.
In Japan, we believe that global leaders such as Toyota Motor, Murata Manufacturing Company and Fast Retailing, will continue to prosper whether the new economic policy platform being rolled out by the new Japanese Prime Minister, Shinzo Abe, dubbed “Abenomics”, will succeed or not. Murata Manufacturing is a global leader in electronic components-primarily in the manufacturing of ceramic passive electronic components, such as capacitors. The company has an overwhelming global market share in ceramic filters, high frequency parts and sensors. These electronic components are everywhere, in mobile phones, computers, cars, trucks, refrigerators, televisions, air conditioners, dishwashers, medical devices and the list goes on. Murata Manufacturing reported strong monthly orders for the first half of 2013, high utilization of its high end product lines and is likely to benefit from the future growth of the smart phone and tablet industry worldwide.
Outlook:
Currently, the Fund has overweight postures in Technology, Consumer Discretionary, and Consumer Staples; underweight postures in Industrials, Energy, Utilities, Healthcare and Materials; close to neutral postures in Financials and Telecommunication Services relative to the MSCI ACWI Index.
Recent purchases or additions in the Fund based on our fundamental research include Keyence, Hyundai Motor, Continental, and Schlumberger. Recent sells or reductions based on our disciplined investment process to take profit or remove stocks that no longer meet our fundamental investment and valuation criteria include Reliance Industries, China Life Insurance, China Shenhua Energy, and PetroChina.
Going forward, the Fund will continue to be anchored with and favor shareholder value creators, such as Google, Fast Retailing, MasterCard, Tencent and LVMH Moet Hennessy Louis Vuitton.
At the regional and country level, we think that the markets, especially those in selected emerging markets, Western Europe and Japan have already discounted many of the uncertainties and risks facing investors. Consequently, we see numerous investment opportunities for long-term global equity investors among the many attractively valued blue-chip large market capitalization multi-national companies all over the world. We believe that long-term global equity investors will be rewarded by focusing their investments, as we do in the Fund, in high quality blue chip stocks that have impressive track records of creating shareholder value, growing dividends in challenging operating environments, maintaining strong balance sheets, and are well positioned competitively in their respective industries.
In conclusion, the only constant in investing is that the market is ever changing, we believe investors should therefore concentrate on the fundamentals of the individual companies that are shareholder value creators, that make economic-value-added capital allocation decisions, that are market leaders in their respective industries, that are likely beneficiaries of secular changes and growth in different parts of the world, and that have exemplary management track records in delivering shareholder value and quality earnings growth even in challenging environments.
| | |
| Annual Report | September 30, 2013 | | 7 |
| | |
| Drexel Hamilton Centre Global Equity Fund | | Manager Commentary |
| | September 30, 2013 (Unaudited) |
SECTOR WEIGHTINGS
As a percentage of Net Assets
| | |
Financials | | 21.35% |
Information Technology | | 20.32% |
Consumer Discretionary | | 15.18% |
Consumer Staples | | 12.55% |
Health Care | | 8.94% |
Energy | | 6.17% |
Materials | | 5.38% |
Industrials | | 4.59% |
Telecommunication Services | | 3.61% |
Utilities | | 0.71% |
Cash and Cash Equivalents | | 1.20% |
Total | | 100.00% |
COUNTRY WEIGHTINGS
As a percentage of Net Assets
| | |
United States | | 27.30% |
Japan | | 10.82% |
Germany | | 10.35% |
France | | 7.58% |
Great Britain | | 6.89% |
Switzerland | | 5.77% |
China | | 4.24% |
Hong Kong | | 3.64% |
Brazil | | 3.19% |
Australia | | 2.72% |
Korea | | 2.64% |
Taiwan | | 2.52% |
Italy | | 2.33% |
Spain | | 1.84% |
Netherlands | | 1.36% |
Belgium | | 0.99% |
Denmark | | 0.90% |
Mexico | | 0.77% |
Greece | | 0.73% |
Russia | | 0.69% |
India | | 0.58% |
Singapore | | 0.53% |
Turkey | | 0.42% |
Cash and Cash Equivalents | | 1.20% |
Total | | 100.00% |
These sector and country allocations may not reflect the current or future positions of the portfolio.
GROWTH OF HYPOTHETICAL $10,000 INVESTMENT THROUGH
SEPTEMBER 30, 2013
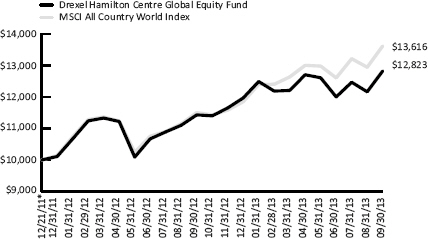
This graph assumes an initial investment of $10,000 at December 21, 2011, the Fund’s inception date, and that any dividends and distributions are reinvested. This graph depicts the performance of the Fund versus the MSCI All Country World Index. Taxes on any Fund distributions or when shares are redeemed, if any, are not reflected. Unlike the Fund, an index is not available for investment, is unmanaged and does not have expenses that affect the results. The comparison is shown for illustrative purposes only.
TOTAL RETURNS – FOR THE PERIOD ENDED SEPTEMBER 30, 2013
| | | | | | | | | | | | | | | | | | | | | | | | | | | | | | |
| | | 1 Month | | 3 Month | | YTD | | 1 Year | | Since Inception* | | |
| Drexel Hamilton Centre Global Equity Fund | | | | 5.43 | % | | | | 6.85 | % | | | | 7.14 | % | | | | 12.19 | % | | | | 15.01 | % | | |
| MSCI All Country World Index | | | | 5.20 | % | | | | 8.02 | % | | | | 14.92 | % | | | | 18.37 | % | | | | 18.96 | % | | |
The performance information quoted above represents past performance, which is not a guarantee of future results, and does not reflect the deduction of taxes that a shareholder would pay on Fund distributions or the redemption of Fund shares. Investment return and principal value of an investment will fluctuate so that an investor’s shares, when redeemed, may be worth more or less than their original cost. Total return includes reinvestment of dividends and capital gains, if any. Current performance may be lower or higher than the performance data quoted. For the most current month-end performance data please call 855-298-4236.
The total annual operating expense ratio (after expense reimbursements) as stated in the fee table of the most currently effective prospectus of the Fund, dated January 14, 2013, was 1.25%.
The Adviser has entered into a written expense limitation agreement under which it has agreed to limit through January 31, 2014 the total operating expenses of the Fund, including investment advisory fees but excluding interest, taxes, litigation, brokerage commissions, other expenditures which are capitalized in accordance with generally accepted accounting principles and extraordinary expenses, to an annual rate of 1.25% of the average daily net assets of the Fund. Without this waiver the total annual fund operating expenses of the Fund would have been 3.04%.
Investing in the securities of foreign companies generally involves greater risk than investing in larger, more established domestic companies. Therefore, investments in the Fund may involve a greater degree of risk than investments in other mutual funds that invest in larger, more established domestic companies.
The MSCI (Morgan Stanley Capital International) All Country World Index is an unmanaged, free float-adjusted market capitalization weighted index composed of stocks of companies located in countries throughout the world. It is designed to measure equity market performance in global developed and emerging markets. You cannot invest directly in an index.
* The Fund’s inception date was December 21, 2011.
| | |
| Drexel Hamilton Multi-Asset Real Return Fund | | Manager Commentary |
| | September 30, 2013 (Unaudited) |
Performance:
For the period since October 9, 2012 (inception) through September 30, 2013, the Drexel Hamilton Multi-Asset Real Return Fund, Institutional Share Class, delivered an absolute return of 0.05%; the Investor Share Class, which launched on January 22, 2013, delivered a loss of 1.36%. Each result was slightly below the increase in the level of the CPI (Consumer Price Index)1. This was due mainly to the disappointing returns from the Fund’s allocation to Treasury Inflation Protected Securities (TIPS)2 and investments linked to commodities in general, as real interest rates rose during the period, dampening investor demand for such inflation protection securities.
Economic and Market Review:
The Drexel Hamilton Multi-Asset Real Return Fund strives to maintain purchasing power and deliver real returns, particularly in environments that exhibit inflationary conditions and potentially higher market volatility than in the recent past, using a fundamental process of asset allocation. In other words, the Fund is designed to maintain the purchasing power of today’s dollar plus deliver a real return on capital to investors through a tactical asset allocation strategy that employs multiple traditional asset classes with strong positive correlation with inflation. The allocation mix consists of Global Equities, Fixed Income (Treasuries and TIPS), commodity-linked instruments, and Cash and Cash Equivalents in an effort to maximize risk-adjusted returns.
The main fundamental input in the Fund’s asset allocation decision process is the level and the directional change in the equity risk premium (ERP)3 relative to other asset classes, simply defined as the excess return that the overall stock market is expected to provide over a risk-free rate indicating the relative valuation of risky assets versus the risk free alternative. Secondly, the overall trend in CPI and other proxies for inflation, namely currency and commodity prices, are used. Thirdly, historical and forecasted volatility for all asset classes are analyzed and modeled.
Currently, we see the implied risk premium for equities versus bonds as high given the distorted treasury yields due to the government’s quantitative easing (QE) programs which has resulted in asset price distortions and potentially a period of high volatility in the future. We note the following historical tendencies during high equity risk premium environments:
| | • | | Equities are undervalued |
| | • | | Earnings are overstated |
| | • | | Investors betting on rising instability |
| | • | | Higher inflationary expectations |
| | • | | Socio-economic instability |
The process remains flexible and allows the Fund to opportunistically shift to each of the various asset classes as conditions warrant based upon the ability of each asset class to perform best during particular market environments.
Global Equities, Treasury Bonds including Treasury Inflation-Protected Securities (TIPS), and commodity-linked instruments are part of the strategy to address inflation. Historically, the returns of these various asset classes move inversely or are less correlated to one another during different investment periods. This offers investors broader diversification and the ability to take advantage of the changes in asset class performance that may take place with changes in different inflationary environments. The Fund is designed to help mitigate the level of risk of delivering real returns that comes from concentrating in a single asset class. Additionally, we aim to overweight asset classes we believe are poised to perform based on our understanding of how different asset classes respond to inflation and changes in economic conditions. The result is a broadly diversified portfolio that can be used as a core holding or as a complementary allocation to existing equity or fixed income strategies.
| 1 | Consumer Price Index (CPI) – An economic measure that tracks the weighted average of prices of a basket of consumer goods and services. Changes in CPI are used to assess price changes associated with the cost of living. You cannot invest directly into an index. |
| 2 | Treasury Inflation Protected Securities (TIPS) – A fixed income treasury security that is indexed against inflation in order to protector investors’ real purchasing power. TIPS are considered low-risk investment backed by the guarantee of the U.S. Government and the par value moves in tandem with the inflation level, as measured by the Consumer Price Index. |
| 3 | Equity Risk Premium (ERP) – The excess return that that the overall stock market is expected to provide over the risk free rate. |
| | |
| Annual Report | September 30, 2013 | | 9 |
| | |
| Drexel Hamilton Multi-Asset Real Return Fund | | Manager Commentary |
| | September 30, 2013 (Unaudited) |
Outlook:
After years of stable inflation in the U.S., investors seem to be less concerned about the prospect of higher inflation in the future despite the U.S. Federal Reserve’s continuous massive QE4 programs. Actions by the U.S. Federal Reserve under its Chairman, Ben Bernanke, have been unprecedented and the Federal Reserve has embarked on three distinct asset purchase programs, all in an effort to push down long-term interest rates. The latest version, QE3, has the Federal Reserve buying $85 billion worth of Treasury securities and other bonds from banks and primary dealers per month. In fact, the Federal Reserve alone has been the majority buyer of new Treasury bonds issuance since the QE programs started. Despite recent talk by the Federal Reserve regarding the tapering of future asset purchases, the actual exit strategy remains undefined, with the potential for tremendous problems. Heightened global market volatility over the last decade and numerous economic recessions have added to investor concerns. The Fund is designed to address those concerns by diversifying risk, hedging against inflation and protecting against capital drawdowns. We believe that due to unprecedented monetary stimulus that’s been provided by the U.S. government and the Federal Reserve’s desire to prevent deflation at all costs, there are prospects of long-term risk of inflation increasing due to:
| | • | | increased debt loads burdening many developed markets |
| | • | | prolonged accommodative monetary policies |
| | • | | uncertain and poor fiscal conditions |
| | • | | increased stress on commodity supplies primarily from emerging markets |
We believe that the monetary stimuli will remain in force as central bankers embrace higher inflation targets with market expectations relatively benign regarding central bank “exit strategies” and discussion over tapering their asset purchases. We see a high potential for disruption and a future with higher inflationary expectations and we are thus positioned accordingly to weather the long-term risk of inflation and the loss of investors’ purchasing power.
All of these factors have created a myriad of outcomes over the next few years that are likely to cause a rise, perhaps a dramatic one, in inflation and the Drexel Hamilton Multi-Asset Real Return Fund will attempt to maintain investors’ purchasing power of today’s dollar in nominal terms plus deliver a positive real return on capital.
The statements and opinions expressed are those of Centre Asset Management, LLC and are as of the date of this report.
| 4 | QE – Quantitative Easing is a monetary policy by the government that is used to increase the money supply by buying government securities and other assets from the market. The goal is to decrease the interest rate and promote economic growth. |
| | |
| Drexel Hamilton Multi-Asset Real Return Fund | | Manager Commentary |
| | September 30, 2013 (Unaudited) |
ASSET TYPE WEIGHTINGS
As a percentage of Net Assets
| | |
Equity Holdings
(Open-End Funds) | | 52.30% |
U.S. Government Bonds | | 27.13% |
ETNs (Commodity Linked) | | 12.85% |
ETFs (Commodity Linked) | | 4.35% |
Cash and Cash Equivalents | | 3.37% |
Total | | 100.00% |
These allocations may not reflect the current or future positions of the portfolio.
GROWTH OF HYPOTHETICAL $10,000 INVESTMENT THROUGH
SEPTEMBER 30, 2013
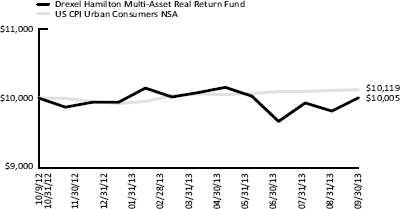
This graph assumes an initial investment of $10,000 at October 9, 2012, the Fund’s inception date, and that any dividends and distributions are reinvested. This graph depicts the performance of the Fund versus the US CPI Urban Consumers NSA Index. Unlike the Fund, an index is not available for investment and is unmanaged and does not have expenses that affect the results. The comparison is shown for illustrative purposes only.
CUMULATIVE TOTAL RETURNS – FOR THE PERIOD ENDED
SEPTEMBER 30, 2013
| | | | | | | | | | | | | | | | | | | | |
| | | 1 Month | | 3 Month | | YTD | | Since Inception* |
| Drexel Hamilton Multi-Asset Real Return Fund – Institutional Class | | | | 1.95 | % | | | | 3.51 | % | | | | 0.64 | % | | | | 0.05 | % |
| US CPI Urban Consumers NSA | | | | 0.12 | % | | | | 0.28 | % | | | | 1.98 | % | | | | 1.19 | % |
| Drexel Hamilton Multi-Asset Real Return Fund – Investor Class** | | | | 1.84 | % | | | | 3.52 | % | | | | – | | | | | -1.36 | % |
| US CPI Urban Consumers NSA | | | | 0.12 | % | | | | 0.28 | % | | | | – | | | | | 1.91 | % |
The performance information quoted above represents past performance, which is not a guarantee of future results, and does not reflect the deduction of taxes that a shareholder would pay on Fund distributions or the redemption of Fund shares. Investment return and principal value of an investment will fluctuate so that an investor’s shares, when redeemed, may be worth more or less than their original cost. Total return includes reinvestment of dividends and capital gains, if any. Current performance may be lower or higher than the performance data quoted. For the most current month-end performance data please call 855-298-4236.
The total annual operating expense ratio (after expense reimbursements) as stated in the fee table of the most recent prospectus, dated January 14, 2013, was 1.81% for the Investor Class and 1.56% for the Institutional Class.
The Adviser has agreed, pursuant to a written expense limitation agreement, to reduce its advisory fees and/or reimburse other expenses of the Fund until January 31, 2014 to the extent necessary to limit the current operating expenses of each class of shares of the Fund (exclusive of any front-end or contingent deferred sales loads, taxes, leverage interest, brokerage commissions, expenses incurred in connection with any merger or reorganization, extraordinary expenses such as litigation and other expenses not incurred in the ordinary course of the Fund’s business, and acquired fund fees and expenses, except that, if an acquired fund is an underlying fund managed by the Adviser and such acquired fund is not subject to an effective expense limitation or fee waiver agreement at any time during the term of the expense limitation agreement relating to the Fund, then, for that time, the operating expenses of each class of shares of the Fund shall not exclude the amount of advisory fees included in such acquired fund’s fees and expenses to which the Fund would otherwise be subject), to 1.25% for Investor Class shares of the Fund and 1.00% for Institutional Class shares of the Fund. Without this waiver the total annual fund operating expenses of the Fund would be 2.37% for the Investor Class and 2.12% for the Institutional Class.
The US CPI Urban Consumers NSA Index is the annual percentage change in the Consumer Price Index (CPI). The CPI is an unmanaged index that represents the rate of inflation of U.S. consumer prices as determined by the U.S. Bureau of Labor Statistics.
* The Fund’s inception date was October 9, 2012.
** Investor’s class inception date was January 22, 2013.
| | |
| Annual Report | September 30, 2013 | | 11 |
| | |
| Drexel Hamilton Mutual Funds | | Disclosure of Fund Expenses |
| | September 30, 2013 (Unaudited) |
As a shareholder of a series of Drexel Hamilton Mutual Funds (each series, a “Fund” and together, the “Funds”), you will incur two types of costs: (1) transaction costs, including any applicable redemption fees; and (2) ongoing costs, including management fees and other Fund expenses. The following examples are intended to help you understand your ongoing costs (in dollars) of investing in a Fund and to compare these costs with the ongoing costs of investing in other mutual funds. The examples are based on an investment of $1,000 invested on April 1, 2013 and held until September 30, 2013.
Actual Expenses. The first line of each table below provides information about actual account values and actual expenses. You may use the information in this line, together with the amount you invested, to estimate the expenses that you paid over the period. Simply divide your account value by $1,000 (for example, an $8,600 account value divided by $1,000 = 8.6), then multiply the result by the number in the first line under the heading “Expenses Paid During Period” to estimate the expenses you paid on your account during this period.
Hypothetical Example for Comparison Purposes. The second line of the table below provides information about hypothetical account values and hypothetical expenses based on each Fund’s actual expense ratio and an assumed rate of return of 5% per year before expenses, which is not the Fund’s actual return. The hypothetical account values and expenses may not be used to estimate the actual ending account balance or expenses you paid for the period. You may use this information to compare the ongoing costs of investing in a Fund to other funds. To do so, compare this 5% hypothetical example with the 5% hypothetical examples that appear in the shareholder reports of the other funds. The expenses shown in the table are meant to highlight ongoing Fund costs only and do not reflect transaction fees, such as redemption fees or exchange fees, if any. Therefore, the second line of each table below is useful in comparing ongoing costs only, and may not help you determine the relative total costs of owning different funds. In addition, if these transactional costs were included, your costs would have been higher.
| | | | | | | | | | | | | | | | | | | | |
| | | BEGINNING ACCOUNT VALUE 04/01/13 | | ENDING ACCOUNT VALUE 09/30/13 | | EXPENSE RATIO(a) | | EXPENSES PAID DURING PERIOD 04/01/13-09/30/13 (b) |
Drexel Hamilton Centre American Equity Fund | | | | | | | | | | | | | | | | | | | | |
Actual | | | $ | 1,000.00 | | | | $ | 1,059.20 | | | | | 1.05% | | | | $ | 5.42 | |
Hypothetical (5% return before expenses) | | | $ | 1,000.00 | | | | $ | 1,019.80 | | | | | 1.05% | | | | $ | 5.32 | |
| | | | |
Drexel Hamilton Centre Global Equity Fund | | | | | | | | | | | | | | | | | | | | |
Actual | | | $ | 1,000.00 | | | | $ | 1,050.50 | | | | | 1.25% | | | | $ | 6.43 | |
Hypothetical (5% return before expenses) | | | $ | 1,000.00 | | | | $ | 1,018.80 | | | | | 1.25% | | | | $ | 6.33 | |
| | | | |
Drexel Hamilton Multi-Asset Real Return Fund | | | | | | | | | | | | | | | | | | | | |
| Institutional Class | | | | | | | | | | | | | | | | | | | | |
Actual | | | $ | 1,000.00 | | | | $ | 992.60 | | | | | 1.00% | | | | $ | 5.00 | |
Hypothetical (5% return before expenses) | | | $ | 1,000.00 | | | | $ | 1,020.05 | | | | | 1.00% | | | | $ | 5.06 | |
| | | | |
Investor Class | | | | | | | | | | | | | | | | | | | | |
Actual | | | $ | 1,000.00 | | | | $ | 990.50 | | | | | 1.25% | | | | $ | 6.24 | |
Hypothetical (5% return before expenses) | | | $ | 1,000.00 | | | | $ | 1,018.80 | | | | | 1.25% | | | | $ | 6.33 | |
| (a) | Annualized, based on the Fund’s most recent fiscal half year expenses. |
| (b) | Expenses are equal to the Portfolios’ annualized expense ratio multiplied by the average account value over the period, multiplied by the number of days in the most recent fiscal half year (183), then divided by 365. |
| | |
| Drexel Hamilton Centre American Equity Fund | | Schedule of Investments |
| | September 30, 2013 |
| | | | | | | | |
| | | Shares | | | Value | |
| |
COMMON STOCKS (99.53%) | | | | | |
Consumer Discretionary (13.30%) | |
Automobiles (1.02%) | | | | | | | | |
Harley-Davidson, Inc. | | | 20,640 | | | $ | 1,325,913 | |
| | | | | | | | |
| |
Hotels Restaurants & Leisure (2.44%) | | | | | |
International Game Technology | | | 57,520 | | | | 1,088,854 | |
Starbucks Corp. | | | 26,960 | | | | 2,075,111 | |
| | | | | | | | |
| | | | | | | 3,163,965 | |
| | | | | | | | |
Internet & Catalog Retail (1.77%) | | | | | |
Amazon.com, Inc.(a) | | | 7,350 | | | | 2,297,904 | |
| | | | | | | | |
| | |
Media (4.29%) | | | | | | | | |
Comcast Corp., Class A | | | 52,670 | | | | 2,378,051 | |
Twenty-First Century Fox, Inc. | | | 44,170 | | | | 1,479,695 | |
Walt Disney Co. | | | 26,560 | | | | 1,712,854 | |
| | | | | | | | |
| | | | | | | 5,570,600 | |
| | | | | | | | |
Specialty Retail (2.53%) | | | | | | | | |
Home Depot, Inc. | | | 29,070 | | | | 2,204,959 | |
Urban Outfitters, Inc.(a) | | | 29,470 | | | | 1,083,612 | |
| | | | | | | | |
| | | | | | | 3,288,571 | |
| | | | | | | | |
Textiles, Apparel & Luxury
Goods (1.25%) | | | | | |
NIKE, Inc., Class B | | | 22,270 | | | | 1,617,693 | |
| | | | | | | | |
| | |
Total Consumer Discretionary | | | | | | | 17,264,646 | |
| | | | | | | | |
| | |
Consumer Staples (10.03%) | | | | | | | | |
Beverages (5.06%) | | | | | | | | |
Coca-Cola Co. | | | 90,200 | | | | 3,416,776 | |
PepsiCo, Inc. | | | 39,670 | | | | 3,153,765 | |
| | | | | | | | |
| | | | | | | 6,570,541 | |
| | | | | | | | |
Household Products (2.05%) | | | | | | | | |
Procter & Gamble Co. | | | 35,120 | | | | 2,654,721 | |
| | | | | | | | |
| | |
Personal Products (0.81%) | | | | | | | | |
Avon Products, Inc. | | | 51,040 | | | | 1,051,424 | |
| | | | | | | | |
| | |
Tobacco (2.11%) | | | | | | | | |
Philip Morris International, Inc. | | | 31,650 | | | | 2,740,573 | |
| | | | | | | | |
| | |
Total Consumer Staples | | | | | | | 13,017,259 | |
| | | | | | | | |
| | |
Energy (7.46%) | | | | | | | | |
Energy Equipment & Services (2.51%) | | | | | |
Noble Corp. | | | 25,200 | | | | 951,804 | |
Schlumberger, Ltd. | | | 26,000 | | | | 2,297,360 | |
| | | | | | | | |
| | | | | | | 3,249,164 | |
| | | | | | | | |
Oil, Gas & Consumable Fuels (4.95%) | | | | | |
EOG Resources, Inc. | | | 11,760 | | | | 1,990,733 | |
Exxon Mobil Corp. | | | 51,560 | | | | 4,436,222 | |
| | | | | | | | |
| | | | | | | 6,426,955 | |
| | | | | | | | |
Total Energy | | | | | | | 9,676,119 | |
| | | | | | | | |
| | | | | | | | |
| | | Shares | | | Value | |
| |
Financials (8.64%) | | | | | | | | |
Capital Markets (2.56%) | | | | | |
BlackRock, Inc. | | | 5,080 | | | $ | 1,374,750 | |
Goldman Sachs Group, Inc. | | | 6,310 | | | | 998,305 | |
State Street Corp. | | | 14,390 | | | | 946,142 | |
| | | | | | | | |
| | | | | | | 3,319,197 | |
| | | | | | | | |
Commercial Banks (1.14%) | | | | | |
US Bancorp | | | 40,330 | | | | 1,475,272 | |
| | | | | | | | |
| |
Consumer Finance (1.97%) | | | | | |
American Express Co. | | | 20,540 | | | | 1,551,181 | |
Capital One Financial Corp. | | | 14,700 | | | | 1,010,478 | |
| | | | | | | | |
| | | | | | | 2,561,659 | |
| | | | | | | | |
Diversified Financial
Services (2.97%) | | | | | |
Bank of America Corp. | | | 208,530 | | | | 2,877,714 | |
Citigroup, Inc. | | | 20,020 | | | | 971,170 | |
| | | | | | | | |
| | | | | | | 3,848,884 | |
| | | | | | | | |
Total Financials | | | | | | | 11,205,012 | |
| | | | | | | | |
| | |
Health Care (17.05%) | | | | | | | | |
Biotechnology (6.20%) | | | | | | | | |
Amgen, Inc. | | | 23,450 | | | | 2,624,993 | |
Biogen Idec, Inc.(a) | | | 8,310 | | | | 2,000,715 | |
Celgene Corp.(a) | | | 9,120 | | | | 1,403,842 | |
Gilead Sciences, Inc.(a) | | | 32,060 | | | | 2,014,650 | |
| | | | | | | | |
| | | | | | | 8,044,200 | |
| | | | | | | | |
Health Care Equipment &
Supplies (1.07%) | | | | | |
Boston Scientific Corp.(a) | | | 118,410 | | | | 1,390,133 | |
| | | | | | | | |
| |
Health Care Providers &
Services (2.75%) | | | | | |
Cardinal Health, Inc. | | | 20,610 | | | | 1,074,811 | |
Express Scripts Holding Co.(a) | | | 21,870 | | | | 1,351,129 | |
HCA Holdings, Inc. | | | 26,850 | | | | 1,147,838 | |
| | | | | | | | |
| | | | | | | 3,573,778 | |
| | | | | | | | |
Pharmaceuticals (7.03%) | | | | | |
AbbVie, Inc. | | | 34,570 | | | | 1,546,316 | |
Johnson & Johnson | | | 29,140 | | | | 2,526,147 | |
Merck & Co., Inc. | | | 58,500 | | | | 2,785,185 | |
Pfizer, Inc. | | | 78,820 | | | | 2,262,922 | |
| | | | | | | | |
| | | | | | | 9,120,570 | |
| | | | | | | | |
Total Health Care | | | | | | | 22,128,681 | |
| | | | | | | | |
| | |
Industrials (5.49%) | | | | | | | | |
Aerospace & Defense (2.51%) | | | | | |
Boeing Co. | | | 14,770 | | | | 1,735,475 | |
Honeywell International, Inc. | | | 18,280 | | | | 1,517,971 | |
| | | | | | | | |
| | | | | | | 3,253,446 | |
| | | | | | | | |
Airlines (0.93%) | | | | | | | | |
Delta Air Lines, Inc. | | | 51,210 | | | | 1,208,044 | |
| | | | | | | | |
| |
Construction & Engineering (0.85%) | | | | | |
Quanta Services, Inc.(a) | | | 40,200 | | | | 1,105,902 | |
| | | | | | | | |
| | |
| Annual Report | September 30, 2013 | | 13 |
| | |
| Drexel Hamilton Centre American Equity Fund | | Schedule of Investments |
| | September 30, 2013 |
| | | | | | | | |
| | | Shares | | | Value | |
Industrials (continued) | | | | | | | | |
Road & Rail (1.20%) | | | | | | | | |
Union Pacific Corp. | | | 10,010 | | | $ | 1,554,954 | |
| | | | | | | | |
| | |
Total Industrials | | | | | | | 7,122,346 | |
| | | | | | | | |
| | |
Information Technology (29.27%) | | | | | | | | |
Communication Equipment (4.72%) | | | | | | | | |
Cisco Systems, Inc. | | | 81,370 | | | | 1,905,686 | |
Juniper Networks, Inc.(a) | | | 50,320 | | | | 999,355 | |
QUALCOMM, Inc. | | | 47,790 | | | | 3,219,134 | |
| | | | | | | | |
| | | | | | | 6,124,175 | |
| | | | | | | | |
Computers & Peripherals (4.99%) | | | | | | | | |
Apple, Inc. | | | 9,010 | | | | 4,295,518 | |
NetApp, Inc. | | | 27,920 | | | | 1,189,950 | |
SanDisk Corp. | | | 16,550 | | | | 984,891 | |
| | | | | | | | |
| | | | | | | 6,470,359 | |
| | | | | | | | |
Internet Software & Services (4.96%) | | | | | | | | |
eBay, Inc.(a) | | | 37,670 | | | | 2,101,609 | |
Google, Inc., Class A(a) | | | 4,950 | | | | 4,335,755 | |
| | | | | | | | |
| | | | | | | 6,437,364 | |
| | | | | | | | |
IT Services (4.35%) | | | | | | | | |
International Business Machines Corp. | | | 10,970 | | | | 2,031,424 | |
Mastercard, Inc., Class A | | | 2,410 | | | | 1,621,400 | |
Visa, Inc., Class A | | | 10,420 | | | | 1,991,262 | |
| | | | | | | | |
| | | | | | | 5,644,086 | |
| | | | | | | | |
Semiconductor & Semiconductor Equipment (5.84%) | |
Intel Corp. | | | 103,440 | | | | 2,370,845 | |
Lam Research Corp.(a) | | | 22,540 | | | | 1,153,822 | |
Micron Technology, Inc.(a) | | | 83,130 | | | | 1,452,281 | |
NVIDIA Corp. | | | 69,510 | | | | 1,081,576 | |
Texas Instruments, Inc. | | | 37,930 | | | | 1,527,441 | |
| | | | | | | | |
| | | | | | | 7,585,965 | |
| | | | | | | | |
Software (4.41%) | | | | | | | | |
Microsoft Corp. | | | 98,910 | | | | 3,294,692 | |
Oracle Corp. | | | 73,170 | | | | 2,427,049 | |
| | | | | | | | |
| | | | | | | 5,721,741 | |
| | | | | | | | |
Total Information Technology | | | | | | | 37,983,690 | |
| | | | | | | | |
| | |
Materials (6.39%) | | | | | | | | |
Chemicals (0.81%) | | | | | | | | |
LyondellBasell Industries, Class A | | | 14,350 | | | | 1,050,851 | |
| | | | | | | | |
| | |
Containers & Packaging (1.51%) | | | | | | | | |
Bemis Co., Inc. | | | 24,650 | | | | 961,596 | |
Sealed Air Corp. | | | 36,640 | | | | 996,242 | |
| | | | | | | | |
| | | | | | | 1,957,838 | |
| | | | | | | | |
Metals & Mining (4.07%) | | | | | | | | |
Agnico Eagle Mines, Ltd. | | | 36,230 | | | | 959,008 | |
Eldorado Gold Corp. | | | 145,300 | | | | 974,963 | |
Goldcorp, Inc. | | | 40,960 | | | | 1,065,370 | |
IAMGOLD Corp. | | | 250,590 | | | | 1,190,302 | |
| | | | | | | | | | | | |
| | | | | | | Shares | | | Value | |
Materials (continued) | | | | | | | | |
Metals & Mining (continued) | | | | | | | | |
Kinross Gold Corp. | | | 215,640 | | | $ | 1,088,982 | |
| | | | | | | | | | | | |
| | | | | | | | | | | 5,278,625 | |
| | | | | | | | | | | | |
Total Materials | | | | | | | 8,287,314 | |
| | | | | | | | | | | | |
| | |
Telecommunication Services (1.06%) | | | | | | | | |
Diversified Telecommunication (1.06%) | | | | | | | | |
Verizon Communications, Inc. | | | 29,360 | | | | 1,369,938 | |
| | | | | | | | | | | | |
| | |
Total Telecommunication Services | | | | | | | 1,369,938 | |
| | | | | | | | | | | | |
| | | | |
Utilities (0.84%) | | | | | | | | | | | | |
Independent Power Producers & Energy Traders (0.84%) | | | | | | | | |
Calpine Corp.(a) | | | 56,400 | | | | 1,095,852 | |
| | | | | | | | | | | | |
| | |
Total Utilities | | | | | | | 1,095,852 | |
| | | | | | | | | | | | |
| | | | | | | | | | | | | |
TOTAL COMMON STOCKS (Cost $116,523,869) | | | | | | | 129,150,857 | |
| | | | | | | | | | | | | | | | |
| | | | |
| | | Expiration
Date | | | Exercise
Price | | | Contracts | | | Value | |
PURCHASED OPTIONS (0.01%) | | | | | | | | | | | | | |
Calls (0.01%) | | | | | | | | | | | | | | | | |
SPDR® Gold Shares: | | | | | | | | | | | | | | | | |
| | | 12/21/2013 | | | $ | 168.00 | | | | 480 | | | | 3,360 | |
| | | 1/18/2014 | | | | 168.00 | | | | 320 | | | | 4,480 | |
| | | | | | | | | | | | | | | | | |
TOTAL PURCHASED OPTIONS (Cost $666,122) | | | | | | | | 7,840 | |
| | | | | | | | | | | | | | | | | |
| | | | | | | | | | | | | | |
| | | | | 7-Day Yield | | | Shares | | | Value | |
SHORT TERM INVESTMENTS (0.44%) | | | | | |
Money Market Fund (0.44%) | | | | | | | | | |
Dreyfus Treasury Prime Cash Management, Institutional Class | | | 0.00004 | % | | | 575,926 | | | | 575,926 | |
| | | | | | | | | | | | | | |
| | | | | | | | | | | | | | | |
TOTAL SHORT TERM INVESTMENTS (Cost $575,926) | | | | 575,926 | |
| | |
TOTAL INVESTMENTS (Cost $117,765,917) (99.98%) | | | | | | | $ | 129,734,623 | |
| | |
Other Assets In Excess Of Liabilities (0.02%) | | | | | | | | 30,098 | |
NET ASSETS (100.00%) | | | | | | | $ | 129,764,721 | |
| | | | | | | | | | | | | | | |
| (a) | Non-income producing security. |
| SPDR | - Standard & Poor’s Depositary Receipts. |
See Notes to Financial Statements.
| | |
| Drexel Hamilton Centre Global Equity Fund | | Schedule of Investments |
| | September 30, 2013 |
| | | | | | | | |
| | | Shares | | | Value | |
| |
COMMON STOCKS (96.08%) | | | | | | | | |
ASIA (27.69%) | | | | | | | | |
Australia (2.72%) | | | | | | | | |
Financials (0.75%) | | | | | | | | |
Australia & New Zealand Banking Group, Ltd. | | | 3,800 | | | $ | 109,115 | |
| | | | | | | | |
| | |
Materials (1.39%) | | | | | | | | |
BHP Billiton, Ltd. | | | 6,057 | | | | 201,951 | |
| | | | | | | | |
| |
Telecommunication Services (0.58%) | | | | | |
Telstra Corp., Ltd. | | | 18,000 | | | | 83,457 | |
| | | | | | | | |
| | |
Total Australia | | | | | | | 394,523 | |
| | | | | | | | |
| | |
China (4.24%) | | | | | | | | |
Consumer Staples (0.57%) | | | | | | | | |
Hengan International Group Co., Ltd. | | | 7,100 | | | | 83,030 | |
| | | | | | | | |
| | |
Energy (0.55%) | | | | | | | | |
CNOOC, Ltd. | | | 39,000 | | | | 79,348 | |
| | | | | | | | |
| | |
Financials (1.17%) | | | | | | | | |
Bank of China, Ltd., Class H | | | 173,700 | | | | 79,281 | |
China Overseas Land & Investment, Ltd. | | | 31,000 | | | | 91,331 | |
| | | | | | | | |
| | | | | | | 170,612 | |
| | | | | | | | |
Information Technology (1.04%) | | | | | |
Tencent Holdings, Ltd. | | | 2,880 | | | | 151,057 | |
| | | | | | | | |
| |
Telecommunication Services (0.91%) | | | | | |
China Mobile, Ltd. | | | 11,800 | | | | 131,831 | |
| | | | | | | | |
| | |
Total China | | | | | | | 615,878 | |
| | | | | | | | |
| | |
Hong Kong (3.64%) | | | | | | | | |
Consumer Discretionary (2.02%) | | | | | |
Li & Fung, Ltd. | | | 90,800 | | | | 132,058 | |
Sands China, Ltd. | | | 26,100 | | | | 161,360 | |
| | | | | | | | |
| | | | | | | 293,418 | |
| | | | | | | | |
Financials (1.62%) | | | | | | | | |
AIA Group, Ltd. | | | 28,300 | | | | 133,000 | |
Cheung Kong Holdings, Ltd. | | | 6,700 | | | | 102,022 | |
| | | | | | | | |
| | | | | | | 235,022 | |
| | | | | | | | |
Total Hong Kong | | | | | | | 528,440 | |
| | | | | | | | |
| | |
India (0.58%) | | | | | | | | |
Information Technology (0.58%) | | | | | |
Infosys, Ltd., Sponsored ADR | | | 1,750 | | | | 84,193 | |
| | | | | | | | |
| | |
Total India | | | | | | | 84,193 | |
| | | | | | | | |
| | |
Japan (10.82%) | | | | | | | | |
Consumer Discretionary (5.29%) | | | | | |
Denso Corp. | | | 2,180 | | | | 101,576 | |
Fast Retailing Co., Ltd. | | | 490 | | | | 183,697 | |
Honda Motor Co., Ltd. | | | 4,930 | | | | 187,329 | |
| | | | | | | | |
| | | Shares | | | Value | |
| |
Japan (continued) | | | | | | | | |
Consumer Discretionary (continued) | | | | | |
Toyota Motor Corp. | | | 4,650 | | | $ | 296,612 | |
| | | | | | | | |
| | | | | | | 769,214 | |
| | | | | | | | |
Financials (3.84%) | | | | | | | | |
Daiwa Securities Group, Inc. | | | 22,900 | | | | 205,016 | |
Mitsubishi UFJ Financial Group, Inc. | | | 26,300 | | | | 167,761 | |
Nomura Holdings, Inc. | | | 23,800 | | | | 185,228 | |
| | | | | | | | |
| | | | | | | 558,005 | |
| | | | | | | | |
Information Technology (1.69%) | | | | | |
Murata Manufacturing Co., Ltd. | | | 1,540 | | | | 117,347 | |
Yahoo Japan Corp. | | | 22,500 | | | | 127,499 | |
| | | | | | | | |
| | | | | | | 244,846 | |
| | | | | | | | |
Total Japan | | | | | | | 1,572,065 | |
| | | | | | | | |
| | |
Korea (2.64%) | | | | | | | | |
Consumer Discretionary (0.56%) | | | | | |
Hyundai Motor Co. | | | 350 | | | | 81,746 | |
| | | | | | | | |
| | |
Financials (0.50%) | | | | | | | | |
Shinhan Financial Group Co., Ltd. | | | 1,800 | | | | 73,110 | |
| | | | | | | | |
| |
Information Technology (1.58%) | | | | | |
Samsung Electronics Co., Ltd. | | | 180 | | | | 228,962 | |
| | | | | | | | |
| | |
Total Korea | | | | | | | 383,818 | |
| | | | | | | | |
| | |
Singapore (0.53%) | | | | | | | | |
Industrials (0.53%) | | | | | | | | |
Singapore Technologies Engineering, Ltd. | | | 23,300 | | | | 77,447 | |
| | | | | | | | |
| | |
Total Singapore | | | | | | | 77,447 | |
| | | | | | | | |
| | |
Taiwan (2.52%) | | | | | | | | |
Information Technology (2.52%) | | | | | |
Delta Electronics, Inc. | | | 16,800 | | | | 81,537 | |
MediaTek, Inc. | | | 9,800 | | | | 121,145 | |
Taiwan Semiconductor Manufacturing Co., Ltd. | | | 47,800 | | | | 162,475 | |
| | | | | | | | |
| | | | | | | 365,157 | |
| | | | | | | | |
Total Taiwan | | | | | | | 365,157 | |
| | | | | | | | |
| | |
TOTAL ASIA (Cost $3,418,705) | | | | | | | 4,021,521 | |
| |
| | |
EUROPE (38.98%) | | | | | | | | |
Belgium (0.99%) | | | | | | | | |
Consumer Staples (0.99%) | | | | | | | | |
Anheuser-Busch InBev NV | | | 1,448 | | | | 144,138 | |
| | | | | | | | |
| | |
Total Belgium | | | | | | | 144,138 | |
| | | | | | | | |
| | |
| Annual Report | September 30, 2013 | | 15 |
| | |
| Drexel Hamilton Centre Global Equity Fund | | Schedule of Investments |
| | September 30, 2013 |
| | | | | | | | |
| | | Shares | | | Value | |
| |
Denmark (0.90%) | | | | | | | | |
Health Care (0.90%) | | | | | | | | |
Novo Nordisk A/S, Class B | | | 770 | | | $ | 130,729 | |
| | | | | | | | |
| | |
Total Denmark | | | | | | | 130,729 | |
| | | | | | | | |
| | |
France (7.58%) | | | | | | | | |
Consumer Discretionary (1.00%) | | | | | | | | |
LVMH Moet Hennessy Louis Vuitton SA | | | 740 | | | | 145,761 | |
| | | | | | | | |
| | |
Consumer Staples (2.24%) | | | | | | | | |
Danone SA | | | 1,210 | | | | 91,080 | |
L’Oreal SA | | | 1,360 | | | | 233,572 | |
| | | | | | | | |
| | | | | | | 324,652 | |
| | | | | | | | |
Financials (0.99%) | | | | | | | | |
BNP Paribas SA | | | 2,130 | | | | 144,079 | |
| | | | | | | | |
| | |
Health Care (2.46%) | | | | | | | | |
Essilor International SA | | | 1,700 | | | | 182,838 | |
Sanofi | | | 1,713 | | | | 173,738 | |
| | | | | | | | |
| | | | | | | 356,576 | |
| | | | | | | | |
Information Technology (0.89%) | | | | | | | | |
Dassault Systemes SA | | | 970 | | | | 129,494 | |
| | | | | | | | |
| | |
Total France | | | | | | | 1,100,562 | |
| | | | | | | | |
| | |
Germany (9.54%) | | | | | | | | |
Consumer Discretionary (3.17%) | | | | | | | | |
Adidas AG | | | 1,600 | | | | 173,555 | |
Daimler AG | | | 3,684 | | | | 287,172 | |
| | | | | | | | |
| | | | | | | 460,727 | |
| | | | | | | | |
Financials (1.19%) | | | | | | | | |
Muenchener Rueckversicherungs AG | | | 880 | | | | 171,969 | |
| | | | | | | | |
| | |
Health Care (1.27%) | | | | | | | | |
Bayer AG | | | 1,565 | | | | 184,536 | |
| | | | | | | | |
| | |
Industrials (1.73%) | | | | | | | | |
Siemens AG | | | 2,086 | | | | 251,331 | |
| | | | | | | | |
| | |
Information Technology (0.88%) | | | | | | | | |
SAP AG | | | 1,732 | | | | 128,099 | |
| | | | | | | | |
| | |
Materials (1.30%) | | | | | | | | |
BASF SE | | | 1,020 | | | | 97,836 | |
Linde AG | | | 460 | | | | 91,106 | |
| | | | | | | | |
| | | | | | | 188,942 | |
| | | | | | | | |
Total Germany | | | | | | | 1,385,604 | |
| | | | | | | | |
| | |
Great Britain (6.83%) | | | | | | | | |
Consumer Staples (3.36%) | | | | | | | | |
Diageo Plc | | | 4,040 | | | | 128,519 | |
Imperial Tobacco Group Plc | | | 4,380 | | | | 162,167 | |
Reckitt Benckiser Group Plc | | | 1,250 | | | | 91,468 | |
Tesco Plc | | | 18,300 | | | | 106,358 | |
| | | | | | | | |
| | | | | | | 488,512 | |
| | | | | | | | |
| | | | | | | | |
| | | Shares | | | Value | |
| |
Great Britain (continued) | | | | | | | | |
Financials (2.77%) | | | | | | | | |
Barclays Plc | | | 27,300 | | | $ | 117,341 | |
HSBC Holdings Plc | | | 26,268 | | | | 284,666 | |
| | | | | | | | |
| | | | | | | 402,007 | |
| | | | | | | | |
Industrials (0.70%) | | | | | | | | |
BAE Systems Plc | | | 13,800 | | | | 101,517 | |
| | | | | | | | |
| | |
Total Great Britain | | | | | | | 992,036 | |
| | | | | | | | |
| | |
Greece (0.73%) | | | | | | | | |
Consumer Staples (0.73%) | | | | | | | | |
Coca-Cola Hellenic Bottling Co. AG | | | 3,570 | | | | 105,770 | |
| | | | | | | | |
| | |
Total Greece | | | | | | | 105,770 | |
| | | | | | | | |
| | |
Italy (2.33%) | | | | | | | | |
Consumer Discretionary (0.51%) | | | | | | | | |
Luxottica Group SpA | | | 1,380 | | | | 73,408 | |
| | | | | | | | |
| | |
Financials (1.82%) | | | | | | | | |
Assicurazioni Generali SpA | | | 7,680 | | | | 153,251 | |
Intesa Sanpaolo SpA | | | 54,200 | | | | 111,820 | |
| | | | | | | | |
| | | | | | | 265,071 | |
| | | | | | | | |
Total Italy | | | | | | | 338,479 | |
| | | | | | | | |
| | |
Netherlands (1.36%) | | | | | | | | |
Consumer Staples (0.58%) | | | | | | | | |
Unilever NV | | | 2,154 | | | | 83,793 | |
| | | | | | | | |
| | |
Industrials (0.78%) | | | | | | | | |
Koninklijke Philips NV | | | 3,540 | | | | 114,124 | |
| | | | | | | | |
| | |
Total Netherlands | | | | | | | 197,917 | |
| | | | | | | | |
| | |
Russia (0.69%) | | | | | | | | |
Energy (0.69%) | | | | | | | | |
Gazprom OAO, Sponsored ADR | | | 11,415 | | | | 100,566 | |
| | | | | | | | |
| | |
Total Russia | | | | | | | 100,566 | |
| | | | | | | | |
| | |
Spain (1.84%) | | | | | | | | |
Consumer Discretionary (0.67%) | | | | | | | | |
Inditex SA | | | 630 | | | | 97,076 | |
| | | | | | | | |
| | |
Financials (1.17%) | | | | | | | | |
Banco Bilbao Vizcaya Argentaria SA | | | 15,182 | | | | 169,652 | |
| | | | | | | | |
| | |
Total Spain | | | | | | | 266,728 | |
| | | | | | | | |
| | |
Switzerland (5.77%) | | | | | | | | |
Consumer Discretionary (1.15%) | | | | | | | | |
Cie Financiere Richemont SA, Class A | | | 1,660 | | | | 166,303 | |
| | | | | | | | |
| | |
| Drexel Hamilton Centre Global Equity Fund | | Schedule of Investments |
| | September 30, 2013 |
| | | | | | | | |
| | | Shares | | | Value | |
| |
Switzerland (continued) | | | | | | | | |
Consumer Staples (1.39%) | | | | | | | | |
Nestle SA | | | 2,890 | | | $ | 202,126 | |
| | | | | | | | |
| | |
Health Care (2.64%) | | | | | | | | |
Novartis AG | | | 2,150 | | | | 165,229 | |
Roche Holding AG | | | 810 | | | | 218,454 | |
| | | | | | | | |
| | | | | | | 383,683 | |
| | | | | | | | |
| | |
Materials (0.59%) | | | | | | | | |
Syngenta AG | | | 210 | | | | 85,779 | |
| | | | | | | | |
| | |
Total Switzerland | | | | | | | 837,891 | |
| | | | | | | | |
| | |
Turkey (0.42%) | | | | | | | | |
Financials (0.42%) | | | | | | | | |
Turkiye Garanti Bankasi AS | | | 15,500 | | | | 61,078 | |
| | | | | | | | |
| | |
Total Turkey | | | | | | | 61,078 | |
| | | | | | | | |
| | |
TOTAL EUROPE (Cost $4,862,151) | | | | | | | 5,661,498 | |
| |
| | |
NORTH AMERICA (28.07%) | | | | | | | | |
Mexico (0.77%) | | | | | | | | |
Telecommunication Services (0.77%) | | | | | |
America Movil, Series L | | | 113,000 | | | | 112,055 | |
| | | | | | | | |
| | |
Total Mexico | | | | | | | 112,055 | |
| | | | | | | | |
| | |
United States (27.30%) | | | | | | | | |
Consumer Staples (2.06%) | | | | | | | | |
Coca-Cola Co. | | | 2,790 | | | | 105,685 | |
CVS Caremark Corp. | | | 1,350 | | | | 76,612 | |
Procter & Gamble Co. | | | 1,550 | | | | 117,165 | |
| | | | | | | | |
| | | | | | | 299,462 | |
| | | | | | | | |
Energy (4.21%) | | | | | | | | |
Chevron Corp. | | | 1,620 | | | | 196,830 | |
Exxon Mobil Corp. | | | 2,990 | | | | 257,259 | |
Schlumberger, Ltd. | | | 1,780 | | | | 157,281 | |
| | | | | | | | |
| | | | | | | 611,370 | |
| | | | | | | | |
Financials (4.51%) | | | | | | | | |
Bank of America Corp. | | | 5,000 | | | | 69,000 | |
Berkshire Hathaway, Inc., Class B(a) | | | 1,430 | | | | 162,319 | |
Citigroup, Inc. | | | 3,210 | | | | 155,717 | |
JPMorgan Chase & Co. | | | 2,330 | | | | 120,438 | |
Wells Fargo & Co. | | | 3,580 | | | | 147,926 | |
| | | | | | | | |
| | | | | | | 655,400 | |
| | | | | | | | |
Health Care (1.67%) | | | | | | | | |
Johnson & Johnson | | | 1,680 | | | | 145,639 | |
Pfizer, Inc. | | | 3,350 | | | | 96,179 | |
| | | | | | | | |
| | | | | | | 241,818 | |
| | | | | | | | |
Industrials (0.85%) | | | | | | | | |
General Electric Co. | | | 5,180 | | | | 123,750 | |
| | | | | | | | |
| |
Information Technology (11.14%) | | | | | |
Apple, Inc. | | | 640 | | | | 305,120 | |
Cisco Systems, Inc. | | | 9,540 | | | | 223,427 | |
| | | | | | | | |
| | | Shares | | | Value | |
| |
United States (continued) | | | | | | | | |
Information Technology (continued) | | | | | |
Google, Inc., Class A(a) | | | 170 | | | $ | 148,905 | |
Intel Corp. | | | 2,780 | | | | 63,717 | |
International Business Machines Corp. | | | 790 | | | | 146,292 | |
Mastercard, Inc., Class A | | | 370 | | | | 248,928 | |
Microsoft Corp. | | | 5,760 | | | | 191,866 | |
Oracle Corp. | | | 3,410 | | | | 113,110 | |
QUALCOMM, Inc. | | | 2,630 | | | | 177,157 | |
| | | | | | | | |
| | | | | | | 1,618,522 | |
| | | | | | | | |
Materials (1.51%) | | | | | | | | |
Monsanto Co. | | | 2,100 | | | | 219,177 | |
| | | | | | | | |
| |
Telecommunication Services (1.35%) | | | | | |
AT&T, Inc. | | | 3,380 | | | | 114,311 | |
Verizon Communications, Inc. | | | 1,760 | | | | 82,122 | |
| | | | | | | | |
| | | | | | | 196,433 | |
| | | | | | | | |
Total United States | | | | | | | 3,965,932 | |
| | | | | | | | |
| | |
TOTAL NORTH AMERICA (Cost $3,714,238) | | | | | | | 4,077,987 | |
| |
| | |
SOUTH AMERICA (1.34%) | | | | | | | | |
Brazil (1.34%) | | | | | | | | |
Consumer Staples (0.63%) | | | | | | | | |
Cia de Bebidas das Americas | | | 2,390 | | | | 91,662 | |
| | | | | | | | |
| | |
Utilities (0.71%) | | | | | | | | |
Cia de Saneamento Basico do Estado de Sao Paulo | | | 10,480 | | | | 103,083 | |
| | | | | | | | |
| | |
Total Brazil | | | | | | | 194,745 | |
| | | | | | | | |
| | |
TOTAL SOUTH AMERICA (Cost $220,592) | | | | | | | 194,745 | |
| |
| | | | | | | | |
| |
TOTAL COMMON STOCKS (Cost $12,215,686) | | | | | | | 13,955,751 | |
| |
| |
PREFERRED STOCKS (2.66%) | | | | | |
EUROPE (0.81%) | | | | | | | | |
Germany (0.81%) | | | | | | | | |
Consumer Discretionary (0.81%) | | | | | |
Volkswagen AG | | | 500 | | | | 117,868 | |
| | | | | | | | |
| | |
Total Germany | | | | | | | 117,868 | |
| | | | | | | | |
| | |
TOTAL EUROPE (Cost $114,319) | | | | | | | 117,868 | |
| |
| | |
SOUTH AMERICA (1.85%) | | | | | | | | |
Brazil (1.85%) | | | | | | | | |
Energy (0.72%) | | | | | | | | |
Petroleo Brasileiro SA | | | 12,560 | | | | 104,388 | |
| | | | | | | | |
| | |
| Annual Report | September 30, 2013 | | 17 |
| | |
| Drexel Hamilton Centre Global Equity Fund | | Schedule of Investments |
| | September 30, 2013 |
| | | | | | | | | | | | |
| | | | | | Shares | | | Value | |
| |
Brazil (continued) | | | | | | | | | | | | |
Financials (0.54%) | | | | | | | | | | | | |
Itau Unibanco Holding SA | | | | | | | 5,511 | | | $ | 78,029 | |
| | | | | | | | | | | | |
| | | |
Materials (0.59%) | | | | | | | | | | | | |
Vale SA | | | | | | | 6,080 | | | | 86,661 | |
| | | | | | | | | | | | |
| | | |
Total Brazil | | | | | | | | | | | 269,078 | |
| | | | | | | | | | | | |
| | |
TOTAL SOUTH AMERICA (Cost $306,967) | | | | | | | | 269,078 | |
| |
| | | | | | | | | | | | |
| |
TOTAL PREFERRED STOCKS (Cost $421,286) | | | | | | | | 386,946 | |
| |
| | | |
| | | | | | Shares | | | Value | |
| |
RIGHTS (0.06%) | | | | | | | | | | | | |
EUROPE (0.06%) | | | | | | | | | | | | |
Great Britain (0.06%) | | | | | | | | | | | | |
Financials (0.06%) | | | | | | | | | | | | |
Barclays Plc, Rights, expires 10/02/13, strike price $1.85(a) | | | | | | | 6,825 | | | $ | 8,922 | |
| | | | | | | | | | | | |
| | | |
Total Great Britain | | | | | | | | | | | 8,922 | |
| | | | | | | | | | | | |
| | | |
TOTAL EUROPE (Cost $0) | | | | | | | | | | | 8,922 | |
| |
| | | | | | | | | | | | |
| |
TOTAL RIGHTS (Cost $0) | | | | | | | | | | | 8,922 | |
| |
| | | |
| | | 7-Day Yield | | | Shares | | | Value | |
| |
SHORT TERM INVESTMENTS (0.54%) | |
Money Market Fund (0.54%) | | | | | |
Dreyfus Treasury Prime Cash Management, Institutional Class | | | 0.00004 | % | | | 77,743 | | | | 77,743 | |
| | | | | | | | | | | | |
| | | | | | | | | | | | |
| |
TOTAL SHORT TERM INVESTMENTS (Cost $77,743) | | | | 77,743 | |
| |
| |
TOTAL INVESTMENTS (Cost $12,714,715) (99.34%) | | | $ | 14,429,362 | |
| |
Other Assets In Excess Of Liabilities (0.66%) | | | | 96,330 | |
| |
NET ASSETS (100.00%) | | | | | | | $ | 14,525,692 | |
| |
| (a) | Non-income producing security. |
Common Abbreviations:
| ADR | - American Depository Receipt. |
| AG | - Aktiengesellschaft is a German term that refers to a corporation that is limited by shares, i.e., owned by shareholders. |
| A/S | - Aktieselskab is the Danish term for Joint Stock Company. |
| AS | - Andonim Sirketi is the Turkish term for Joint Stock Company. |
| NV | - Naamloze Vennootschap is the Dutch term for a public limited liability corporation. |
| OAO | - Otkrytoe Aktsionernoe Obschestvo (a Russian open joint stock corporation) |
| Plc | - Public Limited Company. |
| SA | - Generally designates corporations in various countries, mostly those employing the civil law. |
| SE | - SE Regulation. A European Company which can operate on a Europe-wide basis and be governed by Community law directly applicable in all Member States. |
| SpA | - Societa Per Azioni is an Italian shared company. |
| UFJ | - United Financial of Japan. |
See Notes to Financial Statements.
| | |
| Drexel Hamilton Multi-Asset Real Return Fund | | Schedule of Investments |
| | September 30, 2013 |
| | | | | | | | |
| | | Shares | | | Value | |
| |
EXCHANGE TRADED FUNDS (4.35%) | | | | | |
PowerShares DB Commodity Index Tracking Fund ETF(a) | | | 94,780 | | | $ | 2,441,533 | |
| |
TOTAL EXCHANGE TRADED FUNDS (Cost $2,613,515) | | | | 2,441,533 | |
| |
| |
EXCHANGE TRADED NOTES (12.85%) | | | | | |
ELEMENTS Linked to the Rogers International Commodity Index-Total Return ETN(a) | | | 300,800 | | | | 2,487,616 | |
ETRACS DJ-UBS Commodity Index Total Return ETN(a) | | | 100,880 | | | | 2,388,838 | |
iPath Dow Jones-UBS Commodity Index Total Return ETN(a) | | | 62,950 | | | | 2,345,517 | |
| |
TOTAL EXCHANGE TRADED NOTES (Cost $8,024,441) | | | | 7,221,971 | |
| |
| | |
OPEN-END FUNDS (52.30%) | | | | | | | | |
Drexel Hamilton Centre American Equity Fund(b) | | | 1,434,664 | | | | 14,891,817 | |
Drexel Hamilton Centre Global Equity Fund(b) | | | 1,223,258 | | | | 14,495,607 | |
| |
TOTAL OPEN-END FUNDS (Cost $29,517,361) | | | | 29,387,424 | |
| |
| | |
| | | Principle
Amount | | | Value | |
| |
U.S. GOVERNMENT BONDS (27.13%) | | | | | |
U.S. Treasury Inflation Indexed Bonds | | | | | |
1/15/2014, 2.000% | | $ | 1,896,315 | | | $ | 1,906,388 | |
1/15/2016, 2.000% | | | 1,765,380 | | | | 1,889,094 | |
1/15/2017, 2.375% | | | 1,737,480 | | | | 1,928,467 | |
7/15/2020, 1.250% | | | 856,888 | | | | 938,393 | |
1/15/2021, 1.125% | | | 1,674,373 | | | | 1,804,072 | |
7/15/2021, 0.625% | | | 932,778 | | | | 971,875 | |
1/15/2025, 2.375% | | | 1,487,088 | | | | 1,777,186 | |
4/15/2029, 3.875% | | | 1,136,752 | | | | 1,632,350 | |
4/15/2032, 3.375% | | | 1,118,617 | | | | 1,568,904 | |
2/15/2041, 2.125% | | | 693,342 | | | | 822,693 | |
| |
TOTAL U.S. GOVERNMENT BONDS (Cost $16,345,633) | | | | 15,239,422 | |
| |
| | | | | | | | | | | | |
| | | 7-Day
Yield | | | Shares | | | Value | |
| |
SHORT TERM INVESTMENTS (3.30%) | | | | | |
Money Market Fund (3.30%) | | | | | | | | | |
Dreyfus Treasury Prime Cash Management, Institutional Class | | | 0.00004 | % | | | 1,854,046 | | | | 1,854,046 | |
| | | | | | | | | | | | |
| |
| |
| |
| |
| |
| |
| |
| |
TOTAL SHORT TERM INVESTMENTS (Cost $1,854,046) | | | | 1,854,046 | |
| |
| | | | |
| | | Value | |
| |
TOTAL INVESTMENTS (Cost $58,354,996) (99.93%) | | $ | 56,144,396 | |
| |
Other Assets In Excess Of Liabilities (0.07%) | | | 42,062 | |
| |
NET ASSETS (100.00%) | | $ | 56,186,458 | |
| |
| (a) | Non-income producing security. |
| (b) | Affiliated with the Fund, as each is a series of Drexel Hamilton Mutual Funds and have the same investment adviser. |
Common Abbreviations:
ETF - Exchange Traded Fund.
ETN - Exchange Traded Note.
See Notes to Financial Statements.
| | |
| Annual Report | September 30, 2013 | | 19 |
| | |
| Drexel Hamilton Mutual Funds | | Statements of Assets and Liabilities |
| | September 30, 2013 |
| | | | | | | | | | | | |
| | | Drexel Hamilton
Centre American
Equity Fund | | | Drexel Hamilton
Centre Global Equity
Fund | | | Drexel Hamilton
Multi-Asset Real
Return Fund | |
| | | | |
ASSETS: | | | | | | | | | | | | |
Investments, at value | | $ | 129,734,623 | | | $ | 14,429,362 | | | $ | 26,756,972 | |
Investments in affiliates, at value | | | – | | | | – | | | | 29,387,424 | |
Foreign currency, at value (Cost $–, $712 and $–, respectively) | | | – | | | | 724 | | | | – | |
Receivable for dividends and interest | | | 146,501 | | | | 41,162 | | | | 78,907 | |
Receivable due from investment adviser | | | 47,695 | | | | 86,271 | | | | – | |
Receivable for shares sold | | | 2,576 | | | | – | | | | – | |
Deferred offering cost | | | – | | | | – | | | | 2,483 | |
Prepaid and other assets | | | 9,025 | | | | 1,324 | | | | 4,160 | |
| | | | | | | | | | | | |
Total Assets | | | 129,940,420 | | | | 14,558,843 | | | | 56,229,946 | |
| | | | | | | | | | | | |
LIABILITIES: | | | | | | | | | | | | |
Payable to administrator | | | 16,605 | | | | 4,636 | | | | 7,011 | |
Payable to transfer agency | | | 11,029 | | | | 1,828 | | | | 1,834 | |
Payable for shares redeemed | | | 83,077 | | | | – | | | | – | |
Payable to investment adviser | | | 3,289 | | | | 2,388 | | | | 4,916 | |
Accrued 12b-1 fees (existing Class) | | | 20,576 | | | | – | | | | – | |
Payable for custodian fees | | | 2,619 | | | | 2,516 | | | | 933 | |
Payable for printing | | | 11,942 | | | | 585 | | | | 2,300 | |
Payable for legal and audit fees | | | 22,898 | | | | 19,631 | | | | 16,697 | |
Payable to trustees | | | – | | | | 5 | | | | 145 | |
Payable under the Chief Compliance Officer Services Agreement | | | 2,639 | | | | 282 | | | | 1,147 | |
Other payables | | | 1,025 | | | | 1,280 | | | | 8,505 | |
| | | | | | | | | | | | |
Total Liabilities | | | 175,699 | | | | 33,151 | | | | 43,488 | |
| | | | | | | | | | | | |
NET ASSETS | | $ | 129,764,721 | | | $ | 14,525,692 | | | $ | 56,186,458 | |
| | | | | | | | | | | | |
| | | |
NET ASSETS CONSIST OF: | | | | | | | | | | | | |
Paid-in capital | | $ | 125,019,483 | | | $ | 12,507,075 | | | $ | 58,961,795 | |
Accumulated net investment income/(loss) | | | 826,831 | | | | 160,128 | | | | (313,635 | ) |
Accumulated net realized gain/(loss) on investments and foreign currency transactions | | | (8,050,299 | ) | | | 142,977 | | | | (251,102 | ) |
Net unrealized appreciation/(depreciation) on investments and translation of assets and liabilities denominated in foreign currencies | | | 11,968,706 | | | | 1,715,512 | | | | (2,210,600 | ) |
| | | | | | | | | | | | |
NET ASSETS | | $ | 129,764,721 | | | $ | 14,525,692 | | | $ | 56,186,458 | |
| | | | | | | | | | | | |
| | | |
INVESTMENTS, AT COST | | $ | 117,765,917 | | | $ | 12,714,715 | | | $ | 28,837,635 | |
| | | |
INVESTMENTS IN AFFILIATES, AT COST | | | – | | | | – | | | | 29,517,361 | |
| | | |
PRICING OF SHARES | | | | | | | | | | | | |
| | | |
Net Assets | | $ | 129,764,721 | | | $ | 14,525,692 | | | | | |
Shares Outstanding | | | 12,503,329 | | | | 1,226,285 | | | | | |
Net Asset Value, offering and redemption price per share | | | $10.38 | | | | $11.85 | | | | | |
Institutional | | | | | | | | | | | | |
Net Assets | | | | | | | | | | $ | 56,181,528 | |
Shares outstanding | | | | | | | | | | | 5,959,990 | |
Net Asset Value, offering and redemption price per share | | | | | | | | | | | $9.43 | |
Investor | | | | | | | | | | | | |
Net Assets | | | | | | | | | | $ | 4,930 | |
Shares outstanding | | | | | | | | | | | 524 | |
Net Asset Value, offering and redemption price per share | | | | | | | | | | | $9.41 | |
See Notes to Financial Statements.
| | |
| Drexel Hamilton Mutual Funds | | Statements of Operations |
| | |
| | | | | | | | | | | | |
| | | Drexel Hamilton
Centre American
Equity Fund | | | Drexel Hamilton
Centre Global Equity
Fund | | | Drexel Hamilton
Multi-Asset Real
Return Fund(a) | |
| | | | |
| | | For the Fiscal Year
Ended September 30,
2013 | | | For the Fiscal Year
Ended September 30,
2013 | | | For the Fiscal
Period October 9,
2012 (Inception)
to September 30,
2013 | |
INVESTMENT INCOME: | | | | | | | | | | | | |
Interest | | $ | – | | | $ | – | | | $ | 81,667 | |
Dividends | | | 1,918,479 | | | | 419,498 | | | | – | |
Dividends from affiliated securities | | | – | | | | – | | | | 3,262,240 | |
Foreign taxes withheld | | | (3,729) | | | | (33,521) | | | | – | |
| | | | | | | | | | | | |
Total Investment Income | | | 1,914,750 | | | | 385,977 | | | | 3,343,907 | |
| | | | | | | | | | | | |
| | | |
EXPENSES: | | | | | | | | | | | | |
Investment advisory fees | | | 741,671 | | | | 128,540 | | | | 288,676 | |
Administration fees | | | 149,686 | | | | 42,212 | | | | 101,929 | |
Transfer agent fees | | | 69,497 | | | | 22,176 | | | | 22,423 | |
Custodian fees | | | 13,259 | | | | 24,811 | | | | 5,626 | |
Legal fees | | | 154,039 | | | | 26,204 | | | | 83,878 | |
Audit fees | | | 4,379 | | | | 15,909 | | | | 11,243 | |
Trustees’ fees and expenses | | | 24,708 | | | | 4,192 | | | | 18,036 | |
Registration/filing fees | | | 26,399 | | | | 2,327 | | | | 4,654 | |
12b-1 fees (existing Class) | | | 231,233 | | | | N/A | | | | N/A | |
12b-1 fees (Investor Class) | | | N/A | | | | N/A | | | | 8 | |
Chief Compliance Officer services fees | | | 26,768 | | | | 4,608 | | | | 18,605 | |
Offering costs | | | 2,060 | | | | 1,248 | | | | 67,879 | |
Miscellaneous expenses | | | 48,824 | | | | 10,229 | | | | 27,426 | |
| | | | | | | | | | | | |
Total expenses before waivers | | | 1,492,523 | | | | 282,456 | | | | 650,383 | |
Fees waived/reimbursed by investment adviser (Note 5) | | | (446,410) | | | | (121,781) | | | | – | |
Fees waived/reimbursed by investment adviser (Institutional Class) (Note 5) | | | – | | | | – | | | | (125,504) | |
Fees waived/reimbursed by investment adviser (Investor Class) (Note 5) | | | – | | | | – | | | | (5) | |
| | | | | | | | | | | | |
Net Expenses | | | 1,046,113 | | | | 160,675 | | | | 524,874 | |
| | | | | | | | | | | | |
Net Investment Income | | | 868,637 | | | | 225,302 | | | | 2,819,033 | |
| | | | | | | | | | | | |
| | | |
Net realized gain on investments | | | 30,858,549 | | | | 531,667 | | | | – | |
Net realized loss on affiliated investments | | | – | | | | – | | | | (253,750) | |
Net realized loss on foreign currencies | | | – | | | | (30,687) | | | | – | |
Net change in unrealized appreciation/(depreciation) on investments | | | (18,112,474) | | | | 673,423 | | | | (2,080,662) | |
Net change in unrealized depreciation on affiliated investments | | | – | | | | – | | | | (129,938) | |
Net change in unrealized appreciation on translation of assets and liabilities denominated in foreign currency transactions | | | – | | | | 851 | | | | – | |
| | | | | | | | | | | | |
NET REALIZED AND UNREALIZED GAIN/(LOSS) ON INVESTMENTS AND FOREIGN CURRENCIES | | | 12,746,075 | | | | 1,175,254 | | | | (2,464,350) | |
| | | | | | | | | | | | |
NET INCREASE IN NET ASSETS RESULTING FROM OPERATIONS | | $ | 13,614,712 | | | $ | 1,400,556 | | | $ | 354,683 | |
| | | | | | | | | | | | |
| (a) | Institutional Class commenced operations on October 9, 2012. Investor Class commenced operations on January 22, 2013. |
See Notes to Financial Statements.
| | |
| Annual Report | September 30, 2013 | | 21 |
| | |
Drexel Hamilton Centre American Equity Fund | | Statements of Changes in Net Assets |
| | |
| | | | | | | | |
| | | For the Year Ended
September 30, 2013 | | | For the Period
December 21, 2011
(Inception) to
September 30, 2012 | |
| | | | | | | | |
OPERATIONS: | | | | | | | | |
Net investment income | | $ | 868,637 | | | $ | 121,695 | |
Net realized gain on investments | | | 30,858,549 | | | | 582,333 | |
Net change in unrealized appreciation/(depreciation) on investments | | | (18,112,474 | ) | | | 2,964,367 | |
| | | | | | | | |
Net increase in net assets resulting from operations | | | 13,614,712 | | | | 3,668,395 | |
| | | | | | | | |
| | |
DISTRIBUTIONS TO SHAREHOLDERS: | | | | | | | | |
From net investment income | | | (175,273 | ) | | | – | |
From net realized gains on investments | | | (2,212,550 | ) | | | – | |
| | | | | | | | |
Total distributions | | | (2,387,823 | ) | | | – | |
| | | | | | | | |
CAPITAL SHARE TRANSACTIONS: | | | | | | | | |
Proceeds from sale of shares | | | 31,193,682 | | | | 20,527,005 | |
Shares issued in reinvestment of distributions | | | 2,387,824 | | | | – | |
Cost of shares redeemed | | | (69,298,215 | ) | | | – | |
Redemption fees | | | 959 | | | | – | |
Acquisition costs (Note 10) | | | 130,033,182 | | | | – | |
| | | | | | | | |
Net increase from capital share transactions | | | 94,317,432 | | | | 20,527,005 | |
| | | | | | | | |
| | |
Net increase in net assets | | $ | 105,544,321 | | | $ | 24,195,400 | |
| | | | | | | | |
NET ASSETS: | | | | | | | | |
Beginning of period | | | 24,220,400 | | | | 25,000 | |
| | | | | | | | |
End of period* | | $ | 129,764,721 | | | $ | 24,220,400 | |
| | | | | | | | |
*Including accumulated net investment income of: | | $ | 826,831 | | | $ | 131,605 | |
| | |
OTHER INFORMATION: | | | | | | | | |
Share Transactions: | | | | | | | | |
Beginning Shares | | | 2,054,881 | | | | 2,500 | |
Shares sold | | | 2,734,444 | | | | 2,052,381 | |
Shares issued in reinvestment of dividends | | | 266,498 | | | | – | |
Shares redeemed | | | (6,430,102 | ) | | | – | |
Acquisition shares (Note 10) | | | 13,877,608 | | | | – | |
| | | | | | | | |
Ending Shares | | | 12,503,329 | | | | 2,054,881 | |
| | | | | | | | |
See Notes to Financial Statements.
| | |
Drexel Hamilton Centre Global Equity Fund | | Statements of Changes in Net Assets |
| | |
| | | | | | | | |
| | | For the Year Ended
September 30, 2013 | | | For the Period
December 21, 2011
(Inception) to
September 30, 2012 | |
| | | | | | | | |
OPERATIONS: | | | | | | | | |
Net investment income | | $ | 225,302 | | | $ | 181,259 | |
Net realized gain on investments | | | 531,667 | | | | 287,517 | |
Net realized loss on foreign currency transactions | | | (30,687) | | | | (14,391) | |
Net change in unrealized appreciation on investments and translation of assets and liabilities denominated in foreign currencies | | | 674,274 | | | | 1,041,238 | |
| | | | | | | | |
Net increase in net assets resulting from operations | | | 1,400,556 | | | | 1,495,623 | |
| | | | | | | | |
| | |
DISTRIBUTIONS TO SHAREHOLDERS: | | | | | | | | |
From net investment income | | | (207,005) | | | | – | |
From net realized gains on investments | | | (676,187) | | | | – | |
| | | | | | | | |
Total distributions | | | (883,192) | | | | – | |
| | | | | | | | |
CAPITAL SHARE TRANSACTIONS: | | | | | | | | |
Proceeds from sale of shares | | | 17,881,198 | | | | 10,467,667 | |
Shares issued in reinvestment of distributions | | | 883,192 | | | | – | |
Cost of shares redeemed | | | (16,744,352) | | | | – | |
| | | | | | | | |
Net increase from capital share transactions | | | 2,020,038 | | | | 10,467,667 | |
| | | | | | | | |
| | |
Net increase in net assets | | $ | 2,537,402 | | | $ | 11,963,290 | |
| | | | | | | | |
NET ASSETS: | | | | | | | | |
Beginning of period | | | 11,988,290 | | | | 25,000 | |
| | | | | | | | |
End of period* | | $ | 14,525,692 | | | $ | 11,988,290 | |
| | | | | | | | |
*Including accumulated net investment income of: | | $ | 160,128 | | | $ | 171,696 | |
| | |
OTHER INFORMATION: | | | | | | | | |
Share Transactions: | | | | | | | | |
Beginning Shares | | | 1,048,994 | | | | 2,500 | |
Shares sold | | | 1,567,071 | | | | 1,046,494 | |
Shares issued in reinvestment of dividends | | | 79,927 | | | | – | |
Shares redeemed | | | (1,469,707) | | | | – | |
| | | | | | | | |
Ending Shares | | | 1,226,285 | | | | 1,048,994 | |
| | | | | | | | |
See Notes to Financial Statements.
| | |
| Annual Report | September 30, 2013 | | 23 |
| | |
| Drexel Hamilton Multi-Asset Real Return Fund | | Statements of Changes in Net Assets |
| | |
| | | | |
| | | For the Period
October 9, 2012 (Inception)
to September 30, 2013 | |
| | | | |
OPERATIONS: | | | | |
Net investment income | | $ | 2,819,033 | |
Net realized loss on affiliated investments | | | (253,750) | |
Net change in unrealized depreciation on investments and affiliated investments | | | (2,210,600) | |
| | | | |
Net increase in net assets resulting from operations | | | 354,683 | |
| | | | |
DISTRIBUTIONS TO SHAREHOLDERS: | | | | |
From net investment income | | | | |
Institutional | | | (3,201,213) | |
| | | | |
Total distributions | | | (3,201,213) | |
| | | | |
CAPITAL SHARE TRANSACTIONS: | | | | |
Institutional Class | | | | |
Proceeds from sale of shares | | | 55,826,775 | |
Shares issued in reinvestment of distributions | | | 3,201,213 | |
| | | | |
Net increase from capital share transactions | | | 59,027,988 | |
| | | | |
Investor Class | | | | |
Proceeds from sale of shares | | | 5,000 | |
| | | | |
Net increase from capital share transactions | | | 5,000 | |
| | | | |
Net increase in net assets | | $ | 56,186,458 | |
| | | | |
NET ASSETS: | | | | |
Beginning of period | | | – | |
| | | | |
End of period* | | $ | 56,186,458 | |
| | | | |
*Including accumulated net investment loss of: | | $ | (313,635) | |
| |
OTHER INFORMATION: | | | | |
Share Transactions: | | | | |
Investor Class | | | | |
Beginning Shares | | | – | |
Shares sold | | | 524 | |
| | | | |
Ending Shares | | | 524 | |
| | | | |
Institutional Class | | | | |
Beginning Shares | | | – | |
Shares sold | | | 5,617,248 | |
Shares issued in reinvestment of dividends | | | 342,742 | |
| | | | |
Ending Shares | | | 5,959,990 | |
| | | | |
See Notes to Financial Statements.
| | |
| Drexel Hamilton Centre American Equity Fund | | Financial Highlights |
| | For a share outstanding throughout the periods presented. |
| | | | | | | | |
| | | For the Year Ended
September 30, 2013 | | | For the Period
December 21, 2011
(inception) to
September 30, 2012 | |
NET ASSET VALUE, BEGINNING OF PERIOD | | $ | 11.79 | | | $ | 10.00 | |
INCOME FROM INVESTMENT OPERATIONS: | | | | | | | | |
Net investment income(a) | | | 0.09 | | | | 0.07 | |
Net realized and unrealized gain on investments | | | 0.97 | | | | 1.72 | |
Total income from investment operations | | | 1.06 | | | | 1.79 | |
| | |
DISTRIBUTIONS: | | | | | | | | |
Net investment income | | | (0.18) | | | | – | |
Net realized gains on investments | | | (2.29) | | | | – | |
Total distributions | | | (2.47) | | | | – | |
REDEMPTION FEES ADDED TO PAID-IN CAPITAL (NOTE 2) | | | 0.00 | (b) | | | – | |
NET INCREASE/(DECREASE) IN NET ASSET VALUE | | | (1.41) | | | | 1.79 | |
NET ASSET VALUE, END OF PERIOD | | $ | 10.38 | | | $ | 11.79 | |
| | | | | | | | | |
| | |
Total Return | | | 12.30 | % | | | 17.90 | %(c) |
| | |
RATIOS/SUPPLEMENTAL DATA: | | | | | | | | |
Net assets, end of period (000) | | $ | 129,765 | | | $ | 24,220 | |
| | |
RATIOS TO AVERAGE NET ASSETS: | | | | | | | | |
Net investment income including reimbursement/waiver | | | 0.88 | % | | | 0.69 | %(d) |
Operating expenses excluding reimbursement/waiver | | | 1.51 | % | | | 2.32 | %(d) |
Operating expenses including reimbursement/waiver | | | 1.06 | %(e) | | | 1.25 | %(d) |
PORTFOLIO TURNOVER RATE | | | 175 | % | | | 67 | %(f) |
| (a) | Calculated using the average shares method. |
| (b) | Less than $0.005 per share. |
| (c) | Total returns are for the period indicated and have not been annualized. Total returns would have been lower had certain expenses not been waived during the period. Returns shown do not reflect the deduction of taxes that a shareholder would pay on fund distributions or the redemption of fund shares. |
| (e) | Effective January 11, 2013, the net expense limitation changed from 1.25% to 1.05%. |
| (f) | Portfolio turnover rate for periods less than one full year have not been annualized. |
See Notes to Financial Statements.
| | |
| Annual Report | September 30, 2013 | | 25 |
| | |
| Drexel Hamilton Centre Global Equity Fund | | Financial Highlights |
| | For a share outstanding throughout the periods presented. |
| | | | | | | | | | |
| | | For the Year Ended September 30, 2013 | | For the Period December 21, 2011 (inception) to September 30, 2012 |
| | |
NET ASSET VALUE, BEGINNING OF PERIOD | | | $ | 11.43 | | | | $ | 10.00 | |
INCOME FROM INVESTMENT OPERATIONS: | | | | | | | | | | |
Net investment income(a) | | | | 0.20 | | | | | 0.21 | |
Net realized and unrealized gain on investments and foreign currency transactions | | | | 1.12 | | | | | 1.22 | |
Total income from investment operations | | | | 1.32 | | | | | 1.43 | |
| | |
DISTRIBUTIONS: | | | | | | | | | | |
Net investment income | | | | (0.21) | | | | | – | |
Net realized gains on investments | | | | (0.69) | | | | | – | |
Total distributions | | | | (0.90) | | | | | – | |
NET INCREASE IN NET ASSET VALUE | | | | 0.42 | | | | | 1.43 | |
NET ASSET VALUE, END OF PERIOD | | | $ | 11.85 | | | | $ | 11.43 | |
| | | | | | | | | | | |
| | |
Total Return | | | | 12.19 | % | | | | 14.30 | %(b) |
| | |
RATIOS/SUPPLEMENTAL DATA: | | | | | | | | | | |
Net assets, end of period (000) | | | $ | 14,526 | | | | $ | 11,988 | |
| | |
RATIOS TO AVERAGE NET ASSETS: | | | | | | | | | | |
Net investment income including reimbursement/waiver | | | | 1.75 | % | | | | 2.06 | %(c) |
Operating expenses excluding reimbursement/waiver | | | | 2.20 | % | | | | 3.04 | %(c) |
Operating expenses including reimbursement/waiver | | | | 1.25 | % | | | | 1.25 | %(c) |
PORTFOLIO TURNOVER RATE | | | | 111 | % | | | | 87 | %(d) |
| (a) | Calculated using the average shares method. |
| (b) | Total returns are for the period indicated and have not been annualized. Total returns would have been lower had certain expenses not been waived during the period. Returns shown do not reflect the deduction of taxes that a shareholder would pay on fund distributions or the redemption of fund shares. |
| (d) | Portfolio turnover rate for periods less than one full year have not been annualized. |
See Notes to Financial Statements.
| | |
| Drexel Hamilton Multi-Asset Real Return Fund | | Financial Highlights |
Institutional Class | | For a share outstanding throughout the period presented. |
| | | | | |
| | | For the Period October 9, 2012 (inception) to September 30, 2013 |
| |
NET ASSET VALUE, BEGINNING OF PERIOD | | | $ | 10.00 | |
INCOME/(LOSS) FROM INVESTMENT OPERATIONS: | | | | | |
Net investment income(a) | | | | 0.50 | |
Net realized and unrealized loss on investments | | | | (0.50) | |
Total income from investment operations | | | | – | |
| |
DISTRIBUTIONS: | | | | | |
Net investment income | | | | (0.57) | |
Net realized gains on investments | | | | – | |
Total distributions | | | | (0.57) | |
NET DECREASE IN NET ASSET VALUE | | | | (0.57) | |
NET ASSET VALUE, END OF PERIOD | | | $ | 9.43 | |
| | | | | | |
| |
Total Return(b) | | | | 0.05 | % |
| |
RATIOS/SUPPLEMENTAL DATA: | | | | | |
Net assets, end of period (000) | | | $ | 56,182 | |
| |
RATIOS TO AVERAGE NET ASSETS: | | | | | |
Net investment income including reimbursement/waiver | | | | 5.37 | %(c) |
Operating expenses excluding reimbursement/waiver(d) | | | | 1.24 | %(c) |
Operating expenses including reimbursement/waiver(d) | | | | 1.00 | %(c) |
PORTFOLIO TURNOVER RATE | | | | 43 | %(e) |
| (a) | Calculated using the average shares method. |
| (b) | Total returns are for the period indicated and have not been annualized. Total returns would have been lower had certain expenses not been waived during the period. Returns shown do not reflect the deduction of taxes that a shareholder would pay on fund distributions or the redemption of fund shares. |
| (d) | Excludes expenses of the affiliated funds in which the Fund invests. |
| (e) | Portfolio turnover rate for periods less than one full year have not been annualized. |
See Notes to Financial Statements.
| | |
| Annual Report | September 30, 2013 | | 27 |
| | |
| Drexel Hamilton Multi-Asset Real Return Fund | | Financial Highlights |
Investor Class | | For a share outstanding throughout the period presented. |
| | | | | |
| | | For the Period January 22, 2013 (inception) to September 30, 2013 |
| |
NET ASSET VALUE, BEGINNING OF PERIOD | | | $ | 9.54 | |
INCOME/(LOSS) FROM INVESTMENT OPERATIONS: | | | | | |
Net investment loss(a) | | | | (0.09) | |
Net realized and unrealized loss on investments | | | | (0.04) | |
Total loss from investment operations | | | | (0.13) | |
NET DECREASE IN NET ASSET VALUE | | | | (0.13) | |
NET ASSET VALUE, END OF PERIOD | | | $ | 9.41 | |
| | | | | | |
| |
Total Return(b) | | | | (1.36) | % |
| |
RATIOS/SUPPLEMENTAL DATA: | | | | | |
Net assets, end of period (000) | | | $ | 5 | |
| |
RATIOS TO AVERAGE NET ASSETS: | | | | | |
Net investment loss including reimbursement/waiver | | | | (1.01) | %(c) |
Operating expenses excluding reimbursement/waiver(d) | | | | 1.39 | %(c) |
Operating expenses including reimbursement/waiver(d) | | | | 1.25 | %(c) |
PORTFOLIO TURNOVER RATE | | | | 43 | %(e) |
| (a) | Calculated using the average shares method. |
| (b) | Total returns are for the period indicated and have not been annualized. Total returns would have been lower had certain expenses not been waived during the period. Returns shown do not reflect the deduction of taxes that a shareholder would pay on fund distributions or the redemption of fund shares. |
| (d) | Excludes expenses of the affiliated funds in which the Fund invests. |
| (e) | Portfolio turnover rate for periods less than one full year have not been annualized. |
See Notes to Financial Statements.
| | |
| Drexel Hamilton Mutual Funds | | Notes to Financial Statements |
| | September 30, 2013 |
1. ORGANIZATION
Drexel Hamilton Mutual Funds (the “Trust”) was organized on March 17, 2011 as a Delaware statutory trust and is registered as an open-end management investment company under the Investment Company Act of 1940, as amended (the “1940 Act”). The Trust currently offers shares of beneficial interest (“shares”) of Drexel Hamilton Centre American Equity Fund (“American Equity Fund”), Drexel Hamilton Centre Global Equity Fund (“Global Equity Fund”) and Drexel Hamilton Multi-Asset Real Return Fund (“Real Return Fund”) (the “Funds”). American Equity Fund and Global Equity Fund are diversified portfolios with an investment objective of seeking long-term growth of capital. Real Return Fund seeks real return, which is total return that exceeds U.S. inflation over a full inflation cycle, which is typically 5 years. The affairs of the Trust are overseen by a Board of Trustees (the “Board”) or (the “Trustees”). The Declaration of Trust of the Trust permits the Trustees to create additional series of the Trust and share classes. Effective September 14, 2013, Centre Asset Management, LLC (the “Adviser”) serves as investment adviser to the Funds.
All classes of shares have identical rights to earnings, assets and voting privileges, except for class-specific expenses and exclusive rights to vote on matters affecting only individual classes.
2. SIGNIFICANT ACCOUNTING POLICIES
The following is a summary of significant accounting policies followed by the Funds in the preparation of the Financial Statements:
| (a) | Portfolio securities traded on a national securities exchange or in the over-the-counter market are valued at last sale price and if, for an OTC, if there is no available price, last bid price on the principal exchange or market as of the close of regular trading hours on the day the securities are being valued. Foreign securities are valued on the basis of quotations from the primary market in which they are traded, and are translated from the local currency into U.S. dollars using exchange rates as of the close of the New York Stock Exchange (“the Exchange”) or using methods determined by the Board. Debt securities having maturities of 60 days or less may be valued at amortized cost, which approximates market value. Securities and other assets for which quotations are not readily available or deemed unreliable are valued at their fair value using methods determined by the Board. Fair valuation of a particular security is an inherently subjective process, with no single standard to utilize when determining a security’s fair value. As such, different mutual funds could reasonably arrive at a different fair value price for the same security. In each case where a security is fair valued, consideration is given to the facts and circumstances relevant to the particular situation. This consideration includes reviewing various factors set forth in the pricing procedures adopted by the Board and other factors as warranted. In making a fair value determination, factors that may be considered, among others, include: the type and structure of the security; unusual events or circumstances relating to the security’s issuer; general market conditions; prior day’s valuation; fundamental analytical data; size of the holding; cost of the security on the date of purchase; nature and duration of any restriction on disposition; trading activities and prices of similar securities or financial instruments. |
| (b) | The per share net asset value (the “NAV”) of each Fund is calculated as of the close of trading on the Exchange (normally 4:00 p.m. Eastern time) every day the Exchange is open. The NAV is calculated by taking the total value of each Fund’s assets, subtracting the Fund’s liabilities, and then dividing by the total number of shares outstanding, rounded to the nearest cent. The offering price and redemption price per share is equal to the NAV per share, except that shares of American Equity Fund and Global Equity Fund are subject to a redemption fee of 2% if redeemed within 90 days of purchase. |
| (c) | The Trust treats each Fund as a separate entity for Federal income tax purposes. Each Fund intends to continue to qualify each year as a “regulated investment company” under Subchapter M of the Internal Revenue Code. By so qualifying, each Fund will not be subject to Federal income taxes to the extent that it distributes substantially all of its taxable or tax-exempt income, if any, for its tax year ending December 31. In addition, by distributing in each calendar year substantially all of its net investment income, capital gains and certain other amounts, if any, each Fund will not be subject to a Federal excise tax. Therefore, no provision is made by the Funds for Federal income or excise taxes. Withholding taxes on foreign dividends are paid or provided for in accordance with the applicable country’s tax rules and rates. |
As of and during the Fiscal year ended September 30, 2013, the Funds did not have a liability for any unrecognized tax benefits in the accompanying financial statements. The Funds recognize the interest and penalties, if any, related to the unrecognized tax benefits as income tax expense in the Statement of Operations. During the period, the Funds did not incur any interest or penalties.
Each of the Fund’s Federal tax returns for the year ended September 30, 2013, remain subject to examination by the Internal Revenue Service.
| (d) | For financial reporting purposes, transactions on the last business day of the reporting period are accounted for on the trade date. Net realized gains and losses on investments are computed on the identified cost basis. The portion of security gains and losses resulting from changes in foreign exchange rates is included with net realized and unrealized gains or losses from investments. Dividend income is recognized on the ex-dividend date or for certain foreign securities, as soon as information is available, and interest income is recognized on an accrual basis. The Funds amortize premium and accrete discount on investments utilizing the effective interest method. Foreign dividend income may be subject to foreign withholding taxes. |
| | |
| Annual Report | September 30, 2013 | | 29 |
| | |
| Drexel Hamilton Mutual Funds | | Notes to Financial Statements |
| | September 30, 2013 |
| (e) | A restricted security is a security that has been purchased through a private offering and cannot be resold to the general public without prior registration under the Securities Act of 1933 (the “Act”) or pursuant to the resale limitations provided by Rule 144 under the Act, or an exemption from the registration requirements of the Act. Whether a restricted security is illiquid is determined pursuant to guidelines established by the Board. Not all restricted securities are considered to be illiquid. As of September 30, 2013, the Funds did not hold any restricted securities. |
| (f) | The preparation of financial statements in conformity with accounting standards generally accepted in the United States of America (“GAAP”) requires management to make estimates and assumptions that affect the amounts reported in financial statements during the reporting period. Management believes the estimates and security valuations are appropriate; however, actual results may differ from those estimates, and the security valuations reflected in the financial statements may differ from the value the Funds ultimately realize upon sale of the securities. The financial statements have been prepared as of the close of the Exchange on September 30, 2013. |
| (g) | The Funds bear expenses incurred specifically on each Fund’s behalf as well as a portion of general Trust expenses, which may be allocated on the basis of relative net assets or the nature of the services performed relative to applicability to each Fund. Expenses that are specific to a Fund or class of shares of a Fund are charged directly to that Fund or share class. For Real Return Fund, which offers multiple share classes, all of the realized and unrealized gains and losses and net investment income of the Fund, other than class-specific expenses, are allocated daily to each class in proportion to its average daily net assets. Fees provided under the distribution (Rule 12b-1) plan for Investor class shares of the Fund are charged with respect to such class. |
| (h) | Dividends from net investment income and distributions of net realized capital gains, if any, will be declared and paid at least annually. Income and capital gains distributions are determined in accordance with income tax regulations, which may differ from GAAP. Distributions to shareholders are recorded on the ex-dividend date. |
| (i) | Each Fund may directly purchase securities of foreign issuers. Investing in securities of foreign issuers involves special risks not typically associated with investing in securities of U.S. issuers. The risks include possible reevaluation of currencies, the inability to repatriate foreign currency, less complete financial information about companies and possible future adverse political and economic developments. Moreover, securities of many foreign issuers and their markets may be less liquid and their prices more volatile than those of securities of comparable U.S. issuers. |
| (j) | The books and records of the Funds are maintained in U.S. dollars. Investment valuations and other assets and liabilities initially expressed in foreign currencies are converted each business day into U.S. dollars based upon current exchange rates. The portion of realized and unrealized gains or losses on investments due to fluctuations in foreign currency exchange rates is not separately disclosed and is included in realized and unrealized gains or losses on investments, when applicable. |
| (k) | Offering costs, including costs of printing initial prospectuses, legal and registration fees, are being amortized over twelve months from the respective inception dates of the Funds. As of September 30, 2013, $2,483 of offering costs remain to be amortized for the Multi-Asset Real Return Fund. |
3. FAIR VALUE MEASUREMENTS
A three-tier hierarchy has been established to classify fair value measurements for disclosure purposes. Inputs refer broadly to the assumptions that market participants would use in pricing the asset or liability, including assumptions about risk. Inputs may be observable or unobservable. Observable inputs are inputs that reflect the assumptions market participants would use in pricing the asset or liability that are developed based on market data obtained from sources independent of the reporting entity. Unobservable inputs are inputs that reflect the reporting entity’s own assumptions about the assumptions market participants would use in pricing the asset or liability that are developed based on the best information available.
Various inputs are used in determining the value of each Fund’s investments as of the reporting period end. These inputs are categorized in the following hierarchy under applicable financial accounting standards:
| | Level 1 - | Unadjusted quoted prices in active markets for identical, unrestricted assets or liabilities that a Fund has the ability to access at the measurement date. |
| | |
| Drexel Hamilton Mutual Funds | | Notes to Financial Statements |
| | September 30, 2013 |
| | | | |
| | Level 2 - | | Quoted prices which are not active, quoted prices for similar assets or liabilities in active markets or inputs other than quoted prices that are observable (either directly or indirectly) for substantially the full term of the asset or liability. |
| | Level 3 - | | Significant unobservable prices or inputs (including the oversight of the Board and Adviser’s Pricing Committee’s own assumptions in determining the fair value of investments) where there is little or no market activity for the asset or liability at measurement date. |
The inputs or methodology used for valuing securities are not necessarily an indication of the risk associated with investing in those securities.
The following is a summary of each Fund’s investments in the fair value hierarchy as of September 30, 2013:
Drexel Hamilton Centre American Equity Fund
| | | | | | | | | | | | | | | | |
| Investments in Securities at Value(a) | | Level 1 -
Quoted Prices | | | Level 2 -
Other Significant
Observable Inputs | | | Level 3 -
Significant
Unobservable
Inputs | | | Total | |
Common Stocks | | $ | 129,150,857 | | | $ | – | | | $ | – | | | $ | 129,150,857 | |
Purchased Options | | | 7,840 | | | | – | | | | – | | | | 7,840 | |
Short Term Investments | | | 575,926 | | | | – | | | | – | | | | 575,926 | |
Total | | $ | 129,734,623 | | | $ | – | | | $ | – | | | $ | 129,734,623 | |
| | | | | | | | | | | | | | | | | |
| | | | |
| Drexel Hamilton Centre Global Equity Fund | | | | | | | | | | | | | | | | |
| | | | |
| Investments in Securities at Value(a) | | Level 1 -
Quoted Prices | | | Level 2 - Other Significant
Observable Inputs | | | Level 3 -
Significant
Unobservable
Inputs | | | Total | |
Common Stocks | | $ | 13,955,751 | | | $ | – | | | $ | – | | | $ | 13,955,751 | |
Preferred Stocks | | | 386,946 | | | | – | | | | – | | | | 386,946 | |
Rights | | | 8,922 | | | | – | | | | – | | | | 8,922 | |
Short Term Investments | | | 77,743 | | | | – | | | | – | | | | 77,743 | |
Total | | $ | 14,429,362 | | | $ | – | | | $ | – | | | $ | 14,429,362 | |
| | | | | | | | | | | | | | | | | |
|
| Drexel Hamilton Multi-Asset Real Return Fund | |
| | | | |
| Investments in Securities at Value(a) | | Level 1 -
Quoted Prices | | | Level 2 - Other Significant
Observable Inputs | | | Level 3 -
Significant
Unobservable
Inputs | | | Total | |
Exchange Traded Funds | | $ | 2,441,533 | | | $ | – | | | $ | – | | | $ | 2,441,533 | |
Exchange Traded Notes | | | 7,221,971 | | | | – | | | | – | | | | 7,221,971 | |
Open-End Funds | | | 29,387,424 | | | | – | | | | – | | | | 29,387,424 | |
U.S. Government Bonds | | | – | | | | 15,239,422 | | | | – | | | | 15,239,422 | |
Short Term Investments | | | 1,854,046 | | | | – | | | | – | | | | 1,854,046 | |
Total | | $ | 40,904,974 | | | $ | 15,239,422 | | | $ | – | | | $ | 56,144,396 | |
| | | | | | | | | | | | | | | | | |
| (a) | For detailed descriptions of sectors, industries and countries, see the accompanying Schedule of Investments. |
The Funds did not hold any investments at the beginning or end of the period in which significant unobservable inputs were used in determining fair value; therefore, no reconciliation of Level 3 securities is included for this reporting period. The Funds recognize transfers between levels as of the beginning of the fiscal year. There were no transfers between Level 1 and Level 2 as of September 30, 2013.
Derivative Financial Instruments
The following discloses the Funds’ use of derivative instruments.
The Funds are permitted to purchase investment securities and enter into various types of derivative contracts such as purchased and written options. In doing so, the Funds may employ strategies in differing combinations to permit them to increase, decrease, or change the level or types of exposure to market factors or to hedge. The Funds may invest assets in derivatives, cash management instruments and other instruments to help manage interest rate exposure, protect the Fund’s assets or enhance returns. A Fund may also be exposed to exchange-traded derivative products, such as exchange-traded futures and options that are fully collateralized by cash or securities, for temporary cash management or investment transition purposes, or to hedge the risks of existing positions.
| | |
| Annual Report | September 30, 2013 | | 31 |
| | |
| Drexel Hamilton Mutual Funds | | Notes to Financial Statements |
| | September 30, 2013 |
Market Risk Factors: In pursuit of their investment objectives, the Funds may seek to use derivatives to increase or decrease their exposure to the following market risk factors:
Equity Risk: Equity risk relates to the change in value of equity securities as they relate to increases or decreases in the general market.
Foreign Exchange Rate Risk: Foreign exchange rate risk relates to the change in the U.S. dollar value of a security held that is denominated in a foreign currency. The value of a foreign currency denominated security will decrease as the dollar appreciates against the currency, while the value of the foreign currency denominated security will increase as the dollar depreciates against the currency.
Risk of Investing in Derivatives
The Funds’ use of derivatives can result in losses due to unanticipated changes in the market risk factors and the overall market.
Derivatives may have little or no initial cash investment relative to their market value exposure and therefore can produce significant gains or losses in excess of their cost. This use of embedded leverage allows the Funds to increase their market value exposure relative to their net assets and can substantially increase the volatility of the Funds’ performance.
Additional associated risks from investing in derivatives also exist and potentially could have significant effects on the valuation of the derivatives and the Fund. Typically, the associated risks are not the risks that the Funds are attempting to increase or decrease exposure to, per their investment objectives, but are the additional risks from investing in derivatives.
One example of these associated risks is liquidity risk, which is the risk that the Funds will not be able to sell the derivative in the open market in a timely manner, and counterparty credit risk, which is the risk that the counterparty will not fulfill its obligation to the Funds.
Option Writing/Purchasing
The Funds may write or purchase option contracts to adjust risk and return of their overall investment positions, subject to any restrictions set forth in each Fund’s prospectus. When a Fund writes or purchases an option, an amount equal to the premium received or paid by the Fund is recorded as a liability or an asset and is subsequently adjusted to the current market value of the option written or purchased. Premiums received or paid from writing or purchasing options that expire unexercised are treated by the Fund on the expiration date as realized gains or losses. The difference between the premium and the amount paid or received on affecting a closing purchase or sale transaction, including brokerage commissions, is also treated as a realized gain or loss. If an option is exercised, the premium paid or received is added to the cost of the purchase or proceeds from the sale in determining whether the Fund has realized a gain or loss on investment transactions. Risks from entering into option transactions arise from, among other things, the potential inability of counterparties to meet the terms.
Statement of Assets and Liabilities - Fair Value of Derivative Instruments as of September 30, 2013:
| | | | | | |
| Derivatives | | Asset Derivatives Statement of Asset and Liabilities Location | | Fair Value | |
American Equity Fund | | | | | | |
| | |
Equity Contracts (Purchased Option Contracts) | | Investments, at value | | $ | 7,840 | |
| | | | | | |
| | | | $ | 7,840 | |
| | | | | | |
The effect of derivative instruments on the Statement of Operations for the year ended September 30, 2013:
| | | | | | | | | | |
| Derivatives | | Locations Of Gains/(Loss) On Derivatives Recognized In Income | | Realized Gain/(Loss) On
Derivatives Recognized In Income | | | Changed On Unrealized
Gain/(Loss) On Derivatives Recognized in Income | |
American Equity Fund | | | | | | | | | | |
Equity Contracts (Purchased Option Contracts) | | Net realized gain on Investments/Change in unrealized depreciation on Investments | | $ | – | | | $ | (658,282 | ) |
| | | | | | |
| | | | $ | – | | | $ | (658,282 | ) |
| | | | | | |
| | |
| Drexel Hamilton Mutual Funds | | Notes to Financial Statements |
| | September 30, 2013 |
4. BENEFICIAL INTEREST TRANSACTIONS
On September 30, 2013, there was an unlimited number of shares of beneficial interest authorized for each Fund. Transactions in shares of beneficial interest are shown in the Statement of Changes in Net Assets.
Shares of American Equity Fund and Global Equity Fund that are redeemed within 90 days of purchase may incur a 2% redemption fee deducted from the redemption amount. For the year ended September 30, 2013, redemption fees retained by these Funds are disclosed in the Statement of Changes in Net Assets.
Beneficial Ownership: The beneficial ownership, either directly or indirectly, of more than 25% of the voting securities of a Fund creates a presumption of control of the Fund under Section 2(a)(9) of the 1940 Act. As of September 30, 2013, the following entities owned beneficially more than 25% of each Fund’s outstanding shares. The shares may be held under omnibus accounts (whereby the transactions of two or more shareholders are combined and carried in the name of the originating broker rather than designated separately).
| | | | | | |
| Drexel Hamilton Centre American Equity Fund | | | | | | |
| | |
Entity | | | | | Percentage | |
Charles Schwab & CO., Inc. | | | | | 49.02% | |
| | |
| Drexel Hamilton Centre Global Equity Fund | | | | | | |
| | |
Entity | | | | | Percentage | |
SEI Private Trust CO. c/o Drexel Hamilton Multi - Asset Real Return Fund | | | | | 99.75% | |
| | |
| Drexel Hamilton Multi - Asset Real Return Fund | | | | | | |
| | |
Entity | | Class | | | Percentage | |
Sanlam Drexel Hamilton Multi - Asset Real Return Feeder Fund | | Institutional | | | 99.91% | |
James A Abate | | Investor | | | 100.00% | |
5. INVESTMENT ADVISORY AGREEMENTS AND RELATED-PARTY TRANSACTIONS
On September 13, 2013, the Trustees approved for each Fund a new investment advisory agreement between the Trust, on behalf of the Fund, and Centre Asset Management, LLC (“Centre”), as the new investment adviser to the Funds (each, a “New Advisory Agreement” and collectively, the “New Advisory Agreements”), and recommended that shareholders of each Fund approve the New Advisory Agreement for their Fund. As described below, the New Advisory Agreements do not materially differ from the interim advisory agreements currently in effect between Centre and the Trust, on behalf of the Funds (the “Interim Advisory Agreements”) and the previous advisory agreements for the Funds between Drexel Hamilton Investment Partners, LLC (“DHIP”) and the Trust, on behalf of the Funds, that were approved previously by each Fund’s shareholders (each, a “Previous Advisory Agreement” and collectively, the “Previous Advisory Agreements”). At an in-person Joint Special Meeting of the Shareholders of the Funds, the shareholders of each Fund approved the New Advisory Agreement for their Fund.
The owners of DHIP recently sold all of the membership units of DHIP to Centre (the “Transaction”). Under the 1940 Act, an advisory agreement of a mutual fund automatically terminates in the event of its “assignment” (as that term is defined in the 1940 Act), and an assignment is deemed to occur when a controlling block of the securities of the fund’s investment adviser is transferred. The Transaction resulted in a change of control of DHIP, with Centre being the sole owner of DHIP. The Transaction also resulted in the assignment of the Previous Advisory Agreements and the automatic termination of those agreements. In anticipation of such assignments and terminations, the Trust, on behalf of the Funds, entered into the Interim Advisory Agreements to provide for the management of the Funds. The 1940 Act requires that shareholders of a fund approve any advisory agreement between the fund and its investment adviser.
The Adviser serves as the investment adviser to each Fund pursuant to the New Advisory Agreements with the Trust. Subject to the general oversight of the Board, the Adviser is responsible for among other things, developing a continuing investment program for each Fund in accordance with their respective investment objectives, reviewing the investment strategies and policies of each Fund and advising the Board on the selection of sub-advisers, if any. In this capacity, the Adviser advises and assists the officers of the Trust in conducting the business of the Funds and is responsible for providing general investment advice and guidance to the Funds.
| | |
| Annual Report | September 30, 2013 | | 33 |
| | |
| Drexel Hamilton Mutual Funds | | Notes to Financial Statements |
| | September 30, 2013 |
As compensation for the investment advisory services provided to the Funds, the Adviser currently receives monthly compensation based on each Fund’s average daily net assets at the annual rate of:
| | |
| Fund | | Management
Fee Rate |
Drexel Hamilton Centre American Equity Fund (total net assets under $1 billion) | | 0.75% |
Drexel Hamilton Centre American Equity Fund (total net assets over $1 billion) | | 0.70% |
Drexel Hamilton Centre Global Equity Fund | | 1.00% |
Drexel Hamilton Multi-Asset Real Return Fund | | 0.55% |
For the Drexel Hamilton Multi-Asset Real Return Fund, effective September 14, 2013, the investment adviser to the Fund, Centre Asset Management, LLC (the “Adviser”), has contractually agreed, pursuant to a written Interim Expense Limitation Agreement (the “Interim Expense Limitation Agreement”), to reduce its advisory fees, distribution/service (Rule 12b-1) fees, and/or reimburse other expenses of the Fund until termination of the Interim Expense Limitation Agreement to the extent necessary to limit the current operating expenses of each class of shares of the Fund (exclusive of any front-end or contingent deferred sales loads, taxes, leverage interest, brokerage commissions, expenses incurred in connection with any merger or reorganization, extraordinary expenses such as litigation and other expenses not incurred in the ordinary course of the Fund’s business, and acquired fund fees and expenses, except that, if an acquired fund is an underlying fund managed by the Adviser and such acquired fund is not subject to an effective expense limitation or fee waiver agreement at any time during the term of the Interim Expense Limitation Agreement, then, for that time, the operating expenses of each class of shares of the Fund shall not exclude the amount of advisory fees included in such acquired fund’s fees and expenses to which the Fund would otherwise be subject), to 1.25% for Investor Class shares of the Fund and 1.00% for Institutional Class shares of the Fund. The Expense Limitation Agreement may be terminated at any time, and without payment of any penalty, by the Board of the Trust, on behalf of the Fund, upon 60 days’ written notice to the Adviser. The Adviser may receive reimbursement of any amount waived pursuant to the Expense Limitation Agreement, provided that the reimbursement does not cause the Fund to exceed the then-existing expense limitation for that class at the time such reimbursement is to be paid by the Fund.
For the American Equity Fund, effective September 14, 2013, Drexel Hamilton Investment Partners, LLC (“Assignor”) has assigned to the Adviser certain Amended and Restated Expense Limitation Agreement by and between Assignor and Drexel Hamilton Mutual Funds, on behalf of its series, Drexel Hamilton Centre American Equity Fund, dated as of September 17, 2012. The Adviser has agrees to assume and faithfully perform and discharge all the terms, conditions, and obligations of Assignor under the Expense Limitation Agreement which it has agreed to limit for a period of two years from January 11, 2013 the total expenses of the existing class of shares of the Fund (including (but not limited to) investment advisory fees of the Adviser and distribution/service (Rule 12b-1) fees, but excluding interest, taxes, litigation, brokerage commissions and extraordinary expenses not incurred in the ordinary course of the Fund’s business) to an annual rate of 1.05% of the average daily net assets of the Fund. This limitation may not be terminated and will remain in place through the end of the two-year period beginning after January 11, 2013. The Adviser may recoup any waived or reimbursed amount pursuant to the agreement in the first, second and third fiscal years following the fiscal year in which any such reimbursement or waiver occurs, if the total annual operating expenses for the applicable following year, after giving effect to the repayment, do not exceed the expense limitation in effect at the time the waiver or reimbursement is made (or any lower expense limitation or limitations to which the parties may otherwise agree).
For the Global Equity Fund, the Adviser has entered into a written Interim Expense Limitation Agreement under which it has agreed to limit through termination of the Interim Expense Limitation Agreement the total operating expenses of the Fund (including (but not limited to) investment advisory fees, but excluding interest, taxes, litigation, brokerage, other expenditures which are capitalized in accordance with generally accepted accounting principles and extraordinary expenses) to 1.25% of the average daily net assets of the Fund. The Interim Expense Limitation Agreement may be terminated by Centre Asset Management, LLC or the Trust, with respect to the Fund, at any time and without payment of penalty, provided that the terminating party provides 90 days prior written notice of such termination to the other party, and such termination will not be effective before January 31, 2014 (unless otherwise specifically agreed upon). In addition, any termination sought by the Trust must be authorized by resolution of a majority of the Trustees who are not “interested persons” (as defined by the 1940 Act) of the Trust or by vote of a majority of the outstanding shares of the Fund. The Adviser may recoup any waived amount, including organizational fees, from the Fund pursuant to this agreement in the first, second and third fiscal years following the fiscal year in which any such reimbursement or waiver occurs, if the total annual operating expenses for the applicable following year, after giving effect to the repayment, do not exceed the expense limitation in effect at the time the waiver or reimbursement is made (or any lower expense limitation or limitations to which the parties may otherwise agree).
| | |
| Drexel Hamilton Mutual Funds | | Notes to Financial Statements |
| | September 30, 2013 |
During the year ended September 30, 2013, the fee waivers and/or reimbursments were as follows:
| | | | | |
| | | Fees Waived/Reimbursed by Adviser |
Drexel Hamilton Centre American Equity Fund | | | | $ 446,410 | |
Drexel Hamilton Centre Global Equity Fund | | | | 121,781 | |
Drexel Hamilton Multi-Asset Real Return Fund | | | | | |
Institutional Class | | | | 125,504 | |
Investor Class | | | | 5 | |
As of September 30, 2013, the balances of recoupable expenses for each Fund were as follows:
| | | | | | | | | | | | |
| | | Expires 2015 | | | Expires 2016 | | | Total | |
Drexel Hamilton Centre American Equity Fund | | $ | 189,101 | | | $ | 446,410 | | | $ | 635,511 | |
Drexel Hamilton Centre Global Equity Fund | | | 157,721 | | | | 121,781 | | | | 279,502 | |
Drexel Hamilton Multi-Asset Real Return Fund | | | | | | | | | | | | |
Institutional Class | | | N/A | | | | 125,504 | | | | 125,504 | |
Investor Class | | | N/A | | | | 5 | | | | 5 | |
ALPS Fund Services, Inc. (“ALPS” or the “Administrator”) serves as administrator to the Funds. ALPS receives a monthly fee paid by the Funds subject to a minimum monthly fee. Pursuant to an administrative agreement, ALPS provides operational services to the Funds including, but not limited to fund accounting and fund administration and general assistance in each Fund’s operations.
ALPS, pursuant to a Transfer Agency and Services agreement with the Trust, serves as Transfer Agent for the Funds. Under the Transfer Agency and Services Agreement, ALPS receives from the Trust an annual minimum fee per Fund and a fee based upon each shareholder account and its account activity and is reimbursed for out-of-pocket expenses.
ALPS provides Chief Compliance Officer services to the Funds. Additionally, ALPS provides services in monitoring and testing the policies and procedures of the Trust in conjunction with requirements under Rule 38a-1 under the 1940 Act. ALPS is compensated under the Chief Compliance Officer Services Agreement.
The Trust has adopted a plan pursuant to Rule 12b-1 under the Investment Company Act of 1940, as amended (the “Plan”). The Plan permits the Trust, on behalf of certain classes of shares of the applicable Funds, to pay one or more entities for services rendered and expenses borne in connection with providing shareholder or distribution services with respect to the existing class of shares of American Equity Fund and the Investor class shares of Real Return Fund.
ALPS Distributors, Inc. (the “Distributor”) acts as the sole distributor of the Funds. There were no payments to the Distributor by the Funds during the year ended September 30, 2013.
Officers of the Trust and Trustees who are “interested persons” of the Trust or the Adviser will receive no salary or fees from the Trust. Each Trustee who is not an “interested person” receives an annual retainer of $15,000 paid quarterly. The Trust reimburses each Trustee and Officer for his or her travel and other expenses relating to attendance at such meetings.
One Trustee is an officer of Centre.
6. FEDERAL INCOME TAX AND TAX BASIS INFORMATION
As of and during the period ended September 30, 2013, the Funds did not have a liability for any unrecognized tax benefits. The Funds file U.S. federal, state, and local tax returns as required. The Funds’ tax returns are subject to examination by the relevant tax authorities until expiration of the applicable statute of limitations which is generally three years after the filing of the tax return but which can be extended to six years in certain circumstances. Tax returns for open years have incorporated no uncertain tax positions that require a provision for income taxes.
| | |
| Annual Report | September 30, 2013 | | 35 |
| | |
| Drexel Hamilton Mutual Funds | | Notes to Financial Statements |
| | September 30, 2013 |
Components of Distributable Earnings on a Tax Basis: At September 30, 2013, permanent differences in book and tax accounting were reclassified. These differences had no effect on net assets and were primarily attributed to differences in the book and tax treatment of non-deductible expenses, currency transactions and capital loss carryforwards attributed to the merger of Drexel Hamilton Centre American Equity and Ameristock. The reclassifications were as follows:
| | | | | | | | | | | | |
| Fund | | Accumulated Net
Investment Income | | | Accumulated Net
Realized Gain/(Loss) | | | Paid-in
Capital | |
Drexel Hamilton Centre American Equity Fund | | $ | 1,862 | | | $ | (37,278,631 | ) | | $ | 37,276,769 | |
Drexel Hamilton Centre Global Equity Fund | | | (29,865 | ) | | | 30,686 | | | | (821 | ) |
Drexel Hamilton Multi-Asset Real Return Fund | | | 68,545 | | | | 2,648 | | | | (71,193 | ) |
There were no net operating losses offset to Paid-in-Capital included in the amounts reclassified above.
As of September 30, 2013, the components of distributable earnings on a tax basis were as follows:
| | | | | | | | | | | | | | | | |
| Fund | | Accumulated
Capital Gain/(Loss)
Undistributed | | | Ordinary Income
Undistributed | | | Net Unrealized
Appreciation/
(Depreciation) | | | Other Cumulative
Effect of Timing
Differences | |
Drexel Hamilton Centre American Equity Fund | | $ | 14,415 | | | $ | 832,160 | | | $ | 11,915,056 | | | $ | (8,016,393) | |
Drexel Hamilton Centre Global Equity Fund | | | 74,116 | | | | 303,638 | | | | 1,640,863 | | | | 0 | |
Drexel Hamilton Multi-Asset Real Return Fund | | | (225,130 | ) | | | (313,635 | ) | | | (2,236,572 | ) | | | 0 | |
Capital Losses: As of September 30, 2013 the following Funds had capital loss carryforwards which may reduce the Funds’ taxable income arising from future net realized gains on investments, if any, to the extent permitted by the Code and thus may reduce the amount of the distributions to shareholders which would otherwise be necessary to relieve the Funds of any liability for federal tax. Pursuant to the Code, such capital loss carryforwards will expire as follows:
Pre-Enactment Capital Losses:
| | | | | | |
| Fund | | Expiring in 2017 | | | |
Drexel Hamilton Centre American Equity Fund | | $ | 8,011,064 | | | |
| | |
Capital loss carryovers utilized during the period ended September 30, 2013, were: | | | | | | |
| | |
| Fund | | Amount | | | |
Drexel Hamilton Centre American Equity Fund | | $ | (29,267,568 | ) | | |
Under the recently enacted Regulated Investment Company Modernization Act of 2010, capital losses incurred by each Fund after January 1, 2011 will not be subject to expiration. In addition, such losses must be utilized prior to the losses incurred in the years preceding enactment.
Post-Enactment Capital Losses*
Capital losses deferred to next tax year were as follows:
| | | | | | |
| Fund | | Short-Term | | | |
Drexel Hamilton Multi-Asset Real Return Fund | | $ | 191,180 | | | |
| * | Post-Enactment Capital Losses arise in fiscal years beginning after December 22, 2010, and exclude any elective late-year capital losses (during the period November 1st to December 31st) deferred for the current fiscal year. As a result of the enactment of the Regulated Investment Company Act of 2010, pre-enactment capital loss carryforwards may be more likely to expire unused. Additionally, post-enactment capital losses that are carried forward will retain their character as either short-term or long-term losses rather than being considered all short-term as under previous law. |
| | |
| Drexel Hamilton Mutual Funds | | Notes to Financial Statements |
| | September 30, 2013 |
Elective Deferrals: The Fund elect to defer to the period ending September 30, 2014, capital losses recognized during the period November 1, 2012–September 30, 2013 in the amount of:
| | | | | | |
| Fund | | Amount | | | |
Drexel Hamilton Multi-Asset Real Return Fund | | $ | 33,950 | | | |
| | |
The Funds elect to defer to the period ending September 30, 2014, late year ordinary losses in the amount of: | | | | | | |
| | |
| Fund | | Amount | | | |
Drexel Hamilton Multi-Asset Real Return Fund | | $ | 313,635 | | | |
Distributions to Shareholders: Each Fund normally pays dividends and net investment income, if any, on an annual basis. Each Fund normally distributes capital gains, if any, on an annual basis. Income dividend distributions are derived from interest and other income each Fund receives from its investments, including distributions of short term capital gains. Capital gain distributions are derived from gains realized when each Fund sells a security it has owned for more than one year. Each Fund may make additional distributions and dividends at other times if the Adviser believes doing so may be necessary for each Fund to avoid or reduce taxes. Net investment income/(loss) and net realized gain/(loss) may differ for financial statement and tax purposes.
The tax character of distributions paid for the year ended September 30, 2013 were as follows:
| | | | | | | | |
| Distributions Paid From: | | Ordinary Income | | | Long-Term Capital Gains | |
Drexel Hamilton Centre American Equity Fund | | $ | 2,387,823 | | | $ | 0 | |
Drexel Hamilton Centre Global Equity Fund | | | 883,192 | | | | 0 | |
Drexel Hamilton Multi-Asset Real Return Fund | | | 3,201,213 | | | | 0 | |
Unrealized Appreciation and Depreciation on Investments: The amount of net unrealized appreciation/(depreciation) and the cost of investment securities for tax purposes, including short-term securities at September 30, 2013, are displayed in the table below. The difference between book and tax basis unrealized appreciation/(depreciation) for the Funds is primarily attributable to wash sales and investments in partnerships.
| | | | | | | | | | | | | | | | | | | | |
| | | Tax Cost of
Investments | | | Gross Unrealized
Appreciation | | | Gross Unrealized
Depreciation | | | Net Appreciation of
Foreign Currency
and Derivatives | | | Net Tax Unrealized
Appreciation on
Investments | |
Drexel Hamilton Centre American Equity Fund | | $ | 117,819,567 | | | $ | 15,710,847 | | | $ | (3,795,791) | | | $ | 0 | | | $ | 11,915,056 | |
Drexel Hamilton Centre Global Equity Fund | | | 12,789,364 | | | | 1,926,988 | | | | (286,990) | | | | 865 | | | | 1,640,863 | |
Drexel Hamilton Multi-Asset Real Return Fund | | | 58,380,968 | | | | 1,064,180 | | | | (3,300,752) | | | | 0 | | | | (2,236,572) | |
7. AFFILIATED COMPANIES:
Real Return Fund may invest in certain securities that are considered securities issued by affiliated companies. As defined by the Investment Company Act of 1940, an affiliated person, including an affiliated company, is one in which a Fund owns 5% or more of the outstanding voting securities, or a company which is under common ownership or control with the Fund. The purchases, sales, dividend income, capital gains, return of capital distributions received, shares and value of investments in affiliated companies for the year ended September 30, 2013 were as follows:
Drexel Multi-Asset Real Return Fund
| | | | | | | | | | | | | | | | | | | | | | | | | | | | |
| Security Name | | Share Balance
October 9, 2012
(Inception) | | | Purchases | | | Sales | | | Share Balance
September 30,
2013 | | | Dividend
Income | | | Realized
Gain/(Loss) | | | Market Value
September 30,
2013 | |
Drexel Hamilton Centre American Equity Fund | | | – | | | | 2,867,064 | | | | (1,432,400) | | | | 1,434,664 | | | $ | 2,381,586 | | | $ | (257,925) | | | $ | 14,891,817 | |
Drexel Hamilton Centre Global Equity Fund | | | – | | | | 1,646,768 | | | | (423,510) | | | | 1,223,258 | | | | 880,654 | | | | 4,175 | | | | 14,495,607 | |
| | | | – | | | | | | | | | | | | | | | $ | 3,262,240 | | | $ | (253,750) | | | $ | 29,387,424 | |
| | | | | | | | | | | | | | | | | | | | | | | | | | | | | |
| | |
| Annual Report | September 30, 2013 | | 37 |
| | |
| Drexel Hamilton Mutual Funds | | Notes to Financial Statements |
| | September 30, 2013 |
8. PURCHASES AND SALES OF INVESTMENT SECURITIES
For the year ended September 30, 2013, the aggregate cost of purchases and proceeds from sales of investment securities (excluding any U.S. Government Obligations short-term securities) were as follows:
| | | | | | | | |
| Fund | | Purchases of Securities | | | Proceeds From Sales of
Securities | |
Drexel Hamilton Centre American Equity Fund | | $ | 167,078,071 | | | $ | 198,053,161 | |
Drexel Hamilton Centre Global Equity Fund | | | 14,945,735 | | | | 13,649,658 | |
Drexel Hamilton Multi-Asset Real Return Fund | | | 61,666,708 | | | | 21,257,642 | |
For the year ended September 30, 2013, the aggregate cost of purchases and proceeds from sales of U.S. Government obligations were as follows:
| | | | | | | | |
| Fund | | Purchases of Securities | | | Proceeds from Sales
of Securities | |
Drexel Hamilton Multi-Asset Real Return Fund | | $ | 16,521,542 | | | $ | – | |
9. INDEMNIFICATIONS
Under the Trust’s organizational documents, its officers and Trustees are indemnified against certain liabilities relating to their duties to the Trust. Additionally, in the ordinary course of business, the Trust enters into contracts with service providers that may contain general indemnification clauses. The Trust’s maximum exposure under these arrangements is unknown, as this would involve future claims that may be made against the Trust that have not yet occurred.
10. FUND REORGANIZATIONS
Reorganization of the Ameristock Mutual Fund, Inc., into Drexel Hamilton Centre American Equity Fund
On September 19, 2012, the Board approved a form of Agreement and Plan of Reorganization that provided for the reorganization of the Ameristock Mutual Fund, Inc. (the “Acquired Fund”) and Drexel Hamilton Mutual Funds, on behalf of its series, the American Equity Fund (the “Acquiring Fund”). Under the plan, the Acquired Fund would be reorganized in the Acquiring Fund.
As of the close of business on January 11, 2013, the assets of the Acquired Fund were acquired by the Acquiring Fund in exchange for shares of the Acquiring Fund and the assumption by the Acquiring Fund of the liabilities of the Acquired Fund. Upon the closing of the reorganization, the Acquiring Fund issued 13,877,608 shares in exchange for net assets of the Acquired Fund valued at $130,033,182. The investment portfolio of the Acquired Fund, with a fair value of $122,680,756 and identified cost of $95,563,800 at January 11, 2013, was the principal asset acquired by the Fund. On January 14, 2013, the combined value of the Acquired Fund (which included realized losses of $(2,404,260) and unrealized appreciation of $27,116,956) and the Acquiring Fund was $141,597,250. The exchange of shares qualified as a tax-free reorganization for Federal income tax purposes. The unused capital loss carryforward totaled $37,278,632 for potential utilization and are subject to tax limitations.
Assuming the acquisition had been completed on October 1, 2012, the beginning of the annual reporting period of the Acquiring Fund, the Acquiring Fund’s pro forma results of operations for the year ended September 30, 2013, are as follows:
| | | | |
Net Investment Income | | $ | 1,537,659 | |
Net Realized and Unrealized Gain on Investments | | | 17,835,799 | |
Net Increase in Net Assets Resulting from Operations | | $ | 19,373,458 | |
| | | | | |
11. RECENT ACCOUNTING PRONOUNCEMENTS
In December 2011, the Financial Accounting Standards Board (FASB) issued Accounting Standards Update (ASU) No. 2011-11, Balance Sheet (Topic 210): Disclosures about Offsetting Assets and Liabilities. The amendments in the ASU enhance disclosures about offsetting of financial assets and liabilities to enable investors to understand the effect of these arrangements on a Fund’s financial position. In January 2013, FASB issued ASU No. 2013-01, Balance Sheet (Topic 210): Clarifying the Scope of Disclosures about Offsetting Assets and Liabilities. The amendments in ASU No. 2013-01 clarify the intended scope of disclosures required by ASU No. 2011-11. These ASUs are effective for interim and annual reporting periods beginning on or after January 1, 2013. The Funds believes the adoption of these ASUs will not have a material impact on its financial statements.
| | |
| Drexel Hamilton Mutual Funds | | Notes to Financial Statements |
| | September 30, 2013 |
In June 2013, the FASB issued ASU 2013-08, Amendments to the Scope, Measurement and Disclosure Requirements (“ASU 2013-08”), modifying Accounting Standards Codification (“ASC”) 946. The modifications were a result of a joint effort by the FASB and the International Accounting Standards Board to develop a consistent approach for determining whether an entity is an investment company for which fair value of investments is the most relevant measurement. ASU 2013-08 requires reporting entities to disclose that it is an investment company and is applying the guidance as set forth in ASC 946, to disclose any changes in, and the reasons for, its status as an investment company and to disclose information related to whether it has provided or is contractually required to provide financial support to any of its investees. The effective date of ASU 2013-08 is for interim and annual periods beginning after December 15, 2013. At this time, management is evaluating the implications of this requirement and the impact it will have to the financial statement amounts and footnote disclosures, if any.
12. SUBSEQUENT EVENTS
A Joint Special Meeting (the “Meeting”) of the Shareholders of the Funds was held on October 31, 2013 for the purpose of consideration of the proposed New Advisory Agreement. At the Meeting, the shareholders of each Fund considered and approved the new Investment Advisory Agreement between the Trust, on behalf of the Funds, and Centre Asset Management, LLC.
| | |
| Annual Report | September 30, 2013 | | 39 |
| | |
| Drexel Hamilton Mutual Funds | | Report of Independent Registered Public Accountant |
| | September 30, 2013 |
To the Board of Trustees and Shareholders of Drexel Hamilton Mutual Funds
We have audited the accompanying statements of assets and liabilities, including the schedules of investments, of Drexel Hamilton Centre American Equity Fund (“American Equity Fund”), Drexel Hamilton Centre Global Equity Fund (“Global Equity Fund”), and Drexel Hamilton Multi-Asset Real Return Fund (“Real Return Fund”) (collectively, the “Funds”), each a series of Drexel Hamilton Mutual Funds (the “Trust”) as of September 30, 2013 and: (a) the related statements of operations for the year ended September 30, 2013 and the changes in net assets and financial highlights for the year ended September 30, 2013 and the period December 21, 2011 (inception) through September 30, 2012 for the American Equity Fund and the Global Equity Fund; and (b) the related statement of operations, changes in net assets and financial highlights for the period October 9, 2012 (inception) through September 30, 2013 for the Real Return Fund. These financial statements are the responsibility of the Funds’ management. Our responsibility is to express an opinion on these financial statements based on our audits.
We conducted our audits in accordance with the standards of the Public Company Accounting Oversight Board (United States). Those standards require that we plan and perform the audits to obtain reasonable assurance about whether the financial statements are free of material misstatement. An audit includes examining, on a test basis, evidence supporting the amounts and disclosures in the financial statements and financial highlights. Our procedures included confirmation of securities owned as of September 30, 2013 by correspondence with the custodian. An audit also includes assessing the accounting principles used and significant estimates made by management, as well as evaluating the overall financial statement presentation. We believe that our audits provide a reasonable basis for our opinion.
In our opinion, the financial statements referred to above present fairly, in all material respects, the financial position of the Drexel Hamilton Centre American Equity Fund, Drexel Hamilton Centre Global Equity Fund, and Drexel Hamilton Multi-Asset Real Return Fund as of September 30, 2013, and the results of their operations, the changes in their net assets, and the financial highlights for the periods noted above for each of the respective Funds, in conformity with U.S. generally accepted accounting principles.

Walnut Creek, California
November 26, 2013
| | |
| Drexel Hamilton Mutual Funds | | Additional Information |
| | September 30, 2013 (Unaudited) |
PROXY VOTING GUIDELINES
A description of the policies and procedures that the Funds used to determine how to vote proxies relating to portfolio securities and information regarding how the Funds voted proxies during the most recent 12-month period ended June 30, is available without charge upon request by (1) calling the Funds at (888) 848-7569 and (2) from Form N-PX filed by the Trust with the Securities and Exchange Commission (“SEC”) on the SEC’s website at www.sec.gov.
PORTFOLIO HOLDINGS DISCLOSURE POLICY
The Trust files, with regard to each Fund, with the SEC a complete schedule of investments for the first and third quarter of each fiscal year on Form N-Q. The Funds’ first and third fiscal quarters end on December 31 and June 30. The Form N-Q filing must be made within 60 days of the end of the quarter, and the Trust’s first Form N-Q was filed with the SEC on February 27, 2012. Forms N-Q are available on the SEC’s website at www.sec.gov, and may be reviewed and copied at the SEC’s Public Reference Room in Washington, DC (call 1-800-732-0330 for information on the operations of the Public Reference Room). You may also obtain copies by calling the Funds at 1-855-298-4236.
APPROVAL OF INVESTMENT ADVISORY AGREEMENT
Effective September 14, 2013, Centre Asset Management, LLC (“Centre”) acquired all of the assets, and assumed all of the liabilities, of Drexel Hamilton Investment Partners, LLC (the “Transaction”). Until September 14, 2013, Drexel Hamilton Investment Partners, LLC (“DHIP”) served as the investment adviser to the Drexel Hamilton Centre American Equity Fund (the “American Equity Fund”), the Drexel Hamilton Centre Global Equity Fund (the “Global Equity Fund”) and the Drexel Hamilton Multi-Asset Real Return Fund (the “Multi-Asset Real Return Fund” together with the American Equity Fund and the Global Equity Fund, the “Funds”) pursuant to existing investment advisory agreements between DHIP and the Trust, on behalf of the Funds (the “Previous Advisory Agreements”), and Centre served as the sub-adviser to the American Equity Fund and the Global Equity Fund pursuant to existing sub-advisory agreements between DHIP and Centre (the “Previous Sub-Advisory Agreements”).
Approval of Previous Sub-Advisory Agreements on behalf of the American Equity Fund and the Global Equity Fund
At an in-person meeting held on May 23, 2013, the Trustees, including the Independent Trustees, reviewed and unanimously approved the renewal of the Previous Sub-Advisory Agreements for the American Equity Fund and the Global Equity Fund. In connection with this review, the Board reviewed statements of, and materials provided by or relating to, Centre, including, among other things, the expertise and experience of Centre’s investment personnel and Centre’s investment approach, which focuses on both fundamental stock selection and quantitative portfolio construction, and the services provided by Centre to each Fund under the applicable Previous Sub-Advisory Agreement, the Funds’ absolute and relative performance, as well as the Funds’ total operating expense ratios and advisory fees compared to their respective peer funds and to Centre’s other advisory clients.
In approving the Agreements, the Board, including the Independent Trustees, considered and made the following conclusions with respect to the following relevant factors.
Nature, Extent and Quality of Services
The Trustees considered information provided to them concerning the services performed by Centre as sub-adviser for each of the Funds pursuant to the Previous Sub-Advisory Agreements. The Trustees reviewed information concerning the nature, extent, and quality of sub-advisory services provided by Centre, including information concerning the personnel responsible for the day-to-day portfolio management of Funds, the investment style and approach of Centre, and Centre’s performance record and overall reputation. The Trustees also considered information describing Centre’s compliance policies and procedures, including policies reasonably designed to ensure each Fund’s compliance with its investment objective, policies, and restrictions and applicable regulatory requirements. The Trustees noted that the Funds, and the services provided by Centre to the Funds, differed from Centre’s other advisory accounts because such accounts are not subject to the same regulatory requirements as the Funds, may have different investment restrictions, holdings and goals than the Funds and require different levels of servicing than the Funds. The Trustees considered their discussion with sub-advisory personnel about Centre’s compliance program. The Trustees also considered their discussions with sub-advisory personnel about Centre’s responses to the questions presented by Trust counsel in its Section 15(c) request letter. The Trustees noted the relationship between Centre and DHIP, as the Funds’ investment adviser, and the ownership structures of each. In light of such relationship and ownership structures, they discussed the stated reasons as to why DHIP initially selected Centre as the sub-adviser to recommend for Board approval and agreed that they were satisfied with such response. The Trustees concluded that the nature, extent and quality of services provided by Centre to each Fund were appropriate and sufficient to support renewal of the Previous Sub-Advisory Agreements.
| | |
| Annual Report | September 30, 2013 | | 41 |
| | |
| Drexel Hamilton Mutual Funds | | Additional Information |
| | September 30, 2013 (Unaudited) |
Investment Performance
The Trustees considered information regarding the performance of each Fund, including Centre’s views on such performance. The Trustees considered information reflecting that, for the 2012 calendar year, the American Equity Fund returned 13.09% compared to the S&P 500 Index’s return of 15.22%, and that the Global Equity Fund returned 18.37% compared to the MSCI All World Index’s return of 16.13%. The Trustees also reviewed and considered the performance of similarly situated mutual funds for the six-month, one-year and since inception periods ended March 31, 2013, noting that the performance of each Fund was comparable to, and within the range of performance of, such similarly situated funds.
Sub-Advisory Fees
The Trustees considered information concerning the sub-advisory fees paid to Centre under the Previous Sub-Advisory Agreements, including information comparing the investment advisory and sub-advisory fees paid with respect to the Funds to the fees charged to similarly situated mutual funds. They also noted that Centre had entered into an agreement with DHIP to waive or limit the sub-advisory fees in a manner that was consistent with the expense limitation agreement between the Trust and DHIP. In addition, the Trustees considered each Fund’s asset size and relatively short period of operation, well as Centre’s management of the portfolios in a manner that was consistent with Centre’s investment philosophy and the Funds’ investment objectives. After reviewing information presented to them concerning fees, expenses, performance and other matters, the Trustees concluded that the sub-advisory fees paid to Centre under the Previous Sub-Advisory Agreements were reasonable in light of the services provided.
Profitability and Other Benefits
The Trustees considered information regarding the estimated profitability of the Funds to Centre. They considered their discussions with sub-advisory personnel about Centre’s ability to receive benefits in the form of soft-dollar credits for research as a result of the allocation of its advisory clients’ brokerage, including the Funds’ brokerage, to certain brokers and dealers. The Trustees concluded that the estimated profitability of the Funds to Centre was not such as to prevent them from approving the renewal of each Previous Sub-Advisory Agreement.
Economies of Scale
The Trustees considered information concerning economies of scale for the American Equity Fund and the Global Equity Fund, including the current assets of each Fund. In particular, the Trustees noted that the sub-advisory fees were paid by DHIP, not the Funds, and that the Funds remained subject to an expense limitation agreement covering the advisory fees charged to the Funds. The Trustees also considered the Funds’ assets under management, noting that the increase in assets of the American Equity Fund was primarily due to the Fund’s acquisition of Ameristock Mutual Fund, Inc. They concluded that this factor was not as to prevent them from approving the renewal of the Previous Sub-Advisory Agreements, and that no modification to the existing sub-advisory arrangements was warranted based on economies of scale.
Conclusion
The Trustees concluded their consideration of the Previous Sub-Advisory Agreements, noting that their decision was based on an evaluation of the totality of factors and information presented or available to them and not on any one factor, report, representation or response.
Approval of Interim Advisory Agreements and New Advisory Agreements on behalf of the American Equity Fund, the Global Equity Fund and the Multi-Asset Real Return Fund
At an in-person meeting held on September 13, 2013, the Trustees, including the Independent Trustees, considered and unanimously approved (i) interim investment advisory agreements (the “Interim Advisory Agreements”) for the American Equity Fund, the Global Equity Fund and the Multi-Asset Real Return Fund and (ii) new investment advisory agreements (the “New Advisory Agreements,” together with the Interim Advisory Agreements, the “Agreements”) for the Funds, based on its review of the Transaction, the information Centre provided about the Transaction’s effect on the Agreements and the Funds and the information Centre provided in response to requests for information made pursuant to Section 15(c) of the Investment Company Act of 1940 Act, as amended (the “Section 15(c) Information”).
In connection with its determinations, the Board considered, among other things, the following information:
| | (i) | there is not expected to be any diminution in the nature, quality and extent of services provided to a Fund and its shareholders by Centre; |
| | (ii) | the Transaction is not expected to result in any changes in the investment adviser’s investment approach with respect to a Fund; |
| | (iii) | the advisory fee rates charged to a Fund under the New Advisory Agreements will not change as a result of the Transaction; |
| | (iv) | the New Advisory Agreements do not materially differ from the Previous Advisory Agreements, except for the effective and termination dates; |
| | |
| Drexel Hamilton Mutual Funds | | Additional Information |
| | September 30, 2013 (Unaudited) |
| | (v) | the information contained in Centre’s Section 15(f) representation; and |
| | (vi) | Centre has agreed to pay all expenses of a Fund in connection with the Board’s consideration of the New Advisory Agreements and all costs of soliciting shareholder proxies and, as a result, a Fund will bear no costs in obtaining shareholder approval of the New Advisory Agreements. |
In its deliberations on the Agreements, the Board also considered the Section 15(c) Information provided to it by Centre. The Board did not identify any particular information that was all-important or controlling, and evaluated all information available to it. The Board concluded, on the basis of each Trustee’s business judgment after considering all of the factors taken as a whole, that the terms of the Agreements are appropriate, that the fees to be paid are reasonable in light of the services to be provided to each Fund, that the Agreements should be approved, and that the New Advisory Agreements should be recommended to Fund shareholders for their approval. In approving the Agreements, the Board, including the Independent Trustees, considered and made the following conclusions with respect to the following relevant factors.
Nature, Extent and Quality of Services Provided by Centre
The Board reviewed the scope of services to be provided by Centre. The Board considered the scope of services Centre provides to its other advisory clients and the scope of services it previously provided in its capacity as the sub-adviser of the American Equity Fund and the Global Equity Fund.
As to each Fund, the Board considered the nature and quality of services to be provided by or overseen by Centre on behalf of the Funds. The Board considered the compliance procedures of Centre, including its trade allocation procedures, and the internal control systems of Centre. The Board also considered Centre’s resources, including its in-house research capabilities, and future plans for each Fund. On the basis of these factors, the Board then determined that the nature and quality of the services to be provided by or overseen by Centre were consistent with its duties under the Agreements and appropriate and consistent with the investment program of each Fund.
Based on this review, the Board concluded that the range and quality of services to be provided by Centre to the Funds were appropriate.
Centre Profitability
The Board reviewed Centre’s potential profitability. The Board considered representations made by Centre with respect to (i) the potential profitability of managing the Funds to Centre, and (ii) other benefits that might accrue to Centre as a result of its relationship with the Funds. Those benefits include the fact that the Funds’ public performance record may at times attract inquiries regarding Centre’s advisory services and may result in the acquisition of new advisory clients. The Board determined that these factors would not prevent the Board from approving the Agreements.
Economies of Scale
The Board reviewed information regarding potential economies of scale or other efficiencies resulting from increases, if any, in the Funds’ respective asset levels. The Board considered economies of scale and whether existing fees might require adjustment.
The Board did not believe that any modification of existing fee levels was necessary in light of the fact that each Fund’s total annual expense ratio was comparable to the average and median expense ratios of the Fund’s peers included in the statistical information provided by Centre, some of which was derived from information made available publicly on Morningstar.com and some of which was derived from information provided by Centre and the Funds’ administrator.
Comparisons of the Services to be Rendered and Fee Amounts
The Board reviewed the fees to be paid to Centre and the Funds’ overall expense ratios and considered whether the fees were reasonable in light of the services to be provided by Centre and the fees charged by other advisers to similarly-situated funds. In evaluating the Funds’ advisory fees, the Board also took into account the demands, complexity and quality of the investment management of the Funds.
Although the Board discussed the fees received by Centre from its other advisory clients, the Board did not compare those fees and the fees to be paid to Centre by the Funds due to differences in the services provided to those advisory clients and the Funds and to differences between the contractual and regulatory requirements applicable to the Funds and those other advisory clients.
The Board noted that the investment advisory fees to be paid to Centre under the New Advisory Agreements would be the same as the investment advisory fees paid to DHIP under the Previous Advisory Agreements. The Board also reviewed the Funds’ investment advisory fee and total expense information, as compared to those of peer groups of mutual funds compiled by Centre. The Board observed that the investment advisory fees to be paid under the New Advisory Agreements and the total expense ratio of the Funds were comparable to the average investment advisory fees and total expense ratios of each Fund’s peer group of funds. The Board also noted that Centre agreed to enter into or assume an expense limitation agreement with substantially the same terms as the previous expense limitation agreement with DHIP. Based their review of the information made available to them and matters discussed at the meeting, the Trustees concluded that, with respect to each Fund, the investment advisory fee was reasonable and that total net expense ratio was reasonable and satisfactory in light of the services provided.
| | |
| Annual Report | September 30, 2013 | | 43 |
| | |
| Drexel Hamilton Mutual Funds | | Additional Information |
| | September 30, 2013 (Unaudited) |
The Board concluded, therefore, that the fees to be charged by Centre are reasonable in light of the quality and nature of the services to be provided by Centre.
Conclusion
The Trustees noted that the services to be provided under the Agreements do not materially differ from those provided under each of the Previous Advisory Agreements. The Trustees concluded that the advisory fee rates are reasonable in relation to the services to be provided and that the Agreements are in the best interests of the respective Fund’s shareholders. The Trustees concluded also that it was appropriate for Centre to be compensated for its services under the Interim Advisory Agreements by the payment to Centre of the advisory fees escrowed pursuant to escrow agreements.
| | |
| Drexel Hamilton Mutual Funds | | Trustees and Officers |
| | September 30, 2013 |
The following tables provide certain information regarding the Trustees and Officers of Drexel Hamilton Mutual Funds as of September 30, 2013 of each of the persons currently serving as a Trustee or Officer of the Trust. Unless otherwise noted, the business address of each Trustee or Officer is 45 Rockefeller Plaza, Suite 2000, New York, NY 10111.
INDEPENDENT TRUSTEES1
| | | | | | | | | | |
Name, Address & Age | | Position(s)
Held with
Funds or
Trust | | Length of
Time Served | | Principal Occupation(s) During Past 5 Years | | Number of
Portfolios in
Fund
Complex
Overseen by
Trustee | | Other
Directorships
Held by
Trustee During
Past 5 Years |
Dr. James L. Grant Age: 63 | | Trustee,
Chairman | | Since 6/2011 | | President of JLG Research from 1999–present; Assistant Professor of Accounting and Finance at University of Massachusetts Boston from 2005–2011; Advisory Analyst at major Wall Street firms from 1999- present; Ph.D in Business from the University of Chicago Booth School of Business; member of Editorial Advisory Boards of The Journal of Portfolio Management and Journal of Investing; author of Foundations of Economic Value Added Second Edition; co-author of Focus on Value: A Corporate and Investor Guide to Wealth Creation; co-author and co-editor (with Frank J. Fabozzi) of Equity Portfolio Management and Value-Based Metrics: Foundations and Practice. | | 3 | | None |
Dr. Aloke Ghosh Age: 49 | | Trustee | | Since 6/2011 | | Professor of Accountancy at the Zicklin School of Business, Baruch College, The City University of New York from 1993-present; Director of the Executive MS in Financial Statement Analysis and Securities Valuation from 2008-present; Doctoral Program Coordinator of Accountancy at the Zicklin School of Business of Baruch College from 2005-2011; Accounting Academic Fellow at the U.S. Securities and Exchange Commission from 2003-2005; Visiting Associate Professor at the Goizueta Business School of Emory University from 1999-2005; accounting consultant to several leading hedge funds in the U.S. and around the world including acting as a consultant for Gerson Lehrman Group; Ph.D. in Business and Economics from Tulane University. | | 3 | | None |
Joseph M. Marinaro Age: 55 | | Trustee | | Since 6/2012 | | Executive Vice President, AltX Group, Inc. (financial technology) 2012 to present; Managing Director at Surge Trading, Inc. 2009 to 2011; Managing Director, JMM Capital, Inc. 2008 to 2009; Managing Director, Morgan Stanley 2006 to 2008. | | 3 | | None |
| 1 | An “Independent Trustee” is one who is not considered an “interested person” of the Trust, as that term is defined in Section 2(a)(19) of the 1940 Act. |
| | |
| Annual Report | September 30, 2013 | | 45 |
| | |
| Drexel Hamilton Mutual Funds | | Trustees and Officers |
| | September 30, 2013 (Unaudited) |
INTERESTED TRUSTEES
| | | | | | | | | | |
Name, Address & Age | | Position(s)
Held with
Funds or
Trust | | Length of
Time Served | | Principal Occupation(s) During Past 5 Years | | Number of
Portfolios in
Fund
Complex
Overseen by
Trustee | | Other
Directorships
Held by
Trustee During
Past 5 Years |
James A. Abate Age: 48 | | Trustee | | Since 6/2011 | | Managing Director, Centre Asset Management and Fund Manager for Centre’s American Equity and Absolute Return strategies from 2006-present; US Investment Director for GAM from 2001-2006; Managing Director and Portfolio Manager at Credit Suisse Asset Management from 1995-2000; Manager in Price Waterhouse’s Valuation/Corporate Finance Group from 1987-1993; BS in Accounting from Fairleigh Dickinson University and an MBA in Finance from St. John’s University; Visiting Professor in the graduate program at the Zicklin School of Business, Baruch College; commissioned officer in the U.S. Army (and Reserves) from 1983-1990. | | 3 | | None |
|
OFFICERS |
Name, Address & Age | | Position(s)
Held with
Funds or
Trust | | Length of
Time Served | | Principal Occupation(s) During Past 5 Years | | Number of
Portfolios in
Fund
Complex
Overseen by
Trustee | | Other
Directorships
Held by
Trustee During
Past 5 Years |
Theodore J. Uhl Age: 38 1290 Broadway, Suite 1100 Denver, CO 80203 | | Chief
Compliance
Officer | | Since 6/2011 | | Mr. Uhl joined ALPS Fund Services in October 2006, and is currently Deputy Compliance Officer of ALPS. Prior to his current role, Mr. Uhl served as Senior Risk Manager for ALPS from October 2006 until June 2010. Before joining ALPS, Mr. Uhl served a Sr. Analyst with Enenbach and Associates (RIA), and a Sr. Financial Analyst at Sprint. | | N/A | | N/A |
Andrew Bang Age: 44 | | President
and
Treasurer | | Since 6/2011 | | Partner and Managing Director of Drexel Hamilton Investment Partners, LLC from 2010-2013; Consultant (Business Development for private equity and hedge funds) from 2008-2010; Senior Vice President at Shinhan Investment America from 2007-2008; Vice President, Relationship Manager at AIG Global Investments from 2006-2007;Client Portfolio Manager at GE Asset Management (GEAM) pension group from 2001-2005; Client Relationship Manager at GE Equity’s start-up private equity group, Venturemine.com from 2000-2001; Manager, International Equity at UBS from 1998-2000; Captain in the U.S. Army from 1992-1998; United States Military Academy at West Point, B.S.; Johnson Graduate School of Management, Cornell University, MBA. | | N/A | | N/A |
Page Intentionally Left Blank.
Page Intentionally Left Blank.

Must be accompanied or preceded by a prospectus. ALPS
Distributors, Inc., distributor for Drexel Hamilton Mutual Funds.
Item 2. Code of Ethics.
| | (a) | The Registrant, as of the end of the period covered by this report, has adopted a code of ethics that applies to the Registrant’s principal executive officer, principal financial officer, principal accounting officer or controller or any persons performing similar functions on behalf of the Registrant. |
| | (c) | During the period covered by this report, no amendments were made to the provisions of the code of ethics adopted in Item 2(a) above. |
| | (d) | During the period covered by this report, no implicit or explicit waivers to the provisions of the code of ethics adopted in Item 2(a) above were granted. |
| | (f) | The Registrant’s Code of Ethics is attached as an Exhibit to this report. |
Item 3. Audit Committee Financial Expert.
The Board of Trustees of the Registrant has determined that the Registrant has at least one audit committee financial expert serving on its audit committee. The Board of Trustees has designated Dr. Aloke Ghosh as the Trust’s “audit committee financial expert,” as defined in Form N-CSR under the 1940 Act, based on the Board’s review of his qualifications. Dr. Ghosh is “independent” as defined in paragraph (a)(2) of Item 3 to Form N-CSR.
Item 4. Principal Accountant Fees and Services.
| | (a) | Audit Fees: For the Registrant’s fiscal years ended September 30, 2013 and September 30, 2012, the aggregate fees billed for professional services rendered by the principal accountant for the audit of the Registrant’s annual financial statements were $36,000 and $15,550, respectively. |
| | (b) | Audit-Related Fees: For the Registrant’s fiscal years ended September 30, 2013 and September 30, 2012, the aggregate fees billed for assurance and related services by the principal accountant that are reasonably related to the performance of the audit of the Registrant’s annual financial statements and are not reported under paragraph (a) of this Item were $0 and $0, respectively. |
| | (c) | Tax Fees: For the Registrant’s fiscal years ended September 30, 2013 and September 30, 2012, the aggregate fees billed for professional services rendered by the principal accountant for tax compliance, tax advice, and tax planning were $9,000 and $7,000, respectively. The fiscal years 2013 and 2012 tax fees were for services for dividend calculation, excise tax preparation and tax return preparation. |
| | (d) | All Other Fees: For the Registrant’s fiscal years ended September 30, 2013 and September 30, 2012, the aggregate fees billed by the principal accountant for services other than the services reported in paragraphs (a) through (c) of this item were $0 and $0, respectively. |
| | (e)(1) | Audit Committee Pre-Approval Policies and Procedures: All services to be performed by the Registrant’s principal accountant must be pre-approved by the Registrant’s audit committee. |
| | (e)(2) | No services described in paragraphs (b) through (d) were approved pursuant to paragraph (c)(7)(i)(C) of Rule 2-01 of Regulation S-X. |
| | (g) | The aggregate non-audit fees billed by the Registrant’s principal accountant for the fiscal years ended September 30, 2013 and September 30, 2012 were $0 and $0, respectively. |
Item 5. Audit Committee of Listed Registrants.
Not applicable.
Item 6. Investments.
The Schedule of Investments is included as part of the Report to Stockholders filed under Item 1 of this report.
Item 7. Disclosure of Proxy Voting Policies and Procedures for Closed-End Management Investment Companies.
Not applicable.
Item 8. Portfolio Managers of Closed-End Management Investment Companies.
Not applicable.
Item 9. Purchases of Equity Securities by Closed-End Management Investment Company and Affiliated Purchasers.
Not applicable.
Item 10. Submission of Matters to a Vote of Security Holders.
There have been no material changes to the procedures by which shareholders may recommend nominees to the Registrant’s Board of Trustees.
Item 11. Controls and Procedures.
| | (a) | The Registrant’s principal executive and principal financial officers, or persons performing similar functions, have concluded that the Registrant’s disclosure controls and procedures (as defined in Rule 30a-3(c) under the Investment Company Act of 1940, as amended (the “1940 Act”) (17 CFR 270.30a-3(c))) are effective, as of a date within 90 days of the filing date of this report that includes the disclosure required by this paragraph, based on their evaluation of these controls and procedures required by Rule 30a-3(b) under the 1940 Act (17 CFR 270.30a-3(b)) and Rules 13a-15(b) or 15d-15(b) under the Securities Exchange Act of 1934, as amended (17 CFR 240.13a-15(b) or 240.15d-15(b)). |
| | (b) | No changes in the Registrant’s internal control over financial reporting (as defined in Rule 30a-3(d) under the 1940 Act (17 CFR 270.30a-3(d)) occurred during the Registrant’s second fiscal quarter of the period covered by this report that have materially affected, or are reasonably likely to materially affect, the Registrant’s internal control over financial reporting. |
Item 12. Exhibits.
| (a)(1) | The Registrant’s Code of Ethics (Amended and Restated as of August 29, 2012), which is the subject of the disclosure required by Item 2 of Form N-CSR, was filed as Ex. 12(A)(1) to the Registrant’s
Form N-CSR filed with the Securities and Exchange Commission on December 7, 2012 and is incorporated by reference herein. |
| | (a)(2) | The certifications required by Rule 30a-2(a) under the 1940 Act, as amended, and Section 302 of the Sarbanes-Oxley Act of 2002 are attached hereto as Ex99.Cert. |
| | (b) | The certifications by the Registrant’s principal executive officer and principal financial officer, as required by Rule 30a-2(b) under the 1940 Act and Section 906 of the Sarbanes-Oxley Act of 2002 are attached hereto as Ex99.906Cert. |
SIGNATURES
Pursuant to the requirements of the Securities Exchange Act of 1934 and the Investment Company Act of 1940, the Registrant has duly caused this report to be signed on its behalf by the undersigned, thereunto duly authorized.
DREXEL HAMILTON MUTUAL FUNDS
| | |
By: | | /s/ James A. Abate |
| | James A. Abate |
| | President (Principal Executive Officer) |
| |
Date: | | December 6, 2013 |
Pursuant to the requirements of the Securities Exchange Act of 1934 and the Investment Company Act of 1940, this report has been signed below by the following persons on behalf of the Registrant and in the capacities and on the dates indicated.
| | |
By: | | /s/ James A. Abate |
| | James A. Abate |
| | President (Principal Executive Officer) |
| |
Date: | | December 6, 2013 |
| |
By: | | /s/ Vu Phong Nguyen |
| | Vu Phong Nguyen |
| | Treasurer (Principal Financial Officer) |
| |
Date: | | December 6, 2013 |