UNITED STATES
SECURITIES AND EXCHANGE COMMISSION
Washington, D.C. 20549
FORM N-CSR
CERTIFIED SHAREHOLDER REPORT OF REGISTERED
MANAGEMENT INVESTMENT COMPANIES
Investment Company Act file number: 811-22545
CENTRE FUNDS
(Exact name of registrant as specified in charter)
48 Wall Street, Suite 1100, New York, New York 10005
(Address of principal executive offices) (Zip code)
James A. Abate
48 Wall Street, Suite 1100
New York, New York 10005
(Name and address of agent for service)
Registrant’s telephone number, including area code: (212) 918-4705
Date of fiscal year end: September 30
Date of reporting period: October 1, 2013 – September 30, 2014
Item 1. Reports to Stockholders.
TABLE OF CONTENTS
| | |
| Centre Funds | | Shareholder Letter |
| | September 30, 2014 (Unaudited) |
Dear Shareholders,
It is with my pleasure that we publish the Centre Funds annual report covering the one year period ending September 30, 2014 and I want to thank my fellow shareholders for their continued support and confidence in the Centre Funds.
In January 2014, the Trust changed its name to Centre Funds following the Board of Trustees and the Funds’ shareholders approving the change in investment adviser of each existing Fund to Centre Asset Management, LLC. Later in January 2014, the Trust launched the Centre Active U.S. Treasury Fund to expand its offerings and continue its focus on delivering fundamentally-driven, specialist active funds in core investment strategies to our clients.
The Centre Funds offer four differentiated funds to choose from, each available in investor and institutional share classes, and offer investors true active management using specialist talent across a target range of funds that includes the:
| | • | | Centre American Select Equity Fund |
U.S. large capitalization valuation sensitive growth stock fund that seeks long-term growth of capital and is focused on blue-chip securities and risk adjusted returns through active management.
| | • | | Centre Global Select Equity Fund |
Foreign large capitalization stock fund that seeks long-term growth of capital and focuses on intrinsic value and strategic geographic allocation in portfolio construction. The Fund invests in international developed markets’ blue chip companies and emerging blue chips from the developing world.
| | • | | Centre Active U.S. Treasury Fund |
U.S. Treasury securities fund that seeks to maximize investors’ total return through capital appreciation and current income using active duration management of U.S. Treasury securities and cash equivalents. Portfolio has the potential for capital appreciation/preservation in various interest rate environments through a proprietary interest rate forecasting process that aims to take advantage of interest rate changes through active duration management.
| | • | | Centre Multi-Asset Real Return Fund |
Asset allocation fund that seeks real return by using a systematic, flexible process of tactical allocation to broad asset classes (underlying funds, U.S. and non-U.S. equities, fixed income securities, including Treasury Inflation-Protected Securities, exchange-traded notes and exchange-traded funds with returns that track broad commodity indices or the price of gold bullion, and cash and equivalents) with the goal of preserving and growing investment capital in excess of inflation.
Our aim at Centre Funds is to deliver strong, long-term performance results for our clients through an exceptional focus on producing returns and managing risk in a select number of investment strategies. Each investment strategy aims to capitalize on defined market opportunities using talented and experienced Portfolio Managers with differentiated, consistent and repeatable investment processes. At Centre Funds, we place service excellence at the core of everything that we do and are committed to providing useful, high quality information on all of our Funds. Our Portfolio Managers remain focused on fundamentally-driven investment approaches within truly active, high conviction, disciplined and research intensive processes.
Sincerely,
James Abate
President, Centre Funds
Mutual fund investing involves risks, including loss of principal. Investors should consider a Fund’s investment objective, risks, charges and expenses carefully before investing. Any performance data quoted herein represents past performance and does not guarantee future results. The investment return and principal value of an investment in the Fund will fluctuate so that an investor’s shares, when redeemed, may be worth more or less than their original cost. Current performance may be lower or higher than any performance data provided herein. Most recent month-end performance, and answers to any questions you may have, can be obtained by calling 1-855-298-4236.
| | |
Annual Report | September 30, 2014 | | 1 |
| | |
| Centre American Select Equity Fund | | Manager Commentary |
| | September 30, 2014 (Unaudited) |
Performance & Strategy Summary
For the one year period ended September 30, 2014, the Centre American Select Equity Fund, Investor Share Class, delivered a total return of 17.3%. The Institutional Share Class, which launched on January 21, 2014, delivered a total return of 6.1% from its inception through September 30, 2014.
During the past one year period, sectors such as Technology, Health Care, Materials, Financials, and Industrials were market leaders whilst sectors such as Telecomm, Consumer Discretionary, and Energy lagged. Our principal sector exposures over the year were Technology, Health Care, and Industrials driven by bottom-up stock level opportunities and we maintain our general avoidance of the Financials sector as regulatory scrutiny and increased capital requirements continue to depress returns on equity and intrinsic values. Stocks that were the strongest performers within the Fund over the one year period ended September 30, 2014 included those within Technology – Micron, SanDisk, and Microsoft; within Industrials – Delta Air Lines, General Dynamics, and Union Pacific; and within Energy – Halliburton, Schlumberger, and EOG Resources. Sectors and stocks that negatively impacted relative performance included within Staples – Avon Products; within Consumer Discretionary – Las Vegas Sands, Priceline, and Amazon; and within Materials select gold miners such as Gold Corp and Eldorado Gold. Furthermore, the Fund was negatively impacted by the amortization costs of certain hedges and other investments that we deemed to be capital protective in nature but proved untimely in a strongly rising stock market over the past one year period. As of September 30, 2014, the Fund continued to hold capital protection hedges given certain potentially de-stabilizing factors that we believe could impact systematically the value of the underlying equity securities held in the Fund.
As always, our process in managing the Fund is to focus bottom-up on each individual company’s growth outlook and capacity to create shareholder value utilizing a “bottom-up”1 fundamental stock selection process. We utilize a disciplined, Economic Value Added (EVA)2 framework to select investments. The framework focuses on the fundamentals of wealth creation and wealth destruction similar to the way a traditional, long-term focused corporate financier looking at all aspects of the business would assess a company’s value. In the shorter-term, markets may often undervalue or overvalue a company’s ability to create or destroy wealth. The framework seeks to identify and exploit these investment opportunities. The approach is designed to capture excess returns when the market price of a stock converges toward our target price. We analyze not only earnings but we also strive to understand and link the capital allocation decisions being made today by each company and how they will lead to future earnings growth. In other words, we expect companies to invest in productive assets of the business, organically and through opportunistic purchases which, in turn, should provide the foundation for future revenue and profits growth that will create shareholder value. Alternatively, if companies cannot invest in productive assets due to a cyclical downturn or existing excess capacity, we expect these companies to “wisely contract” through the restructuring of their assets and other resources to regain their footing for future shareholder value creation. Our top-down views on interest rates and risk premiums are important as many of those are inputs into our company models and, at the end of the day, reconciled to the bottom-up information we gather and process from company performance. The end result is our attempt to deliver a Fund with attractive risk adjusted returns over the long term. The Fund may employ hedges and other capital protective strategies when deemed appropriate.
Market Review & Outlook
The current bull market which began in early 2009 from the depths of the financial crisis now ranks as one of the strongest and longest lasting bull markets in US stock market history. Inexpensive valuations, Federal Reserve easing of interest rates, and a cyclical recovery in profits led by improved margins and returns on capital from recessionary lows were the ingredients for its start and magnitude. As the bull market advanced, certain of these drivers contributed more than others during different phases of its maturity. Our optimistic cyclical outlook for the U.S. economy as well as U.S. stocks from early 2009 was anchored in our belief that the restructuring and streamlining of corporations we witnessed after the collapse of Lehman Brothers and during the successive recession was the most effective, efficient and broad-based that we have seen in our careers. Most investors underappreciated that profit margins and asset efficiency were going to reach and, in some cases, surpass prior peak levels despite a top-line revenue environment that would remain challenging. By the spring of 2012, we no longer felt that the U.S. stock market could rely upon strong profit growth to power its advance. Accordingly, the proportion of stocks held by the Centre American Select Equity Fund which could be characterized as economically sensitive fell from about one half down to less than one third of net assets. Our emphasis then shifted to more stable, consistent earnings-type stocks in anticipation of a change in attribution away from cyclical profit recovery to stability. Our allocation to what we call “Defensive Value” or “Stable Growth” and away from “Cyclical Growth” increased significantly as we saw the profit picture across the board becoming more difficult and fewer companies being able to generate earnings growth in the current environment. While continuing our bullish view on equities but recognizing that the driver of returns was being passed at this stage, we expected the principal driver of stock market returns to be a positive re-rating of shares resulting in expanding price to earnings3 and other valuation multiples due to still low interest rates as well as lower economic and stock market volatility as the difficulties of 2008-9 faded leading to reduced investor risk premiums for equities. Accordingly, between June 2012 and September 2014 the S&P 500 Index witnessed its price to earnings multiple rise from 13.6 times to 18.1 times based upon trailing twelve month earnings. This nearly one-third increase in valuation multiples contributed to the majority of stock price gains over the period.
| 1 | Bottom-up - An investment approach that de-emphasizes the significance of economic and market cycles. This approach focuses on the analysis of individual stocks. In bottom-up investing, therefore, the investor focuses his or her attention on a specific company rather than on the industry in which that company operates or on the economy as a whole. |
| 2 | EVA® is a registered service mark of EVA Dimensions LLC. Economic Value Added (EVA) - An estimate of a firm’s economic profit - being the value created in excess of the required return of the company’s investors (being shareholders and debt holders). Quite simply, EVA is the profit earned by the firm less the cost of financing the firm’s capital. The idea is that value is created when the return on the firm’s economic capital employed is greater than the cost of that capital. |
| 3 | Price-to-Earnings - A valuation ratio of a company’s current share price compared to its per-share earnings. |
| | |
| Centre American Select Equity Fund | | Manager Commentary |
| | September 30, 2014 (Unaudited) |
At this stage, we see the sustainability of the recent pickup in U.S. economic activity being almost wholly dependent upon a significant increase of business capital investment which is highly vulnerable to economic weakness in Europe, Asia, and emerging markets. With returns on invested capital decelerating (leading indicator), we see little incentive for a sharp pickup in business investment and U.S. companies continue to show a strong preference for cash flow use directed towards share repurchases and dividends rather than reinvestment. Thus, in illustrating where we stand today versus early 2009 we make the following observations:
| | • | | The S&P 500 Index (ex-Financials) is at its most expensive valuation level ever using certain valuation metrics based on revenues given the incredibly high level of earnings as a result of profit margin improvements and asset efficiency (negative for stocks); |
| | • | | The “typical” catalysts of high asset growth (earnings are now growing faster than assets which is good), a rise in interest rates, or an increase in costs of goods and labor resulting in a contraction in profit margins are not yet evident (positive for stocks); and |
| | • | | The indicators to adopt a longer-term secular bullish posture on equities, namely innovation and productivity driven capital investment that can provide the foundation for improving top-line revenue growth, are not evident (negative for stocks). |
With what we see as a much less friendly systemic backdrop for equities as a whole, our focus remains on stock selection rather than sector/industry themes to achieve out-performance as no single area of the market seems uniformly inexpensive with operating trends improving. Large-capitalization Technology, Industrials, and Health Care companies remain our main areas of emphasis given their high degree of idiosyncratic or company specific risk. While the “not too hot, not too cold” economic backdrop continues (historically good for financial assets), we see growing risk that policy makers may embrace higher inflation in exchange for higher nominal growth as real wage gains are dependent upon increases in productivity or structural fiscal reforms, neither of which are evident. The negative real short term interest rate policy will likely remain in effect until US wage inflation reaches at least 3.5+% nominal (now at <2%) so short-term rates should stay lower for longer. However, we worry more about the impact to stocks from an increase in long-term interest rates due to rising investor inflation premiums. Furthermore, we believe investors currently underestimate the deflationary and negative growth impact from the aging populations across the developed countries, including the U.S., and perhaps will be a contributing reason why monetary/inflationary stimuli will be needed to offset in absence of productivity increase. On the other side of the advent of higher inflation expectations, one of our biggest concerns is that we lurch from an unexciting economic recovery straight into the next economic downturn with real interest rates already negative and debt levels high leading to deflation/recession due to demographics regardless of the actions by the Federal Reserve; genuine paths of either fire (monetary policy) or ice (demographics).
We remain cyclically bullish on US equities until the arrival of signs of economic contraction (ice) or a rise in interest rates due to increased inflation expectations (fire). We do, however, feel that a violent change in sentiment within an expectations environment of stability and complacency/low volatility could compress valuation multiples akin to sharp corrections seen in 1998 or 2011. As we progress into 2015, despite our bottom-up optimism for the companies owned, we are less enthusiastic about the prospects for further sizable gains in U.S. stocks as a whole relative to what we believe remains a very bullish consensus.
As we look back to the ingredients that were present at the start of the current bull market, we see today the opposite of conditions then: expensive valuations, a high degree of uncertainty regarding future Federal Reserve action over interest rates leading to volatility, and profit margins and returns on capital at or above prior peaks observed at the top of prior economic expansion cycles with dependency upon an uncertain top-line revenue growth outlook leaving little room, if any, for further progress. We believe that our large capitalization valuation sensitive growth approach to stock selection with a cognizance of risk management that includes tactically implementing capital protective investments within the portfolio seems positioned to perform well relative to less protective strategies under the current circumstances.
| | |
Annual Report | September 30, 2014 | | 3 |
| | |
| Centre American Select Equity Fund | | Manager Commentary |
| | September 30, 2014 (Unaudited) |
| | |
SECTOR WEIGHTINGS As a percentage of Net Assets |
Information Technology | | 31.38% |
Industrials | | 16.98% |
Health Care | | 11.77% |
Consumer Discretionary | | 10.66% |
Energy | | 8.29% |
Consumer Staples | | 5.17% |
Materials | | 4.79% |
Utilities | | 4.08% |
Financials | | 2.87% |
Telecommunication Services | | 2.02% |
Purchased Options | | 1.78% |
Cash, Cash Equivalents
& Other | | 0.21% |
Total | | 100.00% |
These allocations may not reflect the current or future positions of the portfolio. |
GROWTH OF HYPOTHETICAL $10,000 INVESTMENT THROUGH SEPTEMBER 30, 2014
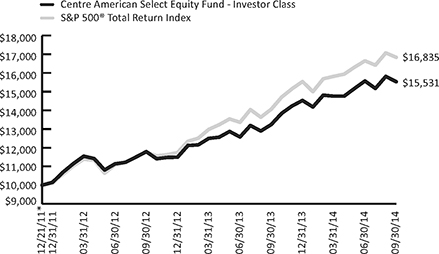
This graph assumes an initial investment of $10,000 at December 21, 2011, the Fund’s inception date, and that any dividends and distributions are reinvested. This graph depicts the performance of the Fund’s Investor Class versus the S&P 500® Total Return Index. Taxes on any Fund distributions or when shares are redeemed, if any, are not reflected. Unlike the Fund, an index is not available for investment, is unmanaged and does not have expenses that affect the results. The comparison is shown for illustrative purposes only.
TOTAL RETURNS – FOR THE PERIOD ENDED SEPTEMBER 30, 2014
| | | | | | | | | | | | | | | | | | | | | | | | | |
| | | 1 Month | | 3 Month | | YTD* | | 1 Year | | Since Inception* |
Centre American Select Equity Fund – Investor Class | | | | -1.79% | | | | | -0.25% | | | | | 6.90% | | | | | 17.31% | | | | | 17.17% | |
S&P 500® Total Return Index | | | | -1.40% | | | | | 1.13% | | | | | 8.34% | | | | | 19.73% | | | | | 20.62% | |
Centre American Select Equity Fund – Institutional Class | | | | -1.87% | | | | | -0.25% | | | | | 6.06% | | | | | – | | | | | 6.06% | |
S&P 500® Total Return Index | | | | -1.40% | | | | | 1.13% | | | | | 8.54% | | | | | – | | | | | 8.54% | |
| * | Inception date of December 21, 2011 for Investor Class. Inception date of January 21, 2014 for Institutional Class. |
The performance information quoted above represents past performance, which is not a guarantee of future results, and does not reflect the deduction of taxes that a shareholder would pay on Fund distributions or the redemption of Fund shares. Investment return and principal value of an investment will fluctuate so that an investor’s shares, when redeemed, may be worth more or less than their original cost. Total return includes reinvestment of dividends and capital gains, if any. Current performance may be lower or higher than the performance data quoted. For the most current month-end performance data, please call 855-298-4236.
Total Annual Fund Operating Expenses (before fee waiver and/or expense reimbursements), as stated in the fee table of the prospectus of the Fund dated January 17, 2014, were 1.53% for the Investor Class and 1.28% for the Institutional Class. The investment adviser to the Fund, Centre Asset Management, LLC (the “Adviser” or “Centre”), has entered into a written expense limitation agreement (the Expense Limitation Agreement), under which it has agreed to reduce its advisory fees and/or reimburse other expenses of the Fund for a period of two years from January 11, 2013, to the extent necessary to limit the current operating expenses of each class of shares of the Fund (including (but not limited to) investment advisory fees of the Adviser and distribution/service (Rule 12b-1) fees, but excluding interest, taxes, litigation, brokerage, and extraordinary expenses) incurred by the Fund in the fiscal year, to an annual rate of 1.05% of the average daily net assets of the Investor Class shares and 0.95% of the average daily net assets of the Institutional Class shares.
The S&P 500® Total Return Index is a commonly recognized, market-capitalization weighted index of 500 widely held securities, designed to measure broad U.S. equity performance. You cannot invest directly in an index.
The line graph above shows the performance of Investor Class shares only, since the Investor Class has the longest period of annual returns. The performance of the Institutional Class shares will differ from the performance shown because the Institutional Class shares have different expenses than the Investor Class shares.
| | |
| Centre Global Select Equity Fund | | Manager Commentary |
| | September 30, 2014 (Unaudited) |
Performance & Strategy Summary
For the one year period ended September 30, 2014, the Centre Global Select Equity Fund, Institutional Share Class, delivered a total return of 1.4%. The Investor Share Class, which launched on January 21, 2014, delivered a total return of -3.9% from its inception through September 30, 2014.
During the past one year period ended September 30, 2014 on a regional basis versus broad global equity indexes, North American, Western Europe, and Central Asian equity markets outperformed while Eastern Europe, Asia Pacific, and South & Central America underperformed. The best performing regional exposures for the Fund over the one year period were North America, Western Europe, and Central Asia. However, the worst performing regional exposures for the Fund over the period were Eastern Europe and South & Central America. Within the Central Asia region, India was the best performing market in the time period due to optimism about a new government implementing long needed structural, business friendly reforms. Within Eastern Europe, the Russian and Ukrainian geopolitical conflict caused those markets to perform poorly. From a sector perspective, Information Technology, Health Care, and Energy contributed the most to performance over the one year period ended September 30, 2014, while exposures to Industrials and Consumer Staples detracted the most. Stocks that were the strongest performers within the Fund over the one year period ended September 30, 2014 included Apple, Tencent Holdings, Gilead Sciences, Novo Nordisk, and Petrochina. Stocks that most negatively detracted from performance over the one year period ended September 30, 2014 included Tesco, Sberbank, and Coca Cola HBC.
Our process in managing the Fund is to focus on each individual company’s growth outlook and capacity to create shareholder value utilizing a “bottom-up” fundamental stock selection process. We utilize a disciplined, Economic Value Added (EVA)1 framework to select investments. The framework focuses on the fundamentals of wealth creation and wealth destruction similar to the way a traditional, long-term focused corporate financier looking at all aspects of the business would assess a company’s value. In the shorter-term, markets may often undervalue or overvalue a company’s ability to create or destroy wealth. The framework seeks to identify and exploit these investment opportunities. The approach is designed to capture excess returns when the market price of a stock converges towards our target price. We analyze not only earnings, but we also strive to understand and link the capital allocation decisions being made today by each company and how they will lead to future earnings growth. In other words, we expect companies to invest in productive assets of the business, organically and through opportunistic purchases which, in turn, should provide the foundation for future revenue and profits growth that will create shareholder value. Alternatively, if companies cannot invest in productive assets due to a cyclical downturn or existing excess capacity, we expect these companies to “wisely contract” through the restructuring of their assets and other resources to regain their footing for future shareholder value creation.
The differentiated stock selection process is combined with a smart beta2 approach to portfolio construction that is focused on Gross Domestic Product (“GDP”)-driven regional weightings rather than regional bias tied to overall regional relative market capitalization. By utilizing a “smart beta” approach to portfolio construction that focuses on GDP weights instead of market capitalization as guideposts for regional, country and stock weightings, the Fund is tilted towards the world’s fastest growing economies and attempts to underweight or to avoid overvalued markets. Because the GDP-weightings adjust over time to focus on the fastest growing economies, investors maintain exposure to the most promising regions. When compared to conventional market capitalization-based funds, GDP-weighted portfolios have higher emerging market exposure. They also have higher exposure to developed market powerhouses like Germany, Hong Kong, and Israel. This gives the Fund two sources of potential excess return: stock selection alpha3 and portfolio construction smart beta.
Market Review & Outlook
As overall global economic growth moderates further as we expect, we anticipate a more challenging investment landscape in the medium term. Recent company commentary has skewed to the negative side with several firms citing increasing difficulty in selling goods and services into Europe, Asia, and South America. In the first quarter of 2014, investors were optimistic about a European economic recovery. However, macro indicators peaked in Europe in the third quarter of 2014. While the Purchasing Managers Index, an economic indicator derived from monthly surveys of private sector companies, was solidly indicating expansion in the first quarter of 2014, it fell in the third quarter of 2014. From a valuation perspective, valuation ratios in Europe are slightly higher when compared to 2013, but corporate profitability is unchanged, indicating that stocks are discounting improvement. Within Europe, the United Kingdom, Sweden, and Spain are the fastest growing economies while Italy remains moribund. The Euro has depreciated 7% against the U.S. dollar since the fourth quarter of 2013 indicating the outlook of relative growth between the regions. In Asia, both China and Japan are growing, albeit at a slower pace than was forecast generally at the beginning of 2014. While China suffered from over investment and continues trying to shift its economy to a consumption society from export-led manufacturing, Japan continues to suffer from overly restrictive labor markets and protectionism. During the past one year period, aggregate Chinese corporate operating margins decreased from 15% to 14.5%, but valuations were unchanged indicating deceleration in fundamentals but, unlike Europe, little anticipation of improvement by investors. In Japan, aggregate corporate profitability and valuations remained roughly unchanged over the past one year period. The yen depreciated 12% against the U.S. dollar since the fourth quarter of 2013. In South America, there was optimism in Brazil that a new government could improve the nation’s business climate. Brazilian corporate operating margins rose over the last one year period from 13% to 14%, however valuations remained unchanged. The Brazilian real depreciated 10% against the U.S. dollar since the fourth quarter of 2013. Optimism about structural reforms from new leadership also drove the strength in Indian and Indonesian markets over the last one year period.
| 1 | EVA® is a registered service mark of EVA Dimensions LLC. Economic Value Added (EVA) - An estimate of a firm’s economic profit - being the value created in excess of the required return of the company’s investors (being shareholders and debt holders). Quite simply, EVA is the profit earned by the firm less the cost of financing the firm’s capital. The idea is that value is created when the return on the firm’s economic capital employed is greater than the cost of that capital. |
| 2 | Beta - A measure of the volatility, or systematic risk, of a security or a portfolio in comparison to the market as a whole. Beta is used in the capital asset pricing model (CAPM), a model that calculates the expected return of an asset based on its beta and expected market returns. |
| 3 | Alpha - A measure of performance on a risk-adjusted basis. Alpha takes the volatility (price risk) of a mutual fund and compares its risk-adjusted performance to a benchmark index. The excess return of the fund relative to the return of the benchmark index is a fund’s alpha. |
| | |
Annual Report | September 30, 2014 | | 5 |
| | |
| Centre Global Select Equity Fund | | Manager Commentary |
| | September 30, 2014 (Unaudited) |
| | |
| | |
There are a number of macro crosswinds with which companies must contend: slowing global GDP growth, weaker oil prices, a stronger U.S. dollar, and conflicting central bank messages from the United States Federal Reserve Bank, the European Central Bank, The Bank of England, and the Bank of Japan. Due to quantitative easing1 just now being introduced in Europe and the weak economic backdrop, we see lower interest rates for a longer period of time in Europe. We expect new oil and gas supply from North American producers and slowing emerging market demand to continue to pressure energy prices lower globally. While economic crosswinds can make forecasting challenging, we will focus our research efforts on the net beneficiaries in this environment. Going forward, we anticipate less correlation2 among stocks with only the best positioned firms doing well resulting in a narrowing of stock performance leaders. Given that our stock selection framework focuses on the fundamentals of wealth creation and wealth destruction from a bottom-up perspective, we believe that the companies with these general attributes will stand out going forward:
| | • | | Uncorrelated Growth Stories: Companies with growth opportunities that are uncorrelated to GDP growth should do well in the slower environment. These opportunities can present themselves, for example, through a new product launch cycle or through the replacement of an aged existing fleet. |
| | • | | Restructuring Stories: Companies that can control their operating destiny through restructuring or cost control – what we call wise contraction, rather than hoping for accelerating sales growth from an improving economy, should outperform firms that generate profit growth primarily through sales growth. We like companies that have shown a recent positive inflection in their profit margins and returns on capital, especially after a long period of negative performance. |
| | • | | Firms with High Amounts of Recurring Sales: Companies with subscription business models or companies that have a high amount of maintenance/repair sales rather than new sales or those dependent historically upon price increases should outperform the market. A high proportion of repeat business generates predictability in an uncertain environment. |
| | • | | Firms with Net Cash Balances or Underleveraged Balance Sheets: Companies with strong balance sheets have options to generate value for investors by buying back shares, raising their dividends, or doing value enhancing acquisitions. These firms can execute these actions regardless of the economic environment. |
| | • | | International Exporters: Given the stronger U.S. dollar, companies with cost bases outside the United States that sell significant amounts into the United States should benefit. These exporters can use the weaker Yen and Euro as an opportunity to lower prices and take market share from American competitors. Additionally, the U.S. dollar revenue raises the profits of international firms in their local currency. |
| | • | | European Yield Providers: Given the European Central Bank’s quantitative easing actions, we anticipate lower interest rates in Europe for the medium term. This will drive yield hungry investors such as pensions and insurance companies towards investments that provide generous dividend yields. |
| | • | | Firms with Oil Intensive Production Processes: Due to falling oil prices, companies that use large amounts of oil or oil-derived chemicals in their production process should see lower input cost pressure going forward. This could provide a catalyst for margin upgrades for these players. |
We believe that our bottom-up research process, with its focus on large capitalization companies that measure favorably in the EVA framework, combined with a smart beta approach to portfolio construction that is focused on GDP-driven regional weightings rather than market capitalization should permit the Fund to take advantage of these attributes.
| 1 | Quantitative Easing - An unconventional monetary policy in which a central bank purchases government securities or other securities from the market in order to lower interest rates and increase the money supply. Quantitative easing increases the money supply by flooding financial institutions with capital in an effort to promote increased lending and liquidity. Quantitative easing is considered when short-term interest rates are at or approaching zero, and does not involve the printing of new banknotes. |
| 2 | Correlation - a statistical measure of how two securities move in relation to each other. Correlations are used in advanced portfolio management. |
| | |
| Centre Global Select Equity Fund | | Manager Commentary |
| | September 30, 2014 (Unaudited) |
| | |
SECTOR WEIGHTINGS As a percentage of Net Assets |
Financials | | 32.81% |
Energy | | 11.29% |
Telecommunication
Services | | 8.55% |
Consumer Discretionary | | 8.46% |
Consumer Staples | | 7.94% |
Information Technology | | 7.57% |
Materials | | 6.52% |
Health Care | | 5.11% |
Industrials | | 4.62% |
Utilities | | 4.25% |
Cash, Cash Equivalents
& Other | | 2.88% |
Total | | 100.00% |
|
COUNTRY WEIGHTINGS As a percentage of Net Assets |
China | | 15.74% |
Japan | | 8.32% |
Germany | | 8.14% |
Hong Kong | | 6.19% |
France | | 5.08% |
Italy | | 4.69% |
Great Britain | | 4.52% |
Canada | | 4.29% |
Brazil | | 4.28% |
United States | | 3.13% |
Australia | | 3.09% |
Spain | | 3.01% |
Mexico | | 2.91% |
Cash and Cash Equivalents | | 2.88% |
India | | 2.87% |
Russia | | 2.79% |
Netherlands | | 1.56% |
Switzerland | | 1.37% |
Indonesia | | 1.34% |
Turkey | | 1.28% |
Taiwan | | 1.23% |
Korea | | 1.07% |
Norway | | 1.02% |
Thailand | | 0.89% |
Belgium | | 0.89% |
Sweden | | 0.82% |
Austria | | 0.79% |
Malaysia | | 0.79% |
South Korea | | 0.76% |
Denmark | | 0.74% |
South Africa | | 0.72% |
Israel | | 0.70% |
Singapore | �� | 0.66% |
Philippines | | 0.62% |
Peru | | 0.41% |
Greece | | 0.41% |
Total | | 100.00% |
|
These sector and country allocations may not reflect the current or future positions of the portfolio. |
GROWTH OF HYPOTHETICAL $10,000 INVESTMENT THROUGH SEPTEMBER 30, 2014
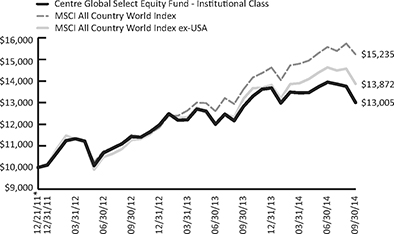
This graph assumes an initial investment of $10,000 at December 21, 2011, the Fund’s inception date, and that any dividends and distributions are reinvested. This graph depicts the performance of the Fund’s Institutional Class versus broad-based securities market indices. Taxes on any Fund distributions or when shares are redeemed, if any, are not reflected. Unlike the Fund, an index is not available for investment, is unmanaged and does not have expenses that affect the results. The comparison is shown for illustrative purposes only.
TOTAL RETURNS – FOR THE PERIOD ENDED SEPTEMBER 30, 2014
| | | | | | | | | | | | | | |
| | | 1 Month | | 3 Month | | YTD* | | 1 Year | | | Since
Inception* | |
Centre Global Select Equity Fund – Investor Class | | -5.39% | | -6.68% | | -3.90% | | | – | | | | -3.90% | |
MSCI All Country World Index ex-USA | | -4.81% | | -5.19% | | 0.98% | | | | | | | 0.98% | |
MSCI All Country World Index | | -3.20% | | -2.20% | | 4.55% | | | – | | | | 4.55% | |
Centre Global Select Equity Fund – Institutional Class | | -5.46% | | -6.76% | | -4.92% | | | 1.42% | | | | 9.92% | |
MSCI All Country World Index ex-USA | | -4.81% | | -5.19% | | 0.39% | | | 5.22% | | | | 12.50% | |
MSCI All Country World Index | | -3.20% | | -2.20% | | 4.16% | | | 11.89% | | | | 16.36% | |
| * | Inception date of January 21, 2014 for Investor Class. Inception date of December 21, 2011 for Institutional Class. |
The performance information quoted above represents past performance, which is not a guarantee of future results, and does not reflect the deduction of taxes that a shareholder would pay on Fund distributions or the redemption of Fund shares. Investment return and principal value of an investment will fluctuate so that an investor’s shares, when redeemed, may be worth more or less than their original cost. Total return includes reinvestment of dividends and capital gains, if any. Current performance may be lower or higher than the performance data quoted. For the most current month-end performance data, please call 855-298-4236.
Total Annual Fund Operating Expenses (before fee waiver and/or expense reimbursements), as stated in the fee table of the prospectus of the Fund dated January 17, 2014, were 2.45% for the Investor Class and 2.20% for the Institutional Class. The “Adviser” has entered into a written expense limitation agreement under which it has agreed to limit through October 31, 2015 the total operating expenses of the Fund (including (but not limited to) investment advisory fees of the Adviser and distribution/service (Rule 12b-1) fees, but excluding interest, taxes, litigation, brokerage, other expenditures which are capitalized in accordance with generally accepted accounting principles and extraordinary expenses) to an annual rate of 1.45% of the average daily net assets of the Investor Class shares, and 1.25% of the average daily net assets of the Institutional Class shares.
Investing in the securities of foreign companies, including companies in emerging markets, generally involves greater risk than investing in larger, more established domestic companies. Therefore, investments in the Fund may involve a greater degree of risk than investments in other mutual funds that invest in larger, more established domestic companies.
The benchmark for the Centre Global Select Equity Fund has changed to the MSCI ACWI ex-USA from the MSCI ACWI Index with effect on August 1, 2014 to reflect a more appropriate basis for comparing the Fund’s performance, including ex-post results.
The MSCI All Country World Index ex-USA is a free float-adjusted market capitalization weighted index that is designed to measure the equity market performance of international developed and emerging markets. You cannot invest directly in an index.
The MSCI All Country World Index is a free float-adjusted market capitalization weighted index that is designed to measure the equity market performance of developed and emerging markets. You cannot invest directly in an index.
The line graph above shows the performance of Institutional Class shares only, since the Institutional Class has the longest period of annual returns. The performance of the Investor Class shares will differ from the performance shown because the Investor Class shares have different expenses than the Institutional Class shares.
| | |
| Annual Report | September 30, 2014 | | 7 |
| | |
| Centre Active U.S. Treasury Fund | | Manager Commentary |
| | September 30, 2014 (Unaudited) |
Performance & Strategy Summary
The Centre Active U.S. Treasury Fund, Institutional Share Class and Investor Share Class, was launched on January 21, 2014. For the period from inception to September 30, 2014, the Centre Active U.S. Treasury Fund, Institutional Share Class, delivered a total return of 0.9%; the Investor Share Class delivered a total return of 0.7%.
The Fund’s investment objective is to maximize total return through capital appreciation and current income. The Fund pursues this objective by using an active interest rate management strategy. We adjust the portfolio’s duration, if appropriate, based on a monthly assessment of the likely change in interest rates. Our fundamentally-driven active duration management seeks potential for capital appreciation/preservation in variable interest rate environments utilizing U.S. Treasury securities including bills, notes, bonds, Treasury inflation protected securities (TIPS), and cash equivalents.
Performance attribution in the Centre Active U.S. Treasury portfolio reflects our duration decisions. As there are no corporate or mortgage related securities in the portfolio, there are no “spread” components to performance. Additionally, the utilization of Treasuries provides attractive diversification properties, as the correlation between Treasury market returns and those of the U.S. equity market is generally negative during “Bearish Stock Markets.”
During the period from inception to September 30, 2014, the Fund benefited mostly from its duration bias relative to its benchmark but a material allocation to cash equivalents during the July and August time frame when Treasury yields declined negatively impacted relative performance.
Market Review & Outlook
The U.S. economy remains in a sluggish rebound from the “Great Recession”, relative to prior recoveries. While job growth appears to be improving and the unemployment rate continues to decline, the number of workers who are only temporarily employed or have only part time employment remains stubbornly high. Also labor demand, as evidenced by job openings, continues to fluctuate from month to month--no sustained significantly positive trend. Wage growth, in both real and nominal terms, has been subpar. The increases we have seen in consumer spending would seem to reflect optimistic views about the future more so than continuation of the current economic conditions. This argument is consistent with the fact that the “quits rate”--workers leaving their jobs voluntarily--is at a relatively low level compared to its level before the recession. Consumer spending may also be buoyed by the improved equity market and the improvements recorded in home prices, the so-called wealth effect.
Additionally, while production has improved somewhat, the pace of improvement has not been sufficient to generate the pressure that would require significant new hires or generate significant price increases. Indeed, precious metals are signaling that inflation worries have perhaps declined. The Federal Reserve’s survey, discussed at its Federal Open Market Committee meetings, suggest that longer term inflationary expectations remain stable. Furthermore, both the Consumer Price Index (“CPI”) and the Fed’s preferred inflation monitor of consumer expenditures that excludes food and energy show no signs of sustained acceleration.
Last spring, we cited several arguments to explain the slow pace of recovery. One of these, the length of an economic recovery following a “financial crisis”, has recently been questioned by research from the Federal Reserve Bank of Cleveland which maintains that the aftermath of a housing “bubble” has held back the current recovery’s pace. We believe that the second argument that we highlighted, policy uncertainty, continues to be a factor in hiring and investment decisions on the part of businesses.
Another issue is determining what growth would generate the full employment of capital and labor resources. In the 20th century, the U.S. economy’s potential for growth in real terms was roughly 3%. If that is in fact still the case, then the Fed still faces a significant output/jobs gap. However if the potential for growth is now only 2% or less, the economy may be much closer to its potential for growth and the perceived slowness in the recovery may not be as dramatic as believed.
Reasons for a reduced potential for growth relate to declining labor force participation and to the end of the benefits of the technology boom1 that boosted productivity and real growth in the 1990s. Regarding the declining rate of participation in the labor force, there is a significant uncertainty as to whether it is structural, cyclical, or both. Because of uncertainty over whether the recovery is slow and, to what degree relative to the past, the Fed is likely to maintain the target for the Federal Funds rate at its “zero lower bound.” The real rate is negative after subtracting the inflation rate. At the current time its primary focus would seem to be on promoting the growth and employment aspect, rather than price stability, of its dual policy mandate.
| 1 | Boom - A period of time during which sales of a product or business activity increases very rapidly. In the stock market, booms are associated with bull markets, whereas busts are associated with bear markets. The cyclical nature of the market and the economy in general suggests that every strong economic growth bull market in history has been followed by a sluggish low growth bear market. |
| | |
| Centre Active U.S. Treasury Fund | | Manager Commentary |
| | September 30, 2014 (Unaudited) |
As we go forward, scrutiny of the Fed’s policy statements may be even more detailed than normal as investors try to glean where the economy actually is, what the likelihood of upward price pressure is, and how quickly the Fed may shift in its policy focus. As has been the case historically, the market may well move before the policy maker. Additionally, while the front end of the treasury yield curve is anchored by the Federal Funds Rate, longer maturity yields are not so constrained. While, they have been dormant for some time, the bond market vigilantes may act quickly to move the market to higher yield levels as the above uncertainties are resolved and higher inflation premiums are demanded by investors. Three economic scenarios continue in our view to define the paths the U.S. economy could follow: 1) Global Recession (more likely now than before--given recent events in Europe and Asia); (2) Stagflation1 (more likely now than before--particularly if potential real growth is at 2% or less); and (3) Boom/Bust2 (still most likely—particularly if labor issues are cyclical and the Fed keeps policy too easy for too long due to its own uncertainty). Based upon our assessment of the above probabilities, higher interest rates seem likely. Ultimately the rate of inflation will be the key as to how high rates may go. Recent “tapering” of its bond buying program is not tightening and the Fed appears likely to err on the side of being overly stimulative to avoid the risk of recession. Inflation has momentum, waiting until it has already begun to accelerate will make it more difficult to bringing it under control.
The Fund’s discipline since inception has been neutral on the market’s outlook for the most part, reflecting the uncertainties noted above. There were two months when the outlook was fully bearish and one of a moderately bearish stance. Our review of portfolio duration indicates that these changes are consistent with the view that rate behavior reflects, over time, changing investor expectations regarding the fundamentals--real growth and inflation--with an allowance for market dynamics that reflect investor psychology and the tendency for “overshooting.” While the discipline does draw on market prices for information concerning investors’ mood toward rates, our measures will not capture the type of intra month knee jerk reaction to political/terrorist events that drove yields in August despite a somewhat improved picture on the economic front.
Our discipline is intended to preserve capital in periods of significant rate increases by moving to shorter duration Treasury maturities or cash equivalents with the flexibility to extend duration or re-enter the market when our discipline suggests lower rates are likely. What is relevant to the potential success of our discipline is whether interest rates continue to exhibit cyclical volatility--that the business cycle is not dead. Continued cyclical behavior will provide a basis for success even if the longer term equilibrium level of the economy’s real rate--due to a reduced real growth potential—is lower.
We believe that our strategy serves well as a core fixed income portfolio. Over time, it is intended to provide the same yield as the Treasury market with diversification benefits. We believe the strategy is positioned to accommodate both systematic and unforeseen cash needs, given the liquidity of the Treasury market.
| 1 | Stagflation - An inflationary period accompanied by slow economic growth and rising unemployment. |
| 2 | Bust - A period of time during which economic growth decreases rapidly. In the stock market, busts are usually associated with bear markets. |
Diversification does not eliminate the risk of experiencing investment losses.
| | |
Annual Report | September 30, 2014 | | 9 |
| | |
| Center Active U.S. Treasury Fund | | Manager Commentary |
| | September 30, 2014 (Unaudited) |
| | |
| | |
ASSET TYPE WEIGHTINGS
As a percentage of Net Assets
| | | | |
U.S. Government Bonds & Notes | | | 96.37 | % |
Cash, Cash Equivalents & Other | | | 3.63 | % |
Total | | | 100.00 | % |
| | | | |
These allocations may not reflect the current or future positions of the portfolio. | |
GROWTH OF HYPOTHETICAL $10,000 INVESTMENT THROUGH SEPTEMBER 30, 2014
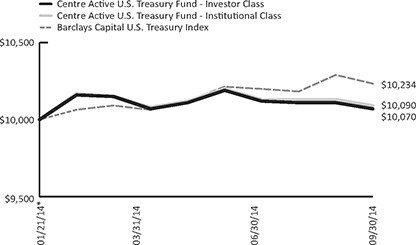
This line graph assumes an initial investment of $10,000 at January 21, 2014, the Fund’s inception date, and that any dividends and distributions are reinvested. This graph depicts the performance of the Fund versus the Barclays Capital U.S. Treasury Index. Unlike the Fund, an index is not available for investment and is unmanaged and does not have expenses that affect the results. The comparison is shown for illustrative purposes only.
TOTAL RETURNS – FOR THE PERIOD ENDED SEPTEMBER 30, 2014
| | | | | | | | |
| | | 1 Month | | 3 Month | | YTD | | Since Inception
(January 21, 2014) |
Centre Active U.S. Treasury Fund – Investor Class | | -0.40% | | -0.49% | | 0.70% | | 0.70% |
Centre Active U.S. Treasury Fund – Institutional Class | | -0.39% | | -0.39% | | 0.90% | | 0.90% |
Barclays Capital U.S. Treasury Index | | -0.55% | | 0.34% | | 2.34% | | 2.34% |
The performance information quoted above represents past performance, which is not a guarantee of future results, and does not reflect the deduction of taxes that a shareholder would pay on Fund distributions or the redemption of Fund shares. Investment return and principal value of an investment will fluctuate so that an investor’s shares, when redeemed, may be worth more or less than their original cost. Total return includes reinvestment of dividends and capital gains, if any. Current performance may be lower or higher than the performance data quoted. For the most current month-end performance data, please call 855-298-4236.
Total Annual Operating Expenses (before fee waiver and/or expense reimbursements), as stated in the fee table of the prospectus of the Fund dated January 17, 2014, was 2.28% for the Investor Class and 2.03% for the Institutional Class. The Adviser has entered into a written expense limitation agreement, dated and effective as of November 4, 2013, under which it has agreed to reduce its advisory fees and/or reimburse other expenses of the Fund, for at least an initial period of not less than two years and until the next following effective date of the Post-Effective Amendment to the registration statement of the Trust relating to the Fund incorporating the Fund’s financial statements for the Fund’s fiscal year (the “Initial Term”), to the extent necessary to limit the current operating expenses of each class of shares of the Fund (including (but not limited to) investment advisory fees of the Adviser and distribution/service (Rule 12b-1) fees, but excluding, as applicable, any front-end or contingent deferred sales loads, taxes, leverage interest, brokerage commissions, expenses incurred in connection with any merger or reorganization, and extraordinary expenses (such as litigation and other expenses not incurred in the ordinary course of the Fund’s business), and acquired fund fees and expenses), to an annual rate of 0.85% of the average daily net assets of the Investor Class shares and 0.60% of the average daily net assets of the Institutional Class shares.
Barclays Capital U.S. Treasury Index – includes public obligations of the U.S. Treasury. Treasury bills are excluded by the maturity constraint but are part of a separate Short Treasury Index. In addition, certain special issues, such as state and local government series bonds (SLGs), as well as U.S. Treasury TIPS, are excluded. You cannot invest directly into an index.
| | |
| Centre Multi-Asset Real Return Fund | | Manager Commentary |
| | September 30, 2014 (Unaudited) |
Performance & Strategy Summary
For the one year period ended September 30, 2014, the Centre Multi-Asset Real Return Fund, Institutional Share Class, delivered a total return of 4.6%; the Investor Share Class delivered a total return of 4.4%.
The Centre Multi-Asset Real Return Fund is designed to meet investor concerns of future inflationary conditions and increased market volatility with the goal of producing real returns as measured against inflation. The Fund aims to maintain the purchasing power of today’s dollar in nominal terms plus a real return on capital and is intended to be relatively well positioned to withstand market shocks. The Consumer Price Index estimates the average change in prices for a basket of goods and services and serves as the baseline hurdle for real returns. The Fund, which is structured as a limited fund of funds that can invest in other registered investment companies (primarily those advised by the investment adviser), is an actively managed product that strives to help preserve and enhance purchasing power over a variety of investment environments using a fundamental tactical asset allocation strategy employing multiple asset classes with positive correlation with inflation. Under normal market conditions, the Fund will allocate its net assets among the broad asset classes, namely the underlying funds, U.S. and Non-U.S. Equities, Fixed Income, Commodity-Linked ETNs and ETFs, Real Estate Investment Trusts (“REIT”)1 and ETNs and ETFs with returns linked to REIT Indexes, and Cash & Equivalents in an effort to maximize inflation-adjusted returns. Under volatile market conditions, the Fund may adopt the posture of capital preservation with a significant tactical allocation to cash equivalents.
For the one year period ended September 30, 2014, U.S. Equities as an asset class contributed positively to the Fund’s return as did Real Estate-Linked Securities, Non-U.S. Equities and to a lesser degree Treasury bonds. Most notably, Commodity-Linked Securities, including those tied to the price of gold, performed poorly over the period as they were negatively impacted by a strengthening U.S. dollar and concerns over global economic growth, particularly in foreign economies. During the period, our tactical allocation to Equities was increased and our exposure to Commodity-Linked Securities largely eliminated.
The principal input in the Fund’s asset allocation decision is the implied equity risk premium, which is the expected excess return that the overall stock market provides over a risk-free rate. This shows the relative valuation of risky assets versus the “risk free” alternative, intermediate term U.S. Treasury bonds. The equity risk premium (high or low) and its directional change are used as inputs in our process. The secondary inputs comprise CPI trends and trends in inflation proxies such as currency and commodity prices. Lastly, historical data and forecasts of volatility for all asset classes are included.
Market Review & Outlook
Equities witnessed a strongly positive re-rating by investors as evidenced by the price-to-earnings multiple for the S&P 500 Index expanding and accounting for the majority of gains over the past one year, as opposed to earnings growth or dividends. This price to earnings multiple expansion was driven by increased investor optimism as demonstrated by a decrease in the implied equity risk premium. Currently, the implied risk premium for equities versus bonds is at a level last seen in mid-2008 and edging higher slightly. It seems that the positive re-rating driver for stock price increases is over and future relative performance for Equities versus Bonds will be lower and dependent upon earnings growth or dividends. Equities seem vulnerable to a major correction in the face of higher Fixed Income yields which will likely occur only if inflation expectations rise.
Our process in managing the Fund’s portfolio remains flexible and allows the Fund to opportunistically shift to each of the various asset classes as conditions warrant based upon the ability of each asset class to perform best during particular market environments. For example, during the period we reduced our exposure to gold-linked securities and eliminated our exposure to other (non-precious metal) commodity-linked securities.. Incorporating additional asset classes such as these, sometimes inversely or uncorrelated to the more traditional U.S. stocks and bonds held within balanced funds, offers enhanced diversification benefits and the ability to take advantage of the changes in asset class performance that may take place with changes in different inflationary environments. The Fund is designed to help reduce the level of risk to delivering real returns that comes from concentrating in a single asset class. Additionally, we aim to emphasize asset classes we believe are poised to perform based on our understanding of how different asset classes respond to inflation and changes in economic conditions. The result is a broadly diversified portfolio that may be used as a core flexible balanced type holding or as a complement to existing equity or fixed income strategies. We believe the Fund is well positioned to withstand a market correction relatively well in light of its investment strategies.
| 1 | REIT - A security that sells like a stock on the major exchanges and invests in real estate directly, either through properties or mortgages. REITs receive special tax considerations and typically offer investors high yields, as well as a highly liquid method of investing in real estate. |
| | |
Annual Report | September 30, 2014 | | 11 |
| | |
| Centre Multi-Asset Real Return Fund | | Manager Commentary |
| | September 30, 2014 (Unaudited) |
With competing inflationary/deflationary forces, namely ultra-accommodative monetary policy now in its sixth year and aging demographics with the baby booming generation just beginning to retire in earnest respectively, competing against one another like “fire” and “ice”, we think the risk of inflation is higher than it has been in quite some time but recognize that market signals such as an appreciating U.S. dollar, overseas economic weakness and slack in existing industrial capacity have given deflationary pressures the upper hand during 2014 thus far. The failure of U.S. fiscal policy has caused dependency on this unprecedented and massive monetary easing and allowed the U.S. financial sector to heal distinct from the tremendous restructuring undertaken by business and consumer focused corporate America. That said, companies in general seem to have exhausted profit margin improvements without stronger contribution from top line growth and it is unlikely that monetary policy will suddenly gain the value in transmission to the real economy (as opposed to financial assets), when it has not in the past six years. The vast bulk of the Federal Reserve’s bond purchases have made their way right back in the form of bank reserves deposited at the Federal Reserve. If released however, the outlook for inflation should rise.
A significant issue not widely discussed is the fact that the Federal Reserve is likely to taper its bond purchases simply because the amount of debt issuance by the U.S. government is falling, and if the Fed maintained its current rate of Treasury bond purchases, it would essentially be monetizing all the federal government’s new deficit financing. The U.S. dollar’s reserve currency status has been the only factor preventing the normal inflationary impact that it has had on other countries that have pursued this type of debt monetization program. To us, the more important lever is what the Fed does with the policy rate, now at essentially zero and negative in real terms. Our forecast is that it will continue to pursue a policy of negative real interest rates and perhaps introduce other non-traditional stimulus measures to advance the rate of employment growth until a higher rate of inflation (greater than three percent) is well entrenched into the economy. Unfortunately, that monetary policy may contribute to an increase in market volatility just when expectations are the exact opposite.
On the deflationary side, in a number of industrialized countries, including the U.S., on the assumption that fertility remains at or close to present levels, populations will start to decline and, in some cases, do so quite rapidly in the near future. The impact on developed societies will be decreasing demand for goods and services but increasing pension liabilities. This can be crushing in terms of taxation on younger workers and a potential source of unrest and political disruption. Japan, the pathfinder of this phenomenon as it embraced Western family planning even before Europe and the U.S. and where adult diapers outsell those for children, shows the debilitative impact from an aging society and need to resort to new radical inflationary macroeconomic policies to combat its ill effects. No developed world country is immune from this significant problem which is just starting to be felt. With regard to near-term relevance to Federal Reserve policies, we see that the U.S. Civilian Labor Force Participation Rate has dropped below a level that we last saw thirty years ago, when women began to join the workforce in earnest. A large part of the current fall in the unemployment rate has been due to this “dropping out” of the labor force, either due to discouragement, early retirement, or public assistance. This collapse in the civilian workforce participation rate and increase in the number of persons on government dependency since the economic recovery began in 2009 has never happened before during previous recoveries. Productivity and the growth in the average hourly wages have fallen significantly as inflation has slowed and competition for jobs domestically and from overseas is limiting consumer consumption as evidenced by the latest drop in consumer spending being consistent only with past recessions.
These factors have created a myriad of possible outcomes over the next few years that are likely to see a rise, perhaps dramatically, in the volatility of inflation expectations. This is due to the negative macro circumstances being unlike any in the past and the lack of confidence in the ability of public officials to manage them given the unprecedented fiscal and monetary policy employed thus far without the expected success, without creating a more volatile investment landscape. The Centre Multi-Asset Real Return Fund will attempt to deliver on a maintaining investor purchasing power of today’s dollar in nominal terms plus deliver a positive real return on capital.
| Diversification | does not eliminate the risk of experiencing investment losses. |
| | |
| Center Multi-Asset Real Return Fund | | Manager Commentary |
| | September 30, 2014 (Unaudited) |
| | |
ASSET TYPE WEIGHTINGS As a percentage of Net Assets |
Other Open-End Funds | | 76.14% |
Exchange-Traded Funds | | 23.72% |
Cash, Cash Equivalents & Other | | 0.14% |
Totals | | 100.00% |
| | |
These allocations may not reflect the current or future positions of the portfolio. |
GROWTH OF HYPOTHETICAL $10,000 INVESTMENT THROUGH SEPTEMBER 30, 2014
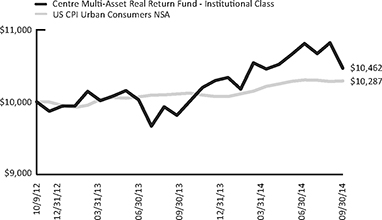
This line graph assumes an initial investment of $10,000 at October 9, 2012, the Fund’s inception date, and that any dividends and distributions are reinvested. This graph depicts the performance of the Fund (Institutional Class) versus the U.S. CPI Urban Consumers NSA Index. Unlike the Fund, an index is not available for investment and is unmanaged and does not have expenses that affect the results. The comparison is shown for illustrative purposes only.
TOTAL RETURNS – FOR THE PERIOD ENDED SEPTEMBER 30, 2014
| | | | | | | | | | |
| | | 1 Month | | 3 Month | | YTD | | 1 Year | | Since Inception* |
Centre Multi-Asset Real Return Fund – Investor Class | | -3.25% | | -3.16% | | 1.13% | | 4.36% | | 1.73% |
U.S. CPI Urban Consumers NSA Index | | 0.08% | | -0.13% | | 2.14% | | 1.66% | | 2.12% |
Centre Multi-Asset Real Return Fund – Institutional Class | | -3.24% | | -3.14% | | 1.23% | | 4.56% | | 2.31% |
U.S. CPI Urban Consumers NSA Index | | 0.08% | | -0.13% | | 2.14% | | 1.66% | | 1.44% |
| * | Inception date of October 9, 2012 for Institutional Class. Inception date of January 22, 2013 for Investor Class. |
The performance information quoted above represents past performance, which is not a guarantee of future results, and does not reflect the deduction of any taxes that a shareholder would pay on Fund distributions or the redemption of Fund shares. Investment return and principal value of an investment will fluctuate so that an investor’s shares, when redeemed, may be worth more or less than their original cost. Total return includes reinvestment of dividends and capital gains, if any. Current performance may be lower or higher than the performance data quoted. For the most current month-end performance data please call 855-298-4236.
Total Annual Fund Operating Expenses (before fee waiver and/or expense reimbursements) as stated in the fee table of the prospectus of the Fund, dated January 17, 2014 was 2.17% for the Investor Class and 1.92% for the Institutional Class. The “Adviser” has contractually agreed, pursuant to a written expense limitation agreement (the “Expense Limitation Agreement”), to reduce its advisory fees and/or reimburse other expenses of the Fund until September 14, 2015 to the extent necessary to limit the current operating expenses of each class of shares of the Fund including (but not limited to) investment advisory fees of the Adviser and distribution/service (Rule 12b-1) fees but exclusive of any front-end or contingent deferred sales loads, taxes, leverage interest, brokerage commissions, expenses incurred in connection with any merger or reorganization, extraordinary expenses such as litigation and other expenses not incurred in the ordinary course of the Fund’s business, and acquired fund fees and expenses, except that, if an acquired fund is an underlying fund managed by the Adviser and such acquired fund is not subject to an effective expense limitation or fee waiver agreement at any time during the term of the Expense Limitation Agreement, then, for that time, the operating expenses of each class of shares of the Fund shall not exclude the amount of advisory fees included in such acquired fund’s fees and expenses to which the Fund would otherwise be subject, to an annual rate of 1.25% of the average daily net assets of the Investor Class shares and 1.00% of the average daily net assets of the Institutional Class shares.
The U.S. CPI Urban Consumers NSA Index is the annual percentage change in the Consumer Price Index (CPI). The CPI is described as “an unmanaged index that represents the rate of inflation of U.S. consumer prices as determined by the U.S. Bureau of Labor Statistics” in the Prospectus. You cannot invest directly into an index.
The chart above shows the performance of Institutional Class shares only, since the Institutional Class has the longest period of annual returns. The performance of the Investor Class shares will differ from the performance shown because the Investor Class shares have different expenses than the Institutional Class shares.
| | |
| Annual Report | September 30, 2014 | | 13 |
| | |
| Centre Funds | | Disclosure of Fund Expenses |
| | September 30, 2014 (Unaudited) |
As a shareholder of a series of Centre Funds (each series, a “Fund” and together, the “Funds”), you will incur two types of costs: (1) transaction costs, including any applicable redemption fees; and (2) ongoing costs, including management fees, distribution and/or service (12b-1) fees and other Fund expenses. The following examples are intended to help you understand your ongoing costs (in dollars) of investing in a Fund and to compare these costs with the ongoing costs of investing in other mutual funds. The examples are based on an investment of $1,000 invested on April 1, 2014 and held through September 30, 2014.
Actual Expenses. The first line under each class of the table below provides information about actual account values and actual expenses. You may use the information in this line, together with the amount you invested, to estimate the expenses that you paid over the period. Simply divide your account value by $1,000 (for example, an $8,600 account value divided by $1,000 = 8.6), then multiply the result by the number in the first line under the heading “Expenses Paid During Period 04/01/2014 – 09/30/2014” to estimate the expenses you paid on your account during this period.
Hypothetical Example for Comparison Purposes. The second line under each class of the table below provides information about hypothetical account values and hypothetical expenses based on each Fund’s actual expense ratio and an assumed rate of return of 5% per year before expenses, which is not the Fund’s actual return. The hypothetical account values and expenses may not be used to estimate the actual ending account balance or expenses you paid for the period. You may use this information to compare the ongoing costs of investing in a Fund and to other funds. To do so, compare this 5% hypothetical example with the 5% hypothetical examples that appear in the shareholder reports of the other funds. Please note that the expenses shown in the table are meant to highlight your ongoing costs only and do not reflect any transactional costs, such as redemption fees, if any. Therefore, the second line under each class of the table below is useful in comparing ongoing costs only, and will not help you determine the relative total costs of owning different funds. In addition, if these transactional costs were included, your costs would have been higher.
| | | | | | | | | | | | | | | | | | |
| | | Beginning
Account Value
04/01/14 | | | Ending
Account Value
09/30/14 | | | Expense Ratio(a) | | Expenses Paid
During Period
04/01/14-09/30/14(b) |
Centre American Select Equity Fund | | | | | | | | | | | | | | | | | | |
Investor Class | | | | | | | | | | | | | | | | | | |
Actual | | $ | 1,000.00 | | | $ | 1,052.30 | | | 1.05% | | | | $ | 5.40 | | | |
Hypothetical (5% return before expenses) | | $ | 1,000.00 | | | $ | 1,019.80 | | | 1.05% | | | | $ | 5.32 | | | |
Institutional Class | | | | | | | | | | | | | | | | | | |
Actual | | $ | 1,000.00 | | | $ | 1,051.30 | | | 0.95% | | | | $ | 4.89 | | | |
Hypothetical (5% return before expenses) | | $ | 1,000.00 | | | $ | 1,020.31 | | | 0.95% | | | | $ | 4.81 | | | |
Centre Global Select Equity Fund | | | | | | | | | | | | | | | | | | |
Investor Class | | | | | | | | | | | | | | | | | | |
Actual | | $ | 1,000.00 | | | $ | 966.60 | | | 1.45% | | | | $ | 7.15 | | | |
Hypothetical (5% return before expenses) | | $ | 1,000.00 | | | $ | 1,017.80 | | | 1.45% | | | | $ | 7.33 | | | |
Institutional Class | | | | | | | | | | | | | | | | | | |
Actual | | $ | 1,000.00 | | | $ | 966.60 | | | 1.25% | | | | $ | 6.16 | | | |
Hypothetical (5% return before expenses) | | $ | 1,000.00 | | | $ | 1,018.80 | | | 1.25% | | | | $ | 6.33 | | | |
Centre Active U.S. Treasury Fund | | | | | | | | | | | | | | | | | | |
Investor Class | | | | | | | | | | | | | | | | | | |
Actual | | $ | 1,000.00 | | | $ | 1,000.00 | | | 0.85% | | | | $ | 4.26 | | | |
Hypothetical (5% return before expenses) | | $ | 1,000.00 | | | $ | 1,020.81 | | | 0.85% | | | | $ | 4.31 | | | |
Institutional Class | | | | | | | | | | | | | | | | | | |
Actual | | $ | 1,000.00 | | | $ | 1,001.00 | | | 0.60% | | | | $ | 3.01 | | | |
Hypothetical (5% return before expenses) | | $ | 1,000.00 | | | $ | 1,022.06 | | | 0.60% | | | | $ | 3.04 | | | |
Centre Multi-Asset Real Return Fund | | | | | | | | | | | | | | | | | | |
Investor Class | | | | | | | | | | | | | | | | | | |
Actual | | $ | 1,000.00 | | | $ | 1,001.00 | | | 1.25% | | | | $ | 6.27 | | | |
Hypothetical (5% return before expenses) | | $ | 1,000.00 | | | $ | 1,018.80 | | | 1.25% | | | | $ | 6.33 | | | |
Institutional Class | | | | | | | | | | | | | | | | | | |
Actual | | $ | 1,000.00 | | | $ | 1,001.00 | | | 1.00% | | | | $ | 5.02 | | | |
Hypothetical (5% return before expenses) | | $ | 1,000.00 | | | $ | 1,020.05 | | | 1.00% | | | | $ | 5.06 | | | |
| (a) | Annualized, based on the Fund’s most recent fiscal half year expenses. |
| (b) | Expenses are equal to the Fund’s annualized expense ratio, multiplied by the average account value over the period, multiplied by the number of days in the most recent fiscal half year (183), divided by 365. |
| | |
| Centre American Select Equity Fund | | Schedule of Investments |
| | September 30, 2014 |
| | |
| | |
| | | | | | |
| | | Shares | | | Value |
COMMON STOCKS (98.01%) |
Consumer Discretionary (10.66%) |
Hotels, Restaurants & Leisure (2.70%) |
Las Vegas Sands Corp. | | | 18,450 | | | $ 1,147,774 |
Starbucks Corp. | | | 31,980 | | | 2,413,211 |
| | | | | | |
| | | | | | 3,560,985 |
| | | | | | |
Internet & Catalog Retail (1.85%) |
Amazon.com, Inc.(a) | | | 7,550 | | | 2,434,422 |
| | | | | | |
|
Media (2.61%) |
Comcast Corp., Class A | | | 39,430 | | | 2,120,546 |
Walt Disney Co. | | | 14,870 | | | 1,323,876 |
| | | | | | |
| | |
| | | | | | 3,444,422 |
| | | | | | |
Specialty Retail (3.50%) |
Home Depot, Inc. | | | 12,870 | | | 1,180,694 |
Lowe’s Cos, Inc. | | | 40,390 | | | 2,137,439 |
Tiffany & Co. | | | 13,530 | | | 1,303,074 |
| | | | | | |
| | | | | | 4,621,207 |
| | | | | | |
Total Consumer Discretionary | | | 14,061,036 |
| | | | | | |
| | |
Consumer Staples (5.17%) | | | | | | |
Beverages (2.70%) |
Coca-Cola Co. | | | 36,480 | | | 1,556,237 |
PepsiCo, Inc. | | | 21,540 | | | 2,005,159 |
| | | | | | |
| | | | | | 3,561,396 |
| | | | | | |
Food Products (1.27%) |
Archer-Daniels-Midland Co. | | | 32,760 | | | 1,674,036 |
| | | | | | |
|
Household Products (1.20%) |
Procter & Gamble Co. | | | 18,930 | | | 1,585,198 |
| | | | | | |
| | |
Total Consumer Staples | | | | | | 6,820,630 |
| | | | | | |
| | |
Energy (8.29%) | | | | | | |
Energy Equipment & Services (5.13%) |
FMC Technologies, Inc.(a) | | | 32,530 | | | 1,766,704 |
Halliburton Co. | | | 29,080 | | | 1,875,951 |
Schlumberger, Ltd. | | | 30,640 | | | 3,115,782 |
| | | | | | |
| | | | | | 6,758,437 |
| | | | | | |
|
Oil, Gas & Consumable Fuels (3.16%) |
EOG Resources, Inc. | | | 17,880 | | | 1,770,477 |
Newfield Exploration Co.(a) | | | 30,010 | | | 1,112,471 |
Suncor Energy, Inc. | | | 35,680 | | | 1,289,832 |
| | | | | | |
| | | | | | 4,172,780 |
| | | | | | |
Total Energy | | | | | | 10,931,217 |
| | | | | | |
| | |
Financials (2.87%) | | | | | | |
Capital Markets (1.33%) |
BlackRock, Inc. | | | 5,320 | | | 1,746,662 |
| | | | | | |
|
Consumer Finance (1.54%) |
American Express Co. | | | 23,190 | | | 2,030,053 |
| | | | | | |
| | |
Total Financials | | | | | | 3,776,715 |
| | | | | | |
| | | | | | |
| | | Shares | | | Value |
Health Care (11.77%) |
Biotechnology (5.98%) |
Amgen, Inc. | | | 17,340 | | | $ 2,435,576 |
Biogen Idec, Inc.(a) | | | 5,180 | | | 1,713,596 |
Gilead Sciences, Inc.(a) | | | 35,080 | | | 3,734,266 |
| | | | | | |
| | | | | | 7,883,438 |
| | | | | | |
Pharmaceuticals (5.79%) |
AbbVie, Inc. | | | 24,760 | | | 1,430,137 |
Johnson & Johnson | | | 34,610 | | | 3,689,080 |
Merck & Co., Inc. | | | 19,270 | | | 1,142,326 |
Pfizer, Inc. | | | 46,570 | | | 1,377,075 |
| | | | | | |
| | | | | | 7,638,618 |
| | | | | | |
Total Health Care | | | | | | 15,522,056 |
| | | | | | |
| | |
Industrials (16.98%) | | | | | | |
Aerospace & Defense (3.50%) |
Boeing Co. | | | 11,350 | | | 1,445,763 |
General Dynamics Corp. | | | 11,380 | | | 1,446,284 |
Honeywell International, Inc. | | | 18,510 | | | 1,723,651 |
| | | | | | |
| | | | | | 4,615,698 |
| | | | | | |
Airlines (1.09%) |
Delta Air Lines, Inc. | | | 39,930 | | | 1,443,470 |
| | | | | | |
|
Commercial Services & Supplies (2.03%) |
Republic Services, Inc. | | | 34,290 | | | 1,337,996 |
Tyco International, Ltd. | | | 29,980 | | | 1,336,208 |
| | | | | | |
| | | | | | 2,674,204 |
| | | | | | |
Construction & Engineering (0.85%) |
Quanta Services, Inc.(a) | | | 30,990 | | | 1,124,627 |
| | | | | | |
|
Industrial Conglomerates (2.12%) |
3M Co. | | | 19,690 | | | 2,789,679 |
| | | | | | |
|
Machinery (3.32%) |
Illinois Tool Works, Inc. | | | 21,250 | | | 1,793,925 |
ITT Corp. | | | 28,280 | | | 1,270,903 |
PACCAR, Inc. | | | 23,060 | | | 1,311,538 |
| | | | | | |
| | | | | | 4,376,366 |
| | | | | | |
Road & Rail (4.07%) |
Norfolk Southern Corp. | | | 19,660 | | | 2,194,056 |
Union Pacific Corp. | | | 29,310 | | | 3,177,790 |
| | | | | | |
| | | | | | 5,371,846 |
| | | | | | |
Total Industrials | | | | | | 22,395,890 |
| | | | | | |
|
Information Technology (31.38%) |
Communications Equipment (1.33%) |
QUALCOMM, Inc. | | | 23,540 | | | 1,760,086 |
| | | | | | |
|
Computers & Peripherals (7.81%) |
Apple, Inc. | | | 72,440 | | | 7,298,330 |
NetApp, Inc. | | | 37,020 | | | 1,590,379 |
SanDisk Corp. | | | 14,370 | | | 1,407,542 |
| | | | | | |
| | | | | | 10,296,251 |
| | | | | | |
Internet Software & Services (7.32%) |
Facebook, Inc., Class A(a) | | | 35,880 | | | 2,835,955 |
Google, Inc., Class A(a) | | | 4,980 | | | 2,930,282 |
| | |
Annual Report | September 30, 2014 | | 15 |
| | |
| Centre American Select Equity Fund | | Schedule of Investments |
| | September 30, 2014 |
| | |
| | |
| | | | | | |
| | | Shares | | | Value |
Information Technology (continued) | | | |
Internet Software & Services (continued) |
Google, Inc., Class C(a) | | | 6,740 | | | $ 3,891,406 |
| | | | | | |
| | | | | | 9,657,643 |
| | | | | | |
IT Services (3.04%) | | | | | | |
International Business Machines Corp. | | | 8,740 | | | 1,659,114 |
Visa, Inc., Class A | | | 10,980 | | | 2,342,803 |
| | | | | | |
| | | | | | 4,001,917 |
| | | | | | |
Semiconductors & Semiconductor Equipment (8.02%) |
First Solar, Inc.(a) | | | 17,750 | | | 1,168,127 |
Lam Research Corp. | | | 18,140 | | | 1,355,058 |
Linear Technology Corp. | | | 29,610 | | | 1,314,388 |
Microchip Technology, Inc. | | | 36,230 | | | 1,711,143 |
Micron Technology, Inc.(a) | | | 49,080 | | | 1,681,481 |
NVIDIA Corp. | | | 72,120 | | | 1,330,614 |
Texas Instruments, Inc. | | | 42,300 | | | 2,017,287 |
| | | | | | |
| | | | | | 10,578,098 |
| | | | | | |
Software (3.86%) | | | | | | |
Microsoft Corp. | | | 109,830 | | | 5,091,719 |
| | | | | | |
| |
Total Information Technology | | | 41,385,714 |
| | | | | | |
| | |
Materials (4.79%) | | | | | | |
Chemicals (2.66%) | | | | | | |
International Flavors & Fragrances, Inc. | | | 16,750 | | | 1,605,990 |
Monsanto Co. | | | 16,870 | | | 1,898,043 |
| | | | | | |
| | | | | | 3,504,033 |
| | | | | | |
Construction Materials (1.22%) | | | |
Vulcan Materials Co. | | | 26,760 | | | 1,611,755 |
| | | | | | |
| | |
Metals & Mining (0.91%) | | | | | | |
Allegheny Technologies, Inc. | | | 32,310 | | | 1,198,701 |
| | | | | | |
| | |
Total Materials | | | | | | 6,314,489 |
| | | | | | |
| |
Telecommunication Services (2.02%) | | | |
Diversified Telecommunication (2.02%) | | | |
Verizon Communications, Inc. | | | 53,120 | | | 2,655,469 |
| | | | | | |
| |
Total Telecommunication Services | | | 2,655,469 |
| | | | | | |
| | |
Utilities (4.08%) | | | | | | |
Electric Utilities (2.08%) | | | | | | |
Duke Energy Corp. | | | 18,570 | | | 1,388,479 |
Entergy Corp. | | | 17,540 | | | 1,356,368 |
| | | | | | |
| | | | | | 2,744,847 |
| | | | | | |
Independent Power Producers & Energy Traders (2.00%) |
Calpine Corp.(a) | | | 70,450 | | | 1,528,765 |
NRG Energy, Inc. | | | 36,270 | | | 1,105,510 |
| | | | | | |
| | | | | | 2,634,275 |
| | | | | | |
Total Utilities | | | | | | 5,379,122 |
| | | | | | |
|
|
TOTAL COMMON STOCKS (Cost $104,370,206) | | | | | | 129,242,338 |
|
| | | | | | | | | | | | | | | | |
| | | Expiration
Date | | | Exercise Price | | | Contracts | | | Value | |
PURCHASED OPTIONS (1.78%) | | | | | |
Calls (0.24%) | | | | | | | | | | | | | |
SPDR® Gold Shares: | | | | | |
| | | 12/20/2014 | | | $ | 132.00 | | | | 1,000 | | | $ | 23,000 | |
| | | 1/17/2015 | | | | 132.00 | | | | 450 | | | | 17,100 | |
| | | 3/20/2015 | | | | 132.00 | | | | 500 | | | | 43,000 | |
| | | 6/19/2015 | | | | 128.00 | | | | 1,000 | | | | 234,000 | |
| | | | | | | | | | | | | | | | |
Total Calls | | | | | | | | | | | | 317,100 | |
| | | | | | | | | | | | | | | | |
| | | |
Puts (1.54%) | | | | | | | | | | | | | |
S&P 500® Index: | | | | | |
| | | 3/20/2015 | | | | 1,825.00 | | | | 470 | | | | 2,028,050 | |
| | | | | | | | | | | | | | | | |
Total Puts | | | | 2,028,050 | |
| | | | | | | | | | | | | | | | |
|
| |
TOTAL PURCHASED OPTIONS (Cost $2,908,867) | | | | 2,345,150 | |
| |
| | | | |
| | | | | | 7-Day Yield | | | Shares | | | Value | |
SHORT TERM INVESTMENTS (0.25%) | |
Money Market Fund (0.25%) | | | | | |
Dreyfus Treasury Prime Cash Management, Institutional Class 0.00004% 333,359 | | | | | | | | 333,359 | |
| | | | | | | | | | | | | | | | |
|
| |
TOTAL SHORT TERM INVESTMENTS (Cost $333,359) | | | | 333,359 | |
| |
| |
TOTAL INVESTMENTS (100.04%) (Cost $107,612,432) | | | $ | 131,920,847 | |
Liabilities in Excess of Other Assets (-0.04%) | | | | (49,721) | |
| |
NET ASSETS (100.00%) | | | $ | 131,871,126 | |
| |
| (a) | Non-income producing security. |
Common Abbreviations:
Ltd. - Limited.
S&P - Standard & Poor’s.
SPDR - Standard & Poor’s Depositary Receipts.
See Notes to Financial Statements.
| | |
| Centre Global Select Equity Fund | | Schedule of Investments |
| | September 30, 2014 |
| | |
| | |
| | | | | | | | |
| | | Shares | | | Value | |
COMMON STOCKS (94.36%) | | | | | |
AFRICA (0.72%) | | | | | | | | |
South Africa (0.72%) | | | | | | | | |
Financials (0.72%) | | | | | | | | |
Coronation Fund Managers, Ltd. | | | 12,300 | | | $ | 105,364 | |
| | | | | | | | |
| | |
Total South Africa | | | | | | | 105,364 | |
| | | | | | | | |
| | |
TOTAL AFRICA (Cost $112,607) | | | | | | | 105,364 | |
| |
| | |
ASIA (43.53%) | | | | | | | | |
Australia (3.09%) | | | | | | | | |
Financials (1.34%) | | | | | | | | |
Westpac Banking Corp. | | | 7,020 | | | | 197,544 | |
| | | | | | | | |
| | |
Materials (1.75%) | | | | | | | | |
BHP Billiton, Ltd. | | | 2,717 | | | | 80,572 | |
Rio Tinto, Ltd. | | | 3,400 | | | | 177,362 | |
| | | | | | | | |
| | | | | | | 257,934 | |
| | | | | | | | |
Total Australia | | | | | | | 455,478 | |
| | | | | | | | |
| | |
China (15.74%) | | | | | | | | |
Consumer Staples (2.63%) | | | | | |
Hengan International Group Co., Ltd. | | | 18,600 | | | | 182,890 | |
Want Want China Holdings, Ltd. | | | 164,300 | | | | 204,823 | |
| | | | | | | | |
| | | | | | | 387,713 | |
| | | | | | | | |
Energy (3.24%) | | | | | |
China Petroleum & Chemical Corp., Class H | | | 296,800 | | | | 259,920 | |
China Shenhua Energy Co., Ltd., Class H | | | 78,000 | | | | 217,480 | |
| | | | | | | | |
| | | | | | | 477,400 | |
| | | | | | | | |
Financials (4.22%) | | | | | |
Agricultural Bank of China, Ltd., Class H | | | 484,400 | | | | 214,600 | |
China Merchants Bank Co., Ltd., Class H | | | 114,500 | | | | 195,826 | |
China Pacific Insurance Group Co., Ltd.,
Class H | | | 60,100 | | | | 211,302 | |
| | | | | | | | |
| | | | | | | 621,728 | |
| | | | | | | | |
Information Technology (2.44%) | | | | | |
Tencent Holdings, Ltd. | | | 24,200 | | | | 359,968 | |
| | | | | | | | |
| |
Telecommunication Services (3.21%) | | | | | |
China Mobile, Ltd. | | | 41,000 | | | | 473,899 | |
| | | | | | | | |
| | |
Total China | | | | | | | 2,320,708 | |
| | | | | | | | |
| | |
Hong Kong (6.15%) | | | | | | | | |
Consumer Discretionary (1.23%) | | | | | |
Belle International Holdings, Ltd. | | | 161,700 | | | | 181,799 | |
| | | | | | | | |
| | |
Financials (2.48%) | | | | | | | | |
China Overseas Land & Investment, Ltd. | | | 80,200 | | | | 206,365 | |
Yuexiu Property Co., Ltd. | | | 895,400 | | | | 159,134 | |
| | | | | | | | |
| | | | | | | 365,499 | |
| | | | | | | | |
| | |
Industrials (1.23%) | | | | | | | | |
Shanghai Industrial Holdings, Ltd. | | | 61,200 | | | | 181,279 | |
| | | | | | | | |
| | | | | | | | |
| | | Shares | | | Value | |
Hong Kong (continued) | | | | | | | | |
Utilities (1.21%) | | | | | | | | |
China Gas Holdings, Ltd. | | | 107,600 | | | $ | 178,482 | |
| | | | | | | | |
| | |
Total Hong Kong | | | | | | | 907,059 | |
| | | | | | | | |
| | |
India (2.87%) | | | | | | | | |
Energy (1.25%) | | | | | | | | |
Reliance Industries, Ltd., Sponsored GDR(a) | | | 6,030 | | | | 183,915 | |
| | | | | | | | |
Information Technology (1.62%) | | | | | |
Infosys, Ltd., Sponsored ADR | | | 3,950 | | | | 238,936 | |
| | | | | | | | |
| | |
Total India | | | | | | | 422,851 | |
| | | | | | | | |
| | |
Indonesia (1.34%) | | | | | | | | |
Consumer Discretionary (1.34%) | | | | | |
Astra International Tbk PT | | | 342,000 | | | | 197,874 | |
| | | | | | | | |
| | |
Total Indonesia | | | | | | | 197,874 | |
| | | | | | | | |
| | |
Japan (8.32%) | | | | | | | | |
Consumer Discretionary (2.71%) | | | | | |
Honda Motor Co., Ltd. | | | 6,000 | | | | 207,887 | |
Sumitomo Electric Industries, Ltd. | | | 13,000 | | | | 192,081 | |
| | | | | | | | |
| | | | | | | 399,968 | |
| | | | | | | | |
Financials (2.86%) | | | | | | | | |
Mitsubishi UFJ Financial Group, Inc. | | | 38,470 | | | | 217,544 | |
Sumitomo Mitsui Financial Group, Inc. | | | 5,000 | | | | 203,829 | |
| | | | | | | | |
| | | | | | | 421,373 | |
| | | | | | | | |
Industrials (1.32%) | | | | | |
ITOCHU Corp. | | | 16,000 | | | | 195,487 | |
| | | | | | | | |
Telecommunication Services (1.43%) | | | | | |
SoftBank Corp. | | | 3,000 | | | | 210,321 | |
| | | | | | | | |
| | |
Total Japan | | | | | | | 1,227,149 | |
| | | | | | | | |
| | |
Korea (1.07%) | | | | | | | | |
Consumer Discretionary (1.07%) | | | | | |
Hyundai Motor Co. | | | 870 | | | | 157,058 | |
| | | | | | | | |
| | |
Total Korea | | | | | | | 157,058 | |
| | | | | | | | |
| | |
Malaysia (0.79%) | | | | | | | | |
Materials (0.79%) | | | | | | | | |
Lafarge Malaysia Bhd | | | 37,000 | | | | 116,171 | |
| | | | | | | | |
| | |
Total Malaysia | | | | | | | 116,171 | |
| | | | | | | | |
| | |
Philippines (0.62%) | | | | | | | | |
Industrials (0.62%) | | | | | |
International Container Terminal Services, Inc. | | | 37,100 | | | | 91,267 | |
| | | | | | | | |
| | |
Total Philippines | | | | | | | 91,267 | |
| | | | | | | | |
| | |
Annual Report | September 30, 2014 | | 17 |
| | |
| Centre Global Select Equity Fund | | Schedule of Investments |
| | September 30, 2014 |
| | |
| | |
| | | | | | | | |
| | | Shares | | | Value | |
Singapore (0.66%) | | | | | | | | |
Industrials (0.66%) | | | | | | | | |
ComfortDelGro Corp., Ltd. | | | 52,000 | | | $ | 97,829 | |
| | | | | | | | |
| | |
Total Singapore | | | | | | | 97,829 | |
| | | | | | | | |
| | |
South Korea (0.76%) | | | | | | | | |
Consumer Discretionary (0.76%) | | | | | |
Paradise Co., Ltd. | | | 3,400 | | | | 111,320 | |
| | | | | | | | |
| | |
Total South Korea | | | | | | | 111,320 | |
| | | | | | | | |
| | |
Taiwan (1.23%) | | | | | | | | |
Information Technology (1.23%) | | | | | |
Taiwan Semiconductor Manufacturing Co., Ltd. | | | 46,060 | | | | 181,699 | |
| | | | | | | | |
| | |
Total Taiwan | | | | | | | 181,699 | |
| | | | | | | | |
| | |
Thailand (0.89%) | | | | | | | | |
Energy (0.89%) | | | | | | | | |
PTT Exploration & Production Pcl | | | 26,500 | | | | 130,763 | |
| | | | | | | | |
| | |
Total Thailand | | | | | | | 130,763 | |
| | | | | | | | |
| | |
TOTAL ASIA (Cost $6,757,249) | | | | | | | 6,417,226 | |
| |
| | |
EUROPE (37.80%) | | | | | | | | |
Austria (0.79%) | | | | | | | | |
Industrials (0.79%) | | | | | | | | |
Andritz AG | | | 2,200 | | | | 117,318 | |
| | | | | | | | |
| | |
Total Austria | | | | | | | 117,318 | |
| | | | | | | | |
| | |
Belgium (0.89%) | | | | | | | | |
Materials (0.89%) | | | | | | | | |
Umicore SA | | | 3,000 | | | | 131,238 | |
| | | | | | | | |
| | |
Total Belgium | | | | | | | 131,238 | |
| | | | | | | | |
| | |
Denmark (0.74%) | | | | | | | | |
Health Care (0.74%) | | | | | | | | |
Novo Nordisk A/S,
Class B | | | 2,300 | | | | 110,053 | |
| | | | | | | | |
| | |
Total Denmark | | | | | | | 110,053 | |
| | | | | | | | |
| | |
France (5.08%) | | | | | | | | |
Energy (1.90%) | | | | | | | | |
Total SA | | | 4,310 | | | | 280,082 | |
| | | | | | | | |
| | |
Financials (3.18%) | | | | | | | | |
AXA SA | | | 9,450 | | | | 232,869 | |
BNP Paribas SA | | | 3,550 | | | | 235,492 | |
| | | | | | | | |
| | | | | | | 468,361 | |
| | | | | | | | |
Total France | | | | | | | 748,443 | |
| | | | | | | | |
| | | | | | | | |
| | | Shares | | | Value | |
Germany (8.14%) | | | | | | | | |
Consumer Discretionary (1.35%) | | | | | |
adidas AG | | | 2,650 | | | $ | 198,316 | |
| | | | | | | | |
| | |
Financials (1.64%) | | | | | | | | |
Deutsche Bank AG | | | 6,910 | | | | 242,412 | |
| | | | | | | | |
| |
Information Technology (0.60%) | | | | | |
SAP SE | | | 1,232 | | | | 88,853 | |
| | | | | | | | |
| | |
Materials (1.50%) | | | | | | | | |
Linde AG | | | 1,150 | | | | 221,000 | |
| | | | | | | | |
| |
Telecommunication Services (1.50%) | | | | | |
Deutsche Telekom AG | | | 14,630 | | | | 221,742 | |
| | | | | | | | |
| | |
Utilities (1.55%) | | | | | | | | |
E.ON SE | | | 12,450 | | | | 227,935 | |
| | | | | | | | |
Total Germany | | | | | | | 1,200,258 | |
| | | | | | | | |
| | |
Great Britain (4.52%) | | | | | | | | |
Energy (1.44%) | | | | | | | | |
BP Plc | | | 28,900 | | | | 212,445 | |
| | | | | | | | |
| | |
Financials (1.60%) | | | | | | | | |
HSBC Holdings Plc | | | 23,318 | | | | 236,677 | |
| | | | | | | | |
| | |
Health Care (1.48%) | | | | | | | | |
GlaxoSmithKline Plc | | | 9,500 | | | | 217,614 | |
| | | | | | | | |
Total Great Britain | | | | | | | 666,736 | |
| | | | | | | | |
| | |
Greece (0.41%) | | | | | | | | |
Materials (0.41%) | | | | | | | | |
Titan Cement Co., SA | | | 2,400 | | | | 60,020 | |
| | | | | | | | |
Total Greece | | | | | | | 60,020 | |
| | | | | | | | |
| | |
Israel (0.70%) | | | | | | | | |
Health Care (0.70%) | | | | | | | | |
Teva Pharmaceutical Industries, Ltd., Sponsored ADR | | | 1,920 | | | | 103,200 | |
| | | | | | | | |
Total Israel | | | | | | | 103,200 | |
| | | | | | | | |
| | |
Italy (4.69%) | | | | | | | | |
Financials (4.69%) | | | | | | | | |
Assicurazioni Generali SpA | | | 11,430 | | | | 240,516 | |
Intesa Sanpaolo SpA | | | 84,450 | | | | 256,636 | |
UniCredit SpA | | | 24,550 | | | | 194,111 | |
| | | | | | | | |
| | | | | | | 691,263 | |
| | | | | | | | |
Total Italy | | | | | | | 691,263 | |
| | | | | | | | |
| | |
| Centre Global Select Equity Fund | | Schedule of Investments |
| | September 30, 2014 |
| | |
| | |
| | | | | | | | |
| | | Shares | | | Value | |
Netherlands (1.56%) | | | | | | | | |
Consumer Staples (1.56%) | | | | | | | | |
Unilever NV | | | 5,780 | | | $ | 230,184 | |
| | | | | | | | |
Total Netherlands | | | | | | | 230,184 | |
| | | | | | | | |
| | |
Norway (1.02%) | | | | | | | | |
Energy (1.02%) | | | | | | | | |
Statoil ASA | | | 5,500 | | | | 149,983 | |
| | | | | | | | |
| | |
Total Norway | | | | | | | 149,983 | |
| | | | | | | | |
| | |
Russia (2.79%) | | | | | | | | |
Energy (1.55%) | | | | | | | | |
NOVATEK OAO, Sponsored
GDR(b) | | | 2,200 | | | | 229,240 | |
| | | | | | | | |
| |
Telecommunication Services (1.24%) | | | | | |
Mobile Telesystems OJSC, Sponsored ADR | | | 12,200 | | | | 182,268 | |
| | | | | | | | |
| | |
Total Russia | | | | | | | 411,508 | |
| | | | | | | | |
| | |
Spain (3.00%) | | | | | | | | |
Financials (1.51%) | | | | | | | | |
Banco Bilbao Vizcaya Argentaria SA | | | 18,007 | | | | 217,226 | |
Banco Santander SA | | | 492 | | | | 4,730 | |
| | | | | | | | |
| | | | | | | 221,956 | |
| | | | | | | | |
Utilities (1.49%) | | | | | | | | |
Iberdrola SA | | | 30,700 | | | | 219,859 | |
| | | | | | | | |
| | |
Total Spain | | | | | | | 441,815 | |
| | | | | | | | |
| | |
Sweden (0.82%) | | | | | | | | |
Health Care (0.82%) | | | | | | | | |
Elekta AB, Class B | | | 12,300 | | | | 121,278 | |
| | | | | | | | |
| | |
Total Sweden | | | | | | | 121,278 | |
| | | | | | | | |
| | |
Switzerland (1.37%) | | | | | | | | |
Health Care (1.37%) | | | | | | | | |
Roche Holding AG | | | 680 | | | | 201,642 | |
| | | | | | | | |
| | |
Total Switzerland | | | | | | | 201,642 | |
| | | | | | | | |
| | |
Turkey (1.28%) | | | | | | | | |
Consumer Staples (1.28%) | | | | | |
BIM Birlesik Magazalar AS | | | 9,000 | | | | 188,377 | |
| | | | | | | | |
| | |
Total Turkey | | | | | | | 188,377 | |
| | | | | | | | |
| | |
TOTAL EUROPE (Cost $5,513,670) | | | | | | | 5,573,316 | |
| |
| | |
NORTH AMERICA (10.33%) | | | | | | | | |
Canada (4.29%) | | | | | | | | |
Financials (4.29%) | | | | | | | | |
Bank of Nova Scotia | | | 3,400 | | | | 210,293 | |
Royal Bank of Canada | | | 2,800 | | | | 200,134 | |
| | | | | | | | |
| | | Shares | | | Value | |
Canada (continued) | | | | | | | | |
Financials (continued) | | | | | | | | |
Toronto-Dominion Bank | | | 4,500 | | | $ | 222,077 | |
| | | | | | | | |
| | | | | | | 632,504 | |
| | | | | | | | |
Total Canada | | | | | | | 632,504 | |
| | | | | | | | |
| | |
Mexico (2.91%) | | | | | | | | |
Consumer Staples (0.90%) | | | | | |
Fomento Economico Mexicano SAB de CV | | | 14,400 | | | | 132,426 | |
| | | | | | | | |
| | |
Financials (0.84%) | | | | | | | | |
Grupo Financiero Banorte SAB de CV | | | 19,300 | | | | 123,599 | |
| | | | | | | | |
|
Telecommunication Services (1.17%) | |
Grupo Televisa SAB | | | 25,500 | | | | 173,063 | |
| | | | | | | | |
Total Mexico | | | | | | | 429,088 | |
| | | | | | | | |
| | |
United States (3.13%) | | | | | | | | |
Financials (1.45%) | | | | | | | | |
HDFC Bank, Ltd., ADR | | | 4,600 | | | | 214,268 | |
| | | | | | | | |
| |
Information Technology (1.68%) | | | | | |
Lenovo Group, Ltd. | | | 165,900 | | | | 246,985 | |
| | | | | | | | |
| | |
Total United States | | | | | | | 461,253 | |
| | | | | | | | |
| | |
TOTAL NORTH AMERICA (Cost $1,582,349) | | | | | | | 1,522,845 | |
| |
| | |
SOUTH AMERICA (1.98%) | | | | | | | | |
Brazil (1.57%) | | | | | | | | |
Consumer Staples (1.57%) | |
AMBEV SA | | | 35,100 | | | | 231,013 | |
| | | | | | | | |
| | |
Total Brazil | | | | | | | 231,013 | |
| | | | | | | | |
| | |
Peru (0.41%) | | | | | | | | |
Financials (0.41%) | | | | | | | | |
Credicorp, Ltd. | | | 400 | | | | 61,356 | |
| | | | | | | | |
| | |
Total Peru | | | | | | | 61,356 | |
| | | | | | | | |
| | |
TOTAL SOUTH AMERICA (Cost $310,256) | | | | | | | 292,369 | |
| |
| | | | | | | | |
| |
TOTAL COMMON STOCKS (Cost $14,276,131) | | | | | | | 13,911,120 | |
| |
| |
PREFERRED STOCKS (2.71%) | | | | | |
SOUTH AMERICA (2.71%) | |
Brazil (2.71%) | | | | | | | | |
Financials (1.53%) | | | | | | | | |
Banco Bradesco SA | | | 15,800 | | | | 225,922 | |
| | | | | | | | |
| | |
Annual Report | September 30, 2014 | | 19 |
| | |
| Centre Global Select Equity Fund | | Schedule of Investments |
| | September 30, 2014 |
| | |
| | |
| | | | | | | | | | | | |
| | | | | | Shares | | | Value | |
Brazil (continued) | | | | | | | | | |
Materials (1.18%) | | | | | | | | | |
Vale SA | | | | | | | 17,900 | | | $ | 173,899 | |
| | | | | | | | | | | | |
Total Brazil | | | | | | | | 399,821 | |
| | | | | | | | | | | | |
TOTAL SOUTH AMERICA (Cost $465,686) | | | | | | | | 399,821 | |
| |
| | | | | | | | | | | | |
| |
TOTAL PREFERRED STOCKS (Cost $465,686) | | | | 399,821 | |
| |
| | | |
| | | | | | Shares | | | Value | |
| | | |
RIGHTS (0.05%) | | | | | | | | | | | | |
ASIA (0.04%) | | | | | | | | | | | | |
Hong Kong (0.04%) | | | | | | | | | |
Financials (0.04%) | | | | | | | | | |
Yuexiu Property Co., Ltd., Rights, Strike Price $1.25 (expiring 10/14/14)(c) | | | | 295,482 | | | | 4,947 | |
| | | | | | | | | | | | |
| | | |
Total Hong Kong | | | | | | | | | | | 4,947 | |
| | | | | | | | | | | | |
| | | |
TOTAL ASIA (Cost $0) | | | | | | | | | | | 4,947 | |
| |
| | | |
EUROPE (0.01%) | | | | | | | | | | | | |
Spain (0.01%) | | | | | | | | | |
Financials (0.01%) | | | | | | | | | |
Banco Bilbao Vizcaya, Rights, (expiring 10/31/14)(c) | | | | 18,007 | | | | 1,797 | |
| | | | | | | | | | | | |
| | | |
Total Spain | | | | | | | | | | | 1,797 | |
| | | | | | | | | | | | |
| | | |
TOTAL EUROPE (Cost $0) | | | | | | | | | | | 1,797 | |
| |
| | | | | | | | | | | | |
| |
TOTAL RIGHTS (Cost $0) | | | | | | | | | | | 6,744 | |
| |
| | | |
| | | 7-Day | | | | | | | |
| | | Yield | | | Shares | | | Value | |
SHORT TERM INVESTMENTS (2.58%) | | | | | |
Money Market Fund (2.58%) | | | | | |
Dreyfus Treasury Prime Cash Management, Institutional Class | | | 0.00004 | % | | | 380,706 | | | | 380,706 | |
| | | | | | | | | | | | |
| | | | | | | | | | | | |
| |
TOTAL SHORT TERM INVESTMENTS (Cost $380,706) | | | | 380,706 | |
| |
| |
TOTAL INVESTMENTS (99.70%) (Cost $15,122,523) | | | $ | 14,698,391 | |
| | | | | | | | | | | | |
Other Assets In Excess Of Liabilities (0.30%) | | | | 44,136 | |
| |
NET ASSETS (100.00%) | | | $ | 14,742,527 | |
| |
| |
| (a) | Security exempt from registration under Rule 144A of the Securities Act of 1933. These securities may be resold in transactions exempt from registration, normally to qualified institutional buyers. At September 30, 2014, these securities amount to a value of $183,915 or 1.25% of net assets. |
| (b) | Securities were purchased pursuant to Regulation S under the Securities Act of 1933, which exempts securities offered and sold outside the Untied States from registration. Such securities cannot be sold in the United States without either an effective registration statement filed pursuant to Securities Act of 1933, or pursuant to an exemption from registration. These securities have been deemed liquid under guidelines approved by the Fund’s Board of Trustees. At period end, the aggregate market value of those securities was $229,240, representing 1.55% of net assets. |
| (c) | Non-income producing security. |
Common Abbreviations:
| AB | - Aktiebolag is the Swedish equivalent of the term corporation. |
| ADR | - American Depositary Receipt. |
| AG | - Aktiengesellschaft is a German term that refers to a corporation that is limited by shares, i.e., owned by shareholders. |
| A/S | - Aktieselskab is the Danish term for Joint Stock Company. |
| AS | - Anonim Sirketi, Joint Stock Company in Turkey. |
| ASA | - Allmennaksjeselskap in the Norwegian term for public limited company. |
| Bhd | - Berhad, public limited company in Malaysia. |
| GDR | - Global Depositary Receipt. |
| NV | - Naamloze Vennootschap is the Dutch term for a public limited liability corporation. |
| OAO | - Otkrytoe Aktsionernoe Obschestvo (a Russian open joint stock corporation) |
| OJSC | - Open Joint Stock Company. |
| Pcl | - A rearrangement of the letters for public limited company, used in Thailand. |
| Plc | - Public Limited Company. |
| SA | - Generally designates corporations in various countries, mostly those employing the civil law. |
| SAB | - Sociedad Anonima Busatil is the Spanish term used for publicly held company. |
| SAB | de CV - A variable capital company. |
| SE | - SE Regulation. A European Company which can operate on a Europe-wide basis and be governed by Community law directly applicable in all Member States. |
| SpA | - Societa Per Azioni is an Italian shared company. |
| Tbk | PT - Terbuka is the Indonesian term for limited liability company. |
| UFJ | - United Financial of Japan. |
See Notes to Financial Statements.
| | |
| Centre Active U.S. Treasury Fund | | Schedule of Investments |
| | September 30, 2014 |
| | |
| | |
| | | | | | | | | | | | |
| | | | | | Principal | | | | |
| | | | | | Amount | | | Value | |
U.S. GOVERNMENT BONDS & NOTES (96.37%) | |
U.S. Treasury Bonds (16.80%) | | | | | |
11/15/2026, 6.500% | | | $ | 545,000 | | | $ | 763,000 | |
2/15/2031, 5.375% | | | | 545,000 | | | | 721,742 | |
11/15/2040, 4.250% | | | | 436,000 | | | | 523,916 | |
2/15/2043, 3.125% | | | | 436,000 | | | | 429,869 | |
| | | | | | | | | | | | |
Total U.S. Treasury Bonds | | | | 2,438,527 | |
| | | | | | | | | | | | |
| |
U.S. Treasury Notes (79.57%) | | | | | |
7/31/2015, 1.750% | | | | 1,527,000 | | | | 1,547,996 | |
2/29/2016, 2.125% | | | | 1,636,000 | | | | 1,678,019 | |
11/30/2016, 2.750% | | | | 1,417,000 | | | | 1,479,658 | |
2/15/2018, 3.500% | | | | 1,636,000 | | | | 1,755,186 | |
5/15/2019, 3.125% | | | | 1,636,000 | | | | 1,739,273 | |
5/15/2021, 3.125% | | | | 1,308,000 | | | | 1,386,633 | |
11/15/2022, 1.625% | | | | 545,000 | | | | 515,408 | |
2/15/2024, 2.750% | | | | 1,417,000 | | | | 1,450,985 | |
| | | | | | | | | | | | |
Total U.S. Treasury Notes | | | | 11,553,158 | |
| | | | | | | | | | | | |
| | | | | |
| |
TOTAL U.S. GOVERNMENT BONDS & NOTES (Cost $14,045,633) | | | | 13,991,685 | |
| |
| | | |
| | | 7-Day | | | | | | | |
| | | Yield | | | Shares | | | Value | |
SHORT TERM INVESTMENTS (2.83%) | | | | | |
Money Market Fund (2.83%) | | | | | |
Dreyfus
Treasury
Prime Cash
Management, Institutional Class | | | 0.00004 | % | | | 410,893 | | | | 410,893 | |
| | | | | | | | | | | | |
| | | | | |
| |
TOTAL SHORT TERM INVESTMENTS (Cost $410,893) | | | | 410,893 | |
| |
| |
TOTAL INVESTMENTS (99.20%) (Cost $14,456,526) | | | $ | 14,402,578 | |
Other Assets In Excess Of
Liabilities (0.80%) | | | | 116,588 | |
| |
NET ASSETS (100.00%) | | | | | | | $ | 14,519,166 | |
| |
| |
See Notes to Financial Statements.
| | |
Annual Report | September 30, 2014 | | 21 |
| | |
| Centre Multi-Asset Real Return Fund | | Schedule of Investments |
| | September 30, 2014 |
| | |
| | |
| | | | | | | | | | | | |
| | | | | | Shares | | | Value | |
EXCHANGE-TRADED FUNDS (23.72%) | | | | | |
iShares® MSCI ACWI ETF | | | | 94,000 | | | $ | 5,536,600 | |
iShares® U.S. Real Estate ETF | | | | 83,000 | | | | 5,743,600 | |
SPDR® Gold Shares(a) | | | | 23,600 | | | | 2,742,556 | |
| | | | | | | | | |
| |
TOTAL EXCHANGE-TRADED FUNDS (Cost $13,817,548) | | | | 14,022,756 | |
| |
| |
OPEN-END FUNDS (76.14%) | | | | | |
Centre Active U.S. Treasury Fund, Institutional
Class(a)(b) | | | | 1,437,698 | | | | 14,506,377 | |
Centre American Select Equity Fund, Institutional
Class(a)(b) | | | | 1,307,665 | | | | 15,796,594 | |
Centre Global Select Equity Fund, Institutional Class(b) | | | | 1,268,486 | | | | 14,701,753 | |
| | | | | | | | | |
| |
TOTAL OPEN-END FUNDS (Cost $45,846,269) | | | | | | | | 45,004,724 | |
| |
| | | |
| | | 7-Day | | | | | | | |
| | | Yield | | | Shares | | | Value | |
SHORT TERM INVESTMENTS (0.13%) | | | | | |
Money Market Fund (0.13%) | | | | | |
Dreyfus Treasury Prime Cash Management, Institutional Class | | | 0.00004 | % | | | 73,932 | | | | 73,932 | |
| | | | | | | | | | | | |
| | | | | | | | | | | | |
| |
TOTAL SHORT TERM INVESTMENTS (Cost $73,932) | | | | 73,932 | |
| |
| |
TOTAL INVESTMENTS (99.99%) (Cost $59,737,749) | | | $ | 59,101,412 | |
Other Assets In Excess Of Liabilities (0.01%) | | | | 6,302 | |
| |
NET ASSETS (100.00%) | | | $ | 59,107,714 | |
| |
| |
| (a) | Non-income producing security. |
| (b) | Affiliated with the Fund, as each is a series of Centre Funds and has the same investment adviser. |
Common Abbreviations:
| ACWI | - All Country World Index. |
| ETF | - Exchange Traded Fund. |
| MSCI | - Morgan Stanley Capital International. |
| SPDR | - Standard & Poor’s Depositary Receipts. |
See Notes to Financial Statements.
| | |
| Centre Funds | | Statements of Assets and Liabilities |
| | September 30, 2014 |
| | |
| | |
| | | | | | | | | | | | | | | | |
| | | Centre American
Select Equity Fund | | | Centre Global
Select Equity Fund | | | Centre Active U.S.
Treasury Fund | | | Centre Multi-Asset
Real Return Fund | |
ASSETS: | | | | | | | | | | | | | | | | |
| | | | |
Investments, at value | | $ | 131,920,847 | | | $ | 14,698,391 | | | $ | 14,402,578 | | | $ | 14,096,688 | |
Investments in affiliates, at value | | | – | | | | – | | | | – | | | | 45,004,724 | |
Foreign currency, at value (Cost $–, $12,321, $– and $–, respectively) | | | – | | | | 12,140 | | | | – | | | | – | |
Receivable for dividends and interest | | | 93,709 | | | | 51,950 | | | | 96,821 | | | | 52,289 | |
Receivable due from investment adviser | | | – | | | | 1,298 | | | | 8,789 | | | | – | |
Receivable for shares sold | | | 1,818 | | | | – | | | | – | | | | – | |
Deferred offering cost | | | 2,418 | | | | 275 | | | | 30,375 | | | | – | |
Prepaid and other assets | | | 10,105 | | | | 7,685 | | | | 1,225 | | | | 7,952 | |
| | | | | | | | | | | | | | | | |
Total Assets | | | 132,028,897 | | | | 14,771,739 | | | | 14,539,788 | | | | 59,161,653 | |
| | | | | | | | | | | | | | | | |
| | | | |
LIABILITIES: | | | | | | | | | | | | | | | | |
Payable to administrator | | | 18,058 | | | | 4,338 | | | | 2,474 | | | | 8,062 | |
Payable to transfer agency | | | 11,864 | | | | 2,048 | | | | 2,043 | | | | 2,048 | |
Payable for shares redeemed | | | 30,635 | | | | – | | | | – | | | | – | |
Payable to investment adviser | | | 22,622 | | | | – | | | | – | | | | 15,030 | |
Accrued 12b-1 fees (Investor Class) | | | 20,345 | | | | – | | | | – | | | | – | |
Payable for custodian fees | | | 2,623 | | | | 2,500 | | | | 833 | | | | 1,008 | |
Payable for printing | | | 12,254 | | | | 755 | | | | 645 | | | | 2,941 | |
Payable for legal and audit fees | | | 34,721 | | | | 16,992 | | | | 14,085 | | | | 22,140 | |
Payable under the Chief Compliance Officer Services Agreement | | | 2,967 | | | | 349 | | | | 327 | | | | 1,357 | |
Other payables | | | 1,682 | | | | 2,230 | | | | 215 | | | | 1,353 | |
| | | | | | | | | | | | | | | | |
Total Liabilities | | | 157,771 | | | | 29,212 | | | | 20,622 | | | | 53,939 | |
| | | | | | | | | | | | | | | | |
| | | | |
NET ASSETS | | $ | 131,871,126 | | | $ | 14,742,527 | | | $ | 14,519,166 | | | $ | 59,107,714 | |
| | | | | | | | | | | | | | | | |
| | | | |
NET ASSETS CONSIST OF: | | | | | | | | | | | | | | | | |
Paid-in capital | | $ | 106,998,784 | | | $ | 13,046,985 | | | $ | 14,379,623 | | | $ | 59,287,598 | |
Accumulated net investment income | | | 492,491 | | | | 237,950 | | | | 57,516 | | | | 0 | |
Accumulated net realized gain on investments and foreign currency transactions | | | 71,436 | | | | 1,883,384 | | | | 135,975 | | | | 456,453 | |
Net unrealized appreciation/(depreciation) on investments and translation of assets and liabilities denominated in foreign currencies | | | 24,308,415 | | | | (425,792) | | | | (53,948) | | | | (636,337) | |
| | | | | | | | | | | | | | | | |
NET ASSETS | | $ | 131,871,126 | | | $ | 14,742,527 | | | $ | 14,519,166 | | | $ | 59,107,714 | |
| | | | | | | | | | | | | | | | |
| | | | |
INVESTMENTS, AT COST | | $ | 107,612,432 | | | $ | 15,122,523 | | | $ | 14,456,526 | | | $ | 13,891,480 | |
| | | | |
INVESTMENTS IN AFFILIATES, AT COST | | | – | | | | – | | | | – | | | | 45,846,269 | |
| | | | |
PRICING OF SHARES | | | | | | | | | | | | | | | | |
| | | | |
Investor Class | | | | | | | | | | | | | | | | |
Net Assets | | $ | 116,044,764 | | | $ | 4,803 | | | $ | 5,037 | | | $ | 5,145 | |
Shares outstanding | | | 9,609,264 | | | | 415 | | | | 500 | | | | 524 | |
Net Asset Value, offering and redemption price per share | | $ | 12.08 | | | $ | 11.59 | | | $ | 10.07 | | | $ | 9.82 | |
Institutional Class | | | | | | | | | | | | | | | | |
Net Assets | | $ | 15,826,362 | | | $ | 14,737,724 | | | $ | 14,514,129 | | | $ | 59,102,569 | |
Shares outstanding | | | 1,309,948 | | | | 1,271,210 | | | | 1,438,198 | | | | 5,993,180 | |
Net Asset Value, offering and redemption price per share | | $ | 12.08 | | | $ | 11.59 | | | $ | 10.09 | | | $ | 9.86 | |
| | |
See Notes to Financial Statements. | | |
Annual Report | September 30, 2014 | | 23 |
| | |
| Centre Funds | | Statements of Operations |
| | |
| | |
| | |
| | | | | | | | | | | | | | | | |
| | | Centre American | | | Centre Global | | | Centre Active U.S. | | | Centre Multi-Asset | |
| | | Select Equity Fund | | | Select Equity Fund | | | Treasury Fund | | | Real Return Fund | |
| | | | | | | | | For the Period | | | | |
| | | | | | | | | January 21, 2014 | | | | |
| | | For the Year | | | For the Year | | | (Inception) to | | | For the Year | |
| | | Ended September | | | Ended September | | | September 30, | | | Ended September | |
| | | 30, 2014 | | | 30, 2014 | | | 2014 | | | 30, 2014 | |
INVESTMENT INCOME: | | | | | | | | | | | | | | | | |
Interest | | $ | – | | | $ | – | | | $ | 84,156 | | | $ | (47,916) | |
Dividends | | | 2,096,449 | | | | 498,794 | | | | – | | | | 24,309 | |
Dividends from affiliated securities | | | – | | | | – | | | | – | | | | 664,689 | |
Foreign taxes withheld | | | 1,603 | | | | (39,895) | | | | – | | | | – | |
| | | | | | | | | | | | | | | | |
Total Investment Income | | | 2,098,052 | | | | 458,899 | | | | 84,156 | | | | 641,082 | |
| | | | | | | | | | | | | | | | |
| | | | |
EXPENSES: | | | | | | | | | | | | | | | | |
Investment advisory fees | | | 996,023 | | | | 152,927 | | | | 38,005 | | | | 324,374 | |
Administration fees | | | 203,891 | | | | 38,757 | | | | 16,378 | | | | 91,537 | |
Transfer agent fees | | | 87,923 | | | | 22,990 | | | | 15,977 | | | | 22,983 | |
Custodian fees | | | 15,795 | | | | 14,930 | | | | 3,468 | | | | 6,002 | |
Legal fees | | | 124,016 | | | | 18,458 | | | | 7,972 | | | | 52,540 | |
Audit fees | | | 16,610 | | | | 13,940 | | | | 11,533 | | | | 12,490 | |
Trustees’ fees and expenses | | | 34,936 | | | | 4,029 | | | | 2,724 | | | | 15,344 | |
Recoupment of past fees waived by adviser (Institutional Class) | | | – | | | | – | | | | – | | | | 6,285 | |
Registration/filing fees | | | 31,857 | | | | 17,119 | | | | 1,569 | | | | 17,259 | |
12b-1 fees (Investor Class) | | | 257,170 | | | | 221 | | | | 8 | | | | 13 | |
Printing fees | | | 45,813 | | | | 2,864 | | | | 1,894 | | | | 11,044 | |
Chief Compliance Officer services fees | | | 34,793 | | | | 4,025 | | | | 2,594 | | | | 15,487 | |
Offering costs | | | 2,071 | | | | 236 | | | | 72,331 | | | | 2,483 | |
Miscellaneous expenses | | | 31,933 | | | | 8,228 | | | | 1,864 | | | | 11,938 | |
| | | | | | | | | | | | | | | | |
Total expenses before waivers | | | 1,882,831 | | | | 298,724 | | | | 176,317 | | | | 589,779 | |
Fees waived/reimbursed by investment adviser (Investor Class) (Note 5) | | | (466,774) | | | | (1,094) | | | | (43) | | | | – | |
Fees waived/reimbursed by investment adviser (Institutional Class) (Note 5) | | | (31,966) | | | | (106,294) | | | | (119,257) | | | | – | |
| | | | | | | | | | | | | | | | |
Net Expenses | | | 1,384,091 | | | | 191,336 | | | | 57,017 | | | | 589,779 | |
| | | | | | | | | | | | | | | | |
Net Investment Income | | | 713,961 | | | | 267,563 | | | | 27,139 | | | | 51,303 | |
| | | | | | | | | | | | | | | | |
| | | | |
Net realized gain/(loss) on investments | | | 8,136,150 | | | | 2,113,284 | | | | 135,975 | | | | (2,087,974) | |
Net realized gain on affiliated investments | | | – | | | | – | | | | – | | | | 2,835,413 | |
Net realized loss on foreign currencies | | | – | | | | (23,077) | | | | – | | | | – | |
Net change in unrealized appreciation/(depreciation) on investments | | | 12,339,709 | | | | (2,138,779) | | | | (53,948) | | | | 2,285,870 | |
Net change in unrealized depreciation on affiliated investments | | | – | | | | – | | | | – | | | | (711,607) | |
Net change in unrealized depreciation on translation of assets and liabilities denominated in foreign currency transactions | | | – | | | | (2,525) | | | | – | | | | – | |
Long-term capital gains from other investment companies | | | – | | | | – | | | | – | | | | 220,477 | |
| | | | | | | | | | | | | | | | |
NET REALIZED AND UNREALIZED GAIN/(LOSS) ON INVESTMENTS AND FOREIGN CURRENCIES | | | 20,475,859 | | | | (51,097) | | | | 82,027 | | | | 2,542,179 | |
| | | | | | | | | | | | | | | | |
NET INCREASE IN NET ASSETS RESULTING FROM OPERATIONS | | $ | 21,189,820 | | | $ | 216,466 | | | $ | 109,166 | | | $ | 2,593,482 | |
| | | | | | | | | | | | | | | | |
| | |
See Notes to Financial Statements. | | |
24 | | centrefunds.com |
| | |
| Centre American Select Equity Fund | | Statements of Changes in Net Assets |
| | |
| | |
| | |
| | | | | | | | |
| | | For The
Year Ended
September 30, 2014(a) | | | For The
Year Ended
September 30, 2013 | |
OPERATIONS: | | | | | | | | |
Net investment income | | $ | 713,961 | | | $ | 868,637 | |
Net realized gain on investments | | | 8,136,150 | | | | 30,858,549 | |
Net change in unrealized appreciation/(depreciation) on investments | | | 12,339,709 | | | | (18,112,474) | |
| | | | | | | | |
Net increase in net assets resulting from operations | | | 21,189,820 | | | | 13,614,712 | |
| | | | | | | | |
DISTRIBUTIONS TO SHAREHOLDERS: | | | | | | | | |
From net investment income | | | | | | | | |
Investor Class | | | (1,048,251) | | | | (175,273) | |
From net realized gains on investments | | | | | | | | |
Investor Class | | | (14,465) | | | | (2,212,550) | |
| | | | | | | | |
Total distributions | | | (1,062,716) | | | | (2,387,823) | |
| | | | | | | | |
CAPITAL SHARE TRANSACTIONS: | | | | | | | | |
Investor Class | | | | | | | | |
Proceeds from sale of shares | | | 15,830,656 | | | | 31,193,682 | |
Shares issued in reinvestment of distributions | | | 1,051,275 | | | | 2,387,824 | |
Cost of shares redeemed | | | (49,865,652) | | | | (69,298,215) | |
Redemption fees | | | 1,022 | | | | 959 | |
Acquisition costs (Note 10) | | | – | | | | 130,033,182 | |
| | | | | | | | |
Net increase/(decrease) from capital share transactions | | | (32,982,699) | | | | 94,317,432 | |
| | | | | | | | |
Institutional Class | | | | | | | | |
Proceeds from sale of shares | | | 29,614,000 | | | | – | |
Cost of shares redeemed | | | (14,652,000) | | | | – | |
| | | | | | | | |
Net increase from capital share transactions | | | 14,962,000 | | | | – | |
| | | | | | | | |
Net increase in net assets | | $ | 2,106,405 | | | $ | 105,544,321 | |
| | | | | | | | |
NET ASSETS: | | | | | | | | |
Beginning of period | | | 129,764,721 | | | | 24,220,400 | |
| | | | | | | | |
End of period* | | $ | 131,871,126 | | | $ | 129,764,721 | |
| | | | | | | | |
*Including accumulated net investment income of: | | $ | 492,491 | | | $ | 826,831 | |
| | |
OTHER INFORMATION: | | | | | | | | |
Share Transactions: | | | | | | | | |
Investor Class | | | | | | | | |
Beginning shares | | | 12,503,329 | | | | 2,054,881 | |
Shares sold | | | 1,303,814 | | | | 2,734,444 | |
Shares issued in reinvestment of dividends | | | 95,138 | | | | 266,498 | |
Shares redeemed | | | (4,293,017) | | | | (6,430,102) | |
Acquisition shares (Note 10) | | | – | | | | 13,877,608 | |
| | | | | | | | |
Ending Shares | | | 9,609,264 | | | | 12,503,329 | |
| | | | | | | | |
Institutional Class | | | | | | | | |
Beginning shares | | | – | | | | – | |
Shares sold | | | 2,509,948 | | | | – | |
Shares redeemed | | | (1,200,000) | | | | – | |
| | | | | | | | |
Ending Shares | | | 1,309,948 | | | | – | |
| | | | | | | | |
| (a) | The Centre American Select Equity Fund began offering Institutional Class shares on January 21, 2014. |
| | |
See Notes to Financial Statements. | | |
Annual Report | September 30, 2014 | | 25 |
| | |
| Centre Global Select Equity Fund | | Statements of Changes in Net Assets |
| | |
| | |
| | |
| | | | | | | | |
| | | For The
Year Ended
September 30, 2014(a) | | | For The
Year Ended
September 30, 2013 | |
OPERATIONS: | | | | | | | | |
Net investment income | | $ | 267,563 | | | $ | 225,302 | |
Net realized gain on investments | | | 2,113,284 | | | | 531,667 | |
Net realized loss on foreign currency transactions | | | (23,077) | | | | (30,687) | |
Net change in unrealized appreciation/(depreciation) on investments and translation of assets and liabilities denominated in foreign currencies | | | (2,141,304) | | | | 674,274 | |
| | | | | | | | |
Net increase in net assets resulting from operations | | | 216,466 | | | | 1,400,556 | |
| | | | | | | | |
DISTRIBUTIONS TO SHAREHOLDERS: | | | | | | | | |
From net investment income | | | | | | | | |
Institutional Class | | | (166,664) | | | | (207,005) | |
From net realized gains on investments | | | | | | | | |
Institutional Class | | | (372,877) | | | | (676,187) | |
| | | | | | | | |
Total distributions | | | (539,541) | | | | (883,192) | |
| | | | | | | | |
CAPITAL SHARE TRANSACTIONS: | | | | | | | | |
Investor Class | | | | | | | | |
Proceeds from sale of shares | | | 15,509,595 | | | | – | |
Cost of shares redeemed | | | (15,526,268) | | | | – | |
| | | | | | | | |
Net decrease from capital share transactions | | | (16,673) | | | | – | |
| | | | | | | | |
Institutional Class | | | | | | | | |
Proceeds from sale of shares | | | 15,522,941 | | | | 17,881,198 | |
Shares issued in reinvestment of distributions | | | 539,541 | | | | 883,192 | |
Cost of shares redeemed | | | (15,505,899) | | | | (16,744,352) | |
| | | | | | | | |
Net increase from capital share transactions | | | 556,583 | | | | 2,020,038 | |
| | | | | | | | |
Net increase in net assets | | $ | 216,835 | | | $ | 2,537,402 | |
| | | | | | | | |
NET ASSETS: | | | | | | | | |
Beginning of period | | | 14,525,692 | | | | 11,988,290 | |
| | | | | | | | |
End of period* | | $ | 14,742,527 | | | $ | 14,525,692 | |
| | | | | | | | |
*Including accumulated net investment income of: | | $ | 237,950 | | | $ | 160,128 | |
| | |
OTHER INFORMATION: | | | | | | | | |
Share Transactions: | | | | | | | | |
Investor Class | | | | | | | | |
Beginning shares | | | – | | | | – | |
Shares sold | | | 1,268,901 | | | | – | |
Shares redeemed | | | (1,268,486) | | | | – | |
| | | | | | | | |
Ending Shares | | | 415 | | | | – | |
| | | | | | | | |
Institutional Class | | | | | | | | |
Beginning shares | | | 1,226,285 | | | | 1,048,994 | |
Shares sold | | | 1,268,486 | | | | 1,567,071 | |
Shares issued in reinvestment of dividends | | | 45,340 | | | | 79,927 | |
Shares redeemed | | | (1,268,901) | | | | (1,469,707) | |
| | | | | | | | |
Ending Shares | | | 1,271,210 | | | | 1,226,285 | |
| | | | | | | | |
| (a) | The Centre Global Select Equity Fund began offering Investor Class shares on January 21, 2014. |
| | |
See Notes to Financial Statements. | | |
26 | | centrefunds.com |
| | |
| Centre Active U.S. Treasury Fund | | Statement of Changes in Net Assets |
| | |
| | |
| | |
| | | | |
| | | For the Period
January 21, 2014
(Inception)
to September 30, 2014 | |
OPERATIONS: | | | | |
Net investment income | | $ | 27,139 | |
Net realized gain on investments | | | 135,975 | |
Net change in unrealized depreciation on investments | | | (53,948) | |
| | | | |
Net increase in net assets resulting from operations | | | 109,166 | |
| | | | |
CAPITAL SHARE TRANSACTIONS: | | | | |
Investor Class | | | | |
Proceeds from sale of shares | | | 5,000 | |
| | | | |
Net increase from capital share transactions | | | 5,000 | |
| | | | |
Institutional Class | | | | |
Proceeds from sale of shares | | | 14,405,000 | |
| | | | |
Net increase from capital share transactions | | | 14,405,000 | |
| | | | |
Net increase in net assets | | $ | 14,519,166 | |
| | | | |
NET ASSETS: | | | | |
Beginning of period | | | – | |
| | | | |
End of period* | | $ | 14,519,166 | |
| | | | |
*Including accumulated net investment income of: | | $ | 57,516 | |
| |
OTHER INFORMATION: | | | | |
Share Transactions: | | | | |
Investor Class | | | | |
Beginning shares | | | – | |
Shares sold | | | 500 | |
| | | | |
Ending Shares | | | 500 | |
| | | | |
Institutional Class | | | | |
Beginning shares | | | – | |
Shares sold | | | 1,438,198 | |
| | | | |
Ending Shares | | | 1,438,198 | |
| | | | |
| | |
See Notes to Financial Statements. | | |
Annual Report | September 30, 2014 | | 27 |
| | |
| Centre Multi-Asset Real Return Fund | | Statements of Changes in Net Assets |
| | |
| | |
| | |
| | | | | | | | |
| | | For The
Year Ended
September 30, 2014 | | | For the Period
October 9, 2012 (Inception)
to September 30, 2013(a) | |
OPERATIONS: | | | | | | | | |
Net investment income | | $ | 51,303 | | | $ | 2,819,033 | |
Net realized loss on investments | | | (2,087,974) | | | | – | |
Net realized gain/(loss) on affiliated investments | | | 2,835,413 | | | | (253,750) | |
Long-term capital gain distributions from other investment companies | | | 220,477 | | | | – | |
Net change in unrealized appreciation/(depreciation) on investments and affiliated investments | | | 1,574,263 | | | | (2,210,600) | |
| | | | | | | | |
Net increase in net assets resulting from operations | | | 2,593,482 | | | | 354,683 | |
| | | | | | | | |
DISTRIBUTIONS TO SHAREHOLDERS: | | | | | | | | |
From net investment income | | | | | | | | |
Institutional Class | | | – | | | | (3,201,213) | |
| | | | | | | | |
Total distributions | | | – | | | | (3,201,213) | |
| | | | | | | | |
CAPITAL SHARE TRANSACTIONS: | | | | | | | | |
Investor Class | | | | | | | | |
Proceeds from sale of shares | | | – | | | | 5,000 | |
| | | | | | | | |
Net increase from capital share transactions | | | – | | | | 5,000 | |
| | | | | | | | |
Institutional Class | | | | | | | | |
Proceeds from sale of shares | | | 337,774 | | | | 55,826,775 | |
Shares issued in reinvestment of distributions | | | – | | | | 3,201,213 | |
Cost of shares redeemed | | | (10,000) | | | | – | |
| | | | | | | | |
Net increase from capital share transactions | | | 327,774 | | | | 59,027,988 | |
| | | | | | | | |
Net increase in net assets | | $ | 2,921,256 | | | $ | 56,186,458 | |
| | | | | | | | |
NET ASSETS: | | | | | | | | |
Beginning of period | | | 56,186,458 | | | | – | |
| | | | | | | | |
End of period* | | $ | 59,107,714 | | | $ | 56,186,458 | |
| | | | | | | | |
*Including accumulated net investment loss of: | | $ | – | | | $ | (313,635) | |
| | |
OTHER INFORMATION: | | | | | | | | |
Share Transactions: | | | | | | | | |
Investor Class | | | | | | | | |
Beginning shares | | | 524 | | | | – | |
Shares sold | | | – | | | | 524 | |
| | | | | | | | |
Ending Shares | | | 524 | | | | 524 | |
| | | | | | | | |
Institutional Class | | | | | | | | |
Beginning shares | | | 5,959,990 | | | | – | |
Shares sold | | | 34,219 | | | | 5,617,248 | |
Shares issued in reinvestment of dividends | | | – | | | | 342,742 | |
Shares redeemed | | | (1,029) | �� | | | – | |
| | | | | | | | |
Ending Shares | | | 5,993,180 | | | | 5,959,990 | |
| | | | | | | | |
| (a) | The Centre Multi-Asset Real Return Fund began offering Investor Class shares on January 22, 2013. |
| | |
See Notes to Financial Statements. | | |
28 | | centrefunds.com |
| | |
| Centre American Select Equity Fund | | Financial Highlights |
Investor Class | | For a share outstanding throughout the periods presented. |
| | |
| | |
| | | | | | | | | | | | | | | |
| | | For the Year Ended September 30, 2014(a) | | For the Year Ended September 30, 2013 | | For the Period
December 21, 2011
(Inception) to
September 30, 2012 |
| | | |
NET ASSET VALUE, BEGINNING OF PERIOD | | | $ | 10.38 | | | | $ | 11.79 | | | | $ | 10.00 | |
INCOME FROM INVESTMENT OPERATIONS: | | | | | | | | | | | | | | | |
Net investment income(b) | | | | 0.06 | | | | | 0.09 | | | | | 0.07 | |
Net realized and unrealized gain on investments | | | | 1.73 | | | | | 0.97 | | | | | 1.72 | |
Total income from investment operations | | | | 1.79 | | | | | 1.06 | | | | | 1.79 | |
| | | |
DISTRIBUTIONS: | | | | | | | | | | | | | | | |
Net investment income | | | | (0.09) | | | | | (0.18) | | | | | – | |
Net realized gains on investments | | | | (0.00) | (c) | | | | (2.29) | | | | | – | |
Total distributions | | | | (0.09) | | | | | (2.47) | | | | | – | |
REDEMPTION FEES ADDED TO PAID-IN CAPITAL (NOTE 2) | | | | 0.00 | (d) | | | | 0.00 | (d) | | | | – | |
NET INCREASE/(DECREASE) IN NET ASSET VALUE | | | | 1.70 | | | | | (1.41) | | | | | 1.79 | |
NET ASSET VALUE, END OF PERIOD | | | $ | 12.08 | | | | $ | 10.38 | | | | $ | 11.79 | |
| | | | | | | | | | | | | | | | |
| | | |
Total Return(e) | | | | 17.31% | | | | | 12.30% | | | | | 17.90% | |
| | | |
SUPPLEMENTAL DATA: | | | | | | | | | | | | | | | |
Net assets, end of period (000) | | | $ | 116,045 | | | | $ | 129,765 | | | | $ | 24,220 | |
| | | |
RATIOS TO AVERAGE NET ASSETS: | | | | | | | | | | | | | | | |
Net investment income including
reimbursement/waiver | | | | 0.53% | | | | | 0.88% | | | | | 0.69% | (f) |
Operating expenses excluding reimbursement/waiver | | | | 1.43% | | | | | 1.51% | | | | | 2.32% | (f) |
Operating expenses including reimbursement/waiver | | | | 1.05% | | | | | 1.06% | (g) | | | | 1.25% | (f) |
| | | |
PORTFOLIO TURNOVER RATE | | | | 72% | | | | | 175% | | | | | 67% | (h) |
| (a) | Prior to January 21, 2014, the Centre American Select Equity Fund was named the Drexel Hamilton Centre American Equity Fund. |
| (b) | Calculated using the average shares method. |
| (c) | Less than $(0.005) per share. |
| (d) | Less than $0.005 per share. |
| (e) | Total returns are for the period indicated and have not been annualized. Total returns would have been lower had certain expenses not been waived during the period. Returns shown do not reflect the deduction of taxes that a shareholder would pay on fund distributions or the redemption of fund shares. |
| (g) | Effective January 11, 2013, the net expense limitation changed from 1.25% to 1.05%. |
| (h) | Portfolio turnover rate for periods less than one full year have not been annualized. |
| | |
See Notes to Financial Statements. | | |
Annual Report | September 30, 2014 | | 29 |
| | |
| Centre American Select Equity Fund | | Financial Highlights |
Institutional Class | | For a share outstanding throughout the period presented. |
| | |
| | |
| | | | | | | | | | | | | | | |
| | | For the Period
January 21, 2014
(Inception) to September 30, 2014 |
| | | |
NET ASSET VALUE, BEGINNING OF PERIOD | | | $ | | | | | | 11.39 | | | |
INCOME/(LOSS) FROM INVESTMENT OPERATIONS: | | | | | | | | | | | | |
Net investment income(a) | | | | | | | | | 0.05 | | | |
Net realized and unrealized gain on investments | | | | | | | | | 0.64 | | | |
Total income from investment operations | | | | | | | | | 0.69 | | | |
NET INCREASE IN NET ASSET VALUE | | | | | | | | | 0.69 | | | |
NET ASSET VALUE, END OF PERIOD | | | $ | | | | | | 12.08 | | | |
| | | | | | | | | | | | | | |
| | | |
Total Return(b) | | | | | | | | | 6.06% | | | |
| | | |
SUPPLEMENTAL DATA: | | | | | | | | | | | | |
Net assets, end of period (000) | | | $ | | | | | | 15,826 | | | |
| | | |
RATIOS TO AVERAGE NET ASSETS: | | | | | | | | | | | | |
Net investment income including reimbursement/waiver | | | | | | | | | 0.65% | (c) | | |
Operating expenses excluding reimbursement/waiver | | | | | | | | | 1.26% | (c) | | |
Operating expenses including reimbursement/waiver | | | | | | | | | 0.95% | (c) | | |
| | | |
PORTFOLIO TURNOVER RATE | | | | | | | | | 72% | (d) | | |
| (a) | Calculated using the average shares method. |
| (b) | Total returns are for the period indicated and have not been annualized. Total returns would have been lower had certain expenses not been waived during the period. Returns shown do not reflect the deduction of taxes that a shareholder would pay on fund distributions or the redemption of fund shares. |
| (d) | Portfolio turnover rate for periods less than one full year have not been annualized. |
| | |
See Notes to Financial Statements. | | |
30 | | centrefunds.com |
| | |
| Centre Global Select Equity Fund | | Financial Highlights |
Investor Class | | For a share outstanding throughout the period presented. |
| | |
| | |
| | | | | | | | | | | | | | | |
| | | For the Period
January 21, 2014
(Inception) to
September 30, 2014 |
| | | |
NET ASSET VALUE, BEGINNING OF PERIOD | | | $ | | | | | | 12.06 | | | |
INCOME/(LOSS) FROM INVESTMENT OPERATIONS: | | | | | | | | | | | | |
Net investment loss(a) | | | | | | | | | (0.30) | | | |
Net realized and unrealized loss on investments | | | | | | | | | (0.17) | | | |
Total loss from investment operations | | | | | | | | | (0.47) | | | |
NET DECREASE IN NET ASSET VALUE | | | | | | | | | (0.47) | | | |
NET ASSET VALUE, END OF PERIOD | | | $ | | | | | | 11.59 | | | |
| | | | | | | | | | | | | | |
| | | |
Total Return(b) | | | | | | | | | (3.90% | ) | | | |
| | | |
SUPPLEMENTAL DATA: | | | | | | | | | | | | |
Net assets, end of period (000) | | | $ | | | | | | 5 | | | |
| | | |
RATIOS TO AVERAGE NET ASSETS: | | | | | | | | | | | | |
Net investment loss including reimbursement/waiver | | | | | | | | | (1.30% | )(c) | | |
Operating expenses excluding reimbursement/waiver | | | | | | | | | 2.69% | (c) | | |
Operating expenses including reimbursement/waiver | | | | | | | | | 1.45% | (c) | | |
| | | |
PORTFOLIO TURNOVER RATE | | | | | | | | | 156% | (d) | | |
| (a) | Calculated using the average shares method. |
| (b) | Total returns are for the period indicated and have not been annualized. Total returns would have been lower had certain expenses not been waived during the period. Returns shown do not reflect the deduction of taxes that a shareholder would pay on fund distributions or the redemption of fund shares. |
| (d) | Portfolio turnover rate for periods less than one full year have not been annualized. |
| | |
See Notes to Financial Statements. | | |
Annual Report | September 30, 2014 | | 31 |
| | |
| Centre Global Select Equity Fund | | Financial Highlights |
Institutional Class | | For a share outstanding throughout the periods presented. |
| | |
| | |
| | | | | | | | | | | | | | | | | | |
| | | For the Year Ended
September 30, 2014(a) | | For the Year Ended September 30, 2013 | | For the Period
December 21, 2011
(Inception) to
September 30, 2012 |
| | | | | | |
NET ASSET VALUE, BEGINNING OF PERIOD | | $ | 11.85 | | | | | $ | 11.43 | | | | | $ | 10.00 | | | |
INCOME FROM INVESTMENT OPERATIONS: | | | | | | | | | | | | | | | | | | |
Net investment income(b) | | | 0.21 | | | | | | 0.20 | | | | | | 0.21 | | | |
Net realized and unrealized gain/(loss) on investments | | | (0.03) | | | | | | 1.12 | | | | | | 1.22 | | | |
Total income from investment operations | | | 0.18 | | | | | | 1.32 | | | | | | 1.43 | | | |
| | | | | | |
DISTRIBUTIONS: | | | | | | | | | | | | | | | | | | |
Net investment income | | | (0.14) | | | | | | (0.21) | | | | | | – | | | |
Net realized gains on investments | | | (0.30) | | | | | | (0.69) | | | | | | – | | | |
Total distributions | | | (0.44) | | | | | | (0.90) | | | | | | – | | | |
NET INCREASE/(DECREASE) IN NET ASSET VALUE | | | (0.26) | | | | | | 0.42 | | | | | | 1.43 | | | |
NET ASSET VALUE, END OF PERIOD | | $ | 11.59 | | | | | $ | 11.85 | | | | | $ | 11.43 | | | |
| | | | | | | | | | | | | | | | | | | |
| | | | | | |
Total Return(c) | | | 1.42% | | | | | | 12.19% | | | | | | 14.30% | | | |
| | | | | | |
SUPPLEMENTAL DATA: | | | | | | | | | | | | | | | | | | |
Net assets, end of period (000) | | $ | 14,738 | | | | | $ | 14,526 | | | | | $ | 11,988 | | | |
| | | | | | |
RATIOS TO AVERAGE NET ASSETS: | | | | | | | | | | | | | | | | | | |
Net investment income including reimbursement/waiver | | | 1.77% | | | | | | 1.75% | | | | | | 2.06% | (d) | | |
Operating expenses excluding reimbursement/waiver | | | 1.95% | | | | | | 2.20% | | | | | | 3.04% | (d) | | |
Operating expenses including reimbursement/waiver | | | 1.25% | | | | | | 1.25% | | | | | | 1.25% | (d) | | |
| | | | | | |
PORTFOLIO TURNOVER RATE | | | 156% | | | | | | 111% | | | | | | 87% | (e) | | |
| (a) | Prior to January 21, 2014, the Centre Global Select Equity Fund was named the Drexel Hamilton Centre Global Equity Fund. |
| (b) | Calculated using the average shares method. |
| (c) | Total returns are for the period indicated and have not been annualized. Total returns would have been lower had certain expenses not been waived during the period. Returns shown do not reflect the deduction of taxes that a shareholder would pay on fund distributions or the redemption of fund shares. |
| (e) | Portfolio turnover rate for periods less than one full year have not been annualized. |
| | |
See Notes to Financial Statements. | | |
32 | | centrefunds.com |
| | |
| Centre Active U.S. Treasury Fund | | Financial Highlights |
Investor Class | | For a share outstanding throughout the period presented. |
| | |
| | |
| | | | | | | | | | | | | | | |
| | | For the Period January 21, 2014 (Inception) to September 30, 2014 |
| | | |
NET ASSET VALUE, BEGINNING OF PERIOD | | | $ | | | | | | 10.00 | | | |
INCOME/(LOSS) FROM INVESTMENT OPERATIONS: | | | | | | | | | | | | |
Net investment income(a) | | | | | | | | | 0.00 | (b) | | |
Net realized and unrealized gain on investments | | | | | | | | | 0.07 | | | |
Total income from investment operations | | | | | | | | | 0.07 | | | |
NET INCREASE IN NET ASSET VALUE | | | | | | | | | 0.07 | | | |
NET ASSET VALUE, END OF PERIOD | | | $ | | | | | | 10.07 | | | |
| | | | | | | | | | | | | | |
| | | |
Total Return(c) | | | | | | | | | 0.70% | | | | |
| | | |
SUPPLEMENTAL DATA: | | | | | | | | | | | | |
Net assets, end of period (000) | | | $ | | | | | | 5 | | | |
| | | |
RATIOS TO AVERAGE NET ASSETS: | | | | | | | | | | | | |
Net investment income including reimbursement/waiver | | | | | | | | | 0.07% | (d) | | |
Operating expenses excluding reimbursement/waiver | | | | | | | | | 2.09% | (d) | | |
Operating expenses including reimbursement/waiver | | | | | | | | | 0.85% | (d) | | |
| | | |
PORTFOLIO TURNOVER RATE | | | | | | | | | 439% | (e) | | |
| (a) | Calculated using the average shares method. |
| (b) | Less than $0.005 per share. |
| (c) | Total returns are for the period indicated and have not been annualized. Total returns would have been lower had certain expenses not been waived during the period. Returns shown do not reflect the deduction of taxes that a shareholder would pay on fund distributions or the redemption of fund shares. |
| (e) | Portfolio turnover rate for periods less than one full year have not been annualized. |
| | |
See Notes to Financial Statements. | | |
Annual Report | September 30, 2014 | | 33 |
| | |
| Centre Active U.S. Treasury Fund | | Financial Highlights |
Institutional Class | | For a share outstanding throughout the period presented. |
| | |
| | |
| | | | | | | | | | |
| | | For the Period
January 21, 2014
(Inception) to
September 30, 2014 |
| | | |
NET ASSET VALUE, BEGINNING OF PERIOD | | $ | | | | | 10.00 | | | |
INCOME/(LOSS) FROM INVESTMENT OPERATIONS: | | | | | | | | | | |
Net investment income(a) | | | | | | | 0.02 | | | |
Net realized and unrealized gain on investments | | | | | | | 0.07 | | | |
Total income from investment operations | | | | | | | 0.09 | | | |
NET INCREASE IN NET ASSET VALUE | | | | | | | 0.09 | | | |
NET ASSET VALUE, END OF PERIOD | | $ | | | | | 10.09 | | | |
| | | | | | | | | | | |
| | | |
Total Return(b) | | | | | | | 0.90% | | | |
| | | |
SUPPLEMENTAL DATA: | | | | | | | | | | |
Net assets, end of period (000) | | $ | | | | | 14,514 | | | |
| | | |
RATIOS TO AVERAGE NET ASSETS: | | | | | | | | | | |
Net investment income including reimbursement/waiver | | | | | | | 0.29% | (c) | | |
Operating expenses excluding reimbursement/waiver | | | | | | | 1.86% | (c) | | |
Operating expenses including reimbursement/waiver | | | | | | | 0.60% | (c) | | |
| | | |
PORTFOLIO TURNOVER RATE | | | | | | | 439% | (d) | | |
| (a) | Calculated using the average shares method. |
| (b) | Total returns are for the period indicated and have not been annualized. Total returns would have been lower had certain expenses not been waived during the period. Returns shown do not reflect the deduction of taxes that a shareholder would pay on fund distributions or the redemption of fund shares. |
| (d) | Portfolio turnover rate for periods less than one full year have not been annualized. |
| | |
See Notes to Financial Statements. | | |
34 | | centrefunds.com |
| | |
| Centre Multi-Asset Real Return Fund | | Financial Highlights |
Investor Class | | For a share outstanding throughout the periods presented. |
| | |
| | |
| | | | | | | | |
| | | | | | For the Period | |
| | | For the | | | January 22, 2013 | |
| | | Year Ended | | | (Inception) to | |
| | | September 30, 2014(a) | | | September 30, 2013 | |
| | |
NET ASSET VALUE, BEGINNING OF PERIOD | | $ | 9.41 | | | $ | 9.54 | |
INCOME/(LOSS) FROM INVESTMENT OPERATIONS: | | | | | | | | |
Net investment loss(b) | | | (0.02) | | | | (0.09) | |
Net realized and unrealized gain/(loss) on investments | | | 0.43 | | | | (0.04) | |
Total income/(loss) from investment operations | | | 0.41 | | | | (0.13) | |
NET INCREASE/(DECREASE) IN NET ASSET VALUE | | | 0.41 | | | | (0.13) | |
NET ASSET VALUE, END OF PERIOD | | $ | 9.82 | | | $ | 9.41 | |
| | | | | | | | | |
| | |
Total Return(c) | | | 4.36% | | | | (1.36%) | |
| | |
SUPPLEMENTAL DATA: | | | | | | | | |
Net assets, end of period (000) | | $ | 5 | | | $ | 5 | |
| | |
RATIOS TO AVERAGE NET ASSETS: | | | | | | | | |
Net investment loss including reimbursement/waiver | | | (0.16%) | | | | (1.01%)(d) | |
Operating expenses excluding reimbursement/waiver(e) | | | 1.25% | | | | 1.39%(d) | |
Operating expenses including reimbursement/waiver(e) | | | 1.25% | | | | 1.25%(d) | |
| | |
PORTFOLIO TURNOVER RATE | | | 199% | | | | 43%(f) | |
| (a) | Prior to January 21, 2014, the Centre Multi-Asset Real Return Fund was named the Drexel Hamilton Multi-Asset Real Return Fund. |
| (b) | Calculated using the average shares method. |
| (c) | Total returns are for the period indicated and have not been annualized. Total returns would have been lower had certain expenses not been waived during the period. Returns shown do not reflect the deduction of taxes that a shareholder would pay on fund distributions or the redemption of fund shares. |
| (e) | Excludes Advisory fees of the affiliated funds in which the Fund invests. |
| (f) | Portfolio turnover rate for periods less than one full year have not been annualized. |
| | |
See Notes to Financial Statements. | | |
Annual Report | September 30, 2014 | | 35 |
| | |
| Centre Multi-Asset Real Return Fund | | Financial Highlights |
Institutional Class | | For a share outstanding throughout the periods presented. |
| | |
| | |
| | | | | | | | |
| | | | | | For the Period | |
| | | For the | | | October 9, 2012 | |
| | | Year Ended | | | (Inception) to | |
| | | September 30, 2014(a) | | | September 30, 2013 | |
| | |
NET ASSET VALUE, BEGINNING OF PERIOD | | $ | 9.43 | | | $ | 10.00 | |
INCOME/(LOSS) FROM INVESTMENT OPERATIONS: | | | | | | | | |
Net investment income(b) | | | 0.01 | | | | 0.50 | |
Net realized and unrealized gain/(loss) on investments | | | 0.42 | | | | (0.50) | |
Total income from investment operations | | | 0.43 | | | | – | |
| | |
DISTRIBUTIONS: | | | | | | | | |
Net investment income | | | – | | | | (0.57) | |
Net realized gains on investments | | | – | | | | – | |
Total distributions | | | – | | | | (0.57) | |
NET INCREASE/(DECREASE) IN NET ASSET VALUE | | | 0.43 | | | | (0.57) | |
NET ASSET VALUE, END OF PERIOD | | $ | 9.86 | | | $ | 9.43 | |
| | | | | | | | | |
| | |
Total Return(c) | | | 4.56% | | | | 0.05% | |
| | |
SUPPLEMENTAL DATA: | | | | | | | | |
Net assets, end of period (000) | | $ | 59,103 | | | $ | 56,182 | |
| | |
RATIOS TO AVERAGE NET ASSETS: | | | | | | | | |
Net investment income including reimbursement/waiver | | | 0.09% | | | | 5.37%(d) | |
Operating expenses excluding reimbursement/waiver(e) | | | 1.00% | | | | 1.24%(d) | |
Operating expenses including reimbursement/waiver(e) | | | 1.00% | | | | 1.00%(d) | |
| | |
PORTFOLIO TURNOVER RATE | | | 199% | | | | 43%(f) | |
| (a) | Prior to January 21, 2014, the Centre Multi-Asset Real Return Fund was named the Drexel Hamilton Multi-Asset Real Return Fund. |
| (b) | Calculated using the average shares method. |
| (c) | Total returns are for the period indicated and have not been annualized. Total returns would have been lower had certain expenses not been waived during the period. Returns shown do not reflect the deduction of taxes that a shareholder would pay on fund distributions or the redemption of fund shares. |
| (e) | Excludes Advisory fees of the affiliated funds in which the Fund invests. |
| (f) | Portfolio turnover rate for periods less than one full year have not been annualized. |
| | |
See Notes to Financial Statements. | | |
36 | | centrefunds.com |
| | |
| Centre Funds | | Notes to Financial Statements |
| | September 30, 2014 |
| | |
| | |
1. ORGANIZATION
Centre Funds (the “Trust”) was organized on March 17, 2011 as a Delaware statutory trust and is registered as an open-end management investment company under the Investment Company Act of 1940, as amended (the “1940 Act”). Prior to January 17, 2014, the Trust was known as Drexel Hamilton Mutual Funds. The Trust currently offers shares of beneficial interest (“shares”) of Centre American Select Equity Fund (the “American Select Equity Fund”), Centre Global Select Equity Fund (the “Global Select Equity Fund”), Centre Active U.S. Treasury Fund (the “Treasury Fund”), and Centre Multi-Asset Real Return Fund (the “Multi-Asset Real Return Fund”) (collectively the “Funds”). The affairs of the Trust are overseen by a Board of Trustees (the “Board” or the “Trustees”). The Declaration of Trust of the Trust permits the Trustees to create additional series of the Trust and share classes.
Information in the accompanying Funds’ financial statements pertain to the Investor Class and Institutional Class shares offered by the Centre Funds. All classes of shares have identical rights to earnings, assets, and voting privileges, except for class-specific expenses and exclusive rights to vote on matters affecting only individual classes.
2. SIGNIFICANT ACCOUNTING POLICIES
The following is a summary of significant accounting policies followed by the Funds in the preparation of the Financial Statements:
| (a) | Portfolio securities traded on a securities exchange or are quoted by NASDAQ are valued at last sale price on the principal exchange on which they are traded at the time the securities are valued, or, if not traded on that day, are valued at the closing bid price. Securities traded in the OTC market and are not quoted by NASDAQ are valued at their last sale price or, if there is no available price, the last bid price quoted by brokers that make markets in the securities as of the close of regular trading hours on the day the securities are being valued. Foreign securities are valued on the basis of quotations from the primary market in which they are traded, and are translated from the local currency into U.S. dollars using exchange rates as of the close of the New York Stock Exchange (the “Exchange”) or using methods determined by the Board. Short-term instruments with maturities of 60 days or less may be valued at amortized cost, which approximates market value. Securities and other assets for which quotations are not readily available or deemed unreliable are valued at their fair value using methods determined by the Board. Fair valuation of a particular security is an inherently subjective process, with no single standard to utilize when determining a security’s fair value. As such, different mutual funds could reasonably arrive at a different fair value price for the same security. In each case where a security is fair valued, consideration is given to the facts and circumstances relevant to the particular situation. This consideration includes reviewing various factors set forth in the pricing procedures adopted by the Board and other factors as warranted. In making a fair value determination, factors that may be considered, among others, may include: the type and structure of the security; unusual events or circumstances relating to the security’s issuer; general market conditions; prior day’s valuation; fundamental analytical data; size of the holding; cost of the security on the date of purchase; nature and duration of any restriction on disposition; trading activities, and prices of similar securities or financial instruments. |
| (b) | The per share net asset value (the “NAV”) of each Fund is calculated as of the close of trading on the Exchange (normally 4:00 p.m. Eastern time) every day the Exchange is open. The per share NAV is calculated by deducting from the Fund’s assets, the Fund’s liabilities, and then dividing the resulting net assets by the total number of shares outstanding, rounded to the nearest cent. The purchase price and redemption price per share is equal to the next determined NAV per share. Redemption of shares of American Select Equity Fund and Global Select Equity Fund are subject to a redemption fee of 2% if redeemed within 90 days of purchase. |
| (c) | The Trust treats each Fund as a separate entity for Federal income tax purposes. Each Fund intends to continue to qualify each year as a “regulated investment company” under Subchapter M of the Internal Revenue Code of 1986, as amended (the “Code”). By so qualifying, each Fund will not be subject to Federal income taxes to the extent that it distributes substantially all of its taxable or tax-exempt income, if any, for its tax year ending September 30. In addition, by distributing in each calendar year substantially all of its net investment income, capital gains and certain other amounts, if any, each Fund will not be subject to a Federal excise tax. Therefore, no provision is made by the Funds for Federal income or excise taxes. Withholding taxes on foreign dividends are paid or provided for in accordance with the applicable country’s tax rules and rates. |
| | As of and during the year ended September 30, 2014, the Funds did not have a liability for any unrecognized tax benefits in the accompanying financial statements. The Funds recognize the interest and penalties, if any, related to the unrecognized tax benefits as income tax expense in the Statement of Operations. During the period, the Funds did not incur any interest or penalties. |
| | Each of the Fund’s Federal tax returns for the year ended September 30, 2014, remain subject to examination by the Internal Revenue Service. |
| (d) | Net realized gains and losses on investments are computed on the identified cost basis. The portion of security gains and losses resulting from changes in foreign exchange rates is included with net realized and unrealized gains or losses from investments. Dividend income is recognized on the ex-dividend date or for certain foreign securities, as soon as information is available, and interest income is recognized on an accrual basis. The Funds amortize premium and accrete discount on investments utilizing the effective interest method. Foreign dividend income may be subject to foreign withholding taxes. |
| | |
Annual Report | September 30, 2014 | | 37 |
| | |
| Centre Funds | | Notes to Financial Statements |
| | September 30, 2014 |
| | |
| | |
| (e) | A restricted security is a security that has been purchased through a private offering and cannot be resold to the general public without prior registration under the Securities Act of 1933, as amended (the “1933 Act”), or pursuant to the resale limitations provided by Rule 144 under the 1933 Act, or an exemption from the registration requirements of the 1933 Act. Whether a restricted security is illiquid is determined pursuant to guidelines established by the Board. Not all restricted securities are considered to be illiquid. As of September 30, 2014, the Funds did not hold any restricted securities. |
| (f) | The preparation of financial statements in conformity with accounting standards generally accepted in the United States of America (“GAAP”) requires management to make estimates and assumptions that affect the amounts reported in financial statements during the reporting period. Management believes the estimates and security valuations are appropriate; however, actual results may differ from those estimates, and the security valuations reflected in the financial statements may differ from the value the Funds ultimately realize upon sale of the securities. The financial statements have been prepared as of the close of the Exchange on September 30, 2014. Each Fund is considered an investment company for financial reporting purposes under GAAP. |
| (g) | The Funds bear expenses incurred specifically on each Fund’s behalf as well as a portion of general Trust expenses, which may be allocated on the basis of relative net assets or the nature of the services performed relative to applicability to each Fund. Expenses that are specific to a Fund or class of shares of a Fund are charged directly to that Fund or share class. All of the realized and unrealized gains and losses and net investment income of a Fund, other than class-specific expenses, are allocated daily to each class in proportion to its average daily net assets. Fees payable under the distribution (Rule 12b-1) plan for Investor class shares of a Fund are charged with respect to such class. |
| (h) | Dividends from net investment income and distributions of net realized capital gains, if any, will be declared and paid at least annually. Income and capital gains distributions are determined in accordance with income tax regulations, which may differ from GAAP. Distributions to shareholders are recorded on the ex-dividend date. |
| (i) | A Fund may directly purchase securities of foreign issuers. Investing in securities of foreign issuers involves special risks not typically associated with investing in securities of U.S. issuers. The risks include possible reevaluation of currencies, the inability to repatriate foreign currency, less complete financial information about companies and possible future adverse political and economic developments. Moreover, securities of many foreign issuers and their markets may be less liquid and their prices more volatile than those of securities of comparable U.S. issuers. |
| (j) | The books and records of the Funds are maintained in U.S. dollars. Investment valuations and other assets and liabilities initially expressed in foreign currencies are converted each business day into U.S. dollars based upon current exchange rates. The portion of realized and unrealized gains or losses on investments due to fluctuations in foreign currency exchange rates is not separately disclosed and is included in realized and unrealized gains or losses on investments, when applicable. |
| (k) | Offering costs, including costs of printing prospectuses, and legal and registration fees, are being amortized over 12 months from the respective inception dates of the Funds. As of September 30, 2014, $30,375 of offering costs remain to be amortized for the Multi-Asset Real Return Fund. |
3. FAIR VALUE MEASUREMENTS
The Funds normally use third-party pricing services to obtain market quotations for their portfolio investments. Securities and other assets for which representative market quotations are not readily available or which cannot be accurately valued using the Trust’s normal pricing procedures are valued at fair value as determined in good faith under policies approved by the Trustees. Fair value pricing may be used, for example, in situations where (i) an exchange-traded portfolio security is so thinly traded that there have been no transactions for that security over an extended period of time or the validity of a market quotation received is questionable; (ii) the exchange on which the portfolio security is principally traded closes early; or (iii) trading of the portfolio security is halted during the day and does not resume prior to the NAV calculation.
The inputs used in determining the fair value of each Fund’s investments are summarized into three levels, as described in the following hierarchy:
| | |
Level 1 - | | Unadjusted quoted prices in active markets for identical, unrestricted assets or liabilities that a Fund has the ability to access at the measurement date. |
Level 2 - | | Quoted prices which are not active, quoted prices for similar assets or liabilities in active markets or inputs other than quoted prices that are observable (either directly or indirectly). |
Level 3 - | | Significant unobservable prices or inputs (including the oversight of the Board and Adviser in determining the fair value of investments) where there is little or no market activity for the asset or liability at measurement date. |
The inputs or methodology used for valuing securities are not necessarily an indication of the risk associated with investing in those securities.
| | |
| Centre Funds | | Notes to Financial Statements |
| | September 30, 2014 |
| | |
| | |
The following is a summary of each Fund’s investments in the fair value hierarchy as of September 30, 2014:
Centre American Select Equity Fund
| | | | | | | | | | | | | | | | |
| Investments in Securities at Value(a) | | Level 1 -
Quoted Prices | | | Level 2 - Other Significant
Observable Inputs | | | Level 3 - Significant Unobservable Inputs | | | Total | |
Common Stocks | | $ | 129,242,338 | | | $ | – | | | $ | – | | | $ | 129,242,338 | |
Purchased Options | | | 2,345,150 | | | | – | | | | – | | | | 2,345,150 | |
Short Term Investments | | | 333,359 | | | | – | | | | – | | | | 333,359 | |
Total | | $ | 131,920,847 | | | $ | – | | | $ | – | | | $ | 131,920,847 | |
| | | | | | | | | | | | | | | | | |
|
| Centre Global Select Equity Fund | |
| Investments in Securities at Value(a) | | Level 1 - Quoted Prices | | | Level 2 - Other Significant
Observable Inputs | | | Level 3 - Significant Unobservable
Inputs | | | Total | |
Common Stocks | | $ | 13,911,120 | | | $ | – | | | $ | – | | | $ | 13,911,120 | |
Preferred Stocks | | | 399,821 | | | | – | | | | – | | | | 399,821 | |
Rights | | | 1,797 | | | | 4,947 | | | | – | | | | 6,744 | |
Short Term Investments | | | 380,706 | | | | – | | | | – | | | | 380,706 | |
Total | | $ | 14,693,444 | | | $ | 4,947 | | | $ | – | | | $ | 14,698,391 | |
| | | | | | | | | | | | | | | | | |
|
| Centre Active U.S. Treasury Fund | |
| Investments in Securities at Value(a) | | Level 1 - Quoted Prices | | | Level 2 - Other Significant
Observable Inputs | | | Level 3 - Significant Unobservable Inputs | | | Total | |
U.S. Government Bonds & Notes | | $ | – | | | $ | 13,991,685 | | | $ | – | | | $ | 13,991,685 | |
Short Term Investments | | | 410,893 | | | | – | | | | – | | | | 410,893 | |
Total | | $ | 410,893 | | | $ | 13,991,685 | | | $ | – | | | $ | 14,402,578 | |
| | | | | | | | | | | | | | | | | |
|
| Centre Multi-Asset Real Return Fund | |
| Investments in Securities at Value(a) | | Level 1 - Quoted Prices | | | Level 2 - Other Significant
Observable Inputs | | | Level 3 - Significant Unobservable Inputs | | | Total | |
Exchange-Traded Funds | | $ | 14,022,756 | | | $ | – | | | $ | – | | | $ | 14,022,756 | |
Open-End Funds | | | 45,004,724 | | | | – | | | | – | | | | 45,004,724 | |
Short Term Investments | | | 73,932 | | | | – | | | | – | | | | 73,932 | |
Total | | $ | 59,101,412 | | | $ | – | | | $ | – | | | $ | 59,101,412 | |
| | | | | | | | | | | | | | | | | |
| (a) | For detailed descriptions of sectors, industries, and countries, see the accompanying Schedule of Investments. |
The Funds did not hold any investments at the beginning or end of the period in which significant unobservable inputs were used in determining fair value; therefore, no reconciliation of Level 3 securities is included for this reporting period. The Funds recognize transfers between levels as of the beginning of the fiscal year. There were no transfers between Level 1 and Level 2 as of September 30, 2014.
Derivative Financial Instruments
The following discloses the Funds’ use of derivative instruments.
A Fund is generally permitted to purchase investment securities and enter into various types of derivative contracts such as purchased and written options. In doing so, the Fund may employ strategies in differing combinations to permit them to increase, decrease, or change the level or types of exposure to market factors or to hedge. A Fund may invest its assets in derivatives, cash management instruments, and other instruments to help manage interest rate exposure, protect the Fund’s assets, or enhance returns. A Fund may also be exposed to certain exchange-traded derivative products, such as exchange-traded futures and options that are fully collateralized by cash or securities, for temporary cash management or investment transition purposes, or to hedge the risks of existing positions.
| | |
Annual Report | September 30, 2014 | | 39 |
| | |
| Centre Funds | | Notes to Financial Statements |
| | September 30, 2014 |
| | |
| | |
Market Risk Factors: In pursuit of its investment objectives, a Fund may seek to use derivatives to increase or decrease its exposure to the following market risk factors:
Equity Risk: Equity risk relates to the change in value of equity securities as they relate to increases or decreases in the general market.
Foreign Exchange Rate Risk: Foreign exchange rate risk relates to the change in the U.S. dollar value of a security held that is denominated in a foreign currency. The value of a foreign currency denominated security will decrease as the dollar appreciates against the currency, while the value of the foreign currency denominated security will increase as the dollar depreciates against the currency.
Risk of Investing in Derivatives
Use of derivatives can result in losses due to unanticipated changes in the market risk factors and the overall market.
Derivatives may have little or no initial cash investment relative to their market value exposure and therefore can produce significant gains or losses in excess of their cost. This use of embedded leverage may allow a Fund to increase its market value exposure relative to its net assets and can substantially increase the volatility of the Fund’s performance.
Additional associated risks from investing in derivatives also exist and potentially could have significant effects on the valuation of the derivatives and a Fund. Typically, the associated risks are not the risks that a Fund is attempting to increase or decrease exposure, but are the additional risks from investing in derivatives.
Example of these associated risks are liquidity risk, which is the risk that a Fund will not be able to sell the derivative in the open market in a timely manner, and counterparty credit risk, which is the risk that the counterparty will not fulfill its obligation to the Fund.
Option Writing/Purchasing
A Fund may write or purchase option contracts to adjust risk and return of its overall investment positions, subject to any restrictions set forth in the Fund’s prospectus. When a Fund writes or purchases an option, an amount equal to the premium received or paid by the Fund is recorded as a liability or an asset and is subsequently adjusted to the current market value of the option written or purchased. Premiums received or paid from writing or purchasing options that expire unexercised are treated by a Fund on the expiration date as realized gains or losses. The difference between the premium and the amount paid or received on affecting a closing purchase or sale transaction, including brokerage commissions, is also treated as a realized gain or loss. If an option is exercised, the premium paid or received is added to the cost of the purchase or proceeds from the sale in determining whether a Fund has realized a gain or loss on investment transactions. Risks from entering into option transactions arise from, among other things, the potential inability of counterparties to meet the terms.
Statement of Assets and Liabilities - Fair Value of Derivative Instruments as of September 30, 2014:
| | | | | | |
| Risk Exposure | | Derivatives Statement of Assets and Liabilities Location | | Fair Value | |
Centre American Select Equity Fund | | | | | | |
Equity Contracts
(Purchased Options) | | Investments at value | | $ | 2,345,150 | |
| | | | | | |
| | | | $ | 2,345,150 | |
| | | | | | |
The effect of derivative instruments on the Statement of Operations for the year ended September 30, 2014:
| | | | | | | | | | |
| Derivatives | | Location of Gains/(Loss) On Derivatives
Recognized In Income | | Realized Gain/(Loss) on Derivatives
Recognized in Income | | | Change in Unrealized Gain/(Loss) on
Derivatives Recognized in Income | |
Centre American Select Equity Fund | |
Equity Contracts
(Purchased options) | | Net realized loss on investments/change in unrealized appreciation on investments | | $ | (666,123) | | | $ | 94,565 | |
| | | | | | |
| | | | $ | (666,123) | | | $ | 94,565 | |
| | | | | | |
4. BENEFICIAL INTEREST TRANSACTIONS
On September 30, 2014, there was an unlimited number of shares of beneficial interest authorized for each Fund. Transactions in shares of beneficial interest are shown in the Statement of Changes in Net Assets.
| | |
| Centre Funds | | Notes to Financial Statements |
| | September 30, 2014 |
| | |
| | |
Shares of American Select Equity Fund and Global Select Equity Fund that are redeemed within 90 days of purchase may incur a 2% redemption fee deducted from the redemption amount. For the year ended September 30, 2014, redemption fees retained by these Funds are disclosed in the Statement of Changes in Net Assets.
Beneficial Ownership: The beneficial ownership, either directly or indirectly, of more than 25% of the voting securities of a Fund creates a presumption of control of the Fund under Section 2(a)(9) of the 1940 Act. As of September 30, 2014, the following entities owned beneficially more than 25% of each Fund’s outstanding shares. The shares may be held under omnibus accounts (whereby the transactions of two or more shareholders are combined and carried in the name of the originating broker rather than designated separately).
| | | | | | | | | | |
| Centre American Select Equity Fund | | Class | | | | Percentage | | | |
| | | | |
SEI Private Trust CO | | Institutional | | | | | 99.83% | | | |
| | | | |
Charles Schwab & CO. Inc | | Investor | | | | | 54.72% | | | |
| | | | |
| Centre Global Select Equity Fund | | Class | | | | Percentage | | | |
| | | | |
SEI Private Trust CO | | Institutional | | | | | 99.79% | | | |
| | | | |
James A. Abate | | Investor | | | | | 100.00% | | | |
| | | | |
| Centre Active U.S. Treasury Fund | | Class | | | | Percentage | | | |
| | | | |
SEI Private Trust CO | | Institutional | | | | | 99.97% | | | |
| | | | |
James A. Abate | | Investor | | | | | 100.00% | | | |
| | | | |
| Centre Multi-Asset Real Return Fund | | Class | | | | Percentage | | | |
| | | | |
Brown Brothers Harriman & CO | | Institutional | | | | | 99.36% | | | |
| | | | |
James A. Abate | | Investor | | | | | 100.00% | | | |
5. INVESTMENT ADVISORY AGREEMENTS AND RELATED-PARTY TRANSACTIONS
Centre Asset Management, LLC (the “Adviser”) serves as the investment adviser to each Fund pursuant to Investment Advisory Agreements with the Trust. Hudson Canyon serves as sub-adviser to the Treasury Fund pursuant to a Sub-Advisory Agreement with the Trust. Subject to the general oversight of the Board, the Adviser is responsible for among other things, developing a continuing investment program for each Fund in accordance with its investment objectives reviewing the investment strategies and policies of each Fund and advising the Board on the selection of sub-advisers, if any. In this capacity, the Adviser advises and assists the officers of the Trust in conducting the business of the Funds and is responsible for providing general investment advice and guidance to the Funds.
As compensation for the investment advisory services provided to the Funds, the Adviser currently receives monthly compensation based on each Fund’s average daily net assets at the annual rate of:
| | |
| Fund | | Management Fee Rate |
Centre American Select Equity Fund (total net assets under $1 billion) | | 0.75% |
| |
Centre American Select Equity Fund (total net assets over $1 billion) | | 0.70% |
| |
Centre Global Select Equity Fund | | 1.00% |
| |
Centre Active U.S. Treasury Fund | | 0.40% |
| |
Centre Multi-Asset Real Return Fund | | 0.55% |
American Select Equity Fund
For the American Select Equity Fund, the Adviser has agreed to reduce its advisory fees and/or reimburse other expenses of the Fund for a period of two years from January 11, 2013, to the extent necessary to limit the current operating expenses of each class of shares of the Fund (including (but not limited to) investment advisory fees of the Adviser and distribution/service (Rule 12b-1) fees, but excluding interest, taxes, litigation, brokerage, and extraordinary expenses) incurred by the Fund in the fiscal year, to an annual rate of 1.05% of the average daily net assets of the Investor Class shares and 0.95% of the average daily net assets of the Institutional Class shares. The expense limitation agreement may not be terminated and will remain in place through the end of the two-year period beginning after January 11, 2013. The Adviser may recoup any waived or reimbursed amount pursuant to the agreement in the first, second and third fiscal years following the fiscal year in which any such reimbursement or waiver occurs, if the total annual operating expenses for the applicable following year, after giving effect to the repayment, do not exceed the expense limitation in effect at the time the waiver or reimbursement is made (or any lower expense limitation or limitations to which the parties may otherwise agree).
| | |
Annual Report | September 30, 2014 | | 41 |
| | |
| Centre Funds | | Notes to Financial Statements |
| | September 30, 2014 |
| | |
| | |
Global Select Equity Fund
For the Global Select Equity Fund, the Adviser has entered into a written expense limitation agreement under which it has agreed to limit through October 31, 2015 the total operating expenses of the Fund (including (but not limited to) investment advisory fees of the Adviser and distribution/service (Rule 12b-1) fees, but excluding interest, taxes, litigation, brokerage, other expenditures which are capitalized in accordance with generally accepted accounting principles and extraordinary expenses) to an annual rate of 1.45% of the average daily net assets of the Investor Class shares, and 1.25% of the average daily net assets of the Institutional Class shares. The expense limitation agreement may be terminated by the Adviser or the Trust, with respect to the Fund, at any time and without payment of penalty, provided that the terminating party provides 90 days prior written notice of such termination to the other party, and such termination will not be effective before October 31, 2015 (unless otherwise specifically agreed upon). In addition, any termination sought by the Trust must be authorized by resolution of a majority of the Trustees who are not “interested persons” (as defined by the Investment Company Act 1940, as amended) of the Trust or by vote of a majority of the outstanding shares of the Fund. The Adviser may recoup any waived amount, including organizational fees, from the Fund pursuant to this agreement if such reimbursement does not cause the Fund to exceed the then existing expense limitation at the time the waiver or reimbursement is made and the reimbursement is made within three fiscal years after the year in which the Adviser incurred the expense.
Treasury Fund
For the Treasury Fund, the Adviser has entered into a written expense limitation agreement, dated and effective as of November 4, 2013 under which it has agreed to reduce its advisory fees and/or reimburse other expenses of the Fund, for at least an initial period of not less than two years and until the next following effective date of the Post-Effective Amendment to the registration statement of the Trust relating to the Fund incorporating the Fund’s financial statements for the Fund’s fiscal year (the “Initial Term”), to the extent necessary to limit the current operating expenses of each class of shares of the Fund (including (but not limited to) investment advisory fees of the Adviser and distribution/service (Rule 12b-1) fees, but excluding, as applicable, any front-end or contingent deferred sales loads, taxes, leverage interest, brokerage commissions, expenses incurred in connection with any merger or reorganization, and extraordinary expenses (such as litigation and other expenses not incurred in the ordinary course of the Fund’s business), and acquired fund fees and expenses), to an annual rate of 0.85% of the average daily net assets of the Investor Class shares and 0.60% of the average daily net assets of the Institutional Class shares. Unless sooner terminated, the expense limitation agreement will remain in effect for the Initial Term and from year to year thereafter. The expense limitation agreement may be terminated at any time, and without payment of any penalty, by the Board of Trustees of the Trust, on behalf of the Fund, upon 60 days’ written notice to the Adviser. The expense limitation agreement may not be terminated by the Adviser without the consent of the Board, which consent will not be unreasonably withheld. The expense limitation agreement will automatically terminate if the investment advisory agreement between the Adviser and the Trust, on behalf of the Treasury Fund, is terminated, with such termination effective upon the effective date of the advisory agreement’s termination. The Adviser may recoup any waived or reimbursed amount pursuant to the expense limitation agreement in the first, second, and third fiscal years following the fiscal year in which any such reimbursement or waiver occurs, provided that the reimbursement does not cause the Treasury Fund to exceed the then-existing expense limitation for that class at the time such reimbursement is to be paid by the Treasury Fund.
Multi-Asset Real Return Fund
For the Multi-Asset Real Return Fund, the Adviser has contractually agreed, pursuant to a written expense limited in agreement, to reduce its advisory fees and/or reimburse other expenses of the Fund through October 31, 2015 to the extent necessary to limit the current operating expenses of each class of shares of the Fund including (but not limited to) investment advisory fees of the Adviser and distribution/service (Rule 12b-1) fees but exclusive of any front-end or contingent deferred sales loads, taxes, leverage interest, brokerage commissions, expenses incurred in connection with any merger or reorganization, extraordinary expenses such as litigation and other expenses not incurred in the ordinary course of the Fund’s business, and acquired fund fees and expenses, except that, if an acquired fund is an underlying fund managed by the Adviser and such acquired fund is not subject to an effective expense limitation or fee waiver agreement at any time during the term of the expense limitation agreement, then, for that time, the operating expenses of each class of shares of the Fund shall not exclude the amount of advisory fees included in such acquired fund’s fees and expenses to which the Fund would otherwise be subject, to an annual rate of 1.25% of the average daily net assets of the Investor Class shares and 1.00% of the average daily net assets of the Institutional Class shares. The expense limitation agreement may be terminated at any time, and without payment of any penalty, by the Board of Trustees of the Trust, on behalf of the Fund, upon 60 days’ written notice to the Adviser. The Adviser may receive reimbursement of any amount waived pursuant to the expense limitation agreement, provided that the reimbursement does not cause the Fund to exceed the then-existing expense limitation for that class at the time such reimbursement is to be paid by the Fund.
| | |
| Centre Funds | | Notes to Financial Statements |
| | September 30, 2014 |
| | |
| | |
During the year ended September 30, 2014, the fee waivers and/or reimbursements were as follows:
| | | | | | |
| | | Fees Waived/Reimbursed | | | |
| Fund | | by Adviser | | | |
Centre American Select Equity Fund | | | | | | |
Investor | | $ | 466,774 | | | |
Institutional | | | 31,966 | | | |
Centre Global Select Equity Fund | | | | | | |
Investor | | | 1,094 | | | |
Institutional | | | 106,294 | | | |
Centre Active U.S. Treasury Fund | | | | | | |
Investor | | | 43 | | | |
Institutional | | | 119,257 | | | |
Centre Multi-Asset Real Return Fund | | | | | | |
Investor | | | – | | | |
Institutional | | | – | | | |
During the year ended September 30, 2014, the Institutional Class of the Centre Multi-Asset Real Return Fund had recoupments of $6,284.
As of September 30, 2014, the balances of recoupable expenses for each Fund were as follows:
| | | | | | | | | | | | | | | | |
| Fund | | Expires 2015 | | | Expires 2016 | | | Expires 2017 | | | Total | |
Centre American Select Equity Fund | | | | | | | | | | | | | | | | |
Investor Class | | $ | 189,101 | | | $ | 446,410 | | | $ | 467,347 | | | $ | 1,102,858 | |
Institutional Class | | | N/A | | | | N/A | | | | 32,014 | | | | 32,014 | |
Centre Global Select Equity Fund | | | | | | | | | | | | | | | | |
Investor Class | | | N/A | | | | N/A | | | | 1,094 | | | | 1,094 | |
Institutional Class | | | 157,721 | | | | 121,781 | | | | 106,294 | | | | 385,796 | |
Centre Active U.S. Treasury Fund | | | | | | | | | | | | | | | | |
Investor Class | | | N/A | | | | N/A | | | | 43 | | | | 43 | |
Institutional Class | | | N/A | | | | N/A | | | | 119,257 | | | | 119,257 | |
Centre Multi-Asset Real Return Fund | | | | | | | | | | | | | | | | |
Investor Class | | | N/A | | | | 4 | | | | N/A | | | | 4 | |
Institutional Class | | | N/A | | | | 119,220 | | | | N/A | | | | 119,220 | |
ALPS Fund Services, Inc. (“ALPS” or the “Administrator”) serves as administrator to the Funds. ALPS receives a monthly fee paid by the Funds subject to a minimum monthly fee and is reimbursed for certain out-of-pocket expenses. Pursuant to an administrative agreement with the Trust, ALPS provides operational services to the Funds including, but not limited to fund accounting and fund administration services and general assistance in each Fund’s operations.
ALPS, pursuant to a transfer agency and services agreement with the Trust, serves as transfer agent for the Funds. Under the transfer agency and services agreement, ALPS receives an annual minimum fee per Fund and a fee based upon each shareholder account and its account activity and is reimbursed for certain out-of-pocket expenses.
ALPS, pursuant to a chief compliance officer services agreement with the Trust, provides chief compliance officer services to the Funds. Additionally, ALPS provides services in monitoring and testing the policies and procedures of the Trust in conjunction with requirements under Rule 38a-1 under the 1940 Act. ALPS recieves an annual fee for these services and is reimbursed for certain out-of-pocket expenses, pursuant to the chief compliance officer services agreement.
The Trust has adopted a plan pursuant to Rule 12b-1 under the 1940 Act (the “Plan”). The Plan permits the Trust, on behalf of Investor class shares of the Funds, to pay one or more entities for services rendered and expenses borne in connection with providing shareholder or distribution services with respect to the Investor class shares of each Fund.
ALPS Distributors, Inc. (the “Distributor”) acts as the principal underwriter of the Funds pursuant to a distribution agreement with the Trust. There were no payments to the Distributor by the Funds during the year ended September 30, 2014.
Officers of the Trust and Trustees who are “interested persons” of the Trust or the Adviser will receive no salary or fees from the Trust. As of January 1, 2014, each Trustee who is not an “interested person” receives an annual retainer of $20,000 paid quarterly. The Trust reimburses each Trustee and Officer for his or her travel and other expenses relating to attendance at Board meetings.
One Trustee is an officer of the Adviser.
| | |
Annual Report | September 30, 2014 | | 43 |
| | |
| Centre Funds | | Notes to Financial Statements |
| | September 30, 2014 |
| | |
| | |
6. FEDERAL INCOME TAX AND TAX BASIS INFORMATION
As of and during the period ended September 30, 2014, the Funds did not have a liability for any unrecognized tax benefits. The Funds file U.S. Federal, state, and local tax returns as required. The Funds’ tax returns are subject to examination by the relevant tax authorities until expiration of the applicable statute of limitations which is generally three years after the filing of the tax return but which can be extended to six years in certain circumstances. Tax returns for open years have incorporated no uncertain tax positions that require a provision for income taxes.
Components of Distributable Earnings on a Tax Basis: At September 30, 2014, permanent differences in book and tax accounting were reclassified. These differences had no effect on net assets and were primarily attributed to differences in the book and tax treatment of non-deductible expenses, currency transactions, net operating loss, and certain other investments.
| | | | | | | | | | | | |
| Fund | | Accumulated Net
Investment Income/(Loss) | | | Accumulated Net
Realized Gain/(Loss) | | | Paid-in Capital | |
Centre American Select Equity Fund | | $ | (50) | | | $ | 50 | | | $ | – | |
Centre Global Select Equity Fund | | | (23,077) | | | | 23,077 | | | | – | |
Centre Active U.S. Treasury Fund | | | 30,377 | | | | – | | | | (30,377) | |
Centre Multi-Asset Real Return Fund | | | 262,332 | | | | (260,361) | | | | (1,971) | |
There were no net operating losses offset to Paid-in-Capital included in the amounts reclassified above.
As of September 30, 2014, the components of distributable earnings on a tax basis were as follows:
| | | | | | | | | | | | | | | | |
| | | Accumulated | | | | | | Net Unrealized | | | Other Cumulative | |
| | | Capital Gain/(Loss) | | | Ordinary Income | | | Appreciation/ | | | Effect of Timing | |
| Fund | | Undistributed | | | Undistributed | | | (Depreciation) | | | Differences | |
Centre American Select Equity Fund | | $ | (268,786) | | | $ | 497,415 | | | $ | 24,084,920 | | | $ | 558,793 | |
Centre Global Select Equity Fund | | | 1,277,650 | | | | 845,084 | | | | (427,192) | | | | – | |
Centre Active U.S. Treasury Fund | | | – | | | | 193,491 | | | | (53,948) | | | | – | |
Centre Multi-Asset Real Return Fund | | | – | | | | 448,290 | | | | (628,174) | | | | – | |
Capital Losses: As of September 30, 2014, the following Funds had capital loss carryforwards which may reduce the Funds’ taxable income arising from future net realized gains on investments, if any, to the extent permitted by the Code and thus may reduce the amount of the distributions to shareholders which would otherwise be necessary to relieve the Funds of any liability for federal tax. Pursuant to the Code, such capital loss carryforwards will expire as follows:
Pre-Enactment Capital Losses:
| | | | | | |
| Fund | | Expiring in 2017 | | | |
Centre American Select Equity Fund | | $ | 268,786 | | | |
|
Capital loss carryovers utilized during the period ended September 30 2014, were: |
| | |
| Fund | | Amount | | | |
Centre American Select Equity Fund | | $ | (7,739,331) | | | |
Under the recently enacted Regulated Investment Company Modernization Act of 2010, capital losses incurred by each Fund after January 1, 2011 will not be subject to expiration. In addition, such losses must be utilized prior to the losses incurred in the years preceding enactment.
Distributions to Shareholders: Each Fund normally pays dividends and net investment income, if any, on an annual basis. Each Fund normally distributes capital gains, if any, on an annual basis. Income dividend distributions are derived from interest and other income each Fund receives from its investments, including distributions of short term capital gains. Capital gain distributions are derived from gains realized when each Fund sells a security it has owned for more than one year. Each Fund may make additional distributions and dividends at other times if the Adviser believes doing so may be necessary for each Fund to avoid or reduce taxes. Net investment income/(loss) and net realized gain/(loss) may differ for financial statement and tax purposes. The amounts and characteristics of tax basis distributable earnings/(accumulated losses) are finalized at fiscal year-end.
| | |
| Centre Funds | | Notes to Financial Statements |
| | September 30, 2014 |
| | |
| | |
The tax character of distributions paid for the fiscal year ended September 30, 2014 were as follows:
| | | | | | | | |
| Distributions Paid From: | | Ordinary Income | | | Long-Term Capital Gains | |
Centre American Select Equity Fund | | $ | 1,048,301 | | | $ | 14,415 | |
Centre Global Select Equity Fund | | | 320,244 | | | | 219,297 | |
Centre Active U.S. Treasury Fund | | | – | | | | – | |
Centre Multi-Asset Real Return Fund | | | – | | | | – | |
|
The tax character of distributions paid for the fiscal year ended September 30, 2013 were as follows: | |
| | |
| Distributions Paid From: | | Ordinary Income | | | Long-Term Capital Gains | |
Centre American Select Equity Fund | | $ | 2,387,823 | | | $ | – | |
Centre Global Select Equity Fund | | | 883,192 | | | | – | |
Centre Active U.S. Treasury Fund | | | – | | | | – | |
Centre Multi-Asset Real Return Fund | | | 3,201,213 | | | | – | |
Unrealized Appreciation and Depreciation on Investments: The amount of net unrealized appreciation/(depreciation) and the cost of investment securities for tax purposes, including short-term securities at September 30, 2014 are displayed in the table below. The difference between book and tax basis unrealized appreciation/(depreciation) for the Funds is primarily attributable to wash sales and certain other investments.
| | | | | | | | | | | | | | | | | | | | |
| | | | | | | | | | | | Net Appreciation | | | | |
| | | | | | | | | | | | of Foreign | | | Net Tax Unrealized | |
| | | Tax Cost of | | | Gross Unrealized | | | Gross Unrealized | | | Currency and | | | Appreciation/(Depreciation) | |
| | | Investments | | | Appreciation | | | Depreciation | | | Derivatives | | | on Investments | |
Centre American Select Equity Fund | | $ | 107,835,927 | | | $ | 26,159,965 | | | $ | (2,075,045) | | | $ | – | | | $ | 24,084,920 | |
Centre Global Select Equity Fund | | | 15,123,923 | | | | 509,702 | | | | (935,234) | | | | (1,660) | | | | (427,192) | |
Centre Active U.S. Treasury Fund | | | 14,456,526 | | | | – | | | | (53,948) | | | | – | | | | (53,948) | |
Centre Multi-Asset Real Return Fund | | | 59,729,586 | | | | 540,758 | | | | (1,168,932) | | | | – | | | | (628,174) | |
7. AFFILIATED COMPANIES:
Multi-Asset Real Return Fund, in accordance with its investment strategies, may invest in certain securities that are considered securities issued by affiliated companies. As defined by the 1940 Act, an affiliated person, including an affiliated company, is one in which a Fund owns 5% or more of the outstanding voting securities, or a company which is under common ownership or control with the Fund. The purchases, sales, dividend income, capital gains, return of capital distributions received, shares, and value of investments in affiliated companies for the year ended September 30, 2014 were as follows:
| | | | | | | | | | | | | | | | | | | | | | | | | | | | |
| Security Name | | Share Balance
October 1,
2013 | | | Purchases | | | Sales | | | Share Balance
September 30,
2014 | | | Dividend
Income | | | Realized
Gain | | | Market Value
September 30,
2014 | |
Centre American Select Equity Fund, Investor Class | | | 1,434,664 | | | | 1,211,446 | | | | (2,646,110) | | | | – | | | $ | 126,480 | | | $ | 801,367 | | | $ | – | |
Centre American Select Equity Fund, Institutional Class | | | – | | | | 2,507,665 | | | | (1,200,000) | | | | 1,307,665 | | | | – | | | | 984,000 | | | | 15,796,594 | |
Centre Global Select Equity Fund, Investor Class | | | – | | | | 1,268,486 | | | | (1,268,486) | | | | – | | | | – | | | | 25,370 | | | | – | |
Centre Global Select Equity Fund, Institutional Class | | | 1,223,258 | | | | 1,313,714 | | | | (1,268,486) | | | | 1,268,486 | | | | 538,209 | | | | 1,024,676 | | | | 14,701,753 | |
Centre Active U.S. Treasury Fund, Institutional Class | | | – | | | | 1,437,698 | | | | – | | | | 1,437,698 | | | | – | | | | – | | | | 14,506,377 | |
| | | | | | | | | | | | | | | | | | | $ | 664,689 | | | $ | 2,835,413 | | | $ | 45,004,724 | |
| | | | | | | | | | | | | | | | | | | | | | | | | | | | | |
| | |
Annual Report | September 30, 2014 | | 45 |
| | |
| Centre Funds | | Notes to Financial Statements |
| | September 30, 2014 |
| | |
| | |
8. PURCHASES AND SALES OF INVESTMENT SECURITIES
For the year ended September 30, 2014, the aggregate cost of purchases and proceeds from sales of investment securities (excluding any U.S. Government Obligations short-term securities) were as follows:
| | | | | | | | |
| | | | | | Proceeds From Sales of | |
| Fund | | Purchases of Securities | | | Securities | |
Centre American Select Equity Fund | | $ | 94,899,647 | | | $ | 115,808,422 | |
Centre Global Select Equity Fund | | | 23,293,494 | | | | 23,301,932 | |
Centre Active U.S. Treasury Fund | | | – | | | | – | |
Centre Multi-Asset Real Return Fund | | | 118,413,673 | | | | 100,884,932 | |
For the year ended September 30, 2014, the aggregate cost of purchases and proceeds from sales of U.S. Government Obligations investment securities were as follows:
| | | | | | | | |
| | | | | | Proceeds from Sales of | |
| Fund | | Purchases of Securities | | | Securities | |
Centre Active U.S. Treasury Fund | | $ | 52,238,706 | | | $ | 38,240,616 | |
Centre Multi-Asset Real Return Fund | | | – | | | | 14,983,447 | |
9. INDEMNIFICATIONS
Under the Trust’s organizational documents, its officers and Trustees are indemnified against certain liabilities relating to their duties to the Trust. Additionally, in the ordinary course of business, the Trust enters into contracts with service providers that may contain general indemnification clauses. The Trust’s maximum exposure under these arrangements is unknown, as this would involve future claims that may be made against the Trust that have not yet occurred.
10. FUND REORGANIZATIONS
Reorganization of the Ameristock Mutual Fund, Inc., into Centre American Select Equity Fund
On September 19, 2012, the Board approved a form of Agreement and Plan of Reorganization between Ameristock Mutual Fund, Inc. (the “Acquired Fund”) and the Trust, on behalf of its series, Centre American Select Equity Fund (the “Acquiring Fund”). Under the plan, the Acquired Fund was reorganized in the Acquiring Fund.
As of the close of business on January 11, 2013, the assets of the Acquired Fund were acquired by the Acquiring Fund in exchange for the existing class of shares of the Acquiring Fund and the assumption by the Acquiring Fund of the liabilities of the Acquired Fund. Upon the closing of the reorganization, the Acquiring Fund issued 13,877,608 shares in exchange for net assets of the Acquired Fund valued at $130,033,182. The assets of the Acquired Fund, with a net value of $122,680,756 and identified cost of $95,563,800 at January 11, 2013, was the principal asset acquired by the Fund. On January 14, 2013, the combined value of the Acquired Fund (which included realized losses of $(2,404,260) and unrealized appreciation of $27,116,956) and the Acquiring Fund was $141,597,250. The reorganization qualified as a tax-free reorganization for Federal income tax purposes. The unused capital loss carryforwards totaled $37,278,632 for potential utilization and are subject to tax limitations.
11. CHANGES IN ACCOUNTANTS
On June 30, 2014, KPMG LLP acquired certain assets of ROTHSTEIN-KASS, P.A. (d/b/a Rothstein Kass & Company, P.C.) and certain of its affiliates (“Rothstein Kass”), the independent public accounting firm for each series (the “Funds”) of the Centre Funds (the “Trust”). As a result of this transaction, on June 30, 2014, Rothstein Kass resigned as the independent registered public accounting firm for the Trust.
The reports of Rothstein Kass on the Funds’ financial statements for the past two fiscal years ended September 30, 2012 and September 30, 2013 contained no adverse opinion or disclaimer of opinion and were not qualified or modified as to uncertainty, audit scope or accounting principles.
During the two most recent fiscal years ended September 30, 2013 and September 30, 2012 and through June 30, 2014, there have been no disagreements with Rothstein Kass on any matter of accounting principles or practices, financial statement disclosure or auditing scope or procedure, which disagreements, if not resolved to the satisfaction of Rothstein Kass, would have caused Rothstein Kass to make reference thereto in its reports on the financial statements for such years.
| | |
| Centre Funds | | Notes to Financial Statements |
| | September 30, 2014 |
| | |
| | |
During the two most recent fiscal years ended September 30, 2012 and September 30, 2013 and through June 30, 2014, there have been no reportable events (as defined in Item 304(a)(1)(v)) of Regulation S-K).
The Board of Trustees of the Trust approved the selection of KPMG to serve as each Fund’s independent registered public accounting firm for the Funds’ fiscal year ending September 30, 2014 at an in-person meeting held on September 12, 2014. During the two most recent fiscal years ended September 30, 2012 and September 30, 2013 and through June 30, 2014, the Trust has not consulted with KPMG LLP regarding either (i) the application of accounting principles to a specified transaction, either completed or proposed; or the type of audit opinion that might be rendered on the Funds’ financial statements, and neither a written report was provided to the Trust or oral advice was provided that KPMG LLP concluded was an important factor considered by the Trust in reaching a decision as to the accounting, auditing or financial reporting issue; or (ii) any matter that was either the subject of a disagreement, as that term is defined in Item 304(a)(1)(iv) of Regulation S-K and the related instructions to Item 304 of Regulation S-K, or a reportable event, as that term is defined in Item 304(a)(1)(v) of Regulation S-K.
| | |
Annual Report | September 30, 2014 | | 47 |
| | |
| Centre Funds | | Report of Independent Registered Public Accounting Firm |
The Board of Trustees and Shareholders of Centre Funds:
We have audited the accompanying statement of assets and liabilities, including the schedules of investments, of Centre American Select Equity Fund (“American Select Equity Fund”), Centre Global Select Equity Fund (“Global Select Equity Fund”), Centre Active U.S. Treasury Fund (“Treasury Fund”), and Centre Multi-Asset Real Return Fund (“Multi-Asset Real Return Fund”) (collectively, the “Funds”), each a series of Centre Funds (the “Trust”) as of September 30, 2014, and: (a) the related statements of operations and changes in net assets for the year then ended for American Select Equity Fund, Global Select Equity Fund and Multi-Asset Real Return Fund, and for the period January 21, 2014 (Inception) to September 30, 2014 for Treasury Fund; and (b) the financial highlights for the year then ended for American Select Equity Fund (Investor Class), Global Select Equity Fund (Institutional Class), Multi-Asset Real Return Fund (Investor Class and Institutional Class), and for the period January 21, 2014 (Inception) to September 30, 2014 for American Select Equity Fund (Institutional Class), Global Select Equity Fund (Investor Class), and Treasury Fund (Investor Class and Institutional Class). These financial statements and financial highlights are the responsibility of the Funds’ management. Our responsibility is to express an opinion on these financial statements and financial highlights based on our audits. The accompanying (a) statements of changes in net assets for the year ended September 30, 2013 for American Select Equity Fund and Global Select Equity Fund, and for the period October 9, 2012 (Inception) to September 30, 2013 for Multi-Asset Real Return Fund; and (b) financial highlights for the year ended September 30, 2013 and the period December 21, 2011 (Inception) to September 30, 2012 for American Select Equity Fund (Investor Class) and Global Select Equity Fund (Institutional Class), the period January 22, 2013 (Inception) to September 30, 2013 for Multi-Asset Real Return Fund (Investor Class), and the period October 9, 2012 (Inception) to September 30, 2013 for Multi-Asset Real Return Fund (Institutional Class) were audited by prior auditors whose report thereon dated November 26, 2013, expressed an unqualified opinion on those financial statements and financial highlights.
We conducted our audits in accordance with the standards of the Public Company Accounting Oversight Board (United States). Those standards require that we plan and perform the audit to obtain reasonable assurance about whether the financial statements and financial highlights are free of material misstatement. An audit includes examining, on a test basis, evidence supporting the amounts and disclosures in the financial statements. Our procedures included confirmation of securities owned as of September 30, 2014, by correspondence with the custodian. An audit also includes assessing the accounting principles used and significant estimates made by management, as well as evaluating the overall financial statement presentation. We believe that our audits provide a reasonable basis for our opinion.
In our opinion, the financial statements and financial highlights referred to above present fairly, in all material respects, the financial position of Centre American Select Equity Fund, Centre Global Select Equity Fund, Centre Active U.S. Treasury Fund, and Centre Multi-Asset Real Return Fund as of September 30, 2014, and the results of their operations, changes in their net assets, and their financial highlights for the periods noted above for each of the respective Funds, in conformity with U.S. generally accepted accounting principles.
/s/ KPMG LLP
San Francisco, California
November 26, 2014
| | |
| Centre Funds | | Additional Information |
| | September 30, 2014 (Unaudited) |
| | |
| | |
PROXY VOTING GUIDELINES
A description of the policies and procedures that the Funds use to determine how to vote proxies relating to portfolio securities and information regarding how the Funds voted proxies during the most recent 12-month period ended June 30, is available without charge, upon request, by (1) calling the Funds at 1-855-298-4236 and (2) from Form N-PX filed by the Trust with the Securities and Exchange Commission (“SEC”) on the SEC’s website at http://www.sec.gov.
PORTFOLIO HOLDINGS DISCLOSURE POLICY
The Trust files, with regard to each Fund, with the SEC a complete schedule of investments for the first and third quarter of each fiscal year on Form N-Q. The Funds’ first and third fiscal quarters end on December 31 and June 30. The Form N-Q filing must be made within 60 days of the end of the quarter, and the Trust’s first Form N-Q was filed with the SEC on February 27, 2012. Forms N-Q are available on the SEC’s website at http://www.sec.gov and may be reviewed and copied at the SEC’s Public Reference Room in Washington, DC (call 1-800-732-0330 for information on the operations of the Public Reference Room). You may also obtain copies by calling the Funds at 1-855-298-4236.
TAX DESIGNATIONS
Pursuant to Section 852(b)(3) of the Internal Revenue Code, the Centre Global Select Equity Fund and Centre American Select Equity Fund designate $219,297 and $14,415 respectively as long-term capital gain dividends.
| | |
| | |
Annual Report | September 30, 2014 | | 49 |
| | |
| Centre Funds | | Trustees and Officers |
| | September 30, 2014 (Unaudited) |
| | |
| | |
The following tables provide certain information regarding the Trustees and Officers of Centre Funds as of September 30, 2014 of each of the persons currently serving as a Trustee or Officer of the Trust. The business address of each Trustee or Officer is c/o Centre Funds, 1290 Broadway, Suite 1100, Denver, Colorado 80203. Additional information about members of the Board of Trustees and officers of the Trust is available in the Statement of Additional Information and is available, without charge, upon request, by calling the Funds (toll-free) at 1-855-298-4236.
INDEPENDENT TRUSTEES1
| | | | | | | | | | |
Name, Year of Birth | | Position(s)
Held with
Funds or Trust | | Length of
Time Served | | Principal Occupation(s) During Past 5 Years | | Number of
Portfolios in
Fund
Complex
Overseen by
Trustee | | Other
Directorships
Held by
Trustee During
Past 5 Years |
Dr. James L. Grant 1949 | | Trustee, Chairman | | Since 6/2011 | | President of JLG Research from 1999-present; Assistant Professor of Accounting and Finance at University of Massachusetts Boston from 2005-2011, Associate Professor from 2012-present (tenured); Advisory Analyst at major Wall Street firms from 1999-present; Ph.D in Business from the University of Chicago Booth School of Business; member of Editorial Advisory Boards of The Journal of Portfolio Management and Journal of Investing; author of Foundations of Economic Value Added Second Edition; co-author of Focus on Value: A Corporate and Investor Guide to Wealth Creation; co-author and co-editor (with Frank J. Fabozzi) of Equity Portfolio Management and Value-Based Metrics: Foundations and Practice. | | 4 | | None |
Dr. Aloke Ghosh 1963 | | Trustee | | Since 6/2011 | | Professor of Accountancy at the Zicklin School of Business, Baruch College, The City University of New York from 1993-present; Director of the Executive MS in Financial Statement Analysis and Securities Valuation from 2008-present; Doctoral Program Coordinator of Accountancy at the Zicklin School of Business of Baruch College from 2005-2011; Accounting Academic Fellow at the U.S. Securities and Exchange Commission from 2003-2005; Visiting Associate Professor at the Goizueta Business School of Emory University from 1999-2005; accounting consultant to several leading hedge funds in the U.S. and around the world including acting as a consultant for Gerson Lehrman Group; Ph.D. in Business and Economics from Tulane University. | | 4 | | None |
Joseph M. Marinaro 1958 | | Trustee | | Since 6/2012 | | Executive Vice President, AltX Group, Inc. (financial technology) 2012 to present; Managing Director at Surge Trading, Inc. 2009 to 2011; Managing Director, JMM Capital, Inc. 2008 to 2009; Managing Director, Morgan Stanley 2006 to 2008. | | 4 | | None |
| 1 | An “Independent Trustee” is one who is not considered an “interested person” of the Trust, as that term is defined in Section 2(a)(19) of the 1940 Act. |
| | |
| Centre Funds | | Trustees and Officers |
| | September 30, 2014 (Unaudited) |
| | |
| | |
INTERESTED TRUSTEE
| | | | | | | | | | |
Name, Year of Birth | | Position(s)
Held with
Funds or Trust | | Length of
Time Served | | Principal Occupation(s) During Past 5 Years | | Number of
Portfolios in
Fund
Complex
Overseen by
Trustee | | Other
Directorships
Held by
Trustee During
Past 5 Years |
James A. Abate 1965 | | Trustee President and Secretary | | Since 6/2011 Since 11/2013 | | Founder, Managing Director and Chief Investment Officer of Centre Asset Management, LLC and Fund Manager for Centre’s American Select Equity and Real Return strategies from 2006-present; US Investment Director for GAM from 2001-2006; Managing Director and Portfolio Manager at Credit Suisse Asset Management from 1995-2000; Manager in Price Waterhouse’s Valuation/Corporate Finance Group from 1987-1993; BS in Accounting from Fairleigh Dickinson University and an MBA in Finance from St. John’s University; Visiting Professor in the graduate program at the Zicklin School of Business, Baruch College from 2009-2013; commissioned officer in the U.S. Army (and Reserves) from 1983-1990. | | 4 | | None |
| | | | | |
| OFFICERS | | | | | | | | | | |
| | | | | |
Name, Year of Birth | | Position(s)
Held with
Funds or Trust | | Length of
Time Served | | Principal Occupation(s) During Past 5 Years | | Number of
Portfolios in
Fund
Complex
Overseen by
Trustee | | Other
Directorships
Held by
Trustee During
Past 5 Years |
Theodore J. Uhl 1974 | | Chief Compliance Officer | | Since 6/2011 | | Mr. Uhl joined ALPS Fund Services in October 2006, and is currently Deputy Compliance Officer of ALPS. Prior to his current role, Mr. Uhl served as Senior Risk Manager for ALPS from October 2006 until June 2010. Before joining ALPS, Mr. Uhl served as Senior Analyst with Enenbach and Associates (RIA), and as Senior Financial Analyst at Sprint. | | N/A | | N/A |
Vu Phong Nguyen 1987 | | Treasurer | | Since 11/2013 | | Mr. Nguyen joined Centre Asset Management, LLC in October 2013 as an analyst. Prior to his current role, Mr. Nguyen was an operations and marketing consultant to Drexel Hamilton Investment Partners, LLC (from November 2012 until August 2013). Mr. Nguyen held several consultant positions with private wealth management divisions of UBS Financial and Bank of America Merrill Lynch prior to joining Drexel Hamilton Investment Partners. He is a CFA Level III candidate and earned a Master’s degree in Financial Statement Analysis and Securities Valuation, as well as a Bachelor’s degree in Finance and Investments, from Baruch Zicklin School of Business. | | N/A | | N/A |
| | |
| | |
Annual Report | September 30, 2014 | | 51 |
Page Intentionally Left Blank

Item 2. Code of Ethics.
| | (a) | The Registrant, as of the end of the period covered by this report, has adopted a code of ethics that applies to the Registrant’s principal executive officer, principal financial officer, principal accounting officer or controller or any persons performing similar functions on behalf of the Registrant. |
| | (c) | During the period covered by this report, no amendments were made to the provisions of the code of ethics adopted in Item 2(a) above. |
| | (d) | During the period covered by this report, no implicit or explicit waivers to the provisions of the code of ethics adopted in Item 2(a) above were granted. |
| | (f) | The Registrant’s Code of Ethics is attached as an Exhibit to this report. |
Item 3. Audit Committee Financial Expert.
The Board of Trustees of the Registrant has determined that the Registrant has at least one audit committee financial expert serving on its audit committee. The Board of Trustees has designated Dr. Aloke Ghosh as the Trust’s “audit committee financial expert,” as defined in Form N-CSR under the 1940 Act, based on the Board’s review of his qualifications. Dr. Ghosh is “independent” as defined in paragraph (a)(2) of Item 3 to Form N-CSR.
Item 4. Principal Accountant Fees and Services.
(a) Audit Fees: For the Registrant’s fiscal years ended September 30, 2014 and September 30, 2013, the aggregate fees billed for professional services rendered by the principal accountant for the audit of the Registrant’s annual financial statements were $35,500 and $36,000, respectively.
(b) Audit-Related Fees: For the Registrant’s fiscal years ended September 30, 2014 and September 30, 2013, the aggregate fees billed for assurance and related services by the principal accountant that are reasonably related to the performance of the audit of the Registrant’s annual financial statements and are not reported under paragraph (a) of this Item were $0 and $0, respectively.
(c) Tax Fees: For the Registrant’s fiscal years ended September 30, 2014 and September 30, 2013, the aggregate fees billed for professional services rendered by the principal accountant for tax compliance, tax advice, and tax planning were $12,400 and $9,000, respectively. The fiscal years 2014 and 2013 tax fees were for services for dividend calculation, excise tax preparation and tax return preparation.
(d) All Other Fees: For the Registrant’s fiscal years ended September 30, 2014 and September 30, 2013, the aggregate fees billed by the principal accountant for services other than the services reported in paragraphs (a) through (c) of this item were $0 and $0, respectively.
| | (e)(1) | Audit Committee Pre-Approval Policies and Procedures: All services to be performed by the Registrant’s principal accountant must be pre-approved by the Registrant’s audit committee. |
| | (e)(2) | No services described in paragraphs (b) through (d) were approved pursuant to paragraph (c)(7)(i)(C) of Rule 2-01 of Regulation S-X. |
| | (g) | The aggregate non-audit fees billed by the Registrant’s principal accountant for the fiscal years ended September 30, 2014 and September 30, 2013 were $0 and $0, respectively. |
Item 5. Audit Committee of Listed Registrants.
Not applicable.
Item 6. Investments.
The Schedule of Investments is included as part of the Report to Stockholders filed under Item 1 of this report.
Item 7. Disclosure of Proxy Voting Policies and Procedures for Closed-End Management Investment Companies.
Not applicable.
Item 8. Portfolio Managers of Closed-End Management Investment Companies.
Not applicable.
Item 9. Purchases of Equity Securities by Closed-End Management Investment Company and Affiliated Purchasers.
Not applicable.
Item 10. Submission of Matters to a Vote of Security Holders.
There have been no material changes to the procedures by which shareholders may recommend nominees to the Registrant’s Board of Trustees.
Item 11. Controls and Procedures.
| | (a) | The Registrant’s principal executive and principal financial officers, or persons performing similar functions, have concluded that the Registrant’s disclosure controls and procedures (as defined in Rule 30a-3(c) under the Investment Company Act of 1940, as amended (the “1940 Act”) (17 CFR 270.30a-3(c))) are effective, as of a date within 90 days of the filing date of this report that includes the disclosure required by this paragraph, based on their evaluation of these controls and procedures required by Rule 30a-3(b) under the 1940 Act (17 CFR 270.30a-3(b)) and Rules 13a-15(b) or 15d-15(b) under the Securities Exchange Act of 1934, as amended (17 CFR 240.13a-15(b) or 240.15d-15(b)). |
| | (b) | No changes in the Registrant’s internal control over financial reporting (as defined in Rule 30a-3(d) under the 1940 Act (17 CFR 270.30a-3(d)) occurred during the Registrant’s second fiscal quarter of the period covered by this report that have materially affected, or are reasonably likely to materially affect, the Registrant’s internal control over financial reporting. |
Item 12. Exhibits.
| | (a)(1) | The code of ethics that applies to the registrant’s principal executive officer and principal financial offer is attached hereto as EX-12.A.1. |
| | (a)(2) | The certifications required by Rule 30a-2(a) under the 1940 Act, as amended, and Section 302 of the Sarbanes-Oxley Act of 2002 are attached hereto as Ex99.Cert. |
| | (b) | The certifications by the Registrant’s principal executive officer and principal financial officer, as required by Rule 30a-2(b) under the 1940 Act and Section 906 of the Sarbanes-Oxley Act of 2002 are attached hereto as Ex99.906Cert. |
SIGNATURES
Pursuant to the requirements of the Securities Exchange Act of 1934 and the Investment Company Act of 1940, the Registrant has duly caused this report to be signed on its behalf by the undersigned, thereunto duly authorized.
| | |
| CENTRE FUNDS |
| |
| By: | | /s/ James A. Abate |
| | James A. Abate |
| | President (Principal Executive Officer) |
| |
| Date: | | December 8, 2014 |
Pursuant to the requirements of the Securities Exchange Act of 1934 and the Investment Company Act of 1940, this report has been signed below by the following persons on behalf of the Registrant and in the capacities and on the dates indicated.
| | |
| By: | | /s/ James A. Abate |
| | James A. Abate |
| | President (Principal Executive Officer) |
| |
| Date: | | December 8, 2014 |
| | |
| By: | | /s/ Vu Phong Nguyen |
| | Vu Phong Nguyen |
| | Treasurer (Principal Financial Officer) |
| |
| Date: | | December 8, 2014 |