UNITED STATES
SECURITIES AND EXCHANGE COMMISSION
Washington, D.C. 20549
FORM N-CSR
CERTIFIED SHAREHOLDER REPORT OF REGISTERED
MANAGEMENT INVESTMENT COMPANIES
Investment Company Act file number: 811-22545
CENTRE FUNDS
(Exact name of registrant as specified in charter)
48 Wall Street, Suite 1100, New York, New York 10005
(Address of principal executive offices) (Zip code)
James A. Abate
48 Wall Street, Suite 1100
New York, New York 10005
(Name and address of agent for service)
Registrant’s telephone number, including area code: (212) 918-4705
Date of fiscal year end: September 30
Date of reporting period: October 1, 2022 – March 31, 2023
Item 1. Reports to Stockholders.
TABLE OF CONTENTS
| | PAGE |
| SHAREHOLDER LETTER | 1 |
| PORTFOLIO UPDATE | 6 |
| Centre American Select Equity Fund | 6 |
| Centre Global Infrastructure Fund | 8 |
| DISCLOSURE OF FUND EXPENSES | 10 |
| SCHEDULES OF INVESTMENTS | 11 |
| Centre American Select Equity Fund | 11 |
| Centre Global Infrastructure Fund | 13 |
| STATEMENTS OF ASSETS AND LIABILITIES | 15 |
| STATEMENTS OF OPERATIONS | 16 |
| STATEMENTS OF CHANGES IN NET ASSETS | 17 |
| Centre American Select Equity Fund | 17 |
| Centre Global Infrastructure Fund | 18 |
| FINANCIAL HIGHLIGHTS | 19 |
| Centre American Select Equity Fund | 19 |
| Centre Global Infrastructure Fund | 21 |
| NOTES TO FINANCIAL STATEMENTS | 25 |
| ADDITIONAL INFORMATION | 33 |
| CONSIDERATION AND APPROVAL OF INVESTMENT ADVISORY AGREEMENTS | 34 |
| Centre Funds | Shareholder Letter |
March 31, 2023 (Unaudited)
Dear Fellow Shareholders,
It is with pleasure that we publish the Centre Funds’ Semi-Annual Report covering the six-month period ended March 31, 2023. We want to thank our fellow shareholders for their continued support and confidence in the Centre Funds. The Centre Funds offer a select series of fundamentally-driven, actively managed funds to choose from, each available in investor and institutional share classes. We are passionate about active management.
Our aim at Centre Funds is to deliver strong, long-term performance results for investors through an exceptional focus on producing returns and managing risk and downside volatility in select investment strategies. We want investors to associate Centre Funds with high-conviction, differentiated fund strategies that may not be available elsewhere and are tactical, pragmatic, and opportunistic. Each Fund’s investment strategy aims to capitalize on defined market opportunities with consistent methodology and repeatable investment processes to achieve differentiated returns and risk profiles. We remain focused on fundamentally-driven investment approaches within truly active, high conviction, disciplined and research-intensive processes. At Centre Funds, we place service excellence at the core of everything that we do and are committed to providing useful information on the Funds.
Centre American Select Equity Fund (the “Equity Fund”)
The Equity Fund is a U.S. large capitalization valuation sensitive capital appreciation stock fund that seeks long-term growth of capital and is focused on risk adjusted returns through active and pragmatic management; the Equity Fund may complement its equity securities with hedges and other capital preservation strategies when deemed appropriate. The Equity Fund is intended to be a risk managed core equity fund.
Centre Global Infrastructure Fund (the “Infrastructure Fund”)
The Infrastructure Fund pursues a bottom-up, active management approach and invests in what we deem the most attractive listed infrastructure-related companies from the United States and developed international economies. Also, the Infrastructure Fund seeks to balance its exposures to where the weights of the Telecommunication, Utilities, Energy, Transportation, and Social Infrastructure industries are broadly represented. The Infrastructure Fund’s objective is to seek long-term growth of capital and current income, and distributes dividend and interest income monthly.
Funds’ Performance
Equity Fund
For the six-month period ended March 31, 2023, the Equity Fund, Investor Share Class, delivered a total return of 11.25%; and the Institutional Share Class delivered a total return of 11.41%1. During the same six-month period, the key barometer of the U.S. stock market, as measured by the S&P 500 Index, delivered a total return of 15.60%.
The strongest contributors to performance within the Equity Fund over the six-month period ended March 31, 2023, included the Equity Fund’s investments within the Health Care sector: Gilead Sciences, Amgen, Cardinal Health, and Zimmer Biomet; and the Consumer Discretionary sector: Mercadolibre and Tesla. In general, stock selection contributed positively to relative performance, particularly within the Health Care sector, while sectoral biases, particularly our underweight posture in Financials, contributed positively as well. Stock investments that contributed negatively to relative the Equity Fund’s performance over the period were in the natural resources industries and included EQT Corp., Range Resources, Peabody Energy, CF Industries, Sibanye-Stillwater, and Corteva. The Equity Fund’s performance was also negatively impacted from a total return and drawdown2 perspective from certain hedges and other investments that Centre Asset Management, LLC, the investment adviser to the Fund (“Centre” or the “Adviser”), viewed as capital protective in nature. These hedges, namely put options on U.S. large capitalization indices such as the S&P 500 or Nasdaq 100, accounted for the bulk of negative relative performance as the put option positions were affected negatively from the rise in S&P 500 but also from the corresponding sharp fall in implied volatility. Despite the negative impact over the six-month period ended March 31, 2023, the beneficial use of hedges was evident during previous sharp corrective episodes, most notably in January 2022, February/March 2020, and such capital protection measures implemented by Centre, over the longer-term, have insulated the Equity Fund from the same magnitude of maximum drawdown experienced by the overall stock market over prior volatile3 episodes, namely in August 2015, January 2016, February 2018, and December 2018. Given the continued presence of certain potentially de-stabilizing factors that the Adviser believes could negatively impact the value of underlying equity securities held in the Fund’s portfolio, the Fund may continue the strategy of tactically and opportunistically purchasing put options on leading benchmark equity indexes as a potential hedge against the systematic or general market risk of its underlying stock holdings.
| 1 | Disclosure: Past performance does not guarantee future results. |
| 2 | Maximum drawdown is the maximum loss from a peak to a trough of a portfolio before a new peak is attained. |
| 3 | Volatility is a measure of systematic risk of a security or a portfolio in comparison to the market as a whole. |
| Semi-Annual Report | March 31, 2023 | 1 |
| Centre Funds | Shareholder Letter |
March 31, 2023 (Unaudited)
Infrastructure Fund
For the six-month period ended March 31, 2023, the Infrastructure Fund, Investor Share Class, delivered a total return of 12.14%; and the Institutional Share Class delivered a total return of 12.36%4 with the trailing annual dividend distribution yield of 2.03%5. During the same six-month period, as a comparison, the S&P Global Infrastructure Index delivered a total return of 14.96%.
During the period, investments providing the strongest contribution to the Infrastructure Fund’s performance within the Energy sector included: Enbridge, TC Energy, and Cheniere Energy; and within the Utilities sector: Enel, Mercury NZ, and CK Infrastructure Holdings; and within the Communications sector: AT&T and Deutsche Telekom. Stocks that contributed negatively to the Infrastructure Fund’s performance included Northland Power, Osaka Gas, KDDI Corp., and Range Resources. Despite the relative performance drag from the Energy sector partially offsetting the positive contribution from the Utilities sector, we continue to believe that our combined approach of differentiated stock selection and portfolio construction, whereby the Infrastructure Fund is diversified across regions and developed countries as well as balanced across Telecommunication, Utilities, Energy, Transportation, and Social Infrastructure industries, is the most favorable for investors seeking to feature listed infrastructure investments as part of an overall balanced portfolio seeking capital appreciation and income.
Market Review & Outlook
Each generation of investors thinks of its experiences in the stock market as unique, but that is true only with respect to the names of the companies and high-profile individuals involved. However, the story is nearly always the same: recurring booms and busts, excessive optimism followed by pessimism, money made, and money lost. The market is always about the rhythm of ups and downs. At the extremes, many well-credentialed otherwise intelligent people come to believe that the good times, or bad times, will never end. This said, simply accepting this as inevitable in markets provides no magic wand to investment success. If market cycles were the same each time in duration and magnitude, everyone would know what to do, and when. Nobody rings a bell to say, “it’s over.” All investors can do is weigh the fundamental evidence and attempt to identify the best stocks and portfolio composition to produce a desired return within acceptable parameters of risk.
Regardless of exactly where the current market cycle is and its relationship to the underlying business cycle, company management and investors must address how much of a company’s ability to create shareholder wealth will be driven by both company-specific decisions as well as sector and/or economic influences. To repeat ourselves from our prior shareholder letter (please see Centre Funds’ Annual Report dated September 30, 2022 (the “Report”)), idiosyncratic risk refers to inherent risks exclusive to a company while systematic risks refer to broader trends that could impact the overall market or sector. In that Report, we addressed our outlook through the lens of the three principal effects: 1) systematic or pervasive market risk that impacts all stocks, 2) a residual return effect due to systematic non-market influences, principally sector and industry driven, and 3) idiosyncratic or the company specific return effect of real investment decisions made by the firm’s management. At the time of that Report, we felt that rising interest rates as well as further risk aversion by investors would limit gains from market risk; the large opportunities that previously existed at the sector and industry level, i.e., energy and other natural resources, had mostly run their course as stock prices had narrowed the gap to the improvement in fundamentals; and that idiosyncratic or company specific risk would be the most fruitful avenue for delivering positive returns. While maintaining that opportunities still remain largely idiosyncratic, in this current Outlook we’d like to attempt to reconcile the aggregate information that we’re assembling in our mosaic from bottom-up research to determine if a more pervasive thematic tilt, e.g., cyclical or secular growth, or defensive, etc., will have persistence, and determine the opportunity, if any, from what we believe is the consensus top-down view as observed in the market’s current orientation, which still favors secular growth mainly in the largest companies within the Technology and Communication Services sectors.
Unexpected, counterintuitive, contradictory, antithesis, converse, antonym, paradox, are just some words that mean the opposite of what one would expect and that we feel are most appropriate to describe the consensus environment today when companies and industries are routinely and dogmatically grouped as either cyclical or secular growth based on a very short recent historical time horizon. In investing, the profit opportunity from cyclical stocks is likely to follow with the fluctuations in the wider economy and, notably, the build-up of excess capacity, organically or through overpriced mergers and acquisitions, just prior to economic contraction is the most probable cause of the boom-and-bust cycle. Defensive growth refers to businesses with a low correlation to the business cycle and one that is likely to provide a product or service, even during a recession or economic downturn with time endurance. Coca-Cola or your local funeral parlor being examples. Secular growth and defensive growth are sometimes used interchangeably but, in our opinion, are quite different in that secular growth exhibits a high initial growth period, independent of the business cycle due to technological differentiation, but which is followed by slow growth or, in many cases, irrelevance, as the innovative uniqueness and appeal is fleeting; Polaroid, America Online (AOL), or even Apple prior to its resurgence under Steve Jobs from near bankruptcy in 1997. Why this differentiation, particularly between cyclical and secular, is important is that having managed equity funds since the early 1990s, including the post dot.com bubble era and housing and commodity booms leading up to the global financial crisis (GFC)6, experience has imparted on us that the most wealth destruction to investors occurs when a trend that is relied upon as being secular, leading to excessive future earnings expectations and current valuation, inflects negatively due to cyclical pressures.
| 4 | Disclosure: Past performance does not guarantee future results. |
| 6 | The 2008 financial crisis, or Global Financial Crisis (GFC). |
| Centre Funds | Shareholder Letter |
March 31, 2023 (Unaudited)
As we have articulated in many of our prior communications, the unwinding of the unprecedented misallocation of capital investment over the past decade away from real durable assets and towards intangible asset only companies with, in most cases, ridiculously excessive valuations, very high replacement risk from substitution, and negligible societal benefit, still has significant persistence and the recent shift away from certain investment themes, namely so-called disruptive technologies, will not be transitory. We repeat this because it’s our belief that what most investors rely upon as being secular in nature may be intensely prone to cyclical pressures unmasking their so-called secular insulation from the economic cycle and, on the contrary, certain companies and industries that have historically been relied upon as cyclical will be prime beneficiaries of a persistent secular influence due to lack of investment over the past decade and continuing constrained supply (e.g., energy distribution, agriculture). Furthermore, investors sometimes banter about and conflate “growth-companies” with secular and “value-companies” with cyclical. In contrast, through the lens of economic profit or EVA7, a real growth company means a company that is focused on maximizing economic profit and shareholder value through capital investment while a real value company is a firm that is efficiently restructuring – or de-investing out of – a negative economic profit situation in an effort to boost ongoing and future economic profit leading to shareholder wealth creation8. So, rather than accept the conventional boom-and-bust cycle, we attempt to understand the relationship between changes and persistence in generating economic profit to the level of capital investment and distinguish between good or misguided capital growth.
In technology, the notable secular growth trends continuing to be highly valued by the stock market are driven by digital transformation, cloud computing, cybersecurity, automation, and, most importantly, artificial intelligence/machine learning. These represent a continuation and, in some cases, an acceleration of dominant themes from 2020 and 2021 when COVID-related disruptions impacted demand and go-to-market motions for some areas of the sector. Despite the hype of these themes and much like in the year 2000 however, a substantial part of the profits for the largest technology companies comes from advertising; about 80 to 90% of Alphabet and Meta’s total revenue come from digital advertising9 and the vast majority of aggregate advertising revenue, or around 68% to be precise, has ended up going to the Big Four tech companies; Apple, Alphabet, Amazon, and Meta10. For decades, a decline in local print advertising was an early warning sign of an upcoming recession. Digital advertising is cyclical, like all advertising, and from a relatively low penetration a decade ago, digital advertising today serves as the primary platform for most companies’ marketing activity. When marketing budgets come under pressure in a stressed economy as we expect, the secular shift to digital advertising may be overwhelmed by the cyclical pressures on advertising budget cutbacks as a whole which is why we’ve cautioned investors that this current economic slowdown period is not 2020-1. Back then (please see Centre Funds’ Semi-Annual Report dated March 31, 2021) we warned of the speculative fever encompassing certain segments of the stock market, cryptocurrencies, nonfungible tokens or NFTs, meme stocks, celebrity led special purpose acquisition companies (SPACs), etc., was parallel, if not worse, than the very end of the dot-com era twenty years ago and estimated that the loss of paper wealth would be multiples of the prior episode as people realized that there was literally zero substance to most of these speculative assets which represented nothing more than a high-tech version of alchemy. This has largely played out as the Adviser expected as so-called profitless technology stocks have crashed. On the other hand, we remarked that if the FAANGs11 could truly demonstrate earnings resilience during the brief recession in 2020, we believed that these leadership stocks would get re-rated even higher and to unprecedented valuation levels given record low interest rates and lack of growth elsewhere. Frankly, not having adequate ownership of the FAANGs within a portfolio nearly guaranteed underperformance against broad market indexes back then. Similarly, for the first quarter of 2023, the group is being perceived now as a safe haven and beneficiary of falling long-term interest rates. The FAANGs continue to represent a historically large and significant part of the S&P 500 Index thus leaving investors with a challenge on whether to underweight or simply exclude these companies from a large capitalization focused portfolio. But, unlike 2020, we see the decision around these stocks as asymmetrical with little advantage to significantly overweighting the FAANGs now, despite their pullback in price in 2022 and price momentum thus far in 2023, as their underlying bottom-up fundamentals are plateauing and lacking the sales growth, profit margin expansion, and asset efficiency gains from operating leverage demonstrated in 2020 while potentially facing the first genuine digital advertising and marketing slowdown as well as the Big Four tech companies facing new online advertising pressure from ByteDance Ltd.’s TikTok and others.
One of the remarkable issues today is the inability to reconcile the top-down indicators to bottom-up research. Top-down indicators used by economists and strategists such as the slope of the yield curve, manufacturing surveys such as the ISM Index12, pace of Federal Reserve interest rate hikes, etc. strongly point to a relatively sharp recession, akin to 2001 or 2008-9. However, when we aggregate our bottom-up research, we see that EVA Fundamentals have been moving sideways through 2023, as EVA Margin (profitability and asset efficiency), although having contracted somewhat, remains historically elevated, mainly through cost cutting and improved pricing, and has offset the deterioration in sales growth and the unfavorable move higher in the cost of capital from rising interest rates. Thus, our bottom-up aggregation of information indicates a soft landing or even a shallow rolling slowdown instead of a deeper and long economic and credit crunch contraction akin to 2001 or 2008-9. This difference is quite important in that a recession is pronounced, pervasive, and spread across nearly all industries and the country as a whole, and no bear market has ever bottomed before a recession. Translating this to portfolio construction, in order to benefit from a thematic tilt, e.g., cyclical or secular growth, defensive, etc., one needs to reconcile the following: 1) is a shift to cyclicals warranted on the basis that a recession is shallow or actually avoided, 2) if a recession unfolds, will the so-called secular large cap technology stocks provide fundamental resilience, and 3) will recession be sufficiently drawn out so that secular growth companies are not immune so that investors revert to the traditional havens of defensive companies.
| 7 | Economic Value Added (EVA) is an estimate of a company’s economic profit. Economic profit, which refers to the profit earned by a company minus the cost of financing the company’s capital, is an amount that may be considered in the assessment of a company’s overall value. |
| 8 | Focus on Value: A Corporate and Investor Guide to Wealth Creation, Book by James A. Abate and James L. Grant, originally published: October 25, 2001. |
| 10 | Source: DIGITALINFORMATIONWORLD |
| 11 | “FAANG” is an acronym that refers to the stocks of five prominent American technology companies: Facebook, Amazon, Apple, Netflix, and Alphabet (formerly known as Google). Microsoft, Tesla, and Nvidia are also frequently included in the reference. |
| 12 | The ISM manufacturing index, also known as the purchasing managers' index (PMI), is a monthly indicator of U.S. economic activity based on a survey of purchasing managers at more than 300 manufacturing firms. It is considered to be a key indicator of the state of the U.S. economy. |
| Semi-Annual Report | March 31, 2023 | 3 |
| Centre Funds | Shareholder Letter |
March 31, 2023 (Unaudited)
As noted, EVA Margin (profitability and asset efficiency) remains historically elevated and, when dissecting the individual components, the key risk we see to equity prices in general is further profit margin erosion which offsets the benefits from higher asset turnover (efficiency). For the first quarter of 2023 alone, S&P 500 aggregate profit margins are expected to contract approximately ten percent. Pressure from labor cost increases, rising faster than at any point in the past thirty years, and persistent inflation in other inputs will likely keep the trend stable at best. Additionally, unlike the post-recessionary period of 2009, layoffs and restructurings now will only slow what are historically excessive profit margins from collapsing further and not provide a positive inflection higher for most companies any time soon (EBIT13 margins for S&P 500 companies expanded by 16% and 33% in 2009 and 2010, respectively). This stresses the importance today of identifying companies with a “margin of safety” whose profit margins are depressed relative to history due to COVID or lingering supply chain issues but now accelerating higher. The key for the direction of profit margins going forward will be sales growth enabling economies of operating scale but, as we’ve remarked in the past, never underestimate how well most American companies are managed in the face of adverse economic circumstances if they should linger or move decisively worse. While cheap energy and cheap labor were commonplace over the past decade, which led to a sense of complacency for many companies and consumers, we’re seeing increased signs of action by underlying companies to address the new environment. In terms of downside risks, if profit margins continue to fall, rather than reverse higher as expected by most sell-side analysts next year, the denominator in valuation ratios such as price-to-earnings could decline substantially, revealing that equity valuations are not reasonable relative to history but actually expensive, further weakening the case for systematic risk or beta.
“We wanted flying cars, instead we got 140 characters” – Peter Thiel, co-founder of PayPal and Palantir Technologies. Few quotes (in reference to Twitter) capture the essence of certain technological improvements and whether or not they make our lives better somehow. While we nearly always try to address and reconcile top-down observations from assembling and aggregating bottom-up information gleaned from our companies’ research, one data point that we do examine in-depth due to its long-term secular impact is the decline in productivity despite the massive investment in so-called transformative technologies, namely app-based companies, social media, ecommerce, cloud computing, and software as a service. Our preferred metric is total factor productivity (TFP) for the U.S. business sector as TFP is often considered the primary contributor to GDP growth rate with factors including labor inputs, human capital, and physical capital to determine a measure of productive efficiency (the efficiency with which both capital and labor are used). Quite simply, are the visions of endless technological advances actually contributing to higher productivity which, in turn, has a long-term relationship with prosperity and shareholder wealth creation? There have been many new eras in the past century plus – from railroads, through the development of the automobile, radio, telephone, and national electrification. Are today’s technological advances contributing to an increase in real earnings growth which forms the basis of stock price and valuation multiple expansion? While markets and corporations have been focused on labor productivity, and that productivity measure accelerated after the dot.com investment period as well as the post-GFC, it has collapsed into negative figures since the COVID lockdowns and has yet to recover. When looking at TFP, it has fallen equally drastically without recovering potentially indicating that, despite the trend of (mostly intangible) capital investment deepening (the amount of capital employed per worker), worker productivity is dismal and, thus, the return on investment for much of this era’s adopted technology advances is negative and investors relying upon secular growth trends continuing to be highly valued by the stock market will eventually be disappointed.
Centre continues to believe that now is one of the more challenging market outlooks during our careers as we see limited upside from market participation driven by a valuation re-rating should interest rates move lower, with the potential of a significant drawdown if an earnings recession takes hold. Despite the current challenges, we believe stock picking opportunities exist and, when deemed tactically advantageous, we will continue to complement underlying equity securities with hedges and other capital preservation strategies in order to further dampen the negative impact from downside beta. In the Equity Fund, we continue to emphasize more idiosyncratic risk-oriented companies that are less influenced by a pervasive market effect in the Health Care and Consumer Staples sectors. Within cyclical segments, the Equity Fund is focused on special situation stocks in the Industrials sector and Oil & Gas Transportation and Agricultural Chemicals industries. In sum, the Equity Fund’s portfolio is designed to be relatively defensive thematically in an environment of a shallow but lingering economic slowdown with falling but persistently higher inflation (than the Federal Reserve’s two percent target) in the U.S. In the Infrastructure Fund, diversification across regions and developed countries as well as being balanced across the Telecommunication, Utilities, Energy, Transportation, and Social Infrastructure sectors should aid in returns and risk management. Centre believes its disciplined high-conviction approach to stock selection, with a cognizance of risk management, seems positioned to perform well relative to less risk aware and less historically appreciative strategies.
| 13 | EBIT (earnings before interest and taxes) is a company's net income before income tax expense and interest expenses are deducted. |
| Centre Funds | Shareholder Letter |
March 31, 2023 (Unaudited)
Sincerely,
James Abate
President, Centre Funds
Definitions and References
| 1. | A valuation multiple measures some aspect of a company’s financial well-being, determined by dividing one metric by another metric. |
| 2. | Diversification is a risk management strategy that mixes a wide variety of investments within a portfolio. A diversified portfolio contains a mix of distinct asset types and investment vehicles in an attempt at limiting exposure to any single asset or risk. |
| 3. | Macroeconomics is a branch of economics that studies how an overall economy—the markets, businesses, consumers, and governments—behave. Macroeconomics examines economy-wide phenomena such as inflation, price levels, rate of economic growth, national income, gross domestic product (GDP), and changes in unemployment. |
| 4. | Bottom-up investing is an investment approach that focuses on analyzing individual stocks and de-emphasizes the significance of macroeconomic and market cycles. In other words, bottom-up investing typically involves focusing on a specific company’s fundamentals, such as revenue or earnings, versus the industry or the overall economy. |
| 5. | Top-down investing is an investment analysis approach that focuses on the macro factors of the economy, such as GDP, employment, taxation, interest rates, etc. before examining micro factors such as specific sectors or companies. |
| 6. | Value investing is an investment strategy that involves picking stocks that appear to be trading for less than their intrinsic or book value. |
| 7. | Growth investing is an investment style and strategy that is focused on increasing an investor’s capital. Growth investors typically invest in growth stocks—that is, young or small companies whose earnings are expected to increase at an above-average rate compared to their industry sector or the overall market. |
| 8. | The price-to-earnings ratio is the ratio for valuing a company that measures its current share price relative to its earnings per share (EPS). The price-to-earnings ratio is also sometimes known as the price multiple or the earnings multiple. |
| 9. | The S&P 500 is an index of 500 stocks seen as a leading indicator of U.S. equities and a reflection of the performance of the large cap universe, made up of companies selected by economists. |
| 10. | The Nasdaq 100 is a stock market index made up of 101 equity securities issued by 100 of the largest non-financial companies listed on the Nasdaq stock market. It is a modified capitalization-weighted index. |
| 11. | The S&P Global Infrastructure Net Total Return Index is designed to track performance of the stocks of large infrastructure companies in developed or emerging markets that must be domiciled in developed markets, or whose stocks are listed on developed market exchanges around the world. The Index includes companies involved in utilities, energy, and transportation infrastructure, such as the management or ownership of oil and gas storage and transportation; airport services; highways and rail tracks; marine ports and services; and electric, gas and water utilities. |
| 12. | A risk premium is the return in excess of the risk-free rate of return an investment is expected to yield; an asset’s risk premium is a form of compensation for investors who tolerate the extra risk, compared to that of a risk-free asset, in a given investment. |
| 13. | The risk-free rate of return is the theoretical rate of return of an investment with zero risk. The risk-free rate represents the interest an investor would expect from an absolutely risk-free investment over a specified period of time. |
| 14. | Economic Value Added (EVA) is an estimate of a company’s economic profit. Economic profit, which refers to the profit earned by a company minus the cost of financing the company’s capital, is an amount that may be considered in the assessment of a company’s overall value. |
| 15. | Stagflation refers to an economy that is experiencing a simultaneous increase in inflation and stagnation of economic output. |
| 16. | The financial crisis of 2007-2008, also known as the global financial crisis, was a severe worldwide financial crisis. Excessive risk-taking by banks combined with the bursting of the United States housing bubble caused the values of securities tied to U.S. real estate to plummet, damaging financial institutions globally, culminating with the bankruptcy of Lehman Brothers on September 15, 2008, and an international banking crisis. |
| 17. | The dot.com bubble was a rapid rise in U.S. technology stock equity valuations fueled by investments in Internet-based companies during the bull market in the late 1990s. The value of equity markets grew exponentially during this period, with the technology-dominated Nasdaq index rising from under 1,000 to more than 5,000 between the years 1995 and 2000. Things started to change in 2000, and the bubble burst between 2001 and 2002 with equities entering a bear market. |
| 18. | Passive investing is an investment strategy to maximize returns by minimizing buying and selling. Index investing is one common passive investing strategy whereby investors purchase a representative benchmark, such as the S&P 500 index, and hold it over a long-time horizon. |
| 19. | A put option is a contract giving the owner the right, but not the obligation, to sell a specified amount of an underlying security at a pre-determined price within a specified time frame. This pre-determined price that buyer of the put option can sell at is called the strike price. |
| 20. | Alpha is a term used in investing to describe an investment strategy’s ability to beat the market, or its “edge”. |
| Semi-Annual Report | March 31, 2023 | 5 |
| Centre American Select Equity Fund | Portfolio Update |
March 31, 2023 (Unaudited)
SECTOR WEIGHTINGS
As a percentage of Net Assets
| Consumer Staples | 21.31% |
| Information Technology | 17.05% |
| Health Care | 15.78% |
| Energy | 13.95% |
| Materials | 7.75% |
| Industrials | 7.23% |
| Consumer Discretionary | 5.94% |
| Financials | 4.58% |
| Communication Services | 4.16% |
| Purchased Options | 0.67% |
| Cash, Cash Equivalents, and Other | 1.58% |
| Totals | 100.00% |
These allocations may not reflect the current or future positions of the portfolio.
GROWTH OF HYPOTHETICAL $10,000 INVESTMENT THROUGH MARCH 31, 2023
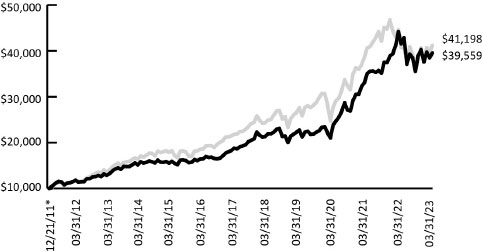
This graph assumes an initial investment of $10,000 at December 21, 2011, the inception date for Investor Class shares, which have the longest period of annual returns, and that any dividends and distributions are reinvested. This graph depicts the performance of the Fund's Investor Class versus the S&P 500® Total Return Index. Taxes on Fund distributions or when shares are redeemed, if any, are not reflected. Unlike the Fund, an index is not available for investment, is unmanaged and does not have expenses that affect the results. The comparison is shown for illustrative purposes only.
The line graph above shows the performance of Investor Class shares only, since the Investor Class has the longest period of annual returns. The performance of the Institutional Class shares will differ from the performance shown because the Institutional Class shares have different expenses than the Investor Class shares.
TOTAL RETURNS – FOR THE PERIOD ENDED MARCH 31, 2023
| | 1 Month | 6 Month | YTD | 1 Year | 3 Year Average Annualized | 5 Year Average Annualized | 10 Year Average Annualized | Since Inception* Average Annualized |
| Centre American Select Equity Fund – Investor Class | 2.70% | 11.25% | 5.23% | -10.50% | 23.48% | 13.26% | 12.21% | 12.97% |
| S&P 500® Total Return Index | 3.67% | 15.63% | 7.50% | -7.73% | 18.60% | 11.19% | 12.24% | 13.38% |
| Centre American Select Equity Fund – Institutional Class | 2.70% | 11.41% | 5.24% | -10.19% | 24.03% | 13.81% | N/A | 11.77% |
| S&P 500® Total Return Index | 3.67% | 15.63% | 7.50% | -7.73% | 18.60% | 11.19% | N/A | 11.22% |
| * | Inception date of December 21, 2011 for Investor Class. Inception date of January 21, 2014 for Institutional Class. |
The performance information quoted above represents past performance, which is not a guarantee of future results, and does not reflect the deduction of taxes that a shareholder would pay on Fund distributions or the redemption of Fund shares. Investment return and principal value of an investment will fluctuate so that an investor’s shares, when redeemed, may be worth more or less than their original cost. Total return includes reinvestment of dividends and capital gains, if any. Current performance may be lower or higher than the performance data quoted. For the most current month-end performance data, please call 855-298-4236.
The investment adviser to the Fund, Centre Asset Management, LLC (the “Adviser” or “Centre”), has contractually agreed to reduce its advisory fees and/or reimburse other expenses of the Fund for not less than one year and until the next following effective date of the post-effective amendment to the registration statement of Centre Funds relating to the Fund (on or about January 29, 2024) to the extent necessary to limit the total operating expenses of the Fund including (but not limited to) investment advisory fees of the Adviser, but excluding, as applicable, any front-end or contingent deferred sales loads, taxes, leverage interest, distribution/service (Rule 12b-1) fees, shareholder services fees, brokerage commissions, acquired fund fees and expenses, expenses incurred in connection with any merger or reorganization, and extraordinary expenses (such as litigation and other expenses not incurred in the ordinary course of the Fund's business) to an annual rate of 1.10% of the average daily net assets of the Investor Class shares and 0.90% of the average daily net assets of the Institutional Class shares (the “Expense Limitation Agreement”). The Expense Limitation Agreement may be terminated at any time, and without payment of any penalty, by the Board of Trustees of the Trust (the “Board”), on behalf of the Fund, upon 60 days' written notice to the Adviser, but may not be terminated by the Adviser without the consent of the Board. No recoupment will be made more than three years after the date that the applicable amount was initially waived or reimbursed by the Adviser, and the recoupment may not cause the Fund to exceed the then-existing expense limitation for that class at the time such waiver or reimbursement was made.
| Centre American Select Equity Fund | Portfolio Update |
March 31, 2023 (Unaudited)
The S&P 500® Total Return Index is a commonly recognized, market-capitalization weighted index of 500 widely held securities, designed to measure broad U.S. equity performance.
You cannot invest directly in an index.
| Semi-Annual Report | March 31, 2023 | 7 |
| Centre Global Infrastructure Fund | Portfolio Update |
March 31, 2023 (Unaudited)
INDUSTRY WEIGHTINGS
As a percentage of Net Assets
| Oil, Gas & Consumable Fuels | 27.19% |
| Electric Utilities | 19.68% |
| Diversified Telecommunication Services | 19.18% |
| Wireless Telecommunication Services | 10.19% |
| Multi-Utilities | 6.75% |
| Health Care Providers & Services | 5.57% |
| Transportation Infrastructure | 3.78% |
| Gas Utilities | 3.06% |
| Machinery | 1.59% |
| Marine Transportation | 1.36% |
| Water Utilities | 0.57% |
| Diversified Telecommunications | 0.56% |
| Cash, Cash Equivalents, and Other | 0.52% |
| Totals | 100.00% |
COUNTRY WEIGHTINGS
As a percentage of Net Assets
| United States | 56.52% |
| Canada | 11.32% |
| Japan | 7.86% |
| Spain | 4.36% |
| Germany | 3.72% |
| Australia | 2.98% |
| Italy | 2.83% |
| Hong Kong | 2.78% |
| Great Britain | 2.23% |
| France | 2.03% |
| New Zealand | 1.65% |
| Switzerland | 0.64% |
| Singapore | 0.56% |
| Cash, Cash Equivalents, and Other | 0.52% |
| Totals | 100.00% |
These allocations may not reflect the current or future positions of the portfolio.
GROWTH OF HYPOTHETICAL $10,000 INVESTMENT THROUGH MARCH 31, 2023
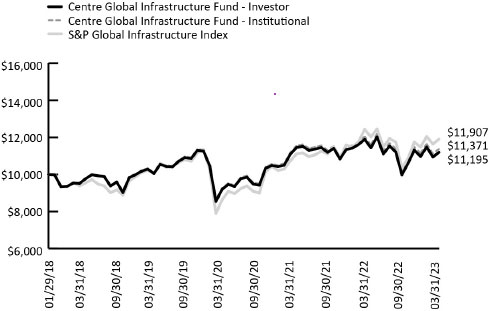
This graph assumes an initial investment of $10,000 at January 29, 2018, the Fund’s inception date, and that any dividends and distributions are reinvested. This graph depicts the performance of the Fund versus the S&P Global Infrastructure Index. Taxes on any Fund distributions or when shares are redeemed, if any, are not reflected. Unlike the Fund, an index is not available for investment, is unmanaged and does not have expenses that affect the results. The comparison is shown for illustrative purposes only.
TOTAL RETURNS – FOR THE PERIOD ENDED MARCH 31, 2023
| | 1 Month | 6 Month | YTD | 1 Year | 3 Year Average Annualized | 5 Year Average Annualized | Since Inception Average Annualized (January 29, 2018) |
| Centre Global Infrastructure Fund – Investor | 2.27% | 12.14% | 2.03% | -5.86% | 9.42% | 3.65% | 2.21% |
| Centre Global Infrastructure Fund – Institutional | 2.19% | 12.36% | 2.02% | -5.58% | 9.74% | 3.97% | 2.52% |
| S&P Global Infrastructure Index | 2.30% | 14.96% | 3.73% | -4.25% | 14.69% | 4.97% | 3.44% |
The performance information quoted above represents past performance, which is not a guarantee of future results, and does not reflect the deduction of taxes that a shareholder would pay on Fund distributions or the redemption of Fund shares. Investment return and principal value of an investment will fluctuate so that an investor’s shares, when redeemed, may be worth more or less than their original cost. Total return includes reinvestment of dividends and capital gains, if any. Current performance may be lower or higher than the performance data quoted. For the most current month-end performance data, please call 855-298-4236.
The Adviser has contractually agreed to reduce its advisory fees and/or reimburse other expenses of the Fund for an initial period of not less than one year and until the next following effective date of the post-effective amendment to the registration statement of Centre Funds relating to the Fund (on or about January 29, 2024) incorporating the Fund's financial statements for that fiscal year to the extent necessary to limit the total operating expenses of the Fund, including (but not limited to) investment advisory fees of the Adviser, but excluding, as applicable, any front-end or contingent deferred sales loads taxes, leverage interest, distribution/ service (Rule 12b-1) fees, shareholder services fees, brokerage commissions, acquired fund fees and expenses, expenses incurred in connection with any merger or reorganization, and extraordinary expenses (such as litigation and other expenses not incurred in the ordinary course of the Fund's business) to an annual rate of 1.25% of the average daily net assets of the Investor Class shares and 1.10% of the average daily net assets of the Institutional Class shares. The Expense Limitation Agreement may be terminated at any time, and without payment of any penalty, by the Board, on behalf of the Fund, upon 60 days' written notice to the Adviser, but may not be terminated by the Adviser without the consent of the Board. No recoupment will be made more than three years after the date that the applicable amount was initially waived or reimbursed by the Adviser, and the recoupment may not cause the Fund to exceed the then-existing expense limitation for that class at the time such waiver or reimbursement was made.
| Centre Global Infrastructure Fund | Portfolio Update |
March 31, 2023 (Unaudited)
The S&P Global Infrastructure Net Total Return Index is designed to track performance of the stocks of large infrastructure companies in developed or emerging markets that must be domiciled in developed markets, or whose stocks are listed on developed market exchanges around the world. The index includes companies involved in utilities, energy and transportation infrastructure, such as the management or ownership of oil and gas storage and transportation; airport services; highways and rail tracks; marine ports and services; and electric, gas and water utilities.
You cannot invest directly in an index.
| Semi-Annual Report | March 31, 2023 | 9 |
| Centre Funds | Disclosure of Fund Expenses |
March 31, 2023 (Unaudited)
The Example. As a shareholder of a series of Centre Funds (each series, a “Fund” and together, the “Funds”), you will incur two types of costs: (1) transaction costs, including any applicable redemption fees; and (2) ongoing costs, including management fees, distribution and/or service (12b-1) fees (if applicable) and other Fund expenses. The following examples are intended to help you understand your ongoing costs (in dollars) of investing in a Fund and to compare these costs with the ongoing costs of investing in other mutual funds. The examples are based on an investment of $1,000 invested on October 1, 2022 and held through March 31, 2023.
Actual Expenses. The first line under each class of the table below provides information about actual account values and actual expenses. You may use the information in this line, together with the amount you invested, to estimate the expenses that you paid over the period. Simply divide your account value by $1,000 (for example, an $8,600 account value divided by $1,000 = 8.6), then multiply the result by the number in the first line under the heading “Expenses Paid During Period 10/1/2022-3/31/2023” to estimate the expenses you paid on your account during this period.
Hypothetical Example for Comparison Purposes. The second line under each class of the table below provides information about hypothetical account values and hypothetical expenses based on each Fund’s actual expense ratio and an assumed rate of return of 5% per year before expenses, which is not the Fund’s actual return. The hypothetical account values and expenses may not be used to estimate the actual ending account balance or expenses you paid for the period. You may use this information to compare the ongoing costs of investing in a Fund and to other funds. To do so, compare this 5% hypothetical example with the 5% hypothetical examples that appear in the shareholder reports of the other funds. Please note that the expenses shown in the table are meant to highlight your ongoing costs only and do not reflect any transactional costs, such as redemption fees, if any. Therefore, the second line under each class of the table below is useful in comparing ongoing costs only, and will not help you determine the relative total costs of owning different funds. In addition, if these transactional costs were included, your costs would have been higher.
| | Beginning Account Value 10/01/2022 | Ending Account Value 03/31/2023 | Expense Ratio(a) | Expenses Paid During Period 10/1/2022-3/31/2023(b) |
| Centre American Select Equity Fund | | | | |
| Investor Class | | | | |
| Actual | $1,000.00 | $1,112.50 | 1.36% | $7.16 |
| Hypothetical (5% return before expenses) | $1,000.00 | $1,018.15 | 1.36% | $6.84 |
| Institutional Class | | | | |
| Actual | $1,000.00 | $1,114.10 | 0.98% | $5.17 |
| Hypothetical (5% return before expenses) | $1,000.00 | $1,020.04 | 0.98% | $4.94 |
| Centre Global Infrastructure Fund | | | | |
| Investor Class | | | | |
| Actual | $1,000.00 | $1,121.40 | 1.57% | $8.30 |
| Hypothetical (5% return before expenses) | $1,000.00 | $1,017.10 | 1.57% | $7.90 |
| Institutional Class | | | | |
| Actual | $1,000.00 | $1,123.60 | 1.18% | $6.25 |
| Hypothetical (5% return before expenses) | $1,000.00 | $1,019.05 | 1.18% | $5.94 |
| (a) | Annualized, based on the Fund's most recent fiscal half year expenses less any waivers/reimbursements. |
| (b) | Expenses are equal to the Fund's annualized expense ratio, multiplied by the average account value over the period, multiplied by the number of days in the most recent fiscal half year (182), divided by 365. |
| Centre American Select Equity Fund | Schedule of Investments |
March 31, 2023 (Unaudited)
| | | Shares | | | Value | |
| COMMON STOCKS (97.75%) | | | | | | | | |
| Communication Services (4.16%) | | | | | | | | |
| Interactive Media & Services (4.16%) | | | | | | | | |
| Alphabet, Inc., Class A(a) | | | 56,463 | | | $ | 5,856,907 | |
| Alphabet, Inc., Class C(a) | | | 58,124 | | | | 6,044,896 | |
| Meta Platforms, Inc., Class A(a) | | | 19,625 | | | | 4,159,322 | |
| | | | | | | | 16,061,125 | |
| Total Communication Services | | | | | | | 16,061,125 | |
| | | | | | | | | |
| Consumer Discretionary (5.94%) | | | | | | | | |
| Automobiles (1.04%) | | | | | | | | |
| Tesla, Inc.(a) | | | 19,334 | | | | 4,011,032 | |
| | | | | | | | | |
| Broadline Retail (4.05%) | | | | | | | | |
| Amazon.com, Inc.(a) | | | 78,788 | | | | 8,138,012 | |
| MercadoLibre, Inc.(a) | | | 5,692 | | | | 7,502,398 | |
| | | | | | | | 15,640,410 | |
| | | | | | | | | |
| Specialty Retail (0.85%) | | | | | | | | |
| The Home Depot, Inc. | | | 11,126 | | | | 3,283,505 | |
| | | | | | | | | |
| Total Consumer Discretionary | | | | | | | 22,934,947 | |
| | | | | | | | | |
| Consumer Staples (21.31%) | | | | | | | | |
| Beverages (5.14%) | | | | | | | | |
| Boston Beer Co., Inc., Class A(a) | | | 19,787 | | | | 6,503,987 | |
| Coca-Cola Co. | | | 42,806 | | | | 2,655,256 | |
| Molson Coors Beverage Co., Class B | | | 153,968 | | | | 7,957,066 | |
| PepsiCo, Inc. | | | 14,943 | | | | 2,724,109 | |
| | | | | | | | 19,840,418 | |
| | | | | | | | | |
| Consumer Staples Distribution & Retail (2.19%) | | | | | | | | |
| Costco Wholesale Corp. | | | 4,842 | | | | 2,405,845 | |
| Sysco Corp. | | | 78,552 | | | | 6,066,571 | |
| | | | | | | | 8,472,416 | |
| | | | | | | | | |
| Food Products (5.24%) | | | | | | | | |
| Archer-Daniels-Midland Co. | | | 74,648 | | | | 5,946,460 | |
| Campbell Soup Co. | | | 127,581 | | | | 7,014,403 | |
| Ingredion, Inc. | | | 71,444 | | | | 7,267,998 | |
| | | | | | | | 20,228,861 | |
| | | | | | | | | |
| Household Products (5.83%) | | | | | | | | |
| Clorox Co. | | | 72,835 | | | | 11,525,411 | |
| Kimberly-Clark Corp. | | | 52,691 | | | | 7,072,186 | |
| Procter & Gamble Co. | | | 26,235 | | | | 3,900,882 | |
| | | | | | | | 22,498,479 | |
| | | | | | | | | |
| Tobacco (2.91%) | | | | | | | | |
| Altria Group, Inc. | | | 251,805 | | | | 11,235,539 | |
| | | | | | | | | |
| Total Consumer Staples | | | | | | | 82,275,713 | |
| | | | | | | | | |
| Energy (13.95%) | | | | | | | | |
| Energy Equipment & Services (1.94%) | | | | | | | | |
| Schlumberger Ltd. | | | 152,675 | | | | 7,496,342 | |
| | | | | | | | | |
| Oil, Gas & Consumable Fuels (12.01%) | | | | | | | | |
| Chevron Corp. | | | 53,839 | | | | 8,784,372 | |
| Exxon Mobil Corp. | | | 129,382 | | | | 14,188,030 | |
| Kinder Morgan, Inc. | | | 342,749 | | | | 6,001,535 | |
| ONEOK, Inc. | | | 96,543 | | | | 6,134,342 | |
| Peabody Energy Corp.(a) | | | 211,130 | | | | 5,404,928 | |
| | | Shares | | | Value | |
| Energy (continued) | | | | | | | | |
| The Williams Cos., Inc. | | | 195,357 | | | $ | 5,833,360 | |
| | | | | | | | 46,346,567 | |
| Total Energy | | | | | | | 53,842,909 | |
| | | | | | | | | |
| Financials (4.58%) | | | | | | | | |
| Banks (1.08%) | | | | | | | | |
| JPMorgan Chase & Co. | | | 31,987 | | | | 4,168,226 | |
| | | | | | | | | |
| Financial Services (3.50%) | | | | | | | | |
| Berkshire Hathaway, Inc., Class B(a) | | | 19,923 | | | | 6,151,625 | |
| Mastercard, Inc., Class A | | | 9,270 | | | | 3,368,810 | |
| Visa, Inc., Class A | | | 17,728 | | | | 3,996,955 | |
| | | | | | | | 13,517,390 | |
| Total Financials | | | | | | | 17,685,616 | |
| | | | | | | | | |
| Health Care (15.78%) | | | | | | | | |
| Biotechnology (5.28%) | | | | | | | | |
| AbbVie, Inc. | | | 19,464 | | | | 3,101,978 | |
| Biogen, Inc.(a) | | | 32,753 | | | | 9,106,317 | |
| Gilead Sciences, Inc. | | | 98,417 | | | | 8,165,658 | |
| | | | | | | | 20,373,953 | |
| | | | | | | | | |
| Health Care Equipment & Supplies (5.22%) | | | | | | | | |
| Medtronic PLC | | | 134,304 | | | | 10,827,589 | |
| Zimmer Biomet Holdings, Inc. | | | 72,087 | | | | 9,313,640 | |
| | | | | | | | 20,141,229 | |
| | | | | | | | | |
| Health Care Providers & Services (1.29%) | | | | | | | | |
| UnitedHealth Group, Inc. | | | 10,574 | | | | 4,997,166 | |
| | | | | | | | | |
| Life Sciences Tools & Services (0.64%) | | | | | | | | |
| Thermo Fisher Scientific, Inc. | | | 4,282 | | | | 2,468,016 | |
| | | | | | | | | |
| Pharmaceuticals (3.35%) | | | | | | | | |
| Eli Lilly & Co. | | | 8,722 | | | | 2,995,309 | |
| Johnson & Johnson | | | 29,066 | | | | 4,505,230 | |
| Merck & Co., Inc. | | | 27,484 | | | | 2,924,023 | |
| Pfizer, Inc. | | | 62,141 | | | | 2,535,353 | |
| | | | | | | | 12,959,915 | |
| Total Health Care | | | | | | | 60,940,279 | |
| | | | | | | | | |
| Industrials (7.23%) | | | | | | | | |
| Aerospace & Defense (3.60%) | | | | | | | | |
| Hexcel Corp. | | | 104,342 | | | | 7,121,341 | |
| Spirit AeroSystems Holdings, Inc. | | | 196,283 | | | | 6,777,652 | |
| | | | | | | | 13,898,993 | |
| | | | | | | | | |
| Machinery (1.96%) | | | | | | | | |
| Flowserve Corp. | | | 222,940 | | | | 7,579,960 | |
| | | | | | | | | |
| Marine Transportation (1.67%) | | | | | | | | |
| Kirby Corp.(a) | | | 92,395 | | | | 6,439,932 | |
| | | | | | | | | |
| Total Industrials | | | | | | | 27,918,885 | |
| | | | | | | | | |
| Information Technology (17.05%) | | | | | | | | |
| Communications Equipment (2.01%) | | | | | | | | |
| Juniper Networks, Inc. | | | 225,975 | | | | 7,778,060 | |
| See Notes to Financial Statements. | |
| Semi-Annual Report | March 31, 2023 | 11 |
| Centre American Select Equity Fund | Schedule of Investments |
March 31, 2023 (Unaudited)
| | | Shares | | | Value | |
| Information Technology (continued) | | | | | | | | |
| IT Services (2.19%) | | | | | | | | |
| International Business Machines Corp. | | | 64,379 | | | $ | 8,439,443 | |
| | | | | | | | | |
| Semiconductors & Semiconductor Equipment (1.66%) | | | | | | | | |
| Broadcom, Inc. | | | 4,426 | | | | 2,839,456 | |
| NVIDIA Corp. | | | 12,904 | | | | 3,584,344 | |
| | | | | | | | 6,423,800 | |
| | | | | | | | | |
| Software (5.12%) | | | | | | | | |
| Microsoft Corp. | | | 68,501 | | | | 19,748,838 | |
| | | | | | | | | |
| Technology Hardware, Storage & Peripherals (6.07%) | | | | | | | | |
| Apple, Inc. | | | 142,104 | | | | 23,432,950 | |
| | | | | | | | | |
| Total Information Technology | | | | | | | 65,823,091 | |
| | | | | | | | | |
| Materials (7.75%) | | | | | | | | |
| Chemicals (3.86%) | | | | | | | | |
| Corteva, Inc. | | | 148,031 | | | | 8,927,750 | |
| FMC Corp. | | | 48,984 | | | | 5,982,416 | |
| | | | | | | | 14,910,166 | |
| | | | | | | | | |
| Metals & Mining (3.89%) | | | | | | | | |
| Agnico Eagle Mines, Ltd. | | | 122,101 | | | | 6,223,488 | |
| Allegheny Technologies, Inc.(a) | | | 222,857 | | | | 8,793,937 | |
| | | | | | | | 15,017,425 | |
| Total Materials | | | | | | | 29,927,591 | |
| | | | | | | | | |
| TOTAL COMMON STOCKS | | | | | | | | |
| (Cost $313,725,556) | | | | | | | 377,410,156 | |
| Expiration Date | | Exercise Price | | | Contracts | | | Notional Value | | | Value | |
| PURCHASED OPTIONS (0.67%) | | | | | | | | | | | | | | | | |
| Puts | | | | | | | | | | | | | | | | |
| S&P 500® Index: | | | | | | | | | | | | | | | | |
| 9/15/2023 | | $ | 3,200 | | | | 884 | | | $ | 363,263,004 | | | | 2,585,700 | |
| | | | | | | | | | | | | | | | | |
| Total Puts | | | | | | | | | | | | | | | 2,585,700 | |
| | | | | | | | | | | | | | | | | |
| TOTAL PURCHASED OPTIONS | | | | | | | | | | | | | | | | |
| (Cost $3,844,619) | | | | | | | | | | | | | | | 2,585,700 | |
| | | 7-Day Yield | | | Shares | | | Value | |
| SHORT TERM INVESTMENTS (1.49%) | | | | | | | | | | | | |
| Money Market Fund (1.49%) | | | | | | | | | | | | |
| First American Treasury Obligation | | | 4.430 | % | | | 5,734,311 | | | | 5,734,311 | |
| | | | | | | | | | | | | |
| TOTAL SHORT TERM INVESTMENTS | | | | | | | | | | | | |
| (Cost $5,734,311) | | | | | | | | | | | 5,734,311 | |
| | | | | | | | | | | | | |
| TOTAL INVESTMENTS (99.91%) | | | | | | | | | | | | |
| (Cost $323,304,486) | | | | | | | | | | $ | 385,730,167 | |
| Other Assets In Excess Of Liabilities (0.09%)(b) | | | | | | | | | | | 358,584 | |
| NET ASSETS (100.00%) | | | | | | | | | | $ | 386,088,751 | |
| (a) | Non-income producing security. |
| (b) | See Statements of Assets and Liabilities |
| See Notes to Financial Statements. |
| Centre Global Infrastructure Fund | Schedule of Investments |
| | March 31, 2023 (Unaudited) |
| | | Shares | | | Value | |
| COMMON STOCKS (99.48%) | | | | | | | | |
| ASIA (15.83%) | | | | | | | | |
| Australia (2.98%) | | | | | | | | |
| Health Care Providers & Services (0.61%) | | | | | | | | |
| Ramsay Health Care, Ltd. | | | 4,446 | | | $ | 197,752 | |
| | | | | | | | | |
| Transportation Infrastructure (2.37%) | | | | | | | | |
| Transurban Group | | | 81,440 | | | | 773,571 | |
| | | | | | | | | |
| Total Australia | | | | | | | 971,323 | |
| | | | | | | | | |
| Hong Kong (2.78%) | | | | | | | | |
| Electric Utilities (1.25%) | | | | | | | | |
| CK Infrastructure Holdings, Ltd. | | | 75,000 | | | | 407,967 | |
| | | | | | | | | |
| Gas Utilities (1.53%) | | | | | | | | |
| Kunlun Energy Co., Ltd. | | | 640,000 | | | | 500,592 | |
| | | | | | | | | |
| Total Hong Kong | | | | | | | 908,559 | |
| | | | | | | | | |
| Japan (7.86%) | | | | | | | | |
| Diversified Telecommunication Services (1.39%) | | | | | | | | |
| Nippon Telegraph & Telephone Corp. | | | 15,200 | | | | 453,567 | |
| | | | | | | | | |
| Gas Utilities (1.53%) | | | | | | | | |
| Tokyo Gas Co., Ltd. | | | 26,600 | | | | 500,046 | |
| | | | | | | | | |
| Wireless Telecommunication Services (4.94%) | | | | | | | | |
| KDDI Corp. | | | 20,800 | | | | 641,193 | |
| SoftBank Corp. | | | 34,600 | | | | 398,444 | |
| SoftBank Group Corp. | | | 14,700 | | | | 573,718 | |
| | | | | | | | 1,613,355 | |
| Total Japan | | | | | | | 2,566,968 | |
| | | | | | | | | |
| New Zealand (1.65%) | | | | | | | | |
| Electric Utilities (1.65%) | | | | | | | | |
| Mercury NZ, Ltd. | | | 136,731 | | | | 539,493 | |
| | | | | | | | | |
| Total New Zealand | | | | | | | 539,493 | |
| | | | | | | | | |
| Singapore (0.56%) | | | | | | | | |
| Diversified Telecommunications (0.56%) | | | | | | | | |
| Singapore Telecommunications, Ltd. | | | 99,400 | | | | 183,742 | |
| | | | | | | | | |
| Total Singapore | | | | | | | 183,742 | |
| | | | | | | | | |
| TOTAL ASIA | | | | | | | | |
| (Cost $5,155,413) | | | | | | | 5,170,085 | |
| | | | | | | | | |
| EUROPE (15.81%) | | | | | | | | |
| France (2.03%) | | | | | | | | |
| Diversified Telecommunication Services (0.89%) | | | | | | | | |
| Orange SA | | | 24,449 | | | | 290,393 | |
| | | | | | | | | |
| Multi-Utilities (0.66%) | | | | | | | | |
| Engie SA | | | 13,635 | | | | 215,509 | |
| | | Shares | | | Value | |
| Transportation Infrastructure (0.48%) | | | | | | | | |
| Getlink SE | | | 9,528 | | | $ | 156,960 | |
| | | | | | | | | |
| Total France | | | | | | | 662,862 | |
| | | | | | | | | |
| Germany (3.72%) | | | | | | | | |
| Diversified Telecommunication Services (3.08%) | | | | | | | | |
| Deutsche Telekom AG | | | 41,457 | | | | 1,004,863 | |
| | | | | | | | | |
| Multi-Utilities (0.64%) | | | | | | | | |
| E.ON SE | | | 16,712 | | | | 208,429 | |
| | | | | | | | | |
| Total Germany | | | | | | | 1,213,292 | |
| | | | | | | | | |
| Great Britain (2.23%) | | | | | | | | |
| Multi-Utilities (1.06%) | | | | | | | | |
| National Grid PLC | | | 25,528 | | | | 345,301 | |
| | | | | | | | | |
| Wireless Telecommunication Services (1.17%) | | | | | | | | |
| Vodafone Group PLC | | | 346,043 | | | | 381,200 | |
| | | | | | | | | |
| Total Great Britain | | | | | | | 726,501 | |
| | | | | | | | | |
| Italy (2.83%) | | | | | | | | |
| Electric Utilities (2.83%) | | | | | | | | |
| Enel SpA | | | 151,656 | | | | 925,482 | |
| | | | | | | | | |
| Total Italy | | | | | | | 925,482 | |
| | | | | | | | | |
| Spain (4.36%) | | | | | | | | |
| Diversified Telecommunication Services (1.65%) | | | | | | | | |
| Cellnex Telecom SA(a)(b) | | | 7,028 | | | | 272,559 | |
| Telefonica SA | | | 61,801 | | | | 266,284 | |
| | | | | | | | 538,843 | |
| Electric Utilities (1.79%) | | | | | | | | |
| Iberdrola SA | | | 46,814 | | | | 583,094 | |
| | | | | | | | | |
| Transportation Infrastructure (0.92%) | | | | | | | | |
| Aena SME SA(a)(b) | | | 1,871 | | | | 302,134 | |
| | | | | | | | | |
| Total Spain | | | | | | | 1,424,071 | |
| | | | | | | | | |
| Switzerland (0.64%) | | | | | | | | |
| Diversified Telecommunication Services (0.64%) | | | | | | | | |
| Swisscom AG | | | 329 | | | | 209,709 | |
| | | | | | | | | |
| Total Switzerland | | | | | | | 209,709 | |
| | | | | | | | | |
| TOTAL EUROPE | | | | | | | | |
| (Cost $4,620,079) | | | | | | | 5,161,917 | |
| | | | | | | | | |
| NORTH AMERICA (67.84%) | | | | | | | | |
| Canada (11.32%) | | | | | | | | |
| Oil, Gas & Consumable Fuels (10.76%) | | | | | | | | |
| Enbridge, Inc. | | | 51,952 | | | | 1,980,826 | |
| Pembina Pipeline Corp. | | | 15,348 | | | | 497,178 | |
| TC Energy Corp. | | | 26,598 | | | | 1,034,596 | |
| | | | | | | | 3,512,600 | |
See Notes to Financial Statements.
| Semi-Annual Report | March 31, 2023 | 13 |
| Centre Global Infrastructure Fund | Schedule of Investments |
March 31, 2023 (Unaudited)
| | | Shares | | | Value | |
| Wireless Telecommunication Services (0.56%) | | | | | | | | |
| Rogers Communications, Inc., Class B | | | 3,986 | | | $ | 184,745 | |
| | | | | | | | | |
| Total Canada | | | | | | | 3,697,345 | |
| | | | | | | | | |
| United States (56.52%) | | | | | | | | |
| Diversified Telecommunication Services (11.53%) | | | | | | | | |
| AT&T, Inc. | | | 89,552 | | | | 1,723,876 | |
| Verizon Communications, Inc. | | | 52,469 | | | | 2,040,519 | |
| | | | | | | | 3,764,395 | |
| Electric Utilities (12.16%) | | | | | | | | |
| American Electric Power Co., Inc. | | | 3,825 | | | | 348,037 | |
| Constellation Energy Corp. | | | 2,272 | | | | 178,352 | |
| Duke Energy Corp. | | | 5,874 | | | | 566,665 | |
| Edison International | | | 2,497 | | | | 176,263 | |
| Eversource Energy | | | 2,599 | | | | 203,398 | |
| Exelon Corp. | | | 7,357 | | | | 308,185 | |
| NextEra Energy, Inc. | | | 15,248 | | | | 1,175,316 | |
| PG&E Corp.(c) | | | 11,247 | | | | 181,864 | |
| The Southern Co. | | | 8,010 | | | | 557,336 | |
| Xcel Energy, Inc. | | | 4,081 | | | | 275,222 | |
| | | | | | | | 3,970,638 | |
| Health Care Providers & Services (4.97%) | | | | | | | | |
| HCA Healthcare, Inc. | | | 5,386 | | | | 1,420,180 | |
| Universal Health Services, Inc., Class B | | | 1,589 | | | | 201,962 | |
| | | | | | | | 1,622,142 | |
| Machinery (1.58%) | | | | | | | | |
| Flowserve Corp. | | | 15,228 | | | | 517,752 | |
| | | | | | | | | |
| Marine Transportation (1.36%) | | | | | | | | |
| Kirby Corp.(c) | | | 6,381 | | | | 444,756 | |
| | | | | | | | | |
| Multi-Utilities (4.40%) | | | | | | | | |
| Consolidated Edison, Inc. | | | 2,620 | | | | 250,655 | |
| Dominion Energy, Inc. | | | 6,212 | | | | 347,313 | |
| Public Service Enterprise Group, Inc. | | | 3,862 | | | | 241,182 | |
| Sempra Energy | | | 2,478 | | | | 374,575 | |
| WEC Energy Group, Inc. | | | 2,346 | | | | 222,377 | |
| | | | | | | | 1,436,102 | |
| Oil, Gas & Consumable Fuels (16.44%) | | | | | | | | |
| Cheniere Energy, Inc. | | | 5,927 | | | | 934,095 | |
| Kinder Morgan, Inc. | | | 72,920 | | | | 1,276,829 | |
| ONEOK, Inc. | | | 16,574 | | | | 1,053,112 | |
| Peabody Energy Corp.(c) | | | 17,767 | | | | 454,835 | |
| Targa Resources Corp. | | | 5,459 | | | | 398,234 | |
| The Williams Cos., Inc. | | | 41,881 | | | | 1,250,567 | |
| | | | | | | | 5,367,672 | |
| Water Utilities (0.57%) | | | | | | | | |
| American Water Works Co., Inc. | | | 1,264 | | | | 185,163 | |
| | | | | | | | | |
| Wireless Telecommunication Services (3.51%) | | | | | | | | |
| T-Mobile US, Inc.(c) | | | 7,916 | | | | 1,146,554 | |
| | | | | | | | | |
| Total United States | | | | | | | 18,455,174 | |
| | | | | | | | | |
| TOTAL NORTH AMERICA | | | | | | | | |
| (Cost $19,225,210) | | | | | | | 22,152,519 | |
| | | | | | Shares | | | Value | |
| | | | | | | | | | |
| TOTAL COMMON STOCKS | | | | | | | | | | | | |
| (Cost $29,000,702) | | | | | | | | | | | 32,484,521 | |
| | | | 7-Day Yield | | | | Shares | | | | Value | |
| SHORT TERM INVESTMENTS (0.27%) | | | | | | | | | | | | |
| Money Market Fund (0.27%) | | | | | | | | | | | | |
| First American Treasury Obligation | | | 4.430 | % | | | 87,931 | | | $ | 87,931 | |
| | | | | | | | | | | | | |
| TOTAL SHORT TERM INVESTMENTS | | | | | | | | | | | | |
| (Cost $87,931) | | | | | | | | | | | 87,931 | |
| | | | | | | | | | | | Value | |
| TOTAL INVESTMENTS (99.75%) | | | | | | | | | | | | |
| (Cost $29,088,633) | | | | | | | | | | $ | 32,572,452 | |
| Other Assets In Excess Of Liabilities (0.25%)(d) | | | | | | | | | | | 80,859 | |
| NET ASSETS (100.00%) | | | | | | | | | | $ | 32,653,311 | |
| (a) | Security was purchased pursuant to Rule 144A under the Securities Act of 1933 and may be resold in transactions exempt from registration only to qualified institutional buyers. As of March 31, 2023, these securities had a total aggregate market value of $574,693, representing 1.76% of net assets. |
| (b) | Securities were purchased pursuant to Regulation S under the Securities Act of 1933, which exempts securities offered and sold outside the United States from registration. Such securities cannot be sold in the United States without either an effective registration statement filed pursuant to Securities Act of 1933, or pursuant to an exemption from registration. These securities have been deemed liquid under guidelines approved by the Fund's Board of Trustees. At period end, the aggregate market value of those securities was $574,693, representing 1.76% of net assets. |
| (c) | Non-income producing security. |
| (d) | See Statements of Assets and Liabilities |
| See Notes to Financial Statements. | |
| Centre Funds | Statements of Assets and Liabilities |
| | March 31, 2023 (Unaudited) |
| | | Centre American Select Equity Fund | | | Centre Global Infrastructure Fund | |
| ASSETS: | | | | | | |
| Investments, at value | | $ | 385,730,167 | | | $ | 32,572,452 | |
| Foreign currency, at value (Cost $– and $45,656, respectively) | | | – | | | | 46,033 | |
| Receivable for dividends | | | 640,559 | | | | 100,592 | |
| Deposit with broker for options | | | 5,847 | | | | – | |
| Receivable for fund shares sold | | | 314,146 | | | | – | |
| Prepaid and other assets | | | 66,114 | | | | 25,394 | |
| Total Assets | | | 386,756,833 | | | | 32,744,471 | |
| LIABILITIES: | | | | | | | | |
| Payable to investment adviser | | | 226,727 | | | | 20,997 | |
| Payable to administrator | | | 28,472 | | | | 10,073 | |
| Payable to transfer agent | | | 19,604 | | | | 13,894 | |
| Payable for fund shares redeemed | | | 268,682 | | | | 7,552 | |
| Accrued 12b-1 and service fees | | | 82,537 | | | | 15,664 | |
| Payable for custodian fees | | | – | | | | 9,679 | |
| Payable for printing | | | 4,196 | | | | 923 | |
| Payable for legal and audit fees | | | 11,708 | | | | 8,249 | |
| Payable to trustees | | | 16,569 | | | | 1,664 | |
| Payable under the Chief Compliance Officer Services Agreement | | | 6,724 | | | | 809 | |
| Other payables | | | 2,863 | | | | 1,656 | |
| Total Liabilities | | | 668,082 | | | | 91,160 | |
| NET ASSETS | | $ | 386,088,751 | | | $ | 32,653,311 | |
| NET ASSETS CONSIST OF: | | | | | | | | |
| Paid-in capital | | $ | 331,770,442 | | | $ | 57,676,992 | |
| Total distributable earnings/(accumulated deficit) | | | 54,318,309 | | | | (25,023,681 | ) |
| NET ASSETS | | $ | 386,088,751 | | | $ | 32,653,311 | |
| INVESTMENTS, AT COST | | $ | 323,304,486 | | | $ | 29,088,633 | |
| PRICING OF SHARES | | | | | | | | |
| Investor Class | | | | | | | | |
| Net Assets | | $ | 229,879,613 | | | $ | 28,389,477 | |
| Shares outstanding | | | 16,319,899 | | | | 2,879,706 | |
| Net Asset Value, offering and redemption price per share | | $ | 14.09 | | | $ | 9.86 | |
| Institutional Class | | | | | | | | |
| Net Assets | | $ | 156,209,138 | | | $ | 4,263,834 | |
| Shares outstanding | | | 10,793,599 | | | | 432,227 | |
| Net Asset Value, offering and redemption price per share | | $ | 14.47 | | | $ | 9.86 | |
| See Notes to Financial Statements. | |
| Semi-Annual Report | March 31, 2023 | 15 |
| Centre Funds | Statements of Operations |
| | March 31, 2023 (Unaudited) |
| | | Centre American Select Equity Fund | | | Centre Global Infrastructure Fund | |
| INVESTMENT INCOME: | | | | | | | | |
| Dividends | | $ | 3,618,516 | | | $ | 636,365 | |
| Foreign taxes withheld | | | (7,371 | ) | | | (31,025 | ) |
| Total Investment Income | | | 3,611,145 | | | | 605,340 | |
| | | | | | | | | |
| EXPENSES: | | | | | | | | |
| Investment advisory fees | | | 1,369,944 | | | | 141,233 | |
| Administration fees | | | 134,418 | | | | 17,861 | |
| Transfer agent fees | | | 49,036 | | | | 20,260 | |
| Custodian fees | | | 20,590 | | | | 11,546 | |
| Legal fees | | | 23,824 | | | | 2,322 | |
| Audit and tax fees | | | 10,092 | | | | 7,775 | |
| Trustees' fees and expenses | | | 42,327 | | | | 4,096 | |
| Registration/filing fees | | | 46,503 | | | | 14,823 | |
| 12b-1 fees (Investor Class) | | | 299,475 | | | | 35,890 | |
| Shareholder service fees | | | 182,064 | | | | 11,857 | |
| Printing fees | | | 11,990 | | | | 2,185 | |
| Chief Compliance Officer services fees | | | 33,191 | | | | 3,218 | |
| Recoupment of previously waived fees - Investor class | | | 46,442 | | | | – | |
| Miscellaneous expenses | | | 20,096 | | | | 4,166 | |
| Total expenses before waivers | | | 2,289,992 | | | | 277,232 | |
| Fees waived/reimbursed by investment adviser (Investor Class) (Note 5) | | | – | | | | (18,757 | ) |
| Fees waived/reimbursed by investment adviser (Institutional Class) (Note 5) | | | (40,333 | ) | | | (6,387 | ) |
| Net Expenses | | | 2,249,659 | | | | 252,088 | |
| Net Investment Income | | | 1,361,486 | | | | 353,252 | |
| REALIZED AND UNREALIZED GAIN/(LOSS) ON INVESTMENTS, DERIVATIVES AND FOREIGN CURRENCIES: | | | | | | | | |
| Net realized gain/(loss) on investments and derivatives | | | (1,424,971 | ) | | | 297,059 | |
| Net realized loss on foreign currencies | | | – | | | | (6,544 | ) |
| Total realized gain/(loss) | | | (1,424,971 | ) | | | 290,515 | |
| Net change in unrealized appreciation on investments and derivatives | | | 39,421,622 | | | | 3,168,473 | |
| Net change in unrealized appreciation on foreign currencies | | | – | | | | 3,933 | |
| Total change in unrealized appreciation | | | 39,421,622 | | | | 3,172,406 | |
| NET REALIZED AND UNREALIZED GAIN ON INVESTMENTS, DERIVATIVES AND FOREIGN CURRENCIES: | | | 37,996,651 | | | | 3,462,921 | |
| NET INCREASE IN NET ASSETS RESULTING FROM OPERATIONS | | $ | 39,358,137 | | | $ | 3,816,173 | |
| See Notes to Financial Statements. | |
| Centre American Select Equity Fund | Statements of Changes in Net Assets |
| | | For The Six Months Ending March 31, 2023 (Unaudited) | | | For The Year Ended September 30, 2022 | |
| | | | | | | |
| OPERATIONS: | | | | | | | | |
| Net investment income | | $ | 1,361,486 | | | $ | 2,372,154 | |
| Net realized loss | | | (1,424,971 | ) | | | (2,200,296 | ) |
| Net change in unrealized appreciation/(depreciation) | | | 39,421,622 | | | | (40,366,558 | ) |
| Net increase/(decrease) in net assets resulting from operations | | | 39,358,137 | | | | (40,194,700 | ) |
| DISTRIBUTIONS TO SHAREHOLDERS: | | | | | | | | |
| Investor | | | (3,010,568 | ) | | | (21,253,776 | ) |
| Institutional | | | (1,781,935 | ) | | | (2,190,070 | ) |
| Total distributions | | | (4,792,503 | ) | | | (23,443,846 | ) |
| CAPITAL SHARE TRANSACTIONS: | | | | | | | | |
| Investor Class | | | | | | | | |
| Proceeds from sale of shares | | | 42,190,590 | | | | 173,177,205 | |
| Shares issued in reinvestment of distributions | | | 2,912,852 | | | | 20,750,611 | |
| Cost of shares redeemed | | | (83,101,996 | ) | | | (48,949,160 | ) |
| Redemption fees | | | 67,783 | | | | 212,544 | |
| Net increase/(decrease) from capital share transactions | | | (37,930,771 | ) | | | 145,191,200 | |
| Institutional Class | | | | | | | | |
| Proceeds from sale of shares | | | 102,123,664 | | | | 184,687,613 | |
| Shares issued in reinvestment of distributions | | | 1,715,622 | | | | 1,967,802 | |
| Cost of shares redeemed | | | (56,901,958 | ) | | | (80,552,993 | ) |
| Redemption fees | | | 10,623 | | | | 4,713 | |
| Net increase from capital share transactions | | | 46,947,951 | | | | 106,107,135 | |
| Net increase in net assets | | | 43,582,814 | | | | 187,659,789 | |
| NET ASSETS: | | | | | | | | |
| Beginning of period | | | 342,505,937 | | | | 154,846,148 | |
| End of period | | $ | 386,088,751 | | | $ | 342,505,937 | |
| | | | | | | | | |
| OTHER INFORMATION: | | | | | | | | |
| Share Transactions: | | | | | | | | |
| Investor Class | | | | | | | | |
| Beginning shares | | | 18,950,131 | | | | 9,437,873 | |
| Shares sold | | | 3,060,680 | | | | 11,475,454 | |
| Shares issued in reinvestment of dividends | | | 219,507 | | | | 1,462,340 | |
| Shares redeemed | | | (5,910,419 | ) | | | (3,425,536 | ) |
| Ending shares | | | 16,319,899 | | | | 18,950,131 | |
| Institutional Class | | | | | | | | |
| Beginning shares | | | 7,521,817 | | | | 1,056,382 | |
| Shares sold | | | 7,147,234 | | | | 11,963,066 | |
| Shares issued in reinvestment of dividends | | | 125,963 | | | | 135,617 | |
| Shares redeemed | | | (4,001,415 | ) | | | (5,633,248 | ) |
| Ending shares | | | 10,793,599 | | | | 7,521,817 | |
| See Notes to Financial Statements. | |
| Semi-Annual Report | March 31, 2023 | 17 |
| Centre Global Infrastructure Fund | Statements of Changes in Net Assets |
| | | For The Six Months Ending March 31, 2023 (Unaudited) | | | For The Year Ended September 30, 2022 | |
| | | | | | | |
| OPERATIONS: | | | | | | | | |
| Net investment income | | $ | 353,252 | | | $ | 749,901 | |
| Net realized gain/(loss) | | | 290,515 | | | | (219,957 | ) |
| Net change in unrealized appreciation/(depreciation) | | | 3,172,406 | | | | (4,235,659 | ) |
| Net increase/(decrease) in net assets resulting from operations | | | 3,816,173 | | | | (3,705,715 | ) |
| DISTRIBUTIONS TO SHAREHOLDERS: | | | | | | | | |
| Investor | | | (154,677 | ) | | | (759,919 | ) |
| Institutional | | | (33,133 | ) | | | (151,642 | ) |
| From return of capital | | | | | | | | |
| Investor | | | – | | | | (9,453 | ) |
| Total distributions | | | (187,810 | ) | | | (921,014 | ) |
| CAPITAL SHARE TRANSACTIONS: | | | | | | | | |
| Investor Class | | | | | | | | |
| Proceeds from sale of shares | | | 87,410 | | | | 38,178 | |
| Shares issued in reinvestment of distributions | | | 120,062 | | | | 591,596 | |
| Cost of shares redeemed | | | (2,197,762 | ) | | | (3,974,348 | ) |
| Redemption fees | | | – | | | | 239 | |
| Net decrease from capital share transactions | | | (1,990,290 | ) | | | (3,344,335 | ) |
| Institutional Class | | | | | | | | |
| Proceeds from sale of shares | | | 310,749 | | | | 262,361 | |
| Shares issued in reinvestment of distributions | | | 31,474 | | | | 143,190 | |
| Cost of shares redeemed | | | (1,086,915 | ) | | | (1,200,563 | ) |
| Redemption fees | | | 164 | | | | 4 | |
| Net decrease from capital share transactions | | | (744,528 | ) | | | (795,008 | ) |
| Net increase/(decrease) in net assets | | | 893,545 | | | | (8,766,072 | ) |
| NET ASSETS: | | | | | | | | |
| Beginning of period | | | 31,759,766 | | | | 40,525,838 | |
| End of period | | $ | 32,653,311 | | | $ | (31,759,766 | ) |
| | | | | | | | | |
| OTHER INFORMATION: | | | | | | | | |
| Share Transactions: | | | | | | | | |
| Investor Class | | | | | | | | |
| Beginning shares | | | 3,085,768 | | | | 3,411,897 | |
| Shares sold | | | 8,978 | | | | 3,719 | |
| Shares issued in reinvestment of dividends | | | 12,424 | | | | 57,914 | |
| Shares redeemed | | | (227,464 | ) | | | (387,762 | ) |
| Ending shares | | | 2,879,706 | | | | 3,085,768 | |
| Institutional Class | | | | | | | | |
| Beginning shares | | | 507,023 | | | | 584,641 | |
| Shares sold | | | 32,548 | | | | 25,607 | |
| Shares issued in reinvestment of dividends | | | 3,250 | | | | 14,019 | |
| Shares redeemed | | | (110,594 | ) | | | (117,244 | ) |
| Ending shares | | | 432,227 | | | | 507,023 | |
| See Notes to Financial Statements. | |
| Centre American Select Equity Fund | Financial Highlights |
| Investor Class | For a share outstanding throughout the periods presented. |
| | | For the Six Months Ended March 31, 2023 (Unaudited) | | | For the Year Ended September 30, 2022 | | | For the Year Ended September 30, 2021 | | | For the Year Ended September 30, 2020 | | | For the Year Ended September 30, 2019 | | | For the Year Ended September 30, 2018 | |
| NET ASSET VALUE, BEGINNING OF PERIOD | | $ | 12.84 | | | $ | 14.73 | | | $ | 11.88 | | | $ | 10.55 | | | $ | 13.63 | | | $ | 13.05 | |
| INCOME/(LOSS) FROM INVESTMENT OPERATIONS: | | | | | | | | | | | | | | | | | | | | | | | | |
| Net investment income/(loss)(a) | | | 0.04 | | | | 0.11 | | | | 0.02 | | | | 0.10 | | | | 0.04 | | | | (0.01 | ) |
| Net realized and unrealized gain/(loss) on investments | | | 1.39 | | | | 0.27 | | | | 3.40 | | | | 2.25 | | | | (0.96 | ) | | | 2.20 | |
| Total income/(loss) from investment operations | | | 1.43 | | | | 0.38 | | | | 3.42 | | | | 2.35 | | | | (0.92 | ) | | | 2.19 | |
| | | | | | | | | | | | | | | | | | | | | | | | | |
| DISTRIBUTIONS: | | | | | | | | | | | | | | | | | | | | | | | | |
| Net investment income | | | (0.05 | ) | | | (0.14 | ) | | | (0.11 | ) | | | (0.02 | ) | | | (0.03 | ) | | | (0.00 | )(b) |
| Net realized gains on investments | | | (0.13 | ) | | | (2.15 | ) | | | (0.46 | ) | | | (1.00 | ) | | | (2.13 | ) | | | (1.61 | ) |
| Total distributions | | | (0.18 | ) | | | (2.29 | ) | | | (0.57 | ) | | | (1.02 | ) | | | (2.16 | ) | | | (1.61 | ) |
| REDEMPTION FEES ADDED TO PAID-IN CAPITAL (NOTE 4) | | | 0.00 | (c) | | | 0.02 | | | | 0.00 | (c) | | | 0.00 | (c) | | | 0.00 | (c) | | | 0.00 | (c) |
| NET INCREASE/(DECREASE) IN NET ASSET VALUE | | | 1.25 | | | | (1.89 | ) | | | 2.85 | | | | 1.33 | | | | (3.08 | ) | | | 0.58 | |
| NET ASSET VALUE, END OF PERIOD | | $ | 14.09 | | | $ | 12.84 | | | $ | 14.73 | | | $ | 11.88 | | | $ | 10.55 | | | $ | 13.63 | |
| | | | | | | | | | | | | | | | | | | | | | | | | |
| Total Return(d) | | | 11.25 | % | | | 1.23 | % | | | 29.60 | % | | | 23.82 | % | | | (5.12 | %) | | | 18.10 | % |
| | | | | | | | | | | | | | | | | | | | | | | | | |
| SUPPLEMENTAL DATA: | | | | | | | | | | | | | | | | | | | | | | | | |
| Net assets, end of period (000) | | $ | 229,880 | | | $ | 243,353 | | | $ | 138,985 | | | $ | 151,342 | | | $ | 104,838 | | | $ | 129,231 | |
| | | | | | | | | | | | | | | | | | | | | | | | | |
| | | | | | | | | | | | | | | | | | | | | | | | |
| RATIOS TO AVERAGE NET ASSETS: | | | | | | | | | | | | | | | | | | | | | | | | |
| Net investment income/(loss) including reimbursement/waiver | | | 0.60 | %(e) | | | 0.78 | % | | | 0.17 | % | | | 0.93 | % | | | 0.32 | % | | | (0.06 | %) |
| Operating expenses excluding reimbursement/waiver | | | 1.36 | %(e) | | | 1.46 | % | | | 1.44 | % | | | 1.56 | % | | | 1.58 | % | | | 1.60 | % |
| Operating expenses including reimbursement/waiver | | | 1.36 | %(e) | | | 1.46 | % | | | 1.46 | % | | | 1.47 | % | | | 1.45 | % | | | 1.32 | %(f) |
| | | | | | | | | | | | | | | | | | | | | | | | | |
| PORTFOLIO TURNOVER RATE | | | 53 | %(g) | | | 138 | % | | | 86 | % | | | 94 | % | | | 114 | % | | | 87 | % |
| (a) | Calculated using the average shares method. |
| (b) | Less than $(0.005) per share. |
| (c) | Less than $0.005 per share. |
| (d) | Total returns would have been lower had certain expenses not been waived during the period. Returns shown do not reflect the deduction of taxes that a shareholder would pay on fund distributions or the redemption of fund shares. |
| (f) | Effective January 29, 2018, the net expense limitation changed from 1.05% to 1.10%, excluding, among other fees and expenses, 12b-1 fees and shareholder service fees. |
| (g) | Portfolio turnover rate for periods less than one full year have not been annualized. |
| See Notes to Financial Statements. | |
| Semi-Annual Report | March 31, 2023 | 19 |
| Centre American Select Equity Fund | Financial Highlights |
| Institutional Class | For a share outstanding throughout the periods presented. |
| | | For the Six Months Ended March 31, 2023 (Unaudited) | | | For the Year Ended September 30, 2022 | | | For the Year Ended September 30, 2021 | | | For the Year Ended September 30, 2020 | | | For the Year Ended September 30, 2019 | | | For the Year Ended September 30, 2018 | |
| NET ASSET VALUE, BEGINNING OF PERIOD | | $ | 13.18 | | | $ | 15.01 | | | $ | 12.06 | | | $ | 10.66 | | | $ | 13.68 | | | $ | 13.05 | |
| INCOME/(LOSS) FROM INVESTMENT OPERATIONS: | | | | | | | | | | | | | | | | | | | | | | | | |
| Net investment income(a) | | | 0.07 | | | | 0.18 | | | | 0.09 | | | | 0.20 | | | | 0.09 | | | | 0.04 | (b) |
| Net realized and unrealized gain/(loss) on investments | | | 1.42 | | | | 0.30 | | | | 3.45 | | | | 2.23 | | | | (0.95 | ) | | | 2.21 | |
| Total income/(loss) from investment operations | | | 1.49 | | | | 0.48 | | | | 3.54 | | | | 2.43 | | | | (0.86 | ) | | | 2.25 | |
| | | | | | | | | | | | | | | | | | | | | | | | | |
| DISTRIBUTIONS: | | | | | | | | | | | | | | | | | | | | | | | | |
| Net investment income | | | (0.07 | ) | | | (0.16 | ) | | | (0.13 | ) | | | (0.03 | ) | | | (0.03 | ) | | | (0.01 | ) |
| Net realized gains on investments | | | (0.13 | ) | | | (2.15 | ) | | | (0.46 | ) | | | (1.00 | ) | | | (2.13 | ) | | | (1.61 | ) |
| Total distributions | | | (0.20 | ) | | | (2.31 | ) | | | (0.59 | ) | | | (1.03 | ) | | | (2.16 | ) | | | (1.62 | ) |
| REDEMPTION FEES ADDED TO PAID-IN CAPITAL (NOTE 4) | | | 0.00 | (c) | | | 0.00 | (c) | | | 0.00 | (c) | | | 0.00 | (c) | | | 0.00 | (c) | | | – | |
| NET INCREASE/(DECREASE) IN NET ASSET VALUE | | | 1.29 | | | | (1.83 | ) | | | 2.95 | | | | 1.40 | | | | (3.02 | ) | | | 0.63 | |
| NET ASSET VALUE, END OF PERIOD | | $ | 14.47 | | | $ | 13.18 | | | $ | 15.01 | | | $ | 12.06 | | | $ | 10.66 | | | $ | 13.68 | |
| | | | | | | | | | | | | | | | | | | | | | | | | |
| Total Return(d) | | | 11.41 | % | | | 1.78 | % | | | 30.18 | % | | | 24.42 | % | | | (4.61 | %) | | | 18.55 | % |
| | | | | | | | | | | | | | | | | | | | | | | | | |
| SUPPLEMENTAL DATA: | | | | | | | | | | | | | | | | | | | | | | | | |
| Net assets, end of period (000) | | $ | 156,209 | | | $ | 99,153 | | | $ | 15,861 | | | $ | 11,682 | | | $ | 2,932 | | | $ | 2,554 | |
| | | | | | | | | | | | | | | | | | | | | | | | | |
| RATIOS TO AVERAGE NET ASSETS: | | | | | | | | | | | | | | | | | | | | | | | | |
| Net investment income including reimbursement/waiver | | | 1.01 | %(e) | | | 1.24 | % | | | 0.65 | % | | | 1.73 | % | | | 0.84 | % | | | 0.32 | % |
| Operating expenses excluding reimbursement/waiver | | | 1.04 | %(e) | | | 1.05 | % | | | 1.16 | % | | | 1.26 | % | | | 1.29 | % | | | 1.27 | % |
| Operating expenses including reimbursement/waiver | | | 0.98 | %(e) | | | 0.98 | % | | | 0.98 | % | | | 0.99 | % | | | 0.95 | % | | | 0.93 | %(f) |
| | | | | | | | | | | | | | | | | | | | | | | | | |
| PORTFOLIO TURNOVER RATE | | | 53 | %(g) | | | 138 | % | | | 86 | % | | | 94 | % | | | 114 | % | | | 87 | % |
| (a) | Calculated using the average shares method. |
| (b) | The per share amount does not correspond to activity reflected in the Statement of Operations due to class specific expenses during the period. |
| (c) | Less than $0.005 per share. |
| (d) | Total returns would have been lower had certain expenses not been waived during the period. Returns shown do not reflect the deduction of taxes that a shareholder would pay on fund distributions or the redemption of fund shares. |
| (f) | Effective January 29, 2018, the net expense limitation changed from 0.95% to 0.90%, excluding, among other fees and expenses, shareholder service fees. |
| (g) | Portfolio turnover rate for periods less than one full year have not been annualized. |
| See Notes to Financial Statements. | |
| Centre Global Infrastructure Fund | Financial Highlights |
| Investor Class | For a share outstanding throughout the periods presented. |
| | | For the Six Months Ended March 31, 2023 (Unaudited) | | | For the Year Ended September 30, 2022 | | | For the Year Ended September 30, 2021 | | | For the Year Ended September 30, 2020 | | | For the Year Ended September 30, 2019 | | | For the Period January 29, 2018 (Inception) to September 30, 2018 | |
| NET ASSET VALUE, BEGINNING OF PERIOD | | $ | 8.84 | | | $ | 10.14 | | | $ | 8.76 | | | $ | 10.18 | | | $ | 9.64 | | | $ | 10.00 | |
| INCOME/(LOSS) FROM INVESTMENT OPERATIONS: | | | | | | | | | | | | | | | | | | | | | | | | |
| Net investment income(a) | | | 0.10 | | | | 0.19 | | | | 0.18 | | | | 0.25 | | | | 0.22 | | | | 0.12 | |
| Net realized and unrealized gain/(loss) on investments | | | 0.97 | | | | (1.25 | ) | | | 1.39 | | | | (1.41 | ) | | | 0.57 | | | | (0.29 | ) |
| Total income/(loss) from investment operations | | | 1.07 | | | | (1.06 | ) | | | 1.57 | | | | (1.16 | ) | | | 0.79 | | | | (0.17 | ) |
| | | | | | | | | | | | | | | | | | | | | | | | | |
| DISTRIBUTIONS: | | | | | | | | | | | | | | | | | | | | | | | | |
| Net investment income | | | (0.05 | ) | | | (0.24 | ) | | | (0.19 | ) | | | (0.26 | ) | | | (0.25 | ) | | | (0.15 | ) |
| Net realized gains on investments | | | – | | | | – | | | | – | | | | – | | | | – | | | | (0.10 | ) |
| Tax return of capital | | | – | | | | (0.00 | )(b) | | | – | | | | – | | | | – | | | | – | |
| Total distributions | | | (0.05 | ) | | | (0.24 | ) | | | (0.19 | ) | | | (0.26 | ) | | | (0.25 | ) | | | (0.25 | ) |
| REDEMPTION FEES ADDED TO PAID-IN CAPITAL (NOTE 4) | | | – | | | | 0.00 | (c) | | | 0.00 | (c) | | | 0.00 | (c) | | | 0.00 | (c) | | | 0.06 | |
| NET INCREASE/(DECREASE) IN NET ASSET VALUE | | | 1.02 | | | | (1.30 | ) | | | 1.38 | | | | (1.42 | ) | | | 0.54 | | | | (0.36 | ) |
| NET ASSET VALUE, END OF PERIOD | | $ | 9.86 | | | $ | 8.84 | | | $ | 10.14 | | | $ | 8.76 | | | $ | 10.18 | | | $ | 9.64 | |
| | | | | | | | | | | | | | | | | | | | | | | | |
| Total Return(d) | | | 12.14 | % | | | (10.77 | %) | | | 18.00 | % | | | (11.49 | %) | | | 8.41 | % | | | (1.18 | %) |
| | | | | | | | | | | | | | | | | | | | | | | | | |
| SUPPLEMENTAL DATA: | | | | | | | | | | | | | | | | | | | | | | | | |
| Net assets, end of period (000) | | $ | 28,389 | | | $ | 27,275 | | | $ | 34,594 | | | $ | 35,527 | | | $ | 28,879 | | | $ | 14,843 | |
| | | | | | | | | | | | | | | | | | | | | | | | | |
| RATIOS TO AVERAGE NET ASSETS: | | | | | | | | | | | | | | | | | | | | | | | | |
| Net investment income including reimbursement/waiver | | | 2.03 | %(e) | | | 1.89 | % | | | 1.79 | % | | | 2.62 | % | | | 2.28 | % | | | 1.87 | %(e) |
| Operating expenses excluding reimbursement/waiver | | | 1.70 | %(e) | | | 1.75 | % | | | 1.74 | % | | | 1.89 | % | | | 2.29 | % | | | 2.34 | %(e) |
| Operating expenses including reimbursement/waiver | | | 1.57 | %(e) | | | 1.57 | % | | | 1.50 | %(f) | | | 1.28 | %(g) | | | 1.30 | %(h) | | | 1.33 | %(e) |
| | | | | | | | | | | | | | | | | | | | | | | | |
| PORTFOLIO TURNOVER RATE | | | 15 | %(i) | | | 39 | % | | | 25 | % | | | 75 | % | | | 233 | % | | | 49 | %(i) |
| (a) | Calculated using the average shares method. |
| (b) | Less than $(0.005) per share. |
| (c) | Less than $0.005 per share. |
| See Notes to Financial Statements. | |
| Semi-Annual Report | March 31, 2023 | 21 |
| Centre Global Infrastructure Fund | Financial Highlights |
| Investor Class | For a share outstanding throughout the periods presented. |
| (d) | Total returns are for the period indicated and have not been annualized. Total returns would have been lower had certain expenses not been waived during the period. Returns shown do not reflect the deduction of taxes that a shareholder would pay on fund distributions or the redemption of fund shares. |
| (f) | Effective January 28, 2021, the net expense limitation changed from 1.05% to 1.25%, excluding, among other fees and expenses, 12B-1 fees and shareholder service fees. |
| (g) | Effective July 21, 2020, the net expense limitation changed from 1.25% to 1.05%, excluding, among other fees and expenses, 12b-1 fees and shareholder service fees. |
| (h) | Effective July 22, 2019, the net expense limitation changed from 1.05% to 1.25%, including, among other fees and expenses, 12b-1 fees and shareholder service fees. |
| (i) | Portfolio turnover rate for periods less than one full year have not been annualized. |
| See Notes to Financial Statements. | |
| Centre Global Infrastructure Fund | Financial Highlights |
| Institutional Class | For a share outstanding throughout the periods presented. |
| | | For the Six Months Ended March 31, 2023 (Unaudited) | | | For the Year Ended September 30, 2022 | | | For the Year Ended September 30, 2021 | | | For the Year Ended September 30, 2020 | | | For the Year Ended September 30, 2019 | | | For the Period January 29, 2018 (Inception) to September 30, 2018 | |
| NET ASSET VALUE, BEGINNING OF PERIOD | | $ | 8.84 | | | $ | 10.15 | | | $ | 8.77 | | | $ | 10.20 | | | $ | 9.67 | | | $ | 10.00 | |
| INCOME/(LOSS) FROM INVESTMENT OPERATIONS: | | | | | | | | | | | | | | | | | | | | | | | | |
| Net investment income(a) | | | 0.12 | | | | 0.23 | | | | 0.21 | | | | 0.26 | | | | 0.24 | | | | 0.15 | |
| Net realized and unrealized gain/(loss) on investments | | | 0.97 | | | | (1.26 | ) | | | 1.40 | | | | (1.40 | ) | | | 0.57 | | | | (0.23 | ) |
| Total income/(loss) from investment operations | | | 1.09 | | | | (1.03 | ) | | | 1.61 | | | | (1.14 | ) | | | 0.81 | | | | (0.08 | ) |
| | | | | | | | | | | | | | | | | | | | | | | | | |
| DISTRIBUTIONS: | | | | | | | | | | | | | | | | | | | | | | | | |
| Net investment income | | | (0.07 | ) | | | (0.28 | ) | | | (0.23 | ) | | | (0.29 | ) | | | (0.28 | ) | | | (0.15 | ) |
| Net realized gains on investments | | | – | | | | – | | | | – | | | | – | | | | – | | | | (0.10 | ) |
| Tax return of capital | | | – | | | | (0.00 | )(b) | | | – | | | | – | | | | – | | | | – | |
| Total distributions | | | (0.07 | ) | | | (0.28 | ) | | | (0.23 | ) | | | (0.29 | ) | | | (0.28 | ) | | | (0.25 | ) |
| REDEMPTION FEES ADDED TO PAID-IN CAPITAL (NOTE 4) | | | 0.00 | (c) | | | 0.00 | (c) | | | 0.00 | (c) | | | 0.00 | (c) | | | – | | | | – | |
| NET INCREASE/(DECREASE) IN NET ASSET VALUE | | | 1.02 | | | | (1.31 | ) | | | 1.38 | | | | (1.43 | ) | | | 0.53 | | | | (0.33 | ) |
| NET ASSET VALUE, END OF PERIOD | | $ | 9.86 | | | $ | 8.84 | | | $ | 10.15 | | | $ | 8.77 | | | $ | 10.20 | | | $ | 9.67 | |
| | | | | | | | | | | | | | | | | | | | | | | | | |
| Total Return(d) | | | 12.36 | % | | | (10.51 | %) | | | 18.35 | % | | | (11.30 | %) | | | 8.59 | % | | | (0.78 | %) |
| | | | | | | | | | | | | | | | | | | | | | | | | |
| SUPPLEMENTAL DATA: | | | | | | | | | | | | | | | | | | | | | | | | |
| Net assets, end of period (000) | | $ | 4,264 | | | $ | 4,484 | | | $ | 5,932 | | | $ | 6,243 | | | $ | 23,663 | | | $ | 1,424 | |
| | | | | | | | | | | | | | | | | | | | | | | | | |
| RATIOS TO AVERAGE NET ASSETS: | | | | | | | | | | | | | | | | | | | | | | | | |
| Net investment income including reimbursement/waiver | | | 2.42 | %(e) | | | 2.28 | % | | | 2.10 | % | | | 2.60 | % | | | 2.48 | % | | | 2.28 | %(e) |
| Operating expenses excluding reimbursement/waiver | | | 1.46 | %(e) | | | 1.51 | % | | | 1.51 | % | | | 1.63 | % | | | 1.61 | % | | | 7.96 | %(e) |
| Operating expenses including reimbursement/waiver | | | 1.18 | %(e) | | | 1.18 | % | | | 1.20 | % | | | 1.02 | %(f) | | | 1.01 | %(g) | | | 1.16 | %(e) |
| | | | | | | | | | | | | | | | | | | | | | | | | |
| PORTFOLIO TURNOVER RATE | | | 15 | %(h) | | | 39 | % | | | 25 | % | | | 75 | % | | | 233 | % | | | 49 | %(h) |
| (a) | Calculated using the average shares method. |
| (b) | Less than $(0.005) per share. |
| (c) | Less than $0.005 per share. |
| (d) | Total returns are for the period indicated and have not been annualized. Total returns would have been lower had certain expenses not been waived during the period. Returns shown do not reflect the deduction of taxes that a shareholder would pay on fund distributions or the redemption of fund shares. |
| See Notes to Financial Statements. | |
| Semi-Annual Report | March 31, 2023 | 23 |
| Centre Global Infrastructure Fund | Financial Highlights |
| Institutional Class | For a share outstanding throughout the periods presented. |
| (f) | Effective July 21, 2020, the net expense limitation changed from 1.00% to 1.10%, excluding, among other fees and expenses, 12b-1 fees and shareholder service fees. |
| (g) | Effective July 22, 2019, the net expense limitation changed from 1.10% to 1.00%, including, among other fees and expenses, 12b-1 fees and shareholder service fees. |
| (h) | Portfolio turnover rate for periods less than one full year have not been annualized. |
| See Notes to Financial Statements. | |
| Centre Funds | Notes to Financial Statements |
March 31, 2023 (Unaudited)
1. ORGANIZATION
Centre Funds (the “Trust”) was organized on March 17, 2011, as a Delaware statutory trust and is registered as an open-end management investment company under the Investment Company Act of 1940, as amended (the “1940 Act”). Prior to January 17, 2014, the Trust was known as Drexel Hamilton Mutual Funds. The Trust currently offers shares of beneficial interest (“shares”) of Centre American Select Equity Fund (the “American Select Equity Fund") and Centre Global Infrastructure Fund (the “Infrastructure Fund”) (each individually a "Fund" and collectively, the “Funds”). The affairs of the Trust are overseen by a Board of Trustees (the “Board” or the “Trustees”). The Declaration of Trust permits the Trustees to create additional series of the Trust and share classes.
Information in the accompanying Funds’ financial statements pertain to the Investor Class and Institutional Class shares offered by each of the Funds. All classes of shares have identical rights to earnings, assets, and voting privileges, except for class-specific expenses and exclusive rights to vote on matters affecting only individual classes.
2. SIGNIFICANT ACCOUNTING POLICIES
The following is a summary of significant accounting policies followed by the Funds in the preparation of the Financial Statements. These policies are in conformity with accounting principles generally accepted in the United States of America (“GAAP”). Each Fund is an investment company and accordingly follows the investment company accounting and reporting guidance of the Financial Accounting Standards Board Accounting Standard Codification Topic 946 Financial Services - Investment Companies.
| (a) | The Funds present or record their investments at fair value. Portfolio securities traded on a securities exchange or quoted by NASDAQ are valued at the last sale price on the principal exchange on which they are traded at the time the securities are valued, or, if not traded on that day, are valued at the closing bid price. In the case of portfolio securities listed on the NASDAQ, valuation is determined by using the NASDAQ Official Closing Price. Securities traded in the OTC market and not quoted by NASDAQ are valued at their last sale price or, if there is no available price, the last bid price quoted by brokers that make markets in the securities as of the close of regular trading hours on the day the securities are being valued. Foreign securities are valued on the basis of quotations from the primary market in which they are traded, and are translated from the local currency into U.S. dollars using exchange rates as of the close of regular trading (normally 4:00 p.m. Eastern time) on the New York Stock Exchange (the “Exchange”) or using methods determined by the Board. Short-term instruments with maturities of 60 days or less are valued at the price supplied by an approved independent pricing source. Options contracts listed for trading on a securities exchange or board of trade shall be valued at the mean of the highest bid and lowest asked quotation across the exchanges on which the option is traded. Futures contracts are ordinarily valued at the closing settlement price on the exchange on which they are primarily traded or based upon the current settlement price for a like instrument acquired on the day on which the instrument is being valued. Securities and other assets for which quotations are not readily available or deemed unreliable are valued at their fair value using methods determined by the Board. Fair valuation of a particular security is an inherently subjective process, with no single standard to utilize when determining a security’s fair value. As such, different mutual funds could reasonably arrive at a different fair value price for the same security. In each case where a security is fair valued, consideration is given to the facts and circumstances relevant to the particular situation. This consideration includes reviewing various factors set forth in the pricing procedures adopted by the Board and other factors as warranted. In making a fair value determination, factors that may be considered, among others, may include: the type and structure of the security; unusual events or circumstances relating to the security’s issuer; general market conditions; prior day’s valuation; fundamental analytical data; size of the holding; cost of the security on the date of purchase; nature and duration of any restriction on disposition; trading activities; and prices of similar securities or financial instruments. If a Fund invests in shares of other open-end mutual funds, including Money Market Funds, (each, an “Underlying Fund”), the Fund calculates the net asset value of its shares using the reported net asset value of the applicable Underlying Fund. For each Underlying Fund, the net asset value per share for a class of shares is determined as of the close of the Exchange on each day the Exchange is open by dividing the value of the Underlying Fund’s net assets attributable to that class by the number of outstanding shares of that class on that day. |
| (b) | The per share net asset value (the “NAV”) of each Fund is calculated as of the close of regular trading on the Exchange (normally 4:00 p.m. Eastern time) each day the Exchange is open. The per share NAV is calculated by deducting from the Fund’s assets, the Fund’s liabilities, and then dividing the resulting net assets by the total number of shares outstanding, rounded to the nearest cent. The purchase price and redemption price per share is equal to the next determined NAV per share. Redemption of shares of American Select Equity Fund and Infrastructure Fund are subject to a redemption fee of 2% if redeemed within 90 days of purchase. |
| (c) | The Trust treats each Fund as a separate entity for Federal income tax purposes. Each Fund intends to continue to qualify each year as a “regulated investment company” under Subchapter M of the Internal Revenue Code of 1986, as amended (the “Code”). By so qualifying, each Fund will not be subject to Federal income taxes to the extent that it distributes substantially all of its taxable or tax-exempt income, if any, for its tax year ending September 30. In addition, by distributing in each calendar year substantially all of its net investment income, capital gains and certain other amounts, if any, each Fund will not be subject to a Federal excise tax. Therefore, no provision is made by the Funds for Federal income or excise taxes. Withholding taxes on foreign dividends are paid or provided for in accordance with the applicable country’s tax rules and rates. |
| Semi-Annual Report | March 31, 2023 | 25 |
| Centre Funds | Notes to Financial Statements |
March 31, 2023 (Unaudited)
As of and during the six-month period ended March 31, 2023, the Funds did not have a liability for any unrecognized tax benefits in the accompanying financial statements. The Funds recognize the interest and penalties, if any, related to the unrecognized tax benefits as income tax expense in the Statements of Operations. During the six-month period ended March 31, 2023, the Funds did not incur any interest or penalties.
| (d) | Net realized gains and losses on investments are computed on the identified cost basis. Dividend income is recognized on the ex-dividend date or for certain foreign securities, as soon as information is available, and interest income is recognized on an accrual basis. The Funds amortize premium and accrete discount on investments utilizing the effective interest method. Foreign dividend income may be subject to foreign withholding taxes. |
| (e) | A restricted security is a security that has been purchased through a private offering and cannot be resold to the general public without prior registration under the Securities Act of 1933, as amended (the “1933 Act”), or pursuant to the resale limitations provided by Rule 144 under the 1933 Act, or an exemption from the registration requirements of the 1933 Act. Whether a restricted security is illiquid is determined pursuant to guidelines established by the Board. Not all restricted securities are considered to be illiquid. As of March 31, 2023, the Funds did not hold any illiquid or restricted securities. |
| (f) | The accompanying financial statements were prepared in accordance with GAAP, which require the use of estimates and assumptions made by management. These may affect the reported amounts of assets and liabilities and disclosure of contingent assets and liabilities at the date of the financial statements and the reported amounts of increases and decreases in net assets from operations during the reporting period. Actual results could differ from those estimates. |
| (g) | Each Fund bears expenses incurred specifically by such Fund, as well as its pro rata portion of Trust expenses, which may be allocated on the basis of relative net assets or the nature of the services performed relative to applicability to each Fund. Expenses that are specific to a Fund or class of shares of a Fund are charged directly to that Fund or share class. All of the realized and unrealized gains and losses and net investment income of a Fund, other than class-specific expenses, are allocated daily to each class in proportion to its average daily net assets. Fees payable under the distribution (Rule 12b-1) plan and shareholder services plan are charged to each respective fund or share class. |
| (h) | The Funds intend to distribute to shareholders all of their net income and/or capital gains on an annual basis. Income and capital gains distributions are determined in accordance with income tax regulations, which may differ from GAAP. Distributions to shareholders are recorded on the ex-dividend date. |
| (i) | A Fund may directly purchase securities of foreign issuers. Investing in securities of foreign issuers involves special risks not typically associated with investing in securities of U.S. issuers. The risks include possible reevaluation of currencies, the inability to repatriate foreign currency, less complete financial information about companies and possible future adverse political and economic developments. Moreover, securities of many foreign issuers and their markets may be less liquid and their prices more volatile than those of securities of comparable U.S. issuers. |
| (j) | The books and records of the Funds are maintained in U.S. dollars. Investment valuations and other assets and liabilities initially expressed in foreign currencies are converted each business day into U.S. dollars based upon current exchange rates. The portion of realized and unrealized gains or losses on investments due to fluctuations in foreign currency exchange rates is not separately disclosed and is not included in net realized and net change in unrealized gains or losses on foreign currencies. |
| (k) | Idle cash may be swept into various overnight demand deposits and is classified as cash and cash equivalents on the Statements of Assets and Liabilities. The Funds maintain cash in bank deposit accounts which, at times, may exceed United States federally insured limits. Amounts swept overnight are available on the next business day. |
3. FAIR VALUE MEASUREMENTS
The Funds normally use third-party pricing services to obtain market quotations for their portfolio investments. Securities and other assets for which representative market quotations are not readily available or which cannot be accurately valued using the Trust’s normal pricing procedures are valued at fair value as determined in good faith under policies approved by the Trustees. Fair value pricing may be used, for example, in situations where (i) an exchange-traded portfolio security is so thinly traded that there have been no transactions for that security over an extended period of time or the validity of a market quotation received is questionable; (ii) the exchange on which the portfolio security is principally traded closes early; or (iii) trading of the portfolio security is halted during the day and does not resume prior to the NAV calculation.
| Centre Funds | Notes to Financial Statements |
March 31, 2023 (Unaudited)
The inputs used in determining the fair value of each Fund’s investments are summarized into three levels, as described in the following hierarchy:
Level 1 - Unadjusted quoted prices in active markets for identical, unrestricted assets or liabilities that a Fund has the ability to access at the measurement date.
Level 2 - Quoted prices which are not active, quoted prices for similar assets or liabilities in active markets or inputs other than quoted prices that are observable (either directly or indirectly).
Level 3 - Significant unobservable prices or inputs (including the oversight of the Board and Centre Asset Management, LLC (the “Adviser”) in determining the fair value of investments) where there is little or no market activity for the asset or liability at measurement date.
The inputs or methodology used for valuing securities are not necessarily an indication of the risk associated with investing in those securities.
The following is a summary of each Fund’s investments in the fair value hierarchy as of March 31, 2023:
Centre American Select Equity Fund
| Investments in Securities at Value(a) | | Level 1 -
Quoted Prices | | | Level 2 -
Other Significant
Observable Inputs | | | Level 3 -
Significant Unobservable
Inputs | | | Total | |
| Common Stocks | | $ | 377,410,156 | | | $ | – | | | $ | – | | | $ | 377,410,156 | |
| Purchased Options | | | 2,585,700 | | | | – | | | | – | | | | 2,585,700 | |
| Short Term Investments | | | 5,734,311 | | | | – | | | | – | | | | 5,734,311 | |
| Total | | $ | 385,730,167 | | | $ | – | | | $ | – | | | $ | 385,730,167 | |
Centre Global Infrastructure Fund
| Investments in Securities at Value(a) | | Level 1 -
Quoted Prices | | | Level 2 -
Other Significant
Observable Inputs | | | Level 3 -
Significant Unobservable
Inputs | | | Total | |
| Common Stocks | | $ | 32,484,521 | | | $ | – | | | $ | – | | | $ | 32,484,521 | |
| Short Term Investments | | | 87,931 | | | | – | | | | – | | | | 87,931 | |
| Total | | $ | 32,572,452 | | | $ | – | | | $ | – | | | $ | 32,572,452 | |
| (a) | For detailed descriptions of sectors, industries, and countries, see the accompanying Schedules of Investments. |
Derivative Financial Instruments
A Fund may use derivative contracts, such as exchange-traded options and futures that are related to stock market or bond indices, foreign exchange, fixed income or other securities, or be exposed to exchange-traded derivative products. A Fund may invest its assets in derivatives and other instruments to help manage interest rate exposure, protect the Fund’s assets, or enhance returns. A Fund may also be exposed to certain exchange- traded derivative products, such as exchange-traded futures and options that are fully collateralized by cash or securities, for temporary cash management or investment transition purposes, or to hedge the risks of existing positions or overall capital protection.
Derivative Risk: One or more Funds may use derivatives, such as exchange-traded options and futures that are related to stock market or bond indexes, foreign exchange, fixed income or other securities or be exposed to exchange-traded derivative products. Loss may result from a Fund’s investments in exchange-traded futures and options. The value of derivatives in which a Fund may invest may rise or fall more rapidly than other investments. Other risks of investments in derivatives include imperfect correlation between the value of these instruments and the underlying assets; risks of default by the other party to the derivative transactions; risk that the transactions may result in losses that offset gains in portfolio positions; and risks that the derivative transactions may not be liquid. Derivatives, such as exchange-traded futures and options, contain “inherent” leverage because derivative contracts may give rise to an obligation on the part of a Fund for future payment or liabilities that are larger than the initial margin or premiums required to establish such positions. Combined with the volatility of derivatives prices, the leveraged nature of derivatives trading could cause a Fund to sustain large and sudden losses. The use of derivatives, such as futures and options, can lead to losses, including those magnified by leverage, particularly when derivatives are used to enhance return rather than mitigate risk. Correlation risk is the risk that changes in the value of the derivative may not correlate perfectly with the underlying asset, rate or index. Certain derivative instruments may be difficult to sell when the Adviser believes it would be appropriate to do so.
Derivatives may have little or no initial cash investment relative to their market value exposure and therefore can produce significant gains or losses in excess of their cost. This use of embedded leverage may allow a Fund to increase its market value exposure relative to its net assets and can substantially increase the volatility of the Fund’s performance.
| Semi-Annual Report | March 31, 2023 | 27 |
| Centre Funds | Notes to Financial Statements |
March 31, 2023 (Unaudited)
Additional associated risks from investing in derivatives also exist and potentially could have significant effects on the valuation of the derivatives held by a Fund. Typically, a Fund may attempt to increase or decrease exposure to the risks associated with the securities or other traditional investments in which it invests. The risks associated with a Fund’s use of derivative instruments, including but not limited to volatility risk, correlation risk, segregation risk, and hedging risks, are additional risks that a Fund does not typically seek to increase or decrease exposure to. Examples of these associated risks are liquidity risk, which is the risk that a Fund will not be able to sell the derivative in the open market in a timely manner, and counterparty credit risk, which is the risk that the counterparty will not fulfill its obligation to the Fund.
Option Writing/Purchasing
A Fund may write or purchase option contracts to adjust risk and return of its overall investment positions, subject to any restrictions set forth in the Fund’s prospectus. When a Fund writes or purchases an option, an amount equal to the premium received or paid by the Fund is recorded as a liability or an asset and is subsequently adjusted to the current market value of the option written or purchased. Premiums received or paid from writing or purchasing options that expire unexercised are treated by a Fund on the expiration date as realized gains or losses. The difference between the premium and the amount paid or received on affecting a closing purchase or sale transaction, including brokerage commissions, is also treated as a realized gain or loss. If an option is exercised, the premium paid or received is netted to the cost of the purchase or proceeds from the sale in determining whether a Fund has realized a gain or loss on investment transactions. Risks from entering into option transactions arise from, among other things, the potential inability of counterparties to meet the terms.
Futures
A Fund may use futures subject to any restrictions set forth in the Fund’s prospectus. A Fund may also be exposed to exchange-traded futures that are fully collateralized by cash or securities, for temporary cash management or investment transition purposes, or to hedge the risks of existing positions. To the extent that the Fund uses derivatives for temporary cash management, investment transition purposes, managing duration or to hedge the risks of existing positions, the Fund will be subject to the risks associated with such transactions. During the six-month period ended March 31, 2023, the Funds did not invest in futures contracts.
| Risk Exposure | | Derivatives
Statements of Assets and Liabilities Location | | Fair Value | |
| Centre American Select Equity Fund | | | | | | |
| Equity Contracts (Purchased Options) | | Investments, at value | | $ | 2,585,700 | |
| | | | | $ | 2,585,700 | |
The effect of derivative instruments on the Statements of Operations for the six-month period ended March 31, 2023 (Net realized gain/(loss) on purchased options contracts are included in Net realized gain/(loss) on investments within the Statements of Operations):
| Derivatives | | Location of Gains/(Loss) On Derivatives
Recognized In Income | | Realized Gain/(Loss) on Derivatives
Recognized in Income | | | Change in Unrealized Gain/(Loss) on
Derivatives Recognized in Income | |
| Centre American Select Equity Fund | | | | | | | | |
| Equity Contracts (Purchased Options) | | Net realized gain/(loss) on investments/Net change in unrealized appreciation/(depreciation) on investments | | $ | (4,146,340 | ) | | $ | (4,465,598 | ) |
| | | | | $ | (4,146,340 | ) | | $ | (4,465,598 | ) |
| Centre Funds | Notes to Financial Statements |
March 31, 2023 (Unaudited)
Volume of Derivative Instruments for the Funds during the six-month period ended March 31, 2023, was as follows:
| Derivative Type | | Unit of Measurement | | | Monthly Average | |
| Centre American Select Equity Fund | | | | | | | |
| Purchased Option Contracts | | Notional value of contracts outstanding | | | $ | 356,135,100 | |
During the ordinary course of business, the Funds may enter into transactions subject to enforceable netting agreements or other similar arrangements (“netting agreements”). Generally, the right to offset in netting agreements allows the Funds to offset any exposure to a specific counterparty with any collateral received or delivered to that counterparty based on the terms of the agreement. Generally, the Funds manage their cash collateral and securities collateral on a counterparty basis.
4. BENEFICIAL INTEREST TRANSACTIONS
On March 31, 2023, there was an unlimited number of shares of beneficial interest authorized for each Fund. Transactions in shares of beneficial interest are shown in the Statements of Changes in Net Assets.
Shares of American Select Equity Fund and Infrastructure Fund that are redeemed within 90 days of purchase may incur a 2% redemption fee deducted from the redemption amount. For the six-month period ended March 31, 2023, redemption fees retained by these Funds are disclosed in the Statements of Changes in Net Assets.
Beneficial Ownership: The beneficial ownership, either directly or indirectly, of more than 25% of the voting securities of a Fund creates a presumption of control of the Fund under Section 2(a)(9) of the 1940 Act. As of March 31, 2023, the following entities owned beneficially more than 25% of each Fund’s outstanding shares. The shares may be held under omnibus accounts (whereby the transactions of two or more shareholders are combined and carried in the name of the originating broker rather than designated separately). Any transaction by these investors could have a material impact on the share class.
| Centre American Select Equity Fund | Percentage |
| Charles Schwab & Co. Inc. | 30.49% |
| National Financial Services, LLC | 28.02% |
5. INVESTMENT ADVISORY AGREEMENTS AND RELATED-PARTY TRANSACTIONS
The Adviser serves as the investment adviser to each Fund pursuant to an Investment Advisory Agreement with the Trust on behalf of the Fund.
As compensation for the investment advisory services provided to the Funds, the Adviser is entitled to receive monthly compensation, subject to waivers, based on each Fund’s average daily net assets at the annual rate of:
| Fund | Management Fee Rate |
| Centre American Select Equity Fund (total net assets less than or equal to $1 billion) | 0.75% |
| Centre American Select Equity Fund (total net assets over $1 billion) | 0.70% |
| Centre Global Infrastructure Fund | 0.85% |
American Select Equity Fund
The Adviser has contractually agreed to reduce its advisory fees and/or reimburse other expenses of the Fund for not less than one year and until the next following effective date of the post-effective amendment to the registration statement of Centre Funds relating to the Fund (on or about January 29, 2024) to the extent necessary to limit the total operating expenses of the Fund including (but not limited to) investment advisory fees of the Adviser, but excluding, as applicable, any front-end or contingent deferred sales loads, taxes, leverage interest, distribution/service (Rule 12b-1) fees, shareholder services fees, brokerage commissions, acquired fund fees and expenses, expenses incurred in connection with any merger or reorganization, and extraordinary expenses (such as litigation and other expenses not incurred in the ordinary course of the Fund’s business) to an annual rate of 1.10% of the average daily net assets of the Investor Class shares and 0.90% of the average daily net assets of the Institutional Class shares (the “Expense Limitation Agreement”). The Expense Limitation Agreement may be terminated at any time, and without payment of any penalty, by the Board of Trustees of the Trust (the “Board”), on behalf of the Fund, upon 60 days’ written notice to the Adviser, but may not be terminated by the Adviser without the consent of the Board. No recoupment will be made more than three years after the date that the applicable amount was initially waived or reimbursed by the Adviser, and the recoupment may not cause the Fund to exceed the then-existing expense limitation for that class at the time such waiver or reimbursement was made.
| Semi-Annual Report | March 31, 2023 | 29 |
| Centre Funds | Notes to Financial Statements |
March 31, 2023 (Unaudited)
Infrastructure Fund
The Adviser has contractually agreed to reduce its advisory fees and/or reimburse other expenses of the Fund for an initial period of not less than one year and until the next following effective date of the post-effective amendment to the registration statement of Centre Funds relating to the Fund (on or about January 29, 2024) incorporating the Fund’s financial statements for that fiscal year to the extent necessary to limit the total operating expenses of the Fund, including (but not limited to) investment advisory fees of the Adviser, but excluding, as applicable, any front-end or contingent deferred sales loads, taxes, leverage interest, distribution/service (Rule 12b-1) fees, shareholder services fees, brokerage commissions, acquired fund fees and expenses, expenses incurred in connection with any merger or reorganization, and extraordinary expenses (such as litigation and other expenses not incurred in the ordinary course of the Fund’s business) to an annual rate of 1.25% of the average daily net assets of the Investor Class shares and 1.10% of the average daily net assets of the Institutional Class shares. The Expense Limitation Agreement may be terminated at any time, and without payment of any penalty, by the Board, on behalf of the Fund, upon 60 days’ written notice to the Adviser, but may not be terminated by the Adviser without the consent of the Board. No recoupment will be made more than three years after the date that the applicable amount was initially waived or reimbursed by the Adviser, and the recoupment may not cause the Fund to exceed the then-existing expense limitation for that class at the time such waiver or reimbursement was made.
During the six-month period ended March 31, 2023, the fee waivers and/or reimbursements were as follows:
| Fund | | Fees Waived and/or Reimbursed
by Adviser | |
| Centre American Select Equity Fund | | | | |
| Investor | | $ | – | |
| Institutional | | | 40,333 | |
| Centre Global Infrastructure Fund | | | | |
| Investor | | | 18,757 | |
| Institutional | | | 6,387 | |
As of March 31, 2023, the balances of recoupable expenses for each Fund were as follows:
| Fund | | Expires 2023 | | | Expires 2024 | | | Expires 2025 | | | Total | |
| Centre American Select Equity Fund | | | | | | | | | | | | | | | | |
| Investor | | $ | – | | | $ | – | | | $ | – | | | $ | N/A | |
| Institutional | | | 23,001 | | | | 18,989 | | | | 37,978 | | | | 79,968 | |
| Centre Global Infrastructure Fund | | | | | | | | | | | | | | | | |
| Investor | | $ | 85,269 | | | $ | 47,066 | | | $ | 18,157 | | | $ | 150,492 | |
| Institutional | | | 19,898 | | | | 15,683 | | | | 6,503 | | | | 42,084 | |
Centre American Select Equity Fund Investor Class recovered $46,442 during the six-month period ended March 31, 2023.
ALPS Fund Services, Inc. (“ALPS” or the “Administrator”) serves as administrator to the Funds. ALPS receives a monthly fee paid by the Funds subject to a minimum monthly fee and is reimbursed for certain out-of-pocket expenses. Pursuant to an administrative agreement with the Trust, ALPS provides operational services to the Funds including, but not limited to fund accounting and fund administration services and general assistance in each Fund’s operations.
ALPS, pursuant to a transfer agency and services agreement with the Trust, serves as transfer agent for the Funds. Under the transfer agency and services agreement, ALPS receives an annual minimum fee per Fund and a fee based upon each shareholder account and its account activity and is reimbursed for certain out-of-pocket expenses.
ALPS, pursuant to a chief compliance officer services agreement with the Trust, provides chief compliance officer services to the Funds. Additionally, ALPS provides services in monitoring and testing the policies and procedures of the Trust in conjunction with requirements under Rule 38a-1 under the 1940 Act. ALPS receives an annual fee for these services and is reimbursed for certain out-of-pocket expenses, pursuant to the chief compliance officer services agreement.
The Trust has adopted a plan pursuant to Rule 12b-1 under the 1940 Act (the “Plan”). The Plan permits the Trust, on behalf of Investor Class shares of the Funds, to pay up to 0.25% per year to one or more entities for services rendered and expenses borne in connection with providing shareholder or distribution services with respect to the Investor class shares of each Fund.
| Centre Funds | Notes to Financial Statements |
March 31, 2023 (Unaudited)
The Trust has also adopted a shareholder services plan for certain non-distribution shareholder services provided by financial intermediaries. With respect to each Fund, the shareholder services plan authorizes annual payment of up to 0.15% of the average daily net assets attributable to Investor Class shares of the Fund, and up to 0.10% of the average daily net assets attributable to Institutional Class shares of the Fund.
ALPS Distributors, Inc. (the “Distributor”) acts as the principal underwriter of the Funds pursuant to a distribution agreement with the Trust. No payments were retained by the Distributor by the Funds during the six-month period ended March 31, 2023.
Officers of the Trust and Trustees who are “interested persons” of the Trust or the Adviser receive no salary or fees from the Trust. Each Trustee who is not an “interested person” receives an annual retainer of $30,000 paid quarterly. The Trust reimburses each Trustee and Officer for his or her travel and other expenses relating to attendance at Board meetings.
One Trustee is an officer of the Trust, and serves as Managing Director and Chief Investment Officer of the Adviser.
6. FEDERAL INCOME TAX AND TAX BASIS INFORMATION
As of and during the six-month period ended March 31, 2023, no Fund had a liability for any unrecognized tax benefits. The Funds file U.S. Federal, state, and local tax returns as required. The Funds’ tax returns are subject to examination by the relevant tax authorities until expiration of the applicable statute of limitations, which is generally three years after the filing of the tax return but which can be extended to six years in certain circumstances. Tax returns for open years have incorporated no uncertain tax positions that require a provision for income taxes.
Components of Distributable Earnings on a Tax Basis: At September 30, 2022, there were no permanent differences that resulted in adjustments to distributable earnings (accumulated deficit) and additional paid-in capital.
As of September 30, 2022, the components of distributable earnings on a tax basis were as follows:
| Fund | | Accumulated Capital and Other Losses | | | Ordinary Income Undistributed | | | Net Unrealized Appreciation/(Depreciation) | | | Other Cumulative Effect of Timing Differences | | | Total Accumulated Earnings/(Deficit) | |
| Centre American Select Equity Fund | | $ | 3,239,250 | | | $ | 769,246 | | | $ | 15,745,864 | | | $ | (1,685 | ) | | $ | 19,752,675 | |
| Centre Global Infrastructure Fund | | | (28,134,260 | ) | | | – | | | | (517,784 | ) | | | – | | | | (28,652,044 | ) |
Elective Deferrals: Capital Losses and specified ordinary losses arising in the post-October period of the current fiscal year may be deferred to the next fiscal year if the fund elects to defer the recognition of these losses. When this election is made, any losses recognized during the period are treated as having occurred on the first day of the next fiscal year separate from and in addition to the application of normal capital loss carry forwards as described below.
The Funds elect to defer to the period ending September 30, 2023, capital losses recognized during the period November 1, 2021 - September 30, 2022 in the amount of:
| Fund | | Amount | |
| Centre Global Infrastructure Fund | | $ | 177,366 | |
The Funds elect to defer to the period ending September 30, 2023, late year ordinary losses in the amount of:
| Fund | | Amount | |
| Centre Global Infrastructure Fund | | $ | 110,270 | |
Under current law, capital losses maintain their character as short-term or long-term and are carried forward to the next tax year without expiration. As of the current fiscal year end, the following amounts are available as carry forwards to the next tax year:
| Fund | | Short-Term | | | Long-Term | |
| Centre Global Infrastructure Fund | | $ | 12,206,636 | | | $ | 15,639,988 | |
Distributions to Shareholders: The Centre American Select Equity Fund normally pays dividends and net investment income, if any, on an annual basis and the Centre Global Infrastructure Fund, intends to make monthly income distributions. Each Fund normally distributes capital gains, if any, on an annual basis. Income dividend distributions are derived from interest and other income each Fund receives from its investments, including distributions of short term capital gains. Capital gain distributions are derived from gains realized when each Fund sells a security it has owned for more than one year. Each Fund may make additional distributions and dividends at other times if the Adviser believes doing so may be necessary for each Fund to avoid or reduce taxes. Net investment income/ (loss) and net realized gain/ (loss) may differ for financial statement and tax purposes. The amounts and characteristics of tax basis distributable earnings/ (accumulated losses) are finalized at fiscal year-end.
| Semi-Annual Report | March 31, 2023 | 31 |
| Centre Funds | Notes to Financial Statements |
March 31, 2023 (Unaudited)
The tax character of distributions paid for the fiscal year ended September 30, 2022 were as follows:
| Distributions Paid From: | | Ordinary Income | | | Long-Term Capital Gains | | | Return of Capital | |
| Centre American Select Equity Fund | | $ | 10,126,681 | | | $ | 13,317,165 | | | $ | – | |
| Centre Global Infrastructure Fund | | | 911,561 | | | | – | | | | 9,453 | |
Unrealized Appreciation and Depreciation on Investments: The amount of net unrealized appreciation/(depreciation) and the cost of investment securities for tax purposes, including short-term securities at March 31, 2023 are displayed in the table below. The difference between book and tax basis unrealized appreciation/(depreciation) for the Funds is primarily attributable to wash sales, mark-to-market on options and certain other investments.
Net unrealized appreciation/depreciation of investments based on federal tax cost were as follows:
| | | Tax Cost of Investments | | | Gross Unrealized Appreciation | | | Gross Unrealized Depreciation | | | Net Tax Unrealized Appreciation/(Depreciation)on Investments | |
| Centre American Select Equity Fund | | $ | 327,706,668 | | | $ | 65,950,176 | | | $ | (7,926,677 | ) | | $ | 58,023,499 | |
| Centre Global Infrastructure Fund | | | 29,904,885 | | | | 5,121,979 | | | | (2,454,412 | ) | | | 2,667,567 | |
7. PURCHASES AND SALES OF INVESTMENT SECURITIES
For the six-month period ended March 31, 2023, the aggregate cost of purchases and proceeds from sales of investment securities (excluding any U.S. Government Obligations, short-term securities, and purchased options and futures) were as follows:
| Fund | | Purchases of Securities | | | Proceeds From Sales of Securities | |
| Centre American Select Equity Fund | | $ | 193,255,034 | | | $ | 193,358,715 | |
| Centre Global Infrastructure Fund | | | 5,073,121 | | | | 7,655,849 | |
8. INDEMNIFICATIONS
Under the Trust’s organizational documents, its officers and Trustees are indemnified against certain liabilities relating to their duties to the Trust. Additionally, in the ordinary course of business, the Trust enters into contracts with service providers that may contain general indemnification clauses. The Trust’s maximum exposure under these arrangements is unknown, as this would involve future claims that may be made against the Trust that have not yet occurred.
9. SUBSEQUENT EVENTS
The Funds have evaluated the need for disclosures and/or adjustments resulting from subsequent events through the date the financial statements were issued. Based on this evaluation, no adjustments were required to the financial statements as of March 31, 2023.
| Centre Funds | Additional Information |
March 31, 2023 (Unaudited)
PROXY VOTING GUIDELINES AND RECORDS
A description of the policies and procedures that the Funds use to determine how to vote proxies relating to portfolio securities and information regarding how the Funds voted proxies during the most recent 12-month period ended June 30, is available without charge, upon request, by (1) calling the Funds at 1-855-298-4236 and (2) on the U.S. Securities and Exchange Commission’s (“SEC”) website at http://www.sec.gov.
PORTFOLIO HOLDINGS DISCLOSURE POLICY
The Trust files, with regard to each Fund, with the SEC a complete schedule of investments for the first and third quarters of each fiscal year as an exhibit to its reports on Form N-PORT. The Funds’ first and third fiscal quarters end on December 31 and June 30. Form N-PORT reports are available on the SEC’s website at http://www.sec.gov. You may also obtain copies by calling the Funds at 1-855-298-4236.
TAX DESIGNATIONS
Qualified Dividend Income
The percentage of ordinary income dividends distributed during the calendar year ended December 31, 2022 are designated as qualified dividend income (QDI) as defined in Section 1(h)(11) of the Internal Revenue Code in the following percentages:
| | Amount |
| Centre American Select Equity Fund | 100.00% |
| Centre Global Infrastructure Fund | 100.00% |
Dividends Received Deduction
For corporate shareholders, the following ordinary dividends paid during the calendar year ended December 31, 2022 qualify for the corporate dividends received deduction:
| | Amount |
| Centre American Select Equity Fund | 100.00% |
| Centre Global Infrastructure Fund | 64.83% |
Pursuant to Section 852(b)(3) of the Internal Revenue Code, the following amounts were designated as long-term capital gain dividends:
| | Amount |
| Centre American Select Equity Fund | $3,239,208 |
| Semi-Annual Report | March 31, 2023 | 33 |
| Centre Funds | Consideration and Approval of Investment Advisory Agreements |
March 31, 2023 (Unaudited)
At a meeting held on September 9, 2022, the Board of Trustees (the “Board” or the “Trustees”) of Centre Funds (the “Trust”), including a majority of the Trustees who are not parties to any of the Advisory Agreements (defined below) or interested persons of any such party (the “Disinterested Trustees”), considered and unanimously approved the renewal of the Investment Advisory Agreement between Centre Asset Management, LLC (“Centre” or the “Adviser”) and the Trust, on behalf of the Centre American Select Equity Fund (the “American Equity Fund”) and the Investment Advisory Agreement between the Adviser and the Trust, on behalf of the Centre Global Infrastructure Fund (the “Infrastructure Fund”). In considering whether to approve the renewal of each Investment Advisory Agreement (together, the “Advisory Agreements”), the Trustees considered the factors discussed below, and information made available to them in connection with the meeting relating to such factors (the “Meeting Materials”), including information provided by the Adviser in response to questions from the Trustees, and any other information the Trustees deemed relevant. The Trustees’ approval of the renewal of the Advisory Agreements was not based on any single factor, but on a consideration of the totality of factors and information they reviewed and evaluated.
Nature, Extent, and Quality of Services
The Trustees reviewed and discussed information concerning the nature, extent, and quality of advisory services provided by the Adviser to the Funds pursuant to the Advisory Agreements, including information concerning the Adviser’s investment philosophy. They discussed the Adviser’s disciplined, fundamental stock selection process to evaluate the value of a company, and emphasis on position sizing to mitigate risk. The Trustees considered the investment personnel responsible for the day-to-day management of each Fund’s portfolio and such personnel’s experience in the investment management area. The Trustees also considered information it received from the Trust’s Chief Compliance Officer regarding the Adviser’s compliance policies and procedures, its adherence to those policies and procedures, and the Adviser’s compliance resources. They noted their satisfaction with the Trustee’s access to senior management of the Adviser. They discussed the Adviser’s commitment to the Funds and the resources dedicated to servicing the Funds. The Trustees concluded that the nature and extent of the services provided by the Adviser as the investment adviser to the Funds were of high quality, appropriate and sufficient to support the renewal of the Advisory Agreements.
Performance
The Trustees considered information regarding each Fund’s performance, including information comparing performance to the applicable benchmark, an Adviser selected peer group, its Morningstar category, and another fund managed by the Adviser for various time periods as of June 30, 2022. The Trustees also considered the respective investment strategy of each Fund, the positive absolute performance of both Funds and the risk metrics provided by the Adviser, including standard deviation and maximum drawdown. They discussed the very strong relative performance of the Equity Fund over the past one-year period and its impact on overall relative performance. They noted that the Infrastructure Fund had outperformed broad global equity indices over the one-year, while underperforming other sector-specific benchmarks over that period. Based on the foregoing, the Board determined that the performance of each Fund was acceptable.
Profitability
The Trustees then analyzed whether the Adviser reaped excessive profits from the management of either of the Funds. The Trustees reviewed the gross advisory fee profit for the Equity Fund as well as the amount of any fee waiver or expense reimbursements paid by the Adviser. The Trustees then reviewed the gross advisory fee profits of the Infrastructure Fund. They considered the amount of any fee waivers or expense reimbursements, the Adviser’s overhead costs and other benefits provided by the Adviser to form their conclusion. The Trustees then concluded that the Adviser’s profitability from each Fund was not unreasonable.
Economies of Scale
The Trustees considered information concerning potential economies of scale for each Fund, noting that the Funds (through January 29, 2024) each benefit from an expense limitation agreement covering most operating expenses, including the advisory fees charged to the Fund, but excluding expenses such as fees payable by the Funds pursuant to the Trust’s Rule 12b-1 Plan and Shareholder Services Plan. They also noted the Equity Fund’s fee breakpoint at $1 billion of assets under management. The Trustees also considered current asset levels and expectations for growth, and concluded that it was unlikely that the Adviser had achieved material economies of scale in managing either Fund, and the Board would reevaluate the issue of economies of scale at the next renewal.
Comparisons of the Advisory Fees and Select Expense Ratios
The Trustees reviewed and discussed the advisory fees payable to the Adviser under each Advisory Agreement for the services it provided thereunder and the net expense ratios of the Investor Class shares of each Fund. The Trustees reviewed, with respect to each Fund, a comparison of the expense ratio of the Fund’s Investor Class shares compared to the applicable Morningstar category average expense ratio of similarly situated funds determined by Morningstar. The Trustees discussed the advisory fees and expense information included in the Board materials with respect to each Fund and considered whether the advisory fees were reasonable in light of the active management strategy provided by the Adviser to the Funds and the quality of the services provided. They noted that the fee paid by the Infrastructure Fund of 0.85% was slightly below the average fees of the peer group of 0.88%, while the fees paid by the Equity Fund of 0.75% were higher than the peer group average of 0.58%, but well within the range of those comparable fees.
| Centre Funds | Consideration and Approval of Investment Advisory Agreements |
March 31, 2023 (Unaudited)
After reviewing all of the information presented to them, the Trustees concluded that the advisory fees payable to the Adviser by the Funds under the Advisory Agreements were not unreasonable in light of the services provided.
Conclusion
The Trustees, including a majority of the Independent Trustees, concluded, based on their consideration of the foregoing and their evaluation of all of the information reviewed by the Trustees, that renewal of the Advisory Agreements was in the best interest of the Funds and their respective shareholders.
At a meeting held on November 11, 2022, the Board, including a majority of the Disinterested Trustees, considered and unanimously approved new Investment Advisory Agreements between Centre and the Trust, on behalf of the American Equity Fund and the Infrastructure Fund (each “New Agreement” and together, the “New Agreements”). The Board noted that it had previously renewed the advisory agreements at the September 9, 2022 meeting however, due to a proposed change in partial ownership of the Adviser, the Board was being asked to approve the New Agreements. In considering whether to approve each New Agreement, the Trustees considered the factors discussed at the previous meeting (noted above) as well as the information made available to them in connection with the meeting, including information provided by the Adviser in response to questions from the Trustees, and any other information the Trustees deemed relevant. The Trustees’ approval of the New Agreements was not based on any single factor, but on a consideration of the totality of factors and information they reviewed and evaluated.
Nature, Extent, and Quality of Services
The Trustees reviewed and discussed information concerning the nature, extent, and quality of advisory services to be provided by the Adviser to the Funds pursuant to the New Agreements, including information concerning the Adviser’s investment philosophy. They discussed the Adviser’s disciplined, fundamental stock selection process to evaluate the value of a company, and emphasis on position sizing to mitigate risk. The Trustees considered the investment personnel responsible for the day-to-day management of each Fund’s portfolio and such personnel’s experience in the investment management area, and that no change in personnel was anticipated. The Trustees also considered information it received from the Trust’s Chief Compliance Officer regarding the Adviser’s compliance policies and procedures, its adherence to those policies and procedures, and the Adviser’s compliance resources. They noted their satisfaction with the Trustee’s access to senior management of the Adviser. They discussed the Adviser’s commitment to the Funds and the resources dedicated to servicing the Funds. The Trustees concluded that the nature and extent of the services to be provided by the Adviser as the investment adviser to the Funds would be of high quality, appropriate and sufficient to support the approval of the New Agreements.
Performance
The Trustees considered information regarding each Fund’s performance, including information comparing performance to the applicable benchmark, an adviser selected peer group, its Morningstar category, and another fund managed by the Adviser for various time periods as of July 31, 2022. The Trustees also considered the respective investment strategy of each Fund, the positive absolute performance of both Funds and the risk metrics provided by the Adviser, including standard deviation and maximum drawdown. They discussed the very strong relative performance of the Equity Fund over the past one-year, three-year, and five-year periods and the impact on overall relative performance. They noted that the Infrastructure Fund had outperformed broad global equity indices over the past one-year and ranked in the first quartile of its Morningstar category, while performing similar to its applicable benchmark over other periods. Based on the foregoing, the Board determined that the performance of each Fund was acceptable.
Profitability
The Trustees then analyzed whether the Adviser reaped excessive profits from the management of either of the Funds and the potential impact of the Transaction on Adviser profits. The Trustees reviewed the gross advisory fee profit for the Equity Fund as well as the amount of any fee waiver or expense reimbursements paid by the Adviser. The Trustees then reviewed the gross advisory fee profits of the Infrastructure Fund. They considered the amount of any fee waivers or expense reimbursements, the Adviser’s overhead costs and other benefits provided by the Adviser to form their conclusion. The Trustees then concluded that the Adviser’s profitability from each Fund was not unreasonable.
Economies of Scale
The Trustees considered information concerning potential economies of scale for each Fund, noting that the Funds (through January 29, 2024) each benefit from an expense limitation agreement covering most operating expenses, including the advisory fees charged to the Fund, but excluding expenses such as fees payable by the Funds pursuant to the Trust’s Rule 12b-1 Plan and Shareholder Services Plan. They also noted the Equity Fund’s fee breakpoint at $1 billion of assets under management. The Trustees also considered current asset levels and expectations for growth, and concluded that it that the Board would reevaluate the issue of economies of scale at the next renewal.
Comparisons of the Advisory Fees and Select Expense Ratios
The Trustees considered that each New Agreement was identical in all material respects to the Current Agreement that it would replace except for the dates of commencement and renewal. The Trustees reviewed and discussed the advisory fees payable to the Adviser under each New Agreement for the services it provided thereunder and the net expense ratios of the Investor Class shares of each Fund. The Trustees reviewed, with respect to each Fund, a comparison of the expense ratio of the Fund’s Investor Class shares compared to the applicable Morningstar category average expense ratio of similarly situated funds determined by Morningstar. The Trustees discussed the advisory fees and expense information included in the Board materials with respect to each Fund and considered whether the advisory fees were reasonable in light of the active management strategy provided by the Adviser to the Funds and the quality of the services provided. They noted that the fee paid by the Infrastructure Fund of 0.85% was slightly below the average fees of the peer group of 0.88%, while the fees paid by the Equity Fund of 0.75% were higher than the peer group average of 0.58%, but well within the range of those comparable fees.
| Semi-Annual Report | March 31, 2023 | 35 |
| Centre Funds | Consideration and Approval of Investment Advisory Agreements |
March 31, 2023 (Unaudited)
Additionally, the Trustees noted the fees to be charged under the New Agreements are identical to the fees charged under the Current Agreements. After reviewing all of the information presented to them, the Trustees concluded that the advisory fees payable to the Adviser by the Funds under the New Agreements were not unreasonable in light of the services provided.
Conclusion
The Trustees, including a majority of the Independent Trustees, concluded, based on their consideration of the foregoing and their evaluation of all of the information reviewed by the Trustees, that approval of the New Agreements was in the best interests of the Funds and their respective shareholders.

| (b) | Not Applicable to the Registrant |
Item 2. Code of Ethics.
Not applicable to semi-annual report.
Item 3. Audit Committee Financial Expert.
Not applicable to semi-annual report.
Item 4. Principal Accountant Fees and Services.
Not applicable to semi-annual report.
Item 5. Audit Committee of Listed Registrants.
Not applicable to the Registrant.
Item 6. Schedule of Investments.
| (a) | The Registrant’s “Schedule I – Investments in securities of unaffiliated issuers” (as set forth in 17 CFR 210.12-12) is included in Item 1 of this Form N-CSR. |
| (b) | Not applicable to the Registrant. |
Item 7. Disclosure of Proxy Voting Policies and Procedures for Closed-End Management Investment Companies.
Not applicable to the Registrant.
Item 8. Portfolio Managers of Closed-End Management Investment Companies.
Not applicable to the Registrant.
Item 9. Purchases of Equity Securities by Closed-End Management Investment Company and Affiliated Purchasers.
Not applicable to the Registrant.
Item 10. Submission of Matters to a Vote of Security Holders.
None.
Item 11. Controls and Procedures.
| (a) | The Registrant’s principal executive officer and principal financial officer have evaluated the Registrant’s disclosure controls and procedures (as defined in Rule 30a-3(c) under the Investment Company Act of 1940, as amended) within 90 days of this filing and have concluded that the Registrant’s disclosure controls and procedures were effective as of that date. |
| (b) | There was no change in the Registrant’s internal control over financial reporting (as defined in Rule 30a-3(d) under the Investment Company Act of 1940, as amended) during the second fiscal quarter of the period covered by this report that has materially affected, or is reasonably likely to materially affect, the Registrant’s internal control over financial reporting. |
Item 12. Disclosure of Securities Lending Activities for Closed-End Management Investment Companies.
Not applicable.
Item 13. Exhibits.
| (a)(1) | Not applicable to semi-annual report. |
SIGNATURES
Pursuant to the requirements of the Securities Exchange Act of 1934 and the Investment Company Act of 1940, the Registrant has duly caused this report to be signed on its behalf by the undersigned, thereunto duly authorized.
CENTRE FUNDS
| By: | /s/ James A. Abate | |
| | James A. Abate | |
| | President (Principal Executive Officer) | |
| | | |
| Date: | May 26, 2023 | |
Pursuant to the requirements of the Securities Exchange Act of 1934 and the Investment Company Act of 1940, this report has been signed below by the following persons on behalf of the Registrant and in the capacities and on the dates indicated.
| By: | /s/ James A. Abate | |
| | James A. Abate | |
| | President (Principal Executive Officer) | |
| | | |
| Date: | May 26, 2023 | |
| By: | /s/ James A. Abate | |
| | James A. Abate | |
| | Treasurer (Principal Financial Officer) | |
| | | |
| Date: | May 26, 2023 | |