UNITED STATES
SECURITIES AND EXCHANGE COMMISSION
Washington, D.C. 20549
FORM N-CSR
CERTIFIED SHAREHOLDER REPORT OF REGISTERED
MANAGEMENT INVESTMENT COMPANIES
Investment Company Act file number: 811-22545
CENTRE FUNDS
(Exact name of registrant as specified in charter)
48 Wall Street, Suite 1100, New York, New York 10005
(Address of principal executive offices) (Zip code)
James A. Abate
48 Wall Street, Suite 1100
New York, New York 10005
(Name and address of agent for service)
Registrant’s telephone number, including area code: (212) 918-4705
Date of fiscal year end: September 30
Date of reporting period: October 1, 2020 – March 31, 2021
Item 1. Reports to Stockholders.
(a)
TABLE OF CONTENTS
| | PAGE |
| SHAREHOLDER LETTER | 1 |
| MANAGER COMMENTARY | 2 |
| Centre American Select Equity Fund | 2 |
| Centre Global Infrastructure Fund | 7 |
| DISCLOSURE OF FUND EXPENSES | 11 |
| SCHEDULE OF INVESTMENTS | 12 |
| Centre American Select Equity Fund | 12 |
| Centre Global Infrastructure Fund | 14 |
| STATEMENTS OF ASSETS AND LIABILITIES | 17 |
| STATEMENTS OF OPERATIONS | 18 |
| STATEMENTS OF CHANGES IN NET ASSETS | 19 |
| Centre American Select Equity Fund | 19 |
| Centre Global Infrastructure Fund | 20 |
| FINANCIAL HIGHLIGHTS | 21 |
| Centre American Select Equity Fund | 21 |
| Centre Global Infrastructure Fund | 23 |
| NOTES TO FINANCIAL STATEMENTS | 25 |
| ADDITIONAL INFORMATION | 34 |
| Centre Funds | Shareholder Letter |
| | March 31, 2021 (Unaudited) |
Dear Shareholders,
It is with my pleasure that we publish the Centre Funds Semi-Annual Report covering the six-month period ended March 31, 2021. I want to thank my fellow shareholders for their continued support and confidence in Centre Funds. The Centre Funds offer a select series of fundamentally-driven, actively managed funds to choose from, each available in investor and institutional share classes. We are passionate about active management.
Centre American Select Equity Fund
The Fund is a U.S. large capitalization valuation sensitive core growth stock fund that seeks long-term growth of capital and is focused on risk adjusted returns through active and pragmatic management; the Fund may complement its equity securities with hedges and other capital preservation strategies when deemed appropriate. The Fund is intended to be a risk managed core growth fund.
Centre Global Infrastructure Fund
The Fund is for investors seeking to potentially benefit from a renewed focus on infrastructure spending but wish to have liquidity in publicly traded investments in developed global markets rather than illiquid private investments. The Fund pursues a bottom-up, active management approach and invests in what we deem the most attractive infrastructure-related companies from the United States and developed international economies. Also, the Fund seeks to balance its exposures to where the weights of the Telecommunication, Utilities, Energy, Transportation, and Social Infrastructure industries are broadly represented. The Fund focuses on higher dividend yielding assets and distributes dividend and interest income monthly.
Our aim at Centre Funds is to deliver strong, long-term performance results for investors through an exceptional focus on producing returns and managing risk and downside volatility in select investment strategies. We want investors to associate Centre Funds with high-conviction, differentiated fund strategies that may not be available elsewhere and are tactical, pragmatic, and opportunistic. Each investment strategy aims to capitalize on defined market opportunities with consistent methodology and repeatable investment and processes to achieve differentiated returns and risk profiles. We remain focused on fundamentally-driven investment approaches within truly active, high conviction, disciplined and research intensive processes. At Centre Funds, we place service excellence at the core of everything that we do and are committed to providing useful information on all of the Funds. Again, I want to thank my fellow shareholders for their continued support and confidence in the Centre Funds.
Sincerely,
James Abate
President, Centre Funds
| Semi-Annual Report | March 31, 2021 | 1 |
| Centre American Select Equity Fund | Manager Commentary |
| | March 31, 2021 (Unaudited) |
Performance & Strategy Summary
For the six-month period ended March 31, 2021, the Centre American Select Equity Fund (the “Fund”), Investor Share Class, delivered a total return of 22.03 percent; the Institutional Share Class delivered a total return of 22.37 percent.
During the same six-month period, the key barometer of the U.S. stock market as a whole, as measured by the S&P 500 Index1, delivered a total return of 19.06 percent. Companies with expectations of high economic recovery sensitivity and best able to be operationally leveraged to improving sales growth following the sharp but short recession in the early part of 2020 as COVID-192 pandemic lockdowns were put in place globally fared best. These were mainly in the traditional cyclical sectors such as Energy, Financials, Industrials, and Materials. Stable growth sectors such as Consumer Staples, Utilities, and Health Care performed relatively less well but still provided positive absolute returns.
The strongest contributors to performance within the Fund over the six-month period ended March 31, 2021 included the Fund’s investments within the Energy sector, Cimarex Energy, Exxon Mobil, APA Corp., Chevron, Kinder Morgan, and Williams; the chemicals industry within the Materials sector, Olin Corp., LyondellBasell, and Eastman Chemical; and the commodity food products industry within Consumer Staples, Bunge, and Archer Daniels Midland. In general, both stock selection and sectoral biases, particularly our overweight postures in the Energy and Materials sectors, and underweight posture in the Health Care sector, contributed to the relative outperformance over the period. Stock investments that contributed negatively to relative Fund performance over the period included Barrick Gold, Salesforce.com, Adobe, Merck, Abbott Laboratories, Pfizer, and Hain Celestial. Fund performance was impacted negatively from a total return perspective by the net realized losses from certain hedges and other investments that Centre Asset Management, LLC, the investment adviser to the Fund (“Centre,” the “Adviser”, “we”, or “the Fund’s portfolio manager”), viewed as capital protective in nature but are a drag to performance in positive markets with little realized drawdowns or downside volatility. These hedges, namely put options3 on the S&P 500 Index, have performed as expected during the stock market’s previous sharp corrective episodes, most notably in February/March 2020 and, over the longer-term, have insulated the Fund from the same magnitude of maximum drawdown4 experienced by the overall stock market over prior volatile5 episodes, namely in August 2015, January 2016, February 2018, and December 2018. Given the continued presence of certain potentially de-stabilizing factors that we believe could negatively impact the value of underlying equity securities held in the Fund’s portfolio, the Fund will continue the strategy of tactically and opportunistically purchasing put options on the S&P 500 Index as a potential hedge against its underlying stock holdings in the event of a material overall stock market correction.
The methodology and process used by Centre to manage the Fund focuses on each individual portfolio company's growth outlook and capacity to create shareholder value, utilizing our bottom-up fundamental stock selection process. We utilize a disciplined, Economic Value Added (EVA)6 framework to select investments. The framework focuses on the fundamentals of wealth creation or wealth destruction similar to the way a traditional, long-term focused corporate investor looking at all aspects of the business would assess a company's value. Our experience is, in the shorter-term, markets may often undervalue or overvalue a company's ability to create or destroy wealth. The framework seeks to identify and capture these investment opportunities. The approach is designed to capture excess returns when a business is creating shareholder wealth and the market price of the stock converges toward our fundamentally-derived target price. Centre not only analyzes earnings but also strives to understand and link the capital allocation decisions being made today by each portfolio company and how they may lead to future earnings growth. In other words, we expect that the companies in which the Fund invests in will themselves invest in productive assets of the business, organically and through opportunistic purchases which, in turn, should provide the foundation for future revenue and profits growth that create shareholder value. Alternatively, if companies cannot invest in productive assets due to a cyclical downturn or existing excess capacity, we expect these companies to “wisely contract” through the restructuring of their assets and other resources to regain their footing for future shareholder value creation. The key is that we look at the company drivers that create true shareholder wealth: capital spending or alternative capital allocations such as acquisitions, stock buybacks, or dividends; company-specific risk levels of a business to determine appropriate hurdle rates7; and whether the company is generating positive or excess returns on its underlying assets vis-à-vis the cost of capital. Wealth creation from growth or from wise contraction – that’s how we believe companies create shareholder value.
| 1 | S&P 500 is an index of 500 stocks seen as a leading indicator of U.S. equities and a reflection of the performance of the large cap universe, made up of companies selected by economists. |
| 2 | In COVID-19, 'CO' stands for 'corona,' 'VI' for 'virus,' and 'D' for disease. Formerly, this disease was referred to as “2019 novel coronavirus” or “2019-nCoV”. There are many types of human coronaviruses including some that commonly cause mild upper-respiratory tract illnesses. |
| 3 | A put option is a contract giving the owner the right, but not the obligation, to sell a specified amount of an underlying security at a specified price within a specified time. |
| 4 | Maximum drawdown is the maximum loss from a peak to a trough of a portfolio, before a new peak is attained. |
| 5 | Volatility is a measure of systematic risk of a security or a portfolio in comparison to the market as a whole. |
| 6 | Economic Value Added (EVA) is an estimate of a company’s economic profit. Economic profit, which refers to the profit earned by a company, minus the cost of financing the company’s capital, is an amount that may be considered in the assessment of a company’s overall value. |
| 7 | A hurdle rate is the minimum rate of return on a project or investment required by a manager or investor. The hurdle rate denotes appropriate compensation for the level of risk present; riskier projects generally have higher hurdle rate than those that are deemed to be less risky. |
| Centre American Select Equity Fund | Manager Commentary |
| | March 31, 2021 (Unaudited) |
To meet its objective as a risk-managed core growth fund, the Fund may complement its equity securities with hedges and other capital preservation strategies when deemed tactically appropriate by Centre. While the use of hedging and certain investment techniques involve risk, the Adviser may tactically, as a defensive position, employ hedges and other capital preservation strategies on up to 100 percent of the value of the Fund’s underlying securities positions when the Adviser’s assessment of market valuation indicates forward returns for the stock market, as a whole, are low relative to downside risk and the cost to upside potential from portfolio preservation tools is deemed reasonable in order to respond to adverse market, economic, political, or other conditions. The Adviser may also tactically employ hedges to reduce volatility. For example, through the tactical use of purchased put options, the Fund may have enhanced performance and more limited risk. Index put options are designed to hedge the Fund from significant market declines that may occur over short periods of time. The value of an index put option generally increases as the underlying securities in the Fund decrease in price and decreases as those securities increase in price. The Adviser may also seek to enhance returns by writing (selling) out of the money covered call options tailored with exercise prices generally above the current market prices of stocks held in the Fund. As the seller of the call option, the Fund receives cash (the premium) from the purchaser8. The Adviser varies its hedging strategy and defensive positions across changing market cycles but has generally employed such strategies within the Fund since late 2014.
Market Review & Outlook
We believe the investment environment today can be best summarized as: 1) stock valuations are extreme relative to history on both an absolute (e.g., Price/Sales, Price/Book Value, Price/Earnings, etc.) and relative basis (as compared to bond yields and most other asset alternatives); 2) economic activity is in firm expansion mode with the industrial segment leading the consumer and service sectors out of the sharp and brief recession of 2020, leading to a very strong earnings outlook for nearly all large companies; 3) pent-up demand and supply constraints have seen inflation inflect higher with persistence for the first time in a generation and will likely be the most discussed investment topic in 2021; 4) the introduction of unprecedented fiscal stimulus during a time of robust economic expansion is without historical parallel in the United States, particularly from a country whose proportional indebtedness (to GDP9) is beyond any precedent outside of the emerging markets; and 5) for the first time since the late 1970’s, the hegemony of the United States is uncertain and being challenged by political and/or economic rivals leading to additional risks. Given this backdrop, we remain selectively bullish on equities relative to other asset classes, and particularly focused on those companies with a “real” asset base and that can produce earnings growth in excess of what we expect will be a period of offsetting valuation multiple compression. While we expect a time correction rather than an abrupt price correction as the more likely outcome, we recognize that broad stock market indexes are fragile and highly vulnerable to a significant dislocation if a negative catalyst is introduced rather than our base case of earnings catching up to stock prices. The successful investment playbook of an indifference to profitability with reliance upon valuation multiples re-rating ever higher that has existed since 2015 is now closed in our opinion.
As we digest the tumultuous past year plus and, perhaps due to the increased dependence on technology during the pandemic period, nearly every person feels the increasingly constant pulse of never-ending bombardment of advertising, promotion, influencing, etc. directed at us all. Given this, we keep becoming nostalgic for the less saturated media environment of the 1980’s and, in particular, the advertising catchphrase “where’s the beef?” Originally introduced as a marketing slogan for fast food purveyor Wendy’s in 1984, it became ubiquitous in usage to question the substance of something with particular popularity in that year’s Presidential election as candidate Walter Mondale questioned other candidates’ programs and policies. Wendy’s even re-introduced the advertisement last year when grocery stores were experiencing a shortage of beef; a testament to its continuing and widespread applicability. Increasingly though, whether it’s our experience (age) or the natural contrarian in our investment deposition, we seem to keep murmuring the phrase to ourselves as we look at the investment (or speculation) environment of today where everyone seems to know the price of everything but few know the intrinsic value of anything, and there’s little historical awareness of risk or, sadly, even basic history for that matter.
Ideas and innovation now represent the overwhelming portion of the world’s capital and wealth. In the past, physical assets such as land, plants, property or equipment made up the bulk of a company’s value. Today, intellectual property such as patents, trademarks, goodwill, and even data and software dominates the assets of most business concerns. When looking at the aggregate balance sheet for the S&P 500 Index on an equal weighted basis, intangible assets represented at year end 2020 approximately fifteen percent of total assets. Perhaps less appreciated is that the Price/Book Value ratio gives further “unrecorded goodwill” value to assets implied by investors that is not reflected on a company’s accounting records or, in other words, the market value added or expectations of value accruing up and above the capital invested in its business, both the tangible and intangible. Today, the Price/Book Value figure is 5.3 times, an all-time high and twice the median level of the past thirty years. We recognize certain accounting treatment of stock buybacks, research and development expenses, etc., can sometimes distort reported book value and not being wholly indicative of invested equity capital. Furthermore, we’re not luddites and absolutely recognize that the advances in artificial intelligence, biotechnology, cloud computing, and other cutting edge technologies will determine who will succeed in an increasingly competitive world. This said, we also need to separate what is undeserving of market value because we can’t identify “where’s the beef” in many money-losing business enterprises and, equally important, where there is genuine substance and profitability or an understandable pathway to it, what does the market value currently already imply based upon the current stock price. Having the experience of managing equity funds, including dedicated technology sector funds, during the late 1990’s technology boom followed by bust, we also recognize that the implosion of securities that lack the beef can negatively impact those that do from a valuation perspective in terms of reduced expectations and higher risk premium demanded by investors.
| 8 | A covered call is an options strategy whereby an investor holds a long position in an asset and writes (sells) call options on that same asset in an attempt to generate increased income from the asset. This is often employed when an investor has a short-term neutral view on the asset and for this reason holds the asset long and simultaneously has a short position via the option to generate income from the option premium. |
| 9 | Gross domestic product (GDP) is a monetary measure of the market value of all the final goods and services produced in a specific time period. |
| Semi-Annual Report | March 31, 2021 | 3 |
| Centre American Select Equity Fund | Manager Commentary |
| | March 31, 2021 (Unaudited) |
The well-known and large S&P 500 Index component group of stocks known as the FAANGs (Facebook, Apple, Amazon, Netflix, and Alphabet) plus certain others to us are expensive on most traditional valuation metrics such as Price/Sales or Book Value noted above. In each of their cases however, a significant portion of their revenue generating asset bases arise from the fact that a large part of their capital invested in the business, research and development costs most notably, are expensed rather than capitalized unlike a building or manufacturing plant due to accounting rules thus providing a mismatch of metrics unless one capitalizes such costs in their analyses, as we do. That said, the reliance on future growth and profitability, as expressed in their stock prices, remains broadly elevated and subject to company specific disappointment but also highly sensitive to systematic influence; i.e., changes in interest rates, risk premium, etc. Our quibble with the FAANGs is not that they lack the beef but, in essence, what’s the appropriate price for the beef, or value of further unrecorded goodwill by the market noted above, especially as we see the systematically influencing factors becoming negative after an extended period of being a tailwind.
On the other hand, the speculative fever now encompassing certain segments of the stock market, cryptocurrencies, nonfungible tokens or NFTs, meme stocks, celebrity led special purpose acquisition companies (SPACs), etc., is parallel, if not worse, than the very end of the dot-com era twenty years ago and we estimate that the loss of paper wealth this time will be multiples of the prior episode as people begin to realize that there is literally zero substance to most of these speculative assets which represent nothing more than a high-tech version of alchemy. We have little doubt that like their historical forerunners the promoters will fail to create something from nothing, but our main concern is what the impact will be from their eventual collapse on the FAANGs and the rest of the stock market. With cryptocurrencies in particular, we cannot reconcile how the United States continues to allow an alternative and anonymous forms of fiat currency to develop further while subjecting transactions in U.S. dollars to anti-money laundering laws and other highly scrutinous and intrusive regulations. Governments hold two important monopolies – the military and currency, and we expect cryptocurrency holders to share an analogous fate to someone trying to build their own armed militia. There’s a reason China, Turkey, and India have already (or plan to shortly) banned their mining, ownership, or usage and we suggest investors who think that it could never happen in the U.S. to read about the gold confiscation of 1933 imposed by President Roosevelt. The fallout from the destruction of $2 trillion plus in paper wealth and the entire ecosystem built around cryptocurrencies may be one of the potential negative shocks to the speculative fervor imbedded in overall market expectations. In the end, we’re confident that people will reflect on this speculative episode after a significant loss of paper wealth and ask themselves, where was the beef?
The timing of inflection points in economic activity, inflation, and other macro variables is notoriously difficult to pinpoint with precision. We thankfully feel that our investment methodology and process that starts with company-level bottom-up research, which we then aggregate into a mosaic, has served us well over many business cycles. It’s this specific objective to avoid inexpensive value traps that continue to underperform because fundamentals have yet to bottom and expectations that continue to fall, while at the same time be a nimble contrarian seller of growth, the period when fundamentals begin to deteriorate but continued price momentum temporarily blinds most investors, that we have a high degree of self-confidence due to our investment methodology. Further, performing our analysis at the root drivers, e.g., sales growth, profit margins, asset efficiency, risk premium, etc., allows us to understand and consolidate what will contribute to a company’s EVA or wealth creation and the future spread between the company’s market value and the capital employed on its balance sheet. In aggregate, today’s outlook is the mirror image of what existed a year ago. Namely, sales growth is a positive driver, profit margin expansion will accrue positive benefits to companies who are operationally leveraged to changes in sales growth, and asset efficiency is positive as many companies have wisely-contracted during the recession and are reluctant to aggressively expand their capital invested. In other words, we expect to see a very high degree of earnings leverage from companies who have kept their wallet in their pocket. What’s negative is that interest rate risk has risen and risk premiums (or aversion to risk) are now at historic lows and vulnerable to a shock to the current complacent speculative psychology.
For the first time since 2001, we are seeing the majority of the best bottom-up opportunities within real assets, namely the Energy and Materials sectors, commodity-oriented food producers, and to a certain extent semiconductor manufacturers within the Technology sector. The commodity bust of 2014-2016 that saw raw material prices for oil, copper, corn, soybeans, cotton, and others fall to extreme lows set in motion a persistent period of capital spending discipline by the management of most companies that operate in those areas, akin to what was last witnessed during the fallout from the currencies crisis in 1998-2000 in emerging markets. The parabolic economic growth and industrialization of China beginning in 2001, and which lasted in earnest through 2008, was the catalyst back then to see the stocks of these resource and industrial companies greatly outperform broad stock market indexes starting in 2002 and, especially, the Technology sector after the bubble popped in 2000 and continued to languish. Although we believe China’s growth will stay robust, the pace of change has tempered simply due to larger numbers today but we think the incremental catalyst now to see a similar set of outcomes will be large scale fiscal and infrastructure-related stimulus in the U.S. and Europe, consumer and industrial pent-up demand from nearly all locked-down economies as they emerge vaccinated or immune from natural infection, as well as inflation being allowed to run much higher than in the past by the Federal Reserve due to the continued suppression of short term interest rates as well as the adoption of modern monetary theory (MMT) or debt monetization, driving the dollar down and boosting the prices of raw commodities given that the dollar is the benchmark pricing mechanism for most commodities. So, where’s the beef? It’s in tangible assets and companies operating in those industries who gain pricing power from a persistently improving commodity price cycle. Examples of recent purchases or additions to the Fund meeting our criteria include food product producers Archer Daniels Midland and Bunge; oil & gas producers and transporters APA Corp, Cimarex, EQT, Kinder Morgan, and Exxon Mobil; mining and materials companies Freeport-McMoRan, Southern Copper, and Weyerhaeuser; and chemical, fertilizer and agricultural science companies Olin, LyondellBasell, Mosaic, and Corteva.
| Centre American Select Equity Fund | Manager Commentary |
| | March 31, 2021 (Unaudited) |
We believe that we have seen the apex of investor exuberance for intangible assets for this stock market cycle and that market leadership towards real assets will gain momentum and have persistence for longer than investors expect due to hard lessons learned from past profligate asset expansion and capital spending by the managements of most of the companies in these industries. We continue to emphasize a barbell of secular leadership growth stocks, cognizant of their valuation risk, with contrarian, opportunistic, cyclical, and mostly commodity-related producing companies who should benefit tremendously from their company specific actions to reduce supply and committed capital investment, as well as what we feel will be a reflationary-driven recovery in economies. While lower in probability in our view, the onset of a stagflationary environment remains a potential danger to the markets but currently this is a very small minority view by professional investors, which makes its potential impact much more profound.
The Fund currently continues to concentrate the number of positions in its portfolio in an attempt to maximize individual stock risk rather than market risk and use derivative instruments intended to hedge the systematic risks of its underlying stock holdings, namely put options on the S&P 500 Index, as a potential hedge in the event of a material market-wide correction. Our pragmatic, large-capitalization, valuation-sensitive growth and concentrated, high-conviction approach to stock selection, with a cognizance of risk management that includes tactically implementing capital protective investments, seems positioned to perform well relative to less risk aware and less historically appreciative strategies.
The market outlook is the opinion of the author and can change at any time.
| | |
| Semi-Annual Report | March 31, 2021 | 5 |
| Centre American Select Equity Fund | Manager Commentary |
| | March 31, 2021 (Unaudited) |
SECTOR WEIGHTINGS
As a percentage of Net Assets
| Information Technology | 23.99% |
| Energy | 19.84% |
| Materials | 15.92% |
| Consumer Discretionary | 10.44% |
| Communication Services | 9.65% |
| Consumer Staples | 6.51% |
| Financials | 3.77% |
| Health Care | 2.57% |
| Real Estate | 2.57% |
| Industrials | 2.12% |
| Utilities | 1.90% |
| Purchased Options | 0.38% |
| Cash and Cash Equivalents | 0.34% |
| Totals | 100.00% |
These allocations may not reflect the current or future positions of the portfolio.
GROWTH OF HYPOTHETICAL $10,000 INVESTMENT THROUGH MARCH 31, 2021

This graph assumes an initial investment of $10,000 at December 21, 2011, the inception date for Investor Class shares, which have the longest period of annual returns, and that any dividends and distributions are reinvested. This graph depicts the performance of the Fund's Investor Class versus the S&P 500® Total Return Index. Taxes on Fund distributions or when shares are redeemed, if any, are not reflected. Unlike the Fund, an index is not available for investment, is unmanaged and does not have expenses that affect the results. The comparison is shown for illustrative purposes only.
The line graph above shows the performance of Investor Class shares only, since the Investor Class has the longest period of annual returns. The performance of the Institutional Class shares will differ from the performance shown because the Institutional Class shares have different expenses than the Investor Class shares.
TOTAL RETURNS – FOR THE PERIOD ENDED MARCH 31, 2021
| | 1 Month | 3 Month | YTD | 6 Month | 1 Year | 3 Year Average Annualized | 5 Year Average Annualized | Since Inception* Average Annualized |
| Centre American Select Equity Fund – Investor Class | 2.59% | 8.36% | 8.36% | 22.03% | 57.41% | 15.93% | 15.19% | 13.76% |
| S&P 500® Total Return Index | 4.38% | 6.18% | 6.18% | 19.07% | 56.35% | 16.78% | 16.29% | 13.52% |
| Centre American Select Equity Fund – Institutional Class | 2.62% | 8.54% | 8.54% | 22.37% | 58.18% | 16.55% | 15.62% | 12.32% |
| S&P 500® Total Return Index | 4.38% | 6.18% | 6.18% | 19.07% | 56.35% | 16.78% | 16.29% | 15.68% |
| * | Inception date of December 21, 2011 for Investor Class. Inception date of January 21, 2014 for Institutional Class. |
The performance information quoted above represents past performance, which is not a guarantee of future results, and does not reflect the deduction of taxes that a shareholder would pay on Fund distributions or the redemption of Fund shares. Investment return and principal value of an investment will fluctuate so that an investor’s shares, when redeemed, may be worth more or less than their original cost. Total return includes reinvestment of dividends and capital gains, if any. Current performance may be lower or higher than the performance data quoted. For the most current month-end performance data, please call 855-298-4236.
Per the prospectus dated January 28, 2021, the Fund had total gross annual operating expenses of 1.53% and 1.25% and net annual operating expenses of 1.46% and 0.98% for the Investor and Institutional Class, respectively.
The S&P 500® Total Return Index is a commonly recognized, market-capitalization weighted index of 500 widely held securities, designed to measure broad U.S. equity performance. You cannot invest directly in an index.
| Centre Global Infrastructure Fund | Manager Commentary |
| | March 31, 2021 (Unaudited) |
Performance & Strategy Summary
For the six-month period ended March 31, 2021, the Centre Global Infrastructure Fund (“the “Fund”), Investor Share Class, delivered a total return of 17.03 percent; the Institutional Share Class delivered a total return of 17.03 percent.
During the same six-month period, as a comparison the MSCI World Index and S&P Global Infrastructure Index delivered total returns of 19.57 percent and 18.06 percent, respectively. During the period, shares providing the strongest contribution to the Fund’s performance included: within the Energy sector, Kinder Morgan, and Williams Cos; within the Communication Services sector, Telecom Italia, and Softbank Corp; within the Transportation and Logistics industries, Knight-Swift Transportation; and within the Utilities sector, AES Corp, Enel Americas, CK Infrastructure, and Edison International. Stocks that contributed negatively to Fund performance included: Bezeq Israeli Telecom, Beijing Enterprises Water, Spark New Zealand, PPL Corp, and Sempra Energy. From a sector allocation standpoint, having a significant weighting to Energy attributed to the Fund’s performance during the period.
We believe that global listed infrastructure securities remain a compelling investment option, characterized by high dividend yields, stable cash flows and attractive risk-adjusted performance while offering a long-term hedge against inflation. Significant funding gaps for infrastructure in developed markets remain, and during the years of continuing debate about replacing outdated backbone systems, infrastructure investment has actually declined as a share of GDP1 in more than half of the G20 economies since the global financial crisis. Years of underinvestment in critical areas such as transportation, water treatment, and power grids could erode future growth potential and productivity. Municipalities are now focusing efforts on connecting institutional investors with projects that need their capital as well as creating an expanded role for public-private partnerships and tax and other incentives to undertake infrastructure investment. We believe the majority of the infrastructure funding gap will likely be financed by the private sector, creating significant opportunities within publicly traded global listed infrastructure assets, especially in the Communication Services and other innovative areas where the intellectual capital resides.
We view infrastructure also as a defensive asset class because of the characteristics of the underlying assets owned by many global listed infrastructure companies including: 1) inelastic demand due to the essential nature of the assets used in everyday life; 2) high barriers to entry due to the critical and often irreplaceable nature of the assets; and 3) contracted revenue streams that offer inflation protection in many cases. Over the past twenty years, Global Listed Infrastructure has demonstrated upside capture versus global equities of 83.8 percent, while only capturing 61.7 percent of the global equity market downside.2 Conventional wisdom holds that you invest in bonds for yield and equities for capital appreciation. While this might be true historically, with 10-Year U.S. Treasury yields collapsing over the past 12 months, infrastructure related stocks now offer equity income on top of capital appreciation potential. Currently, the 4.17% underlying yield3 of the Fund supersedes the S&P 500 Index’s dividend yield of 1.7% as well as all maturities of U.S. Treasury bond yields. From a sector perspective, Infrastructure related sectors such as Communication Services (4.2%), Energy (6.8%), Industrials (5.1%), and Utilities (3.8%) are all well above the broad market as represented by the S&P 500 Index as well the MSCI World Index.
The Fund offers several key differentiators from the broader global equity set of investable companies, as well as core infrastructure universes including: 1) historically, the S&P Global Infrastructure Index has generated a dividend yield greater than the yield on conventional core equity indices like the MSCI World Index; 2) the Fund pays distributions of dividend and interest income monthly rather than annually; 3) hard assets like infrastructure assets tend to retain their “real” value through the long-term; 4) historically, infrastructure indices’ volatility is lower than on conventional equity indices like the MSCI World Index; 5) historically, high Economic Value Added (EVA)4 companies have outperformed low EVA ones; and 6) many infrastructure assets have concession agreements or long-term contracts that link to inflation in the long run. In identifying firms with sustainable pricing power, the Fund seeks investments that exhibit high barriers to entry in their segments and that create positive externalities in their regions. The Fund focuses on industries with lower volatility such as toll roads, power stations, hospitals and schools. Also, by targeting high EVA growth companies, the Fund narrows its focus to high quality infrastructure firms that make wise capital allocation decisions. Through our “bottoms-up” analysis, we seek to avoid names that destroy shareholder wealth by either “empire building” or under-investment. Additionally, the stock-selection approach standardizes accounting across countries which facilitates cross-border comparisons between the best U.S. infrastructure names and international firms. From a portfolio management perspective, the Fund is able take active strategic and tactical bets across sectors and regions based on opportunity sets we see in the market.
| 1 | Gross domestic product (GDP) is a monetary measure of the market value of all the final goods and services produced in a specific time period. |
| 2 | Source: CBRE Clarion, Bloomberg, Morningstar. |
| 3 | Underlying yield reflects the annualized income net of expenses of the fund as a percentage of the market unit price of the fund as at the day shown. It is based on a snapshot of the fund on that day. It does not include any preliminary charge and investors may be subject to tax on distributions. As of March 31, 2021, the Centre Global Infrastructure Fund had an underlying yield of 4.17%. |
| 4 | Economic Value Added (EVA) is an estimate of a company’s economic profit. Economic profit, which refers to the profit earned by a company, minus the cost of financing the company’s capital, is an amount that may be considered in the assessment of a company’s overall value. |
| Semi-Annual Report | March 31, 2021 | 7 |
| Centre Global Infrastructure Fund | Manager Commentary |
| | March 31, 2021 (Unaudited) |
Market Review & Outlook
The Biden-Harris Administration released its $2 trillion "American Jobs Plan", which includes $621 billion in transportation infrastructure and resilience funding, $111 billion in clean drinking water infrastructure investment, $100 billion electric grid investment, and $100 billion for high-speed broadband investment5. The plan invests about 1% of GDP annually over eight years. It is expected to be fully paid within fifteen years in conjunction with the Administration's corporate tax plan proposal. The tax plan proposes raising the corporate tax rate to 28% as well as other corporate and individual tax reforms. During his comments, President Biden expressed that he is open to alternative options on how to fund the proposal but not on the size of the Administration’s plan. Congressional democrats are fully backing this proposal. An infrastructure bill would represent a source of significant upside potential for the Fund’s holdings. President Biden repeatedly emphasized that his plan would prioritize American-based companies, products, and employees. The plan addresses a number of our key investment themes for the stocks in the Fund which include traditional infrastructure: roads, bridges, airports, utilities, pipelines, ports, and waterways, as well as next generation infrastructure: 5G and renewable energy. As such, the plan involves modernizing 20,000 miles of roads, totally refurbishing the 10 most economically significant bridges, and repairing 10,000 bridges across the country.
Moreover, President Biden’s Executive Orders have included restrictions on hydrocarbon leasing in North America, drilling, and pipelines, each of which support higher oil prices. Also, the Administration’s comments suggest no urgency in lifting sanctions with Iran, further tempering global oil supply. As seen with Keystone, new US pipeline projects will face greater obstacles but a clampdown on new lines may make existing ones more valuable, and some could be repurposed in an energy transition. This should benefit the Fund’s holdings including Kinder Morgan and Williams Cos. In addition, pipeline infrastructure could be adapted to play an important role in facilitating many of the changes being advocated to lessen global emissions, i.e., modifying lines to carry green hydrogen or renewable diesel, which should benefit the Fund’s holdings including Pembina Pipeline Corp, TC Energy Corp, Enbridge Inc, ONEOK Inc, and Cheniere Energy Inc. Secular opportunities for green energy and ESG awareness remain thematically intact while cyclical opportunities due to higher oil & gas prices are profound as a result of supply constraints being imposed at the same time demand is rising. We believe this will cause the value of legacy pipeline assets to increase dramatically.
We see opportunities in the electric infrastructure and renewable power integration aspects of the Biden Infrastructure Plan. The Administration plan seeks to make the power grid more resilient and to achieve 100% carbon-free electricity generation by 2035. We believe this will serve as a long-term catalyst for the Fund’s holdings including NextEra, American Electric Power, and Exelon. Another key focus of the plan is the upgrading of the country's drinking water, wastewater, and stormwater systems, which includes replacing all lead pipes and services lines as well as the monitoring and remediation of new contaminants such as PFAS (perfluoroalkyl substances). This should serve as a catalyst for American Water Works, which is held by the Fund. Furthermore, there is potential to transform the Utilities sector from being a “bond proxy” to a genuine growth industry as well as an excellent inflation hedge from regulated power generation assets as the Biden-Harris Administration looks to monetize renewable generation and storage tax credits through direct pay. We also note that the plan calls for an extension of investment tax credits (ITC) and production tax credits (PTC) for 10 years. At the end of 2020, the wind PTC tax credit was extended for one year, while the ITC for solar was extended for two years. However, the Administration's plan calls for direct-pay tax credits versus the existing tax equity way of monetizing the credits. The direct-pay method would make funding available to more entities. President Biden added that the direct-pay method addresses the inequalities that the Biden-Harris Administration sees in the current clean energy policy. Growing renewable energy, cheap natural gas, and emission regulations will continue to crowd out coal as utilities use more renewable energy and natural gas for electricity generation. By 2030, renewable energy will pass coal, nuclear, and hydro as the second-largest source of power generation in the United States regardless of who is sitting in the Oval Office. Renewable energy growth (excluding hydro) will grow at 8% annual during the next decade, which will benefit the Fund’s holdings in NextEra, American Electric Power, and Exelon.
The Biden-Harris Administration’s broadband plan looks to bring broadband service to communities underserved such as the inner city and rural areas. We expect tax and research and development (R&D) incentives to be most impactful raising returns on incremental capital investments. When Biden campaigned with a plan to close the disparities that exist in the nation’s internet infrastructure, he spoke about expanding broadband capability to every household in the US by investing heavily in rural connectivity, backing municipal-run networks, and encouraging more competition among internet service providers (ISPs). A $300 billion R&D investment program would cover everything from electric vehicle technology to lightweight materials to 5G and artificial intelligence. President Biden’s 5G tax credits should speed the deployment of 5G nationwide and benefit service providers. Infrastructure returns on capital with 5G technological transformations would potentially improve the United States’ overall productivity and operational efficiency. Also, continued emphasis on improving energy monitoring and management as well as gaining better control of the energy generation and distribution network is expected to boost the adoption and government incentives for 5G services. The overarching point, as it concerns telecom investment and secular demand, is that between growth in data usage and 5G rollout, telecom will continue to be one of the global epicenters of technology investment over the next 20 years. We believe the carrier investment in LTE densification6 and 5G will unleash the growth potential of a new generation of telecom services, sparking a virtuous cycle that should lead to increased subscriber growth, sales, and ARPU (average revenue per unit). We believe US carriers (Verizon, AT&T, and T-Mobile) will benefit immensely from 5G credits under the Biden-Harris Administration given their mmWave7 spectrum position and small cell/fiber footprints.
| 5 | The White House, FACT SHEET: The American Jobs Plan |
| 6 | Network densification is adding more cell sites to increase the amount of available capacity. Cell sites placed in capacity-strained areas add more capacity where it is most needed and also help offload traffic from surrounding sites. Urban areas and large public venues are candidates for network densification because of the high concentration of mobile users. A major component of 5G, which is still not standardized or defined, will be ultra-dense network configurations, particularly in metro areas heavy with users. |
| Centre Global Infrastructure Fund | Manager Commentary |
| | March 31, 2021 (Unaudited) |
In terms of social infrastructures, continued evolution towards a single payor system will ironically boost health care facility profit margins. The pandemic’s economic calamity has led to increases in uncompensated care and bad debt expense for providers. As the economy rebounds from COVID-19 lows and the Affordable Care Act (ACA) is strengthened by the Biden Presidency, hospitals should benefit from a significantly lower bad debt expense due to ACA Basic High-Deductible Health Plans becoming more “patient” friendly. Healthcare companies held by the Fund have significantly outperformed since Biden was inaugurated including HCA healthcare, Universal Health Services, and Ramsay Health Care. In particular, HCA demonstrated exceptional operational and financial execution during the largest COVID-19 spike seen during 2020. Overall, we believe hospitals are successfully navigating the slowdown of COVID-19 and replacing it with elective surgeries. Hospitals have significantly outperformed the S&P 500 Index year-to-date and we see this outperformance continuing despite a slowdown in COVID-19 cases as vaccinations increase.
We believe the Fund will perform relatively well with exposure to favorable areas of the world’s equity markets. Also, undervalued international infrastructure-related stocks with strong balance sheets and free cash flows, solid dividend yields, and cyclically depressed profits are poised to outperform in our opinion. The Fund is positioned by targeting energy, telecom, industrials, and other undervalued areas of globally listed infrastructure industries and sub-sectors. The combination of low embedded growth and a robust stream of income payments effectively lowers the duration of the portfolio and, if interest rates rise, this will help protect against a broader based contraction in valuation multiples. Lastly, the Fund’s unique exposure to next-generation global infrastructure adjacencies, including public cloud deployments, data center monitoring, cybersecurity, and IIoT (Industrial Internet of Things) is a key differentiator against legacy managed infrastructure portfolios, which overlook these powerful trends within the industry. Despite the negative performance drag from the Energy sector in 2020, we continue to believe that our combined approach of differentiated stock selection and portfolio construction, whereby the Fund is diversified across regions and developed countries as well as balanced across Telecommunication Infrastructure; Utilities; and the Energy, Transportation, and Social Infrastructure sectors is the most favorable for investors seeking to feature listed infrastructure investments as part of an overall balanced portfolio.
The market outlook is the opinion of the author and can change at any time.
| 7 | Millimeter wave spectrum is the band of spectrum between 30 GHz and 300 GHz. Wedged between microwave and infrared waves. |
| Semi-Annual Report | March 31, 2021 | 9 |
| Centre Global Infrastructure Fund | Manager Commentary |
| | March 31, 2021 (Unaudited) |
INDUSTRY WEIGHTINGS
As a percentage of Net Assets
| Oil, Gas & Consumable Fuels | 22.15% |
| Diversified Telecommunication Services | 21.33% |
| Electric Utilities | 17.00% |
| Wireless Telecommunication Services | 10.30% |
| Multi-Utilities | 7.33% |
| Health Care Providers & Services | 6.16% |
| Transportation Infrastructure | 5.56% |
| Independent Power and Renewable Electricity Producers | 2.91% |
| Water Utilities | 1.94% |
| Road & Rail | 1.53% |
| Construction & Engineering | 1.15% |
| Equity Real Estate Investment Trusts (REITs) | 1.05% |
| Cash and Cash Equivalents | 1.59% |
| Totals | 100.00% |
COUNTRY WEIGHTINGS
As a percentage of Net Assets
| United States | 48.87% |
| Canada | 11.12% |
| Japan | 7.97% |
| Australia | 4.50% |
| Italy | 4.29% |
| Spain | 3.41% |
| Hong Kong | 3.09% |
| Germany | 2.48% |
| Great Britain | 2.39% |
| New Zealand | 2.05% |
| France | 2.02% |
| Chile | 1.51% |
| China | 1.41% |
| Greece | 1.32% |
| Sweden | 1.15% |
| Denmark | 0.83% |
| Cash and Cash Equivalents | 1.59% |
| Totals | 100.00% |
These allocations may not reflect the current or future positions of the portfolio.
GROWTH OF HYPOTHETICAL $10,000 INVESTMENT THROUGH MARCH 31, 2021
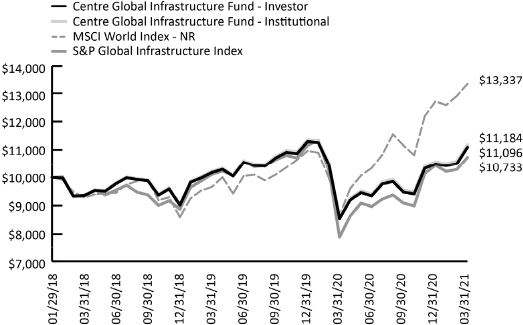
This graph assumes an initial investment of $10,000 at January 29, 2018, the Fund’s inception date, and that any dividends and distributions are reinvested. This graph depicts the performance of the Fund versus the MSCI World Index and the S&P Global Infrastructure Index. Taxes on any Fund distributions or when shares are redeemed, if any, are not reflected. Unlike the Fund, an index is not available for investment, is unmanaged and does not have expenses that affect the results. The comparison is shown for illustrative purposes only.
TOTAL RETURNS – FOR THE PERIOD ENDED MARCH 31, 2021
| | 1 Month | 3 Month | YTD | 6 Month | 1 Year | 3 Year | Since Inception (January 29, 2018 |
| Centre Global Infrastructure Fund – Investor | 5.67% | 5.81% | 5.81% | 17.03% | 29.83% | 5.85% | 3.34% |
| Centre Global Infrastructure Fund – Institutional | 5.60% | 5.89% | 5.89% | 17.03% | 29.97% | 6.11% | 3.60% |
| MSCI World Index – NR | 3.33% | 4.92% | 4.92% | 13.47% | 54.03% | 12.81% | 9.52% |
| S&P Global Infrastructure Index | 4.33% | 2.80% | 2.80% | 18.06% | 35.99% | 4.74% | 2.26% |
The performance information quoted above represents past performance, which is not a guarantee of future results, and does not reflect the deduction of taxes that a shareholder would pay on Fund distributions or the redemption of Fund shares. Investment return and principal value of an investment will fluctuate so that an investor’s shares, when redeemed, may be worth more or less than their original cost. Total return includes reinvestment of dividends and capital gains, if any. Current performance may be lower or higher than the performance data quoted. For the most current month-end performance data, please call 855-298-4236.
Per the prospectus dated January 28, 2021, the Fund had total gross annual operating expenses of 1.83% and 1.63% and net annual operating expenses of 1.57% and 1.20% for the Investor and Institutional Class, respectively.
The MSCI World Index is a broad global equity index that represents large and mid-cap equity performance across 23 developed markets countries. It covers approximately 85% of the free float-adjusted market capitalization in each country. The MSCI World Index does not offer exposure to emerging markets.
The S&P Global Infrastructure Net Total Return Index is designed to track performance of the stocks of large infrastructure companies in developed or emerging markets that must be domiciled in developed markets, or whose stocks are listed on developed market exchanges around the world. The index includes companies involved in utilities, energy and transportation infrastructure, such as the management or ownership of oil and gas storage and transportation; airport services; highways and rail tracks; marine ports and services; and electric, gas and water utilities.
You cannot invest directly in an index.
| Centre Funds | Disclosure of Fund Expenses |
| | March 31, 2021 (Unaudited) |
Example. As a shareholder of a series of Centre Funds (each series, a “Fund” and together, the “Funds”), you will incur two types of costs: (1) transaction costs, including any applicable redemption fees; and (2) ongoing costs, including management fees, distribution and/or service (12b-1) fees (if applicable) and other Fund expenses. The following examples are intended to help you understand your ongoing costs (in dollars) of investing in a Fund and to compare these costs with the ongoing costs of investing in other mutual funds. The examples are based on an investment of $1,000 invested on October 1, 2020 and held through March 31, 2021.
Actual Expenses. The first line under each class of the table below provides information about actual account values and actual expenses. You may use the information in this line, together with the amount you invested, to estimate the expenses that you paid over the period. Simply divide your account value by $1,000 (for example, an $8,600 account value divided by $1,000 = 8.6), then multiply the result by the number in the first line under the heading “Expenses Paid During Period 10/01/2020-03/31/2021” to estimate the expenses you paid on your account during this period.
Hypothetical Example for Comparison Purposes. The second line under each class of the table below provides information about hypothetical account values and hypothetical expenses based on each Fund’s actual expense ratio and an assumed rate of return of 5% per year before expenses, which is not the Fund’s actual return. The hypothetical account values and expenses may not be used to estimate the actual ending account balance or expenses you paid for the period. You may use this information to compare the ongoing costs of investing in a Fund and to other funds. To do so, compare this 5% hypothetical example with the 5% hypothetical examples that appear in the shareholder reports of the other funds. Please note that the expenses shown in the table are meant to highlight your ongoing costs only and do not reflect any transactional costs, such as redemption fees, if any. Therefore, the second line under each class of the table below is useful in comparing ongoing costs only, and will not help you determine the relative total costs of owning different funds. In addition, if these transactional costs were included, your costs would have been higher.
| | | Beginning Account Value 10/01/2020 | | | Ending Account Value 03/31/2021 | | | Expense Ratio(a) | | | Expenses Paid During Period 10/1/2020-3/31/2021 (b) | |
| Centre American Select Equity Fund | | | | | | | | | | | | |
| Investor Class | | | | | | | | | | | | |
| Actual | | $ | 1,000.00 | | | $ | 1,220.30 | | | | 1.46 | % | | $ | 8.08 | |
| Hypothetical (5% return before expenses) | | $ | 1,000.00 | | | $ | 1,017.65 | | | | 1.46 | % | | $ | 7.34 | |
| Institutional Class | | | | | | | | | | | | | | | | |
| Actual | | $ | 1,000.00 | | | $ | 1,223.70 | | | | 0.98 | % | | $ | 5.43 | |
| Hypothetical (5% return before expenses) | | $ | 1,000.00 | | | $ | 1,020.04 | | | | 0.98 | % | | $ | 4.94 | |
| Centre Global Infrastructure Fund | | | | | | | | | | | | | | | | |
| Investor Class | | | | | | | | | | | | | | | | |
| Actual | | $ | 1,000.00 | | | $ | 1,170.30 | | | | 1.44 | % | | $ | 7.79 | |
| Hypothetical (5% return before expenses) | | $ | 1,000.00 | | | $ | 1,017.75 | | | | 1.44 | % | | $ | 7.24 | |
| Institutional Class | | | | | | | | | | | | | | | | |
| Actual | | $ | 1,000.00 | | | $ | 1,170.30 | | | | 1.20 | % | | $ | 6.49 | |
| Hypothetical (5% return before expenses) | | $ | 1,000.00 | | | $ | 1,018.95 | | | | 1.20 | % | | $ | 6.04 | |
| (a) | Annualized, based on the Fund's most recent fiscal half year expenses less any waivers/reimbursements. |
| (b) | Expenses are equal to the Fund's annualized expense ratio, multiplied by the average account value over the period, multiplied by the number of days in the most recent fiscal half year (182), divided by 365. |
| Semi-Annual Report | March 31, 2021 | 11 |
| Centre American Select Equity Fund | Schedule of Investments |
| | March 31, 2021 (Unaudited) |
| | | Shares | | | Value | |
| COMMON STOCKS (99.28%) | | | | | | |
| Communication Services (9.65%) | | | | | | |
| Entertainment (0.99%) | | | | | | |
| Walt Disney Co.(a) | | | 8,560 | | | $ | 1,579,491 | |
| | | | | | | | | |
| Interactive Media & Services (8.66%) | | | | | | | | |
| Alphabet, Inc. Class A, Class A(a) | | | 2,200 | | | | 4,537,544 | |
| Alphabet, Inc. Class C, Class C(a) | | | 2,105 | | | | 4,354,466 | |
| Facebook, Inc., Class A(a) | | | 16,690 | | | | 4,915,706 | |
| | | | | | | | 13,807,716 | |
| Total Communication Services | | | | | | | 15,387,207 | |
| | | | | | | | | |
| Consumer Discretionary (10.44%) | | | | | | | | |
| Automobiles (1.84%) | | | | | | | | |
| Tesla, Inc.(a) | | | 4,390 | | | | 2,932,212 | |
| | | | | | | | | |
| Household Durables (1.82%) | | | | | | | | |
| Mohawk Industries, Inc.(a) | | | 15,080 | | | | 2,900,035 | |
| | | | | | | | | |
| Internet & Direct Marketing Retail (5.82%) | | | | | | | | |
| Amazon.com, Inc.(a) | | | 3,000 | | | | 9,282,240 | |
| | | | | | | | | |
| Specialty Retail (0.96%) | | | | | | | | |
| The Home Depot, Inc. | | | 5,000 | | | | 1,526,250 | |
| | | | | | | | | |
| Total Consumer Discretionary | | | | | | | 16,640,737 | |
| | | | | | | | | |
| Consumer Staples (6.51%) | | | | | | | | |
| Food Products (5.06%) | | | | | | | | |
| Archer-Daniels-Midland Co. | | | 62,000 | | | | 3,534,000 | |
| Bunge, Ltd. | | | 57,200 | | | | 4,534,244 | |
| | | | | | | | 8,068,244 | |
| | | | | | | | | |
| Household Products (1.45%) | | | | | | | | |
| Procter & Gamble Co. | | | 17,010 | | | | 2,303,664 | |
| | | | | | | | | |
| Total Consumer Staples | | | | | | | 10,371,908 | |
| | | | | | | | | |
| Energy (19.84%) | | | | | | | | |
| Oil, Gas & Consumable Fuels (19.84%) | | | | | | | | |
| APA Corp. | | | 244,260 | | | | 4,372,254 | |
| Chevron Corp. | | | 45,000 | | | | 4,715,550 | |
| Cimarex Energy Co. | | | 95,150 | | | | 5,650,959 | |
| EQT Corp.(a) | | | 133,000 | | | | 2,471,140 | |
| Exxon Mobil Corp. | | | 125,480 | | | | 7,005,548 | |
| Kinder Morgan, Inc. | | | 230,000 | | | | 3,829,501 | |
| The Williams Cos., Inc. | | | 151,210 | | | | 3,582,165 | |
| | | | | | | | 31,627,117 | |
| Total Energy | | | | | | | 31,627,117 | |
| | | | | | | | | |
| Financials (3.77%) | | | | | | | | |
| Banks (1.58%) | | | | | | | | |
| JPMorgan Chase & Co. | | | 16,600 | | | | 2,527,018 | |
| | | | | | | | | |
| Diversified Financial Services (2.19%) | | | | | | | | |
| Berkshire Hathaway, Inc., Class B(a) | | | 13,670 | | | | 3,492,275 | |
| | | | | | | | | |
| Total Financials | | | | | | | 6,019,293 | |
| | | Shares | | | Value | |
| Health Care (2.57%) | | | | | | |
| Health Care Providers & Services (1.13%) | | | | | | |
| UnitedHealth Group, Inc. | | | 4,850 | | | $ | 1,804,540 | |
| | | | | | | | | |
| Pharmaceuticals (1.44%) | | | | | | | | |
| Johnson & Johnson | | | 14,000 | | | | 2,300,900 | |
| | | | | | | | | |
| Total Health Care | | | | | | | 4,105,440 | |
| | | | | | | | | |
| Industrials (2.12%) | | | | | | | | |
| Road & Rail (2.12%) | | | | | | | | |
| Knight-Swift Transportation Holdings, Inc. | | | 70,400 | | | | 3,385,536 | |
| | | | | | | | | |
| Total Industrials | | | | | | | 3,385,536 | |
| | | | | | | | | |
| Information Technology (23.99%) | | | | | | | | |
| IT Services (2.04%) | | | | | | | | |
| Mastercard, Inc., Class A | | | 4,030 | | | | 1,434,881 | |
| Visa, Inc., Class A | | | 8,560 | | | | 1,812,409 | |
| | | | | | | | 3,247,290 | |
| | | | | | | | | |
| Semiconductors & Semiconductor Equipment (6.36%) | | | | | | | | |
| Intel Corp. | | | 83,000 | | | | 5,312,000 | |
| Micron Technology, Inc.(a) | | | 37,100 | | | | 3,272,591 | |
| NVIDIA Corp. | | | 2,900 | | | | 1,548,397 | |
| | | | | | | | 10,132,988 | |
| | | | | | | | | |
| Software (7.41%) | | | | | | | | |
| Microsoft Corp. | | | 50,117 | | | | 11,816,085 | |
| | | | | | | | | |
| Technology Hardware, Storage & Peripherals (8.18%) | | | | | | | | |
| Apple, Inc. | | | 106,800 | | | | 13,045,620 | |
| | | | | | | | | |
| Total Information Technology | | | | | | | 38,241,983 | |
| | | | | | | | | |
| Materials (15.92%) | | | | | | | | |
| Chemicals (10.71%) | | | | | | | | |
| Corteva, Inc. | | | 67,000 | | | | 3,123,540 | |
| Eastman Chemical Co. | | | 28,580 | | | | 3,147,230 | |
| LyondellBasell Industries, Class A | | | 32,450 | | | | 3,376,422 | |
| Mosaic Co. | | | 94,000 | | | | 2,971,340 | |
| Olin Corp. | | | 117,500 | | | | 4,461,475 | |
| | | | | | | | 17,080,007 | |
| | | | | | | | | |
| Metals & Mining (5.21%) | | | | | | | | |
| Barrick Gold Corp. | | | 281,960 | | | | 5,582,808 | |
| Southern Copper Corp. | | | 40,000 | | | | 2,714,800 | |
| | | | | | | | 8,297,608 | |
| Total Materials | | | | | | | 25,377,615 | |
| | | | | | | | | |
| Real Estate (2.57%) | | | | | | | | |
| Equity Real Estate Investment Trusts (REITs)(2.57%) | | | | | | | | |
| Weyerhaeuser Co. | | | 115,000 | | | | 4,094,000 | |
| | | | | | | | | |
| Total Real Estate | | | | | | | 4,094,000 | |
| See Notes to Financial Statements. | |
| 12 | centrefunds.com |
| Centre American Select Equity Fund | Schedule of Investments |
| | March 31, 2021 (Unaudited) |
| | | Shares | | | Value | |
| Utilities (1.90%) | | | | | | |
| Independent Power and Renewable Electricity Producers (1.90%) | | | | | | | | |
| AES Corp. | | | 113,000 | | | $ | 3,029,530 | |
| | | | | | | | | |
| Total Utilities | | | | | | | 3,029,530 | |
| | | | | | | | | |
| TOTAL COMMON STOCKS | | | | | | | | |
| (Cost $93,357,354) | | | | | | | 158,280,366 | |
| Expiration Date | | Exercise Price | | | Contracts | | | Notional Value | | | Value | |
| PURCHASED OPTIONS (0.38%) | | | | | | | | | | | | |
| S&P 500® Index: | | | | | | | | | | | | |
| 9/17/2021 | | $ | 3,150.00 | | | | 132 | | | | 52,442,148 | | | | 603,240 | |
| | | | | | | | | | | | | | | | | |
| TOTAL PURCHASED OPTIONS | | | | | | | | | | | | | | | | |
| (Cost $866,145) | | | | | | | | | | | | | | | 603,240 | |
| | | 7-Day Yield | | | Shares | | | Value | |
| SHORT TERM INVESTMENTS (0.45%) | | | | | | | | | |
| Money Market Fund (0.45%) | | | | | | | | | |
| Dreyfus Treasury Prime Cash | | | | | | | | | |
| Management, Institutional Class | | | 0.010 | % | | | 721,412 | | | | 721,412 | |
| | | | | | | | | | | | | |
| TOTAL SHORT TERM INVESTMENTS | | | | | | | | | | | | |
| (Cost $721,412) | | | | | | | | | | | 721,412 | |
| | | | | | | | | | | | | |
| TOTAL INVESTMENTS (100.11%) | | | | | | | | | | | | |
| (Cost $94,944,911) | | | | | | | | | | $ | 159,605,018 | |
| Liabilities in Excess of Other Assets (-0.11%) | | | | | | | | | | | (179,147 | ) |
| NET ASSETS (100.00%) | | | | | | | | | | $ | 159,425,871 | |
| (a) | Non-income producing security. |
| See Notes to Financial Statements. | |
| Semi-Annual Report | March 31, 2021 | 13 |
| Centre Global Infrastructure Fund | Schedule of Investments |
| | March 31, 2021 (Unaudited) |
| | | Shares | | | Value | |
| COMMON STOCKS (98.41%) | | | | | | |
| ASIA (19.02%) | | | | | | |
| Australia (4.50%) | | | | | | |
| Health Care Providers & Services (0.84%) | | | | | | | | |
| Ramsay Health Care, Ltd. | | | 7,000 | | | $ | 356,229 | |
| | | | | | | | | |
| Multi-Utilities (1.22%) | | | | | | | | |
| AGL Energy, Ltd. | | | 71,000 | | | | 520,405 | |
| | | | | | | | | |
| Transportation Infrastructure (2.44%) | | | | | | | | |
| Transurban Group | | | 103,030 | | | | 1,042,375 | |
| | | | | | | | | |
| Total Australia | | | | | | | 1,919,009 | |
| | | | | | | | | |
| China (1.41%) | | | | | | | | |
| Independent Power and Renewable Electricity Producers (1.41%) | | | | | | | | |
| Datang International Power Generation Co., Ltd. | | | 3,761,000 | | | | 599,894 | |
| | | | | | | | | |
| Total China | | | | | | | 599,894 | |
| | | | | | | | | |
| Hong Kong (3.09%) | | | | | | | | |
| Electric Utilities (1.71%) | | | | | | | | |
| CK Infrastructure Holdings, Ltd. | | | 123,000 | | | | 730,966 | |
| | | | | | | | | |
| Water Utilities (1.38%) | | | | | | | | |
| Beijing Enterprises Water Group, Ltd. | | | 1,550,000 | | | | 588,171 | |
| | | | | | | | | |
| Total Hong Kong | | | | | | | 1,319,137 | |
| | | | | | | | | |
| Japan (7.97%) | | | | | | | | |
| Diversified Telecommunication Services (1.04%) | | | | | | | | |
| Nippon Telegraph & Telephone Corp. | | | 17,200 | | | | 441,476 | |
| | | | | | | | | |
| Wireless Telecommunication Services (6.93%) | | | | | | | | |
| KDDI Corp. | | | 18,900 | | | | 579,503 | |
| SoftBank Corp. | | | 65,400 | | | | 849,654 | |
| SoftBank Group Corp. | | | 18,100 | | | | 1,525,157 | |
| | | | | | | | 2,954,314 | |
| Total Japan | | | | | | | 3,395,790 | |
| | | | | | | | | |
| New Zealand (2.05%) | | | | | | | | |
| Diversified Telecommunication Services (1.43%) | | | | | | | | |
| Spark New Zealand, Ltd. | | | 195,500 | | | | 611,688 | |
| | | | | | | | | |
| Transportation Infrastructure (0.62%) | | | | | | | | |
| Auckland International Airport, Ltd.(a) | | | 48,000 | | | | 262,823 | |
| | | | | | | | | |
| Total New Zealand | | | | | | | 874,511 | |
| | | | | | | | | |
| TOTAL ASIA | | | | | | | | |
| (Cost $7,360,830) | | | | | | | 8,108,341 | |
| | | Shares | | | Value | |
| EUROPE (17.89%) | | | | | | |
| Denmark (0.83%) | | | | | | |
| Electric Utilities (0.83%) | | | | | | |
| Orsted AS(b)(c) | | | 2,200 | | | $ | 355,323 | |
| | | | | | | | | |
| Total Denmark | | | | | | | 355,323 | |
| | | | | | | | | |
| France (2.02%) | | | | | | | | |
| Diversified Telecommunication Services (0.77%) | | | | | | | | |
| Orange SA | | | 26,420 | | | | 325,475 | |
| | | | | | | | | |
| Multi-Utilities (0.60%) | | | | | | | | |
| Engie SA(a) | | | 18,100 | | | | 256,940 | |
| | | | | | | | | |
| Transportation Infrastructure (0.65%) | | | | | | | | |
| Groupe Eurotunnel(a) | | | 18,050 | | | | 276,868 | |
| | | | | | | | | |
| Total France | | | | | | | 859,283 | |
| | | | | | | | | |
| Germany (2.48%) | | | | | | | | |
| Diversified Telecommunication Services (1.94%) | | | | | | | | |
| Deutsche Telekom AG | | | 41,010 | | | | 825,750 | |
| | | | | | | | | |
| Multi-Utilities (0.54%) | | | | | | | | |
| RWE AG | | | 5,900 | | | | 231,231 | |
| | | | | | | | | |
| Total Germany | | | | | | | 1,056,981 | |
| | | | | | | | | |
| Great Britain (2.39%) | | | | | | | | |
| Multi-Utilities (0.96%) | | | | | | | | |
| National Grid PLC | | | 34,260 | | | | 408,077 | |
| | | | | | | | | |
| Wireless Telecommunication Services (1.43%) | | | | | | | | |
| Vodafone Group PLC | | | 335,640 | | | | 610,229 | |
| | | | | | | | | |
| Total Great Britain | | | | | | | 1,018,306 | |
| | | | | | | | | |
| Greece (1.32%) | | | | | | | | |
| Diversified Telecommunication Services (1.32%) | | | | | | | | |
| Hellenic Telecommunications Organization SA | | | 35,200 | | | | 564,699 | |
| | | | | | | | | |
| Total Greece | | | | | | | 564,699 | |
| | | | | | | | | |
| Italy (4.29%) | | | | | | | | |
| Diversified Telecommunication Services (1.60%) | | | | | | | | |
| Telecom Italia SpA | | | 1,257,900 | | | | 680,336 | |
| | | | | | | | | |
| Electric Utilities (1.85%) | | | | | | | | |
| Enel SpA | | | 79,240 | | | | 789,213 | |
| | | | | | | | | |
| Transportation Infrastructure (0.84%) | | | | | | | | |
| Atlantia SpA(a) | | | 19,230 | | | | 359,690 | |
| | | | | | | | | |
| Total Italy | | | | | | | 1,829,239 | |
| See Notes to Financial Statements. | |
| 14 | centrefunds.com |
| Centre Global Infrastructure Fund | Schedule of Investments |
| | March 31, 2021 (Unaudited) |
| | | Shares | | | Value | |
| Spain (3.41%) | | | | | | |
| Diversified Telecommunication Services (0.66%) | | | | | | |
| Telefonica SA | | | 62,900 | | | $ | 281,554 | |
| | | | | | | | | |
| Electric Utilities (1.75%) | | | | | | | | |
| Iberdrola SA | | | 57,865 | | | | 745,426 | |
| | | | | | | | | |
| Transportation Infrastructure (1.00%) | | | | | | | | |
| Abertis Infraestructuras SA(d) | | | 1,200 | | | | 25,837 | |
| Aena SME SA(a)(b)(c) | | | 2,470 | | | | 400,597 | |
| | | | | | | | 426,434 | |
| Total Spain | | | | | | | 1,453,414 | |
| | | | | | | | | |
| Sweden (1.15%) | | | | | | | | |
| Construction & Engineering (1.15%) | | | | | | | | |
| Skanska AB | | | 19,500 | | | | 488,982 | |
| | | | | | | | | |
| Total Sweden | | | | | | | 488,982 | |
| | | | | | | | | |
| TOTAL EUROPE | | | | | | | | |
| (Cost $6,982,520) | | | | | | | 7,626,227 | |
| | | | | | | | | |
| NORTH AMERICA (59.99%) | | | | | | | | |
| Canada (11.12%) | | | | | | | | |
| Oil, Gas & Consumable Fuels (11.12%) | | | | | | | | |
| Enbridge, Inc. | | | 71,280 | | | | 2,596,641 | |
| Pembina Pipeline Corp. | | | 21,200 | | | | 612,366 | |
| TC Energy Corp. | | | 33,400 | | | | 1,531,132 | |
| | | | | | | | 4,740,139 | |
| Total Canada | | | | | | | 4,740,139 | |
| | | | | | | | | |
| United States (48.87%) | | | | | | | | |
| Diversified Telecommunication Services (12.58%) | | | | | | | | |
| AT&T, Inc. | | | 83,862 | | | | 2,538,503 | |
| Verizon Communications, Inc. | | | 48,598 | | | | 2,825,974 | |
| | | | | | | | 5,364,477 | |
| Electric Utilities (9.35%) | | | | | | | | |
| American Electric Power Co., Inc. | | | 4,570 | | | | 387,079 | |
| Duke Energy Corp. | | | 6,669 | | | | 643,759 | |
| Eversource Energy | | | 3,267 | | | | 282,889 | |
| Exelon Corp. | | | 8,958 | | | | 391,823 | |
| NextEra Energy, Inc. | | | 18,004 | | | | 1,361,282 | |
| The Southern Co. | | | 9,529 | | | | 592,323 | |
| Xcel Energy, Inc. | | | 4,953 | | | | 329,424 | |
| | | | | | | | 3,988,579 | |
| Equity Real Estate Investment Trusts (REITs) (1.05%) | | | | | | | | |
| Uniti Group, Inc. | | | 40,510 | | | | 446,825 | |
| | | | | | | | | |
| Health Care Providers & Services (5.32%) | | | | | | | | |
| HCA Healthcare, Inc. | | | 9,907 | | | | 1,865,884 | |
| Universal Health Services, Inc., Class B | | | 3,020 | | | | 402,838 | |
| | | | | | | | 2,268,722 | |
| Independent Power and Renewable Electricity Producers (1.50%) | | | | | | | | |
| AES Corp. | | | 23,820 | | | | 638,614 | |
| | | | | | | | | |
| Multi-Utilities (4.01%) | | | | | | | | |
| Dominion Energy, Inc. | | | 7,529 | | | | 571,903 | |
| DTE Energy Co. | | | 1,710 | | | | 227,669 | |
| | | Shares | | | Value | |
| United States (continued) | | | | | | |
| Multi-Utilities (continued) | | | | | | |
| Public Service Enterprise Group, Inc. | | | 4,759 | | | $ | 286,539 | |
| Sempra Energy | | | 2,565 | | | | 340,068 | |
| WEC Energy Group, Inc. | | | 3,020 | | | | 282,642 | |
| | | | | | | | 1,708,821 | |
| Oil, Gas & Consumable Fuels (11.04%) | | | | | | | | |
| Cheniere Energy, Inc.(a) | | | 8,000 | | | | 576,080 | |
| Kinder Morgan, Inc. | | | 104,826 | | | | 1,745,353 | |
| ONEOK, Inc. | | | 15,872 | | | | 804,075 | |
| The Williams Cos., Inc. | | | 66,710 | | | | 1,580,360 | |
| | | | | | | | 4,705,868 | |
| Road & Rail (1.53%) | | | | | | | | |
| Knight-Swift Transportation Holdings, Inc. | | | 13,530 | | | | 650,658 | |
| | | | | | | | | |
| Water Utilities (0.56%) | | | | | | | | |
| American Water Works Co., Inc. | | | 1,590 | | | | 238,373 | |
| | | | | | | | | |
| Wireless Telecommunication Services (1.93%) | | | | | | | | |
| T-Mobile US, Inc.(a) | | | 6,580 | | | | 824,408 | |
| | | | | | | | | |
| Total United States | | | | | | | 20,835,345 | |
| | | | | | | | | |
| TOTAL NORTH AMERICA | | | | | | | | |
| (Cost $22,670,138) | | | | | | | 25,575,484 | |
| | | | | | | | | |
| SOUTH AMERICA (1.51%) | | | | | | | | |
| Chile (1.51%) | | | | | | | | |
| Electric Utilities (1.51%) | | | | | | | | |
| Enel Americas SA, ADR | | | 75,800 | | | | 642,784 | |
| | | | | | | | | |
| Total Chile | | | | | | | 642,784 | |
| | | | | | | | | |
| TOTAL SOUTH AMERICA | | | | | | | | |
| (Cost $491,177) | | | | | | | 642,784 | |
| | | | | | | | | |
| TOTAL COMMON STOCKS | | | | | | | | |
| (Cost $37,504,665) | | | | | | | 41,952,836 | |
| | | 7-Day Yield | | | Shares | | | Value | |
| SHORT TERM INVESTMENTS (0.56%) | | | | | | | | | |
| Money Market Fund (0.56%) | | | | | | | | | |
| Dreyfus Treasury Prime Cash Management, Institutional Class | | | 0.010 | % | | | 236,724 | | | | 236,724 | |
| | | | | | | | | | | | | |
| TOTAL SHORT TERM INVESTMENTS | | | | | | | | | | | | |
| (Cost $236,724) | | | | | | | | | | | 236,724 | |
| | | Value | |
| TOTAL INVESTMENTS (98.97%) | | | |
| (Cost $37,741,389) | | $ | 42,189,560 | |
| Other Assets In Excess Of Liabilities (1.03%) | | | 441,024 | |
| NET ASSETS (100.00%) | | $ | 42,630,584 | |
| See Notes to Financial Statements. | |
| Semi-Annual Report | March 31, 2021 | 15 |
| Centre Global Infrastructure Fund | Schedule of Investments |
| | March 31, 2021 (Unaudited) |
| (a) | Non-income producing security. |
| (b) | Security was purchased pursuant to Rule 144A under the Securities Act of 1933 and may be resold in transactions exempt from registration only to qualified institutional buyers. As of March 31, 2021, these securities had a total aggregate market value of $755,920, representing 1.77% of net assets. |
| (c) | Securities were purchased pursuant to Regulation S under the Securities Act of 1933, which exempts securities offered and sold outside the United States from registration. Such securities cannot be sold in the United States without either an effective registration statement filed pursuant to Securities Act of 1933, or pursuant to an exemption from registration. These securities have been deemed liquid under guidelines approved by the Fund's Board of Trustees. At period end, the aggregate market value of those securities was $755,920, representing 1.77% of net assets. |
| (d) | As a result of the use of significant unobservable inputs to determine fair value, these investments have been classified as Level 3 assets. (See Note 3) |
| See Notes to Financial Statements. | |
| 16 | centrefunds.com |
| Centre Funds | Statements of Assets and Liabilities |
| | March 31, 2021 (Unaudited) |
| | | Centre American Select Equity Fund | | | Centre Global Infrastructure Fund | |
| ASSETS: | | | | | | |
| Investments, at value | | $ | 159,605,018 | | | $ | 42,189,560 | |
| Foreign currency, at value (Cost $– and $372,103, respectively) | | | – | | | | 367,247 | |
| Receivable for dividends | | | 19,725 | | | | 128,495 | |
| Deposit with broker for futures contracts | | | 12,414 | | | | – | |
| Receivable for fund shares sold | | | 10,763 | | | | – | |
| Prepaid and other assets | | | 31,980 | | | | 21,512 | |
| Total Assets | | | 159,679,900 | | | | 42,706,814 | |
| LIABILITIES: | | | | | | | | |
| Payable to investment adviser | | | 100,874 | | | | 24,141 | |
| Payable to administrator | | | 19,631 | | | | 11,031 | |
| Payable to transfer agent | | | 5,452 | | | | 8,840 | |
| Payable for fund shares redeemed | | | 35,390 | | | | 1,623 | |
| Accrued 12b-1 and service fees | | | 47,988 | | | | 11,206 | |
| Payable for custodian fees | | | 11 | | | | 6,688 | |
| Payable for printing | | | 11,817 | | | | 2,418 | |
| Payable for legal and audit fees | | | 13,470 | | | | 4,462 | |
| Payable to trustees | | | 12,898 | | | | 2,675 | |
| Payable under the Chief Compliance Officer Services Agreement | | | 4,880 | | | | 496 | |
| Other payables | | | 1,618 | | | | 2,650 | |
| Total Liabilities | | | 254,029 | | | | 76,230 | |
| NET ASSETS | | $ | 159,425,871 | | | $ | 42,630,584 | |
| NET ASSETS CONSIST OF: | | | | | | | | |
| Paid-in capital | | $ | 85,987,286 | | | $ | 66,663,745 | |
| Total distributable earnings/(accumulated deficit) | | | 73,438,585 | | | | (24,033,161 | ) |
| NET ASSETS | | $ | 159,425,871 | | | $ | 42,630,584 | |
| INVESTMENTS, AT COST | | $ | 94,944,911 | | | $ | 37,741,389 | |
| PRICING OF SHARES | | | | | | | | |
| Investor Class | | | | | | | | |
| Net Assets | | $ | 148,273,363 | | | $ | 36,627,104 | |
| Shares outstanding | | | 10,688,181 | | | | 3,602,593 | |
| Net Asset Value, offering and redemption price per share | | $ | 13.87 | | | $ | 10.17 | |
| Institutional Class | | | | | | | | |
| Net Assets | | $ | 11,152,508 | | | $ | 6,003,480 | |
| Shares outstanding | | | 790,394 | | | | 590,095 | |
| Net Asset Value, offering and redemption price per share | | $ | 14.11 | | | $ | 10.17 | |
| See Notes to Financial Statements. | |
| Semi-Annual Report | March 31, 2021 | 17 |
| Centre Funds | Statements of Operations |
| | March 31, 2021 (Unaudited) |
| | | Centre American Select Equity Fund | | | Centre Global Infrastructure Fund | |
| INVESTMENT INCOME: | | | | | | |
| Dividends | | $ | 1,808,723 | | | $ | 845,494 | |
| Foreign taxes withheld | | | (6,587 | ) | | | (51,164 | ) |
| Total Investment Income | | | 1,802,136 | | | | 794,330 | |
| | | | | | | | | |
| EXPENSES: | | | | | | | | |
| Investment advisory fees | | | 613,438 | | | | 183,409 | |
| Administration fees | | | 97,822 | | | | 30,839 | |
| Transfer agent fees | | | 35,559 | | | | 30,156 | |
| Custodian fees | | | 14,354 | | | | 9,076 | |
| Legal fees | | | 20,787 | | | | 5,246 | |
| Audit and tax fees | | | 6,631 | | | | 7,958 | |
| Trustees' fees and expenses | | | 23,616 | | | | 6,052 | |
| Registration/filing fees | | | 17,202 | | | | 18,829 | |
| 12b-1 fees (Investor Class) | | | 191,332 | | | | 45,992 | |
| Shareholder service fees | | | 88,393 | | | | 16,059 | |
| Printing fees | | | 12,326 | | | | 3,300 | |
| Chief Compliance Officer services fees | | | 26,283 | | | | 6,639 | |
| Recoupment of previously waived fees - Investor class | | | 22,326 | | | | – | |
| Miscellaneous expenses | | | 7,507 | | | | 5,494 | |
| Total expenses before waivers | | | 1,177,576 | | | | 369,049 | |
| Fees waived/reimbursed by investment adviser (Investor Class) (Note 5) | | | – | | | | (56,039 | ) |
| Fees waived/reimbursed by investment adviser (Institutional Class) (Note 5) | | | (8,821 | ) | | | (10,257 | ) |
| Net Expenses | | | 1,168,755 | | | | 302,753 | |
| Net Investment Income | | | 633,381 | | | | 491,577 | |
| REALIZED AND UNREALIZED GAIN/(LOSS) ON INVESTMENTS: | | | | | | | | |
| Net realized gain/(loss) on investments | | | 10,371,218 | | | | (25,634 | ) |
| Net realized loss on foreign currencies | | | – | | | | (28,583 | ) |
| Total realized gain/(loss) | | | 10,371,218 | | | | (54,217 | ) |
| Net change in unrealized appreciation on investments | | | 21,855,185 | | | | 6,324,682 | |
| Net change in unrealized depreciation on foreign currencies | | | – | | | | (5,249 | ) |
| Total change in unrealized appreciation | | | 21,855,185 | | | | 6,319,433 | |
| NET REALIZED AND UNREALIZED GAIN ON INVESTMENTS AND FOREIGN CURRENCIES | | | 32,226,403 | | | | 6,265,216 | |
| NET INCREASE IN NET ASSETS RESULTING FROM OPERATIONS | | $ | 32,859,784 | | | $ | 6,756,793 | |
| See Notes to Financial Statements. | |
| 18 | centrefunds.com |
| Centre American Select Equity Fund | Statements of Changes in Net Assets |
| | | For The Six Months Ending March 31, 2021 (Unaudited) | | | For The Year Ended September 30, 2020 | |
| OPERATIONS: | | | | | | |
| Net investment income | | $ | 633,381 | | | $ | 1,117,412 | |
| Net realized gain | | | 10,371,218 | | | | 7,634,372 | |
| Net change in unrealized appreciation | | | 21,855,185 | | | | 14,321,634 | |
| Net increase in net assets resulting from operations | | | 32,859,784 | | | | 23,073,418 | |
| DISTRIBUTIONS TO SHAREHOLDERS: | | | | | | | | |
| Investor | | | (6,630,906 | ) | | | (9,646,868 | ) |
| Institutional | | | (344,539 | ) | | | (257,746 | ) |
| Total distributions | | | (6,975,445 | ) | | | (9,904,614 | ) |
| CAPITAL SHARE TRANSACTIONS: | | | | | | | | |
| Investor Class | | | | | | | | |
| Proceeds from sale of shares | | | 5,695,912 | | | | 40,905,684 | |
| Shares issued in reinvestment of distributions | | | 6,495,564 | | | | 9,374,951 | |
| Cost of shares redeemed | | | (39,321,846 | ) | | | (16,434,671 | ) |
| Redemption fees | | | 37,798 | | | | 2,612 | |
| Net increase/(decrease) from capital share transactions | | | (27,092,572 | ) | | | 33,848,576 | |
| Institutional Class | | | | | | | | |
| Proceeds from sale of shares | | | 7,306,225 | | | | 9,703,259 | |
| Shares issued in reinvestment of distributions | | | 286,344 | | | | 208,376 | |
| Cost of shares redeemed | | | (9,983,435 | ) | | | (1,675,613 | ) |
| Redemption fees | | | 721 | | | | 485 | |
| Net increase/(decrease) from capital share transactions | | | (2,390,145 | ) | | | 8,236,507 | |
| Net increase/(decrease) in net assets | | | (3,598,378 | ) | | | 55,253,887 | |
| NET ASSETS: | | | | | | | | |
| Beginning of period | | | 163,024,249 | | | | 107,770,362 | |
| End of period | | $ | 159,425,871 | | | $ | 163,024,249 | |
| | | | | | | | | |
| OTHER INFORMATION: | | | | | | | | |
| Share Transactions: | | | | | | | | |
| Investor Class | | | | | | | | |
| Beginning shares | | | 12,741,887 | | | | 9,939,604 | |
| Shares sold | | | 431,197 | | | | 3,417,489 | |
| Shares issued in reinvestment of dividends | | | 507,863 | | | | 918,212 | |
| Shares redeemed | | | (2,992,767 | ) | | | (1,533,418 | ) |
| Ending shares | | | 10,688,180 | | | | 12,741,887 | |
| Institutional Class | | | | | | | | |
| Beginning shares | | | 968,618 | | | | 275,120 | |
| Shares sold | | | 540,129 | | | | 831,613 | |
| Shares issued in reinvestment of dividends | | | 22,027 | | | | 20,172 | |
| Shares redeemed | | | (740,380 | ) | | | (158,287 | ) |
| Ending shares | | | 790,394 | | | | 968,618 | |
| See Notes to Financial Statements. | |
| Semi-Annual Report | March 31, 2021 | 19 |
| Centre Global Infrastructure Fund | Statements of Changes in Net Assets |
| | | For The Six Months Ending March 31, 2021 (Unaudited) | | | For The Year Ended September 30, 2020 | |
| OPERATIONS: | | | | | | |
| Net investment income | | $ | 491,577 | | | $ | 962,414 | |
| Net realized loss | | | (54,217 | ) | | | (3,898,926 | ) |
| Net change in unrealized appreciation/(depreciation) | | | 6,319,433 | | | | (3,757,999 | ) |
| Net increase/(decrease) in net assets resulting from operations | | | 6,756,793 | | | | (6,694,511 | ) |
| DISTRIBUTIONS TO SHAREHOLDERS: | | | | | | | | |
| Investor | | | (291,870 | ) | | | (668,430 | ) |
| Institutional | | | (57,850 | ) | | | (331,972 | ) |
| Total distributions | | | (349,720 | ) | | | (1,000,402 | ) |
| CAPITAL SHARE TRANSACTIONS: | | | | | | | | |
| Investor Class | | | | | | | | |
| Proceeds from sale of shares | | | 39,318 | | | | 19,961,747 | (a) |
| Shares issued in reinvestment of distributions | | | 221,720 | | | | 484,386 | |
| Cost of shares redeemed | | | (4,624,137 | ) | | | (9,205,661 | ) |
| Redemption fees | | | 3,274 | | | | 5,989 | |
| Net increase/(decrease) from capital share transactions | | | (4,359,825 | ) | | | 11,246,461 | |
| Institutional Class | | | | | | | | |
| Proceeds from sale of shares | | | 269,573 | | | | 1,766,343 | (a) |
| Shares issued in reinvestment of distributions | | | 50,846 | | | | 293,344 | |
| Cost of shares redeemed | | | (1,507,057 | ) | | | (16,384,503 | ) |
| Redemption fees | | | 27 | | | | 1,649 | |
| Net decrease from capital share transactions | | | (1,186,611 | ) | | | (14,323,167 | ) |
| Net increase/(decrease) in net assets | | | 860,637 | | | | (10,771,619 | ) |
| NET ASSETS: | | | | | | | | |
| Beginning of period | | | 41,769,947 | | | | 52,541,566 | |
| End of period | | $ | 42,630,584 | | | $ | 41,769,947 | |
| | | | | | | | | |
| OTHER INFORMATION: | | | | | | | | |
| Share Transactions: | | | | | | | | |
| Investor Class | | | | | | | | |
| Beginning shares | | | 4,054,414 | | | | 2,837,654 | |
| Shares sold | | | 4,189 | | | | 2,120,533 | (a) |
| Shares issued in reinvestment of dividends | | | 22,991 | | | | 52,264 | |
| Shares redeemed | | | (479,001 | ) | | | (956,037 | ) |
| Ending shares | | | 3,602,593 | | | | 4,054,414 | |
| Institutional Class | | | | | | | | |
| Beginning shares | | | 711,901 | | | | 2,321,016 | |
| Shares sold | | | 27,726 | | | | 228,362 | (a) |
| Shares issued in reinvestment of dividends | | | 5,267 | | | | 30,128 | |
| Shares redeemed | | | (154,799 | ) | | | (1,867,605 | ) |
| Ending shares | | | 590,095 | | | | 711,901 | |
| (a) | Includes acquisitions described in Note 9. |
| See Notes to Financial Statements. | |
| 20 | centrefunds.com |
| Centre American Select Equity Fund | Financial Highlights |
| Investor Class | For a share outstanding throughout the periods presented. |
| | |
| | | For the Six Months Ended March 31, 2021 (Unaudited) | | | For the Year Ended September 30, 2020 | | | For the Year Ended September 30, 2019 | | | For the Year Ended September 30, 2018 | | | For the Year Ended September 30, 2017 | | | For the Year Ended September 30, 2016 | |
| NET ASSET VALUE, BEGINNING OF PERIOD | | $ | 11.88 | | | $ | 10.55 | | | $ | 13.63 | | | $ | 13.05 | | | $ | 11.65 | | | $ | 11.67 | |
| INCOME/(LOSS) FROM INVESTMENT OPERATIONS: | | | | | | | | | | | | | | | | | | | | | | | | |
| Net investment income/(loss)(a) | | | 0.05 | | | | 0.10 | | | | 0.04 | | | | (0.01 | ) | | | 0.06 | | | | 0.09 | |
| Net realized and unrealized gain/(loss) on investments | | | 2.51 | | | | 2.25 | | | | (0.96 | ) | | | 2.20 | | | | 1.74 | | | | 1.11 | |
| Total income/(loss) from investment operations | | | 2.56 | | | | 2.35 | | | | (0.92 | ) | | | 2.19 | | | | 1.80 | | | | 1.20 | |
| | | | | | | | | | | | | | | | | | | | | | | | | |
| DISTRIBUTIONS: | | | | | | | | | | | | | | | | | | | | | | | | |
| Net investment income | | | (0.11 | ) | | | (0.02 | ) | | | (0.03 | ) | | | (0.00 | )(b) | | | (0.15 | ) | | | (0.02 | ) |
| Net realized gains on investments | | | (0.46 | ) | | | (1.00 | ) | | | (2.13 | ) | | | (1.61 | ) | | | (0.25 | ) | | | (1.20 | ) |
| Total distributions | | | (0.57 | ) | | | (1.02 | ) | | | (2.16 | ) | | | (1.61 | ) | | | (0.40 | ) | | | (1.22 | ) |
| REDEMPTION FEES ADDED TO PAID-IN CAPITAL (NOTE 4) | | | 0.00 | (c) | | | 0.00 | (c) | | | 0.00 | (c) | | | 0.00 | (c) | | | 0.00 | (c) | | | 0.00 | (c) |
| NET INCREASE/(DECREASE) IN NET ASSET VALUE | | | 1.99 | | | | 1.33 | | | | (3.08 | ) | | | 0.58 | | | | 1.40 | | | | (0.02 | ) |
| NET ASSET VALUE, END OF PERIOD | | $ | 13.87 | | | $ | 11.88 | | | $ | 10.55 | | �� | $ | 13.63 | | | $ | 13.05 | | | $ | 11.65 | |
| | | | | | | | | | | | | | | | | | | | | | | | | |
| Total Return(d) | | | 22.03 | % | | | 23.82 | % | | | (5.12 | %) | | | 18.10 | % | | | 15.99 | % | | | 10.74 | % |
| | | | | | | | | | | | | | | | | | | | | | | | | |
| SUPPLEMENTAL DATA: | | | | | | | | | | | | | | | | | | | | | | | | |
| Net assets, end of period (000) | | $ | 148,273 | | | $ | 151,342 | | | $ | 104,838 | | | $ | 129,231 | | | $ | 123,938 | | | $ | 126,238 | |
| | | | | | | | | | | | | | | | | | | | | | | | | |
| RATIOS TO AVERAGE NET ASSETS: | | | | | | | | | | | | | | | | | | | | | | | | |
| Net investment income/(loss) including reimbursement/waiver | | | 0.74 | %(e) | | | 0.93 | % | | | 0.32 | % | | | (0.06 | %) | | | 0.47 | % | | | 0.77 | % |
| Operating expenses excluding reimbursement/waiver | | | 1.46 | %(e) | | | 1.56 | % | | | 1.58 | % | | | 1.60 | % | | | 1.46 | % | | | 1.36 | % |
| Operating expenses including reimbursement/waiver | | | 1.46 | %(e) | | | 1.47 | % | | | 1.45 | % | | | 1.32 | %(f) | | | 1.05 | % | | | 1.05 | % |
| | | | | | | | | | | | | | | | | | | | | | | | | |
| PORTFOLIO TURNOVER RATE | | | 52 | %(g) | | | 94 | % | | | 114 | % | | | 87 | % | | | 81 | % | | | 74 | % |
| (a) | Calculated using the average shares method. |
| (b) | Less than $(0.005) per share. |
| (c) | Less than $0.005 per share. |
| (d) | Total returns would have been lower had certain expenses not been waived during the period. Returns shown do not reflect the deduction of taxes that a shareholder would pay on fund distributions or the redemption of fund shares. |
| (f) | Effective January 29, 2018, the net expense limitation changed from 1.05% to 1.10%, excluding, among other fees and expenses, 12b-1 fees and shareholder service fees. |
| (g) | Portfolio turnover rate for periods less than one full year have not been annualized. |
| See Notes to Financial Statements. | |
| Semi-Annual Report | March 31, 2021 | 21 |
| Centre American Select Equity Fund | Financial Highlights |
| Institutional Class | For a share outstanding throughout the periods presented. |
| | | For the Six Months Ended March 31, 2021 (Unaudited) | | | For the Year Ended September 30, 2020 | | | For the Year Ended September 30, 2019 | | | For the Year Ended September 30, 2018 | | | For the Year Ended September 30, 2017 | | | For the Year Ended September 30, 2016 | |
| NET ASSET VALUE, BEGINNING OF PERIOD | | $ | 12.06 | | | $ | 10.66 | | | $ | 13.68 | | | $ | 13.05 | | | $ | 11.67 | | | $ | 11.69 | |
| INCOME/(LOSS) FROM INVESTMENT OPERATIONS: | | | | | | | | | | | | | | | | | | | | | | | | |
| Net investment income(a) | | | 0.08 | | | | 0.20 | | | | 0.09 | | | | 0.04 | (b) | | | 0.08 | | | | 0.10 | |
| Net realized and unrealized gain/(loss) on investments | | | 2.56 | | | | 2.23 | | | | (0.95 | ) | | | 2.21 | | | | 1.74 | | | | 1.11 | |
| Total income/(loss) from investment operations | | | 2.64 | | | | 2.43 | | | | (0.86 | ) | | | 2.25 | | | | 1.82 | | | | 1.21 | |
| | | | | | | | | | | | | | | | | | | | | | | | | |
| DISTRIBUTIONS: | | | | | | | | | | | | | | | | | | | | | | | | |
| Net investment income | | | (0.13 | ) | | | (0.03 | ) | | | (0.03 | ) | | | (0.01 | ) | | | (0.19 | ) | | | (0.03 | ) |
| Net realized gains on investments | | | (0.46 | ) | | | (1.00 | ) | | | (2.13 | ) | | | (1.61 | ) | | | (0.25 | ) | | | (1.20 | ) |
| Total distributions | | | (0.59 | ) | | | (1.03 | ) | | | (2.16 | ) | | | (1.62 | ) | | | (0.44 | ) | | | (1.23 | ) |
| REDEMPTION FEES ADDED TO PAID-IN CAPITAL (NOTE 4) | | | 0.00 | (c) | | | 0.00 | (c) | | | 0.00 | (c) | | | – | | | | 0.00 | (c) | | | – | |
| NET INCREASE/(DECREASE) IN NET ASSET VALUE | | | 2.05 | | | | 1.40 | | | | (3.02 | ) | | | 0.63 | | | | 1.38 | | | | (0.02 | ) |
| NET ASSET VALUE, END OF PERIOD | | $ | 14.11 | | | $ | 12.06 | | | $ | 10.66 | | | $ | 13.68 | | | $ | 13.05 | | | $ | 11.67 | |
| | | | | | | | | | | | | | | | | | | | | | | | | |
| Total Return(d) | | | 22.37 | % | | | 24.42 | % | | | (4.61 | %) | | | 18.55 | % | | | 16.20 | % | | | 10.74 | % |
| | | | | | | | | | | | | | | | | | | | | | | | | |
| SUPPLEMENTAL DATA: | | | | | | | | | | | | | | | | | | | | | | | | |
| Net assets, end of period (000) | | $ | 11,153 | | | $ | 11,682 | | | $ | 2,932 | | | $ | 2,554 | | | $ | 2,440 | | | $ | 21,058 | |
| | | | | | | | | | | | | | | | | | | | | | | | | |
| RATIOS TO AVERAGE NET ASSETS: | | | | | | | | | | | | | | | | | | | | | | | | |
| Net investment income including reimbursement/waiver | | | 1.28 | %(e) | | | 1.73 | % | | | 0.84 | % | | | 0.32 | % | | | 0.66 | % | | | 0.88 | % |
| Operating expenses excluding reimbursement/waiver | | | 1.15 | %(e) | | | 1.26 | % | | | 1.29 | % | | | 1.27 | % | | | 1.18 | % | | | 1.13 | % |
| Operating expenses including reimbursement/waiver | | | 0.98 | %(e) | | | 0.99 | % | | | 0.95 | % | | | 0.93 | %(f) | | | 0.95 | % | | | 0.95 | % |
| | | | | | | | | | | | | | | | | | | | | | | | | |
| PORTFOLIO TURNOVER RATE | | | 52 | %(g) | | | 94 | % | | | 114 | % | | | 87 | % | | | 81 | % | | | 74 | % |
| (a) | Calculated using the average shares method. |
| (b) | The per share amount does not correspond to activity reflected in the Statement of Operations due to class specific expenses during the period. |
| (c) | Less than $0.005 per share. |
| (d) | Total returns would have been lower had certain expenses not been waived during the period. Returns shown do not reflect the deduction of taxes that a shareholder would pay on fund distributions or the redemption of fund shares. |
| (f) | Effective January 29, 2018, the net expense limitation changed from 0.95% to 0.90%, excluding, among other fees and expenses, shareholder service fees. |
| (g) | Portfolio turnover rate for periods less than one full year have not been annualized. |
| See Notes to Financial Statements. | |
| 22 | centrefunds.com |
| Centre Global Infrastructure Fund | Financial Highlights |
| Investor Class | For a share outstanding throughout the periods presented. |
| | | For the Six Months Ended March 31, 2021 (Unaudited) | | | For the Year Ended September 30, 2020 | | | For the Year Ended September 30, 2019 | | | For the Period January 29, 2018 (Inception) to September 30, 2018 | |
| NET ASSET VALUE, BEGINNING OF PERIOD | | $ | 8.76 | | | $ | 10.18 | | | $ | 9.64 | | | $ | 10.00 | |
| INCOME/(LOSS) FROM INVESTMENT OPERATIONS: | | | | | | | | | | | | | | | | |
| Net investment income(a) | | | 0.11 | | | | 0.25 | | | | 0.22 | | | | 0.12 | |
| Net realized and unrealized gain/(loss) on investments | | | 1.38 | | | | (1.41 | ) | | | 0.57 | | | | (0.29 | ) |
| Total income/(loss) from investment operations | | | 1.49 | | | | (1.16 | ) | | | 0.79 | | | | (0.17 | ) |
| | | | | | | | | | | | | | | | | |
| DISTRIBUTIONS: | | | | | | | | | | | | | | | | |
| Net investment income | | | (0.08 | ) | | | (0.26 | ) | | | (0.25 | ) | | | (0.15 | ) |
| Net realized gains on investments | | | – | | | | – | | | | – | | | | (0.10 | ) |
| Total distributions | | | (0.08 | ) | | | (0.26 | ) | | | (0.25 | ) | | | (0.25 | ) |
| REDEMPTION FEES ADDED TO PAID-IN CAPITAL (NOTE 4) | | | 0.00 | (b) | | | 0.00 | (b) | | | 0.00 | (b) | | | 0.06 | |
| NET INCREASE/(DECREASE) IN NET ASSET VALUE | | | 1.41 | | | | (1.42 | ) | | | 0.54 | | | | (0.36 | ) |
| NET ASSET VALUE, END OF PERIOD | | $ | 10.17 | | | $ | 8.76 | | | $ | 10.18 | | | $ | 9.64 | |
| | | | | | | | | | | | | | | | | |
| Total Return(c) | | | 17.03 | % | | | (11.49 | %) | | | 8.41 | % | | | (1.18 | %) |
| | | | | | | | | | | | | | | | | |
| SUPPLEMENTAL DATA: | | | | | | | | | | | | | | | | |
| Net assets, end of period (000) | | $ | 36,627 | | | $ | 35,527 | | | $ | 28,879 | | | $ | 14,843 | |
| | | | | | | | | | | | | | | | | |
| RATIOS TO AVERAGE NET ASSETS: | | | | | | | | | | | | | | | | |
| Net investment income including reimbursement/waiver | | | 2.24 | %(d) | | | 2.62 | % | | | 2.28 | % | | | 1.87 | %(d) |
| Operating expenses excluding reimbursement/waiver | | | 1.74 | %(d) | | | 1.89 | % | | | 2.29 | % | | | 2.34 | %(d) |
| Operating expenses including reimbursement/waiver | | | 1.44 | % | | | 1.28 | %(e) | | | 1.30 | %(f) | | | 1.33 | %(g) |
| | | | | | | | | | | | | | | | | |
| PORTFOLIO TURNOVER RATE | | | 15 | %(h) | | | 75 | % | | | 233 | % | | | 49 | %(h) |
| (a) | Calculated using the average shares method. |
| (b) | Less than $0.005 per share. |
| (c) | Total returns are for the period indicated and have not been annualized. Total returns would have been lower had certain expenses not been waived during the period. Returns shown do not reflect the deduction of taxes that a shareholder would pay on fund distributions or the redemption of fund shares. |
| (e) | Effective July 21, 2020, the net expense limitation changed from 1.25% to 1.05%, excluding, among other fees and expenses, 12b-1 fees and shareholder service fees. |
| (f) | Effective July 22, 2019, the net expense limitation changed from 1.05% to 1.25%, including, among other fees and expenses, 12b-1 fees and shareholder service fees. |
| (g) | Effective May 18, 2018, the net expense limitation changed from 1.30% to 1.05%, excluding among other fees and expenses, 12b-1 fees and shareholder service fees. |
| (h) | Portfolio turnover rate for periods less than one full year have not been annualized. |
| See Notes to Financial Statements. | |
| Semi-Annual Report | March 31, 2021 | 23 |
| Centre Global Infrastructure Fund | Financial Highlights |
| Institutional Class | For a share outstanding throughout the periods presented. |
| | | For the Six Months Ended March 31, 2021 (Unaudited) | | | For the Year Ended September 30, 2020 | | | For the Year Ended September 30, 2019 | | | For the Period January 29, 2018 (Inception) to September 30, 2018 | |
| NET ASSET VALUE, BEGINNING OF PERIOD | | $ | 8.77 | | | $ | 10.20 | | | $ | 9.67 | | | $ | 10.00 | |
| INCOME/(LOSS) FROM INVESTMENT OPERATIONS: | | | | | | | | | | | | | | | | |
| Net investment income(a) | | | 0.12 | | | | 0.26 | | | | 0.24 | | | | 0.15 | |
| Net realized and unrealized gain/(loss) on investments | | | 1.37 | | | | (1.40 | ) | | | 0.57 | | | | (0.23 | ) |
| Total income/(loss) from investment operations | | | 1.49 | | | | (1.14 | ) | | | 0.81 | | | | (0.08 | ) |
| | | | | | | | | | | | | | | | | |
| DISTRIBUTIONS: | | | | | | | | | | | | | | | | |
| Net investment income | | | (0.09 | ) | | | (0.29 | ) | | | (0.28 | ) | | | (0.15 | ) |
| Net realized gains on investments | | | – | | | | – | | | | – | | | | (0.10 | ) |
| Total distributions | | | (0.09 | ) | | | (0.29 | ) | | | (0.28 | ) | | | (0.25 | ) |
| REDEMPTION FEES ADDED TO PAID-IN CAPITAL (NOTE 4) | | | 0.00 | (b) | | | 0.00 | (b) | | | – | | | | – | |
| NET INCREASE/(DECREASE) IN NET ASSET VALUE | | | 1.40 | | �� | | (1.43 | ) | | | 0.53 | | | | (0.33 | ) |
| NET ASSET VALUE, END OF PERIOD | | $ | 10.17 | | | $ | 8.77 | | | $ | 10.20 | | | $ | 9.67 | |
| | | | | | | | | | | | | | | | | |
| Total Return(c) | | | 17.03 | % | | | (11.30 | %) | | | 8.59 | % | | | (0.78 | %) |
| | | | | | | | | | | | | | | | | |
| SUPPLEMENTAL DATA: | | | | | | | | | | | | | | | | |
| Net assets, end of period (000) | | $ | 6,003 | | | $ | 6,243 | | | $ | 23,663 | | | $ | 1,424 | |
| | | | | | | | | | | | | | | | | |
| RATIOS TO AVERAGE NET ASSETS: | | | | | | | | | | | | | | | | |
| Net investment income including reimbursement/waiver | | | 2.47 | %(d) | | | 2.60 | % | | | 2.48 | % | | | 2.28 | %(d) |
| Operating expenses excluding reimbursement/waiver | | | 1.52 | %(d) | | | 1.63 | % | | | 1.61 | % | | | 7.96 | %(d) |
| Operating expenses including reimbursement/waiver | | | 1.20 | % | | | 1.02 | %(e) | | | 1.01 | %(f) | | | 1.16 | % |
| | | | | | | | | | | | | | | | | |
| PORTFOLIO TURNOVER RATE | | | 15 | %(g) | | | 75 | % | | | 233 | % | | | 49 | %(g) |
| (a) | Calculated using the average shares method. |
| (b) | Less than $0.005 per share. |
| (c) | Total returns are for the period indicated and have not been annualized. Total returns would have been lower had certain expenses not been waived during the period. Returns shown do not reflect the deduction of taxes that a shareholder would pay on fund distributions or the redemption of fund shares. |
| (e) | Effective July 21, 2020, the net expense limitation changed from 1.00% to 1.10%, excluding, among other fees and expenses, 12b-1 fees and shareholder service fees. |
| (f) | Effective July 22, 2019, the net expense limitation changed from 1.10% to 1.00%, including, among other fees and expenses, 12b-1 fees and shareholder service fees. |
| (g) | Portfolio turnover rate for periods less than one full year have not been annualized. |
| See Notes to Financial Statements. | |
| 24 | centrefunds.com |
| Centre Funds | Notes to Financial Statements |
| | March 31, 2021 (Unaudited) |
1. ORGANIZATION
Centre Funds (the “Trust”) was organized on March 17, 2011, as a Delaware statutory trust and is registered as an open-end management investment company under the Investment Company Act of 1940, as amended (the “1940 Act”). Prior to January 17, 2014, the Trust was known as Drexel Hamilton Mutual Funds. The Trust currently offers shares of beneficial interest (“shares”) of Centre American Select Equity Fund (the “American Select Equity Fund") and Centre Global Infrastructure Fund (the “Infrastructure Fund”) (each individually a "Fund" and collectively, the “Funds”). The affairs of the Trust are overseen by a Board of Trustees (the “Board” or the “Trustees”). The Declaration of Trust permits the Trustees to create additional series of the Trust and share classes.
Information in the accompanying Funds’ financial statements pertain to the Investor Class and Institutional Class shares offered by each of the Funds. All classes of shares have identical rights to earnings, assets, and voting privileges, except for class-specific expenses and exclusive rights to vote on matters affecting only individual classes.
2. SIGNIFICANT ACCOUNTING POLICIES
The following is a summary of significant accounting policies followed by the Funds in the preparation of the Financial Statements. These policies are in conformity with accounting principles generally accepted in the United States of America (“GAAP”). Each Fund is an investment company and accordingly follows the investment company accounting and reporting guidance of the Financial Accounting Standards Board Accounting Standard Codification Topic 946 Financial Services – Investment Companies.
| (a) | Portfolio securities traded on a securities exchange or quoted by NASDAQ are valued at the last sale price on the principal exchange on which they are traded at the time the securities are valued, or, if not traded on that day, are valued at the closing bid price. Securities traded in the OTC market and not quoted by NASDAQ are valued at their last sale price or, if there is no available price, the last bid price quoted by brokers that make markets in the securities as of the close of regular trading hours on the day the securities are being valued. Foreign securities are valued on the basis of quotations from the primary market in which they are traded, and are translated from the local currency into U.S. dollars using exchange rates as of the close of regular trading (normally 4:00 p.m. Eastern time) on the New York Stock Exchange (the “Exchange”) or using methods determined by the Board. Short-term instruments with maturities of 60 days or less are valued at the price supplied by an approved independent pricing source. Options contracts listed for trading on a securities exchange or board of trade shall be valued at the mean of the highest bid and lowest asked quotation across the exchanges on which the option is traded. Futures contracts are ordinarily valued at the closing settlement price on the exchange on which they are primarily traded or based upon the current settlement price for a like instrument acquired on the day on which the instrument is being valued. Securities and other assets for which quotations are not readily available or deemed unreliable are valued at their fair value using methods determined by the Board. Fair valuation of a particular security is an inherently subjective process, with no single standard to utilize when determining a security’s fair value. As such, different mutual funds could reasonably arrive at a different fair value price for the same security. In each case where a security is fair valued, consideration is given to the facts and circumstances relevant to the particular situation. This consideration includes reviewing various factors set forth in the pricing procedures adopted by the Board and other factors as warranted. In making a fair value determination, factors that may be considered, among others, may include: the type and structure of the security; unusual events or circumstances relating to the security’s issuer; general market conditions; prior day’s valuation; fundamental analytical data; size of the holding; cost of the security on the date of purchase; nature and duration of any restriction on disposition; trading activities; and prices of similar securities or financial instruments. If a Fund invests in shares of other open-end mutual funds, including Money Market Funds, (each, an “Underlying Fund”), the Fund calculates the net asset value of its shares using the reported net asset value of the applicable Underlying Fund. For each Underlying Fund, the net asset value per share for a class of shares is determined as of the close of the Exchange on each day the Exchange is open by dividing the value of the Underlying Fund’s net assets attributable to that class by the number of outstanding shares of that class on that day. |
| (b) | The per share net asset value (the “NAV”) of each Fund is calculated as of the close of regular trading on the Exchange (normally 4:00 p.m. Eastern time) each day the Exchange is open. The per share NAV is calculated by deducting from the Fund’s assets, the Fund’s liabilities, and then dividing the resulting net assets by the total number of shares outstanding, rounded to the nearest cent. The purchase price and redemption price per share is equal to the next determined NAV per share. Redemption of shares of American Select Equity Fund and Infrastructure Fund are subject to a redemption fee of 2% if redeemed within 90 days of purchase. |
| (c) | The Trust treats each Fund as a separate entity for Federal income tax purposes. Each Fund intends to continue to qualify each year as a “regulated investment company” under Subchapter M of the Internal Revenue Code of 1986, as amended (the “Code”). By so qualifying, each Fund will not be subject to Federal income taxes to the extent that it distributes substantially all of its taxable or tax-exempt income, if any, for its tax year ending September 30. In addition, by distributing in each calendar year substantially all of its net investment income, capital gains and certain other amounts, if any, each Fund will not be subject to a Federal excise tax. Therefore, no provision is made by the Funds for Federal income or excise taxes. Withholding taxes on foreign dividends are paid or provided for in accordance with the applicable country’s tax rules and rates. |
| Semi-Annual Report | March 31, 2021 | 25 |
| Centre Funds | Notes to Financial Statements |
| | March 31, 2021 (Unaudited) |
As of and during the period ended March 31, 2021, the Funds did not have a liability for any unrecognized tax benefits in the accompanying financial statements. The Funds recognize the interest and penalties, if any, related to the unrecognized tax benefits as income tax expense in the Statements of Operations. During the year, the Funds did not incur any interest or penalties.
| (d) | Net realized gains and losses on investments are computed on the identified cost basis. Dividend income is recognized on the ex-dividend date or for certain foreign securities, as soon as information is available, and interest income is recognized on an accrual basis. The Funds amortize premium and accrete discount on investments utilizing the effective interest method. Foreign dividend income may be subject to foreign withholding taxes. |
| (e) | A restricted security is a security that has been purchased through a private offering and cannot be resold to the general public without prior registration under the Securities Act of 1933, as amended (the “1933 Act”), or pursuant to the resale limitations provided by Rule 144 under the 1933 Act, or an exemption from the registration requirements of the 1933 Act. Whether a restricted security is illiquid is determined pursuant to guidelines established by the Board. Not all restricted securities are considered to be illiquid. As of March 31, 2021, the Funds did not hold any illiquid securities. |
| (f) | The accompanying financial statements were prepared in accordance with GAAP, which require the use of estimates and assumptions made by management. These may affect the reported amounts of assets and liabilities and disclosure of contingent assets and liabilities at the date of the financial statements and the reported amounts of increases and decreases in net assets from operations during the reporting period. Actual results could differ from those estimates. |
| (g) | Each Fund bears expenses incurred specifically by such Fund, as well as its pro rata portion of Trust expenses, which may be allocated on the basis of relative net assets or the nature of the services performed relative to applicability to each Fund. Expenses that are specific to a Fund or class of shares of a Fund are charged directly to that Fund or share class. All of the realized and unrealized gains and losses and net investment income of a Fund, other than class-specific expenses, are allocated daily to each class in proportion to its average daily net assets. Fees payable under the distribution (Rule 12b-1) plan and shareholder services plan are charged to each respective fund or share class. |
| (h) | The Funds intend to distribute to shareholders all of their net income and/or capital gains on an annual basis. Income and capital gains distributions are determined in accordance with income tax regulations, which may differ from GAAP. Distributions to shareholders are recorded on the ex-dividend date. |
| (i) | A Fund may directly purchase securities of foreign issuers. Investing in securities of foreign issuers involves special risks not typically associated with investing in securities of U.S. issuers. The risks include possible reevaluation of currencies, the inability to repatriate foreign currency, less complete financial information about companies and possible future adverse political and economic developments. Moreover, securities of many foreign issuers and their markets may be less liquid and their prices more volatile than those of securities of comparable U.S. issuers. |
| (j) | The books and records of the Funds are maintained in U.S. dollars. Investment valuations and other assets and liabilities initially expressed in foreign currencies are converted each business day into U.S. dollars based upon current exchange rates. The portion of realized and unrealized gains or losses on investments due to fluctuations in foreign currency exchange rates is not separately disclosed and is not included in net realized and net change in unrealized gains or losses on foreign currencies. |
| (k) | Idle cash may be swept into various overnight demand deposits and is classified as cash and cash equivalents on the Statements of Assets and Liabilities. The Funds maintain cash in bank deposit accounts which, at times, may exceed United States federally insured limits. Amounts swept overnight are available on the next business day. |
3. FAIR VALUE MEASUREMENTS
The Funds normally use third-party pricing services to obtain market quotations for their portfolio investments. Securities and other assets for which representative market quotations are not readily available or which cannot be accurately valued using the Trust’s normal pricing procedures are valued at fair value as determined in good faith under policies approved by the Trustees. Fair value pricing may be used, for example, in situations where (i) an exchange-traded portfolio security is so thinly traded that there have been no transactions for that security over an extended period of time or the validity of a market quotation received is questionable; (ii) the exchange on which the portfolio security is principally traded closes early; or (iii) trading of the portfolio security is halted during the day and does not resume prior to the NAV calculation.
| Centre Funds | Notes to Financial Statements |
| | March 31, 2021 (Unaudited) |
The inputs used in determining the fair value of each Fund’s investments are summarized into three levels, as described in the following hierarchy:
| Level 1 - | Unadjusted quoted prices in active markets for identical, unrestricted assets or liabilities that a Fund has the ability to access at the measurement date. |
| Level 2 - | Quoted prices which are not active, quoted prices for similar assets or liabilities in active markets or inputs other than quoted prices that are observable (either directly or indirectly). |
| Level 3 - | Significant unobservable prices or inputs (including the oversight of the Board and Centre Asset Management, LLC (the “Adviser”) in determining the fair value of investments) where there is little or no market activity for the asset or liability at measurement date. |
The inputs or methodology used for valuing securities are not necessarily an indication of the risk associated with investing in those securities.
The following is a summary of each Fund’s investments in the fair value hierarchy as of March 31, 2021:
Centre American Select Equity Fund
| Investments in Securities at Value(a) | | Level 1 - Quoted Prices | | | Level 2 - Other Significant Observable Inputs | | | Level 3 - Significant Unobservable Inputs | | | Total | |
| Common Stocks | | $ | 158,280,366 | | | $ | – | | | $ | – | | | $ | 158,280,366 | |
| Purchased Options | | | 603,240 | | | | – | | | | – | | | | 603,240 | |
| Short Term Investments | | | 721,412 | | | | – | | | | – | | | | 721,412 | |
| Total | | $ | 159,605,018 | | | $ | – | | | $ | – | | | $ | 159,605,018 | |
Centre Global Infrastructure Fund
| Investments in Securities at Value(a) | | Level 1 - Quoted Prices | | | Level 2 - Other Significant Observable Inputs | | | Level 3 - Significant Unobservable Inputs | | | Total | |
| Common Stocks | | $ | 41,926,999 | | | $ | – | | | $ | 25,837 | | | $ | 41,952,836 | |
| Short Term Investments | | | 236,724 | | | | – | | | | – | | | | 236,724 | |
| Total | | $ | 42,163,723 | | | $ | – | | | $ | 25,837 | | | $ | 42,189,560 | |
| (a) | For detailed descriptions of sectors, industries, and countries, see the accompanying Schedules of Investments. |
The following is a summary of valuation techniques and quantitative information used in determining the fair value of the Centre Global Infrastructure Fund’s Level 3 investments at March 31, 2021:
| Asset Type | | Balance as of September 30, 2020 | | | Accrued Discount/ premium | | | Realized Gain/(Loss) | | | Change in Unrealized Appreciation/ Depreciation | | | Purchases | | | Sales Proceeds | | | Transfer into Level 3 | | | Transfer Out of Level 3 | | | Balance as of March 31, 2021 | | | Net change in unrealized appreciation/(depreciation) included in the Statements of Operations attributable to Level 3 investments held at March 31, 2021 | |
| Common Stocks | | $ | 25,832 | | | $ | – | | | $ | – | | | $ | 5 | | | $ | – | | | $ | – | | | $ | – | | | $ | – | | | $ | 25,837 | | | $ | 5 | |
| | | $ | 25,832 | | | $ | – | | | $ | – | | | $ | 5 | | | $ | – | | | $ | – | | | $ | – | | | $ | – | | | $ | 25,837 | | | $ | 5 | |
Derivative Financial Instruments
A Fund may use derivative contracts, such as exchange-traded options and futures, that are related to stock market or bond indices, foreign exchange, fixed income or other securities, or be exposed to exchange-traded derivative products. A Fund may invest its assets in derivatives and other instruments to help manage interest rate exposure, protect the Fund’s assets, or enhance returns. A Fund may also be exposed to certain exchange-traded derivative products, such as exchange-traded futures and options that are fully collateralized by cash or securities, for temporary cash management or investment transition purposes, or to hedge the risks of existing positions or overall capital protection.
Derivative Risk: One or more Funds may use derivatives, such as exchange-traded options and futures, that are related to stock market or bond indexes, foreign exchange, fixed income or other securities or be exposed to exchange-traded derivative products. Loss may result from a Fund’s investments in exchange-traded futures and options. The value of derivatives in which a Fund may invest may rise or fall more rapidly than other investments. Other risks of investments in derivatives include imperfect correlation between the value of these instruments and the underlying assets; risks of default by the other party to the derivative transactions; risk that the transactions may result in losses that offset gains in portfolio positions; and risks that the derivative transactions may not be liquid. Derivatives, such as exchange-traded futures and options, contain “inherent” leverage because derivative contracts may give rise to an obligation on the part of a Fund for future payment or liabilities that are larger than the initial margin or premiums required to establish such positions. Combined with the volatility of derivatives prices, the leveraged nature of derivatives trading could cause a Fund to sustain large and sudden losses. The use of derivatives, such as futures and options, can lead to losses, including those magnified by leverage, particularly when derivatives are used to enhance return rather than mitigate risk. Correlation risk is the risk that changes in the value of the derivative may not correlate perfectly with the underlying asset, rate or index. Certain derivative instruments may be difficult to sell when the Adviser believes it would be appropriate to do so.
| Semi-Annual Report | March 31, 2021 | 27 |
| Centre Funds | Notes to Financial Statements |
| | March 31, 2021 (Unaudited) |
Derivatives may have little or no initial cash investment relative to their market value exposure and therefore can produce significant gains or losses in excess of their cost. This use of embedded leverage may allow a Fund to increase its market value exposure relative to its net assets and can substantially increase the volatility of the Fund’s performance.
Additional associated risks from investing in derivatives also exist and potentially could have significant effects on the valuation of the derivatives held by a Fund. Typically, a Fund may attempt to increase or decrease exposure to the risks associated with the securities or other traditional investments in which it invests. The risks associated with a Fund’s use of derivative instruments, including but not limited to volatility risk, correlation risk, segregation risk, and hedging risks, are additional risks that a Fund does not typically seek to increase or decrease exposure to. Examples of these associated risks are liquidity risk, which is the risk that a Fund will not be able to sell the derivative in the open market in a timely manner, and counterparty credit risk, which is the risk that the counterparty will not fulfill its obligation to the Fund.
Option Writing/Purchasing
A Fund may write or purchase option contracts to adjust risk and return of its overall investment positions, subject to any restrictions set forth in the Fund’s prospectus. When a Fund writes or purchases an option, an amount equal to the premium received or paid by the Fund is recorded as a liability or an asset and is subsequently adjusted to the current market value of the option written or purchased. Premiums received or paid from writing or purchasing options that expire unexercised are treated by a Fund on the expiration date as realized gains or losses. The difference between the premium and the amount paid or received on affecting a closing purchase or sale transaction, including brokerage commissions, is also treated as a realized gain or loss. If an option is exercised, the premium paid or received is netted to the cost of the purchase or proceeds from the sale in determining whether a Fund has realized a gain or loss on investment transactions. Risks from entering into option transactions arise from, among other things, the potential inability of counterparties to meet the terms.
Futures
A Fund may use futures subject to any restrictions set forth in the Fund’s prospectus. A Fund may also be exposed to exchange-traded futures that are fully collateralized by cash or securities, for temporary cash management or investment transition purposes, or to hedge the risks of existing positions. To the extent that the Fund uses derivatives for temporary cash management, investment transition purposes, managing duration or to hedge the risks of existing positions, the Fund will be subject to the risks associated with such transactions. During the period ended March 31, 2021, the Funds did not invest in futures contracts.
| Risk Exposure | | Derivatives Statements of Assets and Liabilities Location | | Fair Value | |
| Centre American Select Equity Fund | | | | | |
| Equity Contracts | | | | | |
| (Purchased Options) | | Investments, at value | | $ | 603,240 | |
| | | | | $ | 603,240 | |
The effect of derivative instruments on the Statements of Operations for the period ended March 31, 2021 (Net realized gain/(loss) on purchased options contracts are included in Net realized gain/(loss) on investments within the Statements of Operations):
| Derivatives | | Location of Gains/(Loss) On Derivatives Recognized In Income | | Realized Gain/(Loss) on Derivatives Recognized in Income | | | Change in Unrealized Gain/(Loss) on Derivatives Recognized in Income | |
| Centre American Select Equity Fund | | | | | | | | |
Equity Contracts (Purchased Options) | | Net realized gain/(loss) on investments/Net change in unrealized appreciation/(depreciation) on investments | | $ | (3,583,265 | ) | | $ | 1,195,408 | |
| | | | | $ | (3,583,265 | ) | | $ | 1,195,408 | |
| Centre Funds | Notes to Financial Statements |
| | March 31, 2021 (Unaudited) |
Volume of Derivative Instruments for the Funds during the period ended March 31, 2021, was as follows:
| Derivative Type | | Unit of Measurement | | | Monthly Average | |
| Centre American Select Equity Fund | | | | | | |
| Purchased Option Contracts | | | Notional value of contracts outstanding | | | $ | 93,694,908 | |
During the ordinary course of business, the Funds may enter into transactions subject to enforceable netting agreements or other similar arrangements (“netting agreements”). Generally, the right to offset in netting agreements allows the Funds to offset any exposure to a specific counterparty with any collateral received or delivered to that counterparty based on the terms of the agreement. Generally, the Funds manage their cash collateral and securities collateral on a counterparty basis.
4. BENEFICIAL INTEREST TRANSACTIONS
On March 31, 2021, there was an unlimited number of shares of beneficial interest authorized for each Fund. Transactions in shares of beneficial interest are shown in the Statements of Changes in Net Assets.
Shares of American Select Equity Fund and Infrastructure Fund that are redeemed within 90 days of purchase may incur a 2% redemption fee deducted from the redemption amount. For the period ended March 31, 2021, redemption fees retained by these Funds are disclosed in the Statements of Changes in Net Assets.
Beneficial Ownership: The beneficial ownership, either directly or indirectly, of more than 25% of the voting securities of a Fund creates a presumption of control of the Fund under Section 2(a)(9) of the 1940 Act. As of March 31, 2021, the following entities owned beneficially more than 25% of each Fund’s outstanding shares. The shares may be held under omnibus accounts (whereby the transactions of two or more shareholders are combined and carried in the name of the originating broker rather than designated separately). Any transaction by these investors could have a material impact on the share class.
| Centre American Select Equity Fund | Percentage |
| Charles Schwab & Co. Inc | 46.72% |
5. INVESTMENT ADVISORY AGREEMENTS AND RELATED-PARTY TRANSACTIONS
The Adviser serves as the investment adviser to each Fund pursuant to an Investment Advisory Agreement with the Trust on behalf of the Fund.
As compensation for the investment advisory services provided to the Funds, the Adviser is entitled to receive monthly compensation, subject to waivers, based on each Fund’s average daily net assets at the annual rate of:
| Fund | Management Fee Rate |
| Centre American Select Equity Fund (total net assets less than or equal to $1 billion) | 0.75% |
| Centre American Select Equity Fund (total net assets over $1 billion) | 0.70% |
| Centre Global Infrastructure Fund | 0.85% |
American Select Equity Fund
The Adviser has contractually agreed to reduce its advisory fees and/or reimburse other expenses of the Fund for not less than one year and until the next following effective date of the post-effective amendment to the registration statement of Centre Funds relating to the Fund (on or about January 29, 2022) to the extent necessary to limit the total operating expenses of the Fund including (but not limited to) investment advisory fees of the Adviser, but excluding, as applicable, any front-end or contingent deferred sales loads, taxes, leverage interest, distribution/service (Rule 12b-1) fees, shareholder services fees, brokerage commissions, acquired fund fees and expenses, expenses incurred in connection with any merger or reorganization, and extraordinary expenses (such as litigation and other expenses not incurred in the ordinary course of the Fund’s business) to an annual rate of 1.10% of the average daily net assets of the Investor Class shares and 0.90% of the average daily net assets of the Institutional Class shares (the “Expense Limitation Agreement”). The Expense Limitation Agreement may be terminated at any time, and without payment of any penalty, by the Board of Trustees of the Trust (the “Board”), on behalf of the Fund, upon 60 days’ written notice to the Adviser, but may not be terminated by the Adviser without the consent of the Board. No recoupment will be made more than three years after the date that the applicable amount was initially waived or reimbursed by the Adviser, and the recoupment may not cause the Fund to exceed the then-existing expense limitation for that class at the time such waiver or reimbursement was made.
| Semi-Annual Report | March 31, 2021 | 29 |
| Centre Funds | Notes to Financial Statements |
| | March 31, 2021 (Unaudited) |
Infrastructure Fund
The Adviser has contractually agreed to reduce its advisory fees and/or reimburse other expenses of the Fund for an initial period of not less than one year and until the next following effective date of the post-effective amendment to the registration statement of Centre Funds relating to the Fund (on or about January 29, 2022) incorporating the Fund’s financial statements for that fiscal year to the extent necessary to limit the total operating expenses of the Fund, including (but not limited to) investment advisory fees of the Adviser, but excluding, as applicable, any front-end or contingent deferred sales loads taxes, leverage interest, distribution/service (Rule 12b-1) fees, shareholder services fees, brokerage commissions, acquired fund fees and expenses, expenses incurred in connection with any merger or reorganization, and extraordinary expenses (such as litigation and other expenses not incurred in the ordinary course of the Fund’s business) to an annual rate of 1.25% of the average daily net assets of the Investor Class shares and 1.10% of the average daily net assets of the Institutional Class shares. The Expense Limitation Agreement may be terminated at any time, and without payment of any penalty, by the Board, on behalf of the Fund, upon 60 days’ written notice to the Adviser, but may not be terminated by the Adviser without the consent of the Board. No recoupment will be made more than three years after the date that the applicable amount was initially waived or reimbursed by the Adviser, and the recoupment may not cause the Fund to exceed the then-existing expense limitation for that class at the time such waiver or reimbursement was made.
During the period ended March 31, 2021, the fee waivers and/or reimbursements were as follows:
| Fund | | Fees Waived and/or Reimbursed by Adviser | |
| Centre American Select Equity Fund | | | | |
| Investor | | $ | – | |
| Institutional | | | 8,821 | |
| Centre Global Infrastructure Fund | | | | |
| Investor | | | 56,039 | |
| Institutional | | | 10,257 | |
As of March 31, 2021, the balances of recoupable expenses for each Fund were as follows:
| Fund | | Expires 2022 | | | Expires 2023 | | | Expires 2024 | | | Total | |
| Centre American Select Equity Fund | | | | | | | | | | | | | | | | |
| Investor | | $ | 132,139 | | | $ | 98,153 | | | $ | – | | | $ | 230,292 | |
| Institutional | | | 10,516 | | | | 12,046 | | | | 8,821 | | | | 31,383 | |
| Centre Global Infrastructure Fund | | | | | | | | | | | | | | | | |
| Investor | | $ | 156,006 | | | $ | 147,882 | | | $ | 56,039 | | | $ | 359,927 | |
| Institutional | | | 33,985 | | | | 77,189 | | | | 10,257 | | | | 121,431 | |
ALPS Fund Services, Inc. (“ALPS” or the “Administrator”) serves as administrator to the Funds. ALPS receives a monthly fee paid by the Funds subject to a minimum monthly fee and is reimbursed for certain out-of-pocket expenses. Pursuant to an administrative agreement with the Trust, ALPS provides operational services to the Funds including, but not limited to fund accounting and fund administration services and general assistance in each Fund’s operations.
ALPS, pursuant to a transfer agency and services agreement with the Trust, serves as transfer agent for the Funds. Under the transfer agency and services agreement, ALPS receives an annual minimum fee per Fund and a fee based upon each shareholder account and its account activity and is reimbursed for certain out-of-pocket expenses.
ALPS, pursuant to a chief compliance officer services agreement with the Trust, provides chief compliance officer services to the Funds. Additionally, ALPS provides services in monitoring and testing the policies and procedures of the Trust in conjunction with requirements under Rule 38a-1 under the 1940 Act. ALPS receives an annual fee for these services and is reimbursed for certain out-of-pocket expenses, pursuant to the chief compliance officer services agreement.
The Trust has adopted a plan pursuant to Rule 12b-1 under the 1940 Act (the “Plan”). The Plan permits the Trust, on behalf of Investor Class shares of the Funds, to pay up to 0.25% per year to one or more entities for services rendered and expenses borne in connection with providing shareholder or distribution services with respect to the Investor class shares of each Fund.
The Trust has also adopted a shareholder services plan for certain non-distribution shareholder services provided by financial intermediaries. With respect to each Fund, the shareholder services plan authorizes annual payment of up to 0.15% of the average daily net assets attributable to Investor Class shares of the Fund, and up to 0.10% of the average daily net assets attributable to Institutional Class shares of the Fund.
| Centre Funds | Notes to Financial Statements |
| | March 31, 2021 (Unaudited) |
ALPS Distributors, Inc. (the “Distributor”) acts as the principal underwriter of the Funds pursuant to a distribution agreement with the Trust. No payments were retained by the Distributor by the Funds during the period ended March 31, 2021.
Officers of the Trust and Trustees who are “interested persons” of the Trust or the Adviser receive no salary or fees from the Trust. Each Trustee who is not an “interested person” receives an annual retainer of $20,000 paid quarterly. The Trust reimburses each Trustee and Officer for his or her travel and other expenses relating to attendance at Board meetings.
One Trustee is an officer of the Trust, and serves as Managing Director and Chief Investment Officer of the Adviser.
6. FEDERAL INCOME TAX AND TAX BASIS INFORMATION
As of and during the period ended March 31, 2021, no Fund had a liability for any unrecognized tax benefits. The Funds file U.S. Federal, state, and local tax returns as required. The Funds’ tax returns are subject to examination by the relevant tax authorities until expiration of the applicable statute of limitations, which is generally three years after the filing of the tax return but which can be extended to six years in certain circumstances. Tax returns for open years have incorporated no uncertain tax positions that require a provision for income taxes.
Components of Distributable Earnings on a Tax Basis: At March 31, 2021, permanent differences in book and tax accounting were reclassified. These differences had no effect on net assets and were primarily attributed to differences in the book and tax treatment of currency transactions, book/tax distribution differences, and non-deductible expenses.
Elective Deferrals: Capital Losses arising in the post-October period of the current fiscal year may be deferred to the next fiscal year if the fund elects to defer the recognition of these losses. When this election is made, any losses recognized during the period are treated as having occurred on the first day of the next fiscal year separate from and in addition to the application of normal capital loss carry forwards as described above.
The Funds elect to defer to the period ending September 30, 2021, capital losses recognized during the period November 1, 2019 - September 30, 2020 in the amount of:
| Fund | | Amount | |
| Centre American Select Equity Fund | | $ | 3,162,014 | |
The Funds elect to defer to the period ending September 30, 2021, late year ordinary losses in the amount of:
| Fund | | Amount | |
| Centre Global Infrastructure Fund | | $ | 2,457 | |
Under current law, capital losses maintain their character as short-term or long-term and are carried forward to the next tax year without expiration. As of the current fiscal year end, the following amounts are available as carry forwards to the next tax year:
| Fund | | Short-Term | | | Long-Term | |
| Centre Global Infrastructure Fund | | $ | 12,146,245 | | | $ | 16,171,702 | |
Distributions to Shareholders: The Centre American Select Equity Fund normally pays dividends and net investment income, if any, on an annual basis and the Centre Global Infrastructure Fund, intends to make monthly income distributions. Each Fund normally distributes capital gains, if any, on an annual basis. Income dividend distributions are derived from interest and other income each Fund receives from its investments, including distributions of short term capital gains. Capital gain distributions are derived from gains realized when each Fund sells a security it has owned for more than one year. Each Fund may make additional distributions and dividends at other times if the Adviser believes doing so may be necessary for each Fund to avoid or reduce taxes. Net investment income/(loss) and net realized gain/(loss) may differ for financial statement and tax purposes. The amounts and characteristics of tax basis distributable earnings/(accumulated losses) are finalized at fiscal year-end.
The tax character of distributions paid for the fiscal year ended September 30, 2020 were as follows:
| Distributions Paid From: | | Ordinary Income | | | Long-Term Capital Gains | |
| Centre American Select Equity Fund | | $ | 563,328 | | | $ | 9,341,286 | |
| Centre Global Infrastructure Fund | | | 1,000,402 | | | | – | |
| Semi-Annual Report | March 31, 2021 | 31 |
| Centre Funds | Notes to Financial Statements |
| | March 31, 2021 (Unaudited) |
The tax character of distributions paid for the fiscal year ended September 30, 2019 were as follows:
| Distributions Paid From: | | Ordinary Income | | | Long-Term Capital Gains | |
| Centre American Select Equity Fund | | $ | 243,623 | | | $ | 20,045,940 | |
| Centre Global Infrastructure Fund | | | 484,644 | | | | – | |
Unrealized Appreciation and Depreciation on Investments: The amount of net unrealized appreciation/(depreciation) and the cost of investment securities for tax purposes, including short-term securities at March 31, 2021 are displayed in the table below. The difference between book and tax basis unrealized appreciation/(depreciation) for the Funds is primarily attributable to wash sales and certain other investments.
| | | Tax Cost of Investments | | | Gross Unrealized Appreciation | | | Gross Unrealized Depreciation | | | Net Tax Unrealized Appreciation/(Depreciation) on Investments | |
| Centre American Select Equity Fund | | $ | 95,010,097 | | | $ | 65,111,032 | | | $ | (516,111 | ) | | $ | 64,594,921 | |
| Centre Global Infrastructure Fund | | | 37,940,875 | | | | 6,262,294 | | | | (2,013,609 | ) | | | 4,248,685 | |
7. PURCHASES AND SALES OF INVESTMENT SECURITIES
For the period ended March 31, 2021, the aggregate cost of purchases and proceeds from sales of investment securities (excluding any U.S. Government Obligations, short-term securities, and purchased options and futures) were as follows:
| Fund | | Purchases of Securities | | | Proceeds From Sales of Securities | |
| Centre American Select Equity Fund | | $ | 82,410,844 | | | $ | 120,986,023 | |
| Centre Global Infrastructure Fund | | | 6,448,405 | | | | 11,261,698 | |
8. INDEMNIFICATIONS
Under the Trust’s organizational documents, its officers and Trustees are indemnified against certain liabilities relating to their duties to the Trust. Additionally, in the ordinary course of business, the Trust enters into contracts with service providers that may contain general indemnification clauses. The Trust’s maximum exposure under these arrangements is unknown, as this would involve future claims that may be made against the Trust that have not yet occurred.
9. FUND REORGANIZATIONS
At a special meeting of shareholders held on August 20, 2020, the shareholders of Centre Active U.S. Treasury Fund (the “Treasury Fund”), a former series of the Trust, approved the reorganization, pursuant to an Agreement and Plan of Reorganization (the “Plan”), of the Treasury Fund into the Infrastructure Fund. The Board of Trustees of the Trust had previously approved the Plan providing for the reorganization.
Following the completion of the reorganization on August 21, 2020, and pursuant to the terms of the Plan, Investor Class and Institutional Class shareholders of the Treasury Fund became shareholders of the Infrastructure Fund and received Investor Class and Institutional Class shares, respectively, of the Infrastructure Fund. The reorganization did not qualify as a tax-free “reorganization” under the Internal Revenue Code of 1986, as amended (the “Code”) for U.S. federal income tax purposes. The reorganization was accomplished by an exchange of 128,686 shares of the Treasury Fund’s Investor Class, valued at $1,177,292, for 127,537 shares of the Infrastructure Fund’s Investor Class, and 2,124,296 shares of the Treasury Fund’s Institutional Class, valued at $19,301,378, for 2,092,823 shares of the Infrastructure Fund’s Institutional Class.
| Acquiring Fund | | Shares Outstanding of Acquiring Fund | | | Net Assets of Acquiring Fund | | | Acquired Fund | | | Acquired Fund Shares Exchanged | | | Net Assets of Acquired Fund Exchanged | |
| Infrastructure Fund | | | 2,667,214 | | | $ | 24,603,879 | | | | Treasury Fund | | | | 2,252,982 | | | $ | 20,478,670 | |
| Centre Funds | Notes to Financial Statements |
| | March 31, 2021 (Unaudited) |
The investment portfolio fair value and unrealized depreciation for the Treasury Fund immediately prior to the reorganization were as follows:
| Acquired Fund | | Portfolio Market Value | | | Unrealized Depreciation* | |
| Treasury Fund | | $ | 20,506,079 | | | $ | 0 | |
| * | Realized upon completion of the reorganization as it was not tax-free |
Immediately following the reorganization the net assets of the combined Fund was as follows:
| | | Combined Net Assets | |
| Infrastructure Fund | | $ | 45,082,549 | |
There were no unused capital loss carryforwards of the Treasury Fund, subject to tax limitations, for potential utilization as of the closing date of the reorganization, August 21, 2020.
Assuming the reorganization had been completed on October 1, 2019, the inception date of the Infrastructure Fund, the Infrastructure Fund’s pro forma results of operations for the year ended September 30, 2020 would be as follows:
| | | Net Investment Income | | | Net Realized and Unrealized Gain/(Loss) on Investments | | | Net Increase/(Decrease) in Net Assets Resulting from Operations | |
| Infrastructure Fund | | $ | 591,863 | | | $ | (9,170,409 | ) | | $ | (8,578,546 | ) |
Because of the investment portfolios that were combined through the reorganization have been managed as a single integrated portfolio since the closing of the reorganization, it is not practicable to separate the amounts of revenue and earnings of the Treasury Fund that have been included in the Infrastructure Fund’s Statement of Operations since August 21, 2020.
10. SUBSEQUENT EVENTS
The Funds have evaluated the need for disclosures and/or adjustments resulting from subsequent events through the date the financial statements were issued. Based on this evaluation, no adjustments were required to the financial statements as of March 31, 2021.
| Semi-Annual Report | March 31, 2021 | 33 |
| Centre Funds | Additional Information |
| | March 31, 2021 (Unaudited) |
PROXY VOTING GUIDELINES AND RECORDS
A description of the policies and procedures that the Funds use to determine how to vote proxies relating to portfolio securities and information regarding how the Funds voted proxies during the most recent 12-month period ended June 30, is available without charge, upon request, by (1) calling the Funds at 1-855-298-4236 and (2) on the U.S. Securities and Exchange Commission’s (“SEC”) website at http://www.sec.gov.
PORTFOLIO HOLDINGS DISCLOSURE POLICY
The Trust files, with regard to each Fund, with the SEC a complete schedule of investments for the first and third quarters of each fiscal year as an exhibit to its reports on Form N-PORT. The Funds’ first and third fiscal quarters end on December 31 and June 30. Form N-PORT reports are available on the SEC’s website at http://www.sec.gov. You may also obtain copies by calling the Funds at 1-855-298-4236.
FUNDS' LIQUIDITY RISK MANAGEMENT PROGRAM
The Centre Funds have an established liquidity risk management program (the “Program”) to govern the Trust’s approach to managing liquidity risk for each fund. The Program is overseen by the Liquidity Committee (the “Committee”), a committee comprised of representatives of the Adviser. The Trust’s Board of Trustees (the “Board”) has approved the designation of the Committee to oversee the Program. The Program’s principal objectives include supporting each Fund’s compliance with limits on investments in illiquid assets and mitigating the risk that a Fund will be unable to meet its redemption obligations in a timely manner.
The Program also includes a number of elements that support the management and assessment of liquidity risk, including, among others, an annual assessment of factors that influence a Fund’s liquidity the periodic classification and re-classification of the Fund’s investments into groupings that reflect the Committee’s assessment of their relative liquidity under both current market conditions and reasonably foreseeable stressed conditions, as well as minimum levels of highly liquid investments. At a meeting that occurred on November 13, 2020, the Board received a report from the Committee that addressed the operation of the Program and assessed its adequacy and effectiveness of implementation.
The report revealed that, during the period covered by the report, there were no liquidity events that impacted the Funds or their ability to timely meet redemptions without dilution to existing shareholders. The report further discussed the liquidity classification methodology of each Fund, the effectiveness of the operation of certain Funds’ Highly Liquid Investment Minimum (“HLIM”) where applicable, and the liquidity classification of each Fund’s investments over the period. The report further noted that no material changes have been made to the Program since its implementation. The report provided to the Board included a conclusion that the Program appeared to be reasonably designed and operated effectively during the review period.
Page Intentionally Left Blank

| (b) | Not Applicable to the Registrant |
Item 2. Code of Ethics.
Not applicable to semi-annual report.
Item 3. Audit Committee Financial Expert.
Not applicable to semi-annual report.
Item 4. Principal Accountant Fees and Services.
Not applicable to semi-annual report.
Item 5. Audit Committee of Listed Registrants.
Not applicable to the Registrant.
Item 6. Schedule of Investments.
| (a) | The Registrant’s “Schedule I – Investments in securities of unaffiliated issuers” (as set forth in 17 CFR 210.12-12) is included in Item 1 of this Form N-CSR. |
| (b) | Not applicable to the Registrant. |
Item 7. Disclosure of Proxy Voting Policies and Procedures for Closed-End Management Investment Companies.
Not applicable to the Registrant.
Item 8. Portfolio Managers of Closed-End Management Investment Companies.
Not applicable to the Registrant.
Item 9. Purchases of Equity Securities by Closed-End Management Investment Company and Affiliated Purchasers.
Not applicable to the Registrant.
Item 10. Submission of Matters to a Vote of Security Holders.
None.
Item 11. Controls and Procedures.
| (a) | The Registrant’s principal executive officer and principal financial officer have evaluated the Registrant’s disclosure controls and procedures (as defined in Rule 30a-3(c) under the Investment Company Act of 1940, as amended) within 90 days of this filing and have concluded that the Registrant’s disclosure controls and procedures were effective as of that date. |
| (b) | There was no change in the Registrant’s internal control over financial reporting (as defined in Rule 30a-3(d) under the Investment Company Act of 1940, as amended) during the second fiscal quarter of the period covered by this report that has materially affected, or is reasonably likely to materially affect, the Registrant’s internal control over financial reporting. |
Item 12. Disclosure of Securities Lending Activities for Closed-End Management Investment Companies.
Not applicable.
Item 13. Exhibits.
| (a)(1) | Not applicable to semi-annual report. |
SIGNATURES
Pursuant to the requirements of the Securities Exchange Act of 1934 and the Investment Company Act of 1940, the Registrant has duly caused this report to be signed on its behalf by the undersigned, thereunto duly authorized.
CENTRE FUNDS
| By: | /s/ James A. Abate | |
| | James A. Abate | |
| | President (Principal Executive Officer) | |
| | | |
| Date: | June 2, 2021 | |
Pursuant to the requirements of the Securities Exchange Act of 1934 and the Investment Company Act of 1940, this report has been signed below by the following persons on behalf of the Registrant and in the capacities and on the dates indicated.
| By: | /s/ James A. Abate | |
| | James A. Abate | |
| | President (Principal Executive Officer) | |
| | | |
| Date: | June 2, 2021 | |
| By: | /s/ James A. Abate | |
| | James A. Abate | |
| | Treasurer (Principal Financial Officer) | |
| | | |
| Date: | June 2, 2021 | |