UNITED STATES
SECURITIES AND EXCHANGE COMMISSION
Washington, D.C. 20549
FORM N-CSR
CERTIFIED SHAREHOLDER REPORT OF REGISTERED
MANAGEMENT INVESTMENT COMPANIES
Investment Company Act file number: 811-22545
CENTRE FUNDS
(Exact name of registrant as specified in charter)
48 Wall Street, Suite 1100, New York, New York 10005
(Address of principal executive offices) (Zip code)
James A. Abate
48 Wall Street, Suite 1100
New York, New York 10005
(Name and address of agent for service)
Registrant’s telephone number, including area code: (212) 918-4705
Date of fiscal year end: September 30
Date of reporting period: October 1, 2017 – March 31, 2018
| Item 1. | Reports to Stockholders. |
TABLE OF CONTENTS
| | | PAGE |
| SHAREHOLDER LETTER | | 1 |
| MANAGER COMMENTARY | | 2 |
| Centre American Select Equity Fund | | 2 |
| Centre Active U.S. Treasury Fund | | 7 |
| Centre Active U.S. Tax Exempt Fund | | 12 |
| Centre Global Infrastructure Fund | | 16 |
| DISCLOSURE OF FUND EXPENSES | | 19 |
| SCHEDULE OF INVESTMENTS | | 20 |
| Centre American Select Equity Fund | | 20 |
| Centre Active U.S. Treasury Fund | | 22 |
| Centre Active U.S. Tax Exempt Fund | | 23 |
| Centre Global Infrastructure Fund | | 24 |
| STATEMENTS OF ASSETS AND LIABILITIES | | 27 |
| STATEMENTS OF OPERATIONS | | 28 |
| STATEMENTS OF CHANGES IN NET ASSETS | | 29 |
| Centre American Select Equity Fund | | 29 |
| Centre Active U.S. Treasury Fund | | 30 |
| Centre Active U.S. Tax Exempt Fund | | 31 |
| Centre Global Infrastructure Fund | | 32 |
| FINANCIAL HIGHLIGHTS | | 33 |
| Centre American Select Equity Fund | | 33 |
| Centre Active U.S. Treasury Fund | | 35 |
| Centre Active U.S. Tax Exempt Fund | | 37 |
| Centre Global Infrastructure Fund | | 39 |
| NOTES TO FINANCIAL STATEMENTS | | 41 |
| ADDITIONAL INFORMATION | | 52 |
| Centre Funds | Shareholder Letter |
March 31, 2018 (Unaudited)
Dear Shareholders,
It is with my pleasure that we publish the Centre Funds Semi-Annual Report covering the six-month period ended March 31, 2018. I want to thank my fellow shareholders for their continued support and confidence in Centre Funds. We are committed to truly active fund management with distinction.
Each series of Centre Funds is a fundamentally-driven, actively managed Fund in core investment strategies with differentiation and using specialist talent. We offer a select series of funds to choose from, each available in investor and institutional share classes.
Centre American Select Equity Fund
The Fund is a U.S. large capitalization valuation sensitive growth stock fund that seeks long-term growth of capital and is focused on risk adjusted returns through active and pragmatic management; the Fund may complement its equity securities with hedges and other capital preservation strategies when deemed appropriate. The Fund is intended to be a risk managed core growth fund.
Centre Active U.S. Treasury Fund
The Fund is a nontraditional U.S. Treasury securities fund that seeks to maximize investors’ total return through capital appreciation and current income through investments in primarily U.S. Treasury securities. The Fund has the potential for capital appreciation/preservation in various interest rate environments through a proprietary interest rate forecasting process that aims to take advantage of interest rate changes through active duration and interest rate management.
Centre Active U.S. Tax Exempt Fund
The Fund is a nontraditional municipal securities fund that seeks to maximize investors’ total return through capital appreciation and income exempt from federal income tax using active duration management of a core portfolio of highly rated federally tax exempt securities of state and local governments in the U.S. and their political subdivisions, agencies and instrumentalities. The Fund has the potential for capital appreciation/preservation in various interest rate environments through a proprietary interest rate forecasting process that aims to take advantage of interest rate changes through active duration and interest rate management.
Centre Global Infrastructure Fund
The Fund is for investors seeking to potentially benefit from a renewed focus on infrastructure spending revival, but wish to have liquidity in publicly traded investments in developed global markets rather than illiquid private investments. The Fund pursues a bottom-up, active management approach and invests in what we deem the most attractive infrastructure stocks from the United States and developed international economies. Also, the Fund seeks to balance its exposures to where the weights of the Telecommunication, Utilities, Energy, Transportation, and Social Infrastructure industries are broadly represented.
Our aim at Centre Funds is to deliver strong, long-term performance results for investors through an exceptional focus on producing returns and managing risk and downside volatility in select investment strategies. We want investors to associate Centre Funds with high-conviction, differentiated fund strategies that may not be available elsewhere and are tactical, pragmatic, and opportunistic. Each investment strategy aims to capitalize on defined market opportunities using talented and experienced portfolio managers with consistent and repeatable investment processes who aim to achieve true differentiated returns. Our portfolio managers remain focused on fundamentally-driven investment approaches within truly active, high conviction, disciplined and research intensive processes. At Centre Funds, we place service excellence at the core of everything that we do and are committed to providing useful information on all of the Funds. Again, I want to thank my fellow shareholders for their continued support and confidence in the Centre Funds.
Sincerely,
James Abate
President, Centre Funds
| Semi-Annual Report | March 31, 2018 | 1 |
| Centre American Select Equity Fund | Manager Commentary |
March 31, 2018 (Unaudited)
Performance & Strategy Summary
For the six-month period ended March 31, 2018, the Centre American Select Equity Fund, Investor Share Class, delivered a total return of 8.66 percent; the Institutional Share Class delivered a total return of 8.76 percent.
During this past six-month period, the key barometer of the U.S. stock market as a whole, as measured by the S&P 500 Index1 , delivered a total return of 5.83 percent, led by pro-cyclical sectors such as Consumer Discretionary, Technology, Financials, Industrials, and Materials, whilst more historically defensive sectors such as Telecommunications, Utilities, Real Estate, and Consumer Staples lagged along with Energy.
Stocks that were the strongest contributors to performance within the Fund over the six-month period ended March 31, 2018 included: within the Consumer Discretionary sector, Netflix, Amazon, Ralph Lauren, Viacom, and The Gap; within the Technology sector, Adobe Systems, NVidia, Microsoft, and Intel; and companies in other sectors. Other stocks that helped were Freeport-McMoRan, NRG Energy, CBRE Group, Raytheon, and ConocoPhillips. Stocks that contributed negatively included: Devon Energy, Microchip Technology, Cabot Oil & Gas, McDonald’s, and Hershey. The Fund was negatively impacted from a total return perspective by the amortization costs of certain hedges and other investments that Centre Asset Management, LLC (“Centre,” the “Adviser” or “we”), the investment adviser to the Fund, viewed, and continues to view, as capital protective in nature. That said, these capital protection hedges, namely protective put options2 on the S&P 500 Index, have in the past insulated the Fund from the same magnitude of maximum drawdown3 experienced by the overall stock market over prior volatile4 episodes, namely in August 2015, January 2016 and, more recently, February 2018. Given the continued presence of certain potentially de-stabilizing factors that we believe could negatively impact the value of underlying equity securities held in the Fund’s portfolio, as of March 31, 2018, the Fund continued to hold put options on the S&P 500 Index as a potential hedge against its underlying stock holdings in the event of a material stock market correction.
The process used by Centre to manage the Fund focuses on each individual portfolio company’s growth outlook and capacity to create shareholder value, utilizing our bottom-up fundamental stock selection process. We utilize a disciplined, Economic Value Added5 framework to select investments. The framework focuses on the fundamentals of wealth creation or wealth destruction similar to the way a traditional, long-term focused corporate investor looking at all aspects of the business would assess a company’s value. In the shorter-term, markets may often undervalue or overvalue a company’s ability to create or destroy wealth. The framework seeks to identify and capture these investment opportunities. The approach is designed to capture excess returns when a business is creating shareholder wealth and the market price of the stock converges toward our target price. Centre not only analyzes earnings but also strives to understand and link the capital allocation decisions being made today by each portfolio company and how they may lead to future earnings growth. In other words, we expect that the companies in which the Fund invests will themselves invest in productive assets of the business, organically and through opportunistic purchases which, in turn, should provide the foundation for future revenue and profits growth that should create shareholder value. Alternatively, if companies cannot invest in productive assets due to a cyclical downturn or existing excess capacity, we expect these companies to “wisely contract” through the restructuring of their assets and other resources to regain their footing for future shareholder value creation. The key is that we look at the company drivers that create true shareholder wealth: capital spending or alternative capital allocations such as acquisitions, stock buybacks, or dividends; company specific risk levels of a business to determine appropriate hurdle rates6 ; and whether the company is generating operating returns on its underlying assets vis-à-vis the cost of capital. Wealth creation from growth or from wise-contraction – that’s how we believe companies create shareholder value.
To meet its objective as a risk managed growth fund, the Fund may complement its equity securities with hedges and other capital preservation strategies when deemed tactically appropriate by Centre. While use of hedging and certain investment techniques involve risk, in accordance with the Fund’s investment policies, the Adviser may tactically employ hedges and other capital preservation strategies on up to 100 percent of the value of the Fund’s underlying securities positions when the Adviser’s assessment of market valuation indicates forward returns for the stock market, as a whole, are low relative to downside risk and the cost to upside potential from portfolio preservation tools is deemed reasonable in order to respond to adverse market, economic, political or other conditions. The Adviser may also tactically employ hedges to reduce volatility. For example, through the tactical use of put options, the Fund may have enhanced performance and more limited risk. Index put options are designed to hedge the Fund from significant market declines that may occur over short periods of time. The value of an index put option generally increases as the underlying securities in the Fund decrease in price and decreases as those securities increase in price. The Adviser may also seek to enhance returns by writing (selling) out of the money call options tailored with exercise prices generally above the current market prices of stocks held in the Fund. As the seller of the call option, the Fund receives cash (the premium) from the purchaser7 . The Adviser varies its hedging strategy and defensive positions across changing market cycles but has generally employed such strategies within the Fund since late 2014.
| 1 | S&P 500 is an index of 500 stocks seen as a leading indicator of U.S. equities and a reflection of the performance of the large cap universe, made up of companies selected by economists. |
| 2 | A put option is a contract giving the owner the right, but not the obligation, to sell a specified amount of an underlying security at a specified price within a specified time. |
| 3 | Maximum drawdown is the maximum loss from a peak to a trough of a portfolio, before a new peak is attained. |
| 4 | Volatility is a measure of systematic risk of a security or a portfolio in comparison to the market as a whole. |
| 5 | Economic Value Added (EVA) is an estimate of a company’s economic profit. Economic profit, which refers to the profit earned by a company, minus the cost of financing the company’s capital, is an amount that may be considered in the assessment of a company’s overall value. |
| 6 | A hurdle rate is the minimum rate of return on a project or investment required by a manager or investor. The hurdle rate denotes appropriate compensation for the level of risk present; riskier projects generally have higher hurdle rates than those that are deemed to be less risky. |
| 7 | A covered call is an options strategy whereby an investor holds a long position in an asset and writes (sells) call options on that same asset in an attempt to generate increased income from the asset. This is often employed when an investor has a short-term neutral view on the asset and for this reason holds the asset long and simultaneously has a short position via the option to generate income from the option premium. |
| Centre American Select Equity Fund | Manager Commentary |
March 31, 2018 (Unaudited)
Market Review & Outlook
As investors move forward further into 2018, it is becoming clearer that the low volatility, highly optimistic tone that embodied U.S. stocks in 2017 has been disturbed and, in advance of such increased volatility and potential downside risks, we have positioned the portfolio accordingly. The most frequent argument we hear championed for a continuation of the positive momentum in the stock market is that revenue and profit growth for the vast majority of companies in the S&P 500 Index, as well as in aggregate, are expected to be the strongest since the economic recovery began in 2010. Unfortunately, in our view, economic and profit growth, whilst being the single biggest factor influencing stock prices over the long-term, have little to no correlation in the short and even intermediate term, as stock prices will be much more highly influenced by changes in interest rates and investors’ re-pricing of risk. In other words, while understanding both secular and, even more importantly, cyclical trends as growth oriented investors, we believe that valuation is the single most critical element of successful investing year over year and over a three to five year “normal” investment cycle. The key is to find great companies when they present themselves as great stock investments. Unfortunately, the number of companies meeting both criteria to us is small and shrinking now.
The term “paradigm shift” is technically a valid way to describe material change but it has been so overused in the business world as to lose its efficacy in calling attention to matters. Regardless, we’re at a loss for a substitute, with the change in course by the Federal Reserve to begin the process of normalizing short term interest rates and start reducing its vast holdings of Treasury Bonds and other assets while, simultaneously, the supply of new Treasury issuance explodes due to increasing budget deficits, bringing about the first challenge to the environment of ultra-accommodative monetary policy, liquidity, and suppressed low cost of capital that’s been in place since 2009. While we do not expect interest rates to rise dramatically, especially on longer maturities, the rise in short term rates plus the prospect of additional increases in the Target Federal Funds Rate8 in 2018 and 2019 will negatively impact stock valuations as the “risk-free” Treasury rate is the foundation of asset pricing for all levels of risk assets. Historically, rising interest rates are the kryptonite to long-dated, richly valued assets, namely stocks. One way to roughly estimate the impact that ultra-accommodative monetary policy and, in particular suppressed interest rates, have had is to isolate analysis to the Utilities Sector. The purpose of doing this is that it nearly eliminates the argumentative contrast that U.S. companies are more efficient, innovative and profitable now as demonstrated by secularly rising Returns on Assets (ROA) and Returns on Equity (ROE) for the S&P 500 Index in aggregate. Most utilities within the Sector, while admittedly better run than in the past, are regulated and subject to legislative caps on their ROE’s as well as being capital intensive. Proving this point is the fact that, over the past twenty-five years, there has not been any material fundamental improvement in ROE’s or ROA’s for the Utilities Sector on an equal weighted basis, unlike the case for nearly all other Sectors of the S&P 500 Index. This being said, valuation multiples9 that we emphasize for the Utilities Sector show the group being valued forty percent higher than its long term average, with all of the re-rating occurring since 2010. Applying this insight across the board means that stocks are up to forty percent overvalued simply from the suppressed level of interest rates in place since then but which are now seemingly moving higher and, perhaps, while not dramatically, will be significant amounts proportionally from the near zero levels enjoyed since 2010.
There have also been changes in stock-bond yield correlations, which have been largely positive since the late 1990’s, increased significantly following the global financial crisis of 2008-2009, and have remained at a high level until very recently. This positive correlation is consistent with other episodes where there was an increase in uncertainty about the outlook for economic growth, such as the 1930s Depression. The recent period of positive stock-bond yield correlation has been in place for the past twenty years or so but, it’s important to remember that this is abnormal and changes in U.S. monetary policy have historically driven correlations lower. Why the recent change in correlations from positive to negative is so critical now is that the traditional stock-bond mix of a balanced portfolio held assets that provided diversified returns with one directionally gaining and offsetting the loss on the other side and vice-versa. For the first time in many investment professionals’ careers, the environment looks to be “back to the future” with potentially no place to hide other than cash amongst traditional asset classes (which has been largely abandoned in asset allocation due to the low level of short term interest rates), raising the value of hedges. The trading disruption from so-called “risk-parity” funds, which are nothing but an updated version of what used to be called tactical asset allocation funds, can be more dramatic now in an environment of increasing volatility and false sense of liquidity given the new phenomenon of smart-beta indexing, high frequency trading, artificial intelligence, and other so-called improvements to financial markets away from human fact based decision making and interaction and floor exchange based trading.
Looking at things optimistically, it is plausible to temper the negative impact from rising interest rates (from essentially zero) given the tremendous growth in earnings that began in 2017 which is expected to continue in 2018 and 2019. Aggregate S&P 500 Bottom Up ($/share) earnings estimates for calendar years 2019 and 2018 are expected to be $173.93 and $157.96, respectively, up from $132.00 in 2017 and $118.10 in 2016. This represents sequential growth rates of ten percent, twenty percent, and twelve percent, respectively10 , and highlights a definite change in the “secular stagnation” environment of 2014-2016. It is this rather positive outlook which underlies our belief that a long, drawn out bear market in anticipation of a recession remains a very low probability despite this economic recovery being one of the longest on record. Furthermore, many of the late cycle excesses in terms of over-aggressive asset growth – new plant and equipment, inventories, etc., are not evident now.
| 8 | The federal funds rate is the rate at which depository institutions (banks) lend reserve balances to other banks on an overnight basis. Reserves are excess balances held at the Federal Reserve to maintain reserve requirements. |
| 9 | Valuation multiples is a valuation theory based on the idea that similar assets sell at similar prices. This assumes that a ratio comparing value to some firm-specific variable (operating margins, cash flow, etc.) is the same across similar firms. |
| 10 | Source: Thomson Reuters I/B/E/S |
| Semi-Annual Report | March 31, 2018 | 3 |
| Centre American Select Equity Fund | Manager Commentary |
March 31, 2018 (Unaudited)
With rising interest rates in the minus column and increasing profits on the plus side, what tips our view to negative in this paradigm shift? In one word, it’s risk. The mathematics in any valuation model, from basic to complex, captures a foundation risk-free interest rate, some measure of earnings or cash flow, a growth rate associated with such earnings or cash flow, plus a risk premium to represent compensation for risk, measured relative to the risk-free rate. Based upon our analysis, the equity risk premium has been extraordinarily low since the end of 2014 (and continued to fall), which explains why stocks rose in price in 2015 and 2016 despite the stagnation in aggregate S&P 500 ($/share) earnings and relative stability in interest rates. The compression of risk premiums has not been isolated to stocks but, in fact, has been more profoundly evident in bonds as overly cheap credit is best illustrated by the fact that European High Yield Bond Indexes, i.e., “junk bonds”11 , have a lower yield than comparable maturity U.S. Treasury Bonds. The most significant driver of this has been not only ultra-accommodative policies and liquidity supplied from the U.S. Federal Reserve but their counter-parts in the Eurozone, Japan, and China. From our proprietary analytical work, it is important to point out that risk premiums being low (as they are today) in themselves are not problematic as long as they are directionally trending even lower. Historically, market corrections occur when risk premium are low but the trend has turned to rising, recent example being years 2000 and 2008.
With the U.S. scaling back its monetary stimulus, the Eurozone under increasing pressure to not expand or extend its Quantitative Easing (QE) program, Japan’s multi-pronged efforts to weaken the yen largely played out, and China’s credit bubble reaching untenable levels, we see the suppression of risk premiums having run its course negatively impacting the valuation of all risky assets and, in particular, long duration assets most sensitive to changes in the required rate of return such as U.S. stocks. Aside from central bank policies, risk needs to be examined comprehensively and fundamentally, not just expressed in terms of stock market movements. Negatively, outside of the banking industry, the U.S. has not experienced a deleveraging since 2009 but has actually increased its risk from leverage, the difference being that it is now in the corporate and government sectors rather than the household sector. Furthermore, while it’s been a positive that the use of such increased leverage in the corporate sector has not led to excessive industrial capacity and inventories, such debt financed cash sources have been used primarily in aggregate for stock buybacks. Thus, corporations have increased their risk from more leverage to purchase an asset that has no future utility in terms of generating revenue or cash flow to service such debt. From this perspective, risk has likely increased negatively impacting valuation multiples.
Consistent with his America First campaign pledges, President Trump has begun the process of trying to institute remedies that would offset the mercantilist export advantages and attacks on America’s intellectual property that China has enjoyed since joining the World Trade Organization (“WTO”) in 2001. The early stages of this relationship, cheap and plentiful consumer goods for U.S. consumers and the potential for democratic, pro-Western liberal reforms in China, was viewed as more than offsetting the costs of de-industrialization of America and potential loss of long-term competitive advantage. Furthermore, the “offshoring”12 of America’s prior inventory and excess capacity cycles to China diminished the traditional recession risks from excess capacity, which is why the recession in 2009 was largely a Wall Street phenomenon rather than a Main Street one.
Now after almost two decades of unprecedented trade imbalances and a rise in China’s industrialization on a scale last seen by America in the mid-and late 19th century followed shortly thereafter by Bismarck’s Germany (both at the expense of the United Kingdom), the age old argument of protective tariffs favoring local industry versus a progressive posture favoring consumers is front and center in American politics at a temperature level likely last seen during the turn of the 20th Century when Theodore Roosevelt was President. It’s unimportant in terms of personal views on which side is right (our personal view is that despite China being a natural ally and partner of the U.S. for many reasons, this fight should have happened more than a dozen years ago within the mechanisms of the WTO but America still holds the one asset that no one else can match, access to the largest and richest consumption market in the World), the issue for corporations and stocks is that the net impact from this enormous change in politics and Sino-American trade relations will be a negative hit to profits margins (due to higher input and labor costs) and, within our paradigm shift proposal, an increase in risk, geopolitically as well as at the corporate level, negatively impacting valuation multiples.
Although somewhat extraneous to the points raised above, the parabolic rise (and fall in 2018 thus far) in bitcoin and other crypto-currencies is somewhat useful in that it highlights how sudden a change in risk appetites can have on the price of a “so-called” asset. Having served as a fund manager of U.S. equity and technology-focused sector funds and navigated the rise in technology-related stocks in 1999 and their subsequent collapse in early 2000 ahead of the corrections in broader stock market indexes back then, it is tough not to similarly view the recent collapse of these crypto-currencies as the canary in the coal mine for other risky assets; crypto-currencies simply represent the most extreme point on the risk tolerance scale like dot-com stocks did back then.
| 11 | A junk bond refers to high-yield or noninvestment-grade bonds. Junk bonds are fixed-income instruments that carry a credit rating of BB or lower by Standard & Poor’s, or Ba or below by Moody’s Investors Service. Junk bonds are so called because of their higher default risk in relation to investment-grade bonds. |
| 12 | Offshoring is the relocation of a business process from one country to another—typically an operational process, such as manufacturing, or supporting processes, such as accounting. |
| Centre American Select Equity Fund | Manager Commentary |
March 31, 2018 (Unaudited)
In sum, we have a U.S. stock market trading at valuation multiples that are potentially up to forty percent above intrinsic value with the contributing factors that led to the re-rating higher, suppressed low interest rates and risk premiums, now reversing. On the other hand, profits are rising and certain Sectors, namely Energy, are displaying the best earnings growth in some time and, having underwent a severe rationalization due to the commodity price collapse in 2015-2016, is doing so more efficiently than in the past. We remain consistent in our belief that a bear market due to an oncoming recession is a low probability but an increase in sudden and sharp drawdowns, i.e., crashes, are more probable and likely to occur. Our biggest concern is rather unorthodox. What we mean is that unlike the normal sequence of events of the stock market being a leading forecast of the economy, the financialization13 of the economy, best evidenced by the wholesale embracement of stock buybacks as the main usage of cash flows may lead to a reverse in sequence, whereby a stock market sell-off due to any number of reasons, is then compounded by the reliance upon low financial market volatility, which then leads to slowdown in corporate and consumer confidence that leads to slower economic growth, and becoming circular in impact to stock markets.
In light of these conditions, with risks creating what we deem to be a potentially dangerous backdrop for not only capital growth but capital preservation, we continue to emphasize a barbell of secular growth stocks with contrarian, opportunistic cyclical growth companies. In addition, we continue to employ tail hedges on the Fund’s underlying stock portfolio with deep out of the money protective put options as well as deep out of the money single stock covered call selling. So, despite our bottom-up optimism for the companies owned currently by the Fund, we remain less enthusiastic about the prospects for capital gains in U.S. stocks as a whole than we have been in the past. Also, with capital protection from traditional diversification ebbing, we believe that our pragmatic large capitalization valuation sensitive growth and concentrated, high-conviction approach to stock selection, with a cognizance of risk management that includes tactically implementing capital protective investments, seems positioned to perform well relative to less risk aware strategies.
| 13 | Financialization refers to the increase in size and importance of a country’s financial sector relative to its overall economy. Financialization has occurred as countries have shifted away from industrial capitalism. This impacts both the macroeconomy and the microeconomy by changing how financial markets are structured and operated and by influencing corporate behavior and economic policy. |
The market outlook is the opinion of the author and can change at any time.
| Semi-Annual Report | March 31, 2018 | 5 |
| Centre American Select Equity Fund | Manager Commentary |
March 31, 2018 (Unaudited)
SECTOR WEIGHTINGS
As a percentage of Net Assets
| Information Technology | 37.72% |
| Consumer Discretionary | 20.30% |
| Energy | 13.42% |
| Industrials | 6.56% |
| Health Care | 6.52% |
| Consumer Staples | 3.65% |
| Utilities | 3.35% |
| Materials | 3.34% |
| Purchased Options | 1.95% |
| Real Estate | 1.51% |
| Financials | 1.34% |
| Cash, Cash Equivalents, and Other | 0.34% |
| Totals | 100.00% |
These allocations may not reflect the current or future positions of the portfolio.
GROWTH OF HYPOTHETICAL $10,000 INVESTMENT THROUGH MARCH 31, 2018
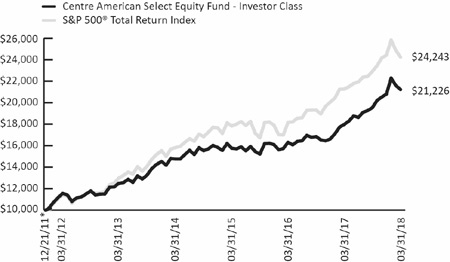
This graph assumes an initial investment of $10,000 at December 21, 2011, the inception date for Investor Class shares, which have the longest period of annual returns, and that any dividends and distributions are reinvested. This graph depicts the performance of the Fund's Investor Class versus the S&P 500® Total Return Index. Taxes on Fund distributions or when shares are redeemed, if any, are not reflected. Unlike the Fund, an index is not available for investment, is unmanaged and does not have expenses that affect the results. The comparison is shown for illustrative purposes only.
TOTAL RETURNS – FOR THE PERIOD ENDED MARCH 31, 2018
| | 1 Month | 3 Month | YTD | 1 Year | 3 Year Average Annualized | 5 Year Average Annualized | Since Inception* Average Annualized |
| Centre American Select Equity Fund – Investor Class | -1.72% | 2.03% | 2.03% | 18.06% | 10.44% | 11.17% | 12.74% |
| S&P 500® Total Return Index | -2.54% | -0.76% | -0.76% | 13.99% | 10.78% | 13.31% | 15.15% |
| Centre American Select Equity Fund – Institutional Class | -1.72% | 2.03% | 2.03% | 18.18% | 10.58% | – | 9.39% |
| S&P 500® Total Return Index | -2.54% | -0.76% | -0.76% | 13.99% | 10.78% | – | 11.25% |
| * | Inception date of December 21, 2011 for Investor Class. Inception date of January 21, 2014 for Institutional Class. |
The performance information quoted above represents past performance, which is not a guarantee of future results, and does not reflect the deduction of taxes that a shareholder would pay on Fund distributions or the redemption of Fund shares. Investment return and principal value of an investment will fluctuate so that an investor’s shares, when redeemed, may be worth more or less than their original cost. Total return includes reinvestment of dividends and capital gains, if any. Current performance may be lower or higher than the performance data quoted. For the most current month-end performance data, please call 855-298-4236.
The S&P 500® Total Return Index is a commonly recognized, market-capitalization weighted index of 500 widely held securities, designed to measure broad U.S. equity performance. You cannot invest directly in an index.
The line graph above shows the performance of Investor Class shares only, since the Investor Class has the longest period of annual returns. The performance of the Institutional Class shares will differ from the performance shown because the Institutional Class shares have different expenses than the Investor Class shares.
| Centre Active U.S. Treasury Fund | Manager Commentary |
March 31, 2018 (Unaudited)
Performance & Strategy Summary
For the six-month period ended March 31, 2018, the Centre Active U.S. Treasury Fund (also referred to as the “Fund”), Investor Share Class, delivered a total return of 0.59 percent; the Institutional Share Class delivered a total return of 0.85 percent.
Performance attribution in the Fund’s portfolio reflects interest income combined with our active duration management decisions that impact capital gain or loss capture. As of March 31, 2018, there are no corporate or mortgage related securities in the portfolio, there are no “spread” components to performance. Performance during the six-month period ended March 31, 2018 reflects, to a large degree, the Bearish calls (target duration of zero) in January and February followed by a market duration “Neutral” call in March based on our Interest Rate Scorecard1 investment discipline.
The Bearish calls late in the year resulted from the ongoing strength in the U.S. labor market which indicated, in turn, ongoing real growth in the economy and the likelihood that inflation would begin to move toward the Federal Open Market Committee’s (“FOMC2 ”) 2% goal. Labor market strength pushed the official unemployment rate well below current estimates of the sustainable rate (NAIRU3 ) over the longer term. The expectation of eventually accelerating inflation reflected both the strong labor market acting through the Phillips Curve relationship and the anticipated exhaustion of special factors which had kept the rate below the target value. While the nature or even the existence of the Phillips Curve4 relationship, unemployment below NAIRU leading to greater inflation, had been called into question monetary policy makers continued to give it credence.
As a result, over the six-month period, the FOMC continued its two pronged approach to monetary policy normalization, gradually raising the target for the federal fund’s rate and reducing, in an orderly and well communicated process, the Federal Reserve’s holdings of securities. Policy normalization and economic growth in the period pushed the yield on the benchmark 10-Year U.S. Treasury note5 from 2.33% at the end of September to a peak of 2.9% in early March. While real growth and policy normalization drove rates higher, the increases experienced were held somewhat in check by continued moderate inflation concerns on the part of investors. Investors seemed to be waiting for inflation to move to or above the 2% target before raising the inflation premium required from rates for the loss of buying in the future.
The Fund’s investment objective is to maximize total return through capital appreciation and current income. The Fund pursues this objective primarily by using an active interest rate risk management strategy. In other words, when interest rates are expected to decline, the Fund extends duration6 and when interest rates are expected to rise, the Fund shortens duration. The portfolio’s duration is adjusted based on a monthly assessment by Centre Asset Management, LLC (“Centre” or “we”), the investment adviser to the Fund, of the likely change in interest rates. Our fundamentally-driven active duration management strategy seeks the potential for capital appreciation and/or preservation in variable interest rate environments by utilizing U.S. Treasury securities including bills, notes, bonds, Treasury inflation protected securities (TIPS), cash equivalents and, in certain market environments, futures contracts on U.S. Treasury notes and bonds.
The Centre Active U.S. Treasury Fund is intended to serve as a tactical (long, short or neutral duration relative to that of the Treasury market) fixed income investment by managing market exposure to achieve performance (i.e., managing interest rate beta7 to achieve alpha8 ). Over time, it is intended to provide the same yield as the Treasury market with attractive diversification benefits given the underlying core portfolio of fixed income yielding bonds9 . In addition to its capital appreciation and current income generation objectives, the strategy is designed to accommodate both systematic and unforeseen cash needs, given the liquidity of the Treasury market.
| 1 | Interest Rate ScorecardSM is a proprietary fact based discipline that involves the review and adjustments of the portfolio’s targeted duration in light of changing economic conditions and bond market valuations. Centre Asset Management distributes a monthly publication featuring its assessment and analysis of the macroeconomic environment and policy implications for the bond market based on the investment discipline. |
| 2 | The Federal Open Market Committee (FOMC) consists of twelve members--the seven members of the Board of Governors of the Federal Reserve System; the president of the Federal Reserve Bank of New York; and four of the remaining eleven Reserve Bank presidents, who serve one-year terms on a rotating basis. |
| 3 | The Non-Accelerating Inflation Rate of Unemployment (NAIRU) – also referred to as the long-run Phillips curve – is the specific level of unemployment that is evident in an economy that does not cause inflation to rise up. |
| 4 | The Phillips curve is an economic concept developed by A. W. Phillips which states that inflation and unemployment have a stable and inverse relationship. The theory states that with economic growth comes inflation, which in turn should lead to more jobs and less unemployment. |
| 5 | The 10-year Treasury note is a debt obligation issued by the United States government with a maturity of 10 years upon initial issuance. A 10- year Treasury note pays interest at a fixed rate once every six months, and pays the face value to the holder at maturity. |
| 6 | Duration is a measure of the sensitivity of the price -- the value of principal -- of a fixed-income investment to a change in interest rates. |
| 7 | Beta is a measure of the volatility, or systematic risk, of a security or a portfolio in comparison to the market as a whole. Beta is used in the capital asset pricing model (CAPM), which calculates the expected return of an asset based on its beta and expected market returns. |
| 8 | Alpha is a measure of performance on a risk-adjusted basis. Alpha takes the volatility (price risk) of a mutual fund and compares its risk adjusted performance to a benchmark index. The excess return of the fund relative to the return of the benchmark index is a fund's alpha. |
| 9 | Diversification does not guarantee against loss. |
| Semi-Annual Report | March 31, 2018 | 7 |
| Centre Active U.S. Treasury Fund | Manager Commentary |
March 31, 2018 (Unaudited)
Furthermore, the utilization of Treasury securities within asset allocation is designed to provide attractive diversification properties, as the correlation between Treasury market returns and those of the U.S. equity market has historically been negative during recession related “bear” equity markets, particularly over the previous two decades. The Fund’s investment discipline is designed to identify the risks and opportunities of trends and short term deviations from those trends in interest rate behavior by incorporating the Federal Reserve’s (“Fed”) policies, measures of real growth, inflation expectations, and market valuations. The Fund’s investment discipline is intended to preserve capital in periods of significant rate increases by decreasing the portfolio duration and provide the flexibility to extend portfolio duration when rates are likely to decline.
Market Review & Outlook
Over the long run, interest rate behavior primarily reflects real economic growth, investors’ inflation expectations or concerns, monetary policy, and bond market valuations. Our view is that over the next few years - barring recession and/or exogenous shocks to the economy - steady real growth, the waning of special factors (e.g. Medicaid payments) exerting downward pressure on inflation and continued monetary policy normalization should push interest rates higher. As of now, the U.S. economy seems to be continuing to be in an expansionary phase, is entering the ninth year of economic recovery and will soon be the second longest expansion in American economic history.
Research suggests that expansions do not “die of old age”, so we are of the opinion that we are not “due” for a recession. Over 2 million jobs were created in 2017 and the level of labor market activity remains strong with positive momentum which has taken the unemployment rate below the level that is sustainable, NAIRU, over time based on population growth and the labor force participation rate. The official unemployment rate is 4.1% and current estimates place NAIRU at around 4.7%. Additionally, our research indicates that the shape of the Treasury yield curve10 , currently viewed by some as a recession warning sign, is not troubling. We agree with the assessment of former FOMC Chairman Alan Greenspan that it is the level of the federal funds rate relative to the “Natural Rate” consistent with full employment and target inflation that changes the pace of economic activity.
Labor market strength is further confirmed by the Non-Employment Index, a measure designed to answer critiques of the “official” unemployment rate by evaluating the likelihood of a return to the labor force by those no longer counted as active job seekers. Additionally, research on “informal work hours” is consistent with the argument that the labor market slack created during the Great Recession has been eliminated. Besides continuing the process of policy normalization at its most recent meeting, FOMC members have increased their expectations for real growth in 2018 from 2.1% to 2.5%. According to participants in the Survey of Professional Forecasters from the Philadelphia Federal Reserve Bank, real growth over the next two years is projected to be even higher than the FOMC’s forecasts, at 2.8% and 2.5% in 2018 and 2019, respectively. Survey participants have also materially reduced their estimates of experiencing negative growth in any quarter out through the end of 2018.
The increases in real growth forecasts are consistent with the view that current tax legislation changes could boost near term real growth by up to 0.5% per year over the next two years and with improving growth overseas. However, both FOMC members and Survey participants accept the Congressional Budget Office’s (CBO) estimate of potential real growth of around 1.8% longer term. We believe that real growth will be higher than projections from both the FOMC and professional forecaster longer term and will likely be in the 2.75% range starting in 2019. Our outlook assumes that the current regulatory environment will continue to be more pro-growth oriented through legislative action or executive orders, that the recent tax restructuring will increase incentives to both work and invest, that infrastructure spending to facilitate growth will take place, that expanding energy exports can generate additional income and that a trade of significance can be avoided.
While inflation has run below the desired 2% target of the FOMC since 2012, the shortfall appears attributable to transitory factors and to a recovery that has been slow relative to past expansions until recently. The slower expansion reflects a debt overhang, now eliminated in both household and business balance sheets, and an increased aversion to risk. The slow pace of inflation has caused investors’ inflationary expectations to be well anchored at a rate below the Fed’s 2% target. Expectations are critical to achieving the inflation target as they are built into the pricing decisions of manufacturers and service providers and the spending decisions of consumers. Presently, most policy makers and forecasters expect the 2% goal to be attained and maintained in the next two years. FOMC Chairman Jerome Powell has seemingly accepted Janet Yellen’s argument to let the labor market “overheat” 11 and allow inflation to move “somewhat” above 2% for a “temporary” period. While inflation expectations have not yet “broken out”, recent data from the Philadelphia Fed suggests they are beginning to increase.
Furthermore, there are currently, among monetary policy makers, an increasing number of advocates for “price-level” targeting12 . Given the shortfall since 2012, this approach would require an inflation rate well above 2% for an extended period of time in order to bring the price level to a value consistent with 2% increases since 2012. Our view is that inflation will likely exceed 2% this year causing inflation concerns to become unanchored and putting additional upward pressure on rates beyond that due to simply achieving the FOMC’s target rate.
| 10 | A yield curve is a line that plots the interest rates, at a set point in time, of bonds having equal credit quality but differing maturity dates. |
| 11 | An overheated market is one that is expanding at an unsustainable pace. |
| 12 | Price-level targeting is a monetary policy framework that can be used to achieve price stability. Price-level targeting establishes targets for a price index like the consumer price index. |
| Centre Active U.S. Treasury Fund | Manager Commentary |
March 31, 2018 (Unaudited)
As a result of continued real growth and the expectation that inflation will reach the specified target in the “near term”, the FOMC will likely continue its programs of policy normalization regarding both further target rate increases and Federal Reserve Balance Sheet decreases. FOMC policy makers believe the Federal Funds Rate will average 2.1% for all of 2018 and reach an average level of about 2.7% in 2019. The Taylor Rule Analysis at the Cleveland Federal Reserve Bank “Seven Simple Monetary Policy Rules” indicates a median value of the federal funds rate of 2.6% in the first quarter of 2018 and 2019. Additionally, research on the Natural Rate of interest (or “r*” as it has become known) by San Francisco Federal Reserve Bank President John Williams and others indicates an equilibrium funds rate of 2.5% based on full employment and target rate inflation. These forecasts/analyses imply three to four more target rate increases (assuming 0.25% moves) within eighteen months.
Historically, the FOMC’s decision process has displayed an inertia that leads to a number of small target increases initially with larger ones later as policy makers realize that both the unemployment rate and the inflation rate have exceeded their sustainable unemployment or desired inflation goals. Unemployment is already well below estimates of NAIRU and inflation seems to reflect transitory and temporary factors. If our own projections for real growth and inflation prove accurate, the equilibrium value for the fund’s rate will be at least 3%. In fact, the median forecast from the FOMC is for a 3% fund’s rate in 2020. As a result, the tendency for policy to lag behind will, we believe, require target rate increases of 50- 75 basis points13 at least once or twice before December 31, 2019 as policy makers are forced to play “catch-up”.
Historically, the spread between the 10-year yield14 and the funds rate has been 150 basis points. A 2.5% funds rate would be consistent with a 4% 10-year yield. John Williams, President of the Federal reserve Bank of San Francisco and a voting member of the FOMC, has suggested that a 1% spread may be normal going forward, which would put the 10-year rate at 3.5%. However, it is not clear why the Treasury term premia15 should be permanently lower unless the Fed can control inflation volatility better going forward than they have accomplished historically. Further, as it is unclear how the aging of the population will impact investors’ overall willingness to take on risk in order to gain return and the desire to save rather than spend, the long-run average risk premium demanded by investors is our best estimate. This should put the yield on the 10-year Treasury 1.5% above the Federal Funds Rate on average.
According to Federal Reserve Board Governor Lael Brainard, the term premia on longer term rates (currently well below average) would move higher by 40 basis points even if short term rates were stable after the balance sheet normalization got in full swing. These various arguments place the 10-year rate between 3.0% and 4.0% over the next twelve months. Given the tendency historically of policy makers to foster overshooting of the unemployment and inflation rate targets, our view is that rates will actually break through the 4% level before December 31, 2018.
Risks to the interest rate forecasts described above are more likely to the upside rather than the downside. Like stock prices, rates tend to overshoot the level indicated by the fundamentals. Additionally, the Federal Reserve has never achieved a “soft-landing” in reaching its dual mandate of full employment and price stability, which is currently defined as an inflation rate of 2% and an unemployment rate above where it stands today. Such an achievement may be even less probable given the expressed willingness to breach the 2% target by a “small amount” for a “temporary period”, as neither “small” nor “temporary” were well specified, or, if price-level targeting becomes accepted policy. Once currently well anchored inflationary expectations break free, actual inflation could spike higher, as business and household expectations become embodied in pricing and spending decisions.
Furthermore, if investors become convinced that tax simplification and restructuring as well as growth facilitating infrastructure spending will occur, in addition to an improved regulatory environment, rates could again spike higher. Longer term, yields will likely settle in the 5% area if our expectations for real growth are realized and inflation, after a period of overshooting, settles at the Fed’s 2% target. If this is accurate, we think investors will cause rates to move into this range sooner rather than later.
Moving forward, the inflation rate and real growth and, as a result, interest rate levels will reflect political, economic, and demographic related issues more so than monetary policy. The real growth projection based on the “New Normal” for the U.S. economy from the San Francisco Federal Reserve Bank is 1.75% while the CBO is projecting a 1.8% real growth through 2027. The arguments that form the basis for this significantly slower pace of growth relative to the 20th century average of around 3.0%-3.25% revolve around a reduced rate of technological advancement, less contribution from education, and slower growth in the labor force. In “The Rise and Fall of American Growth”, Robert Gordon argues that the technology related ideas of today are much less dramatic in their growth impact than the innovations of the past, such as the steam engine. John Fernald of the San Francisco Federal Reserve Bank projects productivity growth in line with its “pace for most of the period since 1973” of about 1%. He assumes that any contribution from educational attainment (increased human capital) has “plateaued” and that capital “deepening” (increased capital per worker) will not spur labor productivity dramatically. The arguments for a reduced rate of growth in the future point to a slowing pace of labor force growth, which in turn reflects both slower population growth and the retirement of the “baby boomers”.
| 13 | Basis points, otherwise known as bps, are a unit of measure used in finance to describe the percentage change in the value or rate of a financial instrument. One basis point is equivalent to 0.01% (1/100th of a percent) or 0.0001 in decimal form. |
| 14 | The 10-year yield is the interest rate that the U.S. government pays to borrow money over 10 years. |
| 15 | An asset's risk premium (or premia) is a form of compensation for investors who tolerate the extra risk, compared to that of a wholly risk-free asset. |
| Semi-Annual Report | March 31, 2018 | 9 |
| Centre Active U.S. Treasury Fund | Manager Commentary |
March 31, 2018 (Unaudited)
Our own long term outlook and its implications for rates rest on the following assumptions. The educational process has not plateaued. While the number of opportunities for middle manager type jobs may have decreased, there are ample job opportunities if workers have the necessary skills. Increasingly, the educational process must focus on technical/vocational type studies and apprenticeships in order to eliminate any skills mismatch between available jobs and those seeking employment. Provided proper incentives, the labor force can grow despite the demographics of an aging population. The employment-to-population ratio for prime-age workers is 1% below its pre-crisis level and the participation rate for 65+ workers is already increasing. The extent to which capital deepening can enhance productivity remains to be seen. A legal and regulatory framework that encourages new business formation will, in addition to spurring new hiring, be a source of new innovations that lead to increased productivity. Finally, there is a lag between the development of new technologies and their utilization in the production and distribution of goods and services. To argue that current technologies are not as impactful as earlier ones may be overlooking the time to achieve maximum benefit.
The downside to our more optimistic longer term forecast comes from the increasing size of the federal deficit. If it grows at the current pace it will likely reach $20 trillion in five years. If interest rates were to rise to 5% (our view) instead of the Trump administration’s prediction of just under 3.5%, the interest cost alone would be $1 trillion. Thus, more than half of all personal taxes would be needed to pay bondholders, potentially crowding out expenditures on the infrastructure needed to facilitate growth. Recent research has highlighted the significant negative correlation between increasing deficits and the potential real growth rate. An increasing deficit is also the cause of a worsening trade deficit. If domestic spending exceeds domestic saving, capital must be imported. Positive capital inflows are funded by negative trade flows. So, addressing the deficit also has implications for the trade balance.
Regardless of the eventual outcomes for growth and inflation rates, there is nothing in this debate to suggest that the business cycle has been tamed out of existence or that it will not be exacerbated by monetary policy, either conventional or unconventional, as has been true in the past. In fact, some suggest that business cycles may occur more frequently and potentially be of greater downside magnitude if a lower real Federal Funds Rate, consistent with slower trend growth, limits the Fed’s ability to stimulate growth through conventional monetary policy. If true, this would increase opportunities to benefit from the eventual cyclical decline as policy makers move in to rein in accelerating inflation. If, on the other hand, real growth reverts toward its 20th century norm, there will be a great need to protect portfolio value against rising rates near term, but with an opportunity to benefit from the eventual cyclical decline as policy makers move in to rein in accelerating inflation. So, going forward, rate behavior seems most likely to continue to be cyclical in nature and jagged or violent in pattern as both market participants and policy makers react and overreact to the impacts of changing economic conditions. The Interest Rate Scorecard is intended to anticipate rate moves and adjust portfolio duration tactically for the benefit of shareholders of the Centre Active U.S. Treasury Fund by taking advantage of rate declines and shielding value against rate increases.
The market outlook is the opinion of the author and can change at any time.
| Centre Active U.S. Treasury Fund | Manager Commentary |
March 31, 2018 (Unaudited)
ASSET TYPE WEIGHTINGS As a percentage of Net Assets
| U.S. Treasury Bonds | 74.89% |
| U.S. Treasury Notes | 15.89% |
| Cash, Cash Equivalents, and Other | 9.22% |
| Totals | 100.00% |
These allocations may not reflect the current or future positions of the portfolio.
GROWTH OF HYPOTHETICAL $10,000 INVESTMENT THROUGH MARCH 31, 2018
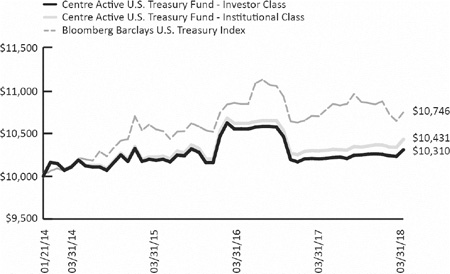
This line graph assumes an initial investment of $10,000 at January 21, 2014, the Fund’s inception date, and that any dividends and distributions are reinvested. This graph depicts the performance of the Fund versus the Bloomberg Barclays U.S. Treasury Index. Unlike the Fund, an index is not available for investment, is unmanaged and does not have expenses that affect the results. The comparison is shown for illustrative purposes only.
TOTAL RETURNS – FOR THE PERIOD ENDED MARCH 31, 2018
| | 1 Month | 3 Month | YTD | 1 Year | 3 Year | Since Inception (January 21, 2014) Average Annualized |
| Centre Active U.S. Treasury Fund – Investor Class | 0.76% | 0.53% | 0.53% | 1.03% | 0.37% | 0.73% |
| Centre Active U.S. Treasury Fund – Institutional Class | 0.90% | 0.62% | 0.62% | 1.32% | 0.67% | 1.01% |
| Bloomberg Barclays U.S. Treasury Index | 0.94% | -1.18% | -1.18% | 0.43% | 0.45% | 1.73% |
The performance information quoted above represents past performance, which is not a guarantee of future results, and does not reflect the deduction of taxes that a shareholder would pay on Fund distributions or the redemption of Fund shares. Investment return and principal value of an investment will fluctuate so that an investor’s shares, when redeemed, may be worth more or less than their original cost. Total return includes reinvestment of dividends and capital gains, if any. Current performance may be lower or higher than the performance data quoted. For the most current month-end performance data, please call 855-298-4236.
Bloomberg Barclays U.S. Treasury Index – includes public obligations of the U.S. Treasury. Treasury bills are excluded by the maturity constraint but are part of a separate Short Treasury Index. In addition, certain special issues, such as state and local government series bonds (SLGs), as well as U.S. Treasury TIPS, are excluded. STRIPS are excluded from the index because their inclusion would result in double-counting. You cannot invest directly into an index.
| Semi-Annual Report | March 31, 2018 | 11 |
| Centre Active U.S. Tax Exempt Fund | Manager Commentary |
March 31, 2018 (Unaudited)
Performance & Strategy Summary
For the six-month period ended March 31, 2018, the Centre Active U.S. Tax Exempt Fund, Investor Share Class, delivered a total return of -1.08 percent; the Institutional Share Class delivered a total return of -0.93 percent.
Performance during the period reflects, to a large degree, the outperformance of lower quality bonds offsetting the market duration calls of our Interest Rate Scorecard1 investment discipline. The Scorecard called for Bearish positions in four of the six months with market neutral duration calls in December and March. And, while rates generally rose in the period, the yield on the 10-year benchmark U.S. Treasury note increased from 2.33% to 2.9% in early March before declining to 2.8% at quarter end, spreads on lesser quality issues tightened as investors reached for return from higher yielding bonds.
The Fund’s investment objective is to maximize total return through capital appreciation and current income exempt from federal income tax through investment in a portfolio consisting primarily of federally tax exempt securities of state and local governments in the U.S. and their political subdivisions, agencies and instrumentalities. We attempt to preserve principal and to enhance return by adjusting the Fund’s portfolio duration, which is its sensitivity to interest rate changes. We adjust the portfolio’s duration based on our monthly assessment of the likely change in interest rates.
The Fund’s portfolio has an orientation toward high quality rated municipal securities. This orientation allows us to better manage credit spread risk2 and to facilitate duration management through the use primarily of U.S. Treasury-based futures contracts3 . We also maintain a high quality bias in an effort to avoid losses from price declines associated with credit downgrades or outright defaults. This quality bias has generally kept us out of hospital and airport-related issues and out of issues of many states with large debt issuance. While we believe this approach provides an optimal risk reward profile over the long-term, it can lead to underperformance in shorter time periods.
A monthly review of the duration of the investments held by the Fund and its overall portfolio provides the opportunity to capture not only cyclical trends in rates but also deviations away from such trends that invariably occur. Our fundamentally-driven active duration management includes, in certain market environments, using futures contracts on U.S. Treasury securities. These contracts are exchange traded, backed by cash collateral, extremely liquid with minimal transaction charges, and have a long history of use in risk management. Additionally, they currently receive favorable capital gains tax treatment. As a result, Treasury based futures tend to provide a low cost tax-advantaged means of managing interest rate risk, leaving the Fund’s core municipal security holdings in place to generate tax-free income. The performance of the Fund is intended to reflect this income as well as any change in value experienced by our duration adjustments. Our goal is to provide the tax-advantaged cash flow desired by investors with a contribution to meeting investors’ goals for wealth accumulation through our focus on total returns.
Market Review & Outlook
Over the long run, interest rate behavior primarily reflects real economic growth, investors’ inflation expectations or concerns, monetary policy, and bond market valuations. In the view of the Fund’s portfolio managers(or “we”), over the next few years - barring recession and/or exogenous shocks to the economy - steady real growth, the waning of special factors (e.g., Medicaid payments), exerting downward pressure on inflation and continued monetary policy normalization should push interest rates higher. We believe that the U.S. economy continues to be in an expansionary phase and will soon be the second longest expansion in American economic history.
Over two million jobs were created in 2017 and the level of labor market activity remains strong with positive momentum which has taken the unemployment rate below the level that is sustainable, NAIRU4 , over time based on population growth and the labor force participation rate. The official unemployment rate is 4.1% as of March 2018 and current estimates place NAIRU at around 4.7%. Additionally, our research indicates that the shape of the Treasury yield curve, currently viewed by some as a recession warning sign, is not troubling. Labor market strength is further confirmed by the Non-Employment Index, a measure designed to answer critiques of the “official” unemployment rate by evaluating the likelihood of a return to the labor force by those no longer counted as active job seekers. Additionally, research on “informal work hours” is consistent with the argument that the labor market slack created during the Great Recession has been eliminated. Besides continuing the process of policy normalization at its most recent meeting, FOMC5 members have increased their expectations for real growth in 2018 from 2.1% to 2.5%. According to participants in the Survey of Professional Forecasters from the Philadelphia Federal Reserve Bank, real growth over the next two years is projected to be even higher than the FOMC’s forecasts, at 2.8% and 2.5% in 2018 and 2019, respectively. Survey participants have also materially reduced their estimates of experiencing negative growth in any quarter out through the end of 2018.
| 1 | Interest Rate ScorecardSM (“Scorecard”) is a proprietary fact based discipline that involves the review and adjustments of the portfolio’s targeted duration in light of changing economic conditions and bond market valuations. Centre Asset Management distributes a monthly publication featuring its assessment and analysis of the macroeconomic environment and policy implications for the bond market based on the investment discipline. |
| 2 | A credit spread is the difference in yield between a U.S. Treasury bond and a debt security with the same maturity but of lesser quality. Credit spread risk is the risk that credit spreads will widen. |
| 3 | A futures contract is a legal agreement, generally made on the trading floor of a futures exchange, to buy or sell a particular commodity or financial instrument at a predetermined price at a specified time in the future. |
| 4 | The Non-Accelerating Inflation Rate of Unemployment (NAIRU) refers to the level of unemployment that is evident in an economy that does not cause inflation to rise up. |
| 5 | The Federal Open Market Committee (FOMC) consists of twelve members--the seven members of the Board of Governors of the Federal Reserve System; the president of the Federal Reserve Bank of New York; and four of the remaining eleven Reserve Bank presidents, who serve one-year terms on a rotating basis. |
| Centre Active U.S. Tax Exempt Fund | Manager Commentary |
March 31, 2018 (Unaudited)
The increases in real growth forecasts are consistent with the view that current tax legislation changes could boost near term real growth by up to 0.5% per year over the next two years and with improving growth overseas. We believe that real growth will likely be in the 2.75% range starting in 2019. Our outlook assumes that the current regulatory environment will continue to be more pro-growth oriented through legislative action or executive orders, that the recent tax restructuring will increase incentives to both work and invest, that infrastructure spending to facilitate growth will take place, that expanding energy exports can generate additional income and that a trade war between the U.S. and its major trading partners of significance can be avoided.
While inflation has run below the desired 2% target of the FOMC since 2012, the shortfall appears attributable to transitory factors and to a recovery that has been slow relative to past expansions until recently. The slower expansion reflects a debt overhang, now eliminated in both household and business balance sheets, and an increased aversion to risk. The slow pace of inflation has caused investors’ inflationary expectations to be well anchored at a rate below the Fed’s 2% target. Expectations are critical to achieving the inflation target as they are built into the pricing decisions of manufacturers and service providers and the spending decisions of consumers. Presently, most policy makers and forecasters expect the 2% goal to be attained and maintained in the next two years. Recent data from the Philadelphia Fed suggests that inflation expectations are beginning to increase.
Furthermore, there are, among monetary policy makers, an increasing number of advocates for “price-level” targeting. Given the shortfall since 2012, this approach would require an inflation rate well above 2% for an extended period of time in order to bring the price level to a value consistent with 2% increases since 2012. Our view is that inflation will likely exceed 2% this year causing inflation concerns to become unanchored and putting additional upward pressure on rates beyond that due to simply achieving the FOMC’s target rate.
As a result of continued real growth and the expectation that inflation will reach the specified target in the near term, it seems that the FOMC is likely continue its programs of policy normalization regarding both further target rate increases and Federal Reserve Balance Sheet decreases. FOMC policy makers have expressed their view that the Federal Funds Rate will average 2.1% for all of 2018 and reach an average level of about 2.7% in 2019. The Taylor Rule Analysis at the Cleveland Federal Reserve Bank “Seven Simple Monetary Policy Rules” indicates a median value of the Federal Funds Rate of 2.6% in the first quarter of 2018 and 2019. Additionally, research on the Natural Rate of interest (or “r*” as it has become known) by San Francisco Federal Reserve Bank President John Williams and others indicates an equilibrium funds rate of 2.5% based on full employment and target rate inflation. These forecasts/analyses imply three to four more target rate increases (assuming 0.25% moves) within eighteen months.
Historically, the FOMC’s decision process has displayed an inertia that leads to a number of small target increases initially with larger ones later as policy makers realize that both the unemployment rate and the inflation rate have exceeded their sustainable unemployment or desired inflation goals. Unemployment is already well below estimates of NAIRU and inflation seems to reflect transitory and temporary factors. If our own projections for real growth and inflation prove accurate, the equilibrium value for the Federal Funds Rate will be at least 3%. In fact, the median forecast from the FOMC is for a 3% fund’s rate in 2020. As a result, the tendency for policy to lag behind will, we believe, require target rate increases of 50-75 basis points at least once or twice before December 31, 2019 as policy makers are forced to play “catch-up”.
Historically, the spread between the 10-year yield and the funds rate has been 1.5%. A 2.5% funds rate would be consistent with a 4% 10-year yield. John Williams, President of the Federal reserve Bank of San Francisco and a voting member of the FOMC, has suggested that a 1% spread may be normal going forward, which would put the 10-year rate at 3.5%. However, it is not clear why the Treasury term premia6 should be permanently lower unless the Fed can control inflation volatility better going forward than they have accomplished historically. Further, as it is unclear how the aging of the population will impact investors’ overall willingness to take on risk in order to gain return and the desire to save rather than spend, the long-run average risk premium demanded by investors is our best estimate. This should put the yield on the 10-year Treasury 1.5% above the Federal Funds Rate on average.
According to recent comments by Federal Reserve Board Governor Lael Brainard, the term premia on longer term rates (currently well below average) would move higher by 0.40% even if short term rates were stable after the balance sheet normalization got in full swing. These various arguments place the 10-year rate between 3.0% and 4.0% over the next twelve months. Given the tendency historically of policy makers to foster overshooting of the unemployment and inflation rate targets, our view is that rates will actually break through the 4% level before December 31, 2018.
| 6 | An asset's risk premium (or premia) is a form of compensation for investors who tolerate the extra risk, compared to that of a wholly risk-free asset |
| Semi-Annual Report | March 31, 2018 | 13 |
| Centre Active U.S. Tax Exempt Fund | Manager Commentary |
March 31, 2018 (Unaudited)
Risks to the interest rate forecasts described above are more likely to the upside rather than the downside. Like stock prices, rates tend to overshoot the level indicated by the fundamentals. Additionally, the Federal Reserve has never achieved a “soft-landing” in reaching its dual mandate of full employment and price stability, which is currently defined as an inflation rate of 2% and an unemployment rate above where it stands today. Once currently well anchored inflationary expectations break free, actual inflation could spike higher, as business and household expectations become embodied in pricing and spending decisions.
Furthermore, if investors become convinced that tax simplification and restructuring as well as growth facilitating infrastructure spending will occur, in addition to an improved regulatory environment, rates could again spike higher. Longer term, yields will likely settle in the 5% area if our expectations for real growth are realized and inflation, after a period of overshooting, settles at the Fed’s 2% target. If this is accurate, we think investors will cause rates to move into this range sooner rather than later.
Moving forward, we believe that the inflation rate and real growth and, as a result, interest rate levels will reflect political, economic, and demographic related issues more so than monetary policy. The real growth projection based on the “New Normal” for the U.S. economy from the San Francisco Federal Reserve Bank is 1.75% while the CBO is projecting a 1.8% real growth through 2027. The arguments that form the basis for this significantly slower pace of growth relative to the 20th century average of around 3.0%-3.25% revolve around a reduced rate of technological advancement, less contribution from education, and slower growth in the labor force. The arguments for a reduced rate of growth in the future point to a slowing pace of labor force growth, which in turn reflects both slower population growth and the retirement of the “baby boomers”.
Our own long term outlook and its implications for rates rest on the following assumptions. The educational process has not plateaued. While the number of opportunities for middle manager type jobs may have decreased, there are ample job opportunities if workers have the necessary skills. Increasingly, the educational process must focus on technical/vocational type studies and apprenticeships in order to eliminate any skills mismatch between available jobs and those seeking employment. Provided proper incentives, the labor force can grow despite the demographics of an aging population. We believe that a legal and regulatory framework that encourages new business formation will, in addition to spurring new hiring, be a source of new innovations that lead to increased productivity. Finally, there is a lag between the development of new technologies and their utilization in the production and distribution of goods and services. To argue that current technologies are not as impactful as earlier ones may be overlooking the time to achieve maximum benefit.
The downside to our more optimistic longer term forecast comes from the increasing size of the federal deficit. If it grows at the current pace it will likely reach $20 trillion in five years. If interest rates were to rise to, as we believe, 5% instead of the Trump administration’s prediction of just under 3.5%, the interest cost alone would be $1 trillion. Thus, more than half of all personal taxes would be needed to pay bondholders, potentially crowding out expenditures on the infrastructure needed to facilitate growth. Recent research has highlighted the significant negative correlation between increasing deficits and the potential real growth rate. An increasing deficit is also the cause of a worsening trade deficit. Addressing the deficit also has implications for the trade balance.
Regardless of the eventual outcomes for growth and inflation rates, there is nothing in this debate to suggest that the business cycle has been tamed out of existence or that it will not be exacerbated by monetary policy. In fact, some suggest that business cycles may occur more frequently and potentially be of greater downside magnitude if a lower real Federal Funds Rate, consistent with slower trend growth, limits the Fed’s ability to stimulate growth through conventional monetary policy. If true, this would increase opportunities to benefit from the eventual cyclical decline as policy makers move in to rein in accelerating inflation. If, on the other hand, real growth reverts toward its 20th century norm, there will be a great need to protect portfolio value against rising rates near term, but with an opportunity to benefit from the eventual cyclical decline as policy makers move in to rein in accelerating inflation. So, going forward, rate behavior seems most likely to continue to be cyclical in nature and jagged or violent in pattern as both market participants and policy makers react and overreact to the impacts of changing economic conditions.
The market outlook is the opinion of the author and can change at any time.
| Centre Active U.S. Tax Exempt Fund | Manager Commentary |
March 31, 2018 (Unaudited)
SECTOR WEIGHTINGS As a percentage of Net Assets
| General Obligation | 59.70% |
| Prerefunded Issues | 12.93% |
| Revenue Bonds | 12.12% |
| Open-End Funds | 9.45% |
| Cash, Cash Equivalents, and Other | 5.80% |
| Totals | 100.00% |
These allocations may not reflect the current or future positions of the portfolio.
GROWTH OF HYPOTHETICAL $10,000 INVESTMENT THROUGH MARCH 31, 2018
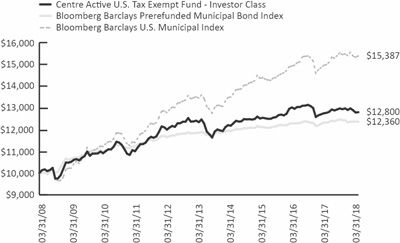
This line graph assumes an initial investment of $10,000 at March 31, 2008, and that any dividends and distributions are reinvested. The Fund’s performance returns quoted for periods prior to March 18, 2015 is that of Managed Municipal Fund, Inc. (the “Predecessor Fund”), which was reorganized into the Fund on March 17, 2015. Prior there-to, the Predecessor Fund was managed by International Strategy & Investment Inc. This graph depicts the performance of the Fund versus the Bloomberg Barclays Prerefunded Municipal Bond Index and the Bloomberg Barclays U.S. Municipal Index. Unlike the Fund, an index is not available for investment and is unmanaged and does not have expenses that affect the results. The comparison is shown for illustrative purposes only.
TOTAL RETURNS – FOR THE PERIOD ENDED MARCH 31, 2018
| | 1 Month | 3 Month | YTD | 1 Year | 3 Year Average Annualized | 5 Year Average Annualized | 10 Year Average Annualized | Since Inception* Average Annualized |
| Centre Active U.S. Tax Exempt Fund – Investor | 0.11% | -1.35% | -1.35% | 0.2 4% | 0.68% | 0.73% | 2.50% | 4.38% |
| Bloomberg Barclays Prerefunded Municipal Bond Index | -0.05% | -0.04% | -0.04% | 0.34% | 0.67% | 0.86% | 2.14% | 2.06% |
| Bloomberg Barclays U.S. Municipal Index | 0.37% | -1.11% | -1.11% | 2.66% | 2.25% | 2.73% | 4.40% | 5.67% |
| Centre Active U.S. Tax Exempt Fund –Institutional | 0.14% | -1.27% | -1.27% | 0.52% | 0.91% | 0.86% | – | 1.75% |
| Bloomberg Barclays Prerefunded Municipal Bond Index | -0.05% | -0.04% | -0.04% | 0.34% | 0.67% | 0.86% | – | 1.24% |
| Bloomberg Barclays U.S. Municipal Index | 0.37% | -1.11% | -1.11% | 2.66% | 2.25% | 2.73% | – | 3.57% |
| * | Inception date of February 26, 1990 for Investor Class. Inception date of October 7, 2010 for Institutional Class. The Predecessor Fund, which was managed by International Strategy & Investment Inc., was reorganized into the Centre Active U.S. Tax Exempt Fund on March 17, 2015. Centre Asset Management, LLC has been the Fund’s investment adviser since March 18, 2015. |
The performance information quoted above represents past performance, which is not a guarantee of future results, and does not reflect the deduction of taxes that a shareholder would pay on Fund distributions or the redemption of Fund shares. Investment return and principal value of an investment will fluctuate so that an investor’s shares, when redeemed, may be worth more or less than their original cost. Total return includes reinvestment of dividends and capital gains, if any. Current performance may be lower or higher than the performance data quoted. For the most current month-end performance data, please call 855-298-4236.
Bloomberg Barclays U.S. Municipal Index is an index that represents average market-weighted performance of general obligations securities that have been issued in the last five years with maturities greater than one year.
Bloomberg Barclays Prerefunded Municipal Index is intended to track the overall performance of the U.S. dollar denominated pre-refunded or escrowed-to-maturity tax-exempt bond market.
You cannot invest directly in an index.
The line graph above shows the performance of Investor Class shares only, since the Investor Class has the longest period of annual returns. The performance of the Institutional Class shares will differ from the performance shown because the Institutional Class shares have different expenses than the Investor Class shares.
| Semi-Annual Report | March 31, 2018 | 15 |
| Centre Global Infrastructure Fund | Manager Commentary |
March 31, 2018 (Unaudited)
Performance & Strategy Summary
The new Centre Global Infrastructure Fund (also referred to as the “Fund”) commenced operations on January 29, 2018, DHINX (Institutional Class) and DHIVX (Investor Class). From inception through March 31, 2018, the Centre Global Infrastructure Fund, Investor Share Class, delivered a total return of -6.45 percent; the Institutional Share Class delivered a total return of -6.40 percent.
Stocks that were the strongest contributors to performance within the Fund in the period ended March 31, 2018 included: within the Energy sector, China Petroleum and Chemical, Altagas and Haliburton; within the Industrials sector, Fraport, Hutchison Port Holdings, BOC Aviation; within the Telecommunications sector, Verizon, Softbank and Vodaphone. Stocks that contributed negatively included: Enbridge, Williams, Kinder Morgan and General Electric. The Fund was negatively impacted from a total return perspective by a pronounced divergence between energy prices and energy share performances, compounded by an unfavorable Federal Energy Regulatory Commission announcement regarding tax treatment of Master Limited Partnerships (“MLPs”).
The current environment and the long term capital growth and income prospects for the Fund are extremely supportive of “infrastructure-related companies,” given 1) from a historical context, the current monetary environment is still accommodative on a relative basis; 2) “significant dry powder”1 in the private markets2 could lift the valuation of listed companies as investors and private market participants opt for listed alternative exposures amid well-above historical transaction premiums and waning opportunities in private markets; and 3) currently improving global economic conditions and fundamentals.
The Fund offers several key differentiations from the broader global equity set of investable companies, including: 1) historically, the MSCI Global Infrastructure Index3 has generated a dividend yield4 that is higher than the yield on conventional core equity indices like the MSCI World Index; 2) the Fund generally expects to pay distributions from net income5 , if any, quarterly rather than annually; 3) hard assets like infrastructure assets tend to retain their “real” value through the long-term; 4) historically, the volatility on infrastructure indices is lower than on conventional equity indices like the MSCI World Index; 5) historically, high Economic Value Added (EVA6 ) companies have outperformed low EVA ones. Many companies may have concession agreements or long-term contracts that link to inflation in the long run. In identifying potential portfolio companies for the Fund with sustainable pricing power, Centre Asset Management, LLC (“Centre” or “we”), the investment adviser to the Fund, seeks to select investments that exhibit high barriers to entry in their segments and that create positive externalities in their regions, and areas with lower volatility such as toll roads, power stations, hospitals and schools. Also, by targeting high EVA growth companies for the Fund, Centre focuses on identifying high quality infrastructure companies that make wise capital allocation decisions. Through our “bottoms-up” analysis, we seek to avoid names that destroy shareholder wealth by either “empire building” or under-investment. Additionally, the stock-selection approach standardizes accounting across countries, which in turn facilitates cross-border comparisons between the best U.S. infrastructure names and international companies. From a portfolio management perspective, we believe the Fund is positioned to take active strategic and tactical bets across sectors and regions based on opportunity sets we see in the market.
Market Review & Outlook
Markets continued to trade sideways as strong global fundamentals are overlooked by what we believe are transient geopolitical “crises”, seemingly triggered by President Donald Trump’s actions turning from tailwinds to headwinds for equity prices due to an elevated level of risk perception in the market. Notwithstanding our political views, as active managers, we expect to thrive in an environment of increased volatility as we are now observing an increasing set of opportunities in stock price dislocations from investors taking a “sell first, ask questions later” stance to risk-off7 events. We believe the market has entered a new regime as global central banks seem to be in lockstep in their attempts to prevent asset prices from overheating further by gradually raising interest rates after nine years of accommodative monetary policies. That said, higher interest rates do not necessary lead to a protracted bear market in our view, if earnings are strong. As rates continue to creep higher following the Federal Reserve’s dot plot8 , we are increasingly mindful of valuation risk over earnings risk in our portfolio.
| 1 | Dry powder refers to marketable securities that are highly liquid and considered cash-like. |
| 2 | According to Preqin, private infrastructure funds held more than $150 billion in un-invested capital waiting to be deployed towards infrastructure projects, compared with $109 billion at the end of 2015. |
| 3 | MSCI World Infrastructure Index captures the global opportunity set of companies that are owners or operators of infrastructure assets. Constituents are selected from the equity universe of MSCI World, the parent index. |
| 4 | Fund distributions are not guaranteed. |
| 5 | MSCI World Infrastructure Index captures the global opportunity set of companies that are owners or operators of infrastructure assets. Constituents are selected from the equity universe of MSCI World, the parent index. |
| 6 | Economic Value Added (EVA) is an estimate of a company’s economic profit. Economic profit, which refers to the profit earned by a company, minus the cost of financing the company’s capital, is an amount that may be considered in the assessment of a company’s overall value. |
| 7 | Investors tend to change asset classes depending on the perceived risk in the markets. For instance, stocks are generally seen as riskier assets than bonds. ... When stocks are selling off and investors run for shelter in bonds or gold, the environment is said to be risk-off. |
| 8 | The "dot plot," part of the FOMC's Summary of Economic Projections released along with the policy decision statement, shows where each participant in the meeting thinks the Fed Funds Rate should be at the end of the year for the next few years and in the longer run. |
| Centre Global Infrastructure Fund | Manager Commentary |
March 31, 2018 (Unaudited)
In what seems to be the late stages of a protracted economic recovery, we believe the Fund is positioned to take advantage of the pro-cyclical nature of a selective group of global energy, technology, utility, and industrial holdings while attempting to limit downside risk as these companies provide a myriad of essential services in their respective regions and industries. Additionally, we view the global telecommunications sector as extremely favorable from risk-reward, fundamental and macro perspectives likely to benefit from improving dynamics going forward while being cautious on the broad utility sector based on negative sensitivity to interest rates and muted benefits from tax reform due to the costs pass-through nature of utility companies.
In the Fund, from a sector perspective, we believe the latest price divergence between energy prices and energy shares presents attractive investment opportunities as fundamentals will ultimately triumph over short-term negative sentiments and turn laggards into leaders going forward. We believe investors can benefit from exposure to select U.S. midstream and MLPs within an actively managed, globally-diversified infrastructure portfolio concentrated on key balance sheet and profitability characteristics. From a regional perspective, we favor regions most likely to benefit from corporate tax reforms in the U.S. as well as other markets exposed to secular growth trends.
The market outlook is the opinion of the author and can change at any time.
| Semi-Annual Report | March 31, 2018 | 17 |
| Centre Global Infrastructure Fund | Manager Commentary |
March 31, 2018 (Unaudited)
| INDUSTRY WEIGHTINGS | | |
| As a percentage of Net Assets | | |
| Diversified Telecommunication Services | | 20.25% |
| Oil, Gas & Consumable Fuels | | 19.62% |
| Electric Utilities | | 12.62% |
| Wireless Telecommunication Services | | 8.86% |
| Multi-Utilities | | 6.86% |
| Transportation Infrastructure | | 5.97% |
| Health Care Providers & Services | | 5.56% |
| Energy Equipment & Services | | 2.91% |
| Technology Hardware, Storage & Peripherals | | 1.74% |
| Trading Companies & Distributors | | 1.52% |
| Internet Software & Services | | 1.48% |
| Construction & Engineering | | 1.35% |
| Semiconductors & Semiconductor Equipment | | 1.31% |
| Industrial Conglomerates | | 1.27% |
| Aerospace & Defense | | 1.25% |
| Cash, Cash Equivalents, and Other | | 7.43% |
| Totals | | 100.00% |
| COUNTRY WEIGHTINGS | | |
| As a percentage of Net Assets | | |
| United States | | 46.52% |
| Canada | | 9.48% |
| Spain | | 5.27% |
| Japan | | 5.12% |
| China | | 4.78% |
| Italy | | 4.63% |
| Great Britain | | 4.12% |
| Australia | | 2.49% |
| Germany | | 2.37% |
| France | | 2.37% |
| Singapore | | 2.16% |
| Hong Kong | | 1.38% |
| Switzerland | | 1.35% |
| Norway | | 0.53% |
| Cash, Cash Equivalents, and Other | | 7.43% |
| Totals | | 100.00% |
These allocations may not reflect the current or future positions of the portfolio.
GROWTH OF HYPOTHETICAL $10,000 INVESTMENT THROUGH MARCH 31, 2018
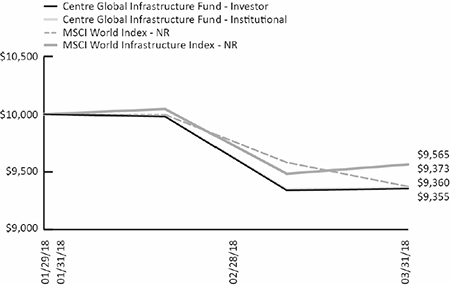
This graph assumes an initial investment of $10,000 at January 29, 2018, the Fund’s inception date, and that any dividends and distributions are reinvested. This graph depicts the performance of the Fund versus the MSCI World Index and the MSCI World Infrastructure Index. Taxes on any Fund distributions or when shares are redeemed, if any, are not reflected. Unlike the Fund, an index is not available for investment, is unmanaged and does not have expenses that affect the results. The comparison is shown for illustrative purposes only.
TOTAL RETURNS – FOR THE PERIOD ENDED MARCH 31, 2018
| | 1 Month | Since Inception (January 29, 2018) Average Annualized |
| Centre Global Infrastructure Fund – Investor | 0.17% | -6.45% |
| Centre Global Infrastructure Fund – Institutional | 0.11% | -6.40% |
| MSCI World Index – NR | -2.18% | -6.27% |
| MSCI World Infrastructure Index – NR | 0.85% | -4.35% |
The performance information quoted above represents past performance, which is not a guarantee of future results, and does not reflect the deduction of taxes that a shareholder would pay on Fund distributions or the redemption of Fund shares. Investment return and principal value of an investment will fluctuate so that an investor’s shares, when redeemed, may be worth more or less than their original cost. Total return includes reinvestment of dividends and capital gains, if any. Current performance may be lower or higher than the performance data quoted. For the most current month-end performance data, please call 855-298-4236.
The MSCI World Index is a broad global equity index that represents large and mid-cap equity performance across 23 developed markets countries. It covers approximately 85% of the free float-adjusted market capitalization in each country. The MSCI World Index does not offer exposure to emerging markets.
MSCI World Infrastructure Index captures the global opportunity set of companies that are owners or operators of infrastructure assets. Constituents are selected from the equity universe of MSCI World, the parent index.
You cannot invest directly in an index.
| Centre Funds | Disclosure of Fund Expenses |
March 31, 2018 (Unaudited)
Example. As a shareholder of a series of Centre Funds (each series, a “Fund” and together, the “Funds”), you will incur two types of costs: (1) transaction costs, including any applicable redemption fees; and (2) ongoing costs, including management fees, distribution and/or service (12b-1) fees (if applicable) and other Fund expenses. The following examples are intended to help you understand your ongoing costs (in dollars) of investing in a Fund and to compare these costs with the ongoing costs of investing in other mutual funds. The examples are based on an investment of $1,000 invested on October 1, 2017 and held through March 31, 2018.
Actual Expenses. The first line under each class of the table below provides information about actual account values and actual expenses. You may use the information in this line, together with the amount you invested, to estimate the expenses that you paid over the period. Simply divide your account value by $1,000 (for example, an $8,600 account value divided by $1,000 = 8.6), then multiply the result by the number in the first line under the heading “Expenses Paid During Period 10/01/2017 – 03/31/2018” to estimate the expenses you paid on your account during this period.
Hypothetical Example for Comparison Purposes. The second line under each class of the table below provides information about hypothetical account values and hypothetical expenses based on each Fund’s actual expense ratio and an assumed rate of return of 5% per year before expenses, which is not the Fund’s actual return. The hypothetical account values and expenses may not be used to estimate the actual ending account balance or expenses you paid for the period. You may use this information to compare the ongoing costs of investing in a Fund and to other funds. To do so, compare this 5% hypothetical example with the 5% hypothetical examples that appear in the shareholder reports of the other funds. Please note that the expenses shown in the table are meant to highlight your ongoing costs only and do not reflect any transactional costs, such as redemption fees, if any. Therefore, the second line under each class of the table below is useful in comparing ongoing costs only, and will not help you determine the relative total costs of owning different funds. In addition, if these transactional costs were included, your costs would have been higher.
| | Beginning
Account Value
10/01/17 | Ending
Account Value
03/31/18 | Expense Ratio(a) | Expenses Paid
During Period
10/1/2017-3/31/2018(b) |
| Centre American Select Equity Fund | | | | |
| Investor Class | | | | |
| Actual | $1,000.00 | $1,086.60 | 1.19% | $6.19 |
| Hypothetical (5% return before expenses) | $1,000.00 | $1,019.00 | 1.19% | $5.99 |
| Institutional Class | | | | |
| Actual | $1,000.00 | $1,087.60 | 0.94% | $4.89 |
| Hypothetical (5% return before expenses) | $1,000.00 | $1,020.24 | 0.94% | $4.73 |
| Centre Active U.S. Treasury Fund | | | | |
| Investor Class | | | | |
| Actual | $1,000.00 | $1,005.90 | 0.93% | $4.65 |
| Hypothetical (5% return before expenses) | $1,000.00 | $1,020.29 | 0.93% | $4.68 |
| Institutional Class | | | | |
| Actual | $1,000.00 | $1,007.50 | 0.61% | $3.05 |
| Hypothetical (5% return before expenses) | $1,000.00 | $1,021.89 | 0.61% | $3.07 |
| Centre Active U.S. Tax Exempt Fund | | | | |
| Investor Class | | | | |
| Actual | $1,000.00 | $989.20 | 1.03% | $5.11 |
| Hypothetical (5% return before expenses) | $1,000.00 | $1,019.80 | 1.03% | $5.19 |
| Institutional Class | | | | |
| Actual | $1,000.00 | $990.70 | 0.72% | $3.57 |
| Hypothetical (5% return before expenses) | $1,000.00 | $1,021.34 | 0.72% | $3.63 |
| Centre Global Infrastructure Fund(c) | | | | |
| Investor Class | | | | |
| Actual(d) | $1,000.00 | $935.50 | 1.67% | $2.75 |
| Hypothetical (5% return before expenses) | $1,000.00 | $1,005.66 | 1.67% | $2.84 |
| Institutional Class | | | | |
| Actual(d) | $1,000.00 | $936.00 | 1.18% | $1.94 |
| Hypothetical (5% return before expenses) | $1,000.00 | $1,006.49 | 1.18% | $2.01 |
| (a) | Annualized, based on the Fund's most recent fiscal half year expenses less any waivers/reimbursements. |
| (b) | Expenses are equal to the Fund's annualized expense ratio, multiplied by the average account value over the period, multiplied by the number of days in the most recent fiscal half year (182), divided by 365. |
| (c) | The Centre Global Infrastructure Fund commenced operations on January 29, 2018. |
| (d) | Reflects expenses paid during the period from January 29, 2018 (Inception) to March 31, 2018. |
| Semi-Annual Report | March 31, 2018 | 19 |
| Centre American Select Equity Fund | Schedule of Investments |
March 31, 2018 (Unaudited)
| | | Shares | | | Value | |
| COMMON STOCKS (97.71%) | | | | | | | | |
| Consumer Discretionary (20.30%) | | | | | | | | |
| Auto Components (1.88%) | | | | | | | | |
| BorgWarner, Inc. | | | 47,470 | | | $ | 2,384,418 | |
| | | | | | | | | |
| Hotels, Restaurants & Leisure (2.55%) | | | | | | | | |
| McDonald's Corp. | | | 8,570 | | | | 1,340,177 | |
| Wyndham Worldwide Corp. | | | 16,650 | | | | 1,905,259 | |
| | | | | | | | 3,245,436 | |
| | | | | | | | | |
| Internet & Direct Marketing Retail (7.06%) | | | | | | | | |
| Amazon.com, Inc.(a) | | | 4,300 | | | | 6,223,562 | |
| Netflix, Inc.(a) | | | 9,300 | | | | 2,746,755 | |
| | | | | | | | 8,970,317 | |
| | | | | | | | | |
| Media (2.96%) | | | | | | | | |
| Omnicom Group, Inc. | | | 25,180 | | | | 1,829,831 | |
| Viacom, Inc., Class B | | | 62,120 | | | | 1,929,447 | |
| | | | | | | | 3,759,278 | |
| | | | | | | | | |
| Multiline Retail (1.97%) | | | | | | | | |
| Dollar Tree, Inc.(a) | | | 26,370 | | | | 2,502,513 | |
| | | | | | | | | |
| | | | | | | | | |
| Specialty Retail (1.74%) | | | | | | | | |
| The Home Depot, Inc. | | | 12,417 | | | | 2,213,206 | |
| | | | | | | | | |
| | | | | | | | | |
| Textiles, Apparel & Luxury Goods (2.14%) | | | | | | | | |
| Ralph Lauren Corp. | | | 24,260 | | | | 2,712,268 | |
| | | | | | | | | |
| | | | | | | | | |
| Total Consumer Discretionary | | | | | | | 25,787,436 | |
| | | | | | | | | |
| Consumer Staples (3.65%) | | | | | | | | |
| Beverages (3.65%) | | | | | | | | |
| Coca-Cola Co. | | | 58,700 | | | | 2,549,341 | |
| PepsiCo, Inc. | | | 19,160 | | | | 2,091,314 | |
| | | | | | | | 4,640,655 | |
| Total Consumer Staples | | | | | | | 4,640,655 | |
| | | | | | | | | |
| Energy (13.42%) | | | | | | | | |
| Energy Equipment & Services (1.72%) | | | | | | | | |
| Halliburton Co. | | | 46,470 | | | | 2,181,302 | |
| | | | | | | | | |
| Oil, Gas & Consumable Fuels (11.70%) | | | | | | | | |
| Anadarko Petroleum Corp. | | | 26,900 | | | | 1,625,029 | |
| Cabot Oil & Gas Corp. | | | 106,100 | | | | 2,544,278 | |
| ConocoPhillips | | | 47,540 | | | | 2,818,646 | |
| Devon Energy Corp. | | | 69,330 | | | | 2,204,001 | |
| EOG Resources, Inc. | | | 14,810 | | | | 1,559,049 | |
| EQT Corp. | | | 45,540 | | | | 2,163,605 | |
| Suncor Energy, Inc. | | | 56,520 | | | | 1,952,201 | |
| | | | | | | | 14,866,809 | |
| Total Energy | | | | | | | 17,048,111 | |
| | | | | | | | | |
| Financials (1.34%) | | | | | | | | |
| Banks (1.34%) | | | | | | | | |
| Bank of America Corp. | | | 56,680 | | | | 1,699,833 | |
| | | | | | | | | |
| Total Financials | | | | | | | 1,699,833 | |
| | | Shares | | | Value | |
| Health Care (6.52%) | | | | | | | | |
| Biotechnology (1.27%) | | | | | | | | |
| AbbVie, Inc. | | | 16,980 | | | $ | 1,607,157 | |
| | | | | | | | | |
| Health Care Equipment & Supplies (0.87%) | | | | | | | | |
| Abbott Laboratories | | | 18,400 | | | | 1,102,528 | |
| | | | | | | | | |
| Health Care Providers & Services (2.83%) | | | | | | | | |
| UnitedHealth Group, Inc. | | | 16,810 | | | | 3,597,340 | |
| | | | | | | | | |
| | | | | | | | | |
| Pharmaceuticals (1.55%) | | | | | | | | |
| Johnson & Johnson | | | 15,400 | | | | 1,973,510 | |
| | | | | | | | | |
| | | | | | | | | |
| Total Health Care | | | | | | | 8,280,535 | |
| | | | | | | | | |
| Industrials (6.56%) | | | | | | | | |
| Aerospace & Defense (2.99%) | | | | | | | | |
| Raytheon Co. | | | 8,440 | | | | 1,821,521 | |
| The Boeing Co. | | | 6,030 | | | | 1,977,116 | |
| | | | | | | | 3,798,637 | |
| | | | | | | | | |
| Construction & Engineering (1.21%) | | | | | | | | |
| Fluor Corp. | | | 26,730 | | | | 1,529,491 | |
| | | | | | | | | |
| | | | | | | | | |
| Industrial Conglomerates (1.09%) | | | | | | | | |
| 3M Co. | | | 6,320 | | | | 1,387,366 | |
| | | | | | | | | |
| | | | | | | | | |
| Machinery (1.27%) | | | | | | | | |
| Dover Corp. | | | 16,400 | | | | 1,610,808 | |
| | | | | | | | | |
| Total Industrials | | | | | | | 8,326,302 | |
| | | | | | | | | |
| Information Technology (37.72%) | | | | | | | | |
| Internet Software & Services (8.38%) | | | | | | | | |
| Alphabet, Inc., Class A(a) | | | 3,190 | | | | 3,308,477 | |
| Alphabet, Inc., Class C(a) | | | 3,185 | | | | 3,286,251 | |
| Facebook, Inc., Class A(a) | | | 25,330 | | | | 4,047,481 | |
| | | | | | | | 10,642,209 | |
| | | | | | | | | |
| IT Services (3.20%) | | | | | | | | |
| Mastercard, Inc., Class A | | | 9,910 | | | | 1,735,835 | |
| Visa, Inc., Class A | | | 19,490 | | | | 2,331,394 | |
| | | | | | | | 4,067,229 | |
| | | | | | | | | |
| Semiconductors & Semiconductor Equipment (6.45%) | | | | | | | | |
| Applied Materials, Inc. | | | 49,350 | | | | 2,744,353 | |
| Intel Corp. | | | 28,560 | | | | 1,487,405 | |
| NVIDIA Corp. | | | 12,420 | | | | 2,876,348 | |
| Texas Instruments, Inc. | | | 10,400 | | | | 1,080,456 | |
| | | | | | | | 8,188,562 | |
| | | | | | | | | |
| Software (11.31%) | | | | | | | | |
| Adobe Systems, Inc.(a) | | | 12,600 | | | | 2,722,608 | |
| Microsoft Corp. | | | 81,697 | | | | 7,456,485 | |
| Oracle Corp. | | | 43,030 | | | | 1,968,623 | |
| Red Hat, Inc.(a) | | | 14,800 | | | | 2,212,748 | |
| | | | | | | | 14,360,464 | |
| | | | | | | | | |
| Technology Hardware, Storage & Peripherals (8.38%) | | | | | | | | |
| Apple, Inc. | | | 47,078 | | | | 7,898,747 | |
| Centre American Select Equity Fund | Schedule of Investments |
March 31, 2018 (Unaudited)
| | | Shares | | | Value | |
| Information Technology (continued) | | | | | | | | |
| Technology Hardware, Storage & Peripherals (continued) | | | | | | | | |
| Western Digital Corp. | | | 29,820 | | | $ | 2,751,491 | |
| | | | | | | | 10,650,238 | |
| Total Information Technology | | | | | | | 47,908,702 | |
| | | | | | | | | |
| Materials (3.34%) | | | | | | | | |
| Chemicals (1.17%) | | | | | | | | |
| Mosaic Co. | | | 61,230 | | | | 1,486,665 | |
| | | | | | | | | |
| Metals & Mining (2.17%) | | | | | | | | |
| Freeport-McMoRan, Inc.(a) | | | 156,890 | | | | 2,756,557 | |
| | | | | | | | | |
| Total Materials | | | | | | | 4,243,222 | |
| | | | | | | | | |
| Real Estate (1.51%) | | | | | | | | |
| Equity Real Estate (1.51%) | | | | | | | | |
| American Tower Corp. | | | 13,210 | | | | 1,919,941 | |
| | | | | | | | | |
| Total Real Estate | | | | | | | 1,919,941 | |
| | | | | | | | | |
| Utilities (3.35%) | | | | | | | | |
| Independent Power and Renewable Electricity Producers (2.16%) | | | | | | | | |
| NRG Energy, Inc. | | | 89,930 | | | | 2,745,563 | |
| | | | | | | | | |
| Multi-Utilities (1.19%) | | | | | | | | |
| WEC Energy Group, Inc. | | | 24,130 | | | | 1,512,951 | |
| | | | | | | | | |
| | | | | | | | | |
| Total Utilities | | | | | | | 4,258,514 | |
| | | | | | | | | |
| TOTAL COMMON STOCKS (Cost $87,028,444) | | | | | | | 124,113,251 | |
| Expiration Date | | Exercise
Price | | | Contracts | | | Notional
Value | | | Value | |
| PURCHASED OPTIONS (1.95%) | | | | | | | | | | | | | | | | |
| Puts (1.95%) | | | | | | | | | | | | | | | | |
| S&P 500 Index Put Options: | | | | | | | | | | | | | | | | |
| 9/21/2018 | | $ | 350.00 | | | | 480 | | | | 126,761,760 | | | | 2,472,000 | |
| | | | | | | | | | | | | | | | | |
| Total Puts | | | | | | | | | | | | | | | 2,472,000 | |
| | | | | | | | | | | | | | | | | |
TOTAL PURCHASED OPTIONS (Cost $1,521,709) | | | | | | | | | | | | | | | 2,472,000 | |
| | | 7-Day Yield | | | Shares | | | Value | |
| SHORT TERM INVESTMENTS (0.44%) | | | | | | | | | | | | |
| Money Market Fund (0.44%) | | | | | | | | | | | | |
| Dreyfus Treasury Prime Cash Management, Institutional Class | | | 1.45400 | % | | | 560,567 | | | | 560,567 | |
| | | | | | | | | | | | | |
| TOTAL SHORT TERM INVESTMENTS (Cost $560,567) | | | | | | | | | | | 560,567 | |
| Expiration Date | | Exercise
Price
(continued) | | | Contracts
(continued) | | | Notional
Value
(continued) | | | Value
(continued) | |
| TOTAL INVESTMENTS (100.10%) (Cost $89,110,720) | | | | | | | | | | | $ | 127,145,818 | |
| Liabilities in Excess of Other Assets (-0.10%) | | | | | | | | | | | | | | | (124,411 | ) |
| NET ASSETS (100.00%) | | | | | | | | | | | | | | $ | 127,021,407 | |
| (a) | Non-income producing security. |
See Notes to Financial Statements.
| Semi-Annual Report | March 31, 2018 | 21 |
Centre Active U.S. Treasury Fund | Schedule of Investments |
March 31, 2018 (Unaudited)
| | | Principal
Amount | | | Value | |
| U.S. GOVERNMENT BONDS & NOTES (90.78%) | | | | | | | | |
| U.S. Treasury Bonds (74.89%) | | | | | | | | |
| 8/15/2019, 8.125% | | $ | 7,956,000 | | | $ | 8,594,572 | |
| 2/15/2020, 8.500% | | | 5,500,000 | | | | 6,136,604 | |
| 8/15/2020, 8.750% | | | 7,350,000 | | | | 8,436,534 | |
| 2/15/2043, 3.125% | | | 5,470,000 | | | | 5,628,717 | |
| 5/15/2044, 3.375% | | | 5,470,000 | | | | 5,872,004 | |
| Total U.S. Treasury Bonds | | | | | | | 34,668,431 | |
| | | | | | | | | |
| U.S. Treasury Notes (15.89%) | | | | | | | | |
| 7/31/2021, 2.250% | | | 2,200,000 | | | | 2,186,071 | |
| 11/15/2022, 1.625% | | | 1,500,000 | | | | 1,439,803 | |
| 5/15/2024, 2.500% | | | 1,500,000 | | | | 1,486,987 | |
| 8/15/2024, 2.375% | | | 1,000,000 | | | | 982,750 | |
| 11/15/2025, 2.250% | | | 1,300,000 | | | | 1,257,749 | |
| Total U.S. Treasury Notes | | | | | | | 7,353,360 | |
| | | | | | | | | |
| TOTAL U.S. GOVERNMENT BONDS & NOTES (Cost $41,447,430) | | | | | | | 42,021,791 | |
| | | 7-Day Yield | | | Shares | | | Value | |
| SHORT TERM INVESTMENTS (1.31%) | | | | | | | | | | | | |
| Money Market Fund (1.31%) | | | | | | | | | | | | |
| Dreyfus Treasury Prime Cash Management, Institutional Class | | | 1.45400 | % | | | 606,594 | | | | 606,594 | |
| | | | | | | | | | | | | |
| TOTAL SHORT TERM INVESTMENTS (Cost $606,594) | | | | | | | | | | | 606,594 | |
| | | | | | | | | | | | |
| TOTAL INVESTMENTS (92.09%) (Cost $42,054,024) | | | | | | | | | | $ | 42,628,385 | |
| Other Assets In Excess Of Liabilities (7.91%) | | | | | | | | | | | 3,661,598 | (a) |
| NET ASSETS (100.00%) | | | | | | | | | | $ | 46,289,983 | |
| (a) | Includes cash which is being held as collateral for futures contracts. |
See Notes to Financial Statements.
| Centre Active U.S. Tax Exempt Fund | Schedule of Investments |
March 31, 2018 (Unaudited)
| | | Shares | | | Value | |
| OPEN-END FUNDS (9.45%) | | | | | | | | |
| Centre Global Infrastructure Fund, Institutional Class(a) | | | 213,588 | | | $ | 1,992,775 | |
| | | | | | | | | |
TOTAL OPEN-END FUNDS (Cost $2,132,413) | | | | | | | 1,992,775 | |
| | | Principal
Amount | | | Value | |
| MUNICIPAL BONDS (84.75%) | | | | | | | | |
| General Obligation (59.70%) | | | | | | | | |
| Arlington County, VA | | | | | | | | |
| 8/15/2024, 4.000% | | $ | 900,000 | | | $ | 998,559 | |
| Baltimore County, MD | | | | | | | | |
| 8/1/2022, 4.000% | | | 500,000 | | | | 524,725 | |
| City of Arlington, TX | | | | | | | | |
| 8/15/2025, 5.000% | | | 850,000 | | | | 993,386 | |
| City of Columbus, OH, Series 2013 1 | | | | | | | | |
| 7/1/2029, 4.000% | | | 500,000 | | | | 538,675 | |
| City of Richardson, TX | | | | | | | | |
| 2/15/2033, 3.125% | | | 235,000 | | | | 231,008 | |
| 2/15/2035, 3.250% | | | 660,000 | | | | 651,532 | |
| | | | | | | | 882,540 | |
| City of Rochester, NH, Series A | | | | | | | | |
| 2/15/2034, 3.250% | | | 400,000 | | | | 399,004 | |
| City of San Antonio, TX | | | | | | | | |
| 2/1/2024, 5.000% | | | 750,000 | | | | 863,363 | |
| City of Seattle, WA | | | | | | | | |
| 11/1/2025, 5.000% | | | 500,000 | | | | 594,145 | |
| County of Sullivan, TN | | | | | | | | |
| 5/1/2045, 4.000% | | | 500,000 | | | | 519,230 | |
| Dallas Independent School District, TX | | | | | | | | |
| 2/15/2019, 5.000% | | | 500,000 | | | | 514,650 | |
| King County, WA, Series E | | | | | | | | |
| 12/1/2029, 5.000% | | | 650,000 | | | | 761,651 | |
| Montgomery County, MD, Series B | | | | | | | | |
| 11/1/2027, 5.000% | | | 750,000 | | | | 868,485 | |
| North Carolina State, Series B | | | | | | | | |
| 6/1/2026, 5.000% | | | 750,000 | | | | 894,945 | |
| State of Georgia,, Series C | | | | | | | | |
| 7/1/2028, 5.000% | | | 700,000 | | | | 848,771 | |
| State of Ohio, Series 2015 B | | | | | | | | |
| 6/15/2035, 5.000% | | | 900,000 | | | | 992,925 | |
| State of Texas, Series E | | | | | | | | |
| 8/1/2024, 5.000% | | | 765,000 | | | | 888,899 | |
| Wake County, NC, Series A | | | | | | | | |
| 5/1/2029, 3.000% | | | 500,000 | | | | 503,515 | |
| Total General Obligation | | | | | | | 12,587,468 | |
| | | | | | | | | |
| Prerefunded Issues(b) (12.93%) | | | | | | | | |
| Arizona State, Water Infrastructure Finance Authority, Series A, | | | | | | | | |
| 10/01/19 @ 100 | | | | | | | | |
| 10/1/2021, 5.000% | | | 500,000 | | | | 524,775 | |
| City of Norfolk, VA, Series C, | | | | | | | | |
| 4/01/21 @ 100 | | | | | | | | |
| 10/1/2027, 5.000% | | | 635,000 | | | | 694,169 | |
| | | Principal
Amount | | | Value | |
| Prerefunded Issues(b) (continued) | | | | | | | | |
| Oregon State, Lottery Revenue, Series A, | | | | | | | | |
| 4/01/19 @ 100 | | | | | | | | |
| 4/1/2021, 5.000% | | $ | 500,000 | | | $ | 516,905 | |
| Utah State, Series A, 7/01/21 @ 100 | | | | | | | | |
| 7/1/2023, 5.000% | | | 900,000 | | | | 990,342 | |
| Total Prerefunded Issues | | | | | | | 2,726,191 | |
| | | | | | | | | |
| Revenue Bonds (12.12%) | | | | | | | | |
| Gwinnett County, GA, Water & Sewerage Authority, Series A | | | | | | | | |
| 8/1/2028, 4.000% | | | 500,000 | | | | 511,700 | |
| New York State, Environmental Facilities Corp. | | | | | | | | |
| 11/15/2033, 5.000% | | | 900,000 | | | | 1,024,128 | |
| Washington, MD, Suburban Sanitation District, Public Improvements | | | | | | | | |
| 6/1/2026, 3.000% | | | 1,000,000 | | | | 1,019,620 | |
| Total Revenue Bonds | | | | | | | 2,555,448 | |
| | | | | | | | | |
TOTAL MUNICIPAL BONDS (Cost $17,901,326) | | | | | | | 17,869,107 | |
| | | 7-Day Yield | | | Shares | | | Value | |
| SHORT TERM INVESTMENTS (1.45%) | | | | | | | | | | | | |
| Money Market Fund (1.45%) | | | | | | | | | | | | |
| Dreyfus Treasury Prime Cash Management, Institutional Class | | | 1.45400 | % | | | 305,619 | | | | 305,619 | |
| | | | | | | | | | | | | |
TOTAL SHORT TERM INVESTMENTS (Cost $305,619) | | | | | | | | | | | 305,619 | |
| | | | | | | | | | | | | |
TOTAL INVESTMENTS (95.65%) (Cost $20,339,358) | | | | | | | | | | $ | 20,167,501 | |
| Other Assets In Excess Of Liabilities (4.35%) | | | | | | | | | | | 917,152 | (c) |
| NET ASSETS (100.00%) | | | | | | | | | | $ | 21,084,653 | |
| (a) | Affiliated company. See note 7 to notes to financial statements. |
| (b) | Prerefunded Issues are bonds which are prerefunded and collateralized by U.S. Treasury securities held in escrow and used to pay principal and interest on tax-exempt issues and to retire the bonds in full at the earliest refunding date. |
| (c) | Includes cash which is being held as collateral for futures contracts. |
See Notes to Financial Statements.
| Semi-Annual Report | March 31, 2018 | 23 |
| Centre Global Infrastructure Fund | Schedule of Investments |
March 31, 2018 (Unaudited)
| | | Shares | | | Value | |
| COMMON STOCKS (92.57%) | | | | | | | | |
| ASIA (15.93%) | | | | | | | | |
| Australia (2.49%) | | | | | | | | |
| Health Care Providers & Services (0.45%) | | | | | | | | |
| Ramsay Health Care, Ltd. | | | 200 | | | $ | 9,573 | |
| | | | | | | | | |
| Transportation Infrastructure (2.04%) | | | | | | | | |
| Sydney Airport | | | 1,900 | | | | 9,792 | |
| Transurban Group | | | 3,800 | | | | 33,330 | |
| | | | | | | | 43,122 | |
| Total Australia | | | | | | | 52,695 | |
| | | | | | | | | |
| China (4.78%) | | | | | | | | |
| Health Care Providers & Services (1.70%) | | | | | | | | |
| Sinopharm Group Co., Ltd., Class H | | | 7,200 | | | | 36,054 | |
| | | | | | | | | |
| Internet Software & Services (1.48%) | | | | | | | | |
| Tencent Holdings, Ltd. | | | 600 | | | | 31,314 | |
| | | | | | | | | |
| Oil, Gas & Consumable Fuels (1.60%) | | | | | | | | |
| China Petroleum & Chemical Corp., Class H | | | 38,500 | | | | 33,800 | |
| | | | | | | | | |
| Total China | | | | | | | 101,168 | |
| | | | | | | | | |
| Hong Kong (1.38%) | | | | | | | | |
| Wireless Telecommunication Services (1.38%) | | | | | | | | |
| China Mobile, Ltd. | | | 3,200 | | | | 29,337 | |
| | | | | | | | | |
| Total Hong Kong | | | | | | | 29,337 | |
| | | | | | | | | |
| Japan (5.12%) | | | | | | | | |
| Diversified Telecommunication Services (0.87%) | | | | | | | | |
| Nippon Telegraph & Telephone Corp. | | | 400 | | | | 18,428 | |
| | | | | | | | | |
| Wireless Telecommunication Services (4.25%) | | | | | | | | |
| KDDI Corp. | | | 1,200 | | | | 30,512 | |
| NTT DOCOMO, Inc. | | | 900 | | | | 22,748 | |
| SoftBank Corp. | | | 500 | | | | 36,681 | |
| | | | | | | | 89,941 | |
| Total Japan | | | | | | | 108,369 | |
| | | | | | | | | |
| Singapore (2.16%) | | | | | | | | |
| Diversified Telecommunication Services (0.64%) | | | | | | | | |
| Singapore Telecommunications, Ltd. | | | 5,300 | | | | 13,622 | |
| | | | | | | | | |
| Trading Companies & Distributors (1.52%) | | | | | | | | |
| BOC Aviation, Ltd.(a) | | | 5,400 | | | | 32,098 | |
| | | | | | | | | |
| Total Singapore | | | | | | | 45,720 | |
| | | | | | | | | |
TOTAL ASIA (Cost $340,336) | | | | | | | 337,289 | |
| | | | | | | | | |
| EUROPE (20.64%) | | | | | | | | |
| France (2.37%) | | | | | | | | |
| Diversified Telecommunication Services (1.04%) | | | | | | | | |
| Orange SA | | | 1,300 | | | | 22,050 | |
| | | Shares | | | Value | |
| France (continued) | | | | | | | | |
| Multi-Utilities (0.79%) | | | | | | | | |
| Engie SA | | | 1,000 | | | $ | 16,679 | |
| | | | | | | | | |
| Transportation Infrastructure (0.54%) | | | | | | | | |
| Getlink SE | | | 800 | | | | 11,419 | |
| | | | | | | | | |
| Total France | | | | | | | 50,148 | |
| | | | | | | | | |
| Germany (2.37%) | | | | | | | | |
| Diversified Telecommunication Services (1.69%) | | | | | | | | |
| Deutsche Telekom AG | | | 2,200 | | | | 35,868 | |
| | | | | | | | | |
| Multi-Utilities (0.68%) | | | | | | | | |
| E.ON SE | | | 1,300 | | | | 14,428 | |
| | | | | | | | | |
| Total Germany | | | | | | | 50,296 | |
| | | | | | | | | |
| Great Britain (4.12%) | | | | | | | | |
| Diversified Telecommunication Services (0.83%) | | | | | | | | |
| BT Group Plc | | | 5,500 | | | | 17,555 | |
| | | | | | | | | |
| Multi-Utilities (1.06%) | | | | | | | | |
| National Grid Plc | | | 2,000 | | | | 22,510 | |
| | | | | | | | | |
| Wireless Telecommunication Services (2.23%) | | | | | | | | |
| Vodafone Group Plc | | | 17,300 | | | | 47,141 | |
| | | | | | | | | |
| Total Great Britain | | | | | | | 87,206 | |
| | | | | | | | | |
| Italy (4.62%) | | | | | | | | |
| Aerospace & Defense (1.25%) | | | | | | | | |
| Leonardo SpA | | | 2,300 | | | | 26,540 | |
| | | | | | | | | |
| Electric Utilities (1.36%) | | | | | | | | |
| Enel SpA | | | 4,700 | | | | 28,742 | |
| | | | | | | | | |
| Oil, Gas & Consumable Fuels (0.84%) | | | | | | | | |
| Snam SpA | | | 3,900 | | | | 17,914 | |
| | | | | | | | | |
| Transportation Infrastructure (1.17%) | | | | | | | | |
| Atlantia SpA | | | 800 | | | | 24,757 | |
| | | | | | | | | |
| Total Italy | | | | | | | 97,953 | |
| | | | | | | | | |
| Norway (0.53%) | | | | | | | | |
| Diversified Telecommunication Services (0.53%) | | | | | | | | |
| Telenor ASA | | | 500 | | | | 11,290 | |
| | | | | | | | | |
| Total Norway | | | | | | | 11,290 | |
| | | | | | | | | |
| Spain (5.27%) | | | | | | | | |
| Diversified Telecommunication Services (1.35%) | | | | | | | | |
| Telefonica SA | | | 2,900 | | | | 28,646 | |
| | | | | | | | | |
| Electric Utilities (1.18%) | | | | | | | | |
| Iberdrola SA | | | 3,400 | | | | 24,984 | |
| Centre Global Infrastructure Fund | Schedule of Investments |
March 31, 2018 (Unaudited)
| | | Shares | | | Value | |
| Spain (continued) | | | | | | | | |
| Oil, Gas & Consumable Fuels (0.52%) | | | | | | | | |
| Enagas SA | | | 400 | | | $ | 10,941 | |
| | | | | | | | | |
| Transportation Infrastructure (2.22%) | | | | | | | | |
| Abertis Infraestructuras SA | | | 1,200 | | | | 26,903 | |
| Aena SME SA(a)(b) | | | 100 | | | | 20,136 | |
| | | | | | | | 47,039 | |
| Total Spain | | | | | | | 111,610 | |
| | | | | | | | | |
| Switzerland (1.36%) | | | | | | | | |
| Energy Equipment & Services (1.36%) | | | | | | | | |
| Transocean, Ltd.(c) | | | 2,900 | | | | 28,710 | |
| | | | | | | | | |
| Total Switzerland | | | | | | | 28,710 | |
| | | | | | | | | |
TOTAL EUROPE (Cost $470,148) | | | | | | | 437,213 | |
| | | | | | | | | |
| NORTH AMERICA (56.00%) | | | | | | | | |
| Canada (9.48%) | | | | | | | | |
| Oil, Gas & Consumable Fuels (9.06%) | | | | | | | | |
| Enbridge, Inc. | | | 2,900 | | | | 91,208 | |
| Inter Pipeline, Ltd. | | | 600 | | | | 10,413 | |
| Pembina Pipeline Corp. | | | 900 | | | | 28,083 | |
| TransCanada Corp. | | | 1,500 | | | | 62,033 | |
| | | | | | | | 191,737 | |
| Wireless Telecommunication Services (0.42%) | | | | | | | | |
| Rogers Communications, Inc., Class B | | | 200 | | | | 8,932 | |
| | | | | | | | | |
| Total Canada | | | | | | | 200,669 | |
| | | | | | | | | |
| United States (46.52%) | | | | | | | | |
| Construction & Engineering (1.35%) | | | | | | | | |
| Fluor Corp. | | | 500 | | | | 28,610 | |
| | | | | | | | | |
| Diversified Telecommunication Services (13.30%) | | | | | | | | |
| AT&T, Inc. | | | 4,000 | | | | 142,600 | |
| CenturyLink, Inc. | | | 600 | | | | 9,858 | |
| Verizon Communications, Inc. | | | 2,700 | | | | 129,114 | |
| | | | | | | | 281,572 | |
| Electric Utilities (10.08%) | | | | | | | | |
| American Electric Power Co., Inc. | | | 300 | | | | 20,577 | |
| Duke Energy Corp. | | | 400 | | | | 30,988 | |
| Edison International | | | 200 | | | | 12,732 | |
| Eversource Energy | | | 200 | | | | 11,784 | |
| Exelon Corp. | | | 600 | | | | 23,406 | |
| NextEra Energy, Inc. | | | 300 | | | | 48,999 | |
| PG&E Corp. | | | 300 | | | | 13,179 | |
| PPL Corp. | | | 400 | | | | 11,316 | |
| The Southern Co. | | | 600 | | | | 26,796 | |
| Xcel Energy, Inc. | | | 300 | | | | 13,644 | |
| | | | | | | | 213,421 | |
| Energy Equipment & Services (1.55%) | | | | | | | | |
| Halliburton Co. | | | 700 | | | | 32,858 | |
| | | | | | | | | |
| Health Care Providers & Services (3.41%) | | | | | | | | |
| HCA Healthcare, Inc. | | | 500 | | | | 48,500 | |
| | | Shares | | | Value | |
| United States (continued) | | | | | | | | |
| Health Care Providers & Services (continued) | | | | | | | | |
| Universal Health Services, Inc., Class B | | | 200 | | | $ | 23,682 | |
| | | | | | | | 72,182 | |
| Industrial Conglomerates (1.27%) | | | | | | | | |
| General Electric Co. | | | 2,000 | | | | 26,960 | |
| | | | | | | | | |
| Multi-Utilities (4.33%) | | | | | | | | |
| Consolidated Edison, Inc. | | | 200 | | | | 15,588 | |
| Dominion Energy, Inc. | | | 400 | | | | 26,972 | |
| DTE Energy Co. | | | 100 | | | | 10,440 | |
| Public Service Enterprise Group, Inc. | | | 300 | | | | 15,072 | |
| Sempra Energy | | | 100 | | | | 11,122 | |
| WEC Energy Group, Inc. | | | 200 | | | | 12,540 | |
| | | | | | | | 91,734 | |
| Oil, Gas & Consumable Fuels (7.60%) | | | | | | | | |
| Cheniere Energy, Inc.(c) | | | 300 | | | | 16,035 | |
| Kinder Morgan, Inc. | | | 3,500 | | | | 52,710 | |
| ONEOK, Inc. | | | 700 | | | | 39,844 | |
| Targa Resources Corp. | | | 400 | | | | 17,600 | |
| The Williams Cos., Inc. | | | 1,400 | | | | 34,804 | |
| | | | | | | | 160,993 | |
| Semiconductors & Semiconductor Equipment (1.31%) | | | | | | | | |
| QUALCOMM, Inc. | | | 500 | | | | 27,705 | |
| | | | | | | | | |
| Technology Hardware, Storage & Peripherals (1.74%) | | | | | | | | |
| Western Digital Corp. | | | 400 | | | | 36,908 | |
| | | | | | | | | |
| Wireless Telecommunication Services (0.58%) | | | | | | | | |
| T-Mobile US, Inc.(c) | | | 200 | | | | 12,208 | |
| | | | | | | | | |
| Total United States | | | | | | | 985,151 | |
| | | | | | | | | |
TOTAL NORTH AMERICA (Cost $1,281,239) | | | | | | | 1,185,820 | |
| | | | | | | | | |
TOTAL COMMON STOCKS (Cost $2,091,723) | | | | | | | 1,960,322 | |
| | | 7-Day Yield | | | Shares | | | Value | |
| SHORT TERM INVESTMENTS (4.36%) | | | | | | | | | | | | |
| Money Market Fund (4.36%) | | | | | | | | | | | | |
| Dreyfus Treasury Prime Cash Management, Institutional Class | | | 1.45400 | % | | | 92,338 | | | | 92,338 | |
| | | | | | | | | | | | | |
TOTAL SHORT TERM INVESTMENTS (Cost $92,338) | | | | | | | | | | | 92,338 | |
| | | | | | | | | | | | | |
TOTAL INVESTMENTS (96.93%) (Cost $2,184,061) | | | | | | | | | | $ | 2,052,660 | |
| Other Assets In Excess Of Liabilities (3.07%) | | | | | | | | | | | 65,020 | |
| NET ASSETS (100.00%) | | | | | | | | | | $ | 2,117,680 | |
| Semi-Annual Report | March 31, 2018 | 25 |
| Centre Global Infrastructure Fund | Schedule of Investments |
March 31, 2018 (Unaudited)
| (a) | Security was purchased pursuant to Rule 144A under the Securities Act of 1933 and may be resold in transactions exempt from registration only to qualified institutional buyers. As of March 31, 2018, these securities had a total aggregate market value of $52,234. |
| (b) | Securities were purchased pursuant to Regulation S under the Securities Act of 1933, which exempts securities offered and sold outside the United States from registration. Such securities cannot be sold in the United States without either an effective registration statement filed pursuant to Securities Act of 1933, or pursuant to an exemption from registration. These securities have been deemed liquid under guidelines approved by the Fund's Board of Trustees. At period end, the aggregate market value of those securities was $52,234, representing 2.47% of net assets. |
| (c) | Non-income producing security. |
See Notes to Financial Statements.
| Centre Funds | Statements of Assets and Liabilities |
March 31, 2018 (Unaudited)
| | | Centre American Select Equity Fund | | | Centre Active U.S. Treasury Fund | | | Centre Active U.S. Tax Exempt Fund | | | Centre Global Infrastructure Fund | |
| ASSETS: | | | | | | | | | | | | |
| Investments, at value | | $ | 127,145,818 | | | $ | 42,628,385 | | | $ | 18,174,726 | | | $ | 2,052,660 | |
| Investments in affiliates, at value | | | – | | | | – | | | | 1,992,775 | | | | – | |
| Foreign currency, at value (Cost $–, $–, $– and $88, respectively) | | | – | | | | – | | | | – | | | | 88 | |
| Receivable for dividends and interest | | | 78,851 | | | | 356,215 | | | | 207,048 | | | | 3,324 | |
| Deposit with broker for futures contracts | | | 35,674 | | | | 3,400,400 | | | | 822,448 | | | | – | |
| Receivable due from investment adviser | | | – | | | | – | | | | 4,039 | | | | 12,108 | |
| Receivable for fund shares sold | | | – | | | | 202 | | | | – | | | | – | |
| Deferred offering cost | | | – | | | | – | | | | – | | | | 67,594 | |
| Prepaid and other assets | | | 16,036 | | | | 18,838 | | | | 23,204 | | | | 837 | |
| Total Assets | | | 127,276,379 | | | | 46,404,040 | | | | 21,224,240 | | | | 2,136,611 | |
| LIABILITIES: | | | | | | | | | | | | | | | | |
| Payable to custodian | | | 27,196 | | | | 18,414 | | | | 86,613 | | | | – | |
| Payable to administrator | | | 28,929 | | | | 10,881 | | | | 7,268 | | | | 4,325 | |
| Payable to transfer agent | | | 12,650 | | | | 10,958 | | | | 3,780 | | | | 3,690 | |
| Payable for fund shares redeemed | | | 17,392 | | | | 25,180 | | | | 29,774 | | | | – | |
| Payable to investment adviser | | | 70,305 | | | | 7,841 | | | | – | | | | – | |
| Accrued 12b-1 and service fees | | | 38,831 | | | | 10,911 | | | | 4,956 | | | | 354 | |
| Payable for custodian fees | | | 2,345 | | | | 1,594 | | | | 827 | | | | 1,672 | |
| Payable for printing | | | 10,958 | | | | 4,290 | | | | 1,772 | | | | 78 | |
| Payable for legal and audit fees | | | 29,082 | | | | 16,583 | | | | 130 | | | | 3,533 | |
| Payable to Trustees | | | 12,902 | | | | 5,371 | | | | 2,490 | | | | 138 | |
| Payable under the Chief Compliance Officer Services Agreement | | | 2,343 | | | | 1,392 | | | | 653 | | | | 74 | |
| Other payables | | | 2,039 | | | | 642 | | | | 1,324 | | | | 5,067 | |
| Total Liabilities | | | 254,972 | | | | 114,057 | | | | 139,587 | | | | 18,931 | |
| NET ASSETS | | $ | 127,021,407 | | | $ | 46,289,983 | | | $ | 21,084,653 | | | $ | 2,117,680 | |
| NET ASSETS CONSIST OF: | | | | | | | | | | | | | | | | |
| Paid-in capital | | $ | 76,188,051 | | | $ | 45,073,512 | | | $ | 21,022,299 | | | $ | 2,264,232 | |
| Accumulated net investment income/(loss) | | | (1,453,661 | ) | | | 9,054 | | | | 9,374 | | | | (1,244 | ) |
| Accumulated net realized gain/(loss) | | | 14,251,919 | | | | 633,056 | | | | 224,837 | | | | (13,915 | ) |
| Net unrealized appreciation/(depreciation) | | | 38,035,098 | | | | 574,361 | | | | (171,857 | ) | | | (131,393 | ) |
| NET ASSETS | | $ | 127,021,407 | | | $ | 46,289,983 | | | $ | 21,084,653 | | | $ | 2,117,680 | |
| INVESTMENTS, AT COST | | $ | 89,110,720 | | | $ | 42,054,024 | | | $ | 18,206,945 | | | $ | 2,184,061 | |
| INVESTMENTS IN AFFILIATES, AT COST | | | – | | | | – | | | | 2,132,413 | | | | – | |
| PRICING OF SHARES | | | | | | | | | | | | | | | | |
| Investor Class | | | | | | | | | | | | | | | | |
| Net Assets | | $ | 124,742,646 | | | $ | 42,469,082 | | | $ | 19,677,093 | | | $ | 31,084 | |
| Shares outstanding | | | 9,950,256 | | | | 4,368,995 | | | | 2,002,136 | | | | 3,326 | |
| Net Asset Value, offering and redemption price per share | | $ | 12.54 | | | $ | 9.72 | | | $ | 9.83 | | | $ | 9.35 | |
| Institutional Class | | | | | | | | | | | | | | | | |
| Net Assets | | $ | 2,278,762 | | | $ | 3,820,901 | | | $ | 1,407,559 | | | $ | 2,086,597 | |
| Shares outstanding | | | 181,513 | | | | 390,330 | | | | 144,075 | | | | 223,620 | |
| Net Asset Value, offering and redemption price per share | | $ | 12.55 | | | $ | 9.79 | | | $ | 9.77 | | | $ | 9.33 | |
See Notes to Financial Statements.
| Semi-Annual Report | March 31, 2018 | 27 |
| Centre Funds | Statements of Operations |
March 31, 2018 (Unaudited)
| | | Centre American Select Equity Fund | | | Centre Active U.S. Treasury Fund | | | Centre Active U.S. Tax Exempt Fund | | | Centre Global Infrastructure Fund(a) | |
| INVESTMENT INCOME: | | | | | | | | | | | | |
| Interest | | $ | – | | | $ | 663,574 | | | $ | 300,346 | | | $ | – | |
| Dividends | | | 766,916 | | | | – | | | | – | | | | 10,213 | |
| Dividends from affiliated investments | | | – | | | | – | | | | 6,413 | | | | – | |
| Foreign taxes withheld | | | (4,534 | ) | | | – | | | | – | | | | (493 | ) |
| Total Investment Income | | | 762,382 | | | | 663,574 | | | | 306,759 | | | | 9,720 | |
| | | | | | | | | | | | | | | | | |
| EXPENSES: | | | | | | | | | | | | | | | | |
| Investment advisory fees | | | 488,523 | | | | 96,610 | | | | 43,259 | | | | 3,108 | |
| Administration fees | | | 101,514 | | | | 39,102 | | | | 20,736 | | | | 4,553 | |
| Transfer agent fees | | | 32,555 | | | | 28,452 | | | | 14,709 | | | | 3,949 | |
| Custodian fees | | | 7,778 | | | | 4,065 | | | | 2,493 | | | | 1,672 | |
| Legal fees | | | 57,010 | | | | 22,512 | | | | 16,413 | | | | 407 | |
| Audit fees | | | 6,257 | | | | 6,257 | | | | 6,257 | | | | 3,126 | |
| Trustees' fees and expenses | | | 19,865 | | | | 8,012 | | | | 3,710 | | | | 138 | |
| Registration/filing fees | | | 14,054 | | | | 11,340 | | | | 16,564 | | | | – | |
| 12b-1 fees (Investor Class) | | | 159,887 | | | | 55,294 | | | | 26,046 | | | | 11 | |
| Shareholder service fees | | | 63,749 | | | | 8,789 | | | | 4,073 | | | | 347 | |
| Printing fees | | | 15,489 | | | | 5,030 | | | | 1,912 | | | | 78 | |
| Chief Compliance Officer services fees | | | 18,204 | | | | 7,284 | | | | 3,373 | | | | 128 | |
| Offering costs | | | – | | | | – | | | | – | | | | 13,560 | |
| Miscellaneous expenses | | | 8,954 | | | | 4,772 | | | | 2,777 | | | | 77 | |
| Total expenses before waivers | | | 993,839 | | | | 297,519 | | | | 162,322 | | | | 31,154 | |
| Fees waived/reimbursed by investment adviser (Investor Class) (Note 5) | | | (220,897 | ) | | | (72,049 | ) | | | (46,290 | ) | | | (325 | ) |
| Fees waived/reimbursed by investment adviser (Institutional Class) (Note 5) | | | (2,873 | ) | | | (7,802 | ) | | | (3,811 | ) | | | (26,597 | ) |
| Net Expenses | | | 770,069 | | | | 217,668 | | | | 112,221 | | | | 4,232 | |
| Net Investment Income/(Loss) | | | (7,687 | ) | | | 445,906 | | | | 194,538 | | | | 5,488 | |
| | | | | | | | | | | | | | | | | |
| Net realized gain/(loss) on investments | | | 15,181,682 | | | | 90,966 | | | | 48,118 | | | | (13,331 | ) |
| Net realized loss on written option contracts | | | (168,497 | ) | | | – | | | | – | | | | – | |
| Net realized gain on futures contracts | | | – | | | | 1,323,000 | | | | 342,288 | | | | – | |
| Net realized gain/(loss) on foreign currencies | | | 127 | | | | – | | | | – | | | | (584 | ) |
| Total realized gain/(loss) | | | 15,013,312 | | | | 1,413,966 | | | | 390,406 | | | | (13,915 | ) |
| Net change in unrealized depreciation on investments | | | (4,145,363 | ) | | | (1,082,673 | ) | | | (572,047 | ) | | | (131,401 | ) |
| Net change in unrealized depreciation on futures contracts | | | – | | | | (482,385 | ) | | | (111,081 | ) | | | – | |
| Net change in unrealized depreciation on affiliated investments | | | – | | | | – | | | | (139,638 | ) | | | – | |
| Net change in unrealized appreciation on foreign currencies | | | – | | | | – | | | | – | | | | 8 | |
| Total change in unrealized depreciation | | | (4,145,363 | ) | | | (1,565,058 | ) | | | (822,766 | ) | | | (131,393 | ) |
| NET REALIZED AND UNREALIZED GAIN/(LOSS) ON INVESTMENTS, FUTURES CONTRACTS AND FOREIGN CURRENCIES | | | 10,867,949 | | | | (151,092 | ) | | | (432,360 | ) | | | (145,308 | ) |
| NET INCREASE/(DECREASE) IN NET ASSETS RESULTING FROM OPERATIONS | | $ | 10,860,262 | | | $ | 294,814 | | | $ | (237,822 | ) | | $ | (139,820 | ) |
| (a) | For the period January 29, 2018 (Inception) to March 31, 2018. |
See Notes to Financial Statements.
| Centre American Select Equity Fund | Statements of Changes in Net Assets |
| | | For The Six
Months Ending
March 31, 2018
(Unaudited) | | | For The
Year Ended
September 30,
2017 | |
| OPERATIONS: | | | | | | | | |
| Net investment income/(loss) | | $ | (7,687 | ) | | $ | 608,811 | |
| Net realized gain | | | 15,013,312 | | | | 14,300,964 | |
| Net change in unrealized appreciation/(depreciation) | | | (4,145,363 | ) | | | 3,090,750 | |
| Net increase in net assets resulting from operations | | | 10,860,262 | | | | 18,000,525 | |
| DISTRIBUTIONS TO SHAREHOLDERS: | | | | | | | | |
| From net investment income | | | | | | | | |
| Investor | | | (1,416,211 | ) | | | (1,539,748 | ) |
| Institutional | | | (26,054 | ) | | | (31,694 | ) |
| From net realized gains on investments | | | | | | | | |
| Investor | | | (13,481,726 | ) | | | (2,560,364 | ) |
| Institutional | | | (241,895 | ) | | | (41,384 | ) |
| Total distributions | | | (15,165,886 | ) | | | (4,173,190 | ) |
| CAPITAL SHARE TRANSACTIONS: | | | | | | | | |
| Investor Class | | | | | | | | |
| Proceeds from sale of shares | | | 278,607 | | | | 1,050,779 | |
| Shares issued in reinvestment of distributions | | | 14,497,752 | | | | 3,956,485 | |
| Cost of shares redeemed | | | (9,730,180 | ) | | | (21,306,500 | ) |
| Redemption fees | | | 154 | | | | 179 | |
| Net increase/(decrease) from capital share transactions | | | 5,046,333 | | | | (16,299,057 | ) |
| Institutional Class | | | | | | | | |
| Proceeds from sale of shares | | | 4,491 | | | | 2,314,265 | |
| Shares issued in reinvestment of distributions | | | 253,610 | | | | 73,078 | |
| Cost of shares redeemed | | | (355,408 | ) | | | (20,833,579 | ) |
| Redemption fees | | | – | | | | 194 | |
| Net decrease from capital share transactions | | | (97,307 | ) | | | (18,446,042 | ) |
| Net increase/(decrease) in net assets | | | 643,402 | | | | (20,917,764 | ) |
| NET ASSETS: | | | | | | | | |
| Beginning of period | | | 126,378,005 | | | | 147,295,769 | |
| End of period* | | $ | 127,021,407 | | | $ | 126,378,005 | |
| *Including accumulated net investment loss of: | | $ | (1,453,661 | ) | | $ | (3,709 | ) |
| | | | | | | | | |
| OTHER INFORMATION: | | | | | | | | |
| Share Transactions: | | | | | | | | |
| Investor Class | | | | | | | | |
| Beginning shares | | | 9,500,318 | | | | 10,837,210 | |
| Shares sold | | | 20,991 | | | | 87,523 | |
| Shares issued in reinvestment of dividends | | | 1,173,907 | | | | 354,206 | |
| Shares redeemed | | | (744,960 | ) | | | (1,778,621 | ) |
| Ending shares | | | 9,950,256 | | | | 9,500,318 | |
| Institutional Class | | | | | | | | |
| Beginning shares | | | 186,978 | | | | 1,803,739 | |
| Shares sold | | | 335 | | | | 186,898 | |
| Shares issued in reinvestment of dividends | | | 20,519 | | | | 6,543 | |
| Shares redeemed | | | (26,319 | ) | | | (1,810,202 | ) |
| Ending shares | | | 181,513 | | | | 186,978 | |
See Notes to Financial Statements.
| Semi-Annual Report | March 31, 2018 | 29 |
| Centre Active U.S. Treasury Fund | Statements of Changes in Net Assets |
| | | For The Six
Months Ending
March 31, 2018
(Unaudited) | | | For The
Year Ended
September 30,
2017 | |
| OPERATIONS: | | | | | | | | |
| Net investment income | | $ | 445,906 | | | $ | 1,139,445 | |
| Net realized gain/(loss) | | | 1,413,966 | | | | (674,540 | ) |
| Net change in unrealized depreciation | | | (1,565,058 | ) | | | (3,164,674 | ) |
| Net increase/(decrease) in net assets resulting from operations | | | 294,814 | | | | (2,699,769 | ) |
| DISTRIBUTIONS TO SHAREHOLDERS: | | | | | | | | |
| From net investment income | | | | | | | | |
| Investor | | | (395,068 | ) | | | (1,955,451 | ) |
| Institutional | | | (41,784 | ) | | | (212,411 | ) |
| From net realized gains on investments | | | | | | | | |
| Investor | | | – | | | | (89,059 | ) |
| Institutional | | | – | | | | (6,599 | ) |
| Total distributions | | | (436,852 | ) | | | (2,263,520 | ) |
| CAPITAL SHARE TRANSACTIONS: | | | | | | | | |
| Investor Class | | | | | | | | |
| Proceeds from sale of shares | | | 238,818 | | | | 3,103,324 | |
| Shares issued in reinvestment of distributions | | | 307,529 | | | | 1,594,318 | |
| Cost of shares redeemed | | | (5,854,421 | ) | | | (16,176,105 | ) |
| Net decrease from capital share transactions | | | (5,308,074 | ) | | | (11,478,463 | ) |
| Institutional Class | | | | | | | | |
| Proceeds from sale of shares | | | 206,881 | | | | 1,525,346 | |
| Shares issued in reinvestment of distributions | | | 37,405 | | | | 200,579 | |
| Cost of shares redeemed | | | (1,082,117 | ) | | | (17,198,743 | ) |
| Net decrease from capital share transactions | | | (837,831 | ) | | | (15,472,818 | ) |
| Net decrease in net assets | | | (6,287,943 | ) | | | (31,914,570 | ) |
| NET ASSETS: | | | | | | | | |
| Beginning of period | | | 52,577,926 | | | | 84,492,496 | |
| End of period* | | $ | 46,289,983 | | | $ | 52,577,926 | |
| *Including accumulated net investment income of: | | $ | 9,054 | | | $ | – | |
| | | | | | | | | |
| OTHER INFORMATION: | | | | | | | | |
| Share Transactions: | | | | | | | | |
| Investor Class | | | | | | | | |
| Beginning shares | | | 4,915,018 | | | | 6,071,514 | |
| Shares sold | | | 24,661 | | | | 314,241 | |
| Shares issued in reinvestment of dividends | | | 31,693 | | | | 162,313 | |
| Shares redeemed | | | (602,377 | ) | | | (1,633,050 | ) |
| Ending shares | | | 4,368,995 | | | | 4,915,018 | |
| Institutional Class | | | | | | | | |
| Beginning shares | | | 475,762 | | | | 2,007,623 | |
| Shares sold | | | 21,199 | | | | 155,042 | |
| Shares issued in reinvestment of dividends | | | 3,828 | | | | 20,104 | |
| Shares redeemed | | | (110,459 | ) | | | (1,707,007 | ) |
| Ending shares | | | 390,330 | | | | 475,762 | |
See Notes to Financial Statements.
| Centre Active U.S. Tax Exempt Fund | Statements of Changes in Net Assets |
| | | For The Six
Months Ending
March 31, 2018
(Unaudited) | | | For The
Year Ended
September 30,
2017 | |
| OPERATIONS: | | | | | | | | |
| Net investment income | | $ | 194,538 | | | $ | 605,336 | |
| Net realized gain/(loss) | | | 390,406 | | | | (15,057 | ) |
| Net change in unrealized depreciation | | | (822,766 | ) | | | (1,255,321 | ) |
| Net decrease in net assets resulting from operations | | | (237,822 | ) | | | (665,042 | ) |
| DISTRIBUTIONS TO SHAREHOLDERS: | | | | | | | | |
| From net investment income | | | | | | | | |
| Investor | | | (174,546 | ) | | | (504,192 | ) |
| Institutional | | | (14,382 | ) | | | (99,585 | ) |
| From net realized gains on investments | | | | | | | | |
| Investor | | | (139,771 | ) | | | (376,137 | ) |
| Institutional | | | (10,721 | ) | | | (97,777 | ) |
| Total distributions | | | (339,420 | ) | | | (1,077,691 | ) |
| CAPITAL SHARE TRANSACTIONS: | | | | | | | | |
| Investor Class | | | | | | | | |
| Proceeds from sale of shares | | | 103,995 | | | | 756,092 | |
| Shares issued in reinvestment of distributions | | | 232,891 | | | | 672,313 | |
| Cost of shares redeemed | | | (3,202,940 | ) | | | (10,845,671 | ) |
| Net decrease from capital share transactions | | | (2,866,054 | ) | | | (9,417,266 | ) |
| Institutional Class | | | | | | | | |
| Proceeds from sale of shares | | | 253,443 | | | | 448,952 | |
| Shares issued in reinvestment of distributions | | | 24,011 | | | | 141,136 | |
| Cost of shares redeemed | | | (248,446 | ) | | | (6,147,199 | ) |
| Net increase/(decrease) from capital share transactions | | | 29,008 | | | | (5,557,111 | ) |
| Net decrease in net assets | | | (3,414,288 | ) | | | (16,717,110 | ) |
| NET ASSETS: | | | | | | | | |
| Beginning of period | | | 24,498,941 | | | | 41,216,051 | |
| End of period* | | $ | 21,084,653 | | | $ | 24,498,941 | |
| *Including accumulated net investment income of: | | $ | 9,374 | | | $ | 3,764 | |
| | | | | | | | | |
| OTHER INFORMATION: | | | | | | | | |
| Share Transactions: | | | | | | | | |
| Investor Class | | | | | | | | |
| Beginning shares | | | 2,286,976 | | | | 3,214,038 | |
| Shares sold | | | 10,318 | | | | 75,040 | |
| Shares issued in reinvestment of dividends | | | 23,330 | | | | 66,811 | |
| Shares redeemed | | | (318,488 | ) | | | (1,068,913 | ) |
| Ending shares | | | 2,002,136 | | | | 2,286,976 | |
| Institutional Class | | | | | | | | |
| Beginning shares | | | 141,413 | | | | 696,141 | |
| Shares sold | | | 25,355 | | | | 44,806 | |
| Shares issued in reinvestment of dividends | | | 2,421 | | | | 14,114 | |
| Shares redeemed | | | (25,114 | ) | | | (613,648 | ) |
| Ending shares | | | 144,075 | | | | 141,413 | |
See Notes to Financial Statements.
| Semi-Annual Report | March 31, 2018 | 31 |
| Centre Global Infrastructure Fund | Statement of Changes in Net Assets |
| | | For The Period
January 29, 2018
(Inception) to
March 31, 2018 | |
| OPERATIONS: | | | | |
| Net investment income | | $ | 5,488 | |
| Net realized loss | | | (13,915 | ) |
| Net change in unrealized depreciation | | | (131,393 | ) |
| Net decrease in net assets resulting from operations | | | (139,820 | ) |
| DISTRIBUTIONS TO SHAREHOLDERS: | | | | |
| From net investment income | | | | |
| Investor | | | (18 | ) |
| Institutional | | | (6,714 | ) |
| Total distributions | | | (6,732 | ) |
| CAPITAL SHARE TRANSACTIONS: | | | | |
| Investor Class | | | | |
| Proceeds from sale of shares | | | 31,500 | |
| Shares issued in reinvestment of distributions | | | 18 | |
| Net increase from capital share transactions | | | 31,518 | |
| Institutional Class | | | | |
| Proceeds from sale of shares | | | 2,226,000 | |
| Shares issued in reinvestment of distributions | | | 6,714 | |
| Net increase from capital share transactions | | | 2,232,714 | |
| Net increase in net assets | | | 2,117,680 | |
| NET ASSETS: | | | | |
| Beginning of period | | | – | |
| End of period* | | $ | 2,117,680 | |
| *Including accumulated net investment loss of: | | $ | (1,244 | ) |
| | | | | |
| OTHER INFORMATION: | | | | |
| Share Transactions: | | | | |
| Investor Class | | | | |
| Beginning shares | | | – | |
| Shares sold | | | 3,324 | |
| Shares issued in reinvestment of dividends | | | 2 | |
| Ending shares | | | 3,326 | |
| Institutional Class | | | | |
| Beginning shares | | | – | |
| Shares sold | | | 222,897 | |
| Shares issued in reinvestment of dividends | | | 723 | |
| Ending shares | | | 223,620 | |
See Notes to Financial Statements.
| Centre American Select Equity Fund | Financial Highlights |
| Investor Class | For a share outstanding throughout the periods presented. |
| | | For the Six Months Ended March 31, 2018 (Unaudited) | | | For the Year Ended September 30,
2017 | | | For the Year Ended September 30,
2016 | | | For the Year Ended September 30,
2015 | | | For the Year Ended September 30,
2014(a) | | | For the Year Ended September 30,
2013 | |
| NET ASSET VALUE, BEGINNING OF PERIOD | | $ | 13.05 | | | $ | 11.65 | | | $ | 11.67 | | | $ | 12.08 | | | $ | 10.38 | | | $ | 11.79 | |
| INCOME/(LOSS) FROM INVESTMENT OPERATIONS: | | | | | | | | | | | | | | | | | | | | |
| Net investment income(b) | | | 0.00 | (c) | | | 0.06 | | | | 0.09 | | | | 0.07 | | | | 0.06 | | | | 0.09 | |
| Net realized and unrealized gain/(loss) on investments | | | 1.10 | | | | 1.74 | | | | 1.11 | | | | (0.31 | ) | | | 1.73 | | | | 0.97 | |
| Total income/(loss) from investment operations | | | 1.10 | | | | 1.80 | | | | 1.20 | | | | (0.24 | ) | | | 1.79 | | | | 1.06 | |
| | | | | | | | | | | | | | | | | | | | | | | | | |
| DISTRIBUTIONS: | | | | | | | | | | | | | | | | | | | | | | | | |
| Net investment income | | | (0.15 | ) | | | (0.15 | ) | | | (0.02 | ) | | | (0.17 | ) | | | (0.09 | ) | | | (0.18 | ) |
| Net realized gains on investments | | | (1.46 | ) | | | (0.25 | ) | | | (1.20 | ) | | | – | | | | (0.00 | )(d) | | | (2.29 | ) |
| Total distributions | | | (1.61 | ) | | | (0.40 | ) | | | (1.22 | ) | | | (0.17 | ) | | | (0.09 | ) | | | (2.47 | ) |
| REDEMPTION FEES ADDED TO PAID-IN CAPITAL (NOTE 4) | | | 0.00 | (c) | | | 0.00 | (c) | | | 0.00 | (c) | | | 0.00 | (c) | | | 0.00 | (c) | | | 0.00 | (c) |
| NET INCREASE/(DECREASE) IN NET ASSET VALUE | | | (0.51 | ) | | | 1.40 | | | | (0.02 | ) | | | (0.41 | ) | | | 1.70 | | | | (1.41 | ) |
| NET ASSET VALUE, END OF PERIOD | | $ | 12.54 | | | $ | 13.05 | | | $ | 11.65 | | | $ | 11.67 | | | $ | 12.08 | | | $ | 10.38 | |
| | | | | | | | | | | | | | | | | | | | | | | | | |
| Total Return(e) | | | 8.66 | % | | | 15.99 | % | | | 10.74 | % | | | (2.07 | %) | | | 17.31 | % | | | 12.30 | % |
| | | | | | | | | | | | | | | | | | | | | | | | | |
| SUPPLEMENTAL DATA: | | | | | | | | | | | | | | | | | | | | | | | | |
| Net assets, end of period (000) | | $ | 124,743 | | | $ | 123,938 | | | $ | 126,238 | | | $ | 148,314 | | | $ | 116,045 | | | $ | 129,765 | |
| | | | | | | | | | | | | | | | | | | | | | | | | |
| RATIOS TO AVERAGE NET ASSETS: | | | | | | | | | | | | | | | | | | | | | | | | |
| Net investment income/(loss) including reimbursement/waiver | | | (0.02 | %)(f) | | | 0.47 | % | | | 0.77 | % | | | 0.58 | % | | | 0.53 | % | | | 0.88 | % |
| Operating expenses excluding reimbursement/waiver | | | 1.53 | %(f) | | | 1.46 | % | | | 1.36 | % | | | 1.33 | % | | | 1.43 | % | | | 1.51 | % |
| Operating expenses including reimbursement/waiver | | | 1.19 | %(f)(g) | | | 1.05 | % | | | 1.05 | % | | | 1.05 | % | | | 1.05 | % | | | 1.06 | %(h) |
| | | | | | | | | | | | | | | | | | | | | | | | | |
| PORTFOLIO TURNOVER RATE | | | 42 | %(i) | | | 81 | % | | | 74 | % | | | 105 | % | | | 72 | % | | | 175 | % |
| (a) | Prior to January 21, 2014, the Centre American Select Equity Fund was named the Drexel Hamilton Centre American Equity Fund. |
| (b) | Calculated using the average shares method. |
| (c) | Less than $0.005 per share. |
| (d) | Less than $(0.005) per share. |
| (e) | Total returns are for the period indicated and have not been annualized. Total returns would have been lower had certain expenses not been waived during the period. Returns shown do not reflect the deduction of taxes that a shareholder would pay on fund distributions or the redemption of fund shares. |
| (g) | Effective January 29, 2018, the net expense limitation changed from 1.05% to 1.10%, excluding 12b-1 fees and shareholder services fees. |
| (h) | Effective January 11, 2013, the net expense limitation changed from 1.25% to 1.05%. |
| (i) | Portfolio turnover rate for periods less than one full year have not been annualized. |
See Notes to Financial Statements.
| Semi-Annual Report | March 31, 2018 | 33 |
| Centre American Select Equity Fund | Financial Highlights |
| Institutional Class | For a share outstanding throughout the periods presented. |
| | | For the Six Months Ended March 31, 2018 (Unaudited) | | | For the Year Ended September 30, 2017 | | | For the Year
Ended
September 30, 2016 | | | For the Year Ended September 30, 2015 | | | For the Period January 21, 2014 (Inception) to September 30, 2014 | |
| NET ASSET VALUE, BEGINNING OF PERIOD | | $ | 13.05 | | | $ | 11.67 | | | $ | 11.69 | | | $ | 12.08 | | | $ | 11.39 | |
| INCOME/(LOSS) FROM INVESTMENT OPERATIONS: | | | | | | | | | | | | | | | | | |
| Net investment income(a) | | | 0.01 | | | | 0.08 | | | | 0.10 | | | | 0.08 | | | | 0.05 | |
| Net realized and unrealized gain/(loss) on investments | | | 1.11 | | | | 1.74 | | | | 1.11 | | | | (0.30 | ) | | | 0.64 | |
| Total income/(loss) from investment operations | | | 1.12 | | | | 1.82 | | | | 1.21 | | | | (0.22 | ) | | | 0.69 | |
| | | | | | | | | | | | | | | | | | | | | |
| DISTRIBUTIONS: | | | | | | | | | | | | | | | | | | | | |
| Net investment income | | | (0.16 | ) | | | (0.19 | ) | | | (0.03 | ) | | | (0.17 | ) | | | – | |
| Net realized gains on investments | | | (1.46 | ) | | | (0.25 | ) | | | (1.20 | ) | | | – | | | | – | |
| Total distributions | | | (1.62 | ) | | | (0.44 | ) | | | (1.23 | ) | | | (0.17 | ) | | | – | |
| REDEMPTION FEES ADDED TO PAID-IN CAPITAL (NOTE 4) | | | – | | | | 0.00 | (b) | | | – | | | | – | | | | – | |
| NET INCREASE/(DECREASE) IN NET ASSET VALUE | | | (0.50 | ) | | | 1.38 | | | | (0.02 | ) | | | (0.39 | ) | | | 0.69 | |
| NET ASSET VALUE, END OF PERIOD | | $ | 12.55 | | | $ | 13.05 | | | $ | 11.67 | | | $ | 11.69 | | | $ | 12.08 | |
| | | | | | | | | | | | | | | | | | | | | |
| Total Return(c) | | | 8.76 | % | | | 16.20 | % | | | 10.74 | % | | | (1.89 | %) | | | 6.06 | % |
| | | | | | | | | | | | | | | | | | | | | |
| SUPPLEMENTAL DATA: | | | | | | | | | | | | | | | | | | | | |
| Net assets, end of period (000) | | $ | 2,279 | | | $ | 2,440 | | | $ | 21,058 | | | $ | 16,907 | | | $ | 15,826 | |
| | | | | | | | | | | | | | | | | | | | | |
| RATIOS TO AVERAGE NET ASSETS: | | | | | | | | | | | | | | | | | | | | |
| Net investment income including reimbursement/waiver | | | 0.23 | %(d) | | | 0.66 | % | | | 0.88 | % | | | 0.67 | % | | | 0.65 | %(d) |
| Operating expenses excluding reimbursement/waiver | | | 1.18 | %(d) | | | 1.18 | % | | | 1.13 | % | | | 1.11 | % | | | 1.26 | %(d) |
| Operating expenses including reimbursement/waiver | | | 0.94 | %(d)(e) | | | 0.95 | % | | | 0.95 | % | | | 0.95 | % | | | 0.95 | %(d) |
| | | | | | | | | | | | | | | | | | | | | |
| PORTFOLIO TURNOVER RATE | | | 42 | %(f) | | | 81 | % | | | 74 | % | | | 105 | % | | | 72 | %(f) |
| (a) | Calculated using the average shares method. |
| (b) | Less than $0.005 per share. |
| (c) | Total returns are for the period indicated and have not been annualized. Total returns would have been lower had certain expenses not been waived during the period. Returns shown do not reflect the deduction of taxes that a shareholder would pay on fund distributions or the redemption of fund shares. |
| (e) | Effective January 29, 2018, the net expense limitation changed from 0.95% to 0.90%, excluding shareholder service fees. |
| (f) | Portfolio turnover rate for periods less than one full year have not been annualized. |
See Notes to Financial Statements.
| Centre Active U.S. Treasury Fund | Financial Highlights |
| Investor Class | For a share outstanding throughout the periods presented. |
| | | For the Six Months Ended March 31, 2018 (Unaudited) | | | For the Year Ended September 30, 2017 | | | For the Year Ended September 30, 2016 | | | For the Year Ended September 30, 2015 | | | For the Period January 21, 2014 (Inception) to September 30, 2014 | |
| NET ASSET VALUE, BEGINNING OF PERIOD | | $ | 9.75 | | | $ | 10.44 | | | $ | 10.19 | | | $ | 10.07 | | | $ | 10.00 | |
| INCOME/(LOSS) FROM INVESTMENT OPERATIONS: | | | | | | | | | | | | | | | | | | | | |
| Net investment income(a) | | | 0.09 | | | | 0.18 | | | | 0.16 | | | | 0.12 | | | | 0.00 | (b) |
| Net realized and unrealized gain/(loss) on investments | | | (0.03 | ) | | | (0.50 | ) | | | 0.09 | | | | 0.13 | | | | 0.07 | |
| Total income/(loss) from investment operations | | | 0.06 | | | | (0.32 | ) | | | 0.25 | | | | 0.25 | | | | 0.07 | |
| | | | | | | | | | | | | | | | | | | | | |
| DISTRIBUTIONS: | | | | | | | | | | | | | | | | | | | | |
| Net investment income | | | (0.09 | ) | | | (0.35 | ) | | | – | | | | (0.05 | ) | | | – | |
| Net realized gains on investments | | | – | | | | (0.02 | ) | | | – | | | | (0.08 | ) | | | – | |
| Total distributions | | | (0.09 | ) | | | (0.37 | ) | | | – | | | | (0.13 | ) | | | – | |
| NET INCREASE/(DECREASE) IN NET ASSET VALUE | | | (0.03 | ) | | | (0.69 | ) | | | 0.25 | | | | 0.12 | | | | 0.07 | |
| NET ASSET VALUE, END OF PERIOD | | $ | 9.72 | | | $ | 9.75 | | | $ | 10.44 | | | $ | 10.19 | | | $ | 10.07 | |
| | | | | | | | | | | | | | | | | | | | | |
| Total Return(c) | | | 0.59 | % | | | (3.06 | %) | | | 2.45 | % | | | 2.48 | % | | | 0.70 | % |
| | | | | | | | | | | | | | | | | | | | | |
| SUPPLEMENTAL DATA: | | | | | | | | | | | | | | | | | | | | |
| Net assets, end of period (000) | | $ | 42,469 | | | $ | 47,908 | | | $ | 63,398 | | | $ | 79,867 | | | $ | 5 | |
| | | | | | | | | | | | | | | | | | | | | |
| RATIOS TO AVERAGE NET ASSETS: | | | | | | | | | | | | | | | | | | | | |
| Net investment income including reimbursement/waiver | | | 1.82 | %(d) | | | 1.84 | % | | | 1.56 | % | | | 1.20 | % | | | 0.07 | %(d) |
| Operating expenses excluding reimbursement/waiver | | | 1.25 | %(d) | | | 1.14 | % | | | 1.09 | % | | | 0.94 | % | | | 2.09 | %(d) |
| Operating expenses including reimbursement/waiver | | | 0.93 | %(d)(e) | | | 0.85 | % | | | 0.85 | % | | | 0.85 | % | | | 0.85 | %(d) |
| | | | | | | | | | | | | | | | | | | | | |
| PORTFOLIO TURNOVER RATE | | | – | %(f) | | | 4 | % | | | 2 | % | | | 70 | % | | | 439 | %(f) |
| (a) | Calculated using the average shares method. |
| (b) | Less than $0.005 per share. |
| (c) | Total returns are for the period indicated and have not been annualized. Total returns would have been lower had certain expenses not been waived during the period. Returns shown do not reflect the deduction of taxes that a shareholder would pay on fund distributions or the redemption of fund shares. |
| (e) | Effective January 29, 2018, the net expense limitation changed from 0.85% to 0.80%, excluding 12b-1 fees and shareholder service fees. |
| (f) | Portfolio turnover rate for periods less than one full year have not been annualized. |
See Notes to Financial Statements.
| Semi-Annual Report | March 31, 2018 | 35 |
| Centre Active U.S. Treasury Fund | Financial Highlights |
| Institutional Class | For a share outstanding throughout the periods presented. |
| | | For the Six Months Ended March 31, 2018 (Unaudited) | | | For the Year Ended September 30, 2017 | | | For the Year
Ended
September 30, 2016 | | | For the Year Ended September 30, 2015 | | | For the Period January 21, 2014 (Inception) to September 30, 2014 | |
| NET ASSET VALUE, BEGINNING OF PERIOD | | $ | 9.82 | | | $ | 10.51 | | | $ | 10.23 | | | $ | 10.09 | | | $ | 10.00 | |
| INCOME/(LOSS) FROM INVESTMENT OPERATIONS: | | | | | | | | | | | | | | | | |
| Net investment income(a) | | | 0.10 | | | | 0.20 | | | | 0.19 | | | | 0.09 | | | | 0.02 | |
| Net realized and unrealized gain/(loss) on investments | | | (0.03 | ) | | | (0.49 | ) | | | 0.09 | | | | 0.19 | | | | 0.07 | |
| Total income/(loss) from investment operations | | | 0.07 | | | | (0.29 | ) | | | 0.28 | | | | 0.28 | | | | 0.09 | |
| | | | | | | | | | | | | | | | | | | | | |
| DISTRIBUTIONS: | | | | | | | | | | | | | | | | | | | | |
| Net investment income | | | (0.10 | ) | | | (0.38 | ) | | | – | | | | (0.06 | ) | | | – | |
| Net realized gains on investments | | | – | | | | (0.02 | ) | | | – | | | | (0.08 | ) | | | – | |
| Total distributions | | | (0.10 | ) | | | (0.40 | ) | | | – | | | | (0.14 | ) | | | – | |
| NET INCREASE/(DECREASE) IN NET ASSET VALUE | | | (0.03 | ) | | | (0.69 | ) | | | 0.28 | | | | 0.14 | | | | 0.09 | |
| NET ASSET VALUE, END OF PERIOD | | $ | 9.79 | | | $ | 9.82 | | | $ | 10.51 | | | $ | 10.23 | | | $ | 10.09 | |
| | | | | | | | | | | | | | | | | | | | | |
| Total Return(b) | | | 0.75 | % | | | (2.78 | %)(c) | | | 2.74 | % | | | 2.73 | % | | | 0.90 | % |
| | | | | | | | | | | | | | | | | | | | | |
| SUPPLEMENTAL DATA: | | | | | | | | | | | | | | | | | | | | |
| Net assets, end of period (000) | | $ | 3,821 | | | $ | 4,670 | | | $ | 21,095 | | | $ | 21,573 | | | $ | 14,514 | |
| | | | | | | | | | | | | | | | | | | | | |
| RATIOS TO AVERAGE NET ASSETS: | | | | | | | | | | | | | | | | | | |
| Net investment income including reimbursement/waiver | | | 2.14 | %(d) | | | 2.01 | % | | | 1.81 | % | | | 0.94 | % | | | 0.29 | %(d) |
| Operating expenses excluding reimbursement/waiver | | | 0.99 | %(d) | | | 0.88 | % | | | 0.84 | % | | | 1.01 | % | | | 1.86 | %(d) |
| Operating expenses including reimbursement/waiver | | | 0.61 | %(d) | | | 0.60 | % | | | 0.60 | % | | | 0.60 | % | | | 0.60 | %(d) |
| | | | | | | | | | | | | | | | | | | | | |
| PORTFOLIO TURNOVER RATE | | | – | %(e) | | | 4 | % | | | 2 | % | | | 70 | % | | | 439 | %(e) |
| (a) | Calculated using the average shares method. |
| (b) | Total returns are for the period indicated and have not been annualized. Total returns would have been lower had certain expenses not been waived during the period. Returns shown do not reflect the deduction of taxes that a shareholder would pay on fund distributions or the redemption of fund shares. |
| (c) | Performance difference between Manager Commentary and Financial Highlights is due to financial reporting adjustments. |
| (e) | Portfolio turnover rate for periods less than one full year have not been annualized. |
See Notes to Financial Statements.
| Centre Active U.S. Tax Exempt Fund | Financial Highlights |
| Investor Class | For a share outstanding throughout the periods presented. |
| | | For the Six Months Ended March 31, 2018 (Unaudited) | | | For the Year Ended September 30,
2017 | | | For the Year Ended September 30,
2016 | | | For the Period November 1, 2014 to September 30,
2015(a)(b) | | | For the Year Ended October 31,
2014 | | | For the Year Ended October 31,
2013 | |
| NET ASSET VALUE, BEGINNING OF PERIOD | | $ | 10.09 | | | $ | 10.55 | | | $ | 10.65 | | | $ | 10.68 | | | $ | 10.57 | | | $ | 11.18 | |
| INCOME/(LOSS) FROM INVESTMENT OPERATIONS: | | | | | | | | | | | | | | | | | |
| Net investment income(c) | | | 0.09 | | | | 0.19 | | | | 0.22 | | | | 0.19 | | | | 0.22 | | | | 0.24 | |
| Net realized and unrealized gain/(loss) on investments | | | (0.20 | ) | | | (0.31 | ) | | | 0.13 | | | | (0.03 | ) | | | 0.19 | | | | (0.56 | ) |
| Total income/(loss) from investment operations | | | (0.11 | ) | | | (0.12 | ) | | | 0.35 | | | | 0.16 | | | | 0.41 | | | | (0.32 | ) |
| | | | | | | | | | | | | | | | | | | | | | | | | |
| DISTRIBUTIONS: | | | | | | | | | | | | | | | | | | | | | | | | |
| Net investment income | | | (0.08 | ) | | | (0.20 | ) | | | (0.22 | ) | | | (0.19 | ) | | | (0.22 | ) | | | (0.24 | ) |
| Net realized gains on investments | | | (0.07 | ) | | | (0.14 | ) | | | (0.23 | ) | | | – | | | | (0.08 | ) | | | (0.05 | ) |
| Total distributions | | | (0.15 | ) | | | (0.34 | ) | | | (0.45 | ) | | | (0.19 | ) | | | (0.30 | ) | | | (0.29 | ) |
| NET INCREASE/(DECREASE) IN NET ASSET VALUE | | | (0.26 | ) | | | (0.46 | ) | | | (0.10 | ) | | | (0.03 | ) | | | 0.11 | | | | (0.61 | ) |
| NET ASSET VALUE, END OF PERIOD | | $ | 9.83 | | | $ | 10.09 | | | $ | 10.55 | | | $ | 10.65 | | | $ | 10.68 | | | $ | 10.57 | |
| | | | | | | | | | | | | | | | | | | | | | | | | |
| Total Return(d) | | | (1.08 | %) | | | (1.11 | %) | | | 3.29 | % | | | 1.51 | % | | | 3.95 | % | | | (2.90 | %) |
| | | | | | | | | | | | | | | | | | | | | | | | | |
| SUPPLEMENTAL DATA: | | | | | | | | | | | | | | | | | | | | | | | | |
| Net assets, end of period (000) | | $ | 19,677 | | | $ | 23,080 | | | $ | 33,913 | | | $ | 41,127 | | | $ | 61,869 | | | $ | 83,371 | |
| | | | | | | | | | | | | | | | | | | | | | | | | |
| RATIOS TO AVERAGE NET ASSETS: | | | | | | | | | | | | | | | | | | | | | |
| Net investment income including reimbursement/waiver | | | 1.73 | %(e) | | | 1.92 | % | | | 2.03 | % | | | 1.90 | %(e) | | | 2.09 | % | | | 2.20 | % |
| Operating expenses excluding reimbursement/waiver | | | 1.47 | %(e) | | | 1.25 | % | | | 1.13 | % | | | 1.09 | %(e) | | | 1.16 | % | | | 1.04 | % |
| Operating expenses including reimbursement/waiver | | | 1.03 | %(e)(f) | | | 0.95 | % | | | 0.95 | % | | | 1.03 | %(e)(g) | | | 1.16 | % | | | 1.04 | % |
| | | | | | | | | | | | | | | | | | | | | | | | | |
| PORTFOLIO TURNOVER RATE | | | 13 | %(h) | | | 9 | % | | | 6 | % | | | 32 | %(h) | | | 6 | % | | | 13 | % |
| (a) | Centre Active U.S. Tax Exempt Fund ("the Fund") is the successor to Managed Municipal Fund, Inc. (the "Acquired Fund") through a reorganization, the closing date for which was March 17, 2015. The fiscal year end of the Acquired Fund was October 31st. The fiscal year end of the Centre Active U.S. Tax Exempt Fund is September 30th. |
| (b) | As part of the reorganization Class A shareholders of the Acquired Fund exchanged such shares for Investor Class shares of the Fund. |
| (c) | Calculated using the average shares method. |
| (d) | Total returns are for the period indicated and have not been annualized. Total returns would have been lower had certain expenses not been waived during the period. Returns shown do not reflect the deduction of taxes that a shareholder would pay on fund distributions or the redemption of fund shares. |
| (f) | Effective January 29, 2018, the net expense limitation changed from 0.95% to 0.90%, excluding 12b-1 fees and shareholder service fees. |
| (g) | Effective March 17, 2015, a net expense limitation of 0.95% was implemented. Prior to this date, there was no expense cap. |
| (h) | Portfolio turnover rate for periods less than one full year have not been annualized. |
| See Notes to Financial Statements. | |
| Semi-Annual Report | March 31, 2018 | 37 |
| Centre Active U.S. Tax Exempt Fund | Financial Highlights |
| Institutional Class | For a share outstanding throughout the periods presented. |
| | | For the Six Months Ended March 31, 2018 (Unaudited) | | | For the Year Ended September 30,
2017 | | | For the Year Ended September 30,
2016 | | | For the Period November 1, 2014 to September 30,
2015(a)(b) | | | For the Year Ended October 31,
2014 | | | For the Year Ended October 31,
2013 | |
| NET ASSET VALUE, BEGINNING OF PERIOD | | $ | 10.03 | | | $ | 10.49 | | | $ | 10.59 | | | $ | 10.62 | | | $ | 10.57 | | | $ | 11.19 | |
| INCOME/(LOSS) FROM INVESTMENT OPERATIONS: | | | | | | | | | | | | | |
| Net investment income(c) | | | 0.10 | | | | 0.22 | | | | 0.24 | | | | 0.21 | | | | 0.24 | | | | 0.27 | |
| Net realized and unrealized gain/(loss) on investments | | | (0.19 | ) | | | (0.32 | ) | | | 0.13 | | | | (0.03 | ) | | | 0.14 | | | | (0.57 | ) |
| Total income/(loss) from investment operations | | | (0.09 | ) | | | (0.10 | ) | | | 0.37 | | | | 0.18 | | | | 0.38 | | | | (0.30 | ) |
| | | | | | | | | | | | | | | | | | | | | | | | | |
| DISTRIBUTIONS: | | | | | | | | | | | | | | | | | | | | | | | | |
| Net investment income | | | (0.10 | ) | | | (0.22 | ) | | | (0.24 | ) | | | (0.21 | ) | | | (0.25 | ) | | | (0.27 | ) |
| Net realized gains on investments | | | (0.07 | ) | | | (0.14 | ) | | | (0.23 | ) | | | – | | | | (0.08 | ) | | | (0.05 | ) |
| Total distributions | | | (0.17 | ) | | | (0.36 | ) | | | (0.47 | ) | | | (0.21 | ) | | | (0.33 | ) | | | (0.32 | ) |
| NET INCREASE/(DECREASE) IN NET ASSET VALUE | | | (0.26 | ) | | | (0.46 | ) | | | (0.10 | ) | | | (0.03 | ) | | | 0.05 | | | | (0.62 | ) |
| NET ASSET VALUE, END OF PERIOD | | $ | 9.77 | | | $ | 10.03 | | | $ | 10.49 | | | $ | 10.59 | | | $ | 10.62 | | | $ | 10.57 | |
| | | | | | | | | | | | | | | | | | | | | | | | | |
| Total Return(d) | | | (0.93 | %) | | | (0.86 | %) | | | 3.57 | % | | | 1.74 | % | | | 3.64 | % | | | (2.75 | %) |
| | | | | | | | | | | | | | | | | | | | | | | | | |
| SUPPLEMENTAL DATA: | | | | | | | | | | | | | | | | | | | | | | | | |
| Net assets, end of period (000) | | $ | 1,408 | | | $ | 1,419 | | | $ | 7,303 | | | $ | 7,465 | | | $ | 7,969 | | | $ | 7,228 | |
| | | | | | | | | | | | | | | | | | | | | | | | | |
| RATIOS TO AVERAGE NET ASSETS: | | | | | | | | | | | | | | | | | | | | | | | | |
| Net investment income including reimbursement/waiver | | | 2.04 | %(e) | | | 2.21 | % | | | 2.28 | % | | | 2.18 | %(e) | | | 2.31 | % | | | 2.46 | % |
| Operating expenses excluding reimbursement/waiver | | | 1.25 | %(e) | | | 0.99 | % | | | 0.94 | % | | | 0.84 | %(e) | | | 0.92 | % | | | 0.79 | % |
| Operating expenses including reimbursement/waiver | | | 0.72 | %(e) | | | 0.70 | % | | | 0.70 | % | | | 0.77 | %(e)(f) | | | 0.92 | % | | | 0.79 | % |
| | | | | | | | | | | | | | | | | | | | | | | | | |
| PORTFOLIO TURNOVER RATE | | | 13 | %(g) | | | 9 | % | | | 6 | % | | | 32 | %(g) | | | 6 | % | | | 13 | % |
| (a) | Centre Active U.S. Tax Exempt Fund ("the Fund") is the successor to Managed Municipal Fund, Inc. (the "Acquired Fund") through a reorganization, the closing date for which was March 17, 2015. The fiscal year end of the Acquired Fund was October 31st. The fiscal year end of the Centre Active U.S. Tax Exempt Fund is September 30th. |
| (b) | As part of the reorganization Class I shareholders of the Acquired Fund exchanged such shares for Institutional Class shares of the Fund. |
| (c) | Calculated using the average shares method. |
| (d) | Total returns are for the period indicated and have not been annualized. Total returns would have been lower had certain expenses not been waived during the period. Returns shown do not reflect the deduction of taxes that a shareholder would pay on fund distributions or the redemption of fund shares. |
| (f) | Effective March 17, 2015, a net expense limitation of 0.70% was implemented. Prior to this date, there was no expense cap. |
| (g) | Portfolio turnover rate for periods less than one full year have not been annualized. |
| See Notes to Financial Statements. | |
| Centre Global Infrastructure Fund | Financial Highlights |
| Investor Class | For a share outstanding throughout the period presented. |
| | | For the Period January 29, 2018 (Inception) to March 31, 2018 | |
| NET ASSET VALUE, BEGINNING OF PERIOD | | $ | 10.00 | |
| LOSS FROM INVESTMENT OPERATIONS: | | | | |
| Net investment income(a) | | | 0.02 | |
| Net realized and unrealized loss on investments | | | (0.66 | ) |
| Total loss from investment operations | | | (0.64 | ) |
| | | | | |
| DISTRIBUTIONS: | | | | |
| Net investment income | | | (0.01 | ) |
| Total distributions | | | (0.01 | ) |
| NET DECREASE IN NET ASSET VALUE | | | (0.65 | ) |
| NET ASSET VALUE, END OF PERIOD | | $ | 9.35 | |
| | | | | |
| Total Return(b) | | | (6.45 | %) |
| | | | | |
| SUPPLEMENTAL DATA: | | | | |
| Net assets, end of period (000) | | $ | 31 | |
| | | | | |
| RATIOS TO AVERAGE NET ASSETS: | | | | |
| Net investment income including reimbursement/waiver | | | 1.41 | %(c) |
| Operating expenses excluding reimbursement/waiver | | | 9.03 | %(c) |
| Operating expenses including reimbursement/waiver | | | 1.67 | %(c) |
| | | | | |
| PORTFOLIO TURNOVER RATE | | | 1 | %(d) |
| (a) | Calculated using the average shares method. |
| (b) | Total returns are for the period indicated and have not been annualized. Total returns would have been lower had certain expenses not been waived during the period. Returns shown do not reflect the deduction of taxes that a shareholder would pay on fund distributions or the redemption of fund shares. |
| (d) | Portfolio turnover rate for periods less than one full year have not been annualized. |
| See Notes to Financial Statements. | |
| Semi-Annual Report | March 31, 2018 | 39 |
| Centre Global Infrastructure Fund | Financial Highlights |
| Institutional Class | For a share outstanding throughout the period presented. |
| | | For the Period January 29, 2018 (Inception) to March 31, 2018 | |
| NET ASSET VALUE, BEGINNING OF PERIOD | | $ | 10.00 | |
| LOSS FROM INVESTMENT OPERATIONS: | | | | |
| Net investment income(a) | | | 0.03 | |
| Net realized and unrealized loss on investments | | | (0.67 | ) |
| Total loss from investment operations | | | (0.64 | ) |
| | | | | |
| DISTRIBUTIONS: | | | | |
| Net investment income | | | (0.03 | ) |
| Total distributions | | | (0.03 | ) |
| NET DECREASE IN NET ASSET VALUE | | | (0.67 | ) |
| NET ASSET VALUE, END OF PERIOD | | $ | 9.33 | |
| | | | | |
| Total Return(b) | | | (6.40 | %) |
| | | | | |
| SUPPLEMENTAL DATA: | | | | |
| Net assets, end of period (000) | | $ | 2,087 | |
| | | | | |
| RATIOS TO AVERAGE NET ASSETS: | | | | |
| Net investment income including reimbursement/waiver | | | 1.54 | %(c) |
| Operating expenses excluding reimbursement/waiver | | | 8.73 | %(c) |
| Operating expenses including reimbursement/waiver | | | 1.18 | %(c) |
| | | | | |
| PORTFOLIO TURNOVER RATE | | | 1 | %(d) |
| (a) | Calculated using the average shares method. |
| (b) | Total returns are for the period indicated and have not been annualized. Total returns would have been lower had certain expenses not been waived during the period. Returns shown do not reflect the deduction of taxes that a shareholder would pay on fund distributions or the redemption of fund shares. |
| (d) | Portfolio turnover rate for periods less than one full year have not been annualized. |
| See Notes to Financial Statements. | |
| Centre Funds | Notes to Financial Statements |
March 31, 2018 (Unaudited)
1. ORGANIZATION
Centre Funds (the “Trust”) was organized on March 17, 2011 as a Delaware statutory trust and is registered as an open-end management investment company under the Investment Company Act of 1940, as amended (the “1940 Act”). Prior to January 17, 2014, the Trust was known as Drexel Hamilton Mutual Funds. The Trust currently offers shares of beneficial interest (“shares”) of Centre American Select Equity Fund (the “American Select Equity Fund"), Centre Active U.S. Treasury Fund (the “Treasury Fund”), Centre Active U.S. Tax Exempt Fund (the “Tax Exempt Fund”), and Centre Global Infrastructure Fund (the “Infrastructure Fund”) (collectively, the “Funds”). The affairs of the Trust are overseen by a Board of Trustees (the “Board” or the “Trustees”). The Declaration of Trust of the Trust permits the Trustees to create additional series of the Trust and share classes.
Information in the accompanying Funds’ financial statements pertain to the Investor Class and Institutional Class shares offered by the Funds. All classes of shares have identical rights to earnings, assets, and voting privileges, except for class-specific expenses and exclusive rights to vote on matters affecting only individual classes.
2. SIGNIFICANT ACCOUNTING POLICIES
The following is a summary of significant accounting policies followed by the Funds in the preparation of the Financial Statements:
| (a) | Portfolio securities traded on a securities exchange or quoted by NASDAQ are valued at the last sale price on the principal exchange on which they are traded at the time the securities are valued, or, if not traded on that day, are valued at the closing bid price. Securities traded in the OTC market and not quoted by NASDAQ are valued at their last sale price or, if there is no available price, the last bid price quoted by brokers that make markets in the securities as of the close of regular trading hours on the day the securities are being valued. Foreign securities are valued on the basis of quotations from the primary market in which they are traded, and are translated from the local currency into U.S. dollars using exchange rates as of the close of regular trading (normally 4:00 p.m. Eastern time) on the New York Stock Exchange (the “Exchange”) or using methods determined by the Board. Short-term instruments with maturities of 60 days or less are valued at the price supplied by an approved independent pricing source. Options contracts listed for trading on a securities exchange or board of trade shall be valued at the mean of the highest bid and lowest asked quotation across the exchanges on which the option is traded. Futures contracts are ordinarily valued at the closing settlement price on the exchange on which they are primarily traded or based upon the current settlement price for a like instrument acquired on the day on which the instrument is being valued. Securities and other assets for which quotations are not readily available or deemed unreliable are valued at their fair value using methods determined by the Board. Fair valuation of a particular security is an inherently subjective process, with no single standard to utilize when determining a security’s fair value. As such, different mutual funds could reasonably arrive at a different fair value price for the same security. In each case where a security is fair valued, consideration is given to the facts and circumstances relevant to the particular situation. This consideration includes reviewing various factors set forth in the pricing procedures adopted by the Board and other factors as warranted. In making a fair value determination, factors that may be considered, among others, may include: the type and structure of the security; unusual events or circumstances relating to the security’s issuer; general market conditions; prior day’s valuation; fundamental analytical data; size of the holding; cost of the security on the date of purchase; nature and duration of any restriction on disposition; trading activities; and prices of similar securities or financial instruments. If a Fund invests in shares of other open-end mutual funds (each, an “Underlying Fund”), the Fund calculates the net asset value of its shares using the reported net asset value of the applicable Underlying Fund. For each Underlying Fund, the net asset value per share for a class of shares is determined as of the close of the Exchange on each day the Exchange is open by dividing the value of the Underlying Fund’s net assets attributable to that class by the number of outstanding shares of that class on that day. |
| (b) | The per share net asset value (the “NAV”) of each Fund is calculated as of the close of regular trading on the Exchange (normally 4:00 p.m. Eastern time) each day the Exchange is open. The per share NAV is calculated by deducting from the Fund’s assets, the Fund’s liabilities, and then dividing the resulting net assets by the total number of shares outstanding, rounded to the nearest cent. The purchase price and redemption price per share is equal to the next determined NAV per share. Redemption of shares of American Select Equity Fund are subject to a redemption fee of 2% if redeemed within 90 days of purchase. |
| (c) | The Trust treats each Fund as a separate entity for Federal income tax purposes. Each Fund intends to continue to qualify each year as a “regulated investment company” under Subchapter M of the Internal Revenue Code of 1986, as amended (the “Code”). By so qualifying, each Fund will not be subject to Federal income taxes to the extent that it distributes substantially all of its taxable or tax-exempt income, if any, for its tax year ending September 30. In addition, by distributing in each calendar year substantially all of its net investment income, capital gains and certain other amounts, if any, each Fund will not be subject to a Federal excise tax. Therefore, no provision is made by the Funds for Federal income or excise taxes. Withholding taxes on foreign dividends are paid or provided for in accordance with the applicable country’s tax rules and rates. |
| Semi-Annual Report | March 31, 2018 | 41 |
| Centre Funds | Notes to Financial Statements |
March 31, 2018 (Unaudited)
As of and during the period ended March 31, 2018, the Funds did not have a liability for any unrecognized tax benefits in the accompanying financial statements. The Funds recognize the interest and penalties, if any, related to the unrecognized tax benefits as income tax expense in the Statement of Operations. During the period, the Funds did not incur any interest or penalties.
| (d) | Net realized gains and losses on investments are computed on the identified cost basis. Dividend income is recognized on the ex-dividend date or for certain foreign securities, as soon as information is available, and interest income is recognized on an accrual basis. The Funds amortize premium and accrete discount on investments utilizing the effective interest method. Foreign dividend income may be subject to foreign withholding taxes. |
| (e) | A restricted security is a security that has been purchased through a private offering and cannot be resold to the general public without prior registration under the Securities Act of 1933, as amended (the “1933 Act”), or pursuant to the resale limitations provided by Rule 144 under the 1933 Act, or an exemption from the registration requirements of the 1933 Act. Whether a restricted security is illiquid is determined pursuant to guidelines established by the Board. Not all restricted securities are considered to be illiquid. As of March 31, 2018, the Funds did not hold any restricted securities. |
| (f) | The financial statements are prepared in conformity with accounting standards generally accepted in the United States of America (“GAAP”), which requires management to make estimates and assumptions that affect the amounts reported in financial statements during the reporting period. Management believes the estimates and security valuations are appropriate; however, actual results may differ from those estimates, and the security valuations reflected in the financial statements may differ from the value the Funds ultimately realize upon sale of the securities. The financial statements have been prepared as of the close of the Exchange on March 31, 2018. Each Fund is considered an investment company for financial reporting purposes under GAAP. |
| (g) | Each Fund bears expenses incurred specifically by such Fund, as well as its pro rata portion of Trust expenses, which may be allocated on the basis of relative net assets or the nature of the services performed relative to applicability to each Fund. Expenses that are specific to a Fund or class of shares of a Fund are charged directly to that Fund or share class. All of the realized and unrealized gains and losses and net investment income of a Fund, other than class-specific expenses, are allocated daily to each class in proportion to its average daily net assets. Fees payable under the distribution (Rule 12b-1) plan and shareholder services plan are charged to each respective fund or share class. |
| (h) | The Funds intend to distribute to shareholders all of their net income and/or capital gains on an annual basis, with the exception of the Centre Active U.S. Treasury Fund and the Centre Active U.S. Tax Exempt Fund, which intend to make monthly income distributions. Income and capital gains distributions are determined in accordance with income tax regulations, which may differ from GAAP. Distributions to shareholders are recorded on the ex-dividend date. |
| (i) | A Fund may directly purchase securities of foreign issuers. Investing in securities of foreign issuers involves special risks not typically associated with investing in securities of U.S. issuers. The risks include possible reevaluation of currencies, the inability to repatriate foreign currency, less complete financial information about companies and possible future adverse political and economic developments. Moreover, securities of many foreign issuers and their markets may be less liquid and their prices more volatile than those of securities of comparable U.S. issuers. |
| (j) | The books and records of the Funds are maintained in U.S. dollars. Investment valuations and other assets and liabilities initially expressed in foreign currencies are converted each business day into U.S. dollars based upon current exchange rates. The portion of realized and unrealized gains or losses on investments due to fluctuations in foreign currency exchange rates is separately disclosed and is included in net realized and net change in unrealized gains or losses on foreign currencies. |
3. FAIR VALUE MEASUREMENTS
The Funds normally use third-party pricing services to obtain market quotations for their portfolio investments. Securities and other assets for which representative market quotations are not readily available or which cannot be accurately valued using the Trust’s normal pricing procedures are valued at fair value as determined in good faith under policies approved by the Trustees. Fair value pricing may be used, for example, in situations where (i) an exchange-traded portfolio security is so thinly traded that there have been no transactions for that security over an extended period of time or the validity of a market quotation received is questionable; (ii) the exchange on which the portfolio security is principally traded closes early; or (iii) trading of the portfolio security is halted during the day and does not resume prior to the NAV calculation.
| Centre Funds | Notes to Financial Statements |
March 31, 2018 (Unaudited)
The inputs used in determining the fair value of each Fund’s investments are summarized into three levels, as described in the following hierarchy:
| Level 1 - | Unadjusted quoted prices in active markets for identical, unrestricted assets or liabilities that a Fund has the ability to access at the measurement date. |
| Level 2 - | Quoted prices which are not active, quoted prices for similar assets or liabilities in active markets or inputs other than quoted prices that are observable (either directly or indirectly). |
| Level 3 - | Significant unobservable prices or inputs (including the oversight of the Board and Centre Asset Management, LLC (the “Adviser”) in determining the fair value of investments) where there is little or no market activity for the asset or liability at measurement date. |
The inputs or methodology used for valuing securities are not necessarily an indication of the risk associated with investing in those securities.
The following is a summary of each Fund’s investments in the fair value hierarchy as of March 31, 2018:
Centre American Select Equity Fund
| Investments in Securities at Value(a) | | Level 1 - Quoted Prices | | | Level 2 - Other Significant Observable Inputs | | | Level 3 - Significant Unobservable Inputs | | | Total | |
| Common Stocks | | $ | 124,113,251 | | | $ | – | | | $ | – | | | $ | 124,113,251 | |
| Purchased Options | | | 2,472,000 | | | | – | | | | – | | | | 2,472,000 | |
| Short Term Investments | | | 560,567 | | | | – | | | | – | | | | 560,567 | |
| Total | | $ | 127,145,818 | | | $ | – | | | $ | – | | | $ | 127,145,818 | |
Centre Active U.S. Treasury Fund
| Investments in Securities at Value(a) | | Level 1 - Quoted Prices | | | Level 2 - Other Significant Observable Inputs | | | Level 3 - Significant Unobservable Inputs | | | Total | |
| U.S. Government Bonds & Notes | | $ | – | | | $ | 42,021,791 | | | $ | – | | | $ | 42,021,791 | |
| Short Term Investments | | | 606,594 | | | | – | | | | – | | | | 606,594 | |
| Total | | $ | 606,594 | | | $ | 42,021,791 | | | $ | – | | | $ | 42,628,385 | |
Centre Active U.S. Tax Exempt Fund
| Investments in Securities at Value(a) | | Level 1 - Quoted Prices | | | Level 2 - Other Significant Observable Inputs | | | Level 3 - Significant Unobservable Inputs | | | Total | |
| Open-End Funds | | $ | 1,992,775 | | | $ | – | | | $ | – | | | $ | 1,992,775 | |
| Municipal Bonds | | | – | | | | 17,869,107 | | | | – | | | | 17,869,107 | |
| Short Term Investments | | | 305,619 | | | | – | | | | – | | | | 305,619 | |
| Total | | $ | 2,298,394 | | | $ | 17,869,107 | | | $ | – | | | $ | 20,167,501 | |
Centre Global Infrastructure Fund
| Investments in Securities at Value(a) | | Level 1 - Quoted Prices | | | Level 2 - Other Significant Observable Inputs | | | Level 3 - Significant Unobservable Inputs | | | Total | |
| Common Stocks | | $ | 1,960,322 | | | $ | – | | | $ | – | | | $ | 1,960,322 | |
| Short Term Investments | | | 92,338 | | | | – | | | | – | | | | 92,338 | |
| Total | | $ | 2,052,660 | | | $ | – | | | $ | – | | | $ | 2,052,660 | |
| (a) | For detailed descriptions of sectors, industries, and countries, see the accompanying Schedule of Investments. |
It is the Funds’ policy to recognize transfers into and out of all levels at the end of the reporting period. There were no transfers among Levels 1, 2, and 3 during the year.
There were no material amounts classified as Level 3 securities during the period, thus, a reconciliation of assets in which significant unobservable inputs (Level 3) were used is not applicable for the Funds.
| Semi-Annual Report | March 31, 2018 | 43 |
| Centre Funds | Notes to Financial Statements |
March 31, 2018 (Unaudited)
Derivative Financial Instruments
A Fund may use derivative contracts, such as exchange-traded options and futures, that are related to stock market or bond indices, foreign exchange, fixed income or other securities, or be exposed to exchange-traded derivative products. A Fund may invest its assets in derivatives and other instruments to help manage interest rate exposure, protect the Fund’s assets, or enhance returns. A Fund may also be exposed to certain exchange-traded derivative products, such as exchange-traded futures and options that are fully collateralized by cash or securities, for temporary cash management or investment transition purposes, or to hedge the risks of existing positions or overall capital protection.
Derivative Risk: One or more Funds may use derivatives, such as exchange-traded options and futures, that are related to stock market or bond indexes, foreign exchange, fixed income or other securities or be exposed to exchange-traded derivative products. Loss may result from a Fund’s investments in exchange-traded futures and options. The value of derivatives in which a Fund may invest may rise or fall more rapidly than other investments. Other risks of investments in derivatives include imperfect correlation between the value of these instruments and the underlying assets; risks of default by the other party to the derivative transactions; risk that the transactions may result in losses that offset gains in portfolio positions; and risks that the derivative transactions may not be liquid. Derivatives, such as exchange-traded futures and options, contain “inherent” leverage because derivative contracts may give rise to an obligation on the part of a Fund for future payment or liabilities that are larger than the initial margin or premiums required to establish such positions. Combined with the volatility of derivatives prices, the leveraged nature of derivatives trading could cause a Fund to sustain large and sudden losses. The use of derivatives, such as futures and options, can lead to losses, including those magnified by leverage, particularly when derivatives are used to enhance return rather than mitigate risk. Correlation risk is the risk that changes in the value of the derivative may not correlate perfectly with the underlying asset, rate or index. Certain derivative instruments may be difficult to sell when the Adviser believes it would be appropriate to do so.
Derivatives may have little or no initial cash investment relative to their market value exposure and therefore can produce significant gains or losses in excess of their cost. This use of embedded leverage may allow a Fund to increase its market value exposure relative to its net assets and can substantially increase the volatility of the Fund’s performance.
Additional associated risks from investing in derivatives also exist and potentially could have significant effects on the valuation of the derivatives held by a Fund. Typically, a Fund may attempt to increase or decrease exposure to the risks associated with the securities or other traditional investments in which it invests. The risks associated with a Fund’s use of derivative instruments, including but not limited to volatility risk, correlation risk, segregation risk, and hedging risks, are additional risks that a Fund does not typically seek to increase or decrease exposure to. Examples of these associated risks are liquidity risk, which is the risk that a Fund will not be able to sell the derivative in the open market in a timely manner, and counterparty credit risk, which is the risk that the counterparty will not fulfill its obligation to the Fund.
Option Writing/Purchasing
A Fund may write or purchase option contracts to adjust risk and return of its overall investment positions, subject to any restrictions set forth in the Fund’s prospectus. When a Fund writes or purchases an option, an amount equal to the premium received or paid by the Fund is recorded as a liability or an asset and is subsequently adjusted to the current market value of the option written or purchased. Premiums received or paid from writing or purchasing options that expire unexercised are treated by a Fund on the expiration date as realized gains or losses. The difference between the premium and the amount paid or received on affecting a closing purchase or sale transaction, including brokerage commissions, is also treated as a realized gain or loss. If an option is exercised, the premium paid or received is netted to the cost of the purchase or proceeds from the sale in determining whether a Fund has realized a gain or loss on investment transactions. Risks from entering into option transactions arise from, among other things, the potential inability of counterparties to meet the terms.
Futures
A Fund may use futures subject to any restrictions set forth in the Fund’s prospectus. A Fund may also be exposed to exchange-traded futures that are fully collateralized by cash or securities, for temporary cash management or investment transition purposes, or to hedge the risks of existing positions. To the extent that the Fund uses derivatives for temporary cash management, investment transition purposes, managing duration or to hedge the risks of existing positions, the Fund will be subject to the risks associated with such transactions.
The effect of derivative instruments on the Statement of Assets and Liabilities - Fair Value of Derivative Instruments as of March 31, 2018:
| Risk Exposure | | Derivatives Statement of Assets and Liabilities Location | | Fair Value | |
| Centre American Select Equity Fund | | | | | | |
| Equity Contracts | | | | | | |
| (Purchased Options) | | Investments, at value | | $ | 2,472,000 | |
| | | | | $ | 2,472,000 | |
| Centre Funds | Notes to Financial Statements |
March 31, 2018 (Unaudited)
The effect of derivative instruments on the Statement of Operations for the period ended March 31, 2018 (Net realized gain/(loss) on options contracts are included in Net realized gain/(loss) on investments within the Statement of Operations):
| Derivatives | | Location of Gains/(Loss) On Derivatives Recognized In Income | | Realized Gain/(Loss) on Derivatives Recognized in Income | | | Change in Unrealized Gain/(Loss) on Derivatives Recognized in Income | |
| Centre American Select Equity Fund | | | | | | | | | | |
Equity Contracts
(Purchased Options) | | Net realized gain/(loss) on investments/Net change in unrealized appreciation/(depreciation) on investments | | $ | (1,776,633 | ) | | $ | 723,270 | |
Equity Contracts
(Written Options) | | Net realized gain/(loss) on investments/Net change in unrealized appreciation/(depreciation) on investments | | $ | (168,497 | ) | | $ | – | |
| | | | | $ | (1,945,130 | ) | | $ | 723,270 | |
| Centre Active U.S. Treasury Fund | | | | | | | | | | |
Fixed Income Contracts
(Futures Contracts) | | Net realized gain/(loss) on futures contracts/Net change in unrealized appreciation/(depreciation) on futures contracts | | $ | 1,323,000 | | | $ | (482,385 | ) |
| | | | | $ | 1,323,000 | | | $ | (482,385 | ) |
| Centre Active U.S. Tax Exempt Fund | | | | | | | | | | |
Fixed Income Contracts
(Futures Contracts) | | Net realized gain/(loss) on futures contracts/Net change in unrealized appreciation/(depreciation) on futures contracts | | $ | 342,288 | | | $ | (111,081 | ) |
| | | | | $ | 342,288 | | | $ | (111,081 | ) |
Volume of Derivative Instruments for the Funds during the period ended March 31, 2018, was as follows:
| Derivative Type | | Unit of Measurement | | | Monthly Average | |
| Centre American Select Equity Fund | | | | | | | |
| Purchased Option Contracts | | Notional value of contracts outstanding | | | $ | 133,512,947 | |
| Derivative Type | | Unit of Measurement | | | Monthly Average | |
| Centre Active U.S. Treasury Fund | | | | | | | |
| Purchased (Sold) Futures Contracts | | Notional value of contracts outstanding | | | $ | (28,423,328 | ) |
| Derivative Type | | Unit of Measurement | | | Monthly Average | |
| Centre Active U.S. Tax Exempt Fund | | | | | | | |
| Purchased (Sold) Futures Contracts | | Notional value of contracts outstanding | | | $ | (7,740,096 | ) |
During the ordinary course of business, the Funds may enter into transactions subject to enforceable netting agreements or other similar arrangements (“netting agreements”). Generally, the right to offset in netting agreements allows the Funds to offset any exposure to a specific counterparty with any collateral received or delivered to that counterparty based on the terms of the agreement. Generally, the Funds manage their cash collateral and securities collateral on a counterparty basis. The amounts shown in the Statements of Assets and Liabilities do not take into consideration the effects of legally enforceable master netting agreements.
| Semi-Annual Report | March 31, 2018 | 45 |
| Centre Funds | Notes to Financial Statements |
March 31, 2018 (Unaudited)
4. BENEFICIAL INTEREST TRANSACTIONS
On March 31, 2018, there was an unlimited number of shares of beneficial interest authorized for each Fund. Transactions in shares of beneficial interest are shown in the Statement of Changes in Net Assets.
Shares of American Select Equity Fund and Infrastructure Fund that are redeemed within 90 days of purchase may incur a 2% redemption fee deducted from the redemption amount. For the period ended March 31, 2018, redemption fees retained by these Funds are disclosed in the Statement of Changes in Net Assets.
Beneficial Ownership: The beneficial ownership, either directly or indirectly, of more than 25% of the voting securities of a Fund creates a presumption of control of the Fund under Section 2(a)(9) of the 1940 Act. As of March 31, 2018, the following entities owned beneficially more than 25% of each Fund’s outstanding shares. The shares may be held under omnibus accounts (whereby the transactions of two or more shareholders are combined and carried in the name of the originating broker rather than designated separately). Any transaction by these investors could have a material impact on the share class.
| Centre American Select Equity Fund | Class | Percentage |
| Wells Fargo Advisors, LLC | Institutional | 53.06% |
| Charles Schwab & Co. Inc | Institutional | 36.89% |
| Charles Schwab & Co. Inc | Investor | 46.80% |
| Centre Active U.S. Treasury Fund | Class | Percentage |
| Wells Fargo Advisors, LLC | Institutional | 83.04% |
| Centre Active U.S. Tax Exempt Fund | Class | Percentage |
| Charles Schwab & Co. Inc. | Institutional | 50.40% |
| Wells Fargo Advisors, LLC | Institutional | 47.15% |
| Centre Global Infrastructure Fund | Class | Percentage |
| SEI Private Trust Co. | Institutional | 95.51% |
| David Wilson | Investor | 80.44% |
5. INVESTMENT ADVISORY AGREEMENTS AND RELATED-PARTY TRANSACTIONS
The Adviser serves as the investment adviser to each Fund pursuant to an Investment Advisory Agreement with the Trust on behalf of the Fund.
As compensation for the investment advisory services provided to the Funds, the Adviser is entitled to receive monthly compensation, subject to waivers, based on each Fund’s average daily net assets at the annual rate of:
| Fund | Management Fee Rate |
| Centre American Select Equity Fund (total net assets less than or equal to $1 billion) | 0.75% |
| Centre American Select Equity Fund (total net assets over $1 billion) | 0.70% |
| Centre Active U.S. Treasury Fund | 0.40% |
| Centre Active U.S. Tax Exempt Fund | 0.40% |
| Centre Global Infrastructure Fund | 0.90% |
American Select Equity Fund
For the American Select Equity Fund, the Adviser has agreed, pursuant to an amended and restated written expense limitation agreement (the “Expense Limitation Agreement”), to reduce its advisory fees and/or reimburse other expenses of the Fund through at least October 31, 2019 to the extent necessary to limit the current operating expenses of the Fund including, as applicable, investment advisory fees, but excluding, as applicable, any taxes, leverage interest, distribution/service (Rule 12b-1) fees, shareholder services fees, brokerage commissions, acquired fund fees and expenses, expenses incurred in connection with any merger or reorganization, and extraordinary expenses (such as litigation and other expenses not incurred in the ordinary course of the Fund’s business) to an annual rate of 1.10% of the average daily net assets of the Investor Class shares and 0.90% of the average daily net assets of the Institutional Class shares. The Expense Limitation Agreement may be terminated at any time by the Board of Trustees of the Trust (the “Board”) upon 60 days’ written notice to the Adviser, but may not be terminated by the Adviser without the consent of the Board. No recoupment will be made more than three years after the date that the applicable amount was initially waived or reimbursed by the Adviser, and the recoupment may not cause the Fund to exceed the then-existing expense limitation for that class at the time such waiver or reimbursement was made.
| Centre Funds | Notes to Financial Statements |
March 31, 2018 (Unaudited)
Treasury Fund
For the Treasury Fund, the Adviser has agreed, pursuant to an amended and restated written expense limitation agreement (the “Expense Limitation Agreement”), to reduce its advisory fees and/or reimburse other expenses of the Fund through at least October 31, 2019 to the extent necessary to limit the current operating expenses of the Fund, including, as applicable, investment advisory fees, but excluding, as applicable, any taxes, leverage interest, distribution/service (Rule 12b-1) fees, shareholder service fees, brokerage commissions, acquired fund fees and expenses, expenses incurred in connection with any merger or reorganization, and extraordinary expenses (such as litigation and other expenses not incurred in the ordinary course of the Fund’s business), to an annual rate of 0.80% of the average daily net assets of the Investor Class shares and 0.60% of the average daily net assets of the Institutional Class shares. The Expense Limitation Agreement may be terminated at any time by the Board of Trustees of the Trust (the “Board”), upon 60 days’ written notice to the Adviser, but may not be terminated by the Adviser without the consent of the Board. No recoupment will be made more than three years after the date that the applicable amount was initially waived or reimbursed by the Adviser, and the recoupment may not cause the Fund to exceed the then-existing expense limitation for that class at the time such waiver or reimbursement was made.
Tax Exempt Fund
For the Tax Exempt Fund, the Adviser has agreed, pursuant to an amended and restated written expense limitation agreement (the “Expense Limitation Agreement”), to reduce its advisory fees and/or reimburse other expenses of the Fund through at least October 31, 2019 to the extent necessary to limit the current operating expenses of the Fund, including, as applicable, investment advisory fees, but excluding, as applicable, any taxes, leverage interest, distribution/service (Rule 12b-1) fees, shareholder services fees, brokerage commissions, acquired fund fees and expenses, expenses incurred in connection with any merger or reorganization, and extraordinary expenses (such as litigation and other expenses not incurred in the ordinary course of the Fund’s business) to an annual rate of 0.90% of the average daily net assets of the Investor Class shares and 0.70% of the average daily net assets of the Institutional Class shares. The Expense Limitation Agreement may be terminated at any time by the Board of Trustees of the Trust (the “Board”) upon 60 days’ written notice to the Adviser, but may not be terminated by the Adviser without the consent of the Board. No recoupment will be made more than three years after the date that the applicable amount was initially waived or reimbursed by the Adviser, and the recoupment may not cause the Fund to exceed the then-existing expense limitation for that class at the time such reimbursement or waiver was made.
Infrastructure Fund
For the Infrastructure Fund, the Adviser has agreed, pursuant to a written expense limitation agreement (the “Expense Limitation Agreement”), to reduce its advisory fees and/or reimburse other expenses of the Fund for an initial period of not less than two years and until the next following effective date of the post-effective amendment to the registration statement of the Trust relating to the Fund incorporating the Fund’s financial statements for that fiscal year (the “Initial Term”) to the extent necessary to limit the current operating expenses of the Fund, including, as applicable, investment advisory fees, but excluding, as applicable, any taxes, leverage interest, distribution/service (Rule 12b-1) fees, shareholder services fees, brokerage commissions, acquired fund fees and expenses, expenses incurred in connection with any merger or reorganization, and extraordinary expenses (such as litigation and other expenses not incurred in the ordinary course of the Fund’s business) to an annual rate of 1.30% of the average daily net assets of the Investor Class shares and 1.10% of the average daily net assets of the Institutional Class shares. The Expense Limitation Agreement may be terminated at any time by the Board of Trustees of the Trust (the “Board”), upon 60 days’ written notice to the Adviser, but may not be terminated by the Adviser without the consent of the Board. No recoupment will be made more than three years after the date that the applicable amount was initially waived or reimbursed by the Adviser, and the recoupment may not cause the Fund to exceed the then-existing expense limitation for that class at the time such reimbursement or waiver was made.
| Semi-Annual Report | March 31, 2018 | 47 |
| Centre Funds | Notes to Financial Statements |
March 31, 2018 (Unaudited)
During the period ended March 31, 2018, the fee waivers and/or reimbursements were as follows:
| Fund | | Fees Waived and/or Reimbursed by Adviser | |
| Centre American Select Equity Fund | | | | |
| Investor | | $ | 220,897 | |
| Institutional | | | 2,873 | |
| Centre Active U.S. Treasury Fund | | | | |
| Investor | | | 72,049 | |
| Institutional | | | 7,802 | |
| Centre Active U.S. Tax Exempt Fund | | | | |
| Investor | | | 46,290 | |
| Institutional | | | 3,811 | |
| Centre Global Infrastructure Fund | | | | |
| Investor | | | 325 | |
| Institutional | | | 26,597 | |
As of September 30, 2017, the balances of recoupable expenses for each Fund were as follows:
| Fund | | Expires 2018 | | | Expires 2019 | | | Expires 2020 | | | Total | |
| Centre American Select Equity Fund | | | | | | | | | | | | | | | | |
| Investor Class | | $ | 412,390 | | | $ | 439,701 | | | $ | 504,641 | | | $ | 1,356,732 | |
| Institutional Class | | | 26,975 | | | | 35,622 | | | | 12,695 | | | | 75,292 | |
| Centre Active U.S. Treasury Fund | | | | | | | | | | | | | | | | |
| Investor Class | | $ | 43,702 | | | $ | 167,361 | | | $ | 156,165 | | | $ | 207,834 | |
| Institutional Class | | | 75,161 | | | | 51,626 | | | | 20,594 | | | | 307,212 | |
| Centre Active U.S. Tax Exempt Fund | | | | | | | | | | | | | | | | |
| Investor Class | | $ | 27,685 | | | $ | 65,122 | | | $ | 78,400 | | | $ | 143,522 | |
| Institutional Class | | | 4,789 | | | | 17,852 | | | | 13,016 | | | | 30,868 | |
ALPS Fund Services, Inc. (“ALPS” or the “Administrator”) serves as administrator to the Funds. ALPS receives a monthly fee paid by the Funds subject to a minimum monthly fee and is reimbursed for certain out-of-pocket expenses. Pursuant to an administrative agreement with the Trust, ALPS provides operational services to the Funds including, but not limited to fund accounting and fund administration services and general assistance in each Fund’s operations.
ALPS, pursuant to a transfer agency and services agreement with the Trust, serves as transfer agent for the Funds. Under the transfer agency and services agreement, ALPS receives an annual minimum fee per Fund and a fee based upon each shareholder account and its account activity and is reimbursed for certain out-of-pocket expenses.
ALPS, pursuant to a chief compliance officer services agreement with the Trust, provides chief compliance officer services to the Funds. Additionally, ALPS provides services in monitoring and testing the policies and procedures of the Trust in conjunction with requirements under Rule 38a-1 under the 1940 Act. ALPS receives an annual fee for these services and is reimbursed for certain out-of-pocket expenses, pursuant to the chief compliance officer services agreement.
The Trust has adopted a plan pursuant to Rule 12b-1 under the 1940 Act (the “Plan”). The Plan permits the Trust, on behalf of Investor class shares of the Funds, to pay up to 0.25% per year to one or more entities for services rendered and expenses borne in connection with providing shareholder or distribution services with respect to the Investor class shares of each Fund.
ALPS Distributors, Inc. (the “Distributor”) acts as the principal underwriter of the Funds pursuant to a distribution agreement with the Trust. There were no payments to the Distributor by the Funds during the period ended March 31, 2018.
Officers of the Trust and Trustees who are “interested persons” of the Trust or the Adviser receive no salary or fees from the Trust. Each Trustee who is not an “interested person” receives an annual retainer of $20,000 paid quarterly. The Trust reimburses each Trustee and Officer for his or her travel and other expenses relating to attendance at Board meetings.
One Trustee is an officer of the Trust, and serves as Managing Director and Chief Investment Officer of the Adviser.
| Centre Funds | Notes to Financial Statements |
March 31, 2018 (Unaudited)
6. FEDERAL INCOME TAX AND TAX BASIS INFORMATION
As of and during the period ended March 31, 2018, no Funds had a liability for any unrecognized tax benefits. The Funds file U.S. Federal, state, and local tax returns as required. The Funds’ tax returns are subject to examination by the relevant tax authorities until expiration of the applicable statute of limitations which is generally three years after the filing of the tax return but which can be extended to six years in certain circumstances. Tax returns for open years have incorporated no uncertain tax positions that require a provision for income taxes.
Components of Distributable Earnings on a Tax Basis: At March 31, 2018, permanent differences in book and tax accounting were reclassified. These differences had no effect on net assets and were primarily attributed to differences in the book and tax treatment of currency transactions, book/tax distribution differences, distributions paid to meet excise and certain other investments.
Distributions to Shareholders: Each Fund normally pays dividends and net investment income, if any, on an annual basis, with the exception of the Centre Active U.S. Treasury Fund and the Centre Active U.S. Tax Exempt Fund, which intend to make monthly income distributions. Each Fund normally distributes capital gains, if any, on an annual basis. Income dividend distributions are derived from interest and other income each Fund receives from its investments, including distributions of short term capital gains. Capital gain distributions are derived from gains realized when each Fund sells a security it has owned for more than one year. Each Fund may make additional distributions and dividends at other times if the Adviser believes doing so may be necessary for each Fund to avoid or reduce taxes. Net investment income/(loss) and net realized gain/(loss) may differ for financial statement and tax purposes. The amounts and characteristics of tax basis distributable earnings/(accumulated losses) are finalized at fiscal year-end.
The tax character of distributions paid for the fiscal year ended September 30, 2017 were as follows:
| Distributions Paid From: | | Ordinary Income | | | Tax-Exempt Income | | | Long-Term Capital Gains | |
| Centre American Select Equity Fund | | $ | 1,571,442 | | | $ | – | | | $ | 2,601,748 | |
| Centre Active U.S. Treasury Fund | | | 2,199,698 | | | | – | | | | 63,822 | |
| Centre Active U.S. Tax Exempt Fund | | | 6,769 | | | | 600,166 | | | | 470,756 | |
The tax character of distributions paid for the fiscal year ended September 30, 2016 were as follows:
| Distributions Paid From: | | Ordinary Income | | | Tax-Exempt Income | | | Long-Term Capital Gains | |
| Centre American Select Equity Fund | | $ | 317,070 | | | $ | – | | | $ | 16,168,823 | |
| Centre Active U.S. Tax Exempt Fund | | | 7,177 | | | | 911,840 | | | | 960,301 | |
Unrealized Appreciation and Depreciation on Investments: The amount of net unrealized appreciation/(depreciation) and the cost of investment securities for tax purposes, including short-term securities at March 31, 2018 are displayed in the table below. The difference between book and tax basis unrealized appreciation/(depreciation) for the Funds is primarily attributable to wash sales and certain other investments.
| | | Tax Cost of Investments | | | Gross Unrealized Appreciation | | | Gross Unrealized Depreciation | | | Net Tax Unrealized Appreciation/(Depreciation) on Investments | |
| Centre American Select Equity Fund | | $ | 89,181,103 | | | $ | 39,748,459 | | | $ | (1,783,744 | ) | | $ | 37,964,715 | |
| Centre Active U.S. Treasury Fund | | | 42,054,024 | | | | 766,847 | | | | (192,486 | ) | | | 574,361 | |
| Centre Active U.S. Tax Exempt Fund | | | 20,339,358 | | | | 132,915 | | | | (304,772 | ) | | | (171,857 | ) |
| Centre Global Infrastructure Fund | | | 2,184,061 | | | | 18,482 | | | | (149,883 | ) | | | (131,401 | ) |
| Semi-Annual Report | March 31, 2018 | 49 |
| Centre Funds | Notes to Financial Statements |
March 31, 2018 (Unaudited)
7. AFFILIATED COMPANIES:
The Centre Active U.S. Tax Exempt Fund, which is structured as a limited fund of funds, may, in accordance with its investment strategies as described in its Prospectus, invest up to 10% of its net assets in an Underlying Fund, and may hold more than 3% of an Underlying Fund’s voting securities. As defined by the 1940 Act, an affiliated person of a Fund includes a person in which a Fund owns 5% or more of the outstanding voting securities, or a company which is under common ownership or control with the Fund. The purchases, sales, dividend income, capital gains, return of capital distributions received, shares, and value of investments in affiliated companies for the period ended March 31, 2018 were as follows:
| Security Name | | Share Balance October 1, 2017 | | | Purchases | | | Sales | | | Share Balance March 31, 2018 | | | Dividend Income | | | Realized Gain/(Loss) | | | Market Value March 31, 2018 | |
| Centre Global Infrastructure Fund, Institutional Class | | | – | | | | 213,588 | | | | – | | | | 213,588 | | | $ | 6,413 | | | $ | – | | | $ | 1,992,775 | |
| | | | | | | | | | | | | | | | | | | $ | 6,413 | | | $ | – | | | $ | 1,992,775 | |
8. PURCHASES AND SALES OF INVESTMENT SECURITIES
For the period ended March 31, 2018, the aggregate cost of purchases and proceeds from sales of investment securities (excluding any U.S. Government Obligations short-term securities and purchased options and futures) were as follows:
| Fund | | Purchases of Securities | | | Proceeds From Sales of Securities | |
| Centre American Select Equity Fund | | $ | 53,530,590 | | | $ | 65,315,742 | |
| Centre Active U.S. Tax Exempt Fund | | | 2,745,087 | | | | 4,804,687 | |
| Centre Global Infrastructure Fund | | | 2,125,207 | | | | 20,153 | |
For the period ended March 31, 2018, the aggregate cost of purchases and proceeds from sales of U.S. Government Obligations investment securities were as follows:
| Fund | | Purchases of Securities | | | Proceeds from Sales of Securities | |
| Centre Active U.S. Treasury Fund | | $ | – | | | $ | 2,310,613 | |
9. INDEMNIFICATIONS
Under the Trust’s organizational documents, its officers and Trustees are indemnified against certain liabilities relating to their duties to the Trust. Additionally, in the ordinary course of business, the Trust enters into contracts with service providers that may contain general indemnification clauses. The Trust’s maximum exposure under these arrangements is unknown, as this would involve future claims that may be made against the Trust that have not yet occurred.
10. SUBSEQUENT EVENT
At an in-person meeting of the Board of Trustees on May 18, 2018:
| (1) | The Board, including the Independent Trustees, unanimously approved an amendment to the distribution policy of the Centre Global Infrastructure Fund (the “Infrastructure Fund”). As amended, effective as of the close of business on June 1, 2018, the Infrastructure Fund expects to pay distributions from net income, if any, on a monthly basis. |
| (2) | The Board, including the Independent Trustees, unanimously approved an amendment to the expense limitation agreement between Centre Asset Management, LLC (the “Adviser”) and the Trust, on behalf of the Infrastructure Fund. Pursuant to agreement as amended, the Adviser has agreed to reduce its advisory fees and/or reimburse other expenses of the Fund for the Initial Term (as defined in the Prospectus of the Infrastructure Fund) of the agreement to the extent necessary to limit the current operating expenses of the Fund, including investment advisory fees, but excluding, as applicable, any taxes, leverage interest, distribution/service (Rule 12b-1) fees, shareholder services fees, brokerage commissions, acquired fund fees and expenses, expenses incurred with any merger or reorganization and extraordinary expenses (such as litigation and other expenses not incurred in the ordinary course of the Fund’s business) to an annual rate of 1.05% of the average daily net assets of the Investor Class shares of the Fund and 1.10% of the average daily net assets of the Institutional Class shares of the Fund. In addition, the Adviser agreed to bear the unamortized offering costs of the Infrastructure Fund, subject to the approval by shareholders of the Centre Active U.S. Tax Exempt Fund (the “Tax Exempt Fund”) of the proposed Reorganization (defined below). |
| Centre Funds | Notes to Financial Statements |
March 31, 2018 (Unaudited)
| (3) | The Board voted to approve, subject to certain conditions, an Agreement and Plan of Reorganization (the “Plan”) among the Trust, on behalf of the Tax Exempt Fund; the Trust, on behalf of the Infrastructure Fund; and the Adviser. The Plan provides for (i) the transfer of all of the assets and liabilities of the Tax Exempt Fund to the Infrastructure Fund in exchange for (a) Investor Class shares of the Infrastructure Fund, which will be distributed by the Tax Exempt Fund to its Investor Class shareholders, and (b) Institutional Class shares of the Infrastructure Fund, which will be distributed by the Tax Exempt Fund to its Institutional Class shareholders; and (ii) the termination of the Tax Exempt Fund (the “Reorganization”). The Board also voted to recommend that shareholders of the Tax Exempt Fund approve the proposed Plan at a special shareholder meeting of the Fund’s shareholders (the “Special Meeting”). The terms of the proposed Plan, information about the Reorganization, including the reasons for the Reorganization, information about the Special Meeting and information about the Funds will be contained in a combined proxy statement/prospectus (the “Proxy Statement/Prospectus”). The Proxy Statement/Prospectus is expected to be mailed to Tax Exempt Fund shareholders in July 2018. If Tax Exempt Fund shareholders approve the Plan, the Reorganization is expected to be completed as soon as practicable after such shareholder approval has been obtained. |
| Semi-Annual Report | March 31, 2018 | 51 |
| Centre Funds | Additional Information |
March 31, 2018 (Unaudited)
PROXY VOTING GUIDELINES AND RECORDS
A description of the policies and procedures that the Funds use to determine how to vote proxies relating to portfolio securities and information regarding how the Funds voted proxies during the most recent 12-month period ended June 30, is available without charge, upon request, by (1) calling the Funds at 1-855-298-4236 and (2) on the U.S. Securities and Exchange Commission’s (“SEC”) website at http://www.sec.gov.
PORTFOLIO HOLDINGS DISCLOSURE POLICY
The Trust files, with regard to each Fund, with the SEC a complete schedule of investments for the first and third quarters of each fiscal year on Form N-Q. The Funds’ first and third fiscal quarters end on December 31 and June 30. The Form N-Q filing must be made within 60 days of the end of the quarter. Forms N-Q are available on the SEC’s website at http://www.sec.gov and may be reviewed and copied at the SEC’s Public Reference Room in Washington, DC (call 1-800-732-0330 for information on the operations of the Public Reference Room). You may also obtain copies by calling the Funds at 1-855-298-4236.
APPROVAL OF INVESTMENT ADVISORY AGREEMENTS
At an in-person meeting held on March 9, 2018, the Board of Trustees (the “Board” or the “Trustees”) of the Trust, including a majority of the Trustees who are not parties to the Advisory Agreement (defined below) or interested persons of any such party (the “Disinterested Trustees”), considered and unanimously approved the renewal of the Investment Advisory Agreement between Centre Asset Management, LLC (the “Adviser”) and the Trust, on behalf of the Centre Global Infrastructure Fund (the “Infrastructure Fund”). In considering whether to approve the renewal of the Investment Advisory Agreement (the “Advisory Agreement”), the Trustees considered the factors discussed below, and the information relating to such factors made available to them in connection with the meeting (the “Meeting Materials”), including information provided by the Adviser in response to questions from the Trustees, and any other information the Trustees deemed relevant. The Trustees’ approval of the renewal of the Advisory Agreement was not based on any single factor, but on a consideration of the totality of factors and information they reviewed and evaluated.
Nature, Extent, and Quality of Services
The Trustees reviewed and discussed information concerning the nature, extent, and quality of advisory services provided by the Adviser to the Infrastructure Fund pursuant to the Advisory Agreement, including information concerning the investment style and approach of the Adviser. The Trustees considered the investment personnel responsible for the day-to-day management of the Fund’s portfolio and such personnel’s portfolio management experience, as well as information describing the Adviser’s compliance policies and procedures. The Trustees also considered the Adviser’s statements regarding its plans to grow the Infrastructure Fund. The Trustees concluded that the nature, extent, and quality of services provided by the Adviser as the investment adviser to the Fund was appropriate and sufficient to support approval of the renewal of the Advisory Agreement.
Performance
The Trustees considered information regarding the Fund’s performance, noting that the Fund only recently commenced operations on January 29, 2018, and therefore had a limited performance history against which the Fund’s performance could be evaluated. The Trustees discussed generally the performance of the other Funds, particularly the American Select Equity Fund, for which Mr. Abate, the portfolio manager of the Infrastructure Fund, also served as portfolio manager. The Trustees considered the investment strategies of the Infrastructure Fund, noting the Adviser’s representation that the Fund is managed to achieve its investment objective over a long-term investment cycle. Based on the foregoing, the Board determined that the Adviser’s management of the Infrastructure Fund could benefit the Fund and its shareholders.
Profitability
The Trustees considered information regarding the estimated profitability of the Infrastructure Fund to the Adviser, including information about the approximate monthly gross profit to the Adviser for managing the Fund. The Trustees also considered other benefits to the Adviser as a result of its relationship with the Fund. The Trustees concluded that the Adviser’s profitability would not prevent them from approving the renewal of the Advisory Agreement.
Economies of Scale
The Trustees considered information concerning potential economies of scale for the Infrastructure Fund, noting that the Fund is subject to an operating expense limitation agreement covering, among other operating expenses, the advisory fees charged to the Fund.
Advisory Fee and Expense Ratios
The Trustees reviewed and discussed the advisory fee paid to the Adviser under the Advisory Agreement for the services it provided thereunder and the net expense ratios of the Investor Class shares and Institutional Class shares of the Infrastructure Fund. The Trustees noted that the expense ratios of the Investor Class shares are higher than those of the Institutional Class shares. The Trustees reviewed, with respect to the Fund as of February 20, 2018, a comparison of the Fund’s advisory fee to the Morningstar Infrastructure Category median advisory fee rate, and the net expense ratio (after fee waiver and expense reimbursement) of the Fund’s Investor Class shares compared to the Morningstar Infrastructure Category average expense ratio. The Trustees also reviewed the median expense ratio of the “peer group” funds, which had been selected by the Adviser based on such funds’ philosophy and asset class. The Trustees discussed the advisory fee and expense information included in the Meeting Materials with respect to the Fund, and considered whether the advisory fee was reasonable in light of the services provided by the Adviser to the Fund. The Trustees also considered that, for the Fund, the Adviser had agreed to waive its fees and/or reimburse Fund expenses pursuant to an operating expense limitation agreement with the Trust. The Trustees also considered the fees and expense ratios charged to other advisory clients of the Adviser.
| Centre Funds | Additional Information |
March 31, 2018 (Unaudited)
After reviewing all of the information presented to them, the Trustees concluded that the advisory fee payable to the Adviser by the Fund under the Advisory Agreement was reasonable in light of the services provided.
Conclusion
The Trustees, including a majority of the Disinterested Trustees, concluded, based on their consideration of the foregoing and their evaluation of all of the information reviewed by the Trustees, that renewal of the Advisory Agreement was in the best interest of the Fund and its shareholders.
| Semi-Annual Report | March 31, 2018 | 53 |

Not applicable to semi-annual report.
| Item 3. | Audit Committee Financial Expert. |
Not applicable to semi-annual report.
| Item 4. | Principal Accountant Fees and Services. |
Not applicable to semi-annual report.
| Item 5. | Audit Committee of Listed Registrants. |
Not applicable to the Registrant.
| Item 6. | Schedule of Investments. |
| (a) | The Registrant’s “Schedule I – Investments in securities of unaffiliated issuers” (as set forth in 17 CFR 210.12-12) is included in Item 1 of this Form N-CSR. |
| (b) | Not applicable to the Registrant. |
| Item 7. | Disclosure of Proxy Voting Policies and Procedures for Closed-End Management Investment Companies. |
Not applicable to the Registrant.
| Item 8. | Portfolio Managers of Closed-End Management Investment Companies. |
Not applicable to the Registrant.
| Item 9. | Purchases of Equity Securities by Closed-End Management Investment Company and Affiliated Purchasers. |
Not applicable to the Registrant.
| Item 10. | Submission of Matters to a Vote of Security Holders. |
None.
| Item 11. | Controls and Procedures. |
| (a) | The Registrant’s principal executive officer and principal financial officer have evaluated the Registrant’s disclosure controls and procedures (as defined in Rule 30a-3(c) under the Investment Company Act of 1940, as amended) within 90 days of this filing and have concluded that the Registrant’s disclosure controls and procedures were effective as of that date. |
| (b) | There was no change in the Registrant’s internal control over financial reporting (as defined in Rule 30a-3(d) under the Investment Company Act of 1940, as amended) during the second fiscal quarter of the period covered by this report that has materially affected, or is reasonably likely to materially affect, the Registrant’s internal control over financial reporting. |
| Item 12. | Disclosure of Securities Lending Activities for Closed-End Management Investment Companies. |
Not applicable.
| (a)(1) | Not applicable to semi-annual report. |
| (a)(2) | A separate certification for the Registrant’s Principal Executive Officer and Principal Financial Officer as required by Rule 30a-2(a) under the Investment Company Act of 1940, as amended (17 CFR 270.30a-2(a)), is attached hereto as Ex 99.Cert. |
| (b) | The certifications by the Registrant’s Principal Executive Officer and Principal Financial Officer, as required by Rule 30a-2(b) of the Investment Company Act of 1940, as amended, and Section 906 of the Sarbanes-Oxley Act of 2002 are attached hereto as Ex99.906Cert. |
SIGNATURES
Pursuant to the requirements of the Securities Exchange Act of 1934 and the Investment Company Act of 1940, the Registrant has duly caused this report to be signed on its behalf by the undersigned, thereunto duly authorized.
CENTRE FUNDS
| By: | /s/ James A. Abate | |
| | James A. Abate | |
| | President (Principal Executive Officer) | |
| | | |
| Date: | June 6, 2018 | |
Pursuant to the requirements of the Securities Exchange Act of 1934 and the Investment Company Act of 1940, this report has been signed below by the following persons on behalf of the Registrant and in the capacities and on the dates indicated.
| By: | /s/ James A. Abate | |
| | James A. Abate | |
| | President (Principal Executive Officer) | |
| | | |
| Date: | June 6 , 2018 | |
| By: | /s/ James A. Abate | |
| | James A. Abate | |
| | Treasurer (Principal Financial Officer) | |
| | | |
| Date: | June 6, 2018 | |