UNITED STATES
SECURITIES AND EXCHANGE COMMISSION
Washington, D.C. 20549
FORM N-CSR
CERTIFIED SHAREHOLDER REPORT OF REGISTERED
MANAGEMENT INVESTMENT COMPANIES
Investment Company Act file number: 811-22545
CENTRE FUNDS
(Exact name of registrant as specified in charter)
48 Wall Street, Suite 1100, New York, New York 10005
(Address of principal executive offices) (Zip code)
James A. Abate
48 Wall Street, Suite 1100
New York, New York 10005
(Name and address of agent for service)
Registrant’s telephone number, including area code:(212) 918-4705
Date of fiscal year end:September 30
Date of reporting period:October 1, 2019 – March 31, 2020
| Item 1. | Reports to Stockholders. |
TABLE OF CONTENTS
| | PAGE |
| SHAREHOLDER LETTER | 1 |
| MANAGER COMMENTARY | 2 |
| Centre American Select Equity Fund | 2 |
| Centre Active U.S. Treasury Fund | 7 |
| Centre Global Infrastructure Fund | 11 |
| DISCLOSURE OF FUND EXPENSES | 15 |
| SCHEDULE OF INVESTMENTS | 16 |
| Centre American Select Equity Fund | 16 |
| Centre Active U.S. Treasury Fund | 18 |
| Centre Global Infrastructure Fund | 19 |
| STATEMENTS OF ASSETS AND LIABILITIES | 22 |
| STATEMENTS OF OPERATIONS | 23 |
| STATEMENTS OF CHANGES IN NET ASSETS | 24 |
| Centre American Select Equity Fund | 24 |
| Centre Active U.S. Treasury Fund | 25 |
| Centre Global Infrastructure Fund | 26 |
| FINANCIAL HIGHLIGHTS | 27 |
| Centre American Select Equity Fund | 27 |
| Centre Active U.S. Treasury Fund | 29 |
| Centre Global Infrastructure Fund | 31 |
| NOTES TO FINANCIAL STATEMENTS | 33 |
| ADDITIONAL INFORMATION | 43 |
Beginning on January 1, 2021, as permitted by regulations adopted by the SEC, paper copies of annual and semi-annual shareholder reports will no longer be sent by mail, unless you specifically request paper copies of the reports. Instead, the reports will be made available on the Trust’s website at www.centrefunds.com, and you will be notified by mail each time a report is posted and provided with a website link to access the report.
You may, notwithstanding the availability of shareholder reports online, elect to receive all future shareholder reports in paper free of charge. If you invest through a financial intermediary, you can contact your financial intermediary to request that you continue to receive paper copies of your shareholder reports. If you invest directly with a Fund, you can contact your financial intermediary to request that you continue to receive paper copies of your shareholder reports.
If you invest directly with a Fund, you can call (855) 298-4236 to let the Fund know you wish to continue receiving paper copies of your shareholder reports. If you already elected to receive shareholder reports electronically, you will not be affected by this change and you need not take any action. You may elect to receive shareholder reports and other communications from a Fund electronically anytime by contacting your financial intermediary or, if you are a direct investor, by enrolling at www.centrefunds.com.
| Centre Funds | Shareholder Letter |
| | March 31, 2020 (Unaudited) |
Dear Shareholders,
It is with my pleasure that we publish the Centre Funds Semi-Annual Report covering the six-month period ended March 31, 2020. I want to thank my fellow shareholders for their continued support and confidence in Centre Funds. We are committed to truly active fund management with distinction. Each series of Centre Funds is a fundamentally-driven, actively managed Fund in core investment strategies with differentiation and uses specialist talent. We offer a select series of funds to choose from, each available in investor and institutional share classes.
Centre American Select Equity Fund
The Fund is a U.S. large capitalization valuation sensitive growth stock fund that seeks long-term growth of capital and is focused on risk adjusted returns through active and pragmatic management; the Fund may complement its equity securities with hedges and other capital preservation strategies when deemed appropriate. The Fund is intended to be a risk managed core growth fund.
Centre Active U.S. Treasury Fund
The Fund is a nontraditional U.S. Treasury securities fund that seeks to maximize investors’ total return through capital appreciation and current income through investments in primarily U.S. Treasury securities. The Fund has the potential for capital appreciation/preservation in various interest rate environments using a proprietary interest rate forecasting process that aims to take advantage of interest rate changes through active duration and interest rate management.
Centre Global Infrastructure Fund
The Fund is for investors seeking to potentially benefit from a renewed focus on infrastructure spending but wish to have liquidity in publicly traded investments in developed global markets rather than illiquid private investments. The Fund pursues a bottom-up, active management approach and invests in what we deem the most attractive infrastructure-related companies from the United States and developed international economies. Also, the Fund seeks to balance its exposures to where the weights of the Telecommunication, Utilities, Energy, Transportation, and Social Infrastructure industries are broadly represented.
Our aim at Centre Funds is to deliver strong, long-term performance results for investors through an exceptional focus on producing returns and managing risk and downside volatility in select investment strategies. We want investors to associate Centre Funds with high-conviction, differentiated fund strategies that may not be available elsewhere and are tactical, pragmatic, and opportunistic. Each investment strategy aims to capitalize on defined market opportunities using talented and experienced portfolio managers with consistent and repeatable investment processes who aim to achieve true differentiated returns. Our portfolio managers remain focused on fundamentally-driven investment approaches within truly active, disciplined and research-intensive processes. At Centre Funds, we place service excellence at the core of everything that we do and are committed to providing useful information and transparency on the Funds. Again, I want to thank my fellow shareholders for their continued support and confidence in the Centre Funds.
Sincerely,
James Abate
President, Centre Funds
| Semi-Annual Report | March 31, 2020 | 1 |
| Centre American Select Equity Fund | Manager Commentary |
| | March 31, 2020 (Unaudited) |
Performance & Strategy Summary
For the six-month period ended March 31, 2020, the Centre American Select Equity Fund (the “Fund”), Investor Share Class, delivered a total return of-4.01 percent; the Institutional Share Class delivered a total return of-3.75 percent.
During this past six-month period, the key barometer of the U.S. stock market as a whole, as measured by the S&P 500 Index1, delivered a total return of-12.32 percent, with the drawdown led by economically sensitive sectors such as Energy, Financials, Industrials, and Materials. The more historically defensive growth sectors such as Health Care, Consumer Staples, Communication Services, as well as Utilities performed relatively better. Somewhat surprisingly, many of the leading technology-related companies, sometimes referred to as the FAANGs2, performed relatively well despite remaining highly elevated in terms of valuation when compared to the average company in the S&P 500 Index as quality as an investment factor greatly explained relative performance over the period.
The strongest contributors to performance within the Fund over the six-month period ended March 31, 2020 included the Fund’s investments within the Technology sector, Microsoft; within the Health Care sector, Eli Lilly and HCA Healthcare; within the Materials sector, Barrick Gold; and within the Consumer sector, Amazon, Hain Celestial, and Philip Morris. In general, both stock selection and sectoral biases, particularly our underweight postures in the Financials, Industrials, and Consumer Discretionary sectors contributed to the relative outperformance over the period. Stock investments that contributed negatively to relative underperformance over the period included Schlumberger, Twitter, Alaska Air, and Molson Coors. Fund performance was impacted positively from a total return and risk perspective by the net realized gains from certain hedges and other investments that Centre Asset Management, LLC, the investment adviser to the Fund (“Centre,” the “Adviser”, “we”, or “the Fund’s portfolio manager”), viewed, as capital protective in nature. These hedges, namely put options3 on the S&P 500 Index, performed as expected during the stock market’s sharp correction beginning in February 2020 and, as demonstrated now on several occasions in the past, have insulated the Fund from the same magnitude of maximum drawdown4 experienced by the overall stock market over prior volatile5 episodes, namely in August 2015, January 2016, February 2018, and December 2018. Given the continued presence of certain potentially de-stabilizing factors that we believe could negatively impact the value of underlying equity securities held in the Fund’s portfolio, the Fund will continue the strategy of tactically and opportunistically purchasing put options on the S&P 500 Index as a potential hedge against its underlying stock holdings in the event of a material stock market correction.
The process used by Centre to manage the Fund focuses on each individual portfolio company's growth outlook and capacity to create shareholder value, utilizing our bottom-up fundamental stock selection process. We utilize a disciplined, Economic Value Added6 framework to select investments. The framework focuses on the fundamentals of wealth creation or wealth destruction similar to the way a traditional, long-term focused corporate investor looking at all aspects of the business would assess a company's value. In the shorter-term, markets may often undervalue or overvalue a company's ability to create or destroy wealth. The framework seeks to identify and capture these investment opportunities. The approach is designed to capture excess returns when a business is creating shareholder wealth and the market price of the stock converges toward our target price. Centre not only analyzes earnings but also strives to understand and link the capital allocation decisions being made today by each portfolio company and how they may lead to future earnings growth. In other words, we expect that the companies in which the Fund invests will themselves invest in productive assets of the business, organically and through opportunistic purchases which, in turn, should provide the foundation for future revenue and profits growth that create shareholder value. Alternatively, if companies cannot invest in productive assets due to a cyclical downturn or existing excess capacity, we expect these companies to “wisely contract” through the restructuring of their assets and other resources to regain their footing for future shareholder value creation. The key is that we look at the company drivers that create true shareholder wealth: capital spending or alternative capital allocations such as acquisitions, stock buybacks, or dividends; company-specific risk levels of a business to determine appropriate hurdle rates7; and whether the company is generating positive or excess returns on its underlying assets vis-à-vis the cost of capital. Wealth creation from growth or from wise contraction – that’s how we believe companies create shareholder value.
To meet its objective as a risk-managed growth fund, the Fund may complement its equity securities with hedges and other capital preservation strategies when deemed tactically appropriate by Centre. While the use of hedging and certain investment techniques involve risk, in accordance with the Fund’s investment policies, the Adviser may tactically employ hedges and other capital preservation strategies on up to 100 percent of the value of the Fund’s underlying securities positions when the Adviser’s assessment of market valuation indicates forward returns for the stock market, as a whole, are low relative to downside risk and the cost to upside potential from portfolio preservation tools is deemed reasonable in order to respond to adverse market, economic, political, or other conditions. The Adviser may also tactically employ hedges to reduce volatility. For example, through the tactical use of put options, the Fund may have enhanced performance and more limited risk. Index put options are designed to hedge the Fund from significant market declines that may occur over short periods of time. The value of an index put option generally increases as the underlying securities in the Fund decrease in price and decreases as those securities increase in price. The Adviser may also seek to enhance returns by writing (selling) out of the money call options tailored with exercise prices generally above the current market prices of stocks held in the Fund. As the seller of the call option, the Fund receives cash (the premium) from the purchaser8. The Adviser varies its hedging strategy and defensive positions across changing market cycles but has generally employed such strategies within the Fund since late 2014.
| 1 | S&P 500 is an index of 500 stocks seen as a leading indicator of U.S. equities and a reflection of the performance of the large cap universe, made up of companies selected by economists. |
| 2 | “FAANG” is an acronym that refers to the stocks of five prominent American technology companies: Facebook, Amazon, Apple, Netflix, and Alphabet (formerly known as Google). |
| 3 | A put option is a contract giving the owner the right, but not the obligation, to sell a specified amount of an underlying security at a specified price within a specified time. |
| 4 | Maximum drawdown is the maximum loss from a peak to a trough of a portfolio, before a new peak is attained. |
| 5 | Volatility is a measure of systematic risk of a security or a portfolio in comparison to the market as a whole. |
| 6 | Economic Value Added (EVA) is an estimate of a company’s economic profit. Economic profit, which refers to the profit earned by a company, minus the cost of financing the company’s capital, is an amount that may be considered in the assessment of a company’s overall value. |
| 7 | A hurdle rate is the minimum rate of return on a project or investment required by a manager or investor. The hurdle rate denotes appropriate compensation for the level of risk present; riskier projects generally have higher hurdle rates than those that are deemed to be less risky. |
| 8 | A covered call is an options strategy whereby an investor holds a long position in an asset and writes (sells) call options on that same asset in an attempt to generate increased income from the asset. This is often employed when an investor has a short-term neutral view on the asset and for this reason holds the asset long and simultaneously has a short position via the option to generate income from the option premium. |
| Centre American Select Equity Fund | Manager Commentary |
| | March 31, 2020 (Unaudited) |
Market Review & Outlook
As we entered 2020, we continued espousing our belief that the U.S. stock market was extremely fragile due to elevated valuations that were reliant upon unreasonable profit margin expansion expectations as well as financial engineering (i.e., stock buybacks financed by increased leverage), and major stock market indexes were vulnerable to a significant dislocation, just lacking a catalyst. Well, that catalyst arrived in the form of the COVID-199 virus and, fortunately for Fund investors, we believe our pragmatic and risk-aware outlook, with the Fund positioned quite defensively as we began the year, has allowed Fund investors to weather the sharpest stock market correction on record and quickest onset of an economy-wide recession since the Great Depression quite well thus far. The key issues moving forward are 1) has the pull-back in valuations compensated for the over-valuation that existed previously, and 2) has the longer-term outlook for the economy been harmed to such degree by the quarantining and related short-term business shut down actions imposed that the de-rating needs to be even further than the pullback experienced thus far and, thus, investors should expect potentially a second leg down in indexes akin to the market-wide experience in 2002 after the then technology sector bubble had already burst in 2001?
With the service economy now in shambles and the focus of financial media attention, it’s important to remember that just a couple of months ago the manufacturing sectors of the economy were operating in near-recessionary conditions while the services and consumer segments continued to hum along at near record paces. Our warnings then about the potential spill-over of negative consequences of the manufacturing contraction (i.e., reduced profits leading layoffs) impacting the services sector, and more sober expectations of a recovery in manufacturing led us to a high degree of pessimism versus what was the market consensus. Namely, we felt that the services economy would weaken rather than the manufacturing segment catch up, leading us to remain patient in embracing emerging value opportunities in the Industrial, Energy, Financials and other more-cyclical sectors despite the near-record divergence in the fortunes of so-called traditional value-oriented companies vis-à-vis growth since 2017. Our historically aware valuation approach led us to warn that the performance penalty for being too early on embracing cyclical stocks would be pronounced and asymmetric. Namely, the economy historically needs to be in recession for cyclical stocks to assume leadership away from defensives and, importantly, only when cyclicals have suffered the double hit of an earnings collapse as well as a significant de-rating reflecting pessimism on any type of imminent recovery. At this point, neither dynamic has played out fully yet – while the recession has begun to impact earnings it’s still too soon to gauge the severity and absolute valuations for most cyclical businesses and they are nowhere close to past troughs on sales or other historically reliable metrics. While we do, however, expect to be adding more underlying cyclicality to the portfolio given the sharp price corrections since February 2020 in certain areas, we plan to do so on an opportunistic basis and bottoms-up driven basis, not a wholesale shift as financial stress remains under-appreciated by the markets.
The other matter of focus we warned about in the past is the increasing importance of price, in isolation, and not of relating price to some underlying fundamental variable such as earnings or revenue. The dominance of passive investing over the past few years, to us, was skewing the thinking of even the most sophisticated investors whereby we believed that increased reliance on deductive modeling relationships and forecasting using past price action as the dominant future forecasting variable was setting the stage for a reversal in a virtuous upward movement to a vicious downward move. As we discussed, markets were fragile and we expected crashes, not just grinding corrections due to the discounting of future recessions. Furthermore, this unprecedented growth in passive and systematic strategies, each of which in many cases rely on momentum and asset volatility to determine the level of risk taking (e.g., volatility targeting10, risk parity11, trend following12, option replication hedging13, etc.). As we originally highlighted starting in May 2010 with the so-called “flash crash”, a market correction of even modest amounts could prompt these strategies to programmatically sell into weakness. Also, in exchange market making, there has been a shift from human market makers, who are slower and deliberate, to programmatic liquidity that is faster and relies on volatility-based value-at-risk models to quickly adjust the amount of risk taking. This trend strengthens momentum, in up and down markets, and reduces day-to-day volatility but increases the risk of major market disruptions as we witnessed this past March when the selloffs triggered an automatic halt on trading, i.e., circuit breaker rule, four times when there had been only one prior trading halt previously in 1997.
| 9 | In COVID-19, 'CO' stands for 'corona,' 'VI' for 'virus,' and 'D' for disease. Formerly, this disease was referred to as “2019 novel coronavirus” or “2019-nCoV”. There are many types of human coronaviruses including some that commonly cause mild upper-respiratory tract illnesses. |
| 10 | Volatility targeting is a sophisticated approach used by hedge funds to determine the amount of leverage that will be used. Volatility targeting means that the manager will increase or decrease the amount of leverage to ensure that the volatility of the portfolio remains close to the target. As such, if the volatility goes up, he or she will scale down the portfolio. If the volatility goes down, the manager will take more leverage. The aim is to ensure that the amount of dollar risk remains the same. |
| 11 | Risk parity is a portfolio allocation strategy using risk to determine allocations across various components of an investment portfolio. The risk parity strategy follows the modern portfolio theory (MPT) approach to investing which seeks to diversify an investment portfolio among specified assets to optimize returns while adhering to market risk parameters by viewing the risk and returns for the entire portfolio. |
| 12 | Trend following or trend trading is a trading strategy that involves buying an asset when its price trend goes up, and selling when its trend goes down, expecting price movements to continue. |
| 13 | Option replication hedging relates to the creation of a portfolio that perfectly replicates an option, exactly matches the option’s payout and hedging cost of creating this portfolio, and exactly matches the initial option price. |
| Semi-Annual Report | March 31, 2020 | 3 |
| Centre American Select Equity Fund | Manager Commentary |
| | March 31, 2020 (Unaudited) |
The previously virtuous and essentially “cost-less” debt financed stock buybacks over this current market cycle, that began in 2009, have sown the seeds of earnings manipulation and complacency, and, most importantly, witnessed the re-direction of cash flow usage away from productive assets. Furthermore, the evidence seems to support that corporations in the S&P 500 Index executed stock buybacks over the past twenty plus years with an indifference to stock prices at best, or rather tied to price momentum at worst, highlighted by the fact that share repurchases virtually came to a halt broadly during the collapse in stock prices arising from the financial crisis in 2008 and 2009. Current research indicates that stock buybacks have so far been impacted negatively from the fallout of the virus as financial distress and overall caution has impacted corporate leadership thinking, and how the $2 trillion stimulus bill includes curbs on stock buybacks due to the government’s widespread financial assistance to many companies and, even for those companies not receiving aid, will be implicitly frowned upon this year as they are an indirect way to compensate executives by reducing the dilutive impact of stock option awards. Our quibble is not with companies who recognize that they must wisely contract and re-direct their cash flow usage of their business after, in hindsight, a too aggressive period of expansion. Our focus is that since 2014, aggregate stock buybacks for the S&P 500 have exceeded free cash flow with the shortfall, plus whatever growth capital expenditures were made, financed with new borrowings leaving the debt to asset ratio for the average S&P 500 company the highest in modern times. This seems to have been mainly an attempt to water down the impact of executive stock compensation plans and make per share metrics look better, rather than expand and create productive assets as well as research and development whose cash flow would service the debt in the future. Call us at Centre old fashioned, but we believe borrowings should be used to invest, not leverage buybacks. More to the point, it seemed irreconcilable to us that the stock market should simultaneously have a current market cycle high implied long term growth rate, or value of future growth, when there was an unprecedented re-direction of cash flow usage away from productive assets that will support future growth. We estimate stock buybacks will decline by approximately-50% in 2020, at a rate equal to that of the decline seen during the financial crisis in 2008-9 but feel that estimate will turn out to be conservative, as it’s more likely that buybacks will fall by a much greater amount this time given the higher financial leverage ratios now across all sectors of the market. However, the per share negative impact to earnings and increase in debt service costs for non-investment grade borrowing will only become clear as the next quarters unfold when we can assess which companies used financial engineering to the long-term detriment of their shareholders.
We firmly believe that we are transitioning away from systematic risk moves to unprecedented heterogeneity in markets that will give the best opportunity for active stock selection in quite some time. Unfortunately, this does not imply a shift to value per se but rather the rewarding of companies that can offer stable growth and sustainable dividend yields. So, while stock buybacks will be tempered, we see more resiliency in dividends. This said, many companies will likely emerge from the recession weakened and left with structurally higher debt loads and unsustainable capital return programs. It will become imperative to differentiate between high vs. low quality dividends given the risk of dividend suspensions and credit risk. Conversely, we expect investors will re-rate positively companies with sustainable dividends, especially in a zero or negative interest rate environment, expanding Central Bank quantitative easing programs, and very low earnings visibility. Sustainable and high dividend yields with low debt to capital ratios is of increased emphasis in the Fund and gives us a great degree of optimism on the income and capital appreciation opportunity for many of the investments within the Fund. In other words, the one thing that will matter most in the near term is cash dividends, determining their sustainability is key and our fundamentally-driven investment process seems well suited for this environment.
In sum, we have a U.S. stock market trading at valuation multiples that we believe are still in excess of intrinsic value that itself seems to be shifting even lower, with the contributing factors that led to valuation multiples expanding to record levels prior to the most recent correction – an ample supply of debt capital usage dedicated to stock buybacks with complicit company Boards allowing financial leverage to increase to levels never seen before and profit margins at well above prior peak levels due to globalization as multi-national companies led in the offshoring of manufacturing and labor allowing significant positive operating leverage that compounded the valuation re-rating – now reversing.
| Centre American Select Equity Fund | Manager Commentary |
| | March 31, 2020 (Unaudited) |
As we move forward from the initial stock market crash and onset of recession, we remain focused on several key broader issues. Firstly, the stock price resilience of large-cap technology companies (FAANGs) during the Feb./Mar. market correction was somewhat surprising to us. A second and more significant leg down in markets can occur we believe if any of the major so-called secular growth, wide moat technology companies get exposed as being cyclical akin to what occurred in 2002 after the initial stock market correction and recession onset in 2001. On the other hand, if the FAANGs can truly demonstrate earnings resilience, we believe these leadership stocks will get re-rated even higher and to unprecedented levels given record low interest rates and lack of growth elsewhere. In this environment, we have greater risk awareness associated with Facebook and Alphabet, the dominant players in the digital advertising market. Secondly, despite doing well performance-wise, we feel that gold should have risen even more given the literal bankrupting of the U.S. by the self-proclaimed “King of Debt” (President Trump) with the recent massive but short-term focused stimulus programs; we maintain the Fund’s significant position weight in leading gold mining company Barrick Gold with many high quality properties and that has made many significant operational improvements, providing optimism about its potential to be geared positively to a higher gold price. Thirdly, the demographic decline in developed economies will set the stage for widespread upcoming debt crises that will make the experiences of Greece, Puerto Rico, et al seem mild by comparison with COVID-19 being the catalyst and feel that it wasn’t a coincidence that the countries hit proportionally the hardest (Italy, Spain) have some of the worst demographic attributes in terms of elderly population proportions. Fourth, it remains uncertain how much corporate net profitability since 2016 suggests its strength owes to financial engineering and the recent tax reduction. In other words, what’s the real trough in earnings as this recession progresses. Lastly, given that elevated valuations are linked to elevated corporate net profitability, what’s the real bottom in valuations if profit margins contract meaningfully and financial engineering evaporates. In sum, we struggle to see what driver will move market indexes higher and feel that the next five years will certainly not replicate the past as profit margin expectations, the reduced impact from stock buybacks, and the difficult revenue growth environment for a large number of companies all weigh negatively. However, and importantly, we see opportunity and reiterate the strong bottoms-up positives that we are now witnessing the beginning of a period of unprecedented heterogeneity of company performance and in markets that will give the best opportunity for active stock selection in quite some time. We are finding ample opportunity of investment in companies that can offer stable growth as well as high and sustainable dividend yields.
The process used by Centre to manage the Fund stays disciplined and focused on each individual portfolio company's growth outlook and capacity to create shareholder value, utilizing our bottom-up fundamental stock selection process and consider valuation, or the price one pays at purchase, as the most critical element of successful investment. We believe that our pragmatic, large-capitalization, valuation-sensitive growth, and concentrated, high-conviction approach to stock selection, with a cognizance of risk management that includes tactically implementing capital protective investments, seems positioned to perform well relative to less risk aware strategies.
The market outlook is the opinion of the author and can change at any time.
| Semi-Annual Report | March 31, 2020 | 5 |
| Centre American Select Equity Fund | Manager Commentary |
| | March 31, 2020 (Unaudited) |
SECTOR WEIGHTINGS
As a percentage of Net Assets
| Information Technology | 29.06% |
| Consumer Staples | 21.68% |
| Health Care | 13.33% |
| Communication Services | 13.21% |
| Consumer Discretionary | 7.46% |
| Energy | 5.39% |
| Materials | 5.34% |
| Utilities | 3.09% |
| Financials | 1.05% |
| Cash and Cash Equivalents | 0.39% |
| Totals | 100.00% |
These allocations may not reflect the current or future positions of the portfolio.
GROWTH OF HYPOTHETICAL $10,000 INVESTMENT THROUGH MARCH 31, 2020
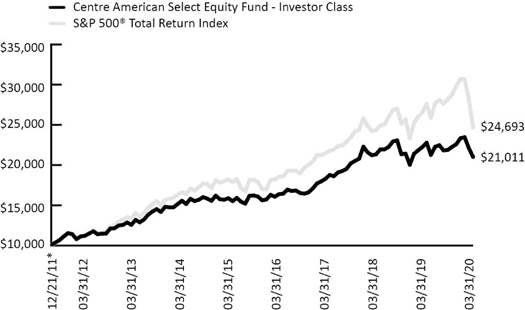
This graph assumes an initial investment of $10,000 at December 21, 2011, the inception date for Investor Class shares, which have the longest period of annual returns, and that any dividends and distributions are reinvested. This graph depicts the performance of the Fund's Investor Class versus the S&P 500® Total Return Index. Taxes on Fund distributions or when shares are redeemed, if any, are not reflected. Unlike the Fund, an index is not available for investment, is unmanaged and does not have expenses that affect the results. The comparison is shown for illustrative purposes only.
The line graph above shows the performance of Investor Class shares only, since the Investor Class has the longest period of annual returns. The performance of the Institutional Class shares will differ from the performance shown because the Institutional Class shares have different expenses than the Investor Class shares.
TOTAL RETURNS – FOR THE PERIOD ENDED MARCH 31, 2020
| | 1 Month | 3 Month | YTD | 1 Year | 3 Year Average Annualized | 5 Year Average Annualized | Since Inception* Average Annualized |
| Centre American Select Equity Fund – Investor Class | -4.95% | -9.97% | -9.97% | -5.62% | 5.33% | 5.92% | 9.39% |
| S&P 500® Total Return Index | -12.35% | -19.60% | -19.60% | -6.98% | 5.10% | 6.73% | 11.54% |
| Centre American Select Equity Fund – Institutional Class | -4.89% | -9.86% | -9.86% | -5.08% | 5.75% | 6.24% | 6.28% |
| S&P 500® Total Return Index | -12.35% | -19.60% | -19.60% | -6.98% | 5.10% | 6.73% | 7.80% |
| * | Inception date of December 21, 2011 for Investor Class. Inception date of January 21, 2014 for Institutional Class. |
The performance information quoted above represents past performance, which is not a guarantee of future results, and does not reflect the deduction of taxes that a shareholder would pay on Fund distributions or the redemption of Fund shares. Investment return and principal value of an investment will fluctuate so that an investor’s shares, when redeemed, may be worth more or less than their original cost. Total return includes reinvestment of dividends and capital gains, if any. Current performance may be lower or higher than the performance data quoted. For the most current month-end performance data, please call 855-298-4236.
Per the prospectus dated January 28, 2020, the Fund had total gross annual operating expenses of 1.58% and 1.30% and net annual operating expenses of 1.45% and 0.97% for the Investor and Institutional Class, respectively.
The S&P 500® Total Return Index is a commonly recognized, market-capitalization weighted index of 500 widely held securities, designed to measure broad U.S. equity performance. You cannot invest directly in an index.
| Centre Active U.S. Treasury Fund | Manager Commentary |
| | March 31, 2020 (Unaudited) |
Performance & Strategy Summary
For the six-month period ended March 31, 2020, the Centre Active U.S. Treasury Fund (the “Fund”), Investor Share Class, delivered a total return of-1.60 percent; the Institutional Share Class delivered a total return of-1.44 percent.
During this past six-month period, the Bloomberg Barclays U.S. Treasury Index1 returned 7.34 percent. Performance attribution in the Centre Active U.S. Treasury portfolio reflects interest income combined with our active duration2 management decisions that impact capital gain or loss capture. Duration decisions are implemented using futures contracts on U.S. Treasury securities. These contracts are very liquid and allow us to maintain consistent cash flow from the core portfolio of U.S. Treasury notes and bonds. As there are no corporate or mortgage related securities in the portfolio, there are no “spread” components to performance. Active duration decisions are based on the near-term outlook for interest rates which is based, in turn, on a monthly review of economic conditions and current bond market valuation processed through our investment discipline, the Interest Rate Scorecard. The cautious stance, duration targeted at the zero lower bound, prior to March reflected the ongoing strength of labor market activity, both level and momentum, in the U.S., a rate of inflation consistent with the Federal Open Market Committee’s (FOMC) 2% goal, monetary policy that was likely overly accommodative and, at times, an extremely overbought condition in the U.S. Treasury market.
In March, despite the low level of interest rates and inflationary expectations that did not indicate any dramatic near-term acceleration in inflation, mixed signals from bond market prices and increasing concern among FOMC officials about global growth prospects and the possible negative growth impact of COVID-193 made the outlook for rates highly uncertain, and warranted a market neutral duration stance. The number of reported COVID-19 cases increased sharply in March and the World Health Organization (WHO) declared the disease a global pandemic on March 11th. The Federal Reserve (or “Fed”) took intervening action twice in the month, reducing the federal fund’s target range by 1/2 percentage point on March 3 and by a full percentage point on March 15th. The cut on the 15th returned the target range to the Zero Lower Bound (ZLB). Besides these “conventional” responses to worsening economic conditions the Fed announced a program of purchasing longer dated treasury securities to help hold down the level of rates and the purchase of mortgage securities and corporate bonds to support the housing market and the borrowing capacity of businesses. Additionally, the Fed encouraged bank lending to businesses and households by lowering the discount rate, reducing reserve requirements and encouraging banks to utilize their capital and liquidity buffers. Further, it established a number of credit facilities. Two are aimed at providing funding to large companies and three at small and medium sized businesses.
The Fed acted with speed in its attempts to slow the transition of a dramatic global (including the U.S.) supply constraint to a lessened demand for the nation’s output of goods and services. Non-pharmaceutical interventions, e.g. lockdowns, the closure of non-essential businesses and self-quarantine measures impacted roughly a third of the economy. The Fed’s efforts were supported when Congress passed the Cares Act and the Treasury created additional programs to support household income through increased unemployment benefits and loans to businesses to support continued operations and employment.
The Fund’s investment objective is to maximize total return through capital appreciation and current income. The Fund pursues this objective by using an active interest rate risk management strategy that aims to capture general cyclical interest rate trends while allowing for the potential to benefit from short-term deviations. This strategy involves the use of a proprietary fundamentally-driven interest rate forecasting process designed to forecast interest rates on a monthly basis. The Fund’s duration is adjusted based on a monthly assessment of the likely change in interest rates. When interest rates are expected to decline, the Fund extends duration, and when interest rates are expected to rise, the Fund shortens duration. The Adviser’s active duration management strategy for the Fund seeks the potential for capital appreciation and/or preservation of capital in variable interest rate environments by utilizing U.S. Treasury securities, including bills, notes and bonds, Treasury inflation protected securities4 (TIPS), cash equivalents and, in certain market environments, futures contracts on U.S. Treasury Notes and Bonds.
| 1 | The Bloomberg Barclays U.S. Treasury Index includes public obligations of the U.S. Treasury. Treasury bills are excluded by the maturity constraint but are part of a separate Short Treasury Index. In addition, certain special issues, such as state and local government series bonds (SLGs), as well as U.S. Treasury TIPS, are excluded. STRIPS are excluded from the index because their inclusion would result in double-counting. |
| 2 | Duration is a measure of the sensitivity of the price – the value of principal – of a fixed-income investment to a change in interest rates. Duration is expressed as a number of years. Bond prices are said to have an inverse relationship with interest rates. Therefore, rising interest rates indicate bond prices are likely to fall, while declining interest rates indicate bond prices are likely to rise. |
| 3 | In COVID-19, 'CO' stands for 'corona,' 'VI' for 'virus,' and 'D' for disease. Formerly, this disease was referred to as “2019 novel coronavirus” or “2019-nCoV”. There are many types of human coronaviruses including some that commonly cause mild upper-respiratory tract illnesses. |
| 4 | Treasury inflation protected securities (TIPS) refer to a treasury security that is indexed to inflation in order to protect investors from the negative effects of inflation. TIPS are considered an extremely low-risk investment because they are backed by the U.S. government and because the par value rises with inflation, as measured by the Consumer Price Index, while the interest rate remains fixed. |
| Semi-Annual Report | March 31, 2020 | 7 |
| Centre Active U.S. Treasury Fund | Manager Commentary |
| | March 31, 2020 (Unaudited) |
The Fund is intended to serve as a tactical (long5, short6 or neutral duration relative to that of the Treasury market) fixed income investment by managing market exposure to achieve performance(i.e., managing interest rate beta7 to achieve alpha8). Over time, it is intended to provide the same distribution yield as the Treasury market with attractive diversification benefits given the underlying core portfolio of Treasury securities. The Adviser’s strategy for the Fund is also designed to accommodate both systematic and unforeseen cash needs, given the ample liquidity of the Treasury market.
The utilization of Treasury securities within an investor’s portfolio asset allocation is designed to provide attractive diversification properties, as the correlation between Treasury market returns and those of the equity market has historically been negative during recession-related “bear” equity markets. The Adviser’s investment discipline for the Fund is designed to identify the risks and opportunities of trends and short-term deviations from those trends in interest rates by combining measures of the Fed’s policies, real growth, inflation expectations, and current bond market valuations. This investment discipline is intended to preserve capital in periods of significant rate increases by decreasing the Fund’s portfolio duration and provide the flexibility to extend portfolio duration when rates are likely to decline.
Market Review & Outlook
While both monetary and fiscal policies are in place in the U.S., according to Austan Goolsbee professor of economics at the University of Chicago and former Chair of the Council of Economic Advisors, “…the difference of virus economics from regular business cycle economics is this paradox that the best thing you can do for the economy has nothing to do with the economy.”9 Non-pharmaceutical interventions, e.g. social distancing, can have a dramatic impact on leveling the mortality curve, increasing the likelihood that businesses can begin to reopen. However, there is currently debate over the types of interventions to be imposed and, given the nature of the intervention, how long it should remain in place. Timeline estimates for the type of non-pharmaceutical interventions in place in the U.S. range between 10 and 18 months. This wide range reflects the concern that, absent the development and deployment of a successful vaccine, there could be a “second wave” of virus infections and deaths in the fall. In research from the Federal Reserve Bank of Philadelphia the authors note “… that moderating the epidemiological response of social distancing according to the models may come at a steep price of extending the duration of the pandemic…”.
The most effective program appears to be that in place in Korea. There is massive surveillance of the civilian population and case (contact) tracking once an infected individual is identified. Quarantine is mandated and is individual specific for the ill as well as contacts even if the contact does not yet show symptoms. This type of program obviously requires significant intrusions into civil liberties and may not be acceptable in the U.S.
To support the “data dependent” FOMC in its need for reliable information in its policy deliberations, a number of academics and federal reserve economists have developed short-term assessment tools. A News Sentiment Index has been developed at the Federal reserve Bank of San Francisco to trace the more popular Michigan and Conference Board Surveys. The News Sentiment Index plunged during March though it has not yet reached the low points of the past three recessions. A weekly economic index developed at the New York Fed has dipped the level reached during the Financial Crisis and associated Great Contraction. A key component of this index is weekly claims for unemployment insurance which surged off the charts with 15,000,000 new filings over the last recorded readings in March. Consistent with its historical relationship with the weekly index, industrial production decreased significantly on a year-over-year basis. Precious metals’ prices declined, and survey-based measures of inflation expectations fell to the 1-1.5% range. In the midst of major health care concerns, deteriorating economic conditions, falling expectations for future inflation and Treasury buying, U.S. Treasury securities experienced significantly greater demand and yields fell to record lows.
Near-term negative real growth in the first and second quarters seems highly likely. In addition to the data cited above, housing starts are down over 20% and, based on late March data, the Nowcast from the Atlanta Fed is for growth of roughly-0.3% in the first quarter with the caveat that the estimate does not include the full effect of the corona-virus while the Blue Chip Survey has real growth down 4%. Consistent with its historical relationship to the newly developed News Sentiment Index, the Michigan Survey registered its fourth largest one-month decline in the index since 1980. Research is consistent with the outcome that a one standard deviation drop in the Michigan survey would likely reduce consumer spending by 2.3%.
Another recently developed short-term economic monitor shows the unemployment rate potentially reaching 20% in April and the elimination of all the jobs gained since the end of the great contraction in June of 2009. The full ripple effects of the current “lockdown”, estimated through an input-output analysis at the Congressional Budget Office, have not yet been felt. Further, income inequality has been exacerbated and broad-based consumer spending affected as those workers most impacted are typically in the lower strata of wage earners. Additionally, lending programs in some instances are snarled in paperwork and/or have already exhausted allocated funds. So, it seems unlikely that the economy could rebound by the second quarter. Going forward the major questions are whether the recovery will be V-shaped, or saucer shaped and when is it likely to begin.
| 5 | Duration is loosely tied to maturity. A fund with a long duration holds bonds that have longer maturities, typically 10 years or more. |
| 6 | A short duration strategy involves buying bonds with shorter-dated maturities and selling long-dated bonds in order to lower the overall price sensitivity to interest rate movements and, as such, minimize potential capital losses. |
| 7 | Beta is a measure of the volatility, or systematic risk, of a security or a portfolio in comparison to the market as a whole. Beta is used in the capital asset pricing model (CAPM), which calculates the expected return of an asset based on its beta and expected market returns. |
| 8 | Alpha is a measure of performance on a risk-adjusted basis. Alpha takes the volatility (price risk) of a mutual fund and compares its risk-adjusted performance to a benchmark index. The excess return of the fund relative to the return of the benchmark index is a fund's alpha. |
| 9 | *National Public Radio, Planet Money (podcast). “Medicine for the Economy,” Episode 979. |
| Centre Active U.S. Treasury Fund | Manager Commentary |
| | March 31, 2020 (Unaudited) |
Our expectation is that the recovery will begin in the third quarter and will be more saucer shaped. It will require for some time the continuation of the security buying program by the Fed as the ZLB precludes further use of conventional policy. Lending support may need to continue as well. The shape and speed depend on damage done. There will likely be some debt overhang, at least for businesses. While any debt problem can be dealt with, outright forgiveness would create excessive liquidity. However, given the low level of inflationary expectations currently and the Fed’s ability to pay interest on reserves, an outbreak of inflation seems problematic. Further, to the extent that organizational capital is destroyed by bankruptcy, it will need to be rebuilt by business formation. Moral hazard could come into play if loans are made to “too big to fail” firms which fail. It will take time to work out any such problems and thus slow the pace of recovery though not derail it. Real growth is unlikely to move above trend until the fourth quarter or perhaps the first quarter of 2021. The vigor of the recovery could be enhanced by development of a successful vaccine or even by a widespread testing program that allows a large portion of the workforce to return to work.
There will be some lasting effects from the pandemic on interest rates in the intermediate term. First, it seems likely that there will be an increase in global risk aversion and hence increased savings and demand for the riskless asset. Increased savings and risk aversion will reduce somewhat the global natural rate of interest at least for a while. Additionally, the term premium demanded will be lower as concerns about increases in short-term rates and inflation will be subdued. This intermediate term effect will eventually be offset as growth resumes and attractive investment opportunities become available, as conventional monetary policy is again feasible and as accelerating inflation is again deemed possible. Ultimately, even if the natural rate is only 1% and the term premium is likewise only 1%, equilibrium for the 10-year Treasury note would be 4%.
Going forward and consistent with history and the current environment, rate behavior seems likely to continue to be cyclical in nature, and jagged or violent in pattern as both market participants and policy makers react and overreact to the impacts of changing economic, inflation, political and unforeseen crisis conditions. Currently, rate behavior reflects uncertainty about the proper approach and length of time required to deal with the health crisis, the ability of monetary and fiscal policies to address its economic impact and any lasting effects of such policies. The Interest Rate Scorecard is designed to anticipate rate moves as the data on growth and inflation measures and bond market prices reflect the changing economic environment due to policy changes or other forces. It indicates portfolio duration adjustments tactically for the benefit of shareholders of the Treasury Fund by taking advantage of rate declines and shielding value against rate increases.
The market outlook is the opinion of the author and can change at any time.
| Semi-Annual Report | March 31, 2020 | 9 |
| Centre Active U.S. Treasury Fund | Manager Commentary |
| | March 31, 2020 (Unaudited) |
ASSET TYPE WEIGHTINGS
As a percentage of Net Assets
| Government Bond | 87.85% |
| Cash, Cash Equivalents, and Other | 12.15% |
| Totals | 100.00% |
These allocations may not reflect the current or future positions of the portfolio.
GROWTH OF HYPOTHETICAL $10,000 INVESTMENT THROUGH MARCH 31, 2020
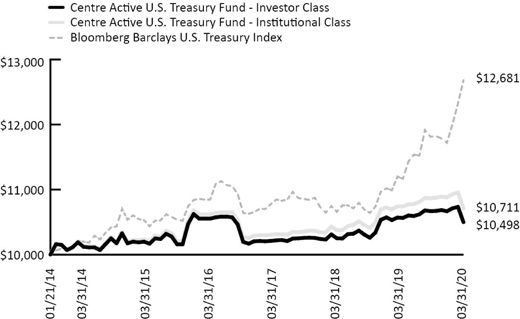
This line graph assumes an initial investment of $10,000 at January 21, 2014, the Fund’s inception date, and that any dividends and distributions are reinvested. This graph depicts the performance of the Fund versus the Bloomberg Barclays U.S. Treasury Index. Unlike the Fund, an index is not available for investment, is unmanaged and does not have expenses that affect the results. The comparison is shown for illustrative purposes only.
TOTAL RETURNS – FOR THE PERIOD ENDED MARCH 31, 2020
| | 1 Month | 3 Month | YTD | 1 Year | 3 Year | 5 Year | Since Inception (January 21, 2014) Average Annualized |
| Centre Active U.S. Treasury Fund – Investor Class | -2.20% | -1.59% | -1.59% | -0.67% | 0.95% | 0.58% | 0.79% |
| Centre Active U.S. Treasury Fund – Institutional Class | -2.23% | -1.55% | -1.55% | -0.27% | 1.33% | 0.93% | 1.12% |
| Bloomberg Barclays U.S. Treasury Index | 2.89% | 8.20% | 8.20% | 13.23% | 5.82% | 3.64% | 3.91% |
The performance information quoted above represents past performance, which is not a guarantee of future results, and does not reflect the deduction of taxes that a shareholder would pay on Fund distributions or the redemption of Fund shares. Investment return and principal value of an investment will fluctuate so that an investor’s shares, when redeemed, may be worth more or less than their original cost. Total return includes reinvestment of dividends and capital gains, if any. Current performance may be lower or higher than the performance data quoted. For the most current month-end performance data, please call 855-298-4236.
Per the prospectus dated January 28, 2020, the Fund had total gross annual operating expenses of 1.37% and 1.13% and net annual operating expenses of 1.11% and 0.67% for the Investor and Institutional Class, respectively.
Bloomberg Barclays U.S. Treasury Index – includes public obligations of the U.S. Treasury. Treasury bills are excluded by the maturity constraint but are part of a separate Short Treasury Index. In addition, certain special issues, such as state and local government series bonds (SLGs), as well as U.S. Treasury TIPS, are excluded. STRIPS are excluded from the index because their inclusion would result in double-counting. You cannot invest directly into an index.
| Centre Global Infrastructure Fund | Manager Commentary |
| | March 31, 2020 (Unaudited) |
Performance & Strategy Summary
For the six-month period ended March 31, 2020, the Centre Global Infrastructure Fund (the “Fund”), Investor Share Class, delivered a total return of-20.22 percent; the Institutional Share Class delivered a total return of-20.14 percent.
During this past six-month period, the MSCI World Index1 and MSCI World Infrastructure Index2 delivered a total return of percent-14.30 and-15.24 percent, respectively. The strongest contributors to performance within the Fund over the six-month period ended March 31, 2020 included the Fund’s investments within the Energy sector, TC Energy and CenterPoint Energy; within Telecom, Bezeq Israeli Telecom, Spark New Zealand and Verizon; and within Utilities, China Resources Gas, CLP Holdings and Hong Kong & China Gas. Stock investments that contributed negatively to relative underperformance over the period included ONEOK, Williams Companies, Grupo Aeroportuario del Pacífico, and Kinder Morgan. From a sector allocation standpoint, being overweight Energy and Industrials due to the Fund’s balanced portfolio construction approach across infrastructure-related areas detracted from the Fund’s performance during the period versus the MSCI World Infrastructure Index. (The Fund is diversified across regions and developed countries as well as balanced across Telecommunication Infrastructure; Utilities; and the Energy, Transportation, and Social Infrastructure sectors.)
Over the past 20 years, global listed infrastructure securities as an asset class have demonstrated upside capture versus global equities of 83.8 percent while only capturing 61.7 percent of the global equity market downside. During the previous market sell-off from September 30, 2018 to December 31, 2018, the Fund exhibited only a 49.6 percent downside capture and then, during the 9-month period of recovery from December 31, 2018 to September 30, 2019, the Fund realized a 107.83 percent upside capture. However, during the most recent market selloff that began in February 2020, Technology, Health Care and other traditional growth areas of the broader market performed relatively strong while more value-oriented and cyclical sectors such as Industrials and Energy, in particular, fared quite poorly.
Global listed infrastructure securities remain a compelling investment option, characterized by high dividend yields, stable cash flows and attractive risk-adjusted performance while offering a long-term hedge against inflation. Despite significant funding gaps for infrastructure in developed markets, and the years of debate about replacing outdated backbone systems, infrastructure investment has declined as a share of GDP (Gross Domestic Product) in more than half of the G20 economies since the global financial crisis. Years of underinvestment in critical areas such as transportation, water treatment, and power grids could erode future growth potential and productivity. Municipalities are now focusing efforts on connecting institutional investors with projects that need their capital as well as creating an expanded role for public-private partnerships and tax and other incentives to undertake infrastructure investment. We believe the majority of the infrastructure funding gap will likely be financed by the private sector, creating significant opportunities within publicly traded global listed infrastructure assets, especially in the Telecom and other innovative areas where the intellectual capital resides.
Infrastructure is also a defensive asset class because of the characteristics of the underlying assets owned by many global listed infrastructure companies including: 1) inelastic demand due to the essential nature of the assets used in everyday life; 2) high barriers to entry due to the critical and often irreplaceable nature of the assets; and 3) contracted revenue streams that offer inflation protection in many cases. Conventional wisdom holds that you invest in bonds for yield and equities for capital appreciation. While this might be true historically, with 10-Year Treasury yields collapsing over the past 12 months, infrastructure related stocks now offer the best of both. Currently, the 5.1% underlying yield3 of the Fund supersedes the S&P 500 Index’s dividend yield of 2.1% as well as all maturities of Treasury bond yields. From a sector perspective, Infrastructure related sectors such as Telecom (4.4%), Energy (7.1%), Industrials (5.1%), and Utilities (4.1%) are all well above the market.
The Fund offers several key differentiators from the broader global equity set of investable companies, as well as core infrastructure universes including: 1) historically, the MSCI Global Infrastructure Index has generated a dividend yield greater than the yield on conventional core equity indices like the MSCI World Index; 2) the Fund pays distributions of dividend and interest income monthly rather than annually; 3) hard assets like infrastructure assets tend to retain their “real” value through the long-term; 4) historically, infrastructure indices’ volatility is lower than on conventional equity indices like the MSCI World Index; 5) historically, high Economic Value Added4 (EVA) companies have outperformed low EVA ones; and 6) many infrastructure assets have concession agreements or long-term contracts that link to inflation in the long run. In identifying firms with sustainable pricing power, the Fund seeks investments that exhibit high barriers to entry in their segments and that create positive externalities in their regions. The Fund focuses on industries with lower volatility such as toll roads, power stations, hospitals and schools. Also, by targeting high EVA growth companies, the Fund narrows its focus to high quality infrastructure firms that make wise capital allocation decisions. Through our “bottoms-up” analysis, we seek to avoid names that destroy shareholder wealth by either “empire building” or under-investment. Additionally, the stock-selection approach standardizes accounting across countries which facilitates cross-border comparisons between the best U.S. infrastructure names and international firms. From a portfolio management perspective, the Fund is able take active strategic and tactical bets across sectors and regions based on opportunity sets we see in the market.
| 1 | MSCI World Index is a broad global equity benchmark that represents large and mid-cap equity performance across 23 developed markets countries. |
| 2 | MSCI World Infrastructure Index captures the global opportunity set of companies that are owners or operators of infrastructure assets. Constituents are selected from the equity universe of MSCI World, the parent index. |
| 4 | Economic Value Added (EVA) is an estimate of a company’s economic profit. Economic profit, which refers to the profit earned by a company, minus the cost of financing the company’s capital, is an amount that may be considered in the assessment of a company’s overall value. |
| Semi-Annual Report | March 31, 2020 | 11 |
| Centre Global Infrastructure Fund | Manager Commentary |
| | March 31, 2020 (Unaudited) |
Market Review & Outlook
We remain upbeat on global telecom, cable and communications infrastructure industries (“Telcos”). The sell-off in markets due to COVID-195 and the impact of lower oil prices on high-yield credit has been severe and sharp. The Telcos have fared only slightly better, which is disappointing, especially as most have reported increased network usage due to home-working and school closures. Telcos are reporting an increase in both data and voice calls (fixed as well as mobile). On this basis, it appears that a large part of the sector has been oversold relative to predicted performance. Looking back at the credit crunch of 2008, we note a similar performance of the Telcos, which sold off with the market by roughly 30% before outperforming. From October 2008 to March 2009 the Telcos then outperformed a still-falling market in excess of 40%. Having been struck by the similar levels of Telco performance in the early stages of the sell-off in both 2008 and 2020, we view the subsequent outperformance in 2008/09 as supportive for the sector today. 5G deployments and mobile data are arguably now more essential for many customers, and recently reported mobile and fixed traffic growth of 60-70% could lead to the upsell of bigger bundles and faster connections. Overall, we view that Telcos have been harshly treated in the recent market sell-off, likely substantially due to liquidity factors, and will likely see minimal impact from the virus or credit market contagion in the near medium-term (other sectors will likely see a more immediate impact from these factors in Q1/Q2 earnings).
With many countries in lockdown requiring the population to work from home, data usage is expected to surge, which is positive for communication assets such as fiber, towers and data centers. This pandemic may also make companies rethink their disaster recovery plans and lead to a longer-term boost to network and data center activity. We believe the Fund’s top holding Verizon (VZ) offers the most attractive combination of total return and risk for three key reasons: 1) Stable/growing EPS and FCF even in a tougher economy, 2) Attractive dividend yield (4.3%) which is well covered (50% 2020E FCF payout), 3) Strong balance sheet; with 2.0x net unsecured debt/EBITDA6, Verizon is among the least-levered large cap US telecom and cable operators.
As most utilities are declared an essential service, earnings of companies in the utility sector are relatively insulated from the COVID-19 lockdown compared to other sectors. As a highly regulated business, the sector has minor exposure to demand trends (mainly in electricity transmission and gas transportation) and predictable revenues. As of mid-April, the utilities sector is trading 14% below its record February 18th high. By comparison, the broad-based S&P 500 has fallen almost 18% over the same period. Utilities will continue to supply power, supported by long-term power purchase agreements (PPA), however demand for power has fallen in certain areas as Industrial clients and commercial consumers have logged off from the electrical network. While many utility assets will benefit from the increased residential demand, some firms are struggling due to the closure of their enterprises and, with a strong rise in unemployment, there is a greater risk of non-payment than normal.
Regulated utility networks remain resilient to the near-term volatility, given their cash flows are protected by regulations or long-term contracts. This is evident in the outperformance of Duke Energy (DUK.US), NextEra (NEE.US), and Xcel Energy (XEL.US). Pure play regulated utilities appear well-positioned for a risky market as companies like Consolidated Edison (ED.US) and Eversource (ES.US) have virtually no commodity exposure and sell primarily to residential customers. American Electric Power (AEP.US) has more industrial sales, including in the oil patch, yet also boasts a strong balance sheet, diversified territories and growth potential. The Chinese utility sector outperformed the Hang Seng Index7 (HSI) in 2003 during the spread of SARS8, especially the gas distributors and independent power producers (IPP) such as China Recourses Gas (1193.HK). The dent to energy retailers and waste companies' profit will likely be front-end loaded, while hedging should soften the hit for power generators. We continue to prefer Utilities over Energy, as the companies offer (1) superior returns, (2) lower risk profiles, (3) more sustainable dividends and (4) a better ESG profile.
On April 12, OPEC+9 (Organization of the Petroleum Exporting Countries) announced its largest-ever production cut of 9.7 mbpd (million barrels per day) effective May 1, 2020 through June 30, 2020 with October 2018 output levels used as the baseline for all members except for Saudi Arabia and Russia (both using 11.0 mbpd). The cut would reduce to 7.7 mbpd effective July 1, 2020 through December 31, 2020 and then decrease further to 5.8 mbpd effective January 1, 2021 through April 30, 2022 (subject to review in December 2021). Iran, Venezuela, and Libya are exempt from the cuts. In our view, the announced production cut is better than expected in terms of magnitude (consensus was ~8.5 mbpd) and duration (consensus was for OPEC+ cuts through 2020) and will slow the pace of inventory builds, however it will still not be enough given the 20 mbpd supply overhang expected for the 2Q20. We estimate markets are 6.3 mbpd oversupplied in 2020 and 6.6 mbpd undersupplied in 2021. We believe the inventory surplus will be removed by 2H21, which assumes full compliance with OPEC+ cuts, U.S. operators continuing to operate in survival mode in 2021 (no rig adds), and economic activity returning to pre-COVID-19 levels in 2021. In terms of oil price, we believe prices will remain depressed throughout most of 2020 ($25-35/bbl. WTI) as the market suppresses discretionary development and forces shut-ins of higher-priced oil. We expect to see a recovery towards late 4Q20 and early 2021 ($45-50/bbl. WTI) as inventory draws materialize and higher prices are required to address the projected undersupplied market in 2022. While far from unscathed, Kinder Morgan (KMI.US), we believe, is better positioned than peers to withstand the oil collapse. Contracted natural gas pipelines and more floating rate debt than peers are mitigants in the current environment. However, KMI's CO2 business, refined products pipelines and (modest) G&P businesses will be impacted. We expect KMI's incremental capital return ambitions to be pushed out, but we do see KMI's current dividend (6.78%) as secure.
| 5 | In COVID-19, 'CO' stands for 'corona,' 'VI' for 'virus,' and 'D' for disease. Formerly, this disease was referred to as “2019 novel coronavirus” or “2019-nCoV”. There are many types of human coronaviruses including some that commonly cause mild upper-respiratory tract illnesses. |
| 6 | The net unsecured debt-to-EBITDA (earnings before interest depreciation and amortization) ratio is a measurement of leverage, calculated as a company’s interest-bearing liabilities minus cash or cash equivalents, dividend by its EBITDA. |
| 7 | The Hang Seng Index is a free float-adjusted market-capitalization-weighted stock-market index in Hong Kong. It is used to record and monitor daily changes of the largest companies of the Hong Kong stock market and is the main indicator of the overall market performance in Hong Kong. |
| 8 | SARS is a contagious and sometimes fatal respiratory illness caused by a coronavirus. SARS appeared in 2002 in China. It spread worldwide within a few months, though it was quickly contained. |
| 9 | OPEC+ refers to OPEC’s cooperation with non-OPEC oil producers to effect production cuts. In an attempt to cut production and raise oil prices, OPEC, which currently comprises 15 member countries, came together and agreed on a production cut where each member country would cut production by a small amount. In addition to including OPEC countries in this production cut, OPEC invited non-OPEC nations, mainly Russia and former U.S.S.R. states like Azerbaijan that are still heavily influenced by Russia. |
| Centre Global Infrastructure Fund | Manager Commentary |
| | March 31, 2020 (Unaudited) |
As with previous pandemics such as SARS and Ebola, transportation infrastructure (airports, roads, tunnels, and rail tracks, and marine ports) are likely to be the hardest hit sector. In addition to being highly correlated to GDP, the extensive travel bans being imposed globally will have a detrimental impact on the industry. The Airports Council International Europe (ACI) has provided some early indications of the impact, saying that European passenger traffic was down 54% in the week between 9-15 March compared to a year ago. The International Air Transport Association (IATA) estimates demand could tumble 38% Y/Y in 2020, resulting in $252 billion in revenue losses. Clearly, a complete travel ban could completely wipe out earnings for some airports leading to a liquidity crisis. Airports will be able to flex some costs to mitigate a decline in passengers but around 80% of its members' costs are fixed. Ports have fared better to date, perhaps reflecting their lower exposure to passengers and that they may not yet feel the full impact of the China shutdown. Trade continues to flow but ultimately the future outlook for the sector is intrinsically linked to the production levels in China and the rest of the world.
Road transport is regarded as crucial for essential services during the coronavirus pandemic, however, Transurban (TCL.US) had been significantly affected by the COVID-19 crisis, with traffic falling almost 40% on Melbourne Australia toll roads. We assume global toll roads, airports and ferry traffic will be severely disrupted for five months, more than was seen in the immediate aftermath of the AH1N110 outbreak. We believe select areas of transportation infrastructure will realize a V-shaped recovery, with the bottom in 2Q20. Our high level takeaway is that COVID-19 has potential to significantly accelerate consumer adoption of e-commerce (which today is still less than 15% of U.S. retail sales ex. auto and gas). With higher B2C (business-to-consumer) shipments assumed post COVID-19 we believe when the dust settles there will be attractive entry points within transportation infrastructure as discretionary cargo demand could recover sharply. We are monitoring the discretionary container trade sector for a good entry point when exports/imports hit trough levels for China Merchants Port Holdings Co (144.HK), Costamare Inc. (CMRE.US), Matson, Inc. (MATX.US), and Seaspan Corporation (SSW.US).
President Trump recirculated his proposal for a massive infrastructure bill that calls for investing US$2 trillion in infrastructure. Trump has long advocated for an infrastructure plan; in his 2018 State of the Union address, he called on Congress to dedicate more than US$1.5 trillion in new infrastructure investments. The final plan never came to fruition due to disagreements with Democrats over federal funding. We believe Trump might get more support for his infrastructure bill this time around given the significant economic disruption caused by COVID-19. We note that the White House and Congress have already started to discuss a fourth round of stimulus to combat the economic fallout from the outbreak. Interestingly, Speaker Pelosi recently mentioned the prospect of infrastructure legislation as part of the next round of fiscal stimulus.
We believe the Fund will perform relatively well with exposure to favorable areas of the world’s equity markets. Also, undervalued international infrastructure-related stocks with strong balance sheets and free cash flows, solid dividend yields, and cyclically depressed profits are poised to outperform in our opinion. The Fund is positioned by targeting energy, telecom, industrials, and other undervalued areas of globally listed infrastructure industries and sub-sectors. The combination of low embedded growth and a robust stream of income payments effectively lowers the duration of the portfolio and, if interest rates rise, this will help protect against a broader based contraction in valuation multiples. Lastly, the Fund’s unique exposure to next-generation global infrastructure adjacencies, including public cloud deployments, data center monitoring, cybersecurity, and IIoT (Industrial Internet of Things) is a key differentiator against legacy managed infrastructure portfolios, which overlook these powerful trends within the industry. Despite the negative performance drag from the Energy sector in 2020, we continue to believe that our combined approach of differentiated stock selection and portfolio construction, whereby the Fund is diversified across regions and developed countries as well as balanced across Telecommunication Infrastructure; Utilities; and the Energy, Transportation, and Social Infrastructure sectors is the most favorable for investors seeking to feature listed infrastructure investments as part of an overall balanced portfolio.
| 10 | Influenza A virus subtype H1N1 is the subtype of Influenza A virus that was the most common cause of human influenza in 2009, and is associated with the 1918 Spanish flu outbreak. |
The market outlook is the opinion of the author and can change at any time.
| Semi-Annual Report | March 31, 2020 | 13 |
| Centre Global Infrastructure Fund | Manager Commentary |
| | March 31, 2020 (Unaudited) |
INDUSTRY WEIGHTINGS
As a percentage of Net Assets
| Diversified Telecommunication Services | 27.37% |
| Oil, Gas & Consumable Fuels | 20.13% |
| Electric Utilities | 15.92% |
| Wireless Telecommunication Services | 9.43% |
| Multi-Utilities | 8.42% |
| Transportation Infrastructure | 5.07% |
| Water Utilities | 3.67% |
| Health Care Providers & Services | 3.19% |
| Independent Power and Renewable Electricity Producers | 2.78% |
| Gas Utilities | 2.05% |
| Cash and Cash Equivalents | 1.97% |
| Totals | 100.00% |
COUNTRY WEIGHTINGS
As a percentage of Net Assets
| United States | 46.30% |
| Canada | 10.75% |
| Japan | 8.16% |
| Italy | 3.94% |
| Australia | 3.77% |
| Hong Kong | 3.65% |
| Spain | 3.63% |
| Great Britain | 2.82% |
| Germany | 2.39% |
| Greece | 1.78% |
| Israel | 1.77% |
| New Zealand | 1.69% |
| Mexico | 1.68% |
| Chile | 1.63% |
| China | 1.61% |
| Brazil | 1.49% |
| France | 0.97% |
| Cash and Cash Equivalents | 1.97% |
| Totals | 100.00% |
These allocations may not reflect the current or future positions of the portfolio.
GROWTH OF HYPOTHETICAL $10,000 INVESTMENT THROUGH MARCH 31, 2020
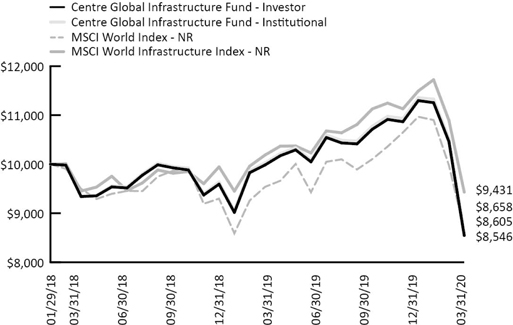
This graph assumes an initial investment of $10,000 at January 29, 2018, the Fund’s inception date, and that any dividends and distributions are reinvested. This graph depicts the performance of the Fund versus the MSCI World Index and the MSCI World Infrastructure Index. Taxes on any Fund distributions or when shares are redeemed, if any, are not reflected. Unlike the Fund, an index is not available for investment, is unmanaged and does not have expenses that affect the results. The comparison is shown for illustrative purposes only.
TOTAL RETURNS – FOR THE PERIOD ENDED MARCH 31, 2020
| | | | | | Since Inception |
| | 1 Month | 3 Month | YTD | 1 Year | (January 29, 2018) |
| Centre Global Infrastructure Fund – Investor | -18.32% | -24.34% | -24.34% | -15.99% | -6.99% |
| Centre Global Infrastructure Fund – Institutional | -18.32% | -24.23% | -24.23% | -15.78% | -6.70% |
| MSCI World Index – NR | -13.23% | -21.05% | -21.05% | -10.39% | -6.43% |
| MSCI World Infrastructure Index – NR | -13.43% | -17.93% | -17.93% | -9.03% | -2.66% |
The performance information quoted above represents past performance, which is not a guarantee of future results, and does not reflect the deduction of taxes that a shareholder would pay on Fund distributions or the redemption of Fund shares. Investment return and principal value of an investment will fluctuate so that an investor’s shares, when redeemed, may be worth more or less than their original cost. Total return includes reinvestment of dividends and capital gains, if any. Current performance may be lower or higher than the performance data quoted. For the most current month-end performance data, please call 855-298-4236.
Per the prospectus dated January 28, 2020, the Fund had total gross annual operating expenses of 1.89% and 1.61% and net annual operating expenses of 1.37% and 1.14% for the Investor and Institutional Class, respectively.
The MSCI World Index is a broad global equity index that represents large and mid-cap equity performance across 23 developed markets countries. It covers approximately 85% of the free float-adjusted market capitalization in each country. The MSCI World Index does not offer exposure to emerging markets.
MSCI World Infrastructure Index captures the global opportunity set of companies that are owners or operators of infrastructure assets. Constituents are selected from the equity universe of MSCI World, the parent index.
You cannot invest directly in an index.
| Centre Funds | Disclosure of Fund Expenses |
| | March 31, 2020 (Unaudited) |
Example. As a shareholder of a series of Centre Funds (each series, a “Fund” and together, the “Funds”), you will incur two types of costs: (1) transaction costs, including any applicable redemption fees; and (2) ongoing costs, including management fees, distribution and/or service (12b-1) fees (if applicable) and other Fund expenses. The following examples are intended to help you understand your ongoing costs (in dollars) of investing in a Fund and to compare these costs with the ongoing costs of investing in other mutual funds. The examples are based on an investment of $1,000 invested on October 1, 2019 and held through March 31, 2020.
Actual Expenses.The first line under each class of the table below provides information about actual account values and actual expenses. You may use the information in this line, together with the amount you invested, to estimate the expenses that you paid over the period. Simply divide your account value by $1,000 (for example, an $8,600 account value divided by $1,000 = 8.6), then multiply the result by the number in the first line under the heading “Expenses Paid During Period 10/01/2019 – 03/31/2020” to estimate the expenses you paid on your account during this period.
Hypothetical Example for Comparison Purposes.The second line under each class of the table below provides information about hypothetical account values and hypothetical expenses based on each Fund’s actual expense ratio and an assumed rate of return of 5% per year before expenses, which is not the Fund’s actual return. The hypothetical account values and expenses may not be used to estimate the actual ending account balance or expenses you paid for the period. You may use this information to compare the ongoing costs of investing in a Fund and to other funds. To do so, compare this 5% hypothetical example with the 5% hypothetical examples that appear in the shareholder reports of the other funds. Please note that the expenses shown in the table are meant to highlight your ongoing costs only and do not reflect any transactional costs, such as redemption fees, if any. Therefore, the second line under each class of the table below is useful in comparing ongoing costs only, and will not help you determine the relative total costs of owning different funds. In addition, if these transactional costs were included, your costs would have been higher.
| | | Beginning Account Value 10/01/19 | | | Ending Account Value 03/31/20 | | | Expense Ratio(a) | | | Expenses Paid During Period 10/1/2019-3/31/2020(b) | |
| Centre American Select Equity Fund | | | | | | | | | | | | | | | | |
| Investor Class | | | | | | | | | | | | | | | | |
| Actual | | $ | 1,000.00 | | | $ | 959.90 | | | | 1.46 | % | | $ | 7.15 | |
| Hypothetical (5% return before expenses) | | $ | 1,000.00 | | | $ | 1,017.70 | | | | 1.46 | % | | $ | 7.36 | |
| Institutional Class | | | | | | | | | | | | | | | | |
| Actual | | $ | 1,000.00 | | | $ | 962.50 | | | | 0.98 | % | | $ | 4.81 | |
| Hypothetical (5% return before expenses) | | $ | 1,000.00 | | | $ | 1,020.10 | | | | 0.98 | % | | $ | 4.95 | |
| Centre Active U.S. Treasury Fund | | | | | | | | | | | | | | | | |
| Investor Class | | | | | | | | | | | | | | | | |
| Actual | | $ | 1,000.00 | | | $ | 984.00 | | | | 1.11 | % | | $ | 5.51 | |
| Hypothetical (5% return before expenses) | | $ | 1,000.00 | | | $ | 1,019.45 | | | | 1.11 | % | | $ | 5.60 | |
| Institutional Class | | | | | | | | | | | | | | | | |
| Actual | | $ | 1,000.00 | | | $ | 985.60 | | | | 0.63 | % | | $ | 3.13 | |
| Hypothetical (5% return before expenses) | | $ | 1,000.00 | | | $ | 1,021.85 | | | | 0.63 | % | | $ | 3.18 | |
| Centre Global Infrastructure Fund | | | | | | | | | | | | | | | | |
| Investor Class | | | | | | | | | | | | | | | | |
| Actual | | $ | 1,000.00 | | | $ | 797.80 | | | | 1.25 | % | | $ | 5.62 | |
| Hypothetical (5% return before expenses) | | $ | 1,000.00 | | | $ | 1,018.75 | | | | 1.25 | % | | $ | 6.31 | |
| Institutional Class | | | | | | | | | | | | | | | | |
| Actual | | $ | 1,000.00 | | | $ | 798.60 | | | | 1.00 | % | | $ | 4.50 | |
| Hypothetical (5% return before expenses) | | $ | 1,000.00 | | | $ | 1,020.00 | | | | 1.00 | % | | $ | 5.05 | |
| (a) | Annualized, based on the Fund's most recent fiscal half year expenses less any waivers/reimbursements. |
| (b) | Expenses are equal to the Fund's annualized expense ratio, multiplied by the average account value over the period, multiplied by the number of days in the most recent fiscal half year (183), divided by 366. |
| Semi-Annual Report | March 31, 2020 | 15 |
| Centre American Select Equity Fund | Schedule of Investments |
| | March 31, 2020 (Unaudited) |
| | | Shares | | | Value | |
| COMMON STOCKS (99.61%) | | | | | | | | |
| Communication Services (13.21%) | | | | | | | | |
| Diversified Telecommunication Services (3.27%) | | | | | | | | |
| AT&T, Inc. | | | 57,710 | | | $ | 1,682,247 | |
| Verizon Communications, Inc. | | | 26,000 | | | | 1,396,980 | |
| | | | | | | | 3,079,227 | |
| Entertainment (1.28%) | | | | | | | | |
| Netflix, Inc.(a) | | | 3,200 | | | | 1,201,600 | |
| | | | | | | | | |
| Interactive Media & Services (8.66%) | | | | | | | | |
| Alphabet, Inc., Class A(a) | | | 2,200 | | | | 2,556,290 | |
| Alphabet, Inc., Class C(a) | | | 2,195 | | | | 2,552,368 | |
| Facebook, Inc., Class A(a) | | | 18,190 | | | | 3,034,092 | |
| | | | | | | | 8,142,750 | |
| Total Communication Services | | | | | | | 12,423,577 | |
| | | | | | | | | |
| Consumer Discretionary (7.46%) | | | | | | | | |
| Internet & Direct Marketing Retail (6.32%) | | | | | | | | |
| Amazon.com, Inc.(a) | | | 3,050 | | | | 5,946,646 | |
| | | | | | | | | |
| Specialty Retail (1.14%) | | | | | | | | |
| The Home Depot, Inc. | | | 5,730 | | | | 1,069,848 | |
| | | | | | | | | |
| Total Consumer Discretionary | | | | | | | 7,016,494 | |
| | | | | | | | | |
| Consumer Staples (21.68%) | | | | | | | | |
| Beverages (2.45%) | | | | | | | | |
| Molson Coors Beverage Co., Class B | | | 59,000 | | | | 2,301,590 | |
| | | | | | | �� | | |
| Food Products (13.08%) | | | | | | | | |
| Bunge, Ltd. | | | 75,500 | | | | 3,097,765 | |
| Hain Celestial Group, Inc.(a) | | | 84,740 | | | | 2,200,698 | |
| Ingredion, Inc. | | | 30,500 | | | | 2,302,750 | |
| JM Smucker Co. | | | 19,360 | | | | 2,148,960 | |
| Kraft Heinz Co. | | | 103,000 | | | | 2,548,220 | |
| | | | | | | | 12,298,393 | |
| Household Products (1.26%) | | | | | | | | |
| Procter & Gamble Co. | | | 10,800 | | | | 1,188,000 | |
| | | | | | | | | |
| Tobacco (4.89%) | | | | | | | | |
| Altria Group, Inc. | | | 66,000 | | | | 2,552,220 | |
| Philip Morris International, Inc. | | | 28,000 | | | | 2,042,880 | |
| | | | | | | | 4,595,100 | |
| Total Consumer Staples | | | | | | | 20,383,083 | |
| | | | | | | | | |
| Energy (5.39%) | | | | | | | | |
| Energy Equipment & Services (1.36%) | | | | | | | | |
| Schlumberger Ltd. | | | 95,000 | | | | 1,281,550 | |
| | | | | | | | | |
| Oil, Gas & Consumable Fuels (4.03%) | | | | | | | | |
| Kinder Morgan, Inc. | | | 130,000 | | | | 1,809,600 | |
| The Williams Cos., Inc. | | | 140,000 | | | | 1,981,000 | |
| | | | | | | | 3,790,600 | |
| Total Energy | | | | | | | 5,072,150 | |
| | | Shares | | | Value | |
| Financials (1.05%) | | | | | | | | |
| Banks (1.05%) | | | | | | | | |
| JPMorgan Chase & Co. | | | 11,000 | | | $ | 990,330 | |
| | | | | | | | | |
| Total Financials | | | | | | | 990,330 | |
| | | | | | | | | |
| Health Care (13.33%) | | | | | | | | |
| Health Care Equipment & Supplies (5.98%) | | | | | | | | |
| Abbott Laboratories | | | 41,000 | | | | 3,235,310 | |
| Medtronic PLC | | | 26,500 | | | | 2,389,770 | |
| | | | | | | | 5,625,080 | |
| Life Sciences Tools & Services (0.91%) | | | | | | | | |
| Thermo Fisher Scientific, Inc. | | | 3,020 | | | | 856,472 | |
| | | | | | | | | |
| Pharmaceuticals (6.44%) | | | | | | | | |
| Eli Lilly & Co. | | | 16,800 | | | | 2,330,496 | |
| Johnson & Johnson | | | 8,200 | | | | 1,075,266 | |
| Merck & Co., Inc. | | | 34,400 | | | | 2,646,736 | |
| | | | | | | | 6,052,498 | |
| Total Health Care | | | | | | | 12,534,050 | |
| | | | | | | | | |
| Information Technology (29.06%) | | | | | | | | |
| IT Services (4.83%) | | | | | | | | |
| Mastercard, Inc., Class A | | | 6,700 | | | | 1,618,452 | |
| PayPal Holdings, Inc.(a) | | | 8,720 | | | | 834,853 | |
| Visa, Inc., Class A | | | 12,980 | | | | 2,091,337 | |
| | | | | | | | 4,544,642 | |
| Semiconductors & Semiconductor Equipment (4.34%) | | | | | | | | |
| Intel Corp. | | | 18,100 | | | | 979,572 | |
| Maxim Integrated Products, Inc. | | | 39,400 | | | | 1,915,234 | |
| NVIDIA Corp. | | | 4,500 | | | | 1,186,200 | |
| | | | | | | | 4,081,006 | |
| Software (11.61%) | | | | | | | | |
| Adobe Systems, Inc.(a) | | | 3,580 | | | | 1,139,299 | |
| Microsoft Corp. | | | 55,997 | | | | 8,831,287 | |
| salesforce.com, Inc.(a) | | | 6,610 | | | | 951,708 | |
| | | | | | | | 10,922,294 | |
| Technology Hardware, Storage & Peripherals (8.28%) | | | | | | | | |
| Apple, Inc. | | | 30,600 | | | | 7,781,274 | |
| | | | | | | | | |
| Total Information Technology | | | | | | | 27,329,216 | |
| | | | | | | | | |
| Materials (5.34%) | | | | | | | | |
| Metals & Mining (5.34%) | | | | | | | | |
| Barrick Gold Corp. | | | 273,960 | | | | 5,018,947 | |
| | | | | | | | | |
| Total Materials | | | | | | | 5,018,947 | |
| | | | | | | | | |
| Utilities (3.09%) | | | | | | | | |
| Independent Power and Renewable Electricity Producers (1.52%) | | | | | | | | |
| AES Corp. | | | 105,000 | | | | 1,428,000 | |
| Centre American Select Equity Fund | Schedule of Investments |
| | March 31, 2020 (Unaudited) |
| | | Shares | | | Value | |
| Utilities (continued) | | | | | | | | |
| Multi-Utilities (1.57%) | | | | | | | | |
| Dominion Energy, Inc. | | | 20,500 | | | $ | 1,479,895 | |
| | | | | | | | | |
| Total Utilities | | | | | | | 2,907,895 | |
| | | | | | | | | |
| TOTAL COMMON STOCKS | | | | | | | | |
| (Cost $76,229,824) | | | | | | | 93,675,742 | |
| | | | | | | | | |
| TOTAL INVESTMENTS (99.61%) | | | | | | | | |
| (Cost $76,229,824) | | | | | | $ | 93,675,742 | |
| Other Assets In Excess Of Liabilities (0.39%) | | | | | | | 371,271 | |
| NET ASSETS (100.00%) | | | | | | $ | 94,047,013 | |
| (a) | Non-income producing security. |
See Notes to Financial Statements.
| Semi-Annual Report | March 31, 2020 | 17 |
| Centre Active U.S. Treasury Fund | Schedule of Investments |
| | March 31, 2020 (Unaudited) |
| | | Principal Amount | | | Value | |
| U.S. GOVERNMENT BONDS & NOTES (87.85%) | | | | | | | | |
| U.S. Treasury Bond (52.71%) | | | | | | | | |
| 8/15/2020, 8.750% | | $ | 5,500,000 | | | $ | 5,676,816 | |
| 5/15/2027, 2.375% | | | 700,000 | | | | 790,016 | |
| 2/15/2043, 3.125% | | | 3,410,000 | | | | 4,664,773 | |
| 5/15/2044, 3.375% | | | 3,280,000 | | | | 4,690,144 | |
| Total U.S. Treasury Bond | | | | | | | 15,821,749 | |
| | | | | | | | | |
| U.S. Treasury Notes (35.14%) | | | | | | | | |
| 7/31/2021, 2.250% | | | 2,200,000 | | | | 2,260,285 | |
| 11/15/2022, 1.625% | | | 2,100,000 | | | | 2,174,607 | |
| 5/15/2024, 2.500% | | | 2,100,000 | | | | 2,285,473 | |
| 8/15/2024, 2.375% | | | 1,600,000 | | | | 1,740,313 | |
| 11/15/2025, 2.250% | | | 1,900,000 | | | | 2,087,402 | |
| Total U.S. Treasury Notes | | | | | | | 10,548,080 | |
| | | | | | | | | |
| TOTAL U.S. GOVERNMENT BONDS & NOTES | | | | | | | | |
| (Cost $22,986,896) | | | | | | | 26,369,829 | |
| | | 7-Day Yield | | | Shares | | | Value | |
| SHORT TERM INVESTMENTS (6.26%) | | | | | | | | | | | | |
| Money Market Fund (6.26%) | | | | | | | | | | | | |
| Dreyfus Treasury Prime Cash Management, Institutional Class | | | 0.543 | % | | | 1,880,524 | | | | 1,880,524 | |
| | | | | | | | | | | | | |
| TOTAL SHORT TERM INVESTMENTS | | | | | | | | | | | | |
| (Cost $1,880,524) | �� | | | | | | | | | | 1,880,524 | |
| | | | | | | | | | | | | |
| TOTAL INVESTMENTS (94.11%) | | | | | | | | | | | | |
| (Cost $24,867,420) | | | | | | | | | | $ | 28,250,353 | |
| Other Assets In Excess Of Liabilities (5.89%) | | | | | | | | | | | 1,767,717 | |
| NET ASSETS (100.00%) | | | | | | | | | | $ | 30,018,070 | |
See Notes to Financial Statements.
| Centre Global Infrastructure Fund | Schedule of Investments |
| | March 31, 2020 (Unaudited) |
| | | Shares | | | Value | |
| COMMON STOCKS (98.03%) | | | | | | |
| ASIA(18.89%) | | | | | | |
| Australia (3.77%) | | | | | | |
| Multi-Utilities (1.84%) | | | | | | | | |
| AGL Energy, Ltd. | | | 42,600 | | | $ | 450,435 | |
| | | | | | | | | |
| Transportation Infrastructure (1.93%) | | | | | | | | |
| Transurban Group | | | 64,030 | | | | 474,194 | |
| | | | | | | | | |
| Total Australia | | | | | | | 924,629 | |
| | | | | | | | | |
| China (1.61%) | | | | | | | | |
| Independent Power and Renewable Electricity Producers (1.61%) | | | | | | | | |
| Datang International Power Generation Co., Ltd. | | | 2,950,000 | | | | 395,731 | |
| | | | | | | | | |
| Total China | | | | | | | 395,731 | |
| | | | | | | | | |
| Hong Kong (3.65%) | | | | | | | | |
| Gas Utilities (2.06%) | | | | | | | | |
| China Resources Gas Group, Ltd. | | | 100,200 | | | | 504,053 | |
| | | | | | | | | |
| Water Utilities (1.59%) | | | | | | | | |
| Beijing Enterprises Water Group, Ltd. | | | 1,000,000 | | | | 390,829 | |
| | | | | | | | | |
| Total Hong Kong | | | | | | | 894,882 | |
| | | | | | | | | |
| Japan (8.17%) | | | | | | | | |
| Diversified Telecommunication Services (1.29%) | | | | | | | | |
| Nippon Telegraph & Telephone Corp. | | | 13,200 | | | | 316,174 | |
| | | | | | | | | |
| Wireless Telecommunication Services (6.88%) | | | | | | | | |
| KDDI Corp. | | | 16,900 | | | | 501,381 | |
| NTT DOCOMO, Inc. | | | 13,000 | | | | 408,287 | |
| Softbank Corp. | | | 16,400 | | | | 209,642 | |
| SoftBank Group Corp. | | | 16,100 | | | | 567,187 | |
| | | | | | | | 1,686,497 | |
| Total Japan | | | | | | | 2,002,671 | |
| | | | | | | | | |
| | | | | | | | | |
| New Zealand (1.69%) | | | | | | | | |
| Diversified Telecommunication Services (1.69%) | | | | | | | | |
| Spark New Zealand, Ltd. | | | 170,100 | | | | 414,623 | |
| | | | | | | | | |
| Total New Zealand | | | | | | | 414,623 | |
| | | | | | | | | |
| TOTAL ASIA | | | | | | | | |
| (Cost $5,449,965) | | | | | | | 4,632,536 | |
| | | | | | | | | |
| EUROPE(15.53%) | | | | | | | | |
| France (0.97%) | | | | | | | | |
| Diversified Telecommunication Services (0.97%) | | | | | | | | |
| Orange SA | | | 19,420 | | | | 238,493 | |
| | | | | | | | | |
| Total France | | | | | | | 238,493 | |
| | | Shares | | | Value | |
| Germany (2.39%) | | | | | | |
| Diversified Telecommunication Services (1.72%) | | | | | | | | |
| Deutsche Telekom AG | | | 32,460 | | | $ | 422,943 | |
| | | | | | | | | |
| Multi-Utilities (0.67%) | | | | | | | | |
| E.ON SE | | | 15,750 | | | | 163,997 | |
| | | | | | | | | |
| Total Germany | | | | | | | 586,940 | |
| | | | | | | | | |
| Great Britain (2.82%) | | | | | | | | |
| Multi-Utilities (1.33%) | | | | | | | | |
| National Grid PLC | | | 27,760 | | | | 326,394 | |
| | | | | | | | | |
| Wireless Telecommunication Services (1.49%) | | | | | | | | |
| Vodafone Group PLC | | | 259,440 | | | | 364,142 | |
| | | | | | | | | |
| Total Great Britain | | | | | | | 690,536 | |
| | | | | | | | | |
| Greece (1.78%) | | | | | | | | |
| Diversified Telecommunication Services (1.78%) | | | | | | | | |
| Hellenic Telecommunications Organization SA | | | 36,000 | | | | 435,954 | |
| | | | | | | | | |
| Total Greece | | | | | | | 435,954 | |
| | | | | | | | | |
| Italy (3.94%) | | | | | | | | |
| Diversified Telecommunication Services (1.58%) | | | | | | | | |
| Telecom Italia SpA(a) | | | 943,500 | | | | 387,514 | |
| | | | | | | | | |
| Electric Utilities (1.75%) | | | | | | | | |
| Enel SpA | | | 61,340 | | | | 428,846 | |
| | | | | | | | | |
| Transportation Infrastructure (0.61%) | | | | | | | | |
| Atlantia SpA | | | 11,930 | | | | 150,391 | |
| | | | | | | | | |
| Total Italy | | | | | | | 966,751 | |
| | | | | | | | | |
| Spain (3.63%) | | | | | | | | |
| Diversified Telecommunication Services (0.85%) | | | | | | | | |
| Telefonica SA | | | 45,420 | | | | 209,066 | |
| | | | | | | | | |
| Electric Utilities (1.93%) | | | | | | | | |
| Iberdrola SA | | | 47,704 | | | | 472,673 | |
| | | | | | | | | |
| Transportation Infrastructure (0.85%) | | | | | | | | |
| Abertis Infraestructuras SA(a)(b) | | | 1,200 | | | | 24,299 | |
| Aena SME SA(c)(d) | | | 1,670 | | | | 183,301 | |
| | | | | | | | 207,600 | |
| Total Spain | | | | | | | 889,339 | |
| | | | | | | | | |
| TOTAL EUROPE | | | | | | | | |
| (Cost $4,521,423) | | | | | | | 3,808,013 | |
| Semi-Annual Report | March 31, 2020 | 19 |
| Centre Global Infrastructure Fund | Schedule of Investments |
| | March 31, 2020 (Unaudited) |
| | | Shares | | | Value | |
| MIDDLE EAST(1.77%) | | | | | | |
| Israel (1.77%) | | | | | | |
| Diversified Telecommunication Services (1.77%) | | | | | | |
| Bezeq The Israeli Telecommunication Corp., Ltd.(a) | | | 600,000 | | | $ | 435,070 | |
| | | | | | | | | |
| Total Israel | | | | | | | 435,070 | |
| | | | | | | | | |
| TOTAL MIDDLE EAST | | | | | | | | |
| (Cost $417,629) | | | | | | | 435,070 | |
| | | | | | | | | |
NORTH AMERICA(58.72%) Canada (10.75%) | | | | | | | | |
| Oil, Gas & Consumable Fuels (10.75%) | | | | | | | | |
| Enbridge, Inc. | | | 47,980 | | | | 1,397,158 | |
| Pembina Pipeline Corp. | | | 14,000 | | | | 262,630 | |
| TC Energy Corp. | | | 22,000 | | | | 977,830 | |
| | | | | | | | 2,637,618 | |
| Total Canada | | | | | | | 2,637,618 | |
| | | | | | | | | |
| Mexico (1.68%) | | | | | | | | |
| Transportation Infrastructure (1.68%) | | | | | | | | |
| Grupo Aeroportuario del Pacifico SAB de CV, ADR | | | 7,640 | | | | 412,102 | |
| | | | | | | | | |
| Total Mexico | | | | | | | 412,102 | |
| | | | | | | | | |
| United States (46.29%) | | | | | | | | |
| Diversified Telecommunication Services (15.72%) | | | | | | | | |
| AT&T, Inc. | | | 65,002 | | | | 1,894,808 | |
| Verizon Communications, Inc. | | | 36,498 | | | | 1,961,038 | |
| | | | | | | | 3,855,846 | |
| Electric Utilities (10.61%) | | | | | | | | |
| American Electric Power Co., Inc. | | | 3,300 | | | | 263,934 | |
| Duke Energy Corp. | | | 4,899 | | | | 396,231 | |
| Eversource Energy | | | 2,197 | | | | 171,827 | |
| Exelon Corp. | | | 6,598 | | | | 242,872 | |
| FirstEnergy Corp. | | | 3,596 | | | | 144,092 | |
| NextEra Energy, Inc. | | | 3,296 | | | | 793,084 | |
| The Southern Co. | | | 6,999 | | | | 378,926 | |
| Xcel Energy, Inc. | | | 3,503 | | | | 211,231 | |
| | | | | | | | 2,602,197 | |
| Health Care Providers & Services (3.19%) | | | | | | | | |
| HCA Healthcare, Inc. | | | 6,547 | | | | 588,248 | |
| Universal Health Services, Inc., Class B | | | 1,950 | | | | 193,206 | |
| | | | | | | | 781,454 | |
| | | | | | | | | |
| Independent Power and Renewable Electricity Producers (1.16%) | | | | | | | | |
| AES Corp. | | | 21,000 | | | | 285,600 | |
| | | | | | | | | |
| Multi-Utilities (4.58%) | | | | | | | | |
| Consolidated Edison, Inc. | | | 2,248 | | | | 175,344 | |
| Dominion Energy, Inc. | | | 5,499 | | | | 396,973 | |
| Public Service Enterprise Group, Inc. | | | 3,399 | | | | 152,649 | |
| Sempra Energy | | | 1,895 | | | | 214,116 | |
| WEC Energy Group, Inc. | | | 2,100 | | | | 185,073 | |
| | | | | | | | 1,124,155 | |
| | | Shares | | | Value | |
| United States (continued) | | | | | | |
| Oil, Gas & Consumable Fuels (9.38%) | | | | | | |
| Cheniere Energy, Inc.(a) | | | 5,590 | | | $ | 187,265 | |
| Kinder Morgan, Inc. | | | 72,216 | | | | 1,005,247 | |
| ONEOK, Inc. | | | 10,002 | | | | 218,143 | |
| The Williams Cos., Inc. | | | 62,900 | | | | 890,035 | |
| | | | | | | | 2,300,690 | |
| Water Utilities (0.58%) | | | | | | | | |
| American Water Works Co., Inc. | | | 1,200 | | | | 143,472 | |
| | | | | | | | | |
| Wireless Telecommunication Services (1.07%) | | | | | | | | |
| T-Mobile US, Inc.(a) | | | 3,120 | | | | 261,768 | |
| | | | | | | | | |
| Total United States | | | | | | | 11,355,182 | |
| | | | | | | | | |
| TOTAL NORTH AMERICA | | | | | | | | |
| (Cost $16,975,886) | | | | | | | 14,404,902 | |
| | | | | | | | | |
| SOUTH AMERICA(3.12%) | | | | | | | | |
| Brazil (1.49%) | | | | | | | | |
| Water Utilities (1.49%) | | | | | | | | |
| Cia de Saneamento Basico do Estado de Sao Paulo, ADR | | | 49,470 | | | | 365,089 | |
| | | | | | | | | |
| Total Brazil | | | | | | | 365,089 | |
| | | | | | | | | |
| Chile (1.63%) | | | | | | | | |
| Electric Utilities (1.63%) | | | | | | | | |
| Enel Americas SA, ADR | | | 66,100 | | | | 400,566 | |
| | | | | | | | | |
| Total Chile | | | | | | | 400,566 | |
| | | | | | | | | |
| TOTAL SOUTH AMERICA | | | | | | | | |
| (Cost $1,068,637) | | | | | | | 765,655 | |
| | | | | | | | | |
| TOTAL COMMON STOCKS | | | | | | | | |
| (Cost $28,433,540) | | | | | | | 24,046,176 | |
| | | Value | |
| TOTAL INVESTMENTS (98.03%) | | | |
| (Cost $28,433,540) | | $ | 24,046,176 | |
| Other Assets In Excess Of Liabilities (1.97%) | | | 484,038 | |
| NET ASSETS (100.00%) | | $ | 24,530,214 | |
| Centre Global Infrastructure Fund | Schedule of Investments |
| | March 31, 2020 (Unaudited) |
| (a) | Non-income producing security. |
| (b) | As a result of the use of significant unobservable inputs to determine fair value, these investments have been classified as Level 3 assets. (See Note 3) |
| (c) | Security was purchased pursuant to Rule 144A under the Securities Act of 1933 and may be resold in transactions exempt from registration only to qualified institutional buyers. As of March 31, 2020, these securities had a total aggregate market value of $183,301, representing 0.75% of net assets. |
| (d) | Securities were purchased pursuant to Regulation S under the Securities Act of 1933, which exempts securities offered and sold outside the United States from registration. Such securities cannot be sold in the United States without either an effective registration statement filed pursuant to Securities Act of 1933, or pursuant to an exemption from registration. These securities have been deemed liquid under guidelines approved by the Fund's Board of Trustees. At period end, the aggregate market value of those securities was $183,301, representing 0.75% of net assets. |
See Notes to Financial Statements.
| Semi-Annual Report | March 31, 2020 | 21 |
| Centre Funds | Statements of Assets and Liabilities |
| | March 31, 2020 (Unaudited) |
| | | Centre American Select Equity Fund | | | Centre Active U.S. Treasury Fund | | | Centre Global Infrastructure Fund | |
| ASSETS: | | | | | | | | | | | | |
| Investments, at value | | $ | 93,675,742 | | | $ | 28,250,353 | | | $ | 24,046,176 | |
| Foreign currency, at value (Cost $–, $– and $219,532, respectively) | | | – | | | | – | | | | 227,739 | |
| Receivable for dividends and interest | | | 168,778 | | | | 187,088 | | | | 93,446 | |
| Deposit with broker for futures contracts | | | 488,506 | | | | 1,607,712 | | | | – | |
| Receivable for investments sold | | | – | | | | – | | | | 441,662 | |
| Receivable for fund shares sold | | | 587 | | | | – | | | | – | |
| Deferred offering cost | | | – | | | | – | | | | 222 | |
| Prepaid and other assets | | | 17,878 | | | | 16,212 | | | | 26,657 | |
| Total Assets | | | 94,351,491 | | | | 30,061,365 | | | | 24,835,902 | |
| LIABILITIES: | | | | | | | | | | | | |
| Payable to custodian | | | 104,282 | | | | – | | | | 215,274 | |
| Payable to administrator | | | 20,835 | | | | 8,786 | | | | 14,306 | |
| Payable to transfer agent | | | 5,795 | | | | 4,841 | | | | 19,295 | |
| Payable for investments purchased | | | – | | | | – | | | | 14,099 | |
| Payable for fund shares redeemed | | | 44,908 | | | | – | | | | 3,615 | |
| Payable to investment adviser | | | 44,306 | | | | 1,099 | | | | 732 | |
| Accrued 12b-1 and service fees | | | 31,597 | | | | 6,355 | | | | 5,066 | |
| Payable for custodian fees | | | 2,654 | | | | 1,430 | | | | 68 | |
| Payable for printing | | | 5,878 | | | | 1,633 | | | | 920 | |
| Payable for legal and audit fees | | | 32,914 | | | | 15,309 | | | | 17,601 | |
| Payable to trustees | | | 8,166 | | | | 2,721 | | | | 4,473 | |
| Payable under the Chief Compliance Officer Services Agreement | | | 2,445 | | | | 977 | | | | 2,214 | |
| Other payables | | | 698 | | | | 144 | | | | 8,025 | |
| Total Liabilities | | | 304,478 | | | | 43,295 | | | | 305,688 | |
| NET ASSETS | | $ | 94,047,013 | | | $ | 30,018,070 | | | $ | 24,530,214 | |
| | | | | | | | | | | | | |
| NET ASSETS CONSIST OF: | | | | | | | | | | | | |
| Paid-in capital | | $ | 73,195,098 | | | $ | 30,467,955 | | | $ | 56,267,807 | |
| Total distributable earnings | | | 20,851,915 | | | | (449,885 | ) | | | (31,737,593 | ) |
| NET ASSETS | | $ | 94,047,013 | | | $ | 30,018,070 | | | $ | 24,530,214 | |
| INVESTMENTS, AT COST | | $ | 76,229,824 | | | $ | 24,867,420 | | | $ | 28,433,540 | |
| PRICING OF SHARES | | | | | | | | | | | | |
| Investor Class | | | | | | | | | | | | |
| Net Assets | | $ | 91,814,019 | | | $ | 26,852,289 | | | $ | 18,208,063 | |
| Shares outstanding | | | 9,968,309 | | | | 2,885,436 | | | | 2,273,367 | |
| Net Asset Value, offering and redemption price per share | | $ | 9.21 | | | $ | 9.31 | | | $ | 8.01 | |
| Institutional Class | | | | | | | | | | | | |
| Net Assets | | $ | 2,232,994 | | | $ | 3,165,778 | | | $ | 6,322,151 | |
| Shares outstanding | | | 239,370 | | | | 337,893 | | | | 788,682 | |
| Net Asset Value, offering and redemption price per share | | $ | 9.33 | | | $ | 9.37 | | | $ | 8.02 | |
See Notes to Financial Statements.
| Centre Funds | Statements of Operations |
| | March 31, 2020 (Unaudited) |
| | | Centre American Select Equity Fund | | | Centre Active U.S. Treasury Fund | | | Centre Global Infrastructure Fund | |
| INVESTMENT INCOME: | | | | | | | | | |
| Interest | | $ | 522 | | | $ | 411,073 | | | $ | – | |
| Dividends | | | 1,088,433 | | | | 15,162 | | | | 821,406 | |
| Foreign taxes withheld | | | (4,975 | ) | | | – | | | | (40,667 | ) |
| Total Investment Income | | | 1,083,980 | | | | 426,235 | | | | 780,739 | |
| | | | | | | | | | | | | |
| EXPENSES: | | | | | | | | | | | | |
| Investment advisory fees | | | 397,975 | | | | 67,658 | | | | 203,243 | |
| Administration fees | | | 98,798 | | | | 33,186 | | | | 46,331 | |
| Transfer agent fees | | | 33,436 | | | | 25,011 | | | | 22,480 | |
| Custodian fees | | | 6,837 | | | | 2,822 | | | | 11,857 | |
| Legal fees | | | 33,024 | | | | 10,798 | | | | 16,843 | |
| Audit and tax fees | | | 6,706 | | | | 6,774 | | | | 6,727 | |
| Trustees' fees and expenses | | | 16,856 | | | | 5,448 | | | | 8,056 | |
| Registration/filing fees | | | 14,292 | | | | 13,169 | | | | 17,007 | |
| 12b-1 fees (Investor Class) | | | 129,169 | | | | 35,507 | | | | 32,409 | |
| Shareholder service fees | | | 58,140 | | | | 9,492 | | | | 12,209 | |
| Printing fees | | | 13,006 | | | | 3,497 | | | | 6,244 | |
| Chief Compliance Officer services fees | | | 19,390 | | | | 6,325 | | | | 9,580 | |
| Miscellaneous expenses | | | 7,614 | | | | 3,078 | | | | 3,927 | |
| Total expenses before waivers | | | 835,243 | | | | 222,765 | | | | 396,913 | |
| Fees waived/reimbursed by investment adviser (Investor Class) (Note 5) | | | (63,271 | ) | | | (35,870 | ) | | | (82,268 | ) |
| Fees waived/reimbursed by investment adviser (Institutional Class) (Note 5) | | | (4,485 | ) | | | (12,121 | ) | | | (57,249 | ) |
| Net Expenses | | | 767,487 | | | | 174,774 | | | | 257,396 | |
| Net Investment Income | | | 316,493 | | | | 251,461 | | | | 523,343 | |
| | | | | | | | | | | | | |
| Net realized gain/(loss) on investments | | | 7,091,963 | | | | 619,670 | | | | (2,686,478 | ) |
| Net realized loss on futures contracts | | | – | | | | (2,699,713 | ) | | | – | |
| Net realized gain on foreign currencies | | | – | | | | – | | | | 801 | |
| Total realized gain/(loss) | | | 7,091,963 | | | | (2,080,043 | ) | | | (2,685,677 | ) |
| Net change in unrealized appreciation/(depreciation) on investments | | | (11,037,370 | ) | | | 1,259,930 | | | | (6,268,704 | ) |
| Net change in unrealized appreciation on futures contracts | | | – | | | | 6,456 | | | | – | |
| Net change in unrealized appreciation on foreign currencies | | | – | | | | – | | | | 7,785 | |
| Total change in unrealized appreciation/(depreciation) | | | (11,037,370 | ) | | | 1,266,386 | | | | (6,260,919 | ) |
| NET REALIZED AND UNREALIZED LOSS ON INVESTMENTS, FUTURES CONTRACTS AND FOREIGN CURRENCIES | | | (3,945,407 | ) | | | (813,657 | ) | | | (8,946,596 | ) |
| NET DECREASE IN NET ASSETS RESULTING FROM OPERATIONS | | $ | (3,628,914 | ) | | $ | (562,196 | ) | | $ | (8,423,253 | ) |
See Notes to Financial Statements.
| Semi-Annual Report | March 31, 2020 | 23 |
| Centre American Select Equity Fund | Statements of Changes in Net Assets |
| | | For The Six Months Ending March 31, 2020 (Unaudited) | | | For The Year Ended September 30, 2019 | |
| | | | | | | |
| OPERATIONS: | | | | | | |
| Net investment income | | $ | 316,493 | | | $ | 382,945 | |
| Net realized gain | | | 7,091,963 | | | | 10,568,992 | |
| Net change in unrealized depreciation | | | (11,037,370 | ) | | | (17,947,797 | ) |
| Net decrease in net assets resulting from operations | | | (3,628,914 | ) | | | (6,995,860 | ) |
| DISTRIBUTIONS TO SHAREHOLDERS: | | | | | | | | |
| Investor | | | (9,646,867 | ) | | | (19,868,502 | ) |
| Institutional | | | (257,746 | ) | | | (421,061 | ) |
| Total distributions | | | (9,904,613 | ) | | | (20,289,563 | ) |
| CAPITAL SHARE TRANSACTIONS: | | | | | | | | |
| Investor Class | | | | | | | | |
| Proceeds from sale of shares | | | 160,118 | | | | 576,912 | |
| Shares issued in reinvestment of distributions | | | 9,374,951 | | | | 19,354,617 | |
| Cost of shares redeemed | | | (9,366,128 | ) | | | (17,577,238 | ) |
| Redemption fees | | | 11 | | | | 7,969 | |
| Net increase from capital share transactions | | | 168,952 | | | | 2,362,260 | |
| Institutional Class | | | | | | | | |
| Proceeds from sale of shares | | | 541,511 | | | | 3,204,613 | |
| Shares issued in reinvestment of distributions | | | 208,376 | | | | 403,144 | |
| Cost of shares redeemed | | | (1,108,661 | ) | | | (2,699,050 | ) |
| Redemption fees | | | – | | | | 209 | |
| Net increase/(decrease) from capital share transactions | | | (358,774 | ) | | | 908,916 | |
| Net decrease in net assets | | | (13,723,349 | ) | | | (24,014,247 | ) |
| NET ASSETS: | | | | | | | | |
| Beginning of period | | | 107,770,362 | | | | 131,784,609 | |
| End of period | | $ | 94,047,013 | | | $ | 107,770,362 | |
| | | | | | | | | |
| OTHER INFORMATION: | | | | | | | | |
| Share Transactions: | | | | | | | | |
| Investor Class | | | | | | | | |
| Beginning shares | | | 9,939,604 | | | | 9,481,676 | |
| Shares sold | | | 15,920 | | | | 53,925 | |
| Shares issued in reinvestment of dividends | | | 918,213 | | | | 2,022,426 | |
| Shares redeemed | | | (905,428 | ) | | | (1,618,423 | ) |
| Ending shares | | | 9,968,309 | | | | 9,939,604 | |
| Institutional Class | | | | | | | | |
| Beginning shares | | | 275,120 | | | | 186,632 | |
| Shares sold | | | 53,916 | | | | 291,039 | |
| Shares issued in reinvestment of dividends | | | 20,172 | | | | 41,820 | |
| Shares redeemed | | | (109,838 | ) | | | (244,371 | ) |
| Ending shares | | | 239,370 | | | | 275,120 | |
See Notes to Financial Statements.
| Centre Active U.S. Treasury Fund | Statements of Changes in Net Assets |
| | | For The Six Months Ending March 31, 2020 (Unaudited) | | | For The Year Ended September 30, 2019 | |
| OPERATIONS: | | | | | | |
| Net investment income | | $ | 251,461 | | | $ | 704,053 | |
| Net realized loss | | | (2,080,043 | ) | | | (1,514,938 | ) |
| Net change in unrealized appreciation | | | 1,266,386 | | | | 2,248,437 | |
| Net increase/(decrease) in net assets resulting from operations | | | (562,196 | ) | | | 1,437,552 | |
| DISTRIBUTIONS TO SHAREHOLDERS: | | | | | | | | |
| Investor | | | (205,592 | ) | | | (1,554,100 | ) |
| Institutional | | | (50,115 | ) | | | (325,349 | ) |
| Total distributions | | | (255,707 | ) | | | (1,879,449 | ) |
| CAPITAL SHARE TRANSACTIONS: | | | | | | | | |
| Investor Class | | | | | | | | |
| Proceeds from sale of shares | | | 813,840 | | | | 1,344,084 | |
| Shares issued in reinvestment of distributions | | | 170,680 | | | | 1,264,590 | |
| Cost of shares redeemed | | | (3,934,668 | ) | | | (8,797,456 | ) |
| Net decrease from capital share transactions | | | (2,950,148 | ) | | | (6,188,782 | ) |
| Institutional Class | | | | | | | | |
| Proceeds from sale of shares | | | 1,899,820 | | | | 4,617,924 | |
| Shares issued in reinvestment of distributions | | | 37,260 | | | | 291,287 | |
| Cost of shares redeemed | | | (4,323,230 | ) | | | (3,196,083 | ) |
| Net increase/(decrease) from capital share transactions | | | (2,386,150 | ) | | | 1,713,128 | |
| Net decrease in net assets | | | (6,154,201 | ) | | | (4,917,551 | ) |
| NET ASSETS: | | | | | | | | |
| Beginning of period | | | 36,172,271 | | | | 41,089,822 | |
| End of period | | $ | 30,018,070 | | | $ | 36,172,271 | |
| | | | | | | | | |
| OTHER INFORMATION: | | | | | | | | |
| Share Transactions: | | | | | | | | |
| Investor Class | | | | | | | | |
| Beginning shares | | | 3,194,963 | | | | 3,842,796 | |
| Shares sold | | | 86,136 | | | | 140,196 | |
| Shares issued in reinvestment of dividends | | | 17,990 | | | | 132,789 | |
| Shares redeemed | | | (413,653 | ) | | | (920,818 | ) |
| Ending shares | | | 2,885,436 | | | | 3,194,963 | |
| Institutional Class | | | | | | | | |
| Beginning shares | | | 595,711 | | | | 420,928 | |
| Shares sold | | | 198,105 | | | | 476,937 | |
| Shares issued in reinvestment of dividends | | | 3,896 | | | | 30,370 | |
| Shares redeemed | | | (459,819 | ) | | | (332,524 | ) |
| Ending shares | | | 337,893 | | | | 595,711 | |
| See Notes to Financial Statements. | |
| Semi-Annual Report | March 31, 2020 | 25 |
| Centre Global Infrastructure Fund | Statements of Changes in Net Assets |
| | | For The Six Months Ending March 31, 2020 (Unaudited) | | | For The Year Ended September 30, 2019 | |
| | | | | | | |
| OPERATIONS: | | | | | | |
| Net investment income | | $ | 523,343 | | | $ | 501,618 | |
| Net realized loss | | | (2,685,677 | ) | | | (19,709 | ) |
| Net change in unrealized appreciation/(depreciation) | | | (6,260,919 | ) | | | 567,655 | |
| Net increase/(decrease) in net assets resulting from operations | | | (8,423,253 | ) | | | 1,049,564 | |
| DISTRIBUTIONS TO SHAREHOLDERS: | | | | | | | | |
| Investor | | | (328,375 | ) | | | (366,658 | ) |
| Institutional | | | (240,125 | ) | | | (117,986 | ) |
| Total distributions | | | (568,500 | ) | | | (484,644 | ) |
| CAPITAL SHARE TRANSACTIONS: | | | | | | | | |
| Investor Class | | | | | | | | |
| Proceeds from sale of shares | | | 253,130 | | | | 27,332,017 | (a) |
| Shares issued in reinvestment of distributions | | | 233,781 | | | | 280,825 | |
| Cost of shares redeemed | | | (6,150,387 | ) | | | (14,081,842 | ) |
| Redemption fees | | | 273 | | | | 2,653 | |
| Net increase/(decrease) from capital share transactions | | | (5,663,203 | ) | | | 13,533,653 | |
| Institutional Class | | | | | | | | |
| Proceeds from sale of shares | | | 686,489 | | | | 29,910,835 | (a) |
| Shares issued in reinvestment of distributions | | | 214,395 | | | | 105,629 | |
| Cost of shares redeemed | | | (14,258,883 | ) | | | (7,840,625 | ) |
| Redemption fees | | | 1,603 | | | | – | |
| Net increase/(decrease) from capital share transactions | | | (13,356,396 | ) | | | 22,175,839 | |
| Net increase/(decrease) in net assets | | | (28,011,352 | ) | | | 36,274,412 | |
| NET ASSETS: | | | | | | | | |
| Beginning of period | | | 52,541,566 | | | | 16,267,154 | |
| End of period | | $ | 24,530,214 | | | $ | 52,541,566 | |
| | | | | | | | | |
| OTHER INFORMATION: | | | | | | | | |
| Share Transactions: | | | | | | | | |
| Investor Class | | | | | | | | |
| Beginning shares | | | 2,837,654 | | | | 1,539,125 | |
| Shares sold | | | 24,517 | | | | 2,708,602 | (a) |
| Shares issued in reinvestment of dividends | | | 24,004 | | | | 29,170 | |
| Shares redeemed | | | (612,808 | ) | | | (1,439,243 | ) |
| Ending shares | | | 2,273,367 | | | | 2,837,654 | |
| Institutional Class | | | | | | | | |
| Beginning shares | | | 2,321,016 | | | | 147,361 | |
| Shares sold | | | 69,771 | | | | 2,960,052 | (a) |
| Shares issued in reinvestment of dividends | | | 21,226 | | | | 10,647 | |
| Shares redeemed | | | (1,623,331 | ) | | | (797,044 | ) |
| Ending shares | | | 788,682 | | | | 2,321,016 | |
| (a) | Includes acquisitions described in Note 9. |
| See Notes to Financial Statements. | |
| Centre American Select Equity Fund | Financial Highlights |
| Investor Class | For a share outstanding throughout the periods presented. |
| | | For the Six Months Ended March 31, 2020 (Unaudited) | | | For the Year Ended September 30, 2019 | | | For the Year Ended September 30, 2018 | | | For the Year Ended September 30, 2017 | | | For the Year Ended September 30, 2016 | | | For the Year Ended September 30, 2015 | |
| | | | | | | | | | | | | | | | | | | |
| NET ASSET VALUE, BEGINNING OF PERIOD | | $ | 10.55 | | | $ | 13.63 | | | $ | 13.05 | | | $ | 11.65 | | | $ | 11.67 | | | $ | 12.08 | |
| INCOME/(LOSS) FROM INVESTMENT OPERATIONS: | | | | | | | | | | | | | | | | | | | | | | | | |
| Net investment income/(loss)(a) | | | 0.03 | | | | 0.04 | | | | (0.01 | ) | | | 0.06 | | | | 0.09 | | | | 0.07 | |
| Net realized and unrealized gain/(loss) on investments | | | (0.35 | ) | | | (0.96 | ) | | | 2.20 | | | | 1.74 | | | | 1.11 | | | | (0.31 | ) |
| Total income/(loss) from investment operations | | | (0.32 | ) | | | (0.92 | ) | | | 2.19 | | | | 1.80 | | | | 1.20 | | | | (0.24 | ) |
| | | | | | | | | | | | | | | | | | | | | | | | | |
| DISTRIBUTIONS: | | | | | | | | | | | | | | | | | | | | | | | | |
| Net investment income | | | (0.02 | ) | | | (0.03 | ) | | | (0.00 | )(b) | | | (0.15 | ) | | | (0.02 | ) | | | (0.17 | ) |
| Net realized gains on investments | | | (1.00 | ) | | | (2.13 | ) | | | (1.61 | ) | | | (0.25 | ) | | | (1.20 | ) | | | – | |
| Total distributions | | | (1.02 | ) | | | (2.16 | ) | | | (1.61 | ) | | | (0.40 | ) | | | (1.22 | ) | | | (0.17 | ) |
| REDEMPTION FEES ADDED TO PAID-IN CAPITAL (NOTE 4) | | | 0.00 | (c) | | | 0.00 | (c) | | | 0.00 | (c) | | | 0.00 | (c) | | | 0.00 | (c) | | | 0.00 | (c) |
| NET INCREASE/(DECREASE) IN NET ASSET VALUE | | | (1.34 | ) | | | (3.08 | ) | | | 0.58 | | | | 1.40 | | | | (0.02 | ) | | | (0.41 | ) |
| NET ASSET VALUE, END OF PERIOD | | $ | 9.21 | | | $ | 10.55 | | | $ | 13.63 | | | $ | 13.05 | | | $ | 11.65 | | | $ | 11.67 | |
| | | | | | | | | | | | | | | | | | | | | | | | | |
| Total Return(d) | | | (4.01 | %) | | | (5.12 | %) | | | 18.10 | % | | | 15.99 | % | | | 10.74 | % | | | (2.07 | %) |
| | | | | | | | | | | | | | | | | | | | | | | | | |
| SUPPLEMENTAL DATA: | | | | | | | | | | | | | | | | | | | | | | | | |
| Net assets, end of period (000) | | $ | 91,814 | | | $ | 104,838 | | | $ | 129,231 | | | $ | 123,938 | | | $ | 126,238 | | | $ | 148,314 | |
| | | | | | | | | | | | | | | | | | | | | | | | | |
| RATIOS TO AVERAGE NET ASSETS: | | | | | | | | | | | | | | | | | �� | | | | | | | |
| Net investment income/(loss) including reimbursement/waiver | | | 0.58 | %(e) | | | 0.32 | % | | | (0.06 | %) | | | 0.47 | % | | | 0.77 | % | | | 0.58 | % |
| Operating expenses excluding reimbursement/waiver | | | 1.58 | %(e) | | | 1.58 | % | | | 1.60 | % | | | 1.46 | % | | | 1.36 | % | | | 1.33 | % |
| Operating expenses including reimbursement/waiver | | | 1.46 | %(e) | | | 1.45 | % | | | 1.32 | %(f) | | | 1.05 | % | | | 1.05 | % | | | 1.05 | % |
| | | | | | | | | | | | | | | | | | | | | | | | | |
| PORTFOLIO TURNOVER RATE | | | 62 | %(g) | | | 114 | % | | | 87 | % | | | 81 | % | | | 74 | % | | | 105 | % |
| (a) | Calculated using the average shares method. |
| (b) | Less than $(0.005) per share. |
| (c) | Less than $0.005 per share. |
| (d) | Total returns would have been lower had certain expenses not been waived during the period. Returns shown do not reflect the deduction of taxes that a shareholder would pay on fund distributions or the redemption of fund shares. |
| (f) | Effective January 29, 2018, the net expense limitation changed from 1.05% to 1.10%, excluding, among other fees and expenses, 12b-1 fees and shareholder service fees. (g) Portfolio turnover rate for periods less than one full year have not been annualized. |
| See Notes to Financial Statements. | |
| Semi-Annual Report | March 31, 2020 | 27 |
| Centre American Select Equity Fund | Financial Highlights |
| Institutional Class | For a share outstanding throughout the periods presented. |
| | | For the Six Months Ended March 31, 2020 (Unaudited) | | | For the Year Ended September 30, 2019 | | | For the Year Ended September 30, 2018 | | | For the Year Ended September 30, 2017 | | | For the Year Ended September 30, 2016 | | | For the Year Ended September 30, 2015 | |
| | | | | | | | | | | | | | | | | | | |
| NET ASSET VALUE, BEGINNING OF PERIOD | | $ | 10.66 | | | $ | 13.68 | | | $ | 13.05 | | | $ | 11.67 | | | $ | 11.69 | | | $ | 12.08 | |
| INCOME/(LOSS) FROM INVESTMENT OPERATIONS: | | | | | | | | | | | | | | | | | | | | | | | | |
| Net investment income(a) | | | 0.06 | | | | 0.09 | | | | 0.04 | (b) | | | 0.08 | | | | 0.10 | | | | 0.08 | |
| Net realized and unrealized gain/(loss) on investments | | | (0.36 | ) | | | (0.95 | ) | | | 2.21 | | | | 1.74 | | | | 1.11 | | | | (0.30 | ) |
| Total income/(loss) from investment operations | | | (0.30 | ) | | | (0.86 | ) | | | 2.25 | | | | 1.82 | | | | 1.21 | | | | (0.22 | ) |
| | | | | | | | | | | | | | | | | | | | | | | | | |
| DISTRIBUTIONS: | | | | | | | | | | | | | | | | | | | | | | | | |
| Net investment income | | | (0.03 | ) | | | (0.03 | ) | | | (0.01 | ) | | | (0.19 | ) | | | (0.03 | ) | | | (0.17 | ) |
| Net realized gains on investments | | | (1.00 | ) | | | (2.13 | ) | | | (1.61 | ) | | | (0.25 | ) | | | (1.20 | ) | | | – | |
| Total distributions | | | (1.03 | ) | | | (2.16 | ) | | | (1.62 | ) | | | (0.44 | ) | | | (1.23 | ) | | | (0.17 | ) |
| REDEMPTION FEES ADDED TO PAID-IN CAPITAL (NOTE 4) | | | – | | | | 0.00 | (c) | | | – | | | | 0.00 | (c) | | | – | | | | – | |
| NET INCREASE/(DECREASE) IN NET ASSET VALUE | | | (1.33 | ) | | | (3.02 | ) | | | 0.63 | | | | 1.38 | | | | (0.02 | ) | | | (0.39 | ) |
| NET ASSET VALUE, END OF PERIOD | | $ | 9.33 | | | $ | 10.66 | | | $ | 13.68 | | | $ | 13.05 | | | $ | 11.67 | | | $ | 11.69 | |
| | | | | | | | | | | | | | | | | | | | | | | | | |
| Total Return(d) | | | (3.75 | %) | | | (4.61 | %) | | | 18.55 | % | | | 16.20 | % | | | 10.74 | % | | | (1.89 | %) |
| | | | | | | | | | | | | | | | | | | | | | | | | |
| SUPPLEMENTAL DATA: | | | | | | | | | | | | | | | | | | | | | | | | |
| Net assets, end of period (000) | | $ | 2,233 | | | $ | 2,932 | | | $ | 2,554 | | | $ | 2,440 | | | $ | 21,058 | | | $ | 16,907 | |
| | | | | | | | | | | | | | | | | | | | | | | | | |
| RATIOS TO AVERAGE NET ASSETS: | | | | | | | | | | | | | | | | | | | | | | | | |
| Net investment income including reimbursement/waiver | | | 1.07 | %(e) | | | 0.84 | % | | | 0.32 | % | | | 0.66 | % | | | 0.88 | % | | | 0.67 | % |
| Operating expenses excluding reimbursement/waiver | | | 1.30 | %(e) | | | 1.29 | % | | | 1.27 | % | | | 1.18 | % | | | 1.13 | % | | | 1.11 | % |
| Operating expenses including reimbursement/waiver | | | 0.98 | %(e) | | | 0.95 | % | | | 0.93 | %(f) | | | 0.95 | % | | | 0.95 | % | | | 0.95 | % |
| | | | | | | | | | | | | | | | | | | | | | | | | |
| PORTFOLIO TURNOVER RATE | | | 62 | %(g) | | | 114 | % | | | 87 | % | | | 81 | % | | | 74 | % | | | 105 | % |
| (a) | Calculated using the average shares method. |
| (b) | The per share amount does not correspond to activity reflected in the Statement of Operations due to class specific expenses during the period. |
| (c) | Less than $0.005 per share. |
| (d) | Total returns would have been lower had certain expenses not been waived during the period. Returns shown do not reflect the deduction of taxes that a shareholder would pay on fund distributions or the redemption of fund shares. |
| (f) | Effective January 29, 2018, the net expense limitation changed from 0.95% to 0.90%, excluding, among other fees and expenses, shareholder service fees. |
| (g) | Portfolio turnover rate for periods less than one full year have not been annualized. |
| See Notes to Financial Statements. | |
| Centre Active U.S. Treasury Fund | Financial Highlights |
| Investor Class | For a share outstanding throughout the periods presented. |
| | | For the Six Months Ended March 31, 2020 (Unaudited) | | | For the Year Ended September 30, 2019 | | | For the Year Ended September 30, 2018 | | | For the Year Ended September 30, 2017 | | | For the Year Ended September 30, 2016 | | | For the Year Ended September 30, 2015 | |
| | | | | | | | | | | | | | | | | | | |
| NET ASSET VALUE, BEGINNING OF PERIOD | | $ | 9.53 | | | $ | 9.63 | | | $ | 9.75 | | | $ | 10.44 | | | $ | 10.19 | | | $ | 10.07 | |
| INCOME/(LOSS) FROM INVESTMENT OPERATIONS: | | | | | | | | | | | | | | | | | | | | | | | | |
| Net investment income(a) | | | 0.07 | | | | 0.16 | | | | 0.17 | | | | 0.18 | | | | 0.16 | | | | 0.12 | |
| Net realized and unrealized gain/(loss) on investments | | | (0.22 | ) | | | 0.17 | | | | (0.12 | ) | | | (0.50 | ) | | | 0.09 | | | | 0.13 | |
| Total income/(loss) from investment operations | | | (0.15 | ) | | | 0.33 | | | | 0.05 | | | | (0.32 | ) | | | 0.25 | | | | 0.25 | |
| | | | | | | | | | | | | | | | | | | | | | | | | |
| DISTRIBUTIONS: | | | | | | | | | | | | | | | | | | | | | | | | |
| Net investment income | | | (0.07 | ) | | | (0.16 | ) | | | (0.17 | ) | | | (0.35 | ) | | | – | | | | (0.05 | ) |
| Net realized gains on investments | | | – | | | | (0.27 | ) | | | – | | | | (0.02 | ) | | | – | | | | (0.08 | ) |
| Total distributions | | | (0.07 | ) | | | (0.43 | ) | | | (0.17 | ) | | | (0.37 | ) | | | – | | | | (0.13 | ) |
| NET INCREASE/(DECREASE) IN NET ASSET VALUE | | | (0.22 | ) | | | (0.10 | ) | | | (0.12 | ) | | | (0.69 | ) | | | 0.25 | | | | 0.12 | |
| NET ASSET VALUE, END OF PERIOD | | $ | 9.31 | | | $ | 9.53 | | | $ | 9.63 | | | $ | 9.75 | | | $ | 10.44 | | | $ | 10.19 | |
| | | | | | | | | | | | | | | | | | | | | | | | | |
| Total Return(b) | | | (1.60 | %) | | | 3.50 | % | | | 0.56 | % | | | (3.06 | %) | | | 2.45 | % | | | 2.48 | % |
| | | | | | | | | | | | | | | | | | | | | | | | | |
| SUPPLEMENTAL DATA: | | | | | | | | | | | | | | | | | | | | | | | | |
| Net assets, end of period (000) | | $ | 26,852 | | | $ | 30,454 | | | $ | 37,008 | | | $ | 47,908 | | | $ | 63,398 | | | $ | 79,867 | |
| | | | | | | | | | | | | | | | | | | | | | | | | |
| RATIOS TO AVERAGE NET ASSETS: | | | | | | | | | | | | | | | | | | | | | | | | |
| Net investment income including reimbursement/waiver | | | 1.41 | %(c) | | | 1.70 | % | | | 1.80 | % | | | 1.84 | % | | | 1.56 | % | | | 1.20 | % |
| Operating expenses excluding reimbursement/waiver | | | 1.36 | %(c) | | | 1.34 | % | | | 1.31 | % | | | 1.14 | % | | | 1.09 | % | | | 0.94 | % |
| Operating expenses including reimbursement/waiver | | | 1.11 | %(c) | | | 1.09 | % | | | 1.01 | %(d) | | | 0.85 | % | | | 0.85 | % | | | 0.85 | % |
| | | | | | | | | | | | | | | | | | | | | | | | | |
| PORTFOLIO TURNOVER RATE | | | 0 | %(e) | | | 9 | % | | | 0 | % | | | 4 | % | | | 2 | % | | | 70 | % |
| (a) | Calculated using the average shares method. |
| (b) | Total returns would have been lower had certain expenses not been waived during the period. Returns shown do not reflect the deduction of taxes that a shareholder would pay on fund distributions or the redemption of fund shares. |
| (d) | Effective January 29, 2018, the net expense limitation changed from 0.85% to 0.80%, excluding, among other fees and expenses, 12b-1 fees and shareholder service fees. |
| (e) | Portfolio turnover rate for periods less than one full year have not been annualized. |
| See Notes to Financial Statements. | |
| Semi-Annual Report | March 31, 2020 | 29 |
| Centre Active U.S. Treasury Fund | Financial Highlights |
| Institutional Class | For a share outstanding throughout the periods presented. |
| | | For the Six Months Ended March 31, 2020 (Unaudited) | | | For the Year Ended September 30, 2019 | | | For the Year Ended September 30, 2018 | | | For the Year Ended September 30, 2017 | | | For the Year Ended September 30, 2016 | | | For the Year Ended September 30, 2015 | |
| | | | | | | | | | | | | | | | | | | |
| NET ASSET VALUE, BEGINNING OF PERIOD | | $ | 9.60 | | | $ | 9.70 | | | $ | 9.82 | | | $ | 10.51 | | | $ | 10.23 | | | $ | 10.09 | |
| INCOME/(LOSS) FROM INVESTMENT OPERATIONS: | | | | | | | | | | | | | | | | | | | | | | | | |
| Net investment income(a) | | | 0.09 | | | | 0.21 | | | | 0.21 | | | | 0.20 | | | | 0.19 | | | | 0.09 | |
| Net realized and unrealized gain/(loss) on investments | | | (0.23 | ) | | | 0.17 | | | | (0.12 | ) | | | (0.49 | ) | | | 0.09 | | | | 0.19 | |
| Total income/(loss) from investment operations | | | (0.14 | ) | | | 0.38 | | | | 0.09 | | | | (0.29 | ) | | | 0.28 | | | | 0.28 | |
| | | | | | | | | | | | | | | | | | | | | | | | | |
| DISTRIBUTIONS: | | | | | | | | | | | | | | | | | | | | | | | | |
| Net investment income | | | (0.09 | ) | | | (0.21 | ) | | | (0.21 | ) | | | (0.38 | ) | | | – | | | | (0.06 | ) |
| Net realized gains on investments | | | – | | | | (0.27 | ) | | | – | | | | (0.02 | ) | | | – | | | | (0.08 | ) |
| Total distributions | | | (0.09 | ) | | | (0.48 | ) | | | (0.21 | ) | | | (0.40 | ) | | | – | | | | (0.14 | ) |
| NET INCREASE/(DECREASE) IN NET ASSET VALUE | | | (0.23 | ) | | | (0.10 | ) | | | (0.12 | ) | | | (0.69 | ) | | | 0.28 | | | | 0.14 | |
| NET ASSET VALUE, END OF PERIOD | | $ | 9.37 | | | $ | 9.60 | | | $ | 9.70 | | | $ | 9.82 | | | $ | 10.51 | | | $ | 10.23 | |
| | | | | | | | | | | | | | | | | | | | | | | | | |
| Total Return(b) | | | (1.44 | %) | | | 3.96 | % | | | 0.96 | %(c) | | | (2.78 | %) | | | 2.74 | % | | | 2.73 | % |
| | | | | | | | | | | | | | | | | | | | | | | | | |
| SUPPLEMENTAL DATA: | | | | | | | | | | | | | | | | | | | | | | | | |
| Net assets, end of period (000) | | $ | 3,166 | | | $ | 5,718 | | | $ | 4,082 | | | $ | 4,670 | | | $ | 21,095 | | | $ | 21,573 | |
| | | | | | | | | | | | | | | | | | | | | | | | | |
| RATIOS TO AVERAGE NET ASSETS: | | | | | | | | | | | | | | | | | | | | | | | | |
| Net investment income including reimbursement/waiver | | | 1.89 | %(d) | | | 2.17 | % | | | 2.18 | % | | | 2.01 | % | | | 1.81 | % | | | 0.94 | % |
| Operating expenses excluding reimbursement/waiver | | | 1.08 | %(d) | | | 1.07 | % | | | 1.05 | % | | | 0.88 | % | | | 0.84 | % | | | 1.01 | % |
| Operating expenses including reimbursement/waiver | | | 0.63 | %(d) | | | 0.62 | % | | | 0.62 | %(e) | | | 0.60 | % | | | 0.60 | % | | | 0.60 | % |
| | | | | | | | | | | | | | | | | | | | | | | | | |
| PORTFOLIO TURNOVER RATE | | | 0 | %(f) | | | 9 | % | | | 0 | % | | | 4 | % | | | 2 | % | | | 70 | % |
| (a) | Calculated using the average shares method. |
| (b) | Total returns would have been lower had certain expenses not been waived during the period. Returns shown do not reflect the deduction of taxes that a shareholder would pay on fund distributions or the redemption of fund shares. |
| (c) | Difference between total return data appearing in the Manager Commentary and Financial Highlights is due to financial reporting adjustments. |
| (e) | Effective January 29, 2018, the net expense limitation agreement changed to exclude shareholder service fees. |
| (f) | Portfolio turnover rate for periods less than one full year have not been annualized. |
| See Notes to Financial Statements. | |
| Centre Global Infrastructure Fund | Financial Highlights |
| Investor Class | For a share outstanding throughout the periods presented. |
| | | For the Six Months Ended March 31, 2020 (Unaudited) | | | For the Year Ended September 30, 2019 | | | For the Period January 29, 2018 (Inception) to September 30, 2018 | |
| | | | | | | | | | |
| NET ASSET VALUE, BEGINNING OF PERIOD | | $ | 10.18 | | | $ | 9.64 | | | $ | 10.00 | |
| INCOME/(LOSS) FROM INVESTMENT OPERATIONS: | | | | | | | | | | | | |
| Net investment income(a) | | | 0.11 | | | | 0.22 | | | | 0.12 | |
| Net realized and unrealized gain/(loss) on investments | | | (2.15 | ) | | | 0.57 | | | | (0.29 | ) |
| Total income/(loss) from investment operations | | | (2.04 | ) | | | 0.79 | | | | (0.17 | ) |
| | | | | | | | | | | | | |
| DISTRIBUTIONS: | | | | | | | | | | | | |
| Net investment income | | | (0.13 | ) | | | (0.25 | ) | | | (0.15 | ) |
| Net realized gains on investments | | | – | | | | – | | | | (0.10 | ) |
| Total distributions | | | (0.13 | ) | | | (0.25 | ) | | | (0.25 | ) |
| REDEMPTION FEES ADDED TO PAID-IN CAPITAL (NOTE 4) | | | 0.00 | (b) | | | 0.00 | (b) | | | 0.06 | |
| NET INCREASE/(DECREASE) IN NET ASSET VALUE | | | (2.17 | ) | | | 0.54 | | | | (0.36 | ) |
| NET ASSET VALUE, END OF PERIOD | | $ | 8.01 | | | $ | 10.18 | | | $ | 9.64 | |
| | | | | | | | | | | | | |
| Total Return(c) | | | (20.22 | %) | | | 8.41 | % | | | (1.18 | %) |
| | | | | | | | | | | | | |
| SUPPLEMENTAL DATA: | | | | | | | | | | | | |
| Net assets, end of period (000) | | $ | 18,208 | | | $ | 28,879 | | | $ | 14,843 | |
| | | | | | | | | | | | | |
| RATIOS TO AVERAGE NET ASSETS: | | | | | | | | | | | | |
| Net investment income including reimbursement/waiver | | | 2.24 | %(d) | | | 2.28 | % | | | 1.87 | %(d) |
| Operating expenses excluding reimbursement/waiver | | | 1.89 | %(d) | | | 2.29 | % | | | 2.34 | %(d) |
| Operating expenses including reimbursement/waiver | | | 1.25 | %(d) | | | 1.30 | %(e) | | | 1.33 | %(d)(f) |
| | | | | | | | | | | | | |
| PORTFOLIO TURNOVER RATE | | | 9 | %(g) | | | 233 | % | | | 49 | %(g) |
| (a) | Calculated using the average shares method. |
| (b) | Less than $0.005 per share. |
| (c) | Total returns are for the period indicated and have not been annualized. Total returns would have been lower had certain expenses not been waived during the period. Returns shown do not reflect the deduction of taxes that a shareholder would pay on fund distributions or the redemption of fund shares. |
| (e) | Effective July 22, 2019, the net expense limitation changed from 1.05% to 1.25%, including, among other fees and expenses, 12b-1 fees and shareholder service fees. |
| (f) | Effective May 18, 2018, the net expense limitation changed from 1.30% to 1.05%, excluding, among other fees and expenses, 12b-1 fees and shareholder service fees. |
| (g) | Portfolio turnover rate for periods less than one full year have not been annualized. |
| See Notes to Financial Statements. | |
| Semi-Annual Report | March 31, 2020 | 31 |
| Centre Global Infrastructure Fund | Financial Highlights |
| Institutional Class | For a share outstanding throughout the periods presented. |
| | | For the Six Months Ended March 31, 2020 (Unaudited) | | | For the Year Ended September 30, 2019 | | | For the Period January 29, 2018 (Inception) to September 30, 2018 | |
| | | | | | | | | | |
| NET ASSET VALUE, BEGINNING OF PERIOD | | $ | 10.20 | | | $ | 9.67 | | | $ | 10.00 | |
| INCOME/(LOSS) FROM INVESTMENT OPERATIONS: | | | | | | | | | | | | |
| Net investment income(a) | | | 0.13 | | | | 0.24 | | | | 0.15 | |
| Net realized and unrealized gain/(loss) on investments | | | (2.16 | ) | | | 0.57 | | | | (0.23 | ) |
| Total income/(loss) from investment operations | | | (2.03 | ) | | | 0.81 | | | | (0.08 | ) |
| | | | | | | | | | | | | |
| DISTRIBUTIONS: | | | | | | | | | | | | |
| Net investment income | | | (0.15 | ) | | | (0.28 | ) | | | (0.15 | ) |
| Net realized gains on investments | | | – | | | | – | | | | (0.10 | ) |
| Total distributions | | | (0.15 | ) | | | (0.28 | ) | | | (0.25 | ) |
| REDEMPTION FEES ADDED TO PAID-IN CAPITAL (NOTE 4) | | | 0.00 | (b) | | | – | | | | – | |
| NET INCREASE/(DECREASE) IN NET ASSET VALUE | | | (2.18 | ) | | | 0.53 | | | | (0.33 | ) |
| NET ASSET VALUE, END OF PERIOD | | $ | 8.02 | | | $ | 10.20 | | | $ | 9.67 | |
| | | | | | | | | | | | | |
| Total Return(c) | | | (20.14 | %) | | | 8.59 | % | | | (0.78 | %) |
| | | | | | | | | | | | | |
| SUPPLEMENTAL DATA: | | | | | | | | | | | | |
| Net assets, end of period (000) | | $ | 6,322 | | | $ | 23,663 | | | $ | 1,424 | |
| | | | | | | | | | | | | |
| RATIOS TO AVERAGE NET ASSETS: | | | | | | | | | | | | |
| Net investment income including reimbursement/waiver | | | 2.45 | %(d) | | | 2.48 | % | | | 2.28 | %(d) |
| Operating expenses excluding reimbursement/waiver | | | 1.60 | %(d) | | | 1.61 | % | | | 7.96 | %(d) |
| Operating expenses including reimbursement/waiver | | | 1.00 | %(d) | | | 1.01 | %(e) | | | 1.16 | %(d) |
| | | | | | | | | | | | | |
| PORTFOLIO TURNOVER RATE | | | 9 | %(f) | | | 233 | % | | | 49 | %(f) |
| (a) | Calculated using the average shares method. |
| (b) | Less than $0.005 per share. |
| (c) | Total returns are for the period indicated and have not been annualized. Total returns would have been lower had certain expenses not been waived during the period. Returns shown do not reflect the deduction of taxes that a shareholder would pay on fund distributions or the redemption of fund shares. |
| (e) | Effective July 22, 2019, the net expense limitation changed from 1.10% to 1.00%, including, among other fees and expenses, 12b-1 fees and shareholder service fees. |
| (f) | Portfolio turnover rate for periods less than one full year have not been annualized. |
| See Notes to Financial Statements. | |
| Centre Funds | Notes to Financial Statements |
| | March 31, 2020 (Unaudited) |
1. ORGANIZATION
Centre Funds (the “Trust”) was organized on March 17, 2011, as a Delaware statutory trust and is registered as an open-end management investment company under the Investment Company Act of 1940, as amended (the “1940 Act”). Prior to January 17, 2014, the Trust was known as Drexel Hamilton Mutual Funds. The Trust currently offers shares of beneficial interest (“shares”) of Centre American Select Equity Fund (the “American Select Equity Fund"), Centre Active U.S. Treasury Fund (the “Treasury Fund”), and Centre Global Infrastructure Fund (the “Infrastructure Fund”) (collectively, the “Funds”). The affairs of the Trust are overseen by a Board of Trustees (the “Board” or the “Trustees”). The Declaration of Trust permits the Trustees to create additional series of the Trust and share classes.
Information in the accompanying Funds’ financial statements pertain to the Investor Class and Institutional Class shares offered by each of the Funds. All classes of shares have identical rights to earnings, assets, and voting privileges, except for class-specific expenses and exclusive rights to vote on matters affecting only individual classes.
2. SIGNIFICANT ACCOUNTING POLICIES
The following is a summary of significant accounting policies followed by the Funds in the preparation of the Financial Statements. These policies are in conformity with accounting principles generally accepted in the United States of America (“GAAP”). Each Fund is an investment company and accordingly follows the investment company accounting and reporting guidance of the Financial Accounting Standards Board (FASB) Accounting Standard Codification Topic 946Financial Services – Investment Companies.
| (a) | Portfolio securities traded on a securities exchange or quoted by NASDAQ are valued at the last sale price on the principal exchange on which they are traded at the time the securities are valued, or, if not traded on that day, are valued at the closing bid price. Securities traded in the OTC market and not quoted by NASDAQ are valued at their last sale price or, if there is no available price, the last bid price quoted by brokers that make markets in the securities as of the close of regular trading hours on the day the securities are being valued. Foreign securities are valued on the basis of quotations from the primary market in which they are traded, and are translated from the local currency into U.S. dollars using exchange rates as of the close of regular trading (normally 4:00 p.m. Eastern time) on the New York Stock Exchange (the “Exchange”) or using methods determined by the Board. Short-term instruments with maturities of 60 days or less are valued at the price supplied by an approved independent pricing source. Options contracts listed for trading on a securities exchange or board of trade shall be valued at the mean of the highest bid and lowest asked quotation across the exchanges on which the option is traded. Futures contracts are ordinarily valued at the closing settlement price on the exchange on which they are primarily traded or based upon the current settlement price for a like instrument acquired on the day on which the instrument is being valued. Securities and other assets for which quotations are not readily available or deemed unreliable are valued at their fair value using methods determined by the Board. Fair valuation of a particular security is an inherently subjective process, with no single standard to utilize when determining a security’s fair value. As such, different mutual funds could reasonably arrive at a different fair value price for the same security. In each case where a security is fair valued, consideration is given to the facts and circumstances relevant to the particular situation. This consideration includes reviewing various factors set forth in the pricing procedures adopted by the Board and other factors as warranted. In making a fair value determination, factors that may be considered, among others, may include: the type and structure of the security; unusual events or circumstances relating to the security’s issuer; general market conditions; prior day’s valuation; fundamental analytical data; size of the holding; cost of the security on the date of purchase; nature and duration of any restriction on disposition; trading activities; and prices of similar securities or financial instruments. If a Fund invests in shares of other open-end mutual funds, including Money Market Funds, (each, an “Underlying Fund”), the Fund calculates the net asset value of its shares using the reported net asset value of the applicable Underlying Fund. For each Underlying Fund, the net asset value per share for a class of shares is determined as of the close of the Exchange on each day the Exchange is open by dividing the value of the Underlying Fund’s net assets attributable to that class by the number of outstanding shares of that class on that day. |
| (b) | The per share net asset value (the “NAV”) of each Fund is calculated as of the close of regular trading on the Exchange (normally 4:00 p.m. Eastern time) each day the Exchange is open. The per share NAV is calculated by deducting from the Fund’s assets, the Fund’s liabilities, and then dividing the resulting net assets by the total number of shares outstanding, rounded to the nearest cent. The purchase price and redemption price per share is equal to the next determined NAV per share. Redemption of shares of American Select Equity Fund and Infrastructure Fund are subject to a redemption fee of 2% if redeemed within 90 days of purchase. |
| (c) | The Trust treats each Fund as a separate entity for Federal income tax purposes. Each Fund intends to continue to qualify each year as a “regulated investment company” under Subchapter M of the Internal Revenue Code of 1986, as amended (the “Code”). By so qualifying, each Fund will not be subject to Federal income taxes to the extent that it distributes substantially all of its taxable or tax-exempt income, if any, for its tax year ending September 30. In addition, by distributing in each calendar year substantially all of its net investment income, capital gains and certain other amounts, if any, each Fund will not be subject to a Federal excise tax. Therefore, no provision is made by the Funds for Federal income or excise taxes. Withholding taxes on foreign dividends are paid or provided for in accordance with the applicable country’s tax rules and rates. |
| Semi-Annual Report | March 31, 2020 | 33 |
| Centre Funds | Notes to Financial Statements |
| | March 31, 2020 (Unaudited) |
As of and during the period ended March 31, 2020, the Funds did not have a liability for any unrecognized tax benefits in the accompanying financial statements. The Funds recognize the interest and penalties, if any, related to the unrecognized tax benefits as income tax expense in the Statements of Operations. During the year, the Funds did not incur any interest or penalties.
| (d) | Net realized gains and losses on investments are computed on the identified cost basis. Dividend income is recognized on the ex-dividend date or for certain foreign securities, as soon as information is available, and interest income is recognized on an accrual basis. The Funds amortize premium and accrete discount on investments utilizing the effective interest method. Foreign dividend income may be subject to foreign withholding taxes. |
| (e) | A restricted security is a security that has been purchased through a private offering and cannot be resold to the general public without prior registration under the Securities Act of 1933, as amended (the “1933 Act”), or pursuant to the resale limitations provided by Rule 144 under the 1933 Act, or an exemption from the registration requirements of the 1933 Act. Whether a restricted security is illiquid is determined pursuant to guidelines established by the Board. Not all restricted securities are considered to be illiquid. As of March 31, 2020, the Funds did not hold any illiquid securities. |
| (f) | The accompanying financial statements were prepared in accordance with GAAP, which require the use of estimates and assumptions made by management. These may affect the reported amounts of assets and liabilities and disclosure of contingent assets and liabilities at the date of the financial statements and the reported amounts of increases and decreases in net assets from operations during the reporting period. Actual results could differ from those estimates. |
| (g) | Each Fund bears expenses incurred specifically by such Fund, as well as its pro rata portion of Trust expenses, which may be allocated on the basis of relative net assets or the nature of the services performed relative to applicability to each Fund. Expenses that are specific to a Fund or class of shares of a Fund are charged directly to that Fund or share class. All of the realized and unrealized gains and losses and net investment income of a Fund, other than class-specific expenses, are allocated daily to each class in proportion to its average daily net assets. Fees payable under the distribution (Rule 12b-1) plan and shareholder services plan are charged to each respective fund or share class. |
| (h) | The Funds intend to distribute to shareholders all of their net income and/or capital gains on an annual basis, with the exception of the Treasury Fund, which intends to make monthly income distributions. Income and capital gains distributions are determined in accordance with income tax regulations, which may differ from GAAP. Distributions to shareholders are recorded on the ex-dividend date. |
| (i) | A Fund may directly purchase securities of foreign issuers. Investing in securities of foreign issuers involves special risks not typically associated with investing in securities of U.S. issuers. The risks include possible reevaluation of currencies, the inability to repatriate foreign currency, less complete financial information about companies and possible future adverse political and economic developments. Moreover, securities of many foreign issuers and their markets may be less liquid and their prices more volatile than those of securities of comparable U.S. issuers. |
| (j) | The books and records of the Funds are maintained in U.S. dollars. Investment valuations and other assets and liabilities initially expressed in foreign currencies are converted each business day into U.S. dollars based upon current exchange rates. The portion of realized and unrealized gains or losses on investments due to fluctuations in foreign currency exchange rates is not separately disclosed and is not included in net realized and net change in unrealized gains or losses on foreign currencies. |
| (k) | Offering costs incurred in connection with the offering and initial registration of the Infrastructure Fund, including costs of printing prospectuses, legal and registration fees, are being amortized over twelve months from the Fund’s commencement of operations. As of March 31, 2020, no offering costs remain to be amortized for the Fund. |
| (l) | Idle cash may be swept into various overnight demand deposits and is classified as cash and cash equivalents on the Statement of Assets and Liabilities. The Funds maintains cash in bank deposit account which, at times, may exceed United States federally insured limits. Amounts swept overnight are available on the next business day. |
3. FAIR VALUE MEASUREMENTS
The Funds normally use third-party pricing services to obtain market quotations for their portfolio investments. Securities and other assets for which representative market quotations are not readily available or which cannot be accurately valued using the Trust’s normal pricing procedures are valued at fair value as determined in good faith under policies approved by the Trustees. Fair value pricing may be used, for example, in situations where (i) an exchange-traded portfolio security is so thinly traded that there have been no transactions for that security over an extended period of time or the validity of a market quotation received is questionable; (ii) the exchange on which the portfolio security is principally traded closes early; or (iii) trading of the portfolio security is halted during the day and does not resume prior to the NAV calculation.
| Centre Funds | Notes to Financial Statements |
| | March 31, 2020 (Unaudited) |
The inputs used in determining the fair value of each Fund’s investments are summarized into three levels, as described in the following hierarchy:
| Level 1- | Unadjusted quoted prices in active markets for identical, unrestricted assets or liabilities that a Fund has the ability to access at the measurement date. |
| Level 2- | Quoted prices which are not active, quoted prices for similar assets or liabilities in active markets or inputs other than quoted prices that are observable (either directly or indirectly). |
| Level 3- | Significant unobservable prices or inputs (including the oversight of the Board and Centre Asset Management, LLC (the “Adviser”) in determining the fair value of investments) where there is little or no market activity for the asset or liability at measurement date. |
The inputs or methodology used for valuing securities are not necessarily an indication of the risk associated with investing in those securities.
The following is a summary of each Fund’s investments in the fair value hierarchy as of March 31, 2020:
Centre American Select Equity Fund
| Investments in Securities at Value(a) | | Level 1 - Quoted Prices | | | Level 2 - Other Significant Observable Inputs | | | Level 3 - Significant Unobservable Inputs | | | Total | |
| Common Stocks | | $ | 93,675,742 | | | $ | – | | | $ | – | | | $ | 93,675,742 | |
| Total | | $ | 93,675,742 | | | $ | – | | | $ | – | | | $ | 93,675,742 | |
Centre Active U.S. Treasury Fund
| Investments in Securities at Value(a) | | Level 1 - Quoted Prices | | | Level 2 - Other Significant Observable Inputs | | | Level 3 - Significant Unobservable Inputs | | | Total | |
| U.S. Government Bonds & Notes | | $ | – | | | $ | 26,369,829 | | | $ | – | | | $ | 26,369,829 | |
| Short Term Investments | | | 1,880,524 | | | | – | | | | – | | | | 1,880,524 | |
| Total | | $ | 1,880,524 | | | $ | 26,369,829 | | | $ | – | | | $ | 28,250,353 | |
Centre Global Infrastructure Fund
| Investments in Securities at Value(a) | | Level 1 - Quoted Prices | | | Level 2 - Other Significant Observable Inputs | | | Level 3 - Significant Unobservable Inputs | | | Total | |
| Common Stocks | | $ | 24,021,877 | | | $ | – | | | $ | 24,299 | | | $ | 24,046,176 | |
| Total | | $ | 24,021,877 | | | $ | – | | | $ | 24,299 | | | $ | 24,046,176 | |
| (a) | For detailed descriptions of sectors, industries, and countries, see the accompanying Schedules of Investments. |
The following is a summary of valuation techniques and quantitative information used in determining the fair value of the Centre Global Infrastructure Fund’s Level 3 investments at March 31, 2020:
| Asset Type | | Balance as of September 30, 2019 | | | Accrued Discount/ premium | | | Realized Gain/(Loss) | | | Change in Unrealized Appreciation/ Depreciation | | | Purchases | | | Sales Proceeds | | | Transfer into Level 3 | | | Transfer Out of Level 3 | | | Balance as of March 31, 2020 | | | Net change in unrealized appreciation/(depreciation) included in the Statements of Operations attributable to Level 3 investments held at March 31, 2020 | |
| Common Stocks | | $ | – | | | $ | – | | | $ | – | | | $ | (273 | ) | | $ | 24,572 | | | $ | – | | | $ | – | | | $ | – | | | $ | 24,299 | | | $ | (273 | ) |
| | | $ | – | | | $ | – | | | $ | – | | | $ | (273 | ) | | $ | 24,572 | | | $ | – | | | $ | – | | | $ | – | | | $ | 24,299 | | | $ | (273 | ) |
| Semi-Annual Report | March 31, 2020 | 35 |
| Centre Funds | Notes to Financial Statements |
| | March 31, 2020 (Unaudited) |
Derivative Financial Instruments
A Fund may use derivative contracts, such as exchange-traded options and futures, that are related to stock market or bond indices, foreign exchange, fixed income or other securities, or be exposed to exchange-traded derivative products. A Fund may invest its assets in derivatives and other instruments to help manage interest rate exposure, protect the Fund’s assets, or enhance returns. A Fund may also be exposed to certain exchange-traded derivative products, such as exchange-traded futures and options that are fully collateralized by cash or securities, for temporary cash management or investment transition purposes, or to hedge the risks of existing positions or overall capital protection.
Derivative Risk:One or more Funds may use derivatives, such as exchange-traded options and futures, that are related to stock market or bond indexes, foreign exchange, fixed income or other securities or be exposed to exchange-traded derivative products. Loss may result from a Fund’s investments in exchange-traded futures and options. The value of derivatives in which a Fund may invest may rise or fall more rapidly than other investments. Other risks of investments in derivatives include imperfect correlation between the value of these instruments and the underlying assets; risks of default by the other party to the derivative transactions; risk that the transactions may result in losses that offset gains in portfolio positions; and risks that the derivative transactions may not be liquid. Derivatives, such as exchange-traded futures and options, contain “inherent” leverage because derivative contracts may give rise to an obligation on the part of a Fund for future payment or liabilities that are larger than the initial margin or premiums required to establish such positions. Combined with the volatility of derivatives prices, the leveraged nature of derivatives trading could cause a Fund to sustain large and sudden losses. The use of derivatives, such as futures and options, can lead to losses, including those magnified by leverage, particularly when derivatives are used to enhance return rather than mitigate risk. Correlation risk is the risk that changes in the value of the derivative may not correlate perfectly with the underlying asset, rate or index. Certain derivative instruments may be difficult to sell when the Adviser believes it would be appropriate to do so.
Derivatives may have little or no initial cash investment relative to their market value exposure and therefore can produce significant gains or losses in excess of their cost. This use of embedded leverage may allow a Fund to increase its market value exposure relative to its net assets and can substantially increase the volatility of the Fund’s performance.
Additional associated risks from investing in derivatives also exist and potentially could have significant effects on the valuation of the derivatives held by a Fund. Typically, a Fund may attempt to increase or decrease exposure to the risks associated with the securities or other traditional investments in which it invests. The risks associated with a Fund’s use of derivative instruments, including but not limited to volatility risk, correlation risk, segregation risk, and hedging risks, are additional risks that a Fund does not typically seek to increase or decrease exposure to. Examples of these associated risks are liquidity risk, which is the risk that a Fund will not be able to sell the derivative in the open market in a timely manner, and counterparty credit risk, which is the risk that the counterparty will not fulfill its obligation to the Fund.
Option Writing/Purchasing
A Fund may write or purchase option contracts to adjust risk and return of its overall investment positions, subject to any restrictions set forth in the Fund’s prospectus. When a Fund writes or purchases an option, an amount equal to the premium received or paid by the Fund is recorded as a liability or an asset and is subsequently adjusted to the current market value of the option written or purchased. Premiums received or paid from writing or purchasing options that expire unexercised are treated by a Fund on the expiration date as realized gains or losses. The difference between the premium and the amount paid or received on affecting a closing purchase or sale transaction, including brokerage commissions, is also treated as a realized gain or loss. If an option is exercised, the premium paid or received is netted to the cost of the purchase or proceeds from the sale in determining whether a Fund has realized a gain or loss on investment transactions. Risks from entering into option transactions arise from, among other things, the potential inability of counterparties to meet the terms.
Futures
A Fund may use futures subject to any restrictions set forth in the Fund’s prospectus. A Fund may also be exposed to exchange-traded futures that are fully collateralized by cash or securities, for temporary cash management or investment transition purposes, or to hedge the risks of existing positions. To the extent that the Fund uses derivatives for temporary cash management, investment transition purposes, managing duration or to hedge the risks of existing positions, the Fund will be subject to the risks associated with such transactions.
| Centre Funds | Notes to Financial Statements |
| | March 31, 2020 (Unaudited) |
The effect of derivative instruments on the Statements of Operations for the period ended March 31, 2020 (Net realized gain/(loss) on purchased options contracts are included in Net realized gain/(loss) on investments within the Statements of Operations):
| Derivatives | | Location of Gains/(Loss) On Derivatives Recognized In Income | | Realized Gain/(Loss) on Derivatives Recognized in Income | | | Change in Unrealized Gain/(Loss) on Derivatives Recognized in Income | |
| Centre American Select Equity Fund | | | | | | | | | | |
| Equity Contracts (Purchased Options) | | Net realized gain/(loss) on investments/Net change in unrealized appreciation/(depreciation) on investments | | $ | 3,337,215 | | | $ | (55,003 | ) |
| | | | | $ | 3,337,215 | | | $ | (55,003 | ) |
| Centre Active U.S. Treasury Fund | | | | | | | | | | |
| Fixed Income Contracts (Futures Contracts) | | Net realized gain/(loss) on futures contracts/Net change in unrealized appreciation/(depreciation) on futures contracts | | $ | (2,699,713 | ) | | $ | 6,456 | |
| | | | | $ | (2,699,713 | ) | | $ | 6,456 | |
Volume of Derivative Instruments for the Funds during the period ended March 31, 2020, was as follows:
| Derivative Type | | Unit of Measurement | | Monthly Average | |
| Centre American Select Equity Fund | | | | | | |
| Purchased Option Contracts | | Notional value of contracts outstanding | | $ | 69,747,860 | |
| Derivative Type | | Unit of Measurement | | Monthly Average | |
| Centre Active U.S. Treasury Fund | | | | | | |
| Purchased (Sold) Futures Contracts | | Notional value of contracts outstanding | | $ | (21,106,036 | ) |
During the ordinary course of business, the Funds may enter into transactions subject to enforceable netting agreements or other similar arrangements (“netting agreements”). Generally, the right to offset in netting agreements allows the Funds to offset any exposure to a specific counterparty with any collateral received or delivered to that counterparty based on the terms of the agreement. Generally, the Funds manage their cash collateral and securities collateral on a counterparty basis.
4. BENEFICIAL INTEREST TRANSACTIONS
On March 31, 2020, there was an unlimited number of shares of beneficial interest authorized for each Fund. Transactions in shares of beneficial interest are shown in the Statements of Changes in Net Assets.
Shares of American Select Equity Fund and Infrastructure Fund that are redeemed within 90 days of purchase may incur a 2% redemption fee deducted from the redemption amount. For the period ended March 31, 2020, redemption fees retained by these Funds are disclosed in the Statements of Changes in Net Assets.
Beneficial Ownership: The beneficial ownership, either directly or indirectly, of more than 25% of the voting securities of a Fund creates a presumption of control of the Fund under Section 2(a)(9) of the 1940 Act. As of March 31, 2020, the following entities owned beneficially more than 25% of each Fund’s outstanding shares. The shares may be held under omnibus accounts (whereby the transactions of two or more shareholders are combined and carried in the name of the originating broker rather than designated separately). Any transaction by these investors could have a material impact on the share class.
| Centre American Select Equity Fund | Class | Percentage |
| Charles Schwab & Co. Inc | Investor | 45.78% |
| Semi-Annual Report | March 31, 2020 | 37 |
| Centre Funds | Notes to Financial Statements |
| | March 31, 2020 (Unaudited) |
5. INVESTMENT ADVISORY AGREEMENTS AND RELATED-PARTY TRANSACTIONS
The Adviser serves as the investment adviser to each Fund pursuant to an Investment Advisory Agreement with the Trust on behalf of the Fund.
As compensation for the investment advisory services provided to the Funds, the Adviser is entitled to receive monthly compensation, subject to waivers, based on each Fund’s average daily net assets at the annual rate of:
| Fund | Management Fee Rate |
| Centre American Select Equity Fund (total net assets less than or equal to $1 billion) | 0.75% |
| Centre American Select Equity Fund (total net assets over $1 billion) | 0.70% |
| Centre Active U.S. Treasury Fund | 0.40% |
| Centre Global Infrastructure Fund | 0.90% |
American Select Equity Fund
For the American Select Equity Fund, the Adviser has agreed to reduce its advisory fees and/or reimburse other expenses of the Fund through at least October 31, 2020 to the extent necessary to limit the current operating expenses of the Fund including, as applicable, investment advisory fees, but excluding, as applicable, any taxes, leverage interest, distribution/service (Rule 12b-1) fees, shareholder services fees, brokerage commissions, acquired fund fees and expenses, expenses incurred in connection with any merger or reorganization, and extraordinary expenses (such as litigation and other expenses not incurred in the ordinary course of the Fund’s business) to an annual rate of 1.10% of the average daily net assets of the Investor Class shares and 0.90% of the average daily net assets of the Institutional Class shares (the “Expense Limitation Agreement”). The Expense Limitation Agreement may be terminated at any time by the Board of Trustees of the Trust (the “Board”) upon 60 days’ written notice to the Adviser, but may not be terminated by the Adviser without the consent of the Board. No recoupment will be made more than three years after the date that the applicable amount was initially waived or reimbursed by the Adviser, and the recoupment may not cause the Fund to exceed the then-existing expense limitation for that class at the time such waiver or reimbursement was made.
Treasury Fund
For the Treasury Fund, the Adviser has agreed, to reduce its advisory fees and/or reimburse other expenses of the Fund through at least October 31, 2020 to the extent necessary to limit the current operating expenses of the Fund, including, as applicable, investment advisory fees but excluding, as applicable, any taxes, leverage interest, distribution/ service (Rule 12b-1) fees, shareholder service fees, brokerage commissions, acquired fund fees and expenses, expenses incurred in connection with any merger or reorganization, and extraordinary expenses (such as litigation and other expenses not incurred in the ordinary course of the Fund’s business), to an annual rate of 0.80% of the average daily net assets of the Investor Class shares and 0.60% of the average daily net assets of the Institutional Class shares (the “Expense Limitation Agreement”). The Expense Limitation Agreement may be terminated at any time by the Board of Trustees of the Trust (the “Board”), upon 60 days’ written notice to the Adviser, but may not be terminated by the Adviser without the consent of the Board. No recoupment will be made more than three years after the date that the applicable amount was initially waived or reimbursed by the Adviser, and the recoupment may not cause the Fund to exceed the then-existing expense limitation for that class at the time such waiver or reimbursement was made.
Infrastructure Fund
Effective as of the close of business on May 18, 2018, the Adviser has contractually agreed to reduce its advisory fees and/or reimburse other expenses of the Fund for an initial period of not less than two years and until the next following effective date of the post-effective amendment to the registration statement of Centre Funds relating to the Fund incorporating the Fund’s financial statements for that fiscal year (the “Initial Term”) to the extent necessary to limit the current operating expenses of the Fund, including investment advisory fees, but excluding, as applicable, any taxes, leverage interest, distribution/service (Rule 12b-1) fees, shareholder services fees, brokerage commissions, acquired fund fees and expenses, expenses incurred in connection with any merger or reorganization, and extraordinary expenses (such as litigation and other expenses not incurred in the ordinary course of the Fund’s business) to an annual rate of 1.05% of the average daily net assets of the Investor Class shares and 1.10% of the average daily net assets of the Institutional Class shares; expenses in the table above reflect this expense limitation. Effective July 22, 2019, the Adviser further contractually agreed, to limit its advisory fees and/or reimburse other expenses of the Fund through July 21, 2020 to the extent necessary to limit total net operating expenses of the Fund, including (but not limited to) investment advisory fees of the Adviser, distribution/service (Rule 12b-1) fees, and shareholder services fees, but excluding, as applicable, any taxes, leverage interest, brokerage commissions, acquired fund fees and expenses, expenses incurred in connection with any merger or reorganization, and extraordinary expenses (such as litigation and other expenses not incurred in the ordinary course of the Fund’s business) to an annual rate of 1.25% of the average daily net assets of the Investor Class shares and 1.00% of the average daily net assets of the Institutional Class shares. Each expense limitation agreement may be terminated at any time by the Board, upon 60 days’ written notice to the Adviser, but may not be terminated by the Adviser without the consent of the Board. No recoupment will be made more than three years after the date that the applicable amount was initially waived or reimbursed by the Adviser, and the recoupment may not cause the Fund to exceed the then-existing expense limitation for that class at the time such reimbursement or waiver was made. Any recoupment provision is limited to the lesser of (A) the expense limitation in effect at the time of the waiver; and (B) the expense limitation in effect at the time of recoupment.
| Centre Funds | Notes to Financial Statements |
| | March 31, 2020 (Unaudited) |
During the period ended March 31, 2020, the fee waivers and/or reimbursements were as follows:
| Fund | | Fees Waived and/or Reimbursed by Adviser | |
| Centre American Select Equity Fund | | | |
| Investor | | $ | 63,271 | |
| Institutional | | | 4,485 | |
| Centre Active U.S. Treasury Fund | | | | |
| Investor | | | 35,870 | |
| Institutional | | | 12,121 | |
| Centre Global Infrastructure Fund | | | | |
| Investor | | | 82,268 | |
| Institutional | | | 57,249 | |
As of September 30, 2019, the balances of recoupable expenses for each Fund were as follows:
| Fund | | Expires 2020 | | | Expires 2021 | | | Expires 2022 | | | Total | |
| Centre American Select Equity Fund | | | | | | | | | | | | |
| Investor Class | | $ | 492,419 | | | $ | 357,720 | | | $ | 154,465 | | | $ | 1,004,604 | |
| Institutional Class | | | 12,240 | | | | 8,130 | | | | 10,516 | | | | 30,886 | |
| Centre Active U.S. Treasury Fund | | | | | | | | | | | | | | | | |
| Investor Class | | $ | 156,165 | | | $ | 126,667 | | | $ | 84,517 | | | $ | 367,349 | |
| Institutional Class | | | 20,594 | | | | 16,945 | | | | 26,934 | | | | 64,473 | |
| Centre Global Infrastructure Fund | | | | | | | | | | | | | | | | |
| Investor Class | | $ | – | | | $ | 16,342 | | | $ | 155,997 | | | $ | 172,339 | |
| Institutional Class | | | – | | | | 92,541 | | | | 33,985 | | | | 126,526 | |
ALPS Fund Services, Inc. (“ALPS” or the “Administrator”) serves as administrator to the Funds. ALPS receives a monthly fee paid by the Funds subject to a minimum monthly fee and is reimbursed for certain out-of-pocket expenses. Pursuant to an administrative agreement with the Trust, ALPS provides operational services to the Funds including, but not limited to fund accounting and fund administration services and general assistance in each Fund’s operations.
ALPS, pursuant to a transfer agency and services agreement with the Trust, serves as transfer agent for the Funds. Under the transfer agency and services agreement, ALPS receives an annual minimum fee per Fund and a fee based upon each shareholder account and its account activity and is reimbursed for certain out-of-pocket expenses.
ALPS, pursuant to a chief compliance officer services agreement with the Trust, provides chief compliance officer services to the Funds. Additionally, ALPS provides services in monitoring and testing the policies and procedures of the Trust in conjunction with requirements under Rule 38a-1 under the 1940 Act. ALPS receives an annual fee for these services and is reimbursed for certain out-of-pocket expenses, pursuant to the chief compliance officer services agreement.
The Trust has adopted a plan pursuant to Rule 12b-1 under the 1940 Act (the “Plan”). The Plan permits the Trust, on behalf of Investor class shares of the Funds, to pay up to 0.25% per year to one or more entities for services rendered and expenses borne in connection with providing shareholder or distribution services with respect to the Investor class shares of each Fund.
The Trust has also adopted a shareholder services plan for certain non-distribution shareholder services provided by financial intermediaries. With respect to each Fund, the shareholder services plan authorizes annual payment of up to 0.15% of the average daily net assets attributable to Investor Class shares of the Fund, and up to 0.10% of the average daily net assets attributable to Institutional Class shares of the Fund.
ALPS Distributors, Inc. (the “Distributor”) acts as the principal underwriter of the Funds pursuant to a distribution agreement with the Trust. No payments were retained by the Distributor by the Funds during the period ended March 31, 2020.
Officers of the Trust and Trustees who are “interested persons” of the Trust or the Adviser receive no salary or fees from the Trust. Each Trustee who is not an “interested person” receives an annual retainer of $20,000 paid quarterly. The Trust reimburses each Trustee and Officer for his or her travel and other expenses relating to attendance at Board meetings.
One Trustee is an officer of the Trust, and serves as Managing Director and Chief Investment Officer of the Adviser.
| Semi-Annual Report | March 31, 2020 | 39 |
| Centre Funds | Notes to Financial Statements |
| | March 31, 2020 (Unaudited) |
6. FEDERAL INCOME TAX AND TAX BASIS INFORMATION
As of and during the period ended March 31, 2020, no Fund had a liability for any unrecognized tax benefits. The Funds file U.S. Federal, state, and local tax returns as required. The Funds’ tax returns are subject to examination by the relevant tax authorities until expiration of the applicable statute of limitations, which is generally three years after the filing of the tax return but which can be extended to six years in certain circumstances. Tax returns for open years have incorporated no uncertain tax positions that require a provision for income taxes.
Components of Distributable Earnings on a Tax Basis: At March 31, 2020, permanent differences in book and tax accounting were reclassified. These differences had no effect on net assets and were primarily attributed to differences in the book and tax treatment of currency transactions, book/tax distribution differences, and non-deductible expenses.
Elective Deferrals: The Funds elect to defer to the period ending September 30, 2020, capital losses recognized during the period November 1, 2018- September 30, 2019 in the amount of:
| Fund | | Amount | |
| Centre Active U.S. Treasury Fund | | $ | 1,759,989 | |
Under current law, capital losses maintain their character as short-term or long-term and are carried forward to the next tax year without expiration. As of the current fiscal year end, the following amounts are available as carry forwards to the next tax year:
| Fund | | Short-Term | | | Long-Term | |
| Centre Global Infrastructure Fund | | $ | 8,882,812 | | | $ | 15,691,529 | |
Distributions to Shareholders: The Centre American Select Equity Fund normally pays dividends and net investment income, if any, on an annual basis, and the Centre Active U.S. Treasury Fund and Centre Global Infrastructure Fund, intend to make monthly income distributions. Each Fund normally distributes capital gains, if any, on an annual basis. Income dividend distributions are derived from interest and other income each Fund receives from its investments, including distributions of short term capital gains. Capital gain distributions are derived from gains realized when each Fund sells a security it has owned for more than one year. Each Fund may make additional distributions and dividends at other times if the Adviser believes doing so may be necessary for each Fund to avoid or reduce taxes. Net investment income/(loss) and net realized gain/(loss) may differ for financial statement and tax purposes. The amounts and characteristics of tax basis distributable earnings/(accumulated losses) are finalized at fiscal year-end.
The tax character of distributions paid for the fiscal year ended September 30, 2019 were as follows:
| Distributions Paid From: | | Ordinary Income | | | Tax-Exempt Income | | | Long-Term Capital Gains | |
| Centre American Select Equity Fund | | $ | 243,623 | | | $ | – | | | $ | 20,045,940 | |
| Centre Active U.S. Treasury Fund | | | 990,208 | | | | – | | | | 889,241 | |
| Centre Global Infrastructure Fund | | | 484,644 | | | | – | | | | – | |
The tax character of distributions paid for the fiscal year ended September 30, 2018 were as follows:
| Distributions Paid From: | | Ordinary Income | | | Tax-Exempt Income | | | Long-Term Capital Gains | |
| Centre American Select Equity Fund | | $ | 1,052,197 | | | $ | – | | | $ | 14,113,689 | |
| Centre Active U.S. Treasury Fund | | | 837,098 | | | | – | | | | – | |
| Centre Global Infrastructure Fund | | | 68,896 | | | | – | | | | – | |
| Centre Funds | Notes to Financial Statements |
| | March 31, 2020 (Unaudited) |
Unrealized Appreciation and Depreciation on Investments: The amount of net unrealized appreciation/(depreciation) and the cost of investment securities for tax purposes, including short-term securities at March 31, 2020 are displayed in the table below. The difference between book and tax basis unrealized appreciation/(depreciation) for the Funds is primarily attributable to wash sales and certain other investments.
| | | Tax Cost of Investments | | | Gross Unrealized Appreciation | | | Gross Unrealized Depreciation | | | Net Tax Unrealized Appreciation/(Depreciation) on Investments | |
| Centre American Select Equity Fund | | $ | 76,341,030 | | | $ | 24,245,399 | | | $ | (6,910,687 | ) | | $ | 17,334,712 | |
| Centre Active U.S. Treasury Fund | | | 24,867,420 | | | | 3,382,933 | | | | – | | | | 3,382,933 | |
| Centre Global Infrastructure Fund | | | 28,433,540 | | | | 1,144,393 | | | | (5,531,757 | ) | | | (4,387,364 | ) |
7. PURCHASES AND SALES OF INVESTMENT SECURITIES
For the period ended March 31, 2020, the aggregate cost of purchases and proceeds from sales of investment securities (excluding any U.S. Government Obligations, short-term securities, and purchased options and futures) were as follows:
| Fund | | Purchases of Securities | | | Proceeds From Sales of Securities | |
| Centre American Select Equity Fund | | $ | 63,913,153 | | | $ | 69,837,726 | |
| Centre Global Infrastructure Fund | | | 3,975,906 | | | | 22,247,112 | |
For the period ended March 31, 2020, the aggregate cost of purchases and proceeds from sales of U.S. Government Obligations investment securities were as follows:
| Fund | | Purchases of Securities | | | Proceeds from Sales of Securities | |
| Centre Active U.S. Treasury Fund | | $ | – | | | $ | 5,937,475 | |
8. INDEMNIFICATIONS
Under the Trust’s organizational documents, its officers and Trustees are indemnified against certain liabilities relating to their duties to the Trust. Additionally, in the ordinary course of business, the Trust enters into contracts with service providers that may contain general indemnification clauses. The Trust’s maximum exposure under these arrangements is unknown, as this would involve future claims that may be made against the Trust that have not yet occurred.
9. FUND REORGANIZATIONS
At a special meeting of shareholders held on June 27, 2019, the shareholders of SkyBridge Dividend Value Fund (the “Dividend Value Fund”), a series of FundVantage Trust, a Delaware statutory trust, approved the reorganization, pursuant to an Agreement and Plan of Reorganization (the “Plan”), of the Dividend Value Fund into the Infrastructure Fund. The Board of Trustees of the Trust (the “Board”) had previously approved the Plan providing for the reorganization.
Following the completion of the reorganization on July 19, 2019, and pursuant to the terms of the Plan, Class A and Class C shareholders of the Dividend Value Fund became Investor Class shareholders of the Infrastructure Fund, and Class I shareholders of the Dividend Value Fund became Institutional Class shareholders of the Infrastructure Fund. The reorganization qualified as a tax-free “reorganization” under the Internal Revenue Code of 1986, as amended (the “Code”) for U.S. federal income tax purposes. The reorganization was accomplished by an exchange of 1,546,099 shares of the Dividend Value Fund’s Class A, valued at $12,150,948, for 1,204,042 shares of the Infrastructure Fund’s Investor Class, 1,948,500 shares of the Dividend Value Fund’s Class C, valued at $15,102,238, for 1,496,486 shares of the Infrastructure Fund’s Investor Class and 3,702,732 shares of the Dividend Value Fund’s Class I, valued at $29,073,849, for 2,875,211 shares of the Infrastructure Fund’s Institutional Class.
| Acquiring Fund | | Shares Outstanding of Acquiring Fund | | | Net Assets of Acquiring Fund | | | Acquired Fund | | Acquired Fund Shares Exchanged | | | Net Assets of Acquired Fund Exchanged | |
| Infrastructure Fund | | | 1,201,899 | | | $ | 12,130,749 | | | Dividend Value Fund | | | 7,197,331 | | | | 56,327,035 | |
| Semi-Annual Report | March 31, 2020 | 41 |
| Centre Funds | Notes to Financial Statements |
| | March 31, 2020 (Unaudited) |
The investment portfolio fair value and unrealized appreciation for the Dividend Value Fund immediately prior to the reorganization were as follows:
| Acquired Fund | | Portfolio Value | | | Unrealized Appreciation | |
| Dividend Value Fund | | $ | 57,041,528 | | | $ | 1,529,861 | |
Immediately following the reorganization the net assets of the combined Fund was as follows:
| | | Combined Net Assets | |
| Infrastructure Fund | | $ | 68,457,784 | |
There was $23,971,840 of unused capital loss carryforward of the Dividend Value Fund, that is not subject to tax limitations, for potential utilization as of the closing date of the reorganization, July 19, 2019.
Assuming the reorganization had been completed on October 1, 2018, the Infrastructure Fund’s pro forma results of operations for the period ended September 30, 2019 would be as follows:
| | | Net Investment Income | | | Net Realized and Unrealized Gain/(Loss) on Investments | | | Net Increase/(Decrease) in Net Assets Resulting from Operations | |
| Infrastructure Fund | | $ | 3,519,579 | | | $ | (18,604,646 | ) | | $ | (15,085,067 | ) |
Because of the investment portfolios that were combined through the reorganization have been managed as a single integrated portfolio since the closing of the reorganization, it is not practicable to separate the amounts of revenue and earnings of the Dividend Value Fund that have been included in the Infrastructure Fund’s Statement of Operations since July 19, 2019.
10. SUBSEQUENT EVENTS
The Funds have evaluated the need for disclosures and/or adjustments resulting from subsequent events through the date the financial statements were issued. Based on this evaluation, no adjustments were required to the financial statements as of March 31, 2020.
| Centre Funds | Additional Information |
| | March 31, 2020 (Unaudited) |
PROXY VOTING GUIDELINES AND RECORDS
A description of the policies and procedures that the Funds use to determine how to vote proxies relating to portfolio securities and information regarding how the Funds voted proxies during the most recent 12-month period ended June 30, is available without charge, upon request, by (1) calling the Funds at 1-855-298-4236 and (2) on the U.S. Securities and Exchange Commission’s (“SEC”) website at http://www.sec.gov.
PORTFOLIO HOLDINGS DISCLOSURE POLICY
The Trust files, with regard to each Fund, with the SEC a complete schedule of investments for the first and third quarters of each fiscal year as an exhibit to its reports on Form N-PORT. The Funds’ first and third fiscal quarters end on December 31 and June 30. Form N-PORT reports are available on the SEC’s website at http://www.sec.gov. You may also obtain copies by calling the Funds at 1-855-298-4236.
| Semi-Annual Report | March 31, 2020 | 43 |

Not applicable to semi-annual report.
| Item 3. | Audit Committee Financial Expert. |
Not applicable to semi-annual report.
| Item 4. | Principal Accountant Fees and Services. |
Not applicable to semi-annual report.
| Item 5. | Audit Committee of Listed Registrants. |
Not applicable to the Registrant.
| Item 6. | Schedule of Investments. |
| (a) | The Registrant’s “Schedule I – Investments in securities of unaffiliated issuers” (as set forth in 17 CFR 210.12-12) is included in Item 1 of this Form N-CSR. |
| (b) | Not applicable to the Registrant. |
| Item 7. | Disclosure of Proxy Voting Policies and Procedures for Closed-End Management Investment Companies. |
Not applicable to the Registrant.
| Item 8. | Portfolio Managers of Closed-End Management Investment Companies. |
Not applicable to the Registrant.
| Item 9. | Purchases of Equity Securities by Closed-End Management Investment Company and Affiliated Purchasers. |
Not applicable to the Registrant.
| Item 10. | Submission of Matters to a Vote of Security Holders. |
None.
| Item 11. | Controls and Procedures. |
| (a) | The Registrant’s principal executive officer and principal financial officer have evaluated the Registrant’s disclosure controls and procedures (as defined in Rule 30a-3(c) under the Investment Company Act of 1940, as amended) within 90 days of this filing and have concluded that the Registrant’s disclosure controls and procedures were effective as of that date. |
| (b) | There was no change in the Registrant’s internal control over financial reporting (as defined in Rule 30a-3(d) under the Investment Company Act of 1940, as amended) during the second fiscal quarter of the period covered by this report that has materially affected, or is reasonably likely to materially affect, the Registrant’s internal control over financial reporting. |
| Item 12. | Disclosure of Securities Lending Activities for Closed-End Management Investment Companies. |
Not applicable.
| (a)(1) | Not applicable to semi-annual report. |
SIGNATURES
Pursuant to the requirements of the Securities Exchange Act of 1934 and the Investment Company Act of 1940, the Registrant has duly caused this report to be signed on its behalf by the undersigned, thereunto duly authorized.
CENTRE FUNDS
| By: | /s/ James A. Abate | |
| | James A. Abate | |
| | President (Principal Executive Officer) | |
| | | |
| Date: | May 26, 2020 | |
Pursuant to the requirements of the Securities Exchange Act of 1934 and the Investment Company Act of 1940, this report has been signed below by the following persons on behalf of the Registrant and in the capacities and on the dates indicated.
| By: | /s/ James A. Abate | |
| | James A. Abate | |
| | President (Principal Executive Officer) | |
| | | |
| Date: | May 26, 2020 | |
| By: | /s/ James A. Abate | |
| | James A. Abate | |
| | Treasurer (Principal Financial Officer) | |
| | | |
| Date: | May 26, 2020 | |