UNITED STATES
SECURITIES AND EXCHANGE COMMISSION
Washington, D.C. 20549
FORM N-CSR
CERTIFIED SHAREHOLDER REPORT OF REGISTERED
MANAGEMENT INVESTMENT COMPANIES
Investment Company Act file number: 811-22545
CENTRE FUNDS
(Exact name of registrant as specified in charter)
48 Wall Street, Suite 1100, New York, New York 10005
(Address of principal executive offices) (Zip code)
James A. Abate
48 Wall Street, Suite 1100
New York, New York 10005
(Name and address of agent for service)
Registrant’s telephone number, including area code:(212) 918-4705
Date of fiscal year end:September 30
Date of reporting period:October 1, 2018 – March 31, 2019
| Item 1. | Reports to Stockholders. |
| | PAGE |
| SHAREHOLDER LETTER | 1 |
| MANAGER COMMENTARY | 2 |
| Centre American Select Equity Fund | 2 |
| Centre Active U.S. Treasury Fund | 7 |
| Centre Global Infrastructure Fund | 11 |
| DISCLOSURE OF FUND EXPENSES | 15 |
| SCHEDULE OF INVESTMENTS | 16 |
| Centre American Select Equity Fund | 16 |
| Centre Active U.S. Treasury Fund | 18 |
| Centre Global Infrastructure Fund | 19 |
| STATEMENTS OF ASSETS AND LIABILITIES | 22 |
| STATEMENTS OF OPERATIONS | 23 |
| STATEMENTS OF CHANGES IN NET ASSETS | 24 |
| Centre American Select Equity Fund | 24 |
| Centre Active U.S. Treasury Fund | 25 |
| Centre Global Infrastructure Fund | 26 |
| FINANCIAL HIGHLIGHTS | 27 |
| Centre American Select Equity Fund | 27 |
| Centre Active U.S. Treasury Fund | 29 |
| Centre Global Infrastructure Fund | 31 |
| NOTES TO FINANCIAL STATEMENTS | 33 |
| ADDITIONAL INFORMATION | 43 |
Beginning on January 1, 2021, as permitted by regulations adopted by the SEC, paper copies of annual and semi-annual shareholder reports will no longer be sent by mail, unless you specifically request paper copies of the reports. Instead, the reports will be made available on the Trust’s website at www.centrefunds.com, and you will be notified by mail each time a report is posted and provided with a website link to access the report.
Beginning on January 1, 2019, you may, notwithstanding the availability of shareholder reports online, elect to receive all future shareholder reports in paper free of charge. If you invest through a financial intermediary, you can contact your financial intermediary to request that you continue to receive paper copies of your shareholder reports. If you invest directly with a Fund, you can contact your financial intermediary to request that you continue to receive paper copies of your shareholder reports. If you invest directly with a Fund, you can call (855) 298-4236 to let the Fund know you wish to continue receiving paper copies of your shareholder reports.
If you already elected to receive shareholder reports electronically, you will not be affected by this change and you need not take any action. You may elect to receive shareholder reports and other communications from a Fund electronically anytime by contacting your financial intermediary or, if you are a direct investor, by enrolling at www.centrefunds.com.
| Centre Funds | Shareholder Letter |
| | March 31, 2019 (Unaudited) |
Dear Shareholders,
It is with my pleasure that we publish the Centre Funds Semi-Annual Report covering the six-month period ended March 31, 2019. I want to thank my fellow shareholders for their continued support and confidence in Centre Funds. We are committed to truly active fund management with distinction. Each series of Centre Funds is a fundamentally-driven, actively managed Fund in core investment strategies with differentiation and uses specialist talent. We offer a select series of funds to choose from, each available in investor and institutional share classes.
Centre American Select Equity Fund
The Fund is a U.S. large capitalization valuation sensitive growth stock fund that seeks long-term growth of capital and is focused on risk adjusted returns through active and pragmatic management; the Fund may complement its equity securities with hedges and other capital preservation strategies when deemed appropriate. The Fund is intended to be a risk managed core growth fund.
Centre Active U.S. Treasury Fund
The Fund is a nontraditional U.S. Treasury securities fund that seeks to maximize investors’ total return through capital appreciation and current income through investments in primarily U.S. Treasury securities. The Fund has the potential for capital appreciation/preservation in various interest rate environments using a proprietary interest rate forecasting process that aims to take advantage of interest rate changes through active duration and interest rate management.
Centre Global Infrastructure Fund
The Fund is for investors seeking to potentially benefit from a renewed focus on infrastructure spending but wish to have liquidity in publicly traded investments in developed global markets rather than illiquid private investments. The Fund pursues a bottom-up, active management approach and invests in what we deem the most attractive infrastructure-related companies from the United States and developed international economies. Also, the Fund seeks to balance its exposures to where the weights of the Telecommunication, Utilities, Energy, Transportation, and Social Infrastructure industries are broadly represented.
Our aim at Centre Funds is to deliver strong, long-term performance results for investors through an exceptional focus on producing returns and managing risk and downside volatility in select investment strategies. We want investors to associate Centre Funds with high-conviction, differentiated fund strategies that may not be available elsewhere and are tactical, pragmatic, and opportunistic. Each investment strategy aims to capitalize on defined market opportunities using talented and experienced portfolio managers with consistent and repeatable investment processes who aim to achieve true differentiated returns. Our portfolio managers remain focused on fundamentally-driven investment approaches within truly active, disciplined and research-intensive processes. At Centre Funds, we place service excellence at the core of everything that we do and are committed to providing useful information and transparency on the Funds. Again, I want to thank my fellow shareholders for their continued support and confidence in the Centre Funds.
Sincerely,
James Abate
President, Centre Funds
| Semi-Annual Report | March 31, 2019 | 1 |
| Centre American Select Equity Fund | Manager Commentary |
| | March 31, 2019 (Unaudited) |
Performance & Strategy Summary
For the six-month period ended March 31, 2019, the Centre American Select Equity Fund (“the Fund”), Investor Share Class, delivered a total return of -3.50%; the Institutional Share Class delivered a total return of -3.27%.
During this past six-month period, the key barometer of the U.S. stock market, as measured by the S&P 500 Index1, delivered a total return of -1.73%, with only the Real Estate, Utilities, and Consumer Staples sectors posting positive absolute returns. Cyclical growth sectors such as Energy, Financials, Consumer Discretionary, and Materials fared worst as stock markets fell in the fourth quarter on global growth and rising interest rate concerns. The subsequent alleviation of macro concerns by investors and early 2019 stock market rally offset most of the fourth quarter drawdown.
The largest detractors to relative performance over the six month period ended March 31, 2019 included the Fund’s investments within the Energy sector, Noble Energy, Cimarex Energy, and Exxon Mobil; within the Materials sector, Mosaic, Nucor, CF Industries, and Albemarle; and within the Technology sector, Apple and Intel. Investments that added to the Fund’s relative performance included investments within the Utilities sector, NRG Energy, PPL Corp., and AES Corp; and within the Health Care sector and the biotechnology industry in particular, Celgene, Incyte, and Regeneron.
The Fund’s performance was positively impacted from a total return perspective by realized gains of certain hedges and other investments that Centre Asset Management, LLC, the investment adviser to the Fund (“Centre,” the “Adviser” or “we”), viewed, and continues to view, as capital protective in nature. These hedges, namely put options2 on the S&P 500 Index, aided during the volatile month of December and partly insulated the Fund from the same magnitude of drawdown3 experienced by the overall stock market, consistent with other prior volatile4 episodes, namely in August 2015, January 2016, and February 2018. Given the continued presence of certain potentially de-stabilizing factors that we believe could negatively impact the value of underlying equity securities held in the Fund’s portfolio, as of March 31, 2019, the Fund continued to hold put options on the S&P 500 Index as a potential hedge against its underlying stock holdings in the event of a material stock market correction. In terms of derivative activity during the six-month period, the Adviser reduced the hedge ratio5 of the Fund in late December by selling approximately one half of its purchased put option contracts but then restored the notional value of the put options held in late January by purchasing back essentially the number of put option contracts sold to increase the hedge ratio to again approximate the value of the underlying stock portfolio.
The process used by Centre to manage the Fund focuses on each individual portfolio company's growth outlook and capacity to create shareholder value, utilizing our bottom-up fundamental stock selection process. We utilize a disciplined, Economic Value Added6 framework to select investments. The framework focuses on the fundamentals of wealth creation or wealth destruction similar to the way a traditional, long-term focused corporate investor looking at all aspects of the business would assess a company's value. In the shorter-term, markets may often undervalue or overvalue a company's ability to create or destroy wealth. The framework seeks to identify and capture these investment opportunities. The approach is designed to capture excess returns when a business is creating shareholder wealth and the market price of the stock converges toward our target price. Centre not only analyzes earnings but also strives to understand and link the capital allocation decisions being made today by each portfolio company and how they may lead to future earnings growth. In other words, we expect that the companies in which the Fund invests will themselves invest in productive assets of the business, organically and through opportunistic purchases which, in turn, should provide the foundation for future revenue and profits growth that should create shareholder value. Alternatively, if companies cannot invest in productive assets due to a cyclical downturn or existing excess capacity, we expect these companies to “wisely contract” through the restructuring of their assets and other resources to regain their footing for future shareholder value creation. The key is that we look at the company drivers that create true shareholder wealth: capital spending or alternative capital allocations such as acquisitions, stock buybacks, or dividends; company-specific risk levels of a business to determine appropriate hurdle rates;7 and whether the company is generating operating returns on its underlying assets vis-à-vis the cost of capital. Wealth creation from growth or from wise contraction – that’s how we believe companies create long-term shareholder value.
| 1 | S&P 500 is an index of 500 stocks seen as a leading indicator of U.S. equities and a reflection of the performance of the large cap universe, made up of companies selected by economists. |
| 2 | A put option is a contract giving the owner the right, but not the obligation, to sell a specified amount of an underlying security at a specified price within a specified time. |
| 3 | Maximum drawdown is the maximum loss from a peak to a trough of a portfolio, before a new peak is attained. |
| 4 | Volatility is a measure of systematic risk of a security or a portfolio in comparison to the market as a whole. |
| 5 | The hedge ratio compares the value of a position protected through the use of a hedge with the size of the entire position itself. In this case, the notional value of put options related to the value of underlying stock positions. |
| 6 | Economic Value Added (EVA) is an estimate of a company’s economic profit. Economic profit, which refers to the profit earned by a company, minus the cost of financing the company’s capital, is an amount that may be considered in the assessment of a company’s overall value. |
| 7 | A hurdle rate is the minimum rate of return on a project or investment required by a manager or investor. The hurdle rate denotes appropriate compensation for the level of risk present; riskier projects generally have higher hurdle rates than those that are deemed to be less risky. |
| Centre American Select Equity Fund | Manager Commentary |
| | March 31, 2019 (Unaudited) |
To meet its objective as a risk-managed growth fund, the Fund may complement its equity securities with hedges and other capital preservation strategies when deemed tactically appropriate by Centre. While the use of hedging and certain investment techniques involve risk, in accordance with the Fund’s investment policies, the Adviser may tactically employ hedges and other capital preservation strategies on up to notionally one hundred percent of the value of the Fund’s underlying securities positions when the Adviser’s assessment of market valuation indicates forward returns for the stock market, as a whole, are low relative to downside risk and the cost to upside potential from portfolio preservation tools is deemed reasonable in order to respond to adverse market, economic, political or other conditions. The Adviser may also tactically employ hedges to reduce volatility. For example, through the tactical use of put options, the Fund may have enhanced performance and more limited risk. Index put options are designed to hedge the Fund from significant market declines that may occur over short periods of time. The value of an index put option generally increases as the underlying securities in the Fund decrease in price and decreases as those securities increase in price. The Adviser may also seek to enhance returns by writing (selling) out of the money call options8 tailored with exercise prices generally above the current market prices of stocks held in the Fund. As the seller of the call option, the Fund receives cash (the premium) from the purchaser9. The Adviser varies its hedging strategy and defensive positions across changing market cycles but has generally employed such strategies within the Fund since late 2014.
Market Review & Outlook
The very strong rebound in U.S. stock market indexes during the first quarter of 2019, the best start since 1998, has laid the foundation for expectations that 2019 overall will be solid, as each time the S&P 500 Index has scored a gain of 10% or more in the first quarter of a year since 1935, the market managed to climb up 6% more on average for the rest of the year, with positive performance during 11 of those 12 times, 1987 being the only exception10. This said, it must be remembered that indexes are still just near their peak levels of last September and, furthermore, we reiterate our belief that the current market dynamics are unique despite our erstwhile attempts to find a historical analog for guidance. The two contributing attributes leading to this uniqueness are the levels of overall stock market valuation and the most important economic phenomenon that may be persistent for the next two decades, namely demographic decline in the developed economies, including China, and its impact on growth and inflation.
The catalyst behind the strong start to the year lays at the feet of Federal Reserve Chairman Jerome Powell who surprised markets by doing a complete U-turn on monetary policy. After the financial markets impact of the current rate hiking cycle began to have significance,i.e., a stock market correction, Chairman Powell abruptly communicated a full reversal in short-term interest rate targets for 2019 and, not only removed expectations of further planned tightening through 2019, but instilled confidence that the Federal Reserve would actually move to accommodation with up to two interest rate cuts imbedding themselves into market expectations. Concurrently, the Federal Reserve unveiled a plan to stop scaling back the vast portfolio of bonds it built up to spur an economic recovery from the 2007-2009 financial crisis, leaving the Federal Reserve still holding at least $3.5 trillion in bonds, more than four times the roughly $800 billion it had heading into the crisis more than a decade ago. Furthermore, the European Central Bank (ECB), although it decided to end its bond purchases in December 2018, announced that it intends to continue reinvesting, in full, the principal payments from maturing securities purchased for an extended period to maintain favorable liquidity conditions and an ample degree of monetary accommodation. Never before in modern times have the world’s leading central banks abandoned a monetary tightening cycle before even moving real interest rates above zero and, in the case of the Japanese and Swiss Central Banks, expanded their mandates to engage in massive purchases of equities.
The key factor that will determine whether stock markets can follow the path of history as noted above is whether the expected deterioration in earnings, anticipated for 2019 vis-à-vis 2018, can be offset with further valuation multiple11 expansion, akin to what occurred in 2015 and early 2016 as well as other “soft landing” episodes over the past few decades,e.g., 1995. The bear case would be if we had a flat or decreasing earnings environment combined with valuation multiple compression or a further de-rating. Thus, in our opinion U.S. stock market indexes offer an asymmetrical return profile from this point – up modestly with downside risk of up to 30%.
The bear case of a potential 30% plus decline in markets arises from the foundation of what is supporting market valuations currently, specifically continued low interest rates, unparalleled usage of cash flows and debt to finance stock buybacks, and perceived permanence of the recently enacted reduction in the federal corporate tax rate from 35% to 21%. With the U.S. Presidential election cycle kicking into high gear already ahead of the 2020 election, we believe the greatest risks are geared towards increasing probabilities that policies under the next administration and Congress could curtail stock buybacks and a full or partial roll-back of the corporate tax cuts. Ironically, the bear case becomes tautological and gains its own momentum if the stock market or economy falters over the next few quarters, raising the likelihood of President Trump’s defeat by a
| 8 | Call options are agreements that give the option buyer the right, but not the obligation, to buy a stock, bond, commodity or other instrument at a specified price within a specific time period. The stock, bond, or commodity is called the underlying asset. |
| 9 | A covered call is an options strategy whereby an investor holds a long position in an asset and writes (sells) call options on that same asset in an attempt to generate increased income from the asset. This is often employed when an investor has a short-term neutral view on the asset and for this reason holds the asset long and simultaneously has a short position via the option to generate income from the option premium. |
| 10 | Source: BMO Financial Group |
| 11 | A valuation multiple is simply an expression of market value of an asset relative to a key statistic that is assumed to relate to that value. To be useful, that statistic – whether earnings, cash flow or some other measure – must bear a logical relationship to the market value observed; to be seen, in fact, as the driver of that market value. |
| Semi-Annual Report | March 31, 2019 | 3 |
| Centre American Select Equity Fund | Manager Commentary |
| | March 31, 2019 (Unaudited) |
progressive Democratic Party candidate who is likely to implement such changes. With regard to the permanence of the corporate tax rate cuts and the deficit, we remain old-fashioned in the belief that a dollar of debt will cut today’s tax bill by a dollar, but at the cost of raising it by a dollar plus interest tomorrow. A more bullish case can be supported, returns higher than up modestly, if there is some resurgence in global growth, profit margin pressures abate, and the massive fiscal deficits being accrued from the recent tax cuts genuinely don’t matter to bond or stock markets which allows the U.S. economy to potentially exit a recessionary window of vulnerability given the current low level of global growth. Alternatively, given the most recent example whereby monetary policy accommodation has come riding over the hill to “bail-out” stock markets after a greater than ten percent drawdown may lead investors to extrapolate the current re-rating phase of this stock market cycle indefinitely into the future without taking into account the effects of the normal economic and business cycles. We now find ourselves here again at peak optimism in the same manner as in 2000 and 2007 and, more importantly, witnessing deterioration in aggregate U.S. company fundamentals, operating profit margins rolling over and diminished assets efficiency, with an increasing reliance upon monetary policy accommodation to “bail-out” stock markets after significant drawdowns but leading to one of the oldest questions in investing, "how high is too high" when it comes to valuations?
With regard to economic growth, which has a strong correlation to S&P 500 Index aggregate revenues, we remain believers in our long-held thesis that demography is destiny. This holds that population trends determine the future growth rates of a country, region or even the entire world. For example, if working age populations increase too fast or too slowly, or if there are too many young or old people, then certain outcomes are likely to follow, such as economic boom or bust, inflation, or even political unrest. Low fertility and an aging population are two of our greatest concerns. In the future, nearly all developed countries may have to depend on immigrants to make up for the decline in native populations, for without them, the U.S. and nearly every country in Europe may face the prospect of a shrinking workforce and a stagnant economy akin to the Japanese experience over the recent decade. Thus, the debt crises witnessed in Greece, Puerto Rico, Italy, etc., where population declines have been most pronounced and leading, are the literal canaries in the coal mine for what experiences are likely to occur across larger countries or even regions. All developed countries have reached the point where productivity must compensate for the decline in populations or allow mass migration, which in Europe and the U.S. is one of the most argumentative and politically volatile topics and will only intensify with time. From an economic perspective, while we may experience periods of cyclical inflation, we remain convinced that lower economic growth will be consistent with continued low real interest rates and demography, more than globalization, automation, or even de-unionization, will be the primary contributor going forward.
While low real interest rates have allowed debt service levels to remain manageable, they have also led to an unprecedented increase in corporate leverage, with the debt to assets and debt per share ratios at levels last seen in the year 2000 for the average company in the S&P 500 Index. The difference, however, has been in the usage of such increased leverage. As opposed to the vast majority of cash flow usage back then being directed towards investing activities, we now are witnessing a majority directed towards financing activities, specifically stock buybacks. Corporations like stock buybacks because they generally raise earnings per share12 by reducing the number of outstanding shares and increasing per share returns on assets and equity, used widely as performance measures for executive compensation least of all. Stock buybacks also serve as a stealth transfer of wealth from shareholders to executives as they offset the dilution from stock option issuance. In 2018, partially fueled by the lower corporate tax rates, S&P 500 constituents spent $800 billion purchasing their stock, and this year it’s estimated they will spend close to $1 trillion13, much greater than the amount distributed as dividends. The low interest rate environment may have literally trapped corporations into the classic “Minsky moment” whereby the current long period of low rates and prosperity have encouraged a diminished perception of risk, which has promoted the leveraged risk of using borrowed money instead of cash flow from operations. We believe the debt-leveraged financing of stock buybacks exposes corporations to a potential future cash flow crisis as they have underinvested in productive cash flow generating assets, which may be triggered with a short period of declining asset prices that gains furious momentum. Some of the recent notable bankruptcies of private equity owned firms,e.g., food retailer Winn-Dixie Stores, highlights that even fundamentally sound and stable businesses can succumb to simply choking on too much debt, so buybacks will continue to be a major factor behind the overall U.S. market’s climb, until they too exhaust themselves.
Given the “aggregate” market concerns, the process used by Centre to manage the Fund stays disciplined and focused on each individual portfolio company's growth outlook and capacity to create shareholder value, utilizing our bottom-up fundamental stock selection process. Although we derive our investment ideas on a bottom-up basis, with the slowdown in global growth and the fall in interest rates, we do expect that performance can be attained in two thematic areas – stable growth stocks and idiosyncratic restructuring stories. Regarding the former, with bond yields so low we continue to emphasize a “new Nifty-Fifty14” group of companies in the Fund such as Microsoft, Amazon, and Alphabet. Of course, knowing when to sell is perhaps the most critical issue but it’s important also to ignore the natural human tendency to want to take profits in stocks that have had enormous run-ups, a stock like Amazon being an example, the risk being that you sell prematurely. In our view, it simply depends on the company and our ability to manage the Fund with an alertness to selling a stock if we see fundamentals deteriorate even in the slightest as we did with long-time Fund holding Nvidia during 2018, thankfully prior to its material drawdown in the fourth quarter of 2018. That said, in an environment where sales growth and margin improvement is becoming an ever-scarce attribute, many of these stocks in the new Nifty-Fifty could get more expensive with their stocks' prices relative to their earnings going much higher because of rising expectations that corporate earnings
| 12 | Earnings per share (EPS) is the portion of a company’s profit allocated to each share of common stock. Earnings per share serve as an indicator of a company’s profitability. |
| 13 | Source: S&P Down Jones Indices |
| 14 | The 50 or so stocks that were most favored by institutional investors in the late 1960s and early 1970s. Companies in this group were usually characterized by consistent earnings growth and high P/E ratios. |
| Centre American Select Equity Fund | Manager Commentary |
| | March 31, 2019 (Unaudited) |
growth overall is going to slow markedly in coming years and assuming interest rates remain secularly depressed. Alternative to stable growth, we see increasing opportunities for idiosyncratic restructuring stories such as Barrick Gold, Noble Energy, AT&T, Knight-Swift Transportation, and Wells Fargo. In each case, these companies represent contrarian recovery candidates and, through our lens, have begun to fundamentally inflect positively in terms of profits margins and asset efficiency derived mainly from cost-cutting and asset restructurings with the benefit of very attractive relative, and in some cases, attractive absolute valuations.
While we admit that the three underpinnings of the U.S. stock market’s excess valuation, arising from elevated profit margins, can sustain themselves for longer and, thus, keeping indexes stable until a resumption of global growth allows earnings to grow into the existing prices to justify stability, we see fragility and indexes vulnerable to significant dislocations just lacking a catalyst. Ironically, this is at a time when market prices for forward volatility are back to near all-time lows and, thus, allowing us to efficiently purchase protective options to help insulate the Fund’s underlying holdings against a material decline occurring over a short period of time in stock prices.
Whether labelled a traditional growth or value stock, we consider valuation or the price one pays at purchase as the most critical element of successful investment. Currently, the consensus driver to enable the stock market in aggregate to move higher is continued reliance upon already stratospheric valuation multiples re-rating higher still, on further accommodative monetary policies or a significant increase in risk appetite by investors, as well as momentum of highly elevated net profit margins reliant upon factors that are likely to reverse course. To repeat ourselves for emphasis, we see fragility and major stock market indexes vulnerable to significant dislocations in 2019, just lacking a catalyst. Given this, the Fund currently continues to concentrate the number of positions in its portfolio in an attempt to maximize individual stock risk rather than market risk and use derivative instruments intended to hedge the risks of existing equity positions, namely put options on the S&P 500 Index, as a potential hedge against its underlying stock holdings in the event of a material correction. We continue to emphasize a barbell15 of secular growth stocks16 with contrarian, opportunistic cyclical growth companies in the midst of business restructurings. We believe that our pragmatic, large-capitalization, valuation-sensitive growth and concentrated, high-conviction approach to stock selection, with a cognizance of risk management that includes tactically implementing capital protective investments, seems positioned to perform well relative to less risk aware strategies.
| 15 | A barbell strategy in reference to a stock portfolio consists of half the portfolio anchored in defensive, low-beta sectors or assets, and the other half in aggressive, high-beta sectors or assets. |
| 16 | A stock is secular when the associated company earnings remain constant regardless of other trends occurring within the market. |
The market outlook is the opinion of the author and can change at any time.
| Semi-Annual Report | March 31, 2019 | 5 |
| Centre American Select Equity Fund | Manager Commentary |
| | March 31, 2019 (Unaudited) |
SECTOR WEIGHTINGS
As a percentage of Net Assets
| Communication Services | 18.27% |
| Information Technology | 15.91% |
| Health Care | 12.07% |
| Energy | 10.95% |
| Materials | 10.37% |
| Industrials | 10.15% |
| Consumer Discretionary | 8.73% |
| Financials | 5.50% |
| Utilities | 4.75% |
| Consumer Staples | 1.20% |
| Purchased Options | 0.70% |
| Cash, Cash Equivalents, and Other | 1.40% |
| Totals | 100.00% |
These allocations may not reflect the current or future positions of the portfolio.
GROWTH OF HYPOTHETICAL $10,000 INVESTMENT THROUGH MARCH 31, 2019

This graph assumes an initial investment of $10,000 at December 21, 2011, the inception date for Investor Class shares, which have the longest period of annual returns, and that any dividends and distributions are reinvested. This graph depicts the performance of the Fund's Investor Class versus the S&P 500® Total Return Index. Taxes on Fund distributions or when shares are redeemed, if any, are not reflected. Unlike the Fund, an index is not available for investment, is unmanaged and does not have expenses that affect the results. The comparison is shown for illustrative purposes only.
TOTAL RETURNS – FOR THE PERIOD ENDED MARCH 31, 2019
| | 1 Month | 3 Month | YTD | 1 Year | 3 Year Average Annualized | 5 Year Average Annualized | Since Inception* Average Annualized |
| Centre American Select Equity Fund – Investor Class | 1.90% | 11.08% | 11.08% | 4.88% | 10.93% | 8.57% | 11.63% |
| S&P 500® Total Return Index | 1.94% | 13.65% | 13.65% | 9.50% | 13.51% | 10.91% | 14.36% |
| Centre American Select Equity Fund – Institutional Class | 1.89% | 11.21% | 11.21% | 5.44% | 11.23% | 8.77% | 8.62% |
| S&P 500® Total Return Index | 1.94% | 13.65% | 13.65% | 9.50% | 13.51% | 10.91% | 10.91% |
| * | Inception date of December 21, 2011 for Investor Class. Inception date of January 21, 2014 for Institutional Class. |
The performance information quoted above represents past performance, which is not a guarantee of future results, and does not reflect the deduction of taxes that a shareholder would pay on Fund distributions or the redemption of Fund shares. Investment return and principal value of an investment will fluctuate so that an investor’s shares, when redeemed, may be worth more or less than their original cost. Total return includes reinvestment of dividends and capital gains, if any. Current performance may be lower or higher than the performance data quoted. For the most current month-end performance data, please call 855-298-4236.
The S&P 500® Total Return Index is a commonly recognized, market-capitalization weighted index of 500 widely held securities, designed to measure broad U.S. equity performance. You cannot invest directly in an index.
The line graph above shows the performance of Investor Class shares only, since the Investor Class has the longest period of annual returns. The performance of the Institutional Class shares will differ from the performance shown because the Institutional Class shares have different expenses than the Investor Class shares.
| Centre Active U.S. Treasury Fund | Manager Commentary |
| | March 31, 2019 (Unaudited) |
Performance & Strategy Summary
For the six-month period ended March 31, 2019, the Centre Active U.S. Treasury Fund ( “the Fund”), Institutional Share Class, delivered a total return of 2.74%; the Investor Share Class delivered a total return of 2.54%. Over this period, the Bloomberg Barclays U.S. Treasury Index1 returned 4.73%.
Performance attribution in the Centre Active U.S. Treasury portfolio reflects interest income combined with our active duration2 management decisions that impact capital gain or loss capture. As there are no corporate or mortgage related securities in the portfolio, there are no “credit spread3” components to performance. Performance during the six-month period ended March 30, 2019, reflected our generally cautious outlook for the U.S. Treasury market based on our investment process, as our target portfolio durations were bearish as we entered 2019, but U.S. Treasury securities prices continued to move higher driven by reversals in Central Bank policies and low inflation readings.
The Fund’s active duration decisions are based on the near-term outlook for interest rates which is based, in turn, on a monthly review of economic conditions and current bond market valuation. Factors utilized in the assessment of the outlook make up our proprietary Interest Rate Scorecard. The Fund’s generally cautious stance over the six months, particularly since the start of the year, reflects the strong U.S. labor market which saw the unemployment rate decline to 3.8% and weekly claims for unemployment insurance decline to a level not seen since December 1969 when the labor force was significantly smaller. While investors’ inflation rate expectations remain well anchored, reported inflation over the last twelve months is roughly in line with the Federal Open Market Committee (FOMC)’s 2% target. Additionally, wage growth and the inflation measures calculated by the various Federal Reserve Banks,e.g., “sticky-price4”, trimmed mean and the “underlying inflation gauge5”, are also consistent with the 2% goal. Finally, the term premia6 on longer dated Treasuries are well below those demanded on average in the past by investors for taking on maturity risk. The low premia available likely reflect, to a decreasing degree, earlier episodes of “Quantitative Easing7” and the current state of economic political policy uncertainty, both in the U.S. and elsewhere. History shows that global uncertainty generates a demand for the global safe haven investment, U.S. Treasury securities.8 As policy issues are sorted out, the fundamentals of strong growth and inflation that is at least in line with the FOMC’s goal should push rates higher.
The Fund’s investment objective is to maximize total return through capital appreciation and current income. The Fund pursues this objective by using an active interest rate risk management strategy that aims to capture general cyclical interest rate trends while allowing for the potential to benefit from short-term deviations. This strategy involves the use of a proprietary fundamentally-driven interest rate forecasting process designed to forecast interest rates on a monthly basis. The Fund’s duration is adjusted based on a monthly assessment of the likely change in interest rates. When interest rates are expected to decline, the Fund extends duration, and when interest rates are expected to rise, the Fund shortens duration. The Adviser’s active duration management strategy for the Fund seeks the potential for capital appreciation and/or preservation of capital in variable interest rate environments by utilizing U.S. Treasury securities, including bills, notes and bonds, Treasury inflation protected securities9 (TIPS), cash equivalents and, in certain market environments, futures contracts on U.S. Treasury Notes and Bonds.
The Fund is intended to serve as a tactical (long10, short11 or neutral duration relative to that of the Treasury market) fixed income investment by managing market exposure to achieve performance(i.e., managing interest rate beta12 to achieve alpha13). Over time, it is intended to provide the
| 1 | The Bloomberg Barclays U.S. Treasury Index includes public obligations of the U.S. Treasury. Treasury bills are excluded by the maturity constraint but are part of a separate Short Treasury Index. In addition, certain special issues, such as state and local government series bonds (SLGs), as well as U.S. Treasury TIPS, are excluded. STRIPS are excluded from the index because their inclusion would result in double-counting. |
| 2 | Duration is a measure of the sensitivity of the price – the value of principal – of a fixed-income investment to a change in interest rates. Duration is expressed as a number of years. Bond prices are said to have an inverse relationship with interest rates. Therefore, rising interest rates indicate bond prices are likely to fall, while declining interest rates indicate bond prices are likely to rise. |
| 3 | A credit spread is the difference in yield between a U.S. Treasury bond and another debt security of the same maturity but different credit quality. |
| 4 | Price stickiness (or sticky prices) is the resistance of market price(s) to change quickly despite changes in the broad economy that suggest a different price is optimal. |
| 5 | The underlying inflation gauge (UIG) captures sustained movements in inflation from information contained in a broad set of price, real activity, and financial data. |
| 6 | The term premia is the compensation that investors require for bearing the risk that short-term Treasury yields do not evolve as they are expected. |
| 7 | Quantitative easing is an unconventional monetary policy in which a central bank purchases government securities or other securities from the market in order to increase the monetary supply and encourage lending and investment. |
| 8 | U.S. Treasury securities are bonds issued by the U.S. government. There are various types of Treasury securities. The shortest maturity issues are called Treasury bills. Bonds that mature in two to 10 years (from the time they are issued) are called Treasury notes. |
| 9 | Treasury inflation protected securities (TIPS) refer to a treasury security that is indexed to inflation in order to protect investors from the negative effects of inflation. TIPS are considered an extremely low-risk investment because they are backed by the U.S. government and because the par value rises with inflation, as measured by the Consumer Price Index, while the interest rate remains fixed. |
| 10 | Duration is loosely tied to maturity. A fund with a long duration holds bonds that have longer maturities, typically 10 years or more. |
| 11 | A short duration strategy involves buying bonds with shorter-dated maturities and selling long-dated bonds in order to lower the overall price sensitivity to interest rate movements and, as such, minimize potential capital losses. |
| 12 | Beta is a measure of the volatility, or systematic risk, of a security or a portfolio in comparison to the market as a whole. Beta is used in the capital asset pricing model (CAPM), which calculates the expected return of an asset based on its beta and expected market returns. |
| 13 | Alpha is a measure of performance on a risk-adjusted basis. Alpha takes the volatility (price risk) of a mutual fund and compares its risk-adjusted performance to a benchmark index. The excess return of the fund relative to the return of the benchmark index is a fund's alpha. |
| Semi-Annual Report | March 31, 2019 | 7 |
| Centre Active U.S. Treasury Fund | Manager Commentary |
| | March 31, 2019 (Unaudited) |
same yield as the Treasury market with attractive diversification benefits given the underlying core portfolio of Treasury securities. The Adviser’s strategy for the Fund is also designed to accommodate both systematic and unforeseen cash needs, given the ample liquidity of the Treasury market.
The utilization of Treasury securities within an investor’s portfolio asset allocation is designed to provide attractive diversification properties, as the correlation between Treasury market returns and those of the equity market has historically been negative during recession-related “bear” equity markets. The Adviser’s investment discipline for the Fund is designed to identify the risks and opportunities of trends and short-term deviations from those trends in interest rates by combining measures of the Federal Reserve (Fed)’s policies, real growth, inflation expectations, and current bond market valuations. This investment discipline is intended to preserve capital in periods of significant rate increases by decreasing the Fund’s portfolio duration and provide the flexibility to extend portfolio duration when rates are likely to decline.
Market and Outlook
Over the long run, interest rate behavior primarily reflects real economic growth, investors’ inflation expectations or concerns, monetary policy, and bond market valuations. The Fund portfolio manager’s view is that over the next few years, barring a recessionary shock, steady real growth in the U.S. economy is likely to continue and that is likely to become the longest expansion in the post WWII period. Labor market activity has been and remains strong and has positive momentum. We believe this strength has taken the unemployment rate well below the level that is sustainable, NAIRU14. Current estimates of NAIRU, based on projected population growth and estimates of the labor force participation rate, are in the range of 4.5-4.7%. The unemployment rate is currently at 3.8%. Job openings reported by the Department of Labor continue at a high level as does the “quits” rate. The quits rate is an indicator of confidence on the part of workers as it indicates those leaving current employment to search for a better position. Labor market strength is further confirmed by the Non-Employment Index, a measure designed to answer critiques of the “official” unemployment rate by evaluating the likelihood of a return to the labor force by those no longer counted as active job seekers. Additionally, the lack of acceleration in the inflation rate as the unemployment rate has fallen to such a low level, the seeming failure of the Phillips Curve15, may be indicative of some remaining labor market slack. The employment-to-population ratio for prime age labor market participants remains 1% below pre-crisis levels and may be evidence of such slack. So, as various FOMC members have said, it seems likely that the Fed is willing to support some overheating of the labor market and an inflation rate somewhat above target for a period. Finally, James Bullard, President of the St. Louis Federal Reserve Bank, has recently said that the FOMC must be sensitive to not “invert the yield curve”. While our own assessment is that yield curve inversions do not have the predictive power typically attributed to them, many others including policy makers and academics continue to focus on them as indicative of recessions. Our own analysis focuses on the relation between the federal fund’s target and the economy’s neutral or natural rate. Currently, monetary policy is not restrictive. We believe the federal fund’s rate target is likely ¼ of a percent below the natural rate and the Fed’s balance sheet remains significantly larger than that required for the efficient implementation of monetary policy.
Historically, the spread between the 10-year yield16 and the federal funds rate has been 150 basis points17. So, the Fund’s current target range would be consistent with a 10-year yield in the 3.75-4% range. John Williams, newly appointed President of the Federal Reserve Bank of New York and now a permanent voting member of the FOMC, has suggested that a 1% spread may be normal going forward, which would put the 10-year rate at 3.25-3.5%. However, we see no reason why investors should willingly accept lesser term premia going forward unless the Fed proves to be a more stabilizing force than has been true in the past. Given our growth expectations and the indicated willingness of policy makers to foster overshooting of the unemployment and inflation rate targets, our view is that rates could be in the 3.5-3.75% range before December 31, 2019.
Risks to the interest rate forecasts described above are more likely to the upside than the downside. Like stock prices, rates tend to overshoot the level indicated by the fundamentals. Additionally, the Federal Reserve has very rarely achieved a “soft-landing” in reaching its dual mandate of full employment and price stability, defined as an inflation rate of 2% and an unemployment rate somewhat above where it stands today. Upside risk may be even more probable given the expressed willingness to breach the 2% target by a “small amount” for a “temporary period”, as neither “small” nor “temporary” were well specified. Once currently well anchored inflationary expectations break free, actual inflation could spike higher, creating a vicious cycle as business and household expectations become embodied in pricing and spending decisions.
Continued progress in rolling back growth hindering regulations could create a more favorable climate for business than anticipated and accelerate the pace of hiring and investment for plant and equipment. Furthermore, if investors become convinced that tax simplification and restructuring as well as growth facilitating infrastructure spending will occur, in addition to an improved regulatory environment, rates could again spike higher.
| 14 | The Non-Accelerating Inflation Rate of Unemployment (NAIRU) – also referred to as the long-run Phillips curve – is the specific level of unemployment that is evident in an economy that does not cause inflation to rise. |
| 15 | Phillips curve is an economic concept developed by A. W. Phillips stating that inflation and unemployment have a stable and inverse relationship. The theory claims that with economic growth comes inflation, which in turn should lead to more jobs and less unemployment. |
| 16 | The 10-year yield is the return on investment, expressed as a percentage, on the debt obligation issued by the U.S. government with a maturity of 10 years upon initial issuance. |
| 17 | Basis point refers to a common unit of measure for interest rates and other percentages in finance. One basis point is equal to 1/100th of 1%, or 0.01%, or 0.0001, and is used to denote the percentage change in a financial instrument. |
| Centre Active U.S. Treasury Fund | Manager Commentary |
| | March 31, 2019 (Unaudited) |
Longer term, yields will likely settle in the 4-5% range if our expectations for real growth are realized and inflation, after a period of overshooting, settles at the Fed’s 2% target. If this becomes the generally accepted outlook, we think investors will cause rates to move into this range sooner rather than later.
Risks to the downside of our outlook come from those who argue that the best days for growth are behind us. Over time, inflation and real growth and interest rate levels will reflect political, economic, and demographic related issues. Our growth outlook, for the reasons mentioned above, resembles, though it is somewhat less than, the economy’s potential growth during much of the 20th and early part of the 21st centuries. In contrast, real growth projections based on the “New Normal18” for the U.S. economy from the San Francisco Federal Reserve Bank are in the range of 1.5%-1.75% while the Congressional Budget Office (CBO) is projecting a 1.8% real growth through 2027. Combined with the Fed’s 2% goal for inflation, these growth projections would place the equilibrium value for the 10-year yield at roughly 3.5%-4% longer term, still higher than current levels. The arguments that form the basis for this significantly slower pace of growth relative to the 20th century average of around 3.0%-3.25% revolve around a reduced rate of technological advancement, less contribution from education, and slower growth in the labor force (demographics).
In “The Rise and Fall of American Growth”, Robert Gordon argues that the technology-related ideas of today are much less dramatic in their growth impact than the innovations of the past, such as the steam engine. John Fernald of the San Francisco Federal Reserve Bank projects productivity growth in line with its “pace for most of the period since 1973” of about 1%. He assumes that any contribution from educational attainment (increased human capital) has “plateaued” and that capital “deepening” (increased capital per worker) will not spur labor productivity dramatically. The arguments for a reduced rate of growth in the future point to a slowing pace of labor force growth, which in turn reflects both slower population growth and the retirement of the “baby boomers”.
Forecasting an ongoing lack of meaningful technological advancements and the failure of the educational system to adapt to changing skill requirements seems both problematic and pessimistic. And, to the extent that “capital deepening”, more capital per worker, has an impact on productivity, the ongoing pace of business investment spending is encouraging. This investment reflects the attractive after-tax rate of return currently being earned which has been stable to increasing of late according to research at the St. Louis Federal Reserve Bank.
This research also calls into question the work concluding that a decline in the economy’s natural rate of interest, the rate in real terms consistent with potential output growth and target rate inflation, has occurred. An explanation for why the real or natural rate of interest is below the return on capital may be an increased aversion to risk on the part of investors and a greater demand for the riskless asset19, U.S. Treasury securities (as noted above). Increased risk aversion could reflect demographic changes, global political and economic policy uncertainty and the lingering aftermath of the global financial crisis. If investors become less concerned, they may be less willing to pay a higher premium for perceived safety.
Apart from the contrasting position noted above, there is a “stagflation20” scenario that merits concern. From the Hoover Institute: “if, for example, interest rates were to rise to 5%, instead of the Trump administration’s prediction of just under 3.5%, the interest cost alone on the projected $20 trillion of public debt would total $1 trillion per year. More than half of all personal income taxes would be needed to pay bondholders. Such high interest payments would crowd out financing of needed expenditures to restore our national defense budget, our depleted domestic infrastructure, and other critical government activities.” A reduction in outlays for infrastructure could slow the economy’s potential for growth.
Regardless of the eventual outcomes for growth and inflation rates, there is nothing in this debate to suggest that the business cycle has been tamed out of existence or that it will not be exacerbated by monetary policy, either conventional or unconventional, as has been true in the past. In fact, some suggest that business cycles may occur more frequently and potentially be of greater downside magnitude if a lower real federal funds rate, consistent with slower trend growth, limits the Fed’s ability to stimulate growth through conventional monetary policy. If true, this would increase opportunities to benefit more frequently from cyclical declines in rates. If, on the other hand, real growth reverts toward its 20th century norm and inflation accelerates as policy makers delay too long in the normalization process, there may be a great need to protect portfolio value against rising rates. There may, of course, be an opportunity to benefit from the eventual cyclical decline in rates and changes in term premia as policy makers eventually act to rein in accelerating inflation.
Going forward and consistent with history, rate behavior seems likely to continue to be cyclical in nature and jagged or violent in pattern as both market participants and policy makers react and overreact to the impacts of changing economic, inflation and political conditions. Our investment process is designed for such a world and is intended to anticipate rate moves and adjust portfolio duration tactically for the benefit of shareholders of the Fund by taking advantage of rate declines and shielding value against rate increases.
| 18 | The term “New Normal” refers to a permanent downward departure from America’s historic 3% growth rate. New Normal projections could be a response to the trauma of the financial panic, the European debt crisis, deleveraging, and downtrending demographics, summing to a suggestion of slower growth. |
| 19 | A risk-free asset has a certain future return. Treasuries (especially T-bills) are considered to be risk-free because they are backed by the U.S. government. |
| 20 | Stagflation is a condition of slow economic growth and relatively high unemployment, or economic stagnation, accompanied by rising prices, or inflation. It can also be defined as inflation and a decline in gross domestic product (GDP). |
The market outlook is the opinion of the author and can change at any time.
| Semi-Annual Report | March 31, 2019 | 9 |
| Centre Active U.S. Treasury Fund | Manager Commentary |
| | March 31, 2019 (Unaudited) |
ASSET TYPE WEIGHTINGS
As a percentage of Net Assets
| Government Bond | 91.53% |
| Cash, Cash Equivalents, and Other | 8.47% |
| Totals | 100.00% |
These allocations may not reflect the current or future positions of the portfolio.
GROWTH OF HYPOTHETICAL $10,000 INVESTMENT THROUGH MARCH 31, 2019

This line graph assumes an initial investment of $10,000 at January 21, 2014, the Fund’s inception date, and that any dividends and distributions are reinvested. This graph depicts the performance of the Fund versus the Bloomberg Barclays U.S. Treasury Index. Unlike the Fund, an index is not available for investment, is unmanaged and does not have expenses that affect the results. The comparison is shown for illustrative purposes only.
TOTAL RETURNS – FOR THE PERIOD ENDED MARCH 31, 2019
| | 1 Month | 3 Month | YTD | 1 Year | 3 Year | 5 Year | Since Inception (January 21, 2014) Average Annualized |
| Centre Active U.S. Treasury Fund – Investor Class | 0.36% | 0.31% | 0.31% | 2.51% | 0.05% | 0.97% | 1.07% |
| Centre Active U.S. Treasury Fund – Institutional Class | 0.39% | 0.42% | 0.42% | 2.95% | 0.38% | 1.28% | 1.38% |
| Bloomberg Barclays U.S. Treasury Index | 1.91% | 2.11% | 2.11% | 4.22% | 1.04% | 2.16% | 2.21% |
The performance information quoted above represents past performance, which is not a guarantee of future results, and does not reflect the deduction of taxes that a shareholder would pay on Fund distributions or the redemption of Fund shares. Investment return and principal value of an investment will fluctuate so that an investor’s shares, when redeemed, may be worth more or less than their original cost. Total return includes reinvestment of dividends and capital gains, if any. Current performance may be lower or higher than the performance data quoted. For the most current month-end performance data, please call 855-298-4236.
Bloomberg Barclays U.S. Treasury Index – includes public obligations of the U.S. Treasury. Treasury bills are excluded by the maturity constraint but are part of a separate Short Treasury Index. In addition, certain special issues, such as state and local government series bonds (SLGs), as well as U.S. Treasury TIPS, are excluded. STRIPS are excluded from the index because their inclusion would result in double-counting. You cannot invest directly into an index.
| Centre Global Infrastructure Fund | Manager Commentary |
| | March 31, 2019 (Unaudited) |
Performance & Strategy Summary
For the six-month period ended March 31, 2019, the Centre Global Infrastructure Fund (“the Fund”), Investor Share Class, delivered a total return of 2.95%; the Institutional Share Class delivered a total return of 2.98%.
During this past six-month period, the MSCI World Index1 and MSCI World Infrastructure Index2 delivered total returns of -2.61% and 5.27%, respectively. During the period, investments providing the strongest contribution to the Fund’s relative performance included: within Utilities, Companhia de Saneamento Básico, AGL Energy, China Resources Gas, and Centrica; within Industrials, Aéroports de Paris; and within Communication Services, Verizon Communications. The largest detractors from relative performance included: Talend, Whiting Petroleum, Blue Prism, and Halliburton. From a sector allocation standpoint, emphasis to the Communication Services, Energy, and Industrials sectors contributed positively to the Fund’s relative performance during the period, while emphasis to Utilities, Healthcare, Materials, and Technology modestly detracted from the Fund’s relative performance during the period. Historically, shares of companies linked to infrastructure have demonstrated asymmetrical upside versus downside capture against broad global equity indexes such as the MSCI World Index. During the deep market sell-off in the fourth quarter last year, the Fund declined 9.37% while the MSCI World Index declined 14.02%, exhibiting a 66.8% downside capture ratio3. Furthermore, during the year-to-date recovery through March 31, 2019, the Fund gained 13.62% while the MSCI World Index gained 13.27%, realizing a 102.63% upside capture relative to the broader global equity benchmark.
We believe the Fund is well positioned to continue taking advantage of the pro-cyclical nature of a selective group of global infrastructure-related holdings, while attempting to limit downside risk as these companies provide a myriad of essential services in their respective regions and industries. The Fund offers several key differentiators from the broader global equity set of investable companies, as well as core infrastructure universes including: 1) historically, the MSCI World Infrastructure Index has generated a dividend yield4 greater than the yield on conventional core equity indexes like the MSCI World Index; 2) the Fund pays distributions of dividend and interest income monthly; 3) hard assets like infrastructure assets tend to retain their “real” value over the long-term; 4) historically, the volatility of infrastructure indexes is lower than that of conventional equity indexes like the MSCI World Index; 5) high Economic Value Added5 (EVA) companies, the foundation of our stock selection process, have historically outperformed low EVA ones; and 6) many infrastructure assets have concession agreements or long-term contracts that link to inflation in the long run. In identifying firms with sustainable pricing power, the Fund seeks investments that exhibit high barriers to entry in their segments and that create positive externalities in their regions. The Fund focuses on industries with lower volatility such as toll roads, power stations, hospitals and schools. Also, by targeting high EVA growth companies, the Fund narrows its focus to high quality infrastructure firms that make wise capital allocation decisions. Through our “bottoms-up” analysis, we seek to avoid names that destroy shareholder wealth by either “empire building” or under-investment. Additionally, the stock-selection approach standardizes accounting across countries, which facilitates cross-border comparisons between the best U.S. infrastructure names and international firms. From a portfolio management perspective, the Fund can make active strategic and tactical investments across sectors and regions based on opportunity sets we see in the market.
Market Review & Outlook
Securities in the global infrastructure sector remain a compelling investment option at this stage of the global business and market cycle, characterized by high dividend yields, stable cash flows, attractive risk-adjusted performance, better relative performance during periods of market drawdowns, lower correlations with other asset classes, and a long-term hedge against inflation. Infrastructure’s uniquely defensive attributes are driven by underlying long lived assets with high barriers to entry, economies of scale, inelastic demand, and high operating margins. We divide infrastructure in two types: economic infrastructure (e.g., transport, utilities, communication, and renewable energy) and social infrastructure (e.g., schools, healthcare, and datacenters). Since the global financial crisis, significant funding gaps for infrastructure in developed markets have emerged, and despite the years of debate about replacing outdated backbone systems, infrastructure investment has declined as a percentage of GDP in more than half of the G20 economies. Years of underinvestment in mission critical areas such as transportation, water treatment, and power grids could erode future growth potential and productivity of developed economies. To mitigate the economic impact on stressed governmental finances, the federal government and municipalities are now focusing efforts to incentivize public companies to take on projects that have capital requirement gaps, creating an expanded role for publicly listed infrastructure companies.
Historically, infrastructure-related investments generally show superior performance over broad equity market indexes prior to an economic downturn. To this point, the Federal Reserve’s univariate probit regression relating the probability of a U.S. recession at some point over the next
| 1 | The MSCI World Index is a broad global equity benchmark that represents large and mid-cap equity performance across 23 developed markets countries. |
| 2 | The MSCI World Infrastructure Index captures the global opportunity set of companies that are owners or operators of infrastructure assets. Constituents are selected from the equity universe of MSCI World, the parent index. |
| 3 | Upside/Downside capture ratio measures a fund’s performance in up/down markets relative to the market/benchmark itself. It is calculated by |
taking the fund’s upside/downside capture return and dividing it by the benchmark’s upside/downside capture return.
| 4 | The dividend yield is the ratio of a company’s annual dividend compared to its share price. |
| 5 | Economic Value Added (EVA) is an estimate of a company’s economic profit. Economic profit, which refers to the profit earned by a company, minus the cost of financing the company’s capital, is an amount that may be considered in the assessment of a company’s overall value. |
| Semi-Annual Report | March 31, 2019 | 11 |
| Centre Global Infrastructure Fund | Manager Commentary |
| | March 31, 2019 (Unaudited) |
year to the slope of the yield curve predicts that the near-term recession probability has risen significantly. Also, using five-year peak-inflation-adjusted price-to-earnings (P/E) ratios6, international developed markets remain at a discount to those for the U.S., providing a relatively favorable long-term valuation backdrop for non-U.S. stocks. As active managers, we intend to take advantage of undervalued international stocks with strong balance sheets and free cash flows, solid dividend yields, and cyclically depressed profits that are inflecting higher and which are poised to outperform and complement our U.S. companies exposure. With non-U.S. stocks sitting at decade-low relative performance and valuation levels, there is a broad opportunity set that matches our targeted criteria.
From a sectoral point, we believe Energy is favorable from a risk-reward perspective. Specifically, we favor energy infrastructure companies operating crude oil and liquids pipeline systems, those involved in international energy projects, and natural gas transmission and midstream businesses. Brent Crude is now trading at approximately $74/barrel (bbl.) levels, which will likely provide a significant cash flow windfall to producers going forward. The year-to-date recovery in crude prices now ranks among one of the most impressive in modern oil trading history. The Organization of the Petroleum Exporting Countries (OPEC) supply cuts as well as the rise in political tensions in Venezuela and Iran, have contributed to the sharp turnaround in fundamentals despite the tepid economic growth levels in most countries outside the U.S. The price shock from escalating tensions with Iran is likely to only increase with the U.S. government’s demand that all buyers of Iranian oil stop purchases by May 1st, a move that sent crude prices to six-month highs recently. As noted, Venezuela has also factored into the move, with recent power blackouts reportedly wiping out roughly half of the country’s rapidly diminishing output. More fundamentally-driven upside risks to oil prices include positive outcomes from U.S.-China trade negotiations, which may boost demand growth. The Trump administration recently announced two executive orders aimed at freeing up construction for more pipelines to supply the United States with oil and gas as well as for export. The Presidential orders could give the federal government more power over states in approving energy projects such as pipelines, where certain projects were formerly held up. The United States today is producing more oil and gas than any point in its history, in large part because of the shale boom in the Permian Basin in West Texas. But producers have had trouble getting the excess supply to customers due to constraints on the number of pipelines completed. In the Fund, we prefer the large-cap midstream companies given their diversified footprints, better balance sheets and lower external equity needs. When coupling midstream assets’ starting enterprise value / earnings before interest depreciation amortization (EV/EBITDA)7 valuations (~10.6x) and current yields (~6.7%), we believe investors seeking a mix of income and capital appreciation will be rewarded. Furthermore, we view the pending acquisition of Anadarko Petroleum favorably from a macro standpoint for midstream assets, as consolidating Permian acreage/upstream investment should yield higher volume growth for midstream assets. Midstream buyouts in the Permian are now being valued in certain transactions at up to 18x EBITDA, an example being the recent acquisition of Glass Mountain Pipeline, which are at a significant premium when compared with a 11–13x cash-flow multiple for most publicly traded midstream energy companies and, thus, we believe the Fund is well positioned to take advantage of the upward re-rating of public company valuations. Midstream MLPs and U.S. midstream both trade at a 1.0x discount to their 24-month average (~10% discount). The Fund’s top energy holdings are well positioned to capitalize on secular trends within their transmission and midstream businesses including Enbridge (ENB), TransCanada (TRP), Kinder Morgan (KMI), Williams Companies (WMB), ONEOK (OKE), Pembina Pipeline (PBA), and Cheniere Energy (LNG).
Utilities as a sector are accelerating investments in the grid as they push to address aging asset challenges, a changing generation landscape, and hardening the grid by upgrading old distribution pipes to mitigate downtime. The stocks of North American Utilities sector companies now possess a relative valuation (ex-California and PPL Corp. with its U.K. exposure) of a 20% P/E premium to the S&P 500 Index and absolute valuations near prior peak levels, with Utilities now trading at an 18.5x P/E multiple mainly due to the significant fall in bond yields. That said, with a lower yield backdrop and continuing directional uncertainty over the macro and global growth outlook, it is not too surprising that Utilities have proven to be resilient despite trading close to prior highs in terms of valuation multiples; the sector continues to be supported by lower yields. We believe infrastructure or power generation focused utilities, as opposed to distribution, remain an attractive total income return (dividend yield plus growth) investment option with a relatively low beta8 in comparison to other sectors. In North America, the Fund sees opportunity with Edison International (EIX) given the fast-growing regulated utility is exposed to clean renewables migration and is trading at a significant discount to peers given the speculation of liabilities from the wildfires that occurred in California. Governor Newsom’s team recently called for less utility liability on wildfire and we believe the most likely outcome is that California creates a state fund to provide EIX access to cash to pay wildfire damage claims while state regulators decide if the utility can pass the cost to ratepayers. Internationally, we see continued momentum for Brazilian utilities given positive sector outlook post the election of President Jair Bolsonaro, together with the expectation of reforms and a solution to legal and regulatory disputes. The Fund favors Companhia de Saneamento Básico (SBS) and Enel Américas (ENIA) given smaller, provincial utilities will find it difficult to compete with large international players such as SBS and ENIA for renewable buildout contracts due to the higher cost of capital as well as scale and expertise factors. We believe the privatization program on both federal and state levels is achievable with the federal government (i.e., Economy Minister Paulo Guedes) vocally in favor of the need to attract more investments in the sanitation sector, alongside a state government that seems determined to pursue privatization. We also see opportunity in the European Utility sector including Enel, Iberdrola, RWE, EDP/EDPR,
| 6 | The price-to-earnings ratio (P/E multiple) is the ratio for valuing a company that measures its current share price relative to its per-share earnings (EPS). |
| 7 | The EV/EBITDA ratio is a popular metric used as a valuation tool to compare the value of a company, debt included, to the company’s cash earnings less non-cash expenses. EV (the numerator) is the company’s enterprise value and EBITDA (the denominator) stands for earnings before interest, taxes, depreciation, and amortization. |
| 8 | A beta coefficient is a measure of the volatility, or systematic risk, of an individual stock in comparison to the unsystematic risk of the entire market. |
| Centre Global Infrastructure Fund | Manager Commentary |
| | March 31, 2019 (Unaudited) |
Engie and Orsted, which have significantly upgraded their renewable ambitions. The new renewable targets are supported by the expansion in the addressable wind and solar markets in Europe, the U.S. and Latin America. We view the ongoing improvement in renewable economics (lower costs, corporate PPAs) as an important catalyst in 2019.
In Telecom, the next advancement in cellular technology, fifth generation (5G), is expected to be so fast that it will be able to surpass the speed of fiber wire internet service now provided by cable companies. We believe the carrier investment in LTE9 densification and 5G will lead to increased subscriber growth, sales, and average revenue per user (ARPU) for select service providers (carriers). In President Trump’s latest comments, he made it clear that the United States’ 5G roll-out will be led by the private sector. The U.S. wireless industry praised Trump’s move, and we believe that a private sector led roll-out will allow for faster migration from 5G non-standalone to 5G standalone. While certain semiconductor and communication companies (primarily Towers and Fiber) have been early beneficiaries of 5G, the stock prices of carriers are yet to reflect the meaningful benefit of 5G coverage/use cases becoming more widespread. The prior generation cycle change from 2011 to 2012 shows that ARPU growth serves as a strong catalyst for service provider shares, as investors begin to net buy in earnest when concerns over capex shift to confidence in the success of a service driven by ARPU growth. Verizon's pricing for mobile 5G (~$10/month extra per unlimited line) represents an approximate 15-20% premium over its rates for LTE unlimited plans. We believe 5G is far more significant as a potential incremental tailwind for the carriers given their spectrum position and Small Cell/fiber footprints. We favor the large cell phone carriers such as Verizon (VZ) and AT&T (T), as small cells present a cost-effective solution for filling coverage gaps, increasing bandwidth, and getting the networks ready for 5G without the need to build more expensive macro sites. While Sprint/T-Mobile and other smaller carriers will also see some benefit, their lack of significant owned fiber holdings and limited capex will push will push them toward leasing other companies’ fiber/pole infrastructure. President Trump is also working to streamline the permitting process for Small Cell infrastructure companies across state and local governments. Also, as local authorities review applications for small cells and potentially revise the current capping fees local governments can charge wireless companies, we believe consensus forecasts will prove to be conservative for the Small Cell sector.
We continue to believe that infrastructure forecasts of efficiency gains are underestimating the proliferation of technology use cases which are expected to reduce costs associated with maintaining infrastructure assets. Emerging areas to support global infrastructure projects that we believe aren’t priced into earnings estimates include predictive maintenance, IIoT (Industrial Internet of Things), and cybersecurity. The oil and gas industry has been one of the first sectors to deploy IIoT and predictive maintenance software leading to significant reduction in downtime and elimination of breakdowns. The oil and gas industry still faces serious challenges, including the costs of maintaining its aging infrastructure. On average, 42% of offshore equipment is more than 15 years old and has 13% downtime – the majority of which is unplanned. It is estimated that refiners in the U.S. alone lose around $6.6 billion a year due to unplanned downtimes. Data optimization and predictive maintenance can push rig performance beyond 95%, increase production by 2% to 5%, improve efficiency and thus, reduce costs by 10% – and perhaps most importantly, it can help prevent disasters like oil spills or wildfires. Chevron expects to outfit oil machinery with sensors for predictive maintenance by 2019 in a wide-scale pilot program and aims to have sensors connected to much of the high-value equipment that could significantly disrupt oil and gas operations and create lost profit opportunities by 2024. IIoT’s impact may span many other major industries besides energy, including transportation, manufacturing, and healthcare. Governments and infrastructure owners have also been sharpening their focus on predictive maintenance and cybersecurity, as asset management techniques have also moved into the digital era, and security protocols (both physical and virtual) have become more sophisticated. Over the coming year, we expect infrastructure security and resilience concerns to be prioritized due to more internet access points and higher traffic, while IIoT could give additional impetus. As active managers we favor select companies that are embracing technology for cost savings and revenue generation throughout the infrastructure industry, including Duke Energy (DUK), Kinder Morgan (KMI), Oneok (OKE), and Pembina Pipeline (Canada - PPL).
To conclude, we believe the Fund will perform well with exposure to undervalued U.S. and international stocks with strong balance sheets and free cash flows, solid dividend yields, and, in certain cases, cyclically depressed profits that are inflecting higher. Furthermore, the Fund is well positioned by targeting energy, telecom, industrials, and other undervalued areas of global infrastructure sector. With non-U.S. value stocks sitting at decade-low relative performance and valuation levels, there is a broad opportunity set that matches our targeted criteria to complement the Fund’s U.S. investments. Lastly, the Fund’s unique exposure to next-generation global infrastructure adjacencies, including public cloud deployments, data center monitoring, cybersecurity, and IIoT is a key differentiator against legacy managed infrastructure portfolios, which overlook these powerful trends within the industry.
| 9 | Long-Term Evolution (LTE) is a standard for wireless broadband communication for mobile devices and data terminals. |
The market outlook is the opinion of the author and can change at any time.
| Semi-Annual Report | March 31, 2019 | 13 |
| Centre Global Infrastructure Fund | Manager Commentary |
| | March 31, 2019 (Unaudited) |
INDUSTRY WEIGHTINGS
As a percentage of Net Assets
| Diversified Telecommunication Services | 22.92% |
| Oil, Gas & Consumable Fuels | 22.36% |
| Electric Utilities | 17.26% |
| Multi-Utilities | 9.32% |
| Wireless Telecommunication Services | 8.15% |
| Transportation Infrastructure | 5.13% |
| Health Care Providers & Services | 3.81% |
| Software | 2.89% |
| Gas Utilities | 2.44% |
| Water Utilities | 2.17% |
| Construction & Engineering | 1.40% |
| Building Products | 1.26% |
| Cash, Cash Equivalents, and Other | 0.89% |
| Totals | 100.00% |
COUNTRY WEIGHTINGS
As a percentage of Net Assets
| United States | 50.13% |
| Canada | 11.58% |
| Japan | 7.37% |
| Spain | 4.49% |
| Australia | 3.63% |
| Italy | 3.56% |
| Great Britain | 3.33% |
| Hong Kong | 2.96% |
| Germany | 2.46% |
| Brazil | 2.16% |
| France | 1.78% |
| Chile | 1.75% |
| South Korea | 1.19% |
| Greece | 1.11% |
| Mexico | 1.03% |
| Singapore | 0.58% |
| Cash, Cash Equivalents, and Other | 0.89% |
| Totals | 100.00% |
These allocations may not reflect the current or future positions of the portfolio.
GROWTH OF HYPOTHETICAL $10,000 INVESTMENT THROUGH MARCH 31, 2019
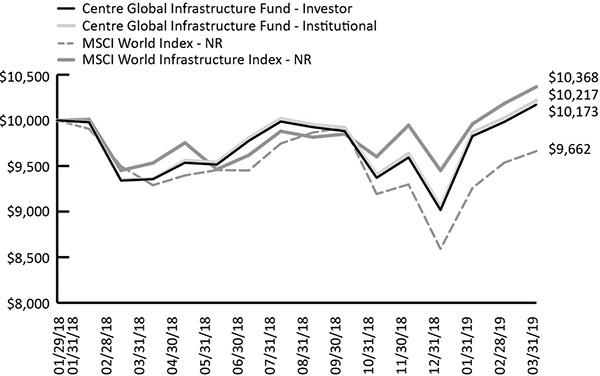
This graph assumes an initial investment of $10,000 at January 29, 2018, the Fund’s inception date, and that any dividends and distributions are reinvested. This graph depicts the performance of the Fund versus the MSCI World Index and the MSCI World Infrastructure Index. Taxes on any Fund distributions or when shares are redeemed, if any, are not reflected. Unlike the Fund, an index is not available for investment, is unmanaged and does not have expenses that affect the results. The comparison is shown for illustrative purposes only.
TOTAL RETURNS – FOR THE PERIOD ENDED MARCH 31, 2019
| | 1 Month | 3 Month | YTD | 1 Year | Since Inception (January 29, 2018) |
| Centre Global Infrastructure Fund – Investor | 1.89% | 12.82% | 12.82% | 8.74% | 1.48% |
| Centre Global Infrastructure Fund – Institutional | 1.91% | 12.84% | 12.84% | 9.16% | 1.86% |
| MSCI World Index – NR | 1.31% | 12.48% | 12.48% | 4.01% | -2.90% |
| MSCI World Infrastructure Index – NR | 1.79% | 9.71% | 9.71% | 8.77% | 3.14% |
The performance information quoted above represents past performance, which is not a guarantee of future results, and does not reflect the deduction of taxes that a shareholder would pay on Fund distributions or the redemption of Fund shares. Investment return and principal value of an investment will fluctuate so that an investor’s shares, when redeemed, may be worth more or less than their original cost. Total return includes reinvestment of dividends and capital gains, if any. Current performance may be lower or higher than the performance data quoted. For the most current month-end performance data, please call 855-298-4236.
The MSCI World Index is a broad global equity index that represents large and mid-cap equity performance across 23 developed markets countries. It covers approximately 85% of the free float-adjusted market capitalization in each country. The MSCI World Index does not offer exposure to emerging markets.
MSCI World Infrastructure Index captures the global opportunity set of companies that are owners or operators of infrastructure assets. Constituents are selected from the equity universe of MSCI World, the parent index.
You cannot invest directly in an index.
The Fund is new and has a limited operating history.
| Centre Funds | Disclosure of Fund Expenses |
| | March 31, 2019 (Unaudited) |
Example.As a shareholder of a series of Centre Funds (each series, a “Fund” and together, the “Funds”), you will incur two types of costs: (1) transaction costs, including any applicable redemption fees; and (2) ongoing costs, including management fees, distribution and/or service (12b-1) fees (if applicable) and other Fund expenses. The following examples are intended to help you understand your ongoing costs (in dollars) of investing in a Fund and to compare these costs with the ongoing costs of investing in other mutual funds. The examples are based on an investment of $1,000 invested on October 1, 2018 and held through March 31, 2019.
Actual Expenses.The first line under each class of the table below provides information about actual account values and actual expenses. You may use the information in this line, together with the amount you invested, to estimate the expenses that you paid over the period. Simply divide your account value by $1,000 (for example, an $8,600 account value divided by $1,000 = 8.6), then multiply the result by the number in the first line under the heading “Expenses Paid During Period 10/01/2018 – 03/31/2019” to estimate the expenses you paid on your account during this period.
Hypothetical Example for Comparison Purposes.The second line under each class of the table below provides information about hypothetical account values and hypothetical expenses based on each Fund’s actual expense ratio and an assumed rate of return of 5% per year before expenses, which is not the Fund’s actual return. The hypothetical account values and expenses may not be used to estimate the actual ending account balance or expenses you paid for the period. You may use this information to compare the ongoing costs of investing in a Fund and to other funds. To do so, compare this 5% hypothetical example with the 5% hypothetical examples that appear in the shareholder reports of the other funds. Please note that the expenses shown in the table are meant to highlight your ongoing costs only and do not reflect any transactional costs, such as redemption fees, if any. Therefore, the second line under each class of the table below is useful in comparing ongoing costs only, and will not help you determine the relative total costs of owning different funds. In addition, if these transactional costs were included, your costs would have been higher.
| | Beginning
Account Value
10/01/18 | Ending
Account Value
03/31/19 | Expense Ratio(a) | Expenses Paid
During Period
10/1/2018-
3/31/2019 (b) |
| Centre American Select Equity Fund | | | | |
| Investor Class | | | | |
| Actual | $ 1,000.00 | $ 965.00 | 1.45% | $ 7.10 |
| Hypothetical (5% return before expenses) | $ 1,000.00 | $ 1,017.70 | 1.45% | $ 7.29 |
| Institutional Class | | | | |
| Actual | $ 1,000.00 | $ 967.30 | 0.95% | $ 4.66 |
| Hypothetical (5% return before expenses) | $ 1,000.00 | $ 1,020.19 | 0.95% | $ 4.78 |
| Centre Active U.S. Treasury Fund | | | | |
| Investor Class | | | | |
| Actual | $ 1,000.00 | $ 1,025.40 | 1.09% | $ 5.50 |
| Hypothetical (5% return before expenses) | $ 1,000.00 | $ 1,019.50 | 1.09% | $ 5.49 |
| Institutional Class | | | | |
| Actual | $ 1,000.00 | $ 1,027.40 | 0.63% | $ 3.18 |
| Hypothetical (5% return before expenses) | $ 1,000.00 | $ 1,021.79 | 0.63% | $ 3.18 |
| Centre Global Infrastructure Fund | | | | |
| Investor Class | | | | |
| Actual | $ 1,000.00 | $ 1,029.50 | 1.33% | $ 6.73 |
| Hypothetical (5% return before expenses) | $ 1,000.00 | $ 1,018.30 | 1.33% | $ 6.69 |
| Institutional Class | | | | |
| Actual | $ 1,000.00 | $ 1,029.80 | 1.12% | $ 5.67 |
| Hypothetical (5% return before expenses) | $ 1,000.00 | $ 1,019.35 | 1.12% | $ 5.64 |
| (a) | Annualized, based on the Fund's most recent fiscal half year expenses less any waivers/reimbursements. |
| (b) | Expenses are equal to the Fund's annualized expense ratio, multiplied by the average account value over the period, multiplied by the number of days in the most recent fiscal half year (182), divided by 365. |
| Semi-Annual Report | March 31, 2019 | 15 |
| Centre American Select Equity Fund | Schedule of Investments |
| | March 31, 2019 (Unaudited) |
| | | Shares | | | Value | |
| COMMON STOCKS (97.90%) | | | | | | | | |
| Communication Services (18.27%) | | | | | | | | |
| Diversified Telecommunication Services (4.15%) | | | | | | | | |
| AT&T, Inc. | | | 80,260 | | | $ | 2,516,954 | |
| Verizon Communications, Inc. | | | 39,860 | | | | 2,356,922 | |
| | | | | | | | 4,873,876 | |
| Entertainment (2.75%) | | | | | | | | |
| Activision Blizzard, Inc. | | | 38,330 | | | | 1,745,165 | |
| Netflix, Inc.(a) | | | 4,190 | | | | 1,493,986 | |
| | | | | | | | 3,239,151 | |
| Interactive Media & Services (11.37%) | | | | | | | | |
| Alphabet, Inc., Class C(a) | | | 2,935 | | | | 3,443,665 | |
| Alphabet, Inc., Class A(a) | | | 2,910 | | | | 3,424,750 | |
| Facebook, Inc., Class A(a) | | | 23,220 | | | | 3,870,541 | |
| Twitter, Inc.(a) | | | 79,660 | | | | 2,619,221 | |
| | | | | | | | 13,358,177 | |
| Total Communication Services | | | | | | | 21,471,204 | |
| | | | | | | | | |
| Consumer Discretionary (8.73%) | | | | | | | | |
| Hotels, Restaurants & Leisure (1.21%) | | | | | | | | |
| McDonald's Corp. | | | 7,470 | | | | 1,418,553 | |
| | | | | | | | | |
| Internet & Direct Marketing Retail (6.00%) | | | | | | | | |
| Amazon.com, Inc.(a) | | | 3,960 | | | | 7,051,770 | |
| | | | | | | | | |
| Textiles, Apparel & Luxury Goods (1.52%) | | | | | | | | |
| Ralph Lauren Corp. | | | 13,780 | | | | 1,786,991 | |
| | | | | | | | | |
| Total Consumer Discretionary | | | | | | | 10,257,314 | |
| | | | | | | | | |
| Consumer Staples (1.20%) | | | | | | | | |
| Household Products (1.20%) | | | | | | | | |
| Procter & Gamble Co. | | | 13,560 | | | | 1,410,918 | |
| Total Consumer Staples | | | | | | | 1,410,918 | |
| | | | | | | | | |
| Energy (10.95%) | | | | | | | | |
| Oil, Gas & Consumable Fuels (10.95%) | | | | | | | | |
| Cabot Oil & Gas Corp. | | | 92,160 | | | | 2,405,376 | |
| Cimarex Energy Co. | | | 32,590 | | | | 2,278,041 | |
| Devon Energy Corp. | | | 82,180 | | | | 2,593,601 | |
| Exxon Mobil Corp. | | | 38,250 | | | | 3,090,600 | |
| Noble Energy, Inc. | | | 101,380 | | | | 2,507,127 | |
| | | | | | | | 12,874,745 | |
| Total Energy | | | | | | | 12,874,745 | |
| | | | | | | | | |
| Financials (5.50%) | | | | | | | | |
| Banks (3.95%) | | | | | | | | |
| KeyCorp | | | 152,250 | | | | 2,397,938 | |
| Wells Fargo & Co. | | | 46,450 | | | | 2,244,464 | |
| | | | | | | | 4,642,402 | |
| Diversified Financial Services (1.55%) | | | | | | | | |
| Berkshire Hathaway, Inc., Class B(a) | | | 9,070 | | | | 1,822,072 | |
| | | | | | | | | |
| Total Financials | | | | | | | 6,464,474 | |
| | | Shares | | | Value | |
| Health Care (12.07%) | | | | | | | | |
| Biotechnology (2.78%) | | | | | | | | |
| Alexion Pharmaceuticals, Inc.(a) | | | 10,720 | | | $ | 1,449,130 | |
| Incyte Corp.(a) | | | 21,150 | | | | 1,819,111 | |
| | | | | | | | 3,268,241 | |
| Health Care Equipment & Supplies (3.67%) | | | | | | | | |
| Abbott Laboratories | | | 16,940 | | | | 1,354,184 | |
| Medtronic PLC | | | 32,480 | | | | 2,958,278 | |
| | | | | | | | 4,312,462 | |
| Pharmaceuticals (5.62%) | | | | | | | | |
| Johnson & Johnson | | | 15,370 | | | | 2,148,573 | |
| Merck & Co., Inc. | | | 25,110 | | | | 2,088,399 | |
| Pfizer, Inc. | | | 55,790 | | | | 2,369,401 | |
| | | | | | | | 6,606,373 | |
| Total Health Care | | | | | | | 14,187,076 | |
| | | | | | | | | |
| Industrials (10.15%) | | | | | | | | |
| Aerospace & Defense (3.52%) | | | | | | | | |
| Raytheon Co. | | | 12,100 | | | | 2,203,168 | |
| The Boeing Co. | | | 5,080 | | | | 1,937,613 | |
| | | | | | | | 4,140,781 | |
| Construction & Engineering (1.57%) | | | | | | | | |
| Quanta Services, Inc. | | | 48,740 | | | | 1,839,448 | |
| | | | | | | | | |
| Industrial Conglomerates (1.98%) | | | | | | | | |
| 3M Co. | | | 11,220 | | | | 2,331,292 | |
| | | | | | | | | |
| Machinery (1.63%) | | | | | | | | |
| Illinois Tool Works, Inc. | | | 13,300 | | | | 1,908,949 | |
| | | | | | | | | |
| Road & Rail (1.45%) | | | | | | | | |
| Knight-Swift Transportation Holdings, Inc. | | | 52,170 | | | | 1,704,915 | |
| | | | | | | | | |
| Total Industrials | | | | | | | 11,925,385 | |
| | | | | | | | | |
| Information Technology (15.91%) | | | | | | | | |
| Communications Equipment (2.01%) | | | | | | | | |
| Cisco Systems, Inc. | | | 43,640 | | | | 2,356,123 | |
| | | | | | | | | |
| IT Services (4.01%) | | | | | | | | |
| Mastercard, Inc., Class A | | | 8,760 | | | | 2,062,542 | |
| Visa, Inc., Class A | | | 16,940 | | | | 2,645,859 | |
| | | | | | | | 4,708,401 | |
| Semiconductors & Semiconductor Equipment (1.34%) |
| Intel Corp. | | | 29,400 | | | | 1,578,780 | |
| | | | | | | | | |
| Software (8.55%) | | | | | | | | |
| Adobe Systems, Inc.(a) | | | 4,780 | | | | 1,273,822 | |
| Microsoft Corp. | | | 74,437 | | | | 8,779,100 | |
| | | | | | | | 10,052,922 | |
| Total Information Technology | | | | | | | 18,696,226 | |
| | | | | | | | | |
| Materials (10.37%) | | | | | | | | |
| Chemicals (3.62%) | | | | | | | | |
| CF Industries Holdings, Inc. | | | 53,510 | | | | 2,187,489 | |
| Mosaic Co. | | | 75,750 | | | | 2,068,732 | |
| | | | | | | | 4,256,221 | |
| Centre American Select Equity Fund | Schedule of Investments |
| | March 31, 2019 (Unaudited) |
| | | Shares | | | Value | |
| Materials (continued) | | | | | | | | |
| Construction Materials (1.51%) | | | | | | | | |
| Vulcan Materials Co. | | | 14,940 | | | $ | 1,768,896 | |
| | | | | | | | | |
| Metals & Mining (5.24%) | | | | | | | | |
| Barrick Gold Corp. | | | 275,850 | | | | 3,781,903 | |
| Nucor Corp. | | | 40,710 | | | | 2,375,429 | |
| | | | | | | | 6,157,332 | |
| Total Materials | | | | | | | 12,182,449 | |
| | | | | | | | | |
| Utilities (4.75%) | | | | | | | | |
| Electric Utilities (3.16%) | | | | | | | | |
| Edison International | | | 27,500 | | | | 1,702,800 | |
| PPL Corp. | | | 63,290 | | | | 2,008,825 | |
| | | | | | | | 3,711,625 | |
| Independent Power and Renewable Electricity Producers (1.59%) | | | | | | | | |
| AES Corp. | | | 103,280 | | | | 1,867,302 | |
| | | | | | | | | |
| Total Utilities | | | | | | | 5,578,927 | |
| | | | | | | | | |
| TOTAL COMMON STOCKS | | | | | | | | |
| (Cost $86,816,780) | | | | | | | 115,048,718 | |
| Expiration Date | | Exercise
Price | | | Contracts | | Notional
Value | | | Value | |
| PURCHASED OPTIONS (0.70%) | | | | | | | | | | | | | | |
| Puts | | | | | | | | | | | | | | |
| S&P 500® Index: | | | | | | | | | | | | | | |
| 9/20/2019 | | $ | 2,350.00 | | | 410 | | | 116,210,400 | | | | 822,050 | |
| | | | | | | | | | | | | | | |
| Total Puts | | | | | | | | | | | | | 822,050 | |
| | | | | | | | | | | | | | | |
| TOTAL PURCHASED OPTIONS | | | | | | | | | | | | | | |
| (Cost $3,587,325) | | | | | | | | | | | | | 822,050 | |
| | | 7-Day Yield | | Shares | | | Value | |
| SHORT TERM INVESTMENTS (0.73%) | | | | | | | | | | |
| Money Market Fund (0.73%) | | | | | | | | | | |
| Dreyfus Treasury Prime Cash Management, Institutional Class | | 2.280% | | | 853,174 | | | | 853,174 | |
| | | | | | | | | | | |
| TOTAL SHORT TERM INVESTMENTS | | | | | | | | | | |
| (Cost $853,174) | | | | | | | | | 853,174 | |
| | | | | | | | | | | |
| TOTAL INVESTMENTS (99.33%) | | | | | | | | | | |
| (Cost $91,257,279) | | | | | | | | $ | 116,723,942 | |
| Other Assets In Excess Of Liabilities (0.67%) | | | | | | | | | 787,384 | |
| NET ASSETS (100.00%) | | | | | | | | $ | 117,511,326 | |
| (a) | Non-income producing security. |
See Notes to Financial Statements.
| Semi-Annual Report | March 31, 2019 | 17 |
| Centre Active U.S. Treasury Fund | Schedule of Investments |
| | March 31, 2019 (Unaudited) |
| | | Principal
Amount | | | Value | |
| U.S. GOVERNMENT BONDS & NOTES (91.53%) | | | | | | | | |
| U.S. Treasury Bond (67.53%) | | | | | | | | |
| 8/15/2019, 8.125% | | $ | 3,500,000 | | | $ | 3,571,777 | |
| 2/15/2020, 8.500% | | | 5,000,000 | | | | 5,263,379 | |
| 8/15/2020, 8.750% | | | 6,500,000 | | | | 7,055,547 | |
| 5/15/2027, 2.375% | | | 700,000 | | | | 701,463 | |
| 2/15/2043, 3.125% | | | 5,170,000 | | | | 5,490,600 | |
| 5/15/2044, 3.375% | | | 5,170,000 | | | | 5,727,391 | |
| Total U.S. Treasury Bond | | | | | | | 27,810,157 | |
| | | | | | | | | |
| U.S. Treasury Notes (24.00%) | | | | | | | | |
| 7/31/2021, 2.250% | | | 2,200,000 | | | | 2,199,785 | |
| 11/15/2022, 1.625% | | | 2,100,000 | | | | 2,056,811 | |
| 5/15/2024, 2.500% | | | 2,100,000 | | | | 2,125,512 | |
| 8/15/2024, 2.375% | | | 1,600,000 | | | | 1,609,125 | |
| 11/15/2025, 2.250% | | | 1,900,000 | | | | 1,892,652 | |
| Total U.S. Treasury Notes | | | | | | | 9,883,885 | |
| | | | | | | | | |
| TOTAL U.S. GOVERNMENT BONDS & NOTES | | | | | | | | |
| (Cost $36,840,135) | | | | | | | 37,694,042 | |
| | | 7-Day Yield | | Shares | | | Value | |
| SHORT TERM INVESTMENTS (3.17%) | | | | | | | | | | |
| Money Market Fund (3.17%) | | | | | | | | | | |
| Dreyfus Treasury Prime Cash Management, Institutional Class | | 2.280% | | | 1,304,388 | | | | 1,304,388 | |
| | | | | | | | | | | |
| TOTAL SHORT TERM INVESTMENTS | | | | | | | | | | |
| (Cost $1,304,388) | | | | | | | | | 1,304,388 | |
| | | | | | | | | | | |
| TOTAL INVESTMENTS (94.70%) | | | | | | | | | | |
| (Cost $38,144,523) | | | | | | | | $ | 38,998,430 | |
| Other Assets In Excess Of Liabilities (5.30%) | | | | | | | | | 2,180,929 | (a) |
| NET ASSETS (100.00%) | | | | | | | | $ | 41,179,359 | |
| (a) | Includes cash which is being held as collateral for futures contracts. |
FUTURES CONTRACTS
At March 31, 2019, the Fund had outstanding futures contracts:
| Description | | Counterparty | | Position | | Contracts | | Expiration Date | | Notional Amount/ Fair Value | | | Unrealized Depreciation | |
| U.S. 10 Year Treasury Note Future | | Interactive Brokers, LLC | | Short | | 10 | | 6/20/2019 | | $ | (1,242,188 | ) | | $ | (15,329 | ) |
| U.S. 2 Year Treasury Note Future | | Interactive Brokers, LLC | | Short | | 53 | | 7/01/2019 | | | (11,293,969 | ) | | | (40,656 | ) |
| U.S. 5 Year Treasury Note Future | | Interactive Brokers, LLC | | Short | | 59 | | 7/01/2019 | | | (6,833,859 | ) | | | (55,402 | ) |
| U.S. Treasury Long Bond Future | | Interactive Brokers, LLC | | Short | | 49 | | 6/20/2019 | | | (7,333,156 | ) | | | (188,426 | ) |
| U.S. Ultra Long Term U.S. Treasury Bond Future | | Interactive Brokers, LLC | | Short | | 28 | | 6/20/2019 | | | (4,704,000 | ) | | | (179,423 | ) |
| | | | | | | | | | | $ | (31,407,172 | ) | | $ | (479,236 | ) |
See Notes to Financial Statements.
| Centre Global Infrastructure Fund | Schedule of Investments |
| | March 31, 2019 (Unaudited) |
| | | Shares | | | Value | |
| COMMON STOCKS (99.11%) | | | | | | | | |
| ASIA (15.73%) | | | | | | | | |
| Australia (3.63%) | | | | | | | | |
| Multi-Utilities (1.82%) | | | | | | | | |
| AGL Energy, Ltd. | | | 14,200 | | | $ | 219,500 | |
| | | | | | | | | |
| Transportation Infrastructure (1.81%) | | | | | | | | |
| Transurban Group | | | 23,200 | | | | 217,446 | |
| | | | | | | | | |
| Total Australia | | | | | | | 436,946 | |
| | | | | | | | | |
| Hong Kong (2.96%) | | | | | | | | |
| Electric Utilities (0.52%) | | | | | | | | |
| CLP Holdings, Ltd. | | | 5,400 | | | | 62,599 | |
| | | | | | | | | |
| Gas Utilities (2.44%) | | | | | | | | |
| China Resources Gas Group, Ltd. | | | 45,300 | | | | 213,517 | |
| Hong Kong & China Gas Co., Ltd. | | | 33,300 | | | | 79,836 | |
| | | | | | | | 293,353 | |
| Total Hong Kong | | | | | | | 355,952 | |
| | | | | | | | | |
| Japan (7.37%) | | | | | | | | |
| Building Products (1.26%) | | | | | | | | |
| Daikin Industries, Ltd. | | | 1,300 | | | | 152,134 | |
| | | | | | | | | |
| Diversified Telecommunication Services (0.92%) | | | | | | | | |
| Nippon Telegraph & Telephone Corp. | | | 2,600 | | | | 110,329 | |
| | | | | | | | | |
| Wireless Telecommunication Services (5.19%) | | | | | | | | |
| KDDI Corp. | | | 6,800 | | | | 146,332 | |
| NTT DOCOMO, Inc. | | | 4,900 | | | | 108,386 | |
| Softbank Corp. | | | 6,100 | | | | 68,634 | |
| SoftBank Group Corp. | | | 3,100 | | | | 300,546 | |
| | | | | | | | 623,898 | |
| Total Japan | | | | | | | 886,361 | |
| | | | | | | | | |
| Singapore (0.58%) | | | | | | | | |
| Diversified Telecommunication Services (0.58%) | | | | | | | | |
| Singapore Telecommunications, Ltd. | | | 31,300 | | | | 69,748 | |
| | | | | | | | | |
| Total Singapore | | | | | | | 69,748 | |
| | | | | | | | | |
| South Korea (1.19%) | | | | | | | | |
| Diversified Telecommunication Services (1.19%) | | | | | | | | |
KT Corp., ADR(a) | | | 11,480 | | | | 142,811 | |
| | | | | | | | | |
| Total South Korea | | | | | | | 142,811 | |
| | | | | | | | | |
| TOTAL ASIA | | | | | | | | |
| (Cost $1,846,881) | | | | | | | 1,891,818 | |
| | | | | | | | | |
| EUROPE (16.73%) | | | | | | | | |
| France (1.78%) | | | | | | | | |
| Diversified Telecommunication Services (1.02%) | | | | | | | | |
| Orange SA | | | 7,550 | | | | 122,804 | |
| | | Shares | | | Value | |
| France (continued) | | | | | | | | |
| Multi-Utilities (0.76%) | | | | | | | | |
| Engie SA | | | 6,100 | | | $ | 90,871 | |
| | | | | | | | | |
| Total France | | | | | | | 213,675 | |
| | | | | | | | | |
| Germany (2.46%) | | | | | | | | |
| Diversified Telecommunication Services (1.73%) | | | | | | | | |
| Deutsche Telekom AG | | | 12,500 | | | | 207,454 | |
| | | | | | | | | |
| Multi-Utilities (0.73%) | | | | | | | | |
| E.ON SE | | | 7,900 | | | | 87,838 | |
| | | | | | | | | |
| Total Germany | | | | | | | 295,292 | |
| | | | | | | | | |
| Great Britain (3.33%) | | | | | | | | |
| Diversified Telecommunication Services (0.77%) | | | | | | | | |
| BT Group PLC | | | 31,800 | | | | 92,342 | |
| | | | | | | | | |
| Multi-Utilities (1.04%) | | | | | | | | |
| National Grid PLC | | | 11,300 | | | | 125,218 | |
| | | | | | | | | |
| Wireless Telecommunication Services (1.52%) | | | | | | | | |
| Vodafone Group PLC | | | 100,800 | | | | 183,539 | |
| | | | | | | | | |
| Total Great Britain | | | | | | | 401,099 | |
| | | | | | | | | |
| Greece (1.11%) | | | | | | | | |
| Diversified Telecommunication Services (1.11%) | | | | | | | | |
| Hellenic Telecommunications Organization SA, ADR | | | 20,070 | | | | 133,666 | |
| | | | | | | | | |
| Total Greece | | | | | | | 133,666 | |
| | | | | | | | | |
| Italy (3.56%) | | | | | | | | |
| Electric Utilities (1.45%) | | | | | | | | |
| Enel SpA | | | 27,200 | | | | 174,038 | |
| | | | | | | | | |
| Oil, Gas & Consumable Fuels (1.01%) | | | | | | | | |
| Snam SpA | | | 23,800 | | | | 122,249 | |
| | | | | | | | | |
| Transportation Infrastructure (1.10%) | | | | | | | | |
| Atlantia SpA | | | 5,100 | | | | 132,096 | |
| | | | | | | | | |
| Total Italy | | | | | | | 428,383 | |
| | | | | | | | | |
| Spain (4.49%) | | | | | | | | |
| Diversified Telecommunication Services (1.23%) | | | | | | | | |
| Telefonica SA | | | 17,700 | | | | 148,297 | |
| | | | | | | | | |
| Electric Utilities (1.51%) | | | | | | | | |
| Iberdrola SA | | | 20,645 | | | | 181,238 | |
| | | | | | | | | |
| Oil, Gas & Consumable Fuels (0.55%) | | | | | | | | |
| Enagas SA | | | 2,300 | | | | 66,926 | |
| Semi-Annual Report | March 31, 2019 | 19 |
| Centre Global Infrastructure Fund | Schedule of Investments |
| | March 31, 2019 (Unaudited) |
| | | Shares | | | Value | |
| Spain (continued) | | | | | | | | |
| Transportation Infrastructure (1.20%) | | | | | | | | |
| Aena SME SA(b)(c) | | | 800 | | | $ | 144,033 | |
| | | | | | | | | |
| Total Spain | | | | | | | 540,494 | |
| | | | | | | | | |
| TOTAL EUROPE | | | | | | | | |
| (Cost $1,942,032) | | | | | | | 2,012,609 | |
| | | | | | | | | |
| NORTH AMERICA (62.74%) | | | | | | | | |
| Canada (11.58%) | | | | | | | | |
| Oil, Gas & Consumable Fuels (10.86%) | | | | | | | | |
| Enbridge, Inc. | | | 18,680 | | | | 676,553 | |
| Inter Pipeline, Ltd. | | | 4,100 | | | | 67,835 | |
| Pembina Pipeline Corp. | | | 4,800 | | | | 176,325 | |
| TransCanada Corp. | | | 8,600 | | | | 386,255 | |
| | | | | | | | 1,306,968 | |
| Wireless Telecommunication Services (0.72%) | | | | | | | | |
| Rogers Communications, Inc., Class B | | | 1,600 | | | | 86,050 | |
| | | | | | | | | |
| Total Canada | | | | | | | 1,393,018 | |
| | | | | | | | | |
| Mexico (1.03%) | | | | | | | | |
| Transportation Infrastructure (1.03%) | | | | | | | | |
| Grupo Aeroportuario del Pacifico SAB de CV, ADR | | | 1,390 | | | | 123,668 | |
| | | | | | | | | |
| Total Mexico | | | | | | | 123,668 | |
| | | | | | | | | |
| United States (50.13%) | | | | | | | | |
| Construction & Engineering (1.40%) | | | | | | | | |
| Quanta Services, Inc. | | | 4,470 | | | | 168,698 | |
| | | | | | | | | |
| Diversified Telecommunication Services (14.38%) | | | | | | | | |
| AT&T, Inc. | | | 26,630 | | | | 835,116 | |
| Verizon Communications, Inc. | | | 15,130 | | | | 894,637 | |
| | | | | | | | 1,729,753 | |
| Electric Utilities (12.04%) | | | | | | | | |
| American Electric Power Co., Inc. | | | 1,590 | | | | 133,163 | |
| Duke Energy Corp. | | | 2,280 | | | | 205,200 | |
| Edison International | | | 2,970 | | | | 183,903 | |
| Eversource Energy | | | 1,020 | | | | 72,369 | |
| Exelon Corp. | | | 3,140 | | | | 157,408 | |
| FirstEnergy Corp. | | | 1,540 | | | | 64,079 | |
| NextEra Energy, Inc. | | | 1,540 | | | | 297,713 | |
| PPL Corp. | | | 2,260 | | | | 71,732 | |
| The Southern Co. | | | 3,280 | | | | 169,510 | |
| Xcel Energy, Inc. | | | 1,660 | | | | 93,309 | |
| | | | | | | | 1,448,386 | |
| Health Care Providers & Services (3.81%) | | | | | | | | |
| HCA Healthcare, Inc. | | | 2,660 | | | | 346,811 | |
| Universal Health Services, Inc., Class B | | | 830 | | | | 111,029 | |
| | | | | | | | 457,840 | |
| Multi-Utilities (4.97%) | | | | | | | | |
| Consolidated Edison, Inc. | | | 1,020 | | | | 86,506 | |
| Dominion Energy, Inc. | | | 2,110 | | | | 161,753 | |
| DTE Energy Co. | | | 590 | | | | 73,596 | |
| Public Service Enterprise Group, Inc. | | | 1,640 | | | | 97,432 | |
| Sempra Energy | | | 780 | | | | 98,171 | |
| | | Shares | | | Value | |
| United States (continued) | | | | | | | | |
| WEC Energy Group, Inc. | | | 1,020 | | | $ | 80,662 | |
| | | | | | | | 598,120 | |
| Oil, Gas & Consumable Fuels (9.92%) | | | | | | | | |
| Cheniere Energy, Inc.(a) | | | 1,920 | | | | 131,251 | |
| Kinder Morgan, Inc. | | | 18,810 | | | | 376,388 | |
| ONEOK, Inc. | | | 3,900 | | | | 272,376 | |
| Targa Resources Corp. | | | 2,070 | | | | 86,009 | |
| The Williams Cos., Inc. | | | 11,400 | | | | 327,408 | |
| | | | | | | | 1,193,432 | |
| Software (2.89%) | | | | | | | | |
| Mitek Systems, Inc.(a) | | | 11,580 | | | | 141,739 | |
| New Relic, Inc.(a) | | | 2,090 | | | | 206,283 | |
| | | | | | | | 348,022 | |
| Wireless Telecommunication Services (0.72%) | | | | | | | | |
| T-Mobile US, Inc.(a) | | | 1,260 | | | | 87,066 | |
| | | | | | | | | |
| Total United States | | | | | | | 6,031,317 | |
| | | | | | | | | |
| TOTAL NORTH AMERICA | | | | | | | | |
| (Cost $7,181,007) | | | | | | | 7,548,003 | |
| | | | | | | | | |
| SOUTH AMERICA (3.91%) | | | | | | | | |
| Brazil (2.16%) | | | | | | | | |
| Water Utilities (2.16%) | | | | | | | | |
| Cia de Saneamento Basico do Estado de Sao Paulo, ADR | | | 24,620 | | | | 260,480 | |
| | | | | | | | | |
| Total Brazil | | | | | | | 260,480 | |
| | | | | | | | | |
| Chile (1.75%) | | | | | | | | |
| Electric Utilities (1.75%) | | | | | | | | |
| Enel Americas SA, ADR | | | 23,530 | | | | 210,123 | |
| | | | | | | | | |
| Total Chile | | | | | | | 210,123 | |
| | | | | | | | | |
| TOTAL SOUTH AMERICA | | | | | | | | |
| (Cost $366,651) | | | | | | | 470,603 | |
| | | | | | | | | |
| TOTAL COMMON STOCKS | | | | | | | | |
| (Cost $11,336,571) | | | | | | | 11,923,033 | |
| | | 7-Day Yield | | Shares | | | Value | |
| SHORT TERM INVESTMENTS (0.31%) | | | | | | | | | | |
| Money Market Fund (0.31%) | | | | | | | | | | |
| Dreyfus Treasury Prime Cash Management, Institutional Class | | 1.629% | | | 37,441 | | | | 37,441 | |
| | | | | | | | | | | |
| TOTAL SHORT TERM INVESTMENTS | | | | | | | | | | |
| (Cost $37,441) | | | | | | | | | 37,441 | |
| | | Value | |
| TOTAL INVESTMENTS (99.42%) | | | | |
| (Cost $11,374,012) | | $ | 11,960,474 | |
| Other Assets In Excess Of Liabilities (0.58%) | | | 69,893 | |
| NET ASSETS (100.00%) | | $ | 12,030,367 | |
| Centre Global Infrastructure Fund | Schedule of Investments |
| | March 31, 2019 (Unaudited) |
| (a) | Non-income producing security. |
| (b) | Security was purchased pursuant to Rule 144A under the Securities Act of 1933 and may be resold in transactions exempt from registration only to qualified institutional buyers. As of March 31, 2019, these securities had a total aggregate market value of $144,033, representing 1.20% of net assets. |
| (c) | Securities were purchased pursuant to Regulation S under the Securities Act of 1933, which exempts securities offered and sold outside the United States from registration. Such securities cannot be sold in the United States without either an effective registration statement filed pursuant to Securities Act of 1933, or pursuant to an exemption from registration. These securities have been deemed liquid under guidelines approved by the Fund's Board of Trustees. At period end, the aggregate market value of those securities was $144,033, representing 1.20% of net assets. |
See Notes to Financial Statements.
| Semi-Annual Report | March 31, 2019 | 21 |
| Centre Funds | Statements of Assets and Liabilities |
| | March 31, 2019 (Unaudited) |
| | | Centre American Select Equity Fund | | | Centre Active U.S. Treasury Fund | | | Centre Global Infrastructure Fund | |
| ASSETS: | | | | | | | | | |
| Investments, at value | | $ | 116,723,942 | | | $ | 38,998,430 | | | $ | 11,960,474 | |
| Cash | | | – | | | | 56,648 | | | | – | |
| Foreign currency, at value (Cost $–, $– and $39,663, respectively) | | | – | | | | – | | | | 39,400 | |
| Receivable for dividends and interest | | | 366,201 | | | | 315,359 | | | | 29,089 | |
| Deposit with broker for futures contracts | | | 262,965 | | | | 1,884,222 | | | | – | |
| Deposit with broker for options | | | – | | | | – | | | | – | |
| Receivable due from investment adviser | | | – | | | | – | | | | 2,196 | |
| Receivable for investments sold | | | 1,135,138 | | | | – | | | | – | |
| Receivable for fund shares sold | | | 600 | | | | 22,709 | | | | – | |
| Deferred offering cost | | | – | | | | – | | | | 222 | |
| Prepaid and other assets | | | 15,144 | | | | 21,278 | | | | 25,039 | |
| Total Assets | | | 118,503,990 | | | | 41,298,646 | | | | 12,056,420 | |
| LIABILITIES: | | | | | | | | | | | | |
| Payable to administrator | | | 20,763 | | | | 7,925 | | | | 9,891 | |
| Payable to transfer agent | | | 4,275 | | | | 3,260 | | | | 2,200 | |
| Payable for investments purchased | | | 814,315 | | | | 56,643 | | | | – | |
| Payable for fund shares redeemed | | | 526 | | | | 16,072 | | | | – | |
| Payable to investment adviser | | | 59,110 | | | | 4,070 | | | | – | |
| Accrued 12b-1 and service fees | | | 31,409 | | | | 8,796 | | | | 2,037 | |
| Payable for custodian fees | | | 2,895 | | | | 1,303 | | | | 145 | |
| Payable for printing | | | 4,433 | | | | 863 | | | | 31 | |
| Payable for legal and audit fees | | | 41,146 | | | | 16,264 | | | | 9,927 | |
| Payable to trustees | | | 10,419 | | | | 3,413 | | | | 1,566 | |
| Payable under the Chief Compliance Officer Services Agreement | | | 3,373 | | | | 678 | | | | 256 | |
| Total Liabilities | | | 992,664 | | | | 119,287 | | | | 26,053 | |
| NET ASSETS | | $ | 117,511,326 | | | $ | 41,179,359 | | | $ | 12,030,367 | |
| NET ASSETS CONSIST OF: | | | | | | | | | | | | |
| Paid-in capital | | $ | 81,259,266 | | | $ | 40,873,443 | | | $ | 12,294,581 | |
| Total distributable earnings | | | 36,252,060 | | | | 305,916 | | | | (264,214 | ) |
| NET ASSETS | | $ | 117,511,326 | | | $ | 41,179,359 | | | $ | 12,030,367 | |
| INVESTMENTS, AT COST | | $ | 91,257,279 | | | $ | 38,144,523 | | | $ | 11,374,012 | |
| PRICING OF SHARES | | | | | | | | | | | | |
| Investor Class | | | | | | | | | | | | |
| Net Assets | | $ | 114,399,497 | | | $ | 34,203,628 | | | $ | 11,347,905 | |
| Shares outstanding | | | 10,661,398 | | | | 3,594,395 | | | | 1,156,849 | |
| Net Asset Value, offering and redemption price per share | | $ | 10.73 | | | $ | 9.52 | | | $ | 9.81 | |
| Institutional Class | | | | | | | | | | | | |
| Net Assets | | $ | 3,111,829 | | | $ | 6,975,731 | | | $ | 682,461 | |
| Shares outstanding | | | 287,742 | | | | 727,756 | | | | 69,430 | |
| Net Asset Value, offering and redemption price per share | | $ | 10.81 | | | $ | 9.59 | | | $ | 9.83 | |
| See Notes to Financial Statements. | |
| 22 | centrefunds.com |
| Centre Funds | Statements of Operations |
| | March 31, 2019 (Unaudited) |
| | | Centre American Select Equity Fund | | | Centre Active U.S. Treasury Fund | | | Centre Global Infrastructure Fund | |
| INVESTMENT INCOME: | | | | | | | | | |
| Interest | | $ | 2,711 | | | $ | 595,305 | | | $ | 4,676 | |
| Dividends | | | 971,446 | | | | – | | | | 235,159 | |
| Foreign taxes withheld | | | (2,907 | ) | | | – | | | | (13,087 | ) |
| Total Investment Income | | | 971,250 | | | | 595,305 | | | | 226,748 | |
| EXPENSES: | | | | | | | | | | | | |
| Investment advisory fees | | | 439,969 | | | | 83,491 | | | | 58,587 | |
| Administration fees | | | 111,444 | | | | 40,472 | | | | 18,700 | |
| Transfer agent fees | | | 34,295 | | | | 28,497 | | | | 14,176 | |
| Custodian fees | | | 7,581 | | | | 3,152 | | | | 6,538 | |
| Legal fees | | | 66,884 | | | | 22,356 | | | | 12,851 | |
| Audit fees | | | 6,257 | | | | 6,257 | | | | 6,245 | |
| Trustees' fees and expenses | | | 21,025 | | | | 6,904 | | | | 2,445 | |
| Registration/filing fees | | | 7,884 | | | | 10,158 | | | | 3,986 | |
| 12b-1 fees (Investor Class) | | | 143,389 | | | | 44,307 | | | | 15,272 | |
| Shareholder service fees | | | 58,731 | | | | 7,993 | | | | 1,944 | |
| Printing fees | | | 15,128 | | | | 4,161 | | | | 1,901 | |
| Chief Compliance Officer services fees | | | 20,172 | | | | 6,650 | | | | 2,673 | |
| Offering costs | | | – | | | | – | | | | 21,826 | |
| Miscellaneous expenses | | | 7,301 | | | | 2,878 | | | | 1,511 | |
| Total expenses before waivers | | | 940,060 | | | | 267,276 | | | | 168,655 | |
| Fees waived/reimbursed by investment adviser (Investor Class) (Note 5) | | | (91,838 | ) | | | (40,735 | ) | | | (77,939 | ) |
| Fees waived/reimbursed by investment adviser (Institutional Class) (Note 5) | | | (4,689 | ) | | | (13,556 | ) | | | (4,915 | ) |
| Net Expenses | | | 843,533 | | | | 212,985 | | | | 85,801 | |
| Net Investment Income | | | 127,717 | | | | 382,320 | | | | 140,947 | |
| Net realized gain/(loss) on investments | | | 15,707,463 | | | | 477 | | | | (802,667 | ) |
| Net realized gain on futures contracts | | | – | | | | 163,340 | | | | – | |
| Net realized loss on foreign currencies | | | – | | | | – | | | | (5,465 | ) |
| Total realized gain/(loss) | | | 15,707,463 | | | | 163,817 | | | | (808,132 | ) |
| Net change in unrealized appreciation/(depreciation) on investments | | | (20,964,422 | ) | | | 1,111,368 | | | | 802,801 | |
| Net change in unrealized appreciation on futures contracts | | | – | | | | (604,807 | ) | | | – | |
| Net change in unrealized depreciation on foreign currencies | | | – | | | | – | | | | (247 | ) |
| Total change in unrealized appreciation/(depreciation) | | | (20,964,422 | ) | | | 506,561 | | | | 802,554 | |
| NET REALIZED AND UNREALIZED GAIN/(LOSS) ON INVESTMENTS, FUTURES CONTRACTS AND FOREIGN CURRENCIES | | | (5,256,959 | ) | | | 670,378 | | | | (5,578 | ) |
| NET INCREASE/(DECREASE) IN NET ASSETS RESULTING FROM OPERATIONS | | $ | (5,129,242 | ) | | $ | 1,052,698 | | | $ | 135,369 | |
| See Notes to Financial Statements. | |
| Semi-Annual Report | March 31, 2019 | 23 |
| Centre American Select Equity Fund | Statements of Changes in Net Assets |
| | | For The
Six Months Ending
March 31, 2019
(Unaudited) | | | For The
Year Ended
September 30, 2018 | |
| OPERATIONS: | | | | | | |
| Net investment income/(loss) | | $ | 127,717 | | | $ | (73,723 | ) |
| Net realized gain | | | 15,707,463 | | | | 17,520,870 | |
| Net change in unrealized appreciation/(depreciation) | | | (20,964,422 | ) | | | 4,250,624 | |
| Net increase/(decrease) in net assets resulting from operations | | | (5,129,242 | ) | | | 21,697,771 | |
| DISTRIBUTIONS TO SHAREHOLDERS: | | | | | | | | |
| Investor | | | (19,868,502 | ) | | | (14,897,937 | ) |
| Institutional | | | (421,061 | ) | | | (267,949 | ) |
| Total distributions | | | (20,289,563 | ) | | | (15,165,886 | ) |
| CAPITAL SHARE TRANSACTIONS: | | | | | | | | |
| Investor Class | | | | | | | | |
| Proceeds from sale of shares | | | 197,315 | | | | 532,620 | |
| Shares issued in reinvestment of distributions | | | 19,354,617 | | | | 14,497,752 | |
| Cost of shares redeemed | | | (9,444,951 | ) | | | (16,126,205 | ) |
| Redemption fees | | | – | | | | 154 | |
| Net increase/(decrease) from capital share transactions | | | 10,106,981 | | | | (1,095,679 | ) |
| Institutional Class | | | | | | | | |
| Proceeds from sale of shares | | | 912,047 | | | | 103,347 | |
| Shares issued in reinvestment of distributions | | | 403,144 | | | | 253,610 | |
| Cost of shares redeemed | | | (276,650 | ) | | | (386,559 | ) |
| Net increase/(decrease) from capital share transactions | | | 1,038,541 | | | | (29,602 | ) |
| Net increase/(decrease) in net assets | | | (14,273,283 | ) | | | 5,406,604 | |
| NET ASSETS: | | | | | | | | |
| Beginning of period | | | 131,784,609 | | | | 126,378,005 | |
| End of period | | $ | 117,511,326 | | | $ | 131,784,609 | |
| | | | | | | | | |
| OTHER INFORMATION: | | | | | | | | |
| Share Transactions: | | | | | | | | |
| Investor Class | | | | | | | | |
| Beginning shares | | | 9,481,676 | | | | 9,500,318 | |
| Shares sold | | | 17,897 | | | | 40,141 | |
| Shares issued in reinvestment of dividends | | | 2,022,426 | | | | 1,173,907 | |
| Shares redeemed | | | (860,601 | ) | | | (1,232,690 | ) |
| Ending shares | | | 10,661,398 | | | | 9,481,676 | |
| Institutional Class | | | | | | | | |
| Beginning shares | | | 186,632 | | | | 186,978 | |
| Shares sold | | | 81,918 | | | | 7,871 | |
| Shares issued in reinvestment of dividends | | | 41,820 | | | | 20,519 | |
| Shares redeemed | | | (22,628 | ) | | | (28,736 | ) |
| Ending shares | | | 287,742 | | | | 186,632 | |
| See Notes to Financial Statements. | |
| 24 | centrefunds.com |
| Centre Active U.S. Treasury Fund | Statements of Changes in Net Assets |
| | | For The
Six Months Ending
March 31, 2019
(Unaudited) | | | For The
Year Ended
September 30, 2018 | |
| OPERATIONS: | | | | | | |
| Net investment income | | $ | 382,320 | | | $ | 843,242 | |
| Net realized gain | | | 163,817 | | | | 1,716,571 | |
| Net change in unrealized appreciation/(depreciation) | | | 506,561 | | | | (2,271,309 | ) |
| Net increase in net assets resulting from operations | | | 1,052,698 | | | | 288,504 | |
| DISTRIBUTIONS TO SHAREHOLDERS: | | | | | | | | |
| Investor | | | (1,291,050 | ) | | | (751,913 | ) |
| Institutional | | | (265,647 | ) | | | (85,185 | ) |
| Total distributions | | | (1,556,697 | ) | | | (837,098 | ) |
CAPITAL SHARE TRANSACTIONS: | | | | | | | | |
| Investor Class | | | | | | | | |
| Proceeds from sale of shares | | | 1,125,328 | | | | 614,797 | |
| Shares issued in reinvestment of distributions | | | 1,054,525 | | | | 587,181 | |
| Cost of shares redeemed | | | (4,566,633 | ) | | | (11,602,374 | ) |
| Net decrease from capital share transactions | | | (2,386,780 | ) | | | (10,400,396 | ) |
| Institutional Class | | | | | | | | |
| Proceeds from sale of shares | | | 3,828,154 | | | | 706,467 | |
| Shares issued in reinvestment of distributions | | | 244,359 | | | | 73,923 | |
| Cost of shares redeemed | | | (1,092,197 | ) | | | (1,319,504 | ) |
| Net increase/(decrease) from capital share transactions | | | 2,980,316 | | | | (539,114 | ) |
| Net increase/(decrease) in net assets | | | 89,537 | | | | (11,488,104 | ) |
| NET ASSETS: | | | | | | | | |
| Beginning of period | | | 41,089,822 | | | | 52,577,926 | |
| End of period | | $ | 41,179,359 | | | $ | 41,089,822 | |
| | | | | | | | | |
| OTHER INFORMATION: | | | | | | | | |
| Share Transactions: | | | | | | | | |
| Investor Class | | | | | | | | |
| Beginning shares | | | 3,842,796 | | | | 4,915,018 | |
| Shares sold | | | 117,190 | | | | 63,545 | |
| Shares issued in reinvestment of dividends | | | 110,714 | | | | 60,622 | |
| Shares redeemed | | | (476,305 | ) | | | (1,196,389 | ) |
| Ending shares | | | 3,594,395 | | | | 3,842,796 | |
| Institutional Class | | | | | | | | |
| Beginning shares | | | 420,928 | | | | 475,762 | |
| Shares sold | | | 394,501 | | | | 72,389 | |
| Shares issued in reinvestment of dividends | | | 25,472 | | | | 7,580 | |
| Shares redeemed | | | (113,145 | ) | | | (134,803 | ) |
| Ending shares | | | 727,756 | | | | 420,928 | |
| See Notes to Financial Statements. | |
| Semi-Annual Report | March 31, 2019 | 25 |
| Centre Global Infrastructure Fund | Statement of Changes in Net Assets |
| | | For The
Six Months Ending
March 31, 2019
(Unaudited) | | | For The Period
January 29, 2018
(Inception)
to September 30, 2018 | |
| OPERATIONS: | | | | | | |
| Net investment income | | $ | 140,947 | | | $ | 61,322 | |
| Net realized loss | | | (808,132 | ) | | | (46,634 | ) |
| Net change in unrealized appreciation/(depreciation) | | | 802,554 | | | | (216,357 | ) |
| Net increase/(decrease) in net assets resulting from operations | | | 135,369 | | | | (201,669 | ) |
| DISTRIBUTIONS TO SHAREHOLDERS: | | | | | | | | |
| Investor | | | (136,395 | ) | | | (12,520 | ) |
| Institutional | | | (9,616 | ) | | | (56,376 | ) |
| Total distributions | | | (146,011 | ) | | | (68,896 | ) |
| CAPITAL SHARE TRANSACTIONS: | | | | | | | | |
| Investor Class | | | | | | | | |
| Proceeds from sale of shares | | | 39,730 | | | | 265,571 | |
| Shares issued in reinvestment of distributions | | | 104,998 | | | | 9,467 | |
| Cost of shares redeemed | | | (3,648,910 | ) | | | (1,532,577 | ) |
| Redemption fees | | | (1,480 | ) | | | 15,435 | |
| Acquisition (Note 9) | | | – | | | | 16,291,332 | |
| Net increase/(decrease) from capital share transactions | | | (3,505,662 | ) | | | 15,049,228 | |
| Institutional Class | | | | | | | | |
| Proceeds from sale of shares | | | 184,726 | | | | 2,233,149 | |
| Shares issued in reinvestment of distributions | | | 8,873 | | | | 56,376 | |
| Cost of shares redeemed | | | (914,082 | ) | | | (2,136,631 | ) |
| Acquisition (Note 9) | | | – | | | | 1,335,597 | |
| Net increase/(decrease) from capital share transactions | | | (720,483 | ) | | | 1,488,491 | |
| Net increase/(decrease) in net assets | | | (4,236,787 | ) | | | 16,267,154 | |
| NET ASSETS: | | | | | | | | |
| Beginning of period | | | 16,267,154 | | | | – | |
| End of period | | $ | 12,030,367 | | | $ | 16,267,154 | |
| OTHER INFORMATION: | | | | | | | | |
| Share Transactions: | | | | | | | | |
| Investor Class | | | | | | | | |
| Beginning shares | | | 1,539,125 | | | | – | |
| Shares sold | | | 4,151 | | | | 26,875 | |
| Shares issued in reinvestment of dividends | | | 11,467 | | | | 981 | |
| Shares redeemed | | | (397,894 | ) | | | (159,328 | ) |
| Acquisition shares (Note 9) | | | – | | | | 1,670,597 | |
| Ending shares | | | 1,156,849 | | | | 1,539,125 | |
| Institutional Class | | | | | | | | |
| Beginning shares | | | 147,361 | | | | – | |
| Shares sold | | | 19,887 | | | | 223,582 | |
| Shares issued in reinvestment of dividends | | | 971 | | | | 5,823 | |
| Shares redeemed | | | (98,789 | ) | | | (218,822 | ) |
| Acquisition shares (Note 9) | | | – | | | | 136,778 | |
| Ending shares | | | 69,430 | | | | 147,361 | |
| See Notes to Financial Statements. | |
| 26 | centrefunds.com |
| Centre American Select Equity Fund | Financial Highlights |
| Investor Class | For a share outstanding throughout the periods presented. |
| | | For the
Six Months
Ended
March 31, 2019
(Unaudited) | | | For the
Year Ended
September 30, 2018 | | | For the
Year Ended
September 30, 2017 | | | For the
Year Ended
September 30, 2016 | | | For the
Year Ended
September 30, 2015 | | | For the
Year Ended
September 30, 2014(a) | |
| NET ASSET VALUE, BEGINNING OF PERIOD | | $ | 13.63 | | | $ | 13.05 | | | $ | 11.65 | | | $ | 11.67 | | | $ | 12.08 | | | $ | 10.38 | |
| INCOME/(LOSS) FROM INVESTMENT OPERATIONS: |
| Net investment income/(loss)(b) | | | 0.01 | | | | (0.01 | ) | | | 0.06 | | | | 0.09 | | | | 0.07 | | | | 0.06 | |
| Net realized and unrealized gain/(loss) on investments | | | (0.75 | ) | | | 2.20 | | | | 1.74 | | | | 1.11 | | | | (0.31 | ) | | | 1.73 | |
| Total income/(loss) from investment operations | | | (0.74 | ) | | | 2.19 | | | | 1.80 | | | | 1.20 | | | | (0.24 | ) | | | 1.79 | |
| | | | | | | | | | | | | | | | | | | | | | | | | |
| DISTRIBUTIONS: | | | | | | | | | | | | | | | | | | | | | | | | |
| Net investment income | | | 0.00 | | | | (0.00 | )(c) | | | (0.15 | ) | | | (0.02 | ) | | | (0.17 | ) | | | (0.09 | ) |
| Net realized gains on investments | | | (2.16 | ) | | | (1.61 | ) | | | (0.25 | ) | | | (1.20 | ) | | | – | | | | (0.00 | )(d) |
| Total distributions | | | (2.16 | ) | | | (1.61 | ) | | | (0.40 | ) | | | (1.22 | ) | | | (0.17 | ) | | | (0.09 | ) |
| REDEMPTION FEES ADDED TO PAID-IN CAPITAL (NOTE 4) | | | – | | | | 0.00 | (c) | | | 0.00 | (c) | | | 0.00 | (c) | | | 0.00 | (c) | | | 0.00 | (c) |
| NET INCREASE/ (DECREASE) IN NET ASSET VALUE | | | (2.90 | ) | | | 0.58 | | | | 1.40 | | | | (0.02 | ) | | | (0.41 | ) | | | 1.70 | |
| NET ASSET VALUE, END OF PERIOD | | $ | 10.73 | | | $ | 13.63 | | | $ | 13.05 | | | $ | 11.65 | | | $ | 11.67 | | | $ | 12.08 | |
| | | | | | | | | | | | | | | | | | | | | | | | | |
| Total Return(e) | | | (3.50 | %) | | | 18.10 | % | | | 15.99 | % | | | 10.74 | % | | | (2.07 | %) | | | 17.31 | % |
| SUPPLEMENTAL DATA: | | | | | | | | | | | | | | | | | | | | | | | | |
| Net assets, end of period (000) | | $ | 114,399 | | | $ | 129,231 | | | $ | 123,938 | | | $ | 126,238 | | | $ | 148,314 | | | $ | 116,045 | |
| | | | | | | | | | | | | | | | | | | | | | | | | |
| RATIOS TO AVERAGE NET ASSETS: | | | | | | | | | | | | | | | | | | | | | | | | |
| Net investment income/(loss) including reimbursement/waiver | | | 0.21 | %(f) | | | (0.06 | %) | | | 0.47 | % | | | 0.77 | % | | | 0.58 | % | | | 0.53 | % |
| Operating expenses excluding reimbursement/waiver | | | 1.61 | %(f) | | | 1.60 | % | | | 1.46 | % | | | 1.36 | % | | | 1.33 | % | | | 1.43 | % |
| Operating expenses including reimbursement/waiver | | | 1.45 | %(f) | | | 1.32 | %(g) | | | 1.05 | % | | | 1.05 | % | | | 1.05 | % | | | 1.05 | % |
| | | | | | | | | | | | | | | | | | | | | | | | | |
| PORTFOLIO TURNOVER RATE | | | 65 | %(h) | | | 87 | % | | | 81 | % | | | 74 | % | | | 105 | % | | | 72 | % |
| (a) | Prior to January 21, 2014, the Centre American Select Equity Fund was named the Drexel Hamilton Centre American Equity Fund. |
| (b) | Calculated using the average shares method. |
| (c) | Less than $0.005 per share. |
| (d) | Less than $(0.005) per share. |
| (e) | Total returns are for the period indicated and have not been annualized. Total returns would have been lower had certain expenses not been waived during the period. Returns shown do not reflect the deduction of taxes that a shareholder would pay on fund distributions or the redemption of fund shares. |
| (g) | Effective January 29, 2018, the net expense limitation changed from 1.05% to 1.10%, excluding, among other fees and expenses, 12b-1 fees and shareholder services fees. |
| (h) | Portfolio turnover rate for periods less than one full year have not been annualized. |
| See Notes to Financial Statements. | |
| Semi-Annual Report | March 31, 2019 | 27 |
| Centre American Select Equity Fund | Financial Highlights |
| Institutional Class | For a share outstanding throughout the periods presented. |
| | | For the
Six Months
Ended
March 31, 2019
(Unaudited) | | | For the
Year Ended
September 30, 2018 | | | For the
Year Ended
September 30, 2017 | | | For the
Year Ended
September 30, 2016 | | | For the
Year Ended
September 30, 2015 | | | For the Period
January 21, 2014
(Inception) to
September 30, 2014 | |
| NET ASSET VALUE, BEGINNING OF PERIOD | | $ | 13.68 | | | $ | 13.05 | | | $ | 11.67 | | | $ | 11.69 | | | $ | 12.08 | | | $ | 11.39 | |
| INCOME/(LOSS) FROM INVESTMENT OPERATIONS: | | | | | | | | | | | | | | | | | | | | | | | | |
| Net investment income(a) | | | 0.04 | | | | 0.04 | (b) | | | 0.08 | | | | 0.10 | | | | 0.08 | | | | 0.05 | |
| Net realized and unrealized gain/(loss) on investments | | | (0.75 | ) | | | 2.21 | | | | 1.74 | | | | 1.11 | | | | (0.30 | ) | | | 0.64 | |
| Total income/(loss) from investment operations | | | (0.71 | ) | | | 2.25 | | | | 1.82 | | | | 1.21 | | | | (0.22 | ) | | | 0.69 | |
| | | | | | | | | | | | | | | | | | | | | | | | | |
| DISTRIBUTIONS: | | | | | | | | | | | | | | | | | | | | | | | | |
| Net investment income | | | – | | | | (0.01 | ) | | | (0.19 | ) | | | (0.03 | ) | | | (0.17 | ) | | | – | |
| Net realized gains on investments | | | (2.16 | ) | | | (1.61 | ) | | | (0.25 | ) | | | (1.20 | ) | | | – | | | | – | |
| Total distributions | | | (2.16 | ) | | | (1.62 | ) | | | (0.44 | ) | | | (1.23 | ) | | | (0.17 | ) | | | – | |
| REDEMPTION FEES ADDED TO PAID-IN CAPITAL (NOTE 4) | | | – | | | | – | | | | 0.00 | (c) | | | – | | | | – | | | | – | |
| NET INCREASE/ (DECREASE) IN NET ASSET VALUE | | | (2.87 | ) | | | 0.63 | | | | 1.38 | | | | (0.02 | ) | | | (0.39 | ) | | | 0.69 | |
| NET ASSET VALUE, END OF PERIOD | | $ | 10.81 | | | $ | 13.68 | | | $ | 13.05 | | | $ | 11.67 | | | $ | 11.69 | | | $ | 12.08 | |
| | | | | | | | | | | | | | | | | | | | | | | | | |
| Total Return(d) | | | (3.27 | %) | | | 18.55 | % | | | 16.20 | % | | | 10.74 | % | | | (1.89 | %) | | | 6.06 | % |
| | | | | | | | | | | | | | | | | | | | | | | | | |
| SUPPLEMENTAL DATA: | | | | | | | | | | | | | | | | | | | | | | | | |
| Net assets, end of period (000) | | $ | 3,112 | | | $ | 2,554 | | | $ | 2,440 | | | $ | 21,058 | | | $ | 16,907 | | | $ | 15,826 | |
| | | | | | | | | | | | | | | | | | | | | | | | | |
| RATIOS TO AVERAGE NET ASSETS: | | | | | | | | | | | | | | | | | | | | | | | | |
| Net investment income including reimbursement/waiver | | | 0.72 | %(e) | | | 0.32 | % | | | 0.66 | % | | | 0.88 | % | | | 0.67 | % | | | 0.65 | %(e) |
| Operating expenses excluding reimbursement/waiver | | | 1.31 | %(e) | | | 1.27 | % | | | 1.18 | % | | | 1.13 | % | | | 1.11 | % | | | 1.26 | %(e) |
| Operating expenses including reimbursement/waiver | | | 0.95 | %(e) | | | 0.93 | %(f) | | | 0.95 | % | | | 0.95 | % | | | 0.95 | % | | | 0.95 | %(e) |
| | | | | | | | | | | | | | | | | | | | | | | | | |
| PORTFOLIO TURNOVER RATE | | | 65 | %(g) | | | 87 | % | | | 81 | % | | | 74 | % | | | 105 | % | | | 72 | %(g) |
| (a) | Calculated using the average shares method. |
| (b) | The per share amount does not correspond to activity reflected in the Statement of Operations due to class specific expenses during the period. |
| (c) | Less than $0.005 per share. |
| (d) | Total returns are for the period indicated and have not been annualized. Total returns would have been lower had certain expenses not been waived during the period. Returns shown do not reflect the deduction of taxes that a shareholder would pay on fund distributions or the redemption of fund shares. |
| (f) | Effective January 29, 2018, the net expense limitation changed from 0.95% to 0.90%, excluding, among other fees and expenses, shareholder service fees. |
| (g) | Portfolio turnover rate for periods less than one full year have not been annualized. |
| See Notes to Financial Statements. | |
| 28 | centrefunds.com |
| Centre Active U.S. Treasury Fund | Financial Highlights |
| Investor Class | For a share outstanding throughout the periods presented. |
| | | For the
Six Months
Ended
March 31, 2019 (Unaudited) | | | For the
Year Ended
September 30, 2018 | | | For the
Year Ended
September 30, 2017 | | | For the
Year Ended
September 30, 2016 | | | For the
Year Ended
September 30, 2015 | | | For the Period
January 21, 2014
(Inception) to
September 30, 2014 | |
| NET ASSET VALUE, BEGINNING OF PERIOD | | $ | 9.63 | | | $ | 9.75 | | | $ | 10.44 | | | $ | 10.19 | | | $ | 10.07 | | | $ | 10.00 | |
| INCOME/(LOSS) FROM INVESTMENT OPERATIONS: | | | | | | | | | | | | | | | | | | | | | | | | |
| Net investment income(a) | | | 0.08 | | | | 0.17 | | | | 0.18 | | | | 0.16 | | | | 0.12 | | | | 0.00 | (b) |
| Net realized and unrealized gain/(loss) on investments | | | 0.16 | | | | (0.12 | ) | | | (0.50 | ) | | | 0.09 | | | | 0.13 | | | | 0.07 | |
| Total income/(loss) from investment operations | | | 0.24 | | | | 0.05 | | | | (0.32 | ) | | | 0.25 | | | | 0.25 | | | | 0.07 | |
| | | | | | | | | | | | | | | | | | | | | | | | | |
| DISTRIBUTIONS: | | | | | | | | | | | | | | | | | | | | | | | | |
| Net investment income | | | (0.08 | ) | | | (0.17 | ) | | | (0.35 | ) | | | – | | | | (0.05 | ) | | | – | |
| Net realized gains on investments | | | (0.27 | ) | | | – | | | | (0.02 | ) | | | – | | | | (0.08 | ) | | | – | |
| Total distributions | | | (0.35 | ) | | | (0.17 | ) | | | (0.37 | ) | | | – | | | | (0.13 | ) | | | – | |
| NET INCREASE/ (DECREASE) IN NET ASSET VALUE | | | (0.11 | ) | | | (0.12 | ) | | | (0.69 | ) | | | 0.25 | | | | 0.12 | | | | 0.07 | |
| NET ASSET VALUE, END OF PERIOD | | $ | 9.52 | | | $ | 9.63 | | | $ | 9.75 | | | $ | 10.44 | | | $ | 10.19 | | | $ | 10.07 | |
| | | | | | | | | | | | | | | | | | | | | | | | | |
| Total Return(c) | | | 2.54 | % | | | 0.56 | % | | | (3.06 | %) | | | 2.45 | % | | | 2.48 | % | | | 0.70 | % |
| | | | | | | | | | | | | | | | | | | | | | | | | |
| SUPPLEMENTAL DATA: | | | | | | | | | | | | | | | | | | | | | | | | |
| Net assets, end of period (000) | | $ | 34,204 | | | $ | 37,008 | | | $ | 47,908 | | | $ | 63,398 | | | $ | 79,867 | | | $ | 5 | |
| | | | | | | | | | | | | | | | | | | | | | | | | |
| RATIOS TO AVERAGE NET ASSETS: | | | | | | | | | | | | | | | | | | | | | | | | |
| Net investment income including reimbursement/waiver | | | 1.76 | %(d) | | | 1.80 | % | | | 1.84 | % | | | 1.56 | % | | | 1.20 | % | | | 0.07 | %(d) |
| Operating expenses excluding reimbursement/waiver | | | 1.32 | %(d) | | | 1.31 | % | | | 1.14 | % | | | 1.09 | % | | | 0.94 | % | | | 2.09 | %(d) |
| Operating expenses including reimbursement/waiver | | | 1.09 | %(d) | | | 1.01 | %(e) | | | 0.85 | % | | | 0.85 | % | | | 0.85 | % | | | 0.85 | %(d) |
| | | | | | | | | | | | | | | | | | | | | | | | | |
| PORTFOLIO TURNOVER RATE | | | 8 | %(f) | | | 0 | % | | | 4 | % | | | 2 | % | | | 70 | % | | | 439 | %(f) |
| (a) | Calculated using the average shares method. |
| (b) | Less than $0.005 per share. |
| (c) | Total returns are for the period indicated and have not been annualized. Total returns would have been lower had certain expenses not been waived during the period. Returns shown do not reflect the deduction of taxes that a shareholder would pay on fund distributions or the redemption of fund shares. |
| (e) | Effective January 29, 2018, the net expense limitation changed from 0.85% to 0.80%, excluding, among other fees and expenses, 12b-1 fees and shareholder service fees. |
| (f) | Portfolio turnover rate for periods less than one full year have not been annualized. |
| See Notes to Financial Statements. | |
| Semi-Annual Report | March 31, 2019 | 29 |
| Centre Active U.S. Treasury Fund | Financial Highlights |
| Institutional Class | For a share outstanding throughout the periods presented. |
| | | For the
Six Months
Ended
March 31, 2019 (Unaudited) | | | For the
Year Ended
September 30, 2018 | | | For the
Year Ended
September 30, 2017 | | | For the
Year Ended
September 30, 2016 | | | For the
Year Ended
September 30, 2015 | | | For the Period
January 21, 2014
(Inception) to
September 30, 2014 | |
| NET ASSET VALUE, BEGINNING OF PERIOD | | $ | 9.70 | | | $ | 9.82 | | | $ | 10.51 | | | $ | 10.23 | | | $ | 10.09 | | | $ | 10.00 | |
| INCOME/(LOSS) FROM INVESTMENT OPERATIONS: | | | | | | | | | | | | | | | | | | | | | | | | |
| Net investment income(a) | | | 0.11 | | | | 0.21 | | | | 0.20 | | | | 0.19 | | | | 0.09 | | | | 0.02 | |
| Net realized and unrealized gain/(loss) on investments | | | 0.16 | | | | (0.12 | ) | | | (0.49 | ) | | | 0.09 | | | | 0.19 | | | | 0.07 | |
| Total income/(loss) from investment operations | | | 0.27 | | | | 0.09 | | | | (0.29 | ) | | | 0.28 | | | | 0.28 | | | | 0.09 | |
| | | | | | | | | | | | | | | | | | | | | | | | | |
| DISTRIBUTIONS: | | | | | | | | | | | | | | | | | | | | | | | | |
| Net investment income | | | (0.11 | ) | | | (0.21 | ) | | | (0.38 | ) | | | – | | | | (0.06 | ) | | | – | |
| Net realized gains on investments | | | (0.27 | ) | | | – | | | | (0.02 | ) | | | – | | | | (0.08 | ) | | | – | |
| Total distributions | | | (0.38 | ) | | | (0.21 | ) | | | (0.40 | ) | | | – | | | | (0.14 | ) | | | – | |
| NET INCREASE/ (DECREASE) IN NET ASSET VALUE | | | (0.11 | ) | | | (0.12 | ) | | | (0.69 | ) | | | 0.28 | | | | 0.14 | | | | 0.09 | |
| NET ASSET VALUE, END OF PERIOD | | $ | 9.59 | | | $ | 9.70 | | | $ | 9.82 | | | $ | 10.51 | | | $ | 10.23 | | | $ | 10.09 | |
| | | | | | | | | | | | | | | | | | | | | | | | | |
| Total Return(b) | | | 2.74 | % | | | 0.96 | %(c) | | | (2.78 | %) | | | 2.74 | % | | | 2.73 | % | | | 0.90 | % |
| | | | | | | | | | | | | | | | | | | | | | | | | |
| SUPPLEMENTAL DATA: | | | | | | | | | | | | | | | | | | | | | | | | |
| Net assets, end of period (000) | | $ | 6,976 | | | $ | 4,082 | | | $ | 4,670 | | | $ | 21,095 | | | $ | 21,573 | | | $ | 14,514 | |
| | | | | | | | | | | | | | | | | | | | | | | | | |
| RATIOS TO AVERAGE NET ASSETS: | | | | | | | | | | | | | | | | | | | | | | | | |
| Net investment income including reimbursement/waiver | | | 2.23 | %(d) | | | 2.18 | % | | | 2.01 | % | | | 1.81 | % | | | 0.94 | % | | | 0.29 | %(d) |
| Operating expenses excluding reimbursement/waiver | | | 1.06 | %(d) | | | 1.05 | % | | | 0.88 | % | | | 0.84 | % | | | 1.01 | % | | | 1.86 | %(d) |
| Operating expenses including reimbursement/waiver | | | 0.63 | %(d) | | | 0.62 | %(e) | | | 0.60 | % | | | 0.60 | % | | | 0.60 | % | | | 0.60 | %(d) |
| | | | | | | | | | | | | | | | | | | | | | | | | |
| PORTFOLIO TURNOVER RATE | | | 8 | %(f) | | | 0 | % | | | 4 | % | | | 2 | % | | | 70 | % | | | 439 | %(f) |
| (a) | Calculated using the average shares method. |
| (b) | Total returns are for the period indicated and have not been annualized. Total returns would have been lower had certain expenses not been waived during the period. Returns shown do not reflect the deduction of taxes that a shareholder would pay on fund distributions or the redemption of fund shares. |
| (c) | Difference between total return data appearing in the Manager Commentary and Financial Highlights is due to financial reporting adjustments. |
| (e) | Effective January 29, 2018, the net expense limitation agreement changed to exclude shareholder service fees. |
| (f) | Portfolio turnover rate for periods less than one full year have not been annualized. |
| See Notes to Financial Statements. | |
| 30 | centrefunds.com |
| Centre Global Infrastructure Fund | Financial Highlights |
| Investor Class | For a share outstanding throughout the periods presented. |
| | | For the
Six Months Ended
March 31, 2019
(Unaudited) | | | For the Period
January 29, 2018
(Inception) to
September 30, 2018 | |
| NET ASSET VALUE, BEGINNING OF PERIOD | | | | | | | | |
| INCOME/(LOSS) FROM INVESTMENT OPERATIONS: | | $ | 9.64 | | | $ | 10.00 | |
| Net investment income(a) | | | 0.10 | | | | 0.12 | |
| Net realized and unrealized gain/(loss) on investments | | | 0.18 | | | | (0.29 | ) |
| Total income/(loss) from investment operations | | | 0.28 | | | | (0.17 | ) |
| | | | | | | | | |
| DISTRIBUTIONS: | | | | | | | | |
| Net investment income | | | (0.11 | ) | | | (0.15 | ) |
| Net realized gains on investments | | | – | | | | (0.10 | ) |
| Total distributions | | | (0.11 | ) | | | (0.25 | ) |
| REDEMPTION FEES ADDED TO PAID-IN CAPITAL (NOTE 4) | | | 0.00 | (b) | | | 0.06 | |
| NET INCREASE/(DECREASE) IN NET ASSET VALUE | | | 0.17 | | | | (0.36 | ) |
| NET ASSET VALUE, END OF PERIOD | | $ | 9.81 | | | $ | 9.64 | |
| | | | | | | | | |
| Total Return(c) | | | 2.95 | % | | | (1.18 | %) |
| | | | | | | | | |
| SUPPLEMENTAL DATA: | | | | | | | | |
| Net assets, end of period (000) | | $ | 11,348 | | | $ | 14,843 | |
| | | | | | | | | |
| RATIOS TO AVERAGE NET ASSETS: | | | | | | | | |
| Net investment income including reimbursement/waiver | | | 2.16 | %(d) | | | 1.87 | %(d) |
| Operating expenses excluding reimbursement/waiver | | | 2.61 | %(d) | | | 2.34 | %(d) |
| Operating expenses including reimbursement/waiver | | | 1.33 | %(d) | | | 1.33 | %(d)(e) |
| | | | | | | | | |
| PORTFOLIO TURNOVER RATE | | | 20 | %(f) | | | 49 | %(f) |
| (a) | Calculated using the average shares method. |
| (b) | Less than $0.005 per share. |
| (c) | Total returns are for the period indicated and have not been annualized. Total returns would have been lower had certain expenses not been waived during the period. Returns shown do not reflect the deduction of taxes that a shareholder would pay on fund distributions or the redemption of fund shares. |
| (e) | Effective May 18, 2018, the net expense limitation changed from 1.30% to 1.05%. |
| (f) | Portfolio turnover rate for periods less than one full year have not been annualized. |
| See Notes to Financial Statements. | |
| Semi-Annual Report | March 31, 2019 | 31 |
| Centre Global Infrastructure Fund | Financial Highlights |
| Institutional Class | For a share outstanding throughout the periods presented. |
| | | For the
Six Months Ended
March 31, 2019
(Unaudited) | | | For the Period
January 29, 2018
(Inception) to
September 30, 2018 | |
| NET ASSET VALUE, BEGINNING OF PERIOD | | $ | 9.67 | | | $ | 10.00 | |
| INCOME/(LOSS) FROM INVESTMENT OPERATIONS: | | | | | | | | |
| Net investment income(a) | | | 0.11 | | | | 0.15 | |
| Net realized and unrealized gain/(loss) on investments | | | 0.17 | | | | (0.23 | ) |
| Total income/(loss) from investment operations | | | 0.28 | | | | (0.08 | ) |
| | | | | | | | | |
| DISTRIBUTIONS: | | | | | | | | |
| Net investment income | | | (0.12 | ) | | | (0.15 | ) |
| Net realized gains on investments | | | – | | | | (0.10 | ) |
| Total distributions | | | (0.12 | ) | | | (0.25 | ) |
| NET INCREASE/(DECREASE) IN NET ASSET VALUE | | | 0.16 | | | | (0.33 | ) |
| NET ASSET VALUE, END OF PERIOD | | $ | 9.83 | | | $ | 9.67 | |
| | | | | | | | | |
| Total Return(b) | | | 2.98 | % | | | (0.78 | %) |
| | | | | | | | | |
| SUPPLEMENTAL DATA: | | | | | | | | |
| Net assets, end of period (000) | | $ | 682 | | | $ | 1,424 | |
| | | | | | | | | |
| RATIOS TO AVERAGE NET ASSETS: | | | | | | | | |
| Net investment income including reimbursement/waiver | | | 2.28 | %(c) | | | 2.28 | %(c) |
| Operating expenses excluding reimbursement/waiver | | | 2.35 | %(c) | | | 7.96 | %(c) |
| Operating expenses including reimbursement/waiver | | | 1.12 | %(c) | | | 1.16 | %(c) |
| | | | | | | | | |
| PORTFOLIO TURNOVER RATE | | | 20 | %(d) | | | 49 | %(d) |
| (a) | Calculated using the average shares method. |
| (b) | Total returns are for the period indicated and have not been annualized. Total returns would have been lower had certain expenses not been waived during the period. Returns shown do not reflect the deduction of taxes that a shareholder would pay on fund distributions or the redemption of fund shares. |
| (d) | Portfolio turnover rate for periods less than one full year have not been annualized. |
| See Notes to Financial Statements. | |
| 32 | centrefunds.com |
| Centre Funds | Notes to Financial Statements |
| | March 31, 2019 (Unaudited) |
1. ORGANIZATION
Centre Funds (the “Trust”) was organized on March 17, 2011 as a Delaware statutory trust and is registered as an open-end management investment company under the Investment Company Act of 1940, as amended (the “1940 Act”). Prior to January 17, 2014, the Trust was known as Drexel Hamilton Mutual Funds. The Trust currently offers shares of beneficial interest (“shares”) of Centre American Select Equity Fund (the “American Select Equity Fund"), Centre Active U.S. Treasury Fund (the “Treasury Fund”), and Centre Global Infrastructure Fund (the “Infrastructure Fund”) (collectively, the “Funds”). The affairs of the Trust are overseen by a Board of Trustees (the “Board” or the “Trustees”). The Declaration of Trust permits the Trustees to create additional series of the Trust and share classes.
Information in the accompanying Funds’ financial statements pertain to the Investor Class and Institutional Class shares offered by the Funds. All classes of shares have identical rights to earnings, assets, and voting privileges, except for class-specific expenses and exclusive rights to vote on matters affecting only individual classes.
2. SIGNIFICANT ACCOUNTING POLICIES
The following is a summary of significant accounting policies followed by the Funds in the preparation of the Financial Statements. These policies are in conformity with U.S. generally accepted accounting principles (“GAAP”). Each Fund is an investment company and accordingly follows the investment company accounting and reporting guidance of the Financial Accounting Standards Board (FASB) Accounting Standard Codification Topic 946Financial Services – Investment Companies.
| (a) | Portfolio securities traded on a securities exchange or quoted by NASDAQ are valued at the last sale price on the principal exchange on which they are traded at the time the securities are valued, or, if not traded on that day, are valued at the closing bid price. Securities traded in the OTC market and not quoted by NASDAQ are valued at their last sale price or, if there is no available price, the last bid price quoted by brokers that make markets in the securities as of the close of regular trading hours on the day the securities are being valued. Foreign securities are valued on the basis of quotations from the primary market in which they are traded, and are translated from the local currency into U.S. dollars using exchange rates as of the close of regular trading (normally 4:00 p.m. Eastern time) on the New York Stock Exchange (the “Exchange”) or using methods determined by the Board. Short-term instruments with maturities of 60 days or less are valued at the price supplied by an approved independent pricing source. Options contracts listed for trading on a securities exchange or board of trade shall be valued at the mean of the highest bid and lowest asked quotation across the exchanges on which the option is traded. Futures contracts are ordinarily valued at the closing settlement price on the exchange on which they are primarily traded or based upon the current settlement price for a like instrument acquired on the day on which the instrument is being valued. Securities and other assets for which quotations are not readily available or deemed unreliable are valued at their fair value using methods determined by the Board. Fair valuation of a particular security is an inherently subjective process, with no single standard to utilize when determining a security’s fair value. As such, different mutual funds could reasonably arrive at a different fair value price for the same security. In each case where a security is fair valued, consideration is given to the facts and circumstances relevant to the particular situation. This consideration includes reviewing various factors set forth in the pricing procedures adopted by the Board and other factors as warranted. In making a fair value determination, factors that may be considered, among others, may include: the type and structure of the security; unusual events or circumstances relating to the security’s issuer; general market conditions; prior day’s valuation; fundamental analytical data; size of the holding; cost of the security on the date of purchase; nature and duration of any restriction on disposition; trading activities; and prices of similar securities or financial instruments. If a Fund invests in shares of other open-end mutual funds (each, an “Underlying Fund”), the Fund calculates the net asset value of its shares using the reported net asset value of the applicable Underlying Fund. For each Underlying Fund, the net asset value per share for a class of shares is determined as of the close of the Exchange on each day the Exchange is open by dividing the value of the Underlying Fund’s net assets attributable to that class by the number of outstanding shares of that class on that day. |
| (b) | The per share net asset value (the “NAV”) of each Fund is calculated as of the close of regular trading on the Exchange (normally 4:00 p.m. Eastern time) each day the Exchange is open. The per share NAV is calculated by deducting from the Fund’s assets, the Fund’s liabilities, and then dividing the resulting net assets by the total number of shares outstanding, rounded to the nearest cent. The purchase price and redemption price per share is equal to the next determined NAV per share. Redemption of shares of American Select Equity Fund are subject to a redemption fee of 2% if redeemed within 90 days of purchase. |
| (c) | The Trust treats each Fund as a separate entity for Federal income tax purposes. Each Fund intends to continue to qualify each year as a “regulated investment company” under Subchapter M of the Internal Revenue Code of 1986, as amended (the “Code”). By so qualifying, each Fund will not be subject to Federal income taxes to the extent that it distributes substantially all of its taxable or tax-exempt income, if any, for its tax year ending September 30. In addition, by distributing in each calendar year substantially all of its net investment income, capital gains and certain other amounts, if any, each Fund will not be subject to a Federal excise tax. Therefore, no provision is made by the Funds for Federal income or excise taxes. Withholding taxes on foreign dividends are paid or provided for in accordance with the applicable country’s tax rules and rates. |
| Semi-Annual Report | March 31, 2019 | 33 |
| Centre Funds | Notes to Financial Statements |
| | March 31, 2019 (Unaudited) |
As of and during the period ended March 31, 2019, the Funds did not have a liability for any unrecognized tax benefits in the accompanying financial statements. The Funds recognize the interest and penalties, if any, related to the unrecognized tax benefits as income tax expense in the Statement of Operations. During the period, the Funds did not incur any interest or penalties.
| (d) | Net realized gains and losses on investments are computed on the identified cost basis. Dividend income is recognized on the ex-dividend date or for certain foreign securities, as soon as information is available, and interest income is recognized on an accrual basis. The Funds amortize premium and accrete discount on investments utilizing the effective interest method. Foreign dividend income may be subject to foreign withholding taxes. |
| (e) | A restricted security is a security that has been purchased through a private offering and cannot be resold to the general public without prior registration under the Securities Act of 1933, as amended (the “1933 Act”), or pursuant to the resale limitations provided by Rule 144 under the 1933 Act, or an exemption from the registration requirements of the 1933 Act. Whether a restricted security is illiquid is determined pursuant to guidelines established by the Board. Not all restricted securities are considered to be illiquid. As of March 31, 2019, the Funds did not hold any restricted securities. |
| (f) | The accompanying financial statements were prepared in accordance with GAAP, which require the use of estimates and assumptions made by management. These may affect the reported amounts of assets and liabilities and disclosure of contingent assets and liabilities at the date of the financial statements and the reported amounts of increases and decreases in net assets from operations during the reporting period. Actual results could differ from those estimates. |
| (g) | Each Fund bears expenses incurred specifically by such Fund, as well as its pro rata portion of Trust expenses, which may be allocated on the basis of relative net assets or the nature of the services performed relative to applicability to each Fund. Expenses that are specific to a Fund or class of shares of a Fund are charged directly to that Fund or share class. All of the realized and unrealized gains and losses and net investment income of a Fund, other than class-specific expenses, are allocated daily to each class in proportion to its average daily net assets. Fees payable under the distribution (Rule 12b-1) plan and shareholder services plan are charged to each respective fund or share class. |
| (h) | The Funds intend to distribute to shareholders all of their net income and/or capital gains on an annual basis, with the exception of the Centre Active U.S. Treasury Fund, which intends to make monthly income distributions. Income and capital gains distributions are determined in accordance with income tax regulations, which may differ from GAAP. Distributions to shareholders are recorded on the ex-dividend date. |
| (i) | A Fund may directly purchase securities of foreign issuers. Investing in securities of foreign issuers involves special risks not typically associated with investing in securities of U.S. issuers. The risks include possible reevaluation of currencies, the inability to repatriate foreign currency, less complete financial information about companies and possible future adverse political and economic developments. Moreover, securities of many foreign issuers and their markets may be less liquid and their prices more volatile than those of securities of comparable U.S. issuers. |
| (j) | The books and records of the Funds are maintained in U.S. dollars. Investment valuations and other assets and liabilities initially expressed in foreign currencies are converted each business day into U.S. dollars based upon current exchange rates. The portion of realized and unrealized gains or losses on investments due to fluctuations in foreign currency exchange rates is separately disclosed and is included in net realized and net change in unrealized gains or losses on foreign currencies. |
| (k) | Offering costs incurred in connection with the offering and initial registration of the Infrastructure Fund, including costs of printing prospectuses, legal and registration fees, are being amortized over twelve months from the Fund’s commencement of operations. As of March 31, 2019, no offering costs remain to be amortized for the Fund. |
3. FAIR VALUE MEASUREMENTS
The Funds normally use third-party pricing services to obtain market quotations for their portfolio investments. Securities and other assets for which representative market quotations are not readily available or which cannot be accurately valued using the Trust’s normal pricing procedures are valued at fair value as determined in good faith under policies approved by the Trustees. Fair value pricing may be used, for example, in situations where (i) an exchange-traded portfolio security is so thinly traded that there have been no transactions for that security over an extended period of time or the validity of a market quotation received is questionable; (ii) the exchange on which the portfolio security is principally traded closes early; or (iii) trading of the portfolio security is halted during the day and does not resume prior to the NAV calculation.
| Centre Funds | Notes to Financial Statements |
| | March 31, 2019 (Unaudited) |
The inputs used in determining the fair value of each Fund’s investments are summarized into three levels, as described in the following hierarchy:
| Level 1- | Unadjusted quoted prices in active markets for identical, unrestricted assets or liabilities that a Fund has the ability to access at the measurement date. |
| Level 2- | Quoted prices which are not active, quoted prices for similar assets or liabilities in active markets or inputs other than quoted prices that are observable (either directly or indirectly). |
| Level 3- | Significant unobservable prices or inputs (including the oversight of the Board and Centre Asset Management, LLC (the “Adviser”) in determining the fair value of investments) where there is little or no market activity for the asset or liability at measurement date. |
The inputs or methodology used for valuing securities are not necessarily an indication of the risk associated with investing in those securities. The following is a summary of each Fund’s investments in the fair value hierarchy as of March 31, 2019:
Centre American Select Equity Fund
| Investments in Securities at Value(a) | | Level 1 -
Quoted Prices | | | Level 2 -
Other Significant Observable Inputs | | | Level 3 -
Significant
Unobservable
Inputs | | | Total | |
| Common Stocks | | $ | 115,048,718 | $– | | $ | – | | | $ | 115,048,718 | | | | | |
| Purchased Options | | | 822,050 | | | | – | | | | – | | | | 822,050 | |
| Short Term Investments | | | 853,174 | | | | – | | | | – | | | | 853,174 | |
| Total | | $ | 116,723,942 | | | $ | – | | | $ | – | | | $ | 116,723,942 | |
Centre Active U.S. Treasury Fund
| Investments in Securities at Value(a) | | Level 1 -
Quoted Prices | | | Level 2 -
Other Significant Observable Inputs | | | Level 3 -
Significant
Unobservable
Inputs | | | Total | |
| U.S. Government Bonds & Notes | | $ | – | | | $ | 37,694,042 | | | $ | – | | | $ | 37,694,042 | |
| Short Term Investments | | | 1,304,388 | | | | – | | | | – | | | | 1,304,388 | |
| Total | | $ | 1,304,388 | | | $ | 37,694,042 | | | $ | – | | | $ | 38,998,430 | |
| Other Financial Instruments | | | | | | | | | | | | | | | | |
| Liabilities: | | | | | | | | | | | | | | | | |
| Futures Contracts | | $ | (479,236 | ) | | $ | – | | | $ | – | | | $ | (479,236 | ) |
| Total | | $ | (479,236 | ) | | $ | – | | | $ | – | | | $ | (479,236 | ) |
Centre Global Infrastructure Fund
| Investments in Securities at Value(a) | | Level 1 -
Quoted Prices | | | Level 2 -
Other Significant Observable Inputs | | | Level 3 -
Significant
Unobservable
Inputs | | | Total | |
| Common Stocks | | $ | 11,923,033 | | | $ | – | | | $ | – | | | $ | 11,923,033 | |
| Short Term Investments | | | 37,441 | | | | – | | | | – | | | | 37,441 | |
| Total | | $ | 11,960,474 | | | $ | – | | | $ | – | | | $ | 11,960,474 | |
| (a) | For detailed descriptions of sectors, industries, and countries, see the accompanying Schedule of Investments. |
There were no material amounts classified as Level 3 securities during the period, thus, a reconciliation of assets in which significant unobservable inputs (Level 3) were used is not applicable for the Funds.
Derivative Financial Instruments
A Fund may use derivative contracts, such as exchange-traded options and futures, that are related to stock market or bond indices, foreign exchange, fixed income or other securities, or be exposed to exchange-traded derivative products. A Fund may invest its assets in derivatives and other instruments to help manage interest rate exposure, protect the Fund’s assets, or enhance returns. A Fund may also be exposed to certain exchange-traded derivative products, such as exchange-traded futures and options that are fully collateralized by cash or securities, for temporary cash management or investment transition purposes, or to hedge the risks of existing positions or overall capital protection.
Derivative Risk:One or more Funds may use derivatives, such as exchange-traded options and futures, that are related to stock market or bond indexes, foreign exchange, fixed income or other securities or be exposed to exchange-traded derivative products. Loss may result from a Fund’s investments in exchange-traded futures and options. The value of derivatives in which a Fund may invest may rise or fall more rapidly than other
| Semi-Annual Report | March 31, 2019 | 35 |
| Centre Funds | Notes to Financial Statements |
| | March 31, 2019 (Unaudited) |
investments. Other risks of investments in derivatives include imperfect correlation between the value of these instruments and the underlying assets; risks of default by the other party to the derivative transactions; risk that the transactions may result in losses that offset gains in portfolio positions; and risks that the derivative transactions may not be liquid. Derivatives, such as exchange-traded futures and options, contain “inherent” leverage because derivative contracts may give rise to an obligation on the part of a Fund for future payment or liabilities that are larger than the initial margin or premiums required to establish such positions. Combined with the volatility of derivatives prices, the leveraged nature of derivatives trading could cause a Fund to sustain large and sudden losses. The use of derivatives, such as futures and options, can lead to losses, including those magnified by leverage, particularly when derivatives are used to enhance return rather than mitigate risk. Correlation risk is the risk that changes in the value of the derivative may not correlate perfectly with the underlying asset, rate or index. Certain derivative instruments may be difficult to sell when the Adviser believes it would be appropriate to do so.
Derivatives may have little or no initial cash investment relative to their market value exposure and therefore can produce significant gains or losses in excess of their cost. This use of embedded leverage may allow a Fund to increase its market value exposure relative to its net assets and can substantially increase the volatility of the Fund’s performance.
Additional associated risks from investing in derivatives also exist and potentially could have significant effects on the valuation of the derivatives held by a Fund. Typically, a Fund may attempt to increase or decrease exposure to the risks associated with the securities or other traditional investments in which it invests. The risks associated with a Fund’s use of derivative instruments, including but not limited to volatility risk, correlation risk, segregation risk, and hedging risks, are additional risks that a Fund does not typically seek to increase or decrease exposure to. Examples of these associated risks are liquidity risk, which is the risk that a Fund will not be able to sell the derivative in the open market in a timely manner, and counterparty credit risk, which is the risk that the counterparty will not fulfill its obligation to the Fund.
Option Writing/Purchasing
A Fund may write or purchase option contracts to adjust risk and return of its overall investment positions, subject to any restrictions set forth in the Fund’s prospectus. When a Fund writes or purchases an option, an amount equal to the premium received or paid by the Fund is recorded as a liability or an asset and is subsequently adjusted to the current market value of the option written or purchased. Premiums received or paid from writing or purchasing options that expire unexercised are treated by a Fund on the expiration date as realized gains or losses. The difference between the premium and the amount paid or received on affecting a closing purchase or sale transaction, including brokerage commissions, is also treated as a realized gain or loss. If an option is exercised, the premium paid or received is netted to the cost of the purchase or proceeds from the sale in determining whether a Fund has realized a gain or loss on investment transactions. Risks from entering into option transactions arise from, among other things, the potential inability of counterparties to meet the terms.
Futures
A Fund may use futures subject to any restrictions set forth in the Fund’s prospectus. A Fund may also be exposed to exchange-traded futures that are fully collateralized by cash or securities, for temporary cash management or investment transition purposes, or to hedge the risks of existing positions. To the extent that the Fund uses derivatives for temporary cash management, investment transition purposes, managing duration or to hedge the risks of existing positions, the Fund will be subject to the risks associated with such transactions.
The effect of derivative instruments on the Statement of Assets and Liabilities - Fair Value of Derivative Instruments as of March 31, 2019:
| Risk Exposure | | Derivatives
Statement of Assets and Liabilities Location | | Fair Value | |
| Centre American Select Equity Fund | | | | | | |
Equity Contracts
(Purchased Options) | | Investments, at value | | $ | 822,050 | |
| | | | | $ | 822,050 | |
| Centre Active U.S. Treasury Fund | | | | | | |
Fixed Income Contracts - (Interest rate risk)
(Futures Contracts) | | Deposit with broker for futures contracts | | $ | (479,236 | ) |
| | | | | $ | (479,236 | ) |
The effect of derivative instruments on the Statement of Operations for the period ended March 31, 2019 (Net realized gain/(loss) on purchased options contracts are included in Net realized gain/(loss) on investments within the Statement of Operations):
| Centre Funds | Notes to Financial Statements |
| | March 31, 2019 (Unaudited) |
| Derivatives | | Location of Gains/(Loss) On Derivatives Recognized In Income | | Realized Gain/(Loss) on Derivatives Recognized in Income | | | Change in Unrealized Gain/(Loss) on Derivatives Recognized in Income | |
| Centre American Select Equity Fund | | | | | | | | |
| Equity Contracts (Purchased Options) | | Net realized gain/(loss) on investments/Net change in unrealized appreciation/(depreciation) on investments | | $ | 3,014,583 | | | $ | (1,904,212 | ) |
| | | | | $ | 3,014,583 | | | $ | (1,904,212 | ) |
| Centre Active U.S. Treasury Fund | | | | | | | | |
| Fixed Income Contracts (Futures Contracts) | | Net realized gain on futures contracts/Net change in unrealized appreciation on futures contracts | | $ | 163,340 | | | $ | (604,807 | ) |
| | | | | $ | 163,340 | | | $ | (604,807 | ) |
Volume of Derivative Instruments for the Funds during the period ended March 31, 2019, was as follows:
| Derivative Type | | Unit of Measurement | | Monthly Average | |
| Centre American Select Equity Fund | | | | | | |
| Purchased Option Contracts | | Notional value of contracts outstanding | | $ | 116,210,400 | |
| Derivative Type | | Unit of Measurement | | Monthly Average | |
| Centre Active U.S. Treasury Fund | | | | | | |
| Purchased (Sold) Futures Contracts | | Notional value of contracts outstanding | | $ | (31,407,172 | ) |
During the ordinary course of business, the Funds may enter into transactions subject to enforceable netting agreements or other similar arrangements (“netting agreements”). Generally, the right to offset in netting agreements allows the Funds to offset any exposure to a specific counterparty with any collateral received or delivered to that counterparty based on the terms of the agreement. Generally, the Funds manage their cash collateral and securities collateral on a counterparty basis.
4. BENEFICIAL INTEREST TRANSACTIONS
On March 31, 2019, there was an unlimited number of shares of beneficial interest authorized for each Fund. Transactions in shares of beneficial interest are shown in the Statement of Changes in Net Assets.
Shares of American Select Equity Fund and Infrastructure Fund that are redeemed within 90 days of purchase may incur a 2% redemption fee deducted from the redemption amount. For the period ended March 31, 2019, redemption fees retained by these Funds are disclosed in the Statement of Changes in Net Assets.
Beneficial Ownership:The beneficial ownership, either directly or indirectly, of more than 25% of the voting securities of a Fund creates a presumption of control of the Fund under Section 2(a)(9) of the 1940 Act. As of March 31, 2019, the following entities owned beneficially more than 25% of each Fund’s outstanding shares. The shares may be held under omnibus accounts (whereby the transactions of two or more shareholders are combined and carried in the name of the originating broker rather than designated separately). Any transaction by these investors could have a material impact on the share class.
| Centre American Select Equity Fund | Class | Percentage |
| Charles Schwab & Co. Inc | Investor | 46.04% |
| Semi-Annual Report | March 31, 2019 | 37 |
| Centre Funds | Notes to Financial Statements |
| | March 31, 2019 (Unaudited) |
5. INVESTMENT ADVISORY AGREEMENTS AND RELATED-PARTY TRANSACTIONS
The Adviser serves as the investment adviser to each Fund pursuant to an Investment Advisory Agreement with the Trust on behalf of the Fund.
As compensation for the investment advisory services provided to the Funds, the Adviser is entitled to receive monthly compensation, subject to waivers, based on each Fund’s average daily net assets at the annual rate of:
| Fund | Management Fee Rate |
| Centre American Select Equity Fund (total net assets less than or equal to $1 billion) | 0.75% |
| Centre American Select Equity Fund (total net assets over $1 billion) | 0.70% |
| Centre Active U.S. Treasury Fund | 0.40% |
| Centre Global Infrastructure Fund | 0.90% |
American Select Equity Fund
For the American Select Equity Fund, effective as of the close of business on January 29, 2018, the Adviser has agreed, pursuant to an amended and restated written expense limitation agreement (the “Expense Limitation Agreement”), to reduce its advisory fees and/or reimburse other expenses of the Fund through at least October 31, 2019 to the extent necessary to limit the current operating expenses of the Fund including, as applicable, investment advisory fees, but excluding, as applicable, any taxes, leverage interest, distribution/service (Rule 12b-1) fees, shareholder services fees, brokerage commissions, acquired fund fees and expenses, expenses incurred in connection with any merger or reorganization, and extraordinary expenses (such as litigation and other expenses not incurred in the ordinary course of the Fund’s business) to an annual rate of 1.10% of the average daily net assets of the Investor Class shares and 0.90% of the average daily net assets of the Institutional Class shares. The Expense Limitation Agreement may be terminated at any time by the Board of Trustees of the Trust (the “Board”) upon 60 days’ written notice to the Adviser, but may not be terminated by the Adviser without the consent of the Board. No recoupment will be made more than three years after the date that the applicable amount was initially waived or reimbursed by the Adviser, and the recoupment may not cause the Fund to exceed the then-existing expense limitation for that class at the time such waiver or reimbursement was made. Prior to the close of business on January 29, 2018, the Adviser had agreed to limit the operating expenses of the Fund to an annual rate of 1.05% of the average daily net assets of the Investor Class shares and 0.95% of the average daily net assets of the Institutional Class shares.
Treasury Fund
For the Treasury Fund, effective as of the close of business on January 29, 2018, the Adviser has agreed, pursuant to an amended and restated written expense limitation agreement (the “Expense Limitation Agreement”), to reduce its advisory fees and/or reimburse other expenses of the Fund through at least October 31, 2019 to the extent necessary to limit the current operating expenses of the Fund, including, as applicable, investment advisory fees, but excluding, as applicable, any taxes, leverage interest, distribution/service (Rule 12b-1) fees, shareholder service fees, brokerage commissions, acquired fund fees and expenses, expenses incurred in connection with any merger or reorganization, and extraordinary expenses (such as litigation and other expenses not incurred in the ordinary course of the Fund’s business), to an annual rate of 0.80% of the average daily net assets of the Investor Class shares and 0.60% of the average daily net assets of the Institutional Class shares. The Expense Limitation Agreement may be terminated at any time by the Board of Trustees of the Trust (the “Board”), upon 60 days’ written notice to the Adviser, but may not be terminated by the Adviser without the consent of the Board. No recoupment will be made more than three years after the date that the applicable amount was initially waived or reimbursed by the Adviser, and the recoupment may not cause the Fund to exceed the then-existing expense limitation for that class at the time such waiver or reimbursement was made. Prior to the close of business on January 29, 2018, the Adviser had agreed to limit the operating expenses of the Fund to an annual rate of 0.85% of the average daily net assets of the Investor Class shares and 0.60% of the average daily net assets of the Institutional Class shares.
Infrastructure Fund
For the Infrastructure Fund, effective as of the close of business on May 18, 2018, the Adviser has agreed, pursuant to a written expense limitation agreement (the “Expense Limitation Agreement”), to reduce its advisory fees and/or reimburse other expenses of the Fund for an initial period of not less than two years and until the next following effective date of the post-effective amendment to the registration statement of the Trust relating to the Fund incorporating the Fund’s financial statements for that fiscal year (the “Initial Term”) to the extent necessary to limit the current operating expenses of the Fund, including, as applicable, investment advisory fees, but excluding, as applicable, any taxes, leverage interest, distribution/service (Rule 12b-1) fees, shareholder services fees, brokerage commissions, acquired fund fees and expenses, expenses incurred in connection with any merger or reorganization, and extraordinary expenses (such as litigation and other expenses not incurred in the ordinary course of the Fund’s business) to an annual rate of 1.05% of the average daily net assets of the Investor Class shares and 1.10% of the average daily net assets of the Institutional Class shares. The Expense Limitation Agreement may be terminated at any time by the Board of Trustees of the Trust (the “Board”), upon 60 days’ written notice to the Adviser, but may not be terminated by the Adviser without the consent of the Board. No recoupment will be made more than three years after the date that the applicable amount was initially waived or reimbursed by the Adviser, and the recoupment may not cause the Fund to exceed the then-existing expense limitation for that class at the time such reimbursement or waiver
| Centre Funds | Notes to Financial Statements |
| | March 31, 2019 (Unaudited) |
was made. Prior to the close of business on May 18, 2018, the Adviser had agreed to limit the operating expenses of the Fund to an annual rate of 1.30% of the average daily net assets of the Investor Class shares.
During the period ended March 31, 2019, the fee waivers and/or reimbursements were as follows:
| Fund | | Fees Waived and/or Reimbursed by Adviser | |
| Centre American Select Equity Fund | | | | |
| Investor | | $ | 91,838 | |
| Institutional | | | 4,689 | |
| Centre Active U.S. Treasury Fund | | | | |
| Investor | | | 40,735 | |
| Institutional | | | 13,556 | |
| Centre Global Infrastructure Fund | | | | |
| Investor | | | 77,939 | |
| Institutional | | | 4,915 | |
As of September 30, 2018, the balances of recoupable expenses for each Fund were as follows:
| Fund | | Expires 2019 | | | Expires 2020 | | | Expires 2021 | | | Total | |
| Centre American Select Equity Fund | | | | | | | | | | | | | | | | |
| Investor Class | | $ | 439,701 | | | $ | 504,641 | | | $ | 357,720 | | | $ | 1,302,062 | |
| Institutional Class | | | 35,622 | | | | 12,695 | | | | 8,130 | | | | 56,447 | |
| Centre Active U.S. Treasury Fund | | | | | | | | | | | | | | | | |
| Investor Class | | $ | 167,361 | | | $ | 156,165 | | | $ | 126,667 | | | $ | 450,193 | |
| Institutional Class | | | 51,626 | | | | 20,594 | | | | 16,945 | | | | 89,165 | |
| Centre Global Infrastructure Fund | | | | | | | | | | | | | | | | |
| Investor Class | | $ | – | | | $ | – | | | $ | 16,342 | | | $ | 16,342 | |
| Institutional Class | | | – | | | | – | | | | 92,541 | | | | 92,541 | |
ALPS Fund Services, Inc. (“ALPS” or the “Administrator”) serves as administrator to the Funds. ALPS receives a monthly fee paid by the Funds subject to a minimum monthly fee and is reimbursed for certain out-of-pocket expenses. Pursuant to an administrative agreement with the Trust, ALPS provides operational services to the Funds including, but not limited to fund accounting and fund administration services and general assistance in each Fund’s operations.
ALPS, pursuant to a transfer agency and services agreement with the Trust, serves as transfer agent for the Funds. Under the transfer agency and services agreement, ALPS receives an annual minimum fee per Fund and a fee based upon each shareholder account and its account activity and is reimbursed for certain out-of-pocket expenses.
ALPS, pursuant to a chief compliance officer services agreement with the Trust, provides chief compliance officer services to the Funds. Additionally, ALPS provides services in monitoring and testing the policies and procedures of the Trust in conjunction with requirements under Rule 38a-1 under the 1940 Act. ALPS receives an annual fee for these services and is reimbursed for certain out-of-pocket expenses, pursuant to the chief compliance officer services agreement.
The Trust has adopted a plan pursuant to Rule 12b-1 under the 1940 Act (the “Plan”). The Plan permits the Trust, on behalf of Investor class shares of the Funds, to pay up to 0.25% per year to one or more entities for services rendered and expenses borne in connection with providing shareholder or distribution services with respect to the Investor class shares of each Fund.
ALPS Distributors, Inc. (the “Distributor”) acts as the principal underwriter of the Funds pursuant to a distribution agreement with the Trust. No payments were retained by the Distributor by the Funds during the period ended March 31, 2019.
Officers of the Trust and Trustees who are “interested persons” of the Trust or the Adviser receive no salary or fees from the Trust. Each Trustee who is not an “interested person” receives an annual retainer of $20,000 paid quarterly. The Trust reimburses each Trustee and Officer for his or her travel and other expenses relating to attendance at Board meetings.
One Trustee is an officer of the Trust, and serves as Managing Director and Chief Investment Officer of the Adviser.
| Semi-Annual Report | March 31, 2019 | 39 |
| Centre Funds | Notes to Financial Statements |
| | March 31, 2019 (Unaudited) |
6. FEDERAL INCOME TAX AND TAX BASIS INFORMATION
As of and during the period ended March 31, 2019, no Fund had a liability for any unrecognized tax benefits. The Funds file U.S. Federal, state, and local tax returns as required. The Funds’ tax returns are subject to examination by the relevant tax authorities until expiration of the applicable statute of limitations, which is generally three years after the filing of the tax return but which can be extended to six years in certain circumstances. Tax returns for open years have incorporated no uncertain tax positions that require a provision for income taxes.
Components of Distributable Earnings on a Tax Basis:At March 31, 2019, permanent differences in book and tax accounting were reclassified. These differences had no effect on net assets and were primarily attributed to differences in the book and tax treatment of currency transactions, book/tax distribution differences, and non-deductible expenses.
Distributions to Shareholders:Each Fund normally pays dividends and net investment income, if any, on an annual basis, with the exception of the Centre Active U.S. Treasury Fund, which intends to make monthly income distributions. Each Fund normally distributes capital gains, if any, on an annual basis. Income dividend distributions are derived from interest and other income each Fund receives from its investments, including distributions of short term capital gains. Capital gain distributions are derived from gains realized when each Fund sells a security it has owned for more than one year. Each Fund may make additional distributions and dividends at other times if the Adviser believes doing so may be necessary for each Fund to avoid or reduce taxes. Net investment income/(loss) and net realized gain/(loss) may differ for financial statement and tax purposes. The amounts and characteristics of tax basis distributable earnings/(accumulated losses) are finalized at fiscal year-end.
The tax character of distributions paid for the fiscal year or period ended September 30, 2018 were as follows:
| Distributions Paid From: | | Ordinary Income | | | Tax-Exempt Income | | | Long-Term
Capital Gains | |
| Centre American Select Equity Fund | | $ | 1,052,197 | | | $ | – | | | $ | 14,113,689 | |
| Centre Active U.S. Treasury Fund | | | 837,098 | | | | – | | | | – | |
| Centre Global Infrastructure Fund | | | 68,896 | | | | – | | | | – | |
The tax character of distributions paid for the fiscal year ended September 30, 2017 were as follows:
| Distributions Paid From: | | Ordinary Income | | | Tax-Exempt Income | | | Long-Term
Capital Gains | |
| Centre American Select Equity Fund | | $ | 1,571,442 | | | $ | – | | | $ | 2,601,748 | |
| Centre Active U.S. Treasury Fund | | | 2,199,698 | | | | – | | | | 63,822 | |
Unrealized Appreciation and Depreciation on Investments:The amount of net unrealized appreciation/(depreciation) and the cost of investment securities for tax purposes, including short-term securities at March 31, 2019 are displayed in the table below. The difference between book and tax basis unrealized appreciation/(depreciation) for the Funds is primarily attributable to wash sales and certain other investments.
| | | Tax Cost ofInvestments | | | Gross Unrealized Appreciation | | | Gross Unrealized Depreciation | | | Net Tax Unrealized Appreciation/
(Depreciation) on Investments | |
| Centre American Select Equity Fund | | $ | 91,390,900 | | | $ | 29,885,317 | | | $ | (4,552,275 | ) | | $ | 25,333,042 | |
| Centre Active U.S. Treasury Fund | | | 38,144,523 | | | | 917,569 | | | | (542,898 | ) | | | 374,671 | |
| Centre Global Infrastructure Fund | | | 11,374,012 | | | | 831,254 | | | | (244,792 | ) | | | 586,462 | |
7. PURCHASES AND SALES OF INVESTMENT SECURITIES
For the period ended March 31, 2019, the aggregate cost of purchases and proceeds from sales of investment securities (excluding any U.S. Government Obligations, short-term securities, and purchased options and futures) were as follows:
| Fund | | Purchases of Securities | | | Proceeds From Sales of Securities | |
| Centre American Select Equity Fund | | $ | 75,490,786 | | | $ | 82,008,549 | |
| Centre Global Infrastructure Fund | | | 2,608,907 | | | | 6,637,826 | |
| Centre Funds | Notes to Financial Statements |
| | March 31, 2019 (Unaudited) |
For the period ended March 31, 2019, the aggregate cost of purchases and proceeds from sales of U.S. Government Obligations investment securities were as follows:
| Fund | | Purchases of Securities | | | Proceeds from Sales of Securities | |
| Centre Active U.S. Treasury Fund | | $ | 2,997,851 | | | $ | 3,458,321 | |
8. INDEMNIFICATIONS
Under the Trust’s organizational documents, its officers and Trustees are indemnified against certain liabilities relating to their duties to the Trust. Additionally, in the ordinary course of business, the Trust enters into contracts with service providers that may contain general indemnification clauses. The Trust’s maximum exposure under these arrangements is unknown, as this would involve future claims that may be made against the Trust that have not yet occurred.
9. FUND REORGANIZATION
At a special meeting of shareholders held on August 22, 2018, the shareholders of Centre Active U.S. Tax Exempt Fund (the “Tax Exempt Fund”), a former series of the Trust, approved the reorganization, pursuant to an Agreement and Plan of Reorganization (the “Plan”), of the Tax Exempt Fund into the Infrastructure Fund. The Board of Trustees of the Trust had previously approved the Plan providing for the reorganization.
Following the completion of the reorganization on August 24, 2018, and pursuant to the terms of the Plan, Investor Class and Institutional Class shareholders of the Tax Exempt Fund became shareholders of the Infrastructure Fund and received Investor Class and Institutional Class shares, respectively, of the Infrastructure Fund. The reorganization did not qualify as a tax-free “reorganization” under the Internal Revenue Code of 1986, as amended (the “Code”) for U.S. federal income tax purposes. The reorganization was accomplished by an exchange of 1,679,000 shares of the Tax Exempt Fund’s Investor Class, valued at $16,291,332, for 1,670,597 shares of the Infrastructure Fund’s Investor Class, and 138,494 shares of the Tax Exempt Fund’s Institutional Class, valued at $1,335,597, for 136,778 shares of the Infrastructure Fund’s Institutional Class.
| Acquiring Fund | Shares Outstanding of Acquiring Fund | Net Assets of Acquiring Fund | Acquired Fund | Acquired Fund Shares Exchanged | Net Assets of Acquired Fund Exchanged |
| Infrastructure Fund | 237,966 | $2,323,443 | Tax Exempt Fund | 1,817,494 | $17,626,030 |
The investment portfolio fair value and unrealized depreciation for the Tax Exempt Fund immediately prior to the reorganization were as follows:
| Acquired Fund | | Portfolio Value | | | Unrealized Depreciation* | |
| Tax Exempt Fund | | $ | 17,616,003 | | | $ | (71,208 | ) |
| * | Realized upon completion of the reorganization as it was not tax-free |
Immediately following the reorganization the net assets of the combined Fund was as follows:
| | | Combined Net Assets | |
| Infrastructure Fund | | $ | 17,817,459 | * |
| * | The net assets of the Tax Exempt Fund included an investment in the Infrastructure Fund, which was liquidated during the reorganization and therefore is not included in the combined net assets immediately following the reorganization. |
There were no unused capital loss carryforwards of the Tax Exempt Fund, subject to tax limitations, for potential utilization as of the closing date of the reorganization, August 24, 2018.
Assuming the reorganization had been completed on January 29, 2018, the inception date of the Infrastructure Fund, the Infrastructure Fund’s pro forma results of operations for the period ended September 30, 2018 would be as follows:
| | | Net Investment Income | | | Net Realized and Unrealized Gain/(Loss) on Investments | | | Net Increase/(Decrease in Net Assets Resulting from Operations | |
| Infrastructure Fund | | $ | 190,524 | | | $ | (457,851 | ) | | $ | (267,327 | ) |
| Semi-Annual Report | March 31, 2019 | 41 |
| Centre Funds | Notes to Financial Statements |
| | March 31, 2019 (Unaudited) |
Because of the investment portfolios that were combined through the reorganization have been managed as a single integrated portfolio since the closing of the reorganization, it is not practicable to separate the amounts of revenue and earnings of the Tax Exempt Fund that have been included in the Infrastructure Fund’s Statement of Operations since August 24, 2018.
10. SEC REGULATIONS
In August 2018, the Financial Accounting Standards Board (“FASB”) issued Accounting Standards Update (“ASU”) 2018-13, which changes the fair value measurement disclosure requirements of FASB Accounting Standards Codification Topic 820, Fair Value Measurement. The update to Topic 820 includes new, eliminated, and modified disclosure requirements. ASU 2018-13 is effective for fiscal years beginning after December 15, 2019, including interim periods. Early adoption is permitted for any eliminated or modified disclosures. The Funds’ adoption of those amendments, included in these financial statements, had no effect on the Funds’ net assets or results of operations.
| Centre Funds | Additional Information |
| | March 31, 2019 (Unaudited) |
PROXY VOTING GUIDELINES AND RECORDS
A description of the policies and procedures that the Funds use to determine how to vote proxies relating to portfolio securities and information regarding how the Funds voted proxies during the most recent 12-month period ended June 30, is available without charge, upon request, by (1) calling the Funds at 1-855-298-4236 and (2) on the U.S. Securities and Exchange Commission’s (“SEC”) website at http://www.sec.gov.
PORTFOLIO HOLDINGS DISCLOSURE POLICY
The Trust files, with regard to each Fund, with the SEC a complete schedule of investments for the first and third quarters of each fiscal year on Form N-Q. The Funds’ first and third fiscal quarters end on December 31 and June 30. The Form N-Q filing must be made within 60 days of the end of the quarter. Forms N-Q are available on the SEC’s website at http://www.sec.gov and may be reviewed and copied at the SEC’s Public Reference Room in Washington, DC (call 1-800-732-0330 for information on the operations of the Public Reference Room). You may also obtain copies by calling the Funds at 1-855-298-4236.
| Semi-Annual Report | March 31, 2019 | 43 |

Not applicable to semi-annual report.
| Item 3. | Audit Committee Financial Expert. |
Not applicable to semi-annual report.
| Item 4. | Principal Accountant Fees and Services. |
Not applicable to semi-annual report.
| Item 5. | Audit Committee of Listed Registrants. |
Not applicable to the Registrant.
| Item 6. | Schedule of Investments. |
| (a) | The Registrant’s “Schedule I – Investments in securities of unaffiliated issuers” (as set forth in 17 CFR 210.12-12) is included in Item 1 of this Form N-CSR. |
| (b) | Not applicable to the Registrant. |
| Item 7. | Disclosure of Proxy Voting Policies and Procedures for Closed-End Management Investment Companies. |
Not applicable to the Registrant.
| Item 8. | Portfolio Managers of Closed-End Management Investment Companies. |
Not applicable to the Registrant.
| Item 9. | Purchases of Equity Securities by Closed-End Management Investment Company and Affiliated Purchasers. |
Not applicable to the Registrant.
| Item 10. | Submission of Matters to a Vote of Security Holders. |
None.
| Item 11. | Controls and Procedures. |
| (a) | The Registrant’s principal executive officer and principal financial officer have evaluated the Registrant’s disclosure controls and procedures (as defined in Rule 30a-3(c) under the Investment Company Act of 1940, as amended) within 90 days of this filing and have concluded that the Registrant’s disclosure controls and procedures were effective as of that date. |
| (b) | There was no change in the Registrant’s internal control over financial reporting (as defined in Rule 30a-3(d) under the Investment Company Act of 1940, as amended) during the second fiscal quarter of the period covered by this report that has materially affected, or is reasonably likely to materially affect, the Registrant’s internal control over financial reporting. |
| Item 12. | Disclosure of Securities Lending Activities for Closed-End Management Investment Companies. |
Not applicable.
| (a)(1) | Not applicable to semi-annual report. |
| (a)(2) | A separate certification for the Registrant’s Principal Executive Officer and Principal Financial Officer as required by Rule 30a-2(a) under the Investment Company Act of 1940, as amended (17 CFR 270.30a-2(a)), is attached hereto as Ex 99.Cert. |
| (b) | The certifications by the Registrant’s Principal Executive Officer and Principal Financial Officer, as required by Rule 30a-2(b) of the Investment Company Act of 1940, as amended, and Section 906 of the Sarbanes-Oxley Act of 2002 are attached hereto as Ex99.906Cert. |
SIGNATURES
Pursuant to the requirements of the Securities Exchange Act of 1934 and the Investment Company Act of 1940, the Registrant has duly caused this report to be signed on its behalf by the undersigned, thereunto duly authorized.
CENTRE FUNDS
| By: | /s/ James A. Abate | |
| | James A. Abate | |
| | President (Principal Executive Officer) | |
| | | |
| Date: | June 5, 2019 | |
Pursuant to the requirements of the Securities Exchange Act of 1934 and the Investment Company Act of 1940, this report has been signed below by the following persons on behalf of the Registrant and in the capacities and on the dates indicated.
| By: | /s/ James A. Abate | |
| | James A. Abate | |
| | President (Principal Executive Officer) | |
| | | |
| Date: | June 5, 2019 | |
| By: | /s/ James A. Abate | |
| | James A. Abate | |
| | Treasurer (Principal Financial Officer) | |
| | | |
| Date: | June 5, 2019 | |