UNITED STATES
SECURITIES AND EXCHANGE COMMISSION
Washington, D.C. 20549
FORM N-CSR
CERTIFIED SHAREHOLDER REPORT OF REGISTERED
MANAGEMENT INVESTMENT COMPANIES
Investment Company Act file number: 811-22545
CENTRE FUNDS
(Exact name of registrant as specified in charter)
48 Wall Street, Suite 1100, New York, New York 10005
(Address of principal executive offices) (Zip code)
James A. Abate
48 Wall Street, Suite 1100
New York, New York 10005
(Name and address of agent for service)
Registrant’s telephone number, including area code: (212) 918-4705
Date of fiscal year end: September 30
Date of reporting period: October 1, 2014 – March 31, 2015
Item 1. Reports to Stockholders.
TABLE OF CONTENTS
| | |
| Centre Funds | | Shareholder Letter |
| | March 31, 2015 (Unaudited) |
Dear Shareholders,
It is with my pleasure that we publish the Centre Funds semi-annual report covering the six month period ending March 31, 2015. I want to thank my fellow shareholders for their continued support and confidence in the Centre Funds. We are committed to truly active fund management with distinction across core asset class offerings.
As part of its commitment to growth, on March 17, 2015, the Centre Funds completed the reorganization of the former ISI Funds. Specifically, shareholders of the Total Return U.S. Treasury Fund, Inc., North American Government Bond Fund, Inc., ISI Strategy Fund, Inc., and Managed Municipal Fund, Inc. (collectively, the “ISI Funds”), approved the reorganization under which (i) Total Return U.S. Treasury Fund, Inc. and North American Government Bond Fund, Inc. were reorganized into Centre Active U.S. Treasury Fund; (ii) ISI Strategy Fund, Inc. was reorganized into Centre American Select Equity Fund; and (iii) Managed Municipal Fund, Inc. was reorganized into the newly formed Centre Active U.S. Tax Exempt Fund. The Centre Funds’ and ISI Funds’ Boards approved the reorganization in December 2014. We believe the former ISI Funds’ as well as Centre Funds’ shareholders will benefit from greater efficiencies while participating in larger funds with similar investment objectives and policies as part of the Centre Funds’ commitment to delivering fundamentally-driven, specialist active funds in core investment strategies.
The Centre Funds offer a select series of funds to choose from, each available in investor and institutional share classes, and offer investors true active management using specialist talent across a target range of funds that includes the:
| | — | | Centre American Select Equity Fund |
U.S. large capitalization valuation sensitive growth stock fund that seeks long-term growth of capital and is focused on blue-chip securities and risk adjusted returns through active management; the Fund is intended to be a risk managed core growth fund.
| | — | | Centre Global Select Equity Fund |
Foreign (Global ex-U.S.) large capitalization stock fund that seeks long-term growth of capital and focuses on intrinsic value and strategic geographic allocation in portfolio construction. The Fund invests in international developed markets’ blue chip companies and emerging blue chips from the developing world.
| | — | | Centre Active U.S. Treasury Fund |
U.S. Treasury securities fund that seeks to maximize investors’ total return through capital appreciation and current income using active duration management of U.S. Treasury securities and cash equivalents. Portfolio has the potential for capital appreciation/preservation in various interest rate environments through a proprietary interest rate forecasting process that aims to take advantage of interest rate changes through active duration management.
| | — | | Centre Active U.S. Tax Exempt Fund |
U.S. Municipal National Short/Intermediate securities fund that seeks to maximize investors’ total return through capital appreciation and current income using active duration management of a core portfolio of high quality and highly rated federally tax exempt municipal bond securities to provide tax advantaged income. Portfolio has the potential for capital appreciation/preservation in various interest rate environments through a proprietary interest rate forecasting process that aims to take advantage of interest rate changes through active duration management.
| | — | | Centre Multi-Asset Real Return Fund |
Asset allocation fund that seeks real return by using a systematic, flexible process of tactical allocation to broad asset classes (underlying funds, U.S. and non-U.S. equities, fixed income securities, exchange-traded notes and exchange-traded funds with returns that track broad commodity indices or the price of gold bullion, real estate linked securities, and cash and equivalents) with the goal of preserving and growing investment capital in excess of inflation.
Our aim at Centre Funds is to deliver strong, long-term performance results for investors through an exceptional focus on producing returns and managing risk in a select number of investment strategies. Each investment strategy aims to capitalize on defined market opportunities using talented and experienced Portfolio Managers with differentiated, consistent, and repeatable investment processes. Our Portfolio Managers remain focused on fundamentally-driven investment approaches within truly active, high conviction, disciplined and research intensive processes. At Centre Funds, we place service excellence at the core of everything that we do and are committed to providing useful, high quality information on all of our Funds. Again, I want to thank my fellow shareholders for their continued support and confidence in the Centre Funds.
Sincerely,
James Abate
President, Centre Funds
Mutual fund investing involves risks, including loss of principal. Investors should consider a Fund’s investment objective, risks, charges and expenses carefully before investing. Any performance data quoted herein represents past performance and does not guarantee future results. The investment return and principal value of an investment in the Fund will fluctuate so that an investor’s shares, when redeemed, may be worth more or less than their original cost. Current performance may be lower or higher than any performance data provided herein. Most recent month-end performance, and answers to any questions you may have, can be obtained by calling 1-855-298-4236 or visit us online at www.centrefunds.com.
| | |
| | |
| Semi-Annual Report | March 31, 2015 | | 1 |
| | |
| Centre American Select Equity Fund | | Manager Commentary |
| | March 31, 2015 (Unaudited) |
Performance & Strategy Summary
For the six month period ended March 31, 2015, the Centre American Select Equity Fund, Investor Share Class, delivered a total return of 1.5%; the Institutional Share Class delivered a total return of 1.6%.
During the past six month period, sectors such as Health Care, Consumer Discretionary, and Consumer Staples were market leaders whilst sectors such as Energy, Telecoms, and Materials lagged. Our principal sector exposures over the period were Technology, Industrials, Health Care, and Consumer Discretionary driven by bottom-up stock level opportunities. Currently, we maintain our general avoidance of the Financials sector as regulatory scrutiny and increased capital requirements continue to depress returns on equity and intrinsic values. Unlike consensus, we do not subscribe to the thesis that rising interest rates will be substantially beneficial to the sector. Over the period, the largest companies underperformed other equity indices as blue-chip companies, as represented by the S&P 100 Index, lagged the S&P 500 Index. This was driven by expectations of an improving domestic economy and the strong rise in the U.S. dollar which typically hurts the earnings for many multi-national companies. Stocks that were the strongest performers within the Fund over the six month period ended March 31, 2015 included Lowes, Vulcan Materials, Biogen, Apple, Starbucks, International Flavors & Fragrances, Delta Airlines, Visa, Texas Instruments, and 3M. Stocks that negatively impacted relative performance included FMC Technologies, Microsoft, Allegheny Technologies, Newfield Exploration, Gilead Sciences, Google, Intel, Micron, ITT, and Schlumberger. Furthermore, the Fund was negatively impacted by the amortization costs of certain hedges and other investments that we deemed to be capital protective in nature but proved untimely in a flat to rising stock market over the six month period. Given the presence of certain potentially de-stabilizing factors that we believe could negatively impact the value of equity securities held in the Fund, as of March 31, 2015, the Fund continued to hold capital protection hedges, namely put options on the S&P 500 Index.
As always, our process in managing the Fund is to focus bottom-up on each individual company’s growth outlook and capacity to create shareholder value by utilizing our “bottom-up” fundamental stock selection process. We utilize a disciplined, Economic Value Added (EVA) framework to select investments. The framework focuses on the fundamentals of wealth creation and wealth destruction similar to the way a traditional, long-term focused corporate financier looking at all aspects of the business would assess a company’s value. In the shorter-term, markets may often undervalue or overvalue a company’s ability to create or destroy wealth. The framework seeks to identify and exploit these investment opportunities. The approach is designed to capture excess returns when the market price of a stock converges toward our target price. We analyze not only earnings but we also strive to understand and link the capital allocation decisions being made today by each company and how they will lead to future earnings growth. In other words, we expect the companies in which the Fund invests to invest in productive assets of the business, organically and through opportunistic purchases which, in turn, should provide the foundation for future revenue and profits growth that will create shareholder value. Alternatively, if companies cannot invest in productive assets due to a cyclical downturn or existing excess capacity, we expect these companies to “wisely contract” through the restructuring of their assets and other resources to regain their footing for future shareholder value creation. Our top-down views on interest rates and risk premiums are important as many of those are inputs into our company models and, at the end of the day, reconciled to the bottom-up information we gather and process from company performance. The Fund may tactically employ hedges and other capital protective strategies when deemed appropriate in meeting its objective as a risk managed growth fund. The end result is our attempt to deliver a Fund with attractive risk adjusted returns and, in particular, downside risk management over the long term.
Market Review & Outlook
As we recently celebrated the six year anniversary of the current U.S. bull market and provide an outlook for the future, it’s important for us to articulate and reconcile the linkage from the economy, interest rates, corporate profits, and the pricing of risk and future growth, back to what we believe the returns from the stock market will be going forward. In sum, cyclical economic activity is still expanding but at a decelerating pace, things are becoming less good but not yet shrinking, and structurally the collapse in productivity will hamper real wage gains, economic growth, and further exasperate the divide between “haves” and “have-nots.” While this has been beneficial to Wall Street rather than Main Street, we don’t see it persisting due to exceptionally high valuations and an under-appreciation that an economic slowdown is underway that could well turn into a recession having a strongly negative impact on corporate profits and stock prices.
Starting with the basics, there are six major determinants of economic growth: 1) demographic trends; 2) productivity trends; 3) trade balance trends; 4) fiscal trends; 5) household consumption trends; and 6) business investment trends. Unfortunately, in our view, the trends for all six variables are weak to poor. Of all of them, our principal secular concerns are that investors tend to underestimate the deflationary and negative growth impact from aging populations and collapse in productivity – not wholly related - across the developed countries, including the U.S. The failure for the U.S. economy to achieve so called “escape velocity” growth despite unprecedented stimuli over the past few years highlights the structural, as opposed to purely cyclical, impediments to higher and more normal post-recession growth rates. This is demonstrated superbly by the breakdown in a core tenet of monetarists’ constant velocity theory, as we’ve witnessed a 300 percent increase in money supply by the Federal Reserve be offset by a collapse in velocity. In other words, the classical transition mechanism from Federal Reserve policy changes to the underlying economy is broken but still remains the focus of policy makers worldwide to try to stimulate consumer demand and business investment. In the absence of any fiscal or structural reforms, e.g., tax reform, or pro-natalistic and immigration policies that can offset ageing demographics, we believe monetary stimuli will continue to be in place for the foreseeable future under the belief that the stimulus from negative real interest rates will offset the shrinking labor force and absence of productivity increases. This likely leaves the Federal Reserve trapped in keeping its short term policy rate below normalized levels lower for a longer period and may contribute to an increase in market volatility, just when market expectations are the exact opposite with confidence in central banks at unprecedented highs.
Away from monetary policy and on a positive note, the normal “CEO Hubris” seen at this advanced stage of the business cycle, namely increased and overpriced mergers & acquisitions, high capital spending, aggressive hiring, and inventory growth, is not widespread. This may allow the
| | |
| Centre American Select Equity Fund | | Manager Commentary |
| | March 31, 2015 (Unaudited) |
potential for the U.S. to escape a normal five to seven year business cycle as experienced since the 1950’s with a continued mediocre, muddling low volatility economy. Also, the usual disturbance (i.e., demand shock) to the economy – a sharp rise in interest rates leading to recession – is not evident as real interest rates are and will likely remain negative despite the Federal Reserve’s articulated plan to raise rates gradually later in 2015. So, unfortunately, we see the U.S. economy potentially lurching into recession or, at best, continuing to muddle through at well below expected growth rates and going from crisis to crisis unless genuine structural reforms are put in place and, with the current state of political inaction and lack of creative America-first visions, we see little cause for optimism. Importantly and given the unusual current set of circumstances, we constantly remind ourselves that the economic, demographic, monetary, and fiscal situations in the U.S. and other developed countries today are unlike any circumstances endured in the past and can lead to shocks and instability much more quickly as a result of the still high level of leverage and dependence upon ultra-low interest rates in the financial system. Also, despite falling unemployment and above trend utilization, the collapse in real wages and productivity we’re undergoing has been associated typically with pre-WWI recessions and not experienced first-hand by any current portfolio manager practitioner.
In terms of observations on corporate profits, there are several positives which bear mentioning. Firstly, aggregate Return on Invested Capital/Return on Assets (ROA) for companies in the S&P 500 Index remains high while the cost of equity & debt for companies remains low and, thus, creating Economic Value Added. Also, low corporate investment growth supports the continued business cycle without creating excess or overcapacity so reversion to the mean in terms of profits is lacking a disturbance or catalyst. In other words, earnings growth is outpacing asset growth as falling ROA typically comes from increased competition and asset increases. Furthermore, the efficacy of post-2008 financial crisis restructuring by corporate America has had a very long shelf life and impacted CEO behavior significantly. Finally, we believe it’s a long term losing bet to go against the flexibility and speed of best-in-class American companies to restructure responsively to slowdowns and crisis. On the other hand, net profit margins for industrial companies are now 1.5 standard deviations from normal, the highest ever, meaning companies are over-earning at an unprecedented rate and margins historically have mean reverted more consistently than other indicators. Second, gross and EBITDA margins are decelerating in aggregate for the average company in the S&P 500 Index while net profit margins are plateauing which may be a sign of “financial engineering” as well as the strong influence from low borrowing costs. Unlike 1999, stock prices are not inflated relative to earnings; rather, earnings are inflated masking the expensiveness of stocks from a rudimentary Price/Earnings ratio basis. Overall, within the industrial sectors, wealth creation from expanding companies is becoming harder to find and the Fund unusually has a very high level of wise-contractors or companies restructuring for this stage of the business cycle. We continue to believe in a new “Nifty-Fifty” of companies that can generate and maintain profits acceleration and attempt to concentrate the Fund in such companies maintaining cognizance of our valuation sensitivity. Lastly and for financial companies, increased capital requirements and regulation are hampering their ability to leverage improving ROA’s into improving and pre-2008 Returns on Equity (ROE). In sum, the stocks of banks, brokers and the financial sector in general hold little appreciation potential from here and will trade near book value for foreseeable future as ROE’s equals the cost of equity for most firms.
Our key observations on the pricing of risk & expectations for future growth are that most valuation measures to include Price/Sales, Price/Book, Price/Normalized Earnings, and Price/EBITDA are at or near all-time highs for the average company within the S&P 500 Index. Also, there seems to be little to no reflection of the potential normalization of profit margins in the future which now stand at 1.5 standard deviations away from their long-term mean. This means that the market implied growth rate for the S&P Industrials (how the market is currently pricing expected earnings growth for all companies in the S&P 500 Index less the financial sector) is now approximately 11 percent versus 8 percent in mid-2012 when the re-rating phase of the current bull market began in earnest. (The primary driver from 2009 through 2011 was the rebound in profits.) While economic reality seems at odds with the market for risk assets, the suppression of yields in fixed income, poor choice of alternative investments in commodities due to dollar strength, illiquidity of real estate, etc., make stocks seem the only choice now for investors. This “there is no alternative” seems largely driven by stick rather than carrot however. Also of concern is that given the high ratio of overall stock market capitalization to U.S. GDP, any stock market disruption will have large GDP connotations. In terms of whether this current bull market can continue principally from a continuing rise in valuation multiples, we remind investors that this is not 1995 with a strong foundation for an extended secular bull market. The conditions then versus now seem not to support this: 1) pent-up demand from former communist countries then, emerging market countries contracting now; 2) free trade expansion then, currency wars now; 3) peace with the U.S. as the world’s uni-polar military power then, perpetual conflict now, particularly in the Middle East where we’re witnessing the start of its version of the Thirty Years’ War, along with simmering Eastern European unrest; and 4) start of productivity enhancing technology revolution then now replaced with social media explosion which has proven to depress productivity and it seems to add little in our view in terms of direct and tangible payback to companies.
While we continue to see a much less friendly systemic backdrop for equities as a whole, our focus remains on stock selection rather than sector/industry themes to achieve performance as no single area of the stock market seems uniformly inexpensive with operating trends improving. With such a backdrop, we believe a small crisis can morph easily into a global problem (Thailand 1997, sub-prime lending sector 2008, Greece 2011...2015?). With the pricing of risk & expectations for future growth where they are, it’s tough to see market appreciation driven by further re-rating. Large-capitalization Technology, Health Care, and Consumer companies remain our main areas of emphasis given their higher degree of idiosyncratic or company specific risk. One of our biggest concerns is that we could lurch from an unexciting economic recovery straight into the next economic downturn with real interest rates already negative and debt levels high leading to deflation/recession regardless of the actions taken by the Federal Reserve. We do, however, feel that a violent change in sentiment within an expectations environment of stability and complacency and low volatility could compress valuation multiples akin to sharp corrections seen in 1987, 1998 or 2011. As we progress further into 2015, despite our bottom-up optimism for the companies owned in the Fund, we are less enthusiastic about the prospects for further sizable gains in U.S. stocks as a whole relative to what we believe remains a very bullish consensus. With the risk mitigating benefits from traditional diversification ebbing combined with low volatility makes option costs reasonable, especially given our expectation of a sharp “valuation re-set” or correction rather than a drawn out bear market. We believe that our large capitalization valuation sensitive growth approach to stock selection, with a cognizance of risk management that includes tactically employing investments that may mitigate downside losses, seems positioned to perform well relative to less risk aware strategies.
| | |
| | |
| Semi-Annual Report | March 31, 2015 | | 3 |
| | |
| Centre American Select Equity Fund | | Manager Commentary |
| | March 31, 2015 (Unaudited) |
| | | | |
SECTOR WEIGHTINGS As a percentage of Net Assets | | |
| | |
| Information Technology | | 30.88% | | |
| Health Care | | 18.67% | | |
| Consumer Discretionary | | 14.86% | | |
| Consumer Staples | | 11.94% | | |
| Industrials | | 9.44% | | |
| Materials | | 4.57% | | |
| Financials | | 3.43% | | |
| Purchased Options | | 3.09% | | |
| Energy | | 1.99% | | |
| Government | | 0.81% | | |
| Telecommunication Services | | 0.33% | | |
| Rights | | 0.00% | | |
| Cash and Cash Equivalents | | -0.01% | | |
| Totals | | 100.00% | | |
| |
These allocations may not reflect the current or future positions of the portfolio. | | |
| | |
| | |
| | |
| | |
| | |
| | |
| | |
| | |
| | |
| | |
| | |
| | |
| | |
| | |
| | |
| | |
| | |
| | |
| | |
| | |
| | |
| | |
| | |
| | |
| | |
| | |
| | |
| | |
| | |
| | |
| | |
| | |
| | |
| | |
| | |
| | |
| | |
| | |
| | |
| | |
| | |
| | |
| | |
| | |
| GROWTH OF HYPOTHETICAL $10,000 INVESTMENT THROUGH MARCH 31, 2015 |
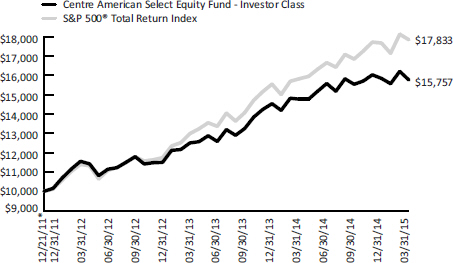
This graph assumes an initial investment of $10,000 at December 21, 2011, the Fund’s inception date, and that any dividends and distributions are reinvested. This graph depicts the performance of the Fund’s Investor Class versus the S&P 500® Total Return Index. Taxes on any Fund distributions or when shares are redeemed, if any, are not reflected. Unlike the Fund, an index is not available for investment, is unmanaged and does not have expenses that affect the results. The comparison is shown for illustrative purposes only.
TOTAL RETURNS – FOR THE PERIOD ENDED MARCH 31, 2015
| | | | | | | | | | | | | | | | | | | | | | | | | | | | | | |
| | | 1
Month | | 3
Month | | YTD | | 1 Year | | 3 Year | | Since
Inception* |
Centre American Select Equity Fund – Investor Class | | | | -2.74 | % | | | | -0.49 | % | | | | -0.49 | % | | | | 6.75 | % | | | | 10.91% | | | | | 14.89 | % |
| S&P 500® Total Return Index | | | | -1.58 | % | | | | 0.95 | % | | | | 0.95 | % | | | | 12.73 | % | | | | 16.11% | | | | | 19.31 | % |
Centre American Select Equity Fund – Institutional Class | | | | -2.73 | % | | | | -0.41 | % | | | | -0.41 | % | | | | 6.77 | % | | | | – | | | | | 6.44 | % |
| S&P 500® Total Return Index | | | | -1.58 | % | | | | 0.95 | % | | | | 0.95 | % | | | | 12.73 | % | | | | – | | | | | 12.45 | % |
| * | Inception date of December 21, 2011 for Investor Class. Inception date of January 21, 2014 for Institutional Class. |
The performance information quoted above represents past performance, which is not a guarantee of future results, and does not reflect the deduction of taxes that a shareholder would pay on Fund distributions or the redemption of Fund shares. Investment return and principal value of an investment will fluctuate so that an investor’s shares, when redeemed, may be worth more or less than their original cost. Total return includes reinvestment of dividends and capital gains, if any. Current performance may be lower or higher than the performance data quoted. For the most current month-end performance data, please call 855-298-4236.
The Total Annual Operating Expense Ratio (before expense reimbursements) as stated in the fee table of the most currently effective prospectus of the Fund, dated January 28, 2015, was 1.43% for the Investor Class shares and 1.26% for the Institutional Class shares. The Adviser has entered into a written expense limitation agreement (the “Expense Limitation Agreement”), under which it has agreed to limit through January 31, 2016 the total operating expenses of the Fund including (but not limited to) investment advisory fees of the Adviser and distribution/service (Rule 12b-1) fees, but excluding interest, taxes, litigation, brokerage and extraordinary expenses incurred by the Fund in the fiscal year, to an annual rate of 1.05% of the average daily net assets of the Investor Class shares and 0.95% of the average daily net assets of the Institutional Class shares.
The S&P 500® Total Return Index is a commonly recognized, market-capitalization weighted index of 500 widely held securities, designed to measure broad U.S. equity performance. You cannot invest directly in an index.
The line graph above shows the performance of Investor Class shares only, since the Investor Class has the longest period of annual returns. The performance of the Institutional Class shares will differ from the performance shown because the Institutional Class shares have different expenses than the Investor Class shares.
| | |
| Centre Global Select Equity Fund | | Manager Commentary |
| | March 31, 2015 (Unaudited) |
Performance & Strategy Summary
For the six month period ended March 31, 2015, the Centre Global Select Equity Fund, Institutional Share Class, delivered a total return of -0.3%. The Investor Share Class delivered a total return of -0.6% for the six month period ended March 31, 2015.
During the past six month period ended March 31, 2015 on a regional basis versus broad global equity indexes, Asia Pacific and Central Asian equity markets outperformed while Eastern Europe and South & Central America underperformed. The best performing regional exposures for the Fund over the six month period were Central Asia, Africa/Middle East, and Asia Pacific. However, the worst performing regional exposures for the Fund over the period were Eastern Europe and North America. Within the Central Asia region, India was the best performing market during the time period due, in large part if not wholly, to expectations that newly elected Prime Minister Modi would reform and reinvigorate India’s economy. Within Eastern Europe, the Russian and Ukrainian geopolitical conflict caused those markets to perform poorly. From a sector perspective, Information Technology, Industrials, and Health Care contributed positively to performance over the six month period ended March 31, 2015, while exposures to Energy, Utilities, and Consumer Discretionary detracted the most. Stocks that were the strongest performers within the Fund over the six month period ended March 31, 2015 included Tencent Holdings, China Merchants Bank, Fibria Celulose, and Bridgestone. Stocks that most negatively detracted from performance over the six month period ended March 31, 2015 included Novatek, Sberbank, and Vale.
Our process in managing the Fund is to focus on each individual company’s growth outlook and capacity to create shareholder value by utilizing our “bottom-up” fundamental stock selection process. We utilize a disciplined, Economic Value Added (EVA) framework to select investments. The framework focuses on the fundamentals of wealth creation and wealth destruction similar to the way a traditional, long-term focused corporate financier looking at all aspects of the business would assess a company’s value. In the shorter-term, markets may often undervalue or overvalue a company’s ability to create or destroy wealth. The framework seeks to identify and exploit these investment opportunities. The approach is designed to capture excess returns when the market price of a stock converges towards our target price. We analyze not only earnings, but we also strive to understand and link the capital allocation decisions being made today by each company and how they will lead to future earnings growth. In other words, we expect the companies which the Fund invests in to invest in productive assets of the business, organically and through opportunistic purchases which, in turn, should provide the foundation for future revenue and profits growth that will create shareholder value. Alternatively, if companies cannot invest in productive assets due to a cyclical downturn or existing excess capacity, we expect these companies to “wisely contract” through the restructuring of their assets and other resources to regain their footing for future shareholder value creation.
The differentiated stock selection process is combined with a smart beta approach to portfolio construction that is focused on Gross Domestic Product (“GDP”)-driven regional weightings rather than regional bias tied to overall regional relative market capitalization. In other words, regional weights are guided by economic footprint rather than market capitalization. By utilizing a “smart beta” approach to portfolio construction that focuses on GDP weights instead of market capitalization as guideposts for regional, country and stock weightings, the Fund is tilted towards the world’s fastest growing economies and attempts to underweight or to avoid overvalued markets. Because the GDP-weightings adjust over time to focus on the fastest growing economies, investors maintain exposure to the most promising regions. When compared to conventional market capitalization-based funds, GDP-weighted portfolios have higher emerging market exposure. They also have higher exposure to developed market powerhouses like Germany, Hong Kong, and Israel, all of which the Fund typically has exposure to. This gives the Fund two sources of potential excess return: stock selection alpha and portfolio construction smart beta.
Market Review & Outlook
The current global investing environment with its mixed GDP growth trends, weak raw material prices, and conflicting central bank messaging is confusing at best. While these economic crosswinds make forecasting challenging, we are focusing our research efforts on the net beneficiaries in this environment of deflation, currency wars, and public sector debt woes. When aggregating our bottom-up stock level research by regions, it indicates better fundamental trends overall in Asia Pacific versus Europe. While European exporters will perform well in the current environment, several European companies show rising stock prices and increasing expectations but stagnant operating fundamentals. However the opposite is true in Asia Pacific; investors are underestimating recent reforms and improving data points.
Europe: “Getting ahead of itself”
In sum, we believe European markets are getting ahead of themselves. While European markets have outpaced other regions year to date in local currency price terms, European exporters will likely be one of the few categories that experience sustained outperformance through the year. Companies focused on the domestic economies or within Europe only should struggle given poor economic growth and little benefit from a depreciating euro. Since the 2011 Greek-inspired Euro Crisis, Europe has experienced margin declines. This is best represented by the fact that in 2012, the MSCI Pan Europe Index had operating margins of 11.5 percent. By March 2015, these margins had declined to 10.2 percent. Despite the margin deceleration, European valuations have increased over the last few years. The market multiple on an enterprise value to sales basis increased from approximately 1.3x in 2012 to 1.6x in 2015. Currently, Europe has the ignoble honor of having the highest percentage of stocks that show negative company fundamentals momentum, but positive relative stock price momentum. A high proportion of stocks with such divergent characteristics lays a risky foundation for further stock price appreciation. From a sector perspective, the Consumer Discretionary and Consumer Staples sectors have the largest concentration of companies with these negative divergent characteristics.
We estimate that European stocks are outperforming and being re-rated based on speculation that the European Central Bank’s quantitative easing will lift the economy and the stock market as similar actions did in the United States. An important note of distinction is that U.S. corporations underwent one of the most efficacious period of restructuring and cost saving reforms during this period of time to compound the benefits from lower borrowing costs. Even without such reforms in Europe and, to the extent that these monetary actions devalue the euro, we believe that some sectors will disproportionately benefit from quantitative easing. Europe’s exporters should perform well in a weak euro environment.
| | |
| | |
| Semi-Annual Report | March 31, 2015 | | 5 |
| | |
| Centre Global Select Equity Fund | | Manager Commentary |
| | March 31, 2015 (Unaudited) |
Europe’s auto producers and aerospace manufacturers receive a substantial amount of sales in U.S. dollars but have material euro cost basis. A weak euro improves the cost competitiveness of such firms. Additionally, the weak euro can help these manufacturers price more aggressively, aiding in market share gains. Over the six month period ending March 31, 2015, the euro has depreciated approximately 15 percent against the U.S. dollar. In the late 1990s, the euro experienced a similar decline (parity with the U.S. dollar) and it aided manufacturers like Airbus to grow their civil aerospace market share from 20 percent to 50 percent. Despite the fall in the euro, European manufacturers should benefit from raw materials such as copper, nickel, and steel being down 40 percent from 2011 levels given weakness across many of the resource-consuming countries, most notably in the emerging markets such as China.
A sustained 2015 advance in European stocks will depend on whether a cheaper euro and lower commodity prices translate into higher margins for the region. Unfortunately despite central bank actions, Europe has not improved its global competitiveness, and this is what is needed to close the growth and profitability gap with other regions. Based on our assessment of the environment and current market conditions described above, we continue to own European exporters such as Daimler, Kone, Michelin, and Safran in the Centre Global Select Equity Fund.
Asia: “Investors underestimating reforms”
In Asia, investors are underestimating recent reforms and improving data points. While Europe’s operating margin as a whole has languished since 2011, profit margins in both China and Japan have increased materially. Operating margins for the Hong Kong Hang Seng China Index increased from 13.6 percent in 2012 to 14.4 percent by March 2015; the operating margin for the Nikkei 225 Index increased from 6.2 percent in 2012 to 7.0 percent by March 2015. The Japanese market’s margin improvements have come mainly from companies within the consumer discretionary, industrials, and information technology sectors. Valuations in these markets have also increased markedly but the corporate operating performance in the region has justified the higher multiples, unlike the situation in Europe. The Chinese market, on an enterprise value to sales basis, increased from approximately 1.1x in 2012 to 1.4x in March 2015; the Japanese market multiple on an enterprise value to sales basis increased from approximately 0.7x in 2012 to 1.2x in March 2015. Both current figures remain below that for Europe and well below the figure for the U.S., perhaps highlighting the relative valuation attractiveness of non-U.S. stocks in general.
Compounding the relative valuation attractiveness, Asia hosts many companies that currently have positive operating momentum but negative relative stock performance; it is one region where a genuine contrarian stance with a positive fundamental catalyst exists broadly. Globally, Asia Pacific has the highest proportion of firms with these characteristics. We think investors will eventually prefer these stocks, causing the region to outperform led by its two major economic powers, Japan and China.
Japan
In Japan, the Industrials sector has the highest number of companies with rising fundamentals but lagging relative share price performance and continued undervaluation. Low raw materials prices and flat Japanese wages have kept the cost base inline for Japanese industrials. This said, continued market appreciation will require corporate Japan to further its recent positive trajectory. Additional progress is possible because, despite recent share price gains, Japanese private sector performance still lags other developed markets substantially. While U.S. operating profit margins are 14 percent, China’s are 13 percent, and Europe is 10 percent, Japan’s operating margins are at 7 percent indicating room to improve despite many of its companies being considered foremost in the world in their operating efficiency. The use of more technology in Japan’s service sector, matching the levels employed in its manufacturing sector, would aid in closing the margin gap. To position the Centre Global Select Equity Fund for these trends, we have invested in and, barring no changes in our outlook, intend to hold Murata Manufacturing, Hitachi High Technologies, Sony, and Bridgestone.
China
In China, the Financials sector has the highest number of companies with improving fundamentals but lagging relative share performance. Chinese banks such as China Construction Bank, Bank of Communications, and Industrial and Commercial Bank lead globally in terms of profitability, profitability momentum, and low valuations. Many investors are fearful of China’s growing debt and consequently shy away from the nation’s banks. However, we are encouraged by China’s recent banking reforms and we think investors are under-appreciating them. We estimate that the following reforms will strengthen China’s financial system and will eventually allay investors’ deepest debt concerns:
| | — | | Future performance reviews of local government officials will include local debt levels to discourage excessive borrowing; |
| | — | | New debt limits for local municipalities; |
| | — | | New public private partnerships for infrastructure projects. National government will encourage bond market participation as a way of getting the market’s approval for local infrastructure projects to improve asset quality; |
| | — | | Deposit insurance so that smaller underfunded banks can fail without damaging public sentiment; and |
| | — | | Greater use asset backed securities by banks to diversify credit risk away from corporate loans towards mortgages, auto loans, and student debt. |
To position the Centre Global Select Equity Fund for these trends, we are invested in Agricultural Bank of China, China Merchants Bank, and China Pacific Insurance.
We believe that our bottom-up research process, with its focus on large capitalization companies that measure favorably in the EVA framework, combined with a smart beta approach to portfolio construction that is focused on GDP-driven regional weightings rather than market capitalization should permit the Fund to take advantage of these better fundamental trends overall in Asia Pacific versus Europe and, to a lesser degree, opportunities in the Americas, Middle East, and Africa, by investing in the most attractive large capitalization blue chip names from the developed world and emerging blue chips from the developing world.
| | |
| Centre Global Select Equity Fund | | Manager Commentary |
| | March 31, 2015 (Unaudited) |
| | | | |
SECTOR WEIGHTINGS As a percentage of Net Assets | | |
| | |
| Financials | | 25.78% | | |
Information
Technology | | 15.68% | | |
| Industrials | | 11.40% | | |
Telecommunication
Services | | 8.87% | | |
| Consumer Staples | | 7.74% | | |
Consumer
Discretionary | | 7.07% | | |
| Health Care | | 6.53% | | |
| Materials | | 5.51% | | |
| Energy | | 5.13% | | |
| Utilities | | 5.00% | | |
Cash and Cash
Equivalents | | 1.29% | | |
| Totals | | 100.00% | | |
| |
COUNTRY WEIGHTINGS As a percentage of Net Assets | | |
| | |
| Japan | | 14.12% | | |
| China | | 12.60% | | |
| Hong Kong | | 7.58% | | |
| India | | 7.40% | | |
| Germany | | 6.30% | | |
| Great Britain | | 5.50% | | |
| France | | 5.34% | | |
| Italy | | 4.79% | | |
| Brazil | | 4.13% | | |
| Canada | | 4.05% | | |
| Spain | | 3.75% | | |
| Mexico | | 2.82% | | |
| Denmark | | 2.39% | | |
| Australia | | 2.34% | | |
| Switzerland | | 2.13% | | |
| Sweden | | 1.75% | | |
| Korea | | 1.70% | | |
| Taiwan | | 1.68% | | |
| Israel | | 1.38% | | |
| Finland | | 1.34% | | |
| Russia | | 1.24% | | |
| Turkey | | 1.09% | | |
| Belgium | | 0.75% | | |
| Singapore | | 0.74% | | |
| Norway | | 0.71% | | |
| Philippines | | 0.61% | | |
| South Africa | | 0.48% | | |
Cash and Cash
Equivalents | | 1.29% | | |
| Totals | | 100.00% | | |
| | | | |
These sector and country allocations may not reflect the current or future positions of the portfolio. | | |
| | |
| | |
| | |
| | |
| | |
| | |
| | |
| | |
| | |
| | |
| | |
| | |
| | |
| | |
| | |
| | |
| | |
| | |
| | |
| | |
GROWTH OF HYPOTHETICAL $10,000 INVESTMENT THROUGH MARCH 31, 2015
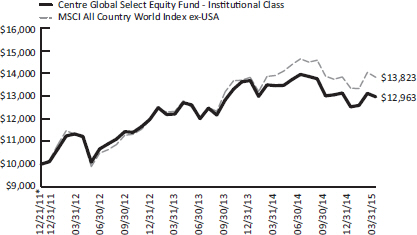
This graph assumes an initial investment of $10,000 at December 21, 2011, the Fund’s inception date, and that any dividends and distributions are reinvested. This graph depicts the performance of the Fund’s Institutional Class versus broad-based securities market indices. Taxes on any Fund distributions or when shares are redeemed, if any, are not reflected. Unlike the Fund, an index is not available for investment, is unmanaged and does not have expenses that affect the results. The comparison is shown for illustrative purposes only.
TOTAL RETURNS – FOR THE PERIOD ENDED MARCH 31, 2015
| | | | | | | | | | | | | | | | | | | | | | | | | | | | | | |
| | | 1
Month | | 3
Month | | YTD | | 1 Year | | 3 Year | | Since
Inception* |
Centre Global Select Equity Fund – Investor Class | | | | -1.25 | % | | | | 3.42 | % | | | | 3.42 | % | | | | -3.93 | % | | | | – | | | | | -3.79 | % |
| MSCI All Country World Index ex-USA** | | | | -1.54 | % | | | | 3.59 | % | | | | 3.59 | % | | | | -0.57 | % | | | | – | | | | | 0.52 | % |
Centre Global Select Equity Fund – Institutional Class | | | | -1.15 | % | | | | 3.51 | % | | | | 3.51 | % | | | | -3.65 | % | | | | 4.59% | | | | | 8.24 | % |
| MSCI All Country World Index ex-USA** | | | | -1.54 | % | | | | 3.59 | % | | | | 3.59 | % | | | | -0.57 | % | | | | 6.89% | | | | | 10.38 | % |
| * | Inception date of January 21, 2014 for Investor Class. Inception date of December 21, 2011 for Institutional Class. |
| ** | The benchmark has changed to the MSCI All Country World Index ex-USA from the MSCI All Country World Index on August 1, 2014 to reflect a more appropriate basis for comparing the Fund’s performance. |
The performance information quoted above represents past performance, which is not a guarantee of future results, and does not reflect the deduction of taxes that a shareholder would pay on Fund distributions or the redemption of Fund shares. Investment return and principal value of an investment will fluctuate so that an investor’s shares, when redeemed, may be worth more or less than their original cost. Total return includes reinvestment of dividends and capital gains, if any. Current performance may be lower or higher than the performance data quoted. For the most current month-end performance data, please call 855-298-4236.
The Total Annual Operating Expense Ratio (before expense reimbursements) as stated in the fee table of the most currently effective prospectus of the Fund, dated January 28, 2015, was 2.69% for the Investor Class shares and 1.95% for the Institutional Class shares. The Adviser has entered into a written expense limitation agreement under which it has agreed to limit through January 31, 2016 the total operating expenses of the Fund including (but not limited to) investment advisory fees of the Adviser and distribution/service (Rule 12b-1) fees, but excluding interest, taxes, litigation, brokerage, other expenditures which are capitalized in accordance with generally accepted accounting principles and extraordinary expenses) to an annual rate of 1.45% of the average daily net assets of the Investor Class shares, and 1.25% of the average daily net assets of the Institutional Class shares.
Investing in the securities of foreign companies, including companies in emerging markets, generally involves greater risk than investing in larger, more established domestic companies. Therefore, investments in the Fund may involve a greater degree of risk than investments in other mutual funds that invest in larger, more established domestic companies.
The MSCI All Country World Index ex-USA is a free float-adjusted market capitalization weighted index that is designed to measure the equity market performance of international developed and emerging markets. You cannot invest directly in an index.
The MSCI All Country World Index is a free float-adjusted market capitalization weighted index that is designed to measure the equity market performance of developed and emerging markets. You cannot invest directly in an index.
The line graph above shows the performance of Institutional Class shares only, since the Institutional Class has the longest period of annual returns. The performance of the Investor Class shares will differ from the performance shown because the Investor Class shares have different expenses than the Institutional Class shares.
| | |
| | |
| Semi-Annual Report | March 31, 2015 | | 7 |
| | |
| Centre Active U.S. Treasury Fund | | Manager Commentary |
| | March 31, 2015 (Unaudited) |
Performance & Strategy Summary
For the six month period ended March 31, 2015, the Centre Active U.S. Treasury Fund, Institutional Share Class, delivered a total return of 1.3%; the Investor Share Class delivered a total return of 1.3%.
Performance attribution in the Centre Active U.S. Treasury portfolio is transparent and reflects interest income combined with our duration management decisions that impact capital gain or loss capture. As there are no corporate or mortgage related securities in the portfolio, there are no “spread” components to performance. Performance during the six month period ended March 31, 2015, reflects our investment discipline’s generally bearish outlook for bond prices. The Federal Reserve’s (the FED) target of 2 percent for inflation and potential real growth, currently estimated at around 2 percent, for the U.S. economy would be consistent with a yield of roughly 4 percent for the 10-year U.S. Treasury Note. Additionally, certain indicators of growth, mainly employment and utilization related, have been above the U.S. economy’s growth potential, seemingly increasing the likelihood that the Federal Reserve’s monetary policy would start to move its Federal Fund’s target toward a level more consistent with a long term “normal” policy stance during 2015.
The Fund’s investment objective is to maximize total return through capital appreciation and current income. The Fund pursues this objective by using an active interest rate risk management strategy. We adjust the portfolio’s duration based on a monthly assessment of the likely change in interest rates. Our fundamentally-driven active duration management seeks the potential for capital appreciation and preservation in variable interest rate environments utilizing U.S. Treasury securities including bills, notes, bonds, inflation protected securities (TIPS), cash equivalents and, in certain market environments, futures contracts on U.S. Treasury Notes and Bonds.
Market Review & Outlook
Interest rate behavior during six month review period ended March 31, 2015, was volatile as yields moved lower. At September 30, the yield on the 10-year Treasury—the generally accepted “benchmark” for the U.S. fixed income marketplace—stood at roughly 2.5 percent. It fell to as low as 1.75 percent, moved back to almost 2.25 percent, and ended the quarter slightly below 2 percent. Our discipline, though generally bearish over the period, did participate in the downward move in rates (and upward move in bond prices) between early January and early February as our research review for that period warranted a market like duration. Some of the downward move in rates during the six month time period was due to investor geopolitical concerns and uncertainty over the likely short term impact of lower oil prices. While problems in the Middle East and Russia are nothing new, negative headlines during the period caused capital inflows to the perceived safe haven provided by the U.S. Treasury market. Additionally, while the Federal Reserve did finally remove the “patience” language from its policy statements, its downwardly revised estimates for its average Federal Funds’ Target rate seems to have been interpreted as the potential that the Fed will not act to increase rates as early as its June meeting which had been anticipated.
While the timing of our investment decisions is based on our monthly portfolio research review process, it seems likely that the general trend will be to higher yield levels as we move forward. This assessment is based on the view that the economy will, for a time, continue to grow and that at some point inflationary pressure will begin to build. These forces will, at some point, force the Fed to tighten its policy stance. Additionally, yields on longer maturity securities, which are less dependent upon Fed policy, will likely increase to bring risk premia to more normal levels. Recently published research and analysis of the current state of the U.S. economy is consistent with the view that both the output and employment gaps caused by the “Great Contraction” and the associated financial crisis may be closing faster than expected. The current recovery has now been in place since June of 2009 according to the National Bureau of Economic Research. And, if potential growth is 2 percent rather than the 20th Century average of 3-3.25 percent then the real growth experienced to date may not be as sluggish as originally thought.
Beyond the period of positive growth experienced so far, the unemployment rate has declined from 6.8 percent a year ago to 5.5 percent currently. This level may be equal to or not far off NAIRU, the non-accelerating inflation rate of unemployment. NAIRU is the rate of unemployment that is consistent with healthy or stable growth. And, the U6 unemployment rate which tracks those marginally attached to the labor force as well as those only able to find part time work has also been declining over the last year and is now at 10.9 percent versus 12.8 percent a year ago. Finally, unemployment claims have now moved back to pre-crisis levels. These current conditions would be consistent with research published at the Federal Reserve Bank of Kansas City in 2013 in which it was argued that given the level and rate of change in labor force activity at that time, historical employment “norms” could be reached by the summer of 2015. So, the labor market seems healthy although wage growth has yet to show the acceleration expected as the economic recovery matures. However, if the Job Openings data continue to show an increasing demand for labor increased wages can’t be far behind and there is already anecdotal—Walmart raising its wages—evidence to that effect.
In our view the very recent slowdowns in the pace of economic activity and hiring are not indicative of a return to sub-par growth. Research on the 2013-2014 winter from the Federal Reserve Bank of Chicago concludes that colder than normal temperatures can have a statistically significant negative impact on reported employment. While some Western states including California have had very warm weather, the heavily populated states of the Northeast and Ohio experienced their second coldest winters on record. William Dudley, President of the New York Federal Reserve Bank, recently referred to the harsh winter as a contributor to the likely weaker 1st quarter GDP. Furthermore, he offered an above trend growth outlook—2.7 percent growth—for 2015 as a whole. The weaker ISM manufacturing report for March could reflect—anecdotal based on the responses from Survey participants—both the cold winter and the impact of the strong dollar on exporters.
| | |
| Centre Active U.S. Treasury Fund | | Manager Commentary |
| | March 31, 2015 (Unaudited) |
Going forward, scrutiny of the Fed’s policy statements may be even more intense as investors search for guidance from policy makers about the future direction of monetary policy. Analyses from both the private and public sectors suggest that the Federal Reserve’s policy may already be behind the curve. That is, the Federal Reserve may have already waited too long to begin tightening. Such a delay would be typical of past policy moves—apart from those during “the Great Moderation”. These analyses are based on versions, linear and non-linear, of the Taylor rule which relates the appropriate Federal Funds rate to the size of the output gap and to the difference between actual and target inflation. A related body of investigation as to the correctness of current Fed policy is based on the concept of the “Shadow” Federal Funds Rate. This analysis is based on the concept of a target policy rate that “should” be negative in value at times—in nominal not just real terms. Both approaches would suggest that the Federal Funds rate should currently be 1 percent or higher—not its current zero to 0.25 percent.
Further delay in tightening would be based on the view that the economy is not yet “out of the woods” due to the strong dollar, weak European and Asian growth, or the short term impact of lower oil prices. We have spoken above to the idea that the economy is faltering, and further extended easing could have one of two poor outcomes in our view. The more likely is that extended easing would lead to a more dramatic acceleration in longer-term inflation than would otherwise be the case. This outcome is consistent with the business cycle experience of the U.S.—economic cycle exacerbated by the policy cycle. An alternative outcome that is currently being discussed in policy debates is that the Fed guides, by extending the time period for the near zero target Fund’s rate, the economy into a sustained period of low rates, subpar growth and/or deflation as a zero target rate is not consistent with a continued recovery and a positive inflation goal, i.e. the U.S. becomes Japan. We believe the appropriate policy to prevent this latter outcome would be an increase in the policy rate—again a Fed tightening—accompanied by more quantitative easing or QE.
Longer term the Fisher relationship governs the level of interest rates. This relationship posits that the nominal interest rate—the rate we observe in the marketplace—must equal the real rate plus the expected rate of inflation. Over time the real rate reflects the economy’s real growth potential and, if the Federal Reserve has credibility, inflationary expectations will converge to its target for inflation. Recently, published research from the Federal Reserve Bank of St. Louis appears consistent with the outcomes we anticipate. There would seem to be three likely rate scenarios—though the reasoning is somewhat different. Two result in higher rates—the degree depends on the Fed’s ability/credibility in managing to its inflation target. The third results in a generally low level of rates and poor economic performance.
A reasonable expectation would be that the 10-year yield reaches at least 4 percent. It will be higher with the typical cyclical overshooting and potentially much higher if the Fed’s inflation policy loses credibility and/or is too long delayed. Additionally, if history is a guide, the upward trajectory will not be a smooth one. Rather it will somewhat violent with significant increases followed by periods of decline. In the period from January 1973 to September 1981 the 10-year yield increased by about 10 percent from just over 5 percent to almost 16 percent. But, rates increased in only about 60 percent of the 105 months. If anticipated, downward deviations provide an opportunity for return enhancement.
Our investment discipline utilizes measures of real growth, inflation expectations, market based measures of current valuation and of the likely course of Fed policy changes—historically the market has always moved ahead of policy—in assessing the likely near term course of interest rates. It is intended to preserve capital in periods of significant rate increases by decreasing duration but with the flexibility to extend duration or re-enter the market when our discipline suggests lower rates are likely. As this recovery matures, uncertainty increases as to how much longer it can go on. Periods of “softness” in the data will likely occur providing the opportunity to add value by lengthening exposure.
At some point the Fed will be called on to bring policy in line with reality. Historically, tightening has been associated with contraction and declining rates which is a profit opportunity for bond investors. What is relevant to the potential success of our discipline is that interest rates continue to exhibit cyclical volatility—that the business cycle is not dead. Continued cyclical behavior will provide a basis for success even if the longer term equilibrium level of the economy’s real rate—due to a reduced real growth potential—is lower. While panic buying can move rates dramatically for short time periods, rate behavior over time in driven by the business cycle.
The Centre Active U.S. Treasury Fund is intended to serve as a core fixed income investment. Over time, it is intended to provide a comparable yield as the Treasury market with attractive diversification benefits. In addition to its wealth accumulation and diversification objectives, the strategy readily accommodates both systematic and unforeseen cash needs, given the liquidity of the Treasury market. Furthermore, the utilization of Treasury securities within asset allocation provides attractive diversification properties, as the correlation between Treasury market returns and those of the U.S. equity market is, historically, negative during declining equity markets.
| | |
| | |
| Semi-Annual Report | March 31, 2015 | | 9 |
| | |
| Centre Active U.S. Treasury Fund | | Manager Commentary |
| | March 31, 2015 (Unaudited) |
| | | | |
ASSET TYPE WEIGHTINGS As a percentage of Net Assets | | |
| | |
| Government Bond | | 67.41% | | |
Cash and Cash
Equivalents | | 32.59% | | |
| Totals | | 100.00% | | |
| |
These allocations may not reflect the current or future positions of the portfolio. | | |
| | |
| | |
| | |
| | |
| | |
| | |
| | |
| | |
| | |
| | |
| | |
| | |
| | |
| | |
| | |
| | |
| | |
| | |
| | |
| | |
| | |
| | |
| | |
| | |
| | |
| | |
| | |
| | |
| | |
| | |
| | |
| | |
| | |
| | |
| | |
| | |
| | |
| | |
| | |
| | |
| | |
| | |
| | |
| | |
| | |
| | |
| | |
| | |
| | |
| | |
| | |
| | |
| | |
| GROWTH OF HYPOTHETICAL $10,000 INVESTMENT THROUGH MARCH 31, 2015 |
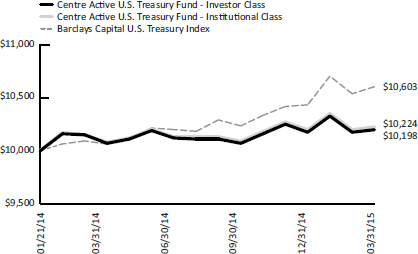
This line graph assumes an initial investment of $10,000 at January 21, 2014, the Fund’s inception date, and that any dividends and distributions are reinvested. This graph depicts the performance of the Fund versus the Barclays Capital U.S. Treasury Index. Unlike the Fund, an index is not available for investment and is unmanaged and does not have expenses that affect the results. The comparison is shown for illustrative purposes only.
TOTAL RETURNS – FOR THE PERIOD ENDED MARCH 31, 2015
| | | | | | | | | | | | | | | | | | | | | | | | | |
| | | 1 Month | | 3 Month | | YTD | | 1 Year | | Since Inception (January 21, 2014) |
Centre Active U.S. Treasury Fund – Investor Class | | | | 0.23 | % | | | | 0.23 | % | | | | 0.23 | % | | | | 1.27 | % | | | | 1.66 | % |
Centre Active U.S. Treasury Fund – Institutional Class | | | | 0.26 | % | | | | 0.26 | % | | | | 0.26 | % | | | | 1.43 | % | | | | 1.88 | % |
Barclays Capital U.S. Treasury Index | | | | 0.63 | % | | | | 1.64 | % | | | | 1.64 | % | | | | 5.36 | % | | | | 5.05 | % |
The performance information quoted above represents past performance, which is not a guarantee of future results, and does not reflect the deduction of taxes that a shareholder would pay on Fund distributions or the redemption of Fund shares. Investment return and principal value of an investment will fluctuate so that an investor’s shares, when redeemed, may be worth more or less than their original cost. Total return includes reinvestment of dividends and capital gains, if any. Current performance may be lower or higher than the performance data quoted. For the most current month-end performance data, please call 855-298-4236.
The Total Annual Operating Expense Ratio (before expense reimbursements) as stated in the fee table of the most currently effective prospectus of the Fund, dated January 28, 2015, was 2.16% for the Investor Class shares and 1.93% for the Institutional Class shares. The Adviser has entered into a written expense limitation agreement under which it has agreed to limit for a period of two years from November 4, 2013 the total expenses of the existing class of shares of the Fund (including (but not limited to) investment advisory fees of the Adviser and distribution/ service (Rule 12b-1) fees, but excluding interest, taxes, litigation, brokerage commissions and extraordinary expenses not incurred in the ordinary course of the Fund’s business) to an annual rate of 0.92% of the average daily net assets of the Investor Class shares and 0.67% of the average daily net assets of the Institutional Class shares.
Barclays Capital U.S. Treasury Index – includes public obligations of the U.S. Treasury. Treasury bills are excluded by the maturity constraint but are part of a separate Short Treasury Index. In addition, certain special issues, such as state and local government series bonds (SLGs), as well as U.S. Treasury TIPS, are excluded. You cannot invest directly into an index.
| | |
| Centre Active U.S. Tax Exempt Fund | | Manager Commentary |
| | March 31, 2015 (Unaudited) |
Performance & Strategy Summary
For the six month period ended March 31, 2015, the Centre Active U.S. Tax Exempt Fund, Institutional Share Class, delivered a total return of 0.8%; the Investor Share Class delivered a total return of 0.6%. Institutional and Investor Class Shares commenced operations on March 18, 2015. Performance for the period from October 1, 2014 to the date of reorganization represents the performance of its predecessor fund, the Managed Municipal Fund, Inc., which was reorganized into the newly formed Centre Fund on March 17, 2015.
The Fund’s investment objective is to maximize investors’ total return through capital appreciation and current income exempt from federal income tax. The Fund seeks to achieve its investment objective through investment in a portfolio consisting primarily of federally tax exempt municipal obligations of state and local governments in the U.S. and their political subdivisions, agencies, and instrumentalities. We attempt to preserve principal and to enhance return by adjusting the portfolio’s duration, which is its sensitivity to interest rate changes. We adjust the portfolio’s duration based on a monthly assessment of the likely change in interest rates. Our orientation toward high quality municipal securities allows us to better manage credit spread risk and to facilitate duration management. A monthly review provides the opportunity to capture not only the cyclical trend in rates but also the deviations away from the trend that invariably occur. Our fundamentally-driven active duration management includes, in certain market environments, using futures contracts on U.S. Treasury securities. These contracts are exchange traded and backed, are extremely liquid with minimal transaction charges, and have a long history of use in risk management. Additionally, they currently receive favorable capital gains tax treatment. As a result, Treasury based futures provide a low cost tax-advantaged means of managing interest rate risk, leaving the portfolio’s core municipal security holdings in place to generate tax-free income. The performance of the portfolio is intended to reflect this income as well as any change in value experienced by our duration adjustments.
Market Review and Outlook
During the six month review period ended March 31, 2015 the municipal bond market generally continued its return to normalcy relative to the U.S. Treasury market. Since the early 1980s, municipal bond returns had a positive correlation with Treasury market returns of almost 0.7. However, the normal relationship was distorted as dire warnings were issued about the likely insolvency of a large number of municipalities and states because of pension and health care liabilities. The correlation of returns fell to nearly 0.3 as municipal securities’ prices fell and yields increased, actually “traded through” yields on comparable maturity Treasuries. While some municipality and state securities continue to have problematic outlooks, e.g., Detroit, California, Illinois, the municipal bond market in general has performed well as the correlation has moved back in line with long term averages. The return to normalcy in the relationship between Treasury and municipal security returns facilitates the use of treasury futures in managing duration and interest rate exposure.
As we look forward, our expectation is that interest rate risk will increase as yields in general move higher as the economic recovery continues and inflationary pressures begin to build. If we are correct, interest rate risk to the value of municipal holdings will increase. Recently published research and analysis of the U.S. economy is consistent with the view that both the output and employment gaps caused by the “Great Contraction” and the associated financial crisis may be closing faster than expected. The current recovery has now been in place since June 2009 according to the National Bureau of Economic Research. And, if potential growth is 2 percent rather than the 20th century average of 3-3.25 percent, then the real growth experienced to date may not be as sluggish as originally thought.
Beyond the period of positive growth experienced so far, the unemployment rate has declined from 6.8 percent a year ago to 5.5 percent currently. This level may be equal to or not far off NAIRU, the non-accelerating inflation rate of unemployment. NAIRU is the rate of unemployment that is consistent with healthy or stable growth. And, the U6 unemployment rate which tracks those marginally attached to the labor force as well as those only able to find part time work has also been declining over the last year and is now at 10.9 percent versus 12.8 percent a year ago. Finally, unemployment claims have now moved back to “pre-crisis” levels. These current conditions would be consistent with research published at the Federal Reserve Bank of Kansas City in 2013 in which it was argued that given the level and rate of change in labor force activity at that time, historical employment “norms” could be reached by the summer of 2015. So, the labor market appears healthy, although wage growth has yet to show the acceleration expected as an economic recovery matures. However, if the Job Openings data continue to show an increasing demand for labor, increased wages cannot be far behind and there is already anecdotal—Walmart raising its wages—evidence to that effect.
In our view recent slowdowns in the pace of economic activity and hiring are not indicative of a return to sub-par growth. Research on the 2013-2014 winter from the Federal Reserve Bank of Chicago concludes that colder than normal temperatures can have a statistically significant negative impact on reported employment. While some Western states including California have had very warm weather, the heavily populated states of the Northeast and Ohio experienced their second coldest winters on record. William Dudley, President of the New York Federal Reserve Bank, recently referred to the harsh winter as a contributor to the likely weaker 1st quarter GDP. Furthermore, he offered an above trend growth outlook—2.7 percent growth—for 2015 as a whole. The weaker ISM manufacturing report for March could reflect—anecdotal based on the responses from survey participants—both the cold winter and the impact of the strong dollar.
Going forward, scrutiny of the Fed’s policy statements may be even more intense as investors search for guidance from policy makers about the future direction of monetary policy. Analysis from both the private and public sectors suggest that the Federal Reserve’s policy may already be “behind the curve.” That is, the Federal Reserve may have already waited too long to begin tightening. Such a delay would be typical of past policy moves—apart from those during “the Great Moderation”. These analyses are based on versions, linear and non-linear, of the Taylor rule which relates the appropriate Federal Funds rate to the size of the output gap and to the difference between actual and target inflation. A related body
| | |
| | |
| Semi-Annual Report | March 31, 2015 | | 11 |
| | |
| Centre Active U.S. Tax Exempt Fund | | Manager Commentary |
| | March 31, 2015 (Unaudited) |
of investigation as to the correctness of current Fed policy is based on the concept of the “Shadow” Federal Funds Rate. This analysis is based on the concept of a target policy rate that “should” be negative in value at times—in nominal not just real terms. Both approaches would suggest that the Federal Funds rate should currently be 1 percent or higher—not 0.25 percent.
Further delay in tightening would be based on the view that the economy is not yet out of the woods due to the strong dollar, weak European and Asian growth, or the short term impact of lower oil prices. We have spoken above to the idea that the economy is faltering, and further extended easing could have one of two poor outcomes. The more likely is that extended easing would lead to a more dramatic acceleration in inflation than would otherwise be the case. This outcome is consistent with the business cycle experience of the U.S.—economic cycle exacerbated by the policy cycle. An alternative outcome that is currently being discussed in policy debates is that the Fed guides, by extending the time period for the near zero target Fund’s rate, the economy into a sustained period of low rates, subpar growth and/or deflation as a zero target rate is not consistent with a continued recovery and a positive inflation goal, i.e. the U.S. becomes Japan. We believe the appropriate policy to prevent this latter outcome would be an increase in the policy rate—again a Fed tightening—accompanied by more quantitative easing or QE.
Longer term the Fisher relationship governs the level of interest rates. This relationship posits that the nominal interest rate—the rate we observe in the marketplace—must equal the real rate plus the expected rate of inflation. Over time the real rate reflects the economy’s real growth potential and, if the Federal Reserve has credibility, inflationary expectations will converge to its target for inflation. Recently published research from the Federal Reserve Bank of St. Louis appears consistent with the outcomes we anticipate. There would seem to be three likely rate scenarios—though the reasoning is somewhat different. Two result in higher rates—the degree depends on the Fed’s ability/credibility in managing to its inflation target. The third results in a generally low level of rates and poor economic performance.
A reasonable expectation would be that the 10-year yield reaches at least 4 percent. It will be higher with the typical cyclical overshooting and potentially much higher if the Fed’s inflation policy loses credibility and/or is too delayed. Additionally, if history is a guide, the upward trajectory will not be a smooth one. Rather it will be somewhat violent with significant increase followed by periods of decline. In the period from January 1973 to September 1981 the 10-year yield increased by about 10 percent from just over 5 percent to almost 16 percent. But rates increased in only about 60 percent of the 105 months. If anticipated, downward deviations provide an opportunity for return enhancement.
Municipal rates will move higher as Treasury yields rise especially as the normal relationship—correlation—between the two markets has been reestablished. And, since the municipal bond yield curve rarely inverts, the ability to mitigate against rising rates through the use of Treasury based futures should allow the core municipal portfolio’s yield to continue to benefit from the risk premium available from longer maturity holdings.
Our investment discipline utilizes measures of real growth, inflation expectations, market based measures of current valuation and of the likely course of Fed policy changes—historically the market has always moved ahead of policy—in assessing the likely near term course of interest rates. It is intended to preserve capital in periods of significant rate increases by decreasing duration but with the flexibility to extend duration or re-enter the market when our discipline suggests lower rates are likely. As this recovery matures, uncertainty increases as to how much longer it can go on. Periods of “softness” in the data will likely occur providing the opportunity to add value by lengthening exposure.
At some point the Fed will be called on to bring policy in line with reality. Historically, tightening has been associated with contraction and declining rates which is a profit opportunity for bond investors. What is relevant to the potential success of our discipline is that interest rates continue to exhibit cyclical volatility—that the business cycle is not dead. Continued cyclical behavior will provide a basis for success even if the longer term equilibrium level of the economy’s real rate—due to a reduced real growth potential—is lower. While panic buying can move rates dramatically for short time periods, rate behavior over time in driven by the business cycle.
The Centre Active U.S. Tax Exempt Fund is intended to serve as a core fixed income investment. It is designed to help mitigate against the loss of value from rising rates while continuing to provide tax-free cash flow. Additionally, its design allows for increased exposure and enhanced return as rates experience downward deviations from a rising trend or when the economy moves back into contraction. Our emphasis on investing in higher quality obligations helps control default risk as the next contraction impacts revenue collection negatively and it also facilitates hedging through the use of Treasury related securities. Finally, the potential return from successfully managing interest rate exposure will likely outweigh any return pick-up from holding higher yield lower quality bonds. Avoiding a 1 percent rise in rates prevents a 5 percent loss of value; it would be difficult if to gain that much extra return even from “junk” municipal securities.
| | |
| Centre Active U.S. Tax Exempt Fund | | Manager Commentary |
| | March 31, 2015 (Unaudited) |
| | | | |
SECTOR WEIGHTINGS As a percentage of Net Assets | | |
| | |
| General Obligation | | 41.48% | | |
| Prerefunded Issues | | 29.06% | | |
| Revenue Bonds | | 16.20% | | |
Cash and Cash
Equivalents | | 13.26% | | |
| Totals | | 100.00% | | |
| |
COUNTRY WEIGHTINGS As a percentage of Net Assets | | |
| | |
United States | | 86.74% | | |
Cash and
Cash Equivalents | | 13.26% | | |
Totals | | 100.00% | | |
| |
These allocations may not reflect the current or future positions of the portfolio. | | |
| | | | |
| | | | |
| | | | |
| | | | |
| | | | |
| | | | |
| | | | |
| | | | |
| | | | |
| | | | |
| | | | |
| | | | |
| | | | |
| | | | |
| | | | |
| | | | |
| | | | |
| | | | |
| | | | |
| | | | |
| | | | |
| | | | |
| | | | |
| | | | |
| | | | |
| | | | |
| | | | |
| | | | |
| | | | |
| | | | |
| | | | |
| | | | |
| | | | |
| | | | |
| | | | |
| | | | |
| | | | |
| | | | |
| | | | |
| | | | |
| | | | |
| | | | |
| | | | |
| | | | |
| | | | |
| | | | |
| | | | |
| | | | |
| | | | |
| | | | |
| | | | |
| | | | |
| | | | |
| | | | |
| | | | |
| | | | |
| | | | |
| | | | |
| | | | |
| | | | |
| | | | |
| | | | |
| | | | |
| | | | |
| | |
| GROWTH OF HYPOTHETICAL $10,000 INVESTMENT THROUGH MARCH 31, 2015 |

This line graph assumes an initial investment of $10,000 at March 31, 2005, and that any dividends and distributions are reinvested. This graph depicts the performance of the Fund versus the Barclays Capital Pre-Refunded Municipal Bond Index and the Barclays Capital General Obligation Index. Unlike the Fund, an index is not available for investment and is unmanaged and does not have expenses that affect the results. The comparison is shown for illustrative purposes only.
TOTAL RETURNS – FOR THE PERIOD ENDED MARCH 31, 2015
| | | | | | | | | | | | | | | | | | | | | | | | | | | | | | | | | | | | | | | | |
| | | 1
Month | | 3
Month | | YTD | | 1
Year | | 3
Year | | 5 Year | | 10
Year | | Since
Inception* |
Centre Active U.S. Tax Exempt Fund – Investor | | | | 0.26 | % | | | | 0.46 | % | | | | 0.46 | % | | | | 3.00 | % | | | | 1.49 | % | | | | 2.82% | | | | | 3.27% | | | | | 4.83 | % |
Barclays Capital Pre-Refunded Municipal Bond Index | | | | 0.01 | % | | | | 0.32 | % | | | | 0.32 | % | | | | 1.53 | % | | | | 1.33 | % | | | | 1.99% | | | | | 3.22% | | | | | 2.22 | % |
Barclays Capital General Obligation Index | | | | 0.22 | % | | | | 0.87 | % | | | | 0.87 | % | | | | 5.54 | % | | | | 3.58 | % | | | | 4.78% | | | | | 4.80% | | | | | 5.97 | % |
Centre Active U.S. Tax Exempt Fund – Institutional | | | | 0.37 | % | | | | 0.61 | % | | | | 0.61 | % | | | | 3.26 | % | | | | 1.59 | % | | | | – | | | | | – | | | | | 2.32 | % |
Barclays Capital Pre-Refunded Municipal Bond Index | | | | 0.01 | % | | | | 0.32 | % | | | | 0.32 | % | | | | 1.53 | % | | | | 1.33 | % | | | | – | | | | | – | | | | | 1.63 | % |
Barclays Capital General Obligation Index | | | | 0.22 | % | | | | 0.87 | % | | | | 0.87 | % | | | | 5.54 | % | | | | 3.58 | % | | | | – | | | | | – | | | | | 4.05 | % |
| * | Inception date of February 26, 1990 for Investor Class. Inception date of October 7, 2010 for Institutional Class. |
The performance information quoted above represents past performance, which is not a guarantee of future results, and does not reflect the deduction of taxes that a shareholder would pay on Fund distributions or the redemption of Fund shares. Investment return and principal value of an investment will fluctuate so that an investor’s shares, when redeemed, may be worth more or less than their original cost. Total return includes reinvestment of dividends and capital gains, if any. Current performance may be lower or higher than the performance data quoted. For the most current month-end performance data, please call 855-298-4236.
The Total Annual Operating Expense Ratio (before expense reimbursements) as stated in the fee table of the most currently effective prospectus of the Fund, dated February 5, 2015 was 0.92% for the Investor Class shares and 0.67% for the Institutional Class shares. The Adviser has entered into a written expense limitation agreement dated December 8, 2014 under which it has agreed to reduce its advisory fees and/or reimburse other expenses of the Fund, for an initial period of not less than two years from the date of the closing of the reorganization of the Acquired Fund into the Fund and until the next following effective date of the post-effective amendment to the registration statement of the Trust relating to the Fund incorporating the Fund’s financial statements for that fiscal year, to the extent necessary to limit the current operating expenses of each class of shares of the Fund, including (but not limited to) investment advisory fees of the Adviser and distribution/service (Rule 12b-1) fees, but excluding any taxes, leverage interest, brokerage commissions, acquired fund fees and expenses, expenses incurred in connection with any merger or reorganization, and extraordinary expenses (such as litigation and other expenses not incurred in the ordinary course of the Fund’s business) to an annual rate of 0.95% of the average daily net assets of the Investor Class shares and 0.70% of the average daily net assets of the Institutional Class shares. You cannot invest directly in an index.
Barclays Capital General Obligation Index is an index that represents average market-weighted performance of general obligations securities that have been issued in the last five years with maturities greater than one year. Barclays Capital Pre-Refunded Municipal Index is intended to track the overall performance of the U.S. dollar denominated pre-refunded or escrowed-to-maturity tax-exempt bond market.
The line graph above shows the performance of Investor Class shares only, since the Investor Class has the longest period of annual returns. The performance of the Institutional Class shares will differ from the performance shown because the Institutional Class shares have different expenses than the Investor Class shares.
| | |
| | |
| Semi-Annual Report | March 31, 2015 | | 13 |
| | |
| Centre Multi-Asset Real Return Fund | | Manager Commentary |
| | March 31, 2015 (Unaudited) |
Performance & Strategy Summary
For the six month period ended March 31, 2015, the Centre Multi-Asset Real Return Fund, Institutional Share Class, delivered a total return of 0.0%; the Investor Share Class delivered a total return of -0.1%.
The Centre Multi-Asset Real Return Fund is designed to meet investor concerns of future inflationary conditions and increased market volatility with the goal of producing real returns as measured against inflation. The Fund aims to maintain the purchasing power of today’s dollar in nominal terms plus a real return on capital. It is also intended to be relatively well positioned to withstand market shocks by having the capability to dynamically change its allocation posture and take defensive positions in an attempt to respond to adverse market, economic, political, or other conditions. The Fund, which is structured as a limited fund of funds that can invest in other registered investment companies (primarily those advised by the investment adviser), is an actively managed product that strives to help preserve and enhance purchasing power over a variety of investment environments using a fundamental tactical asset allocation strategy employing multiple asset classes with mostly positive correlation with inflation. Under normal market conditions, the Fund will allocate its net assets among the broad asset classes, namely the underlying funds, U.S. and Non-U.S. Equities, Fixed Income, Commodity-Linked ETNs and ETFs, Real Estate Investment Trusts (“REIT”) and ETNs and ETFs with returns linked to REIT Indexes, and Cash & Equivalents in an effort to maximize inflation-adjusted returns. Under volatile market conditions, the Fund may adopt the posture of capital preservation with a significant tactical allocation to cash equivalents.
The principal input in the Fund’s asset allocation decisions is the implied equity risk premium, which is the expected excess return that the overall stock market provides over a risk-free rate. This shows the relative valuation of risky assets versus the “risk free” alternative, intermediate term U.S. Treasury bonds. The equity risk premium (high or low) and its directional change are used as inputs in our process. The secondary inputs comprise CPI trends and trends in inflation proxies such as currency and commodity prices. Lastly, historical data and forecasts of volatility for all asset classes are included.
Market Review & Outlook
For the six month period ended March 31, 2015, U.S. Equities and Fixed Income as asset classes contributed positively to the Fund’s return as did Real Estate-Linked Securities. Non-U.S. Equities and, in particular, Commodity-Linked Securities performed poorly over the period as they were negatively impacted by a strengthening U.S. dollar and concerns over global economic growth, particularly in heavy resource consuming foreign economies, most notably in the emerging markets. During the period, our tactical allocation to non-U.S. Equities was increased and our exposure to Commodity-Linked Securities, except for those linked to the price of gold, mostly eliminated. We also eliminated our exposure to Real Estate-Linked Securities as we’ve seen their correlation to other asset classes increase and valuations reach our target.
Our process in managing the Fund’s portfolio remains flexible and allows the Fund to opportunistically shift to each of the various asset classes as conditions warrant based upon the ability for each asset class to perform best during particular market environments. For example, during the period we reduced our exposure to gold-linked securities and increased our exposures to Fixed Income. Incorporating asset classes such as Commodity-Linked ETNs and ETFs, Real Estate Investment Trusts, and ETNs and ETFs with returns linked to REIT Indexes, that are sometimes inversely or uncorrelated to the more traditional U.S. stocks and bonds held within balanced funds, offers enhanced diversification benefits and the ability to take advantage of the changes in asset class performance that may take place with changes in different inflationary environments. The Fund is designed to help reduce the level of risk to delivering real returns that comes from concentrating in a single asset class. Additionally, we aim to emphasize asset classes we believe are poised to perform based on our understanding of how different asset classes respond to inflation and changes in economic conditions. The result is a broadly diversified portfolio that may be used as a core flexible balanced type holding or as a complement to existing equity or fixed income strategies. Also, given that certain historical correlations between asset classes tend to change, particularly during periods of market stress, the Fund is able to take defensive positions in an attempt to respond to adverse market, economic, political, or other conditions when deemed prudent.
With competing inflationary/deflationary forces in a “tug of war”, namely ultra-accommodative monetary policy now in its sixth year and aging demographics with the baby booming generation just beginning to retire in earnest respectively, we think the longer-term risk of inflation is higher than it has been in quite some time. However, we also recognize that shorter and intermediate-term market signals such as an appreciating U.S. dollar, overseas economic weakness and slack industrial capacity have given deflationary pressures the upper hand and will continue to do so. The irony is that we expect inflation to increase only after a sustained period of deflation which results in a change in central bank and fiscal policies.
In our view, the failure of U.S. fiscal policy to stimulate growth has caused dependency on this unprecedented and massive monetary easing. On a positive note, monetary policy has allowed the U.S. financial sector to heal distinct from the tremendous restructuring undertaken by business and consumer focused corporate America. That said, it is unlikely that monetary policy will suddenly transmit value and growth stimulus to the real economy (as opposed to financial assets) when it has not in the past six years given the collapse in monetary velocity. The vast bulk of the Federal Reserve’s bond purchases have made their way right back in the form of bank reserves deposited at the Federal Reserve and the nearly 300 percent increase in the money supply has been offset by the collapse in velocity. If velocity should turn up however, the outlook for inflation should rise and do so substantially.
| | |
| Centre Multi-Asset Real Return Fund | | Manager Commentary |
| | March 31, 2015 (Unaudited) |
On the deflationary side, in a number of industrialized countries, including the U.S., on the assumption that fertility remains at or close to present levels, populations will start to decline and, in some cases, do so quite rapidly in the near future. The impact on developed societies will be decreasing demand for goods and services but increasing pension liabilities. This can be crushing in terms of taxation on younger workers and a potential source of unrest and political disruption. Japan, the pathfinder of this phenomenon as it embraced Western family planning even before Europe and the U.S. and where adult diapers now outsell those for children, shows the debilitative impact from an aging society and need to resort to new radical inflationary macroeconomic policies to combat its ill effects. No developed world country is immune from this significant problem which is just starting to be felt in Europe, the U.S., and elsewhere. With regard to near-term relevance to Federal Reserve policies, we see that the U.S. Civilian Labor Force Participation Rate has dropped below a level that we last saw thirty years ago, when women began to join the workforce in earnest. A large part of the current fall in the unemployment rate has been due to this “dropping out” of the labor force, either due to discouragement, early retirement, or public assistance. This collapse in the civilian workforce participation rate and increase in the number of persons on government dependency since the economic recovery began in 2009 has never happened before during previous recoveries. Productivity and the growth in average hourly wages have fallen significantly as inflation has slowed and competition for jobs domestically and from overseas is limiting consumer consumption as evidenced by the latest drop in consumer spending being consistent only with past recessions.
These factors have created a myriad of possible outcomes over the next few years that are likely to see a rise in the volatility of inflation expectations but only after a sustained period of deflation. This is due to the negative macro circumstances being unlike any in the past and our lack of confidence in the ability of public officials to manage them given the unprecedented monetary policy stimulus employed thus far without the expected success. Given its investment flexibility, the Centre Multi-Asset Real Return Fund will attempt to deliver on maintaining investor purchasing power of today’s dollar in nominal terms plus deliver a positive real return on capital.
| | |
| | |
| Semi-Annual Report | March 31, 2015 | | 15 |
| | |
| Centre Multi-Asset Real Return Fund | | Manager Commentary |
| | March 31, 2015 (Unaudited) |
| | | | |
ASSET TYPE WEIGHTINGS As a percentage of Net Assets | | |
| | |
| Open-End Funds | | 94.85% | | |
Exchange-Traded
Funds | | 5.12% | | |
Cash and Cash Equivalents | | 0.03% | | |
| Totals | | 100.00% | | |
| |
These allocations may not reflect the current or future positions of the portfolio. | | |
| | | | |
| | | | |
| | | | |
| | | | |
| | | | |
| | | | |
| | | | |
| | | | |
| | | | |
| | | | |
| | | | |
| | | | |
| | | | |
| | | | |
| | | | |
| | | | |
| | | | |
| | | | |
| | | | |
| | | | |
| | | | |
| | | | |
| | | | |
| | | | |
| | | | |
| | | | |
| | | | |
| | | | |
| | | | |
| | | | |
| | | | |
| | | | |
| | | | |
| | | | |
| | | | |
| | | | |
| | | | |
| | | | |
| | | | |
| | | | |
| | | | |
| | | | |
| | | | |
| | | | |
| | | | |
| | | | |
| | | | |
| | | | |
| | | | |
| | | | |
| | | | |
| | | | |
| | | | |
| | | | |
| | | | |
| | | | |
| | | | |
| | | | |
| | | | |
| | | | |
| | | | |
| | | | |
| | | | |
| | |
| GROWTH OF HYPOTHETICAL $10,000 INVESTMENT THROUGH MARCH 31, 2015 |
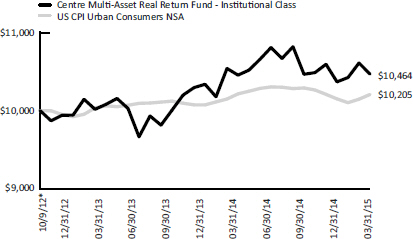
This line graph assumes an initial investment of $10,000 at October 9, 2012, the Fund’s inception date, and that any dividends and distributions are reinvested. This graph depicts the performance of the Fund (Institutional Class) versus the U.S. CPI Urban Consumers NSA Index. Unlike the Fund, an index is not available for investment and is unmanaged and does not have expenses that affect the results. The comparison is shown for illustrative purposes only.
TOTAL RETURNS – FOR THE PERIOD ENDED MARCH 31, 2015
| | | | | | | | | | | | | | | | | | | | | | | | | |
| | | 1 Month | | 3 Month | | YTD | | 1 Year | | Since Inception* |
Centre Multi-Asset Real Return Fund – Investor Class | | | | -1.34 | % | | | | 0.85 | % | | | | 0.85 | % | | | | -0.04 | % | | | | 1.26 | % |
| U.S. CPI Urban Consumers NSA Index | | | | 0.60 | % | | | | 0.56 | % | | | | 0.56 | % | | | | -0.07 | % | | | | 1.26 | % |
Centre Multi-Asset Real Return Fund – Institutional Class | | | | -1.34 | % | | | | 0.95 | % | | | | 0.95 | % | | | | 0.12 | % | | | | 1.85 | % |
| U.S. CPI Urban Consumers NSA Index | | | | 0.60 | % | | | | 0.56 | % | | | | 0.56 | % | | | | -0.07 | % | | | | 0.82 | % |
| * | Inception date of October 9, 2012 for Institutional Class. Inception date of January 22, 2013 for Investor Class. |
The performance information quoted above represents past performance, which is not a guarantee of future results, and does not reflect the deduction of any taxes that a shareholder would pay on Fund distributions or the redemption of Fund shares. Investment return and principal value of an investment will fluctuate so that an investor’s shares, when redeemed, may be worth more or less than their original cost. Total return includes reinvestment of dividends and capital gains, if any. Current performance may be lower or higher than the performance data quoted. For the most current month-end performance data please call 855-298-4236.
The Total Annual Operating Expense Ratio (before expense reimbursements) as stated in the fee table of the most currently effective prospectus of the Fund, dated January 28, 2015, was 2.02% for the Investor Class shares and 1.77% for the Institutional Class shares. The Adviser has contractually agreed, pursuant to a written expense limitation agreement (the “Expense Limitation Agreement”), to reduce its advisory fees and/or reimburse other expenses of the Fund until January 31, 2016 to the extent necessary to limit the current operating expenses of each class of shares of the Fund including (but not limited to) investment advisory fees of the Adviser and distribution/service (Rule 12b-1) fees but exclusive of any front-end or contingent deferred sales loads, taxes, leverage interest, brokerage commissions, expenses incurred in connection with any merger or reorganization, extraordinary expenses such as litigation and other expenses not incurred in the ordinary course of the Fund’s business, and acquired fund fees and expenses, except that, if an acquired fund is an underlying fund managed by the Adviser and such acquired fund is not subject to an effective expense limitation or fee waiver agreement at any time during the term of the Expense Limitation Agreement, then, for that time, the operating expenses of each class of shares of the Fund shall not exclude the amount of advisory fees included in such acquired fund’s fees and expenses to which the Fund would otherwise be subject, to an annual rate of 1.25% of the average daily net assets of the Investor Class shares and 1.00% of the average daily net assets of the Institutional Class shares
The U.S. CPI Urban Consumers NSA Index is the annual percentage change in the Consumer Price Index (CPI). The CPI is described as “an unmanaged index that represents the rate of inflation of U.S. consumer prices as determined by the U.S. Bureau of Labor Statistics” in the Prospectus. You cannot invest directly into an index.
The chart above shows the performance of Institutional Class shares only, since the Institutional Class has the longest period of annual returns. The performance of the Investor Class shares will differ from the performance shown because the Investor Class shares have different expenses than the Institutional Class shares.
| | |
| Centre Funds | | Glossary/Definitions |
| | |
Alpha – A measure of performance on a risk-adjusted basis. Alpha takes the volatility (price risk) of a mutual fund and compares its risk adjusted performance to a benchmark index. The excess return of the fund relative to the return of the benchmark index is a fund’s alpha.
Amortization – The paying off of debt with a fixed repayment schedule in regular installments over a period of time.
Beta – A measure of the volatility, or systematic risk, of a security or a portfolio in comparison to the market as a whole. Beta is used in the capital asset pricing model (CAPM), a model that calculates the expected return of an asset based on its beta and expected market returns.
Blue Chip – A nationally recognized, well-established and financially sound company.
Bottom-up – An investment approach that de-emphasizes the significance of economic and market cycles. This approach focuses on the analysis of individual stocks. In bottom-up investing, therefore, the investor focuses his or her attention on a specific company rather than on the industry in which that company operates or on the economy as a whole.
CEO Hubris – The CEO characteristic of excessive confidence or arrogance, which leads a person to believe that he or she may do no wrong.
The Consumer Price Index (CPI) – Estimates inflation or the average change in prices for a basket of goods and services and serves as the baseline hurdle for real returns.
Correlation – A statistical measure of how two securities move in relation to each other.
EBITDA – is essentially net income with interest, taxes, depreciation, and amortization added back to it, and can be used to analyze and compare profitability between companies and industries because it eliminates the effects of financing and accounting decisions.
Economic Value Added (EVA) – An estimate of a firm’s economic profit - being the value created in excess of the required return of the company’s investors (being shareholders and debt holders). Quite simply, EVA is the profit earned by the firm less the cost of financing the firm’s capital. The idea is that value is created when the return on the firm’s economic capital employed is greater than the cost of that capital. EVA® is a registered service mark of EVA Dimensions LLC.
Enterprise value to sales – Gives investors an idea of how much it costs to buy the company’s sales. This measure is an expansion of the price-to-sales valuation, which uses market capitalization instead of enterprise value.
Euro Crisis – Is a multi-year debt crisis that has taken place in several Eurozone member states since the end of 2009.
Fisher relationship – An economic theory proposed by economist Irving Fisher that describes the relationship between inflation and both real and nominal interest rates. The Fisher effect states that the real interest rate equals the nominal interest rate minus the expected inflation rate. Therefore, real interest rates fall as inflation increases, unless nominal rates increase at the same rate as inflation.
Great Contraction – The Great Contraction is Milton Friedman’s term for the recession which led to the Great Depression.
The Great Moderation – The Great Moderation is the name given to the period of decreased macroeconomic volatility experienced in the United States since the 1980s.
Gross Domestic Product (GDP) – The monetary value of all the finished goods and services produced within a country’s borders in a specific time period, though GDP is usually calculated on an annual basis. It includes all of private and public consumption, government outlays, investments and exports less imports that occur within a defined territory.
Hong Kong Hang Seng China Index – Is the major index that tracks the performance of China enterprises listed in Hong Kong in the form of H shares.
Monetary Velocity – The rate at which money is exchanged from one transaction to another, and how much a unit of currency is used in a given period of time. Velocity of money is usually measured as a ratio of GNP to a country’s total supply of money.
MSCI Pan Europe Index – Captures large cap representation across 15 Developed Markets (DM) countries in Europe*. With 204 constituents, the index covers approximately 70% of the free float-adjusted market capitalization across the European DM equity universe.
Nifty-Fifty – The 50 stocks that were most favored by institutional investors in the 1960s and 1970s.
Nikkei 225 Index – It is a price-weighted index comprised of Japan’s top 225 blue-chip companies on the Tokyo Stock Exchange.
Non-Accelerating Rate of Unemployment (NAIRU) – The specific level of unemployment that exists in an economy that does not cause inflation to increase. The non-accelerating rate of unemployment (NAIRU) often represents an equilibrium between the state of the economy and the labor market.
Price/Book – A ratio used to compare a stock’s market value to its book value. It is calculated by dividing the current closing price of the stock by the latest quarter’s book value per share.
P/E Ratio – A valuation ratio of a company’s current share price compared to its per-share earnings.
| | |
| | |
| Semi-Annual Report | March 31, 2015 | | 17 |
| | |
| Centre Funds | | Glossary/Definitions |
| | |
Price/Normalized Earnings – A valuation ratio of a company’s current share price compared to its normalized earnings. By normalizing earnings, analysts average a company’s earnings over a period of time to get a more accurate account of its financial productivity.
Price/Sales – A valuation ratio that compares a company’s stock price to its revenues. The price-to-sales ratio is an indicator of the value placed on each dollar of a company’s sales or revenues.
REIT – A security that sells like a stock on the major exchanges and invests in real estate directly, either through properties or mortgages. REITs receive special tax considerations and typically offer investors high yields, as well as a highly liquid method of investing in real estate.
Return on Assets – Calculated by dividing a company’s annual earnings by its total assets, ROA is displa
Returns on Equity – The amount of net income returned as a percentage of shareholders equity. Return on equity measures a corporation’s profitability by revealing how much profit a company generates with the money shareholders have invested.yed as a percentage.
S&P 100 Index – A subset of the S&P 500, measures the performance of large-cap companies in the U.S. The index comprises 100 major, blue-chip companies across multiple industry groups.
Standard deviation – A measure of the dispersion of a set of data from its mean.
U6 Unemployment Rate – This number reflects the government’s “U-6” report, which accounts for the full unemployment picture including those “marginally attached to the labor force,” plus those “employed part time for economic reasons.”
| | |
| Centre Funds | | Disclosure of Fund Expenses |
| | March 31, 2015 (Unaudited) |
As a shareholder of a series of Centre Funds (each series, a “Fund” and together, the “Funds”), you will incur two types of costs: (1) transaction costs, including any applicable redemption fees; and (2) ongoing costs, including management fees, distribution and/or service (12b-1) fees (if applicable) and other Fund expenses. The following examples are intended to help you understand your ongoing costs (in dollars) of investing in a Fund and to compare these costs with the ongoing costs of investing in other mutual funds. The examples are based on an investment of $1,000 invested on October 1, 2014 and held through March 31, 2015.
Actual Expenses. The first line under each class of the table below provides information about actual account values and actual expenses. You may use the information in this line, together with the amount you invested, to estimate the expenses that you paid over the period. Simply divide your account value by $1,000 (for example, an $8,600 account value divided by $1,000 = 8.6), then multiply the result by the number in the first line under the heading “Expenses Paid During Period 10/01/2014 – 03/31/2015” to estimate the expenses you paid on your account during this period.
Hypothetical Example for Comparison Purposes. The second line under each class of the table below provides information about hypothetical account values and hypothetical expenses based on each Fund’s actual expense ratio and an assumed rate of return of 5% per year before expenses, which is not the Fund’s actual return. The hypothetical account values and expenses may not be used to estimate the actual ending account balance or expenses you paid for the period. You may use this information to compare the ongoing costs of investing in a Fund and to other funds. To do so, compare this 5% hypothetical example with the 5% hypothetical examples that appear in the shareholder reports of the other funds. Please note that the expenses shown in the table are meant to highlight your ongoing costs only and do not reflect any transactional costs, such as redemption fees, if any. Therefore, the second line under each class of the table below is useful in comparing ongoing costs only, and will not help you determine the relative total costs of owning different funds. In addition, if these transactional costs were included, your costs would have been higher.
| | | | | | | | | | | | | | |
| | | Beginning Account Value
10/01/14 | | | Ending
Account Value
03/31/15 | | | Expense Ratio(a) | | Expenses Paid
During Period
10/01/14-03/31/15 | |
Centre American Select Equity Fund(b) | | | | | | | | | | | | | | |
Investor Class | | | | | | | | | | | | | | |
Actual | | $ | 1,000.00 | | | $ | 1,014.50 | | | 1.05% | | $ | 5.27 | |
Hypothetical (5% return before expenses) | | $ | 1,000.00 | | | $ | 1,019.70 | | | 1.05% | | $ | 5.29 | |
Institutional Class | | | | | | | | | | | | | | |
Actual | | $ | 1,000.00 | | | $ | 1,015.60 | | | 0.95% | | $ | 4.77 | |
Hypothetical (5% return before expenses) | | $ | 1,000.00 | | | $ | 1,020.19 | | | 0.95% | | $ | 4.78 | |
Centre Global Select Equity Fund(b) | | | | | | | | | | | | | | |
Investor Class | | | | | | | | | | | | | | |
Actual | | $ | 1,000.00 | | | $ | 993.80 | | | 1.45% | | $ | 7.21 | |
Hypothetical (5% return before expenses) | | $ | 1,000.00 | | | $ | 1,017.70 | | | 1.45% | | $ | 7.29 | |
Institutional Class | | | | | | | | | | | | | | |
Actual | | $ | 1,000.00 | | | $ | 996.80 | | | 1.25% | | $ | 6.22 | |
Hypothetical (5% return before expenses) | | $ | 1,000.00 | | | $ | 1,018.70 | | | 1.25% | | $ | 6.29 | |
Centre Active U.S. Treasury Fund(b) | | | | | | | | | | | | | | |
Investor Class | | | | | | | | | | | | | | |
Actual | | $ | 1,000.00 | | | $ | 1,012.70 | | | 0.69% | | $ | 3.46 | |
Hypothetical (5% return before expenses) | | $ | 1,000.00 | | | $ | 1,021.49 | | | 0.69% | | $ | 3.48 | |
Institutional Class | | | | | | | | | | | | | | |
Actual | | $ | 1,000.00 | | | $ | 1,013.30 | | | 0.60% | | $ | 3.01 | |
Hypothetical (5% return before expenses) | | $ | 1,000.00 | | | $ | 1,021.94 | | | 0.60% | | $ | 3.02 | |
Centre Active U.S. Tax Exempt Fund(c) | | | | | | | | | | | | | | |
Investor Class | | | | | | | | | | | | | | |
Actual | | $ | 1,000.00 | | | $ | 1,005.20 | | | 1.08% | | $ | 4.48 | |
Hypothetical (5% return before expenses) | | $ | 1,000.00 | | | $ | 1,019.55 | | | 1.08% | | $ | 5.44 | |
Institutional Class | | | | | | | | | | | | | | |
Actual | | $ | 1,000.00 | | | $ | 1,007.10 | | | 1.06% | | $ | 4.40 | |
Hypothetical (5% return before expenses) | | $ | 1,000.00 | | | $ | 1,019.65 | | | 1.06% | | $ | 5.34 | |
Centre Multi-Asset Real Return Fund(b) | | | | | | | | | | | | | | |
Investor Class | | | | | | | | | | | | | | |
Actual | | $ | 1,000.00 | | | $ | 998.50 | | | 1.25% | | $ | 6.23 | |
Hypothetical (5% return before expenses) | | $ | 1,000.00 | | | $ | 1,018.70 | | | 1.25% | | $ | 6.29 | |
Institutional Class | | | | | | | | | | | | | | |
Actual | | $ | 1,000.00 | | | $ | 1,000.20 | | | 1.00% | | $ | 4.99 | |
Hypothetical (5% return before expenses) | | $ | 1,000.00 | | | $ | 1,019.95 | | | 1.00% | | $ | 5.04 | |
| | |
| | |
| Semi-Annual Report | March 31, 2015 | | 19 |
| | |
| Centre Funds | | Disclosure of Fund Expenses |
| | March 31, 2015 (Unaudited) |
| (a) | Annualized, based on the Fund’s most recent fiscal half year expenses. |
| (b) | Expenses are equal to the Fund’s annualized expense ratio, multiplied by the average account value over the period, multiplied by the number of days in the most recent fiscal half year (182), divided by 365. |
| (c) | Centre Active U.S. Tax Exempt Fund is the successor to Managed Municipal Fund, Inc. (the “Acquired Fund”) through a reorganization, the closing date for which was March 17, 2015. The fiscal year end of the Acquired Fund was October 31st. The fiscal year end of the Centre Active U.S. Tax Exempt Fund is September 30th, therefore expenses are equal to the Fund’s annualized expense ratio, multiplied by the average account value over the period, multiplied by the number of days in the most recent fiscal period (151), divided by 365. |
| | |
| Centre American Select Equity Fund | | Schedule of Investments |
| | March 31, 2015 (Unaudited) |
| | | | | | | | |
| | | Shares | | | Value | |
COMMON STOCKS (96.11%) | | | | | |
Consumer Discretionary (14.86%) | | | | | |
Hotels, Restaurants & Leisure (2.96%) | | | | | |
Chipotle Mexican Grill, Inc.(a) | | | 4,850 | | | $ | 3,155,119 | |
Starbucks Corp. | | | 33,320 | | | | 3,155,404 | |
| | | | | | | | |
| | | | | | | 6,310,523 | |
| | | | | | | | |
Internet & Catalog Retail (1.86%) | | | | | |
Amazon.com, Inc.(a) | | | 10,640 | | | | 3,959,144 | |
| | | | | | | | |
| |
Media (3.87%) | | | | | |
Comcast Corp., Class A | | | 62,500 | | | | 3,529,375 | |
Time Warner Cable, Inc. | | | 3,730 | | | | 559,052 | |
Walt Disney Co. | | | 39,828 | | | | 4,177,559 | |
| | | | | | | | |
| | | | | | | 8,265,986 | |
| | | | | | | | |
Multiline Retail (1.10%) | | | | | |
Target Corp. | | | 28,616 | | | | 2,348,515 | |
| | | | | | | | |
| |
Specialty Retail (5.07%) | | | | | |
Home Depot, Inc. | | | 37,927 | | | | 4,308,886 | |
Lowe’s Cos., Inc. | | | 64,325 | | | | 4,785,137 | |
Tiffany & Co. | | | 19,460 | | | | 1,712,675 | |
| | | | | | | | |
| | | | | | | 10,806,698 | |
| | | | | | | | |
Total Consumer Discretionary | | | | | | | 31,690,866 | |
| | | | | | | | |
| |
Consumer Staples (11.94%) | | | | | |
Beverages (3.91%) | | | | | | | | |
Coca-Cola Co. | | | 100,910 | | | | 4,091,900 | |
PepsiCo, Inc. | | | 44,319 | | | | 4,237,783 | |
| | | | | | | | |
| | | | | | | 8,329,683 | |
| | | | | | | | |
Food & Staples Retailing (3.73%) | | | | | |
Costco Wholesale Corp. | | | 9,150 | | | | 1,386,179 | |
CVS Health Corp. | | | 39,105 | | | | 4,036,027 | |
Wal-Mart Stores, Inc. | | | 30,817 | | | | 2,534,698 | |
| | | | | | | | |
| | | | | | | 7,956,904 | |
| | | | | | | | |
Food Products (1.38%) | | | | | | | | |
Archer-Daniels-Midland Co. | | | 62,100 | | | | 2,943,540 | |
| | | | | | | | |
| | |
Household Products (1.37%) | | | | | | | | |
Procter & Gamble Co. | | | 35,588 | | | | 2,916,081 | |
| | | | | | | | |
| | |
Tobacco (1.55%) | | | | | | | | |
Altria Group, Inc. | | | 66,140 | | | | 3,308,323 | |
| | | | | | | | |
| | |
Total Consumer Staples | | | | | | | 25,454,531 | |
| | | | | | | | |
| |
Energy (1.99%) | | | | | |
Energy Equipment & Services (1.10%) | | | | | |
Cameron International
Corp.(a) | | | 52,010 | | | | 2,346,691 | |
| | | | | | | | |
| |
Oil, Gas & Consumable Fuels (0.89%) | | | | | |
Chevron Corp. | | | 6,871 | | | | 721,318 | |
Exxon Mobil Corp. | | | 13,943 | | | | 1,185,155 | |
| | | | | | | | |
| | | | | | | 1,906,473 | |
| | | | | | | | |
Total Energy | | | | | | | 4,253,164 | |
| | | | | | | | |
| | | | | | | | |
| | | Shares | | | Value | |
Financials (3.43%) | | | | | |
Banks (2.96%) | | | | | | | | |
SunTrust Banks, Inc. | | | 57,430 | | | $ | 2,359,799 | |
Wells Fargo & Co. | | | 72,708 | | | | 3,955,315 | |
| | | | | | | | |
| | | | | | | 6,315,114 | |
| | | | | | | | |
Diversified Financial Services (0.47%) | | | | | |
Berkshire Hathaway, Inc.,
Class B(a) | | | 6,986 | | | | 1,008,219 | |
| | | | | | | | |
| | |
Total Financials | | | | | | | 7,323,333 | |
| | | | | | | | |
| |
Health Care (18.67%) | | | | | |
Biotechnology (9.08%) | | | | | |
Amgen, Inc. | | | 25,673 | | | | 4,103,829 | |
Biogen, Inc.(a) | | | 12,820 | | | | 5,413,117 | |
Celgene Corp.(a) | | | 25,390 | | | | 2,926,959 | |
Gilead Sciences, Inc.(a) | | | 61,985 | | | | 6,082,588 | |
Pharmacyclics, Inc.(a) | | | 3,270 | | | | 836,957 | |
| | | | | | | | |
| | | | | | | 19,363,450 | |
| | | | | | | | |
Health Care Equipment & Supplies (2.79%) | | | | | |
CR Bard, Inc. | | | 17,630 | | | | 2,950,380 | |
Medtronic Plc | | | 38,550 | | | | 3,006,515 | |
| | | | | | | | |
| | | | | | | 5,956,895 | |
| | | | | | | | |
Health Care Providers & Services (0.34%) | | | | | |
Express Scripts Holding Co.(a) | | | 8,411 | | | | 729,822 | |
| | | | | | | | |
| | |
Pharmaceuticals (6.46%) | | | | | | | | |
AbbVie, Inc. | | | 49,791 | | | | 2,914,765 | |
Actavis Plc(a) | | | 10,270 | | | | 3,056,557 | |
Johnson & Johnson | | | 40,100 | | | | 4,034,060 | |
Merck & Co., Inc. | | | 44,187 | | | | 2,539,869 | |
Pfizer, Inc. | | | 35,025 | | | | 1,218,520 | |
| | | | | | | | |
| | | | | | | 13,763,771 | |
| | | | | | | | |
Total Health Care | | | | | | | 39,813,938 | |
| | | | | | | | |
| |
Industrials (9.44%) | | | | | |
Aerospace & Defense (2.56%) | | | | | |
General Dynamics Corp. | | | 17,190 | | | | 2,333,199 | |
Lockheed Martin Corp. | | | 3,542 | | | | 718,884 | |
Textron, Inc. | | | 54,060 | | | | 2,396,480 | |
| | | | | | | | |
| | | | | | | 5,448,563 | |
| | | | | | | | |
Air Freight & Logistics (1.34%) | | | | | |
CH Robinson Worldwide, Inc. | | | 39,010 | | | | 2,856,312 | |
| | | | | | | | |
| |
Industrial Conglomerates (2.28%) | | | | | |
3M Co. | | | 17,758 | | | | 2,929,182 | |
General Electric Co. | | | 78,115 | | | | 1,938,033 | |
| | | | | | | | |
| | | | | | | 4,867,215 | |
| | | | | | | | |
Machinery (1.24%) | | | | | | | | |
Illinois Tool Works, Inc. | | | 27,290 | | | | 2,650,951 | |
| | | | | | | | |
| | |
Road & Rail (2.02%) | | | | | | | | |
Union Pacific Corp. | | | 39,838 | | | | 4,314,854 | |
| | | | | | | | |
| | |
Total Industrials | | | | | | | 20,137,895 | |
| | | | | | | | |
| | |
| | |
| Semi-Annual Report | March 31, 2015 | | 21 |
| | |
| Centre American Select Equity Fund | | Schedule of Investments |
| | March 31, 2015 (Unaudited) |
| | | | | | | | |
| | | Shares | | | Value | |
Information Technology (30.88%) | | | | | | | | |
Communications Equipment (2.72%) | | | | | |
Cisco Systems, Inc. | | | 75,130 | | | $ | 2,067,953 | |
QUALCOMM, Inc. | | | 53,970 | | | | 3,742,280 | |
| | | | | | | | |
| | | | | | | 5,810,233 | |
| | | | | | | | |
Electronic Equipment & Instruments (0.95%) | | | | | | | | |
Corning, Inc. | | | 88,974 | | | | 2,017,930 | |
| | | | | | | | |
| | |
Internet Software & Services (5.53%) | | | | | | | | |
Facebook, Inc., Class A(a) | | | 54,750 | | | | 4,501,271 | |
Google, Inc., Class A(a) | | | 5,590 | | | | 3,100,773 | |
Google, Inc., Class C(a) | | | 7,636 | | | | 4,184,528 | |
| | | | | | | | |
| | | | | | | 11,786,572 | |
| | | | | | | | |
IT Services (2.89%) | | | | | | | | |
Mastercard, Inc., Class A | | | 25,360 | | | | 2,190,850 | |
Visa, Inc., Class A | | | 60,660 | | | | 3,967,771 | |
| | | | | | | | |
| | | | | | | 6,158,621 | |
| | | | | | | | |
Semiconductors & Semiconductor Equipment (6.75%) | | | | | |
Intel Corp. | | | 99,249 | | | | 3,103,516 | |
Linear Technology Corp. | | | 64,640 | | | | 3,025,152 | |
Micron Technology, Inc.(a) | | | 102,850 | | | | 2,790,320 | |
NVIDIA Corp. | | | 108,840 | | | | 2,277,477 | |
Texas Instruments, Inc. | | | 56,100 | | | | 3,208,079 | |
| | | | | | | | |
| | | | | | | 14,404,544 | |
| | | | | | | | |
Software (4.45%) | | | | | | | | |
Microsoft Corp. | | | 179,667 | | | | 7,304,362 | |
Oracle Corp. | | | 50,559 | | | | 2,181,621 | |
| | | | | | | | |
| | | | | | | 9,485,983 | |
| | | | | | | | |
Technology Hardware, Storage & Peripherals (7.59%) | | | | | |
Apple, Inc. | | | 112,138 | | | | 13,953,332 | |
EMC Corp. | | | 87,220 | | | | 2,229,343 | |
| | | | | | | | |
| | | | | | | 16,182,675 | |
| | | | | | | | |
Total Information Technology | | | | | | | 65,846,558 | |
| | | | | | | | |
| | |
Materials (4.57%) | | | | | | | | |
Chemicals (1.55%) | | | | | | | | |
International Flavors & Fragrances, Inc. | | | 28,190 | | | | 3,309,506 | |
| | | | | | | | |
| |
Construction Materials (1.79%) | | | | | |
Vulcan Materials Co. | | | 45,300 | | | | 3,818,790 | |
| | | | | | | | |
| | |
Metals & Mining (1.23%) | | | | | | | | |
Allegheny Technologies, Inc. | | | 86,850 | | | | 2,606,369 | |
| | | | | | | | |
| | |
Total Materials | | | | | | | 9,734,665 | |
| | | | | | | | |
| |
Telecommunication Services (0.33%) | | | | | |
Diversified Telecommunication (0.33%) | | | | | |
Verizon Communications, Inc. | | | 14,370 | | | | 698,813 | |
| | | | | | | | |
| |
Total Telecommunication Services | | | | 698,813 | |
| | | | | | | | |
| | |
| | | | | | | | |
TOTAL COMMON STOCKS (Cost $172,485,336) | | | | | | | 204,953,763 | |
| | | | | | | | |
| | | Shares | | | Value | |
RIGHTS (0.00%)(b) | | | | | | | | |
Casa Ley, CVR(a)(c)(d) | | | 2,960 | | | $ | 3,004 | |
PDC, CVR(a)(c)(d) | | | 2,960 | | | | 145 | |
| | | | | | | | |
| | | | | | | 3,149 | |
| | | | | | | | |
| |
| | | | | |
TOTAL RIGHTS (Cost $3,149) | | | | | | | 3,149 | |
| | |
| | Principal
Amount | | | Value | |
U.S. GOVERNMENT BONDS & NOTES (0.81%) | |
U.S. Treasury Bonds (0.33%) | | | | | |
8/15/2019, 8.125% | | $ | 550,000 | | | | 711,691 | |
| | | | | | | | |
| |
Total U.S. Treasury Bonds | | | | 711,691 | |
| | | | | | | | |
| |
U.S. Treasury Notes (0.48%) | | | | | |
1/31/2016, 2.000% | | | 1,000,000 | | | | 1,014,531 | |
| | | | | | | | |
| |
Total U.S. Treasury Notes | | | | 1,014,531 | |
| | | | | | | | |
| |
| | | | | |
TOTAL U.S. GOVERNMENT BONDS & NOTES (Cost $1,675,644) | | | | 1,726,222 | |
| | | | | | | | | | | | |
| | | | |
| | Expiration
Date | | Exercise Price | | | Contracts | | Value | |
PURCHASED OPTIONS (3.09%) | | | | | | | |
Puts (3.09%) | | | | | | | | | | | | |
S&P 500® Index: | | | | | | | | | | | | |
| | 1/15/2016 | | $ | 1,900.00 | | | 880 | | | 6,582,400 | |
| | | | | | | | | | | | |
| | | | |
Total Puts | | | | | | | | | | | 6,582,400 | |
| | | | | | | | | | | | |
| | | | |
| | | | | | | | | | | | |
TOTAL PURCHASED OPTIONS (Cost $5,639,046) | | | | | | 6,582,400 | |
| | |
TOTAL INVESTMENTS (100.01%) (Cost $179,803,175) | | | | | $ | 213,265,534 | |
Liabilities in Excess of Other Assets (-0.01%) | | | (24,248) | |
NET ASSETS (100.00%) | | | | | $ | 213,241,286 | |
| | | | | | | | | | | | | |
| (a) | Non-income producing security. |
| (c) | Security fair valued using methods determined in good faith by the Valuation Committee. As of March 31, 2015, the total market value of these securities was $3,149, representing less than 0.01% of net assets. |
| (d) | Security considered illiquid. On March 31, 2015, the total market value of these securities was $3,149, representing less than 0.01% of net assets. |
| | |
| Centre American Select Equity Fund | | Schedule of Investments |
| | March 31, 2015 (Unaudited) |
Securities are determined to be illiquid under the procedures approved by the Fund’s Board of Trustees. Information related to the illiquid securities is as follows:
| | | | | | | | | | | | |
Date(s) of Purchase | | Security | | Cost | | | Market
Value | | | % of Net
Assets |
1/30/2015 | | Casa Ley, CVR | | $ | 3,004 | | | $ | 3,004 | | | 0.00% |
1/30/2015 | | PDC, CVR | | | 145 | | | | 145 | | | 0.00% |
| | | | | | | | $ | 3,149 | | | 0.00% |
| | | | | | | | | | | | | |
Common Abbreviations:
CVR - Contingent Value Rights.
Plc - Public Limited Company.
S&P - Standard & Poor’s.
See Notes to Financial Statements.
| | |
| | |
| Semi-Annual Report | March 31, 2015 | | 23 |
| | |
| Centre Global Select Equity Fund | | Schedule of Investments |
| | March 31, 2015 (Unaudited) |
| | | | | | | | |
| | | Shares | | | Value | |
COMMON STOCKS (97.71%) | | | | | | | | |
AFRICA (0.48%) | | | | | | | | |
South Africa (0.48%) | | | | | | | | |
Financials (0.48%) | | | | | | | | |
Coronation Fund Managers, Ltd. | | | 12,300 | | | $ | 99,635 | |
| | | | | | | | |
| | |
Total South Africa | | | | | | | 99,635 | |
| | | | | | | | |
| | |
TOTAL AFRICA (Cost $112,607) | | | | | | | 99,635 | |
| | |
ASIA (48.77%) | | | | | | | | |
Australia (2.34%) | | | | | | | | |
Financials (1.43%) | | | | | | | | |
Westpac Banking Corp. | | | 9,800 | | | | 293,939 | |
| | | | | | | | |
| | |
Materials (0.91%) | | | | | | | | |
BHP Billiton, Ltd. | | | 7,942 | | | | 187,701 | |
| | | | | | | | |
| | |
Total Australia | | | | | | | 481,640 | |
| | | | | | | | |
| | |
China (12.60%) | | | | | | | | |
Consumer Staples (2.70%) | | | | | | | | |
Hengan International Group Co.,Ltd. | | | 26,040 | | | | 312,709 | |
Want Want China Holdings, Ltd. | | | 228,590 | | | | 242,665 | |
| | | | | | | | |
| | | | | | | 555,374 | |
| | | | | | | | |
Energy (1.04%) | | | | | | | | |
China Petroleum & Chemical Corp., Class H | | | 269,210 | | | | 214,253 | |
| | | | | | | | |
| | |
Financials (2.75%) | | | | | | | | |
Agricultural Bank of China, Ltd., Class H | | | 338,110 | | | | 167,471 | |
China Merchants Bank Co., Ltd., Class H | | | 80,380 | | | | 196,371 | |
China Pacific Insurance Group Co., Ltd., Class H | | | 42,460 | | | | 202,095 | |
| | | | | | | | |
| | | | | | | 565,937 | |
| | | | | | | | |
Health Care (1.42%) | | | | | | | | |
Roche Holding AG | | | 1,060 | | | | 292,432 | |
| | | | | | | | |
| | |
Industrials (1.27%) | | | | | | | | |
Zhejiang Expressway Co., Ltd., Class H | | | 197,000 | | | | 261,222 | |
| | | | | | | | |
| | |
Information Technology (3.42%) | | | | | | | | |
NetEase, Inc., ADR | | | 2,020 | | | | 212,706 | |
Tencent Holdings, Ltd. | | | 25,900 | | | | 491,765 | |
| | | | | | | | |
| | | | | | | 704,471 | |
| | | | | | | | |
Total China | | | | | | | 2,593,689 | |
| | | | | | | | |
| | |
Hong Kong (7.58%) | | | | | | | | |
Financials (1.76%) | | | | | | | | |
China Overseas Land & Investment, Ltd. | | | 68,920 | | | | 222,691 | |
Yuexiu Property Co., Ltd. | | | 709,920 | | | | 139,189 | |
| | | | | | | | |
| | | | | | | 361,880 | |
| | | | | | | | |
| | |
Industrials (1.28%) | | | | | | | | |
Shanghai Industrial Holdings, Ltd. | | | 85,370 | | | | 263,180 | |
| | | | | | | | |
| | | | | | | | |
| | | Shares | | | Value | |
Hong Kong (continued) | | | | | | | | |
Telecommunication Services (2.69%) | | | | | |
China Mobile, Ltd. | | | 42,330 | | | $ | 552,559 | |
| | | | | | | | |
| | |
Utilities (1.85%) | | | | | | | | |
China Gas Holdings, Ltd. | | | 119,060 | | | | 195,038 | |
China Resources Power Holdings Co., Ltd. | | | 74,100 | | | | 185,999 | |
| | | | | | | | |
| | | | | | | 381,037 | |
| | | | | | | | |
Total Hong Kong | | | | | | | 1,558,656 | |
| | | | | | | | |
| | |
India (7.40%) | | | | | | | | |
Consumer Discretionary (1.18%) | | | | | |
Tata Motors, Ltd., Sponsored ADR | | | 5,360 | | | | 241,522 | |
| | | | | | | | |
| | |
Energy (0.78%) | | | | | | | | |
Reliance Industries, Ltd., Sponsored GDR(a) | | | 6,030 | | | | 159,493 | |
| | | | | | | | |
| | |
Financials (1.84%) | | | | | | | | |
HDFC Bank, Ltd., ADR | | | 6,440 | | | | 379,252 | |
| | | | | | | | |
| | |
Health Care (1.34%) | | | | | | | | |
Dr. Reddy’s Laboratories, Ltd., ADR | | | 4,840 | | | | 276,364 | |
| | | | | | | | |
| |
Information Technology (2.26%) | | | | | |
Infosys, Ltd., Sponsored ADR | | | 13,260 | | | | 465,161 | |
| | | | | | | | |
| | |
Total India | | | | | | | 1,521,792 | |
| | | | | | | | |
| | |
Japan (14.12%) | | | | | | | | |
Consumer Discretionary (3.80%) | | | | | |
Bridgestone Corp. | | | 8,620 | | | | 346,137 | |
Sony Corp.(b) | | | 7,600 | | | | 202,143 | |
Sumitomo Electric Industries, Ltd. | | | 17,790 | | | | 233,620 | |
| | | | | | | | |
| | | | | | | 781,900 | |
| | | | | | | | |
Financials (2.94%) | | | | | | | | |
Mitsubishi UFJ Financial Group, Inc. | | | 54,000 | | | | 334,846 | |
Sumitomo Mitsui Financial Group, Inc. | | | 7,040 | | | | 270,101 | |
| | | | | | | | |
| | | | | | | 604,947 | |
| | | | | | | | |
Industrials (3.45%) | | | | | | | | |
ITOCHU Corp. | | | 22,430 | | | | 243,404 | |
Japan Airlines Co., Ltd. | | | 8,142 | | | | 253,897 | |
Mitsubishi Electric Corp. | | | 17,800 | | | | 212,009 | |
| | | | | | | | |
| | | | | | | 709,310 | |
| | | | | | | | |
Information Technology (2.74%) | | | | | |
Hirose Electric Co., Ltd. | | | 809 | | | | 104,758 | |
Hitachi High-Technologies Corp. | | | 7,300 | | | | 223,075 | |
Murata Manufacturing Co., Ltd. | | | 1,710 | | | | 235,751 | |
| | | | | | | | |
| | | | | | | 563,584 | |
| | | | | | | | |
Telecommunication Services (1.19%) | | | | | |
SoftBank Corp. | | | 4,230 | | | | 246,178 | |
| | | | | | | | |
| | |
Total Japan | | | | | | | 2,905,919 | |
| | | | | | | | |
| | |
| Centre Global Select Equity Fund | | Schedule of Investments |
| | March 31, 2015 (Unaudited) |
| | | | | | | | |
| | Shares | | | Value | |
Korea (1.70%) | | | | | | | | |
Information Technology (1.70%) | | | | | | | | |
Samsung Electronics Co., Ltd. | | | 270 | | | $ | 350,687 | |
| | | | | | | | |
| | |
Total Korea | | | | | | | 350,687 | |
| | | | | | | | |
| | |
Philippines (0.61%) | | | | | | | | |
Industrials (0.61%) | | | | | | | | |
International Container Terminal Services, Inc. | | | 51,920 | | | | 125,444 | |
| | | | | | | | |
| | |
Total Philippines | | | | | | | 125,444 | |
| | | | | | | | |
| | |
Singapore (0.74%) | | | | | | | | |
Industrials (0.74%) | | | | | | | | |
ComfortDelGro Corp., Ltd. | | | 72,550 | | | | 152,781 | |
| | | | | | | | |
| | |
Total Singapore | | | | | | | 152,781 | |
| | | | | | | | |
| | |
Taiwan (1.68%) | | | | | | | | |
Information Technology (1.68%) | | | | | | | | |
Taiwan Semiconductor Manufacturing Co., Ltd. | | | 74,130 | | | | 344,708 | |
| | | | | | | | |
| | |
Total Taiwan | | | | | | | 344,708 | |
| | | | | | | | |
| | |
TOTAL ASIA (Cost $9,533,491) | | | | | | | 10,035,316 | |
| | |
| | |
EUROPE (38.46%) | | | | | | | | |
Belgium (0.75%) | | | | | | | | |
Materials (0.75%) | | | | | | | | |
Solvay SA | | | 1,070 | | | | 154,802 | |
| | | | | | | | |
| | |
Total Belgium | | | | | | | 154,802 | |
| | | | | | | | |
| | |
Denmark (2.39%) | | | | | | | | |
Health Care (2.39%) | | | | | | | | |
Novo Nordisk A/S, Class B | | | 9,187 | | | | 491,831 | |
| | | | | | | | |
| | |
Total Denmark | | | | | | | 491,831 | |
| | | | | | | | |
| | |
Finland (1.34%) | | | | | | | | |
Industrials (1.34%) | | | | | | | | |
Kone OYJ, Class B | | | 6,225 | | | | 276,305 | |
| | | | | | | | |
| | |
Total Finland | | | | | | | 276,305 | |
| | | | | | | | |
| | |
France (5.34%) | | | | | | | | |
Consumer Discretionary (1.13%) | | | | | | | | |
Cie Generale des Etablissements Michelin | | | 2,341 | | | | 233,114 | |
| | | | | | | | |
| | |
Energy (1.07%) | | | | | | | | |
TOTAL SA | | | 4,420 | | | | 219,927 | |
| | | | | | | | |
| | | | | | | | |
| | Shares | | | Value | |
France (continued) | | | | | | | | |
Financials (0.86%) | | | | | | | | |
AXA SA | | | 6,980 | | | $ | 176,036 | |
| | | | | | | | |
| | |
Industrials (0.96%) | | | | | | | | |
Safran SA | | | 2,840 | | | | 198,491 | |
| | | | | | | | |
| | |
Utilities (1.32%) | | | | | | | | |
GDF Suez | | | 13,740 | | | | 271,914 | |
| | | | | | | | |
| | |
Total France | | | | | | | 1,099,482 | |
| | | | | | | | |
| | |
Germany (6.30%) | | | | | | | | |
Consumer Discretionary (0.96%) | | | | | |
Daimler AG | | | 2,050 | | | | 197,789 | |
| | | | | | | | |
| | |
Financials (1.07%) | | | | | | | | |
Muenchener Rueckversicherungs-Gesellschaft AG in Muenchen | | | 1,020 | | | | 220,174 | |
| | | | | | | | |
| |
Information Technology (2.30%) | | | | | |
Infineon Technologies AG | | | 29,020 | | | | 347,298 | |
SAP SE | | | 1,732 | | | | 125,763 | |
| | | | | | | | |
| | | | | | | 473,061 | |
| | | | | | | | |
Materials (0.65%) | | | | | | | | |
Linde AG | | | 660 | | | | 134,588 | |
| | | | | | | | |
| |
Telecommunication Services (1.32%) | | | | | |
Deutsche Telekom AG | | | 14,760 | | | | 270,595 | |
| | | | | | | | |
| | |
Total Germany | | | | | | | 1,296,207 | |
| | | | | | | | |
| | |
Great Britain (5.50%) | | | | | | | | |
Consumer Staples (1.65%) | | | | | | | | |
Unilever NV | | | 8,100 | | | | 338,931 | |
| | | | | | | | |
| | |
Energy (1.13%) | | | | | | | | |
BP Plc | | | 35,917 | | | | 232,671 | |
| | | | | | | | |
| | |
Materials (1.04%) | | | | | | | | |
Rio Tinto, Ltd. | | | 4,910 | | | | 214,023 | |
| | | | | | | | |
| |
Telecommunication Services (1.68%) | | | | | |
BT Group Plc | | | 53,250 | | | | 345,981 | |
| | | | | | | | |
| | |
Total Great Britain | | | | | | | 1,131,606 | |
| | | | | | | | |
| | |
Israel (1.38%) | | | | | | | | |
Health Care (1.38%) | | | | | | | | |
Teva Pharmaceutical Industries, Ltd., Sponsored ADR | | | 4,560 | | | | 284,088 | |
| | | | | | | | |
| | |
Total Israel | | | | | | | 284,088 | |
| | | | | | | | |
| | |
Italy (4.79%) | | | | | | | | |
Financials (4.79%) | | | | | | | | |
Assicurazioni Generali SpA | | | 11,720 | | | | 230,741 | |
Intesa Sanpaolo SpA | | | 153,350 | | | | 522,041 | |
| | |
| | |
| Semi-Annual Report | March 31, 2015 | | 25 |
| | |
| Centre Global Select Equity Fund | | Schedule of Investments |
| | March 31, 2015 (Unaudited) |
| | | | | | | | |
| | | Shares | | | Value | |
Italy (continued) | | | | | | | | |
Financials (continued) | | | | | | | | |
UniCredit SpA | | | 34,310 | | | $ | 233,525 | |
| | | | | | | | |
| | | | | | | 986,307 | |
| | | | | | | | |
Total Italy | | | | | | | 986,307 | |
| | | | | | | | |
| | |
Norway (0.71%) | | | | | | | | |
Energy (0.71%) | | | | | | | | |
Statoil ASA | | | 8,220 | | | | 145,713 | |
| | | | | | | | |
| | |
Total Norway | | | | | | | 145,713 | |
| | | | | | | | |
| | |
Russia (1.24%) | | | | | | | | |
Energy (0.40%) | | | | | | | | |
NOVATEK OAO, Sponsored GDR(c) | | | 1,090 | | | | 81,750 | |
| | | | | | | | |
| |
Telecommunication Services (0.84%) | | | | | |
Mobile Telesystems OJSC, Sponsored ADR | | | 17,200 | | | | 173,720 | |
| | | | | | | | |
| | |
Total Russia | | | | | | | 255,470 | |
| | | | | | | | |
| | |
Spain (3.75%) | | | | | | | | |
Financials (1.92%) | | | | | | | | |
Banco Bilbao Vizcaya Argentaria SA | | | 39,169 | | | | 396,232 | |
| | | | | | | | |
| |
Utilities (1.83%) | | | | | |
Iberdrola SA | | | 58,294 | | | | 376,209 | |
| | | | | | | | |
| | |
Total Spain | | | | | | | 772,441 | |
| | | | | | | | |
| | |
Sweden (1.75%) | | | | | | | | |
Industrials (1.75%) | | | | | | | | |
Securitas AB, B Shares | | | 25,000 | | | | 359,086 | |
| | | | | | | | |
| | |
Total Sweden | | | | | | | 359,086 | |
| | | | | | | | |
| | |
Switzerland (2.13%) | | | | | | | | |
Financials (2.13%) | | | | | | | | |
Zurich Insurance Group AG | | | 1,290 | | | | 437,124 | |
| | | | | | | | |
| | |
Total Switzerland | | | | | | | 437,124 | |
| | | | | | | | |
| | |
Turkey (1.09%) | | | | | | | | |
Consumer Staples (1.09%) | | | | | | | | |
BIM Birlesik Magazalar AS | | | 12,600 | | | | 223,507 | |
| | | | | | | | |
| | |
Total Turkey | | | | | | | 223,507 | |
| | | | | | | | |
| | |
TOTAL EUROPE (Cost $7,880,562) | | | | | | | 7,913,969 | |
| | |
| | |
NORTH AMERICA (6.87%) | | | | | | | | |
Canada (4.05%) | | | | | | | | |
Financials (2.47%) | | | | | | | | |
Royal Bank of Canada | | | 3,950 | | | | 237,770 | |
Toronto-Dominion Bank | | | 6,310 | | | | 270,076 | |
| | | | | | | | |
| | | | | | | 507,846 | |
| | | | | | | | |
| | | | | | | | |
| | | Shares | | | Value | |
Canada (continued) | | | | | | | | |
Information Technology (1.58%) | | | | | |
Lenovo Group, Ltd. | | | 222,940 | | | $ | 325,525 | |
| | | | | | | | |
| | |
Total Canada | | | | | | | 833,371 | |
| | | | | | | | |
| | |
Mexico (2.82%) | | | | | | | | |
Consumer Staples (0.91%) | | | | | | | | |
Fomento Economico Mexicano SAB de CV(b) | | | 20,210 | | | | 188,923 | |
| | | | | | | | |
| | |
Financials (0.76%) | | | | | | | | |
Grupo Financiero Banorte SAB de CV | | | 26,950 | | | | 156,257 | |
| | | | | | | | |
| |
Telecommunication Services (1.15%) | | | | | |
Grupo Televisa SAB(b) | | | 35,800 | | | | 236,320 | |
| | | | | | | | |
| | |
Total Mexico | | | | | | | 581,500 | |
| | | | | | | | |
| | |
TOTAL NORTH AMERICA (Cost $1,556,463) | | | | | | | 1,414,871 | |
| | |
| | |
SOUTH AMERICA (3.13%) | | | | | | | | |
Brazil (3.13%) | | | | | | | | |
Consumer Staples (1.39%) | | | | | | | | |
Ambev SA | | | 49,300 | | | | 284,843 | |
| | | | | | | | |
| | |
Materials (1.74%) | | | | | | | | |
Fibria Celulose SA, Sponsored ADR(b) | | | 25,390 | | | | 358,761 | |
| | | | | | | | |
| | |
Total Brazil | | | | | | | 643,604 | |
| | | | | | | | |
| | |
TOTAL SOUTH AMERICA (Cost $616,610) | | | | | | | 643,604 | |
| | |
| | | | | | | | |
| | |
TOTAL COMMON STOCKS (Cost $19,699,733) | | | | | | | 20,107,395 | |
| | |
| |
PREFERRED STOCKS (1.00%) | | | | | |
SOUTH AMERICA (1.00%) | | | | | |
Brazil (1.00%) | | | | | | | | |
Financials (0.58%) | | | | | | | | |
Banco Bradesco SA | | | 12,696 | | | | 117,868 | |
| | | | | | | | |
| | |
Materials (0.42%) | | | | | | | | |
Vale SA | | | 17,900 | | | | 86,821 | |
| | | | | | | | |
| | |
Total Brazil | | | | | | | 204,689 | |
| | | | | | | | |
| | |
TOTAL SOUTH AMERICA (Cost $381,898) | | | | | | | 204,689 | |
| | |
| | | | | | | | |
| | |
TOTAL PREFERRED STOCKS (Cost $381,898) | | | | | | | 204,689 | |
| | |
| | |
| Centre Global Select Equity Fund | | Schedule of Investments |
| | March 31, 2015 (Unaudited) |
| | | | | | | | | | | | |
| | 7-Day
Yield | | | Shares | | | Value | |
SHORT TERM INVESTMENTS (1.02%) | |
Money Market Fund (1.02%) | |
Dreyfus Treasury Prime Cash
Management,
Institutional Class | | | 0.00004 | % | | | 210,716 | | | $ | 210,716 | |
| | | | | | | | | | | | |
| | | |
| | | | | | | | | | | | | |
TOTAL SHORT TERM INVESTMENTS (Cost $210,716) | | | | 210,716 | |
| |
TOTAL INVESTMENTS (99.73%) (Cost $20,292,347) | | | $ | 20,522,800 | |
Other Assets In Excess Of Liabilities (0.27%) | | | | 55,721 | |
NET ASSETS (100.00%) | | | | | | | | | | $ | 20,578,521 | |
| | | | | | | | | | | | | |
| (a) | Security exempt from registration under Rule 144A of the Securities Act of 1933. These securities may be resold in transactions exempt from registration, normally to qualified institutional buyers. At March 31, 2015, these securities amount to a value of $159,493 or 0.78% of net assets. |
| (b) | Non-income producing security. |
| (c) | Securities were purchased pursuant to Regulation S under the Securities Act of 1933, which exempts securities offered and sold outside the United States from registration. Such securities cannot be sold in the United States without either an effective registration statement filed pursuant to Securities Act of 1933, or pursuant to an exemption from registration. These securities have been deemed liquid under guidelines approved by the Fund’s Board of Trustees. At period end, the aggregate market value of those securities was $81,750, representing 0.40% of net assets. |
Common Abbreviations:
| AB | - Aktiebolag is the Swedish equivalent of the term corporation. |
| ADR | - American Depositary Receipt. |
| AG | - Aktiengesellschaft is a German term that refers to a corporation that is limited by shares, i.e., owned by shareholders. |
| A/S | - Aktieselskab is the Danish term for Joint Stock Company. |
| AS | - Anonim Sirketi, Joint Stock Company in Turkey. |
| ASA | - Allmennaksjeselskap in the Norwegian term for public limited company. |
| GDR | - Global Depositary Receipt. |
| NV | - Naamloze Vennootschap is the Dutch term for a public limited liability corporation. |
| OAO | - Otkrytoe Aktsionernoe Obschestvo (a Russian open joint stock corporation) |
| OJSC | - Open Joint Stock Company. |
| OYJ | - Osakeyhtio is the Finnish equivalent of a public limited company. |
| Plc | - Public Limited Company. |
| SA | - Generally designates corporations in various countries, mostly those employing the civil law. |
| SAB | - Sociedad Anonima Busatil is the Spanish term used for publicly held company. |
| SAB | de CV - A variable capital company. |
| SE | - SE Regulation. A European Company which can operate on a Europe-wide basis and be governed by Community law directly applicable in all Member States. |
| SpA | - Societa Per Azioni is an Italian shared company. |
| UFJ | - United Financial of Japan. |
See Notes to Financial Statements.
| | |
| | |
| Semi-Annual Report | March 31, 2015 | | 27 |
| | |
| Centre Active U.S. Treasury Fund | | Schedule of Investments |
| | March 31, 2015 (Unaudited) |
| | | | | | | | | | | | |
| | | | | | Principal
Amount | | | Value | |
U.S. GOVERNMENT BONDS & NOTES (67.41%) | |
U.S. Treasury Bonds (50.42%) | | | | | |
5/15/2017, 8.750% | | | $ | 8,000,000 | | | $ | 9,374,376 | |
8/15/2017, 8.875% | | | | 5,700,000 | | | | 6,803,486 | |
8/15/2019, 8.125% | | | | 13,000,000 | | | | 16,821,792 | |
2/15/2020, 8.500% | | | | 6,000,000 | | | | 8,032,968 | |
8/15/2020, 8.750% | | | | 13,300,000 | | | | 18,347,762 | |
| | | | | | | | | | | | |
Total U.S. Treasury Bonds | | | | 59,380,384 | |
| | | | | | | | | | | | |
| |
U.S. Treasury Notes (16.99%) | | | | | |
1/31/2019, 1.250% | | | | 15,735,000 | | | | 15,792,779 | |
7/31/2019, 1.625% | | | | 1,900,000 | | | | 1,928,351 | |
7/31/2021, 2.250% | | | | 2,200,000 | | | | 2,281,640 | |
| | | | | | | | | | | | |
Total U.S. Treasury Notes | | | | 20,002,770 | |
| | | | | | | | | | | | |
| | | |
| | | | | | | | | | | | | |
TOTAL U.S. GOVERNMENT BONDS & NOTES (Cost $74,906,753) | | | | 79,383,154 | |
| | | | |
| | | | | | | | | | | | |
| | | |
| | 7-Day
Yield | | | Shares | | | Value | |
SHORT TERM INVESTMENTS (27.73%) | |
Money Market Fund (27.73%) | |
Dreyfus Treasury Prime Cash Management, Institutional Class | | | 0.00004 | % | | | 32,653,599 | | | | 32,653,599 | |
| | | | | | | | | | | | |
| | | |
| | | | | | | | | | | | | |
TOTAL SHORT TERM INVESTMENTS (Cost $32,653,599) | | | | 32,653,599 | |
| | | | |
| | | | | | | | | | | | |
| |
TOTAL INVESTMENTS (95.14%) (Cost $107,560,352) | | | $ | 112,036,753 | |
| |
Other Assets In Excess Of Liabilities (4.86%) | | | | 5,720,243 (a) | |
| | | | | | | | | | | | | |
NET ASSETS (100.00%) | | | $ | 117,756,996 | |
| | | | | | | | | | | | | |
| (a) | Includes cash which is being held as collateral for futures contracts. |
FUTURES CONTRACTS
At March 31, 2015, the Fund had outstanding futures contracts:
| | | | | | | | | | | | | | |
| Description | | Position | | Contracts | | Expiration
Date | | Underlying
Face Amount at
Value | | | Unrealized
Appreciation/
(Depreciation) | |
Fixed Income Contracts | | | | | |
U.S. 10 Year Treasury Note Future | | Short | | 20 | | 6/22/2015 | | $ | (2,578,126) | | | $ | (24,093) | |
U.S. 2 Year Treasury Note Future | | Short | | 122 | | 7/01/2015 | | | (26,737,056) | | | | (90,559) | |
U.S. 5 Year Treasury Note Future | | Short | | 439 | | 7/01/2015 | | | (52,772,585) | | | | (463,968) | |
| | | | | | | | | | | | | | |
| | | | | | | | $ | (82,087,789) | | | $ | (578,620) | |
| | | | | | | | | | | | | | |
See Notes to Financial Statements.
| | |
| Centre Active U.S. Tax Exempt Fund | | Schedule of Investments |
| | March 31, 2015 (Unaudited) |
| | | | | | | | |
| | | Principal | | | | |
| | | Amount | | | Value | |
MUNICIPAL BONDS (86.74%) | | | | | | | | |
General Obligation (41.48%) | | | | | | | | |
Baltimore County, MD
8/1/2022, 4.000% | | $ | 1,665,000 | | | $ | 1,880,667 | |
City of Columbus, OH, Series 1 7/1/2029, 4.000% | | | 500,000 | | | | 548,085 | |
Delaware State, Series B
7/1/2019, 3.000% | | | 1,400,000 | | | | 1,507,982 | |
Delaware State, Series A
8/1/2026, 3.000% | | | 1,500,000 | | | | 1,579,065 | |
Fairfax County, VA, Series A
10/1/2027, 3.000% | | | 2,000,000 | | | | 2,089,140 | |
Georgia State
10/1/2023, 4.125% | | | 2,000,000 | | | | 2,113,980 | |
Georgia State, Series B
4/1/2025, 4.250% | | | 1,120,000 | | | | 1,194,838 | |
Mecklenburg County, NC
2/1/2026, 3.500% | | | 2,000,000 | | | | 2,228,680 | |
Mecklenburg County, NC, Series A 4/1/2030, 3.000% | | | 1,500,000 | | | | 1,512,915 | |
Prince George’s County, MD, Public Improvements
7/15/2026, 4.125% | | | 2,000,000 | | | | 2,167,140 | |
Utah State, Series A
7/1/2023, 5.000% | | | 2,785,000 | | | | 3,342,975 | |
Wake County, NC, Series A
5/1/2029, 3.000% | | | 2,525,000 | | | | 2,555,755 | |
Washington, MD, Suburban Sanitation District, Public Improvements 6/1/2026, 3.000% | | | 2,000,000 | | | | 2,081,080 | |
Total General Obligation | | | | | | | 24,802,302 | |
| | | | | | | | |
| | |
Prerefunded Issues(a) (29.06%) | | | | | | | | |
Fairfax County, VA, Water Authority Water Revenue, 04/01/17 @ 100
4/1/2027, 4.500% | | | 355,000 | | | | 383,219 | |
Henrico County, VA, Public Improvements, 07/15/17 @ 100
7/15/2024, 4.250% | | | 2,830,000 | | | | 2,863,083 | |
Kansas State, Development Finance Authority, DW-1, 01/01/17 @ 100
4/1/2020, 3.000% | | | 2,865,000 | | | | 2,960,003 | |
Kansas State, Development Finance Authority, DW-1, 01/01/99 @ 100 4/1/2022, 3.125% | | | 2,975,000 | | | | 3,124,315 | |
Tennessee State, Series A, 05/01/17
@ 100
5/1/2026, 5.000% | | | 500,000 | | | | 546,555 | |
5/1/2027, 5.000% | | | 2,075,000 | | | | 2,268,203 | |
| | | | | | | | |
| | | | | | | 2,814,758 | |
| | | | | | | | |
Virginia State, Series B, 06/01/16
@ 100
6/1/2026, 4.250% | | | 2,500,000 | | | | 2,615,875 | |
| | | | | | | | | | | | |
| | | | | | Principal | | | | |
| | | | | | Amount | | | Value | |
Prerefunded Issues(a) (continued) | | | | | |
Washington, MD, Suburban Sanitation District, Water Supply, 06/01/16 @100 6/1/2026, 4.250% | | | $ | 2,500,000 | | | $ | 2,615,875 | |
Total Prerefunded Issues | | | | 17,377,128 | |
| | | | | | | | | | | | |
| |
Revenue Bonds (16.20%) | | | | | |
Fairfax County, VA, Water Authority Water Revenue 4/1/2027, 4.500% | | | | 2,145,000 | | | | 2,285,841 | |
Gwinnett County, GA, Water & Sewerage Authority, Series A 8/1/2028, 4.000% | | | | 2,000,000 | | | | 2,165,860 | |
North Carolina State, Series B 6/1/2026, 5.000% | | | | 1,500,000 | | | | 1,891,560 | |
Virginia State, Resources Authority Clean Water Revenue
10/1/2028, 4.500% | | | | 3,000,000 | | | | 3,341,340 | |
Total Revenue Bonds | | | | | | | | 9,684,601 | |
| | | | | | | | | | | | |
| | | |
| | | | | | | | | | | | | |
TOTAL MUNICIPAL BONDS (Cost $49,011,183) | | | | 51,864,031 | |
| | | |
| | | | | | | | | | | | |
| | | |
| | 7-Day
Yield | | | Shares | | | Value | |
SHORT TERM INVESTMENTS (7.77%) | |
Money Market Fund (7.77%) | |
Dreyfus Treasury Prime Cash Management, Institutional Class | | | 0.00004 | % | | | 4,645,048 | | | | 4,645,048 | |
| | | | | | | | | | | | |
| | | |
| | | | | | | | | | | | | |
TOTAL SHORT TERM INVESTMENTS (Cost $4,645,048) | | | | 4,645,048 | |
| | | | |
| | | | | | | | | | | | |
| |
TOTAL INVESTMENTS (94.51%) (Cost $53,656,231) | | | $ | 56,509,079 | |
Other Assets In Excess Of Liabilities (5.49%) | | | | 3,281,929 (b) | |
| | | | | | | | | | | | | |
NET ASSETS (100.00%) | | | $ | 59,791,008 | |
| | | | | | | | | | | | | |
| (a) | Prerefunded Issues are bonds which are prerefunded and collateralized by U.S. Treasury securities held in escrow and used to pay principal and interest on tax-exempt issues and to retire the bonds in full at the earliest refunding date. |
| (b) | Includes cash which is being held as collateral for futures contracts. |
| | |
| | |
| Semi-Annual Report | March 31, 2015 | | 29 |
| | |
| Centre Active U.S. Tax Exempt Fund | | Schedule of Investments |
| | March 31, 2015 (Unaudited) |
FUTURES CONTRACTS
At March 31, 2015, the Fund had outstanding futures contracts:
| | | | | | | | | | | | | | | | |
| Description | | Position | | Contracts | | Expiration
Date | | | Underlying
Face Amount at
Value | | | Unrealized
Appreciation/
(Depreciation) | |
Fixed Income Contracts | | | | | |
U.S. 10 Year Treasury Note Future | | Short | | 70 | | | 6/22/2015 | | | $ | (9,023,441) | | | $ | (19,443) | |
U.S. 2 Year Treasury Note Future | | Short | | 60 | | | 7/01/2015 | | | | (13,149,372) | | | | (6,225) | |
U.S. 5 Year Treasury Note Future | | Short | | 75 | | | 7/01/2015 | | | | (9,015,818) | | | | (13,308) | |
| | | | | | | | | | | | | | | | |
| | | | | | | | | | $ | (31,188,633) | | | $ | (38,975) | |
| | | | | | | | | | | | | | | | |
See Notes to Financial Statements.
| | |
| Centre Multi-Asset Real Return Fund | | Schedule of Investments |
| | March 31, 2015 (Unaudited) |
| | | | | | | | | | | | |
| | | | | | Shares | | | Value | |
EXCHANGE-TRADED FUNDS (5.12%) | | | | | |
SPDR® Gold Shares(a) | | | | | | | 26,300 | | | $ | 2,989,258 | |
| | | |
| | | | | | | | | | | | | |
TOTAL EXCHANGE-TRADED FUNDS (Cost $3,138,312) | | | | 2,989,258 | |
| | | | |
| | | | | | | | | | | | |
OPEN-END FUNDS (94.85%) | | | | | |
Centre Active U.S. Treasury Fund, Institutional Class(b) | | | | 1,713,323 | | | | 17,287,425 | |
Centre American Select Equity Fund, Institutional Class(b) | | | | 1,448,641 | | | | 17,528,551 | |
Centre Global Select Equity Fund, Institutional Class(b) | | | | 1,992,952 | | | | 20,547,337 | |
| | | |
| | | | | | | | | | | | | |
TOTAL OPEN-END FUNDS (Cost $58,386,466) | | | | 55,363,313 | |
| | | | |
| | | | | | | | | | | | |
| | | |
| | 7-Day
Yield | | | Shares | | | Value | |
SHORT TERM INVESTMENTS (0.12%) | | | | | |
Money Market Fund (0.12%) | | | | | |
Dreyfus Treasury Prime Cash Management, Institutional Class | | | 0.00004 | % | | | 73,101 | | | | 73,101 | |
| | | | | | | | | | | | |
| | | |
| | | | | | | | | | | | | |
TOTAL SHORT TERM INVESTMENTS (Cost $73,101) | | | | 73,101 | |
| | | | |
| | | | | | | | | | | | |
TOTAL INVESTMENTS (100.09%) (Cost $61,597,879) | | | $ | 58,425,672 | |
Liabilities in Excess of Other Assets (-0.09%) | | | | (55,417 | ) |
| | | | | | | | | | | | | |
NET ASSETS (100.00%) | | | | | | | | | | $ | 58,370,255 | |
| | | | | | | | | | | | | |
| (a) | Non-income producing security. |
| (b) | Affiliated with the Fund, as each is a series of Centre Funds and has the same investment adviser. |
Common Abbreviations:
SPDR - Standard & Poor’s Depositary Receipts.
See Notes to Financial Statements.
| | |
| | |
| Semi-Annual Report | March 31, 2015 | | 31 |
| | |
| Centre Funds | | Statements of Assets and Liabilities |
| | March 31, 2015 (Unaudited) |
| | | | | | | | | | | | | | | | | | | | |
| | | Centre American
Select Equity
Fund | | | Centre Global
Select Equity
Fund | | | Centre Active
U.S. Treasury
Fund | | | Centre Active
U.S. Tax Exempt
Fund | | | Centre Multi-
Asset Real
Return Fund | |
ASSETS: | | | | | | | | | | | | | | | | | | | | |
Investments, at value | | $ | 213,265,534 | | | $ | 20,522,800 | | | $ | 112,036,753 | | | $ | 56,509,079 | | | $ | 3,062,359 | |
Investments in affiliates, at value | | | – | | | | – | | | | – | | | | – | | | | 55,363,313 | |
Foreign currency, at value (Cost $–, $4,889, $–, $– and $–, respectively) | | | – | | | | 4,889 | | | | – | | | | – | | | | – | |
Receivable for dividends and interest | | | 218,123 | | | | 63,368 | | | | 713,090 | | | | 622,272 | | | | 11,171 | |
Deposit with broker for futures contracts | | | – | | | | – | | | | 6,000,000 | | | | 2,750,000 | | | | – | |
Receivable for investments sold | | | 1,255,583 | | | | – | | | | – | | | | – | | | | – | |
Receivable for shares sold | | | 4,131 | | | | – | | | | – | | | | – | | | | – | |
Prepaid and other assets | | | 42,566 | | | | 16,273 | | | | 72,404 | | | | 67,099 | | | | 18,333 | |
| | | | | | | | | | | | | | | | | | | | |
Total Assets | | | 214,785,937 | | | | 20,607,330 | | | | 118,822,247 | | | | 59,948,450 | | | | 58,455,176 | |
| | | | | | | | | | | | | | | | | | | | |
LIABILITIES: | | | | | | | | | | | | | | | | | | | | |
| | | | | |
Payable to custodian | | | 1,094,507 | | | | – | | | | – | | | | – | | | | – | |
Variation margin payable | | | – | | | | – | | | | 578,620 | | | | 38,975 | | | | – | |
Payable to administrator | | | 26,841 | | | | 5,923 | | | | 7,480 | | | | 3,269 | | | | 6,861 | |
Payable to transfer agency | | | 17,030 | | | | 2,062 | | | | 17,063 | | | | 4,073 | | | | 2,059 | |
Payable for shares redeemed | | | 192,461 | | | | – | | | | 380,706 | | | | 75,735 | | | | – | |
Payable to investment adviser | | | 71,931 | | | | 4,225 | | | | 19,724 | | | | 8,812 | | | | 37,630 | |
Accrued 12b-1 fees (Investor Class) | | | 32,536 | | | | – | | | | 9,634 | | | | 5,050 | | | | – | |
Payable for custodian fees | | | 8,799 | | | | 160 | | | | 2,869 | | | | 1,254 | | | | 1,012 | |
Payable for printing | | | 11,457 | | | | 1,235 | | | | 5,680 | | | | 3,193 | | | | 3,481 | |
Payable for legal and audit fees | | | 79,014 | | | | 11,317 | | | | 29,298 | | | | 9,673 | | | | 31,507 | |
Payable to trustees | | | 3,567 | | | | 21 | | | | 7,010 | | | | 3,408 | | | | 63 | |
Payable under the Chief Compliance Officer Services Agreement | | | 5,101 | | | | 355 | | | | 4,167 | | | | 2,033 | | | | 1,300 | |
Other payables | | | 1,407 | | | | 3,511 | | | | 3,000 | | | | 1,967 | | | | 1,008 | |
| | | | | | | | | | | | | | | | | | | | |
Total Liabilities | | | 1,544,651 | | | | 28,809 | | | | 1,065,251 | | | | 157,442 | | | | 84,921 | |
| | | | | | | | | | | | | | | | | | | | |
NET ASSETS | | $ | 213,241,286 | | | $ | 20,578,521 | | | $ | 117,756,996 | | | $ | 59,791,008 | | | $ | 58,370,255 | |
| | | | | | | | | | | | | | | | | | | | |
NET ASSETS CONSIST OF: | | | | | | | | | | | | | | | | | | | | |
| | | | | |
Paid-in capital | | $ | 164,191,191 | | | $ | 21,085,093 | | | $ | 116,328,983 | | | $ | 56,874,064 | | | $ | 60,173,537 | |
Accumulated net investment income/(loss) | | | (942,523) | | | | 41,105 | | | | (9,726) | | | | 798 | | | | 1,146,603 | |
Accumulated net realized gain/(loss) on investments and foreign currency transactions | | | 16,530,259 | | | | (774,055) | | | | (2,460,042) | | | | 102,273 | | | | 222,322 | |
Net unrealized appreciation/(depreciation) on investments, futures contracts and translation of assets and liabilities denominated in foreign currencies | | | 33,462,359 | | | | 226,378 | | | | 3,897,781 | | | | 2,813,873 | | | | (3,172,207) | |
| | | | | | | | | | | | | | | | | | | | |
NET ASSETS | | $ | 213,241,286 | | | $ | 20,578,521 | | | $ | 117,756,996 | | | $ | 59,791,008 | | | $ | 58,370,255 | |
| | | | | | | | | | | | | | | | | | | | |
INVESTMENTS, AT COST | | $ | 179,803,175 | | | $ | 20,292,347 | | | $ | 107,560,352 | | | $ | 53,656,231 | | | $ | 3,211,413 | |
| | | | | |
INVESTMENTS IN AFFILIATES, AT COST | | | – | | | | – | | | | – | | | | – | | | | 58,386,466 | |
| | | | | |
PRICING OF SHARES | | | | | | | | | | | | | | | | | | | | |
Investor Class | | | | | | | | | | | | | | | | | | | | |
Net Assets | | $ | 195,675,530 | | | $ | 4,776 | | | $ | 97,940,951 | | | $ | 51,961,983 | | | $ | 5,139 | |
Shares outstanding | | | 16,183,996 | | | | 465 | | | | 9,726,741 | | | | 4,872,639 | | | | 539 | |
Net Asset Value, offering and redemption price per share | | | $12.09 | | | | $10.28 | | | | $10.07 | | | | $10.66 | | | | $9.54 | |
Institutional Class | | | | | | | | | | | | | | | | | | | | |
Net Assets | | $ | 17,565,756 | | | $ | 20,573,745 | | | $ | 19,816,045 | | | $ | 7,829,025 | | | $ | 58,365,116 | |
Shares outstanding | | | 1,451,786 | | | | 1,996,005 | | | | 1,963,331 | | | | 738,172 | | | | 6,084,963 | |
Net Asset Value, offering and redemption price per share | | | $12.10 | | | | $10.31 | | | | $10.09 | | | | $10.61 | | | | $9.59 | |
| | |
See Notes to Financial Statements. | | |
| 32 | | centrefunds.com |
| | |
| Centre Funds | | Statements of Operations |
| | |
| | | | | | | | | | | | | | | | | | | | |
| | | Centre American
Select Equity
Fund | | | Centre Global
Select Equity
Fund | | | Centre Active
U.S. Treasury
Fund | | | Centre Active
U.S. Tax Exempt
Fund | | | Centre Multi-
Asset Real Return
Fund | |
| | | For the Six
Months Ended
March 31, 2015
(Unaudited) | | | For the Six
Months Ended
March 31, 2015
(Unaudited) | | | For the Six
Months Ended
March 31, 2015
(Unaudited) | | | For the Period
November 1,
2014 to
March 31, 2015
(Unaudited) | | | For the Six
Months Ended
March 31, 2015
(Unaudited) | |
INVESTMENT INCOME: | | | | | | | | | | | | | | | | | | | | |
Interest | | $ | 1,117 | | | $ | – | | | $ | 141,929 | | | $ | 769,151 | | | $ | – | |
Dividends | | | 1,094,067 | | | | 188,222 | | | | – | | | | – | | | | – | |
Dividends from affiliated securities | | | – | | | | – | | | | – | | | | – | | | | 2,608,834 | |
Foreign taxes withheld | | | 890 | | | | (19,742) | | | | – | | | | – | | | | – | |
| | | | | | | | | | | | | | | | | | | | |
Total Investment Income | | | 1,096,074 | | | | 168,480 | | | | 141,929 | | | | 769,151 | | | | 2,608,834 | |
| | | | | | | | | | | | | | | | | | | | |
| | | | | |
EXPENSES: | | | | | | | | | | | | | | | | | | | | |
Investment advisory fees | | | 518,198 | | | | 91,080 | | | | 48,564 | | | | 109,775 | | | | 160,790 | |
Administration fees | | | 103,479 | | | | 21,288 | | | | 15,645 | | | | 1,932 | | | | 45,337 | |
Transfer agent fees | | | 40,993 | | | | 11,332 | | | | 11,396 | | | | 15,316 | | | | 11,333 | |
Custodian fees | | | 7,843 | | | | 13,141 | | | | 2,502 | | | | 2,838 | | | | 3,004 | |
Legal fees | | | 60,936 | | | | 11,336 | | | | 7,217 | | | | 21,606 | | | | 21,118 | |
Audit fees | | | 3,112 | | | | 7,277 | | | | 33 | | | | 9,212 | | | | 5,913 | |
Trustees’ fees and expenses | | | 17,976 | | | | 2,399 | | | | 2,110 | | | | 8,370 | | | | 8,104 | |
Recoupment of past fees waived by adviser (Investor Class) | | | – | | | | – | | | | 43 | | | | – | | | | – | |
Recoupment of past fees waived by adviser (Institutional Class) | | | – | | | | – | | | | – | | | | – | | | | 6,621 | |
Registration/filing fees | | | 15,143 | | | | 13,641 | | | | 7,301 | | | | 7,969 | | | | 13,235 | |
12b-1 fees (Investor Class) | | | 147,997 | | | | 5 | | | | 9,639 | | | | 5,049 | | | | 7 | |
Printing fees | | | 25,424 | | | | 1,409 | | | | 1,012 | | | | 4,201 | | | | 5,100 | |
Chief Compliance Officer services fees | | | 17,579 | | | | 2,331 | | | | 2,131 | | | | 8,103 | | | | 7,821 | |
Offering costs | | | 2,418 | | | | 275 | | | | 30,375 | | | | – | | | | – | |
Miscellaneous expenses | | | 10,763 | | | | 3,475 | | | | 1,907 | | | | 100,715 | | | | 3,970 | |
| | | | | | | | | | | | | | | | | | | | |
Total expenses before waivers | | | 971,861 | | | | 178,989 | | | | 139,875 | | | | 295,086 | | | | 292,353 | |
Fees waived/reimbursed by investment adviser (Investor Class) (Note 5) | | | (233,549) | | | | (18) | | | | – | | | | (416) | | | | – | |
Fees waived/reimbursed by investment adviser (Institutional Class) (Note 5) | | | (21,350) | | | | (65,116) | | | | (63,668) | | | | (67) | | | | – | |
| | | | | | | | | | | | | | | | | | | | |
Net Expenses | | | 716,962 | | | | 113,855 | | | | 76,207 | | | | 294,603 | | | | 292,353 | |
| | | | | | | | | | | | | | | | | | | | |
Net Investment Income | | | 379,112 | | | | 54,625 | | | | 65,722 | | | | 474,548 | | | | 2,316,481 | |
| | | | | | | | | | | | | | | | | | | | |
| | | | | |
Net realized gain/(loss) on investments | | | 16,458,823 | | | | (375,077) | | | | 516,090 | | | | 266,075 | | | | 270,524 | |
Net realized loss on affiliated investments | | | – | | | | – | | | | – | | | | – | | | | (56,314) | |
Net realized loss on foreign currencies | | | – | | | | (397,573) | | | | (2,976,119) | | | | – | | | | – | |
Net change in unrealized appreciation/(depreciation) on investments | | | (15,503,408) | | | | 654,585 | | | | 3,475,404 | | | | (321,299) | | | | (354,262) | |
Net change in unrealized depreciation on futures contracts | | | – | | | | – | | | | (578,620) | | | | (38,975) | | | | – | |
Net change in unrealized depreciation on affiliated investments | | | – | | | | – | | | | – | | | | – | | | | (2,181,608) | |
Net change in unrealized depreciation on translation of assets and liabilities denominated in foreign currency transactions | | | – | | | | (2,415) | | | | – | | | | – | | | | – | |
| | | | | | | | | | | | | | | | | | | | |
NET REALIZED AND UNREALIZED GAIN/(LOSS) ON INVESTMENTS, FUTURES CONTRACTS AND FOREIGN CURRENCIES | | | 955,415 | | | | (120,480) | | | | 436,755 | | | | (94,199) | | | | (2,321,660) | |
| | | | | | | | | | | | | | | | | | | | |
NET INCREASE/(DECREASE) IN NET ASSETS RESULTING FROM OPERATIONS | | $ | 1,334,527 | | | $ | (65,855) | | | $ | 502,477 | | | $ | 380,349 | | | $ | (5,179) | |
| | | | | | | | | | | | | | | | | | | | |
| | |
| See Notes to Financial Statements. | | |
| Semi-Annual Report | March 31, 2015 | | 33 |
| | |
| Centre American Select Equity Fund | | Statements of Changes in Net Assets |
| | |
| | | | | | | | |
| | | For The
Six Months Ending
March 31, 2015
(Unaudited) | | | For The
Year Ended
September 30, 2014(a) | |
OPERATIONS: | | | | | | | | |
Net investment income | | $ | 379,112 | | | $ | 713,961 | |
Net realized gain on investments | | | 16,458,823 | | | | 8,136,150 | |
Net change in unrealized appreciation/(depreciation) on investments | | | (15,503,408) | | | | 12,339,709 | |
| | | | | | | | |
Net increase in net assets resulting from operations | | | 1,334,527 | | | | 21,189,820 | |
| | | | | | | | |
DISTRIBUTIONS TO SHAREHOLDERS: | | | | | | | | |
From net investment income | | | | | | | | |
Investor Class | | | (1,569,650) | | | | (1,048,251) | |
Institutional Class | | | (244,476) | | | | – | |
From net realized gains on investments | | | | | | | | |
Investor Class | | | – | | | | (14,465) | |
| | | | | | | | |
Total distributions | | | (1,814,126) | | | | (1,062,716) | |
| | | | | | | | |
CAPITAL SHARE TRANSACTIONS: | | | | | | | | |
Investor Class | | | | | | | | |
Proceeds from sale of shares | | | 2,261,016 | | | | 15,830,656 | |
Shares issued in reinvestment of distributions | | | 1,549,760 | | | | 1,051,275 | |
Cost of shares redeemed | | | (12,911,724) | | | | (49,865,652) | |
Redemption fees | | | 3,594 | | | | 1,022 | |
Acquisition (Note 10) | | | 89,192,637 | | | | – | |
| | | | | | | | |
Net increase/(decrease) from capital share transactions | | | 80,095,283 | | | | (32,982,699) | |
| | | | | | | | |
Institutional Class | | | | | | | | |
Proceeds from sale of shares | | | 1,660,000 | | | | 29,614,000 | |
Shares issued in reinvestment of distributions | | | 244,476 | | | | – | |
Cost of shares redeemed | | | (150,000) | | | | (14,652,000) | |
| | | | | | | | |
Net increase from capital share transactions | | | 1,754,476 | | | | 14,962,000 | |
| | | | | | | | |
Net increase in net assets | | $ | 81,370,160 | | | $ | 2,106,405 | |
| | | | | | | | |
NET ASSETS: | | | | | | | | |
Beginning of period | | | 131,871,126 | | | | 129,764,721 | |
| | | | | | | | |
End of period* | | $ | 213,241,286 | | | $ | 131,871,126 | |
| | | | | | | | |
*Including accumulated net investment income/(loss) of: | | $ | (942,523) | | | $ | 492,491 | |
| | |
OTHER INFORMATION: | | | | | | | | |
Share Transactions: | | | | | | | | |
Investor Class | | | | | | | | |
Beginning shares | | | 9,609,264 | | | | 12,503,329 | |
Shares sold | | | 186,348 | | | | 1,303,814 | |
Shares issued in reinvestment of dividends | | | 127,030 | | | | 95,138 | |
Shares redeemed | | | (1,060,287) | | | | (4,293,017) | |
Acquisition shares (Note 10) | | | 7,321,641 | | | | – | |
| | | | | | | | |
Ending Shares | | | 16,183,996 | | | | 9,609,264 | |
| | | | | | | | |
Institutional Class | | | | | | | | |
Beginning shares | | | 1,309,948 | | | | – | |
Shares sold | | | 134,326 | | | | 2,509,948 | |
Shares issued in reinvestment of dividends | | | 20,023 | | | | – | |
Shares redeemed | | | (12,511) | | | | (1,200,000) | |
| | | | | | | | |
Ending Shares | | | 1,451,786 | | | | 1,309,948 | |
| | | | | | | | |
| (a) | The Centre American Select Equity Fund began offering Institutional Class shares on January 21, 2014. |
| | |
| See Notes to Financial Statements. | | |
| 34 | | centrefunds.com |
| | |
| Centre Global Select Equity Fund | | Statements of Changes in Net Assets |
| | |
| | | | | | | | |
| | | For The
Six Months Ending
March 31, 2015
(Unaudited) | | | For The
Year Ended
September 30, 2014(a) | |
OPERATIONS: | | | | | | | | |
Net investment income | | $ | 54,625 | | | $ | 267,563 | |
Net realized gain/(loss) on investments | | | (375,077) | | | | 2,113,284 | |
Net realized loss on foreign currency transactions | | | (397,573) | | | | (23,077) | |
Net change in unrealized appreciation/(depreciation) on investments and translation of assets and liabilities denominated in foreign currencies | | | 652,170 | | | | (2,141,304) | |
| | | | | | | | |
Net increase/(decrease) in net assets resulting from operations | | | (65,855) | | | | 216,466 | |
| | | | | | | | |
DISTRIBUTIONS TO SHAREHOLDERS: | | | | | | | | |
From net investment income | | | | | | | | |
Investor Class | | | (57) | | | | – | |
Institutional Class | | | (251,413) | | | | (166,664) | |
From net realized gains on investments | | | | | | | | |
Investor Class | | | (435) | | | | – | |
Institutional Class | | | (1,884,354) | | | | (372,877) | |
| | | | | | | | |
Total distributions | | | (2,136,259) | | | | (539,541) | |
| | | | | | | | |
CAPITAL SHARE TRANSACTIONS: | | | | | | | | |
Investor Class | | | | | | | | |
Proceeds from sale of shares | | | – | | | | 15,509,595 | |
Shares issued in reinvestment of distributions | | | 492 | | | | – | |
Cost of shares redeemed | | | – | | | | (15,526,268) | |
| | | | | | | | |
Net increase/(decrease) from capital share transactions | | | 492 | | | | (16,673) | |
| | | | | | | | |
Institutional Class | | | | | | | | |
Proceeds from sale of shares | | | 6,076,850 | | | | 15,522,941 | |
Shares issued in reinvestment of distributions | | | 2,135,766 | | | | 539,541 | |
Cost of shares redeemed | | | (175,000) | | | | (15,505,899) | |
| | | | | | | | |
Net increase from capital share transactions | | | 8,037,616 | | | | 556,583 | |
| | | | | | | | |
Net increase in net assets | | $ | 5,835,994 | | | $ | 216,835 | |
| | | | | | | | |
NET ASSETS: | | | | | | | | |
Beginning of period | | | 14,742,527 | | | | 14,525,692 | |
| | | | | | | | |
End of period* | | $ | 20,578,521 | | | $ | 14,742,527 | |
| | | | | | | | |
*Including accumulated net investment income of: | | $ | 41,105 | | | $ | 237,950 | |
| | |
OTHER INFORMATION: | | | | | | | | |
Share Transactions: | | | | | | | | |
Investor Class | | | | | | | | |
Beginning shares | | | 415 | | | | – | |
Shares sold | | | – | | | | 1,268,901 | |
Shares issued in reinvestment of dividends | | | 50 | | | | – | |
Shares redeemed | | | – | | | | (1,268,486) | |
| | | | | | | | |
Ending Shares | | | 465 | | | | 415 | |
| | | | | | | | |
Institutional Class | | | | | | | | |
Beginning shares | | | 1,271,210 | | | | 1,226,285 | |
Shares sold | | | 526,134 | | | | 1,268,486 | |
Shares issued in reinvestment of dividends | | | 216,609 | | | | 45,340 | |
Shares redeemed | | | (17,948) | | | | (1,268,901) | |
| | | | | | | | |
Ending Shares | | | 1,996,005 | | | | 1,271,210 | |
| | | | | | | | |
| (a) | The Centre Global Select Equity Fund began offering Investor Class shares on January 21, 2014. |
| | |
| See Notes to Financial Statements. | | |
| Semi-Annual Report | March 31, 2015 | | 35 |
| | |
| Centre Active U.S. Treasury Fund | | Statements of Changes in Net Assets |
| | |
| | | | | | | | |
| | | For The
Six Months Ending
March 31, 2015
(Unaudited) | | | For The
Period January 21, 2014
(Inception) to
September 30, 2014 | |
OPERATIONS: | | | | | | | | |
Net investment income | | $ | 65,722 | | | $ | 27,139 | |
Net realized gain on investments | | | 516,090 | | | | 135,975 | |
Net realized loss on foreign currency transactions | | | (2,976,119) | | | | – | |
Net change in unrealized appreciation/(depreciation) on investments and futures contracts | | | 2,896,784 | | | | (53,948) | |
| | | | | | | | |
Net increase in net assets resulting from operations | | | 502,477 | | | | 109,166 | |
| | | | | | | | |
DISTRIBUTIONS TO SHAREHOLDERS: | | | | | | | | |
From net investment income | | | | | | | | |
Investor Class | | | (35,013) | | | | – | |
Institutional Class | | | (97,951) | | | | – | |
From net realized gains on investments | | | | | | | | |
Investor Class | | | (39) | | | | – | |
Institutional Class | | | (135,949) | | | | – | |
| | | | | | | | |
Total distributions | | | (268,952) | | | | – | |
| | | | | | | | |
CAPITAL SHARE TRANSACTIONS: | | | | | | | | |
Investor Class | | | | | | | | |
Proceeds from sale of shares | | | 106,664 | | | | 5,000 | |
Shares issued in reinvestment of distributions | | | 24,360 | | | | – | |
Cost of shares redeemed | | | (3,607,980) | | | | – | |
Acquisition (Note 10) | | | 101,150,828 | | | | – | |
| | | | | | | | |
Net increase from capital share transactions | | | 97,673,872 | | | | 5,000 | |
| | | | | | | | |
Institutional Class | | | | | | | | |
Proceeds from sale of shares | | | 3,099,992 | | | | 14,405,000 | |
Shares issued in reinvestment of distributions | | | 233,563 | | | | – | |
Cost of shares redeemed | | | (552,419) | | | | – | |
Acquisition (Note 10) | | | 2,549,297 | | | | – | |
| | | | | | | | |
Net increase from capital share transactions | | | 5,330,433 | | | | 14,405,000 | |
| | | | | | | | |
Net increase in net assets | | $ | 103,237,830 | | | $ | 14,519,166 | |
| | | | | | | | |
NET ASSETS: | | | | | | | | |
Beginning of period | | | 14,519,166 | | | | – | |
| | | | | | | | |
End of period* | | $ | 117,756,996 | | | $ | 14,519,166 | |
| | | | | | | | |
*Including accumulated net investment income/(loss) of: | | $ | (9,726) | | | $ | 57,516 | |
| | |
OTHER INFORMATION: | | | | | | | | |
Share Transactions: | | | | | | | | |
Investor Class | | | | | | | | |
Beginning shares | | | 500 | | | | – | |
Shares sold | | | 10,502 | | | | 500 | |
Shares issued in reinvestment of dividends | | | 2,419 | | | | – | |
Shares redeemed | | | (358,269) | | | | – | |
Acquisition shares (Note 10) | | | 10,071,589 | | | | – | |
| | | | | | | | |
Ending Shares | | | 9,726,741 | | | | 500 | |
| | | | | | | | |
Institutional Class | | | | | | | | |
Beginning shares | | | 1,438,198 | | | | – | |
Shares sold | | | 303,613 | | | | 1,438,198 | |
Shares issued in reinvestment of dividends | | | 23,192 | | | | – | |
Shares redeemed | | | (54,842) | | | | – | |
Acquisition shares (Note 10) | | | 253,170 | | | | – | |
| | | | | | | | |
Ending Shares | | | 1,963,331 | | | | 1,438,198 | |
| | | | | | | | |
| | |
| See Notes to Financial Statements. | | |
| 36 | | centrefunds.com |
| | |
| Centre Active U.S. Tax Exempt Fund | | Statements of Changes in Net Assets |
| | |
| | | | | | | | |
| | | For The
Period November 1, 2014
through
March 31, 2015(a)(b)
(Unaudited) | | | For The
Year Ended
October 31, 2014 | |
OPERATIONS: | | | | | | | | |
Net investment income | | $ | 474,548 | | | $ | 1,548,195 | |
Net realized gain/(loss) on investments | | | 266,075 | | | | (163,756) | |
Net change in unrealized appreciation/(depreciation) on investments and futures contracts | | | (360,274) | | | | 1,316,845 | |
| | | | | | | | |
Net increase in net assets resulting from operations | | | 380,349 | | | | 2,701,284 | |
| | | | | | | | |
DISTRIBUTIONS TO SHAREHOLDERS: | | | | | | | | |
From net investment income | | | | | | | | |
Investor Class | | | (408,756) | | | | (1,403,630) | |
Institutional Class | | | (63,305) | | | | (144,440) | |
From net realized gains on investments | | | | | | | | |
Investor Class | | | – | | | | (515,643) | |
Institutional Class | | | – | | | | (9,915) | |
| | | | | | | | |
Total distributions | | | (472,061) | | | | (2,073,628) | |
| | | | | | | | |
CAPITAL SHARE TRANSACTIONS: | | | | | | | | |
Investor Class | | | | | | | | |
Proceeds from sale of shares | | | 2,111,537 | | | | 5,197,492 | |
Shares issued in reinvestment of distributions | | | 253,191 | | | | 1,206,579 | |
Cost of shares redeemed | | | (12,188,422) | | | | (28,464,938) | |
| | | | | | | | |
Net decrease from capital share transactions | | | (9,823,694) | | | | (22,060,867) | |
| | | | | | | | |
Institutional Class | | | | | | | | |
Proceeds from sale of shares | | | 16,000 | | | | 7,653,287 | |
Shares issued in reinvestment of distributions | | | 47,464 | | | | 119,104 | |
Cost of shares redeemed | | | (194,928) | | | | (7,100,171) | |
| | | | | | | | |
Net increase/(decrease) from capital share transactions | | | (131,464) | | | | 672,220 | |
| | | | | | | | |
Net decrease in net assets | | $ | (10,046,870) | | | $ | (20,760,991) | |
| | | | | | | | |
NET ASSETS: | | | | | | | | |
Beginning of period | | | 69,837,878 | | | | 90,598,869 | |
| | | | | | | | |
End of period* | | $ | 59,791,008 | | | $ | 69,837,878 | |
| | | | | | | | |
*Including accumulated net investment income/(loss) of: | | $ | 798 | | | $ | (1,689) | |
| | |
OTHER INFORMATION: | | | | | | | | |
Share Transactions: | | | | | | | | |
Investor Class | | | | | | | | |
Beginning shares | | | 5,795,267 | | | | 7,890,625 | |
Shares sold | | | 198,330 | | | | 491,162 | |
Shares issued in reinvestment of dividends | | | 23,743 | | | | 114,574 | |
Shares redeemed | | | (1,144,701) | | | | (2,701,094) | |
| | | | | | | | |
Ending Shares | | | 4,872,639 | | | | 5,795,267 | |
| | | | | | | | |
Institutional Class | | | | | | | | |
Beginning shares | | | 750,565 | | | | 683,556 | |
Shares sold | | | 1,511 | | | | 729,469 | |
Shares issued in reinvestment of dividends | | | 4,477 | | | | 11,276 | |
Shares redeemed | | | (18,381) | | | | (673,736) | |
| | | | | | | | |
Ending Shares | | | 738,172 | | | | 750,565 | |
| | | | | | | | |
| (a) | Centre Active U.S. Tax Exempt Fund is the successor to Managed Municipal Fund, Inc. (the “Acquired Fund”) through a reorganization, the closing date for which was March 17, 2015. The fiscal year end of the Acquired Fund was October 31st. The fiscal year end of the Centre Active U.S. Tax Exempt Fund is September 30th. |
| (b) | As part of the reorganization, effective the close of business March 17, 2015, Class A shareholders of the Acquired Fund exchanged their shares for Investor Class shares in the Acquiring Fund and Class I shareholders of the Acquired Fund exchanged their shares for Institutional Class shares in the Acquiring Fund. |
| | |
| See Notes to Financial Statements. | | |
| Semi-Annual Report | March 31, 2015 | | 37 |
| | |
| Centre Multi-Asset Real Return Fund | | Statements of Changes in Net Assets |
| | |
| | | | | | | | |
| | | For The
Six Months Ending
March 31, 2015
(Unaudited) | | | For The
Year Ended
September 30, 2014 | |
OPERATIONS: | | | | | | | | |
Net investment income | | $ | 2,316,481 | | | $ | 51,303 | |
Net realized gain/(loss) on investments | | | 270,524 | | | | (2,087,974) | |
Net realized gain/(loss) on affiliated investments | | | (56,314) | | | | 2,835,413 | |
Long-term capital gain distributions from other investment companies | | | – | | | | 220,477 | |
Net change in unrealized appreciation/(depreciation) on investments and affiliated investments | | | (2,535,870) | | | | 1,574,263 | |
| | | | | | | | |
Net increase/(decrease) in net assets resulting from operations | | | (5,179) | | | | 2,593,482 | |
| | | | | | | | |
DISTRIBUTIONS TO SHAREHOLDERS: | | | | | | | | |
From net investment income | | | | | | | | |
Investor Class | | | (99) | | | | – | |
Institutional Class | | | (1,169,779) | | | | – | |
From net realized gains on investments | | | | | | | | |
Investor Class | | | (39) | | | | – | |
Institutional Class | | | (448,302) | | | | – | |
| | | | | | | | |
Total distributions | | | (1,618,219) | | | | – | |
| | | | | | | | |
CAPITAL SHARE TRANSACTIONS: | | | | | | | | |
Investor Class | | | | | | | | |
Shares issued in reinvestment of distributions | | | 138 | | | | – | |
| | | | | | | | |
Net increase from capital share transactions | | | 138 | | | | – | |
| | | | | | | | |
Institutional Class | | | | | | | | |
Proceeds from sale of shares | | | 27,731 | | | | 337,774 | |
Shares issued in reinvestment of distributions | | | 1,618,080 | | | | – | |
Cost of shares redeemed | | | (760,010) | | | | (10,000) | |
| | | | | | | | |
Net increase from capital share transactions | | | 885,801 | | | | 327,774 | |
| | | | | | | | |
Net increase/(decrease) in net assets | | $ | (737,459) | | | $ | 2,921,256 | |
| | | | | | | | |
NET ASSETS: | | | | | | | | |
Beginning of period | | | 59,107,714 | | | | 56,186,458 | |
| | | | | | | | |
End of period* | | $ | 58,370,255 | | | $ | 59,107,714 | |
| | | | | | | | |
*Including accumulated net investment income of: | | $ | 1,146,603 | | | $ | – | |
| | |
OTHER INFORMATION: | | | | | | | | |
Share Transactions: | | | | | | | | |
Investor Class | | | | | | | | |
Beginning shares | | | 524 | | | | 524 | |
Shares issued in reinvestment of dividends | | | 15 | | | | – | |
| | | | | | | | |
Ending Shares | | | 539 | | | | 524 | |
| | | | | | | | |
Institutional Class | | | | | | | | |
Beginning shares | | | 5,993,180 | | | | 5,959,990 | |
Shares sold | | | 2,910 | | | | 34,219 | |
Shares issued in reinvestment of dividends | | | 169,966 | | | | – | |
Shares redeemed | | | (81,093) | | | | (1,029) | |
| | | | | | | | |
Ending Shares | | | 6,084,963 | | | | 5,993,180 | |
| | | | | | | | |
| | |
| See Notes to Financial Statements. | | |
| 38 | | centrefunds.com |
| | |
| Centre American Select Equity Fund | | Financial Highlights |
| Investor Class | | For a share outstanding throughout the periods presented. |
| | | | | | | | | | | | | | | | |
| . | | For the
Six Months Ended
March 31, 2015
(Unaudited) | | | For the Year Ended September 30, 2014(a) | | | For the Year Ended
September 30, 2013 | | | For the Period
December 21, 2011
(Inception) to
September 30, 2012 | |
| | | | |
NET ASSET VALUE, BEGINNING OF PERIOD | | $ | 12.08 | | | $ | 10.38 | | | $ | 11.79 | | | $ | 10.00 | |
INCOME FROM INVESTMENT OPERATIONS: | | | | | | | | | |
Net investment income(b) | | | 0.03 | | | | 0.06 | | | | 0.09 | | | | 0.07 | |
Net realized and unrealized gain on investments | | | 0.15 | | | | 1.73 | | | | 0.97 | | | | 1.72 | |
Total income from investment operations | | | 0.18 | | | | 1.79 | | | | 1.06 | | | | 1.79 | |
| | | | |
DISTRIBUTIONS: | | | | | | | | | | | | | | | | |
Net investment income | | | (0.17) | | | | (0.09) | | | | (0.18) | | | | – | |
Net realized gains on investments | | | – | | | | (0.00) | (c) | | | (2.29) | | | | – | |
Total distributions | | | (0.17) | | | | (0.09) | | | | (2.47) | | | | – | |
REDEMPTION FEES ADDED TO PAID-IN CAPITAL (NOTE 2) | | | 0.00 | (d) | | | 0.00 | (d) | | | 0.00 | (d) | | | – | |
NET INCREASE/(DECREASE) IN NET ASSET VALUE | | | 0.01 | | | | 1.70 | | | | (1.41) | | | | 1.79 | |
NET ASSET VALUE, END OF PERIOD | | $ | 12.09 | | | $ | 12.08 | | | $ | 10.38 | | | $ | 11.79 | |
| | | | | | | | | | | | | | | | | |
| | | | |
Total Return(e) | | | 1.45% | | | | 17.31% | | | | 12.30% | | | | 17.90% | |
| | | | |
SUPPLEMENTAL DATA: | | | | | | | | | | | | | | | | |
Net assets, end of period (000) | | $ | 195,676 | | | $ | 116,045 | | | $ | 129,765 | | | $ | 24,220 | |
| | | | |
RATIOS TO AVERAGE NET ASSETS: | | | | | | | | | | | | | | | | |
Net investment income including reimbursement/waiver | | | 0.53%(f) | | | | 0.53% | | | | 0.88% | | | | 0.69%(f) | |
Operating expenses excluding reimbursement/waiver | | | 1.44%(f) | | | | 1.43% | | | | 1.51% | | | | 2.32%(f) | |
Operating expenses including reimbursement/waiver | | | 1.05%(f) | | | | 1.05% | | | | 1.06% | (g) | | | 1.25%(f) | |
| | | | |
PORTFOLIO TURNOVER RATE | | | 84%(h) | | | | 72% | | | | 175% | | | | 67%(h) | |
| (a) | Prior to January 21, 2014, the Centre American Select Equity Fund was named the Drexel Hamilton Centre American Equity Fund. |
| (b) | Calculated using the average shares method. |
| (c) | Less than $(0.005) per share. |
| (d) | Less than $ 0.005 per share. |
| (e) | Total returns are for the period indicated and have not been annualized. Total returns would have been lower had certain expenses not been waived during the period. Returns shown do not reflect the deduction of taxes that a shareholder would pay on fund distributions or the redemption of fund shares. |
| (g) | Effective January 11, 2013, the net expense limitation changed from 1.25% to 1.05%. |
| (h) | Portfolio turnover rate for periods less than one full year have not been annualized. |
| | |
| See Notes to Financial Statements. | | |
| Semi-Annual Report | March 31, 2015 | | 39 |
| | |
| Centre American Select Equity Fund | | Financial Highlights |
| Institutional Class | | For a share outstanding throughout the periods presented. |
| | | | | | | | |
. | | For the
Six Months Ended
March 31, 2015
(Unaudited) | | | For the Period
January 21, 2014
(Inception) to
September 30, 2014 | |
| | |
NET ASSET VALUE, BEGINNING OF PERIOD | | $ | 12.08 | | | $ | 11.39 | |
INCOME/(LOSS) FROM INVESTMENT OPERATIONS: | | | | | | | | |
Net investment income(a) | | | 0.04 | | | | 0.05 | |
Net realized and unrealized gain on investments | | | 0.15 | | | | 0.64 | |
Total income from investment operations | | | 0.19 | | | | 0.69 | |
| | |
DISTRIBUTIONS: | | | | | | | | |
Net investment income | | | (0.17) | | | | – | |
Net realized gains on investments | | | – | | | | – | |
Total distributions | | | (0.17) | | | | – | |
NET INCREASE IN NET ASSET VALUE | | | 0.02 | | | | 0.69 | |
NET ASSET VALUE, END OF PERIOD | | $ | 12.10 | | | $ | 12.08 | |
| | | | | | | | | |
| | |
Total Return(b) | | | 1.56% | | | | 6.06% | |
| | |
SUPPLEMENTAL DATA: | | | | | | | | |
Net assets, end of period (000) | | $ | 17,566 | | | $ | 15,826 | |
| | |
RATIOS TO AVERAGE NET ASSETS: | | | | | | | | |
Net investment income including reimbursement/waiver | | | 0.66% | (c) | | | 0.65% | (c) |
Operating expenses excluding reimbursement/waiver | | | 1.20% | (c) | | | 1.26% | (c) |
Operating expenses including reimbursement/waiver | | | 0.95% | (c) | | | 0.95% | (c) |
| | |
PORTFOLIO TURNOVER RATE | | | 84% | (d) | | | 72% | (d) |
| (a) | Calculated using the average shares method. |
| (b) | Total returns are for the period indicated and have not been annualized. Total returns would have been lower had certain expenses not been waived during the period. Returns shown do not reflect the deduction of taxes that a shareholder would pay on fund distributions or the redemption of fund shares. |
| (d) | Portfolio turnover rate for periods less than one full year have not been annualized. |
| | |
| See Notes to Financial Statements. | | |
| 40 | | centrefunds.com |
| | |
| Centre Global Select Equity Fund | | Financial Highlights |
Investor Class | | For a share outstanding throughout the periods presented. |
| | | | | | | | |
| . | | For the
Six Months Ended
March 31, 2015
(Unaudited) | | | For the Period
January 21, 2014
(Inception) to
September 30, 2014 | |
| | |
NET ASSET VALUE, BEGINNING OF PERIOD | | $ | 11.59 | | | $ | 12.06 | |
INCOME/(LOSS) FROM INVESTMENT OPERATIONS: | | | | | | | | |
Net investment income/(loss)(a) | | | 0.02 | | | | (0.30) | |
Net realized and unrealized loss on investments | | | (0.14) | | | | (0.17) | |
Total loss from investment operations | | | (0.12) | | | | (0.47) | |
| | |
DISTRIBUTIONS: | | | | | | | | |
Net investment income | | | (0.14) | | | | – | |
Net realized gains on investments | | | (1.05) | | | | – | |
Total distributions | | | (1.19) | | | | – | |
NET DECREASE IN NET ASSET VALUE | | | (1.31) | | | | (0.47) | |
NET ASSET VALUE, END OF PERIOD | | $ | 10.28 | | | $ | 11.59 | |
| | |
| | |
Total Return(b) | | | (0.62%) | | | | (3.90%) | |
| | |
SUPPLEMENTAL DATA: | | | | | | | | |
Net assets, end of period (000) | | $ | 5 | | | $ | 5 | |
| | |
RATIOS TO AVERAGE NET ASSETS: | | | | | | | | |
Net investment income/(loss) including reimbursement/waiver | | | 0.41%(c) | | | | (1.30%)(c) | |
Operating expenses excluding reimbursement/waiver | | | 2.20%(c) | | | | 2.69%(c) | |
Operating expenses including reimbursement/waiver | | | 1.45%(c) | | | | 1.45%(c) | |
| | |
PORTFOLIO TURNOVER RATE | | | 64%(d) | | | | 156%(d) | |
| (a) | Calculated using the average shares method. |
| (b) | Total returns are for the period indicated and have not been annualized. Total returns would have been lower had certain expenses not been waived during the period. Returns shown do not reflect the deduction of taxes that a shareholder would pay on fund distributions or the redemption of fund shares. |
| (d) | Portfolio turnover rate for periods less than one full year have not been annualized. |
| | |
| See Notes to Financial Statements. | | |
| Semi-Annual Report | March 31, 2015 | | 41 |
| | |
| Centre Global Select Equity Fund | | Financial Highlights |
Institutional Class | | For a share outstanding throughout the periods presented. |
| | | | | | | | | | | | | | | | |
| . | | For the
Six Months Ended
March 31, 2015
(Unaudited) | | | For the Year Ended September 30, 2014(a) | | | For the Year Ended September 30, 2013 | | | For the Period
December 21, 2011
(Inception) to
September 30, 2012 | |
| | | | |
NET ASSET VALUE, BEGINNING OF PERIOD | | $ | 11.59 | | | $ | 11.85 | | | $ | 11.43 | | | $ | 10.00 | |
INCOME/(LOSS) FROM INVESTMENT OPERATIONS: | | | | | | | | | | | | | | | | |
Net investment income(b) | | | 0.03 | | | | 0.21 | | | | 0.20 | | | | 0.21 | |
Net realized and unrealized gain/(loss) on investments | | | (0.12) | | | | (0.03) | | | | 1.12 | | | | 1.22 | |
Total income/(loss) from investment operations | | | (0.09) | | | | 0.18 | | | | 1.32 | | | | 1.43 | |
| | | | |
DISTRIBUTIONS: | | | | | | | | | | | | | | | | |
Net investment income | | | (0.14) | | | | (0.14) | | | | (0.21) | | | | – | |
Net realized gains on investments | | | (1.05) | | | | (0.30) | | | | (0.69) | | | | – | |
Total distributions | | | (1.19) | | | | (0.44) | | | | (0.90) | | | | – | |
NET INCREASE/(DECREASE) IN NET ASSET VALUE | | | (1.28) | | | | (0.26) | | | | 0.42 | | | | 1.43 | |
NET ASSET VALUE, END OF PERIOD | | $ | 10.31 | | | $ | 11.59 | | | $ | 11.85 | | | $ | 11.43 | |
| | | | | | |
| | | | |
Total Return(c) | | | (0.32%) | | | | 1.42% | | | | 12.19% | | | | 14.30% | |
| | | | |
SUPPLEMENTAL DATA: | | | | | | | | | | | | | | | | |
Net assets, end of period (000) | | $ | 20,574 | | | $ | 14,738 | | | $ | 14,526 | | | $ | 11,988 | |
| | | | |
RATIOS TO AVERAGE NET ASSETS: | | | | | | | | | | | | | | | | |
Net investment income including reimbursement/waiver | | | 0.60%(d) | | | | 1.77% | | | | 1.75% | | | | 2.06%(d) | |
Operating expenses excluding reimbursement/waiver | | | 1.97%(d) | | | | 1.95% | | | | 2.20% | | | | 3.04%(d) | |
Operating expenses including reimbursement/waiver | | | 1.25%(d) | | | | 1.25% | | | | 1.25% | | | | 1.25%(d) | |
| | | | |
PORTFOLIO TURNOVER RATE | | | 64%(e) | | | | 156% | | | | 111% | | | | 87%(e) | |
| (a) | Prior to January 21, 2014, the Centre Global Select Equity Fund was named the Drexel Hamilton Centre Global Equity Fund. |
| (b) | Calculated using the average shares method. |
| (c) | Total returns are for the period indicated and have not been annualized. Total returns would have been lower had certain expenses not been waived during the period. Returns shown do not reflect the deduction of taxes that a shareholder would pay on fund distributions or the redemption of fund shares. |
| (e) | Portfolio turnover rate for periods less than one full year have not been annualized. |
| | |
| See Notes to Financial Statements. | | |
| 42 | | centrefunds.com |
| | |
| Centre Active U.S. Treasury Fund | | Financial Highlights |
| Investor Class | | For a share outstanding throughout the periods presented. |
| | | | | | | | |
| | For the Six Months Ended March 31, 2015
(Unaudited) | | | For the Period
January 21, 2014
(Inception) to
September 30, 2014 | |
| | |
NET ASSET VALUE, BEGINNING OF PERIOD | | $ | 10.07 | | | $ | 10.00 | |
INCOME/(LOSS) FROM INVESTMENT OPERATIONS: | | | | | | | | |
Net investment income(a) | | | 0.06 | | | | 0.00 | (b) |
Net realized and unrealized gain on investments | | | 0.07 | | | | 0.07 | |
Total income from investment operations | | | 0.13 | | | | 0.07 | |
| | |
DISTRIBUTIONS: | | | | | | | | |
Net investment income | | | (0.05) | | | | – | |
Net realized gains on investments | | | (0.08) | | | | – | |
Total distributions | | | (0.13) | | | | – | |
NET INCREASE IN NET ASSET VALUE | | | – | | | | 0.07 | |
NET ASSET VALUE, END OF PERIOD | | $ | 10.07 | | | $ | 10.07 | |
| | | | | | | | | |
| | |
Total Return(c) | | | 1.27% | | | | 0.70% | |
| | |
SUPPLEMENTAL DATA: | | | | | | | | |
Net assets, end of period (000) | | $ | 97,941 | | | $ | 5 | |
| | |
RATIOS TO AVERAGE NET ASSETS: | | | | | | | | |
Net investment income including reimbursement/waiver | | | 1.18% | (d) | | | 0.07% | (d) |
Operating expenses excluding reimbursement/waiver | | | 0.69% | (d) | | | 2.09% | (d) |
Operating expenses including reimbursement/waiver | | | 0.69% | (d) | | | 0.85% | (d) |
| | |
PORTFOLIO TURNOVER RATE | | | 84% | (e) | | | 439% | (e) |
| (a) | Calculated using the average shares method. |
| (b) | Less than $0.005 per share. |
| (c) | Total returns are for the period indicated and have not been annualized. Total returns would have been lower had certain expenses not been waived during the period. Returns shown do not reflect the deduction of taxes that a shareholder would pay on fund distributions or the redemption of fund shares. |
| (e) | Portfolio turnover rate for periods less than one full year have not been annualized. |
| | |
| See Notes to Financial Statements. | | |
| Semi-Annual Report | March 31, 2015 | | 43 |
| | |
| Centre Active U.S. Treasury Fund | | Financial Highlights |
| Institutional Class | | For a share outstanding throughout the periods presented. |
| | | | | | | | |
| | | For the Six Months Ended
March 31, 2015
(Unaudited) | | | For the Period
January 21, 2014
(Inception) to
September 30, 2014 | |
| | |
NET ASSET VALUE, BEGINNING OF PERIOD | | $ | 10.09 | | | $ | 10.00 | |
INCOME/(LOSS) FROM INVESTMENT OPERATIONS: | | | | | | | | |
Net investment income(a) | | | 0.01 | | | | 0.02 | |
Net realized and unrealized gain on investments | | | 0.13 | | | | 0.07 | |
Total income from investment operations | | | 0.14 | | | | 0.09 | |
| | |
DISTRIBUTIONS: | | | | | | | | |
Net investment income | | | (0.06) | | | | – | |
Net realized gains on investments | | | (0.08) | | | | – | |
Total distributions | | | (0.14) | | | | – | |
NET INCREASE IN NET ASSET VALUE | | | – | | | | 0.09 | |
NET ASSET VALUE, END OF PERIOD | | $ | 10.09 | | | $ | 10.09 | |
| | | | | | | | | |
| | |
Total Return(b) | | | 1.33% | | | | 0.90% | |
| | |
SUPPLEMENTAL DATA: | | | | | | | | |
Net assets, end of period (000) | | $ | 19,816 | | | $ | 14,514 | |
| | |
RATIOS TO AVERAGE NET ASSETS: | | | | | | | | |
Net investment income including reimbursement/waiver | | | 0.24% | (c) | | | 0.29% | (c) |
Operating expenses excluding reimbursement/waiver | | | 1.37% | (c) | | | 1.86% | (c) |
Operating expenses including reimbursement/waiver | | | 0.60% | (c) | | | 0.60% | (c) |
| | |
PORTFOLIO TURNOVER RATE | | | 84% | (d) | | | 439% | (d) |
| (a) | Calculated using the average shares method. |
| (b) | Total returns are for the period indicated and have not been annualized. Total returns would have been lower had certain expenses not been waived during the period. Returns shown do not reflect the deduction of taxes that a shareholder would pay on fund distributions or the redemption of fund shares. |
| (d) | Portfolio turnover rate for periods less than one full year have not been annualized. |
| | |
| See Notes to Financial Statements. | | |
| 44 | | centrefunds.com |
| | |
| Centre Active U.S. Tax Exempt Fund | | Financial Highlights |
| Insvestor Class | | For a share outstanding throughout the periods presented. |
| | | | | | | | | | | | | | | | | | | | | | | | |
| | | For the Period
November 1, 2014 to March 31,
2015(a)(b)
(Unaudited) | | | For
theYear
Ended
October 31, 2014 | | | For the
Year Ended
October 31, 2013 | | | For the
Year Ended
October 31, 2012 | | | For the
Year Ended
October 31, 2011 | | | For the
Year Ended
October 31, 2010 | |
| | | | | | |
NET ASSET VALUE, BEGINNING OF PERIOD | | $ | 10.68 | | | $ | 10.57 | | | $ | 11.18 | | | $ | 10.77 | | | $ | 10.82 | | | $ | 10.68 | |
INCOME FROM INVESTMENT OPERATIONS: | | | | | | | | | | | | | | | | | | | | | | | | |
Net investment income(c) | | | 0.08 | | | | 0.22 | | | | 0.24 | | | | 0.27 | | | | 0.28 | | | | 0.31 | |
Net realized and unrealized gain/(loss) on investments | | | (0.02) | | | | 0.19 | | | | (0.56) | | | | 0.41 | | | | 0.02 | | | | 0.18 | |
Total income/(loss) from investment operations | | | 0.06 | | | | 0.41 | | | | (0.32) | | | | 0.68 | | | | 0.30 | | | | 0.49 | |
| | | | | | |
DISTRIBUTIONS: | | | | | | | | | | | | | | | | | | | | | | | | |
Net investment income | | | (0.08) | | | | (0.22) | | | | (0.24) | | | | (0.27) | | | | (0.28) | | | | (0.31) | |
Net realized gains on investments | | | – | | | | (0.08) | | | | (0.05) | | | | – | | | | (0.07) | | | | (0.04) | |
Total distributions | | | (0.08) | | | | (0.30) | | | | (0.29) | | | | (0.27) | | | | (0.35) | | | | (0.35) | |
NET INCREASE/(DECREASE) IN NET ASSET VALUE | | | (0.02) | | | | 0.11 | | | | (0.61) | | | | 0.41 | | | | (0.05) | | | | 0.14 | |
NET ASSET VALUE, END OF PERIOD | | $ | 10.66 | | | $ | 10.68 | | | $ | 10.57 | | | $ | 11.18 | | | $ | 10.77 | | | $ | 10.82 | |
| | | | | | | | | | | | | | | | | | | | | | | | | |
| | | | | | |
Total Return(d) | | | 0.52% | | | | 3.95% | | | | (2.90%) | | | | 6.34% | | | | 2.93% | | | | 4.62% | |
| | | | | | |
SUPPLEMENTAL DATA: | | | | | | | | | | | | | | | | | | | | | | | | |
Net assets, end of period (000) | | $ | 51,962 | | | $ | 61,869 | | | $ | 83,371 | | | $ | 110,060 | | | $ | 104,342 | | | $ | 112,203 | |
| | | | | | |
RATIOS TO AVERAGE NET ASSETS: | | | | | | | | | | | | | | | | | | | | | | | | |
Net investment income including reimbursement/waiver | | | 1.72% | (e) | | | 2.09% | | | | 2.20% | | | | 2.42% | | | | 2.65% | | | | 2.89% | (e) |
Operating expenses excluding reimbursement/waiver | | | 1.08% | (e) | | | 1.16% | | | | 1.04% | | | | 0.99% | | | | 1.01% | | | | 0.97% | (e) |
Operating expenses including reimbursement/waiver | | | 1.08% | (e) | | | 1.16% | | | | 1.04% | | | | 0.99% | | | | 1.01% | | | | 0.97% | (e) |
| | | | | | |
PORTFOLIO TURNOVER RATE | | | 7% | (f) | | | 6% | | | | 13% | | | | 17% | | | | 10% | | | | 22% | (f) |
| (a) | Centre Active U.S. Tax Exempt Fund is the successor to Managed Municipal Fund, Inc.(the “Acquired Fund”) through a reorganization, the closing date for which was March 17, 2015. The fiscal year end of the Acquired Fund was October 31st.The fiscal year end of the Centre Active U.S. Tax Exempt Fund is September 30th. |
| (b) | As part of the reorganization, effective the close of business March 17, 2015, Class A shareholders of the Acquired Fund exchanged their shares for Investor Class shares in the Acquiring Fund. |
| (c) | Calculated using the average shares method. |
| (d) | Total returns are for the period indicated and have not been annualized. Total returns would have been lower had certain expenses not been waived during the period. Returns shown do not reflect the deduction of taxes that a shareholder would pay on fund distributions or the redemption of fund shares. |
| (f) | Portfolio turnover rate for periods less than one full year have not been annualized. |
| | |
| See Notes to Financial Statements. | | . |
| Semi-Annual Report | March 31, 2015 | | 45 |
| | |
| Centre Active U.S. Tax Exempt Fund | | Financial Highlights |
| Institutional Class | | For a share outstanding throughout the periods presented. |
| | | | | | | | | | | | | | | | | | | | | | | | |
| | | For the Period November 1, 2014 to March 31, 2015(a)(b)
(Unaudited) | | | For the Year Ended October 31, 2014 | | | For the
Year Ended
October 31, 2013 | | | For the Year Ended October 31, 2012 | | | For the Year Ended
October 31, 2011 | | | For the Period
Ended
October 31,
2010(c) | |
NET ASSET VALUE, BEGINNING OF PERIOD | | $ | 10.62 | | | $ | 10.57 | | | $ | 11.19 | | | $ | 10.78 | | | $ | 10.82 | | | $ | 10.94 | |
INCOME FROM INVESTMENT OPERATIONS: | | | | | | | | | | | | | | | | | | | | | | | | |
Net investment income(d) | | | 0.08 | | | | 0.24 | | | | 0.27 | | | | 0.30 | | | | 0.31 | | | | 0.02 | |
Net realized and unrealized gain/(loss) on investments | | | – | | | | 0.14 | | | | (0.57) | | | | 0.41 | | | | 0.03 | | | | (0.11) | |
Total income/(loss) from investment operations | | | 0.08 | | | | 0.38 | | | | (0.30) | | | | 0.71 | | | | 0.34 | | | | (0.09) | |
| | | | | | |
DISTRIBUTIONS: | | | | | | | | | | | | | | | | | | | | | | | | |
Net investment income | | | (0.09) | | | | (0.25) | | | | (0.27) | | | | (0.30) | | | | (0.31) | | | | (0.03) | |
Net realized gains on investments | | | – | | | | (0.08) | | | | (0.05) | | | | – | | | | (0.07) | | | | – | |
Total distributions | | | (0.09) | | | | (0.33) | | | | (0.32) | | | | (0.30) | | | | (0.38) | | | | (0.03) | |
NET INCREASE/(DECREASE) IN NET ASSET VALUE | | | (0.01) | | | | 0.05 | | | | (0.62) | | | | 0.41 | | | | (0.04) | | | | (0.12) | |
NET ASSET VALUE, END OF PERIOD | | $ | 10.61 | | | $ | 10.62 | | | $ | 10.57 | | | $ | 11.19 | | | $ | 10.78 | | | $ | 10.82 | |
| | | | | | | | | | | | | | | | | | | | | | | | | |
| | | | | | |
Total Return(e) | | | 0.71% | | | | 3.64% | | | | (2.75% | ) | | | 6.60% | | | | 3.28% | | | | (0.86% | ) |
| | | | | | |
SUPPLEMENTAL DATA: | | | | | | | | | | | | | | | | | | | | | | | | |
Net assets, end of period (000) | | $ | 7,829 | | | $ | 7,969 | | | $ | 7,228 | | | $ | 6,523 | | | $ | 3,605 | | | $ | 76 | |
| | | | | | |
RATIOS TO AVERAGE NET ASSETS: | | | | | | | | | | | | | | | | | | | | | | | | |
Net investment income including reimbursement/waiver | | | 1.77 | %(f) | | | 2.31% | | | | 2.46% | | | | 2.66% | | | | 2.92% | | | | 2.83% | (f) |
Operating expenses excluding reimbursement/waiver | | | 1.06 | %(f) | | | 0.92% | | | | 0.79% | | | | 0.74% | | | | 0.76% | | | | 0.70% | (f) |
Operating expenses including reimbursement/waiver | | | 1.06% | (f)(g) | | | 0.92% | | | | 0.79% | | | | 0.74% | | | | 0.76% | | | | 0.70% | (f) |
| | | | | | |
PORTFOLIO TURNOVER RATE | | | 7 | %(h) | | | 6% | | | | 13% | | | | 17% | | | | 10% | | | | 22% | (h) |
| (a) | Centre Active U.S. Tax Exempt Fund is the successor to Managed Municipal Fund, Inc. (the “Acquired Fund”) through a reorganization, the closing date for which was March 17, 2015. The fiscal year end of the Acquired Fund was October 31st. The fiscal year end of the Centre Active U.S. Tax Exempt Fund is September 30th. |
| (b) | As part of the reorganization, effective the close of business March 17, 2015, Class I shareholders of the Acquired Fund exchanged their shares for Institutional Class shares in the Acquiring Fund. |
| (c) | Class I Shares of the Acquired Fund commenced operations on October 7, 2010. |
| (d) | Calculated using the average shares method. |
| (e) | Total returns are for the period indicated and have not been annualized. Total returns would have been lower had certain expenses not been waived during the period. Returns shown do not reflect the deduction of taxes that a shareholder would pay on fund distributions or the redemption of fund shares. |
| (g) | Portfolio turnover rate for periods less than one full year have not been annualized. |
| | |
| See Notes to Financial Statements. | | |
| 46 | | centrefunds.com |
| | |
| Centre Multi-Asset Real Return Fund | | Financial Highlights |
| Investor Class | | For a share outstanding throughout the periods presented. |
| | | | | | | | | | | | |
| . | | For the
Six Months Ended
March 31, 2015
(Unaudited) | | | For the Year Ended September 30, 2014(a) | | | For the Period
January 22, 2013
(Inception) to
September 30, 2013 | |
| | | |
NET ASSET VALUE, BEGINNING OF PERIOD | | $ | 9.82 | | | $ | 9.41 | | | $ | 9.54 | |
INCOME/(LOSS) FROM INVESTMENT OPERATIONS: | | | | | | | | | | | | |
Net investment income/(loss)(b) | | | 0.37 | | | | (0.02) | | | | (0.09) | |
Net realized and unrealized gain/(loss) on investments | | | (0.39) | | | | 0.43 | | | | (0.04) | |
Total income/(loss) from investment operations | | | (0.02) | | | | 0.41 | | | | (0.13) | |
| | | |
DISTRIBUTIONS: | | | | | | | | | | | | |
Net investment income | | | (0.19) | | | | – | | | | – | |
Net realized gains on investments | | | (0.07) | | | | – | | | | – | |
Total distributions | | | (0.26) | | | | – | | | | – | |
NET INCREASE/(DECREASE) IN NET ASSET VALUE | | | (0.28) | | | | 0.41 | | | | (0.13) | |
NET ASSET VALUE, END OF PERIOD | | $ | 9.54 | | | $ | 9.82 | | | $ | 9.41 | |
| | |
| | | |
Total Return(c) | | | (0.15%) | | | | 4.36% | | | | (1.36%) | |
| | | |
SUPPLEMENTAL DATA: | | | | | | | | | | | | |
Net assets, end of period (000) | | $ | 5 | | | $ | 5 | | | $ | 5 | |
| | | |
RATIOS TO AVERAGE NET ASSETS: | | | | | | | | | | | | |
Net investment income/(loss) including reimbursement/waiver | | | 7.62% | (d) | | | (0.16%) | | | | (1.01%) | (d) |
Operating expenses excluding reimbursement/waiver(e) | | | 1.25% | (d) | | | 1.25% | | | | 1.39% | (d) |
Operating expenses including reimbursement/waiver(e) | | | 1.25% | (d) | | | 1.25% | | | | 1.25% | (d) |
| | | |
PORTFOLIO TURNOVER RATE | | | 37% | (f) | | | 199% | | | | 43% | (f) |
| (a) | Prior to January 21, 2014, the Centre Multi-Asset Real Return Fund was named the Drexel Hamilton Multi-Asset Real Return Fund. |
| (b) | Calculated using the average shares method. |
| (c) | Total returns are for the period indicated and have not been annualized. Total returns would have been lower had certain expenses not been waived during the period. Returns shown do not reflect the deduction of taxes that a shareholder would pay on fund distributions or the redemption of fund shares. |
| (e) | Excludes Advisory fees of the affiliated funds in which the Fund invests. |
| (f) | Portfolio turnover rate for periods less than one full year have not been annualized. |
| | |
| See Notes to Financial Statements. | | |
| Semi-Annual Report | March 31, 2015 | | 47 |
| | |
| Centre Multi-Asset Real Return Fund | | Financial Highlights |
Institutional Class | | For a share outstanding throughout the periods presented. |
| | | | | | | | | | | | |
| . | | For the
Six Months Ended
March 31, 2015
(Unaudited) | | | For the Year Ended September 30, 2014(a) | | | For the Period
October 9, 2012
(Inception) to
September 30, 2013 | |
| | | |
NET ASSET VALUE, BEGINNING OF PERIOD | | $ | 9.86 | | | $ | 9.43 | | | $ | 10.00 | |
INCOME/(LOSS) FROM INVESTMENT OPERATIONS: | | | | | | | | | | | | |
Net investment income(b) | | | 0.38 | | | | 0.01 | | | | 0.50 | |
Net realized and unrealized gain/(loss) on investments | | | (0.38) | | | | 0.42 | | | | (0.50) | |
Total income from investment operations | | | – | | | | 0.43 | | | | – | |
| | | |
DISTRIBUTIONS: | | | | | | | | | | | | |
Net investment income | | | (0.20) | | | | – | | | | (0.57) | |
Net realized gains on investments | | | (0.07) | | | | – | | | | – | |
Total distributions | | | (0.27) | | | | – | | | | (0.57) | |
NET INCREASE/(DECREASE) IN NET ASSET VALUE | | | (0.27) | | | | 0.43 | | | | (0.57) | |
NET ASSET VALUE, END OF PERIOD | | $ | 9.59 | | | $ | 9.86 | | | $ | 9.43 | |
| | |
| | | |
Total Return(c) | | | 0.02% | | | | 4.56% | | | | 0.05% | |
| | | |
SUPPLEMENTAL DATA: | | | | | | | | | | | | |
Net assets, end of period (000) | | $ | 58,365 | | | $ | 59,103 | | | $ | 56,182 | |
| | | |
RATIOS TO AVERAGE NET ASSETS: | | | | | | | | | | | | |
Net investment income including reimbursement/waiver | | | 7.92% | (d) | | | 0.09% | | | | 5.37% | (d) |
Operating expenses excluding reimbursement/waiver(e) | | | 1.00% | (d) | | | 1.00% | | | | 1.24% | (d) |
Operating expenses including reimbursement/waiver(e) | | | 1.00% | (d) | | | 1.00% | | | | 1.00% | (d) |
| | | |
PORTFOLIO TURNOVER RATE | | | 37% | (f) | | | 199% | | | | 43% | (f) |
| (a) | Prior to January 21, 2014, the Centre Multi-Asset Real Return Fund was named the Drexel Hamilton Multi-Asset Real Return Fund. |
| (b) | Calculated using the average shares method. |
| (c) | Total returns are for the period indicated and have not been annualized. Total returns would have been lower had certain expenses not been waived during the period. Returns shown do not reflect the deduction of taxes that a shareholder would pay on fund distributions or the redemption of fund shares. |
| (e) | Excludes Advisory fees of the affiliated funds in which the Fund invests. |
| (f) | Portfolio turnover rate for periods less than one full year have not been annualized. |
| | |
| See Notes to Financial Statements. | | |
| 48 | | centrefunds.com |
| | |
| Centre Funds | | Notes to Financial Statements |
| | March 31, 2015 (Unaudited) |
1. ORGANIZATION
Centre Funds (the “Trust”) was organized on March 17, 2011 as a Delaware statutory trust and is registered as an open-end management investment company under the Investment Company Act of 1940, as amended (the “1940 Act”). Prior to January 17, 2014, the Trust was known as Drexel Hamilton Mutual Funds. The Trust currently offers shares of beneficial interest (“shares”) of Centre American Select Equity Fund (the “American Select Equity Fund”), Centre Global Select Equity Fund (the “Global Select Equity Fund”), Centre Active U.S. Treasury Fund (the “Treasury Fund”), Centre Multi-Asset Real Return Fund (the “Multi-Asset Real Return Fund”) and Centre Active U.S. Tax Exempt Fund (“Tax Exempt Fund”) (collectively the “Funds”). The affairs of the Trust are overseen by a Board of Trustees (the “Board” or the “Trustees”). The Declaration of Trust of the Trust permits the Trustees to create additional series of the Trust and share classes.
Information in the accompanying Funds’ financial statements pertain to the Investor Class and Institutional Class shares offered by the Funds. All classes of shares have identical rights to earnings, assets, and voting privileges, except for class-specific expenses and exclusive rights to vote on matters affecting only individual classes.
2. SIGNIFICANT ACCOUNTING POLICIES
The following is a summary of significant accounting policies followed by the Funds in the preparation of the Financial Statements:
| (a) | Portfolio securities traded on a securities exchange or are quoted by NASDAQ are valued at last sale price on the principal exchange on which they are traded at the time the securities are valued, or, if not traded on that day, are valued at the closing bid price. Securities traded in the OTC market and are not quoted by NASDAQ are valued at their last sale price or, if there is no available price, the last bid price quoted by brokers that make markets in the securities as of the close of regular trading hours on the day the securities are being valued. Foreign securities are valued on the basis of quotations from the primary market in which they are traded, and are translated from the local currency into U.S. dollars using exchange rates as of the close of the New York Stock Exchange (the “Exchange”) or using methods determined by the Board. Short-term instruments with maturities of 60 days or less are valued at by an approved pricing source. Securities and other assets for which quotations are not readily available or deemed unreliable are valued at their fair value using methods determined by the Board. Fair valuation of a particular security is an inherently subjective process, with no single standard to utilize when determining a security’s fair value. As such, different mutual funds could reasonably arrive at a different fair value price for the same security. In each case where a security is fair valued, consideration is given to the facts and circumstances relevant to the particular situation. This consideration includes reviewing various factors set forth in the pricing procedures adopted by the Board and other factors as warranted. In making a fair value determination, factors that may be considered, among others, may include: the type and structure of the security; unusual events or circumstances relating to the security’s issuer; general market conditions; prior day’s valuation; fundamental analytical data; size of the holding; cost of the security on the date of purchase; nature and duration of any restriction on disposition; trading activities, and prices of similar securities or financial instruments. |
| (b) | The per share net asset value (the “NAV”) of each Fund is calculated as of the close of trading on the Exchange (normally 4:00 p.m. Eastern time) every day the Exchange is open. The per share NAV is calculated by deducting from the Fund’s assets, the Fund’s liabilities, and then dividing the resulting net assets by the total number of shares outstanding, rounded to the nearest cent. The purchase price and redemption price per share is equal to the next determined NAV per share. Redemption of shares of American Select Equity Fund and Global Select Equity Fund are subject to a redemption fee of 2% if redeemed within 90 days of purchase. |
| (c) | The Trust treats each Fund as a separate entity for Federal income tax purposes. Each Fund intends to continue to qualify each year as a “regulated investment company” under Subchapter M of the Internal Revenue Code of 1986, as amended (the “Code”). By so qualifying, each Fund will not be subject to Federal income taxes to the extent that it distributes substantially all of its taxable or tax-exempt income, if any, for its tax year ending September 30. In addition, by distributing in each calendar year substantially all of its net investment income, capital gains and certain other amounts, if any, each Fund will not be subject to a Federal excise tax. Therefore, no provision is made by the Funds for Federal income or excise taxes. Withholding taxes on foreign dividends are paid or provided for in accordance with the applicable country’s tax rules and rates. |
As of and during the period ended March 31, 2015, the Funds did not have a liability for any unrecognized tax benefits in the accompanying financial statements. The Funds recognize the interest and penalties, if any, related to the unrecognized tax benefits as income tax expense in the Statement of Operations. During the period, the Funds did not incur any interest or penalties.
Each of the Fund’s Federal tax returns for the year ended September 30, 2014, remain subject to examination by the Internal Revenue Service.
| (d) | Net realized gains and losses on investments are computed on the identified cost basis. The portion of security gains and losses resulting from changes in foreign exchange rates is included with net realized and unrealized gains or losses from investments. Dividend income is recognized on the ex-dividend date or for certain foreign securities, as soon as information is available, and interest income is recognized on an accrual basis. The |
| | |
| | |
| Semi-Annual Report | March 31, 2015 | | 49 |
| | |
| Centre Funds | | Notes to Financial Statements |
| | March 31, 2015 (Unaudited) |
| | Funds amortize premium and accrete discount on investments utilizing the effective interest method. Foreign dividend income may be subject to foreign withholding taxes. |
| (e) | A restricted security is a security that has been purchased through a private offering and cannot be resold to the general public without prior registration under the Securities Act of 1933, as amended (the “1933 Act”), or pursuant to the resale limitations provided by Rule 144 under the 1933 Act, or an exemption from the registration requirements of the 1933 Act. Whether a restricted security is illiquid is determined pursuant to guidelines established by the Board. Not all restricted securities are considered to be illiquid. |
| (f) | The preparation of financial statements in conformity with accounting standards generally accepted in the United States of America (“GAAP”) requires management to make estimates and assumptions that affect the amounts reported in financial statements during the reporting period. Management believes the estimates and security valuations are appropriate; however, actual results may differ from those estimates, and the security valuations reflected in the financial statements may differ from the value the Funds ultimately realize upon sale of the securities. The financial statements have been prepared as of the close of the Exchange on March 31, 2015. Each Fund is considered an investment company for financial reporting purposes under GAAP. |
| (g) | The Funds bear expenses incurred specifically on each Fund’s behalf as well as a portion of general Trust expenses, which may be allocated on the basis of relative net assets or the nature of the services performed relative to applicability to each Fund. Expenses that are specific to a Fund or class of shares of a Fund are charged directly to that Fund or share class. All of the realized and unrealized gains and losses and net investment income of a Fund, other than class-specific expenses, are allocated daily to each class in proportion to its average daily net assets. Fees payable under the distribution (Rule 12b-1) plan for Investor class shares of a Fund are charged with respect to such class. |
| (h) | The Funds intend to annually distribute to shareholders all of their net income and/or capital gains with the exception of the Centre Active U.S. Treasury Fund and the Centre Active U.S. Tax Exempt Fund which will make monthly income distributions. Income and capital gains distributions are determined in accordance with income tax regulations, which may differ from GAAP. Distributions to shareholders are recorded on the ex-dividend date. |
| (i) | A Fund may directly purchase securities of foreign issuers. Investing in securities of foreign issuers involves special risks not typically associated with investing in securities of U.S. issuers. The risks include possible reevaluation of currencies, the inability to repatriate foreign currency, less complete financial information about companies and possible future adverse political and economic developments. Moreover, securities of many foreign issuers and their markets may be less liquid and their prices more volatile than those of securities of comparable U.S. issuers. |
| (j) | The books and records of the Funds are maintained in U.S. dollars. Investment valuations and other assets and liabilities initially expressed in foreign currencies are converted each business day into U.S. dollars based upon current exchange rates. The portion of realized and unrealized gains or losses on investments due to fluctuations in foreign currency exchange rates is not separately disclosed and is included in realized and unrealized gains or losses on investments, when applicable. |
3. FAIR VALUE MEASUREMENTS
The Funds normally use third-party pricing services to obtain market quotations for their portfolio investments. Securities and other assets for which representative market quotations are not readily available or which cannot be accurately valued using the Trust’s normal pricing procedures are valued at fair value as determined in good faith under policies approved by the Trustees. Fair value pricing may be used, for example, in situations where (i) an exchange-traded portfolio security is so thinly traded that there have been no transactions for that security over an extended period of time or the validity of a market quotation received is questionable; (ii) the exchange on which the portfolio security is principally traded closes early; or (iii) trading of the portfolio security is halted during the day and does not resume prior to the NAV calculation.
The inputs used in determining the fair value of each Fund’s investments are summarized into three levels, as described in the following hierarchy:
| | |
Level 1 - | | Unadjusted quoted prices in active markets for identical, unrestricted assets or liabilities that a Fund has the ability to access at the measurement date. |
Level 2 - | | Quoted prices which are not active, quoted prices for similar assets or liabilities in active markets or inputs other than quoted prices that are observable (either directly or indirectly). |
Level 3 - | | Significant unobservable prices or inputs (including the oversight of the Board and Adviser in determining the fair value of investments) where there is little or no market activity for the asset or liability at measurement date. |
The inputs or methodology used for valuing securities are not necessarily an indication of the risk associated with investing in those securities.
| | |
| Centre Funds | | Notes to Financial Statements |
| | March 31, 2015 (Unaudited) |
The following is a summary of each Fund’s investments in the fair value hierarchy as of March 31, 2015:
Centre American Select Equity Fund
| | | | | | | | | | | | | | | | |
| Investments in Securities at Value(a) | | Level 1 -
Quoted Prices | | | Level 2 -
Other Significant
Observable Inputs | | | Level 3 -
Significant Unobservable
Inputs | | | Total | |
Common Stocks | | $ | 204,953,763 | | | $ | – | | | $ | – | | | $ | 204,953,763 | |
Rights | | | – | | | | – | | | | 3,149 | | | | 3,149 | |
Purchased Options | | | 6,582,400 | | | | – | | | | – | | | | 6,582,400 | |
U.S. Government Bonds & Notes | | | – | | | | 1,726,222 | | | | – | | | | 1,726,222 | |
Total | | $ | 211,536,163 | | | $ | 1,726,222 | | | $ | 3,149 | | | $ | 213,265,534 | |
| | |
| | |
Centre Global Select Equity Fund | | | | | | | | | |
| | | | |
| Investments in Securities at Value(a) | | Level 1 -
Quoted Prices | | | Level 2 -
Other Significant
Observable Inputs | | | Level 3 -
Significant Unobservable
Inputs | | | Total | |
Common Stocks | | $ | 20,107,395 | | | $ | – | | | $ | – | | | $ | 20,107,395 | |
Preferred Stocks | | | 204,689 | | | | – | | | | – | | | | 204,689 | |
Short Term Investments | | | 210,716 | | | | – | | | | – | | | | 210,716 | |
Total | | $ | 20,522,800 | | | $ | – | | | $ | – | | | $ | 20,522,800 | |
| | |
| | |
Centre Active U.S. Treasury Fund | | | | | | | | | |
| | | | |
| Investments in Securities at Value(a) | | Level 1 -
Quoted Prices | | | Level 2 -
Other Significant
Observable Inputs | | | Level 3 -
Significant Unobservable
Inputs | | | Total | |
U.S. Government Bonds & Notes | | $ | – | | | $ | 79,383,154 | | | $ | – | | | $ | 79,383,154 | |
Short Term Investments | | | 32,653,599 | | | | – | | | | – | | | | 32,653,599 | |
Total | | $ | 32,653,599 | | | $ | 79,383,154 | | | $ | – | | | $ | 112,036,753 | |
| | |
Other Financial Instruments | | | | | | | | | | | | | | | | |
Liabilities: | | | | | | | | | | | | | | | | |
Futures Contracts | | $ | (578,620) | | | $ | – | | | $ | – | | | $ | (578,620) | |
Total | | $ | (578,620) | | | $ | – | | | $ | – | | | $ | (578,620) | |
| | |
| | |
Centre Active U.S. Tax Exempt Fund | | | | | | | | | |
| | | | |
| Investments in Securities at Value(a) | | Level 1 -
Quoted Prices | | | Level 2 -
Other Significant
Observable Inputs | | | Level 3 -
Significant Unobservable
Inputs | | | Total | |
Municipal Bonds | | $ | – | | | $ | 51,864,031 | | | $ | – | | | $ | 51,864,031 | |
Short Term Investments | | | 4,645,048 | | | | – | | | | – | | | | 4,645,048 | |
Total | | $ | 4,645,048 | | | $ | 51,864,031 | | | $ | – | | | $ | 56,509,079 | |
| | |
Other Financial Instruments | | | | | | | | | | | | | | | | |
Liabilities: | | | | | | | | | | | | | | | | |
Futures Contracts | | $ | (38,975) | | | $ | – | | | $ | – | | | $ | (38,975) | |
Total | | $ | (38,975) | | | $ | – | | | $ | – | | | $ | (38,975) | |
| | |
| | |
Centre Multi-Asset Real Return Fund | | | | | | | | | |
| | | | |
| Investments in Securities at Value(a) | | Level 1 -
Quoted Prices | | | Level 2 -
Other Significant
Observable Inputs | | | Level 3 -
Significant Unobservable
Inputs | | | Total | |
Exchange-Traded Funds | | $ | 2,989,258 | | | $ | – | | | $ | – | | | $ | 2,989,258 | |
Open-End Funds | | | 55,363,313 | | | | – | | | | – | | | | 55,363,313 | |
Short Term Investments | | | 73,101 | | | | – | | | | – | | | | 73,101 | |
Total | | $ | 58,425,672 | | | $ | – | | | $ | – | | | $ | 58,425,672 | |
| | |
| (a) | For detailed descriptions of sectors, industries, and countries, see the accompanying Schedule of Investments. |
| | |
| | |
| Semi-Annual Report | March 31, 2015 | | 51 |
| | |
| Centre Funds | | Notes to Financial Statements |
| | March 31, 2015 (Unaudited) |
The following is a reconciliation of the investments in which significant unobservable inputs (Level 3) were used in determining fair value:
Centre American Select Equity Fund
| | | | | | | | | | | | | | | | | | | | | | | | | | | | | | | | | | | | |
Investments in Securities | | Balance
as of
September 30, 2014 | | | Realized
Gain/
(Loss) | | | Change in
Unrealized
Appreciation/
(Depreciation) | | | Purchases | | | Sales
Proceeds | | | Transfer
into
Level 3 | | | Transfer
out of
Level 3 | | | Balance as of March 31,
2015 | | | Net change in unrealized
Appreciation/
(Depreciation) included in
the Statements of Operations attributable to
Level 3 investments held
at March 31, 2015 | |
Rights | | $ | – | | | $ | – | | | $ | – | | | $ | – | | | $ | – | | | $ | 3,149 | | | $ | – | | | $ | 3,149 | | | $ | – | |
Total | | $ | – | | | $ | – | | | $ | – | | | $ | – | | | $ | – | | | $ | 3,149 | | | $ | – | | | $ | 3,149 | | | $ | – | |
| | | | | | | | | | | | | | | | | | | | | | | | | | | | | | | | | | | | | |
For the other Funds there were no securities classified as Level 3 securities during the period, thus, a reconciliation of assets in which significant unobservable inputs (Level 3) were used are not applicable for these Funds.
Derivative Financial Instruments
The following discloses the Funds’ use of derivative instruments.
A Fund is generally permitted to purchase investment securities and enter into various types of derivative contracts such as purchased and written options. In doing so, the Fund may employ strategies in differing combinations to permit them to increase, decrease, or change the level or types of exposure to market factors or to hedge. A Fund may invest its assets in derivatives, cash management instruments, and other instruments to help manage interest rate exposure, protect the Fund’s assets, or enhance returns. A Fund may also be exposed to certain exchange-traded derivative products, such as exchange-traded futures and options that are fully collateralized by cash or securities, for temporary cash management or investment transition purposes, or to hedge the risks of existing positions or overall capital protection.
Market Risk Factors: In pursuit of its investment objectives, a Fund may seek to use derivatives to increase or decrease its exposure to the following market risk factors, if applicable:
Equity Risk: Equity risk relates to the change in value of equity securities as they relate to increases or decreases in the general market.
Foreign Exchange Rate Risk: Foreign exchange rate risk relates to the change in the U.S. dollar value of a security held that is denominated in a foreign currency. The value of a foreign currency denominated security will decrease as the dollar appreciates against the currency, while the value of the foreign currency denominated security will increase as the dollar depreciates against the currency.
Risk of Investing in Derivatives
Use of derivatives can result in losses due to unanticipated changes in the market risk factors and the overall market.
Derivatives may have little or no initial cash investment relative to their market value exposure and therefore can produce significant gains or losses in excess of their cost. This use of embedded leverage may allow a Fund to increase its market value exposure relative to its net assets and can substantially increase the volatility of the Fund’s performance.
Additional associated risks from investing in derivatives also exist and potentially could have significant effects on the valuation of the derivatives and a Fund. Typically, the associated risks are not the risks that a Fund is attempting to increase or decrease exposure, but are the additional risks from investing in derivatives.
Example of these associated risks are liquidity risk, which is the risk that a Fund will not be able to sell the derivative in the open market in a timely manner, and counterparty credit risk, which is the risk that the counterparty will not fulfill its obligation to the Fund.
Option Writing/Purchasing
A Fund may write or purchase option contracts to adjust risk and return of its overall investment positions, subject to any restrictions set forth in the Fund’s prospectus. When a Fund writes or purchases an option, an amount equal to the premium received or paid by the Fund is recorded as a liability or an asset and is subsequently adjusted to the current market value of the option written or purchased. Premiums received or paid from writing or purchasing options that expire unexercised are treated by a Fund on the expiration date as realized gains or losses. The difference between the premium and the amount paid or received on affecting a closing purchase or sale transaction, including brokerage commissions, is also treated as a realized gain or loss. If an option is exercised, the premium paid or received is added to the cost of the purchase or proceeds from
| | |
| Centre Funds | | Notes to Financial Statements |
| | March 31, 2015 (Unaudited) |
the sale in determining whether a Fund has realized a gain or loss on investment transactions. Risks from entering into option transactions arise from, among other things, the potential inability of counterparties to meet the terms.
Futures
A Fund may use futures subject to any restrictions set forth in the Fund’s prospectus. A Fund may also be exposed to exchange-traded futures that are fully collateralized by cash or securities, for temporary cash management or investment transition purposes, or to hedge the risks of existing positions. To the extent that the Fund uses derivatives for temporary cash management, investment transition purposes, managing duration or to hedge the risks of existing positions, the Fund will be subject to the risks associated with such transactions.
Statement of Assets and Liabilities - Fair Value of Derivative Instruments as of March 31, 2015:
| | | | | | |
| Risk Exposure | | Derivatives
Statement of Assets and Liabilities Location | | Fair Value | |
Centre American Select Equity Fund | | | | | | |
Equity Contracts
(Purchased Options) | | Investments, at value | | $ | 6,582,400 | |
| | | | | | |
| | | | $ | 6,582,400 | |
| | | | | | |
| | |
Centre Active U.S. Treasury Fund | | | | | | |
Fixed Income Contracts
(Futures Contracts) | | Variation margin payable | | $ | 578,620 | |
| | | | | | |
| | | | $ | 578,620 | |
| | | | | | |
| | |
Centre Active U.S. Tax Exempt Fund | | | | | | |
Fixed Income Contracts
(Futures Contracts) | | Variation margin payable | | $ | 38,975 | |
| | | | | | |
| | | | $ | 38,975 | |
| | | | | | |
The effect of derivative instruments on the Statement of Operations for the period ended March 31, 2015:
| | | | | | | | | | |
| Derivatives | | Location of Gains/ (Loss) On Derivatives Recognized In Income | | Realized Gain/ (Loss) on Derivatives Recognized in Income | | | Change in Unrealized Gain/(Loss) on
Derivatives Recognized in Income | |
Centre American Select Equity Fund | | | | | | | | |
Equity Contracts (Purchased options) | | Net realized gain/(loss) on investments/Net change in unrealized appreciation/(depreciation) on investments | | $ | (4,318,438) | | | $ | 1,507,071 | |
| | | | | | |
| | | | $ | (4,318,438) | | | $ | 1,507,071 | |
| | | | | | |
Centre Active U.S. Treasury Fund | | | | | | | | |
Fixed Income Contracts (Futures Contracts) | | N/A/Net change in unrealized depreciation on futures contracts | | $ | – | | | $ | (578,620) | |
| | | | | | |
| | | | $ | – | | | $ | (578,620) | |
| | | | | | |
Centre Active U.S. Tax Exempt Fund | | | | | | | | |
Fixed Income Contracts (Futures Contracts) | | N/A/Net change in unrealized depreciation on futures contracts | | $ | – | | | $ | (38,975) | |
| | | | | | |
| | | | $ | – | | | $ | (38,975) | |
| | | | | | |
4. BENEFICIAL INTEREST TRANSACTIONS
On March 31, 2015, there was an unlimited number of shares of beneficial interest authorized for each Fund. Transactions in shares of beneficial interest are shown in the Statement of Changes in Net Assets.
Shares of American Select Equity Fund and Global Select Equity Fund that are redeemed within 90 days of purchase may incur a 2% redemption fee deducted from the redemption amount. For the period ended March 31, 2015, redemption fees retained by these Funds are disclosed in the Statement of Changes in Net Assets.
| | |
| | |
| Semi-Annual Report | March 31, 2015 | | 53 |
| | |
| Centre Funds | | Notes to Financial Statements |
| | March 31, 2015 (Unaudited) |
Beneficial Ownership: The beneficial ownership, either directly or indirectly, of more than 25% of the voting securities of a Fund creates a presumption of control of the Fund under Section 2(a)(9) of the 1940 Act. As of March 31, 2015, the following entities owned beneficially more than 25% of each Fund’s outstanding shares. The shares may be held under omnibus accounts (whereby the transactions of two or more shareholders are combined and carried in the name of the originating broker rather than designated separately).
| | | | | | |
Centre American Select Equity Fund | | | | | | |
| Entity | | Class | | Percentage | |
SEI Private Trust CO | | Institutional | | | 99.78 | % |
Charles Schwab & CO. Inc | | Investor | | | 34.29 | % |
| | |
Centre Global Select Equity Fund | | | | | | |
| Entity | | Class | | Percentage | |
SEI Private Trust CO | | Institutional | | | 99.85 | % |
James A. Abate | | Investor | | | 100.00 | % |
| | |
Centre Active U.S. Treasury Fund | | | | | | |
| Entity | | Class | | Percentage | |
SEI Private Trust CO | | Institutional | | | 87.32 | % |
| | |
Centre Active U.S. Tax Exempt Fund | | | | | | |
| Entity | | Class | | Percentage | |
Wells Fargo Advisors LLC | | Institutional | | | 92.99 | % |
| | |
Centre Multi-Asset Real Return Fund | | | | | | |
| Entity | | Class | | Percentage | |
Brown Brothers Harriman & CO | | Institutional | | | 99.32 | % |
James A. Abate | | Investor | | | 100.00 | % |
5. INVESTMENT ADVISORY AGREEMENTS AND RELATED-PARTY TRANSACTIONS
Centre Asset Management, LLC (the “Adviser”) serves as the investment adviser to each Fund pursuant to Investment Advisory Agreements with the Trust.
As compensation for the investment advisory services provided to the Funds, the Adviser currently receives monthly compensation based on each Fund’s average daily net assets at the annual rate of:
| | |
| Fund | | Management Fee Rate |
Centre American Select Equity Fund (total net assets under $1 billion) | | 0.75% |
Centre American Select Equity Fund (total net assets over $1 billion) | | 0.70% |
Centre Global Select Equity Fund | | 1.00% |
Centre Active U.S. Treasury Fund | | 0.40% |
Centre Active U.S. Tax Exempt Fund | | 0.40% |
Centre Multi-Asset Real Return Fund | | 0.55% |
American Select Equity Fund
For the American Select Equity Fund, the Adviser has agreed to limit through January 31, 2016 the total operating expenses of the Fund including (but not limited to) investment advisory fees of the Adviser and distribution/service (Rule 12b-1) fees, but excluding interest, taxes, litigation, brokerage and extraordinary expenses incurred by the Fund in the fiscal year, to an annual rate of 1.05% of the average daily net assets of the Investor Class shares and 0.95% of the average daily net assets of the Institutional Class shares. To the extent the Fund incurs any interest, taxes, litigation, brokerage or extraordinary expenses, and such expenses are included in the calculation of Total Annual Fund Operating Expenses, the Fund’s Total Annual Fund Operating Expenses (before fee waiver and/or expense reimbursements) would be higher. The Expense Limitation Agreement may be terminated by the Adviser or the Trust, with respect to the Fund, at any time and without payment of penalty, provided that the terminating party provides 90 days’ prior written notice of such termination to the other party. The Adviser may request repayment by the Fund of any expense waived or reimbursed by the Adviser pursuant to the Expense Limitation Agreement in the first, second and third fiscal years following the fiscal year in which the waiver or reimbursement occurs, provided that the total annual Fund operating expenses for the applicable following
| | |
| Centre Funds | | Notes to Financial Statements |
| | March 31, 2015 (Unaudited) |
year, after giving effect to the repayment, do not exceed the expense limitation in effect at the time the waiver or reimbursement is made (or any lower expense limitation or limitations to which the parties may otherwise agree).
Global Select Equity Fund
For the Global Select Equity Fund, the Adviser has entered into a written expense limitation agreement under which it has agreed to limit through January 31, 2016 the total operating expenses of the Fund including (but not limited to) investment advisory fees of the Adviser and distribution/service (Rule 12b-1) fees, but excluding interest, taxes, litigation, brokerage, other expenditures which are capitalized in accordance with generally accepted accounting principles and extraordinary expenses) to an annual rate of 1.45% of the average daily net assets of the Investor Class shares, and 1.25% of the average daily net assets of the Institutional Class shares. To the extent the Fund incurs any interest, taxes, litigation, brokerage, or extraordinary expenses, and such expenses are included in the calculation of Total Annual Fund Operating Expenses, the Fund’s Total Annual Fund Operating Expenses (before fee waiver and/or expense reimbursements) would be higher. The expense limitation agreement may be terminated by the Adviser or the Trust, with respect to the Fund, at any time and without payment of penalty, provided that the terminating party provides 90 days’ prior written notice of such termination to the other party. The Adviser may recoup any waived amount, including organizational fees, from the Fund pursuant to this agreement if such reimbursement does not cause the Fund to exceed the then existing expense limitation at the time the waiver or reimbursement is made and the reimbursement is made within three fiscal years after the year in which the Adviser incurred the expense.
Treasury Fund
For the Treasury Fund, the Adviser has entered into a written expense limitation agreement, dated and effective as of November 4, 2013 (the “Expense Limitation Agreement”), under which it has agreed to limit through at least January 31, 2016 the total operating expenses of the Fund including (but not limited to) investment advisory fees of the Adviser and distribution/service (Rule 12b-1) fees, but excluding, as applicable, any front-end or contingent deferred sales loads, taxes, leverage interest, brokerage commissions, expenses incurred in connection with any merger or reorganization, and extraordinary expenses (such as litigation and other expenses not incurred in the ordinary course of the Fund’s business), and acquired fund fees and expenses, to an annual rate of 0.85% of the average daily net assets of the Investor Class shares and 0.60% of the average daily net assets of the Institutional Class shares. To the extent the Fund incurs any front-end or contingent deferred sales loads, taxes, leverage interest, brokerage commissions, expenses incurred in connection with any merger or reorganization, and extraordinary expenses, and such expenses are included in the calculation of Total Annual Fund Operating Expenses, the Fund’s Total Annual Fund Operating Expenses (before fee waiver and/or expense reimbursements) would be higher. The Expense Limitation Agreement may be terminated at any time, and without payment of any penalty, by the Board of Trustees of the Trust, on behalf of the Fund, upon 60 days’ written notice to the Adviser. The Expense Limitation Agreement may not be terminated by the Adviser without the consent of the Board. The Expense Limitation Agreement will automatically terminate if the investment advisory agreement between the Adviser and the Trust, on behalf of the Fund (the “Advisory Agreement”) is terminated, with such termination effective upon the effective date of the Advisory Agreement’s termination. The Adviser may recoup any waived or reimbursed amount pursuant to the Expense Limitation Agreement in the first, second and third fiscal years following the fiscal year in which any such reimbursement or waiver occurs. The Adviser has agreed that the reimbursement will not cause the Fund to exceed the then-existing expense limitation for that class at the time the waiver or reimbursement was made.
Tax Exempt Fund
For the Tax Exempt Fund, the Adviser has entered into a written expense limitation agreement dated December 8, 2014 (the “Expense Limitation Agreement”), under which it has agreed to reduce its advisory fees and/or reimburse other expenses of the Fund, for an initial period of not less than two years from the date of the closing of the reorganization of Managed Municipal Fund, Inc. into the Fund (the “Reorganization”) and until the next following effective date of the post-effective amendment to the registration statement of the Trust relating to the Fund incorporating the Fund’s financial statements for that fiscal year, to the extent necessary to limit the current operating expenses of each class of shares of the Fund, including (but not limited to) investment advisory fees of the Adviser and distribution/service (Rule 12b-1) fees, but excluding any taxes, leverage interest, brokerage commissions, acquired fund fees and expenses, expenses incurred in connection with any merger or reorganization, and extraordinary expenses (such as litigation and other expenses not incurred in the ordinary course of the Fund’s business) to an annual rate of 0.95% of the average daily net assets of the Investor Class shares and 0.70% of the average daily net assets of the Institutional Class shares. The Expense Limitation Agreement may be terminated at any time, and without payment of any penalty, by the Board, on behalf of the Fund, upon 60 days’ written notice to the Adviser. The Expense Limitation Agreement may not be terminated by the Adviser without the consent of the Board. The Expense Limitation Agreement will automatically terminate if the investment advisory agreement between the Adviser and the Trust, on behalf of the Fund (the “Advisory Agreement”) is terminated, with such termination effective upon the effective date of the Advisory Agreement’s termination. The Adviser may recoup any waived or reimbursed amount pursuant to the Expense Limitation Agreement in the first, second and third fiscal years following the fiscal year in which any such reimbursement or waiver occurs, provided that the reimbursement does not cause the Fund to exceed the then-existing expense limitation for that class at the time such reimbursement or waiver was made.
Multi-Asset Real Return Fund
For the Multi-Asset Real Return Fund, the Adviser has contractually agreed, pursuant to a written expense limitation agreement (the “Expense Limitation Agreement”), to reduce its advisory fees and/or reimburse other expenses of the Fund until January 31, 2016 to the extent necessary to limit the current operating expenses of each class of shares of the Fund including (but not limited to) investment advisory fees of the Adviser and
| | |
| | |
| Semi-Annual Report | March 31, 2015 | | 55 |
| | |
| Centre Funds | | Notes to Financial Statements |
| | March 31, 2015 (Unaudited) |
distribution/service (Rule 12b-1) fees but exclusive of any front-end or contingent deferred sales loads, taxes, leverage interest, brokerage commissions, expenses incurred in connection with any merger or reorganization, extraordinary expenses such as litigation and other expenses not incurred in the ordinary course of the Fund’s business, and acquired fund fees and expenses, except that, if an acquired fund is an underlying fund managed by the Adviser and such acquired fund is not subject to an effective expense limitation or fee waiver agreement at any time during the term of the Expense Limitation Agreement, then, for that time, the operating expenses of each class of shares of the Fund shall not exclude the amount of advisory fees included in such acquired fund’s fees and expenses to which the Fund would otherwise be subject, to an annual rate of 1.25% of the average daily net assets of the Investor Class shares and 1.00% of the average daily net assets of the Institutional Class shares. The Expense Limitation Agreement may be terminated by the Adviser or the Trust, with respect to the Fund, at any time and without payment of penalty, provided that the terminating party provides 90 days’ prior written notice of such termination to the other party. The Adviser may receive reimbursement of any amount waived pursuant to the Expense Limitation Agreement, provided that the reimbursement does not cause the Fund to exceed the then-existing expense limitation for that class at the time such reimbursement is to be paid by the Fund.
During the period ended March 31, 2015, the fee waivers and/or reimbursements were as follows:
| | | | | | |
| Fund | | Fees Waived/Reimbursed
by Adviser | | | |
Centre American Select Equity Fund | | | | | | |
Investor | | | $ 233,549 | | | |
Institutional | | | 21,350 | | | |
Centre Global Select Equity Fund | | | | | | |
Investor | | | 18 | | | |
Institutional | | | 65,116 | | | |
Centre Active U.S. Treasury Fund | | | | | | |
Investor | | | – | | | |
Institutional | | | 63,668 | | | |
Centre Active U.S. Tax Exempt Fund | | | | | | |
Investor | | | 416 | | | |
Institutional | | | 67 | | | |
Centre Multi-Asset Real Return Fund | | | | | | |
Investor | | | – | | | |
Institutional | | | – | | | |
During the period ended March 31, 2015, Investor Class of the Centre Active U.S. Treasury Fund and Institutional Class of the Centre Multi-Asset Real Return Fund had recoupments of $43 and $6,621 respectively.
As of September 30, 2014, the balances of recoupable expenses for each Fund were as follows:
| | | | | | | | | | | | | | | | |
| Fund | | Expires 2015 | | | Expires 2016 | | | Expires 2017 | | | Total | |
Centre American Select Equity Fund | | | | | | | | | | | | | | | | |
Investor Class | | $ | 189,101 | | | $ | 446,410 | | | $ | 467,347 | | | $ | 1,102,858 | |
Institutional Class | | | N/A | | | | N/A | | | | 32,014 | | | | 32,014 | |
Centre Global Select Equity Fund | | | | | | | | | | | | | | | | |
Investor Class | | | N/A | | | | N/A | | | | 1,094 | | | | 1,094 | |
Institutional Class | | | 157,721 | | | | 121,781 | | | | 106,294 | | | | 385,796 | |
Centre Active U.S. Treasury Fund | | | | | | | | | | | | | | | | |
Investor Class | | | N/A | | | | N/A | | | | N/A | | | | N/A | |
Institutional Class | | | N/A | | | | N/A | | | | N/A | | | | N/A | |
Centre Active U.S. Tax Exempt Fund | | | | | | | | | | | | | | | | |
Investor Class | | | N/A | | | | N/A | | | | 43 | | | | 43 | |
Institutional Class | | | N/A | | | | N/A | | | | 119,257 | | | | 119,257 | |
Centre Multi-Asset Real Return Fund | | | | | | | | | | | | | | | | |
Investor Class | | | N/A | | | | 4 | | | | N/A | | | | 4 | |
Institutional Class | | | N/A | | | | 119,220 | | | | N/A | | | | 119,220 | |
ALPS Fund Services, Inc. (“ALPS” or the “Administrator”) serves as administrator to the Funds. ALPS receives a monthly fee paid by the Funds subject to a minimum monthly fee and is reimbursed for certain out-of-pocket expenses. Pursuant to an administrative agreement with the Trust, ALPS provides operational services to the Funds including, but not limited to fund accounting and fund administration services and general assistance in each Fund’s operations.
| | |
| Centre Funds | | Notes to Financial Statements |
| | March 31, 2015 (Unaudited) |
ALPS, pursuant to a transfer agency and services agreement with the Trust, serves as transfer agent for the Funds. Under the transfer agency and services agreement, ALPS receives an annual minimum fee per Fund and a fee based upon each shareholder account and its account activity and is reimbursed for certain out-of-pocket expenses.
ALPS, pursuant to a chief compliance officer services agreement with the Trust, provides chief compliance officer services to the Funds. Additionally, ALPS provides services in monitoring and testing the policies and procedures of the Trust in conjunction with requirements under Rule 38a-1 under the 1940 Act. ALPS receives an annual fee for these services and is reimbursed for certain out-of-pocket expenses, pursuant to the chief compliance officer services agreement.
The Trust has adopted a plan pursuant to Rule 12b-1 under the 1940 Act (the “Plan”). The Plan permits the Trust, on behalf of Investor class shares of the Funds, to pay one or more entities for services rendered and expenses borne in connection with providing shareholder or distribution services with respect to the Investor class shares of each Fund.
ALPS Distributors, Inc. (the “Distributor”) acts as the principal underwriter of the Funds pursuant to a distribution agreement with the Trust. There were no payments to the Distributor by the Funds during the period ended March 31, 2015.
Officers of the Trust and Trustees who are “interested persons” of the Trust or the Adviser will receive no salary or fees from the Trust. As of January 1, 2014, each Trustee who is not an “interested person,” as defined by the 1940 Act (the “Independent Trustees”), receives an annual retainer of $20,000 paid quarterly. The Trust reimburses each Trustee and Officer for his or her travel and other expenses relating to attendance at Board meetings.
One Trustee is an officer of the Adviser.
|
| 6. FEDERAL INCOME TAX AND TAX BASIS INFORMATION |
As of and during the period ended March 31, 2015, the Funds did not have a liability for any unrecognized tax benefits. The Funds file U.S. Federal, state, and local tax returns as required. The Funds’ tax returns are subject to examination by the relevant tax authorities until expiration of the applicable statute of limitations which is generally three years after the filing of the tax return but which can be extended to six years in certain circumstances. Tax returns for open years have incorporated no uncertain tax positions that require a provision for income taxes.
Components of Distributable Earnings on a Tax Basis: At March 31, 2015, permanent differences in book and tax accounting were reclassified. These differences had no effect on net assets and were primarily attributed to differences in the book and tax treatment of non-deductible expenses, currency transactions, net operating loss, and certain other investments.
Capital Losses: As of September 30, 2014 the following Funds had capital loss carryforwards which may reduce the Funds’ taxable income arising from future net realized gains on investments, if any, to the extent permitted by the Code and thus may reduce the amount of the distributions to shareholders which would otherwise be necessary to relieve the Funds of any liability for federal tax. Pursuant to the Code, such capital loss carryforwards will expire as follows:
| | | | | | |
| Pre-Enactment Capital Losses: | | | | | | |
| | |
| Fund | | Expiring in 2017 | | | |
Centre American Select Equity Fund | | $ | 268,786 | | | |
| |
Capital loss carryovers utilized during the period ended September 30, 2014, were: | | | |
| | |
| Fund | | Amount | | | |
Centre American Select Equity Fund | | $ | (7,739,331 | ) | | |
Under the recently enacted Regulated Investment Company Modernization Act of 2010, capital losses incurred by each Fund after January 1, 2011 will not be subject to expiration. In addition, such losses must be utilized prior to the losses incurred in the years preceding enactment.
| | |
| | |
| Semi-Annual Report | March 31, 2015 | | 57 |
| | |
| Centre Funds | | Notes to Financial Statements |
| | March 31, 2015 (Unaudited) |
The tax character of distributions paid for the fiscal year ended September 30, 2014 were as follows:
| | | | | | | | |
| Distributions Paid From: | | Ordinary Income | | | Long-Term Capital Gains | |
Centre American Select Equity Fund | | $ | 1,048,301 | | | $ | 14,415 | |
Centre Global Select Equity Fund | | | 320,244 | | | | 219,297 | |
Centre Active U.S. Treasury Fund | | | – | | | | – | |
Centre Multi-Asset Real Return Fund | | | – | | | | – | |
Unrealized Appreciation and Depreciation on Investments: The amount of net unrealized appreciation/(depreciation) and the cost of investment securities for tax purposes, including short-term securities at March 31, 2015 are displayed in the table below. The difference between book and tax basis unrealized appreciation/(depreciation) for the Funds is primarily attributable to wash sales and certain other investments.
| | | | | | | | | | | | | | | | |
| | | Tax Cost of
Investments | | | Gross Unrealized
Appreciation | | | Gross Unrealized
Depreciation | | | Net Tax Unrealized
Appreciation/(Depreciation)
on Investments | |
Centre American Select Equity Fund | | $ | 179,886,825 | | | $ | 37,020,561 | | | $ | (3,641,852) | | | $ | 33,378,709 | |
Centre Global Select Equity Fund | | | 20,353,415 | | | | 1,543,875 | | | | (1,374,490) | | | | 169,385 | |
Centre Active U.S. Treasury Fund | | | 107,560,352 | | | | 4,476,401 | | | | – | | | | 4,476,401 | |
Centre Active U.S. Tax Exempt Fund | | | 53,656,231 | | | | 2,852,848 | | | | – | | | | 2,852,848 | |
Centre Multi-Asset Real Return Fund | | | 61,787,696 | | | | 88,165 | | | | (3,450,189) | | | | (3,362,024) | |
The Multi-Asset Real Return Fund, in accordance with its investment strategies, may invest in certain securities that are considered securities issued by affiliated companies. As defined by the 1940 Act, an affiliated person, including an affiliated company, includes one in which a Fund owns 5% or more of the outstanding voting securities, or a company which is under common ownership or control with the Fund. The purchases, sales, dividend income, capital gains, return of capital distributions received, shares, and value of investments in affiliated companies for the period ended March 31, 2015 were as follows:
| | | | | | | | | | | | | | | | | | | | |
| Security Name | | Share Balance
October 1, 2014 | | Purchases | | Sales | | Share Balance
March 31, 2015 | | Dividend
Income | | | Realized
Loss | | | Market Value
March 31, 2015 | |
Centre American Select Equity Fund, Institutional Class | | 1,307,665 | | 153,486 | | 12,510 | | 1,448,641 | | $ | 244,089 | | | $ | (4,629 | ) | | $ | 17,528,551 | |
Centre Global Select Equity Fund, Institutional Class | | 1,268,486 | | 742,415 | | 17,949 | | 1,992,952 | | | 2,132,530 | | | | (44,692 | ) | | | 20,547,337 | |
Centre Active U.S. Treasury Fund, Institutional Class | | 1,437,698 | | 325,575 | | 49,950 | | 1,713,323 | | | 232,215 | | | | (6,993 | ) | | | 17,287,425 | |
| | | | | | | | | | $ | 2,608,834 | | | $ | (56,314 | ) | | $ | 55,363,313 | |
| | |
|
| 8. PURCHASES AND SALES OF INVESTMENT SECURITIES |
For the period ended March 31, 2015, the aggregate cost of purchases and proceeds from sales of investment securities (excluding any U.S. Government Obligations short-term securities) were as follows:
| | | | | | | | |
| Fund | | Purchases of Securities | | | Proceeds From Sales of
Securities | |
Centre American Select Equity Fund | | | $ 118,327,860 | | | | $ 134,231,277 | |
Centre Global Select Equity Fund | | | 17,476,497 | | | | 11,379,589 | |
Centre Active U.S. Treasury Fund | | | – | | | | – | |
Centre Active U.S. Tax Exempt Fund | | | 3,565,680 | | | | 10,391,795 | |
Centre Multi-Asset Real Return Fund | | | 23,022,377 | | | | 21,375,626 | |
| | |
| Centre Funds | | Notes to Financial Statements |
| | March 31, 2015 (Unaudited) |
For the year ended March 31, 2015, the aggregate cost of purchases and proceeds from sales of U.S. Government Obligations investment securities were as follows:
| | | | | | | | |
| Fund | | Purchases of Securities
| | | Proceeds from Sales
of Securities | |
Centre American Select Equity Fund | | $ | – | | | $ | 1,007,188 | |
Centre Active U.S. Treasury Fund | | | 16,695,637 | | | | 49,854,599 | |
Under the Trust’s organizational documents, its officers and Trustees are indemnified against certain liabilities relating to their duties to the Trust. Additionally, in the ordinary course of business, the Trust enters into contracts with service providers that may contain general indemnification clauses. The Trust’s maximum exposure under these arrangements is unknown, as this would involve future claims that may be made against the Trust that have not yet occurred.
On March 17, 2015, the following transactions (collectively, the “Reorganization”) occurred: (i) all of the assets and stated liabilities of Total Return U.S. Treasury Fund, Inc. (the “ISI Treasury Fund”) were transferred to the Centre Active U.S. Treasury Fund in exchange for Investor Class shares of the Centre Active U.S. Treasury Fund, which were distributed by the ISI Treasury Fund to its shareholders; (ii) all of the assets and stated liabilities of North American Government Bond Fund, Inc. (the “ISI Bond Fund”) were transferred to the Centre Active U.S. Treasury Fund in exchange for Investor Class shares of the Centre Active U.S. Treasury Fund, which were distributed by the ISI Bond Fund to its Class A and Class C shareholders, and Institutional Class shares of the Centre Active U.S. Treasury Fund, which were distributed by the ISI Bond Fund to its Class I shareholders; (iii) all of the assets and stated liabilities of ISI Strategy Fund, Inc. (the “ISI Strategy Fund”) were transferred to the Centre American Select Equity Fund in exchange for Investor Class shares of the Centre American Select Equity Fund, which were distributed by the ISI Strategy Fund to its shareholders; and (iv) all of the assets and stated liabilities of Managed Municipal Fund, Inc. (the “ISI Municipal Fund,” and together with the ISI Treasury Fund, the ISI Bond Fund and the ISI Strategy Fund, the “Acquired Funds”) were transferred to the Centre Active U.S. Tax Exempt Fund in exchange for Investor Class shares of the Centre Active U.S. Tax Exempt Fund, which were distributed by the ISI Municipal Fund to its Class A shareholders, and Institutional Class shares of the Centre Active U.S. Tax Exempt Fund, which were distributed by the ISI Municipal Fund to its Class I shareholders. Prior to the Reorganization, the Acquired Funds were managed by International Strategy & Investment Inc. Through the Reorganization, shareholders of the ISI Treasury Fund and the ISI Bond Fund became shareholders of Centre Active U.S. Treasury Fund, shareholders of the ISI Strategy Fund became shareholders of the Centre American Select Equity Fund, and shareholders of the ISI Municipal Fund became shareholders of the Centre Active U.S. Tax Exempt Fund. The Reorganization was designed to qualify as a tax-free reorganization for federal income tax purposes.
| | | | | | | | | | | | | | |
| Acquiring Fund | | Shares issued by
Acquiring Fund | | | Net Assets of
Acquiring Fund | | | Acquired Fund | | Acquired Fund
Shares Exchanged | | Net Assets of
Acquired Fund
Exchanged |
Centre American Select Equity Fund | | | 10,706,599 | | | $ | 130,437,982 | | | ISI Strategy Fund | | 7,321,641 | | $ 89,192,637 |
Centre Active U.S. Treasury Fund | | | 1,714,335 | | | $ | 17,263,236 | | | ISI Treasury Fund | | 5,009,326 | | $ 50,307,353 |
Centre Active U.S. Treasury Fund | | | 1,714,335 | | | $ | 17,263,236 | | | ISI Bond Fund | | 5,315,433 | | $ 53,392,772 |
Centre Active U.S. Tax Exempt Fund | | | – | | | $ | – | | | ISI Muni Fund | | 5,713,586 | | $ 60,767,166 |
The investment portfolio fair value and unrealized appreciation as of March 17, 2015 for each of the Acquired Funds were as follows:
| | | | | | | | |
| Acquired Fund | | Portfolio Fair Value | | | Unrealized appreciation/depreciation
of Acquired Fund | | |
Total Return U.S. Treasury Fund | | $ | 49,913,765 | | | 2,125,302 | | |
Managed Municipal Fund | | $ | 60,450,343 | | | 2,692,281 | | |
North American Government Bond Fund | | $ | 52,835,686 | | | (1,063,386) | | |
ISI Strategy Fund | | $ | 90,586,178 | | | 24,657,375 | | |
Immediately following the Reorganization the net assets of the combined Funds were as follows:
| | | | |
| | | Combined Net Assets | | |
Centre American Select Equity Fund | | $ 219,630,619 | | |
Centre Active U.S. Treasury Fund | | $ 120,963,361 | | |
Centre Active U.S. Tax Exempt Fund | | $ 60,767,166 | | |
| | |
| | |
| Semi-Annual Report | March 31, 2015 | | 59 |
| | |
| Centre Funds | | Notes to Financial Statements |
| | March 31, 2015 (Unaudited) |
There were no unused capital loss carryforwards of the Acquired Funds, subject to tax limitations, for potential utilization as of the closing date of the Reorganization, March 17, 2015.
Assuming the Reorganization had been completed on October 1, 2014, the beginning of the annual reporting period for the Acquiring Funds, the Acquiring Funds’ pro forma results of operations for the period ended March 31, 2015 are as follows:
| | | | | | | | | | | | | | | |
| Acquiring Fund | | Net Investment Income | | Net Realized and Unrealized
Gain/Loss on Investments | | Net Increase in Net Assets
Resulting from Operations |
Centre American Select Equity Fund | | | $ | 840,250 | | | | $ | 7,055,439 | | | | $ | 7,895,689 | |
Centre Active U.S. Treasury Fund | | | $ | 1,165,066 | | | | $ | (1,127,406) | | | | $ | 37,659 | |
Centre Active U.S. Tax Exempt Fund | | | $ | 645,605 | | | | $ | (186,059) | | | | $ | 459,546 | |
Because the combined investment portfolios have been managed as single integrated portfolios since the Reorganization was completed, it is not practicable to separate the amounts of revenue and earnings of the Acquired Funds that have been included in the applicable Acquiring Funds’ Statement of Operations since March 17, 2015.
| | |
| Centre Funds | | Additional Information |
| | March 31, 2015 (Unaudited) |
PROXY VOTING GUIDELINES
A description of the policies and procedures that the Funds use to determine how to vote proxies relating to portfolio securities and information regarding how the Funds voted proxies during the most recent 12-month period ended June 30, is available without charge, upon request, by (1) calling the Funds at 1-855-298-4236 and (2) from Form N-PX filed by the Trust with the Securities and Exchange Commission (“SEC”) on the SEC’s website at http://www.sec.gov.
PORTFOLIO HOLDINGS DISCLOSURE POLICY
The Trust files, with regard to each Fund, with the SEC a complete schedule of investments for the first and third quarter of each fiscal year on Form N-Q. The Funds’ first and third fiscal quarters end on December 31 and June 30. The Form N-Q filing must be made within 60 days of the end of the quarter, and the Trust’s first Form N-Q was filed with the SEC on February 27, 2012. Forms N-Q are available on the SEC’s website at http://www.sec.gov and may be reviewed and copied at the SEC’s Public Reference Room in Washington, DC (call 1-800-732-0330 for information on the operations of the Public Reference Room). You may also obtain copies by calling the Funds at 1-855-298-4236.
APPROVAL OF THE INVESTMENT ADVISORY AGREEMENT – CENTRE ACTIVE U.S. TAX EXEMPT FUND
At an in-person meeting held on December 8, 2014, the Trustees, including a majority of the Independent Trustees, considered and unanimously approved an Investment Advisory Agreement between the Adviser and the Trust, on behalf of the Centre Active U.S. Tax Exempt Fund (the “Advisory Agreement”). In connection with such approval, the Trustees, including the Independent Trustees, considered, among other things, (i) the Section 15(c) Memorandum dated November 25, 2014 provided by counsel to the Trust dated December 1, 2014; (ii) the Section 15(c) Request Letter dated November 22, 2014 from counsel to the Trust to the Adviser; and (iii) the Adviser’s responses to the Section 15(c) Request Letter and related exhibits (together, “Section 15(c) Information”).
In their deliberations on the Advisory Agreement, the Trustees reviewed and considered the information provided by the Adviser in response to the Section 15(c) Request Letter, the information provided by Adviser during the Meeting, and other information the Trustees deemed relevant, including (i) the nature, extent and quality of services to be provided by the Adviser; (ii) the proposed advisory fee to be charged to the Tax Exempt Fund and whether such fee was reasonable; (iii) the performance of the Tax Exempt Fund; (iv) the profitability of the Tax Exempt Fund to the Adviser; and (v) potential economies of scale, and information made available to them at the Meeting relating to such factors. The Trustees did not identify any particular information that was all-important or controlling and evaluated all information available to it. The Trustees concluded, on the basis of each Trustee’s business judgment after considering all of the factors taken as a whole, that the terms of the Advisory Agreement are appropriate, that the fees to be paid are reasonable in light of the services to be provided to the Tax Exempt Fund, and that the Advisory Agreement should be approved. In approving the Advisory Agreement, the Board, including the Independent Trustees, who are not parties to the Advisory Agreement or interested persons of any such party, considered and made the following conclusions with respect to the relevant factors described below.
Nature, Extent, and Quality of Services to be Provided by the Adviser
The Trustees reviewed and discussed the information concerning the nature, extent, and quality of advisory services to be provided by the Adviser to the Tax Exempt Fund, including information concerning the personnel responsible for the day-to-day portfolio management of the Tax Exempt Fund, the investment style and approach of the Adviser, and the Adviser’s performance record and overall reputation. The Trustees considered the investment personnel who would be responsible for the day-to-day management of the Fund’s portfolio and their experience managing investment vehicles employing investment strategies similar to those to be employed by the Tax Exempt Fund. The Trustees also considered information describing the Adviser’s compliance policies and procedures, including policies reasonably designed to ensure the Tax Exempt Fund’s compliance with its investment objective, policies and restrictions, and applicable regulatory requirements. The Trustees considered their discussions with advisory personnel of The Adviser about the firm’s responses to the questions presented in the Section 15(c) Request Letter. The Trustees concluded that the nature, extent, and quality of services to be provided by the Adviser as the investment adviser to the Tax Exempt Fund were appropriate and sufficient to support approval of the Advisory Agreement.
Performance
The Trustees noted that, since the Tax Exempt Fund had not yet commenced operations, it had no historical performance. As such, the Trustees considered the performance of the American Select Equity Fund, the Global Select Equity Fund, the Multi-Asset Real Return Fund and the Treasury Fund for which the Adviser serves as investment adviser. In connection with their consideration of the Treasury Fund’s performance, the Trustees also noted that that Fund’s portfolio manager, Mr. Barneby, would serve as the portfolio manager of the Tax Exempt Fund.
Profitability
The Trustees considered information regarding the estimated profitability of the Tax Exempt Fund to the Adviser. The Board considered representations made by the Adviser with respect to (i) the potential profitability of managing the Tax Exempt Fund, and (ii) other indirect benefits
| | |
| | |
| Semi-Annual Report | March 31, 2015 | | 61 |
| | |
| Centre Funds | | Additional Information |
| | March 31, 2015 (Unaudited) |
that might accrue to the Adviser as a result of its relationship with the Tax Exempt Fund, such as the receipt of qualified soft dollar research services and publicity regarding the Tax Exempt Fund from media coverage, industry ranking services, and marketing materials distributed by the Tax Exempt Fund, which may result in the acquisition by the Adviser of new advisory clients. The Trustees concluded that these factors would not prevent the Board from approving the Advisory Agreement.
Economies of Scale
The Trustees considered information concerning potential economies of scale for the Tax Exempt Fund, noting that the Fund was newly formed and had not yet commenced investment operations. The Trustees noted that the Tax Exempt Fund would be subject to an operating expense limitation agreement covering, among other operating expenses, the advisory fees to be charged to the Fund. The Trustees concluded that this factor did not prevent them from approving the Advisory Agreement.
Comparisons of the Services to be Rendered and Fee Amounts
The Trustees reviewed and discussed the proposed advisory fee payable to the Adviser under the Advisory Agreement and the estimated expense ratios of the Investor Class and Institutional Class shares of the Fund. The Trustees considered whether the proposed advisory fee was reasonable in light of the services to be provided by the Adviser and the fees charged to similarly-situated funds. The Trustees discussed the proposed advisory fee and expense information included in the Board Materials with respect to the Tax Exempt Fund, noting that the proposed advisory fee of 0.40% was the same as the advisory fee charged to the ISI Municipal Fund. The Trustees also considered that the Adviser had agreed to enter into an operating expense limitation agreement with the Trust, on behalf of the Tax Exempt Fund, to waive or limit the advisory fees and certain other expenses of the Fund for an initial period of not less than two years from the date of the closing of the reorganization of the ISI Municipal Fund into the Tax Exempt Fund and until the next following effective date of the post-effective amendment to the registration statement of the Trust relating to the Tax Exempt Fund incorporating the Tax Exempt Fund’s financial statements for that fiscal year.
After reviewing all of the information presented to them concerning fees, expenses, and other matters, the Trustees concluded that the proposed advisory fee payable to the Adviser by the Tax Exempt Fund under the Advisory Agreement was reasonable in light of the services to be provided.
Conclusion
The Trustees concluded their consideration of the Advisory Agreement, noting that their decision was based on an evaluation of the totality of factors and information presented or available to them and not on any one factor, report, representation or response.
Page Intentionally Left Blank

| | |
| Item 2. | | Code of Ethics. |
| |
| | Not applicable to semi-annual report. |
| |
| Item 3. | | Audit Committee Financial Expert. |
| |
| | Not applicable to semi-annual report. |
| |
| Item 4. | | Principal Accountant Fees and Services. |
| |
| | Not applicable to semi-annual report. |
| |
| Item 5. | | Audit Committee of Listed Registrants. |
| |
| | Not applicable to the Registrant. |
| |
| Item 6. | | Schedule of Investments. |
| |
| | (a) The Registrant’s “Schedule I – Investments in securities of unaffiliated issuers” (as set forth in 17 CFR 210.12-12) is included in Item 1 of this Form N-CSR. |
| |
| | (b) Not applicable to the Registrant. |
| |
| Item 7. | | Disclosure of Proxy Voting Policies and Procedures for Closed-End Management Investment Companies. |
| |
| | Not applicable to the Registrant. |
| |
| Item 8. | | Portfolio Managers of Closed-End Management Investment Companies. |
| |
| | Not applicable to the Registrant. |
| |
| Item 9. | | Purchases of Equity Securities by Closed-End Management Investment Company and Affiliated Purchasers. |
| |
| | Not applicable to the Registrant. |
| |
| Item 10. | | Submission of Matters to a Vote of Security Holders. |
| |
| | None. |
| | |
| Item 11. | | Controls and Procedures. |
| |
| (a) | | The Registrant’s principal executive officer and principal financial officer have evaluated the Registrant’s disclosure controls and procedures (as defined in Rule 30a-3(c) under the Investment Company Act of 1940, as amended) within 90 days of this filing and have concluded that the Registrant’s disclosure controls and procedures were effective as of that date. |
| |
| (b) | | There was no change in the Registrant’s internal control over financial reporting (as defined in
Rule 30a-3(d) under the Investment Company Act of 1940, as amended) during the second fiscal quarter of the period covered by this report that has materially affected, or is reasonably likely to materially affect, the Registrant’s internal control over financial reporting. |
| |
| Item 12. | | Exhibits. |
| |
| (a)(1) | | Not applicable to semi-annual report. |
| |
| (a)(2) | | A separate certification for the Registrant’s Principal Executive Officer and Principal Financial Officer as required by Rule 30a-2(a) under the Investment Company Act of 1940, as amended
(17 CFR 270.30a-2(a)), is attached hereto as Ex 99.Cert. |
| |
| (a)(3) | | None. |
| |
| (b) | | The certifications by the Registrant’s Principal Executive Officer and Principal Financial Officer, as required by Rule 30a-2(b) of the Investment Company Act of 1940, as amended, and Section 906 of the Sarbanes-Oxley Act of 2002 are attached hereto as Ex99.906Cert. |
SIGNATURES
Pursuant to the requirements of the Securities Exchange Act of 1934 and the Investment Company Act of 1940, the Registrant has duly caused this report to be signed on its behalf by the undersigned, thereunto duly authorized.
CENTRE FUNDS
| | |
| By: | | /s/ James A. Abate |
| | James A. Abate |
| | President (Principal Executive Officer) |
| |
| Date: | | June 5, 2015 |
Pursuant to the requirements of the Securities Exchange Act of 1934 and the Investment Company Act of 1940, this report has been signed below by the following persons on behalf of the Registrant and in the capacities and on the dates indicated.
| | |
| By: | | /s/ James A. Abate |
| | James A. Abate |
| | President (Principal Executive Officer) |
| |
| Date: | | June 5, 2015 |
| | |
| By: | | /s/ Vu Phong Nguyen |
| | Vu Phong Nguyen |
| | Treasurer (Principal Financial Officer) |
| |
| Date: | | June 5, 2015 |