UNITED STATES
SECURITIES AND EXCHANGE COMMISSION
Washington, D.C. 20549
FORM N-CSRS
CERTIFIED SHAREHOLDER REPORT OF REGISTERED
MANAGEMENT INVESTMENT COMPANIES
Investment Company Act file number: 811-22545
CENTRE FUNDS
(Exact name of registrant as specified in charter)
48 Wall Street, Suite 1100, New York, New York 10005
(Address of principal executive offices) (Zip code)
James Abate
48 Wall Street, Suite 1100
New York, New York 10005
(Name and address of agent for service)
Registrant’s telephone number, including area code: (855) 298-4236
Date of fiscal year end: September 30
Date of reporting period: October 1, 2013 – March 31, 2014
Item 1. Reports to Stockholders.
TABLE OF CONTENTS
| | |
| Centre Funds | | Shareholder Letter |
| | March 31, 2014 (Unaudited) |
Dear Shareholders,
It is with my pleasure that we publish the Centre Funds semi-annual report covering the six month period ending March 31, 2014.
On September 13, 2013, the Board of Trustees of the former Drexel Hamilton Mutual Funds approved the change in investment adviser to Centre Asset Management, LLC whereby it assumed direct investment advisory responsibilities for the Funds. Effective January 17, 2014, the Trust changed its name to Centre Funds as well as launched the Centre Active U.S. Treasury Fund to expand its offerings to clients and continue its focus on targeted growth opportunities.
The Centre Funds now offer four differentiated funds to choose from, each available in investor and institutional share classes, and offer investors active management using specialist investment management talent across a target range of funds that includes the:
| | — | | Centre American Select Equity Fund |
U.S. large capitalization valuation sensitive growth fund focused on risk adjusted returns through active management; high conviction portfolio of what we believe to be the best 45 to 75 stocks of large cap U.S. companies, focused in the top 20 names.
| | — | | Centre Global Select Equity Fund |
World large capitalization core/growth fund differentiated by GDP adjusted regional allocation in portfolio construction; high conviction portfolio of what we believe to be the best 80 to 100 stocks of developed markets blue chip companies and emerging blue chips from the developing world, focused in top 40 names.
| | — | | Centre Active U.S. Treasury Fund (new) |
Intermediate government bond fund using active duration management of U.S. Treasury securities and cash equivalents with potential for capital appreciation/preservation in various interest rate environments using a proprietary interest rate forecasting process and taking advantage of rate changes through active duration management.
| | — | | Centre Multi-Asset Real Return Fund |
Tactical asset allocation balanced fund that uses a systematic, flexible process of tactical allocation to traditional asset classes (global equities, fixed income, commodity and real estate linked securities, and cash) in seeking real return while preserving and growing investment capital.
Our aim at Centre Funds is to deliver strong, long-term performance results for our clients through an exceptional focus on producing returns and managing risk in a select number of investment strategies. Each investment strategy aims to capitalize on defined market opportunities using talented and experienced Fund Managers with differentiated, consistent and repeatable investment processes.
I want to thank my fellow shareholders, particularly the former Ameristock Fund holders, now part of the family of Centre American Select Equity Fund holders, for their continued support and confidence in the Centre Funds. Our Fund Managers remain focused on fundamentally-driven approaches within high conviction, disciplined and research intensive processes.
If you have any questions or comments about this report or your investment in the Centre Funds, please call us toll-free at 1-855-298-4236 or visit our website at www.centrefunds.com. Please refer to the prospectus for information about each Fund’s investment objectives and strategies.
Sincerely yours,
James Abate
President, Centre Funds
| | |
| | |
| Semi-Annual Report | March 31, 2014 | | 1 |
| | |
| Centre American Select Equity Fund | | Manager Commentary |
| | March 31, 2014 (Unaudited) |
Performance & Strategy Summary
For the six month period ended March 31, 2014, the Centre American Select Equity Fund, Investor Share Class, delivered a total return of 11.5%. The Institutional Share Class, which launched on January 21, 2014, delivered a total return of 0.9% from its inception through March 31, 2014.
During the past six month period, sectors such as Health Care, Technology, Materials, and Industrials were market leaders whilst sectors such as Telecomm, Consumer Discretionary, and Energy lagged. Our principal overweight sectors were Technology and Health Care driven by bottom-up stock level opportunities and we maintain our general avoidance of the Financial sector as regulatory scrutiny and increased capital requirements continue to depress returns on equity and intrinsic values. Stocks that were strong performers within the Fund over the six month period ended March 31, 2014 included Google, Delta Air Lines, Halliburton, Quanta Services, First Solar, Juniper Networks, Micron Technology, Microsoft, SanDisk, and Paccar; stocks that were laggards included Avon Products, Noble Corp., Goldcorp, IAMGold, Starbucks, and Network Appliance. Furthermore, the Fund was negatively impacted by certain hedges and other investments that we deemed to be capital protective in nature but proved untimely in a strongly rising market.
As always, our process in managing the Fund is to focus bottom-up on each individual company’s growth outlook and capacity to create shareholder value utilizing a “bottom-up” fundamental stock selection process. We utilize a disciplined, Economic Value Added (EVA®)* framework to select investments. The framework focuses on the fundamentals of wealth creation and wealth destruction similar to the way a traditional, long-term focused corporate financier looking at all aspects of the business would assess a company’s value. In the shorter-term, markets often undervalue or overvalue a company’s ability to create or destroy wealth. The framework seeks to identify and exploit these investment opportunities. The approach is designed to capture excess returns when the market price of a stock converges toward our target price. We analyze not only earnings but we also strive to understand and link the capital allocation decisions being made today by each company and how they will lead to future earnings growth. In other words, we expect companies to invest in productive assets of the business, organically and through opportunistic purchases which, in turn, should provide the foundation for future revenue and profits growth that will create shareholder value. Alternatively, if companies cannot invest in productive assets due to a cyclical downturn or existing excess capacity, we expect these companies to “wisely contract” through the restructuring of their assets and other resources to regain their footing for future shareholder value creation. Our top-down views on interest rates, etc. are important as many of those are inputs into our company models and, at the end of the day, reconciled to the bottom-up information we gather and process from company performance. The end result is our attempt to find the best 45-75 stocks of large capitalization U.S. companies, focused in the top 20 names, and weight those securities in a manner that delivers a Fund with superior risk adjusted returns over the long term.
Market Review & Outlook
Our optimistic cyclical outlook for the U.S. economy as well as U.S. stocks since 2009 was anchored in our belief that the restructuring and streamlining of corporations we witnessed after the collapse of Lehman Brothers and during the successive recession was the most effective, efficient and broad-based that we have seen in our careers. Most investors underappreciated that profit margins and asset efficiency were going to reach and, in some cases, surpass prior peak levels despite a top-line revenue environment that would remain challenging. By the spring of 2012, we no longer felt that the U.S. stock market could rely upon strong profit growth to power its advance. Accordingly, the proportion of stocks held by the Centre American Select Equity Fund which could be characterized as economically sensitive has fallen from about one half down to less than one third of net assets. Our emphasis has therefore shifted to more stable, consistent earnings-type stocks. Our allocation to what we call “Defensive Value” or “Stable Growth” and away from “Cyclical Growth” has increased significantly as we see the profit picture across the board becoming more difficult and fewer companies being able to generate earnings growth in the current environment.
Despite the continuing muted economic trends, those companies most dependent upon stronger economic growth, namely smaller companies, have performed best and were the key beneficiaries of the market’s positive re-rating in 2013. They outperformed larger companies significantly and, in particular, outpaced the largest “mega”-capitalization companies, as represented by the Russell Top 50 index; an area where we had significantly biased our Fund from a stock selection and portfolio construction basis. This performance gap implies substantial economic and earnings growth re-acceleration and that market expectations for the U.S. economy are consistent with the early/mid-cycle stage of the business cycle, not in 5th year of recovery as we actually are. That said, recent indicators such as the ISM Composite Manufacturing Index (ISM) are signaling a continuing improvement in the economic outlook for 2014 but it is yet to be seen whether these recent signs of economic and earnings growth re-acceleration are set to continue and translate into longer term capital investment acceleration, or it will be a shorter term mid-cycle inventory led bounce.
We see the sustainability of the recent pickup in economic activity being almost wholly dependent upon a significant increase of business capital investment in 2014. With returns on capital decelerating during 2013 (leading indicator), we see little incentive for a sharp pickup in business investment in 2014. In fact, over 60% of free cash flow for U.S. companies has been directed towards share repurchases and dividends in 2013, the highest proportion since 2009.
| * | EVA® is a registered service mark of EVA Dimensions LLC |
| | |
| Centre American Select Equity Fund | | Manager Commentary |
| | March 31, 2014 (Unaudited) |
At this stage, our focus remains on stock selection rather than sector/industry themes to achieve out-performance as no single area of the market seems uniformly inexpensive with operating trends improving. However, Mega-Cap stocks (those larger than $40 billion in capitalization) are trading at the cheapest relative valuation to small and mid-cap stocks in the recent past. We continue to believe that the catalyst to “harmonize” valuations will be moderate economic growth and disappointment of realized earnings growth versus expectations. We also expect a shift in investor preference away from smaller companies to higher quality, mega-size companies as 2014 progresses. Large-capitalization technology and health care remain our main areas of emphasis.
While operating margins have recently improved for many companies, without a pickup in top-line revenue growth, we may have seen the peak in profit margins and returns on capital for this business cycle. As a result, 2014-2016 earnings estimates appear at risk. Cost-cutting to boost profit margins seems to be less impactful, particularly now in the more cyclical sectors/industries, such as Materials, Energy, and Consumer Discretionary. The lack of corporate tax incentives and sound infrastructure policy will continue to drive capital away from investment in long-term operating assets to the level necessary to see the capital expenditures/sales ratio for all S&P 500 Index industrial companies (which now stands at 6.2% and consistent with the 10 year average) move to the higher level of the 1990’s and at a level for us to become “strategically longer-term bullish” on the more cyclical, capital-intensive areas of the market.
Our principal secular concerns are that investors underestimate the deflationary and negative growth impact from the aging population across the developed countries, including the U.S., which we believe is why monetary/inflationary stimuli will be needed for the foreseeable future to offset the shrinking labor force and absence of productivity increases. In addition, normalized interest rates would produce an uncontrollable government debt service and massive increase in federal budget deficits. This leaves the Federal Reserve trapped in keeping its short-term policy rate lower for a longer period and monetary policy may contribute to an increase in market volatility, just when expectations are the exact opposite.
As we progress through 2014 and 2015, despite our bottom-up optimism, we are less enthusiastic about the prospects for further sizable gains in U.S. stocks as a whole relative to what we believe is a very bullish consensus. This is due primarily to the negative macro circumstances being unlike any evidenced in the past and the lack of confidence in the ability of public officials to manage their unwinding, without creating a more volatile investment landscape for companies to operate in successfully. While we see a modestly improving growth outlook for operating profits through 2014, we do not foresee a cost of capital decline driving a re-rating of shares as was the case in 2013 and, more importantly due to high valuation levels, investor confidence is likely to erode as the improving tone of economic growth falters and companies as a whole disappoint in terms of lofty profit expectations as the year progresses. In fact, nearly every Wall Street Strategists’ report that we have read recently fixates on justifying expanding valuation multiples and a further re-rating in the context of a secular bull market that began in 2009 with little passing thought to what will drive aggregate company-level economic profit creation and market value added in 2014 and beyond.
As a natural contrarian, it is important for us not to reflexively adopt a posture away from consensus but to identify how we think the major investment themes and drivers reconcile to our conclusion and, most importantly, what inferences can we draw from the overall picture we get from the substantial bottom-up information we gather on a constant research basis from the stocks within our investment universe. The “goldilocks” environment of two percent growth with no inflation will continue for the very near-term, but we expect increasing concern as the year progresses and we think higher inflation expectations in 2014 and a stagflationary like recession in 2015 is a growing possibility. Our large capitalization valuation sensitive growth approach to stock selection with a cognizance of risk management seems primed to outperform other investment styles under the current circumstances.
| | |
| | |
| Semi-Annual Report | March 31, 2014 | | 3 |
| | |
| Centre American Select Equity Fund | | Manager Commentary |
| | March 31, 2014 (Unaudited) |
| | | | | | |
SECTOR WEIGHTINGS As a percentage of Net Assets | | | |
| | |
Information Technology | | | 30.15 | % | | |
| Industrials | | | 16.09 | % | | |
| Health Care | | | 15.99 | % | | |
Consumer Discretionary | | | 12.00 | % | | |
| Consumer Staples | | | 8.89 | % | | |
| Energy | | | 5.72 | % | | |
| Financials | | | 4.73 | % | | |
Telecommunication Services | | | 2.20 | % | | |
| Materials | | | 1.91 | % | | |
| Utilities | | | 1.82 | % | | |
Purchased Options and Other | | | 0.30 | % | | |
| Cash and Cash Equivalents | | | 0.20 | % | | |
| Total | | | 100.00 | % | | |
| |
These allocations may not reflect the current or future positions of the portfolio. | | | |
| | | |
| | | |
| | | |
| | | |
| | | |
| | | |
| | | |
| | | |
| | | |
| | | |
| | | |
| | | |
| | | |
| | | |
| | | |
| | | |
| | | |
| | | |
| | | |
| | | |
| | | |
| | | |
| | | |
| | | |
| | | |
| | | |
| | | |
| | | |
| | | |
| | | |
| | | |
| | | |
| | | |
| | | |
| | | |
| | | |
| | | |
| | | |
| | | |
| | | |
| | | |
| | | |
| | | |
| | | |
| | |
| GROWTH OF HYPOTHETICAL $10,000 INVESTMENT THROUGH MARCH 31, 2014 |
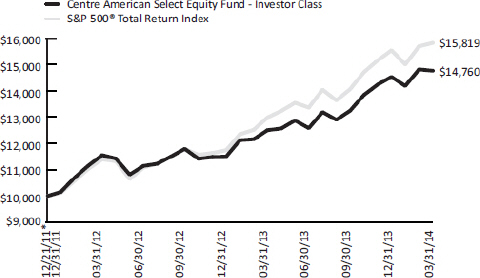
This graph assumes an initial investment of $10,000 at December 21, 2011, the Fund’s inception date, and that any dividends and distributions are reinvested. This graph depicts the performance of the Fund’s Investor Class versus the S&P 500 Index. Taxes on any Fund distributions or when shares are redeemed, if any, are not reflected. Unlike the Fund, an index is not available for investment, is unmanaged and does not have expenses that affect the results. The comparison is shown for illustrative purposes only.
TOTAL RETURNS – FOR THE PERIOD ENDED MARCH 31, 2014
| | | | | | | | | | | | | | | | | | | | | | | | | |
| | | 1 Month | | 3 Month | | YTD | | 1 Year | | Since Inception* |
| Centre American Select Equity Fund – Investor – NAV | | | | -0.35 | % | | | | 1.59 | % | | | | 1.59 | % | | | | 18.08 | % | | | | 18.65 | % |
| S&P 500® Total Return Index | | | | 0.84 | % | | | | 1.81 | % | | | | 1.81 | % | | | | 21.86 | % | | | | 22.32 | % |
| Centre American Select Equity Fund – Institutional – NAV | | | | -0.26 | % | | | | – | | | | | – | | | | | – | | | | | 0.88 | % |
| S&P 500® Total Return Index | | | | 0.84 | % | | | | – | | | | | – | | | | | – | | | | | 1.99 | % |
| * | Inception date of December 21, 2011 for Investor Class. Inception date of January 21, 2014 for Institutional Class. |
The performance information quoted above represents past performance, which is not a guarantee of future results, and does not reflect the deduction of taxes that a shareholder would pay on Fund distributions or the redemption of Fund shares. Investment return and principal value of an investment will fluctuate so that an investor’s shares, when redeemed, may be worth more or less than their original cost. Total return includes reinvestment of dividends and capital gains, if any. Current performance may be lower or higher than the performance data quoted. For the most current month-end performance data please call 855-298-4236.
Total Annual Fund Operating Expenses (before fee waiver and/or expense reimbursements) as stated in the fee table of the prospectus of the Fund, dated January 17, 2014, were 1.53% for the Investor Class and 1.28% for the Institutional Class. The investment adviser to the Fund, Centre Asset Management, LLC (the “Adviser” or “Centre”), has entered into a written expense limitation agreement (the Expense Limitation Agreement), under which it has agreed to reduce its advisory fees and/or reimburse other expenses of the Fund for a period of two years from January 11, 2013, to the extent necessary to limit the current operating expenses of each class of shares of the Fund including (but not limited to investment advisory fees of the Adviser and distribution/service (Rule 12b-1) fees, but excluding interest, taxes, litigation, brokerage and extraordinary expenses incurred by the Fund in the fiscal year, to an annual rate of 1.05% of the average daily net assets of the Investor Class shares and 0.95% of the average daily net assets of the Institutional Class shares.
The S&P 500® Index is a commonly recognized, market-capitalization weighted index of 500 widely held securities, designed to measure broad U.S. equity performance. You cannot invest directly in an index.
The chart above shows the performance of Investor Class shares only, since the Investor Class has the longest period of annual returns. The performance of the Institutional Class shares will differ from the performance shown because the Institutional Class shares have different expenses than the Investor Class shares.
| | |
| Centre Global Select Equity Fund | | Manager Commentary |
| | March 31, 2014 (Unaudited) |
Performance & Strategy Summary
For the six month period ended March 31, 2014, the Centre Global Select Equity Fund, Institutional Share Class, delivered a total return of 4.8%. The Investor Share Class, which launched on January 21, 2014, delivered a total return of -0.6% from its inception through March 31, 2014.
During the past six month period, North American and Developed European markets outperformed the global equity average as measured by the MSCI All Country World Index (MSCI ACWI), while Asia Pacific and Emerging Markets in general underperformed MSCI ACWI. Within Europe, Greece, Italy, Denmark, and Ireland were among the best performing markets in this period whereas Hungary, Russia, and Austria were some of the worst performing markets in Europe during this period. In Asia Pacific, India, Pakistan and Indonesia were among the best performing markets whilst Thailand, Japan and China were some of the worst performing. Within Emerging Markets specifically, Greece, Egypt, and India outperformed MSCI ACWI significantly but Russia, Brazil, and China materially underperformed. During this period, good stock selection in Western Europe and Latin America contributed positively to the Fund’s relative performance. On the other hand, stock selection in Asia, Eastern Europe, the U.S. as well as overweight postures in Asia, Europe, Latin America and underweight posture in North America detracted from the Fund’s relative performance. Among the Fund’s stock holdings, Continental AG and Daimler of Germany, Tencent Holdings Limited of China, Hellenic Telecommunications Organization S.A. (OTE) of Greece, Intesa Sanpaolo and Enel of Italy, Google, Bank of America and Qualcomm of the U.S. contributed positively to the Fund’s performance. On the negative side, CNOOC and China Mobile of China, Yahoo Japan and Nomura Holdings of Japan, Tesco of UK and Petrobras of Brazil detracted from Fund’s performance.
Our process in managing the Fund is to focus on each individual company’s growth outlook and capacity to create shareholder value utilizing a “bottom-up” fundamental stock selection process. We utilize a disciplined Economic Value Added (EVA®)* framework to select investments. The framework focuses on the fundamentals of wealth creation and wealth destruction similar to the way a traditional, long-term focused corporate financier looking at all aspects of the business would assess a company’s value. In the shorter-term, markets often undervalue or overvalue a company’s ability to create or destroy wealth. The framework seeks to identify and exploit these investment opportunities. The approach is designed to capture excess returns when the market price of a stock converges towards our target price. We analyze not only earnings, but we also strive to understand and link the capital allocation decisions being made today by each company and how they will lead to future earnings growth. In other words, we expect companies to invest in productive assets of the business, organically and through opportunistic purchases which, in turn, should provide the foundation for future revenue and profits growth that will create shareholder value. Alternatively, if companies cannot invest in productive assets due to a cyclical downturn or existing excess capacity, we expect these companies to “wisely contract” through the restructuring of their assets and other resources to regain their footing for future shareholder value creation. The differentiated stock selection process is combined with a macro research overlay that is focused on GDP-driven regional weightings rather than market capitalization. This gives the Fund two sources of a potential excess return: stock selection alpha and portfolio construction “smart beta”. The end result is our attempt to find the best 80 to 100 stocks of large-capitalization global companies, focused in the top 40 names, that delivers a Fund with superior capital growth over the long term.
Market Review & Outlook
Looking ahead, we are cautiously optimistic. The Fund’s holdings continue to emphasize high quality large market capitalization blue chips from the developed markets and emerging blue chips from the developing countries that have impressive track records of creating shareholder value in good times and bad. The Fund also continues to favor companies that have a long track record of growing their earnings and dividends over complete economic and business cycles.
We expect the U.S. Federal Reserve to continue to reduce quantitative easing, while at the same time keeping interest rates low for the foreseeable future. It is likely that the European Central Bank will introduce additional quantitative liquidity measures to combat the risk of deflation. We also expect that policy makers in Japan will keep the liquidity spigot on, while the Chinese central government probably will not introduce significant economic stimulus packages, which many investors have been hoping for in recent years. Although some investors fear inflation and others fear deflation over the next few years, in the next 6 to 12 months, we expect the current global macroeconomic trends to continue, namely, moderate economic growth, mildly improving corporate earnings, slow improvement in labor markets and below trend inflation in most developed economies. In the emerging markets, China is trying to wean itself off the capital investment driven economic growth model. China is like the substance abuser that just joined a rehabilitation program, the longer it stays sober, the brighter its long-term future will be. But the temptation of just one more drink is always there and the urge is especially strong in the early stages of trying to stay sober. Many Chinese and foreign investors have been urging the Chinese government to implement one more large stimulus package as the Chinese economy shows more signs of slowing. Our base case scenario, however, is that the Chinese policy makers are not going to implement any sizable stimulus any time soon. The slowing economic growth in China has negatively impacted commodity rich developing economies such as Brazil, which is expected to grow less than 2% in 2014 while facing higher inflationary pressures.
| * | EVA® is a registered service mark of EVA Dimensions LLC |
| | |
| | |
| Semi-Annual Report | March 31, 2014 | | 5 |
| | |
| Centre Global Select Equity Fund | | Manager Commentary |
| | March 31, 2014 (Unaudited) |
The good news is that the stock market is a discounting mechanism and the stock valuations in various markets have adjusted to reflect the fundamentals mentioned above. Despite near term sentiment, the valuation foundation of emerging markets vis-à-vis developed markets has become more attractive as the valuation differentials have widened dramatically, particularly since 2011. In the near-term, global equity markets could become more volatile but for long-term global equity investors, market volatilities often provide good investment opportunities. We see numerous investment opportunities for long-term global equity investors among the many attractively valued blue-chip large market capitalization companies all over the world. We believe that long-term global equity investors will be rewarded by focusing their investments, as we do in the Fund, in high quality blue chip stocks that have impressive track records of creating shareholder value, growing dividends in challenging operating environments, maintaining strong balance sheets and are well positioned competitively in their respective industries.
The Centre Global Select Equity Fund offers a unique investment vehicle for investors by focusing on large capitalization blue chips in the developed world and emerging blue chips in the developing countries. The Fund’s investment process combines bottom-up stock selection with structured portfolio construction and risk management that’s cognizant of secular growth forces. Our top-down views on macro outlook of various markets, regions and global sectors etc. are important as many of those are inputs into our company models and at the end of the day, are reconciled to the bottom-up information we gather and process from company performance and operating results.
Our unique and disciplined Economic Value Added based stock selection process and unique dynamic GDP-adjusted focused portfolio construction process ensures that the Fund is unencumbered by traditional market capitalization weighted benchmark restrictions and goes where the bottom-up stock opportunities are globally. Consequently, the Fund is well positioned to benefit and profit from the positive demographics and long-term economic growth in many developing economies as well as attractive investment opportunities in developed countries across the globe.
Currently, the Fund has overweight postures in Financials, Telecommunication Services, Information Technology and Energy sectors; underweight postures in Industrials, Materials, Consumer Discretionary and Utilities; approximate to neutral postures in Healthcare and Consumer Staples; all relative to MSCI ACWI.
Recent purchases or additions in the Fund, based on our fundamental research, include Accor (Hotels Restaurants & Leisure), Coloplast (Health Care Equipment & Supplies), Discover Financial Services (Consumer Finance), Berkshire Hathaway (Diversified Financial Services), Next (Multiline Retail) and Red Electrica Corp. (Electric Utilities). Recent sells or reductions based on our disciplined investment process to take profit or remove stocks that no longer meet our fundamental investment and valuation criteria include Citigroup, Linde, Royal Bank of Canada, Honda Motor, Denso and MasterCard.
Going forward, the Fund will continue to be anchored with shareholder value creators who 1) have long track records of growing their cash earnings and dividends in both good times and bad, 2) are in strong competitive positions locally or globally in their respective industries and markets, and 3) are likely to be the main beneficiaries of good fundamental long-term economic growth and demographics in various parts of the world, such as Daimler, Wells Fargo, Hyundai Motors, Google, Samsung Electronics, Berkshire Hathaway, Taiwan Semiconductor Manufacturing and Sands China.
| | |
| Centre Global Select Equity Fund | | Manager Commentary |
| | March 31, 2014 (Unaudited) |
| | | | |
SECTOR WEIGHTINGS As a percentage of Net Assets | | |
| | |
| Financials | | 29.06% | | |
| Information Technology | | 14.18% | | |
| Health Care | | 11.02% | | |
| Energy | | 10.21% | | |
| Consumer Discretionary | | 9.28% | | |
| Consumer Staples | | 8.71% | | |
| Telecommunication Services | | 6.82% | | |
| Industrials | | 3.88% | | |
| Utilities | | 2.19% | | |
| Materials | | 2.17% | | |
| Cash and Cash Equivalents | | 2.48% | | |
| Total | | 97.83% | | |
| |
COUNTRY WEIGHTINGS As a percentage of Net Assets | | |
| | |
| United States | | 31.26% | | |
| China | | 11.80% | | |
| Japan | | 7.53% | | |
| Germany | | 6.43% | | |
| France | | 5.22% | | |
| Great Britain | | 5.19% | | |
| Italy | | 4.92% | | |
| Spain | | 4.10% | | |
| Greece | | 3.03% | | |
| Australia | | 2.83% | | |
| Switzerland | | 2.58% | | |
| Cash and Cash Equivalents | | 2.48% | | |
| Brazil | | 2.18% | | |
| Taiwan | | 1.96% | | |
| Korea | | 1.84% | | |
| Russia | | 1.73% | | |
| Denmark | | 1.60% | | |
| Mexico | | 0.98% | | |
| Hong Kong | | 0.79% | | |
| Belgium | | 0.67% | | |
| Netherlands | | 0.51% | | |
| India | | 0.37% | | |
| Total | | 100.00% | | |
| | | | |
| | | | |
These sector and country allocations may not reflect the current or future positions of the portfolio. | | |
| | | | |
| | | | |
| | | | |
| | | | |
| | | | |
| | | | |
| | | | |
| | | | |
| | | | |
| | | | |
| | | | |
| | | | |
| | | | |
| | | | |
| | | | |
| | | | |
| | | | |
| | | | |
| | | | |
| | | | |
| | |
| GROWTH OF HYPOTHETICAL $10,000 INVESTMENT THROUGH MARCH 31, 2014 |
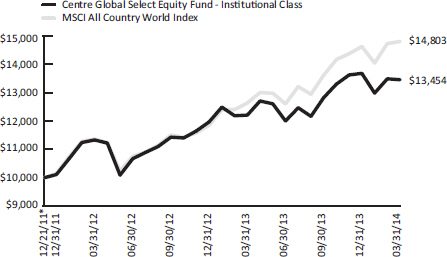
This graph assumes an initial investment of $10,000 at December 21, 2011, the Fund’s inception date, and that any dividends and distributions are reinvested. This graph depicts the performance of the Fund’s Institutional Class versus the MSCI All Country World Index. Taxes on any Fund distributions or when shares are redeemed, if any, are not reflected. Unlike the Fund, an index is not available for investment, is unmanaged and does not have expenses that affect the results. The comparison is shown for illustrative purposes only.
TOTAL RETURNS – FOR THE PERIOD ENDED MARCH 31, 2014
| | | | | | | | | | | | | | | | | | | | | | | | | |
| | | 1 Month | | 3 Month | | YTD | | 1 Year | | Since Inception* |
| Centre Global Select Equity Fund – Investor – NAV | | | | -0.25 | % | | | | – | | | | | – | | | | | – | | | | | -0.58 | % |
| MSCI All Country World | | | | 0.50 | % | | | | – | | | | | – | | | | | – | | | | | 1.59 | % |
| Centre Global Select Equity Fund – Institutional – NAV | | | | -0.25 | % | | | | -1.64 | % | | | | -1.64 | % | | | | 10.28 | % | | | | 13.92 | % |
| MSCI All Country World | | | | 0.50 | % | | | | 1.21 | % | | | | 1.21 | % | | | | 17.17 | % | | | | 18.80 | % |
| * | Inception date of January 21, 2014 for Investor Class. Inception date of December 21, 2011 for Institutional Class. |
The performance information quoted above represents past performance, which is not a guarantee of future results, and does not reflect the deduction of taxes that a shareholder would pay on Fund distributions or the redemption of Fund shares. Investment return and principal value of an investment will fluctuate so that an investor’s shares, when redeemed, may be worth more or less than their original cost. Total return includes reinvestment of dividends and capital gains, if any. Current performance may be lower or higher than the performance data quoted. For the most current month-end performance data please call 855-298-4236.
Total Annual Fund Operating Expenses (before fee waiver and/or expense reimbursements) as stated in the fee table of the prospectus of the Fund, dated January 17, 2014, were 2.45% for the Investor Class and 2.20% for the Institutional Class. The investment adviser to the Fund, Centre Asset Management, LLC (the “Adviser” or “Centre”), has entered into a written expense limitation agreement under which it has agreed to limit through October 31, 2015 the total operating expenses of the Fund including (but not limited to) investment advisory fees of the Adviser and distribution/service (Rule 12b-1) fees, but excluding interest, taxes, litigation, brokerage, other expenditures which are capitalized in accordance with generally accepted accounting principles and extraordinary expenses) to an annual rate of 1.45% of the average daily net assets of the Investor Class shares, and 1.25% of the average daily net assets of the Institutional Class shares.
Investing in the securities of foreign companies generally involves greater risk than investing in larger, more established domestic companies. Therefore, investments in the Fund may involve a greater degree of risk than investments in other mutual funds that invest in larger, more established domestic companies.
The MSCI (Morgan Stanley Capital International) All Country World Index is an unmanaged, free float-adjusted market capitalization weighted index composed of stocks of companies located in countries throughout the world. It is designed to measure equity market performance in global developed and emerging markets. You cannot invest directly in an index.
The chart above shows the performance of Institutional Class shares only, since the Institutional Class has the longest period of annual returns. The performance of the Investor Class shares will differ from the performance shown because the Investor Class shares have different expenses than the Institutional Class shares.
| | |
| | |
| Semi-Annual Report | March 31, 2014 | | 7 |
| | |
| Centre Active U.S. Treasury Fund | | Manager Commentary |
| | March 31, 2014 (Unaudited) |
Performance & Strategy Summary
The Centre Active U.S. Treasury Fund was launched on January 21, 2014 with Investor and Institutional Share Classes. For the period from its inception through March 31, 2014, the Centre Active U.S. Treasury Fund, Investor Share Class, delivered a total return of 0.7%; the Institutional Share Class delivered a total return of 0.8%.
The Fund’s investment objective is to maximize investors’ total return through capital appreciation with a secondary objective of current income. The Fund strives to achieve its primary objective through the active management of the portfolio’s exposure to changes in interest rates affecting the U.S. Treasury securities and other assets in which the Fund may invest. We adjust the portfolio’s duration based on a monthly assessment of the likely movement in rates and implement our view based on our forecasting discipline. Our fundamentally-driven active duration management seeks potential for capital appreciation/preservation in variable interest rate environments utilizing U.S. Treasury bills, notes, bonds and cash equivalents.
Market Review & Outlook
Despite some encouraging signs from consumer spending, the U.S. economy is not yet on the kind of sustained path consistent and associated with most recoveries. For example, after a strong February showing the pace of deliveries as reported by ISM decelerated recently—an inverse correlation with growth. Additionally, labor demand declined in March and is basically flat for the year. So, the current economic recovery in the U.S. which began in June 2009 continues to be anemic by Post World War II standards. Real growth has, in fact, more than likely been at an average pace below that of the economy’s long run potential. This comparison is relative to recent estimates of the economy’s current potential real growth rate which is significantly lower than the accepted range of 3-3.25% during the 20th century. As a result, measured inflation has not yet accelerated as would have been anticipated given the aggressive nature of the Federal Reserve’s conduct of monetary policy. While interest rates, which reflect both potential real growth and inflationary fears, have not established the upward trend that would typically be the case this late in an economic recovery. Additionally, rates have continued to be buffeted by concerns about the changing global political situation. All the hype about the dollar notwithstanding, it is still the global “safe harbor”. The 10-year U.S. Treasury yield has fluctuated between 2 1⁄2 - 3%.
While there are undoubtedly several contributors to the slow recovery, two have been referenced frequently. First, recoveries from recessions that are impacted by financial crises are typically more drawn out than those from more “typical recessions”. This argument has recently been documented by Rogoff and Reinhart, This Time is Different, but has been noted by many economists over the years, namely Fisher, Kindleberger and Minsky. Second, policy uncertainty, mentioned several times by Federal Reserve Chairman Bernanke (and now Janet Yellen) in various speeches, has likely been a contributor as well. On their site, policyuncertainty.com, the authors Baker, Bloom and Davis point to the negative correlation between uncertainty over fiscal and monetary policy, regulatory actions and legislative issues, e.g. health care, and the pace of hiring and investment decisions.
As we go forward, we believe that three economic scenarios are likely to define the paths the U.S. economy could follow:
1) Global Recession (currently not very likely)
This scenario would likely come about if the Chinese economy slows further, Europe’s recovery, such as it is, falters and Japan’s attempts to right its economy fail. Of course, some combination of these three to varying degrees could also push the global economy back into recession. Currently, it looks like Europe will muddle through but maintaining the Euro will keep the outlook uncertain for a while longer as will any failure to deal with the issues of public sector employment and its associated employee benefits. It is also unlikely that the Chinese authorities will fail to act to promote growth but, in a highly structured economy where market forces do not dictate the allocation of resources, such macro policies could have limited effect. Japan also suffers from being a somewhat structured economy, and, the Japanese are experiencing declining population and labor force growth—neither good for economic prosperity. Finally, recent social unrest in Latin American, e.g. Brazil, Venezuela and Argentina might slow overall global growth making the above factors even more important.
2) Stagflation (more likely than recession)
This scenario would result from failure to recognize that the economy’s growth potential has been permanently reduced. A slower potential for growth could be the result of many factors. Two that have been topics of discussion in various publications are slower labor force growth and slower capital investment and hence slower productivity growth. The former could be the result of slower population growth or a lower labor force participation rate. The latter could reflect a more lasting impact of the recent recession/financial crisis, ongoing policy uncertainty, and/or of an educational mismatch between current workers and available jobs—lack of “human” capital. Inflation comes about as monetary authorities globally attempt to inflate to avoid a return to recession—too much money chasing a limited ability to produce goods.
3) Boom/Bust (most likely)
This scenario would be more typical of the Post World War II global economy and would reflect an attempt and failure on the part of monetary and fiscal policy makers to “fine tune” the economy. In some sense this is an “optimistic outlook” in that it implies that we will have addressed at least some of the issues in Scenario (2) above which will help in boosting real growth near-term. It also assumes that despite headwind that we may have
| | |
| Centre Active U.S. Treasury Fund | | Manager Commentary |
| | March 31, 2014 (Unaudited) |
put in the path of our recovery, monetary policy, as it always has with “lags that are long and variable” will win out. But, it implies also that policy makers will not adopt “rules”, e.g. the “Taylor Rule” for guiding policy decisions. Thus, the period in the latter part of the 1980s and in the 1990s—the “Great Moderation”—may prove to be the anomaly as economic behavior continues the “Boom and Bust” of recent times and that has characterized much of the Pre and Post World War II period in the U.S.
Based upon our assessment of the above probabilities, higher interest rates seem likely. Over time, there is a positive correlation between nominal growth and the yield on the 10-year U.S. Treasury. For example, if nominal growth is 4 1⁄2%—2 1⁄2% real and 2% inflation—the yield on the 10-year Treasury should reach 4 1⁄2%. This of course makes no allowance for the type of overshooting that would be typical of Scenarios (2) and (3). Scenarios (2) and (3) lead to significantly higher rates. In Scenario (2), yields increase because investor’s demand an increasingly greater inflation premium. We would not expect to see the 10-year yield near 16%—September 1981— again, but it could certainly move into the high single maybe even low double digits. In Scenario (3) both increased credit demand from strong real growth and accelerating inflation push rates toward the levels of scenario (3.)
Ultimately the rate of inflation will be the key as to how high rates may go. Recent “tapering” of bond purchases by the Federal Reserve is not tightening and the Fed appears likely to err on the side of being overly stimulative to avoid the risk of recession and deflation. Inflation has momentum, waiting until it has already begun to accelerate will make it more difficult to bring it under control.
Inception to date, the Funds’ discipline has been bullish, neutral and bearish—in cash—with respect to the outlook for bond prices. These changes, based on the discipline and its monthly review of portfolio duration, are consistent with the view that rate behavior reflects, over time, changing investor expectations regarding the fundamentals—real growth and inflation—with an allowance for market sentiment that reflects investor psychology and the tendency for “overshooting”. Even during the extraordinary period from the early 1970s to the early 1980s which saw an increase of almost 10 percentage points in the U.S. Treasury 10-year yield, rates did not increase every month—in fact only about 60% of the time.
Our discipline is intended to preserve capital in periods of significant rate increases by moving to very short Treasury maturities and cash or cash equivalents but with the flexibility to reenter the market and extend duration when our process suggests lower rates are likely. It is also designed to identify recessionary episodes and extend duration. What is relevant for the potential success of our discipline is that rates continue to exhibit cyclical volatility—that the business cycle is not dead.
The active management of interest rate risk, if successful, can make a meaningful contribution to the achievement of long term wealth accumulation goals. This contribution may be increasingly important, as the U.S. population continues to age and the allocation to fixed income assets as a percentage of overall portfolio value increases. Increased bond holdings materially increase the risk to portfolio value from rising interest rates. This risk is further increased if investors have, as part of the movement into bonds, also lengthened maturity—typical of many “muni” holdings and sought out higher yielding or so-called “junk bonds” in search of yield.
We feel our strategy serves well as a core fixed income portfolio. Over time, it is intended to provide the same yield as the Intermediate Government market and offers superior diversification benefits relative to other fixed income management approaches as it utilizes primarily U.S. Treasury securities, and seeks to generate competitive performance through adjusting the portfolio’s interest rate exposure (duration). The strategy is designed to readily accommodate both systematic and unforeseen cash needs, given the liquidity of the Treasury market.
The investment discipline underlying our management approach has been in evolution since the early 1970s. While the conceptual framework, grounded in the economics of interest rate behavior over the business cycle has not changed, our research, over the years, has identified better measures of the underlying fundamentals—real growth and inflation concerns. Additionally, it has led us to improved technical factors—our attempt to capture investor psychology. Finally and importantly, once our monthly decision is reached we do not second guess it or override the discipline’s outcome. Such behavior reduces the likelihood of long term performance, which is the Fund’s goal for the investors.
| | |
| | |
| Semi-Annual Report | March 31, 2014 | | 9 |
| | |
| Centre Active U.S. Treasury Fund | | Manager Commentary |
| | March 31, 2014 (Unaudited) |
| | | | | | |
ASSET TYPE WEIGHTINGS As a percentage of Net Assets | | | |
| | |
| Cash and Cash Equivalents | | | 100.00 | % | | |
| Total | | | 100.00 | % | | |
| |
These allocations may not reflect the current or future positions of the portfolio. | | | |
| | | |
| | | |
| | | |
| | | |
| | | |
| | | |
| | | |
| | | |
| | | |
| | | |
| | | |
| | | |
| | | |
| | | |
| | | |
| | | |
| | | |
| | | |
| | | |
| | | |
| | | |
| | | |
| | | |
| | | |
| | | |
| | | |
| | | |
| | | |
| | | |
| | | |
| | | |
| | | |
| | | |
| | | |
| | | |
| | | |
| | | |
| | | |
| | | |
| | | |
| | | |
| | | |
| | | |
| | | |
| | | |
| | | |
| | | |
| | | |
| | | |
| | | |
| | | |
| | | |
| | | |
| | | |
| | | |
| | | |
| | | |
| | | |
| | | |
| | | |
| | | |
| | | |
| | |
| GROWTH OF HYPOTHETICAL $10,000 INVESTMENT THROUGH MARCH 31, 2014 |
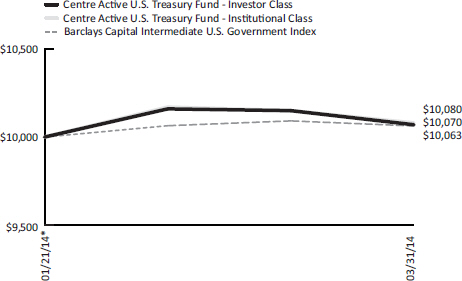
This graph assumes an initial investment of $ 10,000 at January 21, 2014, the Fund’s inception date, and that any dividends and distributions are reinvested. This graph depicts the performance of the Fund versus the Barclays Capital Intermediate U.S. Government Index. Unlike the Fund, an index is not available for investment and is unmanaged and does not have expenses that affect the results. The comparison is shown for illustrative purposes only.
CUMULATIVE TOTAL RETURNS – FOR THE PERIOD ENDED MARCH 31, 2014
| | | | | | | | | | |
| | | 1 Month | | Since Inception January 21, 2014 |
Centre Active U.S. Treasury Fund – Investor – NAV | | | | -0.79 | % | | | | 0.70 | % |
Centre Active U.S. Treasury Fund – Institutional – NAV | | | | -0.69 | % | | | | 0.80 | % |
Barclays Capital Intermediate U.S. Government Index | | | | -0.29 | % | | | | 0.63 | % |
The performance information quoted above represents past performance, which is not a guarantee of future results, and does not reflect the deduction of taxes that a shareholder would pay on Fund distributions or the redemption of Fund shares. Investment return and principal value of an investment will fluctuate so that an investor’s shares, when redeemed, may be worth more or less than their original cost. Total return includes reinvestment of dividends and capital gains, if any. Current performance may be lower or higher than the performance data quoted. For the most current month-end performance data please call 855-298-4236.
The total annual operating expense ratio (before expense reimbursements) as stated in the fee table of the prospectus of the Fund, dated January 17, 2014, was 2.28% for the Investor Class shares and 2.03% for the Institutional Class shares. The Adviser has entered into a written expense limitation agreement, dated and effective as of November 4, 2013 (the “Expense Limitation Agreement”), under which it has agreed to reduce its advisory fees and/or reimburse other expenses of the Fund, for at least an initial period of not less than two years and until the next following effective date of the Post-Effective Amendment to the registration statement of the Trust relating to the Fund incorporating the Fund’s financial statements for the Fund’s fiscal year (the “Initial Term”), to the extent necessary to limit the current operating expenses of each class of shares of the Fund (including (but not limited to) investment advisory fees of the Adviser and distribution/service (Rule 12b-1) fees, but excluding, as applicable, any front-end or contingent deferred sales loads, taxes, leverage interest, brokerage commissions, expenses incurred in connection with any merger or reorganization, and extraordinary expenses (such as litigation and other expenses not incurred in the ordinary course of the Fund’s business), and acquired fund fees and expenses), to an annual rate of 0.85% of the average daily net assets of the Investor Class shares and 0.60% of the average daily net assets of the Institutional Class shares.
Barclays Capital Intermediate U.S. Government Index – The U.S. Treasury Index includes public obligations of the U.S. Treasury. Treasury bills are excluded by the maturity constraint but are part of a separate Short Treasury Index. In addition, certain special issues, such as state and local government series bonds (SLGs), as well as U.S. Treasury TIPS, are excluded. You cannot invest directly into an index.
| | |
| Centre Multi-Asset Real Return Fund | | Manager Commentary |
| | March 31, 2014 (Unaudited) |
Performance & Strategy Summary
For the six month period ended March 31, 2014, the Centre Multi-Asset Real Return Fund, Institutional Share Class, delivered a total return of 4.5%; the Investor Share Class delivered a total return of 4.3%. Effective September 14, 2013, Centre Asset Management, LLC assumed investment advisory responsibilities for the Fund.
The Centre Multi-Asset Real Return Fund was launched to meet investor concerns of future inflationary conditions and increased market volatility with the goal to produce real returns as measured against inflation and the loss of purchasing power. In other words, the Fund is designed to deliver on maintaining purchasing power of today’s dollar in nominal terms plus a real return on capital as well as be designed to withstand market shocks. CPI or the Consumer Price Index estimates the average change in prices for a basket of goods and services and serves as the baseline hurdle for real returns. The Fund, which is structured as a limited fund of funds, is an actively managed product that strives to help preserve and enhance purchasing power over a variety of investment environments using a fundamental tactical asset allocation strategy employing multiple asset classes with strong positive correlation with inflation and, when deemed prudent for defensive purposes, adopt a posture of capital protection. Under normal market conditions, the Fund will allocate its net assets among the broad asset classes, namely U.S. and Non-U.S. Equities, including other registered investment companies (primarily those advised by the investment adviser), Fixed Income, Commodity Linked Securities, Real Estate Linked Securities, and Cash & Equivalents in an effort to maximize risk-adjusted returns.
For the six month period ended March 31, 2014, U.S. Equities as an asset class contributed positively to returns as did Non-U.S. Equities and exposure to broad commodity indexes but to a lesser degree. Treasury bonds, most notably Treasury Inflation-Protected Securities (“TIPS”), performed poorly over the period.
The principal input and critical component in the Fund’s asset allocation decision process is the implied equity risk premium, simply defined as the excess return that the overall stock market provides over a risk-free rate indicating the relative valuation of risky assets versus the risk free alternative as measured by U.S. Treasury bonds. The level (high or low) plus the directional change in the equity risk premium are each used as inputs in our process. Second, the overall trend in CPI and other proxies for inflation, namely currency and commodity prices are used. Lastly, historical data and forecasts of volatility for all asset classes are analyzed and modeled.
Market Review & Outlook
Equities witnessed a strongly positive re-rating as evidenced by the price-to-earnings (P/E) multiple expanding and accounting for the majority of gains in 2013, as opposed to earnings growth or dividends. This P/E expansion was driven by increased investor optimism as demonstrated by a decrease in the implied equity risk premium. Currently, the implied risk premium for equities versus bonds is at a level last seen in early 2008, but consistent with the median level over the past fifteen years. In simple terms, future relative performance for Equities versus Bonds will be lower and dependent upon earnings growth or dividends, but Equities only seem vulnerable to a major correction in the face of higher Fixed Income yields.
Our process remains flexible and allows the Fund to opportunistically shift to each of the various asset classes as conditions warrant based upon the ability of each asset class to perform best during particular market environments.
Investments by the Fund in commodity-linked securities and, to a lesser extent, REITS and Real Estate linked securities are part of the tactical strategy to address inflation. Incorporating additional asset classes such as these, sometimes inversely or uncorrelated to stocks and bonds, offer enhanced diversification benefits and the ability to take advantage of the changes in asset class performance that may take place with changes in different inflationary environments. The Fund is designed to help reduce the level of risk to delivering real returns that comes from concentrating in a single asset class. Additionally, we aim to overweight asset classes we believe are poised to perform based on our understanding of how different asset classes respond to inflation and changes in economic conditions. The result is a broadly diversified portfolio solution that can be used as a core holding or a complement to existing equity or fixed income strategies.
With competing inflationary/deflationary forces, namely monetary policy and demographics respectively, competing against one another like “fire” and “ice”, we think the risk of inflation is higher than it has been in quite some time.
The failure of U.S. fiscal policy has caused the dependency on unprecedented and massive monetary easing and allowed the U.S. financial sector to heal distinct from the tremendous restructuring undertaken by business and consumer focused corporate America. That said, companies cannot sustain the pace of profit margin improvement without top line growth and it is unlikely that monetary policy will suddenly gain the value in transmission to the real economy (as opposed to financial assets), when it has not in the past five years. The vast bulk of the Federal Reserve’s bond purchases have made their way right back in the form of bank reserves deposited at the Federal Reserve. If released however, the outlook for inflation should rise.
A significant issue not widely discussed is the fact that the Federal Reserve is likely to taper its bond purchases simply because the amount of debt issuance by the U.S. government is falling and, if the Fed maintained its current rate of Treasury bond purchases, it would essentially be monetizing
| | |
| | |
| Semi-Annual Report | March 31, 2014 | | 11 |
| | |
| Centre Multi-Asset Real Return Fund | | Manager Commentary |
| | March 31, 2014 (Unaudited) |
all the federal government’s new deficit financing. The U.S. dollar’s reserve currency status has been the only fact to allow this not to have the normal inflationary impact that it has had on other countries that have pursued this type of debt monetization program. To us, the more important lever is what the Fed does with the policy rate, now at essentially zero and negative in real terms. Our forecast is that it will continue to pursue a policy of negative real interest rates and perhaps introduce other non-traditional stimulus measures to advance the rate of employment growth and until a higher rate of inflation (greater than three percent) is well entrenched into the economy. This is the only way to somehow allow it to unwind a $4 trillion balance sheet as well as avoid a meaningful interest rate rise and risk a recession meaning that monetary policy may contribute to an increase in market volatility just when expectations are the exact opposite.
At this stage of the cycle under “normal” circumstances, the Federal Reserve would be raising U.S. interest rates and the stock market drivers of return would be away from further expansion of valuation multiples and a focus on the delivery of profits as previously accommodative conditions tighten. There seems little to no justification for the Fed support of the private sector or the continuing low level of yields. That said, a sustained and large rise in interest rates is politically unacceptable and will negatively affect the U.S. budget deficit. On the assumption that the U.S. has balanced budgets forever but the government pays “normalized interest rates”, interest payments would be nearly one third of annual federal government spending. In other words, normalized interest rates would produce an uncontrollable U.S. debt service budget item that would sharply increase U.S. budget deficits and the national debt. The Federal Reserve will be required to keep its policy rates low to maintain the public sector mal-investment. In other words, the Federal Reserve is likely to succumb to political pressure and will allow a higher rate of inflation to become imbedded into the economy before it begins to increase the Federal Funds rate in any meaningful way. The impact from this on the private sector will be disruptive and is likely to contribute to increased volatility in interest rates and higher inflation expectations.
On the deflationary side, in a number of industrialized countries, including the U.S., on the assumption that fertility remains at or close to present levels, populations will start to decline and, in some cases, do so quite rapidly in the near future. The impact of this on developed societies is that the combined demand for goods and services will decrease and increasing pension liabilities that can be crushing in terms of taxation on younger workers will be an issue and, potentially, a source of unrest and political disruption. Japan, the pathfinder of this phenomenon as it embraced Western family planning even before Europe and the U.S., shows the debilitative impact from an aging society and need to resort to new radical inflationary macroeconomic policies to combat its ill effects. Russia, on the other hand, has introduced its annual “day of conception” worker holiday as a desperate gesture to increase Russia’s struggling birth rate. No developed world country is immune from this significant problem which is just starting to be felt. With regard to near-term relevance to Federal Reserve policies, we see that the U.S. Civilian Labor Force Participation Rate has dropped below a level that we last saw thirty years ago, when women began to join the workforce in earnest. A large part of the current fall in the unemployment rate has been due to this “dropping out” of the labor force, either due to discouragement, early retirement, or public assistance. This collapse in the civilian workforce participation rate and increase in the number of persons on government dependency since the recovery began in June 2009 has never happened before during previous recoveries. Productivity and the growth in the average hourly wages have fallen significantly as inflation has slowed and competition for jobs domestically and from overseas is limiting consumer consumption as evidenced by the latest drop in consumer spending being consistent only with past recessions.
These factors have created a myriad of possible outcomes over the next few years that are likely to see a rise, perhaps dramatically, in inflation. This is due primarily to the negative macro circumstances being unlike any evidenced in the past and the lack of confidence in the ability of public officials to manage their unwinding, without creating a more volatile investment landscape. The Centre Multi-Asset Real Return Fund will attempt to deliver on a maintaining investor purchasing power of today’s dollar in nominal terms plus deliver a positive real return on capital.
| | |
| Centre Multi-Asset Real Return Fund | | Manager Commentary |
| | March 31, 2014 (Unaudited) |
| | | | | | |
ASSET TYPE WEIGHTINGS As a percentage of Net Assets | | | |
| | |
| Exchange-Traded Funds | | | 24.39 | % | | |
| Other Open-End Funds | | | 75.36 | % | | |
| Cash and Cash Equivalents | | | 0.25 | % | | |
| Total | | | 100.00 | % | | |
| |
These allocations may not reflect the current or future positions of the portfolio. | | | |
| | | |
| | | |
| | | |
| | | |
| | | |
| | | |
| | | |
| | | |
| | | |
| | | |
| | | |
| | | |
| | | |
| | | |
| | | |
| | | |
| | | |
| | | |
| | | |
| | | |
| | | |
| | | |
| | | |
| | | |
| | | |
| | | |
| | | |
| | | |
| | | |
| | | |
| | | |
| | | |
| | | |
| | | |
| | | |
| | | |
| | | |
| | | |
| | | |
| | | |
| | | |
| | | |
| | | |
| | | |
| | | |
| | | |
| | | |
| | | |
| | | |
| | | |
| | | |
| | | |
| | | |
| | | |
| | | |
| | | |
| | | |
| | | |
| | | |
| | | |
| | | |
| | | |
| | | |
| | |
| GROWTH OF HYPOTHETICAL $10,000 INVESTMENT THROUGH MARCH 31, 2014 |
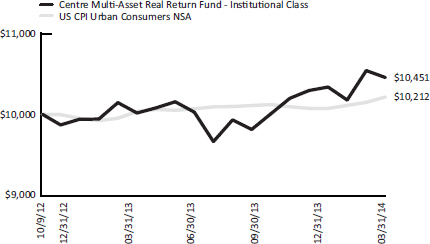
This graph assumes an initial investment of $10,000 at October 9, 2012, the Fund’s inception date, and that any dividends and distributions are reinvested. This graph depicts the performance of the Fund (Institutional Class) versus the U.S. CPI Urban Consumers NSA Index. Unlike the Fund, an index is not available for investment and is unmanaged and does not have expenses that affect the results. The comparison is shown for illustrative purposes only.
CUMULATIVE TOTAL RETURNS – FOR THE PERIOD ENDED MARCH 31, 2014
| | | | | | | | | | | | | | | | | | | | | | | | | |
| | | 1 Month | | 3 Month | | YTD | | 1 Year | | Since Inception* |
| Centre Multi-Asset Real Return Fund – Investor – NAV | | | | -0.91 | % | | | | 1.03 | % | | | | 1.03 | % | | | | 3.26 | % | | | | 2.38 | % |
| U.S. CPI Urban Consumers NSA | | | | 0.64 | % | | | | 1.39 | % | | | | 1.39 | % | | | | 1.51 | % | | | | 2.39 | % |
| Centre Multi-Asset Real Return Fund – Institutional – NAV | | | | -0.81 | % | | | | 1.13 | % | | | | 1.13 | % | | | | 3.68 | % | | | | 3.04 | % |
| U.S. CPI Urban Consumers NSA | | | | 0.64 | % | | | | 1.39 | % | | | | 1.39 | % | | | | 1.51 | % | | | | 1.43 | % |
| * | Inception date of October 9, 2012 for Institutional Class. Inception date of January 22, 2013 for Investor Class. |
The performance information quoted above represents past performance, which is not a guarantee of future results, and does not reflect the deduction of any taxes that a shareholder would pay on Fund distributions or the redemption of Fund shares. Investment return and principal value of an investment will fluctuate so that an investor’s shares, when redeemed, may be worth more or less than their original cost. Total return includes reinvestment of dividends and capital gains, if any. Current performance may be lower or higher than the performance data quoted. For the most current month-end performance data please call 855-298-4236.
Total Annual Fund Operating Expenses (before fee waiver and/or expense reimbursements) as stated in the fee table of the prospectus of the Fund, dated January 17, 2014, 2.17% for the Investor Class and 1.92% for the Institutional Class. The investment adviser to the Fund, Centre Asset Management, LLC (the “Adviser” or “Centre”), has contractually agreed, pursuant to a written expense limitation agreement (the “Expense Limitation Agreement”), to reduce its advisory fees and/or reimburse other expenses of the Fund until September 14, 2015 to the extent necessary to limit the current operating expenses of each class of shares of the Fund including (but not limited to) investment advisory fees of the Advisor and distribution/service (Rule 12b-1) fees but exclusive of any front-end or contingent deferred sales loads, taxes, leverage interest, brokerage commissions, expenses incurred in connection with any merger or reorganization, extraordinary expenses such as litigation and other expenses not incurred in the ordinary course of the Fund’s business, and acquired fund fees and expenses, except that, if an acquired fund is an underlying fund managed by the Adviser and such acquired fund is not subject to an effective expense limitation or fee waiver agreement at any time during the term of the Expense Limitation Agreement, then, for that time, the operating expenses of each class of shares of the Fund shall not exclude the amount of advisory fees included in such acquired fund’s fees and expenses to which the Fund would otherwise be subject, to an annual rate of 1.25% of the average daily net assets of the Investor Class shares and 1.00% of the average daily net assets of the Institutional Class shares.
The U.S. CPI Urban Consumers NSA Index is the annual percentage change in the Consumer Price Index (CPI). The CPI is an economic measure that tracks the weighted average of prices of a basket of consumer goods and services. Changes in CPI are used to assess price changes associated with the cost of living. You cannot invest directly into an index.
The chart above shows the performance of Institutional Class shares only, since the Institutional Class has the longest period of annual returns. The performance of the Investor Class shares will differ from the performance shown because the Investor Class shares have different expenses than the Institutional Class shares.
| | |
| | |
| Semi-Annual Report | March 31, 2014 | | 13 |
| | |
| Centre Funds | | Disclosure of Fund Expenses |
| | March 31, 2014 (Unaudited) |
As a shareholder of a series of Centre Funds (each series, a “Fund” and together, the “Funds”), you will incur, two types of costs: (1) transaction costs, including any applicable redemption fees; and (2) ongoing costs, including management fees, distribution and/or service (12b-1) fees and other Fund expenses. The following examples are intended to help you understand your ongoing costs (in dollars) of investing in a Fund and to compare these costs with the ongoing costs of investing in other mutual funds. The examples are based on an investment of $1,000 invested on October 1, 2013 and held through March 31, 2014.
Actual Expenses. The first line under each class of the table below provides information about actual account values and actual expenses. You may use the information in this line, together with the amount you invested, to estimate the expenses that you paid over the period. Simply divide your account value by $1,000 (for example, an $8,600 account value divided by $1,000 = 8.6), then multiply the result by the number in the first line under the heading “Expenses Paid During Period October 1, 2013 – March 31, 2014” to estimate the expenses you paid on your account during this period.
Hypothetical Example for Comparison Purposes. The second line under each class of the table below provides information about hypothetical account values and hypothetical expenses based on each Fund’s actual expense ratio and an assumed rate of return of 5% per year before expenses, which is not the Fund’s actual return. The hypothetical account values and expenses may not be used to estimate the actual ending account balance or expenses you paid for the period. You may use this information to compare the ongoing costs of investing in a Fund and to other funds. To do so, compare this 5% hypothetical example with the 5% hypothetical examples that appear in the shareholder reports of the other funds. Please note that the expenses shown in the table are meant to highlight your ongoing costs only and do not reflect any transactional costs, such as redemption fees, if any. Therefore, the second line under each class of the table below is useful in comparing ongoing costs only, and will not help you determine the relative total costs of owning different funds. In addition, if these transactional costs were included, your costs would have been higher.
| | | | | | | | |
| | | Beginning
Account Value
10/01/13 | | Ending
Account Value
03/31/14 | | Expense Ratio(a) | | Expenses Paid
During Period
10/01/13-03/31/14(b) |
Centre American Select Equity Fund | | | | | | | | |
Investor Class | | | | | | | | |
Actual | | $ 1,000.00 | | $ 1,114.80 | | 1.05% | | $ 5.54 |
Hypothetical (5% return before expenses) | | $ 1,000.00 | | $ 1,019.70 | | 1.05% | | $ 5.29 |
Institutional Class | | | | | | | | |
Actual(c) | | $ 1,000.00 | | $ 1,008.80 | | 0.95% | | $ 1.80 |
Hypothetical (5% return before expenses) | | $ 1,000.00 | | $ 1,020.19 | | 0.95% | | $ 4.78 |
Centre Global Select Equity Fund | | | | | | | | |
Investor Class | | | | | | | | |
Actual(c) | | $ 1,000.00 | | $ 994.20 | | 1.45% | | $ 2.73 |
Hypothetical (5% return before expenses) | | $ 1,000.00 | | $ 1,017.70 | | 1.45% | | $ 7.29 |
Institutional Class | | | | | | | | |
Actual | | $ 1,000.00 | | $ 1,049.20 | | 1.25% | | $ 6.39 |
Hypothetical (5% return before expenses) | | $ 1,000.00 | | $ 1,018.70 | | 1.25% | | $ 6.29 |
Centre Active U.S. Treasury Fund(d) | | | | | | | | |
Investor Class | | | | | | | | |
Actual(c) | | $ 1,000.00 | | $ 1,007.00 | | 0.85% | | $ 1.61 |
Hypothetical (5% return before expenses) | | $ 1,000.00 | | $ 1,020.69 | | 0.85% | | $ 4.28 |
Institutional Class | | | | | | | | |
Actual(c) | | $ 1,000.00 | | $ 1,008.00 | | 0.60% | | $ 1.14 |
Hypothetical (5% return before expenses) | | $ 1,000.00 | | $ 1,021.94 | | 0.60% | | $ 3.02 |
Centre Multi-Asset Real Return Fund | | | | | | | | |
Investor Class | | | | | | | | |
Actual | | $ 1,000.00 | | $ 1,042.50 | | 1.25% | | $ 6.37 |
Hypothetical (5% return before expenses) | | $ 1,000.00 | | $ 1,018.70 | | 1.25% | | $ 6.29 |
Institutional Class | | | | | | | | |
Actual | | $ 1,000.00 | | $ 1,044.50 | | 1.00% | | $ 5.10 |
Hypothetical (5% return before expenses) | | $ 1,000.00 | | $ 1,019.95 | | 1.00% | | $ 5.04 |
| (a) | Annualized, based on the Fund’s most recent fiscal half year expenses. |
| (b) | Expenses are equal to the Fund’s annualized expense ratio, multiplied by the average account value over the period, multiplied by the number of days in the most recent fiscal half year (182), divided by 365. |
| (c) | The actual expenses paid during the period is based on January 21, 2014 (Inception). |
| (d) | The Centre Active U.S. Treasury Fund commenced operations on January 21, 2014. |
| | |
| Centre American Select Equity Fund | | Schedule of Investments |
| | March 31, 2014 (Unaudited) |
| | | | | | | | |
| | | Shares | | | Value | |
COMMON STOCKS (99.50%) | | | | | |
Consumer Discretionary (12.00%) | | | | | |
Hotels Restaurants & Leisure (1.57%) | | | | | |
Starbucks Corp. | | | 28,240 | | | $ | 2,072,251 | |
| | | | | | | | |
| |
Internet & Catalog Retail (3.09%) | | | | | |
Amazon.com, Inc.(a) | | | 7,550 | | | | 2,540,726 | |
Priceline.com, Inc.(a) | | | 1,280 | | | | 1,525,619 | |
| | | | | | | | |
| | | | | | | 4,066,345 | |
| | | | | | | | |
Media (3.60%) | | | | | |
Comcast Corp., Class A | | | 53,450 | | | | 2,673,569 | |
Walt Disney Co. | | | 25,870 | | | | 2,071,411 | |
| | | | | | | | |
| | | | | | | 4,744,980 | |
| | | | | | | | |
Specialty Retail (3.74%) | | | | | |
Home Depot, Inc. | | | 27,460 | | | | 2,172,910 | |
Tiffany & Co. | | | 16,250 | | | | 1,399,937 | |
Urban Outfitters, Inc.(a) | | | 36,970 | | | | 1,348,296 | |
| | | | | | | | |
| | | | | | | 4,921,143 | |
| | | | | | | | |
Total Consumer Discretionary | | | | | | | 15,804,719 | |
| | | | | | | | |
| |
Consumer Staples (8.89%) | | | | | |
Beverages (3.62%) | | | | | |
Coca-Cola Co. | | | 42,410 | | | | 1,639,571 | |
PepsiCo, Inc. | | | 37,420 | | | | 3,124,570 | |
| | | | | | | | |
| | | | | | | 4,764,141 | |
| | | | | | | | |
Food Products (1.08%) | | | | | |
Archer-Daniels-Midland Co. | | | 32,760 | | | | 1,421,456 | |
| | | | | | | | |
| |
Household Products (1.86%) | | | | | |
Procter & Gamble Co. | | | 30,380 | | | | 2,448,628 | |
| | | | | | | | |
| |
Personal Products (0.99%) | | | | | |
Avon Products, Inc. | | | 89,130 | | | | 1,304,863 | |
| | | | | | | | |
| |
Tobacco (1.34%) | | | | | |
Philip Morris International, Inc. | | | 21,600 | | | | 1,768,392 | |
| | | | | | | | |
Total Consumer Staples | | | | | | | 11,707,480 | |
| | | | | | | | |
| |
Energy (5.72%) | | | | | |
Energy Equipment & Services (2.27%) | | | | | |
Schlumberger, Ltd. | | | 30,640 | | | | 2,987,400 | |
| | | | | | | | |
| |
Oil, Gas & Consumable Fuels (3.45%) | | | | | |
EOG Resources, Inc. | | | 12,160 | | | | 2,385,427 | |
Halliburton Co. | | | 36,600 | | | | 2,155,374 | |
| | | | | | | | |
| | | | | | | 4,540,801 | |
| | | | | | | | |
Total Energy | | | | | | | 7,528,201 | |
| | | | | | | | |
| |
Financials (4.73%) | | | | | |
Capital Markets (1.48%) | | | | | |
BlackRock, Inc. | | | 6,190 | | | | 1,946,631 | |
| | | | | | | | |
| |
Consumer Finance (1.58%) | | | | | |
American Express Co. | | | 23,190 | | | | 2,087,796 | |
| | | | | | | | |
| | | | | | | | |
| | | Shares | | | Value | |
Financials (continued) | | | | | |
Diversified Financial Services (1.67%) | | | | | |
Bank of America Corp. | | | 61,660 | | | $ | 1,060,552 | |
Citigroup, Inc. | | | 23,880 | | | | 1,136,688 | |
| | | | | | | | |
| | | | | | | 2,197,240 | |
| | | | | | | | |
Total Financials | | | | | | | 6,231,667 | |
| | | | | | | | |
| |
Health Care (15.99%) | | | | | |
Biotechnology (5.36%) | | | | | |
Amgen, Inc. | | | 17,340 | | | | 2,138,716 | |
Biogen Idec, Inc.(a) | | | 8,440 | | | | 2,581,543 | |
Gilead Sciences, Inc.(a) | | | 32,890 | | | | 2,330,585 | |
| | | | | | | | |
| | | | | | | 7,050,844 | |
| | | | | | | | |
| |
Health Care Equipment & Supplies (1.34%) | | | | | |
Boston Scientific Corp.(a) | | | 130,860 | | | | 1,769,227 | |
| | | | | | | | |
| |
Health Care Providers & Services (2.06%) | | | | | |
Cardinal Health, Inc. | | | 19,390 | | | | 1,356,912 | |
HCA Holdings, Inc.(a) | | | 25,910 | | | | 1,360,275 | |
| | | | | | | | |
| | | | | | | 2,717,187 | |
| | | | | | | | |
| |
Pharmaceuticals (7.23%) | | | | | |
AbbVie, Inc. | | | 26,690 | | | | 1,371,866 | |
Johnson & Johnson | | | 40,190 | | | | 3,947,864 | |
Merck & Co., Inc. | | | 29,600 | | | | 1,680,392 | |
Pfizer, Inc. | | | 78,540 | | | | 2,522,705 | |
| | | | | | | | |
| | | | | | | 9,522,827 | |
| | | | | | | | |
Total Health Care | | | | | | | 21,060,085 | |
| | | | | | | | |
| |
Industrials (16.09%) | | | | | |
Aerospace & Defense (5.74%) | | | | | |
Boeing Co. | | | 12,230 | | | | 1,534,743 | |
General Dynamics Corp. | | | 16,460 | | | | 1,792,823 | |
Honeywell International, Inc. | | | 22,760 | | | | 2,111,217 | |
United Technologies Corp. | | | 18,190 | | | | 2,125,320 | |
| | | | | | | | |
| | | | | | | 7,564,103 | |
| | | | | | | | |
Air Freight & Logistics (1.77%) | | | | | |
United Parcel Service, Inc., Class B | | | 23,890 | | | | 2,326,408 | |
| | | | | | | | |
| |
Airlines (1.43%) | | | | | |
Delta Air Lines, Inc. | | | 54,270 | | | | 1,880,456 | |
| | | | | | | | |
| |
Construction & Engineering (1.17%) | | | | | |
Quanta Services, Inc.(a) | | | 41,840 | | | | 1,543,896 | |
| | | | | | | | |
| |
Electronics (0.90%) | | | | | |
Tyco International, Ltd. | | | 27,990 | | | | 1,186,776 | |
| | | | | | | | |
| |
Industrial Conglomerates (2.03%) | | | | | |
3M Co. | | | 19,690 | | | | 2,671,146 | |
| | | | | | | | |
| |
Machinery (1.45%) | | | | | |
PACCAR, Inc. | | | 28,400 | | | | 1,915,296 | |
| | | | | | | | |
| | |
| | |
| Semi-Annual Report | March 31, 2014 | | 15 |
| | |
| Centre American Select Equity Fund | | Schedule of Investments |
| | March 31, 2014 (Unaudited) |
| | | | | | | | |
| | Shares | | | Value | |
Industrials (continued) | | | | | |
Road & Rail (1.60%) | | | | | | | | |
Union Pacific Corp. | | | 11,190 | | | $ | 2,099,915 | |
| | | | | | | | |
| | |
Total Industrials | | | | | | | 21,187,996 | |
| | | | | | | | |
| |
Information Technology (30.15%) | | | | | |
Communication Equipment (2.64%) | |
Juniper Networks, Inc.(a) | | | 51,020 | | | | 1,314,275 | |
QUALCOMM, Inc. | | | 27,400 | | | | 2,160,764 | |
| | | | | | | | |
| | | | | | | 3,475,039 | |
| | | | | | | | |
Computers & Peripherals (4.80%) | | | | | |
Apple, Inc. | | | 7,210 | | | | 3,869,895 | |
NetApp, Inc. | | | 29,710 | | | | 1,096,299 | |
SanDisk Corp. | | | 16,730 | | | | 1,358,309 | |
| | | | | | | | |
| | | | | | | 6,324,503 | |
| | | | | | | | |
Internet Software & Services (6.41%) | |
Facebook, Inc.,
Class A(a) | | | 35,880 | | | | 2,161,411 | |
Google, Inc., Class A(a) | | | 5,640 | | | | 6,285,836 | |
| | | | | | | | |
| | | | | | | 8,447,247 | |
| | | | | | | | |
IT Services (4.75%) | | | | | | | | |
International Business Machines Corp. | | | 10,720 | | | | 2,063,493 | |
Mastercard, Inc.,
Class A | | | 24,300 | | | | 1,815,210 | |
Visa, Inc., Class A | | | 10,980 | | | | 2,370,143 | |
| | | | | | | | |
| | | | | | | 6,248,846 | |
| | | | | �� | | | |
Semiconductor & Semiconductor Equipment (6.97%) | |
First Solar, Inc.(a) | | | 14,620 | | | | 1,020,330 | |
Lam Research Corp.(a) | | | 20,460 | | | | 1,125,300 | |
Linear Technology Corp. | | | 30,430 | | | | 1,481,637 | |
Microchip Technology, Inc. | | | 32,790 | | | | 1,566,050 | |
Micron Technology,
Inc.(a) | | | 58,160 | | | | 1,376,066 | |
NVIDIA Corp. | | | 57,640 | | | | 1,032,332 | |
Texas Instruments, Inc. | | | 33,370 | | | | 1,573,395 | |
| | | | | | | | |
| | | | | | | 9,175,110 | |
| | | | | | | | |
Software (4.58%) | | | | | |
Microsoft Corp. | | | 118,480 | | | | 4,856,495 | |
Oracle Corp. | | | 28,840 | | | | 1,179,845 | |
| | | | | | | | |
| | | | | | | 6,036,340 | |
| | | | | | | | |
Total Information Technology | | | | 39,707,085 | |
| | | | | | | | |
| |
Materials (1.91%) | | | | | |
Chemicals (0.81%) | | | | | |
International Flavors & Fragrances, Inc. | | | 11,220 | | | | 1,073,418 | |
| | | | | | | | |
| |
Containers & Packaging (1.10%) | | | | | |
Sealed Air Corp. | | | 44,090 | | | | 1,449,238 | |
| | | | | | | | |
| | |
Total Materials | | | | | | | 2,522,656 | |
| | | | | | | | |
|
Telecommunication Services (2.20%) | |
Diversified Telecommunication (2.20%) | |
Verizon Communications, Inc. | | | 61,050 | | | | 2,904,148 | |
| | | | | | | | |
| |
Total Telecommunication Services | | | | 2,904,148 | |
| | | | | | | | |
| | | | | | | | | | | | |
| | | | | | | Shares | | Value | |
Utilities (1.82%) | | | | | | | |
Electric Utilities (0.78%) | | | | | | | |
Duke Energy Corp. | | | 14,380 | | $ | 1,024,144 | |
| | | | | | | | | | | | |
Independent Power Producers & Energy Traders (1.04%) | |
Calpine Corp.(a) | | | 65,610 | | | 1,371,905 | |
| | | | | | | | | | | | |
| | | |
Total Utilities | | | | | | | | | 2,396,049 | |
| | | | | | | | | | | | |
| | | | | | | | | | | | |
TOTAL COMMON STOCKS (Cost $108,873,847) | | | | | | 131,050,086 | |
| | | | |
| | Expiration
Date | | Exercise
Price | | | Contracts | | Value | |
PURCHASED OPTIONS (0.30%) | | | | |
Calls (0.30%) | | | | |
SPDR® Gold | | | | | | | | | | | | |
Shares | | 12/20/2014 | | $ | 132.00 | | | 1,000 | | | 399,000 | |
TOTAL PURCHASED OPTIONS (Cost $510,503) | | | | | | 399,000 | |
| | | | | | | | | | | | | |
| | | | 7-Day
Yield | | | Shares | | Value | |
SHORT TERM INVESTMENTS (1.06%) | |
Money Market Fund (1.06%) | | | | |
Dreyfus Treasury Prime Cash Management, Institutional Class | | | 0.00004 | % | | 1,390,346 | | | 1,390,346 | |
| | | | | | | | | | | | |
| | | | | | | | | | | | |
TOTAL SHORT TERM INVESTMENTS (Cost $1,390,346) | | | 1,390,346 | |
| | |
TOTAL INVESTMENTS (Cost $110,774,696) (100.86%) | | | | | $ | 132,839,432 | |
| |
Liabilities in Excess of Other Assets (-0.86%) | | | (1,130,508) | |
NET ASSETS (100.00%) | | | | | $ | 131,708,924 | |
| (a) | Non-income producing security. |
Common Abbreviations:
Ltd. - Limited.
SPDR - Standard & Poor’s Depositary Receipts.
See Notes to Financial Statements.
| | |
| Centre Global Select Equity Fund | | Schedule of Investments |
| | March 31, 2014 (Unaudited) |
| | | | | | | | |
| | Shares | | | Value | |
COMMON STOCKS (96.54%) | | | | | | | | |
ASIA (27.12%) | | | | | | | | |
Australia (2.83%) | | | | | | | | |
Financials (1.94%) | | | | | | | | |
Commonwealth Bank of Australia | | | 2,100 | | | $ | 150,818 | |
Westpac Banking Corp. | | | 4,520 | | | | 144,871 | |
| | | | | | | | |
| | | | | | | 295,689 | |
| | | | | | | | |
Materials (0.89%) | | | | | | | | |
BHP Billiton, Ltd. | | | 4,017 | | | | 135,864 | |
| | | | | | | | |
| | |
Total Australia | | | | | | | 431,553 | |
| | | | | | | | |
| | |
China (11.80%) | | | | | | | | |
Energy (3.32%) | | | | | | | | |
China Petroleum & Chemical Corp., Class H | | | 210,000 | | | | 187,894 | |
CNOOC, Ltd. | | | 102,000 | | | | 153,332 | |
PetroChina Co., Ltd., Class H | | | 152,500 | | | | 166,135 | |
| | | | | | | | |
| | | | | | | 507,361 | |
| | | | | | | | |
Financials (6.43%) | | | | | | | | |
Bank of China, Ltd., Class H | | | 443,700 | | | | 196,780 | |
China Construction Bank Corp., Class H | | | 333,000 | | | | 233,119 | |
China Life Insurance Co., Ltd., Class H | | | 62,000 | | | | 175,453 | |
Industrial & Commercial Bank of China, Class H | | | 354,000 | | | | 217,699 | |
Ping An Insurance Group Co., Class H | | | 19,000 | | | | 157,507 | |
| | | | | | | | |
| | | | | | | 980,558 | |
| | | | | | | | |
Information Technology (0.53%) | | | | | |
Tencent Holdings, Ltd. | | | 1,160 | | | | 80,683 | |
| | | | | | | | |
| |
Telecommunication Services (1.52%) | | | | | |
China Mobile, Ltd. | | | 25,300 | | | | 231,587 | |
| | | | | | | | |
| | |
Total China | | | | | | | 1,800,189 | |
| | | | | | | | |
| | |
Hong Kong (0.79%) | | | | | | | | |
Consumer Discretionary (0.79%) | | | | | |
Sands China, Ltd. | | | 16,100 | | | | 120,285 | |
| | | | | | | | |
| | |
Total Hong Kong | | | | | | | 120,285 | |
| | | | | | | | |
| | |
India (0.37%) | | | | | | | | |
Information Technology (0.37%) | | | | | |
Infosys, Ltd., Sponsored ADR | | | 1,050 | | | | 56,889 | |
| | | | | | | | |
| | |
Total India | | | | | | | 56,889 | |
| | | | | | | | |
| | |
Japan (7.53%) | | | | | | | | |
Consumer Discretionary (1.98%) | | | | | |
Fast Retailing Co., Ltd. | | | 340 | | | | 123,314 | |
Toyota Motor Corp. | | | 3,150 | | | | 177,803 | |
| | | | | | | | |
| | | | | | | 301,117 | |
| | | | | | | | |
Financials (2.81%) | | | | | |
Daiwa Securities Group, Inc. | | | 18,740 | | | | 163,044 | |
Mitsubishi UFJ Financial Group, Inc. | | | 20,470 | | | | 112,450 | |
Nomura Holdings, Inc. | | | 23,800 | | | | 152,648 | |
| | | | | | | | |
| | | | | | | 428,142 | |
| | | | | | | | |
| | | | | | | | |
| | Shares | | | Value | |
Japan (continued) | | | | | | | | |
Information Technology (2.74%) | | | | | | | | |
Keyence Corp. | | | 470 | | | $ | 193,847 | |
Murata Manufacturing Co., Ltd. | | | 1,340 | | | | 126,385 | |
Yahoo Japan Corp. | | | 20,000 | | | | 98,048 | |
| | | | | | | | |
| | | | | | | 418,280 | |
| | | | | | | | |
Total Japan | | | | | | | 1,147,539 | |
| | | | | | | | |
| | |
Korea (1.84%) | | | | | | | | |
Consumer Discretionary (0.57%) | | | | | | | | |
Hyundai Motor Co. | | | 370 | | | | 87,247 | |
| | | | | | | | |
| | |
Financials (0.77%) | | | | | | | | |
Shinhan Financial Group Co., Ltd. | | | 2,650 | | | | 117,009 | |
| | | | | | | | |
| | |
Information Technology (0.50%) | | | | | | | | |
Samsung Electronics Co., Ltd. | | | 60 | | | | 75,701 | |
| | | | | | | | |
| | |
Total Korea | | | | | | | 279,957 | |
| | | | | | | | |
| | |
Taiwan (1.96%) | | | | | | | | |
Information Technology (1.96%) | | | | | | | | |
Delta Electronics, Inc. | | | 17,800 | | | | 109,889 | |
MediaTek, Inc. | | | 5,930 | | | | 87,531 | |
Taiwan Semiconductor Manufacturing Co., Ltd. | | | 26,060 | | | | 101,407 | |
| | | | | | | | |
| | | | | | | 298,827 | |
| | | | | | | | |
Total Taiwan | | | | | | | 298,827 | |
| | | | | | | | |
| | |
TOTAL ASIA | | | | | | | | |
(Cost $3,801,667) | | | | | | | 4,135,239 | |
| | |
EUROPE (35.97%) | | | | | | | | |
Belgium (0.67%) | | | | | | | | |
Consumer Staples (0.67%) | | | | | | | | |
Anheuser-Busch InBev NV | | | 970 | | | | 101,695 | |
| | | | | | | | |
| | |
Total Belgium | | | | | | | 101,695 | |
| | | | | | | | |
| | |
Denmark (1.60%) | | | | | | | | |
Health Care (1.60%) | | | | | | | | |
Coloplast A/S, Class B | | | 1,440 | | | | 116,516 | |
Novo Nordisk A/S, Class B | | | 2,800 | | | | 127,513 | |
| | | | | | | | |
| | | | | | | 244,029 | |
| | | | | | | | |
Total Denmark | | | | | | | 244,029 | |
| | | | | | | | |
| | |
France (5.22%) | | | | | | | | |
Consumer Discretionary (0.78%) | | | | | | | | |
Accor SA | | | 2,310 | | | | 118,273 | |
| | | | | | | | |
| | |
Consumer Staples (1.23%) | | | | | | | | |
L’Oreal SA | | | 1,140 | | | | 187,992 | |
| | | | | | | | |
| | |
Energy (1.25%) | | | | | | | | |
Total SA | | | 2,910 | | | | 190,828 | |
| | | | | | | | |
| | |
| | |
| Semi-Annual Report | March 31, 2014 | | 17 |
| | |
| Centre Global Select Equity Fund | | Schedule of Investments |
| | March 31, 2014 (Unaudited) |
| | | | | | | | |
| | | Shares | | | Value | |
France (continued) | | | | | | | | |
Financials (1.04%) | | | | | | | | |
BNP Paribas SA | | | 2,050 | | | $ | 158,127 | |
| | | | | | | | |
| | |
Health Care (0.92%) | | | | | | | | |
Sanofi | | | 1,353 | | | | 141,065 | |
| | | | | | | | |
| | |
Total France | | | | | | | 796,285 | |
| | | | | | | | |
| | |
Germany (6.43%) | | | | | | | | |
Consumer Discretionary (1.29%) | | | | | |
Daimler AG | | | 2,084 | | | | 196,925 | |
| | | | | | | | |
| | |
Financials (1.55%) | | | | | | | | |
Allianz SE | | | 1,000 | | | | 169,039 | |
Deutsche Bank AG | | | 1,510 | | | | 67,556 | |
| | | | | | | | |
| | | | | | | 236,595 | |
| | | | | | | | |
Health Care (0.53%) | | | | | | | | |
Bayer AG | | | 595 | | | | 80,479 | |
| | | | | | | | |
Industrials (1.29%) | | | | | | | | |
Siemens AG | | | 1,456 | | | | 195,973 | |
| | | | | | | | |
Information Technology (0.49%) | | | | | |
SAP AG | | | 932 | | | | 75,446 | |
| | | | | | | | |
Materials (1.28%) | | | | | | | | |
BASF SE | | | 1,760 | | | | 195,623 | |
| | | | | | | | |
| | |
Total Germany | | | | | | | 981,041 | |
| | | | | | | | |
| | |
Great Britain (5.19%) | | | | | | | | |
Consumer Discretionary (0.89%) | | | | | |
Next Plc | | | 1,230 | | | | 135,338 | |
| | | | | | | | |
| | |
Consumer Staples (1.88%) | | | | | | | | |
Reckitt Benckiser Group Plc | | | 1,520 | | | | 123,839 | |
Tesco Plc | | | 32,960 | | | | 162,319 | |
| | | | | | | | |
| | | | | | | 286,158 | |
| | | | | | | | |
Financials (2.03%) | | | | | | | | |
Barclays Plc | | | 42,965 | | | | 167,181 | |
HSBC Holdings Plc | | | 14,018 | | | | 141,973 | |
| | | | | | | | |
| | | | | | | 309,154 | |
| | | | | | | | |
Telecommunication Services (0.39%) | | | | | |
Vodafone Group Plc | | | 16,363 | | | | 60,097 | |
| | | | | | | | |
| | |
Total Great Britain | | | | | | | 790,747 | |
| | | | | | | | |
| | |
Greece (3.03%) | | | | | | | | |
Consumer Discretionary (1.17%) | | | | | |
OPAP SA | | | 11,100 | | | | 178,917 | |
| | | | | | | | |
| | |
Consumer Staples (0.58%) | | | | | | | | |
Coca-Cola Hellenic Bottling Co. AG | | | 3,570 | | | | 88,528 | |
| | | | | | | | |
| | | | | | | | |
| | | Shares | | | Value | |
Greece (continued) | | | | | | | | |
Telecommunication Services (1.28%) | | | | | |
Hellenic Telecommunications | | | | | | | | |
Organization SA(a) | | | 11,790 | | | $ | 194,911 | |
| | | | | | | | |
| | |
Total Greece | | | | | | | 462,356 | |
| | | | | | | | |
| | |
Italy (4.92%) | | | | | | | | |
Energy (0.50%) | | | | | | | | |
Eni SpA | | | 3,020 | | | | 75,763 | |
| | | | | | | | |
| | |
Financials (3.05%) | | | | | | | | |
Assicurazioni Generali SpA | | | 5,230 | | | | 116,579 | |
Intesa Sanpaolo SpA | | | 50,950 | | | | 172,671 | |
UniCredit SpA | | | 19,250 | | | | 175,827 | |
| | | | | | | | |
| | | | | | | 465,077 | |
| | | | | | | | |
Utilities (1.37%) | | | | | | | | |
Enel SpA | | | 36,870 | | | | 208,663 | |
| | | | | | | | |
| | |
Total Italy | | | | | | | 749,503 | |
| | | | | | | | |
| | |
Netherlands (0.51%) | | | | | | | | |
Consumer Staples (0.51%) | | | | | | | | |
Unilever NV | | | 1,880 | | | | 77,273 | |
| | | | | | | | |
| | |
Total Netherlands | | | | | | | 77,273 | |
| | | | | | | | |
| | |
Russia (1.73%) | | | | | | | | |
Energy (1.18%) | | | | | | | | |
Gazprom OAO, Sponsored ADR | | | 11,155 | | | | 85,893 | |
Lukoil OAO, Sponsored ADR | | | 1,710 | | | | 95,008 | |
| | | | | | | | |
| | | | | | | 180,901 | |
| | | | | | | | |
Financials (0.55%) | | | | | | | | |
Sberbank of Russia, Sponsored ADR | | | 8,730 | | | | 83,539 | |
| | | | | | | | |
| | |
Total Russia | | | | | | | 264,440 | |
| | | | | | | | |
| | |
Spain (4.09%) | | | | | | | | |
Consumer Discretionary (0.85%) | | | | | |
Inditex SA | | | 860 | | | | 129,023 | |
| | | | | | | | |
| | |
Financials (1.98%) | | | | | | | | |
Banco Bilbao Vizcaya Argentaria SA | | | 6,382 | | | | 76,651 | |
Banco Santander SA | | | 23,641 | | | | 225,411 | |
| | | | | | | | |
| | | | | | | 302,062 | |
| | | | | | | | |
Telecommunication Services (0.44%) | | | | | |
Telefonica SA | | | 4,260 | | | | 67,403 | |
| | | | | | | | |
| | |
Utilities (0.82%) | | | | | | | | |
Red Electrica Corp. SA | | | 1,540 | | | | 125,174 | |
| | | | | | | | |
| | |
Total Spain | | | | | | | 623,662 | |
| | | | | | | | |
| | |
Switzerland (2.58%) | | | | | | | | |
Health Care (2.58%) | | | | | | | | |
Novartis AG | | | 2,240 | | | | 190,034 | |
| | |
| Centre Global Select Equity Fund | | Schedule of Investments |
| | March 31, 2014 (Unaudited) |
| | | | | | | | |
| | Shares | | | Value | |
Switzerland (continued) | | | | | | | | |
Health Care (continued) | | | | | | | | |
Roche Holding AG | | | 680 | | | $ | 203,835 | |
| | | | | | | | |
| | | | | | | 393,869 | |
| | | | | | | | |
Total Switzerland | | | | | | | 393,869 | |
| | | | | | | | |
| | |
TOTAL EUROPE (Cost $4,763,933) | | | | | | | 5,484,900 | |
| | |
| | |
NORTH AMERICA (32.24%) | | | | | | | | |
Mexico (0.98%) | | | | | | | | |
Telecommunication Services (0.98%) | | | | | |
America Movil, Series L | | | 150,500 | | | | 150,091 | |
| | | | | | | | |
| | |
Total Mexico | | | | | | | 150,091 | |
| | | | | | | | |
United States (31.26%) | | | | | | | | |
Consumer Discretionary (0.97%) | | | | | |
DIRECTV(a) | | | 1,930 | | | | 147,490 | |
| | | | | | | | |
| | |
Consumer Staples (2.63%) | | | | | | | | |
Coca-Cola Co. | | | 3,710 | | | | 143,429 | |
Kimberly-Clark Corp. | | | 1,200 | | | | 132,300 | |
Procter & Gamble Co. | | | 1,550 | | | | 124,930 | |
| | | | | | | | |
| | | | | | | 400,659 | |
| | | | | | | | |
Energy (3.95%) | | | | | | | | |
Chevron Corp. | | | 1,310 | | | | 155,772 | |
Exxon Mobil Corp. | | | 2,260 | | | | 220,757 | |
Schlumberger, Ltd. | | | 2,320 | | | | 226,200 | |
| | | | | | | | |
| | | | | | | 602,729 | |
| | | | | | | | |
Financials (5.94%) | | | | | | | | |
Bank of America Corp. | | | 10,300 | | | | 177,160 | |
Berkshire Hathaway, Inc., Class B(a) | | | 1,360 | | | | 169,959 | |
Discover Financial Services | | | 2,390 | | | | 139,074 | |
JPMorgan Chase & Co. | | | 3,330 | | | | 202,165 | |
Wells Fargo & Co. | | | 4,380 | | | | 217,861 | |
| | | | | | | | |
| | | | | | | 906,219 | |
| | | | | | | | |
Health Care (5.39%) | | | | | | | | |
Amgen, Inc. | | | 1,210 | | | | 149,242 | |
Gilead Sciences, Inc.(a) | | | 2,340 | | | | 165,812 | |
Johnson & Johnson | | | 1,680 | | | | 165,026 | |
Merck & Co., Inc. | | | 2,460 | | | | 139,654 | |
Pfizer, Inc. | | | 6,280 | | | | 201,714 | |
| | | | | | | | |
| | | | | | | 821,448 | |
| | | | | | | | |
Industrials (2.59%) | | | | | | | | |
General Electric Co. | | | 6,380 | | | | 165,178 | |
United Technologies Corp. | | | 1,970 | | | | 230,175 | |
| | | | | | | | |
| | | | | | | 395,353 | |
| | | | | | | | |
Information Technology (7.59%) | | | | | |
Apple, Inc. | | | 590 | | | | 316,677 | |
Google, Inc., Class A(a) | | | 230 | | | | 256,337 | |
International Business
Machines Corp. | | | 920 | | | | 177,091 | |
Microsoft Corp. | | | 4,510 | | | | 184,865 | |
QUALCOMM, Inc. | | | 2,820 | | | | 222,385 | |
| | | | | | | | |
| | | | | | | 1,157,355 | |
| | | | | | | | |
Telecommunication Services (2.20%) | | | | | |
AT&T, Inc. | | | 5,360 | | | | 187,975 | |
| | | | | | | | |
| | Shares | | | Value | |
United States (continued) | | | | | | | | |
Telecommunication Services (continued) | | | | | |
Verizon Communications, Inc. | | | 3,100 | | | $ | 147,467 | |
| | | | | | | | |
| | | | | | | 335,442 | |
| | | | | | | | |
Total United States | | | | | | | 4,766,695 | |
| | | | | | | | |
| | |
TOTAL NORTH AMERICA (Cost $4,366,812) | | | | | | | 4,916,786 | |
| | |
| | |
SOUTH AMERICA (1.21%) | | | | | | | | |
Brazil (1.21%) | | | | | | | | |
Consumer Staples (1.21%) | | | | | | | | |
AMBEV SA | | | 24,900 | | | | 185,241 | |
| | | | | | | | |
| | |
Total Brazil | | | | | | | 185,241 | |
| | | | | | | | |
| | |
TOTAL SOUTH AMERICA (Cost $177,758) | | | | | | | 185,241 | |
| | |
| | | | | | | | |
| | |
TOTAL COMMON STOCKS (Cost $13,110,170) | | | | | | | 14,722,166 | |
| | |
| |
PREFERRED STOCKS (0.97%) | | | | | |
SOUTH AMERICA (0.97%) | | | | | | | | |
Brazil (0.97%) | | | | | | | | |
Financials (0.97%) | | | | | | | | |
Itau Unibanco Holding SA | | | 9,941 | | | | 148,261 | |
| | | | | | | | |
| | |
Total Brazil | | | | | | | 148,261 | |
| | | | | | | | |
| | |
TOTAL SOUTH AMERICA (Cost $147,489) | | | | | | | 148,261 | |
| | |
| | | | | | | | |
| | |
TOTAL PREFERRED STOCKS (Cost $147,489) | | | | | | | 148,261 | |
| | |
| | |
| | Shares | | | Value | |
RIGHTS (0.01%) | | | | | | | | |
EUROPE (0.01%) | | | | | | | | |
Spain (0.01%) | | | | | | | | |
Financials (0.01%) | | | | | | | | |
Banco Bilbao Vizcaya, Rights
(expiring 04/14/14)(a) | | | 6,382 | | | $ | 1,495 | |
| | | | | | | | |
| | |
Total Spain | | | | | | | 1,495 | |
| | | | | | | | |
TOTAL EUROPE (Cost $0) | | | | | | | 1,495 | |
| | |
| | | | | | | | |
| | |
TOTAL RIGHTS (Cost $0) | | | | | | | 1,495 | |
| | |
| | |
| | |
| Semi-Annual Report | March 31, 2014 | | 19 |
| | |
| Centre Global Select Equity Fund | | Schedule of Investments |
| | March 31, 2014 (Unaudited) |
| | | | | | | | | | | | |
| | 7-Day
Yield | | | Shares | | | Value | |
SHORT TERM INVESTMENTS (2.25%) | |
Money Market Fund (2.25%) | |
Dreyfus Treasury Prime Cash Management,
Institutional Class | | | 0.00004% | | | | 342,990 | | | $ | 342,990 | |
| | | | | | | | | | | | |
| | | |
| | | | | | | | | | | | | |
TOTAL SHORT TERM INVESTMENTS (Cost $342,990) | | | | 342,990 | |
TOTAL INVESTMENTS (Cost $13,600,649) (99.77%) | | | $ | 15,214,912 | |
| |
Other Assets In Excess Of Liabilities (0.23%) | | | | 35,705 | |
NET ASSETS (100.00%) | | | | | | | | | | $ | 15,250,617 | |
| | | | | | | | | | | | | |
| (a) | Non-income producing security. |
Common Abbreviations:
| ADR | - American Depository Receipt. |
| AG | - Aktiengesellschaft is a German term that refers to a corporation that is limited by shares, i.e., owned by shareholders. |
| A/S | - Aktieselskab is the Danish term for Joint Stock Company. |
| NV | - Naamloze Vennootschap is the Dutch term for a public limited liability corporation. |
| OAO | - Otkrytoe Aktsionernoe Obschestvo (a Russian open joint stock corporation) |
| Plc | - Public Limited Company. |
| SA | - Generally designates corporations in various countries, mostly those employing the civil law. |
| SE | - SE Regulation. A European Company which can operate on a Europe-wide basis and be governed by Community law directly applicable in all Member States. |
| SpA | - Societa Per Azioni is an Italian shared company. |
| UFJ | - United Financial of Japan. |
See Notes to Financial Statements.
| | |
| Centre Active U.S. Treasury Fund | | Schedule of Investments |
| | March 31, 2014 (Unaudited) |
| | | | | | | | | | | | |
| | 7-Day
Yield | | | Shares | | | Value | |
| SHORT TERM INVESTMENTS (100.02%) | |
Funds (100.02%) | | | | | | | | | | | | |
Dreyfus Treasury Prime Cash Management, Institutional Class | | | 0.00004% | | | | 14,503,679 | | | $ | 14,503,679 | |
| | | | | | | | | | | | |
| | | |
| | | | | | | | | | | | | |
TOTAL SHORT TERM INVESTMENTS (Cost $14,503,679) | | | | 14,503,679 | |
| | | | | | | | | | | | | |
| |
TOTAL INVESTMENTS (Cost $14,503,679) (100.02%) | | | $ | 14,503,679 | |
| |
Liabilities in Excess of Other Assets (-0.02%) | | | | (2,291) | |
| | | | | | | | | | | | | |
NET ASSETS (100.00%) | | | | | | | $ | 14,501,388 | |
| | | | | | | | | | | | | |
See Notes to Financial Statements.
| | |
| | |
| Semi-Annual Report | March 31, 2014 | | 21 |
| | |
| Centre Multi-Asset Real Return Fund | | Schedule of Investments |
| | March 31, 2014 (Unaudited) |
| | | | | | | | | | | | |
| | | | | Shares | | | Value | |
EXCHANGE-TRADED FUNDS (24.39%) | | | | | |
iShares Gold Trust(a) | | | | 252,000 | | | $ | 3,134,880 | |
iShares US Real Estate ETF | | | | 83,000 | | | | 5,616,610 | |
SPDR Gold Shares(a) | | | | 45,000 | | | | 5,562,450 | |
| | | |
| | | | | | | | | | | | | |
TOTAL EXCHANGE-TRADED FUNDS (Cost $13,797,378) | | | | 14,313,940 | |
| | | | |
| | | | | | | | | | | | |
OTHER OPEN-END FUNDS (75.36%) | |
Centre Active U.S. Treasury
Fund(a)(b) | | | | 1,437,698 | | | | 14,492,000 | |
Centre American Select Equity Fund(b) | | | | 1,264,267 | | | | 14,526,427 | |
Centre Global Select Equity Fund(b) | | | | 1,268,486 | | | | 15,209,143 | |
| | | |
| | | | | | | | | | | | | |
TOTAL OTHER OPEN-END FUNDS (Cost $43,276,222) | | | | 44,227,570 | |
| | | | |
| | | | | | | | | | | | |
| | | |
| | 7-Day
Yield | | | Shares | | | Value | |
SHORT TERM INVESTMENTS (0.22%) | |
Money Market Fund (0.22%) | |
Dreyfus Treasury Prime Cash Management, Institutional Class | | | 0.00004% | | | | 130,685 | | | | 130,685 | |
| | | | | | | | | | | | |
| | | |
| | | | | | | | | | | | | |
TOTAL SHORT TERM INVESTMENTS (Cost $130,685) | | | | 130,685 | |
| | | | |
| | | | | | | | | | | | |
| |
TOTAL INVESTMENTS (Cost $57,204,285) (99.97%) | | | $ | 58,672,195 | |
| |
Other Assets In Excess Of Liabilities (0.03%) | | | | 16,332 | |
| | | | | | | | | | | | | |
NET ASSETS (100.00%) | | | $ | 58,688,527 | |
| | | | | | | | | | | | | |
| (a) | Non-income producing security. |
| (b) | Affiliated with the Fund, as each is a series of Centre Funds and has the same investment adviser. |
Common Abbreviations:
ETF - Exchange Traded Fund.
See Notes to Financial Statements.
| | |
| Centre Funds | | Statements of Assets and Liabilities |
| | March 31, 2014 (Unaudited) |
| | | | | | | | | | | | | | | | |
| | | Centre American
Select Equity Fund | | | Centre Global
Select Equity Fund | | | Centre Active U.S.
Treasury Fund | | | Centre Multi-
Asset
Real Return Fund | |
ASSETS: | | | | | | | | | | | | | | | | |
Investments, at value | | $ | 132,839,432 | | | $ | 15,214,912 | | | $ | 14,503,679 | | | $ | 14,444,625 | |
Investments in affiliates, at value | | | – | | | | – | | | | – | | | | 44,227,570 | |
Foreign currency, at value (Cost $–, $8,635, $– and $–,respectively) | | | – | | | | 8,624 | | | | – | | | | – | |
Receivable for dividends and interest | | | 88,546 | | | | 33,479 | | | | – | | | | 63,867 | |
Receivable due from investment adviser | | | – | | | | – | | | | 666 | | | | – | |
Receivable for shares sold | | | 2,725 | | | | – | | | | – | | | | – | |
Deferred offering cost | | | – | | | | – | | | | 5,425 | | | | – | |
Prepaid and other assets | | | 31,165 | | | | 20,649 | | | | 2,358 | | | | 20,366 | |
| | | | | | | | | | | | | | | | |
Total Assets | | | 132,961,868 | | | | 15,277,664 | | | | 14,512,128 | | | | 58,756,428 | |
| | | | | | | | | | | | | | | | |
LIABILITIES: | | | | | | | | | | | | | | | | |
Payable to administrator | | | 21,054 | | | | 6,356 | | | | 2,197 | | | | 9,187 | |
Payable to transfer agency | | | 11,988 | | | | 1,925 | | | | 1,858 | | | | 2,008 | |
Payable for investments purchased | | | 1,056,049 | | | | – | | | | – | | | | – | |
Payable for shares redeemed | | | 34,458 | | | | – | | | | – | | | | – | |
Payable to investment adviser | | | 38,748 | | | | 1,372 | | | | – | | | | 26,470 | |
Accrued 12b-1 fees (Investor Class) | | | 21,034 | | | | – | | | | – | | | | – | |
Payable for custodian fees | | | 4,112 | | | | 1,502 | | | | 1,123 | | | | 1,578 | |
Payable for printing | | | 21,322 | | | | 1,587 | | | | 195 | | | | 6,182 | |
Payable for legal and audit fees | | | 40,628 | | | | 13,761 | | | | 4,828 | | | | 21,120 | |
Payable to trustees | | | 1,533 | | | | 247 | | | | 3 | | | | 928 | |
Payable under the Chief Compliance Officer Services Agreement | | | 2,018 | | | | 297 | | | | 180 | | | | 428 | |
Other payables | | | – | | | | – | | | | 356 | | | | – | |
| | | | | | | | | | | | | | | | |
Total Liabilities | | | 1,252,944 | | | | 27,047 | | | | 10,740 | | | | 67,901 | |
| | | | | | | | | | | | | | | | |
NET ASSETS | | $ | 131,708,924 | | | $ | 15,250,617 | | | $ | 14,501,388 | | | $ | 58,688,527 | |
| | | | | | | | | | | | | | | | |
NET ASSETS CONSIST OF: | | | | | | | | | | | | | | | | |
Paid-in capital | | $ | 113,500,410 | | | $ | 13,046,616 | | | $ | 14,410,000 | | | $ | 58,957,794 | |
Accumulated net investment income | | | 165,140 | | | | 72,909 | | | | 15,054 | | | | 79,098 | |
Accumulated net realized gain/(loss) on investments and foreign currency transactions | | | (4,021,362 | ) | | | 516,131 | | | | 76,334 | | | | (1,816,275 | ) |
Net unrealized appreciation on investments and translation of assets and liabilities denominated in foreign currencies | | | 22,064,736 | | | | 1,614,961 | | | | – | | | | 1,467,910 | |
| | | | | | | | | | | | | | | | |
| | | | |
NET ASSETS | | $ | 131,708,924 | | | $ | 15,250,617 | | | $ | 14,501,388 | | | $ | 58,688,527 | |
| | | | | | | | | | | | | | | | |
INVESTMENTS, AT COST | | $ | 110,774,696 | | | $ | 13,600,649 | | | $ | 14,503,679 | | | $ | 13,928,063 | |
| | | | |
INVESTMENTS IN AFFILIATES, AT COST | | | – | | | | – | | | | – | | | | 43,276,222 | |
PRICING OF SHARES | | | | | | | | | | | | | | | | |
| | | | |
Investor Class | | | | | | | | | | | | | | | | |
Net Assets | | $ | 117,159,733 | | | $ | 4,973 | | | $ | 5,037 | | | $ | 5,144 | |
Shares outstanding | | | 10,202,147 | | | | 415 | | | | 500 | | | | 524 | |
Net Asset Value, offering and redemption price per share | | | $11.48 | | | | $11.99 | | | | $10.07 | | | | $9.81 | |
Institutional Class | | | | | | | | | | | | | | | | |
Net Assets | | $ | 14,549,191 | | | $ | 15,245,644 | | | $ | 14,496,351 | | | $ | 58,683,383 | |
Shares outstanding | | | 1,266,550 | | | | 1,271,210 | | | | 1,438,198 | | | | 5,959,569 | |
Net Asset Value, offering and redemption price per share | | | $11.49 | | | | $11.99 | | | | $10.08 | | | | $9.85 | |
| | |
| See Notes to Financial Statements. | | |
| Semi-Annual Report | March 31, 2014 | | 23 |
| | |
| Centre Funds | | Statements of Operations |
| | |
| | | | | | | | | | | | | | | | |
| | | Centre American
Select Equity
Fund | | | Centre Global
Select Equity
Fund | | | Centre Active U.S.
Treasury Fund | | | Centre Multi-
Asset Real Return
Fund | |
| | | For the Six Months Ended
March 31, 2014
(Unaudited) | | | For the Six
Months Ended
March 31, 2014
(Unaudited) | | | For the Period
January 21, 2014
(Inception) to March 31, 2014
(Unaudited) | | | For the Six Months Ended
March 31, 2014
(Unaudited) | |
INVESTMENT INCOME: | | | | | | | | | | | | | | | | |
Interest | | $ | – | | | $ | – | | | $ | 28,253 | | | $ | (47,916 | ) |
Dividends | | | 1,081,526 | | | | 181,997 | | | | – | | | | 63,867 | |
Dividends from affiliated securities | | | – | | | | – | | | | – | | | | 664,689 | |
Foreign taxes withheld | | | (656 | ) | | | (8,648 | ) | | | – | | | | – | |
| | | | | | | | | | | | | | | | |
Total Investment Income | | | 1,080,870 | | | | 173,349 | | | | 28,253 | | | | 680,640 | |
| | | | | | | | | | | | | | | | |
| | | | |
EXPENSES: | | | | | | | | | | | | | | | | |
Investment advisory fees | | | 497,849 | | | | 75,122 | | | | 8,798 | | | | 158,345 | |
Administration fees | | | 97,296 | | | | 18,858 | | | | 4,116 | | | | 42,612 | |
Transfer agent fees | | | 44,027 | | | | 11,396 | | | | 4,340 | | | | 11,472 | |
Custodian fees | | | 8,154 | | | | 7,631 | | | | 1,123 | | | | 3,085 | |
Legal fees | | | 40,456 | | | | 4,721 | | | | 1,737 | | | | 17,242 | |
Audit fees | | | 8,431 | | | | 8,504 | | | | 3,091 | | | | 5,846 | |
Trustees’ fees and expenses | | | 18,447 | | | | 2,154 | | | | 723 | | | | 8,027 | |
Recoupment of past fees waived by adviser | | | – | | | | – | | | | – | | | | 12,743 | |
Registration/filing fees | | | 15,418 | | | | 5,455 | | | | 509 | | | | 6,117 | |
12b-1 fees (Investor Class) | | | 133,775 | | | | 2 | | | | 2 | | | | 6 | |
Printing fees | | | 23,772 | | | | 1,906 | | | | 632 | | | | 7,330 | |
Chief Compliance Officer services fees | | | 15,970 | | | | 1,884 | | | | 527 | | | | 6,440 | |
Offering costs | | | – | | | | – | | | | 21,899 | | | | 2,483 | |
Miscellaneous expenses | | | 19,385 | | | | 3,243 | | | | 490 | | | | 6,159 | |
| | | | | | | | | | | | | | | | |
Total expenses before waivers | | | 922,980 | | | | 140,876 | | | | 47,987 | | | | 287,907 | |
Fees waived/reimbursed by investment adviser (Investor Class) (Note 5) | | | (220,547 | ) | | | (7 | ) | | | (15 | ) | | | – | |
Fees waived/reimbursed by investment adviser (Institutional Class) (Note 5) | | | (8,123 | ) | | | (46,965 | ) | | | (34,773 | ) | | | – | |
| | | | | | | | | | | | | | | | |
Net Expenses | | | 694,310 | | | | 93,904 | | | | 13,199 | | | | 287,907 | |
| | | | | | | | | | | | | | | | |
Net Investment Income | | | 386,560 | | | | 79,445 | | | | 15,054 | | | | 392,733 | |
| | | | | | | | | | | | | | | | |
| | | | |
Net realized gain/(loss) on investments | | | 4,043,402 | | | | 758,287 | | | | 76,334 | | | | (799,807 | ) |
Net realized loss on affiliated investments | | | – | | | | – | | | | – | | | | (765,366 | ) |
Net realized loss on foreign currencies | | | – | | | | (12,256 | ) | | | – | | | | – | |
Net change in unrealized appreciation/(depreciation) on investments | | | 10,096,030 | | | | (100,384 | ) | | | – | | | | 2,597,225 | |
Net change in unrealized appreciation on affiliated investments | | | – | | | | – | | | | – | | | | 1,081,285 | |
Net change in unrealized depreciation on translation of assets and liabilities denominated in foreign currency transactions | | | – | | | | (167 | ) | | | – | | | | – | |
| | | | | | | | | | | | | | | | |
NET REALIZED AND UNREALIZED GAIN ON INVESTMENTS AND FOREIGN CURRENCIES | | | 14,139,432 | | | | 645,480 | | | | 76,334 | | | | 2,113,337 | |
| | | | | | | | | | | | | | | | |
NET INCREASE IN NET ASSETS RESULTING FROM OPERATIONS | | $ | 14,525,992 | | | $ | 724,925 | | | $ | 91,388 | | | $ | 2,506,070 | |
| | | | | | | | | | | | | | | | |
| | |
| See Notes to Financial Statements. | | |
| 24 | | centrefunds.com |
| | |
| Centre American Select Equity Fund | | Statements of Changes in Net Assets |
| | |
| | | | | | | | |
| | | For the
Six Months Ended
March 31, 2014(a)
(Unaudited) | | | Year Ended
September 30, 2013 | |
OPERATIONS: | | | | | | | | |
Net investment income | | $ | 386,560 | | | $ | 868,637 | |
Net realized gain on investments | | | 4,043,402 | | | | 30,858,549 | |
Net change in unrealized appreciation/(depreciation) on investments | | | 10,096,030 | | | | (18,112,474 | ) |
| | | | | | | | |
Net increase in net assets resulting from operations | | | 14,525,992 | | | | 13,614,712 | |
| | | | | | | | |
DISTRIBUTIONS TO SHAREHOLDERS: | | | | | | | | |
From net investment income | | | | | | | | |
Investor Class | | | (1,048,251 | ) | | | (175,273 | ) |
From net realized gains on investments | | | | | | | | |
Investor Class | | | (14,465 | ) | | | (2,212,550 | ) |
| | | | | | | | |
Total distributions | | | (1,062,716 | ) | | | (2,387,823 | ) |
| | | | | | | | |
CAPITAL SHARE TRANSACTIONS: | | | | | | | | |
Investor Class | | | | | | | | |
Proceeds from sale of shares | | | 586,630 | | | | 31,193,682 | |
Shares issued in reinvestment of distributions | | | 1,051,275 | | | | 2,387,824 | |
Cost of shares redeemed | | | (27,582,986 | ) | | | (69,298,215 | ) |
Redemption fees | | | 8 | | | | 959 | |
Acquisition costs (Note 10) | | | – | | | | 130,033,182 | |
| | | | | | | | |
Net increase/(decrease) from capital share transactions | | | (25,945,073 | ) | | | 94,317,432 | |
| | | | | | | | |
Institutional Class | | | | | | | | |
Proceeds from sale of shares | | | 14,426,000 | | | | – | |
| | | | | | | | |
Net increase from capital share transactions | | | 14,426,000 | | | | – | |
| | | | | | | | |
Net increase in net assets | | $ | 1,944,203 | | | $ | 105,544,321 | |
| | | | | | | | |
NET ASSETS: | | | | | | | | |
Beginning of period | | | 129,764,721 | | | | 24,220,400 | |
| | | | | | | | |
End of period* | | $ | 131,708,924 | | | $ | 129,764,721 | |
| | | | | | | | |
*Including accumulated net investment income of: | | $ | 165,140 | | | $ | 826,831 | |
| | |
OTHER INFORMATION: | | | | | | | | |
Share Transactions: | | | | | | | | |
Investor Class | | | | | | | | |
Beginning shares | | | 12,503,329 | | | | 2,054,881 | |
Shares sold | | | 52,852 | | | | 2,734,444 | |
Shares issued in reinvestment of dividends | | | 95,138 | | | | 266,498 | |
Shares Redeemed | | | (2,449,172 | ) | | | (6,430,102 | ) |
Acquisition Shares (Note 10) | | | – | | | | 13,877,608 | |
| | | | | | | | |
Ending Shares | | | 10,202,147 | | | | 12,503,329 | |
| | | | | | | | |
Institutional Class | | | | | | | | |
Beginning shares | | | – | | | | – | |
Shares sold | | | 1,266,550 | | | | – | |
| | | | | | | | |
Ending Shares | | | 1,266,550 | | | | – | |
| | | | | | | | |
| (a) | The Centre American Select Equity Fund began offering Institutional Class shares on January 21, 2014. |
| | |
| See Notes to Financial Statements. | | |
| Semi-Annual Report | March 31, 2014 | | 25 |
| | |
| Centre Global Select Equity Fund | | Statements of Changes in Net Assets |
| | | | | | | | | | |
| | | For the
Six Months Ended
March 31, 2014(a)
(Unaudited) | | Year Ended
September 30, 2013 |
| | |
OPERATIONS: | | | | | | | | | | |
Net investment income | | | $ | 79,445 | | | | $ | 225,302 | |
Net realized gain on investments | | | | 758,287 | | | | | 531,667 | |
Net realized loss on foreign currency transactions | | | | (12,256 | ) | | | | (30,687 | ) |
Net change in unrealized appreciation/(depreciation) on investments and translation of assets and liabilities denominated in foreign currencies | | | | (100,551 | ) | | | | 674,274 | |
| | | | | | | | | | |
Net increase in net assets resulting from operations | | | | 724,925 | | | | | 1,400,556 | |
| | | | | | | | | | |
DISTRIBUTIONS TO SHAREHOLDERS: | | | | | | | | | | |
From net investment income | | | | | | | | | | |
Institutional Class | | | | (166,664 | ) | | | | (207,005 | ) |
From net realized gains on investments | | | | | | | | | | |
Institutional Class | | | | (372,877 | ) | | | | (676,187 | ) |
| | | | | | | | | | |
Total distributions | | | | (539,541 | ) | | | | (883,192 | ) |
| | | | | | | | | | |
CAPITAL SHARE TRANSACTIONS: | | | | | | | | | | |
Investor Class | | | | | | | | | | |
Proceeds from sale of shares | | | | 5,000 | | | | | – | |
| | | | | | | | | | |
Net increase from capital share transactions | | | | 5,000 | | | | | – | |
| | | | | | | | | | |
Institutional Class | | | | | | | | | | |
Proceeds from sale of shares | | | | – | | | | | 17,881,198 | |
Shares issued in reinvestment of distributions | | | | 539,541 | | | | | 883,192 | |
Cost of shares redeemed | | | | (5,000 | ) | | | | (16,744,352 | ) |
| | | | | | | | | | |
Net increase from capital share transactions | | | | 534,541 | | | | | 2,020,038 | |
| | | | | | | | | | |
Net increase in net assets | | | $ | 724,925 | | | | $ | 2,537,402 | |
| | | | | | | | | | |
NET ASSETS: | | | | | | | | | | |
Beginning of period | | | | 14,525,692 | | | | | 11,988,290 | |
| | | | | | | | | | |
End of period* | | | $ | 15,250,617 | | | | $ | 14,525,692 | |
| | | | | | | | | | |
*Including accumulated net investment income of: | | | $ | 72,909 | | | | $ | 160,128 | |
| | |
OTHER INFORMATION: | | | | | | | | | | |
Share Transactions: | | | | | | | | | | |
Investor Class | | | | | | | | | | |
Beginning shares | | | | – | | | | | – | |
Shares sold | | | | 415 | | | | | – | |
| | | | | | | | | | |
Ending Shares | | | | 415 | | | | | – | |
| | | | | | | | | | |
Institutional Class | | | | | | | | | | |
Beginning shares | | | | 1,226,285 | | | | | 1,048,994 | |
Shares sold | | | | – | | | | | 1,567,071 | |
Shares issued in reinvestment of dividends | | | | 45,340 | | | | | 79,927 | |
Shares Redeemed | | | | (415 | ) | | | | (1,469,707 | ) |
| | | | | | | | | | |
Ending Shares | | | | 1,271,210 | | | | | 1,226,285 | |
| | | | | | | | | | |
| (a) | The Centre Global Select Equity Fund began offering Investor Class shares on January 21, 2014. |
| | |
| See Notes to Financial Statements. | | |
| 26 | | centrefunds.com |
| | |
| Centre Active U.S. Treasury Fund | | Statement of Changes in Net Assets |
| | | | |
| | | For the Period
January 21, 2014
(Inception)
to March 31, 2014
(Unaudited) | |
OPERATIONS: | | | | |
Net investment income | | $ | 15,054 | |
Net realized gain on investments | | | 76,334 | |
| | | | |
Net increase in net assets resulting from operations | | | 91,388 | |
| | | | |
CAPITAL SHARE TRANSACTIONS: | | | | |
Investor Class | | | | |
Proceeds from sale of shares | | | 5,000 | |
| | | | |
Net increase from capital share transactions | | | 5,000 | |
| | | | |
Institutional Class | | | | |
Proceeds from sale of shares | | | 14,405,000 | |
| | | | |
Net increase from capital share transactions | | | 14,405,000 | |
| | | | |
Net increase in net assets | | $ | 14,501,388 | |
| | | | |
NET ASSETS: | | | | |
Beginning of period | | | – | |
| | | | |
End of period* | | $ | 14,501,388 | |
| | | | |
*Including accumulated net investment income of: | | $ | 15,054 | |
| |
OTHER INFORMATION: | | | | |
Share Transactions: | | | | |
Investor Class | | | | |
Beginning shares | | | – | |
Shares sold | | | 500 | |
| | | | |
Ending Shares | | | 500 | |
| | | | |
Institutional Class | | | | |
Beginning shares | | | – | |
Shares sold | | | 1,438,198 | |
| | | | |
Ending Shares | | | 1,438,198 | |
| | | | |
| | |
| See Notes to Financial Statements. | | |
| Semi-Annual Report | March 31, 2014 | | 27 |
| | |
| Centre Multi-Asset Real Return Fund | | Statements of Changes in Net Assets |
| | | | | | | | |
| | | For the
Six Months Ended
March 31, 2014
(Unaudited) | | | For the Period
October 9, 2012 (Inception)
to September 30, 2013(a) | |
OPERATIONS: | | | | | | | | |
Net investment income | | $ | 392,733 | | | $ | 2,819,033 | |
Net realized loss on investments | | | (799,807 | ) | | | – | |
Net realized loss on affiliated investments | | | (765,366 | ) | | | (253,750 | ) |
Net change in unrealized appreciation/(depreciation) on investments and affiliated investments | | | 3,678,510 | | | | (2,210,600 | ) |
| | | | | | | | |
Net increase in net assets resulting from operations | | | 2,506,070 | | | | 354,683 | |
| | | | | | | | |
DISTRIBUTIONS TO SHAREHOLDERS: | | | | | | | | |
From net investment income | | | | | | | | |
Institutional Class | | | – | | | | (3,201,213 | ) |
| | | | | | | | |
Total distributions | | | – | | | | (3,201,213 | ) |
| | | | | | | | |
CAPITAL SHARE TRANSACTIONS: | | | | | | | | |
Investor Class | | | | | | | | |
Proceeds from sale of shares | | | – | | | | 5,000 | |
| | | | | | | | |
Net increase from capital share transactions | | | – | | | | 5,000 | |
| | | | | | | | |
Institutional Class | | | | | | | | |
Proceeds from sale of shares | | | 5,999 | | | | 55,826,775 | |
Shares issued in reinvestment of distributions | | | – | | | | 3,201,213 | |
Cost of shares redeemed | | | (10,000 | ) | | | – | |
| | | | | | | | |
Net increase/(decrease) from capital share transactions | | | (4,001 | ) | | | 59,027,988 | |
| | | | | | | | |
Net increase in net assets | | $ | 2,502,069 | | | $ | 56,186,458 | |
| | | | | | | | |
NET ASSETS: | | | | | | | | |
Beginning of period | | | 56,186,458 | | | | – | |
| | | | | | | | |
End of period* | | $ | 58,688,527 | | | $ | 56,186,458 | |
| | | | | | | | |
*Including accumulated net investment income/(loss) of: | | $ | 79,098 | | | $ | (313,635 | ) |
| | |
OTHER INFORMATION: | | | | | | | | |
Share Transactions: | | | | | | | | |
Investor Class | | | | | | | | |
Beginning shares | | | 524 | | | | – | |
Shares sold | | | – | | | | 524 | |
| | | | | | | | |
Ending Shares | | | 524 | | | | 524 | |
| | | | | | | | |
Institutional Class | | | | | | | | |
Beginning shares | | | 5,959,990 | | | | – | |
Shares sold | | | 608 | | | | 5,617,248 | |
Shares issued in reinvestment of dividends | | | – | | | | 342,742 | |
Shares Redeemed | | | (1,029 | ) | | | – | |
| | | | | | | | |
Ending Shares | | | 5,959,569 | | | | 5,959,990 | |
| | | | | | | | |
| (a) | The Centre Multi-Asset Real Return Fund began offering Investor Class shares on January 22, 2013. |
| | |
| See Notes to Financial Statements. | | |
| 28 | | centrefunds.com |
| | |
| Centre American Select Equity Fund | | Financial Highlights |
| Investor Class | | For a share outstanding throughout the periods presented. |
| | | | | | | | | | | | | | | |
| | | For the Six Months Ended
March 31, 2014(a)
(Unaudited) | | For the Year Ended
September 30, 2013 | | For the Period
December 21, 2011
(inception) to
September 30, 2012 |
| | | |
NET ASSET VALUE, BEGINNING OF PERIOD | | | $ | 10.38 | | | | $ | 11.79 | | | | $ | 10.00 | |
INCOME FROM INVESTMENT OPERATIONS: | | | | | | | | | | | | | | | |
Net investment income(b) | | | | 0.03 | | | | | 0.09 | | | | | 0.07 | |
Net realized and unrealized gain on investments | | | | 1.16 | | | | | 0.97 | | | | | 1.72 | |
Total income from investment operations | | | | 1.19 | | | | | 1.06 | | | | | 1.79 | |
| | | |
DISTRIBUTIONS: | | | | | | | | | | | | | | | |
Net investment income | | | | (0.09 | ) | | | | (0.18 | ) | | | | – | |
Net realized gains on investments | | | | (0.00 | )(c) | | | | (2.29 | ) | | | | – | |
Total distributions | | | | (0.09 | ) | | | | (2.47 | ) | | | | – | |
REDEMPTION FEES ADDED TO PAID-IN CAPITAL (NOTE 2) | | | | 0.00 | (d) | | | | 0.00 | (d) | | | | – | |
NET INCREASE/(DECREASE) IN NET ASSET VALUE | | | | 1.10 | | | | | (1.41 | ) | | | | 1.79 | |
NET ASSET VALUE, END OF PERIOD | | | $ | 11.48 | | | | $ | 10.38 | | | | $ | 11.79 | |
| | | | | | | | | | | | | | | | |
| | | |
Total Return(e) | | | | 11.48% | | | | | 12.30% | | | | | 17.90% | |
| | | |
SUPPLEMENTAL DATA: | | | | | | | | | | | | | | | |
Net assets, end of period (000) | | | $ | 117,160 | | | | $ | 129,765 | | | | $ | 24,220 | |
| | | |
RATIOS TO AVERAGE NET ASSETS: | | | | | | | | | | | | | | | |
Net investment income including reimbursement/waiver | | | | 0.57% | (f) | | | | 0.88% | | | | | 0.69% | (f) |
Operating expenses excluding reimbursement/waiver | | | | 1.40% | (f) | | | | 1.51% | | | | | 2.32% | (f) |
Operating expenses including reimbursement/waiver | | | | 1.05% | (f) | | | | 1.06% | (g) | | | | 1.25% | (f) |
PORTFOLIO TURNOVER RATE | | | | 41% | | | | | 175% | | | | | 67% | |
| (a) | Prior to January 21, 2014, the Centre American Select Equity Fund was named the Drexel Hamilton Centre American Equity Fund. |
| (b) | Calculated using the average shares method. |
| (c) | Less than $(0.005) per share. |
| (d) | Less than $0.005 per share. |
| (e) | Total returns are for the period indicated and have not been annualized. Total returns would have been lower had certain expenses not been waived during the period. Returns shown do not reflect the deduction of taxes that a shareholder would pay on fund distributions or the redemption of fund shares. |
| (g) | Effective January 11, 2013, the net expense limitation changed from 1.25% to 1.05%. |
| | |
| See Notes to Financial Statements. | | |
| Semi-Annual Report | March 31, 2014 | | 29 |
| | |
| Centre American Select Equity Fund | | Financial Highlights |
| Institutional Class | | For a share outstanding throughout the period presented. |
| | | | |
| | For the Period
January 21, 2014
(inception) to
March 31, 2014
(Unaudited) | |
| |
NET ASSET VALUE, BEGINNING OF PERIOD | | $ | 11.39 | |
INCOME/(LOSS) FROM INVESTMENT OPERATIONS: | | | | |
Net investment income(a) | | | 0.02 | |
Net realized and unrealized gain on investments | | | 0.08 | |
Total income from investment operations | | | 0.10 | |
NET INCREASE IN NET ASSET VALUE | | | 0.10 | |
NET ASSET VALUE, END OF PERIOD | | $ | 11.49 | |
| | | | | |
| |
Total Return(b) | | | 0.88% | |
| |
SUPPLEMENTAL DATA: | | | | |
Net assets, end of period (000) | | $ | 14,549 | |
| |
RATIOS TO AVERAGE NET ASSETS: | | | | |
Net investment income including reimbursement/waiver | | | 0.83% | (c) |
Operating expenses excluding reimbursement/waiver | | | 1.25% | (c) |
Operating expenses including reimbursement/waiver | | | 0.95% | (c) |
PORTFOLIO TURNOVER RATE | | | 41% | |
| (a) | Calculated using the average shares method. |
| (b) | Total returns are for the period indicated and have not been annualized. Total returns would have been lower had certain expenses not been waived during the period. Returns shown do not reflect the deduction of taxes that a shareholder would pay on fund distributions or the redemption of fund shares. |
| | |
| See Notes to Financial Statements. | | |
| 30 | | centrefunds.com |
| | |
| Centre Global Select Equity Fund | | Financial Highlights |
Investor Class | | For a share outstanding throughout the period presented. |
| | | | |
| | For the Period
January 21, 2014
(inception) to
March 31, 2014
(Unaudited) | |
| |
NET ASSET VALUE, BEGINNING OF PERIOD | | $ | 12.06 | |
INCOME/(LOSS) FROM INVESTMENT OPERATIONS: | | | | |
Net investment income(a) | | | 0.06 | |
Net realized and unrealized loss on investments | | | (0.13) | |
Total loss from investment operations | | | (0.07) | |
NET DECREASE IN NET ASSET VALUE | | | (0.07) | |
NET ASSET VALUE, END OF PERIOD | | $ | 11.99 | |
| | | | | |
| |
Total Return(b) | | | (0.58%) | |
| |
SUPPLEMENTAL DATA: | | | | |
Net assets, end of period (000) | | $ | 5 | |
| |
RATIOS TO AVERAGE NET ASSETS: | | | | |
Net investment income including reimbursement/waiver | | | 2.63% | (c) |
Operating expenses excluding reimbursement/waiver | | | 2.22% | (c) |
Operating expenses including reimbursement/waiver | | | 1.45% | (c) |
PORTFOLIO TURNOVER RATE | | | 73% | |
| (a) | Calculated using the average shares method. |
| (b) | Total returns are for the period indicated and have not been annualized. Total returns would have been lower had certain expenses not been waived during the period. Returns shown do not reflect the deduction of taxes that a shareholder would pay on fund distributions or the redemption of fund shares. |
| | |
| See Notes to Financial Statements. | | |
| Semi-Annual Report | March 31, 2014 | | 31 |
| | |
| Centre Global Select Equity Fund | | Financial Highlights |
Institutional Class | | For a share outstanding throughout the periods presented. |
| | | | | | | | | | | | | | | |
| | | For the
Six Months Ended
March 31, 2014(a)
(Unaudited) | | For the Year Ended September 30, 2013 | | For the Period
December 21, 2011
(inception) to
September 30, 2012 |
| | | |
NET ASSET VALUE, BEGINNING OF PERIOD | | | $ | 11.85 | | | | $ | 11.43 | | | | $ | 10.00 | |
INCOME FROM INVESTMENT OPERATIONS: | | | | | | | | | | | | | | | |
Net investment income(b) | | | | 0.06 | | | | | 0.20 | | | | | 0.21 | |
Net realized and unrealized gain on investments | | | | 0.52 | | | | | 1.12 | | | | | 1.22 | |
Total income from investment operations | | | | 0.58 | | | | | 1.32 | | | | | 1.43 | |
| | | |
DISTRIBUTIONS: | | | | | | | | | | | | | | | |
Net investment income | | | | (0.14) | | | | | (0.21) | | | | | – | |
Net realized gains on investments | | | | (0.30) | | | | | (0.69) | | | | | – | |
Total distributions | | | | (0.44) | | | | | (0.90) | | | | | – | |
NET INCREASE IN NET ASSET VALUE | | | | 0.14 | | | | | 0.42 | | | | | 1.43 | |
NET ASSET VALUE, END OF PERIOD | | | $ | 11.99 | | | | $ | 11.85 | | | | $ | 11.43 | |
| | |
| | | |
Total Return(c) | | | | 4.92% | | | | | 12.19% | | | | | 14.30% | |
| | | |
SUPPLEMENTAL DATA: | | | | | | | | | | | | | | | |
Net assets, end of period (000) | | | $ | 15,246 | | | | $ | 14,526 | | | | $ | 11,988 | |
| | | |
RATIOS TO AVERAGE NET ASSETS: | | | | | | | | | | | | | | | |
Net investment income including reimbursement/waiver | | | | 1.06% | (d) | | | | 1.75% | | | | | 2.06% | (d) |
Operating expenses excluding reimbursement/waiver | | | | 1.88% | (d) | | | | 2.20% | | | | | 3.04% | (d) |
Operating expenses including reimbursement/waiver | | | | 1.25% | (d) | | | | 1.25% | | | | | 1.25% | (d) |
PORTFOLIO TURNOVER RATE | | | | 73% | | | | | 111% | | | | | 87% | |
| (a) | Prior to January 21, 2014, the Centre Global Select Equity Fund was named the Drexel Hamilton Centre Global Equity Fund. |
| (b) | Calculated using the average shares method. |
| (c) | Total returns are for the period indicated and have not been annualized. Total returns would have been lower had certain expenses not been waived during the period. Returns shown do not reflect the deduction of taxes that a shareholder would pay on fund distributions or the redemption of fund shares. |
| | |
| See Notes to Financial Statements. | | |
| 32 | | centrefunds.com |
| | |
| Centre Active U.S. Treasury Fund | | Financial Highlights |
Investor Class | | For a share outstanding throughout the period presented. |
| | | | |
| | | For the Period
January 21, 2014
(inception) to
March 31, 2014
(Unaudited) | |
| |
NET ASSET VALUE, BEGINNING OF PERIOD | | $ | 10.00 | |
INCOME/(LOSS) FROM INVESTMENT OPERATIONS: | | | | |
Net investment income(a) | | | 0.01 | |
Net realized and unrealized gain on investments | | | 0.06 | |
Total income from investment operations | | | 0.07 | |
NET INCREASE IN NET ASSET VALUE | | | 0.07 | |
NET ASSET VALUE, END OF PERIOD | | $ | 10.07 | |
| | |
| |
Total Return(b) | | | 0.70% | |
| |
SUPPLEMENTAL DATA: | | | | |
Net assets, end of period (000) | | $ | 5 | |
| |
RATIOS TO AVERAGE NET ASSETS: | | | | |
Net investment income including reimbursement/waiver | | | 0.45% | (c) |
Operating expenses excluding reimbursement/waiver | | | 2.39% | (c) |
Operating expenses including reimbursement/waiver | | | 0.85% | (c) |
PORTFOLIO TURNOVER RATE | | | 227% | |
| (a) | Calculated using the average shares method. |
| (b) | Total returns are for the period indicated and have not been annualized. Total returns would have been lower had certain expenses not been waived during the period. Returns shown do not reflect the deduction of taxes that a shareholder would pay on fund distributions or the redemption of fund shares. |
| | |
| See Notes to Financial Statements. | | |
| Semi-Annual Report | March 31, 2014 | | 33 |
| | |
| Centre Active U.S. Treasury Fund | | Financial Highlights |
| Institutional Class | | For a share outstanding throughout the period presented. |
| | | | |
| | For the Period
January 21, 2014
(inception) to
March 31, 2014
(Unaudited) | |
| |
NET ASSET VALUE, BEGINNING OF PERIOD | | $ | 10.00 | |
INCOME/(LOSS) FROM INVESTMENT OPERATIONS: | | | | |
Net investment income(a) | | | 0.01 | |
Net realized and unrealized gain on investments | | | 0.07 | |
Total income from investment operations | | | 0.08 | |
NET INCREASE IN NET ASSET VALUE | | | 0.08 | |
NET ASSET VALUE, END OF PERIOD | | $ | 10.08 | |
| | | | | |
| |
Total Return(b) | | | 0.80% | |
| |
SUPPLEMENTAL DATA: | | | | |
Net assets, end of period (000) | | $ | 14,496 | |
| |
RATIOS TO AVERAGE NET ASSETS: | | | | |
Net investment income including reimbursement/waiver | | | 0.68% | (c) |
Operating expenses excluding reimbursement/waiver | | | 2.18% | (c) |
Operating expenses including reimbursement/waiver | | | 0.60% | (c) |
PORTFOLIO TURNOVER RATE | | | 227% | |
| (a) | Calculated using the average shares method. |
| (b) | Total returns are for the period indicated and have not been annualized. Total returns would have been lower had certain expenses not been waived during the period. Returns shown do not reflect the deduction of taxes that a shareholder would pay on fund distributions or the redemption of fund shares. |
| | |
| See Notes to Financial Statements. | | |
| 34 | | centrefunds.com |
| | |
| Centre Multi-Asset Real Return Fund | | Financial Highlights |
| Investor Class | | For a share outstanding throughout the periods presented. |
| | | | | | | | |
| | For the Six Months Ended
March 31, 2014(a)(b)
(Unaudited) | | | For the Period
January 22, 2013
(inception) to
September 30, 2013 | |
| | |
NET ASSET VALUE, BEGINNING OF PERIOD | | $ | 9.41 | | | $ | 9.54 | |
INCOME/(LOSS) FROM INVESTMENT OPERATIONS: | | | | | | | | |
Net investment income/(loss)(c) | | | 0.05 | | | | (0.09) | |
Net realized and unrealized gain/(loss) on investments | | | 0.35 | | | | (0.04) | |
Total income/(loss) from investment operations | | | 0.40 | | | | (0.13) | |
NET INCREASE/(DECREASE) IN NET ASSET VALUE | | | 0.40 | | | | (0.13) | |
NET ASSET VALUE, END OF PERIOD | | $ | 9.81 | | | $ | 9.41 | |
| | | | | | | | | |
| | |
Total Return(d) | | | 4.25% | | | | (1.36% | ) |
| | |
SUPPLEMENTAL DATA: | | | | | | | | |
Net assets, end of period (000) | | $ | 5 | | | $ | 5 | |
| | |
RATIOS TO AVERAGE NET ASSETS: | | | | | | | | |
Net investment income/(loss) including reimbursement/waiver | | | 1.12% | (e) | | | (1.01% | )(e) |
Operating expenses excluding reimbursement/waiver | | | 1.25% | (e) | | | 1.39% | (e) |
Operating expenses including reimbursement/waiver | | | 1.25% | (e) | | | 1.25% | (e) |
PORTFOLIO TURNOVER RATE | | | 77% | | | | 43% | |
| (a) | Prior to January 21, 2014, the Centre Multi-Asset Real Return Fund was named the Drexel Hamilton Multi-Asset Real Return Fund. |
| (b) | Effective September 14, 2013, Centre Asset Management, LLC assumed investment advisory responsibilities for the Fund. |
| (c) | Calculated using the average shares method. |
| (d) | Total returns are for the period indicated and have not been annualized. Total returns would have been lower had certain expenses not been waived during the period. Returns shown do not reflect the deduction of taxes that a shareholder would pay on fund distributions or the redemption of fund shares. |
| | |
| See Notes to Financial Statements. | | |
| Semi-Annual Report | March 31, 2014 | | 35 |
| | |
| Centre Multi-Asset Real Return Fund | | Financial Highlights |
| Institutional Class | | For a share outstanding throughout the periods presented. |
| | | | | | | | |
| | For the Six Months Ended
March 31, 2014(a)(b)
(Unaudited) | | | For the Period
October 9, 2012
(inception) to
September 30, 2013 | |
| | |
NET ASSET VALUE, BEGINNING OF PERIOD | | $ | 9.43 | | | $ | 10.00 | |
INCOME/(LOSS) FROM INVESTMENT OPERATIONS: | | | | | | | | |
Net investment income(c) | | | 0.07 | | | | 0.50 | |
Net realized and unrealized gain/(loss) on investments | | | 0.35 | | | | (0.50) | |
Total income from investment operations | | | 0.42 | | | | – | |
| | |
DISTRIBUTIONS: | | | | | | | | |
Net investment income | | | – | | | | (0.57) | |
Net realized gains on investments | | | – | | | | – | |
Total distributions | | | – | | | | (0.57) | |
NET INCREASE/(DECREASE) IN NET ASSET VALUE | | | 0.42 | | | | (0.57) | |
NET ASSET VALUE, END OF PERIOD | | $ | 9.85 | | | | $9.43 | |
| | | | | | | | | |
| | |
Total Return(d) | | | 4.45% | | | | 0.05% | |
| | |
SUPPLEMENTAL DATA: | | | | | | | | |
Net assets, end of period (000) | | $ | 58,683 | | | $ | 56,182 | |
| | |
RATIOS TO AVERAGE NET ASSETS: | | | | | | | | |
Net investment income including reimbursement/waiver | | | 1.36% | (e) | | | 5.37% | (e) |
Operating expenses excluding reimbursement/waiver | | | 1.00% | (e) | | | 1.24% | (e) |
Operating expenses including reimbursement/waiver | | | 1.00% | (e) | | | 1.00% | (e) |
PORTFOLIO TURNOVER RATE | | | 77% | | | | 43% | |
| (a) | Prior to January 21, 2014, the Centre Multi-Asset Real Return Fund was named the Drexel Hamilton Multi-Asset Real Return Fund. |
| (b) | Effective September 14, 2013, Centre Asset Management, LLC assumed investment advisory responsibilities for the Fund. |
| (c) | Calculated using the average shares method. |
| (d) | Total returns are for the period indicated and have not been annualized. Total returns would have been lower had certain expenses not been waived during the period. Returns shown do not reflect the deduction of taxes that a shareholder would pay on fund distributions or the redemption of fund shares. |
| | |
| See Notes to Financial Statements. | | |
| 36 | | centrefunds.com |
| | |
| Centre Funds | | Notes to Financial Statements |
| | March 31, 2014 (Unaudited) |
1. ORGANIZATION
Centre Funds (the “Trust”) was organized on March 17, 2011 as a Delaware statutory trust and is registered as an open-end management investment company under the Investment Company Act of 1940, as amended (the “1940 Act”). Prior to January 17, 2014, the Trust was known as Drexel Hamilton Mutual Funds. The Trust currently offers shares of beneficial interest (“shares”) of Centre American Select Equity Fund (the “American Select Equity Fund”), Centre Global Select Equity Fund (the “Global Select Equity Fund”), Centre Active U.S. Treasury Fund (the “Treasury Fund”), and Centre Multi-Asset Real Return Fund (the “Multi-Asset Real Return Fund”) (collectively the “Funds”). The affairs of the Trust are overseen by a Board of Trustees (the “Board” or the “Trustees”). The Declaration of Trust of the Trust permits the Trustees to create additional series of the Trust and share classes.
Information in the accompanying Funds’ financial statements pertain to the Investor Class and Institutional Class shares offered by the Trust. All classes of shares have identical rights to earnings, assets, and voting privileges, except for class-specific expenses and exclusive rights to vote on matters affecting only individual classes.
2. SIGNIFICANT ACCOUNTING POLICIES
The following is a summary of significant accounting policies followed by the Funds in the preparation of the Financial Statements:
| (a) | Portfolio securities traded on a national securities exchange or are quoted by NASDAQ are valued at last sale price, or, if not traded on that day, are valued at the closing bid price. Securities traded in the OTC market and are not quoted by NASDAQ are valued at their last sale price or, if there is no available price, the last bid price quoted by brokers that make the market as of the close of regular trading hours on the day the securities are being valued. Foreign securities are valued on the basis of quotations from the primary market in which they are traded, and are translated from the local currency into U.S. dollars using exchange rates as of the close of the New York Stock Exchange (the “Exchange”) or using methods determined by the Board. Debt securities having maturities of 60 days or less may be valued at amortized cost, which approximates market value. Securities and other assets for which quotations are not readily available or deemed unreliable are valued at their fair value using methods determined by the Board. Fair valuation of a particular security is an inherently subjective process, with no single standard to utilize when determining a security’s fair value. As such, different mutual funds could reasonably arrive at a different fair value price for the same security. In each case where a security is fair valued, consideration is given to the facts and circumstances relevant to the particular situation. This consideration includes reviewing various factors set forth in the pricing procedures adopted by the Board and other factors as warranted. In making a fair value determination, factors that may be considered, among others, include: the type and structure of the security; unusual events or circumstances relating to the security’s issuer; general market conditions; prior day’s valuation; fundamental analytical data; size of the holding; cost of the security on the date of purchase; nature and duration of any restriction on disposition; trading activities, and prices of similar securities or financial instruments. |
| (b) | The per share net asset value (the “NAV”) of each Fund is calculated as of the close of trading on the Exchange (normally 4:00 p.m. Eastern time) every day the Exchange is open. The per share NAV is calculated by deducting from the Fund’s assets, the Fund’s liabilities, and then dividing the resulting net assets by the total number of shares outstanding, rounded to the nearest cent. The purchase price and redemption price per share is equal to the next determined NAV per share. Redemption of shares of American Select Equity Fund and Global Select Equity Fund are subject to a redemption fee of 2% if redeemed within 90 days of purchase. |
| (c) | The Trust treats each Fund as a separate entity for Federal income tax purposes. Each Fund intends to continue to qualify each year as a “regulated investment company” under Subchapter M of the Internal Revenue Code of 1986, as amended (the “Code”). By so qualifying, each Fund will not be subject to Federal income taxes to the extent that it distributes substantially all of its taxable or tax-exempt income, if any, for its tax year ending September 30. In addition, by distributing in each calendar year substantially all of its net investment income, capital gains and certain other amounts, if any, each Fund will not be subject to a Federal excise tax. Therefore, no provision is made by the Funds for Federal income or excise taxes. Withholding taxes on foreign dividends are paid or provided for in accordance with the applicable country’s tax rules and rates. |
As of and during the six months ended March 31, 2014, the Funds did not have a liability for any unrecognized tax benefits in the accompanying financial statements. The Funds recognize the interest and penalties, if any, related to the unrecognized tax benefits as income tax expense in the Statement of Operations. During the period, the Funds did not incur any interest or penalties.
Each of the Fund’s Federal tax returns for the year ended September 30, 2013, remain subject to examination by the Internal Revenue Service.
| (d) | Net realized gains and losses on investments are computed on the identified cost basis. The portion of security gains and losses resulting from changes in foreign exchange rates is included with net realized and unrealized gains or losses from investments. Dividend income is recognized on the ex-dividend date or for certain foreign securities, as soon as information is available, and interest income is recognized on an accrual basis. The |
| | |
| | |
| Semi-Annual Report | March 31, 2014 | | 37 |
| | |
| Centre Funds | | Notes to Financial Statements |
| | March 31, 2014 (Unaudited) |
| | Funds amortize premium and accrete discount on investments utilizing the effective interest method. Foreign dividend income may be subject to foreign withholding taxes. |
| (e) | A restricted security is a security that has been purchased through a private offering and cannot be resold to the general public without prior registration under the Securities Act of 1933, as amended (the “1933 Act”), or pursuant to the resale limitations provided by Rule 144 under the 1933 Act, or an exemption from the registration requirements of the 1933 Act. Whether a restricted security is illiquid is determined pursuant to guidelines established by the Board. Not all restricted securities are considered to be illiquid. As of March 31, 2014, the Funds did not hold any restricted securities. |
| (f) | The preparation of financial statements in conformity with accounting standards generally accepted in the United States of America (“GAAP”) requires management to make estimates and assumptions that affect the amounts reported in financial statements during the reporting period. Management believes the estimates and security valuations are appropriate; however, actual results may differ from those estimates, and the security valuations reflected in the financial statements may differ from the value the Funds ultimately realize upon sale of the securities. The financial statements have been prepared as of the close of the Exchange on March 31, 2014. |
| (g) | The Funds bear expenses incurred specifically on each Fund’s behalf as well as a portion of general Trust expenses, which may be allocated on the basis of relative net assets or the nature of the services performed relative to applicability to each Fund. Expenses that are specific to a Fund or class of shares of a Fund are charged directly to that Fund or share class. All of the realized and unrealized gains and losses and net investment income of a Fund, other than class-specific expenses, are allocated daily to each class in proportion to its average daily net assets. Fees payable under the distribution (Rule 12b-1) plan for Investor class shares of a Fund are charged with respect to such class. |
| (h) | Dividends from net investment income and distributions of net realized capital gains, if any, will be declared and paid at least annually. Income and capital gains distributions are determined in accordance with income tax regulations, which may differ from GAAP. Distributions to shareholders are recorded on the ex-dividend date. |
| (i) | A Fund may directly purchase securities of foreign issuers. Investing in securities of foreign issuers involves special risks not typically associated with investing in securities of U.S. issuers. The risks include possible reevaluation of currencies, the inability to repatriate foreign currency, less complete financial information about companies and possible future adverse political and economic developments. Moreover, securities of many foreign issuers and their markets may be less liquid and their prices more volatile than those of securities of comparable U.S. issuers. |
| (j) | The books and records of the Funds are maintained in U.S. dollars. Investment valuations and other assets and liabilities initially expressed in foreign currencies are converted each business day into U.S. dollars based upon current exchange rates. The portion of realized and unrealized gains or losses on investments due to fluctuations in foreign currency exchange rates is not separately disclosed and is included in realized and unrealized gains or losses on investments, when applicable. |
| (k) | Offering costs, including costs of printing prospectuses, legal and registration fees, are being amortized over twelve months from the respective inception dates of the Funds. As of March 31, 2014, $5,425 of offering costs remain to be amortized for the Treasury Fund. |
3. FAIR VALUE MEASUREMENTS
The Funds normally use third-party pricing services to obtain market quotations. Securities and assets for which representative market quotations are not readily available or which cannot be accurately valued using the Trust’s normal pricing procedures are valued at fair value as determined in good faith under policies approved by the Trustees. Fair value pricing may be used, for example, in situations where (i) an exchange-traded portfolio security is so thinly traded that there have been no transactions for that security over an extended period of time or the validity of a market quotation received is questionable; (ii) the exchange on which the portfolio security is principally traded closes early; or (iii) trading of the portfolio security is halted during the day and does not resume prior to the NAV calculation.
The inputs used in determining the fair value of each Fund’s investments are summarized into three levels, as described in the following hierarchy:
| | |
Level 1 - | | Unadjusted quoted prices in active markets for identical, unrestricted assets or liabilities that a Fund has the ability to access at the measurement date. |
Level 2 - | | Quoted prices which are not active, quoted prices for similar assets or liabilities in active markets or inputs other than quoted prices that are observable (either directly or indirectly). |
Level 3 - | | Significant unobservable prices or inputs (including the oversight of the Board and Adviser in determining the fair value of investments) where there is little or no market activity for the asset or liability at measurement date. |
The inputs or methodology used for valuing securities are not necessarily an indication of the risk associated with investing in those securities.
| | |
| Centre Funds | | Notes to Financial Statements |
| | March 31, 2014 (Unaudited) |
The following is a summary of each Fund’s investments in the fair value hierarchy as of March 31, 2014:
Centre American Select Equity Fund
| | | | | | | | | | | | | | | | |
| Investments in Securities at Value(a) | | Level 1 - Quoted Prices | | | Level 2 - Other Significant
Observable Inputs | | | Level 3 - Significant Unobservable
Inputs | | | Total | |
Common Stocks | | $ | 131,050,086 | | | $ | – | | | $ | – | | | $ | 131,050,086 | |
Purchased Options | | | 399,000 | | | | – | | | | – | | | | 399,000 | |
Short Term Investments | | | 1,390,346 | | | | – | | | | – | | | | 1,390,346 | |
Total | | $ | 132,839,432 | | | $ | – | | | $ | – | | | $ | 132,839,432 | |
| | |
| | |
Centre Global Select Equity Fund | | | | | | | | | |
| Investments in Securities at Value(a) | | Level 1 -
Quoted Prices | | | Level 2 -
Other Significant
Observable Inputs | | | Level 3 -
Significant Unobservable
Inputs | | | Total | |
Common Stocks | | $ | 14,722,166 | | | $ | – | | | $ | – | | | $ | 14,722,166 | |
Preferred Stocks | | | 148,261 | | | | – | | | | – | | | | 148,261 | |
Rights | | | 1,495 | | | | – | | | | – | | | | 1,495 | |
Short Term Investments | | | 342,990 | | | | – | | | | – | | | | 342,990 | |
Total | | $ | 15,214,912 | | | $ | – | | | $ | – | | | $ | 15,214,912 | |
| | |
| | |
Centre Active U.S. Treasury Fund | | | | | | | | | |
| Investments in Securities at Value(a) | | Level 1 -
Quoted Prices | | | Level 2 -
Other Significant
Observable Inputs | | | Level 3 -
Significant Unobservable
Inputs | | | Total | |
Short Term Investments | | $ | 14,503,679 | | | $ | – | | | $ | – | | | $ | 14,503,679 | |
Total | | $ | 14,503,679 | | | $ | – | | | $ | – | | | $ | 14,503,679 | |
| | |
| | |
Centre Multi-Asset Real Return Fund | | | | | | | | | |
| Investments in Securities at Value(a) | | Level 1 -
Quoted Prices | | | Level 2 -
Other Significant
Observable Inputs | | | Level 3 -
Significant Unobservable
Inputs | | | Total | |
Exchange-Traded Funds | | $ | 14,313,940 | | | $ | – | | | $ | – | | | $ | 14,313,940 | |
Other Open-End Funds | | | 44,227,570 | | | | – | | | | – | | | | 44,227,570 | |
Short Term Investments | | | 130,685 | | | | – | | | | – | | | | 130,685 | |
Total | | $ | 58,672,195 | | | $ | – | | | $ | – | | | $ | 58,672,195 | |
| | |
| (a) | For detailed descriptions of sectors, industries and countries, see the accompanying Schedule of Investments. |
The Funds did not hold any investments at the beginning or end of the period in which significant unobservable inputs were used in determining fair value; therefore, no reconciliation of Level 3 securities is included for this reporting period. The Funds recognize transfers between levels as of the beginning of the fiscal year. There were no transfers between Level 1 and Level 2 as of March 31, 2014.
Derivative Financial Instruments
The following discloses the Funds’ use of derivative instruments.
The Funds are generally permitted to purchase investment securities and enter into various types of derivative contracts such as purchased and written options. In doing so, the Funds may employ strategies in differing combinations to permit them to increase, decrease, or change the level or types of exposure to market factors or to hedge. A Fund may invest its assets in all or certain derivatives, cash management instruments and other instruments to help manage interest rate exposure, protect the Fund’s assets or enhance returns. A Fund may also be exposed to certain exchange-traded derivative products, such as exchange-traded futures and options that are fully collateralized by cash or securities, for temporary cash management or investment transition purposes, or to hedge the risks of existing positions.
Market Risk Factors: In pursuit of its investment objectives, a Fund may seek to use derivatives to increase or decrease its exposure to the following market risk factors:
Equity Risk: Equity risk relates to the change in value of equity securities as they relate to increases or decreases in the general market.
| | |
| | |
| Semi-Annual Report | March 31, 2014 | | 39 |
| | |
| Centre Funds | | Notes to Financial Statements |
| | March 31, 2014 (Unaudited) |
Foreign Exchange Rate Risk: Foreign exchange rate risk relates to the change in the U.S. dollar value of a security held that is denominated in a foreign currency. The value of a foreign currency denominated security will decrease as the dollar appreciates against the currency, while the value of the foreign currency denominated security will increase as the dollar depreciates against the currency.
Risk of Investing in Derivatives
Use of derivatives can result in losses due to unanticipated changes in the market risk factors and the overall market.
Derivatives may have little or no initial cash investment relative to their market value exposure and therefore can produce significant gains or losses in excess of their cost. This use of embedded leverage may allow a Fund to increase its market value exposure relative to its net assets and can substantially increase the volatility of the Fund’s performance.
Additional associated risks from investing in derivatives also exist and potentially could have significant effects on the valuation of the derivatives and a Fund. Typically, the associated risks are not the risks that a Fund is attempting to increase or decrease exposure, but are the additional risks from investing in derivatives.
One example of these associated risks is liquidity risk, which is the risk that a Fund will not be able to sell the derivative in the open market in a timely manner, and counterparty credit risk, which is the risk that the counterparty will not fulfill its obligation to the Fund.
Option Writing/Purchasing
A Fund may write or purchase option contracts to adjust risk and return of their overall investment positions, subject to any restrictions set forth in each Fund’s prospectus. When a Fund writes or purchases an option, an amount equal to the premium received or paid by a Fund is recorded as a liability or an asset and is subsequently adjusted to the current market value of the option written or purchased. Premiums received or paid from writing or purchasing options that expire unexercised are treated by a Fund on the expiration date as realized gains or losses. The difference between the premium and the amount paid or received on affecting a closing purchase or sale transaction, including brokerage commissions, is also treated as a realized gain or loss. If an option is exercised, the premium paid or received is added to the cost of the purchase or proceeds from the sale in determining whether a Fund has realized a gain or loss on investment transactions. Risks from entering into option transactions arise from, among other things, the potential inability of counterparties to meet the terms.
Statement of Assets and Liabilities - Fair Value of Derivative Instruments as of March 31, 2014:
| | | | | | |
| Risk Exposure | | Asset Derivatives
Statement of Assets and Liabilities Location | | Fair Value | |
Centre American Select Equity Fund | | | | | | |
Equity Contracts
(Purchased Options) | | Investments at value | | $ | 399,000 | |
| | | | | | |
| | | | $ | 399,000 | |
| | | | | | |
The effect of derivative instruments on the Statement of Operations for the six months ended March 31, 2014:
| | | | | | | | | | |
| Derivatives | | Location of Gains/(Loss)
On Derivatives Recognized In Income | | Realized Gain/(Loss)
on Derivatives Recognized in Income | | | Change in Unrealized Gain/(Loss) on Derivatives Recognized in Income | |
Centre American Select Equity Fund | | | | | | | | |
Equity Contracts
(Purchased options) | | Net realized gain on investments/change in unrealized depreciation on investments | | $ | (666,123) | | | $ | (111,503) | |
| | | | | | |
| | | | $ | (666,123) | | | $ | (111,503) | |
| | | | | | |
4. BENEFICIAL INTEREST TRANSACTIONS
On March 31, 2014, there was an unlimited number of shares of beneficial interest authorized for each Fund. Transactions in shares of beneficial interest are shown in the Statement of Changes in Net Assets.
Shares of American Select Equity Fund and Global Select Equity Fund that are redeemed within 90 days of purchase may incur a 2% redemption fee deducted from the redemption amount. For the six months ended March 31, 2014, redemption fees retained by these Funds are disclosed in the Statement of Changes in Net Assets.
| | |
| Centre Funds | | Notes to Financial Statements |
| | March 31, 2014 (Unaudited) |
Beneficial Ownership: The beneficial ownership, either directly or indirectly, of more than 25% of the voting securities of a Fund creates a presumption of control of the Fund under Section 2(a)(9) of the 1940 Act. As of March 31, 2014, the following entities owned beneficially more than 25% of each Fund’s outstanding shares. The shares may be held under omnibus accounts (whereby the transactions of two or more shareholders are combined and carried in the name of the originating broker rather than designated separately).
| | | | |
| Centre American Select Equity Fund | | | | |
| Entity | | Class | | Percentage |
| SEI Private Trust CO | | Institutional | | 99.82% |
| Charles Schwab & CO. Inc | | Investor | | 55.25% |
| | |
| Centre Global Select Equity Fund | | | | |
| Entity | | Class | | Percentage |
| SEI Private Trust CO | | Institutional | | 99.79% |
| James A. Abate | | Investor | | 100.00% |
| | |
Centre Active U.S. Treasury Fund | | | | |
| Entity | | Class | | Percentage |
| SEI Private Trust CO | | Institutional | | 99.97% |
| James A. Abate | | Investor | | 100.00% |
| | |
Centre Multi-Asset Real Return Fund | | | | |
| Entity | | Class | | Percentage |
| JPMBI Re Sanlam Drexel Hamilton | | Institutional | | 99.92% |
| James A. Abate | | Investor | | 100.00% |
|
5. INVESTMENT ADVISORY AGREEMENTS AND RELATED-PARTY TRANSACTIONS |
Centre Asset Management, LLC (the “Adviser”) serves as the investment adviser to each Fund pursuant to the Investment Advisory Agreements with the Trust. Subject to the general oversight of the Board, the Adviser is responsible for among other things, developing a continuing investment program for each Fund in accordance with their respective investment objectives, reviewing the investment strategies and policies of each Fund and advising the Board on the selection of sub-advisers, if any. In this capacity, the Adviser advises and assists the officers of the Trust in conducting the business of the Funds and is responsible for providing general investment advice and guidance to the Funds.
As compensation for the investment advisory services provided to the Funds, the Adviser currently receives monthly compensation based on each Fund’s average daily net assets at the annual rate of:
| | | | | |
| Fund | | Management Fee Rate |
Centre American Select Equity Fund (total net assets under $1 billion) | | | | 0.75 | % |
Centre American Select Equity Fund (total net assets over $1 billion) | | | | 0.70 | % |
Centre Global Select Equity Fund | | | | 1.00 | % |
Centre Active U.S. Treasury Fund | | | | 0.40 | % |
Centre Multi-Asset Real Return Fund | | | | 0.55 | % |
American Select Equity Fund
For the American Select Equity Fund, the Adviser has entered into a written expense limitation agreement under which it has agreed to reduce its advisory fees and/or reimburse other expenses of the Fund for a period of two years from January 11, 2013, to the extent necessary to limit the current operating expenses of each class of shares of the Fund (including (but not limited to) investment advisory fees of the Adviser and distribution/service (Rule 12b-1) fees, but excluding interest, taxes, litigation, brokerage and extraordinary expenses) incurred by the Fund in the fiscal year, to an annual rate of 1.05% of the average daily net assets of the Investor Class shares and 0.95% of the average daily net assets of the Institutional Class shares. The expense limitation agreement may not be terminated and will remain in place through the end of the two-year period beginning after January 11, 2013. The Adviser may recoup any waived or reimbursed amount pursuant to the agreement in the first, second and third fiscal years following the fiscal year in which any such reimbursement or waiver occurs, if the total annual operating expenses for the
| | |
| | |
| Semi-Annual Report | March 31, 2014 | | 41 |
| | |
| Centre Funds | | Notes to Financial Statements |
| | March 31, 2014 (Unaudited) |
applicable following year, after giving effect to the repayment, do not exceed the expense limitation in effect at the time the waiver or reimbursement is made (or any lower expense limitation or limitations to which the parties may otherwise agree).
Global Select Equity Fund
For the Global Select Equity Fund, The Adviser has entered into a written expense limitation agreement under which it has agreed to limit through October 31, 2015 the total operating expenses of the Fund (including (but not limited to) investment advisory fees of the Adviser and distribution/service (Rule 12b-1) fees, but excluding interest, taxes, litigation, brokerage, other expenditures which are capitalized in accordance with generally accepted accounting principles and extraordinary expenses) to an annual rate of 1.45% of the average daily net assets of the Investor Class shares, and 1.25% of the average daily net assets of the Institutional Class shares. The expense limitation agreement may be terminated by the Adviser or the Trust, with respect to the Fund, at any time and without payment of penalty, provided that the terminating party provides 90 days prior written notice of such termination to the other party, and such termination will not be effective before October 31, 2015 (unless otherwise specifically agreed upon). In addition, any termination sought by the Trust must be authorized by resolution of a majority of the Trustees who are not “interested persons” (as defined by the Investment Company Act 1940, as amended) of the Trust or by vote of a majority of the outstanding shares of the Fund. The Adviser may recoup any waived amount, including organizational fees, from the Fund pursuant to this agreement if such reimbursement does not cause the Fund to exceed the then existing expense limitation at the time the waiver or reimbursement is made and the reimbursement is made within three fiscal years after the year in which the Adviser incurred the expense.
Treasury Fund
For the Treasury Fund, the Adviser has entered into a written expense limitation agreement under which it has agreed to reduce its advisory fees and/or reimburse other expenses of the Fund, for at least an initial period of not less than two years and until the next following effective date of the Post-Effective Amendment to the registration statement of the Trust relating to the Fund incorporating the Fund’s financial statements for the Fund’s fiscal year (the “Initial Term”), to the extent necessary to limit the current operating expenses of each class of shares of the Fund (including (but not limited to) investment advisory fees of the Adviser and distribution/service (Rule 12b-1) fees, but excluding, as applicable, any front-end or contingent deferred sales loads, taxes, leverage interest, brokerage commissions, expenses incurred in connection with any merger or reorganization, and extraordinary expenses (such as litigation and other expenses not incurred in the ordinary course of the Fund’s business), and acquired fund fees and expenses), to an annual rate of 0.85% of the average daily net assets of the Investor Class shares and 0.60% of the average daily net assets of the Institutional Class shares. Unless sooner terminated, the expense limitation agreement will remain in effect for the Initial Term and from year to year thereafter. The expense limitation agreement may be terminated at any time, and without payment of any penalty, by the Board of Trustees of the Trust, on behalf of the Fund, upon 60 days’ written notice to the Adviser. The expense limitation agreement may not be terminated by the Adviser without the consent of the Board, which consent will not be unreasonably withheld. The expense limitation agreement will automatically terminate if the investment advisory agreement between the Adviser and the Trust, on behalf of the Treasury Fund is terminated, with such termination effective upon the effective date of the advisory agreement’s termination. The Adviser may recoup any waived or reimbursed amount pursuant to the expense limitation agreement in the first, second, and third fiscal years following the fiscal year in which any such reimbursement or waiver occurs, provided that the reimbursement does not cause the Treasury Fund to exceed the then-existing expense limitation for that class at the time such reimbursement is to be paid by the Treasury Fund.
Multi-Asset Real Return Fund
For the Multi-Asset Real Return Fund, the Adviser has entered into a written expense limitation agreement under which it has agreed to reduce its advisory fees and/or reimburse other expenses of the Fund until September 14, 2015 to the extent necessary to limit the current operating expenses of each class of shares of the Fund including (but not limited to) investment advisory fees of the Adviser and distribution/service (Rule 12b-1) fees but exclusive of any front-end or contingent deferred sales loads, taxes, leverage interest, brokerage commissions, expenses incurred in connection with any merger or reorganization, extraordinary expenses such as litigation and other expenses not incurred in the ordinary course of the Fund’s business, and acquired fund fees and expenses, except that, if an acquired fund is an underlying fund managed by the Adviser and such acquired fund is not subject to an effective expense limitation or fee waiver agreement at any time during the term of the expense limitation agreement, then, for that time, the operating expenses of each class of shares of the Fund shall not exclude the amount of advisory fees included in such acquired fund’s fees and expenses to which the Fund would otherwise be subject, to an annual rate of 1.25% of the average daily net assets of the Investor Class shares and 1.00% of the average daily net assets of the Institutional Class shares. The expense limitation agreement may be terminated at any time, and without payment of any penalty, by the Board of Trustees of the Trust, on behalf of the Fund, upon 60 days’ written notice to the Adviser. The Adviser may receive reimbursement of any amount waived pursuant to the expense limitation agreement, provided that the reimbursement does not cause the Fund to exceed the then-existing expense limitation for that class at the time such reimbursement is to be paid by the Fund.
| | |
| Centre Funds | | Notes to Financial Statements |
| | March 31, 2014 (Unaudited) |
During the six months ended March 31, 2014, the fee waivers and/or reimbursements were as follows:
| | | | |
| Fund | | Fees
Waived/Reimbursed
by Adviser | |
Centre American Select Equity Fund | | | | |
Investor | | $ | 220,547 | |
Institutional | | | 8,123 | |
Centre Global Select Equity Fund | | | | |
Investor | | | 7 | |
Institutional | | | 46,965 | |
Centre Active U.S. Treasury Fund | | | | |
Investor | | | 15 | |
Institutional | | | 34,773 | |
Centre Multi-Asset Real Return Fund | | | | |
Investor | | | – | |
Institutional | | | – | |
As of March 31, 2014, the balances of recoupable expenses for each Fund were as follows:
| | | | | | | | | | | | | | | | |
| | | Expires 2015 | | | Expires 2016 | | | Expires 2017 | | | Total | |
Centre American Select Equity Fund | | | | | | | | | | | | | | | | |
Investor Class | | $ | 189,101 | | | $ | 446,410 | | | $ | 220,547 | | | $ | 856,058 | |
Institutional Class | | | N/A | | | | N/A | | | | 8,123 | | | | 8,123 | |
Centre Global Select Equity Fund | | | | | | | | | | | | | | | | |
Investor Class | | | N/A | | | | N/A | | | | 7 | | | | 7 | |
Institutional Class | | | 157,721 | | | | 121,781 | | | | 46,965 | | | | 326,467 | |
Centre Active U.S. Treasury Fund | | | | | | | | | | | | | | | | |
Investor Class | | | N/A | | | | N/A | | | | 15 | | | | 15 | |
Institutional Class | | | N/A | | | | N/A | | | | 34,773 | | | | 34,773 | |
Centre Multi-Asset Real Return Fund | | | | | | | | | | | | | | | | |
Investor Class | | | N/A | | | | 4 | | | | N/A | | | | 4 | |
Institutional Class | | | N/A | | | | 112,762 | | | | N/A | | | | 112,762 | |
ALPS Fund Services, Inc. (“ALPS” or the “Administrator”) serves as administrator to the Funds. ALPS receives a monthly fee paid by the Funds subject to a minimum monthly fee and is reimbursed for certain out-of-pocket expenses. Pursuant to an administrative agreement with the Trust, ALPS provides operational services to the Funds including, but not limited to fund accounting and fund administration and general assistance in each Fund’s operations.
ALPS, pursuant to a Transfer Agency and Services Agreement with the Trust, serves as transfer agent for the Funds. Under the Transfer Agency and Services Agreement ALPS receives an annual minimum fee per Fund and a fee based upon each shareholder account and its account activity and is reimbursed for certain out-of-pocket expenses.
ALPS, pursuant to a Chief Compliance Officer Services Agreement with the Trust, provides chief compliance officer services to the Funds. Additionally, ALPS provides services in monitoring and testing the policies and procedures of the Trust in conjunction with requirements under Rule 38a-1 under the 1940 Act. ALPS, recieves an annual fee for service and is reimbursed for certain out-of-pocket expenses, compensated under the Chief Compliance Officer Services Agreement.
The Trust has adopted a plan pursuant to Rule 12b-1 under the 1940 Act (the “Plan”). The Plan permits the Trust, on behalf of certain classes of shares of the Funds, to pay one or more entities for services rendered and expenses borne in connection with providing shareholder or distribution services with respect to the Investor class shares of each Fund.
ALPS Distributors, Inc. (the “Distributor”) acts as the principal underwriter of the Funds. There were no payments to the Distributor by the Funds during the six months ended March 31, 2014.
Officers of the Trust and Trustees who are “interested persons” of the Trust or the Adviser will receive no salary or fees from the Trust. As of January 1, 2014, each Trustee who is not an “interested person” receives an annual retainer of $20,000 paid quarterly. The Trust reimburses each Trustee and Officer for his or her travel and other expenses relating to attendance at such meetings.
One Trustee is an officer of the Adviser.
| | |
| | |
| Semi-Annual Report | March 31, 2014 | | 43 |
| | |
| Centre Funds | | Notes to Financial Statements |
| | March 31, 2014 (Unaudited) |
6. FEDERAL INCOME TAX AND TAX BASIS INFORMATION
As of and during the period ended March 31, 2014, the Funds did not have a liability for any unrecognized tax benefits. The Funds file U.S. Federal, state, and local tax returns as required. The Funds’ tax returns are subject to examination by the relevant tax authorities until expiration of the applicable statute of limitations which is generally three years after the filing of the tax return but which can be extended to six years in certain circumstances. Tax returns for open years have incorporated no uncertain tax positions that require a provision for income taxes.
Capital Losses: As of September 30, 2013 the following Funds had capital loss carryforwards which may reduce the Funds’ taxable income arising from future net realized gains on investments, if any, to the extent permitted by the Code and thus may reduce the amount of the distributions to shareholders which would otherwise be necessary to relieve the Funds of any liability for federal tax. Pursuant to the Code, such capital loss carryforwards will expire as follows:
Pre-Enactment Capital Losses:
| | | | |
| Fund | | Expiring in 2017 | | |
Centre American Select Equity Fund | | $ 8,011,064 | | |
Capital loss carryovers utilized during the period ended September 30 2013, were:
| | | | |
| Fund | | Amount | | |
Centre American Select Equity Fund | | $ (29,267,568) | | |
Under the recently enacted Regulated Investment Company Modernization Act of 2010, capital losses incurred by each Fund after January 1, 2011 will not be subject to expiration. In addition, such losses must be utilized prior to the losses incurred in the years preceding enactment.
Post-Enactment Capital Losses*
Capital losses deferred to next tax year were as follows:
| | | | |
| Fund | | Short-Term | | |
Centre Multi-Asset Real Return Fund | | $ 191,180 | | |
| * | Post-Enactment Capital Losses arise in fiscal years beginning after December 22, 2010, and exclude any elective late-year capital losses (during the period November 1st to December 31st) deferred for the current fiscal year. As a result of the enactment of the Regulated Investment Company Act of 2010, pre-enactment capital loss carryforwards may be more likely to expire unused. Additionally, post-enactment capital losses that are carried forward will retain their character as either short-term or long-term losses rather than being considered all short-term as under previous law. |
Elective Deferrals: The Funds elect to defer to the period ending September 30, 2014 capital losses recognized during the period November 1, 2012–September 30, 2013 in the amount of:
| | | | |
| Fund | | Amount | | |
Centre Multi-Asset Real Return Fund | | $ 33,950 | | |
The Funds elect to defer to the period ending September 30, 2014 last year’s ordinary losses in the amount of:
| | | | |
| Fund | | Amount | | |
Centre Multi-Asset Real Return Fund | | $ 313,635 | | |
Distributions to Shareholders: Each Fund normally pays dividends and net investment income, if any, on an annual basis. Each Fund normally distributes capital gains, if any, on an annual basis. Income dividend distributions are derived from interest and other income each Fund receives from its investments, including distributions of short term capital gains. Capital gain distributions are derived from gains realized when each Fund sells a security it has owned for more than one year. Each Fund may make additional distributions and dividends at other times if the Adviser believes doing so may be necessary for each Fund to avoid or reduce taxes. Net investment income/(loss) and net realized gain/(loss) may differ for financial statement and tax purposes. The amounts and characteristics of tax basis distributable earnings/(accumulated losses) are finalized at fiscal year-end. Accordingly, tax basis balances have not been determined as of March 31, 2014.
| | |
| Centre Funds | | Notes to Financial Statements |
| | March 31, 2014 (Unaudited) |
The tax character of distributions paid for the fiscal year ended September 30, 2013 were as follows:
| | | | | | | | |
| Distributions Paid From: | | Ordinary Income | | | Long-Term Capital Gains | |
Centre American Select Equity Fund | | $ | 2,387,823 | | | $ | 0 | |
Centre Global Select Equity Fund | | | 883,192 | | | | 0 | |
Centre Active U.S. Treasury Fund | | | N/A | | | | 0 | |
Centre Multi-Asset Real Return Fund | | | 3,201,213 | | | | 0 | |
Unrealized Appreciation and Depreciation on Investments: The amount of net unrealized appreciation/(depreciation) and the cost of investment securities for tax purposes, including short-term securities at March 31, 2014, are displayed in the table below. The difference between book and tax basis unrealized appreciation/(depreciation) for the Funds is primarily attributable to wash sales and investments in partnerships.
| | | | | | | | | | | | | | | | | | | | |
| | Tax Cost of Investments | | | Gross Unrealized Appreciation | | | Gross Unrealized Depreciation | | | Net Appreciation of Foreign Currency and Derivatives | | | Net Tax Unrealized Appreciation on Investments | |
Centre American Select Equity Fund | | $ | 110,869,475 | | | $ | 23,536,706 | | | $ | (1,566,749 | ) | | $ | 0 | | | $ | 21,969,957 | |
Centre Global Select Equity Fund | | | 13,630,596 | | | | 1,996,738 | | | | (412,422 | ) | | | 0 | | | | 1,584,316 | |
Centre Active U.S. Treasury Fund | | | 14,503,679 | | | | – | | | | – | | | | 0 | | | | – | |
Centre Multi-Asset Real Return Fund | | | 57,204,328 | | | | 1,467,867 | | | | – | | | | 0 | | | | 1,467,867 | |
7. AFFILIATED COMPANIES:
Multi-Asset Real Return Fund may invest in certain securities that are considered securities issued by affiliated companies. As defined by the Investment Company Act of 1940, an affiliated person, including an affiliated company, is one in which a Fund owns 5% or more of the outstanding voting securities, or a company which is under common ownership or control with the Fund. The purchases, sales, dividend income, capital gains, return of capital distributions received, shares and value of investments in affiliated companies for the six months ended March 31, 2014 were as follows:
| | | | | | | | | | | | | | | | | | | | | | | | | | | | |
| Security Name | | Share Balance September 30,
2013 | | | Purchases | | | Sales | | | Share Balance March 31, 2014 | | | Dividend Income | | | Realized Gain | | | Market Value March 31, 2014 | |
Centre American Select Equity Fund | | | 1,434,664 | | | | 1,275,713 | | | | (1,446,110 | ) | | | 1,264,267 | | | $ | 126,480 | | | $ | 765,366 | | | $ | 14,526,427 | |
Centre Global Select Equity Fund | | | 1,223,258 | | | | 45,228 | | | | – | | | | 1,268,486 | | | | 538,209 | | | | – | | | | 15,209,143 | |
Centre Active U.S. Treasury Fund | | | – | | | | 1,437,698 | | | | – | | | | 1,437,698 | | | | – | | | | – | | | | 14,492,000 | |
| | | | | | | | | | | | | | | | | | | | | | | | | | | | | |
| | | | | | | | | | | | | | | | | | $ | 664,689 | | | $ | 765,366 | | | $ | 44,227,570 | |
| | | | | | | | | | | | | | | | | | | | | | | | | | | | | |
8. PURCHASES AND SALES OF INVESTMENT SECURITIES
For the six months ended March 31, 2014, the aggregate cost of purchases and proceeds from sales of U.S. Government Obligations were as follows:
| | | | | | | | |
| Fund | | Purchases of Securities | | | Proceeds From Sales of Securities | |
Centre American Select Equity Fund | | $ | 54,217,423 | | | $ | 66,576,970 | |
Centre Global Select Equity Fund | | | 10,806,332 | | | | 10,943,931 | |
Centre Active U.S. Treasury Fund | | | 0 | | | | 0 | |
Centre Multi-Asset Real Return Fund | | | 46,029,341 | | | | 28,778,204 | |
For the six months March 31, 2014, the aggregate cost of purchases and proceeds from sales of U.S. Government Obligations were as follows:
| | | | | | | | |
| Fund | | Purchases of Securities | | | Proceeds from Sales of Securities | |
Centre Active U.S. Treasury Fund | | $ | 17,017,486 | | | $ | 17,074,381 | |
Centre Multi-Asset Real Return Fund | | | 0 | | | | 14,983,447 | |
| | |
| | |
| Semi-Annual Report | March 31, 2014 | | 45 |
| | |
| Centre Funds | | Notes to Financial Statements |
| | March 31, 2014 (Unaudited) |
9. INDEMNIFICATIONS
Under the Trust’s organizational documents, its officers and Trustees are indemnified against certain liabilities relating to their duties to the Trust. Additionally, in the ordinary course of business, the Trust enters into contracts with service providers that may contain general indemnification clauses. The Trust’s maximum exposure under these arrangements is unknown, as this would involve future claims that may be made against the Trust that have not yet occurred.
10. FUND REORGANIZATIONS
Reorganization of the Ameristock Mutual Fund, Inc., into Centre American Select Equity Fund
On September 19, 2012, the Board approved a form of Agreement and Plan of Reorganization that provided for the reorganization of the Ameristock Mutual Fund, Inc. (the “Acquired Fund”) and the Trust, on behalf of its series, now named the Centre American Select Equity Fund (the “Acquiring Fund”). Under the plan, the Acquired Fund was reorganized in the Acquiring Fund.
As of the close of business on January 11, 2013, the assets of the Acquired Fund were acquired by the Acquiring Fund in exchange for shares of the Acquiring Fund and the assumption by the Acquiring Fund of the liabilities of the Acquired Fund. Upon the closing of the reorganization, the Acquiring Fund issued 13,877,608 shares in exchange for net assets of the Acquired Fund valued at $130,033,182. The investment portfolio of the Acquired Fund, with a fair value of $122,680,756 and identified cost of $95,563,800 at January 11, 2013, was the principal asset acquired by the Fund. On January 14, 2013, the combined value of the Acquired Fund (which included realized losses of $(2,404,260) and unrealized appreciation of $27,116,956) and the Acquiring Fund was $141,597,250. The exchange of shares qualified as a tax-free reorganization for Federal income tax purposes. The unused capital loss carryforward totaled $37,278,632 for potential utilization and are subject to tax limitations.
The acquisition had been completed on October 1, 2012, the beginning of the annual reporting period of the Acquiring Fund. The Acquiring Fund’s pro forma results of operations for the year ended September 30, 2013, are as follows:
| | | | |
Net Investment Income | | $ | 1,537,659 | |
Net Realized and Unrealized Gain on Investments | | | 17,835,799 | |
| | | | | |
Net Increase in Net Assets Resulting from Operations | | $ | 19,373,458 | |
| | | | | |
11. RECENT ACCOUNTING PRONOUNCEMENTS
In June 2013, the FASB issued ASU 2013-08, Amendments to the Scope, Measurement and Disclosure Requirements (“ASU 2013-08”), modifying Accounting Standards Codification (“ASC”) 946. The modifications were a result of a joint effort by the FASB and the International Accounting Standards Board to develop a consistent approach for determining whether an entity is an investment company for which fair value of investments is the most relevant measurement. ASU 2013-08 requires reporting entities to disclose that it is an investment company and is applying the guidance as set forth in ASC 946, to disclose any changes in, and the reasons for, its status as an investment company and to disclose information related to whether it has provided or is contractually required to provide financial support to any of its investees. The effective date of ASU 2013-08 is for interim and annual periods beginning after December 15, 2013. At this time, management is evaluating the implications of this requirement and the impact it will have to the financial statement amounts and footnote disclosures, if any.
| | |
| See Notes to Financial Statements. | | |
| 46 | | centrefunds.com |
| | |
| Centre Funds | | Notes to Financial Statements |
| | March 31, 2014 (Unaudited) |
12. ADDITIONAL INFORMATION
On October 31, 2013, the Trust held a Special Meeting of Shareholders to consider the following proposal: To approve a new investment advisory agreements between the Trust, on behalf of each of its series and Centre Asset Management, LLC.
The following votes were recorded:
| | | | | | | | | | |
| American Select Equity Fund | | # of Votes Cast | | % of Votes Cast |
For | | | | 5,066,699 | | | | | 79.66 | % |
Against | | | | 92,412 | | | | | 1.45 | % |
Abstain | | | | 1,201,424 | | | | | 18.89 | % |
Total | | | | 6,360,535 | | | | | 100.00 | % |
| | | | | | | | | | | |
| | |
| Global Select Equity Fund | | # of Votes Cast | | % of Votes Cast |
For | | | | 1,226,285 | | | | | 100.00 | % |
Against | | | | – | | | | | 0.00 | % |
Abstain | | | | – | | | | | 0.00 | % |
Total | | | | 1,226,285 | | | | | 100.00 | % |
| | | | | | | | | | | |
| | |
| Multi-Asset Real Return Fund | | # of Votes Cast | | % of Votes Cast |
For | | | | 5,960,514 | | | | | 100.00 | % |
Against | | | | – | | | | | 0.00 | % |
Abstain | | | | – | | | | | 0.00 | % |
Total | | | | 5,960,514 | | | | | 100.00 | % |
| | | | | | | | | | | |
| | |
| | |
| Semi-Annual Report | March 31, 2014 | | 47 |
| | |
| Centre Funds | | Additional Information |
| | March 31, 2014 (Unaudited) |
PROXY VOTING GUIDELINES
A description of the policies and procedures that the Funds use to determine how to vote proxies relating to portfolio securities and information regarding how the Funds voted proxies during the most recent 12-month period ended June 30, is available without charge, upon request, by (1) calling the Funds at 1-855-298-4236 and (2) from Form N-PX filed by the Trust with the Securities and Exchange Commission (“SEC”) on the SEC’s website at http://www.sec.gov.
PORTFOLIO HOLDINGS DISCLOSURE POLICY
The Trust files, with regard to each Fund, with the SEC a complete schedule of investments for the first and third quarter of each fiscal year on Form N-Q. The Funds’ first and third fiscal quarters end on December 31 and June 30. The Form N-Q filing must be made within 60 days of the end of the quarter, and the Trust’s first Form N-Q was filed with the SEC on February 27, 2012. Forms N-Q are available on the SEC’s website at http://www.sec.gov and may be reviewed and copied at the SEC’s Public Reference Room in Washington, DC (call 1-800-732-0330 for information on the operations of the Public Reference Room). You may also obtain copies by calling the Funds at 1-855-298-4236.
APPROVAL OF THE INVESTMENT ADVISORY AGREEMENT AND THE SUB-ADVISORY AGREEMENT ON BEHALF OF THE TREASURY FUND
At an in-person meeting held on November 4, 2013, the Trustees, including the Independent Trustees, considered and unanimously approved an Investment Advisory Agreement between the Adviser and the Trust, on behalf of the Treasury Fund, and a Sub-Advisory Agreement between the Adviser and Hudson Canyon Investment Counselors LLC (“Hudson Canyon”) with respect to the Treasury Fund (together, the “Agreements”). In connection with such approval, the Trustees, including the Independent Trustees, considered, among other things, (i) the Section 15(c) Memorandum dated October 23, 2013 provided by counsel to the Trust and to the Independent Trustees, (ii) the Section 15(c) Request Letter from counsel to the Trust to the Adviser and the Adviser’s responses to the Section 15(c) Request Letter and related exhibits; and (iii) the Section 15(c) Request Letter from counsel to the Trust to Hudson Canyon and Hudson Canyon’s responses to the Section 15(c) Request Letter and related exhibits (together, “Section 15(c) Information”).
In its deliberations on the Agreements, the Board did not identify any particular information that was all-important or controlling and evaluated all information available to it. The Board concluded, on the basis of each Trustee’s business judgment after considering all of the factors taken as a whole, that the terms of the Agreements are appropriate and that the fees to be paid are reasonable in light of the services to be provided to the Treasury Fund. In approving the Agreements, the Board, including the Independent Trustees, considered and made the following conclusions with respect to the following relevant factors.
Nature, Extent and Quality of Services Provided by the Adviser and Hudson Canyon
The Board reviewed the scope of services to be performed by the Adviser as adviser and Hudson Canyon as sub-adviser to the Treasury Fund. The Trustees reviewed information concerning the nature, extent, and quality of sub-advisory services to be provided by Hudson Canyon, including information concerning the personnel responsible for the day-to-day portfolio management of the Treasury Fund, the investment style and approach of Hudson Canyon, and Hudson Canyon’s performance record and overall reputation. The Trustees also considered information describing the Adviser’s and Hudson Canyon’s compliance policies and procedures, including policies reasonably designed to ensure the Treasury Fund’s compliance with its investment objective, policies and restrictions and applicable regulatory requirements. The Trustees noted that the Treasury Fund, and the services to be provided by Hudson Canyon to the Treasury Fund, differed from Hudson Canyon’s other advisory accounts because such accounts are not subject to the same regulatory requirements as the Treasury Fund, may have different investment restrictions, holdings and goals than the Fund and require different levels of servicing than the Fund. The Trustees considered their discussions with advisory personnel of the Adviser and Hudson Canyon about the firms’ respective responses to the questions presented by Trust Counsel in its Section 15(c) Request Letters. The Trustees also discussed the stated reasons as to why the Adviser selected Hudson Canyon as the sub-adviser to recommend for Board approval and agreed that they were satisfied with such response. The Trustees concluded that the nature, extent, and quality of services provided by the Adviser as the adviser, and by Hudson Canyon as sub-adviser, to the Treasury Fund were appropriate and sufficient to support approval of the Agreements.
Performance
The Trustees noted that, since the Treasury Fund had not yet commenced operations, it had no historical performance. As such, the Trustees considered the performance of the American Select Equity Fund, the Global Select Equity Fund and the Multi-Asset Real Return, for which the Adviser serves as investment adviser and, with respect to the American Select Equity Fund and the Global Select Equity Fund, for which the Adviser previously served as sub-adviser. The Trustees also considered the performance of a composite utilizing a substantially identical investment strategy as that to be used by Hudson Canyon to manage the Treasury Fund. The Trustees also discussed information provided by Hudson Canyon regarding the hypothetical performance of the Treasury Fund compared to the benchmark index.
| | |
| Centre Funds | | Additional Information |
| | March 31, 2014 (Unaudited) |
Profitability
The Trustees considered information regarding the estimated profitability of the Treasury Fund to the Adviser and Hudson Canyon. The Board considered representations made by the Adviser and Hudson Canyon with respect to (i) the potential profitability of managing the Treasury Fund, and (ii) other indirect benefits that might accrue to each firm as a result of its relationship with the Fund, such as publicity regarding the Treasury Fund from newspaper and magazine coverage, industry ranking services, and marketing materials distributed by the Fund, which may result in the acquisition by the Adviser and/or Hudson Canyon of new advisory clients. The Trustees concluded that these factors would not prevent the Board from approving the Agreements.
Economies of Scale
The Trustees considered information concerning potential economies of scale for the Treasury Fund, noting that the Fund was newly formed and had not yet commenced investment operations. The Trustees noted that the sub-advisory fees payable under the Sub-Advisory Agreement were paid by the Adviser, not the Treasury Fund, and that the Fund would be subject to an operating expense limitation agreement covering the advisory fees charged to the Fund. The Trustees concluded that this factor did not prevent them from approving the Agreements.
Comparisons of the Services to be Rendered and Fee Amounts
The Trustees reviewed the proposed fees payable to the Adviser and Hudson Canyon under the Investment Advisory Agreement and the Sub-Advisory Agreement, respectively, and the Treasury Fund’s overall expense ratios, and considered whether the fees were reasonable in light of the services to be provided by the Adviser and Hudson Canyon and the fees charged to similarly-situated funds. In evaluating the advisory fees and sub-advisory fees, the Trustees also took into account the demands, complexity, and quality of the investment management of the Treasury Fund.
The Trustees discussed the comparative advisory fee and expense information provided to them, noting that, based on the table reflecting comparative data for the Lipper peer group, the proposed advisory fees payable under the Investment Advisory Agreement were lower than the Lipper peer group average. The Trustees also noted that the estimated total expenses of the Treasury Fund were lower than the Lipper peer group average. The Trustees considered the advisory fees payable by the American Select Equity Fund, the Global Select Equity Fund, and the Multi-Asset Real Return Fund under the investment advisory agreements relating to those Funds. The Trustees also considered that the Adviser had agreed to enter into an operating expense limitation agreement with the Trust, on behalf of the Treasury Fund, to waive or limit the advisory fees of the Fund.
The Trustees considered representations from Hudson Canyon personnel and information in Hudson Canyon’s Form ADV indicating that the sub-advisory fee payable by the Adviser under the Sub-Advisory Agreement is equal to the fee (ignoring the impact of waivers by Hudson Canyon which would make the realized fee lower) that would be derived using Hudson Canyon’s typical fee structure, which considers the product type, size of the account, and level of services required. They also noted that Hudson Canyon had entered into an agreement with the Adviser to waive or limit the sub-advisory fees in a manner that was consistent with the expense limitation agreement to be entered into by the Trust, on behalf of the Treasury Fund, and the Adviser. In addition, the Trustees considered the Treasury Fund’s estimated asset size and Hudson Canyon’s management of the portfolios in a manner that was consistent with Hudson Canyon’s investment philosophy and the Fund’s investment objective.
After reviewing all of the information presented to them concerning fees, expenses, and other matters, the Trustees concluded that the advisory fees payable to the Adviser by the Treasury Fund under the Advisory Agreement and the sub-advisory fees payable to Hudson Canyon by the Adviser under the Sub-Advisory Agreement were reasonable in light of the services to be provided.
Conclusion
The Trustees concluded their consideration of the Investment Advisory Agreement and the Sub-Advisory Agreement, noting that their decision was based on an evaluation of the totality of factors and information presented or available to them and not on any one factor, report, representation, or response.
| | |
| | |
| Semi-Annual Report | March 31, 2014 | | 49 |

| | |
| Item 2. | | Code of Ethics. |
| |
| | Not applicable to semi-annual report. |
| |
| Item 3. | | Audit Committee Financial Expert. |
| |
| | Not applicable to semi-annual report. |
| |
| Item 4. | | Principal Accountant Fees and Services. |
| |
| | Not applicable to semi-annual report. |
| |
| Item 5. | | Audit Committee of Listed Registrants. |
| |
| | Not applicable to the Registrant. |
| |
| Item 6. | | Schedule of Investments. |
| |
| | (a) The Registrant’s “Schedule I – Investments in securities of unaffiliated issuers” (as set forth in 17 CFR 210.12-12) is included in Item 1 of this Form N-CSR. |
| |
| | (b) Not applicable to the Registrant. |
| |
| Item 7. | | Disclosure of Proxy Voting Policies and Procedures for Closed-End Management Investment Companies. |
| |
| | Not applicable to the Registrant. |
| |
| Item 8. | | Portfolio Managers of Closed-End Management Investment Companies. |
| |
| | Not applicable to the Registrant. |
| |
| Item 9. | | Purchases of Equity Securities by Closed-End Management Investment Company and Affiliated Purchasers. |
| |
| | Not applicable to the Registrant. |
| |
| Item 10. | | Submission of Matters to a Vote of Security Holders. |
| |
| | None. |
| | |
| Item 11. | | Controls and Procedures. |
| |
| (a) | | The Registrant’s principal executive officer and principal financial officer have evaluated the Registrant’s disclosure controls and procedures (as defined in Rule 30a-3(c) under the Investment Company Act of 1940, as amended) within 90 days of this filing and have concluded that the Registrant’s disclosure controls and procedures were effective as of that date. |
| |
| (b) | | There was no change in the Registrant’s internal control over financial reporting (as defined in Rule 30a-3(d) under the Investment Company Act of 1940, as amended) during the second fiscal quarter of the period covered by this report that has materially affected, or is reasonably likely to materially affect, the Registrant’s internal control over financial reporting. |
| |
| Item 12. | | Exhibits. |
| |
| (a)(1) | | Not applicable to semi-annual report. |
| |
| (a)(2) | | A separate certification for the Registrant’s Principal Executive Officer and Principal Financial Officer as required by Rule 30a-2(a) under the Investment Company Act of 1940, as amended (17 CFR 270.30a-2(a)), are attached hereto as Ex 99.Cert. |
| |
| (a)(3) | | None. |
| |
| (b) | | The certifications by the Registrant’s Principal Executive Officer and Principal Financial Officer, as required by Rule 30a-2(b) of the Investment Company Act of 1940, as amended, and Section 906 of the Sarbanes-Oxley Act of 2002 are attached hereto as Ex99.906Cert. |
SIGNATURES
Pursuant to the requirements of the Securities Exchange Act of 1934 and the Investment Company Act of 1940, the Registrant has duly caused this report to be signed on its behalf by the undersigned, thereunto duly authorized.
| | |
| CENTRE FUNDS |
| |
| By: | | /s/ James A. Abate |
| | James A. Abate |
| | President |
| |
| Date: | | June 4, 2014 |
Pursuant to the requirements of the Securities Exchange Act of 1934 and the Investment Company Act of 1940, this report has been signed below by the following persons on behalf of the Registrant and in the capacities and on the dates indicated.
| | |
| By: | | /s/ James A. Abate |
| | James A. Abate |
| | President (Principal Executive Officer) |
| |
| Date: | | June 4, 2014 |
| |
| By: | | /s/ Vu Phong Nguyen |
| | Vu Phong Nguyen |
| | Treasurer (Principal Financial Officer) |
| |
| Date: | | June 4, 2014 |