UNITED STATES
SECURITIES AND EXCHANGE COMMISSION
Washington, D.C. 20549
FORM N-CSRS
CERTIFIED SHAREHOLDER REPORT OF REGISTERED
MANAGEMENT INVESTMENT COMPANIES
Investment Company Act file number: 811-22545
DREXEL HAMILTON MUTUAL FUNDS
(exact name of registrant as specified in charter)
45 Rockefeller Plaza, Suite 2000, New York, NY 10111
(Address of principal executive offices) (Zip code)
Andrew Bang
45 Rockefeller Plaza, Suite 2000
New York, NY 10111
(Name and address of agent for service)
Registrant’s telephone number, including area code: 855.298.4236
Date of fiscal year end: September 30
Date of reporting period: October 1, 2011 – March 31, 2012
| Item 1. | Reports to Stockholders. |
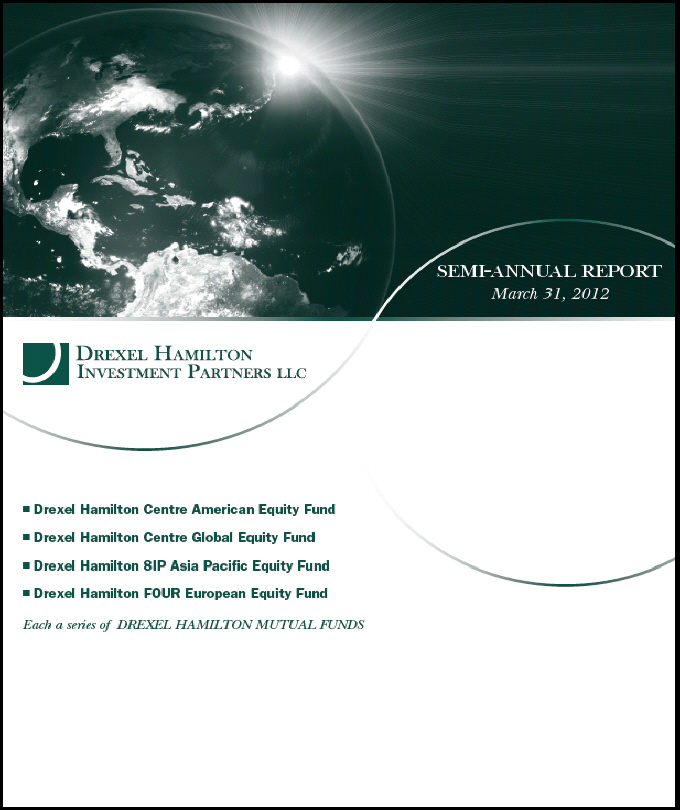
TABLE OF CONTENTS
| | |
| Drexel Hamilton Mutual Funds | | Shareholder Letter |
| | March 31, 2012 (Unaudited) |
Dear Shareholders,
It is our pleasure to publish the inaugural Drexel Hamilton Mutual Funds semi-annual report covering the results of the Funds since inception on December 21, 2011 through March 31, 2012. These institutional class-only equity Funds are:
| | • | | Drexel Hamilton Centre American Equity Fund (DHAMX) |
| | • | | Drexel Hamilton Centre Global Equity Fund (DHGLX) |
| | • | | Drexel Hamilton 8IP Asia Pacific Equity Fund (DHAPX) |
| | • | | Drexel Hamilton FOUR European Equity Fund (DHEUX) |
The preceding months have provided a critically important foundation for the launch of the Funds, and we are pleased to report positive and benchmark beating returns by the Funds during their initial full quarter of performance. During these challenging market and economic conditions domestically and globally, the Funds’ focus on fundamentals, and the stock selection skills and disciplined and research intensive processes by its Portfolio Managers have laid the building blocks in keeping with the investment objectives of seeking long-term growth of capital.
The Funds provide access to experienced, established regional specialist and global Portfolio Managers across both investment styles and markets whose talents otherwise would not be available to U.S. fund investors. Each of the locally based Portfolio Managers bring deep experience and regional insights gathered through years spent working and living in the markets they invest in. This differentiated insight allows them to develop independent views and invest with conviction.
Drexel Hamilton Investment Partners LLC, the Adviser, offers investment management services to institutional clients, intermediaries, advisers and distributors as a leading Service Disabled Veteran Owned Small Business investment manager.
We believe that the Funds are off to a strong start.
Sincerely yours,
Andrew Bang
President
The statements and opinions expressed are those of the Adviser and are as of the date of this report.
| | |
Semi-Annual Report | March 31, 2012 (Unaudited) | | 1 |
| | |
| Drexel Hamilton Centre American Equity Fund | | Manager Commentary |
| | March 31, 2012 (Unaudited) |
Performance:
During the three months ended March 31, 2012, the Drexel Hamilton Centre American Equity Fund (the “Fund”) performed better than its benchmark, the S&P 500® Index, 13.79% vs. 12.59%. Since the inception of the Fund to March 31, 2012, the Fund’s total return is 15.50% vs. 13.91% for the S&P 500® Index.
From inception to March 31, 2012, pro-growth sectors such as Technology, Financials, and Consumer Discretionary were market leaders while more defensive sectors, Utilities, Telecomm, and Energy lagged due to the improving relative strength of US economic growth following the summer and fall 2011 period when the re-emergence of sovereign default worries and their impact on global economic growth weighed on stocks.
Stocks that were strong performers within the Fund included Apple, Microsoft, and Advanced Micro Devices (Technology); and Starbucks, MGM Resorts, International Game Technology and Harley Davidson (Consumer). Stocks that were detractors included Schlumberger (Energy), Allegheny Technology (Materials), and Oracle (Technology), all of which remain in the Fund.
Our principal overweight sectors were Technology and Industrials driven by bottom-up stock level opportunities. We have, however, recently increased our positions within the Health Care and Staples sectors after harvesting some gains in the Materials and Industrials sectors. In Health Care, we continue to add opportunistically to our existing core holdings such as Johnson & Johnson, Merck and Abbott Labs, as well as new positions in medical device manufacturer Zimmer and biotechnology concern Amgen. We recently sold several more cyclical stocks, namely Alcoa, Dell, KLA-Tencor and Parker Hannifin due to recent loss of positive profit margin and return on capital momentum. We maintain our general avoidance of the large “too big to fail” financial stocks as regulatory scrutiny and increased capital requirements continue to depress returns on equity. Our stock selection success in names such as Zions Bancorp and Capital One, part of our stock focus on the regional banking group, offset partially for the sector underweight versus the Index.
Economic and Market Outlook:
Despite the significant rally in US stock prices since October 2011, the rating of shares is still inexpensive relative to the past twenty years with the price to earnings ratio (P/E) of the S&P 500® Index now at around 14 times forward earnings. This said, our thesis for the US market is that a further re-rating of shares will be very selective and concentrated solely on those blue-chip shares that have dominant market shares or are globally positioned to benefit from emerging markets growth, leaders in innovation, or those companies that are driving margin expansion despite rising headwinds from higher energy and other input costs.
The simple case for a broadly expanding P/E multiple for stocks is based upon the relationship of interest rates and stock ratings, namely that low interest rates correlate historically with higher P/E ratios. Unfortunately, we caution investors to take into account the extraordinary and distortive low interest rate environment imposed by the Federal Reserve when trying to induce a higher rating for shares. In other words, we deduce that investors have discounted the normalization of Federal Reserve interest policy and a future rise of rates in the rating of stocks today and, thus, stocks as a whole may not be as inexpensive as perceived relative to interest rates.
The bigger issue facing investors, however, is the dependence of further market gains from multiple expansion; it seems like the only fuel available for a broad market move higher as fundamentals plateau. Simply put, stock prices increase from two basic inputs – growth in earnings or a change in the valuation of those earnings. For the first time since the economic recovery began, we’re seeing more (rather than fewer) companies start to experience a decline in their operating margins and returns on capital, and the overall ratio of negative to positive profits guidance is rising. After being driven by exceptional earnings growth since 2009, stock prices have reached a transition point. The aggregate level of 2012 earnings for companies within the S&P 500® Index have not moved higher materially since the start of the year due to muted profits guidance released thus far as well as a continuation of the low growth economic backdrop in developed economies. So, we believe without a change in the earnings growth outlook, stocks will remain dependent on rating changes for continued gains in 2012.
Portfolio Structure & Strategy:
Our focus in the Fund remains on companies ‘wisely contracting’, remaining disciplined in their capital expenditures and headcount growth and staying ahead of their peers by doing so. Continued profit margin expansion and more rapid asset turns should allow these companies to maintain the positive momentum in their returns on capital and, as we believe, related stock returns. We are also focused on those ‘wealth creators’ that have business models that are able to continue to power through the macro environment by expanding market share and their global sales presence, many of which can be classified as ‘Nifty-Fifty’ type stocks concentrated in the Technology, Industrial and Consumer sectors.
| | |
| Drexel Hamilton Centre American Equity Fund | | Manager Commentary |
| | March 31, 2012 (Unaudited) |
We believe the best strategy to employ in the current environment is a barbell one comprised at least one half of leading mega-capitalization blue chips with those attributes that render them undervalued based upon their current multiples. These companies, whose fundamentals will likely stand out increasingly as the business cycle matures and should distinguish themselves from the broad market through organic growth from innovation and pricing power. US companies such as Apple, Caterpillar, and Google typify these attributes. Combined with this portfolio component in a barbell approach, there remain many companies in the US that continue to harvest growth in earnings and took the initiative during the most recent recession to enhance operations by streamlining labor forces and optimizing assets. US companies such as Textron, Harley-Davidson, and St. Jude Medical typify these attributes.
As always, our process in managing the Fund is to focus bottom-up on each individual company’s growth outlook, not just on earnings but understanding the capital allocation decisions being made today and how they will lead to future earnings growth. We expect companies to invest in productive assets of the business, organically and through opportunistic purchases, which, in turn provides the foundation for future revenue and profit growth that will create shareholder value. Our top-down views on interest rate investment are important as many of those are inputs into our company models and, at the end of the day, are reconciled to the bottom-up information we gather and process from company performance. We see profits moving higher and stock prices have ample room to reflect this growth in profits as well as re-rate positively to reflect this and diminished risk aversion. From a bottom-up perspective, we see continuing profit and return on capital momentum and, most importantly, tremendous upside versus downside asymmetry in price targets in the Fund’s stock positions.
P/E: price to earnings ratio, market value per share/earnings per share.
Nifty-Fifty: The 50 stocks that were most favored by institutional investors in the 1960s and 1970s. Companies in this group were usually characterized by consistent earnings growth and high P/E ratios.
Sovereign debt: Bonds issued by a national government in a foreign currency.
The statements and opinions expressed are those of the Sub-Adviser and are as of the date of this report.
| | |
Semi-Annual Report | March 31, 2012 (Unaudited) | | 3 |
| | |
| Drexel Hamilton Centre American Equity Fund | | Manager Commentary |
| | March 31, 2012 (Unaudited) |
SECTOR WEIGHTINGS
As a percentage of Net Assets
| | |
| Consumer, Non-cyclical | | 28.50% |
| Technology | | 21.05% |
| Consumer, Cyclical | | 13.81% |
| Communications | | 9.31% |
| Energy | | 9.08% |
| Industrials | | 7.21% |
| Financials | | 6.52% |
| Basic Materials | | 4.01% |
| Cash & Equivalents | | 0.40% |
| Other Assets & Liabilities | | 0.11% |
| Total | | 100.00% |
These allocations may not reflect the current or future positions of the portfolio.
| | | | | | | | | | | | | | | |
GROWTH OF HYPOTHETICAL $10,000 INVESTMENT AS OF MARCH 31, 2012 |
|
This graph assumes an initial investment of $10,000 at December 21, 2011, the Fund’s inception date, and that any dividends and distributions are reinvested. This graph depicts the performance of the Fund versus the S&P 500® Index. It is important to note that the Fund is a professionally managed mutual fund while the index is not available for investment and is unmanaged and does not have expenses that affect the results. The comparison is shown for illustrative purposes only. |
| | | | | | | | | | | | | | | |
CUMULATIVE TOTAL RETURNS – FOR THE PERIOD ENDED MARCH 31, 2012 | |
| | | 1 Month | | 3 Month | | Since Inception* |
| Drexel Hamilton Centre American Equity Fund | | | | 3.59 | % | | | | 13.79 | % | | | | 15.50 | % |
| S&P 500® Index | | | | 3.29 | % | | | | 12.59 | % | | | | 13.91 | % |
| | | | | | | | | | | | | | | |
The performance information quoted above represents past performance, which is not a guarantee of future results, and does not reflect the deduction of taxes that a shareholder would pay on Fund distributons or the redemption of Fund shares. Investment return and principal value of an investment will fluctuate so that an investor’s shares, when redeemed, may be worth more or less than their original cost. Total return includes reinvestment of dividends and capital gains. Current performance may be lower or higher than the performance data quoted. For the most current month-end performance data please call 855-298-4236 or visit www.dhipfunds.com. The total annual operating expense ratio (after expense reimbursements) as stated in the fee table of the most recent prospectus, dated November 16, 2011, was 1.25%. The Adviser has entered into a written expense limitation agreement through November 17, 2012 under which it has agreed to limit the total expenses of the Fund (excluding interest, taxes, litigation, brokerage, extraordinary expenses, and any transactions costs associated with short sales which may include but are not limited to brokerage commissions and dividends that are paid to persons from whom the Fund borrows securities) to an annual rate of 1.25% of the average net assets of the Fund. Without this waiver the total annual fund operating expenses of the fund would be 2.19%. The S&P 500® Index is a commonly recognized, market-capitalization weighted index of 500 widely held securities, designed to measure broad U.S. equity performance. You cannot invest directly in an index. * The Fund’s inception date was December 21, 2011. |
| | |
| Drexel Hamilton Centre Global Equity Fund | | Manager Commentary |
| | March 31, 2012 (Unaudited) |
Performance:
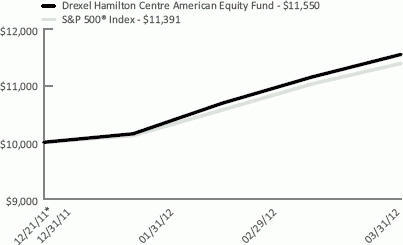
During the three months ended March 31, 2012, the Drexel Hamilton Centre Global Equity Fund (the “Fund”) performed slightly better than its benchmark, MSCI All Country World Index (MSCI ACWI), 12.07% vs. 12.02%. Since the inception of the Fund to March 31, 2012, the Fund’s total return is 13.30% vs. 13.63% for MSCI ACWI.
After suffering double digit declines in the summer of 2011, global equity investors enjoyed a bull-run in the fall and winter as investors were encouraged by the attractive valuations and better than expected fundamental data. Also, the liquidity injections from the European Central Bank calmed investor fear of the Eurozone sovereign debt problems.
From inception to March 31, 2012, good stock selection in Latin America, developed Europe, and North America contributed positively to the Fund’s performance. On the other hand, the Fund’s regional underweight posture in North America and overweight posture in Europe detracted from the Fund’s performance. In this period, North America outperformed the global equity market average as measured by MSCI ACWI whereas Europe and Asia Pacific underperformed. Within Europe, Belgium, Germany and Russian were among the best performing markets globally, while Spain and Portugal some of the worst performing. Asia Pacific, Singapore and India outperformed while China and Japan underperformed. Emerging markets as a group performed better than MSCI ACWI but with mixed results. Turkey and the Philippines outperformed materially both their emerging market peers and the global average whereas Argentina, Indonesia and China underperformed considerably both the emerging market group and the global average.
During this period, among the holdings in the Fund, SABESP and AmBev in Brazil; Tencent and Hengan International in China; EADS in France; Toyota Motor in Japan; Daimler and BASF in Germany; and Qualcomm and JP Morgan in the U.S. made major positive contributions to the Fund’s performance. On the negative side, Belle International and China Shenhua Energy in China; McDonald’s and Verizon Communications in the U.S.; Enel in Italy; Banco do Brasil in Brazil; BBVA in Spain; Teva Pharmaceutical in Israel; and Telstra in Australia detracted from Fund’s performance. All remain in the Fund.
Economic and Market Outlook:
Looking ahead, we think that the world’s largest economy, the United States, will continue its moderate economic growth. We see U.S. companies with strong balance sheets and reasonably good fundamentals. American households continue to deleverage, which ultimately bodes well for the long-term economic health of the country. Moreover, we are encouraged to see early signs of recovering in the residential housing market. In addition, the U.S. financial institutions today are among some of the best capitalized in the developed economies. Finally, the Federal Reserve is expected to keep interest rates low and monetary policy easy until the unemployment rate declines significantly. All of these make us cautiously optimistic about the U.S. economy and stock market.
For the world’s second largest economy, China, we expect a “soft-landing.” China is at the very early stages of transforming its economy to be one that is more domestic demand driven and less export dependent. This is a long and difficult process for an economy as large and complex as China’s. Since the 1980s, China’s export driven economy has been supported by abundant, low cost, young, educated and highly productive labor, which was further enhanced with a well-designed and modern infrastructure, investor friendly regulations and undervalued local currency (Chinese Yuan or Renminbi). However, after decades of breakneck growth, China’s economic growth can no longer be sustained by exports alone. As living standards in China improve, labor costs in China are going up, and the labor force has grown increasingly less abundant and more costly. Additionally, environmental degradation has become a serious threat to the long-term well-being, and some say, the very survival, of the nation. The glaring and growing gap between the rich and poor also threatens the social stability of the country. Well aware of these domestic challenges, Chinese leaders are working earnestly to move China’s economy up the value-added ladder, to increase domestic demand, to address the negative environmental and other social and economic legacies of decades of extraordinary economic growth. Such transformation will certainly be a long and difficult journey and would take years if not decades to accomplish. Fortunately, by all indications, China is moving in the right direction. In the near-term, bank reserve requirements have been lowered, and banks are encouraged to serve better the small and medium size businesses. The policy makers also seem determined to keep a lid on the high-end residential property developments while at the same time encouraging more low-cost housing constructions and investments in the “third tier” cities and less developed areas away from the coastal region.
On the political front in China, despite recent events involving the Bo Xilai clan, we envisage that China will have a relative smooth transition of power from the current leadership to the next, younger generation of leaders later this year. Moreover, we think that the new leadership will likely continue on the current path of economic modernization and growth.
Our big picture outlook for developed Europe is considerably darker than for either the U.S. or China. The sovereign debt issue in Europe continues to worry investors everywhere. The good news is that there are plenty of good, highly competitive and profitable, dividend paying, shareholder value creating companies in Europe; many of them are very attractively valued and held in the Fund. We believe that these companies are likely to
| | |
Semi-Annual Report | March 31, 2012 (Unaudited) | | 5 |
| | |
| Drexel Hamilton Centre Global Equity Fund | | Manager Commentary |
| | March 31, 2012 (Unaudited) |
thrive, the European sovereign debt problems and economic slow-down notwithstanding; good companies in Europe and elsewhere that produce goods and services that are in growing demand will carry on rewarding their shareholders in good times and bad.
Portfolio Structure & Strategy:
The Drexel Hamilton Centre Global Equity Fund offers a unique investment vehicle for investors by focusing on large capitalization blue chips in the developed world and emerging blue chips in the developing countries and combines bottom-up stock selection with structured portfolio construction and risk management that is cognizant of secular growth forces.
Our process in managing the Fund is to focus bottom-up on each individual company’s growth outlook, not just on earnings but understanding the capital allocation decisions being made today and how they will lead to future earnings growth. Our top-down views on macro outlooks of various markets, regions and global sectors etc. are important as many of those are inputs into our company models and at the end of the day, are reconciled to the bottom-up information we gather and process from company performance and operating results.
Our unique and disciplined economic value added-based investment process and unique dynamic gross domestic product adjusted-focused portfolio construction process seek to insure that the Fund is unencumbered by traditional market capitalization weighted benchmarks and goes where the bottom-up stock opportunities are globally. Consequently, the Fund is well positioned to benefit and profit from the positive demographics and long-term economic growth in many developing economies as well as attractive investment opportunities in developed countries across the globe.
We have become more optimistic in our outlook of the global equity markets in 2012 based on specific stock valuations, operating and economic environments, plus other macro factors such as the unusually low interest rate environment in developed markets and easier monetary policies implemented in many developing countries. We have made adjustments to the Fund in early 2012. Specifically, we have added more stocks in sectors such as Technology, Financials and Industrials as we saw more attractive investment opportunities based on our bottom-up research and analysis. The Fund maintains its above benchmark dividend yield, its overweight postures in Technology, Telecomm, Energy and Consumer Staples, and underweight postures in Materials, Financials, Industrials and Health Care.
Going forward, the Fund will continue to be anchored with what we perceive to be shareholder value creators who 1) have long track records of growing their cash earnings and dividends in both good times and bad, 2) are in excellent competitive positions locally or globally in their respective industries and markets, and 3) are likely to be the main beneficiaries of good fundamental long-term economic growth and demographics in various parts of the world, such as Apple, IBM, AmBev, British American Tobacco, Samsung Electronics and China Mobile.
The statements and opinions expressed are those of the Sub-Adviser and are as of the date of this report.
| | |
| Drexel Hamilton Centre Global Equity Fund | | Manager Commentary |
| | March 31, 2012 (Unaudited) |
SECTOR WEIGHTINGS
As a percentage of Net Assets
| | |
| Consumer, Non-cyclical | | 17.83% |
| Financials | | 15.88% |
| Technology | | 13.73% |
| Energy | | 12.78% |
| Consumer, Cyclical | | 12.46% |
| Communications | | 11.69% |
| Industrials | | 6.32% |
| Basic Materials | | 5.19% |
| Utilities | | 2.95% |
| Currency | | 0.02% |
| Cash & Equivalents | | 0.87% |
| Other Assets & Liabilities | | 0.28% |
| Total | | 100.00% |
COUNTRY WEIGHTINGS
As a percentage of Net Assets
| | |
United States | | 27.79% |
China | | 10.76% |
Brazil | | 8.12% |
Germany | | 7.17% |
Great Britain | | 4.65% |
Japan | | 3.77% |
Netherlands | | 3.47% |
Cayman Islands | | 3.21% |
France | | 3.02% |
Spain | | 2.84% |
Italy | | 2.82% |
Russia | | 2.79% |
Australia | | 2.59% |
Israel | | 1.82% |
Jersey | | 1.63% |
Bermuda | | 1.61% |
Switzerland | | 1.60% |
Mexico | | 1.24% |
South Korea | | 1.23% |
Belgium | | 1.16% |
Indonesia | | 1.13% |
Denmark | | 1.03% |
Thailand | | 0.93% |
Taiwan | | 0.92% |
India | | 0.79% |
Singapore | | 0.76% |
Cash & Equivalents | | 1.15% |
Total | | 100.00% |
These sector and country allocations may not reflect the current or future positions of the portfolio.
| | | | | | |
GROWTH OF HYPOTHETICAL $10,000 INVESTMENT AS OF MARCH 31, 2012 |
This graph assumes an initial investment of $10,000 at December 21, 2011, the Fund’s inception date, and that any dividends and distributions are reinvested. This graph depicts the performance of the Fund versus the MSCI All Country World Index. It is important to note that the Fund is a professionally managed mutual fund while the index is not available for investment and is unmanaged and does not have expenses that affect the results. The comparison is shown for illustrative purposes only. CUMULATIVE TOTAL RETURNS – FOR THE PERIOD ENDED MARCH 31, 2012 |
| | | | | | | | | | | | | | | |
| | | 1 Month | | 3 Month | | Since Inception* |
Drexel Hamilton Centre Global Equity Fund | | | | 0.80 | % | | | | 12.07 | % | | | | 13.30 | % |
MSCI All Country World Index | | | | 0.71 | % | | | | 12.02 | % | | | | 13.63 | % |
| | | | | | | | | | | | | | | |
The performance information quoted above represents past performance, which is not a guarantee of future results, and does not reflect the deduction of taxes that a shareholder would pay on Fund distributions or the redemption of Fund shares. Investment return and principal value of an investment will fluctuate so that an investor’s shares, when redeemed, may be worth more or less than their original cost. Total return includes reinvestment of dividends and capital gains. Current performance may be lower or higher than the performance data quoted. For the most current month-end performance data please call 855-298-4236 or visit www.dhipfunds.com. The total annual operating expense ratio (after expense reimbursements) as stated in the fee table of the most recent prospectus, dated November 16, 2011, was 1.25%. The Adviser has entered into a written expense limitation agreement through November 17, 2012 under which it has agreed to limit the total expenses of the Fund (excluding interest, taxes, litigation, brokerage, extraordinary expenses, and any transactions costs associated with short sales which may include but are not limited to brokerage commissions and dividends that are paid to persons from whom the Fund borrows securities) to an annual rate of 1.25% of the average net assets of the Fund. Without this waiver the total annual fund operating expenses of the fund would be 2.68%. Investing in the securities of foreign companies generally involves greater risk than investing in larger, more established domestic companies. Therefore, investments in the Fund may involve a greater degree of risk than investments in other mutual funds that invest in larger, more established domestic companies. The MSCI (Morgan Stanley Capital International) All Country World Index is an unmanaged, free float-adjusted market capitalization weighted index composed of stocks of companies located in countries throughout the world. It is designed to measure equity market performance in global developed and emerging markets. The index includes reinvestment of dividends, net of foreign withholding taxes. You cannot invest directly in an index. * The Fund’s inception date was December 21, 2011. |
| | |
Semi-Annual Report | March 31, 2012 (Unaudited) | | 7 |
| | |
| Drexel Hamilton 8IP Asia Pacific Equity Fund | | Manager Commentary |
| | March 31, 2012 (Unaudited) |
Performance:
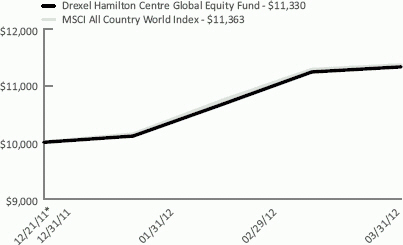
Since its inception on December 21, 2011 to March 31, 2012, the Drexel Hamilton 8IP Asia Pacific Equity Fund (the “Fund”) delivered +14.50% . This was +1.82% relative to the MSCI All Country Asia Pacific Total Return USD Index, the Fund’s benchmark.
The sectors that lagged were Telecommunications, Utilities and Health Care, while cyclical sectors like Financials, IT and Consumer Discretionary were market leaders. Overweight positions in Industrials, Energy and IT sectors (relative to the benchmark) contributed to the Fund’s relative performance. The largest detractor from relative performance was an overweight in Materials. Underweight positions in Health Care, Utilities and Consumer Staples also weighed on returns.
Exposure to the Industrials sector was the biggest contributor to positive performance. While the sector performed well as a whole, Ausenco (AAX AU) ended the quarter with a +78% gain in value and Boart Longyear (BLY AU) gained +49% in value. We believe that there is intrinsic value in both stocks based on their sustainable Return on Equity (RoE), valuation and growth prospects. Despite the strong rise, the stocks remain attractive. Other portfolio holdings that contributed to the Fund’s relative performance were Sakari Resources Limited (with a gain of +27%), JGC Corp (+39%), Catcher Technology Company Limited (+27%) and KWG Property Holding Limited (+71%). Over the period stocks that detracted the most from the Fund’s relative performance were China Lumena New Materials (-4%) and BHP Billiton (+1%).
In an environment of loose global monetary policy, the Fund’s exposure to Financials was increased over the last three months. The Fund added KWG Property Holding Limited, a mid-tier property developer in China that has experienced record high sales volumes in 2012 relative to 2011. The Chinese government’s gradual easing of policy has not only improved liquidity but has benefited the Chinese property market with a recovery in sales volumes. The stock ended the quarter up +71%. Japanese Financials also outperformed after the Bank of Japan announced its 1% reflation initiative, and we expect further moves by the authorities to weaken the yen if required.
Country or regional allocation did not contribute to relative performance as the Fund is broadly in line with its benchmark.
Portfolio Structure and Strategy:
The Fund is classified as an actively managed regional international equity product. The Fund seeks excess returns above the MSCI All Country Asia Pacific Total Return Index (USD) with a focus on low turnover and a long-term investment strategy. The Fund invests in a diversified portfolio of equities across a range of industry sectors within the Asia Pacific region. The “Asia Pacific region” includes, but is not limited to, Australia, China, Hong Kong, India, Indonesia, Japan, Korea, Malaysia, New Zealand, Philippines, Singapore, Taiwan and Thailand.
The Fund uses a fundamentally driven investment process with a focus on generating alpha over the long-term. We search for two key drivers of alpha, namely Return on Equity and valuations. We believe that shareholder value is created by companies that can generate sustainable and positive Return on Equity over the long-term. Only stocks that have a sustainable RoE which is greater than the long-term average of the relevant market or sector are considered for investment. The Fund seeks to invest in a stock when its price/book valuation is below the long-term average on a relative or absolute basis and to sell when the valuation rises close to the long-term high. We believe we have positioned the Fund for a strong recovery in Asian markets. Asian equities are at undemanding valuations by historical standards (Asia ex Japan equities are trading at 1.8x price-to-book long-term average) and there is strong corporate profitability in the region (the average RoE for Asia ex Japan equities is +14%). Markets are experiencing easy monetary conditions; interest rates are at historical lows and central banks are posturing for more quantitative easing. In China, the People’s Bank of China has continued to cut the banks’ Reserve Requirement Ratio and the more aggressive monetary policy stance in Japan is positive for global liquidity.
The Fund has been positioned towards a cyclical upturn with overweight positions in Industrials, IT and Energy and underweight positions in Telecommunications, Utilities, Health Care and Consumer Staples. This is consistent with our bullish view that careful stock selection with a bias towards growth and cyclical exposures should stand to outperform.
Market Outlook:
During the first calendar quarter, Asia Pacific equity markets rose +12% which was in line with global equity markets. The standout performer was Japan which rose +18% while China rose +10%. The recovery in equity markets is consistent with our multi-year bull market thesis. In fact, this bull market looks very similar to those that began in 1982 and 1990. Confounding the bearish views are the combination of low valuations, good corporate profitability, easy monetary policy, and generally defensive investor positioning. We believe the next leg of the bull market in global equities should see key markets hit record highs. At this point, it is likely that investor positioning will turn much less defensive.
| | |
| Drexel Hamilton 8IP Asia Pacific Equity Fund | | Manager Commentary |
| | March 31, 2012 (Unaudited) |
In Asia, the yen weakened 10% and Japanese shares moved sharply higher after the introduction of the 1% inflation target and increased asset purchases by the Bank of Japan. China is lagging, as the easing measures have been very tentative to date despite inflation coming in below the Government’s target of 4%. Either growth is holding up better than the market expects or more aggressive easing will come soon. Both scenarios should see Chinese equities catch up with global equities.
We believe despite good recent performance Asian stock valuations are low. For example, KWG Property Holding Limited expects its property sales volumes to be higher in 2012 than 2011. This is due to bank lending being increased and mortgage rates decreased for first time home buyers. Despite all the bearish noise around Chinese property, end-user demand remains high as urbanization continues to drive people into the cities. KWG’s share price has risen strongly over the past 3 months but the stock is still only trading at 0.8x price-to-book. In 2007, it traded at over 4x price-to-book. We believe Asian stock valuations remain extremely attractive and we expect that the Asian markets will soon resume their structural outperformance of global equities.
RoE: The amount of net income returned as a percentage of shareholder equity. Return on equity measures a corporation’s profitability by revealing how much profit a company generates with the money shareholders have invested.
Alpha: A measure of performance on a risk-adjusted basis. The excess return of the fund relative to the return of the benchmark index is a fund’s alpha.
Price-to-book: A ratio used to compare stock market value to book value.
Quantitative easing: An unconventional monetary policy used by central banks to stimulate the national economy when conventional monetary policy has become ineffective.
The statements and opinions expressed are those of the Sub-Adviser and are as of the date of this report.
| | |
Semi-Annual Report | March 31, 2012 (Unaudited) | | 9 |
| | |
| Drexel Hamilton 8IP Asia Pacific Equity Fund | | Manager Commentary |
| | March 31, 2012 (Unaudited) |
SECTOR WEIGHTINGS
As a percentage of Net Assets
| | |
Financials | | 20.63% |
Industrials | | 18.45% |
Consumer, Cyclical | | 15.15% |
Basic Materials | | 11.79% |
Technology | | 10.42% |
Energy | | 9.46% |
Funds | | 3.97% |
Communications | | 3.76% |
Consumer, Non-cyclical | | 2.78% |
Financial | | 2.58% |
Currency | | 0.04% |
Cash & Equivalents | | 0.34% |
Other Assets & Liabilities | | 0.63% |
Total | | 100.00% |
COUNTRY WEIGHTINGS As a percentage of Net Assets |
Japan | | 40.57% |
Australia | | 13.20% |
China | | 9.11% |
South Korea | | 8.98% |
Singapore | | 7.43% |
Hong Kong | | 6.82% |
Taiwan | | 5.34% |
Thailand | | 2.57% |
Malaysia | | 1.98% |
Cayman Islands | | 1.76% |
Bermuda | | 1.27% |
Cash & Equivalents | | 0.97% |
Total | | 100.00% |
These sector and country allocations may not reflect the current or future positions of the portfolio. |
| | | | | | |
GROWTH OF HYPOTHETICAL $10,000 INVESTMENT AS OF MARCH 31, 2012 |
This graph assumes an initial investment of $10,000 at December 21, 2011, the Fund’s inception date, and that any dividends and distributions are reinvested. This graph depicts the performance of the Fund versus the MSCI All Country Pacific Total Return USD Index. It is important to note that the Fund is a professionally managed mutual fund while the index is not available for investment and is unmanaged and does not have expenses that affect the results. The comparison is shown for illustrative purposes only. CUMULATIVE TOTAL RETURNS – FOR THE PERIOD ENDED MARCH 31, 2012 |
| | | 1 Month | | 3 Month | | Since
Inception* |
Drexel Hamilton 8IP Asia Pacific Equity Fund | | -3.13% | | 14.26% | | 14.50% |
MSCI All Country Asia Pacific Total Return USD Index | | -1.33% | | 12.08% | | 12.78% |
The performance information quoted above represents past performance, which is not a guarantee of future results, and does not reflect the deduction of taxes that a shareholder would pay on Fund distributions or the redemption of Fund shares. Investment return and principal value of an investment will fluctuate so that an investor’s shares, when redeemed, may be worth more or less than their original cost. Total return includes reinvestment of dividends and capital gains. Current performance may be lower or higher than the performance data quoted. For the most current month-end performance data please call 855-298-4236 or visit www.dhipfunds.com. The total annual operating expense ratio (after expense reimbursements) as stated in the fee table of the most recent prospectus, dated November 16, 2011, was 1.25%. The Adviser has entered into a written expense limitation agreement through November 17, 2012 under which it has agreed to limit the total expenses of the Fund (excluding interest, taxes, litigation, brokerage, extraordinary expenses, and any transactions costs associated with short sales which may include but are not limited to brokerage commissions and dividends that are paid to persons from whom the Fund borrows securities) to an annual rate of 1.25% of the average net assets of the Fund. Without this waiver the total annual fund operating expenses of the fund would be 2.71%. Investing in the securities of foreign companies generally involves greater risk than investing in larger, more established domestic companies. Therefore, investments in the Fund may involve a greater degree of risk than investments in other mutual funds that invest in larger, more established domestic companies. The MSCI (Morgan Stanley Capital International) All Country Asia Pacific Total Return USD Index is an unmanaged, free float-adjusted market capitalization weighted index that is designed to measure the equity market performance of the developed and emerging markets in the Pacific region. You cannot invest directly in an index. * The Fund’s inception date was December 21, 2011. |
| | |
| Drexel Hamilton FOUR European Equity Fund | | Manager Commentary |
| | March 31, 2012 (Unaudited) |
The Drexel Hamilton FOUR European Equity Fund produced a total return of +15.67%, compared with its benchmark, the MSCI Europe Index, return of +10.81% during the three months ended March 31, 2012. The return of the Fund since inception is now +16.60% compared with the benchmark return of +13.66%. A mild recession in Europe in 2012 seems to have been discounted by investors. The focus of attention has shifted to the strength of the corporate sector, which in recent years has developed little dependence on the fortunes of domestic Europe.
Market Background:
European equity markets stormed out of the blocks during Q1 2012 to the surprise of many market professionals and pundits. The MSCI Europe Index surged by 10.81% in US dollar terms during the period under review. Notwithstanding the near euphoric start to the year by equities, economic news remains indifferent. Apart from the closely covered and anticipated budget statements from the UK and Spain, the situation in Europe remains unchanged. In other words, fears over the well documented trouble spots remain but a current lack of further bad news serves as a useful building block in the restoration of investor confidence. Indeed, the latter has facilitated further significant declines in the yields of 10 year government bonds of Italy and Spain in particular. This positive development has been firmly underpinned by a series of successful bond auctions during the period as those countries continue with their re-financing programs. The changing economic prospects have had little impact on currency movements during the past three months; major currencies have continued to trade within a narrow range. Overall, economic developments during the period may best be described as reassuring rather than inspirational.
In contrast to the muted economic data released during the period, the publication of FY 2011 results from the corporate sector has been universally positive. There continues to exist a strong misperception by global investors of a high correlation between European economic activity and the performance of European corporations. The extent to which European companies have evolved into truly global entities continues to be underestimated. In excess of 60 percent of turnover and operating profit are derived from outside of Europe by the largest European quoted companies. This number continues to grow and once again was a major factor behind the overwhelming number of positive earnings surprises published recently. In addition to this development the pronounced effect on cash flow and balance sheet strength is highly visible; a staggering number of European companies now boast net cash positions whilst many more should achieve surplus cash by year end 2012.
Investment Performance:
The pace of advance of European equity indices represents the strongest first quarter return in over a decade. Similarly to trading patterns during previous quarters the divergence of sector returns during the period under review was noteworthy and consistent with a market reflecting improving economic and corporate trends. The sectors that produced the strongest returns during the period were Autos (+31.6%), Financial Services (+19.9%), and insurance (+19.6%). Against this, the sectors that produced the worst returns were Telecommunications (+1.5%), Health Care (+2.7%), and Oil & Gas (+5.1%). The Fund carries relatively low exposure to Telecommunication Services and Healthcare. Exposure to the other aforementioned sectors remained broadly neutral. The portfolio holdings that produced the most positive contribution to performance during the period under review were Gemalto (+35.5%), Barclays PLC (+39.5%), Umicore (+33.3%), Infineon (+37.7%) and Volvo (+33.1%). Gemalto published a stunning set of FY 2011 results which exceeded market expectations in every respect. Particularly pleasing is the recovery of the original SIM Card business which is now not only poised to sustain mid to high-teen EBIT margins, but also to grow revenues in response to the onset of 4G. The share price of Barclays surged as investors sought to add quality financial names to their portfolios. The strength of recovery of Barclays’ share price is from exceptionally low levels. Umicore, Infineon, and Volvo are each positively correlated to improving global economic activity. We would also argue that additionally each company possesses unique characteristics which reflect its own merits. The stocks that detracted the most from the Fund’s relative performance during the period under review were Novozymes (-4.7%), Vodafone (-0.8%), Eutelsat (-5.4%), Gas Natural (-4.5%) and Julius Baer (+3.0%). Absence from index heavyweights Daimler (+38%) and BASF (+25%) similarly weighted on performance.
Investment Outlook:
It has already been stated that the pace of advance of European equity markets during the period under review has exceeded most expectations. It would be unreasonable to expect a repeat performance during the next three months. We anticipate markets to achieve higher levels by year end 2012. We had previously presented a thesis which argued for a modest rise in markets during the course of calendar year 2012. We concurred with the consensus macro-economic view we presented a strong argument to suggest that European equity markets index levels and valuations at the time were discounting a worst case scenario vis-a-vis the development of corporate earnings during 2012. Our macro-economic view for Europe is that the robustness of Germany and Northern Europe will continue to mitigate the trouble spots of Southern Europe. We continue to believe that economic activity throughout Europe is currently bumping along the bottom and will begin to show tangible signs of recovery by Q4 2012. Against this fragile background markets will remain vulnerable to investors’ jitters in the event of negative macro-economic developments and cautious optimism. Our view is reinforced by the strength of the FY 2011 corporate reporting season during the period under review. In an otherwise uneventful, yet fruitful, economic environment a significant number of European companies across a range of industries have again demonstrated the ability to improve operating efficiencies, including noteworthy reductions in working capital. Free cash flow has again grown materially. Subsequently, shareholder returns continue to increase. We expect this trend to continue and to far exceed current consensus expectations. The financial health of Corporate Europe similarly paves the way for potentially increased corporate activity which we expect to accelerate henceforth.
EBIT Margins: Earnings Before Interest Taxes Margins, metric used to assess a company’s profitability by comparing its revenue with earnings.
Free Cash Flow: A measure of financial performance calculated as operating cash flow minus capital expenditures.
The statements and opinions expressed are those of the Sub-Adviser and are as of the date of this report.
| | |
Semi-Annual Report | March 31, 2012 (Unaudited) | | 11 |
| | |
| Drexel Hamilton FOUR European Equity Fund | | Manager Commentary |
| | March 31, 2012 (Unaudited) |
SECTOR WEIGHTINGS
As a percentage of Net Assets
| | |
Consumer, Non-cyclical | | 22.32% |
Financials | | 20.85% |
Industrials | | 15.59% |
Technology | | 10.74% |
Energy | | 8.69% |
Basic Materials | | 8.41% |
Consumer, Cyclical | | 5.17% |
Communications | | 5.02% |
Utilities | | 2.67% |
Currency | | 0.04% |
Cash & Equivalents | | 0.32% |
Other Assets & Liabilities | | 0.18% |
Total | | 100.00% |
COUNTRY WEIGHTINGS As a percentage of Net Assets |
Great Britain | | 25.40% |
Switzerland | | 17.10% |
France | | 14.44% |
Sweden | | 6.45% |
Germany | | 6.41% |
Netherlands | | 6.28% |
Spain | | 4.60% |
Italy | | 4.16% |
Denmark | | 4.04% |
Finland | | 3.15% |
Belgium | | 3.00% |
Norway | | 1.95% |
Jersey | | 1.42% |
Ireland | | 1.10% |
Cash & Equivalents | | 0.50% |
Total | | 100.00% |
These sector and country allocations may not reflect the current or future positions of the portfolio. |
| | | | | | |
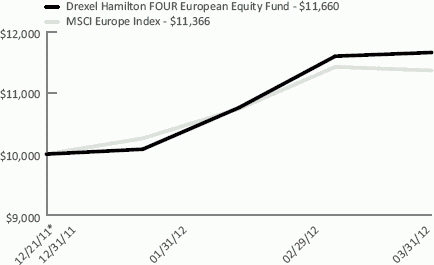
GROWTH OF HYPOTHETICAL $10,000 INVESTMENT AS OF MARCH 31, 2012 |
|
| | | | | | |
This graph assumes an initial investment of $10,000 at December 21, 2011, the Fund’s inception date, and that any dividends and distributions are reinvested. This graph depicts the performance of the Fund versus the MSCI Europe Index. It is important to note that the Fund is a professionally managed mutual fund while the index is not available for investment and is unmanaged and does not have expenses that affect the results. The comparison is shown for illustrative purposes only. |
| | | | | | |
CUMULATIVE TOTAL RETURNS – FOR THE PERIOD ENDED MARCH 31, 2012 |
| | | 1 Month | | 3 Month | | Since Inception* |
Drexel Hamilton FOUR European Equity Fund | | 0.52% | | 15.67% | | 16.60% |
MSCI Europe Index | | -0.52% | | 10.81% | | 13.66% |
The performance information quoted above represents past performance, which is not a guarantee of future results, and does not reflect the deduction of taxes that a shareholder would pay on Fund distributions or the redemption of Fund shares. Investment return and principal value of an investment will fluctuate so that an investor’s shares, when redeemed, may be worth more or less than their original cost. Current performance may be lower or higher than the performance data quoted. For the most current month-end performance data please call 855-298-4236 or visit www.dhipfunds.com. The total annual operating expense ratio (after expense reimbursements) as stated in the fee table of the most recent prospectus, dated November 16, 2011, was 1.25%. The Adviser has entered into a written expense limitation agreement through November 17, 2012 under which it has agreed to limit the total expenses of the Fund (excluding interest, taxes, litigation, brokerage, extraordinary expenses, and any transactions costs associated with short sales which may include but are not limited to brokerage commissions and dividends that are paid to persons from whom the Fund borrows securities) to an annual rate of 1.25% of the average net assets of the Fund. Without this waiver the total annual fund operating expenses of the fund would be 2.71%. Total return includes reinvestment of dividends and capital gains. Investing in the securities of foreign companies generally involves greater risk than investing in larger, more established domestic companies. Therefore, investments in the Fund may involve a greater degree of risk than investments in other mutual funds that invest in larger, more established domestic companies. The MSCI (Morgan Stanley Capital International) Europe Index is an unmanaged, free float-adjusted market capitalization weighted index that is designed to measure the equity market performance of the developed markets in Europe. You cannot invest directly in an index. * The Fund’s inception date was December 21, 2011. |
| | |
| Drexel Hamilton Mutual Funds | | Disclosure of Fund Expenses |
| | March 31, 2012 (Unaudited) |
As a shareholder of a series of Drexel Hamilton Mutual Funds (each series, a “Fund” and together, the “Funds”), you will incur two types of costs: (1) transaction costs, including applicable redemption fees; and (2) ongoing costs, including management fees and other Fund expenses. The following examples are intended to help you understand your ongoing costs (in dollars) of investing in the Fund and to compare these costs with the ongoing costs of investing in other mutual funds. The examples are based on an investment of $1,000 invested on October 1, 2011 and held until March 31, 2012.
Actual Expenses. The first line of each table below provides information about actual account values and actual expenses. You may use the information in this line, together with the amount you invested, to estimate the expenses that you paid over the period. Simply divide your account value by $1,000 (for example, an $8,600 account value divided by $1,000 = 8.6), then multiply the result by the number in the first line under the heading “Expenses Paid During Period” to estimate the expenses you paid on your account during this period.
Hypothetical Example for Comparison Purposes. The second line of the table below provides information about hypothetical account values and hypothetical expenses based on the Fund’s actual expense ratio and an assumed rate of return of 5% per year before expenses, which is not the Fund’s actual return. The hypothetical account values and expenses may not be used to estimate the actual ending account balance or expenses you paid for the period. You may use this information to compare the ongoing costs of investing in the Fund and other funds. To do so, compare this 5% hypothetical example with the 5% hypothetical examples that appear in the shareholder reports of the other funds. The expenses shown in the table are meant to highlight ongoing Fund costs only and do not reflect transaction fees, such as redemption fees or exchange fees. Therefore, the second line of each table below is useful in comparing ongoing costs only, and may not help you determine the relative total costs of owning different funds. In addition, if these transactional costs were included, your costs would have been higher.
Please note that the expenses shown in the table below are meant to highlight your ongoing costs only and do not reflect any transactional costs, such as redemption fees. Therefore, the second line for each Fund within the table is useful in comparing ongoing costs only, and will not help you determine the relative total costs of owning different funds. If these transactional costs were included, your costs would have been higher.
| | | | | | | | | | | | | | | | |
| | | BEGINNING
ACCOUNT VALUE
10/01/11 | | | ENDING
ACCOUNT VALUE
03/31/12 | | | EXPENSE RATIO(a) | | | EXPENSES PAID
DURING PERIOD
10/01/11-
03/31/12(b) | |
Drexel Hamilton Centre American Equity Fund | | | | | | | | | | | | | | | | |
Actual | | $ | 1,000.00 | | | $ | 1,155.00 | | | | 1.25 | % | | $ | 3.72 | |
Hypothetical (5% return before expenses)(c) | | $ | 1,000.00 | | | $ | 1,018.75 | | | | 1.25 | % | | $ | 6.31 | |
| | | | |
Drexel Hamilton Centre Global Equity Fund | | | | | | | | | | | | | | | | |
Actual | | $ | 1,000.00 | | | $ | 1,133.00 | | | | 1.25 | % | | $ | 3.68 | |
Hypothetical (5% return before expenses)(c) | | $ | 1,000.00 | | | $ | 1,018.75 | | | | 1.25 | % | | $ | 6.31 | |
| | | | |
Drexel Hamilton 8IP Asia Pacific Equity Fund | | | | | | | | | | | | | | | | |
Actual | | $ | 1,000.00 | | | $ | 1,146.00 | | | | 1.25 | % | | $ | 3.70 | |
Hypothetical (5% return before expenses)(c) | | $ | 1,000.00 | | | $ | 1,018.75 | | | | 1.25 | % | | $ | 6.31 | |
| | | | |
Drexel Hamilton FOUR European Equity Fund | | | | | | | | | | | | | | | | |
Actual | | $ | 1,000.00 | | | $ | 1,165.00 | | | | 1.25 | % | | $ | 3.73 | |
Hypothetical (5% return before expenses)(c) | | $ | 1,000.00 | | | $ | 1,018.75 | | | | 1.25 | % | | $ | 6.31 | |
| (a) | Annualized, based on the Fund’s most recent fiscal half year expenses. |
| (b) | The Fund began operations on December 21, 2011. |
| (c) | Expenses are equal to the Fund’s annualized expense ratio multiplied by the average account value over the period, multiplied by the number of days in the most recent fiscal half year (183), then divided by 366. |
| | |
Semi-Annual Report | March 31, 2012 (Unaudited) | | 13 |
| | |
| Drexel Hamilton Centre American Equity Fund | | Schedule of Investments |
| | March 31, 2012 (Unaudited) |
| | | | | | | | |
| | | Shares | | | Value | |
| |
COMMON STOCKS (99.49%) | | | | | | | | |
Basic Materials (4.01%) | | | | | | | | |
Chemicals (2.23%) | | | | | | | | |
Huntsman Corp. | | | 12,940 | | | $ | 181,289 | |
Monsanto Co. | | | 4,340 | | | | 346,159 | |
| | | | | | | | |
| | | | | | | 527,448 | |
| | | | | | | | |
Iron & Steel (1.78%) | | | | | | | | |
Allegheny Technologies, Inc. | | | 4,620 | | | | 190,205 | |
Nucor Corp. | | | 5,420 | | | | 232,789 | |
| | | | | | | | |
| | | | | | | 422,994 | |
| | | | | | | | |
Total Basic Materials | | | | | | | 950,442 | |
| | | | | | | | |
| | |
Communications (9.31%) | | | | | | | | |
Advertising (1.66%) | | | | | | | | |
Interpublic Group of Cos., Inc. | | | 16,490 | | | | 188,151 | |
Omnicom Group, Inc. | | | 4,060 | | | | 205,639 | |
| | | | | | | | |
| | | | | | | 393,790 | |
| | | | | | | | |
Internet (5.95%) | | | | | | | | |
Amazon.com, Inc.(a) | | | 2,160 | | | | 437,422 | |
F5 Networks, Inc.(a) | | | 1,740 | | | | 234,830 | |
Google, Inc., Class A(a) | | | 1,150 | | | | 737,426 | |
| | | | | | | | |
| | | | | | | 1,409,678 | |
| | | | | | | | |
Telecommunications (1.70%) | | | | | | | | |
Polycom, Inc.(a) | | | 10,520 | | | | 200,616 | |
Verizon Communications, Inc. | | | 5,260 | | | | 201,090 | |
| | | | | | | | |
| | | | | | | 401,706 | |
| | | | | | | | |
Total Communications | | | | | | | 2,205,174 | |
| | | | | | | | |
| | |
Consumer, Cyclical (13.81%) | | | | | | | | |
Airlines (1.77%) | | | | | | | | |
Delta Air Lines, Inc.(a) | | | 22,020 | | | | 218,218 | |
United Continental Holdings, Inc.(a) | | | 9,330 | | | | 200,595 | |
| | | | | | | | |
| | | | | | | 418,813 | |
| | | | | | | | |
| | |
Apparel (1.07%) | | | | | | | | |
Coach, Inc. | | | 3,280 | | | | 253,478 | |
| | | | | | | | |
| | |
Auto Manufacturers (0.95%) | | | | | | | | |
PACCAR, Inc. | | | 4,820 | | | | 225,721 | |
| | | | | | | | |
| | |
Entertainment (0.75%) | | | | | | | | |
International Game Technology | | | 10,560 | | | | 177,303 | |
| | | | | | | | |
| | |
Leisure Time (0.95%) | | | | | | | | |
Harley-Davidson, Inc. | | | 4,590 | | | | 225,277 | |
| | | | | | | | |
| | |
Lodging (0.88%) | | | | | | | | |
MGM Resorts International(a) | | | 15,390 | | | | 209,612 | |
| | | | | | | | |
| | |
Retail (6.68%) | | | | | | | | |
Macy’s, Inc. | | | 4,980 | | | | 197,856 | |
McDonald’s Corp. | | | 4,180 | | | | 410,058 | |
Staples, Inc. | | | 12,300 | | | | 199,014 | |
Starbucks Corp. | | | 7,770 | | | | 434,265 | |
Wal-Mart Stores, Inc. | | | 5,590 | | | | 342,108 | |
| | | | | | | | |
| | | | | | | 1,583,301 | |
| | | | | | | | |
| | | | | | | | |
| | | Shares | | | Value | |
| |
Consumer, Cyclical (continued) | | | | | | | | |
Textiles (0.76%) | | | | | | | | |
Cintas Corp. | | | 4,610 | | | $ | 180,343 | |
| | | | | | | | |
| | |
Total Consumer, Cyclical | | | | | | | 3,273,848 | |
| | | | | | | | |
| | |
Consumer, Non-cyclical (28.50%) | | | | | | | | |
Agriculture (3.62%) | | | | | | | | |
Philip Morris International, Inc. | | | 7,330 | | | | 649,511 | |
Reynolds American, Inc. | | | 5,010 | | | | 207,615 | |
| | | | | | | | |
| | | | | | | 857,126 | |
| | | | | | | | |
Beverages (5.39%) | | | | | | | | |
Coca-Cola Co. | | | 10,260 | | | | 759,343 | |
PepsiCo, Inc. | | | 7,820 | | | | 518,857 | |
| | | | | | | | |
| | | | | | | 1,278,200 | |
| | | | | | | | |
Biotechnology (1.54%) | | | | | | | | |
Amgen, Inc. | | | 5,370 | | | | 365,106 | |
| | | | | | | | |
| | |
Commercial Services (3.90%) | | | | | | | | |
Manpower, Inc. | | | 4,490 | | | | 212,691 | |
Robert Half International, Inc. | | | 6,410 | | | | 194,223 | |
Total System Services, Inc. | | | 8,420 | | | | 194,250 | |
Visa, Inc. | | | 2,730 | | | | 322,140 | |
| | | | | | | | |
| | | | | | | 923,304 | |
| | | | | | | | |
| | |
Cosmetics & Personal Care (2.45%) | | | | | | | | |
Procter & Gamble Co. | | | 8,650 | | | | 581,367 | |
| | | | | | | | |
| | |
Healthcare-Products (2.75%) | | | | | | | | |
Boston Scientific Corp.(a) | | | 33,410 | | | | 199,792 | |
St Jude Medical, Inc. | | | 5,310 | | | | 235,286 | |
Zimmer Holdings, Inc. | | | 3,380 | | | | 217,266 | |
| | | | | | | | |
| | | | | | | 652,344 | |
| | | | | | | | |
| | |
Healthcare-Services (1.39%) | | | | | | | | |
UnitedHealth Group, Inc. | | | 5,580 | | | | 328,885 | |
| | | | | | | | |
| | |
Pharmaceuticals (7.46%) | | | | | | | | |
Abbott Laboratories | | | 10,820 | | | | 663,158 | |
Johnson & Johnson | | | 10,960 | | | | 722,921 | |
Merck & Co., Inc | | | 9,930 | | | | 381,312 | |
| | | | | | | | |
| | | | | | | 1,767,391 | |
| | | | | | | | |
Total Consumer, Non-cyclical | | | | | | | 6,753,723 | |
| | | | | | | | |
| | |
Energy (9.08%) | | | | | | | | |
Oil & Gas (9.08%) | | | | | | | | |
Chevron Corp. | | | 3,120 | | | | 334,589 | |
Exxon Mobil Corp. | | | 11,820 | | | | 1,025,149 | |
Occidental Petroleum Corp. | | | 3,770 | | | | 359,017 | |
Schlumberger, Ltd. | | | 6,210 | | | | 434,265 | |
| | | | | | | | |
| | | | | | | 2,153,020 | |
| | | | | | | | |
Total Energy | | | | | | | 2,153,020 | |
| | | | | | | | |
| | |
Financials (6.52%) | | | | | | | | |
Banks (6.52%) | | | | | | | | |
BB&T Corp. | | | 6,360 | | | | 199,640 | |
Capital One Financial Corp. | | | 3,160 | | | | 176,138 | |
| | |
| Drexel Hamilton Centre American Equity Fund | | Schedule of Investments |
| | March 31, 2012 (Unaudited) |
| | | | | | | | |
| | | Shares | | | Value | |
| |
Financials (continued) | | | | | | | | |
Fifth Third Bancorp | | | 12,470 | | | $ | 175,204 | |
KeyCorp | | | 21,090 | | | | 179,265 | |
SunTrust Banks, Inc. | | | 9,070 | | | | 219,222 | |
US Bancorp | | | 6,440 | | | | 204,019 | |
Wells Fargo & Co. | | | 5,260 | | | | 179,576 | |
Zions Bancorporation | | | 9,860 | | | | 211,596 | |
| | | | | | | | |
| | | | | | | 1,544,660 | |
| | | | | | | | |
Total Financials | | | | | | | 1,544,660 | |
| | | | | | | | |
| | |
Industrials (7.21%) | | | | | | | | |
Aerospace/Defense (0.76%) | | | | | | | | |
United Technologies Corp. | | | 2,160 | | | | 179,150 | |
| | | | | | | | |
| | |
Electronics (1.31%) | | | | | | | | |
Honeywell International, Inc. | | | 5,090 | | | | 310,745 | |
| | | | | | | | |
| | |
Machinery, Construction & Mining (1.60%) | | | | | | | | |
Caterpillar, Inc. | | | 3,570 | | | | 380,276 | |
| | | | | | | | |
| | |
Miscellaneous Manufacturing (1.52%) | | | | | | | | |
General Electric Co. | | | 8,910 | | | | 178,824 | |
Textron, Inc. | | | 6,530 | | | | 181,730 | |
| | | | | | | | |
| | | | | | | 360,554 | |
| | | | | | | | |
Transportation (2.02%) | | | | | | | | |
Union Pacific Corp. | | | 2,090 | | | | 224,633 | |
United Parcel Service, Inc., Class B | | | 3,140 | | | | 253,461 | |
| | | | | | | | |
| | | | | | | 478,094 | |
| | | | | | | | |
Total Industrials | | | | | | | 1,708,819 | |
| | | | | | | | |
| | |
Technology (21.05%) | | | | | | | | |
Computers (12.93%) | | | | | | | | |
Apple, Inc.(a) | | | 3,500 | | | | 2,098,145 | |
International Business Machines Corp. | | | 4,630 | | | | 966,049 | |
| | | | | | | | |
| | | | | | | 3,064,194 | |
| | | | | | | | |
Semiconductors (3.37%) | | | | | | | | |
Advanced Micro Devices, Inc.(a) | | | 21,800 | | | | 174,836 | |
Intel Corp. | | | 6,660 | | | | 187,213 | |
QUALCOMM, Inc. | | | 6,420 | | | | 436,688 | |
| | | | | | | | |
| | | | | | | 798,737 | |
| | | | | | | | |
Software (4.75%) | | | | | | | | |
Akamai Technologies, Inc.(a) | | | 6,090 | | | | 223,503 | |
Microsoft Corp. | | | 17,650 | | | | 569,213 | |
Oracle Corp. | | | 11,440 | | | | 333,590 | |
| | | | | | | | |
| | | | | | | 1,126,306 | |
| | | | | | | | |
Total Technology | | | | | | | 4,989,237 | |
| | | | | | | | |
| | |
TOTAL COMMON STOCKS (Cost $20,961,871) | | | | | | | 23,578,923 | |
| |
| | | | | | | | | | | | |
| | | 7-Day Yield | | | Shares | | | Value | |
| |
SHORT TERM INVESTMENTS (0.40%) | | | | | |
Money Market Fund (0.40%) | | | | | | | | | |
Dreyfus Treasury | | | | | | | | | | | | |
Prime Cash Management, Institutional Class | | | 0.00004 | % | | | 94,839 | | | $ | 94,839 | |
| | | | | | | | | | | | |
| |
TOTAL SHORT TERM INVESTMENTS (Cost $94,839) | | | | 94,839 | |
| |
| |
TOTAL INVESTMENTS (Cost $21,056,710) (99.89%) | | | $ | 23,673,762 | |
| |
Other Assets In Excess Of Liabilities (0.11%) | | | | 25,748 | |
| |
NET ASSETS (100.00%) | | | $ | 23,699,510 | |
| | |
| (a) | Non-income producing security. |
Common Abbreviations:
Ltd. - Limited.
See Notes to Financial Statements.
| | |
Semi-Annual Report | March 31, 2012 (Unaudited) | | 15 |
| | |
| Drexel Hamilton Centre Global Equity Fund | | Schedule of Investments |
| | March 31, 2012 (Unaudited) |
| | | | | | | | |
| | | Shares | | | Value | |
| |
COMMON STOCKS (94.24%) | | | | | | | | |
ASIA (24.49% ) | | | | | | | | |
Australia (2.59%) | | | | | | | | |
Basic Materials (0.96%) | | | | | | | | |
BHP Billiton, Ltd. | | | 3,157 | | | $ | 113,181 | |
| | | | | | | | |
| | |
Communications (1.63%) | | | | | | | | |
Telstra Corp., Ltd. | | | 56,740 | | | | 193,367 | |
| | | | | | | | |
| | |
Total Australia | | | | | | | 306,548 | |
| | | | | | | | |
| | |
Bermuda (1.61%) | | | | | | | | |
Consumer, Cyclical (1.61%) | | | | | | | | |
Li & Fung Ltd. | | | 83,000 | | | | 190,464 | |
| | | | | | | | |
| | |
Total Bermuda | | | | | | | 190,464 | |
| | | | | | | | |
| | |
China (10.76%) | | | | | | | | |
Communications (2.79%) | | | | | | | | |
China Mobile, Ltd. | | | 16,900 | | | | 185,963 | |
Tencent Holdings, Ltd. | | | 5,200 | | | | 145,041 | |
| | | | | | | | |
| | | | | | | 331,004 | |
| | | | | | | | |
Energy (3.78%) | | | | | | | | |
China Petroleum & Chemical Corp., Class H | | | 100,500 | | | | 109,487 | |
China Shenhua Energy Co., Ltd., Class H | | | 19,000 | | | | 80,129 | |
CNOOC, Ltd. | | | 69,000 | | | | 141,811 | |
PetroChina Co. Ltd., Class H | | | 82,200 | | | | 116,226 | |
| | | | | | | | |
| | | | | | | 447,653 | |
| | | | | | | | |
Financials (4.19%) | | | | | | | | |
Bank of China Ltd., Class H | | | 300,300 | | | | 121,040 | |
China Construction Bank Corp., Class H | | | 187,500 | | | | 144,871 | |
China Life Insurance Co., Ltd.,
Class H | | | 41,000 | | | | 106,386 | |
Industrial & Commercial Bank of China, Class H | | | 193,900 | | | | 125,096 | |
| | | | | | | | |
| | | | | | | 497,393 | |
| | | | | | | | |
Total China | | | | | | | 1,276,050 | |
| | | | | | | | |
| | |
India (0.79%) | | | | | | | | |
Technology (0.79%) | | | | | | | | |
Infosys Ltd., Sponsored ADR | | | 1,650 | | | | 94,099 | |
| | | | | | | | |
| | |
Total India | | | | | | | 94,099 | |
| | | | | | | | |
| | |
Indonesia (1.13%) | | | | | | | | |
Consumer, Cyclical (1.13%) | | | | | | | | |
Astra International Tbk PT | | | 16,500 | | | | 133,440 | |
| | | | | | | | |
| | |
Total Indonesia | | | | | | | 133,440 | |
| | | | | | | | |
| | |
Japan (3.77%) | | | | | | | | |
Consumer, Cyclical (2.09%) | | | | | | | | |
Honda Motor Co., Ltd. | | | 3,000 | | | | 113,990 | |
Toyota Motor Corp. | | | 3,100 | | | | 133,708 | |
| | | | | | | | |
| | | | | | | 247,698 | |
| | | | | | | | |
| | | | | | | | |
| | | Shares | | | Value | |
| |
Japan (continued) | | | | | | | | |
Financials (0.96%) | | | | | | | | |
Mitsubishi UFJ Financial Group, Inc. | | | 22,900 | | | $ | 113,988 | |
| | | | | | | | |
| | |
Technology (0.72%) | | | | | | | | |
Canon, Inc. | | | 1,800 | | | | 85,031 | |
| | | | | | | | |
| | |
Total Japan | | | | | | | 446,717 | |
| | | | | | | | |
| | |
Singapore (0.76%) | | | | | | | | |
Financials (0.76%) | | | | | | | | |
DBS Group Holdings, Ltd. | | | 8,000 | | | | 90,243 | |
| | | | | | | | |
| | |
Total Singapore | | | | | | | 90,243 | |
| | | | | | | | |
| | |
South Korea (1.23%) | | | | | | | | |
Technology (1.23%) | | | | | | | | |
Samsung Electronics Co., Ltd.(a) | | | 130 | | | | 146,287 | |
| | | | | | | | |
| | |
Total South Korea | | | | | | | 146,287 | |
| | | | | | | | |
| | |
Taiwan (0.92%) | | | | | | | | |
Technology (0.92%) | | | | | | | | |
Taiwan Semiconductor Manufacturing Co., Ltd. | | | 38,100 | | | | 109,597 | |
| | | | | | | | |
| | |
Total Taiwan | | | | | | | 109,597 | |
| | | | | | | | |
| | |
Thailand (0.93%) | | | | | | | | |
Communications (0.93%) | | | | | | | | |
Advanced Info Service Pcl | | | 18,400 | | | | 109,744 | |
| | | | | | | | |
| | |
Total Thailand | | | | | | | 109,744 | |
| | | | | | | | |
| | |
TOTAL ASIA | | | | | | | | |
(Cost $2,600,375) | | | | | | | 2,903,189 | |
| |
| | |
EUROPE (34.00%) | | | | | | | | |
Belgium (1.16%) | | | | | | | | |
Consumer, Non-cyclical (1.16%) | | | | | | | | |
Anheuser-Busch InBev NV | | | 1,878 | | | | 137,208 | |
| | | | | | | | |
| | |
Total Belgium | | | | | | | 137,208 | |
| | | | | | | | |
| | |
Denmark (1.03%) | | | | | | | | |
Consumer, Non-cyclical (1.03%) | | | | | | | | |
Novo Nordisk A/S, Class B | | | 882 | | | | 122,116 | |
| | | | | | | | |
| | |
Total Denmark | | | | | | | 122,116 | |
| | | | | | | | |
| | |
France (3.02%) | | | | | | | | |
Consumer, Cyclical (0.78%) | | | | | | | | |
Christian Dior SA | | | 600 | | | | 92,066 | |
| | | | | | | | |
| | |
| Drexel Hamilton Centre Global Equity Fund | | Schedule of Investments |
| | March 31, 2012 (Unaudited) |
| | | | | | | | |
| | | Shares | | | Value | |
| |
France (continued) | | | | | | | | |
Consumer, Non-cyclical (0.47%) | | | | | | | | |
Sanofi | | | 713 | | | $ | 55,373 | |
| | | | | | | | |
| | |
Energy (1.00%) | | | | | | | | |
Total SA | | | 2,317 | | | | 118,169 | |
| | | | | | | | |
| | |
Technology (0.77%) | | | | | | | | |
Dassault Systemes SA | | | 1,000 | | | | 92,012 | |
| | | | | | | | |
| | |
Total France | | | | | | | 357,620 | |
| | | | | | | | |
| | |
Germany (7.17%) | | | | | | | | |
Basic Materials (1.71%) | | | | | | | | |
BASF SE | | | 1,660 | | | | 145,213 | |
Bayer AG | | | 815 | | | | 57,327 | |
| | | | | | | | |
| | | | | | | 202,540 | |
| | | | | | | | |
Consumer, Cyclical (2.17%) | | | | | | | | |
Continental AG(a) | | | 1,080 | | | | 101,937 | |
Daimler AG | | | 2,574 | | | | 155,204 | |
| | | | | | | | |
| | | | | | | 257,141 | |
| | | | | | | | |
Financials (0.89%) | | | | | | | | |
Allianz SE | | | 883 | | | | 105,366 | |
| | | | | | | | |
| | |
Industrials (1.14%) | | | | | | | | |
Siemens AG | | | 1,336 | | | | 134,689 | |
| | | | | | | | |
| | |
Technology (0.78%) | | | | | | | | |
SAP AG | | | 1,332 | | | | 93,017 | |
| | | | | | | | |
| | |
Utilities (0.48%) | | | | | | | | |
E.ON AG | | | 2,367 | | | | 56,698 | |
| | | | | | | | |
| | |
Total Germany | | | | | | | 849,451 | |
| | | | | | | | |
| | |
Great Britain (4.65%) | | | | | | | | |
Communications (0.68%) | | | | | | | | |
Vodafone Group Plc | | | 29,309 | | | | 80,726 | |
| | | | | | | | |
| | |
Consumer, Non-cyclical (1.14%) | | | | | | | | |
British American Tobacco Plc | | | 2,682 | | | | 135,151 | |
| | | | | | | | |
| | |
Energy (1.50%) | | | | | | | | |
BG Group Plc | | | 4,400 | | | | 101,907 | |
BP Plc | | | 10,198 | | | | 75,449 | |
| | | | | | | | |
| | | | | | | 177,356 | |
| | | | | | | | |
Financials (1.33%) | | | | | | | | |
Barclays Plc | | | 26,300 | | | | 98,961 | |
HSBC Holdings Plc | | | 6,588 | | | | 58,462 | |
| | | | | | | | |
| | | | | | | 157,423 | |
| | | | | | | | |
Total Great Britain | | | | | | | 550,656 | |
| | | | | | | | |
| | | | | | | | |
| | | Shares | | | Value | |
| |
Israel (1.82%) | | | | | | | | |
Consumer, Non-cyclical (1.82%) | | | | | | | | |
Teva Pharmaceutical Industries, Ltd., Sponsored ADR | | | 4,800 | | | $ | 216,288 | |
| | | | | | | | |
| | |
Total Israel | | | | | | | 216,288 | |
| | | | | | | | |
| | |
Italy (2.82%) | | | | | | | | |
Energy (1.34%) | | | | | | | | |
ENI SpA | | | 6,799 | | | | 159,504 | |
| | | | | | | | |
| | |
Financials (0.73%) | | | | | | | | |
Assicurazioni Generali SpA | | | 5,573 | | | | 86,517 | |
| | | | | | | | |
| | |
Utilities (0.75%) | | | | | | | | |
Enel SpA | | | 24,520 | | | | 88,689 | |
| | | | | | | | |
| | |
Total Italy | | | | | | | 334,710 | |
| | | | | | | | |
| | |
Jersey (1.63%) | | | | | | | | |
Consumer, Cyclical (0.80%) | | | | | | | | |
Wolseley Plc | | | 2,500 | | | | 95,330 | |
| | | | | | | | |
| | |
Consumer, Non-cyclical (0.83%) | | | | | | | | |
Experian Plc | | | 6,300 | | | | 98,198 | |
| | | | | | | | |
| | |
Total Jersey | | | | | | | 193,528 | |
| | | | | | | | |
| | |
Netherlands (3.47%) | | | | | | | | |
Consumer, Non-cyclical (0.47%) | | | | | | | | |
Unilever NV | | | 1,644 | | | | 55,945 | |
| | | | | | | | |
| | |
Industrials (2.07%) | | | | | | | | |
European Aeronautic Defence and Space Co. NV | | | 6,000 | | | | 245,709 | |
| | | | | | | | |
| | |
Technology (0.93%) | | | | | | | | |
ASML Holding NV | | | 2,200 | | | | 109,972 | |
| | | | | | | | |
| | |
Total Netherlands | | | | | | | 411,626 | |
| | | | | | | | |
| | |
Russia (2.79%) | | | | | | | | |
Energy (1.97%) | | | | | | | | |
Gazprom OAO, Sponsored ADR | | | 11,515 | | | | 140,483 | |
Lukoil OAO, Sponsored ADR | | | 1,534 | | | | 92,347 | |
| | | | | | | | |
| | | | | | | 232,830 | |
| | | | | | | | |
| | |
Financials (0.82%) | | | | | | | | |
Sberbank of Russia, Sponsored ADR(a) | | | 7,567 | | | | 97,389 | |
| | | | | | | | |
| | |
Total Russia | | | | | | | 330,219 | |
| | | | | | | | |
| | |
Spain (2.84%) | | | | | | | | |
Communications (0.44%) | | | | | | | | |
Telefonica SA | | | 3,230 | | | | 52,922 | |
| | | | | | | | |
| | |
Semi-Annual Report | March 31, 2012 (Unaudited) | | 17 |
| | |
| Drexel Hamilton Centre Global Equity Fund | | Schedule of Investments |
| | March 31, 2012 (Unaudited) |
| | | | | | | | |
| | | Shares | | | Value | |
| |
Spain (continued) | | | | | | | | |
Consumer, Cyclical (0.85%) | | | | | | | | |
Inditex SA | | | 1,050 | | | $ | 100,576 | |
| | | | | | | | |
| | |
Financials (1.55%) | | | | | | | | |
Banco Bilbao Vizcaya Argentaria SA | | | 11,830 | | | | 94,146 | |
Banco Santander SA | | | 11,599 | | | | 89,260 | |
| | | | | | | | |
| | | | | | | 183,406 | |
| | | | | | | | |
Total Spain | | | | | | | 336,904 | |
| | | | | | | | |
| | |
Switzerland (1.60%) | | | | | | | | |
Basic Materials (1.60%) | | | | | | | | |
Syngenta AG(a) | | | 550 | | | | 190,157 | |
| | | | | | | | |
| | |
Total Switzerland | | | | | | | 190,157 | |
| | | | | | | | |
| | |
TOTAL EUROPE (Cost $3,637,513) | | | | | | | 4,030,483 | |
| |
| | |
NORTH AMERICA (32.24%) | | | | | | | | |
Cayman Islands (3.21%) | | | | | | | | |
Consumer, Cyclical (1.25%) | | | | | | | | |
Wynn Macau, Ltd. | | | 50,500 | | | | 147,620 | |
| | | | | | | | |
Consumer, Non-cyclical (1.96%) | | | | | | | | |
Hengan International Group Co. Ltd. | | | 23,000 | | | | 232,501 | |
| | | | | | | | |
| | |
Total Cayman Islands | | | | | | | 380,121 | |
| | | | | | | | |
| | |
Mexico (1.24%) | | | | | | | | |
Communications (1.24%) | | | | | | | | |
America Movil, Series L | | | 117,900 | | | | 146,709 | |
| | | | | | | | |
| | |
Total Mexico | | | | | | | 146,709 | |
| | | | | | | | |
| | |
United States (27.79%) | | | | | | | | |
Communications (3.97%) | | | | | | | | |
AT&T, Inc. | | | 3,980 | | | | 124,296 | |
Cisco Systems, Inc. | | | 5,600 | | | | 118,440 | |
Google, Inc., Class A(a) | | | 200 | | | | 128,248 | |
Verizon Communications, Inc. | | | 2,610 | | | | 99,780 | |
| | | | | | | | |
| | | | | | | 470,764 | |
| | | | | | | | |
Consumer, Cyclical (1.80%) | | | | | | | | |
McDonald’s Corp. | | | 1,100 | | | | 107,910 | |
Wal-Mart Stores, Inc. | | | 1,720 | | | | 105,264 | |
| | | | | | | | |
| | | | | | | 213,174 | |
| | | | | | | | |
Consumer, Non-cyclical (6.91%) | | | | | | | | |
Coca-Cola Co. | | | 1,300 | | | | 96,213 | |
Johnson & Johnson | | | 1,900 | | | | 125,324 | |
Merck & Co., Inc | | | 2,890 | | | | 110,976 | |
PepsiCo, Inc. | | | 1,500 | | | | 99,525 | |
Pfizer, Inc. | | | 5,800 | | | | 131,428 | |
Philip Morris International, Inc. | | | 1,400 | | | | 124,054 | |
Procter & Gamble Co. | | | 1,950 | | | | 131,060 | |
| | | | | | | | |
| | | | | | | 818,580 | |
| | | | | | | | |
| | | | | | | | |
| | | Shares | | | Value | |
| |
United States (continued) | | | | | | | | |
Energy (2.35%) | | | | | | | | |
Chevron Corp. | | | 900 | | | $ | 96,516 | |
Exxon Mobil Corp. | | | 2,100 | | | | 182,133 | |
| | | | | | | | |
| | | | | | | 278,649 | |
| | | | | | | | |
Financials (2.08%) | | | | | | | | |
JPMorgan Chase & Co. | | | 2,700 | | | | 124,146 | |
Wells Fargo & Co. | | | 3,600 | | | | 122,904 | |
| | | | | | | | |
| | | | | | | 247,050 | |
| | | | | | | | |
Industrials (3.11%) | | | | | | | | |
General Electric Co. | | | 7,100 | | | | 142,497 | |
United Parcel Service, Inc.,
Class B | | | 2,800 | | | | 226,016 | |
| | | | | | | | |
| | | | | | | 368,513 | |
| | | | | | | | |
Technology (7.57%) | | | | | | | | |
Apple, Inc.(a) | | | 410 | | | | 245,783 | |
Intel Corp. | | | 4,600 | | | | 129,306 | |
International Business Machines Corp. | | | 630 | | | | 131,449 | |
Microsoft Corp. | | | 2,300 | | | | 74,175 | |
Oracle Corp. | | | 2,000 | | | | 58,320 | |
QUALCOMM, Inc. | | | 3,800 | | | | 258,476 | |
| | | | | | | | |
| | | | | | | 897,509 | |
| | | | | | | | |
Total United States | | | | | | | 3,294,239 | |
| | | | | | | | |
| | |
TOTAL NORTH AMERICA (Cost $3,437,435) | | | | | | | 3,821,069 | |
| |
| | |
SOUTH AMERICA (3.51%) | | | | | | | | |
Brazil (3.51%) | | | | | | | | |
Financials (1.79%) | | | | | | | | |
Banco Bradesco SA, ADR | | | 5,890 | | | | 103,075 | |
Banco do Brasil SA | | | 7,700 | | | | 109,376 | |
| | | | | | | | |
| | | | | | | 212,451 | |
| | | | | | | | |
Utilities (1.72%) | | | | | | | | |
Cia de Saneamento Basico do Estado de Sao Paulo | | | 5,350 | | | | 203,719 | |
| | | | | | | | |
| | |
Total Brazil | | | | | | | 416,170 | |
| | | | | | | | |
| | |
TOTAL SOUTH AMERICA (Cost $384,691) | | | | | | | 416,170 | |
| |
| | |
TOTAL COMMON STOCKS (Cost $10,060,014) | | | | | | | 11,170,911 | |
| |
| | |
PREFERRED STOCKS (4.61%) | | | | | | | | |
SOUTH AMERICA (4.61%) | | | | | | | | |
Brazil (4.61%) | | | | | | | | |
Basic Materials (0.92%) | | | | | | | | |
Vale SA | | | 4,840 | | | | 109,503 | |
| | | | | | | | |
| | |
Consumer, Non-cyclical (2.06%) | | | | | | | | |
Cia de Bebidas das Americas | | | 5,900 | | | | 243,731 | |
| | | | | | | | |
| | |
| Drexel Hamilton Centre Global Equity Fund | | Schedule of Investments |
| | March 31, 2012 (Unaudited) |
| | | | | | | | | | | | |
| | | | | | Shares | | | Value | |
| |
Brazil (continued) | | | | | | | | | | | | |
Energy (0.85%) Petroleo Brasileiro SA | | | | 7,900 | | | $ | 100,619 | |
| | | | | | | | | | | | |
| | |
Financials (0.78%) Itau Unibanco Holding SA | | | | 4,810 | | | | 91,960 | |
| | | | | | | | | | | | |
| | | |
Total Brazil | | | | | | | | | | | 545,813 | |
| | | | | | | | | | | | |
| |
TOTAL SOUTH AMERICA (Cost $509,564) | | | | 545,813 | |
| |
| |
TOTAL PREFERRED STOCKS (Cost $509,564) | | | | 545,813 | |
| |
| | | |
| | | 7-Day Yield | | | Shares | | | Value | |
| |
SHORT TERM INVESTMENTS (0.87%) | | | | | |
Money Market Fund (0.87%) | |
Dreyfus Treasury Prime Cash Management, Institutional Class | | | 0.00004 | % | | | 103,829 | | | | 103,829 | |
| | | | | | | | | | | | |
| |
TOTAL SHORT TERM INVESTMENTS (Cost $103,829) | | | | 103,829 | |
| |
| |
TOTAL INVESTMENTS (Cost $10,673,407) (99.72%) | | | $ | 11,820,553 | |
| |
Other Assets In Excess Of Liabilities (0.28%) | | | | 32,780 | |
| |
NET ASSETS (100.00%) | | | $ | 11,853,333 | |
| |
| (a) | Non-income producing security. |
Common Abbreviations:
| | |
ADR - | | American Depository Receipt. |
AG - | | Aktiengesellschaft is a German term that refers to a corporation that is limited by shares, i.e., owned by shareholders. |
A/S - | | Aktieselskab is the Danish term for Joint Stock Company. |
Ltd. - | | Limited. |
NV - | | Naamloze Vennootschap is the Dutch term for a public limited liability corporation. |
Plc - | | Public Limited Company. |
SA - | | Generally designates corporations in various countries, mostly those employing the civil law. |
SpA - | | Societa Per Azioni is an Italian shared company. |
UFJ - | | United Financial of Japan. |
See Notes to Financial Statements.
| | |
Semi-Annual Report | March 31, 2012 (Unaudited) | | 19 |
| | |
| Drexel Hamilton 8IP Asia Pacific Equity Fund | | Schedule of Investments |
| | March 31, 2012 (Unaudited) |
| | | | | | | | |
| | | Shares | | | Value | |
| |
COMMON STOCKS (95.06%) | | | | | | | | |
ASIA (93.30%) | | | | | | | | |
Australia (13.20%) | | | | | | | | |
Basic Materials (7.35%) | | | | | | | | |
Atlas Iron, Ltd. | | | 44,667 | | | $ | 133,253 | |
Ausenco, Ltd. | | | 41,451 | | | | 185,917 | |
BHP Billiton, Ltd. | | | 5,446 | | | | 195,243 | |
Fortescue Metals Group, Ltd. | | | 24,798 | | | | 149,242 | |
Rio Tinto, Ltd. | | | 3,225 | | | | 218,477 | |
| | | | | | | | |
| | | | | | | 882,132 | |
| | | | | | | | |
Energy (1.27%) | | | | | | | | |
Woodside Petroleum, Ltd. | | | 4,219 | | | | 152,128 | |
| | | | | | | | |
| | |
Financials (2.54%) | | | | | | | | |
Macquarie Group, Ltd. | | | 5,377 | | | | 161,969 | |
Westpac Banking Corp. | | | 6,338 | | | | 143,713 | |
| | | | | | | | |
| | | | | | | 305,682 | |
| | | | | | | | |
Industrials (2.04%) | | | | | | | | |
Boart Longyear, Ltd. | | | 32,170 | | | | 138,625 | |
Industrea, Ltd. | | | 100,608 | | | | 106,820 | |
| | | | | | | | |
| | | | | | | 245,445 | |
| | | | | | | | |
Total Australia | | | | | | | 1,585,387 | |
| | | | | | | | |
| | |
Bermuda (1.27%) | | | | | | | | |
Consumer, Cyclical (1.27%) | | | | | | | | |
Yue Yuen Industrial Holdings, Ltd. | | | 43,500 | | | | 152,645 | |
| | | | | | | | |
| | |
Total Bermuda | | | | | | | 152,645 | |
| | | | | | | | |
| | |
China (9.11%) | | | | | | | | |
Basic Materials (1.09%) | | | | | | | | |
China Lumena New Materials Corp. | | | 727,964 | | | | 130,303 | |
| | | | | | | | |
| | |
Consumer, Cyclical (0.99%) | | | | | | | | |
China Resources Enterprise, Ltd. | | | 34,000 | | | | 118,652 | |
| | | | | | | | |
| | |
Energy (1.74%) | | | | | | | | |
CNOOC, Ltd. | | | 54,908 | | | | 112,848 | |
PetroChina Co., Ltd., Class H | | | 68,000 | | | | 96,148 | |
| | | | | | | | |
| | | | | | | 208,996 | |
| | | | | | | | |
Financials (3.72%) | | | | | | | | |
China Construction Bank Corp., Class H | | | 280,000 | | | | 216,340 | |
Industrial & Commercial Bank of China, Class H | | | 148,000 | | | | 95,483 | |
Ping An Insurance Group Co.,
Class H | | | 17,900 | | | | 135,307 | |
| | | | | | | | |
| | | | | | | 447,130 | |
| | | | | | | | |
Industrials (1.57%) | | | | | | | | |
China Communications Construction Co., Ltd., Class H | | | 131,000 | | | | 131,412 | |
China Shipping Development Co., Ltd., Class H | | | 82,000 | | | | 56,810 | |
| | | | | | | | |
| | | | | | | 188,222 | |
| | | | | | | | |
Total China | | | | | | | 1,093,303 | |
| | | | | | | | |
| | | | | | | | |
| | | Shares | | | Value | |
| |
Hong Kong (6.82%) | | | | | | | | |
Basic Materials (1.15%) | | | | | | | | |
Jiangxi Copper Co., Ltd., Class H | | | 60,000 | | | $ | 137,994 | |
| | | | | | | | |
| | |
Consumer, Cyclical (1.09%) | | | | | | | | |
Emperor Watch & Jewellery, Ltd. | | | 830,000 | | | | 131,465 | |
| | | | | | | | |
| | |
Energy (1.29%) | | | | | | | | |
Hidili Industry International Development, Ltd. | | | 434,244 | | | | 154,337 | |
| | | | | | | | |
| | |
Financials (2.16%) | | | | | | | | |
China Everbright, Ltd. | | | 78,000 | | | | 118,323 | |
China Overseas Land & Investment, Ltd. | | | 74,000 | | | | 140,652 | |
| | | | | | | | |
| | | | | | | 258,975 | |
| | | | | | | | |
Technology (1.13%) | | | | | | | | |
Kingdee International Software Group Co., Ltd. | | | 563,063 | | | | 135,590 | |
| | | | | | | | |
| | |
Total Hong Kong | | | | | | | 818,361 | |
| | | | | | | | |
| | |
Japan (40.57%) | | | | | | | | |
Basic Materials (2.22%) | | | | | | | | |
Mitsubishi Chemical Holdings Corp. | | | 23,589 | | | | 125,968 | |
Sumitomo Metal Mining Co., Ltd. | | | 10,000 | | | | 140,510 | |
| | | | | | | | |
| | | | | | | 266,478 | |
| | | | | | | | |
Communications (3.76%) | | | | | | | | |
Monex Group, Inc. | | | 600 | | | | 131,207 | |
SBI Holdings, Inc.(a) | | | 2,010 | | | | 189,659 | |
Softbank Corp.(a) | | | 4,400 | | | | 130,081 | |
| | | | | | | | |
| | | | | | | 450,947 | |
| | | | | | | | |
Consumer, Cyclical (9.72%) | | | | | | | | |
Honda Motor Co., Ltd. | | | 4,400 | | | | 167,186 | |
Isuzu Motors, Ltd. | | | 29,000 | | | | 169,929 | |
Marubeni Corp. | | | 22,000 | | | | 158,681 | |
Mitsubishi Corp. | | | 6,700 | | | | 155,418 | |
Mitsui & Co., Ltd. | | | 8,700 | | | | 142,635 | |
Sumitomo Corp. | | | 10,000 | | | | 144,497 | |
Toyota Motor Corp. | | | 5,300 | | | | 228,597 | |
| | | | | | | | |
| | | | | | | 1,166,943 | |
| | | | | | | | |
Energy (2.02%) | | | | | | | | |
Inpex Corp. | | | 36 | | | | 243,132 | |
| | | | | | | | |
| | |
Financials (8.80%) | | | | | | | | |
Mitsubishi UFJ Financial Group, Inc. | | | 49,700 | | | | 247,389 | |
Mizuho Financial Group, Inc. | | | 154,200 | | | | 251,504 | |
Nomura Holdings, Inc. | | | 56,600 | | | | 250,279 | |
ORIX Corp. | | | 1,600 | | | | 152,712 | |
Sumitomo Mitsui Financial Group, Inc. | | | 4,700 | | | | 154,623 | |
| | | | | | | | |
| | | | | | | 1,056,507 | |
| | | | | | | | |
Industrials (10.59%) | | | | | | | | |
Hitachi, Ltd. | | | 25,000 | | | | 160,384 | |
JGC Corp. | | | 6,000 | | | | 185,937 | |
Komatsu, Ltd. | | | 5,500 | | | | 156,754 | |
Maruwa Co., Ltd. | | | 2,900 | | | | 128,760 | |
| | |
| Drexel Hamilton 8IP Asia Pacific Equity Fund | | Schedule of Investments |
| | March 31, 2012 (Unaudited) |
| | | | | | | | |
| | | Shares | | | Value | |
| |
Japan (continued) | | | | | | | | |
Mitsubishi Electric Corp. | | | 14,000 | | | $ | 123,813 | |
Nikon Corp. | | | 4,600 | | | | 139,606 | |
THK Co., Ltd. | | | 4,900 | | | | 99,634 | |
Toshiba Corp. | | | 33,000 | | | | 145,125 | |
Yaskawa Electric Corp. | | | 14,000 | | | | 131,594 | |
| | | | | | | | |
| | | | | | | 1,271,607 | |
| | | | | | | | |
Technology (3.46%) | | | | | | | | |
Canon, Inc. | | | 3,000 | | | | 141,718 | |
CAPCOM Co., Ltd. | | | 5,500 | | | | 125,655 | |
Tokyo Electron, Ltd. | | | 2,600 | | | | 148,738 | |
| | | | | | | | |
| | | | | | | 416,111 | |
| | | | | | | | |
Total Japan | | | | | | | 4,871,725 | |
| | | | | | | | |
| | |
Malaysia (1.98%) | | | | | | | | |
Financials (1.24%) | | | | | | | | |
CIMB Group Holdings Bhd | | | 59,500 | | | | 149,357 | |
| | | | | | | | |
| | |
Industrials (0.74%) | | | | | | | | |
KNM Group Bhd(a) | | | 326,000 | | | | 88,856 | |
| | | | | | | | |
| | |
Total Malaysia | | | | | | | 238,213 | |
| | | | | | | | |
| | |
Singapore (3.46%) | | | | | | | | |
Consumer, Non-cyclical (2.78%) | | | | | | | | |
China Minzhong Food Corp., Ltd.(a) | | | 91,000 | | | | 72,392 | |
Olam International, Ltd. | | | 77,000 | | | | 144,561 | |
OSIM International, Ltd. | | | 116,000 | | | | 116,733 | |
| | | | | | | | |
| | | | | | | 333,686 | |
| | | | | | | | |
Energy (0.68%) | | | | | | | | |
Sakari Resources, Ltd. | | | 44,000 | | | | 81,556 | |
| | | | | | | | |
| | |
Total Singapore | | | | | | | 415,242 | |
| | | | | | | | |
| | |
South Korea (8.98%) | | | | | | | | |
Consumer, Cyclical (1.15%) | | | | | | | | |
LG Corp.(a) | | | 2,412 | | | | 138,370 | |
| | | | | | | | |
| | |
Energy (1.24%) | | | | | | | | |
SK Innovation Co., Ltd.(a) | | | 1,025 | | | | 149,718 | |
| | | | | | | | |
| | |
Financial (2.58%) | | | | | | | | |
Mirae Asset Securities Co., Ltd.(a) | | | 4,760 | | | | 166,572 | |
Shinhan Financial Group Co., Ltd.(a) | | | 3,700 | | | | 142,866 | |
| | | | | | | | |
| | | | | | | 309,438 | |
| | | | | | | | |
Industrials (1.19%) | | | | | | | | |
GS Engineering & Construction Corp.(a) | | | 1,617 | | | | 142,569 | |
| | | | | | | | |
| | |
Technology (2.82%) | | | | | | | | |
Samsung Electronics Co., Ltd.(a) | | | 199 | | | | 223,931 | |
Silicon Works Co., Ltd.(a) | | | 3,816 | | | | 114,340 | |
| | | | | | | | |
| | | | | | | 338,271 | |
| | | | | | | | |
Total South Korea | | | | | | | 1,078,366 | |
| | | | | | | | |
| | | | | | | | |
| | | Shares | | | Value | |
| |
Taiwan (5.34%) | | | | | | | | |
Industrials (2.33%) | | | | | | | | |
Catcher Technology Co., Ltd. | | | 27,000 | | | $ | 190,737 | |
Kinsus Interconnect Technology Corp. | | | 28,000 | | | | 89,746 | |
| | | | | | | | |
| | | | | | | 280,483 | |
| | | | | | | | |
Technology (3.01%) | | | | | | | | |
Advanced Semiconductor Engineering, Inc. | | | 193,000 | | | | 194,213 | |
Taiwan Semiconductor Manufacturing Co., Ltd. | | | 58,000 | | | | 166,840 | |
| | | | | | | | |
| | | | | | | 361,053 | |
| | | | | | | | |
Total Taiwan | | | | | | | 641,536 | |
| | | | | | | | |
| | |
Thailand (2.57%) | | | | | | | | |
Energy (1.21%) | | | | | | | | |
PTT Pcl | | | 12,700 | | | | 145,731 | |
| | | | | | | | |
| | |
Financials (1.36%) | | | | | | | | |
Kasikornbank Pcl | | | 32,700 | | | | 163,235 | |
| | | | | | | | |
| | |
Total Thailand | | | | | | | 308,966 | |
| | | | | | | | |
| | |
TOTAL ASIA (Cost $10,127,591) | | | | | | | 11,203,744 | |
| |
| | |
NORTH AMERICA (1.76%) | | | | | | | | |
Cayman Islands (1.76%) | | | | | | | | |
Consumer, Cyclical (0.94%) | | | | | | | | |
New World Department Store China, Ltd. | | | 174,000 | | | | 112,705 | |
| | | | | | | | |
| | |
Financials (0.82%) | | | | | | | | |
KWG Property Holding, Ltd. | | | 170,212 | | | | 98,197 | |
| | | | | | | | |
| | |
Total Cayman Islands | | | | | | | 210,902 | |
| | | | | | | | |
| | |
TOTAL NORTH AMERICA (Cost $150,195) | | | | | | | 210,902 | |
| |
| | |
TOTAL COMMON STOCKS (Cost $10,277,786) | | | | | | | 11,414,646 | |
| |
| | |
EXCHANGE TRADED FUNDS (3.97%) | | | | | | | | |
ASIA (3.97%) | | | | | | | | |
Singapore (3.97%) | | | | | | | | |
iShares® MSCI India(a) | | | 79,500 | | | | 477,000 | |
| | | | | | | | |
| | |
Total Singapore | | | | | | | 477,000 | |
| | | | | | | | |
| | |
TOTAL ASIA (Cost $410,465) | | | | | | | 477,000 | |
| |
TOTAL EXCHANGE TRADED FUNDS (Cost $410,465) | | | | | | | 477,000 | |
| |
| | |
Semi-Annual Report | March 31, 2012 (Unaudited) | | 21 |
| | |
| Drexel Hamilton 8IP Asia Pacific Equity Fund | | Schedule of Investments |
| | March 31, 2012 (Unaudited) |
| | | | | | | | | | | | |
| | | 7-Day Yield | | | Shares | | | Value | |
| |
SHORT TERM INVESTMENTS (0.34%) | | | | | |
Money Market Fund (0.34%) | | | | | |
Dreyfus Treasury Prime Cash Management, Institutional Class | | | 0.00004 | % | | | 41,018 | | | $ | 41,018 | |
| | | | | | | | | | | | |
| |
TOTAL SHORT TERM INVESTMENTS (Cost $41,018) | | | | 41,018 | |
| |
| |
TOTAL INVESTMENTS (Cost $10,729,269) (99.37%) | | | $ | 11,932,664 | |
| |
Other Assets In Excess Of Liabilities (0.63%) | | | | 75,969 | |
| |
NET ASSETS (100.00%) | | | $ | 12,008,633 | |
| |
| (a) | Non-income producing security. |
Common Abbreviations:
Bhd - Berhad is the Malaysian Term for Public Limited Company.
Ltd. - Limited.
MSCI - Morgan Stanley Capital International.
Pcl - Public Company Limited.
UFJ - United Financial of Japan.
See Notes to Financial Statements.
| | |
| Drexel Hamilton FOUR European Equity Fund | | Schedule of Investments |
| | March 31, 2012 (Unaudited) |
| | | | | | | | |
| | | Shares | | | Value | |
| |
COMMON STOCKS (99.50%) | | | | | | | | |
EUROPE (99.50%) | | | | | | | | |
Belgium (3.00%) | | | | | | | | |
Basic Materials (3.00%) | | | | | | | | |
Umicore SA | | | 6,610 | | | $ | 364,137 | |
| | | | | | | | |
| | |
Total Belgium | | | | | | | 364,137 | |
| | | | | | | | |
| | |
Denmark (4.04%) | | | | | | | | |
Consumer, Non-cyclical (2.49%) | | | | | | | | |
Novozymes A/S, Class B | | | 10,400 | | | | 302,894 | |
| | | | | | | | |
| | |
Financials (1.55%) | | | | | | | | |
Danske Bank A/S(a) | | | 11,100 | | | | 188,001 | |
| | | | | | | | |
| | |
Total Denmark | | | | | | | 490,895 | |
| | | | | | | | |
| | |
Finland (3.15%) | | | | | | | | |
Financials (2.53%) | | | | | | | | |
Sampo OYJ, Class A | | | 10,640 | | | | 307,511 | |
| | | | | | | | |
| | |
Industrials (0.62%) | | | | | | | | |
YIT OYJ | | | 3,500 | | | | 75,248 | |
| | | | | | | | |
| | |
Total Finland | | | | | | | 382,759 | |
| | | | | | | | |
| | |
France (14.44%) | | | | | | | | |
Communications (1.34%) | | | | | | | | |
Eutelsat Communications SA | | | 4,400 | | | | 162,670 | |
| | | | | | | | |
| | |
Consumer, Non-cyclical (3.22%) | | | | | | | | |
L’Oreal SA | | | 3,170 | | | | 391,034 | |
| | | | | | | | |
| | |
Financials (3.79%) | | | | | | | | |
BNP Paribas SA | | | 9,720 | | | | 461,181 | |
| | | | | | | | |
| | |
Industrials (1.96%) | | | | | | | | |
Alstom SA | | | 6,100 | | | | 238,048 | |
| | | | | | | | |
| | |
Technology (4.13%) | | | | | | | | |
Gemalto NV | | | 7,600 | | | | 501,639 | |
| | | | | | | | |
| | |
Total France | | | | | | | 1,754,572 | |
| | | | | | | | |
| | |
Germany (6.41%) | | | | | | | | |
Industrials (1.89%) | | | | | | | | |
Bilfinger Berger SE | | | 2,450 | | | | 230,136 | |
| | | | | | | | |
| | |
Technology (4.52%) | | | | | | | | |
Infineon Technologies AG | | | 24,370 | | | | 249,164 | |
SAP AG | | | 4,290 | | | | 299,583 | |
| | | | | | | | |
| | | | | | | 548,747 | |
| | | | | | | | |
Total Germany | | | | | | | 778,883 | |
| | | | | | | | |
| | | | | | | | |
| | | Shares | | | Value | |
| |
Great Britain (25.40%) | | | | | | | | |
Basic Materials (1.94%) | | | | | | | | |
Xstrata Plc | | | 13,800 | | | $ | 235,739 | |
| | | | | | | | |
| | |
Communications (3.68%) | | | | | | | | |
Vodafone Group Plc | | | 162,300 | | | | 447,026 | |
| | | | | | | | |
| | |
Consumer, Non-cyclical (2.48%) | | | | | | | | |
Associated British Foods Plc | | | 6,150 | | | | 120,010 | |
Unilever Plc | | | 5,500 | | | | 181,574 | |
| | | | | | | | |
| | | | | | | 301,584 | |
| | | | | | | | |
Energy (6.75%) | | | | | | | | |
BG Group Plc | | | 16,170 | | | | 374,507 | |
BP Plc | | | 60,200 | | | | 445,385 | |
| | | | | | | | |
| | | | | | | 819,892 | |
| | | | | | | | |
Financials (7.00%) | | | | | | | | |
Barclays Plc | | | 115,300 | | | | 433,850 | |
HSBC Holdings Plc | | | 47,040 | | | | 417,431 | |
| | | | | | | | |
| | | | | | | 851,281 | |
| | | | | | | | |
Industrials (2.09%) | | | | | | | | |
BBA Aviation Plc | | | 74,200 | | | | 253,980 | |
| | | | | | | | |
| | |
Utilities (1.46%) | | | | | | | | |
Centrica Plc | | | 35,000 | | | | 177,127 | |
| | | | | | | | |
| | |
Total Great Britain | | | | | | | 3,086,629 | |
| | | | | | | | |
| | |
Ireland (1.10%) | | | | | | | | |
Consumer, Non-cyclical (1.10%) | | | | | | | | |
C&C Group Plc | | | 25,980 | | | | 133,748 | |
| | | | | | | | |
| | |
Total Ireland | | | | | | | 133,748 | |
| | | | | | | | |
| | |
Italy (4.16%) | | | | | | | | |
Consumer, Cyclical (2.65%) | | | | | | | | |
Piaggio & C SpA | | | 109,700 | | | | 322,462 | |
| | | | | | | | |
| | |
Consumer, Non-cyclical (1.51%) | | | | | | | | |
Atlantia SpA | | | 11,030 | | | | 183,149 | |
| | | | | | | | |
| | |
Total Italy | | | | | | | 505,611 | |
| | | | | | | | |
| | |
Jersey (1.42%) | | | | | | | | |
Basic Materials (1.42%) | | | | | | | | |
Bellzone Mining Plc(a) | | | 337,500 | | | | 172,745 | |
| | | | | | | | |
| | |
Total Jersey | | | | | | | 172,745 | |
| | | | | | | | |
| | |
Netherlands (6.28%) | | | | | | | | |
Consumer, Non-cyclical (0.92%) | | | | | | | | |
Koninklijke Ahold NV | | | 8,050 | | | | 111,550 | |
| | | | | | | | |
| | |
Financials (3.26%) | | | | | | | | |
ING Groep NV(a) | | | 47,520 | | | | 395,921 | |
| | | | | | | | |
| | |
Semi-Annual Report | March 31, 2012 (Unaudited) | | 23 |
| | |
| Drexel Hamilton FOUR European Equity Fund | | Schedule of Investments |
| | March 31, 2012 (Unaudited) |
| | | | | | | | |
| | | Shares | | | Value | |
| |
Netherlands (continued) | | | | | | | | |
Technology (2.10%) | | | | | | | | |
ASML Holding NV | | | 5,120 | | | $ | 255,935 | |
| | | | | | | | |
| | |
Total Netherlands | | | | | | | 763,406 | |
| | | | | | | | |
| | |
Norway (1.95%) | | | | | | | | |
Energy (1.95%) | | | | | | | | |
Petroleum Geo-Services ASA(a) | | | 16,200 | | | | 236,823 | |
| | | | | | | | |
| | |
Total Norway | | | | | | | 236,823 | |
| | | | | | | | |
| | |
Spain (4.60%) | | | | | | | | |
Industrials (3.39%) | | | | | | | | |
Obrascon Huarte Lain SA | | | 13,830 | | | | 411,696 | |
| | | | | | | | |
| | |
Utilities (1.21%) | | | | | | | | |
Gas Natural SDG SA | | | 9,190 | | | | 146,836 | |
| | | | | | | | |
| | |
Total Spain | | | | | | | 558,532 | |
| | | | | | | | |
| | |
Sweden (6.45%) | | | | | | | | |
Consumer, Cyclical (2.52%) | | | | | | | | |
Volvo AB, Class B | | | 21,000 | | | | 305,995 | |
| | | | | | | | |
| | |
Consumer, Non-cyclical (3.93%) | | | | | | | | |
Getinge AB, Class B | | | 8,290 | | | | 236,077 | |
Swedish Match AB | | | 6,070 | | | | 241,669 | |
| | | | | | | | |
| | | | | | | 477,746 | |
| | | | | | | | |
Total Sweden | | | | | | | 783,741 | |
| | | | | | | | |
| | |
Switzerland (17.10%) | | | | | | | | |
Basic Materials (2.05%) | | | | | | | | |
Syngenta AG(a) | | | 720 | | | | 248,933 | |
| | | | | | | | |
| | |
Consumer, Non-cyclical (6.68%) | | | | | | | | |
Adecco SA(a) | | | 5,830 | | | | 305,483 | |
Galenica AG | | | 360 | | | | 235,294 | |
Novartis AG | | | 4,890 | | | | 270,637 | |
| | | | | | | | |
| | | | | | | 811,414 | |
| | | | | | | | |
Financials (2.72%) | | | | | | | | |
Julius Baer Group, Ltd.(a) | | | 8,200 | | | | 331,016 | |
| | | | | | | | |
| | |
Industrials (5.65%) | | | | | | | | |
Implenia AG(a) | | | 7,190 | | | | 246,118 | |
LEM Holding SA | | | 250 | | | | 136,950 | |
Sika AG(a) | | | 140 | | | | 303,047 | |
| | | | | | | | |
| | | | | | | 686,115 | |
| | | | | | | | |
Total Switzerland | | | | | | | 2,077,478 | |
| | | | | | | | |
| | |
TOTAL EUROPE | | | | | | | | |
(Cost $10,472,759) | | | | | | | 12,089,959 | |
| |
| |
TOTAL COMMON STOCKS | | | | | |
(Cost $10,472,759) | | | | 12,089,959 | |
| |
| | | | | | | | | | | | |
| | | 7-Day Yield | | | Shares | | | Value | |
| |
SHORT TERM INVESTMENTS (0.32%) | |
Money Market Fund (0.32%) | |
Dreyfus Treasury | | | | | | | | | | | | |
Prime Cash Management, Institutional Class | | | 0.00004 | % | | | 38,285 | | | $ | 38,285 | |
| | | | | | | | | | | | |
| |
TOTAL SHORT TERM INVESTMENTS | | | | | |
(Cost $38,285) | | | | 38,285 | |
| |
| |
TOTAL INVESTMENTS | | | | | |
(Cost $10,511,044) (99.82%) | | | $ | 12,128,244 | |
| |
Other Assets In Excess Of Liabilities (0.18%) | | | | 22,051 | |
| |
NET ASSETS (100.00%) | | | | | | | | | | $ | 12,150,295 | |
| |
| (a) | Non-income producing security. |
Common Abbreviations:
| | | | |
AB | | - | | Aktiebolag is the Swedish equivalent of the term corporation. |
AG | | - | | Aktiengesellschaft is a German term that refers to a corporation that is limited by shares, i.e., owned by shareholders. |
A/S | | - | | Aktieselskab is the Danish Term for Joint Stock Company. |
Ltd. | | - | | Limited. |
NV | | - | | Naamloze Vennootschap is the Dutch term for a public limited liability corporation. |
OYJ | | - | | Osakeyhtio is the Finnish equivalent of a limited company. |
Plc | | - | | Public Limited Company. |
SA | | - | | Generally designates corporations in various countries, mostly those employing the civil law. |
SE | | - | | SE Regulation. A European Company which can operate on a Europe-wide basis and be governed by Community law directly applicable in all Member States. |
SpA | | - | | Societa Per Azioni is an Italian shared company. |
See Notes to Financial Statements.
| | |
| Drexel Hamilton Mutual Funds | | Statements of Assets and Liabilities |
| | March 31, 2012 (Unaudited) |
| | | | | | | | | | | | | | | | |
| | | Drexel Hamilton
Centre American
Equity Fund | | | Drexel Hamilton
Centre Global Equity
Fund | | | Drexel Hamilton 8IP
Asia Pacific Equity
Fund | | | Drexel Hamilton
FOUR European
Equity Fund | |
| | | | |
ASSETS: | | | | | | | | | | | | | | | | |
| | | | |
Investments, at value | | $ | 23,673,762 | | | $ | 11,820,553 | | | $ | 11,932,664 | | | $ | 12,128,244 | |
Foreign currency, at value
(Cost $–, $2,382, $4,276 and $4,907, respectively) | | | – | | | | 2,382 | | | | 4,276 | | | | 4,907 | |
Dividends and interest | | | 38,424 | | | | 25,218 | | | | 67,324 | | | | 14,470 | |
Receivable due from investment advisor | | | 19,276 | | | | 26,756 | | | | 23,064 | | | | 20,104 | |
Receivable for investments sold | | | – | | | | – | | | | 138,549 | | | | 18,057 | |
Deferred offering cost | | | 12,245 | | | | 6,819 | | | | 6,819 | | | | 6,819 | |
| | | | | | | | | | | | | | | | |
Total Assets | | | 23,743,707 | | | | 11,881,728 | | | | 12,172,696 | | | | 12,192,601 | |
| | | | | | | | | | | | | | | | |
LIABILITIES: | | | | | | | | | | | | | | | | |
| | | | |
Payable for organizational costs | | | 4,485 | | | | 2,619 | | | | 2,619 | | | | 2,619 | |
Payable for investments purchased | | | – | | | | – | | | | 137,401 | | | | 15,585 | |
Payable to trustees | | | 916 | | | | 439 | | | | 450 | | | | 448 | |
Payable to chief compliance officer | | | 2,758 | | | | 1,447 | | | | 1,607 | | | | 1,671 | |
Other payables | | | 36,038 | | | | 23,890 | | | | 21,986 | | | | 21,983 | |
| | | | | | | | | | | | | | | | |
Total Liabilities | | | 44,197 | | | | 28,395 | | | | 164,063 | | | | 42,306 | |
| | | | | | | | | | | | | | | | |
NET ASSETS | | $ | 23,699,510 | | | $ | 11,853,333 | | | $ | 12,008,633 | | | $ | 12,150,295 | |
| | | | | | | | | | | | | | | | |
| | | | |
NET ASSETS CONSIST OF: | | | | | | | | | | | | | | | | |
| | | | |
Paid-in capital | | $ | 20,527,525 | | | $ | 10,465,161 | | | $ | 10,484,322 | | | $ | 10,425,005 | |
Accumulated net investment income | | | 38,695 | | | | 31,081 | | | | 38,479 | | | | 4,851 | |
Accumulated net realized gain on investments and foreign currency transactions | | | 516,238 | | | | 210,497 | | | | 282,341 | | | | 103,091 | |
Net unrealized appreciation on investments and translation of assets and liabilities denominated in foreign currencies | | | 2,617,052 | | | | 1,146,594 | | | | 1,203,491 | | | | 1,617,348 | |
| | | | | | | | | | | | | | | | |
NET ASSETS | | $ | 23,699,510 | | | $ | 11,853,333 | | | $ | 12,008,633 | | | $ | 12,150,295 | |
| | | | | | | | | | | | | | | | |
| | | | |
INVESTMENTS, AT COST | | $ | 21,056,710 | | | $ | 10,673,407 | | | $ | 10,729,269 | | | $ | 10,511,044 | |
| | | | |
PRICING OF SHARES | | | | | | | | | | | | | | | | |
| | | | |
Net Assets | | $ | 23,699,510 | | | $ | 11,853,333 | | | $ | 12,008,633 | | | $ | 12,150,295 | |
Shares outstanding | | | 2,052,752 | | | | 1,046,516 | | | | 1,048,432 | | | | 1,042,501 | |
Net Asset Value, offering and redemption price per share | | | $11.55 | | | | $11.33 | | | | $11.45 | | | | $11.65 | |
See Notes to Financial Statements.
| | |
Semi-Annual Report | March 31, 2012 (Unaudited) | | 25 |
| | |
| Drexel Hamilton Mutual Funds | | Statements of Operations |
For the Period December 21, 2011 (Inception) to March 31, 2012 (Unaudited) |
| | | | | | | | | | | | | | | | |
| | | Drexel Hamilton
Centre American
Equity Fund | | | Drexel Hamilton
Centre Global
Equity Fund | | | Drexel Hamilton
8IP Asia Pacific
Equity Fund | | | Drexel Hamilton
FOUR European
Equity Fund | |
| | | | |
INVESTMENT INCOME: | | | | | | | | | | | | | | | | |
Dividends | | $ | 115,662 | | | $ | 73,455 | | | $ | 85,128 | | | $ | 50,572 | |
Foreign taxes withheld | | | – | | | | (3,321) | | | | (6,521) | | | | (6,092) | |
| | | | | | | | | | | | | | | | |
Total Investment Income | | | 115,662 | | | | 70,134 | | | | 78,607 | | | | 44,480 | |
| | | | | | | | | | | | | | | | |
| | | | |
EXPENSES: | | | | | | | | | | | | | | | | |
Investment advisory fees | | | 46,180 | | | | 31,242 | | | | 30,498 | | | | 30,118 | |
Administration fees | | | 37,903 | | | | 19,268 | | | | 19,744 | | | | 19,492 | |
Transfer agent fees | | | 8,210 | | | | 7,141 | | | | 7,141 | | | | 8,210 | |
Custodian fees | | | 2,880 | | | | 12,932 | | | | 10,054 | | | | 6,477 | |
Legal fees | | | 7,816 | | | | 3,911 | | | | 3,917 | | | | 3,914 | |
Audit fees | | | 7,113 | | | | 4,008 | | | | 3,556 | | | | 2,831 | |
Trustees’ fees and expenses | | | 4,267 | | | | 2,134 | | | | 2,134 | | | | 2,134 | |
Chief compliance officer fees | | | 9,690 | | | | 4,963 | | | | 5,190 | | | | 5,223 | |
Offering costs | | | 1,308 | | | | 1,794 | | | | 1,794 | | | | 1,794 | |
Organization costs | | | 13,385 | | | | 7,694 | | | | 7,694 | | | | 7,694 | |
Miscellaneous expenses | | | 3,671 | | | | 1,965 | | | | 1,968 | | | | 1,963 | |
| | | | | | | | | | | | | | | | |
Total expenses before waivers | | | 142,423 | | | | 97,052 | | | | 93,690 | | | | 89,850 | |
Fees waived/reimbursed by investment advisor (Note 5) | | | (65,456) | | | | (57,999) | | | | (53,562) | | | | (50,221) | |
Net Expenses | | | 76,967 | | | | 39,053 | | | | 40,128 | | | | 39,629 | |
| | | | | | | | | | | | | | | | |
Net Investment Income | | | 38,695 | | | | 31,081 | | | | 38,479 | | | | 4,851 | |
| | | | | | | | | | | | | | | | |
| | | | |
Net realized gain on investments | | | 516,238 | | | | 172,211 | | | | 280,192 | | | | 87,156 | |
Net realized gain on foreign currencies | | | – | | | | 38,286 | | | | 2,149 | | | | 15,935 | |
Net change in unrealized appreciation on investments | | | 2,617,052 | | | | 1,147,146 | | | | 1,203,395 | | | | 1,617,200 | |
Net change in unrealized appreciation/(depreciation) on translation of assets and liabilities denominated in foreign currency transactions | | | – | | | | (552) | | | | 96 | | | | 148 | |
| | | | | | | | | | | | | | | | |
NET REALIZED AND UNREALIZED GAIN ON INVESTMENTS AND FOREIGN CURRENCIES | | | 3,133,290 | | | | 1,357,091 | | | | 1,485,832 | | | | 1,720,439 | |
| | | | | | | | | | | | | | | | |
NET INCREASE IN NET ASSETS RESULTING FROM OPERATIONS | | $ | 3,171,985 | | | $ | 1,388,172 | | | $ | 1,524,311 | | | $ | 1,725,290 | |
| | | | | | | | | | | | | | | | |
See Notes to Financial Statements.
| | |
| Drexel Hamilton Mutual Funds | | Statements of Changes in Net Assets |
| | | | | | | | | | | | | | | | |
| | | Drexel Hamilton
Centre American
Equity Fund | | | Drexel Hamilton
Centre Global
Equity Fund | | | Drexel Hamilton
8IP Asia Pacific
Equity Fund | | | Drexel Hamilton
FOUR European
Equity Fund | |
| | | | |
| | | For the Period
December 21,
2011 (Inception)
to
March 31, 2012
(Unaudited) | | | For the Period
December 21,
2011 (Inception)
to
March 31, 2012
(Unaudited) | | | For the Period
December 21,
2011 (Inception)
to
March 31, 2012
(Unaudited) | | | For the Period
December 21,
2011 (Inception)
to
March 31, 2012
(Unaudited) | |
| | | | |
OPERATIONS: | | | | | | | | | | | | | | | | |
Net investment income | | $ | 38,695 | | | $ | 31,081 | | | $ | 38,479 | | | $ | 4,851 | |
Net realized gain on investments | | | 516,238 | | | | 172,211 | | | | 280,192 | | | | 87,156 | |
Net realized gain on foreign currency transactions | | | – | | | | 38,286 | | | | 2,149 | | | | 15,935 | |
Net change in unrealized appreciation on investments and translation of assets and liabilities denominated in foreign currencies | | | 2,617,052 | | | | 1,146,594 | | | | 1,203,491 | | | | 1,617,348 | |
| | | | | | | | | | | | | | | | |
Net increase in net assets resulting from operations | | | 3,171,985 | | | | 1,388,172 | | | | 1,524,311 | | | | 1,725,290 | |
| | | | | | | | | | | | | | | | |
CAPITAL SHARE TRANSACTIONS: | |
Proceeds from sale of shares | | | 20,502,525 | | | | 10,440,161 | | | | 10,459,322 | | | | 10,400,005 | |
| | | | | | | | | | | | | | | | |
Net increase from capital share transactions | | | 20,502,525 | | | | 10,440,161 | | | | 10,459,322 | | | | 10,400,005 | |
| | | | | | | | | | | | | | | | |
Net increase in net assets | | $ | 23,674,510 | | | $ | 11,828,333 | | | $ | 11,983,633 | | | $ | 12,125,295 | |
| | | | | | | | | | | | | | | | |
NET ASSETS: | | | | | | | | | | | | | | | | |
Beginning of period | | | 25,000 | | | | 25,000 | | | | 25,000 | | | | 25,000 | |
| | | | | | | | | | | | | | | | |
End of period* | | $ | 23,699,510 | | | $ | 11,853,333 | | | $ | 12,008,633 | | | $ | 12,150,295 | |
| | | | | | | | | | | | | | | | |
*Including accumulated net investment income of: | | $ | 38,695 | | | $ | 31,081 | | | $ | 38,479 | | | $ | 4,851 | |
| | | | |
OTHER INFORMATION: | | | | | | | | | | | | | | | | |
Share Transactions: | | | | | | | | | | | | | | | | |
Beginning shares | | | 2,500 | | | | 2,500 | | | | 2,500 | | | | 2,500 | |
Shares sold | �� | | 2,050,252 | | | | 1,044,016 | | | | 1,045,932 | | | | 1,040,001 | |
| | | | | | | | | | | | | | | | |
| | | | |
Net increase in shares outstanding | | | 2,052,752 | | | | 1,046,516 | | | | 1,048,432 | | | | 1,042,501 | |
| | | | | | | | | | | | | | | | |
See Notes to Financial Statements.
| | |
Semi-Annual Report | March 31, 2012 (Unaudited) | | 27 |
| | |
| Drexel Hamilton Centre American Equity Fund | | Financial Highlights |
For a share outstanding throughout the period presented. |
| | | | | |
| | | For the Period December 21, 2011 (inception) to March 31, 2012 (Unaudited) |
| |
NET ASSET VALUE, BEGINNING OF PERIOD | | | $ | 10.00 | |
INCOME FROM INVESTMENT OPERATIONS: | | | | | |
Net investment income(a) | | | | 0.02 | |
Net realized and unrealized gain on investments | | | | 1.53 | |
Total income from investment operations | | | | 1.55 | |
| |
DISTRIBUTIONS: | | | | | |
Net investment income | | | | – | |
Net realized gain | | | | – | |
Total distributions | | | | – | |
REDEMPTION FEES ADDED TO PAID-IN CAPITAL (NOTE 2) | | | | – | |
NET INCREASE IN NET ASSET VALUE | | | | 1.55 | |
NET ASSET VALUE, END OF PERIOD | | | $ | 11.55 | |
| |
Total Return(b) | | | | 15.50% | |
| |
RATIOS/SUPPLEMENTAL DATA: | | | | | |
Net assets, end of period (000) | | | $ | 23,700 | |
| |
RATIOS TO AVERAGE NET ASSETS: | | | | | |
Net investment income including reimbursement/waiver | | | | 0.63%(c) | |
Operating expenses excluding reimbursement/waiver | | | | 2.31%(c) | |
Operating expenses including reimbursement/waiver | | | | 1.25%(c) | |
PORTFOLIO TURNOVER RATE(d) | | | | 39% | |
| (a) | Calculated using the average shares method. |
| (b) | Total returns are for the period indicated and have not been annualized. Total returns would have been lower had certain expenses not been waived during the period. Returns shown do not reflect the deduction of taxes that a shareholder would pay on fund distributions or the redemption of fund shares. |
| (d) | Portfolio turnover rate for periods less than one full year have not been annualized. |
See Notes to Financial Statements.
| | |
Drexel Hamilton Centre Global Equity Fund | | Financial Highlights |
| | For a share outstanding throughout the period presented. |
| | | | | |
| | | For the Period December 21, 2011 (inception) to March 31, 2012 (Unaudited) |
| |
NET ASSET VALUE, BEGINNING OF PERIOD | | | $ | 10.00 | |
INCOME FROM INVESTMENT OPERATIONS: | | | | | |
Net investment income(a) | | | | 0.03 | |
Net realized and unrealized gain on investments | | | | 1.30 | |
Total income from investment operations | | | | 1.33 | |
| |
DISTRIBUTIONS: | | | | | |
Net investment income | | | | – | |
Net realized gain | | | | – | |
Total distributions | | | | – | |
REDEMPTION FEES ADDED TO PAID-IN CAPITAL (NOTE 2) | | | | – | |
NET INCREASE IN NET ASSET VALUE | | | | 1.33 | |
NET ASSET VALUE, END OF PERIOD | | | $ | 11.33 | |
| | | | | | |
| |
Total Return(b) | | | | 13.30% | |
| |
RATIOS/SUPPLEMENTAL DATA: | | | | | |
Net assets, end of period (000) | | | $ | 11,853 | |
| |
RATIOS TO AVERAGE NET ASSETS: | | | | | |
Net investment income including reimbursement/waiver | | | | 0.99%(c) | |
Operating expenses excluding reimbursement/waiver | | | | 3.11%(c) | |
Operating expenses including reimbursement/waiver | | | | 1.25%(c) | |
PORTFOLIO TURNOVER RATE(d) | | | | 39% | |
| (a) | Calculated using the average shares method. |
| (b) | Total returns are for the period indicated and have not been annualized. Total returns would have been lower had certain expenses not been waived during the period. Returns shown do not reflect the deduction of taxes that a shareholder would pay on fund distributions or the redemption of fund shares. |
| (d) | Portfolio turnover rate for periods less than one full year have not been annualized. |
See Notes to Financial Statements.
| | |
Semi-Annual Report | March 31, 2012 (Unaudited) | | 29 |
| | |
Drexel Hamilton 8IP Asia Pacific Equity Fund | | Financial Highlights |
| | For a share outstanding throughout the period presented. |
| | | | | |
| | | For the Period December 21, 2011 (inception) to March 31, 2012 (Unaudited) |
| |
NET ASSET VALUE, BEGINNING OF PERIOD | | | $ | 10.00 | |
INCOME FROM INVESTMENT OPERATIONS: | | | | | |
Net investment income(a) | | | | 0.04 | |
Net realized and unrealized gain on investments | | | | 1.41 | |
Total income from investment operations | | | | 1.45 | |
| |
DISTRIBUTIONS: | | | | | |
Net investment income | | | | – | |
Net realized gain | | | | – | |
Total distributions | | | | – | |
REDEMPTION FEES ADDED TO PAID-IN CAPITAL (NOTE 2) | | | | – | |
NET INCREASE IN NET ASSET VALUE | | | | 1.45 | |
NET ASSET VALUE, END OF PERIOD | | | $ | 11.45 | |
| | | | | | |
| |
Total Return(b) | | | | 14.50% | |
| |
RATIOS/SUPPLEMENTAL DATA: | | | | | |
Net assets, end of period (000) | | | $ | 12,009 | |
| |
RATIOS TO AVERAGE NET ASSETS: | | | | | |
Net investment income including reimbursement/waiver | | | | 1.20%(c) | |
Operating expenses excluding reimbursement/waiver | | | | 2.92%(c) | |
Operating expenses including reimbursement/waiver | | | | 1.25%(c) | |
PORTFOLIO TURNOVER RATE(d) | | | | 22% | |
| (a) | Calculated using the average shares method. |
| (b) | Total returns are for the period indicated and have not been annualized. Total returns would have been lower had certain expenses not been waived during the period. Returns shown do not reflect the deduction of taxes that a shareholder would pay on fund distributions or the redemption of fund shares. |
| (d) | Portfolio turnover rate for periods less than one full year have not been annualized. |
See Notes to Financial Statements.
| | |
| Drexel Hamilton FOUR European Equity Fund | | Financial Highlights |
| | For a share outstanding throughout the period presented. |
| | | | | |
| | | For the Period December 21, 2011 (inception) to March 31, 2012 (Unaudited) |
| |
NET ASSET VALUE, BEGINNING OF PERIOD | | | $ | 10.00 | |
INCOME FROM INVESTMENT OPERATIONS: | | | | | |
Net investment income(b) | | | | 0.00(a) | |
Net realized and unrealized gain on investments | | | | 1.65 | |
Total income from investment operations | | | | 1.65 | |
| |
DISTRIBUTIONS: | | | | | |
Net investment income | | | | – | |
Net realized gain | | | | – | |
Total distributions | | | | – | |
REDEMPTION FEES ADDED TO PAID-IN CAPITAL (NOTE 2) | | | | – | |
NET INCREASE IN NET ASSET VALUE | | | | 1.65 | |
NET ASSET VALUE, END OF PERIOD | | | $ | 11.65 | |
| | | | | | |
| |
Total Return(c) | | | | 16.50% | |
| |
RATIOS/SUPPLEMENTAL DATA: | | | | | |
Net assets, end of period (000) | | | $ | 12,150 | |
| |
RATIOS TO AVERAGE NET ASSETS: | | | | | |
Net investment income including reimbursement/waiver | | | | 0.15%(d) | |
Operating expenses excluding reimbursement/waiver | | | | 2.83%(d) | |
Operating expenses including reimbursement/waiver | | | | 1.25%(d) | |
PORTFOLIO TURNOVER RATE(e) | | | | 11% | |
| (a) | Amount represents less than $0.01 per share. |
| (b) | Calculated using the average shares method. |
| (c) | Total returns are for the period indicated and have not been annualized. Total returns would have been lower had certain expenses not been waived during the period. Returns shown do not reflect the deduction of taxes that a shareholder would pay on fund distributions or the redemption of fund shares. |
| (e) | Portfolio turnover rate for periods less than one full year have not been annualized. |
See Notes to Financial Statements.
| | |
Semi-Annual Report | March 31, 2012 (Unaudited) | | 31 |
| | |
| Drexel Hamilton Mutual Funds | | Notes to Financial Statements |
| | March 31, 2012 (Unaudited) |
1. ORGANIZATION
Drexel Hamilton Mutual Funds (the “Trust”) was organized on March 17, 2011 as a Delaware statutory trust and is registered as an open-end management investment company under the Investment Company Act of 1940, as amended (the “1940 Act”). The Trust currently offers shares of beneficial interest (“shares”) of Drexel Hamilton Centre American Equity Fund, Drexel Hamilton Centre Global Equity Fund, Drexel Hamilton 8IP Asia Pacific Equity Fund and Drexel Hamilton FOUR European Equity Fund (the “Funds”). Each Fund is a diversified portfolio with an investment objective seeking long-term growth of capital. Each Fund offers Institutional Class Shares and is only offered and available to institutional investors. Retail customers may not purchase Institutional Class shares of the Funds. The affairs of the Trust are managed by a Board of Trustees (the “Board”). The Declaration of Trust permits the Trustees to create additional series of the Trust and share classes. Drexel Hamilton Investment Partners, LLC (the “Adviser”) serves as investment adviser to the Funds.
2. SIGNIFICANT ACCOUNTING POLICIES
The following is a summary of significant accounting policies followed by the Funds in the preparation of the Statements of Investments:
| (a) | Portfolio securities traded on a national securities exchange or in the over-the-counter market are valued at the closing price on the principal exchange or market as of the close of regular trading hours on the day the securities are being valued. Foreign securities are valued on the basis of quotations from the primary market in which they are traded, and are translated from the local currency into U.S. dollars using exchange rates as of the close of the New York Stock Exchange (“the Exchange”) or using methods determined by the Board. Debt securities having maturities of 60 days or less may be valued at acquisition cost, plus or minus any amortization or accretion. Securities and other assets for which quotations are not readily available or deemed unreliable are valued at their fair value using methods determined by the Board. Fair valuation of a particular security is an inherently subjective process, with no single standard to utilize when determining a security’s fair value. As such, different mutual funds could reasonably arrive at a different fair value price for the same security. In each case where a security is fair valued, consideration is given to the facts and circumstances relevant to the particular situation. This consideration includes reviewing various factors set forth in the pricing procedures adopted by the Board and other factors as warranted. In making a fair value determination, factors that may be considered, among others, include: the type and structure of the security; unusual events or circumstances relating to the security’s issuer; general market conditions; prior day’s valuation; fundamental analytical data; size of the holding; cost of the security on the date of purchase; nature and duration of any restriction on disposition; trading activities and prices of similar securities or financial instruments. |
| (b) | The net asset value (the “NAV”) is generally calculated as of the close of trading on the Exchange (normally 4:00 p.m. Eastern time) every day the Exchange is open. The NAV is calculated by taking the total value of each Fund’s assets, subtracting the Fund’s liabilities, and then dividing by the total number of shares outstanding, rounded to the nearest cent. The offering price and redemption price per share is equal to the net asset value per share, except that shares of each Fund are subject to a redemption fee of 2% if redeemed within 90 days of purchase. For the period ended March 31, 2012, the Funds collected no redemption fees. |
| (c) | Each Fund’s policy is to comply with the requirements of the Internal Revenue Code of 1986 that are applicable to regulated investment companies and to distribute substantially all of its taxable income to its shareholders. The Funds accordingly pay no Federal income taxes, and no Federal income tax provision is recorded. |
| (d) | For financial reporting purposes, transactions on the last business day of the reporting period are accounted for on trade date. Net realized gains and losses on investments are computed on the identified cost basis. The portion of security gains and losses resulting from changes in foreign exchange rates is included with net realized and unrealized gains or losses from investments. Dividend income is recognized on the ex-dividend date, and interest income is recognized on an accrual basis. The Funds amortize premium and accrete discount on investments utilizing the effective interest method. Foreign dividend income may be subject to foreign withholding taxes. |
| (e) | A restricted security is a security that has been purchased through a private offering and cannot be resold to the general public without prior registration under the Securities Act of 1933 (the “Act”) or pursuant to the resale limitations provided by Rule 144 under the Act, or an exemption from the registration requirements of the Act. Whether a restricted security is illiquid is determined pursuant to guidelines established by the Board. Not all restricted securities are considered to be illiquid. As of March 31, 2012, the Funds did not hold any restricted securities. |
| (f) | The Statements of Investments were prepared in conformity with U.S. Generally Accepted Accounting Principles (GAAP), which requires management to make estimates and assumptions that affect the reported amounts at the date of the Statements of Investments. Actual results could differ from those estimates. |
| | |
| Drexel Hamilton Mutual Funds | | Notes to Financial Statements |
| | March 31, 2012 (Unaudited) |
3. FAIR VALUE MEASUREMENTS
A three-tier hierarchy has been established to classify fair value measurements for disclosure purposes. Inputs refer broadly to the assumptions that market participants would use in pricing the asset or liability, including assumptions about risk. Inputs may be observable or unobservable. Observable inputs are inputs that reflect the assumptions market participants would use in pricing the asset or liability that are developed based on market data obtained from sources independent of the reporting entity. Unobservable inputs are inputs that reflect the reporting entity’s own assumptions about the assumptions market participants would use in pricing the asset or liability that are developed based on the best information available.
Various inputs are used in determining the value of each Fund’s investments as of the reporting period end. These inputs are categorized in the following hierarchy under applicable financial accounting standards:
| | |
Level 1- | | Unadjusted quoted prices in active markets for identical, unrestricted assets or liabilities that a Fund has the ability to access at the measurement date. |
Level 2- | | Quoted prices which are not active, quoted prices for similar assets or liabilities in active markets or input other than quoted prices that are observable (either directly or indirectly) for substantially the full term of the asset or liability. |
Level 3- | | Significant unobservable prices or inputs (including the Board of Trustees’, and Pricing Committee’s, own assumptions in determining the fair value of investments) where there is little or no market activity for the asset or liability at measurement date. |
The inputs or methodology used for valuing securities are not necessarily an indication of the risk associated with investing in those securities.
The following is a summary of the inputs used to value the Funds’ investments as of March 31, 2012:
Drexel Hamilton Centre American Equity Fund
| | | | | | | | | | | | | | | | |
| Investments in Securities at Value(a) | | Level 1 -
Quoted Prices | | | Level 2 -
Other Significant
Observable Inputs | | | Level 3 -
Significant
Unobservable
Inputs | | | Total | |
Common Stocks | | $ | 23,578,923 | | | $ | – | | | $ | – | | | $ | 23,578,923 | |
Short Term Investments | | | 94,839 | | | | – | | | | – | | | | 94,839 | |
Total | | $ | 23,673,762 | | | $ | – | | | $ | – | | | $ | 23,673,762 | |
| | | | | | | | | | | | | | | | | |
Drexel Hamilton Centre Global Equity Fund
| | | | | | | | | | | | | | | | |
| Investments in Securities at Value(a) | | Level 1 -
Quoted Prices | | | Level 2 -
Other Significant
Observable Inputs | | | Level 3 -
Significant
Unobservable
Inputs | | | Total | |
Common Stocks | | $ | 11,170,911 | | | $ | – | | | $ | – | | | $ | 11,170,911 | |
Preferred Stocks | | | 545,813 | | | | – | | | | – | | | | 545,813 | |
Short Term Investments | | | 103,829 | | | | – | | | | – | | | | 103,829 | |
Total | | $ | 11,820,553 | | | $ | – | | | $ | – | | | $ | 11,820,553 | |
| | | | | | | | | | | | | | | | | |
| | |
Semi-Annual Report | March 31, 2012 (Unaudited) | | 33 |
| | |
| Drexel Hamilton Mutual Funds | | Notes to Financial Statements |
| | March 31, 2012 (Unaudited) |
Drexel Hamilton 8IP Asia Pacific Equity Fund
| | | | | | | | | | | | | | | | |
| Investments in Securities at Value(a) | | Level 1 -
Quoted Prices | | | Level 2 -
Other Significant
Observable Inputs | | | Level 3 -
Significant
Unobservable
Inputs | | | Total | |
Common Stocks | | $ | 11,279,056 | | | $ | – | | | $ | – | | | $ | 11,414,646 | |
Exchange Traded Funds | | | 477,000 | | | | – | | | | – | | | | 477,000 | |
Short Term Investments | | | 41,018 | | | | – | | | | – | | | | 41,018 | |
Total | | $ | 11,797,074 | | | $ | – | | | $ | – | | | $ | 11,932,664 | |
| | | | | | | | | | | | | | | | | |
Drexel Hamilton FOUR European Equity Fund
| | | | | | | | | | | | | | | | |
| Investments in Securities at Value(a) | | Level 1 -
Quoted Prices | | | Level 2 -
Other Significant
Observable Inputs | | | Level 3 - Significant
Unobservable
Inputs | | | Total | |
Common Stocks | | $ | 12,089,959 | | | $ | – | | | $ | – | | | $ | 12,089,959 | |
Short Term Investments | | | 38,285 | | | | – | | | | – | | | | 38,285 | |
Total | | $ | 12,128,244 | | | $ | – | | | $ | – | | | $ | 12,128,244 | |
| | | | | | | | | | | | | | | | | |
| (a) | For detailed descriptions of industries and countries, see the accompanying Statements of Investments. |
The Funds did not hold any investments at the beginning or end of the period in which significant unobservable inputs were used in determining fair value; therefore, no reconciliation of Level 3 securities is included for this reporting period. The Funds recognize transfers between levels as of the beginning of the fiscal year. There were no transfers between Level 1 and Level 2 as of March 31, 2012.
4. NEW ACCOUNTING PRONOUNCEMENTS
In May 2011, the Financial Accounting Standards Board issued ASU No. 2011-04 “Amendments to Achieve Common Fair Value Measurement and Disclosure Requirements” in GAAP and the International Financial Reporting Standards (“IFRSs”). ASU No.2011-04 amends FASB ASC Topic 820, “Fair Value Measurements and Disclosures”, to establish common requirements for measuring fair value and for disclosing information about fair value measurements in accordance with GAAP and IFRSs. ASU No.2011-04 is effective for fiscal years beginning after December 15, 2011 and for interim periods within those fiscal years. Management is currently evaluating the impact these amendments may have on the Funds’ financial statements.
5. INVESTMENT ADVISORY AGREEMENTS AND OTHER TRANSACTIONS WITH AFFILIATES
The Adviser serves as the investment adviser to each Fund pursuant to an Investment Advisory Agreement with the Trust. Subject to the general oversight of the Board, the Adviser is responsible for among other things, developing a continuing investment program for the Funds in accordance with their respective investment objectives, reviewing the investment strategies and policies of each Fund and advising the Board on the selection of sub-advisers. In this capacity, the Adviser advises and assists the officers of the Trust in conducting the business of the Funds and is responsible for providing general investment advice and guidance to the Funds, although the Adviser has delegated its responsibility for the selection and ongoing monitoring of the securities in the Funds’ investment portfolio to each Fund’s sub-adviser.
As compensation for the investment advisory services provided to the Funds, the Adviser receives monthly compensation based on each Fund’s average daily net assets at the annual rate of:
| | |
| Fund | | Management Fee Rate |
Drexel Hamilton Centre American Equity Fund | | 0.75% |
Drexel Hamilton Centre Global Equity Fund | | 1.00% |
Drexel Hamilton 8IP Asia Pacific Equity Fund | | 0.95% |
Drexel Hamilton FOUR European Equity Fund | | 0.95% |
| | |
| Drexel Hamilton Mutual Funds | | Notes to Financial Statements |
| | March 31, 2012 (Unaudited) |
Centre Asset Management, LLC serves as sub-adviser to the Drexel Hamilton Centre American Equity Fund and Drexel Hamilton Centre Global Equity Fund, Eight Investment Partners Pty Limited serves as sub-adviser to the Drexel Hamilton 8IP Asia Pacific Equity Fund, and FOUR Capital Partners Limited serves as sub-adviser to the Drexel Hamilton FOUR European Equity Fund. The investment sub-advisers make the day-to-day investment decisions and continuously review, supervise and administer the Fund’s investment programs. As compensation for the sub-investment advisory services provided to each Fund, each sub-adviser receives a monthly fee from the Adviser based on each Fund’s average daily net assets.
The Adviser has entered into a written expense limitation agreement under which it has agreed to limit the total expenses of each Fund (excluding interest, taxes, litigation, brokerage, extraordinary expenses, and any transactions costs associated with short sales which may include but are not limited to brokerage commissions and dividends that are paid to persons from whom the Fund borrows securities) to an annual rate of 1.25% of the average net assets of each Fund. This expense limitation and fee waiver agreement may be terminated by the Adviser at any time after November 17, 2012. Prior to November 17, 2012 the expense limitation and fee waiver agreement may only be terminated by the Board of Trustees of Drexel Hamilton Mutual Funds. The Adviser may recoup any waived amount, including organizational fees, from each Fund pursuant to this agreement if such reimbursement does not cause the Fund to exceed then existing expense limitations, at the time the waiver or reimbursement is made within three years after the year in which the Adviser incurred the expense.
ALPS Fund Services, Inc. (“ALPS” or the “Administrator”) serves as administrator to the Funds. ALPS receives a monthly fee paid by the Funds subject to a minimum monthly fee. Pursuant to an administrative agreement, ALPS will provide operational services to the Funds including, but not limited to fund accounting and fund administration and generally assist in each Fund’s operations.
ALPS, pursuant to a Transfer Agency and Services agreement with the Trust, serves as Transfer Agent for the Funds. Under the Transfer Agency and Services Agreement, ALPS receives from the Trust an annual minimum fee per Fund and a fee based upon each shareholder account and reimbursed for out-of-pocket expenses.
ALPS Distributors, Inc. (the “Distributor”) acts as the sole distributor of the Funds. There were no payments to the Distributor by the Funds during the period ended March 31, 2012.
6. FEDERAL INCOME TAX INFORMATION
On December 22, 2010, The Regulated Investment Company Modernization Act of 2010 (the “Modernization Act”) was signed into law. The Modernization Act is the first major piece of legislation affecting regulated investment companies (“RICs”) since 1986 and it modernizes several of the federal income and excise tax provisions related to RICs. Some highlights of the enacted provisions are as follows:
New capital losses may now be carried forward indefinitely, and retain the character of the original loss. Under pre-enactment law, capital losses could be carried forward for eight years, and carried forward as short-term capital losses, irrespective of the character of the original loss.
The Modernization Act contains simplification provisions, which are aimed at preventing disqualification of a RIC for “inadvertent” failures of the asset diversification and/or qualifying income tests. Additionally, the Modernization Act exempts RICs from the preferential dividend rule, and repealed the 60-day designation requirement for certain types of pay-through income and gains.
Finally, the Modernization Act contains several provisions aimed at preserving the character of distributions made by a fiscal year RIC during the portion of its taxable year ending after October 31 or December 31, reducing the circumstances under which a RIC might be required to file amended Forms 1099 to restate previously reported distributions.
The amount of net unrealized appreciation/(depreciation) and the cost of investment securities for tax purposes, including short-term securities at March 31, 2012, are displayed in the table below. The difference between book and tax basis unrealized appreciation/(depreciation) for the Funds is attributable primarily to the tax deferral of losses on wash sales.
| | | | | | | | | | | | | | | | |
| Fund | | Tax Cost of
Investments | | | Gross
Unrealized
Appreciation | | | Gross
Unrealized
Depreciation | | | Net Tax Unrealized
Appreciation
on Investments | |
Drexel Hamilton Centre American Equity Fund | | $ | 21,056,710 | | | $ | 2,713,851 | | | $ | (96,799 | ) | | $ | 2,617,052 | |
Drexel Hamilton Centre Global Equity Fund | | | 10,673,407 | | | | 1,201,858 | | | | (54,712 | ) | | | 1,147,146 | |
Drexel Hamilton 8IP Asia Pacific Equity Fund | | | 10,729,354 | | | | 1,472,366 | | | | (269,056 | ) | | | 1,203,310 | |
Drexel Hamilton FOUR European Equity Fund | | | 10,517,861 | | | | 1,655,304 | | | | (44,921 | ) | | | 1,610,383 | |
| | |
Semi-Annual Report | March 31, 2012 (Unaudited) | | 35 |
| | |
| Drexel Hamilton Mutual Funds | | Notes to Financial Statements |
| | March 31, 2012 (Unaudited) |
7. PURCHASES AND SALES OF INVESTMENT SECURITIES
For the period ended March 31, 2012, the aggregate cost of purchases and proceeds from sales of investment securities (excluding any short-term securities) were as follows:
| | | | | | | | |
| Fund | | Purchases of Securities | | | Proceeds From Sales of
Securities | |
Drexel Hamilton Centre American Equity Fund | | $ | 29,106,131 | | | $ | 8,660,498 | |
Drexel Hamilton Centre Global Equity Fund | | | 14,588,050 | | | | 4,234,638 | |
Drexel Hamilton 8IP Asia Pacific Equity Fund | | | 12,861,318 | | | | 2,491,476 | |
Drexel Hamilton FOUR European Equity Fund | | | 11,661,385 | | | | 1,281,424 | |
| | |
| Drexel Hamilton Mutual Funds | | Additional Information |
| | March 31, 2012 (Unaudited) |
PROXY VOTING GUIDELINES
A description of the policies and procedures that the Funds used to determine how to vote proxies relating to portfolio securities and information regarding how the Funds voted proxies during the most recent 12-month period ended June 30, will be available without charge upon request by (1) calling the Funds at (888) 848-7569 and (2) from Form N-PX filed by the Funds with the Securities and Exchange Commission (“SEC”) on the SEC’s website at www.sec.gov.
PORTFOLIO HOLDINGS DISCLOSURE POLICY
The Funds file a complete schedule of investments with the SEC for the first and third quarter of each fiscal year on Form N-Q. The Funds’ first and third fiscal quarters end on December 31 and June 30. The Form N-Q filing must be made within 60 days of the end of the quarter, and the Funds’ first Form N-Q was filed with the SEC on February 27, 2012. The Funds’ Forms N-Q are available on the SEC’s website at www.sec.gov, or they may be reviewed and copied at the SEC’s Public Reference Room in Washington, DC (call 1-800-732-0330 for information on the operations of the Public Reference Room). You may also obtain copies by calling the Funds at 1-855-298-4236.
APPROVAL OF THE INVESTMENT ADVISORY AND SUB-ADVISORY AGREEMENTS
The Trustees, including the Independent Trustees, reviewed and unanimously approved the proposed investment advisory and sub-advisory agreements (the “Agreements”) for the Funds at an in-person meeting held on June 28, 2011. In connection with this review, the Board reviewed statements of, and materials provided by or relating to, the Adviser and the Sub-Advisers, including, among other things, information about the proposed advisory fees to be charged to the Funds, including information comparing such fees to those of peer groups of funds; the Funds’ respective investment objectives and strategies; the experience and education of the Adviser’s and Sub-Advisers’ investment staffs; and the compliance policies of the Adviser and Sub-Adviser. Throughout the process, the Trustees were provided with the opportunity to ask questions of, and request additional materials about, the Adviser and the Sub-Advisers.
In considering whether to initially approve the Agreements, the Board, including the Independent Trustees, did not identify any single factor as determinative. Matters considered by the Trustees, including the Independent Trustees, in connection with their consideration and approval of the Agreements included the following:
Nature, Extent and Quality of Services
The Board reviewed and considered the nature and extent of the investment advisory and sub-investment advisory services proposed to be provided by DHIP and the Sub-Advisers to the Funds under the Agreements. The Board considered the role of each Sub-Adviser in all aspects of the applicable Fund’s investment program, including discretionary authority in selecting each Fund’s investments. The Board also reviewed and considered the qualifications of the portfolio managers, and other key personnel of DHIP and each Sub-Adviser who provide the investment advisory and administrative services to the Funds. The Board reviewed the current Form ADV of DHIP and each Sub-Adviser. The Board also considered each Fund’s investment objective and policies and the capabilities of DHIP and each Sub-Adviser to pursue these objectives. The Board determined that DHIP’s and each Sub-Adviser’s portfolio managers and key personnel are qualified by education and/or training and experience to perform the services in an efficient and professional manner. The Board noted the institutional history of DHIP and each Sub-Adviser, including their compliance programs and regulatory history, as well as their risk management processes. The Board reviewed DHIP’s and each Sub-Adviser’s policies for the selection of brokers, their methods of allocating investments and their soft-dollars policy. The Board also reviewed and considered the nature and extent of the non-advisory, administrative services to be provided by DHIP and the Sub-Advisers under the Agreements, including, among other things, providing office facilities, equipment and personnel.
Comparison of Fees
The Board reviewed the advisory fee rates and expected total expense ratios of the Funds. The Board compared the advisory fees and total expense ratios for the Funds with various open-end funds in a peer group universe provided by Lipper. The Board noted that the Funds’ gross advisory fees were within the range of the fees charged to comparable funds. The Board noted that the Funds’ net advisory fees and total expense ratios were also within the range of comparable funds, although the Board noted also that the effect of DHIP’s fee waiver agreement resulted in the Funds’ net advisory fees being the lowest in the Lipper peer group. The Board also noted that the sub-advisory fees paid to each Sub-Adviser would be paid from the advisory fees received by DHIP from each Fund and not directly from any Fund.
The Board concluded that the advisory fees proposed to be paid by the Funds and total expense ratios were reasonable and satisfactory in light of the services proposed to be provided.
| | |
Semi-Annual Report | March 31, 2012 (Unaudited) | | 37 |
| | |
| Drexel Hamilton Mutual Funds | | Additional Information |
| | March 31, 2012 (Unaudited) |
Investment Performance of the Funds, the Adviser and the Sub-Advisers
Because the Funds had not yet commenced operations and the Adviser was newly formed, performance information for the Funds and the Adviser was not considered. However, the Board reviewed information relating to the performance of other accounts managed by the Sub-Advisers. Based on this and other information, the Trustees concluded, within the context of their overall conclusions regarding the Agreements, that the performance record was sufficient to support approval of the Agreements.
Breakpoints and Economies of Scale
The Board reviewed the structure of the investment advisory fees. The Board noted that breakpoints were not appropriate given that the Funds were just being launched. The Board also reviewed the allocation of fees between DHIP and the Sub-Advisers.
Profitability of Adviser, each Sub-Adviser and Their Affiliates
As described above, the Board reviewed financial information relating to the Adviser and the Sub-Advisers, including balance sheets prepared by DHIP and the Sub-Advisers. The Board noted that, based on financial model projections, DHIP did not expect to begin earning a profit unless the Funds reached significant asset levels.
Fall-Out Benefits
The Board considered whether any indirect benefits may be realized by DHIP and the Sub-Advisers from their relationship with the Funds. These included the ability to place accounts that are not interested in DHIP’s or a Sub-Adviser’s separate account service or would be too small for separate account management, and publicity regarding the Funds that may benefit DHIP and the Sub-Advisers. DHIP and the Sub-Advisers may also benefit from soft dollars, if any, used in connection with Fund trades.
General Conclusion
Based on its consideration of all factors that it deemed material, and assisted by the advice of its counsel, the Board concluded it would be in the best interest of the Funds and their investors to approve the Agreements.
Page Intentionally Left Blank

Not applicable to semi-annual report.
| Item 3. | Audit Committee Financial Expert. |
Not applicable to semi-annual report.
| Item 4. | Principal Accountant Fees and Services. |
Not applicable to semi-annual report.
| Item 5. | Audit Committee of Listed Registrants. |
Not applicable.
| Item 6. | Schedule of Investments. |
Not applicable.
| Item 7. | Disclosure of Proxy Voting Policies and Procedures for Closed-End Management Investment Companies. |
Not applicable
| Item 8. | Portfolio Managers of Closed-End Management Investment Companies. |
Not applicable.
| Item 9. | Purchases of Equity Securities by Closed-End Management Investment Company and Affiliated Purchasers. |
Not applicable.
| Item 10. | Submission of Matters to Vote of Security Holders. |
None.
Item 11. Controls and Procedures.
| | (a) | The registrant’s principal executive officer and principal financial officer have evaluated the registrant’s disclosure controls and procedures (as defined in Rule 30a-3(c) under the Investment Company Act of 1940, as amended) within 90 days of this filing and have concluded that the registrant’s disclosure controls and procedures were effective, as of that date. |
| | (b) | There was no change in the registrant’s internal control over financial reporting (as defined in Rule 30a-3(d) under the Investment Company Act of 1940, as amended) during the second fiscal quarter of the period covered by this report that has materially affected, or is reasonably likely to materially affect, the registrant’s internal control over financial reporting. |
Item 12. Exhibits.
| | | | |
| | (a)(1) | | Not applicable to semi-annual report. |
| | |
| | (a)(2) | | A separate certification for the principal executive officer and the principal financial officer of the registrant as required by Rule 30a-2(a) under the Investment Company Act of 1940, as amended (17 CFR 270.30a-2(a)), are filed herewith. |
| | |
| | (a)(3) | | Not applicable. |
| | |
| | (b) | | The certifications by the registrant’s Principal Executive Officer and Principal Financial Officer, as required by Rule 30a-2(b) of the Investment Company Act of 1940, as amended, and Section 906 of the Sarbanes-Oxley Act of 2002 are attached hereto as Ex99.906Cert. |
SIGNATURES
Pursuant to the requirements of the Securities Exchange Act of 1934 and the Investment Company Act of 1940, the registrant has duly caused this report to be signed on its behalf by the undersigned, thereunto duly authorized.
DREXEL HAMILTON MUTUAL FUNDS
| | |
| By: | | /s/ Andrew Bang |
| | Andrew Bang |
| | President |
| |
| Date: | | June 8, 2012 |
Pursuant to the requirements of the Securities Exchange Act of 1934 and the Investment Company Act of 1940, this report has been signed below by the following persons on behalf of the registrant and in the capacities and on the dates indicated.
| | |
| By: | | /s/ Andrew Bang |
| | Andrew Bang |
| | President |
| |
| Date: | | June 8, 2012 |
| | |
| By: | | /s/ Andrew Bang |
| | Andrew Bang |
| | Treasurer |
| |
| Date: | | June 8, 2012 |