UNITED STATES
SECURITIES AND EXCHANGE COMMISSION
Washington, D.C. 20549
FORM N-CSRS
CERTIFIED SHAREHOLDER REPORT OF REGISTERED
MANAGEMENT INVESTMENT COMPANIES
Investment Company Act file number: 811-22545
DREXEL HAMILTON MUTUAL FUNDS
(exact name of registrant as specified in charter)
45 Rockefeller Plaza, Suite 2000, New York, NY 10111
(Address of principal executive offices) (Zip code)
Andrew Bang
45 Rockefeller Plaza, Suite 2000
New York, NY 10111
(Name and address of agent for service)
Registrant’s telephone number, including area code: 855.298.4236
Date of fiscal year end: September 30
Date of reporting period: October 1, 2012 – March 31, 2013
| Item 1. | Reports to Stockholders. |
TABLE OF CONTENTS
| | |
| Drexel Hamilton Mutual Funds | | Shareholder Letter |
| | March 31, 2013 (Unaudited) |
May 2013
Dear Shareholder,
We present the semi-annual report for the series of Drexel Hamilton Mutual Funds for the six-month period ending March 31, 2013.
The Net Asset Value (“NAV”) of the Drexel Hamilton Centre American Equity Fund (DHAMX) increased 6.79% for the six-month period ended March 31,2013 and 22.06% since inception, and the NAV of the Drexel Hamilton Centre Global Equity Fund (DHGLX) increased 6.02% for the six-month period ended March 31, 2013 and 25.00% since inception. The Drexel Hamilton Multi-Asset Real Return Fund (DHMUX), launched on October 9, 2012, has returned 1.39% for the three-month period ended March 31, 2013 and 0.80% since inception. Additional performance and Fund information is available in the following Manager Commentary sections (pages 2-10).
Since our last report to shareholders, Drexel Hamilton Multi-Asset Real Return Fund commenced trading operations, and the reorganization of a similarly managed equity fund, Ameristock Mutual Fund, Inc., into the Drexel Hamilton Centre American Equity Fund was completed.
Drexel Hamilton Multi-Asset Real Return Fund
This Fund complements our equity funds, the Drexel Hamilton Centre American Equity Fund and the Drexel Hamilton Centre Global Equity Fund, and seeks real return, which is total return that exceeds U.S. inflation over a full inflation cycle (typically 5 years) by using a flexible allocation investment strategy that is diversified across various asset classes to include equity, fixed income, exchange-traded notes and exchange-traded funds with returns that are linked to commodity indices and cash and cash equivalents. While navigating changing market conditions, the Fund endeavors to dynamically shift its allocation mix to maximize risk-adjusted returns and to preserve invested capital. Drexel Hamilton Investment Partners, LLC, the Adviser, selects the Fund’s investments and monitors the Fund’s investment portfolio.
Drexel Hamilton Centre American Equity Fund
To former shareholders of the Ameristock Mutual Fund, we extend a special welcome to the Drexel Hamilton Mutual Funds family. The reorganization of the Ameristock Mutual Fund into the Drexel Hamilton Centre American Equity Fund was completed January 11, 2013. The American Equity Fund offers an experienced portfolio manager along with an investment adviser and sub-adviser dedicated to performance, shareholder service and growth of the Fund.
All Funds
In this uncertain market, political and economic environment, the portfolio managers of each series of Drexel Hamilton Mutual Funds will continue to focus on their fundamentally-driven approaches using high conviction, disciplined and research intensive processes in seeking long-term growth of capital or, with respect to the Drexel Hamilton Multi-Asset Real Return Fund, real return.
We have accomplished many significant milestones during this reporting period and will continue to endeavor to provide consistent, risk-adjusted returns for our shareholders. We believe that the Funds are off to strong start this year, and will continue striving to provide differentiation, value and performance.
Drexel Hamilton Investment Partners LLC, the Adviser, offers investment management services to clients, intermediaries, advisers, distributors and retail clients as a leading Service Disabled Veteran Owned Small Business investment manager.
Sincerely yours,
Andrew Bang
President
Past performance is no guarantee of future results and investment returns and principal value of each Fund will fluctuate so that shares, when redeemed, may be worth more or less than their original cost.
Andrew Bang is a registered representative of ALPS Distributors, Inc.
The statements and opinions expressed are those of the Adviser and are as of the date of this report.
| | |
Semi-Annual Report | March 31, 2013 | | 1 |
| | |
| Drexel Hamilton Centre American Equity Fund | | Manager Commentary |
| | March 31, 2013 (Unaudited) |
Performance
For the six-month period ended March 31, 2013, the Drexel Hamilton Centre American Equity Fund delivered a positive absolute return but trailed the S&P 500 Index. During this period, sectors such as Financials, Health Care, and Industrials were market leaders whilst sectors such as Technology, Telecomm, Energy, and Materials lagged. Our underweight for the Financials sector and our overweight in the Technology sector versus the Index negatively impacted performance and, when combined, represented the majority of the Fund’s relative underperformance during the period. Our principal overweight sectors were Technology and Health Care driven by bottom-up stock level opportunities. Despite the performance drag from our underweight posture in Financials, we maintain our general avoidance of the large “too big to fail” financial stocks, as regulatory scrutiny and increased capital requirements continue to depress returns on equity and intrinsic values.
Stocks that were strong performers within the Fund over this period included Delta Air Lines, United Continental, Johnson & Johnson, Sempra Energy, Colgate-Palmolive and Boston Scientific; stocks that were laggards included those mainly in the Technology and Materials sectors such as Apple, Oracle, Eldorado Gold and Kinross Gold, all of which remain in the Fund.
As always, our process in managing the Fund is to focus bottom-up on each individual company’s growth outlook and capacity to create shareholder value. We analyze not only earnings but also strive to understand and link the capital allocation decisions being made today by each company and how they will lead to future earnings growth. In other words, we expect companies to invest in productive assets of the business, organically and through opportunistic purchases which, in turn, should provide the foundation for future revenue and profits growth that will create shareholder value. Alternatively, if companies cannot invest in productive assets due to a cyclical downturn or existing excess capacity, we expect these companies to “wisely contract” through the restructuring of their assets and other resources to regain their footing for future shareholder value creation. Our top-down views on interest rates and other economic factors are important, as many of those are inputs into our company models and, at the end of the day, reconciled to the bottom-up information we gather and process from company performance. This approach is designed to identify what we believe are the best stocks within the S&P 500 and weight those securities in a manner that delivers the Fund above average risk adjusted returns.
Illustrating our investment process, our view on airline investments is that, with recent mergers, carriers are cutting costs by grounding less fuel efficient aircrafts from their fleets and shedding unprofitable routes. This “wise contraction” approach as well as a more tough-minded approach to airline operations is translating into profits and shareholder wealth creation with little influence from the overall stock market direction. The airlines have been able to repeatedly raise ticket prices while still filling their planes – with overall capacity down 5% since 2008, load factors are reaching their highest level in a decade. All of this has rewarded the Fund and other patient investors with higher earnings and ratings. We expect the stocks of Delta and United Continental to continue their strong performance over the next one to two years.
Economic and Market Review
Looking back over 2012, the issues that dominated the stock market headlines were: a) the US presidential election; b) the Federal Reserve’s third round of quantitative easing, and c) the rally in stock markets world-wide since European Central Bank president Mario Draghi made his ‘whatever it takes’ comments about saving the Euro.
Rather than re-hashing the headlines, 2012 can be most importantly described as the year when the continued strong benefit to margins and corporate profits from the material restructuring efforts of 2008-2011 ran out of gas for most US companies. Our optimistic cyclical outlook since 2009 was anchored in our belief that the restructuring and streamlining of corporations we witnessed after the collapse of Lehman Brothers and during the subsequent recession was the most effective, efficient and broad-based that we have seen in our careers. We believed that profit margins and asset efficiency levels were going to reach and, in some cases, surpass prior peak levels despite a top-line revenue environment that would remain challenging.
By the spring of 2012, we no longer felt that the US stock market could rely upon strong profit growth to power its advance. Interestingly, the proportion of stocks held by the Drexel Hamilton Centre American Equity Fund, which could be characterized as cyclical growers, has fallen from, in terms of net assets, about one-half of the Fund’s portfolio to less than one-third of the Fund’s portfolio. Stocks that we sold included truck manufacturer Paccar, UPS, and General Dynamics. Our emphasis as fund managers has shifted to more stable, consistent earnings-type stocks. Our allocation to what we call “Defensive Value” and away from “Cyclical Growth” has increased significantly as we see the profit picture across the board becoming more difficult, and fewer companies are able to generate earnings growth in the current environment. This has resulted in our pro-cyclical posture since 2009, with Technology, Industrials, and Consumer Discretionary stocks being replaced with a less cyclical, “bluer” blue chip posture emphasizing Health Care, Staples and less cyclical industry groups within Technology. For example, the Fund’s top holdings currently include Johnson & Johnson, Exxon Mobil and Colgate Palmolive.
| | |
| Drexel Hamilton Centre American Equity Fund | | Manager Commentary |
| | March 31, 2013 (Unaudited) |
From a pure aggregation of bottom-up data perspective, we’re seeing that, for the first time since 2009, more than half of the S&P 500’s companies universe we cover is showing a decline in operating margins, and more than two-thirds of this same stock universe is experiencing profit margins above their ten-year averages. This indicates limited upside but growing downside risk. Lastly, the returns on equity for Financials remain constrained by new capital and regulatory requirements.
In our view, the investment environment today is different than in previous periods of slower economic growth because, outside of instigating a high inflation policy through further quantitative easing or changing reserve requirements potentially, the Federal Reserve seems impotent in trying to combat the current contraction and massaging the business cycle. US interest rates are already at record lows across the yield spectrum, and although higher rates may be the necessary tonic to bring long-term recovery hopes, we see no chance of that happening. On the positive side, many of the excesses typically seen at the start of recessions, such as excessive reinvestment rates, booming mergers and acquisitions activity, are not evident.
That said, two things loom for the foreseeable future – competitive devaluations amongst the major economic powers gaining steam and, relatedly, the Federal Reserve being forced to maintain its Quantitative Easing (QE) program well past 2013. Either or both of these can lead to a policy mistake hurting equity prices and the US dollar. Because of this, we recently purchased Gold Corp, Kinross, Eldorado Gold, and IAM Gold after these stocks approached their price lows last seen in Fall of 2008. With the price drops, valuations fell below asset levels, and, most importantly, excess capital investment plans were tempered. All of these ingredients should provide a non-correlated asset within the Fund in the event of a policy mistake that could hurt equity prices and the US dollar while benefiting gold materially.
Outlook
We believe the best strategy to employ in the current environment where profitability will likely continue to come under pressure relative to expectations is to focus on leading mega-capitalization blue chips with attributes that, in our view, render them undervalued based upon their current multiples – Defensive Value. It is our opinion that these companies, whose fundamentals will stand out increasingly as the business cycle matures, will distinguish themselves from the broad market through organic growth from innovation and pricing power. US companies such as Exxon-Mobil, Johnson & Johnson, Proctor & Gamble, and Coca-Cola typify companies with these attributes. In addition to emphasizing investment in such blue chips, some US companies continue to harvest growth in earnings have taking the initiative during the most recent recession to enhance operations, streamlined their labor forces and optimized assets. Examples of such companies include Delta and Continental airlines, Harley Davison, Honeywell, Thomson Reuters, and power producer Calpine.
We remain positive on large capitalization stocks as we continue moving towards the next stage of drivers for the stock market, particularly companies that were best able to leverage their invested capital and lean balance sheets during the economic recovery. Now, in an environment in which improving profit margins and returns on invested capital will be more difficult but, at the same time, possible favorable abatement of the macro concerns occur, we expect companies with strong internal reinvestment, innovation and pricing power to become more highly rated by the markets. 2013 may, like 1995, turn out to be the year of the American blue-chip companies with defensive value attributes leading.
S&P 500 Index - The S&P 500 Index is the Standard & Poor’s composite index of 500 stocks, a widely recognized, unmanaged index of common stock prices. You cannot invest directly into an index.
The statements and opinions expressed are those of the Sub-Adviser and are of the date of this report.
| | |
Semi-Annual Report | March 31, 2013 | | 3 |
| | |
Drexel Hamilton Centre American Equity Fund | | Manager Commentary |
| | March 31, 2013 (Unaudited) |
SECTOR WEIGHTINGS
As a percentage of Net Assets
| | | | |
| |
Information Technology | | | 25.97 | % |
Health Care | | | 16.67 | % |
Consumer Discretionary | | | 13.79 | % |
Consumer Staples | | | 12.78 | % |
Materials | | | 9.79 | % |
Energy | | | 8.00 | % |
Financials | | | 7.29 | % |
Utilities | | | 5.40 | % |
Industrials | | | 3.37 | % |
Calls | | | 0.19 | % |
Cash and Cash
Equivalents | | | -3.25 | % |
Total | | | 100.00 | % |
These allocations may not reflect the current or future positions of the portfolio.
|
GROWTH OF HYPOTHETICAL $10,000 INVESTMENT THROUGH MARCH 31, 2013 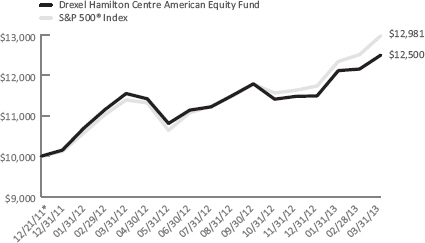
This graph assumes an initial investment of $10,000 at December 21, 2011, the Fund’s inception date, and that any dividends and distributions are reinvested. This graph depicts the performance of the Fund versus the S&P 500® Index. Taxes on any Fund distributions or when shares are redeemed, if any, are not reflected. Unlike the Fund, an index is not available for investment, is unmanaged and does not have expenses that affect the results. The comparison is shown for illustrative purposes only. TOTAL RETURNS – FOR THE PERIOD ENDED MARCH 31, 2013 |
| | | | | | | | | | | | | | | | | | | | | | | | | | | |
| | | | | 1 Month | | 3 Month | | YTD | | 1 Year | | Since
Inception* |
| | | Drexel Hamilton Centre American Equity Fund | | | | 2.83% | | | | | 8.77% | | | | | 8.77% | | | | | 8.23% | | | | | 19.10% | |
| | | S&P 500® Index | | | | 3.75% | | | | | 10.61% | | | | | 10.61% | | | | | 13.96% | | | | | 22.68% | |
|
The performance information quoted above represents past performance, which is not a guarantee of future results, and does not reflect the deduction of taxes that a shareholder would pay on Fund distributions or the redemption of Fund shares. Investment return and principal value of an investment will fluctuate so that an investor’s shares, when redeemed, may be worth more or less than their original cost. Total return includes reinvestment of dividends and capital gains, if any. Current performance may be lower or higher than the performance data quoted. For the most current month-end performance data please call 855-298-4236 or visit www.dhipfunds.com. The total annual operating expense ratio (after expense reimbursements) as stated in the fee table of the most recent prospectus, dated January 14, 2013, was 1.05%. The Adviser has entered into a written expense limitation agreement under which it has agreed to limit for a period of two years from January 11, 2013 the total expenses of the existing class of shares of the Fund (including (but not limited to) investment advisory fees of the Adviser and distribution/service (Rule 12b-1) fees, but excluding interest, taxes, litigation, brokerage commissions, and extraordinary expenses not incurred in the ordinary course of the Fund’s business) to an annual rate of 1.05% of the average daily net assets of the Fund. This limitation may not be terminated and will remain in place through the end of the two-year period beginning after January 11, 2013. Without this waiver the total annual fund operating expenses of the Fund would be 1.15%. The S&P 500® Index is a commonly recognized, market-capitalization weighted index of 500 widely held securities, designed to measure broad U.S. equity performance. You cannot invest directly in an index. * The Fund’s inception date was December 21, 2011. |
| | |
| Drexel Hamilton Centre Global Equity Fund | | Manager Commentary |
| | March 31, 2013 (Unaudited) |
Performance
For the six-month period ended March 31, 2013, the Drexel Hamilton Centre Global Equity Fund delivered a positive absolute return but underperformed its benchmark, the MSCI All Country World Index (ACWI), on a relative basis.
During this period, Japan was one of the best performing markets globally, followed by the U.S. and select European countries while emerging markets as a group lagged. Also during this period, good stock selection in Latin America and an overweight posture in Asia contributed positively to the Fund’s relative performance. On the other hand, stock selections in Asia, Europe and the U.S. and overweight posture in South America detracted from the Fund’s relative performance.
Among the Fund’s stock holdings, Fast Retailing, Daiwa Securities and Toyota Motor in Japan; Sands in China; Compagnie Financiere Richemont in Switzerland; Coloplast in Denmark; Adidas in Germany; and Samsung Electronics in South Korea contributed positively to the Fund’s performance. On the negative side, America Movil of Mexico; Gazprom of Russia; Li & Fung, China Mobile, China Life Insurance, and CNOOC of China; Enel and Intesa SanPaolo of Italy; and Vale of Brazil detracted from Fund’s performance.
Economic and Market Outlook
Looking ahead, we are cautiously optimistic. The Fund’s holdings continue to emphasize high quality large market capitalization stocks with impressive track records of creating shareholder value in good times and bad. The Fund continues to favor companies that have a long record of growing dividends and maintaining above benchmark dividend yield.
In the near-term, we believe the markets will remain volatile, but in our base case scenario, we expect the global equity markets to post positive returns and possibly end the year at higher levels than they are today.
At the regional and country level, we think that the markets, especially those in certain emerging markets, Western Europe and Japan, have already discounted many of the uncertainties and risks facing investors. Consequently, we see numerous investment opportunities for long-term global equity investors among the many attractively valued blue-chip large market capitalization multi-national companies in these regions. We believe that long-term global equity investors will be rewarded by focusing their investments, as we do in the Fund, in high quality blue chip stocks that have impressive track records of creating shareholder value, growing dividends in challenging operating environments and maintaining strong balance sheets, and that are well positioned competitively in their respective industries.
Portfolio Structure & Strategy
The Fund’s investment process combines bottom-up stock selection with structured portfolio construction and risk management that’s cognizant of secular growth forces.
Our approach in managing the Fund is to focus bottom-up on each individual company’s growth outlook, not just on earnings but understanding the capital allocation decisions being made today and how they will lead to future earnings growth. Our top-down views on macro outlooks of various markets, regions and global sectors are important, as many of those are inputs into our company models and, at the end of the day, are reconciled to the bottom-up information we gather and process from company performance and operating results. Our disciplined economic-value-added based investment process, and our GDP-adjusted focused portfolio construction process, is designed to position the Fund to be unencumbered by traditional market capitalization weighted benchmarks and to go where the bottom-up stock opportunities are globally. Consequently, we believe the Fund is well positioned to benefit and profit from the positive demographics and long-term economic growth in many developing economies as well as attractive investment opportunities in developed countries across the globe.
Currently, the Fund has overweight postures in Technology, Financials (European and Asian), Energy, Consumer Discretionary, and Consumer Staples and underweight postures in Industrials, Utilities, and Healthcare. The Fund has close to neutral postures in Materials and Telecommunication Services relative to the MSCI All Country World Index (ACWI).
Recent purchases for or additions to the Fund based on our fundamental research include Daiwa Securities, Nestle, L’Oreal and Honda Motor. Recent sells or reductions based on our disciplined investment process to take profit or remove stocks that no longer meet our fundamental investment and valuation criteria include Coloplast and Commonwealth Bank of Australia. In addition, the Fund has increased its exposure in Japan.
| | |
Semi-Annual Report | March 31, 2013 | | 5 |
| | |
Drexel Hamilton Centre Global Equity Fund | | Manager Commentary |
| | March 31, 2013 (Unaudited) |
Going forward, we believe that the Fund will continue to be anchored with investments in companies with the potential to create shareholder value that 1) have long track records of growing their cash earnings and dividends in both good times and bad, 2) are in excellent competitive positions locally or globally in their respective industries and markets, and 3) are likely to be the main beneficiaries of good fundamental long-term economic growth and demographics in various parts of the world.
MSCI All Country World Index is a free float-adjusted market capitalization weighted index that is designed to measure the equity market performance of developed and emerging markets. You cannot invest directly into an index.
Blue Chip - A nationally recognized well-established and financially sound company. Blue chips generally sell high quality, widely accepted products and services. Blue chip companies are known to generally weather downturns and operate profitably in the face of adverse economic conditions, which help to contribute to their long record of stable and reliable growth.
Gross Domestic Product (GDP) – The monetary value of all the finished goods and services produced within a country’s borders in a specific time period, though GDP is usually calculated on an annual basis.
The statements and opinions expressed are those of the Sub-Adviser and are as of the date of this report.
| | |
| Drexel Hamilton Centre Global Equity Fund | | Manager Commentary |
| | March 31, 2013 (Unaudited) |
SECTOR WEIGHTINGS
As a percentage of Net Assets
| | | | |
Financials | | | 23.55 | % |
Information Technology | | | 14.34 | % |
Energy | | | 12.97 | % |
Consumer Discretionary | | | 12.51 | % |
Consumer Staples | | | 11.72 | % |
Health Care | | | 9.49 | % |
Materials | | | 6.59 | % |
Telecommunication Services | | | 4.15 | % |
Industrials | | | 2.68 | % |
Utilities | | | 0.81 | % |
Cash and Cash Equivalents | | | 1.19 | % |
Total | | | 100.00 | % |
COUNTRY WEIGHTINGS
As a percentage of Net Assets
| | |
United States | | 22.88% |
Germany | | 11.09% |
China | | 10.99% |
France | | 7.95% |
Japan | | 7.92% |
Switzerland | | 6.70% |
Brazil | | 5.72% |
Spain | | 3.37% |
Italy | | 3.33% |
Great Britain | | 3.17% |
Russia | | 2.70% |
Hong Kong | | 2.67% |
Taiwan | | 1.90% |
Korea | | 1.54% |
Australia | | 1.41% |
Belgium | | 1.09% |
Mexico | | 1.02% |
India | | 0.78% |
Greece | | 0.78% |
Denmark | | 0.69% |
Turkey | | 0.62% |
Netherlands | | 0.49% |
Cash and Cash Equivalents | | 1.19% |
Total | | 100.00% |
These sector and country allocations may not reflect the current or future positions of the portfolio.
|
GROWTH OF HYPOTHETICAL $10,000 INVESTMENT THROUGH MARCH 31, 2013 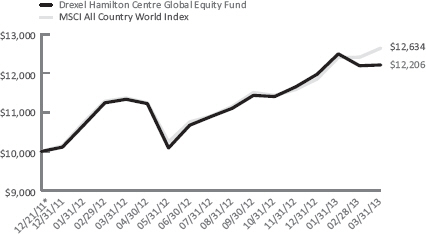
This graph assumes an initial investment of $10,000 at December 21, 2011, the Fund’s inception date, and that any dividends and distributions are reinvested. This graph depicts the performance of the Fund versus the MSCI All Country World Index. Taxes on any fund distributions or when shares are redeemed, if any, are not reflected. Unlike the Fund, an index is not available for investment, is unmanaged and does not have expenses that affect the results. The comparison is shown for illustrative purposes only. TOTAL RETURNS – FOR THE PERIOD ENDED MARCH 31, 2013 |
| | | | | | | | | | | | | | | | | | | | | | | | | | | |
| | | | | 1 Month | | 3 Month | | YTD | | 1 Year | | Since
Inception* |
| | | Drexel Hamilton Centre Global Equity Fund | | | | 0.18% | | | | | 1.99% | | | | | 1.99% | | | | | 7.73% | | | | | 16.90% | |
| | | MSCI All Country World Index | | | | 1.88% | | | | | 6.63% | | | | | 6.63% | | | | | 11.19% | | | | | 20.10% | |
|
The performance information quoted above represents past performance, which is not a guarantee of future results, and does not reflect the deduction of taxes that a shareholder would pay on Fund distributions or the redemption of Fund shares. Investment return and principal value of an investment will fluctuate so that an investor’s shares, when redeemed, may be worth more or less than their original cost. Total return includes reinvestment of dividends and capital gains, if any. Current performance may be lower or higher than the performance data quoted. For the most current month-end performance data please call 855-298-4236 or visit www.dhipfunds.com. The total annual operating expense ratio (after expense reimbursements) as stated in the fee table of the most recent prospectus, dated January 14, 2013, was 1.25%. The Adviser has entered into a written expense limitation agreement under which it has agreed to limit through January 31, 2014 the total operating expenses of the Fund, including investment advisory fees but excluding interest, taxes, litigation, brokerage commissions, other expenditures which are capitalized in accordance with generally accepted accounting principles and extraordinary expenses, to an annual rate of 1.25% of the average daily net assets of the Fund. Without this waiver the total annual fund operating expenses of the Fund would be 3.04%. Investing in the securities of foreign companies generally involves greater risk than investing in larger, more established domestic companies. Therefore, investments in the Fund may involve a greater degree of risk than investments in other mutual funds that invest in larger, more established domestic companies. The MSCI (Morgan Stanley Capital International) All Country World Index is an unmanaged, free float-adjusted market capitalization weighted index composed of stocks of companies located in countries throughout the world. It is designed to measure equity market performance in global developed and emerging markets. You cannot invest directly in an index. * The Fund’s inception date was December 21, 2011. |
| | |
Semi-Annual Report | March 31, 2013 | | 7 |
| | |
Drexel Hamilton Multi-Asset Real Return Fund | | Manager Commentary |
| | March 31, 2013 (Unaudited) |
Performance
For the period from October 9, 2012 (the date of the Fund’s inception) through March 31, 2013, the Drexel Hamilton Multi-Asset Real Return Fund delivered a return of 0.80%. The Fund delivered a return of 1.39% for the three-month period ended March 31, 2013. The Fund has been competitive and performed well relative to its benchmark.
Portfolio Structure & Strategy
The Drexel Hamilton Multi-Asset Real Return Fund was launched at a time of increasing concerns about future inflationary conditions and market volatility with the goal of producing real return, which is total return that exceeds U.S. inflation over a full inflation cycle (typically 5 years) The Fund, which is structured as a limited “fund of funds”, seeks to achieve its investment objective of providing real return by using a flexible allocation strategy that is diversified across various asset classes, including U.S. and foreign equity securities, fixed-income securities (including Treasury Inflation-Protected Securities (TIPS), exchange-traded notes (ETNs) and exchange-traded funds (ETFs) that have returns linked to commodity indices and cash and cash equivalents. In any period shorter than a full inflation cycle, the returns of the Fund may be volatile relative to the Consumer Price Index (CPI) or may lag behind inflation.
Currently, we see the implied risk premium for equities versus bonds as being high, given the distorted treasury yields and considerable uncertainty in the market. We note the following historical tendencies during high equity risk premium environments:
| | • | | Equities are undervalued |
| | • | | Earnings are overstated |
| | • | | Investors betting on rising instability |
| | • | | Higher inflationary expectations |
| | • | | Socio-economic instability |
Considering this outlook and other framework inputs, we have increased the Fund’s equity and commodity-linked holdings at the expense of TIPS and cash. As of March 31, 2013, the Fund’s allocation stands at:
| | | | | | | | | | |
| | | ASSET TYPE | | AS OF MARCH 31, 2013 | | | | | | |
| | Global Equities | | 46% | | | | | | |
| | Commodities | | 19% | | | | | | |
| | Treasuries (TIPS) | | 30% | | | | | | |
| | Cash | | 5% | | | | | | |
The process remains flexible and allows the Fund to opportunistically shift to each of the various asset classes as conditions warrant based upon the ability of each asset class to potentially perform during particular market environments.
Treasury Inflation-Protected Securities (TIPS) and commodities index linked securities (historically uncorrelated to stocks) are part of the strategy to address inflation; incorporating additional asset classes, sometimes inversely or lesser correlated to stocks, offers investors broader diversification and the ability to take advantage of the changes in asset class performance that may take place with changes in different inflationary environments. The Fund is designed to help mitigate the level of risk in delivering real returns that derived from concentrating in a single asset class. Additionally, we aim to overweight asset classes we believe are poised to perform based on our understanding of how different asset classes respond to inflation and changes in economic conditions. The result is a broadly diversified portfolio solution that can be used as a core holding or a complement to existing equity or fixed income strategies.
| | |
| Drexel Hamilton Multi-Asset Real Return Fund | | Manager Commentary |
| | March 31, 2013 (Unaudited) |
Economic and Market Outlook
After years of stable inflation in the U.S., many investors seem less concerned about the prospect of inflation rearing its ugly head but more concerned about short term market volatility. However, inflation is one of the biggest risk factors ahead for retirees investing for their future and retirement. Heightened global market volatility over the last decade and numerous economic recessions have added to investor concerns. We believe that, due to unprecedented monetary stimulus that’s been provided by the U.S. government and the Federal Reserve, the prospect of long-term risk of inflation is increasing due to:
| | • | | increased debt loads burdening many developed markets |
| | • | | prolonged accommodative monetary policies |
| | • | | uncertain and poor fiscal conditions |
| | • | | increased stress on commodity supplies primarily from emerging markets |
As we look ahead, we see global equity markets to be volatile in the near-term, but we expect underlying quality blue-chip holdings to post positive returns in the upcoming year and, given the yield convergence between stocks and bonds, to provide a good alternative to traditional treasury bonds. Since the value of TIPS, currently a key component of the Fund’s portfolio, is linked to CPI, we expect TIPS to accommodate many inflationary inputs in the economy and to be helpful in a low growth, high inflation environment. Commodities have historically provided more volatility versus the market and inflation but with returns derived from different drivers than equities. Thus, commodity-linked instruments may hedge against rising prices and provide protection for other assets classes in the Fund’s portfolio as inflation rises and/or currency volatility increases. Recent downward prices for most commodities appear to have hit a soft patch in the near term, but secular forces underlying the emerging market growth and demand for raw materials and commodities remain at play. Longer term, we believe a rebalancing of growth in China and other emerging market demand is likely to result in favoring commodity-linked instruments, leading to gradual increase in price.
We believe that monetary stimuli will remain in force as central bankers embrace higher inflation targets. We see a great potential for disruption and a future with higher inflationary expectations, and we believe that we are prepared to tactically adjust our posture to weather the long-term risk of inflation.
| | |
The statements and opinions expressed are those of the Adviser and are as of the date of this report. |
Semi-Annual Report | March 31, 2013 | | 9 |
| | |
| Drexel Hamilton Multi-Asset Real Return Fund | | Manager Commentary |
| | March 31, 2013 (Unaudited) |
ASSET TYPE WEIGHTINGS
As a percentage of Net Assets
| | | | |
Equity Holdings
(Open-End Funds) | | | 46.80% | |
U.S. Government Bonds | | | 29.01% | |
ETNs (Commodity Linked) | | | 13.22% | |
ETFs (Commodity Linked) | | | 4.57% | |
Cash and Cash Equivalents | | | 6.40% | |
Total | | | 100.00% | |
These allocations may not reflect the current or future positions of the portfolio.
|
GROWTH OF HYPOTHETICAL $10,000 INVESTMENT THROUGH MARCH 31, 2013 
This graph assumes an initial investment of $10,000 at October 9, 2012, the Fund’s inception date, and that any dividends and distributions are reinvested. This graph depicts the performance of the Fund versus the US CPI Urban Consumers NSA Index. Unlike the Fund, an index is not available for investment and is unmanaged and does not have expenses that affect the results. The comparison is shown for illustrative purposes only. CUMULATIVE TOTAL RETURNS – FOR THE PERIOD ENDED MARCH 31, 2013 |
| | | | | | | | | | | | | | | | | | | | | | |
| | | | | 1 Month | | 3 Month | | YTD | | Since Inception* |
| | Drexel Hamilton Multi-Asset Real Return Fund – Institutional Class | | | | 0.64 | % | | | | 1.39 | % | | | | 1.39 | % | | | | 0.80 | % |
| | Drexel Hamilton Multi-Asset Real Return Fund – Investor Class | | | | 0.74 | % | | | | – | | | | | – | | | | | -0.42 | % |
| | US CPI Urban Consumers NSA | | | | 0.26 | % | | | | 1.38 | % | | | | 1.38 | % | | | | 0.60 | % |
|
The performance information quoted above represents past performance, which is not a guarantee of future results, and does not reflect the deduction of taxes that a shareholder would pay on Fund distributions or the redemption of Fund shares. Investment return and principal value of an investment will fluctuate so that an investor’s shares, when redeemed, may be worth more or less than their original cost. Total return includes reinvestment of dividends and capital gains, if any. Current performance may be lower or higher than the performance data quoted. For the most current month-end performance data please call 855-298-4236 or visit www.dhipfunds.com. The total annual operating expense ratio (after expense reimbursements) as stated in the fee table of the most recent prospectus, dated January 14, 2013, was 1.81% for the Investor Class and 1.56% for the Institutional Class. The Adviser has agreed, pursuant to a written expense limitation agreement, to reduce its advisory fees and/or reimburse other expenses of the Fund until January 31, 2014 to the extent necessary to limit the current operating expenses of each class of shares of the Fund (exclusive of any front-end or contingent deferred sales loads, taxes, leverage interest, brokerage commissions, expenses incurred in connection with any merger or reorganization, extraordinary expenses such as litigation and other expenses not incurred in the ordinary course of the Fund’s business, and acquired fund fees and expenses, except that, if an acquired fund is an underlying fund managed by the Adviser and such acquired fund is not subject to an effective expense limitation or fee waiver agreement at any time during the term of the expense limitation agreement relating to the Fund, then, for that time, the operating expenses of each class of shares of the Fund shall not exclude the amount of advisory fees included in such acquired fund’s fees and expenses to which the Fund would otherwise be subject), to 1.25% for Investor Class shares of the Fund and 1.00% for Institutional Class shares of the Fund. Without this waiver the total annual fund operating expenses of the Fund would be 2.37% for the Investor Class and 2.12% for the Institutional Class. The US CPI Urban Consumers NSA Index is the annual percentage change in the Consumer Price Index (CPI). The CPI is an unmanaged index that represents the rate of inflation of U.S. consumer prices as determined by the U.S. Bureau of Labor Statistics. *The Fund’s inception date was October 9, 2012. |
| | |
| Drexel Hamilton Mutual Funds | | Disclosure of Fund Expenses |
| | March 31, 2013 (Unaudited) |
As a shareholder of a series of Drexel Hamilton Mutual Funds (each series, a “Fund” and together, the “Funds”), you will incur two types of costs: (1) transaction costs, including any applicable redemption fees; and (2) ongoing costs, including management fees and other Fund expenses. The following examples are intended to help you understand your ongoing costs (in dollars) of investing in a Fund and to compare these costs with the ongoing costs of investing in other mutual funds. The examples are based on an investment of $1,000 invested on October 1, 2012 and held until March 31, 2013.
Actual Expenses. The first line of each table below provides information about actual account values and actual expenses. You may use the information in this line, together with the amount you invested, to estimate the expenses that you paid over the period. Simply divide your account value by $1,000 (for example, an $8,600 account value divided by $1,000 = 8.6), then multiply the result by the number in the first line under the heading “Expenses Paid During Period” to estimate the expenses you paid on your account during this period.
Hypothetical Example for Comparison Purposes. The second line of the table below provides information about hypothetical account values and hypothetical expenses based on each Fund’s actual expense ratio and an assumed rate of return of 5% per year before expenses, which is not the Fund’s actual return. The hypothetical account values and expenses may not be used to estimate the actual ending account balance or expenses you paid for the period. You may use this information to compare the ongoing costs of investing in a Fund to other funds. To do so, compare this 5% hypothetical example with the 5% hypothetical examples that appear in the shareholder reports of the other funds. The expenses shown in the table are meant to highlight ongoing Fund costs only and do not reflect transaction fees, such as redemption fees or exchange fees, if any. Therefore, the second line of each table below is useful in comparing ongoing costs only, and may not help you determine the relative total costs of owning different funds. In addition, if these transactional costs were included, your costs would have been higher.
| | | | | | | | | | | | | | | | | | | | |
| | | BEGINNING ACCOUNT VALUE
10/01/12 | | ENDING ACCOUNT VALUE
03/31/13 | | EXPENSE RATIO(a) | | EXPENSES PAID
DURING PERIOD
10/01/12-03/31/13 (b) |
Drexel Hamilton Centre American Equity Fund | | | | | | | | | | | | | | | | | | | | |
Actual | | | $ | 1,000.00 | | | | $ | 1,060.20 | | | | | 1.07 | % | | | $ | 5.50 | |
Hypothetical (5% return before expenses) | | | $ | 1,000.00 | | | | $ | 1,019.60 | | | | | 1.07 | % | | | $ | 5.39 | |
| | | | |
Drexel Hamilton Centre Global Equity Fund | | | | | | | | | | | | | | | | | | | | |
Actual | | | $ | 1,000.00 | | | | $ | 1,067.90 | | | | | 1.25 | % | | | $ | 6.44 | |
Hypothetical (5% return before expenses) | | | $ | 1,000.00 | | | | $ | 1,018.70 | | | | | 1.25 | % | | | $ | 6.29 | |
| | | | |
Drexel Hamilton Multi-Asset Real Return Fund | | | | | | | | | | | | | | | | | | | | |
Institutional Class | | | | | | | | | | | | | | | | | | | | |
Actual(c) | | | $ | 1,000.00 | | | | $ | 1,008.00 | | | | | 1.00 | % | | | $ | 4.76 | |
Hypothetical (5% return before expenses) | | | $ | 1,000.00 | | | | $ | 1,019.95 | | | | | 1.00 | % | | | $ | 5.04 | |
| | | | |
Investor Class | | | | | | | | | | | | | | | | | | | | |
Actual(d) | | | $ | 1,000.00 | | | | $ | 995.80 | | | | | 1.25 | % | | | $ | 2.32 | |
Hypothetical (5% return before expenses) | | | $ | 1,000.00 | | | | $ | 1,018.70 | | | | | 1.25 | % | | | $ | 6.29 | |
| (a) | Annualized, based on the Fund’s most recent fiscal half year expenses. |
| (b) | Expenses are equal to each Fund’s annualized expense ratio multiplied by the average account value over the period, multiplied by the number of days in the most recent fiscal half year (182), then divided by 365. |
| (c) | Note the Actual Expense Paid During Period is based on expense paid since inception of the share class on October 9, 2012. |
| (d) | Note the Actual Expense Paid During Period is based on expense paid since inception of the share class on January 22, 2013. |
| | |
|
Semi-Annual Report | March 31, 2013 | | 11 |
| | |
| Drexel Hamilton Centre American Equity Fund | | Schedule of Investments |
| | March 31, 2013 (Unaudited) |
| | | | | | | | |
| | | Shares | | | Value | |
| |
COMMON STOCKS (103.06%) | | | | | | | | |
Consumer Discretionary (13.79%) | | | | | | | | |
Automobiles (0.73%) | | | | | | | | |
Harley-Davidson, Inc. | | | 18,170 | | | $ | 968,461 | |
| | | | | | | | |
| | |
Hotels Restaurants & Leisure (2.67%) | | | | | | | | |
International Game Technology | | | 63,350 | | | | 1,045,275 | |
Marriott International, Inc., Class A | | | 25,400 | | | | 1,072,642 | |
Starbucks Corp. | | | 25,400 | | | | 1,446,784 | |
| | | | | | | | |
| | | | | | | 3,564,701 | |
| | | | | | | | |
Internet & Catalog Retail (1.37%) | | | | | | | | |
Amazon.com, Inc.(a) | | | 6,850 | | | | 1,825,457 | |
| | | | | | | | |
| | |
Media (5.63%) | | | | | | | | |
Comcast Corp., Class A | | | 31,460 | | | | 1,321,634 | |
Omnicom Group, Inc. | | | 18,490 | | | | 1,089,061 | |
Thomson Reuters Corp. | | | 32,460 | | | | 1,054,301 | |
Time Warner, Inc. | | | 51,500 | | | | 2,967,430 | |
Walt Disney Co. | | | 18,950 | | | | 1,076,360 | |
| | | | | | | | |
| | | | | | | 7,508,786 | |
| | | | | | | | |
Specialty Retail (3.39%) | | | | | | | | |
Home Depot, Inc. | | | 16,940 | | | | 1,182,073 | |
TJX Companies, Inc. | | | 71,400 | | | | 3,337,950 | |
| | | | | | | | |
| | | | | | | 4,520,023 | |
| | | | | | | | |
Total Consumer Discretionary | | | | | | | 18,387,428 | |
| | | | | | | | |
| | |
Consumer Staples (12.78%) | | | | | | | | |
Beverages (3.20%) | | | | | | | | |
Coca-Cola Co. | | | 70,210 | | | | 2,839,293 | |
PepsiCo, Inc. | | | 17,940 | | | | 1,419,233 | |
| | | | | | | | |
| | | | | | | 4,258,526 | |
| | | | | | | | |
Food Products (1.69%) | | | | | | | | |
Archer-Daniels-Midland Co. | | | 33,620 | | | | 1,134,003 | |
Bunge, Ltd. | | | 15,140 | | | | 1,117,786 | |
| | | | | | | | |
| | | | | | | 2,251,789 | |
| | | | | | | | |
Household Products (5.64%) | | | | | | | | |
Colgate-Palmolive Co. | | | 44,390 | | | | 5,239,351 | |
Procter & Gamble Co. | | | 29,630 | | | | 2,283,288 | |
| | | | | | | | |
| | | | | | | 7,522,639 | |
| | | | | | | | |
Tobacco (2.25%) | | | | | | | | |
Philip Morris International, Inc. | | | 32,410 | | | | 3,004,731 | |
| | | | | | | | |
| | |
Total Consumer Staples | | | | | | | 17,037,685 | |
| | | | | | | | |
| | |
Energy (8.00%) | | | | | | | | |
Energy Equipment & Services (2.56%) | | | | | | | | |
Schlumberger, Ltd. | | | 45,530 | | | | 3,409,742 | |
| | | | | | | | |
| | |
Oil & Gas & Consumable Fuels (5.44%) | | | | | | | | |
Exxon Mobil Corp. | | | 69,050 | | | | 6,222,095 | |
Suncor Energy, Inc. | | | 34,580 | | | | 1,037,746 | |
| | | | | | | | |
| | | | | | | 7,259,841 | |
| | | | | | | | |
Total Energy | | | | | | | 10,669,583 | |
| | | | | | | | |
| | | | | | | | |
| | | Shares | | | Value | |
| |
Financials (7.29%) | | | | | | | | |
Capital Markets (2.33%) | | | | | | | | |
Goldman Sachs Group, Inc. | | | 7,040 | | | $ | 1,035,936 | |
State Street Corp. | | | 35,100 | | | | 2,074,059 | |
| | | | | | | | |
| | | | | | | 3,109,995 | |
| | | | | | | | |
Commercial Banks (0.78%) | | | | | | | | |
Fifth Third Bancorp | | | 64,260 | | | | 1,048,081 | |
| | | | | | | | |
| | |
Consumer Finance (0.77%) | | | | | | | | |
Capital One Financial Corp. | | | 18,610 | | | | 1,022,619 | |
| | | | | | | | |
| | |
Diversified Financial Services (3.41%) | | | | | | | | |
Bank of America Corp. | | | 131,650 | | | | 1,603,497 | |
Citigroup, Inc. | | | 23,510 | | | | 1,040,082 | |
JPMorgan Chase & Co. | | | 40,000 | | | | 1,898,400 | |
| | | | | | | | |
| | | | | | | 4,541,979 | |
| | | | | | | | |
Total Financials | | | | | | | 9,722,674 | |
| | | | | | | | |
| | |
Health Care (16.67%) | | | | | | | | |
Biotechnology (1.37%) | | | | | | | | |
Amgen, Inc. | | | 17,830 | | | | 1,827,753 | |
| | | | | | | | |
| | |
Health Care Equipment & Supplies (6.71%) | | | | | | | | |
Abbott Laboratories | | | 34,960 | | | | 1,234,787 | |
Becton Dickinson and Co. | | | 11,000 | | | | 1,051,710 | |
Boston Scientific Corp.(a) | | | 146,710 | | | | 1,145,805 | |
Medtronic, Inc. | | | 26,620 | | | | 1,250,075 | |
St Jude Medical, Inc. | | | 24,640 | | | | 996,442 | |
Stryker Corp. | | | 17,250 | | | | 1,125,390 | |
Varian Medical Systems, Inc.(a) | | | 15,830 | | | | 1,139,760 | |
Zimmer Holdings, Inc. | | | 13,240 | | | | 995,913 | |
| | | | | | | | |
| | | | | | | 8,939,882 | |
| | | | | | | | |
Health Care Provider & Services (0.73%) | | | | | | | | |
Cardinal Health, Inc. | | | 23,340 | | | | 971,411 | |
| | | | | | | | |
| | |
Pharmaceuticals (7.86%) | | | | | | | | |
Johnson & Johnson | | | 90,450 | | | | 7,374,388 | |
Merck & Co., Inc. | | | 35,990 | | | | 1,591,838 | |
Pfizer, Inc. | | | 52,510 | | | | 1,515,439 | |
| | | | | | | | |
| | | | | | | 10,481,665 | |
| | | | | | | | |
Total Health Care | | | | | | | 22,220,711 | |
| | | | | | | | |
| | |
Industrials (3.37%) | | | | | | | | |
Aerospace & Defense (1.95%) | | | | | | | | |
Honeywell International, Inc. | | | 20,120 | | | | 1,516,042 | |
Textron, Inc. | | | 36,200 | | | | 1,079,122 | |
| | | | | | | | |
| | | | | | | 2,595,164 | |
| | | | | | | | |
Airlines (1.42%) | | | | | | | | |
Delta Air Lines, Inc.(a) | | | 56,890 | | | | 939,254 | |
United Continental Holdings, Inc.(a) | | | 29,660 | | | | 949,417 | |
| | | | | | | | |
| | | | | | | 1,888,671 | |
| | | | | | | | |
Total Industrials | | | | | | | 4,483,835 | |
| | | | | | | | |
| | |
| Drexel Hamilton Centre American Equity Fund | | Schedule of Investments |
| | March 31, 2013 (Unaudited) |
| | | | | | | | |
| | | Shares | | | Value | |
| |
Information Technology (25.97%) | | | | | | | | |
Communication Equipment (4.55%) | | | | | | | | |
Cisco Systems, Inc. | | | 173,560 | | | $ | 3,629,140 | |
QUALCOMM, Inc. | | | 36,360 | | | | 2,434,302 | |
| | | | | | | | |
| | | | | | | 6,063,442 | |
| | | | | | | | |
Computers & Peripherals (2.94%) | | | | | | | | |
Apple, Inc. | | | 6,670 | | | | 2,952,342 | |
NetApp, Inc.(a) | | | 28,370 | | | | 969,119 | |
| | | | | | | | |
| | | | | | | 3,921,461 | |
| | | | | | | | |
Internet Software & Services (3.78%) | | | | | | | | |
eBay, Inc.(a) | | | 31,030 | | | | 1,682,446 | |
Google, Inc., Class A(a) | | | 4,230 | | | | 3,358,747 | |
| | | | | | | | |
| | | | | | | 5,041,193 | |
| | | | | | | | |
IT Services (3.89%) | | | | | | | | |
International Business Machines Corp. | | | 17,480 | | | | 3,728,484 | |
Visa, Inc. | | | 8,600 | | | | 1,460,624 | |
| | | | | | | | |
| | | | | | | 5,189,108 | |
| | | | | | | | |
Semiconductor & Semiconductor Equipment (3.36%) | |
Intel Corp. | | | 159,560 | | | | 3,486,386 | |
Maxim Integrated Products, Inc. | | | 30,330 | | | | 990,275 | |
| | | | | | | | |
| | | | | | | 4,476,661 | |
| | | | | | | | |
Software (7.45%) | | | | | | | | |
Microsoft Corp. | | | 162,050 | | | | 4,636,251 | |
Oracle Corp. | | | 163,730 | | | | 5,295,028 | |
| | | | | | | | |
| | | | | | | 9,931,279 | |
| | | | | | | | |
Total Information Technology | | | | | | | 34,623,144 | |
| | | | | | | | |
| | |
Materials (9.79%) | | | | | | | | |
Chemicals (2.76%) | | | | | | | | |
Huntsman Corp. | | | 55,540 | | | | 1,032,488 | |
LyondellBasell Industries, Class A | | | 17,750 | | | | 1,123,397 | |
Monsanto Co. | | | 14,420 | | | | 1,523,185 | |
| | | | | | | | |
| | | | | | | 3,679,070 | |
| | | | | | | | |
Containers & Packaging (0.75%) | | | | | | | | |
Bemis Co., Inc. | | | 24,650 | | | | 994,874 | |
| | | | | | | | |
| | |
Metals & Mining (6.28%) | | | | | | | | |
Alcoa, Inc. | | | 130,200 | | | | 1,109,304 | |
Eldorado Gold Corp. | | | 110,600 | | | | 1,054,018 | |
Goldcorp, Inc. | | | 30,990 | | | | 1,042,194 | |
IAMGOLD Corp. | | | 133,440 | | | | 960,768 | |
Kinross Gold Corp. | | | 141,520 | | | | 1,122,254 | |
Steel Dynamics, Inc. | | | 61,490 | | | | 975,846 | |
Teck Resources, Ltd., Class B | | | 40,020 | | | | 1,126,963 | |
United States Steel Corp. | | | 50,350 | | | | 981,825 | |
| | | | | | | | |
| | | | | | | 8,373,172 | |
| | | | | | | | |
Total Materials | | | | | | | 13,047,116 | |
| | | | | | | | |
| | |
Utilities (5.40%) | | | | | | | | |
Independent Power Producers & Energy Traders (1.55%) | |
Calpine Corp.(a) | | | 52,190 | | | | 1,075,114 | |
NRG Energy, Inc. | | | 37,240 | | | | 986,488 | |
| | | | | | | | |
| | | | | | | 2,061,602 | |
| | | | | | | | |
| | | | | | | | | | | | | | | | |
| | | | | | | | | Shares | | | Value | |
| |
Utilities (continued) | |
Multi-Utilities (3.85%) | | | | | | | | | |
Sempra Energy | | | | | | | | 64,300 | | | $ | 5,140,142 | |
| | | | | | | | | | | | | | | | |
| | | |
Total Utilities | | | | | | | | | | | | 7,201,744 | |
| | | | | | | | | | | | | | | | |
| | | | | | | | | | | | | | | | |
| |
TOTAL COMMON STOCKS (Cost $116,781,319) | | | | | | | | 137,393,920 | |
| |
| | | | |
| | | Expiration
Date | | | Exercise
Price | | | Contracts | | | Value | |
| |
PURCHASED OPTIONS (0.19%) | | | | | | | | | |
Calls (0.19%) | | | | | | | | | | | | | |
SPDR® Gold Shares: | | | | | | | | | |
| | | 12/21/2013 | | | $ | 168.00 | | | | 480 | | | | 144,000 | |
| | | 1/18/2014 | | | | 168.00 | | | | 320 | | | | 108,800 | |
| | | | | | | | | | | | | | | | |
| |
TOTAL PURCHASED OPTIONS (Cost $666,123) | | | | | | | | 252,800 | |
| |
| | | | | | | | | | | | | | | | |
| |
| | | | | | 7-Day Yield | | | Shares | | | Value | |
| |
SHORT TERM INVESTMENTS(0.60%) | | | | | |
Money Market Fund (0.60%) | | | | | | | | | |
Dreyfus Treasury Prime Cash Management, Institutional Class | | | | 0.00004 | % | | | 798,939 | | | | 798,939 | |
| | | | | | | | | | | | | | | | |
| | | | | | | | | | | | | | | | |
| |
TOTAL SHORT TERM INVESTMENTS (Cost $798,939) | | | | 798,939 | |
| |
| | |
TOTAL INVESTMENTS (Cost $118,246,381)(103.85%) | | | | | | | $ | 138,445,659 | |
| |
Liabilities in Excess of Other Assets (-3.85%) | | | | (5,127,676) | |
| |
NET ASSETS (100.00%) | | | $ | 133,317,983 | |
| |
| (a) | Non-income producing security. |
Common Abbreviations:
Ltd. - Limited.
SPDR - Standard & Poor’s Depositary Receipts.
| | |
See Notes to Financial Statements. |
Semi-Annual Report | March 31, 2013 | | 13 |
| | |
| Drexel Hamilton Centre Global Equity Fund | | Schedule of Investments |
| | March 31, 2013 (Unaudited) |
| | | | | | | | |
| | | Shares | | | Value | |
| |
COMMON STOCKS (94.14%) | | | | | | | | |
ASIA (27.21%) | | | | | | | | |
Australia (1.41%) | | | | | | | | |
Materials (1.41%) | | | | | | | | |
BHP Billiton, Ltd. | | | 5,457 | | | $ | 186,127 | |
| | | | | | | | |
| | |
Total Australia | | | | | | | 186,127 | |
| | | | | | | | |
| | |
China (10.99%) | | | | | | | | |
Energy (3.47%) | | | | | | | | |
China Petroleum & Chemical Corp., Class H | | | 90,300 | | | | 106,324 | |
China Shenhua Energy Co., Ltd., Class H | | | 28,100 | | | | 102,082 | |
CNOOC, Ltd. | | | 66,000 | | | | 126,855 | |
PetroChina Co., Ltd., Class H | | | 93,700 | | | | 122,881 | |
| | | | | | | | |
| | | | | | | 458,142 | |
| | | | | | | | |
Financials (5.63%) | | | | | | | | |
Bank of China, Ltd., Class H | | | 343,700 | | | | 159,396 | |
China Construction Bank Corp., Class H | | | 235,500 | | | | 192,343 | |
China Life Insurance Co., Ltd., Class H | | | 40,100 | | | | 103,833 | |
Industrial & Commercial Bank of China,
Class H | | | 230,700 | | | | 161,675 | |
Ping An Insurance Group Co., Class H | | | 16,100 | | | | 124,858 | |
| | | | | | | | |
| | | | | | | 742,105 | |
| | | | | | | | |
Information Technology (0.46%) | | | | | | | | |
Tencent Holdings, Ltd. | | | 1,900 | | | | 60,408 | |
| | | | | | | | |
| | |
Telecommunication Services (1.43%) | | | | | | | | |
China Mobile, Ltd. | | | 17,800 | | | | 188,490 | |
| | | | | | | | |
| | |
Total China | | | | | | | 1,449,145 | |
| | | | | | | | |
| | |
Hong Kong (2.67%) | | | | | | | | |
Consumer Discretionary (1.92%) | | | | | | | | |
Li & Fung, Ltd., Sponsored ADR | | | 96,800 | | | | 133,431 | |
Sands China, Ltd. | | | 23,100 | | | | 119,777 | |
| | | | | | | | |
| | | | | | | 253,208 | |
| | | | | | | | |
Financials (0.75%) | | | | | | | | |
Cheung Kong Holdings, Ltd. | | | 6,700 | | | | 98,913 | |
| | | | | | | | |
| | |
Total Hong Kong | | | | | | | 352,121 | |
| | | | | | | | |
| | |
India (0.78%) | | | | | | | | |
Energy (0.78%) | | | | | | | | |
Reliance Industries, Ltd., Sponsored GDR | | | 3,600 | | | | 102,528 | |
| | | | | | | | |
| | |
Total India | | | | | | | 102,528 | |
| | | | | | | | |
| | |
Japan (7.92%) | | | | | | | | |
Consumer Discretionary (4.60%) | | | | | | | | |
Fast Retailing Co., Ltd. | | | 800 | | | | 254,358 | |
Honda Motor Co., Ltd. | | | 4,030 | | | | 154,119 | |
Toyota Motor Corp. | | | 3,850 | | | | 197,336 | |
| | | | | | | | |
| | | | | | | 605,813 | |
| | | | | | | | |
Financials (3.32%) | | | | | | | | |
Daiwa Securities Group, Inc. | | | 37,900 | | | | 266,530 | |
| | | | | | | | |
| | | Shares | | | Value | |
| |
Japan (continued) | | | | | | | | |
Financials (continued) | | | | | | | | |
Mitsubishi UFJ Financial Group, Inc. | | | 28,600 | | | $ | 171,354 | |
| | | | | | | | |
| | | | | | | 437,884 | |
| | | | | | | | |
Total Japan | | | | | | | 1,043,697 | |
| | | | | | | | |
| | |
Korea (1.54%) | | | | | | | | |
Information Technology (1.54%) | | | | | | | | |
Samsung Electronics Co., Ltd. | | | 150 | | | | 203,577 | |
| | | | | | | | |
| | |
Total Korea | | | | | | | 203,577 | |
| | | | | | | | |
| | |
Taiwan (1.90%) | | | | | | | | |
Information Technology (1.90%) | | | | | | | | |
Delta Electronics, Inc. | | | 28,330 | | | | 118,427 | |
Taiwan Semiconductor Manufacturing Co., Ltd. | | | 39,300 | | | | 131,427 | |
| | | | | | | | |
| | | | | | | 249,854 | |
| | | | | | | | |
Total Taiwan | | | | | | | 249,854 | |
| | | | | | | | |
| | |
TOTAL ASIA (Cost $3,255,773) | | | | | | | 3,587,049 | |
| |
| | |
EUROPE (41.22%) | | | | | | | | |
Belgium (1.09%) | | | | | | | | |
Consumer Staples (1.09%) | | | | | | | | |
Anheuser-Busch InBev NV | | | 1,448 | | | | 143,386 | |
| | | | | | | | |
| | |
Total Belgium | | | | | | | 143,386 | |
| | | | | | | | |
| | |
Denmark (0.69%) | | | | | | | | |
Health Care (0.69%) | | | | | | | | |
Coloplast A/S, Class B | | | 1,680 | | | | 90,377 | |
| | | | | | | | |
| | |
Total Denmark | | | | | | | 90,377 | |
| | | | | | | | |
| | |
France (7.95%) | | | | | | | | |
Consumer Discretionary (0.96%) | | | | | | | | |
LVMH Moet Hennessy Louis Vuitton SA | | | 740 | | | | 127,014 | |
| | | | | | | | |
| | |
Consumer Staples (1.64%) | | | | | | | | |
L’Oreal SA | | | 1,360 | | | | 215,649 | |
| | | | | | | | |
| | |
Energy (1.07%) | | | | | | | | |
Total SA | | | 2,947 | | | | 141,113 | |
| | | | | | | | |
| | |
Financials (0.67%) | | | | | | | | |
BNP Paribas SA | | | 1,730 | | | | 88,793 | |
| | | | | | | | |
| | |
Health Care (2.76%) | | | | | | | | |
Cie Generale d’Optique Essilor International SA | | | 1,700 | | | | 189,042 | |
Sanofi | | | 1,713 | | | | 174,062 | |
| | | | | | | | |
| | | | | | | 363,104 | |
| | | | | | | | |
| | |
| Drexel Hamilton Centre Global Equity Fund | | Schedule of Investments |
| | March 31, 2013 (Unaudited) |
| | | | | | | | |
| | | Shares | | | Value | |
| |
France (continued) | | | | | | | | |
Information Technology (0.85%) | | | | | | | | |
Dassault Systemes SA | | | 970 | | | $ | 112,129 | |
| | | | | | | | |
| | |
Total France | | | | | | | 1,047,802 | |
| | | | | | | | |
| | |
Germany (10.33%) | | | | | | | | |
Consumer Discretionary (2.49%) | | | | | | | | |
Adidas AG | | | 1,600 | | | | 166,005 | |
Daimler AG | | | 2,984 | | | | 162,354 | |
| | | | | | | | |
| | | | | | | 328,359 | |
| | | | | | | | |
Financials (3.37%) | | | | | | | | |
Allianz SE | | | 1,103 | | | | 149,801 | |
Deutsche Bank AG | | | 1,320 | | | | 51,464 | |
Muenchener Rueckversicherungs AG | | | 1,300 | | | | 243,129 | |
| | | | | | | | |
| | | | | | | 444,394 | |
| | | | | | | | |
Health Care (1.23%) | | | | | | | | |
Bayer AG | | | 1,565 | | | | 161,431 | |
| | | | | | | | |
| | |
Industrials (1.13%) | | | | | | | | |
Siemens AG | | | 1,386 | | | | 149,292 | |
| | | | | | | | |
| | |
Information Technology (1.05%) | | | | | | | | |
SAP AG | | | 1,732 | | | | 138,761 | |
| | | | | | | | |
| | |
Materials (1.06%) | | | | | | | | |
BASF SE | | | 1,590 | | | | 139,246 | |
| | | | | | | | |
| | |
Total Germany | | | | | | | 1,361,483 | |
| | | | | | | | |
| | |
Great Britain (3.17%) | | | | | | | | |
Consumer Staples (1.68%) | | | | | | | | |
Diageo Plc | | | 7,040 | | | | 221,962 | |
| | | | | | | | |
| | |
Financials (1.49%) | | | | | | | | |
HSBC Holdings Plc | | | 18,368 | | | | 196,064 | |
| | | | | | | | |
| | |
Total Great Britain | | | | | | | 418,026 | |
| | | | | | | | |
| | |
Greece (0.78%) | | | | | | | | |
Consumer Staples (0.78%) | | | | | | | | |
Coca Cola Hellenic Bottling Co. SA | | | 3,830 | | | | 102,609 | |
| | | | | | | | |
| | |
Total Greece | | | | | | | 102,609 | |
| | | | | | | | |
| | |
Italy (3.33%) | | | | | | | | |
Energy (1.23%) | | | | | | | | |
Eni SpA | | | 7,199 | | | | 161,768 | |
| | | | | | | | |
| | |
Financials (1.29%) | | | | | | | | |
Assicurazioni Generali SpA | | | 6,500 | | | | 101,151 | |
Intesa Sanpaolo SpA | | | 47,200 | | | | 69,095 | |
| | | | | | | | |
| | | | | | | 170,246 | |
| | | | | | | | |
| | | | | | | | |
| | | Shares | | | Value | |
| |
Italy (continued) | |
Utilities (0.81%) | | | | | | | | |
Enel SpA | | | 32,720 | | | $ | 106,785 | |
| | | | | | | | |
| | |
Total Italy | | | | | | | 438,799 | |
| | | | | | | | |
| | |
Netherlands (0.49%) | | | | | | | | |
Consumer Staples (0.49%) | | | | | | | | |
Unilever NV | | | 1,594 | | | | 65,293 | |
| | | | | | | | |
| | |
Total Netherlands | | | | | | | 65,293 | |
| | | | | | | | |
| | |
Russia (2.70%) | | | | | | | | |
Energy (2.07%) | | | | | | | | |
Gazprom OAO, Sponsored ADR | | | 16,565 | | | | 141,631 | |
Lukoil OAO, Sponsored ADR | | | 2,034 | | | | 130,989 | |
| | | | | | | | |
| | | | | | | 272,620 | |
| | | | | | | | |
Financials (0.63%) | | | | | | | | |
Sberbank of Russia, Sponsored ADR | | | 6,467 | | | | 82,856 | |
| | | | | | | | |
| | |
Total Russia | | | | | | | 355,476 | |
| | | | | | �� | | |
| | |
Spain (3.37%) | | | | | | | | |
Consumer Discretionary (0.79%) | | | | | | | | |
Inditex SA | | | 780 | | | | 103,384 | |
| | | | | | | | |
| | |
Financials (1.82%) | | | | | | | | |
Banco Bilbao Vizcaya Argentaria SA | | | 13,835 | | | | 119,938 | |
Banco Santander SA | | | 17,924 | | | | 120,440 | |
| | | | | | | | |
| | | | | | | 240,378 | |
| | | | | | | | |
Telecommunication Services (0.76%) | | | | | | | | |
Telefonica SA | | | 7,430 | | | | 99,909 | |
| | | | | | | | |
| | |
Total Spain | | | | | | | 443,671 | |
| | | | | | | | |
| | |
Switzerland (6.70%) | | | | | | | | |
Consumer Discretionary (0.99%) | | | | | | | | |
Cie Financiere Richemont SA, Class A | | | 1,660 | | | | 130,275 | |
| | | | | | | | |
| | |
Consumer Staples (1.58%) | | | | | | | | |
Nestle SA | | | 2,890 | | | | 208,995 | |
| | | | | | | | |
| | |
Health Care (2.77%) | | | | | | | | |
Novartis AG | | | 2,150 | | | | 152,762 | |
Roche Holding AG | | | 910 | | | | 211,851 | |
| | | | | | | | |
| | | | | | | 364,613 | |
| | | | | | | | |
Materials (1.36%) | | | | | | | | |
Syngenta AG | | | 430 | | | | 179,374 | |
| | | | | | | | |
| | |
Total Switzerland | | | | | | | 883,257 | |
| | | | | | | | |
| | |
|
Semi-Annual Report | March 31, 2013 | | 15 |
| | |
| Drexel Hamilton Centre Global Equity Fund | | Schedule of Investments |
| | March 31, 2013 (Unaudited) |
| | | | | | | | |
| | | Shares | | | Value | |
| |
Turkey (0.62%) | | | | | | | | |
Financials (0.62%) | | | | | | | | |
Turkiye Garanti Bankasi AS | | | 15,500 | | | $ | 82,242 | |
| | | | | | | | |
| | |
Total Turkey | | | | | | | 82,242 | |
| | | | | | | | |
| | |
TOTAL EUROPE (Cost $5,036,638) | | | | | | | 5,432,421 | |
| |
| | |
NORTH AMERICA (23.90%) | | | | | | | | |
Mexico (1.02%) | | | | | | | | |
Telecommunication Services (1.02%) | | | | | | | | |
America Movil, Series L | | | 125,900 | | | | 133,632 | |
| | | | | | | | |
| | |
Total Mexico | | | | | | | 133,632 | |
| | | | | | | | |
| | |
United States (22.88%) | | | | | | | | |
Consumer Staples (3.55%) | | | | | | | | |
Coca-Cola Co. | | | 2,790 | | | | 112,827 | |
CVS Caremark Corp. | | | 3,900 | | | | 214,461 | |
Procter & Gamble Co. | | | 1,830 | | | | 141,020 | |
| | | | | | | | |
| | | | | | | 468,308 | |
| | | | | | | | |
Energy (2.50%) | | | | | | | | |
Chevron Corp. | | | 1,260 | | | | 149,713 | |
Exxon Mobil Corp. | | | 2,000 | | | | 180,220 | |
| | | | | | | | |
| | | | | | | 329,933 | |
| | | | | | | | |
Financials (2.72%) | | | | | | | | |
HDFC Bank, Ltd., ADR | | | 2,600 | | | | 97,292 | |
JPMorgan Chase & Co. | | | 2,710 | | | | 128,617 | |
Wells Fargo & Co. | | | 3,580 | | | | 132,424 | |
| | | | | | | | |
| | | | | | | 358,333 | |
| | | | | | | | |
Health Care (2.04%) | | | | | | | | |
Johnson & Johnson | | | 1,720 | | | | 140,232 | |
Pfizer, Inc. | | | 4,450 | | | | 128,427 | |
| | | | | | | | |
| | | | | | | 268,659 | |
| | | | | | | | |
Industrials (0.91%) | | | | | | | | |
General Electric Co. | | | 5,180 | | | | 119,762 | |
| | | | | | | | |
| | |
Information Technology (8.54%) | | | | | | | | |
Apple, Inc. | | | 370 | | | | 163,773 | |
Cisco Systems, Inc. | | | 8,600 | | | | 179,826 | |
Google, Inc., Class A(a) | | | 80 | | | | 63,522 | |
International Business Machines Corp. | | | 790 | | | | 168,507 | |
Mastercard, Inc., Class A | | | 300 | | | | 162,339 | |
Microsoft Corp. | | | 4,060 | | | | 116,157 | |
Oracle Corp. | | | 3,410 | | | | 110,279 | |
QUALCOMM, Inc. | | | 2,400 | | | | 160,680 | |
| | | | | | | | |
| | | | | | | 1,125,083 | |
| | | | | | | | |
Materials (1.68%) | | | | | | | | |
Monsanto Co. | | | 2,100 | | | | 221,823 | |
| | | | | | | | |
| | | | | | | | |
| | | Shares | | | Value | |
| |
United States (continued) | | | | | | | | |
Telecommunication Services (0.94%) | | | | | | | | |
AT&T, Inc. | | | 3,380 | | | $ | 124,012 | |
| | | | | | | | |
| | |
Total United States | | | | | | | 3,015,913 | |
| | | | | | | | |
| | |
TOTAL NORTH AMERICA (Cost $2,867,332) | | | | | | | 3,149,545 | |
| |
| | |
SOUTH AMERICA (1.81%) | | | | | | | | |
Brazil (1.81%) | | | | | | | | |
Consumer Staples (0.46%) | | | | | | | | |
Natura Cosmeticos SA | | | 2,500 | | | | 60,163 | |
| | | | | | | | |
| | |
Energy (0.71%) | | | | | | | | |
Cosan SA Industria e Comercio | | | 4,200 | | | | 93,862 | |
| | | | | | | | |
| | |
Industrials (0.64%) | | | | | | | | |
CCR SA | | | 8,300 | | | | 84,777 | |
| | | | | | | | |
| | |
Total Brazil | | | | | | | 238,802 | |
| | | | | | | | |
| | |
TOTAL SOUTH AMERICA (Cost $222,150) | | | | | | | 238,802 | |
| |
| | | | | | | | |
| |
TOTAL COMMON STOCKS (Cost $11,381,893) | | | | | | | 12,407,817 | |
| |
| | |
PREFERRED STOCKS (4.67%) | | | | | | | | |
EUROPE (0.76%) | | | | | | | | |
Germany (0.76%) | | | | | | | | |
Consumer Discretionary (0.76%) | | | | | | | | |
Volkswagen AG | | | 500 | | | | 99,344 | |
| | | | | | | | |
| | |
Total Germany | | | | | | | 99,344 | |
| | | | | | | | |
| | |
TOTAL EUROPE (Cost $114,318) | | | | | | | 99,344 | |
| |
| | |
SOUTH AMERICA (3.91%) | | | | | | | | |
Brazil (3.91%) | | | | | | | | |
Consumer Staples (0.45%) | | | | | | | | |
Cia de Bebidas das Americas | | | 1,400 | | | | 59,014 | |
| | | | | | | | |
| | |
Energy (1.14%) | | | | | | | | |
Petroleo Brasileiro SA | | | 16,550 | | | | 150,451 | |
| | | | | | | | |
| | |
Financials (1.24%) | | | | | | | | |
Banco Bradesco SA | | | 4,400 | | | | 74,228 | |
Itau Unibanco Holding SA | | | 5,010 | | | | 89,055 | |
| | | | | | | | |
| | | | | | | 163,283 | |
| | | | | | | | |
| | |
| Drexel Hamilton Centre Global Equity Fund | | Schedule of Investments |
| | March 31, 2013 (Unaudited) |
| | | | | | | | | | | | |
| | | | | | Shares | | | Value | |
| |
Brazil (continued) | | | | | | | | | | | | |
Materials (1.08%) | | | | | | | | | | | | |
Vale SA | | | | | | | 8,640 | | | $ | 142,977 | |
| | | | | | | | | | | | |
| | | |
Total Brazil | | | | | | | | | | | 515,725 | |
| | | | | | | | | | | | |
| | | |
TOTAL SOUTH AMERICA (Cost $532,308) | | | | | | | | | | | 515,725 | |
| |
| | | | | | | | | | | | |
| |
TOTAL PREFERRED STOCKS (Cost $646,626) | | | | | | | | | | | 615,069 | |
| |
| | | |
| | | 7-Day
Yield | | | Shares | | | Value | |
| |
SHORT TERM INVESTMENTS (0.51%) | | | | | |
Money Market Fund (0.51%) | | | | | | | | | | | | |
Dreyfus Treasury Prime Cash Management, Institutional Class | | | 0.00004% | | | | 67,358 | | | | 67,358 | |
| | | | | | | | | | | | |
| | | | | | | | | | | | |
| |
TOTAL SHORT TERM INVESTMENTS (Cost $67,358) | | | | | | | | 67,358 | |
| |
| | |
TOTAL INVESTMENTS (Cost $12,095,877) (99.32%) | | | | | | | $ | 13,090,244 | |
| |
Other Assets In Excess Of Liabilities (0.68%) | | | | 89,559 | |
| |
NET ASSETS (100.00%) | | | | | | | | | | $ | 13,179,803 | |
| |
| (a) | Non-income producing security. |
|
Common Abbreviations: |
ADR - American Depository Receipt. |
AG - Aktiengesellschaft is a German term that refers to a corporation that is limited by shares, i.e., owned by shareholders. |
A/S - Aktieselskab is the Danish term for Joint Stock Company. |
Ltd. - Limited. |
GDR - Global Depository Receipt. |
NV - Naamloze Vennootschap is the Dutch term for a public limited liability corporation. |
OAO - Otkrytoe Aktsionernoe Obschestvo (a Russian open joint stock corporation) |
Plc - Public Limited Company. |
SA - Generally designates corporations in various countries, mostly those employing the civil law. |
SE - SE Regulation. A European Company which can operate on a Europe-wide basis and be governed by Community law directly applicable in all Member States. |
SpA - Societa Per Azioni is an Italian shared company. |
UFJ - United Financial of Japan. |
| | |
See Notes to Financial Statements. |
Semi-Annual Report | March 31, 2013 | | 17 |
| | |
| Drexel Hamilton Multi-Asset Real Return Fund | | Schedule of Investments |
| | March 31, 2013 (Unaudited) |
| | | | | | | | | | | | |
| | | | | | Shares | | | Value | |
| |
EXCHANGE TRADED FUNDS (4.57%) | |
ELEMENTS Linked to the Rogers International Commodity Index- Total Return(a) | | | | | | | 300,800 | | | $ | 2,589,888 | |
| | | | | | | | | | | | |
| |
TOTAL EXCHANGE TRADED FUNDS (Cost $2,645,309) | | | | 2,589,888 | |
| |
|
EXCHANGE TRADED NOTES (13.22%) | |
ETRACS DJ-UBS Commodity Index Total Return ETN(a) | | | | 95,080 | | | | 2,440,703 | |
iPath Dow Jones-UBS Commodity Index Total Return ETN(a) | | | | 62,950 | | | | 2,557,029 | |
PowerShares DB Commodity Index Tracking Fund ETN(a) | | | | 91,280 | | | | 2,492,857 | |
| | | | | | | | | | | | |
| |
TOTAL EXCHANGE TRADED NOTES (Cost $7,752,480) | | | | 7,490,589 | |
| |
|
OPEN-END FUNDS (46.80%) | |
Drexel Hamilton Centre American Equity Fund(b) | | | | 1,364,674 | | | | 13,373,803 | |
Drexel Hamilton Centre Global Equity Fund(b) | | | | 1,164,903 | | | | 13,140,106 | |
| | | | | | | | | | | | |
| |
TOTAL OPEN-END FUNDS (Cost $28,167,361) | | | | 26,513,909 | |
| |
| | | |
| | | | | | Principle
Amount | | | Value | |
| |
U.S. GOVERNMENT BONDS (29.01%) | |
U.S. Treasury Inflation Indexed Bonds | |
1/15/2014, 2.000% | | | | | | $ | 1,869,240 | | | $ | 1,932,473 | |
1/15/2016, 2.000% | | | | | | | 1,740,180 | | | | 1,940,708 | |
1/15/2017, 2.375% | | | | | | | 1,712,685 | | | | 1,999,293 | |
7/15/2020, 1.250% | | | | | | | 844,656 | | | | 1,010,288 | |
1/15/2021, 1.125% | | | | | | | 1,650,477 | | | | 1,948,465 | |
7/15/2021, 0.625% | | | | | | | 919,467 | | | | 1,053,364 | |
1/15/2025, 2.375% | | | | | | | 1,465,860 | | | | 1,972,269 | |
4/15/2029, 3.875% | | | | | | | 1,120,520 | | | | 1,825,572 | |
4/15/2032, 3.375% | | | | | | | 1,102,646 | | | | 1,778,705 | |
2/15/2041, 2.125% | | | | | | | 683,443 | | | | 971,343 | |
| | | | | | | | | | | | |
| |
TOTAL U.S. GOVERNMENT BONDS (Cost $16,354,503) | | | | 16,432,480 | |
| |
| | | |
| | | 7-Day
Yield | | | Shares | | | Value | |
| |
SHORT TERM INVESTMENTS (6.22%) | |
Money Market Fund (6.22%) | | | | | |
Dreyfus Treasury Prime Cash Management, Institutional Class | | | 0.00004 | % | | | 3,524,887 | | | | 3,524,887 | |
| | | | | | | | | | | | |
| | | | | | | | | | | | |
| |
TOTAL SHORT TERM INVESTMENTS (Cost $3,524,887) | | | | 3,524,887 | |
| |
| | | | |
TOTAL INVESTMENTS (Cost $58,444,540) (99.82%) | | $ | 56,551,753 | |
| |
Other Assets In Excess Of Liabilities (0.18%) | | | 100,666 | |
| |
NET ASSETS (100.00%) | | $ | 56,652,419 | |
| |
| |
| (a) | Non-income producing security. |
| (b) | Affiliated with the Fund, as each is a series of Drexel Hamilton Mutual Funds and have the some investment adviser. |
Common Abbreviations:
ETN - Exchange Traded Note.
| | |
See Notes to Financial Statements. |
18 | | www.dhipfunds.com |
| | |
| Drexel Hamilton Mutual Funds | | Statements of Assets and Liabilities |
| | March 31, 2013 (Unaudited) |
| | | | | | | | | | | | |
| | | Drexel Hamilton
Centre American Equity Fund | | | Drexel Hamilton
Centre Global Equity
Fund | | | Drexel Hamilton
Multi-Asset Real
Return Fund | |
| | | | |
ASSETS: | | | | | | | | | | | | |
Investments, at value | | $ | 138,445,659 | | | $ | 13,090,244 | | | $ | 30,037,844 | |
Investments in affiliates, at value | | | – | | | | – | | | | 26,513,909 | |
Foreign currency, at value (Cost $–, $2,579 and $–, respectively) | | | – | | | | 2,579 | | | | – | |
Receivable for dividends and interest | | | 185,087 | | | | 26,133 | | | | 77,347 | |
Receivable due from investment advisor | | | 59,601 | | | | 90,075 | | | | – | |
Receivable for shares sold | | | 15,839 | | | | – | | | | – | |
Deferred offering cost | | | – | | | | – | | | | 51,225 | |
Prepaid and other assets | | | 25,246 | | | | 3,581 | | | | 11,947 | |
| | | | | | | | | | | | |
Total Assets | | | 138,731,432 | | | | 13,212,612 | | | | 56,692,272 | |
| | | | | | | | | | | | |
LIABILITIES: | | | | | | | | | | | | |
Payable to custodian | | | 18,317 | | | | – | | | | – | |
Payable to administrator | | | 17,015 | | | | 5,190 | | | | 9,793 | |
Payable to transfer agency | | | 7,876 | | | | 2,666 | | | | 1,930 | |
Payable for shares redeemed | | | 5,293,429 | | | | – | | | | – | |
Payable to investment advisor | | | – | | | | – | | | | 3,920 | |
Accrued 12b-1 fees (Investor class) | | | 29,336 | | | | – | | | | – | |
Payable for custodian fees | | | 2,852 | | | | 11,727 | | | | 1,159 | |
Payable for printing | | | 5,753 | | | | 615 | | | | 1,441 | |
Payable for legal and audit fees | | | 26,506 | | | | 12,191 | | | | 12,404 | |
Payable to trustees | | | 6,482 | | | | 195 | | | | 927 | |
Payable for chief compliance officer services | | | 5,002 | | | | 177 | | | | 5,793 | |
Other payables | | | 881 | | | | 48 | | | | 2,486 | |
| | | | | | | | | | | | |
Total Liabilities | | | 5,413,449 | | | | 32,809 | | | | 39,853 | |
| | | | | | | | | | | | |
NET ASSETS | | $ | 133,317,983 | | | $ | 13,179,803 | | | $ | 56,652,419 | |
| | | | | | | | | | | | |
NET ASSETS CONSIST OF: | | | | | | | | | | | | |
Paid-in capital | | $ | 98,989,693 | | | $ | 11,847,896 | | | $ | 59,032,987 | |
Accumulated net investment income/(loss) | | | 278,722 | | | | 28,500 | | | | (234,031) | |
Accumulated net realized gain/(loss) on investments and foreign currency transactions | | | 13,850,290 | | | | 309,256 | | | | (253,750) | |
Net unrealized appreciation/(depreciation) on investments and translation of assets and liabilities denominated in foreign currencies | | | 20,199,278 | | | | 994,151 | | | | (1,892,787) | |
| | | | | | | | | | | | |
NET ASSETS | | $ | 133,317,983 | | | $ | 13,179,803 | | | $ | 56,652,419 | |
| | | | | | | | | | | | |
INVESTMENTS, AT COST | | $ | 118,246,381 | | | $ | 12,095,877 | | | $ | 30,277,179 | |
| | | |
INVESTMENTS IN AFFILIATES, AT COST | | | – | | | | – | | | | 28,167,361 | |
| | | |
PRICING OF SHARES | | | | | | | | | | | | |
| | | |
Net Assets | | $ | 133,317,983 | | | $ | 13,179,803 | | | | | |
Shares Outstanding | | | 13,610,254 | | | | 1,167,930 | | | | | |
Net Asset Value, offering and redemption price per share | | | $9.80 | | | | $11.28 | | | | | |
Institutional | | | | | | | | | | | | |
Net Assets | | | | | | | | | | $ | 56,647,442 | |
Shares outstanding | | | | | | | | | | | 5,959,990 | |
Net Asset Value, offering and redemption price per share | | | | | | | | | | | $9.50 | |
Investor | | | | | | | | | | | | |
Net Assets | | | | | | | | | | $ | 4,977 | |
Shares outstanding | | | | | | | | | | | 524 | |
Net Asset Value, offering and redemption price per share | | | | | | | | | | | $9.50 | |
| | |
See Notes to Financial Statements. |
Semi-Annual Report | March 31, 2013 | | 19 |
| | |
| Drexel Hamilton Mutual Funds | | Statements of Operations |
| | |
| | | | | | | | | | | | |
| | | Drexel Hamilton
Centre American
Equity Fund | | | Drexel Hamilton
Centre Global
Equity Fund | | | Drexel Hamilton Multi-Asset Real Return Fund(a) | |
| | | | |
| | | For the Six
Months Ended
March 31, 2013
(Unaudited) | | | For the Six
Months Ended
March 31, 2013
(Unaudited) | | | For the Period
October 9, 2012
(Inception) to
March 31, 2013
(Unaudited) | |
INVESTMENT INCOME: | | | | | | | | | | | | |
Interest | | $ | – | | | $ | – | | | $ | (51,103) | |
Dividends | | | 684,278 | | | | 141,907 | | | | – | |
Dividends from affiliated securities | | | – | | | | – | | | | 3,262,240 | |
Foreign taxes withheld | | | (10,896) | | | | (5,824) | | | | – | |
| | | | | | | | | | | | |
Total Investment Income | | | 673,382 | | | | 136,083 | | | | 3,211,137 | |
| | | | | | | | | | | | |
| | | |
EXPENSES: | | | | | | | | | | | | |
Investment advisory fees | | | 245,157 | | | | 57,778 | | | | 134,174 | |
Administration fees | | | 67,108 | | | | 27,804 | | | | 76,983 | |
Transfer agent fees | | | 20,077 | | | | 11,317 | | | | 10,844 | |
Custodian fees | | | 4,102 | | | | 18,760 | | | | 2,477 | |
Legal fees | | | 86,913 | | | | 19,015 | | | | 55,477 | |
Audit fees | | | 4,035 | | | | 8,367 | | | | 5,468 | |
Trustees’ fees and expenses | | | 8,574 | | | | 2,093 | | | | 9,299 | |
Registration/filing fees | | | 8,450 | | | | 1,028 | | | | 2,056 | |
12b-1 fees | | | 72,002 | | | | N/A | | | | N/A | |
12b-1 fees (Investor class) | | | N/A | | | | N/A | | | | 2 | |
Chief compliance officer services | | | 12,747 | | | | 2,790 | | | | 16,349 | |
Offering costs | | | 2,060 | | | | 1,249 | | | | 19,138 | |
Miscellaneous expenses | | | 8,594 | | | | 3,245 | | | | 7,356 | |
| | | | | | | | | | | | |
Total expenses before waivers | | | 539,819 | | | | 153,446 | | | | 339,623 | |
Fees waived/reimbursed by investment advisor (Note 5) | | | (188,827) | | | | (81,172) | | | | – | |
Fees waived/reimbursed by investment advisor Institutional (Note 5) | | | – | | | | – | | | | (95,665) | |
Fees waived/reimbursed by investment advisor Investor (Note 5) | | | – | | | | – | | | | (3) | |
| | | | | | | | | | | | |
Net Expenses | | | 350,992 | | | | 72,274 | | | | 243,955 | |
| | | | | | | | | | | | |
Net Investment Income | | | 322,390 | | | | 63,809 | | | | 2,967,182 | |
| | | | | | | | | | | | |
| | | |
Net realized gain on investments | | | 15,480,507 | | | | 688,882 | | | | – | |
Net realized loss on affiliated investments | | | – | | | | – | | | | (253,750) | |
Net realized gain on foreign currencies | | | – | | | | 9,063 | | | | – | |
Net change in unrealized depreciation on investments | | | (9,881,902) | | | | (46,857) | | | | (239,335) | |
Net change in unrealized depreciation on affiliated investments | | | – | | | | – | | | | (1,653,452) | |
Net change in unrealized depreciation on translation of assets and liabilities denominated in foreign currency transactions | | | – | | | | (230) | | | | – | |
| | | | | | | | | | | | |
NET REALIZED AND UNREALIZED GAIN/(LOSS) ON INVESTMENTS AND FOREIGN CURRENCIES | | | 5,598,605 | | | | 650,858 | | | | (2,146,537) | |
| | | | | | | | | | | | |
NET INCREASE IN NET ASSETS RESULTING FROM OPERATIONS | | $ | 5,920,995 | | | $ | 714,667 | | | $ | 820,645 | |
| | | | | | | | | | | | |
| (a) | Institutional Class commenced operations on October 9, 2012. Investor Class commenced operations on January 22, 2013. |
| | |
See Notes to Financial Statements. |
20 | | www.dhipfunds.com |
| | |
Drexel Hamilton Centre American Equity Fund | | Statements of Changes in Net Assets |
| | | | | | | | |
| | | For the
Six Months Ended
March 31, 2013
(Unaudited) | | | For the Period
December 21, 2011
(Inception) to
September 30, 2012 | |
OPERATIONS: | | | | | | | | |
Net investment income | | $ | 322,390 | | | $ | 121,695 | |
Net realized gain on investments | | | 15,480,507 | | | | 582,333 | |
Net change in unrealized appreciation/(depreciation) on investments | | | (9,881,902) | | | | 2,964,367 | |
| | | | | | | | |
Net increase in net assets resulting from operations | | | 5,920,995 | | | | 3,668,395 | |
| | | | | | | | |
DISTRIBUTIONS TO SHAREHOLDERS: | | | | | | | | |
From net investment income | | | (175,273) | | | | – | |
From net realized gains on investments | | | (2,212,550) | | | | – | |
| | | | | | | | |
Total distributions | | | (2,387,823) | | | | – | |
| | | | | | | | |
CAPITAL SHARE TRANSACTIONS: | | | | | | | | |
Proceeds from sale of shares | | | 29,820,191 | | | | 20,527,005 | |
Shares issued in reinvestment of distributions | | | 2,387,823 | | | | – | |
Cost of shares redeemed | | | (56,678,400) | | | | – | |
Redemption Fees | | | 1,615 | | | | – | |
Acquisition (See Note 10 in Notes to Financial Statements) | | | 130,033,182 | | | | – | |
| | | | | | | | |
Net increase from capital share transactions | | | 105,564,411 | | | | 20,527,005 | |
| | | | | | | | |
Net increase in net assets | | $ | 109,097,583 | | | $ | 24,195,400 | |
| | | | | | | | |
NET ASSETS: | | | | | | | | |
Beginning of period | | | 24,220,400 | | | | 25,000 | |
| | | | | | | | |
End of period* | | $ | 133,317,983 | | | $ | 24,220,400 | |
| | | | | | | | |
*Including accumulated net investment income of: | | $ | 278,722 | | | $ | 131,605 | |
| | |
OTHER INFORMATION: | | | | | | | | |
Share Transactions: | | | | | | | | |
Beginning Shares | | | 2,054,881 | | | | 2,500 | |
Shares sold | | | 2,596,690 | | | | 2,052,381 | |
Shares issued in reinvestment of dividends | | | 266,498 | | | | – | |
Shares Redeemed | | | (5,185,423) | | | | – | |
Acquisition Shares (See Note 10 in Notes to Financial Statements) | | | 13,877,608 | | | | – | |
| | | | | | | | |
Ending Shares | | | 13,610,254 | | | | 2,054,881 | |
| | | | | | | | |
| | |
See Notes to Financial Statements. |
Semi-Annual Report | March 31, 2013 | | 21 |
| | |
Drexel Hamilton Centre Global Equity Fund | | Statements of Changes in Net Assets |
| | | | | | | | |
| | | For the
Six Months Ended
March 31, 2013
(Unaudited) | | | For the Period
December 21, 2011
(Inception) to
September 30, 2012 | |
OPERATIONS: | | | | | | | | |
Net investment income | | $ | 63,809 | | | $ | 181,259 | |
Net realized gain on investments | | | 688,882 | | | | 287,517 | |
Net realized gain/(loss) on foreign currency transactions | | | 9,063 | | | | (14,391) | |
Net change in unrealized appreciation/(depreciation) on investments and translation of assets and liabilities denominated in foreign currencies | | | (47,087) | | | | 1,041,238 | |
| | | | | | | | |
Net increase in net assets resulting from operations | | | 714,667 | | | | 1,495,623 | |
| | | | | | | | |
DISTRIBUTIONS TO SHAREHOLDERS: | | | | | | | | |
From net investment income | | | (207,005) | | | | – | |
From net realized gains on investments | | | (676,187) | | | | – | |
| | | | | | | | |
Total distributions | | | (883,192) | | | | – | |
| | | | | | | | |
CAPITAL SHARE TRANSACTIONS: | | | | | | | | |
Proceeds from sale of shares | | | 17,221,198 | | | | 10,467,667 | |
Shares issued in reinvestment of distributions | | | 883,192 | | | | – | |
Cost of shares redeemed | | | (16,744,352) | | | | – | |
| | | | | | | | |
Net increase from capital share transactions | | | 1,360,038 | | | | 10,467,667 | |
| | | | | | | | |
Net increase in net assets | | $ | 1,191,513 | | | $ | 11,963,290 | |
| | | | | | | | |
NET ASSETS: | | | | | | | | |
Beginning of period | | | 11,988,290 | | | | 25,000 | |
| | | | | | | | |
End of period* | | $ | 13,179,803 | | | $ | 11,988,290 | |
| | | | | | | | |
*Including accumulated net investment income of: | | $ | 28,500 | | | $ | 171,696 | |
OTHER INFORMATION: | | | | | | | | |
Share Transactions: | | | | | | | | |
Beginning Shares | | | 1,048,994 | | | | 2,500 | |
Shares sold | | | 1,508,716 | | | | 1,046,494 | |
Shares issued in reinvestment of dividends | | | 79,927 | | | | – | |
Shares Redeemed | | | (1,469,707) | | | | – | |
| | | | | | | | |
Ending Shares | | | 1,167,930 | | | | 1,048,994 | |
| | | | | | | | |
| | |
See Notes to Financial Statements. |
22 | | www.dhipfunds.com |
| | |
Drexel Hamilton Multi-Asset Real Return Fund | | Statements of Changes in Net Assets |
| | | | |
| | | For the Period
October 9, 2012 (Inception)
to March 31, 2013
(Unaudited) | |
OPERATIONS: | | | | |
Net investment income | | $ | 2,967,182 | |
Net realized loss on affiliated investments | | | (253,750) | |
Net change in unrealized depreciation on investments and affiliated investments | | | (1,892,787) | |
| | | | |
Net increase in net assets resulting from operations | | | 820,645 | |
| | | | |
DISTRIBUTIONS TO SHAREHOLDERS: | | | | |
From net investment income Institutional | | | (3,201,213) | |
| | | | |
Total distributions | | | (3,201,213) | |
| | | | |
CAPITAL SHARE TRANSACTIONS: | | | | |
Institutional Class | | | | |
Proceeds from sale of shares | | | 55,826,774 | |
Shares issued in reinvestment of distributions | | | 3,201,213 | |
| | | | |
Net increase from capital share transactions | | | 59,027,987 | |
| | | | |
Investor Class | | | | |
Proceeds from sale of shares | | | 5,000 | |
| | | | |
Net increase from capital share transactions | | | 5,000 | |
| | | | |
Net increase in net assets | | $ | 56,652,419 | |
| | | | |
NET ASSETS: | | | | |
Beginning of period | | | – | |
| | | | |
End of period* | | $ | 56,652,419 | |
| | | | |
*Including accumulated net investment (loss) of: | | $ | (234,031) | |
OTHER INFORMATION: | | | | |
Share Transactions: | | | | |
Investor Class | | | | |
Beginning shares | | | – | |
Shares sold | | | 524 | |
| | | | |
Ending Shares | | | 524 | |
| | | | |
Institutional Class | | | | |
Beginning shares | | | – | |
Shares sold | | | 5,617,248 | |
Shares issued in reinvestment of dividends | | | 342,742 | |
| | | | |
Ending Shares | | | 5,959,990 | |
| | | | |
| | |
See Notes to Financial Statements. |
Semi-Annual Report | March 31, 2013 | | 23 |
| | |
| Drexel Hamilton Centre American Equity Fund | | Financial Highlights |
| For a share outstanding throughout the periods presented. |
| | | | | | | | |
| | | For the
Six Months Ended
March 31, 2013
(Unaudited) | | | For the Period
December 21, 2011
(inception) to
September 30, 2012 | |
| | |
NET ASSET VALUE, BEGINNING OF PERIOD | | $ | 11.79 | | | $ | 10.00 | |
INCOME FROM INVESTMENT OPERATIONS: | | | | | | | | |
Net investment income(a) | | | 0.05 | | | | 0.07 | |
Net realized and unrealized gain on investments | | | 0.43 | | | | 1.72 | |
Total income from investment operations | | | 0.48 | | | | 1.79 | |
| | |
DISTRIBUTIONS: | | | | | | | | |
Net investment income | | | (0.18) | | | | – | |
Net realized gains on investments | | | (2.29) | | | | – | |
Total distributions | | | (2.47) | | | | – | |
REDEMPTION FEES ADDED TO PAID-IN CAPITAL (NOTE 2) | | | 0.00 | (b) | | | – | |
NET INCREASE/(DECREASE) IN NET ASSET VALUE | | | (1.99) | | | | 1.79 | |
NET ASSET VALUE, END OF PERIOD | | $ | 9.80 | | | $ | 11.79 | |
| | | | | | | | | |
| | |
Total Return(c) | | | 6 .02 | % | | | 17.90 | % |
| | |
RATIOS/SUPPLEMENTAL DATA: | | | | | | | | |
Net assets, end of period (in 000s) | | $ | 133,318 | | | $ | 24,220 | |
| | |
RATIOS TO AVERAGE NET ASSETS: | | | | | | | | |
Net investment income including reimbursement/waiver | | | 0 ..99 | %(d) | | | 0.69 | %(d) |
Operating expenses excluding reimbursement/waiver | | | 1 ..65 | %(d) | | | 2.32 | %(d) |
Operating expenses including reimbursement/waiver | | | 1.07 | %(d) (e) | | | 1.25 | %(d) |
PORTFOLIO TURNOVER RATE(f) | | | 150 | % | | | 67 | % |
| (a) | Calculated using the average shares method. |
| (b) | Less than $0.005 per share. |
| (c) | Total returns are for the period indicated and have not been annualized. Total returns would have been lower had certain expenses not been waived during the period. Returns shown do not reflect the deduction of taxes that a shareholder would pay on fund distributions or the redemption of fund shares. |
| (e) | Effective January 11, 2013, the expense limitation amount changed from 1.25% to 1.05%. |
| (f) | Portfolio turnover rate is not annualized for less than one full year. |
| | |
See Notes to Financial Statements. |
24 | | www.dhipfunds.com |
| | |
| Drexel Hamilton Centre Global Equity Fund | | Financial Highlights |
| For a share outstanding throughout the periods presented. |
| | | | | | | | |
| | | For the Six Months Ended
March 31, 2013
(Unaudited) | | | For the Period
December 21, 2011
(inception) to
September 30, 2012 | |
| | |
NET ASSET VALUE, BEGINNING OF PERIOD | | $ | 11.43 | | | $ | 10.00 | |
INCOME FROM INVESTMENT OPERATIONS: | | | | | | | | |
Net investment income(a) | | | 0.06 | | | | 0.21 | |
Net realized and unrealized gain on investments and foreign currency transactions | | | 0.69 | | | | 1.22 | |
Total income from investment operations | | | 0.75 | | | | 1.43 | |
| | |
DISTRIBUTIONS: | | | | | | | | |
Net investment income | | | (0.21) | | | | – | |
Net realized gains on investments | | | (0.69) | | | | – | |
Total distributions | | | (0.90) | | | | – | |
NET INCREASE/(DECREASE) IN NET ASSET VALUE | | | (0.15) | | | | 1.43 | |
NET ASSET VALUE, END OF PERIOD | | $ | 11.28 | | | $ | 11.43 | |
| | | | | | | | | |
| | |
Total Return(b) | | | 6.79 | % | | | 14.30 | % |
| | |
RATIOS/SUPPLEMENTAL DATA: | | | | | | | | |
Net assets, end of period (in 000s) | | $ | 13,180 | | | $ | 11,988 | |
| | |
RATIOS TO AVERAGE NET ASSETS: | | | | | | | | |
Net investment income including reimbursement/waiver | | | 1.10 | %(c) | | | 2.06 | %(c) |
Operating expenses excluding reimbursement/waiver | | | 2.66 | %(c) | | | 3.04 | %(c) |
Operating expenses including reimbursement/waiver | | | 1.25 | %(c) | | | 1.25 | %(c) |
PORTFOLIO TURNOVER RATE(d) | | | 82 | % | | | 87 | % |
| (a) | Calculated using the average shares method. |
| (b) | Total returns are for the period indicated and have not been annualized. Total returns would have been lower had certain expenses not been waived during the period. Returns shown do not reflect the deduction of taxes that a shareholder would pay on fund distributions or the redemption of fund shares. |
| (d) | Portfolio turnover rate is not annualized for less than one full year. |
| | |
See Notes to Financial Statements. |
Semi-Annual Report | March 31, 2013 | | 25 |
| | |
| Drexel Hamilton Multi-Asset Real Return Fund | | Financial Highlights |
| | |
Institutional Class | | For a share outstanding throughout the period presented. |
| | | | |
| | | For the Period
October 9, 2012
(inception) to
March 31, 2013 | |
| |
NET ASSET VALUE, BEGINNING OF PERIOD | | $ | 10.00 | |
INCOME/(LOSS) FROM INVESTMENT OPERATIONS: | | | | |
Net investment income(a) | | | 0.56 | |
Net realized and unrealized loss on investments | | | (0.49) | |
Total income from investment operations | | | 0.07 | |
| |
DISTRIBUTIONS: | | | | |
Net investment income | | | (0.57) | |
Net realized gains on investments | | | – | |
Total distributions | | | (0.57) | |
NET DECREASE IN NET ASSET VALUE | | | (0.50) | |
NET ASSET VALUE, END OF PERIOD | | $ | 9.50 | |
| | | | | |
| |
Total Return(b) | | | 0 .80 | % |
| |
RATIOS/SUPPLEMENTAL DATA: | | | | |
Net assets, end of period (in 000s) | | $ | 56,647 | |
| |
RATIOS TO AVERAGE NET ASSETS: | | | | |
Net investment income including reimbursement/waiver | | | 12.16 | %(c) |
Operating expenses excluding reimbursement/waiver(d) | | | 1.39 | %(c) |
Operating expenses including reimbursement/waiver(d) | | | 1.00 | %(c) |
PORTFOLIO TURNOVER RATE(e) | | | 46 | % |
| (a) | Calculated using the average shares method. |
| (b) | Total returns are for the period indicated and have not been annualized. Total returns would have been lower had certain expenses not been waived during the period. Returns shown do not reflect the deduction of taxes that a shareholder would pay on fund distributions or the redemption of fund shares. |
| (d) | Currently excludes expenses of the affiliated funds in which the Fund invests. |
| (e) | Portfolio turnover rate is not annualized for less than one full year. |
| | |
See Notes to Financial Statements. |
26 | | www.dhipfunds.com |
| | |
| Drexel Hamilton Multi-Asset Real Return Fund | | Financial Highlights |
| | |
Investor Class | | For a share outstanding throughout the period presented. |
| | | | |
| | | For the Period
January 22, 2013
(inception) to
March 31, 2013 | |
| |
NET ASSET VALUE, BEGINNING OF PERIOD | | $ | 9.54 | |
INCOME/(LOSS) FROM INVESTMENT OPERATIONS: | | | | |
Net investment loss(a) | | | (0.07) | |
Net realized and unrealized gain on investments | | | 0.03 | |
Total loss from investment operations | | | (0.04) | |
NET DECREASE IN NET ASSET VALUE | | | (0.04) | |
NET ASSET VALUE, END OF PERIOD | | $ | 9.50 | |
| | | | | |
| |
Total Return(b) | | | (0.42) | % |
| |
RATIOS/SUPPLEMENTAL DATA: | | | | |
Net assets, end of period (in 000s) | | $ | 5 | |
| |
RATIOS TO AVERAGE NET ASSETS: | | | | |
Net investment loss including reimbursement/waiver | | | (1.62) | %(c) |
Operating expenses excluding reimbursement/waiver(d) | | | 1.55 | %(c) |
Operating expenses including reimbursement/waiver(d) | | | 1.25 | %(c) |
PORTFOLIO TURNOVER RATE(e) | | | 46 | % |
| (a) | Calculated using the average shares method. |
| (b) | Total returns are for the period indicated and have not been annualized. Total returns would have been lower had certain expenses not been waived during the period. Returns shown do not reflect the deduction of taxes that a shareholder would pay on fund distributions or the redemption of fund shares. |
| (d) | Currently excludes expenses of the affiliated funds in which the Fund invests. |
| (e) | Portfolio turnover rate is not annualized for less than one full year. |
| | |
See Notes to Financial Statements. |
Semi-Annual Report | March 31, 2013 | | 27 |
| | |
| Drexel Hamilton Mutual Funds | | Notes to Financial Statements |
| | March 31, 2013 (Unaudited) |
1. ORGANIZATION
Drexel Hamilton Mutual Funds (the “Trust”) was organized on March 17, 2011 as a Delaware statutory trust and is registered as an open-end management investment company under the Investment Company Act of 1940, as amended (the “1940 Act”). The Trust currently offers shares of beneficial interest (“shares”) of Drexel Hamilton Centre American Equity Fund (“American Equity Fund”), Drexel Hamilton Centre Global Equity Fund (“Global Equity Fund”) and Drexel Hamilton Multi-Asset Real Return Fund (“Real Return Fund”) (the “Funds”). American Equity Fund and Global Equity Fund are diversified portfolios with an investment objective of seeking long-term growth of capital. Real Return Fund seeks real return, which is total return that exceeds U.S. inflation over a full inflation cycle, which is typically 5 years. The affairs of the Trust are managed by a Board of Trustees (the “Board”). The Declaration of Trust permits the Trustees to create additional series of the Trust and share classes. Drexel Hamilton Investment Partners, LLC (the “Adviser”) serves as investment adviser to the Funds. Centre Asset Management, LLC serves as sub-adviser for American Equity Fund and Global Equity Fund.
All classes of shares have identical rights to earnings, assets and voting privileges, except for class-specific expenses and exclusive rights to vote on matters affecting only individual classes.
2. SIGNIFICANT ACCOUNTING POLICIES
The following is a summary of significant accounting policies followed by the Funds in the preparation of the Financial Statements:
| (a) | Portfolio securities traded on a national securities exchange or in the over-the-counter market are valued at last sale price and if, for an OTC, if there is no available price, last bid price on the principal exchange or market as of the close of regular trading hours on the day the securities are being valued. Foreign securities are valued on the basis of quotations from the primary market in which they are traded, and are translated from the local currency into U.S. dollars using exchange rates as of the close of the New York Stock Exchange (“the Exchange”) or using methods determined by the Board. Debt securities having maturities of 60 days or less may be valued at amortized cost, which approximates market value. Securities and other assets for which quotations are not readily available or deemed unreliable are valued at their fair value using methods determined by the Board. Fair valuation of a particular security is an inherently subjective process, with no single standard to utilize when determining a security’s fair value. As such, different mutual funds could reasonably arrive at a different fair value price for the same security. In each case where a security is fair valued, consideration is given to the facts and circumstances relevant to the particular situation. This consideration includes reviewing various factors set forth in the pricing procedures adopted by the Board and other factors as warranted. In making a fair value determination, factors that may be considered, among others, include: the type and structure of the security; unusual events or circumstances relating to the security’s issuer; general market conditions; prior day’s valuation; fundamental analytical data; size of the holding; cost of the security on the date of purchase; nature and duration of any restriction on disposition; trading activities and prices of similar securities or financial instruments. |
| (b) | The per share net asset value (the “NAV”) of each fund is calculated as of the close of trading on the Exchange (normally 4:00 p.m. Eastern time) every day the Exchange is open. The NAV is calculated by taking the total value of each Fund’s assets, subtracting the Fund’s liabilities, and then dividing by the total number of shares outstanding, rounded to the nearest cent. The offering price and redemption price per share is equal to the NAV per share, except that shares of American Equity Fund and Global Equity Fund are subject to a redemption fee of 2% if redeemed within 90 days of purchase. |
| (c) | The Trust treats each Fund as a separate entity for Federal income tax purposes. Each Fund intends to continue to qualify each year as a “regulated investment company” under Subchapter M of the Internal Revenue Code. By so qualifying, each Fund will not be subject to Federal income taxes to the extent that it distributes substantially all of its taxable or tax-exempt income, if any, for its tax year ending December 31. In addition, by distributing in each calendar year substantially all of its net investment income, capital gains and certain other amounts, if any, each Fund will not be subject to a Federal excise tax. Therefore, no provision is made by the Funds for Federal income or excise taxes. Withholding taxes on foreign dividends are paid or provided for in accordance with the applicable country’s tax rules and rates. |
As of and during the six-month period ended March 31, 2013, the Funds did not have a liability for any unrecognized tax benefits in the accompanying financial statements. The Funds recognize the interest and penalties, if any, related to the unrecognized tax benefits as income tax expense in the Statement of Operations. During the period, the Funds did not incur any interest or penalties.
Each of the Fund’s Federal tax returns for the period ended September 30, 2012, remain subject to examination by the Internal Revenue Service.
| (d) | For financial reporting purposes, transactions on the last business day of the reporting period are accounted for on the trade date. Net realized gains and losses on investments are computed on the identified cost basis. The portion of security gains and losses resulting from changes in foreign exchange rates is included with net realized and unrealized gains or losses from investments. Dividend income is recognized on the ex-dividend date or for certain foreign securities, as soon as information is available, and interest income is recognized on an accrual basis. The Funds |
| | |
| Drexel Hamilton Mutual Funds | | Notes to Financial Statements |
| | March 31, 2013 (Unaudited) |
| | amortize premium and accrete discount on investments utilizing the effective interest method. Foreign dividend income may be subject to foreign withholding taxes. |
| (e) | A restricted security is a security that has been purchased through a private offering and cannot be resold to the general public without prior registration under the Securities Act of 1933 (the “Act”) or pursuant to the resale limitations provided by Rule 144 under the Act, or an exemption from the registration requirements of the Act. Whether a restricted security is illiquid is determined pursuant to guidelines established by the Board. Not all restricted securities are considered to be illiquid. As of March 31, 2013, the Funds did not hold any restricted securities. |
| (f) | The preparation of financial statements in conformity with accounting standards generally accepted in the United States of America (“GAAP”) requires management to make estimates and assumptions that affect the amounts reported in financial statements during the reporting period. Management believes the estimates and security valuations are appropriate; however, actual results may differ from those estimates, and the security valuations reflected in the financial statements may differ from the value the Funds ultimately realize upon sale of the securities. The financial statements have been prepared as of the close of the Exchange on March 31, 2013. |
| (g) | The Funds bear expenses incurred specifically on each Fund’s behalf as well as a portion of general Trust expenses, which may be allocated on the basis of relative net assets or the nature of the services performed relative to applicability to each Fund. |
| (h) | The Funds bear expenses incurred specifically on each Fund’s behalf as well as a portion of general Trust expenses, which may be allocated on the basis of relative net assets or the nature of the services performed relative to applicability to each Fund. Expenses that are specific to a Fund or class of shares of a Fund are charged directly to that Fund or share class. For Real Return Fund, which offers multiple share classes, all of the realized and unrealized gains and losses and net investment income of the Fund, other than class-specific expenses, are allocated daily to each class in proportion to its average daily net assets. Fees provided under the distribution (Rule 12b-1) plan for Investor class shares of the Fund are charged with respect to such class. |
| (i) | Dividends from net investment income and distributions of net realized capital gains, if any, will be declared and paid at least annually. Income and capital gains distributions are determined in accordance with income tax regulations, which may differ from GAAP. Distributions to shareholders are recorded on the ex-dividend date. |
| (j) | Each Fund may directly purchase securities of foreign issuers. Investing in securities of foreign issuers involves special risks not typically associated with investing in securities of U.S. issuers. The risks include possible reevaluation of currencies, the inability to repatriate foreign currency, less complete financial information about companies and possible future adverse political and economic developments. Moreover, securities of many foreign issuers and their markets may be less liquid and their prices more volatile than those of securities of comparable U.S. issuers. |
| (k) | The books and records of the Funds are maintained in U.S. dollars. Investment valuations and other assets and liabilities initially expressed in foreign currencies are converted each business day into U.S. dollars based upon current exchange rates. The portion of realized and unrealized gains or losses on investments due to fluctuations in foreign currency exchange rates is not separately disclosed and is included in realized and unrealized gains or losses on investments, when applicable. |
| (l) | Offering costs, including costs of printing initial prospectuses, legal and registration fees, are being amortized over twelve months from the respective inception dates of the Funds. As of March 31, 2013, $51,225 of offering costs remain to be amortized for the Drexel Hamilton Multi-Asset Real Return Fund. |
3. FAIR VALUE MEASUREMENTS
A three-tier hierarchy has been established to classify fair value measurements for disclosure purposes. Inputs refer broadly to the assumptions that market participants would use in pricing the asset or liability, including assumptions about risk. Inputs may be observable or unobservable. Observable inputs are inputs that reflect the assumptions market participants would use in pricing the asset or liability that are developed based on market data obtained from sources independent of the reporting entity. Unobservable inputs are inputs that reflect the reporting entity’s own assumptions about the assumptions market participants would use in pricing the asset or liability that are developed based on the best information available.
| | |
Semi-Annual Report | March 31, 2013 | | 29 |
| | |
Drexel Hamilton Mutual Funds | | Notes to Financial Statements |
| | March 31, 2013 (Unaudited) |
Various inputs are used in determining the value of each Fund’s investments as of the reporting period end. These inputs are categorized in the following hierarchy under applicable financial accounting standards:
| | | | |
| | Level 1 - | | Unadjusted quoted prices in active markets for identical, unrestricted assets or liabilities that a Fund has the ability to access at the measurement date. |
| | Level 2 - | | Quoted prices which are not active, quoted prices for similar assets or liabilities in active markets or input other than quoted prices that are observable (either directly or indirectly) for substantially the full term of the asset or liability. |
| | Level 3 - | | Significant unobservable prices or inputs (including the oversight of the Board of Trustees’ and Adviser’s Pricing Committee’s own assumptions in determining the fair value of investments) where there is little or no market activity for the asset or liability at measurement date. |
The inputs or methodology used for valuing securities are not necessarily an indication of the risk associated with investing in those securities.
The following is a summary of each Fund’s investments in the fair value hierarchy as of March 31, 2013:
Drexel Hamilton Centre American Equity Fund
| | | | | | | | | | | | | | | | |
| Investments in Securities at Value(a) | | Level 1 - Quoted Prices | | | Level 2 -
Other Significant
Observable Inputs | | | Level 3 -
Significant
Unobservable
Inputs | | | Total | |
Common Stocks | | $ | 137,393,920 | | | $ | – | | | $ | – | | | $ | 137,393,920 | |
Purchased Options | | | 252,800 | | | | – | | | | – | | | | 252,800 | |
Short Term Investments | | | 798,939 | | | | – | | | | – | | | | 798,939 | |
Total | | $ | 138,445,659 | | | $ | – | | | $ | – | | | $ | 138,445,659 | |
| | | | | | | | | | | | | | | | | |
|
Drexel Hamilton Centre Global Equity Fund | |
| Investments in Securities at Value(a) | | Level 1 - Quoted Prices | | | Level 2 -
Other Significant
Observable Inputs | | | Level 3 -
Significant
Unobservable
Inputs | | | Total | |
Common Stocks | | $ | 12,407,817 | | | $ | – | | | $ | – | | | $ | 12,407,817 | |
Preferred Stocks | | | 615,069 | | | | – | | | | – | | | | 615,069 | |
Short Term Investments | | | 67,358 | | | | – | | | | – | | | | 67,358 | |
Total | | $ | 13,090,244 | | | $ | – | | | $ | – | | | $ | 13,090,244 | |
| | | | | | | | | | | | | | | | | |
|
Drexel Hamilton Multi-Asset Real Return Fund | |
| Investments in Securities at Value(a) | | Level 1 - Quoted Prices | | | Level 2 -
Other Significant
Observable Inputs | | | Level 3 -
Significant
Unobservable
Inputs | | | Total | |
Exchange Traded Funds | | $ | 2,589,888 | | | $ | – | | | $ | – | | | $ | 2,589,888 | |
Exchange Traded Notes | | | 7,490,589 | | | | – | | | | – | | | | 7,490,589 | |
Open-End Funds | | | 26,513,909 | | | | – | | | | – | | | | 26,513,909 | |
U.S. Government Bonds | | | – | | | | 16,432,480 | | | | – | | | | 16,432,480 | |
Short Term Investments | | | 3,524,887 | | | | – | | | | – | | | | 3,524,887 | |
Total | | $ | 40,119,273 | | | $ | 16,432,480 | | | $ | – | | | $ | 56,551,753 | |
| | | | | | | | | | | | | | | | | |
| (a) | For detailed descriptions of sectors, industries and countries, see the accompanying Schedule of Investments. |
The Funds did not hold any investments at the beginning or end of the period in which significant unobservable inputs were used in determining fair value; therefore, no reconciliation of Level 3 securities is included for this reporting period. The Funds recognize transfers between levels as of the beginning of the fiscal year. There were no transfers between Level 1 and Level 2 as of March 31, 2013.
| | |
| Drexel Hamilton Mutual Funds | | Notes to Financial Statements |
| | March 31, 2013 (Unaudited) |
Derivative Financial Instruments
The following discloses the Funds’ use of derivative instruments.
The Funds’ investment objectives not only permit the Funds to purchase investment securities, they also allow the Funds to enter into various types of derivative contracts such as purchased and written options. In doing so, the Funds will employ strategies in differing combinations to permit them to increase, decrease, or change the level or types of exposure to market factors. Central to those strategies are features inherent to derivatives that make them more attractive for this purpose than equity or debt securities; they require little or no initial cash investment, they can focus exposure on only certain selected risk factors, and they may not require the ultimate receipt or delivery of the underlying security (or securities) to the contract. This may allow the Funds to pursue their objectives more quickly and efficiently than if they were to make direct purchases or sales of securities capable of affecting a similar response to market factors.
Market Risk Factors: In pursuit of their investment objectives, the Funds may seek to use derivatives to increase or decrease their exposure to the following market risk factors:
Equity Risk: Equity risk relates to the change in value of equity securities as they relate to increases or decreases in the general market.
Foreign Exchange Rate Risk: Foreign exchange rate risk relates to the change in the U.S. dollar value of a security held that is denominated in a foreign currency. The value of a foreign currency denominated security will decrease as the dollar appreciates against the currency, while the value of the foreign currency denominated security will increase as the dollar depreciates against the currency.
Risk of Investing in Derivatives
The Funds’ use of derivatives can result in losses due to unanticipated changes in the market risk factors and the overall market.
Derivatives may have little or no initial cash investment relative to their market value exposure and therefore can produce significant gains or losses in excess of their cost. This use of embedded leverage allows the Funds to increase their market value exposure relative to their net assets and can substantially increase the volatility of the Funds’ performance.
Additional associated risks from investing in derivatives also exist and potentially could have significant effects on the valuation of the derivatives and the Funds. Typically, the associated risks are not the risks that the Funds are attempting to increase or decrease exposure to, per their investment objectives, but are the additional risks from investing in derivatives.
One example of these associated risks is liquidity risk, which is the risk that the Funds will not be able to sell the derivative in the open market in a timely manner, and counterparty credit risk, which is the risk that the counterparty will not fulfill its obligation to the Funds.
Option Writing/Purchasing
The Funds may write or purchase option contracts to adjust risk and return of their overall investment positions, subject to any restrictions set forth in each Fund’s prospectus. When a Fund writes or purchases an option, an amount equal to the premium received or paid by the Fund is recorded as a liability or an asset and is subsequently adjusted to the current market value of the option written or purchased. Premiums received or paid from writing or purchasing options that expire unexercised are treated by the Fund on the expiration date as realized gains or losses. The difference between the premium and the amount paid or received on affecting a closing purchase or sale transaction, including brokerage commissions, is also treated as a realized gain or loss. If an option is exercised, the premium paid or received is added to the cost of the purchase or proceeds from the sale in determining whether the Fund has realized a gain or loss on investment transactions. Risks from entering into option transactions arise from, among other things, the potential inability of counterparties to meet the terms.
Statement of Assets and Liabilities - Fair Value of Derivative Instruments as of March 31, 2013:
| | | | | | |
Derivatives Not Accounted For As Hedging Instruments | | Asset Derivatives
Statement of Asset and Liabilities Location | | Fair Value | |
| |
American Equity Fund | | | | | | |
| | |
Equity Contracts (Purchased Option Contracts) | | Investments, at value | | $ | 252,800 | |
| | | | | | |
| | | | $ | 252,800 | |
| | | | | | |
| | |
Semi-Annual Report | March 31, 2013 | | 31 |
| | |
| Drexel Hamilton Mutual Funds | | Notes to Financial Statements |
| | March 31, 2013 (Unaudited) |
The effect of derivative instruments on the Statement of Operations for the six months ended March 31, 2013:
| | | | | | | | | | |
Derivatives Not Accounted For As
Hedging Instruments | | Locations Of Gains/(Loss) On Derivatives Recognized In Income | | Realized Gain/(Loss) On
Derivatives Recognized
In Income | | | Changed On Unrealized Gain/(Loss) On Derivatives Recognized in Income | |
| |
American Equity Fund | |
| | | |
Equity Contracts (Purchased Option Contracts) | | Net realized gain on Investments/Change in unrealized depreciation on Investments | | $ | – | | | $ | (413,323) | |
| | | | | | |
| | | | $ | – | | | $ | (413,323) | |
| | | | | | |
4. BENEFICIAL INTEREST TRANSACTIONS
On March 31, 2013, there was an unlimited number of shares of beneficial interest authorized for each Fund. Transactions in shares of beneficial interest are shown in the Statement of Changes in Net Assets.
Shares of American Equity Fund and Global Equity Fund that are redeemed within 90 days of purchase may incur a 2% redemption fee deducted from the redemption amount. For the six months or period ended March 31, 2013, redemption fees retained by these Funds are disclosed in the Statement of Changes in Net Assets.
Beneficial Ownership: The beneficial ownership, either directly or indirectly, of more than 25% of the voting securities of a Fund creates a presumption of control of the Fund under Section 2(a)(9) of the 1940 Act. As of March 31, 2013, the following entities owned beneficially 25% or greater of each Fund’s outstanding shares. The shares may be held under omnibus accounts (whereby the transactions of two or more shareholders are combined and carried in the name of the originating broker rather than designated separately).
| | | | |
Drexel Hamilton Centre American Equity Fund | | | | |
| Entity | | | | Percentage |
|
Charles Schwab & CO., Inc. | | | | 50.39% |
| | |
Drexel Hamilton Centre Global Equity Fund | | | | |
| Entity | | | | Percentage |
|
SEI Private Trust CO. c/o Drexel Hamilton Multi-Asset Real Return Fund | | | | 99.74% |
| | |
Drexel Hamilton Multi-Asset Real Return Fund | | | | |
| Entity | | Class | | Percentage |
|
Sanlam Drexel Hamilton Multi-Asset Real Return Feeder Fund | | Institutional | | 99.91% |
James A Abate | | Investor | | 100.00% |
5. INVESTMENT ADVISORY AGREEMENTS AND RELATED-PARTY TRANSACTIONS
The Adviser serves as the investment adviser to each Fund pursuant to Investment Advisory Agreements with the Trust. Subject to the general oversight of the Board, the Adviser is responsible for among other things, developing a continuing investment program for each Fund in accordance with their respective investment objectives, reviewing the investment strategies and policies of each Fund and advising the Board on the selection of sub-advisers, if any. In this capacity, the Adviser advises and assists the officers of the Trust in conducting the business of the Funds and is responsible for providing general investment advice and guidance to the Funds. The Adviser has delegated its responsibility for the selection and ongoing monitoring of the securities in the investment portfolios of American Equity Fund and Global Equity Fund to Centre Asset Management, LLC, the sub-adviser for those Funds.
| | |
| Drexel Hamilton Mutual Funds | | Notes to Financial Statements |
| | March 31, 2013 (Unaudited) |
As compensation for the investment advisory services provided to the Funds, the Adviser currently receives monthly compensation based on each Fund’s average daily net assets at the annual rate of:
| | |
| Fund | | Management Fee Rate |
Drexel Hamilton Centre American Equity Fund | | 0.75% |
Drexel Hamilton Centre Global Equity Fund | | 1.00% |
Drexel Hamilton Multi-Asset Real Return Fund | | 0.55% |
Centre Asset Management, LLC serves as sub-adviser to American Equity Fund and Global Equity Fund. The investment sub-adviser makes the day-to-day investment decisions and continuously reviews, supervises and administers each Fund’s investment program. As compensation for the sub-investment advisory services provided to each Fund, the sub-adviser receives a monthly fee from the Adviser based on the Fund’s average daily net assets.
For the Drexel Hamilton Multi-Asset Real Return Fund, the investment adviser to the Fund, Drexel Hamilton Investment Partners, LLC (the “Adviser”), has contractually agreed, pursuant to a written expense limitation agreement (the “Expense Limitation Agreement”), to reduce its advisory fees and/or reimburse other expenses of the Fund until January 31, 2014 to the extent necessary to limit the current operating expenses of each class of shares of the Fund (exclusive of any front-end or contingent deferred sales loads, taxes, leverage interest, brokerage commissions, expenses incurred in connection with any merger or reorganization, extraordinary expenses such as litigation and other expenses not incurred in the ordinary course of the Fund’s business, and acquired fund fees and expenses, except that, if an acquired fund is an underlying fund managed by the Adviser and such acquired fund is not subject to an effective expense limitation or fee waiver agreement at any time during the term of the Expense Limitation Agreement, then, for that time, the operating expenses of each class of shares of the Fund shall not exclude the amount of advisory fees included in such acquired fund’s fees and expenses to which the Fund would otherwise be subject), to 1.25% for Investor Class shares of the Fund and 1.00% for Institutional Class shares of the Fund. The Expense Limitation Agreement may be terminated at any time, and without payment of any penalty, by the Board of Trustees (the “Board” or the “Trustees”) of Drexel Hamilton Mutual Funds (the “Trust”), on behalf of the Fund, upon 60 days’ written notice to the Adviser. The Adviser may receive reimbursement of any amount waived pursuant to the Expense Limitation Agreement, provided that the reimbursement does not cause the Fund to exceed the then-existing expense limitation for that class at the time such reimbursement is to be paid by the Fund.
For the Drexel Hamilton Centre American Equity Fund, the Adviser has entered into a written expense limitation agreement under which it has agreed to limit for a period of two years from January 11, 2013 the total expenses of the existing class of shares of the Fund (including (but not limited to) investment advisory fees of the Adviser and distribution/service (Rule 12b-1) fees, but excluding interest, taxes, litigation, brokerage commissions and extraordinary expenses not incurred in the ordinary course of the Fund’s business) to an annual rate of 1.05% of the average daily net assets of the Fund. This limitation may not be terminated and will remain in place through the end of the two-year period beginning after January 11, 2013. The Adviser may recoup any waived or reimbursed amount pursuant to the agreement in the first, second and third fiscal years following the fiscal year in which any such reimbursement or waiver occurs, if the total annual operating expenses for the applicable following year, after giving effect to the repayment, do not exceed the expense limitation in effect at the time the waiver or reimbursement is made (or any lower expense limitation or limitations to which the parties may otherwise agree).
For the Drexel Hamilton Centre Global Equity Fund, the Adviser has entered into a written expense limitation agreement under which it has agreed to limit through January 31, 2014 the total operating expenses of the Fund (including (but not limited to) investment advisory fees, but excluding interest, taxes, litigation, brokerage, other expenditures which are capitalized in accordance with generally accepted accounting principles and extraordinary expenses) to 1.25% of the average daily net assets of the Fund. The expense limitation agreement may be terminated by the Adviser or the Trust, with respect to the Fund, at any time and without payment of penalty, provided that the terminating party provides 90 days prior written notice of such termination to the other party, and such termination will not be effective before January 31, 2014 (unless otherwise specifically agreed upon). In addition, any termination sought by the Trust must be authorized by resolution of a majority of the Trustees who are not “interested persons” (as defined by the 1940 Act) of the Trust or by vote of a majority of the outstanding shares of the Fund. The Adviser may recoup any waived amount, including organizational fees, from the Fund pursuant to this agreement in the first, second and third fiscal years following the fiscal year in which any such reimbursement or waiver occurs, if the total annual operating expenses for the applicable following year, after giving effect to the repayment, do not exceed the expense limitation in effect at the time the waiver or reimbursement is made (or any lower expense limitation or limitations to which the parties may otherwise agree).
| | |
| | | Fees Waived/Reimbursed by Adviser |
Drexel Hamilton Centre American Equity Fund | | $ 188,827 |
Drexel Hamilton Centre Global Equity Fund | | 81,172 |
Drexel Hamilton Multi-Asset Real Return Fund | | |
Institutional Class | | 95,665 |
Investor Class | | 3 |
| | |
Semi-Annual Report | March 31, 2013 | | 33 |
| | |
| Drexel Hamilton Mutual Funds | | Notes to Financial Statements |
| | March 31, 2013 (Unaudited) |
As of March 31, 2013, the balances of recoupable expenses for each Fund were as follows:
| | | | | | | | | | | | |
| | | Expires 2015 | | | Expires 2016 | | | Total | |
Drexel Hamilton Centre American Equity Fund | | $ | 189,101 | | | $ | 188,827 | | | $ | 377,928 | |
Drexel Hamilton Centre Global Equity Fund | | | 157,721 | | | | 81,172 | | | | 238,893 | |
Drexel Hamilton Multi-Asset Real Return Fund | | | | | | | | | | | | |
Institutional Class | | | N/A | | | | 95,665 | | | | 95,665 | |
Investor Class | | | N/A | | | | 3 | | | | 3 | |
ALPS Fund Services, Inc. (“ALPS” or the “Administrator”) serves as administrator to the Funds. ALPS receives a monthly fee paid by the Funds subject to a minimum monthly fee. Pursuant to an administrative agreement, ALPS provides operational services to the Funds including, but not limited to fund accounting and fund administration and general assistance in each Fund’s operations.
ALPS, pursuant to a Transfer Agency and Services agreement with the Trust, serves as Transfer Agent for the Funds. Under the Transfer Agency and Services Agreement, ALPS receives from the Trust an annual minimum fee per Fund and a fee based upon each shareholder account and its account activity and is reimbursed for out-of-pocket expenses.
ALPS provides Chief Compliance Officer services to the Funds. Additionally, ALPS provides services in monitoring and testing the policies and procedures of the Trust in conjunction with requirements under Rule 38a-1 under the Investment Company Act of 1940. ALPS is compensated under the Chief Compliance Officer Services Agreement.
The Trust has adopted a plan pursuant to Rule 12b-1 under the Investment Company Act of 1940, as amended (the “Plan”). The Plan permits the Trust, on behalf of the applicable Funds, to pay one or more entities, to the Adviser for services rendered and expenses borne in connection with providing shareholder or distribution services with respect to the existing class of shares of American Equity Fund and the Investor class shares of Real Return Fund.
ALPS Distributors, Inc. (the “Distributor”) acts as the sole distributor of the Funds. There were no payments to the Distributor by the Funds during the six-month period ended March 31, 2013.
Officers of the Trust and Trustees who are “interested persons” of the Trust or the Adviser will receive no salary or fees from the Trust. Each Trustee who is not an “interested person” receives an annual retainer of $15,000 paid quarterly. The Trust reimburses each Trustee and Officer for his or her travel and other expenses relating to attendance at such meetings.
One Trustee and one Officer of the Trust are also officers of the Adviser.
6. FEDERAL INCOME TAX AND TAX BASIS INFORMATION
Distributions to Shareholders: Each Fund normally pays dividends and net investment income, if any, on an annual basis. Each Fund normally distributes capital gains, if any, on an annual basis. Income dividend distributions are derived from interest and other income each Fund receives from its investments, including distributions of short term capital gains. Capital gain distributions are derived from gains realized when each Fund sells a security it has owned for more than one year. Each Fund may make additional distributions and dividends at other times if the Adviser believes doing so may be necessary for each Fund to avoid or reduce taxes. Net investment income/(loss) and net realized gain/(loss) may differ for financial statement and tax purposes.
Unrealized Appreciation and Depreciation on Investments: The amount of net unrealized appreciation/(depreciation) and the cost of investment securities for tax purposes, including short-term securities at March 31, 2013, are displayed in the table below. There were no differences between book and tax basis unrealized appreciation/(depreciation) for the Funds. The difference between book and tax basis unrealized appreciation/(depreciation) for the Funds is primarily attributable to wash sales and investments in partnerships.
| | | | | | | | | | | | |
| | | Drexel Hamilton Centre
American Equity Fund | | | Drexel Hamilton Centre
Global Equity Fund | | | Drexel Hamilton Multi-Asset
Real Return Fund | |
Gross unrealized appreciation (excess of value over tax cost) | | $ | 22,097,459 | | | $ | 1,287,172 | | | $ | 388,559 | |
Gross unrealized depreciation (excess of tax cost over value) | | | (1,933,461) | | | | (385,274) | | | | (2,307,318) | |
Net unrealized appreciation/(depreciation) | | $ | 20,163,998 | | | $ | 901,898 | | | $ | (1,918,759) | |
| | | | | | | | | | | | | |
Cost of investments for income tax purposes | | $ | 118,281,661 | | | $ | 12,188,346 | | | $ | 58,470,512 | |
| | | | | | | | | | | | | |
| | |
| Drexel Hamilton Mutual Funds | | Notes to Financial Statements |
| | March 31, 2013 (Unaudited) |
7. AFFILIATED COMPANIES:
Real Return Fund may invest in certain securities that are considered securities issued by affiliated companies. As defined by the Investment Company Act of 1940, an affiliated person, including an affiliated company, is one in which a Fund owns 5% or more of the outstanding voting securities, or a company which is under common ownership or control with the Fund. The purchases, sales, dividend income, capital gains, return of capital distributions received, shares and value of investments in affiliated companies for the period ended March 31, 2013 were as follows:
Drexel Multi-Asset Real Return Fund
| | | | | | | | | | | | | | | | | | | | | | | | | | | | |
| Security Name | | Share Balance
October 9, 2012
(Inception) | | | Purchases | | | Sales | | | Share Balance
March 31, 2013 | | | Dividend
Income | | | Realized Gain/(Loss) | | | Market Value
March 31, 2013 | |
| |
Drexel Hamilton Centre American Equity Fund | | | – | | | | 2,797,074 | | | | (1,432,400 | ) | | | 1,364,674 | | | $ | 2,381,586 | | | $ | (257,924) | | | $ | 13,373,803 | |
Drexel Hamilton Centre Global Equity Fund | | | – | | | | 1,588,413 | | | | (423,510 | ) | | | 1,164,903 | | | | 880,654 | | | | 4,175 | | | | 13,140,106 | |
| |
| | | | | | | | | | | | | | | | | | $ | 3,262,240 | | | $ | (253,749) | | | $ | 26,513,909 | |
| |
| |
8. PURCHASES AND SALES OF INVESTMENT SECURITIES
For the six-month period ended March 31, 2013, the aggregate cost of purchases and proceeds from sales of investment securities (excluding any U.S. Government Obligations short-term securities) were as follows:
| | | | | | | | |
| Fund | | Purchases of Securities | | | Proceeds From Sales
of Securities | |
| |
Drexel Hamilton Centre American Equity Fund | | $ | 99,138,832 | | | $ | 114,478,431 | |
Drexel Hamilton Centre Global Equity Fund | | | 9,642,898 | | | | 9,137,220 | |
Drexel Hamilton Multi-Asset Real Return Fund | | | 60,076,542 | | | | 21,257,642 | |
For the six-month period ended March 31, 2013, the aggregate cost of purchases and proceeds from sales of U.S. Government Obligations investment securities were as follows:
| | | | | | | | |
| Fund | | Purchases of Securities | | | Proceeds from Sales
of Securities | |
| |
Drexel Hamilton Multi-Asset Real Return Fund | | $ | 16,521,542 | | | $ | 0 | |
9. INDEMNIFICATIONS
Under the Trust’s organizational documents, its officers and Trustees are indemnified against certain liabilities of their duties to the Trust. Additionally, in the normal course of business, the Trust enters into contracts with service providers that may contain general indemnification clauses. The Trust’s maximum exposure under these arrangements is unknown, as this would involve future claims that may be made against the Trust that have not yet occurred.
10. FUND REORGANIZATIONS
Reorganization of the Ameristock Mutual Fund, Inc., into Drexel Hamilton Centre American Equity Fund, a series of Drexel Hamilton Mutual Funds
On September 19, 2012, the Board of Directors approved a form of Agreement and Plan of Reorganization (“Reorganization Agreement”) that provided for the reorganization of the Ameristock Mutual Fund, Inc. (the “Acquired Fund”) and Drexel Hamilton Mutual Funds, on behalf of its series, the American Equity Fund (the “Acquiring Fund”). Under the plan, the Acquired Fund would be reorganized in the Acquiring Fund.
As of the close of business on January 11, 2013, the assets of the Acquired Fund were acquired by the Acquiring Fund in exchange for shares of the Acquiring Fund and the assumption by the Acquiring Fund of the liabilities of the Acquired Fund. Upon the closing of the reorganization, the Acquiring Fund issued 13,877,608 shares in exchange for net assets of the Acquired Fund valued at $130,033,182. The investment portfolio of the Acquired Fund, with a fair value of $122,680,756 and identified cost of $95,563,800 at January 11, 2013, was the principal asset acquired by the Fund. On January 14, 2013, the combined value of the Acquired Fund (which included realized losses of $(2,404,260) and unrealized appreciation of $27,116,956) and the Acquiring Fund was $141,597,250. The exchange of shares qualified as a tax-free reorganization for Federal income tax purposes. The unused capital loss carryforward totaled $37,278,632 for potential utilization and are subject to tax limitations.
| | |
Semi-Annual Report | March 31, 2013 | | 35 |
| | |
| Drexel Hamilton Mutual Funds | | Notes to Financial Statements |
| | March 31, 2013 (Unaudited) |
Had the reorganization been completed on October 1, 2012, the beginning of the semi-annual reporting period of the Acquiring Fund, the Acquiring Fund’s pro forma results of operations for the six month ended March 31, 2013, would be as follows:
| | | | |
Net Investment Income | | $ | 991,411 | |
Net Realized and Unrealized Gain on Investments | | | 10,688,329 | |
| | | | |
Net Increase in Net Assets Resulting from Operations | | $ | 11,679,740 | |
| | | | |
11. RECENT ACCOUNTING PRONOUNCEMENTS
In December 2011, the FASB issued ASU No. 2011-11 “Disclosures about Offsetting Assets and Liabilities” to expand current disclosure requirements on the offsetting of certain assets and liabilities. The new disclosures will be required for investments and derivative financial instruments subject to master netting or similar agreements which are eligible for offset in the Statements of Assets and Liabilities and will require an entity to disclose both gross and net information about such investments and transactions in the financial statements. The guidance is effective for financial statements with fiscal years beginning on or after January 1, 2013, and interim periods within those fiscal years. Management is evaluating the impact of this guidance on each Fund’s financial statement disclosures.
| | |
| Drexel Hamilton Mutual Funds | | Additional Information |
| | March 31, 2013 (Unaudited) |
PROXY VOTING GUIDELINES
A description of the policies and procedures that the Funds used to determine how to vote proxies relating to portfolio securities and information regarding how the Funds voted proxies during the most recent 12-month period ended June 30, will be available without charge upon request by (1) calling the Funds at (888) 848-7569 and (2) from Form N-PX filed by the Trust with the Securities and Exchange Commission (“SEC”) on the SEC’s website at www.sec.gov.
PORTFOLIO HOLDINGS DISCLOSURE POLICY
The Trust files, with regard to each Fund, with the SEC a complete schedule of investments for the first and third quarter of each fiscal year on Form N-Q. The Funds’ first and third fiscal quarters end on December 31 and June 30. The Form N-Q filing must be made within 60 days of the end of the quarter, and the Trust’s first Form N-Q was filed with the SEC on February 27, 2012. Forms N-Q are available on the SEC’s website at www.sec.gov, and may be reviewed and copied at the SEC’s Public Reference Room in Washington, DC (call 1-800-732-0330 for information on the operations of the Public Reference Room). You may also obtain copies by calling the Funds at 1-855-298-4236.
APPROVAL OF INVESTMENT ADVISORY AGREEMENT
The Trustees, including the Independent Trustees, reviewed and unanimously approved an Amended and Restated Investment Advisory Agreement (the “Agreement”) for the American Equity Fund and the Global Equity Fund at an in-person meeting held on October 1, 2012. In connection with this review, the Board reviewed statements of, and materials provided by or relating to, the Adviser including, among other things, information about the proposed advisory fees to be charged to the Funds, including information comparing such fees to those of peer groups of funds; the Funds’ respective investment objectives and strategies; the experience and education of the Adviser’s investment staff; and that of the staff of Centre Asset Management, LLC, the Sub-Adviser to the Funds; the Adviser’s capacity for overseeing the Sub-Adviser; and the compliance policies of the Adviser. Throughout the process, the Trustees were provided with the opportunity to ask questions of, and request additional materials about, the Adviser. In considering whether to approve the Agreement, the Board, including the Independent Trustees, did not identify any single factor as determinative.
The Board, including the Independent Trustees reviewed and considered the Adviser’s Form ADV, the advisory services to be provided, the types and size of other accounts managed by the portfolio managers, the allocation of portfolio transactions and brokerage, the Adviser’s compliance policies and procedures, the fees, other benefits and profitability associated with the Agreement, and other information relevant to the Board’s determination. The Board, including the Independent Trustees, reviewed comparative fee and expense information provided by Lipper Analytics (“Lipper”) and the performance of the Funds.
Nature, Extent and Quality of Services
The Trustees reviewed and considered the nature, extent and quality of the investment advisory services provided by the Adviser to each Fund under the Agreement. The Trustees considered information concerning the role of the Adviser in all aspects of each Fund’s investment program, including overseeing the Sub-Adviser and its services to the Funds. The Trustees also reviewed and considered information concerning the qualifications of the portfolio managers of the Funds, their compensation arrangements and services to other clients. The Board reviewed the Adviser’s policies for the selection of brokers and sub-advisers, the Adviser’s methods of allocating investments, and the Adviser’s soft-dollar policy.
The Trustees considered information concerning how the Adviser would monitor compliance by each Fund with its investment policies and restrictions. The Trustees also reviewed and considered information regarding the nature and extent of the non-advisory, administrative services to be provided by the Adviser under the Agreement, including, among other things, providing office facilities, equipment and personnel.
Based their review of the information made available to them and matters discussed at the Meeting, the Trustees concluded that the nature, extent and quality of services provided to each Fund by the Adviser were reasonable.
Comparison of Fees
The Board, including the Independent Trustees, reviewed information concerning each Fund’s investment advisory fee, including a new fee schedule for the American Equity Fund, and the total and net expense ratios of each Fund. The Board also considered information comparing the advisory fees, and the total and net expense ratios, of each Fund to the advisory fees and total and net expense ratios of other funds included in peer groups identified by Lipper and by the Adviser. The Trustees noted that the investment advisory fee for each Fund fell within the range of advisory fees of the peer group funds selected by Lipper and by the Adviser.
The Board, including the Independent Trustees, considered the Adviser’s existing agreements to waive its advisory fee and otherwise limit the operating expenses of the Funds (subject to certain exclusions) to 1.25% of each Fund’s average daily net assets. The Board, including the
| | |
Semi-Annual Report | March 31, 2013 | | 37 |
| | |
| Drexel Hamilton Mutual Funds | | Additional Information |
| | March 31, 2013 (Unaudited) |
Independent Trustees, observed that, taking into account this expense limitation arrangement (which continues through January 31, 2014), the total net expense ratio of each Fund was comparable to the total net expense ratio of each peer group fund selected by the Adviser. Based their review of the information made available to them and matters discussed at the meeting, the Trustees concluded that, with respect to each Fund, the investment advisory fee was reasonable and that total net expense ratio was reasonable and satisfactory in light of the services provided.
The Board considered information discussed at the meeting concerning whether the proposed breakpoint for the American Equity Fund was appropriate as the Fund grows and achieves certain economies of scale and whether a breakpoint would be appropriate for the Global Equity Fund. The Trustees concluded that the proposed breakpoint was appropriate for the American Equity Fund, given its benefit to shareholders and the Adviser’s commitment to include a breakpoint in the fee schedule during its negotiations for the acquisition of Ameristock. The Trustees concluded that a breakpoint was not appropriate at this time for the Global Equity Fund.
Profitability
The Board reviewed information concerning the profitability of the Adviser and other potential benefits of the Agreement to the Adviser. These other benefits included the publicity that each Fund would generate for the Adviser and potential use by the Sub-Adviser of brokerage commissions to acquire research and other services. The Board also noted that the sub-advisory fees paid to the Sub-Adviser would be paid from the advisory fees received by the Adviser from each Fund and not directly from any Fund. The Board concluded that the profitability of each Fund to the Adviser and the other benefits to the Adviser of providing services to the Funds were reasonable.
Other
The Board also considered the extent of the amendments to the current investment advisory agreement and the reasons for the amendments. The Board, including the Independent Trustees, determined that these amendments were reasonable and appropriate in the context of the amendment and restatement of the Agreement.
Based on their consideration of the foregoing and any other information the Board determined was reasonably necessary to evaluate the Agreement, the Board, including the Independent Trustees, concluded that the Agreement would be in the best interest of each Fund and its shareholders and determined to approve the Agreement. In reaching this conclusion, the Board, including the Independent Trustees, did not identify any single factor as determinative.
Page Intentionally Left Blank.

Not applicable to semi-annual report.
| Item 3. | Audit Committee Financial Expert. |
Not applicable to semi-annual report.
| Item 4. | Principal Accountant Fees and Services. |
Not applicable to semi-annual report.
| Item 5. | Audit Committee of Listed Registrants. |
Not applicable.
| Item 6. | Schedule of Investments. |
Not applicable.
| Item 7. | Disclosure of Proxy Voting Policies and Procedures for Closed-End Management Investment Companies. |
Not applicable
| Item 8. | Portfolio Managers of Closed-End Management Investment Companies. |
Not applicable.
| Item 9. | Purchases of Equity Securities by Closed-End Management Investment Company and Affiliated Purchasers. |
Not applicable.
| Item 10. | Submission of Matters to Vote of Security Holders. |
None.
| Item 11. | Controls and Procedures. |
| | (a) | The registrant’s principal executive officer and principal financial officer have evaluated the registrant’s disclosure controls and procedures (as defined in Rule 30a-3(c) under the Investment Company Act of 1940, as amended) within 90 days of this filing and have concluded that the registrant’s disclosure controls and procedures were effective, as of that date. |
| | (b) | There was no change in the registrant’s internal control over financial reporting (as defined in Rule 30a-3(d) under the Investment Company Act of 1940, as amended) during the second fiscal quarter of the period covered by this report that has materially affected, or is reasonably likely to materially affect, the registrant’s internal control over financial reporting. |
| | (a)(1) | Not applicable to semi-annual report. |
| | (a)(2) | A separate certification for the principal executive officer and the principal financial officer of the registrant as required by Rule 30a-2(a) under the Investment Company Act of 1940, as amended (17 CFR 270.30a-2(a)), are filed herewith. |
| | (b) | The certifications by the registrant’s Principal Executive Officer and Principal Financial Officer, as required by Rule 30a-2(b) of the Investment Company Act of 1940, as amended, and Section 906 of the Sarbanes-Oxley Act of 2002 are attached hereto as Ex99.906Cert. |
SIGNATURES
Pursuant to the requirements of the Securities Exchange Act of 1934 and the Investment Company Act of 1940, the registrant has duly caused this report to be signed on its behalf by the undersigned, thereunto duly authorized.
DREXEL HAMILTON MUTUAL FUNDS
| | |
| By: | | /s/ Andrew Bang |
| | Andrew Bang |
| | President (Principal Executive Officer) |
| |
| Date: | | June 7, 2013 |
Pursuant to the requirements of the Securities Exchange Act of 1934 and the Investment Company Act of 1940, this report has been signed below by the following persons on behalf of the registrant and in the capacities and on the dates indicated.
| | |
| By: | | /s/ Andrew Bang |
| | Andrew Bang |
| | President (Principal Executive Officer) |
| |
| Date: | | June 7, 2013 |
| |
| By: | | /s/ Andrew Bang |
| | Andrew Bang |
| | Treasurer (Principal Financial Officer) |
| |
| Date: | | June 7, 2013 |